CONSOLIDATING - AnnualReports.com
224
DR REDDY’S LABORATORIES LIMITED ANNUAL REPORT 2007–08 CONSOLIDATING FOR THE FUTURE
-
Upload
khangminh22 -
Category
Documents
-
view
0 -
download
0
Transcript of CONSOLIDATING - AnnualReports.com
DR REDDY’S LABORATORIES LIMITED | 7-1-27 AMEERPET HYDERABAD | 500 016 INDIA
DR REDDY’S LABORATORIES L IMITED
ANNUAL REPORT 2007–08
DR
RE
DD
Y’S
LA
BO
RA
TO
RIE
S L
IMIT
ED
| AN
NU
AL
RE
PO
RT
20
07
–0
8
DE
SIG
N I
CD
IND
IA.C
OM
| P
RIN
TE
D A
T P
RA
GA
TI
CONSOLIDATINGF O R T H E F U T U R E
DRL_AR2008_CV_PAP.indd 1 6/20/08 6:08:30 PM

After a year of exceptional performance
on the back of strong launches, this year
has been one of consolidation. We have
focussed on strengthening our assets –
intellectual property assets, technology,
people and infrastructure – to prepare
ourselves for the future. These will add
substantially to our competitive muscle and
make us a globally sustainable organization.
This year we have commissioned an
integrated R&D facility, the “Innovation
Plaza” and scaled up our generics
infrastructure to become one of the largest
such manufacturing facilities in Asia. We
have also enhanced our manufacturing
capabilities for cytotoxic formulations
and dedicated blocks for our custom
pharmaceutical business.
We have built various new partnerships,
alliances and collaborations to add teeth
to our own internal R&D capabilities. We
have acquired new facilities and businesses
to gain strategic strengths, the value of
which will reveal itself in time. We have
continued to work at institutionalizing the
principles of Lean management to drive
Execution excellence, thus, improving the
effectiveness of the company. We have also
executed further on our plans to become a
talent factory, where we build and develop
human capability across businesses and
functions.
As we emerge into a strong vertically
integrated global pharmaceutical company,
we shall recall this year as one of focussed
consolidation for the leap forward.
DRL_AR2008_CV_PAP.indd 2 6/20/08 6:08:30 PM

C O N T E N T S b O a r d O f
d i r E C T O r S
d i r E C T O r S ’
r E p O r T
C h a i r m a N ’ S
l E T T E r
m a N a g E m E N T
C O u N C i l
i g a a p S T a N d a l O N E
f i N a N C i a l S
k E y
h i g h l i g h T S
C O r p O r a T E
g O v E r N a N C E
i g a a p C O N S O l i d a T E d
f i N a N C i a l S
h u m a N
r E S O u r C E S
a d d i T i O N a l
S h a r E h O l d E r S ‘
i N f O r m a T i O N
u . S . g a a p C O N S O l i d a T E d
f i N a N C i a l S
S a f E T y , h E a l T h a N d
E N v i r O N m E N T
f i v E y E a r S
a T a g l a N C E
i N f O r m a T i O N O N
T h E f i N a N C i a l S O f
S u b S i d i a r y C O m p a N i E S
C O r p O r a T E S O C i a l
r E S p O N S i b i l T y
r a T i O
a N a l y S i S
S T a T E m E N T p u r S u a N T
T O S E C T i O N 2 1 2
m a N a g E m E N T
d i S C u S S i O N a N d
a N a l y S i S
i N T a N g i b l E
a C C O u N T i N g
N O T i C E O f a N N u a l
g E N E r a l m E E T i N g
2136216
2126112
2116010
165506
121384
77362
6432
DRL_AR2008_CorpPgs_PAP.indd 1 6/18/08 10:50:18 PM

C H A I R M A N ‘ S L E T T E R
2 | A N N U A L R E P O R T 2 0 0 7 – 0 8 C O N S O l i d aT i N g f O r T h E f u T u r E
> as you know, 2006–07 was a phenomenal year for your Company. Thanks to the
uS launch of Simvastatin and finasteride as authorized generics of merck’s Zocor® and proscar®, the 180-days exclusivity launch of Ondansetron, the generic version of Zofran®, and fexofenadine, the generic version of allegra®, we became the largest pharmaceutical player in india. in 2006–07 our consolidated revenue was rs. 65,095 million (u.S.$. 1.51 billion) and profit after tax was rs. 9,327 million (u.S.$. 216 million).
it is not typical for pharmaceutical companies to have four successful uS generic launches in a single year. in that respect, 2006–07 was exceptional. So, too, has been 2007–08, but in the other direction. during the current year, we had no authorized generics or 180-days exclusivity para iv launches in the uS market. Not surprisingly, therefore, your Company’s
consolidated revenue for 2007–08 has reduced to rs. 50,006 million
(u.S.$. 1.25 billion) and profit after tax to rs. 4,678 million (u.S.$. 117 million).
yes, 2007–08 has been a worse year financially compared to
2006–07, and as your Chairman i would be the first to state it. Equally, i would ask you to consider three facts.
first, despite no upsides whatsoever from uS generics, your Company has achieved a consolidated revenue (net of excise duties and sales returns) of over u.S.$. 1.2 billion. in other words, we have become a u.S.$. 1 billion plus entity only on account of our base businesses: active pharmaceutical ingredients (apis), branded formulations(bfroW), Custom pharmaceutical Services (CpS) and the existing uS and European generics play. in fact, even these businesses would have done better had the Company not faced temporary problems with third-party suppliers to both its german subsidiary, betapharm and its CpS operations in mexico — problems that are now things of the past.
Second, between 1999–2000 and 2007–08, your Company has increased its revenues at an exponential trend rate of growth (i.e. trend Cagr) of 27 per cent per year, measured in uS dollars. i submit to you that such a robust trend rate reflects the inherent business strengths and growth potential of your Company.
In 2008–09, we will complete 25 years of being in business. It is a significant milestone. I ask my fellow employees to continue delivering affordable and superior medicines to cure various diseases — and in doing so, provide consistently high growth and excellent long-term shareholder value
DRL_AR2008_CorpPgs_PAP.indd 2 6/18/08 10:50:19 PM

3 | D R . R E D D Y ’ S L A B O R AT O R I E S LT D C h a i r m a N ‘ S l E T T E r
Third, we expect some significant upsides in
2008–09. Let me share with you about one such. In the
third quarter of 2008–09, your Company will exclusively
distribute in US 25 mg, 50 mg and 100 mg strengths
of Sumatriptan succinate, an authorized generic of
GlaxoSmithKline’s Imitrex® tablets. Sumatriptan is
used for the treatment of acute migraine, and enjoys
widespread market acceptability.
I see other upsides as well. My belief is that the worst
in Germany is probably over in terms of further margin
pressures. By migrating production of an increasing
number of formulations to facility in India, we should
generate higher profits from betapharm in 2008–09.
Similarly, the problems of securing raw material from
other suppliers for the CPS facility in Mexico has been
addressed with the Company setting up its dedicated
raw material plant at Miryalaguda, near Hyderabad, at a
cost of U.S.$. 16 million.
In what was a difficult year, 2007–08 saw
outstanding performance of the Branded Formulations
business, with revenues increasing by 16 per cent to
Rs. 15,241 million in 2007–08. Incidentally, this 16
per cent growth was achieved both in India as well as
international markets. I am also delighted that your
Company’s Branded Formulations business in Russia has
now comfortably crossed the U.S.$. 100 million mark.
Modern norms of corporate governance require
listed companies to desist from making ‘forward-
looking’ statements, especially in their Management
Discussion and Analysis. While conscious of such
rectitude, I must share with you what my expectations
are for your Company in 2008–09. In rupee terms,
I expect your Company as a whole to increase its topline
by at least 25 per cent.
This is a do-able target, and I expect it to be achieved
because of changes that have been brought about
across your Company over the last few years — changes
that are now primed to deliver superior financial
results. I shared these with you last year. But they bear
repetition.
Over the past few years, your Company has been
developing the different building blocks of future
growth. Some of these have been: creating a lean
manufacturing organization; strengthening Dr. Reddy’s
position in existing markets and developing new
geographies; building more infrastructure to drive
higher levels of output; creating a faster and more
focused product development process; building wider
technical capabilities; leveraging the new acquisitions;
optimizing efforts across the Company through best-
in-class IT and ERP systems; and, most importantly,
bringing all these together by creating a commonly
aligned organization.
Let me give you a few examples of how these
initiatives are coming into play. During 2007–08, your
Company successfully launched RedituxTM in India, a
monoclonal antibody used in the treatment of cancer,
and thus demonstrated its technological prowess in
manufacturing a product in the biologics space. As
of 31 March 2008, Dr. Reddy’s has filed a total of 122
Abbreviated New Drug Applications (ANDAs); and 281
Drug Master Files (DMFs). In Discovery Research, it has
one significant molecule, DRF 2593 for the treatment of
Type II diabetes, in Phase III clinical trials in association
with Rheoscience.
Your Company has also completed three acquisitions
in April 2008. These are:
A part of the DowPharma’s small molecules business }}
located in Mirfield and Cambridge, in the UK, with
customer contracts, associated products, process
technologies, intellectual property rights and trademarks
Jet Generici Srl in Italy, which gives access to an }}
essential product portfolio, a pipeline of registration
applications and a sales and marketing organization
BASF’s pharmaceutical manufacturing business }}
and facility in Shreveport, Louisiana, USA, which does
contract manufacturing of solid, semi-solid and liquid
dosage forms of generic prescription and OTC products
for companies in the US.
During 2007–08, your Company invested
Rs. 6,293 million on manufacturing, R&D facilities and
other capital expenditure. This is the highest level of
investment in a single financial year up to date. They
will create the capacity to support Dr. Reddy’s strategic
growth agenda.
I am, therefore, confident of your Company’s growth
prospects in 2008–09 and thereafter.
In February 2009, Dr. Reddy’s will have completed
25 years of its life. It will be a significant milestone and
deserves celebrations, which undoubtedly shall happen
at the time. To me, however, milestones are not about
the journey completed, but guideposts to the voyage
ahead. Therefore, I ask my fellow employees to re-
dedicate themselves to develop and deliver affordable
and superior medicines to cure various diseases
for patients worldwide — and in doing so, provide
consistently high growth and excellent long-term
shareholder value.
As always, thank you for your support to Dr. Reddy’s
Laboratories. Many of you have stayed with us for almost
25 years and gained in the process. I say to you, “Stay with
us for the next 25, and gain a great deal more.”
25 years of existence. And 25 per cent growth. That is
not a bad way to be!
Thank you
Yours sincerely
dr. k anji reddyChairman
duriNg 2007–08, yOur COmpaNy successfully launched redituxTm in india, a monoclonal antibody used in the treatment of cancer and thus demonstrated
its technological prowess in manufacturing a product in the biologics space.
>
DRL_AR2008_CorpPgs_PAP.indd 3 6/18/08 10:50:19 PM

K E Y H I G H L I G H T Sbased on u.s. gaap financials
4 | A N N U A L R E P O R T 2 0 0 7 – 0 8 C O N S O l i d aT i N g f O r T h E f u T u r E
financial highlights
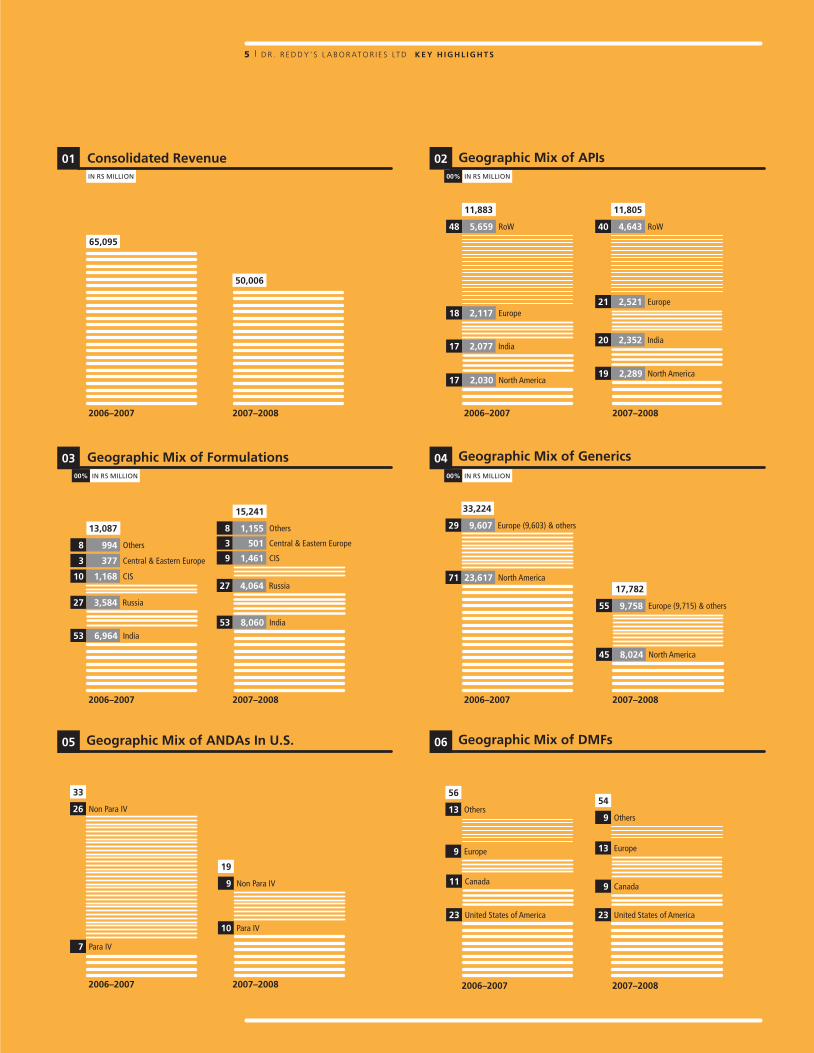
Consolidated revenuesConsolidated revenues
decreased by 23% to
Rs. 50,006 million, or
U.S.$. 1.25 billion in 2007–
08 from Rs. 65,095 million in
2006–07.
Operating incomeOperating Income decreased
by 70% to Rs. 3,358 million
in 2007–08 from Rs. 11,331
million in 2006–07.
profit before Tax and minority interestProfit before tax and minority
interest decreased by 67% to
Rs. 3,438 million in 2007–08
from Rs. 10,500 million in
2006–07.
profit after TaxProfit after tax decreased by
50% to Rs. 4,678 million
in 2007–08 from Rs. 9,327
million in 2006–07.
fully diluted Earnings per ShareFully diluted earnings per
share decreased to Rs. 27.73
in 2007–08 from Rs. 58.56 in
2006–07.
>
>
>
>
aNdas in u.S. In 2007–08, Company filed
19 ANDAs in US including
10 Para IV filings. These
ANDAs address innovator
revenues of about U.S.$. 7.9
billion (IMS MAT, December
2007). Dr. Reddy‘s has filed
122 cumulative ANDAs as of
31March 2008.
highest number of approvals for aNda filings 2007–08 also saw the
highest number of approvals
for the Company’s ANDA
filings: 13 final approvals
from the US and 4 from
Canada, in addition to 7
tentative approvals from the
US. As of 31 March 2008,
the Company’s US Generic
pipeline comprises 70 ANDAs
pending with the USFDA,
including 10 tentative
approvals.
dmfs Regarding APIs, the Company
filed 54 DMFs in 2007–08. Of
these, 23 were filed in US, 9
in Canada, 13 in Europe and
9 in other countries. As on 31
March 2008, the Company
has made cumulative filings
of 281 DMFs, with 127 in
the US.
formulations In Branded Formulations,
a total of 307 dossiers
have been filed for product
registrations in various
countries.
New Chemical Entities (NCEs) As on 31 March 2008,
Dr. Reddy’s had three
molecules or New Chemical
Entities (NCEs), of which two
are in clinical development
and one is in the pre-clinical
stage.
revenue from api Revenues slightly decreased
by 1% to Rs. 11,805 million
in 2007–08 from
Rs. 11,883 million in
2006–07. International
revenues accounted for 80%
of API revenues. Revenues in
2006–07 included the benefit
of upsides in sertraline &
rabeprazole.
formulations revenues Revenues at Rs. 15,241
million in 2007–08 an
increase of 16% over
2006–07. This growth was
primarily driven by the
performance of India, Russia,
Romania, Venezuela & Other
CIS markets.
Revenues in India grew by }
16% to Rs. 8,060 million in
2007–08.
Revenue from International }
markets grew by 17% to
Rs. 7,181 million in 2007–08.
revenues from genericsRevenues decreased by
46% to Rs. 17,782 million
in 2007–08 from Rs. 33,224
million in 2006–07.
North American revenues
at Rs. 8,024 million in 2007–
08 as against Rs. 23,617
million in 2006–07.
Revenues grew by 14% }
to Rs. 5,581 million in
2007–08 from Rs. 4,914
million in 2006–07 excluding
the benefit of upsides from
Authorized Generics &
ondansetron exclusivity.
Commencement of own }
OTC business with the launch
of ranitidine and cetirizine,
revenues for 2007–08 at
Rs. 263 million.
Europe Generics revenues }
grew by 1.2% to Rs. 9,715
million in 2007–08 from
Rs. 9,603 million in 2006–07.
Revenues from }
betapharm grew by 2%
to Rs. 8,189 million in
2007–08 from Rs. 8,004
million in 2006–07.
CpS revenue Revenues decreased by
27% to Rs. 4,818 million
in 2007–08 from Rs. 6,600
million in 2006–07.
Won 4 awards and accolades for its hr initiatives
Ranked 10th in ‘The Best }
Companies to work for in
India’ survey conducted
by Business Today, Mercer
Human Resource Consulting
and TNS India.
Won the Amity Leadership }
Award for best HR practices
in the Pharmaceutical Sector
at the 4th HR Summit.
Received the Recruitment }
and Staffing Best in Class
(RASBIC) award for the third
time in a row in the Asia-
Pacific HRM Congress.
Adjudged by the ISTD for }
the Certificate of Merit for
Innovative Training Practices
among Indian organizations.
aNdas, dmf, product registration and NCEs
revenues from different businesses
hr awards
DRL_AR2008_CorpPgs_PAP.indd 4 6/18/08 10:50:19 PM
geographic mix of apis
5 | D R . R E D D Y ’ S L A B O R AT O R I E S LT D k E y h i g h l i g h T S
IN RS MILLIoN
17 2,030 North America
17 2,077 India
18 2,117 Europe
48 5,659 RoW
2006–2007
11,883
2006–2007
65,095
50,006
2007–2008
Consolidated revenue
geographic mix of formulations
geographic mix of aNdas in u.S.
geographic mix of generics
geographic mix of dmfs
01
05
00% IN RS MILLIoN
02
0300% IN RS MILLIoN 00% IN RS MILLIoN
04
06
2006–2007
7 Para IV
26 Non Para IV
33
2007–2008
10 Para IV
9 Non Para IV
19
2006–2007
23 United States of America
11 Canada
9 Europe
13 Others
56
2007–2008
23 United States of America
9 Canada
13 Europe
9 Others
54
71 23,617 North America
29 9,607 Europe (9,603) & others
2006–2007
33,224
45 8,024 North America
55 9,758 Europe (9,715) & others
2007–2008
17,782
11,805
2007–2008
19 2,289 North America
20 2,352 India
21 2,521 Europe
40 4,643 RoW
53 6,964 India
27 3,584 Russia
10 1,168 CIS
3 377 Central & Eastern Europe
8 994 Others
2006–2007
13,087
15,241
2007–2008
53 8,060 India
27 4,064 Russia
9 1,461 CIS
3 501 Central & Eastern Europe
8 1,155 Others
DRL_AR2008_CorpPgs_PAP.indd 5 6/18/08 10:50:20 PM

H U M A N R E S o U R C E S
6 | A N N U A L R E P O R T 2 0 0 7 – 0 8 C O N S O l i d aT i N g f O r T h E f u T u r E
> POISED FOR FUTURE GROWTH
dr. reddy’s has come a long way over the years and we intend to go a lot further in the next five. Our high aspirations demand that we accelerate our growth and ready our organization for the future. We want to achieve sustainable future growth and that means we must focus on
refreshing our talent pipeline and creating the organizational bench strength that will
propel us forward. We are moving steadily in this
direction, ensuring that the right people are in the right places. Our
global presence has continued to grow, spurred on by significant
new acquisitions in North america and Europe which will not only impact our
core businesses, but have the added advantage of bringing fresh talent on board. Today, our employee strength globally has crossed 9,500 and comprises over 40 nationalities. more than 2,000 employees are at international locations.
One of our top priorities has been to add key talent at the leadership level across several businesses as well as in corporate functions. We have also injected talent in areas such as peptides, polymers, bio-catalysis, material sciences, purification and fermentation, with a number of new employees bringing critical skills from overseas. more than 70 phd candidates were hired during the year, significantly ramping up our r&d capabilities. This is in addition to various specific project hiring across such areas as biologics, pharmaceutical Services & active ingredients (pSai) and generics.
If we think of our company as a living organism, then people are the heart that keeps Dr. Reddy’s ticking and growing. Our people are our pride and our greatest asset. We are proud of the talent we have been able to attract and of the important and innovative ways in which we have nurtured, motivated and engaged them
DRL_AR2008_CorpPgs_PAP.indd 6 6/18/08 10:50:21 PM

>
We are justly proud of our revised maternity benefit policy—which now includes 4 month maternity leave, two hour flexibility for the first year and a flexible work schedule
Our COmmiTmENT TO Our pEOplE has won us the notice and respect of institutions worldwide. We were ranked among the 10 best Companies to Work
for in india as per the business Today – mercer study for 2007 and among the 25 best Employers in india in the hewitt associates – Economic Times survey for 2007.
>
7 | D R . R E D D Y ’ S L A B O R AT O R I E S LT D h u m a N r E S O u r C E S
We also built a support organization around our Global
Oncology business, which is fast growing across various
businesses and geographies. This core team will provide
high quality and high impact support in line with our
strategic aspirations.
EmbRacInG DIvERSITy
As a people-centric organization, we believe in fair
employment opportunities for all. We participated in
job fairs for differently abled candidates, including
career fairs by the Ability Foundation, strengthening our
Diversity Program. Our efforts to build a truly inclusive
organization are also visible in new women-friendly
policies and initiatives in the workplace.
We are justly proud of our revised maternity
benefit policy which has a number of additional
benefits, including 4-month maternity leave, two-
hour flexibility for the first year from the date of the
child’s birth and a flexible work schedule. We also
instituted a comprehensive sexual harassment policy
which includes a process for filing a complaint and
launching an investigation. One of our big initiatives
was the establishment of day care centers at three
locations which are supervised by trained caregivers
and Montessori school teachers and serve a significant
number of our women employees with young children.
We are also supporting the career development of
women associates by providing mentors in every
business unit. Our quarterly women’s meets draw large
crowds and serve as a forum for discussion and self-
expression. At the latest meeting held on Women’s Day,
a number of eminent speakers from the business and
wellness fields spoke on the subject of work-life balance.
Our initiatives have borne fruit, with a significant
increase in hiring from campuses, where almost a third
of all hires were women.
TalEnT manaGEmEnT
We continue to tap into the campus talent pool,
attracting the best and brightest from the country’s top
universities. This year we recruited 13 management
trainees and laterals from prestigious B-Schools
including IIMs, XLRI, ISB & NMIMS as well about 200
Technical Trainees, including a number of IIT graduates.
This year, we also launched a Technical Internship
Program as part of our Global Internship Program.
In line with our thinking on lean processes and
simplification, we have leveraged technology to
optimize the recruitment process. We have developed
an e-recruitment module which is hosted on our
internal portal that serves as a platform for applicant
tracking starting from application creation to on-
boarding. Going a step further, we also developed an
interactive e-joining module, called Connexion, which
has considerably reduced the time spent on the on-
boarding process, while giving prospective employees
wide access to information about the organization and
to transition-related subjects. Many of our policies and
processes have been revisited and redone to unleash
greater empowerment, faster turnaround and more
accountability in our various HR transactions.
SImPlIFyInG PROcESSES
Lean thinking was also implemented successfully in
our HR organization as part of our ongoing efforts
to simplify our processes while adopting global best
practices. We have fully automated our HR and
employee processes, thereby improving productivity
and reducing turnaround time. In line with this, we
also benchmarked HR processes and policies across the
DRL_AR2008_CorpPgs_PAP.indd 7 6/18/08 10:50:21 PM

8 | A N N U A L R E P O R T 2 0 0 7 – 0 8 C O N S O l i d aT i N g f O r T h E f u T u r E
industry and simplified our own in order to eliminate
redundancy and waste. In the course of one of these
exercises, we saw the need to revise our Code of
Business Conduct and Ethics (COBE). The new, reader-
friendly COBE simplifies our Ombudsman procedure,
provides clear and specific guidelines with respect to our
behavior and strongly reinforces our commitment to all
of our stakeholders.
REcOGnITIOnS In HR
We have continued to be recognized by numerous
external agencies for our people practices. We won the
Recruiting and Staffing Best in Class Award (RASBIC)
2007–08 in the ‘Best Use of Technology for Recruiting’
category. This is the third year in a row we have won
this accolade. We also took home the Amity Leadership
Award for best HR practices in the Pharmaceutical
Sector at the 4th HR Summit. Our commitment to our
people has won us the notice and respect of institutions
worldwide. We were ranked among the 10 Best
Companies to Work for in India as per the Business
Today – Mercer study for 2007 and among the 25 Best
Employers in India in the Hewitt Associates – Economic
Times survey for 2007.
However, external recognition is not enough. We
check our internal barometer every alternate year
through the Organizational Climate Survey (OCS), a
diagnostic survey which gauges employee motivation,
satisfaction and commitment and helps us identify areas
for improvement. In the OCS 2007, we received an
Employee Satisfaction Score that put Dr. Reddy’s in the
Top 10-33 % in India.
lEaDERSHIP DEvElOPmEnT
Leadership development has gained a new urgency
within our organization. Knowing we will need high
potential leaders to achieve the aggressive growth
trajectory we have charted out, we have launched a
Leadership Development initiative with the twin agenda
of enhancing our leadership bandwidth and bench and
building a distinctive culture of leadership.
We are also focusing our energies on building
leadership skills and giving potential leaders the tools
and challenges to perform at their optimal levels.
Executive Coaching Services were provided to many
of our senior managers, where intensive one-on-one
interactions with an outside ‘coach’ sought to improve
performance at work and in life.
We held our fifth Technical Conclave on the theme
of Unit Processes – Lab Scale to Commercialization,
where about 400 people across Business Units benefited
from interactions with experts from India and abroad.
We also continue to strengthen our long-term education
efforts with Birla Institute of Technology & Science
(BITS), giving our employees the opportunity to learn
while they earn. This year, we focused on building
organizational technical capability by starting two new
batches in MSc (Pharmaceutical Chemistry) and MS
(Pharmaceutics), which together have more than 70
takers.
We developed customized training programs to meet
business needs throughout the organization. A major
undertaking this year was to facilitate understanding of
the 5S and Lean thinking concepts that were introduced
across the organization through targeted workshops
and training sessions in different business units.
>
Today, our employee strength globally has crossed 9,500 and comprises over 40 nationalities. More than 2,000 employees are at international locations
EffECTivE COmmuNiCaTiON ThrOugh a variety of high-impact channels ensures that all our employees worldwide are kept abreast of the ups and downs,
strategies, plans and performance of our organization. We have a communication cascade procedure which ensures information reaches every single employee in the organization within the shortest time possible.
>
DRL_AR2008_CorpPgs_PAP.indd 8 6/18/08 10:50:22 PM

9 | D R . R E D D Y ’ S L A B O R AT O R I E S LT D h u m a N r E S O u r C E S
vIbRanT & EFFEcTIvE cOmmUnIcaTIOn
Effective communication through a variety of high-
impact channels ensures that all our employees
worldwide are kept abreast of the ups and downs,
strategies, plans and performance of our organization.
We have a communication cascade procedure which
ensures information reaches every single employee
in the organization within the shortest time possible.
The Quarterly Communication Meets remain a major
top down communication tool where members of our
Management Council discuss our business performance
with senior managers who, in turn, trigger the flow
of this information through the organization. The
CEO’s internal website, Perspectives, and his quarterly
Communique, are also valuable platforms for interaction
and exchange within the organization. In addition to
these, we link our workforce across geographies and
business units through such publications as our house
magazine ‘Elixir’, our monthly newsletter ‘Around
Dr Reddy’s’, newsletters of the different business units,
and electronic news posts on our Intranet portal. Our
annual Celebrations in Hyderabad is the mega event
that cements our global integration initiatives and in
recent years we have webcast this event worldwide
in real time to reinforce our commitment to our
international workforce.
We also reached out to former employees of our
company this year by launching a dedicated Alumni
website called ‘Friends Forever’, which has attracted
many alumni to renew their connect with the Company.
cOmmITTED TO a HEalTHy FUTURE
We are deeply committed to the people who make
Dr. Reddy’s the successful, respected organization
that it is. As we look ahead to a future brimming with
opportunities and possibilities, we intend to strengthen
our focus on the people who will take our organization
to the next level of growth. Innovative programs,
best-in-class practices and technology-driven initiatives
will bring out the best in our people and drive them to
higher levels of performance than ever before. Inspired
by our mission and empowered with the tools to
succeed, there is no goal we cannot achieve, no dream
we cannot realize.
>
We were ranked among the 10 Best Companies to Work for in India as per the Business Today – Mercer study for 2007
aS WE lOOk ahEad TO a fuTurE brimming with opportunities and possibilities, we intend to strengthen our focus on the people who will take our
organization to the next level of growth. innovative programs, best-in-class practices and technology-driven initiatives will bring out the best in our people and drive them to higher levels of performance than ever before.
>
DRL_AR2008_CorpPgs_PAP.indd 9 6/18/08 10:50:23 PM

S A F E T Y, H E A L T HA N D E N V I R o N M E N T
10 | A N N U A L R E P O R T 2 0 0 7 – 0 8 C O N S O l i d aT i N g f O r T h E f u T u r E
> Sustainability thinking has been built into our values and touches almost all aspects
of our company, from our purpose and values, marketplace and innovation, workplace safety, people practices, environment management,
human rights to community contribution. We publish our Corporate Sustainability report annually giving a detailed account of our economic,
environmental and social performance.
We have a well-documented safety, health and environment (Sh&E) policy stating our
commitment to the principles of sustainability and Sh&E. programs are in place to implement various elements of this policy.
We view the environmental management from the point of resource conservation. Continuous efforts are being made to reduce the residual environmental impact of our processes. Well-designed effluent treatment facilities based on the state of the art membrane technology coupled with multiple effect evaporators and spray dryers help CTO units to recycle the entire industrial effluent to be reused after treatment in the plant.
At Dr. Reddy’s, we believe that a truly sustainable organization must perform well across all three dimensions of economic, social and environmental performance. As a Company, we are fully committed to the principles of sustainability
DRL_AR2008_CorpPgs_PAP.indd 10 6/18/08 10:50:24 PM
11 | D R . R E D D Y ’ S L A B O R AT O R I E S LT D S a f E T y, h E a lT h a N d E N v i r O N m E N T
Stated below are major highlights seen in the area of
Safety, Health & Environment during the year.
Environmental Clearance obtained for the }}
expansion projects of CTO – V, Miryalaguda & CTO – VI,
Pydibhimavaram.
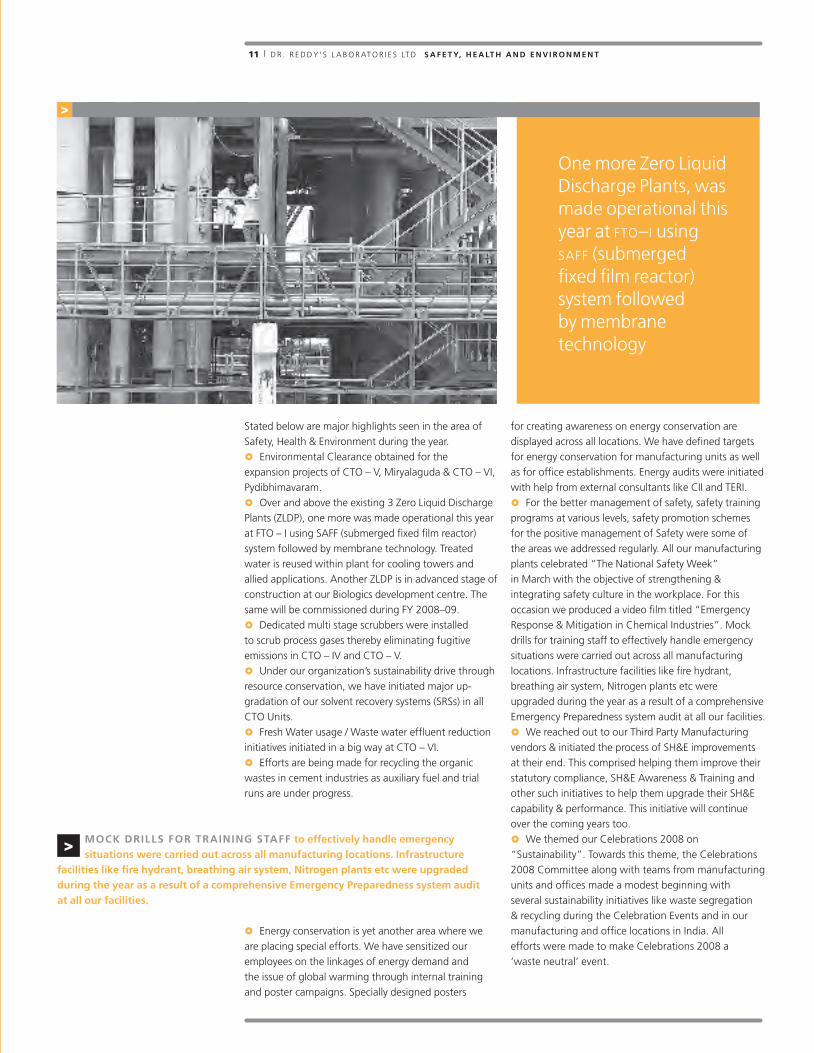
Over and above the existing 3 Zero Liquid Discharge }}
Plants (ZLDP), one more was made operational this year
at FTO – I using SAFF (submerged fixed film reactor)
system followed by membrane technology. Treated
water is reused within plant for cooling towers and
allied applications. Another ZLDP is in advanced stage of
construction at our Biologics development centre. The
same will be commissioned during FY 2008–09.
Dedicated multi stage scrubbers were installed }}
to scrub process gases thereby eliminating fugitive
emissions in CTO – IV and CTO – V.
Under our organization’s sustainability drive through }}
resource conservation, we have initiated major up-
gradation of our solvent recovery systems (SRSs) in all
CTO Units.
Fresh Water usage / Waste water effluent reduction }}
initiatives initiated in a big way at CTO – VI.
Efforts are being made for recycling the organic }}
wastes in cement industries as auxiliary fuel and trial
runs are under progress.
Energy conservation is yet another area where we }}
are placing special efforts. We have sensitized our
employees on the linkages of energy demand and
the issue of global warming through internal training
and poster campaigns. Specially designed posters
for creating awareness on energy conservation are
displayed across all locations. We have defined targets
for energy conservation for manufacturing units as well
as for office establishments. Energy audits were initiated
with help from external consultants like CII and TERI.
For the better management of safety, safety training }}
programs at various levels, safety promotion schemes
for the positive management of Safety were some of
the areas we addressed regularly. All our manufacturing
plants celebrated “The National Safety Week”
in March with the objective of strengthening &
integrating safety culture in the workplace. For this
occasion we produced a video film titled “Emergency
Response & Mitigation in Chemical Industries”. Mock
drills for training staff to effectively handle emergency
situations were carried out across all manufacturing
locations. Infrastructure facilities like fire hydrant,
breathing air system, Nitrogen plants etc were
upgraded during the year as a result of a comprehensive
Emergency Preparedness system audit at all our facilities.
We reached out to our Third Party Manufacturing }}
vendors & initiated the process of SH&E improvements
at their end. This comprised helping them improve their
statutory compliance, SH&E Awareness & Training and
other such initiatives to help them upgrade their SH&E
capability & performance. This initiative will continue
over the coming years too.
We themed our Celebrations 2008 on }}
“Sustainability”. Towards this theme, the Celebrations
2008 Committee along with teams from manufacturing
units and offices made a modest beginning with
several sustainability initiatives like waste segregation
& recycling during the Celebration Events and in our
manufacturing and office locations in India. All
efforts were made to make Celebrations 2008 a
‘waste neutral’ event.
>
One more Zero Liquid Discharge Plants, was made operational this year at fto–i using saff (submerged fixed film reactor) system followed by membrane technology
mOCk drillS fOr TraiNiNg STaff to effectively handle emergency situations were carried out across all manufacturing locations. infrastructure
facilities like fire hydrant, breathing air system, Nitrogen plants etc were upgraded during the year as a result of a comprehensive Emergency preparedness system audit at all our facilities.
>
DRL_AR2008_CorpPgs_PAP.indd 11 6/18/08 10:50:25 PM
C o R P o R A T E S o C I A LR E S P o N S I B I L I T Y
12 | A N N U A L R E P O R T 2 0 0 7 – 0 8 C O N S O l i d aT i N g f O r T h E f u T u r E
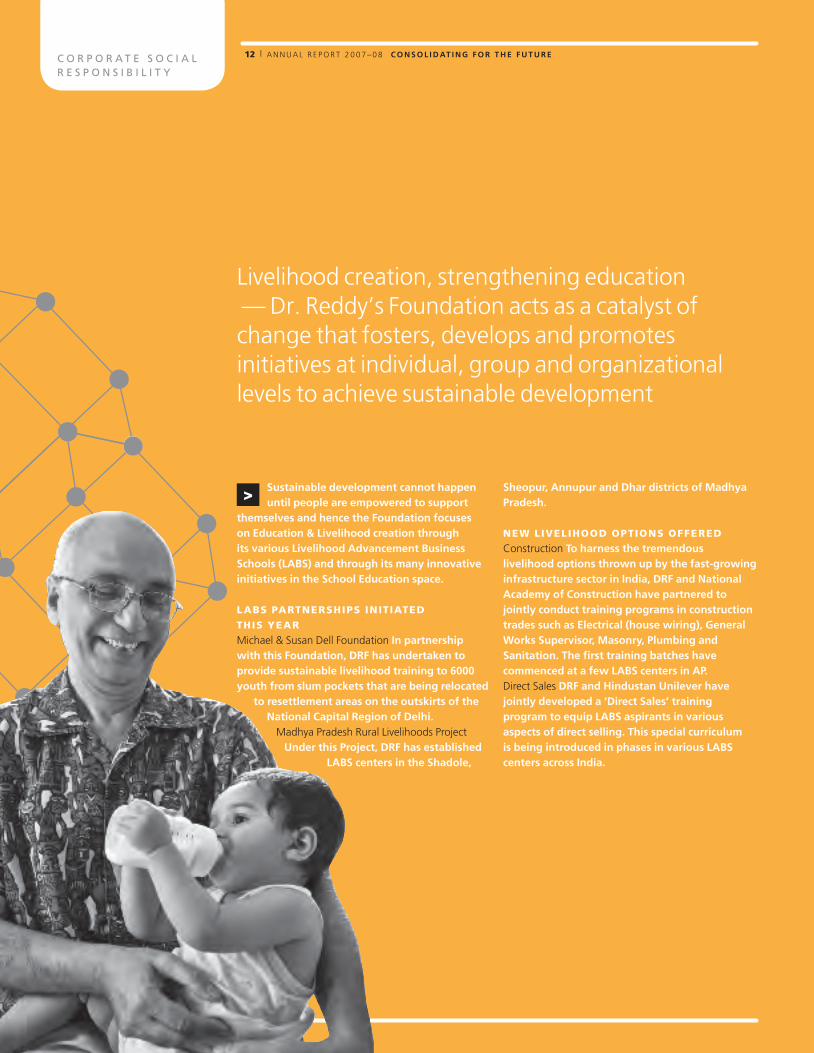
> Sustainable development cannot happen until people are empowered to support
themselves and hence the foundation focuses on Education & livelihood creation through its various livelihood advancement business Schools (labS) and through its many innovative initiatives in the School Education space.
labS PaRTnERSHIPS InITIaTED
THIS yEaR
Michael & Susan Dell Foundation in partnership with this foundation, drf has undertaken to provide sustainable livelihood training to 6000 youth from slum pockets that are being relocated
to resettlement areas on the outskirts of the National Capital region of delhi.
Madhya Pradesh Rural Livelihoods Project under this project, drf has established
labS centers in the Shadole,
Sheopur, annupur and dhar districts of madhya pradesh.
nEW lIvElIHOOD OPTIOnS OFFERED
Construction To harness the tremendous livelihood options thrown up by the fast-growing infrastructure sector in india, drf and National academy of Construction have partnered to jointly conduct training programs in construction trades such as Electrical (house wiring), general Works Supervisor, masonry, plumbing and Sanitation. The first training batches have commenced at a few labS centers in ap. Direct Sales drf and hindustan unilever have jointly developed a ‘direct Sales’ training program to equip labS aspirants in various aspects of direct selling. This special curriculum is being introduced in phases in various labS centers across india.
Livelihood creation, strengthening education — Dr. Reddy’s Foundation acts as a catalyst of change that fosters, develops and promotes initiatives at individual, group and organizational levels to achieve sustainable development
DRL_AR2008_CorpPgs_PAP.indd 12 6/18/08 10:50:26 PM

13 | D R . R E D D Y ’ S L A B O R AT O R I E S LT D C O r p O r aT E S O C i a l r E S p O N S i b i l i T y
PROmOTInG mIcRO-EnTREPREnEURS
Through our LABS program we have developed
innovative models for self-employment through micro-
entrepreneurship programs, which nurture youth for
entrepreneurship through skills development, business
plan development and market linkages.
Under the ‘Aarogya’ program, over 75 mobile }}
food vendors in Karimnagar (AP) have been assisted in
developing their businesses. The program is being scaled
up to include 200 beneficiaries in a few municipalities of
Hyderabad.
Under the ‘Sayodya’ program, 25 partially disabled }}
youth in RR District (AP) have been assisted in earning
their livelihoods through corn vending in specially
designed kiosks. The initiative is being extended to
include 1000 beneficiaries, in association with DRDA,
AP. In August 2007, 50 youth were trained under Phase
II of the program. Five of them have formed an SHG and
set up a canteen in an office complex in Hyderabad.
RASHTRA CHENETHA JANA SAMAKHYADRF signed an MoU with Rashtra Chenetha Jana
Samakhya, a handloom weavers’ union based at Chirala
(AP), under which DRF will provide funding for the
development of a loom that will reduce the strain on
a weaver. The International Institute of Information
Technology, Hyderabad, has been co-opted as the
technological partner in the project.
SPREaDInG SmIlES
THROUGH EDUcaTIOn
Using schools as community learning resource
centres, DRF strives to reduce school drop-out rates
by developing local knowledge, skills and leadership.
Adopting 72 government schools in Balanagar Mandal
(RR District) and Hyderabad-Secunderabad, DRF has
launched several innovative initiatives in curriculum
development, teacher training and community
involvement.
YUVA YoUTH LEARNING CENTERS DRF has set up eight Yuva Youth Learning Centers
in Hyderabad and RR Districts, which run two bridge
programs for disadvantaged youth, to enable them
to obtain lateral entry into the mainstream education
system.
Adolescent Bridge Courses (ABCs) coach 250-500 }}
school dropouts every year to appear for the Class X
Board examinations of the Government of AP. 287
students appeared for the Class X exams that were held
in March-April 2008.
Under the Integrated Learning Program (ILP), never-}}
been-to-school adolescents, child labour and adolescent
girls working as domestic help are put through a
Foundation Course in basic Math, English, Telugu,
environmental sciences and health education. They
are also prepared for Classes VII-IX under the AP Open
School Society. This year, 213 students are appearing for
the Open School examinations.
The Centers offer soft skills, career guidance,
computer education and spoken English, thereby
enabling the youth to make informed choices about
their future. This also minimizes chances of the girls
being compelled into early marriage. Over 250 such
girls have been withdrawn from domestic labour and
admitted to these Centers.
RESIDENTIAL BRIDGE CoURSESUnder the government-supported Sarva Siksha Abhiyan,
DRF also conducted a Residential Bridge Course for out-
of-school children and those engaged in child labour.
101 boys and 67 girls have been mainstreamed into
formal education and housed in government welfare
hostels. To ensure their continued education, DRF has
launched a ‘hostel support program’, which includes a
dedicated hostel volunteer and tutors to coach them to
enhance their educational standards.
> L I V E L I H o o D S C R E AT E D I N T H E C o U N T R Y D U R I N G T H E Y E A R
ANDHRA PRADESH 27636
with AP Urban Services for the Poor, Commissioner & Director Municipal Administration, Department of Youth Services. Employment Generation & Marketing Mission, Greater Visakhapatnam Municipal Corporation, Society for Elimination of Rural Poverty and Union Ministry of Rural Development
WEST BENGAL 141with Union Ministry of Rural Development
RAJASTHAN 2285
with Ministry of Rural Development
UTTAR PRADESH 1279with Union Ministry of Rural Development
MADHYA PRADESH 652with Union Ministry of Rural Development
BIHAR 4073with Bihar Rural Livelihood Promotion Society and Union Ministry of Rural Development
ORISSA 620with Union Ministry of Rural Development
HIMACHAL PRADESH 617with Union Ministry of Rural Development
TAMIL NADU 3163with Aide et Action, Corporation of Chennai, Accenture, Firstsource Solutions, Directorate of Town Panchayats and Union Ministry of Rural Development
KARNATAKA 208with Firstsource Solutions
KERELA 654with Union Ministry of Rural Development
MAHARASHTRA 585with CII-Yi, Kotak Education Foundation and Tata Communications
GUJURAT 1045with Ministry of Rural Development
GOA 108with Mineral Foundation of Goa
IN PARTNERSHIP WITH THE CENTRAL GOVERNMENT, VARIOUS STATE GOVERNMENTS, OTHER NGOS AND THE PRIVATE SECTOR, DRF HAS SET UP LABS ACROSS INDIA. A TOTAL OF 42064 LIVELIHOODS WERE GENERATED IN 2007-08 IN THE FOLLOWING STATES
drf haS SET up eight yuva youth learning Centers in hyderabad and rr districts, which run two bridge programs for disadvantaged youth, to enable
them to obtain lateral entry into the mainstream education system.
>
DRL_AR2008_CorpPgs_PAP.indd 13 6/18/08 10:50:27 PM

14 | A N N U A L R E P O R T 2 0 0 7 – 0 8 C O N S O l i d aT i N g f O r T h E f u T u r E
TRIBAL SCHooL PRoGRAM In VR Puram Mandal (Khammam District, AP), DRF is
working with 33 government schools in areas inhabited
by Koya and Konda tribes. After holding several
workshops and discussions with youth, elders and
teachers in the Mandal, DRF has published several books
(including primers, stories, poems and riddles) in their
dialects, using the Telugu script.
KALLAM ANJI REDDY VIDYALAYA The Kallam Anji Reddy Vidyalaya at Hyderabad has
over 1500 students from KG to Class X. The
co-educational school offers instruction in both English
and Telugu media. Students who successfully clear the
Class X Board exam are assisted in getting admission
in government / private junior colleges, including
vocational junior colleges. Those who have failed in the
Board exam are given intensive coaching to enable them
to pass in subsequent attempts.
For students who have cleared the Class X Board
Examination, the Kallam Anji Reddy Vocational
Junior College offers two-year vocational courses
in ‘Automobile Engineering Technician’, ‘Computer
Graphics & Animation’, ‘Computer Science &
Engineering’, ‘Hotel Operations’, ‘Marketing &
Salesmanship’ and ‘Multi-Purpose Health Worker’. The
students are encouraged to take up higher education
after completing the course. Those interested in
earning vocation-based livelihoods are given placement
assistance.
EDUCATIoN RESoURCE CENTREDRF’s Education Resource Centre (ERC) looks after
the academic and pedagogical requirements of
neighbourhood schools. It also undertakes research
on various aspects of education and schooling. In
partnership with government, civil society agencies and
individuals working in the field of education and child
rights, the ERC generates and shares resources among
partners.
PUDAMI PRIMARY SCHooLSOn 8 June 2007, DRF launched 14 Pudami English
Primaries in Hyderabad. Set up in neighbourhoods
containing large populations of urban poor, these
English-medium Primaries teach Math, English and
Environmental Science. The teachers are assisted by the
ERC in curriculum design and training. These Primaries
will act as feeders for ‘Pudami Neighbourhood Schools’
that will commence in 2008–09.
SPREADING THE NEIGHBoURHooD SCHooL IDEAOn 7 December 2007, DRF organized a ‘National
Conference on Neighbourhood Schools’ at Hyderabad.
Attended by representatives from academia,
bureaucracy, NGOs and the private sector, the
Conference discussed the concept of neighbourhood
schools that would assure access to quality education
for children from all sections of society. It sought to
promote the idea of setting up neighbourhood schools
on private-public partnership.
ALTIUS, THE ADVANCEMENT SCHooLDRF has introduced ALTIUS, an advancement school
that serves as a platform for graduates, post-graduates
and diploma holders to access various career
advancement opportunities by providing them with
requisite employability skills. It offers training in Medical
Transcription, Call Center operations and Accountancy
packages, in addition to Communicative English, soft
skills and computer basics.
>
Under the government-supported Sarva Siksha Abhiyan, dRf also conducted a Residential Bridge Course for out-of-school children and those engaged in child labour
fOr STudENTS WhO havE ClEarEd the Class X board Examination, the kallam anji reddy vocational Junior College offers two-year vocational courses.
The students are encouraged to take up higher education after completing the course.
>
DRL_AR2008_CorpPgs_PAP.indd 14 6/18/08 10:50:27 PM

DR. REDDy’S FOUnDaTIOn
FOR HEalTH EDUcaTIOn, DRFHE
If health is Dr. Reddy’s core purpose, and inclusive
education is its means of connecting with society, DRFHE
is a perfect fusion of the two, providing health care
education to professionals who can assist the medical
fraternity to create a more integrative healthcare service.
It also addresses the gap in patient education, enabling
them with self-care capability and improving the cost-
effectiveness of disease management.
Since 2003, DRFHE’s one year post-graduate
course in health care management has placed 212
students in hospitals, clinics and pharma companies.
Nutrition, pharmacy, dentistry, physiotherapy, hospital
administration and biosciences are some of the subjects.
The graduates work as physician’s assistants, counselors,
educators and associates.
ASSISTING ASSISTANTSDRFHE’s Abhilasha (hope) is a skill-sharpening program
for nurses in cancer, diabetes and cardiology care.
Sarathi (“charioteer”or guide) aims to improve skills and
attitudes of doctor’s assistants. Doctors acknowledge
the course as providing professionals who can
substantialy contribute to patient communication and
care, and who are charged as individuals.
HELPING DoCToRSAt the level of Doctors, the Inner Circle program, assists
young doctors to develop extra-medical soft skills and
business competencies to be more effective in their
professional careers.
ENABLING PATIENTSlife at your DoorstepDr. Reddy’s Foundation for Health Education introduced
two patient education initiatives in the past year. Life
at Your Doorstep, a palliative care program, is focused
on providing relief to chronically and terminally ill
patients through pain and symptom management and
by counseling the family. A team consisting of a doctor,
nurse and patient counselor visits the patient at home.
Since the program’s launch in January 2008, Life at your
Doorstep has reached out to 56 patients.
DRFHE and art of living FoundationDRFHE, in conjunction with Art of Living Foundation
(AOL), launched a pilot lifestyle management program.
This program encourages and helps patients suffering
from chronic illnesses to adopt lifestyle changes to
reduce risk factors and to self-manage their conditions.
Ten metabolic disorder patients benefited from the first
seven-day program.
SparshSparsh, Dr. Reddy’s Patient Assistance Program,
continues to improve the accessibility of Oncology
drugs to patients in need. Over the past year, Sparsh
has provided quality and affordable anti-cancer drugs
to over 500 patients, through their doctors. Of this
number, 200 patients suffering from Non-Hodgkin’s
Lymphoma benefited from our new drug RedituxTM,
which was launched in April 2007.
15 | D R . R E D D Y ’ S L A B O R AT O R I E S LT D C O r p O r aT E S O C i a l r E S p O N S i b i l i T y
>
dRfhe’s one year post-graduate course in health care management has placed 212 students in hospitals, clinics and pharma companies
OvEr ThE paST yEar, SparSh has provided quality and affordable anti-cancer drugs to over 500 patients, through their doctors. Of this number, 200
patients suffering from Non-hodgkin’s lymphoma benefited from our new drug redituxTm, which was launched last year.
>
DRL_AR2008_CorpPgs_PAP.indd 15 6/18/08 10:50:28 PM

M A N A G E M E N T D I S C U S S I o N & A N A L Y S I S
16 | A N N U A L R E P O R T 2 0 0 7 – 0 8 C O N S O l i d aT i N g f O r T h E f u T u r E
>
In the previous year’s Annual Report, we had discussed how Dr. Reddy’s Laboratories (‘Dr. Reddy’s’, ‘DRL’ or ‘the Company’) has been working at putting in place the different building blocks of future growth
These were: creating a lean manufacturing organization across all the businesses;
strengthening dr. reddy’s position in existing markets and in developing new geographies, building infrastructure to drive greater production, creating a faster and more focused product development process, building wider technical capabilities, leveraging the new acquisitions and optimizing efforts across
the entire Company through best-in-class information technology networks.
These are not one-off processes and, therefore, have continued throughout
2007–08 — as they will over the next several years. The Company believes
that in the fast changing
and increasingly competitive world of global pharmaceuticals, these processes will eventually differentiate dr. reddy’s from many other players in the business.
Notwithstanding the organizational and operational gains achieved by the Company through these processes and building blocks for growth, it is a fact that 2007–08 saw a fall in dr. reddy’s consolidated revenues and profits vis-à-vis the previous year. There were four reasons for this.
first, the lack of any major uS generics launch in 2007–08, either as authorized generics or under the 180-day exclusivity provisions of the hatch Waxman act.
DRL_AR2008_CorpPgs_PAP.indd 16 6/18/08 10:50:29 PM
17 | D R . R E D D Y ’ S L A B O R AT O R I E S LT D m a N a g E m E N T d i S C u S S i O N & a N a ly S i S
This was very different from the year earlier, when the
Company launched simvastatin and finasteride, the
generic versions of Zocor® and Proscar® respectively, of
Merck as authorized generic products and ondansetron,
the generic version of Zofran®, under 180-days
exclusivity. In addition, the Company had also launched
Fexofenadine, the generic version of Allegra®. During
2006–07, Simvastatin and Finasteride had contributed
to Rs. 15,813 million or 24 percent of Dr. Reddy’s
total revenues and the Company’s market share for
Fexofenadine was 11 percent as on 31 March 2007. The
current year, 2007–08, saw no such launch — which led
to a fall in revenues compared to 2006–07.
Second, there were issues regarding betapharm, the
Company’s generics acquisition in Germany. For one,
the German generics market remained very challenging.
During the year, the government introduced further
amendments in its health care law, which now require
patients to use medicines endorsed by their sick funds.
This increased the bargaining power of these funds
and resulted in lower prices. For another, in the first
half of the year there were supply chain problems with
betapharm’s contract manufacturer, Salutas, which led
to reductions in the quantity of formulations for the
market. The supply chain problem was a blessing in
disguise. It helped accelerate the process of migrating
the production of a large number of betapharm’s
products to Dr. Reddy’s operating facilities in India
— and the supply pipeline has been restored. This is
discussed in detail later in chapter. Nevertheless, the
combination of lower realizations and supply chain
constraints led to the revenues from betapharm
remaining at same level; Rs. 8,189 million in 2007–08
versus Rs. 8,004 million a year earlier. We believe that
the worst in Germany is probably over and that, thanks
to migrating production to more efficient and lower cost
facilities in India, Dr. Reddy’s is well poised to profitably
leverage demand growth in 2008–09.
Third, the Company’s Custom Pharmaceutical
Services (CPS) business out of Mexico was also
hindered by supply chain constraints in the beginning
of 2007–08. These were linked to the supply of a
key material for naproxen, the largest manufactured
product in the Mexico facility. This, too, has had a
positive outcome. The Company has now set up its own
plant near Hyderabad at a cost of U.S.$. 14 million for
manufacturing the necessary raw material to ensure
uninterrupted supply.
Fourth, 2007–08 saw exceptional fluctuations in the
Indian rupee-US dollar exchange rate. The average daily
US dollar value for 2007–08 was Rs. 40.28 compared to
Rs. 45.24 during the previous year. While the Company
took adequate foreign exchange cover against its
exports, depreciation of the US dollar adversely affected
realizations.
Dr. Reddy’s key financial highlights for 2007–08 are
given below.
Despite the fall in revenue and profits, the Company’s
underlying business drivers have actually strengthened
over the year. Here are some facts:
The Branded Formulations business grew by 16 }}
percent to generate revenue of Rs. 15,241 million
in 2007–08, was driven by growth in both India
as well as international markets. Revenues in India
grew by 16 percent to Rs. 8,060 million, while
revenue from international markets increased by
17 percent to Rs. 7,181 million. In the international
market, growth was primarily in Russia, the other CIS
countries, Romania, Vietnam and Venezuela. Today,
the Company sells over U.S.$. 100 million worth of
branded formulations in Russia alone.
In India, 2007–08 saw Dr. Reddy’s launching }}
RedituxTM, a monoclonal antibody. The product
contributed to a revenue of Rs. 154 million, and
demonstrated the Company’s technological prowess
in manufacturing a product in the biologics space.
We launched 10 new products in the US generics }}
market in 2007–08, including two over-the-counter
(OTC) products. We have filed 122 cumulative
Abbreviated New Drug Applications (ANDAs) up to
date. As on 31 March 2008, there were 70 ANDAs
pending for approval at the US Food and Drug
Authority (USFDA), including 10 tentative approvals.
Regarding Active Pharmaceutical Ingredients (APIs), }}
the Company filed 23 Drug Master Files (DMFs) in
the US during the year, taking the total filings to 127.
It also filed 9 DMFs in Canada, 13 in Europe and 9 in
the rest of the world.
The Company has also completed three acquisitions }}
after 31 March 2008. These are:
A part of the Dow Pharma small molecules a.
business in the UK. We have acquired relevant
customer contracts, associated products, process
technologies, intellectual property rights,
trademarks and the Dow Pharma small molecules
facilities at Mirfield and Cambridge. The two
sites and the business employ approximately 80
people. We have also acquired a non-exclusive
license to Dow’s Pf nex ExpressionTechnology™
for bio-catalysis development.
Jet Generici Srl in Italy, which provides us with b.
access to an essential product portfolio, a pipeline
of registration applications, and a sales and
marketing organization.
BASF’s pharmaceutical contract manufacturing c.
business and manufacturing facility at Shreveport,
Louisiana, USA. The business involves contract
Note Unless otherwise stated, financial data given in
this Management Discussion and Analysis is based on
consolidated US GAAP financials
key financial highlights for 2007–08( U S G A A P, C o N S o L I D AT E D )
Revenues (net of excise }}
duties and sales returns)
was at Rs. 50,006 million,
versus Rs. 65,095 million
in 2006–07. In US dollars,
2007–08 revenue was
U.S.$. 1.25 billion in
2007–08 compared to
U.S.$. 1.51 billion in the
previous year
Profit after tax (net of }}
minority interests) was at
Rs. 4,678 million as against
Rs. 9,327 million in 2006–
07 — or U.S.$. 117 million
in 2007–08 versus U.S.$.
216 million in 2006–07
Earnings per share on a fully }}
diluted basis were at
Rs. 27.73 in 2007–08
as against Rs. 58.56 in
2006–07, or U.S.$. 0.69 on
2007–08 versus U.S.$. 1.36
in the previous year
WE lauNChEd 10 NEW prOduCTS in the uS generics market in 2007–08, including two over-the-counter (OTC) products. We have filed 122 cumulative
abbreviated New drug applications (aNdas) up to date.
>
DRL_AR2008_CorpPgs_PAP.indd 17 6/18/08 10:50:29 PM

18 | A N N U A L R E P O R T 2 0 0 7 – 0 8 C O N S O l i d aT i N g f O r T h E f u T u r E
manufacturing of generic prescription and OTC
products for branded and generic companies
in the US. It also includes customer contracts,
related ANDAs, NDAs and trademarks as well as
the Shreveport facility — which is designed to
manufacture solid, semi-solid and liquid dosage
forms, and employs about 150 people.
During the year, the Company invested Rs. 6,293 }}
million on manufacturing, R&D facilities and other
capital expenditure — the highest level of investment
in a single financial year up to date. These
investments will create the capacity to support
Dr. Reddy’s strategic growth agenda.
TREnDS In GlObal maRkETS
Note Global market share numbers referred to in this
and subsequent sections are based on latest available
reports from IMS Health Inc.
According to IMS Health Inc., the global pharmaceutical
market is forecast to grow to U.S.$. 897 billion by
2011, at a compounded annual growth rate (CAGR) of
6.9 percent over the next five years. The forecast also
predicts global pharmaceutical sales to expand to
U.S.$. 735 billion to U.S.$. 745 billion in 2008,
compared to U.S.$. 665 to U.S.$. 685 billion in 2007.
GLoBAL REGIoNAL PERFoRMANCEIn the US, market growth slowed down to 4-5 percent
in 2007 compared with the 6-7 percent in 2006. The
Medicare Part D prescription drug benefit expanded
the overall US market by nearly 1 percent in 2006, with
a further expansion of 1-2 percent in 2007. However,
the loss of patent protection for several key brands
valued at U.S.$. 10 billion will significantly impact the
market. Growth from new products will not be sufficient
to offset the volume of branded drugs that shift to
generics.
In Europe, the top five markets (France, Germany,
the UK, Italy and Spain) combined grew at 3-4 percent
in 2007 — down from the 4-5 percent growth
witnessed in 2006. While these countries are seeing
increased demand from an ageing population, growth
is being affected by cost-containment measures,
incentives for using generics and increased scrutiny of
the cost / benefit of drugs. The Japanese market grew at
5-6 percent in 2007.
Emerging markets, including China and India, grew
by more than 10 percent in 2006 and 2007, largely due
to their expanding economies, increased affordability
and broader access to healthcare. Growth in China was
15-16 percent, and the market size was around
U.S.$. 15 – U.S.$. 16 billion. Generally, locally
manufactured generics dominate these markets.
Globally, an ageing population and improved
diagnostics have increased demand for oncology
treatment — a challenge that has been met with
a strong innovation pipeline. Products used in the
treatment of oncology reached a global value of
U.S.$. 40 – U.S.$. 45 billion in 2007, and contributed
to nearly a fifth of total market growth. Among other
major therapy classes, lipid-lowering medicines have
grown to U.S.$. 30 – U.S.$. 33 billion in 2007.
KEY MARKET TRENDSEmerging markets are growing fast, while }}
mature markets are slowing down In the US,
Canada and the five largest European markets (France,
Germany Italy, Spain and the UK) sales growth in 2008
is expected to range from 4 percent to 5 percent. The
seven emerging markets of China, Brazil, Mexico, South
Korea, India, Turkey and Russia are expected to grow at
12-13 percent in 2008, to U.S.$. 85 billion – U.S.$. 90
billion. This is due to increased availability of health care,
and the growing need for treatments associated with
chronic diseases.
The wave of genericization will continue}} Drugs
with approximately U.S.$. 20 billion in annual sales will
face patent expiry in 2008 — similar to levels seen over
the past two years. Increased use of generics will be
driven by an ageing population in the mature markets,
higher level of generics prescriptions written in the US,
new government contracting initiatives and a distinctly
pro-generics thrust in Europe.
Specialty and niche products are increasing in }}
share It is anticipated that up to 29 innovative new
medicines will be launched in 2008, of which 80 percent
will be primarily prescribed by specialists. Products
used in the treatment of oncology are expected to
be between U.S.$. 40 billion and U.S.$. 45 billion in
2008, contributing nearly 17 percent of audited market
growth. Overall growth in the audited specialty-driven
market is forecasted at U.S.$. 295 billion to U.S.$. 305
billion, or a 14-15 percent growth in 2008.
higher safety standards for pharmaceutical }}
products The USFDA has established a Risk
Communication Committee, a new arm designed to
improve risk communication to the public. It will make
critical decisions in 2008 regarding post-marketing
surveillance, in light of the provisions of the Food
and Drug Administration Amendments Act (FDAAA)
of 2007, designed to enhance the agency’s ability to
safeguard and advance public health. It is expected
that there will be greater limitation on the claims of
newly approved medicines, the use of more ‘black
box’ warnings on labels, greater clinical evidence
being required by the regulators and slower approvals.
Overall, these will raise the level of uncertainty faced
by companies, as well as their ability to make products
available to patients.
intellectual property rights challenged on }}
multiple fronts Intellectual property issues under
review in 2008 could potentially have significant
glObally, aN agEiNg pOpulaTiON and improved diagnostics have increased demand for oncology treatment — a challenge that has been met with
a strong innovation pipeline. products used in the treatment of oncology reached a global value of u.S.$. 40 – u.S.$. 45 billion in 2007, and contributed to nearly a fifth of total market growth.
>
DRL_AR2008_CorpPgs_PAP.indd 18 6/18/08 10:50:29 PM

19 | D R . R E D D Y ’ S L A B O R AT O R I E S LT D m a N a g E m E N T d i S C u S S i O N & a N a ly S i S
long-term effects on the patent-holders. The issue
of compulsory licensing by nations, court rulings on
composition of product and process patents, granting
of patents in India, enforcement of IP rights in China,
and reform of patent laws in the US and Europe will all
play out to some extent during 2008 and 2009. Each of
these adds uncertainty to the fundamental model that
underpins the R&D-based pharmaceutical industry.
TREnDS In InDIa
Note Information in this section is based on the
Indian Pharmaceutical overview Report, published
by oRG IMS Research Private Ltd. for the year ended
December 2007.
The Indian pharmaceutical market continues to be
highly fragmented and dominated by Indian companies.
Dr. Reddy’s is listed in the Top-10. The industry has
recorded retail sales of U.S.$. 7.76 billion, representing
a value growth of 13 percent and volume growth of
12 percent. All the growth elements — new product
introductions (8 percent growth), price (1 percent
growth) and volume (4 percent growth) showed positive
trends. Towns and cities are the highest contributors,
growing at 13 percent. However, rural markets are
showing a high growth potential — 19 percent — albeit
over a lower base.
While acute therapy dominates, accounting for 75
percent of the overall market in value terms, the chronic
segments are growing at a faster pace — 21 percent
versus 11 percent for the acute segments.
Brand building has been the key growth driver for
2007, with new product introductions reaching new
heights. The top-300 brands account for more than a
fourth of the incremental value and 77 percent of the
growth in market value in India has been contributed by
brands launched after 2000.
The pharmaceutical market is projected to grow at
11-13 percent per annum between fiscal 2008 and fiscal
2020, achieving a terminal market value of U.S.$. 30
billion. The major growth influencers will be population
dynamics, high disease prevalence, increased health
care access, changing health care models and greater
capacity to spend.
DR. REDDy’S maRkET PERFORmancE
REVENUES The Company’s consolidated revenues decreased by 23
percent to Rs. 50,006 million in 2007–08 (U.S.$. 1.25
billion). This was largely on account of four reasons
discussed earlier in the overview. These are:
No major US generics launch in 2007–08. In contrast, a.
in 2006–07, the Company launched Simvastatin
and Finasteride, the generic versions of Zocor® and
Proscar® respectively of Merck, as authorized generic
products and Ondansetron, the generic version of
Zofran®, under 180-days exclusivity. During 2006–07,
Simvastatin and Finasteride had contributed to
Rs. 15,813 million or 24 percent of Dr. Reddy’s total
revenues. However, post-patent expiry, their prices
decreased significantly leading to considerable
reduction in revenues from these products.
The revenues from betapharm have largely remained b.
at the same level at Rs. 8,189 million in 2007–08
versus Rs. 8,004 million a year earlier. This was due
to pricing pressures in the German generics market
as well as supply chain problems with betapharm’s
contract manufacturer, Salutas. The latter problem
has been subsequently resolved with the manufacture
of a large number betapharm’s products migrating to
Dr. Reddy’s facility in India.
The Company’s Custom Pharmaceutical Services c.
(CPS) business out of Mexico was also hindered by
supply chain constraints in the beginning of 2007–08.
The Company has now set up its own plant near
Hyderabad for manufacturing the necessary raw
materials.
Exceptional fluctuations in the Indian rupee-US dollar d.
exchange rate and a significant weakening of the US
dollar vis-à-vis the rupee.
Having said this, it is important to note Dr. Reddy’s
overall growth in revenues from 1999–2000 to
2007–08. Chart A plots the data in US dollars. It shows
a 27 percent exponential trend rate of growth (i.e. trend
CAGR) over the last nine years. It also shows that the
Company, despite its lower performance in 2007–08, is
solidly positioned as a more than U.S.$. 1 billion entity
— and is poised for further growth.
CharT a Growth in Revenues U . S . $ . M I L L I o N S
183
FY 00
234
01
338
02
1,510
07
1,250
08
380
03
463
04
447
05
Exponential Trend line27% Cagr
546
06
DRL_AR2008_CorpPgs_PAP.indd 19 6/18/08 10:50:30 PM
20 | A N N U A L R E P O R T 2 0 0 7 – 0 8 C O N S O l i d aT i N g f O r T h E f u T u r E
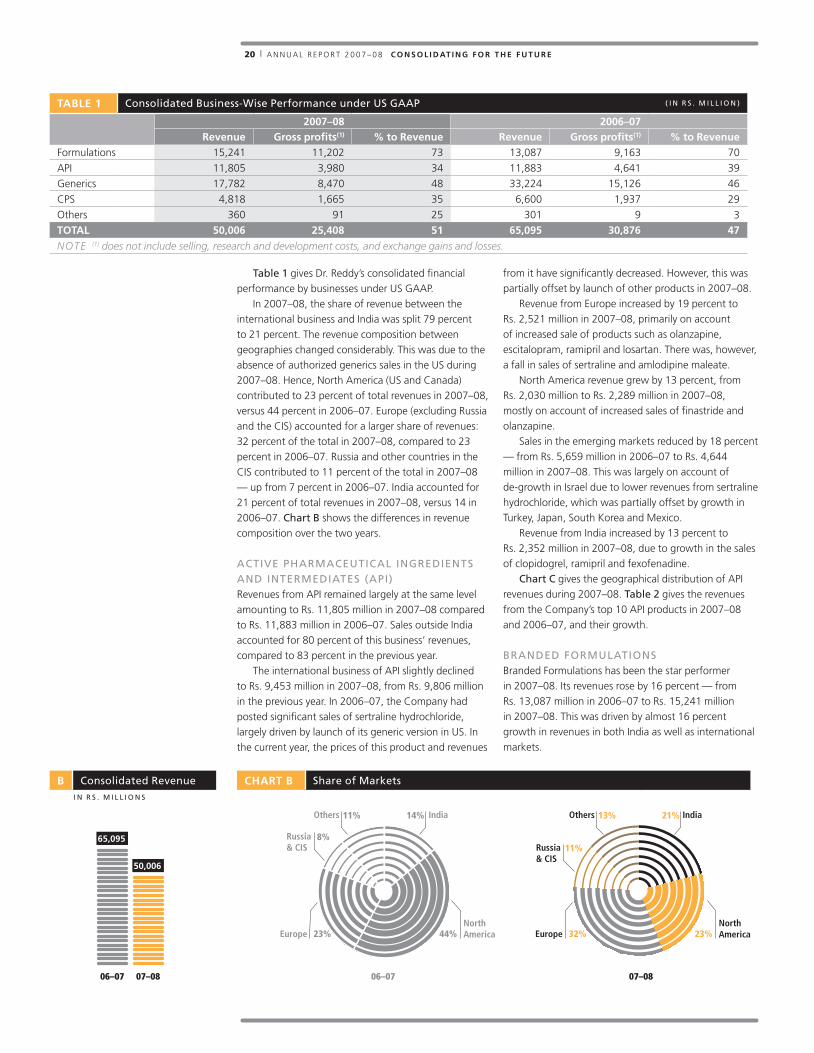
Table 1 gives Dr. Reddy’s consolidated financial
performance by businesses under US GAAP.
In 2007–08, the share of revenue between the
international business and India was split 79 percent
to 21 percent. The revenue composition between
geographies changed considerably. This was due to the
absence of authorized generics sales in the US during
2007–08. Hence, North America (US and Canada)
contributed to 23 percent of total revenues in 2007–08,
versus 44 percent in 2006–07. Europe (excluding Russia
and the CIS) accounted for a larger share of revenues:
32 percent of the total in 2007–08, compared to 23
percent in 2006–07. Russia and other countries in the
CIS contributed to 11 percent of the total in 2007–08
— up from 7 percent in 2006–07. India accounted for
21 percent of total revenues in 2007–08, versus 14 in
2006–07. Chart B shows the differences in revenue
composition over the two years.
ACTIVE PHARMACEUTICAL INGREDIENTS AND INTERMEDIATES (API)Revenues from API remained largely at the same level
amounting to Rs. 11,805 million in 2007–08 compared
to Rs. 11,883 million in 2006–07. Sales outside India
accounted for 80 percent of this business’ revenues,
compared to 83 percent in the previous year.
The international business of API slightly declined
to Rs. 9,453 million in 2007–08, from Rs. 9,806 million
in the previous year. In 2006–07, the Company had
posted significant sales of sertraline hydrochloride,
largely driven by launch of its generic version in US. In
the current year, the prices of this product and revenues
from it have significantly decreased. However, this was
partially offset by launch of other products in 2007–08.
Revenue from Europe increased by 19 percent to
Rs. 2,521 million in 2007–08, primarily on account
of increased sale of products such as olanzapine,
escitalopram, ramipril and losartan. There was, however,
a fall in sales of sertraline and amlodipine maleate.
North America revenue grew by 13 percent, from
Rs. 2,030 million to Rs. 2,289 million in 2007–08,
mostly on account of increased sales of finastride and
olanzapine.
Sales in the emerging markets reduced by 18 percent
— from Rs. 5,659 million in 2006–07 to Rs. 4,644
million in 2007–08. This was largely on account of
de-growth in Israel due to lower revenues from sertraline
hydrochloride, which was partially offset by growth in
Turkey, Japan, South Korea and Mexico.
Revenue from India increased by 13 percent to
Rs. 2,352 million in 2007–08, due to growth in the sales
of clopidogrel, ramipril and fexofenadine.
Chart C gives the geographical distribution of API
revenues during 2007–08. Table 2 gives the revenues
from the Company’s top 10 API products in 2007–08
and 2006–07, and their growth.
BRANDED FoRMULATIoNSBranded Formulations has been the star performer
in 2007–08. Its revenues rose by 16 percent — from
Rs. 13,087 million in 2006–07 to Rs. 15,241 million
in 2007–08. This was driven by almost 16 percent
growth in revenues in both India as well as international
markets.
TablE 1 Consolidated Business-Wise Performance under US GAAP ( I N R S . M I L L I o N )
2007–08 2006–07 revenue gross profits(1) % to revenue revenue gross profits(1) % to revenue
Formulations 15,241 11,202 73 13,087 9,163 70
API 11,805 3,980 34 11,883 4,641 39
Generics 17,782 8,470 48 33,224 15,126 46
CPS 4,818 1,665 35 6,600 1,937 29
Others 360 91 25 301 9 3
TOTal 50,006 25,408 51 65,095 30,876 47
Note (1) does not include selling, research and development costs, and exchange gains and losses.
CharT b Share of Markets
06–07 07–08
India
23%
21%Others 13%
Russia& CIS
11%
32%EuropeNorth America
India
44%23%
14%Others 11%
Russia& CIS
8%
EuropeNorthAmerica
b Consolidated Revenue
06–07
65,095
07–08
50,006
I N R S . M I L L I o N S
DRL_AR2008_CorpPgs_PAP.indd 20 6/18/08 10:50:30 PM

21 | D R . R E D D Y ’ S L A B O R AT O R I E S LT D m a N a g E m E N T d i S C u S S i O N & a N a ly S i S
INDIARevenues in India grew by 16 percent to Rs. 8,060
million in 2007–08, thanks to the performance of the
top-10 brands, especially Omez, Razo and Atocor.
Omez, the Company’s brand of omeprazole, grew }}
by 16 percent compared to overall market growth
of 7 percent, driven by continued success of a line
extension, Omez D. Dr. Reddy’s Omez now accounts
for 47 percent of the total market.
Revenues from sales of Razo, Dr. Reddy’s brand of }}
rabeprazole, grew by 38 percent compared to overall
market growth of 23 percent. The growth was aided
by a specific market campaigns, and the brand now
has a market share of around 12 percent. It also
features in the industry’s list of Top 300 Brands.
Atocor, Dr. Reddy’s brand of Atorvastatin, grew by }}
29 percent compared to overall market growth of 38
percent. The growth was largely due to the launch
of a line extension, Atocor N. The brand is currently
ranked 4th with an 8 percent market share.
During the year, the Company launched Rituximab, }}
the first monoclonal antibody bio-similar, under the
brand name of RedituxTM. The product contributed
Rs. 154 million in revenues in 2007–08.
The Company’s top-10 brands accounted for
revenues worth Rs. 3,724 million (46 percent of Branded
Formulation’s Indian revenues), and grew by 17 percent.
Table 3, in the next page, gives the data for the top-
10 formulations brands in India in 2007–08 and the
previous year.
INTERNATIoNALRevenue from international markets increased by
17 percent — to Rs. 7,181 million in 2007–08, from
Rs. 6,122 million in 2006–07. This growth was primarily
driven by Russia, CIS countries, Romania, Vietnam and
Venezuela.
The Russian pharmaceutical market witnessed a
growth of 15 percent for calendar year 2007. In this
high growth market, Dr. Reddy’s revenues grew by
13 percent — due to strong contributions in the OTC
segment as well as by prescription sales. The growth was
largely led by key brands such as Omez, Nize, Keterol
and Cetrine. Due to the Company’s robust growth, it
maintained its rank at 14th (Pharmexpert MQT, March
2008), with a market share of 1.2 percent. Fiscal 2008
saw Dr. Reddy’s Russian sales cross the
U.S.$. 100 million mark.
Revenue from CIS countries increased by 25 percent,
largely contributed by Ukraine, Belarus and Uzbekistan.
Romania grew by 38 percent, Vietnam by 21 percent
and Venezuela by 68 percent. Chart D gives the
geographical distribution of the Branded Formulations
business.
TablE 2 Revenue from Key API Products (combined for all regions) R S . M I L L I o N
key products 2007–08 2006–07 growthFinasteride 952 581 64%
Ramipril 933 761 23%
Ciprofloxacin Hydrochloride 818 740 11%
Olanzapine 721 157 359%
Clopidogrel 682 384 78%
Naproxen 637 408 56%
Sertraline Hydrochloride 601 2,461 (76%)
Terbinafine HCl 457 484 (6%)
Amlodipine Besylate 404 83 387%
Nizatidine 381 224 70%
Others 5,219 5,600 (6%)
Total 11,805 11,883 0%
07–08
CharT C, d, E Geographical Distribution of API Revenue, Formulation Revenue, Generics Revenue respectively I N R S . M I L L I o N S
Others4,644
39% Europe9,715
55%Others1,656
10%
CIS1,461
10%
India2,352
20% India8,060
53%
Europe2,521 21%
Russia4,064 27%
NorthAmerica2,28920%
NorthAmerica8,02445%
07–08 07–08
DRL_AR2008_CorpPgs_PAP.indd 21 6/18/08 10:50:31 PM

22 | A N N U A L R E P O R T 2 0 0 7 – 0 8 C O N S O l i d aT i N g f O r T h E f u T u r E
GENERICS The Company’s revenues from Generics decreased from
Rs. 33,224 million in 2006–07 to Rs. 17,782 million
in 2007–08. This was largely due to the lack of sales
of authorized generics (AG) in 2007–08 — which had
contributed 48 percent of this segment’s revenues in
2006–07.
North American revenue reduced from Rs. 23,617
million in 2006–07 to Rs. 8,024 million in 2007–08,
again due to lower sales of AG products, which had
accounted for 67 percent of this geography’s revenues
in 2006–07. Excluding AG, the rest of the Company’s
North American generics portfolio witnessed significant
volume growth which more than offset pricing pressure.
During the year, Dr. Reddy’s commenced its own OTC
business with the launch of Ranitidine and Cetirizine.
These products contributed Rs. 263 million of revenues.
Revenues from Europe grew to Rs. 9,715 in
2007–08 from Rs. 9,603 million in 2006–07. betapharm
revenues increased to Rs. 8,189 million from Rs. 8,004
million despite an unfavorable pricing and supply
environment. With German demand looking up and
given the transfer of production of many products to
India, we expect improvements in betapharm’s revenues
as well as profits in 2008–09. Revenues from rest of
Europe declined from Rs. 1,599 million in 2006–07 to
Rs. 1,526 million in 2007–08, largely on account of
decline in prices in UK.
CUSToM PHARMACEUTICAL SERVICES (CPS)Revenue in this segment reduced to Rs. 4,818 million
in 2007–08 from Rs. 6,600 million in 2006–07.
As discussed earlier, this was on account of decrease
in revenues from our key products — naproxen and
naproxen sodium — on account of severe shortage
of raw material at the beginning of the year. The
problem has been resolved with the Company setting
up its own plant at Miryalaguda, near Hyderabad, for
manufacturing the necessary raw materials for its
CPS business.
REGUlaTORy acTIvITy
A strong product pipeline strengthens the foundation of
any pharmaceutical company. Dr. Reddy’s has continued
with its commitment to build a robust generics and API
pipeline.
In 2007–08, the Company filed 19 ANDAs in US
including 10 Para IV filings. These ANDAs address
innovator revenues of about U.S.$. 7.9 billion (IMS MAT,
December 2007). Dr. Reddy’s has filed 122 cumulative
ANDAs as of 31 March 2008.
2007–08 also saw the highest number of approvals
for the Company’s ANDA filings: 13 final approvals
from the US and 4 from Canada, in addition to 7
tentative approvals from the US. As of 31 March 2008,
the Company’s US Generic pipeline comprises 70
ANDAs pending with the USFDA, including 10 tentative
approvals.
Regarding APIs, the Company filed 54 DMFs in
2007–08. Of these, 23 were filed in US, 9 in Canada,
13 in Europe and 9 in other countries. As on 31 March
2008, the Company had cumulative filings of 281 DMFs,
with 127 in the US.
TablE 3 Revenues from the Top-10 Brands in India R S . M I L L I o N
product 2007–08 2006–07 growthOmez 966 830 16
Nise 880 873 1
Stamlo 406 370 10
Stamlo Beta 305 268 14
Razo 291 211 38
Atocor 244 189 29
Enam 180 174 3
Reditux 154 –
Mintop 150 119 26
Reclimet 149 138 8
Others 4,335 3,792 14
Total 8,060 6,964 16
TablE 4 Revenues of the Top-5 Formulation Brands in Russia R S . M I L L I o N S
key products 2007–08 2006–07 growth %Nise 799 666 20%
Omez 849 821 3%
Ketorol 797 634 26%
Cetrine 199 166 20%
Mitotax 105 87 21%
2007–08 alSO SaW ThE highEST NumbEr of approvals for the Company’s aNda filings; 13 final approvals from the uS and 4 from Canada, in
addition to 7 tentative approvals from uS. as of 31 march 2008, the Company’s uS generic pipeline comprises 60 aNdas pending with the uSfda.
>
DRL_AR2008_CorpPgs_PAP.indd 22 6/18/08 10:50:31 PM

23 | D R . R E D D Y ’ S L A B O R AT O R I E S LT D m a N a g E m E N T d i S C u S S i O N & a N a ly S i S
In Branded Formulations, a total of 307 dossiers
have been filed for product registrations in various
countries. This includes 19 dossiers in Australia and 13
dossiers in New Zealand. The Company’s investments
in bio-generics have also started maturing. In 2007–08,
Dr.Reddy’s has launched its second bio-generic product
Reditux™ Dr. Reddy‘s brand of rituximab, a monoclonal
antibody used in the treatment of Non-Hodgkin’s
Lymphoma.
DIScOvERy RESEaRcH
As on 31 March 2008, Dr. Reddy’s had three
molecules or New Chemical Entities (NCEs), of which
two are in clinical development and one is in the pre-
clinical stage. Details of the three NCEs are given in
Table 5 as above.
The Company continues to advance these NCEs
through a combination of in-house development,
partnerships and co-development initiatives. In
2007–08, Dr. Reddy’s entered into an agreement
with 7TM Pharma for drug discovery collaboration
on selected drug targets in the area of metabolic
disorders.
bUIlDInG nEW caPacITIES
Growth requires state-of-the-art capacities. Realizing
this, Dr. Reddy’s has invested considerable efforts and
funds to create new manufacturing and R&D capacities.
A total of Rs. 6,293 million has been spent on building
these capacities in 2007–08, Table 6 as above shows
significant investments during the year.
InTERnal InITIaTIvES
As a part of the Company’s drive to continuously
construct and leverage the different building blocks
of sustainable growth, Dr. Reddy’s has been engaged
in several internal initiatives, some of which are briefly
described below.
LEAN MANAGEMENT The Company, under its initiative myDREEM
(Dr. Reddy’s Execution Excellence Model), has implemented
lean practices which have significantly impacted the
manufacturing operations, IPDO and service operations.
The areas of focus were reducing change-over times,
implementing layouts that facilitate easy manufacturing,
low-cost process control automation, increasing
productivity, and managing inventories and cash cycles
At the Chemical Tech-Ops, the change-over time
has reduced by 50 percent. Solvent recycling systems
have been installed to recover and recycle solvents back
to the process. Quality management has been able
to cater to the higher demand of sample analysis. At
the Formulation Tech-Ops, automation of packaging
lines and solid handling system has lead to improved
productivity. At the Integrated Product Development
Organization (IPDO), laboratory automations have
resulted in reduction in product development cycle
times and enhanced data reliability. The human resource
function is able to value add by adopting lean practices
by simplifying policies and enabling the mySAP business
suite to be used for paperless employee services. The
impact of lean practices in global business services has
led to quicker service levels and improved cash cycles.
UNNATI I I A CUSToMER MANAGEMENT SoLUTIoNUnder its initiative, Unnati II, the Company has
developed a customer management solution.
The sales process effectiveness has been revamped on a
new IT platform, the mySAP business suites, to enable
the ‘handshaking’ of sales and marketing for enhanced
field force productivity. The customer management
solution has web-cum-handled interface to enable
targeting based on customer potential at the brand
level, and to provide real time analytics to the field force
to monitor progress and facilitate course corrections.
TablE 5 Dr. Reddy’s Development Pipeline in DiscoveryResearch
Compound Therapeutic area Status development partner remarksDRF 2593 Metabolic disorders Phase III Rheoscience In Phase III for Type 2 diabetes
DRF 1042 Oncology Phase I ClinTec Scheduled to enter Phase II for solid tumors
COPD Respiratory disorders Pre-clinical Development Argenta Targeted for chronic obstructive pulmonary disease
TablE 6 Investing in Capital Expansion
business unit project Capital spent (rs. millions) present StatusTechops Cytotoxic facility for formulations 660 To be commissioned shortly
Techops Formulations plant at Himachal Pradesh 670 Commissioned and capitalized
Techops Generics: commercial facility expansion 630 Phases 1 & 2 commissioned and capitalized. Phase 3 excepted to be commissioned shortly
Techops IPDO Centre 570 Commissioned
CTO DL Acid facility at Miryalaguda 560 Commissioned
CTO ZLD capacity expansion at Unit V and VI 490 Expected to be completed by end June 2008
CTO Unit 1: Five-year capacity build-up 400 Ongoing
CPS MMC 2 370 Commissioned
Generics SEZ land at Medak district 400 SEZ approval received
Total 4,750
DRL_AR2008_CorpPgs_PAP.indd 23 6/18/08 10:50:31 PM
24 | A N N U A L R E P O R T 2 0 0 7 – 0 8 C O N S O l i d aT i N g f O r T h E f u T u r E
The backbone of this solution is the mySAP business
suite, where the Customer Relation Management
(CRM), Human Resource (HR), Business Intelligence (BI)
and logistics modules interface with hand held mobile
phones. The project covers the Branded Formulations
national marketing field force. The pilot launch has
been successfully deployed to all PSRs and managers
in Andhra Pradesh and a national level roll-out will
be completed by November 2008. This customer
management solution is one of the best-in-class in the
pharmaceuticals business.
HUman RESOURcES
Dr. Reddy’s global employee strength crossed 9,000
in 2007–08, of which over 2,000 were based at
international locations. Over 45 nationalities represent
Dr. Reddy’s across various regions. There is a conscious
effort at building diversity in the workforce, which has
resulted in the rise of the share of women employee to 8
percent of the total. Women colleagues are also moving
up at senior levels.
TALENT ACqUISITIoNA total of 1,602 employees were hired, mostly for
replacement positions. Recruitments in new positions
were under a freeze / strict review. Only key talent and
skills were acquired during the year. The highlights of
the hiring program were:
23 overseas hires, with critical skills added in the }}
areas of purification, fermentation, pre-clinical trials,
biological assays, synthetic chemistry, formulations,
and differentiated products
A core team for global oncology was set up in line }}
with strategic aspirations
Manpower for the entire new Visakhapatnam unit }}
CCM 1 was hired in the areas of quality, engineering,
project management and manufacturing
Large numbers were hired on account of green field }}
project of DL acid plant (Chemical Tech-Ops Unit 5)
in Miryalaguda. This is the plant near Hyderabad to
manufacture inputs for the Mexican CPS facility
170 trainees were hired from campuses to }}
strengthen the feeder pipeline
As a model employer, Dr. Reddy’s also participated
in career fair by the Ability Foundation in 2007 and
2008 in Chennai and New Delhi respectively, and hired
physically disabled candidates for different positions in
the Company.
LEARNING, DEVELoPMENT, EMPLoYEE VoICE AND LEAN HR PRACTICES
Launched an initiative called the Review of }}
Leadership Development, with greater emphasis
on building a distinctive leadership culture and
enhancing both the leadership bandwidth and
the bench
Executive coaching services provided to 30 people in }}
senior management
Joined a consortium of learning partners comprising }}
frontline organization across various industries for
having senior leadership programs with renowned
faculty from across the world
Held the Fifth Technical Conclave for CTO employees. }}
This was on unit-level processes and focused on
moving from laboratory scale to commercialization.
It was the fifth such conclave over the last three years
Continued with long term education efforts }}
in collaboration with BITS by starting two new
batches in MSc (Pharmaceutical Chemistry) and
MS (Pharmaceutics)
Introduced 5S and Lean Thinking across the }}
organization
Carried out an organizational climate survey in 2007. }}
Secured an employee satisfaction score that put
the Company midway in the top 10 percent to
33 percent in India
Benchmarked HR processes and policies across the }}
industry and simplified these in order to eliminate
redundancy. It has also significantly automated HR
processes, and implemented LEAN in HR
Went live with the mySAP e-recruitment model, }}
which has increased compliance and reduced
unproductive time
Launched an e-joining module branded called }}
‘Connexion’ which enables new employees at
various levels to complete their statutory and other
formalities prior to joining
Launched an alumni site to attract ex-employees of }}
Dr. Reddy’s
HR AWARDSConsistently ranked among the Top Ten (10th in }}
2007–08) in ‘The Best Companies to Work for in
India’ Survey conducted jointly by Business Today,
Mercer Human Resource Consulting and TNS India.
Received the Recruitment and Staffing Best in Class }}
(RASBIC) Award for the ‘Best Use of Technology for
Recruiting’ at the Asia Pacific HRM Congress for the
third time
Adjudged by the ISTD for the Certificate of Merit }}
for Innovative Training Practices among Indian
organizations
SaFETy, HEalTH anD EnvIROnmEnT
(SHE)
As a part of Dr. Reddy’s commitment towards the
principles of sustainable development, safety, health
and environment continue to be priority areas for the
Company.
Dr. Reddy’s has been publishing its Sustainability
Report for the last three years — which gives
full account of its activities in safety, health and
rEvENuES dECrEaSEd by 23 pErCENT to rs. 50,006 million in 2007–08 from rs. 65,095 million in 2006–07. as mentioned earlier, last year we had
revenues of rs. 15,813 million from sale of authorized generics. Excluding these, revenues decreased by 3 percent in 2007–08, though there has been a growth of 7% in dollar terms.
>
DRL_AR2008_CorpPgs_PAP.indd 24 6/18/08 10:50:31 PM

25 | D R . R E D D Y ’ S L A B O R AT O R I E S LT D m a N a g E m E N T d i S C u S S i O N & a N a ly S i S
environment, and goes well beyond the statutory
requirements. The Sustainability Report is prepared
according to internationally accepted guidelines issued
by Global Reporting Initiatives, commonly known as GRI
guidelines. GRI is an official collaborating center of the
United Nations Environment Program (UNEP), and works
in cooperation with the UN Secretary General’s Global
Compact. The Company will continue with this initiative
of publishing the Sustainability Report in the future.
Some of the major activities in the area of safety,
health and environment have been:
The use of waste-water recycling plants using }}
membrane technology, multiple effects evaporators
and spray dryers at key API locations
The commissioning of a modern, well-designed }}
zero liquid discharge plant at the Company’s
Formulations Tech-Ops (FTO) unit 1. Another plant
based on similar technology is at an advanced
stage of construction at the Company’s Biologics
Development Center. Multi-stage scrubbers were
installed to fugitive emissions in CTO–IV and CTO–V.
Initiated major upgrading of solvent recovery systems
in all CTO units
Organizing special meets will all vendors to share }}
the Company’s values and expectations in the area
of SHE
Training of staff at all levels in the different units }}
regarding SHE issues
Initiating energy audits with the help of external }}
consultants like the Confederation of Indian Industry
(CII) and The Energy Research Institute (TERI)
Celebrating the National Safety Week at all }}
manufacturing plants with the objective of
strengthening and integrating safety culture in the
workplace
The Company’s annual celebration for 2008 was }}
based on the theme of ‘Sustainability’.
FInancIalS
As before, the financials are given in three sub-sections:
Abridged US GAAP accounts for Dr. Reddy’s as a }}
consolidated entity.
Abridged Indian GAAP consolidated accounts.}}
Abridged Indian GAAP stand-alone accounts for }}
Dr. Reddy’s, as statutorily required under India’s
Companies Act, 1956.
US GaaP cOnSOlIDaTED FInancIalS
Table 7 as above gives the abridged US GAAP financial
performance of Dr. Reddy’s for 2007–08 and 2006–07
on a consolidated basis.
REVENUESRevenues decreased by 23 percent to Rs. 50,006
million in 2007–08 from Rs. 65,095 million in 2006–07.
As mentioned earlier, last year we had revenues of
Rs. 15,813 million from sale of authorized generics.
Excluding AG revenues from both the years, revenues
decreased by 3 percent in 2007–08. During the year,
the US dollar weakened by approximately 11 percent
vis-à-vis the Indian rupee. With around 57 percent of the
Company’s sales invoiced in dollars, this depreciation in
dollar value had a significant impact on our revenues,
and hence lowered the growth rate in the current year.
Excluding the impact of weak dollar and authorized
generics, our revenues actually increased by 7 percent.
GRoSS PRoFIT The Company’s gross profits decreased by 18 percent to
Rs. 25,408 million for 2007–08 from Rs. 30,876 million
TablE 7 Abridged Consolidated Statement of operations, 2007–08, US-GAAP R S . M I L L I o N S
2007–08 2006–07
percent percent increase /rs. mn To sales rs. mn To sales (decrease)
Revenues 50,006 100% 65,095 100% (23%)
gross profit 25,408 51% 30,876 47% (18%)
Selling, general and administrative expenses 15,175 30% 14,051 22% 8%
Research and development expenses 3,533 7% 2,463 4% 43%
Amortization expenses 1,615 3% 1,571 2% 3%
Write down of Intangibles. 2,489 5% 1,770 3% 41%
Write down of Goodwill 90 0% NC
Foreign exchange (gain) / loss (745) (1%) (137) 0% 444%
Other operating (income) / expenses (107) 0% (174) 0% (39%)
Operating income 3,358 7% 11,332 17% (70%)
Equity in (loss) / income of Affiliates 2 0% (63) 0% NC
Other income / (expenses), net 79 0% (769) (1%) NC
income before income taxes and minority interest 3,439 7% 10,500 16% (67%)
Income tax benefit / (expenses) 1,229 2% (1,177) (2%) NC
Minority Interest 10 0% 3 0% 233%
Net income 4,678 9% 9,326 14% (50%)
NoteS NC = Not Comparable.
DRL_AR2008_CorpPgs_PAP.indd 25 6/18/08 10:50:32 PM

26 | A N N U A L R E P O R T 2 0 0 7 – 0 8 C O N S O l i d aT i N g f O r T h E f u T u r E
in 2006–07. Gross profit as a percentage of revenue was
51 percent in 2007–08, versus 47 percent in 2006–07.
The reason: during the last year, revenues from
authorized generics contributed to 24 percent to total
revenues and earned gross margins which are below the
Company’s average.
SELLING, GENERAL AND ADMINISTRATIVE ExPENSESSelling, General and Administrative (SG&A) expenses
increased by 8 percent to Rs. 15,175 million in 2007–08,
compared to Rs. 14,051 million in 2006–07. This was
largely on account of higher manpower costs, which
rose by 12 percent in 2007–08 due to annual increments
and normal year-on-year increase in the headcount.
There was also a growth in marketing expenses, which
increased by 7 percent in 2007–08 — mostly on account
of higher shipping costs and higher commission on
sales due to increased revenues, as well as higher
advertisement expenses due to campaigns undertaken
in Russia, Belarus and Ukraine.
R&D ExPENSESR&D expenses grew by 43 percent to Rs. 3,533 million
for 2007–08 from Rs. 2,463 million for 2006–07. As
a share of total revenue, R&D expenditure was at 7
percent in 2007–08, compared to 4 percent in 2006–07.
The rise in R&D expenses (gross of reductions as
discussed below) was primarily on account of increase
in development activity in the Generics, Biologics and
Discovery segments.
Under the terms of the R&D partnership agreement
with I-VEN Pharma Capital Limited (I-VEN), the
Company has not recorded any reduction in R&D
expense in 2007–08 compared to Rs. 453 million
recorded in 2006–07.
AMoRTIzATIoN ExPENSESAmortization expenses increased by 3 percent to
Rs. 1,615 million in the year ended 31 March 2008
from Rs. 1,571 million in the year ended 31 March
2007. The amortization during the year increased
primarily on account of higher amortization expense for
the beneficial toll manufacturing contract, the useful
life for which was reduced as in February 2007. The
amortization also increased marginally on account of the
increase in the Euro – Rupee exchange rate. The impact
of these movements on amortization expenses was
partially off-set on account of write-down of intangible
assets, which resulted in lower amortization expense.
WRITE-DoWN oF INTANGIBLE ASSETSDuring the year ended 31 March 2008 we effected
a write down of intangible assets for an aggregate
amount of Rs. 2,489 million as compared to Rs. 1,770
million in the year ended 31 March 2007. Write down
during the year ended 31 March 2008 consists of
Write-down amounting to Rs. 2,361 million of 1.
certain product related intangibles of the betapharm
arising out of adverse market conditions in
Germany such as decreases in market price and
increase in the value of rebate and also due to
supply constraints faced by us.
Write-down amounting to Rs. 127 million of 2.
litaphar’s product related intangibles arising out of
adverse market conditions like reduction in sales
and margins and increase in the supply cost.
Write down during the year ended 31 March 2007
consisted of
Write-down expense amounting to Rs. 213 million 1.
associated with core technology rights and other
product related intangible assets acquired through
Trigenesis Therapeutics, Inc. The write down was
recorded with a view that commercialization
of these intangible assets was deemed to be
economically unviable because of further regulatory
and approval process requirements and unfeasible
partnering prospects.
06–07
30,876
07–08
25,408
18%
06–07
9,326
07–08
4,678
50%
06–07
2,463
07–08
3,533
43%
CharT f, g, h US GAAP Gross Profit, R&D Expenses, Net Income respectively I N R S . M I L L I o N S
uNdEr ThE TErmS Of ThE r&d partnership agreement with i-vEN pharma Capital limited (i-vEN), the Company has not recorded any reduction in r&d
expense in 2007–08 compared to rs. 453 million recorded in 2006–07.
>
DRL_AR2008_CorpPgs_PAP.indd 26 6/18/08 10:50:32 PM
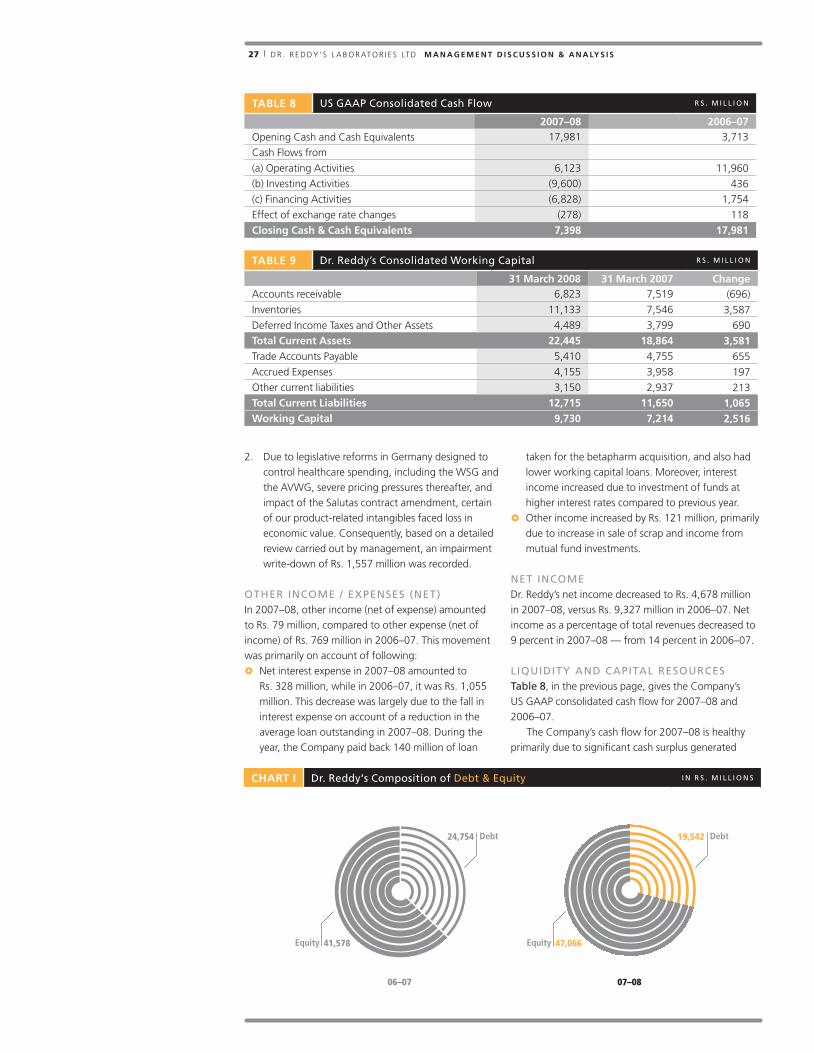
27 | D R . R E D D Y ’ S L A B O R AT O R I E S LT D m a N a g E m E N T d i S C u S S i O N & a N a ly S i S
Due to legislative reforms in Germany designed to 2.
control healthcare spending, including the WSG and
the AVWG, severe pricing pressures thereafter, and
impact of the Salutas contract amendment, certain
of our product-related intangibles faced loss in
economic value. Consequently, based on a detailed
review carried out by management, an impairment
write-down of Rs. 1,557 million was recorded.
oTHER INCoME / ExPENSES (NET)In 2007–08, other income (net of expense) amounted
to Rs. 79 million, compared to other expense (net of
income) of Rs. 769 million in 2006–07. This movement
was primarily on account of following:
Net interest expense in 2007–08 amounted to }}
Rs. 328 million, while in 2006–07, it was Rs. 1,055
million. This decrease was largely due to the fall in
interest expense on account of a reduction in the
average loan outstanding in 2007–08. During the
year, the Company paid back 140 million of loan
taken for the betapharm acquisition, and also had
lower working capital loans. Moreover, interest
income increased due to investment of funds at
higher interest rates compared to previous year.
Other income increased by Rs. 121 million, primarily }}
due to increase in sale of scrap and income from
mutual fund investments.
NET INCoMEDr. Reddy’s net income decreased to Rs. 4,678 million
in 2007–08, versus Rs. 9,327 million in 2006–07. Net
income as a percentage of total revenues decreased to
9 percent in 2007–08 — from 14 percent in 2006–07.
LIqUIDITY AND CAPITAL RESoURCESTable 8, in the previous page, gives the Company’s
US GAAP consolidated cash flow for 2007–08 and
2006–07.
The Company’s cash flow for 2007–08 is healthy
primarily due to significant cash surplus generated
TablE 8 US GAAP Consolidated Cash Flow R S . M I L L I o N
2007–08 2006–07Opening Cash and Cash Equivalents 17,981 3,713
Cash Flows from
(a) Operating Activities 6,123 11,960
(b) Investing Activities (9,600) 436
(c) Financing Activities (6,828) 1,754
Effect of exchange rate changes (278) 118
Closing Cash & Cash Equivalents 7,398 17,981
TablE 9 Dr. Reddy’s Consolidated Working Capital R S . M I L L I o N
31 march 2008 31 march 2007 ChangeAccounts receivable 6,823 7,519 (696)
Inventories 11,133 7,546 3,587
Deferred Income Taxes and Other Assets 4,489 3,799 690
Total Current assets 22,445 18,864 3,581
Trade Accounts Payable 5,410 4,755 655
Accrued Expenses 4,155 3,958 197
Other current liabilities 3,150 2,937 213
Total Current liabilities 12,715 11,650 1,065
Working Capital 9,730 7,214 2,516
07–08
Debt19,542
Equity 47,066
06–07
Debt24,754
Equity 41,578
CharT i Dr. Reddy‘s Composition of Debt & Equity I N R S . M I L L I o N S
DRL_AR2008_CorpPgs_PAP.indd 27 6/18/08 10:50:33 PM

28 | A N N U A L R E P O R T 2 0 0 7 – 0 8 C O N S O l i d aT i N g f O r T h E f u T u r E
from its operations. Investing activities includes net
investment in property, plant and equipment of
Rs. 6,293 million to meet business growth, compared
to Rs. 4,393 million in 2006–07. Investment in mutual
funds net of proceeds from sale amounted to Rs. 3,382
million. Net cash outflow from financing activities in
2007–08 mainly represents the repayment of Rs. 7,719
million of long term debt, and payment of dividends
amounting to Rs. 737 million. These have been partially
offset by net bank borrowings of Rs. 1,613 million.
Table 9 in the previous page gives the Company’s
working capital, excluding cash and cash equivalents,
investment securities, restricted cash, bank borrowings
and long term debt (current).
DEBT-EqUITYThe debt-equity position of the Company as on
31 March 2008 and 2007 is given in Table 10.
Stockholders’ equity increased in 2007–08 due to an
increase in accumulated other comprehensive income
(by Rs. 1,275 million) as well as the profits retained
during the year (by Rs. 3,941 million). Long-term
debt, including the current and non-current portions,
decreased by Rs. 6,862 million in 2007–08 due to
repayment in June 2007 of the non-recourse portion of
the loan taken on account of the betapharm acquisition.
The Company’s ratio of total debt-to-stockholders’
equity ratio improved from 0.60 as on 31 March 2007 to
0.42 on 31 March 2008.
InDIan GaaP cOnSOlIDaTED
FInancIalS
Table 11 gives the break-up of Indian GAAP
consolidated financials for 2007–08 and 2006–07.
REVENUES Gross sales decreased by 24 percent to Rs. 49,700
million in 2007–08. Previous year net sales include
revenues from sales of Authorized Generics products,
which did not materialize in 2007–08. Excluding sales
from these products, the Company’s revenues would
have decreased by 3 percent.
api}} Gross sales decreased by 2 percent to Rs. 11,804
million. This was on account of decrease in revenues
from the ‘Rest of the World’ markets, and was
partially offset by increases in India, North America,
Europe and some other markets.
TablE 10 Dr. Reddy’s Debt-Equity Position I N R S . M I L L I o N
31 march 2008 31 march 2007 ChangeTotal Stockholders’ Equity 47,067 41,578 5,489
Long-term Debt (non-current) 12,864 17,871 (5,007)
Long-term Debt (current) 1,815 3,670 (1,855)
Bank Borrowings 4,863 3,213 1,650
Total debt 19,542 24,754 (5,212)
TablE 11 Financials, Indian GAAP Consolidated I N R S . M I L L I o N
particulars 2007–08 2006–07 increase / (decrease)Gross Sales 49,700 65,126 (24%)
Excise Duty (558) (779) (28%)
Net Sales 49,142 64,346 (24%)
License Fees 35 28 26%
Income from services 740 882 (16%)
Other income 2,038 1,162 75%
Total income 51,955 66,418 (22%)
Material costs 17,847 27,432 (35%)
Excise duty 287 117 145%
Personnel costs 7,311 6,433 14%
Operating and other expenses 12,620 12,187 4%
Research and development expenses 3,447 2,446 41%
Total Expenditure 41,512 48,615 (15%)
EbidTa 10,443 17,803 (41%)
Finance charges 958 1,526 (37%)
Equity in loss of associates, 17 87 (80%)
Depreciation & Amortization of Brand Acquisition Cost
4,019 3,791 6%
pbT 5,450 12,399 (56%)
Provision for Taxation 1,077 2,744 (61%)
Minority interest (9) (4) 125%
Net profit 4,381 9,659 (55%)
DRL_AR2008_CorpPgs_PAP.indd 28 6/18/08 10:50:33 PM

29 | D R . R E D D Y ’ S L A B O R AT O R I E S LT D m a N a g E m E N T d i S C u S S i O N & a N a ly S i S
formulations}} Gross sales of this segment increased
by 16 percent to Rs. 15,650 million, driven by well-
diversified growth across all key geographies.
generics}} Gross sales decreased to Rs. 17,428 million
from Rs. 33,518 million in 2006–07. As explained
earlier, this was due to higher revenues from
authorized generics (simvastatin and finastride), and
new launches (ondansetron and fexofenadine) in
2006–07.
CpS}} Gross sales decreased from Rs. 6,080 million in
2006–07 to Rs. 4,818 million in 2007–08. This was
due to decline in revenues from our key products –
naproxen and naproxen sodium — arising of supply
problems with their key raw materials. The problem
has since been addressed.
MATERIAL CoSTSMaterial costs decreased to Rs. 17,847 million in
2007–08 from Rs. 27,432 million in 2006–07. As a
percent of total income, material costs fell to 34 percent
in 2007–08, from 41 percent in 2006–07. This was due
to lower sales of authorized generics in 2007–08 (which
had contributed 24 percent to total revenues in 2006–
07) and had a higher material cost ratio than others.
PERSoNNEL CoSTSPersonnel costs increased by 14 percent to Rs. 7,311
million in 2007–08. This was on account of annual
increments and increase in number of employees.
As a share of total income, personnel costs increased
from 10 percent in 2006–07 to 14 percent in 2007–08
— due to the fall in revenues.
oPERATING AND oTHER ExPENSESOperating and other expenses rose by 4 percent to
Rs. 12,620 million in 2007–08. The increase was
due to higher advertisement costs, rise in power and
fuel, and repairs and maintenance expenses due to
increase in production and commissioning of two new
manufacturing plants; and increase in carriage outwards
because of higher sales volumes. This increase was
partially offset by a fall in legal and professional and
communication expenses and also of the Directors’
remuneration due to fall in profits. As a share of total
income, this head of expense increased from 18 percent
in 2006–07 to 24 percent in 2007–08, due to fall
in sales.
DEPRECIATIoN AND AMoRTISATIoNDepreciation and amortisation increased by 6 percent
to Rs. 4,018 million in 2007–08 because of increase
in gross block and intangibles. Additional investments
were incurred towards normal capital expenditure
as well as new projects in CPS, API and Generics.
Amortisation marginally decreased from Rs. 2,369
million in 2006–07 to Rs. 2,280 million in 2007–08 due
to amortisation of intangible assets in Trigenesis, and
impairment of product related intangibles at betapharm.
R&D R&D expenses increased by 41 percent to Rs. 3,447
million in 2007–08. As a share of total income, it
increased from 4 percent in 2006–07 to 7 percent in
2007–08 — largely due the decrease in income
from sales.
TablE 12 Financials, Indian GAAP stand-alone I N R S . M I L L I o N
particulars 2007–08 2006–07 increase / (decrease)Gross Sales 33,865 38,261 (11%)
Excise duty in sales (558) (779) (28%)
Net Sales (Net of excise Duty) 33,307 37,482 (11%)
License Fees 216 1,745 (88%)
Income from services 416 447 (7%)
Other income 1,911 1,169 63%
Total income 35,850 40,843 (12%)
Material costs 12,535 11,216 12%
Excise duty 287 117 145%
Personnel costs 3,686 2,798 32%
Operating and other expenses 8,427 8,310 1%
Research and development expenses 3,219 2,457 31%
Decline in long term investment 133 472 (72%)
Total Expenditure 28,287 25,370 12%
EbidTa 7,563 15,474 (51%)
Finance charges 102 480 (79%)
Depreciation & Amortization of Brand Acquisition Cost
1,620 1,335 21%
pbT 5,841 13,658 (57%)
Provision for Taxation (1,089) (1,890) (42%)
Net profit 4,752 11,769 (60%)
DRL_AR2008_CorpPgs_PAP.indd 29 6/18/08 10:50:33 PM
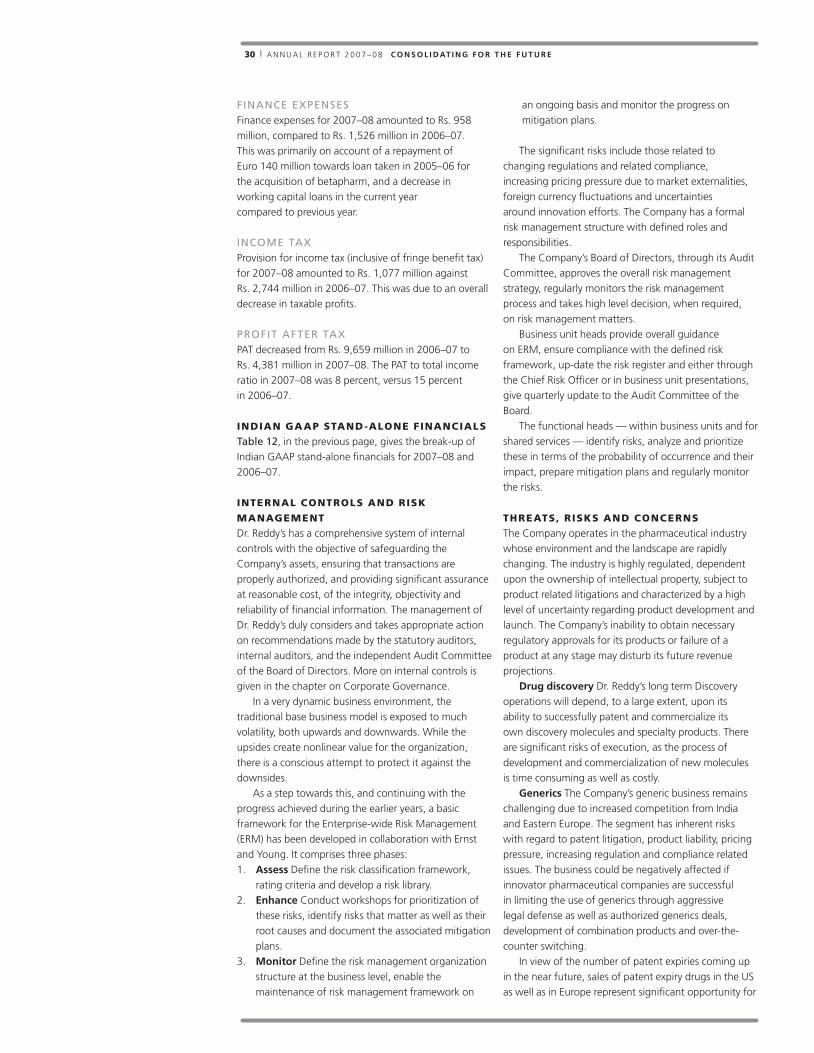
30 | A N N U A L R E P O R T 2 0 0 7 – 0 8 C O N S O l i d aT i N g f O r T h E f u T u r E
FINANCE ExPENSESFinance expenses for 2007–08 amounted to Rs. 958
million, compared to Rs. 1,526 million in 2006–07.
This was primarily on account of a repayment of
Euro 140 million towards loan taken in 2005–06 for
the acquisition of betapharm, and a decrease in
working capital loans in the current year
compared to previous year.
INCoME TAxProvision for income tax (inclusive of fringe benefit tax)
for 2007–08 amounted to Rs. 1,077 million against
Rs. 2,744 million in 2006–07. This was due to an overall
decrease in taxable profits.
PRoFIT AFTER TAxPAT decreased from Rs. 9,659 million in 2006–07 to
Rs. 4,381 million in 2007–08. The PAT to total income
ratio in 2007–08 was 8 percent, versus 15 percent
in 2006–07.
InDIan GaaP STanD-alOnE FInancIalS
Table 12, in the previous page, gives the break-up of
Indian GAAP stand-alone financials for 2007–08 and
2006–07.
InTERnal cOnTROlS anD RISk
manaGEmEnT
Dr. Reddy’s has a comprehensive system of internal
controls with the objective of safeguarding the
Company’s assets, ensuring that transactions are
properly authorized, and providing significant assurance
at reasonable cost, of the integrity, objectivity and
reliability of financial information. The management of
Dr. Reddy’s duly considers and takes appropriate action
on recommendations made by the statutory auditors,
internal auditors, and the independent Audit Committee
of the Board of Directors. More on internal controls is
given in the chapter on Corporate Governance.
In a very dynamic business environment, the
traditional base business model is exposed to much
volatility, both upwards and downwards. While the
upsides create nonlinear value for the organization,
there is a conscious attempt to protect it against the
downsides.
As a step towards this, and continuing with the
progress achieved during the earlier years, a basic
framework for the Enterprise-wide Risk Management
(ERM) has been developed in collaboration with Ernst
and Young. It comprises three phases:
assess1. Define the risk classification framework,
rating criteria and develop a risk library.
Enhance2. Conduct workshops for prioritization of
these risks, identify risks that matter as well as their
root causes and document the associated mitigation
plans.
monitor3. Define the risk management organization
structure at the business level, enable the
maintenance of risk management framework on
an ongoing basis and monitor the progress on
mitigation plans.
The significant risks include those related to
changing regulations and related compliance,
increasing pricing pressure due to market externalities,
foreign currency fluctuations and uncertainties
around innovation efforts. The Company has a formal
risk management structure with defined roles and
responsibilities.
The Company’s Board of Directors, through its Audit
Committee, approves the overall risk management
strategy, regularly monitors the risk management
process and takes high level decision, when required,
on risk management matters.
Business unit heads provide overall guidance
on ERM, ensure compliance with the defined risk
framework, up-date the risk register and either through
the Chief Risk Officer or in business unit presentations,
give quarterly update to the Audit Committee of the
Board.
The functional heads — within business units and for
shared services — identify risks, analyze and prioritize
these in terms of the probability of occurrence and their
impact, prepare mitigation plans and regularly monitor
the risks.
THREaTS, RISkS anD cOncERnS
The Company operates in the pharmaceutical industry
whose environment and the landscape are rapidly
changing. The industry is highly regulated, dependent
upon the ownership of intellectual property, subject to
product related litigations and characterized by a high
level of uncertainty regarding product development and
launch. The Company’s inability to obtain necessary
regulatory approvals for its products or failure of a
product at any stage may disturb its future revenue
projections.
drug discovery Dr. Reddy’s long term Discovery
operations will depend, to a large extent, upon its
ability to successfully patent and commercialize its
own discovery molecules and specialty products. There
are significant risks of execution, as the process of
development and commercialization of new molecules
is time consuming as well as costly.
generics The Company’s generic business remains
challenging due to increased competition from India
and Eastern Europe. The segment has inherent risks
with regard to patent litigation, product liability, pricing
pressure, increasing regulation and compliance related
issues. The business could be negatively affected if
innovator pharmaceutical companies are successful
in limiting the use of generics through aggressive
legal defense as well as authorized generics deals,
development of combination products and over-the-
counter switching.
In view of the number of patent expiries coming up
in the near future, sales of patent expiry drugs in the US
as well as in Europe represent significant opportunity for
DRL_AR2008_CorpPgs_PAP.indd 30 6/18/08 10:50:34 PM

31 | D R . R E D D Y ’ S L A B O R AT O R I E S LT D m a N a g E m E N T d i S C u S S i O N & a N a ly S i S
all generics and API manufacturers. However, obtaining
180-days exclusivity is getting increasingly difficult in
the US, and the generics market is becoming rapidly
commoditized.
drug pricing In India, the Government of India
through its Drugs (Prices Control) Order, 1995 (DPCO)
imposes price controls for specified pharmaceutical
products under certain circumstances. Adverse changes
in the DPCO list or a widening of the span of price
control can affect pricing, and thereby the Indian
revenues.
foreign exchange fluctuations In fiscal 2007–08,
the Company saw unprecedented and significant
fluctuations in the US dollar-Indian rupee exchange
rate coupled with an 11 percent depreciation of the
dollar. Given that the Company has a major portion of
its revenues in US dollars, it has suffered on account of
reduced rupee realizations. Although the Company has
taken adequate foreign exchange cover for its exports,
further depreciation in the dollar may have adverse
impact on profits.
germany As of 1 April 2007, GKV-WSG law to
regulate the German health care system took effect.
The law has significantly increased the power of the
insurance companies (sick funds) by allowing them
to enter into direct rebate contracts with suppliers
of pharmaceuticals. It further incentivizes doctors
to prescribe generic drugs covered by such rebate
contracts. The pharmacist is also required to dispense
such drugs as are covered by rebate contracts. About
85 percent of betapharm’s sales are prescriptions
covered by sick funds. Thus, successfully concluding
rebate contracts with insurance companies is a critical
success factor in competing in the generic prescription
market. betapharm today has rebate contracts with sick
funds covering 77 percent of the insured population in
aggregate. During 2007–08, the reference prices for
generics were reduced on 1 January 2008. Insurance
companies may continue to put pressure on margins by
further adjustments to the reference prices.
patent With implementation of GATT in 2005, India
started recognizing product patent protection with
effect from 1 January 2005. It is expected that the new
product launch opportunities for Indian manufacturers
of API and finished dosages will narrow over the next
few years.
OUTlOOk
Notwithstanding the setbacks in 2007–08, Dr. Reddy’s
looks forward to a strong performance in 2008–09. We
believe that our core businesses of API and Formulations
will show robust revenue growth and consequently,
greater margin contribution. The Company’s North
American Generics business is expected to deliver
stronger performance with new launches and upsides.
The Generics business in Europe should see stabilization
after the effects of significant regulatory and industry
changes in 2007–08. Our initiative to shift some of
the betapharm’s supplies to India has already started
delivering value. With more products being shifted
in 2008–09, the business will be further de-risked.
By setting up a dedicated facility at Miryalaguda,
near Hyderabad, for supplying inputs to Mexico, the
Company believes that it has taken necessary steps to
ensure that supply chain constraints do not affect the
CPS business. We expect healthy growth of this segment
in 2008–09. In addition, our strategic acquisitions
in US and UK are also expected to create value for
shareholders.
We have been steadily building capabilities and
resources over the years, and strengthened these further
with several initiatives at improving productivity and
reducing costs. We see these initiatives coming to bear
in 2008–09 and thereafter — thus contributing to
greater value creation. Moreover, we have committed
significant investments in infrastructure and facilities for
almost all our businesses to support revenue scale-ups in
the near future.
In line with our stated philosophy and strategy, we
will continue to pursue both organic and inorganic
options to achieve faster and more profitable growth.
Having set aggressive targets across geographies and
businesses, we look forward to a good 2008–09.
caUTIOnaRy STaTEmEnT
the management of Dr. Reddy’s has prepared and
is responsible for the financial statements that
appear in this report. these financial statements are
in conformity with accounting principles generally
accepted in India and in the US, and therefore include
amounts based on informed judgments and estimates.
the management also accepts responsibility for the
preparation of other financial information that is
included in this report.
this write-up includes some forward-looking
statements, as defined in the U.S. Private Securities
Litigation Reform Act of 1995. the management has
based these forward-looking statements on its current
expectations and projections about future events.
Such statements involve known and unknown risks,
uncertainties and other factors that may cause actual
results to differ materially. these factors include, but are
not limited to, changes in local and global economic
conditions, the Company’s ability to successfully
implement its strategy, the market’s acceptance of
and demand for its products, growth and expansion,
technological change and exposure to market risks. By
their nature, these expectations and projections are only
estimates and could be materially different from actual
results in the future.
DRL_AR2008_CorpPgs_PAP.indd 31 6/18/08 10:50:34 PM

B o A R D o FD I R E C T o R S
32 | A N N U A L R E P O R T 2 0 0 7 – 0 8 C O N S O l i d aT i N g f O r T h E f u T u r E
S Ta N d i N g l E f T T O r i g h T
d r . O m k a r g O S W a m i
m r . r av i b h O O T h a l i N g a m
m r . S aT i S h r E d dy
m r . a N u pa m p u r i
m r . g v p r a S a d
p r O f. k r i S h N a g pa l E p u
S i T T i N g l E f T T O r i g h T
d r . J p m O r E a u
m S . k a l pa N a m O r pa r i a
d r . k a N J i r E d dy
m r . p N d E va r a J a N
>
DRL_AR2008_CorpPgs_PAP.indd 32 6/18/08 10:50:35 PM

33 | D R . R E D D Y ’ S L A B O R AT O R I E S LT D b O a r d O f d i r E C T O r S
is the founder Chairman of Dr. Reddy’s Laboratories
Limited. Prior to founding Dr. Reddy’s in 1984, he was
the founder-Managing Director of Uniloids Limited
and Standard Organics Limited and also served in the
state-owned Indian Drugs and Pharmaceuticals Limited.
Under Dr. K Anji Reddy’s leadership, Dr. Reddy’s has
become a pioneer in the Indian Pharmaceutical industry.
It has transformed the Indian bulk drug industry from
import-dependent in mid-80s to self-reliant in mid-90s
and finally into the export-oriented industry that it is
today. Under his guidance, Dr. Reddy’s became the
first Indian company to embark upon drug discovery
research in India in 1993 and the first non-Japanese Asia
Pacific pharmaceutical company to list on NYSE in April
2001. Dr. K Anji Reddy has a Bachelor of Science degree
in Pharmaceuticals and Fine Chemicals from Bombay
University and a Ph.D. in Chemical Engineering from
National Chemical Laboratory, Pune.
DR. K ANJI REDDY
C h a i r m a N>
joined the Company’s Board in 2002. From 1970
to 2000, Mr. Anupam Puri was with McKinsey &
Company. He worked globally with corporate clients
in several industries on strategy and organizational
issues, and also served several governments and
multilateral institutions on public policy. Mr. Anupam
Puri spearheaded the development of McKinsey’s
India practice, oversaw the Asian and Latin American
offices, and was an elected member of the Board. He is
currently a Special Advisor for Corsair Capital LLC.
Mr. Anupam Puri holds a M. Phil. in Economics, Nuffield
College, Oxford University, 1969; an MA in Economics
from Balliol College, Oxford University, 1967; and a BA
in Economics from Delhi University, India, 1965. He is
also on the Boards of ICICI Bank Limited, Mahindra &
Mahindra Limited and Tech Mahindra Limited.
MR. ANUPAM PURI
i N d E p E N d E N T d i r E C T O r>
joined the Company as Executive Director in 1993
and was responsible for manufacturing operations of
active pharmaceutical ingredients (API), formulations,
research and development activities and new product
development. He presided over the Company’s
successful transition from a predominantly API
manufacturer to a more value-added, finished dosages
producer. In the year 1995, he was appointed as
Managing Director of Dr. Reddy’s Laboratories with
primary focus on finished dosage forms (formulations),
in the national and international markets. He was
the major force behind the successful acquisition of
American Remedies Limited (1999), a Chennai based
pharmaceutical company. Besides, he was instrumental
in setting up wholly owned subsidiaries in Russia
and Latin America and joint ventures in China and
South Africa. Mr. Satish Reddy has a B. Tech. degree
in Chemical Engineering from Osmania University,
Hyderabad and M.S. degree in Medicinal Chemistry
from Purdue University, USA.
MR. SATISH REDDY
m a N a g i N g d i r E C T O r a N d C h i E f O p E r a T i N g O f f i C E r>
joined the Board in 1986 and leads the core team that is
driving the Company’s growth and transformation from
a Company predominantly selling API, Formulations
& Generics to achieving its vision of becoming a
discovery-led global pharmaceutical Company. As
CEO, Mr. Prasad has championed the globalization
of the Company and has played a vital role in the
Company’s evolution. He has been the architect of the
Company’s global generics strategy. He has helped
create new platforms of growth for Dr. Reddy’s, in the
Custom Pharmaceutical Services, Discovery Services and
Specialty Pharmaceutical segments. Mr. Prasad has a
Bachelors degree in Chemical Engineering from Illinois
Institute of Technology, Chicago, and a Masters in
Industrial Administration from Purdue University, USA.
MR. G V PRASAD
v i C E C h a i r m a N a N d C h i E f E X E C u T i v E O f f i C E r>
DRL_AR2008_CorpPgs_PAP.indd 33 6/18/08 10:50:35 PM

34 | A N N U A L R E P O R T 2 0 0 7 – 0 8 C O N S O l i d aT i N g f O r T h E f u T u r E
joined Company’s Board in 2007. She is Vice Chair –
Insurance, Securities and Asset Management of ICICI
Group and also Chief Strategy and Communications
Officer of ICICI Group. She was the Joint Managing
Director of ICICI Bank Limited and was responsible for
the Corporate Centre at ICICI Bank Limited comprising
operations, planning and strategy, risk management,
human resources management, legal and corporate
communications and corporate brand management. A
graduate in law from Bombay University, Ms. Morparia
joined ICICI Limited in 1975. She worked in the areas
of planning, treasury, resources and corporate legal
services. In 2001, she led the ICICI Group’s major
corporate structuring initiative, the merger of ICICI
Limited with ICICI Bank to create India’s second largest
bank. Ms. Morparia has served on several committees
constituted by the Government of India. In November
2005, she was honoured with the Economic Times
‘Business Women of the Year’ award. In September
2006, she was named one of ‘The 100 Most Powerful
Women’ by Forbes Magazine. She is Vice Chair of
ICICI Prudential Life Insurance Company Limited, ICICI
Lombard General Insurance Company Limited, ICICI
Prudential Asset Management Company Limited,
ICICI Securities Limited and Director on the Boards of
Bennet Coleman & Co Limited, CMC Limited and ICICI
Foundation for Inclusive Growth.
MS. KALPANA MoRPARIA
i N d E p E N d E N T d i r E C T O r>
joined the Company’s Board in 2002. Prof. Palepu
is the Ross Graham Walker Professor of Business
Administration at the Harvard Business School. He holds
the titles of Senior Associate Dean for International
Development. Prof. Palepu’s current teaching and
research activities focus on Globalization and Corporate
Governance. He has published numerous research
papers and cases, and is also the co-author of the
book titled ‘Business Analysis & Valuation: Text and
Cases.’ Prof. Palepu has a Masters degree in physics
from Andhra University, a Postgraduate Diploma in
Management from the Indian Institute of Management,
and a Ph.D. from the Massachusetts Institute of
Technology. He is also a recipient of an Honourary MA
from Harvard, and an Honourary Doctorate from the
Helsinki School of Economics. He serves as a consultant
to a wide variety of businesses and is on the Boards of
Satyam Computer Services Limited, Brooks Automation,
and Polymedica Corporation.
PRoF. KRISHNA G PALEPU
i N d E p E N d E N T d i r E C T O r>
joined Company’s Board in 2007. He is presently
working as Executive Vice-President and Chief Scientific
Officer of the IPSEN Group where he is responsible for
the Group’s Discovery and Innovation with facilities in
Paris, London, Barcelona and Boston. Before that, he
was Vice-President, Research from April 1994 and has
been a member of the Executive Committee of IPSEN
Group since that date. Dr. Moreau has a degree in
Chemistry from the University of Orleans and a D.Sc
in biochemistry. He has also conducted post-doctorate
research at the École Polytechnique. He has published
over 50 articles in scientific journals and is named as
inventor or co-inventor in more than 30 patents. He is a
regular speaker at scientific conferences and a member
of Nitto Denko Scientific Advisory Board. In October
1976, Dr. Moreau founded Biomeasure Incorporated,
based near Boston, and has been its President and CEO
since then.
DR. J P MoREAU
i N d E p E N d E N T d i r E C T O r>
DRL_AR2008_CorpPgs_PAP.indd 34 6/18/08 10:50:35 PM

35 | D R . R E D D Y ’ S L A B O R AT O R I E S LT D b O a r d O f d i r E C T O r S
joined the Company’s Board in 2000. Since April 2004,
he has been the Founder and Chairman of CERG
Advisory Private Limited, a consulting and advisory firm.
A professional economist, Dr. Goswami did his Masters
in Economics from the Delhi School of Economics and
his D.Phil (Ph.D) from Oxford University. He taught and
researched economics for 18 years at Oxford, Delhi
School of Economics, Harvard, Tufts, Jawaharlal Nehru
University, Rutgers University and the Indian Statistical
Institute, New Delhi. In March 1997, he moved away
from formal academics to become the Editor of Business
India, one of India’s prestigious business magazines.
From August 1998 up to March 2004, Dr.Goswami
served as the Chief Economist of the Confederation
of Indian Industry – the apex industry organization of
India. He is also an Independent Director on the Boards
of Infosys Technologies Limited, Crompton Greaves
Limited, Sona Koyo Steering Systems Limited, IDFC
Limited, Ambuja Cements Limited, Cairn India Limited
and DSP-Merrill-Lynch Fund Managers Limited.
DR. oMKAR GoSWAMI
i N d E p E N d E N T d i r E C T O r>
joined the Company’s Board in 2000. He was Director
in Cheminor Drugs Limited, a Company that merged
with Dr. Reddy’s in 2000. He was also member of
the Planning Board of Madhya Pradesh, Chairman
of Research at the Council of National Environment
Engineering Research Institute, member of the
Assessment Committee of Council of Scientific and
Industrial Research and member of the Research Council
of National Chemical Laboratory. He was also a Director
of the Bank of Baroda, member of the Central Board
of Directors of the Reserve Bank of India and Group
President and consultant of Reliance Industries Limited.
He is also a Director on the Board of Kothari Sugars and
Chemicals Limited and Tropical Technologies Private
Limited and BEST and Crompton Engineering Limited.
MR. P N DEVARAJAN
i N d E p E N d E N T d i r E C T O r>
joined the Company’s Board in 2000.
Mr. Bhoothalingam has served as the President of The
Oberoi Group of Hotels and was responsible for the
operations of the Group worldwide. He has also served
as Head of Personnel at BAT Plc, Managing Director of
VST Industries Limited and as a Director of ITC Limited.
Mr. Bhoothalingam holds a Bachelor of Science degree
in Physics from St. Stephens College, Delhi and M.A.
in Experimental Psychology from Gonville and Caius
College, Cambridge University. He is also a Director of
Nicco Internet Ventures Limited and Sona Koyo Steering
Systems Limited.
MR. RAVI BHooTHALINGAM
i N d E p E N d E N T d i r E C T O r>
DRL_AR2008_CorpPgs_PAP.indd 35 6/18/08 10:50:35 PM

M A N A G E M E N T C o U N C I L
36 | A N N U A L R E P O R T 2 0 0 7 – 0 8 C O N S O l i d aT i N g f O r T h E f u T u r E
>
12 8
7
3
4 5
6
2
1
2
3
4
5
9 10
11
1314
15 G V PRASAD
SATISH REDDY
JASPAL SINGH BAJWA
DR. CARTIKEYA REDDY
AMIT PATEL
PRABIR JHA
JEFFREY WASSERSTEIN
ABHIJ IT MUKHERJEE
DR. RAJINDER KUMAR
V S VASUDEVAN
MARK HARTMAN
SAUMEN CHAKRABORTY
ASHWANI K MALHOTRA
RAGHU CIDAMBI
K B SANKARA RAO
6
7
8
9
10
11
12
13
14
151
DRL_AR2008_CorpPgs_PAP.indd 36 6/18/08 10:50:36 PM
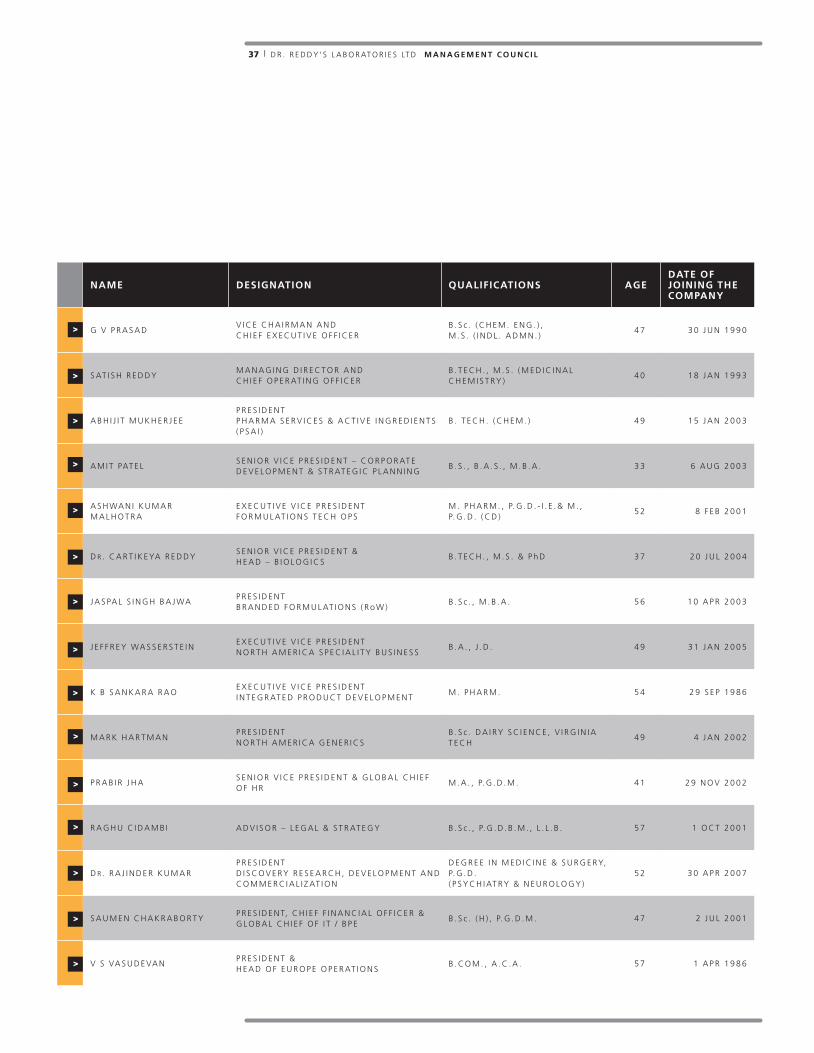
37 | D R . R E D D Y ’ S L A B O R AT O R I E S LT D m a N a g E m E N T C O u N C i l
NamE dESigNaTiON QualifiCaTiONS agEdaTE Of JOiNiNg ThE COmpaNy
G V P R A S A DV I C E C H A I R M A N A N D C H I E F E X E C U T I V E O F F I C E R
B . S c . ( C H E M . E N G . ) , M . S . ( I N D L . A D M N . )
4 7 3 0 J U N 1 9 9 0
S AT I S H R E D D YM A N A G I N G D I R E C T O R A N D C H I E F O P E R AT I N G O F F I C E R
B . T E C H . , M . S . ( M E D I C I N A L C H E M I S T RY )
4 0 1 8 J A N 1 9 9 3
A B H I J I T M U K H E R J E EP R E S I D E N T P H A R M A S E R V I C E S & A C T I V E I N G R E D I E N T S ( P S A I )
B . T E C H . ( C H E M . ) 4 9 1 5 J A N 2 0 0 3
A M I T PAT E LS E N I O R V I C E P R E S I D E N T – C O R P O R AT E D E V E L O P M E N T & S T R AT E G I C P L A N N I N G
B . S . , B . A . S . , M . B . A . 3 3 6 A U G 2 0 0 3
A S H WA N I K U M A R M A L H O T R A
E X E C U T I V E V I C E P R E S I D E N T F O R M U L AT I O N S T E C H O P S
M . P H A R M . , P. G . D . - I . E . & M . , P. G . D . ( C D )
5 2 8 F E B 2 0 0 1
D R . C A R T I K E YA R E D D YS E N I O R V I C E P R E S I D E N T & H E A D – B I O L O G I C S
B . T E C H . , M . S . & P h D 3 7 2 0 J U L 2 0 0 4
J A S PA L S I N G H B A J WA P R E S I D E N T B R A N D E D F O R M U L AT I O N S ( R o W )
B . S c . , M . B . A . 5 6 1 0 A P R 2 0 0 3
J E F F R E Y WA S S E R S T E I NE X E C U T I V E V I C E P R E S I D E N T N O R T H A M E R I C A S P E C I A L I T Y B U S I N E S S
B . A . , J . D . 4 9 3 1 J A N 2 0 0 5
K B S A N K A R A R A O E X E C U T I V E V I C E P R E S I D E N T I N T E G R AT E D P R O D U C T D E V E L O P M E N T
M . P H A R M . 5 4 2 9 S E P 1 9 8 6
M A R K H A R T M A NP R E S I D E N T N O R T H A M E R I C A G E N E R I C S
B . S c . D A I RY S C I E N C E , V I R G I N I A T E C H
4 9 4 J A N 2 0 0 2
P R A B I R J H AS E N I O R V I C E P R E S I D E N T & G L O B A L C H I E F O F H R
M . A . , P. G . D . M . 4 1 2 9 N O V 2 0 0 2
R A G H U C I D A M B I A D V I S O R – L E G A L & S T R AT E G Y B . S c . , P. G . D . B . M . , L . L . B . 5 7 1 O C T 2 0 0 1
D R . R A J I N D E R K U M A RP R E S I D E N T D I S C O V E RY R E S E A R C H , D E V E L O P M E N T A N D C O M M E R C I A L I Z AT I O N
D E G R E E I N M E D I C I N E & S U R G E RY, P. G . D . ( P S Y C H I AT RY & N E U R O L O G Y )
5 2 3 0 A P R 2 0 0 7
S A U M E N C H A K R A B O R T YP R E S I D E N T, C H I E F F I N A N C I A L O F F I C E R & G L O B A L C H I E F O F I T / B P E
B . S c . ( H ) , P. G . D . M . 4 7 2 J U L 2 0 0 1
V S VA S U D E VA NP R E S I D E N T & H E A D O F E U R O P E O P E R AT I O N S
B . C O M . , A . C . A . 5 7 1 A P R 1 9 8 6
>
>
>
>
>
>
>
>
>
>
>
>
>
>
>
DRL_AR2008_CorpPgs_PAP.indd 37 6/18/08 10:50:36 PM

C o R P o R A T E G o V E R N A N C E
38 | A N N U A L R E P O R T 2 0 0 7 – 0 8 C O N S O l i d aT i N g f O r T h E f u T u r E
Keeping in view the Company’s size and complexity
in operations, Dr. Reddy’s corporate governance
framework is based on the following main principles:
Appropriate composition and size of the Board, with }}
each Director bringing in key expertise in different
areas.
Proactive flow of information to the members of the }}
Board and Board Committees to enable effective
discharge of their fiduciary duties.
Ethical business conduct by the management and }}
employees.
Full-fledged systems and processes for internal }}
controls on all operations, risk management and
financial reporting;
Timely and accurate disclosure of all material }}
operational and financial information to the
stakeholders.
The Securities and Exchange Board of India (“SEBI”)
through Clause 49 of the listing agreement with the
stock exchanges regulates corporate governance for
listed companies. Dr. Reddy’s is in full compliance
with Clause 49. It is also in full compliance with the
applicable corporate governance standards of the
New York Stock Exchange (“NYSE”). This chapter
of the Annual Report, the information given under
‘Management Discussion and Analysis’ and Additional
Shareholder Information’ together constitute the
compliance report of the Company on corporate
governance during the year 2007–08.
bOaRD OF DIREcTORS
CoMPoSITIoNAs on 31 March 2008, the Board of Dr. Reddy’s had
ten Directors, comprising three executive Directors,
including the Chairman, and seven independent
Directors as defined under listing Agreement with
Indian Stock Exchanges, and the Corporate Governance
Guidelines of the NYSE. Detailed profiles of Directors
have been discussed in this annual report.
The Directors have expertise in the fields of strategy,
management, finance, human resource development
and economics. The Board provides leadership, strategic
guidance, objective and Independent view to the
Company’s management while discharging its fiduciary
responsibilities, thereby ensuring that the management
adheres to high standards of ethics, transparency and
disclosure. Each Director informs the Company on
annual basis about the Board and Board Committee
positions he occupies in other companies including
Chairmanships and notifies changes during the term of
their directorship in the Company.
Table 1 gives the composition of Dr. Reddy’s Board,
their positions, relationship with other Directors, date of
joining the Board, other Directorships and memberships
of Committees held by each of them.
MEMBERSHIP TERMAs per the provisions of the Companies Act, 1956,
one-third of the Board members (other than executive
Directors) who are subjected to retire by rotation shall
retire every year, and the approval of the shareholders is
sought for the re-appointment of the retiring members
who are so eligible. Executive Directors are appointed
by the shareholders for a maximum period of five
years at a time, but are eligible for re-appointment
upon completion of the term. The Board, on the
recommendations of the Governance Committee,
considers the appointment and re-appointment of
Directors.
SELECTIoN AND APPoINTMENT oF NEW DIRECToRSInduction of any new member on the Board of Directors
is the responsibility of the Governance Committee,
which is entirely composed of independent Directors.
Taking into account the current composition and
organization of the Board, and the requirement of new
skill sets, if any, the Governance Committee reviews
potential candidates in terms of their expertise, skills,
attributes and personal and professional backgrounds.
Candidates that fit the bill are then for by the
Governance Committee, for induction as a Director of
the Company.
DIRECToRS’ SHAREHoLDING IN THE CoMPANYTable 2 gives details of shares and stock options held by
each of the Directors as on 31 March 2008.
ThE COmpaNy’S philOSOphy of corporate governance stems out from its belief that timely disclosures, transparent accounting policies, and a strong and
independent board go a long way in preserving shareholders trust while maximizing long-term corporate values.
>
DRL_AR2008_CorpPgs_PAP.indd 38 6/18/08 10:50:36 PM

39 | D R . R E D D Y ’ S L A B O R AT O R I E S LT D C O r p O r aT E g O v E r N a N C E
MEETINGS oF THE BoARDThe Company plans and prepares the schedule of
the Board and Board Committee meetings a year in
advance to assist the Directors in scheduling their
program. The schedule of meetings and agenda
for meeting is finalized in consultation with an
independent Director of the Company. The agenda
of the meeting is pre-circulated with presentations,
detailed notes, supporting documents and executive
summary. Under Indian laws, the Board of Directors
must meet at least four times a year, with a maximum
time gap of four months between two Board meetings.
Dr. Reddy’s Board met four times during the financial
year under review: on 18 May 2007, 23 July 2007,
24 October 2007 and 25 January 2008. The Company
held one Board meeting in each quarter as required
under the Companies Act, 1956.
Details of Directors and their attendance in Board
meetings and Annual General Meeting are given in
Table 3.
TablE 1 Composition of Dr. Reddy’s Board A S o N 3 1 M A R C H 2 0 0 8
Nam
e
posi
tio
n
rel
atio
nsh
ip W
ith
O
ther
dir
ecto
rs
dat
e O
f Jo
inin
g
dir
ecto
rsh
ips
in in
dia
u/S
27
5 O
f Th
e C
om
pan
ies
a
ct, 1
956
Oth
erd
irec
tors
hip
s (1
)
Co
mm
itte
em
emb
ersh
ip(2
)
Ch
airm
ansh
ip in
C
om
mit
tees
(2)
Dr. K Anji Reddy Executive ChairmanFather of Mr. Satish Reddy & father-in-law of Mr. G V Prasad
24 February 1984 5 38 – –
Mr. G V PrasadVice Chairman & CEO
Son-in-law of Dr. K Anji Reddy & brother-in-law of Mr. Satish Reddy
8 April 1986 10 39 2 1
Mr. Satish ReddyManaging Director & COO
Son of Dr. K Anji Reddy &brother-in-law of Mr. G V Prasad
18 January 1993 6 36 2 –
Mr. Anupam Puri Independent Director None 4 June 2002 4 – 1 1
Dr. J P Moreau (3) Independent Director None 18 May 2007 1 2 – –
Prof. Krishna G Palepu Independent Director None 29 January 2002 2 2 – –
Ms. Kalpana Morparia (3) Independent Director None 5 June 2007 7 1 3 –
Dr. Omkar Goswami Independent Director None 30 October 2000 8 1 9 2
Mr. P N Devarajan Independent Director None 30 October 2000 3 1 1 1
Mr. Ravi Bhoothalingam Independent Director None 30 October 2000 3 – 2 1
(1) other Directorships are those, which are not covered under Section 275 of the Companies Act, 1956.(2) Membership / Chairmanship in Audit and Shareholders’ Grievance Committees of all public limited companies, whether listed or not, including Dr. Reddy’s.
Foreign companies, private limited companies and companies under Section 25 of the Companies Act, 1956 have been excluded.(3) Dr. J P Moreau joined the Board of the Company with effect from 18 May 2007 and Ms. Kalpana Morparia joined the Board with effect from
5 June 2007.
TablE 2 Shares and Stock options Held by the Directors A S o N 3 1 M A R C H 2 0 0 8
Name No. of shares held Stock Options held(2)
Dr. K Anji Reddy(1) 800,956 –
Mr. G V Prasad 1,355,840 –
Mr. Satish Reddy 1,205,832 –
Mr. Anupam Puri 1,500 10,500(3)
Dr. J P Moreau – –
Ms. Kalpana Morparia – –
Prof. Krishna G Palepu 1,500 10,500(3)
Dr. Omkar Goswami 6,000 6,000
Mr. P N Devarajan 6,200 6,000
Mr. Ravi Bhoothalingam 6,000 6,000
(1) Shares held in individual capacity. In addition Dr. K Anji Reddy owns 40% of Dr. Reddy’s Holdings Private Limited, which in turn owns 37,798,290 shares of Dr. Reddy’s Laboratories Limited. Various members of his family own the balance shares in Dr. Reddy’s Holdings Private Limited.
(2) Stock options were granted to independent Directors in the Board meetings held on 6 May 2005, 31 May 2006 and 18 May 2007. (3)10,500 Stock options held pursuant to ADR Stock option Scheme, 2007 granted on 18 May 2007.
DRL_AR2008_CorpPgs_PAP.indd 39 6/18/08 10:50:37 PM
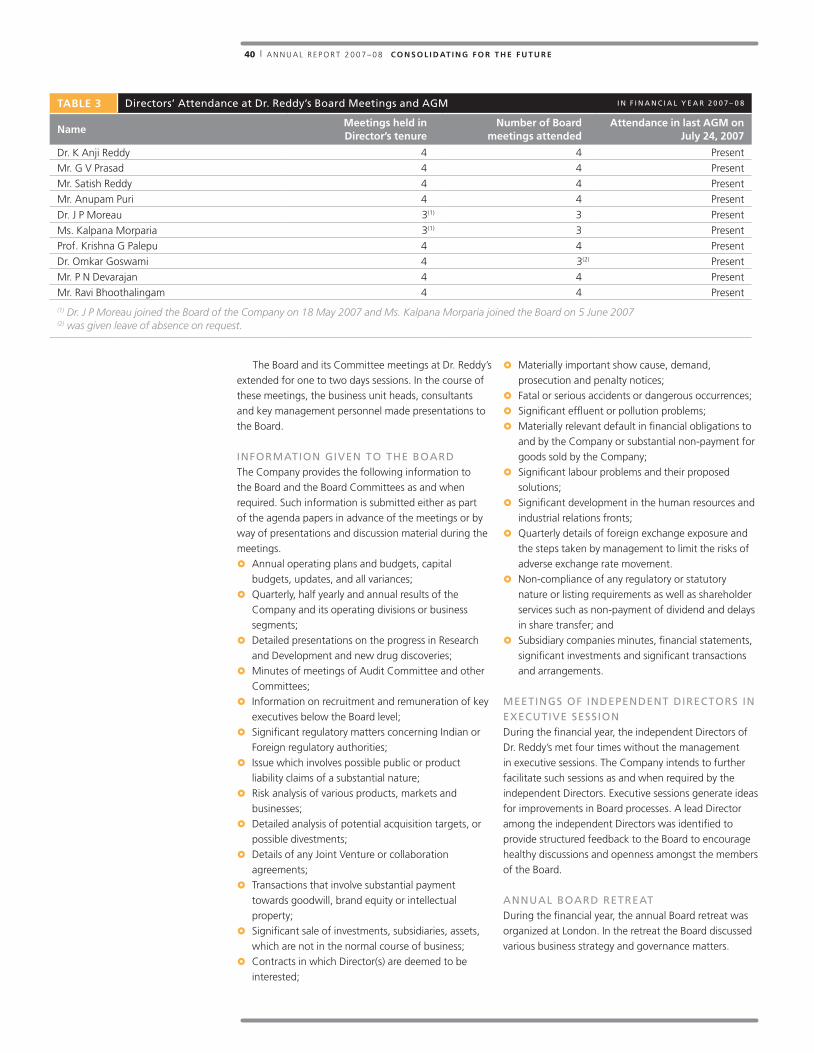
40 | A N N U A L R E P O R T 2 0 0 7 – 0 8 C O N S O l i d aT i N g f O r T h E f u T u r E
The Board and its Committee meetings at Dr. Reddy’s
extended for one to two days sessions. In the course of
these meetings, the business unit heads, consultants
and key management personnel made presentations to
the Board.
INFoRMATIoN GIVEN To THE BoARDThe Company provides the following information to
the Board and the Board Committees as and when
required. Such information is submitted either as part
of the agenda papers in advance of the meetings or by
way of presentations and discussion material during the
meetings.
Annual operating plans and budgets, capital }}
budgets, updates, and all variances;
Quarterly, half yearly and annual results of the }}
Company and its operating divisions or business
segments;
Detailed presentations on the progress in Research }}
and Development and new drug discoveries;
Minutes of meetings of Audit Committee and other }}
Committees;
Information on recruitment and remuneration of key }}
executives below the Board level;
Significant regulatory matters concerning Indian or }}
Foreign regulatory authorities;
Issue which involves possible public or product }}
liability claims of a substantial nature;
Risk analysis of various products, markets and }}
businesses;
Detailed analysis of potential acquisition targets, or }}
possible divestments;
Details of any Joint Venture or collaboration }}
agreements;
Transactions that involve substantial payment }}
towards goodwill, brand equity or intellectual
property;
Significant sale of investments, subsidiaries, assets, }}
which are not in the normal course of business;
Contracts in which Director(s) are deemed to be }}
interested;
Materially important show cause, demand, }}
prosecution and penalty notices;
Fatal or serious accidents or dangerous occurrences;}}
Significant effluent or pollution problems;}}
Materially relevant default in financial obligations to }}
and by the Company or substantial non-payment for
goods sold by the Company;
Significant labour problems and their proposed }}
solutions;
Significant development in the human resources and }}
industrial relations fronts;
Quarterly details of foreign exchange exposure and }}
the steps taken by management to limit the risks of
adverse exchange rate movement.
Non-compliance of any regulatory or statutory }}
nature or listing requirements as well as shareholder
services such as non-payment of dividend and delays
in share transfer; and
Subsidiary companies minutes, financial statements, }}
significant investments and significant transactions
and arrangements.
MEETINGS oF INDEPENDENT DIRECToRS IN ExECUTIVE SESSIoNDuring the financial year, the independent Directors of
Dr. Reddy’s met four times without the management
in executive sessions. The Company intends to further
facilitate such sessions as and when required by the
independent Directors. Executive sessions generate ideas
for improvements in Board processes. A lead Director
among the independent Directors was identified to
provide structured feedback to the Board to encourage
healthy discussions and openness amongst the members
of the Board.
ANNUAL BoARD RETREATDuring the financial year, the annual Board retreat was
organized at London. In the retreat the Board discussed
various business strategy and governance matters.
TablE 3 Directors’ Attendance at Dr. Reddy’s Board Meetings and AGM I N F I N A N C I A L Y E A R 2 0 0 7 – 0 8
Name meetings held in director’s tenure
Number of board meetings attended
attendance in last agm on July 24, 2007
Dr. K Anji Reddy 4 4 Present
Mr. G V Prasad 4 4 Present
Mr. Satish Reddy 4 4 Present
Mr. Anupam Puri 4 4 Present
Dr. J P Moreau 3(1) 3 Present
Ms. Kalpana Morparia 3(1) 3 Present
Prof. Krishna G Palepu 4 4 Present
Dr. Omkar Goswami 4 3(2) Present
Mr. P N Devarajan 4 4 Present
Mr. Ravi Bhoothalingam 4 4 Present
(1) Dr. J P Moreau joined the Board of the Company on 18 May 2007 and Ms. Kalpana Morparia joined the Board on 5 June 2007(2) was given leave of absence on request.
DRL_AR2008_CorpPgs_PAP.indd 40 6/18/08 10:50:37 PM

41 | D R . R E D D Y ’ S L A B O R AT O R I E S LT D C O r p O r aT E g O v E r N a N C E
DIRECToR’S REMUNERATIoNThe remuneration for the three executive Directors,
including the commission based on net profits
of the Company, is recommended by the Board’s
Compensation Committee to the Board for
consideration. After approval, the Board then
recommends these for the approval of shareholders at
the Annual General Meeting. The commission to be paid
each year to the executive Directors is decided by the
Board, within the limits approved by the shareholders.
Executive Directors are appointed by shareholders’
resolution for a period of five years. No severance
fees is payable to the executive Directors. Except
the commission payable, all other components of
remuneration to the executive Directors are fixed,
and in line with the Company’s policies.
The independent Directors receive sitting fees for
attending meetings of the Board and its Committees,
and commission based on the net profits of the
Company. The remuneration including commission
payable to the Directors during the year under review
was in conformity with the applicable provisions of the
Companies Act, 1956, duly considered and approved by
the Board and the shareholders. The remuneration paid
or payable to the Directors for their services rendered
during 2007–08 is given in Table 4.
The criteria for making payments to the executive
Directors are:
Salary, as recommended by the Compensation }}
Committee and approved by the Board and the
shareholders in general meetings. Perquisites and
retirement benefits are also paid in accordance with
the Company’s compensation policies, as applicable
to all employees.
Shareholders of the Company have approved the }}
payment of commission on the net profits calculated
in accordance with Section 198 of the Companies Act,
1956 to all executive Directors.
The Compensation Committee decides the amount }}
of commission payable every year within the overall limit.
Remuneration paid to the executive Directors is }}
determined keeping in view the industry benchmarks.
The criteria for making payments to the independent
Directors is given below.
Independent Directors are paid sitting fees for each }}
meeting of the Board or Board Committee @ Rs. 5,000/-
per meeting attended by them.
Shareholders of the Company have approved }}
payment of commission up to 0.5 per cent of net
profits calculated in accordance with Section 198 of the
Companies Act, 1956 collectively to all the independent
Directors. The Board decides the amount of commission
payable to Independent Directors every year within the
overall limit of 0.5 per cent of net profits.
Remuneration paid to independent Directors is }}
determined by keeping in view industry benchmarks,
and also on the basis of their memberships in various
committees of the Board.
Shareholders of the Company approved granting of }}
up to 200,000 stock options in aggregate at any point
of time during the financial years starting from 2006–07
and ending with 2010–11. Of this, up to 60,000 stock
options can be granted in a single financial year to all
the Directors (except the three executive Directors)
under any of the stock option plans, either existing or
to be framed in future, on such terms and conditions as
the Compensation Committee / Board of Directors may
think fit.
TablE 4 Remuneration Paid or Payable to the Directors for Financial Year 2007–08 I N R S . T H o U S A N D S
Name of directors Sitting fees(1) Commissions(2) Salaries perquisites(3) Total Stock Options (4)
Dr. K Anji Reddy NA 60,310 5,400 497 66,207 NA
Mr. G V Prasad NA 45,233 3,600 687 49,520 NA
Mr. Satish Reddy NA 45,233 3,600 695 49,528 NA
Mr. Anupam Puri 60 2,848 NA NA 2,908 3,000(6)
Dr. J P Moreau(5) 25 2,588 NA NA 2,613 3,000(6)
Ms. Kalpana Morparia(5) 30 2,407 NA NA 2,437 3,000
Prof. Krishna G Palepu 35 2,648 NA NA 2,683 3,000(6)
Dr. Omkar Goswami 55 2,808 NA NA 2,863 3,000
Mr. P N Devarajan 85 2,608 NA NA 2,693 –
Mr. Ravi Bhoothalingam 75 2,608 NA NA 2,683 3,000
(1) Sitting fees include fees for Board as well as Board Committee meetings @ Rs. 5,000 per meeting. (2) Payment of commissions is variable, and based on percentage of net profit calculated according to Section 198 of the Companies Act, 1956. the
commissions would be paid after the approval of shareholders at the Annual General Meeting, scheduled on 22 July 2008. the Board of Directors recommended for a fixed commission of Rs. 2,407,200 (U.S.$. 60,000) per director applicable to all the independent directors, a specific commission of Rs. 401,200 (U.S.$. 10,000) to the Chairman of Audit Committee and Rs. 200,600 (U.S.$. 5,000) to the Chairman of other Committees other than the above, a specific compensation of Rs. 60,180 (U.S.$. 1,500) per meeting was recommended towards foreign travel to the directors outside India.
(3) Perquisites include house rent allowance, medical reimbursement for self and family according to the rules of the Company, leave travel assistance, personal accident insurance, Company’s vehicle for official use with driver, telephone at residence and mobile phone, contribution to Provident Fund and Superannuation Scheme. All these benefits are fixed in nature.
(4) the Company granted stock options to independent Directors on 20 May 2008. the exercise price of the options is Rs. 5 each. the options vest at the end of one year from the date of grant. the exercise period of options is 5 years from the date of vesting.
(5) Dr. J P Moreau joined the Board of the Company on 18 May 2007 and Ms. Kalpana Morparia joined the Board on 5 June 2007.(6) Stock options granted under ADR Stock options Scheme, 2007 on 20 May 2008.
DRL_AR2008_CorpPgs_PAP.indd 41 6/18/08 10:50:38 PM

42 | A N N U A L R E P O R T 2 0 0 7 – 0 8 C O N S O l i d aT i N g f O r T h E f u T u r E
The Board of Directors recommended for a fixed }}
commission of Rs. 2,407,200 (U.S.$. 60,000) per
director applicable to all the independent directors,
a specific commission of Rs. 401,200 (U.S.$. 10,000)
to the Chairman of Audit Committee and Rs. 200,600
(U.S.$. 5,000) to the Chairman of other Committees
Other than the above, a specific compensation of
Rs. 60,180 (U.S.$. 1,500) per meeting was recommended
towards foreign travel to the directors outside India.
LEAD INDEPENDENT DIRECToRThe independent Directors of the Company have
identified the following lead independent Directors for
various matters.
mr. anupam puri }} Corporate strategy;
ms. kalpana morparia}} Internal Audit and control
prof. krishna g palepu}} Board processes and their
improvements and giving structured feedback to
Board on the outcome of executive sessions of
independent Directors meetings;
dr. Omkar goswami}} Finance, internal controls and
risk management;
mr. p N devarajan}} Chief Ombudsman for the
Whistle Blower Policy of the Company; and
mr. ravi bhoothalingam}} Compliance and Driving
agenda for Board and Board Committee meetings
and its development and improvement.
RISK MANAGEMENTThe Company has a detailed enterprise-wide risk
management system in place. During the year, detailed
presentations were made to the Board members on
the enterprise-wide risk management system and a
process was set up to inform Board members about the
risk assessment and minimization procedures. These
procedures are periodically reviewed to ensure that
the management controls the risk through means of a
properly defined framework.
A separate report on risk management and practices
of the Company in minimizing the risk is part of this
annual report.
CoMPLIANCE REVIEWSDr. Reddy’s has a dedicated team and a defined
framework to review the compliances with all laws
applicable to the Company. The compliance status is
periodically updated to the senior management team.
Presentations are scheduled periodically in the Audit
Committee Meetings on compliance status.
CoDE oF BUSINESS CoNDUCT AND ETHICS AND oMBUDSMAN PRoCEDUREThe Company has adopted a Code of Business Conduct
and Ethics (COBE / “the Code”), which applies
to all employees and Directors of the Company, its
subsidiaries and affiliates. It is the responsibility of all
employees and Directors to familiarize themselves with
this Code and comply with its standards.
An Ombudsman Procedure has also been made
under this Code, which describes the ombudsman
framework and procedures for investigation and
communication of any report on any violation or
suspected violation of the Code, appeal against any
decision taken by Ombudsman, and submission of
complaint against any retaliation action against any
employee. An independent Director has been appointed
as Chief Ombudsman, and the reports and complaints
submitted to the Company will be reported to the Audit
Committee.
The Code of Business Conduct and Ethics and
Ombudsman Procedure has been posted on the
Company’s website – www.drreddys.com
The Board and the Senior Management affirms
compliance with the Code of Business Conduct and
Ethics annually. A certificate of the Chief Executive
Officer of the Company to this effect is enclosed as
Exhibit 1 to this section.
RELATED PARTY TRANSACTIoNSThe details of related party transactions are discussed in
detail in page no.s 101 and 102 of this annual Report.
All related party transactions during the year,
whether in the ordinary course of business or not, were
placed before the Audit Committee. All related party
transactions were on arm’s length basis.
SUBSIDIARY CoMPANIESThe Audit Committee of the Company reviews the
financial statements of the subsidiary companies.
During the year, the Audit Committee also reviewed the
investments made by the subsidiary companies, minutes
of the Board meetings of the subsidiary companies
and statement of all significant transactions and
arrangements entered into by the subsidiary companies.
No Indian subsidiary of the Company falls under the
term ‘material non-listed Indian subsidiary’ as defined
under Clause 49 of the Listing Agreement.
DISCLoSURE oN ACCoUNTING TREATMENTIn the preparation of financial statements for 2007–08,
there is no treatment of any transaction different from
that prescribed in the Accounting Standards notified
by Government of India under Section 211(3C) of the
Companies Act, 1956.
CoMMITTEES oF THE BoARD The Board Committees appointed by the Board focus
on specific areas and make informed decisions within
the authority delegated. Each Committee of the Board
is guided by its Charter, which defines the composition,
scope and powers of the Committee.
The Committees also make specific recommendations
to the Board on various matters from time-to time. All
decisions and recommendations of the Committees
are placed before the Board for information or for
approval.
DRL_AR2008_CorpPgs_PAP.indd 42 6/18/08 10:50:38 PM

43 | D R . R E D D Y ’ S L A B O R AT O R I E S LT D C O r p O r aT E g O v E r N a N C E
During the year based on the recommendations and
reviews made by the Board of Directors’ at the Board
retreat held in London proposed for the re-constitution
of the Board Committees and changes in the Board
processes and accordingly the Company has six Board-
level Committees, namely:
Audit Committee}}
Compensation Committee}}
Governance Committee}}
Shareholders’ Grievance Committee}}
Investment Committee and}}
Management Committee}}
audit committeeThe management is responsible for the Company’s
internal controls and the financial reporting process
while the statutory auditors are responsible for
performing independent audits of the Company’s
financial statements in accordance with generally
accepted auditing practices and for issuing reports based
on such audits. The Board of Directors has entrusted the
Audit Committee to supervise these processes and thus
ensure accurate and timely disclosures that maintain the
transparency, integrity and quality of financial control
and reporting. The primary responsibilities of the Audit
Committee are to:
Supervise the financial reporting process;}}
Review the financial results before placing them to }}
the Board along with related disclosures and filing
requirements;
Review the adequacy of internal controls in }}
the Company, including the plan, scope and
performance of the internal audit function;
Discuss with management the Company’s major }}
policies with respect to risk assessment and risk
management;
Hold discussions with statutory auditors on the }}
nature and scope of audits, and any views that
they have about the financial control and reporting
processes;
Ensure compliance with accounting standards, and }}
with listing requirements with respect to the financial
statements;
Recommend the appointment and removal of }}
external auditors and their fees;
Review the independence of auditors;}}
Ensure that adequate safeguards have been taken }}
for legal compliance both for the Company and its
Indian as well as foreign subsidiaries;
Review related party transactions; }}
Review the functioning of Whistle Blower }}
mechanism; and
Implementation of the applicable provisions of the }}
Sarbanes Oxley Act, 2002.
The Audit Committee is entirely composed of
independent Directors, and all members of the Audit
Committee are financially literate, and bring in expertise
in the fields of finance, economics, human resource
development, strategy and management. Mr. Ravi
Bhoothalingam, independent Director has accounting or
related financial management expertise.
During the year the Board of Directors reconstituted
the Audit Committee in terms of its composition
and presently the Committee consists of Dr. Omkar
Goswami, Mr. Ravi Bhoothalingam and Ms. Kalpana
Morparia as members of the Committee and Dr. Omkar
Goswami acts as the Chairman of the Committee.
The Audit Committee met four times during the
year: on 17 May 2007, 23 July 2007, 24 October 2007
and 25 January 2008. The Company is in compliance
with the provisions of the amended Clause 49 of the
listing agreement on the time gap between any two
Audit Committee meetings. In addition, the Chairman
of the Audit Committee and the other members of
the Audit Committee met additionally to review other
processes, particularly the progress on internal control
mechanisms to prepare for certification under Section
404 of the Sarbanes Oxley Act, 2002. Table 5 gives
the composition and attendance record of Audit
Committee.
The Chief Executive Officer, Chief Financial Officer
and Chief Internal Auditor are permanent invitees to all
Audit Committee meetings. The statutory auditors of
the Company were present in all the Audit Committee
meetings during the year. The Company Secretary is the
Secretary of the Committee.
The Audit Committee meetings were generally half-
day sessions, except in the case of half-yearly and annual
results, where they extend to full day sessions. The
agenda for the Audit Committee included the following
items:
TablE 5 Audit Committee Attendance I N F I N A N C I A L Y E A R 2 0 0 7 – 0 8
Committee members position meetings held meetings attendedDr. Omkar Goswami(1) Chairman 4 3
Mr. Anupam Puri(2) Member 3 3
Ms. Kalpana Morparia(3) Member 1 1
Prof. Krishna G Palepu(1) (2) Member 3 2
Mr. P N Devarajan(2) Member 3 3
Mr. Ravi Bhoothalingam Member 4 4(1) were given leave of absence on request.(2) Ceased to be the members of the Committee on reconstitution effective 24 october 2007.(3) Member of the Committee effective 24 october 2007
DRL_AR2008_CorpPgs_PAP.indd 43 6/18/08 10:50:38 PM

44 | A N N U A L R E P O R T 2 0 0 7 – 0 8 C O N S O l i d aT i N g f O r T h E f u T u r E
Review of financial performance, including business }}
level financial performance.
Internal audit, control matters and risk management, }}
including action-taken reports.
Status on the implementation of the compliance }}
with Section 404 of the Sarbanes Oxley Act, 2002
and its sustenance.
Discussion with statutory auditors, including new }}
accounting policies relating to Indian as well as U.S.
accounting principles and practices, and
Detailed operational and financial risk appraisals, as }}
well as risks relating to legal compliance.
The internal and statutory auditors of the Company
discuss their audit findings and updates with the Audit
Committee and submit their views directly to the
Committee. Meetings with internal auditors focus on
detailed reviews of the processes and internal controls
in the Company. This practice enables the Directors in
smaller groups to devote more time towards business
and financial performance during the Audit Committee
meetings.
The report of the Audit Committee is enclosed as
Exhibit 2 to this Section.
compensation committeeThe Compensation Committee, entirely composed of
independent Directors, reviews the performance of
the executive Directors and senior executives one level
below the Board, and also reviews the remuneration
package offered by the Company to different
grades / levels of its employees. While reviewing the
remuneration of senior management personnel, the
Committee takes into account the following:
Financial position of the Company;}}
Trends in the industry;}}
Appointee’s qualifications and experience;}}
Past performance;}}
Past remuneration; etc.}}
The Compensation Committee administers
Dr. Reddy’s Employee Stock Option Scheme, 2002 and
Dr. Reddy’s Employees ADR Stock Option Scheme, 2007.
The details of stock options granted by the Committee
have been discussed in the Directors’ Report.
The Chief of Human Resources makes periodic
presentations to the Compensation Committee on
organization structure, performance appraisals,
increments and performance bonus recommendations.
These keep the Directors updated on various Human
Resources matters.
During the year the Board of Directors reconstituted
the Compensation Committee in terms of its
composition and presently the Committee consists of
Mr. Ravi Bhoothalingam, Dr. J P Moreau, Ms. Kalpana
Morparia and Mr. P N Devarajan as members of the
Committee and Mr. Ravi Bhoothalingam acts as the
Chairman of the Committee.
The Compensation Committee met three times
during the year: on 17 May 2007, 23 July 2007,
24 October 2007 and 25 January 2008. Table 6
gives the composition and attendance record of the
Compensation Committee.
The Chief of Human Resources is the Secretary of the
Committee. The report of the Compensation Committee
is enclosed as Exhibit 3 to this Section.
Governance committeeDuring the year the Board of Directors reconstituted
the Governance Committee in terms of its composition
and renamed the Committee as Governance
Committee. Presently the Committee consists of
Mr. Anupam Puri, Prof. Krishna G Palepu and
Dr. Omkar Goswami as members of the Committee
and Mr. Anupam Puri acts as the Chairman of
the Committee. Mr. P N Devarajan ceased to be
the member of the Committee subsequent to the
reconstitution effective 24 October 2007. The
existing Committee maintains the composition of the
independent Directors as members of the Committee.
The role of the Governance Committee is to:
Shortlist nominees for induction to the Board of the }}
Company;
Selection of nominees on the Board of the Company;}}
Recommend appointment of members to the Board }}
for its consideration; and
Review principles of corporate governance of the }}
Company.
The Governance Committee met once during the
year on 17 May 2007, and all members attended. The
Company Secretary is the Secretary of the Committee.
TablE 6 Compensation Committee Attendance I N F I N A N C I A L Y E A R 2 0 0 7 – 0 8
Committee members position meetings held meetings attendedMr. Ravi Bhoothalingam Chairman 4 4
Mr. Anupam Puri(1) Member 2 2
Dr. J P Moreau(2) Member 2 2
Ms. Kalpana Morparia(2) Member 2 2
Prof. Krishna G Palepu(3) (1) Member 2 1
Dr. Omkar Goswami(1) Member 2 2
Mr. P N Devarajan Member 4 4(1) Ceased to be the members of the Committee on reconstitution effective 24 october 2007.(2) Member of the Committee effective 24 october 2007.(3) was given leave of absence on request.
DRL_AR2008_CorpPgs_PAP.indd 44 6/18/08 10:50:39 PM

45 | D R . R E D D Y ’ S L A B O R AT O R I E S LT D C O r p O r aT E g O v E r N a N C E
Strategy committeeThe role of this Committee is to:
Participate with management to develop or modify }}
the Company’s strategies, including
overall mergers and acquisition plans;}}
Recommend to the Board the adoption or }}
modification of the Company’s strategies;
Oversee the development of plans to implement }}
different strategies;
Review progress and implementation of the }}
strategies; and
Assess and provide guidance on internal and external }}
trends and developments that impact both strategy
and execution.
The Strategy Committee is a combination of
independent Directors and executive Directors.
The Chairman of the Committee is an independent
Director. The Committee met twice during the year
on 17 May 2007 and 24 July 2007. Table 7 gives the
composition and attendance record of the Strategy
Committee. The Company Secretary is the Secretary
of the Committee.
During the year based on the recommendations and
reviews made by the Board of Directors’ at the Board
retreat held in London proposed for the re-constitution
of the Board Committees and changes in the Board
processes. Subsequent to the reconstitution, the
Committee was repealed and accordingly the terms of
reference of the Committee were vested with the Board
of Directors of the Company.
Shareholders’ Grievance committeeThe Shareholders’ Grievance Committee is empowered
to perform all the functions of the Board in relation
to handling of Shareholders’ Grievances. It primarily
focuses on:
Review of investor complaints and their redressal;}}
Review of the queries received from investors;}}
Review of the work done by Share Transfer Agent; }}
and
Review of corporate actions related work.}}
The Shareholders’ Grievance Committee consists of
three Directors, including two executive Directors.
The Chairman of the Committee is an independent
Director. The Committee met four times during the
year: on 17 May 2007, 23 July 2007, 24 October 2007
and 25 January 2008. Table 8 gives the composition
and attendance record of the Shareholders’ Grievance
Committee. The Company Secretary is the Secretary of
the Committee.
The Company Secretary has been designated as
Compliance Officer of the Company. An analysis of
investor queries and complaints received during the year
and pending disposal is given in this Annual Report in
the Chapter on Additional Shareholders Information.
Investment committee The Investment Committee reviews the Company’s
capital investment proposals and ongoing projects.
It consists of three Directors, including two executive
Directors. The Chairman of the Committee is an
executive Director. The Committee met once during the
year on 7 November 2007 and all members attended.
The Company Secretary is the Secretary of
the Committee.
During the year the Board of Directors of the
Company revised the terms of reference in Charter of
the Investment Committee.
During the year, the Committee approved the
investments in the projects for Chemical Technical
Operations for its new block, existing facility
upgradations and for QC, R&D and Office
Infrastructure facilities in Biologics.
management committeeThe role of Management Committee is to authorize
Directors and officers of the Company to deal with day-
to-day business operations such as banking, treasury,
insurance, excise, customs, administrative and dealing
with other government / non-government authorities;
approve loans to subsidiaries or other entities / persons
up to an overall limit of Rs. 250 million; and approve
borrowings from any person up to an overall limit of
Rs. 250 million.
The Management Committee consists of three
Directors including two executive Directors. The
TablE 7 Strategy Committee Attendance I N F I N A N C I A L Y E A R 2 0 0 7 – 0 8
Committee members position meetings held meetings attendedProf. Krishna G Palepu Chairman 2 2
Mr. Anupam Puri Member 2 2
Mr. G V Prasad Member 2 2
Dr. Omkar Goswami Member 2 2
Mr. Satish Reddy Member 2 2
Mr. Ravi Bhoothalingam Member 2 2
TablE 8 Shareholders’ Grievance Committee Attendance I N F I N A N C I A L Y E A R 2 0 0 7 – 0 8
Committee members position meetings meetings attendedMr. P N Devarajan Chairman 4 4
Mr. G V Prasad Member 4 4
Mr. Satish Reddy Member 4 4
DRL_AR2008_CorpPgs_PAP.indd 45 6/18/08 10:50:39 PM

46 | A N N U A L R E P O R T 2 0 0 7 – 0 8 C O N S O l i d aT i N g f O r T h E f u T u r E
Chairman of the Committee is an executive Director.
The Committee held seven meetings during the year:
on 11 May 2007, 24 July 2007, 1 October 2007,
12 November 2007, 14 January 2008, 14 February 2008
and 28 March 2008. The Company Secretary is the
Secretary of the Committee.
manaGEmEnT
The management of Dr. Reddy’s has developed and
implemented policies, procedures and practices that
attempt to translate the Company’s core purpose and
mission into reality. The management also identifies,
measures, monitors and minimizes the risk factors in
the business and ensures safe, sound and efficient
operation. These are internally supervised and
monitored through the Management Council.
MANAGEMENT CoUNCILDr. Reddy’s Management Council consists of all
senior management members from the business
units and corporate centre of the Company. It has a
balanced representation from the Indian as well as its
overseas offices. Page no.s 36 and 37 of this Annual
Report gives the details of the members of
the Management Council.
The Management Council meets once in a quarter
for two to three full day sessions. Background notes
for the meetings are circulated in advance to facilitate
decision-making. Listed below are some of the key
issues that were considered by the Management Council
during the year under review:
Company’s long term strategy, growth initiatives and }}
priorities;
Monitoring overall Company performance, including }}
those of various business units;
Decision on major corporate policies;}}
Discussion and sign-off on annual plans, budgets }}
and investments and any other major initiatives;
Discussion on business alliances proposals and }}
Organizational design and matters.
During the year, out-bound training programmes
for team building were organized amongst the
Management Council members.
MANAGEMENT DISCUSSIoN AND ANALYSISThis annual report has a detailed Chapter on
Management Discussion and Analysis.
MANAGEMENT DISCLoSURESSenior management of the Company (employees at
Senior Director level and above, as well as certain
identified key employees) make annual disclosures
to the Board relating to all material financial and
commercial transactions where they have personal
interest, if any, that may have a potential conflict with
the interest of the Company at large. Such transactions
have been discussed in financials sections of this Annual
Report under Related Party Transactions.
PRoHIBITIoN oF INSIDER TRADINGThe Company has implemented a policy prohibiting
Insider Trading in conformity with applicable
regulations of the Securities Exchange Board of India
(“SEBI”) and Securities Exchange Commission (“SEC”)
of the USA. Necessary procedures have been laid down
for employees, connected persons and persons deemed
to be connected for trading in the securities of the
Company. Blackout / quite periods, when the employees
are not permitted to trade in the securities of the
Company, are intimated to all employees from time
to time.
InTERnal cOnTROl SySTEmS
Effective governance consists of competent
management; implementation of standard policies
and processes; maintenance of an appropriate audit
programme and internal control environment
and effective risk monitoring and management
information systems.
Dr. Reddy’s has both external and internal audit
systems in place. Auditors have access to all records
and information of the Company. The Board and
the management periodically review the findings
and recommendations of the auditors and take
necessary corrective actions wherever necessary.
The Board recognizes the work of the auditors as an
independent check on the information received from
the management on the operations and performance of
the Company.
INTERNAL CoNTRoLSThe Company maintains a system of internal controls
designed to provide reasonable assurance regarding the
achievement of objectives in following categories:
Effectiveness and efficiency of operations;}}
Adequacy of safeguards for assets;}}
Reliability of financial controls; and}}
Compliance with applicable laws and regulations.}}
The integrity and reliability of the internal control
systems are achieved through clear policies and
procedures, process automation, careful selection,
training and development of employees, and an
organization structure that segregates responsibilities.
Internal Audit at Dr. Reddy’s is an independent and
objective assurance function, responsible for evaluating
and improving the effectiveness of risk management,
control, and governance processes.
The department prepares annual audit plans
based on risk assessment, and conducts extensive
reviews covering financial, operational and compliance
controls and risk mitigation. Areas requiring specialized
knowledge are reviewed in partnership with external
experts. Improvement opportunities identified during
reviews are communicated to the management on an
on-going basis.
The Audit Committee of the Board monitors the
performance of internal audit on a periodic basis
DRL_AR2008_CorpPgs_PAP.indd 46 6/18/08 10:50:39 PM

47 | D R . R E D D Y ’ S L A B O R AT O R I E S LT D C O r p O r aT E g O v E r N a N C E
through review of audit plans, audit findings and speed
of issue resolution through follow ups.
STATUToRY AND US GAAP AUDITSFor 2007–08, BSR & Co. audited the financial
statements prepared under the Indian GAAP.
The Company had also appointed KPMG as
independent auditors for the purpose of issuing
opinion on the financial statements prepared under the
US GAAP.
While auditing the operations of the Company,
the external auditors recorded their observations and
findings with the management. These were then
discussed by the management, and the auditors at
Audit Committee meetings as well as Audit Committee
conference calls. Corrective actions suggested by the
auditors and the Audit Committee have been either
implemented or taken up for implementation by
the management. Independent auditors render an
opinion regarding the fair presentation in the financial
statements of the Company’s financial condition and
operating results. Their audit was made in accordance
with generally accepted auditing standards, and
included a review of the internal controls, to the extent
considered necessary, to determine the audit procedures
required to support their opinion.
AUDIToRS’ FEESDuring the year, the Company paid Rs. 6.55 million to
the statutory auditors of the Company BSR & Co. as
auditors’ fees. The Company also paid Rs. 1.23 million
to the statutory auditors of the Company BSR & Co. for
taxation and other matters.
InFORmaTIOn TO STakEHOlDERS
DISSEMINATIoN oF INFoRMATIoNThe Company has established systems and procedures
to disseminate relevant information to its stakeholders,
including shareholders, analysts, suppliers, customers,
employees and the society at large. The primary
source of information regarding the operations of the
Company is the corporate website of the Company
www.drreddys.com.
All official news releases and presentations made
to institutional investors and analysts are posted on the
Company’s website. An analysis of the various means of
dissemination of information in the year under review is
produced in Table 9.
Quarterly and Annual results of the Company are
published in widely circulated national newspapers such
as The Economic Times, Business Line and the local daily
Vaartha. These are also disseminated internationally
through Business Wire.
In addition to the corporate website, the Company
maintains various portals such as www.customer2drl.
com, www.housecallsindia.com and www.drlintouch.
com, which have proved to be effective and widely
appreciated tools for information dissemination.
INFoRMATIoN To SHAREHoLDERSReappointment of Directors MR. ANUPAM PURI
INDEPENDENT DIRECToR
Mr. Anupam Puri joined the Board of Directors of the
Company as Director in 2002.
From 1970 to 2000, Mr. Anupam Puri was with
McKinsey & Company. He worked globally with
corporate clients in several industries on strategy
and organizational issues, and also served several
governments and multilateral institutions on public
policy. Mr. Anupam Puri spearheaded the development
of McKinsey’s India practice, oversaw the Asian and
Latin American offices, and was an elected member
of the Board. He is currently a Special Advisor for
Corsair Capital LLC. Mr. Anupam Puri holds a M. Phil.
in Economics, Nuffield College, Oxford University,
1969; an MA in Economics from Balliol College, Oxford
University, 1967; and a BA in Economics from Delhi
University, India, 1965. He is also on the Boards of ICICI
Bank Limited, Mahindra & Mahindra Limited and Tech
Mahindra Limited.
He has 1,500 equity shares and 2000 ADRs of the
Company as on 31 March 2008.
PRoF. KRISHNA G PALEPU
INDEPENDENT DIRECToR
Prof. Krishna G Palepu joined the Company’s Board
as Director in 2002. Prof. Palepu is the Ross Graham
Walker Professor of Business Administration at the
Harvard Business School. He holds the titles of Senior
Associate Dean for International Development. Prof.
Palepu’s current teaching and research activities focus
on Globalization and Corporate Governance. He
has published numerous research papers and cases,
and is also the co-author of the book titled ‘Business
Analysis & Valuation: Text and Cases.’ Prof. Palepu has
a Masters degree in physics from Andhra University,
a Postgraduate Diploma in Management from the
Indian Institute of Management, and a Ph.D. from
the Massachusetts Institute of Technology. He is also
a recipient of an Honourary MA from Harvard, and
an Honourary Doctorate from the Helsinki School of
Economics. He serves as a consultant to a wide variety
of businesses and is on the Boards of Satyam Computer
Services Limited, Brooks Automation, and Polymedica
Corporation.
TablE 9 Details of Communication made I N F I N A N C I A L Y E A R 2 0 0 7 – 0 8
means of communication frequencyPress releases / statements 27
Earnings calls 4
Publication of results 4
DRL_AR2008_CorpPgs_PAP.indd 47 6/18/08 10:50:39 PM

48 | A N N U A L R E P O R T 2 0 0 7 – 0 8 C O N S O l i d aT i N g f O r T h E f u T u r E
He has 1,500 equity shares of the Company as on
31 March 2008.
compliance Report on nySE corporate Governance GuidelinesPursuant to Section 303A.11 of the NYSE Listed
Companies Manual, Dr. Reddy’s which is a foreign
private issuer as defined by Securities and Exchange
Commission, must make its U.S. investors aware of the
significant ways in which the corporate governance
practices differ from those required of domestic
companies under NYSE listing standards. A detailed
analysis of this has been posted on Dr. Reddy’s website
www.drreddys.com.
Compliance Report on Non-Mandatory Requirements
under Clause 49
The board1. The Chairman of Dr. Reddy’s is an
executive Director and he maintains the Chairman’s
office at the Company’s expenses. The tenure of all
independent Directors on the Board is less than
nine years.
remuneration Committee2. The Board of Directors
has constituted a Compensation Committee, which is
composed of independent Directors. This Committee
also discharges the duties and responsibilities of
Remuneration Committee as contemplated under non
mandatory requirements of Clause 49. Details of the
Compensation Committee and its powers have been
discussed earlier in this section.
Shareholders rights3. The Company did not send
half yearly results to each household of the shareholders
in 2007–08. However, it displays its quarterly and half-
yearly results on its website www.drreddys.com and
published in widely circulated newspapers.
audit Qualifications4. The auditors have not
qualified the financial statements of the Company.
Training of board members5. The Company
believes that for the able discharge of the
responsibilities of the Board it is essential that Board
be continuously empowered with the knowledge of the
latest developments in the Company’s businesses and
the external environment affecting the industry
as a whole.
In pursuit of achieving this goal, during the year, the
Directors were given presentations on global business
environment, all business areas of the Company
including business strategy, risks and opportunities.
The Directors visited various manufacturing and
research locations of the Company.
mechanism for Evaluating independent 6. board members A lead Director amongst the
independent Directors has been identified to provide
structured feedback to the Board on the functioning
and performance of the Board to encourage healthy
discussions and openness amongst the members of
the Board.
Whistle blower policy 7. The Company has framed
a Whistle Blower policy, details of which have been
discussed earlier in this section.
additional shareholder informationThe detailed “additional shareholder information”
section is part of this Annual Report.
ExHIbIT 1
DECLARATIoN oF THE CHIEF ExECUTIVE oFFICER oN CoMPLIANCE WITH CoDE oF BUSINESS CoNDUCT AND ETHICSDr. Reddy’s Laboratories Limited has adopted a Code
of Business Conduct and Ethics (COBE / “the Code”),
which applies to all employees and Directors of the
Company, its subsidiaries and affiliates. Under the code,
it is the responsibility of all employees and Directors to
familiarize themselves with the Code and comply with
its standards.
I hereby certify that the Board members and senior
management personnel of Dr. Reddy’s have affirmed
compliance with the Code of the Company for the
financial year 2007–08.
G V PRASAD
VICE CHAIRMAN & CHIEF ExECUTIVE oFFICER
Date 20 May 2008
ExHIbIT 2
REPoRT oF THE AUDIT CoMMITTEE To the shareholders of Dr. Reddy’s Laboratories Limited
The Audit Committee of the Board of Directors
comprises three Directors. Each member of the
Committee is an independent Director as defined under
Indian laws, Clause 49 of the Listing Agreement and
the New York Stock Exchange Corporate Governance
Guidelines. The Committee operates under a written
charter adopted by the Board of Directors, and has
been vested with all the powers necessary to effectively
discharge its responsibilities.
Dr. Reddy’s management has primary responsibility
for the financial statements and reporting process,
including the systems of internal controls. During the
year, the Committee discussed with the Company’s
internal auditors and statutory auditors the scope
and plans for their respective audits. The Committee
discussed the results of their examination, their
evaluation of the Company’s internal controls, and
overall quality of the Company’s financial reporting.
In fulfilling its oversight responsibilities, the
Committee has reviewed and discussed the Company’s
audited financial statements with the management.
BSR & Co., the Company’s independent auditors for
Indian GAAP financial statements, and KPMG, the
Company’s independent auditors for US GAAP financial
statements are responsible for expressing their opinion
on the conformity of the Company’s audited financial
statements with Generally Accepted Accounting
Principles.
Relying on the review and discussions with the
management and the independent auditors, the Audit
Committee believes that the Company’s financial
statements are fairly presented in conformity with
DRL_AR2008_CorpPgs_PAP.indd 48 6/18/08 10:50:40 PM

49 | D R . R E D D Y ’ S L A B O R AT O R I E S LT D C O r p O r aT E g O v E r N a N C E
Generally Accepted Accounting Principles in all
material aspects.
During the year, the Committee devoted
considerable time and effort towards the compliance
with Section 404 of the US Sarbanes-Oxley Act (SOX)
of 2002. In 2005–06, the Company became the first
Indian manufacturing company to comply with Section
404 of the US Sarbanes-Oxley Act (SOX), in advance of
the mandatory deadline of 31 March 2007 which was
applicable for foreign private issuers.
The Committee also devoted time towards
Enterprise-wide Risk Management processes and
discussed in detail the risk profiles of the Company and
their mitigation plans.
The Audit Committee has ensured that the
Company’s Code of Business Conduct and Ethics has the
mechanism whereby no personnel intending to make a
compliant relating to Securities and Financial reporting
shall be denied access to the Audit Committee.
The Audit Committee has recommended that
the Board accept the audited financial statements
prepared in accordance with Indian GAAP and financial
statements prepared under US GAAP as true and fair
statements of the financial health of the Company.
Further, the Committee has recommended that for
2008–09 the Board re-appoint BSR & Co. and KPMG as
statutory independent auditors for Indian GAAP and US
GAAP respectively.
DR. oMKAR GoSWAMI
CHAIRMAN, AUDIT CoMMITTEE
Date 19 May 2008
ExHIbIT 3
REPoRT oF THE CoMPENSATIoN CoMMITTEE To the shareholders of Dr. Reddy’s Laboratories Limited
The Compensation Committee of the Board of
Directors comprises four Directors. Each member of the
Committee is an independent Director as defined under
Indian laws and New York Stock Exchange Corporate
Governance Guidelines. The Committee operates under
a written charter adopted by the Board of Directors.
It has been vested with all the powers necessary to
effectively discharge its responsibilities.
The Committee believes that its principal objective
is to reward executive performance that will lead
to long-term enhancement of shareholder value.
The compensation policies are vital elements in the
Company’s drive to identify, develop and motivate
high-potential leaders to create and sustain outstanding
performance. The Compensation Committee is
responsible for overseeing performance evaluation,
approving compensation levels for all senior executives
and oversight of the administration of the Employee
Stock Option Plans.
During the year, the Committee discussed the
Company’s performance appraisal systems, and the
outcome of the performance assessment programs
and compensation policies. The Committee devoted
considerable time in discussing the organization design
and succession planning for critical positions within the
Company.
As on 31 March 2008, the Company had 1,115,346
outstanding stock options, which amounts to 0.66%
of total equity capital. The stock options have been
granted to 477 employees of the Company and its
subsidiaries under Dr. Reddy’s Employee Stock Options
Scheme, 2002 and Dr. Reddy’s Employee ADR Stock
Options Scheme, 2007. Out of the total 1,115,346
stock options, 158,780 stock options are exercisable
at Fair Market Value and 956,566 stock options are
exercisable at Par Value i.e. Rs. 5.
RAVI BHooTHALINGAM
CHAIRMAN, CoMPENSATIoN CoMMITTEE
Date 19 May 2008
CERTIFICATE oF CoMPLIANCE To the Members of Dr. Reddy’s Laboratories Limited
We have examined the compliance of conditions of
Corporate Governance by Dr. Reddy’s Laboratories
Limited (“the Company”), for the year ended on
31 March 2008, as stipulated in Clause 49 of the Listing
Agreement of the said Company with the Bombay
Stock Exchange and the National Stock Exchange. The
compliance of conditions of Corporate Governance is
the responsibility of the management. Our examination
was limited to procedures and implementation thereof,
adopted by the Company for ensuring the compliance
of the conditions of the Corporate Governance. It is
neither an audit nor an expression of opinion on the
financial statements of the Company.
In our opinion and to the best of our information
and according to the explanations given to us, we certify
that the Company has complied with the conditions
of Corporate Governance as stipulated in the above
mentioned Listing Agreement.
We further state that such compliance is neither
an assurance as to the future viability of the Company
nor the efficiency or effectiveness with which the
management has conducted the affairs of the Company.
for BSR & Co.CHARTERED ACCoUNTANTS
S SETHURAMAN
PARTNER
Membership No. 203491
Place Hyderabad
Date 20 May 2008
DRL_AR2008_CorpPgs_PAP.indd 49 6/18/08 10:50:40 PM

A D D I T I o N A L S H A R E H o L D E R I N F o R M A T I o N
50 | A N N U A L R E P O R T 2 0 0 7 – 0 8 C O N S O l i d aT i N g f O r T h E f u T u r E
cOnTacT InFORmaTIOn
REGISTERED AND CoRPoRATE oFFICEdr. reddy’s laboratories limited7-1-27, Ameerpet, Hyderabad 500 016
Andhra Pradesh, India
T +91-40-2373 1946
F +91-40-2373 1955
W http://www.drreddys.com
REPRESENTING oFFICERSCorrespondence to the following officers may be
addressed at the registered and corporate office of the
Company.
CHIEF CoMPLIANCE oFFICERSaumen Chakraborty Chief Financial Officer
T +91-40-2373 1946
F +91-40-2373 1955
CoMPLIANCE oFFICERv S SureshCompany Secretary
T +91-40-2373 4504
F +91-40-2373 1955
ADR INVESToRS / INSTITUTIoNAL INVESToRS / FINANCIAL ANALYSTSNikhil Shah Investor Relations
T +91-40-6651 1532
F +91-40-2373 1955
INDIAN RETAIL INVESToRSN v S pavan kumarCorporate Secretarial
T +91-40-2374 5274
F +91-40-2373 1955
E [email protected] / [email protected]
MEDIAm mythiliCorporate Communications
T +91-40-6651 1620
F +91-40-6651 1621
annUal GEnERal mEETInG
Date Tuesday, 22 July 2008
Time 11.30 AM
Venue Grand Ball Room, Hotel Taj Krishna
Road No.1, Banjara Hills, Hyderabad 500 034
Last date for receipt of proxy forms— 20 July 2008
before 11.30 AM.
Financial Calendar
Tentative Calendar for declaration of financial results in 2008–09
For the quarter ending 30 June 2008 Last week of July, 2008
For the quarter and half year ending 30 September 2008 Last week of October, 2008
For the quarter and nine months ending 31 December 2008 Last week of January, 2009
For the year ending 31 March 2009 Last week of May, 2009
AGM for the year ending 31 March 2009 Second fortnight of July, 2009
DIvIDEnD
The Board of Directors of the Company has proposed
a dividend of Rs. 3.75 on equity shares of Rs. 5 each.
The dividend will be paid on or after 26 July 2008, if
approved by the shareholders at the Annual General
Meeting scheduled on 22 July 2008.
bOOk clOSURE DaTE
The dates of book closure are from 8 July 2008 to
12 July 2008 (both days inclusive) for the purpose of
payment of dividend.
DRL_AR2008_CorpPgs_PAP.indd 50 6/18/08 10:50:40 PM
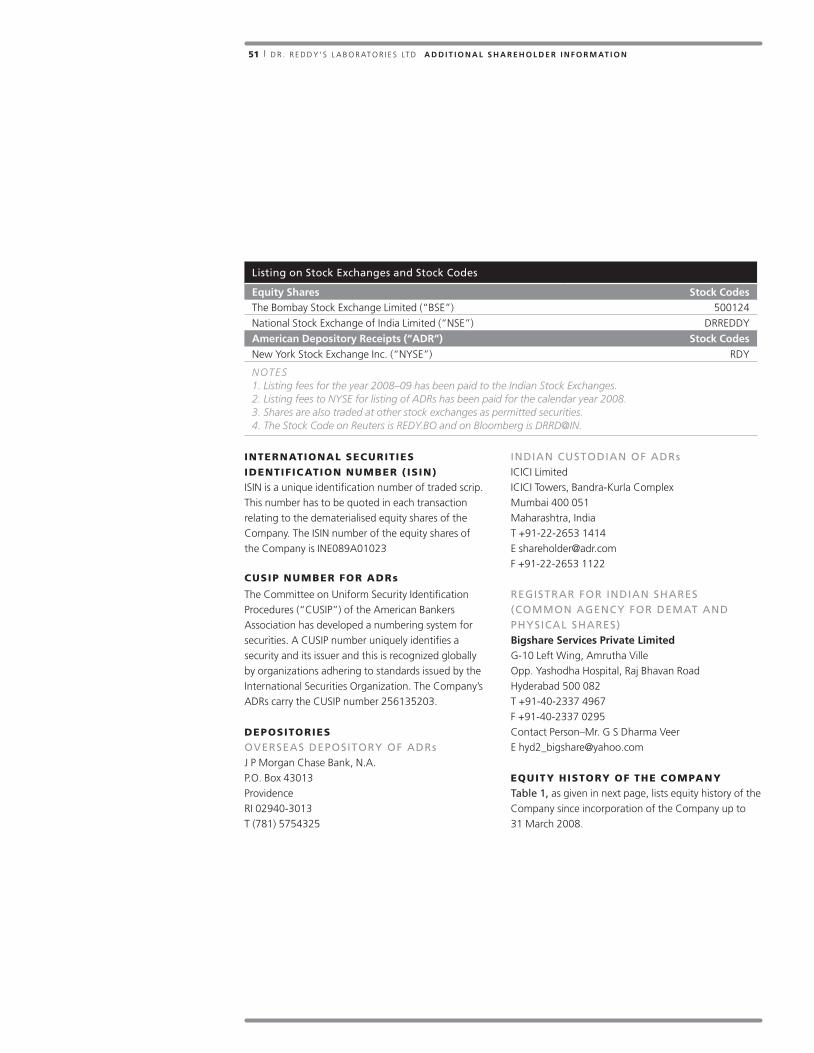
51 | D R . R E D D Y ’ S L A B O R AT O R I E S LT D a d d i T i O N a l S h a r E h O l d E r i N f O r m aT i O N
InTERnaTIOnal SEcURITIES
IDEnTIFIcaTIOn nUmbER ( ISIn)
ISIN is a unique identification number of traded scrip.
This number has to be quoted in each transaction
relating to the dematerialised equity shares of the
Company. The ISIN number of the equity shares of
the Company is INE089A01023
cUSIP nUmbER FOR aDRs
The Committee on Uniform Security Identification
Procedures (“CUSIP”) of the American Bankers
Association has developed a numbering system for
securities. A CUSIP number uniquely identifies a
security and its issuer and this is recognized globally
by organizations adhering to standards issued by the
International Securities Organization. The Company’s
ADRs carry the CUSIP number 256135203.
DEPOSITORIES
oVERSEAS DEPoSIToRY oF ADRsJ P Morgan Chase Bank, N.A.
P.O. Box 43013
Providence
RI 02940-3013
T (781) 5754325
INDIAN CUSToDIAN oF ADRsICICI Limited
ICICI Towers, Bandra-Kurla Complex
Mumbai 400 051
Maharashtra, India
T +91-22-2653 1414
F +91-22-2653 1122
REGISTRAR FoR INDIAN SHARES (CoMMoN AGENCY FoR DEMAT AND PHYSICAL SHARES)bigshare Services private limitedG-10 Left Wing, Amrutha Ville
Opp. Yashodha Hospital, Raj Bhavan Road
Hyderabad 500 082
T +91-40-2337 4967
F +91-40-2337 0295
Contact Person–Mr. G S Dharma Veer
EqUITy HISTORy OF THE cOmPany
Table 1, as given in next page, lists equity history of the
Company since incorporation of the Company up to
31 March 2008.
Listing on Stock Exchanges and Stock Codes
Equity Shares Stock CodesThe Bombay Stock Exchange Limited (“BSE”) 500124
National Stock Exchange of India Limited (“NSE”) DRREDDY
american depository receipts (“adr”) Stock Codes
New York Stock Exchange Inc. (“NYSE”) RDY
NoteS1. Listing fees for the year 2008–09 has been paid to the Indian Stock exchanges.2. Listing fees to NYSe for listing of ADRs has been paid for the calendar year 2008.3. Shares are also traded at other stock exchanges as permitted securities.4. the Stock Code on Reuters is ReDY.Bo and on Bloomberg is DRRD@IN.
DRL_AR2008_CorpPgs_PAP.indd 51 6/18/08 10:50:40 PM
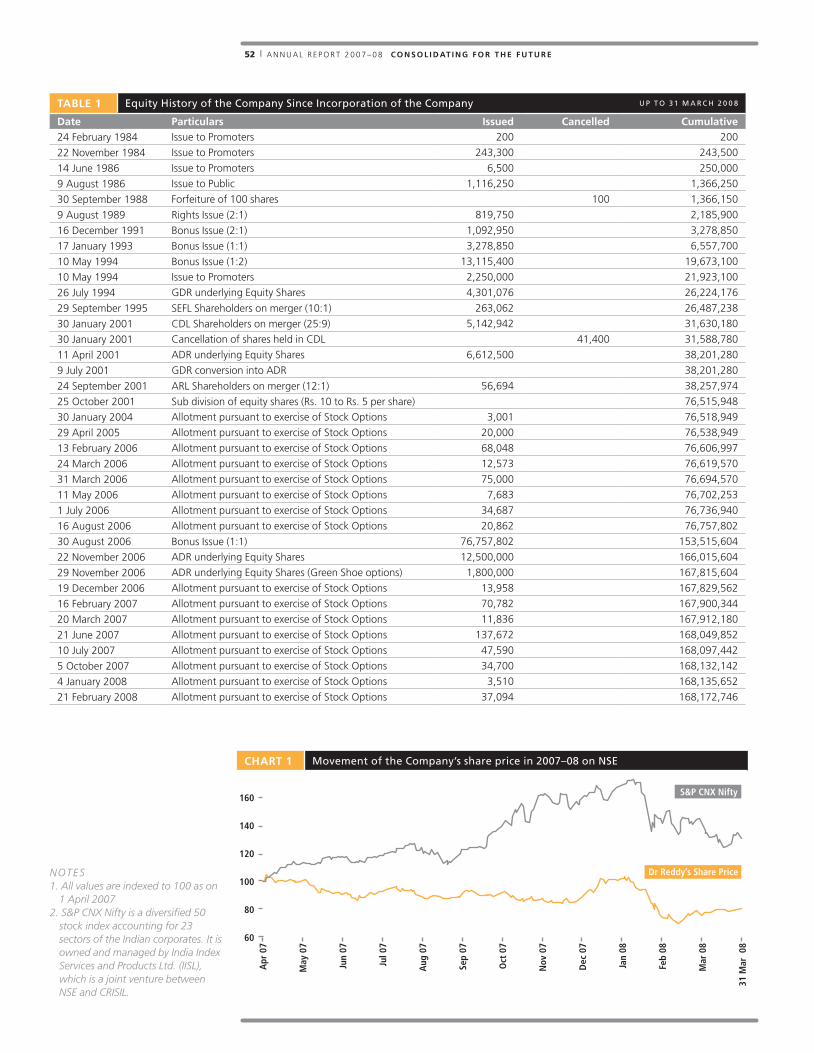
52 | A N N U A L R E P O R T 2 0 0 7 – 0 8 C O N S O l i d aT i N g f O r T h E f u T u r E
TablE 1 Equity History of the Company Since Incorporation of the Company U P T o 3 1 M A R C H 2 0 0 8
date particulars issued Cancelled Cumulative
24 February 1984 Issue to Promoters 200 200
22 November 1984 Issue to Promoters 243,300 243,500
14 June 1986 Issue to Promoters 6,500 250,000
9 August 1986 Issue to Public 1,116,250 1,366,250
30 September 1988 Forfeiture of 100 shares 100 1,366,150
9 August 1989 Rights Issue (2:1) 819,750 2,185,900
16 December 1991 Bonus Issue (2:1) 1,092,950 3,278,850
17 January 1993 Bonus Issue (1:1) 3,278,850 6,557,700
10 May 1994 Bonus Issue (1:2) 13,115,400 19,673,100
10 May 1994 Issue to Promoters 2,250,000 21,923,100
26 July 1994 GDR underlying Equity Shares 4,301,076 26,224,176
29 September 1995 SEFL Shareholders on merger (10:1) 263,062 26,487,238
30 January 2001 CDL Shareholders on merger (25:9) 5,142,942 31,630,180
30 January 2001 Cancellation of shares held in CDL 41,400 31,588,780
11 April 2001 ADR underlying Equity Shares 6,612,500 38,201,280
9 July 2001 GDR conversion into ADR 38,201,280
24 September 2001 ARL Shareholders on merger (12:1) 56,694 38,257,974
25 October 2001 Sub division of equity shares (Rs. 10 to Rs. 5 per share) 76,515,948
30 January 2004 Allotment pursuant to exercise of Stock Options 3,001 76,518,949
29 April 2005 Allotment pursuant to exercise of Stock Options 20,000 76,538,949
13 February 2006 Allotment pursuant to exercise of Stock Options 68,048 76,606,997
24 March 2006 Allotment pursuant to exercise of Stock Options 12,573 76,619,570
31 March 2006 Allotment pursuant to exercise of Stock Options 75,000 76,694,570
11 May 2006 Allotment pursuant to exercise of Stock Options 7,683 76,702,253
1 July 2006 Allotment pursuant to exercise of Stock Options 34,687 76,736,940
16 August 2006 Allotment pursuant to exercise of Stock Options 20,862 76,757,802
30 August 2006 Bonus Issue (1:1) 76,757,802 153,515,604
22 November 2006 ADR underlying Equity Shares 12,500,000 166,015,604
29 November 2006 ADR underlying Equity Shares (Green Shoe options) 1,800,000 167,815,604
19 December 2006 Allotment pursuant to exercise of Stock Options 13,958 167,829,562
16 February 2007 Allotment pursuant to exercise of Stock Options 70,782 167,900,344
20 March 2007 Allotment pursuant to exercise of Stock Options 11,836 167,912,180
21 June 2007 Allotment pursuant to exercise of Stock Options 137,672 168,049,852
10 July 2007 Allotment pursuant to exercise of Stock Options 47,590 168,097,442
5 October 2007 Allotment pursuant to exercise of Stock Options 34,700 168,132,142
4 January 2008 Allotment pursuant to exercise of Stock Options 3,510 168,135,652
21 February 2008 Allotment pursuant to exercise of Stock Options 37,094 168,172,746
NoteS 1. All values are indexed to 100 as on
1 April 20072. S&P CNX Nifty is a diversified 50
stock index accounting for 23 sectors of the Indian corporates. It is owned and managed by India Index Services and Products Ltd. (IISL), which is a joint venture between NSe and CRISIL.
160
140
120
100
80
60
Dr Reddy’s Share Price
S&P CNX Nifty
Apr
07
May
07
Jun
07
Jul 0
7
Aug
07
Sep
07
Oct
07
Nov
07
Dec
07
Jan
08
Feb
08
Mar
08
31 M
ar 0
8
CharT 1 Movement of the Company’s share price in 2007–08 on NSE
DRL_AR2008_CorpPgs_PAP.indd 52 6/18/08 10:50:41 PM
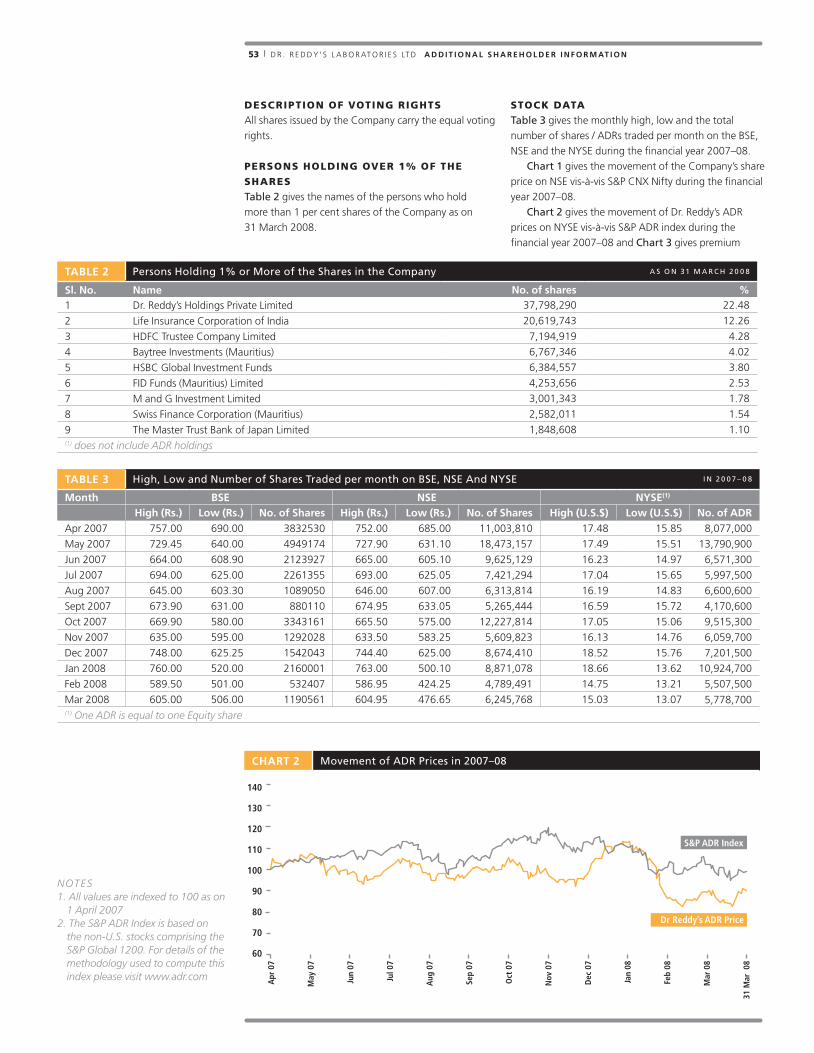
53 | D R . R E D D Y ’ S L A B O R AT O R I E S LT D a d d i T i O N a l S h a r E h O l d E r i N f O r m aT i O N
DEScRIPTIOn OF vOTInG RIGHTS
All shares issued by the Company carry the equal voting
rights.
PERSOnS HOlDInG OvER 1% OF THE
SHaRES
Table 2 gives the names of the persons who hold
more than 1 per cent shares of the Company as on
31 March 2008.
STOck DaTa
Table 3 gives the monthly high, low and the total
number of shares / ADRs traded per month on the BSE,
NSE and the NYSE during the financial year 2007–08.
Chart 1 gives the movement of the Company’s share
price on NSE vis-à-vis S&P CNX Nifty during the financial
year 2007–08.
Chart 2 gives the movement of Dr. Reddy’s ADR
prices on NYSE vis-à-vis S&P ADR index during the
financial year 2007–08 and Chart 3 gives premium
TablE 2 Persons Holding 1% or More of the Shares in the Company A S o N 3 1 M A R C H 2 0 0 8
Sl. No. Name No. of shares % 1 Dr. Reddy’s Holdings Private Limited 37,798,290 22.48
2 Life Insurance Corporation of India 20,619,743 12.26
3 HDFC Trustee Company Limited 7,194,919 4.28
4 Baytree Investments (Mauritius) 6,767,346 4.02
5 HSBC Global Investment Funds 6,384,557 3.80
6 FID Funds (Mauritius) Limited 4,253,656 2.53
7 M and G Investment Limited 3,001,343 1.78
8 Swiss Finance Corporation (Mauritius) 2,582,011 1.54
9 The Master Trust Bank of Japan Limited 1,848,608 1.10 (1) does not include ADR holdings
TablE 3 High, Low and Number of Shares Traded per month on BSE, NSE And NYSE I N 2 0 0 7 – 0 8
month bSE NSE NySE(1)
high (rs.) low (rs.) No. of Shares high (rs.) low (rs.) No. of Shares high (u.S.$) low (u.S.$) No. of adr
Apr 2007 757.00 690.00 3832530 752.00 685.00 11,003,810 17.48 15.85 8,077,000
May 2007 729.45 640.00 4949174 727.90 631.10 18,473,157 17.49 15.51 13,790,900
Jun 2007 664.00 608.90 2123927 665.00 605.10 9,625,129 16.23 14.97 6,571,300
Jul 2007 694.00 625.00 2261355 693.00 625.05 7,421,294 17.04 15.65 5,997,500
Aug 2007 645.00 603.30 1089050 646.00 607.00 6,313,814 16.19 14.83 6,600,600
Sept 2007 673.90 631.00 880110 674.95 633.05 5,265,444 16.59 15.72 4,170,600
Oct 2007 669.90 580.00 3343161 665.50 575.00 12,227,814 17.05 15.06 9,515,300
Nov 2007 635.00 595.00 1292028 633.50 583.25 5,609,823 16.13 14.76 6,059,700
Dec 2007 748.00 625.25 1542043 744.40 625.00 8,674,410 18.52 15.76 7,201,500
Jan 2008 760.00 520.00 2160001 763.00 500.10 8,871,078 18.66 13.62 10,924,700
Feb 2008 589.50 501.00 532407 586.95 424.25 4,789,491 14.75 13.21 5,507,500
Mar 2008 605.00 506.00 1190561 604.95 476.65 6,245,768 15.03 13.07 5,778,700(1) one ADR is equal to one equity share
NoteS1. All values are indexed to 100 as on
1 April 20072. the S&P ADR Index is based on
the non-U.S. stocks comprising the S&P Global 1200. For details of the methodology used to compute this index please visit www.adr.com
140
130
120
110
100
90
80
70
60
Dr Reddy’s ADR Price
S&P ADR Index
Apr
07
May
07
Jun
07
Jul 0
7
Aug
07
Sep
07
Oct
07
Nov
07
Dec
07
Jan
08
Feb
08
Mar
08
31 M
ar 0
8
CharT 2 Movement of ADR Prices in 2007–08
DRL_AR2008_CorpPgs_PAP.indd 53 6/18/08 10:50:42 PM

54 | A N N U A L R E P O R T 2 0 0 7 – 0 8 C O N S O l i d aT i N g f O r T h E f u T u r E
in per cent on ADR traded at NYSE compared to price
quoted at NSE.
SHaREHOlDInG PaTTERn aS On
31 maRcH 2008
Tables 4 and 5 give the data on shareholding classified
on the basis of ownership and shareholder class,
respectively.
DIvIDEnD HISTORy
Chart 4 gives the dividend history of the Company from
1996–97. The dividend proposed for 2007–08 is 75%
i.e Rs. 3.75 pre share of Rs. 5 face value.
nOmInaTIOn FacIlITy
Shareholders holding physical shares may, if they so
want, send their nominations in prescribed Form 2B of
TablE 4 Distribution of Shareholdings on the Basis of ownership
as on 31 march 2008 31 march 2007 No. of shares % of total No. of shares % of total % change
promoter’s holding
Individuals 4,479,484 2.66 4,489,584 2.68 (0.02)
Companies 37,798,290 22.48 37,798,290 22.51 (0.03)
Sub-Total 42,277,774 25.14 42,287,874 25.19 (0.05)
Indian Financial Institutions 21,366,488 12.71 13,961,129 8.31 4.40
Banks 405,898 0.24 523,345 0.31 (0.07)
Mutual Funds 9,691,099 5.76 10,794,465 6.43 (0.67)
foreign holdings
Foreign Institutional Investors 41,726,515 24.81 46,162,315 27.49 (2.68)
Non Resident Indians 3,231,295 1.92 3,412,822 2.03 (0.11)
ADRs / Foreign National 28,174,977 16.75 27,880,976 16.61 0.14
Overseas Corporate Bodies – – – – –
Sub total 104,596,272 62.19 102,735,052 61.18 (1.01)
Indian Public and Corporate 21,298,700 12.67 22,889,254 13.63 (0.96)
Total 168,172,746 100.00 167,912,180 100.00
TablE 5 Distribution of Shareholding According to Shareholder Class o N 3 1 M A R C H 2 0 0 8
Shares held No. of shareholders % of shareholders No. of shares held % of share holding1 – 5,000 96,555 96.17 8,299,806 4.93
5,001 – 10,000 1,590 1.58 2,334,134 1.39
10,001 – 20,000 1,128 1.12 3,326,926 1.98
20,001 – 30,000 355 0.35 1,808,732 1.08
30,001 – 40,000 223 0.22 1,532,020 0.91
40,001 – 50,000 88 0.09 802,367 0.48
50,001 – 100,000 226 0.23 3,062,050 1.82
100,001 and above 231 0.24 118,834,394 70.66
Total, excluding adrs 100,396 100.00 140,000,429 83.25
Equity shares underlying ADRs(1) 1 0.00 28,172,317 16.75
Total 100,397 100.00 168,172,746 100.00(1) held by beneficial owners outside India
NoteS Premium has been calculated on a daily basis using RBI reference exchange rate
10
8
6
4
2
0
-2
-4
-6
-8
-10
Apr
07
May
07
Jun
07
Jul 0
7
Aug
07
Sep
07
Oct
07
Nov
07
Dec
07
Jan
08
Feb
08
31 M
ar 0
8
CharT 3 Premium on ADR Traded at NYSE, Versus Price quoted at the NSE ( I N % )
DRL_AR2008_CorpPgs_PAP.indd 54 6/18/08 10:50:43 PM

55 | D R . R E D D Y ’ S L A B O R AT O R I E S LT D a d d i T i O N a l S h a r E h O l d E r i N f O r m aT i O N
the Companies (Central Government’s) General Rules
and Forms, 1956 to the Registrars & Transfer Agents of
the Company. Those holding shares in dematerialised
form may contact their respective Depository Participant
(DP) to avail the nomination facility.
SHaRE TRanSFER SySTEm
All services relating to share transfers / transmissions and
information may be addressed to:
bigshare Services private limitedG-10 Left Wing, Amrutha Ville
Opp. Yashodha Hospital, Raj Bhavan Road
Hyderabad 500 082
T +91-40-2337 4967
F +91-40-2337 0295
Contact Person–Mr. Dharma Veer, Branch Manager
The Company periodically audits the operations of
Share Transfer Agent. The number of shares transferred /
transmitted in physical form during the last two financial
years is given in Table 6.
DEMATERIALISATIoN oF SHARESThe Company’s scrip forms part of the compulsory
dematerialisation segment for all investors with effect
from 15 February 1999. To facilitate easy access of the
dematerialised system to the investors, the Company
has signed up with both the depositories — namely, the
National Securities Depository Limited (“NSDL”) and the
Central Depository Services (India) Limited (“CDSL”) —
and has established connectivity with the depositories
through its Registrar, Bigshare Services Private Limited.
Chart 5 gives the breakup of dematerialized
shares and shares in certificate form as on 31 March
2008 as compared with that of 31 March 2007.
Dematerialisation of shares is done through Bigshare
Services Private Limited and on an average the
dematerialisation process is completed within 10 days
from the date of receipt of a valid dematerialisation
request along with the relevant documents.
SECRETARIAL AUDIT For each quarter of the financial year 2007–08, a
qualified practicing Company Secretary carried out
secretarial audits to reconcile the total admitted capital
TablE 6 Shares Transferred / Transmitted in Physical Form
2007–08 2006–07Number of transfers / transmissions 188 317
Number of shares 31,811 54,172
CharT 5 Break Up of Dematerialized Shares and Shares in Physical Form
CharT 4 The Dividend History of the Company from 1996–97
30% 30% 30% 30%40%
150%
100% 100% 100%
75%
100%
75%
96-97 97-98 98-99 99-00 00-01 01-02 02-03 03-04 04-05 05-06 06-07 07-08
Final Dividend
Interim Dividend
Electronic FormCDSL
Physical Form2.58%
18.96%
1.28%
Physical FormPromoters
ElectronicFormNSDL
ElectronicFormCDSL
Physical Form2.36%
18.93%
1.16%
77.55%Physical FormPromoters
Electronic FormNSDL
DRL_AR2008_CorpPgs_PAP.indd 55 6/18/08 10:50:43 PM

56 | A N N U A L R E P O R T 2 0 0 7 – 0 8 C O N S O l i d aT i N g f O r T h E f u T u r E
with NSDL and CDSL, and total issued and listed capital.
The audit reports confirm that the total issued / paid up
capital is in agreement with the total number of shares
in physical form and the total number of dematerialized
shares held with NSDL and CDSL.
OUTSTanDInG aDRs anD THEIR ImPacT
On EqUITy SHaRES
The Company’s ADRs are traded in the U.S. on New
York Stock Exchange (“NYSE”) under the ticker symbol
‘RDY’. Each ADR is represented by one equity share.
As on 31 March 2008, there were approximately
22,600 record holders of ADRs evidencing
28,172,317 ADRs.
qUERIES anD REqUESTS REcEIvED FROm
SHaREHOlDERS In 2007– 08
Table 7 gives details of types of shareholder queries
received and replied to during 2007–08. Pending queries
and requests were either received during the last week
of March 2008, or were pending due to non-receipt of
information / documents from the shareholders.
DaTES anD vEnUE OF laST THREE
annUal GEnERal mEETInGS
Table 8 gives the date, time, location and business
transacted at last three Annual General Meetings.
All special resolutions in the Annual General
Meetings held in 2005 and 2006 were passed
through show of hands. There is no proposal to
conduct postal ballot for any matter in ensuing
Annual General Meeting.
DISclOSURE On lEGal PROcEEDInGS
PERTaInInG TO SHaRES
There are six pending cases relating to disputes over title
of the shares, in which the Company has been made a
party. These cases, however, are not material in nature.
UnclaImED DIvIDEnDS
Pursuant to section 205A of the Companies Act,
1956, unclaimed dividends up to and including for the
financial year 1999–2000 have been transferred to the
general revenue account of the Central Government /
Investor Education and Protection Fund.
TablE 7 Shareholder queries and Requests Received and Replied to I N 2 0 0 7 – 0 8
Sl. No. Nature of letters Opening balance received replied Closing balance(1)
1 Change of address – 227 227 –
2 Revalidation and issue of duplicate dividend warrants 33 498 507 24
3 Sub-division of shares – 277 277 –
4 Share transfers 19 203 219 3
5 Transmission of shares – 27 27 –
6 Split of shares – 5 5 –
7 Stop transfer – 35 35 –
8 Power of attorney registration – 1 1 –
9 Change of bank mandate – 34 34 –
10 Correction of name – 1 1 –
11 Dematerialization of Shares 8 1,091 1,095 4
12 Rematerialization of Shares – 8 8 –
13 lssue of duplicate share certificates of Dr. Reddy’s 3 18 20 1
14 lssue of duplicate share certificates of ARL / SEFL / CDL – 26 26 –
15 Letters & emails received from Shareholders 2 308 298 12
16 Complaints received from Stock Exchanges / SEBI etc. – 50 50 –(1)the Company has resolved all the shareholders’ complaints as on 31 March 2008. the above table does not include those shareholders’ complaints,
which are pending in various courts.
TablE 8 Last Three Annual General Meetings
year date and time location Special resolution(s) passed
2004–05 27 July 2005 At 11.30 A.M Hotel Viceroy, Tank Bund Road, Hyderabad 500 080
Amendment in Dr. Reddy’s }}Employees Stock Options Scheme, 2002
Approval to the Employees Stock }}Option Scheme
2005–06 28 July 2006 At 11.30 A.M. Grand Ball Room, Hotel Taj Krishna, Road No. 1, Banjara Hills, Hyderabad – 500 034
Remuneration of Directors other }}than the Managing / Whole-time Directors
Further issue of shares}}
2006–07 24 July 2007 At 11.30 A.M. Grand Ball Room, Hotel Taj Krishna, Road No. 1, Banjara Hills, Hyderabad – 500 034
No Special resolution was passed
DRL_AR2008_CorpPgs_PAP.indd 56 6/18/08 10:50:44 PM
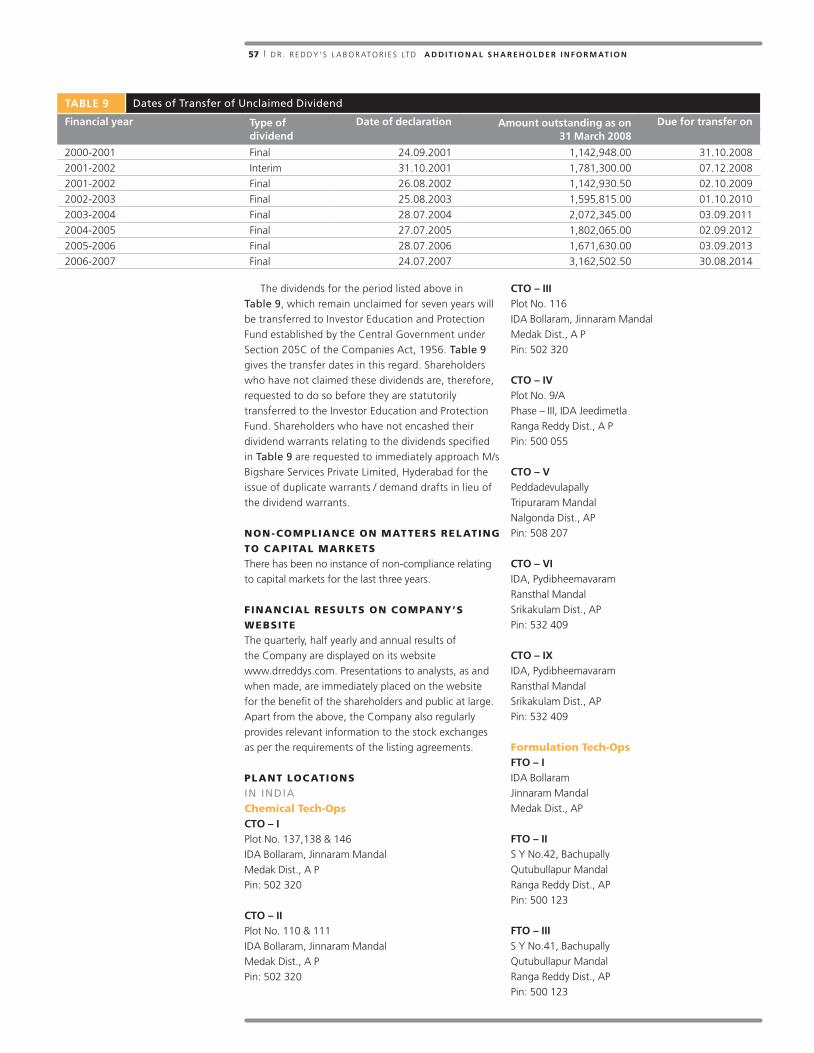
57 | D R . R E D D Y ’ S L A B O R AT O R I E S LT D a d d i T i O N a l S h a r E h O l d E r i N f O r m aT i O N
The dividends for the period listed above in
Table 9, which remain unclaimed for seven years will
be transferred to Investor Education and Protection
Fund established by the Central Government under
Section 205C of the Companies Act, 1956. Table 9
gives the transfer dates in this regard. Shareholders
who have not claimed these dividends are, therefore,
requested to do so before they are statutorily
transferred to the Investor Education and Protection
Fund. Shareholders who have not encashed their
dividend warrants relating to the dividends specified
in Table 9 are requested to immediately approach M/s
Bigshare Services Private Limited, Hyderabad for the
issue of duplicate warrants / demand drafts in lieu of
the dividend warrants.
nOn-cOmPlIancE On maTTERS RElaTInG
TO caPITal maRkETS
There has been no instance of non-compliance relating
to capital markets for the last three years.
FInancIal RESUlTS On cOmPany’S
WEbSITE
The quarterly, half yearly and annual results of
the Company are displayed on its website
www.drreddys.com. Presentations to analysts, as and
when made, are immediately placed on the website
for the benefit of the shareholders and public at large.
Apart from the above, the Company also regularly
provides relevant information to the stock exchanges
as per the requirements of the listing agreements.
PlanT lOcaTIOnS
IN INDIA chemical Tech-OpsCTO – iPlot No. 137,138 & 146
IDA Bollaram, Jinnaram Mandal
Medak Dist., A P
Pin: 502 320
CTO – iiPlot No. 110 & 111
IDA Bollaram, Jinnaram Mandal
Medak Dist., A P
Pin: 502 320
CTO – iiiPlot No. 116
IDA Bollaram, Jinnaram Mandal
Medak Dist., A P
Pin: 502 320
CTO – iv Plot No. 9/A
Phase – III, IDA Jeedimetla
Ranga Reddy Dist., A P
Pin: 500 055
CTO – v Peddadevulapally
Tripuraram Mandal
Nalgonda Dist., AP
Pin: 508 207
CTO – vi IDA, Pydibheemavaram
Ransthal Mandal
Srikakulam Dist., AP
Pin: 532 409
CTO – iX IDA, Pydibheemavaram
Ransthal Mandal
Srikakulam Dist., AP
Pin: 532 409
Formulation Tech-OpsfTO – iIDA Bollaram
Jinnaram Mandal
Medak Dist., AP
fTO – iiS Y No.42, Bachupally
Qutubullapur Mandal
Ranga Reddy Dist., AP
Pin: 500 123
fTO – iiiS Y No.41, Bachupally
Qutubullapur Mandal
Ranga Reddy Dist., AP
Pin: 500 123
TablE 9 Dates of Transfer of Unclaimed Dividend
financial year Type of dividend
date of declaration amount outstanding as on 31 march 2008
due for transfer on
2000-2001 Final 24.09.2001 1,142,948.00 31.10.2008
2001-2002 Interim 31.10.2001 1,781,300.00 07.12.2008
2001-2002 Final 26.08.2002 1,142,930.50 02.10.2009
2002-2003 Final 25.08.2003 1,595,815.00 01.10.2010
2003-2004 Final 28.07.2004 2,072,345.00 03.09.2011
2004-2005 Final 27.07.2005 1,802,065.00 02.09.2012
2005-2006 Final 28.07.2006 1,671,630.00 03.09.2013
2006-2007 Final 24.07.2007 3,162,502.50 30.08.2014
DRL_AR2008_CorpPgs_PAP.indd 57 6/18/08 10:50:44 PM
58 | A N N U A L R E P O R T 2 0 0 7 – 0 8 C O N S O l i d aT i N g f O r T h E f u T u r E
fTO – ivWard-F, Block-4
Adavipolam
Yanam, Pondicherry
Pin: 533 464
fTO – vi Khol, Nalagarh, Solan
Nalagarh Road
Baddi-173205
Himachal Pradesh
Pin: 502 320
fTO – viiPlot No. P1-P9, Phase III
Duvvada, VSEZ
Visakapatanam 530 046
Andhra Pradesh, India
biologicsbiologics development Centre (bdC)Survery No. 47
Qutubullapur Mandal
Ranga Reddy Dist., AP
Pin: 500 123
PlanT lOcaTIOnS
oUTSIDE INDIAdr. reddy’s laboratories (uk) limited Riverview Road, Beverly, East Yorkshire, HU 17 Old,
United Kingdom.
kunshan rotam reddy pharmaceutical Co. limited Huangpujiangzhonglu Kunshan Economic and
Technological Development Zone, Jiangsu province
China.
industrias Quimicas falcon de mexico S.a. de C.v.Km 4.5 Carr. Fed. Cuernavaca-Cuautla
62578 CIVAC, Jiutepec
Morelos, Mexico
discovery research3075, Northwoods Circle
Norcross, Georgia 30071
USA
dr. reddy’s laboratories louisiana llC 8800 Line Avenue
Shreveport L.A 71106
USA
dr. reddy’s laboratories (Eu) limited Steanard Lane, Mirfield
West Yorkshire WF 14, 8HZ
UK
Chirotech Technology limited West Yorkshire
162 Cambridge Science Park
Milton Road
Cambridge CB4 0GH
UK
InFORmaTIOn On DIREcTORS PROPOSED
FOR REaPPOInTmEnT
The information is given in the Chapter on Corporate
Governance.
qUERIES aT annUal GEnERal mEETInG
Shareholders desiring any information with regard to the
accounts are requested to write to the Company at an
early date so as to enable the management to keep the
information ready. The queries relating to operational
and financial performance may be raised at the Annual
General Meeting.
The Company provides the facility of Investor-
Helpdesk at the Annual General Meeting. Shareholders
may post their queries relating to shares, dividends etc.,
at this Investor-Helpdesk.
PROcEDURE FOR cOnvEnInG an
ExTRaORDInaRy GEnERal mEETInG
An Extraordinary General Meeting of the Company
may be called by the requisition of shareholders. Such
a requisition shall set out the matters of consideration
for which the meeting is to be called on, signed by the
requestors, and deposited at the registered office of the
Company.
Pursuant to the provisions of the Companies
Act, 1956, members entitled to the requisition of an
Extraordinary General Meeting with regard to any
matter shall be those who hold not less than one-tenth
of the paid-up capital of the Company as at the date
of the deposit of the requisition, and carry the right of
voting in that matter.
PROcEDURE FOR nOmInaTInG a
DIREcTOR On THE bOaRD
Pursuant to Section 257 of the Companies Act,
1956, any member intending to propose a person for
appointment on the Board of the Company shall leave
a signed notice signifying candidature to the office
of a Director, along with a deposit of Rs. 500 at the
registered office of the Company, not less than fourteen
days before the shareholders’ meeting. All nominations
are considered by the Governance Committee of the
Board of Directors entirely consisting of independent
Directors.
DRL_AR2008_CorpPgs_PAP.indd 58 6/18/08 10:50:44 PM
59 | D R . R E D D Y ’ S L A B O R AT O R I E S LT D a d d i T i O N a l S h a r E h O l d E r i N f O r m aT i O N
InFORmaTIOn On mEmORanDUm anD
aRTIclES OF aSSOcIaTIOn
The Memorandum and Articles of Association of the
Company are available at the corporate website of the
Company, www.drreddys.com.
cERTIFIcaTE FROm THE cOmPany
SEcRETaRy
I, V Viswanath Company Secretary of Dr. Reddy’s
Laboratories Limited, hereby confirm that the
Company has:
Complied with provisions prescribed for Director a.
Identification Number under Companies Act, 1956
and Director Identification Number Rules, 2006 as
amended.
Maintained all the books of account and statutory b.
registers prescribed under the Companies Act, 1956.
Filed all forms and returns and furnished all necessary c.
particulars to the Registrar of Companies and / or
Authorities as required under the Companies
Act, 1956.
Conducted the Board Meetings and Annual General d.
Meetings as per the Companies Act, 1956 and
the minutes thereof were properly recorded in the
minutes books.
Effected share transfers and despatched the e.
certificates within the time limit prescribed by various
authorities.
Not exceeded the borrowing powers. f.
Paid dividend to the shareholders within the time g.
limit prescribed and has also transferred the unpaid
dividend to the Investor Education and Protection
Fund within the time limit.
Complied with the regulations prescribed by the Stock h.
Exchanges, SEBI and other Statutory Authorities and
also the statutory requirements under the Companies
Act, 1956 and other applicable statutes in force.
The certificate is given by the undersigned according
to the best of his knowledge and belief, knowing fully
well that on the faith and strength of what is stated
above, the shareholders of the Company will place full
reliance on it.
V VISWANATH
CoMPANY SECRETARY
Place HyderabadDate 20 May 2008
DRL_AR2008_CorpPgs_PAP.indd 59 6/18/08 10:50:44 PM

F I V E Y E A R SA T A G L A N C Ebased on consolidated u.s. gaap financials
60 | A N N U A L R E P O R T 2 0 0 7 – 0 8 C O N S O l i d aT i N g f O r T h E f u T u r E
Five Years at a Glance A L L F I G U R E S I N R S . M I L L I o N E x C E P T E P S
year ending 31 march 2008 2007 2006 2005 2004
income Statement data
Product sales 49,231 64,185 24,077 19,126 20,081
Service Income 740 882 142 47 22
License fees 35 28 48 346 –
Other – – –
Total revenues 50,006 65,095 24,267 19,519 20,104
Cost of revenues 24,598 34,220 12,417 9,386 9,337
gross profit 25,408 30,876 11,850 10,134 10,767
as a % of revenues 51 47 49 52 54
Operating Expenses
Selling, general and administrative expenses 15,175 14,051 8,029 6,775 6,543
Research and development expenses 3,533 2,463 2,153 2,803 1,992
Amortization expenses 1,615 1,571 420 350 383
Write-down of intangible assets 2,489 1,770
Impairment of Goodwill 90
Foreign exchange (gain) / loss (745) (137) 126 489 (282)
Other Operating (income) / expenses, net (107) (174) (320) 6 83
Total operating expenses 22,050 19,544 10,408 10,423 8,718
Operating income 3,358 11,331 1,442 (289) 2,049
as a % of revenues 7 17 6 (1) 10
Equity in loss of affiliate 2 (63) (88) (58) (44)
Other (expense) / income, net 79 (769) 526 454 536
income before income tax and minority interest 3,438 10,500 1,887 107 2,540
Income tax benefit / (expense) 1,229 (1,177) (258) 94 (69)
Minority interest 10 3 (0) 10 3
Net income / (loss) 4,678 9,327 1,629 211 2,474
as a % of revenues 9 14 7 1 12
Net income / (loss) per equity share
Basic EPS 28 59 11 1 16
Diluted EPS 28 59 11 1 16
Dividend declared per share of Rs. 5 (Rs.) 3.75 3.75 5.00 5.00 5.00
balance Sheet data
Cash and cash equivalents 7,398 17,981 3,713 9,288 4,376
Working capital 15,228 18,933 1,345 10,771 11,103
Total assets 85,445 85,919 68,768 29,288 26,619
Total long-term debt, including current portion 14,679 21,541 21,863 31 184
Total stockholders’ equity 47,067 41,578 22,272 20,953 21,039
additional data
Net cash provided by / (used in):
Operating activities 6,123 11,805 1,643 2,292 3,999
Investing activities (9,600) 592 (34,524) 633 (6,506)
Financing activities (6,828) 1,754 27,211 1,931 (376)
Effect of exchange rate changes on cash (278) 118 95 56 (14)
Expenditure on property, plant and equipment (6,348) (4,477) (1,873) (1,749) (2,416)
Note ePS for 2004 – 2008 has been adjusted for bonus issue.
DRL_AR2008_CorpPgs_PAP.indd 60 6/18/08 10:50:45 PM

R A T I oA N A L Y S I S
61 | D R . R E D D Y ’ S L A B O R AT O R I E S LT D r aT i O a N a ly S i S
Ratio Analysis
ratios 2008 2007 2006
performance ratios
International Revenue / total revenue % 79.1 85.9 65.9
Domestic revenue / total revenue % 20.9 14.1 34.1
Gross profit / total revenue % 50.8 37.4 48.8
—API % 33.7 39.1 28.2
—Formulations % 73.5 70.0 68.9
—Generics % 47.6 45.5 46.5
—Custom pharmaceutical services % 34.6 29.4 24.7
Selling, General and Administrative expenses / total revenue % 30.3 21.6 33.1
R&D Expenses / total revenue % 7.1 3.8 8.9
—Drug Discovery / Total R&D % 24.1 31.5 37.8
Operating profit / total revenue % 6.7 17.4 5.9
Depreciation and amortization / total revenue % 6.8 4.6 6.5
Other income / total revenue % 0.2 1.2 2.2
Profit before tax / total revenue % 6.9 16.1 7.8
Profit after tax / total revenue % 9.4 14.3 6.7
balance Sheet ratios
Fixed Assets turnover ratio 3.4 6.1 3.0
Capital expenditure / total revenue % 12.7 6.9 7.7
Working Capital Turnover ratio 1 5.9 9.8 4.9
Debt / Equity 0.4 0.6 1.39
Debtors turnover (Days) 52.3 35.0 63.0
Inventory turnover ratio (Days) 138.6 77.0 153.0
Cash and cash equivalents / total assets 2 8.7 21.6 14.2
Investments / total assets 5.6 1.3 1.6
growth ratios
Total revenue % (23.3) 168.2 24.3
—API % (0.7) 44.2 18.6
—Formulations % 16.5 31.8 26.9
—Generics % (46.5) 719.2 13.4
—Custom Pharmaceuticals % (27.0) 397.4 325.8
International revenue % (29.3) 249.6 24.7
Selling, General and Administrative expenses % 8.0 75.0 18.5
R&D Expenses % 43.5 14.4 (23.2)
Share data
Book Value (Rs. per Share) 279.9 247.6 145.2
Dividend % 75.0 75.0 100.0
Dividend per share (Rs) 3.75 3.75 5.00
Price / earnings, end of year 21.2 12.38 66.78
Basic earnings per share 27.8 58.82 10.64
Diluted earnings per share 27.7 58.56 10.62
NoteS 1. Working Capital is calculated as [Accounts Receivables; Inventories & other Current Assets] Less [trade Accounts Payables, Accrued expenses & other
Current liabilities].2. Cash & cash equivalents includes Restricted Cash (current & non-current portion)
DRL_AR2008_CorpPgs_PAP.indd 61 6/18/08 10:50:45 PM

I N T A N G I B L E A C o U N T I N G
62 | A N N U A L R E P O R T 2 0 0 7 – 0 8 C O N S O l i d aT i N g f O r T h E f u T u r E
EVA – Economic Value Added ® A S AT 3 1 M A R C H ( R S . I N M I L L I o N S )
2,008 2,007 2,006 2,005 2,004
Shareholders Funds 49,428 41,578 22,272 20,953 21,039
Debt – LT (incl Current portion) 14,679 21,541 25 31 184
Total Capital employed 64,107 63,119 22,297 20,984 21,223
Earnings before Interest & Tax – EBIT 6,128 11,555 2,186 173 2,555
Tax on EBIT* 1,186 2,510 363 2 205
NOpaT (a) 4,942 9,045 1,823 171 2,350
Cost of Debt 3.6% 3.4% 2.1% 2.3% 1.9%
Cost of Equity & Retained Earnings 11.7% 13.8% 13.7% 12.3% 10.8%
Weighted average cost of capital 9.8% 10.7% 13.7% 12.3% 10.7%
Capital charges (b) 6,309 6,475 3,052 2,571 2,269
Economic Value added (a-b) (1,367) 2,570 (1,229) (2,400) 80
® eVA is a registered trademark of Stern Stewart & Co.
Note1. the cost of equity is calculated by using the following formula:
Return on risk-free investment + expected risk premium on equity investment adjusted for the beta variant for Dr. Reddy’s in India2. 10-year G-Sec yield taken as the risk-free rate of investment (7.98%)3. Beta value of 0.45 used for calculation of cost of equity4. taxes on eBIt calculated at the effective tax Rate (excluding deferred taxes)5. All the calculations are based on US GAAP Consolidated Financials6. Long term debt of Rs. 21.8 billion taken in March 2006 has been ignored for 2006 eVA calculation7. eBIt for FY08, excludes one time writedown of intangibles at betapharm of Rs. 2,361 Million
Economic Value Added R S . I N M I L L I o N S
(2,400)
2005
(1,229)
2006
2,570
2007
(1,367)
2008
80
2004
DRL_AR2008_CorpPgs_PAP.indd 62 6/18/08 10:50:46 PM

63 | D R . R E D D Y ’ S L A B O R AT O R I E S LT D i N Ta N g i b l E a C O u N T i N g
MVA – Market Value Added A S AT 3 1 M A R C H ( R S . I N M I L L I o N S )
2,008 2,007 2,006 2,005 2,004
Current Market Value of Debt (1) 14,679 21,541 21,863 31 184
No of outstanding shares (Mn) 168 168 77 77 77
Share price details (2)
High for the year 763 889 1,517 1,004 1,461
Low for the year 424 570 605 650 816
average price 594 730 1,061 827 1,139
Average Market Value of Equity 99,832 122,492 81,216 63,302 87,124
Market Value of Debt & Equity 114,511 144,033 103,079 63,333 87,308
Book Value of Debt & Equity(3) 64,107 63,119 44,135 20,984 21,070
market value at end of year 50,404 80,914 58,944 42,349 66,238
Net mva added during the year (30,510) 21,970 16,595 (23,889) 15,105 1 Book values, including current portion
2 Share prices in 2007 and 2008 adjusted for bonus issue
3 Book value of equity excludes on time writedown of intangibles at betapharm of Rs. 2,361 Million
Market Value Added R S . I N M I L L I o N S
15,105
2004
(23,889)
2005
16,595
2006
21,970
2007
(30,510)
2008
DRL_AR2008_CorpPgs_PAP.indd 63 6/18/08 10:50:46 PM
D I R E C T o R ’ S R E P o R T
64 | A N N U A L R E P O R T 2 0 0 7 – 0 8 C O N S O l i d aT i N g f O r T h E f u T u r E
Dear Members,
Your Directors are pleased to present the 24th Annual
Report for the year ended 31 March 2008.
FInancIal HIGHlIGHTS
Table –1 gives the financial highlights of the Company
in the financial year 2007–08 as compared to previous
financial year on Indian GAAP standalone basis.
DIvIDEnD
Your Directors are pleased to recommend a dividend of
Rs. 3.75 per equity share of Rs. 5.00 for the financial
year 2007–08. The dividend, if approved at the
ensuing Annual General Meeting, will be paid to those
shareholders whose name appears on the register of
members of the Company as on 12 July 2008.
The dividend would be tax-free in the hands of the
shareholders.
EmPlOyEE STOck OPTIOn ScHEmES
Pursuant to the provisions of Guideline 12 of the
Securities and Exchange Board of India (Employee Stock
Option Scheme and Employee Stock Purchase Scheme),
Guidelines, 1999, as amended, the details of stock
options as on 31 March 2008 under the “Dr. Reddy’s
Employees Stock Option Scheme, 2002” and the
“Dr. Reddy’s Employees ADR Stock Option Scheme,
2007” are set out in the Annexure –1 to the
Directors’ Report.
Your Directors proposed to amend further, the
Dr. Reddy’s Employees Stock Option Scheme, 2002”
and the “Dr. Reddy’s Employees ADR Stock Option
Scheme, 2007 in view of the Finance Ministry’s move
on levying the Fringe Benefit Tax (FBT) on the employee
stock options (ESOPs) under the Income Tax Act, 1961
and also proposed to remove the grades / designations
prescribed under the existing Clause 9 (a) of Dr. Reddy’s
Employees Stock Option Scheme 2002 pursuant to
the changes in the work levels in the Organisation
structure of the Company and proposed for necessary
amendment in the said clause of the scheme of the
stock options respectively.
SHaRE caPITal
The paid up Share Capital of your Company increased
by Rs. 1,302,830 in the financial year ended 31 March
2008, due to allotment of 260,566 equity shares on
exercise of Stock Options by the eligible employees
under Dr. Reddy’s Employees Stock Option
Scheme, 2002.
cORPORaTE GOvERnancE anD
aDDITIOnal InFORmaTIOn TO
SHaREHOlDERS
A detailed report on the Corporate Governance system
and practices of the Company are given in a separate
section in this annual report. Detailed information for
the shareholders is given in Additional Shareholders’
Information section.
manaGEmEnT DIScUSSIOn anD
analySIS
A detailed Management Discussion and Analysis is
provided in the annual report.
SUbSIDIaRy cOmPanIES
The Company had 34 subsidiary companies as on
31 March 2008. The members may refer to the
Statement under Section 212 of the Companies Act,
1956 and information on the financials of subsidiaries
appended to the above Statement under Section 212
of the Companies Act, 1956 in this Annual Report for
further information on these subsidiaries.
The Ministry of Company Affairs vide its letter
No. 47/310/2008-CL-III dated 19 May 2008 granted
approval to the Company for not attaching the
financials of subsidiary companies to the financials of
the Company for the financial year 2007–08.
The members, if they desire, may write to Company
Secretary at Dr. Reddy’s Laboratories Ltd.,
7-1-27, Ameerpet, Hyderabad – 500 016 to obtain a
copy of the financials of the subsidiary companies.
DIREcTORS RESPOnSIbIlITy STaTEmEnT
In terms of Section 217(2AA) of the Companies Act,
1956, your Directors confirm as under:
In preparation of annual accounts, the applicable 1.
accounting standards have been followed along
with proper explanation relating to material
departures;
We have selected such accounting policies and 2.
applied them consistently and made judgments and
estimates that are reasonable and prudent so as to
give a true and fair view of the state of affairs of the
Company at the end of the financial year 2007–08
and of profit of the Company for that period;
DRL_AR2008_CorpPgs_PAP.indd 64 6/18/08 10:50:46 PM

65 | D R . R E D D Y ’ S L A B O R AT O R I E S LT D d i r E C T O r ‘ S r E p O rT
We have taken proper and sufficient care for the 3.
maintenance of adequate accounting records
in accordance with the provisions of this Act for
safeguarding the assets of the Company and
for preventing and detecting fraud and other
irregularities;
We have prepared the annual accounts on an on 4.
going concern basis.
FIxED DEPOSITS
Your Company has not accepted any fixed deposits
under Section 58A of the Companies Act, 1956
and hence no amount of principal or interest was
outstanding as of the Balance Sheet date.
DIREcTORS
Mr. Anupam Puri, Mr. P N Devarajan and Dr. Krishna G
Palepu retire by rotation at the ensuing Annual General
Meeting scheduled on 22 July 2008. Mr. P N Devarajan
expressed his unwillingness to be reappointed and
ceased to be the Director of the Company effective
20 May 2008. The other retiring Directors are eligible
for re-appointment. The brief profiles of Mr. Anupam
Puri and Dr. Krishna G Palepu are given in the Corporate
Governance section for the reference of members.
The Board placed a record of their deep appreciation
of the services rendered by Mr. P N Devarajan during his
tenure of office.
aUDITORS
The Statutory Auditors of the Company BSR & Co.,
Chartered Accountants, retire at the ensuing Annual
General Meeting and have confirmed their eligibility
and willingness to accept office of Statutory Auditors,
if reappointed. The Audit Committee and the Board of
Directors recommend BSR & Co. as Statutory Auditors
of the Company for the financial year 2008–09 for
shareholders approval.
cOST aUDIT
Pursuant to Section 233B of the Companies Act, 1956,
the Central Government has prescribed Cost Audit of
the Company’s Bulk Drugs Division and Formulations
Division.
Subject to the approval of the Central Government,
the Board has appointed Sagar& Associates as Cost
Auditors of the Company for the financial year 2007–08.
The Cost Audit is under process and the Company
will submit the Cost Auditors’ report to the Central
Government in time.
PaRTIcUlaRS OF EmPlOyEES
Pursuant to the provisions of Section 217(2A) of the
Companies Act, 1956 read with Companies (Particulars
of Employees) Rules, 1975 as amended, the names
and other particulars of employees are set out in the
Annexure – 2 to the Directors’ Report.
cOnSERvaTIOn OF EnERGy RESEaRcH
anD DEvElOPmEnTS, TEcHnOlOGy
abSORPTIOn, FOREIGn ExcHanGE
EaRnInG anD OUTGO
The particulars as prescribed under Section 217(1)(e)
of the Companies Act, 1956, read with the Companies
(Disclosure of particulars in the report of Board of
Directors) Rules, 1988 are set out in the Annexure – 3
to the Directors’ Report.
TablE 1 Financial Highlights for the Financial Year Ended 31 March ( R S . I N T H o U S A N D S )
2008 2007income 35,850,075 40,843,048
gross profit 7,460,889 14,993,466
Depreciation 1,619,862 1,335,009
Profit before tax 5,841,027 13,658,457
Taxation
Current tax (1,088,808) (1,889,864)
Net profit for the year 4,752,219 11,768,593
Add: Profit and loss brought forward 13,036,395 3,196,508
TOTal availablE fOr apprOpriaTiONS 17,788,614 14,965,101
APPROPRIATIONS
Proposed dividend on equity shares 630,648 629,671
Tax on proposed dividend 107,179 107,013
Dividend of previous year 604 242
Transfer to general reserve 475,222 1,176,859
Balance carried forward 16,574,961 13,051,316
DRL_AR2008_CorpPgs_PAP.indd 65 6/18/08 10:50:46 PM

66 | A N N U A L R E P O R T 2 0 0 7 – 0 8 C O N S O l i d aT i N g f O r T h E f u T u r E
acknOWlEDGEmEnT
Your Directors place on record their sincere appreciation
for significant contribution made by the employees
through their dedication, hard work and commitment
and the trust reposed on us by the medical fraternity
and the patients.
We also acknowledge the support and wise counsel
extended to us by the analysts, bankers, government
agencies, shareholders and investors at large. We look
forward to having the same support in our endeavour to
help people lead healthier lives.
FOR DR. REDDY’S LABORATORIES LIMITED
DR. K ANJI REDDY
CHAIRMAN
Date 20 May 2008Place Hyderabad
DRL_AR2008_CorpPgs_PAP.indd 66 6/18/08 10:50:46 PM

67 | D R . R E D D Y ’ S L A B O R AT O R I E S LT D d i r E C T O r ‘ S r E p O rT
annExURE TO THE DIREcTORS’ REPORT
ANNExURE – 1 Pursuant to the provisions of Guideline 12 of the
Securities and Exchange Board of India (Employee Stock
Option Scheme and Employee Stock Purchase Scheme),
Guidelines, 1999, as amended, the details of stock
options as on 31 March 2008 under the Dr. Reddy’s
Employees Stock Option Scheme, 2002 and the
Dr. Reddy’s Employees ADR Stock Option Scheme, 2007
are as under:
Category B: 573,778 stock options out of the total of 2,295,478 reserved for grant of options having an exercise price equal to the par value of the underlying equity shares (i.e., Rs. 5 per option).
2. Members of the Company approved the amendment in Dr. Reddy’s Employees Stock Option Scheme, 2002 at the Annual General Meeting held on 28 July 2004.
The amendment enabled the Company to grant Stock Options in two categories as discussed in para 2 above. Before this amendment Dr. Reddy’s Employees Stock Option Scheme, 2002 provided for grant of options at fair market value only.
Sl. No. Description Details
dr. reddy’s Employees Stock Option Scheme, 2002dr. reddy’s Employees adr Stock Option Scheme, 2007
1 Options granted 4,975,376 206,818
2 The pricing formula Dr. Reddy’s Employees Stock Option Scheme, 2002 provides for the grant of options in two categories:
Dr. Reddy’s Employees ADR Stock Option Scheme, 2007 provides for the grant of options in two categories:
Category A: 600,000 stock options out of the total of 4,590,956 reserved for grant of options having an exercise price equal to the fair market value of the underlying equity shares on the date of grant; and
Category A: 382,695 shall be available for grant of Stock Options at the fair market value; and
Category B: 3,990,956 stock options out of the total of 4,590,956 reserved for grant of options having an exercise price equal to the par value of the underlying equity shares (i.e., Rs. 5 per option).
Category B: 1,148,084 Options shall be available for grant of Stock Options at par value of the shares i.e. Rs. 5 per option.”
The fair market value of a share on each grant date falling under Category A above is defined as the weighted average closing price for 30 days prior to the grant, in the stock exchange where there is highest trading volume during that period.
The fair market value of a share on each grant date falling under Category A above is defined as the closing price of the Company’s equity shares on the trading day immediately preceding the date of grant, in the stock exchange where there is highest trading volume during that period.
3 Options vested 192,194 Nil
4 Options exercised 841,650 Nil
5 The total number of shares arising as a result of exercise of option
841,650 Nil
6 Options lapsed 3,201,158 24,040
7 Variation of terms of options
1. Members of the Company approved the amendment in Dr. Reddy’s Employees Stock Option Scheme, 2002 at the Annual General Meeting held on 28 July 2004.
Not applicable
The amendment enabled the Company to grant Stock Options in two categories as discussed below. Before this amendment Dr. Reddy’s Employees Stock Option Scheme, 2002 provided for grant of options at fair market value only.
Category A: 1,721,700 stock options out of the total of 2,295,478 reserved for grant of options having an exercise price equal to the fair market value of the underlying equity shares on the date of grant; and
DRL_AR2008_CorpPgs_PAP.indd 67 6/18/08 10:50:47 PM

68 | A N N U A L R E P O R T 2 0 0 7 – 0 8 C O N S O l i d aT i N g f O r T h E f u T u r E
8 Money realised by exercise of options
Rs. 107,559,568.70 Nil
9 Total number of options in force
932,568 182,778
10 Employee wise details as on 31 March 2008 of options granted to
(i) Senior managerial personnel
Name Exercise price No. of options Name Exercise price
No. of options
Mr. V S Vasudevan Fair Market Value 101,480 Mr. Jeff Wasserstein
Par Value 22,000
Par Value 15,000
Mr. Abhijit Mukherjee
Par Value 20,900 Mr. Mark Hartman
Fair Market Value
20,000
Mr. Arun Sawhney Par Value 21,370
Mr. Ashwani Kumar Malhotra
Par Value 16,252
Mr. Jaspal Singh Bajwa
Par Value 22,500
Mr. K B Sankara Rao
Par Value 25,220
Mr. Mark Hartman Fair Market Value 32,000
Mr. Raghu Cidambi Par Value 21,750
Mr. Saumen Chakraborty
Fair Market Value 5,000
Par Value 21,550
(ii) Any other employee who receives a grant in any one year of option amounting to 5% or more of option granted during that year.
Nil Nil
(iii) Identified employees who were granted option, during any one year, equal to or exceeding 1% of the issued capital (excluding outstanding warrants and conversions) of the Company at the time of grant;
Nil Nil
11 Diluted Earnings Per Share (EPS) pursuant to issue of shares on exercise of option calculated in accordance with Accounting Standard (AS) 20 ‘Earnings Per Share’
29.44
DRL_AR2008_CorpPgs_PAP.indd 68 6/18/08 10:50:47 PM

69 | D R . R E D D Y ’ S L A B O R AT O R I E S LT D d i r E C T O r ‘ S r E p O rT
12 The difference between the employee compensation cost computed under Intrinsic Value Method and the employee compensation cost that shall have been recognized if the Company had used the Fair Value Methods and its impact on profits and on EPS of the Company
The employee Compensation Cost on account of ESOP in the financial year 2007–08 based on Intrinsic Value Method is Rs. 207.12 million. Had the Company used the Fair Value Method, the ESOP cost in the financial year 2007–08 would have been Rs. 234.54 million.
There would not have been any adverse effect on the Profit and EPS, on using fair value method of accounting.
13 Weighted-average exercise prices and weighted-average fair values of options for options whose exercise price either equals or exceeds or is less than the market price of the stock
Weighted average exercise price of the outstanding Fair Market Value options as on 31 March 2008 was Rs. 421.79/-.
Weighted average exercise price of the outstanding Par Value options as on 31 March 2008 was Rs. 5.
The weighted average fair value of the outstanding options as on 31 March 2008 was Rs. 526.92.
14 Description of the method and significant assumptions used during the year to estimate the fair values of options:
The Company has opted Intrinsic Value Method for accounting of Compensation Cost arising out of ESOP. However for disclosures in para 12 above the following assumptions have been used:
(i) Risk-free interest rate,
7.8% – 8.2%
(ii) Expected life, 12 months to 78 months
(iii) Expected volatility, 28.40% to 32.70%
(iv) Expected dividends, and
0.75%
(v) The price of the underlying share in market at the time of option grant
Rs. 663.60 to Rs. 747.35
DRL_AR2008_CorpPgs_PAP.indd 69 6/18/08 10:50:48 PM

70 | A N N U A L R E P O R T 2 0 0 7 – 0 8 C O N S O l i d aT i N g f O r T h E f u T u r E
No.NAME oF THE EMPLoYEE
AGEDESIGNATIoN / NATURE oF DUTY
GRoSS REMUNERATIoN
qUALIFICATIoNExPERIENCE IN YEARS
DATE oF CoMMENCEMENT
PARTICULARS oF LAST EMPLoYMENT
Employed for the full year
1 Dr. K Anji Reddy 68 Chairman 145,082,600 B.Sc. (Tech), Ph D 38 24.02.1984 Managing Director – Standard Organics Ltd.
2 Mr. G V Prasad 47 Vice Chairman and CEO 108,689,400 B.Sc. (Chem Eng.), M.S. (Indl. Admn.) 24 30.06.1990 Promoter Director – Benzex Labs Pvt. Ltd.
3 Mr. K Satish Reddy 40 Managing Director and COO 108,674,400 B.Tech., M.S. (Medicinal Chemistry) 16 18.01.1993 Director – Globe Organics Ltd.
4 Mr. Saumen Chakraborty 47 President and Chief Financial Officer 14,223,788 B.Sc. (H), M.B.A.- IIM 24 02.07.2001 Vice President – Tecumseh Products India Pvt. Ltd.
5 Mr. Abhijit Mukharjee 49 President 13,711,512 B.Tech (Chem.) 27 15.01.2003 President – Atul Ltd.
6 Mr. Arun Sawhney 52 President 15,636,448 B.Com., P. G. D. B. M. 25 01.06.2001 Chief Executive – Max-GB Ltd.
7 Mr. Jaspal Singh Bajwa 56 President 14,777,682 B.Sc., M.B.A. 31 10.04.2003 Executive Director and COO – Marico Industries Ltd.
8 Mr. Ashwani Kumar Malhotra 52 Executive Vice President 10,682,044 M.Pharm., P.G.D.- IEM, P.G.D.-CS 28 08.02.2001 Unit Head – Cipla Ltd.
9 Mr. K B Sankara Rao 54 Executive Vice President 10,484,928 M.Pharm. 30 29.09.1986 Production Executive – Cipla Ltd.
10 Mr. Vilas Dholye 58 Executive Vice President 7,532,000 B.Tech (Chem) 29 18.12.2000 VP – Pidilite Industries Ltd.
11 Dr. Apurba Bhattacharya 55 Senior Vice President 6,184,077 M.Sc., Ph D 25 30.12.2005 Associate Proessor – Texas A&M Kingsville
12 Mr. Prabir Kumar Jha 41 Senior Vice President 8,215,047 M.A., P.G.D.M. (XLRI) 19 29.11.2002 Regional Head HR – Mahindra British Telecom
13 Mr. Sharad Tyagi 47 Senior Vice President 4,913,400 B.E., P.G.D.M. 22 16.01.2007 Director – Engelhard Asia Pacific India Pvt. Ltd.
14 Mr. B Madhusudan Rao 41 Vice President 5,538,145 M.Sc., M.Phil. 15 09.07.1993 –
15 Dr. Cartikeya Reddy 38 Vice President 5,927,933 B.Tech, M.S., Ph D 17 20.07.2004 Senior Engineer – Genetech Inc.
16 Dr. C Seshagiri Rao 58 Vice President 5,173,725 M.Sc., Ph D 34 21.04.1994 Senior Research Executive – IDPL
17 Mr. J N G G Shankar 50 Vice President 5,123,779 M.Pharm, M.B.A. 28 28.02.1996 General Manager – John Wyeth (India) Ltd.
18 Dr. Kashi Nath Singh 56 Vice President 7,289,098 M.Sc., Ph D 35 08.08.2003 President – Alkem Laboratories Ltd.
19 Mr. K Ganesh 45 Vice President 4,364,024 B.Com., A.C.A. 17 14.10.2005 Country Treasurer – Philips Electronics Ltd.
20 Mr. K N Reddy 54 Vice President 4,855,473 M.Sc. 31 16.06.1994 Manager – Ranbaxy Laboraoties Ltd.
21 Mr. K P Gopala Krishnan 51 Vice President 4,175,502 B.E., P.G.D.P.M. 24 16.04.2003 General Manager – Sanmar Speciality Chemicals Ltd.
22 Mr. K Ranga Reddy 52 Vice President 3,893,509 B.Com., C.A. Inter 23 12.08.1985 –
23 Dr. K V S Ram Rao 45 Vice President 4,612,233 B.Tech, M.E., Ph D 14 03.04.2000 Senior Manager – Vam Organic Chemicals Ltd.
24 Dr. K Vyas 50 Vice President 4,389,389 M.Sc., Ph D 28 15.07.1994 Post Doctoral Fellow – University of California
25 Ms. Rajini Kesari 36 Vice President 3,492,521 B.Com., A.C.A, A.I.C.W.A. 17 14.08.2001 Senior Auditor – KPMG
26 Dr. Ravi Pillai 47 Vice President 4,539,101 M.S., Ph D 16 04.07.2005 Asociate Director – Ranbaxy Research Laboratories
27 Ms. Ritha Chandrachud 44 Vice President 5,895,913 B.Sc., M.M.S. 22 14.07.2003 Senior Director – Fulford (India) Ltd.
28 Mr. R V Ramesh 39 Vice President 3,998,173 B.E. (Chem.Engg) 16 12.11.2003 Vice President – Shasun Chemiclas & Drugs Ltd.
29 Mr. Sharat P Narsapur 42 Vice President 4,258,489 B.Tech (Chem. Engg.) 23 20.01.1998 Project Manager – Shrirang Agro Chem (P) Ltd.
30 Mr. Singhai Sunil Chand 53 Vice President 5,272,438 M.Pharm. 29 19.02.2001 General Manager – Ranbaxy Laboratories Ltd.
31 Mr. Umang Vohra 36 Vice President 4,763,916 B.E., M.B.A. 13 18.02.2002 Manager – Pepsico. India
32 Mr. V K Chandrasekharan 56 Vice President 4,079,818 B.Sc. 30 17.04.1992 Divisional Manager – Fyto Chem Formulations
33 Mr. Vilas Dahanukar 42 Vice President 4,245,072 M.Pharm., Ph D. 15 12.06.2003 Senior Principal Scientist – Schering Plough
34 Mr. V V Parsuram 41 Vice President 3,255,542 A.C.A., PG Diploma., A.I.C.W.A. 21 06.12.2000 Senior Manager – Tecumseh Products India Pvt. Ltd.
35 Mr. Anindya Choudhury 38 Senior Director 2,855,346 B.E., P.G.D.M. 14 02.05.2005 Manager – Hindustan Lever Ltd.
36 Mr. Antony Raj Gomes 41 Senior Director 2,456,388 B.Sc., P.G.D.I.A.C. 19 20.01.2003 Head – QC Cipla Ltd.
37 Mr. Atul Dhavle 37 Senior Director 3,666,776 B.E. 16 07.06.1999 Deputy Manager – Du Pont Fibres Ltd.
38 Mr. B Karunakar 47 Senior Director 2,728,116 B.Tech., P.G.D.M. 24 30.03.2005 Head – ICFAI Business School
39 Mr. B V Srinivas 48 Senior Director 3,173,812 B.Com, A.C.A., M.B.A. 16 11.12.1991 Assustant Manager – Fenner Finance Ltd.
40 Mr. D Ravinder Rao 48 Senior Director 2,956,361 M.A., M. Phil. 18 02.07.1994 Senior Executive – MM Restaurant & Resorts
41 Dr. Harshal P Bhagwatwar 45 Senior Director 3,648,193 M.Pharm., M.S., Ph D 14 02.08.2004 Associate Driector – Wockhardt Limited
42 Mr. Kalyan Krishnan NH 48 Senior Director 2,789,441 B.Sc., M.Sc., M.B.A. 22 10.02.1998 Manager – Torrent Pharmaceuticals Ltd.
43 Mr. Kaushik Mitter 41 Senior Director 3,036,207 M.A., M.B.A. 16 26.09.2005 Consultant – Tata Sons Ltd.
44 Mr. K R Janardana Sarma 55 Senior Director 3,452,617 M.Tech. 29 14.09.2005 Freelance Consultant
45 Mr. K Subba Raju 57 Senior Director 2,896,954 B.Sc. 30 15.08.1987 Deputy Manager – Du Pont Fibres Ltd.
46 Mr. K Sumesh Reddy 40 Senior Director 4,490,876 B.Sc., L.L.B., L.L.M. 17 01.09.2002 Faculty – ISB Middle Earth
47 Mr. Mannam Venkata Narasimham 40 Senior Director 2,461,348 B.Com., A.C.S. Inter A.C.A. 17 12.06.2000 Executive Manager – Sanmar Group
48 Dr. M V Suryanarayana 47 Senior Director 3,374,021 M.Sc., M.Phil., Ph D 18 22.12.1989 –
49 Mr. Nanda Venkateswarlu 42 Senior Director 3,371,936 B.Tech., P.G.D.I.E. 20 05.10.1998 Manager – IPI Automation Sdn Bhd
50 Mr. N S Yadav 52 Senior Director 3,360,286 B.Sc. 30 01.09.1987 Executive – Cipla Ltd.
51 Mr. P Muralidhar 39 Senior Director 4,454,208 B.E., M.Sc.,Ph D 14 16.11.2001 General Manager – Idika Solutions
52 Dr. P Pratap Reddy 50 Senior Director 2,535,051 B.Sc., M.Sc., Ph D 19 04.08.2003 Associate Professor – Osmania University
53 Mr. P Yugandhar 36 Senior Director 4,258,261 M.M.S. 14 21.02.2001 Manager – Eli Lilly Ranbaxy Ltd.
54 Mr. Raghunathan Sampath 51 Senior Director 3,408,722 B.Com., B.L., A.C.A. 23 02.01.2007 Director – BSR & Co.
ANNExURE – 2 Information as per Section 217 (2A) of the Companies Act, 1956 and Companies (Particulars of Employees) Rules 1975 as amended,
DRL_AR2008_CorpPgs_PAP.indd 70 6/18/08 10:50:48 PM

71 | D R . R E D D Y ’ S L A B O R AT O R I E S LT D i g a a p C O N S O l i d aT E d f i N a N C i a l S
No.NAME oF THE EMPLoYEE
AGEDESIGNATIoN / NATURE oF DUTY
GRoSS REMUNERATIoN
qUALIFICATIoNExPERIENCE IN YEARS
DATE oF CoMMENCEMENT
PARTICULARS oF LAST EMPLoYMENT
Employed for the full year
1 Dr. K Anji Reddy 68 Chairman 145,082,600 B.Sc. (Tech), Ph D 38 24.02.1984 Managing Director – Standard Organics Ltd.
2 Mr. G V Prasad 47 Vice Chairman and CEO 108,689,400 B.Sc. (Chem Eng.), M.S. (Indl. Admn.) 24 30.06.1990 Promoter Director – Benzex Labs Pvt. Ltd.
3 Mr. K Satish Reddy 40 Managing Director and COO 108,674,400 B.Tech., M.S. (Medicinal Chemistry) 16 18.01.1993 Director – Globe Organics Ltd.
4 Mr. Saumen Chakraborty 47 President and Chief Financial Officer 14,223,788 B.Sc. (H), M.B.A.- IIM 24 02.07.2001 Vice President – Tecumseh Products India Pvt. Ltd.
5 Mr. Abhijit Mukharjee 49 President 13,711,512 B.Tech (Chem.) 27 15.01.2003 President – Atul Ltd.
6 Mr. Arun Sawhney 52 President 15,636,448 B.Com., P. G. D. B. M. 25 01.06.2001 Chief Executive – Max-GB Ltd.
7 Mr. Jaspal Singh Bajwa 56 President 14,777,682 B.Sc., M.B.A. 31 10.04.2003 Executive Director and COO – Marico Industries Ltd.
8 Mr. Ashwani Kumar Malhotra 52 Executive Vice President 10,682,044 M.Pharm., P.G.D.- IEM, P.G.D.-CS 28 08.02.2001 Unit Head – Cipla Ltd.
9 Mr. K B Sankara Rao 54 Executive Vice President 10,484,928 M.Pharm. 30 29.09.1986 Production Executive – Cipla Ltd.
10 Mr. Vilas Dholye 58 Executive Vice President 7,532,000 B.Tech (Chem) 29 18.12.2000 VP – Pidilite Industries Ltd.
11 Dr. Apurba Bhattacharya 55 Senior Vice President 6,184,077 M.Sc., Ph D 25 30.12.2005 Associate Proessor – Texas A&M Kingsville
12 Mr. Prabir Kumar Jha 41 Senior Vice President 8,215,047 M.A., P.G.D.M. (XLRI) 19 29.11.2002 Regional Head HR – Mahindra British Telecom
13 Mr. Sharad Tyagi 47 Senior Vice President 4,913,400 B.E., P.G.D.M. 22 16.01.2007 Director – Engelhard Asia Pacific India Pvt. Ltd.
14 Mr. B Madhusudan Rao 41 Vice President 5,538,145 M.Sc., M.Phil. 15 09.07.1993 –
15 Dr. Cartikeya Reddy 38 Vice President 5,927,933 B.Tech, M.S., Ph D 17 20.07.2004 Senior Engineer – Genetech Inc.
16 Dr. C Seshagiri Rao 58 Vice President 5,173,725 M.Sc., Ph D 34 21.04.1994 Senior Research Executive – IDPL
17 Mr. J N G G Shankar 50 Vice President 5,123,779 M.Pharm, M.B.A. 28 28.02.1996 General Manager – John Wyeth (India) Ltd.
18 Dr. Kashi Nath Singh 56 Vice President 7,289,098 M.Sc., Ph D 35 08.08.2003 President – Alkem Laboratories Ltd.
19 Mr. K Ganesh 45 Vice President 4,364,024 B.Com., A.C.A. 17 14.10.2005 Country Treasurer – Philips Electronics Ltd.
20 Mr. K N Reddy 54 Vice President 4,855,473 M.Sc. 31 16.06.1994 Manager – Ranbaxy Laboraoties Ltd.
21 Mr. K P Gopala Krishnan 51 Vice President 4,175,502 B.E., P.G.D.P.M. 24 16.04.2003 General Manager – Sanmar Speciality Chemicals Ltd.
22 Mr. K Ranga Reddy 52 Vice President 3,893,509 B.Com., C.A. Inter 23 12.08.1985 –
23 Dr. K V S Ram Rao 45 Vice President 4,612,233 B.Tech, M.E., Ph D 14 03.04.2000 Senior Manager – Vam Organic Chemicals Ltd.
24 Dr. K Vyas 50 Vice President 4,389,389 M.Sc., Ph D 28 15.07.1994 Post Doctoral Fellow – University of California
25 Ms. Rajini Kesari 36 Vice President 3,492,521 B.Com., A.C.A, A.I.C.W.A. 17 14.08.2001 Senior Auditor – KPMG
26 Dr. Ravi Pillai 47 Vice President 4,539,101 M.S., Ph D 16 04.07.2005 Asociate Director – Ranbaxy Research Laboratories
27 Ms. Ritha Chandrachud 44 Vice President 5,895,913 B.Sc., M.M.S. 22 14.07.2003 Senior Director – Fulford (India) Ltd.
28 Mr. R V Ramesh 39 Vice President 3,998,173 B.E. (Chem.Engg) 16 12.11.2003 Vice President – Shasun Chemiclas & Drugs Ltd.
29 Mr. Sharat P Narsapur 42 Vice President 4,258,489 B.Tech (Chem. Engg.) 23 20.01.1998 Project Manager – Shrirang Agro Chem (P) Ltd.
30 Mr. Singhai Sunil Chand 53 Vice President 5,272,438 M.Pharm. 29 19.02.2001 General Manager – Ranbaxy Laboratories Ltd.
31 Mr. Umang Vohra 36 Vice President 4,763,916 B.E., M.B.A. 13 18.02.2002 Manager – Pepsico. India
32 Mr. V K Chandrasekharan 56 Vice President 4,079,818 B.Sc. 30 17.04.1992 Divisional Manager – Fyto Chem Formulations
33 Mr. Vilas Dahanukar 42 Vice President 4,245,072 M.Pharm., Ph D. 15 12.06.2003 Senior Principal Scientist – Schering Plough
34 Mr. V V Parsuram 41 Vice President 3,255,542 A.C.A., PG Diploma., A.I.C.W.A. 21 06.12.2000 Senior Manager – Tecumseh Products India Pvt. Ltd.
35 Mr. Anindya Choudhury 38 Senior Director 2,855,346 B.E., P.G.D.M. 14 02.05.2005 Manager – Hindustan Lever Ltd.
36 Mr. Antony Raj Gomes 41 Senior Director 2,456,388 B.Sc., P.G.D.I.A.C. 19 20.01.2003 Head – QC Cipla Ltd.
37 Mr. Atul Dhavle 37 Senior Director 3,666,776 B.E. 16 07.06.1999 Deputy Manager – Du Pont Fibres Ltd.
38 Mr. B Karunakar 47 Senior Director 2,728,116 B.Tech., P.G.D.M. 24 30.03.2005 Head – ICFAI Business School
39 Mr. B V Srinivas 48 Senior Director 3,173,812 B.Com, A.C.A., M.B.A. 16 11.12.1991 Assustant Manager – Fenner Finance Ltd.
40 Mr. D Ravinder Rao 48 Senior Director 2,956,361 M.A., M. Phil. 18 02.07.1994 Senior Executive – MM Restaurant & Resorts
41 Dr. Harshal P Bhagwatwar 45 Senior Director 3,648,193 M.Pharm., M.S., Ph D 14 02.08.2004 Associate Driector – Wockhardt Limited
42 Mr. Kalyan Krishnan NH 48 Senior Director 2,789,441 B.Sc., M.Sc., M.B.A. 22 10.02.1998 Manager – Torrent Pharmaceuticals Ltd.
43 Mr. Kaushik Mitter 41 Senior Director 3,036,207 M.A., M.B.A. 16 26.09.2005 Consultant – Tata Sons Ltd.
44 Mr. K R Janardana Sarma 55 Senior Director 3,452,617 M.Tech. 29 14.09.2005 Freelance Consultant
45 Mr. K Subba Raju 57 Senior Director 2,896,954 B.Sc. 30 15.08.1987 Deputy Manager – Du Pont Fibres Ltd.
46 Mr. K Sumesh Reddy 40 Senior Director 4,490,876 B.Sc., L.L.B., L.L.M. 17 01.09.2002 Faculty – ISB Middle Earth
47 Mr. Mannam Venkata Narasimham 40 Senior Director 2,461,348 B.Com., A.C.S. Inter A.C.A. 17 12.06.2000 Executive Manager – Sanmar Group
48 Dr. M V Suryanarayana 47 Senior Director 3,374,021 M.Sc., M.Phil., Ph D 18 22.12.1989 –
49 Mr. Nanda Venkateswarlu 42 Senior Director 3,371,936 B.Tech., P.G.D.I.E. 20 05.10.1998 Manager – IPI Automation Sdn Bhd
50 Mr. N S Yadav 52 Senior Director 3,360,286 B.Sc. 30 01.09.1987 Executive – Cipla Ltd.
51 Mr. P Muralidhar 39 Senior Director 4,454,208 B.E., M.Sc.,Ph D 14 16.11.2001 General Manager – Idika Solutions
52 Dr. P Pratap Reddy 50 Senior Director 2,535,051 B.Sc., M.Sc., Ph D 19 04.08.2003 Associate Professor – Osmania University
53 Mr. P Yugandhar 36 Senior Director 4,258,261 M.M.S. 14 21.02.2001 Manager – Eli Lilly Ranbaxy Ltd.
54 Mr. Raghunathan Sampath 51 Senior Director 3,408,722 B.Com., B.L., A.C.A. 23 02.01.2007 Director – BSR & Co.
the names and other particulars of employees are as under:
DRL_AR2008_CorpPgs_PAP.indd 71 6/18/08 10:50:49 PM

72 | A N N U A L R E P O R T 2 0 0 7 – 0 8 C O N S O l i d aT i N g f O r T h E f u T u r E
No.NAME oF THE EMPLoYEE
AGEDESIGNATIoN / NATURE oF DUTY
GRoSS REMUNERATIoN
qUALIFICATIoNExPERIENCE IN YEARS
DATE oF CoMMENCEMENT
PARTICULARS oF LAST EMPLoYMENT
55 Dr. Ramesh Kumar 38 Senior Director 2,575,600 M.Sc., Ph D, L.L.B. 9 13.01.2000 Research officer – SIRIS Ltd.
56 Mr. Sanjay S Shetgar 39 Senior Director 2,604,611 M.Sc. 32 16.12.2002 Head – QA. Cipla Ltd.
57 Mr. Sanjay Surendra Bhanushali 47 Senior Director 3,415,061 B.Pharm. 25 09.04.1998 Manager – Cipla Ltd.
58 Mr. Savya Sachi 46 Senior Director 3,565,376 B.Sc. 21 15.11.1997 Regional Manager – Cipla Ltd.
59 Dr. Shashank Narayan Rao Lulay 54 Senior Director 3,599,354 M.Pharm., Ph D 25 04.07.2005 General Manager – Wockhard Ltd.
60 Mr. Shrikant G Kale 57 Senior Director 2,604,992 B.E., M.E. 34 01.03.2002 Consultatnt – PEP Consultants
61 Mr. S Milind Hardas 47 Senior Director 4,374,596 B.Sc., D.M.M. 26 17.12.1994 Area Sales Manager – Wockhardt Ltd.
62 Mr. Swapn 37 Senior Director 3,190,882 B.E., M.B.A. 15 15.09.2003 Head (Commercial) – MARS Inc.
63 Mr. T S R Gautam Buddha 54 Senior Director 2,914,359 M.Sc., P.G.D.I.E 9 11.11.1999 Manager – Ranbaxy Research Laboraoties Ltd.
64 Mr. V Narayana Reddy 45 Senior Director 2,574,462 M.A. 21 01.03.1990 APO – Novapoan Ltd.
65 Mr. V S Suresh 50 Senior Director 4,137,369 B.Com, A.I.C.W.A., A.C.S. 29 02.09.1996 Executive Manager – Fisher-Xomox India Ltd.
66 Mr. V V Dikshit 47 Senior Director 2,677,988 B.Tech., P.G.D.B.M. 23 15.06.1994 Deputy Manager – Pfimex International Ltd.
67 Mr. V Viswanath 41 Senior Director 3,544,088 M.Com., A.I.C.W.A., A.C.S. 22 16.01.1995 Assistant Manager – Priyadarshini Cement
68 Dr. J Moses Babu 45 Principal Research Investigator 3,462,932 M.Sc., Ph D 17 01.10.1993 Lecturer – Wesley College, Hyderabad
69 Dr. K B Sunil Kumar 45 Principal research Investigator 3,224,448 M.Sc., Ph D 16 10.04.1996 Assistant Driector – Vimta Labs Ltd.
70 Dr. Sunil Kumar Singh 46 Principal research Investigator 2,668,333 M.Sc., Ph D 30 01.04.1998 Deputy Manager – Nicholas Piramal India Ltd.
71 Mr. Crispin Rivera 52 Director 9,883,654 Chemical Engineer 32 01.11.2006 Industrias Quimicas Falcon de Mexico.
72 Dr. K Srinivas 44 Director 2,435,765 M.Sc., Ph D 13 11.10.2002 Research Scientist – Wockhardt Research Center
73 Mr. N L Narasimha Das 49 Director 2,611,768 B.Sc., B.L. 25 04.04.2002 Senior Manager (legal) – Hindustan Paper Corporation Ltd.
74 Mr. Raj Kumar Kapoor 44 Director 2,532,077 B.Com., A.C.A. 20 06.04.2006 Sr. Manager (Internal Audit) – Price Water House Coopers P. Ltd.
75 Mr. V Ragunathan 45 Director 2,415,229 B.Sc., M.Sc. 14 27.03.1995 Manager – Techscience Servicep Ltd.
Employed for the part of the year
76 Dr. R Rajgopalan 57 President 5,820,429 M.Sc., Ph D 34 18.04.1994 Principal Research Scientist – Hoechst India Ltd.
77 Dr. Rajinder Kumar 52 President, R&D and Commercial 21,374,919 M.Sc., MBBS, PG Dip in Psychiatry & Neurology 25 30.04.2007 CEO and Founding Member – MeRaD Pharmaceuticals Ltd.
78 Mr. Sandeep Sahney 42 Executive Vice President 10,020,092 M.B.A. 20 04.04.2005 Director - Sales & Marketing – Eli Lilly & Co (I) Pvt. Ltd.
79 Dr. Santosh K Mishra 52 Executive Vice President 1,610,515 Ph D 20 18.02.2008 Managing Director – Lilly Systems Biology
80 Dr. N R Srinivas 47 Senior Vice President 8,986,725 B.Pharm., Ph D 17 01.06.2001 Senior Research Investigator – Bristol Myers Sqibbs Company
81 Dr. Darshan B Makhey 41 Vice President-Global Quality 2,384,124 M.Pharm., Ph D 15 01.02.2008 Vice-President – Mayne Pharma (USA) Inc
82 Mr. Indu Bhushan 42 Vice President 4,782,316 M.Pharm. 16 03.11.2003 Associate Director – Lupin Ltd.
83 Mr. Joydeep Chatterjee 47 Vice President 2,501,658 B.Tech., M.B.A. 25 02.04.2007 Vice President – Tecumsech Products India Pvt. Ltd.
84 Mr. K Ramesh 46 Vice President 4,475,971 B.E.(Mech.), M.M.S. 23 25.01.2002 General Manager – Max India Ltd.
85 Mr. Manoj Mehrotra 46 Vice President 3,433,334 B.Tech., P.G.D.B.M. 25 25.07.2007 Vice President – SRF Ltd.
86 Mr. Martin Sanjay K Ghosh 43 Vice President 262,500 B.Tech., M.B.A. 11 10.03.2008 General Works Manager – Ciba Speciality Chemicals (I) Ltd.
87 Mr. M S Mohan 43 Vice President 5,308,552 M.Pharm. 19 01.03.2000 Assistant Manager – Astra IDL Ltd.
88 Dr. Ranjan Chakraborty 49 Vice President 5,763,998 M.Sc., Ph D 24 08.08.1985 Research Associate – University of Massachusetts Medical Centre
89 Dr. Sridhar Narayanan 39 Vice President 2,245,651 B.Pharm., Ph D 11 28.01.2008 Vice President – Glenmark Pharmaceuticals Ltd.
90 Mr. Anant Barbadikar 42 Senior Director 3,200,867 B.Tech. 21 20.06.2002 Project Manager – Gharda Chemicals Ltd.
91 Mr. B S Yadav 46 Senior Director 3,546,558 M.Pharm., P.G.D.M.S. 26 28.07.1999 Works Manager – IPCA Laboratories Ltd.
92 Mr. Dheeraj Mishra 41 Senior Director 2,964,106 B.Com., A.C.A., P.G.D.M.& F. 14 15.05.2006 Financial Controller – Foster‘s India Private Ltd.
93 Mr. M Victor James Edward 47 Senior Director 2,768,586 B.Sc. 26 04.12.1998 TLM – Solares Pharmaceuticals
94 Mr. N Thyagarajan 57 Senior Director 2,517,817 B.Tech., PG Diploma in Mgmt. 37 13.09.2007 Head – Projects, Jubilant Organosys Ltd.
95 Mr. P V Sankar Dass 44 Senior Director 4,889,734 B.Sc., D.M.M. 24 07.10.1991 Director – TDPL
96 Mr. Parimal Upadhyay 42 Senior Director 4,063,833 B.Pharm., M.B.A. 19 09.10.1997 Area Business Manager – Pharmacia & Upjohn
97 Mr. Prashant Kumar Pathak 44 Senior Director 3,507,033 B.Sc. 23 03.01.1994 SOL Pharmaceuticals Ltd.
98 Dr. R Ezhil Arasan 48 Senior Director 5,396,544 M.B.B.S., M.D. 20 27.09.2004 Vice President – USV Ltd.
99 Mr. Raju Subramanyam 42 Senior Director 966,711 B.Tech., M.M. 16 18.02.2008 Project Manager – E I Dupont India Pvt. Ltd.
100 Mr. Siraj Attari 55 Senior Director 228,974 B.A. 23 03.03.2008 General Manager – Nagarjuna Fertilisers and Chemicals Ltd.
101 Mr. V Rajasekaran 44 Senior Director 2,537,541 B.Sc., P.G.D. 22 29.04.2005 Vice President – Shasun Chemicals.
102 Dr. Parimal Misra 43 Principal Research Investigator 3,717,502 M.Sc., Ph D 20 05.11.1996 Associate Director – Council of Scientific Industrial Research
103 Dr. V M Sharma 44 Principal Research Investigator 2,565,651 M.Sc., Ph D 16 02.06.1992 –
NoteS1. All the above employments are contractual.2. Dr. K Anji Reddy, Mr. G V Prasad and Mr. Satish Reddy are relatives within the meaning of Section 6 of the Companies Act, 1956.3. Dr. K Anji Reddy, Mr. G V Prasad and Mr. Satish Reddy are also eligible for commission on the net profits of the company. the Commission has been
included in the remuneration specified above.4. No individual employee is holding equivalent to or more than 2% of the shareholding of the Company
DRL_AR2008_CorpPgs_PAP.indd 72 6/18/08 10:50:50 PM
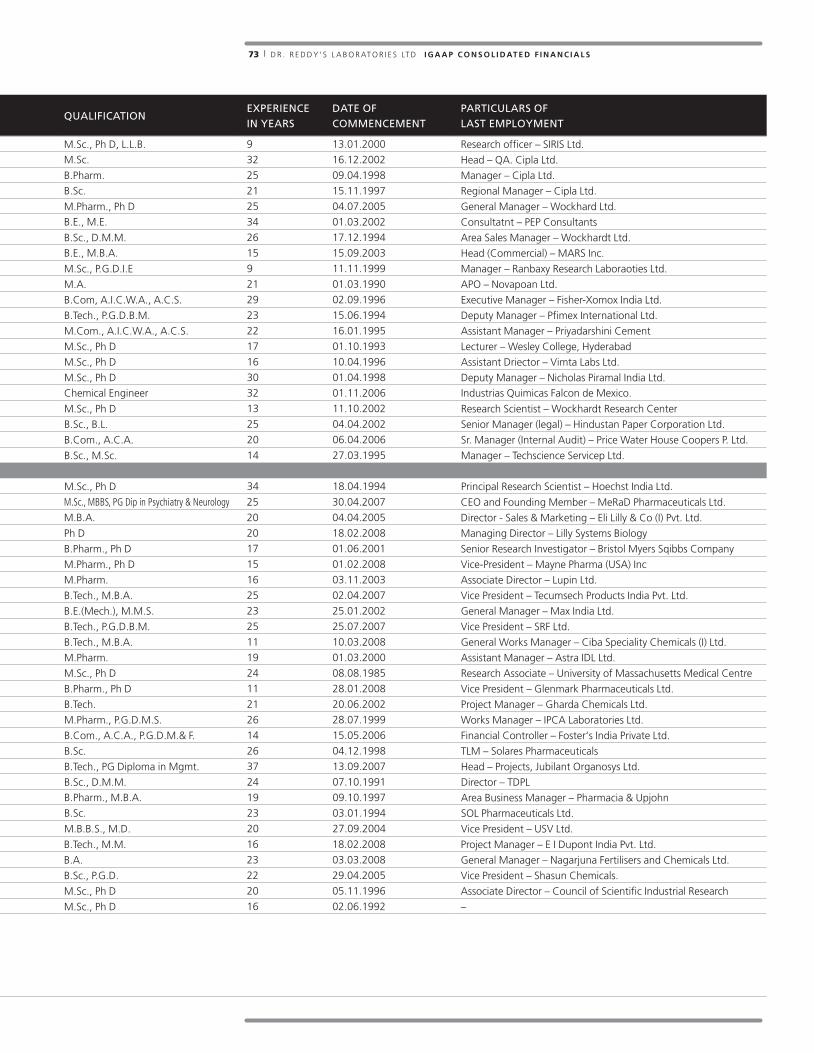
73 | D R . R E D D Y ’ S L A B O R AT O R I E S LT D i g a a p C O N S O l i d aT E d f i N a N C i a l S
No.NAME oF THE EMPLoYEE
AGEDESIGNATIoN / NATURE oF DUTY
GRoSS REMUNERATIoN
qUALIFICATIoNExPERIENCE IN YEARS
DATE oF CoMMENCEMENT
PARTICULARS oF LAST EMPLoYMENT
55 Dr. Ramesh Kumar 38 Senior Director 2,575,600 M.Sc., Ph D, L.L.B. 9 13.01.2000 Research officer – SIRIS Ltd.
56 Mr. Sanjay S Shetgar 39 Senior Director 2,604,611 M.Sc. 32 16.12.2002 Head – QA. Cipla Ltd.
57 Mr. Sanjay Surendra Bhanushali 47 Senior Director 3,415,061 B.Pharm. 25 09.04.1998 Manager – Cipla Ltd.
58 Mr. Savya Sachi 46 Senior Director 3,565,376 B.Sc. 21 15.11.1997 Regional Manager – Cipla Ltd.
59 Dr. Shashank Narayan Rao Lulay 54 Senior Director 3,599,354 M.Pharm., Ph D 25 04.07.2005 General Manager – Wockhard Ltd.
60 Mr. Shrikant G Kale 57 Senior Director 2,604,992 B.E., M.E. 34 01.03.2002 Consultatnt – PEP Consultants
61 Mr. S Milind Hardas 47 Senior Director 4,374,596 B.Sc., D.M.M. 26 17.12.1994 Area Sales Manager – Wockhardt Ltd.
62 Mr. Swapn 37 Senior Director 3,190,882 B.E., M.B.A. 15 15.09.2003 Head (Commercial) – MARS Inc.
63 Mr. T S R Gautam Buddha 54 Senior Director 2,914,359 M.Sc., P.G.D.I.E 9 11.11.1999 Manager – Ranbaxy Research Laboraoties Ltd.
64 Mr. V Narayana Reddy 45 Senior Director 2,574,462 M.A. 21 01.03.1990 APO – Novapoan Ltd.
65 Mr. V S Suresh 50 Senior Director 4,137,369 B.Com, A.I.C.W.A., A.C.S. 29 02.09.1996 Executive Manager – Fisher-Xomox India Ltd.
66 Mr. V V Dikshit 47 Senior Director 2,677,988 B.Tech., P.G.D.B.M. 23 15.06.1994 Deputy Manager – Pfimex International Ltd.
67 Mr. V Viswanath 41 Senior Director 3,544,088 M.Com., A.I.C.W.A., A.C.S. 22 16.01.1995 Assistant Manager – Priyadarshini Cement
68 Dr. J Moses Babu 45 Principal Research Investigator 3,462,932 M.Sc., Ph D 17 01.10.1993 Lecturer – Wesley College, Hyderabad
69 Dr. K B Sunil Kumar 45 Principal research Investigator 3,224,448 M.Sc., Ph D 16 10.04.1996 Assistant Driector – Vimta Labs Ltd.
70 Dr. Sunil Kumar Singh 46 Principal research Investigator 2,668,333 M.Sc., Ph D 30 01.04.1998 Deputy Manager – Nicholas Piramal India Ltd.
71 Mr. Crispin Rivera 52 Director 9,883,654 Chemical Engineer 32 01.11.2006 Industrias Quimicas Falcon de Mexico.
72 Dr. K Srinivas 44 Director 2,435,765 M.Sc., Ph D 13 11.10.2002 Research Scientist – Wockhardt Research Center
73 Mr. N L Narasimha Das 49 Director 2,611,768 B.Sc., B.L. 25 04.04.2002 Senior Manager (legal) – Hindustan Paper Corporation Ltd.
74 Mr. Raj Kumar Kapoor 44 Director 2,532,077 B.Com., A.C.A. 20 06.04.2006 Sr. Manager (Internal Audit) – Price Water House Coopers P. Ltd.
75 Mr. V Ragunathan 45 Director 2,415,229 B.Sc., M.Sc. 14 27.03.1995 Manager – Techscience Servicep Ltd.
Employed for the part of the year
76 Dr. R Rajgopalan 57 President 5,820,429 M.Sc., Ph D 34 18.04.1994 Principal Research Scientist – Hoechst India Ltd.
77 Dr. Rajinder Kumar 52 President, R&D and Commercial 21,374,919 M.Sc., MBBS, PG Dip in Psychiatry & Neurology 25 30.04.2007 CEO and Founding Member – MeRaD Pharmaceuticals Ltd.
78 Mr. Sandeep Sahney 42 Executive Vice President 10,020,092 M.B.A. 20 04.04.2005 Director - Sales & Marketing – Eli Lilly & Co (I) Pvt. Ltd.
79 Dr. Santosh K Mishra 52 Executive Vice President 1,610,515 Ph D 20 18.02.2008 Managing Director – Lilly Systems Biology
80 Dr. N R Srinivas 47 Senior Vice President 8,986,725 B.Pharm., Ph D 17 01.06.2001 Senior Research Investigator – Bristol Myers Sqibbs Company
81 Dr. Darshan B Makhey 41 Vice President-Global Quality 2,384,124 M.Pharm., Ph D 15 01.02.2008 Vice-President – Mayne Pharma (USA) Inc
82 Mr. Indu Bhushan 42 Vice President 4,782,316 M.Pharm. 16 03.11.2003 Associate Director – Lupin Ltd.
83 Mr. Joydeep Chatterjee 47 Vice President 2,501,658 B.Tech., M.B.A. 25 02.04.2007 Vice President – Tecumsech Products India Pvt. Ltd.
84 Mr. K Ramesh 46 Vice President 4,475,971 B.E.(Mech.), M.M.S. 23 25.01.2002 General Manager – Max India Ltd.
85 Mr. Manoj Mehrotra 46 Vice President 3,433,334 B.Tech., P.G.D.B.M. 25 25.07.2007 Vice President – SRF Ltd.
86 Mr. Martin Sanjay K Ghosh 43 Vice President 262,500 B.Tech., M.B.A. 11 10.03.2008 General Works Manager – Ciba Speciality Chemicals (I) Ltd.
87 Mr. M S Mohan 43 Vice President 5,308,552 M.Pharm. 19 01.03.2000 Assistant Manager – Astra IDL Ltd.
88 Dr. Ranjan Chakraborty 49 Vice President 5,763,998 M.Sc., Ph D 24 08.08.1985 Research Associate – University of Massachusetts Medical Centre
89 Dr. Sridhar Narayanan 39 Vice President 2,245,651 B.Pharm., Ph D 11 28.01.2008 Vice President – Glenmark Pharmaceuticals Ltd.
90 Mr. Anant Barbadikar 42 Senior Director 3,200,867 B.Tech. 21 20.06.2002 Project Manager – Gharda Chemicals Ltd.
91 Mr. B S Yadav 46 Senior Director 3,546,558 M.Pharm., P.G.D.M.S. 26 28.07.1999 Works Manager – IPCA Laboratories Ltd.
92 Mr. Dheeraj Mishra 41 Senior Director 2,964,106 B.Com., A.C.A., P.G.D.M.& F. 14 15.05.2006 Financial Controller – Foster‘s India Private Ltd.
93 Mr. M Victor James Edward 47 Senior Director 2,768,586 B.Sc. 26 04.12.1998 TLM – Solares Pharmaceuticals
94 Mr. N Thyagarajan 57 Senior Director 2,517,817 B.Tech., PG Diploma in Mgmt. 37 13.09.2007 Head – Projects, Jubilant Organosys Ltd.
95 Mr. P V Sankar Dass 44 Senior Director 4,889,734 B.Sc., D.M.M. 24 07.10.1991 Director – TDPL
96 Mr. Parimal Upadhyay 42 Senior Director 4,063,833 B.Pharm., M.B.A. 19 09.10.1997 Area Business Manager – Pharmacia & Upjohn
97 Mr. Prashant Kumar Pathak 44 Senior Director 3,507,033 B.Sc. 23 03.01.1994 SOL Pharmaceuticals Ltd.
98 Dr. R Ezhil Arasan 48 Senior Director 5,396,544 M.B.B.S., M.D. 20 27.09.2004 Vice President – USV Ltd.
99 Mr. Raju Subramanyam 42 Senior Director 966,711 B.Tech., M.M. 16 18.02.2008 Project Manager – E I Dupont India Pvt. Ltd.
100 Mr. Siraj Attari 55 Senior Director 228,974 B.A. 23 03.03.2008 General Manager – Nagarjuna Fertilisers and Chemicals Ltd.
101 Mr. V Rajasekaran 44 Senior Director 2,537,541 B.Sc., P.G.D. 22 29.04.2005 Vice President – Shasun Chemicals.
102 Dr. Parimal Misra 43 Principal Research Investigator 3,717,502 M.Sc., Ph D 20 05.11.1996 Associate Director – Council of Scientific Industrial Research
103 Dr. V M Sharma 44 Principal Research Investigator 2,565,651 M.Sc., Ph D 16 02.06.1992 –
NoteS1. All the above employments are contractual.2. Dr. K Anji Reddy, Mr. G V Prasad and Mr. Satish Reddy are relatives within the meaning of Section 6 of the Companies Act, 1956.3. Dr. K Anji Reddy, Mr. G V Prasad and Mr. Satish Reddy are also eligible for commission on the net profits of the company. the Commission has been
included in the remuneration specified above.4. No individual employee is holding equivalent to or more than 2% of the shareholding of the Company
DRL_AR2008_CorpPgs_PAP.indd 73 6/18/08 10:50:51 PM

74 | A N N U A L R E P O R T 2 0 0 7 – 0 8 C O N S O l i d aT i N g f O r T h E f u T u r E
annExURE – 3
FoRM AForm for Disclosure of Particulars with respect to
Conservation of Energy.
a. power and fuel consumption
FoRM BResearch and development (R & D)
Specific areas in which r & d carried out by the 1. Company Our research and development activities can be
classified into several categories, which run parallel to
the activities in our principal areas of operations:
Formulations, where our research and development }}
activities are directed at the development of product
formulations, process validation, bio-equivalency testing
and other data needed to prepare a growing list of
drugs that are equivalent to numerous brand name
products for sale in the emerging markets.
Active pharmaceutical ingredients and intermediates, }}
where our research and development activities
concentrate on development of chemical processes for
the synthesis of active pharmaceutical ingredients for
use in our generics and formulations segments and for
sales in the emerging and developed markets to third
parties.
Generics, where our research and development }}
activities are directed at the development of product
formulations, process validation, bio-equivalency testing
and other data needed to prepare a growing list of
drugs that are equivalent to numerous brand name
products whose patents and regulatory exclusivity
periods have expired or are nearing expiration in the
regulated markets of the United States and Europe.
During fiscal 2004, we integrated the product }}
development capabilities in our API, generics and
formulations segments to increase our focus on
productivity and product delivery, by combining
technical excellence with process excellence. We also
strengthened our technical, intellectual property and
legal skills to enhance our new product development
process. This will help us leverage our core technology
strengths in chemistry and formulation development
with legal, regulatory and intellectual property
management expertise to expand our product pipeline.
Critical care and biotechnology, where research and }}
development activities are directed at the development
of oncology and biotechnology products for the
emerging as well as regulated markets.
Custom pharmaceuticals, where we intend to }}
leverage the strength of our process chemistry skills to
cater to the niche segment of the specialty chemical
industry targeting innovator pharmaceutical companies.
The research and development is directed toward
supporting the business to focus on marketing of
process development and manufacturing services to
emerging and established pharmaceutical companies.
1. Electricity
purchased 2007–08 2006–07
Unit 118,283,306 102,560,471
Total amount (Rs.) 412,897,055 340,274,397
Rate / unit (Rs.) 3.49 3.31
Own generation – through diesel generator set
2007–08 2006–07
Unit 5,322,801 5,163,571
Units per ltr. of diesel oil 3.22 3.25
Rate / unit (Rs.) 10.42 9.43
2. Coal (used in boiler)
2007–08 2006–07
Quantity (tonnes) 50,427 37,777
Total Cost (Rs.) 162,387,363 100,365,087
Average rate (Rs.) 3,220 2,657
3. furnace Oil
2007–08 2006–07
Quantity (K Lts.) 2,604 4,334
Total Cost (Rs.) 60,099,631 72,603,211
Rate / unit (Rs.) 23,080 16,752
DRL_AR2008_CorpPgs_PAP.indd 74 6/18/08 10:50:51 PM

75 | D R . R E D D Y ’ S L A B O R AT O R I E S LT D i g a a p C O N S O l i d aT E d f i N a N C i a l S
Drug discovery, where we are actively pursuing }}
discovery and development of NCEs. Our research
programs focus on the following therapeutic areas:
Metabolic disorders —
Cardiovascular disorders —
Cancer —
Bacterial infections —
We are pursuing an integrated research strategy with
our laboratories in the U.S. focusing on discovery of new
molecular targets and designing of screening assays
to screen for promising lead molecules. Discovery is
followed by selection and optimisation of lead molecules
and further clinical development of those optimised
leads at our laboratories in India.
benefits derived as a result of the r&d 2. Commercial production of the new products }}
Modification of existing manufacturing processes for }}
some of the products and significant savings in cost
of production
Modification of existing manufacturing processes to }}
reduce the time cycle
Indian patents and US patents filings }}
Development of analytical methods for the products }}
in various therapeutic areas
future plan of action 3. Commercialisation of new products for which the }}
products are under trials at development stage.
Several new products have been identified after a
thorough study of the market and the processes to
manufacture these products will be developed in the
R&D lab.
Development of Analytical methods for the new }}
products and method validations.
Expenditure on r & d: 4.
Technology, absorption, adaptation and innovation
FoRM CForeign exchange earnings and outgoPlease refer information given in the notes to the annual
accounts of the Company in Schedule 19 Notes to
accounts item No. 16 to item No. 17.
F o R T H E Y E A R E N D E D 3 1 M A R C H
2008 2007A Capital (Rs. thousand) 115,270 470,868
B Recurring (Rs. thousand) 3,219,204 2,457,109
C Total (Rs. thousand) 3,334,474 2,927,977
Total r & d expenditure as a percentage of total turnover
9.85% 7.56%
1 Efforts, in brief, made towards technology absorption, adaptation and innovation The Company has a full-fledged R&D Division continuously engaged in research on new products and on process development of existing products. The Company has developed indigenous technology in respect of the products manufactured by it. As soon as the technology is developed for a product, it is tested in Pilot Plant and thereafter commercial production is taken up. It is our philosophy to continuously upgrade the technology.
Benefits derived as a result of the above efforts, e.g., product improvement, cost reduction, product development, import substitution, etc.
Product quality improvement, cost reduction, product development, import substitution etc. The continuous up gradation and adoption of new technology has benefited the Company in the form of better production process, better yields, better quality of the end product and cost reduction.
2
3 In case of imported technology (imported during the last 5 years reckoned from the beginning of the financial year), following information may be furnished:
No Imported technology
a) Technology imported
b) Year of import
c) Has technology been fully absorbed
d) If not fully absorbed, areas where this has not taken place, reasons there for and future plans of action.
DRL_AR2008_CorpPgs_PAP.indd 75 6/18/08 10:50:51 PM

This page has been intentionally left blank.
DRL_AR2008_CorpPgs_PAP.indd 76 6/18/08 10:50:51 PM

a u d i t o r s ’ r e p o r t s c h e d u l e s t o
t h e p r o f i t a n d l o s s
a c c o u n t
b a l a n c e s h e e t s c h e d u l e s t o t h e
b a l a n c e s h e e t a n d
p r o f i t a n d l o s s a c c o u n t
p r o f i t a n d l o s s
a c c o u n t
c a s h f l o w s t a t e m e n t
s c h e d u l e s t o
t h e b a l a n c e s h e e t
b a l a n c e s h e e t
a b s t r a c t
I G A A P S T A N D A L O N E
F I N A N C I A L S
11984
11783
9782
9478

78 | A N N U A L R E P O R T 2 0 0 7 – 0 8 c o n s o l i d at i n G f o r t h e f u t u r e
Auditors’ Report to the Members of Dr. Reddy’s Laboratories Limited
We have audited the attached Balance Sheet of Dr. Reddy’s Laboratories Limited (“the Company”) as at 31 March 2008, the Profit and Loss account and the Cash
Flow Statement of the Company for the year ended on that date annexed thereto. These financial statements are the responsibility of the Company’s management.
Our responsibility is to express an opinion on these financial statements based on our audit.
1. We conducted our audit in accordance with auditing standards generally accepted in India. Those Standards require that we plan and perform the audit to
obtain reasonable assurance about whether the financial statements are free of material misstatement. An audit includes examining, on a test basis, evidence
supporting the amounts and disclosures in the financial statements. An audit also includes assessing the accounting principles used and significant estimates
made by management, as well as evaluating the overall financial statement presentation. We believe that our audit provides a reasonable basis for our
opinion.
2. As required by the Companies (Auditor’s Report) Order, 2003, issued by the Central Government of India in terms of sub-section (4A) of Section 227 of the
Companies Act, 1956, we enclose in the Annexure a statement on the matters specified in paragraphs 4 and 5 of the said Order.
3. Further to our comments in the Annexure referred to above, we report that:
(a) we have obtained all the information and explanations, which to the best of our knowledge and belief were necessary for the purpose of our audit;
(b) in our opinion, proper books of account as required by law have been kept by the Company so far as appears from our examination of those books;
(c) the Balance Sheet, Profit and Loss Account and the Cash Flow Statement dealt with by this report are in agreement with the books of account;
(d) in our opinion, the Balance Sheet, the Profit and Loss Account and the Cash Flow Statement dealt with by this report comply with the accounting
standards referred to in sub-section (3C) of Section 211 of the Companies Act, 1956 to the extent applicable;
(e) on the basis of written representations received from the directors, and taken on record by the Board of Directors, we report that none of the directors
are disqualified as at 31 March 2008 from being appointed as a director in terms of clause (g) of sub-section (1) of Section 274 of the Companies Act,
1956; and
(f) in our opinion and to the best of our information and according to the explanations given to us, the said accounts give the information required by the
Companies Act, 1956, in the manner so required and give a true and fair view in conformity with the accounting principles generally accepted in India:
(i) in the case of the Balance Sheet, of the state of affairs of the Company as at 31 March 2008;
(ii) in the case of the Profit and Loss Account, of the profit of the Company for the year ended on that date; and
(iii) in the case of Cash Flow Statement, of the cash flows of the Company for the year ended on that date.
for bsr & co.
Chartered Accountants
S Sethuraman
partner
Membership No. 203491
Place: Hyderabad
Date: 20 may 2008
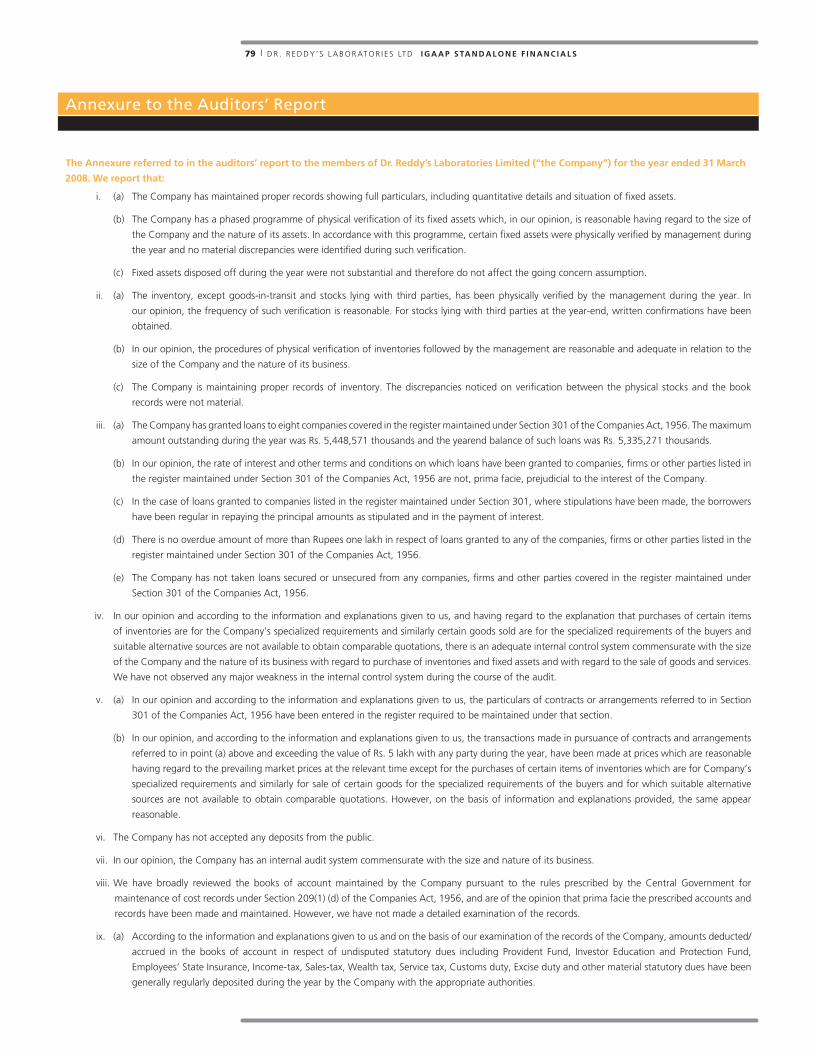
79 | D R . R E D D Y ’ S L A B O R AT O R I E S LT D i G a a p s ta n d a l o n e f i n a n c i a l s
Annexure to the Auditors’ Report
the annexure referred to in the auditors’ report to the members of dr. reddy’s laboratories limited (“the company”) for the year ended 31 march
2008. we report that:
i. (a) The Company has maintained proper records showing full particulars, including quantitative details and situation of fixed assets.
(b) The Company has a phased programme of physical verification of its fixed assets which, in our opinion, is reasonable having regard to the size of
the Company and the nature of its assets. In accordance with this programme, certain fixed assets were physically verified by management during
the year and no material discrepancies were identified during such verification.
(c) Fixed assets disposed off during the year were not substantial and therefore do not affect the going concern assumption.
ii. (a) The inventory, except goods-in-transit and stocks lying with third parties, has been physically verified by the management during the year. In
our opinion, the frequency of such verification is reasonable. For stocks lying with third parties at the year-end, written confirmations have been
obtained.
(b) In our opinion, the procedures of physical verification of inventories followed by the management are reasonable and adequate in relation to the
size of the Company and the nature of its business.
(c) The Company is maintaining proper records of inventory. The discrepancies noticed on verification between the physical stocks and the book
records were not material.
iii. (a) The Company has granted loans to eight companies covered in the register maintained under Section 301 of the Companies Act, 1956. The maximum
amount outstanding during the year was Rs. 5,448,571 thousands and the year end balance of such loans was Rs. 5,335,271 thousands.
(b) In our opinion, the rate of interest and other terms and conditions on which loans have been granted to companies, firms or other parties listed in
the register maintained under Section 301 of the Companies Act, 1956 are not, prima facie, prejudicial to the interest of the Company.
(c) In the case of loans granted to companies listed in the register maintained under Section 301, where stipulations have been made, the borrowers
have been regular in repaying the principal amounts as stipulated and in the payment of interest.
(d) There is no overdue amount of more than Rupees one lakh in respect of loans granted to any of the companies, firms or other parties listed in the
register maintained under Section 301 of the Companies Act, 1956.
(e) The Company has not taken loans secured or unsecured from any companies, firms and other parties covered in the register maintained under
Section 301 of the Companies Act, 1956.
iv. In our opinion and according to the information and explanations given to us, and having regard to the explanation that purchases of certain items
of inventories are for the Company’s specialized requirements and similarly certain goods sold are for the specialized requirements of the buyers and
suitable alternative sources are not available to obtain comparable quotations, there is an adequate internal control system commensurate with the size
of the Company and the nature of its business with regard to purchase of inventories and fixed assets and with regard to the sale of goods and services.
We have not observed any major weakness in the internal control system during the course of the audit.
v. (a) In our opinion and according to the information and explanations given to us, the particulars of contracts or arrangements referred to in Section
301 of the Companies Act, 1956 have been entered in the register required to be maintained under that section.
(b) In our opinion, and according to the information and explanations given to us, the transactions made in pursuance of contracts and arrangements
referred to in point (a) above and exceeding the value of Rs. 5 lakh with any party during the year, have been made at prices which are reasonable
having regard to the prevailing market prices at the relevant time except for the purchases of certain items of inventories which are for Company’s
specialized requirements and similarly for sale of certain goods for the specialized requirements of the buyers and for which suitable alternative
sources are not available to obtain comparable quotations. However, on the basis of information and explanations provided, the same appear
reasonable.
vi. The Company has not accepted any deposits from the public.
vii. In our opinion, the Company has an internal audit system commensurate with the size and nature of its business.
viii. We have broadly reviewed the books of account maintained by the Company pursuant to the rules prescribed by the Central Government for
maintenance of cost records under Section 209(1) (d) of the Companies Act, 1956, and are of the opinion that prima facie the prescribed accounts and
records have been made and maintained. However, we have not made a detailed examination of the records.
ix. (a) According to the information and explanations given to us and on the basis of our examination of the records of the Company, amounts deducted/
accrued in the books of account in respect of undisputed statutory dues including Provident Fund, Investor Education and Protection Fund,
Employees’ State Insurance, Income-tax, Sales-tax, Wealth tax, Service tax, Customs duty, Excise duty and other material statutory dues have been
generally regularly deposited during the year by the Company with the appropriate authorities.

80 | A N N U A L R E P O R T 2 0 0 7 – 0 8 c o n s o l i d at i n G f o r t h e f u t u r e
(b) According to the information and explanations given to us, no undisputed amounts payable in respect of Provident Fund, Investor Education and
Protection Fund, Employees’ State Insurance, Income tax, Sales tax, Wealth tax, Service tax, Customs duty, Excise duty and other material statutory
dues were in arrears as at 31 March 2008 for a period of more than six months from the date they became payable.
(c) Further, since the Central Government has till date not prescribed the amount of cess payable under Section 441A of the Companies Act, 1956,
we are not in a position to comment upon the regularity or otherwise of Company in depositing the same.
(d) According to the information and explanations given to us, the dues set out in Appendix 1 in respect of Income tax, Sales tax, Customs duty and
Excise duty have not been deposited with the appropriate authorities on account of disputes.
x. The Company does not have any accumulated losses at the end of the financial year and has not incurred cash losses during the financial year and in
the immediately preceding financial year.
xi. In our opinion and according to the information and explanations given to us, the Company has not defaulted in repayment of dues to its bankers or
to any financial institutions.
xii. The Company has not granted loans and advances on the basis of security by way of pledge of shares, debentures and other securities.
xiii. In our opinion and according to the information and explanations given to us, the Company is not a chit fund / nidhi / mutual fund / society.
xiv. According to the information and explanations given to us, the Company is not dealing or trading in shares, securities, debentures and other investments.
Accordingly, clause 4(xiv) of the Order is not applicable.
xv. In our opinion and according to the information and explanations given to us, the terms and conditions on which the Company has given guarantees
for loans taken by others from banks or financial institutions are not prejudicial to the interests of the Company.
xvi. In our opinion and according to the information and explanations given to us and on the basis of our examination of the books of account, the term
loans obtained by the Company were applied for the purpose for which such loans were obtained.
xvii. According to the information and explanations given to us and on an overall examination of the balance sheet of the Company, we are of the opinion
that no funds raised on short-term basis have been used for long term investment.
xviii. The Company has not made any preferential allotment of shares to companies / firms / parties covered in the register maintained under Section 301 of
the Companies Act, 1956.
xix. The Company did not have any outstanding debentures during the year.
xx. We have verified the end-use of money raised by public issues as disclosed in the notes to the financial statements.
xxi. According to the information and explanations given to us, no fraud on or by the Company has been noticed or reported during the course of our
audit. However, as indicated in Note 2(iv) of Schedule 20, the Company in the previous year received information from anonymous sources that certain
persons have claimed income tax refunds by filing forged income tax deduction forms of the Company. The matter is currently under investigation. The
Company, however, does not foresee any claim of damages, fine or penalty.
for bsr & co.
Chartered Accountants
S Sethuraman
partner
Membership No. 203491
Place: Hyderabad
Date: 20 may 2008
Annexure to the Auditors’ Report

81 | D R . R E D D Y ’ S L A B O R AT O R I E S LT D i G a a p s ta n d a l o n e f i n a n c i a l s
Appendix 1 as referred to in para ix(d) of Annexure to the Auditors’ Report
name of the statute nature of the dues amount (rs. ’000)period to which the
amount relatedforum where dispute is pending
sales tax (including central sales tax and local sales tax)
Central Sales Tax Act, 1956 – Andhra Pradesh Tax 3,010 2003-04 Appellate Deputy Commissioner
Delhi Sales Tax Act, 1975, Tax and Interest 691 2002-03 Appellate Deputy Commissioner
Central Sales Tax Act, 1969 – Gujarat Tax 733 2003-04 Appellate Deputy Commissioner
Kerala General Sales Tax Act, 1963 Tax and surcharge 262 1997-98 Tax revision case filed with Kerala High Court
Central Sales Tax Act, 1956 – Kerala Tax 245 1997-98 Tax revision case filed with Kerala High Court
Kerala General Sales Tax Act, 1963 Tax 1,610 1998-99 Tax revision case filed with Kerala High Court
Central Sales Tax Act, 1956 – Kerala Tax 66 1998-99 Assessing Officer
Kerala General Sales Tax Act, 1963 Tax and Interest 681 1999-00 Sales Tax Tribunal
Kerala General Sales Tax Act, 1963 Tax 630 2000-01 Sales Tax Tribunal
Kerala General Sales Tax Act, 1963 Tax 57 2001-02 Sales Tax Tribunal
Kerala General Sales Tax Act, 1963 Tax 800 2001-02 Assessing Officer
Kerala General Sales Tax Act, 1963 Tax 86 2002-03 Appellate Deputy Commissioner
Kerala General Sales Tax Act, 1963 Tax 213 2003-04 Appellate Deputy Commissioner
Rajasthan Sales Tax Act, 1954 Tax 88 2004-05 Appellate Deputy Commissioner
excise duty
Central Excise Act,1944 Duty 575 2000-01 Asst. Commissioner
Central Excise Act,1944 Duty 113 2000-01 Asst. Commissioner
Central Excise Act,1944 Duty 85 2002-03 Revision Authority – Delhi
Central Excise Act,1944 Duty and Penalty 69 2004-05 Revision Authority – Delhi
Central Excise Act,1944 Credit and Penalty 116 2005-06 Customs Excise Service Appellate
Central Excise Act,1944 Duty 4,729 2003-05 CESTAT
Central Excise Act,1944 Duty 2,024 2004-06 CESTAT
Central Excise Act,1944 Duty 2,452 2005-06 CESTAT
Central Excise Act,1944 Duty 892 2002-03 Assistant Commissioner
Central Excise Act,1944 Duty 26,744 2005-06 Commissioner of CEX, Pondicherry
Central Excise Act,1944 Duty 702 2005-06 Commissioner-Appeals
Central Excise Act,1944 Duty 392 2005-06 Assistant Commissioner
Central Excise Act,1944 Interest 60 2003-04 Commissioner-Appeals
Central Excise Act,1944 Duty 225 2005-06 Commissioner-Appeals
Central Excise Act,1944 Interest 116 2005-06 Commissioner-Appeals
Central Excise Act,1944 Duty 4,125 2004-06 Additional Commissioner – Hyd-IV
Central Excise Act,1944 Duty 8,491 2005-07 Commissioner Hyd-IV
Central Excise Act,1944 Duty 423 2004-05 Assistant Commissioner
Central Excise Act,1944 Duty 11,786 2005-06 Commissioner Hyd-IV
Central Excise Act,1944 Duty 469 2004-05 Assistant Commissioner
Central Excise Act,1944 Duty 6,084 2005-06 Commissioner Hyd-IV
Central Excise Act,1944 Duty 2,723 1999-04 Commissioner
Central Excise Act,1944 Duty 4,349 2004-05 Commissioner
Central Excise Act,1944 Duty 1,476 2004-05 Assistant Commissioner
Central Excise Act,1944 Duty 9,219 2003-04 CESTAT
Central Excise Act,1944 Duty 368 2004-05 Assistant Commissioner
Central Excise Act,1944 Duty 10,001 2001-04 Commissioner
Central Excise Act,1944 Valuation 398 2005-06 CESTAT
Central Excise Act,1944 Valuation 6,913 2001-05 Commissioner
Central Excise Act,1944 Valuation 78 Prior to July 2000 CESTAT
Central Excise Act,1944 Duty 144 2006-07 & 2007- 08 Assistant Commissioner
Central Excise Act,1944 Duty 144 2006-07 Commissioner
Central Excise Act,1944 Duty 7,450 2006-07 & 2007 -08 Commissioner
Central Excise Act,1944 Duty 152 2002-03 Assistant Commissioner
Central Excise Act,1944 Duty 6,462 2006-07 Commissioner
Central Excise Act,1944 Duty 18,397 2006-07 Commissioner
Central Excise Act,1944 Duty 10,396 2006-07 Assistant Commissioner
Central Excise Act,1944 Duty 6,207 2006-07 Assistant Commissioner
Central Excise Act,1944 Duty 530 2006-07 Assistant Commissioner
Central Excise Act,1944 Duty 4,786 2006-07 Assistant Commissioner
Central Excise Act,1944 Duty 11,209 2006-07 Assistant Commissioner
Central Excise Act,1944 Duty 965 1998-2002 CESTAT
customs duty
Customs Act,1962 Penalty 17,910 1994-00 Supreme Court
Customs Act,1962 Duty 142 2003-04 CESTAT
Customs Act,1962 Duty 258 2003-04 Commissioner
Customs Act,1962 Excess DEPB 11,009 2003-07 Commissioner
income taxes
Income Tax Act, 1961 Tax and Interest 153 1999-00 Tax and Interest
Income Tax Act, 1961 Tax and Interest 140,125 2002-03 Income Tax Appellate Tribunal (ITAT)
Income Tax Act, 1961 Tax and Interest 591 1993-94 ITAT
Income Tax Act, 1961 Tax and Interest 20,334 1993-94 & 1994-95 High Court, Andhra Pradesh
Income Tax Act, 1961 Tax and Interest 324 1991-92 High Court, Andhra Pradesh
Income Tax Act, 1961 Tax and Interest 1,199 1992-93 High Court, Andhra Pradesh
Income Tax Act, 1961 Tax and Interest 1,574 1993-94 High Court, Andhra Pradesh
Income Tax Act, 1961 Tax and Interest 3,838 1994-95 High Court, Andhra Pradesh

82 | A N N U A L R E P O R T 2 0 0 7 – 0 8 c o n s o l i d at i n G f o r t h e f u t u r e
Balance Sheet A S AT 3 1 M A R C h 2 0 0 8
a l l a m o u n t s i n i n d i a n r u p e e s t h o u s a n d s, e x c e p t s h a r e d ata a n d w h e r e o t h e r w i s e s tat e d
as at as at
schedule 31 march 2008 31 march 2007
SOURCES OF FUNDS
shareholders’ funds
Share capital 1 840,865 839,561
Reserves and surplus 2 47,277,184 42,894,005
48,118,049 43,733,566
loan funds
Secured loans 3 34,022 19,225
Unsecured loans 4 4,589,052 3,279,794
4,623,074 3,299,019
deferred tax liability, net 20(3) 868,575 577,404
53,609,698 47,609,989
APPLICATION OF FUNDS
fixed assets and intangibles 5
Gross block 17,502,108 12,911,921
Less: Accumulated depreciation and amortisation (7,627,956) (6,091,535)
Net block 9,874,152 6,820,386
Capital work-in-progress (including capital advances) 2,457,106 2,806,081
12,331,258 9,626,467
investments 6 19,306,197 8,302,126
current assets, loans and advances
Inventories 7 6,409,343 4,875,836
Sundry debtors 8 8,977,086 10,557,008
Cash and bank balances 9 5,373,417 14,567,111
Loans and advances 10 8,921,846 7,044,177
29,681,692 37,044,132
current liabilities and provisions
Current liabilities 11 6,808,568 6,334,275
Provisions 12 900,881 1,028,461
7,709,449 7,362,736
net current assets 21,972,243 29,681,396
53,609,698 47,609,989
Notes to Accounts 20
The schedules referred to above form an integral part of the Balance Sheet
As per our report attached
for BSR & Co. for Dr. Reddy’s Laboratories Limited
Chartered Accountants
s sethuraman Partner dr. K anji reddy Chairman
Membership No. 203491 G V prasad Vice Chairman and CEO
K satish reddy Managing Director and COO
Hyderabad 20 May 2008 saumen chakraborty Chief Financial Officer
V Viswanath Company Secretary

83 | D R . R E D D Y ’ S L A B O R AT O R I E S LT D i G a a p s ta n d a l o n e f i n a n c i a l s
Profit and Loss Account F O R T h E y E A R E N D E D 3 1 M A R C h 2 0 0 8
a l l a m o u n t s i n i n d i a n r u p e e s t h o u s a n d s, e x c e p t s h a r e d ata a n d w h e r e o t h e r w i s e s tat e d
for the year ended
31 march 2008
for the year ended
31 march 2007schedule
Income
Sales, gross 33,864,865 38,261,368
Less: Excise duty on sales (558,308) (779,390)
Sales, net 33,306,557 37,481,978
License fees 215,832 1,744,737
Service income 416,373 447,040
Other income 13 1,911,313 1,169,293
35,850,075 40,843,048
expendIture
Material costs 14 12,534,602 11,215,910
Conversion charges 558,264 1,132,043
Excise duty 286,808 117,191
Personnel costs 15 3,686,203 2,797,652
Operating and other expenses 16 7,869,051 7,177,926
Research and development expenses 3,308,709 3,282,514
Less: Amount reimbursed as per the research and
development arrangements (Refer Note 21, Schedule 20)17 (89,505) 3,219,204 (825,405) 2,457,109
Provision for decline in the value of long-term investments 133,171 472,069
Finance charges 18 101,883 479,682
Depreciation and amortisation 1,619,862 1,335,009
30,009,048 27,184,591
profit before taxation 5,841,027 13,658,457
Income tax expense 19 1,088,808 1,889,864
profit after taxation 4,752,219 11,768,593
Balance in profit and loss account brought forward 13,051,316 3,278,210
Less: Transitional liability recognised pursuant to adoption of
Accounting Standard-15 (Revised) ”Employee Benefits” 20(19) – (81,702)
Transitional loss recognised pursuant to early adoption of
Accounting Standard-30 “Financial Instruments:
Recognition and Measurement“20(18) (14,921) 13,036,395 – 3,196,508
amount available for appropriation 17,788,614 14,965,101
ApproprIAtIons :
Proposed dividend on equity shares 630,648 629,671
Tax on proposed dividend 107,179 107,013
Dividend of previous years 604 242
Transferred to General Reserve 475,222 1,176,859
Balance carried forward 16,574,961 13,051,316
17,788,614 14,965,101
earnings per share 20(4)
Basic – Par value Rs. 5 per share 28.27 74.23
Diluted – Par value Rs. 5 per share 28.09 73.74
Notes to accounts 20
The schedules referred to above form an integral part of the Profit and Loss Account
As per our report attached
for BSR & Co. for Dr. Reddy’s Laboratories Limited
Chartered Accountants
s sethuraman Partner dr. K anji reddy Chairman
Membership No. 203491 G V prasad Vice Chairman and CEO
K satish reddy Managing Director and COO
Hyderabad 20 May 2008 saumen chakraborty Chief Financial Officer
V Viswanath Company Secretary

84 | A N N U A L R E P O R T 2 0 0 7 – 0 8 c o n s o l i d at i n G f o r t h e f u t u r e
Schedules to the Balance Sheet F O R T h E y E A R E N D E D 3 1 M A R C h 2 0 0 8
a l l a m o u n t s i n i n d i a n r u p e e s t h o u s a n d s, e x c e p t s h a r e d ata a n d w h e r e o t h e r w i s e s tat e d
as at as at
31 march 2008 31 march 2007
schedule 1 : shAre cApItAl
authorised
200,000,000 (previous year: 200,000,000) equity shares of Rs. 5 each 1,000,000 1,000,000
issued
168,172,946 (previous year: 167,912,380) equity shares of Rs. 5 each fully paid-up (Note 1) 840,865 839,562
subscribed and paid-up
168,172,746 (previous year: 167,912,180) equity shares of Rs. 5 each fully paid-up 840,864 839,560
Add: Forfeited share capital (Note 2) 1 840,865 1 839,561
840,865 839,561
Notes:
1. Subscribed and paid-up share capital includes:
(a) 111,732,202 (previous year: 111,732,202) equity shares of Rs. 5 each fully paid-up, allotted as bonus shares. Out of total, 34,974,400 shares were alloted
by capitalisation of General Reserve and 76,757,802 equity shares alloted as bonus shares by capitalisation of the Securities Premium Account in the earlier
years.
(b) 1,052,248 (previous year: 1,052,248) equity shares of Rs. 5 each allotted pursuant to a scheme of amalgamation with Standard Equity Fund Limited
without payments being received in cash.
(c) 20,571,768 (previous year: 20,571,768) equity shares of Rs. 5 each allotted and 82,800 (previous year: 82,800) equity shares of Rs. 5 each extinguished
pursuant to a scheme of amalgamation with erstwhile Cheminor Drugs Limited (CDL) without payments being received in cash.
(d) 40,750,000 (previous year: 40,750,000) equity shares of Rs. 5 each allotted against American Depository Shares (ADS). The Company, during the previous
year raised Rs. 10,241,200 through a secondary offering by issuing 14,300,000 ADS, representing 14,300,000 equity shares (one ADS represents one equity
share).
(e) 17,204,304 (previous year: 17,204,304) equity shares of Rs. 5 each allotted against Global Depository Receipts (GDR) that were converted into ADS during
the year ended 31 March 2002.
(f) 226,776 (previous year: 226,776) equity shares of Rs. 5 each allotted to the erstwhile members of American Remedies Limited (ARL) pursuant to a scheme
of amalgamation with ARL without payments being received in cash.
(g) 659,227 (previous year: 398,661) equity shares of Rs. 5 each allotted to the employees of the Company on exercise of the vested stock options in
accordance with the terms of exercise under the “Dr. Reddy’s Employees Stock Option Scheme, 2002”.
2. Represents 200 (previous year: 200) equity shares of Rs. 5 each, amount paid-up Rs. 500/- forfeited due to non-payment of allotment money.
3. 932,568 (previous year: 1,080,832) stock options are outstanding to be issued by the Company on exercise of the vested stock options in accordance with
the terms of exercise under the “Dr. Reddy’s Employees Stock Option Scheme, 2002” and 182,778 (previous year: nil) stock options are outstanding to be issued
by the Company on exercise of the vested stock options in accordance with the terms of exercise under the “Dr. Reddy’s Employees ADR Stock Option Scheme 2007”.
(Refer Note 9, Schedule 20)

85 | D R . R E D D Y ’ S L A B O R AT O R I E S LT D i G a a p s ta n d a l o n e f i n a n c i a l s
Schedules to the Balance Sheet ( C O N T I N u E D )
a l l a m o u n t s i n i n d i a n r u p e e s t h o u s a n d s, e x c e p t s h a r e d ata a n d w h e r e o t h e r w i s e s tat e d
as at as at
31 march 2008 31 march 2007
schedule 2 : reserves And surplus
capital reserve
Balance at the beginning and end of the year 7,276 7,276
securities premium account
Balance at the beginning of the year 17,519,763 7,877,812
Add: Received during the year on exercise of employee stock options 122,574 83,330
Add: Received during the year on issue of American Depository Shares (ADS) – 10,169,700
Less: Utilised for issue of bonus shares – (383,789)
Less: Utilisation towards ADS issue expenses – (227,290)
17,642,337 17,519,763
employee stock options outstanding
Balance at the beginning of the year 448,486 261,053
Add: Options granted during the year 401,502 292,251
Less: Options forfeited during the year (162,261) (36,350)
Less: Options excercised during the year (108,657) (68,468)
Balance at the end of the year (A) 579,070 448,486
deferred stock compensation cost
Balance at the beginning of the year 220,882 146,592
Add: Options granted during the year 401,502 292,251
Less: Amortisation during the year (207,125) (181,611)
Less: Options forfeited during the year (162,261) (36,350)
Balance at the end of the year (B) 252,998 220,882
(A) – (B) 326,072 227,604
General reserve
Balance at the beginning of the year 12,137,044 10,960,185
Add: Transferred from profit and loss account 475,222 1,176,859
12,612,266 12,137,044
foreign currency translation reserve
Balance at the beginning of the year (48,998) –
Additions / deductions during the year (Note 1) 173,334 (48,998)
124,336 (48,998)
hedging reserve
Balance at the beginning of the year – –
Additions / deductions during the year (Refer note 18, Schedule 20) (10,064) –
(10,064) –
profit and loss account
Balance in profit and loss account 16,574,961 13,051,316
47,277,184 42,894,005
Note:
1. The foreign currency translation reserve comprises exchange difference on monetary item that in substance form part of the net investment in Industrias
Quimicas Falcon de Mexico, S.A.de.C.V (Mexico) and Lacock Holdings Limited, Cyprus, non-integral foreign operations as defined in Accounting Standard
(AS) – 11 (Revised 2003) on “The Effects of Changes in Foreign Exchange Rates”.
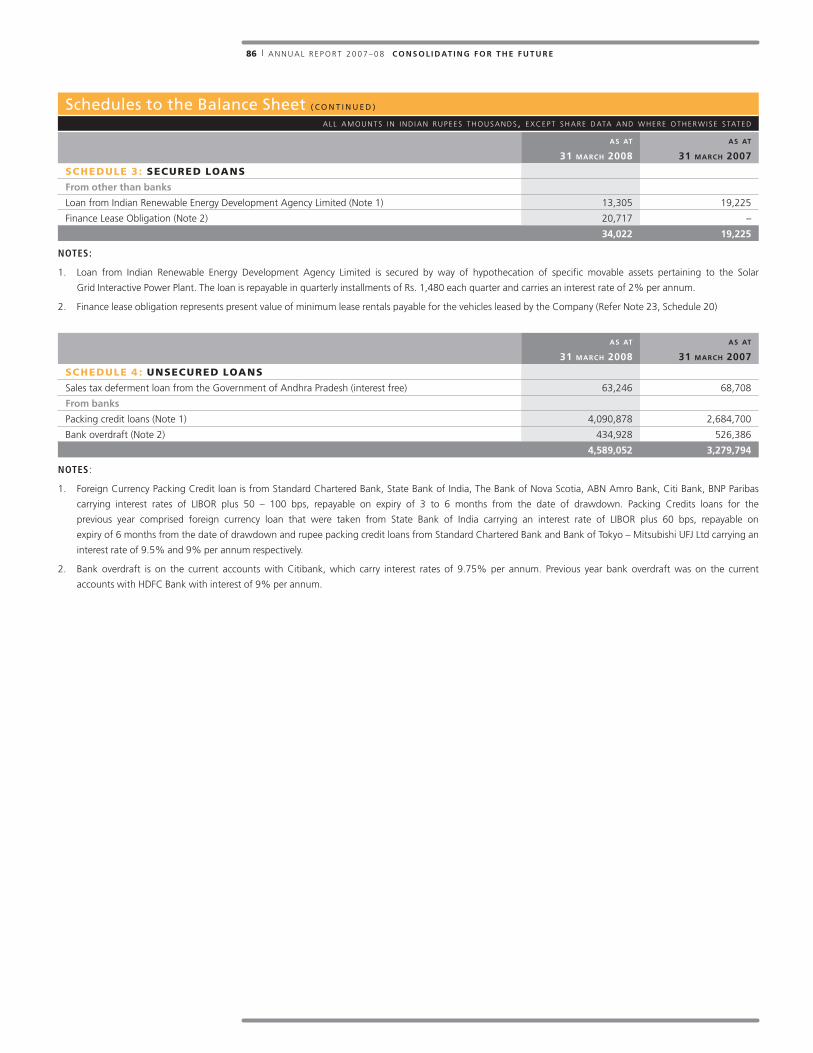
86 | A N N U A L R E P O R T 2 0 0 7 – 0 8 c o n s o l i d at i n G f o r t h e f u t u r e
Schedules to the Balance Sheet ( C O N T I N u E D )
a l l a m o u n t s i n i n d i a n r u p e e s t h o u s a n d s, e x c e p t s h a r e d ata a n d w h e r e o t h e r w i s e s tat e d
as at as at
31 march 2008 31 march 2007
schedule 3 : secured loAns
from other than banks
Loan from Indian Renewable Energy Development Agency Limited (Note 1) 13,305 19,225
Finance Lease Obligation (Note 2) 20,717 –
34,022 19,225
as at as at
31 march 2008 31 march 2007
schedule 4 : unsecured loAns
Sales tax deferment loan from the Government of Andhra Pradesh (interest free) 63,246 68,708
from banks
Packing credit loans (Note 1) 4,090,878 2,684,700
Bank overdraft (Note 2) 434,928 526,386
4,589,052 3,279,794
Notes:
1. Loan from Indian Renewable Energy Development Agency Limited is secured by way of hypothecation of specific movable assets pertaining to the Solar
Grid Interactive Power Plant. The loan is repayable in quarterly installments of Rs. 1,480 each quarter and carries an interest rate of 2% per annum.
2. Finance lease obligation represents present value of minimum lease rentals payable for the vehicles leased by the Company (Refer Note 23, Schedule 20)
Notes:
1. Foreign Currency Packing Credit loan is from Standard Chartered Bank, State Bank of India, The Bank of Nova Scotia, ABN Amro Bank, Citi Bank, BNP Paribas
carrying interest rates of LIBOR plus 50 – 100 bps, repayable on expiry of 3 to 6 months from the date of drawdown. Packing Credits loans for the
previous year comprised foreign currency loan that were taken from State Bank of India carrying an interest rate of LIBOR plus 60 bps, repayable on
expiry of 6 months from the date of drawdown and rupee packing credit loans from Standard Chartered Bank and Bank of Tokyo – Mitsubishi UFJ Ltd carrying an
interest rate of 9.5% and 9% per annum respectively.
2. Bank overdraft is on the current accounts with Citibank, which carry interest rates of 9.75% per annum. Previous year bank overdraft was on the current
accounts with HDFC Bank with interest of 9% per annum.

87 | D R . R E D D Y ’ S L A B O R AT O R I E S LT D i G a a p s ta n d a l o n e f i n a n c i a l s
sc
he
du
le
5:
FIx
ed
As
se
ts
gr
os
s b
lo
ck
de
pr
ec
iat
ion
ne
t b
lo
ck
de
sc
rip
tio
n
as a
t
1 a
pr
il
20
07
ad
dit
ion
s d
el
et
ion
s
as a
t
31
ma
rc
h
20
08
as a
t
1 a
pr
il
20
07
fo
r t
he y
ea
r
de
le
tio
ns
as a
t
31
ma
rc
h
20
08
as a
t
31
ma
rc
h
20
08
as a
t
31
ma
rc
h
20
07
Land
– fr
eeho
ld14
9,17
349
1,19
9 –
64
0,37
2 –
–
––
640,
372
149,
173
Build
ings
2,11
7,44
21,
082,
873
2,3
09
3,19
8,00
641
7,37
810
9,67
6 6
77
526,
377
2,67
1,62
91,
700,
064
Plan
t and
mac
hine
ry (N
ote
1)5,
952,
327
2,04
9,52
044
,692
7,95
7,15
53,
006,
202
803,
578
39,
106
3,77
0,67
44,
186,
481
2,94
6,12
5
Elec
tric
al e
quip
men
t71
6,88
033
8,43
17,
009
1,04
8,30
232
9,44
410
1,34
1 5
,616
42
5,16
962
3,13
338
7,43
6
Labo
rato
ry e
quip
men
t 1
,791
,620
38
1,69
32,
506
2,17
0,80
787
8,82
024
5,49
61,
567
1,12
2,74
91,
048,
058
912,
800
Furn
iture
, fixt
ures
and
offi
ce
equi
pmen
t82
7,88
124
4,09
43,
778
1,06
8,19
755
3,16
714
8,64
52,
878
698,
934
369,
263
274,
714
Vehi
cles
352,
346
87,6
2454
,209
385,
761
149,
793
70,1
6633
,599
186,
360
199,
401
202,
553
Libr
ary
695
– –
695
695
–
– 69
5–
–
inta
ng
ible
s
Cus
tom
er c
ontr
acts
243,
424
––
243,
424
125,
088
86,5
48–
211,
636
31,7
8811
8,33
6
Tech
nica
l kno
w-h
ow45
8,53
3–
–45
8,53
333
5,75
745
,853
–38
1,61
076
,923
122,
776
Non
-com
pete
fees
227,
500
––
227
,500
22
7,50
0–
–22
7,50
0–
–
Pate
nts,
trad
emar
ks a
nd d
esig
ns74
,100
––
74,1
0067
,691
3,65
8–
71,3
492,
751
6,40
9
(incl
udin
g m
arke
ting
know
-how
)
12,9
11,9
214,
675,
434
114,
503
17,4
72,8
526,
091,
535
1,61
4,96
183
,443
7,62
3,05
39,
849,
799
6,82
0,38
6
ass
ets
take
n o
n le
ase
Vehi
cles
–29
,256
–29
,256
–4,
903
–4,
903
24,3
53–
tota
l12
,911
,921
4,70
4,69
011
4,50
3 17
,502
,108
6,09
1,53
51,
619,
864
83,4
437,
627,
956
9,87
4,15
26,
820,
386
Prev
ious
yea
r10
,528
,977
2,57
1,66
318
8,71
912
,911
,921
4,91
0,82
61,
335,
009
154,
300
6,09
1,53
56,
820,
386
No
tes
:
1.
The
Com
pany
ow
ns t
reat
ed e
fflue
nt d
isch
arge
pip
elin
e w
ith a
cos
t of
Rs.
9,2
57 (p
revi
ous
year
: Rs.
9,2
57) a
nd n
et b
ook
valu
e of
Rs.
636
(pre
viou
s ye
ar: R
s. 1
,594
) in
equa
l pro
port
ion
join
tly w
ith a
thi
rd p
arty
in
Pydi
bhee
mav
aram
pur
suan
t to
a m
utua
l agr
eem
ent.
2.
Dep
reci
atio
n fo
r th
e ye
ar in
clud
es d
epre
ciat
ion
amou
ntin
g to
Rs.
362
,882
(pre
viou
s ye
ar: R
s. 3
16,0
35) o
n as
sets
use
d fo
r Re
sear
ch a
nd D
evel
opm
ent.
Dur
ing
the
year
Com
pany
incu
rred
Rs.
1,1
52,7
90 (p
revi
ous
year
: Rs.
470
,868
) tow
ards
cap
ital e
xpen
ditu
re f
or R
esea
rch
& D
evel
opm
ent.
Sch
ed
ule
s to
th
e B
ala
nce
Sh
ee
t (C
ON
TIN
uE
D)
al
l a
mo
un
ts i
n i
nd
ian
ru
pe
es t
ho
us
an
ds,
ex
ce
pt s
ha
re d
at
a a
nd
wh
er
e o
th
er
wis
e s
ta
te
d

88 | A N N U A L R E P O R T 2 0 0 7 – 0 8 c o n s o l i d at i n G f o r t h e f u t u r e
Schedules to the Balance Sheet ( C O N T I N u E D )
a l l a m o u n t s i n i n d i a n r u p e e s t h o u s a n d s, e x c e p t s h a r e d ata a n d w h e r e o t h e r w i s e s tat e d
as at as at
31 march 2008 31 march 2007
schedule 6 : Investments
Long term at cost, unless otherwise specified
I. QUOTED INvESTmENTS
non-trade
(a) equity shares (fully paid-up)
12,000 (previous year: 12,000) equity shares of Rs. 10 each of State Bank of India (Note 1) 3,096 3,096
TOTAL QUOTED LONg TERm INvESTmENTS (I) 3,096 3,096
II. UNQUOTED INvESTmENTS
trade
(a) equity and preference shares (fully paid-up)
In Subsidiary Companies
50,000 (previous year: 50,000) equity shares of Rs. 10 each of DRL Investments Limited, India 500 500
11,625,000 (previous year: 11,625,000) ordinary shares of H.K.$. 1 each of Reddy Pharmaceuticals Hong
Kong Limited, Hong Kong 58,021 58,021
Equity shares of OOO JV Reddy Biomed Limited, Russia (Note 2) 6,635 6,635
500,000 (previous year: 500,000) equity shares of U.S.$. 1 each of Reddy Antilles N.V., Netherlands 17,969 17,969
6,059,231 (previous year: 6,059,231) shares of Real U.S.$. 1 each of Dr. Reddy’s Farmaceutica do Brasil
Ltda, Brazil 97,085 97,085
400,750 (previous year: 400,750) ordinary shares of U.S.$. 10 each of Dr. Reddy’s Laboratories Inc, U.S.A. 175,038 175,038
134,513 (previous year: 134,513) equity shares of Rs. 10 each of Cheminor Investments Limited, India 1345 1345
2,500 (previous year: 2,500) ordinary shares of F.F. 100 each of Reddy Cheminor S.A., France 1,558 1,558
88,644,161 (previous year: 88,644,161) equity shares of Rs. 10 each of Aurigene Discovery Technologies
Limited, India 886,442 886,442
34,476 (previous year: 34,476) ordinary A shares of GBP 0.01 each of Dr. Reddy’s Laboratories (EU)
Limited, U.K. 141,502 141,502
98,124 (previous year: 98,124) ordinary shares of GBP 0.01 each of Dr. Reddy’s Laboratories (EU) Limited,
U.K. 493,324 493,324
360,000 (previous year: 360,000) preference shares of GBP 0.0001 each of Dr. Reddy’s Laboratories (EU)
Limited, U.K. 22,546 22,546
34,022,070 (previous year: 34,022,070) equity shares of Rs. 10 each of Dr. Reddy’s Bio-sciences Limited,
India 266,388 266,388
Equity shares of OOO Dr. Reddy’s Laboratories Limited, Russia (Note 2) 71,843 71,843
60 (previous year: 60) ordinary shares of Rand 1 each of Dr. Reddy’s Laboratories (Proprietory) Limited,
South Africa 3 3
206 (previous year: 206) equity shares of U.S.$. 0.01 each of Trigenesis Therapeutics Inc, U.S.A. 496,715 496,715
12,293 (previous year: 5,000) equity shares of CYP. 1 each of Lacock Holdings Limited, Cyprus 11,578,767 3,952,700
140,526,270 (previous year: 140,526,270) Series “A” shares of Peso 1 each of Industrias Quimicas
Falcon de Mexico, S.A.de.C.V., Mexico 709,039 709,039
5,566,000 (previous year: 5,566,000) Ordinary Shares of Euro 1 each of Reddy Pharma Iberia, Spain 321,130 321,130
700,000 (previous year: 699,993) ordinary shares of Aus$. 1 each of Dr. Reddy’s Laboratories (Australia)
Pty. Limited, Australia 24,640 24,640
100,000 (previous year: nil) Ordinary Shares of CHS 1 each of Dr. Reddy’s Laboratories SA, Switzerland 3,522 –
In associates
2,500,000 (previous year: 2,500,000) equity shares of Re. 1 each of Perlecan Pharma Private Limited,
India (Refer Note 21 of Schedule 20) 170,000 170,000
carried forward 15,544,012 7,914,423

89 | D R . R E D D Y ’ S L A B O R AT O R I E S LT D i G a a p s ta n d a l o n e f i n a n c i a l s
as at as at
31 march 2008 31 march 2007
schedule 6 : Investments (contInued)
Brought forward 15,544,012 7,914,423
Unquoted trade investments (continued)
In joint venture
Equity shares held in Kunshan Rotam Reddy Pharmaceutical Co. Limited, China (Note 2) 429,048 429,048
In other companies
28,693 (previous year: 28,693) ordinary shares of Roubles 1,000 each of Biomed Russia Limited, Russia. 65,557 65,557
(b) in capital of partnership firm (a subsidiary)
Globe Enterprises, India 2,396 2,396
(A partnership firm with Dr. Reddy’s Holdings Private Limited organised under the Indian Partnership Act,
1932 wherein the Company and Dr. Reddy’s Holdings Private Limited share the profit/loss for the year in
the ratio of 95:5 respectively)
Partners capital account:
Dr. Reddy’s Laboratories Limited – Rs. 2,396
Dr. Reddy’s Holdings Private Limited – Rs. 101
non-trade
(a) in debentures
5 (previous year: 5), 0-9% based on offer side fixed rate of 12 month MIOIS, convertible debentures of
Rs. 50,000,000 each of Citicorp Finance (India) Limited 250,000 250,000
10 (previous year: 10), 0-9.5% based on offer side fixed rate of 12 month MIOIS, convertible debentures
of Rs. 50,000,000 each of Citicorp Finance (India) Limited 500,000 500,000
5 (previous year: 5), 0-12.35% based on offer side fixed rate of 12 month MIOIS, convertible debentures
of Rs. 100,000,000 each of Citicorp Finance (India) Limited 500,000 500,000
(b) in equity shares
200,000 (previous year: 200,000) ordinary shares of Rs. 10 each of Altek Engineering Limited, India 2,000 2,000
8,859 (previous year: 8,859) equity shares of Rs. 100 each of Jeedimetla Effluent Treatment Limited, India 965 965
24,000 (previous year: 24,000) equity shares of Rs. 100 each of Progressive Effluent Treatment Limited,
India 2,400 2,400
(c) in mutual fund
Nil (previous year: 2,000) Units of UTI Master Gain 92 – 20
TOTAL UNQUOTED LONg TERm INvESTmENTS (II) 17,296,378 9,666,809
Current Investments at cost or market value which ever is less
UNQUOTED INvESTmENTS
in mutual fund
19,644,524.76 (previous year: nil) units of BSL Interval Income-INSTL-MONTHLY-Series 2-Growth 200,663 –
29,296,588.90 (previous year: nil) units of ABN AMRO Interval Fund Monthly Plan A Growth-Ren 297,785 –
40,193,735.69 (previous year: nil) units of Birla Dynamic Bond Fund-Retail-Growth 509,098 –
100,000,000.00 (previous year: nil) units of SBI Debt Fund Series-30 Days-2-(27-Mar-08)-Growth 1,000,000 –
76,546,233.92 (previous year: nil) units of Tata Dynamic Bond Fund Option B-Growth 1,000,000 –
45,810,967.69 (previous year: nil) units of Reliance Monthly Interval Fund-Seies II – Institutional Growth Plan 500,127 –
TOTAL UNQUOTED CURRENT INvESTmENTS (III) 3,507,673 –
AggREgATE COST OF INvESTmENTS (I + II + III) 20,807,147 9,669,905
Less: Provision for decline, other than temporary, in the value of long term investments (1,500,950) (1,367,779)
total investments, net 19,306,197 8,302,126
Schedules to the Balance Sheet ( C O N T I N u E D )
a l l a m o u n t s i n i n d i a n r u p e e s t h o u s a n d s, e x c e p t s h a r e d ata a n d w h e r e o t h e r w i s e s tat e d
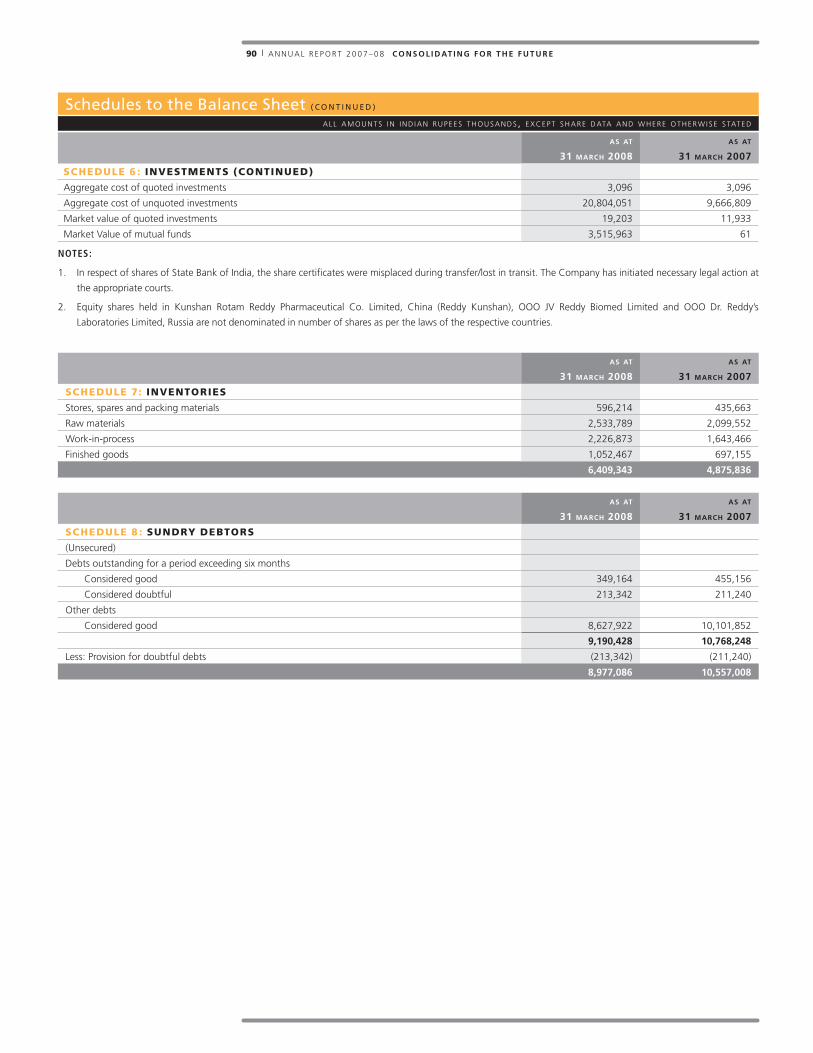
90 | A N N U A L R E P O R T 2 0 0 7 – 0 8 c o n s o l i d at i n G f o r t h e f u t u r e
as at as at
31 march 2008 31 march 2007
schedule 6 : Investments (contInued)
Aggregate cost of quoted investments 3,096 3,096
Aggregate cost of unquoted investments 20,804,051 9,666,809
Market value of quoted investments 19,203 11,933
Market Value of mutual funds 3,515,963 61
as at as at
31 march 2008 31 march 2007
schedule 7: InventorIes
Stores, spares and packing materials 596,214 435,663
Raw materials 2,533,789 2,099,552
Work-in-process 2,226,873 1,643,466
Finished goods 1,052,467 697,155
6,409,343 4,875,836
as at as at
31 march 2008 31 march 2007
schedule 8 : sundry debtors
(Unsecured)
Debts outstanding for a period exceeding six months
Considered good 349,164 455,156
Considered doubtful 213,342 211,240
Other debts
Considered good 8,627,922 10,101,852
9,190,428 10,768,248
Less: Provision for doubtful debts (213,342) (211,240)
8,977,086 10,557,008
Schedules to the Balance Sheet ( C O N T I N u E D )
a l l a m o u n t s i n i n d i a n r u p e e s t h o u s a n d s, e x c e p t s h a r e d ata a n d w h e r e o t h e r w i s e s tat e d
Notes:
1. In respect of shares of State Bank of India, the share certificates were misplaced during transfer/lost in transit. The Company has initiated necessary legal action at
the appropriate courts.
2. Equity shares held in Kunshan Rotam Reddy Pharmaceutical Co. Limited, China (Reddy Kunshan), OOO JV Reddy Biomed Limited and OOO Dr. Reddy’s
Laboratories Limited, Russia are not denominated in number of shares as per the laws of the respective countries.

91 | D R . R E D D Y ’ S L A B O R AT O R I E S LT D i G a a p s ta n d a l o n e f i n a n c i a l s
Schedules to the Balance Sheet ( C O N T I N u E D )
a l l a m o u n t s i n i n d i a n r u p e e s t h o u s a n d s, e x c e p t s h a r e d ata a n d w h e r e o t h e r w i s e s tat e d
as at as at
31 march 2008 31 march 2007
schedule 9 : cAsh And bAnk bAlAnces
Cash in hand 17,490 5,284
Balances with scheduled banks
In current accounts 454,228 579,662
In EEFC current accounts 69,686 673,180
In deposit accounts 4,701,537 13,081,066
In unclaimed dividend accounts 14,372 12,620
In unclaimed fractional share pay order accounts 666 666
Balances with non-scheduled banks outside India
In current accounts 115,438 214,633
5,373,417 14,567,111
Notes:
1. Deposits with scheduled and non-scheduled banks include Rs. 1,268 (previous year:
Rs. 1,621) representing margin money for letters of credit and bank guarantees.
2. Details of unutilised portion of ADS issue proceeds:
Deposit with schedule banks outside India – 8,732,898
[Maximum amount outstanding at any time during the year: Rs. 8,732,898 (previous
year: Rs. 8,732,898)]
Deposit with schedule banks in India 2,500,000 –
Investment in mutual funds 3,507,673 –
3. Closing balances and maximum amounts outstanding at any time during the year on current accounts with banks outside India:
maximum balance balance as at
31 march
2008
31 march
2007
31 march
2008
31 march
2007
Citibank, New York 178,760 178,760 70,656 178,760
Credit Bank of Moscow, Moscow 44,532 20,886 752 10,988
ABN Amro Bank, Romania 5,706 6,517 5,016 3,686
ABN Amro Bank, Kazakhstan 8,150 5,344 1,511 1,750
Golden Taler Bank, Belarus 4,021 5,237 4,021 2,755
Societe Generale Yugoslav Bank Ad, Yugoslavia 49 281 44 49
Exim Bank HCMC, Vietnam 512 2,868 509 118
Standard Chartered Grindlays Bank, Sri Lanka 2,184 376 962 25
Citibank, Malaysia 855 1,120 593 434
Citibank NA, China 4,341 4,460 1,849 2,621
Commercial Bank of Africa Ltd., Kenya 62 62 – 62
Ukreximbank, Ukraine 11,662 7,026 11,662 206
HSBC, U.A.E 3,817 5,644 3,817 2,872
Standard Chartered Bank, Ghana 4 4 3 –
Union Bank of Switzerland, Basel 6,140 3,133 6,140 3,133
National Bank for Foreign Economic Activity, Uzbekistan 1,557 649 1,199 331
Foreign Trade Bank, Myanmar 2,492 2,492 1,396 2,492
Banca Canarias De, Venezuela 4,351 4,351 2,712 4,351
Union Bank, Philipines 1,212 – 1,212 –
Citibank, Moscow 3,225 – 1,384 –
115,438 214,633

92 | A N N U A L R E P O R T 2 0 0 7 – 0 8 c o n s o l i d at i n G f o r t h e f u t u r e
Schedules to the Balance Sheet ( C O N T I N u E D )
a l l a m o u n t s i n i n d i a n r u p e e s t h o u s a n d s, e x c e p t s h a r e d ata a n d w h e r e o t h e r w i s e s tat e d
as at as at
31 march 2008 31 march 2007
schedule 10 : loAns And AdvAnces
(Unsecured)
considered good
Loans and advances to wholly owned subsidiary companies, step down subsidiary
companies, Joint venture and associates5,536,287 4,872,227
Advance recoverable from Perlecan Pharma Private Limited (Refer Note 21, Schedule 20) 20,158 89,716
Advances to material suppliers 382,152 307,058
Staff loans and advances 12,957 16,317
Interest accrued on investments 27,985 5,630
Other advances recoverable in cash or in kind or for value to be received 1,937,289 1,102,344
MAT credit entitlement 24,760 –
Balances with customs, central excise etc. 874,113 546,888
Deposits 106,145 103,997
considered doubtful
Advance towards investment 8,056 8,056
Staff loans and advances 6,500 6,500
Loans and advances to a wholly owned subsidiary companies, joint ventures and associates 361,732 357,699
Other advances recoverable in cash or in kind or for value to be received 54,507 52,671
9,352,641 7,469,103
Less: Provision for doubtful advances (430,795) (424,926)
8,921,846 7,044,177
Staff loans and advances include:
Loans to an officer of the Company Rs. Nil (previous year: Rs. Nil)
[Maximum amount outstanding at anytime during the year Rs. Nil (previous year: Rs. Nil)]
Loans and advances to wholly owned subsidiary companies, step down subsidiary companies, joint ventures and associates:
balance as at
maximum amount
outstanding at any time
during the year
31 march
2008
31 march
2007
31 march
2008
31 march
2007
Aurigene Discovery Technologies Limited, India 358,944 358,944 358,944 358,944
DRL Investments Limited, India 8,534 8,534 8,534 8,534
Cheminor Investments Limited, India 7 7 7 7
Reddy Antilles N.V., Netherlands 222,409 107,197 222,409 114,816
Dr. Reddy’s Farmaceutica Do Brasil Ltda., Brazil 357,068 256,473 357,068 260,871
Dr. Reddy’s Bio-sciences Limited, India 79,147 32,198 79,147 32,198
Dr. Reddy’s Laboratories Inc., USA 3,225 – 3,225 266,003
Kunshan Rotam Reddy Pharmaceutical Company Limited, China 13 222 1,822 47,232
Dr. Reddy’s Laboratories (Proprietary) Limited, South Africa 10,882 18,932 15,254 23,832
APR LLC 105,982 101,948 105,982 101,948
Reddy Holding GmbH, Germany – 48,916 48,916 69,082
Lacock Holdings Limited, Cyprus 3,127,322 2,721,075 3,127,322 2,721,075
Industrias Quimicas Falcon de Mexico, SA de C.V, Mexico 1,517,277 1,575,480 1,575,480 1,830,439
Dr. Reddy’s Laboratories SA, Switzerland 100,300 – 100,300 –
Dr. Reddy’s Laboratories (Australia) Pty. Ltd., Australia 6,909 – 6,909 –
5,898,019 5,229,926

93 | D R . R E D D Y ’ S L A B O R AT O R I E S LT D i G a a p s ta n d a l o n e f i n a n c i a l s
Schedules to the Balance Sheet ( C O N T I N u E D )
a l l a m o u n t s i n i n d i a n r u p e e s t h o u s a n d s, e x c e p t s h a r e d ata a n d w h e r e o t h e r w i s e s tat e d
Notes:
1. The loans and advances in the nature of loans to the subsidiaries and step down subsidiaries are repayable on demand except for Dr. Reddy’s Farmaceutica Do
Brasil Ltda., Brazil, Dr. Reddy’s Laboratories (Proprietary) Limited, South Africa and Reddy Holding GmbH, Germany, where the repayment schedule is beyond seven
years. In respect of amounts receivable from Industrias Quimicas Falcon de Mexico, S.A.de.C.V (Falcon) and Lacock Holdings Limited, Cyprus settlement is neither
planned not likely to occur in foreseeable future. All these loans are interest free loans except for the following loans:
LOAN TO INTEREST RATE PER ANNUm
Dr. Reddy’s Laboratories (Proprietary) Limited, South Africa 6%
Lacock Holdings Limited, Cyprus 5%
Industrias Quimicas Falcon de Mexico, S.A.de.C.V (Falcon) MXN TIIE 28d plus 1.5%
2. There are no investments made by the loanees in the Company and in any of its subsidiaries except in respect of Aurigene Discovery Technologies Limited,
Dr. Reddy’s Laboratories Inc., Reddy Antilles N.V., Reddy Holding Gmbh and Lacock Holdings Limited which have made investments in their wholly owned
subsidiaries.
as at as at
31 march 2008 31 march 2007
schedule 11: current lIAbIlItIes
Sundry creditors
Due to medium and small enterprises (Note 1 & 2) 31,821 27,086
Others (Note 3) 6,100,949 5,957,837
Payable to subsidiary companies, assocoiates and joint venture 492,376 211,071
Interest accrued but not due on loan 5,326 1,226
Unclaimed dividends * 14,372 12,620
Trade deposits 38,095 40,445
Other Liabilities 125,629 83,990
6,808,568 6,334,275 * Investor Protection and Education Fund is being credited by the amounts of unclaimed dividends after seven years from the due date.
Notes:
1. The principal amount paid and that remaining unpaid as at 31 March 2008 in respect of enterprises covered under the “Micro, Small and Medium
Enterprises Development Act, 2006” (MSMDA) are Rs. 485,941 (previous year: Rs. 269,320) and Rs. 28,987 (previous year: Rs. 26,482) respectively. The
interest amount computed based on the provisions under Section 16 of the MSMDA Rs. 2,834 (previous year: Rs. 604) is remaining unpaid as of 31 March
2008. The interest that remained unpaid as at 31 March 2007 was paid during the year.
2. The list of undertakings covered under MSMDA were determined by the Company on the basis of information available with the Company and have been
relied upon by the auditors.
3. Previous year’s amount includes liability towards Leave Encashment amounting to Rs. 143,979 pursuant to amendment of the Company leave encashment
policy.
as at as at
31 march 2008 31 march 2007
schedule 12 : provIsIons
Proposed dividend 630,648 629,671
Tax on proposed dividend (including dividend tax) 107,179 107,013
Provision for tax (net of advance tax Rs. 3,611,941, previous year: Rs. 2,832,253) 106,183 234,902
Provision for
Gratuity 30,191 21,661
Leave encashment 26,680 35,214
900,881 1,028,461

94 | A N N U A L R E P O R T 2 0 0 7 – 0 8 c o n s o l i d at i n G f o r t h e f u t u r e
for the year ended for the year ended
31 march 2008 31 march 2007
schedule 14 : mAterIAl costs
(a) net (increase) / decrease in stock
Opening
Work-in-process 1,643,466 1,278,837
Finished goods 697,155 2,340,621 829,504 2,108,341
Closing
Work-in-process 2,226,873 1,643,466
Finished goods 1,052,467 3,279,340 697,155 2,340,621
net (increase) (938,719) (232,280)
(b) raw materials consumed
Opening stock of raw materials 2,099,552 1,978,164
Add: Purchases 9,200,496 8,996,886
11,300,048 10,975,050
Less: Closing stock (2,533,789) 8,766,259 (2,099,552) 8,875,498
(c) stores, chemicals, spares and packing material consumed 2,013,205 1,046,408
(d) purchase of traded goods 2,693,857 1,526,284
12,534,602 11,215,910
Notes:
1. Raw materials consumed include Rs. 344,905 (previous year: Rs. 155,435) being stocks written-off/written-down, Rs. 155,508 (previous year: Rs. 143,660) being
cost of samples issued and is net of Rs. 997,555 (previous year: Rs. 781,308) being sale of raw materials.
2. Raw material consumption is net of DEPB credit availed amounting to Rs. 455,879 (previous year: Rs. 523,733).
for the year ended for the year ended
31 march 2008 31 march 2007
schedule 15 : personnel costs
Salaries, wages and bonus 2,875,341 2,189,197
Contribution to provident and other funds 200,923 127,651
Workmen and staff welfare expenses 402,814 299,193
Amortisation of deferred stock compensation cost 207,125 181,611
3,686,203 2,797,652
Schedules to the Profit and Loss Accounta l l a m o u n t s i n i n d i a n r u p e e s t h o u s a n d s, e x c e p t s h a r e d ata a n d w h e r e o t h e r w i s e s tat e d
for the year ended for the year ended
31 march 2008 31 march 2007
schedule 13 : other Income
Interest income
On fixed deposits (gross, tax deducted at source: 654,029 489,058
Rs. 1,45,582; previous year: Rs. 70,608)
On loans to subsidiaries and joint venture 258,773 212,825
On non-trade investments (gross, tax deducted at source: Rs. 5,283; 23,315 3,000
previous year: Rs. 673)
On others 16,925 21,941
Gain on redemption of mutual fund units 110,269 869
Sale of spent chemicals 200,105 206,994
Profit on sale of fixed assets, net – 45,618
Royalty income from subsidiary 2,754 1,780
Foreign exchange gain, net 447,677 119,386
Miscellaneous income 197,466 67,822
1,911,313 1,169,293

95 | D R . R E D D Y ’ S L A B O R AT O R I E S LT D i G a a p s ta n d a l o n e f i n a n c i a l s
Schedules to the Profit and Loss Account ( C O N T I N u E D )
a l l a m o u n t s i n i n d i a n r u p e e s t h o u s a n d s, e x c e p t s h a r e d ata a n d w h e r e o t h e r w i s e s tat e d
for the year ended for the year ended
31 march 2008 31 march 2007
schedule 16 : operAtIng And other expenses
Power and fuel 771,163 578,289
Repairs and maintenance
Buildings 53,199 79,100
Plant and machinery 745,197 424,287
Others 395,309 290,147
Rent 111,381 91,903
Rates and taxes 56,998 31,550
Insurance 180,666 193,690
Travelling and conveyance 407,064 317,119
Communication 104,045 82,580
Advertisements 85,941 33,025
Commission on sales 210,606 204,619
Carraige outwards 1,102,033 987,239
Other selling expenses 2,355,162 2,009,118
Printing and stationery 77,211 80,871
Donations 125,455 79,181
Legal and professional 538,817 660,474
Bad debts written-off 30,468 7,467
Provision for doubtful advances, net 5,869 197,671
Provision for doubtful debts, net 2,102 41,900
Directors’ sitting fees 365 350
Directors’ remuneration 183,770 374,361
Auditors’ remuneration 7,872 8,465
Bank Charges 45,018 39,883
Loss on sale of fixed assets, net 3,319 –
Sundry expenses 270,021 364,637
7,869,051 7,177,926

96 | A N N U A L R E P O R T 2 0 0 7 – 0 8 c o n s o l i d at i n G f o r t h e f u t u r e
for the year ended for the year ended
31 march 2008 31 march 2007
schedule 18 : FInAnce chArges
Interest on packing credit loan 64,883 318,385
Other finance charges 37,000 161,297
101,883 479,682
for the year ended for the year ended
31 march 2008 31 march 2007
schedule 19 : Income tAxes
current taxes
Domestic taxes 645,274 1,729,971
MAT credit entitlement (24,760) –
deferred taxes
Domestic taxes 291,171 90,039
fringe benefit tax 177,123 69,854
1,088,808 1,889,864
for the year ended for the year ended
31 march 2008 31 march 2007
schedule 17: reseArch And development expenses
Personnel costs 1,033,282 797,023
Clinical trial expenses 885,372 1,237,999
Chemicals and consumables 880,875 833,626
Legal and professional charges 184,781 92,262
Power and fuel 102,695 78,182
Other expenses 221,704 243,422
3,308,709 3,282,514
Less: Amount reimbursed as per the research and development arrangements
(Refer Note 21, Schedule 20) 89,505 825,405
3,219,204 2,457,109
Schedules to the Profit and Loss Accounta l l a m o u n t s i n i n d i a n r u p e e s t h o u s a n d s, e x c e p t s h a r e d ata a n d w h e r e o t h e r w i s e s tat e d

97 | D R . R E D D Y ’ S L A B O R AT O R I E S LT D i G a a p s ta n d a l o n e f i n a n c i a l s
schedule 20 : notes to Accounts
Schedule to the Balance Sheet | Profit and Loss Accounta l l a m o u n t s i n i n d i a n r u p e e s t h o u s a n d s, e x c e p t s h a r e d ata a n d w h e r e o t h e r w i s e s tat e d
1. sIgnIFIcAnt AccountIng polIcIes
a) basis of preparation
The financial statements of Dr. Reddy’s Laboratories Limited (“DRL” or “the Company”) have been prepared and presented in accordance with Indian
Generally Accepted Accounting Principles (GAAP) under the historical cost convention on the accrual basis. GAAP comprises accounting standards notified
by the Central Government of India under Section 211 (3C) of the Companies Act, 1956, other pronouncements of Institute of Chartered Accountants of
India, the provisions of Companies Act, 1956 and guidelines issued by Securities and Exchange Board of India. The financial statements are rounded of to
nearest thousands.
b) use of estimates
The preparation of the financial statements in conformity with GAAP requires management to make estimates and assumptions that affect the reported
amounts of assets and liabilities and disclosure of contingent liabilities on the date of the financial statements and reported amounts of revenues and
expenses for the year. Actual results could differ from these estimates. Any revision to accounting estimates is recognised prospectively in the current and
future periods.
c) fixed assets and depreciation
Fixed assets are carried at the cost of acquisition or construction less accumulated depreciation. The cost of fixed assets includes non-refundable taxes,
duties, freight and other incidental expenses related to the acquisition and installation of the respective assets. Borrowing costs directly attributable to
acquisition or construction of those fixed assets which necessarily take a substantial period of time to get ready for their intended use are capitalised.
Advances paid towards the acquisition of fixed assets outstanding at each balance sheet date and the cost of fixed assets not ready for their intended use
before such date are disclosed under capital work-in-progress.
Depreciation on fixed assets is provided using the straight-line method at the rates specified in Schedule XIV to the Companies Act, 1956 or based on the
useful life of the assets as estimated by Management, whichever is higher. Depreciation is calculated on a pro-rata basis from the date of installation till the
date the assets are sold or disposed. Individual assets costing less than Rs. 5,000 are depreciated in full in the year of acquisition.
The Management’s estimates of the useful lives for various categories of fixed assets are given below:
years
Buildings
– Factory and administrative buildings 20 to 30
– Ancillary structures 3 to 10
Plant and machinery 3 to 15
Electrical equipment 5 to 15
Laboratory equipment 5 to 15
Furniture, fixtures and office equipment (other than computer equipment) 4 to 8
Computer equipment 3
Vehicles 4 to 5
Library 2
Leaasehold vehicles 3
d) intangible assets and amortisation
Intangible assets are recorded at the consideration paid for acquisition. Intangible assets are amortised over their estimated useful lives on a straight-line
basis, commencing from the date the asset is available to the Company for its use. The management estimates the useful lives for the various intangible
assets as follows:
years
Customer contracts 2 to 5
Technical know-how 10
Non-compete fees 1.5 to 10
Patents, trademarks and designs
(including marketing know-how)3 to 10
e) investments
Long-term investments are carried at cost less any other-than-temporary diminution in value, determined separately for each individual investment.
Current investments are carried at the lower of cost and fair value. The comparison of cost and fair value is done separately in respect of each category of
investment.

98 | A N N U A L R E P O R T 2 0 0 7 – 0 8 c o n s o l i d at i n G f o r t h e f u t u r e
schedule 20 : notes to Accounts (contInued)
Schedule to the Balance Sheet | Profit and Loss Account ( C O N T I N u E D )
a l l a m o u n t s i n i n d i a n r u p e e s t h o u s a n d s, e x c e p t s h a r e d ata a n d w h e r e o t h e r w i s e s tat e d
f) inventories
Inventories are valued at the lower of cost and net realisable value. Cost of inventories comprises all cost of purchase, cost of conversion and other costs
incurred in bringing the inventories to their present location and condition.
The methods of determining cost of various categories of inventories are as follows:
Raw materials First-in-first-out (FIFO)
Stores and spares Weighted average method
Work-in-process and finished goods (manufactured) FIFO and including an appropriate share of production overheads
Finished goods (traded) Specific identification method
g) research and development
Revenue expenditure on research and development is expensed as incurred. Capital expenditure incurred on research and development is capitalised as
fixed assets and depreciated in accordance with the depreciation policy of the Company.
h) employee benefits
Contributions payable to an approved gratuity fund (a defined benefit plan), determined by an independent actuary at the balance sheet date, are charged
to the profit and loss account. Provision for leave encashment cost is made on the basis of actuarial valuation at the balance sheet date, carried out by an
independent actuary. Contributions payable to the recognised provident fund and approved superannuation scheme, which are defined contribution schemes,
are charged to the profit and loss account. All actuarial gains and losses arising during the year are recognized in the Profit and loss Account of the year.
i) foreign currency transactions and balances
Foreign currency transactions are recorded using the exchange rates prevailing on the dates of the respective transactions. Exchange differences arising on
foreign currency transactions settled during the year are recognised in the profit and loss account.
Monetary assets and liabilities denominated in foreign currencies as at the balance sheet date, not covered by forward exchange contracts, are translated at
year-end rates. The resultant exchange differences are recognised in the profit and loss account. Non-monetary assets are recorded at the rates prevailing
on the date of the transaction.
Income and expenditure items at representative offices are translated at the respective monthly average rates. Monetary assets at representative offices at
the balance sheet date are translated using the year-end rates. Non-monetary assets are recorded at the rates prevailing on the date of the transaction.
Forward contracts are entered into to hedge the foreign currency risk of the underlying outstanding at the balance sheet date. The premium or discount
on all such contracts is amortized as income or expense over the life of the contract. Any profit or loss arising on the cancellation or renewal of forward
contracts is recognised as income or expense for the period.
In relation to the forward contracts entered into to hedge the foreign currency risk of the underlying outstanding at the balance sheet date, the exchange
difference is calculated and recorded in accordance with AS-11 (revised). The exchange difference on such a forward exchange contract is calculated as the
difference of the foreign currency amount of the contract translated at the exchange at the reporting date, or the settlement date where the transaction is
settled during the reporting period and the corresponding foreign currency amount translated at the later of the date of inception of the forward exchange
contract and the last reporting date. Such exchange differences are recognized in the profit and loss account in the reporting period in which the exchange
rates change.
Exchange differences arising on a monetary item that, in substance, forms part of an enterprise’s net investment in a non-integral foreign operation has
been accumulated in a foreign currency translation reserve in the enterprise’s financial statements until the disposal of the net investment, at which time
they should be recognised as income or as expenses.
j) derivative instruments and hedge accounting
The Company uses foreign exchange forward contracts and options to hedge its movements in foreign exchange rates and does not use the foreign
exchange forward contracts and options for trading or speculative purposes.
Pursuant to ICAI Announcement “Accounting for Derivatives” on the early adoption of Accounting Standard AS 30 “Financial Instruments: Recognition
and Measurement”, the Company has early adopted the Standard for the year under review, to the extent that the adoption does not conflict with existing
mandatory accounting standards and other authoritative pronouncements, Company law and other regulatory requirements.
The Company classifies foreign currency options in respect of the forecasted transactions at the inception of each contract meeting the hedging criterion,
as cash flow hedges. Changes in the fair value of options classified as cash flow hedges are recognised directly in shareholders’ funds (under the head
“Hedging Reserves”) and are reclassified into the profit and loss account upon the occurrence of the hedged transaction. The gains/losses on options
designated as cash flow hedges are included along with the underlying hedged forecasted transactions. The exchange differences relating to options not
designated as cash flow hedges are recognised in the profit and loss account as they arise. Further, the changes in fair value relating to the ineffective
portion of the cash flow hedges are recognised in the profit and loss account as they arise.

99 | D R . R E D D Y ’ S L A B O R AT O R I E S LT D i G a a p s ta n d a l o n e f i n a n c i a l s
k) revenue recognition
Revenue from sale of goods is recognised when significant risks and rewards in respect of ownership of products are transferred to customers. Revenue from
domestic sales of formulation products is recognised on despatch of products to stockists by clearing and forwarding agents of the Company Revenue from
domestic sales of active pharmaceutical ingredients and intermediates is recognised on dispatch of products from the factories of the Company. Revenue from
export sales is recognised on shipment of products.
Revenue from product sales is stated exclusive of returns, sales tax and applicable trade discounts and allowances.
Service income is recognised as per the terms of contracts with customers when the related services are performed, or the agreed milestones are achieved.
Dividend income is recognised when the unconditional right to receive the income is established. Income from interest on deposits, loans and interest bearing
securities is recognised on the time proportionate method.
Export entitlements are recognised as income when the right to receive credit as per the terms of the scheme is established in respect of the exports made
and where there is no significant uncertainty regarding the ultimate collection of the relevant export proceeds.
The Company enters into certain dossier sales, licensing and supply arrangements with certain third parties. These arrangements include certain performance
obligations by the Company. Revenue from such arrangements is recognized in the period in which the Company completes all its performance obligations.
l) income-tax expense
Income tax expense comprises current tax and deferred tax charge or credit.
current tax
The current charge for income taxes is calculated in accordance with the relevant tax regulations applicable to the Company.
deferred tax
Deferred tax charge or credit reflects the tax effects of timing differences between accounting income and taxable income for the period. The deferred tax
charge or credit and the corresponding deferred tax liabilities or assets are recognised using the tax rates that have been enacted or substantially enacted by
the balance sheet date. Deferred tax assets are recognised only to the extent there is reasonable certainty that the assets can be realised in future; however,
where there is unabsorbed depreciation or carry forward of losses, deferred tax assets are recognised only if there is a virtual certainty of realisation of such
assets. Deferred tax assets are reviewed at each balance sheet date and is written-down or written-up to reflect the amount that is reasonably/virtually
certain (as the case may be) to be realised. The break-up of the major components of the deferred tax assets and liabilities as at balance sheet date has
been arrived at after setting off deferred tax assets and liabilities where the Company has a legally enforceable right to set-off assets against liabilities and
where such assets and liabilities relate to taxes on income levied by the same governing taxation laws.
m) earnings per share
The basic earnings per share (“EPS”) is computed by dividing the net profit after tax for the year by the weighted average number of equity shares
outstanding during the year. For the purpose of calculating diluted earnings per share, net profit after tax for the year and the weighted average number
of shares outstanding during the year are adjusted for the effects of all dilutive potential equity shares. The dilutive potential equity shares are deemed
converted as of the beginning of the period, unless they have been issued at a later date. The diluted potential equity shares have been adjusted for the
proceeds receivable had the shares been actually issued at fair value (i.e. the average market value of the outstanding shares).
n) employee stock option schemes
In accordance with the Securities and Exchange Board of India guidelines, the excess of the market price of shares, at the date of grant of options under
the Employee stock option schemes, over the exercise price is treated as employee compensation and amortised over the vesting period.
o) provisions and contingent liabilities
The Company creates a provision when there is a present obligation as a result of a past event that probably requires an outflow of resources and a reliable
estimate can be made of the amount of the obligation. A disclosure for a contingent liability is made when there is a possible obligation or a present
obligation that may, but probably will not, require an outflow of resources. Where there is possible obligation or a present obligation in respect of which
the likelihood of outflow of resources is remote, no provision or disclosure is made.
p) impairment of assets
The Company assesses at each balance sheet date whether there is any indication that an asset may be impaired. If any such indication exists, the Company
estimates the recoverable amount of the asset. If such recoverable amount of the asset or the recoverable amount of the cash generating unit to which
the asset belongs is less than its carrying amount, the carrying amount is reduced to its recoverable amount. The reduction is treated as an impairment loss
and is recognised in the profit and loss account. If at the balance sheet date there is an indication that if a previously assessed impairment loss no longer
exists, the recoverable amount is reassessed and the asset is reflected at the recoverable amount subject to a maximum of depreciated historical cost.
q) leases
Assets taken on lease where the company acquires substantially the entire risks and rewards incidental to ownership are classified as finance leases. The
amount recorded is the lesser of the present value of minimum lease rental and other incidental expenses during the lease term or the fair value of the
assets taken on lease. The rental obligations, net of interest charges, are reflected as secured loans. Leases that do not transfer substantially all the risks and
rewards of ownership are classified as operating leases and recorded as expense as and when the payments are made over the lease term.
schedule 20 : notes to Accounts (contInued)
Schedule to the Balance Sheet | Profit and Loss Account ( C O N T I N u E D )
a l l a m o u n t s i n i n d i a n r u p e e s t h o u s a n d s, e x c e p t s h a r e d ata a n d w h e r e o t h e r w i s e s tat e d

100 | A N N U A L R E P O R T 2 0 0 7 – 0 8 c o n s o l i d at i n G f o r t h e f u t u r e
2. commItments And contIngent lIAbIlItIes
as at as at
31 march 2008 31 march 2007
i) Commitments / contingent liabilities:
(a) Guarantees issued by banks 85,321 72,900
(b) Guarantees issued by the Company on behalf of subsidiaries, associates and joint venture 16,699,303 16,628,368
(c) Letters of credit outstanding 657,518 716,784
(d) Contingent consideration payable in respect of subsidiaries acquired 12,463 12,463
ii) Claims against the Company not acknowledged as debts in respect of:
(a) Income tax matters, pending decisions on various appeals made by the Company and by the
Department668,569 892,367
(b) Excise matters, under dispute 965 17,451
(c) Custom matters, under dispute 17,911 19,711
(d) Sales tax matters, under dispute 14,625 14,785
(e) Other matters, under dispute 276 16,674
(f) Demand for payment to the credit of the Drug Prices Equalisation Account under Drugs (Price Control) Order, 1995 which is being contested by the
Company in respect of its product “Norfloxacin”. During year ended 31 March 2005, the Hon’ble High Court of Andhra Pradesh dismissed the review
petition filed by the Company against the original order passed by the same Court. Subsequently, the Company had filed a Special Leave Petition with the
Supreme Court of India appealing against the High Court Order.
During the year ended 31 March 2006, the Company received a further demand notice from the authorities for a total of Rs. 284,984 towards the
overcharged sale price (principal) and interest thereon. The Company filed a fresh writ petition in the High Court of Andhra Pradesh challenging the
demand notice. The High Court whilst admitting the writ petition, granted an interim order wherein it ordered the Company to deposit 50% of the
principal amounting to Rs. 77,149. The Company deposited this amount with the authorities under protest on 14 November 2005, while it awaits the
outcome of its appeal with the Supreme Court. In February 2008, the Hon’ble High Court directed the Company to deposit an additional amount of
Rs. 30,000, which was deposited by the Company in March 2008. The Company has provided fully against the potential liability in respect of the principal
amount demanded and believes that possibility of any liability that may arise on account of interest and penalty is remote. In the event that the Company is
unsuccessful in the litigation in Supreme Court, it will be required to remit the sale proceeds in excess of the maximum selling price to Government of India
and penalties or interest if any, the amounts of which are not readily ascertainable.
iii) Estimated amount of contracts remaining to be executed on capital account and not provided for (net
of advances) 1,523,894 1,171,969
iv) During the previous year, the Company received information from anonymous sources that certain persons have claimed income tax refunds by filing forged
income tax deduction forms of the Company. The matter is currently under investigation. The Company, however, does not foresee any claim of damages, fine
or penalty.
v) The Company is also involved in other lawsuits, claims, investigations and proceedings, including patent and commercial matters, which arise in the ordinary
course of business. However, there are no such matters pending that the Company expects to be material in relation to its business.
3. deFerred tAxAtIon
Deferred tax liability, net included in the balance sheet comprises the following:
particularsas at as at
31 march 2008 31 march 2007
deferred tax assets
Sundry debtors 65,674 77,044
Provisions for expenses 55,825 72,625
Current assets, loans and advances 64,530 21,644
Current liabilities 408 408
186,437 171,721
deferred tax liability
Excess of depreciation allowable under Income tax law over depreciation provided in accounts (1,055,012) (749,125)
deferred tax liability, net (868,575) (577,404)
schedule 20 : notes to Accounts (contInued)
Schedule to the Balance Sheet | Profit and Loss Account ( C O N T I N u E D )
a l l a m o u n t s i n i n d i a n r u p e e s t h o u s a n d s, e x c e p t s h a r e d ata a n d w h e r e o t h e r w i s e s tat e d

101 | D R . R E D D Y ’ S L A B O R AT O R I E S LT D i G a a p s ta n d a l o n e f i n a n c i a l s
4. eArnIngs per shAre (eps)
The computation of EPS is set out below:
particularsfor the year ended for the year ended
31 march 2008 31 march 2007
Basic & Diluted EPS Basic & Diluted EPS
earnings
Net profit for the year 4,752,219 11,768,593
shares
Number of shares at the beginning of the year 167,912,180 153,389,140
Add: Equity shares issued on exercise of vested stock options 260,566 223,040
Equity shares issued by way of American Depository Receipts – 14,300,000
Total number of equity shares outstanding at the end of the year 168,172,746 167,912,180
Weighted average number of equity shares outstanding during the year – Basic 168,075,840 158,552,454
Add: Weighted average number of equity shares arising out of outstanding stock options (net of the stock
options forfeited) that have dilutive effect on the EPS1,114,177 1,046,753
Weighted average number of equity shares outstanding during the year – Diluted 169,190,017 159,599,207
earnings per share of par value rs. 5 – basic (rs.) 28.27 74.23
earnings per share of par value rs. 5 – diluted (rs.) 28.09 73.74
5. relAted pArty dIsclosures
a. The related parties where control exists are the subsidiaries, step-down subsidiaries, joint ventures and the partnership firms. There are no other parties over
which the Company has control.
b. Related parties where control / significant influence exists or with whom transactions have taken place during the year:
subsidiaries including step-down subsidiaries
OOO JV Reddy Biomed Limited, Russia;•
Reddy Pharmaceuticals Hong Kong Limited, Hong Kong;•
Dr. Reddy’s Laboratories Inc., USA;•
Reddy Cheminor S.A., France;•
Reddy Antilles N.V., Netherlands;•
Dr. Reddy’s Farmaceutica Do Brasil Ltda., Brazil;•
Aurigene Discovery Technologies Limited, India;•
Aurigene Discovery Technology Inc., USA;•
Cheminor Investments Limited, India;•
DRL Investments Limited, India;•
Reddy Netherlands B.V., Netherlands;•
Trigenesis Therapeutics Inc., USA;•
Reddy US Therapeutics Inc., USA;•
Dr. Reddy’s Laboratories (EU) Limited, UK;•
Dr. Reddy’s Laboratories (UK) Limited, UK;•
Dr. Reddy’s Laboratories (Proprietary) Limited, South Africa;•
OOO Dr. Reddy’s Laboratories Limited, Russia;•
Promius Pharma LLC (formerly Reddy Pharmaceuticals LLC, USA);•
Dr. Reddy’s Bio-sciences Limited, India;•
Globe Enterprises (a partnership firm in India);•
Industrias Quimicas Falcon de Mexico, S.A.de.C.V, Mexico;•
Lacock Holdings Limited, Cyprus;•
Reddy Holding GmbH, Germany;•
betapharm Arzneimittel GmbH, Germany;•
beta Healthcare Solutions GmbH, Germany;•
beta institut fur sozialmedizinische Forschung und Entwicklung GmbH, Germany;•
Reddy Pharma Iberia SA, Spain;•
Reddy Pharma Italia SPA, Italy;•
schedule 20 : notes to Accounts (contInued)
Schedule to the Balance Sheet | Profit and Loss Account ( C O N T I N u E D )
a l l a m o u n t s i n i n d i a n r u p e e s t h o u s a n d s, e x c e p t s h a r e d ata a n d w h e r e o t h e r w i s e s tat e d

102 | A N N U A L R E P O R T 2 0 0 7 – 0 8 c o n s o l i d at i n G f o r t h e f u t u r e
Dr. Reddy’s Laboratories (Australia) Pty. Ltd., Australia;•
Dr. Reddy’s Laboratories SA, Switzerland (from 16 April 2007);•
Affordable Health Care Limited, New Zealand (from 1 Feb 2008);•
Eurobridge Consulting B.V, Netherlands (from 11 Sep 2007);•
OOO DRS Limited, Russia (from 11 Sep 2007);•
Aurigene Discovery Technologies (Malaysia) Sdn Bhd (from 26 Sep 2007);•
associates
Perlecan Pharma Private Limited (“Perlecan”) Enterprise over which the Company has significant influence through 14.31% •
shareholding and through representation on the Board of Directors of Perlecan.
APR LLC 100% Holding in class ‘B’ equity shares•
Joint venture
Kunshan Rotam Reddy Pharmaceutical Enterprise over which the Company exercises •
Company Limited (“Reddy Kunshan”), China joint control with other joint venture partners and holds 51.33% equity stake.
enterprises where principal shareholders have control or significant influence (“significant interest entities”)
Dr. Reddy’s Research Foundation Enterprise over which the principal shareholders •
(“Research Foundation”) have significant influence
Dr. Reddy’s Holdings Private Limited Enterprise owned by principal shareholders•
Institute of Life Sciences Enterprise owned by principal shareholders have significant influence•
others
Diana Hotels Limited Enterprise owned by relative of a director•
Ms. K Samrajyam Spouse of Chairman•
Ms. G Anuradha Spouse of Vice Chairman and Chief Executive Officer•
Ms. Deepthi Reddy Spouse of Managing Director and Chief Operating Officer•
Madras Diabetes Research Foundation Enterprise promoted by Director (till 28 July 2006)•
Dr. Reddy’s Heritage Foundation Enterprise in which the Chairman is a director•
Dr. Reddy’s Foundation for Human and Social development Enterprise where principal shareholders are trustees•
Manava Seva Dharma Samvardhani Trust Enterprise in which a director is managing trustee (till 28 July 2006)•
K K Enterprises Enterprise in which relative of a director has significant influence•
A.R. Life Sciences Private Limited Enterprise in which relative of a director has significant influence•
Key management personnel represented on the board
Dr. K Anji Reddy Chairman•
Mr. G V Prasad Vice Chairman and Chief Executive Officer•
Mr. K Satish Reddy Managing Director and Chief Operating Officer•
non-executive and independent directors on the board
Dr. V Mohan (till 28 July 2006)•
Dr. Omkar Goswami•
Mr. Ravi Bhoothalingam•
Mr. P N Devarajan•
Dr. Krishna G Palepu•
Mr. Anupam Puri •
Ms. Kalpana Morparia (from 5 June 2007)•
Dr. J P Moreau (from 18 May 2007)•
schedule 20 : notes to Accounts (contInued)
Schedule to the Balance Sheet | Profit and Loss Account ( C O N T I N u E D )
a l l a m o u n t s i n i n d i a n r u p e e s t h o u s a n d s, e x c e p t s h a r e d ata a n d w h e r e o t h e r w i s e s tat e d

103 | D R . R E D D Y ’ S L A B O R AT O R I E S LT D i G a a p s ta n d a l o n e f i n a n c i a l s
c. Particulars of related party transactions
The following is a summary of significant related party transactions:
particularsfor the year ended for the year ended
31 march 2008 31 march 2007
(i) Sales to:
Subsidiaries including step-down subsidiaries and joint ventures:
Dr. Reddy’s Laboratories Inc., USA 5,173,241 14,373,119
OOO Dr. Reddy’s Laboratories Limited, Russia 1,474,696 2,002,259
Dr. Reddy’s Laboratories (UK) Limited, UK 1,458,320 1,364,613
Others 1,061,803 217,879
9,168,060 17,957,870
Significant interest entities:
Dr. Reddy’s Holdings Private Limited 285 390
Others:
A.R. Life Sciences Private Limited 88,152 –
(ii) Interest income from subsidiaries including step-down subsidiaries:
Lacock Holdings Limited, Cyprus 130,659 81,392
Industrias Quimicas Falcon de Mexico, S.A.de.C.V, Mexico 126,361 118,391
Others 1,753 13,042
258,773 212,825
(iii) Royalty income from subsidiary:
Dr. Reddy’s Laboratories (Proprietary) Limited, South Africa 2,754 1,780
(iv) Service Income:
Dr. Reddy’s Laboratories Inc., USA 92,107 96,755
Dr. Reddy’s Laboratories (UK) Limited, UK 207,985 92,077
Perlecan Pharma Private Limited, India 40,071 139,335
340,163 328,167
(v) Licence fees:
Dr. Reddy’s Laboratories Inc., USA 209,864 1,718,003
Others 3,296 –
213,160 1,718,003
(vi) Purchases from:
Subsidiaries:
Dr. Reddy’s Laboratories SA, Switzerland 534,448 –
Industrias Quimicas Falcon de Mexico, S.A.de.C.V, Mexico 157,997 20,600
Dr. Reddy’s Laboratories Inc., USA – 19,208
Others 1,403 10
693,848 39,818
Significant interest entities:
Dr. Reddy’s Holdings Private Limited 37,924 36,167
Others:
A.R. Life Sciences Private Limited 174,969 –
Others 6,152 5,522
181,121 5,522
(vii) Lease rentals and other service charges paid to:
Dr. Reddy’s Research Foundation – 8,236
(viii) Operating expenses paid / reimbursed to subsidiaries:
Industrias Quimicas Falcon de Mexico, S.A.de.C.V, Mexico 4,583 20,964
Dr. Reddy’s Laboratories (UK) Limited, UK – 4,124
Others – 464
4,583 25,552
(ix) Contributions made to others for social development:
Dr. Reddy’s Foundation for Human and Social development 113,621 34,100
Institute of Life Sciences – 40,000
113,621 74,100
schedule 20 : notes to Accounts (contInued)
Schedule to the Balance Sheet | Profit and Loss Account ( C O N T I N u E D )
a l l a m o u n t s i n i n d i a n r u p e e s t h o u s a n d s, e x c e p t s h a r e d ata a n d w h e r e o t h e r w i s e s tat e d

104 | A N N U A L R E P O R T 2 0 0 7 – 0 8 c o n s o l i d at i n G f o r t h e f u t u r e
particularsfor the year ended for the year ended
31 march 2008 31 march 2007
(x) Contribution made to subsidiaries and step-down subsidiary for research:
Reddy US Therapeutics Inc., USA 253,434 316,936
Others 21,314 22,357
274,748 339,293
(xi) Hotel expenses paid to:
Diana Hotels Limited 12,596 9,227
(xii) Rent paid to:
Key management personnel:
Dr. K Anji Reddy 4,130 1,872
Mr. K Satish Reddy 9,928 10,395
14,058 12,267
Others:
Ms. G Anuradha 8,663 7,812
Ms. Deepthi Reddy 1,979 1,805
10,642 9,617
(xiii) Executive Directors’ remuneration 165,255 361,320
(xiv) Directors’ sitting fees 365 350
(xv) Investment in subsidiaries, joint venture and associates during the year:
Reddy Pharma Iberia SA, Spain – 321,130
Dr. Reddy’s Laboratories (Australia) Pty. Ltd., Australia – 24,640
Kunshan Rotam Reddy Pharmaceutical Company Limited, China – 89,274
Industrias Quimicas Falcon de Mexico, SA de C.V, Mexico – 52,014
Lacock Holdings Limited, Cyprus 7,626,067 –
Perlecan Pharma Private Limited, India – 69,200
Dr. Reddy’s Laboratories SA, Switzerland 3,522 –
(xvi) Provision for decline in the value of long-term investments and investments written-off, net of write back:
Aurigene Discovery Technologies Limited, India – 157,924
Trigenesis Therapeutics Inc., USA – 274,791
Perlecan Pharma Private Limited, India 133,171 –
Others – 39,354
133,171 472,069
(xvii) Provision for loans given to subsidiary and associate:
APR LLC 4,033 23,187
Aurigene Discovery Technologies Limited, India – 63,947
Dr. Reddy’s Farmaceutica Do Brasil Ltda., Brazil – 87,134
4,033 174,268
(xviii) Purchase of Land, buildings and movable assets from Dr. Reddy’s Research Foundation 140,995 –
(xix) Advance made to Dr. Reddy’s Holdings Private Limited towards acquisition of land 680,000 40,000
(xx) Contract manufacturing charges paid to a Industrias Quimicas Falcon de Mexico, S.A.de.C.V, Mexico 287,962 791,314
(xxi) Guarantee given / (released) on behalf of a subsidiary:
Promius Pharma LLC, USA (194,641) –
Dr. Reddy’s Laboratories Inc., USA (83,481) –
Lacock Holdings Limited, Cyprus (371,564) (6,785,583)
Aurigene Discovery Technologies Limited, India 260,000 –
Dr. Reddy’s Laboratories SA, Switzerland 802,400 –
Others (38,524) (65,552)
374,190 (6,851,135)
(xxii) Reimbursement of Research & development and other expenses by an Associate (Perlecan Pharma
Private Limited, India)89,505 376,533
schedule 20 : notes to Accounts (contInued)
Schedule to the Balance Sheet | Profit and Loss Account ( C O N T I N u E D )
a l l a m o u n t s i n i n d i a n r u p e e s t h o u s a n d s, e x c e p t s h a r e d ata a n d w h e r e o t h e r w i s e s tat e d

105 | D R . R E D D Y ’ S L A B O R AT O R I E S LT D i G a a p s ta n d a l o n e f i n a n c i a l s
d. The Company has the following amounts dues from / to related parties:
particularsfor the year ended for the year ended
31 march 2008 31 march 2007
(i) Due from related parties (included in loans and advances and sundry debtors):
Subsidiaries including step-down subsidiaries, associates and joint ventures (included in sundry
debtors, loans and advances):
betapharm Arzneimittel GmbH, Germany 452,805 –
Dr. Reddy’s Laboratories SA, Switzerland 477,260 –
Dr. Reddy’s Laboratories (UK) Limited, UK 707,022 457,995
Dr. Reddy’s Laboratories Inc., USA 1,024, 663 4,270,172
OOO Dr. Reddy’s Laboratories Limited, Russia 644,278 1,254,313
Others 155,332 184,067
3,461,360 6,166,547
Significant interest entities:
Dr. Reddy’s Holdings Private Limited (included in loans and advances) 680,000 40,000
Others (included in loans and advances):
A.R. Life Sciences Private Limited 26,093 –
Others 209 65
26,302 65
(ii) Provision outstanding at the end of the year towards dues from subsidiaries including step-down
subsidiaries, associates and joint ventures (included in sundry debtors):
OOO Dr. Reddy’s Laboratories Limited, Russia 15,749 –
Reddy Cheminor S.A., France 4,738 4,738
20,487 4,738
(iii) Deposit with Dr. Reddy’s Research Foundation (included in loans and advances) – 3,000
(iv) Due to related parties (included in current liabilities):
Subsidiaries including step-down subsidiaries, associates and joint ventures:
Dr. Reddy’s Laboratories SA, Switzerland 208,250 –
Dr. Reddy’s Laboratories Inc., USA 174,613 32,985
Reddy US Therapeutics Inc., USA 43,856 80,095
Others 65,657 97,991
492,376 211,071
Significant interest entities:
Dr. Reddy’s Research Foundation – 19,012
Others – 1,061
– 20,073
Diana Hotels Limited 450 –
Others:
A.R. Life Sciences Private Limited 16,160 –
Others – 126
16,160 126
e. Details of remuneration paid to the whole-time and non-whole-time directors are given in Note 6, Schedule 20.
f. Equity held in subsidiaries, associates and a joint venture have been disclosed under “Investment”, (Schedule 6). Loans to subsidiaries, joint venture and an
associate have been disclosed under “Loans and advances”, (Schedule 10).
schedule 20 : notes to Accounts (contInued)
Schedule to the Balance Sheet | Profit and Loss Account ( C O N T I N u E D )
a l l a m o u n t s i n i n d i a n r u p e e s t h o u s a n d s, e x c e p t s h a r e d ata a n d w h e r e o t h e r w i s e s tat e d

106 | A N N U A L R E P O R T 2 0 0 7 – 0 8 c o n s o l i d at i n G f o r t h e f u t u r e
6. pArtIculArs oF mAnAgerIAl remunerAtIon
the remuneration paid to managerial personnel during the year:
chairman v ice-chairman & ceo managing director & coonon-executive /
independent directors
particularsfor the year ended
31 march
for the year ended
31 march
for the year ended
31 march
for the year ended
31 march
2008 2007 2008 2007 2008 2007 2008 2007
Salaries and allowances 5400 4,384 3,600 3,600 3,600 3,600 –
Commission 60,310 139,196 45,233 104,400 45,233 104,400 18,515 13,041
Other perquisites 497 382 687 679 695 679 –
66,207 143,962 49,520 108,679 49,528 108,679 18,515 13,041
The executive directors are covered under the Company’s gratuity policy along with the other employees of the Company. Proportionate amount of gratuity is not
included in the aforementioned disclosure.
computation of net profit and director’s commission under section 309(5) of the companies act, 1956 and commission payable to directors.
particularsfor the year ended for the year ended
31 march 2008 31 march 2007
Profit after taxation as per profit and loss account 4,752,219 11,768,593
add:
Income tax expense 1,088,808 1,820,010
Provision for wealth tax 2,574 2,147
Directors’ sitting fees 365 350
Managerial remuneration to directors 183,770 374,361
Depreciation as per books of accounts 1,619,862 1,335,009
7,647,598 15,300,470
less:
Depreciation as envisaged under section 350 of the Companies Act, 1956 (Refer Note 1 below) 1,619,862 1,335,009
Profit / (loss) on sale of fixed assets, net (3,319) 45,618
Profit for the purpose of calculating director’s commission as per the provisions of the Companies Act, 1956 6,031,055 13,919,843
Commission payable to whole-time directors @ 2.5% 150,776 347,996
Commission payable to non-whole-time directors:
Maximum allowed as per the Companies Act, 1956 (1%) 60,310 139,198
Maximum approved by the shareholders (0.5 %) 30,155 69,599
Commission approved by the Board 18,515 13,041
Notes:
1. The Company depreciates fixed assets based on estimated useful lives that are lower than those implicit in Schedule XIV to the Companies Act, 1956. Accordingly,
the rates of depreciation used by the Company are higher than the minimum rates prescribed by Schedule XIV.
2. Stock compensation cost amounting to Rs. 13,656 (previous year: Rs. 11,173) pertaining to stock options issued to non-whole time directors have not been
considered as remuneration in the table above. The stock options were issued pursuant to a shareholder’s resolution dated 24 September 2001.
3. Leave encashment of Rs. Nil (previous year: Rs. 49,000) has not been considered as remuneration in the table above.
7. AudItor’s remunerAtIon
particularsfor the year ended for the year ended
31 march 2008 31 march 2007
a) Audit fees 6,550 6,550
b) Other charges
Taxation matters 330 330
Other matters 900 1,250
c) Reimbursement of out of pocket expenses 92 335
7,872 8,465
schedule 20 : notes to Accounts (contInued)
Schedule to the Balance Sheet | Profit and Loss Account ( C O N T I N u E D )
a l l a m o u n t s i n i n d i a n r u p e e s t h o u s a n d s, e x c e p t s h a r e d ata a n d w h e r e o t h e r w i s e s tat e d

107 | D R . R E D D Y ’ S L A B O R AT O R I E S LT D i G a a p s ta n d a l o n e f i n a n c i a l s
8. Interest In joInt venture
The Company has a 51.33 percent interest in Reddy Kunshan, a joint venture in China. Reddy Kunshan is engaged in manufacturing and marketing of active
pharmaceutical ingredients and intermediates and formulations in China. The contractual arrangement between shareholders of Reddy Kunshan indicates
joint control as the minority shareholders, along with the company, have significant participating rights such that they jointly control the operations of Reddy
Kunshan. The aggregate amounts of the assets, liabilities, income and expenses related to the Company’s share in Reddy Kunshan as at and for the year ended
31 March 2008 are given below:
particularsas at as at
31 march 2008 31 march 2007
balance sheet
Secured loan 82,880 84,609
Unsecured loan – 58,284
Foreign currency translation reserve 1,465 2,786
Fixed assets, net 82,811 89,238
Deferred tax assets, net 13,892 (5,100)
current assets, loans and advances
Inventories 23,953 25,764
Sundry debtors 93,683 75,542
Cash and bank balances 19,002 21,559
Loans and advances 12,969 19,010
current liabilities and provisions
Current liabilities 79,167 32,553
net current assets 70,440 109,322
Estimated amount of contracts remaining to be executed on capital account and not provided for (net of
advances) 541 108
particularsas at as at
31 march 2008 31 march 2007
income statement
income
Sales 450,584 271,573
Other income 64 10,231
expenditure
Material costs 286,137 152,929
Personnel costs 51,420 42,019
Operating and other expenses 87,234 61,332
Research and development expenses 3,133 3,457
Finance charges 5,114 6,272
Depreciation 2,130 8,459
profit / (loss) before taxation 15,480 7,336
Provision for taxation
Current tax – –
Deferred tax (expense) / benefit 19,570 (5,134)
profit / (loss) after taxation 35,050 2,202
9. employee stock optIon scheme
Dr. Reddy’s Employees Stock Option Scheme-2002 (the DRL 2002 Plan): The Company instituted the 2002 Plan for all eligible employees in pursuance of the
special resolution approved by the shareholders in the Annual General Meeting held on 24 September 2001. The Scheme covers all non promoter directors and
employees of DRL (collectively referred to as eligible “employees”) and its subsidiaries. Under the Scheme, the Compensation Committee of the Board (‘the
Committee’) shall administer the Scheme and grant stock options to eligible directors and employees of the Company and its subsidiaries. The Committee shall
determine the employees eligible for receiving the options, the number of options to be granted, the exercise price, the vesting period and the exercise period.
The vesting period is determined for the options issued on the date of the grant.
schedule 20 : notes to Accounts (contInued)
Schedule to the Balance Sheet | Profit and Loss Account ( C O N T I N u E D )
a l l a m o u n t s i n i n d i a n r u p e e s t h o u s a n d s, e x c e p t s h a r e d ata a n d w h e r e o t h e r w i s e s tat e d

108 | A N N U A L R E P O R T 2 0 0 7 – 0 8 c o n s o l i d at i n G f o r t h e f u t u r e
The 2002 Plan was amended on 28 July 2004 at the annual general meeting of shareholders to provide for stock options grants in two categories:
category a: 1,721,700 stock options out of the total of 2,295,478 reserved for grant of options having an exercise price equal to the fair market value of the
underlying equity shares on the date of grant; and
category b: 573,778 stock options out of the total of 2,295,478 reserved for grant of options having an exercise price equal to the par value of the underlying
equity shares (i.e., Rs. 5 per option).
The DRL 2002 Plan was further amended on 27 July 2005 at the annual general meeting of shareholders to provide for stock option grants in two categories:
category a: 300,000 stock options out of the total of 2,295,478 reserved for grant of options having an exercise price equal to the fair market value of the
underlying equity shares on the date of grant; and
category b: 1,995,478 stock options out of the total of 2,295,478 reserved for grant of options having exercise price equal to the par value of the underlying
equity shares (i.e., Rs. 5 per option).
The fair market value of a share on each grant date falling under Category A above is defined as the average closing price (after adjustment of Bonus issue) for
30 days prior to the grant, in the stock exchange where there is highest trading volume during that period. Notwithstanding the foregoing, the Compensation
Committee may, after getting the approval of the shareholders in the annual general meeting, grant options with a per share exercise price other than fair
market value and par value of the equity shares.
As the number of shares that an individual employee is entitled to receive and the price of the option are known at the grant date, the scheme is considered
as a fixed grant.
In the case of termination of employment, all non-vested options would stand cancelled. Options that have vested but have not been exercised can be exercised
within the time prescribed under each option agreement by the Committee or if no time limit is prescribed, within three months of the date of employment
termination, failing which they would stand cancelled.
During the current year, the Company under the 2002 Plan has issued 386,060 options to eligible employees. The vesting period for the options granted varies
from 12 to 48 months.
The date of grant, number of options granted, exercise price fixed by the Committee for respective options and the market price of the shares of the Company
on the date of grant is given below:
date of grant number of options granted exercise price (rupees)market price (rupees)
(as per sebi guidelines)
17-May-07 377,060 5.00 663.60
18-May-07 9,000 5.00 678.45
386,060
Stock option activity under the 2002 Plan was as follows:
category a – fair market value options fiscal year ended 31 march 2007
particularsshares arising
out of options
range of
exercise prices
weighted-
average
exercise price
weighted-
average
remaining
contractual
life (months)
Outstanding at the beginning of the year 234,500 Rs. 362.5 – 531.51 Rs. 439.43 64
Granted during the year – – – –
Expired / forfeited during the year (11,600) 441.5 – 574.50 527.8 –
Exercised during the year (31,320) 441.5 – 531.51 477.4 –
Outstanding at the end of the year 191,580 362.5 – 531.51 427.9 54
Exercisable at the end of the year 103,680 Rs. 362.5 – 531.51 Rs. 447.58 38
schedule 20 : notes to Accounts (contInued)
Schedule to the Balance Sheet | Profit and Loss Account ( C O N T I N u E D )
a l l a m o u n t s i n i n d i a n r u p e e s t h o u s a n d s, e x c e p t s h a r e d ata a n d w h e r e o t h e r w i s e s tat e d

109 | D R . R E D D Y ’ S L A B O R AT O R I E S LT D i G a a p s ta n d a l o n e f i n a n c i a l s
category a – fair market value options fiscal year ended 31 march 2008
particularsshares arising
out of options
range of
exercise prices
weighted-
average
exercise price
weighted-
average
remaining
contractual
life (months)
Outstanding at the beginning of the year 191,580 Rs. 362.5 – 531.51 Rs. 427.9 38
Expired / forfeited during the year (2,100) 442.50 442.5 –
Exercised during the year (30,700) 441.5 – 531.51 458.32 –
Outstanding at the end of the year 158,780 362.5 – 531.51 421.79 44
Exercisable at the end of the year 119,830 Rs. 362.5 – 531.51 Rs. 433.05 36
category b – par value options fiscal year ended 31 march 2007
particularsshares arising
out of options
range of
exercise prices
weighted-
average
exercise price
weighted-
average
remaining
contractual
life (months)
Outstanding at the beginning of the year 729,968 Rs. 5 Rs. 5 81
Granted during the year 427,060 5 5 81
Forfeited during the year (76,056) 5 5 –
Exercised during the year (191,720) 5 5 –
Outstanding at the end of the year 889,252 5 5 77
Exercisable at the end of the year 43,256 Rs. 5 Rs. 5 51
category b – par value options fiscal year ended 31 march 2008
particularsshares arising
out of options
range of
exercise prices
weighted-
average
exercise price
weighted-
average
remaining
contractual
life (months)
Outstanding at the beginning of the period 889,252 Rs. 5 Rs. 5 77
Granted during the period 386,060 5 5 91
Forfeited during the period (133,240) 5 5 –
Surrendered by employees during the period (138,418) 5 5 –
Exercised during the period (229,866) 5 5 –
Outstanding at the end of the period 773,788 5 5 74
Exercisable at the end of the period 72,364 Rs. 5 Rs. 5 50
Dr. Reddy’s Employees ADR Stock Option Scheme-2007 (“the DRL 2007 Plan”): The Company instituted the 2007 Plan for all eligible employees in pursuance
of the special resolution approved by the shareholders in the Annual General Meeting held on 27 July 2005. The 2007 Plan came into effect on approval of the
Board of Directors on 22 January 2007. The 2007 Plan covers all employees of the Company and all employees and directors of its subsidiaries. Under the 2007
Plan, the Compensation Committee of the Board (the “Compensation Committee”) shall administer the 2007 Plan and grant stock options to eligible employees
of the Company and its subsidiaries. The Compensation Committee shall determine the employees eligible for receiving the options, the number of options to
be granted, the exercise price, the vesting period and the exercise period. The vesting period is determined for all options issued on the date of the grant.
During the current year, the Company under the 2007 Plan has issued 206,818 options to eligible employees. The vesting period for the options granted varies
from 12 to 48 months.
schedule 20 : notes to Accounts (contInued)
Schedule to the Balance Sheet | Profit and Loss Account ( C O N T I N u E D )
a l l a m o u n t s i n i n d i a n r u p e e s t h o u s a n d s, e x c e p t s h a r e d ata a n d w h e r e o t h e r w i s e s tat e d

110 | A N N U A L R E P O R T 2 0 0 7 – 0 8 c o n s o l i d at i n G f o r t h e f u t u r e
The date of grant, number of options granted, exercise price fixed by the Committee for respective options and the market price of the shares of the Company
on the date of grant is given below:
date of grant number of options granted exercise price (rupees)market price (rupees)
(as per sebi guidelines)
05-April-07 126,418 5.00 747.35
17-May-07 59,400 5.00 663.60
18-May-07 21,000 5.00 678.45
206,818
Stock option activity under the 2007 Plan was as follows:
category b – par value options fiscal year ended 31 march 2008
particularsshares arising
out of options
range of
exercise prices
weighted-
average
exercise price
weighted-
average
remaining
contractual
life (months)
Outstanding at the beginning of the period – – – –
Granted during the period 206,818 Rs. 5 Rs. 5 84
Forfeited during the period (24,040) 5 5 –
Exercised during the period – – – –
Outstanding at the end of the period 182,778 Rs. 5 Rs. 5 73
Exercisable at the end of the period – – – –
The Company has followed intrinsic method of accounting based on which a compensation expense of Rs. 207,125 (previous year: Rs. 181,661) has been
recognized in the profit and loss account (refer Schedule 2 – Deferred stock compensation cost). The Compensation Committee at its meeting earlier held on
24 October 2007 proposed that the Company will absorb the full liability for the Fringe Benefit Tax (FBT) on the exercising of all stock options granted till the
date of the resolution and further that for future grants from the date of this resolution FBT would be recovered from the concerned employee. In addition,
the above amendment would be proposed at the ensuing Annual General Meeting of the Company proposed in July 2008, if required, for the approval of the
shareholders.
Finance Act, 2007 included Fringe Benefit Tax (“FBT”) on Employee Stock Option plans. FBT expense for the year includes FBT in respect of stock options granted
till October 2007 not collected from employees amounting to Rs. 80,682.
10. utIlIsAtIon oF Funds rAIsed on Ads Issue
In November 2006, the Company made a public offering of its American Depository Shares (ADS) to international investors. The offering consisted of 14,300,000
ADS representing 14,300,000 equity shares having face value of Rs. 5 each, at an offering price of U.S.$. 16 per ADS. Consequently, as of 31 March 2007 the
share capital has increased by Rs. 71,500 and securities premium account has increased by Rs. 9,942,410 net of share issue expenses amounting to Rs. 227,290.
The equity shares represented by the ADS carry equivalent rights with respect to voting and dividends as the ordinary equity shares.
The utilisation of the funds raised on ADS issue is as follows:
particularsfor the year ended for the year ended
31 march 2008 31 march 2007
Working capital requirements 2,309,640 –
Loans and advances to:
Lacock Holdings Limited, Cyprus – 1,017,210
APR LLC – 21,774
total utilisation during the year 2,309,640 1,038,984
Note:
1. Foreign exchange loss of Rs. 415,585 (previous year Rs. 242,028) have not been considered above.
schedule 20 : notes to Accounts (contInued)
Schedule to the Balance Sheet | Profit and Loss Account ( C O N T I N u E D )
a l l a m o u n t s i n i n d i a n r u p e e s t h o u s a n d s, e x c e p t s h a r e d ata a n d w h e r e o t h e r w i s e s tat e d
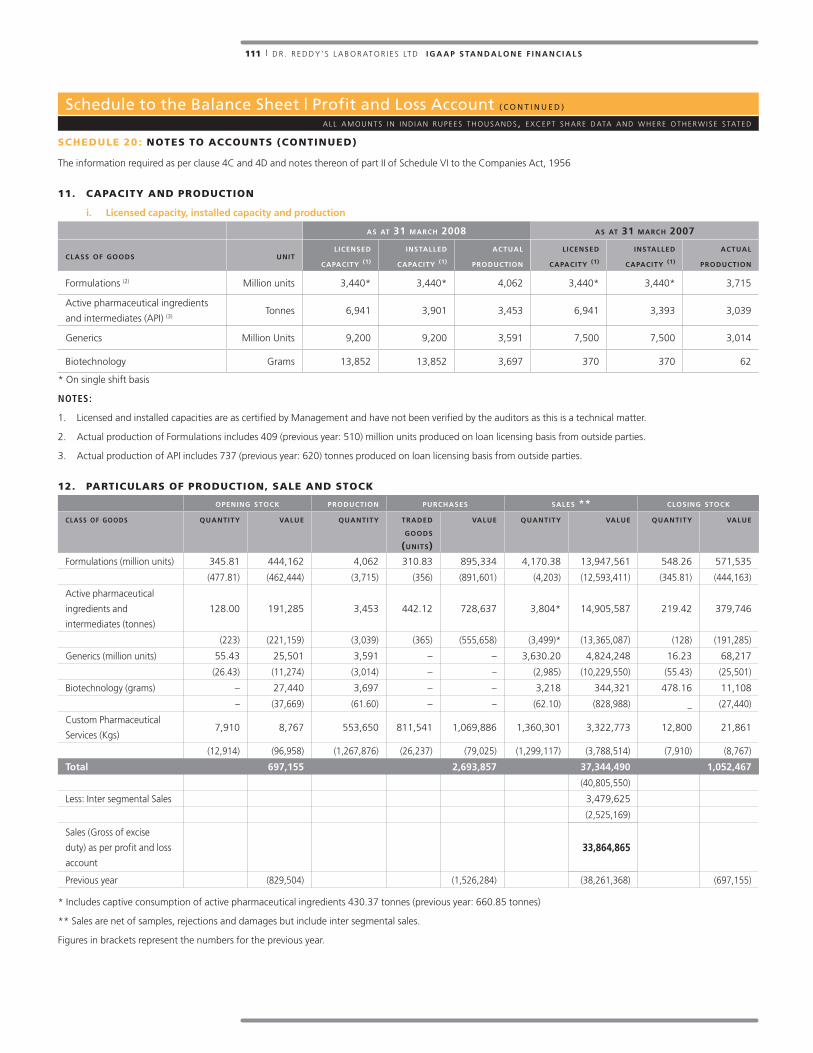
111 | D R . R E D D Y ’ S L A B O R AT O R I E S LT D i G a a p s ta n d a l o n e f i n a n c i a l s
schedule 20 : notes to Accounts (contInued)
Schedule to the Balance Sheet | Profit and Loss Account ( C O N T I N u E D )
a l l a m o u n t s i n i n d i a n r u p e e s t h o u s a n d s, e x c e p t s h a r e d ata a n d w h e r e o t h e r w i s e s tat e d
The information required as per clause 4C and 4D and notes thereon of part II of Schedule VI to the Companies Act, 1956
11. cApAcIty And productIon
i. licensed capacity, installed capacity and production
as at 31 march 2008 as at 31 march 2007
class of goods unitlicensed
capacity (1)
installed
capacity (1)
actual
production
licensed
capacity (1)
installed
capacity (1)
actual
production
Formulations (2) Million units 3,440* 3,440* 4,062 3,440* 3,440* 3,715
Active pharmaceutical ingredients
and intermediates (API) (3)Tonnes 6,941 3,901 3,453 6,941 3,393 3,039
Generics Million Units 9,200 9,200 3,591 7,500 7,500 3,014
Biotechnology Grams 13,852 13,852 3,697 370 370 62
* On single shift basis
Notes:
1. Licensed and installed capacities are as certified by Management and have not been verified by the auditors as this is a technical matter.
2. Actual production of Formulations includes 409 (previous year: 510) million units produced on loan licensing basis from outside parties.
3. Actual production of API includes 737 (previous year: 620) tonnes produced on loan licensing basis from outside parties.
12. pArtIculArs oF productIon, sAle And stock
opening stock production purchases sales ** closing stock
class of goods quantity value quantity traded goods
(units)
value quantity value quantity value
Formulations (million units) 345.81 444,162 4,062 310.83 895,334 4,170.38 13,947,561 548.26 571,535
(477.81) (462,444) (3,715) (356) (891,601) (4,203) (12,593,411) (345.81) (444,163)
Active pharmaceutical
ingredients and
intermediates (tonnes)
128.00 191,285 3,453 442.12 728,637 3,804* 14,905,587 219.42 379,746
(223) (221,159) (3,039) (365) (555,658) (3,499)* (13,365,087) (128) (191,285)
Generics (million units) 55.43 25,501 3,591 – – 3,630.20 4,824,248 16.23 68,217
(26.43) (11,274) (3,014) – – (2,985) (10,229,550) (55.43) (25,501)
Biotechnology (grams) – 27,440 3,697 – – 3,218 344,321 478.16 11,108
– (37,669) (61.60) – – (62.10) (828,988) _ (27,440)
Custom Pharmaceutical
Services (Kgs)7,910 8,767 553,650 811,541 1,069,886 1,360,301 3,322,773 12,800 21,861
(12,914) (96,958) (1,267,876) (26,237) (79,025) (1,299,117) (3,788,514) (7,910) (8,767)
total 697,155 2,693,857 37,344,490 1,052,467
(40,805,550)
Less: Inter segmental Sales 3,479,625
(2,525,169)
Sales (Gross of excise
duty) as per profit and loss
account
33,864,865
Previous year (829,504) (1,526,284) (38,261,368) (697,155)
* Includes captive consumption of active pharmaceutical ingredients 430.37 tonnes (previous year: 660.85 tonnes)
** Sales are net of samples, rejections and damages but include inter segmental sales.
Figures in brackets represent the numbers for the previous year.

112 | A N N U A L R E P O R T 2 0 0 7 – 0 8 c o n s o l i d at i n G f o r t h e f u t u r e
schedule 20 : notes to Accounts (contInued)
Schedule to the Balance Sheet | Profit and Loss Account ( C O N T I N u E D )
a l l a m o u n t s i n i n d i a n r u p e e s t h o u s a n d s, e x c e p t s h a r e d ata a n d w h e r e o t h e r w i s e s tat e d
13. rAw mAterIAls consumed durIng the yeAr
2008 2007
raw materials quantity (kgs) value quantity (kgs) value
Recemiac-2-azabicyclo (3,3,0) Octane 497 6,555 9,203 131,454
2 4-Dichloro-5-Fluoro Acetophenone 481,658 168,216 535,296 210,847
Isobutyl Aceto Phenone (HVD) 342,631 58,605 932,737 153,547
2-Acetyl-6-Methoxy Naphthalene 1,394,800 622,500 607,941 202,794
Methanol 9,623,753 7,806 9,539,105 218,713
Toluene 5,586,261 226,755 3,840,506 177,572
Isopropyl Alcohol IP 2,900,540 149,170 1,948,042 107,245
Fluoro Quinolonic Acid 339,710 241,638 393,097 297,892
(4R-Cis-1,1Dimethylethyl,1-6-Cynaomethyl) 1,621 19,400 4,280 72,688
Others 7,265,614 7,302,746
total 8,766,259 8,875,498
‘Others’ include no item which in value individually accounts for 10 percent or more of the total value of raw materials consumed.
14. detAIls oF Imported And IndIgenous rAw mAterIAls, spAre pArts, chemIcAls, pAckIng mAterIAls And
components consumed
for the year ended 31 march 2008 for the year ended 31 march 2007
particulars value% of total
consumptionvalue
% of total
consumption
raw materials
Imported 2,312,115 24% 3,261,640 37 %
Indigenous 6,454,144 76% 5,613,858 63 %
8,766,259 8,875,498
stores, chemicals, spares and packing materials
Imported 212,313 11% 602,318 58 %
Indigenous 1,800,892 89% 444,090 42 %
2,013,205 1,046,408
15. cIF vAlue oF Imports
particularsfor the year ended for the year ended
31 march 2008 31 march 2007
Raw materials 6,584,784 3,803,269
Capital equipment (including spares and components) 771,814 686,345
7,356,598 4,489,614
16. eArnIngs In ForeIgn currency
particularsfor the year ended for the year ended
31 march 2008 31 march 2007
Exports on FOB basis 22,599,061 28,483,268
Interest on deposits with banks 109,980 176,153
Interest on loan to subsidiaries 258,773 212,825
Service income and license fees 592,134 2,051,181
Royalty income 2,754 1,780
Others 105,660 –
23,668,362 30,925,207

113 | D R . R E D D Y ’ S L A B O R AT O R I E S LT D i G a a p s ta n d a l o n e f i n a n c i a l s
schedule 20 : notes to Accounts (contInued)
Schedule to the Balance Sheet | Profit and Loss Account ( C O N T I N u E D )
a l l a m o u n t s i n i n d i a n r u p e e s t h o u s a n d s, e x c e p t s h a r e d ata a n d w h e r e o t h e r w i s e s tat e d
17. expendIture In ForeIgn currency
particularsfor the year ended for the year ended
31 march 2008 31 march 2007
Travelling 93,850 59,855
Legal and professional fees 551,145 419,089
Bio-studies expenses 343,241 495,397
Other expenditure 2,365,398 2,359,311
3,353,634 3,333,652
18. hedgIng And derIvAtIves
Pursuant to ICAI Announcement “Accounting for Derivatives” on the early adoption of Accounting Standard AS 30“ Financial Instruments: Recognition
and Measurement”, the Company has early adopted the Standard for the year under review, to the extent that the adoption does not conflict with existing
mandatory accounting standards and other authoritative pronouncements, Company law and other regulatory requirements.
Pursuant to the adoption, the transitional loss representing the loss on foreign currency options not classified as cash flow hedges outstanding at the beginning
of the year amounted to Rs. 14,921, net of tax of Rs. 7,683 and this loss has been adjusted against the opening balance of profit and loss account.
The following are the outstanding forward exchange contracts and currency options entered into by the Company:
year ended 31 march 2007 (rs. in millions)
category currency cross currency amount buy / sell purpose
Forward Contract USD INR 398 Sell Hedging
Forward Contract EUR USD 11 Sell Hedging
Currency Options EUR USD 30 Sell Hedging
year ended 31 march 2008 (rs. in millions)
category currency cross currency amount buy / sell purpose
Forward Contract USD INR 137 Sell Hedging
Forward Contract USD INR 77 Buy Hedging
Currency Options USD INR 270 Sell Hedging
Currency Options EUR USD 5 Sell Hedging
The outstanding foreign currency options, which are classified as cashflow hedges and effective as at 31 March 2008 are as follows:
(in millions)
currency cross currency no of contracts amount gain/(loss)
USD INR 1 $ 60 Rs. (10.06)
The year end foreign currency exposures that have not been hedged by a derivative instrument or otherwise are given below:
(in millions)
currencyfor the year ended for the year ended
31 march 2008 31 march 2007
USD – 29.08
EUR 13.31 3.79
GBP 8.88 5.57
The above exposures represent amounts receivable in foreign currency.
19. employee beneFIt plAns
Effective 1 April 2006 the Company had adopted the revised accounting standard on employee benefits. Pursuant to the adoption, the transitional obligations
of the company amounted to Rs. 81,702 net of deferred tax Rs. 43,483. As required by the standard, the obligation has been recorded in the year ended
31 March 2007 with the transfer of Rs. 81,702 to revenue reserves.

114 | A N N U A L R E P O R T 2 0 0 7 – 0 8 c o n s o l i d at i n G f o r t h e f u t u r e
schedule 20 : notes to Accounts (contInued)
Schedule to the Balance Sheet | Profit and Loss Account ( C O N T I N u E D )
a l l a m o u n t s i n i n d i a n r u p e e s t h o u s a n d s, e x c e p t s h a r e d ata a n d w h e r e o t h e r w i s e s tat e d
The following table set out the status of the gratuity plan as required under AS 15 (Revised)
reconciliation of opening and closing balances of the present value of the defined benefit obligation
particularsfor the year ended for the year ended
31 march 2008 31 march 2007
Opening defined benefit obligation 257,986 216,271
Current service cost 33,774 27,789
Interest cost 22,052 15,518
Actuarial losses / (gain) 36,992 20,627
Benefits paid (31,538) (22,219)
Closing defined benefit obligation 319,266 257,986
change in the fair value of assets
particularsfor the year ended for the year ended
31 march 2008 31 march 2007
Opening fair value of plan assets 236,325 220,270
Expected return on plan assets 16,891 16,192
Actuarial gains / (losses) 14,240 603
Contributions by employer 53,157 21,479
Benefits paid (31,538) (22,219)
Closing fair value of plan assets 289,075 236,325
amount recognized in balance sheet
particularsas at as at
31 march 2008 31 march 2007
Present Value of Funded Obligations 319,267 257,986
Fair Value of Plan Assets (289,076) (236,325)
Net Liability 30,191 21,661
Amounts in the balance sheet
Provision for gratuity 30,191 21,661
Net liability / (asset) 30,191 21,661
expense recognized in statement of profit and loss account
particularsfor the year ended for the year ended
31 march 2008 31 march 2007
Current Service Cost 33,774 27,789
Interest on Defined Benefit Obligation 22,052 15,518
Expected Return on Plan Assets (16,891) (16,193)
Net actuarial losses / (gains) recognized in year 22,752 20,024
Amount, included in “Employee Benefit Expense” 61,687 47,138
Actual return on plan assets 31,132 16,796
asset information
category of assetsas at as at
31 march 2008 31 march 2007
Government of India securities 3.91% 4.61%
Corporate bonds 2.81% 3.43%
Insurer managed funds 92.20% 90.54%
Others 1.08% 1.42%
Total 100.00% 100.00%

115 | D R . R E D D Y ’ S L A B O R AT O R I E S LT D i G a a p s ta n d a l o n e f i n a n c i a l s
schedule 20 : notes to Accounts (contInued)
Schedule to the Balance Sheet | Profit and Loss Account ( C O N T I N u E D )
a l l a m o u n t s i n i n d i a n r u p e e s t h o u s a n d s, e x c e p t s h a r e d ata a n d w h e r e o t h e r w i s e s tat e d
the approximate market value of the assets as at 31 march 2008 was rs. 289,076 (previous Year: rs. 236,325), a breakup of the same is as
follows:
category of assetsas at as at
31 march 2008 31 march 2007
Government of India Securities 11,296 10,900
Corporate Bonds 8,115 8,115
Insurer Managed Funds 266,534 213,974
Others 3,131 3,336
Total 289,076 236,325
summary of actuarial assumptions
Financial assumptions at the valuation date:
for the year ended for the year ended
31 march 2008 31 march 2007
Discount Rate 7.80% p.a. 8.00% p.a.
Expected Rate of Return on Plan Assets 7.50% p.a. 7.50% p.a.
Salary Escalation Rate
8% p.a. for next
4 years & 6% p.a.
thereafter
8% p.a. for next
5 years & 6% p.a.
thereafter
discount rate: The discount rate is based on the prevailing market yields of Indian government securities as at the balance sheet date for the estimated term
of the obligations.
expected rate of return on plan assets: This is based on the expectation of the average long term rate of return expected on investments of the fund during
the estimated term of the obligations.
salary escalation rate: The estimates of future salary increases considered takes into account the inflation, seniority, promotion and other relevant factors.
20. dIvIdend remIttAnce In ForeIgn currency
The Company does not make any direct remittances of dividends in foreign currencies to ADS holders. The Company remits the equivalent of the dividends
payable to the ADS holders in Indian Rupees to the depositary bank, which is the registered shareholder on record for all owners of the Company’s ADS. The
depositary bank purchases the foreign currencies and remits dividends to the ADS holders.
21. reseArch And development ArrAngements
i-Ven pharma arrangement
During the year ended 31 March 2005, the Company entered into a joint development and commercialisation agreement with I-VEN Pharma Capital Limited
(“I-VEN”). As per the terms of the agreement, I-VEN will fund up to fifty percent of the project costs (development, registration and legal costs) related to the
specified generic product filings made by the Company for the United States of America market. The terms of the arrangement do not require the Company
to repay the funds or purchase I-VEN’s interest in the event of the failure of the research and development. However, on successful commercialisation of these
products, the Company would pay I-VEN royalty on sales for a period of 5 years for each product. The first tranch advanced by I-VEN of Rs. 985,388 was received
on 28 March 2005.
The amount received from I-VEN will be recognised in the income statement upon completion of specific milestones as detailed in the agreement. Accordingly,
an amount of Rs. Nil (previous year: 452,763) has been recognised in the current year representing the proportionate costs relating to the completion of
specified filings as a credit to research and development expenses. During the year ended 31 March 2007, an amendment agreement has been signed between
the parties to reflect a change in the product portfolio and the royalty rate.
perlecan pharma arrangement
In September 2005, the Company announced the formation of an integrated drug development company, Perlecan Pharma Private Limited (“Perlecan Pharma”),
with a total equity of U.S.$. 52,500 to be contributed jointly by the Company, Citigroup Venture Capital International Growth Partnership Mauritius Limited
(“Citigroup Venture”) and ICICI Venture Funds Management Company (“ICICI Venture”). Perlecan Pharma would be engaged in the clinical development and
out-licensing of New Chemical Entity (“NCE”) assets. As part of this arrangement, the Company has transferred all rights and title, including the development
and commercialization rights, of four NCE assets to Perlecan Pharma, on 27 March 2007 (“the closing date”).
As per the arrangement, Citigroup Venture and ICICI Venture will contribute U.S.$. 22,500 each and the Company will contribute U.S.$. 7,500 towards Perlecan
Pharma’s initial equity capital. As a result, the Company will initially own approximately 14.28% of the equity of Perlecan Pharma. Further, three out of seven
directors on the board of Perlecan Pharma will be from the Company. In addition, Perlecan Pharma will issue to the Company warrants to purchase 45 million

116 | A N N U A L R E P O R T 2 0 0 7 – 0 8 c o n s o l i d at i n G f o r t h e f u t u r e
equity shares of Perlecan Pharma, at Re. 1.00 per warrant, the exercise of which will be contingent upon the success of certain research and development
milestones. If the warrants are fully exercised, then the Company will own approximately 62.5% of the equity shares of Perlecan Pharma.
Further as per the terms of the arrangement, the Company will have the first right to conduct product development and chemical trials on behalf of Perlecan Pharma
on an arm’s length basis subject to the final decision by the board of directors of Perlecan Pharma. Moreover, the research and development expenses incurred
by the Company from 1 April 2005 till the closing date of the arrangement will be reimbursed by Perlecan Pharma (Rs. 89,505 towards 2007–08; previous year
Rs. 372,642).
As of 31 March 2008, the company owns approximately 14.3% of equity of Perlican pharma, in addition, the Company is committed to invest an additional
amount of Rs. 170,000 as its equity contribution in future.
In view of certain adverse developments in the progress of molecules during the year, the Company has made a provision of Rs. 133,171 towards decline, other
than temporary, in the value of its investment.
22. segment InFormAtIon
In accordance with AS 17 – Segment Reporting, segment information has been given in the consolidated financial statements of DRL and therefore no separate
disclosure on segment information is given in these financial statements.
23. FInAnce leAse
The Company has acquired vehicles during the year on finance lease. The future minimum lease payments and their present values as at 31 March 2008 for
each of the following periods are as follows:
present value of
minimum lease
payments
future interestminimum lease
payments
Not later than 1 year 5,493 8,477 13,970
Later than 1 year and not later than 5 years 15,224 6,347 21,571
Beyond 5 years – – –
20,717 14,824 35,541
24. operAtIng leAse
The Company has taken vehicles on non-cancellable operating lease during the year. The total future minimum lease payments under this non-cancellable lease
are as follows:
as at as at
31 march 2008 31 march 2007
Not later than 1 year 17,582 –
Later than 1 year and not later than 5 years 40,127 –
Beyond 5 years – –
57,709 –
Lease rentals on the said lease amounting to Rs. 9,018 (previous year: Rs. nil) has been charged to the profit and loss account. Lease rent under cancellable lease
amounting to Rs. 102,363 (previous year: Rs. 91,903)
25. compArAtIve FIgures
Previous year’s figures have been regrouped / reclassified wherever necessary to conform to current year’s classification.
schedule 20 : notes to Accounts (contInued)
Schedule to the Balance Sheet | Profit and Loss Account ( C O N T I N u E D )
a l l a m o u n t s i n i n d i a n r u p e e s t h o u s a n d s, e x c e p t s h a r e d ata a n d w h e r e o t h e r w i s e s tat e d
As per our report attached
for BSR & Co. for Dr. Reddy’s Laboratories Limited
Chartered Accountants
s sethuraman Partner dr. K anji reddy Chairman
Membership No. 203491 G V prasad Vice Chairman and CEO
K satish reddy Managing Director and COO
Hyderabad 20 May 2008 saumen chakraborty Chief Financial Officer
V Viswanath Company Secretary
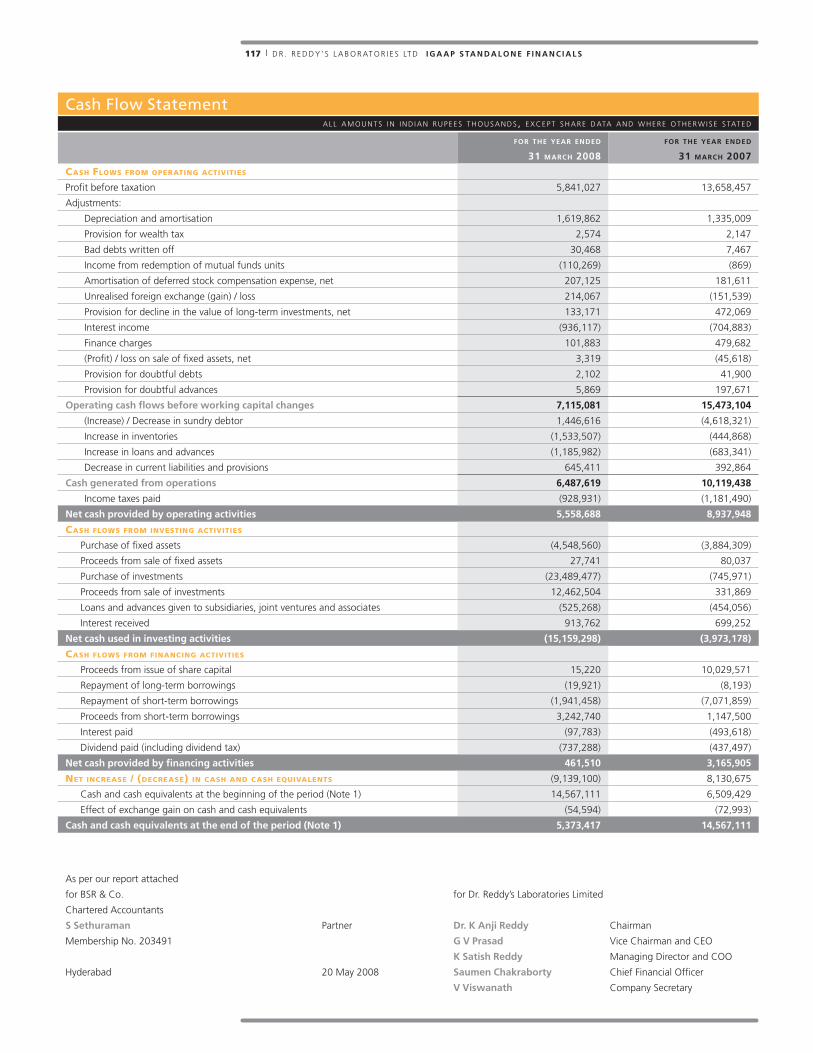
117 | D R . R E D D Y ’ S L A B O R AT O R I E S LT D i G a a p s ta n d a l o n e f i n a n c i a l s
Cash Flow Statementa l l a m o u n t s i n i n d i a n r u p e e s t h o u s a n d s, e x c e p t s h a r e d ata a n d w h e r e o t h e r w i s e s tat e d
for the year ended for the year ended
31 march 2008 31 march 2007
CASh FLOwS FROm OPERATINg ACTIvITIES
Profit before taxation 5,841,027 13,658,457
Adjustments:
Depreciation and amortisation 1,619,862 1,335,009
Provision for wealth tax 2,574 2,147
Bad debts written off 30,468 7,467
Income from redemption of mutual funds units (110,269) (869)
Amortisation of deferred stock compensation expense, net 207,125 181,611
Unrealised foreign exchange (gain) / loss 214,067 (151,539)
Provision for decline in the value of long-term investments, net 133,171 472,069
Interest income (936,117) (704,883)
Finance charges 101,883 479,682
(Profit) / loss on sale of fixed assets, net 3,319 (45,618)
Provision for doubtful debts 2,102 41,900
Provision for doubtful advances 5,869 197,671
operating cash flows before working capital changes 7,115,081 15,473,104
(Increase) / Decrease in sundry debtor 1,446,616 (4,618,321)
Increase in inventories (1,533,507) (444,868)
Increase in loans and advances (1,185,982) (683,341)
Decrease in current liabilities and provisions 645,411 392,864
cash generated from operations 6,487,619 10,119,438
Income taxes paid (928,931) (1,181,490)
net cash provided by operating activities 5,558,688 8,937,948
CASh FLOwS FROm INvESTINg ACTIvITIES
Purchase of fixed assets (4,548,560) (3,884,309)
Proceeds from sale of fixed assets 27,741 80,037
Purchase of investments (23,489,477) (745,971)
Proceeds from sale of investments 12,462,504 331,869
Loans and advances given to subsidiaries, joint ventures and associates (525,268) (454,056)
Interest received 913,762 699,252
net cash used in investing activities (15,159,298) (3,973,178)
CASh FLOwS FROm FINANCINg ACTIvITIES
Proceeds from issue of share capital 15,220 10,029,571
Repayment of long-term borrowings (19,921) (8,193)
Repayment of short-term borrowings (1,941,458) (7,071,859)
Proceeds from short-term borrowings 3,242,740 1,147,500
Interest paid (97,783) (493,618)
Dividend paid (including dividend tax) (737,288) (437,497)
net cash provided by financing activities 461,510 3,165,905
NET INCREASE / (DECREASE) IN CASh AND CASh EQUIvALENTS (9,139,100) 8,130,675
Cash and cash equivalents at the beginning of the period (Note 1) 14,567,111 6,509,429
Effect of exchange gain on cash and cash equivalents (54,594) (72,993)
cash and cash equivalents at the end of the period (note 1) 5,373,417 14,567,111
As per our report attached
for BSR & Co. for Dr. Reddy’s Laboratories Limited
Chartered Accountants
s sethuraman Partner dr. K anji reddy Chairman
Membership No. 203491 G V prasad Vice Chairman and CEO
K satish reddy Managing Director and COO
Hyderabad 20 May 2008 saumen chakraborty Chief Financial Officer
V Viswanath Company Secretary

118 | A N N U A L R E P O R T 2 0 0 7 – 0 8 c o n s o l i d at i n G f o r t h e f u t u r e
Notes:
1. Cash and cash equivalents comprise:
as at as at
31 march 2008 31 march 2007
CASh AND CASh EQUIvALENTS COmPRISE:
Cash in hand 17,490 5,284
Balances with banks:
In current accounts 569,666 794,295
In deposit accounts 4,700,269 13,079,445
In EEFC current accounts 69,686 673,180
In unclaimed dividend account 14,372 12,620
In unclaimed fractional share pay order accounts 666 666
In margin money 1,268 1,621
5,373,417 14,567,111
2.
3.
The Company has undrawn borrowing facilities of Rs. 13,559,000 (previous year Rs. 12,038,000). These facilities are essentially for funding working capital
requirements of the Company.
Previous year’s figures have been regrouped/reclassified, wherever necessary to conform to the current year’s classification.
Cash Flow Statementa l l a m o u n t s i n i n d i a n r u p e e s t h o u s a n d s, e x c e p t s h a r e d ata a n d w h e r e o t h e r w i s e s tat e d

119 | D R . R E D D Y ’ S L A B O R AT O R I E S LT D i G a a p s ta n d a l o n e f i n a n c i a l s
Balance Sheet Abstract and Company’s General Business Profilea l l a m o u n t s i n i n d i a n r u p e e s t h o u s a n d s, e x c e p t s h a r e d ata a n d w h e r e o t h e r w i s e s tat e d
1. Regis t rat ion deta i l s
Reg i s t ra t ion No. : 4 5 0 7 State Code: 0 1
Ba lance Sheet Date : 3 1 0 3 0 8
Date Month Year
2. Capita l ra i sed dur ing the year (Amount in Rs . thousands)
Pub l i c I s sue : N I L R ights I s sue : N I L
Bonus I s sue : N I L P r i va te P lacement : N I L
ADR Issue
Preferential offer of shares under Employee Stock Option Scheme 2002 2 6 0 5 6 6
3. Pos i t ion of Mobl i sat ion and Deployment of Funds (Amount in Rs . thousands)
Tota l L i ab i l i t i e s : 5 3 6 0 9 6 9 8 Tota l Asse t s : 5 3 6 0 9 6 9 8
Sources of Funds :
Pa id -up Cap i ta l : 8 4 0 8 6 5 Reserves and Surp lus : 4 7 2 7 7 1 8 4
Secured Loans : 3 4 0 2 2 Unsecured Loans : 4 5 8 9 0 5 2
Appl icat ion of Funds :
Net F i xed Asse t s : 9 8 7 4 1 5 2 Inves tments : 1 9 3 0 6 1 9 7
Net Cur rent Asse t s : 2 1 9 7 2 2 4 3 Misce l l aneous Exp . : N I L
4. Performance of the Company (Amount in Rs . thousands)
Turnover : 3 3 8 6 4 8 6 5 Tota l Expend i tu re : 3 0 0 0 9 0 4 8
Prof i t Be fore Tax : 5 8 4 1 0 2 7 Prof i t Af te r Tax : 4 7 5 2 2 1 9
Earn ing Per Share in Rs . 2 8 . 2 7 Div idend Rate % 7 5
5. Gener ic Names of Three Pr inc ipal Products / serv ices of Company (as per the monetary terms)
I t em Code No. : 2 9 4 1 9 0 0 3
( ITC Code)
P roduct Desc r ip t ion : C ip rof loxac in Hydroch lo r ide
I tem Code No. : 2 9 4 2 0 0 0 1
( ITC Code)
P roduct Desc r ip t ion : Nor f loxac in
I tem Code No. : 3 0 0 4 9 0 3 8
( ITC Code)
P roduct Desc r ip t ion : Omerprazo le

This page has been intentionally left blank.

I G A A P c o n s o l I d A t e d
F I n A n c I A l s
125
162124
134123
132122
a u d i t o r s ’ r e p o r t s c h e d u l e s t o t h e
c o n s o l i d a t e d p r o f i t
a n d l o s s a c c o u n t
c o n s o l i d a t e d
b a l a n c e s h e e t
s c h e d u l e s t o t h e
c o n s o l i d a t e d b a l a n c e
s h e e t a n d p r o f i t a n d
l o s s a c c o u n t
c o n s o l i d a t e d
p r o f i t a n d l o s s
a c c o u n t
c o n s o l i d a t e d
c a s h f l o w s t a t e m e n t
s c h e d u l e s t o
t h e c o n s o l i d a t e d
b a l a n c e s h e e t

schedule to the consolidated Balance sheet | Profit and loss Account ( c o n t I n u e d )
a l l a m o u n t s i n i n d i a n r u p e e s t h o u s a n d s, e x c e p t s h a r e d ata a n d w h e r e o t h e r w i s e s tat e d
122 | A N N U A L R E P O R T 2 0 0 7 – 0 8 c o n s o l i d at i n G f o r t h e f u t u r e
Auditors’ Report to the Board of directors of dr. Reddy’s laboratories limited
auditors’ report to the board of directors of dr. reddy’s laboratories limited on the consolidated financial statements of dr. reddy’s laboratories
limited and its subsidiaries
1. We have audited the attached consolidated balance sheet of Dr. Reddy’s Laboratories Limited (“the Company”) and its subsidiaries (collectively referred to as
the “Dr. Reddy’s Group”) as at 31 March 2008 and also the consolidated profit and loss account and the consolidated cash flow statement for the year ended
on that date, annexed thereto. These consolidated financial statements are the responsibility of the Company’s management. Our responsibility is to express
an opinion on these consolidated financial statements based on our audit.
2. We conducted our audit in accordance with auditing standards generally accepted in India. Those Standards require that we plan and perform the audit to
obtain reasonable assurance whether the consolidated financial statements are free of material misstatement. An audit includes, examining on a test basis,
evidence supporting the amounts and disclosures in the consolidated financial statements. An audit also includes assessing the accounting principles used and
significant estimates made by management, as well as evaluating the overall consolidated financial statement presentation. We believe that our audit provides
a reasonable basis for our opinion.
3. We did not audit the financial statements and other financial information of certain subsidiaries, which have been audited by other auditors whose reports have
been furnished to us, and our opinion is based on the report of other auditors. The attached consolidated financial statements include assets of Rs. 13,483
million as at 31 March 2008, revenues of Rs. 12,355 million and net cash outflows amounting to Rs. 206 million in respect of the aforementioned subsidiaries
for the year then ended.
4. The consolidated financial statements have been prepared by the Company’s management in accordance with the requirements of Accounting Standard
21 – Consolidated Financial Statements, Accounting Standard 23 – Accounting for Investments in Associates in Consolidated Financial Statements and
Accounting Standard 27 – Financial Reporting of Interests in Joint Ventures, issued by the Institute of Chartered Accountants of India.
5. In our opinion and to the best of our information and according to the explanations given to us, the consolidated financial statements give a true and fair view
in conformity with the accounting principles generally accepted in India:
(i) in the case of the Consolidated Balance Sheet, of the consolidated state of affairs of Dr. Reddy’s Group as at 31 March 2008;
(ii) in the case of Consolidated Profit and Loss Account, of the consolidated results of operations of Dr. Reddy’s Group for the year ended on that date; and
(iii) in the case of Consolidated Cash Flow Statement, of the consolidated cash flows of Dr. Reddy’s Group for the year ended on that date.
for bsr & co.
Chartered Accountants
S Sethuraman
partner
Membership No. 203491
Place: Hyderabad
Date: 20 may 2008

schedule to the consolidated Balance sheet | Profit and loss Account ( c o n t I n u e d )
a l l a m o u n t s i n i n d i a n r u p e e s t h o u s a n d s, e x c e p t s h a r e d ata a n d w h e r e o t h e r w i s e s tat e d
123 | D R . R E D D Y ’ S L A B O R AT O R I E S LT D i G a a p c o n s o l i d at e d f i n a n c i a l s
consolidated Balance sheet A s At 3 1 M A R c h 2 0 0 8
a l l a m o u n t s i n i n d i a n r u p e e s t h o u s a n d s, e x c e p t s h a r e d ata a n d w h e r e o t h e r w i s e s tat e d
as at as at
schedule 31 march 2008 31 march 2007
SOURCES OF FUNDS
shareholders’ funds
Share capital 1 840,865 839,561
Reserves and surplus 2 44,127,978 39,133,040
44,968,843 39,972,601
loan funds
Secured loans 3 720,476 6,144,284
Unsecured loans 4 18,963,394 18,762,313
19,683,870 24,906,597
deferred tax liabilities 19(7) 991,410 1,062,071
minority interest – 10,473
65,644,123 65,951,742
APPLICATION OF FUNDS
fixed assets and intangibles 5
Gross block 54,877,557 47,203,054
Less: Accumulated depreciation (15,752,198) (11,848,819)
Net block 39,125,359 35,354,235
Capital work-in-progress (including capital advances) 2,677,827 2,897,792
41,803,186 38,252,027
deferred tax assets 19(7) 185,615 95,114
investments 6 4,820,832 1,341,169
current assets, loans and advances
Inventories 7 11,018,790 7,471,517
Sundry debtors 8 6,521,681 7,810,410
Cash and bank balances 9 7,452,880 18,610,097
Loans and advances 10 5,349,009 3,600,324
30,342,360 37,492,348
current liabilities and provisions
Current liabilities 11 10,332,422 9,853,512
Provisions 12 1,175,448 1,375,404
11,507,870 11,228,916
net current assets 18,834,490 26,263,432
65,644,123 65,951,742
Notes to consolidated accounts 19
The schedules referred to above form an integral part of the Consolidated Balance Sheet
As per our report attached for Dr. Reddy’s Laboratories Limited
for BSR & Co.
Chartered Accountants
s sethuraman Partner dr. K anji reddy Chairman
Membership No. 203491 G V prasad Vice Chairman and CEO
K satish reddy Managing Director and COO
Hyderabad 20 May 2008 saumen chakraborty Chief Financial Officer
V Viswanath Company Secretary

schedule to the consolidated Balance sheet | Profit and loss Account ( c o n t I n u e d )
a l l a m o u n t s i n i n d i a n r u p e e s t h o u s a n d s, e x c e p t s h a r e d ata a n d w h e r e o t h e r w i s e s tat e d
124 | A N N U A L R E P O R T 2 0 0 7 – 0 8 c o n s o l i d at i n G f o r t h e f u t u r e
consolidated Profit and loss Account F o R t h e y e A R e n d e d 3 1 M A R c h 2 0 0 8
a l l a m o u n t s i n i n d i a n r u p e e s t h o u s a n d s, e x c e p t s h a r e d ata a n d w h e r e o t h e r w i s e s tat e d
for the year ended
31 march 2008
for the year ended
31 march 2007schedule
INCOME
Sales, gross 49,700,024 65,125,674
Less: Excise duty and other similar duties and taxes on sales (558,308) (779,390)
Sales, net 49,141,716 64,346,284
Service income 740,232 882,172
License fees 34,822 27,542
Other income 13 2,037,664 1,161,633
51,954,434 66,417,631
EXPENDITURE
Material costs 14 17,846,647 27,431,721
Conversion charges 600,572 1,142,039
Excise duty and other similar duties and taxes 286,807 117,191
Personnel costs 15 7,310,580 6,432,916
Operating and other expenses 16 12,019,495 11,044,869
Research and development expenses 3,536,622 3,271,457
Less: Amount reimbursed as per the research and development arrangements (Refer Note 13, Schedule 19)
19(13) (89,505) 3,447,117 (825,405) 2,446,052
Finance charges 17 958,331 1,526,193
Equity in loss of associates, net (Refer Note 4, Schedule 19) 19(4) 16,709 86,525
Depreciation 4,018,609 3,791,108
46,504,867 54,018,614
profit before taxation and minority interest 5,449,567 12,399,017
Income tax 18 1,076,923 2,743,686
profit before minority interest 4,372,644 9,655,331
Minority interest 8,681 3,547
profit for the year 4,381,325 9,658,878
Balance in profit and loss account brought forward 8,848,744 1,185,353
Less: Transitional Liability recognised pursuant to adoption of
Accounting standard-15 (Revised) “Employee Benefits” 19(16) – (81,702)Transitional loss recognised pursuant to early adoption of Accounting Standard-30 “Financial Instruments: Recognition and Measurement“ 19(17) (14,921) 8,833,823 – 1,103,651
amount available for appropriation 13,215,148 10,762,529
APPROPRIATIONS
Proposed dividend on equity shares 630,649 629,671
Tax on proposed dividend 107,179 107,013
Dividend of previous years (including tax) 604 242
Transfer to general reserve 475,222 1,176,859
Balance carried forward 12,001,494 8,848,744
13,215,148 10,762,529
earnings per share 19(8)
Basic – Par value Rs. 5 per share 26.07 60.92
Diluted – Par value Rs. 5 per share 25.90 60.52
Notes to consolidated accounts 19
The schedules referred to above form an integral part of the Consolidated Profit and Loss Account
As per our report attached for Dr. Reddy’s Laboratories Limited
for BSR & Co.
Chartered Accountants
s sethuraman Partner dr. K anji reddy Chairman
Membership No. 203491 G V prasad Vice Chairman and CEO
K satish reddy Managing Director and COO
Hyderabad 20 May 2008 saumen chakraborty Chief Financial Officer
V Viswanath Company Secretary

schedule to the consolidated Balance sheet | Profit and loss Account ( c o n t I n u e d )
a l l a m o u n t s i n i n d i a n r u p e e s t h o u s a n d s, e x c e p t s h a r e d ata a n d w h e r e o t h e r w i s e s tat e d
125 | D R . R E D D Y ’ S L A B O R AT O R I E S LT D i G a a p c o n s o l i d at e d f i n a n c i a l s
schedules to the consolidated Balance sheeta l l a m o u n t s i n i n d i a n r u p e e s t h o u s a n d s, e x c e p t s h a r e d ata a n d w h e r e o t h e r w i s e s tat e d
as at as at
31 march 2008 31 march 2007
schedule 1 : share capital
authorised
200,000,000 (previous year: 200,000,000) equity shares of Rs. 5 each 1,000,000 1,000,000
issued
168,172,946 (previous year: 167,912,380) equity shares of
Rs. 5 each fully paid-up (Note 1) 840,865 839,562
subscribed and paid-up
168,172,746 (previous year: 167,912,180) equity shares of Rs. 5 each fully paid-up 840,864 839,560
Add: Forfeited share capital (Note 2) 1 840,865 1 839,561
840,865 839,561
Notes:
1. Subscribed and paid-up share capital includes:
(a) 111,732,202 (previous year: 111,732,202) equity shares of Rs. 5 each fully paid-up, allotted as bonus shares. Out of total, 34,974,400 shares were alloted
by capitalisation of General Reserve and 76,757,802 equity shares were alloted as bonus shares by capitalisation of the Securities Premium Account in earlier
years.
(b) 1,052,248 (previous year: 1,052,248) equity shares of Rs. 5 each allotted pursuant to a scheme of amalgamation with Standard Equity Fund Limited without
payments being received in cash.
(c) 20,571,768 (previous year: 20,571,768) equity shares of Rs. 5 each allotted and 82,800 (previous year: 82,800) equity shares of Rs. 5 each extinguished
pursuant to a scheme of amalgamation with erstwhile Cheminor Drugs Limited without payments being received in cash.
(d) 40,750,000 (previous year: 40,750,000) equity shares of Rs. 5 each allotted against American Depository Shares (ADS). The Company, during previous year,
raised Rs. 10,241,200 through a secondary offering by issuing 14,300,000 ADS, representing 14,300,000 equity shares (one ADS represents one equity
share).
(e) 17,204,304 (previous year: 17,204,304) equity shares of Rs. 5 each allotted against Global Depository Receipts (GDR), that were converted into ADS during
the year ended 31 March 2002.
(f) 226,776 (previous year: 226,776) equity shares of Rs. 5 each allotted to the erstwhile members of American Remedies Limited (ARL) pursuant to a scheme of
amalgamation with ARL without payments being received in cash.
(g) 659,227 (previous year: 398,661) equity shares of Rs. 5 each allotted to the employees of the Company on exercise of the vested stock options in accordance
with the terms of exercise under the “Dr. Reddy’s Employees Stock Option Scheme, 2002”.
2. Represents 200 (previous year: 200) equity shares of Rs. 5 each, amount paid-up Rs. 500/- forfeited due to non-payment of allotment money.
3. 932,568 (previous year: 1,080,832) stock options are outstanding to be issued by the Company on exercise of the vested stock options in accordance with the
terms of exercise under the “Dr. Reddy’s Employees Stock Option Scheme, 2002” and 182,778 (previous year: Nil) stock options are outstanding to be issued by
the Company on exercise of the vested stock options in accordance with the terms of exercise under the “Dr. Reddy’s Employees ADR Stock Option Scheme 2007”
(Refer Note 12, Schedule 19).

schedule to the consolidated Balance sheet | Profit and loss Account ( c o n t I n u e d )
a l l a m o u n t s i n i n d i a n r u p e e s t h o u s a n d s, e x c e p t s h a r e d ata a n d w h e r e o t h e r w i s e s tat e d
126 | A N N U A L R E P O R T 2 0 0 7 – 0 8 c o n s o l i d at i n G f o r t h e f u t u r e
schedules to the consolidated Balance sheet ( c o n t I n u e d )
a l l a m o u n t s i n i n d i a n r u p e e s t h o u s a n d s, e x c e p t s h a r e d ata a n d w h e r e o t h e r w i s e s tat e d
as at as at
31 march 2008 31 march 2007
schedule 2 : reserves and surplus
capital reserve
Balance as at the beginning and at the end of the year 13,769 13,769
13,769 13,769
securities premium account
Balance at the beginning of the year 17,519,763 7,877,812
Add: Received during the year on exercise of employee stock options 122,574 83,330
Add: Received during the year on issue of American Depository Shares (ADSs) – 10,169,700
Less: Utilised for issue of bonus shares – (383,789)
Less: Utilisation towards ADS issue expenses – (227,290)
17,642,337 17,519,763
employees stock options outstanding
Balance at the beginning of the year 448,486 261,053
Add: Options granted during the year 438,411 292,251
Less: Options forfeited during the year (162,261) (36,350)
Less: Options excercised during the year (108,657) (68,468)
Balance at the end of the year (A) 615,979 448,486
deferred stock compensation cost
Balance at the beginning of the year 220,882 146,592
Add: Options granted during the year 438,411 292,251
Less: Amortisation during the year (232,926) (181,611)
Less: Options forfeited during the year (162,261) (36,350)
Balance at the end of the year (B) 264,106 220,882
(A) – (B) 351,873 227,604
General reserve
Balance at the beginning of the year 12,175,560 10,998,701
Add: Transferred from profit and loss account 475,222 1,176,859
12,650,782 12,175,560
hedge reserve
Balance at the beginning of the year – –
Additions for the year (10,064) –
(10,064) –
foreign currency translation reserve
Balance at the begining of the year 347,600 115,227
Additions for the year 1,130,187 232,373
1,477,787 347,600
profit and loss account
Balance in consolidated profit and loss account 12,001,494 8,848,744
44,127,978 39,133,040

schedule to the consolidated Balance sheet | Profit and loss Account ( c o n t I n u e d )
a l l a m o u n t s i n i n d i a n r u p e e s t h o u s a n d s, e x c e p t s h a r e d ata a n d w h e r e o t h e r w i s e s tat e d
127 | D R . R E D D Y ’ S L A B O R AT O R I E S LT D i G a a p c o n s o l i d at e d f i n a n c i a l s
schedules to the consolidated Balance sheet ( c o n t I n u e d )
a l l a m o u n t s i n i n d i a n r u p e e s t h o u s a n d s, e x c e p t s h a r e d ata a n d w h e r e o t h e r w i s e s tat e d
as at as at
31 march 2008 31 march 2007
schedule 3 : secured loans
loans from banks
Long term non recourse loan (Note 1) – 5,787,000
Short term loan from ABN Amro bank (Note 2) 253,750 –
Others (Note 3 and 4) 162,099 85,549
loans from institutions
Finance lease obligations (Note 5) 291,322 252,510
Loan from Indian Renewable Energy Development Agency Limited (Note 6) 13,305 19,225
720,476 6,144,284
Notes:
1. Long term non recourse loan is against a general security of assets of one of the subsidiary. This Loan carries an interest rate of EURIBOR plus 200 bps and has been
repaid during the year.
2. Loan from ABN Amro Bank taken by Dr. Reddy’s laboratories SA, Switzerland (“DRL,SA”) is secured by way of Corporate Guarantee given by Parent Company. The
loan carries an interest rate of Libor + 50 bps.
3. Loan from the ICICI Bank taken by Aurigene Discovery Technologies Limited (“Aurigene”) is secured by way of hypothecation of vehicles acquired by Aurigene. The
loan carries an interest rate of 8.015% per annum.
4. Loan from the Agricultural Bank of China taken by Kunshan Rotam Reddy Pharmaceutical Company Limited (“Reddy Kunshan”), a consolidated joint venture, is
secured by way of hypothecation of leasehold land, buildings and equipment of Reddy Kunshan. This loan carries an interest rate of 5.742% per annum.
5. Finance lease obligations represent present value of minimum lease rental payable for the building and vehicles taken by the Company and its subsidiary companies
respectively. (Refer note 15, Schedule 19).
6. Loan from Indian Renewable Energy Development Agency Limited is secured by way of hypothecation of specific movable assets pertaining to the Solar Grid
Interactive Power plant. The loan is repayable in quarterly installments of Rs. 1,480 each quarter and carries an interest rate of 2% per annum.
as at as at
31 march 2008 31 march 2007
schedule 4 : unsecured loans
Sales tax deferment loan from the Government of Andhra Pradesh (interest free) 63,246 68,708
Packing credit loan (Note 1) 4,090,878 2,684,700
Long term foreign currency loan (Note 2) 14,374,342 15,482,514
Bank Overdraft (Note 3) 434,928 526,391
18,963,394 18,762,313
Notes:
1. Foreign Currency Packing Credit loan is from Standard Chartered Bank, State Bank of India, The Bank Of Nova Scotia, ABN Amro Bank, Citi Bank, BNP Paribas
carrying interest rates of LIBOR plus 50 – 100 bps, repayable on expiry of 3 to 6 months from the date of drawdown. Packing Credit loans for the previous year
comprised foreign currency loan that were taken from State Bank of India carrying an interest rate of LIBOR plus 60 bps, repayable on expiry of 6 months from the
date of drawdown and rupee packing credit loans from Standard Chartered Bank and Bank of Tokyo – Mitsubishi Ufj Ltd carrying an interest rate of 9.5% and 9%
per annum respectively.
2. Long term Euro loan has been guaranteed by the Company and certain subsidiaries of the Group. The loan carried an interest rate of EURIBOR plus 150 basis
points. Effective 24 November 2006, the interest rate has been changed to EURIBOR plus 70 – 200 basis points and LIBOR plus 70 basis points.
3. Bank overdraft is on the current accounts with Citibank, which carry interest rates of 9.75% per annum. Previous year bank overdraft was on the current accounts
with HDFC Bank, with interest rate of 9% per annum.

128 | A N N U A L R E P O R T 2 0 0 7 – 0 8 c o n s o l i d at i n G f o r t h e f u t u r e
sc
he
du
le
5:
Fix
ed
as
se
ts
gr
oss
blo
ck
dep
rec
iati
on
net
blo
ck
de
sc
rip
tio
n
as a
t 1
ap
ril
2
00
7a
dd
itio
ns
de
le
tio
ns
fo
re
ign
ex
ch
an
ge
ad
jus
tm
en
ts
as a
t 3
1 m
ar
ch
20
08
as a
t 1
ap
ril
2
00
7
fo
r t
he
ye
ar
de
le
tio
ns
fo
re
ign
ex
ch
an
ge
ad
jus
tm
en
ts
as a
t 3
1 m
ar
ch
20
08
as a
t 3
1 m
ar
ch
20
08
as a
t 3
1 m
ar
ch
20
07
Land
– fr
eeho
ld (N
ote
1)78
3,70
8 7
03,8
38
12,
533
(24,
991)
1,4
50,0
22
–
–
–
–
–
1,4
50,0
22
783
,708
Land
– le
aseh
old
(Not
e 2)
76,
554
2,1
86
14,
009
90,
976
155
,707
3
,605
1
16
2,3
04
1,9
78
3,3
95
152
,312
7
2,94
9
Build
ings
2,8
70,3
41
1,0
35,8
19
22,
611
(61,
655)
3,8
21,8
94
534
,596
1
53,0
12
13,
984
(6,8
10)
666
,814
3
,155
,080
2
,335
,745
Plan
t and
mac
hine
ry (N
ote
3) 6
,744
,161
2
,190
,095
2
7,95
2 (1
17,8
41)
8,7
88,4
63
3,3
04,4
22
866
,806
2
6,83
0 (1
40,6
52)
4,0
03,7
46
4,7
84,7
17
3,4
39,7
39
Elec
trica
l equ
ipm
ent
820
,568
3
40,1
73
7,0
09
170
1
,153
,902
3
83,1
52
114
,172
5
,616
(6
,654
) 4
85,0
54
668
,848
4
37,4
16
Labo
rato
ry e
quip
men
t 2
,062
,384
4
37,5
41
19,
176
(11,
819)
2,4
68,9
30
1,0
41,6
02
279
,809
4
,574
(4
5,64
1) 1
,271
,196
1
,197
,734
1
,020
,782
Fu
rnitu
re, fi
xtur
es a
nd o
ffice
equi
pmen
t 1
,402
,134
3
90,6
53
9,66
9 (1
57,1
36)
1,6
25,9
82
905
,841
2
34,8
17
7,9
87
(102
,529
) 1
,030
,142
5
95,8
40
496
,293
Vehi
cles
381
,120
9
6,20
8 51
,109
(1
0,98
3) 4
15,2
36
163
,072
7
5,10
9 3
2,63
4 (3
,660
) 2
01,8
87
213
,349
2
18,0
48
Libr
ary
695
–
–
–
6
95
695
–
–
–
6
95
–
–
Inta
ngib
les
Cust
omer
con
tract
s 2
43,4
24
–
–
–
243
,424
1
25,0
88
86,
548
–
–
211
,636
3
1,78
8 1
18,3
36
Goo
dwill
2
2,38
2,87
8 2
06,8
96
–
1,7
65,3
61
24,
355,
135
1,9
21,9
47
1,2
58,8
89
–
103
,789
3
,284
,625
2
1,07
0,51
0 2
0,46
0,93
1
Pate
nts,
trade
mar
ks a
nd d
esig
ns
(inclu
ding
mar
ketin
g kn
ow-h
ow)
8,5
09,6
89
240
,293
–
670,
502
9,4
20,4
84
2,8
92,1
21
888
,924
–
178,
648
3,9
59,6
93
5,4
60,7
91
5,6
17,5
68
Tech
nica
l kno
w–h
ow 4
58,5
33
–
–
–
458
,533
3
35,7
57
45,
853
–
–
381
,610
7
6,92
3 1
22,7
76
Non
–com
pete
fees
227
,500
–
–
–
2
27,5
00
227
,500
–
–
–
2
27,5
00
–
–
46,
963,
689
5,64
3,70
2 16
4,06
8 2,
142,
584
54,
585,
907
11,
839,
398
4,0
04,0
55
93,
929
(21,
531)
15,
727,
993
38,
857,
914
35,
124,
291
Ass
ets
take
n on
leas
e
Build
ings
239
,365
–
–
2
3,02
9 2
62,3
94
9,4
21
9,6
51
–
230
1
9,30
2 2
43,0
92
229
,944
Vehi
cles
29,
256
–
–
29,
256
– 4
,903
–
–
4
,903
2
4,35
3 –
tota
l 4
7,20
3,05
4 5
,672
,958
16
4,06
8 2,
165,
613
54,
877,
557
11,
848,
819
4,0
18,6
09
93,
929
(21,
301)
15,
752,
198
39,
125,
359
35,
354,
235
Prev
ious
yea
r 4
2,01
2,77
1 3
,472
,240
2
47,2
06
1,9
65,2
49
47,
203,
054
8,0
95,5
98
3,7
91,1
08
178
,091
140
,204
1
1,84
8,81
9 3
5,35
4,23
5
No
tes
:
1.
In p
ursu
ance
of a
n al
lotm
ent l
ette
r (“t
he le
tter
”) d
ated
16
Oct
ober
200
1, re
ceiv
ed fr
om K
arna
taka
Indu
stria
l Are
a D
evel
opm
ent B
oard
, Aur
igen
e D
isco
very
Tec
hnol
ogie
s Li
mite
d, a
con
solid
ated
sub
sidi
ary,
acq
uire
d
land
loca
ted
at E
lect
roni
cs C
ity, B
anga
lore
, on
a le
ase–
cum
–sal
e ba
sis.
In t
erm
s of
the
lett
er, t
he le
ase
shal
l be
conv
erte
d in
to a
sal
e at
the
end
of
six
year
s su
bjec
t to
ful
fillm
ent
of a
ll th
e te
rms
and
cond
ition
s of
the
allo
tmen
t. P
endi
ng c
ompl
etio
n of
the
per
iod
of s
ix y
ears
and
ful
fillm
ent
of t
he t
erm
s an
d co
nditi
ons
of t
he a
llotm
ent,
the
am
ount
incu
rred
on
the
land
acq
uisi
tion
aggr
egat
ing
to R
s. 4
9,72
9 (p
revi
ous
year
:
Rs. 4
9,72
9) h
as b
een
acco
unte
d as
leas
ehol
d la
nd. s
ince
the
per
iod
of s
ix y
ears
has
bee
n co
mpl
eted
, con
vert
ing
leas
e in
to s
ale
is u
nder
pro
cess
.
2.
The
Gro
up o
wns
a t
reat
ed e
fflue
nt d
isch
arge
pip
elin
e w
ith a
cos
t of
Rs.
9,2
57 (
Prev
ious
yea
r: R
s. 9
,257
) an
d ne
t bo
ok v
alue
of
Rs.
636
(Pre
viou
s ye
ar:
Rs.
1,59
4) in
equ
al p
ropo
rtio
n jo
intly
with
a t
hird
par
ty in
Pydi
bhee
mav
aram
pur
suan
t to
a m
utua
l agr
eem
ent.
3.
In M
ay 2
006,
the
Com
pany
acq
uire
d m
arke
ting
auth
oris
atio
ns a
nd a
utho
risat
ions
app
licat
ions
for
cer
tain
spe
cial
ity p
harm
aceu
tical
pro
duct
s, a
long
with
the
rel
ated
tra
dem
ark
right
s an
d ph
ysic
al in
vent
orie
s of
the
prod
ucts
, fr
om L
abor
ator
ies
Lith
apar
, S.
A.
(“Li
thap
ar”)
for
a c
onsi
dera
tion
of R
s. 2
18,9
20.
Dur
ing
the
year
end
ed 3
1 M
arch
200
8, t
rigge
red
by c
erta
in a
dver
se m
arke
t co
nditi
ons
like
redu
ctio
n in
sal
es a
nd
mar
gins
of
the
prod
uct
and
incr
ease
in s
uppl
y co
sts,
the
Com
pany
tes
ted
carr
ying
val
ue o
f Li
thap
ar in
tang
ible
s fo
r im
pairm
ent
and
reco
gnis
ed a
n im
pairm
ent
loss
of
Rs.
127,
506
repr
esen
ting
the
net
carr
ying
valu
e of
the
se in
tang
ible
s, w
hich
has
bee
n in
clud
ed in
the
am
ortis
atio
n ex
pens
e fo
r th
e ye
ar e
nded
31
Mar
ch 2
008.
4.
Fore
ign
exch
ange
adj
ustm
ents
rep
rese
nts
exch
ange
diff
eren
ces
resu
lting
fro
m t
rans
latio
n of
fixe
d as
sets
rel
atin
g to
non
-inte
gral
for
eign
ope
ratio
ns.
sch
ed
ule
s to
th
e c
on
soli
da
ted
Ba
lan
ce s
he
et
(co
nt
Inu
ed
)
al
l a
mo
un
ts i
n i
nd
ian
ru
pe
es t
ho
us
an
ds,
ex
ce
pt s
ha
re d
at
a a
nd
wh
er
e o
th
rw
ise s
ta
te
d

schedule to the consolidated Balance sheet | Profit and loss Account ( c o n t I n u e d )
a l l a m o u n t s i n i n d i a n r u p e e s t h o u s a n d s, e x c e p t s h a r e d ata a n d w h e r e o t h e r w i s e s tat e d
129 | D R . R E D D Y ’ S L A B O R AT O R I E S LT D i G a a p c o n s o l i d at e d f i n a n c i a l s
as at
31 march 2008
as at
31 march 2007
schedule 7: inventories
Stores and spares 740,814 554,587
Raw materials 3,525,103 2,472,849
Work-in-process 2,352,993 1,690,584
Finished goods 4,399,880 2,753,497
11,018,790 7,471,517
as at as at
31 march 2008 31 march 2007
schedule 8 : sundry debtors
(Unsecured)
Debts outstanding for a period exceeding six months
Considered good 323,635 310,614
Considered doubtful 488, 667 303,151
Other debts
Considered good 6,198,046 7,499,796
7,010,348 8,113,561
Less: Provision for doubtful debts (488,667) (303,151)
6,521,681 7,810,410
schedules to the consolidated Balance sheet ( c o n t I n u e d )
a l l a m o u n t s i n i n d i a n r u p e e s t h o u s a n d s, e x c e p t s h a r e d ata a n d w h e r e o t h e r w i s e s tat e d
as at
31 march 2008
as at
31 march 2007
schedule 6 : investments
(Long term, unless otherwise specified)
investment in associates
Perlecan Pharma Private Ltd 57,098 69,773
other investments (at cost)
Aggregate cost of quoted investments (Note 1) 3,096 3,096
Aggregate cost of unquoted investments 1,320,922 1,320,922
current investments, at the lower of cost or market value
Mutual funds 3,507,673 15,335
4,888,789 1,409,126
Less: Provision for decline, other than temporary, in the value of investments (67,957) (67,957)
4,820,832 1,341,169
Market value of quoted investments 19,203 11,933
Market value of current investments 3,515,963 15,386
Note:
1. In respect of shares of State Bank of India, the share certificates were misplaced during transfer / lost in transit. The Company has initiated necessary legal action at
the appropriate courts.

schedule to the consolidated Balance sheet | Profit and loss Account ( c o n t I n u e d )
a l l a m o u n t s i n i n d i a n r u p e e s t h o u s a n d s, e x c e p t s h a r e d ata a n d w h e r e o t h e r w i s e s tat e d
130 | A N N U A L R E P O R T 2 0 0 7 – 0 8 c o n s o l i d at i n G f o r t h e f u t u r e
as at as at
31 march 2008 31 march 2007
schedule 9 : cash and bank balances
Cash in hand 21,864 9,407
Balances with banks
In current accounts 2,644,755 3,347,342
In EEFC current accounts 69,686 673,180
In deposit accounts 4,701,537 14,566,882
In unclaimed dividend accounts 14,372 12,620
In unclaimed fractional share pay order accounts 666 666
7,452,880 18,610,097
Notes:
Deposits with banks include:
1. Margin money for letters of credit and bank guarantees 8,118 9,063
2. Details of unutilised portion of ADS issue proceeds:
Deposit with schedule banks outside India – 8,732,898
[Maximum amount outstanding at any time during the year: Rs. 8,732,898 (previous year: Rs. 8,732,898)]
Deposit with schedule banks in India 2,500,000 –
Investment in mutual funds 3,507,673 –
as at
31 march 2008
as at
31 march 2007
schedule 10 : loans and advances
(Unsecured)
considered good
Advances to associate 20,158 89,716
Advances to material suppliers 424,063 288,916
Staff loans and advances 28,996 17,460
Interest accrued on investments 27,985 5,630
Other advances recoverable in cash or in kind or for value to be received 3,148,480 2,014,257
Advance tax, net of provision for current taxes 315,090 43,179
MAT credit entitlement 24,760 –
Balances with statutory authorities 1,178,733 893,303
Deposits 180,744 247,863
5,349,009 3,600,324
considered doubtful
Staff loans and advances 6,500 6,500
Other advances recoverable in cash or in kind or for value to be received 38,758 52,671
Advances towards investment 8,056 8,056
5,402,323 3,667,551
Less: Provision for doubtful advances (53,314) (67,227)
5,349,009 3,600,324
schedules to the consolidated Balance sheet ( c o n t I n u e d )
a l l a m o u n t s i n i n d i a n r u p e e s t h o u s a n d s, e x c e p t s h a r e d ata a n d w h e r e o t h e r w i s e s tat e d

schedule to the consolidated Balance sheet | Profit and loss Account ( c o n t I n u e d )
a l l a m o u n t s i n i n d i a n r u p e e s t h o u s a n d s, e x c e p t s h a r e d ata a n d w h e r e o t h e r w i s e s tat e d
131 | D R . R E D D Y ’ S L A B O R AT O R I E S LT D i G a a p c o n s o l i d at e d f i n a n c i a l s
as at as at
31 march 2008 31 march 2007
schedule 11: current liabilities
Sundry creditors (Note 1-3) 10,274,629 9,795,782
Interest accrued but not due on loan 5,326 4,665
Unclaimed dividends 14,372 12,620
Trade deposits 38,095 40,445
10,332,422 9,853,512
Notes:
1. The principal amount paid and that remaining unpaid as at 31 March 2008 in respect of enterprises covered under the “Micro, Small and Medium Enterprises
Development Act, 2006” (MSMDA) are Rs. 485,941 (previous year: Rs. 269,320) and Rs. 28,987 (previous year: Rs. 26,482) respectively. The interest amount
computed based on the provisions under Section 16 of the MSMDA Rs. 2,834 (previous year: Rs. 604) is remaining unpaid as of 31 March 2008. The interest that
remained unpaid as at 31 March 2007 was paid during the year.
2. The list of undertakings covered under MSMDA were determined by the Company on the basis of information available with the Company and have been relied
upon by the auditors.
3. Previous years figures includes liability towards Leave Encashment amounting to Rs. 145,306 pursuant to an amendment of the Company and one of its subsidiary’s
leave encashment policy.
as at
31 march 2008
as at
31 march 2007
schedule 12 : provisions
Proposed dividend 630,649 629,671
Tax on proposed dividend 107,179 107,013
Provision for
Gratuity 33,266 23,589
Leave encashment 28,870 35,214
Pension, seniority and severence indemnity plan 40,275 56,804
Taxation, net of advance taxes 335,209 523,113
1,175,448 1,375,404
schedules to the consolidated Balance sheet ( c o n t I n u e d )
a l l a m o u n t s i n i n d i a n r u p e e s t h o u s a n d s, e x c e p t s h a r e d ata a n d w h e r e o t h e r w i s e s tat e d
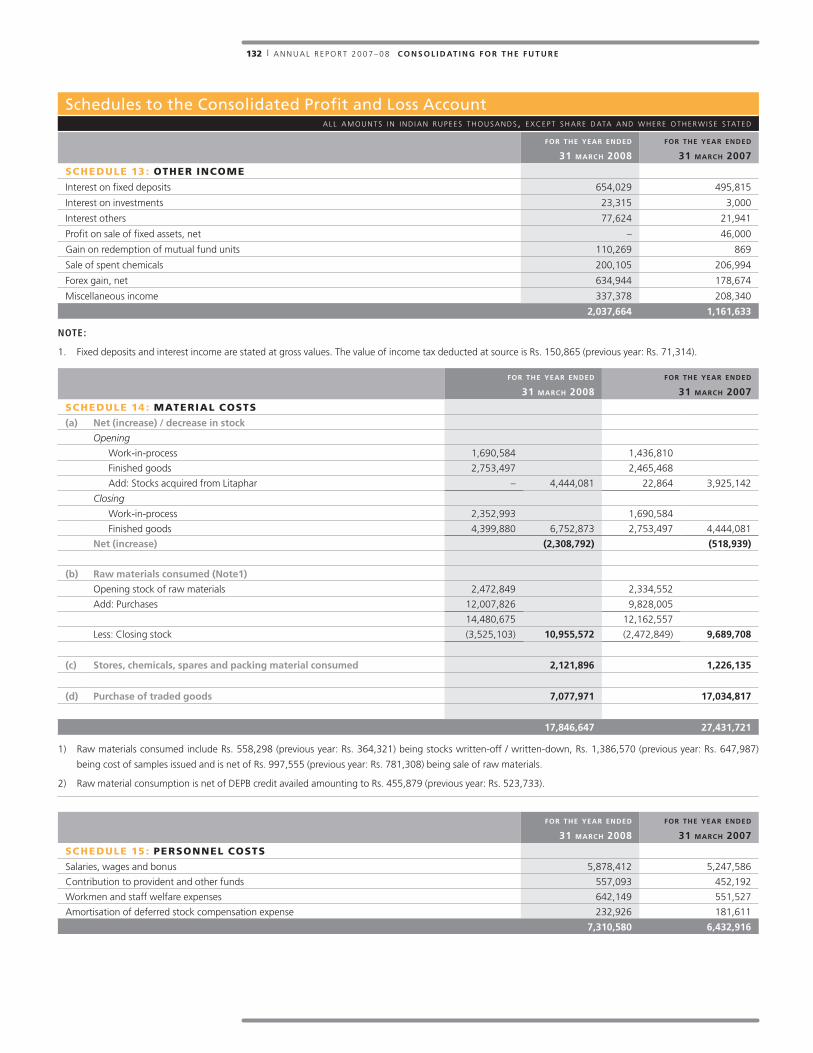
schedule to the consolidated Balance sheet | Profit and loss Account ( c o n t I n u e d )
a l l a m o u n t s i n i n d i a n r u p e e s t h o u s a n d s, e x c e p t s h a r e d ata a n d w h e r e o t h e r w i s e s tat e d
132 | A N N U A L R E P O R T 2 0 0 7 – 0 8 c o n s o l i d at i n G f o r t h e f u t u r e
for the year ended
31 march 2008
for the year ended
31 march 2007
schedule 13 : other income
Interest on fixed deposits 654,029 495,815
Interest on investments 23,315 3,000
Interest others 77,624 21,941
Profit on sale of fixed assets, net – 46,000
Gain on redemption of mutual fund units 110,269 869
Sale of spent chemicals 200,105 206,994
Forex gain, net 634,944 178,674
Miscellaneous income 337,378 208,340
2,037,664 1,161,633
Note:
1. Fixed deposits and interest income are stated at gross values. The value of income tax deducted at source is Rs. 150,865 (previous year: Rs. 71,314).
for the year ended
31 march 2008
for the year ended
31 march 2007
schedule 14 : material costs
(a) net (increase) / decrease in stock
Opening
Work-in-process 1,690,584 1,436,810
Finished goods 2,753,497 2,465,468
Add: Stocks acquired from Litaphar – 4,444,081 22,864 3,925,142
Closing
Work-in-process 2,352,993 1,690,584
Finished goods 4,399,880 6,752,873 2,753,497 4,444,081
net (increase) (2,308,792) (518,939)
(b) raw materials consumed (note1)
Opening stock of raw materials 2,472,849 2,334,552
Add: Purchases 12,007,826 9,828,005
14,480,675 12,162,557
Less: Closing stock (3,525,103) 10,955,572 (2,472,849) 9,689,708
(c) stores, chemicals, spares and packing material consumed 2,121,896 1,226,135
(d) purchase of traded goods 7,077,971 17,034,817
17,846,647 27,431,721
1) Raw materials consumed include Rs. 558,298 (previous year: Rs. 364,321) being stocks written-off / written-down, Rs. 1,386,570 (previous year: Rs. 647,987)
being cost of samples issued and is net of Rs. 997,555 (previous year: Rs. 781,308) being sale of raw materials.
2) Raw material consumption is net of DEPB credit availed amounting to Rs. 455,879 (previous year: Rs. 523,733).
for the year ended
31 march 2008
for the year ended
31 march 2007
schedule 15 : personnel costs
Salaries, wages and bonus 5,878,412 5,247,586
Contribution to provident and other funds 557,093 452,192
Workmen and staff welfare expenses 642,149 551,527
Amortisation of deferred stock compensation expense 232,926 181,611
7,310,580 6,432,916
schedules to the consolidated Profit and loss Accounta l l a m o u n t s i n i n d i a n r u p e e s t h o u s a n d s, e x c e p t s h a r e d ata a n d w h e r e o t h e r w i s e s tat e d
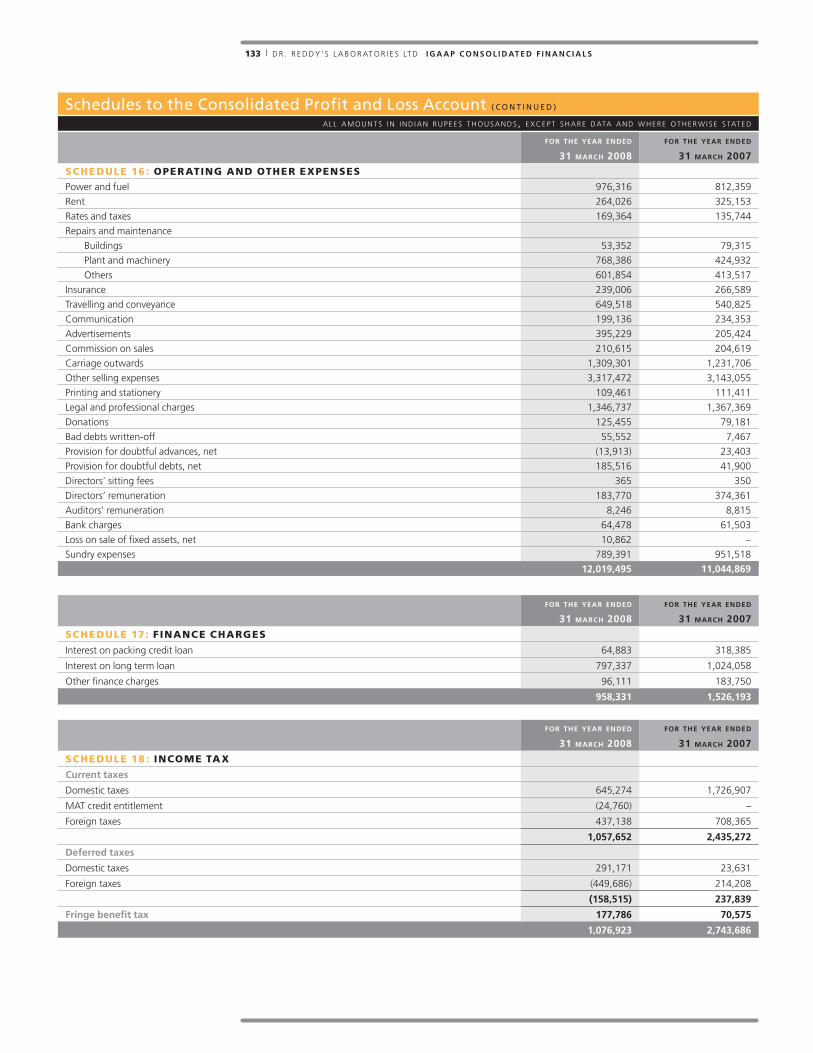
133 | D R . R E D D Y ’ S L A B O R AT O R I E S LT D i G a a p c o n s o l i d at e d f i n a n c i a l s
schedules to the consolidated Profit and loss Account ( c o n t I n u e d )
a l l a m o u n t s i n i n d i a n r u p e e s t h o u s a n d s, e x c e p t s h a r e d ata a n d w h e r e o t h e r w i s e s tat e d
for the year ended for the year ended
31 march 2008 31 march 2007
schedule 16 : operating and other expenses
Power and fuel 976,316 812,359
Rent 264,026 325,153
Rates and taxes 169,364 135,744
Repairs and maintenance
Buildings 53,352 79,315
Plant and machinery 768,386 424,932
Others 601,854 413,517
Insurance 239,006 266,589
Travelling and conveyance 649,518 540,825
Communication 199,136 234,353
Advertisements 395,229 205,424
Commission on sales 210,615 204,619
Carriage outwards 1,309,301 1,231,706
Other selling expenses 3,317,472 3,143,055
Printing and stationery 109,461 111,411
Legal and professional charges 1,346,737 1,367,369
Donations 125,455 79,181
Bad debts written-off 55,552 7,467
Provision for doubtful advances, net (13,913) 23,403
Provision for doubtful debts, net 185,516 41,900
Directors’ sitting fees 365 350
Directors’ remuneration 183,770 374,361
Auditors’ remuneration 8,246 8,815
Bank charges 64,478 61,503
Loss on sale of fixed assets, net 10,862 –
Sundry expenses 789,391 951,518
12,019,495 11,044,869
for the year ended
31 march 2008
for the year ended
31 march 2007
schedule 17: Finance charges
Interest on packing credit loan 64,883 318,385
Interest on long term loan 797,337 1,024,058
Other finance charges 96,111 183,750
958,331 1,526,193
for the year ended for the year ended
31 march 2008 31 march 2007
schedule 18 : income tax
current taxes
Domestic taxes 645,274 1,726,907
MAT credit entitlement (24,760) –
Foreign taxes 437,138 708,365
1,057,652 2,435,272
deferred taxes
Domestic taxes 291,171 23,631
Foreign taxes (449,686) 214,208
(158,515) 237,839
fringe benefit tax 177,786 70,575
1,076,923 2,743,686
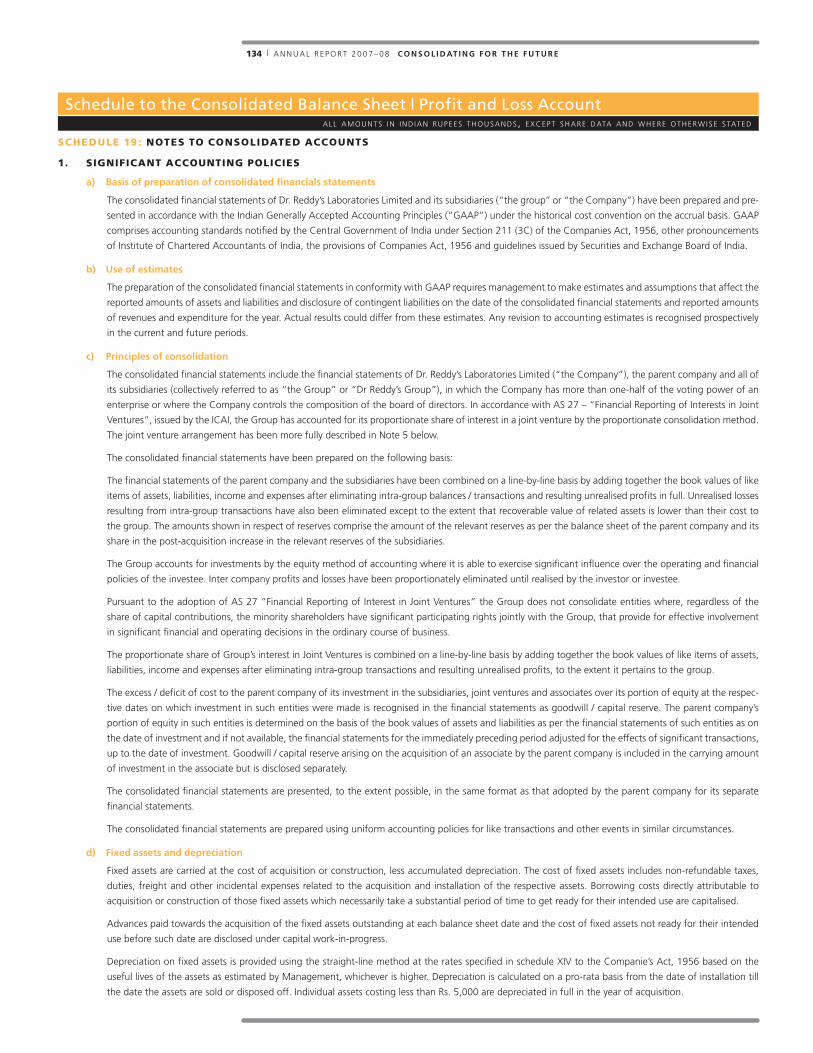
134 | A N N U A L R E P O R T 2 0 0 7 – 0 8 c o n s o l i d at i n G f o r t h e f u t u r e
schedule to the consolidated Balance sheet | Profit and loss Accounta l l a m o u n t s i n i n d i a n r u p e e s t h o u s a n d s, e x c e p t s h a r e d ata a n d w h e r e o t h e r w i s e s tat e d
1. signiFicant accounting policies
a) basis of preparation of consolidated financials statements
The consolidated financial statements of Dr. Reddy’s Laboratories Limited and its subsidiaries (“the group’’ or “the Company”) have been prepared and pre-
sented in accordance with the Indian Generally Accepted Accounting Principles (“GAAP”) under the historical cost convention on the accrual basis. GAAP
comprises accounting standards notified by the Central Government of India under Section 211 (3C) of the Companies Act, 1956, other pronouncements
of Institute of Chartered Accountants of India, the provisions of Companies Act, 1956 and guidelines issued by Securities and Exchange Board of India.
b) use of estimates
The preparation of the consolidated financial statements in conformity with GAAP requires management to make estimates and assumptions that affect the
reported amounts of assets and liabilities and disclosure of contingent liabilities on the date of the consolidated financial statements and reported amounts
of revenues and expenditure for the year. Actual results could differ from these estimates. Any revision to accounting estimates is recognised prospectively
in the current and future periods.
c) principles of consolidation
The consolidated financial statements include the financial statements of Dr. Reddy’s Laboratories Limited (“the Company”), the parent company and all of
its subsidiaries (collectively referred to as “the Group” or “Dr Reddy’s Group”), in which the Company has more than one-half of the voting power of an
enterprise or where the Company controls the composition of the board of directors. In accordance with AS 27 – “Financial Reporting of Interests in Joint
Ventures”, issued by the ICAI, the Group has accounted for its proportionate share of interest in a joint venture by the proportionate consolidation method.
The joint venture arrangement has been more fully described in Note 5 below.
The consolidated financial statements have been prepared on the following basis:
The financial statements of the parent company and the subsidiaries have been combined on a line-by-line basis by adding together the book values of like
items of assets, liabilities, income and expenses after eliminating intra-group balances / transactions and resulting unrealised profits in full. Unrealised losses
resulting from intra-group transactions have also been eliminated except to the extent that recoverable value of related assets is lower than their cost to
the group. The amounts shown in respect of reserves comprise the amount of the relevant reserves as per the balance sheet of the parent company and its
share in the post-acquisition increase in the relevant reserves of the subsidiaries.
The Group accounts for investments by the equity method of accounting where it is able to exercise significant influence over the operating and financial
policies of the investee. Inter company profits and losses have been proportionately eliminated until realised by the investor or investee.
Pursuant to the adoption of AS 27 “Financial Reporting of Interest in Joint Ventures” the Group does not consolidate entities where, regardless of the
share of capital contributions, the minority shareholders have significant participating rights jointly with the Group, that provide for effective involvement
in significant financial and operating decisions in the ordinary course of business.
The proportionate share of Group’s interest in Joint Ventures is combined on a line-by-line basis by adding together the book values of like items of assets,
liabilities, income and expenses after eliminating intra-group transactions and resulting unrealised profits, to the extent it pertains to the group.
The excess / deficit of cost to the parent company of its investment in the subsidiaries, joint ventures and associates over its portion of equity at the respec-
tive dates on which investment in such entities were made is recognised in the financial statements as goodwill / capital reserve. The parent company’s
portion of equity in such entities is determined on the basis of the book values of assets and liabilities as per the financial statements of such entities as on
the date of investment and if not available, the financial statements for the immediately preceding period adjusted for the effects of significant transactions,
up to the date of investment. Goodwill / capital reserve arising on the acquisition of an associate by the parent company is included in the carrying amount
of investment in the associate but is disclosed separately.
The consolidated financial statements are presented, to the extent possible, in the same format as that adopted by the parent company for its separate
financial statements.
The consolidated financial statements are prepared using uniform accounting policies for like transactions and other events in similar circumstances.
d) fixed assets and depreciation
Fixed assets are carried at the cost of acquisition or construction, less accumulated depreciation. The cost of fixed assets includes non-refundable taxes,
duties, freight and other incidental expenses related to the acquisition and installation of the respective assets. Borrowing costs directly attributable to
acquisition or construction of those fixed assets which necessarily take a substantial period of time to get ready for their intended use are capitalised.
Advances paid towards the acquisition of the fixed assets outstanding at each balance sheet date and the cost of fixed assets not ready for their intended
use before such date are disclosed under capital work-in-progress.
Depreciation on fixed assets is provided using the straight-line method at the rates specified in schedule XIV to the Companie’s Act, 1956 based on the
useful lives of the assets as estimated by Management, whichever is higher. Depreciation is calculated on a pro-rata basis from the date of installation till
the date the assets are sold or disposed off. Individual assets costing less than Rs. 5,000 are depreciated in full in the year of acquisition.
schedule 19 : notes to consolidated accounts

135 | D R . R E D D Y ’ S L A B O R AT O R I E S LT D i G a a p c o n s o l i d at e d f i n a n c i a l s
schedule to the consolidated Balance sheet | Profit and loss Account ( c o n t I n u e d )
a l l a m o u n t s i n i n d i a n r u p e e s t h o u s a n d s, e x c e p t s h a r e d ata a n d w h e r e o t h e r w i s e s tat e d
The Management’s estimates of the useful lives for various categories of fixed assets are given below:
years
Buildings
– Factory and administrative buildings 20 to 50
– Ancillary structures 3 to 10
Plant and machinery 3 to 15
Electrical equipment 5 to 15
Laboratory equipment 5 to 15
Furniture, fixtures and office equipment (other than computer equipment) 4 to 8
Computer equipment 3
Vehicles 4 to 5
Library 2
Leasehold building is being amortised over the primary period of the lease.
e) intangible assets and amortisation
Intangible assets are recorded at the consideration paid for acquisition. Intangible assets are amortised over their estimated useful lives on a straight-line
basis, commencing from the date the asset is available to the Group for its use. The management estimates the useful lives for the various intangible assets
as follows:
years
Goodwill 5 to 20
Patents, trademarks and designs (including marketing know-how) 3 to 10
Customer contracts 2 to 5
Technical know-how 10
Non-compete fees 1.5 to 10
f) investments
Long-term investments, other than investments in associates, are stated at cost. A provision for diminution is made to recognise a decline, other than tem-
porary, in the value of long-term investments. Current investments are carried at the lower of cost and fair value. The comparison of cost and fair value is
done separately in respect of each category of investment.
Investments in associates, accounted under the equity method of accounting, are initially recorded at cost, identifying any goodwill / capital reserve at the
time of acquisition. The carrying amount of such investments is adjusted thereafter for the post acquisition change in the Group’s share of net assets of
the investee unless there is an agreement to the contrary. The carrying amount of investment in an associate is reduced to recognise a decline, other than
temporary, in the value of the investment, such reduction being determined and made for each investment individually.
g) inventories
Inventories are valued at the lower of cost and net realisable value. Cost of inventories comprises all costs of purchase, cost of conversion and other costs
incurred in bringing the inventories to their present location and condition.
The methods of determining cost of various categories of inventories are as follows:
Raw materials First in first out (FIFO)
Stores and spares Weighted average method
Work-in-process and finished goods (manufactured) FIFO and including an appropriate share of production overheads
Finished goods (traded) Specific identification method
h) research and development
Revenue expenditure on research and development is expensed as incurred. Capital expenditure incurred on research and development is capitalised as
fixed assets and depreciated in accordance with the depreciation policy of the Group.
i) employee benefits
Contributions payable to an approved gratuity fund (a defined benefit plan) and certain defined benefit plans at overseas subsidiaries determined by
independent actuaries at the balance sheet date, are charged to the profit and loss account. Provision for leave encashment cost is made on the basis of
actuarial valuation at the balance sheet date, carried out by an independent actuary.
Contributions payable to recognised provident funds, approved superannuation scheme, employee pension and social security schemes in certain overseas
subsidiaries, which are defined contribution schemes, are charged to the profit and loss account.
All actuarial gains and losses arising during the year are recognized in the statement of expense of the year.
schedule 19 : notes to consolidated accounts (continued)

schedule to the consolidated Balance sheet | Profit and loss Account ( c o n t I n u e d )
a l l a m o u n t s i n i n d i a n r u p e e s t h o u s a n d s, e x c e p t s h a r e d ata a n d w h e r e o t h e r w i s e s tat e d
136 | A N N U A L R E P O R T 2 0 0 7 – 0 8 c o n s o l i d at i n G f o r t h e f u t u r e
j) foreign currency transactions, balances and translation of financial statements of foreign subsidiaries and joint venture
Foreign currency transactions are recorded using the exchange rates prevailing on the dates of the respective transactions. Exchange differences arising on
foreign currency transactions settled during the year are recognised in the profit and loss account.
Monetary assets and liabilities denominated in foreign currencies as at the balance sheet date not covered by forward exchange contracts are translated at
year-end rates. The resultant exchange differences are recognised in the profit and loss account. Non-monetary assets are recorded at the rates prevailing
on the date of the transaction.
Forward contracts are entered into to hedge the foreign currency risk of the underlying outstanding at the balance sheet date. The premium or discount
on all such contracts arising at the inception of each contract is amortised as expense or income over the life of the contract. Any profit or loss arising on
the cancellation or renewal of forward contracts is recognised as income or expense for the period.
In relation to the forward contracts entered into to hedge the foreign currency risk of the underlying outstanding at the balance sheet date, the exchange
difference is calculated and recorded in accordance with AS – 11 (revised). The exchange difference on such a forward exchange contract is calculated as
the difference the foreign currency amount of the contract translated at the exchange at the reporting date, or the settlement date where the transaction is
settled during the reporting period, and the corresponding foreign currency amount translated at the later of the date of inception of the forward exchange
contract and the last reporting date. Such exchange differences are recognized in the profit and loss account in the reporting period in which the exchange
rates change.
The financial statements of the foreign integral subsidiaries, representative offices and (collectively referred to as the ‘foreign integral operations’) are
translated into Indian rupees as follows:
Revenue items, except opening and closing inventories and depreciation are translated at the respective monthly average rates. Opening and closing in-
ventories are translated at the rates prevalent at the commencement and close respectively of the accounting period. Depreciation is translated at the rates
used for the translation of the values of the assets on which depreciation is calculated.
Monetary items are translated using the closing rate.
Non-monetary items, other than inventories, are translated using the exchange rate at the date of transaction i.e., the date when they were acquired.
The net exchange difference resulting from the translation of items in the financial statements of foreign integral operations is recognised as income or as
expense for the year.
Contingent liabilities are translated at the closing rate.
The consolidated foreign subsidiaries Reddy US, DREU, DRUK, AI, Falcon, RHG, Lacock, Beta group companies, Reddy Pharma Iberia SA, Reddy Pharma Italia
SpA and joint venture KRRP have been identified as non integral operations in accordance with the requirements of AS –11 (Revised 2003) “The Effect of
Changes in Foreign Exchange rates” issued by ICAI which is effective for the accounting periods commencing on or after 1 April 2004. In accordance with
AS –11 (Revised 2003) “The Effect of Changes in Foreign Exchange rates”, the financial statements of such non-integral foreign operations are translated
into Indian rupees as follows:
– All assets and liabilities, both monetary and non-monetary, are translated using the closing rate.
– Revenue items are translated at the respective monthly average rates.
– The resulting net exchange difference is credited or debited to a foreign currency translation reserve. However, an exchange difference arising out of
intragroup monetary item, whether short term or long term is recognised in the profit and loss account.
– Contingent liabilities are translated at the closing rate.
k) derivative instruments and hedge accounting
The Company uses foreign exchange forward contracts and options to hedge its movements in foreign exchange rates and does not use the foreign ex-
change forward contracts and options for trading or speculative purposes.
Pursuant to ICAI Announcement “Accounting for Derivatives” on the early adoption of Accounting Standard AS 30 “Financial Instruments: Recognition
and Measurement”, the Company has early adopted the Standard for the year under review, to the extent that the adoption does not conflict with existing
mandatory accounting standards and other authoritative pronouncements, Company law and other regulatory requirements.
The Company classifies foreign currency options in respect of the forecasted transactions at the inception of each contract meeting the hedging criterion, as
cash flow hedges. Changes in the fair value of options classified as cash flow hedges are recognised directly in shareholders’ funds (under the head “Hedg-
ing Reserves”) and are reclassified into the profit and loss account upon the occurrence of the hedged transaction. The gains / losses on options designated
as cash flow hedges are included along with the underlying hedged forecasted transactions. The exchange differences relating to options not designated
as cash flow hedges are recognised in the profit and loss account as they arise. Further, the changes in fair value relating to the ineffective portion of the
cash flow hedges are recognised in the profit and loss account as they arise.
schedule 19 : notes to consolidated accounts (continued)

schedule to the consolidated Balance sheet | Profit and loss Account ( c o n t I n u e d )
a l l a m o u n t s i n i n d i a n r u p e e s t h o u s a n d s, e x c e p t s h a r e d ata a n d w h e r e o t h e r w i s e s tat e d
137 | D R . R E D D Y ’ S L A B O R AT O R I E S LT D i G a a p c o n s o l i d at e d f i n a n c i a l s
l) revenue recognition
Revenue from sale of goods is recognised when significant risks and rewards in respect of ownership of products are transferred to customers. Revenue
from domestic sales of formulation products is recognised on dispatch of products to stockists by clearing and forwarding agents of the Group. Revenue
from domestic sales of active pharmaceutical ingredients and intermediates is recognised on dispatch of products from the factories of the Group. Revenue
from export sales is recognised on shipment of products.
Revenue from product sales is stated exclusive of returns, sales tax and applicable trade discounts and allowances.
Service income is recognised as per the terms of contracts with customers when the related services are performed, or the agreed milestones are
achieved.
Dividend income is recognised when the unconditional right to receive the income is established. Income from interest on deposits, loans and interest bear-
ing securities is recognised on the time proportionate method.
Export entitlements under the Duty Entitlement Pass Book (“DEPB”) scheme are recognised as income when the right to receive credit as per the terms
of the scheme is established in respect of the exports made and where there is no significant uncertainty regarding the ultimate collection of the relevant
export proceeds.
The Group has entered into marketing arrangements with certain marketing partners for sale of goods in certain overseas territories. Under such arrange-
ments, the Group sells generic products to the marketing partners at a price agreed in the arrangement. Revenue is recognized on these transactions upon
delivery of products to the marketing partners. An additional amount representing profit share is recognized as revenue on the basis of ultimate net sale
proceeds realized by such marketing partners from the end customer. Such amount is determined as per the terms of the arrangement and recognized by
the Group when the realisation is certain.
The Group enters into certain dossier sales, licensing and supply arrangements with certain third parties. These arrangements include certain performance
obligations by the Group. Revenue from such arrangements is recognised in the period in which the Group completes all its performance obligations.
m) income-tax expense
Income tax expense comprises current tax and deferred tax charge or credit.
current tax
The current charge for income taxes is calculated in accordance with the relevant tax regulations applicable to the entities in the Group.
deferred tax
Deferred tax charge or credit reflects the tax effects of timing differences between accounting income and taxable income for the period. The deferred tax
charge or credit and the corresponding deferred tax liabilities or assets are recognised using the tax rates that have been enacted or substantially enacted
by the balance sheet date. Deferred tax assets are recognised only to the extent there is reasonable certainty that the assets can be realised in future; how-
ever, where there is unabsorbed depreciation or carry forward of losses, deferred tax assets are recognised only if there is a virtual certainty of realisation of
such assets. Deferred tax assets are reviewed at each balance sheet date and written-down or written-up to reflect the amount that is reasonably / virtually
certain (as the case may be) to be realised.
The break-up of the major components of the deferred tax assets and liabilities as at the balance sheet date have been arrived at after setting off deferred
tax assets and liabilities where the group has a legally enforceable right to set-off assets against liabilities, and where such assets and liabilities relate to
taxes on income levied by the same governing taxation laws.
n) earnings per share
The basic earnings per share (“EPS”) is computed by dividing the net profit after tax for the year by the weighted average number of equity shares outstand-
ing during the year. For the purpose of calculating diluted earnings per share, net profit after tax for the year and the weighted average number of shares
outstanding during the year are adjusted for the effects of all dilutive potential equity shares. Dilutive potential equity shares are deemed converted as of
the beginning of the year, unless they have been issued at a later date. The diluted potential equity shares have been adjusted for the proceeds receivable
had the shares been actually issued at fair value (i.e. the average market value of the outstanding shares).
o) employee stock option schemes
In accordance with the Securities and Exchange Board of India guidelines, the excess of the market price of shares, at the date of grant of options under
the Employee stock option schemes, over the exercise price is treated as employee compensation and amortised over the vesting period.
schedule 19 : notes to consolidated accounts (continued)
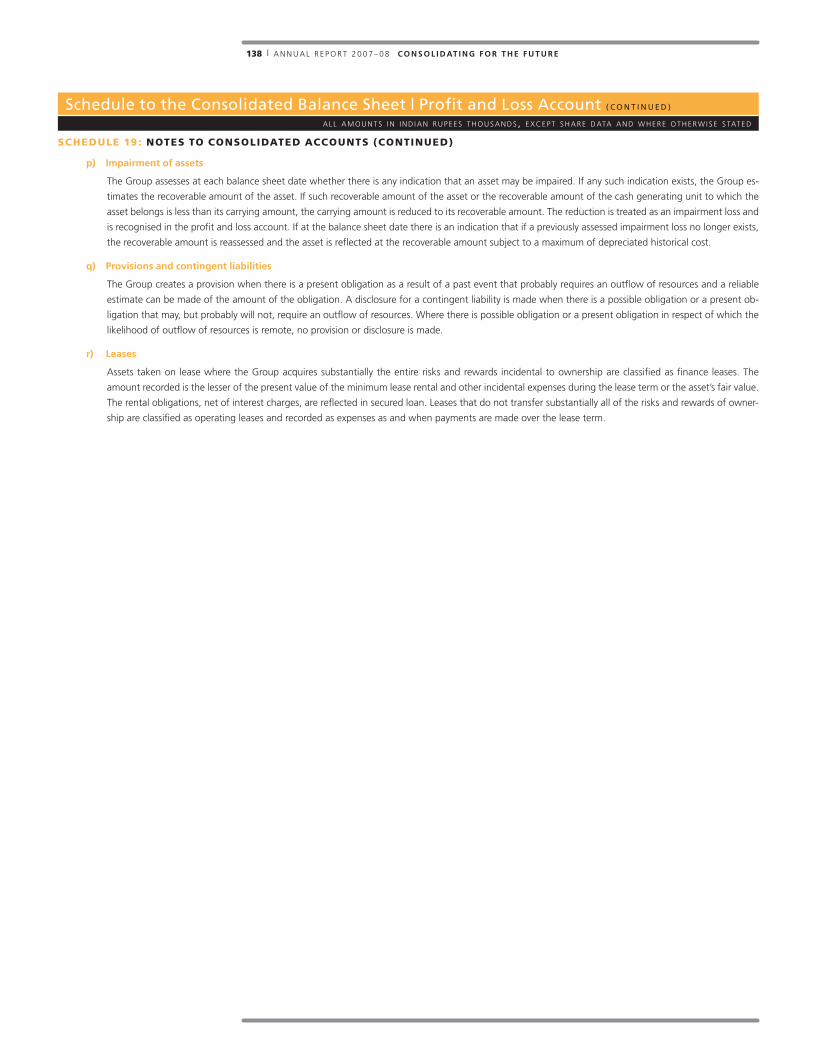
schedule to the consolidated Balance sheet | Profit and loss Account ( c o n t I n u e d )
a l l a m o u n t s i n i n d i a n r u p e e s t h o u s a n d s, e x c e p t s h a r e d ata a n d w h e r e o t h e r w i s e s tat e d
138 | A N N U A L R E P O R T 2 0 0 7 – 0 8 c o n s o l i d at i n G f o r t h e f u t u r e
p) impairment of assets
The Group assesses at each balance sheet date whether there is any indication that an asset may be impaired. If any such indication exists, the Group es-
timates the recoverable amount of the asset. If such recoverable amount of the asset or the recoverable amount of the cash generating unit to which the
asset belongs is less than its carrying amount, the carrying amount is reduced to its recoverable amount. The reduction is treated as an impairment loss and
is recognised in the profit and loss account. If at the balance sheet date there is an indication that if a previously assessed impairment loss no longer exists,
the recoverable amount is reassessed and the asset is reflected at the recoverable amount subject to a maximum of depreciated historical cost.
q) provisions and contingent liabilities
The Group creates a provision when there is a present obligation as a result of a past event that probably requires an outflow of resources and a reliable
estimate can be made of the amount of the obligation. A disclosure for a contingent liability is made when there is a possible obligation or a present ob-
ligation that may, but probably will not, require an outflow of resources. Where there is possible obligation or a present obligation in respect of which the
likelihood of outflow of resources is remote, no provision or disclosure is made.
r) leases
Assets taken on lease where the Group acquires substantially the entire risks and rewards incidental to ownership are classified as finance leases. The
amount recorded is the lesser of the present value of the minimum lease rental and other incidental expenses during the lease term or the asset’s fair value.
The rental obligations, net of interest charges, are reflected in secured loan. Leases that do not transfer substantially all of the risks and rewards of owner-
ship are classified as operating leases and recorded as expenses as and when payments are made over the lease term.
schedule 19 : notes to consolidated accounts (continued)

schedule to the consolidated Balance sheet | Profit and loss Account ( c o n t I n u e d )
a l l a m o u n t s i n i n d i a n r u p e e s t h o u s a n d s, e x c e p t s h a r e d ata a n d w h e r e o t h e r w i s e s tat e d
139 | D R . R E D D Y ’ S L A B O R AT O R I E S LT D i G a a p c o n s o l i d at e d f i n a n c i a l s
2. description oF the group
Dr. Reddy’s Laboratories Limited (“the Company”) together with its subsidiaries (collectively referred to as “the Group” or “Dr. Reddy’s Group”) is a leading
India-based pharmaceutical group headquartered in Hyderabad, India. The Group’s principal areas of operation are active pharmaceutical ingredients and in-
termediates, formulations, generics, custom pharmaceutical services and drug discovery. The Group’s principal research and development and manufacturing
facilities are located in Andhra Pradesh, India with principal marketing facilities in India, Russia, the United States, the United Kingdom, Brazil, Germany, Spain,
Italy, Australia and South Africa. The Company’s shares trade on several stock exchanges in India and on the New York Stock Exchange in the United States
from 11 April 2001.
Dr. Reddy’s subsidiaries, step-down subsidiaries, associates and joint venture are listed below:
entity country of incorporationpercentage
holding(%)
subsidiariesOOO JV Reddy Biomed Limited (“RBL”) A Company organised under the laws of Russia 100
Reddy Pharmaceuticals Hong Kong Limited A Company organised under the laws of Hong Kong 100
Dr. Reddy’s Laboratories Inc. (“DRLI”) A Company organised under the laws of New Jersey, USA 100
Reddy Cheminor S.A. A Company organised under the laws of Chartres, France 100
Reddy Antilles N.V. (“RANV”) A Company organised under the laws of Antilles, Netherlands 100
Dr. Reddy’s Farmaceutica Do Brazil Ltda. A Company organised under the laws of Brazil 100
Aurigene Discovery Technologies Limited A Company organised under the laws of India 100
Dr. Reddy’s Laboratories (EU) Limited (“DREU”) A Company organised under the laws of the United Kingdom 100
Cheminor Investments Limited A Company organised under the laws of India 100
DRL Investments Limited A Company organised under the laws of India 100
OOO Dr. Reddy’s Laboratories Limited A Company organised under the laws of Russia 100
Dr. Reddy’s Laboratories (Proprietary) Limited A Company organised under the laws of the Republic of South Africa 60
Dr. Reddy’s Bio-Sciences Limited A Company organised under the laws of India 100
Trigenesis Therapeutics Inc. A Company organised under laws of New Jersey, USA 100
Industrias Quimicas Falcon de Mexico S.A.de.C.V.(“Falcon”) A Company organised under laws of Mexico 100
Dr. Reddy’s Laboratories (Australia) Pty. Limited A Company organised under laws of Australia 70
Reddy Pharma Iberia SA A Company organised under laws of Spain 100
Lacock Holdings Limited (“Lacock”) A Company organised under laws of Cyprus 100
Dr. Reddy’s Laboratories SA A Company organised under laws of Switzerland 100
step-down subsidiaries
Reddy Netherlands B.V.A subsidiary of Reddy Antilles N.V., organised under the laws of
Netherlands100
Reddy US Therapeutics Inc. (“Reddy US”)A subsidiary of Reddy Antilles N.V., organised under the laws of Atlanta,
USA100
Promius Pharma LLC (formerly Reddy Pharmaceuticals, LLC.) A subsidiary of Dr. Reddy’s Laboratories Inc., organised under the laws of
Delaware, USA100
Dr. Reddy’s Laboratories (UK) Limited (“DRUK”) A subsidiary of Dr. Reddy’s Laboratories (EU) Limited, organised under the
laws of the United Kingdom100
Aurigene Discovery Technologies Inc (“AI”)A subsidiary of Aurigene Discovery Technologies Limited, organised under
the laws of Massachusetts, USA100
Reddy Holding GmbH (“RHG”)A subsidiary of Lacock Holdings Limited organised under the laws of
Germany100
betapharm Arzneimittel GmbHA subsidiary of beta Healthcare GmbH & Co. KG organised under the laws
of Germany100
beta Healthcare Solutions GmbHA subsidiary of beta Healthcare GmbH & Co. KG organised under the laws
of Germany100
beta institut fur sozialmedizinische Forschung und Entwicklung
GmbH
A subsidiary of beta Healthcare GmbH & Co. KG organised under the laws
of Germany100
Reddy Pharma Italia SPA A subsidiary of Lacock Holdings Limited organised under the laws of Italy 100
Eurobridge Consulting B.V. A subsidiary of Reddy Antilles NV organised under the laws of Netherlands 100
schedule 19 : notes to consolidated accounts (continued)

schedule to the consolidated Balance sheet | Profit and loss Account ( c o n t I n u e d )
a l l a m o u n t s i n i n d i a n r u p e e s t h o u s a n d s, e x c e p t s h a r e d ata a n d w h e r e o t h e r w i s e s tat e d
140 | A N N U A L R E P O R T 2 0 0 7 – 0 8 c o n s o l i d at i n G f o r t h e f u t u r e
entity country of incorporationpercentage
holding(%)
OOO DRS LimitedA subsidiary of Eurobridge Consulting B.V. organised under the laws of
Russia100
Aurigine Discovery Technologies (Malaysia) Sdn bhdA subsidiary of Aurigine Discovery Technologies Limited organised under
the laws of Malaysia100
Affordable Health Care LimitedA subsidiary of Dr. Reddy’s Laboratories SA organised under laws of New
Zealand100
partnership firms
Globe Enterprises
A partnership firm with Dr. Reddy’s Holdings Private Limited organised
under the laws of India, wherein Dr. Reddy’s and Dr. Reddy’s Holdings
Private Limited share the profits in the ratio of 95:5
95
Joint Venture
Kunshan Rotam Reddy Pharmaceutical Company Limited
(“Reddy Kunshan” or “KRRP”)A Company organised under the laws of China 51.33
associates
APR LLCA Limited Liability Company (LLC) organised under the laws of Delaware,
USA
100% of Class
B interest
in the LLC
Perlecan Pharma Private Limited A Company organised under the laws of India 14.31
3. commitments and contingent liabilities
particularsas at as at
31 march 2008 31 march 2007
(i) Commitments / contingent liabilities:
(a) Guarantees issued by banks 85,321 282,687
(b) Letters of credit outstanding 664,368 739,857
(c) Contingent consideration payable in respect of subsidiaries acquired 12,463 12,463
(ii) Claims against the Group not acknowledged as debts in respect of:
(a) Income tax matters, pending decisions on various appeals made by the Group and by the
Department
668,569 892,367
(b) Excise matters, under dispute 965 17,451
(c) Sales tax matters, under dispute 14,625 16,605
(d) Customs matter under dispute 17,911 19,711
(e) Other matters, under dispute 276 16,674
(f) Demand for payment to the credit of the Drug Prices Equalisation Account under Drugs (Price Control) Order, 1995 which is being contested by the Company
in respect of its product “Norfloxacin”. During the year ended 31 March 2005, the Hon’ble High Court of Andhra Pradesh dismissed the review petition filed
by the Company against the original order passed by the same Court. Subsequently, the Company had filed a Special Leave Petition with the Supreme Court of
India appealing against the High Court Order.
During the year ended 31 March 2006 the Company received a further demand notice from the authorities for a total of Rs. 284,984 towards the overcharged
sale price (principal) and interest thereon. The Company filed a fresh writ petition in the High Court of Andhra Pradesh challenging the demand notice. The
High Court whilst admitting the writ petition, granted an interim order wherein it ordered the Company to deposit 50% of the principal amounting to Rs.
77,149. The Company deposited this amount with the authorities under protest on 14 November 2005, while it awaits the outcome of its appeal with the
Supreme Court. In February 2008, the High Court directed the Company to deposit additional amount of Rs. 30,000, which was deposited by the Company
in March 2008. The Company has provided fully against the potential liability in respect of the principal amount demanded and believes that possibility of any
liability that may arise on account of interest and penalty is remote. In the event that the Company is unsuccessful in the litigation in Supreme Court, it will be
required to remit the sale proceeds in excess of the maximum selling price to Government of India and penalties or interest if any, the amounts of which are
not readily ascertainable
(iii) Estimated amount of contracts remaining to be executed on capital account and not provided for (net of
advances)1,552,967 1,186,157
schedule 19 : notes to consolidated accounts (continued)

schedule to the consolidated Balance sheet | Profit and loss Account ( c o n t I n u e d )
a l l a m o u n t s i n i n d i a n r u p e e s t h o u s a n d s, e x c e p t s h a r e d ata a n d w h e r e o t h e r w i s e s tat e d
141 | D R . R E D D Y ’ S L A B O R AT O R I E S LT D i G a a p c o n s o l i d at e d f i n a n c i a l s
(iv) In April 2006, the Company launched its fexofenadine hydrochloride 30 mg, 60 mg and 180 mg tablet products, which are generic versions of Sanofi-
Aventis’ (“Aventis”) Allegra® tablets. The Company is currently defending patent infringement actions brought by Aventis in the United States District Court
for the District of New Jersey. There are three formulation patents, three use patents, and two active pharmaceutical ingredients (“API”) patents that are
the subject matter of litigation concerning the Company’s tablets. The Company has obtained summary judgment as to each of the formulation patents.
In September 2005, pursuant to an agreement with Barr Pharmaceuticals, Inc., Teva Pharmaceuticals Industries Limited (“Teva”) launched its fexofenadine
hydrochloride 30 mg, 60 mg and 180 mg tablet products, which are AB-rated to Aventis’ Allegra® tablets. Aventis has brought patent infringement actions
against Teva and its API supplier in the United States District Court for the District of New Jersey. There are three formulation patents, three use patents, and
two API patents at issue in the litigation and Teva has obtained summary judgment as to each of the formulation patents. On 27 January 2006, the District
Court denied Aventis’ motion for a preliminary injunction against Teva and its API supplier on the three use patents, finding those patents likely to be invalid,
and one of the API patents, finding that patent likely to be not infringed. The issues presented during that hearing are likely to be substantially similar to those
which will be presented with respect to Company’s tablet products. A trial has not been scheduled. If Aventis is ultimately successful on its allegation of patent
infringement, the Company could be required to pay damages related to the sales of its fexofenadine hydrochloride tablets and be prohibited from selling
those products in the future.
(v) On 10 April 2008, Dr. Reddy’s received a Civil Investigative Demand (“CID”) from the United States Federal Trade Commission (“FTC”). A CID is a request for
information in the course of a civil investigation and does not constitute the commencement of legal proceedings. Dr. Reddy’s has been informed that the
focus of the civil antitrust investigation relates to the settlement arrangement entered into between Dr. Reddy’s and UCB resolving patent litigation concerning
levetiracetam. Dr. Reddy’s believes that the terms of its settlement arrangement are consistent with all applicable antitrust laws. Dr. Reddy’s is cooperating fully
with the FTC regarding this investigation. The Company however, does not foresee any claim of damages, fine or penalty.
(vi) During the previous year, the Company received information from anonymous sources that certain persons have claimed income tax refunds by filing forged
income tax deduction forms of the Company. The matter is currently under investigation. The Company, however, does not foresee any claim of damages, fine
or penalty.
(vii) Additionally, the Company and its affiliates are involved in other disputes, lawsuits, claims, governmental and/or regulatory inspections, inquiries, investigations
and proceedings, including patent and commercial matters that arise from time to time in the ordinary course of business. The Company believes that there are
no such pending matters that are expected to have any material adverse effect on its financial statements in any given accounting period.
4. accounting For associates
Pursuant to the adoption of AS 23 – “Accounting for Investments in Associates in Consolidated Financial Statements”, the Group has accounted for its invest-
ments in APR LLC and Perlecan Pharma Private Limited under the equity method, as the Group exercises significant influence over the financial and operating
policy decisions of these entities.
perlecan pharma private limited (“perlecan pharma”)
The Group, during the year ended 31 March 2006 invested Rs. 100,800 in Perlecan Pharma for an equity stake of 14.28%. As more fully described in Note 13
of Schedule 19, the Company as per the terms of the agreement has 3 out of the 7 directors on the Board of Perlecan Pharma and has continuing involvement
in the operations of Perlecan Pharma. The Group has therefore concluded that it has a significant influence in the financial and operating policies of Perlecan
pharma and has accounted for its investment in Perlecan Pharma under the equity method. Further during the year ended March 31, 2007, the Company
and the other two investors have additionally invested Rs. 69,200 and Rs. 412,700 in Perlecan Pharma. As a result, the Company as at 31 March 2008 owns
approximately 14.31% of the equity of Perlecan Pharma.
The Group’s losses of Perlecan Pharma amounting to Rs. 12,676 (previous year: Rs. 65,891) has been recognised in these financial statements.
apr llc (“apr”)
On 30 January 2004, the Group invested Rs. 21,859 in the Class B Interest of APR. APR is a development stage Company in the process of developing an active
pharmaceutical ingredient. In accordance with a Development and Supply Agreement between the Group and APR, the Group has agreed to fund APR’s devel-
opment expenses, provided certain milestones are achieved. Such funding is repayable by APR upon successful commercialisation of the product in the future.
In addition to its equity investment of Rs. 21,859 the Group has advanced Rs. 78,500 to APR through 31 March 2005. During the year ended 31 March 2006,
the balance carrying value of the investment and advance amounting to Rs. 13,632 has been adjusted against the Group’s share of losses thereby reducing the
Group’s investment in APR to Rs. Nil at 31 March 2006.
Further during the year ended 31 March 2008, the Company has advanced a sum of Rs. 4,033 (previous year: Rs. 20,634) and the same has been adjusted
against the Group’s share of losses and thereby reducing the Group’s investment in APR to Rs. Nil (previous year: Rs. Nil) at 31 March 2008.
schedule 19 : notes to consolidated accounts (continued)

schedule to the consolidated Balance sheet | Profit and loss Account ( c o n t I n u e d )
a l l a m o u n t s i n i n d i a n r u p e e s t h o u s a n d s, e x c e p t s h a r e d ata a n d w h e r e o t h e r w i s e s tat e d
142 | A N N U A L R E P O R T 2 0 0 7 – 0 8 c o n s o l i d at i n G f o r t h e f u t u r e
schedule 19 : notes to consolidated accounts (continued)
5. accounting For interest in a joint venture (jv)
Kunshan rotam reddy pharmaceuticals company limited (“reddy Kunshan”)
The Company has a 51.33 % interest in Reddy Kunshan, a joint venture (JV) in China. Reddy Kunshan is engaged in manufacturing and marketing of active
pharmaceutical ingredients and intermediates and formulations in China. The contractual arrangement between shareholders of Reddy Kunshan indicates joint
control as the minority shareholders, along with the Group, have significant participating rights such that they jointly control the financial and operating policies
of Reddy Kunshan in the ordinary course of business.
The Group has, in accordance with AS 27 – “Financial Reporting of Interests in Joint Ventures” issued by the ICAI, accounted for its 51.33 % interest in the JV by
the proportionate consolidation method. Thus the Group’s income statement, balance sheet and cash flow statement incorporate the Group’s share of income,
expenses, assets, liabilities and cash flows of the JV on a line-b
particularsas at as at
31 march 2008 31 march 2007
balance sheet
Secured loan 82,880 84,609
Unsecured loan – 58,284
Foreign currency translation reserve 1,465 2,786
Fixed assets, net 82,811 89,238
Deferred tax assets, net 13,892 (5,100)
current assets, loans and advances
Inventories 23,953 25,764
Sundry debtors 93,683 75,542
Cash and bank balances 19,002 21,559
Loans and advances 12,969 19,010
current liabilities and provisions
Current liabilities 79,167 32,553
net current assets 70,440 109,322
Estimated amount of contracts remaining to be executed on capital account and not provided for (net of
advances) 541 108
particularsfor the year ended for the year ended
31 march 2008 31 march 2007
income statement
income
Sales 450,584 271,573
Other income 64 10,231
expenditure
Material costs 286,137 152,929
Personnel costs 51,420 42,019
Operating and other expenses 87,234 61,332
Research and development expenses 3,133 3,457
Finance charges 5,114 6,272
Depreciation 2,130 8,459
profit / (loss) before taxation 15,480 7,336
Provision for taxation
Current tax – –
Deferred tax (expense) / benefit 19,570 (5,134)
profit / (loss) after taxation 35,050 2,202

schedule to the consolidated Balance sheet | Profit and loss Account ( c o n t I n u e d )
a l l a m o u n t s i n i n d i a n r u p e e s t h o u s a n d s, e x c e p t s h a r e d ata a n d w h e r e o t h e r w i s e s tat e d
143 | D R . R E D D Y ’ S L A B O R AT O R I E S LT D i G a a p c o n s o l i d at e d f i n a n c i a l s
6. acquisitions
a. dr. reddy’s laboratories inc. (drli)
In March 2000, Dr. Reddy’s Laboratories Inc. (“DRLI”), a consolidated subsidiary, acquired 25% of its common stock held by a minority shareholder (Pharma,
LLC) for a cash consideration of Rs. 1, 072, which was accounted for by the purchase method. The terms of the Stock Redemption Agreement dated March
2000 and Amendment to Stock Purchase Agreement dated March 2002 also provide for contingent consideration not exceeding U.S.$. 14,000 over the
ten years following such purchase based on achievement of sales of certain covered products. Such payments would be recorded as goodwill in the period
in which the contingency is resolved.
In August 2006, the Company received a letter from Pharma, LLC alleging that sales of certain products were excluded by the Company from its calculation
of gross revenue in computing the amount payable to Pharma, LLC. The Company, in its response, has stated that the stated products, being the authorized
generic products of the partnering innovator company, are not DRLI products and therefore fall within the definition of “excluded products”. Accordingly,
the Company has rejected Pharma LLC’s claim for its share of consideration from sale of these products. Subsequently, in October 2006, Pharma LLC has
instituted an Arbitration Proceeding under the Redemption Agreement. This arbitration was settled during the year ended 31 March 2008 by executing a
settlement arrangement through which all remaining payments amounting to U.S.$. 4,492 has been agreed to be paid in various instalments beginning
1 October 2007 and ending on 1 January 2009 and consequently the Company has recorded the amount payable to Pharma LLC aggregating to Rs. 178,984
(U.S.$. 4,492). Accordingly, as of March 2008, there are no unresolved contingencies and the entire amount of Rs. 612,306 (U.S.$. 14,000) has been
paid / accrued towards such contingent consideration and recorded as goodwill.
b. trigenesis therapeutics inc.
In 2004, the Company, through the acquisition of Trigenesis Therapeutics Inc. (“Trigenesis”), acquired certain technology platforms and marketing rights
for a total consideration of Rs. 496,715 (U.S.$. 11,000). During the year ended 31 March 2007, the Company completed a detailed review of business
opportunities in respect of these core technology platforms and marketing rights. Based on this review, the Company determined that further
commercialization of these intangible assets may not be economically viable due to further regulatory approval process requirements and unfeasible
partnering prospects, and therefore discontinued its efforts to further develop these assets. Accordingly, the net carrying value of these intangible assets as of
31 March 2007 was written down to Rs. Nil, by recording a write-down of Rs. 205,574. This write down, which has been disclosed under depreciation and
amortisation expense in the consolidated profit and loss account for the year ended 31 March 2007.
7. deFerred taxation
particularsas at as at
31 march 2008 31 march 2007
deferred tax assets
Losses carried forward 12,141 16,889
Sundry debtors 68,873
Provisions 13,815 69,859
Inventories 25,643 –
Other current assets 32,396 –
Current liabilities 32,747 8,366
185,615 95,114
deferred tax liability
Sundry debtors – (23,750)
Other current assets – (64,535)
Inventories – (1,537)
Excess of depreciation allowable under Income tax law over depreciation provided in accounts (991,410) (972,249)
(991,410) (1,062,071)
deferred tax liability, net (805,795) (966,957)
schedule 19 : notes to consolidated accounts (continued)

schedule to the consolidated Balance sheet | Profit and loss Account ( c o n t I n u e d )
a l l a m o u n t s i n i n d i a n r u p e e s t h o u s a n d s, e x c e p t s h a r e d ata a n d w h e r e o t h e r w i s e s tat e d
144 | A N N U A L R E P O R T 2 0 0 7 – 0 8 c o n s o l i d at i n G f o r t h e f u t u r e
The net deferred tax liability of Rs. 805,795 (previous year: Rs. 966,957) has been presented in the balance sheet as follows:
particularsas at as at
31 march 2008 31 march 2007
Deferred tax assets 185,615 95,114
Deferred tax liabilities (991,410) (1,062,071)
(805,795) (966,957)
8. earnings per share (eps)
The computation of EPS is set out below:
particularsfor the year ended for the year ended
31 march 2008 31 march 2007
earnings
Net profit for the year 4,381,325 9,658,878
shares
Number of shares at the beginning of the year 167,912,180 153,389,140
Add: Equity shares issued on exercise of vested stock options 260,566 223,040
Equity shares issued by way of American Depository Receipts – 14,300,000
Total number of equity shares outstanding at the end of the year 168,172,746 167,912,180
Weighted average number of equity shares outstanding during the year – Basic 168,075,840 158,552,454
Add: Weighted average number of equity shares arising out of outstanding stock options (net of stock
options forfeited) that have dilutive effect on EPS1,114,177 1,046,753
Weighted average number of equity shares outstanding during the year – Diluted 169,190,017 159,599,207
earnings per share of face value rs. 5 - basic (rs.) 26.07 60.92
earnings per share of face value rs. 5 - diluted (rs.) 25.90 60.52
9. related party disclosures
a. The related parties where control exists are the subsidiaries, step down subsidiaries and partnership firms as described in Note 2. There are no other parties
over which the Group has control.
b. Other related parties with whom transactions have taken place during the year:
associates
APR LLC, USA Enterprise over which the Group has significant influence, through 100% of •
Class B interest.
Perlecan Pharma Private Limited, India Enterprise over which the Group has significant influence, through 14.31% •
shareholding and through representation on Board of Directors of the
Company.
Joint Venture
Kunshan Rotam Reddy Pharmaceutical Company Limited – China Enterprise over which the group exercises joint control with other joint •
(“Reddy Kunshan” or KRRP) venture partners and holds 51.33% equity stake
enterprises where principal shareholders have control or significant influence (“significant interest entities”)
Dr. Reddy’s Research Foundation (“Research Foundation”) Enterprise over which the principal shareholders have significant influence•
Dr. Reddy’s Holdings Private Limited Enterprise owned by principal shareholders•
Institute of Life Sciences Enterprise owned by principal shareholder•
others
Diana Hotels Limited Enterprise owned by relative of a director•
Ms. K Samrajyam Spouse of the Chairman•
Ms. G Anuradha Spouse of the Executive Vice-Chairman and Chief Executive Officer•
Ms. Deepthi Reddy Spouse of the Managing Director and Chief Operating Officer•
Dr. Reddy’s Heritage Foundation Enterprise in which the Chairman is a director•
Dr. Reddy’s Foundation for Human and Social development Enterprise where principal shareholders are trustees•
Madras Diabetes Research Foundation Enterprise promoted by Director (till 28 July 2006)•
Manava Seva Dharma Samvardhani Trust Enterprise in which a director is managing trustee (till 28 July 2006) •
schedule 19 : notes to consolidated accounts (continued)

schedule to the consolidated Balance sheet | Profit and loss Account ( c o n t I n u e d )
a l l a m o u n t s i n i n d i a n r u p e e s t h o u s a n d s, e x c e p t s h a r e d ata a n d w h e r e o t h e r w i s e s tat e d
145 | D R . R E D D Y ’ S L A B O R AT O R I E S LT D i G a a p c o n s o l i d at e d f i n a n c i a l s
K K En• terprises Enterprise in which relative of a director has significant influence
A.R. Life Sciences Private Limited Enterprise in which relative of a director has significant influence•
Key management personnel represented on the board of the company
Dr. K Anji Reddy Chairman•
Mr. G V Prasad Vice-Chairman and Chief Executive Officer•
Mr. K Satish Reddy Managing Director and Chief Operating Officer•
non-executive and independent directors on the board of the company
Dr. V Mohan (till 28 July 2006)•
Dr. Omkar Goswami•
Mr. Ravi Bhoothalingam•
Mr. P N Devarajan•
Dr. Krishna G Palepu•
Mr. Anupam Puri •
Ms. Kalpana Morparia (From 5 June 2007)•
Dr. J P Moreau (From 18 May 2007)•
c. Particulars of related party transactions
The following is a summary of significant related party transactions:
particularsfor the year ended for the year ended
31 march 2008 31 march 2007
(i) Sales to:
Significant interest entities
– Dr. Reddy’s Holdings Private Limited 285 390
Others
– A.R. Life Sciences Private Limited 88,152 –
(ii) Purchases from:
Significant interest entities
– Dr. Reddy’s Holdings Private Limited 37,924 36,167
Others
– A.R. Life Sciences Private Limited 174,969 –
– Others 6,152 5,522
(iii) Lease rentals and other service charges paid to Dr. Reddy’s Research Foundation – 8,236
(iv) Contributions made to others for social development
– Dr. Reddy’s Foundation for Human and Social development 113,621 34,100
– Institute of Life Sciences – 40,000
(v) Service Income from Associate – Perlecan Pharma Private Limited 40,071 139,335
(vi) Reimbursement of research & development and other expenses from Associate (Perlecan) 89,505 376,533
(vii) Hotel expenses paid for:
– Diana Hotels Limited 12,596 9,227
(vii) Rent paid to:
Key management personnel
– Dr. K Anji Reddy 4,130 1,872
– Mr. K Satish Reddy 9,928 10,395
Others
– Ms. G Anuradha 8,663 7,812
– Ms. Deepthi Reddy 1,979 1,805
(ix) Directors’ sitting fees 365 350
(x) Executive Directors’ Remuneration 165,255 361,320
(xi) Investments in associate – Perlecan Pharma Private Limited – 69,200
(xii) Investments in Joint venture – Kunshan Rotam Reddy Pharmaceutical Company Limited – 89,274
(xiii) Loan / advance to an associates (65,525) 23,186
(xiv) Loss pick up of Associates 16,709 86,525
(xv) Purchase of Land, buildings and movable assets from Dr. Reddy’s Research Foundation 140,995 –
(xvi) Advance made to Dr. Reddy’s Holdings Private Limited towards acquisition of land 680,000 40,000
schedule 19 : notes to consolidated accounts (continued)

schedule to the consolidated Balance sheet | Profit and loss Account ( c o n t I n u e d )
a l l a m o u n t s i n i n d i a n r u p e e s t h o u s a n d s, e x c e p t s h a r e d ata a n d w h e r e o t h e r w i s e s tat e d
146 | A N N U A L R E P O R T 2 0 0 7 – 0 8 c o n s o l i d at i n G f o r t h e f u t u r e
d. The Company has the following amounts dues from / to related parties:
particularsas at as at
31 march 2008 31 march 2007
(i) Due from related parties (included in loans and advances and sundry debtors):
Significant interest entities
– Dr. Reddy’s Holdings Private Limited 680,000 40,000
Others
– A.R. Life Sciences Private Limited 26,093 –
– Others 209 65
(ii) Deposit with Dr. Reddy’s Research Foundation – 3,000
(iii) Due to related parties (included in current liabilities):
Significant interest entities –
– Dr. Reddy’s Research Foundation – 19,012
– Others – 1,061
Diana Hotels Limited 450 –
Others
– A.R. Life Sciences Private Limited 16,160 –
– Others – 126
e. Details of remuneration paid to the whole-time and non-whole-time directors are given in Note 11 to Schedule 19.
10. segmental inFormation
The primary and secondary reportable segments are business segments and geographic segments respectively.
business segments:
For management purposes, the Group is organised on a worldwide basis into five strategic business units (SBUs), which are the reportable segments:
• Formulations(includingCriticalcareandBiotechnology);
• ActivePharmaceuticalIngredientsandIntermediates(API);
• Generics;
• DrugDiscoveryand
• CustomPharmaceuticalServices(CPS).
The Group reports its primary segment information on the basis of strategic business units (SBUs). Formulations also referred to as finished dosages consist of
finished pharmaceutical products marketed under brand name and ready for consumption by the patient. Active pharmaceutical ingredients and intermediates,
also known as active pharmaceutical products or bulk drugs, are the principal ingredients for formulations. Active pharmaceutical ingredients and intermediates
become formulations when the dosage is fixed in a form ready for human consumption such as a tablet, capsule or liquid using additional inactive ingredients.
Generics are generic finished dosages with therapeutic equivalence to innovator products. Drug Discovery involves the discovery of new chemical entities meant
for subsequent commercialisation or out licensing. Custom Pharmaceutical Services business caters to the strategic outsourcing needs of large innovator as well
as emerging pharmaceutical companies, spanning the entire value chain of pharmaceutical services.
Geographic segments:
The Group’s business is organised into five key geographic segments. Revenues are attributable to individual geographic segments based on the location of the
customer.
segment revenues and expenses:
All segment revenues and expenses are directly attributable to the segments.
segment assets and liabilities:
According to the internal organisation and management structure of the Group and its system of internal financial reporting, the Chief Operating Decision
Maker does not review the total assets and liabilities for each reportable segment.
The assets and liabilities are not fully identifiable with / allocable to individual reportable segments, as certain assets are interchangeable between segments.
Consequently, the Management believes that it is not practicable to provide segmental disclosures relating to total assets and liabilities by primary segments.
inter-segment transfers:
Segment revenue, segment expenses and segment result include transfers between business segments. Inter-segment transfers are accounted for at cost to the
transferring segment. Such transfers are eliminated on consolidation.
schedule 19 : notes to consolidated accounts (continued)

147 | D R . R E D D Y ’ S L A B O R AT O R I E S LT D i G a a p c o n s o l i d at e d f i n a n c i a l s
sch
ed
ule
to
th
e c
on
soli
da
ted
Ba
lan
ce s
he
et
| Pro
fit
an
d l
oss
Acc
ou
nt
(co
nt
Inu
ed
)
al
l a
mo
un
ts i
n i
nd
ian
ru
pe
es t
ho
us
an
ds,
ex
ce
pt s
ha
re d
at
a a
nd
wh
er
e o
th
er
wis
e s
ta
te
d
sc
he
du
le
19
: n
ot
es
to
co
ns
ol
ida
te
d a
cc
ou
nt
s (
co
nt
inu
ed
)
seg
men
t in
form
atio
n f
or
the
year
en
ded
31
mar
ch 2
008
par
tic
ula
rs
for
mu
lati
on
s
ac
tiv
e p
ha
rm
ac
eu
tic
al
ing
re
die
nts
an
d
inte
rm
ed
iate
s
ge
ne
ric
sd
ru
g d
isc
ov
er
y
cu
sto
m
ph
ar
ma
ce
uti
ca
l s
er
vic
es
oth
er
se
lim
ina
tio
ns
un
all
oc
ab
le it
em
sto
tal
Exte
rnal
Sal
es (G
ross
) 1
5,64
9,52
1 1
1,80
4,08
9 1
7,42
8,13
4 –
4,8
18,2
80
–
–
–
49,
700,
024
Inte
r-se
gmen
t Sa
les
47,
229
3,28
0,94
9 –
–
1
51,4
47
–
(3,4
79,6
25)
–
–
Less
: Exc
ise
duty
and
oth
er
sim
ilar
dutie
s an
d ta
xes
on s
ales
(291
,889
) (2
66,4
19)
–
–
–
–
–
–
(558
,308
)
tota
l sal
es 1
5,40
4,86
1 1
4,81
8,61
9 1
7,42
8,13
4 –
4,9
69,7
27
–
(3,
479,
625)
–
49,
141,
716
Inco
me
from
Ser
vice
s –
–
3
02,4
75
40,
072
76,
210
321
,475
–
–
7
40,2
32
Lice
nse
fees
33
–
34,
789
–
–
–
–
–
34,
822
Sale
of
Spen
t C
hem
ical
s –
20
0,10
5 –
–
–
–
–
–
2
00,1
05
Fore
x, n
et (8
6,73
0) (1
99,8
45)
557
,945
7
44
(864
,298
) 1
,277
,128
–
–
6
34,9
44
Mis
cella
neou
s In
com
e 2
8,40
4 4
9,26
0 2
08,0
02
3,0
67
36,
937
11,
708
–
–
337
,378
seg
men
t r
even
ues
15,
346,
568
14,
868,
999
18,
531,
345
43,8
83 4
,218
,576
1
,560
,311
(
3,47
9,62
5) –
5
1,08
9,19
7
Inte
rest
–
–
–
–
–
–
–
754
,968
7
54,9
68
Oth
er U
nallo
cabl
e In
com
e –
–
–
–
–
–
–
1
10,2
69
110
,269
Tota
l Rev
enue
s
5
1,95
4,43
4
seg
men
t r
esu
lt 4
,596
,569
2
,538
,207
1
,145
,607
(
862,
391)
337
,231
–
–
–
7
,755
,311
Una
lloca
ted
expe
nse
1,
347,
412
1,3
47,4
12
Fina
nce
Cha
rges
–
–
–
–
–
–
–
958
,331
9
58,3
31
Profi
t be
fore
tax
atio
n an
d
min
ority
inte
rest
5,44
9,56
7
Inco
me
tax
expe
nse
1,07
6,92
3
Profi
t af
ter
taxa
tion
but
befo
re
min
ority
inte
rest
4,3
72,6
44
Min
ority
Inte
rest
(8,6
81)
pro
fit
for
the
year
4,38
1,32
5

148 | A N N U A L R E P O R T 2 0 0 7 – 0 8 c o n s o l i d at i n G f o r t h e f u t u r e
sch
ed
ule
to
th
e c
on
soli
da
ted
Ba
lan
ce s
he
et
| Pro
fit
an
d l
oss
Acc
ou
nt
(co
nt
Inu
ed
)
al
l a
mo
un
ts i
n i
nd
ian
ru
pe
es t
ho
us
an
ds,
ex
ce
pt s
ha
re d
at
a a
nd
wh
er
e o
th
er
wis
e s
ta
te
d
sc
he
du
le
19
: n
ot
es
to
co
ns
ol
ida
te
d a
cc
ou
nt
s (
co
nt
inu
ed
)
seg
men
t in
form
atio
n f
or
the
year
en
ded
31
mar
ch 2
007
par
tic
ula
rs
for
mu
lati
on
s
ac
tiv
e p
ha
rm
ac
eu
tic
al
ing
re
die
nts
an
d
inte
rm
ed
iate
s
ge
ne
ric
sd
ru
g d
isc
ov
er
y
cu
sto
m
ph
ar
ma
ce
uti
ca
l s
er
vic
es
oth
er
se
lim
ina
tio
ns
un
all
oc
ab
le it
em
sto
tal
Exte
rnal
Sal
es (G
ross
) 1
3,48
2,12
4 1
2,04
6,16
9 3
3,51
7,68
4 –
6
,079
,697
–
–
–
6
5,12
5,67
4
Inte
r-se
gmen
t Sa
les
99,
195
2,2
33,7
31
–
–
35,
681
–
(2,3
68,6
07)
–
–
Less
: Exc
ise
duty
and
oth
er
sim
ilar
dutie
s an
d ta
xes
on s
ales
(375
,297
) (4
04,0
93)
–
–
–
–
–
–
(779
,390
)
tota
l sal
es 1
3,20
6,02
2 1
3,87
5,80
7 3
3,51
7,68
4 –
6
,115
,378
–
(
2,36
8,60
7) –
6
4,34
6,28
4
Inco
me
from
Ser
vice
s –
1
,139
2
39,8
71
136
,783
3
39,5
85
164
,794
–
–
8
82,1
72
Lice
nse
fees
–
–
27,
542
–
–
–
–
–
27,
542
Sale
of
Spen
t C
hem
ical
s –
20
6,99
4 –
–
–
–
–
–
2
06,9
94
Fore
x, n
et (4
6,66
9) (8
2,24
5) (2
12,4
94)
(2,2
56)
(20,
674)
543
,012
–
–
1
78,6
74
Mis
cella
neou
s In
com
e 3
6,16
1 8
,946
1
21,2
75
1,1
36
32,
555
8,2
68
–
–
208
,341
seg
men
t r
even
ues
13,
195,
514
14,
010,
641
33,
693,
878
135
,663
6
,466
,844
7
16,0
74
(2,
368,
607)
–
65,
850,
007
Inte
rest
–
–
–
–
–
–
–
520
,756
5
20,7
56
Oth
er U
nallo
cabl
e In
com
e –
–
–
–
–
–
–
4
6,86
9 4
6,86
9
Tota
l Rev
enue
s 6
6,41
7,63
1
seg
men
t r
esu
lt 3
,852
,652
3
,750
,057
7
,703
,932
(
863,
151)
1,2
09,8
14
–
–
15,
653,
304
Una
lloca
ted
expe
nse
1,72
8,09
4 1
,728
,094
Fina
nce
Cha
rges
–
–
–
–
–
–
–
1,5
26,1
93
1,5
26,1
93
Profi
t be
fore
tax
atio
n an
d
min
ority
inte
rest
12
,39
9,0
17
Inco
me
tax
expe
nse
2,74
3,68
6
Profi
t af
ter
taxa
tion
but
befo
re
min
ority
inte
rest
9,6
55
,33
1
Min
ority
Inte
rest
3,54
7
pro
fit
for
the
year
9,65
8,87
8

schedule to the consolidated Balance sheet | Profit and loss Account ( c o n t I n u e d )
a l l a m o u n t s i n i n d i a n r u p e e s t h o u s a n d s, e x c e p t s h a r e d ata a n d w h e r e o t h e r w i s e s tat e d
149 | D R . R E D D Y ’ S L A B O R AT O R I E S LT D i G a a p c o n s o l i d at e d f i n a n c i a l s
accounting policies:
The accounting policies consistently used in the preparation of the financial statements are also applied to items of revenues and expenditure in individual seg-
ments.
unallocable and head office expenses:
General administrative expenses, head-office expenses, and other expenses that arise at the corporate level and relate to the Group as a whole, are shown as
unallocable items.
sales by markets:
The following table shows the distribution of the Group’s sales by geographical markets, based on the location of the customer:
sales revenues by geographic markets (Gross of excise and other similar duties)
particularsfor the year ended for the year ended
31 march 2008 31 march 2007
India 10,053,473 8,863,494
North America 11,293,908 28,378,046
Russia and other CIS countries 5,525,828 4,894,484
Europe 15,584,859 14,655,024
Others 7,241,956 8,334,626
49,700,024 65,125,674
analysis of assets by geography
particularsas at as at
31 march 2008 31 march 2007
India 36,583,844 9,499,098
North America 6,310,222 29,964,595
Russia and other CIS countries 1,216,256 4,995,464
Europe 31,592,527 31,744,851
Others 923,679 838,358
76,626,528 77,042,365
cost of tangible and intangible fixed assets acquired by geography
particularsfor the year ended for the year ended
31 march 2008 31 march 2007
India 4,771,304 2,591,602
North America 499,085 396,656
Russia and other CIS countries 4,662 5,611
Europe 384,799 469,008
Others 13,108 9,363
5,672,958 3,472,240
11. particulars oF managerial remuneration
The remuneration paid to managerial personnel during the year:
particularsfor the year ended for the year ended
31 march 2008 31 march 2007
Remuneration and Commission to whole-time directors
Salaries and allowances 12,600 11,584
Commission 150,777 347,996
Other perquisites 1,878 1,740
165,255 361,320
Commission to non-whole-time directors 18,515 13,041
183,770 374,361
The executive directors are covered under the Company’s gratuity policy along with the other employees of the Company. Proportionate amount of gratuity is
not included in the aforementioned disclosure.
schedule 19 : notes to consolidated accounts (continued)

schedule to the consolidated Balance sheet | Profit and loss Account ( c o n t I n u e d )
a l l a m o u n t s i n i n d i a n r u p e e s t h o u s a n d s, e x c e p t s h a r e d ata a n d w h e r e o t h e r w i s e s tat e d
150 | A N N U A L R E P O R T 2 0 0 7 – 0 8 c o n s o l i d at i n G f o r t h e f u t u r e
Note: Computation of Net Profits under Section 309(5) of the Companies Act, 1956 (“the Act”) and the computation of limit on commission payable to non-
whole-time directors have not been disclosed as the limits prescribed under the Act do not apply to the Consolidated financial statements of the Company.
Leave encashment of Rs. Nil (previous year: Rs. 49,000) has not been considered in the above tabular disclosure.
12. employee stock option scheme
dr. reddy’s employees stock option plan-2002 (the “drl 2002 plan”):
The Company instituted the 2002 Scheme for all eligible employees in pursuance of the special resolution approved by the shareholders in the Annual General
Meeting held on 24 September 2001. The DRL 2002 Plan covers all non promoter directors and employees of Dr. Reddy’s and its subsidiaries (collectively referred
to as eligible “employees”). Under the DRL 2002 plan, the Compensation Committee of the Board (‘the Compensation Committee’) shall administer the DRL
2002 plan and grant stock options to directors and eligible employees. The Compensation Committee shall determine the employees eligible for receiving the
options, the number of options to be granted, the exercise price, the vesting period and the exercise period. The vesting period is determined for the options
issued on the date of the grant. The maximum contractual term for aforementioned stock option plan is generally five years. The options issued under the DRL
2002 plan vest in periods ranging between one and four years.
The 2002 Plan was amended on 28 July 2004 at the annual general meeting of shareholders to provide for stock options grants in two categories:
category a: 1,721,700 stock options out of the total of 2,295,478 reserved for grant of options having an exercise price equal to the fair market value of the
underlying equity shares on the date of grant; and
category b: 573,778 stock options out of the total of 2,295,478 reserved for grant of options having an exercise price equal to the par value of the underlying
equity shares (i.e., Rs. 5 per option).
The DRL 2002 Plan was further amended on 27 July 2005 at the annual general meeting of shareholders to provide for stock option grants in two categories:
category a: 300,000 stock options out of the total of 2,295,478 reserved for grant of options having an exercise price equal to the fair market value of the
underlying equity shares on the date of grant; and
category b: 1,995,478 stock options out of the total of 2,295,478 reserved for grant of options having exercise price equal to the par value of the underlying
equity shares (i.e., Rs. 5 per option).
The fair market value of a share on each grant date falling under Category A above is defined as the average closing price (after adjustment of Bonus issue) for
30 days prior to the grant, in the stock exchange where there is highest trading volume during that period. Notwithstanding the foregoing, the Compensation
Committee may, after getting the approval of the shareholders in the annual general meeting, grant options with a per share exercise price other than fair
market value and par value of the equity shares.
As the number of shares that an individual employee is entitled to receive and the price of the option are known at the grant date, the scheme is considered
as a fixed grant.
In the case of termination of employment, all non-vested options would stand cancelled. Options that have vested but have not been exercised can be exercised
within the time prescribed under each option agreement by the Committee or if no time limit is prescribed, within three months of the date of employment
termination, failing which they would stand cancelled.
During the current year, the Company under the DRL 2002 Plan has issued 386,060 options to eligible employees. The vesting period for the options granted
varies from 12 to 48 months.
The date of grant, number of options granted, exercise price fixed by the Committee for respective options and the market price of the shares of the Company
on the date of grant is given below:
date of grantnumber of
options granted
exercise price
(rupees)
market price (rupees)
(as per sebi guidelines)
17-May-07 377,060 5.00 663.60
18-May-07 9,000 5.00 678.45
386,060
schedule 19 : notes to consolidated accounts (continued)

schedule to the consolidated Balance sheet | Profit and loss Account ( c o n t I n u e d )
a l l a m o u n t s i n i n d i a n r u p e e s t h o u s a n d s, e x c e p t s h a r e d ata a n d w h e r e o t h e r w i s e s tat e d
151 | D R . R E D D Y ’ S L A B O R AT O R I E S LT D i G a a p c o n s o l i d at e d f i n a n c i a l s
Stock option activity under the DRL 2002 Plan was as follows:
category a – fair market value options fiscal year ended 31 march 2007
particularsshares arising
out of options
range of
exercise prices
weighted-
average
exercise price
weighted-
average
remaining
contractual
life (months)
Outstanding at the beginning of the year 234,500 Rs. 362.5 – 531.51 Rs. 439.43 64
Granted during the year – – – –
Expired / forfeited during the year (11,600) 441.5 – 574.5 527.8 –
Exercised during the year (31,320) 441.5 – 531.51 477.4 –
Outstanding at the end of the year 191,580 362.5 – 531.51 427.9 54
Exercisable at the end of the year 103,680 Rs. 362.5 – 531.51 Rs. 447.58 38
category a – fair market value options fiscal year ended 31 march 2008
particularsshares arising
out of options
range of
exercise prices
weighted-
average
exercise price
weighted-
average
remaining
contractual
life (months)
Outstanding at the beginning of the year 191,580 Rs. 362.5 – 531.51 Rs. 427.9 38
Expired / forfeited during the year (2,100) 442.5 442.5 –
Exercised during the year (30,700) 441.5 – 531.51 458.32 –
Outstanding at the end of the year 158,780 362.5 – 531.51 421.79 44
Exercisable at the end of the year 119,830 Rs. 362.5 – 531.51 Rs. 433.05 36
category b – par value options fiscal year ended 31 march 2007
particularsshares arising
out of options
range of
exercise prices
weighted-
average
exercise price
weighted-
average
remaining
contractual
life (months)
Outstanding at the beginning of the year 729,968 Rs. 5 Rs. 5 81
Granted during the year 427,060 5 5 81
Forfeited during the year (76,056) 5 5 –
Exercised during the year (191,720) 5 5 –
Outstanding at the end of the year 889,252 5 5 77
Exercisable at the end of the year 43,256 Rs. 5 Rs. 5 51
category b – par value options fiscal year ended 31 march 2008
particularsshares arising
out of options
range of
exercise prices
weighted-
average
exercise price
weighted-
average
remaining
contractual
life (months)
Outstanding at the beginning of the period 889,252 Rs. 5 Rs. 5 77
Granted during the period 386,060 5 5 91
Forfeited during the period (133,240) 5 5 –
Surrendered by employees during the period (138,418) 5 5 –
Exercised during the period (229,866) 5 5 –
Outstanding at the end of the period 773,788 5 5 74
Exercisable at the end of the period 72,364 Rs. 5 Rs. 5 50
schedule 19 : notes to consolidated accounts (continued)

schedule to the consolidated Balance sheet | Profit and loss Account ( c o n t I n u e d )
a l l a m o u n t s i n i n d i a n r u p e e s t h o u s a n d s, e x c e p t s h a r e d ata a n d w h e r e o t h e r w i s e s tat e d
152 | A N N U A L R E P O R T 2 0 0 7 – 0 8 c o n s o l i d at i n G f o r t h e f u t u r e
dr. reddy’s employees adr stock option scheme-2007 (“the drl 2007 plan”):
The Company instituted the DRL 2007 Plan for all eligible employees in pursuance of the special resolution approved by the shareholders in the Annual Gen-
eral Meeting held on 27 July 2005. The DRL 2007 Plan came into effect on approval of the Board of Directors on 22 January 2007. The DRL 2007 Plan covers
all non-promoter Directors and employees of Dr. Reddy’s and its subsidiaries (collectively referred to as “eligible employees”). Under the DRL 2007 Plan, the
Compensation Committee of the Board (the “Compensation Committee”) shall administer the DRL 2007 Plan and grant stock options to directors and eligible
employees. The Compensation Committee shall determine the employees eligible for receiving the options, the number of options to be granted, the exercise
price, the vesting period and the exercise period. The vesting period is determined for all options issued on the date of the grant. The maximum contractual term
for aforementioned stock option plan is generally five years. The options issued under the DRL 2007 plan vest in periods ranging between one and four years.
The DRL 2007 Plan provide for stock option grants in two categories:
category a: 382,695 stock options out of the total of 1,530,779 reserved for grant of options having an exercise price equal to the fair market value of the
underlying equity shares on the date of grant; and
category b: 1,148,084 stock options out of the total of 1,530,779 reserved for grant of options having an exercise price equal to the par value of the underly-
ing equity shares (i.e., Rs. 5 per option).
During the current year, the Company under the DRL 2007 Plan has issued 206,818 options to eligible employees. The vesting period for the options granted
varies from 12 to 48 months
The date of grant, number of options granted, exercise price fixed by the Committee for respective options and the market price of the shares of the Company
on the date of grant is given below:
date of grant number of options granted exercise price (rupees)market price (rupees)
(as per sebi guidelines)
05-April-07 126,418 5.00 747.35
17-May-07 59,400 5.00 663.60
18-May-07 21,000 5.00 678.45
206,818
Stock option activity under the DRL 2007 Plan was as follows:
category b – par value options fiscal year ended 31 march 2008
particularsshares arising
out of options
range of
exercise prices
weighted-
average
exercise price
weighted-
average
remaining
contractual
life (months)
Outstanding at the beginning of the period – – – –
Granted during the period 206,818 Rs. 5 Rs. 5 84
Forfeited during the period (24,040) 5 5 –
Exercised during the period – – – –
Outstanding at the end of the period 182,778 Rs. 5 Rs. 5 73
Exercisable at the end of the period – – – –
The Company has followed intrinsic method of accounting based on which a compensation expense of Rs. 207,125 (previous year: Rs. 181,661) has been
recognized in the profit and loss account (refer Schedule 2 – Deferred stock compensation cost). The Compensation Committee at its meeting earlier held on
24 October 2007 proposed that the Company should absorb the full liability for the Fringe Benefit Tax (FBT) on the exercising of all stock options granted till
the date of the resolution and further that for future grants from the date of this resolution FBT would be recovered from the concerned employee. In addition,
the above amendment would be proposed at the ensuing Annual General Meeting of the Company proposed in July 2008, if required, for the approval of the
shareholders.
Finance Act, 2007 included Fringe Benefit Tax (“FBT”) on Employee Stock Option plans. FBT expense for the year includes FBT in respect of stock options granted
till October 2007 not collected from employees amounting to Rs. 80,682.
aurigene discovery technologies ltd. employee stock option plan (the “aurigene esop plan”):
In fiscal 2004, Aurigene Discovery Technologies Limited (“Aurigene”), a consolidated subsidiary, adopted the Aurigene ESOP Plan to provide for issuance
of stock options to employees. Aurigene has reserved 4,550,000 of its ordinary shares for issuance under this plan. Under the Aurigene ESOP Plan, stock
options may be granted at a price per share as may be determined by the Compensation Committee. The options vest from a period ranging from
one to three years, inlcuding certain options which vest immediately on grant.
schedule 19 : notes to consolidated accounts (continued)

schedule to the consolidated Balance sheet | Profit and loss Account ( c o n t I n u e d )
a l l a m o u n t s i n i n d i a n r u p e e s t h o u s a n d s, e x c e p t s h a r e d ata a n d w h e r e o t h e r w i s e s tat e d
153 | D R . R E D D Y ’ S L A B O R AT O R I E S LT D i G a a p c o n s o l i d at e d f i n a n c i a l s
During the year ended 31 March 2008, the plan was amended to increase the total number of options reserved for issuance to 7,500,000 and recovery of fringe
benefit tax from employees.
Stock option activity under the Aurigene ESOP Plan was as follows:
fiscal year ended 31 march 2007
particularsshares arising
out of optionsexercise price
weighted-
average
exercise price
weighted-
average
remaining
contractual
life (months)
Outstanding at the beginning of the year 528,907 Rs. 10 Rs. 10 67
Granted during the year 910,786 10 10 66
Expired / forfeited during the year (256,110) 10 10 –
Outstanding at the end of the year 1,183,583 10 10 62
Exercisable at the end of the year 7,470 Rs. 10 Rs. 10 28
fiscal year ended 31 march 2008
particularsshares arising
out of options
exercise price
weighted-
average
exercise price
weighted-
average
remaining
contractual
life (months)
Outstanding at the beginning of the year 1,183,583 Rs. 10 Rs. 10 62
Granted during the year 1,877,369 10 10 42
Expired / forfeited during the year (99,836) 10 10 –
Outstanding at the end of the year 2,961,116 10 10 45
Exercisable at the end of the year 1,260,815 Rs. 10 Rs. 10 33
The Company has followed intrinsic method of accounting based on which a compensation expense of Rs. 25,801 (previous year: Rs. Nil) has been recognized
in the profit and loss account (refer Schedule 2 – Deferred stock compensation cost).
aurigene discovery technologies ltd. management Group stock Grant plan (the “management plan”):
In fiscal 2004, Aurigene adopted the Aurigene Discovery Technologies Limited Management Group Stock Grant Plan (the “Aurigene Management Plan”) to
provide for issuance of stock options to management employees of Aurigene and its subsidiary Aurigene Discovery Technologies Inc. Aurigene has reserved
2,950,000 of its ordinary shares for issuance under this plan. Under the Aurigene Management Plan, stock options may be granted at an exercise price as
determined by Aurigene’s Compensation Committee. As of 31 March 2008, there were no stock options outstanding under the Aurigene Management Plan.
The plan was closed by a resolution of the shareholders in January 2008.
13. research and development arrangement
The Group undertakes significant portion of the research and development activities relating to drug discovery through its research facilities located in the United
States and India.
i-Ven pharma arrangement
During the year ended 31 March 2005, the Group entered into a joint development and commercialisation agreement with I-VEN Pharma Capital Limited
(“I-VEN”). As per the terms of the agreement, I-VEN will fund up to fifty percent of the project costs (development, registration and legal costs) related to the
specified generic product filings made by the Group for the United States of America market. The terms of the arrangement do not require the Group to repay
the funds or purchase I-VEN’s interest in the event of the failure of the research and development. However, on successful commercialisation of these products,
the Group would pay I-VEN royalty at agreed rates on sales for a period of 5 years for each product. The first tranch advanced by I-VEN of Rs. 985,388 was
received on 28 March 2005.
The amount received from I-VEN will be recognised in the income statement upon completion of specific milestones as detailed in the agreement. Accordingly,
an amount of Rs. Nil (previous year: 452,763) has been recognised in the current year representing the proportionate costs relating to the completion of speci-
fied filings as a credit to research and development expenses. During the year ended 31 March 2007, an amendment agreement has been signed between the
parties to reflect a change in the product portfolio and the royalty rate.
schedule 19 : notes to consolidated accounts (continued)

schedule to the consolidated Balance sheet | Profit and loss Account ( c o n t I n u e d )
a l l a m o u n t s i n i n d i a n r u p e e s t h o u s a n d s, e x c e p t s h a r e d ata a n d w h e r e o t h e r w i s e s tat e d
154 | A N N U A L R E P O R T 2 0 0 7 – 0 8 c o n s o l i d at i n G f o r t h e f u t u r e
perlecan pharma arrangement
In September 2005, the Company announced the formation of an integrated drug development company, Perlecan Pharma Private Limited (“Perlecan Pharma”),
with a total equity of U.S.$. 52,500 to be contributed jointly by the Company, Citigroup Venture Capital International Growth Partnership Mauritius Limited
(“Citigroup Venture”) and ICICI Venture Funds Management Company (“ICICI Venture”). Perlecan Pharma would be engaged in the clinical development and
out-licensing of New Chemical Entity (“NCE”) assets. As part of this arrangement, the Company has transferred all rights and title, including the development
and commercialization rights, of four NCE assets to Perlecan Pharma, on 27 March 2007 (“the closing date”).
As per the arrangement, Citigroup Venture and ICICI Venture will contribute U.S.$. 22,500 each and the Company will contribute U.S.$. 7,500 towards Perlecan
Pharma’s initial equity capital. As a result, the Company will initially own approximately 14.28% of the equity of Perlecan Pharma. Further, three out of seven
directors on the board of Perlecan Pharma will be from the Company. In addition, Perlecan Pharma will issue to the Company warrants to purchase 45 million
equity shares of Perlecan Pharma, at Re. 1.00 per warrant, the exercise of which will be contingent upon the success of certain research and development mile-
stones. If the warrants are fully exercised, then the Company will own approximately 62.5% of the equity shares of Perlecan Pharma.
Further, as per the terms of the arrangement, the Company will have the first right to conduct product development and chemical trials on behalf of Perlecan
Pharma on an arm’s length basis subject to the final decision by the board of directors of Perlecan Pharma. Moreover, the research and development expenses
incurred by the Company from 1 April 2005 till the closing date of the arrangement will be reimbursed by Perlecan Pharma [Rs. 89, 505 towards 2007-08
(Previous year Rs. 372,642)].
As at 31 March 2008, the Company owns approximately 14.31% of the equity of Perlecan pharma, In addition, the Company is committed to invest an ad-
ditional amount of Rs. 170,000 as its equity contribution in future.
14. operating lease
The Group leases office residential facilities and vehicles under operating lease agreements that are renewable on a periodic basis at the option of both the lessor
and the lessee. Rental expense under those leases was Rs. 264,026 (previous year Rs. 325,153).
The schedule of future minimum rental payments in respect of non-cancellable operating leases is set out below:
particularsas at as at
31 march 2008 31 march 2007
Not later than 1 year 161,543 131,399
Later than 1 year and not later than 5 years 335,959 266,748
Beyond 5 years 30,979 67,181
528,481 465,328
15. Finance lease
The Company has taken buildings and Vehicles under finance lease. Future minimum lease payments under finance leases as at 31 March 2008 are as follows:
particulars
present value of
minimum lease
payments
future interestminimum lease
payments
Not later than 1 year 12,094 8,505 20,599
Later than 1 year and not later than 5 years 46,191 6,477 52,668
Beyond 5 years 233,037 975 234,011
291,322 15,957 307,278
schedule 19 : notes to consolidated accounts (continued)

schedule to the consolidated Balance sheet | Profit and loss Account ( c o n t I n u e d )
a l l a m o u n t s i n i n d i a n r u p e e s t h o u s a n d s, e x c e p t s h a r e d ata a n d w h e r e o t h e r w i s e s tat e d
155 | D R . R E D D Y ’ S L A B O R AT O R I E S LT D i G a a p c o n s o l i d at e d f i n a n c i a l s
schedule 19 : notes to consolidated accounts (continued)
16. employee beneFit plans
Effective 1 April 2006, the company adopted the revised accounting standard on employee benefits. Pursuant to the adoption, the transitional obligations of
the company amounted to Rs. 81,702 net of tax of Rs. 43,483. As required by the standard, the obligation has been recorded in the year ended 31 March 2007
with the transfer of Rs. 81,702 to revenue reserves.
The following table set out the status of the gratuity plan as required under AS 15 (Revised)
16.1.employee beneFit plan note For dr. reddy’s laboratories limited
The disclosure requirements of Dr. Reddy’s Laboratories Limited are shown in the tables below:
reconciliation of benefit obligations and plan assets for the period
a) Change in defined benefit obligation:
particularsfor the year ended for the year ended
31 march 2008 31 march 2007
Opening defined benefit obligation 257,986 216,271
Current service cost 33,774 27,789
Interest cost 22,052 15,518
Actuarial losses / (gain) 36,993 20,627
Benefits paid (31,538) (22,219)
Closing defined benefit obligation 319,267 257,986
b) Change in the Fair value of assets:
particularsfor the year ended for the year ended
31 march 2008 31 march 2007
Opening fair value of plan assets 236,325 220,270
Expected return on plan assets 16,891 16,192
Actuarial gains / (losses) 14,240 603
Contributions by employer 53,157 21,479
Benefits paid (31,538) (22,219)
Closing fair value of plan assets 289,075 236,325
amount recognized in balance sheet
particularsfor the year ended for the year ended
31 march 2008 31 march 2007
Present value of funded obligations 319,267 257,986
Fair value of plan assets (289,075) (236,325)
Net liability 30,192 21,661
Amounts in the balance sheet
Provision for gratuity 30,192 21,661
Net liability / (asset) 30,192 21,661
expense recognized in statement of profit and loss account
particularsfor the year ended for the year ended
31 march 2008 31 march 2007
Current service cost 33,774 27,789
Interest on defined benefit obligation 22,052 15,518
Expected return on plan assets (16,891) (16,193)
Net actuarial losses / (gains) recognized in year 22,752 20,024
Total, included in “employee benefit expense” 61,687 47,138
Actual return on plan assets 31,132 16,796

schedule to the consolidated Balance sheet | Profit and loss Account ( c o n t I n u e d )
a l l a m o u n t s i n i n d i a n r u p e e s t h o u s a n d s, e x c e p t s h a r e d ata a n d w h e r e o t h e r w i s e s tat e d
156 | A N N U A L R E P O R T 2 0 0 7 – 0 8 c o n s o l i d at i n G f o r t h e f u t u r e
schedule 19 : notes to consolidated accounts (continued)
asset information
category of assetsfor the year ended for the year ended
31 march 2008 31 march 2007
Government of India securities 3.91% 4.61%
Corporate bonds 2.81% 3.43%
Insurer managed funds 92.20% 90.54%
Others 1.08% 1.42%
Total 100% 100%
The approximate market value of the assets as at 31 March 2008 was Rs. 289,076 (previous Year Rs. 236,325), a breakup of the same is as follows:
category of assetsfor the year ended for the year ended
31 march 2008 31 march 2007
Government of India securities 11,296 10,900
Corporate bonds 8,115 8,115
Insurer managed funds 266,534 213,974
Others 3,131 3,336
Total 289,076 236,325
summary of actuarial assumptions
Financial assumptions at the valuation date:
for the year ended for the year ended
31 march 2008 31 march 2007
Discount rate 7.80% p.a. 8.00% p.a.
Expected rate of return on plan assets 7.50% p.a. 7.50% p.a.
Salary escalation rate
8% p.a. for next
4 years & 6% p.a.
thereafter
8% p.a. for next
5 years & 6% p.a.
thereafter
discount rate: The discount rate is based on the prevailing market yields of Indian government securities as at the balance sheet date for the estimated term
of the obligations.
expected rate of return on plan assets: This is based on the expectation of the average long term rate of return expected on investments of the Fund during
the estimated term of the obligations.
salary escalation rate: The estimates of future salary increases considered takes into account the inflation, seniority, promotion and other relevant factors.
16.2.employee beneFit plan note For aurigene discovery technologies limited
The disclosure requirements of Aurigine Discovery Technologies Limited are shown in the below tables:
reconciliation of benefit obligations and plan assets for the period
a) Change in defined benefit obligation:
particularsfor the year ended for the year ended
31 march 2008 31 march 2007
Opening defined benefit obligation 1,927 1,036
Current service cost 1,007 705
Interest cost 151 77
Actuarial losses / (gain) 29 109
Benefits paid (40) –
Closing defined benefit obligation 3,074 1,927

schedule to the consolidated Balance sheet | Profit and loss Account ( c o n t I n u e d )
a l l a m o u n t s i n i n d i a n r u p e e s t h o u s a n d s, e x c e p t s h a r e d ata a n d w h e r e o t h e r w i s e s tat e d
157 | D R . R E D D Y ’ S L A B O R AT O R I E S LT D i G a a p c o n s o l i d at e d f i n a n c i a l s
schedule 19 : notes to consolidated accounts (continued)
b) Amount recognized in Balance Sheet:
particularsfor the year ended for the year ended
31 march 2008 31 march 2007
Present value of unfunded obligations 3,074 1,927
Fair value of plan assets – –
Net liability 3,074 1,927
Amounts in the balance sheet
Provision for gratuity 3,074 1,927
Net liability / (asset) 3,074 1,927
expense recognized in statement of profit and loss account
particularsfor the year ended for the year ended
31 march 2008 31 march 2007
Current service cost 1,007 705
Interest on defined benefit obligation 151 77
Expected return on plan assets – –
Net actuarial losses / (gains) recognized in year 29 109
Total, included in “employee benefit expense” 1,187 891
Actual return on plan assets – –
summary of actuarial assumptions
Financial assumptions at the valuation date:
for the year ended for the year ended
31 march 2008 31 march 2007
Discount rate 7.80% p.a. 8.00% p.a.
Expected rate of return on plan assets 0.00% p.a. 0.00% p.a.
Salary escalation rate
10% p.a. for next
4 years & 6% p.a.
thereafter
10% p.a. for next
5 years & 6% p.a.
thereafter
discount rate: The discount rate is based on the prevailing market yields of Indian government securities as at the balance sheet date for the estimated term
of the obligations.
expected rate of return on plan assets: This is based on the expectation of the average long term rate of return expected on investments of the Fund during
the estimated term of the obligations.
salary escalation rate: The estimates of future salary increases considered takes into account the inflation, seniority, promotion and other relevant factors.
16.3.employee beneFit plan notes For industrias quimicas Falcon de mexico s.a. de. c.v.
16.3. (a) pension plan
One of the subsidiaries provides for pension, a defined benefit retirement plan covering certain categories of employees.
The disclosure requirements of Industrias Quimicas Falcon de Mexico are shown in the below tables:
reconciliation of benefit obligations and plan assets for the period
a) Change in defined benefit obligation:
particularsfor the year ended for the year ended
31 march 2008 31 march 2007
Opening defined benefit obligation 203,491 189,360
Current service cost 8,849 8,982
Interest cost 13,931 13,993
Actuarial losses / (gain) 27,866 29,463
Benefits paid (65,442) (38,307)
Closing defined benefit obligation 188,740 203,491

schedule to the consolidated Balance sheet | Profit and loss Account ( c o n t I n u e d )
a l l a m o u n t s i n i n d i a n r u p e e s t h o u s a n d s, e x c e p t s h a r e d ata a n d w h e r e o t h e r w i s e s tat e d
158 | A N N U A L R E P O R T 2 0 0 7 – 0 8 c o n s o l i d at i n G f o r t h e f u t u r e
schedule 19 : notes to consolidated accounts (continued)
b) Change in the Fair value of assets:
particularsfor the year ended for the year ended
31 march 2008 31 march 2007
Opening fair value of plan assets 264,303 234,423
Expected return on plan assets 18,195 17,373
Actuarial gains / (losses) (19,464) 39,594
Contributions by employer 5,152 11,220
Benefits paid (65,442) (38,307)
Closing fair value of plan assets 202,744 264,303
amount recognized in balance sheet
particularsfor the year ended for the year ended
31 march 2008 31 march 2007
Present value of funded obligations 188,740 203,491
Fair value of plan assets (202,744) (264,303)
Amount not recognised as an asset 413 –
Net liability (13,591) (60,812)
Amounts in the balance sheet
Provision for pension (13,591) (60,812)
Net liability / (asset) (13,591) (60,812)
expense recognized in statement of profit and loss account
particularsfor the year ended for the year ended
31 march 2008 31 march 2007
Current service cost 8,894 8,982
Interest on defined benefit obligation 13,931 13,993
Expected return on plan assets (18,195) (17,373)
Net actuarial losses / (gains) recognized in year 47,328 (10,131)
Amount not recognised as an asset 413 –
Total, included in “employee benefit expense” 52,371 (4,529)
Actual return on plan assets (1,269) 56,966
asset information
category of assetsfor the year ended for the year ended
31 march 2008 31 march 2007
Corporate bonds 53% 76%
Equity shares of listed companies 47% 24%
Total 100% 100%
The approximate market value of the assets as at 31 March 2008 was Rs. 202,744 (previous year Rs. 264,303), a breakup of the same is as follows:
category of assetsfor the year ended for the year ended
31 march 2008 31 march 2007
Corporate bonds 107,454 200,870
Equity shares of listed companies 95,290 63,433
Total 202,744 264,303
summary of actuarial assumptions
Financial assumptions at the valuation date:
for the year ended for the year ended
31 march 2008 31 march 2007
Discount rate 7.50% p.a. 7.50% p.a.
Expected rate of return on plan assets 7.50% p.a. 7.50% p.a.
Salary escalation rate 4.50% p.a. 4.50% p.a.
Pension increases 3.75% p.a. 3.75% p.a.

schedule to the consolidated Balance sheet | Profit and loss Account ( c o n t I n u e d )
a l l a m o u n t s i n i n d i a n r u p e e s t h o u s a n d s, e x c e p t s h a r e d ata a n d w h e r e o t h e r w i s e s tat e d
159 | D R . R E D D Y ’ S L A B O R AT O R I E S LT D i G a a p c o n s o l i d at e d f i n a n c i a l s
schedule 19 : notes to consolidated accounts (continued)
discount rate: The discount rate is based on the prevailing market yields of Indian government securities as at the balance sheet date for the estimated term
of the obligations.
expected rate of return on plan assets: This is based on our expectation of the average long term rate of return expected on investments of the Fund during
the estimated term of the obligations.
salary escalation rate: The estimates of future salary increases considered takes into account the inflation, seniority, promotion and other relevant factors.
pension increases: The average annual increases in pension are assumed to increase at the rate of 3.75% p.a.
16.3 (b) seniority pay plans
One of the Subsidiaries provides for seniority, a defined benefit retirement plan covering certain categories of employees.
The disclosure requirements of Industrias Quimicas Falcon de Mexico are shown in the below tables:
reconciliation of benefit obligations and plan assets for the period
a) Change in defined benefit obligation:
particularsfor the year ended for the year ended
31 march 2008 31 march 2007
Opening defined benefit obligation 11,967 11,395
Current service cost 252 267
Interest cost 799 818
Actuarial losses / (gain) 2,709 503
Benefits paid (1,870) (1,016)
Closing defined benefit obligation 13,857 11,967
b) Change in the Fair value of assets:
particularsfor the year ended for the year ended
31 march 2008 31 march 2007
Opening fair value of plan assets 11,577 9,561
Expected return on plan assets 844 754
Actuarial gains / (losses) (907) 1,741
Contributions by employer 446 537
Benefits paid (1,870) (1,016)
Closing fair value of plan assets 10,090 11,577
amount recognized in balance sheet
particularsfor the year ended for the year ended
31 march 2008 31 march 2007
Present value of funded obligations 13,857 11,967
Fair value of plan assets (10,090) (11,577)
Net liability 3,767 390
Amounts in the balance sheet
Provision for seniority pay 3,767 390
Net liability / (asset) 3,767 390
expense recognized in statement of profit and loss account
particularsfor the year ended for the year ended
31 march 2008 31 march 2007
Current service cost 252 267
Interest on defined benefit obligation 799 818
Expected return on plan assets (844) (754)
Net actuarial losses / (gains) recognized in year 3,616 (1,237)
Total, included in “employee benefit expense” 3,823 (906)
Actual return on plan assets (63) 2,495
asset information
category of assetsfor the year ended for the year ended
31 march 2008 31 march 2007
Corporate bonds 53% 76%
Equity shares of listed Companies 47% 24%
Total 100% 100%

schedule to the consolidated Balance sheet | Profit and loss Account ( c o n t I n u e d )
a l l a m o u n t s i n i n d i a n r u p e e s t h o u s a n d s, e x c e p t s h a r e d ata a n d w h e r e o t h e r w i s e s tat e d
160 | A N N U A L R E P O R T 2 0 0 7 – 0 8 c o n s o l i d at i n G f o r t h e f u t u r e
schedule 19 : notes to consolidated accounts (continued)
The approximate market value of the assets as at 31 March 2008 was Rs. 10,090 (previous year Rs. 11,577), a breakup of the same is as follows:
category of assetsfor the year ended for the year ended
31 march 2008 31 march 2007
Corporate bonds 5,348 8,798
Equity shares of listed Companies 4,742 2,779
Total 10,090 11,577
summary of actuarial assumptions
Financial assumptions at the valuation date:
for the year ended for the year ended
31 march 2008 31 march 2007
Discount rate 7.50% p.a. 7.50% p.a.
Expected rate of return on plan assets 7.50% p.a. 7.50% p.a.
Salary escalation rate 4.50% p.a. 4.50% p.a.
discount rate: The discount rate is based on the prevailing market yields of Indian government securities as at the balance sheet date for the estimated term
of the obligations.
expected rate of return on plan assets: This is based on our expectation of the average long term rate of return expected on investments of the Fund during
the estimated term of the obligations.
salary escalation rate: The estimates of future salary increases considered takes into account the inflation, seniority, promotion and other relevant factors.
16.3 (c) severance pay plan
One of the subsidiaries has a scheme of severance pay for the employees who are dismissed from the services of the Employer without any justifiable reason.
The disclosure requirements of Industrias Quimicas Falcon de Mexico are shown in the below tables:
reconciliation of benefit obligations and plan assets for the period
a) Change in defined benefit obligation:
particularsfor the year ended for the year ended
31 march 2008 31 march 2007
Opening defined benefit obligation 56,414 30,427
Current service cost 4,401 2,606
Interest cost 3,509 2,026
Actuarial losses / (gain) 9,264 45,965
Benefits paid (23,489) (24,610)
Closing defined benefit obligation 50,099 56,414
b) Change in the Fair value of assets:
particularsfor the year ended for the year ended
31 march 2008 31 march 2007
Opening fair value of plan assets – –
Expected return on plan assets – –
Actuarial gains / (losses) – –
Contributions by employer 23,489 24,610
Benefits paid (23,489) (24,610)
Closing fair value of plan assets – –
amount recognized in balance sheet
particularsfor the year ended for the year ended
31 march 2008 31 march 2007
Present value of unfunded obligations 50,099 56,414
Fair value of plan assets – –
Net liability 50,099 56,414
Amounts in the balance sheet
Provision for severance pay 50,099 56,414
Net liability / (asset) 50,099 56,414

schedule to the consolidated Balance sheet | Profit and loss Account ( c o n t I n u e d )
a l l a m o u n t s i n i n d i a n r u p e e s t h o u s a n d s, e x c e p t s h a r e d ata a n d w h e r e o t h e r w i s e s tat e d
161 | D R . R E D D Y ’ S L A B O R AT O R I E S LT D i G a a p c o n s o l i d at e d f i n a n c i a l s
expense recognized in statement of profit and loss account
particularsfor the year ended for the year ended
31 march 2008 31 march 2007
Current service cost 4,401 2,606
Interest on defined benefit obligation 3,509 2,026
Expected return on plan assets – –
Net actuarial losses / (gains) recognized in year 9,264 45,965
Total, included in “employee benefit expense” 17,174 50,597
Actual return on plan assets – –
The severance pay scheme liabilities of the company are unfunded and hence there are no assets held to meet the liabilities.
summary of actuarial assumptions
Financial assumptions at the valuation date:
for the year ended for the year ended
31 march 2008 31 march 2007
Discount rate 7.50% p.a. 7.50% p.a.
Expected rate of return on plan assets Not applicable Not applicable
Salary escalation rate 4.50% p.a. 4.50% p.a.
discount rate: The discount rate is based on the prevailing market yields of Indian government securities as at the balance sheet date for the estimated term
of the obligations.
expected rate of return on plan assets: Not Applicable.
salary escalation rate: The estimates of future salary increases considered takes into account the inflation, seniority, promotion and other relevant factors.
17. hedging & derivatives
Pursuant to ICAI Announcement “Accounting for Derivatives” on the early adoption of Accounting Standard AS 30 “Financial Instruments: Recognition and
Measurement”, the Company has early adopted the Standard for the year under review, to the extent that the adoption does not conflict with existing manda-
tory accounting standards and other authoritative pronouncements, Company law and other regulatory requirements.
Pursuant to the adoption, the transitional loss representing the loss on foreign currency options not classified as cash flow hedges outstanding at the beginning
of the year amounted to Rs. 14,921, net of tax of Rs. 7,683 and this loss has been adjusted against the opening balance of profit and loss account.
18. subsequent events
In April 2008, the Company has acquired a unit of The Dow Chemical Company associated with its United Kingdom sites in Mirfield and Cambridge for
a cash consideration (subject to adjustments for working capital etc.) of approximately U.S.$. 33.5 million. The acquisition includes customer contracts,
associated products, process technology, intellectual property, trademarks and the Dowpharma Small Molecules facilities located in Mirfield and Cambridge,
United Kingdom.
In April 2008, the Company acquired Jet Generici Srl, a company engaged in the sale of generic finished dosages in Italy for a total cash consideration (subject
to adjustments for working capital etc.) of Euro 2.3 million.
In April 2008, the Company has acquired BASF’s pharmaceutical contract manufacturing business and its manufacturing facility in Shreveport, Louisiana, USA
for a total cash consideration (subject to adjustments for working capital etc.) of U.S.$. 39.8 million. The business involves contract manufacturing of generic
prescription and OTC products for branded and generic companies in the US. This business includes customer contracts, related ANDAs and NDAs, trademarks
including the Shreveport manufacturing facility.
19. comparative Figures
Previous year’s figures have been regrouped / reclassified wherever necessary, to conform to current year’s classification.
schedule 19 : notes to consolidated accounts (continued)

schedule to the consolidated Balance sheet | Profit and loss Account ( c o n t I n u e d )
a l l a m o u n t s i n i n d i a n r u p e e s t h o u s a n d s, e x c e p t s h a r e d ata a n d w h e r e o t h e r w i s e s tat e d
162 | A N N U A L R E P O R T 2 0 0 7 – 0 8 c o n s o l i d at i n G f o r t h e f u t u r e
consolidated cash Flow statementa l l a m o u n t s i n i n d i a n r u p e e s t h o u s a n d s, e x c e p t s h a r e d ata a n d w h e r e o t h e r w i s e s tat e d
as at
31 march 2008
as at
31 march 2007
CASh FLOwS FROM OPERATINg ACTIvITIES
Profit before taxation 5,449,567 12,399,017
Adjustments:
Depreciation and amortisation 4,018,609 3,791,107
Provision for wealth tax 2,574 2,147
Bad debts written-off 55,552 7,467
Gain on redemption of mutual fund units (110,269) (869)
Unrealized foreign exchange gain 226,852 (120,567)
Deferred employee compensation cost 232,926 181,611
Equity in loss of associates 16,709 86,525
Interest income (677,344) (498,815)
Interest expense 958,331 1,526,193
Profit on sale / retirement of fixed asset, net 10,862 (46,000)
Provision for doubtful debts 185,516 41,900
Provision for doubtful advances (13,913) 23,403
operating cash flows before working capital changes 10,355,972 17,393,119
(Increase) / decrease in sundry debtors 859,232 (2,944,801)
Increase in inventories (3,547,273) (783,442)
Increase in loans and advances (1,426,887) (528,679)
Increase in current liabilities and provisions 418,461 1,282,107
cash generated from operations 6,659,305 14,418,304
Income taxes Paid (1,531,569) (1,829,305)
net cash provided by operating activities 5,127,736 12,588,999
CASh FLOwS FROM INvESTINg ACTIvITIES
Purchase of fixed assets (5,085,794) (4,621,417)
Proceeds from sale of fixed assets 59,277 115,116
Investment in affiliate – (69,200)
Purchase of investments (15,859,887) (331,612)
Sale of investments 12,477,819 331,869
Interest received 654,988 493,185
Cash paid for acquisition, net of cash acquired (344,345) (66,677)
net cash used in investing activities (8,097,942) (4,148,736)
CASh FLOwS FROM FINANCINg ACTIvITIES
Proceeds from issuance of share capital 15,220 10,029,571
Proceeds from long-term borrowings 115,362 –
Repayment of long-term borrowings (7,723,968) (1,897,895)
Repayment of short-term borrowings (1,941,463) (7,071,854)
Proceeds from short-term borrowing 3,475,773 1,147,500
Interest paid (957,670) (1,536,690)
Dividends paid (including dividend tax) (737,288) (437,496)
net cash provided / (used in) by financing activities (7,754,034) 233,136
NET INCREASE IN CASh AND CASh EqUIvALENTS (10,724,240) 8,673,399
Cash and cash equivalents at the beginning of the year (Note 1) 18,610,097 9,796,156
Effect of exchange gain on cash and cash equivalents (432,977) 140,542
cash and cash equivalents at the end of the year (note 1) 7,452,880 18,610,097
As per our report attached for Dr. Reddy’s Laboratories Limited
for BSR & Co.
Chartered Accountants
s sethuraman Partner dr. K anji reddy Chairman
Membership No. 203491 G V prasad Vice Chairman and CEO
K satish reddy Managing Director and COO
Hyderabad 20 May 2008 saumen chakraborty Chief Financial Officer
V Viswanath Company Secretary

schedule to the consolidated Balance sheet | Profit and loss Account ( c o n t I n u e d )
a l l a m o u n t s i n i n d i a n r u p e e s t h o u s a n d s, e x c e p t s h a r e d ata a n d w h e r e o t h e r w i s e s tat e d
163 | D R . R E D D Y ’ S L A B O R AT O R I E S LT D i G a a p c o n s o l i d at e d f i n a n c i a l s
consolidated cash Flow statement ( c o n t I n u e d )
a l l a m o u n t s i n i n d i a n r u p e e s t h o u s a n d s, e x c e p t s h a r e d ata a n d w h e r e o t h e r w i s e s tat e d
notes:
1. Cash and cash equivalents comprise:
particularsas at
31 march 2008
as at
31 march 2007
Cash in hand 21,864 9,407
Balances with banks
In current accounts 2,644,755 3,347,342
In EEFC current accounts 69,686 673,180
In deposit accounts 4,701,537 14,566,882
In unclaimed dividend accounts 14,372 12,620
In unclaimed fractional share pay order accounts 666 666
7,452,880 18,610,097
Deposits with banks include:
(i) Margin money for letters of credit and bank guarantees 8,118 9,063
(ii) Balance of unutilized money out of ADS issue proceeds – 8,732,898
2. Previous year’s figures have been regrouped / reclassified, wherever necessary to conform to the current year’s classification.

This page has been intentionally left blank.

r e p o r t o f m a n a g e m e n t
o n i n t e r n a l c o n t r o l
o v e r f i n a n c i a l
r e p o r t i n g ( i c o f r )
c o n s o l i d a t e d
s t a t e m e n t s o f
o p e r a t i o n s
r e p o r t o f i n d e p e n d e n t
a u d i t o r s ’ o n i c o f r
c o n s o l i d a t e d
s t a t e m e n t s o f s t o c k
h o l d e r s ' e q u i t y a n d
c o m p r e h e n s i v e i n c o m e
r e p o r t o f i n d e p e n d e n t
a u d i t o r s ’ o n
c o n s o l i d a t e d
f i n a n c i a l s t a t e m e n t s
c o n s o l i d a t e d
s t a t e m e n t s o f c a s h
f l o w s
c o n s o l i d a t e d
b a l a n c e s h e e t
U S G A A P c o n S o l i d A t e d
F i n A n c i A l S
169
172168
171167
170166
n o t e s t o t h e
c o n s o l i d a t e d
f i n a n c i a l s t a t e m e n t s
173
166 | A N N U A L R E P O R T 2 0 0 7 – 0 8 c o n s o l i d at i n g f o r t h e f u t u r e
Management’s Report on internal control over Financial Reporting (ICOFR)
Management of Dr. Reddy’s Laboratories Limited (the “Company”) is responsible for establishing and maintaining adequate internal control over financial reporting
and for the assessment of the effectiveness of internal control over financial reporting. As defined by the SEC, internal control over financial reporting is a
process designed under the supervision of the Company’s principal executive and principal financial officers, and effected by the Company’s board of directors,
management and other personnel, to provide reasonable assurance regarding the reliability of financial reporting and the preparation of financial statements in
accordance with generally accepted accounting principles.
The Company’s internal control over financial reporting is supported by written policies and procedures, that (1) pertain to the maintenance of records that, in
reasonable detail, accurately and fairly reflect the transactions and dispositions of the Company’s assets; (2) provide reasonable assurance that transactions are
recorded as necessary to permit preparation of financial statements in accordance with generally accepted accounting principles, and that receipts and expenditures
of the Company are being made only in accordance with authorizations of the Company’s management and directors; and (3) provide reasonable assurance
regarding prevention or timely detection of unauthorized acquisition, use or disposition of the Company’s assets that could have a material effect on the financial
statements.
Because of its inherent limitations, internal control over financial reporting may not prevent or detect misstatements. Projections of any evaluation of effectiveness
to future periods are subject to the risk that controls may become inadequate because of changes in conditions, or that the degree of compliance with the policies
or procedures may deteriorate.
Management of the Company conducted an assessment of the effectiveness of the Company’s internal control over financial reporting as of 31 March 2008 based
on criteria established in Internal Control – Integrated Framework issued by the Committee of Sponsoring Organizations of the Treadway Commission (“the COSO
Framework”).
Based on this assessment, management has concluded that the Company’s internal control over financial reporting was effective as of 31 March 2008.
The effectiveness of the Company’s internal control over financial reporting as of 31 March 2008 has been audited by KPMG, the independent registered public
accounting firm that audited the Company’s financial statements, as stated in their report, a copy of which is included in this annual report.
G V Prasad Saumen Chakraborty
Vice-Chairman and Chief Executive Officer Chief Financial Officer
Place: Hyderabad
Date: 19 June 2008

167 | D R . R E D D Y ’ S L A B O R AT O R I E S LT D u s g a a p c o n s o l i d at e d f i n a n c i a l s
Report of independent Registered Public Accounting Firm on icoFR
The Board of Directors and Stockholders
Dr. Reddy’s Laboratories Limited:
We have audited Dr. Reddy’s Laboratories Limited and subsidiaries’ (the “Company”) internal control over financial reporting as of 31 March 2008, based on
criteria established in Internal Control – Integrated Framework issued by the Committee of Sponsoring Organizations of the Treadway Commission (“COSO”).
The Company’s management is responsible for maintaining effective internal control over financial reporting and for its assessment of the effectiveness of internal
control over financial reporting, included in the accompanying Management’s Annual Report on Internal Control over Financial Reporting. Our responsibility is to
express an opinion on the Company’s internal control over financial reporting based on our audit.
We conducted our audit in accordance with the standards of the Public Company Accounting Oversight Board (United States). Those standards require that we plan
and perform the audit to obtain reasonable assurance about whether effective internal control over financial reporting was maintained in all material respects. Our
audit included obtaining an understanding of internal control over financial reporting, assessing the risk that a material weakness exists, and testing and evaluating
the design and operating effectiveness of internal control based on the assessed risk. Our audit also included performing such other procedures as we considered
necessary in the circumstances. We believe that our audit provides a reasonable basis for our opinion.
A company’s internal control over financial reporting is a process designed to provide reasonable assurance regarding the reliability of financial reporting and
the preparation of financial statements for external purposes in accordance with generally accepted accounting principles. A company’s internal control over
financial reporting includes those policies and procedures that (1) pertain to the maintenance of records that, in reasonable detail, accurately and fairly reflect the
transactions and dispositions of the assets of the company; (2) provide reasonable assurance that transactions are recorded as necessary to permit preparation
of financial statements in accordance with generally accepted accounting principles, and that receipts and expenditures of the company are being made only in
accordance with authorizations of management and directors of the company; and (3) provide reasonable assurance regarding prevention or timely detection of
unauthorized acquisition, use, or disposition of the company’s assets that could have a material effect on the financial statements.
Because of its inherent limitations, internal control over financial reporting may not prevent or detect misstatements. Also, projections of any evaluation of
effectiveness to future periods are subject to the risk that controls may become inadequate because of changes in conditions, or that the degree of compliance with
the policies or procedures may deteriorate.
In our opinion, the Company maintained, in all material respects, effective internal control over financial reporting as of 31 March 2008, based on criteria established
in Internal Control – Integrated Framework issued by the Committee of Sponsoring Organizations of the Treadway Commission.
We also have audited, in accordance with the standards of the Public Company Accounting Oversight Board (United States), the consolidated balance sheets of the
Company as of 31 March 2008 and 2007, and the related consolidated statements of operations, stockholders’ equity and comprehensive income, and cash flows
for each of the years in the three-year period ended 31 March 2008, and our report dated 19 June 2008 expressed an unqualified opinion on those consolidated
financial statements.
KPMG
Hyderabad, India
19 June 2008

168 | A N N U A L R E P O R T 2 0 0 7 – 0 8 c o n s o l i d at i n g f o r t h e f u t u r e
Report of independent Registered Public Accounting Firm
The Board of Directors and Stockholders
Dr. Reddy’s Laboratories Limited:
We have audited the accompanying consolidated balance sheets of Dr. Reddy’s Laboratories Limited and subsidiaries (the “Company”) as of 31 March 2008 and
2007, and the related consolidated statements of operations, stockholders’ equity and comprehensive income, and cash flows for each of the years in the three-
year period ended 31 March 2008. These consolidated financial statements are the responsibility of the Company’s management. Our responsibility is to express an
opinion on these consolidated financial statements based on our audits.
We conducted our audits in accordance with the standards of the Public Company Accounting Oversight Board (United States). Those standards require that we
plan and perform the audit to obtain reasonable assurance about whether the financial statements are free of material misstatement. An audit includes examining,
on a test basis, evidence supporting the amounts and disclosures in the financial statements. An audit also includes assessing the accounting principles used and
significant estimates made by management, as well as evaluating the overall financial statement presentation. We believe that our audits provide a reasonable basis
for our opinion.
In our opinion, the consolidated financial statements referred to above present fairly, in all material respects, the financial position of the Company as of
31 March 2008 and 2007, and the results of their operations and their cash flows for each of the years in the three-year period ended 31 March 2008, in conformity
with U.S. generally accepted accounting principles.
We also have audited, in accordance with the standards of the Public Company Accounting Oversight Board (United States), the Company’s internal control
over financial reporting as of 31 March 2008, based on criteria established in Internal Control — Integrated Framework issued by the Committee of Sponsoring
Organizations of the Treadway Commission (“COSO”), and our report dated 19 June 2008 expressed an unqualified opinion on the effectiveness of the Company’s
internal control over financial reporting.
KPMG
Hyderabad, India
19 June 2008
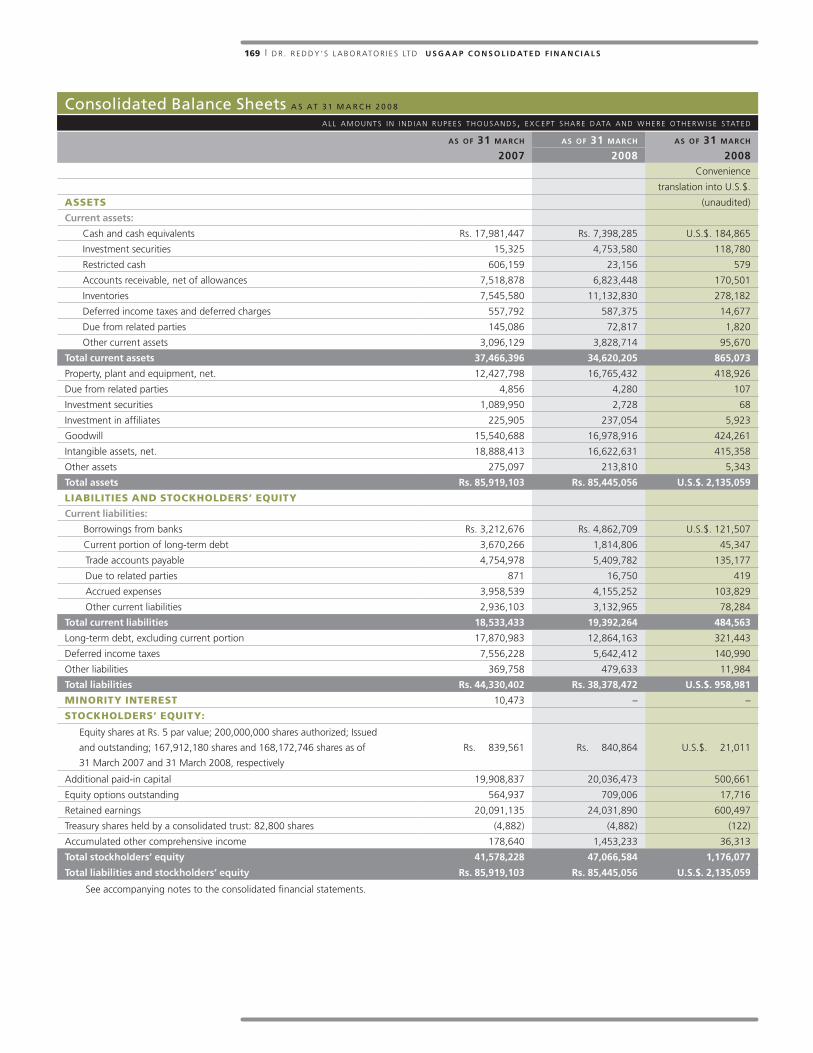
169 | D R . R E D D Y ’ S L A B O R AT O R I E S LT D u s g a a p c o n s o l i d at e d f i n a n c i a l s
Annexure to the Auditor's Reporta l l a m o u n t s i n i n d i a n r u p e e s t h o u s a n d s, e x c e p t s h a r e d ata
consolidated Balance Sheets A S At 3 1 M A R c h 2 0 0 8
a l l a m o u n t s i n i n d i a n r u p e e s t h o u s a n d s, e x c e p t s h a r e d ata a n d w h e r e o t h e r w i s e s tat e d
as of 31 march as of 31 march as of 31 march
2007 2008 2008Convenience
translation into U.S.$.
ASSETS (unaudited)
current assets:
Cash and cash equivalents Rs. 17,981,447 Rs. 7,398,285 U.S.$. 184,865
Investment securities 15,325 4,753,580 118,780
Restricted cash 606,159 23,156 579
Accounts receivable, net of allowances 7,518,878 6,823,448 170,501
Inventories 7,545,580 11,132,830 278,182
Deferred income taxes and deferred charges 557,792 587,375 14,677
Due from related parties 145,086 72,817 1,820
Other current assets 3,096,129 3,828,714 95,670
total current assets 37,466,396 34,620,205 865,073
Property, plant and equipment, net. 12,427,798 16,765,432 418,926
Due from related parties 4,856 4,280 107
Investment securities 1,089,950 2,728 68
Investment in affiliates 225,905 237,054 5,923
Goodwill 15,540,688 16,978,916 424,261
Intangible assets, net. 18,888,413 16,622,631 415,358
Other assets 275,097 213,810 5,343
total assets rs. 85,919,103 rs. 85,445,056 u.s.$. 2,135,059
LIABILITIES AND STOCKHOLDERS’ EQUITY
current liabilities:
Borrowings from banks Rs. 3,212,676 Rs. 4,862,709 U.S.$. 121,507
Current portion of long-term debt 3,670,266 1,814,806 45,347
Trade accounts payable 4,754,978 5,409,782 135,177
Due to related parties 871 16,750 419
Accrued expenses 3,958,539 4,155,252 103,829
Other current liabilities 2,936,103 3,132,965 78,284
total current liabilities 18,533,433 19,392,264 484,563
Long-term debt, excluding current portion 17,870,983 12,864,163 321,443
Deferred income taxes 7,556,228 5,642,412 140,990
Other liabilities 369,758 479,633 11,984
total liabilities rs. 44,330,402 rs. 38,378,472 u.s.$. 958,981
MINORITY INTEREST 10,473 – –
STOCKHOLDERS’ EQUITY:
Equity shares at Rs. 5 par value; 200,000,000 shares authorized; Issued
and outstanding; 167,912,180 shares and 168,172,746 shares as of
31 March 2007 and 31 March 2008, respectively
Rs. 839,561 Rs. 840,864 U.S.$. 21,011
Additional paid-in capital 19,908,837 20,036,473 500,661
Equity options outstanding 564,937 709,006 17,716
Retained earnings 20,091,135 24,031,890 600,497
Treasury shares held by a consolidated trust: 82,800 shares (4,882) (4,882) (122)
Accumulated other comprehensive income 178,640 1,453,233 36,313
total stockholders’ equity 41,578,228 47,066,584 1,176,077
total liabilities and stockholders’ equity rs. 85,919,103 rs. 85,445,056 u.s.$. 2,135,059
See accompanying notes to the consolidated financial statements.

170 | A N N U A L R E P O R T 2 0 0 7 – 0 8 c o n s o l i d at i n g f o r t h e f u t u r e
Auditors’ Report to the Members of dr. Reddy’s laboratory ltd.a l l a m o u n t s i n i n d i a n r u p e e s t h o u s a n d s, e x c e p t s h a r e d ata
consolidated Statements of operations F o R t h e y e A R e n d e d 3 1 M A R c h 2 0 0 8
a l l a m o u n t s i n i n d i a n r u p e e s t h o u s a n d s, e x c e p t s h a r e d ata a n d w h e r e o t h e r w i s e s tat e d
fiscal year ended 31 march
2006 2007 2008 2008
REvENUES:Convenience
translation into U.S.$.
(unaudited)
Product sales, net of allowances for sales returns (includes excise duties of
Rs.1,153,273, Rs.779,390 and Rs. 558,308 for the years ended 31 March
2006, 2007 and 2008, respectively)
Rs. 24,077,209 Rs. 64,185,378 Rs. 49,230,572 U.S.$. 1,230,149
Service Income 142,317 882,172 740,232 18,497
License fees 47,521 27,542 34,822 870
24,267,047 65,095,092 50,005,626 1,249,516
COST Of REvENUES 12,417,413 34,219,539 24,597,589 614,632
gross profit 11,849,634 30,875,553 25,408,037 634,883
Operating expenses:
Selling, general and administrative expenses 8,028,884 14,051,137 15,175,243 379,191
Research and development expenses, net 2,152,950 2,462,660 3,532,878 88,278
Amortization expenses 419,867 1,570,894 1,614,806 40,350
Write-down of intangible assets – 1,770,221 2,488,514 62,182
Impairment of goodwill – – 90,437 2,260
Foreign exchange (gain) / loss, net 126,342 (136,753) (744,915) (18,614)
Other operating (income) / expenses, net (327,688) (174,058) (106,627) (2,664)
total operating expenses: 10,400,355 19,544,101 22,050,336 550,983
Operating income 1,449,279 11,331,452 3,357,701 83,901
Equity in (loss) / income of affiliates, net (88,235) (62,676) 1,783 45
Other income / (expense), net 526,279 (768,501) 78,656 1,965
INCOME BEfORE INCOME TAxES AND MINORITY
INTEREST1,887,323 10,500,275 3,438,140 85,911
Income taxes (expense) / benefit (258,390) (1,176,936) 1,229,429 30,720
Minority interest (76) 3,499 10,473 262
net income rs. 1,628,857 rs. 9,326,838 rs. 4,678,042 u.s.$. 116,893
Earnings per equity share
Basic Rs. 10.64 Rs. 58.82 Rs. 27.83 U.S.$. 0.69
Diluted Rs. 10.62 Rs. 58.56 Rs. 27.73 U.S.$. 0.69
Weighted average number of equity shares used in computing earnings
per equity share
Basic 153,093,316 158,552,422 168,075,840 168,075,840
Diluted 153,403,846 159,256,476 168,690,774 168,690,774
See accompanying notes to the consolidated financial statements.

171 | D R . R E D D Y ’ S L A B O R AT O R I E S LT D u s g a a p c o n s o l i d at e d f i n a n c i a l s
Annexure to the Auditor's Reporta l l a m o u n t s i n i n d i a n r u p e e s t h o u s a n d s, e x c e p t s h a r e d ata
consolidated Statements of Stockholders’ equity and comprehensive incomea l l a m o u n t s i n i n d i a n r u p e e s t h o u s a n d s, e x c e p t s h a r e d ata a n d w h e r e o t h e r w i s e s tat e d
fiscal year ended 31 march
equity shares equity shares held
by a controlled trust
no. of
sharesamount
additional
paid in
capital
comprehen-
sive income
accumulated
other
comprehensive
income
no. of
sharesamount
equity –
options
outstanding
retained
earnings
total
stockholders’
equity
balance as of 1 april 2005 153,037,898 rs. 382,595 rs. 10,089,152 – rs. 76,240 82,800 rs. (4,882) rs. 400,749 rs. 10,009,305 rs. 20,953,159
Issuance of equity shares on exercise
of options 351,242 878 172,631 – – – – (99,870) – 73,639
Cash dividends – – – – – – – – (436,368) (436,368)
Stock based compensation – – – – – – – 162,249 – 162,249
Comprehensive income
Net income – – – Rs. 1,628,857 – – – – 1,628,857 1,628,857
Translation adjustment – – – 11,041 11,041 – – – – 11,041
Unrealized loss on investment net
of tax benefit Rs. 35,079– – – (120,844) (120,844) – – – – (120,844)
Comprehensive income – – – Rs. 1,519,054 – – – – – –
balance as of 31 march 2006 153,389,140 rs. 383,473 rs. 10,261,783 rs. (33,563) 82,800 rs. (4,882) rs. 463,128 rs. 11,201,794 rs. 22,271,733
Stock split effected in the form of a
stock dividend– 383,789 (383,789) – – 82,800 – – – –
Issuance of equity shares on exercise
of options223,040 799 88,433 – – – – (73,571) – 15,661
Commons stock issued 14,300,000 71,500 9,942,410 – – – – – – 10,013,910
Cash dividends – – – – – – – – (437,497) (437,497)
Stock based compensation – – – – – – – 190,186 – 190,186
Cumulative effect adjustment on
adoption of SFAS 123 R– – – – – – – (14,806) – (14,806)
Comprehensive income
Net income – – – Rs. 9,326,838 – – – – 9,326,838 9,326,838
Translation adjustment – – – 251,353 251,353 – – – – 251,353
Unrealized loss on investments,
net of tax benefit Rs. 127– – – (114) (114) – – – – (114)
Comprehensive income – – – Rs. 9,578,077 – – – – – –
Initial adoption of SFAS 158, net of
tax benefit Rs. 20,019– – – – (39,036) – – – – (39,036)
balance as of 31 march 2007 167,912,180 rs. 839,561 rs. 19,908,837 rs. 178,640 82,800 rs. (4,882) rs. 564,937 rs. 20,091,135 rs. 41,578,228
Issuance of equity shares on exercise
of options260,566 1,303 127,636 – – – – (113,719) – 15,220
Cash dividends – – – – – – – – (737,287) (737,287)
Stock based compensation – – – – – – – 257,788 – 257,788
Comprehensive income
Net income – – – Rs. 4,678,042 – – – – 4,678,042 4,678,042Translation adjustment net of tax
expense of Rs. 42,262– – – 1,216,478 1,216,478 – – – – 1,216,478
Unrealized gain on investments,
net of tax expense Rs. 35,260– – – 123,425 123,425 – – – – 123,425
Actuarial gain / (loss), net of tax
benefit Rs. 18,771– – – (41,841) (41,841) – – – – (41,841)
Unrealized loss on cash flow hedging
derivatives, net of tax benefit
Rs. 12,085
– – – (23,469) (23,469) – – – – (23,469)
Comprehensive income – – – Rs. 5,952,635 – – – – – –
balance as of 31 march 2008 168,172,746 rs. 840,864 rs. 20,036,473 rs. 1,453,233 82,800 rs. (4,882) rs. 709,007 rs. 24,031,890 rs. 47,066,584
Convenience translation
into U.S.$. (unaudited)U.S.$. 21,011 U.S.$. 500,661 U.S.$. 36,313 U.S.$.(122) U.S.$. 17,716 U.S.$. 600,497 U.S.$. 1,176,077

172 | A N N U A L R E P O R T 2 0 0 7 – 0 8 c o n s o l i d at i n g f o r t h e f u t u r e
Auditors’ Report to the Members of dr. Reddy’s laboratory ltd.a l l a m o u n t s i n i n d i a n r u p e e s t h o u s a n d s, e x c e p t s h a r e d ata
consolidated Statements of cash Flowsa l l a m o u n t s i n i n d i a n r u p e e s t h o u s a n d s, e x c e p t s h a r e d ata a n d w h e r e o t h e r w i s e s tat e d
fiscal year ended 31 march
2006 2007 2008 2008
CASH fLOwS fROM OpERATINg ACTIvITIES:
Convenience
translation into U.S.$
(unaudited)
Net income Rs. 1,628,857 Rs. 9,326,838 Rs. 4,678,042 116,893
Adjustments to reconcile net income to net cash from operating activities:
Deferred tax benefit (55,157) (1,103,598) (2,351,120) (58,749)
(Gain) / loss on sale of available for sale securities, net 3,924 (869) (110,269) (2,755)
Depreciation and amortization 1,567,090 3,010,192 3,388,304 84,665
Write-down of intangible assets – 1,770,221 2,488,514 62,182
Impairment of goodwill – – 90,437 2,260
Loss / (gain) on sale of property, plant and equipment (320,361) (67,039) 7,629 191
Provision for doubtful accounts receivable 33,629 151,620 226,932 5,665
Allowance for sales returns 239,462 1,325,981 164,295 4,105
Inventory write-downs 100,783 306,235 327,997 8,196
Equity in loss / (income) of affiliates, net 88,235 62,676 (1,783) (45)
Unrealized foreign exchange(gain) / loss, net 67,650 (97,232) 225,893 5,670
Stock based compensation 162,249 175,380 257,788 6,441
Minority interest 76 (3,499) (10,473) (262)
Changes in operating assets and liabilities:
Accounts receivable (781,607) (3,032,373) 608,250 15,199
Inventories (1,851,724) (995,342) (3,908,736) (97,670)
Other assets (1,123,076) (371,099) 1,654,006 41,329
Due to / from related parties, net 15,223 (48,206) 88,724 2,217
Trade accounts payable 1,564,454 1,045,753 1,076,159 26,891
Accrued expenses 243,625 825,207 134,848 3,370
Other liabilities 113,201 (320,250) (2,912,810) (72,784)
net cash provided by operating activities 1,696,533 11,960,596 6,122,627 152,989
CASH fLOwS fROM INvESTINg ACTIvITIES:
Restricted cash (6,017,219) 5,468,926 583,003 14,568
Expenditure on property, plant and equipment (1,873,268) (4,477,049) (6,348,085) (158,623)
Proceeds from sale of property, plant and equipment 691,273 84,061 55,032 1,375
Investment in affiliates (100,800) (158,474) – –
Purchase of investment securities (5,074,184) (331,000) (15,859,878) (396,299)
Proceeds from sale of investment securities 5,274,899 331,869 12,477,799 311,789
Expenditure on intangible assets (41,517) (259,198) (421,503) (12,689)
Cash paid towards contingent consideration (114,244) (66,677) (86,319) (2,157)
Cash paid for acquisition, net of cash acquired (27,322,762) (156,076) – –
net cash provided by / (used in) investing activities (34,577,822) 436,382 (9,599,951) (239,879)
CASH fLOwS fROM fINANCINg ACTIvITIES:
Proceeds from issuance of equity shares 73,639 10,029,571 15,220 380
Proceeds from minority interest shareholder – 10,473 – –
Proceeds from bank borrowings 6,322,206 2,212,983 3,554,417 88,816
Repayment from bank borrowings – (8,083,745) (1,941,458) (48,512)
Proceeds from long-term debt 21,598,301 – – –
Repayment of long-term debt (6,577) (1,888,540) (7,718,506) (192,866)
Debt issuance costs (340,243) (89,565) – –
Dividends (436,368) (437,497) (737,287) (18,423)
net cash provided by / (used in) financing activities 27,210,958 1,753,680 (6,827,614) (170,605)
NET INCREASE / (DECREASE) IN CASH AND CASH
EQUIvALENTS DURINg THE YEAR(5,670,331) 14,150,658 (10,304,938) (257,495)
Effect of exchange rate changes on cash and cash equivalents, net 95,104 118,152 (278,224) (6,952)
Cash and cash equivalents at the beginning of the year 9,287,864 3,712,637 17,981,447 449,312
cash and cash equivalents at the end of the year rs. 3,712,637 rs. 17,981,447 rs. 7,398,285 184,865
See accompanying notes to the consolidated financial statements.

173 | D R . R E D D Y ’ S L A B O R AT O R I E S LT D u s g a a p c o n s o l i d at e d f i n a n c i a l s
Annexure to the Auditor's Reporta l l a m o u n t s i n i n d i a n r u p e e s t h o u s a n d s, e x c e p t s h a r e d ata
notes to the consolidated Financial Statements a l l a m o u n t s i n i n d i a n r u p e e s t h o u s a n d s, e x c e p t s h a r e d ata a n d w h e r e o t h e r w i s e s tat e d
1. OvERvIEw
Dr. Reddy’s Laboratories Limited (“DRL”) together with its subsidiaries (collectively, the “Company”) is a leading India-based pharmaceutical company
headquartered in Hyderabad, India. The Company’s principal areas of operation are formulations, active pharmaceutical ingredients and intermediates, generics,
custom pharmaceutical services and drug discovery. The Company’s principal research and development facilities are located in Andhra Pradesh, India and in
the United States; its principal manufacturing facilities are located in Andhra Pradesh, India, Himachal Pradesh, India and Cuernavaca-Cuautla, Mexico; and its
principal marketing facilities are located in India, Russia, the United States, the United Kingdom, Brazil and Germany. The Company’s shares trade on the Bombay
Stock Exchange and the National Stock Exchange in India and, since 11 April 2001, on the New York Stock Exchange in the United States. As of 31 March 2008,
the list of subsidiaries is as follows:
During fiscal 2007, beta Healthcare Verwaltungs GmbH (“Beta HVG”), beta Healthcare GmbH & Co KG (“Beta KG”) and beta Holding GmbH (“Beta HG”) were
merged into RHG. RHG, Beta HSG, Beta AG and Beta IG are collectively referred to as betapharm, unless explicitly stated.
consolidated Statements of cash Flowsa l l a m o u n t s i n i n d i a n r u p e e s t h o u s a n d s, e x c e p t s h a r e d ata a n d w h e r e o t h e r w i s e s tat e d
• DRL Investments Limited (“DRL Investments”)
• Reddy Pharmaceuticals Hong Kong Limited (“RPHL”)
• Reddy Antilles N.V. (“RANV”)
• Reddy US Therapeutics Inc. (“Reddy US”)
• Dr. Reddy’s Laboratories Inc. (“DRLI”)
• Dr. Reddy’s Farmaceutica Do Brazil Ltda. (“DRFBL”)
• Aurigene Discovery Technologies Limited (“ADTL”)
• Dr. Reddy’s Laboratories (EU) Limited (“DRL EU”)
• Dr. Reddy’s Laboratories (Proprietary) Limited (“DRSA”)
• Promius Pharma LLC (Previously Reddy Pharmaceuticals LLC.) (“PPLLC”)
• Reddy Holding GmbH (“RHG”)
• Beta Healthcare Solutions GmbH (“Beta HSG”)
• betapharm Arzneimittel GmbH (“Beta AG”)
• Beta institut fur sozialmedizinische Forschung und Entwicklung GmbH (“Beta IG”)
• Lacock Holdings Limited (“LHL”)
• OOO JV Reddy Biomed Limited (“Reddy Biomed “ or “RBL”)
• Reddy Netherlands B.V. (“RNBV”)
• Dr. Reddy’s Laboratories Ilac Ticaret Limited (“DRIT”)
• Reddy Cheminor SA (“RCSA”)
• Aurigene Discovery Technologies Inc. (“ADTI”)
• Dr. Reddy’s Laboratories (U.K.) Limited (“DRL U.K.”)
• Cheminor Investment Limited (“CIL”)
• Dr. Reddy’s Bio-sciences Limited (“RBSL”)
• Trigenesis Therapeutics Inc. (“Trigenesis”)
• Industrias Quimicas Falcon de Mexico S.A.de.C.V. (“FALCON”)
• OOO Dr. Reddy’s Laboratories Limited, Russia (“OOO DRL”)
• Dr. Reddy’s Laboratories (Australia) Pty Limited (“DRLA”)
• Reddy Pharma Iberia S.A. (“RPISA”)
• Reddy Pharma Italia SPA. (“RPISPA”)
• Dr. Reddy’s Laboratories Switzerland (“DRSL”)
• Affordable Health Care Limited (“AHL”)
• Eurobridge Consulting BV, Netherlands (“Eurobridge”)
• OOO DRS Limited, Russia (“DRSR”)
• Aurigene Discovery Technologies (M) Sdn bhd (“ADTM”)
• Macred India Private Limited (“MIPL”)
fiscal year ended 31 march
2006 2007 2008 2008
Convenience
translation into U.S.$
(un audited)
SUppLEMENTAL DISCLOSURES:
Cash paid for:
Interest (net of interest capitalized) 225,284 1,589,386 1,043,376 26,071
Income taxes 223,000 1,350,083 1,531,569 38,270
SUppLEMENTAL SCHEDULE Of NON-CASH INvESTINg
ACTIvITIES:
Property, plant and equipment purchased on credit during the
year54,276 313,383 199,499 4,985
Property, plant and equipment purchased under capital lease 223,379 15,986 20,717 518
Provision for contingent consideration – 30,310 150,887 3,770
Promissory notes issued in connection with business acquisition 156,076 – – –
See accompanying notes to the consolidated financial statements

174 | A N N U A L R E P O R T 2 0 0 7 – 0 8 c o n s o l i d at i n g f o r t h e f u t u r e
Auditors’ Report to the Members of dr. Reddy’s laboratory ltd.a l l a m o u n t s i n i n d i a n r u p e e s t h o u s a n d s, e x c e p t s h a r e d ata
notes to the consolidated Financial Statementsa l l a m o u n t s i n i n d i a n r u p e e s t h o u s a n d s, e x c e p t s h a r e d ata a n d w h e r e o t h e r w i s e s tat e d
2. SIgNIfICANT ACCOUNTINg pOLICIES
a) basis of preparation
The accompanying consolidated financial statements have been prepared in accordance with the accounting principles generally accepted in the United
States (U.S. GAAP).
b) estimates and assumptions
The preparation of consolidated financial statements in conformity with U.S. GAAP requires management to make estimates and assumptions that affect
the reported amounts of assets and liabilities, revenues and expenses and disclosure of contingent assets and liabilities. Actual results could differ from
these estimates.
c) functional currency
The functional currency of DRL is the Indian rupee, being the currency of the primary economic environment in which it operates. The functional currencies
of the subsidiaries have been determined as follows, based on an individual and collective evaluation of economic factors described in Statement of
Financial Accounting Standards (“SFAS”) SFAS 52, “Foreign currency translation”:
name of the subsidiary functional currency
DRL Investments, RPHL, RANV, DRLI, DRFBL, ADTL, DRSA, PPLLC, OOO DRL, RBL, RNBV, RCSA, CIL, RBSL, Trigenesis, DRLA,
DRSL, ADTM, Eurobridge, DRSR, AHL, MIPL and DRITIndian Rupee
Reddy US and ADTI U.S. Dollar
DRL EU and DRL U.K. Pound Sterling
FALCON Mexican Peso
RHG, Beta HSG, Beta AG, Beta IG, RPISA, RPISPA and LHL Euro
In respect of all non-Indian subsidiaries that operate as marketing arms of DRL (“the parent company”) in their respective countries / regions (i.e., all
those listed in the first row of the table above), the functional currency has been determined to be the functional currency of the parent company, i.e.
the Indian rupee. Accordingly, the operations of these entities are largely restricted to import of finished goods from the parent company in India, sale of
these products in the foreign country and remittance of the sale proceeds to the parent. The cash flows realized from sale of goods are readily available
for remittance to the parent company and cash is remitted to the parent company on a regular basis. The costs incurred by these entities are primarily the
cost of goods imported from the parent. The financing of these subsidiaries is done directly or indirectly by the parent company. In respect of subsidiaries,
whose operations are self contained and integrated within their respective countries / regions (i.e., all those listed in the second through fifth rows of the
table above), the functional currency has been determined to be the local currency of those countries / regions. The assets and liabilities of such subsidiaries
are translated into Indian rupees at the rate of exchange prevailing as at the balance sheet date. Revenues and expenses are translated into Indian rupees at
average monthly exchange rates prevailing during the year. Resulting translation adjustments are included in accumulated other comprehensive income.
d) foreign currency transactions
Foreign currency transactions are translated into the functional currency at the rates of exchange prevailing on the date of the respective transactions.
Monetary assets and liabilities in foreign currency are converted into the functional currency at the exchange rate prevailing on the balance sheet date. The
resulting exchange gains / losses are included in the consolidated statement of operations.
e) convenience translation (unaudited)
The accompanying financial statements have been prepared in Indian rupees, the national currency of India. Solely for the convenience of the reader, the
financial statements as of and for the fiscal year ended 31 March 2008 have been translated into United States dollars at the noon buying rate in New
York City on 31 March 2008 for cable transfers in Indian rupees, as certified for customs purposes by the Federal Reserve Bank of New York of U.S.$. 1 =
Rs. 40.02. No representation is made that the Indian rupee amounts have been, could have been or could be converted into United States dollars at such
a rate or any other rate.
f) principles of consolidation
The consolidated financial statements include the financial statements of DRL and all of its subsidiaries, which it owns or controls more than 50% of
the voting rights, except where the minority shareholders have certain significant participating rights that provide for effective involvement in significant
decisions in the ordinary course of business of such entities which are accounted for under the equity method. DRL consolidates Dr. Reddy’s Research
Foundation (the “Research Foundation”), a non-profit organization that is funded by and carries out research activities on behalf of and for the benefit
of the Company, and beta Institut for sociomedical research GmbH, a non-profit organization which is engaged in research and development to seek
ways to improve the healthcare process in ways which promote the psychological welfare of patients, including development of patient pathways, case
management, disease management and health systems management. All inter-company balances and transactions are eliminated on consolidation. Newly
acquired subsidiaries are included in the consolidated financial statements from the date of acquisition.

175 | D R . R E D D Y ’ S L A B O R AT O R I E S LT D u s g a a p c o n s o l i d at e d f i n a n c i a l s
Annexure to the Auditor's Reporta l l a m o u n t s i n i n d i a n r u p e e s t h o u s a n d s, e x c e p t s h a r e d ata
The Company follows Financial Accounting Standards Board (“FASB”) Interpretation No. 46 (revised December 2003 “FIN 46R”), Consolidation of Variable
Interest Entities (“VIE”), which addresses how a business enterprise should evaluate whether it has a controlling financial interest in an entity through
means other than voting rights and accordingly should consolidate the entity. For any VIEs that must be consolidated under FIN 46R, the interpretation
generally requires the primary beneficiary initially to measure the assets, liabilities and non-controlling interests of the newly consolidated VIE at their fair
values at the date the enterprise first becomes the primary beneficiary. Based on evaluation of FIN 46R, the Company has consolidated APR LLC, a VIE.
The Company accounts for investments by the equity method of accounting where it is able to exercise significant influence over the operating and
financing policies of the investee. The Company’s equity in the income / loss of equity method affiliates, Kunshan Rotam Reddy Pharmaceuticals (“Reddy
Kunshan” or “KRRP”) and Perlecan Pharma Private Limited (“Perlecan Pharma”) is included in the consolidated statement of operations. Inter company
profits and losses have been eliminated until realized by the investor or investee.
g) cash equivalents
The Company considers all highly liquid investments with remaining maturities at the date of purchase / investment, of three months or less to be cash
equivalents.
h) revenue recognition
Product sales
Revenue is recognized when significant risks and rewards in respect of ownership of products are transferred to customers, generally, the stockists or
formulations manufacturers and when the following criteria are met:
• Persuasive evidence of an arrangement exists;
• The price to the buyer is fixed and determinable; and
• Collectibility of the sales price is reasonably assured.
Revenue from domestic sales of formulation products is recognized on delivery of the product to the stockist by the consignment and clearing and
forwarding agent of the Company. Revenue from domestic sales of active pharmaceutical ingredients and intermediates is recognized on delivery of
products to customers, from the factories of the Company. Revenue from export sales is recognized when significant risks and rewards in respect of
ownership of products are transferred to customers, which is based on terms of the contract. Revenue from product sales includes excise duty and is
recorded net of sales tax and applicable discounts and allowances.
Sales of formulations in India are made through clearing and forwarding agents to stockists. Significant risks and rewards in respect of ownership of
formulation products are transferred by the Company when the goods are delivered to stockists from clearing and forwarding agents. Clearing and
forwarding agents are generally compensated on a commission basis as a percentage of sales made by them.
Sales of active pharmaceutical ingredients and intermediates in India are made directly to the end customers generally, formulation manufacturers, from
the factories of the Company. Sales of formulations and active pharmaceutical ingredients and intermediates outside India are made directly to the end
customers, generally stockists or formulations manufacturers, from the Company or its consolidated subsidiaries.
The Company has entered into marketing arrangements with certain marketing partners for sale of goods. Under such arrangements, the Company sells
generic products to the marketing partners at a price agreed in the arrangement. Revenue is recognized on these transactions upon delivery of products
to the marketing partners, as all the conditions under Staff Accounting Bulletin No.104 (“SAB 104”) are met. Subsequently, the marketing partners remit
to the Company an additional amount based on the sale proceeds of sales made by them to the end customer. Such amount is determined per the terms
of the marketing arrangement, and is recognized by the Company when the realization is certain under the guidance given in SAB 104.
Revenue from sales of generic products is recognized when products are delivered and significant risks and rewards in respect of ownership of products
passes on to the customer. Provisions for chargeback, rebates and medicaid payments are estimated and provided for in the year of sales and recorded as
reduction of revenue. A chargeback claim is a claim made by the wholesaler for the difference between the price at which the product is initially invoiced
to the wholesaler and the net price at which it is agreed to be procured from the Company. Provision for such chargebacks are accrued and estimated
based on historical average chargeback rate actually claimed over a period of time, current contract prices with wholesalers / other customers and average
inventory holding by the wholesaler. Such provisions are disclosed as a reduction of accounts receivable.
The Company accounts for sales returns in accordance with SFAS 48, “Revenue Recognition when Right to Return Exists” by recording an accrual based
on Company’s estimate of expected sales returns.
The Company deals in various products and operates in various markets. Accordingly, the Company’s estimate of sales returns is determined primarily by its
experience in these markets. In respect of established products, the Company determines an estimate of sales returns accrual primarily based on historical
experience of such sales returns. Additionally, other factors that the Company considers in determining the estimate include levels of inventory in the
distribution channel, estimated shelf life, product discontinuances, price changes of competitive products, and introduction of competitive new products, to
the extent each of these factors impact the Company’s business and markets. The Company considers all these factors and adjusts the sales return accrual
to reflect its actual experience.
notes to the consolidated Financial Statements a l l a m o u n t s i n i n d i a n r u p e e s t h o u s a n d s, e x c e p t s h a r e d ata a n d w h e r e o t h e r w i s e s tat e d

176 | A N N U A L R E P O R T 2 0 0 7 – 0 8 c o n s o l i d at i n g f o r t h e f u t u r e
Auditors’ Report to the Members of dr. Reddy’s laboratory ltd.a l l a m o u n t s i n i n d i a n r u p e e s t h o u s a n d s, e x c e p t s h a r e d ata
With respect to new products introduced by the Company, those are either extensions of an existing line of product or in a general therapeutic category
where the Company has historical experience. The Company’s new product launches have historically been in therapeutic categories where established
products exist and are sold either by the Company or its competitors. The Company has not yet introduced products in a new therapeutic category where
the sales returns experience of such products is not known. The amount of sales returns for the Company’s newly launched products do not significantly
differ from sales returns experience of current products marketed by the Company or competitors (as the Company understands based on industry
publications and discussions with its customers). Accordingly, the Company does not expect sales returns for new products to be significantly different
from expected sales returns of current products. The Company evaluates sales returns of all its products at the end of each reporting period and records
necessary adjustments, if any. To date, no significant revision has been determined to be necessary.
Service income
Income from service, which primarily relate to contract research, is recognized as the related services are performed in accordance with the terms of the
contract and when all the conditions under SAB 104 are met. Arrangements with customers for contract research and other related services are either on
a fixed price or a time and material basis.
License fees
Non-refundable milestone payments are recognized in the consolidated statement of operations when earned, in accordance with the terms of the
license agreement, and when the Company has no future obligations or continuing involvement pursuant to such milestone payments. Non-refundable
upfront license fees are deferred and recognized when the milestones are earned, in proportion to the amount that each milestone earned bears to the
total milestone payments agreed in the license agreement. As the upfront license fees are a composite amount and cannot be attributed to a specific
molecule, they are amortized over the development period. The milestone payments increase during the development period as the risk involved decreases.
The agreed milestone payments reflect the progress of the development of the molecule and may not be spread evenly over the development period.
Accordingly, the milestone payments are a fair representation of the extent of progress made in the development of these underlying molecules. In the
event, the development of molecule is discontinued, the corresponding amount of deferred revenue is recognized in the consolidated statement of
operations in the period in which the project is terminated.
The Company has entered into certain dossier sales, licensing and supply arrangements that include certain performance obligations. Based on an
evaluation of whether or not these obligations are inconsequential or perfunctory, the Company defers the upfront payments received under these
arrangements. Such deferred revenue is recognized in the consolidated statement of operations in the period in which the Company completes its
remaining performance obligations.
i) shipping and handling costs
Shipping and handling costs incurred to transport products to customers are included in selling, general and administrative expenses.
j) inventories
Inventories are stated at the lower of cost or market value. Cost is determined using the first-in-first-out method for all categories of inventories except
stores and spares, where cost is determined using the weighted average method. Stores and spares comprise of packing materials, engineering spares
(such as machinery spare parts) and consumables (such as lubricants, cotton waste and oils), which are used in operating machines or consumed as indirect
materials in the manufacturing process. In the case of raw materials and stores and spares, cost comprises purchase price and attributable direct costs, less
trade discounts. In the case of work-in-process and finished goods, cost comprises direct labor, material costs and production overheads.
A write-down of inventory to the lower of cost or market value at the close of a fiscal year creates a new cost basis and is not marked up based on
subsequent changes in underlying facts and circumstances. Such write-downs, if any, are included in cost of revenues.
Inventories are reviewed on a monthly basis for identification and write-off of slow-moving, obsolete and impaired inventory. Such write-downs, if any, are
included in cost of revenues.
k) investment securities
Investment securities consist of available for sale debt and equity securities and non-marketable equity securities accounted for by the cost method.
Available for sale securities are carried at fair value based on quoted market prices. For debt securities where quoted market prices are not available, fair
value is determined using pricing techniques such as discounted cash flow analysis obtained from external sources. Unrealized holding gains and losses,
net of the related tax effect, on available for sale securities are excluded from earnings and are reported as a separate component of stockholders’ equity
until realized. Decline in the fair value of any available for sale security below cost that is determined to be other than temporary, results in reduction in the
carrying amount to fair value. Such impairment is charged to the consolidated statement of operations. Realized gains and losses from the sale of available
for sale securities are determined on a first-in-first-out method and are included in earnings.
Non-marketable equity securities accounted for by the cost method are stated at cost, less provision for any other than temporary decline in value.
notes to the consolidated Financial Statements a l l a m o u n t s i n i n d i a n r u p e e s t h o u s a n d s, e x c e p t s h a r e d ata a n d w h e r e o t h e r w i s e s tat e d

177 | D R . R E D D Y ’ S L A B O R AT O R I E S LT D u s g a a p c o n s o l i d at e d f i n a n c i a l s
Annexure to the Auditor's Reporta l l a m o u n t s i n i n d i a n r u p e e s t h o u s a n d s, e x c e p t s h a r e d ata
l) derivative and hedge accounting
The Company purchases foreign currency forward contracts / option contracts to mitigate the risk of changes in foreign exchange rates on accounts
receivable and forecasted cash flows denominated in certain foreign currencies. The Company also purchases zero-cost collars, which qualify as net
purchased options, to hedge the exposure to variability in expected future foreign currency cash inflows due to exchange rate movements beyond a defined
range.
In accordance with SFAS No. 133, Accounting for Derivative Instruments and Hedging Activities, as amended, the Company recognizes all derivatives as
assets or liabilities measured at their fair value, regardless of the purpose or intent of holding them. In respect of derivatives designated and effective as
cash flow hedges, gains or losses resulting from changes in the fair value are deferred and recorded as a component of accumulated other comprehensive
income within stockholder’s equity until the hedged transaction occurs and are then recognized in the consolidated statement of operations together with
the hedged item. The Company assesses hedge effectiveness based on overall change in fair value of derivative instrument.
Changes in fair value of derivatives not designated as hedges and the ineffective portion of the hedging instruments are recognized in the consolidated
statements of operations of each period and are reported within foreign exchange gain / (loss), net under operating expenses.
In respect of derivatives designated as hedges, the Company formally documents all relationships between the hedging instrument and the hedged item,
as well as its risk management objective and strategy for undertaking the hedge transaction. The Company also formally assesses both at the inception
of the hedge and on an ongoing basis, whether each derivative is highly effective in offsetting changes in fair value or cash flows of the hedged item. If
it is determined that a derivative is not highly effective as a hedge, or if a derivative ceases to be a highly effective hedge, the Company, prospectively,
discontinues hedge accounting with respect to that derivative.
m) property, plant and equipment
Property, plant and equipment including assets acquired under capital lease agreements are stated at cost less accumulated depreciation. The Company
depreciates property, plant and equipment over the estimated useful life using the straight-line method. The estimated useful lives of assets are as
follows:
Buildings
Factory and administrative buildings 25 to 50 years
Ancillary structures 3 to 15 years
Plant and machinery 3 to 15 years
Furniture, fixtures and office equipment 4 to 10 years
Vehicles 4 to 5 years
Computer equipment 3 to 5 years
Advances paid towards the acquisition of property, plant and equipment outstanding at each balance sheet date and the cost of property, plant and
equipment not put to use before such date are disclosed under capital work-in-progress. The interest cost incurred for funding an asset during its
construction period is capitalized based on the actual investment in the asset and the average cost of funds. The capitalized interest is included in the cost
of the relevant asset and is depreciated over the estimated useful life of the asset.
Software for internal use, which is primarily acquired from third-party vendors including consultancy charges for implementing the software are capitalized.
Subsequent costs are charged to the consolidated statement of operations as incurred. The capitalized costs are amortized over the estimated useful life of
the software.
n) goodwill
Goodwill represents the cost of acquired businesses in excess of the fair value of the identifiable tangible and intangible net assets purchased. Goodwill is
tested for impairment on an annual basis, relying on a number of factors including operating results, business plans and future cash flows. Recoverability of
goodwill is evaluated using a two-step process. The first step involves a comparison of the fair value of a reporting unit with its carrying value. If the carrying
value of the reporting unit exceeds its fair value, the second step of the process involves a comparison of the fair value and carrying value of the goodwill
of that reporting unit. If the carrying value of the goodwill of a reporting unit exceeds the fair value of that goodwill, an impairment loss is recognized in
an amount equal to the excess. Goodwill of a reporting unit is tested for impairment between annual tests if an event occurs or circumstances change that
would more likely than not reduce the fair value of the reporting unit below its carrying value.
notes to the consolidated Financial Statements a l l a m o u n t s i n i n d i a n r u p e e s t h o u s a n d s, e x c e p t s h a r e d ata a n d w h e r e o t h e r w i s e s tat e d

178 | A N N U A L R E P O R T 2 0 0 7 – 0 8 c o n s o l i d at i n g f o r t h e f u t u r e
Auditors’ Report to the Members of dr. Reddy’s laboratory ltd.a l l a m o u n t s i n i n d i a n r u p e e s t h o u s a n d s, e x c e p t s h a r e d ata
notes to the consolidated Financial Statements a l l a m o u n t s i n i n d i a n r u p e e s t h o u s a n d s, e x c e p t s h a r e d ata a n d w h e r e o t h e r w i s e s tat e d
o) intangible assets
Intangible assets consist of trademarks, product related intangibles, customer related intangibles, marketing rights, beneficial toll manufacturing contracts
and non-competition arrangements. All intangible assets with definite life are amortized over the expected benefit period or the legal life, whichever is
shorter. Such amortization periods are as follows:
Trademarks
– Trademarks with finite useful life 3 to 10 years
– Trademarks with indefinite life Tested for impairment at least annually
Product related intangibles 12 to 15 years
Beneficial toll manufacturing contract 24 months
Non-competition arrangements 1.5 to 10 years
Marketing rights 3 to 16 years
Customer-related intangibles 2 to 5 years
Other intangibles 5 to 15 years
p) impairment of long-lived assets
Long-lived assets and intangibles with finite useful life are reviewed for impairment whenever events or changes in business circumstances indicate that the
carrying amount of assets may not be fully recoverable. Impairment test is based on a comparison of the undiscounted cash flows expected to be generated
from the use of the asset to its recorded value. If impairment is indicated, the asset is written down to its fair value. Long-lived assets to be disposed are
reported at the lower of carrying value or fair value, less cost to sell. The fair value of the ‘beta’ brand (trademark with indefinite life) is determined applying
the relief from royalty method. The fair value of other intangibles is determined based on discounted cash flow approach.
q) start-up costs
Costs of start-up activities including organization costs are expensed as incurred.
r) research and development
Research and development cost is expensed as incurred. In-process technologies used in research and development projects and having no alternate future
use are expensed upon purchase. Capital expenditure incurred on equipment and facilities acquired or constructed for research and development activities,
and having alternative future use, is capitalized as property, plant and equipment when acquired or constructed.
s) stock-based compensation
Prior to 1 April 2006, the Company accounted for its stock-based compensation plans under SFAS 123 “Accounting for Stock Based Compensation”.
On 1 April 2006, the Company adopted SFAS No. 123(R) (revised 2004) “Share Based Payment” (“SFAS No. 123(R)”) under the modified-prospective
approach. The modified-prospective-approach under SFAS No. 123(R) applies to new awards and to awards modified, repurchased, or cancelled after
adoption.
The Company uses the Black-Scholes option pricing model to determine the fair value of each option grant. Generally, the fair value approach in SFAS
No. 123(R) is similar to the fair value approach described in SFAS No. 123. Upon adoption of SFAS 123(R), the Company elected to continue estimating the
fair value of stock options using the Black-Scholes option pricing model. The Black-Scholes model includes assumptions regarding dividend yields, expected
volatility, expected terms and risk free interest rates. In respect of Par Value Options, the expected term of an option is estimated based on the vesting
term, contractual term, as well as expected exercise behavior of the employees receiving the option. In respect of Fair Market Value options, the expected
term of an option is estimated based on the simplified method. Expected volatility of the option is based on historical volatility, during a period equivalent
to the expected term of the option, of the observed market prices of the Company’s publicly traded equity shares. Dividend yield of the options is based
on recent dividend activity. Risk-free interest rates are based on the government securities yield in effect at the time of the grant. These assumptions reflect
management’s best estimates, but these assumptions involve inherent market uncertainties based on market conditions generally outside of Company’s
control. As a result, if other assumptions had been used in the current period, stock-based compensation expense could have been materially impacted.
Further, if management uses different assumptions in future periods, stock based compensation expense could be materially impacted in future years.
The estimated fair value of stock options is charged to income on a straight-line basis over the requisite service period for each separately vesting portion
of the award as if the award was, in-substance, multiple awards.
The fair value of each option is estimated on the date of grant using the Black-Scholes model with the following assumptions:
fiscal year ended 31 march
2006 2007 2008Dividend yield 0.5% 0.5% 0.75%
Expected term 12 – 78 months 12 – 48 months 12 – 48 months
Risk free interest rates 5.7 – 7.5% 6.5 – 7.4% 7.8 – 8.2%
Volatility 23.4 – 36.9% 30.5 – 33.6% 28.4% – 32.7%

179 | D R . R E D D Y ’ S L A B O R AT O R I E S LT D u s g a a p c o n s o l i d at e d f i n a n c i a l s
Annexure to the Auditor's Reporta l l a m o u n t s i n i n d i a n r u p e e s t h o u s a n d s, e x c e p t s h a r e d ata
notes to the consolidated Financial Statements a l l a m o u n t s i n i n d i a n r u p e e s t h o u s a n d s, e x c e p t s h a r e d ata a n d w h e r e o t h e r w i s e s tat e d
At 31 March 2008, the Company has four stock-based employee compensation plans, which are described more fully in Note 21. DRL and ADTL have two
stock based employee compensation plans each.
The adoption of SFAS No. 123(R) did not have a material impact on Company’s equity-based compensation expense for the year ended 31 March 2007.
Further, the Company believes that the adoption of SFAS No.123(R) will not have a material impact on its future equity-based compensation expense.
Under SFAS 123, the Company had a policy of recognizing the effect of forfeitures only as they occurred. Accordingly, as required by SFAS No. 123 (R), on
1 April 2006, the Company estimated the number of outstanding instruments which are not expected to vest and recognized a credit to stock compensation
expense o f Rs. 14,806 representing reversal of stock compensation expense for such instruments previously recognized in the consolidated statement
of operations.
A recent amendment to the Indian tax regulations requires the Company to pay Fringe Benefit Tax (FBT) on exercise of employee stock options. The FBT is
computed based on the fair market value of the underlying equity share on the date of vesting of an option as reduced by the amount actually paid by the
employee for exercise of the options. The Company’s obligation to pay FBT arises only upon exercise of options and is recorded as compensation expense
in the consolidated statement of operations at that time.
In January 2008, ADTL amended its plan to recover FBT from employees for all new grants. Accordingly, the fair value of stock options granted subsequent
to the date of this amendment has been determined using the Binomial option pricing model.
The Binomial model includes assumptions regarding dividend yields, expected volatility, expected lives, risk free interest rates and expected FBT recovery.
These assumptions reflect management’s best estimates, but these assumptions involve inherent market uncertainties based on market conditions generally
outside of Company’s control. As a result, if other assumptions had been used in the current period, stock-based compensation expense could have been
materially impacted. Further, if management uses different assumptions in future periods, stock based compensation expense could be materially impacted
in future years.
The fair value of each option is estimated on the date of grant using the Binomial model with the following assumptions:
fiscal year ended 31 march
2008Dividend yield –
Expected term 36 – 72 months
Risk free interest rates 7.42 – 7.47%
Volatility 57.38%
t) income taxes
Income taxes are accounted for using the asset and liability method. Deferred tax assets and liabilities are recognized for the future tax consequences
attributable to differences between the financial statement carrying amounts of existing assets and liabilities and their respective tax bases and operating
loss carry-forwards. Deferred tax assets and liabilities are measured using enacted tax rates expected to apply to taxable income in the years in which those
temporary differences are expected to be recovered or settled. The effect on deferred tax assets and liabilities of a change in tax rates is recognized in the
consolidated statement of operations in the period that includes the enactment date. Valuation allowance is established when necessary to reduce deferred
tax assets to the amount considered more likely than not to be realized.
The Company adopted FASB Interpretation No. 48 (FIN 48), Accounting for Uncertainty in Income Taxes – an interpretation of FASB Statement No. 109,
on 1 April 2007. This Interpretation clarifies the accounting for uncertainty in income taxes recognized in an enterprise’s financial statements in accordance
with SFAS No. 109, Accounting for Income Taxes and prescribes a recognition threshold of more-likely-than-not to be sustained upon examination.
Accounting and disclosures of tax positions taken or expected to be taken by the Company are based on the recognition threshold and measurement
attribute prescribed by FIN 48. The Company recognizes penalties and interest related to unrecognized tax benefits as a component of income taxes.
u) leases
Leases of property, plant and equipment that transfer substantially all of the benefits or risks and rewards of ownership are classified as capital leases. The
amount recorded is the lesser of the present value of the rental and other lease payments during the lease term, excluding that portion of the payments
representing executory costs paid to the lessor, or the asset’s fair value. The rental obligations, net of interest charges, are reflected in long term debt.
Leases that do not transfer substantially all of the benefits or risks of ownership are classified as operating leases and recorded as expense on a straight line
basis over the lease term, including leases that have rent holidays and / or escalating lease payments.
v) legal cost
Legal costs incurred in connection with contingencies are expensed as incurred.
w) earnings per share
In accordance with SFAS No.128, “Earnings per Share”, basic earnings per share is computed using the weighted average number of common shares
outstanding during the period. Diluted earnings per share is computed using the weighted average number of common and dilutive common equivalent

180 | A N N U A L R E P O R T 2 0 0 7 – 0 8 c o n s o l i d at i n g f o r t h e f u t u r e
Auditors’ Report to the Members of dr. Reddy’s laboratory ltd.a l l a m o u n t s i n i n d i a n r u p e e s t h o u s a n d s, e x c e p t s h a r e d ata
notes to the consolidated Financial Statements a l l a m o u n t s i n i n d i a n r u p e e s t h o u s a n d s, e x c e p t s h a r e d ata a n d w h e r e o t h e r w i s e s tat e d
shares outstanding during the period, using the treasury stock method for options, except where the results would be anti-dilutive. If securities have been
issued by a subsidiary that enable their holders to obtain subsidiary’s common stock, the earnings of the subsidiary’s shall be included in the consolidated
diluted earnings per share computations based on the Company’s holding of the subsidiary’s securities.
If the number of common shares outstanding increases as a result of a stock dividend or stock split or decreases as a result of a reverse stock split, the
computations of basic and diluted earnings per share are adjusted retroactively for all periods presented to reflect that change in capital structure. If such
changes occur after the close of the reporting period but before issuance of the financial statements, the per-share computations for that period and any
prior-period financial statements presented are based on the new number of shares.
Reclassifications
Certain amounts in the prior year’s consolidated financial statements and notes have been reclassified to conform to the current year’s presentation.
3. BUSINESS COMBINATIONS
All of the Company’s acquisitions have been accounted for using the purchase method of accounting. Revenues and expenses of the acquired businesses have
been included in the accompanying consolidated financial statements beginning on the respective dates of acquisition. Contingent consideration pursuant to
earnout agreements is recorded as an additional cost of the acquisition, when the contingency is resolved and the consideration is issued or becomes issuable.
industrias quimicas falcon de mexico, s.a. de c.v. (“falcon”)
On 30 December 2005, the Company acquired 100% of the share capital of Industrias Quimicas Falcon de Mexico, S.A.de C.V. (“Falcon”), a Roche group
company for a total purchase consideration of Rs. 2,773,126 (U.S.$. 61,233). The Company has accounted for this acquisition under the purchase method as
defined in SFAS No. 141, “Business Combinations”. Accordingly, the financial results of Falcon have been included in the consolidated financial statements
since that date. Falcon was acquired with intent to add steroid manufacturing capabilities and permit the Company to offer a full range of services in its custom
pharmaceutical services business. The operations of Falcon relate to the manufacture and sale of active pharmaceutical ingredients and steroids in accordance
with customer specifications.
The purchase cost of Rs. 2,773,126 has been allocated as follows:
• Property, plant and equipment and intangible assets based on appraisals performed by third party valuer; and
• Others based on management’s estimates.
CURRENT ASSETS
Cash and cash equivalents Rs. 217
Accounts receivable 39,736
Inventories 1,150,730
Other current assets 259,465
Property, plant and equipment 1,418,799
INTANgIBLE ASSETS
Customer contracts 51,493
Non-competition arrangement 20,242
TOTAL ASSETS 2,940,682
Liabilities assumed (40,613)
Deferred tax liability, net (126,943)
pURCHASE COST rs. 2,773,126
The weighted average useful lives of intangibles acquired are as follows:
Customer contracts 2.6 years
Non-competition arrangement 3 years
betapharm
On 3 March 2006, the Company acquired 100% of the outstanding common shares of betapharm. Accordingly, the financial results of betapharm have been
included in the consolidated financial statements since that date. betapharm is a leading generics pharmaceuticals company in Germany. Under the ‘beta’ brand,
the Company markets a broad and diversified portfolio comprising formulations, primarily solid dose, focused on medical conditions requiring long-term therapy
that are typically prescribed by primary care physicians.
The aggregate purchase price of Rs. 26,063,321 (Euro 482,654) includes direct acquisition cost amounting to Rs. 201,548 (Euro 3,732). The acquisition
agreement included payment of contingent consideration amounting up to Rs. 518,400 (Euro 9,600), which was paid into an escrow account. This amount is
subject to set-off for certain indemnity claims in respect of legal and tax matters that might arise, pertaining to the periods prior to the acquisition. The escrow
will lapse and be time barred at the end of 2013. Since the maximum amounts pertaining to such claims are determinable at the date of acquisition, the same
has been included as part of the purchase price.

181 | D R . R E D D Y ’ S L A B O R AT O R I E S LT D u s g a a p c o n s o l i d at e d f i n a n c i a l s
Annexure to the Auditor's Reporta l l a m o u n t s i n i n d i a n r u p e e s t h o u s a n d s, e x c e p t s h a r e d ata
notes to the consolidated Financial Statements a l l a m o u n t s i n i n d i a n r u p e e s t h o u s a n d s, e x c e p t s h a r e d ata a n d w h e r e o t h e r w i s e s tat e d
During the year ended 31 March 2007, the Company completed the final allocation of the aggregate purchase price of Rs. 26,063,321 (Euro 482,654) for
betapharm based on management’s estimate and independent valuations of intangible assets as follows:
CURRENT ASSETS:
Cash and cash equivalents Rs. 1,357,395
Inventories 538,860
Other current assets 552,938
Property, plant and equipment 372,377
INTANgIBLES:
Trademarks 5,546,314
Product related intangibles 13,684,867
Beneficial toll manufacturing contract 621,058
Other assets 142,541
Goodwill 12,848,428
TOTAL ASSETS 35,664,778
Deferred tax liability, net (7,241,686)
Liabilities assumed (2,359,771)
pURCHASE COST rs. 26,063,321
As a result of the final allocation of the aggregate purchase price, there were revisions in useful lives of certain intangibles and the total intangibles increased
from Rs. 16,325,598 as at 31 March 2006 to Rs. 19,852,239. In addition, goodwill decreased from Rs. 14,958,766 as at 31 March 2006 to Rs. 12,848,428 and
deferred tax liability, net increased from Rs. 5,825,383 as at 31 March 2006 to Rs. 7,241,686.
Trademarks have an indefinite useful life and are therefore not subject to amortization but are tested for impairment annually. The weighted average useful
lives of other intangibles acquired are as follows:
Product related intangibles 14.5 years
Beneficial toll manufacturing contract 4.8 years(1)
The adjustments to the values of intangibles, goodwill and deferred tax liability, net and revisions to useful lives did not have any material impact on the results
of the fiscal year ended 31 March 2007.
(1) As more fully described in Note 5, in January 2007, the Company revised the estimated useful life of the beneficial toll manufacturing contract intangible from
58 months to 24 months. Consequently, the unamortized balance as on the date of such amendment is being amortized over the remaining revised estimated
useful life of this intangible.
All goodwill arising from the acquisition of betapharm was assigned to the Company’s generics segment.
pro forma information: The table below reflects unaudited pro forma consolidated results of operations as if both the Falcon and beta Holding GmbH
acquisitions had been made at the beginning of the period presented below:
fiscal year ended 31 march
2006 (un audited)Revenues Rs. 33,766,668
Net income 1,991,090
Earning per equity share Basic 13.00
Diluted 12.98
Weighted average number of equity shares used in computing earnings per equity share
Basic 153,093,316
Diluted 153,403,846
The unaudited proforma consolidated results of operations is presented for illustrative purposes only and is not necessarily indicative of the operating results that
would have occurred if the transaction had been consummated at the date indicated, nor it is necessarily indicative of future operating results of the combined
companies and should not be construed as representative of these amounts for any future dates or periods.
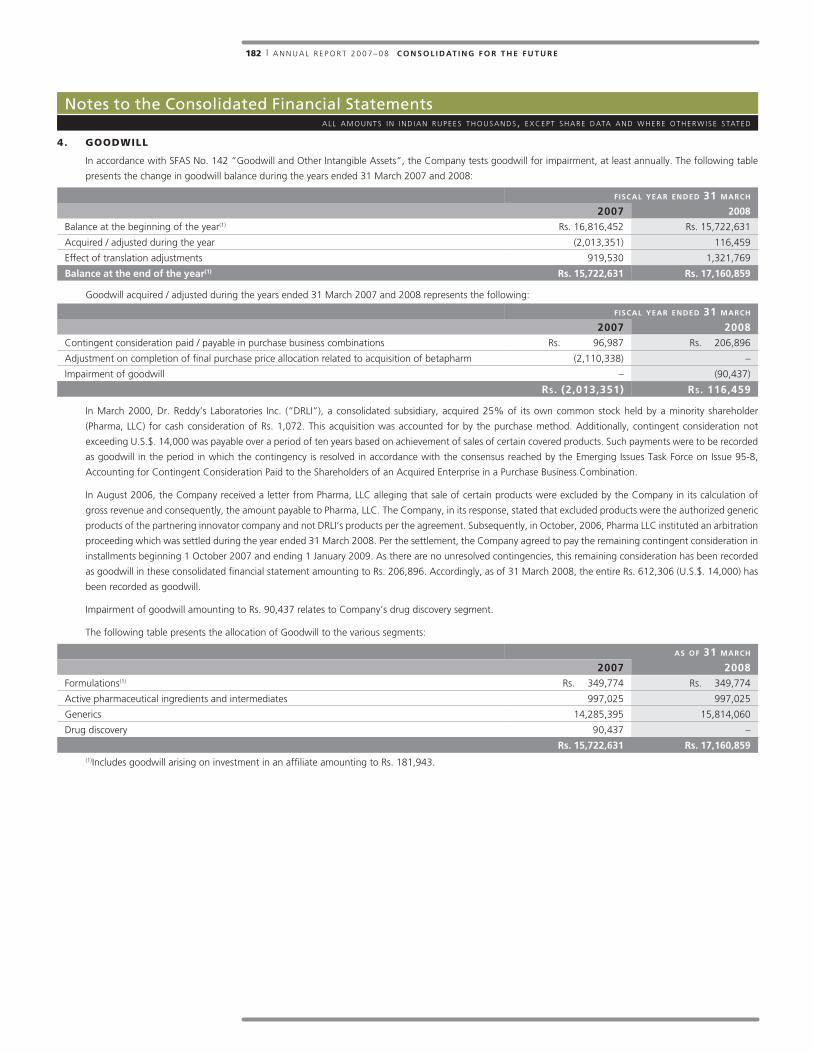
182 | A N N U A L R E P O R T 2 0 0 7 – 0 8 c o n s o l i d at i n g f o r t h e f u t u r e
Auditors’ Report to the Members of dr. Reddy’s laboratory ltd.a l l a m o u n t s i n i n d i a n r u p e e s t h o u s a n d s, e x c e p t s h a r e d ata
notes to the consolidated Financial Statements a l l a m o u n t s i n i n d i a n r u p e e s t h o u s a n d s, e x c e p t s h a r e d ata a n d w h e r e o t h e r w i s e s tat e d
4. gOODwILL
In accordance with SFAS No. 142 “Goodwill and Other Intangible Assets”, the Company tests goodwill for impairment, at least annually. The following table
presents the change in goodwill balance during the years ended 31 March 2007 and 2008:
fiscal year ended 31 march
2007 2008
Balance at the beginning of the year(1) Rs. 16,816,452 Rs. 15,722,631
Acquired / adjusted during the year (2,013,351) 116,459
Effect of translation adjustments 919,530 1,321,769
balance at the end of the year(1) rs. 15,722,631 rs. 17,160,859
Goodwill acquired / adjusted during the years ended 31 March 2007 and 2008 represents the following:
fiscal year ended 31 march
2007 2008Contingent consideration paid / payable in purchase business combinations Rs. 96,987 Rs. 206,896
Adjustment on completion of final purchase price allocation related to acquisition of betapharm (2,110,338) –
Impairment of goodwill – (90,437)
rs. (2,013,351) rs. 116,459
In March 2000, Dr. Reddy’s Laboratories Inc. (“DRLI”), a consolidated subsidiary, acquired 25% of its own common stock held by a minority shareholder
(Pharma, LLC) for cash consideration of Rs. 1,072. This acquisition was accounted for by the purchase method. Additionally, contingent consideration not
exceeding U.S.$. 14,000 was payable over a period of ten years based on achievement of sales of certain covered products. Such payments were to be recorded
as goodwill in the period in which the contingency is resolved in accordance with the consensus reached by the Emerging Issues Task Force on Issue 95-8,
Accounting for Contingent Consideration Paid to the Shareholders of an Acquired Enterprise in a Purchase Business Combination.
In August 2006, the Company received a letter from Pharma, LLC alleging that sale of certain products were excluded by the Company in its calculation of
gross revenue and consequently, the amount payable to Pharma, LLC. The Company, in its response, stated that excluded products were the authorized generic
products of the partnering innovator company and not DRLI’s products per the agreement. Subsequently, in October, 2006, Pharma LLC instituted an arbitration
proceeding which was settled during the year ended 31 March 2008. Per the settlement, the Company agreed to pay the remaining contingent consideration in
installments beginning 1 October 2007 and ending 1 January 2009. As there are no unresolved contingencies, this remaining consideration has been recorded
as goodwill in these consolidated financial statement amounting to Rs. 206,896. Accordingly, as of 31 March 2008, the entire Rs. 612,306 (U.S.$. 14,000) has
been recorded as goodwill.
Impairment of goodwill amounting to Rs. 90,437 relates to Company’s drug discovery segment.
The following table presents the allocation of Goodwill to the various segments:
as of 31 march
2007 2008Formulations(1) Rs. 349,774 Rs. 349,774
Active pharmaceutical ingredients and intermediates 997,025 997,025
Generics 14,285,395 15,814,060
Drug discovery 90,437 –
rs. 15,722,631 rs. 17,160,859(1)Includes goodwill arising on investment in an affiliate amounting to Rs. 181,943.

183 | D R . R E D D Y ’ S L A B O R AT O R I E S LT D u s g a a p c o n s o l i d at e d f i n a n c i a l s
Annexure to the Auditor's Reporta l l a m o u n t s i n i n d i a n r u p e e s t h o u s a n d s, e x c e p t s h a r e d ata
5. INTANgIBLE ASSETS, NET
In accordance with SFAS No. 142, “Goodwill and Other Intangible Assets”, intangible assets are amortized over the expected benefit period or the legal life,
whichever is shorter.
Intangible assets consist of the following:
as of 31 march 2007
gross carrying
amount
accumulated
amortization
net carrying value
Trademarks with finite useful life Rs. 2,597,962 Rs. 2,359,221 Rs. 238,741
Trademarks with indefinite life 5,127,473 – 5,127,473
Product related intangibles 14,078,320 1,078,804 12,999,516
Beneficial toll manufacturing contract 665,505 179,691 485,814
Non-competition arrangements 131,214 120,030 11,184
Marketing rights 8,511 8,511 –
Customer-related intangibles 177,375 153,435 23,940
Other intangibles 10,624 8,879 1,745
rs. 22,796,984 rs. 3,908,571 rs. 18,888,413
as of 31 march 2008
gross carrying
amount
accumulated
amortization
net carrying value
Trademarks with finite useful life Rs. 2,581,217 Rs. 2,522,280 Rs. 58,937
Trademarks with indefinite life 5,620,563 – 5,620,563
Product related intangibles 11,866,772 1,250,261 10,616,511
Beneficial toll manufacturing contract 729,531 482,419 247,112
Non-competition arrangements 128,216 123,776 4,440
Marketing rights 7,982 7,982 –
Customer-related intangibles 236,100 161,032 75,068
Other intangibles 9,962 9,962 –
rs. 21,180,343 rs. 4,557,712 rs. 16,622,631
The amortization expense for the years ended 31 March 2006, 2007 and 2008 was Rs. 419,867, Rs. 1,570,894 and Rs. 1,614,806, respectively.
Estimated amortization expense for the next five years and thereafter with respect to such assets is as follows:
for the fiscal year ended 31 march
2009 Rs. 1,191,471
2010 886,083
2011 885,625
2012 859,347
2013 845,765
Thereafter 6,333,777
total rs. 11,002,068
The intangible assets (net of accumulated amortization) as of 31 March 2007 have been allocated to the following segments:
formulations generics
custom
pharmaceutical
services
total
Trademarks with finite useful life Rs. 233,108 Rs. 5,633 – Rs. 238,741
Trademarks with indefinite life – 5,127,473 – 5,127,473
Product related intangibles – 12,999,516 – 12,999,516
Beneficial toll manufacturing contract – 485,814 – 485,814
Non-competition arrangements – 177 11,007 11,184
Customer-related intangibles – 584 23,356 23,940
Other intangibles – 1,745 – 1,745
rs. 233,108 rs. 18,620,942 rs. 34,363 rs. 18,888,413
notes to the consolidated Financial Statements a l l a m o u n t s i n i n d i a n r u p e e s t h o u s a n d s, e x c e p t s h a r e d ata a n d w h e r e o t h e r w i s e s tat e d

184 | A N N U A L R E P O R T 2 0 0 7 – 0 8 c o n s o l i d at i n g f o r t h e f u t u r e
Auditors’ Report to the Members of dr. Reddy’s laboratory ltd.a l l a m o u n t s i n i n d i a n r u p e e s t h o u s a n d s, e x c e p t s h a r e d ata
The intangible assets (net of amortization) as of 31 March 2008 have been allocated to the following segments:
formulations generics
custom
pharmaceutical
services
total
Trademarks with finite useful life Rs. 56,462 Rs. 2,475 – Rs. 58,937
Trademarks with indefinite life – 5,620,563 – 5,620,563
Product related intangibles – 10,616,511 – 10,616,511
Beneficial toll manufacturing contract – 247,112 – 247,112
Non-competition arrangements – – 4,440 4,440
Customer-related intangibles 3,572 65,461 6,035 75,068
rs. 60,034 rs. 16,552,122 rs. 10,475 rs. 16,622,631
Write-down of intangible assets acquired in Trigenesis acquisition
In 2004, the Company, through the acquisition of Trigenesis Therapeutics Inc. (“Trigenesis”), acquired certain technology platforms and marketing rights for a
total consideration of Rs. 496,715 (U.S.$. 11,000) which were accounted as purchase of intangible assets. During the year ended 31 March 2007, the Company
completed a detailed review of business opportunities in respect of these core technology platforms and marketing rights. Based on this review, the Company
determined that further commercialization of these intangible assets may not be economically viable due to further regulatory approval process requirements
and unfeasible partnering prospects, and therefore discontinued its efforts to further develop these assets. Accordingly, the net carrying value of these intangible
assets was written down to Rs. Nil, by recording a write-down of Rs. 213,518. This write down, which has been disclosed under “Write-down of intangible
assets” in the consolidated statement of operations for the year ended 31 March 2007, relates to the Company’s generics segment.
Change in estimated useful life of beneficial toll manufacturing contract intangible
betapharm primarily sourced its products from Salutas GmbH (“Salutas”) under a long-term supply contract. The contract gave betapharm a benefit by way of a
longer commitment period to supply products at favorable purchase price. Accordingly, at the time of betapharm’s purchase price allocation, this contract was
identified as a beneficial toll manufacturing contract and recorded as an intangible asset. In January 2007, Salutas served a termination notice to betapharm
cancelling its future commitment to supply products under this contract and renegotiated the terms and prices under this contract. This resulted in a reduction in
the overall committed supply period from 58 months to 24 months and increased procurement prices. Based on this amendment in January 2007, the Company
revised its estimated useful life of this intangible and is amortizing the balance unamortized amount as on the date of such amendment over the remaining
useful life of the intangible.
Write-down of intangible assets acquired in betapharm acquisition
During the year ended 31 March 2007, triggered by the above contract amendment with Salutas resulting in supply constraints in the short-term period and
increased procurement prices and certain market events comprising continuing decrease in market prices and increased competitive intensity, the Company
tested carrying value of betapharm intangibles for impairment. The carrying value of these intangibles included certain product related intangibles and the
‘beta’ brand. ‘beta’ brand was fair valued applying the relief from royalty method. The product related intangibles were fair valued based on discounted cash
flow approach. As a result of this review, the Company recorded a write-down of intangible assets amounting to Rs. 1,556,703 and adjusted the carrying value
of the ‘beta’ brand and certain product related intangibles as of 31 March 2007. This write-down, which has been disclosed under “Write-down of intangible
assets” in the consolidated statement of operations for the year ended 31 March 2007, relates to the Company’s generics segment.
During the year ended 31 March 2008, triggered by certain adverse market conditions such as decrease in market prices and an increasing trend in certain new
type of rebates being negotiated with State Healthcare Insurance Fund (“SHI”) companies, and further affected by supply constraints, the Company tested
carrying value of betapharm intangibles for impairment. As a result of this review, the Company recorded a write-down of intangible assets amounting to
Rs. 2,361,008 and adjusted the carrying value of certain product related intangibles as of 31 March 2008. The fair value of these intangibles was determined
based on discounted cash flow approach. This write down, which has been disclosed under “Write-down of intangible assets” in the consolidated statement
of operations for the year ended 31 March 2008, relates to the Company’s generics segment.
Write-down of intangible assets acquired in Iberia acquisition
In May 2006, the Company acquired marketing authorizations and marketing authorization applications (“MAAs”) for certain specialty pharmaceutical products,
along with the related trademark rights and physical inventories of the products, from Laboratorios Litaphar, S.A. (“Litaphar”) for a total consideration of
Rs. 218,920 (Euro 3,740). Litaphar, a Spanish company was engaged in the promotion, distribution and commercialization of pharmaceutical products and
chemical-pharmaceutical specialties. As a result of this acquisition, the Company acquired an opportunity to sell those products using their existing brand names
through its generics sales and marketing network. During the year ended 31 March 2008, triggered by certain adverse market conditions such as decrease
in sales and increase in cost of procurement, the Company tested carrying value of litaphar intangibles for impairment. The fair values of these intangibles
were determined based on discounted cash flow approach. As a result of this review, the Company recorded a write-down of intangible assets amounting to
Rs. 127,506 and adjusted the carrying value of product related intangibles as of 31 March 2008. The above write down, which has been disclosed under “Write-
down of intangible assets” in the consolidated statement of operations, relates to the Company’s generics segment.
notes to the consolidated Financial Statements a l l a m o u n t s i n i n d i a n r u p e e s t h o u s a n d s, e x c e p t s h a r e d ata a n d w h e r e o t h e r w i s e s tat e d

185 | D R . R E D D Y ’ S L A B O R AT O R I E S LT D u s g a a p c o n s o l i d at e d f i n a n c i a l s
Annexure to the Auditor's Reporta l l a m o u n t s i n i n d i a n r u p e e s t h o u s a n d s, e x c e p t s h a r e d ata
6. fORMATION Of pERLECAN pHARMA pRIvATE LIMITED
In September 2005, the Company announced the formation of an integrated drug development company, Perlecan Pharma Private Limited (“Perlecan Pharma”),
with Citigroup Venture Capital International Growth Partnership Mauritius Limited (“Citigroup Venture”) and ICICI Venture Funds Management Company
(“ICICI Venture”). Perlecan Pharma is engaged in the clinical development and out-licensing of New Chemical Entity (“NCE”) assets. Citigroup Venture and ICICI
Venture each committed to contribute Rs. 1,003,725 (U.S.$. 22,500) and the Company committed to contribute Rs. 340,000 (U.S.$. 7,500) towards equity in
Perlecan Pharma. The arrangement was subject to certain closing conditions, which were completed on 27 March 2006 resulting in an amendment of certain
terms of the investment agreement.
As a result, the Company owned approximately 14.28% of the equity of Perlecan Pharma as of 31 March 2006. In addition, Perlecan Pharma is to issue to the
Company warrants to purchase 45 million equity shares of Perlecan Pharma, at an exercise price of Re.1.00 per equity share, the exercise of which is contingent
upon the success of certain research and development milestones. If the warrants are fully exercised, then the Company will own approximately 62.5% of the
equity of Perlecan Pharma. Further, three out of seven directors on the Board of Directors of Perlecan Pharma will be designated by the Company. In addition,
as per the terms of the arrangement, the Company will have the first right to conduct product development and clinical trials on behalf of Perlecan Pharma on
an arms length basis subject to the final decision by the board of directors of Perlecan Pharma. Considering these factors the Company has accounted for its
investment in Perlecan Pharma in accordance with APB 18, “The Equity Method of Accounting for Investments in Common Stock”.
As of 31 March 2006, the three investors had invested Rs. 705,700 (U.S.$. 15,818) in Perlecan Pharma. The Company’s share of equity investment was
Rs. 100,800 (U.S.$. 2,259). The Company was also committed to invest an additional amount of Rs. 239,200 (U.S.$. 5,241) as its proportionate equity contribution
in the future. As per the terms of the amended agreement, the Company was to be reimbursed by Perlecan Pharma for research and development costs of
Rs. 231,023 that were incurred by the Company prior to closing.
The Company’s equity in the loss of Perlecan Pharma for the period 28 March 2006 through 31 March 2006 amounted to Rs. 40,000. The reimbursement for
research and development costs incurred by the Company prior to the closing has been applied to reduce the carrying value of the equity investment in Perlecan
Pharma as of 31 March 2006 to zero, with the remaining balance of Rs. 170,223 reflected as other liability as of 31 March 2006.
During the year ended 31 March 2007, the Company and the other two investors invested additional amounts of Rs. 69,200 and Rs. 412,700, respectively, in
Perlecan Pharma. As a result, as of 31 March 2007, the Company owned approximately 14.31% of the equity of Perlecan Pharma. The Company’s equity in the
loss of Perlecan Pharma for the year ended 31 March 2007 amounted to Rs. 63,339. Further as of 31 March 2007, the carrying value of Company’s investment
in Perlecan Pharma was Rs. 3,309 and the other liability balance was Rs. 170,223.
The Company’s equity in the loss of Perlecan Pharma for the year ended 31 March 2008 amounted to Rs. 12,675. Further, as of 31 March 2008, the carrying
value of Company’s investment in Perlecan Pharma was Rs. Nil, the other liability balance was Rs. 179,589 and the Company is committed to make additional
equity investment of Rs. 170,000 in Perlecan Pharma.
The Company will continue to reflect its equity in losses of Perlecan Pharma to the extent of its net investment and future funding commitments.
7. CASH, CASH EQUIvALENTS AND RESTRICTED CASH
Cash and cash equivalents as of 31 March 2007 and 2008 amounted to Rs. 17,981,447 and Rs. 7,398,284, respectively. These amounts primarily consisted of
current and time deposits with banks. This excludes restricted cash included in current assets of Rs. 606,159 and Rs. 23,156 as of 31 March 2007 and 2008,
respectively, in respect of following obligations or commitments of the Company:
as of 31 march
2007 2008Against performance guarantees issued by the Company Rs. 1,080 Rs. 1,268
Against long term debt from Citibank 584,517 –
Against unclaimed dividend 13,140 14,372
Against other obligations 7,422 7,516
total restricted cash rs. 606,159 rs. 23,156
The fair value of cash and cash equivalents approximate their carrying values. During the year ended 31 March 2008, restriction on cash deposits amounting to
Rs. 584,517 that were pledged against long-term debt taken from Citibank, was released and these cash deposits were liquidated.
8. ACCOUNTS RECEIvABLE, NET
Accounts receivable as of 31 March 2007 and 2008 are stated net of allowance for doubtful accounts. The Company maintains an allowance for doubtful
accounts based on financial condition of the customer, ageing of the accounts receivable, historical experience of collections from customers and the current
economic environment.
notes to the consolidated Financial Statements a l l a m o u n t s i n i n d i a n r u p e e s t h o u s a n d s, e x c e p t s h a r e d ata a n d w h e r e o t h e r w i s e s tat e d

186 | A N N U A L R E P O R T 2 0 0 7 – 0 8 c o n s o l i d at i n g f o r t h e f u t u r e
Auditors’ Report to the Members of dr. Reddy’s laboratory ltd.a l l a m o u n t s i n i n d i a n r u p e e s t h o u s a n d s, e x c e p t s h a r e d ata
The activity in the allowance for doubtful accounts receivable is given below:
fiscal year ended 31 march
2006 2007 2008Balance at the beginning of the year Rs. 171,154 Rs. 188,001 Rs. 293,618
Additional provision 33,629 151,620 226,932
Bad debts charged to provision (16,782) (46,003) (59,429)
balance at the end of the year rs. 188,001 rs. 293,618 rs. 461,121
9. INvENTORIES
Inventories consist of the following:
as of 31 march
2007 2008Raw materials Rs. 2,147,896 Rs. 3,226,016
Packing materials, stores and spares 560,629 773,433
Work-in-process 1,674,235 2,345,849
Finished goods 3,162,820 4,787,532
rs. 7,545,580 rs. 11,132,830
During the years ended 31 March 2006, 2007 and 2008, the Company recorded inventory write-down of Rs. 100,783, Rs. 306,235 and Rs. 327,997, respectively,
resulting from decline in the market value of certain finished goods and write-down of certain raw materials. These write-down adjustments are included in
cost of revenues.
During the year ended 31 March 2008, the Company recorded a loss on firm purchase commitment on certain finished products under its long-term supply
contract with Salutas amounting to Rs. 268,227, which is included in cost of revenues.
10. OTHER ASSETS
Other assets consist of the following:
as of 31 march
2007 2008Prepaid expenses Rs. 479,141 Rs. 365,879
Advances to suppliers 297,993 499,567
Balances with statutory authorities 1,066,559 946,243
Deposits 240,968 210,772
Export benefits receivable 347,814 464,139
Others 938,751 1,555,924
rs. 3,371,226 rs. 4,042,524
Less: Current assets 3,096,129 3,828,714
275,097 213,810
Balances with statutory authorities represent amounts deposited with the excise authorities and the unutilized excise input credits on purchases. These are
regularly utilized to offset the excise liability on goods produced by the Company. Accordingly, these balances have been classified as current assets.
Deposits mainly comprise telephone, electricity, premises and other deposits. Others mainly represent advance income taxes, interest receivable on fixed
deposits, receivables from banks on derivative contracts etc.
notes to the consolidated Financial Statements a l l a m o u n t s i n i n d i a n r u p e e s t h o u s a n d s, e x c e p t s h a r e d ata a n d w h e r e o t h e r w i s e s tat e d

187 | D R . R E D D Y ’ S L A B O R AT O R I E S LT D u s g a a p c o n s o l i d at e d f i n a n c i a l s
Annexure to the Auditor's Reporta l l a m o u n t s i n i n d i a n r u p e e s t h o u s a n d s, e x c e p t s h a r e d ata
12. INvESTMENT SECURITIES
Investment securities consist of the following:
as of 31 march 2007 as of 31 march 2008
carrying value
gross unrealized
holdingains
gross unrealized
holding losses
fair valuecarrying
value
gross unrealized
holdingains
gross unrealized
holding losses
fair value
AvAILABLE
fOR SALE
Mutual fund units Rs. 15,315 Rs. 10 Rs. – Rs. 15,325 Rs. 3,507,663 Rs. 8,300 Rs. – Rs. 3,515,963
Equity securities 3,096 8,837 – 11,933 3,096 16,106 – 19,202
Debt securities 1,250,020 – (174,731) 1,075,289 1,250,020 – (31,605) 1,218,415
rs. 1,268,431 rs. 8,847 rs. (174,731) rs. 1,102,547 rs. 4,760,779 rs. 24,406 rs. (31,605) rs. 4,753,580
CURRENT:
Less: Current portion
– – – 15,325 – – – 4,753,580
non-current
portion– – – rs. 1,087,222 – – – –
Carrying value of non-marketable equity securities amounted to Rs. 2,728 as of 31 March 2007 and 2008.
Realized gains / (losses) on sale of investment securities during the years ended 31 March 2006, 2007 and 2008 was Rs. (3,924), Rs. 869 and Rs. 110,269,
respectively.
Investments in debt securities, classified as available for sale mature in April, July and October 2008. The following table shows the gross unrealized losses and
fair value of the Company’s investment with unrealized losses that are not deemed to be other-than-temporarily impaired and duration for which the securities
have been in a continuous unrealized loss position for a period of more than twelve months as of 31 March 2008.
31 march 2007 31 march 2008
fair value unrealized losses fair value unrealized losses
Debt securities 1,075,289 174,731 1,218,415 31,605
The unrealized losses on the Company’s investment in debt securities were caused by interest rate changes. The Company had purchased those investments at
a discount relative to their face amount, which is guaranteed by the issuer upon maturity. Since the decline in market value is attributable to changes in interest
rates and not credit quality of the issuer, and the Company has the ability and intent to hold these investments until maturity, the Company does not consider
the decline in fair value of these investments below cost to be other-than-temporary as at 31 March 2008.
11. pROpERTY, pLANT AND EQUIpMENT, NET
Property, plant and equipment consist of the following:
as of 31 march
2007 2008Land Rs. 875,662 Rs. 1,456,439
Buildings 3,063,872 4,147,041
Plant and machinery 9,974,476 12,687,624
Furniture, fixtures and office equipment 936,504 866,810
Vehicles 383,024 437,908
Computer equipment 679,076 888,747
Capital work-in-progress 2,805,221 4,000,647
18,717,835 24,485,216
Accumulated depreciation (6,290,037) (7,719,784)
rs. 12,427,798 rs. 16,765,432
Depreciation expense for the years ended 31 March 2006, 2007 and 2008 was Rs. 1,147,223, Rs. 1,439,298 and Rs. 1,773,498, respectively.
During the year ended 31 March 2008, the Company capitalized interest cost of Rs. 85,484.
notes to the consolidated Financial Statements a l l a m o u n t s i n i n d i a n r u p e e s t h o u s a n d s, e x c e p t s h a r e d ata a n d w h e r e o t h e r w i s e s tat e d

188 | A N N U A L R E P O R T 2 0 0 7 – 0 8 c o n s o l i d at i n g f o r t h e f u t u r e
Auditors’ Report to the Members of dr. Reddy’s laboratory ltd.a l l a m o u n t s i n i n d i a n r u p e e s t h o u s a n d s, e x c e p t s h a r e d ata
13. LEASES
capital leases
Property, plant and equipment include Rs. 239,365 and Rs. 291,650 (accumulated depreciation of Rs. 9,420 and Rs. 24,880) in respect of assets acquired under
capital leases and as of 31 March 2007 and 2008, respectively.
The depreciation expense related to these assets was Rs. 678, Rs. 8,804 and Rs. 13,582 during the years ended 31 March 2006, 2007 and 2008, respectively.
The financial obligations arising from these contractual arrangements are reflected in long-term debt.
operating leases
The Company leases office and residential facilities under operating lease agreements that are renewable on a periodic basis at the option of the lessee. Rental
expense under these leases was Rs. 229,956, Rs. 219,631 and Rs. 264,028 for the years ended 31 March 2006, 2007 and 2008, respectively.
The schedule of future minimum rentals payments in respect of non-cancellable operating leases is set out below:
fiscal year ended 31 march
2009 Rs. 161,543
2010 116,699
2011 92,976
2012 73,437
2013 52,847
Thereafter 30,979
total rs. 528,481
14. INvESTMENT IN AffILIATES
Reddy Kunshan: Reddy Kunshan is engaged in manufacturing and marketing of active pharmaceutical ingredients and intermediates and formulations in
China. During the year ended 31 March 2007, the Company further invested Rs. 89,274 along with one of its other joint venture partners in Reddy Kunshan.
Consequently, the Company’s interest in Reddy Kunshan increased from 51.2% as of 31 March 2006 to 51.3% as of 31 March 2007.
Three directors of the Company are on the Board of directors of Reddy Kunshan, which comprises seven directors. Under the terms of the agreement, all
decisions with respect to operating activities, significant financing and other activities are taken by the approval of at least five of the seven directors of Reddy
Kunshan Board. As the Company does not control Reddy Kunshan’s board and the other partners have significant participating rights, Company’s interest in
Reddy Kunshan has been accounted under the equity method of accounting.
The Company’s equity in the loss of Reddy Kunshan for the year ended 31 March 2006 was Rs. 48,235, and it’s equity in the income of Reddy Kunshan for the
years ended 31 March 2007 and 2008 was Rs. 663 and Rs. 14,458, respectively. The carrying value of Company’s investment in Reddy Kunshan as of 31 March
2007 and 2008 was Rs. 222,596 and Rs. 237,054 respectively.
Perlecan Pharma: As described in Note 6, the Company’s equity in loss of Perlecan Pharma for the year ended 31 March 2006, 2007 and 2008 was Rs. 40,000,
Rs. 63,339 and Rs. 12,675 respectively. The carrying value of Company’s investment in Perlecan Pharma as of 31 March 2007 and 2008 was Rs. 3,309 and
Rs. Nil, respectively.
15. vARIABLE INTEREST ENTITIES
On 30 January 2004, the Company along with two individuals formed APR LLC, a Delaware limited liability company. APR LLC is a development stage enterprise,
which is in the process of developing an active pharmaceutical ingredient (“API”). Equity capital of APR LLC consists of Class A equity interests held by two
individuals and Class B equity interests held by DRL. The initial contribution for the Class A interests was U.S.$. 400 (Rs. 17,487) in cash. Class A interests carry
voting rights and participate in the profits and losses of APR LLC in proportion to the voting interests. DRL contributed U.S.$. 500 (Rs. 21,859) in cash for Class B
non-voting interests, which carry certain protective rights only.
Further, DRL has entered into a development and supply agreement under which DRL and APR LLC will collaborate in the development, marketing and sale
of API and generic dosages. Under the terms of this agreement, DRL is committed to fund the entire research and development of API, which is repayable by
APR LLC upon successful commercialization of the product. DRL has paid U.S.$. Nil (Rs. Nil), U.S.$. 501 (Rs. 21,774) and U.S.$. 99 (Rs. 4,195) during the years
ended 31 March 2006, 2007 and 2008, respectively to fund ongoing research and development of APR LLC. These amounts have been recorded as research
and development expenses in the consolidated statement of operations.
The Company has evaluated this arrangement and concluded that APR LLC is a variable interest entity and the Company is the primary beneficiary. Accordingly,
the Company has consolidated APR LLC under the requirements of FIN 46R.
The creditors of APR LLC do not have any recourse to the general credit of the Company. Further, there are no consolidated assets that are collateral for APR
LLC’s obligations.
notes to the consolidated Financial Statements a l l a m o u n t s i n i n d i a n r u p e e s t h o u s a n d s, e x c e p t s h a r e d ata a n d w h e r e o t h e r w i s e s tat e d

189 | D R . R E D D Y ’ S L A B O R AT O R I E S LT D u s g a a p c o n s o l i d at e d f i n a n c i a l s
Annexure to the Auditor's Reporta l l a m o u n t s i n i n d i a n r u p e e s t h o u s a n d s, e x c e p t s h a r e d ata
16. fINANCIAL INSTRUMENTS
Concentration of risk: Financial instruments that potentially subject the Company to concentrations of credit risk consist principally of cash equivalents, accounts
receivable and investment securities. The Company’s cash resources are invested with financial institutions with high investment grade credit ratings. Limits
have been established by the Company as to the maximum amount of cash that may be invested with any such single entity. To reduce credit risk in respect of
accounts receivable, the Company performs ongoing credit evaluations of customers.
Fair value of financial instruments: The fair value of the Company’s current assets and current liabilities approximate their carrying value because of their short
term maturity. Such financial instruments are classified as current and are expected to be liquidated within the next twelve months. For details of fair value the
Company’s investment securities and long-term debt refer Notes 12 and 19, respectively.
Derivative financial instruments: The Company enters into certain foreign currency forward contracts and option contracts where the counterparty is generally
a bank. The Company does not consider the risk of non-performance by the counterparty to be significant.
The following table presents the aggregate contracted principal amounts of the Company’s derivative financial instruments outstanding:
as of 31 march
2007 2008Forward exchange contracts (U.S.$. – Rs.) (sell) U.S.$. 397,500 U.S.$. 137,500
Forward exchange contracts (U.S.$. – Rs.) (buy) – U.S.$. 77,200
Net Purchased Options (U.S.$. – Rs.) (sell) – U.S.$. 270,000
Cross currency option contracts (EUR / U.S.$.) EUR 30,000 EUR 5,000
Forward exchange contracts (EUR / U.S.$.) (sell) EUR 11,000 EUR –
These foreign currency derivative contracts mature between one to twelve months.
In respect of foreign currency derivative contracts designated as cash flow hedges, the Company has recorded Rs. 35,554 of net loss as a component of
accumulated other comprehensive income within stockholder’s equity as at 31 March 2008. As of 31 March 2008, there were no significant gains or losses on
derivative hedged transactions or portions thereof that have become ineffective as hedges.
In respect of foreign currency derivative contracts not designated as hedges, the Company recorded mark-to-market (gains) / loss of Rs. (196,918) and
Rs. 60,493, as of 31 March 2007 and 2008, respectively, which are included under other current assets / liabilities.
During the years ended 31 March 2006, 2007 and 2008, the Company recorded realized and unrealized losses / (gains) on such derivative contracts amounting
to Rs. 29,230, Rs. (549,522), and Rs. (1,446,472), respectively which are included under foreign exchange (gain) / loss in the consolidated statement of
operations.
17. RESEARCH AND DEvELOpMENT ARRANgEMENTS
During the year ended 31 March 2005, the Company entered into an agreement with I-VEN Pharma Capital Limited (“I-VEN”) for the joint development and
commercialization of generic drug products. As per the terms of the agreement, I-VEN has a right to fund up to fifty percent of the project costs (development,
registration and legal costs) related to these products and the related U.S. Abbreviated New Drug Applications (“ANDA”) filed or to be filed subject to a
maximum contribution of U.S.$. 56,000. The terms of the agreement do not require the Company to repay the funds or purchase I-VEN’s interest in the event
the Company is not able to develop or commercialize one or more of the products under this agreement. However, upon successful commercialization of these
products, the Company will pay I-VEN a royalty on net sales at agreed rates for a period of 5 years from the date of commercialization of each product.
The first tranche of Rs. 985,388 (U.S.$. 22,500) was advanced by I-VEN on 28 March 2005. The amount received from I-VEN has been treated as an advance
and is being recorded in the statement of operation as a reduction from research and development expenses upon completion of specific milestones as detailed
in the agreement. A milestone (i.e. a product filing as per the terms of the agreement) is considered to be completed once the appropriate ANDA has been
submitted by the Company to the U.S. FDA. Achievement of a milestone entitles the Company to reduce the advance and credit research and development
expenses in a fixed amount equal to I-VEN’s share of the research and development costs of the product (which share varies depending on whether the ANDA
is a Paragraph III or Paragraph IV filing).
During the year ended 31 March 2007, the Company signed an amendment agreement with I-VEN to reflect a change in the product portfolio and the royalty
rate. The Company has credited research and development expenses by Rs. 384,488, Rs. 452,763 and Rs. Nil during the years ended 31 March 2006, 2007 and
2008, respectively, upon completion of specified milestones.
notes to the consolidated Financial Statements a l l a m o u n t s i n i n d i a n r u p e e s t h o u s a n d s, e x c e p t s h a r e d ata a n d w h e r e o t h e r w i s e s tat e d

190 | A N N U A L R E P O R T 2 0 0 7 – 0 8 c o n s o l i d at i n g f o r t h e f u t u r e
Auditors’ Report to the Members of dr. Reddy’s laboratory ltd.a l l a m o u n t s i n i n d i a n r u p e e s t h o u s a n d s, e x c e p t s h a r e d ata
18. BORROwINgS fROM BANKS
The Company had lines of credit of Rs. 14,723,000 and Rs. 17,659,000 as of 31 March 2007 and 2008, respectively, from its bankers for working capital
requirements. The line of credit is renewable annually. The Company has an option to draw down these lines of credit based on its requirements.
An interest rate profile of borrowings from banks is given below:
fiscal year ended 31 march
2006 2007 2008Rupee borrowings 10. 5% 9% 9%
Foreign currency borrowings Libor + 65 bps Libor + 60 bps Libor + 50 – 100 bps
19. LONg-TERM DEBT
Long-term debt consists of the following:
as of 31 march
2007 2008Rupee term loan Rs. 19,225 Rs. 13,305
Foreign currency loan 21,269,514 14,374,342
Obligation under capital lease 252,510 291,322
21,541,249 14,678,969
Less: Current portion
– Rupee term loan 5,920 5,920
– Foreign currency loan 3,658,691 1,796,792
– Obligation under capital lease 5,655 12,094
3,670,266 1,814,806
Non Current Portion
– Rupee term loan 13,305 7,385
– Foreign currency Loan 17,610,823 12,577,550
– Obligation under capital lease transaction 246,855 279,228
rs. 17,870,983 rs. 12,864,163
Rupee term loan represents a loan from Indian Renewable Energy Development Agency Limited which is secured by way of hypothecation of specific movable
assets pertaining to the Company’s solar grid interactive power plant located in Bachupally, Hyderabad.
Foreign currency loan represents Euro 400 Million loan originally received from Citibank, N.A., Hong Kong to fund the acquisition of betapharm.
During year ended 31 March 2007, the Rs. 21,602,000 (Euro 400 million) loan initially funded by Citibank N.A., Hong Kong was subsequently syndicated into
a non-recourse loan of Rs. 5,787,000 (Euro 100 million) borrowed by Reddy Holding GmbH and a recourse loan of Rs. 15,482,514 (Euro 268 million) borrowed
by Lacock Holding Limited, which was guaranteed by DRL and its wholly owned subsidiaries, OOO DRL, DRLI and DRL U.K. As part of the syndication process,
an amount of Rs. 1,882,620 (Euro 32 million) was repaid to Citibank N.A. The maturity period of the loan ranges from December 2007 till December 2011.
The Company incurred an amount of Rs. 429,808 as debt issuance costs, which is being amortized over the debt period.
During year ended 31 March 2008, the Company repaid Rs. 5,482,868 (Euro 100 Million) of non-recourse loan and Rs. 2,250,433 (Euro component of
39.49 Million and USD component of 0.51 MIllion) of recourse loan.
The Company is required to comply with certain financial covenants under the recourse loan, which includes limits on capital expenditure and maintenance
of financial ratios (computed based on local GAAP financial statements) as defined in the loan agreement. Such financial ratio requirements include:
(a) Consolidated Net Debt to Consolidated Earnings Before Interest, Tax, Depreciation and Amortization (“EBITDA”) not to exceed 3.5:1, (b) Consolidated
EBITDA to Consolidated Interest Expenses shall not be less than 3.75:1, (c) Total Debt shall not exceed Consolidated Net worth.
As of 31 March 2008, the Company was in compliance with such financial covenants.
An interest rate profile of long-term debt is given below:
fiscal year ended 31 march
2006 2007 2008Rupee term loan 2% 2% 2%
Foreign currency loan EURIBOR + 150 bpsEURIBOR + 70 bps-200 bps
and LIBOR + 70 bps
EURIBOR+70 bps-200 bps
and LIBOR + 70 bps
notes to the consolidated Financial Statements a l l a m o u n t s i n i n d i a n r u p e e s t h o u s a n d s, e x c e p t s h a r e d ata a n d w h e r e o t h e r w i s e s tat e d

191 | D R . R E D D Y ’ S L A B O R AT O R I E S LT D u s g a a p c o n s o l i d at e d f i n a n c i a l s
Annexure to the Auditor's Reporta l l a m o u n t s i n i n d i a n r u p e e s t h o u s a n d s, e x c e p t s h a r e d ata
A maturity profile of the long-term debt outstanding as of 31 March 2008 is as follows:
maturing in the year ending 31 march
rupee loanforeign
currency loancapital lease total
2009 5,920 1,796,792 12,094 1,814,806
2010 5,920 3,294,121 15.660 3,315,701
2011 1,465 3,893,051 14,077 3,908,593
2012 – 5,390,378 7,970 5,398,348
2013 – – 8,485 8,485
Thereafter – – 233,036 233,036
13,305 14,374,342 291,322 14,678,969
The fair value of outstanding payments on the Rupee term loan was Rs. 16,562 and Rs. 11,008 as of 31 March 2007 and 2008, respectively. The fair value of
the foreign currency loan and the capital lease obligation approximate their carrying value as of 31 March 2007 and 2008, respectively.
20. STOCKHOLDERS’ EQUITY
Equity shares and dividend
The Company presently has only one class of equity shares. For all matters submitted to vote in the shareholders meeting, every holder of equity share, as
reflected in the records of the Company on the date of the shareholders meeting shall have one vote in respect of each share held.
Indian law mandates that the dividends shall be declared out of the distributable profits only after the transfer of up to 10% of net income computed in
accordance with current regulations to a general reserve. Should the Company declare and pay dividends, such dividends will be paid in Indian rupees to each
holder of equity shares in proportion to the number of shares held to the total equity shares outstanding as on that date. Indian law on foreign exchange govern
the remittance of dividend outside India.
In the event of liquidation of the Company, all preferential amounts, if any, shall be discharged by the Company. The remaining assets of the Company, shall be
distributed to the holders of equity shares in proportion to the number of shares held to the total equity shares outstanding as on that date.
Final dividends on common stock are recorded as a liability on the date of their approval by the shareholders and interim dividends are recorded as a liability on
the date of declaration by the Board of directors. The Company paid dividends (including dividend tax) of Rs. 436,368, Rs. 437,497 and Rs. 737,287 during the
years ended 31 March 2006, 2007 and 2008, respectively. The dividend per share was Rs. 2.50, Rs. 2.50 and Rs. 3.75 during the years ended 31 March 2006,
2007 and 2008, respectively.
During the year ended 31 March 2007, the shareholders of the Company approved a one-for-one stock split effected in the form of a stock dividend.
Consequently, the authorized share capital of the Company was increased from Rs. 500,000 as of 31 March 2006 to Rs. 1,000,000 as of 31 March 2007 and
2008, respectively.
The information pertaining to number of shares, number of options, exercise price, earnings per share and dividend per share has been retroactively adjusted
for all the periods presented in the consolidated financial statements, except for options earmarked under Category B of the DRL 2002 plan where the exercise
price is equal to the par value of the underlying equity shares (i.e. Rs. 5 per option).
21. EMpLOYEE STOCK INCENTIvE pLANS
Dr. Reddy’s Employees Stock Option Plan-2002 (the “DRL 2002 Plan”):
The Company instituted the DRL 2002 Plan for all eligible employees in pursuance of the special resolution approved by the shareholders in the Annual General
Meeting held on 24 September 2001. The DRL 2002 Plan covers all employees of DRL and all employees and directors of its subsidiaries. The Compensation
Committee of the Board (the “Compensation Committee”) shall administer the DRL 2002 Plan and grant stock options to eligible employees of the Company
and its subsidiaries. The Compensation Committee shall determine the employees eligible for receiving the options, the number of options to be granted, the
exercise price, the vesting period and the exercise period. The vesting period is determined for all options issued on the date of grant. The maximum contractual
term for aforementioned stock option plan is generally five years. The options issued under the DRL 2002 Plan vest in periods ranging between one and four
years.
The DRL 2002 Plan was amended on 28 July 2004 at the annual general meeting of shareholders to provide for stock option grants in two categories:
category a: 1,721,700 stock options out of the total of 2,295,478 options reserved for grant having an exercise price equal to the fair market value of the
underlying equity share on the date of grant; and
category b: 573,778 stock options out of the total of 2,295,478 options reserved for grant having an exercise price equal to the par value of the underlying
equity share (i.e. Rs. 5 per option).
The DRL 2002 Plan was further amended on 27 July 2005 at the annual general meeting of shareholders to provide for stock option grants in two categories:
notes to the consolidated Financial Statements a l l a m o u n t s i n i n d i a n r u p e e s t h o u s a n d s, e x c e p t s h a r e d ata a n d w h e r e o t h e r w i s e s tat e d

192 | A N N U A L R E P O R T 2 0 0 7 – 0 8 c o n s o l i d at i n g f o r t h e f u t u r e
Auditors’ Report to the Members of dr. Reddy’s laboratory ltd.a l l a m o u n t s i n i n d i a n r u p e e s t h o u s a n d s, e x c e p t s h a r e d ata
category a: 300,000 stock options out of the total of 2,295,478 options reserved for grant having an exercise price equal to the fair market value of the
underlying equity share on the date of grant; and
category b: 1,995,478 stock options out of the total of 2,295,478 options reserved for grant having an exercise price equal to the par value of the underlying
equity share (i.e. Rs. 5 per option).
Under the DRL 2002 Plan, the exercise price of the fair market value options granted under Category A above is determined based on the average closing price
for 30 days prior to the grant in the stock exchange where there is highest trading volume during that period. Notwithstanding the foregoing, the Compensation
Committee may, after obtaining the approval of the shareholders in the annual general meeting, grant options with a per share exercise price other than fair
market value and par value of the equity shares.
After the stock split effected in the form of stock dividend issued by the Company in August 2006, the DRL 2002 Plan provides for stock options granted in the
above two categories as follows:
particulars
number of options granted under
category a
number of options granted under
category b
total
Options reserved under original Plan 300,000 1,995,478 2,295,478
Options exercised prior to stock dividend date (A) 94,061 147,793 241,854
Balance of shares that can be allotted on exercise of options (B) 205,939 1,847,685 2,053,624
Options arising from stock dividend (C) 205,939 1,847,685 2,053,624
Options reserved after stock dividend (A+B+C) 505,939 3,843,163 4,349,102
In April 2007, certain employees surrendered their par value options under category B of the DRL 2002 Plan in exchange for par value options under category
B of the DRL 2007 Plan (discussed below). The incremental cost due to such modifications was insignificant.
The Compensation Committee at its meeting held in October 2007, proposed that the Company should absorb the full liability of FBT on exercise of all stock
options granted till the date of this resolution. Further, in respect of new grants to be made by the Company subsequent to the date of this resolution, FBT will
be recovered from employees upon exercise of stock options.
The above amendment would be proposed at the ensuing Annual General Meeting of the shareholders proposed to be held in July 2008.
Stock option activity under the DRL 2002 Plan for the two categories of options was as follows:
category a – fair market value options fiscal year ended 31 march 2006
shares arising out of
options
range of exercise
prices
weighted-average
exercise price
weighted-average
remaining contractual life
(months)
Outstanding at the beginning of the year 597,900 Rs. 373.5 – 574.50 Rs. 488.66 50
Granted during the year 65,000 362.50 362.50 81
Expired / forfeited during the year (273,400) 362.5 – 574.50 472.18 –
Exercised during the year (155,000) 441.5 – 488.65 471.92 –
Outstanding at the end of the year 234,500 362.5 – 531.51 439.43 64
Exercisable at the end of the year 75,764 Rs. 362.5 – 531.51 Rs. 471.93 45
category a – fair market value options fiscal year ended 31 march 2007
shares arising out of
options
range of exercise
prices
weighted-average
exercise price
weighted-average
remaining contractual life
(months)
Outstanding at the beginning of the year 234,500 362.5 – 531.51 439.43 64
Expired / forfeited during the year (11,600) 441.5 – 574.50 527.80 –
Exercised during the year (31,320) 441.5 – 531.51 477.40 –
Outstanding at the end of the year 191,580 362.5 – 531.51 427.90 54
Exercisable at the end of the year 103,680 Rs. 362.5 – 531.51 Rs. 447.58 38
notes to the consolidated Financial Statements a l l a m o u n t s i n i n d i a n r u p e e s t h o u s a n d s, e x c e p t s h a r e d ata a n d w h e r e o t h e r w i s e s tat e d

193 | D R . R E D D Y ’ S L A B O R AT O R I E S LT D u s g a a p c o n s o l i d at e d f i n a n c i a l s
Annexure to the Auditor's Reporta l l a m o u n t s i n i n d i a n r u p e e s t h o u s a n d s, e x c e p t s h a r e d ata
category a – fair market value options fiscal year ended 31 march 2008
shares arising out of
options
range of exercise
prices
weighted-average
exercise price
weighted-average
remaining contractual life
(months)
Outstanding at the beginning of the year 191,580 Rs. 362.5 – 531.51 Rs. 427.90 38
Expired / forfeited during the year (2,100) 442.50 442.50 –
Exercised during the year (30,700) 441.5 – 531.51 458.32 –
Outstanding at the end of the year 158,780 362.5 – 531.51 421.79 44
Exercisable / vested at the end of the year 119,830 362.5 – 531.51 433.05 36
Expected to vest at the end of the year 33,030 362.5 – 442.50 387.20 67
category b – par value options fiscal year ended 31 march 2006
shares arising out of options
exercise
prices
weighted-average
exercise price
weighted-average
remaining contractual life
(months)
Outstanding at the beginning of the year 759,098 Rs. 5 Rs. 5 84
Granted during the year 433,720 5 5 81
Forfeited during the year (266,608) 5 5 –
Exercised during the year (196,242) 5 5 –
Outstanding at the end of the year 729,968 5 5 81
Exercisable at the end of the year 36,272 Rs. 5 Rs. 5 59
category b – par value options fiscal year ended 31 march 2007
shares arising out of options
exercise
prices
weighted-average
exercise price
weighted-average
remaining contractual life
(months)
Outstanding at the beginning of the year 729,968 Rs. 5 Rs. 5 81
Granted during the year 427,060 5 5 81
Forfeited during the year (76,056) 5 5 –
Exercised during the year (191,720) 5 5 –
Outstanding at the end of the year 889,252 5 5 77
Exercisable at the end of the year 43,256 Rs. 5 Rs. 5 51
category b – par value options fiscal year ended 31 march 2008
shares arising out of options
exercise
prices
weighted-average
exercise price
weighted-average
remaining contractual life
(months)
Outstanding at the beginning of the year 889,252 Rs. 5 Rs. 5 77
Granted during the year 386,060 5 5 91
Forfeited during the year (133,240) 5 5 –
Surrendered by employees during the period (138,418) 5 5 –
Exercised during the period (229,866) 5 5 –
Outstanding at the end of the period 773,788 5 5 74
Exercisable / vested at the end of the period 72,364 Rs. 5 Rs. 5 50
Expected to vest at the end of the year 594,808 Rs. 5 Rs. 5 76
The weighted average grant date fair value of options granted during the year ended 31 March 2006 under category A – Fair market value options was
Rs. 293.42. The weighted average grant date fair value of options granted during the years ended 31 March 2006, 2007 and 2008 under category B par
value options was Rs. 705.88, Rs. 575.36 and Rs. 549.57, respectively. The aggregate intrinsic value of options exercised under the DRL 2002 Plan (both
category A and B) during the years ended 31 March 2006, 2007 and 2008 was Rs. 142 million, Rs. 145 million and Rs. 151 million, respectively. As of 31
March 2008, options outstanding and exercisable (vested) under the DRL 2002 Plan (both category A and B) had an aggregate intrinsic value of Rs. 481 million
and Rs. 61 million, respectively. As of 31 March 2008 the intrinsic value of options expected to vest under the DRL 2002 Plan (both category A and B) had an
aggregate intrinsic value of Rs. 355 million.
notes to the consolidated Financial Statements a l l a m o u n t s i n i n d i a n r u p e e s t h o u s a n d s, e x c e p t s h a r e d ata a n d w h e r e o t h e r w i s e s tat e d

194 | A N N U A L R E P O R T 2 0 0 7 – 0 8 c o n s o l i d at i n g f o r t h e f u t u r e
notes to the consolidated Financial Statements a l l a m o u n t s i n i n d i a n r u p e e s t h o u s a n d s, e x c e p t s h a r e d ata a n d w h e r e o t h e r w i s e s tat e d
Dr. Reddy’s Employees ADR Stock Option Plan-2007 (the “DRL 2007 Plan”):
The Company instituted the DRL 2007 Plan for all eligible employees in pursuance of the special resolution approved by the shareholders in the Annual General
Meeting held on 27 July 2005. The DRL 2007 Plan came into effect on approval of the Board of Directors on 22 January 2007. The DRL 2007 Plan covers all
employees of DRL and all employees and directors of its subsidiaries. The Compensation Committee administers the DRL 2007 Plan and grants stock options to
eligible employees of the Company and its subsidiaries. The Compensation Committee determines the employees eligible for receiving the options, the number
of options to be granted, the exercise price, the vesting period and the exercise period. The vesting period is determined for all options issued on the date of
grant. The maximum contractual term for aforementioned stock option plan is generally five years. The options issued under DRL 2007 plan vest in periods
ranging between one and four years.
The DRL 2007 Plan provides for grant of stock options in two categories:
category a: 382,695 stock options out of the total of 1,530,779 stock options reserved for grant having an exercise price equal to the fair market value of the
underlying equity share on the date of grant; and
category b: 1,148,084 stock options out of the total of 1,530,779 stock options reserved for grant having an exercise price equal to the par value of the
underlying equity share (i.e. Rs. 5 per option).
Stock option activity under the DRL 2007 Plan during the year ended 31 March 2008 was as follows:
category b – par value options fiscal year ended 31 march 2007
shares arising out of
options
exercise priceweighted-average
exercise price
weighted-average
remaining contractual life
(months)
Granted during the year 206,818 Rs. 5 5 84
Forfeited during the year (24,040) 5 5 –
Outstanding at the end of the year 182,778 5 5 73
Exercisable / vested at the end of the year – – – –
Exercisable / vested at the end of the year 154,996 Rs. 5 Rs. 5 73
The weighted average grant date fair value of options granted during the year ended 31 March 2008 under category-B par value options was Rs. 550.95. As of
31 March 2008, options outstanding under the DRL 2007 Plan had an aggregate intrinsic value of Rs. 107 million. As of 31 March 2008 the intrinsic value of
options expected to vest under the DRL 2007 Plan (both category A and B) had an aggregate intrinsic value of Rs. 91 million.
Aurigene Discovery Technologies Ltd. Employee Stock Option Plan 2003 (the “Aurigene ESOP Plan”):
Aurigene Discovery Technologies Limited (“Aurigene”), a consolidated subsidiary, adopted the Aurigene Discovery Technologies Limited Employee Stock Option
Plan (the “Aurigene Employee Plan”) to provide for issuance of stock options to employees of Aurigene and its subsidiary, Aurigene Discovery Technologies
Inc., who have completed one full year of service with Aurigene and its subsidiary. Aurigene has reserved 4,550,000 of its ordinary shares for issuance under
this plan. Under the Aurigene Employee Plan, stock options may be granted at an exercise price as determined by Aurigene’s Compensation Committee. The
maximum contractual term for aforementioned stock option plan is generally three years. The options issued under Aurigene ESOP Plan vest in periods ranging
from one to three years, including certain options which vest immediately on grant.
During the year ended 31 March 2008, the plan was amended to increase the total number of options reserved for issuance to 7,500,000 and recovery of FBT
from employees.
As of 31 March 2008, there were 2,961,116 stock options outstanding under the Aurigene Employee Plan.
Stock option activity under the Aurigene ESOP Plan was as follows:
fiscal year ended 31 march 2006
shares arising out ofoptions
exercise priceweighted-average
exercise price
weighted-average
remaining contractual life
(months)
Outstanding at the beginning of the year 197,178 Rs. 10 Rs. 10 59
Granted during the year 500,000 10 10 70
Expired / Forfeited during the year (168,271) 10 10 –
Outstanding at the end of the year 528,907 Rs. 10 Rs. 10 67
Exercisable at the end of the year – – – –

195 | D R . R E D D Y ’ S L A B O R AT O R I E S LT D u s g a a p c o n s o l i d at e d f i n a n c i a l s
fiscal year ended 31 march 2007
shares arising out ofoptions
exercise priceweighted-average
exercise price
weighted-average
remaining contractual life
(months)
Outstanding at the beginning of the year 528,907 Rs. 10 Rs. 10 67
Granted during the year 910,786 10 10 66
Expired / Forfeited during the year (256,110) 10 10 –
Outstanding at the end of the year 1,183,583 10 10 62
Exercisable at the end of the year 7,470 Rs. 10 Rs. 10 28
fiscal year ended 31 march 2008
shares arising out ofoptions
range of exercise price
weighted-average
exercise price
weighted-average
remaining contractual life
(months)
Outstanding at the beginning of the year 1,183,583 Rs. 10.00 Rs. 10.00 62
Granted during the year 1,877,369 14.99 14.99 42
Expired / Forfeited during the year (99,836) 10.00 10.00 –
Outstanding at the end of the year 2,961,116 10-14.99 13.16 45
Exercisable / vested at the end of the year 1,260,815 10-14.99 14.75 33
Expected to vest at the end of the year 1,441,855 Rs. 10-14.99 Rs. 12.18 54
The option weighted average grant date fair value of options granted under the Aurigene ESOP Plan during the years ended 31 March 2006, 2007 and 2008
was Rs. 4.01, Rs. 3.11 and Rs. 18.35, respectively. As of 31 March 2008, options outstanding and exercisable under Aurigene ESOP Plan had an aggregate
intrinsic value of Rs. 47 million and Rs. 18 million, respectively. As of 31 March 2008 the intrinsic value of options expected to vest under the Aurigene ESOP
Plan had an aggregate intrinsic value of Rs. 26 million.
Aurigene Discovery Technologies Limited, Management Group Stock Grant Plan.
In fiscal 2004, Aurigene adopted the Aurigene Discovery Technologies Limited Management Group Stock Grant Plan (the “Aurigene Management Plan”) to
provide for issuance of stock options to management employees of Aurigene and its subsidiary Aurigene Discovery Technologies Inc. Aurigene has reserved
2,950,000 of its ordinary shares for issuance under this plan. Under the Aurigene Management Plan, stock options may be granted at an exercise price as
determined by Aurigene’s Compensation Committee. As of 31 March 2008, there were no stock options outstanding under the Aurigene Management Plan.
The plan was closed by a resolution of the shareholders in January 2008.
For the years ended 31 March 2006, 2007 and 2008 an amount of Rs. 162,249, Rs. 190,186 and Rs. 257,788 respectively, has been recorded as total employee
stock based compensation expense under all the plans. As of 31 March 2008, there is approximately Rs. 228,868 of total unrecognized compensation cost
related to unvested stock options. This cost is expected to be recognized over a weighted-average period of 3.03 years. The FBT expense incurred during the year
ended 31 March 2008 was Rs. 34,957.
22. ALLOwANCES fOR SALES RETURNS
Product sales are net of allowances for sales returns. The activity in allowances for sales returns is given below:
fiscal year ended 31 march
2006 2007 2008Balance at the beginning of the year Rs. 95,123 Rs. 168,356 Rs. 747,018
Acquired during the year 51,251 – –
Additional provision, net 239,462 1,325,981 164,295
Sales returns charged to the provision (217,480) (747,319) (284,314)
balance at the end of the year rs. 168,356 rs. 747,018 rs. 626,999
notes to the consolidated Financial Statements a l l a m o u n t s i n i n d i a n r u p e e s t h o u s a n d s, e x c e p t s h a r e d ata a n d w h e r e o t h e r w i s e s tat e d

196 | A N N U A L R E P O R T 2 0 0 7 – 0 8 c o n s o l i d at i n g f o r t h e f u t u r e
notes to the consolidated Financial Statements a l l a m o u n t s i n i n d i a n r u p e e s t h o u s a n d s, e x c e p t s h a r e d ata a n d w h e r e o t h e r w i s e s tat e d
23. OTHER OpERATINg (INCOME) / ExpENSE, NET
Other operating (income) / expense, net consist of the following:
fiscal year ended 31 march
2006 2007 2008Loss / (gain) on sale of property, plant and equipment, net Rs. (320,361) Rs. (67,039) Rs. 7,629
Others (7,327) (107,019) (114,256)
rs. (327,688) rs. (174,058) rs. (106,627)
The above gain on sale of property, plant and equipment for the year ended 31 March 2006 includes an amount of Rs.387,337 on sale of one of the
manufacturing facilities of the Company in Goa, India.
24. OTHER INCOME / (ExpENSE) NET
Other income / (expense) consists of the following:
fiscal year ended 31 march
2006 2007 2008Interest expense Rs. (298,603) Rs. (1,575,408) Rs. (1,079,521)
Interest income 717,410 520,709 751,100
Gain / (loss) on sale of available for sale securities, net (3,924) 869 110,269
Other 111,396 285,329 296,808
rs. 526,279 rs. (768,501) rs. 78,656
25. pROfIT SHARE ARRANgEMENTS
In January 2006, the Company entered into an agreement with Merck & Co., Inc. (“Merck”), allowing the Company to distribute and sell generic versions
of finasteride tablets 5 mg and simvastatin tablets 10 mg, 20mg, 40mg and 80mg (sold by Merck under the brand names Proscar® and Zocor®), upon the
expiration of Merck’s patents covering these products, provided that another company obtains 180-day exclusivity after the expiration of the patents of these
products. Subsequent to the Company’s entering into this agreement, the patents for both of these products expired and other companies obtained 180-day
exclusivity, thereby allowing the Company to launch the authorized generics products. Accordingly, the Company launched these products in June 2006. Under
the agreement, during the exclusivity period, the Company procured the products from Merck at specified rates and sold to its customers. Further, as per the
terms of the agreement, the Company pays Merck an additional profit share computed based on a pre-determined formula. During the years ended 31 March
2007, and 2008, the Company recorded net revenues of Rs. 15,812,830 and Rs. 1,939,536, respectively, from sale of authorized generic versions of Proscar®
and Zocor®.
26. SHIppINg COSTS
Selling, general and administrative expenses include shipping and handling costs of Rs. 823,883, Rs. 1,233,308 and Rs. 1,308,632 for the years ended 31 March
2006, 2007 and 2008, respectively.
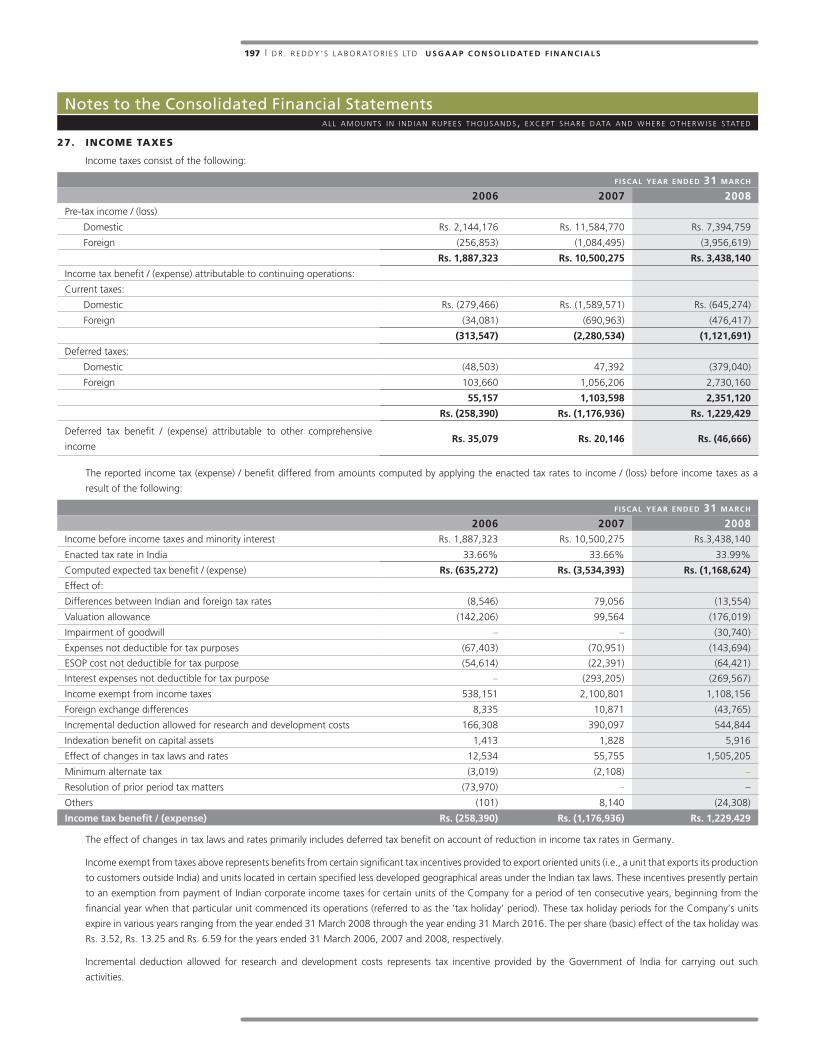
197 | D R . R E D D Y ’ S L A B O R AT O R I E S LT D u s g a a p c o n s o l i d at e d f i n a n c i a l s
notes to the consolidated Financial Statements a l l a m o u n t s i n i n d i a n r u p e e s t h o u s a n d s, e x c e p t s h a r e d ata a n d w h e r e o t h e r w i s e s tat e d
27. INCOME TAxES
Income taxes consist of the following:
fiscal year ended 31 march
2006 2007 2008Pre-tax income / (loss)
Domestic Rs. 2,144,176 Rs. 11,584,770 Rs. 7,394,759
Foreign (256,853) (1,084,495) (3,956,619)
rs. 1,887,323 rs. 10,500,275 rs. 3,438,140
Income tax benefit / (expense) attributable to continuing operations:
Current taxes:
Domestic Rs. (279,466) Rs. (1,589,571) Rs. (645,274)
Foreign (34,081) (690,963) (476,417)
(313,547) (2,280,534) (1,121,691)
Deferred taxes:
Domestic (48,503) 47,392 (379,040)
Foreign 103,660 1,056,206 2,730,160
55,157 1,103,598 2,351,120
rs. (258,390) rs. (1,176,936) rs. 1,229,429
Deferred tax benefit / (expense) attributable to other comprehensive
incomers. 35,079 rs. 20,146 rs. (46,666)
The reported income tax (expense) / benefit differed from amounts computed by applying the enacted tax rates to income / (loss) before income taxes as a
result of the following:
fiscal year ended 31 march
2006 2007 2008Income before income taxes and minority interest Rs. 1,887,323 Rs. 10,500,275 Rs.3,438,140
Enacted tax rate in India 33.66% 33.66% 33.99%
Computed expected tax benefit / (expense) rs. (635,272) rs. (3,534,393) rs. (1,168,624)
Effect of:
Differences between Indian and foreign tax rates (8,546) 79,056 (13,554)
Valuation allowance (142,206) 99,564 (176,019)
Impairment of goodwill – – (30,740)
Expenses not deductible for tax purposes (67,403) (70,951) (143,694)
ESOP cost not deductible for tax purpose (54,614) (22,391) (64,421)
Interest expenses not deductible for tax purpose – (293,205) (269,567)
Income exempt from income taxes 538,151 2,100,801 1,108,156
Foreign exchange differences 8,335 10,871 (43,765)
Incremental deduction allowed for research and development costs 166,308 390,097 544,844
Indexation benefit on capital assets 1,413 1,828 5,916
Effect of changes in tax laws and rates 12,534 55,755 1,505,205
Minimum alternate tax (3,019) (2,108) –
Resolution of prior period tax matters (73,970) – –
Others (101) 8,140 (24,308)
income tax benefit / (expense) rs. (258,390) rs. (1,176,936) rs. 1,229,429
The effect of changes in tax laws and rates primarily includes deferred tax benefit on account of reduction in income tax rates in Germany.
Income exempt from taxes above represents benefits from certain significant tax incentives provided to export oriented units (i.e., a unit that exports its production
to customers outside India) and units located in certain specified less developed geographical areas under the Indian tax laws. These incentives presently pertain
to an exemption from payment of Indian corporate income taxes for certain units of the Company for a period of ten consecutive years, beginning from the
financial year when that particular unit commenced its operations (referred to as the ‘tax holiday’ period). These tax holiday periods for the Company’s units
expire in various years ranging from the year ended 31 March 2008 through the year ending 31 March 2016. The per share (basic) effect of the tax holiday was
Rs. 3.52, Rs. 13.25 and Rs. 6.59 for the years ended 31 March 2006, 2007 and 2008, respectively.
Incremental deduction allowed for research and development costs represents tax incentive provided by the Government of India for carrying out such
activities.
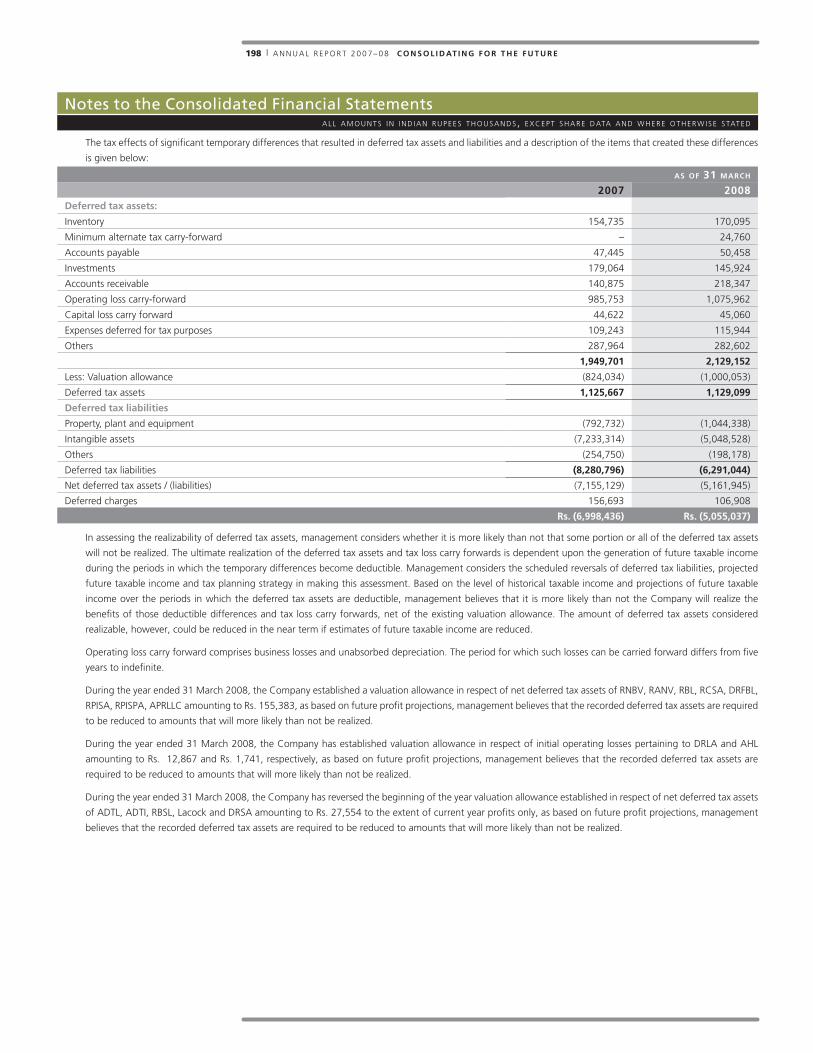
198 | A N N U A L R E P O R T 2 0 0 7 – 0 8 c o n s o l i d at i n g f o r t h e f u t u r e
The tax effects of significant temporary differences that resulted in deferred tax assets and liabilities and a description of the items that created these differences
is given below:
as of 31 march
2007 2008deferred tax assets:
Inventory 154,735 170,095
Minimum alternate tax carry-forward – 24,760
Accounts payable 47,445 50,458
Investments 179,064 145,924
Accounts receivable 140,875 218,347
Operating loss carry-forward 985,753 1,075,962
Capital loss carry forward 44,622 45,060
Expenses deferred for tax purposes 109,243 115,944
Others 287,964 282,602
1,949,701 2,129,152
Less: Valuation allowance (824,034) (1,000,053)
Deferred tax assets 1,125,667 1,129,099
deferred tax liabilities
Property, plant and equipment (792,732) (1,044,338)
Intangible assets (7,233,314) (5,048,528)
Others (254,750) (198,178)
Deferred tax liabilities (8,280,796) (6,291,044)
Net deferred tax assets / (liabilities) (7,155,129) (5,161,945)
Deferred charges 156,693 106,908
rs. (6,998,436) rs. (5,055,037)
In assessing the realizability of deferred tax assets, management considers whether it is more likely than not that some portion or all of the deferred tax assets
will not be realized. The ultimate realization of the deferred tax assets and tax loss carry forwards is dependent upon the generation of future taxable income
during the periods in which the temporary differences become deductible. Management considers the scheduled reversals of deferred tax liabilities, projected
future taxable income and tax planning strategy in making this assessment. Based on the level of historical taxable income and projections of future taxable
income over the periods in which the deferred tax assets are deductible, management believes that it is more likely than not the Company will realize the
benefits of those deductible differences and tax loss carry forwards, net of the existing valuation allowance. The amount of deferred tax assets considered
realizable, however, could be reduced in the near term if estimates of future taxable income are reduced.
Operating loss carry forward comprises business losses and unabsorbed depreciation. The period for which such losses can be carried forward differs from five
years to indefinite.
During the year ended 31 March 2008, the Company established a valuation allowance in respect of net deferred tax assets of RNBV, RANV, RBL, RCSA, DRFBL,
RPISA, RPISPA, APRLLC amounting to Rs. 155,383, as based on future profit projections, management believes that the recorded deferred tax assets are required
to be reduced to amounts that will more likely than not be realized.
During the year ended 31 March 2008, the Company has established valuation allowance in respect of initial operating losses pertaining to DRLA and AHL
amounting to Rs. 12,867 and Rs. 1,741, respectively, as based on future profit projections, management believes that the recorded deferred tax assets are
required to be reduced to amounts that will more likely than not be realized.
During the year ended 31 March 2008, the Company has reversed the beginning of the year valuation allowance established in respect of net deferred tax assets
of ADTL, ADTI, RBSL, Lacock and DRSA amounting to Rs. 27,554 to the extent of current year profits only, as based on future profit projections, management
believes that the recorded deferred tax assets are required to be reduced to amounts that will more likely than not be realized.
notes to the consolidated Financial Statements a l l a m o u n t s i n i n d i a n r u p e e s t h o u s a n d s, e x c e p t s h a r e d ata a n d w h e r e o t h e r w i s e s tat e d

199 | D R . R E D D Y ’ S L A B O R AT O R I E S LT D u s g a a p c o n s o l i d at e d f i n a n c i a l s
notes to the consolidated Financial Statements a l l a m o u n t s i n i n d i a n r u p e e s t h o u s a n d s, e x c e p t s h a r e d ata a n d w h e r e o t h e r w i s e s tat e d
As of 31 March 2008 the Company had operating and capital loss carry-forward of Rs. 3,399,765 that expires as follows:
expiring in the year ending 31 march
2009 Rs. 14,576
2010 –
2011 –
2012 –
2013 –
2014 62,102
Thereafter (2014 – 2025) 479,349
(indefinite) Rs. 2,644,886
rs. 3,200,913
Further, capital loss carry forwards of Rs. 176,422 expires on 31 March 2013 and Rs. 22,430 expires on 31 March 2014. Valuation allowance has been created
for these carry forwards.
Undistributed earnings of Company’s foreign subsidiaries and unrecognized deferred tax liability in respect of such earnings amounted to approximately
Rs. 1,204,443 and Rs. 409,390, respectively as of 31 March 2008. Such earnings are considered to be indefinitely reinvested and, accordingly no provision for
income taxes has been recorded on the undistributed earnings.
Effective 1 April 2007 the Company adopted the provisions of FIN 48. The adoption of FIN 48 did not have a material impact on the retained earnings or
provisions for taxation as of 1 April 2007. Upon adoption of FIN 48, the Company’s policy to include interest and penalties relating unrecognized tax benefits
within the provision for income taxes did not change. A reconciliation of the beginning and ending amount of unrecognized tax benefits is as follows.
year ended 31 march 2008
Balance as of 1 April 2007 1,325,233
Increases related to current year tax positions 78,369
Decreases related to prior year tax positions (8,352)
balance as of 31 march 2008 1,395,250
The Company’s total unrecognized tax benefits, if recognized, would reduce the tax provision by Rs. 1,325,233 and Rs. 1,395,250 as of 1 April 2007, and
31 March 2008, respectively, and thereby would affect the Company’s effective tax rate.
As of 1 April 2007 the Company did not have any significant accrual towards interest and penalties. During the year ended 31 March 2008, the Company has
accrued an amount of Rs. 50,000 towards interest and penalties relating to certain withholding tax payments.
The Company’s major tax jurisdictions are India, U.S. and Germany, though the Company also files tax returns in other foreign jurisdictions. In India, the
assessment is not yet completed for fiscal year 2005 and onwards. Additionally, certain uncertain tax positions relate to fiscal years prior to 2005, which are
currently under dispute with the tax authorities. In the U.S., federal and state tax returns pertaining to fiscal year 2004 onwards are open to examination within
the statute of limitation prescribed by the relevant authorities. In Germany, tax returns pertaining to fiscal year 2004 onwards are open to examination within
the statute of limitation prescribed by the relevant authorities.
Significant changes in the amount of unrecognized tax benefits within the next 12 months cannot be reasonably estimated as the changes would depend upon
the progress of tax examinations with various tax authorities.
28. EARNINgS pER SHARE
A reconciliation of the equity shares used in the computation of basic and diluted earnings per equity share is set out below:
fiscal year ended 31 march
2006 2007 2008Basic earnings per equity share — weighted average number of equity
shares outstanding153,093,316 158,552,422 168,075,840
Effect of dilutive equivalent shares — stock options outstanding 310,530 704,054 614,934
Diluted earnings per equity share — weighted average number of equity
shares outstanding153,403,846 159,256,476 168,690,774

200 | A N N U A L R E P O R T 2 0 0 7 – 0 8 c o n s o l i d at i n g f o r t h e f u t u r e
Auditors’ Report to the Members of dr. Reddy’s laboratory ltd.a l l a m o u n t s i n i n d i a n r u p e e s t h o u s a n d s, e x c e p t s h a r e d ata
notes to the consolidated Financial Statements a l l a m o u n t s i n i n d i a n r u p e e s t h o u s a n d s, e x c e p t s h a r e d ata a n d w h e r e o t h e r w i s e s tat e d
29. EMpLOYEE BENEfIT pLANS
Gratuity benefits: In accordance with applicable Indian laws, the Company provides gratuity, a defined benefit retirement plan (the “Gratuity Plan”) covering
certain categories of employees. The Gratuity Plan provides a lump sum payment to vested employees at retirement or termination of employment. The amount
of payment is based on the respective employee’s last drawn salary and the years of employment with the Company. Effective 1 September 1999, the Company
established Dr. Reddy’s Laboratories Gratuity Fund (the “Gratuity Fund”). Liabilities in respect of the Gratuity Plan are determined by an actuarial valuation,
based on which the Company makes contributions to the Gratuity Fund. Trustees administer the contributions made to the Gratuity Fund. Amounts contributed
to the Gratuity Fund are invested in specific securities as mandated by law and generally consist of federal and state government bonds and debt instruments
of government-owned corporations.
The following table sets out the funded status of the Gratuity Plan and the amounts recognized in the Company’s financial statements:
as of 31 march
2007 2008change in the benefit obligations
Projected benefit obligations (PBO) at the beginning of the year 208,036 227,652
Service cost 27,097 28,945
Interest cost 15,890 20,538
Actuarial (gain) / Loss (1,151) 47,547
Benefits paid (22,220) (31,579)
PBO at the end of the year rs. 227,652 rs. 293,103
change in plan assets
Fair value of plan assets at the beginning of the year Rs. 220,270 236,325
Actual return on plan assets 16,796 31,132
Employer contributions 21,479 53,198
Benefits paid (22,220) (31,579)
Plan assets at the end of the year rs. 236,325 rs. 289,076
funded status 8,673 (4,027)
net amount recognized rs. 8,673 rs. (4,027)
Amounts recognized in the statement of financial position consist of:
Non current asset Rs. 11,131 Rs. –
Current liability (120) (123)
Non current liability (2,338) (3,904)
net amount recognized rs. 8,673 rs. (4,027)
The accumulated benefit obligation for the Gratuity Plan was Rs.140,883 and Rs.181,204 as at 31 March 2007 and 2008, respectively.
Components of net periodic benefit cost:
fiscal year ended 31 march
2006 2007 2008Service cost Rs. 26,926 Rs. 27,097 Rs. 28,945
Interest cost 15,255 15,890 20,538
Expected return on plan assets (9,211) (16,193) (16,022)
Amortization of transition obligation 12,146 – –
Recognized net actuarial loss 7,215 4,725 5,861
net amount recognized rs. 52,331 rs. 31,519 rs. 39,322

201 | D R . R E D D Y ’ S L A B O R AT O R I E S LT D u s g a a p c o n s o l i d at e d f i n a n c i a l s
Annexure to the Auditor's Reporta l l a m o u n t s i n i n d i a n r u p e e s t h o u s a n d s, e x c e p t s h a r e d ata
29. EMpLOYEE BENEfIT pLANS (CONTINUED)
Summary of the actuarial assumptions: The actuarial assumptions used in accounting for the Gratuity Plan are as follows:
The weighted-average assumptions used to determine benefit obligations:
as of 31 march
2007 2008Discount rate 9.75% 9.00%
Rate of compensation increase
8% to 10% per annum
for first 5 years and 6%
per annum thereafter
8% to 10% per annum
for first 4 years and 6%
per annum thereafter
Weighted-average assumptions used to determine net periodic benefit cost:
fiscal year ended 31 march
2006 2007 2008Discount rate 8.0% 8.0% 9.75%
Rate of compensation increase
8% to 10% per annum
for first 5 years and
6.0% per annum
thereafter
8% to 10% per annum
for first 5 years and
6.0% per annum
thereafter
8% to 10% per annum
for first 5 years and
6% per annum
thereafter
Expected long-term return on plan assets 7.5% 7.5% 7.5%
The expected long-term return on plan assets is based on the expectation of the average long-term rate of return expected to prevail over the projected pay out
period for the types of investments prescribed as per the statutory pattern of investment.
Plan assets: The Gratuity plan’s weighted-average asset allocation at 31 March 2007 and 2008, by asset category is as follows:
as of 31 march
2007 2008Debt securities 8% 7%
Funds managed by insurers 91% 92%
Others 1% 1%
Contributions: The Company expects to contribute Rs. 30,123 to its Gratuity Plan during the year ending 31 March 2009.
Amounts recognized in accumulated other comprehensive income consist of the following:
fiscal year ended 31 march 2008Net actuarial (gain) / loss at the beginning of the year Rs. 62,080
Actuarial (gain) / loss on plan assets and obligation during the year 35,911
Actuarial gain / (loss) recognized as component of net periodic benefit cost during the year (5,861)
Net actuarial (gain) / loss at the end of the year rs. 92,130
Amount of actuarial (gain) / loss expected to be recognized as components of net periodic benefit cost during fiscal 2009 is Rs. 8,686.
Estimated future benefit payments: The following benefit payments are expected to be paid:
fiscal year ended 31 march
2009 42,006
2010 36,581
2011 38,175
2012 50,665
2013 52,813
2014 to 2018 301,569
Superannuation benefits: Apart from being covered under the Gratuity Plan described above, the senior officers of the Company also participate in superannuation,
a defined contribution plan administered by the Life Insurance Corporation (“LIC”). The Company makes annual contributions based on a specified percentage
of each covered employee’s salary. The Company has no further obligations under the plan beyond its annual contributions. The Company contributed
Rs. 24,832, Rs. 27,965 and Rs. 39,887 to the superannuation plan during the years ended 31 March 2006, 2007 and 2008, respectively.
Provident fund benefits: In addition to the above benefits, all employees of the Company receive benefits from a provident fund, a defined contribution plan.
Both the employee and employer each make monthly contributions to a government administered fund equal to 12% of the covered employee’s salary. The
Company has no further obligations under the plan beyond its monthly contributions. The Company contributed Rs. 64,443, Rs. 113,533 and Rs. 144,531 to
the provident fund plan during the years ended 31 March 2006, 2007 and 2008, respectively.
notes to the consolidated Financial Statements a l l a m o u n t s i n i n d i a n r u p e e s t h o u s a n d s, e x c e p t s h a r e d ata a n d w h e r e o t h e r w i s e s tat e d
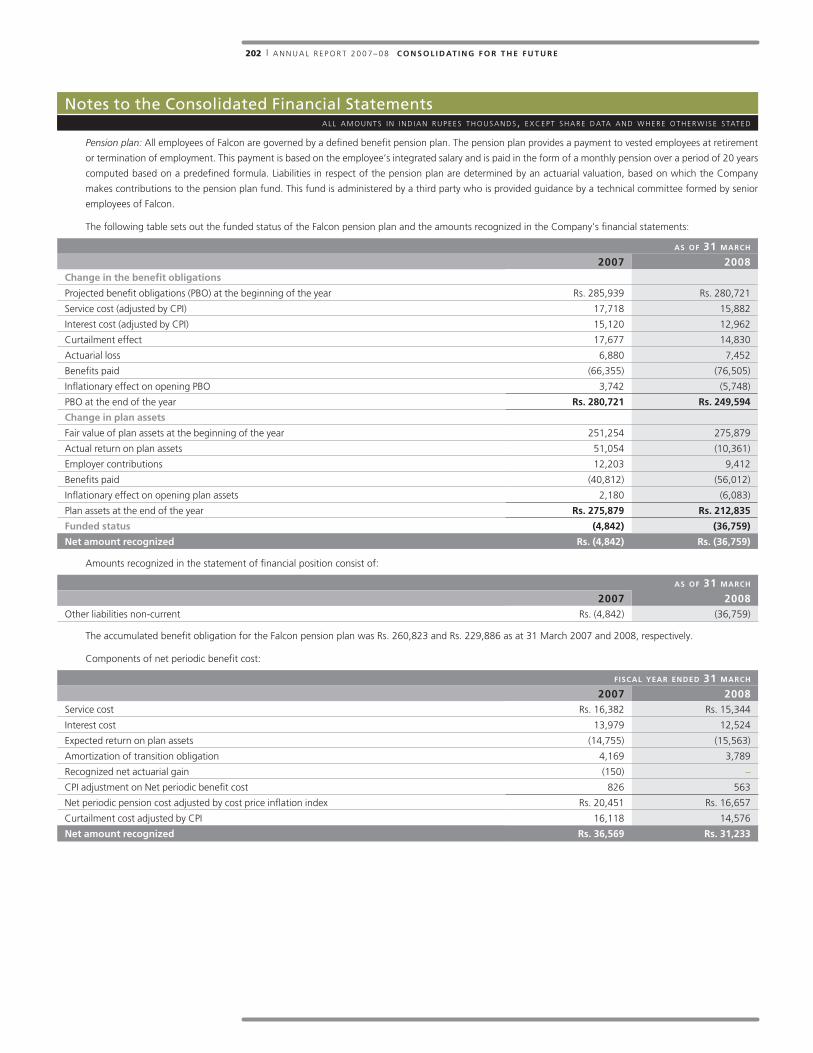
202 | A N N U A L R E P O R T 2 0 0 7 – 0 8 c o n s o l i d at i n g f o r t h e f u t u r e
Auditors’ Report to the Members of dr. Reddy’s laboratory ltd.a l l a m o u n t s i n i n d i a n r u p e e s t h o u s a n d s, e x c e p t s h a r e d ata
Pension plan: All employees of Falcon are governed by a defined benefit pension plan. The pension plan provides a payment to vested employees at retirement
or termination of employment. This payment is based on the employee’s integrated salary and is paid in the form of a monthly pension over a period of 20 years
computed based on a predefined formula. Liabilities in respect of the pension plan are determined by an actuarial valuation, based on which the Company
makes contributions to the pension plan fund. This fund is administered by a third party who is provided guidance by a technical committee formed by senior
employees of Falcon.
The following table sets out the funded status of the Falcon pension plan and the amounts recognized in the Company’s financial statements:
as of 31 march
2007 2008change in the benefit obligations
Projected benefit obligations (PBO) at the beginning of the year Rs. 285,939 Rs. 280,721
Service cost (adjusted by CPI) 17,718 15,882
Interest cost (adjusted by CPI) 15,120 12,962
Curtailment effect 17,677 14,830
Actuarial loss 6,880 7,452
Benefits paid (66,355) (76,505)
Inflationary effect on opening PBO 3,742 (5,748)
PBO at the end of the year rs. 280,721 rs. 249,594
change in plan assets
Fair value of plan assets at the beginning of the year 251,254 275,879
Actual return on plan assets 51,054 (10,361)
Employer contributions 12,203 9,412
Benefits paid (40,812) (56,012)
Inflationary effect on opening plan assets 2,180 (6,083)
Plan assets at the end of the year rs. 275,879 rs. 212,835
funded status (4,842) (36,759)
net amount recognized rs. (4,842) rs. (36,759)
Amounts recognized in the statement of financial position consist of:
as of 31 march
2007 2008Other liabilities non-current Rs. (4,842) (36,759)
The accumulated benefit obligation for the Falcon pension plan was Rs. 260,823 and Rs. 229,886 as at 31 March 2007 and 2008, respectively.
Components of net periodic benefit cost:
fiscal year ended 31 march
2007 2008Service cost Rs. 16,382 Rs. 15,344
Interest cost 13,979 12,524
Expected return on plan assets (14,755) (15,563)
Amortization of transition obligation 4,169 3,789
Recognized net actuarial gain (150) –
CPI adjustment on Net periodic benefit cost 826 563
Net periodic pension cost adjusted by cost price inflation index Rs. 20,451 Rs. 16,657
Curtailment cost adjusted by CPI 16,118 14,576
net amount recognized rs. 36,569 rs. 31,233
notes to the consolidated Financial Statements a l l a m o u n t s i n i n d i a n r u p e e s t h o u s a n d s, e x c e p t s h a r e d ata a n d w h e r e o t h e r w i s e s tat e d

203 | D R . R E D D Y ’ S L A B O R AT O R I E S LT D u s g a a p c o n s o l i d at e d f i n a n c i a l s
Annexure to the Auditor's Reporta l l a m o u n t s i n i n d i a n r u p e e s t h o u s a n d s, e x c e p t s h a r e d ata
Summary of the actuarial assumptions: The actuarial assumptions used in accounting for the Falcon pension plan are as follows:
Weighted-average assumptions used to determine benefit obligations:
as at 31 march
2007 2008Discount rate 5.00% 4.50%
Rate of compensation increase 1.00% 1.00%
Expected long-term return on plan assets 6.25% 6.25%
Cost Price Inflation (CPI) rate of fiscal year 3.50% 3.50%
Weighted-average assumptions used to determine net periodic benefit cost:
for the year ended 31 march
2006 2007 2008Discount rate 5.25% 5.25% 5.00%
Rate of compensation increase 2.00% 0.75% 1.00%
Expected long-term return on plan assets 7.75% 6.25% 6.25%
Cost Price Inflation (CPI) rate of fiscal year 0.87% 4.21% 3.50%
Plan assets: The Falcon pension plan’s weighted-average asset allocation as at 31 March 2007 and 2008, by asset category is as follows:
as at 31 march
2007 2008Equity 24% 47%
Debt 76% 53%
Amounts recognized in accumulated other comprehensive income consist of the following:
fiscal year ended 31 march 2008Net actuarial (gain) / loss at the beginning of the year (3,025)
Actuarial (gain) / loss on plan assets and obligations during the year 34,379
Actuarial gain / (loss) recognized as component of net periodic benefit cost during the year (3,817)
Net actuarial (gain) / loss at the end of the year 27,537
The above amount of net actuarial (gain) / loss at the end of the year includes an amount of Rs. 17,614 as unamortized net transitional obligation. Amount
expected to be recognized as components of net periodic benefit cost during fiscal 2009 is Rs. 3,932.
Estimated future benefit payments: The following benefit payments are expected to be paid:
fiscal year ended 31 march
2009 Rs. 16,368
2010 16,596
2011 17,969
2012 18,289
2013 21,486
2014 to 2018 127,608
30. RELATED pARTY TRANSACTIONS
The Company has entered into transactions with the following related parties:
• Diana Hotels Limited for availing hotel services;
• A.R. Life Sciences Private Limited for availing processing services of raw materials and intermediates;
• Dr. Reddy’s Holdings Private Limited for purchase and sale of active pharmaceutical ingredients and intermediates and purchase of land;
• Dr. Reddy’s Foundation for Human and Social development towards contribution for social development;
• K.K Enterprises for availing packaging services for formulation products; and
• SR Enterprises for transportation services.
The directors of the Company have either a significant ownership interest, controlling interest or exercise significant influence over the above entities (“significant
interest entities”).
notes to the consolidated Financial Statements a l l a m o u n t s i n i n d i a n r u p e e s t h o u s a n d s, e x c e p t s h a r e d ata a n d w h e r e o t h e r w i s e s tat e d

204 | A N N U A L R E P O R T 2 0 0 7 – 0 8 c o n s o l i d at i n g f o r t h e f u t u r e
Auditors’ Report to the Members of dr. Reddy’s laboratory ltd.a l l a m o u n t s i n i n d i a n r u p e e s t h o u s a n d s, e x c e p t s h a r e d ata
The Company has entered into transactions with its two affiliates, Perlecan Pharma and Reddy Kunshan. These transactions are in the nature of reimbursement
of research and development expenses incurred by the Company on behalf of Perlecan Pharma, revenue from research services performed by the Company for
Perlecan Pharma and purchase of active pharmaceutical ingredients by the Company from Reddy Kunshan.
The Company has also entered into cancellable operating lease transactions with directors of the Company and their relatives. Further, the Company has also
provided certain short term interest free loans to its employees which are recovered on a regular basis through salary deductions.
One of the Company’s former executive and U.S. general counsel (resigned effective 31 July 2006), is a partner of a law firm that the Company engaged for
provision of legal services. Legal fees paid by the Company to this law firm during the period this former executive was in employment of the Company were
Rs. 466,567, Rs. 153,620 (till the date of his resignation) and Rs. Nil during the years ended 31 March 2006, 2007 and 2008, respectively.
The following is a summary of significant related party transactions:
fiscal year ended 31 march
2006 2007 2008Purchases from:
Significant interest entities 129,320 260,673 219,044
Affiliates 5,410 – –
Contribution to a significant interest entity towards social development 53,550 34,100 113,621
Revenue from:
Significant interest entities 32,255 – 88,531
Affiliates – 139,335 40,071
Reimbursement of research and development expenses from:
Affiliates – 372,643 89,505
Lease rental paid under cancelable operating leases to:
Directors and their relatives 18,927 21,884 22,635
General and administrative expenses paid to:
Significant interest entities 7,401 9,227 12,596
Advance paid to a significant interest entity towards purchase of land: – – 680,000
The Company has the following amounts due from related parties:
as of 31 march
2007 2008Significant interest entities Rs. – Rs. 26,396
Directors and their relatives 4,380 4,280
Employee loans (interest free) 2,426 19,457
Affiliates 143,136 26,964
rs. 149,942 rs. 77,097
Less: Current portion 145,086 72,817
rs. 4,856 rs. 4,280
The above table does not include an amount of Rs. 680,000 paid as advance towards purchase of land from a significant interest entity, which has been
disclosed under capital work-in-progress.
Employee loans outstanding as of 31 March 2008, are repayable within the year ending 31 March 2009.
The Company has the following amounts due to related parties (current):
as of 31 march
2007 2008Significant interest entities Rs. 871 Rs. 16,750
notes to the consolidated Financial Statements a l l a m o u n t s i n i n d i a n r u p e e s t h o u s a n d s, e x c e p t s h a r e d ata a n d w h e r e o t h e r w i s e s tat e d

205 | D R . R E D D Y ’ S L A B O R AT O R I E S LT D u s g a a p c o n s o l i d at e d f i n a n c i a l s
Annexure to the Auditor's Reporta l l a m o u n t s i n i n d i a n r u p e e s t h o u s a n d s, e x c e p t s h a r e d ata
31. COMMITMENTS AND CONTINgENCIES
Capital Commitments: As of 31 March 2007 and 2008, the Company was committed to spend approximately Rs. 1,186,049 and Rs. 1,552,426, respectively,
under agreements to purchase property, plant and equipment. This amount is net of capital advances paid in respect of such purchases.
Guarantees: In accordance with the provisions of FIN 45, “Guarantor’s Accounting and Disclosure Requirements for Guarantees, including Indirect Guarantees
of Indebtedness of Others”, the Company recognizes the fair value of guarantee and indemnification arrangements issued or modified by the Company, if
these arrangements are within the scope of FIN 45. In addition, the Company continues to monitor the conditions that are subject to these guarantee and
indemnification agreements to identify whether any loss is probable and recognizes such loss, if any when estimable.
The Company’s affiliate, Reddy Kunshan secured a credit facility of Rs. 26,988 from Agricultural Bank of China (“Agricultural Bank”). During the year ended
31 March 2008, the Company issued a corporate guarantee amounting to Rs. 27,196 in favor of Agricultural Bank to enhance the credit standing of Reddy
Kunshan. The guarantee is required to be renewed every year and Company’s liability may arise in case of non-payment by Reddy Kunshan of amounts drawn
under its credit facility. As of 31 March 2008, the fair value of such liability is not material.
Litigations / Contingencies: The Company manufactures and distributes Norfloxacin, a formulations product. Under the Drugs Prices Control Order (the “DPCO”),
the Government of India has the authority to designate a pharmaceutical product as a “specified product” and fix the maximum selling price for such product.
In 1995, the Government of India notified Norfloxacin as a “specified product” and fixed the maximum selling price. In 1996, the Company filed a statutory
Form III before the Government of India for the upward revision of the price and a legal suit in the Andhra Pradesh High Court (the “High Court”) challenging
the validity of the notification on the grounds that the applicable rules of the DPCO were not complied with while fixing the ceiling price. The High Court had
previously granted an interim order in favor of the Company; however it subsequently dismissed the case in April 2004. The Company filed a review petition
in the High Court in April 2004 which was also dismissed by the High Court in October 2004. Subsequently, the Company appealed to the Supreme Court of
India by filing a Special Leave Petition, which is currently pending.
During the year ended 31 March 2006, the Company received a notice from the Government of India demanding the recovery of the price charged by the
Company for sale of Norfloxacin in excess of the maximum selling price fixed by the Government of India, amounting to Rs. 284,984, including interest thereon.
The Company filed a writ petition in the High Court challenging this demand order. The High Court admitted the writ petition and granted an interim order,
directing the Company to deposit 50% of the principal amount claimed by the Government of India, which amounted to Rs. 77,149. The Company deposited
this amount with the Government of India in November 2005 and is awaiting the outcome of its appeal with the Supreme Court. In February 2008, the High
Court directed the Company to deposit an additional amount of Rs. 30,000, which was deposited by the Company in March 2008.
The Company has fully provided the potential liability related to the principal amount demanded by the Government of India (which is included under other
current liabilities) and believes that the liability on account of interest and penalty is remote. In the event the Company is unsuccessful in its litigation in the
Supreme Court, it will be required to remit the sale proceeds in excess of the maximum selling price to the Government of India including penalties or interest,
if any, which amounts are not readily ascertainable.
During the fiscal year ended 31 March 2003, the Central Excise Authorities of India (the “Authorities”) issued a demand notice to a vendor of the Company
regarding the assessable value of products supplied by this vendor to the Company. The Company has been named as a co-defendant in this demand notice.
The Authorities demanded payment of Rs. 175,718 from the vendor, including penalty of Rs. 90,359. Through the same notice, the Authorities, issued a penalty
claim of Rs. 70,000 to the Company. During the year ended 31 March 2005, the Authorities issued an additional notice to this vendor demanding Rs. 225,999
from the vendor, including penalty of Rs. 51,152. Through the same notice, the Authorities, issued a penalty claim of Rs. 6,500 to the Company. Further,
during the year ended 31 March 2006, the Authorities issued an additional notice to this vendor demanding Rs. 33,549. The Company has filed appeals against
these notices. In August and September 2006, the Company attended the hearings conducted by the Customs, Excise and Service Tax Appellate Tribunal (the
“CESTAT”) on this matter. In October 2006, the CESTAT passed an order in favor of the Company setting aside all of the above demand notices. In July 2007,
the Authorities appealed against CESTAT’s order in the Supreme Court. The Company believes that the ultimate outcome of this matter is not expected to have
any material adverse effect on its financial position, results of operations or cash flows in any given accounting period.
In April 2006, the Company launched its fexofenadine hydrochloride 30 mg, 60 mg and 180 mg tablet products, which are generic versions of Sanofi-Aventis’
(“Aventis”) Allegra® tablets. The Company is presently defending patent infringement actions brought by Aventis in the United States District Court for the
District of New Jersey. There are three formulation patents, three use patents, and two active pharmaceutical ingredients (“API”) patents which are under
litigation. The Company has obtained summary judgment in respect of each of the formulation patents.
In September 2005, pursuant to an agreement with Barr Pharmaceuticals, Inc., Teva Pharmaceuticals Industries Limited (“Teva”) launched its fexofenadine
hydrochloride 30 mg, 60 mg and 180 mg tablet products, which are AB-rated (bioequivalent) to Aventis’ Allegra® tablets. Aventis has brought patent
infringement actions against Teva and its API supplier in the United States District Court for the District of New Jersey. There are three formulation patents, three
use patents, and two API patents under litigation. Teva has obtained summary judgment in respect of each of the formulation patents. On 27 January 2006,
the District Court denied Aventis’ motion for a preliminary injunction against Teva and its API supplier on the three use patents, finding those patents likely to
be invalid, and one of the API patents, finding that patent likely to be not infringed.
notes to the consolidated Financial Statements a l l a m o u n t s i n i n d i a n r u p e e s t h o u s a n d s, e x c e p t s h a r e d ata a n d w h e r e o t h e r w i s e s tat e d

206 | A N N U A L R E P O R T 2 0 0 7 – 0 8 c o n s o l i d at i n g f o r t h e f u t u r e
Auditors’ Report to the Members of dr. Reddy’s laboratory ltd.a l l a m o u n t s i n i n d i a n r u p e e s t h o u s a n d s, e x c e p t s h a r e d ata
The issues presented during Teva’s hearing are likely to be substantially similar to those which will be presented with respect to Company’s tablet products. A
trial has not been scheduled. If Aventis is ultimately successful in its allegation of patent infringement, the Company could be required to pay damages related
to fexofenadine hydrochloride tablet sales made by the Company, including be prohibited from selling these products in the future. The Company believes that
the ultimate outcome of this matter is not expected to have any material adverse effect on its financial position, results of operation or cash flows in any given
accounting period.
In April 2007, the Company terminated its Over The Counter (“OTC”) agreement with Leiner Health Products, LLC (“Leiner”). This action was taken by the
Company after receiving notice that, Leiner had been served with a list of Inspection Observations on a Form 483 from the United States Food and Drug
Administration (“U.S. FDA”) inspectors. In response thereto, Leiner suspended all of its packaging, production and distribution of OTC Products manufactured,
packaged or tested at its facilities in the United States. Under the terminated agreements, the Company had supplied to Leiner API to produce OTC products,
finished dose tablets, and access to certain OTC products under development. Subsequently, in March 2008, Leiner filed for bankruptcy. The Company believes
that termination of this OTC agreement and Leiner’s filing for bankruptcy is not expected to have any material adverse effect on its financial position, results of
operations or cash flows in any given accounting period.
In March 2007, the patent for Fosamax (Merck & Co.’s brand name for alendronate sodium, sold by the Company and other companies in generics versions)
in Germany was reinstated in favor of Merck & Co. The Company has filed protective writs to prevent a preliminary injunction without hearing. As of
31 March 2008, no injunction had been granted to Merck & Co. Based on a legal evaluation, the Company continues selling its generic version of this product
and believes that European patent reinstatement does not affect its ability to sell this product. The Company believes that the ultimate outcome of this patent
reinstatement matter is not expected to have any material adverse effect on its financial position, results of operations or cash flows in any given accounting
period.
The Indian Council for Environmental Legal Action filed a writ in 1989 under Article 32 of the Constitution of India against the Union of India and others in the
Supreme Court of India for the safety of people living in the Patancheru and Bollarum areas of Medak district of Andhra Pradesh. The Company has been named
in the list of polluting industries. In 1996, the Andhra Pradesh District Judge proposed that the polluting industries compensate farmers in the Patancheru,
Bollarum and Jeedimetla areas for discharging effluents which damaged the farmers’ agricultural land. The compensation was fixed at Rs. 1.30 per acre for dry
land and Rs. 1.70 per acre for wet land. Accordingly, the Company has paid a total compensation of Rs. 2,013. The matter is pending in the courts and the
possibility of additional liability is remote. The Company would not be able to recover the compensation paid, even if the decision of the court is in favor of the
Company.
The Company is aware of litigation with respect to one of its supplier for Oxycodon, which is sold by the Company and other companies in Germany. The
innovator company has claimed an infringement of formulation patents against the Company’s supplier. In April 2007, the court rejected an application for
an interim order by the innovator company against the Company’s supplier. As of 31 March 2008, based on a legal evaluation, the Company continues to sell
this product and believes that the patent infringement case does not affect its ability to sell the product. The Company believes that the ultimate outcome of
this patent infringement matter is not expected to have any material adverse effect on its financial position, results of operations or cash flows in any given
accounting period.
In April 2008, the Company received a Civil Investigative Demand (“CID”) from the United States Federal Trade Commission (“FTC”). A CID is a request for
information in the course of a civil investigation and does not constitute the commencement of legal proceedings. The Company has been informed that
the focus of this civil antitrust investigation relates to the settlement arrangement entered into between the Company and UCB Pharma Inc. resolving patent
litigation concerning levetiracetam. The Company believes that the terms of its settlement arrangement with UCB Pharma Inc. are consistent with all applicable
antitrust laws. The Company is co-operating fully with the FTC regarding this investigation. The Company believes that the ultimate outcome of this investigation
is not expected to have any material adverse effect on its financial position, results of operations or cash flows in any given accounting period.
Additionally, the Company and its affiliates are involved in other disputes, lawsuits, claims, governmental and / or regulatory inspections, inquiries, investigations
and proceedings, including patent and commercial matters that arise from time to time in the ordinary course of business. The Company believes that there
are no such pending matters that are expected to have any material adverse effect on its financial position, results of operations or cash flows in any given
accounting period.
32. SEgMENT REpORTINg AND RELATED INfORMATION
a) Segment information
The Chief Operating Decision Maker (“CODM”) evaluates the Company’s performance and allocates resources based on an analysis of various performance
indicators by product segments. The product segments and the respective performance indicators reviewed by the CODM are as follows:
• Formulations — Revenues by therapeutic product category; Gross profit
• Active pharmaceutical ingredients and intermediates — Gross profit, revenues by geography and key products;
• Generics — Gross profit;
• Drug discovery — Revenues and expenses; and
• Custom pharmaceutical services — Gross profit.
notes to the consolidated Financial Statements a l l a m o u n t s i n i n d i a n r u p e e s t h o u s a n d s, e x c e p t s h a r e d ata a n d w h e r e o t h e r w i s e s tat e d

207 | D R . R E D D Y ’ S L A B O R AT O R I E S LT D u s g a a p c o n s o l i d at e d f i n a n c i a l s
Annexure to the Auditor's Reporta l l a m o u n t s i n i n d i a n r u p e e s t h o u s a n d s, e x c e p t s h a r e d ata
The CODM of the Company does not review the total assets for each reportable segment. The property, plant and equipment used in the Company’s business,
depreciation and amortization expenses, are not fully identifiable with / allocable to individual reportable segments, as certain assets are used interchangeably
between segments. The other assets are not specifically allocable to the reportable segments. Consequently, management believes that it is not practicable to
provide segment disclosures relating to total assets since allocation among the various reportable segments is not possible.
Formulations
Formulations, also referred to as finished dosages, consist of finished pharmaceutical products ready for consumption by the patient. Effective 1 April 2007, the
Company’s critical care and biotechnology segment was merged into its formulations segment. Accordingly, disclosures relating to the previous year have been
restated to conform to current year presentation. An analysis of revenues by therapeutic category of the formulations segment is given below:
fiscal year ended 31 march
2006 2007 2008Gastro-intestinal Rs. 2,284,254 Rs. 3,141,341 Rs. 3,744,575
Pain control 1,901,814 2,607,817 3,049,402
Cardiovascular 1,708,205 1,874,297 2,132,853
Anti-infectives 1,117,760 1,333,226 1,476,826
Dermatology 539,072 627,153 655,641
Others 3,036,469 3,502,773 4,181,777
Total revenue from external customers rs. 10,587,574 rs. 13,086,607 rs. 15,241,074
cost of revenues 3,290,552 3,923,519 4,038,940
gross profit rs. 7,297,022 rs. 9,163,088 rs. 11,202,134
Inter-segment revenues relating to transfer to the active pharmaceutical ingredients and intermediates segment which is accounted for cost amounting to
Rs. 40,246, Rs. 32,755 and Rs. 47,229 for the years ended 31 March 2006, 2007 and 2008, respectively.
Active pharmaceutical ingredients and intermediates
Active pharmaceutical ingredients and intermediates, also known as active pharmaceutical products or bulk drugs, are the principal ingredients for formulations.
Active pharmaceutical ingredients and intermediates become formulations when the dosage is fixed in a form ready for human consumption such as a tablet,
capsule or liquid using additional inactive ingredients.
An analysis of gross profit for the segment is given below.
fiscal year ended 31 march
2006 2007 2008Revenues from external customers Rs. 8,267,512 Rs. 11,882,959 Rs. 11,804,752
Cost of revenues Rs. 5,946,055 Rs. 7,242,272 Rs. 7,825,217
gross profit rs. 2,321,457 rs. 4,640,687 rs. 3,979,535
Inter-segment revenues relating to transfers to the formulations, generics and custom pharmaceutical services segment which is accounted for at cost amounting
to Rs. 1,064,816, Rs. 1,764,589 and Rs. 3,280,949 for the years ended 31 March 2006, 2007 and 2008, respectively.
An analysis of revenue by geography is given below:
fiscal year ended 31 march
2006 2007 2008North America Rs. 1,654,953 Rs. 2,029,748 Rs. 2,288,570
India Rs. 2,300,390 Rs. 2,077,317 Rs. 2,351,724
Europe Rs. 1,420,930 Rs. 2,116,842 Rs. 2,520,753
Others Rs. 2,891,239 Rs. 5,659,052 Rs. 4,643,705
rs. 8,267,512 rs. 11,882,959 rs. 11,804,752
notes to the consolidated Financial Statements a l l a m o u n t s i n i n d i a n r u p e e s t h o u s a n d s, e x c e p t s h a r e d ata a n d w h e r e o t h e r w i s e s tat e d

208 | A N N U A L R E P O R T 2 0 0 7 – 0 8 c o n s o l i d at i n g f o r t h e f u t u r e
Auditors’ Report to the Members of dr. Reddy’s laboratory ltd.a l l a m o u n t s i n i n d i a n r u p e e s t h o u s a n d s, e x c e p t s h a r e d ata
An analysis of revenues by key products is given below:
fiscal year ended 31 march
2006 2007 2008Sertraline Hydrochloride Rs. 494,101 Rs. 2,461,494 Rs. 600,902
Ramipril 642,538 760,661 933,248
Ciprofloxacin Hydrochloride 778,458 739,625 818,253
Finasteride 98,339 580,775 952,287
Naproxen Sodium 380,409 521,214 268,052
Terbinafine Hydrochloride 537,155 483,896 457,385
Ranitidine Hydrochloride Form 2 404,022 420,334 364,098
Naproxen 374,997 408,004 636,654
Clopidogrel 139,941 384,238 681,529
Ibuprofen 502,263 328,927 304,831
Montelukast 241,090 285,218 319,058
Losartan potassium 172,682 234,432 315,763
Nizatidine 160,857 223,593 380,952
Olanzapine 82,518 156,578 721,335
Amlodipine Besylate 40,876 82,954 403,830
Others 3,217,266 3,811,016 3,646,575
total rs. 8,267,512 rs. 11,882,959 rs. 11,804,752
Generics
Generics are generic finished dosages with therapeutic equivalence to branded formulations.
An analysis of gross profit for the segment is given below:
fiscal year ended 31 march
2006 2007 2008Revenues from external customers Rs. 4,055,764 Rs. 33,224,185 Rs. 17,781,508
Cost of revenues 2,168,800 18,098,552 9,311,074
gross profit rs. 1,886,964 rs. 15,125,633 rs. 8,470,434
Drug discovery
The Company is involved in drug discovery through its research facilities located in the United States and India. The Company commercializes drugs discovered
with other products and also licenses these discoveries to other companies. An analysis of the revenues and expenses of the drug discovery segment is given
below:
fiscal year ended 31 march
2006 2007 2008Revenues from external customers Rs. – Rs. 136,783 Rs. 39,211
Cost of revenues – 121,498 36,154
gross profit – 15,285 3,057
Research & Development expenses Rs. 814,485 Rs. 774,614 Rs. 901,121
Custom pharmaceutical services (“CPS”)
Custom pharmaceutical services operations relate to contract research services and manufacture and sale of active pharmaceutical ingredients and steroids in
accordance with the customer’s requirements.
fiscal year ended 31 march
2006 2007 2008Revenues from external customers Rs. 1,326,828 Rs. 6,599,763 Rs. 4,817,606
Cost of revenues 999,434 4,662,542 3,152,107
gross profit rs. 327,394 rs. 1,937,221 rs. 1,665,499
Inter-segment revenues relating to transfers to the active pharmaceutical ingredients and intermediates segment which is accounted for at cost amounting to
Rs. 151,446 for the year ended 31 March 2008.
notes to the consolidated Financial Statements a l l a m o u n t s i n i n d i a n r u p e e s t h o u s a n d s, e x c e p t s h a r e d ata a n d w h e r e o t h e r w i s e s tat e d
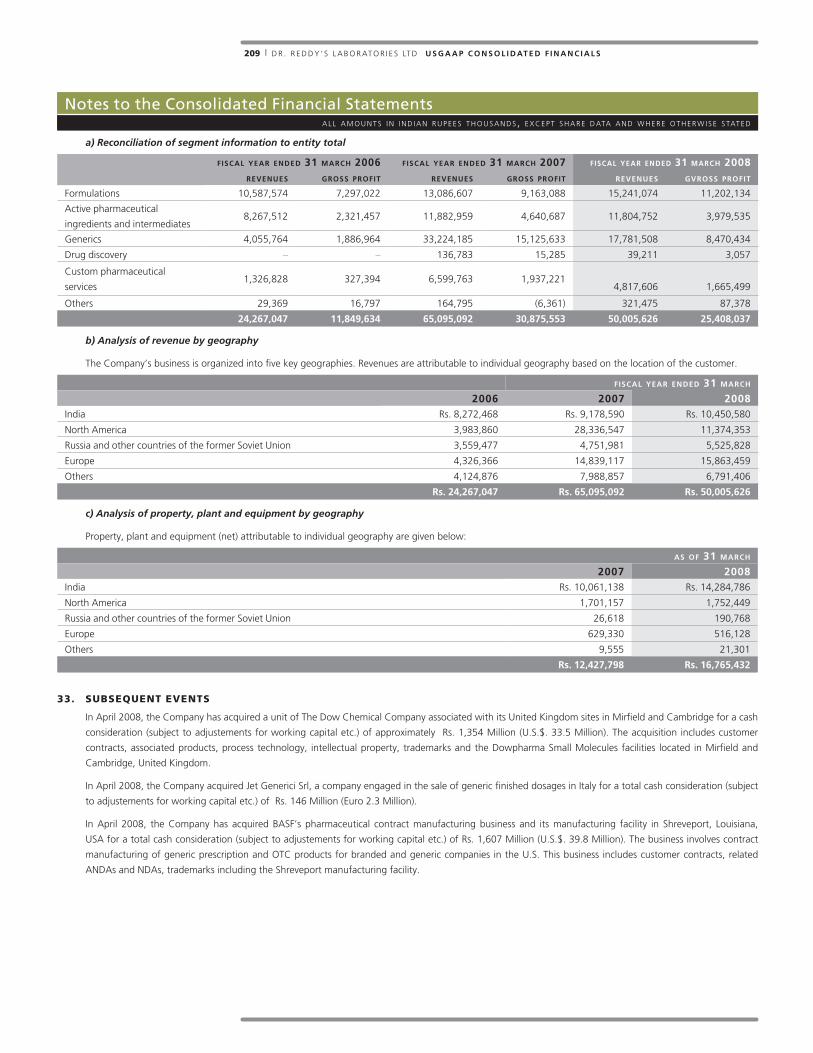
209 | D R . R E D D Y ’ S L A B O R AT O R I E S LT D u s g a a p c o n s o l i d at e d f i n a n c i a l s
Annexure to the Auditor's Reporta l l a m o u n t s i n i n d i a n r u p e e s t h o u s a n d s, e x c e p t s h a r e d ata
a) Reconciliation of segment information to entity total
fiscal year ended 31 march 2006 fiscal year ended 31 march 2007 fiscal year ended 31 march 2008
revenues gross profit revenues gross profit revenues gvross profit
Formulations 10,587,574 7,297,022 13,086,607 9,163,088 15,241,074 11,202,134
Active pharmaceutical
ingredients and intermediates8,267,512 2,321,457 11,882,959 4,640,687 11,804,752 3,979,535
Generics 4,055,764 1,886,964 33,224,185 15,125,633 17,781,508 8,470,434
Drug discovery – – 136,783 15,285 39,211 3,057
Custom pharmaceutical
services1,326,828 327,394 6,599,763 1,937,221
4,817,606 1,665,499
Others 29,369 16,797 164,795 (6,361) 321,475 87,378
24,267,047 11,849,634 65,095,092 30,875,553 50,005,626 25,408,037
b) Analysis of revenue by geography
The Company’s business is organized into five key geographies. Revenues are attributable to individual geography based on the location of the customer.
fiscal year ended 31 march
2006 2007 2008India Rs. 8,272,468 Rs. 9,178,590 Rs. 10,450,580
North America 3,983,860 28,336,547 11,374,353
Russia and other countries of the former Soviet Union 3,559,477 4,751,981 5,525,828
Europe 4,326,366 14,839,117 15,863,459
Others 4,124,876 7,988,857 6,791,406
rs. 24,267,047 rs. 65,095,092 rs. 50,005,626
c) Analysis of property, plant and equipment by geography
Property, plant and equipment (net) attributable to individual geography are given below:
as of 31 march
2007 2008India Rs. 10,061,138 Rs. 14,284,786
North America 1,701,157 1,752,449
Russia and other countries of the former Soviet Union 26,618 190,768
Europe 629,330 516,128
Others 9,555 21,301
rs. 12,427,798 rs. 16,765,432
33. SUBSEQUENT EvENTS
In April 2008, the Company has acquired a unit of The Dow Chemical Company associated with its United Kingdom sites in Mirfield and Cambridge for a cash
consideration (subject to adjustements for working capital etc.) of approximately Rs. 1,354 Million (U.S.$. 33.5 Million). The acquisition includes customer
contracts, associated products, process technology, intellectual property, trademarks and the Dowpharma Small Molecules facilities located in Mirfield and
Cambridge, United Kingdom.
In April 2008, the Company acquired Jet Generici Srl, a company engaged in the sale of generic finished dosages in Italy for a total cash consideration (subject
to adjustements for working capital etc.) of Rs. 146 Million (Euro 2.3 Million).
In April 2008, the Company has acquired BASF’s pharmaceutical contract manufacturing business and its manufacturing facility in Shreveport, Louisiana,
USA for a total cash consideration (subject to adjustements for working capital etc.) of Rs. 1,607 Million (U.S.$. 39.8 Million). The business involves contract
manufacturing of generic prescription and OTC products for branded and generic companies in the U.S. This business includes customer contracts, related
ANDAs and NDAs, trademarks including the Shreveport manufacturing facility.
notes to the consolidated Financial Statements a l l a m o u n t s i n i n d i a n r u p e e s t h o u s a n d s, e x c e p t s h a r e d ata a n d w h e r e o t h e r w i s e s tat e d

This page has been intentionally left blank.

Info
rma
tio
n o
n t
he
fin
an
cia
ls o
f su
bsi
dia
rie
s (P
rep
are
d a
s p
er
IGA
AP
) A
s A
t 3
1 M
Ar
ch
20
08
al
l a
mo
un
ts i
n i
nd
ian
ru
pe
es t
ho
us
an
ds,
ex
ce
pt s
ha
re d
at
a a
nd
wh
er
e o
th
er
wis
e s
ta
te
d
na
me o
f t
he s
ub
sid
iar
y
ca
pit
al
re
se
rv
es
to
ta
l
as
se
ts
to
ta
l
lia
bil
itie
s in
ve
st
me
nt
s t
ur
no
ve
r
pr
of
it
be
fo
re t
ax
pr
ov
isio
n
fo
r t
ax
pr
of
it
af
te
r t
ax
pr
op
os
ed
div
ide
nd
DRL
Inve
stm
ents
Lim
ited
500
1
35
9,1
82
9,1
82
––
(20)
– (2
0)–
Red
dy P
harm
aceu
tical
s H
ongk
ong
Lim
ited
58,
021
14,
234
116
,181
1
16,1
81
––
(6,1
42)
– (6
,142
)–
OO
O J
V R
eddy
Bio
med
Lim
ited
4,5
09
(6,0
88)
27,
170
27,
170
––
(5,5
98)
1
(5,5
99)
Red
dy A
ntill
es N
.V.
17,
969
181
,034
4
26,1
47
426
,147
–
– (1
0,96
0) (5
) (1
0,95
5)–
Dr.
Redd
y’s
Farm
aceu
tica
Do
Bras
il Lt
da.
97,
085
(420
,930
) 8
3,44
5 8
3,44
5 –
34,
862
(85,
063)
– (8
5,06
3)–
Dr.
Redd
y’s
Labo
rato
ries
Inc.
1
75,1
18
548
,990
3
,472
,660
3
,472
,660
–
11,
191,
167
(19,
900)
42,
271
(62,
170)
–
Red
dy U
S Th
erap
eutic
s In
c.
93,
652
(14,
479)
71,
635
71,
635
––
(1,8
67)
(204
) (1
,664
)–
Red
dy C
hem
inor
S.A
. 1
,958
(1
0,28
4) 3
,773
3
,773
–
– (1
,323
)–
(1,3
23)
–
Che
min
or In
vest
men
ts L
imite
d 1
,346
(1
04)
1,2
71
1,2
71
––
(2)
– (2
)–
Aur
igen
e D
isco
very
Tec
hnol
ogie
s Li
mite
d 8
86,4
42
(533
,845
) 8
69,6
35
869
,635
–
– (5
,830
)–
(5,8
30)
–
Kun
shan
Rot
am R
eddy
Pha
rmac
eutic
al C
o. L
imite
d 7
90,5
49
(629
,244
) 4
49,5
28
449
,528
–
877
,818
3
0,15
8 (3
8,12
6) 6
8,28
4 –
Red
dy N
ethe
rland
s BV
7
54
(8,1
96)
9,7
69
9,7
69
––
493
–
493
–
Aur
igen
e D
isco
very
Tec
hnol
ogie
s In
c.
208
,282
(2
23,5
16)
2,3
06
2,3
06
––
(10)
– (1
0)–
Dr.
Redd
y’s
Labo
rato
ries
(EU
) Lim
ited
96
89,
033
121
,014
1
21,0
14
––
(1,8
59)
– (1
,859
)–
Dr.
Redd
y’s
Labo
rato
ries
(UK
) Lim
ited
70
160
,073
1
,199
,982
1
,199
,982
–
2,4
10,7
08
78,
001
24,
315
53,
686
–
Dr.
Redd
y’s
Labo
rato
ries
(Pro
prie
tary
) Lim
ited
– (3
7,80
0) 1
00,5
71
100
,571
–
179
,682
3
,421
–
3,4
21
–
Pro
miu
s Ph
arm
a LL
C (f
orm
erly
Red
dy P
harm
aceu
tical
s LL
C)
122
,692
1
97,6
99
369
,242
3
69,2
42
– 1
55,1
85
72,
352
– 7
2,35
2 –
OO
O D
r. Re
ddy’
s La
bora
torie
s Li
mite
d 7
1,84
3 3
81,4
62
998
,070
9
98,0
70
– 2
,329
,766
3
07,4
19
72,
579
234
,840
–
Dr.
Redd
y’s
Bio-
Scie
nces
Lim
ited
361
,596
(1
54,0
46)
278
,879
2
78,8
79
––
692
–
692
–
Trig
enes
is T
hera
putic
s In
c.
9
(236
,381
) 2
1,90
0 2
1,90
0 –
– (5
92)
– (5
92)
–
Indi
stria
s Q
uim
icas
Fal
con
de M
exic
o, S
.A.
593
,879
2
0,35
0 2
,521
,815
2
,521
,815
–
1,8
04,8
27
(10,
342)
15,
495
(25,
837)
–
Lac
ock
Hol
ding
s Li
mite
d 1
,164
4
53,6
14
31,
160,
704
31,
160,
704
––
523
,568
5
3,04
4 4
70,5
24
–
bet
apha
rm A
rzne
imitt
el G
mbH
59,
177
2,3
13,3
95
3,9
54,7
86
3,9
54,7
86
– 8
,220
,605
6
99,7
43
– 6
99,7
43
–
bet
a H
ealth
care
Sol
utio
ns G
mbH
1,4
47
(11,
863)
316
3
16
––
(8,8
69)
– (8
,869
)–
bet
a In
stitu
t fo
r So
ziai
med
izin
isch
e Fo
rsch
ung
and
Ent
wic
klun
g G
mbH
5,7
87
– 5
0,00
4 5
0,00
4 –
––
––
–
Red
dy H
oldi
ng G
mbH
1,4
47
(5,2
40,7
33)
32,
001,
719
32,
001,
719
––
(2,0
24,4
77)
(194
,031
) (1
,830
,445
)–
Dr.
Redd
y’s
Phar
ma
Italia
SPA
62,
794
(58,
089)
24,
114
24,
114
––
(52,
655)
– (5
2,65
5)–
Dr.
Redd
y’s
Phar
ma
Iber
ia S
A 3
21,0
90
(352
,561
) 1
43,6
11
143
,611
–
51,
093
(274
,398
)–
(274
,398
)–
Dr.
Redd
y’s
Lobo
rato
ries
(Aus
tral
ia) P
ty. L
imite
d 2
4,64
0 (4
2,90
4) 1
,375
1
,375
–
– (4
2,89
0)–
(42,
890)
–
Dr.
Redd
y’s
Labo
rato
ries
SA, S
witz
erla
nd3,
522
(62,
805)
964,
888
964,
888
–59
7,45
4(6
9,24
8)(6
,442
)(6
2,80
5)
Aur
igen
e D
isco
very
Tec
hnol
ogie
s (M
alay
sia)
SD
N B
HD
985
1
4 9
99
999
1
4 –
14
–
Eur
o Br
idge
Con
sulti
ng B
V63
4–
634
634
––
––
––
OO
O D
RS L
imite
d29
,249
(194
)29
,055
29,0
55–
––
––
–
Aff
orda
ble
Hea
lth C
are
Lim
ited
328
(5
,291
) 7
3,18
0 7
3,18
0 4
,398
(5
,291
)–
(5,2
91)
–
No
te: I
nves
tmen
ts in
clud
es in
vest
men
t m
ade
exce
pt in
vest
men
ts m
ade
in s
ubsd
iairy
com
pani
es.
211 | D R . R E D D Y ’ S L A B O R AT O R I E S LT D I N F O R M AT I O N O N T H E F I N A N C I A L O F S U B S I D I A R I E S
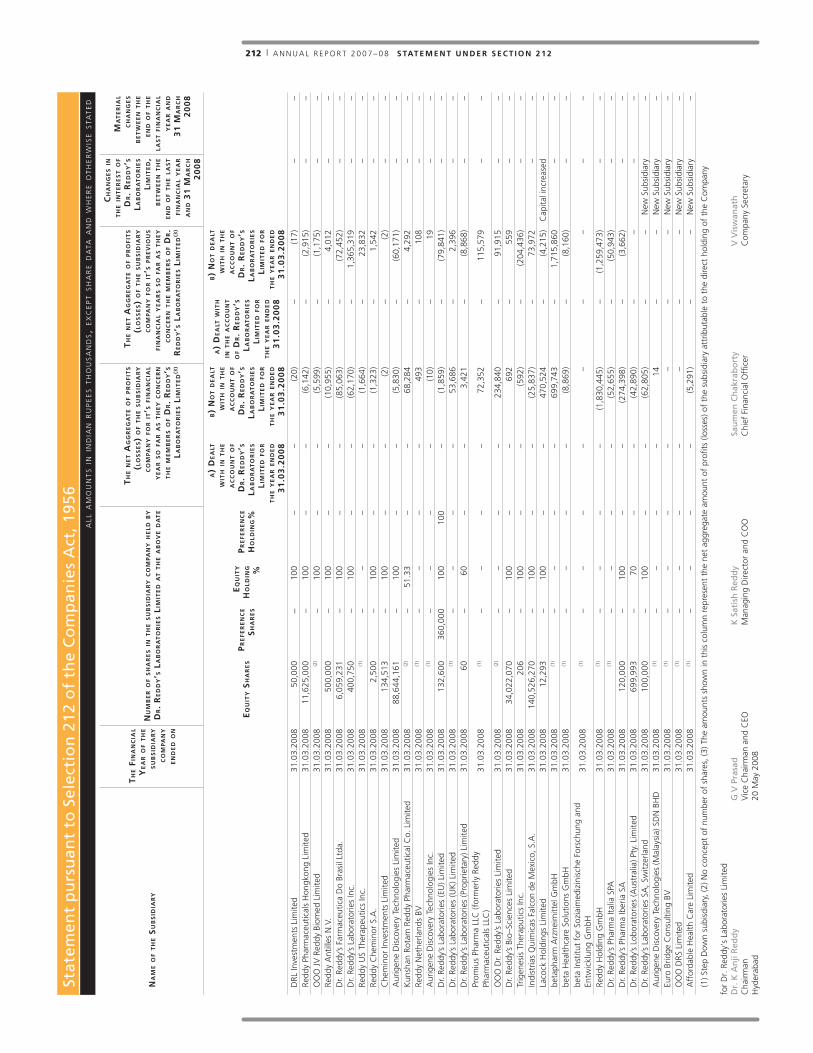
sta
tem
en
t p
urs
ua
nt
to s
ele
ctio
n 2
12
of
the
co
mp
an
ies
Act
, 19
56
al
l a
mo
un
ts i
n i
nd
ian
ru
pe
es t
ho
us
an
ds,
ex
ce
pt s
ha
re d
at
a a
nd
wh
er
e o
th
er
wis
e s
ta
te
d
na
me o
f t
he s
ub
sid
iar
y
th
e f
ina
nc
ial
ye
ar o
f t
he
su
bs
idia
ry
co
mp
an
y
en
de
d o
n
nu
mb
er o
f s
ha
re
s i
n t
he s
ub
sid
iar
y c
om
pa
ny h
el
d b
y
dr.
re
dd
y’s
la
bo
ra
to
rie
s l
imit
ed
at t
he a
bo
ve d
at
e
th
e n
et a
gg
re
ga
te o
f p
ro
fit
s (l
os
se
s)
of t
he s
ub
sid
iar
y
co
mp
an
y f
or i
t’s
fin
an
cia
l y
ea
r s
o f
ar a
s t
he
y c
on
ce
rn
th
e m
em
be
rs o
f d
r.
re
dd
y’s
la
bo
ra
to
rie
s l
imit
ed
(3)
th
e n
et a
gg
re
ga
te o
f p
ro
fit
s (l
os
se
s)
of t
he s
ub
sid
iar
y
co
mp
an
y f
or i
t’s
pr
ev
iou
s f
ina
nc
ial y
ea
rs s
o f
ar a
s t
he
y
co
nc
er
n t
he m
em
be
rs o
f d
r.
re
dd
y’s
la
bo
ra
to
rie
s l
imit
ed
(3)
ch
an
ge
s i
n
th
e i
nt
er
es
t o
f d
r.
re
dd
y’s
la
bo
ra
to
rie
s li
mit
ed
, b
et
we
en
th
e e
nd
of t
he l
as
t f
ina
nc
ial y
ea
r
an
d 3
1 m
ar
ch
20
08
ma
te
ria
l c
ha
ng
es
be
tw
ee
n t
he
en
d o
f t
he
la
st f
ina
nc
ial
ye
ar a
nd
31
ma
rc
h
20
08
eq
uit
y s
ha
re
sp
re
fe
re
nc
e s
ha
re
s
eq
uit
y
ho
ld
ing
%
pr
ef
er
en
ce
ho
ld
ing
%
a)
de
alt
w
ith
in
th
e a
cc
ou
nt o
f d
r.
re
dd
y’s
la
bo
ra
to
rie
s li
mit
ed
fo
r
th
e y
ea
r e
nd
ed
31
.03
.20
08
b)
no
t d
ea
lt
wit
h i
n t
he
ac
co
un
t o
f d
r.
re
dd
y’s
la
bo
ra
to
rie
s li
mit
ed
fo
r
th
e y
ea
r e
nd
ed
31
.03
.20
08
a)
de
alt
wit
h
in t
he a
cc
ou
nt
of d
r.
re
dd
y’s
la
bo
ra
to
rie
s li
mit
ed
fo
r
th
e y
ea
r e
nd
ed
31
.03
.20
08
b)
no
t d
ea
lt
wit
h i
n t
he
ac
co
un
t o
f d
r.
re
dd
y’s
la
bo
ra
to
rie
s li
mit
ed
fo
r
th
e y
ea
r e
nd
ed
31
.03
.20
08
DRL
Inve
stm
ents
Lim
ited
31.0
3.20
08 5
0,00
0 –
100
––
(20)
–(1
7)–
–Re
ddy
Phar
mac
eutic
als
Hon
gkon
g Li
mite
d31
.03.
2008
11,6
25,0
00
–10
0–
– (6
,142
)–
(2,9
15)
––
OO
O J
V R
eddy
Bio
med
Lim
ited
31.0
3.20
08 (2
)–
100
––
(5,5
99)
–(1
,175
)–
–Re
ddy
Ant
illes
N.V
.31
.03.
2008
500
,000
–
100
––
(10,
955)
–4,
012
––
Dr.
Redd
y’s
Farm
aceu
tica
Do
Bras
il Lt
da.
31.0
3.20
08 6
,059
,231
–
100
––
(85,
063)
–(7
2,45
2)–
–D
r. Re
ddy’
s La
bora
torie
s In
c.31
.03.
2008
400
,750
–
100
––
(62,
170)
–1,
365,
319
––
Redd
y U
S Th
erap
eutic
s In
c.31
.03.
2008
(1)
––
––
(1,6
64)
–23
,832
–
–Re
ddy
Che
min
or S
.A.
31.0
3.20
08 2
,500
–
100
––
(1,3
23)
–1,
542
––
Che
min
or In
vest
men
ts L
imite
d31
.03.
2008
134
,513
–
100
––
(2)
–(2
)–
–A
urig
ene
Dis
cove
ry T
echn
olog
ies
Lim
ited
31.0
3.20
0888
,644
,161
–
100
––
(5,8
30)
–(6
0,17
1)–
–K
unsh
an R
otam
Red
dy P
harm
aceu
tical
Co.
Lim
ited
31.0
3.20
08 (2
)–
51.3
3–
– 6
8,28
4 –
4,29
2 –
–Re
ddy
Net
herla
nds
BV31
.03.
2008
(1)
––
––
493
–
108
––
Aur
igen
e D
isco
very
Tec
hnol
ogie
s In
c.31
.03.
2008
(1)
––
––
(10)
–19
–
–D
r. Re
ddy’
s La
bora
torie
s (E
U) L
imite
d31
.03.
2008
132
,600
36
0,00
010
010
0–
(1,8
59)
–(7
9,84
1)–
–D
r. Re
ddy’
s La
bora
torie
s (U
K) L
imite
d31
.03.
2008
(1)
––
––
53,
686
–2,
396
––
Dr.
Redd
y’s
Labo
rato
ries
(Pro
prie
tary
) Lim
ited
31.0
3.20
08 6
0 –
60–
– 3
,421
–
(8,8
68)
––
Prom
ius
Phar
ma
LLC
(for
mer
ly R
eddy
Ph
arm
aceu
tical
s LL
C)
31.0
3.20
08 (1
)–
––
– 7
2,35
2 –
115,
579
––
OO
O D
r. Re
ddy’
s La
bora
torie
s Li
mite
d31
.03.
2008
(2)
––
––
234
,840
–
91,9
15
––
Dr.
Redd
y’s
Bio–
Scie
nces
Lim
ited
31.0
3.20
0834
,022
,070
–
100
––
692
–
559
––
Trig
enes
is T
hera
putic
s In
c.31
.03.
2008
206
–
100
––
(592
)–
(204
,436
)–
–In
dist
rias
Qui
mic
as F
alco
n de
Mex
ico,
S.A
.31
.03.
2008
140,
526,
270
–10
0–
– (2
5,83
7)–
73,9
72
––
Laco
ck H
oldi
ngs
Lim
ited
31.0
3.20
08 1
2,29
3 –
100
––
470
,524
–
(4,2
15)
Cap
ital i
ncre
ased
–be
taph
arm
Arz
neim
ittel
Gm
bH31
.03.
2008
(1)
––
––
699
,743
–
1,71
5,86
0 –
–be
ta H
ealth
care
Sol
utio
ns G
mbH
31.0
3.20
08 (1
)–
––
– (8
,869
)–
(8,1
60)
––
beta
Inst
itut
for
Sozi
aim
ediz
inis
che
Fors
chun
g an
d En
twic
klun
g G
mbH
31.0
3.20
08 (1
)–
––
– –
–
––
–
Redd
y H
oldi
ng G
mbH
31.0
3.20
08 (1
)–
––
– (1
,830
,445
)–
(1,2
59,4
73)
––
Dr.
Redd
y’s
Phar
ma
Italia
SPA
31.0
3.20
08 (1
)–
––
– (5
2,65
5)–
(50,
943)
––
Dr.
Redd
y’s
Phar
ma
Iber
ia S
A31
.03.
2008
120
,000
–
100
––
(274
,398
)–
(3,6
62)
––
Dr.
Redd
y’s
Lobo
rato
ries
(Aus
tral
ia) P
ty. L
imite
d31
.03.
2008
699
,993
–
70–
– (4
2,89
0)–
––
–D
r. Re
ddy’
s La
bora
torie
s SA
, Sw
itzer
land
31.0
3.20
0810
0,00
0–
100
––
(62,
805)
––
New
Sub
sidi
ary
–A
urig
ene
Dis
cove
ry T
echn
olog
ies
(Mal
aysi
a) S
DN
BH
D31
.03.
2008
(1)
––
––
14
––
New
Sub
sidi
ary
–Eu
ro B
ridge
Con
sulti
ng B
V31
.03.
2008
(1)
––
––
–
––
New
Sub
sidi
ary
–O
OO
DRS
Lim
ited
31.0
3.20
08 (1
)–
––
– –
–
–N
ew S
ubsi
diar
y–
Aff
orda
ble
Hea
lth C
are
Lim
ited
31.0
3.20
08 (1
)–
––
– (5
,291
)–
–N
ew S
ubsi
diar
y–
(1) S
tep
Dow
n su
bisd
iary
, (2)
No
conc
ept
of n
umbe
r of
sha
res,
(3) T
he a
mou
nts
show
n in
thi
s co
lum
n re
pres
ent
the
net
aggr
egat
e am
ount
of
profi
ts (l
osse
s) o
f th
e su
bsid
iary
att
ribut
able
to
the
dire
ct h
oldi
ng o
f th
e C
ompa
ny
for
Dr.
Red
dy’s
Lab
orat
orie
s Li
mite
d
D
r. K
An
ji r
edd
y G
V P
rasa
d
K s
atis
h r
edd
y sa
um
en c
hak
rab
ort
y V
Vis
wan
ath
Cha
irman
V
ice
Cha
irman
an
d C
EO
Man
agin
g D
irect
or a
nd
CO
O
Chi
ef F
inan
cial
Offi
cer
Com
pany
Sec
reta
ryH
yder
abad
20
May
200
8
212 | A N N U A L R E P O R T 2 0 0 7 – 0 8 S TAT E M E N T U N D E R S E C T I O N 2 1 2

Sta
tem
en
t p
urs
ua
nt
to S
ele
ctio
n 2
12
of
the
Co
mp
an
ies
Act
, 19
56
al
l a
mo
un
ts i
n i
nd
ian
ru
pe
es t
ho
us
an
ds,
ex
ce
pt s
ha
re d
at
a a
nd
wh
er
e o
th
er
wis
e s
ta
te
d
Na
me o
f t
he S
ub
Sid
iar
y
th
e f
iNa
Nc
ial
ye
ar o
f t
he
Su
bS
idia
ry
co
mp
aN
y
eN
de
d o
N
Nu
mb
er o
f S
ha
re
S i
N t
he S
ub
Sid
iar
y c
om
pa
Ny h
el
d b
y
dr.
re
dd
y’S
la
bo
ra
to
rie
S l
imit
ed
at t
he a
bo
ve d
at
e
th
e N
et a
gg
re
ga
te o
f p
ro
fit
S (l
oS
Se
S)
of t
he S
ub
Sid
iar
y
co
mp
aN
y f
or i
t’S
fiN
aN
cia
l y
ea
r S
o f
ar a
S t
he
y c
oN
ce
rN
th
e m
em
be
rS o
f d
r.
re
dd
y’S
la
bo
ra
to
rie
S l
imit
ed
(3)
th
e N
et a
gg
re
ga
te o
f p
ro
fit
S (l
oS
Se
S)
of t
he S
ub
Sid
iar
y
co
mp
aN
y f
or i
t’S
pr
ev
iou
S f
iNa
Nc
ial y
ea
rS S
o f
ar a
S t
he
y
co
Nc
er
N t
he m
em
be
rS o
f d
r.
re
dd
y’S
la
bo
ra
to
rie
S l
imit
ed
(3)
ch
aN
ge
S i
N
th
e i
Nt
er
eS
t o
f d
r.
re
dd
y’S
la
bo
ra
to
rie
S li
mit
ed
, b
et
we
eN
th
e e
Nd
of t
he l
aS
t f
iNa
Nc
ial y
ea
r
aN
d 3
1 m
ar
ch
20
08
ma
te
ria
l c
ha
Ng
eS
be
tw
ee
N t
he
eN
d o
f t
he
la
St f
iNa
Nc
ial
ye
ar a
Nd
31
ma
rc
h
20
08
eq
uit
y S
ha
re
Sp
re
fe
re
Nc
e S
ha
re
S
eq
uit
y
ho
ld
iNg
%
pr
ef
er
eN
ce
ho
ld
iNg
%
a)
de
alt
w
ith
iN
th
e a
cc
ou
Nt o
f d
r.
re
dd
y’S
la
bo
ra
to
rie
S li
mit
ed
fo
r
th
e y
ea
r e
Nd
ed
31
.03
.20
08
b)
No
t d
ea
lt
wit
h i
N t
he
ac
co
uN
t o
f d
r.
re
dd
y’S
la
bo
ra
to
rie
S li
mit
ed
fo
r
th
e y
ea
r e
Nd
ed
31
.03
.20
08
a)
de
alt
wit
h
iN t
he a
cc
ou
Nt
of d
r.
re
dd
y’S
la
bo
ra
to
rie
S li
mit
ed
fo
r
th
e y
ea
r e
Nd
ed
31
.03
.20
08
b)
No
t d
ea
lt
wit
h i
N t
he
ac
co
uN
t o
f d
r.
re
dd
y’S
la
bo
ra
to
rie
S li
mit
ed
fo
r
th
e y
ea
r e
Nd
ed
31
.03
.20
08
DRL
Inve
stm
ents
Lim
ited
31.0
3.20
08 5
0,00
0 –
100
––
(20)
–(1
7)–
–Re
ddy
Phar
mac
eutic
als
Hon
gkon
g Li
mite
d31
.03.
2008
11,6
25,0
00
–10
0–
– (6
,142
)–
(2,9
15)
––
OO
O J
V R
eddy
Bio
med
Lim
ited
31.0
3.20
08 (2
)–
100
––
(5,5
99)
–(1
,175
)–
–Re
ddy
Ant
illes
N.V
.31
.03.
2008
500
,000
–
100
––
(10,
955)
–4,
012
––
Dr.
Redd
y’s
Farm
aceu
tica
Do
Bras
il Lt
da.
31.0
3.20
08 6
,059
,231
–
100
––
(85,
063)
–(7
2,45
2)–
–D
r. Re
ddy’
s La
bora
torie
s In
c.31
.03.
2008
400
,750
–
100
––
(62,
170)
–1,
365,
319
––
Redd
y U
S Th
erap
eutic
s In
c.31
.03.
2008
(1)
––
––
(1,6
64)
–23
,832
–
–Re
ddy
Che
min
or S
.A.
31.0
3.20
08 2
,500
–
100
––
(1,3
23)
–1,
542
––
Che
min
or In
vest
men
ts L
imite
d31
.03.
2008
134
,513
–
100
––
(2)
–(2
)–
–A
urig
ene
Dis
cove
ry T
echn
olog
ies
Lim
ited
31.0
3.20
0888
,644
,161
–
100
––
(5,8
30)
–(6
0,17
1)–
–K
unsh
an R
otam
Red
dy P
harm
aceu
tical
Co.
Lim
ited
31.0
3.20
08 (2
)–
51.3
3–
– 6
8,28
4 –
4,29
2 –
–Re
ddy
Net
herla
nds
BV31
.03.
2008
(1)
––
––
493
–
108
––
Aur
igen
e D
isco
very
Tec
hnol
ogie
s In
c.31
.03.
2008
(1)
––
––
(10)
–19
–
–D
r. Re
ddy’
s La
bora
torie
s (E
U) L
imite
d31
.03.
2008
132
,600
36
0,00
010
010
0–
(1,8
59)
–(7
9,84
1)–
–D
r. Re
ddy’
s La
bora
torie
s (U
K) L
imite
d31
.03.
2008
(1)
––
––
53,
686
–2,
396
––
Dr.
Redd
y’s
Labo
rato
ries
(Pro
prie
tary
) Lim
ited
31.0
3.20
08 6
0 –
60–
– 3
,421
–
(8,8
68)
––
Prom
ius
Phar
ma
LLC
(for
mer
ly R
eddy
Ph
arm
aceu
tical
s LL
C)
31.0
3.20
08 (1
)–
––
– 7
2,35
2 –
115,
579
––
OO
O D
r. Re
ddy’
s La
bora
torie
s Li
mite
d31
.03.
2008
(2)
––
––
234
,840
–
91,9
15
––
Dr.
Redd
y’s
Bio–
Scie
nces
Lim
ited
31.0
3.20
0834
,022
,070
–
100
––
692
–
559
––
Trig
enes
is T
hera
putic
s In
c.31
.03.
2008
206
–
100
––
(592
)–
(204
,436
)–
–In
dist
rias
Qui
mic
as F
alco
n de
Mex
ico,
S.A
.31
.03.
2008
140,
526,
270
–10
0–
– (2
5,83
7)–
73,9
72
––
Laco
ck H
oldi
ngs
Lim
ited
31.0
3.20
08 1
2,29
3 –
100
––
470
,524
–
(4,2
15)
Cap
ital i
ncre
ased
–be
taph
arm
Arz
neim
ittel
Gm
bH31
.03.
2008
(1)
––
––
699
,743
–
1,71
5,86
0 –
–be
ta H
ealth
care
Sol
utio
ns G
mbH
31.0
3.20
08 (1
)–
––
– (8
,869
)–
(8,1
60)
––
beta
Inst
itut
for
Sozi
aim
ediz
inis
che
Fors
chun
g an
d En
twic
klun
g G
mbH
31.0
3.20
08 (1
)–
––
– –
–
––
–
Redd
y H
oldi
ng G
mbH
31.0
3.20
08 (1
)–
––
– (1
,830
,445
)–
(1,2
59,4
73)
––
Dr.
Redd
y’s
Phar
ma
Italia
SPA
31.0
3.20
08 (1
)–
––
– (5
2,65
5)–
(50,
943)
––
Dr.
Redd
y’s
Phar
ma
Iber
ia S
A31
.03.
2008
120
,000
–
100
––
(274
,398
)–
(3,6
62)
––
Dr.
Redd
y’s
Lobo
rato
ries
(Aus
tral
ia) P
ty. L
imite
d31
.03.
2008
699
,993
–
70–
– (4
2,89
0)–
––
–D
r. Re
ddy’
s La
bora
torie
s SA
, Sw
itzer
land
31.0
3.20
0810
0,00
0–
100
––
(62,
805)
––
New
Sub
sidi
ary
–A
urig
ene
Dis
cove
ry T
echn
olog
ies
(Mal
aysi
a) S
DN
BH
D31
.03.
2008
(1)
––
––
14
––
New
Sub
sidi
ary
–Eu
ro B
ridge
Con
sulti
ng B
V31
.03.
2008
(1)
––
––
–
––
New
Sub
sidi
ary
–O
OO
DRS
Lim
ited
31.0
3.20
08 (1
)–
––
– –
–
–N
ew S
ubsi
diar
y–
Aff
orda
ble
Hea
lth C
are
Lim
ited
31.0
3.20
08 (1
)–
––
– (5
,291
)–
–N
ew S
ubsi
diar
y–
(1) S
tep
Dow
n su
bisd
iary
, (2)
No
conc
ept
of n
umbe
r of
sha
res,
(3) T
he a
mou
nts
show
n in
thi
s co
lum
n re
pres
ent
the
net
aggr
egat
e am
ount
of
profi
ts (l
osse
s) o
f th
e su
bsid
iary
att
ribut
able
to
the
dire
ct h
oldi
ng o
f th
e C
ompa
ny
for
Dr.
Red
dy’s
Lab
orat
orie
s Li
mite
d
D
r. K
An
ji R
edd
y G
V P
rasa
d
K S
atis
h R
edd
y Sa
um
en C
hak
rab
ort
y V
Vis
wan
ath
Cha
irman
V
ice
Cha
irman
an
d C
EO
Man
agin
g D
irect
or a
nd
CO
O
Chi
ef F
inan
cial
Offi
cer
Com
pany
Sec
reta
ryH
yder
abad
20
May
200
8
213 | D R . R E D D Y ’ S L A B O R AT O R I E S LT D n o t i c e o f a g m
Notice
Notice is hereby given that the 24th Annual General Meeting of the Company
will be held on Tuesday, 22 July 2008 at 11.30 A.M. at the Grand Ball Room,
Hotel Taj Krishna, Road No. 1, Banjara Hills, Hyderabad-500 034, to transact the
following business:
oRDinaRY BUSineSS:
1. To receive, consider and adopt the Profit & Loss Account for the year ended
31 March 2008, Balance Sheet as on that date along with the Reports of the
Directors’ and Auditors’ thereon.
2. To declare dividend on the equity shares for the financial year 2007-08.
3. To appoint a Director in place of Mr. Anupam Puri, who retires by rotation,
and being eligible, offers himself for re-appointment.
4. To appoint a Director in place of Dr. Krishna G Palepu, who retires by
rotation, and being eligible, offers himself for re-appointment.
5. To resolve not to fill vacancy, for the time being, caused by the retirement
of Mr. P N Devarajan, who retires by rotation and does not seek
re-appointment.
6. To appoint the Statutory Auditors and fix their remuneration. The retiring
Auditors BSR & Co. are eligible for re-appointment.
SPeciaL BUSineSS:
7. to consider and if thought fit, to pass with or without modification,
the following resolution as a special resolution:
“RESOLVED THAT pursuant to Regulation 6 and 7 of SEBI (Employee Stock
Option Scheme and Employee Stock Purchase Scheme) Guidelines, 1999
and Clause 20 of the Dr. Reddy’s Employees Stock Option Scheme 2002 &
Dr. Reddy’s Employees ADR Stock Option Scheme, 2007 and other relevant
applicable provisions if any, and not withstanding anything to the contrary
stated in this regard in the existing schemes of the Company, the Board of
Directors of the Company (hereinafter referred to as ”Board”, which term
shall be deemed to include the Compensation Committee, for the time
being authorised by the Board of Directors to exercise the powers conferred
on the Board of Directors by this resolution and / or such other persons who
may be authorised in this regard) be and are hereby authorised to modify
certain terms of the existing schemes approved earlier by the shareholders
of the Company to exercise the right to recover from the relevant eligible
employees, the fringe benefit tax in the respect of options which are granted
to or vested or exercised by, the eligible employee under the provisions of
Section 115 WKA of the Income Tax Act, 1961.”
“RESOLVED FURTHER THAT existing Clause 9(a) of Dr. Reddy’s Employees
Stock Option Scheme, 2002 be and is hereby suitably be amended.”
“RESOLVED FURTHER THAT for the purpose of giving effect to the above
resolution, the Board of Directors including the Compensation Committee
thereof, be and are hereby authorised to do all such acts, deeds and things,
matters as may be necessary or expedient in this regard”.
8. to consider and if thought fit, to pass with or without modification,
the following resolution as a special resolution:
“RESOLVED THAT pursuant to the provisions of Section 81(1A) and all
other applicable provisions, if any, of the Companies Act, 1956 including
any statutory modification(s) or re-enactment thereof, for the time being in
force and in accordance with the relevant provisions of the Memorandum
and Articles of Association of the Company, the rules / regulations /
guidelines, if any, prescribed by the Securities Exchange Board of India and
/ or any other regulatory authority, the listing agreement entered into by
the Company with the Stock Exchanges where the equity shares of the
Company are listed and subject to approval(s), consent(s), permission(s) and
/ or sanction(s), if any, of appropriate authorities as may be required and
subject to such conditions as may be prescribed by any one of them while
granting any such approval(s), consent(s), permission(s), and / or sanction(s),
the Board of Directors of the Company (hereinafter referred to as “Board”
which term shall be deemed to include any Committee which the Board may
have constituted or hereinafter constitute to exercise its powers including
the powers conferred by this resolution) be and are hereby authorized
to create, offer, issue, and allot warrants, entitling the warrant holder(s)
from time to time to apply for equity shares of the Company in one or
more tranches, to promoters / promoter group including the entities in the
promoter group / any select group related to promoter(s) of the Company
whether or not members of the Company (subject to the proposed allottee
complying to the applicable SEBI Guidelines on the date of allotment), on
preferential placement basis through offer letter and / or circular and / or
such other documents / writings, in such manner and on such terms and
conditions as may be determined by the Board in this regard in its absolute
discretion, provided that the aggregate number of resultant equity shares
of the Company to be issued against such share warrants shall not exceed
84,06,782 (Eighty four lakhs six thousand and seven hundred and eighty
two only) being 5% of the equity as on 25 January 2008, as fully paid equity
shares of the face value of Rs.5 each at a price equal to:
a) The average of the weekly high and low of the closing prices of the
Company’s shares quoted on the stock exchange (as explained in the
annexed explanatory statement) during the six months preceding the
‘relevant date’; or
b) The average of the weekly high and low of the closing prices of the
Company’s shares quoted on a stock exchange (as explained in the
annexed explanatory statement) during the two weeks preceding the
‘relevant date’;
Whichever is higher; the ‘relevant date’ for this purpose being 22 June 2008
RESOLVED FURTHER THAT the resultant equity shares to be issued and
allotted upon exercise of rights attached to the share warrants in accordance
with the terms of the offer(s) shall rank pari passu with the then existing
equity shares of the Company in all respects and be listed on domestic stock
exchanges where the equity shares of the Company are listed;
RESOLVED FURTHER THAT for the purpose of giving effect to the issue or
allotment of the share warrants and equity shares arising thereon, the Board
of Directors of the Company be and are hereby authorized on behalf of the
Company to take all actions and do all such acts, deeds, matters and things
as it may, in its absolute discretion, deem necessary, proper or desirable for
such purpose and with the power on behalf of the Company to settle all
questions, difficulties or doubts that may arise in the proposed issue, offer
and allotment of the said share warrants and equity shares arising there
from, including utilization of the issue proceeds, without being required
to seek any further consent or approval of members or otherwise to the
end and intent that members shall be deemed to have given their approval
thereto expressly by the authority of this resolution;

214 | A N N U A L R E P O R T 2 0 0 7 – 0 8 n o t i c e o f a g m
Notice ( C o N t i N u e D )
RESOLVED FURTHER THAT the Board be and is hereby authorized to
delegate all or any of the powers herein conferred to any Committee of
Directors or any Director(s) or Officer(s) of the Company to give effect to this
resolution”.
Notes:
1. An explanatory statement pursuant to Section 173 (2) of the Companies
Act, 1956 in respect of the special business is annexed hereto.
2. a member entitled to attend and vote is entitled to appoint a proxy
to attend and vote instead of himself/herself and the proxy need
not be a member of the company. the instrument of proxy in order
to be effective, must be deposited at the registered office of the
company, duly completed and signed not less than 48 hours before
the meeting.
3. The register of members and the share transfer books of the Company will
remain closed from 8 July 2008 (Tuesday) to 12 July 2008 (Saturday) (both
days inclusive in connection with the payment of dividend for the financial
year 2007-08. Dividend, if declared, at the annual general meeting, will be
paid on or after 26 July 2008.
4. The Shareholders are requested to intimate immediately any change in their
address or bank mandates to their depository participants with whom they
are maintaining their demat accounts or to the Company’s Share Transfer
Agent, M/s Bigshare Services Private Limited, if the shares are held in
certificate form.
5. For the convenience of members and for proper conduct of the meeting,
entry to the place of meeting will be regulated by attendance slip, which
is part of the annual report. Members are requested to sign at the place
provided on the attendance slip and hand it over at the entrance to the
venue.
6. Shareholders desiring any information relating to the accounts are requested
to write to the Company at an early date so as to enable the management
to keep the information ready.
By order of the Board
Place: Hyderabad V ViSwANAtH
Date: 20 May 2008 CoMPANy SeCRetARy

215 | D R . R E D D Y ’ S L A B O R AT O R I E S LT D n o t i c e o f a g m
explanatory statement pursuant to Section 173 (2) of the companies act,
1956
item no. 7
The Company at present has two Employees Stock Option Schemes as under:
Scheme 1- Dr. Reddy’s Employees Stock Option Scheme, 2002
Scheme 2- Dr. Reddy’s Employees ADR Stock Option Scheme, 2007
These schemes were duly approved earlier by the Board of Directors and
Shareholders of the Company.
The Compensation Committee at its meeting earlier held on 24 October 2007
proposed that the Company should absorb the full liability for the Fringe Benefit
Tax (FBT) on exercising of all stock options granted till the date of the resolution.
FBT would be recovered on future grants from the concerned employee from the
date of the resolution. In addition, the above modification would be reflected in
a suitable amendment to the scheme of the stock options, which requires the
approval of the shareholders.
It is also proposed to remove the grades or designations prescribed under the
existing Clause 9 (a) of Dr. Reddy’s Employees Stock Option Scheme, 2002
pursuant to the changes in the work levels in the organisation structure of the
Company and proposed for suitable amendment in the said clause of the scheme
respectively.
In view of the above, it is proposed to amend the said schemes accordingly,
without affecting the other terms and conditions of the existing employees stock
option schemes.
Your Directors recommend the resolution for your approval.
None of the Directors are deemed to be concerned or interested in the above
resolution except those who are eligible for grant of stock options.
item no. 8
The Company continues to pursue opportunities to grow in the pharma business
globally. In order to fund this growth, the Company has to strike an optimum mix
between Debt and Equity - such that the long term aspirations are adequately
met without compromising performance in the short term. The Company in
the past has resorted to financing its growth and acquisition both through debt
(March 2006) and a follow on ADR offering (November 2006). Since the current
situation in the fixed income (debt) market worldwide is not conducive to raising
capital, the Company proposes to inject additional equity funds. This is proposed
to be met through a preferential convertible warrants issues to the promoter
group. This will accomplish the objectives of continuing the Company’s growth
momentum, bolstering its cash reserves, (Net debt as on 31 March 2008 is
Rs. 1,468 crores), and leveraging a more beneficial capital structure for potential
future debt issuances.
In view of the above, the Board of Directors of the Company at its meeting earlier
held on 25 January 2008 had proposed to issue and allot convertible warrants
up to 5% of the equity existing as on that date to the said category as above,
on preferential basis upto 84,06,782 (Eighty four lakhs six thousand and seven
hundred and eighty two only) warrants, entitling the warrant holders to apply for
equivalent number of fully paid equity shares of the Company.
As per regulation 13.1A of the SEBI (Disclosure and Investor Protection) Guidelines,
2000 as applicable from time to time, the required details are furnished as
under:
objects of the issue:
As given above
Pricing:
The issue of the equity shares arising through the issue of warrants will be at a
price equal to:
• TheaverageoftheweeklyhighandlowoftheclosingpricesoftheCompany’s
shares quoted on the stock exchange during the six months preceding the
‘relevant date’; or
• TheaverageoftheweeklyhighandlowoftheclosingpricesoftheCompany’s
shares quoted on a stock exchange during the two weeks preceding the
‘relevant date’;
Whichever is higher; and the ‘relevant date’ for this purpose being 22 June 2008.
“Stock exchange” for this purpose means any of the recognised stock exchanges
in which the shares are listed and in which the highest trading volume in respect
of the shares of the company has been recorded during the preceding six months
prior to the relevant date.
Payment & conversion terms:
An amount equal to 10% of the issue price shall be payable on allotment of the
warrants. The warrant holders shall be entitled to apply for and be allotted, in one
or more tranches, one equity share of the face value of Rs. 5 each of the Company
per warrant, any time after the date of allotment of such warrants. Upon exercise
of the right to apply for equity shares, the warrant holders will be liable to make
the payment of the balance amount, being 90% of the issue price. The amount
paid, at the time of allotment of warrants, will be adjusted/ set off against the
issue price of the resultant equity shares. The Board (or a Committee there of)
upon receipt of the entire payment towards issue price, shall allot one equity
share per warrant. If the entitlement against the warrants to apply for the equity
shares is not exercised within the specified period of 18 months, such entitlement
shall lapse and the amount paid on such warrants shall stand forfeited.
intention of Promoters / Directors / Key management Persons to subscribe
to the proposed preferential offer and change in control:
None of the Promoter / Director / Key Management Persons other than the
promoters as mentioned below intend to subscribe to the offer of issue of
warrants. The existing promoters of the Company will continue to be in control
of the Company and there will not be any change in the management or control
of the Company as a result of proposed preferential allotment.
Name of the Shareholders /
Allottees
Pre Issue, as on 25 Jan 2008 Post Issue@
No. of Shares % No. of Shares %
Promoters 42,277,774 25.15% 50,684,556 28.71%
- of which
Dr. Reddy’s Holdings Private Ltd. 37,798,290 22.48% 46,205,072 26.17%
Other Promoters 4,479,484 2.67% 4,479,484 2.54%
@ assuming full exercise of the rights attached to convertible warrants
Annexure to Notice

216 | A N N U A L R E P O R T 2 0 0 7 – 0 8 n o t i c e o f a g m
Annexure to Notice ( C o N t i N u e D )
Shareholding Pattern of the company before and after the proposed
allotment of convertible warrants upon conversion would be as under:
@ assuming full exercise of the rights attached to convertible warrants
Proposed time within which the allotment shall complete:
As per SEBI Guidelines, the allotment of share warrants shall be completed within
15 days from the date of passing of the said resolution by the shareholders.
Provided that, where the allotment is pending on account of any regulatory
authority or from the Central Government, the allotment will be completed
within 15 days on receipt of such approval.
the identity of the proposed allottee(s) and the percentage of the
preferential issue that may be held by the allottee(s):
Dr. Reddy’s Holdings Private Limited – 100%
certification from Statutory auditors:
BSR & Co, Chartered Accountants, Statutory Auditors of the Company, have
certified that the issue of preferential warrants is being made in accordance with
the SEBI Guidelines, except for the provisions which would be required to be
complied at the relevant date or on allotment of the share warrants or thereafter,
for preferential issues. A copy of the said certificate is open for inspection at the
Registered Office of the Company during the office hours on all working days
except Saturdays and Sundays between 11.00 A.M. and 1.00 P.M. till the date of
Annual General Meeting.
Lock-in:
The convertible warrants to be allotted on preferential basis and the resultant
equity shares shall be subject to lock-in as per applicable SEBI Guidelines in this
behalf:
• Thewarrantsandtheresultantsharesallottedshallbesubjecttoalock-in
period of 3 (three) years from the date of allotment.
• The entire pre-preferential allotment shareholding of proposed allottee(s)
shall be under lock-in from the relevant date upto a period of 6 (six) months
from the date of preferential allotment.
• Thelockedinwarrants/sharesmaybetransferredtoandamongstpromoter
/ promoter group or to a new promoter(s) or person(s) in control of the
Company, subject to continuation of lock-in in the hands of transferee(s) for
the remaining period and compliance of SEBI (SAST) Regulations, 1997, as
applicable.
The consent of the shareholders being sought for the special resolution for
issuance of preferential warrants as proposed in the resolution.
Your Directors recommend the resolution for approval.
None of the Directors of the Company is concerned or interested in the said
resolution, except Dr. K Anji Reddy, Mr. G V Prasad and Mr. Satish Reddy,
Directors, being promoters may be deemed to be concerned or interested in the
special resolution to the extent of warrants may be subscribed by them / the
Companies associated with them / bodies corporate of the promoter group.
By order of the Board
Place: Hyderabad V ViSwANAtH
Date: 20 May 2008 CoMPANy SeCRetARy
Category of ShareholderPre Issue, as on 16 May 2008 Post Issue@
No. of Shares % No. of Shares %
PROMOTERS HOLDING
– Individuals 4,479,484 2.66% 4,479,484 2.54%
– Companies
Dr. Reddy’s Holdings Private Ltd. 37,798,290 22.47% 46,205,072 26.16%
Sub total 42,277,774 25.13% 50,684,556 28.70%
INDIAN BANKS / FIs / MFs
Indian Financial Institutions 21,367,012 12.70% 21,367,012 12.10%
Banks 420,435 0.25% 420,435 0.24%
Mutual Funds 9,946,265 5.91% 9,946,265 5.63%
Sub total 31,733,712 18.87% 31,733,712 17.97%
FOREIGN HOLDING
– Foreign Institutional Investors 41,958,619 24.95% 41,958,619 23.76%
– NRIs 3,215,785 1.91% 3,215,785 1.82%
– ADRs / Foreign Nationals 27, 992,581 16.64% 27,992,581 15.85%
Sub total 73,166,985 43.50% 73,166,985 41.43%
INDIAN PUBLIC / CORPORATES 21,025,615 12.50% 21,025,615 11.91%
total 168,204,086 100.00% 176,610,868 100.00%

217 | D R . R E D D Y ’ S L A B O R AT O R I E S LT D g l o s s a ry
ADR American Depository Receipts
ADS American Depository Shares
AG Authorized Generics
ANDA Abbreviated New Drug Application
API Active Pharmaceutical Ingredients and Intermediates
ARL American Remedies Limited
AVWG Arzneimittelversorgungs-Wirtschaftlichkeisgestz
(Economic Optimization of Pharmaceutical Care Act)
BI Business Intelligence
BPE Business Process Excellence
BSE Bombay Stock Exchange Limited
CAGR Compounded Annual Growth Rate
CDL Cheminor Drugs Limited
CDSL Central Depository Services (India) Limited
CEO Chief Executive Officer
CESTAT Customs Excise Service Tax Appellate Tribunal
CFO Chief Financial Officer
cGMP Current Good Manufacturing Practices
CIA Chief Internal Auditor
CII Confederation of Indian Industry
CIS Commonwealth of Independent States
COO Chief Operating Officer
CPS Custom Pharmaceutical Services
CRM Customer Relation Management
CTO Chemical Tech-Ops
DMF Drug Master File
DP Depository Participant
DPCO Drugs (Prices Control) Order, 1995
DREEM Dr. Reddy’s Execution Excellence Model
DRF Dr. Reddy’s Research Foundation
EPS Earnings Per Share
ERM Enterprise-wide Risk Management
ERP Enterprise Resource Planning
ESOP Employees Stock Option Plan
ESOS Employees Stock Option Scheme
FDAAA Food and Drug Administration Amendments Act of 2007
GATT General Agreement on Tariff and Trade
FTO Formulation Tech-Ops
GDR Global Depository Receipts
GRI Global Reporting Initiatives
HR Human Resources
ICAI Institute of Chartered Accountants of India
Indian GAAP Indian Generally Accepted Accounting Principles
IPDO Integrated Product Development Organization
IPM Intellectual Property Management
IPR Intellectual Property Rights
IREDA Indian Renewable Energy Development Agency
IT Information Technology
ITAT Income Tax Appellate Tribunal
M&A Mergers and Acquisitions
NCEs New Chemical Entity’s
NDDS New Drug Delivery System
NSDL National Securities Depository Limited
NSE National Stock Exchange of India Limited
NYSE New York Stock Exchange, Inc.
OTC Over The Counter
R&D Research and Development
ROW Rest of the World
RUSTI Reddy US Therapeutic, Inc.
SBU Strategic Business Unit
SEBI Securities and Exchange Board of India
SEC Securities and Exchange Commission
SEFL Standard Equity Fund Limited
SEZ Special Economic Zone
SRS Solvent Recovery System
TDC Technology Development Centre
TERI The Energy Research Institute
UNEP United Nations Environment Program
US GAAP United States Generally Accepted Accounting Principles
USFDA United States Food and Drug Administration
VAT Value Added Tax
WSG Wettbewerbsstarkungsgesetz
(Statutory Health Insurance Competition Strengthening Act)
WTO World Trade Organization
ZLDP Zero Liquid Discharge Plant
Glossary

Notes

Dr. reddy’s laboratories limitedRegd. Office: 7-1-27, Ameerpet, Hyderabad – 500 016
Attendance Slip
Regd. Folio No. / Client ID :
Name & Address of
First/Sole Shareholder :
No. of Shares held :
I hereby record my presence at the 24th Annual General Meeting on Tuesday, 22 July 2008 at 11.30 AM at the Grand
Ball Room, Hotel Taj Krishna, Road No.1, Banjara Hills, Hyderabad – 500 034.
Signature of Member / Proxy
Note: Member / Proxy wish to attend the meeting must bring this attendance slip to the meeting and handover at the
entrance duly filled in and signed.
Dr. reddy’s laboratories limitedRegd. Office: 7-1-27, Ameerpet, Hyderabad – 500 016
Proxy Form
Regd. Folio No./Client ID :
No. of shares held :
I/We
of being a member/members of
the above named Company, hereby appoint
of or
failing him/her of
as my/our Proxy to attend and vote for me/us on my/our behalf at the 24th Annual General Meeting of the Company
on Tuesday, 22 July 2008 at 11.30 AM at the Grand Ball Room, Hotel Taj Krishna, Road No.1, Banjara Hills, Hyderabad – 500 034,
and at any adjournment thereof.
Signed this day of 2008
Notes:
a) Proxy need not be a member of the Company.
b) The Proxy form duly filled in and signed by the member(s) across Revenue Stamp should reach the Company’s registered office: Dr. Reddy’s Laboratories Ltd., 7-1-27, Ameerpet, Hyderabad – 500 016 at least 48 hours before the time fixed for the meeting.
c) Corporate members intending to send their authorised representative(s) to attend the meeting are requested to send a certified copy of the Board resolution authorizing their representative(s) to attend and vote on their behalf at the meeting.
Revenue Stamp


After a year of exceptional performance
on the back of strong launches, this year
has been one of consolidation. We have
focussed on strengthening our assets –
intellectual property assets, technology,
people and infrastructure – to prepare
ourselves for the future. These will add
substantially to our competitive muscle and
make us a globally sustainable organization.
This year we have commissioned an
integrated R&D facility, the “Innovation
Plaza” and scaled up our generics
infrastructure to become one of the largest
such manufacturing facilities in Asia. We
have also enhanced our manufacturing
capabilities for cytotoxic formulations
and dedicated blocks for our custom
pharmaceutical business.
We have built various new partnerships,
alliances and collaborations to add teeth
to our own internal R&D capabilities. We
have acquired new facilities and businesses
to gain strategic strengths, the value of
which will reveal itself in time. We have
continued to work at institutionalizing the
principles of Lean management to drive
Execution excellence, thus, improving the
effectiveness of the company. We have also
executed further on our plans to become a
talent factory, where we build and develop
human capability across businesses and
functions.
As we emerge into a strong vertically
integrated global pharmaceutical company,
we shall recall this year as one of focussed
consolidation for the leap forward.
DRL_AR2008_CV_PAP.indd 2 6/20/08 6:08:30 PM

DR REDDY’S LABORATORIES LIMITED | 7-1-27 AMEERPET HYDERABAD | 500 016 INDIA
DR REDDY’S LABORATORIES L IMITED
ANNUAL REPORT 2007–08
DR
RE
DD
Y’S
LA
BO
RA
TO
RIE
S L
IMIT
ED
| AN
NU
AL
RE
PO
RT
20
07
–0
8
DE
SIG
N I
CD
IND
IA.C
OM
| P
RIN
TE
D A
T P
RA
GA
TI
CONSOLIDATINGF O R T H E F U T U R E
DRL_AR2008_CV_PAP.indd 1 6/20/08 6:08:30 PM