NYSE_EXTN_2019.pdf - AnnualReports.com
120
To our fellow shareholders, The energy industry’s transition in 2019 from an emphasis on growth to free cash flow and returns caused our customers to significantly reduce capital spending, resulting in a significant reduction in our orders. In spite of this, we delivered solid financial results driven by our strong execution of backlog along with timely startup and commissioning of several projects. While orders slowed for product sales during the year, we managed our operations and costs accordingly and were able to improve margins in the face of declining revenues. We also delivered on the following initiatives as part of our continued execution of the Company’s strategic plan. Continued our focus on safety, achieving even better results than the previous year and best in class metrics; Began transitioning the Company to an energy industrial business, offering environmentally sustainable products and services; Commercialized and grew our Exterran Water Solutions (EWS) business and technology to create economic solutions for the treatment and re-use of water; and Determined to consider strategic alternatives for our U.S. compression fabrication business, allowing us to improve margins and reduce cyclicality. These and many other initiatives were accomplished through the efforts and commitment of our approximately 3,600 global employees. Our 2019 revenue was $1.32 billion, a 3% decrease from 2018, while our EBITDA, as adjusted was $200.7 million, down 2% from the prior year. Our contract operations segment revenue was $368 million while gross margin was 65%, relatively flat from 2018’s 66% gross margin. Revenue was up 2% year over year, and we completed development and commenced operation of new large projects in the Middle East and Africa, and Latin America regions, helping offset foreign currency impact. Backlog for the segment ended at $1.3 billion. While we did not experience large contract operations (ECO) wins during the year, we secured multiple renewals for projects set to roll off, helping mitigate the decline in backlog. We continued to focus on growing our profitable aftermarket services segment. We had significant successes globally, and have our sights on additional expansion. Revenue was $129 million, up 7% year over year with margins at 26%. Our product sales segment had a book to bill of 0.48x on orders of $392 million, including a couple of significant EWS wins in the Middle East totaling over $50 million. Revenue for the segment was $820 million, down 7% year over year. We continued to focus on pricing, efficiencies and quality, but given the downturn in orders (especially in processing and treating), the business mix caused gross margins to decline to 11%. We also announced we were looking at strategic alternatives for our U.S. compression fabrication business, and noted in our fourth quarter of 2019 earnings call that this process was nearing completion. Our constant attention to cash was clear, as net cash from operating activities excluding discontinued operations for the year was $176 million.
-
Upload
khangminh22 -
Category
Documents
-
view
2 -
download
0
Transcript of NYSE_EXTN_2019.pdf - AnnualReports.com
To our fellow shareholders,
The energy industry’s transition in 2019 from an emphasis on growth to free cash flow and returns caused our customers to significantly reduce capital spending, resulting in a significant reduction in our orders. In spite of this, we delivered solid financial results driven by our strong execution of backlog along with timely startup and commissioning of several projects. While orders slowed for product sales during the year, we managed our operations and costs accordingly and were able to improve margins in the face of declining revenues. We also delivered on the following initiatives as part of our continued execution of the Company’s strategic plan.
Continued our focus on safety, achieving even better results than the previous year and best inclass metrics;
Began transitioning the Company to an energy industrial business, offering environmentallysustainable products and services;
Commercialized and grew our Exterran Water Solutions (EWS) business and technology tocreate economic solutions for the treatment and re-use of water; and
Determined to consider strategic alternatives for our U.S. compression fabrication business,allowing us to improve margins and reduce cyclicality.
These and many other initiatives were accomplished through the efforts and commitment of our approximately 3,600 global employees.
Our 2019 revenue was $1.32 billion, a 3% decrease from 2018, while our EBITDA, as adjusted was $200.7 million, down 2% from the prior year.
Our contract operations segment revenue was $368 million while gross margin was 65%, relatively flat from 2018’s 66% gross margin. Revenue was up 2% year over year, and we completed development and commenced operation of new large projects in the Middle East and Africa, and Latin America regions, helping offset foreign currency impact. Backlog for the segment ended at $1.3 billion. While we did not experience large contract operations (ECO) wins during the year, we secured multiple renewals for projects set to roll off, helping mitigate the decline in backlog.
We continued to focus on growing our profitable aftermarket services segment. We had significant successes globally, and have our sights on additional expansion. Revenue was $129 million, up 7% year over year with margins at 26%.
Our product sales segment had a book to bill of 0.48x on orders of $392 million, including a couple of significant EWS wins in the Middle East totaling over $50 million. Revenue for the segment was $820 million, down 7% year over year. We continued to focus on pricing, efficiencies and quality, but given the downturn in orders (especially in processing and treating), the business mix caused gross margins to decline to 11%. We also announced we were looking at strategic alternatives for our U.S. compression fabrication business, and noted in our fourth quarter of 2019 earnings call that this process was nearing completion.
Our constant attention to cash was clear, as net cash from operating activities excluding discontinued operations for the year was $176 million.

2019 was a challenge for the entire industry, but our strong beginning backlog and project execution allowed Exterran to successfully navigate the uncertainties while generating strong operating cash flow. We were able to expand and commercialize our product offerings in water and power, while maintaining a focus on internal systems and processes and a strong control environment. While global uncertainty remains as we move into 2020, our focus on driving operational efficiencies, our global footprint and strong contract operations backlog will provide greater diversity and stability over the near-term. We remain confident in our product business in the coming years given the criticality of our processing and treating facilities in moving gas to downstream applications. The EWS business continues to grow, and our unique and scalable water treatment technology is proving to be a differentiator as the energy-based water industry matures and more focus is placed on global environmental and social sustainability.
Latin America still remains our largest international region. We commenced another large ECO project in the region during the second half of 2019 that was a success, and successfully renewed contracts which helped sustain our strong ECO backlog. Argentina is an important country for us, and despite political changes taking place in the country the Vaca Muerta opportunities remain real and momentum continues to build in the country. We continue to see opportunities in Brazil from outside investments along with other countries within the market.
The Middle East and Africa region continues to provide the largest near-term opportunities, even after our recent project award in the region valued in excess of $400 million. During 2019 we commenced operating a large 10 year project and experienced two large EWS product sales wins totaling over $50 million. We also believe this region will also be a growth driver in the long-term.
Our Asia Pacific region had a very good year not only for aftermarket services, which is its dominant business line, but also within product sales as customers in the region are beginning to invest again. Our longstanding relationships and ability to manufacture in the region should benefit us as we continue to grow in this region.
We spent 2019 talking about managing the business and taking costs out in the midst of slowing product sales orders. It’s now time to talk about our transition into an industrial energy company with improved EBITDA, as adjusted, margins, a strong backlog with recurring revenue and a plan to drive our returns above our cost of capital. We returned over $40 million of capital to shareholders in 2019 in the form of a share buyback. Going forward, our capital allocation plan has not changed as we look to grow ECO backlog and our water business, expand our sustainable product and service offerings and maintain a prudent balance sheet, while looking for ways to return capital to our shareholders.
In summary, 2019 was a strong year of contract execution, and development and commercialization of our water and power product lines. Our robust contract operations backlog provides us the stability needed in 2020 to withstand the evolving energy market, drive additional efficiencies in our business and diversify our portfolio to provide additional sustainable products and services, and ultimately drive shareholder value. We want to thank the Exterran team, and our customers, shareholders and lenders, who have supported and invested in us and in our future.
Andrew J. Way Mark R. Sotir President and Chief Executive Officer Executive Chairman

UNITED STATESSECURITIES AND EXCHANGE COMMISSION
Washington, D.C. 20549
Form 10-K (Mark One)
☒ ANNUAL REPORT PURSUANT TO SECTION 13 OR 15(d) OF THE SECURITIES EXCHANGEACT OF 1934
For the fiscal year ended December 31, 2019 or
☐ TRANSITION REPORT PURSUANT TO SECTION 13 OR 15(d) OF THE SECURITIESEXCHANGE ACT OF 1934
For the transition period from to
Commission file no. 001-36875
Exterran Corporation (Exact name of registrant as specified in its charter)
Delaware 47-3282259(State or other jurisdiction of incorporation or organization) (I.R.S. Employer Identification No.)
11000 Equity DriveHouston Texas 77041
(Address of principal executive offices) (Zip Code)
(281) 836-7000 (Registrant’s telephone number, including area code)
4444 Brittmoore Road, Houston, Texas 77041(Former name or former address, if changed since last report)
Securities registered pursuant to Section 12(b) of the Act:
Title of each class Trading symbol(s) Name of each exchange on which registeredCommon Stock, $0.01 par value per share
EXTN New York Stock Exchange
Securities registered pursuant to 12(g) of the Act: None
Indicate by check mark if the registrant is a well-known seasoned issuer, as defined in Rule 405 of the Securities Act. Yes ☐ No ☒
Indicate by check mark if the registrant is not required to file reports pursuant to Section 13 or Section 15(d) of the Act. Yes ☐ No ☒
Indicate by check mark whether the registrant (1) has filed all reports required to be filed by Section 13 or 15(d) of the Securities ExchangeAct of 1934 during the preceding 12 months (or for such shorter period that the registrant was required to file such reports), and (2) has beensubject to such filing requirements for the past 90 days. Yes ☒ No ☐
Indicate by check mark whether the registrant has submitted electronically every Interactive Data File required to be submitted pursuant toRule 405 of Regulation S-T (§ 232.405 of this chapter) during the preceding 12 months (or for such shorter period that the registrant wasrequired to submit such files). Yes ☒ No ☐
Indicate by check mark whether the registrant is a large accelerated filer, an accelerated filer, a non-accelerated filer, a smaller reportingcompany, or an emerging growth company. See the definitions of “large accelerated filer,” “accelerated filer,” “smaller reporting company,”and “emerging growth company” in Rule 12b-2 of the Exchange Act.

Large accelerated filer ☐ Accelerated filer ☒Non-accelerated filer ☐ Smaller reporting company ☐
Emerging growth company ☐
If an emerging growth company, indicate by check mark if the registrant has elected not to use the extended transition period for complyingwith any new or revised financial accounting standards provided pursuant to section 13(a) of the Exchange Act. ☐
Indicate by check mark whether the registrant is a shell company (as defined in Rule 12b-2 of the Act). Yes ☐ No ☒
The aggregate market value of the common stock of the registrant held by non-affiliates, based on the closing price on the New York StockExchange, as of June 30, 2019 was $421,501,632.
Number of shares of the common stock of the registrant outstanding as of February 20, 2020: 33,038,866 shares.
DOCUMENTS INCORPORATED BY REFERENCE
Portions of the registrant’s definitive proxy statement for the 2020 Meeting of Stockholders, which is expected to be filed with the Securitiesand Exchange Commission within 120 days after December 31, 2019, are incorporated by reference into Part III of this Form 10-K.

TABLE OF CONTENTS
Page
PART IItem 1. Business 2Item 1A. Risk Factors 10Item 1B. Unresolved Staff Comments 22Item 2. Properties 22Item 3. Legal Proceedings 22Item 4. Mine Safety Disclosures 22
PART IIItem 5. Market for Registrant’s Common Equity, Related Stockholder Matters and Issuer Purchases of Equity
Securities 23Item 6. Selected Financial Data 25Item 7. Management’s Discussion and Analysis of Financial Condition and Results of Operations 30Item 7A. Quantitative and Qualitative Disclosures About Market Risk 46Item 8. Financial Statements and Supplementary Data 47Item 9. Changes in and Disagreements with Accountants on Accounting and Financial Disclosure 47Item 9A. Controls and Procedures 47Item 9B. Other Information 49
PART IIIItem 10. Directors, Executive Officers and Corporate Governance 49Item 11. Executive Compensation 49Item 12. Security Ownership of Certain Beneficial Owners and Management and Related Stockholder Matters 49Item 13. Certain Relationships and Related Transactions and Director Independence 50Item 14. Principal Accounting Fees and Services 50
PART IVItem 15. Exhibits and Financial Statement Schedules 51Item 16. Form 10-K Summary 54SIGNATURES 55

[This page intentionally left blank]

PART I
DISCLOSURE REGARDING FORWARD-LOOKING STATEMENTS
This report contains “forward-looking statements” intended to qualify for the safe harbors from liability established by thePrivate Securities Litigation Reform Act of 1995. All statements other than statements of historical fact contained in this reportare forward-looking statements within the meaning of Section 21E of the Securities Exchange Act of 1934, as amended (the“Exchange Act”), including, without limitation, statements regarding our business growth strategy and projected costs; futurefinancial position; the sufficiency of available cash flows to fund continuing operations; the expected amount of our capitalexpenditures; anticipated cost savings, future revenue, gross margin and other financial or operational measures related to ourbusiness and our primary business segments; the future value of our equipment; and plans and objectives of our managementfor our future operations. You can identify many of these statements by looking for words such as “believe,” “expect,”“intend,” “project,” “anticipate,” “estimate,” “will continue” or similar words or the negative thereof.
Such forward-looking statements are subject to various risks and uncertainties that could cause actual results to differmaterially from those anticipated as of the date of this report. Although we believe that the expectations reflected in theseforward-looking statements are based on reasonable assumptions, no assurance can be given that these expectations will proveto be correct. Known material factors that could cause our actual results to differ materially from the expectations reflected inthese forward-looking statements include those described below, in Part I, Item 1A (“Risk Factors”) and Part II, Item 7(“Management’s Discussion and Analysis of Financial Condition and Results of Operations”) of this report. Important factorsthat could cause our actual results to differ materially from the expectations reflected in these forward-looking statementsinclude, among other things:
• conditions in the oil and natural gas industry, including a sustained imbalance in the level of supply or demand foroil or natural gas or a sustained low price of oil or natural gas, which could depress or reduce the demand or pricingfor our natural gas compression and oil and natural gas production and processing equipment and services;
• reduced profit margins or the loss of market share resulting from competition or the introduction of competingtechnologies by other companies;
• economic or political conditions in the countries in which we do business, including civil developments such asuprisings, riots, terrorism, kidnappings, violence associated with drug cartels, legislative changes and theexpropriation, confiscation or nationalization of property without fair compensation;
• changes in currency exchange rates, including the risk of currency devaluations by foreign governments, andrestrictions on currency repatriation;
• risks associated with cyber-based attacks or network security breaches;• changes in international trade relationships, including the imposition of trade restrictions or tariffs relating to any
materials or products (such as aluminum and steel) used in the operation of our business;• risks associated with our operations, such as equipment defects, equipment malfunctions, environmental discharges
and natural disasters;• the risk that counterparties will not perform their obligations under their contracts with us or other changes that
could impact our ability to recover our fixed asset investment;• the financial condition of our customers;• our ability to timely and cost-effectively obtain components necessary to conduct our business; • employment and workforce factors, including our ability to hire, train and retain key employees;• our ability to implement our business and financial objectives, including:
• winning profitable new business;• timely and cost-effective execution of projects;• enhancing or maintaining our asset utilization, particularly with respect to our fleet of compressors and other
assets;• integrating acquired businesses;• generating sufficient cash to satisfy our operating needs, existing capital commitments and other contractual
cash obligations, including our debt obligations; and• accessing the financial markets at an acceptable cost;
• our ability to accurately estimate our costs and time required under our fixed price contracts;• liability related to the use of our products and services;
1

• changes in governmental safety, health, environmental or other regulations, which could require us to makesignificant expenditures; and
• our level of indebtedness and ability to fund our business.
All forward-looking statements included in this report are based on information available to us on the date of this report. Exceptas required by law, we undertake no obligation to publicly update or revise any forward-looking statement, whether as a resultof new information, future events or otherwise. All subsequent written and oral forward-looking statements attributable to us orpersons acting on our behalf are expressly qualified in their entirety by the cautionary statements contained throughout thisreport.
2
Item 1. Business
Exterran Corporation (together with its subsidiaries, “Exterran Corporation,” the “Company,” “our,” “we” or “us”), a Delawarecorporation formed in March 2015, is a global systems and process company offering solutions in the oil, gas, water and powermarkets. We are a leader in natural gas processing and treatment and compression products and services, providing criticalmidstream infrastructure solutions to customers throughout the world. Our manufacturing facilities are located in the UnitedStates of America (“U.S.”), Singapore and the United Arab Emirates.
On November 3, 2015, Archrock, Inc. (named Exterran Holdings, Inc. prior to November 3, 2015) (“Archrock”) completed thespin-off (the ‘‘Spin-off”) of its international contract operations, international aftermarket services and global fabricationbusinesses into an independent, publicly traded company named Exterran Corporation. Following the completion of the Spin-off, we and Archrock became and continue to be independent, publicly traded companies with separate boards of directors andmanagement.
General
We provide our products and services to a global customer base consisting of companies engaged in all aspects of the oil andnatural gas industry, including large integrated oil and natural gas companies, national oil and natural gas companies,independent oil and natural gas producers and oil and natural gas processors, gatherers and pipeline operators. We operate inthree primary business lines: contract operations, aftermarket services and product sales. The nature and inherent interactionsbetween and among our business lines provide us with opportunities to cross-sell and offer integrated product and servicesolutions to our customers.
For financial data relating to our reportable business segments or countries that accounted for 10% or more of our revenue inany of the last three fiscal years or 10% or more of our property, plant and equipment, net, as of December 31, 2019, 2018 or2017, see Part II, Item 7 (“Management’s Discussion and Analysis of Financial Condition and Results of Operations”) and Note22 to our Consolidated Financial Statements included in Part IV, Item 15 (collectively referred to as “Financial Statements,”and individually referred to as “balance sheets,” “statements of operations,” “statements of comprehensive income (loss),”“statements of stockholders’ equity” and “statements of cash flows” herein).
Contract Operations
In our contract operations business, we provide compression and processing and treating services through the operation of ournatural gas compression equipment and crude oil and natural gas production and process equipment for our customers. Inaddition to these services, we also offer water treatment and power solutions to our customers on a stand-alone basis orintegrated into our natural gas compression or crude oil production and processing solutions. Our services include the provisionof personnel, equipment, tools, materials and supplies to meet our customers’ natural gas compression, oil and natural gasproduction and processing water treatment and power generation service needs. To provide these services to meet ourcustomers’ needs, activities we may perform include engineering, designing, sourcing, constructing, installing, operating,servicing, repairing, maintaining and demobilizing equipment owned by us.

We generally enter into contracts with our contract operations customers with initial terms ranging between three to 12 years. Inmany instances, we are able to renew those contracts prior to the expiration of the initial term and in other instances, we maysell the underlying assets to our customers pursuant to purchase options or negotiated sale agreements. If a contract is notrenewed or a customer does not purchase the underlying assets, our equipment is generally returned to our premises for futureredeployment. Our contracts may include several compressor units on one site or entire facilities designed to process and treatproduced oil or natural gas to make them suitable for end use, which may require us to make significant investments inequipment, facilities and related installation costs. Our commercial contracts generally require customers to pay a monthlyservice fee even during periods of limited or disrupted oil or natural gas feed flows, which we believe provide us with relativelystable and predictable cash flows. Additionally, we have limited direct exposure to short-term commodity price fluctuationsbecause we typically do not take title to the oil or natural gas that we compress, process or treat, and because the natural gas weuse as fuel for our equipment is supplied by our customers.
Our equipment is operated and maintained in accordance with established operational procedures and maintenance schedules.These operations and maintenance procedures are updated as technology changes and as our operations team develops newtechniques and procedures. In addition, because our field technicians regularly operate and maintain our contract operationsequipment, they are familiar with the condition of our equipment and can readily identify potential problems. In our experience,this in-house expertise and these maintenance procedures maximize equipment life and unit availability, minimize avoidabledowntime and lower the overall maintenance expenditures over the equipment life. We believe our contract operations servicesgenerally allow our customers to achieve higher production rates and lower unit costs of operation than they would otherwiseachieve with their own operations, resulting in increased revenue and margin for our customers. In addition, outsourcing theseservices allows our customers flexibility for their compression and production and processing needs while minimizing theirupfront capital requirements.
During the year ended December 31, 2019, approximately 28% of our revenue and 66% of our gross margin was generatedfrom contract operations. As of December 31, 2019, we had approximately $1.3 billion of unsatisfied performance obligations(commonly referred to as backlog), of which approximately $268 million is expected to be recognized as revenue beforeDecember 31, 2020. Our contract operations backlog consists of unfilled orders based on signed contracts and does not includepotential sales pursuant to letters of intent received from customers. Our contract operations business is capital intensive. As ofDecember 31, 2019, the net book value of property, plant and equipment associated with our contract operations business was$782.5 million.
Aftermarket Services
In our aftermarket services business, we sell parts and components and provide operations, maintenance, repair, overhaul,upgrade, startup and commissioning and reconfiguration services to customers who own their own oil and natural gascompression, production, processing, treating and related equipment. Our services range from routine maintenance services andparts sales done on a transactional basis to the full operation and maintenance of customer-owned equipment under long-termagreements.
We generally enter into contracts with our operation and maintenance customers with initial terms ranging between one to fouryears, and in some cases, in excess of five years. In many instances, we are able to renew those contracts prior to the expirationof the initial term. We believe that we are particularly well qualified to provide these services because of our highly experiencedoperating personnel and technical and engineering expertise gained through providing similar services as part of our contractoperations business. In addition, our aftermarket services business complements our strategy to provide integrated infrastructuresolutions to our customers because it enables us to continue to serve our customers after the sale of any products or facilitiesmanufactured through our product sales business. Our business approach is designed to leverage our aftermarket services withour product sales business to provide full life-cycle services to customers who buy equipment from us and we also seek to sellthose same aftermarket services to customers who have bought similar equipment from other companies based on our existingexperience and infrastructure available to support them.
During the year ended December 31, 2019, approximately 10% of our revenue and 9% of our gross margin was generated fromaftermarket services.
3

Product Sales
In our product sales business, we design, engineer, manufacture, install and sell natural gas compression packages as well asequipment used in the treating and processing of crude oil, natural gas and water primarily to major and independent oil andnatural gas producers as well as national oil and natural gas companies around the world. We offer a broad range of equipmentdesigned to process crude oil and natural gas into hydrocarbon commodities suitable for end use. Our products includewellhead, gathering, residue and high pressure natural gas compression equipment, cryogenic plants, mechanical refrigerationand dew point control plants, condensate stabilizers, water treatment equipment, integrated power generation and skid-mountedproduction packages designed for both onshore and offshore production facilities. We believe the broad range of products wesell through our global operating structure enables us to take advantage of the ongoing, worldwide energy infrastructure build-out.
We design, engineer, manufacture, sell and, in certain cases, install, skid-mounted natural gas compression equipment to meetstandard or unique customer specifications. Generally, we manufacture compressors sold to third parties according to eachcustomer’s specifications. We purchase components for these compressors from third party suppliers including several majorengine and compressor original equipment manufacturers in the industry. We also sell pre-engineered compressor unitsdesigned to maximize value and fast delivery to our customers. Typically, we expect our compressor equipment backlog to bemanufactured and delivered within a three to 12 month period.
We also sell custom-engineered, built-to-specification natural gas and oil processing and treating equipment, includingdesigning facilities comprised of a combination of our products integrated into a solution that meets our customers’ needs.Some of these projects are located in remote areas and in developing countries with limited oil and natural gas industryinfrastructure. To meet most customers’ rapid schedule requirements and minimize customer downtime, we maintain aninventory of standard products and longer lead-time components used to manufacture our products to our customers’specifications. Typically, we expect our processing and treating equipment backlog to be produced within a six to 24 monthperiod.
During the year ended December 31, 2019, approximately 62% of our revenue and 25% of our gross margin was generatedfrom product sales. As of December 31, 2019, our backlog in product sales was approximately $278.0 million, of whichapproximately $266 million is expected to be recognized as revenue before December 31, 2020. Our product sales backlogconsists of unfilled orders based on signed contracts and does not include potential product sales pursuant to letters of intentreceived from customers.
Competitive Strengths
We believe we have the following key competitive strengths:
• Global footprint and expansive service and product offerings positioned to capitalize on the global energyinfrastructure build-out. The global oil and natural gas production and processing infrastructure build outprovides us with opportunities for growth. We are well positioned to capitalize on increased opportunities in boththe U.S. and international markets. We believe our global customer base will continue to invest in infrastructureprojects based on longer-term fundamentals that are less tied to near-term commodity prices and that our size andgeographic presence provide us with a unique advantage in meeting our customers’ needs. We provide ourcustomers with a broad variety of products and services in approximately 25 countries worldwide, includingcompression, production and processing services, natural gas compression, oil and natural gas processing andtreating equipment, water treatment solutions, installation services and integrated power generation. By offering abroad range of products and services that leverage our core strengths, we believe we provide unique integratedsolutions that meet our customers’ needs. We believe the breadth and quality of our products and services, the depthof our customer relationships and our presence in many major oil and natural gas producing regions place us in aposition to capture additional business on a global basis.
4

• Complementary businesses enable us to offer customers integrated infrastructure solutions. We aim to provideour customers with a single source to meet their energy infrastructure needs and we believe we have the ability toserve our customers’ changing needs in a variety of ways. For customers that seek to manage their capital spendingon energy infrastructure projects, we offer our full project and operations services through our contract operationsbusiness. For customers that prefer to develop and acquire their own infrastructure assets, we are able to sellequipment and facilities to support their operations and, following the sale of our equipment, we can also providecommissioning, start-up, operations, maintenance, overhaul, upgrade and reconfiguration services through ouraftermarket services business. Furthermore, we can combine our products into an integrated solution where we candesign, engineer, procure and, in some cases, construct assets on-site for sale to our customers. Because of thebreadth of our products and our unique ability to deliver those products through our different commercial models,we believe we are able to provide the right solution that is most suitable to our customers in the markets in whichthey operate. We believe this ability to provide our customers with a variety of products and services provides uswith more business opportunities, as we are able to adjust the products and services we provide to reflect ourcustomers’ changing needs.
• High-quality products and services. We have built a network of high-quality energy infrastructure assets that arestrategically deployed across our global platform. Through our history of operating a wide variety of products inmany energy-producing markets around the world, we have developed the technical expertise and experience thatwe believe is required to understand the needs of our customers and to meet those needs through a range ofproducts and services. These products and services include highly customized compression, production, processingand treating solutions as well as standard products based on our expertise, in support of a range of projects, fromthose requiring quick completion to those that may take several years to fully develop. Additionally, our experiencehas enabled us to develop efficient systems and work processes and a skilled workforce that allow us to providehigh-quality services. We seek to continually improve our products and services to enable us to provide ourcustomers with high-quality, comprehensive oil and natural gas infrastructure support worldwide.
• Cash flows from our contract operations business are supported by long-term contracts. We provide contractoperations services to customers located in 12 countries. Within our contract operations business, we seek to enterinto long-term contracts with a diverse collection of customers, including large integrated oil and natural gascompanies and national energy companies. These contracts generally involve initial terms ranging from three to12 years, and typically require our customers to pay a monthly service fee even during periods of limited ordisrupted oil or natural gas flows. Furthermore, our customer base includes companies that are among the largestand most well-known companies within their respective regions and countries.
• Experienced management team. We have an experienced and skilled management team with a long track recordof driving growth through organic expansion and selective acquisitions. The members of our management teamhave strong relationships in the oil and gas industry and have operated through numerous commodity price cyclesthroughout our areas of operations. Members of our management team have spent a significant portion of theirrespective careers at highly regarded energy and manufacturing companies serving the upstream, midstream anddownstream segments of the oil and natural gas market.
• Well-balanced capital structure with sufficient liquidity. We intend to maintain a capital structure with an appropriateamount of leverage and the financial flexibility to invest in our operations and pursue attractive growth opportunitieswhich we believe will increase overall earnings and cash flow generated by our business. As of December 31, 2019,taking into account guarantees through outstanding letters of credit, we had undrawn capacity of $601.8 million underour revolving credit facility, of which $513.3 million was available for additional borrowings as a result of a covenantrestriction included in our credit agreement. In addition, as of December 31, 2019, we had $16.7 million of cash andcash equivalents on hand.
5

Business Strategies
We intend to continue to capitalize on our competitive strengths to meet our customers’ needs through the following keystrategies:
• Strategically grow our business. Our primary strategic focus involves the targeted growth of our core business byexpanding our product and services offerings and by leveraging our existing, proven portfolio of products andservices. We intend to infuse new technology and innovation into our existing midstream products and serviceswhile developing new product and service offerings in water treatment and integrated power generation.Additionally, our strategic focus includes targeting development opportunities in the U.S. energy market andexpansion into new international markets benefiting from the global energy infrastructure build-out. We believe ourdiverse product and service portfolio allows us to readily respond to changes in industry and economic conditionsand that our global footprint allows us to provide the prompt product availability our customers require. We havethe ability to undertake projects in new locations as needed to meet customer demand and to readily deploy ourcapital to construct new or supplemental projects that we can build, own, operate and maintain on behalf of ourcustomers through our contract operations business. In addition, we seek to provide our customers with integratedenergy infrastructure solutions by combining product and service offerings across our businesses. We plan tosupplement our organic growth with select acquisitions, partnerships and other commercial arrangements in keymarkets to further enhance our geographic reach, product offerings and other capabilities. We believe thesearrangements will allow us to generate incremental revenues from existing and new customers and increase marketshare.
• Expand customer base and deepen relationships with existing customers. We believe the unique, broad range ofproducts and services we offer, the quality of our products and services and our diverse geographic footprintposition us to attract new customers and cross-sell our products and services to existing customers. In addition, wehave a long history of providing our products and services to our customers which, coupled with the technicalexpertise of our experienced personnel, enables us to understand and meet our customers’ needs, particularly asthose needs develop and change over time. We intend to continue to devote significant business developmentresources to market our products and services, leverage existing relationships and expedite our growth potential.Additionally, we seek to evolve our products and services offerings by developing new technologies that will allowus to provide differentiated solutions to the critical midstream infrastructure needs of our customers.
• Enhance our safety performance. We believe our safety performance and reputation help us to attract and retaincustomers and employees. We have adopted rigorous processes and procedures to facilitate our compliance withsafety regulations and policies on a global basis. We work diligently to meet or exceed applicable safetyregulations, and continue to focus on our safety as our business grows and operating conditions change.
• Continue to optimize our global platform, products and services and enhance our profitability. We regularlyreview and evaluate the quality of our operations, products and services and portfolio of our product and serviceofferings. This evaluation process includes assessing the quality of our performance and potential opportunities tocreate value for our customers. We believe the development and introduction of new technology into our existingproducts and services offerings will create more value for our customers and us in the market place, which webelieve will further differentiate us from our competitors. Additionally, we believe our ongoing focus on improvingthe quality of our operations, products and services results in greater satisfaction among our customers, which webelieve results in greater profitability and value for our shareholders.
Industry Overview
Natural Gas Compression
Natural gas compression is a mechanical process whereby the pressure of a given volume of natural gas is increased to a desiredpressure for movement from one point to another and is essential to the production and transportation of natural gas.Compression is typically required several times during the natural gas production and transportation cycle, including (i) at thewellhead, (ii) throughout gathering and distribution systems, (iii) into and out of processing and storage facilities and (iv) alongpipelines. Natural gas compression can also be used to re-inject associated gas into producing wells to provide enhanced oilrecovery.
6

Our contract operations business is comprised primarily of large horsepower internal combustion engine or electric motor-driven reciprocating compressors that are typically deployed in facilities comprised of several compressors on one site. Asignificant portion of this business involves comprehensive projects that require the design, engineering, manufacture, deliveryand installation of several compressors on one site coupled with related natural gas treating and processing equipment. We areable to serve our customers’ needs for such projects through our product sales business and with follow-on services from ouraftermarket services business, or through the provision of our contract operations services.
Processing and Treating
Crude oil and natural gas are generally not marketable products as produced raw at the wellhead and must be processed ortreated to meet hydrocarbon commodity specifications before they can be transported to market. Processing and treatingequipment is used to separate and treat oil and natural gas as they are produced to achieve a marketable quality of product.Production processing typically involves the separation of oil and natural gas and the removal of contaminants or the separationof marketable liquids from the gas stream prior to transportation. The end result is “pipeline” or “sales” quality crude oil andnatural gas. Further processing or refining is almost always required before oil or natural gas is suitable for use as fuel orfeedstock for petrochemical production. Production processing normally takes place in the “upstream” and “midstream”sectors, while refining and petrochemical processing is referred to as the “downstream” sector. Wellhead or upstreamprocessing and treating equipment include a wide and diverse range of products.
We manufacture custom-engineered, built-to-specification natural gas and oil processing and treating equipment. We alsoprovide integrated solutions comprised of a combination of our products into a single offering, which typically consist of muchlarger equipment packages than standard equipment and are generally used in much larger scale production operations. Thecustom equipment sector is primarily driven by global economic trends, and the specifications for purchased equipment canvary significantly. Technology, engineering capabilities, project management, available manufacturing space and quality controlstandards are the key drivers in the custom equipment sector.
Water Solutions
We provide a full range of treatment solutions for removing oil and suspended solids from produced water with primary,secondary, and tertiary treatment. Our unique service offerings from customized products to retrofitting, allow us to understandwater challenges and clean-up requirements through expertise in the field, lab studies, and equipment design. We help recoveroil and reduce disposal cost whether shipping it offsite or reinjecting on location.
Outsourcing
Natural gas producers, transporters and processors choose to outsource their operations due to the benefits and flexibility ofcontract operations services. In particular, we believe outsourcing compression, production and processing operations toexperienced operators like us offers customers:
• access to our specialized personnel and technical skills, including engineers, operators and field service andmaintenance employees, which we believe generally leads to improved production rates and increased throughput andtherefore higher revenues and margins;
• the ability to increase their profitability by transporting or producing a higher volume of natural gas through decreasedequipment downtime and reduced operating, maintenance and equipment costs by allowing us, as the service provider,to efficiently manage their operations; and
• the flexibility to deploy their capital on projects more directly related to their primary business of hydrocarbonexploration and production by reducing their investment in compression, production and processing equipment andrelated maintenance capital requirements.
Oil and Natural Gas Industry Cyclicality and Volatility
Changes in oil and natural gas exploration and production spending normally result in changes in demand for our products andservices. However, we believe our contract operations business is less impacted by commodity prices than certain other energyservice products and services because compression, production and processing services are necessary for oil and natural gas tobe delivered from the wellhead to end users. Furthermore, our contract operations business is tied primarily to global oil andnatural gas production and consumption trends, which are generally less cyclical in nature than exploration activities.
7

Demand for oil and natural gas is cyclical and subject to fluctuations. This is primarily because the industry is driven bycommodity demand and corresponding price movements. When oil and natural gas price increases occur, producers typicallyincrease their capital expenditures, which generally results in greater activity levels and revenues for equipment providers to theoil and gas industry. During periods of lower oil or natural gas prices, producers typically decrease their capital expenditures,which generally results in lower activity levels and revenues for equipment providers to the oil and gas industry.
Seasonal Fluctuations
Our results of operations have not historically reflected material seasonal tendencies and we do not believe that seasonalfluctuations will have a material impact on us in the foreseeable future.
Markets, Customers and Competition
Our global customer base consists primarily of companies engaged in all aspects of the oil and natural gas industry, includinglarge integrated oil and natural gas companies, national energy companies, independent producers and natural gas processors,gatherers and pipeline operators.
During the year ended December 31, 2019, XTO Energy Inc. (“XTO”) and Basrah Gas Company (“Basrah Gas”) accounted forapproximately 21% and 12% of our total revenue, respectively. During the year ended December 31, 2018, MPLX LP(“MPLX”) accounted for approximately 15% of our total revenue and during the year ended December 31, 2017, Archrockaccounted for approximately 12% of our total revenue. No other customer accounted for more than 10% of our revenue in2019, 2018 and 2017.
We currently operate in approximately 25 countries. We have manufacturing facilities in the U.S., Singapore and the UnitedArab Emirates and offices in most of the major oil and gas regions around the world.
The markets in which we operate are highly competitive. Overall, we experience considerable competition from companies thatmay be able to more quickly adapt to changes within our industry and changes in economic conditions as a whole and to morereadily take advantage of available opportunities. We believe we are competitive with respect to price, equipment availability,customer service, flexibility in meeting customer needs, technical expertise, quality and reliability of our compression,processing and treating equipment and related services. We face vigorous competition throughout our businesses, with somecompanies competing with us in multiple business segments. In our product sales business, we have different competitors in thestandard and custom-engineered equipment sectors. Competitors in the standard equipment sector include several largecompanies and a large number of small, regional fabricators. Our competition in the custom-engineered sector consists mainlyof larger companies with the ability to provide integrated projects and product support after the sale.
We expect to face increased competition as we seek to diversify our customer base and increase utilization of our serviceofferings.
Sources and Availability of Raw Materials
We manufacture natural gas compression, oil and natural gas processing and treating equipment and water treatment equipmentto provide contract operations services and to sell to third parties from components which we acquire from a wide range ofsuppliers. These components represent a significant portion of the cost of our compression, processing and treating and watertreatment equipment products. Increases in raw material costs cannot always be offset by increases in our products’ sales prices.While many of our materials and components are available from multiple suppliers at competitive prices, we obtain some of thecomponents, including compressors and engines, used in our products from a limited group of suppliers. We occasionallyexperience long lead times for components, including compressors and engines, from our suppliers and, therefore, we may attimes make purchases in anticipation of future orders.
Environmental and Other Regulations
Government Regulation
Our operations are subject to stringent and complex U.S. federal, state, local and international laws and regulations that couldhave a material impact on our operations or financial condition. Our operations are regulated under a number of lawsgoverning, among other things, discharges of substances into the air, ground and regulated waters, the generation,transportation, treatment, storage and disposal of hazardous and non-hazardous substances, disclosure of information abouthazardous materials used or produced in our operations, and occupational health and safety.
8

Compliance with these environmental laws and regulations may expose us to significant costs and liabilities and cause us toincur significant capital expenditures in our operations. Failure to comply with these laws and regulations may result in theassessment of administrative, civil and criminal penalties, imposition of investigatory and remedial obligations, and theissuance of injunctions delaying or prohibiting operations. In certain circumstances, laws may impose strict, joint and severalliability without regard to fault or the legality of the original conduct on classes of persons who are considered to be responsiblefor the release of hazardous substances into the environment. In addition, it is not uncommon for third parties to file claims forpersonal injury, property damage and recovery of response costs allegedly caused by hazardous substances or other pollutantsreleased into the environment. We currently own or lease, and in the past have owned or leased, a number of properties thathave been used in support of our operations for a number of years. Although we have utilized operating and disposal practicesthat were standard in the industry at the time, hydrocarbons, hazardous substances, or other regulated wastes may have beendisposed of, or released, on or under the properties owned by us, leased by us or other locations where such materials have beentaken for disposal by companies sub-contracted by us. In addition, many of these properties have been previously owned oroperated by third parties whose treatment and disposal or release of hydrocarbons, hazardous substances or other regulatedwastes were not under our control. These properties and the materials released or disposed thereon may be subject to variouslaws that could require us to remove or remediate historical property contamination, or to perform certain operations to preventfuture contamination. We are not currently under any order requiring that we undertake or pay for any cleanup activities.However, we cannot provide any assurance that we will not receive any such order in the future.
We believe the global trend in environmental regulation is to place more restrictions on activities that may affect theenvironment, and thus, any changes in these laws and regulations that result in more stringent and costly waste handling,storage, transport, disposal, emission or remediation requirements could have a material adverse effect on our results ofoperations and financial position.
Employees
As of December 31, 2019, we had approximately 3,600 employees. Many of our employees outside of the U.S. are covered bycollective bargaining agreements. We generally consider our relationships with our employees to be satisfactory.
Available Information
Our website address is www.exterran.com. Our annual reports on Form 10-K, quarterly reports on Form 10-Q, current reportson Form 8-K and amendments to those reports are available on our website, without charge, as soon as reasonably practicableafter they are filed electronically with the Securities and Exchange Commission (the “SEC”). Information on our website is notincorporated by reference in this report or any of our other securities filings. Paper copies of our filings are also available,without charge, from Exterran Corporation, 11000 Equity Drive, Houston, Texas 77041, Attention: Investor Relations.
The SEC also maintains a website that contains reports, proxy and information statements and other information regardingissuers who file electronically with the SEC. The SEC’s website address is www.sec.gov.
Additionally, we make available free of charge on our website:• our Code of Conduct;• our Corporate Governance Principles; and• the charters of our audit, compensation and nominating and corporate governance committees.
9

Item 1A. Risk Factors
As described in Part I (“Disclosure Regarding Forward-Looking Statements”), this report contains forward-looking statementsregarding us, our business and our industry. The risk factors described below, among others, could cause our actual results todiffer materially from the expectations reflected in the forward-looking statements. The risk factors described below are not theonly risks we face. Our business could also be affected by additional risks and uncertainties not currently known to us or thatwe currently consider to be immaterial. If any of the following risks or any other risks actually occurs, our business, financialcondition, results of operations and cash flows could be negatively impacted.
Risks Related to Our Business and Industry
Low oil and natural gas prices could depress or reduce demand or pricing for our natural gas compression and oil andnatural gas processing and treating equipment and services and, as a result, adversely affect our business.
Our results of operations depend upon the level of activity in the global energy market, including oil and natural gasdevelopment, production, processing and transportation. Oil and natural gas exploration and development activity and thenumber of well completions typically decline when there is a sustained reduction in oil or natural gas prices or significantinstability in energy markets. Even the perception of longer-term lower oil or natural gas prices by oil and natural gasexploration, development and production companies can result in their decision to cancel, reduce or postpone majorexpenditures or to reduce or shut in well production.
Oil and natural gas prices and the level of drilling and exploration activity can be volatile. In periods of volatile commodityprices, the timing of any change in activity levels by our customers is difficult to predict. As a result, our ability to project theanticipated activity level for our business, and particularly our product sales segment may be limited.
During periods of lower oil or natural gas prices, our customers typically decrease their capital expenditures, which generallyresults in lower activity levels. A reduction in demand for our products and services could force us to reduce our pricingsubstantially, which could have a material adverse effect on our business, financial condition, results of operations and cashflows. For example, due to the low oil and natural gas price environment during 2015 and the majority of 2016, our customerssought to reduce their capital and operating expenditure requirements, and as a result, the demand and pricing for theequipment we manufacture was adversely impacted.
In addition, customer cash flows and returns on capital could drive customer investment priorities. Industry observers believeshareholders are encouraging management teams of energy companies to focus operational and compensation strategies onreturns and free cash flow generation rather than solely on growth. To accomplish these strategies, energy companies may needto better prioritize or reduce capital spending, which could impact resource allocation and production, ultimately constrainingthe amount of new projects by our customers.
Any reduction in demand for our products and services could result in our customers seeking to preserve capital by cancelingcontracts, canceling or delaying scheduled maintenance of their existing natural gas compression and oil and natural gasprocessing and treating equipment, ceasing commitments for new contract operations services contracts or new compression,oil and natural gas processing and treating equipment or new water treatment equipment, or canceling or delaying orders forour products and services, any of which could have a material adverse effect on our business, financial condition, results ofoperations and cash flows.
The erosion of the financial condition of our customers could adversely affect our business.
Many of our customers finance their exploration and development activities through cash flows from operations, the incurrenceof debt or the issuance of equity. During times when the oil or natural gas markets weaken, our customers are more likely toexperience a downturn in their financial condition. A reduction in borrowing bases under reserve-based credit facilities, the lackof availability of debt or equity financing or other factors that negatively impact our customers’ financial condition could resultin our customers seeking to preserve capital by reducing prices under existing contracts, cancelling contracts with us,determining not to renew contracts with us, cancelling or delaying scheduled maintenance of their existing natural gascompression and oil and natural gas processing and treating equipment, determining not to enter into contract operationsagreements or not to purchase new compression, oil and natural gas processing and treating equipment or water treatmentequipment, or determining to cancel or delay orders for our products and services. Any such action by our customers wouldreduce demand for our products and services which could adversely affect our business, financial condition, results ofoperations and cash flows. In addition, in the event of the financial failure of a customer, we could experience a loss on all or aportion of our outstanding accounts receivable associated with that customer.
10

Failure to timely and cost-effectively execute on larger projects could adversely affect our business.
Some of our projects have a relatively larger size and scope than the majority of our projects, which can translate into moretechnically challenging conditions or performance specifications for our products and services. Contracts with our customersfor these projects typically specify delivery dates, performance criteria and penalties for our failure to perform. Any failure toestimate the cost of and execute these larger projects in a timely and cost effective manner could have a material adverse effecton our business, financial condition, results of operations and cash flows.
We may incur losses on fixed-price contracts, which constitute a significant portion of our business.
In connection with projects and services performed under fixed-price contracts, we generally bear the risk of cost over-runs,operating cost inflation, labor availability and productivity, and supplier and subcontractor pricing and performance, unlessadditional costs result from customer-requested change orders. Under both our fixed-price contracts and our cost-reimbursablecontracts, we may rely on third parties for many support services, and we could be subject to liability for their failures. Anyfailure to accurately estimate our costs and the time required for a fixed-price project at the time we enter into a contract couldhave a material adverse effect on our business, financial condition, results of operations and cash flows.
Our operations in international markets are subject to many risks.
The majority of our contract operations and aftermarket services businesses, and a portion of our product sales business, areconducted in countries outside the U.S. We currently operate in approximately 25 countries. With respect to any particularcountry in which we operate, the risks inherent in our activities may include the following, the occurrence of any of whichcould have a material adverse effect on our business, financial condition, results of operations and cash flows:
• difficulties in managing international operations, including our ability to timely and cost effectively execute projects;• unexpected changes in regulatory requirements, laws or policies by foreign agencies or governments;• work stoppages;• training and retaining qualified personnel in international markets;• the burden of complying with multiple and potentially conflicting laws and regulations;• tariffs and other trade barriers;• actions by governments or national oil companies that result in the nullification or renegotiation on less than favorable
terms of existing contracts, or otherwise result in the deprivation of contractual rights, and other difficulties inenforcing contractual obligations;
• governmental actions that: result in restricting the movement of property or that impede our ability to import or exportparts or equipment; require a certain percentage of equipment to contain local or domestic content; or require certainlocal or domestic ownership, control or employee ratios in order to do business in or obtain special incentives ortreatment in certain jurisdictions;
• potentially longer payment cycles;• changes in political and economic conditions in the countries in which we operate, including general political unrest,
the nationalization of energy related assets, civil uprisings, community protests, blockades, riots, kidnappings,violence associated with drug cartels and terrorist acts;
• potentially adverse tax consequences or tax law changes;• currency controls or restrictions on repatriation of earnings;• expropriation, confiscation or nationalization of property without fair compensation;• the risk that our international customers may have reduced access to credit because of higher interest rates, reduced
bank lending or a deterioration in our customers’ or their lenders’ financial condition; • complications associated with installing, operating and repairing equipment in remote locations;• limitations on insurance coverage;• inflation;• the geographic, time zone, language and cultural differences among personnel in different areas of the world; and• difficulties in establishing new international offices and the risks inherent in establishing new relationships in foreign
countries.
11

In addition, we may expand our business in international markets where we have not previously conducted business. The risksinherent in establishing new business ventures, especially in international markets where local customs, laws and businessprocedures present special challenges, may affect our ability to be successful in these ventures or avoid losses that could have amaterial adverse effect on our business, financial condition, results of operations and cash flows.
Our contract operations segment is dependent on companies that are controlled by the government in which it operates.
The countries with our largest contract operations businesses include Argentina, Brazil and Mexico. We generate a significantportion of our revenue in these countries from national oil companies, including Yacimientos Petroliferos Fiscales in Argentina,Petrobras in Brazil and Petroleos Mexicanos in Mexico. Contracts with national oil companies may expose us to greatercommercial, political and operational risks than we assume in other contracts. Our ability to resolve disputes or enforcecontractual provisions may be negatively impacted by the significant bargaining leverage that national oil companies have overus. If our national oil company customers cancel some of our contracts and we are unable to secure new contracts on a timelybasis and on substantially similar terms, or if a number of our contracts are renegotiated, it could adversely affect our business,financial position, results of operations or cash flows.
We are exposed to exchange rate fluctuations in the international markets in which we operate.
We operate in many international countries and anticipate that there will be instances in which costs and revenues will not beexactly matched with respect to currency denomination. Gains and losses from the remeasurement of assets and liabilities thatare receivable or payable in currencies other than our subsidiaries’ functional currency are included in our statements ofoperations. In addition, currency fluctuations cause the U.S. dollar value of our international results of operations and net assetsto vary with exchange rate fluctuations. A decrease in the value of any of these currencies relative to the U.S. dollar could havea negative impact on our business, financial condition, results of operations or cash flows. As we expand geographically, wemay experience economic loss and a negative impact on earnings or net assets solely as a result of foreign currency exchangerate fluctuations. In the future, we may utilize derivative instruments to manage the risk of fluctuations in foreign currencyexchange rates that could potentially impact our future earnings and forecasted cash flows. However, the markets in which weoperate could restrict the removal or conversion of the local or foreign currency, resulting in our inability to hedge against someor all of these risks and/or increase our cost of conversion of local currency to U.S. dollar.
See further discussion of foreign exchange risks under Item 7A “Quantitative and Qualitative Disclosures about Market Risk”included elsewhere in this Annual Report.
Natural disasters, public health crises, other catastrophic events or other events outside of our control may adversely affectour business or the business of third parties on which we depend.
Natural disasters, public health crises, other catastrophic events or other events outside of our control could disrupt operations,impair critical systems and adversely affect our business operations and the operations of our suppliers and customers. Forexample, in September 2017, Hurricane Harvey affected our corporate headquarters and two manufacturing facilities inHouston. While our facilities did not sustain any material damages, our manufacturing locations were closed for more than aweek due to the catastrophic flooding in and around the Houston area. As a result, our operating results were negativelyimpacted by this natural disaster. In December 2019, a novel strain of coronavirus was reported to have surfaced in Wuhan, China, resulting in modifiedoperating hours and business closures in China. At the time of this filing, the outbreak has been largely concentrated in China,although cases have been confirmed in other countries. Although at the time of this filing, we have not been materiallyimpacted, our reliance on suppliers or our suppliers’ reliance on other parties that may be impacted by the business disruptionscaused by this virus could result in the inability to secure products needed for our operations. Additionally, consumer spendingcould be negatively influenced which could adversely affect demand for oil and natural gas and therefore indirectly impactdemand for our products and services and our operating results. These types of events are unpredictable and can materiallyaffect our business, financial condition, results of operations and cash flows.
12

The termination of or any price reductions under certain of our contract operations services contracts could have a materialimpact on our business.
The termination of a contract or a demand by our customers to reduce prices for our contract operations services contracts maylead to a reduction in our revenues and net income, which could have a material adverse effect upon our business, financialcondition, results of operations and cash flows. In addition, we may be unable to renew, or enter into new, contracts withcustomers on favorable commercial terms, if at all. To the extent we are unable to renew our existing contracts or enter intonew contracts on terms that are favorable to us or to successfully manage our overall contract mix over time, our business,results of operations and cash flows may be adversely impacted.
Product sales backlog may be subject to unexpected adjustments and cancellations.
The expected future revenues reflected in our product sales backlog may not be realized or may not result in profits if realized.Due to potential project cancellations or changes in project scope and schedule, we cannot predict with certainty when or ifbacklog will be performed. In addition, even when a project proceeds as scheduled, it is possible that contracted parties maydefault and fail to pay amounts owed to us or poor project performance could increase the cost associated with a project.Delays, suspensions, cancellations, payment defaults, scope changes and poor project execution could materially reduce oreliminate revenues or profits that we actually realize from projects in backlog. We may be at greater risk of delays, suspensionsand cancellations during periods of low oil and natural gas prices.
Reductions in our product sales backlog due to cancellation or modification by a customer or for other reasons may adverselyaffect, potentially to a material extent, the revenues and earnings we actually receive from contracts included in our backlog.Contracts in our product sales backlog provide for cancellation fees in the event customers cancel projects. These cancellationfees usually provide for reimbursement of our out-of-pocket costs, revenues for work performed prior to cancellation and avarying percentage of the profits we would have realized had the contract been completed. However, we typically have nocontractual right upon cancellation to the total revenue reflected in our backlog. Projects may remain in our backlog forextended periods of time. If we experience significant project terminations, suspensions or scope adjustments to contractsreflected in our backlog, our financial condition, results of operations and cash flows may be adversely impacted.
From time to time, we are subject to various claims, litigation and other proceedings that could ultimately be resolvedagainst us, requiring material future cash payments or charges, which could impair our financial condition or results ofoperations.
The size, nature and complexity of our business make us susceptible to various claims, both in litigation and binding arbitrationproceedings. We are currently, and may in the future become, subject to various claims, which, if not resolved within amountswe have accrued, could have a material adverse effect on our financial position, results of operations or cash flows. Similarly,any claims, even if fully indemnified or insured, could negatively impact our reputation among our customers and the public,and make it more difficult for us to compete effectively or obtain adequate insurance in the future.
We depend on particular suppliers and may be vulnerable to product shortages and price increases.
Some of the components used in our products are obtained from a single source or a limited group of suppliers. Our reliance onthese suppliers involves several risks, including price increases, product quality and a potential inability to obtain an adequatesupply of required components in a timely manner. Additionally, we occasionally experience long lead times from our sourcesfor major components and may at times make purchases in anticipation of future business. We do not have long-term contractswith some of these sources, and the partial or complete loss of certain of these sources could have a negative impact on ourresults of operations and could damage our customer relationships. Further, a significant increase in the price of one or more ofthese components could have a negative impact on our results of operations.
We face significant competitive pressures that may cause us to lose market share and harm our financial performance.
Our businesses face intense competition and have low barriers to entry. Our competitors may be able to adapt more quickly totechnological changes within our industry, changes in economic and market conditions or more readily take advantage ofacquisitions and other opportunities. Our ability to renew or replace existing contract operations services contracts with ourcustomers at rates sufficient to maintain current revenue and cash flows could be adversely affected by the activities of ourcompetitors. If our competitors substantially increase the resources they devote to the development and marketing ofcompetitive products, equipment or services or substantially decrease the price at which they offer their products, equipment orservices, we may not be able to compete effectively.
13

In addition, we could face significant competition from new entrants into the markets we serve. Some of our existingcompetitors or new entrants may expand or develop new processing, treating and compression equipment that would createadditional competition for the products, equipment or services we provide to our customers.
We have continued to work toward our strategy to be a company that leverages technology and operational excellence toprovide complete systems and process solutions in energy and industrial applications. Over the past several years, we havemade significant progress in this journey by taking actions to protect our core business, develop important organizationalcapabilities, commercialize new products and services and implement new processes to position Exterran for success. We arefocused on optimizing our portfolio of products and services to better serve our global customers while providing a moreattractive investment option for our investors. As we continue on this path, we are also reviewing options for our U.S.compression fabrication business to be a positive contributor to our strategy. This business has performed well over the pastyear despite difficult market conditions as we worked to maximize margins and returns. We will fully explore our options andwe are committed to supporting our customers, employees and other stakeholders throughout the process. If we decide tochange our strategy with this business, we may incur additional costs or charges that could impact our results of operations.
Our ability to manage and grow our business effectively may be adversely affected if we lose management or operationalpersonnel.
We believe that our ability to hire, train and retain qualified personnel will continue to be challenging and important. Thesupply of experienced operational and field personnel, in particular, decreases as other energy and manufacturing companies’needs for the same personnel increase. Our ability to grow and to continue our current level of service to our customers will beadversely impacted if we are unable to successfully hire, train and retain these important personnel.
Our employees work on projects that are inherently dangerous. If we fail to maintain safe work sites, we can be exposed tosignificant financial losses and reputational harm.
Safety is a leading focus of our business, and our safety record is critical to our reputation and is of paramount importance toour employees, customers and stockholders. However, we often work on large-scale and complex projects which can place ouremployees and others near large mechanized equipment, moving vehicles, dangerous processes and in challengingenvironments. Although we have a functional group whose primary purpose is to implement effective quality, health, safety,environmental and security procedures throughout our company, if we fail to implement effective safety procedures, ouremployees and others may become injured, disabled or lose their lives, our projects may be delayed or we may be exposed tolitigation or investigations.
Unsafe conditions at project work sites also have the potential to increase employee turnover, increase project costs and raiseour operating costs. Additionally, many of our customers require that we meet certain safety criteria to be eligible to bid forcontracts and our failure to maintain adequate safety standards could result in reduced profitability, lost project awards or lossof customers. Any of the foregoing could result in financial losses or reputational harm, which could have a material adverseimpact on our business, financial condition and results of operations.
Our operations entail inherent risks that may result in substantial liability. We do not insure against all potential losses andcould be seriously harmed by unexpected liabilities.
Our operations entail inherent risks, including equipment defects, malfunctions and failures, environmental discharges andnatural disasters, which could result in uncontrollable flows of natural gas or well fluids, fires and explosions. These risks mayexpose us, as an equipment operator and developer, to liability for personal injury, wrongful death, property damage, pollutionor other environmental damage. The insurance we carry against many of these risks may not be adequate to cover our claims orlosses. In addition, we are substantially self-insured for workers’ compensation, employer’s liability, property, auto liability,general liability and employee group health claims in view of the relatively high per-incident deductibles we absorb under ourinsurance arrangements for these risks. Further, insurance covering the risks we expect to face or in the amounts we desire maynot be available in the future or, if available, the premiums may not be commercially justifiable. If we were to incur substantialliability and such damages were not covered by insurance or were in excess of policy limits, or if we were to incur liability at atime when we are not able to obtain liability insurance, our business, financial condition and results of operations could benegatively impacted.
14

We may be subject to risks arising from changes in technology.
The supply chains in which we operate are subject to technological changes and changes in customer requirements. We may notsuccessfully develop or implement new or modified types of products or technologies that may be required by our customers inthe future. Further, the development of new technologies by competitors that may compete with our technologies could reducedemand for our products and affect our financial performance. Should we not be able to maintain or enhance the competitivevalues of our products or develop and introduce new products or technologies successfully, or if new products or technologiesfail to generate sufficient revenues to offset research and development costs, our business, financial condition and operatingresults could be materially adversely affected.
Our information technology infrastructure could be subject to service interruptions, data corruption, cyber-based attacks ornetwork security breaches, which could result in the disruption of operations or the loss of data confidentiality.
We rely on information technology networks and systems, including the internet and third-party service providers, to process,transmit and store electronic information, and to manage or support a variety of business processes and activities, includingprocurement, manufacturing, distribution, invoicing, collection, communication with our employees, customers, suppliers,dealers and suppliers, business acquisitions and other corporate transactions, compliance with regulatory, legal and taxrequirements, and research and development. These information technology networks and systems may be susceptible todamage, disruptions or shutdowns due to failures during the process of upgrading or replacing software, databases orcomponents, power outages, hardware failures, undetected errors or computer viruses. While we have business continuity plansand other safeguards in place, if these information technology systems suffer severe damage, disruption or shutdown andbusiness continuity plans do not effectively resolve the issues in a timely manner, our business, financial condition, results ofoperations, and liquidity could be materially adversely affected. Further, we cannot ensure we have insurance coverages tocover these issues.
In addition, information technology security threats and sophisticated cyber-based attacks, including, but not limited to, denial-of-service attacks, hacking, worms, “phishing” attacks, computer viruses, ransomware, malware, employee or insider error,malfeasance, social engineering, or physical breaches, may cause deliberate or unintentional damage, destruction or misuse,manipulation, denial of access to or disclosure of confidential or important information by our employees, suppliers or third-party service providers. Additionally, advanced persistent attempts to gain unauthorized access to our systems and those ofthird-party service providers we rely on are increasing in sophistication and frequency. We have experienced attacks on ourinformation technology systems and networks, and we expect to continue to confront attempts by hackers and other thirdparties to disrupt or gain unauthorized access to our information technology systems and networks. These attacks to date havenot resulted in unauthorized access to confidential information regarding our customers, suppliers or employees and have nothad a material impact on our business. However, we could in the future experience attacks that materially disrupt our businessor result in access to such confidential information about our customers, suppliers and employees or material information aboutour operations that could have a material adverse effect on our business, financial condition, results of operations or liquidity.
We are continuously developing and enhancing our controls, processes, and practices designed to protect our systems,computers, software, data, and networks from attack, damage, or unauthorized access. This continued development andenhancement will require us to expend additional resources, including to investigate and remediate any information securityvulnerabilities that may be detected. Despite our ongoing investments in security resources, talent, and business practices, weare unable to assure that these enhanced security measures will be effective.
We can provide no assurance that our efforts to actively manage technology risks potentially affecting our systems andnetworks will be successful in eliminating or mitigating risks to our systems, networks and data or in effectively resolving suchrisks when they materialize. A failure of or breach in information technology security of our own systems, or those of our third-party suppliers, could expose us and our employees, customers, dealers and suppliers to risks of misuse of information orsystems, the compromise of confidential information, manipulation and destruction of data, defective products, productiondowntimes and operations disruptions. Any of these events in turn could adversely affect our reputation, competitive position,including loss of customers and revenue, business, results of operations and liquidity. In addition, such breaches in securitycould result in litigation, regulatory action and potential liability, as well as the costs and operational consequences ofimplementing further data protection measures.
15

To conduct our operations, we regularly move data across national and state borders, and consequently we are subject to avariety of continuously evolving and developing laws and regulations in the U.S. and abroad regarding privacy, data protectionand data security. The scope of the laws that may be applicable to us is often uncertain and may be conflicting, particularly withrespect to foreign laws. For example, the European Union’s General Data Protection Regulation, which greatly increases thejurisdictional reach of E.U. law and adds a broad array of requirements for handling personal data, including the publicdisclosure of significant data breaches, became effective in May 2018. Other countries have enacted or are enacting datalocalization laws that require data to stay within their borders and various states are enacting additional data laws that mayimpact us. All of these evolving compliance and operational requirements impose significant costs that are likely to increaseover time.
We are subject to a variety of governmental regulations; failure to comply with these regulations may result inadministrative, civil and criminal enforcement measures and changes in these regulations could increase our costs orliabilities.
We are subject to a variety of U.S. federal, state, local and international laws and regulations relating to, for example, exportcontrols, currency exchange, labor and employment and taxation. Many of these laws and regulations are complex, changefrequently, are becoming increasingly stringent, and the cost of compliance with these requirements can be expected to increaseover time. From time to time, as part of our operations we may be subject to compliance audits by regulatory authorities in thevarious countries in which we operate. Our failure to comply with these laws and regulations may result in a variety ofadministrative, civil and criminal enforcement measures, including assessment of monetary penalties, imposition of remedialrequirements and issuance of injunctions as to future compliance, any of which may have a negative impact on our financialcondition, profitability and results of operations.
Our international operations require us to comply with U.S. and international laws and regulations, including those involvinganti-bribery and anti-corruption. For example, the U.S. Foreign Corrupt Practices Act and similar laws and regulations prohibitimproper payments to foreign officials for the purpose of obtaining or retaining business or gaining any business advantage.
We operate in many parts of the world that experience high levels of corruption, and our business brings us in frequent contactwith foreign officials. Our compliance policies and programs mandate compliance with all applicable anti-corruption laws butmay not be completely effective in ensuring our compliance. Our training and compliance program and our internal controlpolicies and procedures may not always protect us from violations committed by our employees or agents. If we undergo aninvestigation of potential violations of anti-corruption laws or if we fail to comply with these laws, we may incur significantlegal expenses or be subject to criminal and civil penalties and other sanctions and remedial measures, which could have amaterial adverse impact on our reputation, business, financial condition, results of operations and liquidity.
We also are subject to other laws and regulations governing our operations, including regulations administered by the U.S.Department of Treasury’s Office of Foreign Asset Control and various non-U.S. government entities, including applicableexport control regulations, economic sanctions on countries and persons and customs requirements. Trade control laws arecomplex and constantly changing. Our compliance policies and programs increase our cost of doing business and may not workeffectively to ensure our compliance with trade control laws. If we undergo an investigation of potential violations of tradecontrol laws by U.S. or foreign authorities or if we fail to comply with these laws, we may incur significant legal expenses orbe subject to criminal and civil penalties and other sanctions and remedial measures, which could have a material adverseimpact on our reputation, business, financial condition and results of operations.
Tax legislation and administrative initiatives or challenges to our tax positions could adversely affect our results ofoperations and financial condition.
We operate in locations throughout the U.S. and internationally and, as a result, we are subject to the tax laws and regulationsof U.S. federal, state, local and foreign governments. From time to time, various legislative or administrative initiatives may beproposed that could adversely affect our tax positions. In addition, U.S. federal, state, local and foreign tax laws and regulationsare extremely complex and subject to varying interpretations. Moreover, economic and political pressures to increase taxrevenue in various jurisdictions may make resolving tax disputes favorably more difficult. There can be no assurance that ourtax positions will not be challenged by relevant tax authorities or that we would be successful in any such challenge. Changesto our tax positions resulting from tax legislation and administrative initiatives or challenges from taxing authorities couldadversely affect our results of operations and financial condition.
16

U.S. federal, state, local and foreign legislative and regulatory initiatives relating to hydraulic fracturing as well asgovernmental reviews of such activities could result in increased costs and additional operating restrictions or delays in thecompletion of oil and natural gas wells, and adversely affect demand for our products.
Hydraulic fracturing is an important and common practice that is used to stimulate production of natural gas and/or oil, fromdense subsurface rock formations. We do not perform hydraulic fracturing, but many of our customers do. Hydraulic fracturinginvolves the injection of water, sand or alternative proppant and chemicals under pressure into target geological formations tofracture the surrounding rock and stimulate production. Hydraulic fracturing is typically regulated by state agencies, butrecently, there has been increased public concern regarding an alleged potential for hydraulic fracturing to adversely affectdrinking water supplies, and proposals have been made to enact separate U.S. federal, state and local legislation that wouldincrease the regulatory burden imposed on hydraulic fracturing.
For example, at the U.S. federal level, the U. S. Environmental Protection Agency (“EPA”) issued an Advance Notice ofProposed Rulemaking to collect data on chemicals used in hydraulic fracturing operations under Section 8 of the ToxicSubstances Control Act, and proposed regulations under the CWA governing wastewater discharges from hydraulic fracturingand certain other natural gas operations. On March 26, 2015, the Bureau of Land Management (“BLM”) released a final rulethat updates existing regulation of hydraulic fracturing activities on U.S. federal lands, including requirements for chemicaldisclosure, wellbore integrity and handling of flowback water. The final rule never went into effect due to pending litigationand on December 28, 2017, the BLM announced that it had rescinded the 2015 final rule, in part citing a review that found thateach of the 32 states with federal oil and gas leases has regulations that already address hydraulic fracturing.
At the state level, several states have adopted or are considering legal requirements that could impose more stringentpermitting, disclosure, and well construction requirements on hydraulic fracturing activities. For example in May 2013, theTexas Railroad Commission adopted new rules governing well casing, cementing and other standards for ensuring thathydraulic fracturing operations do not contaminate nearby water resources. Local governments may also seek to adoptordinances within their jurisdictions regulating the time, place and manner of, or prohibiting the performance of, drillingactivities in general or hydraulic fracturing activities in particular. In addition, certain interest groups have also proposed ballotinitiatives and constitutional amendments designed to restrict oil and natural-gas development generally and hydraulicfracturing in particular. For example, in 2018, Colorado voters ultimately rejected Proposition 112, a Colorado ballot initiativethat would have drastically limited the use of hydraulic fracturing in Colorado. If new or more stringent federal, state or locallegal restrictions relating to the hydraulic fracturing process are adopted in areas where our natural gas exploration andproduction customers operate, those customers could incur potentially significant added costs to comply with suchrequirements, experience delays or curtailment in the pursuit of exploration, development or production activities and perhapseven be precluded from drilling wells. In countries outside of the U.S., including provincial, regional, tribal or localjurisdictions therein where we conduct operations, there may exist similar governmental restrictions or controls on ourcustomers’ hydraulic fracturing activities, which, if such restrictions or controls exist or are adopted in the future, our foreigncustomers may face the same challenges as our U.S. customers. Any such restrictions, domestically or foreign, could reducedemand for our products, and as a result could have a material adverse effect on our business, financial condition, results ofoperations and cash flows.
Our customers’ inability to acquire adequate supplies of water or dispose of or recycle the water used in operations, couldresult in operating restrictions or delays in the completion of oil and natural gas wells, and adversely affect demand for ourproducts.
Oil and gas development activities require the use of water. For example, the hydraulic fracturing process to producecommercial quantities of oil and natural gas from many reservoirs requires the use and disposal of significant quantities ofwater. In certain areas, there may be a scarcity of water for drilling activities due to various factors, including insufficient localaquifer capacity or government regulations restricting the use of water. Our customers’ inability to secure sufficient amounts ofwater or dispose of or recycle the water used in operations, could adversely impact our or our customers’ operations in certainareas. The imposition of new environmental initiatives and regulations, could further restrict our customers’ ability to conductcertain operations disposal of waste, including, but not limited to, produced water, drilling fluids and other materials associatedwith the exploration, development or production of oil and natural gas. Any such restrictions could reduce demand for ourproducts, and as a result could have a material adverse effect on our business, financial condition, results of operations and cashflows.
17

We are subject to a variety of environmental, health and safety regulations. Failure to comply with these regulations mayresult in administrative, civil and criminal enforcement measures and changes in these regulations could increase our costsor liabilities.
We are subject to a variety of U.S. federal, state, local and international laws and regulations relating to the environment, andworker health and safety. These laws and regulations are complex, change frequently, are becoming increasingly stringent, andthe cost of compliance with these requirements can be expected to increase over time. Failure to comply with these laws andregulations may result in administrative, civil and criminal enforcement measures, including assessment of monetary penalties,imposition of remedial requirements and issuance of injunctions as to future compliance. Certain of these laws also may imposejoint and several and strict liability for environmental contamination, which may render us liable for remediation costs, naturalresource damages and other damages as a result of our conduct that may have been lawful at the time it occurred or the conductof, or conditions caused by, prior owners or operators or other third parties. In addition, where contamination may be present, itis not uncommon for neighboring land owners and other third parties to file claims for personal injury, property damage andrecovery of response costs. Remediation costs and other damages arising as a result of environmental laws and regulations, andcosts associated with new information, changes in existing environmental laws and regulations or the adoption of newenvironmental laws and regulations could be substantial and could negatively impact our financial condition, profitability andresults of operations.
We may need to apply for or amend facility permits or licenses from time to time with respect to storm water or wastewaterdischarges, waste handling, or air emissions relating to manufacturing activities or equipment operations, which subjects us tonew or revised permitting conditions. These permits and authorizations may contain numerous compliance requirements,including monitoring and reporting obligations and operational restrictions, such as emission limits, which may be onerous orcostly to comply with. Given the large number of facilities in which we operate, and the numerous environmental permits andother authorizations that are applicable to our operations, we may occasionally identify or be notified of technical violations ofcertain requirements existing in various permits or other authorizations. Occasionally, we have been assessed penalties for ournon-compliance, and we could be subject to such penalties in the future.
The modification or interpretation of existing environmental, health and safety laws or regulations, the more vigorousenforcement of existing laws or regulations, or the adoption of new laws or regulations may also negatively impact oil andnatural gas exploration and production, gathering and pipeline companies, including our customers, which in turn could have anegative impact on us.
Global climate change is an increased international concern and could increase operating costs or reduce the demand forour products and services.
Continuing political and social attention to the issue of global climate change has resulted in both existing and pendinginternational agreements and national, regional or local legislation and regulatory measures to limit greenhouse gas emissions,such as cap and trade regimes, carbon taxes, restrictive permitting, increased fuel efficiency standards and incentives ormandates for renewable energy. For example, in December 2015, the U.S. joined the international community at the 21stConference of the Parties of the United Nations Framework Convention on Climate Change in Paris that prepared an agreementrequiring member countries to review and represent a progression in their intended greenhouse gas emission reduction goalsevery five years beginning in 2020. While the U.S. announced its intention to withdraw from the Paris Agreement, several U.S.state and local governments and major corporations headquartered in the U.S. announced an intent to honor the U.S.’scommitments. Several U.S. cities, counties and state governments have also filed lawsuits against certain oil and gas companiesseeking compensatory damages and equitable relief to abate alleged climate change impacts. To date, none of these suits havebeen successful, and we are not a party to these proceedings. In the U.S., the EPA has also begun to regulate greenhouse gasemissions under the federal Clean Air Act and regulatory agencies and legislative bodies in other countries where we operatehave adopted greenhouse gas emission reduction programs. The adoption of new or more stringent legislation or regulatoryprograms restricting greenhouse gas emissions in any of the jurisdictions where we or our customers operate could require us toincur higher operating costs or increase the cost of, and thus reduce the demand for, the hydrocarbon products of our customers.These increased costs or reduced demand could have an adverse effect on our business, profitability or results of operations.
18
Further, some scientists have concluded that increasing greenhouse gas concentrations in the atmosphere may produce physicaleffects, such as increased severity and frequency of storms, droughts, floods and other climate events. To the extent there aresignificant changes in the Earth’s climate in the markets we serve or the areas where our assets reside, we could incur increasedexpenses, our operations could be materially impacted, and demand for our products and services could fall. Demand for ourproducts and services may also be adversely affected by conservation plans and efforts undertaken in response to global climatechange. Many governments also provide, or may in the future provide, tax advantages and other subsidies to support the useand development of alternative energy technologies. Our operations and the demand for our products and services or ourcustomers’ products could be materially impacted by the development and adoption of these technologies.
Recently, activists concerned about the potential effects of climate change have directed their attention at sources of funding forcompanies engaged in business involving fossil fuels, which has resulted in certain financial institutions, investment funds andother sources of capital restricting or eliminating their investment in oil and natural gas activities. This could make it moredifficult for our customers to secure funding for exploration and production or midstream energy business activities.
Risks Related to Our Level of Indebtedness
Our outstanding debt obligations could limit our ability to fund future growth and operations and increase our exposure torisk during adverse economic conditions.
At December 31, 2019, we had a long-term debt balance of $443.6 million. Many factors, including factors beyond our control,may affect our ability to make payments on our outstanding indebtedness. These factors include those discussed elsewhere inthese Risk Factors and those listed in the Disclosure Regarding Forward-Looking Statements section included in Part I of thisAnnual report.
Our debt and associated commitments could have important adverse consequences. For example, these commitments could:• make it more difficult for us to satisfy our contractual obligations;• increase our vulnerability to general adverse economic and industry conditions;• limit our ability to fund future working capital, capital expenditures, investments, acquisitions or other corporate
requirements;• increase our vulnerability to interest rate fluctuations because the interest payments on borrowings under our revolving
credit facility are based upon variable interest rates and can adjust based upon certain financial covenant ratios;• limit our flexibility in planning for, or reacting to, changes in our business and our industry;• place us at a disadvantage compared to our competitors that have less debt or less restrictive covenants in such
debt; and• limit our ability to borrow additional funds in the future.
Covenants in our debt agreements may restrict our ability to operate our business.
Our credit agreement, consisting of a $700.0 million revolving credit facility expiring in October 2023, contains variouscovenants with which we, Exterran Energy Solutions, L.P. (“EESLP”), our wholly owned subsidiary, and our respectiverestricted subsidiaries must comply, including, but not limited to, limitations on the incurrence of indebtedness, investments,liens on assets, repurchasing equity, making distributions, transactions with affiliates, mergers, consolidations, dispositions ofassets and other provisions customary in similar types of agreements. Additionally, we are required to maintain certain financialcovenant ratios. If we fail to remain in compliance with these restrictions and financial covenants, we would be in default underour credit agreement. In addition, if we experience a material adverse effect on our assets, liabilities, financial condition,business or operations that, taken as a whole, impact our ability to perform our obligations under our credit agreement, thiscould lead to a default. A default under one of our debt agreements might trigger cross-default provisions under our other debtagreement, which would accelerate our obligation to repay our indebtedness under those agreements. If the repaymentobligations on any of our indebtedness were to be accelerated, we may not be able to repay the debt or refinance the debt onacceptable terms, and our financial position would be materially adversely affected. As of December 31, 2019, we were incompliance with all financial covenants under our credit agreement.
As a result of a covenant restriction included in our credit agreement, $513.3 million of the $601.8 million of undrawn capacityunder our revolving credit facility was available for additional borrowings as of December 31, 2019.
19

Changes in the method pursuant to which the LIBOR rates are determined and potential phasing out of LIBOR after 2021may adversely affect our results of operations.
LIBOR and certain other “benchmarks” are the subject of recent national, international and other regulatory guidance andproposals for reform. These reforms may cause such benchmarks to perform differently than in the past or have otherconsequences which cannot be predicted. In particular, on July 27, 2017, the United Kingdom’s Financial Conduct Authority,which regulates LIBOR, publicly announced that it intends to stop persuading or compelling banks to submit LIBOR rates after2021. It is unclear whether, at that time, LIBOR will cease to exist or if new methods of calculating LIBOR will be established.As of December 31, 2019, $74.0 million of the borrowings under our revolving credit facility had interest rate paymentsdetermined directly or indirectly based on LIBOR. Any uncertainty regarding the continued use and reliability of LIBOR as abenchmark interest rate could adversely affect the performance of LIBOR relative to its historic values. If the methods ofcalculating LIBOR change from current methods for any reason, or if LIBOR ceases to perform as it has historically, ourinterest expense associated with our outstanding indebtedness or any future indebtedness we incur may increase. Further, ifLIBOR ceases to exist, we may be forced to substitute an alternative reference rate under our revolving credit facility or rely onbase rate borrowings in lieu of LIBOR-based borrowings. At this point, it is not clear what, if any, alternative reference ratemay replace LIBOR, however, any such alternative reference rate may increase the interest expense associated with ourexisting or future indebtedness. Any of these occurrences could materially and adversely affect our borrowing costs, businessand results of operations.
We may increase our debt or raise additional capital in the future, which could affect our financial condition, may decreaseour profitability or could dilute our shareholders.
We may increase our debt or raise additional capital in the future, subject to restrictions in our debt agreements. If our cash flowfrom operations is less than we anticipate, or if our cash requirements are more than we expect, we may require more financing.However, debt or equity financing may not be available on terms acceptable to us, if at all. If we incur additional debt or raiseequity through the issuance of preferred stock, the terms of the debt or preferred stock issued may give the holders rights,preferences and privileges senior to those of holders of our common stock, particularly in the event of liquidation. The terms ofthe debt may also impose additional and more stringent restrictions on our operations than we currently have. If we raise fundsthrough the issuance of additional equity, our shareholders’ ownership in us would be diluted. If we are unable to raiseadditional capital when needed, it could affect our financial health, which could negatively affect our shareholders.
Risks Related to the Spin-off
We are subject to continuing contingent tax liabilities of Archrock.
Certain tax liabilities of Archrock may become our obligations. Pursuant to the U.S. Internal Revenue Code and the relatedrules and regulations, each corporation that was a member of the Archrock consolidated U.S. federal income tax reportinggroup during any taxable period or portion of any taxable period ending on or before the effective time of the Spin-off is jointlyand severally liable for the U.S. federal income tax liability of the entire Archrock consolidated tax reporting group for thattaxable period. In connection with the Spin-off, we entered into a tax matters agreement with Archrock that allocates theresponsibility for prior period taxes of the Archrock consolidated tax reporting group between us and Archrock. If Archrock isunable to pay any prior period taxes for which it is responsible, we could be required to pay the entire amount of such taxes.
Our prior and continuing relationship with Archrock exposes us to risks attributable to businesses of Archrock.
Archrock is obligated to indemnify us for losses that third parties may seek to impose upon us or our affiliates for liabilitiesrelating to the business of Archrock that are incurred through a breach of the separation and distribution agreement or anyancillary agreement by Archrock or its affiliates other than us, or losses that are attributable to Archrock in connection with theSpin-off or are not expressly assumed by us under our agreements with Archrock. Any claims made against us that are properlyattributable to Archrock in accordance with these arrangements would require us to exercise our rights under our agreementswith Archrock to obtain payment from Archrock. We are exposed to the risk that, in these circumstances, Archrock cannot, orwill not, make the required payment.
20

In connection with our separation from Archrock, Archrock will indemnify us for certain liabilities, and we will indemnifyArchrock for certain liabilities. If we are required to act on these indemnities to Archrock, we may need to divert cash tomeet those obligations, and our financial results could be negatively impacted. In the case of Archrock’s indemnity, therecan be no assurance that the indemnity will be sufficient to insure us against the full amount of such liabilities, or as toArchrock’s ability to satisfy its indemnification obligations.
Pursuant to the separation and distribution agreement and other agreements with Archrock, Archrock has agreed to indemnifyus for certain liabilities, and we have agreed to indemnify Archrock for certain liabilities, in each case for uncapped amounts.Under the separation and distribution agreement, we and Archrock will generally release the other party from all claims arisingprior to the Spin-off that relate to the other party’s business, subject to certain exceptions. Also pursuant to the separation anddistribution agreement, we have agreed to use our commercially reasonable efforts to remove Archrock as a party to certain ofour contracts with third parties. In the event that Archrock remains as a party, we expect to indemnify Archrock for anyliabilities relating to such contracts. Indemnities that we may be required to provide Archrock will not be subject to any cap,may be significant and could negatively impact our business, particularly indemnities relating to our actions that could impactthe tax-free nature of the Spin-off.
With respect to Archrock’s agreement to indemnify us, there can be no assurance that the indemnity from Archrock will besufficient to protect us against the full amount of such liabilities, or that Archrock will be able to fully satisfy itsindemnification obligations. Moreover, even if we ultimately succeed in recovering from Archrock any amounts for which weare held liable, we may be temporarily required to bear these losses ourselves. Each of these risks could negatively affect ourbusiness, cash flows, results of operations and financial condition.
Risks Related to Our Common Stock
The market price and trading volume of our common stock may be volatile.
The market price of our stock may be influenced by many factors, some of which are beyond our control, including thefollowing:
• the inability to meet the financial estimates of analysts who follow our common stock;• strategic actions by us or our competitors;• announcements by us or our competitors of significant contracts, acquisitions, joint marketing relationships, joint
ventures or capital commitments;• variations in our quarterly operating results and those of our competitors;• general economic and stock market conditions;• risks relating to our business and our industry, including those discussed above;• changes in conditions or trends in our industry, markets or customers;• cyber-attacks, terrorist acts or armed hostilities;• future sales of our common stock or other securities; • material weaknesses in our internal control over financial reporting; and• investor perceptions of the investment opportunity associated with our common stock relative to other investment
alternatives.
These broad market and industry factors may materially reduce the market price of our common stock, regardless of ouroperating performance. In addition, price volatility may be greater if the public float and trading volume of our common stockis low.
21

Our amended and restated certificate of incorporation designates the Court of Chancery of the State of Delaware as the soleand exclusive forum for certain types of actions and proceedings that may be initiated by our stockholders, which couldlimit our stockholders’ ability to choose the judicial forum for disputes with us or our directors, officers or other employees.
Our amended and restated certificate of incorporation provides that, unless we consent in writing to the selection of an alternateforum, the sole and exclusive forum for (i) any derivative action or proceeding brought on our behalf, (ii) any action asserting aclaim of breach of a fiduciary duty owed by any director, officer or other employee to us or our stockholders, (iii) any actionasserting a claim arising pursuant to any provision of the Delaware General Corporation Law, our amended and restatedcertificate of incorporation or our bylaws, in each case, as amended from time to time, or (iv) any action asserting a claimgoverned by the internal affairs doctrine, shall be the Court of Chancery of the State of Delaware, in all cases subject to thecourt’s having personal jurisdiction over the indispensable parties named as defendants. Any person or entity purchasing orotherwise acquiring any interest in shares of our capital stock is deemed to have received notice of and consented to theforegoing provision. This forum selection provision may limit a stockholder’s ability to bring a claim in a judicial forum that itfinds favorable or cost-effective for disputes with us or our directors, officers or other employees, which may discourage suchlawsuits against us and our directors, officers and employees.
22
Item 1B. Unresolved Staff Comments
None.
Item 2. Properties
The following table describes the material facilities we owned or leased as of December 31, 2019:
Location Status Square Feet Uses
Houston, Texas Leased 58,857 Corporate officePort Harcourt, Nigeria Leased 47,333 Contract operations and aftermarket servicesNeuquen, Argentina Owned 43,233 Contract operations and aftermarket servicesReynosa, Mexico Owned 28,912 Contract operations and aftermarket servicesVeracruz, Mexico Leased 25,833 Contract operations and aftermarket servicesSanta Cruz, Bolivia Leased 22,017 Contract operations and aftermarket servicesCamacari, Brazil Owned 86,112 Contract operationsBangkok, Thailand Leased 51,667 Aftermarket servicesHouston, Texas Owned 261,609 Product salesHamriyah Free Zone, UAE Leased 212,742 Product salesBroken Arrow, Oklahoma Owned 145,755 Product salesSingapore, Singapore Leased 111,693 Product sales
Item 3. Legal Proceedings In the ordinary course of business, we are involved in various pending or threatened legal actions. While management is unableto predict the ultimate outcome of these actions, it believes that any ultimate liability arising from any of these actions will nothave a material adverse effect on our financial position, results of operations or cash flows. However, because of the inherentuncertainty of litigation and arbitration proceedings, we cannot provide assurance that the resolution of any particular claim orproceeding to which we are a party will not have a material adverse effect on our financial position, results of operations orcash flows.
Contemporaneously with filing the Form 8-K on April 26, 2016, we self-reported the errors and possible irregularities at BelleliEPC to the SEC. On April 8, 2019, the SEC provided written notice to us stating that based on the information they have as ofthis date, they have concluded their investigation and do not intend to recommend enforcement action against us in connectionwith this matter.
Item 4. Mine Safety Disclosures
Not applicable.

PART II
23
Item 5. Market for Registrant’s Common Equity, Related Stockholder Matters and Issuer Purchases of Equity Securities
Our common stock is listed and traded on the New York Stock Exchange under the stock symbol “EXTN.” As of February 20,2020, there were approximately 950 holders of record of our common stock.
We have not paid, and we do not currently anticipate paying cash dividends on our common stock. Instead, we intend to retainour future earnings to support the growth and development of our business. The declaration of any future cash dividends and, ifdeclared, the amount of any such dividends, will be subject to our financial condition, earnings, capital requirements, financialcovenants, applicable law and other factors our board of directors deems relevant. Therefore, there can be no assurance as towhat level of dividends, if any, will be paid in the future.
For disclosures regarding securities authorized for issuance under our equity compensation plans, see Part III, Item 12(“Security Ownership of Certain Beneficial Owners and Management and Related Stockholder Matters”) of this report.
Comparison of Cumulative Total Return
The performance graph below shows the cumulative total stockholder return on our common stock, compared with the S&P500 Composite Stock Price Index (the “S&P 500 Index”) and the Oilfield Service Index (the “OSX Index”) over the periodfrom November 4, 2015, the first day of trading volume, to December 31, 2019. The results are based on an investment of $100in each of our common stock, the S&P 500 Index and the OSX Index. The graph assumes the reinvestment of dividends andadjusts all closing prices and dividends for stock splits.
Exterran Corporation S&P 500 Index OSX Index
Comparison of Cumulative Total Return
$250
$200
$150
$100
$50
$0
11/04/15 12/31/15 12/31/16 12/31/17 12/31/18 12/31/19
The performance graph shall not be deemed incorporated by reference by any general statement incorporating by referencethis Annual Report on Form 10-K into any filing under the Securities Act of 1933 or the Securities Exchange Act of 1934,except to the extent that we specifically incorporate this information by reference, and shall not otherwise be deemed filedunder those Acts.

Unregistered Sales of Equity Securities and Use of Proceeds
None.
Repurchase of Equity Securities
The following table summarizes our repurchases of equity securities during the three months ended December 31, 2019:
PeriodTotal Number of
Shares Repurchased (1)
AveragePrice PaidPer Unit
Total Number of SharesPurchased as Part ofPublicly Announced
Program
Dollar Value of Shares that may yet to be Purchased
Under thePublicly Announced
Program
October 1, 2019 - October 31, 2019 — $ — — $ 61,061,250November 1, 2019 - November 30, 2019 350,640 8.14 342,021 58,282,207December 1, 2019 - December 31, 2019 99,089 5.61 99,089 57,726,011
Total 449,729 $ 7.58 441,110 $ 57,726,011
(1) Total number of shares repurchased includes 8,619 shares withheld to satisfy employees’ tax withholding obligations inconnection with vesting of restricted stock awards during the period.
Share Repurchase Program
On February 20, 2019, our board of directors approved a share repurchase program, under which the Company is authorized topurchase up to $100.0 million of its outstanding common stock through February 2022. The share repurchase program may beeffected through a variety of methods, including open-market purchases and Rule 10b5-1 trading plans among others. Theamount and timing of any repurchases will depend on general market conditions, among other factors, and may be discontinuedat any time.
24

Item 6. Selected Financial Data
25
The table below presents certain selected historical consolidated and combined financial information as of and for each of theyears in the five-year period ended December 31, 2019. The selected historical consolidated financial data as of December 31,2019 and 2018 and the selected historical consolidated financial data for the years ended December 31, 2019, 2018 and 2017has been derived from our audited Financial Statements included elsewhere in this report. The selected historical consolidatedand combined financial data as of December 31, 2017, 2016 and 2015 and for the years ended December 31, 2016 and 2015has been derived from our financial statements not included in this report.
Our Spin-off from Archrock was completed on November 3, 2015. Selected financial data for periods prior to the Spin-offrepresent the combined results of Archrock’s international services and product sales businesses. The combined financial datamay not be indicative of our future performance and does not necessarily reflect the financial condition and results ofoperations we would have realized had we operated as a separate, stand-alone entity during the periods presented, includingchanges in our operations as a result of our Spin-off from Archrock. The results from continuing operations for all periodspresented exclude the results of our Venezuelan contract operations business, Belleli CPE business (the manufacture of criticalprocess equipment for refinery and petrochemical facilities) and Belleli EPC business (the manufacture of tanks for tank farmsand the manufacture of evaporators and brine heaters for desalination plants). Those results are reflected in discontinuedoperations for all periods presented. The selected financial data presented below should be read together with Management’sDiscussion and Analysis of Financial Condition and Results of Operations and the Financial Statements contained in thisreport.

Years Ended December 31,
(in thousands, except per share data) 2019 2018 2017 2016 2015
Statement of Operations Data:Revenues $ 1,317,440 $ 1,360,856 $ 1,215,294 $ 905,397 $ 1,687,264Cost of sales (excluding depreciation andamortization expense) 954,218 977,428 868,154 596,406 1,189,361Selling, general and administrative 164,314 178,401 176,318 157,485 210,483Depreciation and amortization 162,557 123,922 107,824 132,886 146,318Impairments 74,373 3,858 5,700 14,495 20,788Restatement related charges (recoveries), net 48 (276) 3,419 18,879 —Restructuring and other charges 8,712 1,997 3,189 22,038 31,315Interest expense 38,620 29,217 34,826 34,181 7,272Equity in income of non-consolidated affiliates — — — (10,403) (15,152)Other (income) expense, net (1,829) 6,484 (975) (13,046) 35,516Income (loss) before income taxes (83,573) 39,825 16,839 (47,524) 61,363Provision for income taxes 25,290 39,433 22,695 124,242 39,438Income (loss) from continuing operations (108,863) 392 (5,856) (171,766) 21,925Income (loss) from discontinued operations,net of tax 6,486 24,462 39,736 (56,171) 4,723Net income (loss) (102,377) 24,854 33,880 (227,937) 26,648Income (loss) from continuing operations percommon share: (1)
Basic $ (3.18) $ 0.01 $ (0.17) $ (4.97) $ 0.64Diluted (3.18) 0.01 (0.17) (4.97) 0.64
Weighted average common shares outstandingused in income (loss) from continuingoperations per common share: (1)
Basic 34,283 35,433 34,959 34,568 34,288Diluted 34,283 35,489 34,959 34,568 34,304
Other Financial Data:Total gross margin (2) $ 363,222 $ 383,428 $ 347,140 $ 308,991 $ 497,903EBITDA, as adjusted (2) 200,657 205,498 173,155 155,993 282,031Capital expenditures:
Contract Operations Equipment:Growth (3) $ 163,731 $ 186,240 $ 104,909 $ 53,005 $ 105,169Maintenance (4) 8,753 6,616 15,691 14,440 27,282
Other 20,790 22,252 11,073 6,225 22,893Balance Sheet Data:Cash and cash equivalents $ 16,683 $ 19,300 $ 49,145 $ 35,678 $ 29,032Working capital (5) (6) 109,278 108,746 134,048 177,824 408,488Property, plant and equipment, net 844,410 901,577 822,279 790,922 846,977Total assets (6) 1,418,004 1,567,054 1,460,807 1,374,778 1,788,396Long-term debt (7) 443,587 403,810 368,472 348,970 525,593Total stockholders’ equity (6) (7) 409,538 552,821 554,786 556,771 805,936
(1) For the periods prior to November 3, 2015, the average number of common shares outstanding used to calculate basic anddiluted net income (loss) from continuing operations per common share was based on 34,286,267 shares of our commonstock that were distributed by Archrock in the Spin-off on November 3, 2015.
26

(2) Total gross margin and EBITDA, as adjusted, are non-GAAP financial measures. Total gross margin and EBITDA, asadjusted, are defined, reconciled to income (loss) before income taxes and net income (loss), respectively, and discussedfurther below under “Non-GAAP Financial Measures.”
(3) Growth capital expenditures are made to expand or to replace partially or fully depreciated assets or to expand theoperating capacity or revenue generating capabilities of existing or new assets, whether through construction, acquisitionor modification. The majority of our growth capital expenditures are related to contract operations projects includingacquisition costs of new compressor units and processing and treating equipment and installation costs for projects thatwe add to our contract operations business. In addition, growth capital expenditures can include the upgrading of majorcomponents on an existing compressor unit where the current configuration of the compressor unit is no longer in demandand the compressor unit is not likely to return to an operating status without the capital expenditures. These latterexpenditures substantially modify the operating parameters of the compressor unit such that it can be used in applicationsfor which it previously was not suited.
(4) Maintenance capital expenditures are made to maintain the existing operating capacity of our assets and related cashflows further extending the useful lives of the assets. Maintenance capital expenditures are related to major overhauls ofsignificant components of a compressor unit, such as the engine, compressor and cooler, that return the components to a“like new” condition, but do not modify the applications for which the compressor unit was designed.
(5) Working capital is defined as current assets minus current liabilities.(6) Amounts include balance sheet data for discontinued operations.(7) Pursuant to the separation and distribution agreement with Archrock and certain of our and Archrock’s respective
affiliates, on November 3, 2015, we transferred $532.6 million of net proceeds from borrowings under our credit facilityto Archrock to allow it to repay a portion of its indebtedness in connection with the Spin-off.
27
Non-GAAP Financial Measures
We define gross margin as total revenue less cost of sales (excluding depreciation and amortization expense). We evaluate theperformance of each of our segments based on gross margin. Total gross margin is included as a supplemental disclosurebecause it is a primary measure used by our management to evaluate the results of revenue and cost of sales (excludingdepreciation and amortization expense), which are key components of our operations. We believe gross margin is importantbecause it focuses on the current operating performance of our operations and excludes the impact of the prior historical costsof the assets acquired or constructed that are utilized in those operations, the indirect costs associated with our selling, generaland administrative (“SG&A”) activities, the impact of our financing methods and income taxes. Depreciation and amortizationexpense may not accurately reflect the costs required to maintain and replenish the operational usage of our assets and thereforemay not portray the costs from current operating activity. As an indicator of our operating performance, total gross marginshould not be considered an alternative to, or more meaningful than, income (loss) before income taxes as determined inaccordance with generally accepted accounting principles in the U.S. (“GAAP”). Our gross margin may not be comparable to asimilarly titled measure of another company because other entities may not calculate gross margin in the same manner.
Total gross margin has certain material limitations associated with its use as compared to income (loss) before income taxes.These limitations are primarily due to the exclusion of interest expense, depreciation and amortization expense, SG&Aexpense, impairments and restructuring and other charges. Each of these excluded expenses is material to our statements ofoperations. Because we intend to finance a portion of our operations through borrowings, interest expense is a necessaryelement of our costs and our ability to generate revenue. Additionally, because we use capital assets, depreciation expense is anecessary element of our costs and our ability to generate revenue, and SG&A expenses are necessary to support our operationsand required corporate activities. To compensate for these limitations, management uses total gross margin, a non-GAAPmeasure, as a supplemental measure to other GAAP results to provide a more complete understanding of our performance.

The following table reconciles our net income (loss) before income taxes to total gross margin (in thousands):
Years Ended December 31,2019 2018 2017 2016 2015
Income (loss) before income taxes $ (83,573) $ 39,825 $ 16,839 $ (47,524) $ 61,363Selling, general and administrative 164,314 178,401 176,318 157,485 210,483Depreciation and amortization 162,557 123,922 107,824 132,886 146,318Impairments 74,373 3,858 5,700 14,495 20,788Restatement related charges (recoveries), net 48 (276) 3,419 18,879 —Restructuring and other charges 8,712 1,997 3,189 22,038 31,315Interest expense 38,620 29,217 34,826 34,181 7,272Equity in income of non-consolidated affiliates — — — (10,403) (15,152)Other (income) expense, net (1,829) 6,484 (975) (13,046) 35,516
Total gross margin $ 363,222 $ 383,428 $ 347,140 $ 308,991 $ 497,903
We define EBITDA, as adjusted, as net income (loss) excluding income (loss) from discontinued operations (net of tax),cumulative effect of accounting changes (net of tax), income taxes, interest expense (including debt extinguishment costs),depreciation and amortization expense, impairment charges, restructuring and other charges, non-cash gains or losses fromforeign currency exchange rate changes recorded on intercompany obligations, expensed acquisition costs and other items. Webelieve EBITDA, as adjusted, is an important measure of operating performance because it allows management, investors andothers to evaluate and compare our core operating results from period to period by removing the impact of our capital structure(interest expense from our outstanding debt), asset base (depreciation and amortization), our subsidiaries’ capital structure(non-cash gains or losses from foreign currency exchange rate changes on intercompany obligations), tax consequences,impairment charges, restructuring and other charges, expensed acquisition costs and other items. Management uses EBITDA,as adjusted, as a supplemental measure to review current period operating performance, comparability measures andperformance measures for period to period comparisons. In addition, the compensation committee has used EBITDA, asadjusted, in evaluating the performance of the Company and management and in evaluating certain components of executivecompensation, including performance-based annual incentive programs. Our EBITDA, as adjusted, may not be comparable to asimilarly titled measure of another company because other entities may not calculate EBITDA in the same manner.
EBITDA, as adjusted, is not a measure of financial performance under GAAP and should not be considered in isolation or as analternative to net income (loss), cash flows from operating activities or any other measure determined in accordance withGAAP. Items excluded from EBITDA, as adjusted, are significant and necessary components to the operation of our businessand therefore, EBITDA, as adjusted, should only be used as a supplemental measure of our operating performance.
28

The following table reconciles our net income (loss) to EBITDA, as adjusted (in thousands):
Years Ended December 31,2019 2018 2017 2016 2015
Net income (loss) $ (102,377) $ 24,854 $ 33,880 $ (227,937) $ 26,648(Income) loss from discontinued operations, net of tax (6,486) (24,462) (39,736) 56,171 (4,723)Depreciation and amortization 162,557 123,922 107,824 132,886 146,318Impairments 74,373 3,858 5,700 14,495 20,788Restatement related charges (recoveries), net 48 (276) 3,419 18,879 —Restructuring and other charges 8,712 1,997 3,189 22,038 31,315Investment in non-consolidated affiliates impairment — — — — 33Proceeds from sale of joint venture assets — — — (10,403) (15,185)Interest expense 38,620 29,217 34,826 34,181 7,272(Gain) loss on currency exchange rate remeasurement ofintercompany balances (80) 5,241 (516) (8,559) 30,127Loss on sale of businesses — 1,714 111 — —Penalties from Brazilian tax programs — — 1,763 — —Provision for income taxes 25,290 39,433 22,695 124,242 39,438
EBITDA, as adjusted $ 200,657 $ 205,498 $ 173,155 $ 155,993 $ 282,031
Off-Balance Sheet Arrangements We have no material off-balance sheet arrangements.
29

Item 7. Management’s Discussion and Analysis of Financial Condition and Results of Operations
The following discussion and analysis of our financial condition and results of operations should be read in conjunction withour Financial Statements, the notes thereto, and the other financial information appearing elsewhere in this report. Thefollowing discussion includes forward-looking statements that involve certain risks and uncertainties. See Part I (“DisclosureRegarding Forward-Looking Statements”) and Part I, Item 1A (“Risk Factors”) in this report.
This section of the Form 10-K discusses the results of operations for the year ended December 31, 2019 compared to the yearended December 31, 2018. The results of operations for the year ended December 31, 2018 compared to the year endedDecember 31, 2017 that are not included in this Form 10-K are included in “Management’s Discussion and Analysis ofFinancial Condition and Results of Operations” in Part II, Item 7 of our Annual Report on Form 10-K for the fiscal year endedDecember 31, 2018.
30
Overview
We are a global systems and process company offering solutions in the oil, gas, water and power markets. We are a leader innatural gas processing and treatment and compression products and services providing critical midstream infrastructuresolutions to customers throughout the world. We provide our products and services to a global customer base consisting ofcompanies engaged in all aspects of the oil and natural gas industry, including large integrated oil and natural gas companies,national oil and natural gas companies, independent oil and natural gas producers and oil and natural gas processors, gatherersand pipeline operators. We operate in three primary business lines: contract operations, aftermarket services and product sales.The nature and inherent interactions between and among our business lines provide us with opportunities to cross-sell and offerintegrated product and service solutions to our customers. In our contract operations business line, we provide compression,processing, treating and water treatment services through the operation of our natural gas compression equipment, crude oil andnatural gas production and process equipment and water treatment equipment for our customers. In our aftermarket servicesbusiness line, we sell parts and components and provide operations, maintenance, repair, overhaul, upgrade, startup andcommissioning and reconfiguration services to customers who own their own oil and natural gas compression, production,processing, treating and related equipment. In our product sales business line, we design, engineer, manufacture, install and sellnatural gas compression packages as well as equipment used in the treating and processing of crude oil, natural gas and waterto our customers throughout the world and for use in our contract operations business line. We also offer our customers, oneither a contract operations basis or a sale basis, the engineering, design, project management, procurement and constructionservices necessary to incorporate our products into production, processing and compression facilities, which we refer to asintegrated projects.
Our chief operating decision maker manages business operations, evaluates performance and allocates resources based on theCompany’s three primary business lines, which are also referred to as our segments. In order to more efficiently and effectivelyidentify and serve our customer needs, we classify our worldwide operations into four geographic regions. The North Americaregion is primarily comprised of our operations in Mexico and the U.S. The Latin America region is primarily comprised of ouroperations in Argentina, Bolivia and Brazil. The Middle East and Africa region is primarily comprised of our operations inBahrain, Iraq, Oman, Nigeria and the United Arab Emirates. The Asia Pacific region is primarily comprised of our operations inChina, Indonesia, Thailand and Singapore. Industry Conditions and Trends
Our business environment and corresponding operating results are affected by the level of energy industry spending for theexploration, development and production of oil and natural gas reserves. Spending by oil and natural gas exploration andproduction companies is dependent upon these companies’ forecasts regarding the expected future supply, demand and pricingof oil and natural gas products as well as their estimates of risk-adjusted costs to find, develop and produce reserves. Althoughwe believe our contract operations business, and to a lesser extent our product sales business, is typically less impacted byshort-term commodity prices than certain other energy products and service providers, changes in oil and natural gasexploration and production spending normally result in changes in demand for our products and services.
From a long-term perspective, industry observers anticipate strong continued global demand for hydrocarbons, includingdemand for liquefied natural gas. However, customer cash flows and returns on capital could drive customer investmentpriorities. Industry observers believe shareholders are encouraging management teams of energy companies to focusoperational and compensation strategies on returns and free cash flow generation rather than solely on growth. To accomplishthese strategies, energy companies may need to better prioritize or reduce capital spending, which could impact resourceallocation and production, ultimately constraining the amount of new projects by our customers.

Our Performance Trends and Outlook
Our revenue, earnings and financial position are affected by, among other things, market conditions that impact demand andpricing for natural gas compression, oil and natural gas production and processing and produced water treatment solutionsalong with our customers’ decisions to use our products and services, use our competitors’ products and services or own andoperate the equipment themselves.
We have continued to work toward our strategy to be a company that leverages technology and operational excellence toprovide complete systems and process solutions in energy and industrial applications. Over the past several years, we havemade significant progress in this journey by taking actions to protect our core business, develop important organizationalcapabilities, commercialize new products and services and implement new processes to position Exterran for success. We arefocused on optimizing our portfolio of products and services to better serve our global customers while providing a moreattractive investment option for our investors. As we continue on this path, we are also reviewing options for our U.S.compression fabrication business to be a positive contributor to our strategy. This business has performed well over the pastyear despite difficult market conditions as we worked to maximize margins and returns. We will fully explore our options andwe are committed to supporting our customers, employees and other stakeholders throughout the process.
Historically, oil, natural gas and natural gas liquids and the level of drilling and exploration activity in North America havebeen volatile. The Henry Hub spot price for natural gas was $2.09 per MMBtu at December 31, 2019, which was 36% and 43%lower than prices at December 31, 2018 and 2017, respectively, and the U.S. natural gas liquid composite price was $5.63 perMMBtu for the month of November 2019, which was 12% and 28% lower than prices for the month of December 2018 and forthe month of December 31, 2017, respectively. In addition, the West Texas Intermediate crude oil spot price as of December 31,2019 was 35% and 1% higher than prices at December 31, 2018 and 2017, respectively. Volatility in commodity prices and anindustry trend towards disciplined capital spending and improving returns have caused timing uncertainties in demand recently.These uncertainties have caused delays in the timing of new equipment orders and lower bookings in our product salessegment. Booking activity levels for our product sales segment in North America during the year ended December 31, 2019were $228.6 million, which represents decreases of 75% and 72% compared to the years ended December 31, 2018 and 2017,respectively, and our North America product sales backlog as of December 31, 2019 was $146.1 million, which representsdecreases of 73% and 65% compared to December 31, 2018 and 2017, respectively.
Longer-term fundamentals in our international markets partially depend on international oil and gas infrastructure projects,many of which are based on the longer-term plans of our customers that can be driven by their local market demand and localpricing for natural gas. As a result, we believe our international customers make decisions based on longer-term fundamentalsthat may be less tied to near term commodity prices than our North American customers. Over the long term, we believe thedemand for our products and services in international markets will continue, and we expect to have opportunities to grow ourinternational businesses. Booking activity levels for our manufactured products in international markets during the year endedDecember 31, 2019 were $163.7 million, which represents a decrease of 25% and an increase of 182% compared to the yearsended December 31, 2018 and 2017, respectively, and our international product sales backlog as of December 31, 2019 was$131.9 million, which represents a decrease of 19% and an increase of 232% compared to December 31, 2018 and 2017,respectively.
Aggregate booking activity levels for our product sales segment in North America and international markets during the yearended December 31, 2019 was approximately $392.3 million, which represents decreases of 65% and 56% compared to theyears ended December 31, 2018 and 2017, respectively. Fluctuations in the size and timing of customers’ requests for bidproposals and awards of new contracts tend to create variability in booking activity levels from period to period.
The timing of any change in activity levels by our customers is difficult to predict. As a result, our ability to project theanticipated activity level for our business, and particularly our product sales segment, is limited. Given the volatility of theglobal energy markets and industry capital spending activity levels, we plan to monitor and continue to control our expenselevels necessary to protect our profitability. Additionally, volatility in commodity prices could delay investments by ourcustomers in significant projects, which could result in a material adverse effect on our business, financial condition, results ofoperations and cash flows. Our level of capital spending largely depends on the demand for our contract operations services and the equipment required toprovide such services to our customers. Based on our current backlog of contracts, we currently expect to invest less capital inour contract operations business in 2020 than we did in 2019.
31

A decline in demand for oil and natural gas or prices for those commodities, or instability and rationalization of capital fundingin the global energy markets could cause a reduction in demand for our products and services. We review long-lived assets,including property, plant and equipment and identifiable intangibles that are being amortized, for impairment whenever eventsor changes in circumstances, including the removal of compressor units from our active fleet, indicate that the carrying amountof an asset may not be recoverable.
32
Certain Key Challenges and Uncertainties
Market conditions and competition in the oil and natural gas industry and the risks inherent in international markets continue torepresent key challenges and uncertainties. In addition to these challenges, we believe the following represent some of the keychallenges and uncertainties we will face in the future:
Global Energy Markets and Oil and Natural Gas Pricing. Our results of operations depend upon the level of activity in theglobal energy markets, including oil and natural gas development, production, processing and transportation. Oil and naturalgas prices and the level of drilling and exploration activity can be volatile. If oil and natural gas exploration and developmentactivity and the number of well completions decline due to the reduction in oil and natural gas prices or significant instability inenergy markets, we would anticipate a decrease in demand and pricing for our natural gas compression and oil and natural gasproduction and processing equipment and services. For example, unfavorable market conditions or financial difficultiesexperienced by our customers may result in cancellation of contracts or the delay or abandonment of projects, which couldcause our cash flows generated by our product sales and services to decline and have a material adverse effect on our results ofoperations and financial condition.
Execution on Larger Contract Operations and Product Sales Projects. Some of our projects are significant in size and scope,which can translate into more technically challenging conditions or performance specifications for our products and services.Contracts with our customers generally specify delivery dates, performance criteria and penalties for our failure to perform.Any failure to execute such larger projects in a timely and cost effective manner could have a material adverse effect on ourbusiness, financial condition, results of operations and cash flows.
Personnel, Hiring, Training and Retention. We believe our ability to grow may be challenged by our ability to hire, train andretain qualified personnel. Although we have been able to satisfy our personnel needs thus far, retaining employees in ourindustry continues to be a challenge. Our ability to continue our growth will depend in part on our success in hiring, trainingand retaining these employees.
Summary of Results
Revenue. Revenue during the years ended December 31, 2019, 2018 and 2017 was $1,317.4 million, $1,360.9 million and$1,215.3 million, respectively. The decrease in revenue during the year ended December 31, 2019 compared to the year endedDecember 31, 2018 was due to a revenue decrease in our product sales segment, partially offset by increases in revenue in ouraftermarket services and contract operations segments. The increase in revenue during the year ended December 31, 2018compared to the year ended December 31, 2017 was due to revenue increases in our product sales and aftermarket servicessegments, partially offset by a decrease in revenue in our contract operations segment.
Net income (loss). We generated net loss of $102.4 million during the year ended December 31, 2019 and net income of $24.9million and $33.9 million during the years ended December 31, 2018 and 2017, respectively. The decrease in net income duringthe year ended December 31, 2019 compared to the year ended December 31, 2018 was primarily due to an increase inimpairment charges, an increase in depreciation and amortization expense and a decrease in gross margin for our product salessegments, partially offset by decreases in income taxes and selling, general and administrative (“SG&A”) expense. Net lossduring the year ended December 31, 2019 included income from discontinued operations, net of tax, of $6.5 million and netincome during the year ended December 31, 2018 included income from discontinued operations, net of tax, of $24.5 million.The decrease in net income during the year ended December 31, 2018 compared to the year ended December 31, 2017 wasprimarily due to an increase in income taxes, an increase in depreciation and amortization expense, a decrease in income fromdiscontinued operations, net of tax, and an increase in foreign currency losses of $7.8 million. These activities were partiallyoffset by an increase in gross margin for our product sales segment and a decrease in interest expense. Net income during theyears ended December 31, 2018 and 2017 included income from discontinued operations, net of tax, of $24.5 million and $39.7million, respectively. Income for discontinued operations, net of tax, was positively impacted by installment payments receivedof $19.8 million and $19.7 million associated with our Venezuelan subsidiary’s sale of its previously nationalized assets duringthe years ended December 31, 2018 and 2017, respectively, and recoveries from liquidated damages releases and customerapproved change orders related to Belleli EPC during the year ended December 31, 2017.

EBITDA, as adjusted. Our EBITDA, as adjusted, was $200.7 million, $205.5 million and $173.2 million during the yearsended December 31, 2019, 2018 and 2017, respectively. EBITDA, as adjusted, during the year ended December 31, 2019compared to the year ended December 31, 2018 decreased primarily due to a decrease in gross margin for our product salessegment, partially offset by a decrease in SG&A and increases in gross margin for our aftermarket services and contractoperations segments. EBITDA, as adjusted, during the year ended December 31, 2018 compared to the year endedDecember 31, 2017 increased primarily due to an increase in gross margin for our product sales segment.
EBITDA, as adjusted, is a non-GAAP financial measure. For a reconciliation of EBITDA, as adjusted, to net income (loss), itsmost directly comparable financial measure calculated and presented in accordance with GAAP, please read Part II, Item 6(“Selected Financial Data — Non-GAAP Financial Measures”) of this report.
As discussed in Note 5 to the Financial Statements, the results from continuing operations for all periods presented exclude theresults of our Venezuelan contract operations and Belleli EPC business. Those results are reflected in discontinued operationsfor all periods presented.
Results by Business Segment. The following table summarizes revenue, gross margin and gross margin percentages for each ofour business segments (dollars in thousands):
Years Ended December 31,2019 2018 2017
Revenue:Contract Operations $ 368,126 $ 360,973 $ 375,269Aftermarket Services 129,217 120,676 107,063Product Sales 820,097 879,207 732,962
$ 1,317,440 $ 1,360,856 $ 1,215,294Gross Margin: (1)
Contract Operations $ 239,963 $ 238,835 $ 241,889Aftermarket Services 33,610 31,010 28,842Product Sales 89,649 113,583 76,409
$ 363,222 $ 383,428 $ 347,140Gross Margin Percentage: (2)
Contract Operations 65% 66% 64%Aftermarket Services 26% 26% 27%Product Sales 11% 13% 10%
(1) Gross margin is defined as revenue less cost of sales (excluding depreciation and amortization expense). We evaluate theperformance of each of our segments based on gross margin.
(2) Gross margin percentage is defined as gross margin divided by revenue.
33

Operating Highlights
The following table summarizes the expected timing of revenue recognition from our contract operations backlog (inthousands):
December 31, 2019
Contract Operations Backlog: (1)
2020 $ 268,0822021 232,0572022 181,7592023 152,5032024 118,465Thereafter 299,135
Total contract operations backlog $ 1,252,001
(1) As of December 31, 2019, the total value of our contract operations backlog accounted for as operating leases wasapproximately $185 million, of which $35 million is expected to be recognized in 2020, $45 million is expected to berecognized in 2021, $44 million is expected to be recognized in 2022, $44 million is expected to be recognized in 2023 and$17 million is expected to be recognized in 2024. Contract operations revenues recognized as operating leases for the yearended December 31, 2019 was approximately $54 million.
The following table summarizes our product sales backlog (in thousands):
December 31,
2019 2018 2017
Product Sales Backlog: (1)
Compression equipment $ 160,946 $ 471,827 $ 254,745Processing and treating equipment 69,912 229,258 178,814Production equipment (2) 593 2,438 14,138Other product sales 46,501 2,246 13,349
Total product sales backlog $ 277,952 $ 705,769 $ 461,046
(1) We expect that approximately $266 million of our product sales backlog as of December 31, 2019 will be recognized asrevenue before December 31, 2020.
(2) In June 2018, we completed the sale of our North America production equipment assets (“PEQ assets”), which included$12.0 million in backlog.
34

Results of Operations
The Year Ended December 31, 2019 Compared to the Year Ended December 31, 2018
Contract Operations(dollars in thousands)
Years Ended December 31,2019 2018 Change % change
Revenue $ 368,126 $ 360,973 $ 7,153 2 %Cost of sales (excluding depreciation and amortization expense) 128,163 122,138 6,025 5 %Gross margin $ 239,963 $ 238,835 $ 1,128 — %Gross margin percentage 65% 66% (1)% (2)%
The increase in revenue during the year ended December 31, 2019 compared to the year ended December 31, 2018 wasprimarily due to increases in revenue of $27.7 million and $4.2 million in the Middle East and Africa region and the NorthAmerica region, respectively, partially offset by decreases in revenue of $17.6 million and $7.1 million in the Latin Americaregion and Asia Pacific region, respectively. The revenue increase in the Middle East and Africa region was primarily due to thestart-up of a project that commenced in June 2019 and the start-up of another project that commenced August 2018. Theincrease of revenue in the North America region was primarily due to a renegotiation of a contract in the fourth quarter of 2018that resulted in higher revenue in the current year period. The revenue decrease in the Latin America region was primarilydriven by a decrease of $14.0 million in Argentina largely resulting from projects that terminated operations in 2018 and thecurrent year impact of the devaluation of the Argentine Peso, an $11.6 million decrease in Brazil primarily driven by projectsthat terminated in 2018 and 2019 and the impact of foreign currency exchange rates in Brazil. These revenue decreases in theLatin America region were partially offset by an increase of $8.4 million due to the start-up of a project that was not operatingin the prior year period. The revenue decrease in the Asia Pacific region was primarily driven by a $2.8 million recovery of anearly termination fee in the first quarter of 2018 for a contract that terminated in January 2016 and projects that terminated inthe fourth quarter of 2018. Gross margin and gross margin percentage remained relatively flat during the year endedDecember 31, 2019 compared to the year ended December 31, 2018.
Aftermarket Services(dollars in thousands)
Years Ended December 31,2019 2018 Change % change
Revenue $ 129,217 $ 120,676 $ 8,541 7%Cost of sales (excluding depreciation and amortization expense) 95,607 89,666 5,941 7%Gross margin $ 33,610 $ 31,010 $ 2,600 8%Gross margin percentage 26% 26% —% —%
The increase in revenue during the year ended December 31, 2019 compared to the year ended December 31, 2018 wasprimarily due to increases in installation services and part sales, partially offset by a decrease in operation and maintenanceservices. Gross margin increased during the year ended December 31, 2019 compared to the year ended December 31, 2018primarily due to the revenue increase explained above. Gross margin percentage during the year ended December 31, 2019compared to the year ended December 31, 2018 remained flat.
35

Product Sales(dollars in thousands)
Years Ended December 31,2019 2018 Change % change
Revenue $ 820,097 $ 879,207 $ (59,110) (7)%Cost of sales (excluding depreciation and amortization expense) 730,448 765,624 (35,176) (5)%Gross margin $ 89,649 $ 113,583 $ (23,934) (21)%Gross margin percentage 11% 13% (2)% (15)%
The decrease in revenue during the year ended December 31, 2019 compared to the year ended December 31, 2018 wasprimarily due to decreases in revenue of $158.7 million, $13.7 million and $6.8 million in the North America, Asia Pacific andLatin America regions, partially offset by an increase in revenue of $120.1 million in the Middle East and Africa region. Thedecrease in revenue in the North America region was primarily due to decreases of $213.5 million and $12.5 million inprocessing and treating equipment revenue and production equipment revenue, respectively, partially offset by an increase of$67.3 million in compression equipment revenue. In June 2018, we completed the sale of our PEQ assets. The decrease inrevenue in the Asia Pacific region was primarily due to a decrease of $9.8 million in compression equipment revenue and thedecrease in the Latin America region was primarily due to a decrease of $4.0 million in production equipment. The increase inrevenue in the Middle East and Africa region was primarily due to increases of $102.4 million and $7.8 million in processingand treating equipment revenue and compression equipment revenue, respectively. Gross margin decreased during the yearended December 31, 2019 compared to the year ended December 31, 2018 due to the revenue decrease explained above andhigher expenses on a specific project in the North America region. Gross margin percentage decreased during the year endedDecember 31, 2019 compared to the year ended December 31, 2018 primarily due to the higher expenses discussed above anda shift in product mix in the North America region during the current year period.
Costs and Expenses(dollars in thousands)
Years Ended December 31,2019 2018 Change % change
Selling, general and administrative $ 164,314 $ 178,401 $ (14,087) (8)%Depreciation and amortization 162,557 123,922 38,635 31 %Impairments 74,373 3,858 70,515 1,828 %Restatement related charges (recoveries), net 48 (276) 324 (117)%Restructuring and other charges 8,712 1,997 6,715 336 %Interest expense 38,620 29,217 9,403 32 %Other (income) expense, net (1,829) 6,484 (8,313) (128)%
Selling, general and administrativeSG&A expense decreased during the year ended December 31, 2019 compared to the year ended December 31, 2018 primarilydue to a decrease in compensation and associated costs and a decrease in third-party professional expenses. During the yearsended December 31, 2019 and 2018, SG&A expense as a percentage of revenue was 12% and 13%, respectively.
Depreciation and amortizationDepreciation and amortization expense during the year ended December 31, 2019 compared to the year ended December 31,2018 increased primarily due to an increase in depreciation expense of $22.8 million in the current year period as a result of anamendment to a contract operations contract in the fourth quarter of 2018 that decreased the useful life of certain assets.Additionally, depreciation expense increased by $10.8 million primarily due to additional depreciation on projects that were notoperating in the prior year period.
36

ImpairmentsDuring the year ended December 31, 2019, in an effort to generate cash from idle assets and reduce holding costs, we reviewedthe future deployment of our idle assets used in our contract operations segment for units that were not of the type,configuration, condition, make or model that are cost efficient to maintain and operate. Based on this review, we determinedthat certain idle compressor units and other assets would be retired from future service. The retirement of these units from theactive fleet triggered a review of these assets for impairment. As a result, we recorded a $52.6 million asset impairment toreduce the book value of each unit to its estimated fair value. The fair value of each unit was estimated based on either theexpected net sale proceeds compared to other fleet units we recently sold and/or a review of other units recently offered for saleby third parties, or the estimated component value or scrap value of each compressor unit.
In addition, in connection with our review of options for our U.S. compression sales business within our product sales segment,we reviewed the assets in this business compared to our estimate of future cash flows and recorded a $21.1 million impairmentcharge to adjust the carrying value to our estimate of fair market value.
In the fourth quarter of 2019, we also evaluated other assets for impairment and recorded an impairment of $0.7 million onthese assets.
During the year ended December 31, 2018, we evaluated for impairment idle units that had been previously culled from ourfleet and were available for sale. Based upon that review, we reduced the expected proceeds from disposition for certain units.This resulted in an additional impairment of $2.1 million to reduce the book value of each unit to its estimated fair value duringthe year ended December 31, 2018.
In the fourth quarter of 2017, we classified our PEQ assets primarily related to inventory and property, plant and equipment,net, within our product sales business as assets held for sale in our balance sheets. In June 2018, we completed the sale of ourPEQ assets. During the year ended December 31, 2018, we recorded an impairment of $1.8 million to reduce these assets totheir approximate fair values based on the expected net proceeds. For further details, see Note 13 to the financial statements.
Restatement related chargesAs discussed in Note 14 to the Financial Statements, during the first quarter of 2016, our senior management identified errorsrelating to the application of percentage-of-completion accounting principles to specific Belleli EPC product sales projects.During the years ended December 31, 2019 and 2018, we incurred $0.1 million and $0.9 million, respectively, of external costsassociated with an SEC investigation and remediation activities related to the restatement of our financial statements. Duringthe year ended December 31, 2018, we recorded recoveries from Archrock pursuant to the separation and distributionagreement of $1.2 million for previously incurred restatement related costs.
Restructuring and other chargesThe energy industry’s focus on capital discipline and improving returns has caused delays in the timing of new equipmentorders. As a result, in the second quarter of 2019, we began the consolidation of two of our manufacturing facilities located inHouston, Texas into one facility and announced a cost reduction plan primarily focused on workforce reductions. We incurredrestructuring and other charges associated with these activities of $8.4 million for the year ended December 31, 2019.
In the second quarter of 2018, we initiated a relocation plan in the North America region to better align our contract operationsbusiness with our customers. As a result of this plan, during the years ended December 31, 2019 and 2018, we incurredrestructuring and other charges of $0.3 million and $2.0 million, respectively, primarily related to relocation costs andemployee termination benefits. See Note 15 to the Financial Statements for further discussion of these charges.
Interest expenseThe increase in interest expense during the year ended December 31, 2019 compared to the year ended December 31, 2018 wasprimarily due to a decrease in capitalized interest and a higher average balance of long-term debt. During the years endedDecember 31, 2019 and 2018, the average daily outstanding borrowings of long-term debt were $511.3 million and $428.6million, respectively.
37

Other (income) expense, netThe change in other (income) expense, net, was primarily due to foreign currency losses of $3.8 million and $8.5 millionduring the years ended December 31, 2019 and 2018, respectively. Foreign currency losses included translation gains of $0.3million and translation losses of $5.2 million during the years ended December 31, 2019 and 2018, respectively, related to thecurrency remeasurement of our foreign subsidiaries’ non-functional currency denominated intercompany obligations. Thechange in other (income) expense, net, also included an increase of $1.2 million in gains on sale of property, plant andequipment, a gain of $1.4 million on the sale of a manufacturing facility in the current year period, a loss of $1.7 million on thesale of our PEQ assets in the prior year period and $0.8 million of losses on foreign currency exchange contracts in the currentyear period. For further discussion on the sale of our PEQ assets, see Note 13 to the Financial Statements.
Income Taxes(dollars in thousands)
Years Ended December 31,2019 2018 Change % change
Provision for income taxes $ 25,290 $ 39,433 $ (14,143) (36)%Effective tax rate (30.3)% 99.0% (129.3)% (130.6)%
Our effective tax rate is affected by recurring items, such as tax rates in foreign jurisdictions and the relative amounts of incomewe earn, or losses we incur, in those jurisdictions. It is also affected by discrete items that may occur in any given year but arenot consistent from year to year. Our effective tax rate is also affected by valuation allowances recorded against losscarryforwards in the U.S. and certain other jurisdictions, foreign withholding taxes and changes in foreign currency exchangerates.
For the year ended December 31, 2019:• A $13.8 million increase (16.5% decrease) resulting from negative impacts of foreign currency devaluations primarily
from Argentina.• A $14.0 million increase (16.7% decrease) resulting from the addition of valuation allowances primarily recorded
against U.S. federal net operating losses and certain net operating losses of our foreign subsidiaries.• A $5.5 million increase (6.6% decrease) resulting from foreign withholding taxes primarily against U.S. income, net of
U.S. tax benefits.• A $9.4 million decrease (11.2% increase) resulting from differences in income tax rates for international operations as
compared to U.S. taxes at 21%.
For the year ended December 31, 2018:• A $14.8 million increase (37.3% increase) resulting from negative impacts of foreign currency devaluations primarily
from Argentina.• A $19.0 million decrease (47.6% decrease) resulting from the release of valuation allowances primarily recorded
against U.S. federal net operating losses and certain deferred tax assets of our foreign subsidiaries.• A $14.8 million increase (37.2% increase) resulting from foreign withholding taxes primarily against U.S. income, net
of U.S. tax benefits.• A $9.5 million increase (23.8% increase) related to unrecognized tax benefits recorded in 2018.
Discontinued Operations(dollars in thousands)
Years Ended December 31,2019 2018 Change % change
Income from discontinued operations, net of tax $ 6,486 $ 24,462 $ (17,976) (73)%
Income from discontinued operations, net of tax, includes our Venezuelan subsidiary’s operations that were expropriated inJune 2009 and our Belleli EPC business.
38

Income from discontinued operations, net of tax, during the year ended December 31, 2019 compared to the year endedDecember 31, 2018 decreased primarily due to a $19.9 million decrease in income from our Venezuelan subsidiary. Thedecrease in income from our Venezuelan subsidiary was primarily related to an installment payment, including an annualcharge, of $19.8 million received from PDVSA Gas, S.A. (“PDVSA Gas”) in the prior year period associated with ourVenezuelan subsidiary’s sale of its previously nationalized assets. As of December 31, 2018, we have received all paymentsfrom PDVSA Gas.
For further details on our discontinued operations, see Note 5 to the Financial Statements.
39
Liquidity and Capital Resources
Our unrestricted cash balance was $16.7 million at December 31, 2019 compared to $19.3 million at December 31, 2018.Working capital increased to $109.3 million at December 31, 2019 from $108.7 million at December 31, 2018. The increase inworking capital was primarily due to decreases in contract liabilities and accounts payable, partially offset by decreases inaccounts receivable and contract assets. The decrease in contract liabilities was primarily due to the timing of milestone billingsand overall progression on product sales projects in the Middle East and Africa region and in North America. The decrease inaccounts payable was largely caused by the timing of purchases and payments to suppliers during the current year period. Thedecrease in accounts receivable was primarily due to lower product sales activity in North America and the decrease in contractassets was primarily driven by the timing of milestone billings on product sales projects in North America.
Our cash flows from operating, investing and financing activities, as reflected in the statements of cash flows, are summarizedin the following table (in thousands):
Years Ended December 31,2019 2018
Net cash provided by (used in) continuing operations:Operating activities $ 176,198 $ 153,296Investing activities (174,406) (207,578)Financing activities (6,038) 6,897
Effect of exchange rate changes on cash, cash equivalents and restricted cash (1,058) (3,841)Discontinued operations 2,528 21,013Net change in cash, cash equivalents and restricted cash $ (2,776) $ (30,213)
Operating Activities. The increase in net cash provided by operating activities during the year ended December 31, 2019compared to the year ended December 31, 2018 was primarily attributable to better collections of in-period billings during thecurrent year period and an increase in cash received from upfront billings on contract operations projects, partially offset by adecrease in gross margin in our product sales segment and an increase in income taxes paid in the current year period. Workingcapital cash changes during the year ended December 31, 2019 included a decrease of $50.7 million in accounts receivables, adecrease of $41.1 million in accounts payable and other liabilities and a decrease of $28.4 million in contract assets. Workingcapital cash changes during the year ended December 31, 2018 included an increase of $62.9 million in contract liabilities, anincrease of $59.7 million in inventory and an increase of $34.6 million in contract assets.
Investing Activities. The decrease in net cash used in investing activities during the year ended December 31, 2019 comparedto the year ended December 31, 2018 was primarily attributable to a $21.8 million decrease in capital expenditures and anincrease of $17.1 million in proceeds from the sale of property, plant and equipment.
Financing Activities. The increase in net cash used in financing activities during the year ended December 31, 2019 comparedto the year ended December 31, 2018 was primarily attributable to an increase of $40.4 million in purchases of treasury stock,partially offset by an increase in net borrowings of $4.0 million on our long-term debt and a decrease of $19.2 million in cashtransferred to Archrock pursuant to the separation and distribution agreement. The transfer of cash to Archrock during the yearended December 31, 2018 was required under the separation and distribution agreement upon our receipt of payments fromPDVSA Gas relating to the sale of our previously nationalized assets.
Discontinued Operations. The decrease in net cash provided by discontinued operations during the year ended December 31,2019 compared to year ended December 31, 2018 was primarily attributable to a $19.8 million decrease in proceeds receivedfrom the sale of our Venezuelan subsidiary’s assets to PDVSA Gas.
Capital Requirements. Our contract operations business is capital intensive, requiring significant investment to maintain andupgrade existing operations. Our capital spending is primarily dependent on the demand for our contract operations servicesand the availability of the type of equipment required for us to render those contract operations services to our customers. Ourcapital requirements have consisted primarily of, and we anticipate will continue to consist of, the following:
• growth capital expenditures, which are made to expand or to replace partially or fully depreciated assets or to expandthe operating capacity or revenue generating capabilities of existing or new assets, whether through construction,acquisition or modification; and
• maintenance capital expenditures, which are made to maintain the existing operating capacity of our assets and relatedcash flows further extending the useful lives of the assets.
The majority of our growth capital expenditures are related to installation costs on contract operations services projects andacquisition costs of new compressor units and processing and treating equipment that we add to our contract operations fleet. Inaddition, growth capital expenditures can include the upgrading of major components on an existing compressor unit where thecurrent configuration of the compressor unit is no longer in demand and the compressor unit is not likely to return to anoperating status without the capital expenditures. These latter expenditures substantially modify the operating parameters of thecompressor unit such that it can be used in applications for which it previously was not suited. Maintenance capitalexpenditures are related to major overhauls of significant components of a compressor unit, such as the engine, compressor andcooler, that return the components to a “like new” condition, but do not modify the applications for which the compressor unitwas designed.
Growth capital expenditures were $163.7 million, $186.2 million and $104.9 million during the years ended December 31,2019, 2018 and 2017, respectively. The decrease in growth capital expenditures during the year ended December 31, 2019compared to the year ended December 31, 2018 was primarily due to a decrease in installation expenditures in Oman. Theincrease in growth capital expenditures during the year ended December 31, 2018 compared to the year ended December 31,2017 was primarily due to an increase in installation expenditures on a contract operations services project in Oman and anincrease in compression expenditures on a contract operations services contract in Bolivia during 2018.
Maintenance capital expenditures were $8.8 million, $6.6 million and $15.7 million during the years ended December 31, 2019,2018 and 2017, respectively. The increase in maintenance capital expenditures during the year ended December 31, 2019compared to the year ended December 31, 2018 was primarily driven by increased overhaul activities as a result of delayeddiscretionary spending in 2018. The decrease in maintenance capital expenditures during the year ended December 31, 2018compared to the year ended December 31, 2017 was primarily due to decreased overhaul activities as a result of the delayeddiscretionary spending noted above. We intend to grow our business both organically and through third-party acquisitions. Ifwe are successful in growing our business in the future, we would expect our maintenance capital expenditures to increase overthe long term.
We generally invest funds necessary to manufacture contract operations fleet additions when our idle equipment cannot bereconfigured to economically fulfill a project’s requirements and the new equipment expenditure is expected to generateeconomic returns over its expected useful life that exceeds our targeted return on capital. We currently plan to spendapproximately $80 million to $100 million in capital expenditures during 2020, including (1) approximately $60 million to $70million on contract operations growth capital expenditures and (2) approximately $20 million to $30 million on equipmentmaintenance capital related to our contract operations business and other capital expenditures. Long-Term Debt. We and our wholly owned subsidiary, EESLP, are parties to an amended and restated Credit Agreement (the“Amended Credit Agreement”) consisting of a $700.0 million revolving credit facility expiring in October 2023.
During the years ended December 31, 2019 and 2018, the average daily borrowings of long-term debt were $511.3 million and$428.6 million respectively. The weighted average annual interest rate on outstanding borrowings under our revolving creditfacility at December 31, 2019 and 2018 was 4.6% and 4.3%, respectively. LIBOR and certain other “benchmarks” are thesubject of recent national, international and other regulatory guidance and proposals for reform. In particular, on July 27, 2017,the United Kingdom’s Financial Conduct Authority, which regulates LIBOR, publicly announced that it intends to stoppersuading or compelling banks to submit LIBOR rates after 2021. It is unclear whether, at that time, LIBOR will cease to existor if new methods of calculating LIBOR will be established. Central banks and regulators in a number of major jurisdictions(for example, U.S., United Kingdom, European Union, Switzerland, and Japan) have convened working groups to find andimplement the transition to suitable replacement benchmarks. We are in the beginning stages of creating a program that focuseson identifying, evaluating, and monitoring financial and non-financial risks that may result if LIBOR rates are no longerpublished after 2021.
40

As of December 31, 2019, we had $24.2 million in outstanding letters of credit under our revolving credit facility and, takinginto account guarantees through outstanding letters of credit, we had undrawn capacity of $601.8 million under our revolvingcredit facility. Our Amended Credit Agreement limits our senior secured leverage ratio (as defined in the Amended CreditAgreement) on the last day of the fiscal quarter to no greater than 2.75 to 1.0. As a result of this limitation, $513.3 million ofthe $601.8 million of undrawn capacity under our revolving credit facility was available for additional borrowings as ofDecember 31, 2019.
The Amended Credit Agreement contains various covenants with which we, EESLP and our respective restricted subsidiariesmust comply, including, but not limited to, limitations on the incurrence of indebtedness, investments, liens on assets,repurchasing equity, making distributions, transactions with affiliates, mergers, consolidations, dispositions of assets and otherprovisions customary in similar types of agreements. We are required to maintain, on a consolidated basis, a minimum interestcoverage ratio (as defined in the Amended Credit Agreement) of 2.25 to 1.00; a maximum total leverage ratio (as defined in theAmended Credit Agreement) of 4.50 to 1.00; and a maximum senior secured leverage ratio (as defined in the Amended CreditAgreement) of 2.75 to 1.00. As of December 31, 2019, Exterran Corporation maintained a 6.3 to 1.0 interest coverage ratio, a2.1 to 1.0 total leverage ratio and a 0.3 to 1.0 senior secured leverage ratio. As of December 31, 2019, we were in compliancewith all financial covenants under the Amended Credit Agreement.
In April 2017, our 100% owned subsidiaries EESLP and EES Finance Corp. issued the 2017 Notes, which consists of $375.0million aggregate principal amount of senior unsecured notes. The 2017 Notes are guaranteed by us on a senior unsecuredbasis.
Prior to May 1, 2020, we may redeem all or a portion of the 2017 Notes at a redemption price equal to the sum of (i) theprincipal amount thereof, and (ii) a make-whole premium at the redemption date, plus accrued and unpaid interest, if any, to theredemption date. In addition, we may redeem up to 35% of the aggregate principal amount of the 2017 Notes prior to May 1,2020 with the net proceeds of one or more equity offerings at a redemption price of 108.125% of the principal amount of the2017 Notes, plus any accrued and unpaid interest to the date of redemption, if at least 65% of the aggregate principal amount ofthe 2017 Notes issued under the indenture remains outstanding after such redemption and the redemption occurs within 180days of the date of the closing of such equity offering. On or after May 1, 2020, we may redeem all or a portion of the 2017Notes at redemption prices (expressed as percentages of principal amount) equal to 106.094% for the twelve-month periodbeginning on May 1, 2020, 104.063% for the twelve-month period beginning on May 1, 2021, 102.031% for the twelve-monthperiod beginning on May 1, 2022 and 100.000% for the twelve-month period beginning on May 1, 2023 and at any timethereafter, plus accrued and unpaid interest, if any, to the applicable redemption date of the 2017 Notes.
We may from time to time seek to retire, extend or purchase our outstanding debt through cash purchases and/or exchanges forequity securities, in open market purchases, privately negotiated transactions or otherwise. Such extensions, repurchases orexchanges, if any, will depend on prevailing market conditions, our liquidity requirements, contractual restrictions and otherfactors. The amounts involved may be material.
Historically, we have financed capital expenditures with a combination of net cash provided by operating and financingactivities. Our ability to access the capital markets may be restricted at the time when we would like, or need, to do so, whichcould have an adverse impact on our ability to maintain our operations and to grow. If any of our lenders become unable toperform their obligations under the Amended Credit Agreement, our borrowing capacity under our revolving credit facilitycould be reduced. Inability to borrow additional amounts under our revolving credit facility could limit our ability to fund ourfuture growth and operations. Based on current market conditions, we expect that net cash provided by operating activities andborrowings under our revolving credit facility will be sufficient to finance our operating expenditures, capital expenditures andother contractual cash obligations, including our debt obligations. However, if net cash provided by operating activities andborrowings under our revolving credit facility are not sufficient, we may seek additional debt or equity financing.
Unrestricted Cash. Of our $16.7 million unrestricted cash balance at December 31, 2019, $16.2 million was held by our non-U.S. subsidiaries. In the event of a distribution of earnings to the U.S. in the form of dividends, we may be subject to foreignwithholding taxes. We do not believe that the cash held by our non-U.S. subsidiaries has an adverse impact on our liquiditybecause we expect that the cash we generate in the U.S., the available borrowing capacity under our revolving credit facilityand the repayment of intercompany liabilities from our non-U.S. subsidiaries will be sufficient to fund the cash needs of ourU.S. operations for the foreseeable future.
41

Share Repurchase Program. On February 20, 2019, our board of directors approved a share repurchase program under whichthe Company is authorized to purchase up to $100.0 million of its outstanding common stock through February 2022. Thetiming and method of any repurchases under the program will depend on a variety of factors, including prevailing marketconditions among others. Purchases under the program may be suspended or discontinued at any time and we have noobligation to repurchase any amount of our common shares under the program. Shares of common stock acquired through therepurchase program are held in treasury at cost. During the year ended December 31, 2019, we repurchased 3,495,448 shares ofour common stock for $42.3 million in connection with our share repurchase program. As of December 31, 2019, the remainingauthorized repurchase amount under the share repurchase program was $57.7 million.
Dividends. We do not currently anticipate paying cash dividends on our common stock. We currently intend to retain our futureearnings to support the growth and development of our business. The declaration of any future cash dividends and, if declared,the amount of any such dividends, will be subject to our financial condition, earnings, capital requirements, financialcovenants, applicable law and other factors our board of directors deems relevant.
Contractual Obligations. The following table summarizes our cash contractual obligations as of December 31, 2019 and theeffect such obligations are expected to have on our liquidity and cash flow in future periods (in thousands):
Total 2020 2021-2022 2023-2024 Thereafter
Debt:(1)
Revolving credit facility due October 2023 $ 74,000 $ — $ — $ 74,000 $ —8.125% senior notes due May 2025 (2) 375,000 — — — 375,000Other 237 237 — — —
Total debt 449,237 237 — 74,000 375,000Interest on debt 185,638 35,953 71,906 65,174 12,605Purchase commitments 178,849 171,448 7,401 — —Facilities and other operating leases 51,609 7,154 12,876 9,649 21,930Total contractual obligations $ 865,333 $ 214,792 $ 92,183 $ 148,823 $ 409,535
(1) For more information on our debt, see Note 11 to the Financial Statements.(2) Amounts represent the full face value of the 2017 Notes and do not include unamortized debt financing costs of $5.4
million as of December 31, 2019.
As of December 31, 2019, $23.3 million of unrecognized tax benefits (including discontinued operations) have been recordedas liabilities in accordance with the accounting standard for income taxes related to uncertain tax positions, and we areuncertain as to if or when such amounts may be settled. Related to these unrecognized tax benefits, we have also recorded aliability for potential penalties and interest (including discontinued operations) of $2.3 million.
Indemnifications. In conjunction with, and effective as of the completion of, the Spin-off, we entered into the separation anddistribution agreement with Archrock, which governs, among other things, the treatment between Archrock and us relating tocertain aspects of indemnification, insurance, confidentiality and cooperation. Generally, the separation and distributionagreement provides for cross-indemnities principally designed to place financial responsibility for the obligations and liabilitiesof our business with us and financial responsibility for the obligations and liabilities of Archrock’s business with Archrock.Pursuant to the agreement, we and Archrock will generally release the other party from all claims arising prior to the Spin-offthat relate to the other party’s business, subject to certain exceptions. Additionally, in conjunction with, and effective as of thecompletion of, the Spin-off, we entered into the tax matters agreement with Archrock. Under the tax matters agreement andsubject to certain exceptions, we are generally liable for, and indemnify Archrock against, taxes attributable to our business,and Archrock is generally liable for, and indemnify us against, all taxes attributable to its business. We are generally liable for,and indemnify Archrock against, 50% of certain taxes that are not clearly attributable to our business or Archrock’s business.Any payment made by us to Archrock, or by Archrock to us, is treated by all parties for tax purposes as a nontaxabledistribution or capital contribution, respectively, made immediately prior to the Spin-off.
42
Off-Balance Sheet Arrangements
We have no material off-balance sheet arrangements.
Effects of Inflation
Our revenues and results of operations have not been materially impacted by inflation in the past three fiscal years.
43
Critical Accounting Policies, Practices and Estimates
This discussion and analysis of our financial condition and results of operations is based upon the Financial Statements, whichhave been prepared in accordance with GAAP. The preparation of these financial statements requires us to make estimates andjudgments that affect the reported amounts of assets, liabilities, revenues and expenses, and related disclosure of contingentassets and liabilities. On an ongoing basis, we evaluate our estimates and accounting policies, including those related to baddebt, inventories, accrued demobilization costs, fixed assets, intangible assets, income taxes, revenue recognition,contingencies and litigation. We base our estimates on historical experience and on other assumptions that we believe arereasonable under the circumstances. The results of this process form the basis of our judgments about the carrying values ofassets and liabilities that are not readily apparent from other sources. Actual results may differ from these estimates underdifferent assumptions or conditions, and these differences can be material to our financial condition, results of operations andliquidity. See Note 2 to our Financial Statement for a summary of significant accounting policies.
Allowances and Reserves
We maintain allowances for doubtful accounts for estimated losses resulting from the inability of our customers to makerequired payments. The determination of the collectability of amounts due from our customers requires us to use estimates andmake judgments regarding future events and trends, including monitoring our customers’ payment history and currentcreditworthiness to determine that collectibility is reasonably assured, as well as consideration of the overall business climate inwhich our customers operate. Inherently, these uncertainties require us to make judgments and estimates regarding ourcustomers’ ability to pay amounts due to us in order to determine the appropriate amount of valuation allowances required fordoubtful accounts. We review the adequacy of our allowance for doubtful accounts quarterly. We determine the allowanceneeded based on historical write-off experience and by evaluating significant balances aged greater than 90 days individuallyfor collectibility. Account balances are charged off against the allowance after all means of collection have been exhausted andthe potential for recovery is considered remote. During the years ended December 31, 2019, 2018 and 2017, we recorded baddebt expense of $0.1 million, $0.1 million and $0.9 million, respectively. Our allowance for doubtful accounts wasapproximately 3% and 2% of our gross accounts receivable balance at December 31, 2019 and 2018, respectively.
Inventory is a significant component of current assets and is stated at the lower of cost and net realizable value. This requires usto record provisions and maintain reserves for obsolete and slow moving inventory. To determine these reserve amounts, weregularly review inventory quantities on hand and compare them to historical demand and management estimates of marketconditions and production requirements. These estimates and forecasts inherently include uncertainties and require us to makejudgments regarding potential outcomes. During 2019, 2018 and 2017, we recorded $1.7 million, $0.1 million and $1.3 million,respectively, in inventory write-downs and reserves for inventory which was obsolete or slow moving. Significant orunanticipated changes to our estimates and forecasts could impact the amount and timing of any additional provisions forobsolete or slow moving inventory that may be required. Our reserve for obsolete and slow moving inventory wasapproximately 10% of our gross raw materials inventory balance at December 31, 2019 and 2018.
Accrued Demobilization Costs
The majority of our contract operations services contracts contain contractual requirements for us to perform demobilizationactivities at the end of the contract, with the scope of those activities varying by contract. Demobilization activities typicallyinclude, among other requirements, civil work and the removal of our equipment and installation from the customer’s site.Demobilization activities represent costs to fulfill obligations under our contracts and are not considered distinct within thecontext of our contract operations services contracts. Accrued demobilization costs are recorded, if applicable, at the time webecome contractually obligated to perform these activities, which generally occurs upon our completion of the installation andcommissioning of our equipment at the customer’s site. We record accrued demobilization costs as a liability and an equivalentdemobilization asset as a capitalized fulfillment cost. As of December 31, 2019, we had current and long-term accrueddemobilization costs liability balances of $13.3 million and $30.3 million, respectively. Accrued demobilization costs aresubsequently increased by interest accretion throughout the expected term of the contract. As of December 31, 2019, we hadcapitalized fulfillment costs relating to demobilization assets of $13.9 million. Demobilization assets are amortized on astraight-line basis over the expected term of the contract. Any difference between the actual costs realized for thedemobilization activities and the estimated liability established are recognized in our statement of operations.

Accrued demobilization costs recorded represent the fair value of the estimated cost for future demobilization activities. Theinitial obligation is measured at its estimated fair value using various judgments and assumptions. Fair value is calculated usingan expected present value technique that is based on assumptions of market participants and estimated demobilization costs incurrent period dollars that are inflated to the anticipated demobilization date and then discounted back to the date thedemobilization obligations are expected to be incurred. Changes in assumptions and estimates included within the calculationsof the value of the accrued demobilization costs could result in significantly different results than those identified and recordedin our financial statements. In future periods, we may also make adjustments to accrued demobilization costs as a result of theavailability of new information, contract amendments, technology changes, changes in labor costs and other factors.
Accrued demobilization costs are based on a number of assumptions requiring professional judgment. These include estimatesfor: (1) expected future cash flows related to contractual obligations; (2) anticipated timing of the expected cash flows; (3) ourcredit-adjusted risk free rate that considers our estimated credit rating; (4) the market risk premiums; and (5) relevant inflationfactors. If the expected future cash flows relating to our estimated accrued demobilization costs had been higher or lower by10% in 2019, accrued demobilization costs would have decreased or increased by approximately $3.0 million at December 31,2019. We are unable to predict the type of revisions to these assumptions that will be required in future periods due to theavailability of additional information, contract amendments, technology changes, the price of labor costs and other factors.
Depreciation
Property, plant and equipment is carried at cost. Depreciation for financial reporting purposes is computed on a straight-linebasis using estimated useful lives and salvage values, including idle assets in our active fleet. The assumptions and judgmentswe use in determining the estimated useful lives and salvage values of our property, plant and equipment reflect both historicalexperience and expectations regarding future use of our assets. We periodically analyze our estimates of useful lives of ourproperty, plant and equipment to determine if the depreciable periods and salvage values continue to be appropriate. The use ofdifferent estimates, assumptions and judgments in the establishment of property, plant and equipment accounting policies,especially those involving their useful lives, would likely result in significantly different net book values of our assets andresults of operations.
Long-Lived Assets
We review long-lived assets, including property, plant and equipment and identifiable intangibles that are being amortized, forimpairment whenever events or changes in circumstances, including the removal of compressor units from active service,indicate that the carrying amount of an asset may not be recoverable. Compressor units in our active fleet that were idle as ofDecember 31, 2019 comprise a net book value of approximately $27.7 million. The determination that the carrying amount ofan asset may not be recoverable requires us to make judgments regarding long-term forecasts of future revenue and costsrelated to the assets subject to review. For idle compression units that are removed from the active fleet and that will be sold tothird parties as working compression units, significant assumptions include forecasted sale prices based on future marketconditions and demand, forecasted costs to maintain the assets until sold and the forecasted length of time necessary to sell theassets. These forecasts are uncertain as they require significant assumptions about future market conditions. Significant andunanticipated changes to these assumptions could require a provision for impairment in a future period. Given the nature ofthese evaluations and their application to specific assets and specific times, it is not possible to reasonably quantify the impactof changes in these assumptions. An impairment loss may exist when estimated undiscounted cash flows expected to resultfrom the use of the asset and its eventual disposition are less than its carrying amount. When necessary, an impairment loss isrecognized and represents the excess of the asset’s carrying value as compared to its estimated fair value and is charged to theperiod in which the impairment occurred.
Income Taxes
Our income tax provision, deferred tax assets and liabilities and reserves for unrecognized tax benefits reflect management’sbest assessment of estimated current and future taxes to be paid. We operate in approximately 25 countries and, as a result, weand our subsidiaries file consolidated and separate income tax returns in the U.S. federal jurisdiction and in numerous state andforeign jurisdictions. In addition, certain of our operations were historically included in Archrock’s consolidated income taxreturns in the U.S. federal and state jurisdictions. Our tax provision for periods prior to the Spin-off was determined on aseparate return, stand-alone basis. Differences between the separate return method utilized and Archrock’s U.S. income taxreturns and cash flows attributable to income taxes for our U.S. operations were recognized as distributions to, or contributionsfrom, parent within parent equity. Significant judgments and estimates are required in determining our consolidated income taxprovision.
44

Deferred income taxes arise from temporary differences between the financial statement carrying amounts and the tax basis ofassets and liabilities. In evaluating our ability to recover our deferred tax assets within the jurisdiction from which they arise,we consider all available positive and negative evidence, including scheduled reversals of deferred tax liabilities, projectedfuture taxable income, tax-planning strategies and results of recent operations. In projecting future taxable income, we beginwith historical results adjusted for the results of discontinued operations and changes in accounting policies and incorporateassumptions including the amount of future U.S. federal, state and foreign pretax operating income, the reversal of temporarydifferences and the implementation of feasible and prudent tax-planning strategies. These assumptions require significantjudgment about the forecasts of future taxable income and are consistent with the plans and estimates we are using to managethe underlying businesses. In evaluating the objective evidence that historical results provide, we consider three years ofcumulative operating income (loss).
The accounting standard for income taxes provides that a tax benefit from an uncertain tax position is only recognized when itis more-likely-than-not that the position will be sustained upon examination, including resolutions of any related appeals orlitigation processes, on the basis of the technical merits. In addition, guidance is provided on measurement, derecognition,classification, interest and penalties, accounting in interim periods, disclosure and transition. We adjust reserves forunrecognized tax benefits when our judgment changes as a result of the evaluation of new information not previously available.Because of the complexity of some of these uncertainties, the ultimate resolution may result in a payment that is materiallydifferent from our current estimate of the tax liabilities. These differences will be reflected as increases or decreases to incometax provision in the period in which new information is available.
We consider the earnings of many of our subsidiaries to be indefinitely reinvested, and accordingly, we have not provided fortaxes on the unremitted earnings of these subsidiaries. If we were to make a distribution from the unremitted earnings of thesesubsidiaries, we could be subject to taxes payable to various jurisdictions. If our expectations were to change regarding futuretax consequences, we may be required to record additional deferred taxes that could have a material effect on our consolidatedstatement of financial position, results of operations or cash flows.
Revenue Recognition — Product Sales Recognized Over Time
In our product sales segment, we recognize revenue from the sale of compression equipment and processing and treatingequipment over time based on the proportion of labor hours expended to the total labor hours expected to complete the contractperformance obligation when the applicable criteria are met. During the year ended December 31, 2019, approximately 99% ofour total product sales revenues were recognized over time. This calculation requires management to estimate the number oftotal labor hours required for each project and to estimate the profit expected on the project. The recognition of revenue overtime based on the proportion of labor hours expended to the total labor hours expected to complete depends largely on ourability to make reasonable dependable estimates related to the extent of progress toward completion of the contract, contractrevenues and contract costs. Recognized revenues and profits are subject to revisions as the contract progresses to completion.Revisions in profit estimates are charged to income in the period in which the facts that give rise to the revision become knownusing the cumulative catch-up method. Due to the nature of some of our contracts, developing the estimates of costs oftenrequires significant judgment.
Factors that must be considered in estimating the work to be completed and ultimate profit include labor productivity andavailability, the nature and complexity of work to be performed, the impact of change orders, availability of raw materials andthe impact of delayed performance. Although we continually strive to accurately estimate our progress toward completion andprofitability, adjustments to overall contract revenue and contract costs could be significant in future periods due to severalfactors including but not limited to, settlement of claims against customers, supplier claims by or against us, customer changeorders, changes in cost estimates, changes in project contingencies and settlement of customer claims against us, such asliquidated damage claims. If the aggregate combined cost estimates for uncompleted contracts that are recognized over timebased on the proportion of labor hours expended to the total labor hours expected to complete in our product sales business hadbeen higher or lower by 5% in 2019, our income before income taxes would have decreased or increased by approximately$16.6 million.
45

Contingencies and Litigation
We are substantially self-insured for workers’ compensation, employer’s liability, property, auto liability, general liability andemployee group health claims in view of the relatively high per-incident deductibles we absorb under our insurancearrangements for these risks. Losses up to deductible amounts are estimated and accrued based upon known facts, historicaltrends and industry averages. We review these estimates quarterly and believe such accruals to be adequate. However,insurance liabilities are difficult to estimate due to unknown factors, including the severity of an injury, the determination ofour liability in proportion to other parties, the timeliness of reporting of occurrences, ongoing treatment or loss mitigation,general trends in litigation recovery outcomes and the effectiveness of safety and risk management programs. Therefore, if ouractual experience differs from the assumptions and estimates used for recording the liabilities, adjustments may be required andwould be recorded in the period in which the difference becomes known. As of December 31, 2019 and 2018, we had recordedapproximately $0.9 million and $1.1 million, respectively, in insurance claim reserves.
In the ordinary course of business, we are involved in various pending or threatened legal actions. While we are unable topredict the ultimate outcome of these actions, the accounting standard for contingencies requires management to makejudgments about future events that are inherently uncertain. We are required to record (and have recorded) a loss during anyperiod in which we believe a loss contingency is probable and can be reasonably estimated. In making determinations of likelyoutcomes of pending or threatened legal matters, we consider the evaluation of counsel knowledgeable about each matter.
We regularly assess and, if required, establish accruals for income tax as well as non-income-based tax contingencies pursuantto the applicable accounting standards that could result from assessments of additional tax by taxing jurisdictions in countrieswhere we operate. Tax contingencies are subject to a significant amount of judgment and are reviewed and adjusted on aquarterly basis in light of changing facts and circumstances considering the outcome expected by management. As ofDecember 31, 2019 and 2018, we had recorded approximately $29.1 million and $37.6 million, respectively, of accruals for taxcontingencies (including penalties and interest and discontinued operations). Of these amounts, $25.4 million and $32.5 millionare accrued for income taxes as of December 31, 2019 and 2018, respectively, and $3.7 million and $5.1 million are accrued fornon-income-based taxes as of December 31, 2019 and 2018, respectively. Furthermore, as of December 31, 2019 and 2018, wehad an indemnification receivable from Archrock related to non-income-based taxes of $1.5 million and $2.8 million,respectively. If our actual experience differs from the assumptions and estimates used for recording the liabilities, adjustmentsmay be required and would be recorded in the period in which the difference becomes known.
46
Recent Accounting Pronouncements
See Note 2 to the Financial Statements.
Item 7A. Quantitative and Qualitative Disclosures About Market Risk
We are exposed to market risks associated with changes in foreign currency exchange rates due to our significant internationaloperations. While the majority of our revenue contracts are denominated in the U.S. dollar, certain contracts or portions ofcertain contracts, most notably within our contract operations segment, are exposed to foreign currency fluctuations.Approximately 20% of revenues in our contract operations segment are denominated in a currency other than the U.S. dollar.The currencies for which we have our largest exchange rate exposures are related to changes in the Argentine Peso and theBrazilian Real. During the year ended December 31, 2019, a devaluation of the Argentine Peso and Brazilian Real ofapproximately 37% and 4%, respectively, resulted in a decrease in revenue in our contract operations segment of approximately$5 million and $3 million, respectively. The impact of foreign currency risk on income for these contracts is generally mitigatedby matching costs with revenues in the same currency.

Additionally, the net assets and liabilities of these operations are exposed to changes in foreign currency exchange rates. Theseoperations may have net assets and liabilities not denominated in their functional currency, which exposes us to changes inforeign currency exchange rates that impact income. We recorded foreign currency losses of $3.8 million, $8.5 million and $0.7million in our statements of operations during the years ended December 31, 2019, 2018 and 2017, respectively. Our foreigncurrency losses are primarily due to exchange rate fluctuations related to monetary asset and liability balances denominated incurrencies other than the functional currency, including foreign currency exchange rate changes recorded on intercompanyobligations. Our material exchange rate exposure relates to intercompany loans to subsidiaries whose functional currency is theBrazilian Real or Canadian Dollar, which loans carried U.S. dollars balances of $12.2 million and $23.1 million, respectively,as of December 31, 2019. Foreign currency losses during the years ended December 31, 2019, 2018 and 2017 includedtranslation gains of $0.3 million, translation losses $5.2 million and translation gains of $0.5 million respectively, related to thefunctional currency remeasurement of our foreign subsidiaries’ non-functional currency denominated intercompany obligations.During the year ended December 31, 2019, we entered into forward currency exchange contracts to mitigate exposures in U.S.dollars related to the Argentine Peso, Brazilian Real and Indonesian Rupiah. As a result of entering into these contracts, werecognized losses of $0.8 million during the year ended December 31, 2019. Changes in exchange rates may create gains orlosses in future periods to the extent we maintain net assets and liabilities not denominated in the functional currency.
We also have exposure to foreign currency exchange risk from the translation of certain international operating units from thelocal currency into the U.S. dollar. Our comprehensive income for the years ended December 31, 2019, 2018 and 2017included foreign currency translation adjustment losses of $2.9 million, $7.5 million and $1.8 million, respectively. A 10%increase in the value of the U.S. dollar relative to foreign currencies would have increased our foreign currency translationadjustment loss by approximately $2.0 million for the year ended December 31, 2019. This sensitivity analysis is inherentlylimited as it assumes that rates of multiple foreign currencies will always move in the same direction relative to the value of theU.S. dollar.
As of December 31, 2019, we do not have any derivative financial instruments outstanding to mitigate foreign currency risk. Inthe future, we may utilize derivative instruments to manage the risk of fluctuations in foreign currency exchange rates thatcould potentially impact our future earnings and forecasted cash flows.
47
Item 8. Financial Statements and Supplementary Data
The consolidated financial statements and supplementary information specified by this Item are presented in Part IV, Item 15(“Exhibits and Financial Statement Schedules”) of this report.
Item 9. Changes in and Disagreements with Accountants on Accounting and Financial Disclosure
None.
Item 9A. Controls and Procedures
This Item 9A includes information concerning the controls and controls evaluation referred to in the certifications of our ChiefExecutive Officer (“CEO”) and Chief Financial Officer (“CFO”) required by Rule 13a-14 of the Exchange Act included in thisAnnual Report as Exhibits 31.1 and 31.2.
Management’s Evaluation of Disclosure Controls and Procedures
The CEO and CFO have reviewed and evaluated the effectiveness of the Company’s disclosure controls and procedures (asdefined in Rules 13a-15(e) and 15d-15(e) under the Exchange Act) as of the end of the fiscal year for which this annual reporton Form 10-K is filed. Based on that evaluation, the CEO and CFO have concluded that the disclosure controls and procedureswere effective as of December 31, 2019 to ensure that information required to be disclosed in reports filed or submitted underthe Exchange Act is recorded, processed, summarized and reported within the time periods specified in the SEC rules andforms, and include controls and procedures designed to ensure that information required to be disclosed by the Company insuch reports is accumulated and communicated to management, including the CEO and CFO, as appropriate to allow timelydecisions regarding required disclosures.
Management, including our CEO (principal executive officer) and CFO (principal financial officer), believes the consolidatedfinancial statements included in this Annual Report on Form 10-K fairly represent in all material respects our financialcondition, results of operations and cash flows at and for the periods presented in accordance with U.S. GAAP.

Management’s Annual Report on Internal Control over Financial Reporting
Management, under the supervision of our principal executive officer and principal financial officer, is responsible forestablishing and maintaining adequate internal control over financial reporting (as defined in Rules 13a-15(f) and 15d-15(f)under the Exchange Act). Internal control over financial reporting is designed to provide reasonable assurance regarding thereliability of financial reporting and the preparation of financial statements for external reporting purposes in accordance withGAAP, and includes those policies and procedures that: (i) pertain to the maintenance of records that, in reasonable detail,accurately and fairly reflect the transactions and dispositions of the assets of the Company; (ii) provide reasonable assurancethat transactions are recorded as necessary to permit preparation of financial statements in accordance with GAAP, and thatreceipts and expenditures of the Company are being made only in accordance with authorizations of management and directorsof the Company; and (iii) provide reasonable assurance regarding the prevention or timely detection of unauthorizedacquisition, use or disposition of the Company’s assets that could have a material effect on the financial statements.
Because of its inherent limitations, internal control over financial reporting may not prevent or detect misstatements. Also,projections of any evaluation of effectiveness to future periods are subject to the risk that controls may become inadequatebecause of changes in conditions, or that the degree of compliance with the policies or procedures may deteriorate.
Our management conducted an assessment of the effectiveness of our internal control over financial reporting as ofDecember 31, 2019. This assessment was based on the criteria set forth by the Committee of Sponsoring Organizations of theTreadway Commission in Internal Control-Integrated Framework (2013 framework). Based on this assessment, managementdetermined that our internal control over financial reporting was effective as of December 31, 2019.
Our independent registered public accounting firm has issued a report on the effectiveness of our internal control over financialreporting as of December 31, 2019, which is included on page F-1.
Changes in Internal Control over Financial Reporting
There were no changes in our internal control over financial reporting (as defined in Exchange Act Rules 13a-15(f) and 15d-15(f)) during the fiscal quarter ended December 31, 2019 that materially affected, or are reasonably likely to materially affect, ourinternal control over financial reporting.
48

Item 9B. Other Information
On February 26, 2020, the Company amended and restated its existing severance benefit agreements and change of controlagreements with each of its executive officers. These amendments were intended to harmonize the agreements in line withrecent market and Company practices. Changes to the existing severance benefit agreements and change of control agreementsinclude, among others: (1) increasing the notice period during which the Company may give notice of non-renewal of thechange of control agreements from 90 days to 365 days and reducing the term from 2 years to 1 year, (2) for the officers otherthan the Chief Executive Officer, increasing the notice period during which the Company may give notice of non-renewal ofthe severance benefit agreements from 90 days to 365 days; (3) updating the definition of “cause” to include termination forviolation of the Company’s Code of Business Conduct, (4) for the officers other than the Chief Executive Officer, updating thedefinition of “good reason” to include any requirement to move more than 50 miles from the Company’s primary officelocation, (5) for the officers other than the Chief Executive Officer, in the case of the change of control agreements, requiringthat notice of good reason be given within 90 days following first occurrence or within 12 months of a change of control, (6) inthe case of the Chief Executive Officer, conforming his severance benefit agreement to provide the same medical severancebenefits that other executives receive (i.e., lump sum payment equal to 18 months of COBRA premiums), and reducing hischange of control benefit by deleting his right to 12 months’ of employer retirement plan contributions, (7) clarifying thatunsettled equity will vest pro rata based on the percentage of time elapsed in the grant, with performance awards determined attarget if actual performance results are not determined at the employee’s separation date, (8) clarifying that any severancepayable under each agreement is reduced by any other severance payments, (9) for the officers other than the Chief ExecutiveOfficer, in the case of the change of control agreements, requiring any successor to expressly assume the agreement, and (10)updating and, as applicable, adding non-solicitation and non-competition covenants consistent with market precedent andrecent law.
The description of each of the amended and restated agreements is qualified in its entirety by reference to the amended andrestated forms of agreement, each of which is attached as an exhibit to this report and incorporated by reference.
49
PART III
Item 10. Directors, Executive Officers and Corporate Governance
The information required in Part III, Item 10 of this report is incorporated by reference to the sections entitled “Election ofDirectors,” “Corporate Governance,” “Executive Officers” and “Beneficial Ownership of Common Stock” in our definitiveproxy statement, to be filed with the SEC within 120 days of the end of our fiscal year.
We have adopted a Code of Business Conduct, which is available on our website at http://www.exterran.com under the“Investors — Governance Highlights” section. Any amendments to, or waivers of, the Code of Business Conduct will bedisclosed on our website promptly following the date of such amendment or waiver.
Item 11. Executive Compensation
The information required in Part III, Item 11 of this report is incorporated by reference to the sections entitled “CompensationDiscussion and Analysis” and “Information Regarding Executive Compensation” in our definitive proxy statement, to be filedwith the SEC within 120 days of the end of our fiscal year.
Item 12. Security Ownership of Certain Beneficial Owners and Management and Related Stockholder Matters
See the table below for securities authorized for issuance under our equity compensation plans. Other information required inPart III, Item 12 of this report are incorporated by reference to the section entitled “Beneficial Ownership of Common Stock” inour definitive proxy statement, to be filed with the SEC within 120 days of the end of our fiscal year.

Securities Authorized for Issuance under Equity Compensation Plans
The following table sets forth information as of December 31, 2019, with respect to the Exterran Corporation compensationplans under which our common stock is authorized for issuance, aggregated as follows:
(a)Number of Securities
to be Issued UponExercise of
Outstanding Options,Warrants and Rights
(b)Weighted-AverageExercise Price of
Outstanding Options,Warrants and Rights
(c)Number of Securities
Remaining Available forFuture Issuance Under
Equity Compensation Plans(Excluding Securities
Reflected in Column (a))Plan Category (#) ($) (#)
Equity compensation plans approved bysecurity holders (1) 68,632 $ 25.33 857,514Equity compensation plans not approved bysecurity holders — — —Total 68,632 857,514
(1) Comprised of (i) the Exterran Corporation 2015 Stock Incentive Plan, the (“2015 Plan”) and (ii) the ExterranCorporation 2015 Directors’ Stock and Deferral Plan. The 2015 Plan also governs awards originally granted by Archrockunder the Archrock, Inc. 2013 Stock Incentive Plan. In addition to the outstanding options, as of December 31, 2019,there were 320,229 restricted stock units outstanding, payable in common stock upon vesting, under the 2015 Plan.
50
Item 13. Certain Relationships and Related Transactions and Director Independence
The information required in Part III, Item 13 of this report is incorporated by reference to the sections entitled “CertainRelationships and Related Transactions” and “Corporate Governance” in our definitive proxy statement, to be filed with theSEC within 120 days of the end of our fiscal year.
Item 14. Principal Accounting Fees and Services
The information required in Part III, Item 14 of this report is incorporated by reference to the section entitled “Ratification ofthe Appointment of Independent Registered Public Accounting Firm” in our definitive proxy statement, to be filed with theSEC within 120 days of the end of our fiscal year.

PART IV
51
Item 15. Exhibits and Financial Statement Schedules
(a) Documents filed as a part of this report.
1. Financial Statements. The following financial statements are filed as a part of this report.
Report of Independent Registered Public Accounting Firm F-1Consolidated Balance Sheets F-4Consolidated Statements of Operations F-5Consolidated Statements of Comprehensive Income (Loss) F-6Consolidated Statements of Stockholders’ Equity F-7Consolidated Statements of Cash Flows F-8Notes to Consolidated Financial Statements F-10
2. Financial Statement Schedule
Schedule II — Valuation and Qualifying Accounts S-1
All other schedules have been omitted because they are not required under the relevant instructions.
3. Exhibits
Exhibit No. Description
2.1 Separation and Distribution Agreement, dated as of November 3, 2015, by and among Exterran Holdings, Inc.,Exterran General Holdings LLC, Exterran Energy Solutions, L.P., Exterran Corporation, AROC Corp., EESLP LPLLC, AROC Services GP LLC, AROC Services LP LLC and Archrock Services, L.P., incorporated by referenceto Exhibit 2.1 to the Registrant’s Current Report on Form 8-K filed on November 5, 2015
2.2 First Amendment to Separation and Distribution Agreement, dated as of December 15, 2015, by and amongArchrock, Inc., Exterran General Holdings LLC, Exterran Energy Solutions, L.P., Exterran Corporation, AROCCorp., EESLP LP LLC, AROC Services GP LLC, AROC Services LP LLC and Archrock Services, L.P.,incorporated by reference to Exhibit 2.2 to the Registrant’s Original Annual Report on Form 10-K for the yearended December 31, 2015 filed on February 26, 2016
3.1 Restated Certificate of Incorporation of the Company, incorporated by reference to Exhibit 3.1 to the Registrant’sCurrent Report on From 8-K filed on April 30, 2018
3.2 Amended and Restated Bylaws of Exterran Corporation, incorporated by reference to Exhibit 3.2 to theRegistrant’s Current Report on Form 8-K filed on November 5, 2015
4.1 Indenture, dated as of April 4, 2017, by and among Exterran Energy Solutions, L.P., EES Finance Corp., ExterranCorporation, as parent, the subsidiary guarantors party thereto from time to time, and Wells Fargo Bank, NationalAssociation, as trustee, incorporated by reference to Exhibit 4.1 to the Registrant’s Current Report on Form 8-Kfiled on April 4, 2017
4.2 Description of Securities Registered under Section 12 of the Securities Exchange Act of 193410.1 Tax Matters Agreement, dated as of November 3, 2015, by and between Exterran Holdings, Inc. and Exterran
Corporation, incorporated by reference to Exhibit 10.2 to the Registrant’s Current Report on Form 8-K filed onNovember 5, 2015
10.2 Form of Indemnification Agreement, incorporated by reference to Exhibit 10.5 to the Registrant’s Current Reporton Form 8-K filed on November 5, 2015
10.3 Amended and Restated Credit Agreement, dated as of October 5, 2015, by and among Exterran Holdings, Inc.,Exterran Energy Solutions, L.P., the lenders signatory thereto and Wells Fargo Bank, National Association, asadministrative agent, incorporated by reference to Exhibit 4.2 to Amendment No. 5 to the Company’sRegistration Statement on Form 10-12B, as filed on October 6, 2015
10.4† Exterran Corporation 2015 Stock Incentive Plan, incorporated by reference to Exhibit 99.1 to the Company’sRegistration Statement on Form S-8, as filed on November 2, 2015
10.5† Form of Award Notice and Agreement for Incentive Stock Options pursuant to the 2015 Stock Incentive Plan,incorporated by reference to Exhibit 10.8 to the Registrant’s Current Report on Form 8-K filed on November 5,2015

Exhibit No. Description
10.6† Form of Award Notice and Agreement for Nonqualified Stock Options pursuant to the 2015 Stock Incentive Plan,incorporated by reference to Exhibit 10.9 to the Registrant’s Current Report on Form 8-K filed on November 5,2015
10.7† Form of Award Notice and Agreement for Performance Units pursuant to the 2015 Stock Incentive Plan,incorporated by reference to Exhibit 10.10 to the Registrant’s Current Report on Form 8-K filed on November 5,2015
10.8† Form of Award Notice and Agreement for Restricted Stock pursuant to the 2015 Stock Incentive Plan,incorporated by reference to Exhibit 10.11 to the Registrant’s Current Report on Form 8-K filed on November 5,2015
10.9† Form of Award Notice and Agreement for Cash-Settled Restricted Stock Units pursuant to the 2015 StockIncentive Plan, incorporated by reference to Exhibit 10.12 to the Registrant’s Current Report on Form 8-K filedon November 5, 2015
10.10† Form of Award Notice and Agreement for Stock-Settled Restricted Stock Units pursuant to the 2015 StockIncentive Plan, incorporated by reference to Exhibit 10.13 to the Registrant’s Current Report on Form 8-K filedon November 5, 2015
10.11† Form of Award Notice and Agreement for Common Stock Award for Non-Employee Directors pursuant to the2015 Stock Incentive Plan, incorporated by reference to Exhibit 10.14 to the Registrant’s Current Report onForm 8-K filed on November 5, 2015
10.12† Exterran Corporation Directors’ Stock and Deferral Plan, incorporated by reference to Exhibit 99.2 to theCompany’s Registration Statement on Form S-8, as filed on November 2, 2015
10.13† Form of Employment Letter, incorporated by reference to Exhibit 10.16 to the Registrant’s Current Report onForm 8-K filed on November 5, 2015
10.14† Form of Severance Benefit Agreement, incorporated by reference to Exhibit 10.11 to Amendment No. 4 to theCompany’s Registration Statement on Form 10-12B, as filed on August 5, 2015
10.15† Form of Change of Control Agreement, incorporated by reference to Exhibit 10.10 to Amendment No. 4 to theCompany’s Registration Statement on Form 10-12B, as filed on August 5, 2015
10.16† Exterran Corporation Deferred Compensation Plan, incorporated by reference to Exhibit 10.19 to the Registrant’sCurrent Report on Form 8-K filed on November 5, 2015
10.17† Exterran Corporation Amended and Restated Directors’ Stock and Deferral Plan, incorporated by reference toExhibit 10.20 to the Registrant’s Original Annual Report on Form 10-K for the year ended December 31, 2015filed on February 26, 2016
10.18† First Amendment, Exterran Corporation Deferred Compensation Plan, incorporated by reference to Exhibit 10.3of the Registrant’s Quarterly Report on Form 10-Q for the quarter ended September 30, 2016 filed on January 4,2017
10.19† 2016 Form of Severance Benefit Agreement, incorporated by reference to Exhibit 10.4 of the Registrant’sQuarterly Report on Form 10-Q for the quarter ended September 30, 2016 filed on January 4, 2017
10.20† 2016 Form of Change of Control Agreement, incorporated by reference to Exhibit 10.5 of the Registrant’sQuarterly Report on Form 10-Q for the quarter ended September 30, 2016 filed on January 4, 2017
10.21† Form of Award Notice and Agreement for Performance Units pursuant to the 2015 Stock Incentive Plan,incorporated by reference to Exhibit 10.29 to the Registrant’s Annual Report on Form 10-K for the year endedDecember 31, 2016 filed on March 10, 2017
10.22† Form of Award Notice and Agreement for Restricted Stock pursuant to the 2015 Stock Incentive Plan,incorporated by reference to Exhibit 10.30 to the Registrant’s Annual Report on Form 10-K for the year endedDecember 31, 2016 filed on March 10, 2017
10.23† Form of Award Notice and Agreement for Cash-Settled Restricted Stock Units pursuant to the 2015 StockIncentive Plan, incorporated by reference to Exhibit 10.31 to the Registrant’s Annual Report on Form 10-K forthe year ended December 31, 2016 filed on March 10, 2017
10.24† Form of Award Notice and Agreement for Stock-Settled Restricted Stock Units pursuant to the 2015 StockIncentive Plan, incorporated by reference to Exhibit 10.32 to the Registrant’s Annual Report on Form 10-K forthe year ended December 31, 2016 filed on March 10, 2017
10.25† Form of Award Notice and Agreement for Common Stock Award for Non-Employee Directors pursuant to the2015 Stock Incentive Plan, incorporated by reference to Exhibit 10.33 to the Registrant’s Annual Report onForm 10-K for the year ended December 31, 2016 filed on March 10, 2017
10.26† Form of Award Notice and Agreement for Performance Units pursuant to the 2015 Stock Incentive Plan,incorporated by reference to Exhibit 10.1 to the Registrant’s Quarterly Report on Form 10-Q for the quarterended March 31, 2018 filed on May 3, 2018
52

Exhibit No. Description
10.27† Form of Award Notice and Agreement for Restricted Stock pursuant to the 2015 Stock Incentive Plan,incorporated by reference to Exhibit 10.2 to the Registrant’s Quarterly Report on Form 10-Q for the quarterended March 31, 2018 filed on May 3, 2018
10.28† Form of Award Notice and Agreement for Stock-Settled Restricted Stock Units pursuant to the 2015 StockIncentive Plan, incorporated by reference to Exhibit 10.3 to the Registrant’s Quarterly Report on Form 10-Q forthe quarter ended March 31, 2018 filed on May 3, 2018
10.29† Form of Award Notice and Agreement for Cliff-Vested Restricted Stock pursuant to the 2015 Stock IncentivePlan, incorporated by reference to Exhibit 10.4 to the Registrant’s Quarterly Report on Form 10-Q for the quarterended March 31, 2018 filed on May 3, 2018
10.30 Second Amended and Restated Credit Agreement, dated as of October 9, 2018, by and among ExterranCorporation, Exterran Energy Solutions, L.P., the lenders signatory thereto and Wells Fargo Bank, NationalAssociation, as administrative agent, incorporated by reference to Exhibit 10.1 to the Registrant’s Current Reporton Form 8-K filed on October 9, 2018
10.31† Form of Award Notice and Agreement for Performance Units pursuant to the 2015 Stock Incentive Plan,incorporated by reference to Exhibit 10.1 to the Registrant’s Quarterly Report on Form 10-Q for the quarterended March 31, 2019 filed on May 2, 2019
10.32† Form of Award Notice and Agreement for Time-Vested Restricted Stock pursuant to the 2015 Stock IncentivePlan, incorporated by reference to Exhibit 10.2 to the Registrant’s Quarterly Report on Form 10-Q for the quarterended March 31, 2019 filed on May 2, 2019
10.33† Form of Award Notice and Agreement for Time-Vested Restricted Stock Units pursuant to the 2015 StockIncentive Plan, incorporated by reference to Exhibit 10.3 to the Registrant’s Quarterly Report on Form 10-Q forthe quarter ended March 31, 2019 filed on May 2, 2019
10.34† Form of Award Notice and Agreement for Common Stock Award for Non-Employee Directors pursuant to the2015 Stock Incentive Plan, incorporated by reference to Exhibit 10.4 to the Registrant’s Quarterly Report onForm 10-Q for the quarter ended March 31, 2019 filed on May 2, 2019
10.35†* Form of Amended and Restated Severance Benefit Agreement
10.36†* Form of Amended and Restated Executive Change of Control Agreement
10.37†* Form of Amended and Restated Chief Executive Officer Change of Control Agreement
16.1 Letter from Deloitte & Touche LLP to the Securities and Exchange Commission dated March 4, 2019,incorporated by reference to Exhibit 16.1 to the Registrant’s Current Report on Form 8-K filed on March 5, 2019
21.1* List of Subsidiaries23.1* Consent of PricewaterhouseCoopers LLP23.2* Consent of Deloitte & Touche LLP24.1* Powers of Attorney (included on the signature page to this Report)31.1* Certification of the Principal Executive Officer pursuant to Section 302 of the Sarbanes-Oxley Act of 200231.2* Certification of the Principal Financial Officer pursuant to Section 302 of the Sarbanes-Oxley Act of 200232.1** Certification of the Chief Executive Officer pursuant to 18 U.S.C. Section 1350 as adopted pursuant to
Section 906 of the Sarbanes-Oxley Act of 200232.2** Certification of the Chief Financial Officer pursuant to 18 U.S.C. Section 1350 as adopted pursuant to
Section 906 of the Sarbanes-Oxley Act of 2002101.INS XBRL Instance Document - the instance document does not appear in the Interactive Data File because its XBRL
tags are embedded within the Inline XBRL document.101.SCH XBRL Taxonomy Extension Schema Document.101.CAL XBRL Extension Calculation Linkbase Document.101.DEF XBRL Taxonomy Extension Definition Linkbase Document.101.LAB XBRL Taxonomy Extension Labels Linkbase Document.101.PRE XBRL Taxonomy Extension Presentation Linkbase Document.
104 Cover Page Interactive Data File (formatted as Inline XBRL and contained in Exhibit 101).
53

† Management contract or compensatory plan or arrangement.* Filed herewith.** Furnished, not filed.
54
Item 16. Form 10-K Summary
None.

SIGNATURES
Pursuant to the requirements of Section 13 or 15(d) of the Securities Exchange Act of 1934, the registrant has duly caused thisreport to be signed on its behalf by the undersigned, thereunto duly authorized.
Exterran Corporation
/s/ ANDREW J. WAYName: Andrew J. WayTitle: President and Chief Executive Officer
Date: February 28, 2020
55

POWER OF ATTORNEY
KNOW ALL MEN BY THESE PRESENTS, that each person whose signature appears below constitutes and appoints AndrewJ. Way, David A. Barta and Valerie L. Banner, and each of them, his or her true and lawful attorneys-in-fact and agents, withfull power of substitution and resubstitution for him or her and in his or her name, place and stead, in any and all capacities, tosign any and all amendments to this Report, and to file the same, with all exhibits thereto, and other documents in connectiontherewith, with the Securities and Exchange Commission granting unto said attorneys-in-fact and agents full power andauthority to do and perform each and every act and thing requisite and necessary to be done as fully to all said attorneys-in-factand agents, or any of them, may lawfully do or cause to be done by virtue thereof.
Pursuant to the requirements of the Securities Exchange Act of 1934, this report has been signed below by the followingpersons on behalf of the registrant and in the capacities indicated on February 27, 2020.
Signature Title
/s/ ANDREW J. WAY President and Chief Executive Officer and DirectorAndrew J. Way (Principal Executive Officer)
/s/ DAVID A. BARTA Senior Vice President and Chief Financial OfficerDavid A. Barta (Principal Financial Officer and Principal Accounting Officer)
/s/ WILLIAM M. GOODYEAR DirectorWilliam M. Goodyear
/s/ JOHN P. RYAN DirectorJohn P. Ryan
/s/ CHRISTOPHER T. SEAVER DirectorChristopher T. Seaver
/s/ IEDA GOMES YELL DirectorIeda Gomes Yell
/s/ HATEM SOLIMAN DirectorHatem Soliman
/s/ JAMES C. GOUIN DirectorJames C. Gouin
/s/ MARK R. SOTIR DirectorMark R. Sotir
56

REPORT OF INDEPENDENT REGISTERED PUBLIC ACCOUNTING FIRM
To the Board of Directors and Stockholders of Exterran Corporation
Opinions on the Financial Statements and Internal Control over Financial Reporting
We have audited the accompanying consolidated balance sheet of Exterran Corporation and its subsidiaries (the “Company”) asof December 31, 2019, and the related consolidated statements of operations, comprehensive income (loss), stockholders’equity and cash flows for the year then ended, including the related notes and schedule of valuation and qualifying accounts asof and for the year ended December 31, 2019 appearing on page S-1 (collectively referred to as the “consolidated financialstatements”). We also have audited the Company's internal control over financial reporting as of December 31, 2019, based oncriteria established in Internal Control - Integrated Framework (2013) issued by the Committee of Sponsoring Organizations ofthe Treadway Commission (COSO).
In our opinion, the consolidated financial statements referred to above present fairly, in all material respects, the financialposition of the Company as of December 31, 2019, and the results of its operations and its cash flows for the year then ended inconformity with accounting principles generally accepted in the United States of America. Also in our opinion, the Companymaintained, in all material respects, effective internal control over financial reporting as of December 31, 2019, based oncriteria established in Internal Control - Integrated Framework (2013) issued by the COSO.
Basis for Opinions
The Company's management is responsible for these consolidated financial statements, for maintaining effective internalcontrol over financial reporting, and for its assessment of the effectiveness of internal control over financial reporting, includedin Management’s Annual Report on Internal Control over Financial Reporting appearing under Item 9A. Our responsibility is toexpress opinions on the Company’s consolidated financial statements and on the Company's internal control over financialreporting based on our audit. We are a public accounting firm registered with the Public Company Accounting Oversight Board(United States) (PCAOB) and are required to be independent with respect to the Company in accordance with the U.S. federalsecurities laws and the applicable rules and regulations of the Securities and Exchange Commission and the PCAOB.
We conducted our audit in accordance with the standards of the PCAOB. Those standards require that we plan and perform theaudit to obtain reasonable assurance about whether the consolidated financial statements are free of material misstatement,whether due to error or fraud, and whether effective internal control over financial reporting was maintained in all materialrespects.
Our audit of the consolidated financial statements included performing procedures to assess the risks of material misstatementof the consolidated financial statements, whether due to error or fraud, and performing procedures that respond to those risks.Such procedures included examining, on a test basis, evidence regarding the amounts and disclosures in the consolidatedfinancial statements. Our audit also included evaluating the accounting principles used and significant estimates made bymanagement, as well as evaluating the overall presentation of the consolidated financial statements. Our audit of internalcontrol over financial reporting included obtaining an understanding of internal control over financial reporting, assessing therisk that a material weakness exists, and testing and evaluating the design and operating effectiveness of internal control basedon the assessed risk. Our audit also included performing such other procedures as we considered necessary in thecircumstances. We believe that our audit provides a reasonable basis for our opinions.
Definition and Limitations of Internal Control over Financial Reporting
A company’s internal control over financial reporting is a process designed to provide reasonable assurance regarding thereliability of financial reporting and the preparation of financial statements for external purposes in accordance with generallyaccepted accounting principles. A company’s internal control over financial reporting includes those policies and proceduresthat (i) pertain to the maintenance of records that, in reasonable detail, accurately and fairly reflect the transactions anddispositions of the assets of the company; (ii) provide reasonable assurance that transactions are recorded as necessary topermit preparation of financial statements in accordance with generally accepted accounting principles, and that receipts andexpenditures of the company are being made only in accordance with authorizations of management and directors of thecompany; and (iii) provide reasonable assurance regarding prevention or timely detection of unauthorized acquisition, use, ordisposition of the company’s assets that could have a material effect on the financial statements.
F-1

Because of its inherent limitations, internal control over financial reporting may not prevent or detect misstatements. Also,projections of any evaluation of effectiveness to future periods are subject to the risk that controls may become inadequatebecause of changes in conditions, or that the degree of compliance with the policies or procedures may deteriorate.
/s/ PricewaterhouseCoopers LLP
Houston, TexasFebruary 28, 2020
We have served as the Company’s auditor since 2019.
F-2

REPORT OF INDEPENDENT REGISTERED PUBLIC ACCOUNTING FIRM
To the shareholders and the Board of Directors of Exterran Corporation
Opinion on the Financial Statements
We have audited the accompanying consolidated balance sheet of Exterran Corporation and subsidiaries (the "Company") as ofDecember 31, 2018, the related consolidated statements of operations, comprehensive income (loss), stockholders’ equity, andcash flows, for each of the two years in the period ended December 31, 2018, and the related notes and the schedule listed inthe Index at Item 15 (collectively referred to as the "financial statements"). In our opinion, the financial statements presentfairly, in all material respects, the financial position of the Company as of December 31, 2018, and the results of its operationsand its cash flows for each of the two years in the period ended December 31, 2018, in conformity with accounting principlesgenerally accepted in the United States of America.
Basis for Opinion
These financial statements are the responsibility of the Company's management. Our responsibility is to express an opinion onthe Company's financial statements based on our audits. We are a public accounting firm registered with the Public CompanyAccounting Oversight Board (United States) (PCAOB) and are required to be independent with respect to the Company inaccordance with the U.S. federal securities laws and the applicable rules and regulations of the Securities and ExchangeCommission and the PCAOB.
We conducted our audits in accordance with the standards of the PCAOB. Those standards require that we plan and perform theaudit to obtain reasonable assurance about whether the financial statements are free of material misstatement, whether due toerror or fraud. Our audits included performing procedures to assess the risks of material misstatement of the financialstatements, whether due to error or fraud, and performing procedures that respond to those risks. Such procedures includedexamining, on a test basis, evidence regarding the amounts and disclosures in the financial statements. Our audits also includedevaluating the accounting principles used and significant estimates made by management, as well as evaluating the overallpresentation of the financial statements. We believe that our audits provide a reasonable basis for our opinion.
/s/ DELOITTE & TOUCHE LLP
Houston, TexasFebruary 26, 2019
We began serving as the Company’s auditor in 2014. In 2019, we became the predecessor auditor.
F-3

EXTERRAN CORPORATIONCONSOLIDATED BALANCE SHEETS
(In thousands, except par value and share amounts)
December 31,2019 2018
ASSETS
Current assets:Cash and cash equivalents $ 16,683 $ 19,300Restricted cash 19 178Accounts receivable, net of allowance of $6,019 and $5,474, respectively 202,337 248,467Inventory, net (Note 6) 143,538 150,689Contract assets (Note 3) 46,537 91,602Other current assets 22,477 44,234Current assets associated with discontinued operations (Note 5) 4,332 11,605
Total current assets 435,923 566,075Property, plant and equipment, net (Note 7) 844,410 901,577Operating lease right-of-use assets (Note 4) 26,783 —Deferred income taxes (Note 16) 13,994 11,370Intangible and other assets, net (Note 8) 93,300 86,371Long-term assets held for sale (Note 13) 624 —Long-term assets associated with discontinued operations (Note 5) 2,970 1,661
Total assets $ 1,418,004 $ 1,567,054
LIABILITIES AND STOCKHOLDERS’ EQUITY
Current liabilities:Accounts payable, trade $ 123,444 $ 165,744Accrued liabilities (Note 10) 104,081 123,335Contract liabilities (Note 3) 82,854 153,483Current operating lease liabilities (Note 4) 6,268 —Current liabilities associated with discontinued operations (Note 5) 9,998 14,767
Total current liabilities 326,645 457,329Long-term debt (Note 11) 443,587 403,810Deferred income taxes (Note 16) 993 6,005Long-term contract liabilities (Note 3) 156,262 101,363Long-term operating lease liabilities (Note 4) 30,958 —Other long-term liabilities 49,263 39,812Long-term liabilities associated with discontinued operations (Note 5) 758 5,914
Total liabilities 1,008,466 1,014,233Commitments and contingencies (Note 21)Stockholders’ equity:
Preferred stock, $0.01 par value per share; 50,000,000 shares authorized; zero issued — —Common stock, $0.01 par value per share; 250,000,000 shares authorized;37,508,286 and 36,868,066 shares issued, respectively 375 369Additional paid-in capital 747,622 734,458Accumulated deficit (317,238) (208,677)Treasury stock — 4,467,600 and 721,280 common shares, at cost, respectively (56,567) (11,560)Accumulated other comprehensive income 35,346 38,231
Total stockholders’ equity (Note 17) 409,538 552,821Total liabilities and stockholders’ equity $ 1,418,004 $ 1,567,054
The accompanying notes are an integral part of these consolidated financial statements.
F-4

EXTERRAN CORPORATIONCONSOLIDATED STATEMENTS OF OPERATIONS
(In thousands, except per share amounts)
Years Ended December 31,2019 2018 2017
Revenues (Note 3):Contract operations $ 368,126 $ 360,973 $ 375,269Aftermarket services 129,217 120,676 107,063Product sales 820,097 879,207 732,962
1,317,440 1,360,856 1,215,294Costs and expenses:
Cost of sales (excluding depreciation and amortization expense):Contract operations 128,163 122,138 133,380Aftermarket services 95,607 89,666 78,221Product sales 730,448 765,624 656,553
Selling, general and administrative 164,314 178,401 176,318Depreciation and amortization 162,557 123,922 107,824Impairments (Note 13) 74,373 3,858 5,700Restatement related charges (recoveries), net (Note 14) 48 (276) 3,419Restructuring and other charges (Note 15) 8,712 1,997 3,189Interest expense 38,620 29,217 34,826Other (income) expense, net (1,829) 6,484 (975)
1,401,013 1,321,031 1,198,455Income (loss) before income taxes (83,573) 39,825 16,839Provision for income taxes (Note 16) 25,290 39,433 22,695Income (loss) from continuing operations (108,863) 392 (5,856)Income from discontinued operations, net of tax (Note 5) 6,486 24,462 39,736Net income (loss) $ (102,377) $ 24,854 $ 33,880
Basic net income (loss) per common share (Note 19):Income (loss) from continuing operations per common share $ (3.18) $ 0.01 $ (0.17)Income from discontinued operations per common share 0.19 0.67 1.14Net income (loss) per common share $ (2.99) $ 0.68 $ 0.97
Diluted net income (loss) per common share (Note 19):Income (loss) from continuing operations per common share $ (3.18) $ 0.01 $ (0.17)Income from discontinued operations per common share 0.19 0.67 1.14Net income (loss) per common share $ (2.99) $ 0.68 $ 0.97
Weighted average common shares outstanding used in net income (loss)per common share (Note 19):
Basic 34,283 35,433 34,959Diluted 34,283 35,489 34,959
The accompanying notes are an integral part of these consolidated financial statements.
F-5

EXTERRAN CORPORATIONCONSOLIDATED STATEMENTS OF COMPREHENSIVE INCOME (LOSS)
(In thousands)
Years Ended December 31,2019 2018 2017
Net income (loss) $ (102,377) $ 24,854 $ 33,880Other comprehensive loss:
Foreign currency translation adjustment (2,885) (7,476) (1,801)Comprehensive income (loss) $ (105,262) $ 17,378 $ 32,079
The accompanying notes are an integral part of these consolidated financial statements.
F-6

EXTERRAN CORPORATIONCONSOLIDATED STATEMENTS OF STOCKHOLDERS’ EQUITY
(In thousands, except share data)
Common Stock AdditionalPaid-inCapital
AccumulatedDeficit
Treasury Stock AccumulatedOther
ComprehensiveIncome TotalShares Amount Shares Amount
Balance at January 1, 2017 35,641,113 $ 356 $ 768,304 $ (257,252) (202,430) $ (2,145) $ 47,508 $ 556,771
Cumulative-effect adjustment from adoptionof ASU 2016-09 138 (138) —
Net income 33,880 33,880
Options exercised 69,122 1 683 684
Foreign currency translation adjustment (1,801) (1,801)
Transfer to Archrock, Inc. (Note 17) (44,720) (44,720)
Treasury stock purchased (250,748) (4,792) (4,792)
Stock-based compensation, net of forfeitures 483,695 5 14,759 14,764
Balance at December 31, 2017 36,193,930 $ 362 $ 739,164 $ (223,510) (453,178) $ (6,937) $ 45,707 $ 554,786
Cumulative-effect adjustment from adoptionof ASC 606 (Note 2) (10,021) (10,021)
Net income 24,854 24,854
Options exercised 136,847 1 547 548
Foreign currency translation adjustment (7,476) (7,476)
Transfer to Archrock, Inc. (Note 17) (19,814) (19,814)
Treasury stock purchased (268,102) (4,623) (4,623)
Stock-based compensation, net of forfeitures 537,289 6 14,561 14,567
Balance at December 31, 2018 36,868,066 $ 369 $ 734,458 $ (208,677) (721,280) $ (11,560) $ 38,231 $ 552,821
Cumulative-effect adjustment from adoptionof ASC 842 (Note 2) (6,184) (6,184)
Net loss (102,377) (102,377)
Foreign currency translation adjustment (2,885) (2,885)
Transfer from Archrock, Inc. (Note 17) 420 420
Treasury stock purchased (3,746,320) (45,007) (45,007)
Stock-based compensation, net of forfeitures 640,220 6 12,744 12,750
Balance at December 31, 2019 37,508,286 $ 375 $ 747,622 $ (317,238) (4,467,600) $ (56,567) $ 35,346 $ 409,538
The accompanying notes are an integral part of these consolidated financial statements.
F-7

EXTERRAN CORPORATIONCONSOLIDATED STATEMENTS OF CASH FLOWS
(In thousands)
Years Ended December 31,2019 2018 2017
Cash flows from operating activities:Net income (loss) $ (102,377) $ 24,854 $ 33,880Adjustments to reconcile net income (loss) to cash provided by operating activities:
Depreciation and amortization 162,557 123,922 107,824Impairments 74,373 3,858 5,700Amortization of deferred financing costs 2,512 3,347 4,714Income from discontinued operations, net of tax (6,486) (24,462) (39,736)Provision for doubtful accounts 32 86 863Gain on sale of property, plant and equipment (3,187) (629) (2,517)(Gain) loss on remeasurement of intercompany balances (287) 5,241 (516)Loss on foreign currency derivatives 794 — —Loss on sale of businesses — 1,714 111Stock-based compensation expense 12,750 14,567 14,764Deferred income tax provision (benefit) (10,007) 1,537 (3,193)Changes in assets and liabilities:
Accounts receivable and notes 50,730 8,669 (65,311)Inventory (8,369) (59,676) 20,594Costs and estimated earnings versus billings on uncompleted contracts — — 40,949Contract assets 28,352 (34,571) —Other current assets 20,312 5,045 (1,541)Accounts payable and other liabilities (41,092) 13,801 62,029Deferred revenue — — (13,711)Contract liabilities (8,263) 62,934 —Other 3,854 3,059 (14,483)
Net cash provided by continuing operations 176,198 153,296 150,420Net cash provided by (used in) discontinued operations 2,528 4,004 (1,794)Net cash provided by operating activities 178,726 157,300 148,626
Cash flows from investing activities:Capital expenditures (193,274) (215,108) (131,673)Proceeds from sale of property, plant and equipment 19,662 2,530 8,866Proceeds from sale of businesses — 5,000 894Settlement of foreign currency derivatives (794) — —
Net cash used in continuing operations (174,406) (207,578) (121,913)Net cash provided by discontinued operations — 17,009 19,575Net cash used in investing activities (174,406) (190,569) (102,338)
Cash flows from financing activities:Proceeds from borrowings of debt 642,500 585,014 501,088Repayments of debt (603,951) (550,497) (476,503)Cash transfer from (to) Archrock, Inc. (Note 17) 420 (18,744) (44,720)Payments for debt issuance costs — (4,801) (7,911)Proceeds from stock options exercised — 548 684Purchases of treasury stock (45,007) (4,623) (4,792)
Net cash provided by (used in) financing activities (6,038) 6,897 (32,154)
F-8

The accompanying notes are an integral part of these consolidated financial statements.
Effect of exchange rate changes on cash, cash equivalents and restricted cash (1,058) (3,841) (792)Net increase (decrease) in cash, cash equivalents and restricted cash (2,776) (30,213) 13,342Cash, cash equivalents and restricted cash at beginning of period 19,478 49,691 36,349Cash, cash equivalents and restricted cash at end of period $ 16,702 $ 19,478 $ 49,691
Supplemental disclosure of cash flow information:Income taxes paid, net $ 30,436 $ 11,601 $ 47,403Interest paid, net of capitalized amounts $ 35,891 $ 26,278 $ 28,178
Supplemental disclosure of non-cash transactions:Accrued capital expenditures $ 5,711 $ 21,479 $ 16,735Non-cash proceeds from sale of business $ — $ 14,573 $ —
F-9

EXTERRAN CORPORATION
NOTES TO CONSOLIDATED FINANCIAL STATEMENTS
F-10
Note 1. Description of Business and Basis of Presentation
Description of Business
Exterran Corporation (together with its subsidiaries, “Exterran Corporation,” the “Company,” “our,” “we” or “us”), a Delawarecorporation formed in March 2015, is a global systems and process company offering solutions in the oil, gas, water and powermarkets. We are a leader in natural gas processing and treatment and compression products and services, providing criticalmidstream infrastructure solutions to customers throughout the world. We provide our products and services to a globalcustomer base consisting of companies engaged in all aspects of the oil and natural gas industry, including large integrated oiland natural gas companies, national oil and natural gas companies, independent oil and natural gas producers and oil andnatural gas processors, gatherers and pipeline operators. Our manufacturing facilities are located in the United States ofAmerica (“U.S.”), Singapore and the United Arab Emirates. We operate in three primary business lines: contract operations,aftermarket services and product sales. In our contract operations business line, we provide compression, processing, treatingand water treatment services through the operation of our natural gas compression equipment, crude oil and natural gasproduction and process equipment and water treatment equipment for our customers. In our aftermarket services business line,we sell parts and components and provide operations, maintenance, repair, overhaul, upgrade, startup and commissioning andreconfiguration services to customers who own their own oil and natural gas compression, production, processing, treating andrelated equipment. In our product sales business line, we design, engineer, manufacture, install and sell natural gas compressionpackages as well as equipment used in the treating and processing of crude oil, natural gas and water to our customersthroughout the world and for use in our contract operations business line. We also offer our customers, on either a contractoperations basis or a sale basis, the engineering, design, project management, procurement and construction services necessaryto incorporate our products into production, processing and compression facilities, which we refer to as integrated projects.
On November 3, 2015, Archrock, Inc. (named Exterran Holdings, Inc. prior to November 3, 2015) (“Archrock”) completed thespin-off (the ‘‘Spin-off”) of its international contract operations, international aftermarket services and global fabricationbusinesses into an independent, publicly traded company named Exterran Corporation. Following the completion of the Spin-off, we and Archrock became and continue to be independent, publicly traded companies with separate boards of directors andmanagement.
Basis of Presentation
The accompanying consolidated financial statements of Exterran Corporation included herein have been prepared inaccordance with generally accepted accounting principles in the U.S. (“GAAP”) and the rules and regulations of the Securitiesand Exchange Commission (the “SEC”).
We refer to the consolidated financial statements collectively as “financial statements,” and individually as “balance sheets,”“statements of operations,” “statements of comprehensive income (loss),” “statements of stockholders’ equity” and “statementsof cash flows” herein.
Note 2. Significant Accounting Policies
Use of Estimates in the Financial Statements
The preparation of financial statements in conformity with GAAP requires management to make estimates and assumptionsthat affect the reported amount of assets, liabilities, revenue and expenses, as well as the disclosures of contingent assets andliabilities. Because of the inherent uncertainties in this process, actual future results could differ from those expected at thereporting date. Significant estimates are required for contracts within our product sales segments that are accounted for basedlargely on our estimates on the extent of progress toward completion of the contracts, contract revenues and contract costs. Asof December 31, 2019, we have made these significant estimates on all of our ongoing contracts. However, it is possible thatcurrent estimates could change due to unforeseen events, which could result in adjustments to our estimates. Variations fromestimated contract performance could result in material adjustments to operating results. Management believes that theestimates and assumptions used are reasonable.

Cash and Cash Equivalents
We consider all highly liquid investments purchased with an original maturity of three months or less to be cash equivalents.
Restricted Cash
Restricted cash as of December 31, 2019 and 2018 consists of cash that contractually is not available for immediate use.Restricted cash is presented separately from cash and cash equivalents in our balance sheets.
Revenue Recognition
Revenue is recognized when control of the promised goods or services are transferred to our customers, in an amount thatreflects the consideration that we expect to receive in exchange for those goods or services. See Note 3 for further discussionon revenue recognition.
Concentrations of Credit Risk
Financial instruments that potentially subject us to concentrations of credit risk consist of cash and cash equivalents andaccounts receivable. We believe that the credit risk in temporary cash investments is limited because our cash is held inaccounts with multiple financial institutions. We record trade accounts receivable at the amount we invoice our customers, netof allowance for doubtful accounts. Trade accounts receivable are due from companies of varying sizes engaged principally inoil and natural gas activities throughout the world. We review the financial condition of customers prior to extending credit andgenerally do not obtain collateral for trade receivables. Payment terms are on a short-term basis and in accordance withindustry practice. We consider this credit risk to be limited due to these companies’ financial resources, the nature of productsand services we provide and the terms of our contract operations customer service agreements.
We maintain allowances for doubtful accounts for estimated losses resulting from our customers’ inability to make requiredpayments. The determination of the collectibility of amounts due from our customers requires us to use estimates and makejudgments regarding future events and trends, including monitoring our customers’ payment history and currentcreditworthiness to determine that collectibility is reasonably assured, as well as consideration of the overall business climate inwhich our customers operate. Inherently, these uncertainties require us to make judgments and estimates regarding ourcustomers’ ability to pay amounts due to us in order to determine the appropriate amount of valuation allowances required fordoubtful accounts. We review the adequacy of our allowance for doubtful accounts quarterly. We determine the allowanceneeded based on historical write-off experience and by evaluating significant balances aged greater than 90 days individuallyfor collectibility. Account balances are charged off against the allowance after all means of collection have been exhausted andthe potential for recovery is considered remote. During the years ended December 31, 2019, 2018 and 2017, we recorded baddebt expense of $0.1 million, $0.1 million and $0.9 million, respectively.
Inventory
Inventory consists of parts used for manufacturing or maintenance of natural gas compression equipment, productionequipment, processing and treating equipment and facilities and parts held for sale. Inventory is stated at the lower of cost andnet realizable value using the average cost method. A reserve is recorded against inventory balances for estimated obsolete andslow moving items based on specific identification, historical experience and management estimates of market conditions andproduction requirements.
Property, Plant and Equipment
Property, plant and equipment is recorded at cost and depreciated using the straight-line method over their estimated usefullives as follows:
Compression equipment, processing facilities and other contract operations assets 3 to 23 yearsBuildings 20 to 35 yearsTransportation, shop equipment and other 3 to 10 years
F-11

Installation costs capitalized on contract operations projects are generally depreciated over the life of the underlying contract.Major improvements that extend the useful life of an asset are capitalized. Repairs and maintenance are expensed as incurred.When property, plant and equipment is sold, or otherwise disposed of, the gain or loss is recorded in other (income) expense,net. Interest is capitalized during the construction period on equipment and facilities that are constructed for use in ouroperations. The capitalized interest is included as part of the cost of the asset to which it relates and is amortized over theasset’s estimated useful life.
Computer Software
Certain costs related to the development or purchase of internal-use software are capitalized and amortized over the estimateduseful life of the software, which ranges from three to five years. Costs related to the preliminary project stage and the post-implementation/operation stage of an internal-use computer software development project are expensed as incurred.Capitalized software costs are included in property, plant and equipment, net, in our balance sheets.
Long-Lived Assets
We review long-lived assets such as property, plant and equipment and identifiable intangibles subject to amortization forimpairment whenever events or changes in circumstances, including the removal of compressor units from active service,indicate that the carrying amount of an asset may not be recoverable. An impairment loss may exist when estimatedundiscounted cash flows expected to result from the use of the asset and its eventual disposition are less than its carryingamount. When necessary, the excess of the asset’s carrying value as compared to its estimated fair value is recognized as animpairment in the period in which the impairment occurred. Identifiable intangibles are amortized over the assets’ estimateduseful lives.
Demobilization
The majority of our contract operations services contracts contain contractual requirements for us to perform demobilizationactivities at the end of the contract, with the scope of those activities varying by contract. Demobilization activities typicallyinclude, among other requirements, civil work and the removal of our equipment and installation from the customer’s site.Demobilization activities represent costs to fulfill obligations under our contracts and are not considered distinct within thecontext of our contract operations services contracts. Accrued demobilization costs are recorded, if applicable, at the time webecome contractually obligated to perform these activities, which generally occurs upon our completion of the installation andcommissioning of our equipment at the customer’s site. We record accrued demobilization costs as a liability and an equivalentdemobilization asset as a capitalized fulfillment cost. Accrued demobilization costs are subsequently increased by interestaccretion throughout the expected term of the contract. During the years ended December 31, 2019 and 2018, we recorded $2.2million and $2.6 million, respectively, in accretion expense, which is reflected in depreciation and amortization expense in ourstatements of operations. Demobilization assets are amortized on a straight-line basis over the expected term of the contract.Any difference between the actual costs realized for the demobilization activities and the estimated liability established arerecognized in cost of sales in our statement of operations.
Other (Income) Expense, Net
Other (income) expense, net, is primarily comprised of gains and losses from the remeasurement of our internationalsubsidiaries’ net assets exposed to changes in foreign currency rates, short-term investments and the sale of used assets.
Income Taxes
Our operations are subject to U.S. federal, state and local and foreign income taxes. We and our subsidiaries file consolidatedand separate income tax returns in the U.S. federal jurisdiction and in numerous state and foreign jurisdictions.
We account for income taxes under the asset and liability method, which requires the recognition of deferred tax assets andliabilities for the expected future tax consequences of events included in the financial statements. Under this method, deferredtax assets and liabilities are determined based on the differences between the financial statement carrying amounts and the taxbasis of assets and liabilities using enacted tax rates in effect for the year in which the differences are expected to reverse. Theeffect of a change in tax rates on deferred tax assets and liabilities is recognized in income in the period that includes theenactment date.
F-12

We record net deferred tax assets to the extent we believe these assets will more-likely-than-not be realized. In making such adetermination, we consider all available positive and negative evidence, including future reversals of existing taxabletemporary differences, projected future taxable income, tax-planning strategies and results of recent operations. In the event wewere to determine that we would be able to realize our deferred income tax assets in the future in excess of their net recordedamount, we would make an adjustment to the deferred tax asset valuation allowance, which would reduce the provision forincome taxes.
We record uncertain tax positions in accordance with the accounting standard on income taxes under a two-step processwhereby (1) we determine whether it is more-likely-than-not that the tax positions will be sustained based on the technicalmerits of the position and (2) for those tax positions that meet the more-likely-than-not recognition threshold, we recognize thelargest amount of tax benefit that is greater than 50 percent likely to be realized upon ultimate settlement with the related taxauthority.
Foreign Currency Translation
The financial statements of our subsidiaries outside the U.S., except those for which we have determined that the U.S. dollar isthe functional currency, are measured using the local currency as the functional currency. Assets and liabilities of thesesubsidiaries are translated at the exchange rates in effect at the balance sheet date. Income and expense items are translated ataverage monthly exchange rates. The resulting gains and losses from the translation of accounts into U.S. dollars are includedin accumulated other comprehensive income in our balance sheets. For all subsidiaries, gains and losses from remeasuringforeign currency accounts into the functional currency are included in other (income) expense, net, in our statements ofoperations. We recorded foreign currency losses of $3.8 million, $8.5 million and $0.7 million during the years endedDecember 31, 2019, 2018 and 2017, respectively. Included in our foreign currency losses were non-cash gains of $0.3 million,non-cash losses of $5.2 million and non-cash gains of $0.5 million during the years ended December 31, 2019, 2018 and 2017,respectively, from foreign currency exchange rate changes recorded on intercompany obligations.
During the first quarter of 2019, we entered into forward currency exchange contracts with a total notional value of $26.0million that expired over varying dates through June 28, 2019. We entered into these foreign currency derivatives to mitigateexposures in U.S. dollars related to the Argentine Peso, Brazilian Real and Indonesian Rupiah. We did not designate theseforward currency exchange contracts as hedge transactions. Changes in fair value and gains and losses on settlement on theseforward currency exchange contracts were recognized in other (income) expense, net, in our statements of operations. Duringthe year ended December 31, 2019, we recognized a loss of $0.8 million on forward currency exchange contracts. All of theforward currency exchange contracts that we entered into were settled prior to December 31, 2019.
Recent Accounting Pronouncements
We consider the applicability and impact of all Accounting Standard Updates (“ASUs”). ASUs not listed below were assessedand determined to be not applicable.
Recently Adopted Accounting Pronouncements
In February 2016, the FASB issued ASU 2016-02, Leases (Topic 842) (“ASC 842”). The update requires lessees to recognizeassets and liabilities on the balance sheet for the rights and obligations created by leases. Leases are now classified as eitherfinance or operating, with classification affecting the pattern of expense recognition in the statements of operations. The updatealso requires certain qualitative and quantitative disclosures about the amount, timing and uncertainty of cash flows arisingfrom leases. On January 1, 2019, we adopted the standard using the transition method that allows us to initially apply ASC 842as of January 1, 2019 and recognize a cumulative-effect adjustment to the opening balance of retained earnings in the period ofadoption. Additionally, we elected certain practical expedients permitted by ASC 842 in applying the lease standard uponadoption. Upon implementation of the new lease standard, we did not reassess whether a contract is or contains a lease at thedate of initial application. For contracts entered into before the transition date, we used the lease classification under theaccounting standards in effect prior to adoption. We also excluded initial direct costs for the measurement of the right-of-useasset at the date of initial application. As a result of this adoption, as a lessee, we recorded operating lease assets and leaseliabilities of $21.2 million and $26.5 million, respectively, as of January 1, 2019. The difference between the lease assets andlease liabilities, including prepayments, was recorded as an adjustment to retained earnings. The adoption of this standard didnot have a material effect on our statements of operations and cash flows. See Note 4 for the required disclosures related to theimpact of adopting this standard.
F-13

As a result of the adoption of the new lease guidance, the following adjustments were made to the balance sheet as of January1, 2019 (in thousands):
Impact of Changes in Accounting PoliciesDecember 31, 2018 Adjustments January 1, 2019
ASSETS
Other current assets $ 44,234 $ (506) $ 43,728Operating lease right-of-use assets — 21,181 21,181Intangible and other assets, net 86,371 (353) 86,018
Total assets $ 1,567,054 $ 20,322 $ 1,587,376
LIABILITIES AND STOCKHOLDERS’ EQUITY
Current operating lease liabilities $ — $ 6,769 $ 6,769Long-term operating lease liabilities — 19,737 19,737
Total liabilities 1,014,233 26,506 1,040,739Accumulated deficit (208,677) (6,184) (214,861)
Total stockholders’ equity 552,821 (6,184) 546,637Total liabilities and stockholders’ equity $ 1,567,054 $ 20,322 $ 1,587,376
From a lessor perspective, new customer contracts entered into or modified on or after January 1, 2019 have been assessed inaccordance with ASC 842 and ASU 2014-09, Revenue from Contracts with Customers (Topic 606) (“ASC 606”), as applicableand will be assessed accordingly in future periods. Additionally, for contracts determined to have both a lease component,representing the revenue from the use of the underlying assets, and a nonlease component, representing revenue from providingoperation and maintenance services, we have elected to apply the practical expedient to not separate the components andaccount for those components as a single component, if the applicable conditions are met. Furthermore, for contracts where thenonlease component is determined to be the predominant component, revenue will continue to be recognized in accordancewith ASC 606.
Recently Issued Accounting Pronouncements Not Yet Adopted
In June 2016, the FASB issued ASU 2016-13, Financial Instruments—Credit Losses (Topic 326). The update changes theimpairment model for most financial assets and certain other instruments, including trade and other receivables, held-to-maturity debt securities and loans, and requires entities to use a new forward-looking expected loss model that will result in theearlier recognition of allowance for losses. This update is effective for annual and interim periods beginning after December 15,2019, with early adoption permitted. On January 1, 2020, we will adopt this update using a modified retrospective approach.We do not expect the adoption of this update to be material to our financial statements.
In August 2018, the FASB issued ASU 2018-13, Fair Value Measurement (Topic 820): Disclosure Framework—Changes to theDisclosure Requirements for Fair Value Measurement. The update modifies the disclosure requirements on fair valuemeasurements by removing, modifying and adding certain disclosure requirements. This update is effective for annual andinterim periods beginning after December 15, 2019. Early adoption is permitted for any removed or modified disclosures uponissuance of the guidance and delayed adoption of the additional required disclosures is permitted until the effective date. OnJanuary 1, 2020, we will adopt this update. We do not expect the adoption of this update to be material to our financialstatements.
In December 2019, the FASB issued ASU 2019-12, Income Taxes (Topic 740): Simplifying the Accounting for Income Taxes.The update simplifies the accounting for income taxes and is effective for annual and interim periods beginning after December15, 2020, with early adoption permitted. We are currently evaluating the potential impact of the update on our financialstatements.
F-14

Note 3. Revenue
On January 1, 2018, we adopted ASC 606 applying the modified retrospective method to all contracts that were not completedas of the date of adoption. For contracts that were modified before the effective date, we reflected the aggregate effect of allmodifications when identifying performance obligations and allocating transaction price in accordance with an ASC 606practical expedient. Results for reporting periods beginning after January 1, 2018 are presented under ASC 606, while priorperiod amounts have not been adjusted and continue to be reported under the accounting standards in effect for the prior period.We recorded a net increase to accumulated deficit of $10.0 million as of January 1, 2018 due to the cumulative impact ofadopting ASC 606.
Disaggregation of Revenue
The following tables present disaggregated revenue by product and service lines and by geographical regions for the yearsended December 31, 2019 and 2018 (in thousands):
Year Ended December 31,Revenue by Products and Services 2019 2018
Contract Operations Segment:Contract operations services (1) $ 368,126 $ 360,973
Aftermarket Services Segment:Operation and maintenance services (1) $ 53,944 $ 57,123Part sales (2) 49,721 43,928Other services (1) 25,552 19,625
Total aftermarket services $ 129,217 $ 120,676
Product Sales Segment:Compression equipment (1) $ 539,897 $ 476,480Processing and treating equipment (1) 257,477 368,137Production equipment (2) 2,458 18,932Other product sales (1) (2) 20,265 15,658
Total product sales revenues $ 820,097 $ 879,207
Total revenues $ 1,317,440 $ 1,360,856
(1) Revenue recognized over time.(2) Revenue recognized at a point in time.
Year Ended December 31,Revenue by Geographical Regions 2019 2018
North America $ 705,484 $ 858,934Latin America 246,290 274,414Middle East and Africa 319,866 163,093Asia Pacific 45,800 64,415
Total revenues $ 1,317,440 $ 1,360,856
The North America region is primarily comprised of our operations in Mexico and the U.S. The Latin America region isprimarily comprised of our operations in Argentina, Bolivia and Brazil. The Middle East and Africa region is primarilycomprised of our operations in Bahrain, Iraq, Oman, Nigeria and the United Arab Emirates. The Asia Pacific region is primarilycomprised of our operations in China, Indonesia, Thailand and Singapore.
F-15

Revenue is recognized when control of the promised goods or services are transferred to our customers, in an amount thatreflects the consideration that we expect to receive in exchange for those goods or services. The following is a description ofprincipal activities from which we generate revenue.
Contract Operations Segment
In our contract operations business, we provide compression and processing and treating services through the operation of ournatural gas compression equipment and crude oil and natural gas production and process equipment for our customers. Inaddition to these services, we also offer water treatment and power solutions to our customers on a stand-alone basis orintegrated into our natural gas compression or crude oil production and processing solutions. Our services include the provisionof personnel, equipment, tools, materials and supplies to meet our customers’ natural gas compression, oil and natural gasproduction and processing service needs and water treatment service needs. Activities we may perform in meeting ourcustomers’ needs include engineering, designing, sourcing, constructing, installing, operating, servicing, repairing, maintainingand demobilizing equipment owned by us necessary to provide these services. Contract operations services represent a series ofdistinct monthly services that are substantially the same, with the same pattern of transfer to the customer. Because ourcustomers benefit equally throughout the service period and our efforts in providing contract operations services are incurredrelatively evenly over the period of performance, revenue is recognized over time using a time based measure as we provideour services to the customer. Our contracts generally require customers to pay a monthly service fee, which may containvariable consideration such as production or volume based fees, guaranteed run rates, performance bonuses or penalties,liquidated damages and standby fees. Variable considerations included in our contracts are typically resolved on a monthlybasis, and as such, variable considerations included in our contracts are generally allocated to each distinct month in the serieswithin the contract. In addition, our contracts may include billings prior to or after the performance of our contract operationsservices that are not considered distinct within the context of our contracts, such as mobilization and demobilization revenue.Consideration that does not relate to a distinct good or service are allocated to the contract operations services performanceobligation and recognized as revenue on a straight-line basis over the contract term.
We generally enter into contracts with our contract operations customers with initial terms ranging between three to 12 years. Inmany instances, we are able to renew those contracts prior to the expiration of the initial term and in other instances, we maysell the underlying assets to our customers pursuant to purchase options or negotiated sale agreements. As of December 31,2019, we had contract operations services contracts with unsatisfied performance obligations (commonly referred to asbacklog) extending through the year 2029. The total aggregate transaction price allocated to the unsatisfied performanceobligations as of December 31, 2019 was approximately $1.3 billion, of which approximately $268 million is expected to berecognized in 2020, $232 million is expected to be recognized in 2021, $182 million is expected to be recognized in 2022, $153million is expected to be recognized in 2023 and $118 million is expected to be recognized in 2024. These amounts do notinclude anticipated contract renewals. Additionally, contracts that currently contain month-to-month terms are represented inour backlog as one month of unsatisfied performance obligations. Our contracts are subject to cancellation or modification atthe election of the customer; however, due to the level of capital deployed by our customers on underlying projects, we havenot been materially adversely affected by contract cancellations or modifications in the past.
If the primary component of our contract operations contracts is the lease component, the contracts are accounted for asoperating leases. For these contracts, revenues are recognized on a straight-line basis. As of December 31, 2019, the total valueof our contract operations backlog accounted for as operating leases was approximately $185 million, of which $35 million isexpected to be recognized in 2020, $45 million is expected to be recognized in 2021, $44 million is expected to be recognizedin 2022, $44 million is expected to be recognized in 2023 and $17 million is expected to be recognized in 2024. Contractoperations revenues recognized as operating leases for the year ended December 31, 2019 was approximately $54 million.
Aftermarket Services Segment
In our aftermarket services business, we sell parts and components and provide operations, maintenance, repair, overhaul,upgrade, startup and commissioning and reconfiguration services to customers who own their own oil and natural gascompression, production, processing, treating and related equipment. Our services range from routine maintenance services andparts sales done on a transactional basis to the full operation and maintenance of customer-owned equipment under long-termagreements.
F-16

Operations and maintenance services: Operation and maintenance services include personnel to run the equipment andmonitor the outputs of the equipment, along with performing preventative or scheduled maintenance on customer-ownedequipment. Operation and maintenance services represent a series of distinct monthly services that are substantially the same,with the same pattern of transfer to the customer. Because our customers benefit equally throughout the service period and ourefforts in providing operation and maintenance services are incurred relatively evenly over the period of performance, revenueis recognized over time using a time based measure as we provide our services to the customer. Our contracts generally requirecustomers to pay a monthly service fee, which may contain variable consideration such as production or volume based fees andperformance bonuses or penalties. Variable considerations included in our contracts are typically resolved on a monthly basis,and as such, variable considerations included in our contracts are generally allocated to each distinct month in the series withinthe contract. We generally enter into contracts with our operation and maintenance customers with initial terms rangingbetween one to four years, and in some cases, in excess of five years. In many instances, we are able to renew those contractsprior to the expiration of the initial term.
Parts sales: We offer our customers a full range of parts needed for the maintenance, repair and overhaul of oil and natural gasequipment, including natural gas compressors, industrial engines and production and processing equipment. We recognizerevenue from parts sales at a point in time following the transfer of control of such parts to the customer, which typically occursupon shipment or delivery depending on the terms of the underlying contract. Our contracts require customers to pay a fixedfee upon shipment or delivery of the parts.
Other services: Within our aftermarket services segment we also provide a wide variety of other services such as overhaul,commissioning, upgrade and reconfiguration services on customer-owned equipment. Overhaul services provided to customersare intended to return the major components to a “like new” condition without significantly modifying the applications forwhich the units were designed. Commissioning services that we provide to our customers generally include supervision and theintroduction of fluids or gases into the systems to test vibrations, pressures and temperatures to ensure that customer-ownedequipment is operating properly and is ready for start-up. Upgrade and reconfiguration services modify the operatingparameters of customer-owned equipment such that the equipment can be used in applications for which it previously was notsuited. Generally, the wide array of other services provided within the aftermarket services segment are expected to becompleted within a six month period. Individually these services are generally distinct within the context of the contract and arenot highly interdependent or interrelated with other service offerings. We recognize revenue from these services over timebased on the proportion of labor hours expended to the total labor hours expected to complete the contract performanceobligation. Our contracts generally require customers to pay a service fee that is either fixed or on a time and materials basis,which may include progress billings.
Our aftermarket services contracts are subject to cancellation or modification at the election of the customer.
Product Sales Segment
In our product sales segment, we design, engineer, manufacture, install and sell natural gas compression packages as well asequipment used in the treating and processing of crude oil, natural gas and water primarily to major and independent oil andnatural gas producers as well as national oil and natural gas companies around the world.
Compression equipment: We design, engineer, manufacture and sell skid-mounted natural gas compression equipment to meetstandard or unique customer specifications. We recognize revenue from the sale of compression equipment over time based onthe proportion of labor hours expended to the total labor hours expected to complete the contract performance obligation.Compression equipment manufactured for our customers are specifically designed and engineered to our customers’specification and do not have an alternative use to us. Our contracts include a fixed fee and require our customers to makeprogress payments based on completion of contractual milestones during the life cycle of the manufacturing process. Ourcontracts provide us with an enforceable right to payment for work performed to date. Components of variable considerationsexist in certain of our contracts and may include unpriced change orders, liquidated damages and performance bonuses orpenalties. Typically, we expect the manufacturing of our compressor equipment to be completed within a three to 12 monthperiod.
F-17
Processing and treating equipment: Processing and treating equipment sold to our customers consists of custom-engineeredprocessing and treating plants, such as refrigeration, amine, cryogenic and natural gas processing plants. The manufacturing ofprocessing and treating equipment generally represents a single performance obligation within the context of the contract. Werecognize revenue from the sale of processing and treating equipment over time based on the proportion of labor hoursexpended to the total labor hours expected to complete the contract performance obligation. Processing and treating equipmentmanufactured for our customers are specifically designed and engineered to our customers’ specification and do not have analternative use to us. Our contracts include a fixed fee and require our customers to make progress payments based on ourcompletion of contractual milestones during the life cycle of the manufacturing process. Our contracts provide us with anenforceable right to payment for work performed to date. Components of variable considerations exist in certain of ourcontracts and may include unpriced change orders, liquidated damages and performance bonuses or penalties. Typically, weexpect the manufacturing of our processing and treating equipment to be completed within a six to 24 month period.
Production equipment: In June 2018, we completed the sale of our North America production equipment assets (“PEQassets”), which included $12.0 million in unsatisfied performance obligations. See Note 13 for further details on the sale of ourPEQ assets. In North America, we previously manufactured standard production equipment used for processing wellheadproduction from onshore or shallow-water offshore platform production. The manufacturing of production equipment generallyrepresented a single performance obligation within the context of the contract. We recognized revenue from the sale ofproduction equipment at a point in time following the transfer of control of the equipment to the customer, which typicallyoccurred upon completion of the manufactured equipment, depending on the terms of the underlying contract. Our contractsgenerally required customers to pay a fixed fee upon completion.
Other product sales: Within our product sales segment we also provide for the sale of standard and custom water treatmentequipment and floating production storage and offloading equipment and supervisor site work services. We recognize revenuefrom the sale of standard water treatment equipment at a point in time following the transfer of control of such equipment to thecustomer, which typically occurs upon shipment or delivery depending on the terms of the underlying contract. We recognizerevenue from the sale of custom water treatment equipment over time based on the proportion of costs expended to the totalcosts expected to complete the contract performance obligation. We recognize revenue from the sale of floating productionstorage and offloading equipment and supervisor site work services over time based on the proportion of labor costs expendedto the total labor costs expected to complete the contract performance obligation.
Product sales contracts that include engineering, design, project management, procurement, construction and installationservices necessary to incorporate our products into production, processing and compression facilities are treated as a singleperformance obligation due to the services that significantly integrate each piece of equipment into the combined outputcontracted by the customer.
We provide assurance-type warranties on certain equipment in our product sales contracts. These warranties generally do notconstitute a separate performance obligation. Product warranty reserves are established in the same period that revenue fromthe sale of the related products is recognized, or in the period that a specific issue arises as to the functionality of a product. Thedetermination of such reserves requires that we make estimates of expected costs to repair or to replace the products underwarranty. The amounts of the reserves are based on established terms and our best estimate of the amounts necessary to settlefuture and existing claims on product sales as of the balance sheet date. If actual repair and replacement costs differsignificantly from estimates, adjustments to recognize additional cost of sales may be required in future periods.
As of December 31, 2019, the total aggregate transaction price allocated to the unsatisfied performance obligations for productsales contracts was approximately $278 million, of which approximately $266 million is expected to be recognized in 2020 andapproximately $12 million is expected to be recognized in 2021. Our contracts are subject to cancellation or modification at theelection of the customer; however, due to our enforceable right to payment for work performed, we have not been materiallyadversely affected by contract cancellations or modifications in the past.
Significant Estimates
The recognition of revenue over time based on the proportion of labor hours expended to the total labor hours expected tocomplete depends largely on our ability to make reasonable dependable estimates related to the extent of progress towardcompletion of the contract, contract revenues and contract costs. Recognized revenues and profits are subject to revisions as thecontract progresses to completion. Revisions in profit estimates are charged to income in the period in which the facts that giverise to the revision become known using the cumulative catch-up method. Due to the nature of some of our contracts,developing the estimates of costs often requires significant judgment. To calculate the proportion of labor hours expended tothe total labor hours expected to complete the contract performance obligation, management uses significant judgment toestimate the number of total hours and profit expected for each project.
F-18

Variable Consideration
The nature of our contracts gives rise to several types of variable consideration. We estimate variable consideration at the mostlikely amount to which we expect to be entitled. We include estimated amounts in the transaction price to the extent it isprobable that a significant reversal of cumulative revenue recognized will not occur when the uncertainty associated with thevariable consideration is resolved. Additionally, we include in our contract estimates additional revenue for unapproved changeorders or claims against customers when we believe we have an enforceable right to the modification or claim, the amount canbe estimated reliably and its realization is probable. Our estimates of variable consideration and determination of whether toinclude estimated amounts in the transaction price are based largely on an assessment of our anticipated performance andhistorical, current and forecasted information that is reasonably available to us.
Contracts with Multiple Performance Obligations
Some of our contracts have multiple performance obligations. For instance, some of our product sales contracts includecommissioning services or the supply of spare parts. For contracts with multiple performance obligations, we allocate thecontract’s transaction price to each performance obligation using our best estimate of the standalone selling price of eachdistinct good or service in the contract. The primary method used to estimate standalone selling price is the expected cost plus amargin approach, under which we forecast our expected costs of satisfying a performance obligation and then add anappropriate margin for that distinct good or service.
Contract Assets and Contract Liabilities
The following table provides information about accounts receivables, net, contract assets and contract liabilities from contractswith customers (in thousands):
December 31,2019 2018
Accounts receivables, net $ 202,337 $ 248,467Contract assets and contract liabilities:
Current contract assets 46,537 91,602Long-term contract assets 16,280 5,430Current contract liabilities 82,854 153,483Long-term contract liabilities 156,262 101,363
Accounts receivables are recorded when the right to consideration becomes unconditional. Our contract assets include amountsrelated to revenue that has been recognized in advance of billing the customer. The contract assets in our balance sheets includecosts and estimated earnings in excess of billings and unbilled receivables. When we receive consideration, or suchconsideration is unconditionally due from a customer prior to transferring goods or services to the customer under the terms ofthe contract, we record a contract liability. Our contract liabilities include payments received in advance of performance underthe contract. The contract liabilities in our balance sheets include billings in excess of costs and estimated earnings and deferredrevenue. Billings in excess of costs and estimated earnings primarily relate to billings that have not been recognized as revenueon product sales jobs where the transfer of control to the customer occurs over time. Deferred revenue is primarily comprisedof upfront billings on contract operations jobs and billings related to product sales jobs that have not begun where revenue isrecognized over time. Upfront payments received from customers on contract operations jobs are generally deferred andamortized over the contract term as we perform our services and the customer receives and consumes the benefits of theservices we provide. Contract assets and liabilities are reported in our balance sheets on a net contract asset or liability positionon a contract-by-contract basis at the end of each reporting period.
During the year ended December 31, 2019, revenue recognized from contract operations services included $25.0 million ofrevenue deferred in previous periods. Revenue recognized during the year ended December 31, 2019 from product salesperformance obligations partially satisfied in previous periods was $544.1 million, of which $104.1 million was included inbillings in excess of costs at the beginning of the period. The decreases in current contract assets and current contract liabilitiesduring the year ended December 31, 2019 were primarily driven by the progression of product sales projects and the timing ofmilestone billings in the Middle East and Africa region and in the North America region. The increase in long-term contractliabilities during the year ended December 31, 2019 was primarily driven by advanced billings to contract operations customersin the Latin America region.
F-19

Costs to Fulfill a Contract
We capitalize costs incurred to fulfill our revenue contracts that (i) relate directly to the contract (ii) are expected to generateresources that will be used to satisfy the performance obligation under the contract and (iii) are expected to be recoveredthrough revenue generated under the contract. As of December 31, 2019 and 2018, we had capitalized fulfillment costs of $13.9million and $6.6 million, respectively, related to contractual obligations incurred at the completion of the commissioning phaseand prior to providing services on contracts within our contract operations segment. Contract fulfillment costs are expensed tocost of sales as we satisfy our performance obligations by transferring contract operations services to the customer. Capitalizedfulfillment costs are included in intangible and other assets, net, in the balance sheets.
Costs to Obtain a Contract
We recognize an asset for the incremental costs of obtaining a contract with a customer if we expect the benefit of those coststo be longer than one year. We have determined that certain commissions paid to internal sales representatives and third partyagents meet the requirements to be capitalized. The amount capitalized for incremental costs to obtain contracts as ofDecember 31, 2019 and 2018 was $4.9 million and $6.7 million, respectively. The judgments made in determining the amountof costs incurred include whether the commissions are in fact incremental and would not have occurred absent the customercontract. Capitalized costs to obtain a contract are included in intangible and other assets, net, in the balance sheets and areamortized to selling, general and administrative expense over the expected period of benefit in a manner that is consistent withthe transfer of the related goods or services to which the asset relates. During the years ended December 31, 2019 and 2018, werecorded amortization expense for capitalized costs to obtain a contract of $0.9 million and $1.4 million, respectively.
Practical Expedients and Exemptions
We have elected the following practical expedients:
• We do not adjust the promised amount of consideration for the effects of a significant financing component when weexpect, at contract inception, that the period between our transfer of a promised product or service to a customer andwhen the customer pays for that product or service will be one year or less.
• We treat shipping and handling activities that occur after the transfer of control as costs to fulfill a contract rather thana separate performance obligation.
• We record taxes assessed by a governmental authority that are both imposed on and concurrent with a specificrevenue-producing transaction and collected by us from our customers on a net basis, and thus, such taxes areexcluded from the measurement of a performance obligation’s transaction price.
• We expense sales commissions as incurred when we expect that the amortization period of such costs will be one yearor less.
F-20
Note 4. Leases
As discussed in Note 2, on January 1, 2019, we adopted ASC 842 retrospectively through a cumulative-effect adjustment aspermitted under the specific transitional provisions in ASC 842. Results for reporting periods beginning after January 1, 2019are presented under ASC 842, while prior period amounts have not been adjusted and continue to be reported under theaccounting standards in effect for the prior period.
We primarily lease various offices, warehouses, equipment and vehicles. A right-of-use asset represents our right to use anunderlying asset for the lease term and a lease liability represents our obligation to make lease payments arising from the lease.Our operating lease right-of-use assets and lease liabilities are recognized at the present value of lease payments over the leaseterm at the time of lease commencement, adjusted to include the impact of any lease incentives. Leases with initial terms of 12months or less are not recorded on our balance sheets and leases that contain non-lease components are combined with thelease components and accounted for as a single lease component.

Our lease agreements are negotiated on an individual basis and contain a variety of different terms and conditions. Theygenerally do not contain any material residual value guarantees or material restrictive covenants. Certain lease agreementsinclude rental payments adjusted periodically for inflation. Additionally, some of our leases include one or more options torenew, with renewal terms that can extend the lease term from one month to 10 years. Options to renew our lease terms areincluded in determining the right-of-use asset and lease liability when it is reasonably certain that we will exercise that option.Lease expense is recognized on a straight-line basis over the lease term. During the year ended December 31, 2019, werecorded expenses of $9.0 million for our operating leases, of which $1.0 million of expenses related to operating leases withinitial terms of 12 months or less. We do not have any material leases, individually or in the aggregate, classified as a financeleasing arrangement.
As most of our leases do not provide an implicit rate, we use our incremental borrowing rate based on the information availableat the lease commencement date in determining the present value of lease payments. We used the incremental borrowing rateon January 1, 2019 for operating leases that commenced prior to that date. As of December 31, 2019, the weighted averageremaining lease term and weighted average discount rate applied for our operating leases were nine years and 7%, respectively.
As of December 31, 2019, our lease assets and lease liabilities consisted of the following (in thousands):
Leases Classification December 31, 2019
AssetsOperating lease assets Operating lease right-of-use assets $ 26,783
LiabilitiesOperating - current Current operating lease liabilities $ 6,268Operating - noncurrent Long-term operating lease liabilities 30,958
Total lease liabilities $ 37,226
As of December 31, 2019, maturities of our operating lease liabilities consisted of the following (in thousands):
Maturity of Operating Lease Liabilities December 31, 2019
2020 $ 7,1542021 6,9452022 5,9312023 5,1472024 4,502
Thereafter 21,930Total lease payments 51,609Less: Imputed interest (14,383)Present value of lease liabilities $ 37,226
As of December 31, 2018, commitments for future minimum rental payments with terms in excess of one year were as follows(in thousands):
Future Minimum Rental Payments December 31, 2018
2019 $ 6,0762020 5,9292021 4,5832022 3,7562023 3,038
Thereafter 11,615Total lease payments $ 34,997
F-21

The following table provides supplemental cash flow information related to leases for the year ended December 31, 2019 (inthousands):
Cash Flow Information ClassificationYear Ended
December 31, 2019
Cash paid for amounts included in the measurement of leaseliabilities
Net cash provided by operatingactivities $ 2,134
Leased assets obtained in exchange for new operating lease liabilities Non-cash 12,507
F-22
Note 5. Discontinued Operations
In June 2009, Petroleos de Venezuela S.A. (“PDVSA”) commenced taking possession of our assets and operations in a numberof our locations in Venezuela, and by the end of the second quarter of 2009, PDVSA had assumed control over substantially allof our assets and operations in Venezuela. In March 2010, our Spanish subsidiary filed a request for the institution of anarbitration proceeding against Venezuela with the International Centre for Settlement of Investment Disputes (“ICSID”) relatedto the seized assets and investments under the agreement between Spain and Venezuela for the Reciprocal Promotion andProtection of Investments and under Venezuelan law. The arbitration hearing occurred in July 2012.
In August 2012, our Venezuelan subsidiary sold its previously nationalized assets to PDVSA Gas, S.A. (“PDVSA Gas”) for apurchase price of approximately $441.7 million. We received an initial payment of $176.7 million in cash at closing, of whichwe remitted $50.0 million to repay the amount we collected in January 2010 under the terms of an insurance policy wemaintained for the risk of expropriation. We received installment payments, including an annual charge, totaling $19.8 millionand $19.7 million during the years ended December 31, 2018 and 2017, respectively. As of December 31, 2019, we havereceived all payments from PDVSA Gas. We recognized payments received as income from discontinued operations in theperiods such payments were received. The proceeds from the sale of the assets were not subject to Venezuelan national taxesdue to an exemption allowed under the Venezuelan Reserve Law applicable to expropriation settlements.
In accordance with the separation and distribution agreement from the Spin-off, a subsidiary of Archrock has the right toreceive payments from our wholly owned subsidiary, Exterran Energy Solutions, L.P. (“EESLP”), based on a notional amountcorresponding to payments received by our subsidiaries from PDVSA Gas in respect of the sale of our previously nationalizedassets promptly after such amounts are collected by our subsidiaries. Pursuant to the separation and distribution agreement, wetransferred cash of $18.7 million and $19.7 million to Archrock during the years ended December 31, 2018 and 2017,respectively. The transfers of cash were recognized as reductions to additional paid-in capital in our financial statements.
In the first quarter of 2016, we began executing the exit of our Belleli EPC business that has historically been comprised ofengineering, procurement and construction for the manufacture of tanks for tank farms and the manufacture of evaporators andbrine heaters for desalination plants in the Middle East (referred to as “Belleli EPC” or the “Belleli EPC business” herein) byceasing the bookings of new orders. As of the fourth quarter of 2017, we had substantially exited our Belleli EPC business and,in accordance with GAAP, it is reflected as discontinued operations in our financial statements for all periods presented.Although we have reached mechanical completion on all remaining Belleli EPC contracts, we are still subject to risks anduncertainties potentially resulting from warranty obligations, customer or suppliers claims against us, settlement of claimsagainst customers, completion of demobilization activities and litigation developments. The facility previously utilized tomanufacture products for our Belleli EPC business has been repurposed to manufacture product sales equipment. As such,certain personnel, buildings, equipment and other assets that were previously related to our Belleli EPC business remain a partof our continuing operations. As a result, activities associated with our ongoing operations at our repurposed facility areincluded in continuing operations.

The following table summarizes the operating results of discontinued operations (in thousands):
Years Ended December 31,
2019 2018 2017Belleli Belleli Belleli
Venezuela EPC Total Venezuela EPC Total Venezuela EPC TotalRevenue $ — $ 394 $ 394 $ — $ 16,274 $ 16,274 $ — $ 72,693 $ 72,693Cost of sales (excluding depreciation andamortization expense) — (1,073) (1,073) — 10,271 10,271 — 41,329 41,329Selling, general and administrative 188 1,176 1,364 131 1,652 1,783 131 5,262 5,393Depreciation and amortization — — — — 480 480 — 5,653 5,653Recovery attributable to expropriation — — — (16,564) — (16,564) (16,514) — (16,514)Restructuring related recoveries, net — — — — — — — (439) (439)Other (income) expense, net 1 (353) (352) (3,249) (1,342) (4,591) (3,157) 539 (2,618)Provision for (benefit from) income taxes — (6,031) (6,031) — 433 433 — 153 153Income (loss) from discontinued operations,net of tax $ (189) $ 6,675 $ 6,486 $ 19,682 $ 4,780 $ 24,462 $ 19,540 $ 20,196 $ 39,736
The following table summarizes the balance sheet data for discontinued operations (in thousands):
December 31, 2019 December 31, 2018Belleli EPC Venezuela Belleli EPC Total
Cash $ — $ 3 $ — $ 3Accounts receivable 3,990 — 11,509 11,509Contract assets 46 — — —Other current assets 296 7 86 93Total current assets associated with discontinuedoperations 4,332 10 11,595 11,605Property, plant and equipment, net — — 28 28Intangible and other assets, net 2,970 — 1,633 1,633Total assets associated with discontinued operations $ 7,302 $ 10 $ 13,256 $ 13,266
Accounts payable $ 1,503 $ — $ 4,382 $ 4,382Accrued liabilities 5,959 12 7,831 7,843Contract liabilities 2,536 — 2,542 2,542Total current liabilities associated with discontinuedoperations 9,998 12 14,755 14,767Other long-term liabilities 758 — 5,914 5,914Total liabilities associated with discontinuedoperations $ 10,756 $ 12 $ 20,669 $ 20,681
F-23
Note 6. Inventory, Net
Inventory, net of reserves, consisted of the following amounts (in thousands):
December 31,2019 2018
Parts and supplies $ 92,005 $ 92,016Work in progress 44,565 49,547Finished goods 6,968 9,126Inventory, net $ 143,538 $ 150,689
During the years ended December 31, 2019, 2018 and 2017, we recorded $1.7 million, $0.1 million and $1.3 million,respectively, in inventory write-downs and reserves for obsolete or slow moving inventory. As of December 31, 2019 and 2018,we had inventory reserves of $10.1 million and $10.0 million, respectively.

Note 7. Property, Plant and Equipment, Net
Property, plant and equipment, net, consisted of the following (in thousands):
December 31,2019 2018
Compression equipment, processing facilities and other contract operations assets $ 1,607,769 $ 1,713,153Land and buildings 67,187 101,571Transportation and shop equipment 59,693 82,960Computer software 51,663 54,572Other 38,111 47,210
1,824,423 1,999,466Accumulated depreciation (980,013) (1,097,889)Property, plant and equipment, net $ 844,410 $ 901,577
Depreciation expense was $156.4 million, $118.9 million and $105.0 million during the years ended December 31, 2019, 2018and 2017, respectively. Assets under construction of $86.1 million and $237.7 million as of December 31, 2019 and 2018,respectively, were primarily related to our contract operations business. During the years ended December 31, 2019, 2018 and2017, we capitalized $2.7 million, $9.9 million and $3.4 million of interest related to construction in process, respectively.
F-24
Note 8. Intangible and Other Assets, Net
Intangible and other assets, net, consisted of the following (in thousands):
December 31,2019 2018
Intangible assets, net $ 5,643 $ 8,174Deferred financing costs 5,740 7,237Long-term non-income tax receivable 8,532 8,621Long-term income tax credits 1,994 2,412Long-term notes receivable 16,145 20,399Long-term deposits 14,560 13,492Long-term contract assets 16,280 5,430Contract fulfillment costs 13,907 6,580Contract obtainment costs 4,865 6,739Other 5,634 7,287Intangibles and other assets, net $ 93,300 $ 86,371
Intangible assets and deferred financing costs consisted of the following (in thousands):
December 31, 2019 December 31, 2018Gross
Carrying Amount
Accumulated Amortization
Gross Carrying Amount
Accumulated Amortization
Deferred financing costs (1) $ 13,164 $ (7,424) $ 13,164 $ (5,927)Marketing related (20 year life) 566 (566) 542 (542)Customer related (17-20 year life) 40,608 (35,934) 75,331 (68,423)Technology based (20 year life) 3,291 (3,291) 3,153 (3,153)Contract based (2-11 year life) 45,092 (44,123) 45,059 (43,793)Intangible assets and deferred financing costs $ 102,721 $ (91,338) $ 137,249 $ (121,838)
(1) Represents debt issuance costs relating to our revolving credit facility. See Note 11 for further discussion regarding ourrevolving credit facility.

Amortization of deferred financing costs related to our revolving credit facility totaled $1.5 million, $2.3 million and $1.7million during the years ended December 31, 2019, 2018 and 2017, respectively, and was recorded to interest expense in ourstatements of operations. Amortization of intangible assets totaled $2.0 million, $2.4 million and $2.8 million during the yearsended December 31, 2019, 2018 and 2017, respectively.
Estimated future intangible amortization expense is as follows (in thousands):
2020 $ 1,6152021 1,3202022 9522023 8052024 682Thereafter 269Total $ 5,643
F-25
Note 9. Investments in Non-Consolidated Affiliates
Investments in affiliates that are not controlled by us where we have the ability to exercise significant influence over theoperations are accounted for using the equity method.
We own a 30.0% interest in WilPro Energy Services (PIGAP II) Limited and 33.3% interest in WilPro Energy Services (ElFurrial) Limited, which are joint ventures that provided natural gas compression and injection services in Venezuela. InMay 2009, PDVSA assumed control over the assets of our Venezuelan joint ventures and transitioned the operations, includingthe hiring of their employees, to PDVSA. In March 2011, our Venezuelan joint ventures, together with the Netherlands’ parentcompany of our joint venture partners, filed a request for the institution of an arbitration proceeding against Venezuela withICSID related to the seized assets and investments.
In March 2012, our Venezuelan joint ventures sold their assets to PDVSA Gas. We received an initial payment of $37.6 millionin March 2012. As of December 31, 2019, the remaining principal amount due to us was approximately $4 million. We havenot recognized amounts payable to us by PDVSA Gas as a receivable and will therefore recognize payments received in thefuture as equity in income of non-consolidated affiliates in our statements of operations in the periods such payments arereceived. In connection with the sale of our Venezuelan joint ventures’ assets, the joint ventures and our joint venture partnersagreed to suspend their previously filed arbitration proceeding against Venezuela pending payment in full by PDVSA Gas ofthe purchase price for the assets. The arbitration proceeding has since been dismissed, and the principal amount due to usremains outstanding.
In accordance with the separation and distribution agreement, a subsidiary of Archrock has the right to receive payments fromEESLP based on a notional amount corresponding to payments received by our subsidiaries from PDVSA Gas in respect of thesale of our joint ventures’ previously nationalized assets promptly after such amounts are collected by our subsidiaries.
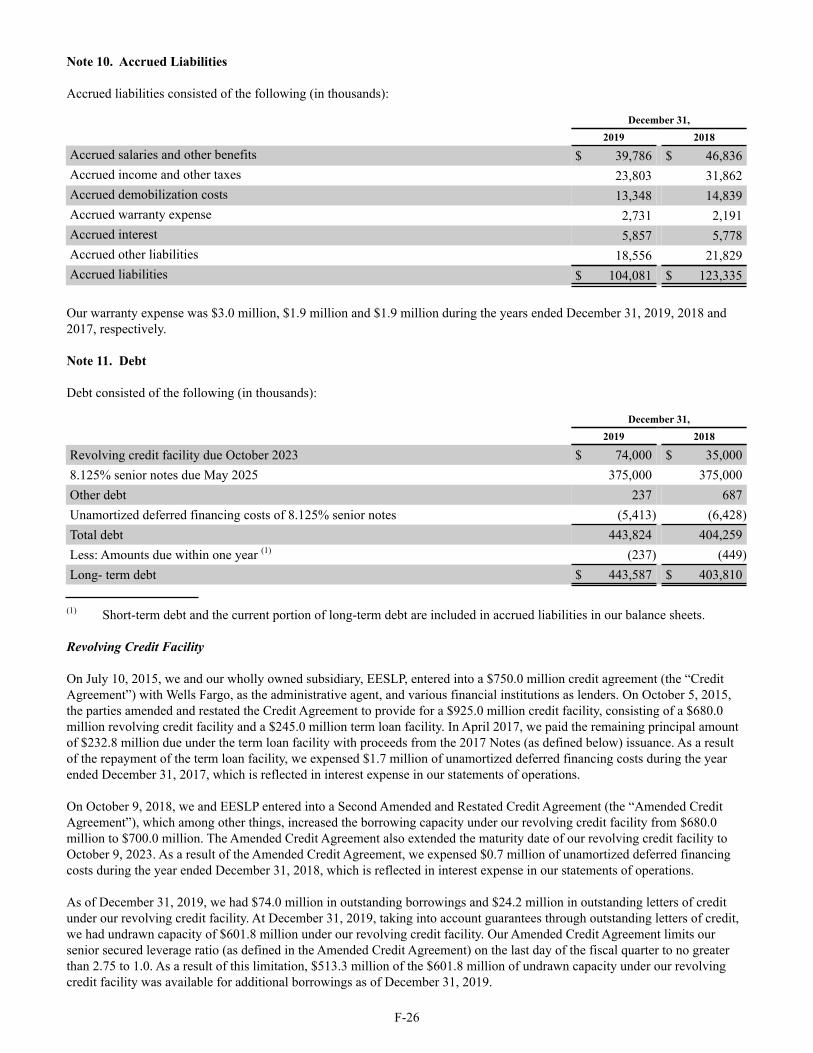
Note 10. Accrued Liabilities
Accrued liabilities consisted of the following (in thousands):
December 31,2019 2018
Accrued salaries and other benefits $ 39,786 $ 46,836Accrued income and other taxes 23,803 31,862Accrued demobilization costs 13,348 14,839Accrued warranty expense 2,731 2,191Accrued interest 5,857 5,778Accrued other liabilities 18,556 21,829Accrued liabilities $ 104,081 $ 123,335
Our warranty expense was $3.0 million, $1.9 million and $1.9 million during the years ended December 31, 2019, 2018 and2017, respectively.
F-26
Note 11. Debt
Debt consisted of the following (in thousands):
December 31,2019 2018
Revolving credit facility due October 2023 $ 74,000 $ 35,0008.125% senior notes due May 2025 375,000 375,000Other debt 237 687Unamortized deferred financing costs of 8.125% senior notes (5,413) (6,428)Total debt 443,824 404,259Less: Amounts due within one year (1) (237) (449)Long- term debt $ 443,587 $ 403,810
(1) Short-term debt and the current portion of long-term debt are included in accrued liabilities in our balance sheets.
Revolving Credit Facility
On July 10, 2015, we and our wholly owned subsidiary, EESLP, entered into a $750.0 million credit agreement (the “CreditAgreement”) with Wells Fargo, as the administrative agent, and various financial institutions as lenders. On October 5, 2015,the parties amended and restated the Credit Agreement to provide for a $925.0 million credit facility, consisting of a $680.0million revolving credit facility and a $245.0 million term loan facility. In April 2017, we paid the remaining principal amountof $232.8 million due under the term loan facility with proceeds from the 2017 Notes (as defined below) issuance. As a resultof the repayment of the term loan facility, we expensed $1.7 million of unamortized deferred financing costs during the yearended December 31, 2017, which is reflected in interest expense in our statements of operations.
On October 9, 2018, we and EESLP entered into a Second Amended and Restated Credit Agreement (the “Amended CreditAgreement”), which among other things, increased the borrowing capacity under our revolving credit facility from $680.0million to $700.0 million. The Amended Credit Agreement also extended the maturity date of our revolving credit facility toOctober 9, 2023. As a result of the Amended Credit Agreement, we expensed $0.7 million of unamortized deferred financingcosts during the year ended December 31, 2018, which is reflected in interest expense in our statements of operations.
As of December 31, 2019, we had $74.0 million in outstanding borrowings and $24.2 million in outstanding letters of creditunder our revolving credit facility. At December 31, 2019, taking into account guarantees through outstanding letters of credit,we had undrawn capacity of $601.8 million under our revolving credit facility. Our Amended Credit Agreement limits oursenior secured leverage ratio (as defined in the Amended Credit Agreement) on the last day of the fiscal quarter to no greaterthan 2.75 to 1.0. As a result of this limitation, $513.3 million of the $601.8 million of undrawn capacity under our revolvingcredit facility was available for additional borrowings as of December 31, 2019.
Revolving borrowings under the Amended Credit Agreement bear interest at a rate equal to, at our option, either the Base Rateor LIBOR (or EURIBOR, in the case of Euro-denominated borrowings) plus the applicable margin. “Base Rate” means thegreatest of (a) the prime rate, (b) the federal funds effective rate plus 0.50% and (c) one-month LIBOR plus 1.00%. Theapplicable margin for revolving borrowings varies (i) in the case of LIBOR and EURIBOR loans, from 1.75% to 2.75% and (ii)in the case of Base Rate loans, from 0.75% to 1.75%, and in each case will be determined based on a total leverage ratio pricinggrid. The weighted average annual interest rate on outstanding borrowings under the revolving credit facility at December 31,2019 was 4.6%.
We guarantee EESLP’s obligations under the revolving credit facility. In addition, EESLP’s obligations under the revolvingcredit facility are secured by (1) substantially all of our assets and the assets of EESLP and our Significant DomesticSubsidiaries (as defined in the Amended Credit Agreement), including certain real property, and (2) all of the equity interests ofour U.S. restricted subsidiaries (other than certain excluded subsidiaries) (as defined in the Amended Credit Agreement) and65% of the voting equity interests in certain of our first-tier foreign subsidiaries.
8.125% Senior Notes Due May 2025
In April 2017, our 100% owned subsidiaries EESLP and EES Finance Corp. issued $375.0 million aggregate principal amountof 8.125% senior unsecured notes due 2025 (the “2017 Notes”). The 2017 Notes are guaranteed by us on a senior unsecuredbasis. The net proceeds of $367.1 million from the 2017 Notes issuance were used to repay all of the borrowings outstandingunder the term loan facility and revolving credit facility and for general corporate purposes. Additionally, pursuant to theseparation and distribution agreement from the Spin-off, EESLP used proceeds from the issuance of the 2017 Notes to pay asubsidiary of Archrock $25.0 million in satisfaction of EESLP’s obligation to pay that sum following the occurrence of aqualified capital raise. The transfer of cash to Archrock’s subsidiary was recognized as a reduction to additional paid-in capitalin the second quarter of 2017.
Prior to May 1, 2020, we may redeem all or a portion of the 2017 Notes at a redemption price equal to the sum of (i) theprincipal amount thereof, and (ii) a make-whole premium at the redemption date, plus accrued and unpaid interest, if any, to theredemption date. In addition, we may redeem up to 35% of the aggregate principal amount of the 2017 Notes prior to May 1,2020 with the net proceeds of one or more equity offerings at a redemption price of 108.125% of the principal amount of the2017 Notes, plus any accrued and unpaid interest to the date of redemption, if at least 65% of the aggregate principal amount ofthe 2017 Notes issued under the indenture remains outstanding after such redemption and the redemption occurs within 180days of the date of the closing of such equity offering. On or after May 1, 2020, we may redeem all or a portion of the 2017Notes at redemption prices (expressed as percentages of principal amount) equal to 106.094% for the twelve-month periodbeginning on May 1, 2020, 104.063% for the twelve-month period beginning on May 1, 2021, 102.031% for the twelve-monthperiod beginning on May 1, 2022 and 100.000% for the twelve-month period beginning on May 1, 2023 and at any timethereafter, plus accrued and unpaid interest, if any, to the applicable redemption date of the 2017 Notes.
Unamortized Debt Financing Costs
In connection with the issuance of the 2017 Notes, we incurred transaction costs of $7.9 million related to the issuance of the2017 Notes. These costs are presented as a direct deduction from the carrying value of the 2017 Notes and are being amortizedover the term of the 2017 Notes. Amortization of deferred financing costs relating to the 2017 Notes totaled $1.0 million, $1.0million and $0.7 million during the years ended December 31, 2019, 2018 and 2017, respectively, and was recorded to interestexpense in our statements of operations. Amortization of deferred financing costs relating to the term loan facility totaled $2.4million during the year ended December 31, 2017 and was recorded to interest expense in our statements of operations. Duringthe year ended December 31, 2018, we incurred transaction costs of approximately $4.8 million related to our revolving creditfacility. Debt issuance costs relating to our revolving credit facility are included in intangible and other assets, net, and arebeing amortized over the term of the facility. See Note 8 for further discussion regarding the amortization of deferred financingcosts related to our revolving credit facility.
F-27
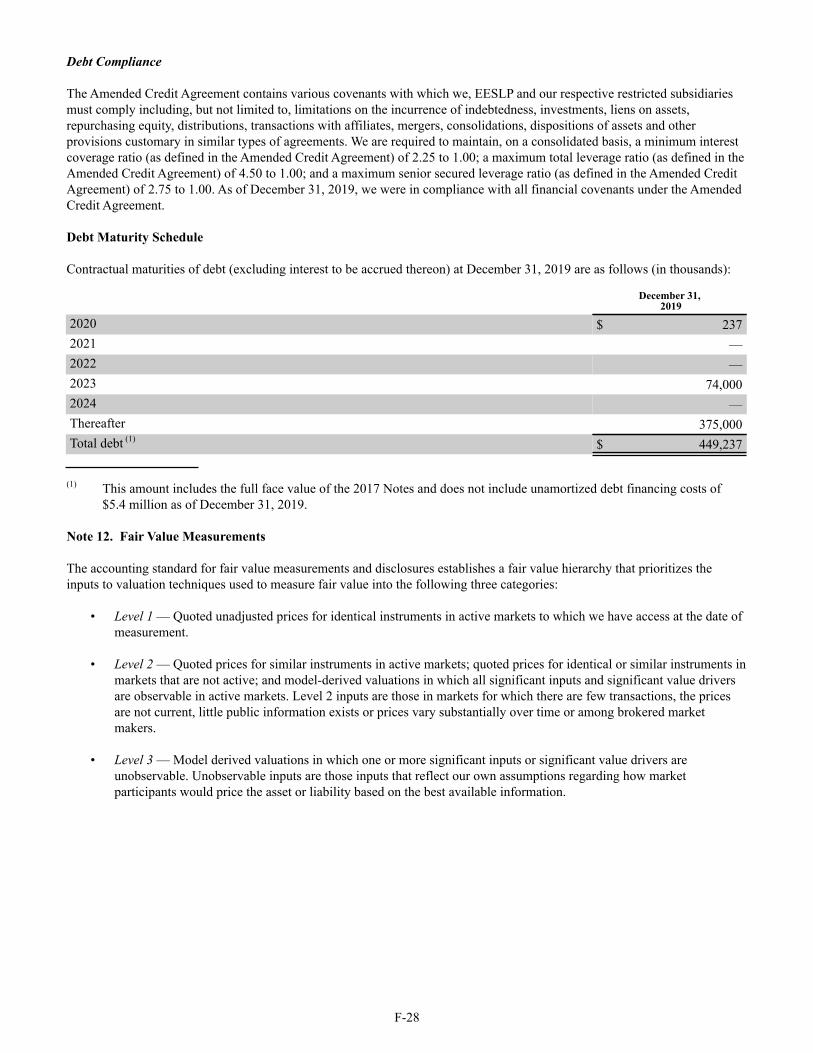
Debt Compliance
The Amended Credit Agreement contains various covenants with which we, EESLP and our respective restricted subsidiariesmust comply including, but not limited to, limitations on the incurrence of indebtedness, investments, liens on assets,repurchasing equity, distributions, transactions with affiliates, mergers, consolidations, dispositions of assets and otherprovisions customary in similar types of agreements. We are required to maintain, on a consolidated basis, a minimum interestcoverage ratio (as defined in the Amended Credit Agreement) of 2.25 to 1.00; a maximum total leverage ratio (as defined in theAmended Credit Agreement) of 4.50 to 1.00; and a maximum senior secured leverage ratio (as defined in the Amended CreditAgreement) of 2.75 to 1.00. As of December 31, 2019, we were in compliance with all financial covenants under the AmendedCredit Agreement.
Debt Maturity Schedule
Contractual maturities of debt (excluding interest to be accrued thereon) at December 31, 2019 are as follows (in thousands):
December 31, 2019
2020 $ 2372021 —2022 —2023 74,0002024 —Thereafter 375,000Total debt (1) $ 449,237
(1) This amount includes the full face value of the 2017 Notes and does not include unamortized debt financing costs of$5.4 million as of December 31, 2019.
F-28
Note 12. Fair Value Measurements
The accounting standard for fair value measurements and disclosures establishes a fair value hierarchy that prioritizes theinputs to valuation techniques used to measure fair value into the following three categories:
• Level 1 — Quoted unadjusted prices for identical instruments in active markets to which we have access at the date ofmeasurement.
• Level 2 — Quoted prices for similar instruments in active markets; quoted prices for identical or similar instruments inmarkets that are not active; and model-derived valuations in which all significant inputs and significant value driversare observable in active markets. Level 2 inputs are those in markets for which there are few transactions, the pricesare not current, little public information exists or prices vary substantially over time or among brokered marketmakers.
• Level 3 — Model derived valuations in which one or more significant inputs or significant value drivers areunobservable. Unobservable inputs are those inputs that reflect our own assumptions regarding how marketparticipants would price the asset or liability based on the best available information.

Nonrecurring Fair Value Measurements
The following table presents our assets and liabilities measured at fair value on a nonrecurring basis as of December 31, 2019and 2018 (in thousands):
December 31, 2019 December 31, 2018(Level 1) (Level 2) (Level 3) (Level 1) (Level 2) (Level 3)
Impaired long-lived assets (1) $ — $ — $ 21,565 $ — $ — $ 550Impaired assets—assets held for sale (2) — — 624 — — —Long-term note receivable (3) — — 15,312 — — 14,573
(1) Our estimate of the fair value of the impaired long-lived assets as of December 31, 2019 and 2018 were primarily basedon the expected net sale proceeds compared to other fleet units we sold and/or our estimate of fair value based on offersto purchase such assets.
(2) Our estimate of the fair value of the impaired assets, which were classified as held for sale as of December 31, 2019, wasbased on the expected net proceeds from the sale of the assets.
(3) Our estimate of the fair value of a note receivable was discounted based on a settlement period of eight years and adiscount rate of 5.2%.
Financial Instruments
Our financial instruments consist of cash, restricted cash, receivables, payables and debt. At December 31, 2019 and 2018, theestimated fair values of cash, restricted cash, receivables and payables approximated their carrying amounts as reflected in ourbalance sheets due to the short-term nature of these financial instruments.
The fair value of the 2017 Notes was estimated based on model derived calculations using market yields observed in activemarkets, which are Level 2 inputs. As of December 31, 2019 and 2018, the carrying amount of the 2017 Notes, excludingunamortized deferred financing costs, of $375.0 million was estimated to have a fair value of $371.0 million and $362.0million, respectively. Due to the variable rate nature of our revolving credit facility, the carrying value as of December 31, 2019approximated the fair value as the rate was comparable to the then-current market rate at which debt with similar terms couldhave been obtained.
F-29
Note 13. Impairments
We review long-lived assets, including property, plant and equipment and identifiable intangibles that are being amortized, forimpairment whenever events or changes in circumstances, including the removal of compressor units from our active fleet,indicate that the carrying amount of an asset may not be recoverable.
During the year ended December 31, 2019, in an effort to generate cash from idle assets and reduce holding costs, we reviewedthe future deployment of our idle assets used in our contract operations segment for units that were not of the type,configuration, condition, make or model that are cost efficient to maintain and operate. Based on this review, we determinedthat certain idle compressor units and other assets would be retired from future service. The retirement of these units from theactive fleet triggered a review of these assets for impairment. As a result, we recorded a $52.6 million asset impairment toreduce the book value of each unit to its estimated fair value. The fair value of each unit was estimated based on either theexpected net sale proceeds compared to other fleet units we recently sold and/or a review of other units recently offered for saleby third parties, or the estimated component value or scrap value of each compressor unit. As of December 31, 2019, $0.6million related to these units was included in assets held for sale on our consolidated balance sheet.
In addition, in connection with our review of options for our U.S. compression fabrication business within our product salessegment, we reviewed the assets in this business compared to our estimate of future cash flows and recorded a $21.1 millionimpairment charge to adjust the carrying value to our estimate of fair market value.
In the fourth quarter of 2019, we also evaluated other assets for impairment and recorded an impairment of $0.7 million onthese assets.

During the year ended December 31, 2018, we evaluated for impairment idle units that had been previously culled from ourfleet and are available for sale. Based upon that review, we reduced the expected proceeds from disposition for certain units.This resulted in an additional impairment of $2.1 million to reduce the book value of each unit to its estimated fair value duringthe year ended December 31, 2018. During the year ended December 31, 2017, we determined that one idle compressor unitwould be retired from the active fleet. The retirement of this unit from the active fleet triggered a review of the active fleet forimpairment, and as a result, we recorded an impairment of $0.6 million to reduce the book value of the unit to its estimated fairvalue. The fair value of each unit was estimated based on either the expected net sale proceeds compared to other fleet units wesold and/or a review of other units offered for sale by third parties during that time or the estimated component value of theequipment on each compressor unit that we planned to use at that time.
In the fourth quarter of 2017, we classified our PEQ assets primarily related to inventory and property, plant and equipment,net, within our product sales business as assets held for sale in our balance sheets. In June 2018, we completed the sale of ourPEQ assets. During the years ended December 31, 2018 and 2017, we recorded impairments of $1.8 million and $2.1 million,respectively, to reduce these assets to their approximate fair values based on the expected net proceeds. Additionally, in thefourth quarter of 2017, we determined that certain other assets within our product sales business were assessed to have nofuture benefit to our ongoing operations. In conjunction with the assessment of these other assets, we recorded an impairmentcharge of $3.0 million to write-down these assets.
F-30
Note 14. Restatement Related Charges (Recoveries), Net
During the first quarter of 2016, our senior management identified errors relating to the application of percentage-of-completion accounting principles to specific Belleli EPC product sales projects. As a result, the Audit Committee of theCompany’s Board of Directors initiated an internal investigation, including the use of services of a forensic accounting firm.Management also engaged a consulting firm to assist in accounting analysis and compilation of restatement adjustments. Weincurred restatement related charges of $0.1 million, $0.9 million and $6.2 million during the years ended December 31, 2019,2018 and 2017, respectively. The costs incurred were external costs associated with an SEC investigation and remediationactivities related to the restatement of our financial statements. We recorded recoveries from Archrock pursuant to theseparation and distribution agreement for previously incurred restatement related costs of $1.2 million and $2.8 million duringthe years ended December 31, 2018 and 2017, respectively. On April 8, 2019, the SEC provided written notice to us stating thatbased on the information they have as of this date, they have concluded their investigation and do not intend to recommendenforcement action against us in connection with this matter.
The following table summarizes the components of charges included in restatement related charges (recoveries), net, in ourstatements of operations for the years ended December 31, 2019, 2018 and 2017 (in thousands):
Years Ended December 31,2019 2018 2017
External accounting costs $ — $ — $ 1,071External legal costs 48 531 4,396Other — 413 753Recoveries from Archrock — (1,220) (2,801)Total restatement related charges (recoveries), net $ 48 $ (276) $ 3,419
Note 15. Restructuring and Other Charges
The energy industry’s focus on capital discipline and improving returns has caused delays in the timing of new equipmentorders. As a result, in the second quarter of 2019, we began the consolidation of two of our manufacturing facilities located inHouston, Texas into one facility and announced a cost reduction plan primarily focused on workforce reductions. We incurredrestructuring and other charges associated with these activities of $8.4 million for the year ended December 31, 2019. Thesecharges are reflected as restructuring and other charges in our statements of operations and accrued liabilities on our balancesheets. We expect to settle these charges within the next twelve months in cash.
In the second quarter of 2018, we initiated a relocation plan in the North America region to better align our contract operationsbusiness with our customers. As a result of this plan, during the years ended December 31, 2019 and 2018, we incurredrestructuring and other charges of $0.3 million and $2.0 million, respectively. The charges incurred in conjunction with thisrelocation plan are included in restructuring and other charges in our statements of operations. In the second quarter of 2019,we completed restructuring activities related to the relocation plan.

In connection with the Spin-off, we incurred restructuring and other charges of $0.6 million during the year ended December31, 2017 primarily related to retention awards to certain employees which were amortized over the required service period ofeach applicable employee. Additionally, we announced a cost reduction plan primarily focused on workforce reductions and thereorganization of certain facilities in the second quarter of 2015. We incurred restructuring and other charges associated withthe cost reduction plan of $2.6 million during the year ended December 31, 2017. Cost incurred for employee terminationbenefits during the year ended December 31, 2017 were $2.1 million. In 2017, we completed restructuring activities related tothe Spin-off and cost reduction plan.
The following table summarizes the changes to our accrued liability balance related to restructuring and other charges for theyears ended December 31, 2018 and 2019 (in thousands):
2019 Cost 2015 CostReduction Plan Reduction Plan Relocation Plan Total
Beginning balance at January 1, 2018 $ — $ 612 $ — $ 612Additions for costs expensed — — 1,997 1,997Reductions for payments — (612) (1,688) (2,300)Ending balance at December 31, 2018 — — 309 309Additions for costs expensed 8,419 — 293 8,712Reductions for payments (6,049) — (602) (6,651)Foreign exchange impact (89) — — (89)Ending balance at December 31, 2019 $ 2,281 $ — $ — $ 2,281
The following table summarizes the components of charges included in restructuring and other charges in our statements ofoperations for the years ended December 31, 2019, 2018 and 2017 (in thousands):
Years Ended December 31,2019 2018 2017
Retention awards to certain employees $ — $ — $ 599Employee termination benefits 7,036 910 2,100Relocation costs 1,035 1,087 —Other 641 — 490Total restructuring and other charges $ 8,712 $ 1,997 $ 3,189
The following table summarizes the components of charges included in restructuring and other charges incurred since theannouncement of the cost reduction plan in the second quarter of 2019 (in thousands):
Total
Employee termination benefits $ 7,036Relocation costs 742Other 641Total restructuring and other charges $ 8,419
F-31
Note 16. Provision for Income Taxes
The components of income (loss) before income taxes were as follows (in thousands):
Years Ended December 31,2019 2018 2017
United States $ (86,918) $ (6,899) $ (43,403)Foreign 3,345 46,724 60,242Income (loss) before income taxes $ (83,573) $ 39,825 $ 16,839

The provision for income taxes consisted of the following (in thousands):
Years Ended December 31,2019 2018 2017
Current tax provision (benefit):U.S. federal $ (534) $ 769 $ —State 228 258 250Foreign 35,603 36,869 25,638
Total current 35,297 37,896 25,888Deferred tax provision (benefit):
U.S. federal 1,673 242 (5,102)State (61) (71) (15)Foreign (11,619) 1,366 1,924
Total deferred (10,007) 1,537 (3,193)Provision for income taxes $ 25,290 $ 39,433 $ 22,695
The provision for income taxes for 2019, 2018 and 2017 resulted in effective tax rates on continuing operations of (30.3)%,99.0% and 134.8%, respectively. The reasons for the differences between these effective tax rates and the U.S. statutory rate areas follows (in thousands):
Years Ended December 31,2019 2018 2017
Income taxes at U.S. federal statutory rate of 21% (35% for 2017) $ (17,550) $ 8,363 $ 5,894Brazil PRT/PERT programs — — (15,148)Unrecognized tax benefits 529 9,496 3,332Change in valuation allowances 13,982 (18,973) (48,059)Nondeductible expenses 5,004 4,340 4,517Capital contributions and distributions related to Spin-off 52 (352) (1,084)Impact of Tax Reform — 873 25,578Foreign tax rate differential (9,378) (1,854) (3,261)Deferred tax adjustments 4,844 1,112 39,067Foreign exchange differences 13,821 14,835 7,606Withholding tax, net of U.S. benefit 5,491 14,825 501Deemed and actual distributions 4,873 1,742 2,214Other 3,622 5,026 1,538Provision for income taxes $ 25,290 $ 39,433 $ 22,695
Tax legislation enacted and signed into law in 2017 in the U.S. and in Argentina resulted in changes to the statutory tax rates atwhich certain deferred tax assets and liabilities are recorded. In 2017, these rate changes resulted in reconciling items betweenincome tax recorded at the U.S. statutory rate and the company’s provision for income taxes of $15.5 million and $(3.1)million, for the U.S. and Argentina, respectively. In the U.S., the valuation allowance that had been previously recorded wasreduced as a result of the U.S. statutory rate changes.
F-32

Deferred income tax balances are the direct effect of temporary differences between the financial statement carrying amountsand the tax basis of assets and liabilities using enacted tax rates in effect for the year in which the differences are expected toreverse. The tax effects of temporary differences that give rise to deferred tax assets and deferred tax liabilities are as follows(in thousands):
December 31,2019 2018
Deferred tax assets:Net operating loss carryforwards $ 71,598 $ 68,377Foreign tax credit carryforwards 81,759 81,759Research and development credit carryforwards 31,251 31,251Alternative minimum tax credit carryforwards 2,943 5,493Deferred revenue 46,137 25,858Accrued liabilities 13,094 7,672Other 33,758 32,079Subtotal 280,540 252,489Valuation allowances (213,034) (200,105)
Total deferred tax assets 67,506 52,384Deferred tax liabilities:
Property, plant and equipment (42,566) (28,413)Other (11,939) (18,606)
Total deferred tax liabilities (54,505) (47,019)Net deferred tax assets $ 13,001 $ 5,365
During the year ended December 31, 2017, our Brazil subsidiary entered into two tax programs: 1) the Tax RegularizationProgram (the “PRT Program”) pursuant to Brazil Provisional Measure No. 766 issued on January 4, 2017 and 2) the TaxSpecial Regularization Program (the “PERT Program”) pursuant to Brazil Provisional Measure No. 783 issued on May 31,2017. These programs allow for the partial settling of debts, both income tax debts and non-income-based tax debts, due byNovember 30, 2016 and April 30, 2017 to Brazil’s Federal Revenue Service for the PRT Program and PERT Program,respectively, with the use of tax credits, including income tax loss carryforwards. A $15.2 million income tax benefit wasrecorded during the year ended December 31, 2017 attributable to the reversal of valuation allowances against certain deferredtax assets related to income tax loss carryforwards that were utilized under the PRT Program and PERT Program, includinginterest income. Additionally, during the year ended December 31, 2017, we incurred $1.8 million in penalties, which isreflected in other (income) expense, net, in our statements of operations, and $2.4 million in interest expense, which is reflectedin interest expense in our statements of operations, attributable to the settling of non-income-based tax debts in connection withthe PRT Program and the PERT Program.
At December 31, 2019, we had U.S. federal net operating loss carryforwards of approximately $68.1 million that are availableto offset future taxable income. If not used, the carryforwards begin to expire in 2036. We also had approximately $177.9million of net operating loss carryforwards in certain foreign jurisdictions (excluding discontinued operations), approximately$105.9 million of which has no expiration date, $17.0 million of which is subject to expiration from 2020 to 2024, and theremainder of which expires in future years through 2039. Foreign tax credit carryforwards of $81.8 million, research anddevelopment credits carryforwards of $31.3 million and alternative minimum tax credit carryforwards of $2.9 million areavailable to offset future payments of U.S. federal income tax. The foreign tax credits will expire in varying amounts beginningin 2020 and research and development credits will expire in varying amounts beginning in 2028. The U.S. corporate alternativeminimum tax (“AMT”) has been repealed for tax years beginning after December 31, 2017. Companies with AMT credits thathave not been utilized may claim a refund in future years for those credits even when no income tax liability exists. We expectour existing AMT credits to be fully utilized or refunded by 2021.
F-33

We record valuation allowances when it is more-likely-than-not that some portion or all of our deferred tax assets will not berealized. The ultimate realization of the deferred tax assets depends on the ability to generate sufficient taxable income of theappropriate character and in the appropriate taxing jurisdictions in the future. If we do not meet our expectations with respect totaxable income, we may not realize the full benefit from our deferred tax assets which would require us to record a valuationallowance in our tax provision in future years. Management assesses all available positive and negative evidence to estimateour ability to generate sufficient future taxable income of the appropriate character, and in the appropriate taxing jurisdictions,to permit use of our existing deferred tax assets. A significant piece of objective negative evidence is a cumulative loss incurredover a three-year period in a taxing jurisdiction. Prevailing accounting practice is that such objective evidence would limit theability to consider other subjective evidence, such as our projections for future growth.
Pursuant to Sections 382 and 383 of the Internal Revenue Code of 1986, as amended (the “Code”), utilization of losscarryforwards and credit carryforwards, such as foreign tax credits, will be subject to annual limitations due to the historicalownership changes of both Hanover Compressor Company (“Hanover”) and Universal Compression Holdings, Inc.(“Universal”). In general, an ownership change, as defined by Section 382 of the Code, results from transactions increasing theownership of certain stockholders or public groups in the stock of a corporation by more than 50 percentage points over a three-year period. The merger of Hanover and Universal to form Archrock (formerly Exterran Holdings, Inc.) in August 2007resulted in such an ownership change for both Hanover and Universal. As of December 31, 2018, we had utilized all of the losscarryforwards subject to the Section 382 limitations.
We consider the earnings of many of our foreign subsidiaries to be indefinitely reinvested, and accordingly, as of December 31,2019, we have not provided for taxes on approximately $404.9 million of cumulative undistributed foreign earnings. If we wereto make a distribution from the unremitted earnings of these subsidiaries, we could be subject to taxes payable to variousjurisdictions. Computation of the potential deferred tax liability associated with these undistributed earnings and any other basisdifferences is not practicable. If our expectations were to change regarding future tax consequences, we may be required torecord additional deferred taxes that could have a material effect on our consolidated statement of financial position, results ofoperations or cash flows.
On December 22, 2017, the U.S. government enacted comprehensive tax legislation. The Tax Reform Act makes broad andcomplex changes to the U.S. tax code, including, but not limited to, (1) reducing the U.S. federal corporate tax rate from 35%to 21%; (2) requiring companies to pay a one-time transition tax on certain unrepatriated earnings of foreign subsidiaries (the“Transition Tax”); (3) generally eliminating U.S. federal income taxes on dividends from foreign subsidiaries; (4) requiring acurrent inclusion in U.S. federal taxable income of certain earnings of controlled foreign corporations; (5) eliminating thecorporate AMT and changing how existing AMT credits can be realized; (6) creating the base erosion anti-abuse tax (“BEAT”),a new minimum tax; (7) creating a new limitation on deductible interest expense; and (8) changing rules related to uses andlimitations of net operating loss carryforwards created in tax years beginning after December 31, 2017. Guidance under U.S.GAAP requires that the impact of tax legislation be recognized in the period in which the law was enacted.
For the year ended December 31, 2017, our provision for income tax included the reversal of previously recorded valuationallowances of $5.6 million against our U.S. AMT carryforwards due to the Tax Cuts and Jobs Act (“Tax Reform Act”) whichprovides for the cancellation of the AMT and allows for a future refund and/or credit against regular income tax carry forwards.
In December 2017, the SEC staff issued Staff Accounting Bulletin No. 118, which addresses how a company recognizesprovisional amounts when a company does not have the necessary information available, prepared or analyzed (includingcomputations) in reasonable detail to complete its accounting for the effect of the changes in the Tax Reform Act. Themeasurement period ends when a company has obtained, prepared and analyzed the information necessary to finalize itsaccounting, but cannot extend beyond one year. We completed our analysis and as a result recorded a $0.9 million adjustmentin the fourth quarter of 2018 to the provisional estimate for Transition Tax that we had recorded for the year ended December31, 2017.
Deemed repatriation transition tax on undistributed earnings: The Transition Tax is a deemed repatriation tax on certainpreviously untaxed accumulated earnings and profits (“E&P”) of our foreign subsidiaries. For the year ended December 31,2017, we were able to reasonably estimate the Transition Tax and recorded a provisional Transition Tax obligation of $10.1million, with a corresponding tax benefit from the reduction of the valuation allowance previously recorded against U.S.deferred tax assets. In the fourth quarter of 2018, we completed our analysis and recorded an additional $0.9 million ofTransition Tax with a corresponding tax benefit from the reduction of the valuation allowance previously recorded against U.S.deferred tax assets.
F-34
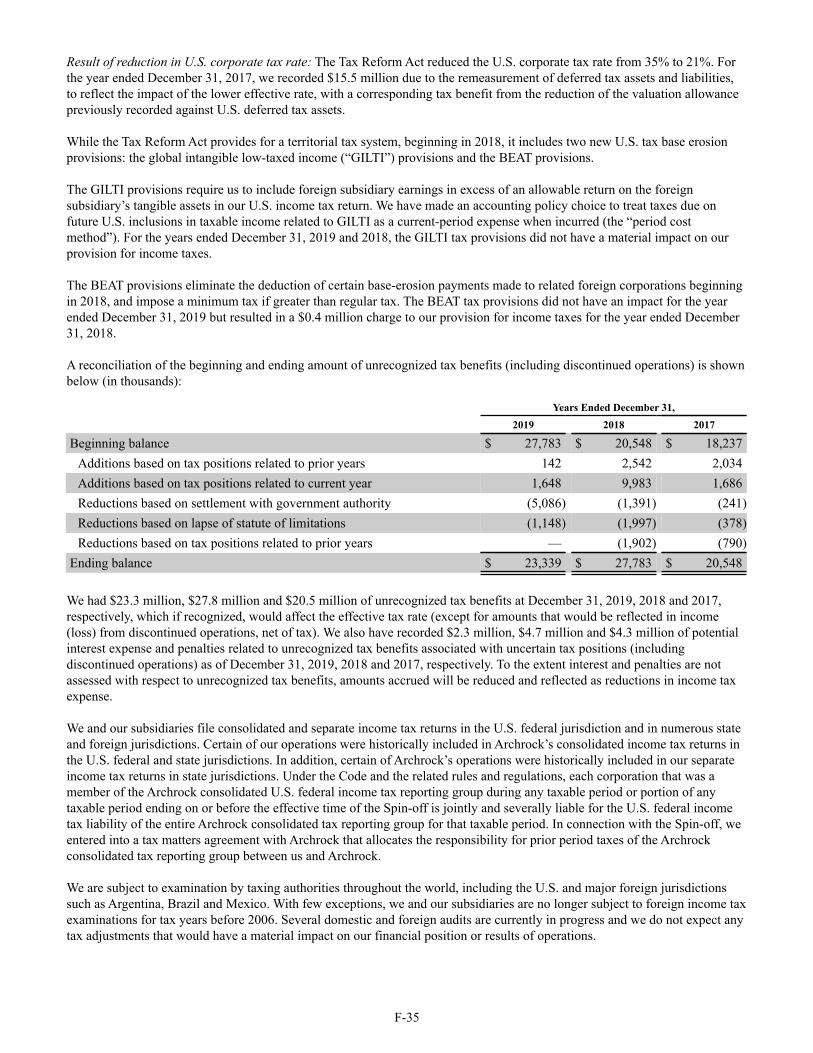
Result of reduction in U.S. corporate tax rate: The Tax Reform Act reduced the U.S. corporate tax rate from 35% to 21%. Forthe year ended December 31, 2017, we recorded $15.5 million due to the remeasurement of deferred tax assets and liabilities,to reflect the impact of the lower effective rate, with a corresponding tax benefit from the reduction of the valuation allowancepreviously recorded against U.S. deferred tax assets.
While the Tax Reform Act provides for a territorial tax system, beginning in 2018, it includes two new U.S. tax base erosionprovisions: the global intangible low-taxed income (“GILTI”) provisions and the BEAT provisions.
The GILTI provisions require us to include foreign subsidiary earnings in excess of an allowable return on the foreignsubsidiary’s tangible assets in our U.S. income tax return. We have made an accounting policy choice to treat taxes due onfuture U.S. inclusions in taxable income related to GILTI as a current-period expense when incurred (the “period costmethod”). For the years ended December 31, 2019 and 2018, the GILTI tax provisions did not have a material impact on ourprovision for income taxes.
The BEAT provisions eliminate the deduction of certain base-erosion payments made to related foreign corporations beginningin 2018, and impose a minimum tax if greater than regular tax. The BEAT tax provisions did not have an impact for the yearended December 31, 2019 but resulted in a $0.4 million charge to our provision for income taxes for the year ended December31, 2018.
A reconciliation of the beginning and ending amount of unrecognized tax benefits (including discontinued operations) is shownbelow (in thousands):
Years Ended December 31,2019 2018 2017
Beginning balance $ 27,783 $ 20,548 $ 18,237Additions based on tax positions related to prior years 142 2,542 2,034Additions based on tax positions related to current year 1,648 9,983 1,686Reductions based on settlement with government authority (5,086) (1,391) (241)Reductions based on lapse of statute of limitations (1,148) (1,997) (378)Reductions based on tax positions related to prior years — (1,902) (790)
Ending balance $ 23,339 $ 27,783 $ 20,548
We had $23.3 million, $27.8 million and $20.5 million of unrecognized tax benefits at December 31, 2019, 2018 and 2017,respectively, which if recognized, would affect the effective tax rate (except for amounts that would be reflected in income(loss) from discontinued operations, net of tax). We also have recorded $2.3 million, $4.7 million and $4.3 million of potentialinterest expense and penalties related to unrecognized tax benefits associated with uncertain tax positions (includingdiscontinued operations) as of December 31, 2019, 2018 and 2017, respectively. To the extent interest and penalties are notassessed with respect to unrecognized tax benefits, amounts accrued will be reduced and reflected as reductions in income taxexpense.
We and our subsidiaries file consolidated and separate income tax returns in the U.S. federal jurisdiction and in numerous stateand foreign jurisdictions. Certain of our operations were historically included in Archrock’s consolidated income tax returns inthe U.S. federal and state jurisdictions. In addition, certain of Archrock’s operations were historically included in our separateincome tax returns in state jurisdictions. Under the Code and the related rules and regulations, each corporation that was amember of the Archrock consolidated U.S. federal income tax reporting group during any taxable period or portion of anytaxable period ending on or before the effective time of the Spin-off is jointly and severally liable for the U.S. federal incometax liability of the entire Archrock consolidated tax reporting group for that taxable period. In connection with the Spin-off, weentered into a tax matters agreement with Archrock that allocates the responsibility for prior period taxes of the Archrockconsolidated tax reporting group between us and Archrock.
We are subject to examination by taxing authorities throughout the world, including the U.S. and major foreign jurisdictionssuch as Argentina, Brazil and Mexico. With few exceptions, we and our subsidiaries are no longer subject to foreign income taxexaminations for tax years before 2006. Several domestic and foreign audits are currently in progress and we do not expect anytax adjustments that would have a material impact on our financial position or results of operations.
F-35

We believe it is reasonably possible that a decrease of up to approximately $1 million in unrecognized tax benefits may benecessary on or before December 31, 2020 due to the cash and non-cash settlement of audits and the expiration of statutes oflimitations. However, due to the uncertain and complex application of tax regulations, it is possible that the ultimate resolutionof these matters may result in liabilities which could materially differ from these estimates.
F-36
Note 17. Stockholders’ Equity
Preferred Stock
We have authorized 50.0 million shares of preferred stock, $0.01 par value per share, none of which was issued and outstandingat December 31, 2019. Our board of directors is authorized to determine the rights, preferences, and restrictions on any seriesof preferred stock that we may issue.
Common Stock
We have authorized 250.0 million shares of common stock, $0.01 par value per share, of which 37,508,286 and 33,040,686shares are issued and outstanding at December 31, 2019, respectively. Each share of common stock is entitled to a single vote.We have not declared or paid any dividends through December 31, 2019.
Share Repurchase Program
On February 20, 2019, our board of directors approved a share repurchase program under which the Company is authorized topurchase up to $100.0 million of its outstanding common stock through February 2022. The timing and method of anyrepurchases under the program will depend on a variety of factors, including prevailing market conditions among others.Purchases under the program may be suspended or discontinued at any time and we have no obligation to repurchase anyamount of our common shares under the program. Shares of common stock acquired through the repurchase program are heldin treasury at cost. During the year ended December 31, 2019, we repurchased 3,495,448 shares of our common stock for $42.3million in connection with our share repurchase program. As of December 31, 2019, the remaining authorized repurchaseamount under the share repurchase program was $57.7 million. Additionally, treasury stock purchased during the years endedDecember 31, 2019 and 2018 included shares withheld to satisfy employees’ tax withholding obligations in connection withvesting of restricted stock awards.
Additional paid-in capital
Pursuant to the separation and distribution agreement, EESLP contributed to a subsidiary of Archrock the right to receivepayments based on a notional amount corresponding to payments received by our subsidiaries from PDVSA Gas in respect ofthe sale of our and our joint ventures’ previously nationalized assets promptly after such amounts are collected by oursubsidiaries. Pursuant to the separation and distribution agreement, we transferred cash of $18.7 million and $19.7 million toArchrock during the years ended December 31, 2018 and 2017, respectively. The transfers of cash were recognized asreductions to additional paid-in capital in our financial statements. Additionally, during the year ended December 31, 2017 wetransferred cash of $25.0 million to Archrock in satisfaction of EESLP’s obligation to pay that sum following the occurrence ofa qualified capital raise as required under the separation and distribution agreement.
Comprehensive Income (Loss)
Components of comprehensive income (loss) are net income (loss) and all changes in stockholders’ equity during a periodexcept those resulting from transactions with owners. Our accumulated other comprehensive income consists of foreigncurrency translation adjustments.

The following table presents the changes in accumulated other comprehensive income, net of tax, during the years endedDecember 31, 2017, 2018 and 2019 (in thousands):
Foreign CurrencyTranslation Adjustment
Accumulated other comprehensive income, January 1, 2017 $ 47,508Loss recognized in other comprehensive income (loss) (1,801)
Accumulated other comprehensive income, December 31, 2017 45,707Loss recognized in other comprehensive income (loss) (7,476)
Accumulated other comprehensive income, December 31, 2018 38,231Loss recognized in other comprehensive income (loss) (2,885)
Accumulated other comprehensive income, December 31, 2019 $ 35,346
F-37
Note 18. Stock-Based Compensation and Awards
Stock Incentive Plan
On October 30, 2015, our compensation committee and board of directors each approved the Exterran Corporation 2015 StockIncentive Plan (the “2015 Plan”) to provide for the granting of stock options, stock appreciation rights, restricted stock,restricted stock units, performance awards, other stock-based awards and dividend equivalents rights to employees, directorsand consultants of Exterran Corporation. The 2015 Plan became effective on November 1, 2015. The maximum aggregatenumber of shares of our common stock that may be issued under the 2015 Plan is 3,000,000 shares, of which 812,859 shareswere available to be issued under the plan as of December 31, 2019. Awards granted under the 2015 Plan that are subsequentlycancelled, terminated or forfeited are available for future grant.
Directors’ Stock and Deferral Plan On October 30, 2015, our compensation committee and board of directors each approved the Exterran Corporation 2015Directors’ Stock and Deferral Plan (the “Director Plan”). Under the Director Plan, which became effective on October 30,2015, members of our board of directors may elect, on an annual basis, to receive 25%, 50%, 75% or 100% of their retainer andmeeting fees (the “Retainer Fees”) in shares of our common stock in lieu of cash. The number of shares of our common stockissued to each director who elects to have a portion of their Retainer Fees paid in shares in lieu of cash is determined bydividing the applicable dollar amount of such portion by the closing sales price per share of our common stock on the lasttrading day of the quarter. Any portion of the Retainer Fees paid in cash will be paid to the director following the close of thecalendar quarter for which such Retainer Fees were earned. Under the Director Plan, members of the board of directors whoelect to receive the Retainer Fees in the form of shares may also elect to defer the receipt of the Retainer Fees until a later date.The maximum aggregate number of shares of our common stock that may be issued under the Director Plan is 125,000 shares,of which 44,655 shares were available to be issued under the plan as of December 31, 2019. The board of directors willadminister the Director Plan and has the authority to make certain equitable adjustments under the Director Plan in the event ofcertain corporate transactions.
Stock-based compensation expense relates to awards to employees, directors and consultants of Exterran Corporation. Weaccount for forfeitures as they occur rather than applying an estimated forfeiture rate. The following table presents the stock-based compensation expense included in our results of operations (in thousands):
Years Ended December 31,2019 2018 2017
Stock options $ — $ — $ 21Restricted stock, restricted stock units, performance units, cash settledrestricted stock units and cash settled performance units 13,325 14,088 14,685Restructuring and other charges—stock-based compensation expense — — 662Total stock-based compensation expense $ 13,325 $ 14,088 $ 15,368

Stock Options
Stock options are granted at fair market value at the grant date, are exercisable according to the vesting schedule establishedand generally expire no later than 10 years after the grant date. Stock options generally vest one-third per year on each of thefirst three anniversaries of the grant date. There were no stock options granted during the years ended December 31, 2019, 2018and 2017.
The table below presents the changes in stock option awards for our common stock during the year ended December 31, 2019.
Stock Options
(in thousands)
Weighted Average
Exercise Price Per Share
Weighted Average
Remaining Life
(in years)
Aggregate Intrinsic
Value (in thousands)
Options outstanding, January 1, 2019 74 $ 25.81Granted — —Exercised — —Cancelled (5) 32.49
Options outstanding, December 31, 2019 69 25.33 0.6 $ —Options exercisable, December 31, 2019 69 25.33 0.6 —
Intrinsic value is the difference between the market value of our common stock and the exercise price of each stock optionmultiplied by the number of stock options outstanding for those stock options where the market value exceeds their exerciseprice.
Restricted Stock, Restricted Stock Units and Performance Units
For grants of restricted stock, restricted stock units and performance units, we recognize compensation expense over theapplicable vesting period equal to the fair value of our common stock at the grant date. Grants of restricted stock, restrictedstock units and performance units generally vest one-third per year on each of the first three anniversaries of the grant date.Certain grants of restricted stock vest on the third anniversary of the grant date and certain grants of performance units vest onthe second anniversary of the grant date.
The table below presents the changes in restricted stock, restricted stock units and performance units for our common stockduring the year ended December 31, 2019.
Shares (in thousands)
Weighted Average
Grant-Date Fair Value Per Share
Non-vested awards, January 1, 2019 1,044 $ 25.89Granted 837 16.80Vested (541) 23.24Cancelled (1) (498) 18.74
Non-vested awards, December 31, 2019 842 22.79
(1) During the year ended December 31, 2019, 318,216 performance units were cancelled and presented within our balancesheets as liabilities due to their expected cash settlement.
As of December 31, 2019, we estimate $11.1 million of unrecognized compensation cost related to unvested restricted stock,restricted stock units and performance units issued to our employees to be recognized over the weighted-average vesting periodof 1.5 years.
F-38

Note 19. Net Income (Loss) Per Common Share
Basic net income (loss) per common share is computed using the two-class method, which is an earnings allocation formulathat determines net income (loss) per share for each class of common stock and participating security according to dividendsdeclared and participation rights in undistributed earnings. Under the two-class method, basic net income (loss) per commonshare is determined by dividing net income (loss) after deducting amounts allocated to participating securities, by the weightedaverage number of common shares outstanding for the period. Participating securities include unvested restricted stock andrestricted stock units that have non-forfeitable rights to receive dividends or dividend equivalents, whether paid or unpaid.During periods of net loss from continuing operations, no effect is given to participating securities because they do not have acontractual obligation to participate in our losses.
Diluted net income (loss) per common share is computed using the weighted average number of common shares outstandingadjusted for the incremental common stock equivalents attributed to outstanding options to purchase common stock and non-participating restricted stock units, unless their effect would be anti-dilutive.
The following table presents a reconciliation of basic and diluted net income (loss) per common share for the years endedDecember 31, 2019, 2018 and 2017 (in thousands, except per share data):
Years Ended December 31,2019 2018 2017
Numerator for basic and diluted net income (loss) per common share:Income (loss) from continuing operations $ (108,863) $ 392 $ (5,856)Income from discontinued operations, net of tax 6,486 24,462 39,736Less: Net income attributable to participating securities — (641) —Net income (loss) — used in basic and diluted net income (loss) percommon share $ (102,377) $ 24,213 $ 33,880
Weighted average common shares outstanding including participatingsecurities 35,040 36,371 35,961
Less: Weighted average participating securities outstanding (757) (938) (1,002)Weighted average common shares outstanding — used in basic net income(loss) per common share 34,283 35,433 34,959Net dilutive potential common shares issuable:
On exercise of options and vesting of restricted stock units * 56 *Weighted average common shares outstanding — used in diluted netincome (loss) per common share 34,283 35,489 34,959
Net income (loss) per common share:Basic $ (2.99) $ 0.68 $ 0.97Diluted $ (2.99) $ 0.68 $ 0.97
* Excluded from diluted net income (loss) per common share as their inclusion would have been anti-dilutive.
The following table shows the potential shares of common stock issuable for the years ended December 31, 2019, 2018 and2017 that were excluded from computing diluted net income (loss) per common share as their inclusion would have been anti-dilutive (in thousands):
Years Ended December 31,2019 2018 2017
Net dilutive potential common shares issuable:On exercise of options where exercise price is greater than averagemarket value for the period 70 35 43On exercise of options and vesting of restricted stock units — — 81
Net dilutive potential common shares issuable 70 35 124
F-39
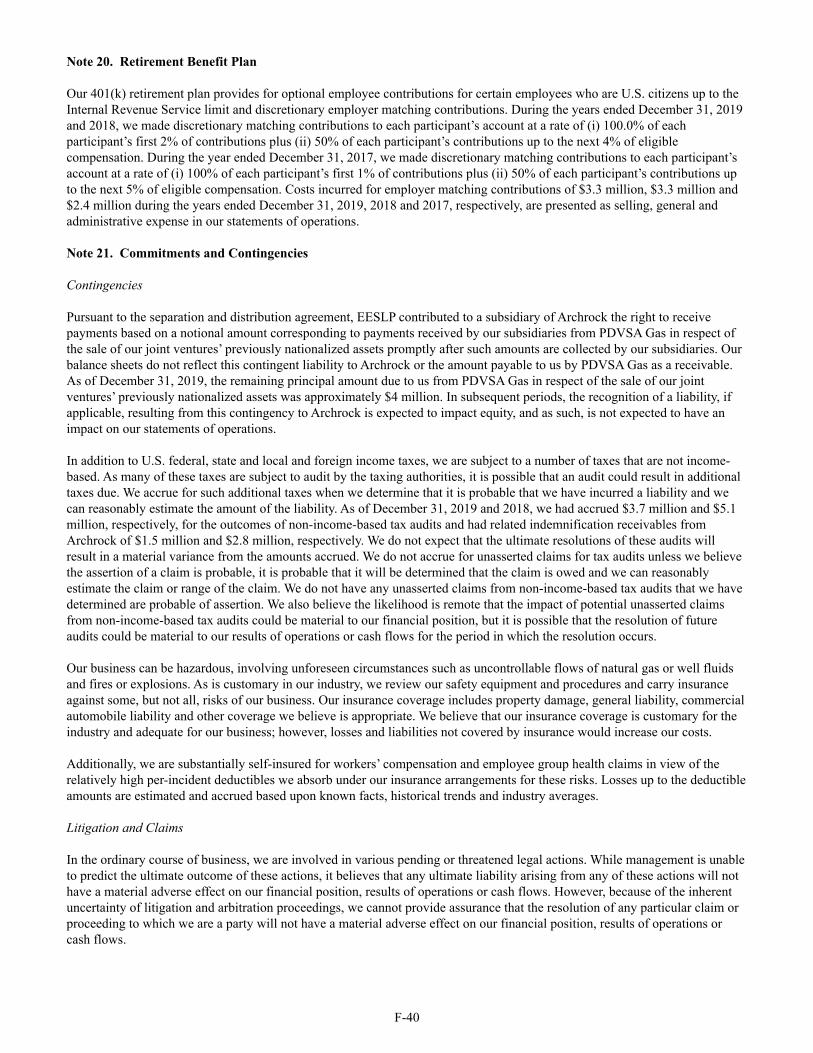
Note 20. Retirement Benefit Plan
Our 401(k) retirement plan provides for optional employee contributions for certain employees who are U.S. citizens up to theInternal Revenue Service limit and discretionary employer matching contributions. During the years ended December 31, 2019and 2018, we made discretionary matching contributions to each participant’s account at a rate of (i) 100.0% of eachparticipant’s first 2% of contributions plus (ii) 50% of each participant’s contributions up to the next 4% of eligiblecompensation. During the year ended December 31, 2017, we made discretionary matching contributions to each participant’saccount at a rate of (i) 100% of each participant’s first 1% of contributions plus (ii) 50% of each participant’s contributions upto the next 5% of eligible compensation. Costs incurred for employer matching contributions of $3.3 million, $3.3 million and$2.4 million during the years ended December 31, 2019, 2018 and 2017, respectively, are presented as selling, general andadministrative expense in our statements of operations.
F-40
Note 21. Commitments and Contingencies
Contingencies
Pursuant to the separation and distribution agreement, EESLP contributed to a subsidiary of Archrock the right to receivepayments based on a notional amount corresponding to payments received by our subsidiaries from PDVSA Gas in respect ofthe sale of our joint ventures’ previously nationalized assets promptly after such amounts are collected by our subsidiaries. Ourbalance sheets do not reflect this contingent liability to Archrock or the amount payable to us by PDVSA Gas as a receivable.As of December 31, 2019, the remaining principal amount due to us from PDVSA Gas in respect of the sale of our jointventures’ previously nationalized assets was approximately $4 million. In subsequent periods, the recognition of a liability, ifapplicable, resulting from this contingency to Archrock is expected to impact equity, and as such, is not expected to have animpact on our statements of operations.
In addition to U.S. federal, state and local and foreign income taxes, we are subject to a number of taxes that are not income-based. As many of these taxes are subject to audit by the taxing authorities, it is possible that an audit could result in additionaltaxes due. We accrue for such additional taxes when we determine that it is probable that we have incurred a liability and wecan reasonably estimate the amount of the liability. As of December 31, 2019 and 2018, we had accrued $3.7 million and $5.1million, respectively, for the outcomes of non-income-based tax audits and had related indemnification receivables fromArchrock of $1.5 million and $2.8 million, respectively. We do not expect that the ultimate resolutions of these audits willresult in a material variance from the amounts accrued. We do not accrue for unasserted claims for tax audits unless we believethe assertion of a claim is probable, it is probable that it will be determined that the claim is owed and we can reasonablyestimate the claim or range of the claim. We do not have any unasserted claims from non-income-based tax audits that we havedetermined are probable of assertion. We also believe the likelihood is remote that the impact of potential unasserted claimsfrom non-income-based tax audits could be material to our financial position, but it is possible that the resolution of futureaudits could be material to our results of operations or cash flows for the period in which the resolution occurs.
Our business can be hazardous, involving unforeseen circumstances such as uncontrollable flows of natural gas or well fluidsand fires or explosions. As is customary in our industry, we review our safety equipment and procedures and carry insuranceagainst some, but not all, risks of our business. Our insurance coverage includes property damage, general liability, commercialautomobile liability and other coverage we believe is appropriate. We believe that our insurance coverage is customary for theindustry and adequate for our business; however, losses and liabilities not covered by insurance would increase our costs.
Additionally, we are substantially self-insured for workers’ compensation and employee group health claims in view of therelatively high per-incident deductibles we absorb under our insurance arrangements for these risks. Losses up to the deductibleamounts are estimated and accrued based upon known facts, historical trends and industry averages.
Litigation and Claims
In the ordinary course of business, we are involved in various pending or threatened legal actions. While management is unableto predict the ultimate outcome of these actions, it believes that any ultimate liability arising from any of these actions will nothave a material adverse effect on our financial position, results of operations or cash flows. However, because of the inherentuncertainty of litigation and arbitration proceedings, we cannot provide assurance that the resolution of any particular claim orproceeding to which we are a party will not have a material adverse effect on our financial position, results of operations orcash flows.

Contemporaneously with filing the Form 8-K on April 26, 2016, we self-reported the errors and possible irregularities at BelleliEPC to the SEC. On April 8, 2019, the SEC provided written notice to us stating that based on the information they have as ofthis date, they have concluded their investigation and do not intend to recommend enforcement action against us in connectionwith this matter.
Indemnifications
In conjunction with, and effective as of the completion of, the Spin-off, we entered into the separation and distributionagreement with Archrock, which governs, among other things, the treatment between Archrock and us relating to certainaspects of indemnification, insurance, confidentiality and cooperation. Generally, the separation and distribution agreementprovides for cross-indemnities principally designed to place financial responsibility for the obligations and liabilities of ourbusiness with us and financial responsibility for the obligations and liabilities of Archrock’s business with Archrock. Pursuantto the agreement, we and Archrock will generally release the other party from all claims arising prior to the Spin-off that relateto the other party’s business, subject to certain exceptions. Additionally, in conjunction with, and effective as of the completionof, the Spin-off, we entered into the tax matters agreement with Archrock. Under the tax matters agreement and subject tocertain exceptions, we are generally liable for, and indemnify Archrock against, taxes attributable to our business, and Archrockis generally liable for, and indemnify us against, all taxes attributable to its business. We are generally liable for, and indemnifyArchrock against, 50% of certain taxes that are not clearly attributable to our business or Archrock’s business. Any paymentmade by us to Archrock, or by Archrock to us, is treated by all parties for tax purposes as a nontaxable distribution or capitalcontribution, respectively, made immediately prior to the Spin-off.
F-41
Note 22. Reportable Segments and Geographic Information
Our chief operating decision maker manages business operations, evaluates performance and allocates resources based uponthe type of product or service provided. We have three reportable segments: contract operations, aftermarket services andproduct sales. In our contract operations segment, we provide compression, processing, treating and water treatment servicesthrough the operation of our natural gas compression equipment, crude oil and natural gas production and process equipmentand water treatment equipment for our customers. In our aftermarket services segment, we sell parts and components andprovide operations, maintenance, repair, overhaul, upgrade, startup and commissioning and reconfiguration services tocustomers who own their own oil and natural gas compression, production, processing, treating and related equipment. In ourproduct sales segment, we design, engineer, manufacture, install and sell natural gas compression packages as well asequipment used in the treating and processing of crude oil, natural gas and water to our customers throughout the world and foruse in our contract operations business line.
We evaluate the performance of our segments based on gross margin for each segment. Revenue only includes sales to externalcustomers. We do not include intersegment sales when we evaluate our segments’ performance.
During the year ended December 31, 2019, XTO Energy Inc. and Basrah Gas Company accounted for approximately 21% and12% of our total revenue, respectively. During the year ended December 31, 2018, MPLX LP accounted for approximately15% of our total revenue and during the year ended December 31, 2017, Archrock accounted for approximately 12% of ourtotal revenue. No other customer accounted for more than 10% of our total revenue in 2019, 2018 and 2017.

The following table presents revenue and other financial information by reportable segment for the years ended December 31,2019, 2018 and 2017 (in thousands):
ContractOperations
AftermarketServices Product Sales
ReportableSegments
Total Other (1) Total (2)
2019:Revenue $ 368,126 $ 129,217 $ 820,097 $ 1,317,440 $ — $ 1,317,440Gross margin (3) 239,963 33,610 89,649 363,222 — 363,222Total assets 816,625 26,456 142,461 985,542 425,160 1,410,702Capital expenditures 176,663 386 12,562 189,611 3,663 193,274
2018:Revenue $ 360,973 $ 120,676 $ 879,207 $ 1,360,856 $ — $ 1,360,856Gross margin (3) 238,835 31,010 113,583 383,428 — 383,428Total assets 860,896 28,071 205,302 1,094,269 459,519 1,553,788Capital expenditures 197,025 474 7,552 205,051 10,057 215,108
2017:Revenue $ 375,269 $ 107,063 $ 732,962 $ 1,215,294 $ — $ 1,215,294Gross margin (3) 241,889 28,842 76,409 347,140 — 347,140Total assets 783,340 22,882 139,454 945,676 487,680 1,433,356Capital expenditures 123,842 339 2,712 126,893 4,780 131,673
(1) Includes corporate related items.(2) Totals exclude assets, capital expenditures and the operating results of discontinued operations.(3) Gross margin is defined as revenue less cost of sales (excluding depreciation and amortization expense).
The following table presents assets from reportable segments reconciled to total assets as of December 31, 2019 and 2018 (inthousands):
December 31,2019 2018
Assets from reportable segments $ 985,542 $ 1,094,269Other assets (1) 425,160 459,519Assets associated with discontinued operations 7,302 13,266
Total assets $ 1,418,004 $ 1,567,054
(1) Includes corporate related items.
F-42

The following tables present geographic data by country as of and for the years ended December 31, 2019, 2018 and 2017 (inthousands):
Years Ended December 31,2019 2018 2017
Revenue:U.S. $ 631,524 $ 789,528 $ 648,290Argentina 125,333 139,987 156,340Brazil 74,017 94,619 98,419Iraq 177,100 58,715 8,091Mexico 73,945 68,745 75,388Other international 235,521 209,262 228,766
Total $ 1,317,440 $ 1,360,856 $ 1,215,294
December 31,2019 2018 2017
Property, plant and equipment, net:U.S. $ 83,127 $ 112,420 $ 76,562Argentina 178,006 197,669 219,840Bolivia 141,776 81,957 42,598Brazil 84,676 105,979 138,835Mexico 68,142 121,312 148,405Oman 201,880 174,165 110,115Other international 86,803 108,075 85,924
Total $ 844,410 $ 901,577 $ 822,279
The following table reconciles income (loss) before income taxes to total gross margin (in thousands):
Years Ended December 31,2019 2018 2017
Income (loss) before income taxes $ (83,573) $ 39,825 $ 16,839Selling, general and administrative 164,314 178,401 176,318Depreciation and amortization 162,557 123,922 107,824Impairments 74,373 3,858 5,700Restatement related charges (recoveries), net 48 (276) 3,419Restructuring and other charges 8,712 1,997 3,189Interest expense 38,620 29,217 34,826Other (income) expense, net (1,829) 6,484 (975)
Total gross margin $ 363,222 $ 383,428 $ 347,140
F-43
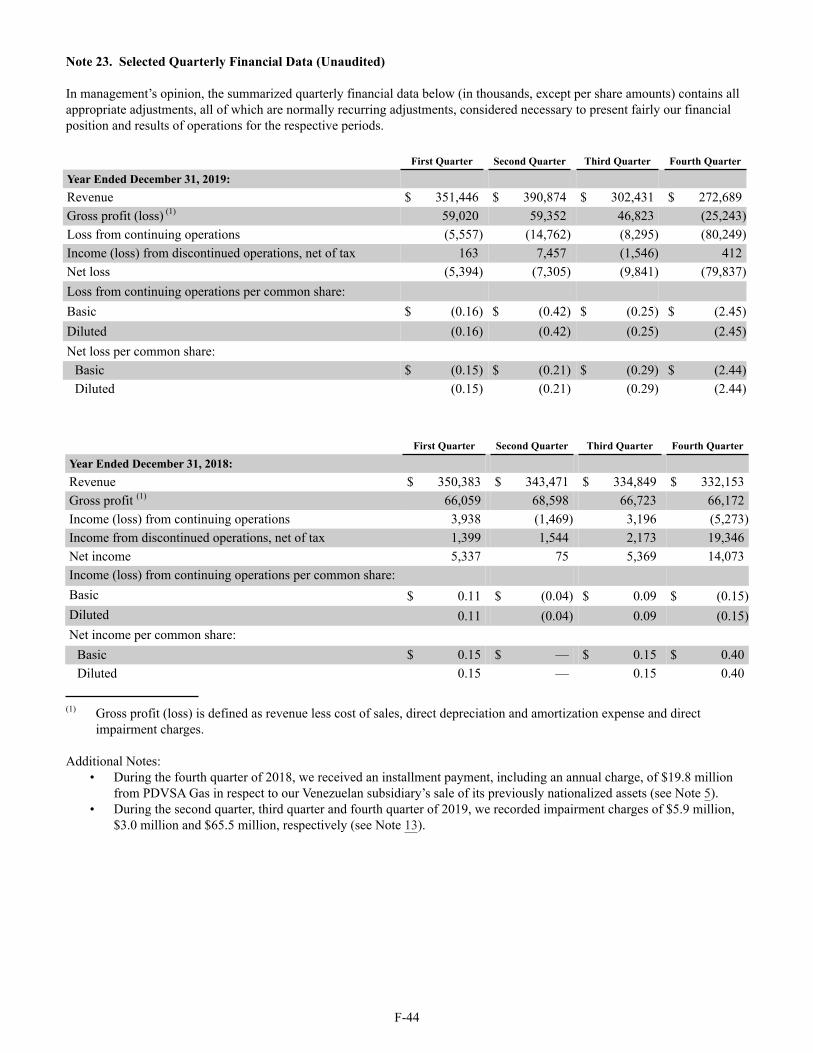
Note 23. Selected Quarterly Financial Data (Unaudited)
In management’s opinion, the summarized quarterly financial data below (in thousands, except per share amounts) contains allappropriate adjustments, all of which are normally recurring adjustments, considered necessary to present fairly our financialposition and results of operations for the respective periods.
First Quarter Second Quarter Third Quarter Fourth Quarter
Year Ended December 31, 2019:Revenue $ 351,446 $ 390,874 $ 302,431 $ 272,689Gross profit (loss) (1) 59,020 59,352 46,823 (25,243)Loss from continuing operations (5,557) (14,762) (8,295) (80,249)Income (loss) from discontinued operations, net of tax 163 7,457 (1,546) 412Net loss (5,394) (7,305) (9,841) (79,837)Loss from continuing operations per common share:Basic $ (0.16) $ (0.42) $ (0.25) $ (2.45)Diluted (0.16) (0.42) (0.25) (2.45)Net loss per common share:
Basic $ (0.15) $ (0.21) $ (0.29) $ (2.44)Diluted (0.15) (0.21) (0.29) (2.44)
First Quarter Second Quarter Third Quarter Fourth Quarter
Year Ended December 31, 2018:Revenue $ 350,383 $ 343,471 $ 334,849 $ 332,153Gross profit (1) 66,059 68,598 66,723 66,172Income (loss) from continuing operations 3,938 (1,469) 3,196 (5,273)Income from discontinued operations, net of tax 1,399 1,544 2,173 19,346Net income 5,337 75 5,369 14,073Income (loss) from continuing operations per common share:Basic $ 0.11 $ (0.04) $ 0.09 $ (0.15)Diluted 0.11 (0.04) 0.09 (0.15)Net income per common share:
Basic $ 0.15 $ — $ 0.15 $ 0.40Diluted 0.15 — 0.15 0.40
(1) Gross profit (loss) is defined as revenue less cost of sales, direct depreciation and amortization expense and directimpairment charges.
Additional Notes:• During the fourth quarter of 2018, we received an installment payment, including an annual charge, of $19.8 million
from PDVSA Gas in respect to our Venezuelan subsidiary’s sale of its previously nationalized assets (see Note 5). • During the second quarter, third quarter and fourth quarter of 2019, we recorded impairment charges of $5.9 million,
$3.0 million and $65.5 million, respectively (see Note 13).
F-44

Note 24. Supplemental Guarantor Financial Information
In April 2017, our 100% owned subsidiaries EESLP and EES Finance Corp. (together, the “Issuers”) issued the 2017 Notes,which consists of $375.0 million aggregate principal amount senior unsecured notes. The 2017 Notes are fully andunconditionally guaranteed on a joint and several senior unsecured basis by Exterran Corporation (the “Parent Guarantor” or“Parent”). All other consolidated subsidiaries of Exterran are collectively referred to as the “Non-Guarantor Subsidiaries.” As aresult of the Parent’s guarantee, we are presenting the following condensed consolidating financial information pursuant toRule 3-10 of Regulation S-X, Financial Statements of Guarantors and Issuers of Guaranteed Securities Registered or BeingRegistered. These schedules are presented using the equity method of accounting for all periods presented. For purposes of thefollowing condensed consolidating financial information, the Parent Guarantor’s investments in its subsidiaries, the Issuers’investments in the Non-Guarantors Subsidiaries and the Non-Guarantor Subsidiaries’ investments in the Issuers are accountedfor under the equity method of accounting. Under this method, investments in subsidiaries are recorded at cost and adjusted forour share in the subsidiaries’ cumulative results of operations, capital contributions and distributions and other changes inequity. Elimination entries relate primarily to the elimination of investments in subsidiaries and associated intercompanybalances and transactions.
F-45

Condensed Consolidating Balance SheetDecember 31, 2019
(In thousands)
Non-Guarantor
SubsidiariesParent
Guarantor Issuers Eliminations ConsolidationASSETS
Cash and cash equivalents $ 149 $ 643 $ 15,891 $ — $ 16,683
Restricted cash — — 19 — 19
Accounts receivable, net — 57,831 144,506 — 202,337
Inventory, net — 77,093 66,445 — 143,538
Contract assets — 29,594 16,943 — 46,537
Intercompany receivables — 224,680 399,645 (624,325) —
Other current assets — 10,472 12,005 — 22,477
Current assets associated with discontinued operations — — 4,332 — 4,332
Total current assets 149 400,313 659,786 (624,325) 435,923
Property, plant and equipment, net — 196,693 647,717 — 844,410
Operating lease right-of-use assets — 10,806 15,977 — 26,783
Investment in affiliates 456,420 855,145 (398,725) (912,840) —
Deferred income taxes — 2,838 11,156 — 13,994
Intangible and other assets, net — 38,771 54,529 — 93,300
Long-term assets held for sale — 624 — — 624
Long-term assets associated with discontinued operations — — 2,970 — 2,970
Total assets $ 456,569 $ 1,505,190 $ 993,410 $ (1,537,165) $ 1,418,004
LIABILITIES AND EQUITY
Accounts payable, trade $ — $ 71,382 $ 52,062 $ — $ 123,444
Accrued liabilities — 33,556 70,525 — 104,081
Contract liabilities — 46,387 36,467 — 82,854
Current operating lease liabilities — 1,971 4,297 — 6,268
Intercompany payables 47,031 399,645 177,649 (624,325) —
Current liabilities associated with discontinuedoperations — — 9,998 — 9,998
Total current liabilities 47,031 552,941 350,998 (624,325) 326,645
Long-term debt — 443,587 — — 443,587
Deferred income taxes — 445 548 — 993
Long-term contract liabilities — 19,980 136,282 — 156,262
Long-term operating lease liabilities — 20,054 10,904 — 30,958
Other long-term liabilities — 11,763 37,500 — 49,263
Long-term liabilities associated with discontinuedoperations — — 758 — 758
Total liabilities 47,031 1,048,770 536,990 (624,325) 1,008,466Total equity 409,538 456,420 456,420 (912,840) 409,538
Total liabilities and equity $ 456,569 $ 1,505,190 $ 993,410 $ (1,537,165) $ 1,418,004
F-46
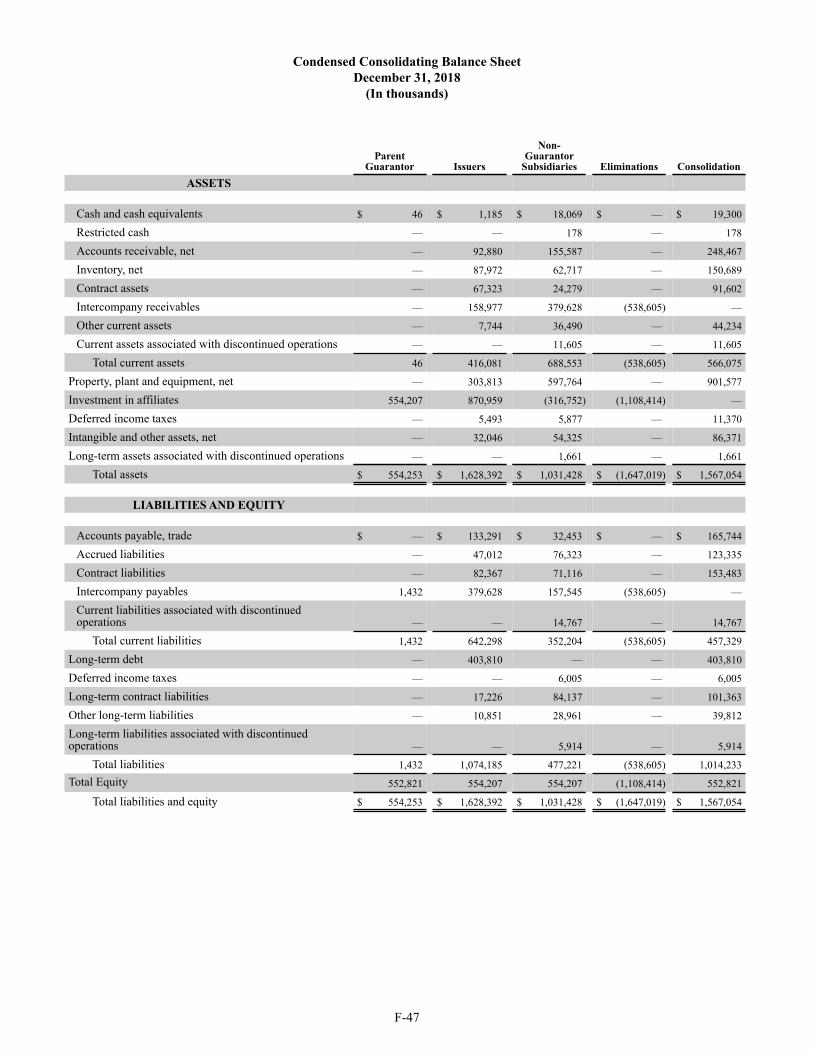
Condensed Consolidating Balance SheetDecember 31, 2018
(In thousands)
Non-Guarantor
SubsidiariesParent
Guarantor Issuers Eliminations ConsolidationASSETS
Cash and cash equivalents $ 46 $ 1,185 $ 18,069 $ — $ 19,300
Restricted cash — — 178 — 178
Accounts receivable, net — 92,880 155,587 — 248,467
Inventory, net — 87,972 62,717 — 150,689
Contract assets — 67,323 24,279 — 91,602
Intercompany receivables — 158,977 379,628 (538,605) —
Other current assets — 7,744 36,490 — 44,234
Current assets associated with discontinued operations — — 11,605 — 11,605
Total current assets 46 416,081 688,553 (538,605) 566,075
Property, plant and equipment, net — 303,813 597,764 — 901,577
Investment in affiliates 554,207 870,959 (316,752) (1,108,414) —
Deferred income taxes — 5,493 5,877 — 11,370
Intangible and other assets, net — 32,046 54,325 — 86,371
Long-term assets associated with discontinued operations — — 1,661 — 1,661
Total assets $ 554,253 $ 1,628,392 $ 1,031,428 $ (1,647,019) $ 1,567,054
LIABILITIES AND EQUITY
Accounts payable, trade $ — $ 133,291 $ 32,453 $ — $ 165,744
Accrued liabilities — 47,012 76,323 — 123,335
Contract liabilities — 82,367 71,116 — 153,483
Intercompany payables 1,432 379,628 157,545 (538,605) —
Current liabilities associated with discontinuedoperations — — 14,767 — 14,767
Total current liabilities 1,432 642,298 352,204 (538,605) 457,329
Long-term debt — 403,810 — — 403,810
Deferred income taxes — — 6,005 — 6,005
Long-term contract liabilities — 17,226 84,137 — 101,363
Other long-term liabilities — 10,851 28,961 — 39,812
Long-term liabilities associated with discontinuedoperations — — 5,914 — 5,914
Total liabilities 1,432 1,074,185 477,221 (538,605) 1,014,233Total Equity 552,821 554,207 554,207 (1,108,414) 552,821
Total liabilities and equity $ 554,253 $ 1,628,392 $ 1,031,428 $ (1,647,019) $ 1,567,054
F-47

Condensed Consolidating Statement of Operations and Comprehensive LossYear Ended December 31, 2019
(In thousands)
Non-Guarantor
SubsidiariesParent
Guarantor Issuers Eliminations Consolidation
Revenues $ — $ 815,456 $ 604,625 $ (102,641) $ 1,317,440
Cost of sales (excluding depreciation and amortizationexpense) — 671,266 385,593 (102,641) 954,218
Selling, general and administrative 1,216 74,260 88,838 — 164,314
Depreciation and amortization — 60,814 101,743 — 162,557
Impairments — 56,939 17,434 — 74,373
Restatement related recoveries, net — 48 — — 48
Restructuring and other charges — 4,732 3,980 — 8,712
Interest expense — 38,330 290 — 38,620
Intercompany charges, net — 3,028 (3,028) — —
Equity in loss of affiliates 101,161 6,635 94,526 (202,322) —
Other (income) expense, net — (6,812) 4,983 — (1,829)
Loss before income taxes (102,377) (93,784) (89,734) 202,322 (83,573)
Provision for income taxes — 7,377 17,913 — 25,290
Loss from continuing operations (102,377) (101,161) (107,647) 202,322 (108,863)
Income from discontinued operations, net of tax — — 6,486 — 6,486
Net loss (102,377) (101,161) (101,161) 202,322 (102,377)
Other comprehensive loss (2,885) (2,885) (2,885) 5,770 (2,885)
Comprehensive loss attributable to Exterran stockholders $ (105,262) $ (104,046) $ (104,046) $ 208,092 $ (105,262)
F-48

Condensed Consolidating Statement of Operations and Comprehensive IncomeYear Ended December 31, 2018
(In thousands)
Non-Guarantor
SubsidiariesParent
Guarantor Issuers Eliminations Consolidation
Revenues $ — $ 927,849 $ 521,879 $ (88,872) $ 1,360,856
Cost of sales (excluding depreciation and amortizationexpense) — 771,731 294,569 (88,872) 977,428
Selling, general and administrative 1,285 86,208 90,908 — 178,401
Depreciation and amortization — 35,754 88,168 — 123,922
Impairments — 3,081 777 — 3,858
Restatement related recoveries, net — (276) — — (276)
Restructuring and other charges — — 1,997 — 1,997
Interest expense — 28,763 454 — 29,217
Intercompany charges, net — 6,647 (6,647) — —
Equity in (income) loss of affiliates (25,986) (32,753) 6,767 51,972 —
Other (income) expense, net (153) (4,625) 11,262 — 6,484
Income before income taxes 24,854 33,319 33,624 (51,972) 39,825
Provision for income taxes — 7,333 32,100 — 39,433
Income from continuing operations 24,854 25,986 1,524 (51,972) 392
Income from discontinued operations, net of tax — — 24,462 — 24,462
Net income 24,854 25,986 25,986 (51,972) 24,854
Other comprehensive loss (7,476) (7,476) (7,476) 14,952 (7,476)
Comprehensive income attributable to Exterranstockholders $ 17,378 $ 18,510 $ 18,510 $ (37,020) $ 17,378
F-49

Condensed Consolidating Statement of Operations and Comprehensive IncomeYear Ended December 31, 2017
(In thousands)
Non-Guarantor
SubsidiariesParent
Guarantor Issuers Eliminations Consolidation
Revenues $ — $ 838,981 $ 495,262 $ (118,949) $ 1,215,294
Cost of sales (excluding depreciation and amortizationexpense) — 716,002 271,101 (118,949) 868,154
Selling, general and administrative 2,327 84,111 89,880 — 176,318
Depreciation and amortization — 35,749 72,075 — 107,824
Impairments — 5,700 — — 5,700
Restatement related charges, net — 3,250 169 — 3,419
Restructuring and other charges — 2,145 1,044 — 3,189
Interest expense — 32,399 2,427 — 34,826
Intercompany charges, net — 6,355 (6,355) — —
Equity in (income) loss of affiliates (36,207) (85,335) 49,128 72,414 —
Other (income) expense, net — (2,577) 1,602 — (975)
Income before income taxes 33,880 41,182 14,191 (72,414) 16,839
Provision for income taxes — 4,974 17,721 — 22,695
Income (loss) from continuing operations 33,880 36,208 (3,530) (72,414) (5,856)
Income from discontinued operations, net of tax — — 39,736 — 39,736
Net income 33,880 36,208 36,206 (72,414) 33,880
Other comprehensive loss (1,801) (1,801) (1,801) 3,602 (1,801)
Comprehensive income attributable to Exterranstockholders $ 32,079 $ 34,407 $ 34,405 $ (68,812) $ 32,079
F-50

Condensed Consolidating Statement of Cash FlowsYear Ended December 31, 2019
(In thousands)
Non-Guarantor
SubsidiariesParent
Guarantor Issuers Eliminations Consolidation
Cash flows from operating activities:Net cash provided by (used in) continuing operations $ (3,222) $ 7,001 $ 172,419 $ — $ 176,198Net cash provided by discontinued operations — — 2,528 — 2,528Net cash provided by (used in) operating activities (3,222) 7,001 174,947 — 178,726
Cash flows from investing activities:Capital expenditures — (77,490) (115,784) — (193,274)Proceeds from sale of property, plant and equipment — 13,076 6,586 — 19,662Intercompany transfers — (45,599) (67,028) 112,627 —Settlement of foreign currency derivatives — (794) — — (794)
Net cash used in investing activities — (110,807) (176,226) 112,627 (174,406)
Cash flows from financing activities:Proceeds from borrowings of debt — 642,500 — — 642,500Repayments of debt — (603,951) — — (603,951)Intercompany transfers 45,599 67,028 — (112,627) —Cash transfer from Archrock, Inc. — 420 — — 420Purchases of treasury stock (42,274) (2,733) — — (45,007)
Net cash provided by (used in) financing activities 3,325 103,264 — (112,627) (6,038)
Effect of exchange rate changes on cash, cash equivalentsand restricted cash — — (1,058) — (1,058)Net increase (decrease) in cash, cash equivalents andrestricted cash 103 (542) (2,337) — (2,776)Cash, cash equivalents and restricted cash at beginning ofperiod 46 1,185 18,247 — 19,478Cash, cash equivalents and restricted cash at end of period $ 149 $ 643 $ 15,910 $ — $ 16,702
F-51

Condensed Consolidating Statement of Cash FlowsYear Ended December 31, 2018
(In thousands)
Non-Guarantor
SubsidiariesParent
Guarantor Issuers Eliminations Consolidation
Cash flows from operating activities:Net cash provided by (used in) continuing operations $ (494) $ 21,192 $ 132,598 $ — $ 153,296Net cash provided by discontinued operations — — 4,004 — 4,004Net cash provided by (used in) operating activities (494) 21,192 136,602 — 157,300
Cash flows from investing activities:Capital expenditures — (91,027) (124,081) — (215,108)Proceeds from sale of property, plant and equipment — 106 2,424 — 2,530Proceeds from sale of business — 5,000 — — 5,000Intercompany transfers — (143) (34,965) 35,108 —
Net cash used in continuing operations — (86,064) (156,622) 35,108 (207,578)Net cash provided by discontinued operations — — 17,009 — 17,009Net cash used in investing activities — (86,064) (139,613) 35,108 (190,569)
Cash flows from financing activities:Proceeds from borrowings of debt — 585,014 — — 585,014Repayments of debt — (550,497) — — (550,497)Intercompany transfers 143 34,965 — (35,108) —Cash transfer to Archrock, Inc. — (18,744) — — (18,744)Payments for debt issuance costs — (4,801) — — (4,801)Proceeds from stock options exercised — 548 — — 548Purchases of treasury stock — (4,623) — — (4,623)
Net cash provided by financing activities 143 41,862 — (35,108) 6,897
Effect of exchange rate changes on cash, cash equivalentsand restricted cash — — (3,841) — (3,841)Net decrease in cash, cash equivalents and restricted cash (351) (23,010) (6,852) — (30,213)Cash, cash equivalents and restricted cash at beginning ofperiod 397 24,195 25,099 — 49,691Cash, cash equivalents and restricted cash at end of period $ 46 $ 1,185 $ 18,247 $ — $ 19,478
F-52

Condensed Consolidating Statement of Cash FlowsYear Ended December 31, 2017
(In thousands)
Non-Guarantor
SubsidiariesParent
Guarantor Issuers Eliminations Consolidation
Cash flows from operating activities:Net cash provided by (used in) continuing operations $ (476) $ 74,003 $ 76,893 $ — $ 150,420Net cash used in discontinued operations — — (1,794) — (1,794)Net cash provided by (used in) operating activities (476) 74,003 75,099 — 148,626
Cash flows from investing activities:Capital expenditures — (54,527) (77,146) — (131,673)Proceeds from sale of property, plant and equipment — 3,809 5,057 — 8,866Proceeds from sale of business — 894 — — 894Intercompany transfers — (742) (16,267) 17,009 —
Net cash used in continuing operations — (50,566) (88,356) 17,009 (121,913)Net cash provided by discontinued operations — — 19,575 — 19,575Net cash used in investing activities — (50,566) (68,781) 17,009 (102,338)
Cash flows from financing activities:Proceeds from borrowings of debt — 501,088 — — 501,088Repayments of debt — (476,503) — — (476,503)Intercompany transfers 742 16,267 — (17,009) —Cash transfer to Archrock, Inc. — (44,720) — — (44,720)Payments for debt issuance costs — (7,911) — — (7,911)Proceeds from stock options exercised — 684 — — 684Purchases of treasury stock — (4,792) — — (4,792)
Net cash provided by (used in) financing activities 742 (15,887) — (17,009) (32,154)
Effect of exchange rate changes on cash, cash equivalentsand restricted cash — — (792) — (792)Net increase in cash, cash equivalents and restricted cash 266 7,550 5,526 — 13,342Cash, cash equivalents and restricted cash at beginning ofperiod 131 16,645 19,573 — 36,349Cash, cash equivalents and restricted cash at end of period $ 397 $ 24,195 $ 25,099 $ — $ 49,691
F-53

EXTERRAN CORPORATIONSCHEDULE II
VALUATION AND QUALIFYING ACCOUNTS(In thousands)
Description
Balance at Beginning of Period
Charged to Costs and Expenses Deductions
Balance at End of Period
Allowance for doubtful accounts deducted fromaccounts receivable in the balance sheets
December 31, 2019 $ 5,474 $ 32 $ (513) (1) $ 6,019December 31, 2018 5,388 86 — 5,474December 31, 2017 5,383 863 858 (1) 5,388
Allowance for obsolete and slow moving inventorydeducted from inventories in the balance sheets
December 31, 2019 $ 10,046 $ 1,680 $ 1,639 (2) $ 10,087December 31, 2018 10,351 87 392 (2) 10,046December 31, 2017 12,877 1,276 3,802 (2) 10,351
Allowance for deferred tax assets not expected to berealized
December 31, 2019 $ 200,105 $ 23,560 $ 10,631 (3) $ 213,034December 31, 2018 222,049 12,648 34,592 (3) 200,105December 31, 2017 276,230 4,343 58,524 (3) 222,049
(1) Uncollectible accounts written off, net of recoveries.(2) Obsolete inventory written off at cost, net of value received.(3) Reflects expected realization of deferred tax assets and amounts credited to other accounts for stock-based compensation
excess tax benefits, expiring net operating losses, changes in tax rates and changes in currency exchange rates.
S-1

[This page intentionally left blank]

[This page intentionally left blank]

DIRECTORS
Mark R. Sotir Executive Chairman of the Board Andrew J. Way President and Chief Executive Officer
William M. Goodyear James C. Gouin John P. Ryan
Hatem Soliman Christopher T. Seaver Ieda Gomes Yell
EXECUTIVE OFFICERS
Mark R. Sotir Executive Chairman of the Board Andrew J. Way President and Chief Executive Officer Girish K. Saligram Senior Vice President and Chief Operating Officer
David A. Barta Senior Vice President, Chief Financial Officer and Chief Accounting Officer Roger George Senior Vice President and President Global Water Solutions
Valerie L. Banner Senior Vice President, General Counsel and Corporate Secretary Tara Wineinger Vice President and Chief Human Resources Officer
INVESTOR INFORMATION
Corporate Headquarters 11000 Equity Drive Houston, Texas 77041 Corporate Website Additional information on Exterran, including securities filings, press releases, Code of Conduct, Corporate Governance Principles and Board Committee Charters is available on our website at www.exterran.com. Annual Meeting The 2020 Annual Meeting will be held May 8, 2020, at 8:30 a.m. Central Daylight Time at Exterran’s Corporate Headquarters Stock Exchange New York Stock Exchange Ticker Symbol: EXTN Transfer Agent and Registrar American Stock Transfer and Trust Company, LLC 6201 15th Avenue Brooklyn, New York 11219 USA (800) 937-5449 or (718) 921-8124
Independent Public Accounting Firm PricewaterhouseCoopers LLP Houston, Texas USA Form 10-K and Investor Contact This Annual Report includes Exterran Corporation’s 2019 Annual Report on Form 10-K filed with the U.S. Securities and Exchange Commission in February 2020. The 2019 Form 10-K can be viewed at www.exterran.com, and is available without charge upon request in writing to [email protected] or to Investor Relations, 11000 Equity Drive, Houston, Texas, 77041. The certifications by our Chief Executive Officer and Chief Financial Officer pursuant to Section 302 of the Sarbanes-Oxley Act of 2002 are filed as exhibits to our 2019 Form 10-K. We have also filed with the New York Stock Exchange the written affirmation certifying that we are not aware of any violations by Exterran of NYSE Corporate Governance Listing Standards.
Board of Directors Contact To report a concern about Exterran’s accounting, internal controls or auditing matters, or any other matter, to the Audit Committee or independent members of the Board of Directors, send a detailed note, with relevant documents, to Exterran’s Corporate Headquarters, Attention: Mark R. Sotir, Executive Chairman, or leave a message at 1-800-281-5439 (U.S. and Canada), or 1-832-554-4859 (outside U.S. and Canada) request reverse charges. www.exterranethicshelpline.com Forward-Looking Statements Certain statements contained in this Annual Report may constitute forward-looking statements within the meaning of the Private Securities Litigation Reform Act of 1995. These statements involve a number of risks, uncertainties and other factors that could cause actual results to be materially different, as discussed more fully elsewhere in this Annual Report and in our filings with the Securities and Exchange Commission, including our 2019 Form 10-K filed on February 28, 2020. Except as required by law, we expressly disclaim any intention or obligation to revise or update any forward looking statements whether as a result of new information, future or otherwise.

——— A LEADING PROCESS AND SYSTEMS COMPANY ———
Exterran Corporation
www.exterran.com 11000 Equity Drive / Houston, Texas 77041
Published March 2020
© 2019 Exterran Corporation all rights reserved
Printed on recycled paper