NYSE_BAC_2013.pdf - AnnualReports.com
284
Bank of America Corporation 2013 Annual Report New New York Charl Charlotte s An Los Angeles ston Houston go Chicago Boston Phoenix London Johannesburg Johannesburg Syd Sydney Hong Hong Kong Wherever we do business, our success depends on understanding what’s important to our customers and clients and connecting them to what they need to help make their financial lives better. Life’s better when we’re connected ™
-
Upload
khangminh22 -
Category
Documents
-
view
0 -
download
0
Transcript of NYSE_BAC_2013.pdf - AnnualReports.com

Bank of America Corporation 2013 Annual Report
New
Yor
kN
ew Y
ork
Char
lott
eCh
arlo
tte
Los
Ange
les
Los
Ange
les
Hou
ston
Hou
ston
Chic
ago
Chic
ago
Bost
onPh
oeni
xPh
oeni
xLo
ndon
Lond
onJo
hann
esbu
rgJo
hann
esbu
rgJo
hann
esbu
rgJo
hann
esbu
rgSy
dney
Sydn
eyH
ong
Kong
Hon
g Ko
ng
Wherever we do business, our success depends on understanding what’s important to our customers and clients and connecting them to what they need to help make their financial lives better.
Life’s better when we’re connected™
Please recycle
Bank of America Corporation 2013 Annual Report00-04-1368B 3/2014
Bank of America Corporation 2013 Annual Report
76788ba_cvr.indd 3 3/14/14 1:09 PM

Des
ign:
Seq
uel,
New
Yor
k
Bank of America Corporation (“Bank of America”) is a financial holding company that, through its subsidiaries and affiliated companies, provides banking and non-banking financial services. Global Wealth and Investment Management is a division of Bank of America Corporation (“BAC”). Merrill Lynch, Merrill Edge™, U.S. Trust, Bank of America Merrill Lynch and BofA™ Global Capital Management are affiliated subdivisions within Global Wealth and Investment Management. Merrill Lynch Wealth makes available products and services offered by Merrill Lynch, Pierce, Fenner & Smith Incorporated (“MLPF&S”) and other subsidiaries of BAC. Merrill Edge is available through MLPF&S, and consists of the Merrill Edge Advisory Center (investment guidance) and self-directed online investing. U.S. Trust, Bank of America Private Wealth Management operates through Bank of America, N.A., and other subsidiaries of BAC. Bank of America Merrill Lynch is a marketing name for the Retirement and Philanthropic Services businesses of BAC. BofA™ Global Capital Management Group, LLC (“BofA Global Capital Management”), is an asset management division of BAC. BofA Global Capital Management entities furnish investment management services and products for institutional and individual investors.
“Bank of America Merrill Lynch” is the marketing name for the global banking and global markets businesses of Bank of America Corporation. Lending, derivatives, and other commercial banking activities are performed globally by banking affiliates of Bank of America Corporation, including Bank of America, N.A., member FDIC. Securities, strategic advisory, and other investment banking activities are performed globally by investment banking affiliates of Bank of America Corporation (“Investment Banking Affiliates”), including, in the United States, Merrill Lynch, Pierce, Fenner & Smith Incorporated and Merrill Lynch Professional Clearing Corp., both of which are registered broker-dealers and members of SIPC, and, in other jurisdictions, by locally registered entities. Merrill Lynch, Pierce, Fenner & Smith Incorporated and Merrill Lynch Professional Clearing Corp. are registered as futures commission merchants with the CFTC and are members of the NFA.
Case studies are intended to illustrate products and services available at Bank of America and Merrill Lynch. You should not consider these as an endorsement of Merrill Lynch as an investment advisor or as a testimonial about a client’s experiences with us as an investment advisor. Case studies do not necessarily represent the experiences of other clients, nor do they indicate future performance. Investment results may vary. The investment strategies discussed are not appropriate for every investor and should be considered given a person’s investment objectives, financial situation and particular needs. Clients should review with their advisor the terms, conditions and risks involved with specific products and services.
Banking products are provided by Bank of America, N.A., and affiliated banks, members FDIC and wholly owned subsidiaries of BAC.
Investment products offered by Investment Banking Affiliates: Are Not FDIC Insured Are Not Bank Guaranteed May Lose Value
MLPF&S is a registered broker-dealer, member SIPC and a wholly owned subsidiary of BAC.
Please recycle. The annual report is printed on 30% post-consumer waste (PCW) recycled paper.
50Mconsumer and small business relationships in the U.S.
14M+banking customers are now making mobile connections, staying in touch with their finances anytime, anywhere
To our shareholders, In 2013, the earnings power of our company began to shine through more clearly. The strategy we outlined several years ago is driving growth as we better connect the outstanding capabilities of our company for the three groups of customers we serve: people, companies and institutional investors. We are helping our teams to connect more deeply with each other so that we can bring everything to bear that customers and clients need to live their financial lives.
For the year, net income increased to $11.4 billion from $4.2 billion a year ago. These results are some of the best we have seen in recent years and a testament to the work the team is doing every day to win in the marketplace.
Last year, Tier 1 common capital grew by 9 percent, and our regulatory capital measures exceed all long-term requirements. Liquidity and time-to-required funding also strengthened, and long-term debt has been reduced by more than $200 billion from its peak, all of which enabled our company to return more than $3 billion in capital to shareholders last year through common share repurchases. We know this is important to you as shareholders and let me assure you the company is committed to returning excess capital over time through both repurchases and dividends.
For Bank of America, growth means making everyday connections — every day. Here’s how:
Brian T. MoynihanChief Executive Officer
Life’s better when we’re connected
76788ba_cvr.indd 3 3/14/14 1:09 PM

1
At the same time, we are making more loans, attracting more deposits, achieving record results in our wealth management business, and maintaining our leadership positions in investment banking. We continue to invest in many areas of the company — averaging about $3.5 billion in initiative spending each year for the past three years.
We’re investing in our industry-leading online and mobile banking platforms. We’re also investing in growth areas, including small business and wealth management. And, we’re investing in the systems that serve our large corporate clients and institutional investors.
We have commercial banking relationships with 83 percent of the 2013 Global Fortune 500 and 98 percent of the 2013 U.S. Fortune 500.
While our earnings nearly tripled from 2012 to 2013, we know we have more work to do to reach our full earnings potential.
As we think about the opportunities we have, we are focused on a very straight-forward purpose: to help make fi nancial lives better, through the power of every connection. What you will see throughout this report are examples where we are doing that in markets across the United States and beyond. Everywhere we operate, our teams are exchanging information and opportunities about the customers and clients they serve, and we are tracking closely to ensure that we are giving those customers the opportunity to do with us all the things they must do to live their fi nancial lives.
mass affluent clients and 3 million entrepreneurs and small business clients connected to 5,151 banking centers and 16,259 ATMs
8M

2
The results are on vivid display throughout these pages…from a brewery in Brooklyn to a lumberyard in Los Angeles…from the second-largest mergers and acquisitions deal in history to supporting a company bringing clean water to the developing world…the stories here demonstrate the power of building relationships, the power of meeting our clients in the markets where they operate and connecting them to the resources they need.
For people, customers benefi t from our focus on helping them achieve their goals. Deposits and total client balances both are at record levels as clients are bringing more of their business to us. For the year, we issued nearly 4 million new credit cards and helped 365,000 customers purchase or refi nance a home. Our wealth management business had a banner year with record revenue, pretax margin and net income.
For companies, they understand the value in our relationship approach and see it as a competitive differentiator. For the year, we extended $10.7 billion in credit to small business clients — an increase of 24 percent over last year. We also had strong commercial loan growth and our global banking loan fl ows have been growing for six consecutive quarters. Most notably, our investment banking team has had a consistent No. 2 global ranking for the past several years — and in the fourth quarter of 2013 we surpassed the competition to become No. 1. We advised on half of the top 20 deals of last year, including Verizon, HJ Heinz and Silver Lake/Dell.
For institutional investors, we have the size, scale and global markets capabilities important to these clients. And, we have the No. 1 research fi rm in the world, for the third straight year. Our sales and trading platform is strong and had $13.1 billion in revenue for the year — an 11 percent increase from last year.
$1.4
$11.
4
$4.
2
’11 ’12 ’13
Net income(in billions, full year)
$64
4.5
$70
0.1
$605
.4
’11 ’12 ’13
Capital raised for clients(in billions, full year)
ATM with Teller Assist This next-generation banking offering combines the technology and convenience of an ATM with the human touch of a teller. Customers have access to a range of services during extended hours to address their daily banking needs, and it provides convenience, control and fl exibility over how, when and where they bank.
Exact change at the ATM New technology allows our customers to get exactly what they need, straight out of the machine.
Life’s better when we’re connected

3
We are helping customers live their fi nancial lives everywhere we serve them; in 2013, deposit levels reached a record $1.12 trillion while we increased our loans and leases by $20 billion to $928 billion, led by strong lending to commercial businesses.
No matter where I’ve traveled, our employees have energy and optimism about the future. All over the world, our team is hard at work serving customers and improving the communities where they live and work. Last year alone, Bank of America employees gave more than 2 million volunteer hours investing in the causes important to them, fulfi lling a longstanding tradition of volunteerism that our company is proud to support.
All of these efforts are in keeping with our Corporate Social Responsibility (CSR) philosophy, which informs our company’s values and provides a platform to support partnerships in the public and private sectors, and reinforces our mission of helping local economies and communities grow and prosper.
Whether it’s our partnership with (RED) to help end mother-to-child transmission of AIDS, or our work with military veterans to help them transition from active duty with jobs, training and education, or how we are improving fi nancial literacy through our Better Money Habits program in partnership with Khan Academy, these and many other initiatives demonstrate our commitment to helping our customers, clients, employees and community partners address a wide range of issues that are important to them.
9.86
%
11.1
9%
11.0
6%
’11 ’12 ’13
Tier 1 common capital ratio(at year-end)
$12.
95 $13.
79
$13.
36’11 ’12 ’13
Tangible book value per share(at year-end)
in partnership withPowered byBetter Money HabitsTM
In 2013, we partnered with Sal Khan and Khan Academy to develop Better Money Habits™, a program designed to help everyone learn about personal fi nance. Every day we connect people to free, engaging and informative videos and resources on www.BetterMoneyHabits.com, and reinforce the lessons through our interactions with customers and the community.

4
Our fi nancial advisors are deepening relationships with their clients. In 2013, our Global Wealth and Investment Management business reported record revenue of $17.8 billion and record net income of $3 billion.
As we look ahead, we will continue to pursue the same strategy that has served us well these past several years — a strategy to make our company more straightforward; a strategy to serve the core fi nancial needs of our customers; a strategy to manage risk, maintain strong capital and liquidity, and to operate efficiently and reduce costs. This is what will drive results and progress.
In the summer of 2014, Bank of America will celebrate 230 years of operations. Our company traces its roots almost to the very beginning of our country’s history. Today, our commitment to our customers and communities, and to help be an engine of economic growth, is as strong as it has ever been.
We value your investment greatly and thank you for continuing to share this journey with us.
Thank you,
Brian T. MoynihanChief Executive OfficerMarch 14, 2014
The power of global connections
Global research fi rm (2011, 2012, 2013) according to Institutional Investor magazine
$700Bin capital raised for clients
No.1

5
No two places are exactly the same, but every customer and client needs the right connections, whether creating a start-up in Charlotte, starting a family in Brooklyn, investing for retirement in Houston or seeking to leverage opportunities in markets across the globe.
Life’s better when we’re connected

Helping L.A. thriveO� en described as the creative capital of the world, Los Angeles is home to dynamic entrepreneurs who are turning innovative ideas into global brands, as well as leaders in fashion, design, entertainment and arts. It’s also where 15,000 Bank of America employees work every day to serve the core fi nancial needs of people, companies and institutional investors by connecting them to what’s important.
L.A. CONNECTIONS
• Through our lending and investing activities, Bank of America is helping to support businesses and communities throughout the Southland, from the revitalization of downtown Los Angeles to our work in the Atlantic Corridor of Long Beach and the ongoing transformation of Boyle Heights.
• Our partnerships with iconic institutions such as the Walt Disney Concert Hall, the Los Angeles Dodgers, the University of Southern California and the Getty Museum are all part of our commitment to spur economic opportunity and enrich the quality of life in Los Angeles.
Supporting Panda Express as it continues on its path of rapid growthPanda Express is one of the largest privately held, fast casual restaurant companies in the U.S., with annual sales of more than $1.8 billion. Bank of America is proud to have helped fi nance the company’s massive growth, from just 100 stores when the relationship started to nearly 1,650 locations and more than 24,000 associates today. Through the years, we’ve worked closely with Panda Express to provide a broad array of advisory and strategic services, including working capital, fi nancing, and cash management and depository services. Panda Express is optimistic about the future, with a goal of becoming a global brand. Bank of America is also optimistic, providing the resources and expertise to help Panda Express achieve its long-term goals.
Helping the oldest lumberyard in CaliforniaIn 1884, an Austrian immigrant named Christian Ganahl and his brother Frank hopped on a train in St. Louis and came to Los Angeles with hopes of capitalizing on the booming construction under way in California. They opened a lumber store and, with business fl ourishing, in 1923 turned to Bank of America to help fi nance their ambitious plans for a network of stores throughout the greater Los Angeles region. Bank of America has served as Ganahl’s primary bank ever since, providing credit to acquire more lumberyards, open stores, and build a cutting-edge distribution center. From its trade mark giant band saw in the front of its Anaheim store to its continued focus on “doing ordinary things extraordinarily well,” Ganahl is shaping the California landscape and supporting the local economy, and Bank of America is proud to be part of the company’s success.
6

7
Spicing up the small business communityWhen the aerospace company that employed Jose-Luis Saavedra shuttered in 1971, he seized the opportunity to turn a longtime hobby into his life’s work, creating Tapatío Hot Sauce. He took on part-time jobs to pay the bills and spent the rest of his time making and selling hot sauce. Large, repeat orders from local grocery stores and restaurants eventually led to full-time operations, and in 1984, Saavedra came to Bank of America with a dream of quadrupling his business. Bank of America helped the family purchase its current facility in 1995 and has since connected the growing business with everything from equipment loans to wealth management services. Today, the company distributes its products nation -wide with exports to many countries. Their entrepreneurial spirit — com bined with support from family and friends like Bank of America — have made Tapatío Hot Sauce an inter national sensation.

8
Setting records in LondonLondon is one of the world’s leading fi nancial centers, with a highly diverse population. From Covent Garden to Canary Wharf, London is a center of excellence for fi nance, the arts, education and global industry. We opened our fi rst office in London 83 years ago with 13 employees. And while we continue to expand our capabilities to serve a new generation of clients in London and the United Kingdom, the one thing that hasn’t changed is our commitment to our clients.
LONDON CONNECTIONS
• Global Ambassadors Programme — We believe strong leaders can be drivers of economic opportunities and that women are a force to drive economic, political and social change. This is the reason why we partnered with the charity Vital Voices to develop our Global Ambassadors Programme. Global Ambassadors invests in the potential of emerging women leaders around the world by matching them with mentors who are established leaders, including our Bank of America Merrill Lynch leaders.
• As a part of our focus on making connections to help improve lives, Bank of America is working with several partner organizations to support global health issues. In recognition of World AIDS Day on December 1, we made a $250,000 contribution to the George W. Bush Institute that will build on efforts to control and treat HIV. We also recently partnered with the Global HIV/AIDS fundraising organization (RED) and rock group U2 to generate more than $10 million to fi ght AIDS.
Lond
onLo
ndon
Supporting the second-largest M&A deal in history In September, Verizon Communications agreed to spend $130 billion for Vodafone Group’s 45 percent stake in Verizon Wireless. Bank of America Merrill Lynch stepped in to provide $61 billion in fi nancing for Verizon to fund operations during the transaction. We played a leading role in Verizon’s execution of the largest high-grade bond transaction. Additionally, working across teams to bring the power of Bank of America Merrill Lynch, we were uniquely positioned to offer mergers and acquisitions advice and a signifi cant balance sheet commitment. The deal attracted more than $100 billion in demand from bond investors, resulting in $49 billion in fi nancing for Verizon, dramatically exceeding market predictions. These milestones established us as a leader in future mergers and acquisitions activity and broke debt-market records, establishing new industry thresholds.
of of the largest high-grade bond transaction. Additionally, working across teams to bring the tionally, working across teams to bring tpower of Bank of America Merrill Lynch, wenk of America Merrill Lyncwere uniquely posisss tioned to offer mergers ananana d were uni el tioned to offe
sitions advviciciiciceeeee and a signifi cant balancccceeeacquisitions a and a signifi cant bala etmenttttt. The deal attracted msheet t commitme Th d morrrrrreeeee
billion innnnn dddddddemee and from bothan $100 billion and from bond ests ors,, resulting innnnn $4$ 9 billiinvestss or resulting i 9 billion in fi nanciiiiinngngngn
for VeVeVV rizooon, dramaticacacacaacalllllllyfor ri n, dramati aallly yyyy exceeding marketttttttttttttpredicii tionnnns. Theseese millesesesessesesesesstotttt nes establisheddddddus assssss a leeeaderader in futuree mmmmmmmeereeeee gers andacquiisitiositioooons activity andd brbrbrbrbrbrrrokoooooooo e debt-markeeeeeeeeeett t t t tttrecorecordrrrrrr s, eeeeestaba lishing new ininininnindudududududududdd stry thresholdldldddddddlllllddsssssssss.ss

Global connectionsFrom the tip of Latin America to the coast of Australia, clients across the globe are looking for new ways to grow businesses and make a difference in the world.
About Water.orgTwenty years ago, Gary White walked into a Bank of America banking center to open a checking account — forging a relationship that would help him bring safe water to areas in need. Water.org was created in 2009 by White and Matt Damon to raise awareness of the large and growing global need for safe water. Through a variety of fi nancial solutions, Bank of America Merrill Lynch has helped the company connect inter-national resources to local suppliers and manage currency, fraud risk and cash fl ow, as well as increase donation processing. Most importantly, we helped keep Water.org’s capital working hard on behalf of people in need worldwide. A relationship that began 20 years ago with a simple checking account has now grown to fi nancing international development projects in Africa, Asia, Latin America and the Caribbean. There is no telling where Water.org will continue to fl ow as they work to solve the global water crisis, and how Bank of America Merrill Lynch will help them get there.
Establishing “green bonds”Connecting our clients and customers to what’s important to them is our core function, and nowhere is this more evident than in our experience supporting the market for “green bonds.” Since 2007, when Merrill Lynch managed the world’s fi rst “green bond” for the European Investment Bank, we’ve been an ardent supporter of this investment theme, where the proceeds are specifi cally earmarked for projects that will benefi t the environment. Bank of America Merrill Lynch has established one of the fi nance industry’s fi rst global green debt capital markets teams. And in 2013, we played a leading role in the growth of “green bonds” with a number of landmark transactions across all time zones. In November, we issued our own “green bond,” the fi rst benchmark-size corporate “green bond.” The proceeds will fund renewable energy and energy efficiency projects that also contribute toward our $50 billion, 10-year environmental business initiative.
Glo
bal C
onne
ctio
ns

Fueling businesses in ChicagoInnovation has a home in America’s third-largest city, Chicago. Home of the fi rst skyscraper, the fi rst Ferris wheel, the fi rst steel railroad and the fi rst modern commodities exchange, Chicago visionaries helped shape the landscape of our cities and fi nancial system.
CHICAGO CONNECTIONS
• Bank of America’s presence in the Windy City is built upon decades of tradition and commitment, including fi nancing the rebuilding of the city a� er the Great Chicago Fire of 1871 and supporting businesses and residents during the Great Depression.
• We are also creating a more vibrant city today through our sponsorships of the Chicago Symphony Orchestra, Chicago Botanic Garden, Art Institute of Chicago, Winter Wonderfest at Navy Pier and the Chicago Cubs.
Spinning off a fl oral giantFTD, a premier global provider of fl oral and related products and services in the U.S., Canada, U.K. and Ireland, has been a client of Bank of America Merrill Lynch since 1973. The business uses the highly recognized FTD and Interfl ora brands, which are represented by the iconic Mercury Man logo, displayed in 40,000 fl oral shops in 150 countries. When FTD planned to spin off into a separate, publicly traded entity from parent company, United Online, in 2012, the Bank of America Merrill Lynch team proposed a debt refi nancing that would save FTD more than $5 million in interest savings. The successful offering cemented our relationship with FTD. Throughout 2013, FTD’s management team became more impressed with our proactive, continued engagement, creative ideas and proven leadership in the syndicated loan market. The relationship has now expanded into additional treasury management, employee benefi ts and merchant services, with more potential on the horizon.
From interns to mentorsIn the summer of 2013, members of Bank of America’s Student Leaders program were assigned internships at Boys & Girls Clubs locations throughout Chicago. They worked side by side with leadership at the youth development organization to advance the academic achievement, character and leadership, and healthy lifestyles of their peers. In the process, these civically minded students learned a lot about themselves and their aspirations for the future. The work of these students builds on the decades-long relationship between Bank of America and the Boys & Girls Clubs of Chicago. The bank named the organization a Neighborhood Builder last year, in addition to providing summer interns over the past 10 years.
10

11
Boosting the local economyThe 36th Bank of America Chicago Marathon took place on October 13, bringing together 45,000 runners, 12,000 volunteers and 1.7 million spectators for an extraordinary race. Participants, including elite runners, wheelchair athletes and nearly 300 employees, converged on Chicago from all 50 states and more than 100 countries. The race started and fi nished in Grant Park, with runners traversing 29 of the city’s diverse neighborhoods. In 2012, the event contributed $243 million in business activity and helped charities raise $15 million. In 2013, we expect even higher contributions locally and to have helped create the equivalent of more than 1,600 full-time jobs and provided millions worth of wages and salary income. Every year, the race attracts new visitors, strengthens Chicago as a tourist destination and diversifi es the city’s economic base.

Helping New York State communities thriveO� en described as the fi nancial capital of the world, New York City is home to the New York Stock Exchange and NASDAQ, the world’s largest stock exchanges by market capitalization and trading activity. But New York State is also highly diverse with a vibrant multifaceted economy that enables it to be the place where dreams are made of.
NEW YORK CONNECTIONS
• From Niagara Falls to Latham, N.Y., Bank of America has served the needs of New York customers and small businesses for more than 200 years — since The National Bank of Orange and Ulster Counties opened its doors in 1812.
• Bank of America is supporting local businesses, fueling the economy, addressing critical needs and revitalizing neighborhoods throughout the state, including a strong track record of support for nonprofi t cultural organizations like Carnegie Hall, Lincoln Center for the Performing Arts, Brooklyn Academy of Music, Whitney Museum of American Art, Albany Institute of History & Art, Buffalo Philharmonic Orchestra, Rochester Museum & Science Center and many others.
Brewing life back into a communityEvery beer has a story — and so does every brewing company. Steve Hindy, founder and president, launched Brooklyn Brewery in 1988 in a community where people once feared walking alone — and the business has helped a community thrive. As the brewery started to grow and change, so did the neighborhood of Williamsburg, Brooklyn. When it was time to expand, Bank of America was there. Today we also handle the brewery’s banking, payroll and retirement plans. The Brooklyn Brewery story is still being written, but for now, it’s a story of shared success between a local business and its surrounding neighborhood.
“Feasting on the demand for organic products”The Hain Celestial Group, Inc., a leading organic and natural food and personal care manufacturer, is 83rd on Fortune’s Fastest-Growing Companies list and a top supplier to retailer Whole Foods Market. Bank of America Merrill Lynch has worked with Hain Celestial and its entrepreneurial founder, Irwin D. Simon, since 1999, providing fi nancial support and mergers and acquisitions advice. In 2013, sales soared for Hain Celestial, and the company now commands a market cap of more than $4 billion. This year, the company has big plans as it targets distribution into key retailers in the U.S. and throughout Europe. Hain Celestial’s powerful and repeatable mergers and acquisitions capability has been complemented by the company’s ability to merge cultures and allow its brands to retain their unique identity while continuing to fl ourish with new corporate resources. As Hain Celestial celebrates its 20th anniversary, Bank of America Merrill Lynch looks forward to continuing to play a big part in the company’s success.
12

1313
Brooklyn Brewery was founded in 1988 by Steve Hindy and is helping revitalize a community as they continue to expand internationally.
The Hain Celestial Group, Inc., a leading organic and natural food and personal care manufacturer, is 83rd on Fortune’s Fastest-Growing Companies list.

Houston is growing in international prominenceIn a state known for being big, bold and proud, Houston shines in everything from the arts to the economy. Best known for its prominence in energy and shipping, Houston’s diverse economic base also draws from the many manufacturing, healthcare and aerospace companies that call Houston home.
HOUSTON CONNECTIONS
• Houston has benefi tted from Bank of America’s lending and investing in the oil, gas and ancillary industries to help make this region the energy capital of the world. Houston’s can-do spirit creates a welcoming environment for people and ideas from all parts of the country and the world.
• Bank of America is proud to invest in community partners addressing the area’s most pressing needs such as New Hope Housing and SER–Jobs for Progress, and support arts and culture partners, including the Children’s Museum of Houston and Houston Grand Opera, which are working to expand their programs to reach a new and vibrantly diverse population.
Rebuilding with community supportEstablished in 1978 by Phin and Phac Nguyen, Mai’s Restaurant was the fi rst Vietnamese restaurant in Houston. When this local landmark was destroyed by a fi re in early 2010, the community rallied around its third-generation family owners and encouraged them to rebuild. Bank of America was integral in securing the fi nancing the family needed to rebuild with a second level and expand into a neighboring property. Our bankers connected the family to the products and services they needed, and today we continue to serve as a trusted advisor. Since Mai’s reopened in April 2011, the family has moved all of their banking over to Bank of America. The restaurant reemerged stronger than ever and today attracts lines of customers at all hours of the day and night.
Supporting Phoenix’s emergent agriculturePhoenix can trace its civilization as far back as 700 A.D. and even then its residents were known as industrious, enterprising and imaginative. That spirit has continued through the ages as this civically minded outpost became a thriving state capital.
PHOENIX CONNECTIONS
• Through our work with Valley of the Sun United Way, Central Arizona Shelter Services and Housing Inc., Bank of America is part of the project to end homelessness in the city of Phoenix. With our fi nancial support of permanent supportive housing for youth and veterans, and our volunteer efforts with Project Homeless Connect, the MANA House and Tumbleweed Center for Youth Development, the city is seeing success in its effort to end homelessness for veterans.
• Bank of America continues to support diversity in the arts, by working with and supporting XICO, Inc., The Phoenix Art Museum, the Children’s Museum of Phoenix and The Musical Instrument Museum.
Growing the family agriculture businessIt’s a family business, guided by a simple philosophy — to offer the highest-quality products and services supported by a staff with years of experience in their respective fi elds. Northside Hay, Arizona’s largest hay broker, specializes in the purchase and sale of products and services for dairies, feedlots, ranchers, stables and horse owners nationwide. The company was started in 1948 by Olen Dryer, but it is run today by his grandson Olen Petznick. In 2011, Northside Hay consolidated its business to Bank of America Merrill Lynch and U.S. Trust. Northside is looking to expand into the United Arab Emirates and Asian markets while continuing to provide superior service, and Bank of America Merrill Lynch is looking forward to supporting this growth for years to come.
141414444

Char
lott
e
Boston’s thriving industrial revolutionFrom its days as a linchpin to colonial trade in the 1600s to today, Boston has a long history of leadership in all areas, including politics, commerce, fi nance and education. Today, Boston has a solid reputation as a center of educational and medical excellence and continues to be regarded as the unofficial capital of New England.
BOSTON CONNECTIONS
• Since the founding of our fi rst predecessor bank, The Massachusetts Bank (1784), we’ve remained strongly committed to lending that strengthens our neighborhoods through community development fi nancing projects such as Tropical Foods in Dudley Square, St. Kevin’s in Upham’s Corner, Center and Main in Brockton, and Highland Terrace in Chelsea’s Box District.
• We value and invest in connections with our customers, clients and communities to make Boston as vital as it can be through partnerships with outstanding organizations, including the Boston Red Sox, the New England Patriots, Boys & Girls Clubs of Boston, The Greater Boston Food Bank, the New England Center for Homeless Veterans and the Museum of Fine Arts, Boston, to name a few.
A community connects in the Chelsea Box District The Box District in Chelsea, Mass., was named for the box manufacturing companies that opened at the beginning of the 20th century and closed in the 1950s. In 2005, a group called The Neighborhood Developers set out to revive the area. Eight years later, they’ve constructed 112 apartments, and with the City of Chelsea, a public park, a place where parents encourage their children to play. Bank of America has been a partner with The Neighborhood Developers since their founding in 1979. Most recently, we helped fi nance Highland Terrace, the third such property in the District.
Charlotte is becoming a new center of commerceThe growing city of Charlotte, with its vibrant metropolitan area and Southern charm, is also the second-largest fi nancial center in the U.S. and home to the Bank of America corporate headquarters.
CHARLOTTE CONNECTIONS
• Bank of America is committed to supporting education and workforce development in Charlotte. We believe supporting nonprofi t organizations that connect people to jobs and skills is part of our efforts to help improve the fi nancial lives of individuals and customers in the communities we serve. We’re proud to support a range of organizations making a signifi cant impact on education and the workforce such as Project L.I.F.T., Communities In Schools, Central Piedmont Community College and Goodwill Industries of the Southern Piedmont.
• We have a long history of supporting arts and culture through grants, loaning art collections and sponsorship events. Recent recipients include the Arts & Science Council, North Carolina Dance Theatre, Opera Carolina, Daniel Stowe Botanical Garden and the Harvey B. Gantt Center for African-American Arts+Culture.
Success through customer serviceWhen Dr. Frank Kendrick decided to start his own dental practice, he knew he wanted to work with children. In 2006, he opened his practice without a patient roster in the Charlotte neighborhood of Eastfi eld. Through advertising and word of mouth, he saw 13 patients on his fi rst day — unheard of in the profession. Since then business has grown exponentially and Dr. Kendrick now sees several hundred patients per week. In 2009, Dr. Kendrick needed a loan to open a second practice. In 2012, when his client manager from Bank of America visited to conduct a complementary cash fl ow review, they determined he was able to refi nance his existing practice as well as fi nance an entirely new location — Southlake Pediatric Dentistry. This relationship between Bank of America and Dr. Kendrick is built on a shared commitment to quality customer service that is integral to the success of both businesses.

16
Bank of America Corporation — Financial Highlights
Bank of America Corporation (NYSE: BAC) is headquartered in Charlotte, N.C. As of December 31, 2013, we operated in all 50 states, the District of Columbia and more than 40 countries. Through our banking and various non-banking subsidiaries throughout the United States and in international markets, we provide a diversifi ed range of banking and non-banking fi nancial services and products through fi ve business segments: Consumer and Business Banking, Consumer Real Estate Services, Global Wealth and Investment Management, Global Banking and Global Markets.
Financial Highlights (in millions, except per share information)
For the year 2013 2012 2011
Revenue, net of interest expense (fully taxable-equivalent basis)1 $ 89,801 $ 84,235 $ 94,426 Net income 11,431 4,188 1,446 Net income, excluding goodwill impairment charges1 11,431 4,188 4,630 Earnings per common share 0.94 0.26 0.01 Diluted earnings per common share 0.90 0.25 0.01 Diluted earnings per common share, excluding goodwill impairment charges1 0.90 0.25 0.32 Dividends paid per common share 0.04 0.04 0.04 Return on average assets 0.53% 0.19% 0.06%Return on average tangible shareholders’ equity1 7.13 2.60 0.96 Efficiency ratio (fully taxable-equivalent basis)1 77.07 85.59 85.01 Average diluted common shares issued and outstanding 11,491 10,841 10,255
At year end 2013 2012 2011
Total loans and leases $ 928,233 $ 907,819 $ 926,200 Total assets 2,102,273 2,209,974 2,129,046 Total deposits 1,119,271 1,105,261 1,033,041 Total shareholders’ equity 232,685 236,956 230,101 Book value per common share 20.71 20.24 20.09 Tangible book value per common share1 13.79 13.36 12.95 Market price per common share 15.57 11.61 5.56 Common shares issued and outstanding 10,592 10,778 10,536 Tier 1 common capital ratio 11.19% 11.06% 9.86%Tangible common equity ratio1 7.20 6.74 6.64
1 Represents a non-GAAP financial measure. Net income and diluted earnings per common share have been calculated excluding goodwill impairment charges of $3.2 billion in 2011. There were no goodwill impairment charges in 2013 or 2012. For more information on these measures and ratios, and a corresponding reconciliation to GAAP financial measures, see Supplemental Financial Data on page 29 and Statistical Table XV on page 139 of the 2013 Financial Review section.
December 31 2008 2009 2010 2011 2012 2013
BAC BANK OF AMERICA CORP $100 $107 $95 $40 $84 $113 SPX S&P 500 COMP $100 $126 $145 $148 $172 $228 BKX KBW BANK SECTOR INDEX $100 $98 $121 $93 $124 $170
2 This graph compares the yearly change in the Corporation’s total cumulative shareholder return on its common stock with (i) the Standard & Poor’s 500 Index and (ii) the KBW Bank Index for the years ended December 31, 2009 through 2013. The graph assumes an initial investment of $100 at the end of 2008 and the reinvestment of all dividends during the years indicated.
Total cumulative shareholder return2
$0
$50
$100
$150
$200
$250
201320122011201020092008
HIGH $18.59 $19.48 $15.25 $11.61 $15.88LOW 3.14 10.95 4.99 5.80 11.03 CLOSE 15.06 13.34 5.56 11.61 15.57
BAC fi ve-year stock performance
$0
$5
$10
$15
$20
20132012201120102009
BAC stock price and credit default swap spread3
12/31/11
500
400
300
200
100
0
$20
$15
$10
$5
$06/30/12 12/31/12 6/30/13 12/31/13
CD
S (b
ps)
Sto
ck P
rice
STOCK PRICE BAC 5Y CDS
3 Credit default swap spreads are calculated off of 5-year LIBOR.

2013 Financial Review
76788ba_financials.indd 17 3/7/14 5:18 PM

18 Bank of America 2013
Financial Review Table of Contents
Page
Executive Summary 20
Recent Events 21
Financial Highlights 23
Balance Sheet Overview 25
Supplemental Financial Data 29
Business Segment Operations 31
Consumer & Business Banking 33
Consumer Real Estate Services 36
Global Wealth & Investment Management 40
Global Banking 42
Global Markets 44
All Other 46
Off-Balance Sheet Arrangements and Contractual Obligations 48
Regulatory Matters 55
Managing Risk 57
Strategic Risk Management 61
Capital Management 61
Liquidity Risk 67
Credit Risk Management 72
Consumer Portfolio Credit Risk Management 73
Commercial Portfolio Credit Risk Management 87
Non-U.S. Portfolio 96
Provision for Credit Losses 100
Allowance for Credit Losses 100
Market Risk Management 104
Trading Risk Management 105
Interest Rate Risk Management for Nontrading Activities 109
Mortgage Banking Risk Management 112
Compliance Risk Management 112
Operational Risk Management 112
Complex Accounting Estimates 113
2012 Compared to 2011 120
Overview 120
Business Segment Operations 121
Statistical Tables 122
Glossary 142
76788ba_financials.indd 18 3/6/14 12:05 PM

Bank of America 2013 19
Management’s Discussion and Analysis of Financial Condition and Results of Operations
This report, the documents that it incorporates by reference and the documents into which it may be incorporated by reference may contain, and from time to time Bank of America Corporation (collectively with its subsidiaries, the Corporation) and its management may make certain statements that constitute forward-looking statements within the meaning of the Private Securities Litigation Reform Act of 1995. These statements can be identified by the fact that they do not relate strictly to historical or current facts. Forward-looking statements often use words such as “expects,” “anticipates,” “believes,” “estimates,” “targets,” “intends,” “plans,” “goal” and other similar expressions or future or conditional verbs such as “will,” “may,” “might,” “should,” “would” and “could.” The forward-looking statements made represent the current expectations, plans or forecasts of the Corporation regarding the Corporation’s future results and revenues, and future business and economic conditions more generally, and other matters. These statements are not guarantees of future results or performance and involve certain risks, uncertainties and assumptions that are difficult to predict and are often beyond the Corporation’s control. Actual outcomes and results may differ materially from those expressed in, or implied by, any of these forward-looking statements.
You should not place undue reliance on any forward-looking statement and should consider the following uncertainties and risks, as well as the risks and uncertainties more fully discussed elsewhere in this report, including under Item 1A. Risk Factors of this Annual Report on Form 10-K and in any of the Corporation’s subsequent Securities and Exchange Commission filings: the Corporation’s ability to resolve representations and warranties repurchase claims made by monolines and private-label and other investors, including as a result of any adverse court rulings, and the chance that the Corporation could face related servicing, securities, fraud, indemnity or other claims from one or more of the government-sponsored enterprises, monolines or private-label and other investors; the possibility that final court approval of negotiated settlements is not obtained; the possibility that the court decision with respect to the BNY Mellon Settlement is appealed and overturned in whole or in part; the possibility that future representations and warranties losses may occur in excess of the Corporation’s recorded liability and estimated range of possible loss for its representations and warranties exposures; the possibility that the Corporation may not collect mortgage insurance claims; the possible impact of a future FASB standard on accounting for credit losses; uncertainties about the financial stability and growth rates of non-U.S. jurisdictions, the risk that those jurisdictions may face difficulties servicing their sovereign debt, and related stresses on financial markets, currencies and trade, and the Corporation’s exposures to such risks, including direct, indirect and operational; uncertainties related to the timing and pace of Federal Reserve tapering of quantitative easing, and the impact on global interest rates, currency exchange rates, and economic conditions in a number of countries; the
possibility of future inquiries or investigations regarding pending or completed foreclosure activities; the possibility that unexpected foreclosure delays could impact the rate of decline of default-related servicing costs; uncertainty regarding timing and the potential impact of regulatory capital and liquidity requirements (including Basel 3); the negative impact of the Dodd-Frank Wall Street Reform and Consumer Protection Act on the Corporation’s businesses and earnings, including as a result of additional regulatory interpretation and rulemaking and the success of the Corporation’s actions to mitigate such impacts; the potential impact on debit card interchange fee revenue in connection with the U.S. District Court for the District of Columbia’s ruling on July 31, 2013 regarding the Federal Reserve’s rules implementing the Financial Reform Act’s Durbin Amendment; the potential impact of implementing and conforming to the Volcker Rule; the potential impact of future derivative regulations; adverse changes to the Corporation’s credit ratings from the major credit rating agencies; estimates of the fair value of certain of the Corporation’s assets and liabilities; reputational damage that may result from negative publicity, fines and penalties from regulatory violations and judicial proceedings; the possibility that the European Commission will impose remedial measures in relation to its investigation of the Corporation’s competitive practices; the impact of potential regulatory enforcement action relating to optional identity theft protection services and certain optional credit card debt cancellation products; unexpected claims, damages, penalties and fines resulting from pending or future litigation and regulatory proceedings, including proceedings instituted by the U.S. Department of Justice, state Attorneys General and other members of the RMBS Working Group of the Financial Fraud Enforcement Task Force; the Corporation’s ability to fully realize the cost savings and other anticipated benefits from Project New BAC, including in accordance with currently anticipated timeframes; a failure in or breach of the Corporation’s operational or security systems or infrastructure, or those of third parties with which we do business, including as a result of cyber attacks; the impact on the Corporation’s business, financial condition and results of operations of a potential higher interest rate environment; and other similar matters.
Forward-looking statements speak only as of the date they are made, and the Corporation undertakes no obligation to update any forward-looking statement to reflect the impact of circumstances or events that arise after the date the forward-looking statement was made.
Notes to the Consolidated Financial Statements referred to in the Management’s Discussion and Analysis of Financial Condition and Results of Operations (MD&A) are incorporated by reference into the MD&A. Certain prior-period amounts have been reclassified to conform to current period presentation. Throughout the MD&A, the Corporation uses certain acronyms and abbreviations which are defined in the Glossary.
76788ba_financials.indd 19 3/6/14 12:05 PM

20 Bank of America 2013
Executive Summary
Business OverviewThe Corporation is a Delaware corporation, a bank holding company (BHC) and a financial holding company. When used in this report, “the Corporation” may refer to Bank of America Corporation individually, Bank of America Corporation and its subsidiaries, or certain of Bank of America Corporation’s subsidiaries or affiliates. Our principal executive offices are located in Charlotte, North Carolina. Through our banking and various nonbanking subsidiaries throughout the U.S. and in international markets, we provide a diversified range of banking and nonbanking financial services and products through five business segments: Consumer & Business Banking (CBB), Consumer Real Estate Services (CRES), Global Wealth & Investment Management (GWIM), Global Banking and Global Markets, with the remaining operations recorded in All Other. We operate our banking activities primarily under two national bank charters: Bank of America, National Association (Bank of America, N.A. or BANA) and FIA Card Services, National Association (FIA Card Services, N.A. or FIA). On October 1, 2013, we completed the merger of our Merrill Lynch & Co., Inc. (Merrill Lynch) subsidiary into Bank of America Corporation. This merger had no effect on the Merrill Lynch name or brand and is not expected to have any effect on customers or clients. At December 31, 2013, the Corporation had approximately $2.1 trillion in assets and approximately 242,000 full-time equivalent employees.
As of December 31, 2013, we operated in all 50 states, the District of Columbia and more than 40 countries. Our retail banking footprint covers approximately 80 percent of the U.S. population and we serve approximately 50 million consumer and small business relationships with approximately 5,100 banking centers, 16,300 ATMs, nationwide call centers, and leading online (www.bankofamerica.com) and mobile banking platforms. We offer industry-leading support to more than three million small business owners. We are a global leader in corporate and investment banking and trading across a broad range of asset classes serving corporations, governments, institutions and individuals around the world.
2013 Economic and Business EnvironmentIn the U.S., economic growth continued in 2013, ending the year in the midst of its fifth consecutive year of recovery. However, the year ended amid uncertainty as to whether the upward trend in economic performance would continue into 2014. Employment gains were generally steady but moderate, and the unemployment rate fell to 6.7 percent at year end, but with significant contribution from a declining labor force participation rate. Retail sales grew at a solid pace through most of 2013, and following extreme weakness through mid-2013, service spending also displayed a modest rebound late in the year. Core inflation fell in 2013 to
almost a full percentage point below the Board of Governors of the Federal Reserve System’s (Federal Reserve) longer-term target of two percent.
U.S. household net worth increased significantly in 2013. Home prices rose approximately 12 percent in 2013, but showed signs of deceleration late in the year, and equity markets surged. U.S. Treasury yields rose over the course of the year amid expectations that the Federal Reserve would adjust the pace of its purchases of agency mortgage-backed securities (MBS) and long-term U.S. Treasury securities if economic progress was sustained.
Despite a partial federal government shutdown in October, the impact on U.S. economic performance was minimal. The Federal Reserve announced that it would begin to reduce its securities purchases early in 2014, but would not raise its federal funds rate target until significantly after the unemployment rate reached its 6.5 percent threshold. By year end, the U.S. Congress agreed on a two-year budget framework that reduced fiscal uncertainty, and pending implementation, restored some of the planned federal sequester spending for 2014.
Internationally, Europe experienced significant economic improvement in 2013. European financial anxieties eased, reflected in sustained narrowing of bond spreads, following the European Central Bank’s 2012 assertion of its role as lender of last resort. Economic performance also improved, with the long six-quarter recession in the European Union ending in the second quarter of 2013, followed by modest growth and varied performance in the second half of the year.
Monetary policies in Japan combined with the sharp depreciation of the yen led to moderate economic expansion in 2013, but economic growth diminished in the second half of 2013. In Japan, inflation rose gradually during the year, exceeding one percent annualized by year end. However, doubts remained about the sustainability of economic improvement in Japan in the absence of clear plans for long-run economic reform. As China’s government focused on issues beyond simply maximizing economic growth, China’s gross domestic product growth in 2013 decelerated.
Additionally, growth rates in a number of emerging nations have decreased, while select countries are also dealing with greater social and political unrest and capital markets volatility. Following the announcement of the Federal Reserve’s intent to reduce securities purchases in mid-2013, investors increased withdrawals of capital from certain emerging market countries, impacting interest rates, foreign exchange rates and credit spreads. These trends intensified as the Federal Reserve initiated its securities purchases tapering actions in January 2014, and investors became more concerned about the implications of a slowing Chinese economy on its key trading partners. For more information on our international exposure, see Non-U.S. Portfolio on page 96.
76788ba_financials.indd 20 3/6/14 12:05 PM

Bank of America 2013 21
Recent Events
BNY Mellon SettlementIn the first quarter of 2014, the New York Supreme Court entered final judgment approving the BNY Mellon Settlement. The court overruled the objections to the settlement, holding that the Trustee, BNY Mellon, acted in good faith, within its discretion and within the bounds of reasonableness in determining that the settlement agreement was in the best interests of the covered trusts. The court declined to approve the Trustee’s conduct only with respect to the Trustee’s consideration of a potential claim that a loan must be repurchased if the servicer modifies its terms. The court’s January 31, 2014 decision, order and judgment remain subject to appeal and the motion to reargue, and it is not possible to predict the timetable for appeals or when the court approval process will be completed. For additional information, including a description of the BNY Mellon Settlement, see Note 7 – Representations and Warranties Obligations and Corporate Guarantees to the Consolidated Financial Statements.
Capital and Liquidity Related MattersIn July 2013, U.S. banking regulators approved final Basel 3 Regulatory Capital rules (Basel 3) which became effective January 1, 2014. Basel 3 generally continues to be subject to interpretation by the U.S. banking regulators. Basel 3 also will require us to calculate a supplementary leverage ratio. For additional information, see Capital Management – Regulatory Capital Changes on page 64.
The Basel Committee on Banking Supervision (Basel Committee) issued two liquidity risk-related standards that are considered part of Basel 3: the Liquidity Coverage Ratio (LCR) and the Net Stable Funding Ratio (NSFR). For additional information, see Liquidity Risk – Basel 3 Liquidity Standards on page 69.
Freddie Mac SettlementOn November 27, 2013, we entered into an agreement with Freddie Mac (FHLMC) under which we paid FHLMC a total of $404 million (less credits of $13 million) to resolve all outstanding and potential mortgage repurchase and make-whole claims arising out of any alleged breach of selling representations and warranties related to loans that had been sold directly to FHLMC by entities related to Bank of America, N.A. from January 1, 2000 to December 31, 2009, and to compensate FHLMC for certain past losses and potential future losses relating to denials, rescissions and cancellations of mortgage insurance (MI).
In 2010, we had entered into an agreement with FHLMC to resolve all outstanding and potential representations and warranties claims related to loans sold by Countrywide Financial Corporation (Countrywide) to FHLMC through 2008.
With these agreements, combined with prior settlements with Fannie Mae (FNMA), Bank of America has resolved substantially all outstanding and potential representations and warranties claims on whole loans sold by legacy Bank of America and Countrywide to FNMA and FHLMC through 2008 and 2009, respectively, subject to certain exceptions which we do not believe are material.
For additional information, see Note 7 – Representations and Warranties Obligations and Corporate Guarantees to the Consolidated Financial Statements.
Common Stock Repurchases and Liability Management ActionsAs disclosed in prior filings, the capital plan that the Corporation submitted to the Federal Reserve in January 2013 pursuant to the 2013 Comprehensive Capital Analysis and Review (CCAR), included a request to repurchase up to $5.0 billion of common stock and redeem $5.5 billion in preferred stock over four quarters beginning in the second quarter of 2013, and continue the quarterly common stock dividend at $0.01 per share. During 2013, we repurchased and retired 231.7 million common shares for an aggregate purchase price of approximately $3.2 billion and redeemed our Series H and 8 preferred stock for $5.5 billion. As of December 31, 2013, under the capital plan, we can purchase up to $1.8 billion of additional common stock through the first quarter of 2014.
In addition to the CCAR actions, during 2013, we redeemed certain of our preferred stock for $1.0 billion and issued $1.0 billion of our Fixed-to-Floating Rate Semi-annual Non-Cumulative Preferred Stock, Series U. For additional information, see Capital Management – Regulatory Capital on page 61 and Note 13 – Shareholders’ Equity to the Consolidated Financial Statements.
During 2013, we repurchased certain of our debt and trust preferred securities with an aggregate carrying value of $10.1 billion for $10.2 billion in cash.
We may conduct additional redemptions, tender offers, exercises and other transactions in the future depending on prevailing market conditions, capital, liquidity and other factors.
76788ba_financials.indd 21 3/6/14 12:05 PM

22 Bank of America 2013
Selected Financial DataTable 1 provides selected consolidated financial data for 2013 and 2012.
Table 1 Selected Financial Data
(Dollars in millions, except per share information) 2013 2012Income statement
Revenue, net of interest expense (FTE basis) (1) $ 89,801 $ 84,235Net income 11,431 4,188Diluted earnings per common share 0.90 0.25Dividends paid per common share 0.04 0.04
Performance ratios Return on average assets 0.53% 0.19%Return on average tangible shareholders’ equity (1) 7.13 2.60Efficiency ratio (FTE basis) (1) 77.07 85.59
Asset quality Allowance for loan and lease losses at December 31 $ 17,428 $ 24,179Allowance for loan and lease losses as a percentage of total loans and leases outstanding at December 31 (2) 1.90% 2.69%Nonperforming loans, leases and foreclosed properties at December 31 (2) $ 17,772 $ 23,555Net charge-offs (3) 7,897 14,908Net charge-offs as a percentage of average loans and leases outstanding (2, 3) 0.87% 1.67%Net charge-offs as a percentage of average loans and leases outstanding, excluding the purchased credit-impaired loan portfolio (2) 0.90 1.73Net charge-offs and purchased credit-impaired write-offs as a percentage of average loans and leases outstanding (2) 1.13 1.99Ratio of the allowance for loan and lease losses at December 31 to net charge-offs (3) 2.21 1.62Ratio of the allowance for loan and lease losses at December 31 to net charge-offs, excluding the purchased credit-impaired loan portfolio 1.89 1.25Ratio of the allowance for loan and lease losses at December 31 to net charge-offs and purchased credit-impaired write-offs 1.70 1.36
Balance sheet at year end Total loans and leases $ 928,233 $ 907,819Total assets 2,102,273 2,209,974Total deposits 1,119,271 1,105,261Total common shareholders’ equity 219,333 218,188Total shareholders’ equity 232,685 236,956
Capital ratios at year end (4) Tier 1 common capital 11.19% 11.06%Tier 1 capital 12.44 12.89Total capital 15.44 16.31Tier 1 leverage 7.86 7.37
(1) Fully taxable-equivalent (FTE) basis, return on average tangible shareholders’ equity and the efficiency ratio are non-GAAP financial measures. Other companies may define or calculate these measures differently. For more information, see Supplemental Financial Data on page 29, and for corresponding reconciliations to GAAP financial measures, see Statistical Table XV.
(2) Balances and ratios do not include loans accounted for under the fair value option. For additional exclusions from nonperforming loans, leases and foreclosed properties, see Consumer Portfolio Credit Risk Management – Nonperforming Consumer Loans, Leases and Foreclosed Properties Activity on page 85 and corresponding Table 41, and Commercial Portfolio Credit Risk Management – Nonperforming Commercial Loans, Leases and Foreclosed Properties Activity on page 92 and corresponding Table 50.
(3) Net charge-offs exclude $2.3 billion of write-offs in the purchased credit-impaired loan portfolio for 2013 compared to $2.8 billion for 2012. These write-offs decreased the purchased credit-impaired valuation allowance included as part of the allowance for loan and lease losses. For more information on purchased credit-impaired write-offs, see Consumer Portfolio Credit Risk Management – Purchased Credit-impaired Loan Portfolio on page 81.
(4) Presents capital ratios in accordance with the Basel 1 – 2013 Rules, which include the Market Risk Final Rule at December 31, 2013. Basel 1 did not include the Basel 1 – 2013 Rules at December 31, 2012.
76788ba_financials.indd 22 3/6/14 12:05 PM

Bank of America 2013 23
Financial HighlightsNet income was $11.4 billion, or $0.90 per diluted share in 2013 compared to $4.2 billion, or $0.25 per diluted share in 2012. The results for 2013 reflect our efforts to stabilize revenue, decrease costs, strengthen the balance sheet and improve credit quality.
Table 2 Summary Income Statement
(Dollars in millions) 2013 2012Net interest income (FTE basis) (1) $ 43,124 $ 41,557Noninterest income 46,677 42,678
Total revenue, net of interest expense (FTE basis) (1) 89,801 84,235Provision for credit losses 3,556 8,169Noninterest expense 69,214 72,093
Income before income taxes 17,031 3,973Income tax expense (benefit) (FTE basis) (1) 5,600 (215)
Net income 11,431 4,188Preferred stock dividends 1,349 1,428
Net income applicable to common shareholders $ 10,082 $ 2,760
Per common share information Earnings $ 0.94 $ 0.26Diluted earnings 0.90 0.25
(1) FTE basis is a non-GAAP financial measure. For more information on this measure, see Supplemental Financial Data on page 29, and for a corresponding reconciliation to GAAP financial measures, see Statistical Table XV.
Net Interest IncomeNet interest income on a fully taxable-equivalent (FTE) basis increased $1.6 billion to $43.1 billion for 2013 compared to 2012. The increase was primarily due to reductions in long-term debt balances, higher yields on debt securities including the impact of market-related premium amortization expense, lower rates paid on deposits, higher commercial loan balances and increased trading-related net interest income, partially offset by lower consumer loan balances as well as lower asset yields and the low rate environment. The net interest yield on a FTE basis increased 12 basis points (bps) to 2.47 percent for 2013 compared to 2012 due to the same factors as described above.
Noninterest Income
Table 3 Noninterest Income
(Dollars in millions) 2013 2012Card income $ 5,826 $ 6,121Service charges 7,390 7,600Investment and brokerage services 12,282 11,393Investment banking income 6,126 5,299Equity investment income 2,901 2,070Trading account profits 7,056 5,870Mortgage banking income 3,874 4,750Gains on sales of debt securities 1,271 1,662Other loss (29) (2,034)
Net impairment losses recognized in earnings on AFSdebt securities (20) (53)
Total noninterest income $ 46,677 $ 42,678
Noninterest income increased $4.0 billion to $46.7 billion for 2013 compared to 2012. The following highlights the significant changes.
Card income decreased $295 million primarily driven by lower revenue as a result of our exit of consumer protection products.Investment and brokerage services income increased $889 million primarily driven by the impact of long-term assets under management (AUM) inflows and higher market levels.Investment banking income increased $827 million primarily due to strong equity issuance fees attributable to a significant increase in global equity capital markets volume and higher debt issuance fees, primarily within leveraged finance and investment-grade underwriting.Equity investment income increased $831 million. The results for 2013 included $753 million of gains related to the sale of our remaining investment in China Construction Bank Corporation (CCB) and gains of $1.4 billion on the sales of a portion of an equity investment. The results for 2012 included $1.6 billion of gains related to sales of certain equity and strategic investments.Trading account profits increased $1.2 billion. Net debit valuation adjustment (DVA) losses on derivatives were $508 million in 2013 compared to losses of $2.5 billion in 2012. Excluding net DVA, trading account profits decreased $783 million due to decreases in our fixed-income, currency and commodities (FICC) businesses driven by a challenging trading environment, partially offset by an increase in our equities businesses.Mortgage banking income decreased $876 million primarily driven by lower servicing income and lower core production revenue, partially offset by lower representations and warranties provision.Other loss decreased $2.0 billion due to lower negative fair value adjustments on our structured liabilities of $649 million compared to negative fair value adjustments of $5.1 billion in 2012. The prior year included gains of $1.6 billion related to debt repurchases and exchanges of trust preferred securities.
Provision for Credit LossesThe provision for credit losses decreased $4.6 billion to $3.6 billion for 2013 compared to 2012. The provision for credit losses was $4.3 billion lower than net charge-offs for 2013, resulting in a reduction in the allowance for credit losses due to continued improvement in the home loans and credit card portfolios. This compared to a reduction of $6.7 billion in the allowance for credit losses for the prior year. If the economy and our asset quality continue to improve, we anticipate additional reductions in the allowance for credit losses in future periods, although at a significantly lower level than in 2013.
Net charge-offs totaled $7.9 billion, or 0.87 percent of average loans and leases for 2013 compared to $14.9 billion, or 1.67 percent for 2012. The decrease in net charge-offs was primarily driven by credit quality improvement across all major portfolios. Also, the prior year included charge-offs associated with the National Mortgage Settlement and loans discharged in Chapter 7 bankruptcy due to the implementation of regulatory guidance. Given improving trends in delinquencies and the Home Price Index, absent any unexpected changes in the economy, we expect net charge-offs to continue to improve in 2014, but at a slower pace than 2013. For more information on the provision for credit losses, see Provision for Credit Losses on page 100.
76788ba_financials.indd 23 3/6/14 12:05 PM

24 Bank of America 2013
Noninterest Expense
Table 4 Noninterest Expense
(Dollars in millions) 2013 2012Personnel $ 34,719 $ 35,648Occupancy 4,475 4,570Equipment 2,146 2,269Marketing 1,834 1,873Professional fees 2,884 3,574Amortization of intangibles 1,086 1,264Data processing 3,170 2,961Telecommunications 1,593 1,660Other general operating 17,307 18,274
Total noninterest expense $ 69,214 $ 72,093
Noninterest expense decreased $2.9 billion to $69.2 billion for 2013 compared to 2012 primarily driven by a $967 million decline in other general operating expense largely due to a provision of $1.1 billion in 2012 for the 2013 Independent Foreclosure Review (IFR) Acceleration Agreement, lower Federal Deposit Insurance Corporation (FDIC) expense, and lower default-related servicing expenses in Legacy Assets & Servicing and mortgage-related assessments, waivers and similar costs related to foreclosure delays. Partially offsetting these declines was a $1.9 billion increase in litigation expense to $6.1 billion in 2013. Personnel expense decreased $929 million in 2013 as we continued to streamline processes and achieve cost savings. Professional fees decreased $690 million due in part to reduced default-related management activities in Legacy Assets & Servicing.
In connection with Project New BAC, which was first announced in the third quarter of 2011, we continue to achieve cost savings in certain noninterest expense categories as we further streamline workflows, simplify processes and align expenses with our overall strategic plan and operating principles. We expect total cost savings from Project New BAC, since inception of the project, to reach $8 billion on an annualized basis, or $2 billion per quarter, by mid-2015, of which approximately $1.5 billion per quarter has been realized.
Income Tax Expense
Table 5 Income Tax Expense
(Dollars in millions) 2013 2012Income before income taxes $ 16,172 $ 3,072Income tax expense (benefit) 4,741 (1,116)Effective tax rate 29.3% (36.3)%
The effective tax rate for 2013 was driven by our recurring tax preference items and by certain tax benefits related to non-U.S. operations, including additional tax benefits from the 2012 non-U.S. restructurings. These benefits were partially offset by the $1.1 billion impact of the U.K. 2013 Finance Act enacted on July 17, 2013, which reduced the U.K. corporate income tax rate by three percent to 20 percent. Two percent of the reduction will become effective April 1, 2014 and the additional one percent reduction on April 1, 2015. These reductions, which represented the final in a series of announced reductions, are expected to favorably affect income tax expense on future U.K. earnings but also required us to remeasure, in the period of enactment, our U.K. net deferred tax assets using the lower tax rates. Because our deferred tax assets in excess of a certain amount are disallowed in calculating regulatory capital, this charge did not impact our capital ratios.
The negative effective tax rate for 2012 included a $1.7 billion tax benefit attributable to the excess of foreign tax credits recognized in the U.S. upon repatriation of the earnings of certain subsidiaries over the related U.S. tax liability. Partially offsetting the benefit was the $788 million impact of the U.K. 2012 Finance Act enacted in July 2012, which reduced the U.K. corporate income tax rate by two percent.
76788ba_financials.indd 24 3/6/14 12:05 PM

Bank of America 2013 25
Balance Sheet Overview
Table 6 Selected Balance Sheet Data
December 31 Average Balance(Dollars in millions) 2013 2012 % Change 2013 2012 % ChangeAssets
Federal funds sold and securities borrowed or purchased under agreements toresell $ 190,328 $ 219,924 (13)% $ 224,331 $ 236,042 (5)%
Trading account assets 200,993 227,775 (12) 217,865 203,799 7Debt securities 323,945 360,331 (10) 337,953 353,577 (4)Loans and leases 928,233 907,819 2 918,641 898,768 2Allowance for loan and lease losses (17,428) (24,179) (28) (21,188) (29,843) (29)All other assets 476,202 518,304 (8) 485,911 529,013 (8)
Total assets $2,102,273 $2,209,974 (5) $2,163,513 $2,191,356 (1)Liabilities
Deposits $1,119,271 $1,105,261 1 $1,089,735 $1,047,782 4Federal funds purchased and securities loaned or sold under agreements to
repurchase 198,106 293,259 (32) 257,601 281,900 (9)
Trading account liabilities 83,469 73,587 13 88,323 78,554 12Short-term borrowings 45,999 30,731 50 43,816 36,500 20Long-term debt 249,674 275,585 (9) 263,416 316,393 (17)All other liabilities 173,069 194,595 (11) 186,675 194,550 (4)
Total liabilities 1,869,588 1,973,018 (5) 1,929,566 1,955,679 (1)Shareholders’ equity 232,685 236,956 (2) 233,947 235,677 (1)
Total liabilities and shareholders’ equity $2,102,273 $2,209,974 (5) $2,163,513 $2,191,356 (1)
Year-end balance sheet amounts may vary from average balance sheet amounts due to liquidity and balance sheet management activities, primarily involving our portfolios of highly liquid assets. These portfolios are designed to ensure the adequacy of capital while enhancing our ability to manage liquidity requirements for the Corporation and our customers, and to position the balance sheet in accordance with the Corporation’s risk appetite. The execution of these activities requires the use of balance sheet and capital-related limits including spot, average and risk-weighted asset limits, particularly within the market-making activities of our trading businesses. One of our key regulatory metrics, Tier 1 leverage ratio, is calculated based on adjusted quarterly average total assets.
Assets
Federal Funds Sold and Securities Borrowed or Purchased Under Agreements to ResellFederal funds transactions involve lending reserve balances on a short-term basis. Securities borrowed or purchased under agreements to resell are collateralized lending transactions utilized to accommodate customer transactions, earn interest rate spreads, and obtain securities for settlement and for collateral. Year-end and average federal funds sold and securities borrowed or purchased under agreements to resell decreased $29.6 billion from December 31, 2012 and $11.7 billion in 2013 compared to 2012 driven by a lower matched-book as we adjust our activity to address the adverse treatment of reverse repurchase agreements under the proposed supplementary leverage ratio.
Trading Account AssetsTrading account assets consist primarily of long positions in equity and fixed-income securities including U.S. government and agency securities, corporate securities, and non-U.S. sovereign debt. Year-end trading account assets decreased $26.8 billion primarily due
to a reduction in U.S. government and agency securities. Average trading account assets increased $14.1 billion primarily due to higher equity securities inventory and client-based activity.
Debt SecuritiesDebt securities primarily include U.S. Treasury and agency securities, MBS, principally agency MBS, foreign bonds, corporate bonds and municipal debt. We use the debt securities portfolio primarily to manage interest rate and liquidity risk and to take advantage of market conditions that create more economically attractive returns on these investments. Year-end and average debt securities decreased $36.4 billion and $15.6 billion primarily due to net sales of U.S. Treasuries, paydowns and decreases in the fair value of available-for-sale (AFS) debt securities resulting from the impact of higher interest rates. For more information on debt securities, see Note 3 – Securities to the Consolidated Financial Statements.
Loans and LeasesYear-end and average loans and leases increased $20.4 billion and $19.9 billion. The increases were primarily due to higher commercial loan balances primarily in the U.S. commercial and non-U.S. commercial product types, partially offset by lower consumer loan balances driven by continued runoff in certain portfolios as well as paydowns and charge-offs outpacing originations. For a more detailed discussion of the loan portfolio, see Credit Risk Management on page 72.
Allowance for Loan and Lease LossesYear-end and average allowance for loan and lease losses decreased $6.8 billion and $8.7 billion primarily due to the impact of the improving economy, partially offset by increases in reserves in the commercial portfolio due to loan growth. For a more detailed discussion, see Allowance for Credit Losses on page 100.
76788ba_financials.indd 25 3/6/14 12:05 PM

26 Bank of America 2013
All Other AssetsYear-end other assets decreased $42.1 billion driven by lower customer and other receivables, other earning assets, loans held-for-sale and derivative assets, partially offset by increases in cash and cash equivalents. Average other assets decreased $43.1 billion primarily driven by lower derivative assets, other earning assets, and cash and cash equivalents.
Liabilities
DepositsYear-end and average deposits increased $14.0 billion from December 31, 2012 and $42.0 billion in 2013 compared to 2012. The increases were primarily driven by customer and client shifts to more liquid products in the low rate environment.
Federal Funds Purchased and Securities Loaned or Sold Under Agreements to RepurchaseFederal funds transactions involve borrowing reserve balances on a short-term basis. Securities loaned or sold under agreements to repurchase are collateralized borrowing transactions utilized to accommodate customer transactions, earn interest rate spreads and finance assets on the balance sheet. Year-end federal funds purchased and securities loaned or sold under agreements to repurchase decreased $95.2 billion primarily driven by a lower matched-book as we adjust our activity to address the adverse treatment of repurchase agreements under the proposed supplementary leverage ratio and lower trading inventory. Average federal funds purchased and securities loaned or sold under agreements to repurchase decreased $24.3 billion due to lower matched-book activity.
Trading Account LiabilitiesTrading account liabilities consist primarily of short positions in equity and fixed-income securities including U.S. government and agency securities, corporate securities, and non-U.S. sovereign debt. Year-end and average trading account liabilities increased $9.9 billion and $9.8 billion primarily due to increased short positions in equity securities.
Short-term BorrowingsShort-term borrowings provide an additional funding source and primarily consist of Federal Home Loan Bank (FHLB) short-term borrowings, notes payable and various other borrowings that generally have maturities of one year or less. Year-end and average short-term borrowings increased $15.3 billion and $7.3 billion due to an increase in short-term FHLB advances. For more information on short-term borrowings, see Note 10 – Federal Funds Sold or Purchased, Securities Financing Agreements and Short-term Borrowings to the Consolidated Financial Statements.
Long-term DebtYear-end and average long-term debt decreased $25.9 billion and $53.0 billion. The decreases were attributable to planned reductions in long-term debt as maturities outpaced new issuances. For more information on long-term debt, see Note 11 – Long-term Debt to the Consolidated Financial Statements.
All Other LiabilitiesYear-end all other liabilities decreased $21.5 billion driven by decreases in noninterest payables and derivative liabilities. Average all other liabilities decreased $7.9 billion driven by a decrease in derivative liabilities.
Shareholders’ EquityYear-end and average shareholders’ equity decreased $4.3 billion and $1.7 billion. The decreases were driven by a decrease in the fair value of AFS debt securities resulting from the impact of higher interest rates, which is recorded in accumulated other comprehensive income (OCI), net preferred stock redemptions and common stock repurchases, partially offset by earnings.
Cash Flows OverviewThe Corporation’s operating assets and liabilities support our global markets and lending activities. We believe that cash flows from operations, available cash balances and our ability to generate cash through short- and long-term debt are sufficient to fund our operating liquidity needs. Our investing activities primarily include the debt securities portfolio and other short-term investments. Our financing activities reflect cash flows primarily related to increased customer deposits and net long-term debt reductions.
Cash and cash equivalents increased $20.6 billion during 2013 due to net cash provided by operating and investing activities, partially offset by net cash used in financing activities. Cash and cash equivalents decreased $9.4 billion during 2012 due to net cash used in operating and investing activities, partially offset by net cash provided by financing activities.
During 2013, net cash provided by operating activities was $92.8 billion. The more significant adjustments to net income to arrive at cash used in operating activities included net decreases in other assets, and trading and derivative instruments, as well as net proceeds from sales, securitizations and paydowns of loans held-for-sale (LHFS). During 2012, net cash used in operating activities was $16.1 billion. The more significant adjustments to net income to arrive at cash used in operating activities included net increases in trading and derivative instruments, and the provision for credit losses.
During 2013, net cash provided by investing activities was $25.1 billion primarily driven by a decrease in federal funds sold and securities borrowed or purchased under agreements to resell and net sales of debt securities, partially offset by net increases in loans and leases. During 2012, net cash used in investing activities was $35.0 billion, primarily driven by net purchases of debt securities.
During 2013, net cash used in financing activities of $95.4 billion primarily reflected a decrease in federal funds purchased and securities loaned or sold under agreements to repurchase and net reductions in long-term debt, partially offset by growth in short-term borrowings and deposits. During 2012, the net cash provided by financing activities of $42.4 billion primarily reflected an increase in federal funds purchased and securities loaned or sold under agreements to repurchase and growth in deposits, partially offset by planned reductions in long-term debt.
76788ba_financials.indd 26 3/6/14 12:05 PM

Bank of America 2013 27
Table 7 Five-year Summary of Selected Financial Data
(In millions, except per share information) 2013 2012 2011 2010 2009Income statement
Net interest income $ 42,265 $ 40,656 $ 44,616 $ 51,523 $ 47,109Noninterest income 46,677 42,678 48,838 58,697 72,534Total revenue, net of interest expense 88,942 83,334 93,454 110,220 119,643Provision for credit losses 3,556 8,169 13,410 28,435 48,570Goodwill impairment — — 3,184 12,400 —Merger and restructuring charges — — 638 1,820 2,721All other noninterest expense (1) 69,214 72,093 76,452 68,888 63,992Income (loss) before income taxes 16,172 3,072 (230) (1,323) 4,360Income tax expense (benefit) 4,741 (1,116) (1,676) 915 (1,916)Net income (loss) 11,431 4,188 1,446 (2,238) 6,276Net income (loss) applicable to common shareholders 10,082 2,760 85 (3,595) (2,204)Average common shares issued and outstanding 10,731 10,746 10,143 9,790 7,729Average diluted common shares issued and outstanding (2) 11,491 10,841 10,255 9,790 7,729
Performance ratios Return on average assets 0.53% 0.19% 0.06% n/m 0.26%Return on average common shareholders’ equity 4.62 1.27 0.04 n/m n/mReturn on average tangible common shareholders’ equity (3) 6.97 1.94 0.06 n/m n/mReturn on average tangible shareholders’ equity (3) 7.13 2.60 0.96 n/m 4.18Total ending equity to total ending assets 11.07 10.72 10.81 10.08% 10.38Total average equity to total average assets 10.81 10.75 9.98 9.56 10.01Dividend payout 4.25 15.86 n/m n/m n/m
Per common share data Earnings (loss) $ 0.94 $ 0.26 $ 0.01 $ (0.37) $ (0.29)Diluted earnings (loss) (2) 0.90 0.25 0.01 (0.37) (0.29)Dividends paid 0.04 0.04 0.04 0.04 0.04Book value 20.71 20.24 20.09 20.99 21.48Tangible book value (3) 13.79 13.36 12.95 12.98 11.94
Market price per share of common stock Closing $ 15.57 $ 11.61 $ 5.56 $ 13.34 $ 15.06High closing 15.88 11.61 15.25 19.48 18.59Low closing 11.03 5.80 4.99 10.95 3.14
Market capitalization $ 164,914 $ 125,136 $ 58,580 $ 134,536 $ 130,273(1) Excludes merger and restructuring charges and goodwill impairment charges.(2) Due to a net loss applicable to common shareholders for 2010 and 2009, the impact of antidilutive equity instruments was excluded from diluted earnings (loss) per share and average diluted
common shares.(3) Tangible equity ratios and tangible book value per share of common stock are non-GAAP financial measures. Other companies may define or calculate these measures differently. For more information
on these ratios, see Supplemental Financial Data on page 29, and for corresponding reconciliations to GAAP financial measures, see Statistical Table XV on page 139.(4) For more information on the impact of the purchased credit-impaired loan portfolio on asset quality, see Consumer Portfolio Credit Risk Management on page 73. (5) Includes the allowance for loan and lease losses and the reserve for unfunded lending commitments.(6) Balances and ratios do not include loans accounted for under the fair value option. For additional exclusions from nonperforming loans, leases and foreclosed properties, see Consumer Portfolio
Credit Risk Management – Nonperforming Consumer Loans, Leases and Foreclosed Properties Activity on page 85 and corresponding Table 41, and Commercial Portfolio Credit Risk Management – Nonperforming Commercial Loans, Leases and Foreclosed Properties Activity on page 92 and corresponding Table 50.
(7) Primarily includes amounts allocated to the U.S. credit card and unsecured consumer lending portfolios in CBB, purchased credit-impaired loans and the non-U.S. credit card portfolio in All Other.(8) Net charge-offs exclude $2.3 billion and $2.8 billion of write-offs in the purchased credit-impaired loan portfolio for 2013 and 2012. These write-offs decreased the purchased credit-impaired valuation
allowance included as part of the allowance for loan and lease losses. For more information on purchased credit-impaired write-offs, see Consumer Portfolio Credit Risk Management – Purchased Credit-impaired Loan Portfolio on page 81.
(9) There were no write-offs of PCI loans in 2011, 2010, and 2009.(10) Presents capital ratios in accordance with the Basel 1 – 2013 Rules, which include the Market Risk Final Rule at December 31, 2013. Basel 1 did not include the Basel 1 – 2013 Rules at December 31,
2012.n/m = not meaningful
76788ba_financials.indd 27 3/6/14 12:05 PM

28 Bank of America 2013
Table 7 Five-year Summary of Selected Financial Data (continued)
(Dollars in millions) 2013 2012 2011 2010 2009Average balance sheet
Total loans and leases $ 918,641 $ 898,768 $ 938,096 $ 958,331 $ 948,805Total assets 2,163,513 2,191,356 2,296,322 2,439,606 2,443,068Total deposits 1,089,735 1,047,782 1,035,802 988,586 980,966Long-term debt 263,416 316,393 421,229 490,497 446,634Common shareholders’ equity 218,468 216,996 211,709 212,686 182,288Total shareholders’ equity 233,947 235,677 229,095 233,235 244,645
Asset quality (4) Allowance for credit losses (5) $ 17,912 $ 24,692 $ 34,497 $ 43,073 $ 38,687Nonperforming loans, leases and foreclosed properties (6) 17,772 23,555 27,708 32,664 35,747
Allowance for loan and lease losses as a percentage of total loans and leases outstanding (6) 1.90% 2.69% 3.68% 4.47% 4.16%
Allowance for loan and lease losses as a percentage of total nonperforming loans and leases (6) 102 107 135 136 111
Allowance for loan and lease losses as a percentage of total nonperforming loans and leases, excluding the PCI loan portfolio (6) 87 82 101 116 99
Amounts included in allowance that are excluded from nonperforming loans and leases (7) $ 7,680 $ 12,021 $ 17,490 $ 22,908 $ 17,690
Allowance as a percentage of total nonperforming loans and leases, excluding amounts included in the allowance that are excluded from nonperforming loans and leases (7) 57% 54% 65% 62% 58%
Net charge-offs (8) $ 7,897 $ 14,908 $ 20,833 $ 34,334 $ 33,688Net charge-offs as a percentage of average loans and leases outstanding (6, 8) 0.87% 1.67% 2.24% 3.60% 3.58%
Net charge-offs as a percentage of average loans and leases outstanding, excluding the PCI loan portfolio (6) 0.90 1.73 2.32 3.73 3.71
Net charge-offs and PCI write-offs as a percentage of average loans and leases outstanding (6, 9) 1.13 1.99 2.24 3.60 3.58
Nonperforming loans and leases as a percentage of total loans and leases outstanding (6) 1.87 2.52 2.74 3.27 3.75
Nonperforming loans, leases and foreclosed properties as a percentage of total loans, leases and foreclosed properties (6) 1.93 2.62 3.01 3.48 3.98
Ratio of the allowance for loan and lease losses at December 31 to net charge-offs (8) 2.21 1.62 1.62 1.22 1.10
Ratio of the allowance for loan and lease losses at December 31 to net charge-offs,excluding the PCI loan portfolio 1.89 1.25 1.22 1.04 1.00
Ratio of the allowance for loan and lease losses at December 31 to net charge-offs and PCI write-offs (9) 1.70 1.36 1.62 1.22 1.10
Capital ratios at year end (10) Risk-based capital:
Tier 1 common capital 11.19% 11.06% 9.86% 8.60% 7.81%Tier 1 capital 12.44 12.89 12.40 11.24 10.40Total capital 15.44 16.31 16.75 15.77 14.66Tier 1 leverage 7.86 7.37 7.53 7.21 6.88Tangible equity (3) 7.86 7.62 7.54 6.75 6.40Tangible common equity (3) 7.20 6.74 6.64 5.99 5.56
For footnotes see page 27.
76788ba_financials.indd 28 3/6/14 12:05 PM

Bank of America 2013 29
Supplemental Financial DataWe view net interest income and related ratios and analyses on a FTE basis, which when presented on a consolidated basis, are non-GAAP financial measures. We believe managing the business with net interest income on a FTE basis provides a more accurate picture of the interest margin for comparative purposes. To derive the FTE basis, net interest income is adjusted to reflect tax-exempt income on an equivalent before-tax basis with a corresponding increase in income tax expense. For purposes of this calculation, we use the federal statutory tax rate of 35 percent. This measure ensures comparability of net interest income arising from taxable and tax-exempt sources.
Certain performance measures including the efficiency ratio and net interest yield utilize net interest income (and thus total revenue) on a FTE basis. The efficiency ratio measures the costs expended to generate a dollar of revenue, and net interest yield measures the bps we earn over the cost of funds.
We also evaluate our business based on certain ratios that utilize tangible equity, a non-GAAP financial measure. Tangible equity represents an adjusted shareholders’ equity or common shareholders’ equity amount which has been reduced by goodwill and intangible assets (excluding mortgage servicing rights (MSRs)), net of related deferred tax liabilities. These measures are used to evaluate our use of equity. In addition, profitability, relationship and investment models all use return on average tangible shareholders’ equity (ROTE) as key measures to support our overall growth goals. These ratios are as follows:
Return on average tangible common shareholders’ equity measures our earnings contribution as a percentage of adjusted common shareholders’ equity. The tangible common equity ratio represents adjusted ending common shareholders’ equity divided by total assets less goodwill and intangible assets (excluding MSRs), net of related deferred tax liabilities. ROTE measures our earnings contribution as a percentage of adjusted average total shareholders’ equity. The tangible equity ratio represents adjusted ending shareholders’ equity divided by total assets less goodwill and intangible assets (excluding MSRs), net of related deferred tax liabilities.
Tangible book value per common share represents adjusted ending common shareholders’ equity divided by ending common shares outstanding.The aforementioned supplemental data and performance
measures are presented in Table 7 and Statistical Table XII. In addition, in Table 8, we have excluded the impact of goodwill impairment charges of $3.2 billion and $12.4 billion recorded in 2011 and 2010 when presenting certain of these metrics. Accordingly, these are non-GAAP financial measures.
We evaluate our business segment results based on measures that utilize return on average allocated capital, and prior to January 1, 2013, the return on average economic capital, both of which represent non-GAAP financial measures. These ratios are calculated as net income adjusted for cost of funds and earnings credits and certain expenses related to intangibles, divided by average allocated capital or average economic capital, as applicable. In addition, for purposes of goodwill impairment testing, the Corporation utilizes allocated equity as a proxy for the carrying value of its reporting units. Allocated equity for the business segments is comprised of allocated capital (or economic capital prior to 2013) plus capital for the portion of goodwill and intangibles specifically assigned to the business segment. For additional information, see Business Segment Operations on page 31 and Note 8 – Goodwill and Intangible Assets to the Consolidated Financial Statements.
In 2009, Common Equivalent Securities were reflected in our reconciliations given the expectation that the underlying Common Equivalent Junior Preferred Stock, Series S would convert into common stock following shareholder approval of additional authorized shares. Shareholders approved the increase in the number of authorized shares of common stock and the Common Equivalent Stock converted into common stock on February 24, 2010.
Statistical Tables XV, XVI and XVII on pages 139, 140 and 141 provide reconciliations of these non-GAAP financial measures to GAAP financial measures. We believe the use of these non-GAAP financial measures provides additional clarity in assessing the results of the Corporation and our segments. Other companies may define or calculate these measures and ratios differently.
Table 8 Five-year Supplemental Financial Data
(Dollars in millions, except per share information) 2013 2012 2011 2010 2009Fully taxable-equivalent basis data
Net interest income (1) $ 43,124 $ 41,557 $ 45,588 $ 52,693 $ 48,410Total revenue, net of interest expense 89,801 84,235 94,426 111,390 120,944Net interest yield (1) 2.47% 2.35% 2.48% 2.78% 2.65%Efficiency ratio 77.07 85.59 85.01 74.61 55.16
Performance ratios, excluding goodwill impairment charges (2) Per common share information
Earnings $ 0.32 $ 0.87 Diluted earnings 0.32 0.86
Efficiency ratio (FTE basis) 81.64% 63.48% Return on average assets 0.20 0.42 Return on average common shareholders’ equity 1.54 4.14 Return on average tangible common shareholders’ equity 2.46 7.03 Return on average tangible shareholders’ equity 3.08 7.11
(1) Net interest income and net interest yield include fees earned on overnight deposits placed with the Federal Reserve and fees earned on deposits, primarily overnight, placed with certain non-U.S. central banks.
(2) Performance ratios are calculated excluding the impact of goodwill impairment charges of $3.2 billion and $12.4 billion recorded in 2011 and 2010.
76788ba_financials.indd 29 3/6/14 12:05 PM

30 Bank of America 2013
Net Interest Income Excluding Trading-related Net Interest IncomeWe manage net interest income on a FTE basis and excluding the impact of trading-related activities. As discussed in Global Markets on page 44, we evaluate our sales and trading results and strategies on a total market-based revenue approach by combining net interest income and noninterest income for Global Markets. An analysis of net interest income, average earning assets and net interest yield on earning assets, all of which adjust for the impact of trading-related net interest income from reported net interest income on a FTE basis, is shown below. We believe the use of this non-GAAP presentation in Table 9 provides additional clarity in assessing our results.
Table 9 Net Interest Income Excluding Trading-relatedNet Interest Income
(Dollars in millions) 2013 2012Net interest income (FTE basis) As reported (1) $ 43,124 $ 41,557Impact of trading-related net interest income (3,868) (3,308)
Net interest income excluding trading-related net interest income (2) $ 39,256 $ 38,249
Average earning assets As reported $ 1,746,974 $1,769,969Impact of trading-related earning assets (469,048) (449,660)
Average earning assets excluding trading-related earning assets (2) $ 1,277,926 $1,320,309
Net interest yield contribution (FTE basis) As reported (1) 2.47% 2.35%Impact of trading-related activities 0.60 0.55
Net interest yield on earning assets excluding trading-related activities (2) 3.07% 2.90%
(1) Net interest income and net interest yield include fees earned on overnight deposits placed with the Federal Reserve and fees earned on deposits, primarily overnight, placed with certain non-U.S. central banks.
(2) Represents a non-GAAP financial measure.
Net interest income excluding trading-related net interest income increased $1.0 billion to $39.3 billion for 2013 compared to 2012. The increase was primarily due to reductions in long-term debt balances and yields, market-related premium amortization expense due to an increase in long-end rates, and lower rates paid on deposits, partially offset by lower consumer loan balances and yields as well as lower net interest income from the discretionary asset and liability management (ALM) portfolio. For more information on the impacts of interest rates, see Interest Rate Risk Management for Nontrading Activities on page 109.
Average earning assets excluding trading-related earning assets decreased $42.4 billion to $1,277.9 billion, or three percent, for 2013 compared to 2012. The decrease was primarily due to declines in consumer loans, debt securities and other earning assets, partially offset by an increase in commercial loans.
Net interest yield on earning assets excluding trading-related activities increased 17 bps to 3.07 percent for 2013 compared to 2012 due to the same factors as described above.
76788ba_financials.indd 30 3/6/14 12:05 PM

Bank of America 2013 31
Business Segment Operations
Segment Description and Basis of PresentationWe report the results of our operations through five business segments: CBB, CRES, GWIM, Global Banking and Global Markets, with the remaining operations recorded in All Other. The primary activities, products or businesses of the business segments and All Other are shown below. For additional detailed information, see the business segment and All Other discussions which follow.
76788ba_financials.indd 31 3/6/14 12:05 PM

32 Bank of America 2013
We prepare and evaluate segment results using certain non-GAAP financial measures. For additional information, see Supplemental Financial Data on page 29. Table 10 provides selected summary financial data for our business segments and All Other for 2013 compared to 2012.
Table 10 Business Segment Results
Total Revenue (1)Provision for Credit
Losses Noninterest Expense Net Income (Loss)
(Dollars in millions) 2013 2012 2013 2012 2013 2012 2013 2012Consumer & Business Banking $ 29,867 $ 29,790 $ 3,107 $ 4,148 $ 16,357 $ 16,995 $ 6,588 $ 5,546Consumer Real Estate Services 7,716 8,751 (156) 1,442 16,013 17,190 (5,155) (6,439)Global Wealth & Investment Management 17,790 16,518 56 266 13,038 12,721 2,974 2,245Global Banking 16,481 15,674 1,075 (342) 7,552 7,619 4,974 5,344Global Markets 16,058 14,284 140 34 12,013 11,295 1,563 1,229All Other 1,889 (782) (666) 2,621 4,241 6,273 487 (3,737)
Total FTE basis 89,801 84,235 3,556 8,169 69,214 72,093 11,431 4,188FTE adjustment (859) (901) — — — — — —
Total Consolidated $ 88,942 $ 83,334 $ 3,556 $ 8,169 $ 69,214 $ 72,093 $ 11,431 $ 4,188(1) Total revenue is net of interest expense and is on a FTE basis which for consolidated revenue is a non-GAAP financial measure. For more information on this measure, see Supplemental Financial
Data on page 29, and for a corresponding reconciliation to a GAAP financial measure, see Statistical Table X V.
The management accounting and reporting process derives segment and business results by utilizing allocation methodologies for revenue and expense. The net income derived for the businesses is dependent upon revenue and cost allocations using an activity-based costing model, funds transfer pricing, and other methodologies and assumptions management believes are appropriate to reflect the results of the business.
Total revenue, net of interest expense, includes net interest income on a FTE basis and noninterest income. The adjustment of net interest income to a FTE basis results in a corresponding increase in income tax expense. The segment results also reflect certain revenue and expense methodologies that are utilized to determine net income. The net interest income of the businesses includes the results of a funds transfer pricing process that matches assets and liabilities with similar interest rate sensitivity and maturity characteristics. For presentation purposes, in segments where the total of liabilities and equity exceeds assets, which are generally deposit-taking segments, we allocate assets to match liabilities. Net interest income of the business segments also includes an allocation of net interest income generated by certain of our ALM activities.
Our ALM activities include an overall interest rate risk management strategy that incorporates the use of various derivatives and cash instruments to manage fluctuations in earnings and capital that are caused by interest rate volatility. Our goal is to manage interest rate sensitivity so that movements in interest rates do not significantly adversely affect earnings and capital. The results of a majority of our ALM activities are allocated to the business segments and fluctuate based on the performance of the ALM activities. ALM activities include external product pricing decisions including deposit pricing strategies, the effects of our internal funds transfer pricing process and the net effects of other ALM activities.
Certain expenses not directly attributable to a specific business segment are allocated to the segments. The most significant of these expenses include data and item processing costs and
certain centralized or shared functions. Data processing costs are allocated to the segments based on equipment usage. Item processing costs are allocated to the segments based on the volume of items processed for each segment. The costs of certain other centralized or shared functions are allocated based on methodologies that reflect utilization.
Effective January 1, 2013, on a prospective basis, we adjusted the amount of capital being allocated to our business segments. The adjustment reflected a refinement to the prior-year methodology (economic capital) which focused solely on internal risk-based economic capital models. The refined methodology (allocated capital) now also considers the effect of regulatory capital requirements in addition to internal risk-based economic capital models. The Corporation’s internal risk-based capital models use a risk-adjusted methodology incorporating each segment’s credit, market, interest rate, business and operational risk components. For more information on the nature of these risks, see Managing Risk on page 57 and Strategic Risk Management on page 61. The capital allocated to the business segments is currently referred to as allocated capital and, prior to January 1, 2013, was referred to as economic capital, both of which represent non-GAAP financial measures. For purposes of goodwill impairment testing, the Corporation utilizes allocated equity as a proxy for the carrying value of its reporting units. For additional information, see Note 8 – Goodwill and Intangible Assets to the Consolidated Financial Statements.
Allocated capital is subject to change over time, and as part of our normal annual planning process, the capital being allocated to our business segments is expected to change in the first quarter of 2014. We expect that this change will result in a reduction of unallocated tangible capital and an aggregate increase to the amount of capital being allocated to the business segments.
For more information on the business segments and reconciliations to consolidated total revenue, net income (loss) and year-end total assets, see Note 24 – Business Segment Information to the Consolidated Financial Statements.
76788ba_financials.indd 32 3/6/14 12:05 PM

Bank of America 2013 33
Consumer & Business Banking
DepositsConsumerLending
Total Consumer &Business Banking
(Dollars in millions) 2013 2012 2013 2012 2013 2012 % ChangeNet interest income (FTE basis) $ 9,808 $ 9,046 $ 10,243 $ 10,807 $ 20,051 $ 19,853 1%Noninterest income:
Card income 60 62 4,744 5,253 4,804 5,315 (10)Service charges 4,208 4,277 — — 4,208 4,277 (2)All other income (loss) 509 397 295 (52) 804 345 133
Total noninterest income 4,777 4,736 5,039 5,201 9,816 9,937 (1)Total revenue, net of interest expense (FTE basis) 14,585 13,782 15,282 16,008 29,867 29,790 —
Provision for credit losses 299 488 2,808 3,660 3,107 4,148 (25)Noninterest expense 10,927 11,310 5,430 5,685 16,357 16,995 (4)
Income before income taxes 3,359 1,984 7,044 6,663 10,403 8,647 20Income tax expense (FTE basis) 1,232 723 2,583 2,378 3,815 3,101 23
Net income $ 2,127 $ 1,261 $ 4,461 $ 4,285 $ 6,588 $ 5,546 19
Net interest yield (FTE basis) 1.88% 1.90% 7.18% 7.18% 3.72% 4.04%Return on average allocated capital (1) 13.82 — 30.60 — 21.98 —Return on average economic capital (1) — 9.72 — 38.83 — 23.12Efficiency ratio (FTE basis) 74.92 82.07 35.53 35.51 54.76 57.05
Balance Sheet
Average
Total loans and leases $ 22,437 $ 23,369 $ 142,133 $149,667 $ 164,570 $173,036 (5)Total earning assets (2) 522,870 477,142 142,725 150,515 539,213 491,767 10Total assets (2) 555,653 510,384 151,443 158,333 580,714 532,827 9Total deposits 518,470 474,822 n/m n/m 518,980 475,180 9Allocated capital (1) 15,400 — 14,600 — 30,000 — n/mEconomic capital (1) — 12,985 — 11,066 — 24,051 n/m
Year end
Total loans and leases $ 22,574 $ 22,907 $ 142,516 $146,359 $ 165,090 $169,266 (2)Total earning assets (2) 534,946 498,147 143,917 146,809 550,610 513,109 7Total assets (2) 567,837 531,354 153,394 155,408 592,978 554,915 7Total deposits 530,947 495,711 n/m n/m 531,707 496,159 7
(1) Effective January 1, 2013, we revised, on a prospective basis, the methodology for allocating capital to the business segments. In connection with the change in methodology, we updated the applicable terminology in the above table to allocated capital from economic capital as reported in prior periods. For additional information, see Business Segment Operations on page 31.
(2) For presentation purposes, in segments and businesses where the total of liabilities and equity exceeds assets, we allocate assets from All Other to match the segments’ and businesses’ liabilities and allocated shareholders’ equity. As a result, total earning assets and total assets of the businesses may not equal total CBB.
n/m = not meaningful
CBB, which is comprised of Deposits and Consumer Lending, offers a diversified range of credit, banking and investment products and services to consumers and businesses. Our customers and clients have access to a franchise network that stretches coast to coast through 31 states and the District of Columbia. The franchise network includes approximately 5,100 banking centers, 16,300 ATMs, nationwide call centers, and online and mobile platforms. During 2013, Business Banking results were moved into Deposits as we continue to integrate these businesses. Also during 2013, consumer Dealer Financial Services (DFS) results were moved into CBB from Global Banking to align this business more closely with our consumer lending activity and better serve the needs of our customers. As a result, Card Services was renamed Consumer Lending. Prior periods were reclassified to conform to current period presentation.
CBB ResultsNet income for CBB increased $1.0 billion to $6.6 billion in 2013 compared to 2012 primarily driven by lower provision for credit losses and noninterest expense. Net interest income of $20.1 billion remained relatively unchanged as the impact of higher deposit balances was offset by the impact of lower average loan balances. Noninterest income of $9.8 billion remained relatively unchanged as the allocation of certain card revenue to GWIM for clients with a credit card, as described below, and lower deposit service charges were offset by the net impact of consumer protection products, primarily due to charges recorded in 2012.
The provision for credit losses decreased $1.0 billion to $3.1 billion in 2013 primarily as a result of improvements in credit quality. Noninterest expense decreased $638 million to $16.4 billion driven by lower operating, personnel and FDIC expenses.
76788ba_financials.indd 33 3/6/14 12:05 PM

34 Bank of America 2013
DepositsDeposits includes the results of consumer deposit activities which consist of a comprehensive range of products provided to consumers and small businesses. Our deposit products include traditional savings accounts, money market savings accounts, CDs and IRAs, noninterest- and interest-bearing checking accounts, as well as investment accounts and products. The revenue is allocated to the deposit products using our funds transfer pricing process that matches assets and liabilities with similar interest rate sensitivity and maturity characteristics. Deposits generates fees such as account service fees, non-sufficient funds fees, overdraft charges and ATM fees, as well as investment and brokerage fees from Merrill Edge accounts. Merrill Edge is an integrated investing and banking service targeted at customers with less than $250,000 in investable assets. Merrill Edge provides investment advice and guidance, client brokerage asset services, a self-directed online investing platform and key banking capabilities including access to the Corporation’s network of banking centers and ATMs.
Business Banking within Deposits provides a wide range of lending-related products and services, integrated working capital management and treasury solutions to clients through our network of offices and client relationship teams along with various product partners. Our clients include U.S.-based companies generally with annual sales of $1 million to $50 million. Our lending products and services include commercial loans, lines of credit and real estate lending. Our capital management and treasury solutions include treasury management, foreign exchange and short-term investing options. Deposits also includes the results of our merchant services joint venture.
Deposits includes the net impact of migrating customers and their related deposit balances between Deposits and GWIM as well as other client-managed businesses. For more information on the migration of customer balances to or from GWIM, see GWIM on page 40.
Net income for Deposits increased $866 million to $2.1 billion in 2013 driven by higher revenue, a decrease in noninterest expense and lower provision for credit losses. Net interest income increased $762 million to $9.8 billion driven by the impact of higher deposit balances, a customer shift to higher spread liquid products and continued pricing discipline, partially offset by compressed deposit spreads due to the continued low rate environment. Noninterest income of $4.8 billion remained relatively unchanged.
The provision for credit losses decreased $189 million to $299 million in 2013 due to improvements in credit quality in Business Banking. Noninterest expense decreased $383 million to $10.9 billion due to lower operating, personnel and FDIC expenses.
Average loans decreased $932 million to $22.4 billion in 2013 primarily driven by continued run-off of non-core portfolios. Average deposits increased $43.6 billion to $518.5 billion in 2013 driven by a customer shift to more liquid products in the low rate environment. Additionally, $15.5 billion of the increase in average deposits was due to net transfers from other businesses, largely GWIM. Growth in checking, traditional savings and money market savings of $49.5 billion was partially offset by a decline in time deposits of $5.9 billion. As a result of our continued pricing discipline and the shift in the mix of deposits, the rate paid on average deposits declined by seven bps to 11 bps.
Key Statistics
2013 2012Total deposit spreads (excludes noninterest costs) 1.52% 1.81%
Year end
Client brokerage assets (in millions) $96,048 $75,946Online banking active accounts (units in thousands) 29,950 29,638Mobile banking active accounts (units in thousands) 14,395 12,013Banking centers 5,151 5,478ATMs 16,259 16,347
Client brokerage assets increased $20.1 billion in 2013 driven by market valuations and increased account flows. Mobile banking customers increased 2.4 million reflecting continuing changes in our customers’ banking preferences. The number of banking centers declined 327 and ATMs declined 88 as we continue to optimize our consumer banking network and improve our cost-to-serve.
Consumer LendingConsumer Lending is one of the leading issuers of credit and debit cards to consumers and small businesses in the U.S. Our lending products and services also include direct and indirect consumer loans such as automotive, marine, aircraft, recreational vehicle and consumer personal loans. In addition to earning net interest spread revenue on its lending activities, Consumer Lending generates interchange revenue from credit and debit card transactions as well as annual credit card fees and other miscellaneous fees.
Beginning in March 2013, the revenue and expense associated with GWIM clients that hold credit cards was allocated to GWIM. Beginning in the fourth quarter of 2013, Consumer Lending migrated these related credit card loan balances to GWIM. For more information on the migration of customer balances to GWIM, see GWIM on page 40.
On July 31, 2013, the U.S. District Court for the District of Columbia issued a ruling regarding the Federal Reserve’s rules implementing the Dodd-Frank Wall Street Reform and Consumer Protection Act’s (Financial Reform Act) Durbin Amendment. The ruling requires the Federal Reserve to reconsider the current $0.21 per transaction cap on debit card interchange fees. The Federal Reserve is appealing the ruling and final resolution is expected in the first half of 2014. If the Federal Reserve, upon final resolution, implements a lower per transaction cap than the initial range, it may have a significant adverse impact on our debit card interchange fee revenue.
Net income for Consumer Lending increased $176 million to $4.5 billion in 2013 as lower provision for credit losses and noninterest expense were partially offset by a decrease in revenue. Net interest income decreased $564 million to $10.2 billion driven by the impact of lower average loan balances. Noninterest income decreased $162 million to $5.0 billion driven by the allocation of certain card revenue to GWIM for clients with a credit card and the net impact of portfolio sales, partially offset by the net impact of consumer protection products, primarily due to charges recorded in 2012.
76788ba_financials.indd 34 3/6/14 12:05 PM

Bank of America 2013 35
The provision for credit losses decreased $852 million to $2.8 billion in 2013 due to improvements in credit quality. Noninterest expense decreased $255 million to $5.4 billion driven by lower operating and personnel expenses.
Average loans decreased $7.5 billion to $142.1 billion in 2013 primarily driven by charge-offs and continued run-off of non-core portfolios.
Key Statistics
(Dollars in millions) 2013 2012Total Corporation U.S. credit card (1)
Gross interest yield 9.73% 10.02%Risk-adjusted margin 8.68 7.54New accounts (in thousands) 3,911 3,258Purchase volumes $ 205,914 $193,500
Debit card purchase volumes $ 267,087 $258,363(1) In addition to the U.S. credit card portfolio in CBB, the remaining U.S. credit card portfolio is in
GWIM.
During 2013, the total Corporation U.S. credit card risk-adjusted margin increased 114 bps due to an improvement in credit quality. During 2013, total Corporation U.S. credit card purchase volumes increased $12.4 billion, or six percent, to $205.9 billion and debit card purchase volumes increased $8.7 billion, or three percent, to $267.1 billion, reflecting higher levels of consumer spending.
76788ba_financials.indd 35 3/6/14 12:05 PM

36 Bank of America 2013
Consumer Real Estate Services
Home LoansLegacy Assets &
ServicingTotal Consumer Real
Estate Services
(Dollars in millions) 2013 2012 2013 2012 2013 2012 % ChangeNet interest income (FTE basis) $ 1,349 $ 1,361 $ 1,541 $ 1,569 $ 2,890 $ 2,930 (1)%Noninterest income:
Mortgage banking income 1,916 3,284 2,669 2,269 4,585 5,553 (17)All other income (loss) (6) 1 247 267 241 268 (10)
Total noninterest income 1,910 3,285 2,916 2,536 4,826 5,821 (17)Total revenue, net of interest expense (FTE basis) 3,259 4,646 4,457 4,105 7,716 8,751 (12)
Provision for credit losses 127 72 (283) 1,370 (156) 1,442 n/mNoninterest expense 3,318 3,195 12,695 13,995 16,013 17,190 (7)
Income (loss) before income taxes (186) 1,379 (7,955) (11,260) (8,141) (9,881) (18)Income tax expense (benefit) (FTE basis) (68) 502 (2,918) (3,944) (2,986) (3,442) (13)
Net income (loss) $ (118) $ 877 $ (5,037) $ (7,316) $ (5,155) $ (6,439) (20)
Net interest yield (FTE basis) 2.54% 2.41% 3.19% 2.45% 2.85% 2.43%Efficiency ratio (FTE basis) n/m 68.77 n/m n/m n/m n/m
Balance Sheet
Average
Total loans and leases $ 47,675 $ 50,023 $ 42,603 $ 53,501 $ 90,278 $103,524 (13)Total earning assets 53,148 56,581 48,272 64,055 101,420 120,636 (16)Total assets 53,429 57,552 67,131 87,817 120,560 145,369 (17)Allocated capital (1) 6,000 — 18,000 — 24,000 — n/mEconomic capital (1) — 3,734 — 9,942 — 13,676 n/m
Year end
Total loans and leases $ 51,021 $ 47,742 $ 38,732 $ 46,918 $ 89,753 $ 94,660 (5)Total earning assets 54,071 54,394 43,092 52,580 97,163 106,974 (9)Total assets 53,927 55,465 59,459 75,594 113,386 131,059 (13)
(1) Effective January 1, 2013, we revised, on a prospective basis, the methodology for allocating capital to the business segments. In connection with the change in methodology, we updated the applicable terminology in the above table to allocated capital from economic capital as reported in prior periods. For additional information, see Business Segment Operations on page 31.
n/m = not meaningful
CRES operations include Home Loans and Legacy Assets & Servicing. Home Loans is responsible for ongoing loan production activities and the CRES home equity loan portfolio not selected for inclusion in the Legacy Assets & Servicing owned portfolio. Legacy Assets & Servicing is responsible for all of our mortgage servicing activities related to loans serviced for others and loans held by the Corporation, including loans that have been designated as the Legacy Assets & Servicing Portfolios. The Legacy Assets & Servicing Portfolios (both owned and serviced), herein referred to as the Legacy Owned and Legacy Serviced Portfolios, respectively (together, the Legacy Portfolios), and as further defined below, include those loans originated prior to January 1, 2011 that would not have been originated under our established underwriting standards as of December 31, 2010. For more information on our Legacy Portfolios, see page 37. In addition, Legacy Assets & Servicing is responsible for managing legacy exposures related to CRES (e.g., representations and warranties). This alignment allows CRES management to lead the ongoing Home Loans business while also providing focus on legacy mortgage issues and servicing activities.
CRES, primarily through its Home Loans operations, generates revenue by providing an extensive line of consumer real estate products and services to customers nationwide. CRES products offered by Home Loans include fixed- and adjustable-rate first-lien mortgage loans for home purchase and refinancing needs, home equity lines of credit (HELOCs) and home equity loans. First
mortgage products are generally either sold into the secondary mortgage market to investors, while we retain MSRs (which are on the balance sheet of Legacy Assets & Servicing) and the Bank of America customer relationships, or are held on the balance sheet in All Other for ALM purposes. Home Loans is compensated for loans held for ALM purposes on a management accounting basis with the corresponding offset in All Other. Newly originated HELOCs and home equity loans are retained on the CRES balance sheet in Home Loans.
CRES includes the impact of migrating customers and their related loan balances between GWIM and CRES. For more information on the transfer of customer balances, see GWIM on page 40.
CRES ResultsThe net loss for CRES decreased $1.3 billion to $5.2 billion for 2013 compared to 2012 primarily driven by lower provision for credit losses and lower noninterest expense, partially offset by lower mortgage banking income. Mortgage banking income decreased $1.0 billion due to both lower servicing income and lower core production revenue, partially offset by a decrease of $3.1 billion in representations and warranties provision as 2012 included provision related to the January 6, 2013 settlement with FNMA (the FNMA Settlement). The provision for credit losses improved $1.6 billion to a benefit of $156 million primarily driven by improved delinquencies, increased home prices and continued
76788ba_financials.indd 36 3/6/14 12:05 PM

Bank of America 2013 37
loan balance run-off. Noninterest expense decreased $1.2 billion primarily due to lower operating expenses in Legacy Assets & Servicing, partially offset by higher litigation expense.
Home LoansHome Loans products are available to our customers through our retail network, direct telephone and online access delivered by a sales force of 3,200 mortgage loan officers, including 1,700 banking center mortgage loan officers covering nearly 2,500 banking centers, and a 900-person centralized sales force based in five call centers.
Net income for Home Loans decreased $995 million to a loss of $118 million driven by a decrease in noninterest income, an increase in noninterest expense and higher provision for credit losses. Noninterest income decreased $1.4 billion due to lower mortgage banking income driven by a decline in core production revenue as a result of continued industry-wide margin compression and lower loan application volumes. The provision for credit losses increased $55 million reflecting a slower rate of credit quality improvement than in 2012. Noninterest expense increased $123 million primarily due to higher production costs. The higher production costs were primarily personnel-related as we added mortgage loan officers earlier in 2013, primarily in banking centers, and other employees in sales and fulfillment areas in order to expand capacity and enhance customer service. While staffing increased in early 2013, total staffing at year end decreased approximately 21 percent from December 31, 2012 following a sharp decline in the market demand for mortgages late in 2013, which is expected to continue into 2014.
Legacy Assets & ServicingLegacy Assets & Servicing is responsible for all of our servicing activities related to the residential mortgage and home equity loan portfolios, including owned loans and loans serviced for others (collectively, the mortgage serviced portfolio). A portion of this portfolio has been designated as the Legacy Serviced Portfolio, which represented 30 percent, 38 percent and 42 percent of the total mortgage serviced portfolio, as measured by unpaid principal balance, at December 31, 2013, 2012 and 2011, respectively.
Legacy Assets & Servicing results reflect the net cost of legacy exposures that are included in the results of CRES, including representations and warranties provision, litigation expense, financial results of the CRES home equity portfolio selected as part of the Legacy Owned Portfolio, the financial results of the servicing operations and the results of MSR activities, including net hedge results. The financial results of the servicing operations reflect certain revenues and expenses on loans serviced for others, including owned loans serviced for Home Loans, GWIM and All Other.
Servicing activities include collecting cash for principal, interest and escrow payments from borrowers, disbursing customer draws for lines of credit, accounting for and remitting principal and interest payments to investors and escrow payments to third parties, and responding to customer inquiries. Our home retention efforts, including single point of contact resources, are also part of our servicing activities, along with the supervision of foreclosures and property dispositions. In an effort to help our customers avoid foreclosure, Legacy Assets & Servicing evaluates various workout options prior to foreclosure which, combined with legislative changes at the state level and ongoing foreclosure delays in states where foreclosure requires a court order following
a legal proceeding (judicial states), have resulted in elongated default timelines. For more information on our servicing activities, including the impact of foreclosure delays, see Off-Balance Sheet Arrangements and Contractual Obligations – Servicing, Foreclosure and Other Mortgage Matters on page 53.
The net loss for Legacy Assets & Servicing decreased $2.3 billion to $5.0 billion driven by a decrease in the provision for credit losses, a decrease in noninterest expense and an increase in noninterest income. Noninterest income increased $380 million due to lower representations and warranties provision, largely offset by lower servicing income primarily driven by a decline in the servicing portfolio, less favorable MSR net-of-hedge performance and the divestiture of an ancillary servicing business in 2012. The provision for credit losses decreased $1.7 billion to a benefit of $283 million primarily driven by improved delinquencies, increased home prices and continued loan balance run-off.
Noninterest expense decreased $1.3 billion primarily due to a $1.6 billion decrease in default-related staffing and other default-related servicing expenses, lower costs as a result of the divestiture of an ancillary servicing business in 2012 and lower mortgage-related assessments, waivers and similar costs related to foreclosure delays. Noninterest expense in 2012 included a $1.1 billion provision for the 2013 IFR Acceleration Agreement. These improvements were partially offset by an increase of $2.2 billion in litigation expense driven by residential mortgage-backedsecurities (RMBS) exposures and the settlement with MBIA Inc. and certain of its affiliates (MBIA) in 2013 (the MBIA Settlement). For more information on the 2013 IFR Acceleration Agreement, see Off-Balance Sheet Arrangements and Contractual Obligations on page 48 and for more information on RMBS litigation, see Note 12 – Commitments and Contingencies to the Consolidated Financial Statements. We expect noninterest expense in Legacy Assets & Servicing, excluding litigation, to decrease to approximately $1.1 billion per quarter by the fourth quarter of 2014 compared to $1.8 billion during the fourth quarter of 2013.
Legacy PortfoliosThe Legacy Portfolios (both owned and serviced) include those loans originated prior to January 1, 2011 that would not have been originated under our established underwriting standards in place as of December 31, 2010. The purchased credit-impaired (PCI) portfolios as well as certain loans that met a pre-defined delinquency status or probability of default threshold as of January 1, 2011 are also included in the Legacy Portfolios. Since determining the pool of loans to be included in the Legacy Portfolios as of January 1, 2011, the criteria have not changed for these portfolios, but will continue to be evaluated over time.
Legacy Owned PortfolioThe Legacy Owned Portfolio includes those loans that met the criteria as described above and are on the balance sheet of the Corporation. The home equity loan portfolio is held on the balance sheet of Legacy Assets & Servicing, and the residential mortgage loan portfolio is held on the balance sheet of All Other. The financial results of the on-balance sheet loans are reported in the segment that owns the loans or in All Other. Total loans in the Legacy Owned Portfolio decreased $19.0 billion in 2013 to $112.1 billion at December 31, 2013, of which $38.7 billion was held on the Legacy Assets & Servicing balance sheet and the remainder was held on the balance sheet of All Other. The decrease was primarily related
76788ba_financials.indd 37 3/6/14 12:05 PM

38 Bank of America 2013
to paydowns, PCI write-offs, charge-offs and loan sales, partially offset by the addition of loans repurchased in connection with the FNMA Settlement. For more information on the loans repurchased in connection with the FNMA Settlement, see Consumer Portfolio Credit Risk Management on page 73.
Legacy Serviced PortfolioThe Legacy Serviced Portfolio includes the Legacy Owned Portfolio and those loans serviced for outside investors that met the criteria as described above. The table below summarizes the balances of the residential mortgage loans included in the Legacy Serviced Portfolio (the Legacy Residential Mortgage Serviced Portfolio) representing 28 percent, 38 percent and 41 percent of the total residential mortgage serviced portfolio of $719 billion, $1.2 trillion and $1.6 trillion as measured by unpaid principal balance at December 31, 2013, 2012 and 2011, respectively. The decline in the Legacy Residential Mortgage Serviced Portfolio in 2013 was primarily due to MSR sales, loan sales and other servicing transfers, modifications, paydowns and payoffs.
Legacy Residential Mortgage Serviced Portfolio, a subset of the Residential Mortgage Serviced Portfolio (1, 2)
December 31(Dollars in billions) 2013 2012 2011Unpaid principal balance
Residential mortgage loansTotal $ 203 $ 467 $ 65960 days or more past due 49 137 235
Number of loans serviced (in thousands)
Residential mortgage loansTotal 1,083 2,542 3,44060 days or more past due 258 649 1,061
(1) Excludes loans for which servicing transferred to third parties as of December 31, 2013, with an effective MSR sale date of January 2, 2014, totaling $57 million of unpaid principal balance.
(2) Excludes $39 billion, $52 billion and $84 billion of home equity loans and HELOCs at December 31, 2013, 2012 and 2011, respectively.
Non-Legacy PortfolioAs previously discussed, Legacy Assets & Servicing is responsible for all of our servicing activities. The table below summarizes the balances of the residential mortgage loans that are not included in the Legacy Serviced Portfolio (the Non-Legacy Residential Mortgage Serviced Portfolio) representing 72 percent, 62 percent and 59 percent of the total residential mortgage serviced portfolio, as measured by unpaid principal balance, at December 31, 2013, 2012 and 2011, respectively. The decline in the Non-Legacy Residential Mortgage Serviced Portfolio was primarily due to MSR sales and other servicing transfers, paydowns and payoffs.
Non-Legacy Residential Mortgage Serviced Portfolio, a subset of the Residential Mortgage Serviced Portfolio (1, 2)
December 31(Dollars in billions) 2013 2012 2011Unpaid principal balance
Residential mortgage loansTotal $ 516 $ 755 $ 95360 days or more past due 12 22 17
Number of loans serviced (in thousands)
Residential mortgage loansTotal 3,267 4,764 5,73160 days or more past due 67 124 95
(1) Excludes loans for which servicing transferred to third parties as of December 31, 2013, with an effective MSR sale date of January 2, 2014, totaling $163 million of unpaid principal balance.
(2) Excludes $52 billion, $58 billion and $67 billion of home equity loans and HELOCs at December 31, 2013, 2012 and 2011, respectively.
Mortgage Banking IncomeCRES mortgage banking income is categorized into production and servicing income. Core production income is comprised primarily of revenue from the fair value gains and losses recognized on our interest rate lock commitments (IRLCs) and LHFS, the related secondary market execution, costs related to representations and warranties in the sales transactions along with other obligations incurred in the sales of mortgage loans, and revenue earned in production-related ancillary businesses. Ongoing costs related to representations and warranties and other obligations that were incurred in the sales of mortgage loans in prior periods are also included in production income.
Servicing income includes income earned in connection with servicing activities and MSR valuation adjustments, net of results from risk management activities used to hedge certain market risks of the MSRs. The costs associated with our servicing activities are included in noninterest expense.
The table below summarizes the components of mortgage banking income.
Mortgage Banking Income
(Dollars in millions) 2013 2012Production income:
Core production revenue $ 2,543 $ 3,760Representations and warranties provision (840) (3,939)
Total production income (loss) 1,703 (179)Servicing income:
Servicing fees 3,030 4,729Amortization of expected cash flows (1) (1,043) (1,484)Fair value changes of MSRs, net of risk management
activities used to hedge certain market risks (2) 867 1,852
Other servicing-related revenue 28 635Total net servicing income 2,882 5,732Total CRES mortgage banking income 4,585 5,553
Eliminations (3) (711) (803)Total consolidated mortgage banking income $ 3,874 $ 4,750
(1) Represents the net change in fair value of the MSR asset due to the recognition of modeled cash flows.
(2) Includes gains (losses) on sales of MSRs.(3) Includes the effect of transfers of mortgage loans from CRES to the ALM portfolio in All Other.
76788ba_financials.indd 38 3/6/14 12:05 PM

Bank of America 2013 39
Core production revenue decreased $1.2 billion due to industry-wide margin compression combined with lower loan application volumes as described below.
The representations and warranties provision decreased $3.1 billion in 2013 to $840 million as 2012 included $2.5 billion in provision related to the FNMA Settlement and $500 million for obligations to FNMA related to MI rescissions. Net servicing income decreased $2.9 billion to $2.9 billion driven by lower servicing fees due to a smaller servicing portfolio, less favorable MSR net-of-hedge performance and lower ancillary income due to the divestiture of an ancillary business in 2012. The decline in the size of our servicing portfolio was driven by strategic sales of MSRs as well as loan prepayment activity, which exceeded new originations primarily due to our exit from non-retail channels. For more information on sales of MSRs, see Sales of Mortgage Servicing Rights on page 39.
Key Statistics
(Dollars in millions, except as noted) 2013 2012
Loan production Total Corporation (1):
First mortgage $ 83,421 $ 75,074 Home equity 6,355 3,585
CRES: First mortgage $ 66,914 $ 55,518 Home equity 5,498 2,832
Year end Mortgage serviced portfolio (in billions) (2, 3) $ 810 $ 1,332
Mortgage loans serviced for investors(in billions) 550 1,045
Mortgage servicing rights: Balance 5,042 5,716
Capitalized mortgage servicing rights (% of loans serviced for investors) 92 bps 55 bps
(1) In addition to loan production in CRES, the remaining first mortgage and home equity loan production is primarily in GWIM.
(2) Servicing of residential mortgage loans, HELOCs and home equity loans.(3) Excludes loans for which servicing transferred to third parties as of December 31, 2013, with
an effective MSR sale date of January 2, 2014, totaling $220 million.
Despite a decline in the overall mortgage market because of higher interest rates during the second half of 2013, first mortgage loan originations in CRES increased $11.4 billion, or 21 percent, to $66.9 billion in 2013, and for the total Corporation, increased $8.3 billion to $83.4 billion as we increased market share due to higher fulfillment capacity. The increase in interest rates also had an adverse impact on our mortgage loan applications, particularly for refinance mortgage loans. Our volume of mortgage applications decreased 15 percent in 2013 corresponding to a decline in the estimated overall U.S. demand for mortgages.
During 2013, 82 percent of our first mortgage production volume was for refinance originations and 18 percent was for purchase originations compared to 84 percent and 16 percent in 2012. HARP refinance originations were 23 percent of all refinance originations compared to 31 percent in 2012. Making Home Affordable non-HARP refinance originations were 19 percent of all refinance originations as compared to 12 percent in 2012. The remaining 58 percent of refinance originations was conventional refinances, and remained relatively unchanged from 2012.
Home equity production was $6.4 billion for 2013 compared to $3.6 billion for 2012 with the increase due to a higher demand in the market based on improving housing trends, and increased market share driven by improved banking center engagement with customers and more competitive pricing.
Mortgage Servicing RightsAt December 31, 2013, the consumer MSR balance was $5.0 billion, which represented 92 bps of the related unpaid principal balance compared to $5.7 billion, or 55 bps of the related unpaid principal balance at December 31, 2012. The consumer MSR balance decreased $674 million during 2013 primarily driven by MSR sales and the recognition of modeled cash flows. These declines were partially offset by the increase in value driven by higher mortgage rates, which resulted in lower forecasted prepayment speeds and was the primary driver for the increase in the MSRs as a percentage of unpaid principal balance. For more information on our servicing activities, see Off-Balance Sheet Arrangements and Contractual Obligations – Servicing, Foreclosure and Other Mortgage Matters on page 53. For more information on MSRs, see Note 23 – Mortgage Servicing Rights to the Consolidated Financial Statements.
Sales of Mortgage Servicing RightsAs previously disclosed, during 2013, we entered into definitive agreements with certain counterparties to sell the servicing rights on certain residential mortgage loans serviced for others, with an aggregate unpaid principal balance of approximately $301 billion. The sales involved approximately two million loans serviced by us as of the applicable contract dates, including approximately 180,000 residential mortgage loans and 11,700 home equity loans that were 60 days or more past due based upon current estimates.
The transfers of servicing rights were substantially completed in the first nine months of 2013. These sales led to a reduction in servicing revenue in the fourth quarter of 2013 of approximately $150 million compared to the fourth quarter of 2012.
76788ba_financials.indd 39 3/6/14 12:05 PM

40 Bank of America 2013
Global Wealth & Investment Management
(Dollars in millions) 2013 2012 % ChangeNet interest income (FTE basis) $ 6,064 $ 5,827 4%Noninterest income:
Investment and brokerage services 9,709 8,849 10All other income 2,017 1,842 10
Total noninterest income 11,726 10,691 10Total revenue, net of interest expense (FTE basis) 17,790 16,518 8
Provision for credit losses 56 266 (79)Noninterest expense 13,038 12,721 2
Income before income taxes 4,696 3,531 33Income tax expense (FTE basis) 1,722 1,286 34
Net income $ 2,974 $ 2,245 32
Net interest yield (FTE basis) 2.41% 2.35%Return on average allocated capital (1) 29.90 —Return on average economic capital (1) — 30.80Efficiency ratio (FTE basis) 73.29 77.02
Balance Sheet
Average
Total loans and leases $ 111,023 $ 100,456 11Total earning assets 251,394 248,475 1Total assets 270,788 268,475 1Total deposits 242,161 242,384 —Allocated capital (1) 10,000 — n/mEconomic capital (1) — 7,359 n/m
Year end Total loans and leases $ 115,846 $ 105,928 9Total earning assets 254,031 277,121 (8)Total assets 274,112 297,326 (8)Total deposits 244,901 266,188 (8)
(1) Effective January 1, 2013, we revised, on a prospective basis, the methodology for allocating capital to the business segments. In connection with the change in methodology, we updated the applicable terminology in the above table to allocated capital from economic capital as reported in prior periods. For additional information, see Business Segment Operations on page 31.
n/m = not meaningful
GWIM consists of two primary businesses: Merrill Lynch Global Wealth Management (MLGWM) and U.S. Trust, Bank of America Private Wealth Management (U.S. Trust).
MLGWM’s advisory business provides a high-touch client experience through a network of financial advisors focused on clients with over $250,000 in total investable assets. MLGWM provides tailored solutions to meet our clients’ needs through a full set of brokerage, banking and retirement products.
U.S. Trust, together with MLGWM’s Private Banking & Investments Group, provides comprehensive wealth management solutions targeted to high net-worth and ultra high net-worth clients, as well as customized solutions to meet clients’ wealth structuring, investment management, trust and banking needs, including specialty asset management services.
Net income increased $729 million to $3.0 billion in 2013 compared to 2012 driven by higher revenue and lower provision for credit losses, partially offset by higher noninterest expense. Revenue increased $1.3 billion to $17.8 billion primarily driven by higher asset management fees related to long-term AUM inflows and higher market levels, as well as higher net interest income. The provision for credit losses decreased $210 million to $56 million driven by continued improvement in the home equity portfolio. Noninterest expense increased $317 million to $13.0 billion primarily due to higher volume-driven expenses and higher support costs, partially offset by lower other personnel costs.
In 2013, revenue from MLGWM was $14.8 billion, up eight percent, and revenue from U.S. Trust was $3.0 billion, up nine percent, both driven by the same factors as described above.
76788ba_financials.indd 40 3/6/14 12:05 PM

Bank of America 2013 41
Net Migration SummaryGWIM results are impacted by the net migration of clients and their related deposit and loan balances to or from CBB, CRES and the ALM portfolio, as presented in the table below. We move clients between business segments to better meet their needs. Transfers in 2013 were primarily comprised of the following: net deposit balances of $21 billion to CBB; HELOC balances of $5 billion to CRES; and credit card balances of $3 billion from CBB. Beginning in March 2013, revenue and expense related to credit card balance transfers are included in GWIM and included in CBB for all prior periods. The balances in the table below represent transfers that occurred during 2013 and 2012.
Net Migration Summary
December 31(Dollars in millions) 2013 2012Total deposits, net – GWIM from / (to) CBB $ (20,974) $ 1,170
Total loans, net – GWIM from / (to) CBB, CRES and the ALM portfolio (1,356) (335)
Client BalancesThe table below presents client balances which consist of AUM, brokerage assets, assets in custody, deposits, and loans and leases.
Client Balances by Type
December 31(Dollars in millions) 2013 2012Assets under management $ 821,449 $ 698,095Brokerage assets 1,045,122 960,351Assets in custody 136,190 117,686Deposits 244,901 266,188Loans and leases (1) 118,776 109,305
Total client balances $ 2,366,438 $ 2,151,625(1) Includes margin receivables which are classified in customer and other receivables on the
Consolidated Balance Sheet.
The increase of $214.8 billion, or 10 percent, in client balances was driven by higher market levels and record long-term AUM inflows, partially offset by the deposit balance transfer of $21.0 billion to CBB as described in the Net Migration Summary section.
76788ba_financials.indd 41 3/6/14 12:05 PM

42 Bank of America 2013
Global Banking
(Dollars in millions) 2013 2012 % ChangeNet interest income (FTE basis) $ 8,914 $ 8,135 10%Noninterest income:
Service charges 2,787 2,867 (3)Investment banking fees 3,235 2,793 16All other income 1,545 1,879 (18)
Total noninterest income 7,567 7,539 —Total revenue, net of interest expense (FTE basis) 16,481 15,674 5
Provision for credit losses 1,075 (342) n/mNoninterest expense 7,552 7,619 (1)
Income before income taxes 7,854 8,397 (6)Income tax expense (FTE basis) 2,880 3,053 (6)
Net income $ 4,974 $ 5,344 (7)
Net interest yield (FTE basis) 2.96% 2.90%Return on average allocated capital (1) 21.64 —Return on average economic capital (1) — 27.69Efficiency ratio (FTE basis) 45.82 48.61
Balance Sheet
Average
Total loans and leases $ 257,245 $ 224,336 15Total earning assets 301,204 280,605 7Total assets 343,464 322,701 6Total deposits 237,457 223,940 6Allocated equity (1) 23,000 — n/mEconomic capital (1) — 19,312 n/m
Year end
Total loans and leases $ 269,469 $ 242,340 11Total earning assets 337,154 288,072 17Total assets 379,207 331,611 14Total deposits 265,718 243,306 9
(1) Effective January 1, 2013, we revised, on a prospective basis, the methodology for allocating capital to the business segments. In connection with the change in methodology, we updated the applicable terminology in the above table to allocated capital from economic capital as reported in prior periods. For additional information, see Business Segment Operations on page 31.
n/m = not meaningful
Global Banking, which includes Global Corporate and Global Commercial Banking, and Investment Banking, provides a wide range of lending-related products and services, integrated working capital management and treasury solutions to clients, and underwriting and advisory services through our network of offices and client relationship teams. Our lending products and services include commercial loans, leases, commitment facilities, trade finance, real estate lending and asset-based lending. Our treasury solutions business includes treasury management, foreign exchange and short-term investing options. We also work with our clients to provide investment banking products such as debt and equity underwriting and distribution, and merger-related and other advisory services. Underwriting debt and equity issuances, fixed-income and equity research, and certain market-based activities are executed through our global broker/dealer affiliates which are our primary dealers in several countries. Within Global Banking, Global Commercial Banking clients generally include middle-market companies, commercial real estate firms, auto dealerships and not-for-profit companies. Global Corporate Banking includes large global corporations, financial institutions and leasing clients.
During 2013, consumer DFS results were moved to CBB from Global Banking to align this business more closely with our consumer lending activity and better serve the needs of our customers. Prior periods were reclassified to conform to current period presentation.
Net income for Global Banking decreased $370 million to $5.0 billion in 2013 compared to 2012 primarily driven by an increase in the provision for credit losses, partially offset by higher revenue. Revenue increased $807 million to $16.5 billion in 2013 as higher net interest income due to the impact of loan growth and higher investment banking fees were partially offset by lower other income due to gains on the liquidation of certain portfolios in 2012.
The provision for credit losses increased $1.4 billion to $1.1 billion in 2013 compared to a benefit of $342 million in 2012 primarily due to increased reserves as a result of commercial loan growth.
Noninterest expense of $7.6 billion remained relatively unchanged in 2013 primarily due to lower personnel expense as we continue to streamline our business operations and achieve cost savings, largely offset by higher litigation expense.
76788ba_financials.indd 42 3/6/14 12:05 PM

Bank of America 2013 43
Global Corporate and Global Commercial Banking Global Corporate and Global Commercial Banking each include Business Lending and Treasury Services activities. Business Lending includes various lending-related products and services including commercial loans, leases, commitment facilities, trade finance, real estate lending and asset-based lending. Treasury
Services includes deposits, treasury management, credit card, foreign exchange, and short-term investment and custody solutions to corporate and commercial banking clients.
The table below presents a summary of Global Corporate and Global Commercial Banking results, which excludes certain capital markets activity in Global Banking.
Global Corporate and Global Commercial Banking
Global Corporate Banking Global Commercial Banking Total(Dollars in millions) 2013 2012 2013 2012 2013 2012Revenue
Business Lending $ 3,407 $ 3,201 $ 3,967 $ 3,622 $ 7,374 $ 6,823Treasury Services 2,815 2,633 2,939 2,988 5,754 5,621
Total revenue, net of interest expense $ 6,222 $ 5,834 $ 6,906 $ 6,610 $ 13,128 $ 12,444
Balance Sheet
Average
Total loans and leases $ 126,669 $ 110,130 $ 130,563 $ 113,640 $ 257,232 $ 223,770Total deposits 128,198 114,200 109,225 109,704 237,423 223,904
Year end
Total loans and leases $ 130,092 $ 116,239 $ 139,374 $ 126,093 $ 269,466 $ 242,332Total deposits 144,312 131,184 121,407 112,083 265,719 243,267
Global Corporate and Global Commercial Banking revenue increased $684 million in 2013 due to higher revenue in both Business Lending and Treasury Services.
Business Lending revenue in Global Corporate Banking increased $206 million in 2013 due to higher net interest income driven by the impact of loan growth, partially offset by lower accretion on acquired portfolios, and gains on the liquidation of certain portfolios in 2012. Business Lending revenue in Global Commercial Banking increased $345 million due to higher net interest income driven by the impact of loan growth in the commercial and industrial, and commercial real estate portfolios, as well as higher accretion on acquired portfolios.
Treasury Services revenue in Global Corporate Banking increased $182 million in 2013 driven by growth in U.S. and non-U.S. deposit balances, partially offset by the impact of the low rate environment. Treasury Services revenue in Global Commercial Banking declined $49 million due to the impacts of lower average deposit balances and the low rate environment.
Average loans and leases in Global Corporate and Global Commercial Banking increased 15 percent in 2013 driven by growth in the commercial and industrial, and commercial real estate portfolios. Average deposits in Global Corporate and Global Commercial Banking increased six percent in 2013 due to client liquidity, international growth and new client acquisitions.
Investment BankingClient teams and product specialists underwrite and distribute debt, equity and loan products, and provide advisory services and tailored risk management solutions. The economics of most
investment banking and underwriting activities are shared primarily between Global Banking and Global Markets based on the contribution by and involvement of each segment. To provide a complete discussion of our consolidated investment banking fees, the table below presents total Corporation investment banking fees as well as the portion attributable to Global Banking.
Investment Banking Fees
Global Banking Total Corporation(Dollars in millions) 2013 2012 2013 2012Products
Advisory $ 1,022 $ 995 $ 1,131 $ 1,066Debt issuance 1,620 1,390 3,805 3,362Equity issuance 593 408 1,469 1,026Gross investment banking
fees 3,235 2,793 6,405 5,454
Self-led (92) (43) (279) (155)Total investment banking
fees $ 3,143 $ 2,750 $ 6,126 $ 5,299
Total Corporation investment banking fees of $6.1 billion, excluding self-led deals, included within Global Banking and Global Markets, increased 16 percent in 2013 due to strong equity issuance fees attributable to a significant increase in global equity capital markets volume and higher debt issuance fees, primarily within leveraged finance and investment-grade underwriting.
76788ba_financials.indd 43 3/6/14 12:05 PM

44 Bank of America 2013
Global Markets
(Dollars in millions) 2013 2012 % ChangeNet interest income (FTE basis) $ 4,239 $ 3,672 15%Noninterest income:
Investment and brokerage services 2,046 1,820 12Investment banking fees 2,722 2,214 23Trading account profits 6,734 5,706 18All other income 317 872 (64)
Total noninterest income 11,819 10,612 11Total revenue, net of interest expense (FTE basis) 16,058 14,284 12
Provision for credit losses 140 34 n/mNoninterest expense 12,013 11,295 6
Income before income taxes 3,905 2,955 32Income tax expense (FTE basis) 2,342 1,726 36
Net income $ 1,563 $ 1,229 27
Return on average allocated capital (1) 5.24% —Return on average economic capital (1) — 8.95%Efficiency ratio (FTE basis) 74.81 79.08
Balance Sheet
Average
Total trading-related assets (2) $ 468,934 $ 466,045 1Total earning assets (2) 481,482 461,487 4Total assets 632,804 606,249 4Allocated capital (1) 30,000 — n/mEconomic capital (1) — 13,824 n/m
Year end
Total trading-related assets (2) $ 411,080 $ 465,836 (12)Total earning assets (2) 432,821 486,470 (11)Total assets 575,709 632,263 (9)
(1) Effective January 1, 2013, we revised, on a prospective basis, the methodology for allocating capital to the business segments. In connection with the change in methodology, we updated the applicable terminology in the above table to allocated capital from economic capital as reported in prior periods. For additional information, see Business Segment Operations on page 31.
(2) Trading-related assets include derivative assets, which are considered non-earning assets.n/m = not meaningful
Global Markets offers sales and trading services, including research, to institutional clients across fixed-income, credit, currency, commodity and equity businesses. Global Markets product coverage includes securities and derivative products in both the primary and secondary markets. Global Markets provides market-making, financing, securities clearing, settlement and custody services globally to our institutional investor clients in support of their investing and trading activities. We also work with our commercial and corporate clients to provide risk management products using interest rate, equity, credit, currency and commodity derivatives, foreign exchange, fixed-income and mortgage-related products. As a result of our market-making activities in these products, we may be required to manage risk in a broad range of financial products including government securities, equity and equity-linked securities, high-grade and high-yield corporate debt securities, syndicated loans, MBS, commodities and asset-backed securities (ABS). In addition, the economics of most investment banking and underwriting activities are shared primarily between Global Markets and Global Banking based on the activities performed by each segment. Global Banking originates certain deal-related transactions with our corporate and commercial clients that are executed and distributed by Global Markets. For more information on investment banking fees on a consolidated basis, see page 43.
Net income for Global Markets increased $334 million to $1.6 billion in 2013 compared to 2012. Excluding net DVA and charges related to the U.K. corporate income tax rate reduction, net income decreased $543 million to $3.0 billion primarily driven by lower FICC revenue due to a challenging trading environment and higher noninterest expense, partially offset by an increase in equities revenue. Net DVA losses on derivatives were $508 million compared to losses of $2.4 billion in 2012. The U.K. corporate income tax rate reduction enacted in 2013 resulted in a $1.1 billion charge to income tax expense in Global Markets for remeasurement of certain deferred tax assets compared to a similar charge of $781 million in 2012. Noninterest expense increased $718 million to $12.0 billion due to an increase in litigation expense.
Average earning assets increased $20.0 billion to $481.5 billion in 2013 largely driven by increased client financing activity in the equities business.
Sales and Trading RevenueSales and trading revenue includes unrealized and realized gains and losses on trading and other assets, net interest income, and fees primarily from commissions on equity securities. Sales and trading revenue is segregated into fixed income (government debt obligations, investment and non-investment grade corporate debt
76788ba_financials.indd 44 3/6/14 12:05 PM

Bank of America 2013 45
obligations, commercial mortgage-backed securities, RMBS, collateralized debt obligations (CDOs), interest rate and credit derivative contracts), currencies (interest rate and foreign exchange contracts), commodities (primarily futures, forwards, swaps and options) and equities (equity-linked derivatives and cash equity activity). The table below and related discussion present sales and trading revenue, substantially all of which is in Global Markets, with the remainder in Global Banking. In addition, the table below and related discussion present sales and trading revenue excluding DVA, which is a non-GAAP financial measure. We believe the use of this non-GAAP financial measure provides clarity in assessing the underlying performance of these businesses.
Sales and Trading Revenue (1, 2)
(Dollars in millions) 2013 2012Sales and trading revenue
Fixed income, currencies and commodities $ 8,882 $ 8,812Equities 4,200 3,014
Total sales and trading revenue $ 13,082 $ 11,826
Sales and trading revenue, excluding net DVA (3)
Fixed income, currencies and commodities $ 9,373 $ 11,007Equities 4,217 3,267
Total sales and trading revenue, excluding net DVA $ 13,590 $ 14,274(1) Includes FTE adjustments of $179 million and $220 million for 2013 and 2012. For more
information on sales and trading revenue, see Note 2 – Derivatives to the Consolidated Financial Statements.
(2) Includes Global Banking sales and trading revenue of $385 million and $522 million for 2013 and 2012.
(3) For this presentation, sales and trading revenue excludes the impact of credit spreads on DVA, which represents a non-GAAP financial measure. Net DVA losses of $491 million and $2.2 billion were included in FICC revenue, and net DVA losses of $17 million and $253 million were included in equities revenue in 2013 and 2012.
FICC revenue, including net DVA, increased $70 million to $8.9 billion in 2013 compared to 2012. Excluding the impact of credit spreads on net DVA, FICC revenue decreased $1.6 billion to $9.4 billion driven by a challenging trading environment arising from investor concerns around the Federal Reserve’s position on economic stimulus, political uncertainty both domestically and abroad as well as the write-down of a receivable related to the MBIA Settlement in 2013. For more information on the MBIA Settlement, see Note 7 – Representations and Warranties Obligations and Corporate Guarantees to the Consolidated Financial Statements. Equities revenue, including net DVA, increased $1.2 billion to $4.2 billion. Excluding net DVA, equities revenue increased $950 million to $4.2 billion primarily due to continued gains in market share, higher market volumes and increased client financing balances. Sales and trading revenue included total commissions and brokerage fee revenue of $2.0 billion in 2013 compared to $1.8 billion in 2012, substantially all from equities, with the $226 million increase due to a higher market share and increased market volumes in equities.
76788ba_financials.indd 45 3/6/14 12:05 PM

46 Bank of America 2013
All Other
(Dollars in millions) 2013 2012 % ChangeNet interest income (FTE basis) $ 966 $ 1,140 (15)%Noninterest income:
Card income 328 360 (9)Equity investment income 2,610 1,135 130Gains on sales of debt securities 1,230 1,510 (19)All other loss (3,245) (4,927) (34)
Total noninterest income (loss) 923 (1,922) n/mTotal revenue, net of interest expense (FTE basis) 1,889 (782) n/m
Provision for credit losses (666) 2,621 n/mNoninterest expense 4,241 6,273 (32)
Loss before income taxes (1,686) (9,676) (83)Income tax benefit (FTE basis) (2,173) (5,939) (63)
Net income (loss) $ 487 $ (3,737) n/m
Balance Sheet
Average
Loans and leases:Residential mortgage $ 208,535 $ 223,795 (7)Non-U.S. credit card 10,861 13,549 (20)Other 16,058 21,897 (27)
Total loans and leases 235,454 259,241 (9)Total assets (1) 215,183 315,735 (32)Total deposits 34,617 43,087 (20)
Year end
Loans and leases:Residential mortgage $ 197,061 $ 211,476 (7)Non-U.S. credit card 11,541 11,697 (1)Other 12,092 18,808 (36)
Total loans and leases 220,694 241,981 (9)Total assets (1) 166,881 262,800 (36)Total deposits 27,702 36,061 (23)
(1) For presentation purposes, in segments where the total of liabilities and equity exceeds assets, which are generally deposit-taking segments, we allocate assets from All Other to those segments to match liabilities (i.e., deposits) and allocated shareholders’ equity. Such allocated assets were $539.5 billion and $504.2 billion for 2013 and 2012, and $570.3 billion and $537.6 billion at December 31, 2013 and 2012.
n/m = not meaningful
All Other consists of ALM activities, equity investments, the international consumer card business, liquidating businesses, residual expense allocations and other. ALM activities encompass the whole-loan residential mortgage portfolio and investment securities, interest rate and foreign currency risk management activities including the residual net interest income allocation, gains/losses on structured liabilities, the impact of certain allocation methodologies and accounting hedge ineffectiveness. The results of certain ALM activities are allocated to our business segments. For more information on our ALM activities, see Interest Rate Risk Management for Nontrading Activities on page 109. Equity investments include Global Principal Investments (GPI) which is comprised of a portfolio of equity, real estate and other alternative investments. These investments are made either directly in a company or held through a fund with related income recorded in equity investment income. Equity investments included our remaining investment in CCB which was sold during 2013, and certain other investments. Additionally, certain residential mortgage loans that are managed by Legacy Assets & Servicing are held in All Other.
Net income for All Other increased $4.2 billion to $487 million in 2013 primarily due to negative fair value adjustments on structured liabilities of $649 million related to the improvement in our credit spreads during 2013 compared to a negative $5.1 billion in 2012, a $3.3 billion reduction in the provision for credit losses, a decrease in noninterest expense of $2.0 billion and an increase in equity investment income of $1.5 billion. Partially offsetting the increases were $1.6 billion in gains related to debt repurchases and exchanges of trust preferred securities in 2012 and a decrease of $280 million in gains on sales of debt securities.
The provision for credit losses improved $3.3 billion to a benefit of $666 million in 2013 primarily driven by continued improvement in portfolio trends including increased home prices in the residential mortgage portfolio.
Noninterest expense decreased $2.0 billion to $4.2 billion primarily due to lower litigation expense. The income tax benefit was $2.2 billion in 2013 compared to a benefit of $5.9 billion in 2012. The decrease was driven by the decline in the pre-tax loss in All Other and lower tax benefits as 2012 included a $1.7 billion tax benefit attributable to the excess of foreign tax credits recognized in the U.S. upon repatriation of the earnings of certain subsidiaries over the related U.S. tax liability.
76788ba_financials.indd 46 3/6/14 12:05 PM

Bank of America 2013 47
Equity Investment ActivityThe following tables present the components of equity investments in All Other at December 31, 2013 and 2012, and also a reconciliation to the total consolidated equity investment income for 2013 and 2012.
Equity Investments
December 31(Dollars in millions) 2013 2012Global Principal Investments $ 1,604 $ 3,470Strategic and other investments 807 2,038
Total equity investments included in All Other $ 2,411 $ 5,508
Equity investments included in All Other decreased $3.1 billion to $2.4 billion during 2013, with the decrease due to sales in the GPI and Strategic investments portfolios. GPI had unfunded equity commitments of $127 million at December 31, 2013 compared to $224 million at December 31, 2012.
Equity Investment Income
(Dollars in millions) 2013 2012Global Principal Investments $ 378 $ 589Strategic and other investments 2,232 546
Total equity investment income included in All Other 2,610 1,135
Total equity investment income included in thebusiness segments 291 935
Total consolidated equity investment income $ 2,901 $ 2,070
Equity investment income included in All Other was $2.6 billion in 2013, an increase of $1.5 billion from 2012. The increase was primarily due to the $753 million gain on the sale of our remaining investment in CCB shares and gains of $1.4 billion on the sales of a portion of an equity investment. Total Corporation equity investment income was $2.9 billion in 2013, an increase of $831 million from 2012, due to the same factors as described above, partially offset by gains in 2012 on equity investments included in the business segments.
76788ba_financials.indd 47 3/6/14 12:05 PM

48 Bank of America 2013
Off-Balance Sheet Arrangements and Contractual ObligationsWe have contractual obligations to make future payments on debt and lease agreements. Additionally, in the normal course of business, we enter into contractual arrangements whereby we commit to future purchases of products or services from unaffiliated parties. Obligations that are legally binding agreements whereby we agree to purchase products or services with a specific minimum quantity at a fixed, minimum or variable price over a specified period of time are defined as purchase obligations. Included in purchase obligations are commitments to purchase loans of $1.5 billion and vendor contracts of $18.4 billion. The most significant vendor contracts include communication services, processing services and software contracts. Other long-term liabilities include our contractual funding obligations related to the Qualified Pension Plans, Non-U.S. Pension Plans, Nonqualified and Other Pension Plans, and Postretirement Health and Life Plans (collectively, the Plans). Obligations to the Plans are based on the current and projected
obligations of the Plans, performance of the Plans’ assets and any participant contributions, if applicable. During 2013 and 2012, we contributed $290 million and $381 million to the Plans, and we expect to make $292 million of contributions during 2014.
Debt, lease, equity and other obligations are more fully discussed in Note 11 – Long-term Debt and Note 12 – Commitments and Contingencies to the Consolidated Financial Statements. The Plans are more fully discussed in Note 17 – Employee Benefit Plans to the Consolidated Financial Statements.
We enter into commitments to extend credit such as loan commitments, standby letters of credit (SBLCs) and commercial letters of credit to meet the financing needs of our customers. For a summary of the total unfunded, or off-balance sheet, credit extension commitment amounts by expiration date, see Credit Extension Commitments in Note 12 – Commitments and Contingencies to the Consolidated Financial Statements.
Table 11 includes certain contractual obligations at December 31, 2013.
Table 11 Contractual Obligations
December 31, 2013
(Dollars in millions)Due in One Year or Less
Due AfterOne Year Through
Three Years
Due AfterThree Years
ThroughFive Years
Due AfterFive Years Total
Long-term debt $ 46,076 $ 63,241 $ 62,830 $ 77,527 $ 249,674
Operating lease obligations 2,841 4,531 3,003 5,672 16,047
Purchase obligations 6,205 6,859 3,873 3,838 20,775
Time deposits 98,201 8,784 1,972 2,278 111,235
Other long-term liabilities 1,289 915 720 1,132 4,056
Estimated interest expense on long-term debt and time deposits (1) 5,189 10,045 9,081 13,247 37,562
Total contractual obligations $ 159,801 $ 94,375 $ 81,479 $ 103,694 $ 439,349 (1) Represents estimated, forecasted net interest expense on long-term debt and time deposits. Forecasts are based on the contractual maturity dates of each liability, and are net of derivative hedges.
Representations and WarrantiesWe securitize first-lien residential mortgage loans generally in the form of MBS guaranteed by the government-sponsored enterprises (GSEs) or by the Government National Mortgage Association (GNMA) in the case of Federal Housing Administration (FHA)-insured, U.S. Department of Veterans Affairs (VA)-guaranteed and Rural Housing Service-guaranteed mortgage loans. In addition, in prior years, legacy companies and certain subsidiaries sold pools of first-lien residential mortgage loans and home equity loans as private-label securitizations (in certain of these securitizations, monolines or financial guarantee providers insured all or some of the securities) or in the form of whole loans. In connection with these transactions, we or certain of our subsidiaries or legacy companies make or have made various representations and warranties. Breaches of these representations and warranties have resulted in and may continue to result in the requirement to repurchase mortgage loans or to otherwise make whole or provide other remedies to the GSEs, U.S. Department of Housing and Urban Development (HUD) with respect to FHA-insured loans, VA, whole-loan investors, securitization trusts, monoline insurers or other financial guarantors (collectively, repurchases). In all such cases, we would be exposed to any credit loss on the repurchased mortgage loans after accounting for any mortgage insurance or mortgage guarantee payments that we may receive.
For more information on accounting for representations and warranties and our representations and warranties repurchase claims and exposures, see Note 7 – Representations and Warranties Obligations and Corporate Guarantees and Note 12 – Commitments and Contingencies to the Consolidated Financial Statements and Item 1A. Risk Factors of this Annual Report on Form 10-K.
We have vigorously contested any request for repurchase when we conclude that a valid basis for repurchase does not exist and will continue to do so in the future. However, in an effort to resolve these legacy mortgage-related issues, we have reached bulk settlements, or agreements for bulk settlements, certain of which have been for significant amounts, in lieu of a loan-by-loan review process, including with the GSEs, with three monoline insurers and with the Bank of New York Mellon (the BNY Mellon Settlement), as trustee (the Trustee) for certain Countrywide private-label securitization trusts in 2011. As a result of various settlements with the GSEs, we have resolved substantially all outstanding and potential representations and warranties repurchase claims on whole loans sold by legacy Bank of America and Countrywide to FNMA and FHLMC through 2008 and 2009, respectively.
76788ba_financials.indd 48 3/6/14 12:05 PM

Bank of America 2013 49
We may reach other settlements in the future if opportunities arise on terms we believe to be advantageous. However, there can be no assurance that we will reach future settlements or, if we do, that the terms of past settlements can be relied upon to predict the terms of future settlements. These bulk settlements generally did not cover all transactions with the relevant counterparties or all potential claims that may arise, including in some instances securities law, fraud and servicing claims. For example, we are currently involved in MBS litigation including purported class action suits, actions brought by individual MBS purchases, actions brought by FHFA as conservator for the GSEs and governmental actions. Our liability in connection with the transactions and claims not covered by these settlements could be material. For more information on our exposure to RMBS matters involving securities law, fraud or related claims, see Note 12 – Commitments and Contingencies to the Consolidated Financial Statements.
The BNY Mellon Settlement remains subject to final court approval and certain other conditions. It is not currently possible to predict the ultimate outcome or timing of the court approval process, which can include appeals and could take a substantial period of time. The court approval hearing began in the New York Supreme Court, New York County, on June 3, 2013 and concluded on November 21, 2013. On January 31, 2014, the court issued a decision, order and judgment approving the BNY Mellon Settlement. The court overruled the objections to the settlement, holding that the Trustee, BNY Mellon, acted in good faith, within its discretion and within the bounds of reasonableness in determining that the settlement agreement was in the best interests of the covered trusts. The court declined to approve the Trustee’s conduct only with respect to the Trustee’s consideration of a potential claim that a loan must be repurchased if the servicer modifies its terms. On February 4, 2014, one of the objectors filed a motion to stay entry of judgment and to hold additional proceedings in the trial court on issues it alleged had not been litigated or decided by the court in its January 31, 2014 decision, order and judgment. On February 18, 2014, the same objector also filed a motion for reargument of the trial court’s January 31, 2014 decision. The court held a hearing on the motion to stay on February 19, 2014, and rejected the application for stay and for further proceedings in the trial court. The court also ruled it would not hold oral argument on the objector’s motion for reargument before April 2014. On February 21, 2014, final judgment was entered and the Trustee filed a notice of appeal regarding the court’s ruling on loan modification claims in the settlement. The court’s January 31, 2014 decision, order and judgment remain subject to appeal and the motion to reargue, and it is not possible to predict the timetable for appeals or when the court approval process will be completed.
Although, we are not a party to the proceeding, certain of our rights and obligations under the settlement agreement are conditioned on final court approval of the settlement. There can be no assurance final court approval will be obtained, that all conditions to the BNY Mellon Settlement will be satisfied, or if certain conditions to the BNY Mellon Settlement permitting withdrawal are met, that we and Countrywide will not withdraw from the settlement. If final court approval is not obtained, or if we and Countrywide withdraw from the BNY Mellon Settlement in accordance with its terms, our future representations and warranties losses could be substantially different from existing accruals and the estimated range of possible loss over existing accruals.
For a summary of the larger bulk settlement actions and the related impact on the representations and warranties provision and liability, see Note 7 – Representations and Warranties Obligations and Corporate Guarantees and Note 12 – Commitments and Contingencies to the Consolidated Financial Statements.
Unresolved Repurchase ClaimsRepurchase claims received from a counterparty are considered unresolved repurchase claims until the underlying loan is repurchased, the claim is rescinded by the counterparty or the claim is otherwise settled. Unresolved repurchase claims represent the notional amount of repurchase claims made by counterparties, typically the outstanding principal balance or the unpaid principal balance at the time of default. In the case of first-lien mortgages, the claim amount is often significantly greater than the expected loss amount due to the benefit of collateral and, in some cases, MI or mortgage guarantee payments. When a claim is denied and we do not receive a response from the counterparty, the claim remains in the unresolved repurchase claims balance until resolution.
Table 12 presents unresolved repurchase claims by counterparty at December 31, 2013 and 2012.
Table 12 Unresolved Repurchase Claims by Counterparty (1, 2)
December 31(Dollars in millions) 2013 2012Private-label securitization trustees, whole-loan
investors, including third-party securitization sponsors and other (3) $ 17,953 $ 12,222
Monolines 1,532 2,442GSEs 170 13,437
Total unresolved repurchase claims (3) $ 19,655 $ 28,101(1) The total notional amount of unresolved repurchase claims does not include any repurchase
claims related to the trusts covered by the BNY Mellon Settlement.(2) At December 31, 2013 and 2012, unresolved repurchase claims did not include repurchase
demands of $1.2 billion and $1.6 billion where the Corporation believes the claimants have not satisfied the contractual thresholds.
(3) Includes $13.8 billion and $11.7 billion of claims based on individual file reviews and $4.1 billion and $519 million of claims submitted without individual file reviews at December 31, 2013 and 2012.
The notional amount of unresolved repurchase claims from private-label securitization trustees, whole-loan investors, including third-party securitization sponsors, and others included $13.8 billion and $11.7 billion of claims based on individual file reviews and $4.1 billion and $519 million of claims submitted without individual file reviews at December 31, 2013 and 2012. The increase in the notional amount of unresolved repurchase claims during 2013 is primarily due to continued submission of claims by private-label securitization trustees; the level of detail, support and analysis accompanying such claims, which impact overall claim quality and, therefore, claims resolution; and the lack of an established process to resolve disputes related to these claims. For example, claims submitted without individual file reviews lack the level of detail and analysis of individual loans found in other claims that is necessary for us to respond to the claim. We expect unresolved repurchase claims related to private-label securitizations to increase as such claims continue to be submitted and there is not an established process for the ultimate resolution of such claims on which there is a disagreement.
76788ba_financials.indd 49 3/6/14 12:05 PM

50 Bank of America 2013
In addition to, and not included in, the total unresolved repurchase claims, we have received repurchase demands from private-label securitization investors and a master servicer where we believe the claimants have not satisfied the contractual thresholds to direct the securitization trustee to take action and/or that these demands are otherwise procedurally or substantively invalid. The total amount outstanding of such demands was $1.2 billion, comprised of $945 million of demands received during 2012 and $273 million of demands related to trusts covered by the BNY Mellon Settlement at December 31, 2013 compared to $1.6 billion at December 31, 2012. The decrease in outstanding demands is a result of certain demands that were replaced by repurchase claims submitted by trustees, which are included in Table 12. We do not believe that the demands outstanding at December 31, 2013 represent valid repurchase claims and, therefore, it is not possible to predict the resolution with respect to such demands.
The decline in unresolved monoline claims is primarily due to the MBIA Settlement. Substantially all of the remaining unresolved monoline claims pertain to second-lien loans and are currently the subject of litigation.
During 2013, we received $8.4 billion in new repurchase claims, including $6.3 billion submitted by private-label securitization trustees and a financial guarantee provider, $1.8 billion submitted by the GSEs for both Countrywide and legacy Bank of America originations not covered by the bulk settlements with the GSEs, $222 million submitted by whole-loan investors and $50 million submitted by monoline insurers. During 2013, $16.7 billion in claims were resolved, including $646 million and $12.2 billion in GSE claims resolved through settlements with FHLMC and FNMA and $945 million resolved through the MBIA Settlement. Of the remaining claims that were resolved, $1.7 billion were resolved through rescissions and $1.2 billion were resolved through mortgage repurchases and make-whole payments, primarily with the GSEs.
Representations and Warranties LiabilityThe liability for representations and warranties and corporate guarantees is included in accrued expenses and other liabilities on the Consolidated Balance Sheet and the related provision is included in mortgage banking income (loss) in the Consolidated Statement of Income. For additional discussion of the representations and warranties liability and the corresponding estimated range of possible loss, see Off-Balance Sheet Arrangements and Contractual Obligations – Estimated Range of Possible Loss on page 52.
At December 31, 2013 and 2012, the liability for representations and warranties was $13.3 billion and $19.0 billion, with the decrease primarily driven by the FNMA Settlement. For 2013, the representations and warranties provision was $840 million compared to $3.9 billion for 2012. The provision for 2013
was driven by our remaining GSE exposures, including the FHLMC Settlement and our obligations related to MI rescissions. The provision for 2012 included $2.5 billion in provision related to the FNMA Settlement and $500 million for obligations to FNMA related to MI rescissions.
Our estimated liability at December 31, 2013 for obligations under representations and warranties is necessarily dependent on, and limited by, a number of factors, including for private-label securitizations the implied repurchase experience based on the BNY Mellon Settlement, as well as certain other assumptions and judgmental factors. Accordingly, future provisions associated with obligations under representations and warranties may be materially impacted if actual experiences are different from historical experience or our understandings, interpretations or assumptions. Although we have not recorded any representations and warranties liability for certain potential private-label securitization and whole-loan exposures where we have had little to no claim activity, these exposures are included in the estimated range of possible loss.
Experience with Government-sponsored EnterprisesAs a result of various settlements with the GSEs, we have resolved substantially all outstanding and potential representations and warranties repurchase claims on whole loans sold by legacy Bank of America and Countrywide to FNMA and FHLMC through 2008 and 2009, respectively. After these settlements, our exposure to representations and warranties liability for loans originated prior to 2009 and sold to the GSEs is limited to loans with an original principal balance of $13.7 billion and loans with certain defects excluded from the settlements that we do not believe will be material, such as title defects and certain specified violations of the GSEs’ charters. As of December 31, 2013, of the $13.7 billion, approximately $10.8 billion in principal has been paid, $941 million in principal has defaulted or was severely delinquent and the notional amount of unresolved repurchase claims submitted by the GSEs was $144 million related to these vintages.
Experience with Investors Other than Government-sponsored EnterprisesIn prior years, legacy companies and certain subsidiaries sold pools of first-lien residential mortgage loans and home equity loans as private-label securitizations or in the form of whole loans originated from 2004 through 2008 with an original principal balance of $965 billion to investors other than GSEs (although the GSEs are investors in certain private-label securitizations), of which $552 billion in principal has been paid, $192 billion in principal has defaulted, $53 billion in principal was severely delinquent, and $168 billion in principal was current or less than 180 days past due at December 31, 2013.
76788ba_financials.indd 50 3/6/14 12:05 PM

Bank of America 2013 51
Table 13 details the population of loans originated between 2004 and 2008 and sold in non-agency securitizations or as whole loans by entity and product together with the defaulted and severely delinquent loans stratified by the number of payments the borrower made prior to default or becoming severely delinquent as of December 31, 2013.
Table 13 Overview of Non-Agency Securitization and Whole-loan Balances
Principal Balance Defaulted or Severely Delinquent
(Dollars in billions)
By Entity
OriginalPrincipalBalance
Outstanding PrincipalBalance
December31, 2013
OutstandingPrincipal Balance
180 Days or More
Past Due
DefaultedPrincipalBalance
Defaulted orSeverely
Delinquent
Borrower Made
Less than 13 Payments
BorrowerMade
13 to 24Payments
BorrowerMade
25 to 36Payments
BorrowerMade
More than 36Payments
Bank of America $ 100 $ 18 $ 3 $ 7 $ 10 $ 1 $ 2 $ 2 $ 5Countrywide 716 173 43 144 187 24 45 45 73Merrill Lynch 67 15 3 16 19 3 4 3 9First Franklin 82 15 4 25 29 5 6 5 13
Total (1, 2) $ 965 $ 221 $ 53 $ 192 $ 245 $ 33 $ 57 $ 55 $ 100
By Product Prime $ 302 $ 66 $ 8 $ 26 $ 34 $ 2 $ 6 $ 7 $ 19Alt-A 172 50 11 39 50 7 12 12 19Pay option 150 37 14 41 55 5 13 15 22Subprime 247 55 18 66 84 17 20 16 31Home equity 88 11 — 18 18 2 5 4 7Other 6 2 2 2 4 — 1 1 2
Total $ 965 $ 221 $ 53 $ 192 $ 245 $ 33 $ 57 $ 55 $ 100(1) Excludes transactions sponsored by Bank of America and Merrill Lynch where no representations or warranties were made.(2) Includes exposures on third-party sponsored transactions related to legacy entity originations.
As it relates to private-label securitizations, a contractual liability to repurchase mortgage loans generally arises only if counterparties prove there is a breach of representations and warranties that materially and adversely affects the interest of the investor or all the investors in a securitization trust or of the monoline insurer or other financial guarantor (as applicable). We believe many of the loan defaults observed in these securitizations and whole-loan balances have been, and continue to be, driven by external factors like the substantial depreciation in home prices, persistently high unemployment and other negative economic trends, diminishing the likelihood that any loan defect (assuming one exists at all) was the cause of a loan’s default. As of December 31, 2013, approximately 25 percent of the loans sold to non-GSEs that were originated between 2004 and 2008 have defaulted or are severely delinquent. Of the original principal balance for Countrywide, $409 billion is included in the BNY Mellon Settlement and, of this amount, $109 billion was defaulted or severely delinquent at December 31, 2013.
Experience with Private-label Securitizations and Whole LoansLegacy entities, and to a lesser extent Bank of America, sold loans to investors via private-label securitizations or as whole loans. The majority of the loans sold were included in private-label securitizations, including third-party sponsored transactions. We provided representations and warranties to the whole-loan investors and these investors may retain those rights even when the whole loans were aggregated with other collateral into private-label securitizations sponsored by the whole-loan investors. The loans sold with an original total principal balance of $780.5 billion, included in Table 13, were originated between 2004 and 2008, of which $449.9 billion have been paid in full and $191.3 billion were defaulted or severely delinquent at December 31, 2013. At least 25 payments have been made on approximately 64 percent of the defaulted and severely delinquent loans. We have received
approximately $25.9 billion of representations and warranties repurchase claims related to these vintages, including $16.9 billion from private-label securitization trustees and a financial guarantee provider, $8.2 billion from whole-loan investors and $809 million from one private-label securitization counterparty. In private-label securitizations, certain presentation thresholds need to be met in order for investors to direct a trustee to assert repurchase claims. Continued high levels of new private-label claims are primarily related to repurchase requests received from trustees and third-party sponsors for private-label securitization transactions not included in the BNY Mellon Settlement, including claims related to first-lien third-party sponsored securitizations that include monoline insurance. Over time, there has been an increase in requests for loan files from certain private-label securitization trustees, as well as requests for tolling agreements to toll the applicable statute of limitations relating to representations and warranties repurchase claims, and we believe it is likely that these requests will lead to an increase in repurchase claims from private-label securitization trustees with standing to bring such claims. In addition, private-label securitization trustees may have obtained loan files through other means, including litigation and administrative subpoenas, which may increase our total exposure.
A recent decision by the New York intermediate appellate court held that, under New York law, which governs many RMBS trusts, the six-year statute of limitations starts to run at the time the representations and warranties are made (i.e., the date the transaction closed and not when the repurchase demand was denied). If upheld, this decision may impact the timeliness of representations and warranties claims and/or lawsuits, where these claims have not already been tolled by agreement. We believe this ruling may lead to an increase in requests for tolling agreements as well as an increase in the pace of representations and warranties claims and/or the filing of lawsuits by private-label
76788ba_financials.indd 51 3/6/14 12:05 PM

52 Bank of America 2013
securitization trustees prior the expiration of the statute of limitations.
We have resolved $8.0 billion of the $25.9 billion of claims received from whole-loan and private-label securitization counterparties with losses of $1.9 billion. The majority of these resolved claims were from third-party whole-loan investors. Approximately $3.3 billion of these claims were resolved through repurchase or indemnification and $4.7 billion were rescinded by the investor. At December 31, 2013, for loans originated between 2004 and 2008, the notional amount of unresolved repurchase claims submitted by private-label securitization trustees, whole-loan investors and a financial guarantee provider was $17.9 billion. We have performed an initial review with respect to $14.6 billion of these claims and do not believe a valid basis for repurchase has been established by the claimant and are still in the process of reviewing the remaining $3.3 billion of these claims. Until we receive a repurchase claim, we generally do not review loan files related to private-label securitizations sponsored by third-party whole-loan investors (and are not required by the governing documents to do so).
Certain whole-loan investors have engaged with us in a consistent repurchase process and we have used that and other experience to record a liability related to existing and future claims from such counterparties. The BNY Mellon Settlement and subsequent activity with certain counterparties led to the determination that we had sufficient experience to record a liability related to our exposure on certain private-label securitizations, including certain private-label securitizations sponsored by third-party whole-loan investors, however, it did not provide sufficient experience to record a liability related to other private-label securitizations sponsored by third-party whole-loan investors. As it relates to the other private-label securitizations sponsored by third-party whole-loan investors and certain other whole-loan sales, it is not possible to determine whether a loss has occurred or is probable and, therefore, no representations and warranties liability has been recorded in connection with these transactions. As discussed below, our estimated range of possible loss related to representations and warranties exposures as of December 31, 2013 included possible losses related to these whole-loan sales and private-label securitizations sponsored by third-party whole-loan investors.
The representations and warranties, as governed by the private-label securitization agreements, generally require that counterparties have the ability to both assert a claim and actually prove that a loan has an actionable defect under the applicable contracts. While the Corporation believes the agreements for private-label securitizations generally contain less rigorous representations and warranties and place higher burdens on claimants seeking repurchases than the express provisions of comparable agreements with the GSEs, without regard to any variations that may have arisen as a result of dealings with the GSEs, the agreements generally include a representation that underwriting practices were prudent and customary. In the case of private-label securitization trustees and third-party sponsors, there is currently no established process in place for the parties to reach a conclusion on an individual loan if there is a disagreement on the resolution of the claim. Private-label securitization investors generally do not have the contractual right to demand repurchase of loans directly or the right to access loan files.
Experience with Monoline InsurersLegacy companies sold $184.5 billion of loans originated between 2004 and 2008 into monoline-insured securitizations, which are included in Table 13. At December 31, 2013, for loans originated between 2004 and 2008, the unpaid principal balance of loans related to unresolved monoline repurchase claims was $1.5 billion compared to $2.4 billion at December 31, 2012. The decrease in unresolved monoline repurchase claims was driven by the resolution of claims through the MBIA Settlement.
During 2013, there was minimal repurchase claim activity with the monolines and the monolines did not request any loan files for review through the representations and warranties process. However, there may be additional claims or file requests in the future.
The MBIA Settlement in 2013 resolved outstanding and potential claims between the parties to the settlement involving 31 first- and 17 second-lien RMBS trusts for which MBIA provided financial guarantee insurance, including $945 million of monoline repurchase claims outstanding at December 31, 2012. For more information on the MBIA Settlement, see Note 7 – Representations and Warranties Obligations and Corporate Guarantees to the Consolidated Financial Statements.
Open Mortgage Insurance Rescission NoticesIn addition to repurchase claims, we receive notices from mortgage insurance companies of claim denials, cancellations or coverage rescission (collectively, MI rescission notices). Although the number of such open notices has remained elevated, they have decreased over the last several quarters as the resolution of open notices exceeded new notices.
At December 31, 2013, we had approximately 101,000 open MI rescission notices compared to 110,000 at December 31, 2012. Open MI rescission notices at December 31, 2013 included 39,000 pertaining principally to first-lien mortgages serviced for others, 10,000 pertaining to loans held-for-investment (HFI) and 52,000 pertaining to ongoing litigation for second-lien mortgages.
For more information on open mortgage insurance rescission notices, see Note 7 – Representations and Warranties Obligations and Corporate Guarantees to the Consolidated Financial Statements.
Estimated Range of Possible LossWe currently estimate that the range of possible loss for representations and warranties exposures could be up to $4 billion over existing accruals at December 31, 2013. The estimated range of possible loss reflects principally non-GSE exposures. It represents a reasonably possible loss, but does not represent a probable loss, and is based on currently available information, significant judgment and a number of assumptions that are subject to change.
The liability for representations and warranties exposures and the corresponding estimated range of possible loss do not consider any losses related to litigation matters, including RMBS litigation or litigation brought by monoline insurers, nor do they include any separate foreclosure costs and related costs, assessments and compensatory fees or any other possible losses related to potential claims for breaches of performance of servicing obligations, except as such losses are included as potential costs of the BNY Mellon Settlement, potential securities law or fraud claims or potential indemnity or other claims against us, including claims related to loans insured by the FHA. We are not able to
76788ba_financials.indd 52 3/6/14 12:05 PM

Bank of America 2013 53
reasonably estimate the amount of any possible loss with respect to any such servicing, securities law, fraud or other claims against us, except to the extent reflected in existing accruals or the estimated range of possible loss for litigation and regulatory matters disclosed in Note 12 – Commitments and Contingencies to the Consolidated Financial Statements; however, in light of the inherent uncertainties involved in these matters and the very large or indeterminate damages sought in some of these matters, an adverse outcome in one or more of these matters could be material to our results of operations or cash flows for any particular reporting period.
Future provisions and/or ranges of possible loss for representations and warranties may be significantly impacted if actual experiences are different from our assumptions in our predictive models, including, without limitation, ultimate resolution of the BNY Mellon Settlement, estimated repurchase rates, estimated MI rescission rates, economic conditions, estimated home prices, consumer and counterparty behavior, and a variety of other judgmental factors.
For more information on the methodology used to estimate the representations and warranties liability and the corresponding estimated range of possible loss, see Item 1A. Risk Factors of this Annual Report on Form 10-K and Note 7 – Representations and Warranties Obligations and Corporate Guarantees to the Consolidated Financial Statements and, for more information related to the sensitivity of the assumptions used to estimate our liability for obligations under representations and warranties, see Complex Accounting Estimates – Representations and Warranties Liability on page 118.
Servicing, Foreclosure and Other Mortgage MattersWe service a large portion of the loans we or our subsidiaries have securitized and also service loans on behalf of third-party securitization vehicles and other investors. Our servicing obligations are set forth in servicing agreements with the applicable counterparty. These obligations may include, but are not limited to, loan repurchase requirements in certain circumstances, indemnifications, payment of fees, advances for foreclosure costs that are not reimbursable, or responsibility for losses in excess of partial guarantees for VA loans.
Servicing agreements with the GSEs generally provide the GSEs with broader rights relative to the servicer than are found in servicing agreements with private investors. The GSEs claim that they have the contractual right to demand indemnification or loan repurchase for certain servicing breaches. In addition, the GSEs’ first-lien mortgage seller/servicer guides provide for timelines to resolve delinquent loans through workout efforts or liquidation, if necessary, and purport to require the imposition of compensatory fees if those deadlines are not satisfied except for reasons beyond the control of the servicer. In addition, many non-agency RMBS and whole-loan servicing agreements state that the servicer may be liable for failure to perform its servicing obligations in keeping with industry standards or for acts or omissions that involve willful malfeasance, bad faith or gross negligence in the performance of, or reckless disregard of, the servicer’s duties.
It is not possible to reasonably estimate our liability with respect to certain potential servicing-related claims. While we have recorded certain accruals for servicing-related claims, the amount of potential liability in excess of existing accruals could be material.
2011 OCC Consent Order and 2013 IFR Acceleration AgreementWe entered into the 2011 Office of the Comptroller of the Currency (OCC) Consent Order on April 13, 2011. This consent order required servicers to make several enhancements to their servicing operations, including implementation of a single point of contact model for borrowers throughout the loss mitigation and foreclosure processes, adoption of measures designed to ensure that foreclosure activity is halted once a borrower has been approved for a modification unless the borrower fails to make payments under the modified loan and implementation of enhanced controls over third-party vendors that provide default servicing support services. In addition, the 2011 OCC Consent Order required that we retain an independent consultant, approved by the OCC, to conduct a review of all foreclosure actions pending or foreclosure sales that occurred between January 1, 2009 and December 31, 2010 and submit a plan to the OCC to remediate all financial injury to borrowers caused by any deficiencies identified through the review.
On January 7, 2013, we and other mortgage servicing institutions entered into an agreement in principle with the OCC and the Federal Reserve to cease the Independent Foreclosure Review (IFR) that had commenced pursuant to consent orders entered into by Bank of America with the Federal Reserve (2011 FRB Consent Order) and the 2011 OCC Consent Order entered into between BANA and the OCC and replaced it with an accelerated remediation process (2013 IFR Acceleration Agreement). The 2013 IFR Acceleration Agreement requires us to provide $1.8 billion of borrower assistance in the form of loan modifications and other foreclosure prevention actions, and in addition, we made a cash payment of $1.1 billion into a qualified settlement fund in 2013, which was fully reserved at December 31, 2012. The borrower assistance program is not expected to result in any incremental credit provision, as we believe that the existing allowance for credit losses is adequate to absorb any costs that have not already been recorded as charge-offs.
National Mortgage SettlementIn March 2012, we entered into settlement agreements (collectively, the National Mortgage Settlement) with (1) the U.S. Department of Justice, various federal regulatory agencies and 49 state Attorneys General to resolve federal and state investigations into certain residential mortgage origination, servicing and foreclosure practices, (2) HUD to resolve certain claims relating to the origination of FHA-insured mortgage loans, primarily originated by Countrywide prior to and for a period following our acquisition of that lender, and (3) each of the Federal Reserve and the OCC regarding civil monetary penalties related to conduct that was the subject of consent orders entered into with the banking regulators in April 2011. The National Mortgage Settlement was entered by the court as a consent judgment on April 5, 2012. The National Mortgage Settlement provided for the establishment of certain uniform servicing standards, upfront cash payments of approximately $1.9 billion to the state and federal governments and for borrower restitution, approximately $7.6 billion in borrower assistance in the form of, among other things, credits earned for principal reduction, short sales, deeds-in-lieu of foreclosure and approximately $1.0 billion of credits earned for interest rate reduction modifications. In addition, the settlement with HUD provided for an upfront cash payment of $500 million to settle certain claims related to FHA-insured loans. We will also be
76788ba_financials.indd 53 3/6/14 12:05 PM

54 Bank of America 2013
obligated to provide additional cash payments of up to $850 million if we fail to earn an additional $850 million of credits stemming from incremental first-lien principal reductions and satisfy certain solicitation requirements over a three-year period.
We also entered into agreements with several states under which we committed to perform certain minimum levels of principal reduction and related activities within those states in connection with the National Mortgage Settlement, and under which we could be required to make additional payments if we fail to meet such minimum levels.
Subject to confirmation by the independent monitor appointed as a result of the National Mortgage Settlement to review and certify compliance with its provisions, we believe we have substantially fulfilled all borrower assistance, rate reduction modification and principal reduction commitments and, therefore, we do not expect to be required to make additional cash payments. The monitor has validated that through December 31, 2012, we have earned nearly $7.8 billion in credits towards our total obligation and we are awaiting confirmation on the remaining credits. The borrower assistance program did not result in any incremental credit losses as of the settlement date, as the existing allowance for credit losses was adequate to absorb any losses that had not already been charged-off. Under the interest rate reduction program, modifications of approximately 24,000 loans with an aggregate unpaid principal balance of $6.4 billion have been completed as of December 31, 2013. These modifications, which are not accounted for as troubled debt restructurings (TDRs), provided for an average interest rate reduction of approximately two percent, resulting in an estimated decrease in fair value of the modified loans of approximately $740 million and a reduction in annual interest income of approximately $120 million.
Under the terms of the National Mortgage Settlement, the federal and participating state governments agreed to release us from further liability for certain alleged residential mortgage origination, servicing and foreclosure deficiencies. In settling origination issues related to FHA-guaranteed loans originated on or before April 30, 2009, we received a release from further liability for all origination claims with respect to such loans if an insurance claim had been submitted to the FHA prior to January 1, 2012 and a release of multiple damages and penalties, but not administrative indemnification claims for single damages, if no such claim had been submitted. In addition, provided we meet our assistance and remediation commitments, the OCC agreed not to assess, and we will not be obligated to pay to the Federal Reserve, any civil monetary penalties.
The National Mortgage Settlement does not cover certain claims arising out of origination, securitization (including representations made to investors with respect to MBS), criminal claims, private claims by borrowers, claims by certain states for injunctive relief or actual economic damages to borrowers related to the Mortgage Electronic Registration Systems, Inc. (MERS), and claims by the GSEs (including repurchase demands), among other items.
Mortgage Electronic Registration Systems, Inc.Mortgage notes, assignments or other documents are often required to be maintained and are often necessary to enforce mortgage loans. There has been significant public commentary regarding the common industry practice of recording mortgages in the name of MERS, as nominee on behalf of the note holder, and whether securitization trusts own the loans purported to be conveyed to them and have valid liens securing those loans. We
currently use the MERS system for a substantial portion of the residential mortgage loans that we originate, including loans that have been sold to investors or securitization trusts. A component of the OCC consent order requires significant changes in the manner in which we service loans that identify MERS as the mortgagee. Additionally, certain local and state governments have commenced legal actions against us, MERS and other MERS members, questioning the validity of the MERS model. Other challenges have also been made to the process for transferring mortgage loans to securitization trusts, asserting that having a mortgagee of record that is different than the holder of the mortgage note could “break the chain of title” and cloud the ownership of the loan. In order to foreclose on a mortgage loan, in certain cases it may be necessary or prudent for an assignment of the mortgage to be made to the holder of the note, which in the case of a mortgage held in the name of MERS as nominee would need to be completed by a MERS signing officer. As such, our practice is to obtain assignments of mortgages from MERS prior to instituting foreclosure. If certain required documents are missing or defective, or if the use of MERS is found not to be valid, we could be obligated to cure certain defects or in some circumstances be subject to additional costs and expenses. Our use of MERS as nominee for the mortgage may also create reputational risks for us.
Impact of Foreclosure DelaysForeclosure delays impact our default-related servicing costs. We believe default-related servicing costs peaked in mid-2013 and they began to decline in late 2013, and we anticipate that this decline will accelerate in 2014. However, unexpected foreclosure delays could impact the rate of decline. Default-related servicing costs include costs related to resources needed for implementing new servicing standards mandated for the industry, including as part of the National Mortgage Settlement, other operational changes and operational costs due to delayed foreclosures, and do not include mortgage-related assessments, waivers and similar costs related to foreclosure delays.
Other areas of our operations are also impacted by foreclosure delays. In 2013, we recorded $514 million of mortgage-related assessments, waivers and similar costs related to foreclosure delays compared to $867 million, including $258 million related to compensatory fees as part of the FNMA Settlement for 2012. It is also possible that the delays in foreclosure sales may result in additional costs and expenses, including costs associated with the maintenance of properties or possible home price declines while foreclosures are delayed. Finally, the time to complete foreclosure sales may continue to be protracted, which may result in a greater number of nonperforming loans and increased servicing advances, and may impact the collectability of such advances and the value of our MSR asset, MBS and real estate owned properties. Accordingly, the ultimate resolution of disagreements with counterparties, delays in foreclosure sales beyond those currently anticipated, and any issues that may arise out of alleged irregularities in our foreclosure process could significantly increase the costs associated with our mortgage operations.
Other Mortgage-related MattersWe continue to be subject to additional borrower and non-borrower litigation and governmental and regulatory scrutiny related to our past and current origination, servicing, transfer of servicing and
76788ba_financials.indd 54 3/6/14 12:05 PM

Bank of America 2013 55
servicing rights, and foreclosure activities, including those claims not covered by the National Mortgage Settlement. This scrutiny may extend beyond our pending foreclosure matters to issues arising out of alleged irregularities with respect to previously completed foreclosure activities. We are also subject to inquiries, investigations, actions and claims from regulators, trustees, investors and other third parties relating to other mortgage-related activities such as the purchase, sale, pooling, and origination and securitization of loans, as well as structuring, marketing, underwriting and issuance of MBS and other securities, including claims relating to the adequacy and accuracy of disclosures in offering documents and representations and warranties made in connection with whole-loan sales or securitizations. The ongoing environment of heightened scrutiny may subject us to governmental or regulatory inquiries, investigations, actions, penalties and fines, including by the DOJ, state Attorneys General and other members of the RMBS Working Group of the Financial Fraud Enforcement Task Force, or by other regulators or government agencies that could significantly adversely affect our reputation and result in material costs to us in excess of current reserves and management’s estimate of the aggregate range of possible loss for litigation matters. Recent actions by regulators and government agencies indicate that they may, on an industry basis, increasingly pursue claims under the Financial Institutions Reform, Recovery, and Enforcement Act of 1989 (FIRREA) and the False Claims Act (FCA). For example, the Civil Division of the U.S. Attorney’s office for the Eastern District of New York is conducting an investigation concerning our compliance with the requirements of the Federal Housing Administration’s Direct Endorsement Program. FIRREA contemplates civil monetary penalties as high as $1.1 million per violation or, if permitted by the court, based on pecuniary gain derived or pecuniary loss suffered as a result of the violation. Treble damages are potentially available for FCA claims. The ongoing environment of additional regulation, increased regulatory compliance burdens, and enhanced regulatory enforcement, combined with ongoing uncertainty related to the continuing evolution of the regulatory environment, has resulted in operational and compliance costs and may limit our ability to continue providing certain products and services. For more information on management’s estimate of the aggregate range of possible loss and regulatory investigations, see Note 12 – Commitments and Contingencies to the Consolidated Financial Statements.
Mortgage-related Settlements – Servicing MattersIn connection with the BNY Mellon Settlement, BANA has agreed to implement certain servicing changes. The Trustee and BANA have agreed to clarify and conform certain servicing standards related to loss mitigation. In particular, the BNY Mellon Settlement clarifies that it is permissible to apply the same loss mitigation strategies to the Covered Trusts as are applied to BANA affiliates’ HFI portfolios. This portion of the agreement was effective in the second quarter of 2011 and is not conditioned on final court approval.
BANA also agreed to transfer the servicing rights related to certain high-risk loans to qualified subservicers on a schedule that began with the signing of the BNY Mellon Settlement. This servicing transfer protocol will reduce the servicing fees payable to BANA in the future. Upon final court approval of the BNY Mellon Settlement, failure to meet the established benchmarking standards for loans not in subservicing arrangements can trigger payment of agreed-upon fees. Additionally, we and Countrywide
have agreed to work to resolve with the Trustee certain mortgage documentation issues related to the enforceability of mortgages in foreclosure and to reimburse the related Covered Trust for any loss if BANA is unable to foreclose on the mortgage and the Covered Trust is not made whole by a title policy because of these issues. These agreements will terminate if final court approval of the BNY Mellon Settlement is not obtained, although we could still have exposure under the pooling and servicing agreements related to the mortgages in the Covered Trusts for these issues.
In connection with the National Mortgage Settlement, BANA has agreed to implement certain additional servicing changes. The uniform servicing standards established under the National Mortgage Settlement are broadly consistent with the residential mortgage servicing practices imposed by the 2011 OCC Consent Order; however, they are more prescriptive and cover a broader range of our residential mortgage servicing activities. These standards are intended to strengthen procedural safeguards and documentation requirements associated with foreclosure, bankruptcy and loss mitigation activities, as well as addressing the imposition of fees and the integrity of documentation, with a goal of ensuring greater transparency for borrowers. These uniform servicing standards also obligate us to implement compliance processes reasonably designed to provide assurance of the achievement of these objectives. Compliance with the uniform servicing standards is being assessed by a monitor based on the measurement of outcomes with respect to these objectives. Implementation of these uniform servicing standards has contributed to elevated costs associated with the servicing process, but is not expected to result in material delays or dislocation in the performance of our mortgage servicing obligations, including the completion of foreclosures.
Regulatory MattersFor more information regarding regulatory matters and risks, see Item 1A. Risk Factors of this Annual Report on Form 10-K, Capital Management – Regulatory Capital on page 61 and Note 12 – Commitments and Contingencies to the Consolidated Financial Statements.
Financial Reform ActThe Financial Reform Act, which was signed into law on July 21, 2010, enacted sweeping financial regulatory reform and has altered and will continue to alter the way in which we conduct certain businesses, increase our costs and reduce our revenues. Many aspects of the Financial Reform Act remain subject to final rulemaking which will take effect over several years, making it difficult to anticipate the precise impact on the Corporation, our customers or the financial services industry.
Debit Interchange FeesOn June 29, 2011, the Federal Reserve adopted a final rule with respect to the Durbin Amendment effective on October 1, 2011 which, among other things, established a regulatory cap for many types of debit interchange transactions to equal no more than $0.21 plus five bps of the value of the transaction. The Federal Reserve also adopted a rule to allow a debit card issuer to recover $0.01 per transaction for fraud prevention purposes if the issuer complies with certain fraud-related requirements, with which we are currently in compliance. The Federal Reserve also approved rules governing routing and exclusivity, requiring issuers to offer two unaffiliated networks for routing transactions on each debit
76788ba_financials.indd 55 3/6/14 12:05 PM

56 Bank of America 2013
or prepaid product, which became effective April 1, 2012. On July 31, 2013, the U.S. District Court for the District of Columbia issued a ruling regarding the Federal Reserve’s rules implementing the Financial Reform Act’s Durbin Amendment. The ruling requires the Federal Reserve to reconsider the $0.21 per transaction cap on debit card interchange fees. The Federal Reserve has appealed the ruling and a decision on the appeal is expected in the first half of 2014. It is possible that revised rules could have a significant adverse impact on debit interchange revenue as well as transaction routing.
Limitations on Proprietary Trading; Sponsorship and Investment in Hedge Funds and Private Equity FundsOn December 10, 2013, the Federal Reserve, OCC, FDIC, Securities and Exchange Commission (SEC) and Commodity Futures Trading Commission (CFTC) issued final regulations under the Financial Reform Act implementing limitations on proprietary trading as well as the sponsorship of or investment in hedge funds and private equity funds (the Volcker Rule) and set a conformance period that will expire on July 21, 2015. The Volcker Rule prohibits insured depository institutions and companies affiliated with insured depository institutions (collectively, banking entities) from engaging in short-term proprietary trading of certain securities, derivatives, commodity futures and options for their own account. The Volcker Rule also imposes limits on banking entities’ investments in, and other relationships with, hedge funds or private equity funds. The Volcker Rule provides exemptions for certain activities, including market making, underwriting, hedging, trading in government obligations, insurance company activities, and organizing and offering hedge funds or private equity funds. The Volcker Rule also clarifies that certain activities are not prohibited, including acting as agent, broker or custodian. A banking entity with significant trading operations, such as the Corporation, will be required to establish a detailed compliance program to comply with the restrictions of the Volcker Rule.
The statutory provisions of the Volcker Rule became effective on July 21, 2012 and gave financial institutions two years from the effective date, with the possibility for extensions for certain investments, to bring activities and investments into compliance with the statutory provisions. The Federal Reserve has now extended the conformance period to July 21, 2015.
Although we exited our stand-alone proprietary trading business as of June 30, 2011 in anticipation of the Volcker Rule and to further our initiative to optimize our balance sheet, we are still in the process of evaluating the full impact of the Volcker Rule on our current trading activities and our ownership interests in and transactions with hedge funds, private equity funds, commodity pools and other subsidiary operations. The Volcker Rule will likely increase our operational and compliance costs, reduce our trading revenues, and adversely affect our results of operations. For more information about our trading business, see Global Markets on page 44.
DerivativesThe Financial Reform Act includes measures to broaden the scope of derivative instruments subject to regulation by requiring clearing and exchange trading of certain derivatives; imposing new capital, margin, reporting, registration and business conduct requirements for certain market participants; and imposing position limits on certain over-the-counter (OTC) derivatives. The Financial Reform Act grants to the CFTC and the SEC substantial new authority and
requires numerous rulemakings by these agencies. Swap dealers conducting dealing activity with U.S. persons above a specified dollar threshold were required to register with the CFTC on or before December 31, 2012, and this registration requirement was extended to guaranteed non-U.S. entities, requiring registration of such entities by December 31, 2013. Upon registration, swap dealers become subject to additional CFTC rules, including measures regarding clearing and exchange trading of certain derivatives, new capital and margin requirements and additional reporting, external and internal business conduct, swap documentation, portfolio compression and reconciliation requirements for derivatives. Most of these requirements, with the exception of margin, capital and exchange/swap execution facility trading, have gone into effect for us, except with respect to swaps between our non-U.S. swap dealers and some non-U.S. branches of BANA with certain non-U.S. counterparties. Swap dealers are now required to clear certain interest rate and index credit derivative transactions when facing all counterparty types unless either counterparty qualifies for the “end-user exception” to the clearing mandate. These products will also likely become subject to exchange/swap execution facility trading requirements beginning in the first quarter of 2014. The timing for margin and capital implementation remains unknown. The SEC must propose and finalize many of its security-based swaps-related rules and has, to date, implemented a small number of clearing-related and definitional rules. The Financial Reform Act also requires banking entities to “push out” certain derivatives activity to one or more non-bank affiliates.
In Europe, the European Commission and European Securities and Markets Authority (ESMA) have been granted authority to adopt and implement the European Market Infrastructure Regulation (EMIR), which regulates OTC derivatives, central counterparties and trade repositories, and imposes requirements for certain market participants with respect to derivatives reporting, clearing, business conduct and collateral. Several of our entities are subject to EMIR requirements regarding record keeping, marking to market, timely confirmation, derivative contract reporting, portfolio reconciliation and dispute resolution. Further EMIR-implementing measures are expected, but the timing is currently unknown.
The ultimate impact of the derivatives regulations that have not yet been finalized and the time it will take to comply remain uncertain. The final regulations will impose additional operational and compliance costs on us and may require us to restructure certain businesses and may negatively impact our results of operations.
Resolution PlanningThe Federal Reserve and the FDIC require that the Corporation and other BHCs with assets of $50 billion or more, as well as companies designated as systemically important by the Financial Stability Oversight Council, submit annually their plans for a rapid and orderly resolution in the event of material financial distress or failure.
A resolution plan is intended to be a detailed roadmap for the orderly resolution of the BHC and material entities pursuant to the U.S. Bankruptcy Code and other applicable resolution regimes under one or more hypothetical scenarios assuming no extraordinary government assistance. If the Federal Reserve and the FDIC determine that our plan is not credible and we fail to cure the deficiencies in a timely manner, the Federal Reserve and the FDIC may jointly impose more stringent capital, leverage or liquidity requirements or restrictions on growth, activities or operations.
76788ba_financials.indd 56 3/6/14 12:05 PM

Bank of America 2013 57
We submitted our 2013 plan in October and are required to update it annually.
Similarly, in the U.K., the Prudential Regulation Authority (PRA) has issued proposed rules requiring the submission of significant information about certain U.K.-incorporated subsidiaries and other financial institutions, as well as branches of non-U.K. banks located in the U.K. (including information on intra-group dependencies, legal entity separation and barriers to resolution) to allow the PRA to develop resolution plans. As a result of the PRA review, we could be required to take certain actions over the next several years which could impose operating costs and potentially result in the restructuring of certain business and subsidiaries.
Orderly Liquidation AuthorityUnder the Financial Reform Act, when a systemically important financial institution such as the Corporation is in default or danger of default, the FDIC may be appointed receiver in order to conduct an orderly liquidation of such systemically important financial institution. In the event of such appointment, the FDIC could invoke a new form of resolution authority, the orderly liquidation authority, instead of the U.S. Bankruptcy Code, if the Secretary of the Treasury makes certain financial distress and systemic risk determinations. The orderly liquidation authority is modeled in part on the Federal Deposit Insurance Act, but also adopts certain concepts from the U.S. Bankruptcy Code.
The orderly liquidation authority contains certain differences from the U.S. Bankruptcy Code. For example, in certain circumstances, the FDIC could permit payment of obligations it determines to be systemically significant (e.g., short-term creditors or operating creditors) in lieu of paying other obligations (e.g., long-term creditors) without the need to obtain creditors’ consent or prior court review. The insolvency and resolution process could also lead to a large reduction or total elimination of the value of a BHC’s outstanding equity. For example, the FDIC could follow a “single point of entry” approach and replace a distressed BHC with a bridge holding company, which could continue operations and result in an orderly resolution of the underlying bank, but whose equity is held solely for the benefit of creditors of the original BHC. Additionally, under the orderly liquidation authority, amounts owed to the U.S. government generally receive a statutory payment priority.
Credit Risk RetentionOn August 28, 2013, federal regulators jointly issued a re-proposal of a rule regarding credit risk retention (Credit Risk Retention Rule) that would, among other things, require sponsors to retain at least five percent of the credit risk of the assets underlying certain ABS and MBS securitizations and would limit sponsors’ ability to transfer or hedge that credit risk. The proposed rule, as currently written, would likely have some adverse impacts on our ability to engage in many types of MBS and ABS securitizations and resecuritizations, impose additional operational and compliance costs, and negatively influence the value, liquidity and transferability of ABS or MBS, loans and other assets. However, it remains unclear what requirements will be included in the final rule and what the ultimate impact will be on our results of operations.
ConsumerCertain federal consumer finance laws to which the Corporation is subject, including, but not limited to, the Equal Credit Opportunity Act, Home Mortgage Disclosure Act, Electronic Fund Transfer Act, Fair Credit Reporting Act, Real Estate Settlement Procedures Act (RESPA), Truth in Lending (TILA) and Truth in Savings Act are enforced by the Consumer Financial Protection Bureau (CFPB), subject to certain statutory limitations. Through its rulemaking authority, the CFPB has promulgated several proposed and final rules that will affect our consumer businesses. On January 10, 2014, several significant CFPB rulemakings became effective, including the Ability-to-Repay and Qualified Mortgage Rule and new mortgage servicing standards. In addition, the CFPB has either proposed or is considering rulemakings related to debt collection, prepaid cards, integrated disclosures under RESPA and TILA, and disclosures related to remittance transfer transactions. Additionally, as noted above, in August 2013 several federal agencies jointly re-proposed the Credit Risk Retention Rule, which will impose credit risk retention requirements on sponsors securitizing certain mortgage loans that do not meet the standards of a “qualified residential mortgage” to be defined in the final version of the Credit Risk Retention Rule. The Corporation is evaluating the various rules and proposals to facilitate compliance with these rules.
Managing Risk
OverviewRisk is inherent in every material business activity that we undertake. Our business exposes us to strategic, credit, market, liquidity, compliance, operational and reputational risks. We must manage these risks to maximize our long-term results by ensuring the integrity of our assets and the quality of our earnings.
Strategic risk is the risk that results from adverse business decisions, inappropriate business plans, ineffective business strategy execution, or failure to respond in a timely manner to changes in the macroeconomic environment, such as business cycles, competitor actions, changing customer preferences, product obsolescence, technology developments and regulatory environment. Credit risk is the risk of loss arising from a borrower’s or counterparty’s inability to meet its obligations. Market risk is the risk that values of assets and liabilities, or revenues will be adversely affected by changes in market conditions such as interest rate movements. Liquidity risk is the risk of an inability to meet contractual and contingent financial obligations, on- or off-balance sheet, as they come due. Compliance risk is the risk that arises from the failure to adhere to laws, rules, regulations, or internal policies and procedures. Operational risk is the risk of loss resulting from inadequate or failed internal processes, people and systems, or external events. Reputational risk is the potential that negative publicity regarding an organization’s conduct or business practices will adversely affect its profitability, operations or customer base, or result in costly litigation or require other measures. Reputational risk is evaluated along with all of the risk categories and throughout the risk management process, and as such is not discussed separately herein. The following sections, Strategic Risk Management and Capital Management both on page 61, Liquidity Risk on page 67, Credit Risk Management on page 72, Market Risk Management on page 104, Compliance Risk Management and Operational Risk Management both on page 112, address in more detail the specific procedures,
76788ba_financials.indd 57 3/6/14 12:05 PM

58 Bank of America 2013
measures and analyses of the major categories of risk that we manage.
In choosing when and how to take risks, we evaluate our capacity for risk and seek to protect our brand and reputation, our financial flexibility, the value of our assets and the strategic potential of the Corporation. We intend to maintain a strong and flexible financial position. We also intend to focus on maintaining our relevance and value to customers, employees and shareholders. As part of our efforts to achieve these objectives, we continue to build a comprehensive risk management culture and to implement governance and control measures to strengthen that culture.
We take a comprehensive approach to risk management. We have a defined risk framework and articulated risk appetite which are approved annually by the Corporation’s Board of Directors (the Board). Risk management planning is integrated with strategic, financial and customer/client planning so that goals and responsibilities are aligned across the organization. Risk is managed in a systematic manner by focusing on the Corporation as a whole as well as managing risk across the enterprise and within individual business units, products, services and transactions, and across all geographic locations. We maintain a governance structure that delineates the responsibilities for risk management activities, as well as governance and oversight of those activities.
Executive management assesses, with Board oversight, the risk-adjusted returns of each business segment. Management reviews and approves strategic and financial operating plans, and recommends to the Board for approval a financial plan annually. Our strategic plan takes into consideration return objectives and financial resources, which must align with risk capacity and risk appetite. Management sets financial objectives for each business by allocating capital and setting a target for return on capital for each business. Capital allocations and operating limits are regularly evaluated as part of our overall governance processes as the businesses and the economic environment in which we operate continue to evolve.
In addition to reputational considerations, businesses operate within their credit, market, compliance and operational risk standards and limits in order to adhere to the risk appetite. These limits are based on analyses of risk and reward in each business. Executive management is responsible for tracking and reporting performance measurements as well as any exceptions to guidelines or limits. The Board, and its committees when appropriate, monitor financial performance, execution of the strategic and financial operating plans, compliance with the risk appetite and the adequacy of internal controls.
As part of its annual review, the Board approved both the Risk Framework and Risk Appetite Statement in January 2014. The Risk Framework defines the accountability of the Corporation and its employees and the Risk Appetite Statement defines the parameters under which we will take risk. Both documents are intended to enable us to maximize our long-term results and ensure the integrity of our assets and the quality of our earnings. The Risk Framework is designed to be used by our employees to understand risk management activities, including their individual roles and accountabilities. It also defines how risk management is integrated into our core business processes, and it defines the risk management governance structure, including management’s involvement. The risk management responsibilities of the businesses, governance and control functions, and Corporate Audit are also clearly defined. The risk management process
includes four critical elements: identify and measure risk, mitigate and control risk, monitor and test risk, and report and review risk, and is applied across all business activities to enable an integrated and comprehensive review of risk consistent with the Risk Appetite Statement.
Risk Management Processes and MethodsTo support our corporate goals and objectives, risk appetite, and business and risk strategies, we maintain a governance structure that delineates the responsibilities for risk management activities, as well as governance and oversight of those activities, by management and the Board. All employees have accountability for risk management. Each employee’s risk management responsibilities fall into one of three major categories: businesses, governance and control, and Corporate Audit.
Business managers and employees are accountable for identifying, managing and escalating attention to all risks in their business units, including existing and emerging risks. Business managers must ensure that their business activities are conducted within the risk appetite defined by management and approved by the Board. The limits and controls for each business must be consistent with the Risk Appetite Statement. Employees in client and customer facing businesses are responsible for day-to-day business activities, including developing and delivering profitable products and services, fulfilling customer requests and maintaining desirable customer relationships. These employees are accountable for conducting their daily work in accordance with policies and procedures. It is the responsibility of each employee to protect the Corporation and defend the interests of the shareholders.
Governance and control functions are comprised of Global Risk Management, Global Compliance, Legal and the enterprise control functions, and are tasked with independently overseeing and managing risk activities. Global Compliance (which includes Regulatory Relations) and Legal report to the Global General Counsel and Head of Compliance and Regulatory Relations Executive. Enterprise control functions consist of the Chief Financial Officer (CFO) Group, Global Technology and Operations, Global Human Resources, and Global Marketing and Corporate Affairs.
Global Risk Management is led by the Chief Risk Officer (CRO). The CRO leads senior management in managing risk, is independent from the Corporation’s businesses and enterprise control functions, and maintains sufficient autonomy to develop and implement meaningful risk management measures. This position serves to protect the Corporation and its shareholders. The CRO reports to the Chief Executive Officer (CEO) and is the management team lead or a participant in Board-level risk governance committees. The CRO has the mandate to ensure that appropriate risk management practices are in place, and are effective and consistent with our overall business strategy and risk appetite. Global Risk Management is comprised of two types of risk teams, Enterprise risk teams and independent business risk teams, which report to the CRO and are independent from the business and enterprise control functions.
Enterprise risk teams are responsible for setting and establishing enterprise policies, programs and standards, assessing program adherence, providing enterprise-level risk oversight, and reporting and monitoring systemic and emerging risk issues. In addition, the enterprise risk teams are responsible for monitoring and ensuring that risk limits are reasonable and
76788ba_financials.indd 58 3/6/14 12:05 PM

Bank of America 2013 59
consistent with the risk appetite. These risk teams also carry out risk-based oversight of the enterprise control functions.
Independent business risk teams are responsible for establishing policies, limits, standards, controls, metrics and thresholds within the defined corporate standards for the businesses to which they are aligned. The independent business risk teams are also responsible for ensuring that risk limits and standards are reasonable and consistent with the risk appetite.
Enterprise control functions are independent of the businesses and have risk governance and control responsibilities for enterprise programs. In this role, they are responsible for setting policies, standards and limits; providing risk reporting; monitoring systemic risk issues including existing and emerging; and implementing procedures and controls at the enterprise and business levels for their respective control functions.
The Corporate Audit function maintains independence from the businesses and governance and control functions by reporting directly to the Audit Committee of the Board. Corporate Audit provides independent assessment and validation through testing of key processes and controls across the Corporation. Corporate Audit also provides an independent assessment of the Corporation’s management and internal control systems. Corporate Audit activities are designed to provide reasonable assurance that resources are adequately protected; significant financial, managerial and operating information is materially complete, accurate and reliable; and employees’ actions are in compliance with the Corporation’s policies, standards, procedures, and applicable laws and regulations.
To assist the Corporation in achieving its goals and objectives, risk appetite, and business and risk strategies, we utilize a risk management process that is applied across the execution of all business activities. This risk management process, which is an integral part of our Risk Framework, enables the Corporation to review risk in an integrated and comprehensive manner across all risk categories and make strategic and business decisions based on that comprehensive view. Corporate goals and objectives are established by management, and management reflects these goals and objectives in our risk appetite.
One of the key tools of the risk management process is the use of Risk and Control Self Assessments (RCSAs). RCSAs are the primary method for facilitating management of the business environment and internal control factor data. The end-to-end RCSA process incorporates risk identification and assessment of the control environment; monitoring, reporting and escalating risk; quality assurance and data validation; and integration with the risk appetite. The RCSA process also incorporates documentation by either the business or governance and control functions of the business environment, risks, controls, and monitoring and reporting. This results in a comprehensive risk management view that enables understanding of and action on operational risks and controls for all of our processes, products, activities and systems.
The formal processes used to manage risk represent a part of our overall risk management process. Corporate culture and the actions of our employees are also critical to effective risk management. Through our Code of Conduct, we set a high standard
for our employees. The Code of Conduct provides a framework for all of our employees to conduct themselves with the highest integrity. We instill a strong and comprehensive risk management culture through communications, training, policies, procedures, and organizational roles and responsibilities. Additionally, we continue to strengthen the link between the employee performance management process and individual compensation to encourage employees to work toward enterprise-wide risk goals.
Enterprise-wide Stress TestingAs a part of our core risk management practices, we conduct enterprise-wide stress tests on a periodic basis to better understand balance sheet, earnings, capital and liquidity sensitivities to certain economic and business scenarios, including economic and market conditions that are more severe than anticipated. These enterprise-wide stress tests provide illustrative hypothetical potential impacts from our risk profile on our balance sheet, earnings, capital and liquidity and serve as a key component of our capital, liquidity and risk management practices. Scenarios are recommended by the Asset Liability and Market Risk Committee (ALMRC) and approved by the CFO and the CRO. Impacts to each business from each scenario are then determined and analyzed, primarily by leveraging the models and processes utilized in everyday management routines. Impacts are assessed along with potential mitigating actions that may be taken. Analysis from such stress scenarios is compiled for and reviewed through our Chief Financial Officer Risk Committee (CFORC), ALMRC and the Board’s Enterprise Risk Committee.
Contingency Planning RoutinesWe have developed and maintain contingency plans that prepare us in advance to respond in the event of potential adverse outcomes and scenarios. These contingency planning routines include capital contingency planning, liquidity contingency funding plans, recovery planning and enterprise resiliency, and provide monitoring, escalation routines and response plans. Contingency response plans are designed to enable us to increase capital, access funding sources and reduce risk through consideration of potential actions that includes asset sales, business sales, capital or debt issuances and other de-risking strategies.
Board Oversight of RiskThe Board is comprised of a substantial majority of independent directors. The Board is committed to strong, independent oversight of management and risk through a governance structure that includes Board committees and management committees. The Board’s standing committees that oversee the management of the majority of the risks faced by the Corporation include the Audit and Enterprise Risk Committees, comprised of independent directors, and the Credit Committee, comprised of non-management directors. This governance structure is designed to align the interests of the Board and management with those of our shareholders and to foster integrity over risk management throughout the Corporation.
76788ba_financials.indd 59 3/6/14 12:05 PM

60 Bank of America 2013
The chart below illustrates the inter-relationship among the Board, Board committees and management committees with the majority of risk oversight responsibilities for the Corporation.
(1) Chart is not comprehensive; there may be additional subcommittees not represented in this chart. This presentation does not include committees for other legal entities.(2) Reports through the Audit Committee for compliance and through the Enterprise Risk Committee for operational and reputational risk.(3) Reports to the CEO and CFO with oversight by the Audit Committee.
Our Board’s Audit, Credit and Enterprise Risk Committees have the principal responsibility for assisting the Board with enterprise-wide oversight of the Corporation’s management and handling of risk.
Our Audit Committee assists the Board in the oversight of, among other things, the integrity of our consolidated financial statements, our compliance with legal and regulatory requirements, and the overall effectiveness of our system of internal controls. Our Audit Committee also, taking into consideration the Board’s allocation of the review of risk among various committees of the Board, discusses with management guidelines and policies to govern the process by which risk assessment and risk management are undertaken, including the assessment of our major financial risk exposures and the steps management has taken to monitor and control such exposures.
Our Credit Committee oversees, among other things, the identification and management of our credit exposures on an enterprise-wide basis, our responses to trends affecting those exposures, the adequacy of the allowance for credit losses and our credit-related policies.
Our Enterprise Risk Committee oversees, among other things, our identification of, management of and planning for material risks on an enterprise-wide basis, including market risk, interest rate risk, liquidity risk, operational risk and reputational risk. Our Enterprise Risk Committee also oversees our capital management and liquidity planning.
Each of these committees regularly reports to our Board on risk-related matters within the committee’s responsibilities, which collectively provides our Board with integrated, thorough insight about our management of enterprise-wide risks. At meetings of our Audit, Credit and Enterprise Risk Committees and our Board, directors receive updates from management regarding enterprise risk management, including our performance against our risk appetite and risk framework.
Executive management develops for Board approval the Corporation’s Risk Framework, Risk Appetite Statement, strategic plans, capital plans and financial operating plans. Management monitors, and the Board oversees, through the Credit, Enterprise Risk and Audit Committees, financial performance, execution of the strategic and financial operating plans, compliance with the risk appetite and the adequacy of internal controls.

Bank of America 2013 61
Strategic Risk ManagementStrategic risk is embedded in every business and is one of the major risk categories along with credit, market, liquidity, compliance, operational and reputational risks. It is the risk that results from adverse business decisions, ineffective or inappropriate business plans, or failure to respond to changes in the macroeconomic environment, such as business cycles, competitor actions, customer preferences, product obsolescence, technology developments and the regulatory environment. We face significant strategic risk due to the changing regulatory environment and the fast-paced development of new products and technologies in the financial services industries. Our appetite for strategic risk is assessed based on the strategic plan, with strategic risks selectively and carefully considered against the backdrop of the evolving marketplace. Strategic risk is managed in the context of our overall financial condition, risk appetite and stress test results, among other considerations. The CEO and executive management team manage and act on significant strategic actions, such as divestitures, consolidation of legal entities or capital actions subsequent to required review and approval by the Board.
Executive management develops and approves a strategic plan each year, which is reviewed and approved by the Board. Annually, executive management develops a financial operating plan, which is reviewed and approved by the Board, that implements the strategic goals for that year. With oversight by the Board, executive management ensures that consistency is applied while executing the Corporation’s strategic plan, core operating tenets and risk appetite. The following are assessed in the executive reviews: forecasted earnings and returns on capital, the current risk profile, current capital and liquidity requirements, staffing levels and changes required to support the plan, stress testing results, and other qualitative factors such as market growth rates and peer analysis. At the business level, as we introduce new products, we monitor their performance to evaluate expectations (e.g., for earnings and returns on capital). With oversight by the Board, executive management performs similar analyses throughout the year, and evaluates changes to the financial forecast or the risk, capital or liquidity positions as deemed appropriate to balance and optimize achieving the targeted risk appetite, shareholder returns and maintaining the targeted financial strength.
We use proprietary models to measure the capital requirements for credit, country, market, operational and strategic risks. The allocated capital assigned to each business is based on its unique risk exposures. With oversight by the Board, executive management assesses the risk-adjusted returns of each business in approving strategic and financial operating plans. The businesses use allocated capital to define business strategies, and price products and transactions. For more information on how this measure is calculated, see Supplemental Financial Data on page 29.
Capital ManagementThe Corporation manages its capital position to maintain sufficient capital to support its business activities and maintain capital, risk and risk appetite commensurate with one another. Additionally, we seek to maintain safety and soundness at all times including under adverse conditions, take advantage of potential growth opportunities, maintain ready access to financial markets, continue to serve as a credit intermediary, remain a source of
strength for our subsidiaries, and satisfy current and future regulatory capital requirements. Capital management is integrated into our risk and governance processes, as capital is a key consideration in the development of the strategic plan, risk appetite and risk limits.
We set goals for capital ratios to meet key stakeholder expectations, including investors, rating agencies and regulators, and achieve our financial performance objectives and strategic goals, while maintaining adequate capital, including during periods of stress. We assess capital adequacy to operate in a safe and sound manner and maintain adequate capital in relation to the risks associated with our business activities and strategy.
At least quarterly we conduct an Internal Capital Adequacy Assessment Process (ICAAP). The ICAAP is a forward-looking assessment of our projected capital needs and resources, incorporating earnings, balance sheet and risk forecasts under baseline and adverse economic and market conditions. We utilize quarterly stress tests to assess the potential impacts to our balance sheet, earnings, capital and liquidity under a variety of stress scenarios. We perform qualitative risk assessments to identify and assess material risks not fully captured in the forecasts, stress tests or economic capital. We assess the capital impacts of proposed changes to regulatory capital requirements. Management assesses ICAAP results and provides documented quarterly assessments of the adequacy of the capital guidelines and capital position to the Board or its committees.
Effective January 1, 2013, on a prospective basis, we adjusted the amount of capital being allocated to our business segments. The adjustment reflects a refinement to the prior-year methodology (economic capital) which focused solely on internal risk-based economic capital models. The refined methodology (allocated capital) also considers the effect of regulatory capital requirements in addition to internal risk-based economic capital models. The Corporation’s internal risk-based capital models use a risk-adjusted methodology incorporating each segment’s credit, market, interest rate, business and operational risk components. For more information on the nature of these risks, see Managing Risk on page 57 and Strategic Risk Management on page 61. The capital allocated to the business segments is currently referred to as allocated capital and, prior to January 1, 2013, was referred to as economic capital, both of which represent non-GAAP financial measures. Allocated capital is reviewed periodically based on business segment exposures and risk profile, regulatory constraints and strategic plans, and is subject to change over time. For more information on the refined methodology, see Business Segment Operations on page 31.
Regulatory CapitalAs a financial services holding company, we are subject to the general risk-based capital rules issued by federal banking regulators which was Basel 1 through December 31, 2012. On January 1, 2013, Basel 1 was amended prospectively, introducing changes to the measurement of risk-weighted assets for exposures subject to market risk (Market Risk Final Rule) and is referred to herein as the Basel 1 – 2013 Rules. The Corporation and its primary affiliated banking entities, BANA and FIA, measure regulatory capital adequacy based upon these rules. For more information on the Market Risk Final Rule, see Capital Management – Regulatory Capital Changes on page 64.
76788ba_financials.indd 61 3/6/14 12:05 PM

62 Bank of America 2013
Federal banking regulators, in connection with the Supervisory Capital Assessment Program in 2009, introduced an additional measure of capital, Tier 1 common capital. Tier 1 common capital is not an official regulatory ratio and is defined as Tier 1 capital less preferred stock, trust preferred securities (Trust Securities), hybrid securities and qualifying noncontrolling interest in subsidiaries.
Risk-weighted assets are calculated for credit risk for all on- and off-balance sheet credit exposures and for market risk on trading assets and liabilities, including derivative exposures. Credit risk-weighted assets are calculated by assigning a prescribed risk-weight to all on-balance sheet assets and to the credit equivalent amount of certain off-balance sheet exposures. The risk-weight is defined in the regulatory rules based upon the obligor or guarantor type and collateral, if applicable. Off-balance sheet exposures include financial guarantees, unfunded lending commitments, letters of credit and derivatives. Market risk-weighted assets are calculated using risk models for trading account positions, including all foreign exchange and commodity positions regardless of the applicable accounting guidance. Any assets that are a direct deduction from the computation of capital are excluded from risk-weighted assets and adjusted average total assets consistent with regulatory guidance. Under Basel 1, there are no risk-weighted assets calculated for operational risk.
The Federal Reserve requires BHCs to submit a capital plan and requests for capital actions on an annual basis, consistent with the rules governing the Comprehensive Capital Analysis and Review (CCAR). The CCAR is the central element of the Federal Reserve’s approach to ensure that large BHCs have adequate capital and robust processes for managing their capital. In January 2013, we submitted our 2013 capital plan, and received results on March 14, 2013. The Federal Reserve’s stress scenario projections for the Corporation, based on the 2013 capital plan, estimated a minimum Tier 1 common capital ratio under the Basel 1 – 2013 Rules of 6.0 percent under severe adverse economic conditions with all proposed capital actions through the end of 2014, exceeding the five percent reference rate for all institutions involved in the CCAR. The capital plan submitted by the Corporation included a request to repurchase up to $5.0 billion of common stock and redeem $5.5 billion in preferred stock over four quarters beginning in the second quarter of 2013, and continue the quarterly common stock dividend at $0.01 per share. As of December 31, 2013, in connection with the 2013 CCAR capital plan, we have repurchased and retired approximately 231.7 million common shares for an aggregate purchase price of approximately $3.2 billion and we redeemed $5.5 billion of preferred stock consisting of Series H and 8. As of December 31, 2013, under the capital plan, we can purchase up to $1.8 billion of additional common stock through the first quarter of 2014.
The timing and amount of common stock repurchases through March 31, 2014 have been and will continue to be consistent with the Corporation’s 2013 capital plan and will be subject to various factors, including the Corporation’s capital position, liquidity, applicable legal considerations, financial performance and
alternative uses of capital, stock trading price, and general market conditions, and may be suspended at any time. The remaining common stock repurchases may be effected through open market purchases or privately negotiated transactions, including repurchase plans that satisfy the conditions of Rule 10b5-1 of the Securities Exchange Act of 1934.
In January 2014, we submitted our 2014 CCAR plan and related supervisory stress tests. The Federal Reserve has announced that it will release summary results, including supervisory projections of capital ratios, losses and revenues under stress scenarios, and publish the results of stress tests conducted under the supervisory adverse scenario in March 2014.
For more information on these and other regulatory requirements, see Note 16 – Regulatory Requirements and Restrictions to the Consolidated Financial Statements.
Capital Composition and RatiosTable 14 presents Bank of America Corporation’s capital ratios and related information in accordance with the Basel 1 – 2013 Rules as measured at December 31, 2013 and Basel 1 at December 31, 2012.
Table 14 Bank of America Corporation RegulatoryCapital – Actual and Pro-Forma
December 31(Dollars in billions) 2013 2012Tier 1 common capital ratio 11.19% 11.06%Tier 1 common capital ratio (pro forma) (1) n/a 10.38Tier 1 capital ratio 12.44 12.89Total capital ratio 15.44 16.31Tier 1 leverage ratio 7.86 7.37Risk-weighted assets $ 1,298 $ 1,206Adjusted quarterly average total assets (2) 2,053 2,111
(1) Pro-forma Tier 1 common capital ratio at December 31, 2012 includes the estimated impact of the Basel 1 – 2013 Rules. Represents a non-GAAP financial measure. On a pro-forma basis, risk-weighted assets would have been approximately $1,285 billion with the inclusion of $78.8 billion in pro-forma risk-weighted assets.
(2) Reflects adjusted average total assets for the three months ended December 31, 2013 and2012.
n/a = not applicable
Tier 1 common capital under the Basel 1 – 2013 Rules was $145.2 billion at December 31, 2013, an increase of $11.8 billion under Basel 1 at December 31, 2012. The increase was due to earnings eligible to be included in capital, partially offset by the impact of the common stock repurchases. At December 31, 2012, pro-forma Tier 1 common capital of $133.4 billion would have been unchanged, assuming the Basel 1 – 2013 Rules had been in effect at that time. During 2013, total capital increased $3.6 billion to $200.3 billion primarily driven by the increase in Tier 1 common capital and the portion of the allowance for loan and lease losses eligible to be included in capital, partially offset by decreases in qualifying preferred stock, qualifying subordinated debt and Trust Securities. For additional information, see Tables 14 and 16.
76788ba_financials.indd 62 3/6/14 12:05 PM

Bank of America 2013 63
In 2013, we entered into an agreement with Berkshire Hathaway, Inc. and its affiliates (Berkshire), who hold all the outstanding shares of the Corporation’s 6% Cumulative Perpetual Preferred Stock, Series T (Series T Preferred Stock) to amend the terms of the Series T Preferred Stock. As of December 31, 2013, the Series T Preferred Stock has a carrying value of $2.9 billion, which does not qualify as Tier 1 capital. The material changes to the terms of the Series T Preferred Stock proposed in the amendment are: (1) dividends will no longer be cumulative; (2) the dividend rate will be fixed at 6%; and (3) we may redeem the Series T Preferred Stock only after the fifth anniversary of the effective date of the amendment. Under Delaware law and our certificate of incorporation, the amendment must be approved by the holders of the Series T Preferred Stock, voting as a separate class, and a majority of the outstanding shares of our common stock, Series B Preferred Stock and Series 1 through 5 Preferred Stock, voting together as a class. The amendment will be presented to our stockholders for approval at the annual meeting of stockholders scheduled to be held on May 7, 2014. Berkshire has granted us an irrevocable proxy to vote their shares of Series T Preferred Stock in favor of the amendment at the annual meeting. If our stockholders approve the amendment and it becomes effective, our Tier 1 capital will increase by approximately $2.9 billion, which will benefit our Tier 1 capital and leverage ratios. We do not expect any impact to our financial condition or results of operations as a result of this amendment. For more information on the Series T Preferred Stock, see Note 13 – Shareholders’ Equity to the Consolidated Financial Statements.
At December 31, 2013, an increase or decrease in our Tier 1 common, Tier 1 or Total capital ratios by one bp would require a change of $130 million in Tier 1 common, Tier 1 or Total capital. We could also increase our Tier 1 common, Tier 1 or Total capital ratios by one bp on such date by a reduction in risk-weighted assets of $1.2 billion, $1.0 billion or $840 million, respectively. An increase in our Tier 1 leverage ratio by one bp on such date would
require $205 million of additional Tier 1 capital or a reduction of $2.6 billion in adjusted average assets.
Risk-weighted assets increased $91.6 billion in 2013 to $1,298 billion at December 31, 2013. The increase was primarily due to the net impact of the Basel 1 – 2013 Rules which increased risk-weighted assets by approximately $87 billion and reduced the Tier 1 common capital ratio by an estimated 77 bps. The Tier 1 leverage ratio increased 49 bps in 2013 primarily driven by the increase in Tier 1 capital and a reduction in adjusted quarterly average total assets.
Table 15 presents Bank of America Corporation’s risk-weighted assets activity for 2013.
Table 15 Risk-weighted Asset Activity
(Dollars in billions) 2013
Risk-weighted assets, January 1 $ 1,206Changes to risk-weighted assets
Increase related to Comprehensive Risk Measure (1) 22Increase related to Incremental Risk Charge (1) 7Increase related to market risk regulatory VaR 21Standard specific risk (2) 28
Increase due to items no longer eligible to be included inmarket risk 9
Increases related to implementation of Basel 1 – 2013 Rules 87Decrease related to trading and banking book exposures (3)Other changes 8
Total risk-weighted assets, December 31 $ 1,298(1) For additional information, see Capital Management – Regulatory Capital Changes on page 64.(2) A measure of the risk of loss on a position that could result from factors other than broad
market movements.
Table 16 presents the capital composition in accordance with the Basel 1 – 2013 Rules as measured at December 31, 2013 and Basel 1 at December 31, 2012.
Table 16 Capital Composition
December 31(Dollars in millions) 2013 2012Total common shareholders’ equity $ 219,333 $ 218,188Goodwill (69,844) (69,976)Nonqualifying intangible assets (includes core deposit intangibles, affinity relationships, customer relationships and other intangibles) (4,263) (4,994)
Net unrealized (gains) losses on AFS debt and marketable equity securities and net losses on derivatives recorded in accumulatedOCI, net-of-tax 5,538 (2,036)
Unamortized net periodic benefit costs recorded in accumulated OCI, net-of-tax 2,407 4,456Fair value adjustments related to structured liabilities (1) 4,485 4,084Disallowed deferred tax asset (13,974) (17,940)Other 1,553 1,621
Total Tier 1 common capital 145,235 133,403Qualifying preferred stock 10,435 15,851Trust preferred securities 5,786 6,207
Total Tier 1 capital 161,456 155,461Long-term debt qualifying as Tier 2 capital 21,175 24,287Allowance for loan and lease losses 17,428 24,179Reserve for unfunded lending commitments 484 513Allowance for loan and lease losses exceeding 1.25 percent of risk-weighted assets (1,637) (9,459)45 percent of the pre-tax net unrealized gains (losses) on AFS marketable equity securities (3) 329Other 1,378 1,370
Total capital $ 200,281 $ 196,680(1) Represents loss on structured liabilities, net-of-tax, that is excluded from Tier 1 common capital, Tier 1 capital and Total capital for regulatory capital purposes.
76788ba_financials.indd 63 3/6/14 12:05 PM

64 Bank of America 2013
Regulatory Capital Changes
Market Risk Final RuleAt December 31, 2013, we measured and reported our capital ratios and related information in accordance with the Basel 1 – 2013 Rules, which introduced new measures of market risk including a charge related to stressed Value-at-Risk (VaR), an incremental risk charge and the comprehensive risk measure (CRM), as well as other technical modifications, all of which were effective January 1, 2013. The CRM is used to determine the risk-weighted assets for correlation trading positions. With approval from U.S. banking regulators, but not sooner than one year following compliance with the Market Risk Final Rule, we may remove a surcharge applicable to the CRM. This benefit is not yet included in our reported results. The implementation of the Basel 1 – 2013 Rules was the primary driver of the changes in total risk-weighted assets, and the Tier 1, Tier 1 common and Total capital ratios from December 31, 2012.
In December 2013, U.S. banking regulators issued an amendment to the Market Risk Final Rule, effective on April 1, 2014, to reflect certain aspects of the final Basel 3 Regulatory Capital rules (Basel 3). Revisions were made to the treatment of sovereign exposures and certain traded securitization positions as well as clarification as to the timing of required disclosures. These revisions are not expected to materially impact us.
Basel 3 Regulatory Capital RulesThe final Basel 3 rules became effective on January 1, 2014. Various aspects of Basel 3 will be subject to multi-year transition periods ending December 31, 2018 and Basel 3 generally continues to be subject to interpretation by the U.S. banking regulators. Basel 3 will materially change our Tier 1 common, Tier 1 and Total capital calculations. Basel 3 introduces new minimum capital ratios and buffer requirements and a supplementary leverage ratio; changes the composition of regulatory capital; revises the adequately capitalized minimum requirements under the Prompt Corrective Action framework; expands and modifies the calculation of risk-weighted assets for credit and market risk (the Advanced approach); and introduces a Standardized approach for the calculation of risk-weighted assets. This will replace the Basel 1 – 2013 Rules effective January 1, 2015. For more information on the Standardized approach, see page 65.
Under Basel 3, we are required to calculate regulatory capital ratios and risk-weighted assets under both the Standardized approach and, upon notification of approval by U.S. banking regulators anytime on or after January 1, 2014, the Advanced approach. For 2014, the Standardized approach uses risk-weighted assets as measured under the Basel 1 – 2013 Rules and Basel 3 capital in the determination of the Basel 3 Standardized approach capital ratios. The approach that yields the lower ratio is to be used to assess capital adequacy including under the Prompt Corrective Action framework. Prior to receipt of notification of approval, we are required to assess our capital adequacy under the Standardized approach only. The Prompt Corrective Action framework establishes categories of capitalization, including “well capitalized,” based on regulatory ratio requirements. U.S. banking regulators are required to take certain mandatory actions depending on the category of capitalization, with no mandatory actions required for “well-
capitalized” banking entities. While we continue to evaluate the impact of both the Standardized and Advanced approaches, we generally expect that initially the Standardized approach will yield lower ratios.
In November 2011, the Basel Committee on Banking Supervision (Basel Committee) published a methodology to identify global systematically important banks (G-SIBs) and impose an additional loss absorbency requirement through the introduction of a buffer of up to 3.5 percent for systemically important financial institutions (SIFIs). The assessment methodology relies on an indicator-based measurement approach to determine a score relative to the global banking industry. The chosen indicators are size, complexity, cross-jurisdictional activity, interconnectedness and substitutability/financial institution infrastructure. Institutions with the highest scores are designated as G-SIBs and are assigned to one of four loss absorbency buckets from one percent to 2.5 percent, in 0.5 percent increments based on each institution’s relative score and supervisory judgment. The fifth loss absorbency bucket of 3.5 percent is currently empty and serves to discourage banks from becoming more systemically important.
In July 2013, the Basel Committee updated the November 2011 methodology to recalibrate the substitutability/financial institution infrastructure indicator by introducing a cap on the weighting of that component, and require the annual publication by the Financial Stability Board (FSB) of key information necessary to permit each G-SIB to calculate its score and observe its position within the buckets and relative to the industry total for each indicator. Every three years, beginning on January 1, 2016, the Basel Committee will reconsider and recalibrate the bucket thresholds. The Basel Committee and FSB expect banks to change their behavior in response to the incentives of the G-SIB framework, as well as other aspects of Basel 3 and jurisdiction-specific regulations.
The SIFI buffer requirement will begin to phase in effective January 2016, with full implementation in January 2019. Data from 2013, measured as of December 31, 2013, will be used to determine the SIFI buffer that will be effective for us in 2016.
As of December 31, 2013, we estimate our SIFI buffer would be 1.5 percent, based on the publication of the key information used in the SIFI methodology by the Basel Committee in November 2013, and considering the FSB’s report, “Update of group of global systemically important banks.” Our SIFI buffer could change each year based on our actions and those of our peers, as the score used to determine each G-SIB’s SIFI buffer is based on the industry total. If our score were to increase, we could be subject to a higher SIFI buffer requirement. U.S. banking regulators have not yet issued proposed or final rules related to the SIFI buffer or disclosure requirements.
Regulatory Capital TransitionsImportant differences in determining the composition of regulatory capital between Basel 1 – 2013 Rules and Basel 3 include changes in capital deductions related to our MSRs, deferred tax assets and defined benefit pension assets, and the inclusion of unrealized gains and losses on AFS debt and certain marketable equity securities recorded in accumulated OCI, each of which will be impacted by future changes in interest rates, overall earnings performance or other corporate actions.
76788ba_financials.indd 64 3/6/14 12:05 PM

Bank of America 2013 65
Changes to the composition of regulatory capital under Basel 3, such as recognizing the impact of unrealized gains or losses on AFS debt securities in Tier 1 common capital, are subject to a transition period where the impact is recognized in 20 percent annual increments. These regulatory capital adjustments and deductions will be fully implemented in 2018. The phase-in period for the new minimum capital ratio requirements and related buffers
under Basel 3 is from January 1, 2014 through December 31, 2018. When presented on a fully phased-in basis, capital, risk-weighted assets and the capital ratios assume all regulatory capital adjustments and deductions are fully recognized.
Table 17 summarizes how certain regulatory capital deductions and adjustments will be transitioned from 2014 through 2018 for Tier 1 common and Tier 1 capital.
Table 17 Summary of Certain Basel 3 Regulatory Capital Transition Provisions
Beginning on January 1 of each year 2014 2015 2016 2017 2018
Tier 1 common capital
Percent of total amount deducted from Tier 1 common capital includes: 20% 40% 60% 80% 100%
Deferred tax assets arising from net operating loss and tax credit carryforwards; intangibles, other than mortgage servicing rights and goodwill; defined benefit pension fund net assets; net gains (losses) related to changes in own credit risk on liabilities, including derivatives, measured at fair value; direct and indirect investments in own Tier 1 common capital instruments; certain amounts exceeding the threshold by 10 percent individually and 15 percent in aggregate
Percent of total amount used to adjust Tier 1 common capital includes (1): 80% 60% 40% 20% 0%
Net unrealized gains (losses) on AFS debt and certain marketable equity securities recorded in accumulated OCI; employee benefit plan adjustments recorded in accumulated OCI
Tier 1 capital
Percent of total amount deducted from Tier 1 capital includes: 80% 60% 40% 20% 0%
Deferred tax assets arising from net operating loss and tax credit carryforwards; defined benefit pension fund net assets; net gains (losses) related to changes in own credit risk on liabilities, including derivatives, measured at fair value
(1) Represents the phase-out percentage of the exclusion by year (e.g., 20 percent of net unrealized gains (losses) on AFS debt and certain marketable equity securities recorded in accumulated OCI will be included in 2014).
In addition, Basel 3 revised the regulatory capital treatment for Trust Securities, requiring them to be partially transitioned from Tier 1 capital into Tier 2 capital in 2014 and 2015, until fully excluded from Tier 1 capital in 2016, and partially transitioned and excluded from Tier 2 capital beginning in 2016. The exclusion from Tier 2 capital starts at 40 percent on January 1, 2016, increasing 10 percent each year until the full amount is excluded from Tier 2 capital beginning on January 1, 2022. As of December 31, 2013, our qualifying Trust Securities were $5.8 billion (approximately 45 bps of Tier 1 capital) and will no longer qualify as Tier 1 capital or Tier 2 capital beginning in 2016, subject to the transition provisions previously described.
Standardized ApproachThe Basel 3 Standardized approach measures risk-weighted assets primarily for market risk and credit risk exposures. Exposures subject to market risk, as defined under the rules, are measured on the same basis as the Market Risk Final Rule, described previously. Credit risk exposures are measured by applying fixed risk weights to the exposure, determined based on the characteristics of the exposure, such as type of obligor, Organization for Economic Cooperation and Development (OECD) country risk code and maturity, among others. Under the Standardized approach, no distinction is made for variations in credit quality for corporate exposures, and the economic benefit of collateral is restricted to a limited list of eligible securities and cash. Some key differences between the Standardized and Advanced approaches are that the Advanced approach includes a measure of operational risk and a credit valuation adjustment (CVA) capital charge in credit risk and relies on internal analytical models to measure credit risk-weighted assets, as more fully described below. Under the Basel 3 Standardized approach, we estimate our Tier 1 common capital ratio, on a fully phased-in basis, to be just above nine percent at December 31, 2013.
Advanced ApproachUnder the Basel 3 Advanced approach, risk-weighted assets are determined primarily for market risk, credit risk and operational risk. Market risk capital measurements are consistent with the Standardized approach, except for securitization exposures, where the Supervisory Formula Approach is also permitted, and certain differences arising from the inclusion of the CVA capital charge in the credit risk capital measurement. Credit risk exposures are measured using advanced internal ratings-based models to determine the applicable risk weight by estimating the probability of default, loss-given default (LGD) and, in certain instances, exposure at default (EAD). The analytical models primarily rely on internal historical default and loss experience. Operational risk is measured using advanced internal models which rely on both internal and external operational loss experience and data. The Basel 3 Advanced approach requires approval by the U.S. regulatory agencies of our internal analytical models used to calculate risk-weighted assets. If these models are not approved, it would likely lead to an increase in our risk-weighted assets, which in some cases could be significant.
Prior to calculating and assessing capital adequacy and reporting regulatory capital ratios using Basel 3 Advanced approach risk-weighted assets, we must receive notification of approval to do so from the U.S banking regulators. Under the Basel 3 Advanced approach, we estimated our Tier 1 common capital ratio, on a fully phased-in basis, to be 9.96 percent at December 31, 2013. As of December 31, 2013, we estimated that our Tier 1 common capital would be $132.3 billion and total risk-weighted assets would be $1,329 billion, on a fully phased-in basis. This assumes approval by U.S. banking regulators of our internal analytical models, but does not include the benefit of the removal of the surcharge applicable to the Comprehensive Risk Measure (CRM). The calculations under Basel 3 require management to make estimates, assumptions and interpre-tations, including the probability of future events based on historical experience. Realized results could differ from those estimates and assumptions.
76788ba_financials.indd 65 3/6/14 12:05 PM

66 Bank of America 2013
Table 18 presents a reconciliation of our Tier 1 common capital and risk-weighted assets in accordance with the Basel 1 – 2013 Rules to our Basel 3 fully phased-in estimates at December 31, 2013 and Basel 1 to Basel 3 fully phased-in estimates at December 31, 2012. Our estimates under the Basel 3 Advanced approach may be refined over time as a result of further rulemaking
or clarification by U.S. banking regulators or as our understanding and interpretation of the rules evolve. Basel 3 regulatory capital metrics are considered non-GAAP financial measures until January 1, 2014 when they are fully adopted and required by U.S. banking regulators.
Table 18 Basel 1 to Basel 3 (fully phased-in) Reconciliation (1)
December 31(Dollars in millions) 2013 2012Regulatory capital – Basel 1 to Basel 3 (fully phased-in)
Basel 1 Tier 1 capital $ 161,456 $ 155,461Deduction of qualifying preferred stock and trust preferred securities (16,221) (22,058)
Basel 1 Tier 1 common capital 145,235 133,403Deduction of defined benefit pension assets (829) (737)Deferred tax assets and threshold deductions (deferred tax asset temporary differences, MSRs and significant investments) (4,803) (3,020)Net unrealized gains (losses) in accumulated OCI on AFS debt and certain marketable equity securities, and employee benefit plans (5,668) 449Other deductions, net (1,620) (1,469)
Basel 3 Advanced approach (fully phased-in) Tier 1 common capital $ 132,315 $ 128,626
Risk-weighted assets – Basel 1 to Basel 3 (fully phased-in)
Basel 1 risk-weighted assets $ 1,297,534 $ 1,205,976Credit and other risk-weighted assets 31,510 103,085Increase due to Market Risk Final Rule (2) — 81,811
Basel 3 Advanced approach (fully phased-in) risk-weighted assets $ 1,329,044 $ 1,390,872
Tier 1 common capital ratios
Basel 1 11.19% 11.06%Basel 3 Advanced approach (fully phased-in) 9.96 9.25
(1) Includes the Market Risk Final Rule at December 31, 2013. Basel 1 did not include the Market Risk Final Rule at December 31, 2012.(2) Excludes the benefit of certain hedges at December 31, 2012. Including these hedges, the increase due to the Market Risk Final Rule would have been $78.8 billion. For additional information, see
Capital Management – Capital Composition and Ratios on page 62.
Supplementary Leverage RatioBasel 3 also will require us to calculate a supplementary leverage ratio, determined by dividing Tier 1 capital by total leverage exposure for each month-end during a fiscal quarter, and then calculating the simple average. Total leverage exposure is comprised of all on-balance sheet assets, plus a measure of certain off-balance sheet exposures, including among others, lending commitments, letters of credit, OTC derivatives, repo-style transactions and margin loan commitments. The minimum supplementary leverage ratio requirement of three percent is not effective until January 1, 2018. We will be required to disclose our supplementary leverage ratio effective January 1, 2015.
In July 2013, U.S. banking regulators issued a notice of proposed rulemaking (NPR) to modify the supplementary leverage ratio minimum requirements under Basel 3 effective in 2018. This proposal would only be applicable to BHCs with more than $700 billion in total assets or more than $10 trillion in total assets under custody. If adopted, it would require the Corporation to maintain a minimum supplementary leverage ratio of three percent, plus a supplementary leverage buffer of two percent, for a total of five percent. If the Corporation’s supplementary leverage buffer is not greater than or equal to two percent, then the Corporation would be subject to mandatory limits on its ability to make distributions of capital to shareholders, whether through dividends, stock repurchases or otherwise. In addition, the insured depository institutions of such BHCs, which for the Corporation would include primarily BANA and FIA, would be required to maintain a minimum six percent leverage ratio to be considered “well capitalized.” As of December 31, 2013, we estimate the Corporation’s supplementary leverage ratio to be in excess of five percent based
on these proposed requirements, and our primary bank subsidiaries, BANA and FIA, to be in excess of the six percent minimum proposed requirement. The proposal is not yet final and, when finalized, could have provisions significantly different from those currently proposed. The provisions of the NPR on the supplementary leverage ratio, if finalized as currently proposed, could have an impact on certain of our businesses. We continue to evaluate the impact of the proposed NPR on us.
On January 12, 2014, the Basel Committee issued final guidance introducing changes to the method of calculating total leverage exposure under the international Basel 3 framework. The total leverage exposure was revised to measure derivatives on a gross basis with cash variation margin reducing the exposure if certain conditions are met, include off-balance sheet commitments measured using the notional amount multiplied by conversion factors between 10 percent and 100 percent consistent with the general risk-based capital rules and a change to measure written credit derivatives using a notional-based approach capped at the maximum loss with limited netting permitted. U.S. banking regulators may consider the Basel Committee’s final guidance in connection with the July 2013 NPR.
Other Regulatory MattersOn February 18, 2014, the Federal Reserve approved a final rule implementing certain enhanced supervisory and prudential requirements established under the Financial Reform Act. The final rule formalizes risk management requirements primarily related to governance and liquidity risk management and reiterates the provisions of previously issued final rules related to risk-based
76788ba_financials.indd 66 3/6/14 12:05 PM

Bank of America 2013 67
and leverage capital and stress test requirements. Also, a debt-to-equity limit may be enacted for an individual BHC if determined to pose a grave threat to the financial stability of the U.S., at the discretion of the Financial Stability Oversight Council (FSOC) or the Federal Reserve on behalf of the FSOC.
For more information regarding Basel 3 and other proposed regulatory capital changes, see Note 16 – Regulatory Requirements and Restrictions to the Consolidated Financial Statements.
Bank of America, N.A. and FIA Card Services, N.A. Regulatory CapitalTable 19 presents regulatory capital information for BANA and FIA at December 31, 2013 and 2012.
Table 19 Bank of America, N.A. and FIA Card Services, N.A. Regulatory Capital (1)
December 31 2013 2012
(Dollars in millions) Ratio Amount Ratio AmountTier 1 capital
Bank of America, N.A. 12.34% $ 125,886 12.44% $ 118,431FIA Card Services, N.A. 16.83 20,135 17.34 22,061
Total capital Bank of America, N.A. 13.84 141,232 14.76 140,434FIA Card Services, N.A. 18.12 21,672 18.64 23,707
Tier 1 leverage Bank of America, N.A. 9.21 125,886 8.59 118,431FIA Card Services, N.A. 12.91 20,135 13.67 22,061
(1) BANA regulatory capital information included the Basel 1 – 2013 Rules at December 31, 2013. At December 31, 2012, BANA regulatory capital information did not include the Basel 1 – 2013 Rules. FIA is not impacted by the Basel 1 – 2013 Rules.
BANA’s Tier 1 capital ratio decreased 10 bps to 12.34 percent and the Total capital ratio decreased 92 bps to 13.84 percent at December 31, 2013 compared to December 31, 2012. The Tier 1 leverage ratio increased 62 bps to 9.21 percent at December 31, 2013 compared to December 31, 2012. The decrease in the Tier 1 capital ratio was driven by an increase in risk-weighted assets of $68.5 billion compared to the prior year, dividends and returns of capital to the Corporation of $8.5 billion and $2.2 billion during 2013, partially offset by earnings eligible to be included in capital of $16.5 billion. The increase in risk-weighted assets was primarily due to the impact of implementing the Basel 1 – 2013 Rules and an increase in loans. The decrease in the Total capital ratio was driven by the same factors as the Tier 1 capital ratio as well as a $7.0 billion decrease in qualifying subordinated debt during 2013. The increase in the Tier 1 leverage ratio was driven by an increase in Tier 1 capital and a decrease in adjusted quarterly average total assets of $11.6 billion.
FIA’s Tier 1 capital ratio decreased 51 bps to 16.83 percent and the Total capital ratio decreased 52 bps to 18.12 percent at December 31, 2013 compared to December 31, 2012. The Tier 1 leverage ratio decreased 76 bps to 12.91 percent at December 31, 2013 compared to December 31, 2012. The decrease in the Tier 1 capital and Total capital ratios was driven by returns of capital of $6.5 billion to the Corporation during 2013, partially offset by earnings eligible to be included in capital of $4.3 billion and a decrease in risk-weighted assets of $7.6 billion primarily due to a decrease in loans. The decrease in the Tier 1 leverage ratio was driven by the decrease in Tier 1 capital, partially offset by a decrease in adjusted quarterly average total assets of
$5.3 billion. FIA was not impacted by the implementation of the Basel 1 – 2013 Rules.
Broker/Dealer Regulatory Capital and Securities RegulationThe Corporation’s principal U.S. broker/dealer subsidiaries are Merrill Lynch, Pierce, Fenner & Smith (MLPF&S) and Merrill Lynch Professional Clearing Corp (MLPCC). MLPCC is a fully-guaranteed subsidiary of MLPF&S and provides clearing and settlement services. Both entities are subject to the net capital requirements of SEC Rule 15c3-1. Both entities are also registered as futures commission merchants and are subject to the Commodity Futures Trading Commission Regulation 1.17.
MLPF&S has elected to compute the minimum capital requirement in accordance with the Alternative Net Capital Requirement as permitted by SEC Rule 15c3-1. At December 31, 2013, MLPF&S’s regulatory net capital as defined by Rule 15c3-1 was $10.0 billion and exceeded the minimum requirement of $951 million by $9.0 billion. MLPCC’s net capital of $2.2 billion exceeded the minimum requirement of $366 million by $1.8 billion.
In accordance with the Alternative Net Capital Requirements, MLPF&S is required to maintain tentative net capital in excess of $1.0 billion, net capital in excess of $500 million and notify the SEC in the event its tentative net capital is less than $5.0 billion. At December 31, 2013, MLPF&S had tentative net capital and net capital in excess of the minimum and notification requirements.
Merrill Lynch International (MLI), a U.K. investment firm, is regulated by the PRA and the FCA and is subject to certain regulatory capital requirements. Following an increase in capital resources in advance of the implementation of Basel 3 in 2014, at December 31, 2013, MLI’s capital resources were $28.2 billion and exceeded the minimum requirement of $10.8 billion and had enough excess to cover any additional requirements as set by the regulators.
Common Stock DividendsFor a summary of our declared quarterly cash dividends on common stock during 2013 and through February 25, 2014, see Note 13 – Shareholders’ Equity to the Consolidated Financial Statements.
Liquidity Risk
Funding and Liquidity Risk ManagementWe define liquidity risk as the potential inability to meet our contractual and contingent financial obligations, on- or off-balance sheet, as they come due. Our primary liquidity objective is to provide adequate funding for our businesses throughout market cycles, including periods of financial stress. To achieve that objective, we analyze and monitor our liquidity risk, maintain excess liquidity and access diverse funding sources including our stable deposit base. We define excess liquidity as readily available assets, limited to cash and high-quality, liquid, unencumbered securities that we can use to meet our funding requirements as those obligations arise.
Global funding and liquidity risk management activities are centralized within Corporate Treasury. We believe that a centralized approach to funding and liquidity risk management enhances our ability to monitor liquidity requirements, maximizes access to funding sources, minimizes borrowing costs and facilitates timely responses to liquidity events.
76788ba_financials.indd 67 3/6/14 12:05 PM

68 Bank of America 2013
The Enterprise Risk Committee approves the Corporation’s liquidity policy and contingency funding plan, including establishing liquidity risk tolerance levels. The ALMRC monitors our liquidity position and reviews the impact of strategic decisions on our liquidity. ALMRC is responsible for managing liquidity risks and maintaining exposures within the established tolerance levels. ALMRC delegates additional oversight responsibilities to the CFORC, which reports to the ALMRC. The CFORC reviews and monitors our liquidity position, cash flow forecasts, stress testing scenarios and results, and implements our liquidity limits and guidelines. For additional information, see Managing Risk – Board Oversight of Risk on page 59. Under this governance framework, we have developed certain funding and liquidity risk management practices which include: maintaining excess liquidity at the parent company and selected subsidiaries, including our bank subsidiaries and other regulated entities; determining what amounts of excess liquidity are appropriate for these entities based on analysis of debt maturities and other potential cash outflows, including those that we may experience during stressed market conditions; diversifying funding sources, considering our asset profile and legal entity structure; and performing contingency planning.
Global Excess Liquidity Sources and Other Unencumbered AssetsWe maintain excess liquidity available to Bank of America Corporation, or the parent company and selected subsidiaries in the form of cash and high-quality, liquid, unencumbered securities. These assets, which we call our Global Excess Liquidity Sources, serve as our primary means of liquidity risk mitigation. Our cash is primarily on deposit with the Federal Reserve and central banks outside of the U.S. We limit the composition of high-quality, liquid, unencumbered securities to U.S. government securities, U.S. agency securities, U.S. agency MBS and a select group of non-U.S. government and supranational securities. We believe we can quickly obtain cash for these securities, even in stressed market conditions, through repurchase agreements or outright sales. We hold our Global Excess Liquidity Sources in entities that allow us to meet the liquidity requirements of our global businesses, and we consider the impact of potential regulatory, tax, legal and other restrictions that could limit the transferability of funds among entities. Our Global Excess Liquidity Sources metric is similar to High Quality Liquid Assets in the proposed LCR rulemaking. For more information on the proposed rulemaking, see Liquidity Risk – Basel 3 Liquidity Standards on page 69.
Our Global Excess Liquidity Sources were $376 billion and $372 billion at December 31, 2013 and 2012 and were maintained as presented in Table 20.
Table 20 Global Excess Liquidity Sources
December 31
Average forThree Months
EndedDecember 31
2013(Dollars in billions) 2013 2012Parent company $ 95 $ 103 $ 92
Bank subsidiaries 249 247 248
Other regulated entities 32 22 30
Total Global Excess Liquidity Sources $ 376 $ 372 $ 370
As shown in Table 20, parent company Global Excess Liquidity Sources totaled $95 billion and $103 billion at December 31, 2013 and 2012. The decrease in parent company liquidity was primarily due to debt maturities and capital actions, partially offset by capital returns from subsidiaries and debt issuances. Typically, parent company cash is deposited overnight with BANA.
Global Excess Liquidity Sources available to our bank subsidiaries totaled $249 billion and $247 billion at December 31, 2013 and 2012. The bank subsidiaries’ liquidity remained relatively unchanged as deposit growth and an increase in short-term borrowings was largely offset by loan growth, a decrease in the fair value of debt securities and capital returns to the parent company. Liquidity amounts are distinct from the cash deposited by the parent company. Our bank subsidiaries can also generate incremental liquidity by pledging a range of other unencumbered loans and securities to certain FHLBs and the Federal Reserve Discount Window. The cash we could have obtained by borrowing against this pool of specifically-identified eligible assets was approximately $218 billion and $194 billion at December 31, 2013 and 2012. We have established operational procedures to enable us to borrow against these assets, including regularly monitoring our total pool of eligible loans and securities collateral. Eligibility is defined by guidelines outlined by the FHLBs and the Federal Reserve and is subject to change at their discretion. Due to regulatory restrictions, liquidity generated by the bank subsidiaries can only be used to fund obligations within the bank subsidiaries and can only be transferred to the parent company or non-bank subsidiaries with prior regulatory approval.
Global Excess Liquidity Sources available to our other regulated entities totaled $32 billion and $22 billion at December 31, 2013 and 2012. Our other regulated entities also held other unencumbered investment-grade securities and equities that we believe could be used to generate additional liquidity. Liquidity held in an other regulated entity is primarily available to meet the obligations of that entity and transfers to the parent company or to any other subsidiary may be subject to prior regulatory approval due to regulatory restrictions and minimum requirements.
Table 21 presents the composition of Global Excess Liquidity Sources at December 31, 2013 and 2012.
Table 21 Global Excess Liquidity Sources Composition
December 31(Dollars in billions) 2013 2012Cash on deposit $ 90 $ 65U.S. Treasuries 20 21U.S. agency securities and mortgage-backed securities 245 271Non-U.S. government and supranational securities 21 15
Total Global Excess Liquidity Sources $ 376 $ 372
Time to Required Funding and Stress ModelingWe use a variety of metrics to determine the appropriate amounts of excess liquidity to maintain at the parent company and our bank subsidiaries and other regulated entities. One metric we use to evaluate the appropriate level of excess liquidity at the parent company is “Time to Required Funding.” This debt coverage measure indicates the number of months that the parent company can continue to meet its unsecured contractual obligations as they come due using only its Global Excess Liquidity Sources without issuing any new debt or accessing any additional liquidity sources. We define unsecured contractual obligations for purposes of this
76788ba_financials.indd 68 3/6/14 12:05 PM

Bank of America 2013 69
metric as maturities of senior or subordinated debt issued or guaranteed by Bank of America Corporation. These include certain unsecured debt instruments, primarily structured liabilities, which we may be required to settle for cash prior to maturity. Our Time to Required Funding was 38 months at December 31, 2013, which is above the Corporation’s target minimum of 21 months. For purposes of calculating Time to Required Funding, at December 31, 2013, we have included in the amount of unsecured contractual obligations the $8.6 billion liability related to the BNY Mellon Settlement. The BNY Mellon Settlement is subject to final court approval and certain other conditions, and the timing of payment is not certain. For information on current developments related to the BNY Mellon Settlement see, Recent Events – BNY Mellon Settlement on page 21. The merger of Merrill Lynch & Co., Inc. into Bank of America Corporation on October 1, 2013 had no impact on the unsecured contractual obligations included in this metric.
We utilize liquidity stress models to assist us in determining the appropriate amounts of excess liquidity to maintain at the parent company and our bank subsidiaries and other regulated entities. These models are risk sensitive and have become increasingly important in analyzing our potential contractual and contingent cash outflows beyond those outflows considered in the Time to Required Funding analysis. We evaluate the liquidity requirements under a range of scenarios with varying levels of severity and time horizons. The scenarios we consider and utilize incorporate market-wide and Corporation-specific events, including potential credit rating downgrades for the parent company and our subsidiaries, and are based on historical experience, regulatory guidance, and both expected and unexpected future events.
The types of potential contractual and contingent cash outflows we consider in our scenarios may include, but are not limited to, upcoming contractual maturities of unsecured debt and reductions in new debt issuance; diminished access to secured financing markets; potential deposit withdrawals; increased draws on loan commitments, liquidity facilities and letters of credit, including Variable Rate Demand Notes; additional collateral that counterparties could call if our credit ratings were downgraded; collateral and margin requirements arising from market value changes; and potential liquidity required to maintain businesses and finance customer activities. Changes in certain market factors, including, but not limited to, credit rating downgrades, could negatively impact potential contractual and contingent outflows and the related financial instruments, and in some cases these impacts could be material to our financial results.
We consider all sources of funds that we could access during each stress scenario and focus particularly on matching available sources with corresponding liquidity requirements by legal entity. We also use the stress modeling results to manage our asset-liability profile and establish limits and guidelines on certain funding sources and businesses.
Basel 3 Liquidity StandardsThe Basel Committee has issued two liquidity risk-related standards that are considered part of the Basel 3 liquidity standards: the LCR and the NSFR. The LCR is calculated as the amount of a financial institution’s unencumbered, high-quality, liquid assets relative to the net cash outflows the institution could encounter under a 30-day period of significant liquidity stress, expressed as a percentage. The Basel Committee’s liquidity risk-related standards do not directly apply to U.S. financial institutions currently, and would only apply once U.S. rules are finalized by the U.S. banking regulators.
On October 24, 2013, the U.S. banking regulators jointly proposed regulations that would implement LCR requirements for the largest U.S. financial institutions on a consolidated basis and for their subsidiary depository institutions with total assets greater than $10 billion. Under the proposal, an initial minimum LCR of 80 percent would be required in January 2015, and would thereafter increase in 10 percentage point increments annually through January 2017. These minimum requirements would be applicable to the Corporation on a consolidated basis and at our insured depository institutions, including BANA, FIA and Bank of America California, N.A. We are evaluating the proposal and the potential impact on our businesses and we expect to meet or exceed the final LCR requirement within the regulatory timelines.
On January 12, 2014, the Basel Committee issued for comment a revised NSFR, the standard that is intended to reduce funding risk over a longer time horizon. The NSFR is designed to ensure an appropriate amount of stable funding, generally capital and liabilities maturing beyond one year, given the mix of assets and off-balance sheet items. The revised proposal would align the NSFR to some of the 2013 revisions to the LCR and give more credit to a wider range of funding. The proposal also includes adjustments to the stable funding required for certain types of assets, some of which reduce the stable funding requirement and some of which increase it. The Basel Committee expects to complete the NSFR recalibration in 2014 and expects the minimum standard to be in place by 2018. Assuming adoption by the U.S. banking regulators, we expect to meet the final NSFR requirement within the regulatory timelines.
Diversified Funding SourcesWe fund our assets primarily with a mix of deposits and secured and unsecured liabilities through a centralized, globally coordinated funding strategy. We diversify our funding globally across products, programs, markets, currencies and investor groups.
The primary benefits expected from our centralized funding strategy include greater control, reduced funding costs, wider name recognition by investors and greater flexibility to meet the variable funding requirements of subsidiaries. Where regulations, time zone differences or other business considerations make parent company funding impractical, certain other subsidiaries may issue their own debt.
76788ba_financials.indd 69 3/6/14 12:05 PM

70 Bank of America 2013
We fund a substantial portion of our lending activities through our deposits, which were $1.12 trillion and $1.11 trillion at December 31, 2013 and 2012. Deposits are primarily generated by our CBB, GWIM and Global Banking segments. These deposits are diversified by clients, product type and geography, and the majority of our U.S. deposits are insured by the FDIC. We consider a substantial portion of our deposits to be a stable, low-cost and consistent source of funding. We believe this deposit funding is generally less sensitive to interest rate changes, market volatility or changes in our credit ratings than wholesale funding sources. Our lending activities may also be financed through secured borrowings, including credit card securitizations and securitizations with GSEs, the FHA and private-label investors, as well as FHLB loans.
Our trading activities in other regulated entities are primarily funded on a secured basis through securities lending and repurchase agreements and these amounts will vary based on customer activity and market conditions. We believe funding these activities in the secured financing markets is more cost-efficient and less sensitive to changes in our credit ratings than unsecured financing. Repurchase agreements are generally short-term and often overnight. Disruptions in secured financing markets for financial institutions have occurred in prior market cycles which resulted in adverse changes in terms or significant reductions in the availability of such financing. We manage the liquidity risks arising from secured funding by sourcing funding globally from a diverse group of counterparties, providing a range of securities collateral and pursuing longer durations, when appropriate. For more information on secured financing agreements, see Note 10 – Federal Funds Sold or Purchased, Securities Financing Agreements and Short-term Borrowings to the Consolidated Financial Statements.
We issue the majority of our long-term unsecured debt at the parent company. During 2013, we issued $31.4 billion of long-term unsecured debt, including structured liabilities of $8.4 billion. We may also issue long-term unsecured debt through BANA in a variety of maturities and currencies to achieve cost-efficient funding and to maintain an appropriate maturity profile. During 2013, we issued $2.5 billion of unsecured long-term debt through BANA. While the cost and availability of unsecured funding may be negatively impacted by general market conditions or by matters specific to the financial services industry or the Corporation, we seek to mitigate refinancing risk by actively managing the amount of our borrowings that we anticipate will mature within any month or quarter.
In 2013, we redeemed $9.0 billion of certain senior notes maturing in 2014 through tender offers. In January 2014, we issued $1.25 billion of 2.6% notes due January 2019, $400 million of floating-rate notes due January 2019, $2.5 billion of 4.125% notes due January 2024 and $2.0 billion of 5.0% notes due January 2044. The Corporation converted substantially all of this newly issued fixed-rate debt to floating-rate exposure with derivative transactions.
Table 22 presents our long-term debt by major currency at December 31, 2013 and 2012.
Table 22 Long-term Debt by Major Currency
December 31(Dollars in millions) 2013 2012U.S. Dollar $ 176,294 $ 180,329Euro 46,029 58,985British Pound 9,772 11,126Japanese Yen 9,115 12,749Canadian Dollar 2,402 3,560Australian Dollar 1,870 2,760Swiss Franc 1,274 1,917Other 2,918 4,159
Total long-term debt $ 249,674 $ 275,585
Total long-term debt decreased $25.9 billion, or nine percent, in 2013, primarily driven by maturities outpacing new issuances. This reflects our ongoing initiative to reduce our debt balances over time and we anticipate that debt levels will continue to decline through 2014, although at a slower pace than 2013. We may, from time to time, purchase outstanding debt instruments in various transactions, depending on prevailing market conditions, liquidity and other factors. In addition, our other regulated entities may make markets in our debt instruments to provide liquidity for investors. For more information on long-term debt funding, see Note 11 – Long-term Debt to the Consolidated Financial Statements.
We use derivative transactions to manage the duration, interest rate and currency risks of our borrowings, considering the characteristics of the assets they are funding. For further details on our ALM activities, see Interest Rate Risk Management for Nontrading Activities on page 109.
We also diversify our unsecured funding sources by issuing various types of debt instruments including structured liabilities, which are debt obligations that pay investors returns linked to other debt or equity securities, indices, currencies or commodities. We typically hedge the returns we are obligated to pay on these liabilities with derivative positions and/or investments in the underlying instruments, so that from a funding perspective, the cost is similar to our other unsecured long-term debt. We could be required to settle certain structured liability obligations for cash or other securities prior to maturity under certain circumstances, which we consider for liquidity planning purposes. We believe, however, that a portion of such borrowings will remain outstanding beyond the earliest put or redemption date. We had outstanding structured liabilities with a carrying value of $48.4 billion and $51.7 billion at December 31, 2013 and 2012.
Substantially all of our senior and subordinated debt obligations contain no provisions that could trigger a requirement for an early repayment, require additional collateral support, result in changes to terms, accelerate maturity or create additional financial obligations upon an adverse change in our credit ratings, financial ratios, earnings, cash flows or stock price.
76788ba_financials.indd 70 3/6/14 12:05 PM

Bank of America 2013 71
Contingency PlanningWe maintain contingency funding plans that outline our potential responses to liquidity stress events at various levels of severity. These policies and plans are based on stress scenarios and include potential funding strategies and communication and notification procedures that we would implement in the event we experienced stressed liquidity conditions. We periodically review and test the contingency funding plans to validate efficacy and assess readiness.
Our U.S. bank subsidiaries can access contingency funding through the Federal Reserve Discount Window. Certain non-U.S. subsidiaries have access to central bank facilities in the jurisdictions in which they operate. While we do not rely on these sources in our liquidity modeling, we maintain the policies, procedures and governance processes that would enable us to access these sources if necessary.
Credit RatingsOur borrowing costs and ability to raise funds are impacted by our credit ratings. In addition, credit ratings may be important to customers or counterparties when we compete in certain markets and when we seek to engage in certain transactions, including OTC derivatives. Thus, it is our objective to maintain high-quality credit ratings, and management maintains an active dialogue with the rating agencies.
Credit ratings and outlooks are opinions expressed by rating agencies on our creditworthiness and that of our obligations or securities, including long-term debt, short-term borrowings, preferred stock and other securities, including asset securitizations. Our credit ratings are subject to ongoing review by the rating agencies and they consider a number of factors, including our own financial strength, performance, prospects and operations as well as factors not under our control. The rating agencies could make adjustments to our ratings at any time and they provide no assurances that they will maintain our ratings at current levels.
Other factors that influence our credit ratings include changes to the rating agencies’ methodologies for our industry or certain security types, the rating agencies’ assessment of the general operating environment for financial services companies, our
mortgage exposures (including litigation), our relative positions in the markets in which we compete, reputation, liquidity position, diversity of funding sources, funding costs, the level and volatility of earnings, corporate governance and risk management policies, capital position, capital management practices, and current or future regulatory and legislative initiatives.
All three agencies have indicated that, as a systemically important financial institution, the senior credit ratings of the Corporation and Bank of America, N.A. (or in the case of Moody’s Investor Service, Inc. (Moody’s), only the ratings of Bank of America, N.A.) currently reflect the expectation that, if necessary, we would receive significant support from the U.S. government, and that they will continue to assess such support in the context of sovereign financial strength and regulatory and legislative developments.
On December 20, 2013, Standard & Poor’s Ratings Services (S&P) affirmed the ratings of Bank of America Corporation. S&P continues to evaluate the possible removal of uplift for extraordinary government support in its holding company ratings for the U.S. banks that it views as having high systemic importance. Due to this ongoing evaluation and Corporation-specific factors, S&P maintained its negative outlook on the Corporation’s ratings. On November 14, 2013, Moody’s concluded its review of the ratings for Bank of America and certain other systemically important U.S. BHCs, affirming our current ratings and noting that those ratings no longer incorporate any uplift for government support. Concurrently, Moody’s upgraded Bank of America, N.A.’s senior debt and stand-alone ratings by one notch, citing a number of positive developments at Bank of America. Moody’s also moved its outlook for all our ratings to stable. On May 16, 2013, Fitch Ratings (Fitch) announced the results of its periodic review of its ratings for 12 large, complex securities trading and universal banks, including Bank of America. As part of this action, Fitch affirmed the Corporation’s senior credit ratings and upgraded the rating of our stand-alone creditworthiness, as well as the ratings for our subordinated debt, trust preferred and preferred stock, each by one notch.
Table 23 presents the Corporation’s current long-term/short-term senior debt ratings and outlooks expressed by the rating agencies.
Table 23 Senior Debt Ratings
Moody’s Investor Service Standard & Poor’s Fitch Ratings
Long-term Short-term Outlook Long-term Short-term Outlook Long-term Short-term OutlookBank of America Corporation Baa2 P-2 Stable A- A-2 Negative A F1 StableBank of America, N.A. A2 P-1 Stable A A-1 Negative A F1 StableMerrill Lynch, Pierce, Fenner & Smith NR NR NR A A-1 Negative A F1 StableMerrill Lynch International NR NR NR A A-1 Negative A F1 Stable
NR = not rated
A reduction in certain of our credit ratings or the ratings of certain asset-backed securitizations may have a material adverse effect on our liquidity, potential loss of access to credit markets, the related cost of funds, our businesses and on certain trading revenues, particularly in those businesses where counterparty creditworthiness is critical. In addition, under the terms of certain OTC derivative contracts and other trading agreements, in the event of downgrades of our or our rated subsidiaries’ credit ratings,
the counterparties to those agreements may require us to provide additional collateral, or to terminate these contracts or agreements, which could cause us to sustain losses and/or adversely impact our liquidity. If the short-term credit ratings of our parent company, bank or broker/dealer subsidiaries were downgraded by one or more levels, the potential loss of access to short-term funding sources such as repo financing and the effect on our incremental cost of funds could be material.
76788ba_financials.indd 71 3/6/14 12:05 PM
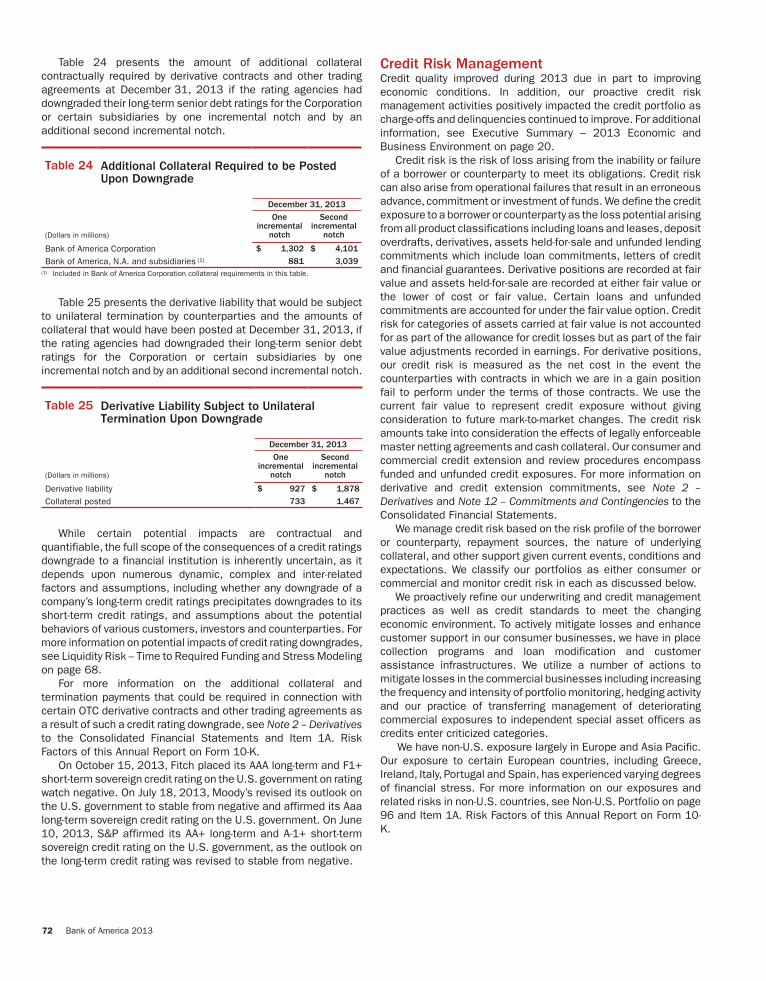
72 Bank of America 2013
Table 24 presents the amount of additional collateral contractually required by derivative contracts and other trading agreements at December 31, 2013 if the rating agencies had downgraded their long-term senior debt ratings for the Corporation or certain subsidiaries by one incremental notch and by an additional second incremental notch.
Table 24 Additional Collateral Required to be PostedUpon Downgrade
December 31, 2013
(Dollars in millions)
One incremental
notch
Secondincremental
notch
Bank of America Corporation $ 1,302 $ 4,101
Bank of America, N.A. and subsidiaries (1) 881 3,039(1) Included in Bank of America Corporation collateral requirements in this table.
Table 25 presents the derivative liability that would be subject to unilateral termination by counterparties and the amounts of collateral that would have been posted at December 31, 2013, if the rating agencies had downgraded their long-term senior debt ratings for the Corporation or certain subsidiaries by one incremental notch and by an additional second incremental notch.
Table 25 Derivative Liability Subject to UnilateralTermination Upon Downgrade
December 31, 2013
(Dollars in millions)
One incremental
notch
Secondincremental
notch
Derivative liability $ 927 $ 1,878
Collateral posted 733 1,467
While certain potential impacts are contractual and quantifiable, the full scope of the consequences of a credit ratings downgrade to a financial institution is inherently uncertain, as it depends upon numerous dynamic, complex and inter-related factors and assumptions, including whether any downgrade of a company’s long-term credit ratings precipitates downgrades to its short-term credit ratings, and assumptions about the potential behaviors of various customers, investors and counterparties. For more information on potential impacts of credit rating downgrades, see Liquidity Risk – Time to Required Funding and Stress Modeling on page 68.
For more information on the additional collateral and termination payments that could be required in connection with certain OTC derivative contracts and other trading agreements as a result of such a credit rating downgrade, see Note 2 – Derivatives to the Consolidated Financial Statements and Item 1A. Risk Factors of this Annual Report on Form 10-K.
On October 15, 2013, Fitch placed its AAA long-term and F1+ short-term sovereign credit rating on the U.S. government on rating watch negative. On July 18, 2013, Moody’s revised its outlook on the U.S. government to stable from negative and affirmed its Aaa long-term sovereign credit rating on the U.S. government. On June 10, 2013, S&P affirmed its AA+ long-term and A-1+ short-term sovereign credit rating on the U.S. government, as the outlook on the long-term credit rating was revised to stable from negative.
Credit Risk ManagementCredit quality improved during 2013 due in part to improving economic conditions. In addition, our proactive credit risk management activities positively impacted the credit portfolio as charge-offs and delinquencies continued to improve. For additional information, see Executive Summary – 2013 Economic and Business Environment on page 20.
Credit risk is the risk of loss arising from the inability or failure of a borrower or counterparty to meet its obligations. Credit risk can also arise from operational failures that result in an erroneous advance, commitment or investment of funds. We define the credit exposure to a borrower or counterparty as the loss potential arising from all product classifications including loans and leases, deposit overdrafts, derivatives, assets held-for-sale and unfunded lending commitments which include loan commitments, letters of credit and financial guarantees. Derivative positions are recorded at fair value and assets held-for-sale are recorded at either fair value or the lower of cost or fair value. Certain loans and unfunded commitments are accounted for under the fair value option. Credit risk for categories of assets carried at fair value is not accounted for as part of the allowance for credit losses but as part of the fair value adjustments recorded in earnings. For derivative positions, our credit risk is measured as the net cost in the event the counterparties with contracts in which we are in a gain position fail to perform under the terms of those contracts. We use the current fair value to represent credit exposure without giving consideration to future mark-to-market changes. The credit risk amounts take into consideration the effects of legally enforceable master netting agreements and cash collateral. Our consumer and commercial credit extension and review procedures encompass funded and unfunded credit exposures. For more information on derivative and credit extension commitments, see Note 2 – Derivatives and Note 12 – Commitments and Contingencies to the Consolidated Financial Statements.
We manage credit risk based on the risk profile of the borrower or counterparty, repayment sources, the nature of underlying collateral, and other support given current events, conditions and expectations. We classify our portfolios as either consumer or commercial and monitor credit risk in each as discussed below.
We proactively refine our underwriting and credit management practices as well as credit standards to meet the changing economic environment. To actively mitigate losses and enhance customer support in our consumer businesses, we have in place collection programs and loan modification and customer assistance infrastructures. We utilize a number of actions to mitigate losses in the commercial businesses including increasing the frequency and intensity of portfolio monitoring, hedging activity and our practice of transferring management of deteriorating commercial exposures to independent special asset officers as credits enter criticized categories.
We have non-U.S. exposure largely in Europe and Asia Pacific. Our exposure to certain European countries, including Greece, Ireland, Italy, Portugal and Spain, has experienced varying degrees of financial stress. For more information on our exposures and related risks in non-U.S. countries, see Non-U.S. Portfolio on page 96 and Item 1A. Risk Factors of this Annual Report on Form 10-K.
76788ba_financials.indd 72 3/6/14 12:05 PM

Bank of America 2013 73
For more information on our credit risk management activities, see Consumer Portfolio Credit Risk Management on page 73, Commercial Portfolio Credit Risk Management on page 87, Non-U.S. Portfolio on page 96, Provision for Credit Losses and Allowance for Credit Losses both on page 100, Note 1 – Summary of Significant Accounting Principles, Note 4 – Outstanding Loans and Leases and Note 5 – Allowance for Credit Losses to the Consolidated Financial Statements.
Consumer Portfolio Credit Risk ManagementCredit risk management for the consumer portfolio begins with initial underwriting and continues throughout a borrower’s credit cycle. Statistical techniques in conjunction with experiential judgment are used in all aspects of portfolio management including underwriting, product pricing, risk appetite, setting credit limits, and establishing operating processes and metrics to quantify and balance risks and returns. Statistical models are built using detailed behavioral information from external sources such as credit bureaus and/or internal historical experience. These models are a component of our consumer credit risk management process and are used in part to assist in making both new and ongoing credit decisions, as well as portfolio management strategies, including authorizations and line management, collection practices and strategies, and determination of the allowance for loan and lease losses and allocated capital for credit risk.
From January 2008 through 2013, Bank of America and Countrywide have completed more than 1.3 million loan modifications with customers. During 2013, we completed nearly 170,000 customer loan modifications with a total unpaid principal balance of approximately $35 billion, including approximately 52,000 permanent modifications under the U.S. government’s Making Home Affordable Program. Of the loan modifications completed in 2013, in terms of both the volume of modifications and the unpaid principal balance associated with the underlying loans, most were in the portfolio serviced for investors and were not on our balance sheet. The most common types of modifications include a combination of rate reduction and/or capitalization of past due amounts which represented 66 percent of the volume of modifications completed in 2013, while principal reductions and forgiveness represented 14 percent, principal forbearance represented 11 percent and capitalization of past due amounts represented six percent. For modified loans on our balance sheet, these modification types are generally considered TDRs. For more information on TDRs and portfolio impacts, see Consumer Portfolio
Credit Risk Management – Nonperforming Consumer Loans, Leases and Foreclosed Properties Activity on page 85 and Note 4 – Outstanding Loans and Leases to the Consolidated Financial Statements.
Consumer Credit PortfolioImprovement in the U.S. economy, labor markets and home prices continued during 2013 resulting in improved credit quality and lower credit losses across nearly all major consumer portfolios compared to 2012. Consumer loans 30 days or more past due declined during 2013 across all consumer portfolios and nonperforming consumer loans and foreclosed property continued to decline as outflows, including the impact of loans sales, outpaced inflows as a result of improved delinquency trends. Although home prices have shown steady improvement since the beginning of 2012, they have not fully recovered to their 2006 levels.
Improved credit quality, increased home prices and continued loan balance run-off across the consumer portfolio drove a $7.7 billion decrease in 2013 to $13.4 billion in the consumer allowance for loan and lease losses. For additional information, see Allowance for Credit Losses on page 100.
In 2013, we entered into the FNMA Settlement to resolve substantially all outstanding and potential repurchase and certain other claims relating to the origination, sale and delivery of residential mortgage loans originated and sold directly to FNMA from January 1, 2000 through December 31, 2008 by entities related to Countrywide and BANA. In connection with the FNMA Settlement, we repurchased certain loans from FNMA and, as of December 31, 2013, these loans had an unpaid principal balance of $5.7 billion and a carrying value of $4.9 billion of which $5.3 billion of unpaid principal balance and $4.6 billion of carrying value were classified as PCI loans. All of these loans are included in the Legacy Assets & Servicing portfolio in Table 29. For more information on PCI loans, see Consumer Portfolio Credit Risk Management – Purchased Credit-impaired Loan Portfolio on page 81 and Note 4 – Outstanding Loans and Leases to the Consolidated Financial Statements. For more information on the FNMA Settlement, see Note 7 – Representations and Warranties Obligations and Corporate Guarantees to the Consolidated Financial Statements.
For more information on our accounting policies regarding delinquencies, nonperforming status, charge-offs and TDRs for the consumer portfolio, see Note 1 – Summary of Significant Accounting Principles to the Consolidated Financial Statements.
76788ba_financials.indd 73 3/6/14 12:05 PM

74 Bank of America 2013
Table 26 presents our outstanding consumer loans and leases, and the PCI loan portfolio. In addition to being included in the “Outstandings” columns in Table 26, PCI loans are also shown separately, net of purchase accounting adjustments, in the “Purchased Credit-impaired Loan Portfolio” columns. The impact of the PCI loan portfolio on certain credit statistics is reported where appropriate. Given the continued run-off of our discontinued real estate portfolio, effective January 1, 2013, pay option loans
are included as part of our residential mortgage and home equity portfolios. The majority of these loans were considered credit-impaired and were written down to fair value upon acquisition. Prior periods were reclassified to conform to current period presentation. For more information on pay option loans, see Consumer Portfolio Credit Risk Management – Purchased Credit-impaired Residential Mortgage Loan Portfolio on page 82.
Table 26 Consumer Loans and Leases
December 31
OutstandingsPurchased Credit-impaired
Loan Portfolio
(Dollars in millions) 2013 2012 2013 2012Residential mortgage (1) $ 248,066 $ 252,929 $ 18,672 $ 17,451Home equity 93,672 108,140 6,593 8,667U.S. credit card 92,338 94,835 n/a n/aNon-U.S. credit card 11,541 11,697 n/a n/aDirect/Indirect consumer (2) 82,192 83,205 n/a n/aOther consumer (3) 1,977 1,628 n/a n/a
Consumer loans excluding loans accounted for under the fair value option 529,786 552,434 25,265 26,118Loans accounted for under the fair value option (4) 2,164 1,005 n/a n/a
Total consumer loans and leases $ 531,950 $ 553,439 $ 25,265 $ 26,118(1) Outstandings include pay option loans of $4.4 billion and $6.7 billion and non-U.S. residential mortgage loans of $0 and $93 million at December 31, 2013 and 2012. We no longer originate pay
option loans.(2) Outstandings include dealer financial services loans of $38.5 billion and $35.9 billion, consumer lending loans of $2.7 billion and $4.7 billion, U.S. securities-based lending loans of $31.2 billion
and $28.3 billion, non-U.S. consumer loans of $4.7 billion and $8.3 billion, student loans of $4.1 billion and $4.8 billion and other consumer loans of $1.0 billion and $1.2 billion at December 31, 2013 and 2012.
(3) Outstandings include consumer finance loans of $1.2 billion and $1.4 billion, consumer leases of $606 million and $34 million, consumer overdrafts of $176 million and $177 million and other non-U.S. consumer loans of $5 million and $5 million at December 31, 2013 and 2012.
(4) Consumer loans accounted for under the fair value option include residential mortgage loans of $2.0 billion and $1.0 billion and home equity loans of $147 million and $0 at December 31, 2013 and 2012. For more information on the fair value option, see Consumer Portfolio Credit Risk Management – Consumer Loans Accounted for Under the Fair Value Option on page 85 and Note 21 – Fair Value Option to the Consolidated Financial Statements.
n/a = not applicable
76788ba_financials.indd 74 3/6/14 12:05 PM

Bank of America 2013 75
Table 27 presents consumer nonperforming loans and accruing consumer loans past due 90 days or more. Nonperforming loans do not include past due consumer credit card loans, other unsecured loans and in general, consumer non-real estate-secured loans (loans discharged in Chapter 7 bankruptcy are included) as these loans are typically charged off no later than the end of the month in which the loan becomes 180 days past due. Real estate-secured past due consumer loans that are insured by the FHA or individually insured under long-term stand-by agreements with
FNMA and FHLMC (collectively, the fully-insured loan portfolio) are reported as accruing as opposed to nonperforming since the principal repayment is insured. Fully-insured loans included in accruing past due 90 days or more are primarily from our repurchases of delinquent FHA loans pursuant to our servicing agreements with GNMA. Additionally, nonperforming loans and accruing balances past due 90 days or more do not include the PCI loan portfolio or loans accounted for under the fair value option even though the customer may be contractually past due.
Table 27 Consumer Credit Quality
December 31
NonperformingAccruing Past Due90 Days or More
(Dollars in millions) 2013 2012 2013 2012Residential mortgage (1) $ 11,712 $ 15,055 $ 16,961 $ 22,157Home equity 4,075 4,282 — —U.S. credit card n/a n/a 1,053 1,437Non-U.S. credit card n/a n/a 131 212Direct/Indirect consumer 35 92 408 545Other consumer 18 2 2 2
Total (2) $ 15,840 $ 19,431 $ 18,555 $ 24,353Consumer loans and leases as a percentage of outstanding consumer loans and leases (2) 2.99% 3.52% 3.50% 4.41%
Consumer loans and leases as a percentage of outstanding loans and leases, excluding PCI and fully-insured loan portfolios (2) 3.80 4.46 0.38 0.50
(1) Residential mortgage loans accruing past due 90 days or more are fully-insured loans. At December 31, 2013 and 2012, residential mortgage included $13.0 billion and $17.8 billion of loans on which interest has been curtailed by the FHA, and therefore are no longer accruing interest, although principal is still insured, and $4.0 billion and $4.4 billion of loans on which interest was still accruing.
(2) Balances exclude consumer loans accounted for under the fair value option. At December 31, 2013 and 2012, $445 million and $391 million of loans accounted for under the fair value option were past due 90 days or more and not accruing interest.
n/a = not applicable
Table 28 presents net charge-offs and related ratios for consumer loans and leases.
Table 28 Consumer Net Charge-offs and Related Ratios
Net Charge-offs (1) Net Charge-off Ratios (1, 2)
(Dollars in millions) 2013 2012 2013 2012Residential mortgage $ 1,084 $ 3,111 0.42% 1.18%Home equity 1,803 4,242 1.80 3.62U.S. credit card 3,376 4,632 3.74 4.88Non-U.S. credit card 399 581 3.68 4.29Direct/Indirect consumer 345 763 0.42 0.90Other consumer 234 232 12.96 9.85
Total $ 7,241 $ 13,561 1.34 2.36(1) Net charge-offs exclude write-offs in the PCI loan portfolio of $1.2 billion in home equity and $1.1 billion in residential mortgage in 2013 compared to $2.8 billion in home equity in 2012. These
write-offs decreased the PCI valuation allowance included as part of the allowance for loan and lease losses. For more information on PCI write-offs, see Consumer Portfolio Credit Risk Management – Purchased Credit-impaired Loan Portfolio on page 81.
(2) Net charge-off ratios are calculated as net charge-offs divided by average outstanding loans and leases excluding loans accounted for under the fair value option.
Net charge-off ratios, excluding the PCI and fully-insured loan portfolios, were 0.74 percent and 2.04 percent for residential mortgage, 1.94 percent and 3.99 percent for home equity and 1.71 percent and 2.99 percent for the total consumer portfolio for 2013 and 2012. These are the only product classifications that include PCI and fully-insured loans for these periods.
Net charge-offs exclude write-offs in the PCI loan portfolio of $1.2 billion in home equity and $1.1 billion in residential mortgage
for 2013, and $2.8 billion in home equity for 2012. These write-offs decreased the PCI valuation allowance included as part of the allowance for loan and lease losses. Net charge-off ratios including the PCI write-offs were 3.05 percent for home equity and 0.85 percent for residential mortgage in 2013, and 6.02 percent for home equity in 2012. For more information on PCI write-offs, see Consumer Portfolio Credit Risk Management – Purchased Credit-impaired Loan Portfolio on page 81.
76788ba_financials.indd 75 3/6/14 12:05 PM

76 Bank of America 2013
Table 29 presents outstandings, nonperforming balances, net charge-offs, allowance for loan and lease losses and provision for loan and lease losses for the Core portfolio and the Legacy Assets & Servicing portfolio within the home loans portfolio. For more information on Legacy Assets & Servicing, see CRES on page 36.
Table 29 Home Loans Portfolio (1)
December 31 Outstandings Nonperforming Net Charge-offs (2)
(Dollars in millions) 2013 2012 2013 2012 2013 2012Core portfolio
Residential mortgage $ 177,336 $ 170,116 $ 3,316 $ 3,193 $ 274 $ 544Home equity 54,499 60,851 1,431 1,265 439 811
Total Core portfolio 231,835 230,967 4,747 4,458 713 1,355Legacy Assets & Servicing portfolio
Residential mortgage 70,730 82,813 8,396 11,862 810 2,567Home equity 39,173 47,289 2,644 3,017 1,364 3,431
Total Legacy Assets & Servicing portfolio 109,903 130,102 11,040 14,879 2,174 5,998Home loans portfolio
Residential mortgage 248,066 252,929 11,712 15,055 1,084 3,111Home equity 93,672 108,140 4,075 4,282 1,803 4,242
Total home loans portfolio $ 341,738 $ 361,069 $ 15,787 $ 19,337 $ 2,887 $ 7,353
December 31
Allowance for Loan and Lease Losses
Provision for Loan and Lease Losses
2013 2012 2013 2012Core portfolio
Residential mortgage $ 728 $ 829 $ 166 $ 523Home equity 965 1,286 119 256
Total Core portfolio 1,693 2,115 285 779Legacy Assets & Servicing portfolio
Residential mortgage 3,356 6,259 (979) 1,802Home equity 3,469 6,559 (430) 1,492
Total Legacy Assets & Servicing portfolio 6,825 12,818 (1,409) 3,294Home loans portfolio
Residential mortgage 4,084 7,088 (813) 2,325Home equity 4,434 7,845 (311) 1,748
Total home loans portfolio $ 8,518 $ 14,933 $ (1,124) $ 4,073(1) Outstandings and nonperforming amounts exclude loans accounted for under the fair value option. Consumer loans accounted for under the fair value option include residential mortgage loans of
$2.0 billion and $1.0 billion and home equity loans of $147 million and $0 at December 31, 2013 and 2012. For more information on the fair value option, see Consumer Portfolio Credit Risk Management – Consumer Loans Accounted for Under the Fair Value Option on page 85 and Note 21 – Fair Value Option to the Consolidated Financial Statements.
(2) Net charge-offs exclude write-offs in the PCI loan portfolio of $1.2 billion in home equity and $1.1 billion in residential mortgage in 2013, which are included in the Legacy Assets & Servicing portfolio, compared to $2.8 billion in home equity in 2012. Write-offs in the PCI loan portfolio decrease the PCI valuation allowance included as part of the allowance for loan and lease losses. For more information on PCI write-offs, see Consumer Portfolio Credit Risk Management – Purchased Credit-impaired Loan Portfolio on page 81.
We believe that the presentation of information adjusted to exclude the impact of the PCI loan portfolio, the fully-insured loan portfolio and loans accounted for under the fair value option is more representative of the ongoing operations and credit quality of the business. As a result, in the following discussions of the residential mortgage and home equity portfolios, we provide information that excludes the impact of the PCI loan portfolio, the fully-insured loan portfolio and loans accounted for under the fair value option in certain credit quality statistics. We separately disclose information on the PCI loan portfolio on page 81.
Residential MortgageThe residential mortgage portfolio makes up the largest percentage of our consumer loan portfolio at 47 percent of consumer loans and leases at December 31, 2013. Approximately 19 percent of the residential mortgage portfolio is in GWIM and represents residential mortgages that are originated for the home purchase and refinancing needs of our wealth management clients. The remaining portion of the portfolio is primarily in All Other and is comprised of originated loans, purchased loans used
in our overall ALM activities, loans repurchased in connection with the FNMA Settlement, delinquent FHA loans repurchased pursuant to our servicing agreements with GNMA as well as loans repurchased related to our representations and warranties.
Outstanding balances in the residential mortgage portfolio, excluding loans accounted for under the fair value option, decreased $4.9 billion during 2013 due to paydowns, charge-offs, transfers to foreclosed properties and sales. These were partially offset by new origination volume retained on our balance sheet, loans repurchased as part of the FNMA Settlement, as well as repurchases of delinquent loans pursuant to our servicing agreements with GNMA, which is part of our mortgage banking activities.
At December 31, 2013 and 2012, the residential mortgage portfolio included $87.2 billion and $90.9 billion of outstanding fully-insured loans. On this portion of the residential mortgage portfolio, we are protected against principal loss as a result of either FHA insurance or long-term stand-by agreements with FNMA and FHLMC. At December 31, 2013 and 2012, $59.0 billion and $66.6 billion had FHA insurance with the remainder protected by
76788ba_financials.indd 76 3/6/14 12:05 PM

Bank of America 2013 77
long-term stand-by agreements. At December 31, 2013 and 2012, $22.5 billion and $25.5 billion of the FHA-insured loan population were repurchases of delinquent FHA loans pursuant to our servicing agreements with GNMA. All of these loans are individually insured and therefore the Corporation does not record a significant allowance for credit losses with respect to these loans.
In addition to the long-term stand-by agreements with FNMA and FHLMC, we have mitigated a portion of our credit risk on the residential mortgage portfolio through the use of synthetic securitization vehicles as described in Note 4 – Outstanding Loans and Leases to the Consolidated Financial Statements. At December 31, 2013 and 2012, the synthetic securitization vehicles referenced principal balances of $12.5 billion and $17.6 billion of residential mortgage loans and provided loss protection up to $339 million and $500 million. At December 31, 2013 and 2012, the Corporation had a receivable of $198 million and $305 million from these vehicles for reimbursement of losses. The Corporation records an allowance for credit losses on loans referenced by the synthetic securitization vehicles. The reported net charge-offs for the residential mortgage portfolio do not include the benefit of amounts reimbursable from these vehicles. Adjusting for the benefit of the credit protection from the synthetic securitizations, the residential mortgage net charge-off ratio,
excluding the PCI and fully-insured loan portfolios, in 2013 and 2012 would have been reduced by three bps and nine bps.
The long-term stand-by agreements with FNMA and FHLMC and to a lesser extent the synthetic securitizations together reduce our regulatory risk-weighted assets due to the transfer of a portion of our credit risk to unaffiliated parties. At December 31, 2013 and 2012, these programs had the cumulative effect of reducing our risk-weighted assets by $8.4 billion and $7.2 billion and increasing our Tier 1 capital ratio by eight bps and increasing our Tier 1 common capital ratio by seven bps at both year ends.
Table 30 presents certain residential mortgage key credit statistics on both a reported basis excluding loans accounted for under the fair value option, and excluding the PCI loan portfolio, our fully-insured loan portfolio and loans accounted for under the fair value option. Additionally, in the “Reported Basis” columns in the table below, accruing balances past due and nonperforming loans do not include the PCI loan portfolio, in accordance with our accounting policies, even though the customer may be contractually past due. As such, the following discussion presents the residential mortgage portfolio excluding the PCI loan portfolio, the fully-insured loan portfolio and loans accounted for under the fair value option. For more information on the PCI loan portfolio, see page 81.
Table 30 Residential Mortgage – Key Credit Statistics
December 31
Reported Basis (1)
Excluding PurchasedCredit-impaired andFully-insured Loans
(Dollars in millions) 2013 2012 2013 2012Outstandings $ 248,066 $ 252,929 $ 142,147 $ 144,624Accruing past due 30 days or more 23,052 28,815 2,371 3,117Accruing past due 90 days or more 16,961 22,157 — —Nonperforming loans 11,712 15,055 11,712 15,055Percent of portfolio
Refreshed LTV greater than 90 but less than or equal to 100 12% 15% 7% 10%Refreshed LTV greater than 100 13 28 10 20Refreshed FICO below 620 21 23 11 142006 and 2007 vintages (2) 21 25 27 34
Net charge-off ratio (3) 0.42 1.18 0.74 2.04(1) Outstandings, accruing past due, nonperforming loans and percentages of portfolio exclude loans accounted for under the fair value option. There were $2.0 billion and $1.0 billion of residential
mortgage loans accounted for under the fair value option at December 31, 2013 and 2012. For more information on the fair value option, see Consumer Portfolio Credit Risk Management – Consumer Loans Accounted for Under the Fair Value Option on page 85 and Note 21 – Fair Value Option to the Consolidated Financial Statements.
(2) These vintages of loans account for 53 percent and 61 percent of nonperforming residential mortgage loans at December 31, 2013 and 2012, and 60 percent and 71 percent of residential mortgage net charge-offs in 2013 and 2012.
(3) Net charge-off ratios are calculated as net charge-offs divided by average outstanding loans excluding loans accounted for under the fair value option.
Nonperforming residential mortgage loans decreased $3.3 billion in 2013 as paydowns, returns to performing status, charge-offs and transfers to foreclosed properties outpaced new inflows. Also impacting the decrease were sales of nonperforming residential mortgage loans of $1.5 billion and transfers to held-for-sale of $663 million, of which $273 million had been sold prior to December 31, 2013.
At December 31, 2013, borrowers were current on contractual payments with respect to $3.9 billion, or 34 percent of nonperforming residential mortgage loans, and $5.8 billion, or 49 percent of nonperforming residential mortgage loans were 180 days or more past due and had been written down to the estimated fair value of the collateral less costs to sell. Accruing loans past due 30 days or more decreased $746 million in 2013.
Net charge-offs decreased $2.0 billion to $1.1 billion in 2013, or 0.74 percent of total average residential mortgage loans,
compared to $3.1 billion, or 2.04 percent in 2012. This decrease in net charge-offs was primarily driven by favorable portfolio trends and decreased write-downs on loans greater than 180 days past due which were written down to the estimated fair value of the collateral less costs to sell, due in part to improvement in home prices and the U.S. economy.
Loans in the residential mortgage portfolio with certain characteristics have greater risk of loss than others. These characteristics include loans with a high refreshed loan-to-value (LTV), loans originated at the peak of home prices in 2006 and 2007, interest-only loans and loans to borrowers located in California and Florida where we have concentrations and where significant declines in home prices had been experienced. Although the disclosures in this section address each of these risk characteristics separately, there is significant overlap in loans with these characteristics, which contributed to a disproportionate
76788ba_financials.indd 77 3/6/14 12:05 PM

78 Bank of America 2013
share of the losses in the portfolio. The residential mortgage loans with all of these higher risk characteristics comprised two percent and four percent of the residential mortgage portfolio at December 31, 2013 and 2012, and accounted for 10 percent and 20 percent of the residential mortgage net charge-offs in 2013 and 2012.
Residential mortgage loans with a greater than 90 percent but less than or equal to 100 percent refreshed LTV represented seven percent and 10 percent of the residential mortgage portfolio at December 31, 2013 and 2012. Loans with a refreshed LTV greater than 100 percent represented 10 percent and 20 percent of the residential mortgage loan portfolio at December 31, 2013 and 2012. Of the loans with a refreshed LTV greater than 100 percent, 94 percent and 92 percent were performing at December 31, 2013 and 2012. Loans with a refreshed LTV greater than 100 percent reflect loans where the outstanding carrying value of the loan is greater than the most recent valuation of the property securing the loan. The majority of these loans have a refreshed LTV greater than 100 percent primarily due to home price deterioration since 2006, somewhat mitigated by recent appreciation. Loans to borrowers with refreshed FICO scores below 620 represented 11 percent and 14 percent of the residential mortgage portfolio at December 31, 2013 and 2012.
Of the $142.1 billion in total residential mortgage loans outstanding at December 31, 2013, as shown in Table 31, 40 percent were originated as interest-only loans. The outstanding balance of interest-only residential mortgage loans that have entered the amortization period was $15.4 billion, or 27 percent,
at December 31, 2013. Residential mortgage loans that have entered the amortization period generally have experienced a higher rate of early stage delinquencies and nonperforming status compared to the residential mortgage portfolio as a whole. At December 31, 2013, $320 million, or two percent of outstanding interest-only residential mortgages that had entered the amortization period were accruing past due 30 days or more compared to $2.4 billion, or two percent for the entire residential mortgage portfolio. In addition, at December 31, 2013, $2.5 billion, or 17 percent of outstanding interest-only residential mortgages that had entered the amortization period were nonperforming compared to $11.7 billion, or eight percent for the entire residential mortgage portfolio. Loans in our interest-only residential mortgage portfolio have an interest-only period of three to ten years and more than 90 percent of these loans will not be required to make a fully-amortizing payment until 2015 or later.
Table 31 presents outstandings, nonperforming loans and net charge-offs by certain state concentrations for the residential mortgage portfolio. The Los Angeles-Long Beach-Santa Ana Metropolitan Statistical Area (MSA) within California represented 13 percent and 12 percent of outstandings at December 31, 2013 and 2012. Loans within this MSA comprised only three percent and eight percent of net charge-offs in 2013 and 2012. In the New York area, the New York-Northern New Jersey-Long Island MSA made up 10 percent of outstandings at both December 31, 2013 and 2012. Loans within this MSA comprised 11 percent and five percent of net charge-offs in 2013 and 2012.
Table 31 Residential Mortgage State Concentrations
December 31 Outstandings (1) Nonperforming (1) Net Charge-offs (2)
(Dollars in millions) 2013 2012 2013 2012 2013 2012California $ 47,885 $ 48,671 $ 3,396 $ 4,580 $ 148 $ 1,139New York (3) 11,787 11,290 789 972 59 82Florida (3) 10,777 11,100 1,359 1,773 117 371Texas 6,766 6,928 407 498 25 55Virginia 4,774 5,096 369 410 31 52Other U.S./Non-U.S. 60,158 61,539 5,392 6,822 704 1,412
Residential mortgage loans (4) $ 142,147 $ 144,624 $ 11,712 $ 15,055 $ 1,084 $ 3,111Fully-insured loan portfolio 87,247 90,854 Purchased credit-impaired residential mortgage loan portfolio 18,672 17,451
Total residential mortgage loan portfolio $ 248,066 $ 252,929 (1) Outstandings and nonperforming amounts exclude loans accounted for under the fair value option. There were $2.0 billion and $1.0 billion of residential mortgage loans accounted for under the fair
value option at December 31, 2013 and 2012. For more information on the fair value option, see Consumer Portfolio Credit Risk Management – Consumer Loans Accounted for Under the Fair Value Option on page 85 and Note 21 – Fair Value Option to the Consolidated Financial Statements.
(2) Net charge-offs exclude $1.1 billion of write-offs in the residential mortgage PCI loan portfolio in 2013 compared to none in 2012. These write-offs decreased the PCI valuation allowance included as part of the allowance for loan and lease losses. For more information on PCI write-offs, see Consumer Portfolio Credit Risk Management – Purchased Credit-impaired Loan Portfolio on page 81.
(3) In these states, foreclosure requires a court order following a legal proceeding (judicial states).(4) Amount excludes the PCI residential mortgage and fully-insured loan portfolios.
The Community Reinvestment Act (CRA) encourages banks to meet the credit needs of their communities for housing and other purposes, particularly in neighborhoods with low or moderate incomes. Our CRA portfolio was $10.3 billion and $11.3 billion at December 31, 2013 and 2012, or seven percent and eight percent of the residential mortgage portfolio. The CRA portfolio included
$1.7 billion and $2.5 billion of nonperforming loans at December 31, 2013 and 2012 representing 14 percent and 16 percent of total nonperforming residential mortgage loans. Net charge-offs in the CRA portfolio were $260 million and $641 million in 2013 and 2012, or 24 percent and 21 percent of total net charge-offs for the residential mortgage portfolio.
76788ba_financials.indd 78 3/6/14 12:05 PM

Bank of America 2013 79
Home EquityAt December 31, 2013, the home equity portfolio made up 18 percent of the consumer portfolio and is comprised of HELOCs, home equity loans and reverse mortgages.
At December 31, 2013, our HELOC portfolio had an outstanding balance of $80.3 billion, or 86 percent of the total home equity portfolio compared to $91.3 billion, or 85 percent at December 31, 2012. HELOCs generally have an initial draw period of 10 years. During the initial draw period, the borrowers are only required to pay the interest due on the loans on a monthly basis. After the initial draw period ends, the loans generally convert to 15-year amortizing loans.
At December 31, 2013, our home equity loan portfolio had an outstanding balance of $12.0 billion, or 13 percent of the total home equity portfolio compared to $15.3 billion, or 14 percent at December 31, 2012. Home equity loans are almost all fixed-rate loans with amortizing payment terms of 10 to 30 years and of the $12.0 billion at December 31, 2013, 51 percent of these loans have 25- to 30-year terms. At both December 31, 2013 and 2012, our reverse mortgage portfolio had an outstanding balance, excluding loans accounted for under the fair value option, of $1.4 billion, or one percent of the total home equity portfolio. We no longer originate these products.
At December 31, 2013, approximately 91 percent of the home equity portfolio was included in CRES while the remainder of the portfolio was primarily in GWIM. Outstanding balances in the home equity portfolio, excluding loans accounted for under the fair value option, decreased $14.5 billion in 2013 primarily due to paydowns
and charge-offs outpacing new originations and draws on existing lines. Of the total home equity portfolio at December 31, 2013 and 2012, $23.0 billion and $24.7 billion, or 25 percent and 23 percent, were in first-lien positions (26 percent and 25 percent excluding the PCI home equity portfolio). At December 31, 2013, outstanding balances in the home equity portfolio that were in a second-lien or more junior-lien position and where we also held the first-lien loan totaled $17.6 billion, or 20 percent of our total home equity portfolio excluding the PCI loan portfolio.
Unused HELOCs totaled $56.8 billion and $60.9 billion at December 31, 2013 and 2012. This decrease was primarily due to customers choosing to close accounts, which more than offset customer paydowns of principal balances as well as the impact of new production. The HELOC utilization rate was 59 percent at December 31, 2013 compared to 60 percent at December 31, 2012.
Table 32 presents certain home equity portfolio key credit statistics on both a reported basis excluding loans accounted for under the fair value option, and excluding the PCI loan portfolio. Additionally, in the “Reported Basis” columns in the table below, accruing balances past due 30 days or more and nonperforming loans do not include the PCI loan portfolio, in accordance with our accounting policies, even though the customer may be contractually past due. As such, the following discussion presents the home equity portfolio excluding the PCI loan portfolio and loans accounted for under the fair value option. For more information on the PCI loan portfolio, see page 81.
Table 32 Home Equity – Key Credit Statistics
December 31
Reported Basis (1)
Excluding PurchasedCredit-impaired Loans
(Dollars in millions) 2013 2012 2013 2012Outstandings $ 93,672 $ 108,140 $ 87,079 $ 99,473Accruing past due 30 days or more (2) 901 1,099 901 1,099Nonperforming loans (2) 4,075 4,282 4,075 4,282Percent of portfolio
Refreshed combined LTV greater than 90 but less than or equal to 100 9% 10% 9% 10%Refreshed combined LTV greater than 100 22 31 19 29Refreshed FICO below 620 8 9 8 82006 and 2007 vintages (3) 48 48 45 46
Net charge-off ratio (4) 1.80 3.62 1.94 3.99(1) Outstandings, accruing past due, nonperforming loans and percentages of portfolio exclude loans accounted for under the fair value option. There were $147 million of home equity loans accounted
for under the fair value option at December 31, 2013 compared to none at December 31, 2012. For more information on the fair value option, see Consumer Portfolio Credit Risk Management – Consumer Loans Accounted for Under the Fair Value Option on page 85 and Note 21 – Fair Value Option to the Consolidated Financial Statements.
(2) Accruing past due 30 days or more includes $164 million and $321 million and nonperforming loans includes $410 million and $824 million of loans where we serviced the underlying first-lien at December 31, 2013 and 2012.
(3) These vintages of loans have higher refreshed combined LTV ratios and accounted for 50 percent and 51 percent of nonperforming home equity loans at December 31, 2013 and 2012, and accounted for 63 percent and 60 percent of net charge-offs in 2013 and 2012.
(4) Net charge-off ratios are calculated as net charge-offs divided by average outstanding loans excluding loans accounted for under the fair value option.
Nonperforming outstanding balances in the home equity portfolio decreased $207 million in 2013 due to charge-offs and returns to performing status outpacing new inflows.
At December 31, 2013, on $2.0 billion, or 48 percent of nonperforming home equity loans, the borrowers were current on contractual payments. At December 31, 2013, $1.4 billion, or 35 percent of nonperforming home equity loans were 180 days or more past due and had been written down to the estimated fair value of the collateral less costs to sell. Outstanding balances accruing past due 30 days or more decreased $198 million in 2013.
In some cases, the junior-lien home equity outstanding balance that we hold is performing, but the underlying first-lien is not. For outstanding balances in the home equity portfolio on which we service the first-lien loan, we are able to track whether the first-lien loan is in default. For loans where the first-lien is serviced by a third party, we utilize credit bureau data to estimate the delinquency status of the first-lien. Given that the credit bureau database we use does not include a property address for the mortgages, we are unable to identify with certainty whether a reported delinquent first-lien mortgage pertains to the same property for which we hold a junior-lien loan. At December 31, 2013, we estimate that $2.1 billion of current and $382 million
76788ba_financials.indd 79 3/6/14 12:05 PM
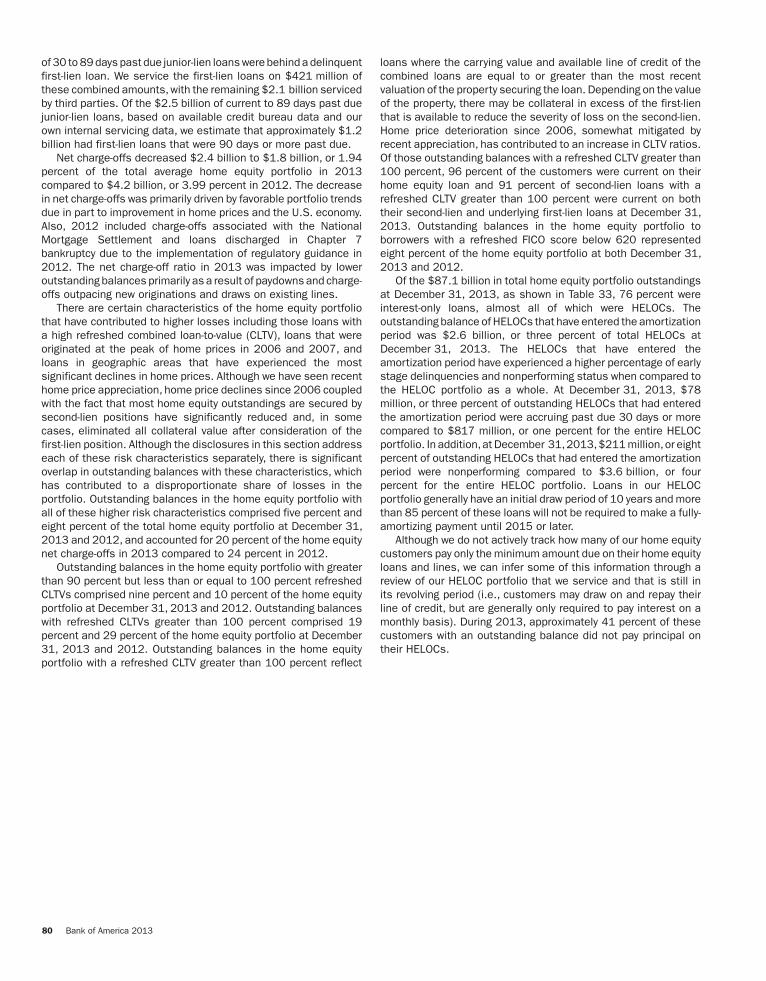
80 Bank of America 2013
of 30 to 89 days past due junior-lien loans were behind a delinquent first-lien loan. We service the first-lien loans on $421 million of these combined amounts, with the remaining $2.1 billion serviced by third parties. Of the $2.5 billion of current to 89 days past due junior-lien loans, based on available credit bureau data and our own internal servicing data, we estimate that approximately $1.2 billion had first-lien loans that were 90 days or more past due.
Net charge-offs decreased $2.4 billion to $1.8 billion, or 1.94 percent of the total average home equity portfolio in 2013 compared to $4.2 billion, or 3.99 percent in 2012. The decrease in net charge-offs was primarily driven by favorable portfolio trends due in part to improvement in home prices and the U.S. economy. Also, 2012 included charge-offs associated with the National Mortgage Settlement and loans discharged in Chapter 7 bankruptcy due to the implementation of regulatory guidance in 2012. The net charge-off ratio in 2013 was impacted by lower outstanding balances primarily as a result of paydowns and charge-offs outpacing new originations and draws on existing lines.
There are certain characteristics of the home equity portfolio that have contributed to higher losses including those loans with a high refreshed combined loan-to-value (CLTV), loans that were originated at the peak of home prices in 2006 and 2007, and loans in geographic areas that have experienced the most significant declines in home prices. Although we have seen recent home price appreciation, home price declines since 2006 coupled with the fact that most home equity outstandings are secured by second-lien positions have significantly reduced and, in some cases, eliminated all collateral value after consideration of the first-lien position. Although the disclosures in this section address each of these risk characteristics separately, there is significant overlap in outstanding balances with these characteristics, which has contributed to a disproportionate share of losses in the portfolio. Outstanding balances in the home equity portfolio with all of these higher risk characteristics comprised five percent and eight percent of the total home equity portfolio at December 31, 2013 and 2012, and accounted for 20 percent of the home equity net charge-offs in 2013 compared to 24 percent in 2012.
Outstanding balances in the home equity portfolio with greater than 90 percent but less than or equal to 100 percent refreshed CLTVs comprised nine percent and 10 percent of the home equity portfolio at December 31, 2013 and 2012. Outstanding balances with refreshed CLTVs greater than 100 percent comprised 19 percent and 29 percent of the home equity portfolio at December 31, 2013 and 2012. Outstanding balances in the home equity portfolio with a refreshed CLTV greater than 100 percent reflect
loans where the carrying value and available line of credit of the combined loans are equal to or greater than the most recent valuation of the property securing the loan. Depending on the value of the property, there may be collateral in excess of the first-lien that is available to reduce the severity of loss on the second-lien. Home price deterioration since 2006, somewhat mitigated by recent appreciation, has contributed to an increase in CLTV ratios. Of those outstanding balances with a refreshed CLTV greater than 100 percent, 96 percent of the customers were current on their home equity loan and 91 percent of second-lien loans with a refreshed CLTV greater than 100 percent were current on both their second-lien and underlying first-lien loans at December 31, 2013. Outstanding balances in the home equity portfolio to borrowers with a refreshed FICO score below 620 represented eight percent of the home equity portfolio at both December 31, 2013 and 2012.
Of the $87.1 billion in total home equity portfolio outstandings at December 31, 2013, as shown in Table 33, 76 percent were interest-only loans, almost all of which were HELOCs. The outstanding balance of HELOCs that have entered the amortization period was $2.6 billion, or three percent of total HELOCs at December 31, 2013. The HELOCs that have entered the amortization period have experienced a higher percentage of early stage delinquencies and nonperforming status when compared to the HELOC portfolio as a whole. At December 31, 2013, $78 million, or three percent of outstanding HELOCs that had entered the amortization period were accruing past due 30 days or more compared to $817 million, or one percent for the entire HELOC portfolio. In addition, at December 31, 2013, $211 million, or eight percent of outstanding HELOCs that had entered the amortization period were nonperforming compared to $3.6 billion, or four percent for the entire HELOC portfolio. Loans in our HELOC portfolio generally have an initial draw period of 10 years and more than 85 percent of these loans will not be required to make a fully-amortizing payment until 2015 or later.
Although we do not actively track how many of our home equity customers pay only the minimum amount due on their home equity loans and lines, we can infer some of this information through a review of our HELOC portfolio that we service and that is still in its revolving period (i.e., customers may draw on and repay their line of credit, but are generally only required to pay interest on a monthly basis). During 2013, approximately 41 percent of these customers with an outstanding balance did not pay principal on their HELOCs.
76788ba_financials.indd 80 3/6/14 12:05 PM

Bank of America 2013 81
Table 33 presents outstandings, nonperforming balances and net charge-offs by certain state concentrations for the home equity portfolio. In the New York area, the New York-Northern New Jersey-Long Island MSA made up 12 percent and 11 percent of the outstanding home equity portfolio at December 31, 2013 and 2012. Loans within this MSA comprised nine percent and eight percent of net charge-offs in 2013 and 2012. The Los Angeles-Long Beach-Santa Ana MSA within California made up 12 percent of the outstanding home equity portfolio at both December 31,
2013 and 2012. Loans within this MSA comprised nine percent and 11 percent of net charge-offs in 2013 and 2012.
For more information on representations and warranties related to our home equity portfolio, see Off-Balance Sheet Arrangements and Contractual Obligations – Representations and Warranties on page 48 and Note 7 – Representations and Warranties Obligations and Corporate Guarantees to the Consolidated Financial Statements.
Table 33 Home Equity State Concentrations
December 31
Outstandings (1) Nonperforming (1) Net Charge-offs (2)
(Dollars in millions) 2013 2012 2013 2012 2013 2012California $ 25,061 $ 28,730 $ 1,047 $ 1,128 $ 509 $ 1,333Florida (3) 10,604 11,899 643 706 315 602New Jersey (3) 6,153 6,789 304 312 93 210New York (3) 6,035 6,736 405 419 110 222Massachusetts 3,881 4,381 144 140 42 91Other U.S./Non-U.S. 35,345 40,938 1,532 1,577 734 1,784
Home equity loans (4) $ 87,079 $ 99,473 $ 4,075 $ 4,282 $ 1,803 $ 4,242Purchased credit-impaired home equity portfolio 6,593 8,667
Total home equity loan portfolio $ 93,672 $ 108,140 (1) Outstandings and nonperforming amounts exclude loans accounted for under the fair value option. There were $147 million of home equity loans accounted for under the fair value option at
December 31, 2013 compared to none at December 31, 2012. For more information on the fair value option, see Consumer Portfolio Credit Risk Management – Consumer Loans Accounted for Under the Fair Value Option on page 85 and Note 21 – Fair Value Option to the Consolidated Financial Statements.
(2) Net charge-offs exclude $1.2 billion of write-offs in the home equity PCI loan portfolio in 2013 compared to $2.8 billion in 2012. These write-offs decreased the PCI valuation allowance included as part of the allowance for loan and lease losses. For more information on PCI write-offs, see Consumer Portfolio Credit Risk Management – Purchased Credit-impaired Loan Portfolio on page 81.
(3) In these states, foreclosure requires a court order following a legal proceeding (judicial states). (4) Amount excludes the PCI home equity portfolio.
Purchased Credit-impaired Loan PortfolioLoans acquired with evidence of credit quality deterioration since origination and for which it is probable at purchase that we will be unable to collect all contractually required payments are accounted for under the accounting guidance for PCI loans, which addresses accounting for differences between contractual and expected cash flows to be collected from the purchaser’s initial investment in loans if those differences are attributable, at least in part, to credit quality. Evidence of credit quality deterioration as of the acquisition date may include statistics such as past due status, refreshed FICO scores and refreshed LTVs. PCI loans are recorded at fair value upon acquisition and the applicable accounting guidance prohibits carrying over or recording a valuation allowance in the initial accounting.
PCI loans that have similar risk characteristics, primarily credit risk, collateral type and interest rate risk, are pooled and accounted for as a single asset with a single composite interest rate and an aggregate expectation of cash flows. Once a pool is assembled, it is treated as if it were one loan for purposes of applying the
accounting guidance for PCI loans. An individual loan is removed from a PCI loan pool if it is sold, foreclosed, forgiven or the expectation of any future proceeds is remote. When a loan is removed from a PCI loan pool and the foreclosure or recovery value of the loan is less than the loan’s carrying value, the difference is first applied against the PCI pool’s nonaccretable difference. If the nonaccretable difference has been fully utilized, only then is the PCI pool’s basis applicable to that loan written-off against its valuation reserve; however, the integrity of the pool is maintained and it continues to be accounted for as if it were one loan.
In 2013, in connection with the FNMA Settlement, we repurchased certain residential mortgage loans that had previously been sold to FNMA, which we have valued at less than the purchase price. As of December 31, 2013, loans repurchased in connection with the FNMA Settlement that we classified as PCI had an unpaid principal balance of $5.3 billion and a carrying value of $4.6 billion. For additional information, see Note 7 – Representations and Warranties Obligations and Corporate Guarantees to the Consolidated Financial Statements.
76788ba_financials.indd 81 3/6/14 12:05 PM

82 Bank of America 2013
Table 34 presents the unpaid principal balance, carrying value, related valuation allowance and the net carrying value as a percentage of the unpaid principal balance for the PCI loan portfolio.
Table 34 Purchased Credit-impaired Loan Portfolio
December 31, 2013
(Dollars in millions)
UnpaidPrincipalBalance
CarryingValue
RelatedValuationAllowance
CarryingValue Net of
ValuationAllowance
Percent ofUnpaid
PrincipalBalance
Residential mortgage $ 19,558 $ 18,672 $ 1,446 $ 17,226 88.08%
Home equity 6,523 6,593 1,047 5,546 85.02
Total purchased credit-impaired loan portfolio $ 26,081 $ 25,265 $ 2,493 $ 22,772 87.31
December 31, 2012Residential mortgage $ 18,069 $ 17,451 $ 3,108 $ 14,343 79.38%Home equity 8,434 8,667 2,428 6,239 73.97
Total purchased credit-impaired loan portfolio $ 26,503 $ 26,118 $ 5,536 $ 20,582 77.66
The total PCI unpaid principal balance decreased $422 million, or two percent, in 2013 primarily driven by liquidations, including sales, payoffs, paydowns and write-offs, partially offset by the $5.3 billion of loans repurchased in connection with the FNMA Settlement.
Of the unpaid principal balance of $26.1 billion at December 31, 2013, $4.7 billion was 180 days or more past due, including $4.6 billion of first-lien mortgages and $91 million of home equity loans. Of the $21.4 billion that was less than 180 days past due, $18.4 billion, or 86 percent of the total unpaid principal balance was current based on the contractual terms while $2.0 billion, or nine percent, was in early stage delinquency.
During 2013, we recorded a provision benefit of $707 million for the PCI loan portfolio including a provision benefit of $552 million for residential mortgage and a provision benefit of $155 million for home equity. This compared to a provision benefit of $103 million in 2012. The provision benefit in 2013 was primarily driven by an improvement in our home price outlook.
The PCI valuation allowance declined $3.0 billion during 2013 due to write-offs in the PCI loan portfolio of $1.2 billion in home equity and $1.1 billion in residential mortgage, and a provision benefit of $707 million for the PCI loan portfolio. Write-offs during 2013 included certain home equity PCI loans that were ineligible for the National Mortgage Settlement, but had similar characteristics as the eligible loans and the expectation of future cash proceeds was considered remote.
Purchased Credit-impaired Residential Mortgage Loan PortfolioThe PCI residential mortgage loan portfolio represented 74 percent of the total PCI loan portfolio at December 31, 2013. Those loans to borrowers with a refreshed FICO score below 620 represented 52 percent of the PCI residential mortgage loan portfolio at December 31, 2013. Loans with a refreshed LTV greater than 90 percent, after consideration of purchase accounting adjustments and the related valuation allowance, represented 39 percent of the PCI residential mortgage loan portfolio and 51 percent based on the unpaid principal balance at December 31, 2013. Table 35 presents outstandings net of purchase accounting adjustments and before the related valuation allowance, by certain state concentrations.
Table 35 Outstanding Purchased Credit-impaired LoanPortfolio – Residential Mortgage StateConcentrations
December 31(Dollars in millions) 2013 2012California $ 8,180 $ 9,238Florida (1) 1,750 1,797Virginia 760 715Maryland 728 417Texas 433 192Other U.S./Non-U.S. 6,821 5,092
Total $ 18,672 $ 17,451(1) In this state, foreclosure requires a court order following a legal proceeding (judicial state).
Pay option adjustable-rate mortgages (ARMs), which are included in the PCI residential mortgage portfolio, have interest rates that adjust monthly and minimum required payments that adjust annually, subject to resetting if minimum payments are made and deferred interest limits are reached. Annual payment adjustments are subject to a 7.5 percent maximum change. To ensure that contractual loan payments are adequate to repay a loan, the fully-amortizing loan payment amount is re-established after the initial five- or ten-year period and again every five years thereafter. These payment adjustments are not subject to the 7.5 percent limit and may be substantial due to changes in interest rates and the addition of unpaid interest to the loan balance. Payment advantage ARMs have interest rates that are fixed for an initial period of five years. Payments are subject to reset if the minimum payments are made and deferred interest limits are reached. If interest deferrals cause a loan’s principal balance to reach a certain level within the first 10 years of the life of the loan, the payment is reset to the interest-only payment; then at the 10-year point, the fully-amortizing payment is required.
The difference between the frequency of changes in a loan’s interest rates and payments along with a limitation on changes in the minimum monthly payments of 7.5 percent per year can result in payments that are not sufficient to pay all of the monthly interest charges (i.e., negative amortization). Unpaid interest is added to the loan balance until the loan balance increases to a specified limit, which can be no more than 115 percent of the original loan amount, at which time a new monthly payment amount adequate to repay the loan over its remaining contractual life is established.
76788ba_financials.indd 82 3/6/14 12:05 PM

Bank of America 2013 83
At December 31, 2013, the unpaid principal balance of pay option loans was $4.5 billion, with a carrying value of $4.4 billion, including $4.0 billion of loans that were credit-impaired upon acquisition and, accordingly, the reserve is based on a life-of-loan loss estimate. The total unpaid principal balance of pay option loans with accumulated negative amortization was $2.2 billion including $137 million of negative amortization. For those borrowers who are making payments in accordance with their contractual terms, five percent and 10 percent at December 31, 2013 and 2012 elected to make only the minimum payment on pay option ARMs. We believe the majority of borrowers are now making scheduled payments primarily because the low rate environment has caused the fully indexed rates to be affordable to more borrowers. We continue to evaluate our exposure to payment resets on the acquired negative-amortizing loans including the PCI pay option loan portfolio and have taken into consideration in the evaluation several assumptions including prepayment and default rates. Of the loans in the pay option portfolio at December 31, 2013 that have not already experienced a payment reset, less than one percent are expected to reset before 2016, 26 percent are expected to reset in 2016 and approximately 10 percent are expected to reset thereafter. In addition, 10 percent are expected to prepay and approximately 53 percent are expected to default prior to being reset, most of which were severely delinquent as of December 31, 2013.
Purchased Credit-impaired Home Equity Loan PortfolioThe PCI home equity portfolio represented 26 percent of the total PCI loan portfolio at December 31, 2013. Those loans with a refreshed FICO score below 620 represented 16 percent of the PCI home equity portfolio at December 31, 2013. Loans with a refreshed CLTV greater than 90 percent, after consideration of purchase accounting adjustments and the related valuation allowance, represented 69 percent of the PCI home equity portfolio and 71 percent based on the unpaid principal balance at December 31, 2013. Table 36 presents outstandings net of purchase accounting adjustments and before the related valuation allowance, by certain state concentrations.
Table 36 Outstanding Purchased Credit-impaired LoanPortfolio – Home Equity State Concentrations
December 31(Dollars in millions) 2013 2012California $ 1,921 $ 2,629Florida (1) 356 524Virginia 310 383Arizona 214 297Colorado 199 264Other U.S./Non-U.S. 3,593 4,570
Total $ 6,593 $ 8,667(1) In this state, foreclosure requires a court order following a legal proceeding (judicial state).
U.S. Credit CardAt December 31, 2013, 96 percent of the U.S. credit card portfolio was managed in CBB with the remainder managed in GWIM. Outstandings in the U.S. credit card portfolio decreased $2.5 billion in 2013 primarily due to higher payment volumes as well as net charge-offs and the transfer of loans to LHFS, partially offset by new originations. Net charge-offs decreased $1.3 billion to $3.4 billion in 2013 due to improvements in delinquencies and bankruptcies as a result of an improved economic environment, account management on higher risk accounts and the impact of higher credit quality originations. U.S. credit card loans 30 days or more past due and still accruing interest decreased $675 million while loans 90 days or more past due and still accruing interest declined $384 million in 2013 as a result of the factors mentioned above that contributed to lower net charge-offs.
Table 37 presents certain key credit statistics for the U.S. credit card portfolio.
Table 37 U.S. Credit Card – Key Credit Statistics
December 31(Dollars in millions) 2013 2012Outstandings $ 92,338 $ 94,835Accruing past due 30 days or more 2,073 2,748Accruing past due 90 days or more 1,053 1,437
2013 2012Net charge-offs $ 3,376 $ 4,632Net charge-off ratios (1) 3.74% 4.88%
(1) Net charge-off ratios are calculated as net charge-offs divided by average outstanding loans.
Unused lines of credit for U.S. credit card totaled $315.1 billion and $335.5 billion at December 31, 2013 and 2012. The $20.4 billion decrease was driven by closure of inactive accounts, partially offset by new originations and credit line increases.
76788ba_financials.indd 83 3/6/14 12:05 PM

84 Bank of America 2013
Table 38 presents certain state concentrations for the U.S. credit card portfolio.
Table 38 U.S. Credit Card State Concentrations
December 31
OutstandingsAccruing Past Due90 Days or More Net Charge-offs
(Dollars in millions) 2013 2012 2013 2012 2013 2012California $ 13,689 $ 14,101 $ 162 $ 235 $ 562 $ 840Florida 7,339 7,469 105 149 359 512Texas 6,405 6,448 72 92 217 290New York 5,624 5,746 70 91 219 263New Jersey 3,868 3,959 48 60 150 178Other U.S. 55,413 57,112 596 810 1,869 2,549
Total U.S. credit card portfolio $ 92,338 $ 94,835 $ 1,053 $ 1,437 $ 3,376 $ 4,632
Non-U.S. Credit CardOutstandings in the non-U.S. credit card portfolio, which are recorded in All Other, decreased $156 million in 2013 due to higher payment volumes as well as net charge-offs, partially offset by new origination volume and a stronger foreign currency exchange rate. Net charge-offs decreased $182 million to $399 million in 2013 due primarily to improvement in delinquencies as a result of higher credit quality originations.
Unused lines of credit for non-U.S. credit card totaled $31.1 billion and $32.2 billion at December 31, 2013 and 2012. The $1.1 billion decrease was driven by closure of accounts, partially offset by new originations, credit line increases and a stronger foreign currency exchange rate.
Table 39 presents certain key credit statistics for the non-U.S. credit card portfolio.
Table 39 Non-U.S. Credit Card – Key Credit Statistics
December 31(Dollars in millions) 2013 2012Outstandings $ 11,541 $ 11,697Accruing past due 30 days or more 248 403Accruing past due 90 days or more 131 212
2013 2012Net charge-offs $ 399 $ 581Net charge-off ratios (1) 3.68% 4.29%
(1) Net charge-off ratios are calculated as net charge-offs divided by average outstanding loans.
Direct/Indirect ConsumerAt December 31, 2013, approximately 50 percent of the direct/ indirect portfolio was included in CBB (consumer dealer financial services – automotive, marine, aircraft, recreational vehicle loans and consumer personal loans), 43 percent was included in GWIM (principally securities-based lending loans and other personal loans) and the remainder was primarily in All Other (the GWIM International Wealth Management (IWM) businesses based outside of the U.S. and student loans).
Outstandings in the direct/indirect portfolio decreased $1.0 billion in 2013 as a loan sale in the securities-based lending portfolio in connection with the Corporation’s agreement to sell the IWM businesses and lower outstandings in the unsecured consumer lending portfolio were partially offset by growth in the consumer dealer financial services auto portfolio and the securities-based lending portfolio. Net charge-offs decreased $418 million to $345 million in 2013, or 0.42 percent of total average direct/indirect loans, compared to $763 million, or 0.90 percent in 2012. This decrease was primarily driven by improvements in delinquencies and bankruptcies in the unsecured consumer lending portfolio as a result of an improved economic environment as well as reduced outstandings in this portfolio.
Net charge-offs in the unsecured consumer lending portfolio decreased $295 million to $190 million in 2013, or 5.26 percent of total average unsecured consumer lending loans compared to 7.68 percent in 2012. Direct/indirect loans that were past due 30 days or more and still accruing interest declined $339 million to $1.0 billion in 2013 due to improvements in the unsecured consumer lending, dealer financial services and student lending portfolios.
76788ba_financials.indd 84 3/6/14 12:05 PM

Bank of America 2013 85
Table 40 presents certain state concentrations for the direct/indirect consumer loan portfolio.
Table 40 Direct/Indirect State Concentrations
December 31
OutstandingsAccruing Past Due90 Days or More Net Charge-offs
(Dollars in millions) 2013 2012 2013 2012 2013 2012California $ 10,041 $ 10,793 $ 57 $ 53 $ 42 $ 102Texas 7,850 7,239 66 41 32 64Florida 7,634 7,363 25 37 41 88New York 4,611 4,794 33 28 20 43Georgia 2,564 2,491 16 31 14 30Other U.S./Non-U.S. 49,492 50,525 211 355 196 436
Total direct/indirect loan portfolio $ 82,192 $ 83,205 $ 408 $ 545 $ 345 $ 763
Other ConsumerAt December 31, 2013, approximately 60 percent of the $2.0 billion other consumer portfolio was associated with certain consumer finance businesses that we previously exited. The remainder is primarily leases within the consumer dealer financial services portfolio included in CBB.
Consumer Loans Accounted for Under the Fair Value OptionOutstanding consumer loans accounted for under the fair value option totaled $2.2 billion at December 31, 2013 and were comprised of residential mortgage loans that were previously classified as held-for-sale, residential mortgage loans held in consolidated variable interest entities (VIEs) and repurchases of home equity loans. The loans that were previously classified as held-for-sale were transferred to the residential mortgage portfolio in connection with the decision to retain the loans. The fair value option had been elected at the time of origination and the loans continue to be measured at fair value after the reclassification. In 2013, we recorded net losses of $2 million resulting from changes in the fair value of these loans, including gains of $41 million on loans held in consolidated VIEs that were offset by losses recorded on related long-term debt.
Nonperforming Consumer Loans, Leases and Foreclosed Properties ActivityTable 41 presents nonperforming consumer loans, leases and foreclosed properties activity during 2013 and 2012. Nonperforming LHFS are excluded from nonperforming loans as they are recorded at either fair value or the lower of cost or fair value. Nonperforming loans do not include past due consumer credit card loans, other unsecured loans and in general, consumer non-real estate-secured loans (loans discharged in Chapter 7 bankruptcy are included) as these loans are typically charged off no later than the end of the month in which the loan becomes 180 days past due. The charge-offs on these loans have no impact on nonperforming activity and, accordingly, are excluded from this table. The fully-insured loan portfolio is not reported as nonperforming as principal repayment is insured. Additionally, nonperforming loans do not include the PCI loan portfolio or loans
accounted for under the fair value option. For more information on nonperforming loans, see Note 1 – Summary of Significant Accounting Principles to the Consolidated Financial Statements. During 2013, nonperforming consumer loans declined $3.6 billion to $15.8 billion as outflows, including the impact of loan sales, outpaced new inflows which continued to improve due to favorable delinquency trends.
The outstanding balance of a real estate-secured loan that is in excess of the estimated property value less costs to sell is charged off no later than the end of the month in which the loan becomes 180 days past due unless repayment of the loan is fully insured. At December 31, 2013, $7.7 billion, or 47 percent of nonperforming consumer real estate loans and foreclosed properties had been written down to their estimated property value less costs to sell, including $7.2 billion of nonperforming loans 180 days or more past due and $533 million of foreclosed properties. In addition, at December 31, 2013, $5.9 billion, or 37 percent of nonperforming consumer loans were modified and are now current after successful trial periods, or are current loans classified as nonperforming loans in accordance with applicable policies.
Foreclosed properties decreased $117 million in 2013 as liquidations outpaced additions. PCI loans are excluded from nonperforming loans as these loans were written down to fair value at the acquisition date; however, once the underlying real estate is acquired by the Corporation upon foreclosure of the delinquent PCI loan, it is included in foreclosed properties. PCI-related foreclosed properties increased $165 million in 2013. Not included in foreclosed properties at December 31, 2013 was $1.4 billion of real estate that was acquired upon foreclosure of delinquent FHA-insured loans. We hold this real estate on our balance sheet until we convey these properties to the FHA. We exclude these amounts from our nonperforming loans and foreclosed properties activity as we expect we will be reimbursed once the property is conveyed to the FHA for principal and, up to certain limits, costs incurred during the foreclosure process and interest incurred during the holding period. For more information on the review of our foreclosure processes, see Off-Balance Sheet Arrangements and Contractual Obligations – Servicing, Foreclosure and Other Mortgage Matters on page 53.
76788ba_financials.indd 85 3/6/14 12:05 PM
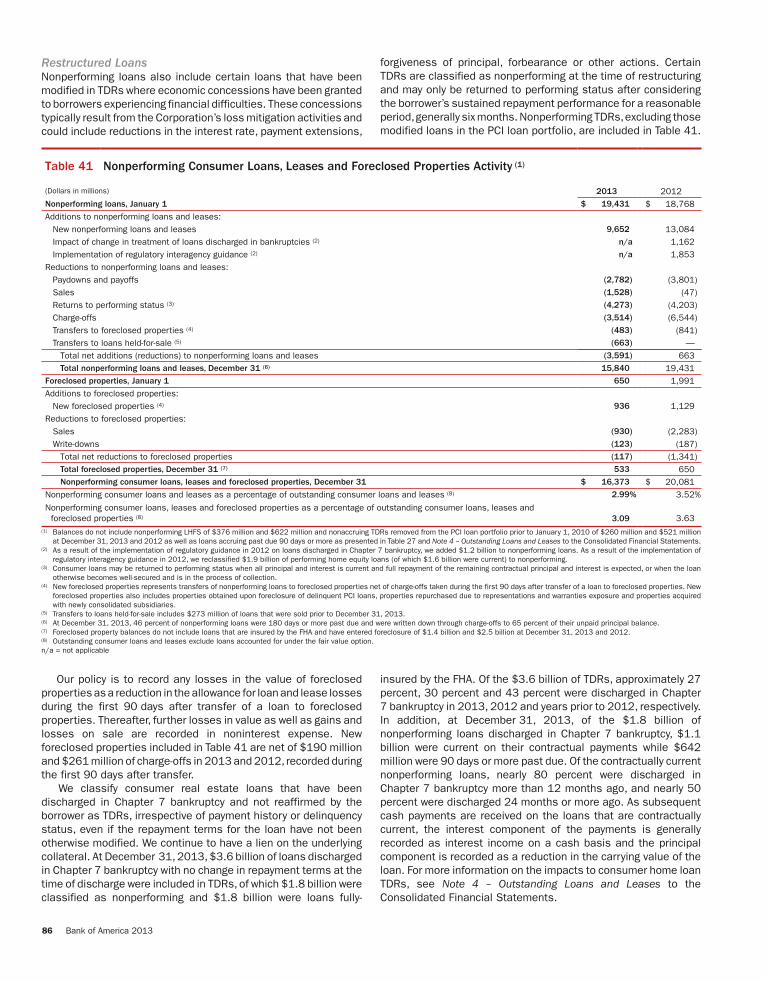
86 Bank of America 2013
Restructured LoansNonperforming loans also include certain loans that have been modified in TDRs where economic concessions have been granted to borrowers experiencing financial difficulties. These concessions typically result from the Corporation’s loss mitigation activities and could include reductions in the interest rate, payment extensions,
forgiveness of principal, forbearance or other actions. Certain TDRs are classified as nonperforming at the time of restructuring and may only be returned to performing status after considering the borrower’s sustained repayment performance for a reasonable period, generally six months. Nonperforming TDRs, excluding those modified loans in the PCI loan portfolio, are included in Table 41.
Table 41 Nonperforming Consumer Loans, Leases and Foreclosed Properties Activity (1)
(Dollars in millions) 2013 2012Nonperforming loans, January 1 $ 19,431 $ 18,768Additions to nonperforming loans and leases:
New nonperforming loans and leases 9,652 13,084Impact of change in treatment of loans discharged in bankruptcies (2) n/a 1,162Implementation of regulatory interagency guidance (2) n/a 1,853
Reductions to nonperforming loans and leases: Paydowns and payoffs (2,782) (3,801)Sales (1,528) (47)Returns to performing status (3) (4,273) (4,203)Charge-offs (3,514) (6,544)Transfers to foreclosed properties (4) (483) (841)Transfers to loans held-for-sale (5) (663) —
Total net additions (reductions) to nonperforming loans and leases (3,591) 663Total nonperforming loans and leases, December 31 (6) 15,840 19,431
Foreclosed properties, January 1 650 1,991Additions to foreclosed properties:
New foreclosed properties (4) 936 1,129Reductions to foreclosed properties:
Sales (930) (2,283)Write-downs (123) (187)
Total net reductions to foreclosed properties (117) (1,341)Total foreclosed properties, December 31 (7) 533 650Nonperforming consumer loans, leases and foreclosed properties, December 31 $ 16,373 $ 20,081
Nonperforming consumer loans and leases as a percentage of outstanding consumer loans and leases (8) 2.99% 3.52%
Nonperforming consumer loans, leases and foreclosed properties as a percentage of outstanding consumer loans, leases and foreclosed properties (8) 3.09 3.63
(1) Balances do not include nonperforming LHFS of $376 million and $622 million and nonaccruing TDRs removed from the PCI loan portfolio prior to January 1, 2010 of $260 million and $521 million at December 31, 2013 and 2012 as well as loans accruing past due 90 days or more as presented in Table 27 and Note 4 – Outstanding Loans and Leases to the Consolidated Financial Statements.
(2) As a result of the implementation of regulatory guidance in 2012 on loans discharged in Chapter 7 bankruptcy, we added $1.2 billion to nonperforming loans. As a result of the implementation of regulatory interagency guidance in 2012, we reclassified $1.9 billion of performing home equity loans (of which $1.6 billion were current) to nonperforming.
(3) Consumer loans may be returned to performing status when all principal and interest is current and full repayment of the remaining contractual principal and interest is expected, or when the loan otherwise becomes well-secured and is in the process of collection.
(4) New foreclosed properties represents transfers of nonperforming loans to foreclosed properties net of charge-offs taken during the first 90 days after transfer of a loan to foreclosed properties. New foreclosed properties also includes properties obtained upon foreclosure of delinquent PCI loans, properties repurchased due to representations and warranties exposure and properties acquired with newly consolidated subsidiaries.
(5) Transfers to loans held-for-sale includes $273 million of loans that were sold prior to December 31, 2013.(6) At December 31, 2013, 46 percent of nonperforming loans were 180 days or more past due and were written down through charge-offs to 65 percent of their unpaid principal balance.(7) Foreclosed property balances do not include loans that are insured by the FHA and have entered foreclosure of $1.4 billion and $2.5 billion at December 31, 2013 and 2012. (8) Outstanding consumer loans and leases exclude loans accounted for under the fair value option.n/a = not applicable
Our policy is to record any losses in the value of foreclosed properties as a reduction in the allowance for loan and lease losses during the first 90 days after transfer of a loan to foreclosed properties. Thereafter, further losses in value as well as gains and losses on sale are recorded in noninterest expense. New foreclosed properties included in Table 41 are net of $190 million and $261 million of charge-offs in 2013 and 2012, recorded during the first 90 days after transfer.
We classify consumer real estate loans that have been discharged in Chapter 7 bankruptcy and not reaffirmed by the borrower as TDRs, irrespective of payment history or delinquency status, even if the repayment terms for the loan have not been otherwise modified. We continue to have a lien on the underlying collateral. At December 31, 2013, $3.6 billion of loans discharged in Chapter 7 bankruptcy with no change in repayment terms at the time of discharge were included in TDRs, of which $1.8 billion were classified as nonperforming and $1.8 billion were loans fully-
insured by the FHA. Of the $3.6 billion of TDRs, approximately 27 percent, 30 percent and 43 percent were discharged in Chapter 7 bankruptcy in 2013, 2012 and years prior to 2012, respectively. In addition, at December 31, 2013, of the $1.8 billion of nonperforming loans discharged in Chapter 7 bankruptcy, $1.1 billion were current on their contractual payments while $642 million were 90 days or more past due. Of the contractually current nonperforming loans, nearly 80 percent were discharged in Chapter 7 bankruptcy more than 12 months ago, and nearly 50 percent were discharged 24 months or more ago. As subsequent cash payments are received on the loans that are contractually current, the interest component of the payments is generally recorded as interest income on a cash basis and the principal component is recorded as a reduction in the carrying value of the loan. For more information on the impacts to consumer home loan TDRs, see Note 4 – Outstanding Loans and Leases to the Consolidated Financial Statements.
76788ba_financials.indd 86 3/6/14 12:05 PM

Bank of America 2013 87
We classify junior-lien home equity loans as nonperforming when the first-lien loan becomes 90 days past due even if the junior-lien loan is performing. At December 31, 2013 and 2012, $1.2 billion and $1.5 billion of such junior-lien home equity loans were included in nonperforming loans and leases.
Table 42 presents TDRs for the home loans portfolio. Performing TDR balances are excluded from nonperforming loans in Table 41.
Table 42 Home Loans Troubled Debt Restructurings
December 31
2013 2012(Dollars in millions) Total Nonperforming Performing Total Nonperforming PerformingResidential mortgage (1, 2) $ 29,312 $ 7,555 $ 21,757 $ 28,125 $ 9,040 $ 19,085Home equity (3) 2,146 1,389 757 2,125 1,242 883
Total home loans troubled debt restructurings $ 31,458 $ 8,944 $ 22,514 $ 30,250 $ 10,282 $ 19,968(1) Residential mortgage TDRs deemed collateral dependent totaled $8.2 billion and $9.4 billion, and included $5.7 billion and $6.4 billion of loans classified as nonperforming and $2.5 billion and
$3.0 billion of loans classified as performing at December 31, 2013 and 2012.(2) Residential mortgage performing TDRs included $14.3 billion and $11.9 billion of loans that were fully-insured at December 31, 2013 and 2012.(3) Home equity TDRs deemed collateral dependent totaled $1.4 billion and $1.4 billion, and included $1.2 billion and $1.0 billion of loans classified as nonperforming and $227 million and $348
million of loans classified as performing at December 31, 2013 and 2012.
We work with customers that are experiencing financial difficulty by modifying credit card and other consumer loans, while complying with Federal Financial Institutions Examination Council (FFIEC) guidelines. Credit card and other consumer loan modifications generally involve a reduction in the customer’s interest rate on the account and placing the customer on a fixed payment plan not exceeding 60 months, all of which are considered TDRs (the renegotiated TDR portfolio). In addition, non-U.S. credit card modifications may involve reducing the interest rate on the account without placing the customer on a fixed payment plan, and these are also considered TDRs (also a part of the renegotiated TDR portfolio).
In all cases, the customer’s available line of credit is canceled. We make modifications primarily through internal renegotiation programs utilizing direct customer contact, but may also utilize external renegotiation programs. The renegotiated TDR portfolio is excluded in large part from Table 41 as substantially all of the loans remain on accrual status until either charged off or paid in full. At December 31, 2013 and 2012, our renegotiated TDR portfolio was $2.1 billion and $3.9 billion, of which $1.6 billion and $3.1 billion were current or less than 30 days past due under the modified terms. The decline in the renegotiated TDR portfolio was primarily driven by paydowns and charge-offs as well as lower program enrollments. For more information on the renegotiated TDR portfolio, see Note 4 – Outstanding Loans and Leases to the Consolidated Financial Statements.
Commercial Portfolio Credit Risk ManagementCredit risk management for the commercial portfolio begins with an assessment of the credit risk profile of the borrower or counterparty based on an analysis of its financial position. As part of the overall credit risk assessment, our commercial credit exposures are assigned a risk rating and are subject to approval based on defined credit approval standards. Subsequent to loan origination, risk ratings are monitored on an ongoing basis, and if necessary, adjusted to reflect changes in the financial condition, cash flow, risk profile or outlook of a borrower or counterparty. In making credit decisions, we consider risk rating, collateral, country, industry and single name concentration limits while also balancing this with total borrower or counterparty relationship. Our business and risk management personnel use a variety of tools to continuously monitor the ability of a borrower or counterparty to perform under its obligations. We use risk rating aggregations to
measure and evaluate concentrations within portfolios. In addition, risk ratings are a factor in determining the level of allocated capital and the allowance for credit losses.
For information on our accounting policies regarding delinquencies, nonperforming status and net charge-offs for the commercial portfolio, see Note 1 – Summary of Significant Accounting Principles to the Consolidated Financial Statements.
Management of Commercial Credit RiskConcentrationsCommercial credit risk is evaluated and managed with the goal that concentrations of credit exposure do not result in undesirable levels of risk. We review, measure and manage concentrations of credit exposure by industry, product, geography, customer relationship and loan size. We also review, measure and manage commercial real estate loans by geographic location and property type. In addition, within our non-U.S. portfolio, we evaluate exposures by region and by country. Tables 47, 52, 60 and 61 summarize our concentrations. We also utilize syndications of exposure to third parties, loan sales, hedging and other risk mitigation techniques to manage the size and risk profile of the commercial credit portfolio.
As part of our ongoing risk mitigation initiatives, we attempt to work with clients experiencing financial difficulty to modify their loans to terms that better align with their current ability to pay. In situations where an economic concession has been granted to a borrower experiencing financial difficulty, we identify these loans as TDRs.
We account for certain large corporate loans and loan commitments, including issued but unfunded letters of credit which are considered utilized for credit risk management purposes, that exceed our single name credit risk concentration guidelines under the fair value option. Lending commitments, both funded and unfunded, are actively managed and monitored, and as appropriate, credit risk for these lending relationships may be mitigated through the use of credit derivatives, with the Corporation’s credit view and market perspectives determining the size and timing of the hedging activity. In addition, we purchase credit protection to cover the funded portion as well as the unfunded portion of certain other credit exposures. To lessen the cost of obtaining our desired credit protection levels, credit exposure may be added within an industry, borrower or counterparty group by selling protection. These credit derivatives
76788ba_financials.indd 87 3/6/14 12:06 PM

88 Bank of America 2013
do not meet the requirements for treatment as accounting hedges. They are carried at fair value with changes in fair value recorded in other income (loss).
Commercial Credit PortfolioDuring 2013, credit quality in the commercial loan portfolio continued to show improvement. Reservable criticized balances and nonperforming loans, leases and foreclosed property balances declined during 2013 with the declines primarily in the U.S. commercial and commercial real estate portfolios. Most other credit quality indicators across the remaining commercial
portfolios also improved. The allowance for loan and lease losses for the commercial portfolio increased $899 million in 2013 to $4.0 billion as continued improvement in credit quality was more than offset by an increase associated with loan growth across the core commercial portfolio (total commercial products excluding U.S. small business). For additional information, see Allowance for Credit Losses on page 100.
Table 43 presents our commercial loans and leases, and related credit quality information at December 31, 2013 and 2012.
Table 43 Commercial Loans and Leases
December 31
Outstandings NonperformingAccruing Past Due90 Days or More
(Dollars in millions) 2013 2012 2013 2012 2013 2012U.S. commercial $ 212,557 $ 197,126 $ 819 $ 1,484 $ 47 $ 65Commercial real estate (1) 47,893 38,637 322 1,513 21 29Commercial lease financing 25,199 23,843 16 44 41 15Non-U.S. commercial 89,462 74,184 64 68 17 —
375,111 333,790 1,221 3,109 126 109U.S. small business commercial (2) 13,294 12,593 88 115 78 120
Commercial loans excluding loans accounted for under the fair value option 388,405 346,383 1,309 3,224 204 229Loans accounted for under the fair value option (3) 7,878 7,997 2 11 — —
Total commercial loans and leases $ 396,283 $ 354,380 $ 1,311 $ 3,235 $ 204 $ 229(1) Includes U.S. commercial real estate loans of $46.3 billion and $37.2 billion and non-U.S. commercial real estate loans of $1.6 billion and $1.5 billion at December 31, 2013 and 2012.(2) Includes card-related products.(3) Commercial loans accounted for under the fair value option include U.S. commercial loans of $1.5 billion and $2.3 billion and non-U.S. commercial loans of $6.4 billion and $5.7 billion at December
31, 2013 and 2012. For more information on the fair value option, see Note 21 – Fair Value Option to the Consolidated Financial Statements.
Outstanding commercial loans and leases increased $41.9 billion in 2013, primarily in U.S. commercial and non-U.S. commercial product types. Nonperforming commercial loans and leases as a percentage of outstanding commercial loans and leases improved during 2013 to 0.33 percent from 0.91 percent
(0.34 percent and 0.93 percent excluding loans accounted for under the fair value option) at December 31, 2012.
Table 44 presents net charge-offs and related ratios for our commercial loans and leases for 2013 and 2012. Improving trends across the portfolio drove lower charge-offs.
Table 44 Commercial Net Charge-offs and Related Ratios
Net Charge-offs Net Charge-off Ratios (1)
(Dollars in millions) 2013 2012 2013 2012U.S. commercial $ 128 $ 242 0.06% 0.13%Commercial real estate 149 384 0.35 1.01Commercial lease financing (25) (6) (0.10) (0.03)Non-U.S. commercial 45 28 0.05 0.05 297 648 0.08 0.21U.S. small business commercial 359 699 2.84 5.46
Total commercial $ 656 $ 1,347 0.18 0.43(1) Net charge-off ratios are calculated as net charge-offs divided by average outstanding loans and leases excluding loans accounted for under the fair value option.
76788ba_financials.indd 88 3/6/14 12:06 PM

Bank of America 2013 89
Table 45 presents commercial credit exposure by type for utilized, unfunded and total binding committed credit exposure. Commercial utilized credit exposure includes SBLCs and financial guarantees, bankers’ acceptances and commercial letters of credit for which we are legally bound to advance funds under prescribed conditions, during a specified time period. Although funds have not yet been advanced, these exposure types are considered utilized for credit risk management purposes. Total
commercial committed credit exposure increased $56.8 billion in 2013 primarily driven by increases in loans and leases.
Total commercial utilized credit exposure increased $35.8 billion in 2013 primarily driven by increases in loans and leases. The utilization rate for loans and leases, SBLCs and financial guarantees, commercial letters of credit and bankers’ acceptances was 58 percent at both December 31, 2013 and 2012.
Table 45 Commercial Credit Exposure by Type
December 31
Commercial Utilized (1)
Commercial Unfunded (2, 3)
Total CommercialCommitted
(Dollars in millions) 2013 2012 2013 2012 2013 2012Loans and leases $ 396,283 $ 354,380 $ 307,478 $ 281,915 $ 703,761 $ 636,295Derivative assets (4) 47,495 53,497 — — 47,495 53,497Standby letters of credit and financial guarantees 35,893 41,036 1,334 2,119 37,227 43,155Debt securities and other investments 18,505 10,937 6,903 6,914 25,408 17,851Loans held-for-sale 6,604 7,928 101 3,763 6,705 11,691Commercial letters of credit 2,054 2,065 515 564 2,569 2,629Bankers’ acceptances 246 185 — 3 246 188Foreclosed properties and other (5) 414 1,699 — — 414 1,699
Total $ 507,494 $ 471,727 $ 316,331 $ 295,278 $ 823,825 $ 767,005(1) Total commercial utilized exposure includes loans and issued letters of credit accounted for under the fair value option and is comprised of loans outstanding of $7.9 billion and $8.0 billion and
letters of credit with a notional amount of $503 million and $672 million at December 31, 2013 and 2012.(2) Total commercial unfunded exposure includes loan commitments accounted for under the fair value option with a notional amount of $12.5 billion and $17.6 billion at December 31, 2013 and 2012.(3) Excludes unused business card lines which are not legally binding.(4) Derivative assets are carried at fair value, reflect the effects of legally enforceable master netting agreements and have been reduced by cash collateral of $47.3 billion and $58.1 billion at December
31, 2013 and 2012. Not reflected in utilized and committed exposure is additional derivative collateral held of $17.1 billion and $18.7 billion which consists primarily of other marketable securities.(5) The net monoline exposure of $1.3 billion at December 31, 2012 was settled during 2013.
Table 46 presents commercial utilized reservable criticized exposure by product type. Criticized exposure corresponds to the Special Mention, Substandard and Doubtful asset categories as defined by regulatory authorities. Total commercial utilized reservable criticized exposure decreased $3.1 billion, or 19 percent, in 2013 primarily in the commercial real estate portfolio
driven largely by continued paydowns, upgrades, charge-offs and sales outpacing downgrades. At December 31, 2013, approximately 84 percent of commercial utilized reservable criticized exposure was secured compared to 82 percent at December 31, 2012.
Table 46 Commercial Utilized Reservable Criticized Exposure
December 31
2013 2012(Dollars in millions) Amount (1) Percent (2) Amount (1) Percent (2)
U.S. commercial $ 8,362 3.45% $ 8,631 3.72%Commercial real estate 1,452 2.92 3,782 9.24Commercial lease financing 988 3.92 969 4.06Non-U.S. commercial 1,424 1.49 1,614 2.02 12,226 2.96 14,996 3.98U.S. small business commercial 635 4.77 940 7.45
Total commercial utilized reservable criticized exposure $ 12,861 3.02 $ 15,936 4.10(1) Total commercial utilized reservable criticized exposure includes loans and leases of $11.5 billion and $14.6 billion and commercial letters of credit of $1.4 billion and $1.3 billion at December 31,
2013 and 2012.(2) Percentages are calculated as commercial utilized reservable criticized exposure divided by total commercial utilized reservable exposure for each exposure category.
U.S. CommercialAt December 31, 2013, 62 percent of the U.S. commercial loan portfolio, excluding small business, was managed in Global Banking, 17 percent in Global Markets, 10 percent in GWIM (business-purpose loans for high net-worth clients) and the remainder primarily in CBB. U.S. commercial loans, excluding loans accounted for under the fair value option, increased $15.4 billion,
or eight percent, in 2013 with growth across the majority of core commercial portfolios. Nonperforming loans and leases decreased $665 million in 2013. Net charge-offs decreased $114 million to $128 million in 2013. The declines were broad-based with respect to clients and industries, driven by improved client credit profiles and liquidity.
76788ba_financials.indd 89 3/6/14 12:06 PM

90 Bank of America 2013
Commercial Real EstateCommercial real estate primarily includes commercial loans and leases secured by non-owner-occupied real estate and is dependent on the sale or lease of the real estate as the primary source of repayment. The portfolio remains diversified across property types and geographic regions. California represented the largest state concentration at 22 percent and 23 percent of commercial real estate loans and leases at December 31, 2013 and 2012. The commercial real estate portfolio is predominantly managed in Global Banking and consists of loans made primarily to public and private developers, and commercial real estate firms. Outstanding loans increased $9.3 billion, or 24 percent, in 2013 primarily due to new originations in major metropolitan markets.
During 2013, we continued to see improvements in credit quality in both the residential and non-residential portfolios. We
use a number of proactive risk mitigation initiatives to reduce adversely rated exposure in the commercial real estate portfolio including transfers of deteriorating exposures to management by independent special asset officers and the pursuit of loan restructurings or asset sales to achieve the best results for our customers and the Corporation.
Nonperforming commercial real estate loans and foreclosed properties decreased $1.4 billion, or 77 percent, and reservable criticized balances decreased $2.3 billion, or 62 percent, in 2013.Net charge-offs declined $235 million to $149 million in 2013. These improvements were primarily in the non-residential portfolio.
Table 47 presents outstanding commercial real estate loans by geographic region, based on the geographic location of the collateral, and by property type.
Table 47 Outstanding Commercial Real Estate Loans
December 31(Dollars in millions) 2013 2012By Geographic Region
California $ 10,358 $ 8,792Northeast 9,487 7,315Southwest 6,913 4,612Southeast 5,314 4,440Midwest 3,109 3,421Florida 3,030 2,148Illinois 2,319 1,700Northwest 2,037 1,553Midsouth 2,013 1,980Non-U.S. 1,582 1,483Other (1) 1,731 1,193
Total outstanding commercial real estate loans $ 47,893 $ 38,637By Property Type Non-residential
Office $ 12,799 $ 9,324Multi-family rental 8,559 5,893Shopping centers/retail 7,470 5,780Industrial/warehouse 4,522 3,839Hotels/motels 3,926 3,095Multi-use 1,960 2,186Land and land development 855 1,157Other 6,283 5,722
Total non-residential 46,374 36,996Residential 1,519 1,641
Total outstanding commercial real estate loans $ 47,893 $ 38,637(1) Includes unsecured loans to real estate investment trusts and national home builders whose portfolios of properties span multiple geographic regions and properties in the states of Colorado, Utah,
Hawaii, Wyoming and Montana.
76788ba_financials.indd 90 3/6/14 12:06 PM

Bank of America 2013 91
Tables 48 and 49 present commercial real estate credit quality data by non-residential and residential property types. The residential portfolio presented in Tables 47, 48 and 49 includes condominiums and other residential real estate. Other property
types in Tables 47, 48 and 49 primarily include special purpose, nursing/retirement homes, medical facilities and restaurants, as well as unsecured loans to borrowers whose primary business is commercial real estate.
Table 48 Commercial Real Estate Credit Quality Data
December 31
Nonperforming Loans andForeclosed Properties (1)
Utilized ReservableCriticized Exposure (2)
(Dollars in millions) 2013 2012 2013 2012Non-residential
Office $ 96 $ 295 $ 367 $ 914Multi-family rental 15 109 234 375Shopping centers/retail 57 230 144 464Industrial/warehouse 22 160 119 324Hotels/motels 5 45 38 202Multi-use 19 123 157 309Land and land development 73 321 92 359Other 23 87 173 301
Total non-residential 310 1,370 1,324 3,248Residential 102 393 128 534
Total commercial real estate $ 412 $ 1,763 $ 1,452 $ 3,782(1) Includes commercial foreclosed properties of $90 million and $250 million at December 31, 2013 and 2012.(2) Includes loans, SBLCs and bankers’ acceptances and excludes loans accounted for under the fair value option.
Table 49 Commercial Real Estate Net Charge-offs and Related Ratios
Net Charge-offs Net Charge-off Ratios (1)
(Dollars in millions) 2013 2012 2013 2012Non-residential
Office $ 42 $ 106 0.39% 1.36%Multi-family rental 2 13 0.02 0.23Shopping centers/retail 12 57 0.18 1.00Industrial/warehouse 23 49 0.55 1.31Hotels/motels 18 11 0.52 0.39Multi-use 5 66 0.26 2.46Land and land development 23 (23) 2.35 (1.73)Other (23) 31 (0.41) 0.51
Total non-residential 102 310 0.25 0.86Residential 47 74 3.04 3.74
Total commercial real estate $ 149 $ 384 0.35 1.01(1) Net charge-off ratios are calculated as net charge-offs divided by average outstanding loans excluding loans accounted for under the fair value option.
At December 31, 2013, total committed non-residential exposure was $68.6 billion compared to $54.5 billion at December 31, 2012, of which $46.4 billion and $37.0 billion were funded secured loans. Non-residential nonperforming loans and foreclosed properties declined $1.1 billion, or 77 percent, to $310 million at December 31, 2013 compared to $1.4 billion at December 31, 2012, which represented 0.67 percent and 3.68 percent of total non-residential loans and foreclosed properties. The decline in nonperforming loans and foreclosed properties in the non-residential portfolio was driven by decreases across all property types. Non-residential utilized reservable criticized exposure decreased $1.9 billion, or 59 percent, to $1.3 billion at December 31, 2013 compared to $3.2 billion at December 31, 2012, which represented 2.75 percent and 8.27 percent of non-residential utilized reservable exposure, with the decrease primarily due to continued resolution of legacy criticized exposure. The decrease in reservable criticized exposure was driven by decreases across all property types. For the non-residential portfolio, net charge-offs decreased $208 million to $102 million
in 2013 primarily due to lower overall levels of criticized and nonperforming assets.
At December 31, 2013, total committed residential exposure was $3.1 billion compared to $3.2 billion at December 31, 2012, of which $1.5 billion and $1.6 billion were funded secured loans. Residential nonperforming loans and foreclosed properties decreased $291 million, or 74 percent, in 2013 due to repayments, sales and loan restructuring. Residential utilized reservable criticized exposure decreased $406 million, or 76 percent, during 2013 due to continued resolution of criticized exposure. The nonperforming loans, leases and foreclosed properties and the utilized reservable criticized ratios for the residential portfolio were 6.65 percent and 7.81 percent at December 31, 2013 compared to 23.33 percent and 31.56 percent at December 31, 2012. Residential portfolio net charge-offs decreased $27 million in 2013 compared to 2012.
At December 31, 2013 and 2012, the commercial real estate loan portfolio included $7.0 billion and $6.7 billion of funded construction and land development loans that were originated to
76788ba_financials.indd 91 3/6/14 12:06 PM

92 Bank of America 2013
fund the construction and/or rehabilitation of commercial properties. Reservable criticized construction and land development loans totaled $431 million and $1.5 billion, and nonperforming construction and land development loans and foreclosed properties totaled $100 million and $730 million at December 31, 2013 and 2012. During a property’s construction phase, interest income is typically paid from interest reserves that are established at the inception of the loan. As construction is completed and the property is put into service, these interest reserves are depleted and interest payments from operating cash flows begin. We do not recognize interest income on nonperforming loans regardless of the existence of an interest reserve.
Non-U.S. CommercialAt December 31, 2013, 70 percent of the non-U.S. commercial loan portfolio was managed in Global Banking and 30 percent in Global Markets. Outstanding loans, excluding loans accounted for under the fair value option, increased $15.3 billion in 2013 primarily due to increased demand from large corporate clients and client financing activity. Net charge-offs increased $17 million to $45 million in 2013. For more information on the non-U.S. commercial portfolio, see Non-U.S. Portfolio on page 96.
U.S. Small Business CommercialThe U.S. small business commercial loan portfolio is comprised of small business card loans and small business loans managed in CBB. Credit card-related products were 43 percent and 45 percent of the U.S. small business commercial portfolio at December 31, 2013 and 2012. Net charge-offs decreased $340 million to $359 million in 2013 driven by lower delinquencies and bankruptcies resulting from an improvement in credit quality within the small business loan portfolio, an improved economic environment, a reduction in higher risk vintages and the impact of higher credit quality originations. Of the U.S. small business commercial net charge-offs, 73 percent were credit card-related products in 2013 compared to 58 percent in 2012.
Commercial Loans Accounted for Under the Fair Value OptionThe portfolio of commercial loans accounted for under the fair value option is managed primarily in Global Banking. Outstanding commercial loans accounted for under the fair value option decreased $119 million to an aggregate fair value of $7.9 billion at December 31, 2013 primarily due to decreased corporate borrowings under bank credit facilities. We recorded net gains of $88 million in 2013 compared to $213 million in 2012 resulting from changes in the fair value of the loan portfolio. These amounts were primarily attributable to changes in instrument-specific credit risk, were recorded in other income (loss) and do not reflect the results of hedging activities.
In addition, unfunded lending commitments and letters of credit accounted for under the fair value option had an aggregate fair value of $354 million and $528 million at December 31, 2013 and 2012 which was recorded in accrued expenses and other liabilities. The associated aggregate notional amount of unfunded lending commitments and letters of credit accounted for under the fair value option was $13.0 billion and $18.3 billion at December 31, 2013 and 2012. We recorded net gains of $180 million from changes in the fair value of commitments and letters of credit during 2013 compared to $704 million in 2012 resulting from maturities and terminations at par value and changes in the fair value of the loan portfolio. These amounts were primarily attributable to changes in instrument-specific credit risk, were recorded in other income (loss) and do not reflect the results of hedging activities.
Nonperforming Commercial Loans, Leases and Foreclosed Properties ActivityTable 50 presents the nonperforming commercial loans, leases and foreclosed properties activity during 2013 and 2012. Nonperforming loans do not include loans accounted for under the fair value option. During 2013, nonperforming commercial loans and leases decreased $1.9 billion to $1.3 billion driven by paydowns, charge-offs and sales outpacing new nonperforming loans. Approximately 91 percent of commercial nonperforming loans, leases and foreclosed properties were secured and approximately 55 percent were contractually current. Commercial nonperforming loans were carried at approximately 71 percent of their unpaid principal balance before consideration of the allowance for loan and lease losses as the carrying value of these loans has been reduced to the estimated property value less costs to sell.
76788ba_financials.indd 92 3/6/14 12:06 PM

Bank of America 2013 93
Table 50 Nonperforming Commercial Loans, Leases and Foreclosed Properties Activity (1, 2)
(Dollars in millions) 2013 2012Nonperforming loans and leases, January 1 $ 3,224 $ 6,337Additions to nonperforming loans and leases:
New nonperforming loans and leases 1,112 2,334Advances 30 85
Reductions to nonperforming loans and leases: Paydowns (1,342) (2,372)Sales (498) (840)Returns to performing status (3) (588) (808)Charge-offs (549) (1,164)Transfers to foreclosed properties (4) (54) (302)Transfers to loans held-for-sale (26) (46)
Total net reductions to nonperforming loans and leases (1,915) (3,113)Total nonperforming loans and leases, December 31 1,309 3,224
Foreclosed properties, January 1 250 612Additions to foreclosed properties:
New foreclosed properties (4) 38 222Reductions to foreclosed properties:
Sales (169) (516)Write-downs (29) (68)
Total net reductions to foreclosed properties (160) (362)Total foreclosed properties, December 31 90 250Nonperforming commercial loans, leases and foreclosed properties, December 31 $ 1,399 $ 3,474
Nonperforming commercial loans and leases as a percentage of outstanding commercial loans and leases (5) 0.34% 0.93%
Nonperforming commercial loans, leases and foreclosed properties as a percentage of outstanding commercial loans, leases and foreclosed properties (5) 0.36 1.00
(1) Balances do not include nonperforming LHFS of $296 million and $437 million at December 31, 2013 and 2012.(2) Includes U.S. small business commercial activity. Small business card loans are excluded as they are not classified as nonperforming.(3) Commercial loans and leases may be returned to performing status when all principal and interest is current and full repayment of the remaining contractual principal and interest is expected or
when the loan otherwise becomes well-secured and is in the process of collection. TDRs are generally classified as performing after a sustained period of demonstrated payment performance.(4) New foreclosed properties represents transfers of nonperforming loans to foreclosed properties net of charge-offs recorded during the first 90 days after transfer of a loan to foreclosed properties.(5) Outstanding commercial loans exclude loans accounted for under the fair value option.
Table 51 presents our commercial TDRs by product type and performing status. U.S. small business commercial TDRs are comprised of renegotiated small business card loans and are not classified as nonperforming as they are charged off no later than
the end of the month in which the loan becomes 180 days past due. For more information on TDRs, see Note 4 – Outstanding Loans and Leases to the Consolidated Financial Statements.
Table 51 Commercial Troubled Debt Restructurings
December 31
2013 2012(Dollars in millions) Total Nonperforming Performing Total Nonperforming PerformingU.S. commercial $ 1,318 $ 298 $ 1,020 $ 1,328 $ 565 $ 763Commercial real estate 835 198 637 1,391 740 651Non-U.S. commercial 48 38 10 100 15 85U.S. small business commercial 88 — 88 202 — 202
Total commercial troubled debt restructurings $ 2,289 $ 534 $ 1,755 $ 3,021 $ 1,320 $ 1,701
Industry ConcentrationsTable 52 presents commercial committed and utilized credit exposure by industry and the total net credit default protection purchased to cover the funded and unfunded portions of certain credit exposures. Our commercial credit exposure is diversified across a broad range of industries. Total committed commercial credit exposure increased $56.8 billion, or seven percent, to $823.8 billion at December 31, 2013. The increase in commercial committed exposure was concentrated in diversified financials, real estate, retailing and capital goods, partially offset by lower exposure in food, beverage and tobacco.
Industry limits are used internally to manage industry concentrations and are based on committed exposures and capital
usage that are allocated on an industry-by-industry basis. A risk management framework is in place to set and approve industry limits as well as to provide ongoing monitoring. Management’s Credit Risk Committee (CRC) oversees industry limit governance.
Diversified financials, our largest industry concentration, experienced an increase in committed exposure of $21.5 billion, or 22 percent, in 2013, driven by higher funded loans and certain asset-backed lending products.
Real estate, our second largest industry concentration, experienced an increase in committed exposure of $10.8 billion, or 16 percent, in 2013 primarily due to new originations and renewals outpacing paydowns and sales. Real estate construction and land development exposure represented 14 percent of the
76788ba_financials.indd 93 3/6/14 12:06 PM

94 Bank of America 2013
total real estate industry committed exposure at December 31, 2013 and 2012. For more information on commercial real estate and related portfolios, see Commercial Portfolio Credit Risk Management – Commercial Real Estate on page 90.
Retailing, our third largest industry concentration, experienced an increase in committed exposure of $6.9 billion, or 14 percent, in 2013 driven by loans to auto dealers and wholesalers, apparel retail, and specialty stores. Committed exposure to the food, beverage and tobacco industry decreased $6.8 billion, or 18 percent, in 2013, primarily related to commitment reductions and paydowns. Capital goods committed exposure increased $3.7 billion, or seven percent, in 2013 driven by heavy electrical equipment and machinery exposure. Healthcare equipment and services committed exposure increased $3.6 billion, or eight percent, in 2013 driven by health care distributors, doctors, dentists and practitioners, and health care equipment. Energy committed exposure increased $2.7 billion, or seven percent, in 2013 reflecting higher exposure to the integrated oil and gas, and exploration and production sectors.
Our committed state and municipal exposure of $35.9 billion at December 31, 2013 consisted of $29.4 billion of commercial utilized exposure (including $18.6 billion of funded loans, $7.3 billion of SBLCs and $1.7 billion of derivative assets) and $6.5 billion of unfunded commercial exposure (primarily unfunded loan commitments and letters of credit) and is reported in the government and public education industry in Table 52. While the slow pace of economic recovery continues to pressure budgets, most state and local governments have implemented offsetting fiscal adjustments and continue to honor debt obligations as agreed. While historical default rates have been low, as part of our overall and ongoing risk management processes, we continually monitor these exposures through a rigorous review process. Additionally, internal communications are regularly circulated such that exposure levels are maintained in compliance with established concentration guidelines.
Table 52 Commercial Credit Exposure by Industry (1)
December 31
Commercial
UtilizedTotal Commercial
Committed
(Dollars in millions) 2013 2012 2013 2012Diversified financials $ 78,423 $ 66,102 $ 121,075 $ 99,574Real estate (2) 54,336 47,479 76,418 65,639Retailing 32,859 28,065 54,616 47,719Capital goods 28,016 25,071 52,849 49,196Healthcare equipment and services 30,828 29,396 49,063 45,488Government and public education 40,253 41,441 48,322 50,277Banking 39,649 39,829 45,095 44,822Materials 22,384 21,809 42,699 40,493Energy 19,739 17,661 41,156 38,441Consumer services 21,080 23,093 34,217 36,367Commercial services and supplies 19,770 19,020 32,007 30,257Food, beverage and tobacco 14,437 14,738 30,541 37,344Utilities 9,253 8,403 25,243 23,425Media 13,070 13,091 22,655 21,705Transportation 15,280 13,791 22,595 20,255Individuals and trusts 14,864 13,916 18,681 17,801Software and services 6,814 5,549 14,172 12,125Pharmaceuticals and biotechnology 6,455 3,846 13,986 11,401Technology hardware and equipment 6,166 5,111 12,733 11,101Insurance, including monolines 5,926 8,491 12,203 14,117Telecommunication services 4,541 4,008 11,423 10,276Consumer durables and apparel 5,427 4,246 9,757 8,438Automobiles and components 3,165 3,312 8,424 7,675Food and staples retailing 3,950 3,528 7,909 6,838Religious and social organizations 5,452 6,850 7,677 9,107Other 5,357 3,881 8,309 7,124
Total commercial credit exposure by industry $ 507,494 $ 471,727 $ 823,825 $ 767,005Net credit default protection purchased on total commitments (3) $ (8,085) $ (14,657)
(1) Includes U.S. small business commercial exposure.(2) Industries are viewed from a variety of perspectives to best isolate the perceived risks. For purposes of this table, the real estate industry is defined based on the borrowers’ or counterparties’
primary business activity using operating cash flows and primary source of repayment as key factors.(3) Represents net notional credit protection purchased. For additional information, see Commercial Portfolio Credit Risk Management – Risk Mitigation on page 95.
76788ba_financials.indd 94 3/6/14 12:06 PM

Bank of America 2013 95
Monoline ExposureMonoline exposure is reported in the insurance industry and managed under insurance portfolio industry limits. We have indirect exposure to monolines primarily in the form of guarantees supporting our loans, investment portfolios, securitizations and credit-enhanced securities as part of our public finance business, and other selected products. Such indirect exposure exists when we purchase credit protection from monolines to hedge all or a portion of the credit risk on certain credit exposures including loans and CDOs. We underwrite our public finance exposure by evaluating the underlying securities.
We also have indirect exposure to monolines in the form of guarantees supporting our mortgage and other loan sales. Indirect exposure may exist when credit protection was purchased from monolines to hedge all or a portion of the credit risk on certain mortgage and other loan exposures. A loss may occur when we are required to repurchase a loan due to a breach of the representations and warranties, and the market value of the loan has declined, or we are required to indemnify or provide recourse for a guarantor’s loss. For more information regarding our exposure to representations and warranties, see Off-Balance Sheet Arrangements and Contractual Obligations – Representations and Warranties on page 48 and Note 7 – Representations and Warranties Obligations and Corporate Guarantees to the Consolidated Financial Statements.
Table 53 presents the notional amount of our monoline derivative credit exposure, mark-to-market adjustment and the counterparty credit valuation adjustment. The notional amount of monoline exposure decreased $2.9 billion in 2013 due to terminations, paydowns and maturities of monoline contracts.
Table 53 Derivative Credit Exposures
December 31(Dollars in millions) 2013 2012Notional amount of monoline exposure $ 10,631 $ 13,547
Mark-to-market $ 97 $ 898Counterparty credit valuation adjustment (15) (118)
Net mark-to-market $ 82 $ 780
2013 2012Gains from credit valuation changes $ 73 $ 213
Risk MitigationWe purchase credit protection to cover the funded portion as well as the unfunded portion of certain credit exposures. To lower the cost of obtaining our desired credit protection levels, we may add credit exposure within an industry, borrower or counterparty group by selling protection.
At December 31, 2013 and 2012, net notional credit default protection purchased in our credit derivatives portfolio to hedge our funded and unfunded exposures for which we elected the fair value option, as well as certain other credit exposures, was $8.1 billion and $14.7 billion. The mark-to-market effects resulted in net losses of $356 million in 2013 compared to $1.0 billion in 2012. The gains and losses on these instruments were offset by gains and losses on the exposures. Table 54 presents the average VaR statistics at a 99 percent confidence interval for the hedged credit exposure, the purchased credit protection and the remaining position. See Trading Risk Management on page 105 for a
description of our VaR calculation for the market-based trading portfolio.
Table 54 Credit Derivative VaR Statistics
(Dollars in millions) 2013 2012Hedged credit exposure, average $ 44 $ 79Purchased credit protection, average 19 52Remaining, average (1) 28 24
(1) Reflects the diversification effect between net credit default protection hedging our credit exposure and the related credit exposure.
Tables 55 and 56 present the maturity profiles and the credit exposure debt ratings of the net credit default protection portfolio at December 31, 2013 and 2012.
Table 55 Net Credit Default Protection by Maturity
December 31
2013 2012Less than or equal to one year 35% 21%Greater than one year and less than or equal to five
years 63 75
Greater than five years 2 4Total net credit default protection 100% 100%
Table 56 Net Credit Default Protection by CreditExposure Debt Rating
December 31
2013 2012
(Dollars in millions)Net
Notional (1)
Percent ofTotal
NetNotional (1)
Percent ofTotal
Ratings (2, 3) AAA $ — —% $ (120) 0.8%AA (7) 0.1 (474) 3.2A (2,560) 31.7 (5,861) 40.0BBB (3,880) 48.0 (6,067) 41.4BB (1,137) 14.1 (1,101) 7.5B (452) 5.6 (937) 6.4CCC and below (115) 1.4 (247) 1.7NR (4) 66 (0.9) 150 (1.0)
Total net creditdefault protection $ (8,085) 100.0% $ (14,657) 100.0%
(1) Represents net credit default protection (purchased) sold.(2) Ratings are refreshed on a quarterly basis.(3) Ratings of BBB- or higher are considered to meet the definition of investment grade.(4) NR is comprised of index positions held and any names that have not been rated.
In addition to our net notional credit default protection purchased to cover the funded and unfunded portion of certain credit exposures, credit derivatives are used for market-making activities for clients and establishing positions intended to profit from directional or relative value changes. We execute the majority of our credit derivative trades in the OTC market with large, multinational financial institutions, including broker/dealers and, to a lesser degree, with a variety of other investors. Because these transactions are executed in the OTC market, we are subject to settlement risk. We are also subject to credit risk in the event that these counterparties fail to perform under the terms of these contracts. In most cases, credit derivative transactions are executed on a daily margin basis. Therefore, events such as a credit downgrade, depending on the ultimate rating level, or a breach of credit covenants would typically require an increase in
76788ba_financials.indd 95 3/6/14 12:06 PM

96 Bank of America 2013
the amount of collateral required by the counterparty, where applicable, and/or allow us to take additional protective measures such as early termination of all trades.
Table 57 presents the total contract/notional amount of credit derivatives outstanding and includes both purchased and written credit derivatives. The credit risk amounts are measured as net asset exposure by counterparty, taking into consideration all contracts with the counterparty. For more information on our written credit derivatives, see Note 2 – Derivatives to the Consolidated Financial Statements.
The credit risk amounts discussed above and presented in Table 57 take into consideration the effects of legally enforceable master netting agreements, while amounts disclosed in Note 2 – Derivatives to the Consolidated Financial Statements are shown on a gross basis. Credit risk reflects the potential benefit from offsetting exposure to non-credit derivative products with the same counterparties that may be netted upon the occurrence of certain events, thereby reducing our overall exposure.
Table 57 Credit Derivatives
December 31
2013 2012
(Dollars in millions)Contract/Notional Credit Risk
Contract/Notional Credit Risk
Purchased credit derivatives: Credit default swaps $ 1,305,090 $ 6,042 $1,559,472 $ 8,987Total return swaps/other 38,094 402 43,489 402
Total purchased credit derivatives $ 1,343,184 $ 6,444 $1,602,961 $ 9,389Written credit derivatives:
Credit default swaps $ 1,265,380 n/a $1,531,504 n/aTotal return swaps/other 63,407 n/a 68,811 n/a
Total written credit derivatives $ 1,328,787 n/a $1,600,315 n/an/a = not applicable
Counterparty Credit Risk Valuation AdjustmentsWe record counterparty credit risk valuation adjustments on certain derivative assets, including our credit default protection purchased, in order to properly reflect the credit risk of the counterparty. We calculate CVA based on a modeled expected exposure that incorporates current market risk factors including changes in market spreads and non-credit related market factors that affect the value of a derivative. The exposure also takes into consideration credit mitigants such as legally enforceable master netting agreements and collateral. For additional information, see Note 2 – Derivatives to the Consolidated Financial Statements.
Table 58 Credit Valuation Gains and Losses
2013 2012(Dollars in millions) Gross Hedge Net Gross Hedge Net
Credit valuationgains (losses) $ 738 $ (834) $ (96) $ 1,022 $ (731) $ 291
Non-U.S. PortfolioOur non-U.S. credit and trading portfolios are subject to country risk. We define country risk as the risk of loss from unfavorable economic and political conditions, currency fluctuations, social instability and changes in government policies. A risk management framework is in place to measure, monitor and manage non-U.S. risk and exposures. Management oversight of country risk, including cross-border risk, is provided by the Country Credit Risk Committee, a subcommittee of the CRC. In addition to the direct risk of doing business in a country, we also are exposed to indirect country risks (e.g., related to the collateral received on secured financing transactions or related to client clearing activities). These indirect exposures are managed in the normal course of business through credit, market and operational risk governance, rather than through country risk governance.
Table 59 presents our total non-U.S. exposure broken out by region at December 31, 2013 and 2012. Non-U.S. exposure is presented on an internal risk management basis and includes sovereign and non-sovereign credit exposure, securities and other investments issued by or domiciled in countries other than the U.S. The risk assignments by country can be adjusted for external guarantees and certain collateral types. Exposures that are subject to external guarantees are reported under the country of the guarantor. Exposures with tangible collateral are reflected in the country where the collateral is held. For securities received, other than cross-border resale agreements, outstandings are assigned to the domicile of the issuer of the securities.
Table 59 Total Non-U.S. Exposure by Region
December 31(Dollars in millions) 2013 2012Europe $ 133,303 $ 137,778Asia Pacific 69,266 92,412Latin America 21,723 21,246Middle East and Africa 8,691 8,200Other (1) 20,866 22,014
Total $ 253,849 $ 281,650(1) Other includes Canada exposure of $19.8 billion and $20.3 billion at December 31, 2013 and
2012.
Our total non-U.S. exposure was $253.8 billion at December 31, 2013, a decrease of $27.8 billion from December 31, 2012. The decrease in non-U.S. exposure was driven by a reduction in Asia Pacific and Europe, partially offset by growth in other regions. Our non-U.S. exposure remained concentrated in Europe which accounted for $133.3 billion, or 53 percent of total non-U.S. exposure. The European exposure was mostly in Western Europe and was distributed across a variety of industries. Select European countries are further presented in Table 61. Asia Pacific was our second largest non-U.S. exposure
76788ba_financials.indd 96 3/6/14 12:06 PM

Bank of America 2013 97
at $69.3 billion, or 27 percent of total non-U.S. exposure. Latin America accounted for $21.7 billion, or nine percent of total non-U.S. exposure. Middle East and Africa accounted for $8.7 billion, or three percent of total non-U.S. exposure. Other non-U.S. exposure accounted for $20.9 billion or eight percent of total non-U.S. exposure. For information on country specific exposures, see Tables 60 and 61.
Funded loans and loan equivalents include loans, leases and other extensions of credit and funds, including letters of credit and due from placements, which have not been reduced by collateral, hedges or credit default protection. Funded loans and loan equivalents are reported net of charge-offs but prior to any allowance for loan and lease losses. Unfunded commitments are the undrawn portion of legally binding commitments related to loans and loan equivalents.
Net counterparty exposure includes the fair value of derivatives, including the counterparty risk associated with credit default swaps (CDS) and secured financing transactions. Derivative exposures are presented net of collateral, which is predominantly cash, pledged under legally enforceable master netting agreements. Secured financing transaction exposures are presented net of eligible cash or securities pledged as collateral.
Securities and other investments are carried at fair value and long securities exposures are netted against short exposures with
the same underlying issuer to, but not below, zero (i.e., negative issuer exposures are reported as zero). Other investments include our GPI portfolio and strategic investments.
Net country exposure represents country exposure less hedges and credit default protection purchased, net of credit default protection sold. We hedge certain of our country exposures with credit default protection primarily in the form of single-name, as well as indexed and tranched CDS. The exposures associated with these hedges represent the amount that would be realized upon the isolated default of an individual issuer in the relevant country assuming a zero recovery rate for that individual issuer, and are calculated based on the CDS notional amount less any fair value receivable or payable. Changes in the assumption of an isolated default can produce different results in a particular tranche.
Table 60 presents our 20 largest non-U.S. country exposures. These exposures accounted for 88 percent and 89 percent of our total non-U.S. exposure at December 31, 2013 and 2012. Net country exposure for these 20 countries decreased $30.5 billion in 2013 driven by a decrease in funded loans and loan equivalents in Japan and France resulting from a decrease in central bank deposits and a reduction in unfunded loan commitments in Singapore.
Table 60 Top 20 Non-U.S. Countries Exposure
(Dollars in millions)
Funded Loansand Loan
Equivalents
UnfundedLoan
Commitments
NetCounterparty
Exposure
Securities/Other
Investments
CountryExposure at
December 312013
Hedges andCredit Default
Protection
Net CountryExposure at
December 312013
Increase(Decrease) fromDecember 31
2012
United Kingdom $ 25,898 $ 12,046 $ 5,259 $ 4,812 $ 48,015 $ (4,429) $ 43,586 $ (3,606)Canada 6,075 6,942 1,568 5,223 19,808 (1,397) 18,411 (565)Brazil 8,591 698 416 4,106 13,811 (179) 13,632 1,129China 10,712 587 642 1,468 13,409 (488) 12,921 3,734Germany 6,262 4,973 2,800 3,173 17,208 (4,490) 12,718 1,698India 6,256 643 361 3,204 10,464 (213) 10,251 (3,467)France 1,914 6,790 976 5,228 14,908 (4,745) 10,163 (6,128)Japan 4,340 477 1,827 2,854 9,498 (1,383) 8,115 (15,724)Australia 4,374 2,136 565 2,048 9,123 (1,126) 7,997 (1,732)Netherlands 3,599 2,758 555 2,496 9,408 (1,773) 7,635 (3,047)Russian Federation 5,824 960 230 621 7,635 (913) 6,722 1,810South Korea 3,771 811 566 2,236 7,384 (949) 6,435 (714)Switzerland 2,760 3,150 625 629 7,164 (1,618) 5,546 (274)Hong Kong 4,296 374 81 847 5,598 (241) 5,357 (86)Italy 3,096 3,573 2,328 763 9,760 (4,558) 5,202 364Taiwan 2,614 — 132 1,385 4,131 (59) 4,072 850Mexico 3,030 687 129 657 4,503 (504) 3,999 340Singapore 2,401 138 157 1,280 3,976 (147) 3,829 (6,345)Spain 3,475 892 115 519 5,001 (1,598) 3,403 749Turkey 2,354 75 10 271 2,710 (17) 2,693 551
Total top 20 non-U.S.countries exposure $ 111,642 $ 48,710 $ 19,342 $ 43,820 $ 223,514 $ (30,827) $ 192,687 $ (30,463)
Certain European countries, including Greece, Ireland, Italy, Portugal and Spain, have experienced varying degrees of financial stress in recent years. Risks from the ongoing financial instability in these countries could continue to disrupt the financial markets which could have a detrimental impact on global economic conditions and sovereign and non-sovereign debt in these
countries. Market volatility is expected to continue as policymakers address the fundamental challenges of competitiveness, growth and fiscal solvency. We expect to continue to support client activities in the region and our exposures may vary over time as we monitor the situation and manage our risk profile.
76788ba_financials.indd 97 3/6/14 12:06 PM

98 Bank of America 2013
Table 61 presents our direct sovereign and non-sovereign exposures in these countries at December 31, 2013. Our total sovereign and non-sovereign exposure to these countries was $17.1 billion at December 31, 2013 compared to $14.5 billion at December 31, 2012. The total exposure to these countries, net of all hedges, was $10.4 billion at December 31, 2013 compared to $9.5 billion at December 31, 2012. At December 31, 2013 and
2012, hedges and credit default protection purchased, net of credit default protection sold, was $6.8 billion and $5.1 billion. Net country exposure increased $901 million in 2013 driven by increased funded loan and loan equivalents with financial institutions in Spain and Italy, partially offset by a decrease in total sovereign exposures.
Table 61 Select European Countries
(Dollars in millions)
Funded Loansand Loan
Equivalents
UnfundedLoan
Commitments
Net Counterparty Exposure (1)
Securities/Other
Investments (2)
CountryExposure at
December 312013
Hedges and Credit Default Protection (3)
Net CountryExposure at
December 312013
Increase(Decrease) fromDecember 31
2012
Greece
Sovereign $ — $ — $ — $ 58 $ 58 $ — $ 58 $ 56Financial institutions — — — 27 27 (30) (3) 2Corporates 63 61 2 13 139 (41) 98 (211)
Total Greece $ 63 $ 61 $ 2 $ 98 $ 224 $ (71) $ 153 $ (153)Ireland
Sovereign $ 19 $ — $ 19 $ — $ 38 $ (43) $ (5) $ (63)Financial institutions 812 10 124 44 990 (10) 980 388Corporates 356 338 69 55 818 (49) 769 (160)
Total Ireland $ 1,187 $ 348 $ 212 $ 99 $ 1,846 $ (102) $ 1,744 $ 165Italy
Sovereign $ 2 $ — $ 1,611 $ 269 $ 1,882 $ (2,095) $ (213) $ (243)Financial institutions 1,938 348 179 175 2,640 (1,230) 1,410 333Corporates 1,156 3,225 538 319 5,238 (1,233) 4,005 274
Total Italy $ 3,096 $ 3,573 $ 2,328 $ 763 $ 9,760 $ (4,558) $ 5,202 $ 364Portugal
Sovereign $ — $ — $ 15 $ 35 $ 50 $ (27) $ 23 $ 60Financial institutions 4 — 2 — 6 (108) (102) (140)Corporates 90 103 — 40 233 (292) (59) (144)
Total Portugal $ 94 $ 103 $ 17 $ 75 $ 289 $ (427) $ (138) $ (224)Spain
Sovereign $ 37 $ — $ 63 $ 2 $ 102 $ (163) $ (61) $ (288)Financial institutions 1,223 1 14 131 1,369 (421) 948 790Corporates 2,215 891 38 386 3,530 (1,014) 2,516 247
Total Spain $ 3,475 $ 892 $ 115 $ 519 $ 5,001 $ (1,598) $ 3,403 $ 749Total
Sovereign $ 58 $ — $ 1,708 $ 364 $ 2,130 $ (2,328) $ (198) $ (478)Financial institutions 3,977 359 319 377 5,032 (1,799) 3,233 1,373Corporates 3,880 4,618 647 813 9,958 (2,629) 7,329 6
Total select Europeanexposure $ 7,915 $ 4,977 $ 2,674 $ 1,554 $ 17,120 $ (6,756) $ 10,364 $ 901
(1) Net counterparty exposure includes the fair value of derivatives, including the counterparty risk associated with CDS, and secured financing transactions. Derivative exposures are presented net of $1.1 billion in collateral, which is predominantly cash, pledged under legally enforceable master netting agreements. Secured financing transaction exposures are presented net of eligible cash or securities pledged as collateral. The notional amount of reverse repurchase transactions was $4.0 billion. Counterparty exposure is not presented net of hedges or credit default protection.
(2) Long securities exposures are netted on a single-name basis to, but not below, zero by short exposures of $4.9 billion and net CDS purchased of $1.9 billion, consisting of $1.5 billion of net single-name CDS purchased and $406 million of net indexed and tranched CDS purchased.
(3) Represents credit default protection purchased, net of credit default protection sold, which is used to mitigate the Corporation’s risk to country exposures as listed, including $4.5 billion, consisting of $3.0 billion in net single-name CDS purchased and $1.5 billion in net indexed and tranched CDS purchased, to hedge loans and securities, $2.3 billion in additional credit default protection purchased to hedge derivative assets and $127 million in other short exposures.
The majority of our CDS contracts on reference assets in Greece, Ireland, Italy, Portugal and Spain are with highly-rated financial institutions primarily outside of the Eurozone and we work to limit or eliminate correlated CDS. Due to our engagement in market-making activities, our CDS portfolio contains contracts with various maturities to a diverse set of counterparties. We work to
limit mismatches in maturities between our exposures and the CDS we use to hedge them. However, there may be instances where the protection purchased has a different maturity than the exposure for which the protection was purchased, in which case, those exposures and hedges are subject to more active monitoring and management.
76788ba_financials.indd 98 3/6/14 12:06 PM

Bank of America 2013 99
Table 62 presents the notional amount and fair value of single-name CDS purchased and sold on reference assets in Greece, Ireland, Italy, Portugal and Spain. Table 62 includes only single-name CDS netted at the counterparty level, whereas, Table 61 includes single-name, indexed and tranched CDS exposures netted by the reference asset that they are intended to hedge; therefore, CDS purchased and sold information is not comparable between tables.
Table 62 Single-Name CDS with Reference Assets in Greece, Ireland, Italy, Portugal and Spain (1)
December 31, 2013
Notional Fair Value(Dollars in billions) Purchased Sold Purchased Sold
Greece
Aggregate $ 1.4 $ 1.4 $ 0.1 $ 0.1
After legally netting (2) 0.3 0.3 — —
Ireland
Aggregate 2.4 2.2 0.1 0.1
After legally netting (2) 0.9 0.7 0.1 —
Italy
Aggregate 53.8 47.9 2.5 1.7
After legally netting (2) 13.0 7.0 1.1 0.4
Portugal
Aggregate 7.5 7.5 0.4 0.4
After legally netting (2) 1.2 1.3 0.1 0.1
Spain
Aggregate 20.7 20.8 0.6 0.6
After legally netting (2) 3.2 3.2 0.1 0.1(1) The majority of our CDS contracts on reference assets in Greece, Ireland, Italy, Portugal and
Spain are primarily with non-Eurozone counterparties. (2) Amounts listed are after consideration of legally enforceable counterparty master netting
agreements.
Losses could result even if there is credit default protection purchased because the purchased credit protection contracts may only pay out under certain scenarios and thus not all losses may be covered by the credit protection contracts. The effectiveness of our CDS protection as a hedge of these risks is influenced by a number of factors, including the contractual terms of the CDS. Generally, only the occurrence of a credit event as defined by the CDS terms (which may include, among other events, the failure to pay by, or restructuring of, the reference entity) results in a payment under the purchased credit protection contracts. The determination as to whether a credit event has occurred is made by the relevant International Swaps and Derivatives Association, Inc. (ISDA) Determination Committee (comprised of various ISDA member firms) based on the terms of the CDS and facts and
circumstances for the event. Accordingly, uncertainties exist as to whether any particular strategy or policy action for addressing the European financial instability would constitute a credit event under the CDS. A voluntary restructuring may not trigger a credit event under CDS terms and consequently may not trigger a payment under the CDS contract.
In addition to our direct sovereign and non-sovereign exposures, a significant deterioration of the European financial instability could result in material reductions in the value of sovereign debt and other asset classes posted as collateral, disruptions in capital markets, widening of credit spreads of U.S. and non-U.S. financial institutions, loss of investor confidence in the financial services industry, a slowdown in global economic activity and other adverse developments. For more information on the financial instability in Europe, see Item 1A. Risk Factors of this Annual Report on Form 10-K.
Table 63 presents countries where total cross-border exposure exceeded one percent of our total assets. At December 31, 2013, the United Kingdom was the only country where total cross-border exposure exceeded one percent of our total assets. At December 31, 2013, France had total cross-border exposure of $17.8 billion representing 0.85 percent of our total assets. No other countries had total cross-border exposure that exceeded 0.75 percent of our total assets at December 31, 2013.
Table 63 Total Cross-border Exposure Exceeding One Percent of Total Assets
United Kingdom(Dollars in millions) 2013 2012Public sector $ 6 $ 95Banks 7,027 5,656Private sector 32,466 31,595
Cross-border exposure $ 39,499 $ 37,346Exposure as a percentage of total assets 1.88% 1.69%
Cross-border exposures are calculated using FFIEC guidelines and not our internal risk management view; therefore, exposures are not comparable between tables. Exposure includes cross-border claims by our non-U.S. offices including loans, acceptances, time deposits placed, trading account assets, securities, derivative assets, other interest-earning investments and other monetary assets. Amounts also include unfunded commitments, letters of credit and financial guarantees, and the notional amount of cash lent under secured financing transactions. Sector definitions are consistent with FFIEC reporting requirements for preparing the Country Exposure Report.
76788ba_financials.indd 99 3/6/14 12:06 PM

100 Bank of America 2013
Provision for Credit LossesThe provision for credit losses decreased $4.6 billion to $3.6 billion in 2013 compared to 2012. The provision for credit losses was $4.3 billion lower than net charge-offs for 2013, resulting in a reduction in the allowance for credit losses due to continued improvement in the home loans and credit card portfolios. This compared to a reduction of $6.7 billion in the allowance for credit losses for 2012. If the economy and our asset quality continue to improve, we anticipate additional reductions in the allowance for credit losses in future periods, although at a significantly lower level than in 2013.
The provision for credit losses for the consumer portfolio decreased $6.0 billion to $2.0 billion in 2013 compared to 2012, due to continued improvement in the home loans portfolio primarily as a result of improved delinquencies, increased home prices, and continued loan balance run-off, as well as improvement in the credit card portfolios primarily driven by lower delinquencies. The provision for credit losses related to the PCI loan portfolio was a benefit of $707 million in 2013 primarily due to improvement in our home price outlook compared to a benefit of $103 million in 2012.
The provision for credit losses for the commercial portfolio, including unfunded lending commitments, increased $1.3 billion to $1.5 billion in 2013 compared to 2012 due to stabilization of credit quality, an increase in reserves due to loan growth and a higher volume of loan resolutions in the prior year within the core commercial portfolio.
Allowance for Credit Losses
Allowance for Loan and Lease LossesThe allowance for loan and lease losses is comprised of two components. The first component covers nonperforming commercial loans and TDRs. The second component covers loans and leases on which there are incurred losses that are not yet individually identifiable, as well as incurred losses that may not be represented in the loss forecast models. We evaluate the adequacy of the allowance for loan and lease losses based on the total of these two components, each of which is described in more detail below. The allowance for loan and lease losses excludes LHFS and loans accounted for under the fair value option as the fair value reflects a credit risk component.
The first component of the allowance for loan and lease losses covers both nonperforming commercial loans and all TDRs within the consumer and commercial portfolios. These loans are subject to impairment measurement based on the present value of projected future cash flows discounted at the loan’s original effective interest rate, or in certain circumstances, impairment may also be based upon the collateral value or the loan’s observable market price if available. Impairment measurement for the renegotiated consumer credit card, small business credit card and unsecured consumer TDR portfolios is based on the present value of projected cash flows discounted using the average portfolio contractual interest rate, excluding promotionally priced loans, in effect prior to restructuring. For purposes of computing this specific loss component of the allowance, larger impaired loans are evaluated individually and smaller impaired loans are evaluated as a pool using historical experience for the respective product types and risk ratings of the loans.
The second component of the allowance for loan and lease losses covers the remaining consumer and commercial loans and
leases that have incurred losses which are not yet individually identifiable. The allowance for consumer and certain homogeneous commercial loan and lease products is based on aggregated portfolio evaluations, generally by product type. Loss forecast models are utilized that consider a variety of factors including, but not limited to, historical loss experience, estimated defaults or foreclosures based on portfolio trends, delinquencies, economic trends and credit scores. Our consumer real estate loss forecast model estimates the portion of loans that will default based on individual loan attributes, the most significant of which are refreshed LTV or CLTV, and borrower credit score as well as vintage and geography, all of which are further broken down into current delinquency status. Additionally, we incorporate the delinquency status of underlying first-lien loans on our junior-lien home equity portfolio in our allowance process. Incorporating refreshed LTV and CLTV into our probability of default allows us to factor the impact of changes in home prices into our allowance for loan and lease losses. These loss forecast models are updated on a quarterly basis to incorporate information reflecting the current economic environment. As of December 31, 2013, the loss forecast process resulted in reductions in the allowance for all major consumer portfolios.
The allowance for commercial loan and lease losses is established by product type after analyzing historical loss experience, internal risk rating, current economic conditions, industry performance trends, geographic and obligor concentrations within each portfolio and any other pertinent information. The statistical models for commercial loans are generally updated annually and utilize our historical database of actual defaults and other data. The loan risk ratings and composition of the commercial portfolios used to calculate the allowance are updated quarterly to incorporate the most recent data reflecting the current economic environment. For risk-rated commercial loans, we estimate the probability of default and the LGD based on our historical experience of defaults and credit losses. Factors considered when assessing the internal risk rating include the value of the underlying collateral, if applicable, the industry in which the obligor operates, the obligor’s liquidity and other financial indicators, and other quantitative and qualitative factors relevant to the obligor’s credit risk. As of December 31, 2013, changes in portfolio size and composition resulted in an increase in the allowance for all major commercial portfolios.
Also included within the second component of the allowance for loan and lease losses are reserves to cover losses that are incurred but, in our assessment, may not be adequately represented in the historical loss data used in the loss forecast models. For example, factors that we consider include, among others, changes in lending policies and procedures, changes in economic and business conditions, changes in the nature and size of the portfolio, changes in portfolio concentrations, changes in the volume and severity of past due loans and nonaccrual loans, the effect of external factors such as competition, and legal and regulatory requirements. We also consider factors that are applicable to unique portfolio segments. For example, we consider the risk of uncertainty in our loss forecasting models related to junior-lien home equity loans that are current, but have first-lien loans that we do not service that are 30 days or more past due. In addition, we consider the increased risk of default associated with our interest-only loans that have yet to enter the amortization period. Given the heightened risk of loss with these loans, additional reserves are recorded to the allowance for loan and
76788ba_financials.indd 100 3/6/14 12:06 PM

Bank of America 2013 101
lease losses. Further, we consider the inherent uncertainty in mathematical models that are built upon historical data.
During 2013, the factors that impacted the allowance for loan and lease losses included significant overall improvements in the credit quality of the portfolios driven by improvements in the U.S. economy and housing and labor markets, continuing proactive credit risk management initiatives and the impact of recent higher credit quality originations. Additionally, the resolution of uncertainties through current recognition of net charge-offs has impacted the amount of reserve needed in certain portfolios. Evidencing the improvements in the U.S. economy and housing and labor markets are modest growth in consumer spending, improvements in unemployment levels, a decrease in the absolute level and our share of national consumer bankruptcy filings, and a rise in both residential building activity and overall home prices. In addition to these improvements, paydowns, charge-offs, sales, returns to performing status and upgrades out of criticized continued to outpace new nonaccrual consumer loans and reservable criticized commercial loans, but such loans remained elevated relative to levels experienced prior to the financial crisis.
We monitor differences between estimated and actual incurred loan and lease losses. This monitoring process includes periodic assessments by senior management of loan and lease portfolios and the models used to estimate incurred losses in those portfolios.
Additions to, or reductions of, the allowance for loan and lease losses generally are recorded through charges or credits to the provision for credit losses. Credit exposures deemed to be uncollectible are charged against the allowance for loan and lease losses. Recoveries of previously charged off amounts are credited to the allowance for loan and lease losses.
The allowance for loan and lease losses for the consumer portfolio, as presented in Table 65, was $13.4 billion at December 31, 2013, a decrease of $7.7 billion from December 31, 2012. The decrease was primarily driven by the home equity and residential mortgage portfolios due to improved delinquencies and home prices as evidenced by improving LTV statistics as presented in Tables 30 and 32 as well as continued loan balance run-off. In addition, the home equity and residential mortgage allowance declined due to write-offs in our PCI loan portfolio. These write-offs decreased the PCI valuation allowance included as part of the allowance for loan and lease losses.
The decrease in the allowance related to the U.S. credit card and unsecured consumer lending portfolios in CBB was primarily due to improvement in delinquencies and bankruptcies. For example, in the U.S. credit card portfolio, accruing loans 30 days or more past due decreased to $2.1 billion at December 31, 2013 from $2.7 billion (to 2.25 percent from 2.90 percent of outstanding U.S. credit card loans) at December 31, 2012, and accruing loans 90 days or more past due declined to $1.1 billion at December 31, 2013 from $1.4 billion (to 1.14 percent from 1.52 percent of outstanding U.S. credit card loans) at December 31, 2012. See Tables 27, 28, 37 and 39 for additional details on key credit statistics for the credit card and other unsecured consumer lending portfolios.
The allowance for loan and lease losses for the commercial portfolio, as presented in Table 65, was $4.0 billion at December 31, 2013, a $899 million increase from December 31, 2012, as continued improvement in credit quality was more than offset by loan growth across the commercial portfolio. The commercial utilized reservable criticized exposure decreased to $12.9 billion at December 31, 2013 from $15.9 billion (to 3.02 percent from 4.10 percent of total commercial utilized reservable exposure) at December 31, 2012. Similarly, nonperforming commercial loans declined to $1.3 billion at December 31, 2013 from $3.2 billion (to 0.34 percent from 0.93 percent of outstanding commercial loans) at December 31, 2012. See Tables 43, 44 and 46 for additional details on key commercial credit statistics.
The allowance for loan and lease losses as a percentage of total loans and leases outstanding was 1.90 percent at December 31, 2013 compared to 2.69 percent at December 31, 2012. The decrease in the ratio was primarily due to improved credit quality driven by improved economic conditions and write-offs in the PCI loan portfolio for home equity and residential mortgage which led to the reduction in the allowance for credit losses discussed above. The December 31, 2013 and 2012 ratios above include the PCI loan portfolio. Excluding the PCI loan portfolio, the allowance for loan and lease losses as a percentage of total loans and leases outstanding was 1.67 percent at December 31, 2013 compared to 2.14 percent at December 31, 2012.
76788ba_financials.indd 101 3/6/14 12:06 PM

102 Bank of America 2013
Table 64 presents a rollforward of the allowance for credit losses, which includes the allowance for loan and lease losses and the reserve for unfunded lending commitments, for 2013 and 2012.
Table 64 Allowance for Credit Losses
(Dollars in millions) 2013 2012Allowance for loan and lease losses, January 1 $ 24,179 $ 33,783Loans and leases charged off
Residential mortgage (1,508) (3,276)Home equity (2,258) (4,573)U.S. credit card (4,004) (5,360)Non-U.S. credit card (508) (835)Direct/Indirect consumer (710) (1,258)Other consumer (273) (274)
Total consumer charge-offs (9,261) (15,576)U.S. commercial (1) (774) (1,309)Commercial real estate (251) (719)Commercial lease financing (4) (32)Non-U.S. commercial (79) (36)
Total commercial charge-offs (1,108) (2,096)Total loans and leases charged off (10,369) (17,672)
Recoveries of loans and leases previously charged off
Residential mortgage 424 165Home equity 455 331U.S. credit card 628 728Non-U.S. credit card 109 254Direct/Indirect consumer 365 495Other consumer 39 42
Total consumer recoveries 2,020 2,015U.S. commercial (2) 287 368Commercial real estate 102 335Commercial lease financing 29 38Non-U.S. commercial 34 8
Total commercial recoveries 452 749Total recoveries of loans and leases previously charged off 2,472 2,764Net charge-offs (7,897) (14,908)
Write-offs of PCI loans (2,336) (2,820)Provision for loan and lease losses 3,574 8,310Other (3) (92) (186)
Allowance for loan and lease losses, December 31 17,428 24,179Reserve for unfunded lending commitments, January 1 513 714Provision for unfunded lending commitments (18) (141)Other (4) (11) (60)
Reserve for unfunded lending commitments, December 31 484 513Allowance for credit losses, December 31 $ 17,912 $ 24,692
(1) Includes U.S. small business commercial charge-offs of $457 million and $799 million in 2013 and 2012.(2) Includes U.S. small business commercial recoveries of $98 million and $100 million in 2013 and 2012.(3) Primarily represents the net impact of portfolio sales, consolidations and deconsolidations, and foreign currency translation adjustments.(4) Primarily represents accretion of the Merrill Lynch purchase accounting adjustment.
76788ba_financials.indd 102 3/6/14 12:06 PM

Bank of America 2013 103
Table 64 Allowance for Credit Losses (continued)
(Dollars in millions) 2013 2012Loan and allowance ratios:
Loans and leases outstanding at December 31 (5) $ 918,191 $ 898,817Allowance for loan and lease losses as a percentage of total loans and leases and outstanding at December 31 (5) 1.90% 2.69%Consumer allowance for loan and lease losses as a percentage of total consumer loans and leases outstanding at December 31 (6) 2.53 3.81Commercial allowance for loan and lease losses as a percentage of total commercial loans and leases outstanding at December 31 (7) 1.03 0.90Average loans and leases outstanding (5) $ 909,127 $ 890,337Net charge-offs as a percentage of average loans and leases outstanding (5, 8) 0.87% 1.67%Net charge-offs and PCI write-offs as a percentage of average loans and leases outstanding (5) 1.13 1.99Allowance for loan and lease losses as a percentage of total nonperforming loans and leases at December 31 (5, 9) 102 107Ratio of the allowance for loan and lease losses at December 31 to net charge-offs (8) 2.21 1.62Ratio of the allowance for loan and lease losses at December 31 to net charge-offs and PCI write-offs 1.70 1.36Amounts included in the allowance for loan and lease losses that are excluded from nonperforming loans and leases at December 31 (10) $ 7,680 $ 12,021
Allowance for loan and lease losses as a percentage of total nonperforming loans and leases, excluding amounts included in the allowance for loan and lease losses that are excluded from nonperforming loans and leases at December 31 (10) 57% 54%
Loan and allowance ratios excluding PCI loans and the related valuation allowance: (11)
Allowance for loan and lease losses as a percentage of total loans and leases outstanding at December 31 (5) 1.67% 2.14%Consumer allowance for loan and lease losses as a percentage of total consumer loans and leases outstanding at December 31 (6) 2.17 2.95Net charge-offs as a percentage of average loans and leases outstanding (5) 0.90 1.73Allowance for loan and lease losses as a percentage of total nonperforming loans and leases at December 31 (5, 9) 87 82Ratio of the allowance for loan and lease losses at December 31 to net charge-offs 1.89 1.25
(5) Outstanding loan and lease balances and ratios do not include loans accounted for under the fair value option, which were $10.0 billion and $9.0 billion at December 31, 2013 and 2012. Average loans accounted for under the fair value option were $9.5 billion and $8.4 billion in 2013 and 2012.
(6) Excludes consumer loans accounted for under the fair value option of $2.2 billion and $1.0 billion at December 31, 2013 and 2012.(7) Excludes commercial loans accounted for under the fair value option of $7.9 billion and $8.0 billion at December 31, 2013 and 2012.(8) Net charge-offs exclude $2.3 billion and $2.8 billion of write-offs in the PCI loan portfolio in 2013 and 2012. These write-offs decreased the PCI valuation allowance included as part of the allowance
for loan and lease losses. For more information on PCI write-offs, see Consumer Portfolio Credit Risk Management – Purchased Credit-impaired Loan Portfolio on page 81.(9) For more information on our definition of nonperforming loans, see pages 85 and 92.(10) Primarily includes amounts allocated to U.S. credit card and unsecured consumer lending portfolios in CBB, PCI loans and the non-U.S. credit card portfolio in All Other.(11) For more information on the PCI loan portfolio and the valuation allowance for PCI loans, see Note 4 – Outstanding Loans and Leases and Note 5 – Allowance for Credit Losses to the Consolidated
Financial Statements.
For reporting purposes, we allocate the allowance for credit losses across products. However, the allowance is generally available to absorb any credit losses without restriction. Table 65 presents our allocation by product type.
Table 65 Allocation of the Allowance for Credit Losses by Product Type
December 31, 2013 December 31, 2012
(Dollars in millions) AmountPercent of
Total
Percent ofLoans and
LeasesOutstanding (1) Amount
Percent ofTotal
Percent ofLoans and
LeasesOutstanding (1)
Allowance for loan and lease losses Residential mortgage $ 4,084 23.43% 1.65% $ 7,088 29.31% 2.80%Home equity 4,434 25.44 4.73 7,845 32.45 7.26U.S. credit card 3,930 22.55 4.26 4,718 19.51 4.97Non-U.S. credit card 459 2.63 3.98 600 2.48 5.13Direct/Indirect consumer 417 2.39 0.51 718 2.97 0.86Other consumer 99 0.58 5.02 104 0.43 6.40
Total consumer 13,423 77.02 2.53 21,073 87.15 3.81U.S. commercial (2) 2,394 13.74 1.06 1,885 7.80 0.90Commercial real estate 917 5.26 1.91 846 3.50 2.19Commercial lease financing 118 0.68 0.47 78 0.32 0.33Non-U.S. commercial 576 3.30 0.64 297 1.23 0.40
Total commercial (3) 4,005 22.98 1.03 3,106 12.85 0.90Allowance for loan and lease losses 17,428 100.00% 1.90 24,179 100.00% 2.69
Reserve for unfunded lending commitments 484 513 Allowance for credit losses (4) $ 17,912 $ 24,692
(1) Ratios are calculated as allowance for loan and lease losses as a percentage of loans and leases outstanding excluding loans accounted for under the fair value option. Consumer loans accounted for under the fair value option included residential mortgage loans of $2.0 billion and $1.0 billion and home equity loans of $147 million and $0 at December 31, 2013 and 2012. Commercial loans accounted for under the fair value option included U.S. commercial loans of $1.5 billion and $2.3 billion and non-U.S. commercial loans of $6.4 billion and $5.7 billion at December 31, 2013 and 2012.
(2) Includes allowance for loan and lease losses for U.S. small business commercial loans of $462 million and $642 million at December 31, 2013 and 2012.(3) Includes allowance for loan and lease losses for impaired commercial loans of $277 million and $475 million at December 31, 2013 and 2012.(4) Includes $2.5 billion and $5.5 billion of valuation allowance included as part of the allowance for credit losses related to PCI loans at December 31, 2013 and 2012.
76788ba_financials.indd 103 3/6/14 12:06 PM

104 Bank of America 2013
Reserve for Unfunded Lending CommitmentsIn addition to the allowance for loan and lease losses, we also estimate probable losses related to unfunded lending commitments such as letters of credit, financial guarantees, unfunded bankers’ acceptances and binding loan commitments, excluding commitments accounted for under the fair value option. Unfunded lending commitments are subject to the same assessment as funded loans, including estimates of probability of default and LGD. Due to the nature of unfunded commitments, the estimate of probable losses must also consider utilization. To estimate the portion of these undrawn commitments that is likely to be drawn by a borrower at the time of estimated default, analyses of the Corporation’s historical experience are applied to the unfunded commitments to estimate the funded EAD. The expected loss for unfunded lending commitments is the product of the probability of default, the LGD and the EAD, adjusted for any qualitative factors including economic uncertainty and inherent imprecision in models.
The reserve for unfunded lending commitments was $484 million at December 31, 2013, a decrease of $29 million from December 31, 2012. The decrease was driven by improved credit quality in the unfunded portfolio.
Market Risk Management Market risk is the risk that values of assets and liabilities or revenues will be adversely affected by changes in market conditions. This risk is inherent in the financial instruments associated with our operations, primarily within our Global Markets segment. We are also exposed to these risks in other areas of the Corporation (e.g., our ALM activities). In the event of market stress, these risks could have a material impact on the results of the Corporation. For additional information, see Interest Rate Risk Management for Nontrading Activities on page 109.
Our traditional banking loan and deposit products are nontrading positions and are generally reported at amortized cost for assets or the amount owed for liabilities (historical cost). However, these positions are still subject to changes in economic value based on varying market conditions, with one of the primary risks being changes in the levels of interest rates. The risk of adverse changes in the economic value of our nontrading positions arising from changes in interest rates is managed through our ALM activities. We have elected to account for certain assets and liabilities under the fair value option.
Our trading positions are reported at fair value with changes reflected in income. Trading positions are subject to various changes in market-based risk factors. The majority of this risk is generated by our activities in the interest rate, foreign exchange, credit, mortgage, equity and commodities markets. In addition, the values of assets and liabilities could change due to market liquidity, correlations across markets and expectations of market volatility. We seek to manage these risk exposures by using a variety of techniques that encompass a broad range of financial instruments. The key risk management techniques are discussed in more detail in the Trading Risk Management section.
Global Markets Risk Management is an independent function within the Corporation that supports the Global Banking and Markets Risk Executive. The Global Markets Risk Committee (GMRC), chaired by the Global Markets Risk Executive, has been designated by ALMRC as the primary risk governance authority for Global Markets. The GMRC’s focus is to take a forward-looking view of the primary credit, market and operational risks impacting Global
Markets and prioritize those that need a proactive risk mitigation strategy.
Global Markets Risk Management is responsible for providing senior management with a clear and comprehensive understanding of the trading risks to which the Corporation is exposed. These responsibilities include ownership of market risk policy, developing and maintaining quantitative risk models, calculating aggregated risk measures, establishing and monitoring position limits consistent with risk appetite, conducting daily reviews and analysis of trading inventory, approving material risk exposures and fulfilling regulatory requirements. Market risks that impact businesses outside of Global Markets are monitored and governed by their respective governance functions.
Quantitative risk models, such as VaR, are an essential component in evaluating the market risks within a portfolio. The Enterprise Model Risk Committee (EMRC) reports to the ALMRC and is responsible for providing management oversight and approval of model risk management and governance. The EMRC defines model risk standards, consistent with the Corporation’s Risk Framework and risk appetite, prevailing regulatory guidance and industry best practice. Models must meet certain validation criteria, including effective challenge of the model development process and a sufficient demonstration of developmental evidence incorporating a comparison of alternative theories and approaches. The EMRC ensures that model standards are consistent with model risk requirements and monitors the effective challenge in the model validation process across the Corporation. In addition, the relevant stakeholders must agree on any required limitations or restrictions to the models and maintain a stringent monitoring process to ensure continued compliance.
For more information on the fair value of certain financial assets and liabilities, see Note 20 – Fair Value Measurements to the Consolidated Financial Statements.
Interest Rate RiskInterest rate risk represents exposures to instruments whose values vary with the level or volatility of interest rates. These instruments include, but are not limited to, loans, debt securities, certain trading-related assets and liabilities, deposits, borrowings and derivatives. Hedging instruments used to mitigate these risks include derivatives such as options, futures, forwards and swaps.
Foreign Exchange RiskForeign exchange risk represents exposures to changes in the values of current holdings and future cash flows denominated in currencies other than the U.S. dollar. The types of instruments exposed to this risk include investments in non-U.S. subsidiaries, foreign currency-denominated loans and securities, future cash flows in foreign currencies arising from foreign exchange transactions, foreign currency-denominated debt and various foreign exchange derivatives whose values fluctuate with changes in the level or volatility of currency exchange rates or non-U.S. interest rates. Hedging instruments used to mitigate this risk include foreign exchange options, currency swaps, futures, forwards, and foreign currency-denominated debt and deposits.
Mortgage RiskMortgage risk represents exposures to changes in the values of mortgage-related instruments. The values of these instruments are sensitive to prepayment rates, mortgage rates, agency debt ratings, default, market liquidity, government participation and
76788ba_financials.indd 104 3/6/14 12:06 PM

Bank of America 2013 105
interest rate volatility. Our exposure to these instruments takes several forms. First, we trade and engage in market-making activities in a variety of mortgage securities including whole loans, pass-through certificates, commercial mortgages and collateralized mortgage obligations including CDOs using mortgages as underlying collateral. Second, we originate a variety of MBS which involves the accumulation of mortgage-related loans in anticipation of eventual securitization. Third, we may hold positions in mortgage securities and residential mortgage loans as part of the ALM portfolio. Fourth, we create MSRs as part of our mortgage origination activities. For more information on MSRs, see Note 1 – Summary of Significant Accounting Principles and Note 23 – Mortgage Servicing Rights to the Consolidated Financial Statements. Hedging instruments used to mitigate this risk include contracts and derivatives such as options, swaps, futures and forwards. For additional information, see Mortgage Banking Risk Management on page 112.
Equity Market RiskEquity market risk represents exposures to securities that represent an ownership interest in a corporation in the form of domestic and foreign common stock or other equity-linked instruments. Instruments that would lead to this exposure include, but are not limited to, the following: common stock, exchange-traded funds, American Depositary Receipts, convertible bonds, listed equity options (puts and calls), OTC equity options, equity total return swaps, equity index futures and other equity derivative products. Hedging instruments used to mitigate this risk include options, futures, swaps, convertible bonds and cash positions.
Commodity RiskCommodity risk represents exposures to instruments traded in the petroleum, natural gas, power and metals markets. These instruments consist primarily of futures, forwards, swaps and options. Hedging instruments used to mitigate this risk include options, futures and swaps in the same or similar commodity product, as well as cash positions.
Issuer Credit RiskIssuer credit risk represents exposures to changes in the creditworthiness of individual issuers or groups of issuers. Our portfolio is exposed to issuer credit risk where the value of an asset may be adversely impacted by changes in the levels of credit spreads, by credit migration or by defaults. Hedging instruments used to mitigate this risk include bonds, CDS and other credit fixed-income instruments.
Market Liquidity RiskMarket liquidity risk represents the risk that the level of expected market activity changes dramatically and, in certain cases, may even cease. This exposes us to the risk that we will not be able to transact business and execute trades in an orderly manner which may impact our results. This impact could be further exacerbated if expected hedging or pricing correlations are compromised by disproportionate demand or lack of demand for certain instruments. We utilize various risk mitigating techniques as discussed in more detail in Trading Risk Management.
Trading Risk ManagementTo evaluate risk in our trading activities, we focus on the actual and potential volatility of revenues generated by individual positions as well as portfolios of positions. Various techniques and procedures are utilized to enable the most complete understanding of these risks. Quantitative measures of market risk are evaluated on a daily basis from a single position to the portfolio of the Corporation. These measures include sensitivities of positions to various market risk factors, such as the potential impact on revenue from a one basis point change in interest rates, and statistical measures utilizing both actual and hypothetical market moves, such as VaR and stress testing. Periods of extreme market stress influence the reliability of these techniques to varying degrees. Qualitative evaluations of market risk utilize the suite of quantitative risk measures while understanding each of their respective limitations. Additionally, risk managers independently evaluate the risk of the portfolios under the current market environment and potential future environments.
VaR is a common statistic used to measure market risk as it allows the aggregation of market risk factors, including the effects of portfolio diversification. A VaR model simulates the value of a portfolio under a range of scenarios in order to generate a distribution of potential gains and losses. VaR represents the loss a portfolio is not expected to exceed more than a certain number of times per period, based on a specified holding period, confidence interval and window of historical data. We use one VaR model consistently across the trading portfolios that uses a historical simulation approach based on a three-year window of historical data. Our primary VaR statistic is equivalent to a 99 percent confidence level. This means that for a VaR with a one-day holding period, there should not be losses in excess of VaR, on average, 99 out of 100 trading days.
Within any VaR model, there are significant and numerous assumptions that will differ from company to company. The accuracy of a VaR model depends on the availability and quality of historical data for each of the risk factors in the portfolio. A VaR model may require additional modeling assumptions for new products that do not have the necessary historical market data or for less liquid positions for which accurate daily prices are not consistently available. For positions with insufficient historical data for the VaR calculation, the process for establishing an appropriate proxy is based on fundamental and statistical analysis of the new product or less liquid position. This analysis identifies reasonable alternatives that replicate both the expected volatility and correlation to other market risk factors that the missing data would be expected to experience.
VaR may not be indicative of realized revenue volatility as changes in market conditions or in the composition of the portfolio can have a material impact on the results. In particular, the historical data used for the VaR calculation might indicate higher or lower levels of portfolio diversification than will be experienced. In order for the VaR model to reflect current market conditions, we update the historical data underlying our VaR model on a bi-weekly basis, or more frequently during periods of market stress, and regularly review the assumptions underlying the model. A relatively minor portion of risks related to our trading positions are not included in VaR. These risks are reviewed as part of our ICAAP.
76788ba_financials.indd 105 3/6/14 12:06 PM

106 Bank of America 2013
Global Markets Risk Management continually reviews, evaluates and enhances our VaR model so that it reflects the material risks in our trading portfolio. Changes to the VaR model are reviewed and approved prior to implementation and any material changes are reported to management through the appropriate governance committees.
Market risk VaR for trading activities as presented in Table 66 differs from VaR used for regulatory capital calculations (regulatory VaR). The VaR disclosed in Table 66 excludes both counterparty CVA, which are adjustments to the mark-to-market value of our derivative exposures to reflect the impact of the credit quality of counterparties on our derivatives assets, and the corresponding hedges. Regulatory standards require that regulatory VaR only
exclude counterparty CVA but include the corresponding hedges. The holding period for regulatory VaR is 10 days while for the market risk VaR presented below, it is one day. Both regulatory and market risk VaR values utilize the same process and methodology. For more information on certain components in regulatory VaR, see Capital Management – Regulatory Capital Changes on page 64.
The market risk across all business segments to which the Corporation is exposed is included in the total market-based trading portfolio VaR results. The majority of this portfolio is within the Global Markets segment.
Table 66 presents year-end, average, high and low daily trading VaR for 2013 and 2012.
Table 66 Market Risk VaR for Trading Activities
2013 2012
(Dollars in millions)YearEnd Average High (1) Low (1)
YearEnd Average High (1) Low (1)
Foreign exchange $ 16 $ 20 $ 42 $ 12 $ 26 $ 21 $ 34 $ 12Interest rate 32 34 66 20 49 46 75 30Credit 66 53 72 33 73 50 81 31Real estate/mortgage 35 28 44 20 37 34 45 28Equities 25 29 56 17 27 28 55 15Commodities 7 12 18 7 13 13 18 7Portfolio diversification (82) (107) — — (103) (117) — —
Total market-based trading portfolio $ 99 $ 69 $ 115 $ 42 $ 122 $ 75 $ 128 $ 42(1) The high and low for the total portfolio may have occurred on different trading days than the high and low for the individual components. Therefore the amount of portfolio diversification, which is the
difference between the total portfolio and the sum of the individual components, is not relevant.
The decrease in average VaR during 2013 was driven by lower levels of exposures in the interest rate and real estate/mortgage markets.
The graph below presents the daily total market-based trading portfolio VaR for 2013, corresponding to the data presented in Table 66.
76788ba_financials.indd 106 3/6/14 3:35 PM

Bank of America 2013 107
To enhance the visibility of the market risks to which we are exposed, additional VaR statistics produced within the Corporation’s single VaR model are provided in Table 67. Evaluating VaR with additional statistics allows for an increased understanding of the risks in the portfolio as the historical market
data used in the VaR calculation does not necessarily follow a predefined statistical distribution. Table 67 presents average trading VaR statistics for 99 percent and 95 percent confidence intervals for 2013 and 2012.
Table 67 Average Market Risk VaR for Trading Activities – Additional VaR Statistics
2013 2012(Dollars in millions) 99 percent 95 percent 99 percent 95 percent (1)
Foreign exchange $ 20 $ 13 $ 21 $ 12Interest rate 34 20 46 26Credit 53 23 50 24Real estate/mortgage 28 17 34 18Equities 29 16 28 16Commodities 12 7 13 7Portfolio diversification (107) (63) (117) (65)
Total market-based trading portfolio $ 69 $ 33 $ 75 $ 38(1) Due to system constraints, the 95 percent VaR for the three months ended March 31, 2012 is not available and therefore average 95 percent VaR for that period has been estimated. It is not
expected that this estimation materially affected the average 95 percent VaR for 2012.
Limits on quantitative risk measures, including VaR, are monitored on a daily basis. The trading limits are independently set by market risk management and reviewed on a regular basis to ensure they remain relevant and within our overall risk appetite for market risks. Limits are reviewed in the context of market liquidity, volatility and strategic business priorities. The limits are set at both a granular level to ensure extensive coverage of risks as well as at aggregated portfolios to account for correlations among risk factors. Trading limits are approved at least annually. The ALMRC has given authority to the GMRC to approve changes to trading limits throughout the year. Approved trading limits are stored and tracked in a centralized limits management system. Trading limit excesses are communicated to management for review. Certain quantitative market risk measures and corresponding limits have been identified as critical in the Corporation’s Risk Appetite Statement. These risk appetite limits are monitored on a daily basis and are approved at least annually by the Board. The market risk based risk appetite limits were not exceeded during 2013.
In periods of market stress, the GMRC members communicate daily to discuss losses, key risk positions and any limit excesses. As a result of this process, the businesses may selectively reduce risk. Where economically feasible, positions are sold or macroeconomic hedges are executed to reduce the exposures.
BacktestingThe accuracy of the VaR methodology is evaluated by backtesting, which compares the daily regulatory VaR results, utilizing a one-day holding period, against the realized daily profit and loss. Backtesting excesses occur when a trading loss exceeds the VaR for the corresponding day. These excesses are evaluated to understand the positions and market moves that produced the trading loss and to ensure that the VaR methodology accurately represents those losses. As our primary VaR statistic used for backtesting is based on a 99 percent confidence interval and a one-day holding period, we expect one trading loss in excess of VaR every 100 days, or between two to three trading losses in excess of VaR over the course of a year. The number of backtesting excesses observed can differ from the statistically expected number of excesses if the current level of market volatility is
materially different than the level of market volatility that existed during the three years of historical data used in the VaR calculation.
We conduct daily backtesting on our portfolios and report the results to senior market risk management. Senior management, including the GMRC, regularly reviews and evaluates the results of these tests. The government agencies that regulate our operations also regularly review these results.
The revenue used for backtesting is defined by regulatory agencies in order to most closely align with the VaR component of the regulatory capital calculation. This revenue differs from total trading-related revenue in that it excludes revenues from trading activities that either do not generate market risk or the market risk cannot be included in VaR. Some examples of the types of revenue excluded for backtesting are fees, commissions, reserves, net interest income and intraday trading revenues. In addition, counterparty CVA is not included in the VaR component of the regulatory capital calculation and is therefore not included in the revenue used for backtesting.
There were no days with backtesting excesses for our total market-based trading portfolio VaR, utilizing a holding period, during 2013.
Total Trading RevenueTotal trading-related revenue, excluding brokerage fees, represents the total amount earned from trading positions, including market-based net interest income, which are taken in a diverse range of financial instruments and markets. Trading account assets and liabilities are reported at fair value. For more information on fair value, see Note 20 – Fair Value Measurements to the Consolidated Financial Statements. Trading-related revenues can be volatile and are largely driven by general market conditions and customer demand. Also, trading-related revenues are dependent on the volume and type of transactions, the level of risk assumed, and the volatility of price and rate movements at any given time within the ever-changing market environment. Significant daily revenues by business are monitored and the primary drivers of these are reviewed. When it is deemed material, an explanation of these revenues is provided to the GMRC.
76788ba_financials.indd 107 3/6/14 3:35 PM

108 Bank of America 2013
The histogram below is a graphic depiction of trading volatility and illustrates the daily level of trading-related revenue for 2013 and 2012. During 2013, positive trading-related revenue was recorded for 96 percent, or 241 of the 251 trading days, of which 74 percent (186 days) were daily trading gains of over $25 million
and the largest loss was $54 million. This compares to 2012 where positive trading-related revenue was recorded for 98 percent, or 243 of the 249 trading days, of which 80 percent (199 days) were daily trading gains of over $25 million and the largest loss was $50 million.
Trading Portfolio Stress TestingBecause the very nature of a VaR model suggests results can exceed our estimates and are dependent on a limited historical window, we also stress test our portfolio using scenario analysis. This analysis estimates the change in value of our trading portfolio that may result from abnormal market movements.
A set of scenarios, categorized as either historical or hypothetical, are computed daily for the overall trading portfolio and individual businesses. These scenarios include shocks to underlying market risk factors that may be well beyond the shocks found in the historical data used to calculate VaR. Historical scenarios simulate the impact of the market moves that occurred during a period of extended historical market stress. Generally, a 10-business day window or longer representing the most severe point during a crisis is selected for each historical scenario. Hypothetical scenarios provide simulations of the estimated portfolio impact from potential future market stress events. Scenarios are reviewed and updated in response to changing
positions and new economic or political information. In addition, new or adhoc scenarios are developed to address specific potential market events. For example, a stress test was conducted to estimate the impact of a significant increase in global interest rates and the corresponding impact across other asset classes. The stress tests are reviewed on a regular basis and the results are presented to senior management.
Stress testing for the trading portfolio is integrated with enterprise-wide stress testing and incorporated into the limits framework. A process is in place to promote consistency between the scenarios used for the trading portfolio and those used for enterprise-wide stress testing. The scenarios used for enterprise-wide stress testing purposes differ from the typical trading portfolio scenarios in that they have a longer time horizon and the results are forecasted over multiple periods for use in consolidated capital and liquidity planning. For additional information, see Managing Risk – Enterprise-wide Stress Testing on page 59.
76788ba_financials.indd 108 3/6/14 3:35 PM

Bank of America 2013 109
Interest Rate Risk Management for Nontrading ActivitiesThe following discussion presents net interest income excluding the impact of trading-related activities.
Interest rate risk represents the most significant market risk exposure to our nontrading balance sheet. Interest rate risk is measured as the potential change in net interest income caused by movements in market interest rates. Client-facing activities, primarily lending and deposit-taking, create interest rate sensitive positions on our balance sheet.
We prepare forward-looking forecasts of net interest income. The baseline forecast takes into consideration expected future business growth, ALM positioning and the direction of interest rate movements as implied by the market-based forward curve. We then measure and evaluate the impact that alternative interest rate scenarios have on the baseline forecast in order to assess interest rate sensitivity under varied conditions. The net interest income forecast is frequently updated for changing assumptions and differing outlooks based on economic trends, market conditions and business strategies. Thus, we continually monitor our balance sheet position in an effort to maintain an acceptable level of exposure to interest rate changes.
The interest rate scenarios that we analyze incorporate balance sheet assumptions such as loan and deposit growth and pricing, changes in funding mix, product repricing and maturity characteristics. Our overall goal is to manage interest rate risk so that movements in interest rates do not significantly adversely affect earnings and capital.
Table 68 presents the spot and 12-month forward rates used in our baseline forecasts at December 31, 2013 and 2012.
Table 68 Forward Rates
December 31, 2013
FederalFunds
Three-MonthLIBOR
10-YearSwap
Spot rates 0.25% 0.25% 3.09%
12-month forward rates 0.25 0.43 3.52
December 31, 2012Spot rates 0.25% 0.31% 1.84%12-month forward rates 0.25 0.37 2.10
Table 69 shows the pre-tax dollar impact to forecasted net interest income over the next 12 months from December 31, 2013 and 2012, resulting from instantaneous parallel and non-parallel shocks to the market-based forward curve. Periodically, we evaluate the scenarios presented to ensure that they are meaningful in the context of the current rate environment. For further discussion of net interest income excluding the impact of trading-related activities, see page 30.
During 2013, the 10-year Treasury rate increased more than 120 bps. We continue to be asset sensitive to both a parallel move in interest rates and to a lesser degree a long-end led steepening of the yield curve. Additionally, rising interest rates impact the fair value of debt securities and, accordingly, for debt securities classified as AFS, may adversely affect accumulated OCI and thus capital levels.
Table 69 Estimated Net Interest Income ExcludingTrading-related Net Interest Income
(Dollars in millions) Short Rate (bps)
Long Rate (bps)
December 31
Curve Change 2013 2012Parallel Shifts
+100 bps instantaneous shift +100 +100 $ 3,229 $ 4,350
-50 bps instantaneous shift -50 -50 (1,616) (2,322)
Flatteners
Short end instantaneous change +100 — 2,210 2,130
Long end instantaneous change — -50 (641) (1,669)
Steepeners
Short end instantaneous change -50 — (937) (648)
Long end instantaneous change — +100 1,066 2,238
The sensitivity analysis in Table 69 assumes that we take no action in response to these rate shocks. As part of our ALM activities, we use securities, residential mortgages, and interest rate and foreign exchange derivatives in managing interest rate sensitivity.
76788ba_financials.indd 109 3/6/14 12:06 PM

110 Bank of America 2013
SecuritiesThe securities portfolio is an integral part of our interest rate risk management, which includes our ALM positioning, and is primarily comprised of debt securities including MBS and to a lesser extent U.S. Treasury, corporate, municipal and other debt securities. As part of the ALM positioning, we use derivatives to hedge interest rate and duration risk. At December 31, 2013 and 2012, our securities portfolio used for ALM positioning had a carrying value of $323.9 billion and $360.3 billion.
During 2013 and 2012, we purchased debt securities of $190.4 billion and $185.5 billion, sold $117.7 billion and $72.4 billion, and had maturities and received paydowns of $94.0 billion and $77.8 billion, respectively. We realized $1.3 billion and $1.7 billion in net gains on sales of AFS debt securities.
At December 31, 2013 and 2012, accumulated OCI included after-tax net unrealized losses of $3.3 billion and gains of $4.4 billion on AFS debt securities and after-tax net unrealized losses of $4 million and gains of $462 million on AFS marketable equity securities. For more information on accumulated OCI, see Note 14 – Accumulated Other Comprehensive Income (Loss) to the Consolidated Financial Statements. The pre-tax net amounts in accumulated OCI related to AFS debt securities decreased $12.2 billion during 2013 to a $5.2 billion net unrealized loss primarily due to the impact of higher interest rates. For more information on our securities portfolio, see Note 3 – Securities to the Consolidated Financial Statements.
We recognized $20 million of other-than-temporary impairment (OTTI) losses in earnings on AFS debt securities in 2013 compared to losses of $53 million in 2012. The recognition of OTTI losses is based on a variety of factors, including the length of time and extent to which the market value has been less than amortized cost, the financial condition of the issuer of the security including credit ratings and any specific events affecting the operations of the issuer, underlying assets that collateralize the debt security, other industry and macroeconomic conditions, and our intent and ability to hold the security to recovery.
Residential Mortgage PortfolioAt December 31, 2013 and 2012, our residential mortgage portfolio was $248.1 billion and $252.9 billion excluding $2.0 billion and $1.0 billion of consumer residential mortgage loans accounted for under the fair value option. For more information on consumer fair value option loans, see Consumer Portfolio Credit Risk Management – Consumer Loans Accounted for Under the Fair Value Option on page 85. The $4.9 billion decrease in 2013 was primarily due to paydowns, charge-offs, transfers to foreclosed
properties and sales. These were partially offset by new origination volume retained on our balance sheet, loans repurchased as part of the FNMA Settlement, as well as repurchases of delinquent loans pursuant to our servicing agreements with GNMA, which is part of our mortgage banking activities. For more information on the FNMA Settlement, see Note 7 – Representations and Warranties Obligations and Corporate Guarantees to the Consolidated Financial Statements.
During 2013, CRES and GWIM originated $44.5 billion of first-lien mortgages that we retained compared to $35.4 billion in 2012. Additionally, during 2013 in connection with the FNMA Settlement, we repurchased $5.3 billion of certain residential mortgage loans as mentioned above. We repurchased, net of loans redelivered, $5.5 billion of loans pursuant to our servicing agreements with GNMA, primarily FHA-insured loans, compared to $7.0 billion in 2012. Sales of loans, excluding redelivered FHA loans, during 2013 were $4.0 billion compared to $302 million in 2012. Substantially all of the loans sold in 2013 were nonperforming or PCI. Gains recognized on the sales of residential mortgages in both years were not material. We received paydowns of $53.0 billion in 2013 compared to $54.3 billion in 2012.
Interest Rate and Foreign Exchange Derivative ContractsInterest rate and foreign exchange derivative contracts are utilized in our ALM activities and serve as an efficient tool to manage our interest rate and foreign exchange risk. We use derivatives to hedge the variability in cash flows or changes in fair value on our balance sheet due to interest rate and foreign exchange components. For more information on our hedging activities, see Note 2 – Derivatives to the Consolidated Financial Statements.
Our interest rate contracts are generally non-leveraged generic interest rate and foreign exchange basis swaps, options, futures and forwards. In addition, we use foreign exchange contracts, including cross-currency interest rate swaps, foreign currency futures contracts, foreign currency forward contracts and options to mitigate the foreign exchange risk associated with foreign currency-denominated assets and liabilities.
Changes to the composition of our derivatives portfolio during 2013 reflect actions taken for interest rate and foreign exchange rate risk management. The decisions to reposition our derivatives portfolio are based on the current assessment of economic and financial conditions including the interest rate and foreign currency environments, balance sheet composition and trends, and the relative mix of our cash and derivative positions.
76788ba_financials.indd 110 3/6/14 12:06 PM

Bank of America 2013 111
Table 70 presents derivatives utilized in our ALM activities including those designated as accounting and economic hedging instruments and shows the notional amount, fair value, weighted-average receive-fixed and pay-fixed rates, expected maturity and average estimated durations of our open ALM derivatives at December 31, 2013 and 2012. These amounts do not include derivative hedges on our MSRs.
Table 70 Asset and Liability Management Interest Rate and Foreign Exchange Contracts
December 31, 2013
Expected Maturity
(Dollars in millions, average estimated duration inyears)
FairValue Total 2014 2015 2016 2017 2018 Thereafter
AverageEstimatedDuration
Receive-fixed interest rate swaps (1, 2) $ 5,074 4.67
Notional amount $ 109,539 $ 7,604 $ 12,873 $ 15,339 $ 19,803 $ 20,733 $ 33,187
Weighted-average fixed-rate 3.42% 3.79% 3.32% 3.12% 3.87% 3.34% 3.29%
Pay-fixed interest rate swaps (1, 2) 427 5.92
Notional amount $ 28,418 $ 4,645 $ 520 $ 1,025 $ 1,527 $ 8,529 $ 12,172
Weighted-average fixed-rate 1.87% 0.54% 2.30% 1.65% 1.84% 1.52% 2.62%
Same-currency basis swaps (3) 6
Notional amount $ 145,184 $ 47,529 $ 25,171 $ 28,157 $ 15,283 $ 9,156 $ 19,888
Foreign exchange basis swaps (2, 4, 5) 1,208
Notional amount 205,560 39,151 37,298 27,293 24,304 14,517 62,997
Option products (6) 21
Notional amount (7) (641) (649) (11) — — — 19
Foreign exchange contracts (2, 5, 8) 1,619
Notional amount (7) (19,515) (35,991) 1,873 (669) 7,224 2,026 6,022
Futures and forward rate contracts 147
Notional amount (7) (19,427) (19,427) — — — — —
Net ALM contracts $ 8,502
December 31, 2012
Expected Maturity
(Dollars in millions, average estimated duration inyears)
FairValue Total 2013 2014 2015 2016 2017 Thereafter
AverageEstimatedDuration
Receive-fixed interest rate swaps (1, 2) $ 10,491 5.30Notional amount $ 85,899 $ 7,175 $ 7,604 $ 11,785 $ 11,362 $ 19,693 $ 28,280 Weighted-average fixed-rate 4.12% 4.06% 3.79% 3.56% 3.98% 3.89% 4.67%
Pay-fixed interest rate swaps (1, 2) (4,903) 15.47Notional amount $ 26,548 $ 27 $ 3,989 $ 520 $ 1,025 $ 1,527 $ 19,460 Weighted-average fixed-rate 3.09% 6.91% 0.79% 2.30% 1.65% 1.84% 3.75%
Same-currency basis swaps (3) 45 Notional amount $213,458 $ 82,716 $ 54,534 $ 19,995 $ 20,361 $ 13,542 $ 22,310
Foreign exchange basis swaps (2, 4, 5) 431 Notional amount 191,925 32,590 44,732 27,569 15,965 20,134 50,935
Option products (6) (147) Notional amount (7) 4,218 4,000 — — — — 218
Foreign exchange contracts (2, 5, 8) 5,636 Notional amount (7) (1,200) (23,438) 8,615 1,303 582 6,183 5,555
Futures and forward rate contracts 24 Notional amount (7) (11,595) (11,595) — — — — —
Net ALM contracts $ 11,577 (1) At December 31, 2013, the receive-fixed interest rate swap notional amounts that represent forward starting swaps and which will not be effective until their respective contractual start dates totaled
$600 million compared to none at December 31, 2012. The forward starting pay-fixed swap positions at December 31, 2013 and 2012 were $1.1 billion and $520 million.(2) Does not include basis adjustments on either fixed-rate debt issued by the Corporation or AFS debt securities, which are hedged using derivatives designated as fair value hedging instruments, that
substantially offset the fair values of these derivatives.(3) At December 31, 2013 and 2012, the notional amount of same-currency basis swaps was comprised of $145.2 billion and $213.5 billion in both foreign currency and U.S. dollar-denominated basis
swaps in which both sides of the swap are in the same currency.(4) Foreign exchange basis swaps consisted of cross-currency variable interest rate swaps used separately or in conjunction with receive-fixed interest rate swaps.(5) Does not include foreign currency translation adjustments on certain non-U.S. debt issued by the Corporation that substantially offset the fair values of these derivatives.(6) The notional amount of option products of $(641) million at December 31, 2013 was comprised of $(2.0) billion in swaptions, $1.4 billion in foreign exchange options and $19 million in purchased
caps/floors. Option products of $4.2 billion at December 31, 2012 were comprised of $4.2 billion in swaptions and $18 million in purchased caps/floors.(7) Reflects the net of long and short positions. Amounts shown as negative reflect a net short position.(8) The notional amount of foreign exchange contracts of $(19.5) billion at December 31, 2013 was comprised of $36.1 billion in foreign currency-denominated and cross-currency receive-fixed swaps,
$(49.3) billion in net foreign currency forward rate contracts, $(10.3) billion in foreign currency-denominated pay-fixed swaps and $4.0 billion in foreign currency futures contracts. Foreign exchange contracts of $(1.2) billion at December 31, 2012 were comprised of $41.9 billion in foreign currency-denominated and cross-currency receive-fixed swaps, $(10.5) billion in foreign currency-denominated pay-fixed swaps and $(32.6) billion in net foreign currency forward rate contracts.
76788ba_financials.indd 111 3/6/14 12:06 PM
112 Bank of America 2013
We use interest rate derivative instruments to hedge the variability in the cash flows of our assets and liabilities and other forecasted transactions (collectively referred to as cash flow hedges). The net losses on both open and terminated cash flow hedge derivative instruments recorded in accumulated OCI, net-of-tax, were $2.3 billion and $2.9 billion at December 31, 2013 and 2012. These net losses are expected to be reclassified into earnings in the same period as the hedged cash flows affect earnings and will decrease income or increase expense on the respective hedged cash flows. Assuming no change in open cash flow derivative hedge positions and no changes in prices or interest rates beyond what is implied in forward yield curves at December 31, 2013, the pre-tax net losses are expected to be reclassified into earnings as follows: $784 million, or 22 percent within the next year, 58 percent in years two through five, and 14 percent in years six through ten, with the remaining six percent thereafter. For more information on derivatives designated as cash flow hedges, see Note 2 – Derivatives to the Consolidated Financial Statements.
We hedge our net investment in non-U.S. operations determined to have functional currencies other than the U.S. dollar using forward foreign exchange contracts that typically settle in less than 180 days, cross-currency basis swaps and foreign exchange options. We recorded net after-tax losses on derivatives in accumulated OCI associated with net investment hedges which were offset by gains on our net investments in consolidated non-U.S. entities at December 31, 2013.
Mortgage Banking Risk ManagementWe originate, fund and service mortgage loans, which subject us to credit, liquidity and interest rate risks, among others. We determine whether loans will be HFI or held-for-sale at the time of commitment and manage credit and liquidity risks by selling or securitizing a portion of the loans we originate.
Interest rate risk and market risk can be substantial in the mortgage business. Fluctuations in interest rates drive consumer demand for new mortgages and the level of refinancing activity, which in turn affects total origination and servicing income. Hedging the various sources of interest rate risk in mortgage banking is a complex process that requires complex modeling and ongoing monitoring. Typically, an increase in mortgage interest rates will lead to a decrease in mortgage originations and related fees. IRLCs and the related residential first mortgage LHFS are subject to interest rate risk between the date of the IRLC and the date the loans are sold to the secondary market, as an increase in mortgage interest rates will typically lead to a decrease in the value of these instruments. To hedge interest rate risk and certain market risks of IRLCs and residential first mortgage LHFS, we utilize forward loan sale commitments and other derivative instruments including purchased options. At December 31, 2013 and 2012, the notional amounts of derivatives economically hedging the IRLCs and residential first mortgage LHFS were $7.9 billion and $31.1 billion.
MSRs are nonfinancial assets created when the underlying mortgage loan is sold to investors and we retain the right to service the loan. Typically, an increase in mortgage rates will lead to an increase in the value of the MSRs driven by lower prepayment expectations. We use certain derivatives such as interest rate options, interest rate swaps, forward settlement contracts and Eurodollar futures, as well as principal-only and interest-only MBS and U.S. Treasuries to hedge interest rate and certain other market
risks of MSRs. The fair value and notional amounts of the derivative contracts and the fair value of securities hedging the MSRs were $(2.9) billion, $1.8 trillion and $2.5 billion at December 31, 2013 and $2.3 billion, $1.6 trillion and $2.3 billion at December 31, 2012. In 2013, we recorded in mortgage banking income losses of $1.1 billion related to the change in fair value of the derivative contracts and other securities used to hedge the market risks of the MSRs compared to gains of $2.3 billion for 2012. For more information on MSRs, see Note 23 – Mortgage Servicing Rights to the Consolidated Financial Statements and for more information on mortgage banking income, see CRES on page 36.
Compliance Risk ManagementThe Global Compliance organization is responsible for overseeing compliance risk, which is the risk of legal or regulatory sanctions, material financial loss or damage to the reputation of the Corporation in the event of the failure of the Corporation to comply with requirements of applicable banking and financial services laws, rules and regulations, related self-regulatory organization standards, and codes of conduct. Compliance is at the core of the Corporation’s culture and is a key component of risk management discipline.
The Global Compliance Framework, an addendum to our Risk Framework, details the high-level requirements of the global compliance program in one comprehensive document. The Global Compliance Framework also clearly defines roles and responsibilities and is supported by policies that articulate detailed requirements for implementation and execution of the global compliance program. As such, the Global Compliance Framework is designed to support responsible, well-informed compliance risk management that incorporates an ongoing, disciplined approach to proactive planning, oversight, escalation and decision making across the Corporation.
The Global Compliance Framework also provides an outline for senior management and the Board, and/or appropriate Board-level committees, such as the Audit Committee, to oversee the Corporation’s compliance risk management. The Board provides oversight of compliance risks through its Audit Committee.
Operational Risk ManagementThe Corporation defines operational risk as the risk of loss resulting from inadequate or failed internal processes, people and systems or from external events. Operational risk may occur anywhere in the Corporation, including outsourced business processes, and is not limited to operations functions. Its effects may extend beyond financial losses. Operational risk includes legal risk. Successful operational risk management is particularly important to diversified financial services companies because of the nature, volume and complexity of the financial services business. Operational risk is a significant component in the calculation of total risk-weighted assets used in the Basel 3 capital determination. For more information on Basel 3, see Capital Management – Regulatory Capital Changes on page 64.
We approach operational risk management from two perspectives to manage operational risk within the structure of the Corporation: (1) at the enterprise level to provide independent, integrated management of operational risk across the organization, and (2) at the business and enterprise control function levels to address operational risk in revenue producing and non-revenue producing units. The Operational Risk Management Program addresses the overarching processes for
76788ba_financials.indd 112 3/6/14 12:06 PM

Bank of America 2013 113
identifying, measuring, mitigating, controlling, monitoring, testing and reviewing operational risk, and reporting operational risk information to management and the Board. A sound internal governance structure enhances the effectiveness of the Corporation’s Operational Risk Management Program and is accomplished at the enterprise level through formal oversight by the Board, the CRO and a variety of management committees and risk oversight groups aligned to the Corporation’s overall risk governance framework and practices. Of these, the Compliance and Operational Risk Committee (CORC) oversees the Corporation’s policies and processes for sound operational risk management. The CORC also serves as an escalation point for critical operational risk matters within the Corporation. The CORC reports operational risk activities to the Enterprise Risk Committee of the Board.
Within the Global Risk Management organization, the Corporate Operational Risk team develops and guides the strategies, policies, practices, controls and monitoring tools for assessing and managing operational risks across the organization and reports results to businesses, enterprise control functions, senior management, governance committees and the Board.
Corporate Audit provides independent assessment and validation through testing of key processes and controls across the Corporation. An annual Audit Plan ensures that coverage activities address the significant aspects of the Corporation’s risk profile. Risk assessments incorporating operational risk are completed within the audit planning process.
The business and enterprise control functions are responsible for managing all the risks within their units, including operational risks. In addition to enterprise risk management tools such as loss reporting, scenario analysis and RCSAs, operational risk executives, working in conjunction with senior business executives, have developed key tools to help identify, measure, mitigate and monitor risk in each business and enterprise control function. Examples of these include personnel management practices; data reconciliation processes; fraud management units; cybersecurity controls, processes and systems; transaction processing, monitoring and analysis; business recovery planning; and new product introduction processes. The business and enterprise control functions are also responsible for consistently implementing and monitoring adherence to corporate practices.
Business and enterprise control function management uses the enterprise RCSA process to identify and evaluate the status of risk and control issues including mitigation plans, as appropriate. The goals of this process are to assess changing market and business conditions, evaluate key risks impacting each business and enterprise control function and assess the controls in place to mitigate the risks. Key operational risk indicators for these risks have been developed and are used to assist in identifying trends and issues on an enterprise, business and enterprise control function level. Independent review and challenge to the Corporation’s overall operational risk management framework is performed by the Corporate Operational Risk Validation Team.
Enterprise control functions have risk governance and control responsibilities for their enterprise programs (e.g., Global Technology and Operations Group, CFO Group, Global Marketing and Corporate Affairs, Global Human Resources). They provide insights on day-to-day risk activities throughout the Corporation by overseeing and managing the performance of their functions against Corporation-wide expectations. The enterprise control functions participate in the operational risk management process
in two ways. First, these organizations manage risk in their functional department. Second, they provide specialized risk management services (e.g., information management, vendor management) within their area of expertise to the enterprise, businesses and other enterprise control functions they support. These groups also work with business and risk executives to develop and guide appropriate strategies, policies, practices, controls and monitoring tools for each business and enterprise control function relative to these programs.
Where appropriate, insurance policies are purchased to mitigate the impact of operational losses. These insurance policies are explicitly incorporated in the structural features of operational risk evaluation. As insurance recoveries, especially given recent market events, are subject to legal and financial uncertainty, the inclusion of these insurance policies is subject to reductions in their expected mitigating benefits.
Complex Accounting EstimatesOur significant accounting principles, as described in Note 1 – Summary of Significant Accounting Principles to the Consolidated Financial Statements are essential in understanding the MD&A. Many of our significant accounting principles require complex judgments to estimate the values of assets and liabilities. We have procedures and processes in place to facilitate making these judgments.
The more judgmental estimates are summarized in the following discussion. We have identified and described the development of the variables most important in the estimation processes that involve mathematical models to derive the estimates. In many cases, there are numerous alternative judgments that could be used in the process of determining the inputs to the models. Where alternatives exist, we have used the factors that we believe represent the most reasonable value in developing the inputs. Actual performance that differs from our estimates of the key variables could impact our results of operations. Separate from the possible future impact to our results of operations from input and model variables, the value of our lending portfolio and market-sensitive assets and liabilities may change subsequent to the balance sheet date, often significantly, due to the nature and magnitude of future credit and market conditions. Such credit and market conditions may change quickly and in unforeseen ways and the resulting volatility could have a significant, negative effect on future operating results. These fluctuations would not be indicative of deficiencies in our models or inputs.
Allowance for Credit LossesThe allowance for credit losses, which includes the allowance for loan and lease losses and the reserve for unfunded lending commitments, represents management’s estimate of probable losses inherent in the Corporation’s loan portfolio excluding those loans accounted for under the fair value option. Our process for determining the allowance for credit losses is discussed in Note 1 – Summary of Significant Accounting Principles to the Consolidated Financial Statements. We evaluate our allowance at the portfolio segment level and our portfolio segments are Home Loans, Credit Card and Other Consumer, and Commercial. Due to the variability in the drivers of the assumptions used in this process, estimates of the portfolio’s inherent risks and overall collectability change with changes in the economy, individual industries, countries, and borrowers’ ability and willingness to repay their obligations. The degree to which any particular
76788ba_financials.indd 113 3/6/14 12:06 PM

114 Bank of America 2013
assumption affects the allowance for credit losses depends on the severity of the change and its relationship to the other assumptions.
Key judgments used in determining the allowance for credit losses include risk ratings for pools of commercial loans and leases, market and collateral values and discount rates for individually evaluated loans, product type classifications for consumer and commercial loans and leases, loss rates used for consumer and commercial loans and leases, adjustments made to address current events and conditions, considerations regarding domestic and global economic uncertainty, and overall credit conditions.
Our estimate for the allowance for loan and lease losses is sensitive to the loss rates and expected cash flows from our Home Loans and Credit Card and Other Consumer portfolio segments, as well as our U.S. small business commercial portfolio within the Commercial portfolio segment. For each one percent increase in the loss rates on loans collectively evaluated for impairment in our Home Loans portfolio segment, excluding PCI loans, coupled with a one percent decrease in the discounted cash flows on those loans individually evaluated for impairment within this portfolio segment, the allowance for loan and lease losses at December 31, 2013 would have increased by $127 million. PCI loans within our Home Loans portfolio segment are initially recorded at fair value. Applicable accounting guidance prohibits carry-over or creation of valuation allowances in the initial accounting. However, subsequent decreases in the expected cash flows from the date of acquisition result in a charge to the provision for credit losses and a corresponding increase to the allowance for loan and lease losses. We subject our PCI portfolio to stress scenarios to evaluate the potential impact given certain events. A one percent decrease in the expected cash flows could result in a $205 million impairment of the portfolio. For each one percent increase in the loss rates on loans collectively evaluated for impairment within our Credit Card and Other Consumer portfolio segment and U.S. small business commercial portfolio coupled with a one percent decrease in the expected cash flows on those loans individually evaluated for impairment within the portfolio segment and the U.S. small business commercial portfolio, the allowance for loan and lease losses at December 31, 2013 would have increased by $59 million.
Our allowance for loan and lease losses is sensitive to the risk ratings assigned to loans and leases within the Commercial portfolio segment (excluding the U.S. small business commercial portfolio). Assuming a downgrade of one level in the internal risk ratings for commercial loans and leases, except loans and leases already risk-rated Doubtful as defined by regulatory authorities, the allowance for loan and lease losses would have increased by $2.2 billion at December 31, 2013.
The allowance for loan and lease losses as a percentage of total loans and leases at December 31, 2013 was 1.90 percent and these hypothetical increases in the allowance would raise the ratio to 2.18 percent.
These sensitivity analyses do not represent management’s expectations of the deterioration in risk ratings or the increases
in loss rates but are provided as hypothetical scenarios to assess the sensitivity of the allowance for loan and lease losses to changes in key inputs. We believe the risk ratings and loss severities currently in use are appropriate and that the probability of the alternative scenarios outlined above occurring within a short period of time is remote.
The process of determining the level of the allowance for credit losses requires a high degree of judgment. It is possible that others, given the same information, may at any point in time reach different reasonable conclusions.
For a discussion of the Financial Accounting Standards Board’s proposed standard on accounting for credit losses, see Note 1 – Summary of Significant Accounting Principles to the Consolidated Financial Statements.
Mortgage Servicing RightsMSRs are nonfinancial assets that are created when a mortgage loan is sold and we retain the right to service the loan. We account for consumer MSRs, including residential mortgage and home equity MSRs, at fair value with changes in fair value recorded in mortgage banking income (loss) in the Consolidated Statement of Income.
We determine the fair value of our consumer MSRs using a valuation model that calculates the present value of estimated future net servicing income. The model incorporates key economic assumptions including estimates of prepayment rates and resultant weighted-average lives of the MSRs, and the option-adjusted spread levels. These variables can, and generally do, change from quarter to quarter as market conditions and projected interest rates change. These assumptions are subjective in nature and changes in these assumptions could materially affect our operating results. For example, increasing the prepayment rate assumption used in the valuation of our consumer MSRs by 10 percent while keeping all other assumptions unchanged could have resulted in an estimated decrease of $244 million in both MSRs and mortgage banking income (loss) for 2013. This impact does not reflect any hedge strategies that may be undertaken to mitigate such risk.
We manage potential changes in the fair value of MSRs through a comprehensive risk management program. The intent is to mitigate the effects of changes in the fair value of MSRs through the use of risk management instruments. To reduce the sensitivity of earnings to interest rate and market value fluctuations, securities including MBS and U.S. Treasuries, as well as certain derivatives such as options and interest rate swaps, may be used to hedge certain market risks of the MSRs, but are not designated as accounting hedges. These instruments are carried at fair value with changes in fair value recognized in mortgage banking income (loss). For additional information, see Mortgage Banking Risk Management on page 112.
For more information on MSRs, including the sensitivity of weighted-average lives and the fair value of MSRs to changes in modeled assumptions, see Note 23 – Mortgage Servicing Rights to the Consolidated Financial Statements.
76788ba_financials.indd 114 3/6/14 12:06 PM

Bank of America 2013 115
Fair Value of Financial InstrumentsWe classify the fair values of financial instruments based on the fair value hierarchy established under applicable accounting guidance which requires an entity to maximize the use of observable inputs and minimize the use of unobservable inputs when measuring fair value. Applicable accounting guidance establishes three levels of inputs used to measure fair value. We carry trading account assets and liabilities, derivative assets and liabilities, AFS debt and equity securities, other debt securities carried at fair value, certain MSRs and certain other assets at fair value. Also, we account for certain loans and loan commitments, LHFS, short-term borrowings, securities financing agreements, asset-backed secured financings, long-term deposits and long-term debt under the fair value option. For additional information, see Note 20 – Fair Value Measurements and Note 21 – Fair Value Option to the Consolidated Financial Statements.
The fair values of assets and liabilities may include adjustments, such as market liquidity and credit quality, where appropriate. Valuations of products using models or other techniques are sensitive to assumptions used for the significant inputs. Where market data is available, the inputs used for valuation reflect that information as of our valuation date. Inputs to valuation models are considered unobservable if they are supported by little or no market activity. In periods of extreme volatility, lessened liquidity or in illiquid markets, there may be more variability in market pricing or a lack of market data to use in the valuation process. In keeping with the prudent application of estimates and management judgment in determining the fair value of assets and liabilities, we have in place various processes and controls that include: a model validation policy that requires review and approval of quantitative models used for deal pricing, financial statement fair value determination and risk quantification; a trading product valuation policy that requires verification of all traded product valuations; and a periodic review and substantiation of daily profit and loss reporting for all traded products. Primarily through validation controls, we utilize both broker and pricing service inputs which can and do include both market-observable and internally-modeled values and/or valuation inputs. Our reliance on this information is tempered by the knowledge of how the broker and/or pricing service develops its data with a higher degree of reliance applied to those that are more directly observable and lesser reliance applied to those developed through their own internal modeling. Similarly, broker quotes that are executable are given a higher level of reliance than indicative broker quotes, which are not executable. These processes and controls are performed independently of the business.
Trading account assets and liabilities are carried at fair value based primarily on actively traded markets where prices are based on either direct market quotes or observed transactions. Liquidity is a significant factor in the determination of the fair values of trading account assets and liabilities. Market price quotes may
not be readily available for some positions, or positions within a market sector where trading activity has slowed significantly or ceased. Situations of illiquidity generally are triggered by the market’s perception of credit uncertainty regarding a single company or a specific market sector. In these instances, fair value is determined based on limited available market information and other factors, principally from reviewing the issuer’s financial statements and changes in credit ratings made by one or more rating agencies.
Trading account profits, which represent the net amount earned from our trading positions, can be volatile and are largely driven by general market conditions and customer demand. Trading account profits are dependent on the volume and type of transactions, the level of risk assumed, and the volatility of price and rate movements at any given time within the ever-changing market environment. To evaluate risk in our trading activities, we focus on the actual and potential volatility of individual positions as well as portfolios. At a portfolio and corporate level, we use trading limits, stress testing and tools such as VaR modeling, which estimates a potential daily loss that we do not expect to exceed with a specified confidence level, to measure and manage market risk. For more information on VaR, see Trading Risk Management on page 105.
The fair values of derivative assets and liabilities traded in the OTC market are determined using quantitative models that utilize multiple market inputs including interest rates, prices and indices to generate continuous yield or pricing curves and volatility factors to value the position. The majority of market inputs are actively quoted and can be validated through external sources, including brokers, market transactions and third-party pricing services. Estimation risk is greater for derivative asset and liability positions that are either option-based or have longer maturity dates where observable market inputs are less readily available, or are unobservable, in which case, quantitative-based extrapolations of rate, price or index scenarios are used in determining fair values. The fair values of derivative assets and liabilities include adjustments for market liquidity, counterparty credit quality and other instrument-specific factors, where appropriate. In addition, the Corporation incorporates within its fair value measurements of OTC derivatives a valuation adjustment to reflect the credit risk associated with the net position. Positions are netted by counterparty, and fair value for net long exposures is adjusted for counterparty credit risk while the fair value for net short exposures is adjusted for our own credit risk. An estimate of severity of loss is also used in the determination of fair value, primarily based on market data. We do not incorporate a funding valuation or funding benefit adjustment (collectively, FVA) into the fair value of our uncollateralized derivatives. There is diversity in industry practice regarding FVA and such views continue to evolve. We continue to evaluate FVA as it relates to our valuation methodologies used to comply with applicable fair value accounting guidance.
76788ba_financials.indd 115 3/6/14 12:06 PM

116 Bank of America 2013
Level 3 Assets and LiabilitiesFinancial assets and liabilities where values are based on valuation techniques that require inputs that are both unobservable and are significant to the overall fair value measurement are classified as Level 3 under the fair value hierarchy established in applicable accounting guidance. The Level 3 financial assets and liabilities include certain loans, MBS, ABS,
CDOs, CLOs and structured liabilities, as well as highly structured, complex or long-dated derivative contracts, private equity investments and consumer MSRs. The fair value of these Level 3 financial assets and liabilities is determined using pricing models, discounted cash flow methodologies or similar techniques for which the determination of fair value requires significant management judgment or estimation.
Table 71 Level 3 Asset and Liability Summary
December 31 2013 2012
(Dollars in millions)Level 3
Fair Value
As a %of TotalLevel 3Assets
As a %of TotalAssets
Level 3Fair Value
As a %of TotalLevel 3Assets
As a %of TotalAssets
Trading account assets $ 9,044 28.46% 0.43% $ 9,559 26.13% 0.43%Derivative assets 7,277 22.90 0.35 8,073 22.06 0.37AFS debt securities 4,760 14.98 0.23 5,091 13.91 0.23All other Level 3 assets at fair value 10,697 33.66 0.50 13,865 37.90 0.63
Total Level 3 assets at fair value (1) $ 31,778 100.00% 1.51% $ 36,588 100.00% 1.66%
Level 3
Fair Value
As a %of TotalLevel 3
Liabilities
As a %of Total
LiabilitiesLevel 3
Fair Value
As a %of TotalLevel 3
Liabilities
As a %of Total
Liabilities
Derivative liabilities $ 7,301 78.20% 0.39% $ 6,605 73.51% 0.33%Long-term debt 1,990 21.32 0.11 2,301 25.61 0.12All other Level 3 liabilities at fair value 45 0.48 — 79 0.88 0.01
Total Level 3 liabilities at fair value (1) $ 9,336 100.00% 0.50% $ 8,985 100.00% 0.46%(1) Level 3 total assets and liabilities are shown before the impact of cash collateral and counterparty netting related to our derivative positions.
During 2013, we recognized net gains of $2.0 billion on Level 3 assets and liabilities. The net gains were primarily gains on MSRs and trading account assets, partially offset by losses on net derivative assets and other assets. Gains on MSRs were primarily due to the impact of the increase in interest rates on forecasted prepayments. Gains on trading account assets were primarily due to realized gains on the sale of corporate bonds as well as distributions received on secondary loan positions held in inventory, partially offset by unrealized losses on certain collateralized loan and debt obligations. Losses on net derivative assets were driven by unrealized losses associated with certain structured products and credit default and total return swaps, partially offset by unrealized gains associated with the performance of various index option contracts as well as gains on IRLCs. Losses on other assets were primarily due to a write-down of a receivable. There were net unrealized gains of $40 million (pre-tax) in accumulated OCI on Level 3 assets and liabilities at December 31, 2013. For more information on the components of net realized and unrealized gains and losses during 2013, see Note 20 – Fair Value Measurements to the Consolidated Financial Statements.
Level 3 financial instruments, such as our consumer MSRs, may be hedged with derivatives classified as Level 1 or 2; therefore, gains or losses associated with Level 3 financial instruments may be offset by gains or losses associated with financial instruments classified in other levels of the fair value hierarchy. The Level 3 gains and losses recorded in earnings did not have a significant impact on our liquidity or capital resources.
We conduct a review of our fair value hierarchy classifications on a quarterly basis. Transfers into or out of Level 3 are made if the significant inputs used in the financial models measuring the fair values of the assets and liabilities became unobservable or
observable, respectively, in the current marketplace. These transfers are considered to be effective as of the beginning of the quarter in which they occur. For more information on the significant transfers into and out of Level 3 during 2013, see Note 20 – Fair Value Measurements to the Consolidated Financial Statements.
Accrued Income Taxes and Deferred Tax AssetsAccrued income taxes, reported as a component of accrued expenses and other liabilities on the Consolidated Balance Sheet, represent the net amount of current income taxes we expect to pay to or receive from various taxing jurisdictions attributable to our operations to date. We currently file income tax returns in more than 100 jurisdictions and consider many factors, including statutory, judicial and regulatory guidance, in estimating the appropriate accrued income taxes for each jurisdiction.
Consistent with the applicable accounting guidance, we monitor relevant tax authorities and change our estimate of accrued income taxes due to changes in income tax laws and their interpretation by the courts and regulatory authorities. These revisions of our estimate of accrued income taxes, which also may result from our income tax planning and from the resolution of income tax controversies, may be material to our operating results for any given period.
Net deferred tax assets, reported as a component of other assets on the Consolidated Balance Sheet, represent the net decrease in taxes expected to be paid in the future because of net operating loss (NOL) and tax credit carryforwards and because of future reversals of temporary differences in the bases of assets and liabilities as measured by tax laws and their bases as reported in the financial statements. NOL and tax credit carryforwards result in reductions to future tax liabilities, and many of these attributes can expire if not utilized within certain periods. We consider the
76788ba_financials.indd 116 3/6/14 12:06 PM
Bank of America 2013 117
need for valuation allowances to reduce net deferred tax assets to the amounts that we estimate are more-likely-than-not to be realized.
While we have established some valuation allowances for certain state and non-U.S. deferred tax assets, we have concluded that no valuation allowance was necessary with respect to all U.S. federal and U.K. deferred tax assets, including NOL and tax credit carryforwards, that are not subject to any special limitations (such as change-in-control limitations) prior to any expiration. Management’s conclusion is supported by recent financial results and forecasts, the reorganization of certain business activities and the indefinite period to carry forward NOLs. The majority of our U.K. net deferred tax assets, which consist primarily of NOLs, are expected to be realized by certain subsidiaries over an extended number of years. However, significant changes to our estimates, such as changes that would be caused by substantial and prolonged worsening of the condition of Europe’s capital markets, could lead management to reassess its U.K. valuation allowance conclusions. See Note 19 – Income Taxes to the Consolidated Financial Statements for a table of significant tax attributes and additional information.
Goodwill and Intangible Assets
BackgroundThe nature of and accounting for goodwill and intangible assets are discussed in Note 1 – Summary of Significant Accounting Principles and Note 8 – Goodwill and Intangible Assets to the Consolidated Financial Statements. Goodwill is reviewed for potential impairment at the reporting unit level on an annual basis, which for the Corporation is as of June 30, and in interim periods if events or circumstances indicate a potential impairment. A reporting unit is an operating segment or one level below. As reporting units are determined after an acquisition or evolve with changes in business strategy, goodwill is assigned to reporting units and it no longer retains its association with a particular acquisition. All of the revenue streams and related activities of a reporting unit, whether acquired or organic, are available to support the value of the goodwill.
Effective January 1, 2013, on a prospective basis, the Corporation adjusted the amount of capital being allocated to the business segments. The adjustment reflects a refinement to the prior-year methodology (economic capital), which focused solely on internal risk-based economic capital models. The refined methodology (allocated capital) now also considers the effect of regulatory capital requirements in addition to internal risk-based economic capital models. For purposes of goodwill impairment testing, we utilized allocated equity as a proxy for the carrying value of our reporting units. Allocated equity in the reporting units is comprised of allocated capital plus capital for the portion of goodwill and intangibles specifically assigned to the reporting unit.
The Corporation’s common stock price improved during 2013; however, our market capitalization remained below our recorded book value. We estimate that the fair value of all reporting units with assigned goodwill in aggregate as of the June 30, 2013 annual goodwill impairment test was $290.9 billion and the aggregate carrying value of all reporting units with assigned goodwill, as measured by allocated equity, was $163.5 billion. The common stock market capitalization of the Corporation as of June 30, 2013 was $138.2 billion ($164.9 billion at December 31, 2013). As none of our reporting units are publicly traded, individual reporting unit fair value determinations do not directly correlate to the
Corporation’s stock price. Although we believe it is reasonable to conclude that market capitalization could be an indicator of fair value over time, we do not believe that our current market capitalization reflects the aggregate fair value of our individual reporting units.
Estimating the fair value of reporting units is a subjective process that involves the use of estimates and judgments, particularly related to cash flows, the appropriate discount rates and an applicable control premium. We determined the fair values of the reporting units using a combination of valuation techniques consistent with the market approach and the income approach and also utilized independent valuation specialists.
The market approach we used estimates the fair value of the individual reporting units by incorporating any combination of the tangible capital, book capital and earnings multiples from comparable publicly-traded companies in industries similar to that of the reporting unit. The relative weight assigned to these multiples varies among the reporting units based on qualitative and quantitative characteristics, primarily the size and relative profitability of the reporting unit as compared to the comparable publicly-traded companies. Since the fair values determined under the market approach are representative of a noncontrolling interest, we added a control premium to arrive at the reporting units’ estimated fair values on a controlling basis.
For purposes of the income approach, we calculated discounted cash flows by taking the net present value of estimated future cash flows and an appropriate terminal value. Our discounted cash flow analysis employs a capital asset pricing model in estimating the discount rate (i.e., cost of equity financing) for each reporting unit. The inputs to this model include the risk-free rate of return, beta, which is a measure of the level of non-diversifiable risk associated with comparable companies for each specific reporting unit, size premium to reflect the historical incremental return on stocks, market equity risk premium and in certain cases an unsystematic (company-specific) risk factor. The unsystematic risk factor is the input that specifically addresses uncertainty related to our projections of earnings and growth, including the uncertainty related to loss expectations. We utilized discount rates that we believe adequately reflect the risk and uncertainty in the financial markets generally and specifically in our internally developed forecasts. We estimated expected rates of equity returns based on historical market returns and risk/return rates for similar industries of each reporting unit. We use our internal forecasts to estimate future cash flows and actual results may differ from forecasted results.
In 2013, the consumer DFS business, including $1.7 billion of goodwill, was moved from Global Banking to CBB in order to align this business more closely with our consumer lending activity and better serve the needs of our customers. In 2012, the International Wealth Management businesses within GWIM, including $230 million of goodwill, were moved to All Other in connection with our agreement to sell these businesses in a series of transactions. Certain of the sales transactions were completed in 2013 and most of the remaining sales transactions are expected to close over the next year. Prior periods were reclassified to conform to current period presentation.
2013 Annual Impairment TestDuring the three months ended September 30, 2013, we completed our annual goodwill impairment test as of June 30, 2013 for all of our reporting units that had goodwill. In performing the first step of the annual goodwill impairment analysis, we
76788ba_financials.indd 117 3/6/14 12:06 PM

118 Bank of America 2013
compared the fair value of each reporting unit to its estimated carrying value as measured by allocated equity, which includes goodwill. During our 2013 annual goodwill impairment test, we also evaluated the U.K. Card business, which is a reporting unit, within All Other, as the U.K. Card business comprises the majority of the goodwill included in All Other. To determine fair value, we utilized a combination of the market approach and the income approach. Under the market approach, we compared earnings and equity multiples of the individual reporting units to multiples of public companies comparable to the individual reporting units. The control premium used in the June 30, 2013 annual goodwill impairment test was 35 percent for all reporting units. Under the income approach, we updated our assumptions to reflect the current market environment. The discount rates used in the June 30, 2013 annual goodwill impairment test ranged from 11 percent to 14 percent depending on the relative risk of a reporting unit. Growth rates developed by management for individual revenue and expense items in each reporting unit ranged from (5.4) percent to 11.4 percent.
Based on the results of step one of the annual goodwill impairment test, we determined that step two was not required for any of the reporting units as their fair value exceeded their carrying value indicating there was no impairment.
As described above, during the three months ended June 30, 2013, the consumer DFS business was moved from Global Banking to CBB and subsequently constitutes a new separate reporting unit. The goodwill allocated to this reporting unit was reviewed for impairment as part of the goodwill testing process. Based on the results of step one of the annual goodwill impairment test, we determined that the fair value of the reporting unit exceeded its carrying value. Although not required, given the recent move and the results of step one, and to further substantiate the value of goodwill, we performed step two of the goodwill impairment test for this reporting unit. The fair value of the reporting unit was estimated based on the income approach. Significant assumptions for the valuation of consumer DFS under the income approach included cash flow estimates, including expected new account growth, the discount rate and the terminal value. In performing step two, significant assumptions used in measuring the fair value of the assets and liabilities of the reporting unit included discount rates, loss rates and interest rates. The results of step two further supported that the goodwill for the consumer DFS reporting unit was not impaired.
On July 31, 2013, the U.S. District Court for the District of Columbia issued a ruling regarding the Federal Reserve’s rules implementing the Financial Reform Act’s Durbin Amendment. The ruling requires the Federal Reserve to reconsider the $0.21 per transaction cap on debit card interchange fees. The Federal Reserve is appealing the ruling and final resolution is expected in the first half of 2014. In performing the annual goodwill impairment test for Card Services within CBB, we considered the impact of the recent ruling in determining the fair value of the reporting unit and, assuming the range initially included in the Federal Reserve’s rule is used for forecasting interchange fees, no goodwill impairment would result. If the Federal Reserve, upon final resolution, implements a lower per transaction cap than the initial range, it may have a significant adverse impact on our debit card interchange fee revenue and the associated goodwill allocated to the Card Services reporting unit.
2012 Annual Impairment TestsDuring the three months ended September 30, 2012, we completed our annual goodwill impairment test as of June 30, 2012 for all of our reporting units which had goodwill. Additionally, we also evaluated the U.K. Card business within All Other as the U.K. Card business comprises the majority of the goodwill included in All Other.
Based on the results of step one of the annual goodwill impairment test, we determined that step two was not required for any of the reporting units as their respective fair values exceeded their carrying values indicating there was no impairment.
Representations and Warranties LiabilityThe methodology used to estimate the liability for obligations under representations and warranties related to transfers of residential mortgage loans is a function of the representations and warranties given and considers a variety of factors. Depending upon the counterparty, these factors include actual defaults, estimated future defaults, historical loss experience, estimated home prices, other economic conditions, estimated probability that we will receive a repurchase request, including consideration of whether presentation thresholds will be met, number of payments made by the borrower prior to default and estimated probability that we will be required to repurchase a loan. It also considers other relevant facts and circumstances, such as bulk settlements and identity of the counterparty or type of counterparty, as appropriate. The estimate of the liability for obligations under representations and warranties is based upon currently available information, significant judgment, and a number of factors, including those set forth above, that are subject to change. Changes to any one of these factors could significantly impact the estimate of our liability.
The representations and warranties provision may vary significantly each period as the methodology used to estimate the expense continues to be refined based on the level and type of repurchase requests presented, defects identified, the latest experience gained on repurchase requests, and other relevant facts and circumstances. The estimate of the liability for representations and warranties is sensitive to future defaults, loss severity and the net repurchase rate. An assumed simultaneous increase or decrease of 10 percent in estimated future defaults, loss severity and the net repurchase rate would result in an increase or decrease of approximately $550 million in the representations and warranties liability as of December 31, 2013. These sensitivities are hypothetical and are intended to provide an indication of the impact of a significant change in these key assumptions on the representations and warranties liability. In reality, changes in one assumption may result in changes in other assumptions, which may or may not counteract the sensitivity.
For more information on representations and warranties exposure and the corresponding estimated range of possible loss, see Off-Balance Sheet Arrangements and Contractual Obligations – Representations and Warranties on page 48, as well as Note 7 – Representations and Warranties Obligations and Corporate Guarantees and Note 12 – Commitments and Contingencies to the Consolidated Financial Statements.
76788ba_financials.indd 118 3/6/14 12:06 PM

Bank of America 2013 119
Litigation ReserveIn accordance with applicable accounting guidance, the Corporation establishes an accrued liability for litigation and regulatory matters when those matters present loss contingencies that are both probable and estimable. In such cases, there may be an exposure to loss in excess of any amounts accrued. When a loss contingency is not both probable and estimable, the Corporation does not establish an accrued liability. As a litigation or regulatory matter develops, the Corporation, in conjunction with any outside counsel handling the matter, evaluates on an ongoing basis whether such matter presents a loss contingency that is both probable and estimable. If, at the time of evaluation, the loss contingency related to a litigation or regulatory matter is not both probable and estimable, the matter will continue to be monitored for further developments that would make such loss contingency both probable and estimable. Once the loss contingency related to a litigation or regulatory matter is deemed to be both probable and estimable, the Corporation will establish an accrued liability with respect to such loss contingency and record a corresponding amount of litigation-related expense. The Corporation will continue to monitor the matter for further developments that could affect the amount of the accrued liability that has been previously established.
For a limited number of the matters disclosed in Note 12 – Commitments and Contingencies to the Consolidated Financial Statements for which a loss is probable or reasonably possible in future periods, whether in excess of a related accrued liability or where there is no accrued liability, we are able to estimate a range of possible loss. In determining whether it is possible to provide an estimate of loss or range of possible loss, the Corporation reviews and evaluates its material litigation and regulatory matters on an ongoing basis, in conjunction with any outside counsel handling the matter, in light of potentially relevant factual and legal developments. These may include information learned through the discovery process, rulings on dispositive motions, settlement discussions, and other rulings by courts, arbitrators or others. In cases in which the Corporation possesses sufficient information to develop an estimate of loss or range of possible loss, that estimate is aggregated and disclosed in Note 12 – Commitments and Contingencies to the Consolidated Financial Statements. For other disclosed matters for which a loss is probable or reasonably possible, such an estimate is not possible. Those matters for which an estimate is not possible are not included within this estimated range. Therefore, the estimated range of possible loss represents what we believe to be an estimate of possible loss only for certain matters meeting these criteria. It does not represent the Corporation’s maximum loss exposure. Information is provided in Note 12 – Commitments and Contingencies to the Consolidated Financial Statements regarding the nature of all of these contingencies and, where specified, the amount of the claim associated with these loss contingencies.
Consolidation and Accounting for Variable Interest EntitiesIn accordance with applicable accounting guidance, an entity that has a controlling financial interest in a VIE is referred to as the primary beneficiary and consolidates the VIE. The Corporation is deemed to have a controlling financial interest and is the primary beneficiary of a VIE if it has both the power to direct the activities of the VIE that most significantly impact the VIE’s economic performance and an obligation to absorb losses or the right to receive benefits that could potentially be significant to the VIE.
Determining whether an entity has a controlling financial interest in a VIE requires significant judgment. An entity must assess the purpose and design of the VIE, including explicit and implicit contractual arrangements, and the entity’s involvement in both the design of the VIE and its ongoing activities. The entity must then determine which activities have the most significant impact on the economic performance of the VIE and whether the entity has the power to direct such activities. For VIEs that hold financial assets, the party that services the assets or makes investment management decisions may have the power to direct the most significant activities of a VIE. Alternatively, a third party that has the unilateral right to replace the servicer or investment manager or to liquidate the VIE may be deemed to be the party with power. If there are no significant ongoing activities, the party that was responsible for the design of the VIE may be deemed to have power. If the entity determines that it has the power to direct the most significant activities of the VIE, then the entity must determine if it has either an obligation to absorb losses or the right to receive benefits that could potentially be significant to the VIE. Such economic interests may include investments in debt or equity instruments issued by the VIE, liquidity commitments, and explicit and implicit guarantees.
On a quarterly basis, we reassess whether we have a controlling financial interest and are the primary beneficiary of a VIE. The quarterly reassessment process considers whether we have acquired or divested the power to direct the activities of the VIE through changes in governing documents or other circumstances. The reassessment also considers whether we have acquired or disposed of a financial interest that could be significant to the VIE, or whether an interest in the VIE has become significant or is no longer significant. The consolidation status of the VIEs with which we are involved may change as a result of such reassessments. Changes in consolidation status are applied prospectively, with assets and liabilities of a newly consolidated VIE initially recorded at fair value. A gain or loss may be recognized upon deconsolidation of a VIE depending on the carrying values of deconsolidated assets and liabilities compared to the fair value of retained interests and ongoing contractual arrangements.
76788ba_financials.indd 119 3/6/14 12:06 PM

120 Bank of America 2013
2012 Compared to 2011The following discussion and analysis provide a comparison of our results of operations for 2012 and 2011. This discussion should be read in conjunction with the Consolidated Financial Statements and related Notes. Tables 7 and 8 contain financial data to supplement this discussion.
Overview
Net IncomeNet income was $4.2 billion in 2012 compared to $1.4 billion in 2011. Including preferred stock dividends, net income applicable to common shareholders was $2.8 billion, or $0.25 per diluted share for 2012 and $85 million, or $0.01 per diluted share for 2011.
Net Interest IncomeNet interest income on a FTE basis was $41.6 billion for 2012, a decrease of $4.0 billion compared to 2011. The decline was primarily due to lower consumer loan balances and yields, recouponing of the ALM portfolio to a lower yield and decreased commercial loan yields. Lower trading-related net interest income also negatively impacted 2012 results. These decreases were partially offset by ongoing reductions in long-term debt and lower rates paid on deposits. The net interest yield on a FTE basis was 2.35 percent for 2012, a decrease of 13 bps compared to 2011 as the yield continued to be under pressure due to the aforementioned items and the low rate environment.
Noninterest IncomeNoninterest income was $42.7 billion in 2012, a decrease of $6.2 billion compared to 2011.
Card income decreased $1.1 billion primarily driven by the implementation of interchange fee rules under the Durbin Amendment, which became effective on October 1, 2011.Service charges decreased $494 million primarily due to the impact of lower accretion on acquired portfolios and reduced reimbursed merchant processing fees.Investment and brokerage services income decreased $433 million primarily driven by lower transactional volumes.Equity investment income decreased $5.3 billion. The results for 2012 included $1.6 billion of gains which primarily related to the sales of certain equity and strategic investments. The results for 2011 included $6.5 billion of gains on the sale of CCB shares, $836 million of CCB dividends and a $377 million gain on the sale of our investment in BlackRock, Inc., partially offset by $1.1 billion of impairment charges on our merchant services joint venture.Trading account profits decreased $827 million. Net DVA losses on derivatives were $2.5 billion in 2012 compared to net DVA gains of $1.0 billion in 2011. Excluding net DVA, trading account profits increased $2.7 billion in 2012 compared to 2011 due to an improved market environment.Mortgage banking income increased $13.6 billion primarily due to an $11.7 billion decrease in the representations and warranties provision. The 2012 results included $2.5 billion in provision related to the FNMA Settlement, a $500 million provision for obligations to FNMA related to MI rescissions, partially offset by an increase in servicing income of $1.1 billion due to improved MSR results. The 2011 results included $15.6
billion in representations and warranties provision related to the agreement to resolve nearly all legacy Countrywide-issued first-lien non-GSE RMBS repurchase exposures and other non-GSE exposures.Other income decreased $10.2 billion due to negative fair value adjustments on our structured liabilities of $5.1 billion compared to positive fair value adjustments of $3.3 billion in 2011. In addition, 2012 included $1.6 billion of gains related to debt repurchases and exchanges of trust preferred securities compared to gains of $1.2 billion in the prior year.
Provision for Credit LossesThe provision for credit losses was $8.2 billion for 2012, a decrease of $5.2 billion compared to 2011. The provision for credit losses was $6.7 billion lower than net charge-offs for 2012, resulting in a reduction in the allowance for credit losses driven by improved portfolio trends and increasing home prices in consumer real estate products, lower bankruptcy filings and delinquencies affecting the credit card portfolio, and improvement in overall credit quality within the core commercial portfolio.
Net charge-offs totaled $14.9 billion, or 1.67 percent of average loans and leases for 2012 compared to $20.8 billion, or 2.24 percent for 2011. The decrease in net charge-offs was primarily driven by fewer delinquent loans and lower bankruptcy filings in the credit card portfolio, as well as lower net charge-offs in the consumer real estate and core commercial portfolios in 2012.
Noninterest ExpenseNoninterest expense was $72.1 billion for 2012, a decrease of $8.2 billion compared to 2011. The decrease was primarily driven by $3.2 billion of goodwill impairment charges in 2011 and none in 2012, a $2.8 billion decrease in other general operating expense primarily related to lower litigation expense and mortgage-related assessments, waivers and similar costs related to foreclosure delays, partially offset by a provision of $1.1 billion in 2012 related to the 2013 IFR Acceleration Agreement. Personnel expense decreased $1.3 billion in 2012 as we continued to streamline processes and achieve cost savings. Partially offsetting the decreases were increases in professional fees and data processing expenses due to continuing default management activities in Legacy Assets & Servicing. Also, 2011 included $638 million in merger and restructuring charges.
Income Tax BenefitThe income tax benefit was $1.1 billion on pre-tax income of $3.1 billion for 2012 compared to an income tax benefit of $1.7 billion on the pre-tax loss of $230 million for 2011. Included in the income tax benefit for 2012 was a $1.7 billion tax benefit attributable to the excess of foreign tax credits recognized in the U.S. upon repatriation of the earnings of certain subsidiaries over the related U.S. tax liability. Also included in the income tax benefit was a $788 million charge to reduce the carrying value of certain U.K. deferred tax assets due to the two percent U.K. corporate income tax rate reduction enacted in 2012. Our effective tax rate for 2012 excluding these two items was a benefit of seven percent and differed from the statutory rate due to the impact of our recurring tax preference items (e.g., affordable housing credits and tax-exempt income) on the level of pre-tax earnings.
76788ba_financials.indd 120 3/6/14 12:06 PM

Bank of America 2013 121
The income tax benefit for 2011 was driven by our recurring tax preference items, a $1.0 billion benefit from the release of the remaining valuation allowance applicable to the Merrill Lynch capital loss carryover deferred tax asset and a benefit of $823 million for planned realization of previously unrecognized deferred tax assets related to the tax basis in certain subsidiaries. These benefits were partially offset by a $782 million charge for the two percent U.K. corporate income tax rate reduction enacted in 2011. The $3.2 billion of goodwill impairment charges recorded during 2011 were non-deductible.
Business Segment Operations
Consumer & Business BankingCBB recorded net income of $5.5 billion in 2012 compared to $7.8 billion in 2011 with the decrease primarily due to lower revenue and higher provision for credit losses, partially offset by lower noninterest expense. Net interest income decreased $2.4 billion to $19.9 billion due to lower average loan balances as well as compressed deposit spreads due to the continued low rate environment. Noninterest income decreased $1.6 billion to $9.9 billion due to lower interchange fees as a result of implementing the Durbin Amendment, lower gains on sales of portfolios and the impact of charges related to our consumer protection products. The provision for credit losses increased $471 million to $4.1 billion as portfolio trends stabilized during 2012. Noninterest expense decreased $917 million to $17.0 billion primarily due to lower FDIC and operating expenses, partially offset by an increase in litigation expense.
Consumer Real Estate ServicesCRES recorded a net loss of $6.4 billion in 2012 compared to $19.4 billion in 2011 with the decrease in the net loss primarily driven by mortgage banking income of $5.6 billion in 2012 compared to a loss of $8.1 billion in 2011. The representations and warranties provision for 2011, which is included in mortgage banking income, included $8.6 billion related to the settlement with BNY Mellon and $7.0 billion related to other non-GSE, and to a lesser extent, GSE exposures. Also contributing to the decrease in the net loss was a decrease in the provision for credit losses and a decline in noninterest expense, partially offset by lower other noninterest income. Mortgage banking income increased $13.7 billion due to an $11.7 decrease in the representations and warranties provision, and higher servicing income and core production revenue. The provision for credit losses decreased $3.1 billion to $1.4 billion due to improved portfolio trends and increasing home prices in both the non-PCI and PCI home equity loan portfolios. Noninterest expense decreased $4.5 billion to $17.2 billion due to a decline in litigation expense and lower mortgage-related assessments, waivers and similar costs related to foreclosure delays, partially offset by higher default-related servicing costs and a provision for the 2013 IFR Acceleration Agreement. Noninterest expense in 2011 included a $2.6 billion goodwill impairment charge.
Global Wealth & Investment ManagementGWIM recorded net income of $2.2 billion in 2012 compared to $1.7 billion in 2011 with the increase driven by lower noninterest expense and lower provision for credit losses. Revenue remained
relatively unchanged as an increase in asset management fees due to higher AUM flows and higher market levels was offset by lower transactional revenue and lower net interest income due to the impact of the continued low rate environment. The provision for credit losses decreased $132 million to $266 million driven by lower delinquencies and improving portfolio trends within the residential mortgage portfolio. Noninterest expense decreased $615 million to $12.7 billion due to lower FDIC expense, lower litigation costs and other expense reductions, partially offset by higher production-related expenses.
Global BankingGlobal Banking recorded net income of $5.3 billion in 2012 compared to $5.6 billion in 2011 with the decrease primarily driven by an increase in the provision for credit losses, partially offset by lower noninterest expense. Revenue remained relatively unchanged with lower investment banking fees and lower net interest income as a result of spread compression and the benefit in the prior year from higher accretion on acquired portfolios, largely offset by the impact of higher average loan and deposit balances and gains on liquidation of certain legacy portfolios. The provision for credit losses was a benefit of $342 million compared to a benefit of $1.3 billion in 2011 with the reduction in the benefit reflecting stabilization of asset quality, core commercial loan growth and the impact of a higher volume of loan resolutions in the commercial real estate portfolio in the prior year. Noninterest expense decreased $410 million to $7.6 billion primarily due to lower personnel and operating expenses.
Global MarketsGlobal Markets recorded net income of $1.2 billion in 2012 compared to $1.1 billion in 2011. Sales and trading revenue decreased due to net DVA losses compared to net DVA gains in the prior year. Excluding net DVA, sales and trading revenue increased $2.4 billion primarily driven by our FICC business as a result of improved performance in our rates and currencies, and credit-related businesses due to an improved global economic climate, and a gain on the sale of an equity investment. Noninterest expense decreased $1.6 billion to $11.3 billion due to a reduction in personnel-related expenses and in brokerage, clearing and exchange fees, and other operating expenses. Income tax expense included a $781 million charge for remeasurement of certain deferred tax assets due to decreases in the U.K. corporate tax rate compared to a similar charge of $774 million in 2011.
All OtherAll Other recorded a net loss of $3.7 billion in 2012 compared to net income of $4.6 billion in 2011 primarily due to negative fair value adjustments on structured liabilities of $5.1 billion related to the improvement in our credit spreads in 2012 compared to $3.3 billion of positive fair value adjustments in 2011, a $6.0 billion decrease in equity investment income as 2011 included a $6.5 billion gain on the sale of portion of our investment in CCB, and lower gains on sales of debt securities. Partially offsetting these items was a reduction in the provision for credit losses of $3.6 billion to $2.6 billion. The income tax benefit included $1.7 billion attributable to the excess of foreign tax credits recognized in the U.S. upon repatriation of the earnings of certain subsidiaries over the related U.S. tax liability.
76788ba_financials.indd 121 3/6/14 12:06 PM

122 Bank of America 2013
Statistical Tables Table of Contents
Page
Table I – Average Balances and Interest Rates – FTE Basis 123
Table II – Analysis of Changes in Net Interest Income – FTE Basis 124
Table III – Preferred Stock Cash Dividend Summary 125
Table IV – Outstanding Loans and Leases 127
Table V – Nonperforming Loans, Leases and Foreclosed Properties 128
Table VI – Accruing Loans and Leases Past Due 90 Days or More 129
Table VII – Allowance for Credit Losses 130
Table VIII – Allocation of the Allowance for Credit Losses by Product Type 132
Table IX – Selected Loan Maturity Data 133
Table X – Non-exchange Traded Commodity Contracts 133
Table XI – Non-exchange Traded Commodity Contract Maturities 133
Table XII – Selected Quarterly Financial Data 134
Table XIII – Quarterly Average Balances and Interest Rates – FTE Basis 136
Table XIV – Quarterly Supplemental Financial Data 138
Table XV – Five-year Reconciliations to GAAP Financial Measures 139
Table XVI – Two-year Reconciliations to GAAP Financial Measures 140
Table XVII – Quarterly Reconciliations to GAAP Financial Measures 141
76788ba_financials.indd 122 3/6/14 12:06 PM

Bank of America 2013 123
Table I Average Balances and Interest Rates – FTE Basis
2013 2012 2011
(Dollars in millions)AverageBalance
InterestIncome/Expense
Yield/Rate
AverageBalance
InterestIncome/Expense
Yield/Rate
AverageBalance
InterestIncome/Expense
Yield/Rate
Earning assets
Time deposits placed and other short-term investments (1) $ 16,066 $ 187 1.16% $ 22,888 $ 237 1.03% $ 28,242 $ 366 1.29%
Federal funds sold and securities borrowed or purchased underagreements to resell 224,331 1,229 0.55 236,042 1,502 0.64 245,069 2,147 0.88
Trading account assets 168,998 4,879 2.89 170,647 5,306 3.11 181,996 6,142 3.37
Debt securities (2) 337,953 9,779 2.89 353,577 8,931 2.53 342,650 9,606 2.80
Loans and leases (3):
Residential mortgage (4) 256,531 9,319 3.63 264,164 9,845 3.73 280,112 11,588 4.14
Home equity 100,267 3,831 3.82 117,339 4,426 3.77 130,945 5,050 3.86
U.S. credit card 90,369 8,792 9.73 94,863 9,504 10.02 105,478 10,808 10.25
Non-U.S. credit card 10,861 1,271 11.70 13,549 1,572 11.60 24,049 2,656 11.04
Direct/Indirect consumer (5) 82,907 2,370 2.86 84,424 2,900 3.44 90,163 3,716 4.12
Other consumer (6) 1,805 72 4.02 2,359 140 5.95 2,760 176 6.39
Total consumer 542,740 25,655 4.73 576,698 28,387 4.92 633,507 33,994 5.37
U.S. commercial 218,875 6,811 3.11 201,352 6,979 3.47 192,524 7,360 3.82
Commercial real estate (7) 42,346 1,392 3.29 37,982 1,332 3.51 44,406 1,522 3.43
Commercial lease financing 23,865 851 3.56 21,879 874 4.00 21,383 1,001 4.68
Non-U.S. commercial 90,815 2,082 2.29 60,857 1,594 2.62 46,276 1,382 2.99
Total commercial 375,901 11,136 2.96 322,070 10,779 3.35 304,589 11,265 3.70
Total loans and leases 918,641 36,791 4.00 898,768 39,166 4.36 938,096 45,259 4.82
Other earning assets 80,985 2,832 3.50 88,047 2,970 3.36 98,606 3,502 3.55
Total earning assets (8) 1,746,974 55,697 3.19 1,769,969 58,112 3.28 1,834,659 67,022 3.65
Cash and cash equivalents (1) 109,014 182 115,739 189 112,616 186
Other assets, less allowance for loan and lease losses 307,525 305,648 349,047
Total assets $ 2,163,513 $2,191,356 $2,296,322
Interest-bearing liabilities
U.S. interest-bearing deposits:
Savings $ 43,868 $ 22 0.05% $ 41,453 $ 45 0.11% $ 40,364 $ 100 0.25%
NOW and money market deposit accounts 506,082 413 0.08 466,096 693 0.15 470,519 1,060 0.23
Consumer CDs and IRAs 82,963 481 0.58 95,559 693 0.73 110,922 1,045 0.94
Negotiable CDs, public funds and other deposits 23,504 106 0.45 20,928 128 0.61 17,227 120 0.70
Total U.S. interest-bearing deposits 656,417 1,022 0.16 624,036 1,559 0.25 639,032 2,325 0.36
Non-U.S. interest-bearing deposits:
Banks located in non-U.S. countries 12,419 70 0.56 14,737 94 0.64 20,782 138 0.66
Governments and official institutions 1,032 2 0.24 1,019 4 0.35 1,985 7 0.35
Time, savings and other 56,193 302 0.54 53,318 333 0.63 61,632 532 0.86
Total non-U.S. interest-bearing deposits 69,644 374 0.54 69,074 431 0.62 84,399 677 0.80
Total interest-bearing deposits 726,061 1,396 0.19 693,110 1,990 0.29 723,431 3,002 0.42
Federal funds purchased, securities loaned or sold underagreements to repurchase and short-term borrowings 301,417 2,923 0.97 318,400 3,572 1.12 324,269 4,599 1.42
Trading account liabilities 88,323 1,638 1.85 78,554 1,763 2.24 84,689 2,212 2.61
Long-term debt 263,416 6,798 2.58 316,393 9,419 2.98 421,229 11,807 2.80
Total interest-bearing liabilities (8) 1,379,217 12,755 0.92 1,406,457 16,744 1.19 1,553,618 21,620 1.39
Noninterest-bearing sources:
Noninterest-bearing deposits 363,674 354,672 312,371
Other liabilities 186,675 194,550 201,238
Shareholders’ equity 233,947 235,677 229,095
Total liabilities and shareholders’ equity $ 2,163,513 $2,191,356 $2,296,322
Net interest spread 2.27% 2.09% 2.26%
Impact of noninterest-bearing sources 0.19 0.25 0.21
Net interest income/yield on earning assets (1) $ 42,942 2.46% $ 41,368 2.34% $ 45,402 2.47%(1) For this presentation, fees earned on overnight deposits placed with the Federal Reserve are included in the cash and cash equivalents line, consistent with the Consolidated Balance Sheet
presentation of these deposits. In addition, beginning in the third quarter of 2012, fees earned on deposits, primarily overnight, placed with certain non-U.S. central banks, which are included in the time deposits placed and other short-term investments line in prior periods, are included in the cash and cash equivalents line. Net interest income and net interest yield are calculated excluding the fees included in the cash and cash equivalents line.
(2) Yields on debt securities carried at fair value are calculated based on fair value rather than the cost basis. The use of fair value does not have a material impact on net interest yield.(3) Nonperforming loans are included in the respective average loan balances. Income on these nonperforming loans is generally recognized on a cost recovery basis. PCI loans were recorded at fair
value upon acquisition and accrete interest income over the remaining life of the loan.(4) Includes non-U.S. residential mortgage loans of $79 million, $90 million and $91 million in 2013, 2012 and 2011, respectively.(5) Includes non-U.S. consumer loans of $6.7 billion, $7.8 billion and $8.5 billion in 2013, 2012 and 2011, respectively.(6) Includes consumer finance loans of $1.3 billion, $1.5 billion and $1.8 billion; consumer leases of $351 million, $0 and $0; other non-U.S. consumer loans of $5 million, $699 million and $878
million; and consumer overdrafts of $153 million, $128 million and $93 million in 2013, 2012 and 2011, respectively.(7) Includes U.S. commercial real estate loans of $40.7 billion, $36.4 billion and $42.1 billion, and non-U.S. commercial real estate loans of $1.6 billion, $1.6 billion and $2.3 billion in 2013, 2012
and 2011, respectively.(8) Interest income includes the impact of interest rate risk management contracts, which decreased interest income on the underlying assets by $205 million, $754 million and $2.6 billion in 2013,
2012 and 2011, respectively. Interest expense includes the impact of interest rate risk management contracts, which decreased interest expense on the underlying liabilities by $2.4 billion, $2.3 billion and $2.6 billion in 2013, 2012 and 2011, respectively. For more information on interest rate contracts, see Interest Rate Risk Management for Nontrading Activities on page 109.
76788ba_financials.indd 123 3/6/14 12:06 PM

124 Bank of America 2013
Table II Analysis of Changes in Net Interest Income – FTE Basis
From 2012 to 2013 From 2011 to 2012 Due to Change in (1) Due to Change in (1)
(Dollars in millions) Volume RateNet
Change Volume RateNet
Change
Increase (decrease) in interest income Time deposits placed and other short-term investments (2) $ (72) $ 22 $ (50) $ (71) $ (58) $ (129)Federal funds sold and securities borrowed or purchased under agreements to resell (66) (207) (273) (70) (575) (645)Trading account assets (50) (377) (427) (391) (445) (836)Debt securities (381) 1,229 848 294 (969) (675)Loans and leases:
Residential mortgage (276) (250) (526) (652) (1,091) (1,743)Home equity (646) 51 (595) (521) (103) (624)U.S. credit card (449) (263) (712) (1,085) (219) (1,304)Non-U.S. credit card (312) 11 (301) (1,160) 76 (1,084)Direct/Indirect consumer (48) (482) (530) (238) (578) (816)Other consumer (33) (35) (68) (25) (11) (36)
Total consumer (2,732) (5,607)U.S. commercial 616 (784) (168) 332 (713) (381)Commercial real estate 154 (94) 60 (219) 29 (190)Commercial lease financing 81 (104) (23) 23 (150) (127)Non-U.S. commercial 785 (297) 488 438 (226) 212
Total commercial 357 (486)Total loans and leases (2,375) (6,093)
Other earning assets (249) 111 (138) (376) (156) (532)Total interest income $ (2,415) $ (8,910)
Increase (decrease) in interest expense U.S. interest-bearing deposits:
Savings $ 3 $ (26) $ (23) $ 4 $ (59) $ (55)NOW and money market deposit accounts 66 (346) (280) 12 (379) (367)Consumer CDs and IRAs (87) (125) (212) (147) (205) (352)Negotiable CDs, public funds and other deposits 15 (37) (22) 26 (18) 8
Total U.S. interest-bearing deposits (537) (766)Non-U.S. interest-bearing deposits:
Banks located in non-U.S. countries (15) (9) (24) (41) (3) (44)Governments and official institutions — (2) (2) (3) — (3)Time, savings and other 21 (52) (31) (73) (126) (199)
Total non-U.S. interest-bearing deposits (57) (246)Total interest-bearing deposits (594) (1,012)
Federal funds purchased, securities loaned or sold under agreements to repurchase andshort-term borrowings (196) (453) (649) (78) (949) (1,027)
Trading account liabilities 215 (340) (125) (162) (287) (449)Long-term debt (1,569) (1,052) (2,621) (2,948) 560 (2,388)
Total interest expense (3,989) (4,876)Net increase (decrease) in net interest income (2) $ 1,574 $ (4,034)
(1) The changes for each category of interest income and expense are divided between the portion of change attributable to the variance in volume and the portion of change attributable to the variance in rate for that category. The unallocated change in rate or volume variance is allocated between the rate and volume variances.
(2) For this presentation, fees earned on overnight deposits placed with the Federal Reserve are included in the cash and cash equivalents line, consistent with the Consolidated Balance Sheet presentation of these deposits. In addition, beginning in the third quarter of 2012, fees earned on deposits, primarily overnight, placed with certain non-U.S. central banks, which are included in the time deposits placed and other short-term investments line in prior periods, are included in the cash and cash equivalents line. Net interest income in the table is calculated excluding the fees included in the cash and cash equivalents line.
76788ba_financials.indd 124 3/6/14 12:06 PM

Bank of America 2013 125
Table III Preferred Stock Cash Dividend Summary (as of February 25, 2014)
December 31, 2013
Preferred Stock
OutstandingNotionalAmount
(in millions) Declaration Date Record Date Payment DatePer Annum
Dividend RateDividend Per
Share
Series B (1) $ 1 February 11, 2014 April 11, 2014 April 25, 2014 7.00% $ 1.75October 24, 2013 January 10, 2014 January 24, 2014 7.00 1.75
July 24, 2013 October 11, 2013 October 25, 2013 7.00 1.75 April 30, 2013 July 11, 2013 July 25, 2013 7.00 1.75 January 23, 2013 April 11, 2013 April 25, 2013 7.00 1.75Series D (2) $ 654 January 13, 2014 February 28, 2014 March 14, 2014 6.204% $ 0.38775 October 15, 2013 November 29, 2013 December 16, 2013 6.204 0.38775 July 2, 2013 August 30, 2013 September 16, 2013 6.204 0.38775 April 2, 2013 May 31, 2013 June 14, 2013 6.204 0.38775 January 3, 2013 February 28, 2013 March 14, 2013 6.204 0.38775Series E (2) $ 317 January 13, 2014 January 31, 2014 February 18, 2014 Floating $ 0.25556 October 15, 2013 October 31, 2013 November 15, 2013 Floating 0.25556 July 2, 2013 July 31, 2013 August 15, 2013 Floating 0.25556 April 2, 2013 April 30, 2013 May 15, 2013 Floating 0.24722 January 3, 2013 January 31, 2013 February 15, 2013 Floating 0.25556Series F $ 141 January 13, 2014 February 28, 2014 March 17, 2014 Floating $ 1,000.00
October 15, 2013 November 29, 2013 December 16, 2013 Floating 1,011.1111July 2, 2013 August 30, 2013 September 16, 2013 Floating 1,022.2222April 2, 2013 May 31, 2013 June 17, 2013 Floating 1,044.44
January 3, 2013 February 28, 2013 March 15, 2013 Floating 1,000.00Series G $ 493 January 13, 2014 February 28, 2014 March 17, 2014 Adjustable $ 1,000.00
October 15, 2013 November 29, 2013 December 16, 2013 Adjustable 1,011.1111July 2, 2013 August 30, 2013 September 16, 2013 Adjustable 1,022.2222April 2, 2013 May 31, 2013 June 17, 2013 Adjustable 1,044.44
January 3, 2013 February 28, 2013 March 15, 2013 Adjustable 1,000.00Series H (2, 3) $ — April 2, 2013 April 15, 2013 May 1, 2013 8.20% $ 0.51250 January 3, 2013 January 15, 2013 February 1, 2013 8.20 0.51250Series I (2) $ 365 January 13, 2014 March 15, 2014 April 1, 2014 6.625% $ 0.4140625 October 15, 2013 December 15, 2013 January 2, 2014 6.625 0.4140625 July 2, 2013 September 15, 2013 October 1, 2013 6.625 0.4140625 April 2, 2013 June 15, 2013 July 1, 2013 6.625 0.41406 January 3, 2013 March 15, 2013 April 1, 2013 6.625 0.41406Series J (2, 4) $ — July 2, 2013 July 15, 2013 August 1, 2013 7.25% $ 0.453125 April 2, 2013 April 15, 2013 May 1, 2013 7.25 0.453125 January 3, 2013 January 15, 2013 February 1, 2013 7.25 0.45312Series K (5, 6) $ 1,544 January 13, 2014 January 15, 2014 January 30, 2014 Fixed-to-floating $ 40.00 July 2, 2013 July 15, 2013 July 30, 2013 Fixed-to-floating 40.00 January 3, 2013 January 15, 2013 January 30, 2013 Fixed-to-floating 40.00Series L $ 3,080 December 16, 2013 January 1, 2014 January 30, 2014 7.25% $ 18.125 September 16, 2013 October 1, 2013 October 30, 2013 7.25 18.125 June 17, 2013 July 1, 2013 July 30, 2013 7.25 18.125 March 15, 2013 April 1, 2013 April 30, 2013 7.25 18.125Series M (5, 6) $ 1,310 October 15, 2013 October 31, 2013 November 15, 2013 Fixed-to-floating $ 40.62500 April 2, 2013 April 30, 2013 May 15, 2013 Fixed-to-floating 40.62500Series T (1, 7) $ 5,000 December 16, 2013 December 26, 2013 January 10, 2014 6.00% $ 1,500.00
September 16, 2013 September 25, 2013 October 10, 2013 6.00 1,500.00June 17, 2013 June 25, 2013 July 10, 2013 6.00 1,500.00
March 15, 2013 March 26, 2013 April 10, 2013 6.00 1,500.00Series U $ 1,000 October 15, 2013 November 15, 2013 December 2, 2013 Fixed-to-floating $ 26.288889
(1) Dividends are cumulative.(2) Dividends per depositary share, each representing a 1/1,000th interest in a share of preferred stock.(3) This series was redeemed on May 1, 2013.(4) This series was redeemed on August 1, 2013.(5) Initially pays dividends semi-annually.(6) Dividends per depositary share, each representing a 1/25th interest in a share of preferred stock.(7) For more information on the restructuring of the Series T Preferred Stock, which is subject to shareholder approval, see Capital Management – Capital Composition and Ratios on page 62.
76788ba_financials.indd 125 3/6/14 12:06 PM

126 Bank of America 2013
Table III Preferred Stock Cash Dividend Summary (as of February 25, 2014) (continued)
December 31, 2013
Preferred Stock
OutstandingNotionalAmount
(in millions) Declaration Date Record Date Payment DatePer Annum
Dividend RateDividend Per
Share
Series 1 (8) $ 98 January 13, 2014 February 15, 2014 February 28, 2014 Floating $ 0.18750 October 15, 2013 November 15, 2013 November 29, 2013 Floating 0.18750 July 2, 2013 August 15, 2013 August 28, 2013 Floating 0.18750 April 2, 2013 May 15, 2013 May 28, 2013 Floating 0.18750 January 3, 2013 February 15, 2013 February 28, 2013 Floating 0.18750Series 2 (8) $ 299 January 13, 2014 February 15, 2014 February 28, 2014 Floating $ 0.19167 October 15, 2013 November 15, 2013 November 29, 2013 Floating 0.19167 July 2, 2013 August 15, 2013 August 28, 2013 Floating 0.19167 April 2, 2013 May 15, 2013 May 28, 2013 Floating 0.18542 January 3, 2013 February 15, 2013 February 28, 2013 Floating 0.19167Series 3 (8) $ 653 January 13, 2014 February 15, 2014 February 28, 2014 6.375% $ 0.3984375 October 15, 2013 November 15, 2013 November 29, 2013 6.375 0.39844 July 2, 2013 August 15, 2013 August 28, 2013 6.375 0.3984375 April 2, 2013 May 15, 2013 May 28, 2013 6.375 0.39843 January 3, 2013 February 15, 2013 February 28, 2013 6.375 0.39843Series 4 (8) $ 210 January 13, 2014 February 15, 2014 February 28, 2014 Floating $ 0.25556 October 15, 2013 November 15, 2013 November 29, 2013 Floating 0.25556 July 2, 2013 August 15, 2013 August 28, 2013 Floating 0.25556 April 2, 2013 May 15, 2013 May 28, 2013 Floating 0.24722 January 3, 2013 February 15, 2013 February 28, 2013 Floating 0.25556Series 5 (8) $ 422 January 13, 2014 February 1, 2014 February 21, 2014 Floating $ 0.25556 October 15, 2013 November 1, 2013 November 21, 2013 Floating 0.25556 July 2, 2013 August 1, 2013 August 21, 2013 Floating 0.25556 April 2, 2013 May 1, 2013 May 21, 2013 Floating 0.24722 January 3, 2013 February 1, 2013 February 21, 2013 Floating 0.25556Series 6 (9, 10) $ — April 2, 2013 June 15, 2013 June 28, 2013 6.70% $ 0.41875 January 3, 2013 March 15, 2013 March 29, 2013 6.70 0.41875Series 7 (9, 10) $ — April 2, 2013 June 15, 2013 June 28, 2013 6.25% $ 0.390625 January 3, 2013 March 15, 2013 March 29, 2013 6.25 0.39062Series 8 (8, 11) $ — April 2, 2013 May 15, 2013 May 28, 2013 8.625% $ 0.53906 January 3, 2013 February 15, 2013 February 28, 2013 8.625 0.53906
(8) Dividends per depositary share, each representing a 1/1,200th interest in a share of preferred stock.(9) Dividends per depositary share, each representing a 1/40th interest in a share of preferred stock.(10) These series were redeemed on June 28, 2013.(11) This series was redeemed on May 28, 2013.
76788ba_financials.indd 126 3/6/14 12:06 PM

Bank of America 2013 127
Table IV Outstanding Loans and Leases (1)
December 31(Dollars in millions) 2013 2012 2011 2010 2009Consumer
Residential mortgage (2) $ 248,066 $ 252,929 $ 273,228 $ 270,901 $ 256,748Home equity 93,672 108,140 124,856 138,161 149,361U.S. credit card 92,338 94,835 102,291 113,785 49,453Non-U.S. credit card 11,541 11,697 14,418 27,465 21,656Direct/Indirect consumer (3) 82,192 83,205 89,713 90,308 97,236Other consumer (4) 1,977 1,628 2,688 2,830 3,110
Total consumer loans excluding loans accounted for under the fair value option 529,786 552,434 607,194 643,450 577,564Consumer loans accounted for under the fair value option (5) 2,164 1,005 2,190 — —
Total consumer 531,950 553,439 609,384 643,450 577,564Commercial
U.S. commercial (6) 225,851 209,719 193,199 190,305 198,903Commercial real estate (7) 47,893 38,637 39,596 49,393 69,447Commercial lease financing 25,199 23,843 21,989 21,942 22,199Non-U.S. commercial 89,462 74,184 55,418 32,029 27,079
Total commercial loans excluding loans accounted for under the fair value option 388,405 346,383 310,202 293,669 317,628Commercial loans accounted for under the fair value option (5) 7,878 7,997 6,614 3,321 4,936
Total commercial 396,283 354,380 316,816 296,990 322,564Total loans and leases $ 928,233 $ 907,819 $ 926,200 $ 940,440 $ 900,128
(1) 2013, 2012, 2011 and 2010 are presented in accordance with consolidation guidance that was effective January 1, 2010.(2) Includes pay option loans of $4.4 billion, $6.7 billion, $9.9 billion, $11.8 billion and $13.4 billion, and non-U.S. residential mortgage loans of $0, $93 million, $85 million, $90 million and $552
million at December 31, 2013, 2012, 2011, 2010 and 2009, respectively. The Corporation no longer originates pay option loans(3) Includes dealer financial services loans of $38.5 billion, $35.9 billion, $43.0 billion, $43.3 billion and $41.6 billion; consumer lending loans of $2.7 billion, $4.7 billion, $8.0 billion, $12.4 billion
and $19.7 billion; U.S. securities-based lending loans of $31.2 billion, $28.3 billion, $23.6 billion, $16.6 billion and $12.9 billion; non-U.S. consumer loans of $4.7 billion, $8.3 billion, $7.6 billion, $8.0 billion and $8.0 billion; student loans of $4.1 billion, $4.8 billion, $6.0 billion, $6.8 billion and $10.8 billion; and other consumer loans of $1.0 billion, $1.2 billion, $1.5 billion, $3.2 billion and $4.2 billion at December 31, 2013, 2012, 2011, 2010 and 2009, respectively.
(4) Includes consumer finance loans of $1.2 billion, $1.4 billion, $1.7 billion, $1.9 billion and $2.3 billion; consumer leases of $606 million, $34 million, $0, $0 and $0; consumer overdrafts of $176 million, $177 million, $103 million, $88 million and $144 million; and other non-U.S. consumer loans of $5 million, $5 million, $929 million, $803 million and $709 million at December 31, 2013, 2012, 2011, 2010 and 2009, respectively.
(5) Consumer loans accounted for under the fair value option were residential mortgage loans of $2.0 billion, $1.0 billion and $2.2 billion, and home equity loans of $147 million, $0 and $0 at December 31, 2013, 2012 and 2011, respectively. There were no consumer loans accounted for under the fair value option prior to 2011. Commercial loans accounted for under the fair value option were U.S. commercial loans of $1.5 billion, $2.3 billion, $2.2 billion, $1.6 billion and $3.0 billion; commercial real estate loans of $0, $0, $0, $79 million and $90 million; and non-U.S. commercial loans of $6.4 billion, $5.7 billion, $4.4 billion, $1.7 billion and $1.9 billion at December 31, 2013, 2012, 2011, 2010 and 2009, respectively.
(6) Includes U.S. small business commercial loans, including card-related products, of $13.3 billion, $12.6 billion, $13.3 billion, $14.7 billion and $17.5 billion at December 31, 2013, 2012, 2011, 2010 and 2009, respectively.
(7) Includes U.S. commercial real estate loans of $46.3 billion, $37.2 billion, $37.8 billion, $46.9 billion and $66.5 billion, and non-U.S. commercial real estate loans of $1.6 billion, $1.5 billion, $1.8 billion, $2.5 billion and $3.0 billion at December 31, 2013, 2012, 2011, 2010 and 2009, respectively.
76788ba_financials.indd 127 3/6/14 12:06 PM

128 Bank of America 2013
Table V Nonperforming Loans, Leases and Foreclosed Properties (1)
December 31(Dollars in millions) 2013 2012 2011 2010 2009Consumer
Residential mortgage $ 11,712 $ 15,055 $ 16,259 $ 18,020 $ 16,841Home equity 4,075 4,282 2,454 2,696 3,808Direct/Indirect consumer 35 92 40 90 86Other consumer 18 2 15 48 104
Total consumer (2) 15,840 19,431 18,768 20,854 20,839Commercial
U.S. commercial 819 1,484 2,174 3,453 4,925Commercial real estate 322 1,513 3,880 5,829 7,286Commercial lease financing 16 44 26 117 115Non-U.S. commercial 64 68 143 233 177
1,221 3,109 6,223 9,632 12,503U.S. small business commercial 88 115 114 204 200
Total commercial (3) 1,309 3,224 6,337 9,836 12,703Total nonperforming loans and leases 17,149 22,655 25,105 30,690 33,542
Foreclosed properties 623 900 2,603 1,974 2,205Total nonperforming loans, leases and foreclosed properties $ 17,772 $ 23,555 $ 27,708 $ 32,664 $ 35,747
(1) Balances do not include PCI loans even though the customer may be contractually past due. PCI loans were recorded at fair value upon acquisition and accrete interest income over the remaining life of the loan. In addition, balances do not include foreclosed properties that are insured by the FHA and have entered foreclosure of $1.4 billion, $2.5 billion and $1.4 billion at December 31, 2013, 2012 and 2011, respectively.
(2) In 2013, $2.3 billion in interest income was estimated to be contractually due on consumer loans and leases classified as nonperforming and TDRs classified as performing, if these loans and leases had been paying according to their terms and conditions. At December 31, 2013, the TDRs classified as performing of $22.5 billion are not included in the table above. Approximately $1.4 billion of the estimated $2.3 billion in contractual interest was received and included in interest income for 2013.
(3) In 2013, $157 million in interest income was estimated to be contractually due on commercial loans and leases classified as nonperforming and TDRs classified as performing, if these loans and leases had been paying according to their terms and conditions. At December 31, 2013, the TDRs classified as performing of $1.8 billion are not included in the table above. Approximately $75 million of the estimated $157 million in contractual interest was received and included in interest income for 2013.
76788ba_financials.indd 128 3/6/14 12:06 PM

Bank of America 2013 129
Table VI Accruing Loans and Leases Past Due 90 Days or More (1)
December 31(Dollars in millions) 2013 2012 2011 2010 2009Consumer
Residential mortgage (2) $ 16,961 $ 22,157 $ 21,164 $ 16,768 $ 11,680U.S. credit card 1,053 1,437 2,070 3,320 2,158Non-U.S. credit card 131 212 342 599 515Direct/Indirect consumer 408 545 746 1,058 1,488Other consumer 2 2 2 2 3
Total consumer 18,555 24,353 24,324 21,747 15,844Commercial
U.S. commercial 47 65 75 236 213Commercial real estate 21 29 7 47 80Commercial lease financing 41 15 14 18 32Non-U.S. commercial 17 — — 6 67
126 109 96 307 392U.S. small business commercial 78 120 216 325 624
Total commercial 204 229 312 632 1,016Total accruing loans and leases past due 90 days or more (3) $ 18,759 $ 24,582 $ 24,636 $ 22,379 $ 16,860
(1) Our policy is to classify consumer real estate-secured loans as nonperforming at 90 days past due, except the PCI loan portfolio, the fully-insured loan portfolio and loans accounted for under the fair value option as referenced in footnote 3.
(2) Balances are fully-insured loans.(3) Balances exclude loans accounted for under the fair value option. At December 31, 2013 and 2009, $8 million and $87 million of loans accounted for under the fair value option were past due 90
days or more and still accruing interest. At December 31, 2012, 2011 and 2010, there were no loans accounted for under the fair value option that were past due 90 days or more and still accruing interest.
76788ba_financials.indd 129 3/6/14 12:06 PM

130 Bank of America 2013
Table VII Allowance for Credit Losses
(Dollars in millions) 2013 2012 2011 2010 2009Allowance for loan and lease losses, January 1 (1) $ 24,179 $ 33,783 $ 41,885 $ 47,988 $ 23,071Loans and leases charged off
Residential mortgage (1,508) (3,276) (4,294) (3,843) (4,525)Home equity (2,258) (4,573) (4,997) (7,072) (7,220)U.S. credit card (4,004) (5,360) (8,114) (13,818) (6,753)Non-U.S. credit card (508) (835) (1,691) (2,424) (1,332)Direct/Indirect consumer (710) (1,258) (2,190) (4,303) (6,406)Other consumer (273) (274) (252) (320) (491)
Total consumer charge-offs (9,261) (15,576) (21,538) (31,780) (26,727)U.S. commercial (2) (774) (1,309) (1,690) (3,190) (5,237)Commercial real estate (251) (719) (1,298) (2,185) (2,744)Commercial lease financing (4) (32) (61) (96) (217)Non-U.S. commercial (79) (36) (155) (139) (558)
Total commercial charge-offs (1,108) (2,096) (3,204) (5,610) (8,756)Total loans and leases charged off (10,369) (17,672) (24,742) (37,390) (35,483)
Recoveries of loans and leases previously charged off Residential mortgage 424 165 377 117 89Home equity 455 331 517 279 155U.S. credit card 628 728 838 791 206Non-U.S. credit card 109 254 522 217 93Direct/Indirect consumer 365 495 714 967 943Other consumer 39 42 50 59 63
Total consumer recoveries 2,020 2,015 3,018 2,430 1,549U.S. commercial (3) 287 368 500 391 161Commercial real estate 102 335 351 168 42Commercial lease financing 29 38 37 39 22Non-U.S. commercial 34 8 3 28 21
Total commercial recoveries 452 749 891 626 246Total recoveries of loans and leases previously charged off 2,472 2,764 3,909 3,056 1,795Net charge-offs (7,897) (14,908) (20,833) (34,334) (33,688)
Write-offs of PCI loans (2,336) (2,820) — — —Provision for loan and lease losses 3,574 8,310 13,629 28,195 48,366Other (4) (92) (186) (898) 36 (549)
Allowance for loan and lease losses, December 31 17,428 24,179 33,783 41,885 37,200Reserve for unfunded lending commitments, January 1 513 714 1,188 1,487 421Provision for unfunded lending commitments (18) (141) (219) 240 204Other (5) (11) (60) (255) (539) 862
Reserve for unfunded lending commitments, December 31 484 513 714 1,188 1,487Allowance for credit losses, December 31 $ 17,912 $ 24,692 $ 34,497 $ 43,073 $ 38,687
(1) The 2010 balance includes $10.8 billion of allowance for loan and lease losses related to the adoption of consolidation guidance that was effective January 1, 2010.(2) Includes U.S. small business commercial charge-offs of $457 million, $799 million, $1.1 billion, $2.0 billion and $3.0 billion in 2013, 2012, 2011, 2010 and 2009, respectively.(3) Includes U.S. small business commercial recoveries of $98 million, $100 million, $106 million, $107 million and $65 million in 2013, 2012, 2011, 2010 and 2009, respectively.(4) The 2013, 2012 and 2011 amounts primarily represent the net impact of portfolio sales, consolidations and deconsolidations, and foreign currency translation adjustments. In addition, the 2011
amount includes a $449 million reduction in the allowance for loan and lease losses related to Canadian consumer card loans that were transferred to LHFS. The 2009 amount includes a $750 million reduction in the allowance for loan and lease losses related to credit card loans of $8.5 billion which were exchanged for $7.8 billion in held-to-maturity debt securities that were issued by the Corporation’s U.S. Credit Card Securitization Trust and retained by the Corporation.
(5) The 2013, 2012, 2011 and 2010 amounts primarily represent accretion of the Merrill Lynch purchase accounting adjustment and the impact of funding previously unfunded positions. The 2009 amount includes the remaining balance of the acquired Merrill Lynch reserve excluding those commitments accounted for under the fair value option, net of accretion, and the impact of funding previously unfunded positions.
76788ba_financials.indd 130 3/6/14 12:06 PM

Bank of America 2013 131
Table VII Allowance for Credit Losses (continued)
(Dollars in millions) 2013 2012 2011 2010 2009Loan and allowance ratios:
Loans and leases outstanding at December 31 (6) $ 918,191 $ 898,817 $ 917,396 $ 937,119 $ 895,192Allowance for loan and lease losses as a percentage of total loans and leases
outstanding at December 31 (6) 1.90% 2.69% 3.68% 4.47% 4.16%
Consumer allowance for loan and lease losses as a percentage of total consumer loans and leases outstanding at December 31 (7) 2.53 3.81 4.88 5.40 4.81
Commercial allowance for loan and lease losses as a percentage of total commercial loans and leases outstanding at December 31 (8) 1.03 0.90 1.33 2.44 2.96
Average loans and leases outstanding (6) $ 909,127 $ 890,337 $ 929,661 $ 954,278 $ 941,862Net charge-offs as a percentage of average loans and leases outstanding (6, 9) 0.87% 1.67% 2.24% 3.60% 3.58%Net charge-offs and PCI write-offs as a percentage of average loans and leases
outstanding (6, 10) 1.13 1.99 2.24 3.60 3.58
Allowance for loan and lease losses as a percentage of total nonperforming loans and leases at December 31 (6, 11) 102 107 135 136 111
Ratio of the allowance for loan and lease losses at December 31 to net charge-offs (9) 2.21 1.62 1.62 1.22 1.10Ratio of the allowance for loan and lease losses at December 31 to net charge-offs and
PCI write-offs (10) 1.70 1.36 1.62 1.22 1.10
Amounts included in allowance for loan and lease losses that are excluded from nonperforming loans and leases at December 31 (12) $ 7,680 $ 12,021 $ 17,490 $ 22,908 $ 17,690
Allowance for loan and lease losses as a percentage of total nonperforming loans and leases, excluding amounts included in the allowance for loan and lease losses that are excluded from nonperforming loans and leases at December 31 (12) 57% 54% 65% 62% 58%
Loan and allowance ratios excluding PCI loans and the related valuation allowance: (13) Allowance for loan and lease losses as a percentage of total loans and leases
outstanding at December 31 (6) 1.67% 2.14% 2.86% 3.94% 3.88%
Consumer allowance for loan and lease losses as a percentage of total consumer loans and leases outstanding at December 31 (7) 2.17 2.95 3.68 4.66 4.43
Net charge-offs as a percentage of average loans and leases outstanding (6) 0.90 1.73 2.32 3.73 3.71Allowance for loan and lease losses as a percentage of total nonperforming loans and
leases at December 31 (6, 11) 87 82 101 116 99
Ratio of the allowance for loan and lease losses at December 31 to net charge-offs 1.89 1.25 1.22 1.04 1.00(6) Outstanding loan and lease balances and ratios do not include loans accounted for under the fair value option, which were $10.0 billion, $9.0 billion, $8.8 billion, $3.3 billion and $4.9 billion at
December 31, 2013, 2012, 2011, 2010 and 2009, respectively. Average loans accounted for under the fair value option were $9.5 billion, $8.4 billion, $8.4 billion, $4.1 billion and $6.9 billion in 2013, 2012, 2011, 2010 and 2009, respectively.
(7) Excludes consumer loans accounted for under the fair value option of $2.2 billion, $1.0 billion and $2.2 billion at December 31, 2013, 2012 and 2011. There were no consumer loans accounted for under the fair value option prior to 2011.
(8) Excludes commercial loans accounted for under the fair value option of $7.9 billion, $8.0 billion, $6.6 billion, $3.3 billion and $4.9 billion at December 31, 2013, 2012, 2011, 2010 and 2009, respectively.
(9) Net charge-offs exclude $2.3 billion and $2.8 billion of write-offs in the PCI loan portfolio in 2013 and 2012. These write-offs decreased the PCI valuation allowance included as part of the allowance for loan and lease losses. For more information on PCI write-offs, see Consumer Portfolio Credit Risk Management – Purchased Credit-impaired Loan Portfolio on page 81.
(10) There were no write-offs of PCI loans in 2011, 2010 and 2009.(11) For more information on our definition of nonperforming loans, see pages 85 and 92.(12) Primarily includes amounts allocated to the U.S. credit card and unsecured lending portfolios in CBB, PCI loans and the non-U.S. credit portfolio in All Other.(13) For more information on the PCI loan portfolio and the valuation allowance for PCI loans, see Note 4 – Outstanding Loans and Leases and Note 5 – Allowance for Credit Losses to the Consolidated
Financial Statements.
76788ba_financials.indd 131 3/6/14 12:06 PM

132 Bank of America 2013
Table VIII Allocation of the Allowance for Credit Losses by Product Type
December 31
2013 2012 2011 2010 2009
(Dollars in millions) AmountPercentof Total Amount
Percentof Total Amount
Percentof Total Amount
Percentof Total Amount
Percentof Total
Allowance for loan and lease losses Residential mortgage $ 4,084 23.43% $ 7,088 29.31% $ 7,985 23.64% $ 6,365 15.20% $ 5,640 15.17%Home equity 4,434 25.44 7,845 32.45 13,094 38.76 12,887 30.77 10,116 27.19U.S. credit card 3,930 22.55 4,718 19.51 6,322 18.71 10,876 25.97 6,017 16.17Non-U.S. credit card 459 2.63 600 2.48 946 2.80 2,045 4.88 1,581 4.25Direct/Indirect consumer 417 2.39 718 2.97 1,153 3.41 2,381 5.68 4,227 11.36Other consumer 99 0.58 104 0.43 148 0.44 161 0.38 204 0.55
Total consumer 13,423 77.02 21,073 87.15 29,648 87.76 34,715 82.88 27,785 74.69U.S. commercial (1) 2,394 13.74 1,885 7.80 2,441 7.23 3,576 8.54 5,152 13.85Commercial real estate 917 5.26 846 3.50 1,349 3.99 3,137 7.49 3,567 9.59Commercial lease financing 118 0.68 78 0.32 92 0.27 126 0.30 291 0.78Non-U.S. commercial 576 3.30 297 1.23 253 0.75 331 0.79 405 1.09
Total commercial (2) 4,005 22.98 3,106 12.85 4,135 12.24 7,170 17.12 9,415 25.31Allowance for loan and lease losses 17,428 100.00% 24,179 100.00% 33,783 100.00% 41,885 100.00% 37,200 100.00%
Reserve for unfunded lending commitments 484 513 714 1,188 1,487Allowance for credit losses (3) $ 17,912 $ 24,692 $ 34,497 $ 43,073 $ 38,687
(1) Includes allowance for loan and lease losses for U.S. small business commercial loans of $462 million, $642 million, $893 million, $1.5 billion and $2.4 billion at December 31, 2013, 2012, 2011, 2010 and 2009, respectively.
(2) Includes allowance for loan and lease losses for impaired commercial loans of $277 million, $475 million, $545 million, $1.1 billion and $1.2 billion at December 31, 2013, 2012, 2011, 2010 and 2009, respectively.
(3) Includes $2.5 billion, $5.5 billion, $8.5 billion, $6.4 billion and $3.9 billion of valuation allowance included as part of the allowance for credit losses related to PCI loans at December 31, 2013, 2012, 2011, 2010 and 2009, respectively.
76788ba_financials.indd 132 3/6/14 12:06 PM

Bank of America 2013 133
Table IX Selected Loan Maturity Data (1, 2)
December 31, 2013
(Dollars in millions)Due in OneYear or Less
Due AfterOne YearThrough
Five YearsDue AfterFive Years Total
U.S. commercial $ 58,522 $ 122,739 $ 46,114 $ 227,375
U.S. commercial real estate 7,244 32,826 6,242 46,312
Non-U.S. and other (3) 78,201 14,026 5,170 97,397
Total selected loans $ 143,967 $ 169,591 $ 57,526 $ 371,084
Percent of total 39% 46% 15% 100%Sensitivity of selected loans to changes in interest rates for loans due after one year:
Fixed interest rates $ 12,668 $ 28,463 Floating or adjustable interest rates 156,923 29,063
Total $ 169,591 $ 57,526 (1) Loan maturities are based on the remaining maturities under contractual terms.(2) Includes loans accounted for under the fair value option.(3) Loan maturities include non-U.S. commercial and commercial real estate loans.
Table X Non-exchange Traded Commodity Contracts
December 31, 2013
(Dollars in millions)Asset
PositionsLiabilityPositions
Net fair value of contracts outstanding, January 1, 2013 $ 4,041 $ 3,977Effects of legally enforceable master netting agreements 5,110 5,110
Gross fair value of contracts outstanding, January 1, 2013 9,151 9,087Contracts realized or otherwise settled (5,494) (5,229)Fair value of new contracts 4,076 4,023Other changes in fair value 1,268 984
Gross fair value of contracts outstanding, December 31, 2013 9,001 8,865Effects of legally enforceable master netting agreements (4,625) (4,625)
Net fair value of contracts outstanding, December 31, 2013 $ 4,376 $ 4,240
Table XI Non-exchange Traded Commodity Contract Maturities
December 31, 2013
(Dollars in millions)Asset
PositionsLiabilityPositions
Less than one year $ 4,737 $ 4,575Greater than or equal to one year and less than three years 2,108 2,411Greater than or equal to three years and less than five years 494 489Greater than or equal to five years 1,662 1,390
Gross fair value of contracts outstanding 9,001 8,865Effects of legally enforceable master netting agreements (4,625) (4,625)
Net fair value of contracts outstanding $ 4,376 $ 4,240
76788ba_financials.indd 133 3/6/14 12:06 PM

134 Bank of America 2013
Table XII Selected Quarterly Financial Data
2013 Quarters 2012 Quarters
(In millions, except per share information) Fourth Third Second First Fourth Third Second First
Income statement
Net interest income $ 10,786 $ 10,266 $ 10,549 $ 10,664 $ 10,324 $ 9,938 $ 9,548 $ 10,846
Noninterest income 10,702 11,264 12,178 12,533 8,336 10,490 12,420 11,432
Total revenue, net of interest expense 21,488 21,530 22,727 23,197 18,660 20,428 21,968 22,278
Provision for credit losses 336 296 1,211 1,713 2,204 1,774 1,773 2,418
Noninterest expense 17,307 16,389 16,018 19,500 18,360 17,544 17,048 19,141
Income (loss) before income taxes 3,845 4,845 5,498 1,984 (1,904) 1,110 3,147 719
Income tax expense (benefit) 406 2,348 1,486 501 (2,636) 770 684 66
Net income 3,439 2,497 4,012 1,483 732 340 2,463 653
Net income (loss) applicable to common shareholders 3,183 2,218 3,571 1,110 367 (33) 2,098 328
Average common shares issued and outstanding 10,633 10,719 10,776 10,799 10,777 10,776 10,776 10,651
Average diluted common shares issued and outstanding (1) 11,404 11,482 11,525 11,155 10,885 10,776 11,556 10,762
Performance ratios
Return on average assets 0.64% 0.47% 0.74% 0.27% 0.13% 0.06% 0.45% 0.12%
Four quarter trailing return on average assets (2) 0.53 0.40 0.30 0.23 0.19 0.25 0.51 n/m
Return on average common shareholders’ equity 5.74 4.06 6.55 2.06 0.67 n/m 3.89 0.62
Return on average tangible common shareholders’ equity (3) 8.61 6.15 9.88 3.12 1.01 n/m 5.95 0.95
Return on average tangible shareholders’ equity (3) 8.53 6.32 9.98 3.69 1.77 0.84 6.16 1.67
Total ending equity to total ending assets 11.07 10.92 10.88 10.91 10.72 11.02 10.92 10.66
Total average equity to total average assets 10.93 10.85 10.76 10.71 10.79 10.86 10.73 10.63
Dividend payout 3.33 4.82 3.01 9.75 29.33 n/m 5.60 34.97
Per common share data
Earnings $ 0.30 $ 0.21 $ 0.33 $ 0.10 $ 0.03 $ 0.00 $ 0.19 $ 0.03
Diluted earnings (1) 0.29 0.20 0.32 0.10 0.03 0.00 0.19 0.03
Dividends paid 0.01 0.01 0.01 0.01 0.01 0.01 0.01 0.01
Book value 20.71 20.50 20.18 20.19 20.24 20.40 20.16 19.83
Tangible book value (3) 13.79 13.62 13.32 13.36 13.36 13.48 13.22 12.87
Market price per share of common stock
Closing $ 15.57 $ 13.80 $ 12.86 $ 12.18 $ 11.61 $ 8.83 $ 8.18 $ 9.57
High closing 15.88 14.95 13.83 12.78 11.61 9.55 9.68 9.93
Low closing 13.69 12.83 11.44 11.03 8.93 7.04 6.83 5.80
Market capitalization $ 164,914 $ 147,429 $ 138,156 $ 131,817 $ 125,136 $ 95,163 $ 88,155 $ 103,123(1) Due to a net loss applicable to common shareholders for the third quarter of 2012, the impact of antidilutive equity instruments was excluded from diluted earnings per share and average diluted
common shares.(2) Calculated as total net income for four consecutive quarters divided by annualized average assets for four consecutive quarters.(3) Tangible equity ratios and tangible book value per share of common stock are non-GAAP financial measures. Other companies may define or calculate these measures differently. For more information
on these ratios, see Supplemental Financial Data on page 29, and for corresponding reconciliations to GAAP financial measures, see Statistical Table XVII.(4) For more information on the impact of the PCI loan portfolio on asset quality, see Consumer Portfolio Credit Risk Management on page 73. (5) Includes the allowance for loan and lease losses and the reserve for unfunded lending commitments.(6) Balances and ratios do not include loans accounted for under the fair value option. For additional exclusions from nonperforming loans, leases and foreclosed properties, see Consumer Portfolio
Credit Risk Management – Nonperforming Consumer Loans, Leases and Foreclosed Properties Activity on page 85 and corresponding Table 41, and Commercial Portfolio Credit Risk Management – Nonperforming Commercial Loans, Leases and Foreclosed Properties Activity on page 92 and corresponding Table 50.
(7) Primarily includes amounts allocated to the U.S. credit card and unsecured consumer lending portfolios in CBB, PCI loans and the non-U.S. credit card portfolio in All Other.(8) Net charge-offs exclude $741 million, $443 million, $313 million and $839 million of write-offs in the PCI loan portfolio for the fourth, third, second and first quarters of 2013, respectively, and $1.1
billion and $1.7 billion for the fourth and third quarters of 2012. These write-offs decreased the PCI valuation allowance included as part of the allowance for loan and lease losses. For more information on PCI write-offs, see Consumer Portfolio Credit Risk Management – Purchased Credit-impaired Loan Portfolio on page 81.
(9) There were no write-offs of PCI loans in the second and first quarters of 2012.(10) Presents capital ratios in accordance with the Basel 1 – 2013 Rules, which include the Market Risk Final Rule at December 31, 2013. Basel 1 did not include the Basel 1 – 2013 Rules at December 31,
2012.n/m = not meaningful
76788ba_financials.indd 134 3/6/14 12:06 PM

Bank of America 2013 135
Table XII Selected Quarterly Financial Data (continued)
2013 Quarters 2012 Quarters
(Dollars in millions) Fourth Third Second First Fourth Third Second First
Average balance sheet
Total loans and leases $ 929,777 $ 923,978 $ 914,234 $ 906,259 $ 893,166 $ 888,859 $ 899,498 $ 913,722
Total assets 2,134,875 2,123,430 2,184,610 2,212,430 2,210,365 2,173,312 2,194,563 2,187,174
Total deposits 1,112,674 1,090,611 1,079,956 1,075,280 1,078,076 1,049,697 1,032,888 1,030,112
Long-term debt 251,055 258,717 270,198 273,999 277,894 291,684 333,173 363,518
Common shareholders’ equity 220,088 216,766 218,790 218,225 219,744 217,273 216,782 214,150
Total shareholders’ equity 233,415 230,392 235,063 236,995 238,512 236,039 235,558 232,566
Asset quality (4)
Allowance for credit losses (5) $ 17,912 $ 19,912 $ 21,709 $ 22,927 $ 24,692 $ 26,751 $ 30,862 $ 32,862
Nonperforming loans, leases and foreclosed properties (6) 17,772 20,028 21,280 22,842 23,555 24,925 25,377 27,790
Allowance for loan and lease losses as a percentage of total loans and leases outstanding (6) 1.90% 2.10% 2.33% 2.49% 2.69% 2.96% 3.43% 3.61%
Allowance for loan and lease losses as a percentage of total nonperforming loans and leases (6) 102 100 103 102 107 111 127 126
Allowance for loan and lease losses as a percentage of total nonperforming loans and leases, excluding the PCI loan portfolio (6) 87 84 84 82 82 81 90 91
Amounts included in allowance that are excluded from nonperforming loans and leases (7) $ 7,680 $ 8,972 $ 9,919 $ 10,690 $ 12,021 $ 13,978 $ 16,327 $ 17,006
Allowance as a percentage of total nonperforming loans and leases, excluding amounts included in the allowance that are excluded from nonperforming loans and leases (7) 57% 54% 55% 53% 54% 52% 59% 60%
Net charge-offs (8) $ 1,582 $ 1,687 $ 2,111 $ 2,517 $ 3,104 $ 4,122 $ 3,626 $ 4,056
Annualized net charge-offs as a percentage of average loans and leases outstanding (6, 8) 0.68% 0.73% 0.94% 1.14% 1.40% 1.86% 1.64% 1.80%
Annualized net charge-offs as a percentage of average loans and leases outstanding, excluding the PCI loan portfolio (6) 0.70 0.75 0.97 1.18 1.44 1.93 1.69 1.87
Annualized net charge-offs and PCI write-offs as a percentage of average loans and leases outstanding (6, 9) 1.00 0.92 1.07 1.52 1.90 2.63 1.64 1.80
Nonperforming loans and leases as a percentage of total loans and leases outstanding (6) 1.87 2.10 2.26 2.44 2.52 2.68 2.70 2.85
Nonperforming loans, leases and foreclosed properties as a percentage of total loans, leases and foreclosed properties (6) 1.93 2.17 2.33 2.53 2.62 2.81 2.87 3.10
Ratio of the allowance for loan and lease losses at period end to annualized net charge-offs (8) 2.78 2.90 2.51 2.20 1.96 1.60 2.08 1.97
Ratio of the allowance for loan and lease losses at period end toannualized net charge-offs, excluding the PCI loan portfolio 2.38 2.42 2.04 1.76 1.51 1.17 1.46 1.43
Ratio of the allowance for loan and lease losses at period end to annualized net charge-offs and PCI write-offs (9) 1.89 2.30 2.18 1.65 1.44 1.13 2.08 1.97
Capital ratios at period end (10)
Risk-based capital:
Tier 1 common capital 11.19% 11.08% 10.83% 10.49% 11.06% 11.41% 11.24% 10.78%
Tier 1 capital 12.44 12.33 12.16 12.22 12.89 13.64 13.80 13.37
Total capital 15.44 15.36 15.27 15.50 16.31 17.16 17.51 17.49
Tier 1 leverage 7.86 7.79 7.49 7.49 7.37 7.84 7.84 7.79
Tangible equity (3) 7.86 7.73 7.67 7.78 7.62 7.85 7.73 7.48
Tangible common equity (3) 7.20 7.08 6.98 6.88 6.74 6.95 6.83 6.58
For footnotes see page 134.
76788ba_financials.indd 135 3/6/14 12:06 PM

136 Bank of America 2013
Table XIII Quarterly Average Balances and Interest Rates – FTE Basis
Fourth Quarter 2013 Third Quarter 2013
(Dollars in millions)AverageBalance
InterestIncome/Expense
Yield/Rate
AverageBalance
InterestIncome/Expense
Yield/Rate
Earning assets
Time deposits placed and other short-term investments (1) $ 15,782 $ 48 1.21% $ 17,256 $ 47 1.07%
Federal funds sold and securities borrowed or purchased under agreements to resell 203,415 304 0.59 223,434 291 0.52
Trading account assets 156,194 1,182 3.01 144,502 1,093 3.01
Debt securities (2) 325,119 2,455 3.02 327,493 2,211 2.70
Loans and leases (3):
Residential mortgage (4) 253,974 2,374 3.74 256,297 2,359 3.68
Home equity 95,388 953 3.97 98,172 930 3.77
U.S. credit card 90,057 2,125 9.36 90,005 2,226 9.81
Non-U.S. credit card 11,171 310 11.01 10,633 317 11.81
Direct/Indirect consumer (5) 82,990 565 2.70 83,773 587 2.78
Other consumer (6) 1,929 17 3.73 1,867 19 3.89
Total consumer 535,509 6,344 4.72 540,747 6,438 4.74
U.S. commercial 225,596 1,700 2.99 221,542 1,704 3.05
Commercial real estate (7) 46,341 374 3.20 43,164 352 3.24
Commercial lease financing 24,468 206 3.37 23,869 204 3.41
Non-U.S. commercial 97,863 544 2.20 94,656 528 2.22
Total commercial 394,268 2,824 2.84 383,231 2,788 2.89
Total loans and leases 929,777 9,168 3.92 923,978 9,226 3.97
Other earning assets 78,214 709 3.61 74,022 677 3.62
Total earning assets (8) 1,708,501 13,866 3.23 1,710,685 13,545 3.15
Cash and cash equivalents (1) 125,259 59 113,064 50
Other assets, less allowance for loan and lease losses 301,115 299,681
Total assets $ 2,134,875 $2,123,430
Interest-bearing liabilities
U.S. interest-bearing deposits:
Savings $ 43,665 $ 5 0.05% $ 43,968 $ 5 0.05%
NOW and money market deposit accounts 514,220 89 0.07 508,136 100 0.08
Consumer CDs and IRAs 77,424 97 0.50 81,190 116 0.56
Negotiable CDs, public funds and other deposits 26,271 28 0.40 24,079 25 0.42
Total U.S. interest-bearing deposits 661,580 219 0.13 657,373 246 0.15
Non-U.S. interest-bearing deposits:
Banks located in non-U.S. countries 13,878 18 0.52 12,789 16 0.47
Governments and official institutions 1,258 — 0.22 1,041 1 0.25
Time, savings and other 59,029 77 0.51 55,446 71 0.52
Total non-U.S. interest-bearing deposits 74,165 95 0.51 69,276 88 0.50
Total interest-bearing deposits 735,745 314 0.17 726,649 334 0.18
Federal funds purchased, securities loaned or sold under agreements to repurchase and short-termborrowings 271,538 682 1.00 279,425 683 0.97
Trading account liabilities 82,393 364 1.75 84,648 375 1.76
Long-term debt 251,055 1,566 2.48 258,717 1,724 2.65
Total interest-bearing liabilities (8) 1,340,731 2,926 0.87 1,349,439 3,116 0.92
Noninterest-bearing sources:
Noninterest-bearing deposits 376,929 363,962
Other liabilities 183,800 179,637
Shareholders’ equity 233,415 230,392
Total liabilities and shareholders’ equity $ 2,134,875 $2,123,430
Net interest spread 2.36% 2.23%
Impact of noninterest-bearing sources 0.19 0.20
Net interest income/yield on earning assets (1) $ 10,940 2.55% $ 10,429 2.43%(1) For this presentation, fees earned on overnight deposits placed with the Federal Reserve are included in the cash and cash equivalents line, consistent with the Consolidated Balance Sheet
presentation of these deposits. In addition, beginning in the third quarter of 2012, fees earned on deposits, primarily overnight, placed with certain non-U.S. central banks, which are included in the time deposits placed and other short-term investments line in prior periods, are included in the cash and cash equivalents line. Net interest income and net interest yield are calculated excluding the fees included in the cash and cash equivalents line.
(2) Yields on debt securities carried at fair value are calculated based on fair value rather than the cost basis. The use of fair value does not have a material impact on net interest yield.(3) Nonperforming loans are included in the respective average loan balances. Income on these nonperforming loans is generally recognized on a cost recovery basis. PCI loans were recorded at fair
value upon acquisition and accrete interest income over the remaining life of the loan.(4) Includes non-U.S. residential mortgage loans of $56 million, $83 million, $86 million and $90 million in the fourth, third, second and first quarters of 2013, respectively, and $93 million in the fourth
quarter of 2012.(5) Includes non-U.S. consumer loans of $5.1 billion, $6.7 billion, $7.5 billion and $7.7 billion in the fourth, third, second and first quarters of 2013, respectively, and $8.1 billion in the fourth quarter
of 2012.(6) Includes consumer finance loans of $1.2 billion, $1.3 billion, $1.3 billion and $1.4 billion in the fourth, third, second and first quarters of 2013, respectively, and $1.4 billion in the fourth quarter
of 2012; consumer leases of $549 million, $422 million, $291 million and $138 million in the fourth, third, second and first quarters of 2013, respectively, and $3 million in the fourth quarter of 2012; other non-U.S. consumer loans of $5 million for each of the quarters of 2013, and $4 million in the fourth quarter of 2012; and consumer overdrafts of $163 million, $172 million, $136 million and $142 million in the fourth, third, second and first quarters of 2013, respectively, and $156 million in the fourth quarter of 2012.
(7) Includes U.S. commercial real estate loans of $44.5 billion, $41.5 billion, $39.1 billion and $37.7 billion in the fourth, third, second and first quarters of 2013, respectively, and $36.7 billion in the fourth quarter of 2012; and non-U.S. commercial real estate loans of $1.8 billion, $1.7 billion, $1.5 billion and $1.5 billion in the fourth, third, second and first quarters of 2013, respectively, and $1.5 billion in the fourth quarter of 2012.
(8) Interest income includes the impact of interest rate risk management contracts, which decreased interest income on the underlying assets by $0, $1 million, $63 million and $141 million in the fourth, third, second and first quarters of 2013, respectively, and $146 million in the fourth quarter of 2012. Interest expense includes the impact of interest rate risk management contracts, which decreased interest expense on the underlying liabilities by $588 million, $556 million, $660 million and $618 million in the fourth, third, second and first quarters of 2013, respectively, and $598 million in the fourth quarter of 2012. For more information on interest rate contracts, see Interest Rate Risk Management for Nontrading Activities on page 109.
76788ba_financials.indd 136 3/6/14 12:06 PM

Bank of America 2013 137
Table XIII Quarterly Average Balances and Interest Rates – FTE Basis (continued)
Second Quarter 2013 First Quarter 2013 Fourth Quarter 2012
(Dollars in millions)AverageBalance
InterestIncome/Expense
Yield/Rate
AverageBalance
InterestIncome/Expense
Yield/Rate
AverageBalance
InterestIncome/Expense
Yield/Rate
Earning assets
Time deposits placed and other short-term investments (1) $ 15,088 $ 46 1.21% $ 16,129 $ 46 1.17% $ 16,967 $ 50 1.14%
Federal funds sold and securities borrowed or purchased underagreements to resell 233,394 319 0.55 237,463 315 0.54 241,950 329 0.54
Trading account assets 181,620 1,224 2.70 194,364 1,380 2.87 186,252 1,362 2.91
Debt securities (2) 343,260 2,557 2.98 356,399 2,556 2.87 360,213 2,201 2.44
Loans and leases (3):
Residential mortgage (4) 257,275 2,246 3.49 258,630 2,340 3.62 256,564 2,292 3.57
Home equity 101,708 951 3.74 105,939 997 3.80 110,270 1,068 3.86
U.S. credit card 89,722 2,192 9.80 91,712 2,249 9.95 92,849 2,336 10.01
Non-U.S. credit card 10,613 315 11.93 11,027 329 12.10 13,081 383 11.66
Direct/Indirect consumer (5) 82,485 598 2.90 82,364 620 3.06 82,583 662 3.19
Other consumer (6) 1,756 17 4.17 1,666 19 4.36 1,602 19 4.57
Total consumer 543,559 6,319 4.66 551,338 6,554 4.79 556,949 6,760 4.84
U.S. commercial 217,464 1,741 3.21 210,706 1,666 3.20 209,496 1,729 3.28
Commercial real estate (7) 40,612 340 3.36 39,179 326 3.38 38,192 341 3.55
Commercial lease financing 23,579 205 3.48 23,534 236 4.01 22,839 184 3.23
Non-U.S. commercial 89,020 543 2.45 81,502 467 2.32 65,690 433 2.62
Total commercial 370,675 2,829 3.06 354,921 2,695 3.07 336,217 2,687 3.18
Total loans and leases 914,234 9,148 4.01 906,259 9,249 4.12 893,166 9,447 4.21
Other earning assets 81,740 713 3.50 90,172 733 3.29 90,388 771 3.40
Total earning assets (8) 1,769,336 14,007 3.17 1,800,786 14,279 3.20 1,788,936 14,160 3.16
Cash and cash equivalents (1) 104,486 40 92,846 33 111,671 42
Other assets, less allowance for loan and lease losses 310,788 318,798 309,758
Total assets $ 2,184,610 $ 2,212,430 $ 2,210,365
Interest-bearing liabilities
U.S. interest-bearing deposits:
Savings $ 44,897 $ 6 0.05% $ 42,934 $ 6 0.05% $ 41,294 $ 6 0.06%
NOW and money market deposit accounts 500,628 107 0.09 501,177 117 0.09 479,130 146 0.12
Consumer CDs and IRAs 85,001 130 0.62 88,376 138 0.63 91,256 156 0.68
Negotiable CDs, public funds and other deposits 22,721 27 0.46 20,880 26 0.52 19,904 27 0.54
Total U.S. interest-bearing deposits 653,247 270 0.17 653,367 287 0.18 631,584 335 0.21
Non-U.S. interest-bearing deposits:
Banks located in non-U.S. countries 10,832 17 0.64 12,155 19 0.64 11,970 22 0.71
Governments and official institutions 924 — 0.26 901 1 0.23 876 1 0.29
Time, savings and other 55,661 79 0.56 54,597 75 0.56 53,649 80 0.60
Total non-U.S. interest-bearing deposits 67,417 96 0.57 67,653 95 0.57 66,495 103 0.62
Total interest-bearing deposits 720,664 366 0.20 721,020 382 0.22 698,079 438 0.25
Federal funds purchased, securities loaned or sold underagreements to repurchase and short-term borrowings 318,028 809 1.02 337,644 749 0.90 336,341 855 1.01
Trading account liabilities 94,349 427 1.82 92,047 472 2.08 80,084 420 2.09
Long-term debt 270,198 1,674 2.48 273,999 1,834 2.70 277,894 1,934 2.77
Total interest-bearing liabilities (8) 1,403,239 3,276 0.94 1,424,710 3,437 0.98 1,392,398 3,647 1.04
Noninterest-bearing sources:
Noninterest-bearing deposits 359,292 354,260 379,997
Other liabilities 187,016 196,465 199,458
Shareholders’ equity 235,063 236,995 238,512
Total liabilities and shareholders’ equity $ 2,184,610 $ 2,212,430 $ 2,210,365
Net interest spread 2.23% 2.22% 2.12%
Impact of noninterest-bearing sources 0.20 0.21 0.22
Net interest income/yield on earning assets (1) $ 10,731 2.43% $ 10,842 2.43% $ 10,513 2.34%
For footnotes see page 136.
76788ba_financials.indd 137 3/6/14 12:06 PM

138 Bank of America 2013
Table XIV Quarterly Supplemental Financial Data
2013 Quarters 2012 Quarters(Dollars in millions, except per share information) Fourth Third Second First Fourth Third Second FirstFully taxable-equivalent basis data (1)
Net interest income (2) $ 10,999 $ 10,479 $ 10,771 $ 10,875 $ 10,555 $ 10,167 $ 9,782 $ 11,053Total revenue, net of interest expense 21,701 21,743 22,949 23,408 18,891 20,657 22,202 22,485Net interest yield (2) 2.56% 2.44% 2.44% 2.43% 2.35% 2.32% 2.21% 2.51%Efficiency ratio 79.75 75.38 69.80 83.31 97.19 84.93 76.79 85.13
(1) FTE basis is a non-GAAP financial measure. For more information on these performance measures and ratios, see Supplemental Financial Data on page 29 and for corresponding reconciliations to GAAP financial measures, see Statistical Table XVII.
(2) Net interest income and net interest yield include fees earned on overnight deposits placed with the Federal Reserve and fees earned on deposits, primarily overnight, placed with certain non-U.S. central banks.
76788ba_financials.indd 138 3/6/14 12:06 PM

Bank of America 2013 139
Table XV Five-year Reconciliations to GAAP Financial Measures (1)
(Dollars in millions, shares in thousands) 2013 2012 2011 2010 2009
Reconciliation of net interest income to net interest income on a fully taxable-equivalent basis
Net interest income $ 42,265 $ 40,656 $ 44,616 $ 51,523 $ 47,109
Fully taxable-equivalent adjustment 859 901 972 1,170 1,301
Net interest income on a fully taxable-equivalent basis $ 43,124 $ 41,557 $ 45,588 $ 52,693 $ 48,410
Reconciliation of total revenue, net of interest expense to total revenue, net of interest expense on a fullytaxable-equivalent basis
Total revenue, net of interest expense $ 88,942 $ 83,334 $ 93,454 $ 110,220 $ 119,643
Fully taxable-equivalent adjustment 859 901 972 1,170 1,301
Total revenue, net of interest expense on a fully taxable-equivalent basis $ 89,801 $ 84,235 $ 94,426 $ 111,390 $ 120,944
Reconciliation of total noninterest expense to total noninterest expense, excluding goodwill impairmentcharges
Total noninterest expense $ 69,214 $ 72,093 $ 80,274 $ 83,108 $ 66,713
Goodwill impairment charges — — (3,184) (12,400) —
Total noninterest expense, excluding goodwill impairment charges $ 69,214 $ 72,093 $ 77,090 $ 70,708 $ 66,713
Reconciliation of income tax expense (benefit) to income tax expense (benefit) on a fully taxable-equivalentbasis
Income tax expense (benefit) $ 4,741 $ (1,116) $ (1,676) $ 915 $ (1,916)
Fully taxable-equivalent adjustment 859 901 972 1,170 1,301
Income tax expense (benefit) on a fully taxable-equivalent basis $ 5,600 $ (215) $ (704) $ 2,085 $ (615)
Reconciliation of net income (loss) to net income, excluding goodwill impairment charges
Net income (loss) $ 11,431 $ 4,188 $ 1,446 $ (2,238) $ 6,276
Goodwill impairment charges — — 3,184 12,400 —
Net income, excluding goodwill impairment charges $ 11,431 $ 4,188 $ 4,630 $ 10,162 $ 6,276
Reconciliation of net income (loss) applicable to common shareholders to net income (loss) applicable tocommon shareholders, excluding goodwill impairment charges
Net income (loss) applicable to common shareholders $ 10,082 $ 2,760 $ 85 $ (3,595) $ (2,204)
Goodwill impairment charges — — 3,184 12,400 —
Net income (loss) applicable to common shareholders, excluding goodwill impairment charges $ 10,082 $ 2,760 $ 3,269 $ 8,805 $ (2,204)
Reconciliation of average common shareholders’ equity to average tangible common shareholders’ equity
Common shareholders’ equity $ 218,468 $ 216,996 $ 211,709 $ 212,686 $ 182,288
Common Equivalent Securities — — — 2,900 1,213
Goodwill (69,910) (69,974) (72,334) (82,600) (86,034)
Intangible assets (excluding MSRs) (6,132) (7,366) (9,180) (10,985) (12,220)
Related deferred tax liabilities 2,328 2,593 2,898 3,306 3,831
Tangible common shareholders’ equity $ 144,754 $ 142,249 $ 133,093 $ 125,307 $ 89,078
Reconciliation of average shareholders’ equity to average tangible shareholders’ equity
Shareholders’ equity $ 233,947 $ 235,677 $ 229,095 $ 233,235 $ 244,645
Goodwill (69,910) (69,974) (72,334) (82,600) (86,034)
Intangible assets (excluding MSRs) (6,132) (7,366) (9,180) (10,985) (12,220)
Related deferred tax liabilities 2,328 2,593 2,898 3,306 3,831
Tangible shareholders’ equity $ 160,233 $ 160,930 $ 150,479 $ 142,956 $ 150,222
Reconciliation of year-end common shareholders’ equity to year-end tangible common shareholders’ equity
Common shareholders’ equity $ 219,333 $ 218,188 $ 211,704 $ 211,686 $ 194,236
Common Equivalent Securities — — — — 19,244
Goodwill (69,844) (69,976) (69,967) (73,861) (86,314)
Intangible assets (excluding MSRs) (5,574) (6,684) (8,021) (9,923) (12,026)
Related deferred tax liabilities 2,166 2,428 2,702 3,036 3,498
Tangible common shareholders’ equity $ 146,081 $ 143,956 $ 136,418 $ 130,938 $ 118,638
Reconciliation of year-end shareholders’ equity to year-end tangible shareholders’ equity
Shareholders’ equity $ 232,685 $ 236,956 $ 230,101 $ 228,248 $ 231,444
Goodwill (69,844) (69,976) (69,967) (73,861) (86,314)
Intangible assets (excluding MSRs) (5,574) (6,684) (8,021) (9,923) (12,026)
Related deferred tax liabilities 2,166 2,428 2,702 3,036 3,498
Tangible shareholders’ equity $ 159,433 $ 162,724 $ 154,815 $ 147,500 $ 136,602
Reconciliation of year-end assets to year-end tangible assets
Assets $ 2,102,273 $ 2,209,974 $ 2,129,046 $ 2,264,909 $ 2,230,232
Goodwill (69,844) (69,976) (69,967) (73,861) (86,314)
Intangible assets (excluding MSRs) (5,574) (6,684) (8,021) (9,923) (12,026)
Related deferred tax liabilities 2,166 2,428 2,702 3,036 3,498
Tangible assets $ 2,029,021 $ 2,135,742 $ 2,053,760 $ 2,184,161 $ 2,135,390
Reconciliation of year-end common shares outstanding to year-end tangible common shares outstanding
Common shares outstanding 10,591,808 10,778,264 10,535,938 10,085,155 8,650,244
Assumed conversion of common equivalent shares (2) — — — — 1,286,000
Tangible common shares outstanding 10,591,808 10,778,264 10,535,938 10,085,155 9,936,244(1) Presents reconciliations of non-GAAP financial measures to GAAP financial measures. We believe the use of these non-GAAP financial measures provides additional clarity in assessing the results
of the Corporation. Other companies may define or calculate these measures differently. For more information on non-GAAP financial measures and ratios we use in assessing the results of the Corporation, see Supplemental Financial Data on page 29.
(2) On February 24, 2010, the common equivalent shares converted into common shares.
76788ba_financials.indd 139 3/6/14 12:06 PM

140 Bank of America 2013
Table XVI Two-year Reconciliations to GAAP Financial Measures (1, 2)
(Dollars in millions) 2013 2012Consumer & Business Banking
Reported net income $ 6,588 $ 5,546Adjustment related to intangibles (3) 7 13
Adjusted net income $ 6,595 $ 5,559
Average allocated equity (4) $ 62,045 $ 56,214Adjustment related to goodwill and a percentage of intangibles (32,045) (32,163)
Average allocated capital/economic capital $ 30,000 $ 24,051
DepositsReported net income $ 2,127 $ 1,261Adjustment related to intangibles (3) 1 2
Adjusted net income $ 2,128 $ 1,263
Average allocated equity (4) $ 35,400 $ 33,006Adjustment related to goodwill and a percentage of intangibles (20,000) (20,021)
Average allocated capital/economic capital $ 15,400 $ 12,985
Consumer LendingReported net income $ 4,461 $ 4,285Adjustment related to intangibles (3) 7 12
Adjusted net income $ 4,468 $ 4,297
Average allocated equity (4) $ 26,644 $ 23,208Adjustment related to goodwill and a percentage of intangibles (12,044) (12,142)
Average allocated capital/economic capital $ 14,600 $ 11,066
Global Wealth & Investment Management
Reported net income $ 2,974 $ 2,245Adjustment related to intangibles (3) 16 22
Adjusted net income $ 2,990 $ 2,267
Average allocated equity (4) $ 20,292 $ 17,729Adjustment related to goodwill and a percentage of intangibles (10,292) (10,370)
Average allocated capital/economic capital $ 10,000 $ 7,359
Global Banking
Reported net income $ 4,974 $ 5,344Adjustment related to intangibles (3) 2 4
Adjusted net income $ 4,976 $ 5,348
Average allocated equity (4) $ 45,412 $ 41,742Adjustment related to goodwill and a percentage of intangibles (22,412) (22,430)
Average allocated capital/economic capital $ 23,000 $ 19,312
Global Markets
Reported net income $ 1,563 $ 1,229Adjustment related to intangibles (3) 8 9
Adjusted net income $ 1,571 $ 1,238
Average allocated equity (4) $ 35,373 $ 19,193Adjustment related to goodwill and a percentage of intangibles (5,373) (5,369)
Average allocated capital/economic capital $ 30,000 $ 13,824(1) Presents reconciliations of non-GAAP financial measures to GAAP financial measures. We believe the use of these non-GAAP financial measures provides additional clarity in assessing the results
of the Corporation and our segments. Other companies may define or calculate these measures differently. For more information on non-GAAP financial measures and ratios we use in assessing the results of the Corporation, see Supplemental Financial Data on page 29.
(2) There are no adjustments to reported net income (loss) or average allocated equity for CRES.(3) Represents cost of funds, earnings credits and certain expenses related to intangibles.(4) Average allocated equity is comprised of average allocated capital (or economic capital prior to 2013) plus capital for the portion of goodwill and intangibles specifically assigned to the business
segment. For more information on allocated capital and economic capital, see Business Segment Operations on page 31 and Note 8 – Goodwill and Intangible Assets to the Consolidated Financial Statements.
76788ba_financials.indd 140 3/6/14 12:06 PM

Bank of America 2013 141
Table XVII Quarterly Reconciliations to GAAP Financial Measures (1)
2013 Quarters 2012 Quarters
(Dollars in millions) Fourth Third Second First Fourth Third Second First
Reconciliation of net interest income to net interest income on a fullytaxable-equivalent basis
Net interest income $ 10,786 $ 10,266 $ 10,549 $ 10,664 $ 10,324 $ 9,938 $ 9,548 $ 10,846
Fully taxable-equivalent adjustment 213 213 222 211 231 229 234 207
Net interest income on a fully taxable-equivalent basis $ 10,999 $ 10,479 $ 10,771 $ 10,875 $ 10,555 $ 10,167 $ 9,782 $ 11,053
Reconciliation of total revenue, net of interest expense to total revenue,net of interest expense on a fully taxable-equivalent basis
Total revenue, net of interest expense $ 21,488 $ 21,530 $ 22,727 $ 23,197 $ 18,660 $ 20,428 $ 21,968 $ 22,278
Fully taxable-equivalent adjustment 213 213 222 211 231 229 234 207
Total revenue, net of interest expense on a fully taxable-equivalentbasis $ 21,701 $ 21,743 $ 22,949 $ 23,408 $ 18,891 $ 20,657 $ 22,202 $ 22,485
Reconciliation of income tax expense (benefit) to income tax expense(benefit) on a fully taxable-equivalent basis
Income tax expense (benefit) $ 406 $ 2,348 $ 1,486 $ 501 $ (2,636) $ 770 $ 684 $ 66
Fully taxable-equivalent adjustment 213 213 222 211 231 229 234 207
Income tax expense (benefit) on a fully taxable-equivalent basis $ 619 $ 2,561 $ 1,708 $ 712 $ (2,405) $ 999 $ 918 $ 273
Reconciliation of average common shareholders’ equity to averagetangible common shareholders’ equity
Common shareholders’ equity $ 220,088 $ 216,766 $ 218,790 $ 218,225 $ 219,744 $ 217,273 $ 216,782 $ 214,150
Goodwill (69,864) (69,903) (69,930) (69,945) (69,976) (69,976) (69,976) (69,967)
Intangible assets (excluding MSRs) (5,725) (5,993) (6,270) (6,549) (6,874) (7,194) (7,533) (7,869)
Related deferred tax liabilities 2,231 2,296 2,360 2,425 2,490 2,556 2,626 2,700
Tangible common shareholders’ equity $ 146,730 $ 143,166 $ 144,950 $ 144,156 $ 145,384 $ 142,659 $ 141,899 $ 139,014
Reconciliation of average shareholders’ equity to average tangibleshareholders’ equity
Shareholders’ equity $ 233,415 $ 230,392 $ 235,063 $ 236,995 $ 238,512 $ 236,039 $ 235,558 $ 232,566
Goodwill (69,864) (69,903) (69,930) (69,945) (69,976) (69,976) (69,976) (69,967)
Intangible assets (excluding MSRs) (5,725) (5,993) (6,270) (6,549) (6,874) (7,194) (7,533) (7,869)
Related deferred tax liabilities 2,231 2,296 2,360 2,425 2,490 2,556 2,626 2,700
Tangible shareholders’ equity $ 160,057 $ 156,792 $ 161,223 $ 162,926 $ 164,152 $ 161,425 $ 160,675 $ 157,430
Reconciliation of period-end common shareholders’ equity to period-endtangible common shareholders’ equity
Common shareholders’ equity $ 219,333 $ 218,967 $ 216,791 $ 218,513 $ 218,188 $ 219,838 $ 217,213 $ 213,711
Goodwill (69,844) (69,891) (69,930) (69,930) (69,976) (69,976) (69,976) (69,976)
Intangible assets (excluding MSRs) (5,574) (5,843) (6,104) (6,379) (6,684) (7,030) (7,335) (7,696)
Related deferred tax liabilities 2,166 2,231 2,297 2,363 2,428 2,494 2,559 2,628
Tangible common shareholders’ equity $ 146,081 $ 145,464 $ 143,054 $ 144,567 $ 143,956 $ 145,326 $ 142,461 $ 138,667
Reconciliation of period-end shareholders’ equity to period-end tangibleshareholders’ equity
Shareholders’ equity $ 232,685 $ 232,282 $ 231,032 $ 237,293 $ 236,956 $ 238,606 $ 235,975 $ 232,499
Goodwill (69,844) (69,891) (69,930) (69,930) (69,976) (69,976) (69,976) (69,976)
Intangible assets (excluding MSRs) (5,574) (5,843) (6,104) (6,379) (6,684) (7,030) (7,335) (7,696)
Related deferred tax liabilities 2,166 2,231 2,297 2,363 2,428 2,494 2,559 2,628
Tangible shareholders’ equity $ 159,433 $ 158,779 $ 157,295 $ 163,347 $ 162,724 $ 164,094 $ 161,223 $ 157,455
Reconciliation of period-end assets to period-end tangible assets
Assets $ 2,102,273 $2,126,653 $2,123,320 $2,174,819 $2,209,974 $2,166,162 $2,160,854 $2,181,449
Goodwill (69,844) (69,891) (69,930) (69,930) (69,976) (69,976) (69,976) (69,976)
Intangible assets (excluding MSRs) (5,574) (5,843) (6,104) (6,379) (6,684) (7,030) (7,335) (7,696)
Related deferred tax liabilities 2,166 2,231 2,297 2,363 2,428 2,494 2,559 2,628
Tangible assets $ 2,029,021 $2,053,150 $2,049,583 $2,100,873 $2,135,742 $2,091,650 $2,086,102 $2,106,405(1) Presents reconciliations of non-GAAP financial measures to GAAP financial measures. We believe the use of these non-GAAP financial measures provides additional clarity in assessing the results
of the Corporation. Other companies may define or calculate these measures differently. For more information on non-GAAP financial measures and ratios we use in assessing the results of the Corporation, see Supplemental Financial Data on page 29.
76788ba_financials.indd 141 3/6/14 12:06 PM

142 Bank of America 2013
Glossary
Alt-A Mortgage – A type of U.S. mortgage that, for various reasons, is considered riskier than A-paper, or “prime,” and less risky than “subprime,” the riskiest category. Alt-A interest rates, which are determined by credit risk, therefore tend to be between those of prime and subprime home loans. Typically, Alt-A mortgages are characterized by borrowers with less than full documentation, lower credit scores and higher LTVs.
Assets in Custody – Consist largely of custodial and non-discretionary trust assets excluding brokerage assets administered for clients. Trust assets encompass a broad range of asset types including real estate, private company ownership interest, personal property and investments.
Assets Under Management (AUM) – The total market value of assets under the investment advisory and discretion of GWIM which generate asset management fees based on a percentage of the assets’ market values. AUM reflects assets that are generally managed for institutional, high net-worth and retail clients, and are distributed through various investment products including mutual funds, other commingled vehicles and separate accounts.
Basel 1 – 2013 Rules – Financial services holding companies are subject to the general risk-based capital rules issued by federal banking regulators which was Basel 1 through December 31, 2012. As of January 1, 2013, Basel 1 was amended prospectively, introducing changes to the measurement of risk-weighted assets for exposures subject to market risk.
Carrying Value (with respect to loans) – The amount at which a loan is recorded on the balance sheet. For loans recorded at amortized cost, carrying value is the unpaid principal balance net of unamortized deferred loan origination fees and costs, and unamortized purchase premium or discount. For loans that are or have been on nonaccrual status, the carrying value is also reduced by any net charge-offs that have been recorded and the amount of interest payments applied as a reduction of principal under the cost recovery method. For PCI loans, the carrying value equals fair value upon acquisition adjusted for subsequent cash collections and yield accreted to date. For credit card loans, the carrying value also includes interest that has been billed to the customer. For loans classified as held-for-sale, carrying value is the lower of carrying value as described in the sentences above, or fair value. For loans for which we have elected the fair value option, the carrying value is fair value.
Client Brokerage Assets – Include client assets which are held in brokerage accounts. This includes non-discretionary brokerage and fee-based assets which generate brokerage income and asset management fee revenue.
Committed Credit Exposure – Includes any funded portion of a facility plus the unfunded portion of a facility on which the lender is legally bound to advance funds during a specified period under prescribed conditions.
Credit Derivatives – Contractual agreements that provide protection against a credit event on one or more referenced obligations. The nature of a credit event is established by the protection purchaser and protection seller at the inception of the transaction, and such events generally include bankruptcy or insolvency of the referenced credit entity, failure to meet payment obligations when due, as well as acceleration of indebtedness and payment repudiation or moratorium. The purchaser of the credit derivative pays a periodic fee in return for a payment by the protection seller upon the occurrence, if any, of such a credit event. A credit default swap is a type of a credit derivative.
Credit Valuation Adjustment (CVA) – A portfolio adjustment required to properly reflect the counterparty credit risk exposure as part of the fair value of derivative instruments.
Debit Valuation Adjustment (DVA) – A portfolio adjustment required to properly reflect the Corporation’s own credit risk exposure as part of the fair value of derivative instruments.
Interest Rate Lock Commitment (IRLC) – Commitment with a loan applicant in which the loan terms, including interest rate and price, are guaranteed for a designated period of time subject to credit approval.
Letter of Credit – A document issued on behalf of a customer to a third party promising to pay the third party upon presentation of specified documents. A letter of credit effectively substitutes the issuer’s credit for that of the customer.
Loan-to-value (LTV) – A commonly used credit quality metric that is reported in terms of ending and average LTV. Ending LTV is calculated as the outstanding carrying value of the loan at the end of the period divided by the estimated value of the property securing the loan. Estimated property values are primarily determined by utilizing the Case-Schiller Home Index, a widely used index based on data from repeat sales of single family homes. Case-Schiller indices are updated quarterly and are reported on a three-month or one-quarter lag. An additional metric related to LTV is combined loan-to-value (CLTV) which is similar to the LTV metric, yet combines the outstanding balance on the residential mortgage loan and the outstanding carrying value on the home equity loan or available line of credit, both of which are secured by the same property, divided by the estimated value of the property. A LTV of 100 percent reflects a loan that is currently secured by a property valued at an amount exactly equal to the carrying value or available line of the loan. Under certain circumstances, estimated values can also be determined by utilizing an automated valuation method (AVM) or Mortgage Risk Assessment Corporation (MRAC) index. An AVM is a tool that estimates the value of a property by reference to large volumes of market data including sales of comparable properties and price trends specific to the MSA in which the property being valued is located. The MRAC index is similar to the Case-Schiller Home Index in that it is an index that is based on data from repeat sales of single family homes and is reported on a lag.
76788ba_financials.indd 142 3/6/14 12:06 PM

Bank of America 2013 143
Margin Receivable – An extension of credit secured by eligible securities in certain brokerage accounts.
Matched-book – Repurchase and resale agreements and securities borrowed and loaned transactions entered into to accommodate customers and earn interest rate spreads.
Mortgage Servicing Right (MSR) – The right to service a mortgage loan when the underlying loan is sold or securitized. Servicing includes collections for principal, interest and escrow payments from borrowers and accounting for and remitting principal and interest payments to investors.
Net Interest Yield – Net interest income divided by average total interest-earning assets.
Nonperforming Loans and Leases – Includes loans and leases that have been placed on nonaccrual status, including nonaccruing loans whose contractual terms have been restructured in a manner that grants a concession to a borrower experiencing financial difficulties (TDRs). Loans accounted for under the fair value option, PCI loans and LHFS are not reported as nonperforming loans and leases. Consumer credit card loans, business card loans, consumer loans secured by personal property (except for certain secured consumer loans, including those that have been modified in a TDR), and consumer loans secured by real estate that are insured by the FHA or through long-term credit protection agreements with FNMA and FHLMC (fully-insured loan portfolio), are not placed on nonaccrual status and are, therefore, not reported as nonperforming loans and leases.
Purchased Credit-impaired (PCI) Loan – A loan purchased as an individual loan, in a portfolio of loans or in a business combination with evidence of deterioration in credit quality since origination for which it is probable, upon acquisition, that the investor will be unable to collect all contractually required payments. These loans are recorded at fair value upon acquisition.
Subprime Loans – Although a standard industry definition for subprime loans (including subprime mortgage loans) does not exist, the Corporation defines subprime loans as specific product offerings for higher risk borrowers, including individuals with one or a combination of high credit risk factors, such as low FICO scores, high debt to income ratios and inferior payment history.
Tier 1 Common Capital – Tier 1 capital less preferred stock, qualifying trust preferred securities, hybrid securities and qualifying noncontrolling interest in subsidiaries.
Troubled Debt Restructurings (TDRs) – Loans whose contractual terms have been restructured in a manner that grants a concession to a borrower experiencing financial difficulties. Certain consumer loans for which a binding offer to restructure has been extended are also classified as TDRs. Concessions could include a reduction in the interest rate to a rate that is below market on the loan, payment extensions, forgiveness of principal, forbearance, loans discharged in bankruptcy or other actions intended to maximize collection. Secured consumer loans that have been discharged in Chapter 7 bankruptcy and have not been reaffirmed by the borrower are classified as TDRs at the time of discharge from bankruptcy. TDRs are generally reported as nonperforming loans and leases while on nonaccrual status. Nonperforming TDRs may be returned to accrual status when, among other criteria, payment in full of all amounts due under the restructured terms is expected and the borrower has demonstrated a sustained period of repayment performance, generally six months. TDRs that are on accrual status are reported as performing TDRs through the end of the calendar year in which the restructuring occurred or the year in which they are returned to accrual status. In addition, if accruing TDRs bear less than a market rate of interest at the time of modification, they are reported as performing TDRs throughout their remaining lives unless and until they cease to perform in accordance with their modified contractual terms, at which time they would be placed on nonaccrual status and reported as nonperforming TDRs.
Value-at-Risk (VaR) – VaR is a model that simulates the value of a portfolio under a range of hypothetical scenarios in order to generate a distribution of potential gains and losses. VaR represents the loss the portfolio is expected to experience with a given confidence level based on historical data. A VaR model is an effective tool in estimating ranges of potential gains and losses on our trading portfolios.
76788ba_financials.indd 143 3/6/14 12:06 PM

144 Bank of America 2013
Acronyms
ABS Asset-backed securities
AFS Available-for-sale
ALM Asset and liability management
ALMRC Asset Liability and Market Risk Committee
ARM Adjustable-rate mortgage
BHC Bank holding company
CCAR Comprehensive Capital Analysis and Review
CDO Collateralized debt obligation
CLO Collateralized loan obligation
CMBS Commercial mortgage-backed securities
CRA Community Reinvestment Act
CRC Credit Risk Committee
EAD Exposure at default
FDIC Federal Deposit Insurance Corporation
FHA Federal Housing Administration
FHLMC Freddie Mac
FICC Fixed income, currencies and commodities
FICO Fair Isaac Corporation (credit score)
FNMA Fannie Mae
FTE Fully taxable-equivalent
GAAP Accounting principles generally accepted in the United States of America
GMRC Global Markets Risk Committee
GNMA Government National Mortgage Association
GSE Government-sponsored enterprise
HELOC Home equity lines of credit
HFI Held-for-investment
HUD U.S. Department of Housing and Urban Development
LCR Liquidity Coverage Ratio
LGD Loss-given default
LHFS Loans held-for-sale
LIBOR London InterBank Offered Rate
MBS Mortgage-backed securities
MD&A Management’s Discussion and Analysis of Financial Condition and Results of Operations
MI Mortgage insurance
MSA Metropolitan statistical area
NSFR Net Stable Funding Ratio
OCC Office of the Comptroller of the Currency
OCI Other comprehensive income
OTC Over-the-counter
OTTI Other-than-temporary impairment
PPI Payment protection insurance
RMBS Residential mortgage-backed securities
SBLCs Standby letters of credit
SEC Securities and Exchange Commission
VA U.S. Department of Veterans Affairs
VIE Variable interest entity
76788ba_financials.indd 144 3/6/14 12:06 PM

Bank of America 2013 145
Financial Statements and Notes Table of Contents
Page
Consolidated Statement of Income 148
Consolidated Statement of Comprehensive Income 149
Consolidated Balance Sheet 150
Consolidated Statement of Changes in Shareholders’ Equity 152
Consolidated Statement of Cash Flows 153
Note 1 – Summary of Significant Accounting Principles 154
Note 2 – Derivatives 165
Note 3 – Securities 175
Note 4 – Outstanding Loans and Leases 180
Note 5 – Allowance for Credit Losses 195
Note 6 – Securitizations and Other Variable Interest Entities 197
Note 7 – Representations and Warranties Obligations and Corporate Guarantees 203
Note 8 – Goodwill and Intangible Assets 212
Note 9 – Deposits 213
Note 10 – Federal Funds Sold or Purchased, Securities Financing Agreements and Short-term Borrowings 213
Note 11 – Long-term Debt 215
Note 12 – Commitments and Contingencies 219
Note 13 – Shareholders’ Equity 230
Note 14 – Accumulated Other Comprehensive Income (Loss) 234
Note 15 – Earnings Per Common Share 236
Note 16 – Regulatory Requirements and Restrictions 237
Note 17 – Employee Benefit Plans 241
Note 18 – Stock-based Compensation Plans 248
Note 19 – Income Taxes 249
Note 20 – Fair Value Measurements 252
Note 21 – Fair Value Option 266
Note 22 – Fair Value of Financial Instruments 268
Note 23 – Mortgage Servicing Rights 270
Note 24 – Business Segment Information 271
Note 25 – Parent Company Information 275
Note 26 – Performance by Geographical Area 276
76788ba_financials.indd 145 3/6/14 12:06 PM
146 Bank of America 2013
Report of Management on Internal Control Over Financial Reporting Bank of America Corporation and Subsidiaries
The management of Bank of America Corporation is responsible for establishing and maintaining adequate internal control over financial reporting.
The Corporation’s internal control over financial reporting is a process designed to provide reasonable assurance regarding the reliability of financial reporting and the preparation of financial statements for external purposes in accordance with accounting principles generally accepted in the United States of America. The Corporation’s internal control over financial reporting includes those policies and procedures that: (i) pertain to the maintenance of records that, in reasonable detail, accurately and fairly reflect the transactions and dispositions of the assets of the Corporation; (ii) provide reasonable assurance that transactions are recorded as necessary to permit preparation of financial statements in accordance with accounting principles generally accepted in the United States of America, and that receipts and expenditures of the Corporation are being made only in accordance with authorizations of management and directors of the Corporation; and (iii) provide reasonable assurance regarding prevention or timely detection of unauthorized acquisition, use, or disposition of the Corporation’s assets that could have a material effect on the financial statements.
Because of its inherent limitations, internal control over financial reporting may not prevent or detect misstatements. Also, projections of any evaluation of effectiveness to future periods are subject to the risk that controls may become inadequate because of changes in conditions, or that the degree of compliance with the policies or procedures may deteriorate.
Management assessed the effectiveness of the Corporation’s internal control over financial reporting as of December 31, 2013 based on the framework set forth by the Committee of Sponsoring Organizations of the Treadway Commission in Internal Control – Integrated Framework (1992). Based on that assessment, management concluded that, as of December 31, 2013, the Corporation’s internal control over financial reporting is effective based on the criteria established in Internal Control – Integrated Framework (1992).
The Corporation’s internal control over financial reporting as of December 31, 2013 has been audited by PricewaterhouseCoopers, LLP, an independent registered public accounting firm, as stated in their accompanying report which expresses an unqualified opinion on the effectiveness of the Corporation’s internal control over financial reporting as of December 31, 2013.
Brian T. MoynihanChief Executive Officer and President
Bruce R. ThompsonChief Financial Officer
76788ba_financials.indd 146 3/6/14 12:06 PM

Bank of America 2013 147
Report of Independent Registered Public Accounting FirmBank of America Corporation and Subsidiaries
To the Board of Directors and Shareholders of Bank of America Corporation:In our opinion, the accompanying Consolidated Balance Sheet and the related Consolidated Statement of Income, Consolidated Statement of Comprehensive Income, Consolidated Statement of Changes in Shareholders’ Equity and Consolidated Statement of Cash Flows present fairly, in all material respects, the financial position of Bank of America Corporation and its subsidiaries at December 31, 2013 and 2012, and the results of their operations and their cash flows for each of the three years in the period ended December 31, 2013 in conformity with accounting principles generally accepted in the United States of America. Also in our opinion, the Corporation maintained, in all material respects, effective internal control over financial reporting as of December 31, 2013, based on criteria established in Internal Control – Integrated Framework (1992) issued by the Committee of Sponsoring Organizations of the Treadway Commission (COSO). The Corporation’s management is responsible for these financial statements, for maintaining effective internal control over financial reporting and for its assessment of the effectiveness of internal control over financial reporting, included in the accompanying Report of Management on Internal Control Over Financial Reporting. Our responsibility is to express opinions on these financial statements and on the Corporation’s internal control over financial reporting based on our integrated audits. We conducted our audits in accordance with the standards of the Public Company Accounting Oversight Board (United States). Those standards require that we plan and perform the audits to obtain reasonable assurance about whether the financial statements are free of material misstatement and whether effective internal control over financial reporting was maintained in all material respects. Our audits of the financial statements included examining, on a test basis, evidence supporting the amounts and disclosures in the financial statements, assessing the accounting principles used and significant estimates made by management, and evaluating the overall financial statement presentation. Our audit of internal control over financial reporting included obtaining an understanding of internal control over financial reporting,
assessing the risk that a material weakness exists, and testing and evaluating the design and operating effectiveness of internal control based on the assessed risk. Our audits also included performing such other procedures as we considered necessary in the circumstances. We believe that our audits provide a reasonable basis for our opinions.
A company’s internal control over financial reporting is a process designed to provide reasonable assurance regarding the reliability of financial reporting and the preparation of financial statements for external purposes in accordance with generally accepted accounting principles. A company’s internal control over financial reporting includes those policies and procedures that (i) pertain to the maintenance of records that, in reasonable detail, accurately and fairly reflect the transactions and dispositions of the assets of the company; (ii) provide reasonable assurance that transactions are recorded as necessary to permit preparation of financial statements in accordance with generally accepted accounting principles, and that receipts and expenditures of the company are being made only in accordance with authorizations of management and directors of the company; and (iii) provide reasonable assurance regarding prevention or timely detection of unauthorized acquisition, use, or disposition of the company’s assets that could have a material effect on the financial statements.
Because of its inherent limitations, internal control over financial reporting may not prevent or detect misstatements. Also, projections of any evaluation of effectiveness to future periods are subject to the risk that controls may become inadequate because of changes in conditions, or that the degree of compliance with the policies or procedures may deteriorate.
Charlotte, North CarolinaFebruary 25, 2014
76788ba_financials.indd 147 3/6/14 12:06 PM

148 Bank of America 2013
Bank of America Corporation and Subsidiaries
Consolidated Statement of Income(Dollars in millions, except per share information) 2013 2012 2011Interest income
Loans and leases $ 36,470 $ 38,880 $ 44,966Debt securities 9,749 8,908 9,525Federal funds sold and securities borrowed or purchased under agreements to resell 1,229 1,502 2,147Trading account assets 4,706 5,094 5,961Other interest income 2,866 3,016 3,637
Total interest income 55,020 57,400 66,236
Interest expense Deposits 1,396 1,990 3,002Short-term borrowings 2,923 3,572 4,599Trading account liabilities 1,638 1,763 2,212Long-term debt 6,798 9,419 11,807
Total interest expense 12,755 16,744 21,620Net interest income 42,265 40,656 44,616
Noninterest income Card income 5,826 6,121 7,184Service charges 7,390 7,600 8,094Investment and brokerage services 12,282 11,393 11,826Investment banking income 6,126 5,299 5,217Equity investment income 2,901 2,070 7,360Trading account profits 7,056 5,870 6,697Mortgage banking income (loss) 3,874 4,750 (8,830)Gains on sales of debt securities 1,271 1,662 3,374Other income (loss) (29) (2,034) 8,215Other-than-temporary impairment losses on available-for-sale debt securities:
Total other-than-temporary impairment losses (21) (57) (360)Less: Portion of other-than-temporary impairment losses recognized in other comprehensive income 1 4 61
Net impairment losses recognized in earnings on available-for-sale debt securities (20) (53) (299)Total noninterest income 46,677 42,678 48,838Total revenue, net of interest expense 88,942 83,334 93,454
Provision for credit losses 3,556 8,169 13,410
Noninterest expense Personnel 34,719 35,648 36,965Occupancy 4,475 4,570 4,748Equipment 2,146 2,269 2,340Marketing 1,834 1,873 2,203Professional fees 2,884 3,574 3,381Amortization of intangibles 1,086 1,264 1,509Data processing 3,170 2,961 2,652Telecommunications 1,593 1,660 1,553Other general operating 17,307 18,274 21,101Goodwill impairment — — 3,184Merger and restructuring charges — — 638
Total noninterest expense 69,214 72,093 80,274Income (loss) before income taxes 16,172 3,072 (230)
Income tax expense (benefit) 4,741 (1,116) (1,676)Net income $ 11,431 $ 4,188 $ 1,446
Preferred stock dividends 1,349 1,428 1,361Net income applicable to common shareholders $ 10,082 $ 2,760 $ 85
Per common share information Earnings $ 0.94 $ 0.26 $ 0.01Diluted earnings 0.90 0.25 0.01Dividends paid 0.04 0.04 0.04
Average common shares issued and outstanding (in thousands) 10,731,165 10,746,028 10,142,625Average diluted common shares issued and outstanding (in thousands) 11,491,418 10,840,854 10,254,824
See accompanying Notes to Consolidated Financial Statements.
76788ba_financials.indd 148 3/6/14 12:06 PM

Bank of America 2013 149
Bank of America Corporation and Subsidiaries
Consolidated Statement of Comprehensive Income(Dollars in millions) 2013 2012 2011Net income $ 11,431 $ 4,188 $ 1,446Other comprehensive income (loss), net-of-tax:
Net change in available-for-sale debt and marketable equity securities (8,166) 1,802 (4,270)Net change in derivatives 592 916 (549)Employee benefit plan adjustments 2,049 (65) (444)Net change in foreign currency translation adjustments (135) (13) (108)
Other comprehensive income (loss) (5,660) 2,640 (5,371)Comprehensive income (loss) $ 5,771 $ 6,828 $ (3,925)
See accompanying Notes to Consolidated Financial Statements.
76788ba_financials.indd 149 3/6/14 12:06 PM

150 Bank of America 2013
Bank of America Corporation and Subsidiaries
Consolidated Balance Sheet
December 31(Dollars in millions) 2013 2012Assets Cash and cash equivalents $ 131,322 $ 110,752Time deposits placed and other short-term investments 11,540 18,694Federal funds sold and securities borrowed or purchased under agreements to resell (includes $75,614 and $98,670 measured at fair
value) 190,328 219,924
Trading account assets (includes $111,817 and $115,821 pledged as collateral) 200,993 227,775Derivative assets 47,495 53,497Debt securities:
Carried at fair value (includes $51,408 and $63,349 pledged as collateral) 268,795 310,850Held-to-maturity, at cost (fair value – $52,430 and $50,270; $20,869 and $22,461 pledged as collateral) 55,150 49,481
Total debt securities 323,945 360,331Loans and leases (includes $10,042 and $9,002 measured at fair value and $74,166 and $50,289 pledged as collateral) 928,233 907,819Allowance for loan and lease losses (17,428) (24,179)
Loans and leases, net of allowance 910,805 883,640Premises and equipment, net 10,475 11,858Mortgage servicing rights (includes $5,042 and $5,716 measured at fair value) 5,052 5,851Goodwill 69,844 69,976Intangible assets 5,574 6,684Loans held-for-sale (includes $6,656 and $11,659 measured at fair value) 11,362 19,413Customer and other receivables 59,448 71,467Other assets (includes $18,055 and $26,490 measured at fair value) 124,090 150,112
Total assets $ 2,102,273 $2,209,974
Assets of consolidated variable interest entities included in total assets above (isolated to settle the liabilities of the variable interest entities)
Trading account assets $ 8,412 $ 7,906Derivative assets 185 333Loans and leases 109,118 123,227Allowance for loan and lease losses (2,674) (3,658)
Loans and leases, net of allowance 106,444 119,569Loans held-for-sale 1,384 1,969All other assets 4,577 4,654
Total assets of consolidated variable interest entities $ 121,002 $ 134,431
See accompanying Notes to Consolidated Financial Statements.
76788ba_financials.indd 150 3/6/14 12:06 PM

Bank of America 2013 151
Bank of America Corporation and Subsidiaries
Consolidated Balance Sheet (continued)
December 31(Dollars in millions) 2013 2012Liabilities Deposits in U.S. offices:
Noninterest-bearing $ 373,092 $ 372,546Interest-bearing (includes $1,899 and $2,262 measured at fair value) 667,714 654,332
Deposits in non-U.S. offices: Noninterest-bearing 8,233 7,573Interest-bearing 70,232 70,810
Total deposits 1,119,271 1,105,261Federal funds purchased and securities loaned or sold under agreements to repurchase (includes $33,684 and $42,639 measured at fair
value) 198,106 293,259
Trading account liabilities 83,469 73,587Derivative liabilities 37,407 46,016Short-term borrowings (includes $1,520 and $4,074 measured at fair value) 45,999 30,731Accrued expenses and other liabilities (includes $11,233 and $16,594 measured at fair value and $484 and $513 of reserve for
unfunded lending commitments) 135,662 148,579
Long-term debt (includes $47,035 and $49,161 measured at fair value) 249,674 275,585Total liabilities 1,869,588 1,973,018
Commitments and contingencies (Note 6 – Securitizations and Other Variable Interest Entities, Note 7 – Representations and Warranties Obligations and Corporate Guarantees and Note 12 – Commitments and Contingencies)
Shareholders’ equity Preferred stock, $0.01 par value; authorized – 100,000,000 shares; issued and outstanding – 3,407,790 and 3,685,410 shares 13,352 18,768Common stock and additional paid-in capital, $0.01 par value; authorized – 12,800,000,000 shares; issued and outstanding –
10,591,808,296 and 10,778,263,628 shares 155,293 158,142
Retained earnings 72,497 62,843Accumulated other comprehensive income (loss) (8,457) (2,797)
Total shareholders’ equity 232,685 236,956Total liabilities and shareholders’ equity $ 2,102,273 $2,209,974
Liabilities of consolidated variable interest entities included in total liabilities above Short-term borrowings (includes $77 and $872 of non-recourse borrowings) $ 1,150 $ 3,731Long-term debt (includes $16,209 and $29,476 of non-recourse debt) 19,448 34,256All other liabilities (includes $138 and $149 of non-recourse liabilities) 253 360
Total liabilities of consolidated variable interest entities $ 20,851 $ 38,347
See accompanying Notes to Consolidated Financial Statements.
76788ba_financials.indd 151 3/6/14 12:06 PM

152 Bank of America 2013
Bank of America Corporation and Subsidiaries
Consolidated Statement of Changes in Shareholders’ Equity
PreferredStock
Common Stock andAdditional Paid-in
Capital RetainedEarnings
AccumulatedOther
ComprehensiveIncome (Loss) Other
TotalShareholders’
Equity(Dollars in millions, shares in thousands) Shares Amount
Balance, December 31, 2010 $ 16,562 10,085,155 $ 150,905 $ 60,849 $ (66) $ (2) $ 228,248Net income 1,446 1,446
Net change in available-for-sale debt and marketableequity securities (4,270) (4,270)
Net change in derivatives (549) (549)Employee benefit plan adjustments (444) (444)Net change in foreign currency translation adjustments (108) (108)Dividends paid:
Common (413) (413)Preferred (1,325) (1,325)
Issuance of preferred stock and warrants 2,918 2,082 5,000
Common stock issued in connection with exchanges ofpreferred stock and trust preferred securities (1,083) 400,000 2,754 (36) 1,635
Common stock issued under employee plans andrelated tax effects 50,783 880 2 882
Other (1) (1)Balance, December 31, 2011 18,397 10,535,938 156,621 60,520 (5,437) — 230,101Net income 4,188 4,188
Net change in available-for-sale debt and marketableequity securities 1,802 1,802
Net change in derivatives 916 916Employee benefit plan adjustments (65) (65)Net change in foreign currency translation adjustments (13) (13)Dividends paid:
Common (437) (437)Preferred (1,472) (1,472)
Net Issuance of preferred stock 667 667
Common stock issued in connection with exchanges ofpreferred stock and trust preferred securities (296) 49,867 412 44 160
Common stock issued under employee plans andrelated tax effects 192.459 1,109 1,109
Balance, December 31, 2012 18,768 10,778,264 158,142 62,843 (2,797) — 236,956Net income 11,431 11,431
Net change in available-for-sale debt and marketableequity securities (8,166) (8,166)
Net change in derivatives 592 592
Employee benefit plan adjustments 2,049 2,049
Net change in foreign currency translation adjustments (135) (135)
Dividends paid:Common (428) (428)
Preferred (1,249) (1,249)
Issuance of preferred stock 1,008 1,008
Redemption of preferred stock (6,461) (100) (6,561)
Common stock issued under employee plans andrelated tax effects 45,288 371 371
Common stock repurchased (231,744) (3,220) (3,220)
Other 37 37
Balance, December 31, 2013 $ 13,352 10,591,808 $ 155,293 $ 72,497 $ (8,457) $ — $ 232,685
See accompanying Notes to Consolidated Financial Statements.
76788ba_financials.indd 152 3/6/14 12:06 PM

Bank of America 2013 153
Bank of America Corporation and Subsidiaries
Consolidated Statement of Cash Flows(Dollars in millions) 2013 2012 2011Operating activities Net income $ 11,431 $ 4,188 $ 1,446Reconciliation of net income to net cash provided by (used in) operating activities:
Provision for credit losses 3,556 8,169 13,410Goodwill impairment — — 3,184Gains on sales of debt securities (1,271) (1,662) (3,374)Fair value adjustments on structured liabilities 649 5,107 (3,320)Depreciation and premises improvements amortization 1,597 1,774 1,976Amortization of intangibles 1,086 1,264 1,509Net amortization of premium/discount on debt securities 1,577 2,580 2,046Deferred income taxes 3,262 (2,735) (1,949)Originations and purchases of loans held-for-sale (65,688) (59,540) (118,168)Proceeds from sales, securitizations and paydowns of loans held-for-sale 77,707 54,817 141,862Net (increase) decrease in trading and derivative instruments 33,870 (47,606) 25,481Net (increase) decrease in other assets 35,154 (11,424) 21,285Net increase (decrease) in accrued expenses and other liabilities (12,919) 24,061 (18,124)Other operating activities, net 2,806 4,951 (2,816)
Net cash provided by (used in) operating activities 92,817 (16,056) 64,448Investing activities Net decrease in time deposits placed and other short-term investments 7,154 7,310 105Net (increase) decrease in federal funds sold and securities borrowed or purchased under agreements to resell 29,596 (8,741) (1,567)Proceeds from sales of debt securities carried at fair value 119,013 74,068 120,125Proceeds from paydowns and maturities of debt securities carried at fair value 85,554 71,509 56,732Purchases of debt securities carried at fair value (175,983) (164,491) (99,536)Proceeds from paydowns and maturities of held-to-maturity debt securities 8,472 6,261 602Purchases of held-to-maturity debt securities (14,388) (20,991) (35,552)Proceeds from sales of loans and leases 12,331 1,837 3,124Purchases of loans and leases (16,734) (9,178) (9,638)Other changes in loans and leases, net (34,256) 2,557 2,864Net sales (purchases) of premises and equipment (521) 5 (1,307)Proceeds from sales of foreclosed properties 1,099 2,799 2,532Proceeds from sales of investments 4,818 2,396 14,840Other investing activities, net (1,097) (320) (895)
Net cash provided by (used in) investing activities 25,058 (34,979) 52,429Financing activities Net increase in deposits 14,010 72,220 22,611Net increase (decrease) in federal funds purchased and securities loaned or sold under agreements to repurchase (95,153) 78,395 (30,495)Net increase (decrease) in short-term borrowings 16,009 (5,017) (24,264)Proceeds from issuance of long-term debt 45,658 22,200 26,001Retirement of long-term debt (65,602) (124,389) (101,814)Proceeds from issuance of preferred stock and warrants 1,008 667 5,000Redemption of preferred stock (6,461) — —Common stock repurchased (3,220) — —Cash dividends paid (1,677) (1,909) (1,738)Excess tax benefits on share-based payments 12 13 42Other financing activities, net (26) 236 3
Net cash provided by (used in) financing activities (95,442) 42,416 (104,654)Effect of exchange rate changes on cash and cash equivalents (1,863) (731) (548)
Net increase (decrease) in cash and cash equivalents 20,570 (9,350) 11,675Cash and cash equivalents at January 1 110,752 120,102 108,427
Cash and cash equivalents at December 31 $ 131,322 $ 110,752 $ 120,102Supplemental cash flow disclosures Interest paid $ 12,912 $ 18,268 $ 25,207Income taxes paid 1,559 1,372 1,653Income taxes refunded (244) (338) (781)
During 2011, the Corporation entered into an agreement with Assured Guaranty Ltd. and subsidiaries which resulted in non-cash increases to loans of $2.2 billion, other assets of $82 million and long-term debt of $2.3 billion.During 2011, the Corporation exchanged preferred stock, with a carrying value of $1.1 billion, for 92 million common shares valued at $522 million and senior notes valued at $360 million.During 2011, the Corporation exchanged trust preferred securities for 308 million common shares valued at $1.7 billion and senior notes valued at $2.0 billion. The trust preferred securities, and underlying junior subordinated notes and stock purchase agreements, with a carrying value of $5.2 billion, were immediately canceled.
See accompanying Notes to Consolidated Financial Statements.
76788ba_financials.indd 153 3/6/14 12:06 PM

154 Bank of America 2013
Bank of America Corporation and SubsidiariesNotes to Consolidated Financial Statements
NOTE 1 Summary of Significant Accounting PrinciplesBank of America Corporation (together with its consolidated subsidiaries, the Corporation), a bank holding company (BHC) and a financial holding company, provides a diverse range of financial services and products throughout the U.S. and in certain international markets. The term “the Corporation” as used herein may refer to Bank of America Corporation individually, Bank of America Corporation and its subsidiaries, or certain of Bank of America Corporation’s subsidiaries or affiliates.
The Corporation conducts its activities through banking and nonbanking subsidiaries. The Corporation operates its banking activities primarily under two charters: Bank of America, National Association (Bank of America, N.A. or BANA) and FIA Card Services, National Association (FIA Card Services, N.A. or FIA).
Principles of Consolidation and Basis of PresentationThe Consolidated Financial Statements include the accounts of the Corporation and its majority-owned subsidiaries, and those variable interest entities (VIEs) where the Corporation is the primary beneficiary. Intercompany accounts and transactions have been eliminated. Results of operations of acquired companies are included from the dates of acquisition and for VIEs, from the dates that the Corporation became the primary beneficiary. Assets held in an agency or fiduciary capacity are not included in the Consolidated Financial Statements. The Corporation accounts for investments in companies for which it owns a voting interest and for which it has the ability to exercise significant influence over operating and financing decisions using the equity method of accounting or at fair value under the fair value option. These investments are included in other assets. Equity method investments are subject to impairment testing and the Corporation’s proportionate share of income or loss is included in equity investment income.
The preparation of the Consolidated Financial Statements in conformity with accounting principles generally accepted in the United States of America requires management to make estimates and assumptions that affect reported amounts and disclosures. Realized results could differ from those estimates and assumptions.
The Corporation evaluates subsequent events through the date of filing with the Securities and Exchange Commission (SEC). Certain prior-period amounts have been reclassified to conform to current period presentation.
New Accounting PronouncementsEffective January 1, 2013, the Corporation retrospectively adopted new accounting guidance from the Financial Accounting Standards Board (FASB) requiring additional disclosures on the effect of netting arrangements on an entity’s financial position. The disclosures relate to derivatives and securities financing agreements that are either offset on the balance sheet under existing accounting guidance or are subject to a legally enforceable master netting or similar agreement. This new guidance addresses only disclosures and, accordingly, did not have an impact on the Corporation’s consolidated financial position or results of operations.
Effective January 1, 2012, the Corporation adopted amendments from the FASB to the fair value accounting guidance. The amendments clarify the application of the highest and best use, and valuation premise concepts, preclude the application of “blockage factors” in the valuation of all financial instruments and include criteria for applying the fair value measurement principles to portfolios of financial instruments. The amendments also prescribe additional disclosures for Level 3 fair value measurements and financial instruments not carried at fair value. The adoption of this guidance did not have a material impact on the Corporation’s consolidated financial position or results of operations. For the related disclosures, see Note 20 – Fair Value Measurements and Note 22 – Fair Value of Financial Instruments.
Effective January 1, 2012, the Corporation adopted new accounting guidance from the FASB on the presentation of comprehensive income in financial statements. The Corporation adopted the new guidance by reporting the components of comprehensive income in two separate but consecutive statements. For the new statement and related information, see the Consolidated Statement of Comprehensive Income and Note 14 – Accumulated Other Comprehensive Income (Loss).
On January 15, 2014, the FASB issued new guidance on accounting for qualified affordable housing projects which permits entities to make an accounting policy election to apply the proportionate amortization method when specific conditions are met. The new accounting guidance is effective on a retrospective basis beginning on January 1, 2015 with early adoption permitted. The Corporation is currently assessing whether it will adopt the proportionate amortization method. If such method is adopted, the Corporation does not expect it to have a material impact on the consolidated financial position or results of operations.
In December 2012, the FASB issued a proposed standard on accounting for credit losses. It would replace multiple existing impairment models, including an “incurred loss” model for loans, with an “expected loss” model. The FASB announced it would establish the effective date when it issues the final standard. The Corporation cannot predict at this time whether or when a final standard will be issued, when it will be effective or what its final provisions will be. The final standard may materially reduce retained earnings in the period of adoption.
Cash and Cash EquivalentsCash and cash equivalents include cash on hand, cash items in the process of collection, cash segregated under federal and other brokerage regulations, and amounts due from correspondent banks, the Federal Reserve Bank and certain non-U.S. central banks.
Securities Financing AgreementsSecurities borrowed or purchased under agreements to resell and securities loaned or sold under agreements to repurchase (securities financing agreements) are treated as collateralized financing transactions except in instances where the transaction is required to be accounted for as individual sale and purchase transactions. Generally, these agreements are recorded at the amounts at which the securities were acquired or sold plus accrued interest, except for certain securities financing agreements that the Corporation accounts for under the fair value option. Changes
76788ba_financials.indd 154 3/6/14 12:06 PM

Bank of America 2013 155
in the fair value of securities financing agreements that are accounted for under the fair value option are recorded in trading account profits in the Consolidated Statement of Income. For more information on securities financing agreements that the Corporation accounts for under the fair value option, see Note 21 – Fair Value Option.
The Corporation’s policy is to obtain possession of collateral with a market value equal to or in excess of the principal amount loaned under resale agreements. To ensure that the market value of the underlying collateral remains sufficient, collateral is generally valued daily and the Corporation may require counterparties to deposit additional collateral or may return collateral pledged when appropriate. Securities financing agreements give rise to negligible credit risk as a result of these collateral provisions and, accordingly, no allowance for loan losses is considered necessary.
Substantially all repurchase and resale activities are transacted under legally enforceable master repurchase agreements that give the Corporation, in the event of default by the counterparty, the right to liquidate securities held and to offset receivables and payables with the same counterparty. The Corporation offsets repurchase and resale transactions with the same counterparty on the Consolidated Balance Sheet where it has such a legally enforceable master netting agreement and the transactions have the same maturity date.
In transactions where the Corporation acts as the lender in a securities lending agreement and receives securities that can be pledged or sold as collateral, it recognizes an asset on the Consolidated Balance Sheet at fair value, representing the securities received, and a liability for the same amount, representing the obligation to return those securities.
In repurchase transactions, typically, the termination date for a repurchase agreement is before the maturity date of the underlying security. However, in certain situations, the Corporation may enter into repurchase agreements where the termination date of the repurchase transaction is the same as the maturity date of the underlying security and these transactions are referred to as “repo-to-maturity” (RTM) transactions. In accordance with applicable accounting guidance, the Corporation accounts for RTM transactions as sales and purchases when the transferred securities are highly liquid. In instances where securities are considered sold or purchased, the Corporation removes the securities from or recognizes the securities on the Consolidated Balance Sheet and, in the case of sales, recognizes a gain or loss, where applicable, in the Consolidated Statement of Income. At December 31, 2013 and 2012, the Corporation had no outstanding RTM transactions that had been accounted for as sales and an immaterial amount of transactions that had been accounted for as purchases.
CollateralThe Corporation accepts securities as collateral that it is permitted by contract or custom to sell or repledge. At December 31, 2013 and 2012, the fair value of this collateral was $575.3 billion and $513.2 billion, of which $361.5 billion and $362.0 billion was sold or repledged. The primary source of this collateral is securities borrowed or purchased under agreements to resell. The Corporation also pledges company-owned securities and loans as collateral in transactions that include repurchase agreements, securities loaned, public and trust deposits, U.S. Treasury tax and loan notes, and short-term borrowings. This collateral, which in
some cases can be sold or repledged by the counterparties to the transactions, is parenthetically disclosed on the Consolidated Balance Sheet.
In certain cases, the Corporation has transferred assets to consolidated VIEs where those restricted assets serve as collateral for the interests issued by the VIEs. These assets are included on the Consolidated Balance Sheet in Assets of Consolidated VIEs.
In addition, the Corporation obtains collateral in connection with its derivative contracts. Required collateral levels vary depending on the credit risk rating and the type of counterparty. Generally, the Corporation accepts collateral in the form of cash, U.S. Treasury securities and other marketable securities. Based on provisions contained in master netting agreements, the Corporation nets cash collateral received against derivative assets. The Corporation also pledges collateral on its own derivative positions which can be applied against derivative liabilities.
Trading InstrumentsFinancial instruments utilized in trading activities are carried at fair value. Fair value is generally based on quoted market prices or quoted market prices for similar assets and liabilities. If these market prices are not available, fair values are estimated based on dealer quotes, pricing models, discounted cash flow methodologies, or similar techniques where the determination of fair value may require significant management judgment or estimation. Realized and unrealized gains and losses are recognized in trading account profits.
Derivatives and Hedging ActivitiesDerivatives are entered into on behalf of customers, for trading or to support risk management activities. Derivatives used in risk management activities include derivatives that are both designated in qualifying accounting hedge relationships and derivatives used to hedge market risks in relationships that are not designated in qualifying accounting hedge relationships (referred to as other risk management activities). Derivatives utilized by the Corporation include swaps, financial futures and forward settlement contracts, and option contracts. A swap agreement is a contract between two parties to exchange cash flows based on specified underlying notional amounts, assets and/or indices. Financial futures and forward settlement contracts are agreements to buy or sell a quantity of a financial instrument (including another derivative financial instrument), index, currency or commodity at a predetermined rate or price during a period or at a date in the future. Option agreements can be transacted on organized exchanges or directly between parties.
All derivatives are recorded on the Consolidated Balance Sheet at fair value, taking into consideration the effects of legally enforceable master netting agreements that allow the Corporation to settle positive and negative positions and offset cash collateral held with the same counterparty on a net basis. For exchange-traded contracts, fair value is based on quoted market prices in active or inactive markets or is derived from observable market- based pricing parameters, similar to those applied to over-the-counter (OTC) derivatives. For non-exchange traded contracts, fair value is based on dealer quotes, pricing models, discounted cash flow methodologies or similar techniques for which the determination of fair value may require significant management judgment or estimation.
76788ba_financials.indd 155 3/6/14 12:06 PM

156 Bank of America 2013
Valuations of derivative assets and liabilities reflect the value of the instrument including counterparty credit risk. These values also take into account the Corporation’s own credit standing.
Trading Derivatives and Other Risk Management ActivitiesDerivatives held for trading purposes are included in derivative assets or derivative liabilities on the Consolidated Balance Sheet with changes in fair value included in trading account profits.
Derivatives used for other risk management activities are included in derivative assets or derivative liabilities. Derivatives used in other risk management activities have not been designated in a qualifying accounting hedge relationship because they did not qualify or the risk that is being mitigated pertains to an item that is reported at fair value through earnings so that the effect of measuring the derivative instrument and the asset or liability to which the risk exposure pertains will offset in the Consolidated Statement of Income to the extent effective. The changes in the fair value of derivatives that serve to mitigate certain risks associated with mortgage servicing rights (MSRs), interest rate lock commitments (IRLCs) and first mortgage loans held-for-sale (LHFS) that are originated by the Corporation are recorded in mortgage banking income (loss). Changes in the fair value of derivatives that serve to mitigate interest rate risk and foreign currency risk are included in other income (loss). Credit derivatives are also used by the Corporation to mitigate the risk associated with various credit exposures. The changes in the fair value of these derivatives are included in other income (loss).
Derivatives Used For Hedge Accounting Purposes (Accounting Hedges)For accounting hedges, the Corporation formally documents at inception all relationships between hedging instruments and hedged items, as well as the risk management objectives and strategies for undertaking various accounting hedges. Additionally, the Corporation primarily uses regression analysis at the inception of a hedge and for each reporting period thereafter to assess whether the derivative used in a hedging transaction is expected to be and has been highly effective in offsetting changes in the fair value or cash flows of a hedged item or forecasted transaction. The Corporation discontinues hedge accounting when it is determined that a derivative is not expected to be or has ceased to be highly effective as a hedge, and then reflects changes in fair value of the derivative in earnings after termination of the hedge relationship.
The Corporation uses its accounting hedges as either fair value hedges, cash flow hedges or hedges of net investments in foreign operations. The Corporation manages interest rate and foreign currency exchange rate sensitivity predominantly through the use of derivatives. Fair value hedges are used to protect against changes in the fair value of the Corporation’s assets and liabilities that are attributable to interest rate or foreign exchange volatility. Cash flow hedges are used primarily to minimize the variability in cash flows of assets or liabilities, or forecasted transactions caused by interest rate or foreign exchange fluctuations. For terminated cash flow hedges, the maximum length of time over which forecasted transactions are hedged is approximately 25 years, with a substantial portion of the hedged transactions being less than 10 years. For open or future cash flow hedges, the maximum length of time over which forecasted transactions are or will be hedged is less than seven years.
Changes in the fair value of derivatives designated as fair value hedges are recorded in earnings, together and in the same income statement line item with changes in the fair value of the related hedged item. Changes in the fair value of derivatives designated as cash flow hedges are recorded in accumulated other comprehensive income (OCI) and are reclassified into the line item in the income statement in which the hedged item is recorded in the same period the hedged item affects earnings. Hedge ineffectiveness and gains and losses on the excluded component of a derivative in assessing hedge effectiveness are recorded in earnings in the same income statement line item. The Corporation records changes in the fair value of derivatives used as hedges of the net investment in foreign operations, to the extent effective, as a component of accumulated OCI.
If a derivative instrument in a fair value hedge is terminated or the hedge designation removed, the previous adjustments to the carrying value of the hedged asset or liability are subsequently accounted for in the same manner as other components of the carrying value of that asset or liability. For interest-earning assets and interest-bearing liabilities, such adjustments are amortized to earnings over the remaining life of the respective asset or liability. If a derivative instrument in a cash flow hedge is terminated or the hedge designation is removed, related amounts in accumulated OCI are reclassified into earnings in the same period or periods during which the hedged forecasted transaction affects earnings. If it becomes probable that a forecasted transaction will not occur, any related amounts in accumulated OCI are reclassified into earnings in that period.
Interest Rate Lock CommitmentsThe Corporation enters into IRLCs in connection with its mortgage banking activities to fund residential mortgage loans at specified times in the future. IRLCs that relate to the origination of mortgage loans that will be classified as held-for-sale are considered derivative instruments under applicable accounting guidance. As such, these IRLCs are recorded at fair value with changes in fair value recorded in mortgage banking income (loss), typically resulting in recognition of a gain when the Corporation enters into IRLCs.
In estimating the fair value of an IRLC, the Corporation assigns a probability that the loan commitment will be exercised and the loan will be funded. The fair value of the commitments is derived from the fair value of related mortgage loans which is based on observable market data and includes the expected net future cash flows related to servicing of the loans. Changes in the fair value of IRLCs are recognized based on interest rate changes, changes in the probability that the commitment will be exercised and the passage of time. Changes from the expected future cash flows related to the customer relationship are excluded from the valuation of IRLCs.
Outstanding IRLCs expose the Corporation to the risk that the price of the loans underlying the commitments might decline from inception of the rate lock to funding of the loan. To manage this risk, the Corporation utilizes forward loan sales commitments and other derivative instruments, including interest rate swaps and options, to economically hedge the risk of potential changes in the value of the loans that would result from the commitments. The changes in the fair value of these derivatives are recorded in mortgage banking income (loss).
76788ba_financials.indd 156 3/6/14 12:06 PM

Bank of America 2013 157
SecuritiesDebt securities are recorded on the Consolidated Balance Sheet as of their trade date. Debt securities bought principally with the intent to buy and sell in the short term as part of the Corporation’s trading activities are reported at fair value in trading account assets with unrealized gains and losses included in trading account profits. Debt securities purchased for longer term investment purposes, as part of asset and liability management (ALM) and other strategic activities are generally reported at fair value as available-for-sale (AFS) securities with net unrealized gains and losses included in accumulated OCI. Certain other debt securities purchased for ALM and other strategic purposes are reported at fair value with unrealized gains and losses reported in other income (loss). These are referred to as other debt securities carried at fair value. AFS securities and other debt securities carried at fair value are reported in debt securities on the Consolidated Balance Sheet. The Corporation may hedge these other debt securities with risk management derivatives with the unrealized gains and losses also reported in other income (loss). The debt securities are carried at fair value with unrealized gains and losses reported in other income (loss) to mitigate accounting asymmetry with the risk management derivatives and to achieve operational simplifications. Debt securities which management has the intent and ability to hold to maturity are reported at amortized cost. Certain debt securities purchased for use in other risk management activities, such as hedging certain market risks related to MSRs, are reported in other assets at fair value with unrealized gains and losses reported in the same line item as the item being hedged.
The Corporation regularly evaluates each AFS and held-to-maturity (HTM) debt security where the value has declined below amortized cost to assess whether the decline in fair value is other than temporary. In determining whether an impairment is other than temporary, the Corporation considers the severity and duration of the decline in fair value, the length of time expected for recovery, the financial condition of the issuer, and other qualitative factors, as well as whether the Corporation either plans to sell the security or it is more-likely-than-not that it will be required to sell the security before recovery of the amortized cost. If the impairment of the AFS or HTM debt security is credit-related, an other-than-temporary impairment (OTTI) loss is recorded in earnings. For AFS debt securities, the non-credit-related impairment loss is recognized in accumulated OCI. If the Corporation intends to sell an AFS debt security or believes it will more-likely-than-not be required to sell a security, the Corporation records the full amount of the impairment loss as an OTTI loss.
Interest on debt securities, including amortization of premiums and accretion of discounts, is included in interest income. Realized gains and losses from the sales of debt securities are determined using the specific identification method.
Marketable equity securities are classified based on management’s intention on the date of purchase and recorded on the Consolidated Balance Sheet as of the trade date. Marketable equity securities that are bought and held principally for the purpose of resale in the near term are classified as trading and are carried at fair value with unrealized gains and losses included in trading account profits. Other marketable equity securities are accounted for as AFS and classified in other assets. All AFS marketable equity securities are carried at fair value with net unrealized gains and losses included in accumulated OCI on an after-tax basis. If there is an other-than-temporary decline in the fair value of any individual AFS marketable equity security, the cost
basis is reduced and the Corporation reclassifies the associated net unrealized loss out of accumulated OCI with a corresponding charge to equity investment income. Dividend income on AFS marketable equity securities is included in equity investment income. Realized gains and losses on the sale of all AFS marketable equity securities, which are recorded in equity investment income, are determined using the specific identification method.
Certain equity investments held by Global Principal Investments (GPI), the Corporation’s diversified equity investor in private equity, real estate and other alternative investments, are subject to investment company accounting under applicable accounting guidance and, accordingly, are carried at fair value with changes in fair value reported in equity investment income. These investments are included in other assets. Initially, the transaction price of the investment is generally considered to be the best indicator of fair value. Thereafter, valuation of direct investments is based on an assessment of each individual investment using methodologies that include publicly-traded comparables derived by multiplying a key performance metric (e.g., earnings before interest, taxes, depreciation and amortization) of the portfolio company by the relevant valuation multiple observed for comparable companies, acquisition comparables, entry level multiples and discounted cash flow analyses, and are subject to appropriate discounts for lack of liquidity or marketability. Certain factors that may influence changes in fair value include but are not limited to recapitalizations, subsequent rounds of financing and offerings in the equity or debt capital markets. For fund investments, the Corporation generally records the fair value of its proportionate interest in the fund’s capital as reported by the respective fund managers. Other investments held by GPI are accounted for under either the equity method or at cost, depending on the Corporation’s ownership interest, and are reported in other assets.
Loans and LeasesLoans, with the exception of loans accounted for under the fair value option, are measured at historical cost and reported at their outstanding principal balances net of any unearned income, charge-offs, unamortized deferred fees and costs on originated loans, and for purchased loans, net of any unamortized premiums or discounts. Loan origination fees and certain direct origination costs are deferred and recognized as adjustments to interest income over the lives of the related loans. Unearned income, discounts and premiums are amortized to interest income using a level yield methodology. The Corporation elects to account for certain consumer and commercial loans under the fair value option with changes in fair value reported in other income (loss).
Under applicable accounting guidance, for reporting purposes, the loan and lease portfolio is categorized by portfolio segment and, within each portfolio segment, by class of financing receivables. A portfolio segment is defined as the level at which an entity develops and documents a systematic methodology to determine the allowance for credit losses, and a class of financing receivables is defined as the level of disaggregation of portfolio segments based on the initial measurement attribute, risk characteristics and methods for assessing risk. The Corporation’s three portfolio segments are Home Loans, Credit Card and Other Consumer, and Commercial. The classes within the Home Loans portfolio segment are core portfolio residential mortgage, Legacy Assets & Servicing residential mortgage, core portfolio home
76788ba_financials.indd 157 3/6/14 12:06 PM

158 Bank of America 2013
equity and Legacy Assets & Servicing home equity. The classes within the Credit Card and Other Consumer portfolio segment are U.S. credit card, non-U.S. credit card, direct/indirect consumer and other consumer. The classes within the Commercial portfolio segment are U.S. commercial, commercial real estate, commercial lease financing, non-U.S. commercial and U.S. small business commercial.
Purchased Credit-impaired LoansThe Corporation purchases loans with and without evidence of credit quality deterioration since origination. Evidence of credit quality deterioration as of the purchase date may include statistics such as past due status, refreshed borrower credit scores and refreshed loan-to-value (LTV) ratios, some of which are not immediately available as of the purchase date. Purchased loans with evidence of credit quality deterioration for which it is probable that the Corporation will not receive all contractually required payments receivable are accounted for as purchased credit- impaired (PCI) loans. The excess of the cash flows expected to be collected on PCI loans, measured as of the acquisition date, over the estimated fair value is referred to as the accretable yield and is recognized in interest income over the remaining life of the loan using a level yield methodology. The difference between contractually required payments as of the acquisition date and the cash flows expected to be collected is referred to as the nonaccretable difference. PCI loans that have similar risk characteristics, primarily credit risk, collateral type and interest rate risk, are pooled and accounted for as a single asset with a single composite interest rate and an aggregate expectation of cash flows. Once a pool is assembled, it is treated as if it was one loan for purposes of applying the accounting guidance for PCI loans. An individual loan is removed from a PCI loan pool if it is sold, foreclosed, forgiven or the expectation of any future proceeds is remote. When a loan is removed from a PCI loan pool and the foreclosure or recovery value of the loan is less than the loan’s carrying value, the difference is first applied against the PCI pool’s nonaccretable difference. If the nonaccretable difference has been fully utilized, only then is the PCI pool’s basis applicable to that loan written-off against its valuation reserve; however, the integrity of the pool is maintained and it continues to be accounted for as if it was one loan.
The Corporation continues to estimate cash flows expected to be collected over the life of the PCI loans using internal credit risk, interest rate and prepayment risk models that incorporate management’s best estimate of current key assumptions such as default rates, loss severity and payment speeds. If, upon subsequent evaluation, the Corporation determines it is probable that the present value of the expected cash flows has decreased, the PCI loan is considered to be further impaired resulting in a charge to the provision for credit losses and a corresponding increase to a valuation allowance included in the allowance for loan and lease losses. The present value of the expected cash flows is then recalculated each period, which may result in additional impairment or a reduction of the valuation allowance. If there is no valuation allowance and it is probable that there is a significant increase in the present value of the expected cash flows, the Corporation recalculates the amount of accretable yield as the excess of the revised expected cash flows over the current carrying value resulting in a reclassification from nonaccretable difference to accretable yield. Reclassifications from nonaccretable difference can also occur if there is a change in the expected lives of the loans. The present value of the expected
cash flows is determined using the PCI loans’ effective interest rate, adjusted for changes in the PCI loans’ interest rate indices.
LeasesThe Corporation provides equipment financing to its customers through a variety of lease arrangements. Direct financing leases are carried at the aggregate of lease payments receivable plus estimated residual value of the leased property less unearned income. Leveraged leases, which are a form of financing leases, are reported net of non-recourse debt. Unearned income on leveraged and direct financing leases is accreted to interest income over the lease terms using methods that approximate the interest method.
Allowance for Credit LossesThe allowance for credit losses, which includes the allowance for loan and lease losses and the reserve for unfunded lending commitments, represents management’s estimate of probable losses inherent in the Corporation’s lending activities. The allowance for loan and lease losses and the reserve for unfunded lending commitments exclude amounts for loans and unfunded lending commitments accounted for under the fair value option as the fair values of these instruments reflect a credit component. The allowance for loan and lease losses does not include amounts related to accrued interest receivable, other than billed interest and fees on credit card receivables, as accrued interest receivable is reversed when a loan is placed on nonaccrual status. The allowance for loan and lease losses represents the estimated probable credit losses on funded consumer and commercial loans and leases while the reserve for unfunded lending commitments, including standby letters of credit and binding unfunded loan commitments, represents estimated probable credit losses on these unfunded credit instruments based on utilization assumptions. Lending-related credit exposures deemed to be uncollectible, excluding loans carried at fair value, are charged off against these accounts. Write-offs on PCI loans on which there is a valuation allowance are written-off against the valuation allowance. For additional information, see the Purchased Credit-impaired Loans in this Note. Cash recovered on previously charged off amounts is recorded as a recovery to these accounts. Management evaluates the adequacy of the allowance for credit losses based on the combined total of the allowance for loan and lease losses and the reserve for unfunded lending commitments.
The Corporation performs periodic and systematic detailed reviews of its lending portfolios to identify credit risks and to assess the overall collectability of those portfolios. The allowance on certain homogeneous consumer loan portfolios, which generally consist of consumer real estate within the Home Loans portfolio segment and credit card loans within the Credit Card and Other Consumer portfolio segment, is based on aggregated portfolio segment evaluations generally by product type. Loss forecast models are utilized for these portfolios which consider a variety of factors including, but not limited to, historical loss experience, estimated defaults or foreclosures based on portfolio trends, delinquencies, bankruptcies, economic conditions and credit scores.
The Corporation’s Home Loans portfolio segment is comprised primarily of large groups of homogeneous consumer loans secured by residential real estate. The amount of losses incurred in the homogeneous loan pools is estimated based on the number of loans that will default and the loss in the event of default. Using
76788ba_financials.indd 158 3/6/14 12:06 PM

Bank of America 2013 159
modeling methodologies, the Corporation estimates the number of homogeneous loans that will default based on the individual loans’ attributes aggregated into pools of homogeneous loans with similar attributes. The attributes that are most significant to the probability of default and are used to estimate defaults include refreshed LTV or, in the case of a subordinated lien, refreshed combined loan-to-value, borrower credit score, months since origination (referred to as vintage) and geography, all of which are further broken down by present collection status (whether the loan is current, delinquent, in default or in bankruptcy). This estimate is based on the Corporation’s historical experience with the loan portfolio. The estimate is adjusted to reflect an assessment of environmental factors not yet reflected in the historical data underlying the loss estimates, such as changes in real estate values, local and national economies, underwriting standards and the regulatory environment. The probability of default on a loan is based on an analysis of the movement of loans with the measured attributes from either current or any of the delinquency categories to default over a 12-month period. On home equity loans where the Corporation holds only a second-lien position and foreclosure is not the best alternative, the loss severity is estimated at 100 percent.
The allowance on certain commercial loans (except business card and certain small business loans) is calculated using loss rates delineated by risk rating and product type. Factors considered when assessing loss rates include the value of the underlying collateral, if applicable, the industry of the obligor, and the obligor’s liquidity and other financial indicators along with certain qualitative factors. These statistical models are updated regularly for changes in economic and business conditions. Included in the analysis of consumer and commercial loan portfolios are reserves which are maintained to cover uncertainties that affect the Corporation’s estimate of probable losses including domestic and global economic uncertainty and large single name defaults.
The remaining portfolios, including nonperforming commercial loans, as well as consumer and commercial loans modified in a troubled debt restructuring (TDR) are reviewed in accordance with applicable accounting guidance on impaired loans and TDRs. If necessary, a specific allowance is established for these loans if they are deemed to be impaired. A loan is considered impaired when, based on current information and events, it is probable that the Corporation will be unable to collect all amounts due, including principal and/or interest, in accordance with the contractual terms of the agreement or the loan has been modified in a TDR. Once a loan has been identified as impaired, management measures impairment primarily based on the present value of payments expected to be received, discounted at the loans’ original effective contractual interest rates, or discounted at the portfolio average contractual annual percentage rate, excluding promotionally priced loans, in effect prior to restructuring. Impaired loans and TDRs may also be measured based on observable market prices, or for loans that are solely dependent on the collateral for repayment, the estimated fair value of the collateral less costs to sell. If the recorded investment in impaired loans exceeds this amount, a specific allowance is established as a component of the allowance for loan and lease losses unless these are secured consumer loans that are solely dependent on the collateral for repayment, in which case the amount that exceeds the fair value of the collateral is charged off.
Generally, when determining the fair value of the collateral securing consumer real estate-secured loans that are solely dependent on the collateral for repayment, prior to performing a
detailed property valuation including a walk-through of a property, the Corporation initially estimates the fair value of the collateral securing these consumer loans using an automated valuation method (AVM). An AVM is a tool that estimates the value of a property by reference to market data including sales of comparable properties and price trends specific to the Metropolitan Statistical Area in which the property being valued is located. In the event that an AVM value is not available, the Corporation utilizes publicized indices or if these methods provide less reliable valuations, the Corporation uses appraisals or broker price opinions to estimate the fair value of the collateral. While there is inherent imprecision in these valuations, the Corporation believes that they are representative of the portfolio in the aggregate.
In addition to the allowance for loan and lease losses, the Corporation also estimates probable losses related to unfunded lending commitments, such as letters of credit and financial guarantees, and binding unfunded loan commitments. The reserve for unfunded lending commitments excludes commitments accounted for under the fair value option. Unfunded lending commitments are subject to individual reviews and are analyzed and segregated by risk according to the Corporation’s internal risk rating scale. These risk classifications, in conjunction with an analysis of historical loss experience, utilization assumptions, current economic conditions, performance trends within the portfolio and any other pertinent information, result in the estimation of the reserve for unfunded lending commitments.
The allowance for credit losses related to the loan and lease portfolio is reported separately on the Consolidated Balance Sheet whereas the reserve for unfunded lending commitments is reported on the Consolidated Balance Sheet in accrued expenses and other liabilities. The provision for credit losses related to the loan and lease portfolio and unfunded lending commitments is reported in the Consolidated Statement of Income.
Nonperforming Loans and Leases, Charge-offs and DelinquenciesNonperforming loans and leases generally include loans and leases that have been placed on nonaccrual status, including nonaccruing loans whose contractual terms have been restructured in a manner that grants a concession to a borrower experiencing financial difficulties. Loans accounted for under the fair value option, PCI loans and LHFS are not reported as nonperforming.
In accordance with the Corporation’s policies, consumer real estate-secured loans, including residential mortgages and home equity loans, are generally placed on nonaccrual status and classified as nonperforming at 90 days past due unless repayment of the loan is insured by the Federal Housing Administration or through individually insured long-term standby agreements with Fannie Mae or Freddie Mac (the fully-insured portfolio). Residential mortgage loans in the fully-insured portfolio are not placed on nonaccrual status and, therefore, are not reported as nonperforming. Junior-lien home equity loans are placed on nonaccrual status and classified as nonperforming when the underlying first-lien mortgage loan becomes 90 days past due even if the junior-lien loan is current. Accrued interest receivable is reversed when a consumer loan is placed on nonaccrual status. Interest collections on nonaccruing consumer loans for which the ultimate collectability of principal is uncertain are generally applied as principal reductions; otherwise, such collections are credited to interest income when received. These loans may be restored
76788ba_financials.indd 159 3/6/14 12:06 PM

160 Bank of America 2013
to accrual status when all principal and interest is current and full repayment of the remaining contractual principal and interest is expected, or when the loan otherwise becomes well-secured and is in the process of collection. The outstanding balance of real estate-secured loans that is in excess of the estimated property value less costs to sell is charged off no later than the end of the month in which the loan becomes 180 days past due unless the loan is fully insured. The estimated property value less costs to sell is determined using the same process as described for impaired loans in the Allowance for Credit Losses in this Note.
Consumer loans secured by personal property, credit card loans and other unsecured consumer loans are not placed on nonaccrual status prior to charge-off and, therefore, are not reported as nonperforming loans, except for certain secured consumer loans, including those that have been modified in a TDR. Personal property-secured loans are charged off to collateral value no later than the end of the month in which the account becomes 120 days past due or, for loans in bankruptcy, 60 days past due. Credit card and other unsecured consumer loans are charged off no later than the end of the month in which the account becomes 180 days past due or within 60 days after receipt of notification of death or bankruptcy.
Commercial loans and leases, excluding business card loans, that are past due 90 days or more as to principal or interest, or where reasonable doubt exists as to timely collection, including loans that are individually identified as being impaired, are generally placed on nonaccrual status and classified as nonperforming unless well-secured and in the process of collection.
Accrued interest receivable is reversed when commercial loans and leases are placed on nonaccrual status. Interest collections on nonaccruing commercial loans and leases for which the ultimate collectability of principal is uncertain are applied as principal reductions; otherwise, such collections are credited to income when received. Commercial loans and leases may be restored to accrual status when all principal and interest is current and full repayment of the remaining contractual principal and interest is expected, or when the loan otherwise becomes well-secured and is in the process of collection. Business card loans are charged off no later than the end of the month in which the account becomes 180 days past due or 60 days after receipt of notification of death or bankruptcy. These loans are not placed on nonaccrual status prior to charge-off and, therefore, are not reported as nonperforming loans. Other commercial loans and leases are generally charged off when all or a portion of the principal amount is determined to be uncollectible.
The entire balance of a consumer loan or commercial loan or lease is contractually delinquent if the minimum payment is not received by the specified due date on the customer’s billing statement. Interest and fees continue to accrue on past due loans and leases until the date the loan is placed on nonaccrual status, if applicable.
PCI loans are recorded at fair value at the acquisition date. Although the PCI loans may be contractually delinquent, the Corporation does not classify these loans as nonperforming as the loans were written down to fair value at the acquisition date and the accretable yield is recognized in interest income over the remaining life of the loan. In addition, reported net charge-offs exclude write-offs on PCI loans as the fair value already considers the estimated credit losses.
Troubled Debt RestructuringsConsumer loans and commercial loans and leases whose contractual terms have been restructured in a manner that grants a concession to a borrower experiencing financial difficulties are classified as TDRs. Concessions could include a reduction in the interest rate to a rate that is below market on the loan, payment extensions, forgiveness of principal, forbearance, or other actions designed to maximize collections. Secured consumer loans that have been discharged in Chapter 7 bankruptcy and have not been reaffirmed by the borrower are classified as TDRs at the time of discharge. Consumer real estate-secured loans for which a binding offer to restructure has been extended are also classified as TDRs. Loans classified as TDRs are considered impaired loans. Loans that are carried at fair value, LHFS and PCI loans are not classified as TDRs.
Secured consumer loans whose contractual terms have been modified in a TDR and are current at the time of restructuring generally remain on accrual status if there is demonstrated performance prior to the restructuring and payment in full under the restructured terms is expected. Otherwise, the loans are placed on nonaccrual status and reported as nonperforming, except for the fully-insured loans, until there is sustained repayment performance for a reasonable period, generally six months. If accruing consumer TDRs cease to perform in accordance with their modified contractual terms, they are placed on nonaccrual status and reported as nonperforming TDRs. Consumer TDRs that bear a below-market rate of interest are generally reported as TDRs throughout their remaining lives. Secured consumer loans that have been discharged in Chapter 7 bankruptcy are placed on nonaccrual status and written down to the estimated collateral value less costs to sell no later than at the time of discharge. If these loans are contractually current, interest collections are generally recorded in interest income on a cash basis. Credit card and other unsecured consumer loans that have been renegotiated in a TDR are not placed on nonaccrual status. Credit card and other unsecured consumer loans that have been renegotiated and placed on a fixed payment plan after July 1, 2012 are generally charged off no later than the end of the month in which the account becomes 120 days past due.
Commercial loans and leases whose contractual terms have been modified in a TDR are typically placed on nonaccrual status and reported as nonperforming until the loans or leases have performed for an adequate period of time under the restructured agreement, generally six months. If the borrower had demonstrated performance under the previous terms and the underwriting process shows the capacity to continue to perform under the modified terms, the loan may remain on accrual status. Accruing commercial TDRs are reported as performing TDRs through the end of the calendar year in which the loans are returned to accrual status. In addition, if accruing commercial TDRs bear less than a market rate of interest at the time of modification, they are reported as performing TDRs throughout their remaining lives unless and until they cease to perform in accordance with their modified contractual terms, at which time they are placed on nonaccrual status and reported as nonperforming TDRs.
A loan that had previously been modified in a TDR and is subsequently refinanced under current underwriting standards at a market rate with no concessionary terms is accounted for as a new loan and is no longer reported as a TDR.
76788ba_financials.indd 160 3/6/14 12:06 PM

Bank of America 2013 161
Loans Held-for-saleLoans that are intended to be sold in the foreseeable future, including residential mortgages, loan syndications, and to a lesser degree, commercial real estate, consumer finance and other loans, are reported as LHFS and are carried at the lower of aggregate cost or fair value. The Corporation accounts for certain LHFS, including first mortgage LHFS, under the fair value option. Mortgage loan origination costs related to LHFS that the Corporation accounts for under the fair value option are recognized in noninterest expense when incurred. Mortgage loan origination costs for LHFS carried at the lower of cost or fair value are capitalized as part of the carrying value of the loans and recognized as a reduction of mortgage banking income (loss) upon the sale of such loans. LHFS that are on nonaccrual status and are reported as nonperforming, as defined in the policy herein, are reported separately from nonperforming loans and leases.
Premises and EquipmentPremises and equipment are carried at cost less accumulated depreciation and amortization. Depreciation and amortization are recognized using the straight-line method over the estimated useful lives of the assets. Estimated lives range up to 40 years for buildings, up to 12 years for furniture and equipment, and the shorter of lease term or estimated useful life for leasehold improvements.
The Corporation capitalizes the costs associated with certain computer hardware, software and internally developed software, and amortizes the costs over the expected useful life. Direct project costs of internally developed software are capitalized when it is probable that the project will be completed and the software will be used for its intended function.
Mortgage Servicing RightsThe Corporation accounts for consumer MSRs, including residential mortgage and home equity MSRs, at fair value with changes in fair value recorded in mortgage banking income (loss). To reduce the volatility of earnings related to interest rate and market value fluctuations, U.S. Treasury securities, mortgage-backed securities and derivatives such as options and interest rate swaps may be used to hedge certain market risks of the MSRs. Such derivatives are not designated as qualifying accounting hedges. These instruments are carried at fair value with changes in fair value recognized in mortgage banking income (loss).
The Corporation estimates the fair value of consumer MSRs using a valuation model that calculates the present value of estimated future net servicing income and, when available, quoted prices from independent parties. The present value calculation is based on an option-adjusted spread (OAS) valuation approach that factors in prepayment risk. This approach consists of projecting servicing cash flows under multiple interest rate scenarios and discounting these cash flows using risk-adjusted discount rates. The key economic assumptions used in MSR valuations include weighted-average lives of the MSRs and the OAS levels. The OAS represents the spread that is added to the discount rate so that the sum of the discounted cash flows equals the market price; therefore, it is a measure of the extra yield over the reference discount factor that the Corporation expects to earn by holding the asset.
Goodwill and Intangible AssetsGoodwill is the purchase premium after adjusting for the fair value of net assets acquired. Goodwill is not amortized but is reviewed for potential impairment on an annual basis, or when events or circumstances indicate a potential impairment, at the reporting unit level. A reporting unit, as defined under applicable accounting guidance, is a business segment or one level below a business segment. The goodwill impairment analysis is a two-step test. The first step of the goodwill impairment test involves comparing the fair value of each reporting unit with its carrying value, including goodwill, as measured by allocated equity. In certain circumstances, the first step may be performed using a qualitative assessment. If the fair value of the reporting unit exceeds its carrying value, goodwill of the reporting unit is considered not impaired; however, if the carrying value of the reporting unit exceeds its fair value, the second step must be performed to measure potential impairment.
The second step involves calculating an implied fair value of goodwill for each reporting unit for which the first step indicated possible impairment. The implied fair value of goodwill is determined in the same manner as the amount of goodwill recognized in a business combination, which is the excess of the fair value of the reporting unit, as determined in the first step, over the aggregate fair values of the assets, liabilities and identifiable intangibles as if the reporting unit was being acquired in a business combination. Measurement of the fair values of the assets and liabilities of a reporting unit is consistent with the requirements of the fair value measurements accounting guidance, as described in Fair Value in this Note. The adjustments to measure the assets, liabilities and intangibles at fair value are for the purpose of measuring the implied fair value of goodwill and such adjustments are not reflected in the Consolidated Balance Sheet. If the implied fair value of goodwill exceeds the goodwill assigned to the reporting unit, there is no impairment. If the goodwill assigned to a reporting unit exceeds the implied fair value of goodwill, an impairment charge is recorded for the excess. An impairment loss recognized cannot exceed the amount of goodwill assigned to a reporting unit. An impairment loss establishes a new basis in the goodwill and subsequent reversals of goodwill impairment losses are not permitted under applicable accounting guidance.
For intangible assets subject to amortization, an impairment loss is recognized if the carrying value of the intangible asset is not recoverable and exceeds fair value. The carrying value of the intangible asset is considered not recoverable if it exceeds the sum of the undiscounted cash flows expected to result from the use of the asset.
Variable Interest EntitiesA VIE is an entity that lacks equity investors or whose equity investors do not have a controlling financial interest in the entity through their equity investments. The entity that has a controlling financial interest in a VIE is referred to as the primary beneficiary and consolidates the VIE. The Corporation is deemed to have a controlling financial interest and is the primary beneficiary of a VIE if it has both the power to direct the activities of the VIE that most significantly impact the VIE’s economic performance and an obligation to absorb losses or the right to receive benefits that could potentially be significant to the VIE. On a quarterly basis, the Corporation reassesses whether it has a controlling financial interest in and is the primary beneficiary of a VIE. The quarterly reassessment process considers whether the Corporation has
76788ba_financials.indd 161 3/6/14 12:06 PM

162 Bank of America 2013
acquired or divested the power to direct the activities of the VIE through changes in governing documents or other circumstances. The reassessment also considers whether the Corporation has acquired or disposed of a financial interest that could be significant to the VIE, or whether an interest in the VIE has become significant or is no longer significant. The consolidation status of the VIEs with which the Corporation is involved may change as a result of such reassessments. Changes in consolidation status are applied prospectively, with assets and liabilities of a newly consolidated VIE initially recorded at fair value. A gain or loss may be recognized upon deconsolidation of a VIE depending on the carrying values of deconsolidated assets and liabilities compared to the fair value of retained interests and ongoing contractual arrangements.
The Corporation primarily uses VIEs for its securitization activities, in which the Corporation transfers whole loans or debt securities into a trust or other vehicle such that the assets are legally isolated from the creditors of the Corporation. Assets held in a trust can only be used to settle obligations of the trust. The creditors of these trusts typically have no recourse to the Corporation except in accordance with the Corporation’s obligations under standard representations and warranties.
When the Corporation is the servicer of whole loans held in a securitization trust, including non-agency residential mortgages, home equity loans, credit cards, automobile loans and student loans, the Corporation has the power to direct the most significant activities of the trust. The Corporation does not have the power to direct the most significant activities of a residential mortgage agency trust unless the Corporation holds substantially all of the issued securities and has the unilateral right to liquidate the trust. The power to direct the most significant activities of a commercial mortgage securitization trust is typically held by the special servicer or by the party holding specific subordinate securities which embody certain controlling rights. The Corporation consolidates a whole-loan securitization trust if it has the power to direct the most significant activities and also holds securities issued by the trust or has other contractual arrangements, other than standard representations and warranties, that could potentially be significant to the trust.
The Corporation may also transfer trading account securities and AFS securities into municipal bond or resecuritization trusts. The Corporation consolidates a municipal bond or resecuritization trust if it has control over the ongoing activities of the trust such as the remarketing of the trust’s liabilities or, if there are no ongoing activities, sole discretion over the design of the trust, including the identification of securities to be transferred in and the structure of securities to be issued, and also retains securities or has liquidity or other commitments that could potentially be significant to the trust. The Corporation does not consolidate a municipal bond or resecuritization trust if one or a limited number of third-party investors share responsibility for the design of the trust or have control over the significant activities of the trust through liquidation or other substantive rights.
Other VIEs used by the Corporation include collateralized debt obligations (CDOs), investment vehicles created on behalf of customers and other investment vehicles. The Corporation does not routinely serve as collateral manager for CDOs and, therefore, does not typically have the power to direct the activities that most significantly impact the economic performance of a CDO. However, following an event of default, if the Corporation is a majority holder of senior securities issued by a CDO and acquires the power to manage the assets of the CDO, the Corporation consolidates the CDO.
The Corporation consolidates a customer or other investment vehicle if it has control over the initial design of the vehicle or manages the assets in the vehicle and also absorbs potentially significant gains or losses through an investment in the vehicle, derivative contracts or other arrangements. The Corporation does not consolidate an investment vehicle if a single investor controlled the initial design of the vehicle or manages the assets in the vehicles or if the Corporation does not have a variable interest that could potentially be significant to the vehicle.
Retained interests in securitized assets are initially recorded at fair value. In addition, the Corporation may invest in debt securities issued by unconsolidated VIEs. Fair values of these debt securities, which are AFS debt securities or trading account assets, are based primarily on quoted market prices in active or inactive markets. Generally, quoted market prices for retained residual interests are not available; therefore, the Corporation estimates fair values based on the present value of the associated expected future cash flows. This may require management to estimate credit losses, prepayment speeds, forward interest yield curves, discount rates and other factors that impact the value of retained interests. Retained residual interests in unconsolidated securitization trusts are classified in trading account assets or other assets with changes in fair value recorded in income. The Corporation may also enter into derivatives with unconsolidated VIEs, which are carried at fair value with changes in fair value recorded in income.
Fair ValueThe Corporation measures the fair values of its financial instruments in accordance with accounting guidance that requires an entity to base fair value on exit price. A three-level hierarchy, provided in the applicable accounting guidance, for inputs is utilized in measuring fair value which maximizes the use of observable inputs and minimizes the use of unobservable inputs by requiring that observable inputs be used to determine the exit price when available. Under applicable accounting guidance, the Corporation categorizes its financial instruments, based on the priority of inputs to the valuation technique, into this three-level hierarchy, as described below. Trading account assets and liabilities, derivative assets and liabilities, AFS debt and equity securities, other debt securities carried at fair value, certain MSRs and certain other assets are carried at fair value in accordance with applicable accounting guidance. The Corporation has also elected to account for certain assets and liabilities under the fair value option, including certain commercial and consumer loans and loan commitments, LHFS, other short-term borrowings, securities financing agreements, asset-backed secured financings, long-term deposits and long-term debt. The following describes the three-level hierarchy.
Level 1 Unadjusted quoted prices in active markets for identical assets or liabilities. Level 1 assets and liabilities include debt and equity securities and derivative contracts that are traded in an active exchange market, as well as certain U.S. Treasury securities that are highly liquid and are actively traded in OTC markets.
Level 2 Observable inputs other than Level 1 prices, such as quoted prices for similar assets or liabilities, quoted prices in markets that are not active, or other inputs that are observable or can be corroborated by observable market data for substantially the full term of the assets or liabilities. Level 2 assets and liabilities include debt
76788ba_financials.indd 162 3/6/14 12:06 PM

Bank of America 2013 163
securities with quoted prices that are traded less frequently than exchange-traded instruments and derivative contracts where fair value is determined using a pricing model with inputs that are observable in the market or can be derived principally from or corroborated by observable market data. This category generally includes U.S. government and agency mortgage-backed debt securities, corporate debt securities, derivative contracts, residential mortgage loans and certain LHFS.
Level 3 Unobservable inputs that are supported by little or no market activity and that are significant to the overall fair value of the assets or liabilities. Level 3 assets and liabilities include financial instruments for which the determination of fair value requires significant management judgment or estimation. The fair value for such assets and liabilities is generally determined using pricing models, market comparables, discounted cash flow methodologies or similar techniques that incorporate the assumptions a market participant would use in pricing the asset or liability. This category generally includes certain private equity investments and other principal investments, retained residual interests in securitizations, residential MSRs, certain asset-backed securities, highly structured, complex or long-dated derivative contracts, certain LHFS, IRLCs and certain CDOs where independent pricing information cannot be obtained for a significant portion of the underlying assets.
Income TaxesThere are two components of income tax expense: current and deferred. Current income tax expense reflects taxes to be paid or refunded for the current period. Deferred income tax expense results from changes in deferred tax assets and liabilities between periods. These gross deferred tax assets and liabilities represent decreases or increases in taxes expected to be paid in the future because of future reversals of temporary differences in the bases of assets and liabilities as measured by tax laws and their bases as reported in the financial statements. Deferred tax assets are also recognized for tax attributes such as net operating loss carryforwards and tax credit carryforwards. Valuation allowances are recorded to reduce deferred tax assets to the amounts management concludes are more-likely-than-not to be realized.
Income tax benefits are recognized and measured based upon a two-step model: first, a tax position must be more-likely-than-not to be sustained based solely on its technical merits in order to be recognized, and second, the benefit is measured as the largest dollar amount of that position that is more-likely-than-not to be sustained upon settlement. The difference between the benefit recognized and the tax benefit claimed on a tax return is referred to as an unrecognized tax benefit. The Corporation records income tax-related interest and penalties, if applicable, within income tax expense.
Retirement BenefitsThe Corporation has retirement plans covering substantially all full-time and certain part-time employees. Pension expense under these plans is charged to current operations and consists of several components of net pension cost based on various actuarial assumptions regarding future experience under the plans.
In addition, the Corporation has unfunded supplemental benefit plans and supplemental executive retirement plans (SERPs) for
selected officers of the Corporation and its subsidiaries that provide benefits that cannot be paid from a qualified retirement plan due to Internal Revenue Code restrictions. The Corporation’s current executive officers do not earn additional retirement income under SERPs. These plans are nonqualified under the Internal Revenue Code and assets used to fund benefit payments are not segregated from other assets of the Corporation; therefore, in general, a participant’s or beneficiary’s claim to benefits under these plans is as a general creditor. In addition, the Corporation has several postretirement healthcare and life insurance benefit plans.
Accumulated Other Comprehensive IncomeThe Corporation records unrealized gains and losses on AFS debt and marketable equity securities, gains and losses on cash flow accounting hedges, certain employee benefit plan adjustments, foreign currency translation adjustments and related hedges of net investments in foreign operations, and the cumulative adjustment related to certain accounting changes in accumulated OCI, net-of-tax. Unrealized gains and losses on AFS debt and marketable equity securities are reclassified to earnings as the gains or losses are realized upon sale of the securities. Unrealized losses on AFS securities deemed to represent OTTI are reclassified to earnings at the time of the impairment charge. For AFS debt securities that the Corporation does not intend to sell or it is not more-likely-than-not that it will be required to sell, only the credit component of an unrealized loss is reclassified to earnings. Gains or losses on derivatives accounted for as cash flow hedges are reclassified to earnings when the hedged transaction affects earnings. Translation gains or losses on foreign currency translation adjustments are reclassified to earnings upon the substantial sale or liquidation of investments in foreign operations.
Revenue RecognitionThe following summarizes the Corporation’s revenue recognition policies as they relate to certain noninterest income line items in the Consolidated Statement of Income.
Card income is derived from fees such as interchange, cash advance, annual, late, over-limit and other miscellaneous fees, which are recorded as revenue when earned, primarily on an accrual basis. Uncollected fees are included in the customer card receivables balances with an amount recorded in the allowance for loan and lease losses for estimated uncollectible card receivables. Uncollected fees are written off when a card receivable reaches 180 days past due.
Service charges include fees for insufficient funds, overdrafts and other banking services and are recorded as revenue when earned. Uncollected fees are included in outstanding loan balances with an amount recorded for estimated uncollectible service fees receivable. Uncollected fees are written off when a fee receivable reaches 60 days past due.
Investment and brokerage services revenue consists primarily of asset management fees and brokerage income that are recognized over the period the services are provided or when commissions are earned. Asset management fees consist primarily of fees for investment management and trust services and are generally based on the dollar amount of the assets being managed. Brokerage income is generally derived from commissions and fees earned on the sale of various financial products.
76788ba_financials.indd 163 3/6/14 12:06 PM

164 Bank of America 2013
Investment banking income consists primarily of advisory and underwriting fees that are recognized in income as the services are provided and no contingencies exist. Revenues are generally recognized net of any direct expenses. Non-reimbursed expenses are recorded as noninterest expense.
Earnings Per Common ShareEarnings per common share (EPS) is computed by dividing net income (loss) allocated to common shareholders by the weighted-average common shares outstanding, except that it does not include unvested common shares subject to repurchase or cancellation. Net income (loss) allocated to common shareholders represents net income (loss) applicable to common shareholders which is net income (loss) adjusted for preferred stock dividends including dividends declared, accretion of discounts on preferred stock including accelerated accretion when preferred stock is repaid early, and cumulative dividends related to the current dividend period that have not been declared as of period end, less income allocated to participating securities (see below for more information). Diluted EPS is computed by dividing income (loss) allocated to common shareholders plus dividends on dilutive convertible preferred stock and preferred stock that can be tendered to exercise warrants, by the weighted-average common shares outstanding plus amounts representing the dilutive effect of stock options outstanding, restricted stock, restricted stock units, outstanding warrants and the dilution resulting from the conversion of convertible preferred stock, if applicable.
Unvested share-based payment awards that contain nonforfeitable rights to dividends are participating securities that are included in computing EPS using the two-class method. The two-class method is an earnings allocation formula under which EPS is calculated for common stock and participating securities according to dividends declared and participating rights in undistributed earnings. Under this method, all earnings, distributed and undistributed, are allocated to participating securities and common shares based on their respective rights to receive dividends.
In an exchange of non-convertible preferred stock, income allocated to common shareholders is adjusted for the difference between the carrying value of the preferred stock and the fair value of the consideration exchanged. In an induced conversion of convertible preferred stock, income allocated to common shareholders is reduced by the excess of the fair value of the consideration exchanged over the fair value of the common stock that would have been issued under the original conversion terms.
Foreign Currency TranslationAssets, liabilities and operations of foreign branches and subsidiaries are recorded based on the functional currency of each entity. For certain of the foreign operations, the functional currency is the local currency, in which case the assets, liabilities and operations are translated, for consolidation purposes, from the local currency to the U.S. dollar reporting currency at period-end rates for assets and liabilities and generally at average rates for results of operations. The resulting unrealized gains or losses as well as gains and losses from certain hedges, are reported as a component of accumulated OCI, net-of-tax. When the foreign entity’s functional currency is determined to be the U.S. dollar, the resulting remeasurement gains or losses on foreign currency-denominated assets or liabilities are included in earnings.
Credit Card and Deposit Arrangements
Endorsing Organization AgreementsThe Corporation contracts with other organizations to obtain their endorsement of the Corporation’s loan and deposit products. This endorsement may provide to the Corporation exclusive rights to market to the organization’s members or to customers on behalf of the Corporation. These organizations endorse the Corporation’s loan and deposit products and provide the Corporation with their mailing lists and marketing activities. These agreements generally have terms that range from two to five years. The Corporation typically pays royalties in exchange for the endorsement. Compensation costs related to the credit card agreements are recorded as contra-revenue in card income.
Cardholder Reward AgreementsThe Corporation offers reward programs that allow its cardholders to earn points that can be redeemed for a broad range of rewards including cash, travel, gift cards and discounted products. The Corporation establishes a rewards liability based upon the points earned that are expected to be redeemed and the average cost per point redeemed. The points to be redeemed are estimated based on past redemption behavior, card product type, account transaction activity and other historical card performance. The liability is reduced as the points are redeemed. The estimated cost of the rewards programs is recorded as contra-revenue in card income.
Accounting PoliciesAll significant accounting policies are discussed either in this Note or included in the Notes herein listed below.
Page
Note 2 – Derivatives
Note 3 – Securities
Note 4 – Outstanding Loans and Leases
Note 6 – Securitizations and Other Variable InterestEntities
Note 7 – Representations and Warranties Obligationsand Corporate Guarantees
Note 12 – Commitments and Contingencies
Note 15 – Earnings Per Common Share
Note 17 – Employee Benefit Plans
Note 18 – Stock-based Compensation Plans
Note 19 – Income Taxes
Note 20 – Fair Value Measurements
Note 23 – Mortgage Servicing Rights
165
175
180
197
203
219
236
241
248
249
252
270
76788ba_financials.indd 164 3/6/14 12:06 PM

Bank of America 2013 165
NOTE 2 Derivatives
Derivative BalancesDerivatives are entered into on behalf of customers, for trading, or to support risk management activities. Derivatives used in risk management activities include derivatives that may or may not be designated in qualifying hedge accounting relationships. Derivatives that are not designated in qualifying hedge accounting relationships are referred to as other risk management derivatives. For more information on the Corporation’s derivatives and hedging
activities, see Note 1 – Summary of Significant Accounting Principles. The following tables present derivative instruments included on the Consolidated Balance Sheet in derivative assets and liabilities at December 31, 2013 and 2012. Balances are presented on a gross basis, prior to the application of counterparty and cash collateral netting. Total derivative assets and liabilities are adjusted on an aggregate basis to take into consideration the effects of legally enforceable master netting agreements and have been reduced by the cash collateral received or paid.
December 31, 2013 Gross Derivative Assets Gross Derivative Liabilities
(Dollars in billions)Contract/Notional (1)
TradingDerivatives
and Other RiskManagementDerivatives
QualifyingAccounting
Hedges Total
TradingDerivatives
and Other RiskManagementDerivatives
QualifyingAccounting
Hedges Total
Interest rate contracts
Swaps $ 33,272.0 $ 659.9 $ 7.5 $ 667.4 $ 658.4 $ 0.9 $ 659.3
Futures and forwards 8,217.6 1.6 — 1.6 1.5 — 1.5
Written options 2,065.4 — — — 64.4 — 64.4
Purchased options 2,028.3 65.4 — 65.4 — — —
Foreign exchange contracts
Swaps 2,284.1 43.1 1.0 44.1 42.7 1.0 43.7
Spot, futures and forwards 2,922.5 32.5 0.7 33.2 33.5 1.1 34.6
Written options 412.4 — — — 9.2 — 9.2
Purchased options 392.4 8.8 — 8.8 — — —
Equity contracts
Swaps 162.0 3.6 — 3.6 4.2 — 4.2
Futures and forwards 71.4 1.1 — 1.1 1.4 — 1.4
Written options 315.6 — — — 29.6 — 29.6
Purchased options 266.7 30.4 — 30.4 — — —
Commodity contracts
Swaps 73.1 3.8 — 3.8 5.7 — 5.7
Futures and forwards 454.4 4.7 — 4.7 2.5 — 2.5
Written options 157.3 — — — 5.0 — 5.0
Purchased options 164.0 5.2 — 5.2 — — —
Credit derivatives
Purchased credit derivatives:
Credit default swaps 1,305.1 15.7 — 15.7 28.1 — 28.1
Total return swaps/other 38.1 2.0 — 2.0 3.2 — 3.2
Written credit derivatives:
Credit default swaps 1,265.4 29.3 — 29.3 13.8 — 13.8
Total return swaps/other 63.4 4.0 — 4.0 0.2 — 0.2
Gross derivative assets/liabilities $ 911.1 $ 9.2 $ 920.3 $ 903.4 $ 3.0 $ 906.4
Less: Legally enforceable master netting agreements (825.5) (825.5)
Less: Cash collateral received/paid (47.3) (43.5)
Total derivative assets/liabilities $ 47.5 $ 37.4(1) Represents the total contract/notional amount of derivative assets and liabilities outstanding.
76788ba_financials.indd 165 3/6/14 12:06 PM
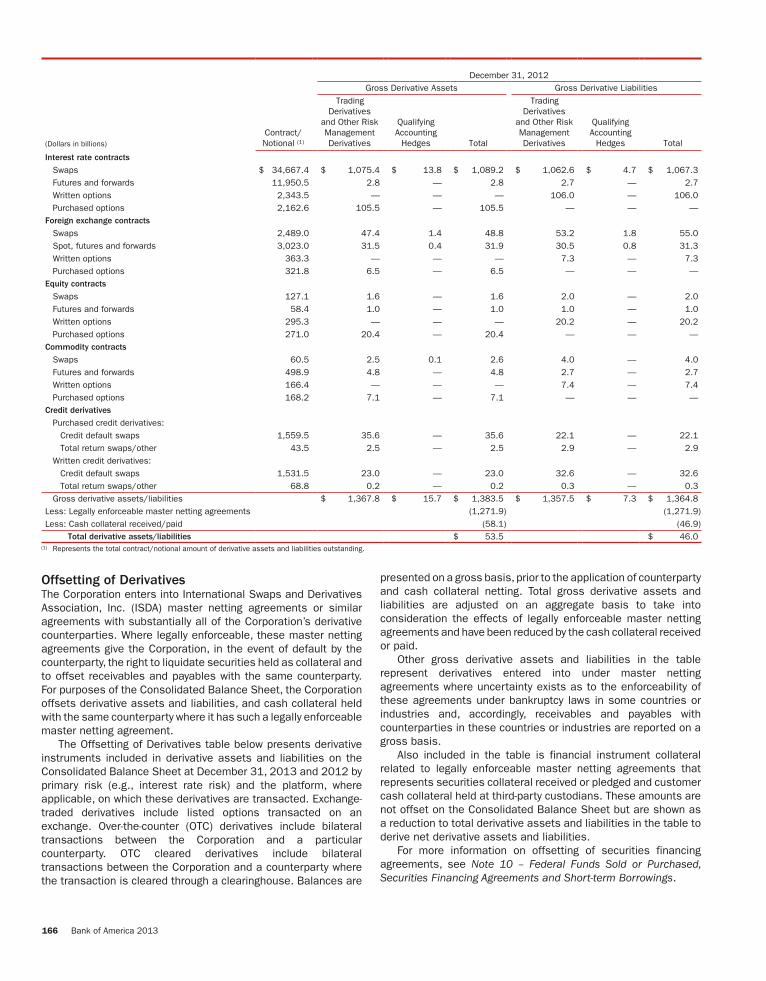
166 Bank of America 2013
December 31, 2012 Gross Derivative Assets Gross Derivative Liabilities
(Dollars in billions)Contract/Notional (1)
TradingDerivatives
and Other RiskManagementDerivatives
QualifyingAccounting
Hedges Total
TradingDerivatives
and Other RiskManagementDerivatives
QualifyingAccounting
Hedges Total
Interest rate contracts Swaps $ 34,667.4 $ 1,075.4 $ 13.8 $ 1,089.2 $ 1,062.6 $ 4.7 $ 1,067.3Futures and forwards 11,950.5 2.8 — 2.8 2.7 — 2.7Written options 2,343.5 — — — 106.0 — 106.0Purchased options 2,162.6 105.5 — 105.5 — — —
Foreign exchange contracts Swaps 2,489.0 47.4 1.4 48.8 53.2 1.8 55.0Spot, futures and forwards 3,023.0 31.5 0.4 31.9 30.5 0.8 31.3Written options 363.3 — — — 7.3 — 7.3Purchased options 321.8 6.5 — 6.5 — — —
Equity contracts Swaps 127.1 1.6 — 1.6 2.0 — 2.0Futures and forwards 58.4 1.0 — 1.0 1.0 — 1.0Written options 295.3 — — — 20.2 — 20.2Purchased options 271.0 20.4 — 20.4 — — —
Commodity contracts Swaps 60.5 2.5 0.1 2.6 4.0 — 4.0Futures and forwards 498.9 4.8 — 4.8 2.7 — 2.7Written options 166.4 — — — 7.4 — 7.4Purchased options 168.2 7.1 — 7.1 — — —
Credit derivatives Purchased credit derivatives:
Credit default swaps 1,559.5 35.6 — 35.6 22.1 — 22.1Total return swaps/other 43.5 2.5 — 2.5 2.9 — 2.9
Written credit derivatives: Credit default swaps 1,531.5 23.0 — 23.0 32.6 — 32.6Total return swaps/other 68.8 0.2 — 0.2 0.3 — 0.3
Gross derivative assets/liabilities $ 1,367.8 $ 15.7 $ 1,383.5 $ 1,357.5 $ 7.3 $ 1,364.8Less: Legally enforceable master netting agreements (1,271.9) (1,271.9)Less: Cash collateral received/paid (58.1) (46.9)
Total derivative assets/liabilities $ 53.5 $ 46.0(1) Represents the total contract/notional amount of derivative assets and liabilities outstanding.
Offsetting of DerivativesThe Corporation enters into International Swaps and Derivatives Association, Inc. (ISDA) master netting agreements or similar agreements with substantially all of the Corporation’s derivative counterparties. Where legally enforceable, these master netting agreements give the Corporation, in the event of default by the counterparty, the right to liquidate securities held as collateral and to offset receivables and payables with the same counterparty. For purposes of the Consolidated Balance Sheet, the Corporation offsets derivative assets and liabilities, and cash collateral held with the same counterparty where it has such a legally enforceable master netting agreement.
The Offsetting of Derivatives table below presents derivative instruments included in derivative assets and liabilities on the Consolidated Balance Sheet at December 31, 2013 and 2012 by primary risk (e.g., interest rate risk) and the platform, where applicable, on which these derivatives are transacted. Exchange-traded derivatives include listed options transacted on an exchange. Over-the-counter (OTC) derivatives include bilateral transactions between the Corporation and a particular counterparty. OTC cleared derivatives include bilateral transactions between the Corporation and a counterparty where the transaction is cleared through a clearinghouse. Balances are
presented on a gross basis, prior to the application of counterparty and cash collateral netting. Total gross derivative assets and liabilities are adjusted on an aggregate basis to take into consideration the effects of legally enforceable master netting agreements and have been reduced by the cash collateral received or paid.
Other gross derivative assets and liabilities in the table represent derivatives entered into under master netting agreements where uncertainty exists as to the enforceability of these agreements under bankruptcy laws in some countries or industries and, accordingly, receivables and payables with counterparties in these countries or industries are reported on a gross basis.
Also included in the table is financial instrument collateral related to legally enforceable master netting agreements that represents securities collateral received or pledged and customer cash collateral held at third-party custodians. These amounts are not offset on the Consolidated Balance Sheet but are shown as a reduction to total derivative assets and liabilities in the table to derive net derivative assets and liabilities.
For more information on offsetting of securities financing agreements, see Note 10 – Federal Funds Sold or Purchased, Securities Financing Agreements and Short-term Borrowings.
76788ba_financials.indd 166 3/6/14 12:06 PM

Bank of America 2013 167
Offsetting of Derivatives
December 31, 2013 December 31, 2012
(Dollars in billions)Derivative
AssetsDerivativeLiabilities
Derivative Assets
DerivativeLiabilities
Interest rate contracts Over-the-counter $ 381.7 $ 365.9 $ 646.7 $ 623.4Exchange-traded 0.4 0.3 — —Over-the-counter cleared 351.2 356.5 539.5 545.1
Foreign exchange contracts
Over-the-counter 82.9 83.9 84.1 88.7Equity contracts
Over-the-counter 20.3 17.6 15.2 13.3Exchange-traded 8.4 9.8 4.8 4.7
Commodity contracts
Over-the-counter 6.3 7.4 6.9 7.9Exchange-traded 3.3 2.9 3.4 3.2
Credit derivatives
Over-the-counter 44.0 38.9 56.0 53.9Over-the-counter cleared 5.8 5.9 3.8 3.4
Total gross derivative assets/liabilities, before nettingOver-the-counter 535.2 513.7 808.9 787.2Exchange-traded 12.1 13.0 8.2 7.9Over-the-counter cleared 357.0 362.4 543.3 548.5
Less: Legally enforceable master netting agreements and cash collateral received/paidOver-the-counter (505.0) (495.4) (780.8) (764.4)Exchange-traded (11.2) (11.2) (5.9) (5.9)Over-the-counter cleared (356.6) (362.4) (543.3) (548.5)
Derivative assets/liabilities, after netting 31.5 20.1 30.4 24.8Other gross derivative assets/liabilities 16.0 17.3 23.1 21.2
Total derivative assets/liabilities 47.5 37.4 53.5 46.0Less: Financial instruments collateral (1) (10.1) (4.6) (11.5) (14.6)
Total net derivative assets/liabilities $ 37.4 $ 32.8 $ 42.0 $ 31.4(1) These amounts are limited to the derivative asset/liability balance and, accordingly, do not include excess collateral received/pledged.
ALM and Risk Management DerivativesThe Corporation’s asset and liability management (ALM) and risk management activities include the use of derivatives to mitigate risk to the Corporation including derivatives designated in qualifying hedge accounting relationships and derivatives used in other risk management activities. Interest rate, foreign exchange, equity, commodity and credit contracts are utilized in the Corporation’s ALM and risk management activities.
The Corporation maintains an overall interest rate risk management strategy that incorporates the use of interest rate contracts, which are generally non-leveraged generic interest rate and basis swaps, options, futures and forwards, to minimize significant fluctuations in earnings that are caused by interest rate volatility. The Corporation’s goal is to manage interest rate sensitivity and volatility so that movements in interest rates do not significantly adversely affect earnings or capital. As a result of interest rate fluctuations, hedged fixed-rate assets and liabilities appreciate or depreciate in fair value. Gains or losses on the derivative instruments that are linked to the hedged fixed-rate assets and liabilities are expected to substantially offset this unrealized appreciation or depreciation.
Market risk, including interest rate risk, can be substantial in the mortgage business. Market risk is the risk that values of mortgage assets or revenues will be adversely affected by changes in market conditions such as interest rate movements. To mitigate the interest rate risk in mortgage banking production income, the Corporation utilizes forward loan sale commitments and other derivative instruments including purchased options, and certain debt securities. The Corporation also utilizes derivatives such as interest rate options, interest rate swaps, forward settlement contracts and Eurodollar futures to hedge certain market risks of MSRs. For more information on MSRs, see Note 23 – Mortgage Servicing Rights.
The Corporation uses foreign exchange contracts to manage the foreign exchange risk associated with certain foreign currency-denominated assets and liabilities, as well as the Corporation’s investments in non-U.S. subsidiaries. Foreign exchange contracts, which include spot and forward contracts, represent agreements to exchange the currency of one country for the currency of another country at an agreed-upon price on an agreed-upon settlement date. Exposure to loss on these contracts will increase or decrease over their respective lives as currency exchange and interest rates fluctuate.
76788ba_financials.indd 167 3/6/14 12:06 PM
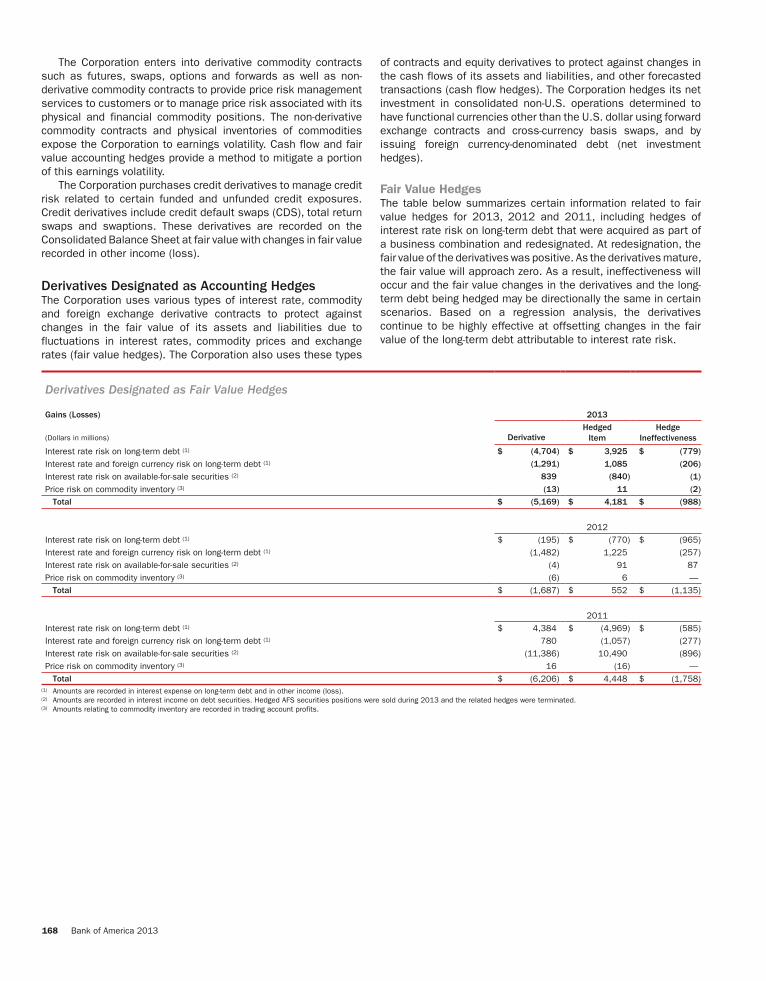
168 Bank of America 2013
The Corporation enters into derivative commodity contracts such as futures, swaps, options and forwards as well as non-derivative commodity contracts to provide price risk management services to customers or to manage price risk associated with its physical and financial commodity positions. The non-derivative commodity contracts and physical inventories of commodities expose the Corporation to earnings volatility. Cash flow and fair value accounting hedges provide a method to mitigate a portion of this earnings volatility.
The Corporation purchases credit derivatives to manage credit risk related to certain funded and unfunded credit exposures. Credit derivatives include credit default swaps (CDS), total return swaps and swaptions. These derivatives are recorded on the Consolidated Balance Sheet at fair value with changes in fair value recorded in other income (loss).
Derivatives Designated as Accounting HedgesThe Corporation uses various types of interest rate, commodity and foreign exchange derivative contracts to protect against changes in the fair value of its assets and liabilities due to fluctuations in interest rates, commodity prices and exchange rates (fair value hedges). The Corporation also uses these types
of contracts and equity derivatives to protect against changes in the cash flows of its assets and liabilities, and other forecasted transactions (cash flow hedges). The Corporation hedges its net investment in consolidated non-U.S. operations determined to have functional currencies other than the U.S. dollar using forward exchange contracts and cross-currency basis swaps, and by issuing foreign currency-denominated debt (net investment hedges).
Fair Value HedgesThe table below summarizes certain information related to fair value hedges for 2013, 2012 and 2011, including hedges of interest rate risk on long-term debt that were acquired as part of a business combination and redesignated. At redesignation, the fair value of the derivatives was positive. As the derivatives mature, the fair value will approach zero. As a result, ineffectiveness will occur and the fair value changes in the derivatives and the long-term debt being hedged may be directionally the same in certain scenarios. Based on a regression analysis, the derivatives continue to be highly effective at offsetting changes in the fair value of the long-term debt attributable to interest rate risk.
Derivatives Designated as Fair Value Hedges
Gains (Losses) 2013
(Dollars in millions) DerivativeHedged
ItemHedge
Ineffectiveness
Interest rate risk on long-term debt (1) $ (4,704) $ 3,925 $ (779)
Interest rate and foreign currency risk on long-term debt (1) (1,291) 1,085 (206)
Interest rate risk on available-for-sale securities (2) 839 (840) (1)
Price risk on commodity inventory (3) (13) 11 (2)
Total $ (5,169) $ 4,181 $ (988)
2012Interest rate risk on long-term debt (1) $ (195) $ (770) $ (965)Interest rate and foreign currency risk on long-term debt (1) (1,482) 1,225 (257)Interest rate risk on available-for-sale securities (2) (4) 91 87Price risk on commodity inventory (3) (6) 6 —
Total $ (1,687) $ 552 $ (1,135)
2011Interest rate risk on long-term debt (1) $ 4,384 $ (4,969) $ (585)Interest rate and foreign currency risk on long-term debt (1) 780 (1,057) (277)Interest rate risk on available-for-sale securities (2) (11,386) 10,490 (896)Price risk on commodity inventory (3) 16 (16) —
Total $ (6,206) $ 4,448 $ (1,758)(1) Amounts are recorded in interest expense on long-term debt and in other income (loss).(2) Amounts are recorded in interest income on debt securities. Hedged AFS securities positions were sold during 2013 and the related hedges were terminated.(3) Amounts relating to commodity inventory are recorded in trading account profits.
76788ba_financials.indd 168 3/6/14 12:06 PM

Bank of America 2013 169
Cash Flow and Net Investment HedgesThe table below summarizes certain information related to cash flow hedges and net investment hedges for 2013, 2012 and 2011. During the next 12 months, net losses in accumulated other comprehensive income (OCI) of $784 million ($494 million after-tax) on derivative instruments that qualify as cash flow hedges are expected to be reclassified into earnings. These net losses reclassified into earnings are expected to primarily reduce net interest income related to the respective hedged items. Amounts related to commodity price risk reclassified from accumulated OCI
are recorded in trading account profits with the underlying hedged item. Amounts related to price risk on restricted stock awards reclassified from accumulated OCI are recorded in personnel expense.
Amounts related to foreign exchange risk recognized in accumulated OCI on derivatives exclude pre-tax losses of $7 million and pre-tax gains of $82 million related to long-term debt designated as a net investment hedge for 2012 and 2011. There were no such hedges for 2013.
Derivatives Designated as Cash Flow and Net Investment Hedges
2013
(Dollars in millions, amounts pre-tax)
Gains (Losses)Recognized in
Accumulated OCIon Derivatives
Gains (Losses)in Income
Reclassified fromAccumulated OCI
HedgeIneffectiveness andAmounts Excludedfrom Effectiveness
Testing (1)
Cash flow hedges
Interest rate risk on variable-rate portfolios $ (321) $ (1,102) $ —
Price risk on restricted stock awards 477 329 —
Total $ 156 $ (773) $ —
Net investment hedges
Foreign exchange risk $ 1,024 $ (355) $ (134)
2012Cash flow hedges
Interest rate risk on variable-rate portfolios $ 10 $ (957) $ —Price risk on restricted stock awards 420 (78) —
Total $ 430 $ (1,035) $ —Net investment hedges
Foreign exchange risk $ (771) $ (26) $ (269)
2011Cash flow hedges
Interest rate risk on variable-rate portfolios $ (2,079) $ (1,392) $ (8)Commodity price risk on forecasted purchases and sales (3) 6 (3)Price risk on restricted stock awards (408) (231) —
Total $ (2,490) $ (1,617) $ (11)Net investment hedges
Foreign exchange risk $ (1,055) $ 384 $ (572)(1) Amounts related to derivatives designated as cash flow hedges represent hedge ineffectiveness and amounts related to net investment hedges represent amounts excluded from effectiveness
testing.
76788ba_financials.indd 169 3/6/14 12:06 PM

170 Bank of America 2013
Other Risk Management DerivativesOther risk management derivatives are used by the Corporation to reduce certain risk exposures. These derivatives are not qualifying accounting hedges because either they did not qualify
for or were not designated as accounting hedges. The table below presents gains (losses) on these derivatives for 2013, 2012 and 2011. These gains (losses) are largely offset by the income or expense that is recorded on the hedged item.
Other Risk Management Derivatives
Gains (Losses)
(Dollars in millions) 2013 2012 2011Price risk on mortgage banking production income (1, 2) $ 968 $ 3,022 $ 2,852Market-related risk on mortgage banking servicing income (1) (1,108) 2,000 3,612Credit risk on loans (3) (47) (95) 30Interest rate and foreign currency risk on ALM activities (4) 2,501 424 (48)Price risk on restricted stock awards (5) 865 1,008 (610)Other (19) 58 281
Total $ 3,160 $ 6,417 $ 6,117(1) Net gains on these derivatives are recorded in mortgage banking income.(2) Includes net gains on interest rate lock commitments related to the origination of mortgage loans that are held-for-sale, which are considered derivative instruments, of $927 million, $3.0 billion
and $3.8 billion for 2013, 2012 and 2011, respectively.(3) Net gains (losses) on these derivatives are recorded in other income (loss).(4) The balance is primarily related to hedges of debt securities carried at fair value and hedges of foreign currency-denominated debt. Results from these items are recorded in other income (loss). The
offsetting mark-to-market, while not included in the table above, is also recorded in other income (loss).(5) Gains (losses) on these derivatives are recorded in personnel expense.
Sales and Trading RevenueThe Corporation enters into trading derivatives to facilitate client transactions and to manage risk exposures arising from trading account assets and liabilities. It is the Corporation’s policy to include these derivative instruments in its trading activities which include derivatives and non-derivative cash instruments. The resulting risk from these derivatives is managed on a portfolio basis as part of the Corporation’s Global Markets business segment. The related sales and trading revenue generated within Global Markets is recorded in various income statement line items including trading account profits and net interest income as well as other revenue categories. However, the majority of income related to derivative instruments is recorded in trading account profits.
Sales and trading revenue includes changes in the fair value and realized gains and losses on the sales of trading and other assets, net interest income, and fees primarily from commissions on equity securities. Revenue is generated by the difference in the client price for an instrument and the price at which the trading desk can execute the trade in the dealer market. For equity
securities, commissions related to purchases and sales are recorded in the “Other” column in the Sales and Trading Revenue table. Changes in the fair value of these securities are included in trading account profits. For debt securities, revenue, with the exception of interest associated with the debt securities, is typically included in trading account profits. Unlike commissions for equity securities, the initial revenue related to broker/dealer services for debt securities is typically included in the pricing of the instrument rather than being charged through separate fee arrangements. Therefore, this revenue is recorded in trading account profits as part of the initial mark to fair value. For derivatives, all revenue is included in trading account profits. In transactions where the Corporation acts as agent, which include exchange-traded futures and options, fees are recorded in other income (loss).
Gains (losses) on certain instruments, primarily loans, that the Global Markets business segment shares with Global Banking are not considered trading instruments and are excluded from sales and trading revenue in their entirety.
76788ba_financials.indd 170 3/6/14 12:06 PM

Bank of America 2013 171
The table below, which includes both derivatives and non-derivative cash instruments, identifies the amounts in the respective income statement line items attributable to the Corporation’s sales and trading revenue in Global Markets, categorized by primary risk, for 2013, 2012 and 2011. The difference between total trading account profits in the table below
and in the Consolidated Statement of Income represents trading activities in business segments other than Global Markets. This table includes debit valuation adjustment (DVA) gains (losses), net of hedges. Global Markets results in Note 24 – Business Segment Information are presented on a fully taxable-equivalent (FTE) basis. The table below is not presented on a FTE basis.
Sales and Trading Revenue
2013
(Dollars in millions)
TradingAccountProfits
NetInterestIncome Other (1) Total
Interest rate risk $ 1,120 $ 1,104 $ 83 $ 2,307
Foreign exchange risk 1,170 4 (26) 1,148
Equity risk 1,994 112 2,094 4,200
Credit risk 2,075 2,711 88 4,874
Other risk 375 (203) 202 374
Total sales and trading revenue $ 6,734 $ 3,728 $ 2,441 $ 12,903
2012Interest rate risk $ 583 $ 1,040 $ (6) $ 1,617Foreign exchange risk 909 5 6 920Equity risk 1,180 (57) 1,891 3,014Credit risk 2,522 2,321 961 5,804Other risk 512 (219) (42) 251
Total sales and trading revenue $ 5,706 $ 3,090 $ 2,810 $ 11,606
2011Interest rate risk $ 2,148 $ 923 $ (63) $ 3,008Foreign exchange risk 1,090 8 (10) 1,088Equity risk 1,482 129 2,347 3,958Credit risk 1,067 2,605 552 4,224Other risk 630 (184) (72) 374
Total sales and trading revenue $ 6,417 $ 3,481 $ 2,754 $ 12,652(1) Represents amounts in investment and brokerage services and other income (loss) that are recorded in Global Markets and included in the definition of sales and trading revenue. Includes investment
and brokerage services revenue of $2.0 billion, $1.8 billion and $2.2 billion for 2013, 2012 and 2011, respectively.
Credit DerivativesThe Corporation enters into credit derivatives primarily to facilitate client transactions and to manage credit risk exposures. Credit derivatives derive value based on an underlying third-party referenced obligation or a portfolio of referenced obligations and generally require the Corporation, as the seller of credit protection, to make payments to a buyer upon the occurrence of a pre-defined credit event. Such credit events generally include bankruptcy of
the referenced credit entity and failure to pay under the obligation, as well as acceleration of indebtedness and payment repudiation or moratorium. For credit derivatives based on a portfolio of referenced credits or credit indices, the Corporation may not be required to make payment until a specified amount of loss has occurred and/or may only be required to make payment up to a specified amount.
76788ba_financials.indd 171 3/6/14 12:06 PM

172 Bank of America 2013
Credit derivative instruments where the Corporation is the seller of credit protection and their expiration are summarized at December 31, 2013 and 2012 in the table below. These instruments are classified as investment and non-investment grade based on the credit quality of the underlying referenced
obligation. The Corporation considers ratings of BBB- or higher as investment grade. Non-investment grade includes non-rated credit derivative instruments. The Corporation discloses internal categorizations of investment grade and non-investment grade consistent with how risk is managed for these instruments.
Credit Derivative Instruments
December 31, 2013
Carrying Value
(Dollars in millions)Less thanOne Year
One toThree Years
Three toFive Years
Over FiveYears Total
Credit default swaps:
Investment grade $ 2 $ 220 $ 974 $ 1,134 $ 2,330
Non-investment grade 424 1,924 2,469 6,667 11,484
Total 426 2,144 3,443 7,801 13,814
Total return swaps/other:
Investment grade 22 — — — 22
Non-investment grade 29 38 2 86 155
Total 51 38 2 86 177
Total credit derivatives $ 477 $ 2,182 $ 3,445 $ 7,887 $ 13,991
Credit-related notes: (1)
Investment grade $ — $ 278 $ 595 $ 4,457 $ 5,330
Non-investment grade 145 107 756 946 1,954
Total credit-related notes $ 145 $ 385 $ 1,351 $ 5,403 $ 7,284
Maximum Payout/Notional
Credit default swaps:
Investment grade $ 170,764 $ 379,273 $ 411,426 $ 36,039 $ 997,502
Non-investment grade 53,316 90,986 95,319 28,257 267,878
Total 224,080 470,259 506,745 64,296 1,265,380
Total return swaps/other:
Investment grade 21,771 — — — 21,771
Non-investment grade 27,784 8,150 4,103 1,599 41,636
Total 49,555 8,150 4,103 1,599 63,407
Total credit derivatives $ 273,635 $ 478,409 $ 510,848 $ 65,895 $ 1,328,787
December 31, 2012Carrying Value
Credit default swaps: Investment grade $ 52 $ 757 $ 5,595 $ 2,903 $ 9,307Non-investment grade 923 4,403 7,030 10,959 23,315
Total 975 5,160 12,625 13,862 32,622Total return swaps/other:
Investment grade 39 — — — 39Non-investment grade 57 104 39 37 237
Total 96 104 39 37 276Total credit derivatives $ 1,071 $ 5,264 $ 12,664 $ 13,899 $ 32,898
Credit-related notes: (1) Investment grade $ 4 $ 12 $ 441 $ 3,849 $ 4,306Non-investment grade 116 161 314 1,425 2,016
Total credit-related notes $ 120 $ 173 $ 755 $ 5,274 $ 6,322
Maximum Payout/NotionalCredit default swaps:
Investment grade $ 260,177 $ 349,125 $ 500,038 $ 90,453 $1,199,793Non-investment grade 79,861 99,043 110,248 42,559 331,711
Total 340,038 448,168 610,286 133,012 1,531,504Total return swaps/other:
Investment grade 43,536 15 — — 43,551Non-investment grade 5,566 11,028 7,631 1,035 25,260
Total 49,102 11,043 7,631 1,035 68,811Total credit derivatives $ 389,140 $ 459,211 $ 617,917 $ 134,047 $1,600,315
(1) For credit-related notes, maximum payout/notional is the same as carrying value.
76788ba_financials.indd 172 3/6/14 12:06 PM

Bank of America 2013 173
The notional amount represents the maximum amount payable by the Corporation for most credit derivatives. However, the Corporation does not monitor its exposure to credit derivatives based solely on the notional amount because this measure does not take into consideration the probability of occurrence. As such, the notional amount is not a reliable indicator of the Corporation’s exposure to these contracts. Instead, a risk framework is used to define risk tolerances and establish limits to help ensure that certain credit risk-related losses occur within acceptable, predefined limits.
The Corporation manages its market risk exposure to credit derivatives by entering into a variety of offsetting derivative contracts and security positions. For example, in certain instances, the Corporation may purchase credit protection with identical underlying referenced names to offset its exposure. The carrying value and notional amount of written credit derivatives for which the Corporation held purchased credit derivatives with identical underlying referenced names and terms were $8.1 billion and $1.0 trillion at December 31, 2013 and $20.7 billion and $1.1 trillion at December 31, 2012.
Credit-related notes in the table on page 172 include investments in securities issued by collateralized debt obligation (CDO), collateralized loan obligation (CLO) and credit-linked note vehicles. These instruments are primarily classified as trading securities. The carrying value of these instruments equals the Corporation’s maximum exposure to loss. The Corporation is not obligated to make any payments to the entities under the terms of the securities owned.
Credit-related Contingent Features and CollateralThe Corporation executes the majority of its derivative contracts in the OTC market with large, international financial institutions, including broker/dealers and, to a lesser degree, with a variety of non-financial companies. Substantially all of the derivative transactions are executed on a daily margin basis. Therefore, events such as a credit rating downgrade (depending on the ultimate rating level) or a breach of credit covenants would typically require an increase in the amount of collateral required of the counterparty, where applicable, and/or allow the Corporation to take additional protective measures such as early termination of all trades. Further, as previously discussed on page 165, the Corporation enters into legally enforceable master netting agreements which reduce risk by permitting the closeout and netting of transactions with the same counterparty upon the occurrence of certain events.
A majority of the Corporation’s derivative contracts contain credit risk-related contingent features, primarily in the form of ISDA master netting agreements and credit support documentation that enhance the creditworthiness of these instruments compared to other obligations of the respective counterparty with whom the Corporation has transacted. These contingent features may be for the benefit of the Corporation as well as its counterparties with respect to changes in the Corporation’s creditworthiness and the mark-to-market exposure under the derivative transactions. At December 31, 2013 and 2012, the Corporation held cash and securities collateral of $74.4 billion and $85.6 billion, and posted
cash and securities collateral of $56.1 billion and $74.1 billion in the normal course of business under derivative agreements.
In connection with certain OTC derivative contracts and other trading agreements, the Corporation can be required to provide additional collateral or to terminate transactions with certain counterparties in the event of a downgrade of the senior debt ratings of the Corporation or certain subsidiaries. The amount of additional collateral required depends on the contract and is usually a fixed incremental amount and/or the market value of the exposure.
At December 31, 2013, the amount of collateral, calculated based on the terms of the contracts, that the Corporation and certain subsidiaries could be required to post to counterparties but had not yet posted to counterparties was approximately $1.3 billion, including $700 million for Bank of America, N.A. (BANA).
Some counterparties are currently able to unilaterally terminate certain contracts, or the Corporation or certain subsidiaries may be required to take other action such as find a suitable replacement or obtain a guarantee. At December 31, 2013, the current liability recorded for these derivative contracts was $385 million, against which the Corporation and certain subsidiaries had posted approximately $350 million of collateral.
The table below presents the amount of additional collateral contractually required by derivative contracts and other trading agreements at December 31, 2013 if the rating agencies had downgraded their long-term senior debt ratings for the Corporation or certain subsidiaries by one incremental notch and by an additional second incremental notch.
Additional Collateral Required to be Posted UponDowngrade
December 31, 2013
(Dollars in millions)
One incremental
notch
Secondincremental
notch
Bank of America Corporation $ 1,302 $ 4,101Bank of America, N.A. and subsidiaries (1) 881 3,039
(1) Included in Bank of America Corporation collateral requirements in this table.
The table below presents the derivative liability that would be subject to unilateral termination by counterparties and the amounts of collateral that would have been posted at December 31, 2013 if the rating agencies had downgraded their long-term senior debt ratings for the Corporation or certain subsidiaries by one incremental notch and by an additional second incremental notch.
Derivative Liability Subject to Unilateral Termination UponDowngrade
December 31, 2013
(Dollars in millions)
One incremental
notch
Secondincremental
notch
Derivative liability $ 927 $ 1,878Collateral posted 733 1,467
76788ba_financials.indd 173 3/6/14 12:06 PM

174 Bank of America 2013
Valuation Adjustments on DerivativesThe Corporation records credit risk valuation adjustments on derivatives in order to properly reflect the credit quality of the counterparties and its own credit quality. The Corporation calculates valuation adjustments on derivatives based on a modeled expected exposure that incorporates current market risk factors. The exposure also takes into consideration credit mitigants such as enforceable master netting agreements and collateral. CDS spread data is used to estimate the default probabilities and severities that are applied to the exposures. Where no observable credit default data is available for counterparties, the Corporation uses proxies and other market data to estimate default probabilities and severity.
Valuation adjustments on derivatives are affected by changes in market spreads, non-credit related market factors such as interest rate and currency changes that affect the expected exposure, and other factors like changes in collateral arrangements and partial payments. Credit spreads and non-credit factors can move independently. For example, for an interest rate swap, changes in interest rates may increase the expected exposure which would increase the counterparty credit valuation adjustment (CVA). Independently, counterparty credit spreads may tighten, which would result in an offsetting decrease to CVA.
The Corporation may enter into risk management activities to offset market driven exposures. The Corporation often hedges the counterparty spread risk in CVA with CDS and often hedges the other market risks in both CVA and DVA primarily with currency and interest rate swaps. Since the components of the valuation adjustments on derivatives move independently and the Corporation may not hedge all of the market driven exposures, the effect of a hedge may increase the gross valuation adjustments on derivatives or may result in a gross positive valuation adjustment on derivatives becoming a negative adjustment (or the reverse).
In 2013, the Corporation refined its methodology for calculating CVA and DVA on a prospective basis, to adjust the way it values mutual termination clauses in derivatives contracts and to more fully incorporate the potential for the counterparties to default prior to a change in their credit ratings. This change in estimate increased CVA by $361 million and DVA by $433 million resulting in a net positive earnings impact of $72 million at the time of the change and is included in the results for 2013. The net CVA and DVA excluding the impact of these refinements was a gain of $265 million and a loss of $508 million for 2013.
The table below presents CVA and DVA gains (losses), which are recorded in trading account profits on a gross and net of hedge basis.
Valuation Adjustments on Derivatives
2013 2012 2011(Dollars in millions) Gross Net Gross Net Gross NetDerivative assets (CVA) (1) $ 738 $ (96) $ 1,022 $ 291 $ (1,863) $ (606)Derivative liabilities (DVA) (2) (39) (75) (2,212) (2,477) 1,385 1,000
(1) At December 31, 2013, 2012 and 2011, the cumulative CVA reduced the derivative assets balance by $1.6 billion, $2.4 billion and $2.8 billion, respectively.(2) At December 31, 2013, 2012 and 2011, the cumulative DVA reduced the derivative liabilities balance by $803 million, $807 million and $2.4 billion, respectively.
76788ba_financials.indd 174 3/6/14 12:06 PM

Bank of America 2013 175
NOTE 3 SecuritiesThe Corporation’s debt securities carried at fair value include debt securities purchased for longer term investment purposes and are used as part of ALM and other strategic activities. Generally, debt securities carried at fair value are accounted for as available-for-sale (AFS) debt securities with unrealized gains and losses reported in accumulated OCI. For certain other debt securities purchased for ALM and other strategic purposes, the Corporation has elected to report those securities at fair value with unrealized gains and losses reported in other income (loss) in the Consolidated Statement of Income.
As a result of growth in the portfolio of debt securities carried at fair value with unrealized gains and losses recorded in other income (loss) and to better reflect how such a portfolio is managed as part of the ALM activities, the Corporation changed the presentation of such securities in 2013 to combine debt securities
carried at fair value into one line item on the Consolidated Balance Sheet. Previously, the portfolio of debt securities carried at fair value with unrealized gains and losses recorded in other income (loss) was classified in other assets. The Corporation may hedge these debt securities with risk management derivatives with the unrealized gains and losses also reported in other income (loss). Certain debt securities are carried at fair value with unrealized gains and losses reported in other income (loss) to mitigate accounting asymmetry with the risk management derivatives and to achieve operational simplifications. Prior-period amounts have been reclassified to conform to the current period presentation.
The table below presents the amortized cost, gross unrealized gains and losses, and fair value of AFS debt securities, other debt securities carried at fair value, held-to-maturity (HTM) debt securities and AFS marketable equity securities at December 31, 2013 and 2012.
Debt Securities and Available-for-Sale Marketable Equity Securities
December 31, 2013
(Dollars in millions)Amortized
Cost
GrossUnrealized
Gains
GrossUnrealized
LossesFair
Value
Available-for-sale debt securities
U.S. Treasury and agency securities $ 8,910 $ 106 $ (62) $ 8,954
Mortgage-backed securities:
Agency 170,112 777 (5,954) 164,935
Agency-collateralized mortgage obligations 22,731 76 (315) 22,492
Non-agency residential (1) 6,124 238 (123) 6,239
Commercial 2,429 63 (12) 2,480
Non-U.S. securities 7,207 37 (24) 7,220
Corporate/Agency bonds 860 20 (7) 873
Other taxable securities, substantially all asset-backed securities 16,805 30 (5) 16,830
Total taxable securities 235,178 1,347 (6,502) 230,023
Tax-exempt securities 5,967 10 (49) 5,928
Total available-for-sale debt securities 241,145 1,357 (6,551) 235,951
Other debt securities carried at fair value 34,145 34 (1,335) 32,844
Total debt securities carried at fair value 275,290 1,391 (7,886) 268,795
Held-to-maturity debt securities, substantially all U.S. agency mortgage-backed securities 55,150 20 (2,740) 52,430
Total debt securities $ 330,440 $ 1,411 $ (10,626) $ 321,225
Available-for-sale marketable equity securities (2) $ 230 $ — $ (7) $ 223
December 31, 2012Available-for-sale debt securities
U.S. Treasury and agency securities $ 24,232 $ 324 $ (84) $ 24,472Mortgage-backed securities:
Agency 183,247 5,048 (146) 188,149Agency-collateralized mortgage obligations 36,329 1,427 (218) 37,538Non-agency residential (1) 9,231 391 (128) 9,494Non-agency commercial 3,576 348 — 3,924
Non-U.S. securities 5,574 50 (6) 5,618Corporate/Agency bonds 1,415 51 (16) 1,450Other taxable securities, substantially all asset-backed securities 12,089 54 (15) 12,128
Total taxable securities 275,693 7,693 (613) 282,773Tax-exempt securities 4,167 13 (47) 4,133
Total available-for-sale debt securities 279,860 7,706 (660) 286,906Other debt securities carried at fair value 23,927 120 (103) 23,944
Total debt securities carried at fair value 303,787 7,826 (763) 310,850Held-to-maturity debt securities, substantially all U.S. agency mortgage-backed securities 49,481 815 (26) 50,270
Total debt securities $ 353,268 $ 8,641 $ (789) $ 361,120Available-for-sale marketable equity securities (2) $ 780 $ 732 $ — $ 1,512
(1) At December 31, 2013 and 2012, the underlying collateral type included approximately 89 percent and 91 percent prime, seven percent and six percent Alt-A, and four percent and three percent subprime.
(2) Classified in other assets on the Consolidated Balance Sheet.
76788ba_financials.indd 175 3/6/14 12:06 PM

176 Bank of America 2013
At December 31, 2013, the accumulated net unrealized loss on AFS debt securities included in accumulated OCI was $3.3 billion, net of the related income tax benefit of $1.9 billion. At December 31, 2013 and 2012, the Corporation had nonperforming AFS debt securities of $103 million and $91 million.
The following table presents the components of other debt securities carried at fair value where the changes in fair value are reported in other income (loss) at December 31, 2013 and 2012. In 2013, the Corporation recorded unrealized mark-to-market net losses in other income (loss) of $1.3 billion and realized losses of $1.0 billion on other debt securities carried at fair value, which excludes the benefit of certain hedges the results of which are also reported in other income (loss). Amounts in 2012 were insignificant.
Other Debt Securities Carried at Fair Value
December 31(Dollars in millions) 2013 2012U.S. Treasury and agency securities $ 4,062 $ 491Mortgage-backed securities:
Agency 16,500 13,073Agency-collateralized mortgage obligations 218 929Commercial 749 —
Non-U.S. securities (1) 11,315 9,451Total $ 32,844 $ 23,944
(1) These securities are primarily used to satisfy certain international regulatory liquidity requirements.
The gross realized gains and losses on sales of AFS debt securities for 2013, 2012 and 2011 are presented in the table below.
Gains and Losses on Sales of AFS Debt Securities
(Dollars in millions) 2013 2012 2011Gross gains $ 1,302 $ 2,128 $ 3,685Gross losses (31) (466) (311)
Net gains on sales of AFS debt securities $ 1,271 $ 1,662 $ 3,374
Income tax expense attributable to realizednet gains on sales of AFS debt securities $ 470 $ 615 $ 1,248
The amortized cost and fair value of the Corporation’s debt securities carried at fair value and HTM debt securities from Fannie Mae (FNMA), the Government National Mortgage Association (GNMA) and Freddie Mac (FHLMC), where the investment exceeded 10 percent of consolidated shareholders’ equity at December 31, 2013 and 2012, are presented in the table below.
Selected Securities Exceeding 10 Percent ofShareholders’ Equity
December 31
2013 2012
(Dollars in millions)Amortized
CostFair
ValueAmortized
CostFair
Value
Fannie Mae $ 123,813 $ 118,708 $ 121,522 $ 123,933
Government NationalMortgage Association 118,700 115,314 124,348 127,541
Freddie Mac 24,908 24,075 22,995 23,502
76788ba_financials.indd 176 3/6/14 12:06 PM

Bank of America 2013 177
The table below presents the fair value and the associated gross unrealized losses on AFS debt securities and whether these securities have had gross unrealized losses for less than 12 months or for 12 months or longer at December 31, 2013 and 2012.
Temporarily Impaired and Other-than-temporarily Impaired AFS Debt Securities
December 31, 2013
Less than Twelve Months Twelve Months or Longer Total
(Dollars in millions)Fair
Value
GrossUnrealized
LossesFair
Value
GrossUnrealized
LossesFair
Value
GrossUnrealized
Losses
Temporarily impaired available-for-sale debt securities
U.S. Treasury and agency securities $ 5,770 $ (61) $ 19 $ (1) $ 5,789 $ (62)
Mortgage-backed securities:
Agency 132,032 (5,457) 9,324 (497) 141,356 (5,954)
Agency-collateralized mortgage obligations 13,438 (210) 2,661 (105) 16,099 (315)
Non-agency residential 819 (15) 1,237 (106) 2,056 (121)
Commercial 286 (12) — — 286 (12)
Non-U.S. securities — — 45 (24) 45 (24)
Corporate/Agency bonds 106 (3) 282 (4) 388 (7)
Other taxable securities, substantially all asset-backed securities 116 (2) 280 (3) 396 (5)
Total taxable securities 152,567 (5,760) 13,848 (740) 166,415 (6,500)
Tax-exempt securities 1,789 (30) 990 (19) 2,779 (49)
Total temporarily impaired available-for-sale debt securities 154,356 (5,790) 14,838 (759) 169,194 (6,549)
Other-than-temporarily impaired available-for-sale debt securities (1)
Non-agency residential mortgage-backed securities 2 (1) 1 (1) 3 (2)
Total temporarily impaired and other-than-temporarily impaired available-for-sale securities (2) $ 154,358 $ (5,791) $ 14,839 $ (760) $ 169,197 $ (6,551)
December 31, 2012Temporarily impaired available-for-sale debt securities
U.S. Treasury and agency securities $ — $ — $ 5,608 $ (84) $ 5,608 $ (84)Mortgage-backed securities:
Agency 15,593 (133) 735 (13) 16,328 (146)Agency-collateralized mortgage obligations 5,135 (121) 4,994 (97) 10,129 (218)Non-agency residential 592 (13) 1,555 (110) 2,147 (123)
Non-U.S. securities 1,715 (1) 563 (5) 2,278 (6)Corporate/Agency bonds — — 277 (16) 277 (16)Other taxable securities, substantially all asset-backed securities 1,678 (1) 1,436 (14) 3,114 (15)
Total taxable securities 24,713 (269) 15,168 (339) 39,881 (608)Tax-exempt securities 1,609 (9) 1,072 (38) 2,681 (47)
Total temporarily impaired available-for-sale debt securities 26,322 (278) 16,240 (377) 42,562 (655)Other-than-temporarily impaired available-for-sale debt securities (1)
Non-agency residential mortgage-backed securities 14 (1) 74 (4) 88 (5)
Total temporarily impaired and other-than-temporarily impaired available-for-sale securities (2) $ 26,336 $ (279) $ 16,314 $ (381) $ 42,650 $ (660)
(1) Includes other-than-temporarily impaired AFS debt securities on which an OTTI loss remains in accumulated OCI.(2) At December 31, 2013 and 2012, the amortized cost of approximately 4,700 and 2,600 AFS debt securities exceeded their fair value by $6.6 billion and $660 million.
76788ba_financials.indd 177 3/6/14 12:06 PM

178 Bank of America 2013
The Corporation recorded other-than-temporary impairment (OTTI) losses on AFS debt securities in 2013, 2012 and 2011 as presented in the table below. A debt security is impaired when its fair value is less than its amortized cost. If the Corporation intends or will more-likely-than-not be required to sell a debt security prior to recovery, the entire impairment loss is recorded in the Consolidated Statement of Income. For AFS debt securities the Corporation does not intend or will not more-likely-than-not be required to sell, an analysis is performed to determine if any of
the impairment is due to credit or whether it is due to other factors (e.g., interest rate). Credit losses are considered unrecoverable and are recorded in the Consolidated Statement of Income with the remaining unrealized losses recorded in accumulated OCI. In certain instances, the credit loss on a debt security may exceed the total impairment, in which case, the portion of the credit loss that exceeds the total impairment is recorded as an unrealized gain in accumulated OCI.
Net Impairment Losses Recognized in Earnings
2013
(Dollars in millions)
Non-agencyResidential
MBS
Non-agencyCommercial
MBS
OtherTaxable
Securities Total
Total OTTI losses (unrealized and realized) $ (21) $ — $ — $ (21)
Unrealized OTTI losses recognized in accumulated OCI 1 — — 1
Net impairment losses recognized in earnings $ (20) $ — $ — $ (20)
2012Total OTTI losses (unrealized and realized) $ (50) $ (7) $ — $ (57)Unrealized OTTI losses recognized in accumulated OCI 4 — — 4
Net impairment losses recognized in earnings $ (46) $ (7) $ — $ (53)
2011Total OTTI losses (unrealized and realized) $ (348) $ (10) $ (2) $ (360)Unrealized OTTI losses recognized in accumulated OCI 61 — — 61
Net impairment losses recognized in earnings $ (287) $ (10) $ (2) $ (299)
The Corporation’s net impairment losses recognized in earnings consist of credit losses in 2013, 2012 and 2011. Also included in 2011 were write-downs to fair value on AFS debt securities the Corporation had the intent to sell.
The table below presents a rollforward of the credit losses recognized in earnings in 2013, 2012 and 2011 on AFS debt securities that the Corporation does not have the intent to sell or will not more-likely-than-not be required to sell.
Rollforward of Credit Losses Recognized
(Dollars in millions) 2013 2012 2011Balance, January 1 $ 243 $ 310 $ 2,148
Additions for credit losses recognized on AFS debt securities that had no previous impairment losses 6 7 72Additions for credit losses recognized on AFS debt securities that had previously incurred impairment losses 14 46 149Reductions for AFS debt securities matured, sold or intended to be sold (51) (120) (2,059)
Balance, December 31 $ 212 $ 243 $ 310
The Corporation estimates the portion of a loss on a security that is attributable to credit using a discounted cash flow model and estimates the expected cash flows of the underlying collateral using internal credit, interest rate and prepayment risk models that incorporate management’s best estimate of current key assumptions such as default rates, loss severity and prepayment rates. Assumptions used for the underlying loans that support the mortgage-backed securities (MBS) can vary widely from loan to loan and are influenced by such factors as loan interest rate, geographic location of the borrower, borrower characteristics and collateral type. Based on these assumptions, the Corporation then determines how the underlying collateral cash flows will be distributed to each MBS issued from the applicable special purpose entity. Expected principal and interest cash flows on an impaired AFS debt security are discounted using the effective yield of each individual impaired AFS debt security.
Significant assumptions used in estimating the expected cash flows for measuring credit losses on non-agency residential mortgage-backed securities (RMBS) were as follows at December 31, 2013.
Significant Assumptions
Range (1)
Weighted-average
10th Percentile (2)
90th Percentile (2)
Prepayment speed 11.6% 1.8% 23.6%
Loss severity 41.3 14.7 52.1
Life default rate 39.4 0.9 99.6(1) Represents the range of inputs/assumptions based upon the underlying collateral.(2) The value of a variable below which the indicated percentile of observations will fall.
76788ba_financials.indd 178 3/6/14 12:06 PM

Bank of America 2013 179
Annual constant prepayment speed and loss severity rates are projected considering collateral characteristics such as loan-to-value (LTV), creditworthiness of borrowers as measured using FICO scores, and geographic concentrations. The weighted-average severity by collateral type was 38.1 percent for prime, 42.0 percent for Alt-A and 49.9 percent for subprime at December 31, 2013. Additionally, default rates are projected by considering collateral characteristics including, but not limited to, LTV, FICO and geographic concentration. Weighted-average life default rates by collateral type were 27.7 percent for prime, 49.1 percent for Alt-
A and 34.1 percent for subprime at December 31, 2013.The expected maturity distribution of the Corporation’s MBS,
the contractual maturity distribution of the Corporation’s debt securities carried at fair value and HTM debt securities, and the yields on the Corporation’s debt securities carried at fair value and HTM debt securities at December 31, 2013 are summarized in the table below. Actual maturities may differ from the contractual or expected maturities since borrowers may have the right to prepay obligations with or without prepayment penalties.
Maturities of Debt Securities Carried at Fair Value and Held-to-maturity Debt Securities
December 31, 2013
Due in OneYear or Less
Due after One Yearthrough Five Years
Due after Five Yearsthrough Ten Years
Due after Ten Years Total
(Dollars in millions) Amount Yield (1) Amount Yield (1) Amount Yield (1) Amount Yield (1) Amount Yield (1)
Amortized cost of debt securities carried at fair value U.S. Treasury and agency securities $ 535 0.62% $ 2,337 1.71% $ 8,844 2.44% $ 1,339 3.84% $ 13,055 2.38%
Mortgage-backed securities:
Agency 11 4.44 9,649 2.93 90,407 3.10 87,728 2.96 187,795 3.03
Agency-collateralized mortgage obligations 1,482 0.01 3,373 2.09 18,036 2.96 29 0.93 22,920 2.63
Non-agency residential 815 4.10 2,200 4.06 1,149 3.13 1,960 2.59 6,124 3.42
Commercial 1,683 5.01 466 6.43 1,089 2.51 7 4.09 3,245 4.37
Non-U.S. securities 16,288 1.04 2,074 3.98 149 3.34 8 3.10 18,519 1.39
Corporate/Agency bonds 395 2.48 206 5.69 112 4.12 147 1.38 860 3.27
Other taxable securities, substantially all asset-backedsecurities 6,655 1.58 7,274 1.37 2,105 2.06 771 0.84 16,805 1.50
Total taxable securities 27,864 1.46 27,579 2.56 121,891 3.01 91,989 2.95 269,323 2.78
Tax-exempt securities 195 1.66 2,324 1.49 2,429 1.90 1,019 0.61 5,967 1.54
Total amortized cost of debt securities carried at fair value $ 28,059 1.47 $ 29,903 2.46 $ 124,320 2.99 $ 93,008 2.92 $ 275,290 2.75
Amortized cost of held-to-maturity debt securities (2) $ — — $ 125 1.79 $ 53,699 2.60 $ 1,326 2.72 $ 55,150 2.61
Debt securities carried at fair value
U.S. Treasury and agency securities $ 537 $ 2,333 $ 8,831 $ 1,315 $ 13,016
Mortgage-backed securities:
Agency 11 9,708 88,191 83,525 181,435
Agency-collateralized mortgage obligations 1,480 3,284 17,916 30 22,710
Non-agency residential 805 2,236 1,173 2,025 6,239
Commercial 1,715 494 1,013 7 3,229
Non-U.S. securities 16,273 2,099 155 8 18,535
Corporate/Agency bonds 395 220 116 142 873
Other taxable securities, substantially all asset-backedsecurities 6,656 7,280 2,120 774 16,830
Total taxable securities 27,872 27,654 119,515 87,826 262,867
Tax-exempt securities 194 2,319 2,409 1,006 5,928
Total debt securities carried at fair value $ 28,066 $ 29,973 $ 121,924 $ 88,832 $ 268,795
Fair value of held-to-maturity debt securities (2) $ — $ 125 $ 51,062 $ 1,243 $ 52,430
(1) Average yield is computed using the effective yield of each security at the end of the period, weighted based on the amortized cost of each security. The effective yield considers the contractual coupon, amortization of premiums and accretion of discounts, and excludes the effect of related hedging derivatives.
(2) Substantially all U.S. agency MBS.
Certain Corporate and Strategic InvestmentsIn 2013, the Corporation sold its remaining investment of 2.0 billion shares of China Construction Bank Corporation (CCB) and realized a pre-tax gain of $753 million reported in equity investment income in the Consolidated Statement of Income. At December 31, 2012, these shares, representing approximately one percent of CCB, were classified as AFS marketable equity securities and carried at fair value with the after-tax unrealized gain included in
accumulated OCI. The strategic assistance agreement between the Corporation and CCB, which includes cooperation in specific business areas, has been extended through 2016.
The Corporation’s 49 percent investment in a merchant services joint venture, which is recorded in Consumer & Business Banking (CBB), had a carrying value of $3.2 billion and $3.3 billion at December 31, 2013 and 2012. For additional information, see Note 12 – Commitments and Contingencies.
76788ba_financials.indd 179 3/6/14 12:06 PM

180 Bank of America 2013
NOTE 4 Outstanding Loans and LeasesThe following tables present total outstanding loans and leases and an aging analysis for the Corporation’s Home Loans, Credit Card and Other Consumer, and Commercial portfolio segments, by class of financing receivables, at December 31, 2013 and 2012.
December 31, 2013
(Dollars in millions)30-59 Days Past Due (1)
60-89 Days Past Due (1)
90 Days orMore
Past Due (2)
Total PastDue 30 Days
or More
Total Current or Less Than 30 Days
Past Due (3)
PurchasedCredit-
impaired (4)
LoansAccountedfor Underthe Fair
Value OptionTotal
Outstandings
Home loans Core portfolio
Residential mortgage $ 2,151 $ 754 $ 7,188 $ 10,093 $ 167,243 $ 177,336
Home equity 243 113 693 1,049 53,450 54,499
Legacy Assets & Servicing portfolioResidential mortgage (5) 2,758 1,412 16,746 20,916 31,142 $ 18,672 70,730
Home equity 444 221 1,292 1,957 30,623 6,593 39,173
Credit card and other consumer
U.S. credit card 598 422 1,053 2,073 90,265 92,338
Non-U.S. credit card 63 54 131 248 11,293 11,541
Direct/Indirect consumer (6) 431 175 410 1,016 81,176 82,192
Other consumer (7) 24 8 20 52 1,925 1,977
Total consumer 6,712 3,159 27,533 37,404 467,117 25,265 529,786
Consumer loans accounted for under the fair value option (8) $ 2,164 2,164
Total consumer loans and leases 6,712 3,159 27,533 37,404 467,117 25,265 2,164 531,950
Commercial
U.S. commercial 363 151 309 823 211,734 212,557
Commercial real estate (9) 30 29 243 302 47,591 47,893
Commercial lease financing 110 37 48 195 25,004 25,199
Non-U.S. commercial 103 8 17 128 89,334 89,462
U.S. small business commercial 87 55 113 255 13,039 13,294
Total commercial 693 280 730 1,703 386,702 388,405
Commercial loans accounted for under the fair value option (8) 7,878 7,878
Total commercial loans and leases 693 280 730 1,703 386,702 7,878 396,283
Total loans and leases $ 7,405 $ 3,439 $ 28,263 $ 39,107 $ 853,819 $ 25,265 $ 10,042 $ 928,233
Percentage of outstandings 0.80% 0.37% 3.04% 4.21% 91.99% 2.72% 1.08% (1) Home loans 30-59 days past due includes fully-insured loans of $2.5 billion and nonperforming loans of $623 million. Home loans 60-89 days past due includes fully-insured loans of $1.2 billion
and nonperforming loans of $410 million.(2) Home loans includes fully-insured loans of $17.0 billion.(3) Home loans includes $5.9 billion and direct/indirect consumer includes $33 million of nonperforming loans.(4) PCI loan amounts are shown gross of the valuation allowance.(5) Total outstandings includes pay option loans of $4.4 billion. The Corporation no longer originates this product.(6) Total outstandings includes dealer financial services loans of $38.5 billion, consumer lending loans of $2.7 billion, U.S. securities-based lending loans of $31.2 billion, non-U.S. consumer loans of
$4.7 billion, student loans of $4.1 billion and other consumer loans of $1.0 billion.(7) Total outstandings includes consumer finance loans of $1.2 billion, consumer leases of $606 million, consumer overdrafts of $176 million and other non-U.S. consumer loans of $5 million.(8) Consumer loans accounted for under the fair value option were residential mortgage loans of $2.0 billion and home equity loans of $147 million. Commercial loans accounted for under the fair value
option were U.S. commercial loans of $1.5 billion and non-U.S. commercial loans of $6.4 billion. For additional information, see Note 20 – Fair Value Measurements and Note 21 – Fair Value Option.(9) Total outstandings includes U.S. commercial real estate loans of $46.3 billion and non-U.S. commercial real estate loans of $1.6 billion.
76788ba_financials.indd 180 3/6/14 12:06 PM

Bank of America 2013 181
December 31, 2012
(Dollars in millions)30-59 DaysPast Due (1)
60-89 Days Past Due (1)
90 Days orMore
Past Due (2)
Total PastDue 30Days
or More
Total Current orLess Than 30 Days
Past Due (3)
PurchasedCredit-
impaired (4)
LoansAccounted for Underthe Fair
Value OptionTotal
Outstandings
Home loans Core portfolio
Residential mortgage (5) $ 2,274 $ 806 $ 6,227 $ 9,307 $ 160,809 $ 170,116Home equity 273 146 591 1,010 59,841 60,851
Legacy Assets & Servicing portfolio Residential mortgage (6) 2,938 1,714 26,728 31,380 33,982 $ 17,451 82,813Home equity 608 357 1,444 2,409 36,213 8,667 47,289
Credit card and other consumer U.S. credit card 729 582 1,437 2,748 92,087 94,835Non-U.S. credit card 106 85 212 403 11,294 11,697Direct/Indirect consumer (7) 569 239 573 1,381 81,824 83,205Other consumer (8) 48 19 4 71 1,557 1,628
Total consumer 7,545 3,948 37,216 48,709 477,607 26,118 552,434Consumer loans accounted for under
the fair value option (9) $ 1,005 1,005
Total consumer loans and leases 7,545 3,948 37,216 48,709 477,607 26,118 1,005 553,439Commercial
U.S. commercial 323 133 639 1,095 196,031 197,126Commercial real estate (10) 79 144 983 1,206 37,431 38,637Commercial lease financing 84 79 30 193 23,650 23,843Non-U.S. commercial 2 — — 2 74,182 74,184U.S. small business commercial 101 75 168 344 12,249 12,593
Total commercial 589 431 1,820 2,840 343,543 346,383Commercial loans accounted for under
the fair value option (9) 7,997 7,997
Total commercial loans and leases 589 431 1,820 2,840 343,543 7,997 354,380Total loans and leases $ 8,134 $ 4,379 $ 39,036 $ 51,549 $ 821,150 $ 26,118 $ 9,002 $ 907,819
Percentage of outstandings 0.90% 0.48% 4.30% 5.68% 90.45% 2.88% 0.99% (1) Home loans 30-59 days past due includes fully-insured loans of $2.3 billion and nonperforming loans of $702 million. Home loans 60-89 days past due includes fully-insured loans of $1.3 billion
and nonperforming loans of $558 million.(2) Home loans includes fully-insured loans of $22.2 billion.(3) Home loans includes $5.5 billion and direct/indirect consumer includes $63 million of nonperforming loans.(4) PCI loan amounts are shown gross of the valuation allowance.(5) Total outstandings includes non-U.S. residential mortgage loans of $93 million.(6) Total outstandings includes pay option loans of $6.7 billion. The Corporation no longer originates this product.(7) Total outstandings includes dealer financial services loans of $35.9 billion, consumer lending loans of $4.7 billion, U.S. securities-based lending loans of $28.3 billion, non-U.S. consumer loans of
$8.3 billion, student loans of $4.8 billion and other consumer loans of $1.2 billion.(8) Total outstandings includes consumer finance loans of $1.4 billion, consumer leases of $34 million, consumer overdrafts of $177 million and other non-U.S. consumer loans of $5 million.(9) Consumer loans accounted for under the fair value option were residential mortgage loans of $1.0 billion. Commercial loans accounted for under the fair value option were U.S. commercial loans
of $2.3 billion and non-U.S. commercial loans of $5.7 billion. For additional information, see Note 20 – Fair Value Measurements and Note 21 – Fair Value Option.(10) Total outstandings includes U.S. commercial real estate loans of $37.2 billion and non-U.S. commercial real estate loans of $1.5 billion.
76788ba_financials.indd 181 3/6/14 12:06 PM

182 Bank of America 2013
The Corporation mitigates a portion of its credit risk on the residential mortgage portfolio through the use of synthetic securitization vehicles. These vehicles issue long-term notes to investors, the proceeds of which are held as cash collateral. The Corporation pays a premium to the vehicles to purchase mezzanine loss protection on a portfolio of residential mortgage loans owned by the Corporation. Cash held in the vehicles is used to reimburse the Corporation in the event that losses on the mortgage portfolio exceed 10 basis points (bps) of the original pool balance, up to the remaining amount of purchased loss protection of $339 million and $500 million at December 31, 2013 and 2012. The vehicles from which the Corporation purchases credit protection are VIEs. The Corporation does not have a variable interest in these vehicles and, accordingly, these vehicles are not consolidated by the Corporation. Amounts due from the vehicles are recorded in other income (loss) in the Consolidated Statement of Income when the Corporation recognizes a reimbursable loss, as described above. Amounts are collected when reimbursable losses are realized through the sale of the underlying collateral. At December 31, 2013 and 2012, the Corporation had a receivable of $198 million and $305 million from these vehicles for reimbursement of losses, and principal of $12.5 billion and $17.6 billion of residential mortgage loans was referenced under these agreements. The Corporation records an allowance for credit losses on these loans without regard to the existence of the purchased loss protection as the protection does not represent a guarantee of individual loans.
In addition, the Corporation has entered into long-term credit protection agreements with FNMA and FHLMC on loans totaling $28.2 billion and $24.3 billion at December 31, 2013 and 2012, providing full protection on residential mortgage loans that become
severely delinquent. All of these loans are individually insured and therefore the Corporation does not record an allowance for credit losses related to these loans. For additional information, see Note 7 – Representations and Warranties Obligations and Corporate Guarantees.
Nonperforming Loans and LeasesThe Corporation classifies junior-lien home equity loans as nonperforming when the first-lien loan becomes 90 days past due even if the junior-lien loan is performing. At December 31, 2013 and 2012, $1.2 billion and $1.5 billion of such junior-lien home equity loans were included in nonperforming loans.
The Corporation classifies consumer real estate loans that have been discharged in Chapter 7 bankruptcy and not reaffirmed by the borrower as troubled debt restructurings (TDRs), irrespective of payment history or delinquency status, even if the repayment terms for the loan have not been otherwise modified. The Corporation continues to have a lien on the underlying collateral. At December 31, 2013, nonperforming loans discharged in Chapter 7 bankruptcy with no change in repayment terms at the time of discharge were $1.8 billion of which $1.1 billion were current on their contractual payments while $642 million were 90 days or more past due. Of the contractually current nonperforming loans, nearly 80 percent were discharged in Chapter 7 bankruptcy more than 12 months ago, and nearly 50 percent were discharged 24 months or more ago. As subsequent cash payments are received on the loans that are contractually current, the interest component of the payments is generally recorded as interest income on a cash basis and the principal component is recorded as a reduction in the carrying value of the loan.
76788ba_financials.indd 182 3/6/14 12:06 PM

Bank of America 2013 183
The table below presents the Corporation’s nonperforming loans and leases including nonperforming TDRs, and loans accruing past due 90 days or more at December 31, 2013 and 2012. Nonperforming loans held-for-sale (LHFS) are excluded from
nonperforming loans and leases as they are recorded at either fair value or the lower of cost or fair value. For more information on the criteria for classification as nonperforming, see Note 1 – Summary of Significant Accounting Principles.
Credit Quality
December 31
Nonperforming Loans and Leases (1)
Accruing Past Due90 Days or More
(Dollars in millions) 2013 2012 2013 2012Home loans
Core portfolioResidential mortgage (2) $ 3,316 $ 3,193 $ 5,137 $ 3,984Home equity 1,431 1,265 — —
Legacy Assets & Servicing portfolio
Residential mortgage (2) 8,396 11,862 11,824 18,173Home equity 2,644 3,017 — —
Credit card and other consumer U.S. credit card n/a n/a 1,053 1,437Non-U.S. credit card n/a n/a 131 212Direct/Indirect consumer 35 92 408 545Other consumer 18 2 2 2
Total consumer 15,840 19,431 18,555 24,353Commercial
U.S. commercial 819 1,484 47 65Commercial real estate 322 1,513 21 29Commercial lease financing 16 44 41 15Non-U.S. commercial 64 68 17 —U.S. small business commercial 88 115 78 120
Total commercial 1,309 3,224 204 229Total loans and leases $ 17,149 $ 22,655 $ 18,759 $ 24,582
(1) Nonperforming loan balances do not include nonaccruing TDRs removed from the PCI loan portfolio prior to January 1, 2010 of $260 million and $521 million at December 31, 2013 and 2012.(2) Residential mortgage loans in the Core and Legacy Assets & Servicing portfolios accruing past due 90 days or more are fully-insured loans. At December 31, 2013 and 2012, residential mortgage
includes $13.0 billion and $17.8 billion of loans on which interest has been curtailed by the FHA, and therefore are no longer accruing interest, although principal is still insured, and $4.0 billion and $4.4 billion of loans on which interest is still accruing.
n/a = not applicable
Credit Quality IndicatorsThe Corporation monitors credit quality within its Home Loans, Credit Card and Other Consumer, and Commercial portfolio segments based on primary credit quality indicators. For more information on the portfolio segments, see Note 1 – Summary of Significant Accounting Principles. Within the Home Loans portfolio segment, the primary credit quality indicators are refreshed LTV and refreshed FICO score. Refreshed LTV measures the carrying value of the loan as a percentage of the value of property securing the loan, refreshed quarterly. Home equity loans are evaluated using combined loan-to-value (CLTV) which measures the carrying value of the combined loans that have liens against the property and the available line of credit as a percentage of the value of the property securing the loan, refreshed quarterly. FICO score measures the creditworthiness of the borrower based on the financial obligations of the borrower and the borrower’s credit
history. At a minimum, FICO scores are refreshed quarterly, and in many cases, more frequently. FICO scores are also a primary credit quality indicator for the Credit Card and Other Consumer portfolio segment and the business card portfolio within U.S. small business commercial. Within the Commercial portfolio segment, loans are evaluated using the internal classifications of pass rated or reservable criticized as the primary credit quality indicators. The term reservable criticized refers to those commercial loans that are internally classified or listed by the Corporation as Special Mention, Substandard or Doubtful, which are asset quality categories defined by regulatory authorities. These assets have an elevated level of risk and may have a high probability of default or total loss. Pass rated refers to all loans not considered reservable criticized. In addition to these primary credit quality indicators, the Corporation uses other credit quality indicators for certain types of loans.
76788ba_financials.indd 183 3/6/14 12:06 PM

184 Bank of America 2013
The following tables present certain credit quality indicators for the Corporation’s Home Loans, Credit Card and Other Consumer, and Commercial portfolio segments, by class of financing receivables, at December 31, 2013 and 2012.
Home Loans – Credit Quality Indicators (1)
December 31, 2013
(Dollars in millions)
Core Portfolio ResidentialMortgage (2)
Legacy Assets & Servicing ResidentialMortgage (2)
Residential Mortgage PCI (3)
Core Portfolio Home Equity (2)
Legacy Assets & Servicing
Home Equity (2)
Home Equity PCI
Refreshed LTV (4) Less than or equal to 90 percent $ 95,833 $ 22,391 $ 11,400 $ 45,898 $ 16,714 $ 2,036
Greater than 90 percent but less than or equal to 100 percent 5,541 4,134 2,653 3,659 4,233 698
Greater than 100 percent 6,250 7,998 4,619 4,942 11,633 3,859
Fully-insured loans (5) 69,712 17,535 — — — —
Total home loans $ 177,336 $ 52,058 $ 18,672 $ 54,499 $ 32,580 $ 6,593
Refreshed FICO score
Less than 620 $ 5,924 $ 10,391 $ 9,792 $ 2,343 $ 4,229 $ 1,072
Greater than or equal to 620 and less than 680 7,863 5,452 3,135 4,057 5,050 1,165
Greater than or equal to 680 and less than 740 24,034 7,791 3,034 11,276 9,032 1,935
Greater than or equal to 740 69,803 10,889 2,711 36,823 14,269 2,421
Fully-insured loans (5) 69,712 17,535 — — — —
Total home loans $ 177,336 $ 52,058 $ 18,672 $ 54,499 $ 32,580 $ 6,593
(1) Excludes $2.2 billion of loans accounted for under the fair value option.(2) Excludes PCI loans.(3) Includes $4.0 billion of pay option loans. The Corporation no longer originates this product.(4) Refreshed LTV percentages for PCI loans are calculated using the carrying value net of the related valuation allowance.(5) Credit quality indicators are not reported for fully-insured loans as principal repayment is insured.
Credit Card and Other Consumer – Credit Quality Indicators
December 31, 2013
(Dollars in millions)U.S. Credit
CardNon-U.S.
Credit CardDirect/Indirect
ConsumerOther
Consumer (1)
Refreshed FICO score
Less than 620 $ 4,989 $ — $ 1,220 $ 539
Greater than or equal to 620 and less than 680 12,753 — 3,345 264
Greater than or equal to 680 and less than 740 35,413 — 9,887 199
Greater than or equal to 740 39,183 — 26,220 188
Other internal credit metrics (2, 3, 4) — 11,541 41,520 787
Total credit card and other consumer $ 92,338 $ 11,541 $ 82,192 $ 1,977
(1) 60 percent of the other consumer portfolio is associated with portfolios from certain consumer finance businesses that the Corporation previously exited.(2) Other internal credit metrics may include delinquency status, geography or other factors.(3) Direct/indirect consumer includes $35.8 billion of securities-based lending which is overcollateralized and therefore has minimal credit risk and $4.1 billion of loans the Corporation no longer
originates.(4) Non-U.S. credit card represents the U.K. credit card portfolio which is evaluated using internal credit metrics, including delinquency status. At December 31, 2013, 98 percent of this portfolio was
current or less than 30 days past due, one percent was 30-89 days past due and one percent was 90 days or more past due.
Commercial – Credit Quality Indicators (1)
December 31, 2013
(Dollars in millions)U.S.
CommercialCommercialReal Estate
CommercialLease
FinancingNon-U.S.
Commercial
U.S. SmallBusiness
Commercial (2)
Risk ratings
Pass rated $ 205,416 $ 46,507 $ 24,211 $ 88,138 $ 1,191
Reservable criticized 7,141 1,386 988 1,324 346
Refreshed FICO score (3)
Less than 620 224
Greater than or equal to 620 and less than 680 534
Greater than or equal to 680 and less than 740 1,567
Greater than or equal to 740 2,779
Other internal credit metrics (3, 4) 6,653
Total commercial $ 212,557 $ 47,893 $ 25,199 $ 89,462 $ 13,294
(1) Excludes $7.9 billion of loans accounted for under the fair value option.(2) U.S. small business commercial includes $289 million of criticized business card and small business loans which are evaluated using refreshed FICO scores or internal credit metrics, including
delinquency status, rather than risk ratings. At December 31, 2013, 99 percent of the balances where internal credit metrics are used was current or less than 30 days past due.(3) Refreshed FICO score and other internal credit metrics are applicable only to the U.S. small business commercial portfolio.(4) Other internal credit metrics may include delinquency status, application scores, geography or other factors.
76788ba_financials.indd 184 3/6/14 12:06 PM

Bank of America 2013 185
Home Loans – Credit Quality Indicators (1)
December 31, 2012
(Dollars in millions)
Core Portfolio ResidentialMortgage (2)
Legacy Assets & Servicing ResidentialMortgage (2)
Residential Mortgage PCI (3)
Core Portfolio Home Equity (2)
Legacy Assets & Servicing
Home Equity (2)
Home Equity PCI
Refreshed LTV (4)
Less than or equal to 90 percent $ 80,585 $ 20,613 $ 8,581 $ 44,971 $ 15,922 $ 2,074
Greater than 90 percent but less than or equal to 100 percent 8,891 5,097 2,368 5,825 4,507 805
Greater than 100 percent 12,984 16,454 6,502 10,055 18,193 5,788
Fully-insured loans (5) 67,656 23,198 — — — —
Total home loans $ 170,116 $ 65,362 $ 17,451 $ 60,851 $ 38,622 $ 8,667
Refreshed FICO score
Less than 620 $ 6,366 $ 14,320 $ 8,647 $ 2,586 $ 5,411 $ 1,989
Greater than or equal to 620 and less than 680 8,561 6,157 2,712 4,500 5,921 1,529
Greater than or equal to 680 and less than 740 25,141 8,611 2,976 12,625 10,395 2,299
Greater than or equal to 740 62,392 13,076 3,116 41,140 16,895 2,850
Fully-insured loans (5) 67,656 23,198 — — — —
Total home loans $ 170,116 $ 65,362 $ 17,451 $ 60,851 $ 38,622 $ 8,667(1) Excludes $1.0 billion of loans accounted for under the fair value option.(2) Excludes PCI loans.(3) Includes $6.1 billion of pay option loans. The Corporation no longer originates this product.(4) Refreshed LTV percentages for PCI loans are calculated using the carrying value net of the related valuation allowance.(5) Credit quality indicators are not reported for fully-insured loans as principal repayment is insured.
Credit Card and Other Consumer – Credit Quality Indicators
December 31, 2012
(Dollars in millions)U.S. Credit
CardNon-U.S.
Credit CardDirect/Indirect
ConsumerOther
Consumer (1)
Refreshed FICO score
Less than 620 $ 6,188 $ — $ 1,896 $ 668
Greater than or equal to 620 and less than 680 13,947 — 3,367 301
Greater than or equal to 680 and less than 740 37,167 — 9,592 232
Greater than or equal to 740 37,533 — 25,164 212
Other internal credit metrics (2, 3, 4) — 11,697 43,186 215
Total credit card and other consumer $ 94,835 $ 11,697 $ 83,205 $ 1,628(1) 87 percent of the other consumer portfolio is associated with portfolios from certain consumer finance businesses that the Corporation previously exited.(2) Other internal credit metrics may include delinquency status, geography or other factors.(3) Direct/indirect consumer includes $36.5 billion of securities-based lending which is overcollateralized and therefore has minimal credit risk and $4.8 billion of loans the Corporation no longer
originates.(4) Non-U.S. credit card represents the U.K. credit card portfolio which is evaluated using internal credit metrics, including delinquency status. At December 31, 2012, 97 percent of this portfolio was
current or less than 30 days past due, one percent was 30-89 days past due and two percent was 90 days or more past due.
Commercial – Credit Quality Indicators (1)
December 31, 2012
(Dollars in millions)U.S.
CommercialCommercialReal Estate
CommercialLease
FinancingNon-U.S.
Commercial
U.S. SmallBusiness
Commercial (2)
Risk ratings
Pass rated $ 189,602 $ 34,968 $ 22,874 $ 72,688 $ 1,690
Reservable criticized 7,524 3,669 969 1,496 573
Refreshed FICO score (3)
Less than 620 400
Greater than or equal to 620 and less than 680 580
Greater than or equal to 680 and less than 740 1,553
Greater than or equal to 740 2,496
Other internal credit metrics (3, 4) 5,301
Total commercial $ 197,126 $ 38,637 $ 23,843 $ 74,184 $ 12,593(1) Excludes $8.0 billion of loans accounted for under the fair value option.(2) U.S. small business commercial includes $366 million of criticized business card and small business loans which are evaluated using refreshed FICO scores or internal credit metrics, including
delinquency status, rather than risk ratings. At December 31, 2012, 98 percent of the balances where internal credit metrics are used was current or less than 30 days past due.(3) Refreshed FICO score and other internal credit metrics are applicable only to the U.S. small business commercial portfolio.(4) Other internal credit metrics may include delinquency status, application scores, geography or other factors.
76788ba_financials.indd 185 3/6/14 12:06 PM

186 Bank of America 2013
Impaired Loans and Troubled Debt RestructuringsA loan is considered impaired when, based on current information, it is probable that the Corporation will be unable to collect all amounts due from the borrower in accordance with the contractual terms of the loan. Impaired loans include nonperforming commercial loans and all consumer and commercial TDRs. For additional information, see Note 1 – Summary of Significant Accounting Principles. Impaired loans exclude nonperforming consumer loans and nonperforming commercial leases unless they are classified as TDRs. Loans accounted for under the fair value option are also excluded. Purchased credit-impaired (PCI) loans are excluded and reported separately on page 194.
Home LoansImpaired home loans within the Home Loans portfolio segment consist entirely of TDRs. Excluding PCI loans, most modifications of home loans meet the definition of TDRs when a binding offer is extended to a borrower. Modifications of home loans are done in accordance with the government’s Making Home Affordable Program (modifications under government programs) or the Corporation’s proprietary programs (modifications under proprietary programs). These modifications are considered to be TDRs if concessions have been granted to borrowers experiencing financial difficulties. Concessions may include reductions in interest rates, capitalization of past due amounts, principal and/or interest forbearance, payment extensions, principal and/or interest forgiveness, or combinations thereof. During 2012, the Corporation implemented a borrower assistance program that provides forgiveness of principal balances in connection with the settlement agreement among the Corporation and certain of its affiliates and subsidiaries, together with the U.S. Department of Justice (DOJ), the U.S. Department of Housing and Urban Development (HUD) and other federal agencies, and 49 state Attorneys General concerning the terms of a global settlement resolving investigations into certain origination, servicing and foreclosure practices (National Mortgage Settlement). In addition, the Corporation also provides interest rate modifications to qualified borrowers pursuant to the National Mortgage Settlement and these interest rate modifications are not considered to be TDRs.
Prior to permanently modifying a loan, the Corporation may enter into trial modifications with certain borrowers under both government and proprietary programs, including the borrower assistance program pursuant to the National Mortgage Settlement. Trial modifications generally represent a three- to four-month period during which the borrower makes monthly payments under the anticipated modified payment terms. Upon successful completion of the trial period, the Corporation and the borrower enter into a permanent modification. Binding trial modifications are classified as TDRs when the trial offer is made and continue to be classified as TDRs regardless of whether the borrower enters into a permanent modification.
Home loans that have been discharged in Chapter 7 bankruptcy with no change in repayment terms at the time of discharge of $3.6 billion were included in TDRs at December 31, 2013, of which $1.8 billion were classified as nonperforming and $1.8 billion were loans fully-insured by the Federal Housing Administration (FHA). Of the $3.6 billion of home loan TDRs, approximately 27 percent,
30 percent and 43 percent were discharged in Chapter 7 bankruptcy in 2013, 2012 and in years prior to 2012, respectively. For more information on loans discharged in Chapter 7 bankruptcy, see Nonperforming Loans and Leases in this Note.
A home loan, excluding PCI loans which are reported separately, is not classified as impaired unless it is a TDR. Once such a loan has been designated as a TDR, it is then individually assessed for impairment. Home loan TDRs are measured primarily based on the net present value of the estimated cash flows discounted at the loan’s original effective interest rate, as discussed in the following paragraph. If the carrying value of a TDR exceeds this amount, a specific allowance is recorded as a component of the allowance for loan and lease losses. Alternatively, home loan TDRs that are considered to be dependent solely on the collateral for repayment (e.g., due to the lack of income verification or as a result of being discharged in Chapter 7 bankruptcy) are measured based on the estimated fair value of the collateral and a charge-off is recorded if the carrying value exceeds the fair value of the collateral. Home loans that reached 180 days past due prior to modification had been charged off to their net realizable value before they were modified as TDRs in accordance with established policy. Therefore, modifications of home loans that are 180 or more days past due as TDRs do not have an impact on the allowance for loan and lease losses nor are additional charge-offs required at the time of modification. Subsequent declines in the fair value of the collateral after a loan has reached 180 days past due are recorded as charge-offs. Fully-insured loans are protected against principal loss, and therefore, the Corporation does not record an allowance for loan and lease losses on the outstanding principal balance, even after they have been modified in a TDR.
The net present value of the estimated cash flows used to measure impairment is based on model-driven estimates of projected payments, prepayments, defaults and loss-given-default (LGD). Using statistical modeling methodologies, the Corporation estimates the probability that a loan will default prior to maturity based on the attributes of each loan. The factors that are most relevant to the probability of default are the refreshed LTV, or in the case of a subordinated lien, refreshed CLTV, borrower credit score, months since origination (i.e., vintage) and geography. Each of these factors is further broken down by present collection status (whether the loan is current, delinquent, in default or in bankruptcy). Severity (or LGD) is estimated based on the refreshed LTV for first mortgages or CLTV for subordinated liens. The estimates are based on the Corporation’s historical experience as adjusted to reflect an assessment of environmental factors that may not be reflected in the historical data, such as changes in real estate values, local and national economies, underwriting standards and the regulatory environment. The probability of default models also incorporate recent experience with modification programs including redefaults subsequent to modification, a loan’s default history prior to modification and the change in borrower payments post-modification.
At December 31, 2013 and 2012, remaining commitments to lend additional funds to debtors whose terms have been modified in a home loan TDR were immaterial. Home loan foreclosed properties totaled $533 million and $650 million at December 31, 2013 and 2012.
76788ba_financials.indd 186 3/6/14 12:06 PM

Bank of America 2013 187
The table below provides information for impaired loans in the Corporation’s Home Loans portfolio segment at December 31, 2013 and 2012, and for 2013, 2012 and 2011, and includes primarily loans managed by Legacy Assets & Servicing. Certain impaired home loans do not have a related allowance as the current valuation of these impaired loans exceeded the carrying value, which is net of previously recorded charge-offs.
Impaired Loans – Home Loans
December 31, 2013 December 31, 2012
(Dollars in millions)
UnpaidPrincipalBalance
CarryingValue
RelatedAllowance
UnpaidPrincipalBalance
CarryingValue
RelatedAllowance
With no recorded allowance Residential mortgage $ 21,567 $ 16,450 $ — $ 20,226 $ 14,967 $ —Home equity 3,249 1,385 — 2,624 1,103 —
With an allowance recorded Residential mortgage 13,341 12,862 991 14,223 13,158 1,252Home equity 893 761 240 1,256 1,022 448
Total Residential mortgage $ 34,908 $ 29,312 $ 991 $ 34,449 $ 28,125 $ 1,252Home equity 4,142 2,146 240 3,880 2,125 448
2013 2012 2011
AverageCarrying
Value
InterestIncome
Recognized (1)
AverageCarryingValue
InterestIncome
Recognized (1)
AverageCarryingValue
InterestIncome
Recognized (1)
With no recorded allowance Residential mortgage $ 16,625 $ 621 $ 10,937 $ 366 $ 6,507 $ 241Home equity 1,245 76 734 49 442 23
With an allowance recorded Residential mortgage 13,926 616 11,575 423 9,552 325Home equity 912 41 1,145 44 1,357 34
Total Residential mortgage $ 30,551 $ 1,237 $ 22,512 $ 789 $ 16,059 $ 566Home equity 2,157 117 1,879 93 1,799 57
(1) Interest income recognized includes interest accrued and collected on the outstanding balances of accruing impaired loans as well as interest cash collections on nonaccruing impaired loans for which the principal is considered collectible.
The table below presents the December 31, 2013, 2012 and 2011 unpaid principal balance, carrying value, and average pre- and post-modification interest rates of home loans that were modified in TDRs during 2013, 2012 and 2011, and net charge-offs that were recorded during the period in which the modification
occurred. The following Home Loans portfolio segment tables include loans that were initially classified as TDRs during the period and also loans that had previously been classified as TDRs and were modified again during the period. These TDRs are managed by Legacy Assets & Servicing.
Home Loans – TDRs Entered into During 2013, 2012 and 2011 (1)
December 31, 2013 2013
(Dollars in millions)
UnpaidPrincipalBalance
CarryingValue
Pre-ModificationInterest Rate
Post-ModificationInterest Rate
Net Charge-offs (2)
Residential mortgage $ 11,233 $ 10,016 5.30% 4.27% $ 235
Home equity 878 521 5.29 3.92 192
Total $ 12,111 $ 10,537 5.30 4.24 $ 427
December 31, 2012 2012Residential mortgage $ 15,088 $ 12,228 5.52% 4.70% $ 523Home equity 1,721 858 5.22 4.39 716
Total $ 16,809 $ 13,086 5.49 4.66 $ 1,239
December 31, 2011 2011Residential mortgage $ 11,764 $ 9,991 5.94% 5.16% $ 308Home equity 1,112 556 6.58 5.25 239
Total $ 12,876 $ 10,547 6.01 5.17 $ 547(1) TDRs entered into during 2013 include residential mortgage modifications with principal forgiveness of $467 million. TDRs entered into during 2012 include residential mortgage modifications with
principal forgiveness of $778 million and home equity modifications of $9 million. Prior to 2012, the principal forgiveness amount was not significant.(2) Net charge-offs include amounts recorded on loans modified during the period that are no longer held by the Corporation at December 31, 2013, 2012 and 2011 due to sales and other dispositions.
76788ba_financials.indd 187 3/6/14 12:06 PM

188 Bank of America 2013
The table below presents the December 31, 2013, 2012 and 2011 carrying value for home loans that were modified in a TDR during 2013, 2012 and 2011 by type of modification.
Home Loans – Modification Programs
TDRs Entered into During 2013
(Dollars in millions)ResidentialMortgage
Home Equity
Total CarryingValue
Modifications under government programs
Contractual interest rate reduction $ 1,815 $ 48 $ 1,863
Principal and/or interest forbearance 35 24 59
Other modifications (1) 100 — 100
Total modifications under government programs 1,950 72 2,022
Modifications under proprietary programs
Contractual interest rate reduction 2,799 40 2,839
Capitalization of past due amounts 132 2 134
Principal and/or interest forbearance 469 17 486
Other modifications (1) 105 25 130
Total modifications under proprietary programs 3,505 84 3,589
Trial modifications 3,410 87 3,497
Loans discharged in Chapter 7 bankruptcy (2) 1,151 278 1,429
Total modifications $ 10,016 $ 521 $ 10,537
TDRs Entered into During 2012Modifications under government programs
Contractual interest rate reduction $ 642 $ 78 $ 720Principal and/or interest forbearance 51 31 82Other modifications (1) 37 1 38
Total modifications under government programs 730 110 840Modifications under proprietary programs
Contractual interest rate reduction 3,350 44 3,394Capitalization of past due amounts 144 — 144Principal and/or interest forbearance 424 16 440Other modifications (1) 97 21 118
Total modifications under proprietary programs 4,015 81 4,096Trial modifications 4,547 69 4,616Loans discharged in Chapter 7 bankruptcy (2) 2,936 598 3,534
Total modifications $ 12,228 $ 858 $ 13,086
TDRs Entered into During 2011Modifications under government programs
Contractual interest rate reduction $ 994 $ 189 $ 1,183Principal and/or interest forbearance 189 36 225Other modifications (1) 64 5 69
Total modifications under government programs 1,247 230 1,477Modifications under proprietary programs
Contractual interest rate reduction 3,531 101 3,632Capitalization of past due amounts 410 1 411Principal and/or interest forbearance 946 49 995Other modifications (1) 441 34 475
Total modifications under proprietary programs 5,328 185 5,513Trial modifications 3,416 141 3,557
Total modifications $ 9,991 $ 556 $ 10,547(1) Includes other modifications such as term or payment extensions and repayment plans.(2) Includes loans discharged in Chapter 7 bankruptcy with no change in repayment terms that are classified as TDRs. The amount for 2012 represents the cumulative impact upon adoption of the
regulatory guidance. During 2013, home loans of $587 million, or 41 percent of loans discharged in Chapter 7 bankruptcy were current or less than 60 days past due.
76788ba_financials.indd 188 3/6/14 12:06 PM

Bank of America 2013 189
The table below presents the carrying value of loans that entered into payment default during 2013, 2012 and 2011 that were modified in a TDR during the 12 months preceding payment default. Included in the table are loans with a carrying value of $2.4 billion, $667 million and $514 million that entered payment default during 2013, 2012 and 2011 but were no longer held by the Corporation as of December 31, 2013, 2012 and 2011 due
to sales and other dispositions. A payment default for home loan TDRs is recognized when a borrower has missed three monthly payments (not necessarily consecutively) since modification. Payment default on a trial modification where the borrower has not yet met the terms of the agreement are included in the table below if the borrower is 90 days or more past due three months after the offer to modify is made.
Home Loans – TDRs Entering Payment Default That Were Modified During the Preceding 12 Months
2013
(Dollars in millions) ResidentialMortgage
Home Equity
Total Carrying Value (1)
Modifications under government programs $ 454 $ 2 $ 456
Modifications under proprietary programs 1,117 4 1,121
Loans discharged in Chapter 7 bankruptcy (2) 964 30 994
Trial modifications 4,376 14 4,390
Total modifications $ 6,911 $ 50 $ 6,961
2012Modifications under government programs $ 202 $ 8 $ 210Modifications under proprietary programs 942 14 956Loans discharged in Chapter 7 bankruptcy (2) 1,228 53 1,281Trial modifications 2,351 20 2,371
Total modifications $ 4,723 $ 95 $ 4,818
2011Modifications under government programs $ 352 $ 2 $ 354Modifications under proprietary programs 2,098 42 2,140Trial modifications 1,101 17 1,118
Total modifications $ 3,551 $ 61 $ 3,612(1) Total carrying value includes loans with a carrying value of $2.4 billion, $667 million and $514 million that entered into payment default during 2013, 2012 and 2011 but were no longer held by the
Corporation as of December 31, 2013, 2012 and 2011 due to sales and other dispositions.(2) Includes loans discharged in Chapter 7 bankruptcy with no change in repayment terms that are classified as TDRs.
Credit Card and Other ConsumerImpaired loans within the Credit Card and Other Consumer portfolio segment consist entirely of loans that have been modified in TDRs (the renegotiated credit card and other consumer TDR portfolio, collectively referred to as the renegotiated TDR portfolio). The Corporation seeks to assist customers that are experiencing financial difficulty by modifying loans while ensuring compliance with federal laws and guidelines. Credit card and other consumer loan modifications generally involve reducing the interest rate on the account and placing the customer on a fixed payment plan not exceeding 60 months, all of which are considered TDRs. In addition, non-U.S. credit card modifications may involve reducing the interest rate on the account without placing the customer on a fixed payment plan, and are also considered TDRs. In all cases, the customer’s available line of credit is canceled. The Corporation makes loan modifications directly with borrowers for debt held only by the Corporation (internal programs). Additionally, the Corporation makes loan modifications for borrowers working with third-party renegotiation agencies that provide solutions to customers’ entire unsecured debt structures (external programs). The Corporation classifies other secured consumer loans that have been discharged in Chapter 7 bankruptcy as TDRs which are written
down to collateral value and placed on nonaccrual status no later than the time of discharge. For more information on the regulatory guidance on loans discharged in Chapter 7 bankruptcy, see Nonperforming Loans and Leases in this Note.
All credit card and substantially all other consumer loans that have been modified in TDRs remain on accrual status until the loan is either paid in full or charged off, which occurs no later than the end of the month in which the loan becomes 180 days past due or generally at 120 days past due for a loan that was placed on a fixed payment plan after July 1, 2012.
The allowance for impaired credit card and substantially all other consumer loans is based on the present value of projected cash flows, which incorporates the Corporation’s historical payment default and loss experience on modified loans, discounted using the portfolio’s average contractual interest rate, excluding promotionally priced loans, in effect prior to restructuring. Credit card and other consumer loans are included in homogeneous pools which are collectively evaluated for impairment. For these portfolios, loss forecast models are utilized that consider a variety of factors including, but not limited to, historical loss experience, delinquency status, economic trends and credit scores.
76788ba_financials.indd 189 3/6/14 12:06 PM

190 Bank of America 2013
The table below provides information on the Corporation’s renegotiated TDR portfolio in the Credit Card and Other Consumer portfolio segment at December 31, 2013 and 2012, and for 2013, 2012 and 2011.
Impaired Loans – Credit Card and Other Consumer – Renegotiated TDRs
December 31, 2013 December 31, 2012
(Dollars in millions)
UnpaidPrincipalBalance
CarryingValue (1)
RelatedAllowance
UnpaidPrincipalBalance
CarryingValue (1)
RelatedAllowance
With an allowance recorded U.S. credit card $ 1,384 $ 1,465 $ 337 $ 2,856 $ 2,871 $ 719Non-U.S. credit card 200 240 149 311 316 198Direct/Indirect consumer 242 282 84 633 636 210Other consumer 27 26 9 30 30 12
With no recorded allowance
Direct/Indirect consumer 75 32 — 105 58 —Other consumer 34 34 — 35 35 —
Total
U.S. credit card $ 1,384 $ 1,465 $ 337 $ 2,856 $ 2,871 $ 719Non-U.S. credit card 200 240 149 311 316 198Direct/Indirect consumer 317 314 84 738 694 210Other consumer 61 60 9 65 65 12
2013 2012 2011
AverageCarrying
Value
InterestIncome
Recognized (2)
AverageCarryingValue
InterestIncome
Recognized (2)
AverageCarryingValue
InterestIncome
Recognized (2)
With an allowance recorded U.S. credit card $ 2,144 $ 134 $ 4,085 $ 253 $ 7,211 $ 433Non-U.S. credit card 266 7 464 10 759 6Direct/Indirect consumer 456 24 929 50 1,582 85Other consumer 28 2 29 2 30 2
With no recorded allowance
Direct/Indirect consumer 42 — 58 — — —Other consumer 34 2 35 2 30 2
Total
U.S. credit card $ 2,144 $ 134 $ 4,085 $ 253 $ 7,211 $ 433Non-U.S. credit card 266 7 464 10 759 6Direct/Indirect consumer 498 24 987 50 1,582 85Other consumer 62 4 64 4 60 4
(1) Includes accrued interest and fees.(2) Interest income recognized includes interest accrued and collected on the outstanding balances of accruing impaired loans as well as interest cash collections on nonaccruing impaired loans for
which the principal is considered collectible.
The table below provides information on the Corporation’s primary modification programs for the renegotiated TDR portfolio at December 31, 2013 and 2012.
Credit Card and Other Consumer – Renegotiated TDRs by Program Type
December 31
Internal Programs External Programs Other TotalPercent of Balances Current orLess Than 30 Days Past Due
(Dollars in millions) 2013 2012 2013 2012 2013 2012 2013 2012 2013 2012U.S. credit card $ 842 $ 1,887 $ 607 $ 953 $ 16 $ 31 $ 1,465 $ 2,871 82.77% 81.48%Non-U.S. credit card 71 99 26 38 143 179 240 316 49.01 43.71Direct/Indirect consumer 170 405 106 225 38 64 314 694 84.29 83.11Other consumer 60 65 — — — — 60 65 71.08 72.73
Total renegotiated TDRs $ 1,143 $ 2,456 $ 739 $ 1,216 $ 197 $ 274 $ 2,079 $ 3,946 78.77 78.58
76788ba_financials.indd 190 3/6/14 12:06 PM

Bank of America 2013 191
The table below provides information on the Corporation’s renegotiated TDR portfolio including the December 31, 2013, 2012 and 2011 unpaid principal balance, carrying value and average pre- and post-modification interest rates of loans that were modified in TDRs during 2013, 2012 and 2011, and net charge-offs that were recorded during the period in which the modification occurred.
Credit Card and Other Consumer – Renegotiated TDRs Entered into During 2013, 2012 and 2011
December 31, 2013 2013
(Dollars in millions)
UnpaidPrincipalBalance
Carrying Value (1)
Pre-ModificationInterest Rate
Post-ModificationInterest Rate
Net Charge-offs
U.S. credit card $ 299 $ 329 16.84% 5.84% $ 30
Non-U.S. credit card 134 147 25.90 0.95 138
Direct/Indirect consumer 47 38 11.53 4.74 15
Other consumer 8 8 9.28 5.25 —
Total $ 488 $ 522 18.89 4.37 $ 183
December 31, 2012 2012U.S. credit card $ 396 $ 400 17.59% 6.36% $ 45Non-U.S. credit card 196 206 26.19 1.15 190Direct/Indirect consumer 160 113 9.59 5.72 52Other consumer 9 9 9.97 6.44 —
Total $ 761 $ 728 18.68 4.79 $ 287
December 31, 2011 2011U.S. credit card $ 890 $ 902 19.04% 6.16% $ 106Non-U.S. credit card 305 322 26.32 1.04 291Direct/Indirect consumer 198 199 15.63 5.22 23Other consumer 17 17 10.01 6.53 —
Total $ 1,410 $ 1,440 20.09 4.89 $ 420(1) Includes accrued interest and fees.
The table below provides information on the Corporation’s primary modification programs for the renegotiated TDR portfolio for loans that were modified in TDRs during 2013, 2012 and 2011.
Credit Card and Other Consumer – Renegotiated TDRs Entered into During the Period by Program Type
2013
(Dollars in millions)Internal
ProgramsExternal
Programs Other Total
U.S. credit card $ 192 $ 137 $ — $ 329
Non-U.S. credit card 73 74 — 147
Direct/Indirect consumer 15 8 15 38
Other consumer 8 — — 8
Total renegotiated TDRs $ 288 $ 219 $ 15 $ 522
2012U.S. credit card $ 248 $ 152 $ — $ 400Non-U.S. credit card 112 94 — 206Direct/Indirect consumer 36 19 58 113Other consumer 9 — — 9
Total renegotiated TDRs $ 405 $ 265 $ 58 $ 728
2011U.S. credit card $ 492 $ 407 $ 3 $ 902Non-U.S. credit card 163 158 1 322Direct/Indirect consumer 112 87 — 199Other consumer 17 — — 17
Total renegotiated TDRs $ 784 $ 652 $ 4 $ 1,440
76788ba_financials.indd 191 3/6/14 12:06 PM

192 Bank of America 2013
Credit card and other consumer loans are deemed to be in payment default during the quarter in which a borrower misses the second of two consecutive payments. Payment defaults are one of the factors considered when projecting future cash flows in the calculation of the allowance for loan and lease losses for impaired credit card and other consumer loans. Based on historical experience, the Corporation estimates that 21 percent of new U.S. credit card TDRs, 70 percent of new non-U.S. credit card TDRs and 13 percent of new direct/indirect consumer TDRs may be in payment default within 12 months after modification. Loans that entered into payment default during 2013, 2012 and 2011 that had been modified in a TDR during the preceding 12 months were $61 million, $203 million and $863 million for U.S. credit card, $236 million, $298 million and $409 million for non-U.S. credit card, and $12 million, $35 million and $180 million for direct/indirect consumer, respectively.
Commercial LoansImpaired commercial loans, which include nonperforming loans and TDRs (both performing and nonperforming), are primarily measured based on the present value of payments expected to be received, discounted at the loan’s original effective interest rate. Commercial impaired loans may also be measured based on observable market prices or, for loans that are solely dependent on the collateral for repayment, the estimated fair value of collateral less costs to sell. If the carrying value of a loan exceeds this amount, a specific allowance is recorded as a component of the allowance for loan and lease losses.
Modifications of loans to commercial borrowers that are experiencing financial difficulty are designed to reduce the Corporation’s loss exposure while providing the borrower with an
opportunity to work through financial difficulties, often to avoid foreclosure or bankruptcy. Each modification is unique and reflects the individual circumstances of the borrower. Modifications that result in a TDR may include extensions of maturity at a concessionary (below market) rate of interest, payment forbearances or other actions designed to benefit the customer while mitigating the Corporation’s risk exposure. Reductions in interest rates are rare. Instead, the interest rates are typically increased, although the increased rate may not represent a market rate of interest. Infrequently, concessions may also include principal forgiveness in connection with foreclosure, short sale or other settlement agreements leading to termination or sale of the loan.
At the time of restructuring, the loans are remeasured to reflect the impact, if any, on projected cash flows resulting from the modified terms. If there was no forgiveness of principal and the interest rate was not decreased, the modification may have little or no impact on the allowance established for the loan. If a portion of the loan is deemed to be uncollectible, a charge-off may be recorded at the time of restructuring. Alternatively, a charge-off may have already been recorded in a previous period such that no charge-off is required at the time of modification. For more information on modifications for the U.S. small business commercial portfolio, see Credit Card and Other Consumer in this Note.
At December 31, 2013 and 2012, remaining commitments to lend additional funds to debtors whose terms have been modified in a commercial loan TDR were immaterial. Commercial foreclosed properties totaled $90 million and $250 million at December 31, 2013 and 2012.
76788ba_financials.indd 192 3/6/14 12:06 PM

Bank of America 2013 193
The table below provides information for impaired loans in the Corporation’s Commercial loan portfolio segment at December 31, 2013 and 2012, and for 2013, 2012 and 2011. Certain impaired commercial loans do not have a related allowance as the valuation of these impaired loans exceeded the carrying value, which is net of previously recorded charge-offs.
Impaired Loans – Commercial
December 31, 2013 December 31, 2012
(Dollars in millions)
UnpaidPrincipalBalance
CarryingValue
RelatedAllowance
UnpaidPrincipalBalance
CarryingValue
RelatedAllowance
With no recorded allowance U.S. commercial $ 609 $ 577 $ — $ 571 $ 476 $ —Commercial real estate 254 228 — 370 316 —Non-U.S. commercial 10 10 — 155 36 —
With an allowance recorded U.S. commercial 1,581 1,262 164 2,431 1,771 159Commercial real estate 1,066 731 61 2,920 1,848 201Non-U.S. commercial 254 64 16 365 117 18U.S. small business commercial (1) 186 176 36 361 317 97
Total U.S. commercial $ 2,190 $ 1,839 $ 164 $ 3,002 $ 2,247 $ 159Commercial real estate 1,320 959 61 3,290 2,164 201Non-U.S. commercial 264 74 16 520 153 18U.S. small business commercial (1) 186 176 36 361 317 97
2013 2012 2011
AverageCarrying
Value
InterestIncome
Recognized (2)
AverageCarryingValue
InterestIncome
Recognized (2)
AverageCarryingValue
InterestIncome
Recognized (2)
With no recorded allowance U.S. commercial $ 442 $ 6 $ 588 $ 9 $ 774 $ 7Commercial real estate 269 3 1,119 3 1,994 7Non-U.S. commercial 28 — 104 — 101 —
With an allowance recorded U.S. commercial 1,553 47 2,104 55 2,422 13Commercial real estate 1,148 28 2,126 29 3,309 19Non-U.S. commercial 109 5 77 4 76 3U.S. small business commercial (1) 236 6 409 13 666 23
Total U.S. commercial $ 1,995 $ 53 $ 2,692 $ 64 $ 3,196 $ 20Commercial real estate 1,417 31 3,245 32 5,303 26Non-U.S. commercial 137 5 181 4 177 3U.S. small business commercial (1) 236 6 409 13 666 23
(1) Includes U.S. small business commercial renegotiated TDR loans and related allowance.(2) Interest income recognized includes interest accrued and collected on the outstanding balances of accruing impaired loans as well as interest cash collections on nonaccruing impaired loans for
which the principal is considered collectible.
76788ba_financials.indd 193 3/6/14 12:06 PM

194 Bank of America 2013
The table below presents the December 31, 2013, 2012 and 2011 unpaid principal balance and carrying value of commercial loans that were modified as TDRs during 2013, 2012 and 2011, and net charge-offs that were recorded during the period in which the modification occurred. The table below includes loans that were initially classified as TDRs during the period and, beginning in the first quarter of 2013, also loans that had previously been classified as TDRs and were modified again during the period.
Commercial – TDRs Entered into During 2013, 2012 and2011
December 31, 2013 2013
(Dollars in millions)
UnpaidPrincipalBalance
CarryingValue
NetCharge-offs
U.S. commercial $ 926 $ 910 $ 33
Commercial real estate 483 425 3
Non-U.S. commercial 61 44 7
U.S. small business commercial (1) 8 9 1
Total $ 1,478 $ 1,388 $ 44
December 31, 2012 2012U.S. commercial $ 590 $ 558 $ 34Commercial real estate 793 721 20Non-U.S. commercial 90 89 1U.S. small business commercial (1) 22 22 5
Total $ 1,495 $ 1,390 $ 60
December 31, 2011 2011U.S. commercial $ 1,381 $ 1,211 $ 74Commercial real estate 1,604 1,333 152Non-U.S. commercial 44 44 —U.S. small business commercial (1) 58 59 10
Total $ 3,087 $ 2,647 $ 236(1) U.S. small business commercial TDRs are comprised of renegotiated small business card loans.
A commercial TDR is generally deemed to be in payment default when the loan is 90 days or more past due, including delinquencies that were not resolved as part of the modification. U.S. small business commercial TDRs are deemed to be in payment default during the quarter in which a borrower misses the second of two consecutive payments. Payment defaults are one of the factors considered when projecting future cash flows, along with observable market prices or fair value of collateral when measuring the allowance for loan losses. TDRs that were in payment default had a carrying value of $55 million, $130 million and $164 million for U.S. commercial, $128 million, $455 million and $446 million for commercial real estate, and $0, $18 million and $68 million for U.S. small business commercial at December 31, 2013, 2012 and 2011, respectively.
Purchased Credit-impaired LoansPCI loans are acquired loans with evidence of credit quality deterioration since origination for which it is probable at purchase date that the Corporation will be unable to collect all contractually required payments. The following table provides details on PCI loans acquired in connection with the January 6, 2013 settlement with FNMA (the FNMA Settlement).
Purchased Loans at Acquisition Date
(Dollars in millions)
Contractually required payments including interest $ 8,274Less: Nonaccretable difference 2,159
Cash flows expected to be collected (1) 6,115Less: Accretable yield 1,125
Fair value of loans acquired $ 4,990(1) Represents undiscounted expected principal and interest cash flows at acquisition.
The table below shows activity for the accretable yield on PCI loans, which includes the Countrywide Financial Corporation (Countrywide) portfolio and loans repurchased in connection with the FNMA Settlement. For more information on the FNMA Settlement, see Note 7 – Representations and Warranties Obligations and Corporate Guarantees. The amount of accretable yield is affected by changes in credit outlooks, including metrics such as default rates and loss severities, prepayments speeds, which can change the amount and period of time over which interest payments are expected to be received, and the interest rates on variable rate loans. The reclassifications from nonaccretable difference during 2013 were due to increases in expected cash flows driven by improved home prices and lower expected defaults, along with a decrease in forecasted prepayment speeds as a result of rising interest rates. Changes in the prepayment assumption affect the expected remaining life of the portfolio which results in a change to the amount of future interest cash flows.
Rollforward of Accretable Yield
(Dollars in millions)
Accretable yield, January 1, 2012 $ 4,990Accretion (1,034)Disposals/transfers (109)Reclassifications from nonaccretable difference 797
Accretable yield, December 31, 2012 4,644Accretion (1,194)
Loans purchased 1,125
Disposals/transfers (361)
Reclassifications from nonaccretable difference 2,480
Accretable yield, December 31, 2013 $ 6,694
For more information on PCI loans, see Note 1 – Summary of Significant Accounting Principles, and for the carrying value and valuation allowance for PCI loans, see Note 5 – Allowance for Credit Losses.
Loans Held-for-saleThe Corporation had LHFS of $11.4 billion and $19.4 billion at December 31, 2013 and 2012. Proceeds, including cash and securities, from sales, securitizations and paydowns of LHFS were $81.0 billion, $58.0 billion and $142.4 billion for 2013, 2012 and 2011, respectively. Amounts used for originations and purchases of LHFS were $65.7 billion, $59.5 billion and $118.2 billion for 2013, 2012 and 2011, respectively.
76788ba_financials.indd 194 3/6/14 12:06 PM

Bank of America 2013 195
NOTE 5 Allowance for Credit LossesThe table below summarizes the changes in the allowance for credit losses by portfolio segment for 2013, 2012 and 2011.
2013
(Dollars in millions)HomeLoans
Credit Cardand OtherConsumer Commercial
Total Allowance
Allowance for loan and lease losses, January 1 $ 14,933 $ 6,140 $ 3,106 $ 24,179
Loans and leases charged off (3,766) (5,495) (1,108) (10,369)
Recoveries of loans and leases previously charged off 879 1,141 452 2,472
Net charge-offs (2,887) (4,354) (656) (7,897)
Write-offs of PCI loans (2,336) — — (2,336)
Provision for loan and lease losses (1,124) 3,139 1,559 3,574
Other (68) (20) (4) (92)
Allowance for loan and lease losses, December 31 8,518 4,905 4,005 17,428
Reserve for unfunded lending commitments, January 1 — — 513 513
Provision for unfunded lending commitments — — (18) (18)
Other — — (11) (11)
Reserve for unfunded lending commitments, December 31 — — 484 484
Allowance for credit losses, December 31 $ 8,518 $ 4,905 $ 4,489 $ 17,912
2012Allowance for loan and lease losses, January 1 $ 21,079 $ 8,569 $ 4,135 $ 33,783
Loans and leases charged off (7,849) (7,727) (2,096) (17,672)Recoveries of loans and leases previously charged off 496 1,519 749 2,764
Net charge-offs (7,353) (6,208) (1,347) (14,908)Write-offs of PCI loans (2,820) — — (2,820)Provision for loan and lease losses 4,073 3,899 338 8,310Other (46) (120) (20) (186)
Allowance for loan and lease losses, December 31 14,933 6,140 3,106 24,179Reserve for unfunded lending commitments, January 1 — — 714 714
Provision for unfunded lending commitments — — (141) (141)Other — — (60) (60)
Reserve for unfunded lending commitments, December 31 — — 513 513Allowance for credit losses, December 31 $ 14,933 $ 6,140 $ 3,619 $ 24,692
2011Allowance for loan and lease losses, January 1 $ 19,252 $ 15,463 $ 7,170 $ 41,885
Loans and leases charged off (9,291) (12,247) (3,204) (24,742)Recoveries of loans and leases previously charged off 894 2,124 891 3,909
Net charge-offs (8,397) (10,123) (2,313) (20,833)Provision for loan and lease losses 10,300 4,025 (696) 13,629Other (76) (796) (26) (898)
Allowance for loan and lease losses, December 31 21,079 8,569 4,135 33,783Reserve for unfunded lending commitments, January 1 — — 1,188 1,188
Provision for unfunded lending commitments — — (219) (219)Other — — (255) (255)
Reserve for unfunded lending commitments, December 31 — — 714 714Allowance for credit losses, December 31 $ 21,079 $ 8,569 $ 4,849 $ 34,497
In 2013, for the PCI loan portfolio, the Corporation recorded a benefit of $707 million in the provision for credit losses with a corresponding decrease in the valuation allowance included as part of the allowance for loan and lease losses. This compared to a benefit of $103 million in 2012 and expense of $2.2 billion in 2011. Write-offs in the PCI loan portfolio totaled $2.3 billion and $2.8 billion with a corresponding decrease in the PCI valuation allowance during 2013 and 2012. There were no write-offs in the PCI loan portfolio in 2011. Write-offs in 2013 included certain PCI loans that were ineligible for the National Mortgage Settlement, but had characteristics similar to the eligible loans and the expectation of future cash proceeds was considered remote. Write-offs of PCI loans in 2012 primarily related to the National Mortgage
Settlement. The valuation allowance associated with the PCI loan portfolio was $2.5 billion, $5.5 billion and $8.5 billion at December 31, 2013, 2012 and 2011, respectively.
The “Other” amount under allowance for loan and lease losses primarily represents the net impact of portfolio sales, consolidations and deconsolidations, and foreign currency translation adjustments. The 2011 amount also includes a $449 million reduction in the allowance for loan and lease losses related to Canadian consumer card loans that were transferred to LHFS.
The “Other” amount under the reserve for unfunded lending commitments primarily represents accretion of the Merrill Lynch & Co., Inc. (Merrill Lynch) purchase accounting adjustment.
76788ba_financials.indd 195 3/6/14 12:06 PM

196 Bank of America 2013
The table below presents the allowance and the carrying value of outstanding loans and leases by portfolio segment at December 31, 2013 and 2012.
Allowance and Carrying Value by Portfolio Segment
December 31, 2013
(Dollars in millions)Home Loans
Credit Cardand OtherConsumer Commercial Total
Impaired loans and troubled debt restructurings (1)
Allowance for loan and lease losses (2) $ 1,231 $ 579 $ 277 $ 2,087
Carrying value (3) 31,458 2,079 3,048 36,585
Allowance as a percentage of carrying value 3.91% 27.85% 9.09% 5.70%
Loans collectively evaluated for impairment
Allowance for loan and lease losses $ 4,794 $ 4,326 $ 3,728 $ 12,848
Carrying value (3, 4) 285,015 185,969 385,357 856,341
Allowance as a percentage of carrying value (4) 1.68% 2.33% 0.97% 1.50%
Purchased credit-impaired loans
Valuation allowance $ 2,493 n/a n/a $ 2,493
Carrying value gross of valuation allowance 25,265 n/a n/a 25,265
Valuation allowance as a percentage of carrying value 9.87% n/a n/a 9.87%
Total
Allowance for loan and lease losses $ 8,518 $ 4,905 $ 4,005 $ 17,428
Carrying value (3, 4) 341,738 188,048 388,405 918,191
Allowance as a percentage of carrying value (4) 2.49% 2.61% 1.03% 1.90%
December 31, 2012Impaired loans and troubled debt restructurings (1)
Allowance for loan and lease losses (2) $ 1,700 $ 1,139 $ 475 $ 3,314Carrying value (3) 30,250 3,946 4,881 39,077Allowance as a percentage of carrying value 5.62% 28.86% 9.73% 8.48%
Loans collectively evaluated for impairment Allowance for loan and lease losses $ 7,697 $ 5,001 $ 2,631 $ 15,329Carrying value (3, 4) 304,701 187,419 341,502 833,622Allowance as a percentage of carrying value (4) 2.53% 2.67% 0.77% 1.84%
Purchased credit-impaired loans Valuation allowance $ 5,536 n/a n/a $ 5,536Carrying value gross of valuation allowance 26,118 n/a n/a 26,118Valuation allowance as a percentage of carrying value 21.20% n/a n/a 21.20%
Total Allowance for loan and lease losses $ 14,933 $ 6,140 $ 3,106 $ 24,179Carrying value (3, 4) 361,069 191,365 346,383 898,817Allowance as a percentage of carrying value (4) 4.14% 3.21% 0.90% 2.69%
(1) Impaired loans include nonperforming commercial loans and all TDRs, including both commercial and consumer TDRs. Impaired loans exclude nonperforming consumer loans unless they are TDRs, and all consumer and commercial loans accounted for under the fair value option.
(2) Allowance for loan and lease losses includes $36 million and $97 million related to impaired U.S. small business commercial loans at December 31, 2013 and 2012.(3) Amounts are presented gross of the allowance for loan and lease losses.(4) Outstanding loan and lease balances and ratios do not include loans accounted for under the fair value option of $10.0 billion and $9.0 billion at December 31, 2013 and 2012.n/a = not applicable
76788ba_financials.indd 196 3/6/14 12:06 PM

Bank of America 2013 197
NOTE 6 Securitizations and Other Variable Interest EntitiesThe Corporation utilizes variable interest entities (VIEs) in the ordinary course of business to support its own and its customers’ financing and investing needs. The Corporation routinely securitizes loans and debt securities using VIEs as a source of funding for the Corporation and as a means of transferring the economic risk of the loans or debt securities to third parties. The assets are transferred into a trust or other securitization vehicle such that the assets are legally isolated from the creditors of the Corporation and are not available to satisfy its obligations. These assets can only be used to settle obligations of the trust or other securitization vehicle. The Corporation also administers, structures or invests in other VIEs including CDOs, investment vehicles and other entities. For more information on the Corporation’s utilization of VIEs, see Note 1 – Summary of Significant Accounting Principles.
The tables within this Note present the assets and liabilities of consolidated and unconsolidated VIEs at December 31, 2013 and 2012, in situations where the Corporation has continuing involvement with transferred assets or if the Corporation otherwise has a variable interest in the VIE. The tables also present the Corporation’s maximum loss exposure at December 31, 2013 and 2012 resulting from its involvement with consolidated VIEs and unconsolidated VIEs in which the Corporation holds a variable interest. The Corporation’s maximum loss exposure is based on the unlikely event that all of the assets in the VIEs become worthless and incorporates not only potential losses associated with assets recorded on the Consolidated Balance Sheet but also potential losses associated with off-balance sheet commitments such as unfunded liquidity commitments and other contractual arrangements. The Corporation’s maximum loss exposure does not include losses previously recognized through write-downs of assets.
The Corporation invests in asset-backed securities (ABS) issued by third-party VIEs with which it has no other form of involvement. These securities are included in Note 20 – Fair Value Measurements and Note 3 – Securities. In addition, the Corporation
uses VIEs such as trust preferred securities trusts in connection with its funding activities. For additional information, see Note 11 – Long-term Debt. The Corporation also uses VIEs in the form of synthetic securitization vehicles to mitigate a portion of the credit risk on its residential mortgage loan portfolio, as described in Note 4 – Outstanding Loans and Leases. The Corporation uses VIEs, such as cash funds managed within Global Wealth & Investment Management (GWIM), to provide investment opportunities for clients. These VIEs, which are not consolidated by the Corporation, are not included in the tables within this Note.
Except as described below, the Corporation did not provide financial support to consolidated or unconsolidated VIEs during 2013 or 2012 that it was not previously contractually required to provide, nor does it intend to do so.
Mortgage-related Securitizations
First-lien MortgagesAs part of its mortgage banking activities, the Corporation securitizes a portion of the first-lien residential mortgage loans it originates or purchases from third parties, generally in the form of MBS guaranteed by government-sponsored enterprises, FNMA and FHLMC (collectively the GSEs), or GNMA in the case of FHA-insured and U.S. Department of Veterans Affairs (VA)-guaranteed mortgage loans. Securitization usually occurs in conjunction with or shortly after origination or purchase. In addition, the Corporation may, from time to time, securitize commercial mortgages it originates or purchases from other entities. The Corporation typically services the loans it securitizes. Further, the Corporation may retain beneficial interests in the securitization trusts including senior and subordinate securities and equity tranches issued by the trusts. Except as described below and in Note 7 – Representations and Warranties Obligations and Corporate Guarantees, the Corporation does not provide guarantees or recourse to the securitization trusts other than standard representations and warranties.
The table below summarizes select information related to first-lien mortgage securitizations for 2013 and 2012.
First-lien Mortgage Securitizations
Residential Mortgage - Agency Commercial Mortgage(Dollars in millions) 2013 2012 2013 2012Cash proceeds from new securitizations (1) $ 49,888 $ 39,526 $ 5,326 $ 2,664Gain (loss) on securitizations (2) 81 (212) 119 65
(1) The Corporation sells residential mortgage loans to GSEs in the normal course of business and receives MBS in exchange which may then be sold into the market to third-party investors for cash proceeds.
(2) Substantially all of the first-lien residential and commercial mortgage loans securitized are initially classified as LHFS and accounted for under the fair value option. As such, gains are recognized on these LHFS prior to securitization. The Corporation recognized $2.0 billion of gains, net of hedges, on loans securitized during both 2013 and 2012.
In addition to cash proceeds as reported in the table above, the Corporation received securities with an initial fair value of $3.3 billion and $3.2 billion in connection with first-lien mortgage securitizations in 2013 and 2012. All of these securities were initially classified as Level 2 assets within the fair value hierarchy. During 2013 and 2012, there were no changes to the initial classification.
The Corporation recognizes consumer MSRs from the sale or securitization of first-lien mortgage loans. Servicing fee and ancillary fee income on consumer mortgage loans serviced, including securitizations where the Corporation has continuing involvement, were $2.9 billion and $4.7 billion in 2013 and 2012.
Servicing advances on consumer mortgage loans, including securitizations where the Corporation has continuing involvement, were $14.1 billion and $23.2 billion at December 31, 2013 and 2012. The Corporation may have the option to repurchase delinquent loans out of securitization trusts, which reduces the amount of servicing advances it is required to make. During 2013 and 2012, $10.8 billion and $9.2 billion of loans were repurchased from first-lien securitization trusts as a result of loan delinquencies or to perform modifications. The majority of these loans repurchased were FHA-insured mortgages collateralizing GNMA securities. For more information on MSRs, see Note 23 – Mortgage Servicing Rights.
76788ba_financials.indd 197 3/6/14 12:06 PM

198 Bank of America 2013
The table below summarizes select information related to first-lien mortgage securitization trusts in which the Corporation held a variable interest at December 31, 2013 and 2012.
First-lien Mortgage VIEs
Residential Mortgage Non-agency
Agency Prime Subprime Alt-ACommercialMortgage
December 31 December 31 December 31(Dollars in millions) 2013 2012 2013 2012 2013 2012 2013 2012 2013 2012Unconsolidated VIEs Maximum loss exposure (1) $ 21,140 $ 28,591 $ 1,527 $ 2,038 $ 406 $ 410 $ 437 $ 367 $ 432 $ 702On-balance sheet assets
Senior securities held (2): Trading account assets $ 650 $ 619 $ — $ 16 $ 1 $ 14 $ 3 $ — $ 14 $ 12Debt securities carried at fair value 19,451 26,421 988 1,388 220 210 109 128 306 581
Subordinate securities held (2): Trading account assets — — — — 8 3 — — 13 13Debt securities carried at fair value — — 15 21 6 9 — — 53 —
Residual interests held — — 13 18 — 9 — — 16 40All other assets (3) 1,039 1,551 71 64 1 1 325 239 — —
Total retained positions $ 21,140 $ 28,591 $ 1,087 $ 1,507 $ 236 $ 246 $ 437 $ 367 $ 402 $ 646Principal balance outstanding (4) $ 437,765 $ 780,202 $ 25,104 $ 47,348 $ 36,854 $ 63,813 $ 56,454 $ 80,860 $ 19,730 $ 56,733
Consolidated VIEs Maximum loss exposure (1) $ 42,420 $ 46,959 $ 79 $ 104 $ 368 $ 390 $ — $ — $ — $ —On-balance sheet assets
Trading account assets $ 1,640 $ — $ — $ — $ — $ — $ — $ — $ — $ —Loans and leases 40,316 45,991 140 283 803 722 — — — —Allowance for loan and lease losses (3) (4) — — — — — — — —Loans held-for-sale — — — — — 914 — — — —All other assets 474 972 — 10 7 91 — — — —
Total assets $ 42,427 $ 46,959 $ 140 $ 293 $ 810 $ 1,727 $ — $ — $ — $ —On-balance sheet liabilities
Short-term borrowings $ — $ — $ — $ — $ — $ 741 $ — $ — $ — $ —Long-term debt 7 — 61 212 803 941 — — — —All other liabilities — — — — 7 — — — — —
Total liabilities $ 7 $ — $ 61 $ 212 $ 810 $ 1,682 $ — $ — $ — $ —(1) Maximum loss exposure excludes the liability for representations and warranties obligations and corporate guarantees and also excludes servicing advances and MSRs. For additional information,
see Note 7 – Representations and Warranties Obligations and Corporate Guarantees and Note 23 – Mortgage Servicing Rights.(2) As a holder of these securities, the Corporation receives scheduled principal and interest payments. During 2013 and 2012, there were no OTTI losses recorded on those securities classified as
AFS debt securities.(3) Not included in the table above are all other assets of $1.6 billion and $12.1 billion, representing the unpaid principal balance of mortgage loans eligible for repurchase from unconsolidated residential
mortgage securitization vehicles, principally guaranteed by GNMA, and all other liabilities of $1.6 billion and $12.1 billion, representing the principal amount that would be payable to the securitization vehicles if the Corporation were to exercise the repurchase option, at December 31, 2013 and 2012.
(4) Principal balance outstanding includes loans the Corporation transferred with which the Corporation has continuing involvement, which may include servicing the loans.
During 2013 and 2012, the Corporation deconsolidated several non-agency residential mortgage trusts with total assets of $871 million and $1.2 billion following the sale of retained interests or the transfer of servicing to a third party.
Home Equity LoansThe Corporation retains interests in home equity securitization trusts to which it transferred home equity loans. These retained interests include senior and subordinate securities and residual interests. In addition, the Corporation may be obligated to provide
subordinate funding to the trusts during a rapid amortization event. The Corporation also services the loans in the trusts. Except as described below and in Note 7 – Representations and Warranties Obligations and Corporate Guarantees, the Corporation does not provide guarantees or recourse to the securitization trusts other than standard representations and warranties. There were no securitizations of home equity loans during 2013 and 2012 and all of the home equity trusts have entered the rapid amortization phase.
76788ba_financials.indd 198 3/6/14 12:06 PM

Bank of America 2013 199
The table below summarizes select information related to home equity loan securitization trusts in which the Corporation held a variable interest at December 31, 2013 and 2012.
Home Equity Loan VIEs
December 31 2013 2012
(Dollars in millions)Consolidated
VIEsUnconsolidated
VIEs TotalConsolidated
VIEsUnconsolidated
VIEs Total
Maximum loss exposure (1) $ 1,269 $ 6,217 $ 7,486 $ 2,004 $ 6,707 $ 8,711On-balance sheet assets
Trading account assets $ — $ 12 $ 12 $ — $ 8 $ 8Debt securities carried at fair value — 25 25 — 14 14Loans and leases 1,329 — 1,329 2,197 — 2,197Allowance for loan and lease losses (80) — (80) (193) — (193)All other assets 20 — 20 — — —
Total $ 1,269 $ 37 $ 1,306 $ 2,004 $ 22 $ 2,026On-balance sheet liabilities
Long-term debt $ 1,450 $ — $ 1,450 $ 2,331 $ — $ 2,331All other liabilities 90 — 90 92 — 92
Total $ 1,540 $ — $ 1,540 $ 2,423 $ — $ 2,423Principal balance outstanding $ 1,329 $ 7,542 $ 8,871 $ 2,197 $ 12,644 $ 14,841
(1) For unconsolidated VIEs, the maximum loss exposure includes outstanding trust certificates issued by trusts in rapid amortization, net of recorded reserves, and excludes the liability for representations and warranties obligations and corporate guarantees.
The maximum loss exposure in the table above includes the Corporation’s obligation to provide subordinated funding to certain consolidated and unconsolidated home equity loan securitizations that have entered a rapid amortization period. During this period, cash payments from borrowers are accumulated to repay outstanding debt securities and the Corporation continues to make advances to borrowers when they draw on their lines of credit. At December 31, 2013 and 2012, home equity loan securitizations in rapid amortization for which the Corporation has a subordinated funding obligation, including both consolidated and unconsolidated trusts, had $7.6 billion and $9.0 billion of trust certificates outstanding. This amount is significantly greater than the amount the Corporation expects to fund. The charges that will ultimately be recorded as a result of the rapid amortization events depend on the undrawn available credit on the home equity lines, which totaled $82 million and $196 million at December 31, 2013 and 2012, as well as performance of the loans, the amount of subsequent draws and the timing of related cash flows. At
December 31, 2013 and 2012, the reserve for losses on expected future draw obligations on the home equity loan securitizations in rapid amortization for which the Corporation has a subordinated funding obligation was $12 million and $51 million.
The Corporation has consumer MSRs from the sale or securitization of home equity loans. The Corporation recorded $47 million and $59 million of servicing fee income related to home equity loan securitizations during 2013 and 2012. The Corporation repurchased $287 million and $87 million of loans from home equity securitization trusts during 2013 and 2012 to perform modifications.
During 2013, the Corporation transferred servicing for consolidated home equity securitization trusts with total assets of $475 million and total liabilities of $616 million to a third party. As the Corporation no longer services the underlying loans, these trusts were deconsolidated, resulting in a gain of $141 million that was recorded in other income (loss) in the Consolidated Statement of Income.
76788ba_financials.indd 199 3/6/14 12:06 PM
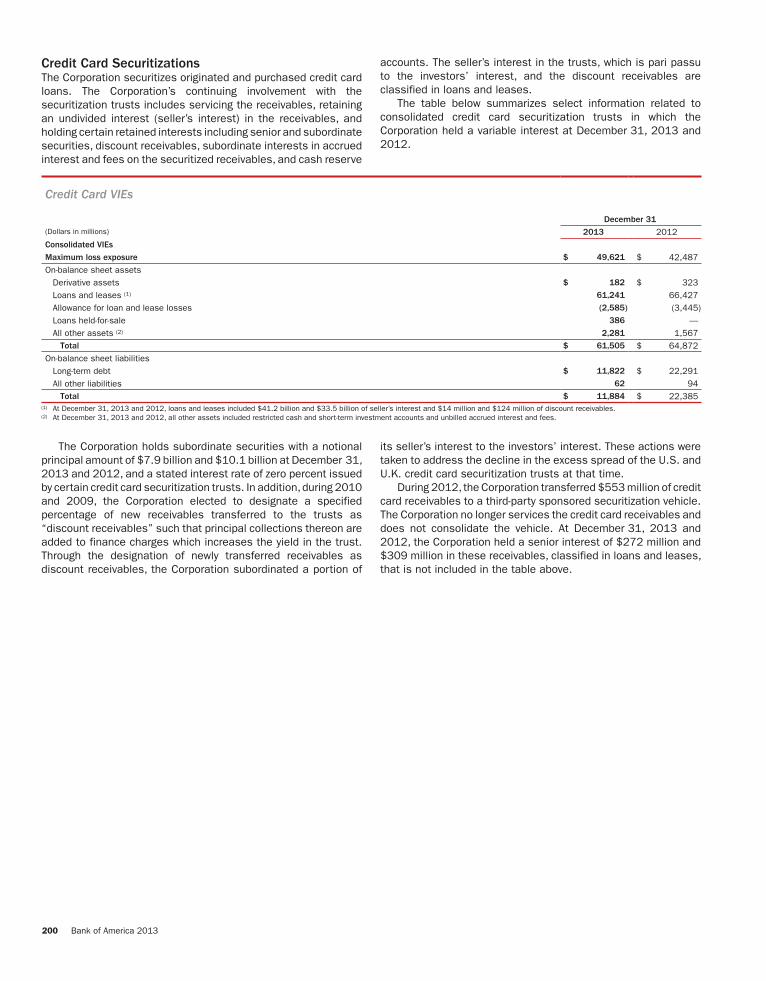
200 Bank of America 2013
Credit Card SecuritizationsThe Corporation securitizes originated and purchased credit card loans. The Corporation’s continuing involvement with the securitization trusts includes servicing the receivables, retaining an undivided interest (seller’s interest) in the receivables, and holding certain retained interests including senior and subordinate securities, discount receivables, subordinate interests in accrued interest and fees on the securitized receivables, and cash reserve
accounts. The seller’s interest in the trusts, which is pari passu to the investors’ interest, and the discount receivables are classified in loans and leases.
The table below summarizes select information related to consolidated credit card securitization trusts in which the Corporation held a variable interest at December 31, 2013 and 2012.
Credit Card VIEs
December 31(Dollars in millions) 2013 2012Consolidated VIEs
Maximum loss exposure $ 49,621 $ 42,487On-balance sheet assets
Derivative assets $ 182 $ 323Loans and leases (1) 61,241 66,427Allowance for loan and lease losses (2,585) (3,445)Loans held-for-sale 386 —All other assets (2) 2,281 1,567
Total $ 61,505 $ 64,872On-balance sheet liabilities
Long-term debt $ 11,822 $ 22,291All other liabilities 62 94
Total $ 11,884 $ 22,385(1) At December 31, 2013 and 2012, loans and leases included $41.2 billion and $33.5 billion of seller’s interest and $14 million and $124 million of discount receivables.(2) At December 31, 2013 and 2012, all other assets included restricted cash and short-term investment accounts and unbilled accrued interest and fees.
The Corporation holds subordinate securities with a notional principal amount of $7.9 billion and $10.1 billion at December 31, 2013 and 2012, and a stated interest rate of zero percent issued by certain credit card securitization trusts. In addition, during 2010 and 2009, the Corporation elected to designate a specified percentage of new receivables transferred to the trusts as “discount receivables” such that principal collections thereon are added to finance charges which increases the yield in the trust. Through the designation of newly transferred receivables as discount receivables, the Corporation subordinated a portion of
its seller’s interest to the investors’ interest. These actions were taken to address the decline in the excess spread of the U.S. and U.K. credit card securitization trusts at that time.
During 2012, the Corporation transferred $553 million of credit card receivables to a third-party sponsored securitization vehicle. The Corporation no longer services the credit card receivables and does not consolidate the vehicle. At December 31, 2013 and 2012, the Corporation held a senior interest of $272 million and $309 million in these receivables, classified in loans and leases, that is not included in the table above.
76788ba_financials.indd 200 3/6/14 12:06 PM

Bank of America 2013 201
Other Asset-backed SecuritizationsOther asset-backed securitizations include resecuritization trusts, municipal bond trusts, and automobile and other securitization trusts. The table below summarizes select information related to other asset-backed securitizations in which the Corporation held a variable interest at December 31, 2013 and 2012.
Other Asset-backed VIEs
Resecuritization Trusts Municipal Bond TrustsAutomobile and OtherSecuritization Trusts
December 31 December 31 December 31(Dollars in millions) 2013 2012 2013 2012 2013 2012Unconsolidated VIEs Maximum loss exposure $ 11,913 $ 20,715 $ 2,192 $ 3,341 $ 81 $ 122On-balance sheet assets
Senior securities held (1, 2): Trading account assets $ 971 $ 1,281 $ 53 $ 12 $ 1 $ 37Debt securities carried at fair value 10,866 19,343 — 540 70 74
Subordinate securities held (1, 2): Debt securities carried at fair value 71 75 — — — —
Residual interests held (3) 5 16 — — — —All other assets — — — — 10 11
Total retained positions $ 11,913 $ 20,715 $ 53 $ 552 $ 81 $ 122Total assets of VIEs (4) $ 40,924 $ 42,818 $ 3,643 $ 4,980 $ 1,788 $ 1,890
Consolidated VIEs Maximum loss exposure $ 164 $ 126 $ 2,667 $ 2,505 $ 94 $ 1,255On-balance sheet assets
Trading account assets $ 319 $ 220 $ 2,684 $ 2,505 $ — $ —Loans and leases — — — — 680 2,523Allowance for loan and lease losses — — — — — (2)All other assets — — — — 61 250
Total assets $ 319 $ 220 $ 2,684 $ 2,505 $ 741 $ 2,771On-balance sheet liabilities
Short-term borrowings $ — $ — $ 1,073 $ 2,859 $ — $ —Long-term debt 155 94 17 — 646 1,513All other liabilities — — — — 1 82
Total liabilities $ 155 $ 94 $ 1,090 $ 2,859 $ 647 $ 1,595(1) As a holder of these securities, the Corporation receives scheduled principal and interest payments. During 2013 and 2012, there were no OTTI losses recorded on those securities classified as
AFS debt securities.(2) The retained senior and subordinate securities were valued using quoted market prices or observable market inputs (Level 2 of the fair value hierarchy).(3) The retained residual interests are carried at fair value which was derived using model valuations (Level 2 of the fair value hierarchy).(4) Total assets include loans the Corporation transferred with which the Corporation has continuing involvement, which may include servicing the loan.
Resecuritization TrustsThe Corporation transfers existing securities, typically MBS, into resecuritization vehicles at the request of customers seeking securities with specific characteristics. The Corporation may also resecuritize securities within its investment portfolio for purposes of improving liquidity and capital, and managing credit or interest rate risk. Generally, there are no significant ongoing activities performed in a resecuritization trust and no single investor has the unilateral ability to liquidate the trust.
The Corporation resecuritized $22.2 billion of securities in 2013 and $37.4 billion in 2012. All of the securities transferred into resecuritization vehicles during 2013 and 2012 were classified as trading account assets. As such, changes in fair value were recorded in trading account profits prior to the resecuritization and no gain or loss on sale was recorded.
Municipal Bond TrustsThe Corporation administers municipal bond trusts that hold highly-rated, long-term, fixed-rate municipal bonds. The trusts obtain financing by issuing floating-rate trust certificates that reprice on
a weekly or other basis to third-party investors. The Corporation may transfer assets into the trusts and may also serve as remarketing agent and/or liquidity provider for the trusts. The floating-rate investors have the right to tender the certificates at specified dates. Should the Corporation be unable to remarket the tendered certificates, it may be obligated to purchase them at par under standby liquidity facilities. The Corporation also provides credit enhancement to investors in certain municipal bond trusts whereby the Corporation guarantees the payment of interest and principal on floating-rate certificates issued by these trusts in the event of default by the issuer of the underlying municipal bond.
During 2013 and 2012, the Corporation was the transferor of assets into unconsolidated municipal bond trusts and received cash proceeds from new securitizations of $188 million and $879 million. The securities transferred into municipal bond trusts during 2013 and 2012 were primarily classified as trading account assets. As such, changes in fair value were recorded in trading account profits prior to the transfer and no gain or loss on sale was recorded.
76788ba_financials.indd 201 3/6/14 12:06 PM

202 Bank of America 2013
The Corporation’s liquidity commitments to unconsolidated municipal bond trusts, including those for which the Corporation was transferor, totaled $2.1 billion and $2.8 billion at December 31, 2013 and 2012. The weighted-average remaining life of bonds held in the trusts at December 31, 2013 was 8.2 years. There were no material write-downs or downgrades of assets or issuers during 2013 and 2012.
Automobile and Other Securitization TrustsThe Corporation transfers automobile and other loans into securitization trusts, typically to improve liquidity or manage credit risk. During 2012, the Corporation transferred automobile loans into an unconsolidated automobile trust, receiving cash proceeds
of $2.4 billion and recording a loss on sale of $7 million. At December 31, 2013 and 2012, the Corporation serviced assets or otherwise had continuing involvement with automobile and other securitization trusts with outstanding balances of $2.5 billion and $4.7 billion, including trusts collateralized by automobile loans of $877 million and $3.5 billion, student loans of $741 million and $897 million, and other loans of $911 million and $290 million.
Other Variable Interest EntitiesThe table below summarizes select information related to other VIEs in which the Corporation held a variable interest at December 31, 2013 and 2012.
Other VIEs
December 31 2013 2012
(Dollars in millions) Consolidated Unconsolidated Total Consolidated Unconsolidated TotalMaximum loss exposure $ 9,716 $ 12,523 $ 22,239 $ 10,803 $ 9,269 $ 20,072On-balance sheet assets
Trading account assets $ 3,769 $ 1,420 $ 5,189 $ 5,181 $ 356 $ 5,537Derivative assets 3 739 742 10 1,277 1,287Debt securities carried at fair value — 1,944 1,944 — 39 39Loans and leases 4,609 270 4,879 5,084 67 5,151Allowance for loan and lease losses (6) — (6) (14) — (14)Loans held-for-sale 998 85 1,083 1,055 157 1,212All other assets 1,734 6,167 7,901 1,764 5,844 7,608
Total $ 11,107 $ 10,625 $ 21,732 $ 13,080 $ 7,740 $ 20,820On-balance sheet liabilities
Short-term borrowings $ 77 $ — $ 77 $ 131 $ — $ 131Long-term debt (1) 4,487 — 4,487 6,874 — 6,874All other liabilities 93 2,538 2,631 92 2,092 2,184
Total $ 4,657 $ 2,538 $ 7,195 $ 7,097 $ 2,092 $ 9,189Total assets of VIEs $ 11,107 $ 38,505 $ 49,612 $ 13,080 $ 39,700 $ 52,780
(1) Includes $1.3 billion, $1.2 billion and $780 million of long-term debt at December 31, 2013 and $2.8 billion, $1.2 billion and $780 million of long-term debt at December 31, 2012 issued by consolidated CDO vehicles, customer vehicles and investment vehicles, respectively, which has recourse to the general credit of the Corporation.
Customer VehiclesCustomer vehicles include credit-linked, equity-linked and commodity-linked note vehicles, repackaging vehicles, and asset acquisition vehicles, which are typically created on behalf of customers who wish to obtain market or credit exposure to a specific company, index, commodity price or financial instrument. The Corporation may transfer assets to and invest in securities issued by these vehicles. The Corporation typically enters into credit, equity, interest rate, commodity or foreign currency derivatives to synthetically create or alter the investment profile of the issued securities.
The Corporation’s maximum loss exposure to consolidated and unconsolidated customer vehicles totaled $5.9 billion and $4.4 billion at December 31, 2013 and 2012, including the notional amount of derivatives to which the Corporation is a counterparty, net of losses previously recorded, and the Corporation’s investment, if any, in securities issued by the vehicles. The maximum loss exposure has not been reduced to reflect the benefit of offsetting swaps with the customers or collateral arrangements. The Corporation also had liquidity commitments, including written
put options and collateral value guarantees, with certain unconsolidated vehicles of $748 million and $742 million at December 31, 2013 and 2012, that are included in the table above.
Collateralized Debt Obligation VehiclesThe Corporation receives fees for structuring CDO vehicles, which hold diversified pools of fixed-income securities, typically corporate debt or ABS, which they fund by issuing multiple tranches of debt and equity securities. Synthetic CDOs enter into a portfolio of CDS to synthetically create exposure to fixed-income securities. CLOs, which are a subset of CDOs, hold pools of loans, typically corporate loans or commercial mortgages. CDOs are typically managed by third-party portfolio managers. The Corporation typically transfers assets to these CDOs, holds securities issued by the CDOs and may be a derivative counterparty to the CDOs, including a CDS counterparty for synthetic CDOs. The Corporation has also entered into total return swaps with certain CDOs whereby the Corporation absorbs the economic returns generated by specified assets held by the CDO.
76788ba_financials.indd 202 3/6/14 12:06 PM

Bank of America 2013 203
The Corporation’s maximum loss exposure to consolidated and unconsolidated CDOs totaled $2.1 billion and $3.6 billion at December 31, 2013 and 2012. This exposure is calculated on a gross basis and does not reflect any benefit from insurance purchased from third parties.
At December 31, 2013, the Corporation had $1.3 billion of aggregate liquidity exposure, included in the Other VIEs table net of previously recorded losses, to unconsolidated CDOs which hold senior CDO debt securities or other debt securities on the Corporation’s behalf. For additional information, see Note 12 – Commitments and Contingencies.
Investment VehiclesThe Corporation sponsors, invests in or provides financing, which may be in connection with the sale of assets, to a variety of investment vehicles that hold loans, real estate, debt securities or other financial instruments and are designed to provide the desired investment profile to investors or the Corporation. At December 31, 2013 and 2012, the Corporation’s consolidated investment vehicles had total assets of $1.2 billion and $1.3 billion. The Corporation also held investments in unconsolidated vehicles with total assets of $5.5 billion and $3.0 billion at December 31, 2013 and 2012. The Corporation’s maximum loss exposure associated with both consolidated and unconsolidated investment vehicles totaled $4.2 billion and $2.1 billion at December 31, 2013 and 2012 comprised primarily of on-balance sheet assets less non-recourse liabilities.
During 2013, the Corporation transferred servicing advance receivables to independent third parties in connection with the sale of MSRs. Portions of the receivables were transferred into unconsolidated securitization trusts. The Corporation retained senior interests in such receivables with a maximum loss exposure and funding obligation of $2.5 billion, including a funded balance of $1.9 billion at December 31, 2013, which was classified in other debt securities carried at fair value.
Leveraged Lease TrustsThe Corporation’s net investment in consolidated leveraged lease trusts totaled $3.8 billion and $4.4 billion at December 31, 2013 and 2012. The trusts hold long-lived equipment such as rail cars, power generation and distribution equipment, and commercial aircraft. The Corporation structures the trusts and holds a significant residual interest. The net investment represents the Corporation’s maximum loss exposure to the trusts in the unlikely event that the leveraged lease investments become worthless. Debt issued by the leveraged lease trusts is non-recourse to the Corporation.
Real Estate VehiclesThe Corporation held investments in unconsolidated real estate vehicles of $5.8 billion and $5.4 billion at December 31, 2013 and 2012, which primarily consisted of investments in unconsolidated limited partnerships that finance the construction and rehabilitation of affordable rental housing and commercial real estate. An unrelated third party is typically the general partner and has control over the significant activities of the partnership. The Corporation earns a return primarily through the receipt of tax credits allocated to the real estate projects. The Corporation’s risk of loss is mitigated by policies requiring that the project qualify for the expected tax credits prior to making its investment. The Corporation may from time to time be asked to invest additional
amounts to support a troubled project. Such additional investments have not been and are not expected to be significant.
Other Asset-backed Financing ArrangementsThe Corporation transferred pools of securities to certain independent third parties and provided financing for up to 75 percent of the purchase price under asset-backed financing arrangements. At December 31, 2013 and 2012, the Corporation’s maximum loss exposure under these financing arrangements was $1.1 billion and $2.5 billion, substantially all of which is classified in loans and leases. All principal and interest payments have been received when due in accordance with their contractual terms. These arrangements are not included in the Other VIEs table because the purchasers are not VIEs.
NOTE 7 Representations and Warranties Obligations and Corporate Guarantees
BackgroundThe Corporation securitizes first-lien residential mortgage loans generally in the form of MBS guaranteed by the GSEs or by GNMA in the case of FHA-insured, VA-guaranteed and Rural Housing Service-guaranteed mortgage loans. In addition, in prior years, legacy companies and certain subsidiaries sold pools of first-lien residential mortgage loans and home equity loans as private-label securitizations (in certain of these securitizations, monolines or financial guarantee providers insured all or some of the securities) or in the form of whole loans. In connection with these transactions, the Corporation or certain of its subsidiaries or legacy companies make or have made various representations and warranties. These representations and warranties, as set forth in the agreements, related to, among other things, the ownership of the loan, the validity of the lien securing the loan, the absence of delinquent taxes or liens against the property securing the loan, the process used to select the loan for inclusion in a transaction, the loan’s compliance with any applicable loan criteria, including underwriting standards, and the loan’s compliance with applicable federal, state and local laws. Breaches of these representations and warranties have resulted in and may continue to result in the requirement to repurchase mortgage loans or to otherwise make whole or provide other remedies to the GSEs, HUD with respect to FHA-insured loans, VA, whole-loan investors, securitization trusts, monoline insurers or other financial guarantors (collectively, repurchases). In all such cases, the Corporation would be exposed to any credit loss on the repurchased mortgage loans after accounting for any mortgage insurance (MI) or mortgage guarantee payments that it may receive.
Subject to the requirements and limitations of the applicable sales and securitization agreements, these representations and warranties can be enforced by the GSEs, HUD, VA, the whole-loan investor, the securitization trustee or others as governed by the applicable agreement or, in certain first-lien and home equity securitizations where monoline insurers or other financial guarantee providers have insured all or some of the securities issued, by the monoline insurer or other financial guarantor, where the contract so provides. In the case of private-label securitizations, the applicable agreements may permit investors, which may include the GSEs, with contractually sufficient holdings to direct or influence action by the securitization trustee. In the case of loans sold to parties other than the GSEs or GNMA, the contractual liability to repurchase typically arises only if there is a
76788ba_financials.indd 203 3/6/14 12:06 PM

204 Bank of America 2013
breach of the representations and warranties that materially and adversely affects the interest of the investor, or investors, or of the monoline insurer or other financial guarantor (as applicable) in the loan. Contracts with the GSEs do not contain equivalent language. Generally the volume of unresolved repurchase claims from the FHA and VA for loans in GNMA-guaranteed securities is not significant because the requests are limited in number and are typically resolved promptly. The Corporation believes that the longer a loan performs prior to default, the less likely it is that an alleged underwriting breach of representations and warranties would have a material impact on the loan’s performance.
The estimate of the liability for representations and warranties exposures and the corresponding estimated range of possible loss is based upon currently available information, significant judgment, and a number of factors and assumptions, including those discussed in Liability for Representations and Warranties and Corporate Guarantees in this Note, that are subject to change. Changes to any one of these factors could significantly impact the estimate of the liability and could have a material adverse impact on the Corporation’s results of operations for any particular period. Given that these factors vary by counterparty, the Corporation analyzes representations and warranties obligations based on the specific counterparty, or type of counterparty, with whom the sale was made.
Settlement ActionsThe Corporation has vigorously contested any request for repurchase when it concludes that a valid basis for repurchase does not exist and will continue to do so in the future. However, in an effort to resolve these legacy mortgage-related issues, the Corporation has reached bulk settlements, or agreements for bulk settlements, including settlement amounts which have been significant, with counterparties in lieu of a loan-by-loan review process. The Corporation may reach other settlements in the future if opportunities arise on terms it believes to be advantageous. However, there can be no assurance that the Corporation will reach future settlements or, if it does, that the terms of past settlements can be relied upon to predict the terms of future settlements. The following provides a summary of the larger bulk settlement actions during the past few years.
Freddie Mac SettlementOn November 27, 2013, the Corporation entered into an agreement with Freddie Mac (FHLMC) under which the Corporation paid FHLMC a total of $404 million (less credits of $13 million) to resolve all outstanding and potential mortgage repurchase and make-whole claims arising out of any alleged breach of selling representations and warranties related to loans that had been sold directly to FHLMC by entities related to Bank of America, N.A. from January 1, 2000 to December 31, 2009, and to compensate FHLMC for certain past losses and potential future losses relating to denials, rescissions and cancellations of mortgage insurance.
In 2010, the Corporation had entered into an agreement with FHLMC to resolve all outstanding and potential representations and warranties claims related to loans sold by Countrywide to FHLMC through 2008.
With these agreements, combined with prior settlements with Fannie Mae (FNMA), the Corporation has resolved substantially all outstanding and potential representations and warranties claims on whole loans sold by legacy Bank of America and Countrywide to FNMA and FHLMC through 2008 and 2009, respectively, subject
to certain exceptions which the Corporation does not believe are material. For further discussion of the settlements with the GSEs, see Fannie Mae Settlement and Government-sponsored Enterprises Experience in this Note.
Fannie Mae SettlementOn January 6, 2013, the Corporation entered into an agreement with FNMA to resolve substantially all outstanding and potential repurchase and certain other claims relating to the origination, sale and delivery of residential mortgage loans originated from January 1, 2000 through December 31, 2008 and sold directly to FNMA by entities related to Countrywide and BANA.
This agreement covers loans with an aggregate original principal balance of approximately $1.4 trillion and an aggregate outstanding principal balance of approximately $300 billion. Unresolved repurchase claims submitted by FNMA for alleged breaches of selling representations and warranties with respect to these loans totaled $12.2 billion of unpaid principal balance at December 31, 2012. This agreement extinguished substantially all of those unresolved repurchase claims, as well as any future representations and warranties repurchase claims associated with such loans, subject to certain exceptions which the Corporation does not expect to be material.
In January 2013, the Corporation made a cash payment to FNMA of $3.6 billion and also repurchased for $6.6 billion certain residential mortgage loans that had previously been sold to FNMA, which the Corporation has valued at less than the purchase price.
This agreement also clarified the parties’ obligations with respect to MI including establishing timeframes for certain payments and other actions, setting parameters for potential bulk settlements and providing for cooperation in future dealings with mortgage insurers. For additional information, see Mortgage Insurance Rescission Notices in this Note.
In addition, pursuant to a separate agreement, the Corporation settled substantially all of FNMA’s outstanding and future claims for compensatory fees arising out of foreclosure delays through December 31, 2012.
Collectively, these agreements are referred to herein as the FNMA Settlement. The Corporation was fully reserved at December 31, 2012 for the FNMA Settlement.
Monoline Settlements
MBIA SettlementOn May 7, 2013, the Corporation entered into a comprehensive settlement with MBIA Inc. and certain of its affiliates (the MBIA Settlement) which resolved all outstanding litigation between the parties, as well as other claims between the parties, including outstanding and potential claims from MBIA related to alleged representations and warranties breaches and other claims involving certain first- and second-lien RMBS trusts for which MBIA provided financial guarantee insurance, certain of which claims were the subject of litigation. At the time of the settlement, the mortgages (first- and second-lien) in RMBS trusts covered by the MBIA Settlement had an original principal balance of $54.8 billion and an unpaid principal balance of $19.1 billion.
Under the MBIA Settlement, all pending litigation between the parties was dismissed and each party received a global release of those claims. The Corporation made a settlement payment to MBIA of $1.6 billion in cash and transferred to MBIA approximately $95 million in fair market value of notes issued by MBIA and previously held by the Corporation. In addition, MBIA issued to the
76788ba_financials.indd 204 3/6/14 12:06 PM

Bank of America 2013 205
Corporation warrants to purchase up to approximately 4.9 percent of MBIA’s currently outstanding common stock, at an exercise price of $9.59 per share, which may be exercised at any time prior to May 2018. In addition, the Corporation provided a senior secured $500 million credit facility to an affiliate of MBIA, which has since been closed.
The parties also terminated various CDS transactions entered into between the Corporation and a MBIA-affiliate, LaCrosse Financial Products, LLC, and guaranteed by MBIA, which constituted all of the outstanding CDS protection agreements purchased by the Corporation from MBIA on commercial mortgage-backed securities (CMBS). Collectively, those CDS transactions had a notional amount of $7.4 billion and a fair value of $813 million as of March 31, 2013. The parties also terminated certain other trades in order to close out positions between the parties. The termination of these trades did not have a material impact on the Corporation’s financial statements.
Syncora SettlementOn July 17, 2012, the Corporation entered into a settlement with a monoline insurer, Syncora Guarantee Inc. and Syncora Holdings, Ltd. (Syncora), to resolve all of Syncora’s outstanding and potential claims related to alleged representations and warranties breaches involving eight first- and six second-lien private-label securitization trusts where it provided financial guarantee insurance. The settlement covers private-label securitization trusts that had an original principal balance of first-lien mortgages of approximately $9.6 billion and second-lien mortgages of approximately $7.7 billion. The settlement provided for a cash payment of $375 million to Syncora and other transactions to terminate certain other relationships among the parties.
Assured Guaranty SettlementOn April 14, 2011, the Corporation, including its Countrywide affiliates, entered into a settlement with Assured Guaranty to resolve all of Assured Guaranty’s outstanding and potential repurchase claims related to alleged representations and warranties breaches involving 21 first- and eight second-lien RMBS trusts where Assured Guaranty provided financial guarantee insurance. The settlement resolves historical loan servicing issues and other potential liabilities with respect to those trusts. The settlement covers RMBS trusts that had an original principal balance of approximately $35.8 billion and total unpaid principal balance of approximately $20.2 billion as of April 14, 2011. The settlement provided for cash payments totaling approximately $1.1 billion to Assured Guaranty, a loss-sharing reinsurance arrangement with an expected value of approximately $470 million at the time of the settlement and other terms, including termination of certain derivative contracts.
Settlement with the Bank of New York Mellon, as TrusteeOn June 28, 2011, the Corporation, BAC Home Loans Servicing, LP (BAC HLS, which was subsequently merged with and into BANA in July 2011), and its Countrywide affiliates entered into a settlement agreement with Bank of New York Mellon (BNY Mellon) as trustee (the Trustee), to resolve all outstanding and potential claims related to alleged representations and warranties breaches (including repurchase claims), substantially all historical loan servicing claims and certain other historical claims with respect to 525 Countrywide first-lien and five second-lien non-GSE residential mortgage-backed securitization trusts (the Covered
Trusts) containing loans principally originated between 2004 and 2008 for which BNY Mellon acts as trustee or indenture trustee (BNY Mellon Settlement). The Covered Trusts had an original principal balance of approximately $424 billion, of which $409 billion was originated between 2004 and 2008, and total outstanding principal and unpaid principal balance of loans that had defaulted (collectively unpaid principal balance) of approximately $220 billion at June 28, 2011, of which $217 billion was originated between 2004 and 2008. The BNY Mellon Settlement is supported by a group of 22 institutional investors (the Investor Group) and is subject to final court approval and certain other conditions.
The BNY Mellon Settlement provides for a cash payment of $8.5 billion (the Settlement Payment) to the Trustee for distribution to the Covered Trusts after final court approval of the BNY Mellon Settlement. In addition to the Settlement Payment, the Corporation is obligated to pay attorneys’ fees and costs to the Investor Group’s counsel as well as all fees and expenses incurred by the Trustee related to obtaining final court approval of the BNY Mellon Settlement and certain tax rulings.
The BNY Mellon Settlement does not cover a small number of Countrywide-issued first-lien non-GSE RMBS transactions with loans originated principally between 2004 and 2008 for various reasons, including for example, six Countrywide-issued first-lien non-GSE RMBS transactions in which BNY Mellon is not the trustee. The BNY Mellon Settlement also does not cover Countrywide-issued second-lien securitization transactions in which a monoline insurer or other financial guarantor provides financial guaranty insurance. In addition, because the settlement is with the Trustee on behalf of the Covered Trusts and releases rights under the governing agreements for the Covered Trusts, the settlement does not release investors’ securities law or fraud claims based upon disclosures made in connection with their decision to purchase, sell or hold securities issued by the Covered Trusts. To date, various investors are pursuing securities law or fraud claims related to one or more of the Covered Trusts. The Corporation is not able to determine whether any additional securities law or fraud claims will be made by investors in the Covered Trusts. For information about mortgage-related securities law or fraud claims, see Litigation and Regulatory Matters in Note 12 – Commitments and Contingencies. For those Covered Trusts where a monoline insurer or other financial guarantor has an independent right to assert repurchase claims directly, the BNY Mellon Settlement does not release such insurer’s or guarantor’s repurchase claims.
Under an order entered by the court in connection with the BNY Mellon Settlement, potentially interested persons had the opportunity to give notice of intent to object to the settlement (including on the basis that more information was needed) until August 30, 2011. Approximately 44 groups or entities appeared prior to the deadline. Certain of these groups or entities filed notices of intent to object, made motions to intervene, or both. On May 3, 2013, pursuant to the court-ordered schedule for filing objections, 13 groups or entities filed five briefs formally objecting to the BNY Mellon Settlement. Several former intervenor-objectors either expressly withdrew from the proceeding or elected not to file an objection at the objection deadline, including the Attorneys General of New York and Delaware, the Federal Deposit Insurance Corporation (FDIC) and the Federal Housing Finance Agency (FHFA). After additional withdrawals, 11 objectors remained in the proceeding at the conclusion of the court approval hearing.
76788ba_financials.indd 205 3/6/14 12:06 PM

206 Bank of America 2013
The BNY Mellon Settlement remains subject to final court approval and certain other conditions. It is not currently possible to predict the ultimate outcome or timing of the court approval process, which can include appeals and could take a substantial period of time. The court approval hearing began in the New York Supreme Court, New York County, on June 3, 2013 and concluded on November 21, 2013. On January 31, 2014, the court issued a decision, order and judgment approving the BNY Mellon Settlement. The court overruled the objections to the settlement, holding that the Trustee, BNY Mellon, acted in good faith, within its discretion and within the bounds of reasonableness in determining that the settlement agreement was in the best interests of the covered trusts. The court declined to approve the Trustee’s conduct only with respect to the Trustee’s consideration of a potential claim that a loan must be repurchased if the servicer modifies its terms. On February 4, 2014, one of the objectors filed a motion to stay entry of judgment and to hold additional proceedings in the trial court on issues it alleged had not been litigated or decided by the court in its January 31, 2014 decision, order and judgment. On February 18, 2014, the same objector also filed a motion for reargument of the trial court’s January 31, 2014 decision. The court held a hearing on the motion to stay on February 19, 2014, and rejected the application for stay and for further proceedings in the trial court. The court also ruled it would not hold oral argument on the objector’s motion for reargument before April 2014. On February 21, 2014, final judgment was entered and the Trustee filed a notice of appeal regarding the court’s ruling on loan modification claims in the settlement. The court’s January 31, 2014 decision, order and judgment remain subject to appeal and the motion to reargue, and it is not possible to predict the timetable for appeals or when the court approval process will be completed.
If final court approval is not obtained by December 31, 2015, the Corporation and Countrywide may withdraw from the BNY Mellon Settlement, if the Trustee consents. The BNY Mellon Settlement also provides that if Covered Trusts holding loans with an unpaid principal balance exceeding a specified amount are excluded from the final BNY Mellon Settlement, based on investor objections or otherwise, the Corporation and Countrywide have the option to withdraw from the BNY Mellon Settlement pursuant to the terms of the BNY Mellon Settlement agreement.
There can be no assurance that final court approval of the settlement will be obtained, that all conditions to the BNY Mellon Settlement will be satisfied or, if certain conditions to the BNY Mellon Settlement permitting withdrawal are met, that the Corporation and Countrywide will not withdraw from the settlement. If final court approval is not obtained or if the Corporation and Countrywide withdraw from the BNY Mellon Settlement in accordance with its terms, the Corporation’s future representations and warranties losses could be substantially different from existing accruals and the estimated range of possible loss over existing accruals described under Whole-loan Sales and Private-label Securitizations Experience in this Note.
Unresolved Repurchase ClaimsUnresolved representations and warranties repurchase claims represent the notional amount of repurchase claims made by counterparties, typically the outstanding principal balance or the unpaid principal balance at the time of default. In the case of first-lien mortgages, the claim amount is often significantly greater than the expected loss amount due to the benefit of collateral and, in
some cases, MI or mortgage guarantee payments. Claims received from a counterparty remain outstanding until the underlying loan is repurchased, the claim is rescinded by the counterparty, or the claim is otherwise resolved. When a claim is denied and the Corporation does not receive a response from the counterparty, the claim remains in the unresolved repurchase claims balance until resolution.
The table below presents unresolved repurchase claims at December 31, 2013 and 2012. The unresolved repurchase claims include only claims where the Corporation believes that the counterparty has the contractual right to submit claims. For additional information, see Whole-loan Sales and Private-label Securitizations Experience in this Note and Note 12 – Commitments and Contingencies. These repurchase claims do not include any repurchase claims related to the BNY Mellon Settlement regarding the Covered Trusts.
Unresolved Repurchase Claims by Counterparty and Product Type (1, 2)
December 31(Dollars in millions) 2013 2012By counterparty
Private-label securitization trustees, whole-loan investors, including third-party securitization
sponsors and other (3) $ 17,953 $ 12,222
Monolines 1,532 2,442GSEs 170 13,437
Total unresolved repurchase claims by counterparty (3) $ 19,655 $ 28,101By product type
Prime loans $ 623 $ 8,724Alt-A 1,536 5,422Home equity 1,889 2,390Pay option 5,776 5,877Subprime 7,502 4,227Other 2,329 1,461
Total unresolved repurchase claims by product type (3) $ 19,655 $ 28,101(1) The total notional amount of unresolved repurchase claims does not include any repurchase
claims related to the trusts covered by the BNY Mellon Settlement.(2) At December 31, 2013 and 2012, unresolved repurchase claims did not include repurchase
demands of $1.2 billion and $1.6 billion where the Corporation believes the claimants have not satisfied the contractual thresholds as noted on page 206.
(3) Includes $13.8 billion and $11.7 billion of claims based on individual file reviews and $4.1 billion and $519 million of claims submitted without individual file reviews at December 31, 2013 and 2012.
The notional amount of unresolved repurchase claims from private-label securitization trustees, whole-loan investors, including third-party securitization sponsors, and others totaled $18.0 billion at December 31, 2013 compared to $12.2 billion at December 31, 2012, including $13.8 billion and $11.7 billion of claims based on individual file reviews and $4.1 billion and $519 million of claims submitted without individual file reviews. The increase in the notional amount of unresolved repurchase claims during 2013 is primarily due to continued submission of claims by private-label securitization trustees; the level of detail, support and analysis accompanying such claims, which impacts overall claim quality and, therefore, claims resolution; and the lack of an established process to resolve disputes related to these claims. For example, claims submitted without individual file reviews lack the level of detail and analysis of individual loans found in other claims that is necessary for the Corporation to respond to the claim. The Corporation expects unresolved repurchase claims related to private-label securitizations to increase as claims continue to be submitted by private-label securitization trustees
76788ba_financials.indd 206 3/6/14 12:06 PM

Bank of America 2013 207
and there is not an established process for the ultimate resolution of claims on which there is a disagreement. For further discussion of the Corporation’s experience with whole loans and private-label securitizations, see Whole-loan Sales and Private-label Securitizations Experience in this Note.
The notional amount of unresolved monoline repurchase claims totaled $1.5 billion at December 31, 2013 compared to $2.4 billion at December 31, 2012. As a result of the MBIA Settlement, $945 million of monoline repurchase claims outstanding at December 31, 2012 were resolved in May 2013. Substantially all of the unresolved monoline claims pertain to second-lien loans and are currently the subject of litigation. As a result, the Corporation has had limited loan-level repurchase claims experience with the remaining monoline insurers. In the Corporation’s experience, the monolines have been generally unwilling to withdraw repurchase claims, regardless of whether and what evidence was offered to refute a claim. For further discussion of the Corporation’s practices regarding litigation accruals and estimated range of possible loss for litigation and regulatory matters, which includes the status of its monoline litigation, see Estimated Range of Possible Loss in this Note and Litigation and Regulatory Matters in Note 12 – Commitments and Contingencies.
The notional amount of unresolved GSE repurchase claims totaled $170 million at December 31, 2013 compared to $13.4 billion at December 31, 2012. As of December 31, 2013, the Corporation has resolved substantially all GSE-related claims due primarily to the settlements with FHLMC and FNMA. As a result of the FNMA Settlement, $12.2 billion of GSE repurchase claims outstanding at December 31, 2012 were resolved in January 2013. As a result of the FHLMC Settlement, $646 million of claims were resolved at the time of the settlement, of which $322 million were outstanding at December 31, 2012. For further discussion of the Corporation’s experience with the GSEs, see Government-sponsored Enterprises Experience in this Note.
In addition to, and not included in, the total unresolved repurchase claims of $19.7 billion at December 31, 2013, the Corporation has received repurchase demands from private-label securitization investors and a master servicer where it believes the claimants have not satisfied the contractual thresholds to direct the securitization trustee to take action and/or that these demands are otherwise procedurally or substantively invalid. The total amount outstanding of such demands was $1.2 billion, comprised of $945 million of demands received during 2012 and $273 million of demands related to trusts covered by the BNY Mellon Settlement at December 31, 2013 compared to $1.6 billion at December 31, 2012. The Corporation does not believe that the $1.2 billion of demands outstanding at December 31, 2013 are valid repurchase claims and, therefore, it is not possible to predict the resolution with respect to such demands.
During 2013, the Corporation received $8.4 billion in new repurchase claims, including $6.3 billion submitted by private-label securitization trustees and a financial guarantee provider, $1.8
billion submitted by the GSEs for both Countrywide and legacy Bank of America originations not covered by the bulk settlements with the GSEs, $222 million submitted by whole-loan investors and $50 million submitted by monoline insurers. During 2013, $16.7 billion in claims were resolved, primarily with the GSEs and through the MBIA Settlement. Of the remaining claims that were resolved, $1.7 billion were resolved through rescissions and $1.2 billion were resolved through mortgage repurchases and make-whole payments, primarily with the GSEs.
Liability for Representations and Warranties and Corporate GuaranteesThe liability for representations and warranties and corporate guarantees is included in accrued expenses and other liabilities on the Consolidated Balance Sheet and the related provision is included in mortgage banking income (loss) in the Consolidated Statement of Income. The liability for representations and warranties is established when those obligations are both probable and reasonably estimable.
The Corporation’s estimated liability at December 31, 2013 for obligations under representations and warranties given to the GSEs and the corresponding estimated range of possible loss considers, and is necessarily dependent on, and limited by, a number of factors, including the Corporation’s experience related to actual defaults, projected future defaults, historical loss experience, estimated home prices and other economic conditions. The methodology also considers such factors as the number of payments made by the borrower prior to default as well as certain other assumptions and judgmental factors.
The Corporation’s estimate of the non-GSE representations and warranties liability and the corresponding estimated range of possible loss at December 31, 2013 considers, among other things, repurchase experience based on the BNY Mellon Settlement, adjusted to reflect differences between the Covered Trusts and the remainder of the population of private-label securitizations, and assumes that the conditions to the BNY Mellon Settlement will be met. Since the non-GSE securitization trusts that were included in the BNY Mellon Settlement differ from those that were not included in the BNY Mellon Settlement, the Corporation adjusted the repurchase experience implied in the settlement in order to determine the estimated non-GSE representations and warranties liability and the corresponding estimated range of possible loss. The judgmental adjustments made include consideration of the differences in the mix of products in the subject securitizations, loan originator, likelihood of claims expected, the differences in the number of payments that the borrower has made prior to default and the sponsor of the securitizations. Where relevant, the Corporation also takes into account more recent experience, such as increased claim activity, its experience with various counterparties and other facts and circumstances, such as bulk settlements, as the Corporation believes appropriate.
76788ba_financials.indd 207 3/6/14 12:06 PM

208 Bank of America 2013
Additional factors that impact the non-GSE representations and warranties liability and the portion of the estimated range of possible loss corresponding to non-GSE representations and warranties exposures include: (1) contractual material adverse effect requirements, (2) the representations and warranties provided, and (3) the requirement to meet certain presentation thresholds. The first factor is based on the Corporation’s belief that a non-GSE contractual liability to repurchase a loan generally arises only if the counterparties prove there is a breach of representations and warranties that materially and adversely affects the interest of the investor or all investors, or of the monoline insurer or other financial guarantor (as applicable), in a securitization trust and, accordingly, the Corporation believes that the repurchase claimants must prove that the alleged representations and warranties breach was the cause of the loss. The second factor is based on the differences in the types of representations and warranties given in non-GSE securitizations from those provided to the GSEs. The Corporation believes the non-GSE securitizations’ representations and warranties are less rigorous and actionable than the explicit provisions of comparable agreements with the GSEs without regard to any variations that may have arisen as a result of dealings with the GSEs. The third factor is related to certain presentation thresholds that need to be met in order for any repurchase claim to be asserted on the initiative of investors under the non-GSE agreements. A securitization trustee may investigate or demand repurchase on its own action, and most agreements contain a presentation threshold, for example 25 percent of the voting rights per trust, that allows investors to declare a servicing event of default under certain circumstances or to request certain action, such as requesting loan files, that the trustee may choose to accept and follow, exempt from liability, provided the trustee is acting in good faith. If there is an uncured servicing event of default and the trustee fails to bring suit during a 60-day period, then, under most agreements, investors may file suit. In addition to this, most agreements also allow investors to direct the securitization trustee to investigate loan files or demand the repurchase of loans if security holders hold a specified percentage, for example, 25 percent, of the voting rights of each tranche of the outstanding securities. Although the Corporation continues to believe that presentation thresholds are a factor in the determination of probable loss, given the BNY Mellon Settlement, the estimated range of possible loss assumes that the presentation threshold can be met for all of the non-GSE securitization transactions. The population of private-label securitizations included in the BNY Mellon Settlement encompasses almost all Countrywide first-lien private-label securitizations including loans originated principally
between 2004 and 2008. For the remainder of the population of private-label securitizations, other claimants have come forward and the Corporation believes it is probable that other claimants in certain types of securitizations may continue to come forward with claims that meet the requirements of the terms of the securitizations. See Estimated Range of Possible Loss in this Note for additional discussion of the representations and warranties liability and the corresponding estimated range of possible loss.
The table below presents a rollforward of the liability for representations and warranties and corporate guarantees.
Representations and Warranties and CorporateGuarantees
(Dollars in millions) 2013 2012
Liability for representations and warranties andcorporate guarantees, January 1 $ 19,021 $ 15,858
Additions for new sales 36 28Net reductions (6,615) (804)Provision 840 3,939
Liability for representations and warranties andcorporate guarantees, December 31 $ 13,282 $ 19,021
For 2013, the provision for representations and warranties and corporate guarantees was $840 million compared to $3.9 billion for 2012. The provision in 2012 included $2.5 billion in provision related to the FNMA Settlement and $500 million for obligations to FNMA related to MI rescissions.
The representations and warranties liability represents the Corporation’s best estimate of probable incurred losses as of December 31, 2013. However, it is reasonably possible that future representations and warranties losses may occur in excess of the amounts recorded for these exposures. Although the Corporation has not recorded any representations and warranties liability for certain potential private-label securitization and whole-loan exposures where it has had little to no claim activity, these exposures are included in the estimated range of possible loss.
Government-sponsored Enterprises ExperienceThe various settlements with the GSEs have resolved substantially all outstanding and potential mortgage repurchase and make-whole claims relating to the origination, sale and delivery of residential mortgage loans that were sold directly to FNMA through December 31, 2008 and to FHLMC through December 31, 2009, subject to certain exclusions, which the Corporation does not believe are material.
76788ba_financials.indd 208 3/6/14 12:06 PM

Bank of America 2013 209
Private-label Securitizations and Whole-loan Sales ExperienceIn private-label securitizations, certain presentation thresholds need to be met in order for investors to direct a trustee to assert repurchase claims. Continued high levels of new private-label claims are primarily related to repurchase requests received from trustees and third-party sponsors for private-label securitization transactions not included in the BNY Mellon Settlement, including claims related to first-lien third-party sponsored securitizations that include monoline insurance. Over time, there has been an increase in requests for loan files from certain private-label securitization trustees, as well as requests for tolling agreements to toll the applicable statute of limitations relating to representations and warranties repurchase claims and the Corporation believes it is likely that these requests will lead to an increase in repurchase claims for private-label securitization trustees with standing to bring such claims. In addition, private-label securitization trustees may have obtained loan files through other means, including litigation and administrative subpoenas, which may increase the Corporation’s total exposure. A recent decision by the New York intermediate appellate court held that, under New York law, which governs many RMBS trusts, the six-year statute of limitations starts to run at the time the representations and warranties are made (i.e., the date the transaction closed and not when the repurchase demand was denied). If upheld, this decision may impact the timeliness of representations and warranties claims and/or lawsuits, where these claims have not already been tolled by agreement. The Corporation believes this ruling may lead to an increase in requests for tolling agreements as well as an increase in the pace of representations and warranties claims and/or the filing of lawsuits by private-label securitization trustees prior to the expiration of the statute of limitations.
The representations and warranties, as governed by the private-label securitization agreements, generally require that counterparties have the ability to both assert a claim and actually prove that a loan has an actionable defect under the applicable contracts. While the Corporation believes the agreements for private-label securitizations generally contain less rigorous representations and warranties and place higher burdens on claimants seeking repurchases than the express provisions of comparable agreements with the GSEs, without regard to any variations that may have arisen as a result of dealings with the GSEs, the agreements generally include a representation that underwriting practices were prudent and customary. In the case of private-label securitization trustees and third-party sponsors, there is currently no established process in place for the parties to reach a conclusion on an individual loan if there is a disagreement on the resolution of the claim. For more information on repurchase demands, see Unresolved Repurchase Claims in this Note.
The majority of the repurchase claims that the Corporation has received and resolved outside of those from the GSEs and monolines are from third-party whole-loan investors. The Corporation provided representations and warranties and the whole-loan investors may retain those rights even when the loans were aggregated with other collateral into private-label securitizations sponsored by the whole-loan investors. The Corporation reviews properly presented repurchase claims for these whole loans on a loan-by-loan basis. If, after the Corporation’s review, it does not believe a claim is valid, it will deny the claim and generally indicate a reason for the denial. When the
whole-loan investor agrees with the Corporation’s denial of the claim, the whole-loan investor may rescind the claim. When there is disagreement as to the resolution of the claim, meaningful dialogue and negotiation between the parties are generally necessary to reach a resolution on an individual claim. Generally, a whole-loan investor is engaged in the repurchase process and the Corporation and the whole-loan investor reach resolution, either through loan-by-loan negotiation or at times, through a bulk settlement. As of December 31, 2013, 16 percent of the whole-loan claims that the Corporation initially denied have subsequently been resolved through repurchase or make-whole payments and 44 percent have been resolved through rescission or repayment in full by the borrower. Although the timeline for resolution varies, once an actionable breach is identified on a given loan, settlement is generally reached as to that loan within 60 days. When a claim has been denied and the Corporation does not have communication with the counterparty for six months, the Corporation views these claims as inactive; however, they remain in the outstanding claims balance until resolution.
At December 31, 2013, for loans originated between 2004 and 2008, the notional amount of unresolved repurchase claims submitted by private-label securitization trustees, a financial guarantee provider and whole-loan investors was $17.9 billion. The Corporation has performed an initial review with respect to $14.6 billion of these claims and does not believe a valid basis for repurchase has been established by the claimant and is still in the process of reviewing the remaining $3.3 billion of these claims.
Monoline Insurers ExperienceThe Corporation has had limited representations and warranties repurchase claims experience with the monoline insurers due to ongoing litigation against Countrywide and/or Bank of America. To the extent the Corporation received repurchase claims from the monolines that are properly presented, it generally reviews them on a loan-by-loan basis. Where a breach of representations and warranties given by the Corporation or subsidiaries or legacy companies is confirmed on a given loan, settlement is generally reached as to that loan within 60 to 90 days. For more information related to the monolines, see Note 12 – Commitments and Contingencies.
The MBIA Settlement resolved outstanding and potential claims between the parties to the settlement involving 31 first- and 17 second-lien RMBS trusts for which MBIA provided financial guarantee insurance, including $945 million of monoline repurchase claims outstanding at December 31, 2012. The first- and second-lien mortgages in the covered RMBS trusts had an original principal balance of $29.3 billion and $25.5 billion, and an unpaid principal balance of $9.8 billion and $9.3 billion at the time of the settlement.
During 2013, there was minimal loan-level repurchase claim activity with the monolines and the monolines did not request any loan files for review through the representations and warranties process.
Open Mortgage Insurance Rescission NoticesIn addition to repurchase claims, the Corporation receives notices from mortgage insurance companies of claim denials, cancellations or coverage rescission (collectively, MI rescission notices). Although the number of such open notices has remained elevated, they have decreased over the last several quarters as
76788ba_financials.indd 209 3/6/14 12:06 PM

210 Bank of America 2013
the resolution of open notices exceeded new notices. By way of background, MI compensates lenders or investors for certain losses resulting from borrower default on a mortgage loan. When there is disagreement with the mortgage insurer as to the resolution of a MI rescission notice, meaningful dialogue and negotiation between the mortgage insurance company and the Corporation are generally necessary to reach a resolution on an individual notice. The level of engagement of the mortgage insurance companies varies and ongoing litigation involving some of the mortgage insurance companies over individual and bulk rescissions or claims for rescission limits the ability of the Corporation to engage in constructive dialogue leading to resolution.
For loans sold to GSEs or private-label securitization trusts (including those wrapped by the monoline bond insurers), when the Corporation receives a MI rescission notice from a mortgage insurance company, it may give rise to a claim for breach of the applicable representations and warranties from the GSEs or private-label securitization trusts, depending on the governing sales contracts and on whether the loan in question is subject to a settlement. In those cases where the governing contract contains MI-related representations and warranties, which upon rescission requires the Corporation to repurchase the affected loan or indemnify the investor for the related loss, the Corporation realizes the loss without the benefit of MI. See below for a discussion of the impact of the FNMA and FHLMC Settlements. In addition, mortgage insurance companies have in some cases asserted the ability to curtail MI payments as a result of alleged foreclosure delays, which if successful, would reduce the MI proceeds available to reduce the loss on the loan.
At December 31, 2013, the Corporation had approximately 101,000 open MI rescission notices compared to 110,000 at December 31, 2012. Open MI rescission notices at December 31, 2013 included 39,000 pertaining principally to first-lien mortgages serviced for others, 10,000 pertaining to loans held-for-investment and 52,000 pertaining to ongoing litigation for second-lien mortgages. Approximately 28,000 of the open MI rescission notices pertaining to first-lien mortgages serviced for others are related to loans sold to the GSEs. As of December 31, 2013, 43 percent of the MI rescission notices received have been resolved. Of those resolved, 16 percent were resolved through the Corporation’s acceptance of the MI rescission, 59 percent were resolved through reinstatement of coverage or payment of the claim by the mortgage insurance company, and 25 percent were resolved on an aggregate basis through settlement, policy commutation or similar arrangement. As of December 31, 2013, 57 percent of the MI rescission notices the Corporation has received have not yet been resolved. Of those not yet resolved, 52 percent are implicated by ongoing litigation where no loan-level review is currently contemplated nor required to preserve the Corporation’s legal rights. In this litigation, the litigating mortgage insurance companies are also seeking bulk rescission of certain policies, separate and apart from loan-by-loan denials or rescissions. The Corporation is in the process of reviewing eight percent of the remaining open MI rescission notices, and it has reviewed and is contesting the MI rescission with respect to 92 percent of these remaining open MI rescission notices. Of the remaining open MI rescission notices, 42 percent are also the subject of ongoing litigation; although, at present, these MI rescissions are being processed in a manner generally consistent with those not affected by litigation.
Although the GSE settlements did not resolve underlying MI rescission notices, the FNMA Settlement clarified the parties’ obligations with respect to MI rescission notices pertaining to loans covered by the settlement, including establishing timeframes for certain payments and other actions, setting parameters for potential bulk settlements and providing for cooperation in future dealings with mortgage insurers while the FHLMC Settlement clarified the requirements of their guidelines. As a result, the Corporation is required to pay or has paid the amount of MI coverage to the GSEs for 26,200 MI claims rescissions pertaining to loans covered by the settlements, which are included in the 28,000 open MI rescission notices referenced in the paragraph above, in advance of collection from the mortgage insurance companies. In certain cases, the Corporation may not ultimately collect all such amounts from the mortgage insurance companies.
Estimated Range of Possible LossThe Corporation currently estimates that the range of possible loss for representations and warranties exposures could be up to $4 billion over existing accruals at December 31, 2013. The estimated range of possible loss reflects principally non-GSE exposures. It represents a reasonably possible loss, but does not represent a probable loss, and is based on currently available information, significant judgment and a number of assumptions that are subject to change.
The liability for representations and warranties exposures and the corresponding estimated range of possible loss do not consider any losses related to litigation matters, including RMBS litigation or litigation brought by monoline insurers, nor do they include any separate foreclosure costs and related costs, assessments and compensatory fees or any other possible losses related to potential claims for breaches of performance of servicing obligations except as such losses are included as potential costs of the BNY Mellon Settlement, potential securities law or fraud claims or potential indemnity or other claims against the Corporation, including claims related to loans insured by the FHA. The Corporation is not able to reasonably estimate the amount of any possible loss with respect to any such servicing, securities law, fraud or other claims against the Corporation, except to the extent reflected in existing accruals or the estimated range of possible loss for litigation and regulatory matters disclosed in Note 12 – Commitments and Contingencies; however, such loss could be material.
Future provisions and/or ranges of possible loss for representations and warranties may be significantly impacted if actual experiences are different from the Corporation’s assumptions in its predictive models, including, without limitation, ultimate resolution of the BNY Mellon Settlement, estimated repurchase rates, estimated MI rescission rates, economic conditions, estimated home prices, consumer and counterparty behavior, and a variety of other judgmental factors. Adverse developments with respect to one or more of the assumptions underlying the liability for representations and warranties and the corresponding estimated range of possible loss could result in significant increases to future provisions and/or the estimated range of possible loss. For example, an appellate court, in the context of claims brought by a monoline insurer, disagreed with the Corporation’s interpretation that a loan must be in default in order to satisfy the underlying agreements’ requirement that a breach have a material and adverse effect. If that decision is
76788ba_financials.indd 210 3/6/14 12:06 PM

Bank of America 2013 211
extended to non-monoline contexts, it could significantly impact the Corporation’s provision and/or the estimated range of possible loss. Additionally, if court rulings, including one related to the Corporation, that have allowed sampling of loan files instead of requiring a loan-by-loan review to determine if a representations and warranties breach has occurred, are followed generally by the courts, private-label securitization counterparties may view litigation as a more attractive alternative compared to a loan-by-loan review. Finally, although the Corporation believes that the representations and warranties typically given in non-GSE transactions are less rigorous and actionable than those given in GSE transactions, the Corporation does not have significant experience resolving loan-level claims in non-GSE transactions to measure the impact of these differences on the probability that a loan will be required to be repurchased.
Cash PaymentsThe table below presents first-lien and home equity loan repurchases and indemnification payments for 2013 and 2012. During 2013 and 2012, the Corporation paid $1.2 billion and $1.8 billion to resolve $1.5 billion and $2.1 billion of repurchase claims through repurchase or reimbursement to the investor or securitization trust for losses they incurred, resulting in a loss on the related loans at the time of repurchase or reimbursement of $609 million and $847 million. Cash paid for loan repurchases includes the unpaid principal balance of the loan plus past due interest. The amount of loss for loan repurchases is reduced by
the fair value of the underlying loan collateral. The repurchase of loans and indemnification payments related to first-lien and home equity repurchase claims generally resulted from material breaches of representations and warranties related to the loans’ material compliance with the applicable underwriting standards, including borrower misrepresentation, credit exceptions without sufficient compensating factors and non-compliance with underwriting procedures. The actual representations and warranties made in a sales transaction and the resulting repurchase and indemnification activity can vary by transaction or investor. A direct relationship between the type of defect that causes the breach of representations and warranties and the severity of the realized loss has not been observed. Transactions to repurchase loans or make indemnification payments related to first-lien residential mortgages primarily involved the GSEs while transactions to repurchase loans or make indemnification payments for home equity loans primarily involved the monoline insurers. The amounts in the table below exclude a cash payment of $391 million paid to FHLMC for the FHLMC Settlement. The amounts in the table also exclude a cash payment of $3.6 billion made in 2013 to FNMA and the repurchase for $6.6 billion of certain residential mortgage loans which the Corporation valued at less than the purchase price, both of which were part of the FNMA Settlement. Additionally, the amounts shown in the table below exclude $1.8 billion and $669 million paid in monoline settlements during 2013 and 2012.
Loan Repurchases and Indemnification Payments
December 31 2013 2012
(Dollars in millions)
UnpaidPrincipalBalance
Cash Paid for
Repurchases Loss
UnpaidPrincipalBalance
Cash Paid for
Repurchases Loss
First-lien Repurchases $ 746 $ 784 $ 149 $ 1,184 $ 1,273 $ 389Indemnification payments 661 383 383 831 425 425
Total first-lien 1,407 1,167 532 2,015 1,698 814Home equity
Repurchases — — — 24 24 —Indemnification payments 74 77 77 36 33 33
Total home equity 74 77 77 60 57 33Total first-lien and home equity $ 1,481 $ 1,244 $ 609 $ 2,075 $ 1,755 $ 847
76788ba_financials.indd 211 3/6/14 12:06 PM

212 Bank of America 2013
NOTE 8 Goodwill and Intangible Assets
GoodwillThe table below presents goodwill balances by business segment at December 31, 2013 and 2012. The reporting units utilized for goodwill impairment testing are the operating segments or one level below.
Goodwill
December 31(Dollars in millions) 2013 2012Consumer & Business Banking $ 31,681 $ 31,681Global Wealth & Investment Management 9,698 9,698Global Banking 22,377 22,377Global Markets 5,197 5,181All Other 891 1,039
Total goodwill $ 69,844 $ 69,976
Effective January 1, 2013, on a prospective basis, the Corporation adjusted the amount of capital being allocated to the business segments. The adjustment reflects a refinement to the prior-year methodology (economic capital), which focused solely on internal risk-based economic capital models. The refined methodology (allocated capital) now also considers the effect of regulatory capital requirements in addition to internal risk-based economic capital models. For purposes of goodwill impairment testing, the Corporation utilizes allocated equity as a proxy for the carrying value of its reporting units. Allocated equity in the reporting units is comprised of allocated capital plus capital for
the portion of goodwill and intangibles specifically assigned to the reporting unit.
There was no goodwill in Consumer Real Estate Services (CRES) at December 31, 2013 and 2012.
In 2013, the consumer Dealer Financial Services (DFS) business, including $1.7 billion of goodwill, was moved from Global Banking to CBB in order to align this business more closely with the Corporation’s consumer lending activity and better serve the needs of its customers. In 2012, the International Wealth Management businesses within GWIM, including $230 million of goodwill, were moved to All Other in connection with the Corporation’s agreement to sell these businesses in a series of transactions. Certain of the sales transactions were completed in 2013 and most of the remaining sales transactions are expected to close over the next year. The decrease in goodwill in 2013 was related to the completed sales transactions. Prior periods were reclassified to conform to current period presentation.
Annual Impairment TestsDuring the three months ended September 30, 2013 and 2012, the Corporation completed its annual goodwill impairment test as of June 30 for all applicable reporting units. Based on the results of the annual goodwill impairment test, the Corporation determined there was no impairment.
Intangible AssetsThe table below presents the gross carrying value and accumulated amortization for intangible assets at December 31, 2013 and 2012.
Intangible Assets (1)
December 31 2013 2012
(Dollars in millions)Gross
Carrying ValueAccumulatedAmortization
NetCarrying Value
GrossCarrying Value
AccumulatedAmortization
NetCarrying Value
Purchased credit card relationships $ 6,160 $ 4,849 $ 1,311 $ 6,184 $ 4,494 $ 1,690Core deposit intangibles 3,592 3,055 537 3,592 2,858 734Customer relationships 4,025 2,281 1,744 4,025 1,884 2,141Affinity relationships 1,575 1,197 378 1,572 1,087 485Other intangibles 2,045 441 1,604 2,139 505 1,634
Total intangible assets $ 17,397 $ 11,823 $ 5,574 $ 17,512 $ 10,828 $ 6,684(1) Excludes fully amortized intangible assets.
At December 31, 2013 and 2012, none of the intangible assets were impaired. Amortization of intangibles expense was $1.1 billion, $1.3 billion and $1.5 billion in 2013, 2012 and 2011, respectively.
The Corporation estimates aggregate amortization expense will be $938 million, $836 million, $739 million, $647 million and $567 million for 2014 through 2018, respectively.
76788ba_financials.indd 212 3/6/14 12:06 PM

Bank of America 2013 213
NOTE 9 DepositsThe Corporation had U.S. certificates of deposit and other U.S. time deposits of $100 thousand or more totaling $38.3 billion and $41.9 billion at December 31, 2013 and 2012. Non-U.S. certificates of deposit and other non-U.S. time deposits of $100 thousand or more totaled $26.2 billion and $29.1 billion at December 31, 2013 and 2012. The table below presents the contractual maturities for time deposits of $100 thousand or more at December 31, 2013.
Time Deposits of $100 Thousand or More
(Dollars in millions)Three Months
or Less
Over ThreeMonths to
Twelve Months Thereafter Total
U.S. certificates of deposit and other time deposits $ 16,246 $ 17,943 $ 4,155 $ 38,344
Non-U.S. certificates of deposit and other time deposits 23,726 1,983 481 26,190
The scheduled contractual maturities for total time deposits at December 31, 2013 are presented in the table below.
Contractual Maturities of Total Time Deposits
(Dollars in millions) U.S. Non-U.S. Total
Due in 2014 $ 71,895 $ 26,306 $ 98,201
Due in 2015 6,523 227 6,750
Due in 2016 1,719 315 2,034
Due in 2017 1,308 14 1,322
Due in 2018 649 1 650
Thereafter 2,274 4 2,278
Total time deposits $ 84,368 $ 26,867 $ 111,235
NOTE 10 Federal Funds Sold or Purchased, Securities Financing Agreements and Short-term BorrowingsThe table below presents federal funds sold or purchased, securities financing agreements which include securities borrowed or purchased under agreements to resell and securities loaned or sold under agreements to repurchase, and short-term borrowings.
2013 2012 2011(Dollars in millions) Amount Rate Amount Rate Amount RateFederal funds sold
At December 31 $ — —% $ 600 0.54% $ 100 0.71%Average during year 7 0.69 351 0.43 273 0.39Maximum month-end balance during year 550 n/a 600 n/a 782 n/a
Securities borrowed or purchased under agreements to resell
At December 31 190,328 0.60 219,324 0.92 211,083 0.76Average during year 224,324 0.55 235,691 0.64 244,796 0.88Maximum month-end balance during year 249,791 n/a 252,985 n/a 270,201 n/a
Federal funds purchased At December 31 186 — 1,151 0.17 243 0.06Average during year 192 0.06 384 0.11 1,658 0.08Maximum month-end balance during year 1,272 n/a 1,211 n/a 4,133 n/a
Securities loaned or sold under agreements to repurchase At December 31 197,920 0.92 292,108 1.11 214,621 1.08Average during year 257,409 0.81 281,516 0.98 270,718 1.31Maximum month-end balance during year 319,608 n/a 319,401 n/a 293,519 n/a
Short-term borrowings At December 31 45,999 1.55 30,731 3.08 35,698 2.36Average during year 43,816 1.89 36,500 2.22 51,893 2.00Maximum month-end balance during year 48,387 n/a 40,129 n/a 62,621 n/a
n/a = not applicable
Bank of America, N.A. maintains a global program to offer up to a maximum of $75 billion outstanding at any one time, of bank notes with fixed or floating rates and maturities of at least seven days from the date of issue. Short-term bank notes outstanding under this program totaled $15.1 billion and $3.9 billion at December 31, 2013 and 2012. These short-term bank notes,
along with Federal Home Loan Bank (FHLB) advances, U.S. Treasury tax and loan notes, and term federal funds purchased, are included in short-term borrowings on the Consolidated Balance Sheet. For information regarding the long-term notes that have been issued under the $75 billion bank note program, see Note 11 – Long-term Debt.
76788ba_financials.indd 213 3/6/14 12:06 PM
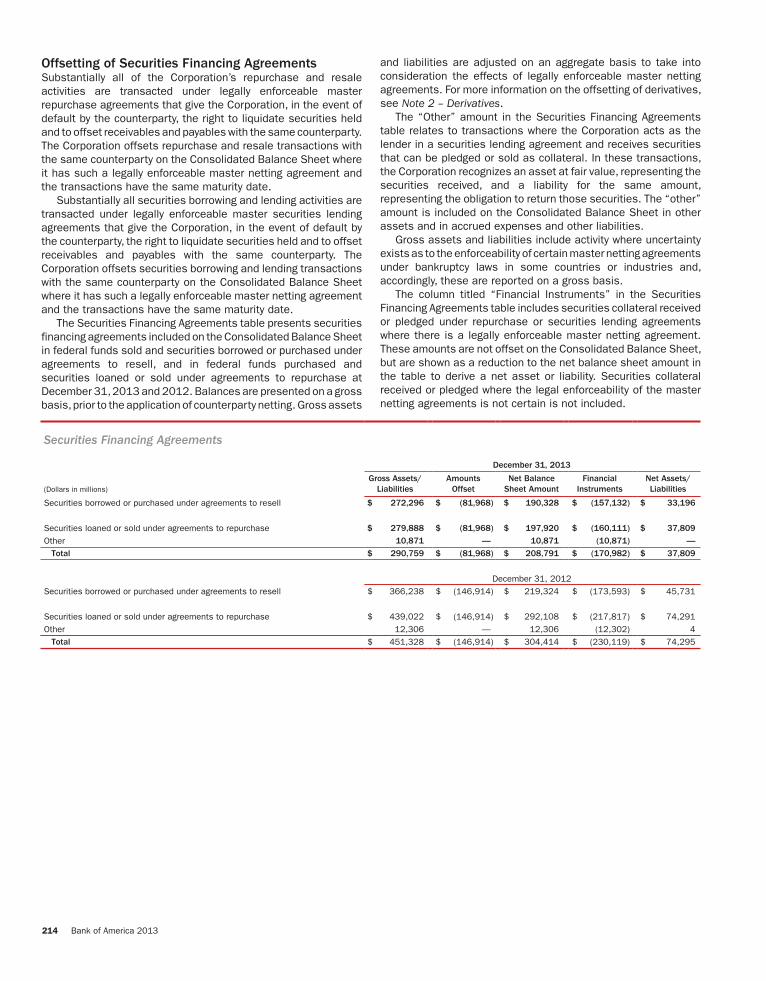
214 Bank of America 2013
Offsetting of Securities Financing AgreementsSubstantially all of the Corporation’s repurchase and resale activities are transacted under legally enforceable master repurchase agreements that give the Corporation, in the event of default by the counterparty, the right to liquidate securities held and to offset receivables and payables with the same counterparty. The Corporation offsets repurchase and resale transactions with the same counterparty on the Consolidated Balance Sheet where it has such a legally enforceable master netting agreement and the transactions have the same maturity date.
Substantially all securities borrowing and lending activities are transacted under legally enforceable master securities lending agreements that give the Corporation, in the event of default by the counterparty, the right to liquidate securities held and to offset receivables and payables with the same counterparty. The Corporation offsets securities borrowing and lending transactions with the same counterparty on the Consolidated Balance Sheet where it has such a legally enforceable master netting agreement and the transactions have the same maturity date.
The Securities Financing Agreements table presents securities financing agreements included on the Consolidated Balance Sheet in federal funds sold and securities borrowed or purchased under agreements to resell, and in federal funds purchased and securities loaned or sold under agreements to repurchase at December 31, 2013 and 2012. Balances are presented on a gross basis, prior to the application of counterparty netting. Gross assets
and liabilities are adjusted on an aggregate basis to take into consideration the effects of legally enforceable master netting agreements. For more information on the offsetting of derivatives, see Note 2 – Derivatives.
The “Other” amount in the Securities Financing Agreements table relates to transactions where the Corporation acts as the lender in a securities lending agreement and receives securities that can be pledged or sold as collateral. In these transactions, the Corporation recognizes an asset at fair value, representing the securities received, and a liability for the same amount, representing the obligation to return those securities. The “other” amount is included on the Consolidated Balance Sheet in other assets and in accrued expenses and other liabilities.
Gross assets and liabilities include activity where uncertainty exists as to the enforceability of certain master netting agreements under bankruptcy laws in some countries or industries and, accordingly, these are reported on a gross basis.
The column titled “Financial Instruments” in the Securities Financing Agreements table includes securities collateral received or pledged under repurchase or securities lending agreements where there is a legally enforceable master netting agreement. These amounts are not offset on the Consolidated Balance Sheet, but are shown as a reduction to the net balance sheet amount in the table to derive a net asset or liability. Securities collateral received or pledged where the legal enforceability of the master netting agreements is not certain is not included.
Securities Financing Agreements
December 31, 2013
(Dollars in millions)Gross Assets/
LiabilitiesAmounts
OffsetNet Balance
Sheet AmountFinancial
InstrumentsNet Assets/Liabilities
Securities borrowed or purchased under agreements to resell $ 272,296 $ (81,968) $ 190,328 $ (157,132) $ 33,196
Securities loaned or sold under agreements to repurchase $ 279,888 $ (81,968) $ 197,920 $ (160,111) $ 37,809
Other 10,871 — 10,871 (10,871) —
Total $ 290,759 $ (81,968) $ 208,791 $ (170,982) $ 37,809
December 31, 2012Securities borrowed or purchased under agreements to resell $ 366,238 $ (146,914) $ 219,324 $ (173,593) $ 45,731
Securities loaned or sold under agreements to repurchase $ 439,022 $ (146,914) $ 292,108 $ (217,817) $ 74,291Other 12,306 — 12,306 (12,302) 4
Total $ 451,328 $ (146,914) $ 304,414 $ (230,119) $ 74,295
76788ba_financials.indd 214 3/6/14 12:06 PM

Bank of America 2013 215
NOTE 11 Long-term DebtLong-term debt consists of borrowings having an original maturity of one year or more. The table below presents the balance of long-term debt at December 31, 2013 and 2012, and the related contractual rates and maturity dates as of December 31, 2013.
December 31(Dollars in millions) 2013 2012Notes issued by Bank of America Corporation (1) Senior notes:
Fixed, with a weighted-average rate of 4.99%, ranging from 1.25% to 8.83%, due 2014 to 2042 $ 109,845 $ 114,493Floating, with a weighted-average rate of 0.99%, ranging from 0.05% to 4.99%, due 2014 to 2044 22,268 24,698
Senior structured notes 30,575 33,962Subordinated notes:
Fixed, with a weighted-average rate of 5.83%, ranging from 2.40% to 10.20%, due 2014 to 2038 22,379 24,118Floating, with a weighted-average rate of 1.13%, ranging from 0.57% to 2.97%, due 2016 to 2026 1,798 1,767
Junior subordinated notes (related to trust preferred securities): Fixed, with a weighted-average rate of 6.84%, ranging from 5.25% to 8.05%, due 2027 to perpetual 6,685 6,655Floating, with a weighted-average rate of 0.92%, ranging from 0.79% to 1.24%, due 2027 to 2056 553 567
Total notes issued by Bank of America Corporation 194,103 206,260Notes issued by Bank of America, N.A. Senior notes:
Fixed, with a weighted-average rate of 2.97%, ranging from 0.07% to 7.72%, due 2014 to 2187 1,670 181Floating, with a weighted-average rate of 0.70%, ranging from 0.35% to 0.75%, due 2016 to 2041 3,684 2,686
Subordinated notes: Fixed, with a weighted-average rate of 5.68%, ranging from 5.30% to 6.10%, due 2016 to 2036 4,876 5,230Floating, with a weighted-average rate of 0.53%, ranging from 0.25% to 0.54%, due 2016 to 2019 1,401 1,401
Advances from Federal Home Loan Banks:Fixed, with a weighted-average rate of 4.91%, ranging from 0.01% to 7.72%, due 2014 to 2034 1,441 6,225Floating, with a weighted-average rate of 0.28%, ranging from 0.27% to 0.29%, due 2015 to 2016 3,001 —
Total notes issued by Bank of America, N.A. 16,073 15,723Other debt Senior notes:
Fixed, with a weighted-average rate of 5.01%, ranging from 4.00% to 5.50%, due 2014 to 2021 194 262Floating, with a weighted-average rate of 2.55%, ranging from 1.93% to 2.71%, due 2014 to 2015 115 705
Structured liabilities 16,913 16,127Junior subordinated notes (related to trust preferred securities):
Fixed, with a weighted-average rate of 7.14%, ranging from 7.00% to 7.28%, perpetual 340 340Floating, with a weighted-average rate of 0.87%, due 2027 66 979
Other 2,422 933Total other debt 20,050 19,346Total long-term debt excluding consolidated VIEs 230,226 241,329
Long-term debt of consolidated VIEs 19,448 34,256Total long-term debt $ 249,674 $ 275,585
(1) On October 1, 2013, the merger of Merrill Lynch & Co., Inc. into Bank of America Corporation was completed. Effective with this merger, Bank of America Corporation assumed outstanding Merrill Lynch & Co., Inc. debt including trust preferred securities.
Bank of America Corporation and Bank of America, N.A. maintain various U.S. and non-U.S. debt programs to offer both senior and subordinated notes. The notes may be denominated in U.S. dollars or foreign currencies. At December 31, 2013 and 2012, the amount of foreign currency-denominated debt translated into U.S. dollars included in total long-term debt was $73.4 billion and $95.3 billion. Foreign currency contracts may be used to convert certain foreign currency-denominated debt into U.S. dollars.
At December 31, 2013, long-term debt of consolidated VIEs in the table above included debt of credit card, home equity and all other VIEs of $11.8 billion, $1.5 billion and $6.2 billion, respectively. Long-term debt of VIEs is collateralized by the assets of the VIEs. For additional information, see Note 6 – Securitizations and Other Variable Interest Entities.
At December 31, 2013 and 2012, Bank of America Corporation had approximately $131.3 billion and $154.9 billion of authorized, but unissued corporate debt and other securities under its existing U.S. shelf registration statements. At December 31, 2013 and
2012, Bank of America, N.A. had $51.8 billion and $65.5 billion of authorized, but unissued bank notes under its existing $75 billion bank note program. Long-term bank notes issued and outstanding under the program totaled $8.1 billion and $5.6 billion at December 31, 2013 and 2012. At both December 31, 2013 and 2012, Bank of America, N.A. had $20.6 billion of authorized, but unissued mortgage notes under its $30 billion mortgage bond program.
The weighted-average effective interest rates for total long-term debt (excluding senior structured notes), total fixed-rate debt and total floating-rate debt were 4.37 percent, 5.14 percent and 0.92 percent, respectively, at December 31, 2013 and 4.71 percent, 5.52 percent and 0.93 percent, respectively, at December 31, 2012. The Corporation’s ALM activities maintain an overall interest rate risk management strategy that incorporates the use of interest rate contracts to manage fluctuations in earnings that are caused by interest rate volatility. The Corporation’s goal is to manage interest rate sensitivity so that movements in interest rates do not significantly adversely affect earnings and capital.
76788ba_financials.indd 215 3/6/14 12:06 PM

216 Bank of America 2013
The weighted-average rates are the contractual interest rates on the debt and do not reflect the impacts of derivative transactions.
Certain senior structured notes are accounted for under the fair value option. For more information on these senior structured notes, see Note 21 – Fair Value Option.
The table below shows the carrying value for aggregate annual contractual maturities of long-term debt as of December 31, 2013. Included in the table are certain structured notes issued by the Corporation that contain provisions whereby the borrowings are redeemable at the option of the holder (put options) at specified dates prior to maturity. Other structured notes have coupon or repayment terms linked to the performance of debt or equity securities, indices, currencies or commodities and the maturity may be accelerated based on the value of a referenced index or
security. In both cases, the Corporation or a subsidiary may be required to settle the obligation for cash or other securities prior to the contractual maturity date. These borrowings are reflected in the table as maturing at their contractual maturity date.
In 2013 and 2012, in a combination of tender offers, calls and open-market transactions, the Corporation purchased senior and subordinated long-term debt with a carrying value of $9.2 billion and $12.4 billion, and recorded net losses of $59 million and net gains of $1.3 billion in connection with these transactions. During 2013, the Corporation had total long-term debt maturities and purchases of $65.6 billion consisting of $39.3 billion for Bank of America Corporation, $4.8 billion for Bank of America, N.A., $7.0 billion of other debt and $14.5 billion for consolidated VIEs.
Long-term Debt by Maturity
(Dollars in millions) 2014 2015 2016 2017 2018 Thereafter Total
Bank of America Corporation (1)
Senior notes $ 24,820 $ 15,365 $ 18,164 $ 18,273 $ 20,311 $ 35,180 $ 132,113
Senior structured notes 6,360 5,561 3,429 1,421 1,989 11,815 30,575
Subordinated notes 4 1,263 5,247 5,676 3,312 8,675 24,177
Junior subordinated notes — — — — — 7,238 7,238
Total Bank of America Corporation 31,184 22,189 26,840 25,370 25,612 62,908 194,103
Bank of America, N.A.
Senior notes 19 — 2,492 2,664 — 179 5,354
Subordinated notes — — 1,082 3,664 — 1,531 6,277
Advances from Federal Home Loan Banks 1,263 1,503 1,504 11 11 150 4,442
Total Bank of America, N.A. 1,282 1,503 5,078 6,339 11 1,860 16,073
Other debt
Senior notes 284 24 — 1 — — 309
Structured liabilities 3,614 2,049 1,520 1,723 1,281 6,726 16,913
Junior subordinated notes — — — — — 406 406
Other 200 56 930 743 37 456 2,422
Total other debt 4,098 2,129 2,450 2,467 1,318 7,588 20,050
Total long-term debt excluding consolidated VIEs 36,564 25,821 34,368 34,176 26,941 72,356 230,226
Long-term debt of consolidated VIEs 9,512 1,255 1,797 1,522 191 5,171 19,448
Total long-term debt $ 46,076 $ 27,076 $ 36,165 $ 35,698 $ 27,132 $ 77,527 $ 249,674(1) On October 1, 2013, the merger of Merrill Lynch & Co., Inc. into Bank of America Corporation was completed. Effective with this merger, Bank of America Corporation assumed outstanding Merrill
Lynch & Co., Inc. debt including trust preferred securities.
Trust Preferred and Hybrid SecuritiesTrust preferred securities (Trust Securities) are primarily issued by trust companies (the Trusts) that are not consolidated. These Trust Securities are mandatorily redeemable preferred security obligations of the Trusts. The sole assets of the Trusts generally are junior subordinated deferrable interest notes of the Corporation or its subsidiaries (the Notes). The Trusts generally are 100 percent-owned finance subsidiaries of the Corporation. Obligations associated with the Notes are included in the long-term debt table on page 215.
Certain of the Trust Securities were issued at a discount and may be redeemed prior to maturity at the option of the Corporation. The Trusts generally have invested the proceeds of such Trust Securities in the Notes. Each issue of the Notes has an interest rate equal to the corresponding Trust Securities distribution rate. The Corporation has the right to defer payment of interest on the Notes at any time or from time to time for a period not exceeding five years provided that no extension period may extend beyond the stated maturity of the relevant Notes. During any such
extension period, distributions on the Trust Securities will also be deferred and the Corporation’s ability to pay dividends on its common and preferred stock will be restricted.
The Trust Securities generally are subject to mandatory redemption upon repayment of the related Notes at their stated maturity dates or their earlier redemption at a redemption price equal to their liquidation amount plus accrued distributions to the date fixed for redemption and the premium, if any, paid by the Corporation upon concurrent repayment of the related Notes.
Periodic cash payments and payments upon liquidation or redemption with respect to Trust Securities are guaranteed by the Corporation or its subsidiaries to the extent of funds held by the Trusts (the Preferred Securities Guarantee). The Preferred Securities Guarantee, when taken together with the Corporation’s other obligations including its obligations under the Notes, generally will constitute a full and unconditional guarantee, on a subordinated basis, by the Corporation of payments due on the Trust Securities.
76788ba_financials.indd 216 3/6/14 12:06 PM

Bank of America 2013 217
In 2013, the Corporation entered into various agreements with certain Trust Securities holders pursuant to which the Corporation paid $933 million in cash in exchange for $934 million aggregate liquidation amount of previously issued Trust Securities. Upon the exchange, the Corporation immediately surrendered the Trust Securities to the unconsolidated Trusts for cancellation, resulting in the cancellation of an equal amount of junior subordinated notes that had a carrying value of $934 million, resulting in an insignificant gain.
In 2012, as described in Note 13 – Shareholders’ Equity, the Corporation entered into separate agreements with certain Trust Securities holders pursuant to which the Corporation issued 19 million shares of common stock valued at $159 million and paid $9.4 billion in cash in exchange for $9.8 billion aggregate liquidation amount of previously issued Trust Securities. Upon the exchange, the Corporation immediately surrendered the Trust Securities to the unconsolidated Trusts for cancellation, resulting in the cancellation of an equal amount of junior subordinated notes that had a carrying value of $9.9 billion, resulting in a gain on extinguishment of debt of $282 million.
During 2012, the Corporation remarketed the remaining outstanding $141 million in aggregate principal amount of its BAC Capital Trust XIII Floating-Rate Preferred Hybrid Income Term Securities (HITS) and the remaining outstanding $493 million in aggregate principal amount of its BAC Capital Trust XIV Fixed-to-Floating Rate Preferred HITS. The Corporation repurchased and retired all of the remarketable notes in the remarketings. The net proceeds from the remarketing of the BAC Capital Trust XIII Floating-Rate Preferred HITS were used to satisfy the obligations of Trust XIII under a stock purchase contract agreement, pursuant to which Trust XIII was obligated to purchase, and the Corporation was obligated to sell, 1,409 shares of the Corporation’s Series F
Floating Rate Non-Cumulative Preferred Stock (Series F Preferred Stock). The net proceeds from the remarketing of the BAC Capital Trust XIV Fixed-to-Floating Rate Preferred HITS were used to satisfy the obligations of Trust XIV under a stock purchase contract agreement, pursuant to which Trust XIV was obligated to purchase, and the Corporation was obligated to sell, 4,926 shares of the Corporation’s Series G Adjustable Rate Non-Cumulative Preferred Stock (Series G Preferred Stock). Following the remarketing of the notes and the subsequent purchase of the Corporation’s preferred stock under the stock purchase contracts, the preferred stock constitutes the sole asset of the applicable trust.
On May 25, 2012, the Corporation completed the repurchase of $134 million aggregate liquidation amount of capital securities of BAC Capital Trust VI, pursuant to a previously announced tender offer for such securities, and the related cancellation and retirement of the underlying 5.625% Junior Subordinated Notes, due 2035 of the Corporation issued to and held by BAC Capital Trust VI. As a result of this repurchase of capital securities and the related cancellation and retirement of the underlying 5.625% Junior Subordinated Notes, the series of covered debt benefiting from the Corporation’s replacement capital covenant, executed February 16, 2007 in connection with the issuance by BAC Capital Trust XIV of its 5.63% Fixed-to-Floating Rate Preferred Hybrid Income Term Securities (the Replacement Capital Covenant), was redesignated. Effective as of May 25, 2012, the 5.625% Junior Subordinated Notes ceased being the covered debt under the Replacement Capital Covenant. Also effective as of May 25, 2012, the Corporation’s 6.875% Junior Subordinated Notes, due 2055 underlying the capital securities of BAC Capital Trust XII, became the covered debt with respect to and in accordance with the terms of the Replacement Capital Covenant.
76788ba_financials.indd 217 3/6/14 12:06 PM

218 Bank of America 2013
The Trust Securities Summary table details the outstanding Trust Securities and the related Notes previously issued which remained outstanding at December 31, 2013. For more information on Trust Securities for regulatory capital purposes, see Note 16 – Regulatory Requirements and Restrictions.
Trust Securities Summary
(Dollars in millions) December 31, 2013
Issuer Issuance Date
AggregatePrincipalAmountof Trust
Securities
AggregatePrincipalAmountof theNotes
Stated Maturityof the Trust Securities
Per Annum InterestRate of the Notes
Interest PaymentDates Redemption Period
Bank of America Capital Trust VI March 2005 $ 36 $ 37 March 2035 5.63% Semi-Annual Any time
Capital Trust VII (1) August 2005 7 7 August 2035 5.25 Semi-Annual Any time
Capital Trust VIII August 2005 524 540 August 2035 6.00 Quarterly On or after 8/25/10
Capital Trust XI May 2006 658 678 May 2036 6.63 Semi-Annual Any time
Capital Trust XV May 2007 2 2 June 2056 3-mo. LIBOR +80 bps Quarterly On or after 6/01/37
NationsBank Capital Trust III February 1997 131 136 January 2027 3-mo. LIBOR +55 bps Quarterly On or after 1/15/07
BankAmerica Capital III January 1997 103 106 January 2027 3-mo. LIBOR +57 bps Quarterly On or after 1/15/02
Barnett Capital III January 1997 64 66 February 2027 3-mo. LIBOR +62.5 bps Quarterly On or after 2/01/07
Fleet Capital Trust V December 1998 79 82 December 2028 3-mo. LIBOR +100 bps Quarterly On or after 12/18/03
BankBoston Capital Trust III June 1997 53 55 June 2027 3-mo. LIBOR +75 bps Quarterly On or after 6/15/07
Capital Trust IV June 1998 102 106 June 2028 3-mo. LIBOR +60 bps Quarterly On or after 6/08/03
MBNA Capital Trust B January 1997 70 73 February 2027 3-mo. LIBOR +80 bps Quarterly On or after 2/01/07
Countrywide
Capital III June 1997 200 206 June 2027 8.05 Semi-Annual Only under special event
Capital IV April 2003 500 515 April 2033 6.75 Quarterly On or after 4/11/08
Capital V November 2006 1,495 1,496 November 2036 7.00 Quarterly On or after 11/01/11
Merrill Lynch
Preferred Capital Trust III January 1998 750 901 Perpetual 7.00 Quarterly On or after 3/08
Preferred Capital Trust IV June 1998 400 480 Perpetual 7.12 Quarterly On or after 6/08
Preferred Capital Trust V November 1998 850 1,021 Perpetual 7.28 Quarterly On or after 9/08
Capital Trust I December 2006 1,050 1,051 December 2066 6.45 Quarterly On or after 12/11
Capital Trust II May 2007 950 951 June 2067 6.45 Quarterly On or after 6/12
Capital Trust III August 2007 750 751 September 2067 7.375 Quarterly On or after 9/12
Total $ 8,774 $ 9,260 (1) Notes are denominated in British Pound. Presentation currency is U.S. Dollar.
76788ba_financials.indd 218 3/6/14 12:06 PM

Bank of America 2013 219
NOTE 12 Commitments and ContingenciesIn the normal course of business, the Corporation enters into a number of off-balance sheet commitments. These commitments expose the Corporation to varying degrees of credit and market risk and are subject to the same credit and market risk limitation reviews as those instruments recorded on the Consolidated Balance Sheet.
Credit Extension CommitmentsThe Corporation enters into commitments to extend credit such as loan commitments, standby letters of credit (SBLCs) and commercial letters of credit to meet the financing needs of its customers. The table below includes the notional amount of unfunded legally binding lending commitments net of amounts distributed (e.g., syndicated) to other financial institutions of $21.9 billion and $23.9 billion at December 31, 2013 and 2012.
At December 31, 2013, the carrying value of these commitments, excluding commitments accounted for under the fair value option, was $503 million, including deferred revenue of $19 million and a reserve for unfunded lending commitments of $484 million. At December 31, 2012, the comparable amounts were $534 million, $21 million and $513 million, respectively. The carrying value of these commitments is classified in accrued expenses and other liabilities on the Consolidated Balance Sheet.
The table below also includes the notional amount of commitments of $13.0 billion and $18.3 billion at December 31, 2013 and 2012 that are accounted for under the fair value option. However, the table below excludes cumulative net fair value adjustments of $354 million and $528 million on these commitments, which are classified in accrued expenses and other liabilities. For more information regarding the Corporation’s loan commitments accounted for under the fair value option, see Note 21 – Fair Value Option.
Credit Extension Commitments
December 31, 2013
(Dollars in millions)Expire in OneYear or Less
Expire AfterOne
Year ThroughThree Years
Expire AfterThree
Years ThroughFive Years
Expire AfterFive
Years Total
Notional amount of credit extension commitments
Loan commitments $ 80,799 $ 105,175 $ 133,290 $ 21,864 $ 341,128
Home equity lines of credit 4,580 16,855 21,074 14,301 56,810
Standby letters of credit and financial guarantees (1) 21,994 8,843 2,876 3,967 37,680
Letters of credit 1,263 899 4 403 2,569
Legally binding commitments 108,636 131,772 157,244 40,535 438,187
Credit card lines (2) 377,846 — — — 377,846
Total credit extension commitments $ 486,482 $ 131,772 $ 157,244 $ 40,535 $ 816,033
December 31, 2012Notional amount of credit extension commitments
Loan commitments $ 103,791 $ 83,885 $ 130,805 $ 19,942 $ 338,423Home equity lines of credit 2,134 13,584 23,344 21,856 60,918Standby letters of credit and financial guarantees (1) 24,593 11,387 3,094 4,751 43,825Letters of credit 2,003 70 10 546 2,629
Legally binding commitments 132,521 108,926 157,253 47,095 445,795Credit card lines (2) 397,862 — — — 397,862
Total credit extension commitments $ 530,383 $ 108,926 $ 157,253 $ 47,095 $ 843,657(1) The notional amounts of SBLCs and financial guarantees classified as investment grade and non-investment grade based on the credit quality of the underlying reference name within the instrument
were $27.6 billion and $9.6 billion at December 31, 2013, and $31.5 billion and $11.6 billion at December 31, 2012. Amounts include consumer SBLCs of $453 million and $669 million at December 31, 2013 and 2012.
(2) Includes business card unused lines of credit.
Legally binding commitments to extend credit generally have specified rates and maturities. Certain of these commitments have adverse change clauses that help to protect the Corporation against deterioration in the borrower’s ability to pay.
Other CommitmentsAt December 31, 2013 and 2012, the Corporation had unfunded equity investment commitments of $195 million and $307 million. At December 31, 2013, the Corporation had a commitment to purchase $1.4 billion of equity securities and, in the event the commitment is funded, intends to sell the underlying securities purchased under this commitment.
At December 31, 2013 and 2012, the Corporation had commitments to purchase loans (e.g., residential mortgage and
commercial real estate) of $1.5 billion and $1.3 billion, which upon settlement will be included in loans or LHFS.
At December 31, 2013 and 2012, the Corporation had commitments to enter into forward-dated resale and securities borrowing agreements of $75.5 billion and $67.3 billion, and commitments to enter into forward-dated repurchase and securities lending agreements of $38.3 billion and $42.3 billion. These commitments expire within the next 12 months.
The Corporation is a party to operating leases for certain of its premises and equipment. Commitments under these leases are approximately $2.8 billion, $2.4 billion, $2.1 billion, $1.7 billion and $1.3 billion for 2014 through 2018, respectively, and $5.7 billion in the aggregate for all years thereafter.
76788ba_financials.indd 219 3/6/14 12:06 PM

220 Bank of America 2013
Other Guarantees
Bank-owned Life Insurance Book Value ProtectionThe Corporation sells products that offer book value protection to insurance carriers who offer group life insurance policies to corporations, primarily banks. The book value protection is provided on portfolios of intermediate investment-grade fixed-income securities and is intended to cover any shortfall in the event that policyholders surrender their policies and market value is below book value. These guarantees are recorded as derivatives and carried at fair value in the trading portfolio. At both December 31, 2013 and 2012, the notional amount of these guarantees totaled $13.4 billion and the Corporation’s maximum exposure related to these guarantees totaled $3.0 billion with estimated maturity dates between 2030 and 2045. The net fair value including the fee receivable associated with these guarantees was $39 million and $52 million at December 31, 2013 and 2012, and reflects the probability of surrender as well as the multiple structural protection features in the contracts.
Employee Retirement ProtectionThe Corporation sells products that offer book value protection primarily to plan sponsors of the Employee Retirement Income Security Act of 1974 (ERISA) governed pension plans, such as 401(k) plans and 457 plans. The book value protection is provided on portfolios of intermediate/short-term investment-grade fixed-income securities and is intended to cover any shortfall in the event that plan participants continue to make qualified withdrawals after all securities have been liquidated and there is remaining book value. The Corporation retains the option to exit the contract at any time. If the Corporation exercises its option, the investment manager will either terminate the contract or convert the portfolio into a high-quality fixed-income portfolio, typically all government or government-backed agency securities, with the proceeds of the liquidated assets to assure the return of principal. To manage its exposure, the Corporation imposes restrictions and constraints on the timing of the withdrawals, the manner in which the portfolio is liquidated and the funds are accessed, and the investment parameters of the underlying portfolio. These constraints, combined with significant structural protections, are designed to provide adequate buffers and guard against payments even under extreme stress scenarios. These guarantees are recorded as derivatives and carried at fair value in the trading portfolio. At December 31, 2013 and 2012, the notional amount of these guarantees totaled $4.6 billion and $18.4 billion with estimated maturity dates up to 2017 if the exit option is exercised on all deals. The decline in notional amount in 2013 was primarily the result of plan sponsors terminating contracts pursuant to exit options. As of December 31, 2013, the Corporation had not made a payment under these products.
IndemnificationsIn the ordinary course of business, the Corporation enters into various agreements that contain indemnifications, such as tax indemnifications, whereupon payment may become due if certain external events occur, such as a change in tax law. The indemnification clauses are often standard contractual terms and were entered into in the normal course of business based on an assessment that the risk of loss would be remote. These agreements typically contain an early termination clause that permits the Corporation to exit the agreement upon these events.
The maximum potential future payment under indemnification agreements is difficult to assess for several reasons, including the occurrence of an external event, the inability to predict future changes in tax and other laws, the difficulty in determining how such laws would apply to parties in contracts, the absence of exposure limits contained in standard contract language and the timing of the early termination clause. Historically, any payments made under these guarantees have been de minimis. The Corporation has assessed the probability of making such payments in the future as remote.
Merchant ServicesIn accordance with credit and debit card association rules, the Corporation sponsors merchant processing servicers that process credit and debit card transactions on behalf of various merchants. In connection with these services, a liability may arise in the event of a billing dispute between the merchant and a cardholder that is ultimately resolved in the cardholder’s favor. If the merchant defaults on its obligation to reimburse the cardholder, the cardholder, through its issuing bank, generally has until six months after the date of the transaction to present a chargeback to the merchant processor, which is primarily liable for any losses on covered transactions. However, if the merchant processor fails to meet its obligation to reimburse the cardholder for disputed transactions, then the Corporation, as the sponsor, could be held liable for the disputed amount. In 2013 and 2012, the sponsored entities processed and settled $623.7 billion and $604.2 billion of transactions and recorded losses of $15 million and $10 million. A significant portion of this activity was processed by a joint venture in which the Corporation holds a 49 percent ownership. At December 31, 2013 and 2012, the sponsored merchant processing servicers held as collateral $203 million and $202 million of merchant escrow deposits which may be used to offset amounts due from the individual merchants.
The Corporation believes the maximum potential exposure for chargebacks would not exceed the total amount of merchant transactions processed through Visa and MasterCard for the last six months, which represents the claim period for the cardholder, plus any outstanding delayed-delivery transactions. As of December 31, 2013 and 2012, the maximum potential exposure for sponsored transactions totaled $258.5 billion and $263.9 billion. However, the Corporation believes that the maximum potential exposure is not representative of the actual potential loss exposure and does not expect to make material payments in connection with these guarantees.
Other Derivative ContractsThe Corporation funds selected assets, including securities issued by CDOs and CLOs, through derivative contracts, typically total return swaps, with third parties and VIEs that are not consolidated by the Corporation. The total notional amount of these derivative contracts was $1.8 billion and $2.9 billion with commercial banks and $1.3 billion and $1.4 billion with VIEs at December 31, 2013 and 2012. The underlying securities are senior securities and substantially all of the Corporation’s exposures are insured. Accordingly, the Corporation’s exposure to loss consists principally of counterparty risk to the insurers. In certain circumstances, generally as a result of ratings downgrades, the Corporation may be required to purchase the underlying assets, which would not result in additional gain or loss to the Corporation as such exposure is already reflected in the fair value of the derivative contracts.
76788ba_financials.indd 220 3/6/14 12:06 PM

Bank of America 2013 221
Other GuaranteesThe Corporation has entered into additional guarantee agreements and commitments, including lease-end obligation agreements, partial credit guarantees on certain leases, real estate joint venture guarantees, sold risk participation swaps, divested business commitments and sold put options that require gross settlement. The maximum potential future payment under these agreements was approximately $6.9 billion and $6.8 billion at December 31, 2013 and 2012. The estimated maturity dates of these obligations extend up to 2033. The Corporation has made no material payments under these guarantees.
In the normal course of business, the Corporation periodically guarantees the obligations of its affiliates in a variety of transactions including ISDA-related transactions and non-ISDA related transactions such as commodities trading, repurchase agreements, prime brokerage agreements and other transactions.
Payment Protection Insurance Claims MatterIn the U.K., the Corporation previously sold payment protection insurance (PPI) through its international card services business to credit card customers and consumer loan customers. PPI covers a consumer’s loan or debt repayment if certain events occur such as loss of job or illness. In response to an elevated level of customer complaints across the industry, heightened media coverage and pressure from consumer advocacy groups, the U.K. Financial Services Authority, which has subsequently been replaced by the Prudential Regulatory Authority (PRA) and the Financial Conduct Authority (FCA), investigated and raised concerns about the way some companies have handled complaints related to the sale of these insurance policies. In connection with this matter, the Corporation established a reserve for PPI. The reserve was $381 million and $510 million at December 31, 2013 and 2012. The Corporation recorded expense of $258 million and $692 million in 2013 and 2012. It is reasonably possible that the Corporation will incur additional expense related to PPI claims; however, the amount of such additional expense cannot be reasonably estimated.
Litigation and Regulatory MattersIn the ordinary course of business, the Corporation and its subsidiaries are routinely defendants in or parties to many pending and threatened legal actions and proceedings, including actions brought on behalf of various classes of claimants. These actions and proceedings are generally based on alleged violations of consumer protection, securities, environmental, banking, employment, contract and other laws. In some of these actions and proceedings, claims for substantial monetary damages are asserted against the Corporation and its subsidiaries. In the ordinary course of business, the Corporation and its subsidiaries are also subject to regulatory and governmental examinations, information gathering requests, inquiries, investigations, and threatened legal actions and proceedings. Certain subsidiaries of the Corporation are registered broker/dealers or investment advisors and are subject to regulation by the SEC, the Financial Industry Regulatory Authority, the European Commission, the PRA, the FCA and other international, federal and state securities regulators. In connection with formal and informal inquiries by those agencies, such subsidiaries receive numerous requests, subpoenas and orders for documents, testimony and information in connection with various aspects of their regulated activities.
In view of the inherent difficulty of predicting the outcome of such litigation, regulatory and governmental matters, particularly where the claimants seek very large or indeterminate damages or where the matters present novel legal theories or involve a large number of parties, the Corporation generally cannot predict what the eventual outcome of the pending matters will be, what the timing of the ultimate resolution of these matters will be, or what the eventual loss, fines or penalties related to each pending matter may be.
In accordance with applicable accounting guidance, the Corporation establishes an accrued liability for litigation, regulatory and governmental matters when those matters present loss contingencies that are both probable and estimable. In such cases, there may be an exposure to loss in excess of any amounts accrued. As a litigation, regulatory or governmental matter develops, the Corporation, in conjunction with any outside counsel handling the matter, evaluates on an ongoing basis whether such matter presents a loss contingency that is probable and estimable. When a loss contingency is not both probable and estimable, the Corporation does not establish an accrued liability. If, at the time of evaluation, the loss contingency related to a litigation, regulatory or governmental matter is not both probable and estimable, the matter will continue to be monitored for further developments that would make such loss contingency both probable and estimable. Once the loss contingency related to a litigation, regulatory or governmental matter is deemed to be both probable and estimable, the Corporation will establish an accrued liability with respect to such loss contingency and record a corresponding amount of litigation-related expense. The Corporation continues to monitor the matter for further developments that could affect the amount of the accrued liability that has been previously established. Excluding expenses of internal or external legal service providers, litigation-related expense of $6.1 billion was recognized for 2013 compared to $4.2 billion for 2012.
For a limited number of the matters disclosed in this Note for which a loss, whether in excess of a related accrued liability or where there is no accrued liability, is reasonably possible in future periods, the Corporation is able to estimate a range of possible loss. In determining whether it is possible to estimate a range of possible loss, the Corporation reviews and evaluates its material litigation, regulatory and governmental matters on an ongoing basis, in conjunction with any outside counsel handling the matter, in light of potentially relevant factual and legal developments. These may include information learned through the discovery process, rulings on dispositive motions, settlement discussions, and other rulings by courts, arbitrators or others. In cases in which the Corporation possesses sufficient appropriate information to estimate a range of possible loss, that estimate is aggregated and disclosed below. There may be other disclosed matters for which a loss is probable or reasonably possible but such an estimate of the range of possible loss may not be possible. For those matters where an estimate of the range of possible loss is possible, management currently estimates the aggregate range of possible loss is $0 to $6.1 billion in excess of the accrued liability (if any) related to those matters. This estimated range of possible loss is based upon currently available information and is subject to significant judgment and a variety of assumptions, and known and unknown uncertainties. The matters underlying the estimated range will change from time to time, and actual results may vary significantly from the current estimate. Those matters for which an estimate is not possible are not included within this estimated range. Therefore, this estimated range of possible loss represents
76788ba_financials.indd 221 3/6/14 12:06 PM

222 Bank of America 2013
what the Corporation believes to be an estimate of possible loss only for certain matters meeting these criteria. It does not represent the Corporation’s maximum loss exposure.
Information is provided below regarding the nature of all of these contingencies and, where specified, the amount of the claim associated with these loss contingencies. Based on current knowledge, management does not believe that loss contingencies arising from pending matters, including the matters described herein, will have a material adverse effect on the consolidated financial position or liquidity of the Corporation. However, in light of the inherent uncertainties involved in these matters, some of which are beyond the Corporation’s control, and the very large or indeterminate damages sought in some of these matters, an adverse outcome in one or more of these matters could be material to the Corporation’s results of operations or cash flows for any particular reporting period.
Bond Insurance Litigation
Ambac Countrywide LitigationThe Corporation, Countrywide and other Countrywide entities are named as defendants in an action filed on September 29, 2010 and as amended on May 28, 2013, by Ambac Assurance Corporation and the Segregated Account of Ambac Assurance Corporation (together, Ambac), entitled Ambac Assurance Corporation and The Segregated Account of Ambac Assurance Corporation v. Countrywide Home Loans, Inc., et al. This action, currently pending in New York Supreme Court, New York County, relates to bond insurance policies provided by Ambac on certain securitized pools of second-lien (and in one pool, first-lien) home equity lines of credit (HELOCs), first-lien subprime home equity loans and fixed-rate second-lien mortgage loans. Plaintiffs allege that they have paid claims as a result of defaults in the underlying loans and assert that the Countrywide defendants misrepresented the characteristics of the underlying loans and breached certain contractual representations and warranties regarding the underwriting and servicing of the loans. Plaintiffs also allege that the Corporation is liable based on successor liability theories. Damages claimed by Ambac are in excess of $2.5 billion and include the amount of payments for current and future claims it has paid or claims it will be obligated to pay under the policies, increasing over time as it pays claims under relevant policies, plus unspecified punitive damages.
Ambac First Franklin LitigationOn April 16, 2012, Ambac sued First Franklin Financial Corp., BANA, Merrill Lynch, Pierce, Fenner & Smith (MLPF&S), Merrill Lynch Mortgage Lending, Inc. (MLML), and Merrill Lynch Mortgage Investors, Inc. in New York Supreme Court, New York County. Plaintiffs’ claims relate to guaranty insurance Ambac provided on a First Franklin securitization (Franklin Mortgage Loan Trust, Series 2007-FFC). The securitization was sponsored by MLML, and certain certificates in the securitization were insured by Ambac. The complaint alleges that defendants breached representations and warranties concerning the origination of the underlying mortgage loans and asserts claims for fraudulent inducement, breach of contract and indemnification. Plaintiffs also assert breach of contract claims against BANA based upon its servicing of the loans in the securitization. The complaint does not specify the amount of damages sought.
On July 19, 2013, the court denied defendants’ motion to dismiss Ambac’s contract and fraud causes of action but granted dismissal of Ambac’s indemnification cause of action. In addition, the court denied defendants’ motion to dismiss Ambac’s claims for attorneys’ fees and punitive damages.
FGICThe Corporation, Countrywide and other Countrywide entities are named as defendants in an action filed on December 11, 2009 by Financial Guaranty Insurance Company (FGIC) entitled Financial Guaranty Insurance Co. v. Countrywide Home Loans, Inc., et al. This action, currently pending in New York Supreme Court, New York County, relates to bond insurance policies provided by FGIC on securitized pools of HELOCs and fixed-rate second-lien mortgage loans. Plaintiff alleges that it has paid claims as a result of defaults in the underlying loans and asserts that the Countrywide defendants misrepresented the characteristics of the underlying loans and breached certain contractual representations and warranties regarding the underwriting and servicing of the loans. Plaintiffs also allege that the Corporation is liable based on successor liability theories. Damages claimed by FGIC are in excess of $1.8 billion and include the amount of payments for current and future claims it has paid or claims it will be obligated to pay under the policies, increasing over time as it pays claims under relevant policies, plus unspecified punitive damages.
Credit Card Debt Cancellation and Identity Theft Protection ProductsFIA has received inquiries from and has been in discussions with regulatory authorities to address concerns regarding the sale and marketing of certain optional credit card debt cancellation products. The Corporation may be subject to a regulatory enforcement action and will be required to pay restitution or provide other relief to customers, and pay penalties to one or more regulators.
In addition, BANA and FIA have been in discussions with regulatory authorities to address concerns that some customers may have paid for but did not receive certain benefits of optional identity theft protection services from third-party vendors of BANA and FIA, including whether appropriate oversight of such vendors existed. The Corporation has issued and will continue to issue refund checks to impacted customers and may be subject to regulatory enforcement actions and penalties.
European Commission – Credit Default Swaps Antitrust InvestigationOn July 1, 2013, the European Commission (Commission) announced that it had addressed a Statement of Objections (SO) to the Corporation, BANA and Banc of America Securities LLC (together, the Bank of America Entities); a number of other financial institutions; Markit Group Limited; and the International Swaps and Derivatives Association (together, the Parties). The SO sets forth the Commission’s preliminary conclusion that the Parties infringed European Union competition law by participating in alleged collusion to prevent exchange trading of CDS and futures. According to the SO, the conduct of the Bank of America Entities took place between August 2007 and April 2009. As part of the Commission’s procedures, the Parties have been given the opportunity to review the evidence in the investigative file, respond to the Commission’s preliminary conclusions and request a hearing before the Commission. If the Commission is satisfied
76788ba_financials.indd 222 3/6/14 12:06 PM

Bank of America 2013 223
that its preliminary conclusions are proved, the Commission has stated that it intends to impose a fine and require appropriate remedial measures.
Fontainebleau Las Vegas Litigation On June 9, 2009, Avenue CLO Fund Ltd., et al. v. Bank of America, N.A., Merrill Lynch Capital Corporation, et al. was filed in the U.S. District Court for the District of Nevada by certain Fontainebleau Las Vegas, LLC (FBLV) project lenders. Plaintiffs alleged that, among other things, BANA breached its duties as disbursement agent under the agreement governing the disbursement of loaned funds to FBLV, then a Chapter 11 debtor-in-possession. Plaintiffs seek monetary damages of more than $700 million, plus interest. This action was subsequently transferred by the U.S. Judicial Panel on Multidistrict Litigation (JPML) to the U.S. District Court for the Southern District of Florida.
On March 19, 2012, the district court granted BANA’s motion for summary judgment on all causes of action against it in its capacity as disbursement agent and denied plaintiffs’ motion for summary judgment on those claims. On July 26, 2013, the U.S. Court of Appeals for the Eleventh Circuit affirmed in part and reversed in part the district court’s dismissal of the disbursement agent claims against BANA, holding that there were factual disputes that could not be resolved on a summary judgment motion, and remanded the case to the district court for further proceedings.
Dismissal of the other claims was affirmed on a separate appeal. On December 13, 2013, the JPML remanded the action to the District of Nevada for trial.
In re Bank of America Securities, Derivative and Employee Retirement Income Security Act (ERISA) LitigationBeginning in January 2009, the Corporation, as well as certain current and former officers and directors, among others, were named as defendants in a variety of actions filed in state and federal courts. The actions generally concern alleged material misrepresentations and/or omissions with respect to certain securities filings by the Corporation. The securities filings contained information with respect to events that took place from September 2008 through January 2009 contemporaneous with the Corporation’s acquisition of Merrill Lynch. Certain federal court actions were consolidated and/or coordinated in the U.S. District Court for the Southern District of New York under the caption In re Bank of America Securities, Derivative and Employee Retirement Income Security Act (ERISA) Litigation.
Securities ActionsPlaintiffs in the consolidated securities class action (the Consolidated Securities Class Action) asserted claims under Sections 14(a), 10(b) and 20(a) of the Securities Exchange Act of 1934, and Sections 11, 12(a)(2) and 15 of the Securities Act of 1933 and asserted damages based on the drop in the stock price upon subsequent disclosures.
On April 5, 2013, the U.S. District Court for the Southern District of New York granted final approval to the settlement of the Consolidated Securities Class Action. Certain class members have appealed the district court’s final approval of the settlement to the U.S. Court of Appeals for the Second Circuit.
Certain shareholders opted to pursue their claims apart from the Consolidated Securities Class Action. These individual plaintiffs asserted substantially the same facts and claims as the class action plaintiffs. Following settlements in an aggregate amount that was fully accrued as of December 31, 2013, the court has dismissed the claims of these plaintiffs with prejudice.
New York Attorney General (NYAG) ActionOn February 4, 2010, the NYAG filed a civil complaint in New York Supreme Court, New York County, entitled People of the State of New York v. Bank of America, et al. The complaint named as defendants the Corporation and the Corporation’s former CEO and CFO, and alleges violations of Sections 352, 352-c(1)(a), 352-c(1)(c) and 353 of the Martin Act, and Section 63(12) of the New York Executive Law. The complaint sought an unspecified amount in disgorgement, penalties, restitution, and damages and other equitable relief. The NYAG has stated publicly that it has withdrawn its demand for damages, but continues to pursue other relief under the Martin Act and New York Executive Law.
Interchange and Related LitigationIn 2005, a group of merchants filed a series of putative class actions and individual actions directed at interchange fees associated with Visa and MasterCard payment card transactions. These actions, which were consolidated in the U.S. District Court for the Eastern District of New York under the caption In Re Payment Card Interchange Fee and Merchant Discount Anti-Trust Litigation (Interchange), named Visa, MasterCard and several banks and bank holding companies, including the Corporation, as defendants. Plaintiffs allege that defendants conspired to fix the level of default interchange rates, which represent the fee an issuing bank charges an acquiring bank on every transaction. Plaintiffs also challenged as unreasonable restraints of trade under Section 1 of the Sherman Act, certain rules of Visa and MasterCard related to merchant acceptance of payment cards at the point of sale. Plaintiffs sought unspecified damages and injunctive relief based on their assertion that interchange would be lower or eliminated absent the alleged conduct.
In addition, plaintiffs filed supplemental complaints against certain defendants, including the Corporation, relating to initial public offerings (IPOs) of MasterCard and Visa. Plaintiffs alleged that the IPOs violated Section 7 of the Clayton Act and Section 1 of the Sherman Act. Plaintiffs also asserted that the MasterCard IPO was a fraudulent conveyance. Plaintiffs sought unspecified damages and to undo the IPOs.
On October 19, 2012, defendants entered an agreement to settle the class plaintiffs’ claims. The defendants also separately agreed to resolve the claims brought by a group of individual retailers that opted out of the class to pursue independent litigation. The settlement agreements provide for, among other things, (i) payments by defendants to the class and individual plaintiffs totaling approximately $6.6 billion, allocated proportionately to each defendant based upon various loss-sharing agreements; (ii) distribution to class merchants of an amount equal to 10 bps of default interchange across all Visa and MasterCard credit card transactions for a period of eight consecutive months, to begin by July 29, 2013, which otherwise would have been paid to issuers and which effectively reduces credit interchange for that period of time; and (iii) modifications to certain Visa and MasterCard rules regarding merchant point of sale practices.
76788ba_financials.indd 223 3/6/14 12:06 PM

224 Bank of America 2013
The court granted final approval of the class settlement agreement on December 13, 2013. Several class members have appealed to the U.S. Court of Appeals for the Second Circuit. In addition, a number of class members opted out of the settlement of their past damages claims. The cash portion of the settlement will be adjusted downward as a result of these opt outs, subject to certain conditions.
Twenty-seven actions have been filed by merchant class members who opted out of the settlement. The Corporation has been named as a defendant in two of these opt out suits and, as a result of various sharing agreements from the main Interchange litigation, remains liable for any settlement or judgment in opt out suits where it is not named as a defendant. All but one of the opt-out suits filed to date have been consolidated in the U.S. District Court for the Eastern District of New York.
LIBOR, Other Reference Rate and Foreign Exchange (FX) Inquiries and LitigationThe Corporation has received subpoenas and information requests from government authorities in North America, Europe and Asia, including the DOJ, the U.S. Commodity Futures Trading Commission and the U.K. Financial Conduct Authority, concerning submissions made by panel banks in connection with the setting of London interbank offered rates (LIBOR) and other reference rates. The Corporation is cooperating with these inquiries.
Government authorities in North America, Europe and Asia are conducting investigations and making inquiries of a significant number of FX market participants, including the Corporation, regarding conduct and practices in certain FX markets over multiple years. The Corporation is cooperating with these investigations and inquiries.
In addition, the Corporation and BANA have been named as defendants along with most of the other LIBOR panel banks in a series of individual and class actions in various U.S. federal and state courts relating to defendants’ LIBOR contributions. All cases naming the Corporation have been or are in the process of being consolidated for pre-trial purposes in the U.S. District Court for the Southern District of New York by the JPML. The Corporation expects that any future cases naming the Corporation will similarly be consolidated for pre-trial purposes. Plaintiffs allege that they held or transacted in U.S. dollar LIBOR-based derivatives or other financial instruments and sustained losses as a result of collusion or manipulation by defendants regarding the setting of U.S. dollar LIBOR. Plaintiffs assert a variety of claims, including antitrust and Racketeer Influenced and Corrupt Organizations claims, and seek compensatory, treble and punitive damages, and injunctive relief.
On March 29, 2013, the court dismissed the antitrust, RICO and related state law claims and, based on the statute of limitations, substantially limited the manipulation claims under the Commodities Exchange Act that are allowed to proceed. The court’s rulings will be applicable to later filed actions to the extent they assert similar claims. The court is continuing to consider motions regarding the remaining claims.
On June 14, 2013, the Monetary Authority of Singapore (MAS) announced the results of its review of the submission processes of panel banks, including BANA (Singapore Branch), relating to reference rates set in Singapore, including the Singapore Interbank Offered Rates (SIBOR), Swap Offered Rates (SOR) and reference rates used to settle non-deliverable forward contracts. All of the banks, including BANA (Singapore Branch), were found to have deficiencies in governance, risk management, internal controls
and surveillance systems from 2007 to 2011 related to their submission processes. All of the banks, including BANA (Singapore Branch), were required to adopt measures to address these deficiencies, report their progress in addressing these deficiencies on a quarterly basis, and conduct independent reviews to ensure the robustness of their remedial measures. Nineteen of the 20 banks were also required to deposit increased statutory reserves with the MAS at zero percent interest for one year; BANA (Singapore Branch) was required to deposit 700 million Singapore Dollars (approximately $551 million U.S. dollars).
MontgomeryThe Corporation, several current and former officers and directors, Banc of America Securities LLC (BAS), MLPF&S and other unaffiliated underwriters have been named as defendants in a putative class action filed in the U.S. District Court for the Southern District of New York entitled Montgomery v. Bank of America, et al. Plaintiff filed an amended complaint on January 14, 2011. Plaintiff seeks to sue on behalf of all persons who acquired certain series of preferred stock offered by the Corporation pursuant to a shelf registration statement dated May 5, 2006. Plaintiff’s claims arise from three offerings dated January 24, 2008, January 28, 2008 and May 20, 2008, from which the Corporation allegedly received proceeds of $15.8 billion. The amended complaint asserts claims under Sections 11, 12(a)(2) and 15 of the Securities Act of 1933, and alleges that the prospectus supplements associated with the offerings: (i) failed to disclose that the Corporation’s loans, leases, CDOs and commercial MBS were impaired to a greater extent than disclosed; (ii) misrepresented the extent of the impaired assets by failing to establish adequate reserves or properly record losses for its impaired assets; (iii) misrepresented the adequacy of the Corporation’s internal controls in light of the alleged impairment of its assets; (iv) misrepresented the Corporation’s capital base and Tier 1 leverage ratio for risk-based capital in light of the allegedly impaired assets; and (v) misrepresented the thoroughness and adequacy of the Corporation’s due diligence in connection with its acquisition of Countrywide. The amended complaint seeks rescission, compensatory and other damages. On March 16, 2012, the district court granted defendants’ motion to dismiss the first amended complaint. On December 3, 2013, the district court denied plaintiffs’ motion to file a second amended complaint. On February 6, 2014, plaintiffs filed a notice of appeal to the U.S. Court of Appeals for the Second Circuit as to the district court’s denial of their motion to amend.
Mortgage-backed Securities Litigation and Other Government Mortgage Origination InvestigationsThe Corporation and its affiliates, Countrywide entities and their affiliates, and Merrill Lynch entities and their affiliates have been named as defendants in a number of cases relating to their various roles as issuer, originator, seller, depositor, sponsor, underwriter and/or controlling entity in MBS offerings, pursuant to which the MBS investors were entitled to a portion of the cash flow from the underlying pools of mortgages. These cases generally include purported class action suits, actions by individual MBS purchasers and governmental actions. Although the allegations vary by lawsuit, these cases generally allege that the registration statements, prospectuses and prospectus supplements for securities issued by securitization trusts contained material misrepresentations and omissions, in violation of the Securities Act of 1933, the Financial Institutions Reform, Recovery, and Enforcement Act of 1989
76788ba_financials.indd 224 3/6/14 12:06 PM

Bank of America 2013 225
(FIRREA) and/or state securities laws and other state statutory and common laws.
These cases generally involve allegations of false and misleading statements regarding: (i) the process by which the properties that served as collateral for the mortgage loans underlying the MBS were appraised; (ii) the percentage of equity that mortgage borrowers had in their homes; (iii) the borrowers’ ability to repay their mortgage loans; (iv) the underwriting practices by which those mortgage loans were originated; (v) the ratings given to the different tranches of MBS by rating agencies; and (vi) the validity of each issuing trust’s title to the mortgage loans comprising the pool for that securitization (collectively, MBS Claims). Plaintiffs in these cases generally seek unspecified compensatory damages, unspecified costs and legal fees and, in some instances, seek rescission. A number of other entities have threatened legal actions against the Corporation and its affiliates, Countrywide entities and their affiliates, and Merrill Lynch entities and their affiliates concerning MBS offerings.
The Corporation, Countrywide, Merrill Lynch and/or their affiliates may have claims for and/or may be subject to claims for contractual indemnification in connection with their various roles in regard to MBS.
On August 15, 2011, the JPML ordered multiple federal court cases involving Countrywide MBS consolidated for pretrial purposes in the U.S. District Court for the Central District of California in a multi-district litigation entitled In re Countrywide Financial Corp. Mortgage-Backed Securities Litigation (the Countrywide RMBS MDL).
AIG LitigationOn August 8, 2011, American International Group, Inc. and certain of its affiliates (collectively, AIG) filed a complaint in New York Supreme Court, New York County, in a case entitled American International Group, Inc., et al. v. Bank of America Corporation, et al. AIG has named the Corporation, Merrill Lynch, Countrywide Home loans, Inc. (CHL) and a number of related entities as defendants. AIG’s complaint asserts certain MBS Claims pertaining to 347 MBS offerings and two private placements in which it alleges that it purchased securities between 2005 and 2007. AIG seeks rescission of its purchases or a rescissory measure of damages or, in the alternative, compensatory damages of no less than $10 billion, punitive damages and other unspecified relief. Defendants removed the case to the U.S. District Court for the Southern District of New York and the district court denied AIG’s motion to remand. On April 19, 2013, the U.S. Court of Appeals for the Second Circuit issued a decision vacating the order denying AIG’s motion to remand, and remanded the case to the district court for further proceedings concerning whether the court will exercise its jurisdiction on other grounds.
On December 21, 2011, the JPML transferred the Countrywide MBS claims to the Countrywide RMBS MDL in the Central District of California. The non-Countrywide MBS claims remain in the U.S. District Court for the Southern District of New York.
On May 23, 2012, the district court in the Central District of California dismissed with prejudice plaintiffs’ federal securities claims and certain of the state law common law claims. On August 31, 2012, AIG filed an amended complaint, which among other things, added claims against the Corporation and certain related entities for constructive fraudulent conveyance and intentional fraudulent conveyance. On May 6, 2013, the district court dismissed the fraudulent conveyance and successor liability claims against the Corporation and related entities. On October
10, 2013, AIG filed a Third Amended Complaint, which is limited to the claims transferred to the Countrywide RMBS MDL. It concerns 159 offerings and asserts damages of approximately $5 billion only with respect to the RMBS at issue in the Countrywide RMBS MDL.
Civil RMBS Matters Filed by the DOJ and the SECOn August 6, 2013, the DOJ and the SEC filed separate civil actions in the U.S. District Court for the Western District of North Carolina against MLPF&S, BANA and Banc of America Mortgage Securities, Inc. (and, in the DOJ case, the Corporation). Both cases allege generally that the offering materials for a single 2008 RMBS offering contained material misstatements and omissions regarding, inter alia, the concentration of loans originated in the wholesale loan channel. The DOJ case asserts violations of FIRREA and the SEC case asserts claims under Sections 17(a)(2) and (3) and Section 5(b)(1) of the Securities Act of 1933. The complaints demand unspecified damages and other relief. Defendants moved to dismiss both complaints on November 8, 2013.
FHFA LitigationFHFA, as conservator for FNMA and FHLMC, filed an action on September 2, 2011 against the Corporation and related entities, Countrywide and related entities, certain former officers of these entities, and NB Holdings Corporation in New York Supreme Court, New York County, entitled Federal Housing Finance Agency v. Countrywide Financial Corporation, et al. (the FHFA Countrywide Litigation). FHFA’s complaint asserts certain MBS Claims in connection with allegations that FNMA and FHLMC purchased MBS issued by Countrywide-related entities in 86 MBS offerings between 2005 and 2008. FHFA seeks, among other relief, rescission of the consideration paid for the securities or, in the alternative, unspecified compensatory damages allegedly incurred by FNMA and FHLMC, including consequential damages. FHFA also seeks recovery of punitive damages.
On September 30, 2011, Countrywide removed the FHFA Countrywide Litigation from New York Supreme Court to the U.S. District Court for the Southern District of New York. On February 7, 2012, the JPML transferred the matter to the Countrywide RMBS MDL. On October 18, 2012, the court dismissed as untimely FHFA’s Section 11 claims as to 24 of the 86 MBS allegedly purchased by FNMA and FHLMC, but otherwise denied the motion to dismiss on statute of limitations and statute of repose grounds. On February 6, 2013, FHFA agreed to voluntarily dismiss certain of its Virginia blue sky claims. On March 15, 2013, the court dismissed the negligent misrepresentation and aiding and abetting claims as to all defendants, and the Securities Act of 1933 and Washington, D.C. blue sky claims as to certain defendants. The court also dismissed FHFA’s successor liability claims but permitted FHFA leave to amend its fraudulent conveyance claims. The court otherwise denied defendants’ motions to dismiss. On June 7, 2013, the court denied with prejudice FHFA’s motion for leave to amend its successor liability claims, based upon fraudulent conveyance theories, against the Corporation.
Also on September 2, 2011, FHFA, as conservator for FNMA and FHLMC, filed complaints in the U.S. District Court for the Southern District of New York against the Corporation and Merrill Lynch-related entities, and certain current and former officers and directors of these entities. The actions are entitled Federal Housing Finance Agency v. Bank of America Corporation, et al. (the FHFA Bank of America Litigation) and Federal Housing Finance Agency v.
76788ba_financials.indd 225 3/6/14 12:06 PM

226 Bank of America 2013
Merrill Lynch & Co., Inc., et al. (the FHFA Merrill Lynch Litigation). The complaints assert certain MBS Claims relating to MBS issued and/or underwritten by the Corporation, Merrill Lynch and related entities in 23 MBS offerings and in 72 MBS offerings, respectively, between 2005 and 2008 and allegedly purchased by either FNMA or FHLMC in their investment portfolio. FHFA seeks, among other relief, rescission of the consideration paid for the securities or alternatively damages allegedly incurred by FNMA and FHLMC, including consequential damages. FHFA also seeks recovery of punitive damages in the FHFA Merrill Lynch Litigation.
On November 8, 2012 and November 28, 2012, the court denied motions to dismiss in the FHFA Merrill Lynch Litigation and the FHFA Bank of America Litigation, respectively.
On December 16, 2013, the district court granted FHFA’s motion for partial summary judgment, ruling that loss causation is not an element of, or a defense to, FHFA’s claims under Virginia or Washington, D.C. blue sky laws. The FHFA Merrill Lynch Litigation is set for trial in June 2014; the FHFA Bank of America Litigation is set for trial in January 2015.
Federal Home Loan Bank LitigationOn January 18, 2011, the Federal Home Loan Bank of Atlanta (FHLB Atlanta) filed a complaint asserting certain MBS Claims against the Corporation, Countrywide and other Countrywide entities in Georgia State Court, Fulton County, entitled Federal Home Loan Bank of Atlanta v. Countrywide Financial Corporation, et al. FHLB Atlanta sought rescission of its purchases or a rescissory measure of damages, unspecified punitive damages and other unspecified relief in connection with its alleged purchase of 16 MBS offerings issued and/or underwritten by Countrywide-related entities between 2004 and 2007. Pursuant to a settlement that was fully accrued as of December 31, 2013 and is not material to the Corporation’s results of operations, FHLB Atlanta voluntarily dismissed its claims with prejudice on December 9, 2013.
On March 15, 2010, the Federal Home Loan Bank of San Francisco (FHLB San Francisco) filed an action in California Superior Court, San Francisco County, entitled Federal Home Loan Bank of San Francisco v. Credit Suisse Securities (USA) LLC, et al. FHLB San Francisco’s complaint asserts certain MBS Claims against BAS, Countrywide and several related entities in connection with its alleged purchase of 51 MBS offerings and one private placement issued and/or underwritten by those defendants between 2004 and 2007 and seeks rescission and unspecified damages. FHLB San Francisco dismissed the federal claims with prejudice on August 11, 2011. On September 8, 2011, the court denied defendants’ motions to dismiss the state law claims. On December 20, 2013, FHLB San Francisco voluntarily dismissed its negligent misrepresentation claims with prejudice.
Luther Class Action Litigation and Related ActionsBeginning in 2007, a number of pension funds and other investors filed putative class action lawsuits alleging certain MBS Claims against Countrywide, several of its affiliates, MLPF&S, the Corporation, NB Holdings Corporation and certain other defendants. Those class action lawsuits concerned a total of 429 MBS offerings involving over $350 billion in securities issued by subsidiaries of Countrywide between 2005 and 2007. The actions, entitled Luther v. Countrywide Financial Corporation, et al., Maine State Retirement System v. Countrywide Financial Corporation, et
al., Western Conference of Teamsters Pension Trust Fund v. Countrywide Financial Corporation, et al., and Putnam Bank v. Countrywide Financial Corporation, et al., were all eventually assigned to the Countrywide RMBS MDL court. On December 6, 2013, the court granted final approval to a settlement of these actions in the amount of $500 million. Beginning on January 14, 2014, a number of class members filed notices of appeal in the U.S. Court of Appeals for the Ninth Circuit.
Prudential Insurance Litigation On March 14, 2013, The Prudential Insurance Company of America and certain of its affiliates (collectively Prudential) filed a complaint in the U.S. District Court for the District of New Jersey, in a case entitled Prudential Insurance Company of America, et al. v. Bank of America, N.A., et al. Prudential has named the Corporation, Merrill Lynch and a number of related entities as defendants. Prudential’s complaint asserts certain MBS Claims pertaining to 54 MBS offerings in which Prudential alleges that it purchased securities between 2004 and 2007. Prudential seeks, among other relief, compensatory damages, rescission or a rescissory measure of damages, treble damages, punitive damages and other unspecified relief.
Regulatory and Governmental InvestigationsThe Corporation has received a number of subpoenas and other requests for information from regulators and governmental authorities regarding MBS and other mortgage-related matters, including inquiries, investigations and potential proceedings related to a number of transactions involving the underwriting and issuance of MBS by the Corporation (including legacy entities the Corporation acquired) and participation in certain CDO and structured investment vehicle offerings. These inquiries and investigations include, among others, investigations by the RMBS Working Group of the Financial Fraud Enforcement Task Force, including the DOJ and state Attorneys General, concerning the purchase, securitization and underwriting of mortgage loans and RMBS. The Corporation has provided documents and testimony, and continues to cooperate fully with these inquiries and investigations.
The staff of the NYAG has advised that they intend to recommend filing an action against MLPF&S as a result of their RMBS investigation. In addition, the staff of a U.S. Attorney’s office advised that they intend to recommend that the DOJ file a civil action against affiliates of the Corporation related to the securitization of RMBS.
The Civil Division of the U.S. Attorney’s office for the Eastern District of New York is conducting an investigation concerning the Corporation's compliance with the requirements of the Federal Housing Administration’s Direct Endorsement Program. The Corporation is cooperating with this investigation.
On December 12, 2013, the SEC and MLPF&S resolved the SEC’s investigation related to risk control, valuation, structuring, marketing and purchase of CDOs by MLPF&S. Without admitting or denying the SEC’s allegations in the settlement order, MLPF&S agreed to pay disgorgement, prejudgment interest and a civil penalty totaling approximately $132 million relating to MLPF&S’s role in the structuring and marketing of three CDOs that closed in late 2006 and early 2007.
76788ba_financials.indd 226 3/6/14 12:06 PM

Bank of America 2013 227
Mortgage Repurchase Litigation
U.S. Bank LitigationOn August 29, 2011, U.S. Bank, National Association (U.S. Bank), as trustee for the HarborView Mortgage Loan Trust 2005-10 (the Trust), a mortgage pool backed by loans originated by CHL, filed a complaint in New York Supreme Court, New York County, in a case entitled U.S. Bank National Association, as Trustee for HarborView Mortgage Loan Trust, Series 2005-10 v. Countrywide Home Loans, Inc. (dba Bank of America Home Loans), Bank of America Corporation, Countrywide Financial Corporation, Bank of America, N.A. and NB Holdings Corporation. U.S. Bank asserts that, as a result of alleged misrepresentations by CHL in connection with its sale of the loans, defendants must repurchase all the loans in the pool, or in the alternative that it must repurchase a subset of those loans as to which U.S. Bank alleges that defendants have refused specific repurchase demands. U.S. Bank asserts claims for breach of contract and seeks specific performance of defendants’ alleged obligation to repurchase the entire pool of loans (alleged to have an original aggregate principal balance of $1.75 billion) or alternatively the aforementioned subset (alleged to have an aggregate principal balance of “over $100 million”), together with reimbursement of costs and expenses and other unspecified relief. On May 29, 2013, New York Supreme Court dismissed U.S. Bank’s claim for repurchase of all the mortgage loans in the Trust. The court granted U.S. Bank leave to amend this claim. The court denied defendants’ motion to dismiss U.S. Bank’s claim that CHL allegedly refused to repurchase specific mortgage loans which were the subject of prior repurchase demands. On June 18, 2013, U.S. Bank filed its second amended complaint seeking to replead its claim for repurchase of all loans in the Trust. By order dated February 13, 2014, the court granted defendants’ motion to dismiss the repleaded claim seeking repurchase of all mortgage loans in the Trust; the same order denied plaintiff’s motion for “resettlement and/or clarification” seeking permission to pursue, under its alternative claim, a remedy with respect to mortgage loans beyond the subset identified in the complaint.
Ocala Litigation
Ocala Investor ActionsOn November 25, 2009, BNP Paribas Mortgage Corporation and Deutsche Bank AG each filed claims (the 2009 Actions) against BANA in the U.S. District Court for the Southern District of New York entitled BNP Paribas Mortgage Corporation v. Bank of America, N.A and Deutsche Bank AG v. Bank of America, N.A. Plaintiffs allege that BANA failed to properly perform its duties as indenture trustee, collateral agent, custodian and depositary for Ocala Funding, LLC (Ocala), a home mortgage warehousing facility, resulting in the loss of plaintiffs’ investment in Ocala. Ocala was a wholly-owned subsidiary of Taylor, Bean & Whitaker Mortgage Corp. (TBW), a home mortgage originator and servicer which is alleged to have committed fraud that led to its eventual bankruptcy. Ocala provided funding for TBW’s mortgage origination activities by issuing notes, the proceeds of which were to be used by TBW to originate home mortgages. Such mortgages and other Ocala assets in turn were pledged to BANA, as collateral agent, to secure the notes. Plaintiffs lost most or all of their investment in Ocala when, as the result of the alleged fraud committed by TBW, Ocala was unable to repay the notes purchased by plaintiffs and there was insufficient collateral to satisfy Ocala’s debt obligations. Plaintiffs allege that BANA breached its contractual, fiduciary and other duties to Ocala,
thereby permitting TBW’s alleged fraud to go undetected. Plaintiffs seek compensatory damages and other relief from BANA, including interest and attorneys’ fees, in an unspecified amount, but which plaintiffs allege exceeds $1.6 billion.
On March 23, 2011, the court issued an order granting in part and denying in part BANA’s motions to dismiss the 2009 Actions.
Plaintiffs filed amended complaints on October 1, 2012 that included additional contractual, tort and equitable claims. On June 6, 2013, the court issued an order granting BANA’s motion to dismiss plaintiffs’ claims for failure to sue, negligence, negligent misrepresentation and equitable relief. On December 9, 2013, the court issued an order denying plaintiffs’ motion for leave to amend to include additional failure to sue claims.
In connection with the Ocala bankruptcy proceeding, the bankruptcy trustee is pursuing litigation against third parties to mitigate the investor losses at issue in the 2009 Actions.
FDIC ActionOn October 1, 2010, BANA filed suit in the U.S. District Court for the District of Columbia against the FDIC as receiver of Colonial Bank, TBW’s primary bank, and Platinum Community Bank (Platinum, a wholly-owned subsidiary of TBW) entitled Bank of America, National Association as indenture trustee, custodian and collateral agent for Ocala Funding, LLC v. Federal Deposit Insurance Corporation (the FDIC Action). The suit seeks judicial review of the FDIC’s denial of the administrative claims brought by BANA in the FDIC’s Colonial and Platinum receivership proceedings. BANA’s claims allege that Ocala’s losses were in whole or in part the result of Colonial and Platinum’s participation in TBW’s alleged fraud. BANA seeks a court order requiring the FDIC to allow BANA’s claims in an amount equal to Ocala’s losses and, accordingly, to permit BANA, as trustee, collateral agent, custodian and depositary for Ocala, to share appropriately in distributions of any receivership assets that the FDIC makes to creditors of the two failed banks.
On August 5, 2011, the FDIC answered and moved to dismiss the amended complaint, and asserted counterclaims against BANA in BANA’s individual capacity seeking approximately $900 million in damages. The counterclaims allege that Colonial sent 4,808 loans to BANA as bailee, that BANA converted the loans into Ocala collateral without first ensuring that Colonial was paid, and that Colonial was never paid for these loans.
On December 10, 2012, the U.S. District Court for the District of Columbia granted in part and denied in part the FDIC’s motion to dismiss BANA’s amended complaint. The court dismissed BANA’s claims to the extent they were brought on behalf of Ocala, holding that those claims were not administratively exhausted, and also dismissed three equitable claims, but allowed BANA to continue to pursue claims in its individual capacity and on behalf of Ocala’s secured parties, principally plaintiffs in the 2009 Actions. The court also granted in part and denied in part BANA’s motion to dismiss the FDIC’s counterclaims, allowing all but one of the FDIC’s 16 counterclaims to go forward.
On February 5, 2013, BANA filed a motion for clarification of the court’s December 10, 2012 ruling on BANA’s motion to dismiss the FDIC’s counterclaims. On March 6, 2013, the court ruled that certain language in the custodial agreement between BANA and Colonial Bank purporting to limit BANA’s liability is unenforceable due to ambiguity, and that BANA is foreclosed from introducing extrinsic evidence to resolve the ambiguity. On June 17, 2013, the court denied BANA’s motion seeking certification for interlocutory appeal of the court’s December 10, 2012 ruling as so clarified. On February 5, 2014, the U.S. Court of Appeals for the District of
76788ba_financials.indd 227 3/6/14 12:06 PM

228 Bank of America 2013
Columbia Circuit denied BANA’s petition for writ of mandamus that sought to vacate the December 10, 2012 and March 6, 2013 rulings.
On May 3, 2013, the FDIC filed a motion to dismiss BANA’s claims against the FDIC in its capacity as receiver for Colonial Bank, citing a Notice of No Value Determination, dated April 15, 2013, published by the FDIC in the Federal Register, 78 Fed. Reg. 76, 23565 (the No Value Determination). On July 22, 2013, BANA filed a complaint against the FDIC in the U.S. District Court for the District of Columbia entitled Bank of America, N.A. v. Federal Deposit Insurance Corporation, challenging the FDIC’s No Value Determination pursuant to the Administrative Procedure Act (the APA Action). On August 26, 2013, the U.S. District Court for the District of Columbia granted the FDIC’s motion to dismiss BANA’s claims against the FDIC in its capacity as receiver for Colonial Bank. The court ruled that the order of judgment would be held in abeyance pending resolution of the APA Action.
O’Donnell LitigationOn February 24, 2012, Edward O’Donnell filed a sealed qui tam complaint against the Corporation, individually, and as successor to Countrywide, CHL and a Countrywide business division known as Full Spectrum Lending. On October 24, 2012, the DOJ filed a complaint-in-intervention to join the matter, adding BANA, Countrywide and CHL as defendants. The action is entitled United States of America, ex rel, Edward O’Donnell, appearing Qui Tam v. Bank of America Corp, et al., and was filed in the U.S. District Court for the Southern District of New York. The complaint-in-intervention asserts certain fraud claims in connection with the sale of loans to FNMA and FHLMC by Full Spectrum Lending and by the Corporation and BANA from 2006 continuing through 2009 and also asserts successor liability against the Corporation and BANA. Plaintiff originally sought treble damages pursuant to the False Claims Act and civil penalties pursuant to FIRREA. On January 11, 2013, the government filed an amended complaint which added Countrywide Bank, FSB (CFSB) and a former officer of the Corporation as defendants. The court dismissed the False Claims Act counts on May 8, 2013. On September 24, 2013, the government dismissed the Corporation as a defendant.
Following a trial, on October 23, 2013, a verdict of liability was returned against CHL, CFSB and BANA. The court may impose civil monetary penalties under FIRREA.
Pennsylvania Public School Employees’ Retirement SystemThe Corporation and several current and former officers were named as defendants in a putative class action filed in the U.S. District Court for the Southern District of New York entitled Pennsylvania Public School Employees’ Retirement System v. Bank of America, et al.
Following the filing of a complaint on February 2, 2011, plaintiff subsequently filed an amended complaint on September 23, 2011 in which plaintiff sought to sue on behalf of all persons who acquired the Corporation’s common stock between February 27, 2009 and October 19, 2010 and “Common Equivalent Securities” sold in a December 2009 offering. The amended complaint asserted claims under Sections 10(b) and 20(a) of the Securities Exchange Act of 1934 and Sections 11 and 15 of the Securities Act of 1933, and alleged that the Corporation’s public statements: (i) concealed problems in the Corporation’s mortgage servicing business resulting from the widespread use of the Mortgage Electronic Recording System; (ii) failed to disclose the Corporation’s exposure to mortgage repurchase claims; (iii) misrepresented the adequacy of internal controls; and (iv) violated certain Generally Accepted Accounting Principles. The amended complaint sought unspecified damages.
On July 11, 2012, the court granted in part and denied in part defendants’ motions to dismiss the amended complaint. All claims under the Securities Act were dismissed against all defendants, with prejudice. The motion to dismiss the claim against the Corporation under Section 10(b) of the Exchange Act was denied. All claims under the Exchange Act against the officers were dismissed, with leave to replead. Defendants moved to dismiss a second amended complaint in which plaintiff sought to replead claims against certain current and former officers under Sections 10(b) and 20(a). On April 17, 2013, the court granted in part and denied in part the motion to dismiss, sustaining Sections 10(b) and 20(a) claims against the current and former officers.
76788ba_financials.indd 228 3/6/14 12:06 PM

Bank of America 2013 229
Policemen’s Annuity LitigationOn April 11, 2012, the Policemen’s Annuity & Benefit Fund of the City of Chicago, on its own behalf and on behalf of a proposed class of purchasers of 41 RMBS trusts collateralized mostly by Washington Mutual-originated (WaMu) mortgages, filed a proposed class action complaint against BANA and other unrelated parties in the United States District Court for the Southern District of New York, entitled Policemen’s Annuity and Benefit Fund of the City of Chicago v. Bank of America, N.A. and U.S. Bank National Association. BANA and U.S. Bank are named as defendants in their capacities as trustees, with BANA (formerly LaSalle Bank National Association) having served as the original trustee and U.S. Bank having replaced BANA as trustee. Plaintiff asserted claims under the federal Trust Indenture Act as well as state common law claims. Plaintiff alleged that, in light of the performance of the RMBS at issue, and in the wake of publicly-available information about the quality of loans originated by WaMu, the trustees were required to take certain steps to protect plaintiff’s interest in the value of the securities, and that plaintiff was damaged by defendants’ failures to notify it of deficiencies in the loans and of defaults under the relevant agreements, to ensure that the underlying mortgages could properly be foreclosed, and to enforce remedies available for loans that contained breaches of representations and warranties. Plaintiff sought unspecified compensatory damages and/or equitable relief, and costs and expenses. On December 7, 2012, the court granted in part and denied in part defendants’ motion to dismiss, and granted plaintiff leave to replead some of the dismissed claims. The court ruled, among other things, that plaintiff had standing to pursue claims on behalf of purchasers of certificates in certain tranches of five trusts, but not on behalf of
purchasers of certificates in the other 36 trusts, in which plaintiff had not invested. Plaintiffs filed a second amended complaint on January 13, 2013, which added plaintiffs and asserted claims concerning 19 trusts in which at least one named plaintiff had invested. On May 6, 2013, the court denied defendants’ motion to dismiss the second amended complaint.
On August 23, 2013, the Vermont Pension Investment Committee and the Washington State Investment Board brought a new putative class action against BANA and other unrelated parties in the U.S. District Court for the Southern District of New York entitled Vermont Pension Investment Committee and the Washington State Investment Board v. Bank of America, N.A. and U.S. Bank National Association (Vermont Pension). The Vermont Pension action was based on similar factual allegations and the same claims and legal theories as the Policemen’s Annuity action, but concerned six different RMBS trusts collateralized mostly by WaMu-originated mortgages for which BANA is the former trustee and U.S. Bank is the current trustee. As in Policemen’s Annuity, plaintiffs sought unspecified compensatory damages and/or equitable relief, and costs and expenses. The case was marked as related to Policemen’s Annuity and assigned to the same judge.
On October 21, 2013, the court consolidated the two cases through summary judgment. On October 31, 2013, plaintiffs filed a consolidated Third Amended Complaint, which asserted materially identical claims concerning the 25 trusts previously at issue in the two consolidated cases, as well as 10 new trusts (also mostly collateralized by WaMu-originated mortgages), bringing the total number of trusts at issue to 35. The new complaint also added four new plaintiffs, bringing the total number of named plaintiffs to 10.
76788ba_financials.indd 229 3/6/14 12:06 PM

230 Bank of America 2013
NOTE 13 Shareholders’ Equity
Common Stock
Declared Quarterly Cash Dividends on Common Stock
Declaration Date Record Date Payment DateDividendPer Share
February 11, 2014 March 7, 2014 March 28, 2014 $ 0.01October 24, 2013 December 6, 2013 December 27, 2013 0.01July 24, 2013 September 6, 2013 September 27, 2013 0.01April 30, 2013 June 7, 2013 June 28, 2013 0.01January 23, 2013 March 1, 2013 March 22, 2013 0.01
On March 14, 2013, the Corporation announced that its Board of Directors (Board) authorized the repurchase of up to $5.0 billion of common stock over four quarters beginning in the second quarter of 2013. The timing and amount of common stock repurchases have been and will continue to be consistent with the Corporation’s 2013 capital plan and will be subject to various factors, including the Corporation’s capital position, liquidity, applicable legal considerations, financial performance and alternative uses of capital, stock trading price, and general market conditions, and may be suspended at any time. The remaining common stock repurchases may be effected through open market purchases or privately negotiated transactions, including repurchase plans that satisfy the conditions of Rule 10b5-1 of the Securities Exchange Act of 1934.
In 2013, the Corporation repurchased and retired 231.7 million shares of common stock, which reduced shareholders’ equity by $3.2 billion.
In 2012 and 2011, in connection with the exchanges described in Preferred Stock in this Note, the Corporation issued 50 million and 400 million shares of common stock.
On September 1, 2011, the Corporation closed the sale to Berkshire Hathaway, Inc. (Berkshire) of 50,000 shares of the Corporation’s 6% Cumulative Perpetual Preferred Stock, Series T (Series T Preferred Stock) and a warrant (the Warrant) to purchase 700 million shares of the Corporation’s common stock for an aggregate purchase price of $5.0 billion in cash. Of the $5.0 billion in cash proceeds, $2.9 billion was allocated to preferred stock and $2.1 billion to the Warrant on a relative fair value basis. The discount on the Series T Preferred Stock is not subject to accretion. The portion of proceeds allocated to the Warrant was recorded as additional paid-in capital. The Warrant is exercisable at the holder’s option at any time, in whole or in part, until September 1, 2021, at an exercise price of $7.142857 per share of common stock. The Warrant may be settled in cash or by exchanging all or a portion of the Series T Preferred Stock. For more information on the Berkshire investment and Series T Preferred Stock, see Preferred Stock in this Note.
At December 31, 2013, the Corporation had warrants outstanding and exercisable to purchase 121.8 million shares of common stock at an exercise price of $30.79 per share expiring on October 28, 2018, and warrants outstanding and exercisable to purchase 150.4 million shares of common stock at an exercise price of $13.30 per share expiring on January 16, 2019. These warrants were originally issued in connection with preferred stock issuances to the U.S. Department of the Treasury in 2010 and are listed on the New York Stock Exchange.
In connection with employee stock plans, in 2013, the Corporation issued approximately 74 million shares and repurchased approximately 29 million shares of its common stock to satisfy tax withholding obligations. At December 31, 2013, the Corporation had reserved 1.8 billion unissued shares of common stock for future issuances under employee stock plans, common stock warrants, convertible notes and preferred stock.
Preferred StockThe cash dividends declared on preferred stock were $1.2 billion, $1.5 billion and $1.3 billion for 2013, 2012 and 2011.
In 2013, the Corporation redeemed for $6.6 billion its Non-Cumulative Preferred Stock, Series H, J, 6, 7 and 8. The $100 million difference between the carrying value of $6.5 billion and the redemption price of the preferred stock was recorded as a preferred stock dividend. In addition, the Corporation issued $1.0 billion of its Fixed-to-Floating Rate Semi-annual Non-Cumulative Preferred Stock, Series U.
In 2012, the Corporation entered into various agreements with certain preferred stock and Trust Securities holders pursuant to which the Corporation and the holders of these securities agreed to exchange shares of various series of non-convertible preferred stock with a carrying value of $296 million and Trust Securities with a carrying value of $760 million for 50 million shares of the Corporation’s common stock with a fair value of $412 million, and $398 million in cash. The $246 million difference between the carrying value of the preferred stock and Trust Securities retired and the fair value of consideration issued was a $44 million reduction to preferred stock dividends recorded in retained earnings and a $202 million gain recorded in noninterest income. In 2012, the Corporation issued shares of the Corporation’s Series F Preferred Stock and Series G Preferred Stock for $633 million under stock purchase contracts. For additional information, see the Preferred Stock Summary table in this Note and Note 11 – Long-term Debt.
In 2011, the Corporation entered into separate agreements with certain institutional preferred stock and Trust Securities holders (the Exchange Agreements) pursuant to which the Corporation and the holders of these securities agreed to exchange shares, or depository shares representing fractional interests in shares, of various series of the Corporation’s preferred stock, par value $0.01 per share, or Trust Securities for an aggregate of 400 million shares of the Corporation’s common stock valued at $2.2 billion and $2.3 billion aggregate principal amount of senior notes. The Exchange Agreements related to Trust Securities are described in Note 11 – Long-term Debt and the Exchange Agreements related to preferred stock are described below.
As part of the Exchange Agreements, the Corporation exchanged non-convertible preferred stock, with an aggregate liquidation preference of $815 million and carrying value of $814 million, for 72 million shares of common stock valued at $399 million and senior notes valued at $231 million. The $184 million difference between the carrying value of the non-convertible preferred stock and the fair value of the consideration issued to the holders of the non-convertible preferred stock was recorded in retained earnings as a non-cash reduction to preferred stock dividends.
76788ba_financials.indd 230 3/6/14 12:06 PM

Bank of America 2013 231
Additionally, as a part of the Exchange Agreements, a portion of the Series L 7.25% Non-Cumulative Perpetual Convertible Preferred Stock (Series L Preferred Stock) with an aggregate liquidation preference and carrying value of $269 million was exchanged for 20 million shares of the Corporation’s common stock valued at $123 million and senior notes valued at $129 million. The $17 million difference between the carrying value of the Series L Preferred Stock and the fair value of the consideration issued to holders of the Series L Preferred Stock was reclassified from preferred stock to common stock and additional paid-in capital. Because the number of common shares issued to the Series L Preferred Stock holders was in excess of the number of common shares issuable pursuant to the original conversion terms, the $220 million fair value of consideration transferred to the Series L Preferred Stock holders in excess of the $32 million fair value of securities issuable pursuant to the original conversion terms was recorded as a non-cash preferred stock dividend. The dividend did not impact total shareholders’ equity since it reduced retained earnings and increased common stock and additional paid-in capital by the same amount.
The Series T Preferred Stock issued as part of the Berkshire investment has a liquidation value of $100,000 per share and dividends on the Series T Preferred Stock accrue on the liquidation value at a rate per annum of six percent but will be paid only when and if declared by the Board out of legally available funds. Subject to the approval of the Board of Governors of the Federal Reserve System (Federal Reserve), the Series T Preferred Stock may be redeemed by the Corporation at any time at a redemption price of $105,000 per share plus any accrued, unpaid dividends. The Series T Preferred Stock has no maturity date and ranks senior to the outstanding common stock with respect to the payment of dividends and distributions in liquidation. At any time when dividends on the Series T Preferred Stock have not been paid in full, the unpaid amounts will accrue dividends at a rate per annum of eight percent and the Corporation will not be permitted to pay dividends or other distributions on, or to repurchase, any outstanding common stock or any of the Corporation’s outstanding preferred stock of any series. Following payment in full of accrued but unpaid dividends on the Series T Preferred Stock, the dividend rate remains at eight percent per annum.
76788ba_financials.indd 231 3/6/14 12:06 PM

232 Bank of America 2013
The table below presents a summary of perpetual preferred stock previously issued by the Corporation and outstanding at December 31, 2013.
Preferred Stock Summary
(Dollars in millions, except as noted)
Series Description
InitialIssuance
Date
TotalShares
Outstanding
LiquidationPreferenceper Share(in dollars)
CarryingValue (1)
Per AnnumDividend Rate Redemption Period
Series B (2)
7% CumulativeRedeemable
June1997 7,571 $ 100 $ 1 7.00% n/a
Series D (3, 4)
6.204% Non-Cumulative
September2006 26,174 25,000 654 6.204%
On or afterSeptember 14, 2011
Series E (3, 4)
Floating Rate Non-Cumulative
November2006 12,691 25,000 317 3-mo. LIBOR + 35 bps (5)
On or afterNovember 15, 2011
Series F (3, 4)
Floating Rate Non-Cumulative
March2012 1,409 100,000 141 3-mo. LIBOR + 40 bps (5)
On or afterMarch 15, 2012
Series G (3, 4)
Adjustable Rate Non-Cumulative
March2012 4,926 100,000 493 3-mo. LIBOR + 40 bps (5)
On or afterMarch 15, 2012
Series I (3, 4)
6.625% Non-Cumulative
September2007 14,584 25,000 365 6.625%
On or afterOctober 1, 2017
Series K (3, 6)
Fixed-to-Floating RateNon-Cumulative
January2008 61,773 25,000 1,544
8.00% through 1/29/18;3-mo. LIBOR + 363 bps
thereafterOn or after
January 30, 2018
Series L
7.25% Non-Cumulative Perpetual
ConvertibleJanuary
2008 3,080,182 1,000 3,080 7.25% n/a
Series M (3, 6)
Fixed-to-Floating RateNon-Cumulative
April2008 52,399 25,000 1,310
8.125% through5/14/18;
3-mo. LIBOR + 364 bpsthereafter
On or afterMay 15, 2018
Series T 6% CumulativeSeptember
2011 50,000 100,000 2,918 6.00%
See description inPreferred Stock in this
Note
Series UFixed-to-Floating Rate
Non-CumulativeMay
2013 40,000 25,000 1,000
5.2% through 6/1/23;3-mo. LIBOR + 313.5 bps
thereafterOn or after
June 1, 2023
Series 1 (3, 7)
Floating Rate Non-Cumulative
November2004 3,275 30,000 98 3-mo. LIBOR + 75 bps (8)
On or afterNovember 28, 2009
Series 2 (3, 7)
Floating Rate Non-Cumulative
March2005 9,967 30,000 299 3-mo. LIBOR + 65 bps (8)
On or afterNovember 28, 2009
Series 3 (3, 7)
6.375% Non-Cumulative
November2005 21,773 30,000 653 6.375%
On or afterNovember 28, 2010
Series 4 (3, 7)
Floating Rate Non-Cumulative
November2005 7,010 30,000 210 3-mo. LIBOR + 75 bps (5)
On or afterNovember 28, 2010
Series 5 (3, 7)
Floating Rate Non-Cumulative
March2007 14,056 30,000 422 3-mo. LIBOR + 50 bps (5)
On or afterMay 21, 2012
Total 3,407,790 $ 13,505 (1) Amounts shown are before certain GAAP accounting adjustments of $153 million.(2) Series B Preferred Stock does not have early redemption/call rights.(3) The Corporation may redeem series of preferred stock on or after the redemption date, in whole or in part, at its option, at the liquidation preference plus declared and unpaid dividends.(4) Ownership is held in the form of depositary shares, each representing a 1/1,000th interest in a share of preferred stock, paying a quarterly cash dividend, if and when declared.(5) Subject to 4.00% minimum rate per annum.(6) Ownership is held in the form of depositary shares, each representing a 1/25th interest in a share of preferred stock, paying a semi-annual cash dividend, if and when declared, until the redemption
date at which time, it adjusts to a quarterly cash dividend, if and when declared, thereafter.(7) Ownership is held in the form of depositary shares, each representing a 1/1,200th interest in a share of preferred stock, paying a quarterly cash dividend, if and when declared.(8) Subject to 3.00% minimum rate per annum.n/a = not applicable
76788ba_financials.indd 232 3/6/14 12:06 PM

Bank of America 2013 233
Series L Preferred Stock listed in the Preferred Stock Summary table does not have early redemption/call rights. Each share of the Series L Preferred Stock may be converted at any time, at the option of the holder, into 20 shares of the Corporation’s common stock plus cash in lieu of fractional shares. The Corporation may cause some or all of the Series L Preferred Stock, at its option, at any time or from time to time, to be converted into shares of common stock at the then-applicable conversion rate if, for 20 trading days during any period of 30 consecutive trading days, the closing price of common stock exceeds 130 percent of the then-applicable conversion price of the Series L Preferred Stock. If a conversion of Series L Preferred Stock occurs subsequent to a dividend record date but prior to the dividend payment date, the Corporation will still pay any accrued dividends payable.
All series of preferred stock in the Preferred Stock Summary table have a par value of $0.01 per share, are not subject to the operation of a sinking fund, have no participation rights, and with the exception of the Series L Preferred Stock, are not convertible. The holders of the Series B Preferred Stock and Series 1 through
5 Preferred Stock have general voting rights, and the holders of the other series included in the table have no general voting rights. All outstanding series of preferred stock of the Corporation have preference over the Corporation’s common stock with respect to the payment of dividends and distribution of the Corporation’s assets in the event of a liquidation or dissolution. With the exception of the Series T Preferred Stock, if any dividend payable on these series is in arrears for three or more semi-annual or six or more quarterly dividend periods, as applicable (whether consecutive or not), the holders of these series and any other class or series of preferred stock ranking equally as to payment of dividends and upon which equivalent voting rights have been conferred and are exercisable (voting as a single class) will be entitled to vote for the election of two additional directors. These voting rights terminate when the Corporation has paid in full dividends on these series for at least two semi-annual or four quarterly dividend periods, as applicable, following the dividend arrearage.
76788ba_financials.indd 233 3/6/14 12:06 PM

234 Bank of America 2013
NOTE 14 Accumulated Other Comprehensive Income (Loss)The table below presents the changes in accumulated OCI after-tax for 2011, 2012 and 2013.
(Dollars in millions)
Available-for-Sale DebtSecurities
Available-for-Sale MarketableEquity Securities Derivatives
EmployeeBenefit Plans (1)
ForeignCurrency (2) Total
Balance, December 31, 2010 $ 714 $ 6,659 $ (3,236) $ (3,947) $ (256) $ (66)Net change 2,386 (6,656) (549) (444) (108) (5,371)
Balance, December 31, 2011 $ 3,100 $ 3 $ (3,785) $ (4,391) $ (364) $ (5,437)Net change 1,343 459 916 (65) (13) 2,640
Balance, December 31, 2012 $ 4,443 $ 462 $ (2,869) $ (4,456) $ (377) $ (2,797)Net change (7,700) (466) 592 2,049 (135) (5,660)
Balance, December 31, 2013 $ (3,257) $ (4) $ (2,277) $ (2,407) $ (512) $ (8,457)(1) During 2013, the Corporation merged certain pension plans into one plan. For more information on employee benefit plans, see Note 17 – Employee Benefit Plans.(2) The net change in fair value represents the impact of changes in spot foreign exchange rates on the Corporation’s net investment in non-U.S. operations, and related hedges.
The table below presents the net change in fair value recorded in accumulated OCI, net realized gains and losses reclassified into earnings and other changes for each component of OCI before- and after-tax for 2013, 2012 and 2011.
Changes in OCI Components Before- and After-tax
2013 2012 2011(Dollars in millions) Before-tax Tax effect After-tax Before-tax Tax effect After-tax Before-tax Tax effect After-taxAvailable-for-sale debt securities:
Net change in fair value $ (10,989) $ 4,077 $ (6,912) $ 3,676 $ (1,319) $ 2,357 $ 6,913 $ (2,590) $ 4,323Net realized gains reclassified into earnings (1,251) 463 (788) (1,609) 595 (1,014) (3,075) 1,138 (1,937)
Net change (12,240) 4,540 (7,700) 2,067 (724) 1,343 3,838 (1,452) 2,386Available-for-sale marketable equity securities:
Net change in fair value 32 (12) 20 748 (277) 471 (4,114) 1,575 (2,539)Net realized gains reclassified into earnings (771) 285 (486) (19) 7 (12) (6,501) 2,384 (4,117)
Net change (739) 273 (466) 729 (270) 459 (10,615) 3,959 (6,656)Derivatives:
Net change in fair value 156 (51) 105 430 (166) 264 (2,490) 923 (1,567)Net realized losses reclassified into earnings 773 (286) 487 1,035 (383) 652 1,617 (599) 1,018
Net change 929 (337) 592 1,465 (549) 916 (873) 324 (549)Employee benefit plans:
Net change in fair value 2,985 (1,128) 1,857 (1,891) 660 (1,231) (1,171) 457 (714)Net realized losses reclassified into earnings 237 (79) 158 490 (192) 298 437 (167) 270Settlements and curtailments 46 (12) 34 1,378 (510) 868 — — —
Net change 3,268 (1,219) 2,049 (23) (42) (65) (734) 290 (444)Foreign currency:
Net change in fair value 244 (384) (140) (226) 233 7 145 (179) (34)Net realized (gains) losses reclassified into earnings 138 (133) 5 (30) 10 (20) (65) (9) (74)
Net change 382 (517) (135) (256) 243 (13) 80 (188) (108)Total other comprehensive income (loss) $ (8,400) $ 2,740 $ (5,660) $ 3,982 $ (1,342) $ 2,640 $ (8,304) $ 2,933 $ (5,371)
76788ba_financials.indd 234 3/6/14 12:07 PM
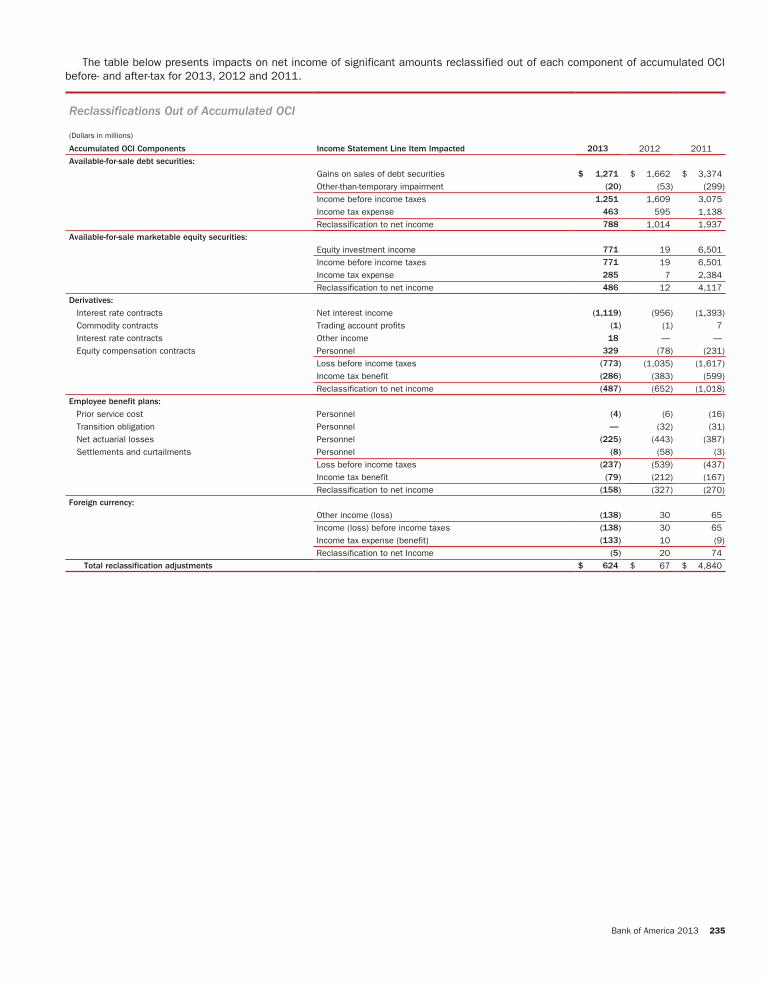
Bank of America 2013 235
The table below presents impacts on net income of significant amounts reclassified out of each component of accumulated OCI before- and after-tax for 2013, 2012 and 2011.
Reclassifications Out of Accumulated OCI
(Dollars in millions)
Accumulated OCI Components Income Statement Line Item Impacted 2013 2012 2011Available-for-sale debt securities:
Gains on sales of debt securities $ 1,271 $ 1,662 $ 3,374Other-than-temporary impairment (20) (53) (299)Income before income taxes 1,251 1,609 3,075Income tax expense 463 595 1,138Reclassification to net income 788 1,014 1,937
Available-for-sale marketable equity securities:
Equity investment income 771 19 6,501Income before income taxes 771 19 6,501Income tax expense 285 7 2,384Reclassification to net income 486 12 4,117
Derivatives:
Interest rate contracts Net interest income (1,119) (956) (1,393)Commodity contracts Trading account profits (1) (1) 7Interest rate contracts Other income 18 — —Equity compensation contracts Personnel 329 (78) (231)
Loss before income taxes (773) (1,035) (1,617)Income tax benefit (286) (383) (599)Reclassification to net income (487) (652) (1,018)
Employee benefit plans:
Prior service cost Personnel (4) (6) (16)Transition obligation Personnel — (32) (31)Net actuarial losses Personnel (225) (443) (387)Settlements and curtailments Personnel (8) (58) (3)
Loss before income taxes (237) (539) (437)Income tax benefit (79) (212) (167)Reclassification to net income (158) (327) (270)
Foreign currency:
Other income (loss) (138) 30 65Income (loss) before income taxes (138) 30 65Income tax expense (benefit) (133) 10 (9)Reclassification to net Income (5) 20 74
Total reclassification adjustments $ 624 $ 67 $ 4,840
76788ba_financials.indd 235 3/6/14 12:07 PM

236 Bank of America 2013
NOTE 15 Earnings Per Common ShareThe calculation of earnings per common share (EPS) and diluted EPS for 2013, 2012 and 2011 is presented below. For more information on the calculation of EPS, see Note 1 – Summary of Significant Accounting Principles.
(Dollars in millions, except per share information; shares in thousands) 2013 2012 2011Earnings per common share Net income $ 11,431 $ 4,188 $ 1,446Preferred stock dividends (1,349) (1,428) (1,361)
Net income applicable to common shareholders 10,082 2,760 85Dividends and undistributed earnings allocated to participating securities (2) (2) (1)
Net income allocated to common shareholders $ 10,080 $ 2,758 $ 84Average common shares issued and outstanding 10,731,165 10,746,028 10,142,625Earnings per common share $ 0.94 $ 0.26 $ 0.01
Diluted earnings per common share Net income applicable to common shareholders $ 10,082 $ 2,760 $ 85Add preferred stock dividends due to assumed conversions 300 — —Dividends and undistributed earnings allocated to participating securities (2) (2) (1)
Net income allocated to common shareholders $ 10,380 $ 2,758 $ 84Average common shares issued and outstanding 10,731,165 10,746,028 10,142,625Dilutive potential common shares (1) 760,253 94,826 112,199
Total diluted average common shares issued and outstanding 11,491,418 10,840,854 10,254,824Diluted earnings per common share $ 0.90 $ 0.25 $ 0.01
(1) Includes incremental shares from restricted stock units, restricted stock, stock options and warrants.
The Corporation previously issued a warrant to purchase 700 million shares of the Corporation’s common stock to the holder of the Series T Preferred Stock. For 2013, 700 million average dilutive potential common shares associated with the Series T Preferred Stock were included in the diluted share count under the “if-converted” method. For 2012 and 2011, 700 million and 234 million average dilutive potential common shares associated with the Series T Preferred Stock were not included in the diluted share count because the result would have been antidilutive under the “if-converted” method. For additional information, see Note 13 – Shareholders’ Equity.
For both 2013 and 2012, 62 million average dilutive potential common shares associated with the Series L Preferred Stock were not included in the diluted share count because the result would have been antidilutive under the “if-converted” method compared to 66 million for 2011. For 2013, 2012 and 2011, average options
to purchase 126 million, 163 million and 217 million shares of common stock, respectively, were outstanding but not included in the computation of EPS because the result would have been antidilutive under the treasury stock method. For 2013, 2012 and 2011, average warrants to purchase 272 million shares of common stock were outstanding but not included in the computation of EPS because the result would have been antidilutive under the treasury stock method.
In connection with the preferred stock actions described in Note 13 – Shareholders’ Equity, the Corporation recorded a $100 million non-cash preferred stock dividend in 2013, a $44 million reduction to preferred stock dividends in 2012 and a net $36 million non-cash preferred stock dividend in 2011, all of which are included in the calculation of net income allocated to common shareholders.
76788ba_financials.indd 236 3/6/14 12:07 PM

Bank of America 2013 237
NOTE 16 Regulatory Requirements and RestrictionsThe Corporation manages regulatory capital to adhere to internal capital guidelines and regulatory standards of capital adequacy based on its current understanding of the rules and the application of such rules to its business as currently conducted.
The Federal Reserve, Office of the Comptroller of the Currency (OCC) and FDIC (collectively, joint agencies) establish regulatory capital guidelines for U.S. banking organizations. The regulatory capital guidelines measure capital in relation to the credit and market risks of both on- and off-balance sheet items using various risk weights. Under the current regulatory capital guidelines, Total capital consists of three tiers of capital. Tier 1 capital includes the sum of “core capital elements,” the principal components of which are qualifying common shareholders’ equity and qualifying non-cumulative perpetual preferred stock. Also included in Tier 1 capital are qualifying trust preferred securities (Trust Securities), hybrid securities and qualifying noncontrolling interests in subsidiaries which are subject to the rules governing “restricted core capital elements.” Goodwill, other disallowed intangible assets, disallowed deferred tax assets and the cumulative changes in fair value of all financial liabilities accounted for under the fair value option that are included in retained earnings and are attributable to changes in the company’s own creditworthiness are excluded from the sum of core capital elements. Tier 2 capital consists of qualifying subordinated debt, a limited portion of the allowance for loan and lease losses, a portion of net unrealized gains on AFS marketable equity securities and other adjustments. The Corporation’s total capital is the total of Tier 1 capital plus supplementary Tier 2 capital. Tier 3 capital includes subordinated debt that is unsecured, fully paid, has an original maturity of at least two years, is not redeemable before maturity without prior approval by the Federal Reserve and includes a lock-in clause precluding payment of either interest or principal if the payment would cause the issuing bank’s risk-based capital ratio to fall or remain below the required minimum. Tier 3 capital can only be used to satisfy the Corporation’s market risk capital requirement and may not be used to support its credit risk requirement. At
December 31, 2013 and 2012, the Corporation had no subordinated debt that qualified as Tier 3 capital.
To meet minimum, adequately capitalized regulatory requirements, an institution must maintain a Tier 1 capital ratio of four percent and a Total capital ratio of eight percent. A “well-capitalized” institution must generally maintain capital ratios 200 bps higher than the minimum guidelines. The risk-based capital rules have been further supplemented by a Tier 1 leverage ratio, defined as Tier 1 capital divided by quarterly average total assets, after certain adjustments. Bank holding companies (BHCs) must have a minimum Tier 1 leverage ratio of at least four percent. National banks must maintain a Tier 1 leverage ratio of at least five percent to be classified as “well-capitalized.” Failure to meet the capital requirements established by the joint agencies can lead to certain mandatory and discretionary actions by regulators that could have a material adverse effect on the Corporation’s financial position. At December 31, 2013, the Corporation’s Tier 1 capital, Total capital and Tier 1 leverage ratios were 12.44 percent, 15.44 percent and 7.86 percent, respectively.
Current guidelines restrict certain core capital elements to 15 percent of total core capital elements for internationally active BHCs. Internationally active BHCs are those that have significant activities in non-U.S. markets with consolidated assets greater than $250 billion or on-balance sheet non-U.S. exposure greater than $10 billion, which includes the Corporation. In addition, the Federal Reserve revised the qualitative standards for capital instruments included in regulatory capital. At December 31, 2013, the Corporation’s restricted core capital elements comprised 3.3 percent of total core capital elements. The Corporation is in compliance with the revised guidelines.
Tier 1 common capital is not an official regulatory ratio, but was introduced by the Federal Reserve during the Supervisory Capital Assessment Program in 2009. Tier 1 common capital is Tier 1 capital less preferred stock, Trust Securities, hybrid securities and qualifying noncontrolling interests in subsidiaries. The Corporation’s Tier 1 common capital was $145.2 billion and the Tier 1 common capital ratio was 11.19 percent at December 31, 2013.
76788ba_financials.indd 237 3/6/14 12:07 PM

238 Bank of America 2013
The table below presents actual and minimum required regulatory capital amounts at December 31, 2013 and 2012.
Regulatory Capital
December 31 2013 2012
Actual Actual
(Dollars in millions) Ratio AmountMinimum
Required (1) Ratio AmountMinimum
Required (1)
Risk-based capital Tier 1 common capital
Bank of America Corporation 11.19% $ 145,235 n/a 11.06% $ 133,403 n/aTier 1 capital
Bank of America Corporation 12.44 161,456 $ 77,852 12.89 155,461 $ 72,359Bank of America, N.A. 12.34 125,886 61,208 12.44 118,431 57,099FIA Card Services, N.A. 16.83 20,135 7,177 17.34 22,061 7,632
Total capital Bank of America Corporation 15.44 200,281 129,753 16.31 196,680 120,598Bank of America, N.A. 13.84 141,232 102,013 14.76 140,434 95,165FIA Card Services, N.A. 18.12 21,672 11,962 18.64 23,707 12,719
Tier 1 leverage Bank of America Corporation 7.86 161,456 82,125 7.37 155,461 84,429Bank of America, N.A. 9.21 125,886 68,379 8.59 118,431 68,957FIA Card Services, N.A. 12.91 20,135 7,801 13.67 22,061 8,067
(1) Dollar amount required to meet guidelines to be considered well-capitalized.n/a = not applicable
The Federal Reserve requires BHCs to submit a capital plan and requests for capital actions on an annual basis, consistent with the rules governing the Comprehensive Capital Analysis and Review (CCAR). The CCAR is the central element of the Federal Reserve’s approach to ensure that large BHCs have adequate capital and robust processes for managing their capital. In January 2013, the Corporation submitted its 2013 capital plan and the Federal Reserve did not object to the Corporation’s 2013 capital plan. In January 2014, the Corporation submitted its 2014 CCAR plan and related supervisory stress tests to the Federal Reserve. The Federal Reserve announced that it will release summary results, including supervisory projections of capital ratios, losses and revenues under stress scenarios, and publish the results of stress tests conducted under the supervisory adverse scenario in March 2014.
Regulatory Capital Developments
Market Risk Final RuleEffective January 1, 2013, Basel 1 was amended by the Market Risk Final Rule, and is referred to herein as the Basel 1 – 2013 Rules. At December 31, 2013, the Corporation measured and reported its capital ratios and related information in accordance with the Basel 1 – 2013 Rules, which introduced new measures of market risk including a charge related to stressed Value-at-Risk (VaR), an incremental risk charge and the comprehensive risk measure (CRM), as well as other technical modifications, all of which were effective January 1, 2013. The CRM is used to determine the risk-weighted assets for correlation trading positions. With approval from U.S. banking regulators, but not sooner than one year following compliance with the Market Risk Final Rule, the Corporation may remove a surcharge applicable to the CRM.
In December 2013, U.S. banking regulators issued an amendment to the Market Risk Final Rule, effective on April 1, 2014, to reflect certain aspects of the final Basel 3 Regulatory
Capital rules (Basel 3). Revisions were made to the treatment of sovereign exposures and certain traded securitization positions as well as clarification as to the timing of required disclosures.
Basel 3 Regulatory Capital RulesThe final Basel 3 regulatory capital rules (Basel 3) became effective on January 1, 2014. Various aspects of Basel 3 will be subject to multi-year transition periods ending December 31, 2018 and Basel 3 generally continues to be subject to interpretation by the U.S. banking regulators. Basel 3 will materially change the Corporation’s Tier 1 common, Tier 1 and Total capital calculations. Basel 3 introduces new minimum capital ratios and buffer requirements and a supplementary leverage ratio; changes the composition of regulatory capital; revises the adequately capitalized minimum requirements under the Prompt Corrective Action framework; expands and modifies the calculation of risk-weighted assets for credit and market risk (the Advanced approach); and introduces a Standardized approach for the calculation of risk-weighted assets. This will replace the Basel 1 – 2013 Rules effective January 1, 2015.
Under Basel 3, the Corporation is required to calculate regulatory capital ratios and risk-weighted assets under both the Standardized approach and, upon notification of approval by U.S. banking regulators anytime on or after January 1, 2014, the Advanced approach. For 2014, the Standardized approach uses risk-weighted assets as measured under the Basel 1 – 2013 Rules and Basel 3 capital in the determination of the Basel 3 Standardized approach capital ratios. The approach that yields the lower ratio is to be used to assess capital adequacy including under the Prompt Corrective Action framework. Prior to receipt of notification of approval, the Corporation is required to assess its capital adequacy under the Standardized approach only. The Prompt Corrective Action framework establishes categories of capitalization, including “well capitalized,” based on regulatory ratio requirements. U.S. banking regulators are required to take certain mandatory actions depending on the category of
76788ba_financials.indd 238 3/6/14 12:07 PM

Bank of America 2013 239
capitalization, with no mandatory actions required for “well-capitalized” banking entities.
In November 2011, the Basel Committee on Banking Supervision (Basel Committee) published a methodology to identify global systematically important banks (G-SIBs) and impose an additional loss absorbency requirement through the introduction of a buffer of up to 3.5 percent for systemically important financial institutions (SIFIs). The assessment methodology relies on an indicator-based measurement approach to determine a score relative to the global banking industry. The chosen indicators are size, complexity, cross-jurisdictional activity, interconnectedness and substitutability/financial institution infrastructure. Institutions with the highest scores are designated as G-SIBs and are assigned to one of four loss absorbency buckets from one percent to 2.5 percent, in 0.5 percent increments based on each institution’s relative score and supervisory judgment. The fifth loss absorbency bucket of 3.5 percent is currently empty and serves to discourage banks from becoming more systemically important.
In July 2013, the Basel Committee updated the November 2011 methodology to recalibrate the substitutability/financial institution infrastructure indicator by introducing a cap on the weighting of that component, and require the annual publication by the Financial Stability Board (FSB) of key information necessary to permit each G-SIB to calculate its score and observe its position within the buckets and relative to the industry total for each indicator. Every three years, beginning on January 1, 2016, the Basel Committee will reconsider and recalibrate the bucket thresholds. The Basel Committee and FSB expect banks to change their behavior in response to the incentives of the G-SIB framework, as well as other aspects of Basel 3 and jurisdiction-specific regulations.
The SIFI buffer requirement will begin to phase in effective January 2016, with full implementation in January 2019. Data from 2013, measured as of December 31, 2013, will be used to determine the SIFI buffer that will be effective for the Corporation in 2016. U.S. banking regulators have not yet issued proposed or final rules related to the SIFI buffer or disclosure requirements.
Regulatory Capital TransitionsImportant differences in determining the composition of regulatory capital between Basel 1 – 2013 Rules and Basel 3 include changes in capital deductions related to MSRs, deferred tax assets and defined benefit pension assets, and the inclusion of unrealized gains and losses on AFS debt and certain marketable equity securities recorded in accumulated OCI, each of which will be impacted by future changes in interest rates, overall earnings performance or other corporate actions.
Changes to the composition of regulatory capital under Basel 3, such as recognizing the impact of unrealized gains or losses on AFS debt securities in Tier 1 common capital, are subject to a transition period where the impact is recognized in 20 percent annual increments. These regulatory capital adjustments and deductions will be fully implemented in 2018. The phase-in period for the new minimum capital ratio requirements and related buffers under Basel 3 is from January 1, 2014 through December 31, 2018. When presented on a fully phased-in basis, capital, risk-weighted assets and the capital ratios assume all regulatory capital adjustments and deductions are fully recognized.
In addition, Basel 3 revised the regulatory capital treatment for Trust Securities, requiring them to be partially transitioned from Tier 1 capital into Tier 2 capital in 2014 and 2015, until fully excluded from Tier 1 capital in 2016, and partially transitioned and excluded from Tier 2 capital beginning in 2016. The exclusion from Tier 2 capital starts at 40 percent on January 1, 2016, increasing 10 percent each year until the full amount is excluded from Tier 2 capital beginning on January 1, 2022.
Standardized ApproachThe Basel 3 Standardized approach measures risk-weighted assets primarily for market risk and credit risk exposures. Exposures subject to market risk, as defined under the rules, are measured on the same basis as the Market Risk Final Rule, described previously. Credit risk exposures are measured by applying fixed risk weights to the exposure, determined based on the characteristics of the exposure, such as type of obligor, Organization for Economic Cooperation and Development (OECD) country risk code and maturity, among others. Under the Standardized approach, no distinction is made for variations in credit quality for corporate exposures, and the economic benefit of collateral is restricted to a limited list of eligible securities and cash. Some key differences between the Standardized and Advanced approaches are that the Advanced approach includes a measure of operational risk and a credit valuation adjustment capital charge in credit risk and relies on internal analytical models to measure credit risk-weighted assets, as more fully described below.
Advanced ApproachUnder the Basel 3 Advanced approach, risk-weighted assets are determined primarily for market risk, credit risk and operational risk. Market risk capital measurements are consistent with the Standardized approach, except for securitization exposures, where the Supervisory Formula Approach is also permitted, and certain differences arising from the inclusion of the CVA capital charge in the credit risk capital measurement. Credit risk exposures are measured using advanced internal ratings-based models to determine the applicable risk weight by estimating the probability of default, LGD and, in certain instances, exposure at default. The analytical models primarily rely on internal historical default and loss experience. Operational risk is measured using advanced internal models which rely on both internal and external operational loss experience and data. The Basel 3 Advanced approach requires approval by the U.S. regulatory agencies of the Corporation’s internal analytical models used to calculate risk-weighted assets.
Supplementary Leverage RatioBasel 3 also will require the Corporation to calculate a supplementary leverage ratio, determined by dividing Tier 1 capital by total leverage exposure for each month-end during a fiscal quarter, and then calculating the simple average. Total leverage exposure is comprised of all on-balance sheet assets, plus a measure of certain off-balance sheet exposures, including, among others, lending commitments, letters of credit, over-the-counter (OTC) derivatives, repo-style transactions and margin loan commitments. The minimum supplementary leverage ratio requirement of three percent is not effective until January 1, 2018. The Corporation will be required to disclose its supplementary leverage ratio effective January 1, 2015.
76788ba_financials.indd 239 3/6/14 12:07 PM

240 Bank of America 2013
In July 2013, U.S. banking regulators issued a notice of proposed rulemaking to modify the supplementary leverage ratio minimum requirements under Basel 3 effective in 2018. This proposal would only apply to BHCs with more than $700 billion in total assets or more than $10 trillion in total assets under custody. If adopted, it would require the Corporation to maintain a minimum supplementary leverage ratio of three percent, plus a supplementary leverage buffer of two percent, for a total of five percent. If the Corporation’s supplementary leverage buffer is not greater than or equal to two percent, then the Corporation would be subject to mandatory limits on its ability to make distributions of capital to shareholders, whether through dividends, stock repurchases or otherwise. In addition, the insured depository institutions of such BHCs, which for the Corporation would include primarily BANA and FIA, would be required to maintain a minimum six percent leverage ratio to be considered “well capitalized.” The proposal is not yet final and, when finalized, could have provisions significantly different from those currently proposed.
On January 12, 2014, the Basel Committee issued final guidance introducing changes to the method of calculating total leverage exposure under the international Basel 3 framework. The total leverage exposure was revised to measure derivatives on a gross basis with cash variation margin reducing the exposure if certain conditions are met, include off-balance sheet commitments measured using the notional amount multiplied by conversion factors between 10 percent and 100 percent consistent with the general risk-based capital rules and a change to measure written credit derivatives using a notional-based approach capped at the maximum loss with limited netting permitted. U.S. banking regulators may consider the Basel Committee’s final guidance in connection with the July 2013 NPR.
Basel 3 Liquidity StandardsThe Basel Committee has issued two liquidity risk-related standards that are considered part of the Basel 3 liquidity standards: the Liquidity Coverage Ratio (LCR) and the Net Stable Funding Ratio (NSFR). The LCR is calculated as the amount of a financial institution’s unencumbered, high-quality, liquid assets relative to the net cash outflows the institution could encounter under a 30-day period of significant liquidity stress, expressed as a percentage. The Basel Committee’s liquidity risk-related standards do not directly apply to U.S. financial institutions currently, and would only apply once U.S. rules are finalized by the U.S. banking regulators.
On October 24, 2013, the U.S. banking regulators jointly proposed regulations that would implement LCR requirements for the largest U.S. financial institutions on a consolidated basis and for their subsidiary depository institutions with total assets greater than $10 billion. Under the proposal, an initial minimum LCR of 80 percent would be required in January 2015, and would thereafter increase in 10 percentage point increments annually through January 2017. These minimum requirements would be applicable to the Corporation on a consolidated basis and at its insured depository institutions, including BANA, FIA and Bank of America California, N.A.
On January 12, 2014, the Basel Committee issued for comment a revised NSFR, the standard that is intended to reduce
funding risk over a longer time horizon. The NSFR is designed to ensure an appropriate amount of stable funding, generally capital and liabilities maturing beyond one year, given the mix of assets and off-balance sheet items. The revised proposal would align the NSFR to some of the 2013 revisions to the LCR and give more credit to a wider range of funding. The proposal also includes adjustments to the stable funding required for certain types of assets, some of which reduce the stable funding requirement and some of which increase it. The Basel Committee expects to complete the NSFR recalibration in 2014 and expects the minimum standard to be in place by 2018.
Other Regulatory MattersOn February 18, 2014, the Federal Reserve approved a final rule implementing certain enhanced supervisory and prudential requirements established under the Dodd-Frank Wall Street Reform and Consumer Protection Act. The final rule formalizes risk management requirements primarily related to governance and liquidity risk management and reiterates the provisions of previously issued final rules related to risk-based and leverage capital and stress test requirements. Also, a debt-to-equity limit may be enacted for an individual BHC if determined to pose a grave threat to the financial stability of the U.S., at the discretion of the Financial Stability Oversight Council (FSOC) or the Federal Reserve on behalf of the FSOC.
The Federal Reserve requires the Corporation’s banking subsidiaries to maintain reserve balances based on a percentage of certain deposits. Average daily reserve balance requirements for the Corporation by the Federal Reserve were $16.6 billion and $16.3 billion for 2013 and 2012. Currency and coin residing in branches and cash vaults (vault cash) are used to partially satisfy the reserve requirement. The average daily reserve balances, in excess of vault cash, held with the Federal Reserve amounted to $7.8 billion and $7.9 billion for 2013 and 2012. As of December 31, 2013 and 2012, the Corporation had cash in the amount of $6.0 billion and $8.5 billion, and securities with a fair value of $8.4 billion and $5.9 billion that were segregated in compliance with securities regulations or deposited with clearing organizations.
The primary sources of funds for cash distributions by the Corporation to its shareholders are capital distributions received from its banking subsidiaries, BANA and FIA. In 2013, the Corporation received $8.5 billion in dividends from BANA. BANA and FIA returned capital of $8.7 billion to the Corporation in 2013. In 2014, BANA can declare and pay dividends of $8.0 billion to the Corporation plus an additional amount equal to its retained net profits for 2014 up to the date of any dividend declaration. The other subsidiary national banks returned capital of $1.4 billion to the Corporation in 2013. Bank of America California, N.A. can pay dividends of $396 million in 2014 plus an additional amount equal to its retained net profits for 2014 up to the date of any such dividend declaration. The amount of dividends that each subsidiary bank may declare in a calendar year is the subsidiary bank’s net profits for that year combined with its retained net profits for the preceding two years. Retained net profits, as defined by the OCC, consist of net income less dividends declared during the period.
76788ba_financials.indd 240 3/6/14 12:07 PM

Bank of America 2013 241
NOTE 17 Employee Benefit Plans
Pension and Postretirement PlansThe Corporation sponsors noncontributory trusteed pension plans, a number of noncontributory nonqualified pension plans, and postretirement health and life plans that cover eligible employees. As discussed below, certain of the pension plans were amended, effective June 30, 2012, to freeze benefits earned. The pension plans provide defined benefits based on an employee’s compensation and years of service. The Bank of America Pension Plan (the Pension Plan) provides participants with compensation credits, generally based on years of service. In 2013, the Corporation merged a defined benefit pension plan, which covered eligible employees of certain legacy companies, into the Bank of America Pension Plan. This plan is referred to as the Qualified Pension Plan (Qualified Pension Plans prior to this merger). For account balances based on compensation credits prior to January 1, 2008, the Pension Plan allows participants to select from various earnings measures, which are based on the returns of certain funds or common stock of the Corporation. The participant-selected earnings measures determine the earnings rate on the individual participant account balances in the Pension Plan. Participants may elect to modify earnings measure allocations on a periodic basis subject to the provisions of the Pension Plan. For account balances based on compensation credits subsequent to December 31, 2007, the account balance earnings rate is based on a benchmark rate. For eligible employees in the Pension Plan on or after January 1, 2008, the benefits become vested upon completion of three years of service. It is the policy of the Corporation to fund no less than the minimum funding amount required by ERISA.
The Pension Plan has a balance guarantee feature for account balances with participant-selected earnings, applied at the time a benefit payment is made from the plan that effectively provides principal protection for participant balances transferred and certain compensation credits. The Corporation is responsible for funding any shortfall on the guarantee feature.
As a result of acquisitions, the Corporation assumed the obligations related to the pension plans of certain legacy companies. The benefit structures under these acquired plans have not changed and remain intact in the merged plan. Certain benefit structures are substantially similar to the Pension Plan discussed above; however, certain of these structures do not allow participants to select various earnings measures; rather the earnings rate is based on a benchmark rate. In addition, these structures include participants with benefits determined under formulas based on average or career compensation and years of service rather than by reference to a pension account. Certain of the other structures provide a participant’s retirement benefits based on the number of years of benefit service and a percentage of the participant’s average annual compensation during the five highest paid consecutive years of the last 10 years of employment.
The 2013 merger of the defined benefit pension plan into the Qualified Pension Plan required a remeasurement of the qualified pension obligations and plan assets at fair value as of the merger date in addition to the required December 31 remeasurement. The 2013 remeasurements resulted in an increase in accumulated OCI of $2.0 billion, net-of-tax.
In 2012, in connection with a redesign of the Corporation’s retirement plans, the Compensation and Benefits Committee of the Board approved amendments to freeze benefits earned in the Qualified Pension Plans effective June 30, 2012. As a result of
freezing the Qualified Pension Plans, a curtailment was triggered and a remeasurement of the qualified pension obligations and plan assets occurred. As of the remeasurement date, the plan assets had increased in value from the prior measurement date resulting in an increase in the funded status of the plan and the curtailment impact reduced the projected benefit obligation. The combined impact resulted in a $1.3 billion increase to the net pension assets recognized in other assets and a corresponding increase in accumulated OCI of $832 million, net-of-tax. The impact of the immediate recognition of the prior service cost of $58 million was recorded in personnel expense as a curtailment loss in 2012. All economic assumptions were consistent with the prior year end including the weighted-average discount rate of 4.95 percent used for remeasurement of the Qualified Pension Plans.
As a result of freezing the Qualified Pension Plans, the amortization period for actuarial gains and losses was changed from the average working life to the estimated average lifetime of benefits being paid. In addition, in 2014, the long-term expected return on assets assumption for the Qualified Pension Plan was reduced to 6.0 percent from 6.5 percent in 2013 and 8.0 percent in 2012 to reflect current market conditions and long-term financial goals.
The Corporation assumed the obligations related to the plans of Merrill Lynch. These plans include a terminated U.S. pension plan (the Other Pension Plan), non-U.S. pension plans, nonqualified pension plans and postretirement plans. The non-U.S. pension plans vary based on the country and local practices.
The Corporation has an annuity contract, previously purchased by Merrill Lynch, that guarantees the payment of benefits vested under the Other Pension Plan. The Corporation, under a supplemental agreement, may be responsible for, or benefit from actual experience and investment performance of the annuity assets. The Corporation made no contribution under this agreement in 2013 or 2012. Contributions may be required in the future under this agreement.
The Corporation sponsors a number of noncontributory, nonqualified pension plans (the Nonqualified Pension Plans). As a result of acquisitions, the Corporation assumed the obligations related to the noncontributory, nonqualified pension plans of certain legacy companies including Merrill Lynch. These plans, which are unfunded, provide defined pension benefits to certain employees.
In addition to retirement pension benefits, full-time, salaried employees and certain part-time employees may become eligible to continue participation as retirees in health care and/or life insurance plans sponsored by the Corporation. Based on the other provisions of the individual plans, certain retirees may also have the cost of these benefits partially paid by the Corporation. The obligations assumed as a result of acquisitions are substantially similar to the Corporation’s postretirement health and life plans, except for Countrywide which did not have a postretirement health and life plan. Collectively, these plans are referred to as the Postretirement Health and Life Plans.
The Pension and Postretirement Plans table summarizes the changes in the fair value of plan assets, changes in the projected benefit obligation (PBO), the funded status of both the accumulated benefit obligation (ABO) and the PBO, and the weighted-average assumptions used to determine benefit obligations for the pension plans and postretirement plans at December 31, 2013 and 2012. Amounts recognized at December 31, 2013 and 2012 are reflected in other assets, and in accrued expenses and other liabilities on the Consolidated Balance Sheet.
76788ba_financials.indd 241 3/6/14 12:07 PM

242 Bank of America 2013
The discount rate assumption is based on a cash flow matching technique and is subject to change each year. This technique utilizes yield curves that are based on Aa-rated corporate bonds with cash flows that match estimated benefit payments of each of the plans to produce the discount rate assumptions. The asset valuation method for the Qualified Pension Plan recognizes 60 percent of the prior year’s market gains or losses at the next measurement date with the remaining 40 percent spread equally over the subsequent four years.
The Corporation’s best estimate of its contributions to be made to the Non-U.S. Pension Plans, Nonqualified and Other Pension Plans, and Postretirement Health and Life Plans in 2014 is $83 million, $103 million and $106 million, respectively. The Corporation does not expect to make a contribution to the Qualified Pension Plan in 2014.
Pension and Postretirement Plans
QualifiedPension Plan (1)
Non-U.S.Pension Plans (1)
Nonqualifiedand Other
Pension Plans (1)
PostretirementHealth and Life
Plans (1)
(Dollars in millions) 2013 2012 2013 2012 2013 2012 2013 2012Change in fair value of plan assets Fair value, January 1 $ 16,274 $ 15,070 $ 2,306 $ 2,022 $ 3,063 $ 3,061 $ 86 $ 91
Actual return on plan assets 2,873 2,020 146 115 (217) 126 9 10Company contributions — — 131 152 98 112 61 117Plan participant contributions — — 1 3 — — 138 139Settlements and curtailments — — (80) — (7) — — —Benefits paid (871) (816) (80) (77) (217) (236) (237) (290)Federal subsidy on benefits paid n/a n/a n/a n/a n/a n/a 15 19Foreign currency exchange rate changes n/a n/a 33 91 n/a n/a n/a n/a
Fair value, December 31 $ 18,276 $ 16,274 $ 2,457 $ 2,306 $ 2,720 $ 3,063 $ 72 $ 86Change in projected benefit obligation Projected benefit obligation, January 1 $ 15,655 $ 14,891 $ 2,460 $ 1,984 $ 3,334 $ 3,137 $ 1,574 $ 1,619
Service cost — 236 32 40 1 1 9 13Interest cost 623 681 98 97 120 138 54 71Plan participant contributions — — 1 3 — — 138 139Plan amendments — — 2 2 — — — —Settlements and curtailments 17 (889) (116) — (7) — — —Actuarial loss (gain) (1,279) 1,552 156 328 (161) 294 (197) (4)Benefits paid (871) (816) (80) (77) (217) (236) (237) (290)Federal subsidy on benefits paid n/a n/a n/a n/a n/a n/a 15 19Foreign currency exchange rate changes n/a n/a 27 83 n/a n/a — 7
Projected benefit obligation, December 31 $ 14,145 $ 15,655 $ 2,580 $ 2,460 $ 3,070 $ 3,334 $ 1,356 $ 1,574Amount recognized, December 31 $ 4,131 $ 619 $ (123) $ (154) $ (350) $ (271) $ (1,284) $ (1,488)
Funded status, December 31 Accumulated benefit obligation $ 14,145 $ 15,655 $ 2,463 $ 2,345 $ 3,067 $ 3,334 n/a n/aOverfunded (unfunded) status of ABO 4,131 619 (6) (39) (347) (271) n/a n/aProvision for future salaries — — 117 115 3 — n/a n/aProjected benefit obligation 14,145 15,655 2,580 2,460 3,070 3,334 $ 1,356 $ 1,574
Weighted-average assumptions, December 31 Discount rate 4.85% 4.00% 4.30% 4.23% 4.55% 3.65% 4.50% 3.65%Rate of compensation increase n/a n/a 3.40 4.37 4.00 4.00 n/a n/a
(1) The measurement date for the Qualified Pension Plan, Non-U.S. Pension Plans, Nonqualified and Other Pension Plans, and Postretirement Health and Life Plans was December 31 of each year reported.
n/a = not applicable
Amounts recognized on the Consolidated Balance Sheet at December 31, 2013 and 2012 are presented in the table below.
Amounts Recognized on Consolidated Balance Sheet
QualifiedPension Plan
Non-U.S.Pension Plans
Nonqualifiedand Other
Pension Plans
PostretirementHealth and Life
Plans
(Dollars in millions) 2013 2012 2013 2012 2013 2012 2013 2012Other assets $ 4,131 $ 676 $ 205 $ 220 $ 777 $ 908 $ — $ —Accrued expenses and other liabilities — (57) (328) (374) (1,127) (1,179) (1,284) (1,488)
Net amount recognized at December 31 $ 4,131 $ 619 $ (123) $ (154) $ (350) $ (271) $ (1,284) $ (1,488)
76788ba_financials.indd 242 3/6/14 12:07 PM

Bank of America 2013 243
Pension Plans with ABO and PBO in excess of plan assets as of December 31, 2013 and 2012 are presented in the table below. For the non-qualified plans not subject to ERISA or non-U.S. pension plans, funding strategies vary due to legal requirements and local practices.
Plans with ABO and PBO in Excess of Plan Assets
Qualified Pension Plan
Non-U.S.Pension Plans
Nonqualifiedand Other
Pension Plans
(Dollars in millions) 2013 2012 2013 2012 2013 2012Plans with ABO in excess of plan assets
PBO n/a $ 7,171 $ 617 $ 883 $ 1,129 $ 1,182ABO n/a 7,171 606 843 1,126 1,181Fair value of plan assets n/a 7,114 290 510 2 2
Plans with PBO in excess of plan assets PBO n/a $ 7,171 $ 720 $ 896 $ 1,129 $ 1,182Fair value of plan assets n/a 7,114 392 522 2 2
n/a = not applicable
Net periodic benefit cost of the Corporation’s plans for 2013, 2012 and 2011 included the following components.
Components of Net Periodic Benefit Cost
Qualified Pension Plan Non-U.S. Pension Plans(Dollars in millions) 2013 2012 2011 2013 2012 2011Components of net periodic benefit cost
Service cost $ — $ 236 $ 423 $ 32 $ 40 $ 43Interest cost 623 681 746 98 97 99Expected return on plan assets (1,024) (1,246) (1,296) (121) (137) (115)Amortization of prior service cost — 9 20 — — —Amortization of net actuarial loss (gain) 242 469 387 2 (9) —Recognized loss (gain) due to settlements and curtailments 17 58 — (7) — —
Net periodic benefit cost (income) $ (142) $ 207 $ 280 $ 4 $ (9) $ 27Weighted-average assumptions used to determine net cost for years ended December 31
Discount rate 4.00% 4.95% 5.45% 4.23% 4.87% 5.32%Expected return on plan assets 6.50 8.00 8.00 5.50 6.65 6.58Rate of compensation increase n/a 4.00 4.00 4.37 4.42 4.85
Nonqualified andOther Pension Plans
Postretirement Healthand Life Plans
(Dollars in millions) 2013 2012 2011 2013 2012 2011Components of net periodic benefit cost
Service cost $ 1 $ 1 $ 3 $ 9 $ 13 $ 15Interest cost 120 138 152 54 71 80Expected return on plan assets (109) (152) (141) (5) (8) (9)Amortization of transition obligation — — — — 32 31Amortization of prior service cost (credits) — (3) (8) 4 4 4Amortization of net actuarial loss (gain) 25 8 16 (42) (38) (17)Recognized loss due to settlements and curtailments 2 — 3 6 — —
Net periodic benefit cost (income) $ 39 $ (8) $ 25 $ 26 $ 74 $ 104Weighted-average assumptions used to determine net cost for years ended December 31
Discount rate 3.65% 4.65% 5.20% 3.65% 4.65% 5.10%Expected return on plan assets 3.75 5.25 5.25 6.50 8.00 8.00Rate of compensation increase 4.00 4.00 4.00 n/a n/a n/a
n/a = not applicable
Net periodic postretirement health and life expense was determined using the “projected unit credit” actuarial method. Gains and losses for all benefit plans except postretirement health care are recognized in accordance with the standard amortization provisions of the applicable accounting guidance. For the Postretirement Health Care Plans, 50 percent of the unrecognized gain or loss at the beginning of the fiscal year (or at subsequent remeasurement) is recognized on a level basis during the year.
The discount rate and expected return on plan assets impact the net periodic benefit cost (income) recorded for the plans. With all other assumptions held constant, a 25 bps decline in the discount rate would result in an increase of approximately $7 million, while a 25 bps decline in the expected return on plan assets would result in an increase of approximately $41 million for the Qualified Pension Plan. For the Postretirement Health and Life Plans, the 25 bps decline in the discount rate would result in
76788ba_financials.indd 243 3/6/14 12:07 PM

244 Bank of America 2013
an increase of approximately $9 million. For the Non-U.S. Pension Plans and the Nonqualified and Other Pension Plans, the 25 bps decline in rates would not have a significant impact.
Assumed health care cost trend rates affect the postretirement benefit obligation and benefit cost reported for the Postretirement Health and Life Plans. The assumed health care cost trend rate used to measure the expected cost of benefits covered by the Postretirement Health and Life Plans is 7.00 percent for 2014, reducing in steps to 5.00 percent in 2019 and later years. A one-
percentage-point increase in assumed health care cost trend rates would have increased the service and interest costs, and the benefit obligation by $2 million and $54 million in 2013. A one-percentage-point decrease in assumed health care cost trend rates would have lowered the service and interest costs, and the benefit obligation by $2 million and $47 million in 2013.
Pre-tax amounts included in accumulated OCI for employee benefit plans at December 31, 2013 and 2012 are presented in the table below.
Pre-tax Amounts included in Accumulated OCI
Qualified
Pension PlanNon-U.S.
Pension Plans
Nonqualifiedand Other
Pension Plans
PostretirementHealth andLife Plans Total
(Dollars in millions) 2013 2012 2013 2012 2013 2012 2013 2012 2013 2012Net actuarial loss (gain) $ 2,794 $ 6,164 $ 271 $ 144 $ 855 $ 718 $ (171) $ (28) $ 3,749 $ 6,998Prior service cost (credits) — — (9) 5 — — 24 29 15 34
Amounts recognized in accumulated OCI $ 2,794 $ 6,164 $ 262 $ 149 $ 855 $ 718 $ (147) $ 1 $ 3,764 $ 7,032
Pre-tax amounts recognized in OCI for employee benefit plans in 2013 included the following components.
Pre-tax Amounts Recognized in OCI in 2013
(Dollars in millions)Qualified
Pension PlanNon-U.S.
Pension Plans
Nonqualifiedand Other
Pension Plans
PostretirementHealth andLife Plans Total
Current year actuarial loss (gain) $ (3,128) $ 113 $ 164 $ (180) $ (3,031)Amortization of actuarial gain (loss) (242) (2) (27) 36 (235)Current year prior service cost — 2 — — 2Amortization of prior service cost — — — (4) (4)
Amounts recognized in OCI $ (3,370) $ 113 $ 137 $ (148) $ (3,268)
The estimated pre-tax amounts that will be amortized from accumulated OCI into expense in 2014 are presented in the table below.
Estimated Pre-tax Amounts Amortized from Accumulated OCI into Period Cost in 2014
(Dollars in millions)Qualified
Pension PlanNon-U.S.
Pension Plans
Nonqualifiedand Other
Pension Plans
PostretirementHealth andLife Plans Total
Net actuarial loss (gain) $ 108 $ 3 $ 25 $ (85) $ 51Prior service cost — 1 — 4 5
Total amounts amortized from accumulated OCI $ 108 $ 4 $ 25 $ (81) $ 56
76788ba_financials.indd 244 3/6/14 12:07 PM

Bank of America 2013 245
Plan AssetsThe Qualified Pension Plan has been established as a retirement vehicle for participants, and trusts have been established to secure benefits promised under the Qualified Pension Plan. The Corporation’s policy is to invest the trust assets in a prudent manner for the exclusive purpose of providing benefits to participants and defraying reasonable expenses of administration. The Corporation’s investment strategy is designed to provide a total return that, over the long term, increases the ratio of assets to liabilities. The strategy attempts to maximize the investment return on assets at a level of risk deemed appropriate by the Corporation while complying with ERISA and any applicable regulations and laws. The investment strategy utilizes asset allocation as a principal determinant for establishing the risk/return profile of the assets. Asset allocation ranges are established, periodically reviewed and adjusted as funding levels and liability characteristics change. Active and passive investment managers are employed to help enhance the risk/return profile of the assets. An additional aspect of the investment strategy used to minimize risk (part of the asset allocation plan) includes matching the equity exposure of participant-selected earnings measures. For example, the common stock of the Corporation held in the trust is maintained as an offset to the exposure related to participants who elected to receive an earnings measure based on the return performance of common stock of the Corporation. No plan assets are expected to be returned to the Corporation during 2014.
The assets of the Non-U.S. Pension Plans are primarily attributable to a U.K. pension plan. This U.K. pension plan’s assets
are invested prudently so that the benefits promised to members are provided with consideration given to the nature and the duration of the plan’s liabilities. The current investment strategy was set following an asset-liability study and advice from the trustee’s investment advisors. The selected asset allocation strategy is designed to achieve a higher return than the lowest risk strategy while maintaining a prudent approach to meeting the plan’s liabilities.
The expected return on asset assumption was developed through analysis of historical market returns, historical asset class volatility and correlations, current market conditions, anticipated future asset allocations, the funds’ past experience, and expectations on potential future market returns. The expected return on asset assumption is determined using the calculated market-related value for the Qualified Pension Plan and the Other Pension Plan and the fair value for the Non-U.S. Pension Plans and Postretirement Health and Life Plans. The expected return on asset assumption represents a long-term average view of the performance of the assets in the Qualified Pension Plan, the Non-U.S. Pension Plans, the Other Pension Plan, and Postretirement Health and Life Plans, a return that may or may not be achieved during any one calendar year. The terminated Other U.S. Pension Plan is invested solely in an annuity contract which is primarily invested in fixed-income securities structured such that asset maturities match the duration of the plan’s obligations.
The target allocations for 2014 by asset category for the Qualified Pension Plan, Non-U.S. Pension Plans, Nonqualified and Other Pension Plans, and Postretirement Health and Life Plans are presented in the table below.
2014 Target Allocation
Percentage
Asset CategoryQualified
Pension PlanNon-U.S.
Pension Plans
Nonqualifiedand Other
Pension Plans
PostretirementHealth and Life
Plans
Equity securities 30 - 60 10 - 35 0 - 5 20 - 50Debt securities 40 - 70 40 - 80 95 - 100 50 - 80Real estate 0 - 10 0 - 15 0 - 5 0 - 5Other 0 - 5 0 - 15 0 - 5 0 - 5
Equity securities for the Qualified Pension Plan include common stock of the Corporation in the amounts of $200 million (1.10 percent of total plan assets) and $156 million (0.96 percent of total plan assets) at December 31, 2013 and 2012.
76788ba_financials.indd 245 3/6/14 12:07 PM

246 Bank of America 2013
Fair Value MeasurementsFor information on fair value measurements, including descriptions of Level 1, 2 and 3 of the fair value hierarchy and the valuation methods employed by the Corporation, see Note 1 – Summary of Significant Accounting Principles and Note 20 – Fair Value Measurements.
Combined plan investment assets measured at fair value by level and in total at December 31, 2013 and 2012 are summarized in the Fair Value Measurements table.
Fair Value Measurements
December 31, 2013(Dollars in millions) Level 1 Level 2 Level 3 Total
Cash and short-term investments
Money market and interest-bearing cash $ 2,586 $ — $ — $ 2,586
Cash and cash equivalent commingled/mutual funds — 223 — 223
Fixed income
U.S. government and government agency securities 1,590 2,245 12 3,847
Corporate debt securities — 1,233 — 1,233
Asset-backed securities — 1,455 — 1,455
Non-U.S. debt securities 547 502 6 1,055
Fixed income commingled/mutual funds 89 1,279 — 1,368
Equity
Common and preferred equity securities 7,463 — — 7,463
Equity commingled/mutual funds 213 2,308 — 2,521
Public real estate investment trusts 127 — — 127
Real estate
Private real estate — — 119 119
Real estate commingled/mutual funds — 7 462 469
Limited partnerships — 117 145 262
Other investments (1) — 662 135 797
Total plan investment assets, at fair value $ 12,615 $ 10,031 $ 879 $ 23,525
December 31, 2012Cash and short-term investments
Money market and interest-bearing cash $ 1,404 $ — $ — $ 1,404Cash and cash equivalent commingled/mutual funds — 96 — 96
Fixed income U.S. government and government agency securities 1,317 2,829 13 4,159Corporate debt securities — 1,062 — 1,062Asset-backed securities — 1,109 — 1,109Non-U.S. debt securities 70 535 10 615Fixed income commingled/mutual funds 99 1,432 — 1,531
Equity Common and preferred equity securities 7,432 — — 7,432Equity commingled/mutual funds 290 2,316 — 2,606Public real estate investment trusts 236 — — 236
Real estate Private real estate — — 110 110Real estate commingled/mutual funds — 10 324 334
Limited partnerships — 110 231 341Other investments (1) 22 543 129 694
Total plan investment assets, at fair value $ 10,870 $ 10,042 $ 817 $ 21,729(1) Other investments include interest rate swaps of $435 million and $311 million, participant loans of $87 million and $76 million, commodity and balanced funds of $229 million and $239 million
and other various investments of $46 million and $68 million at December 31, 2013 and 2012.
76788ba_financials.indd 246 3/6/14 12:07 PM

Bank of America 2013 247
The Level 3 Fair Value Measurements table presents a reconciliation of all plan investment assets measured at fair value using significant unobservable inputs (Level 3) during 2013, 2012 and 2011.
Level 3 Fair Value Measurements
2013
(Dollars in millions)Balance
January 1
Actual Return onPlan Assets Still
Held at theReporting Date Purchases
Sales andSettlements
Transfers into/(out of) Level 3
BalanceDecember 31
Fixed income
U.S. government and government agency securities $ 13 $ — $ — $ (1) $ — $ 12
Non-U.S. debt securities 10 (2) — (2) — 6
Real estate
Private real estate 110 4 7 (2) — 119
Real estate commingled/mutual funds 324 15 123 — — 462
Limited partnerships 231 8 23 (89) (28) 145
Other investments 129 (6) 13 (1) — 135
Total $ 817 $ 19 $ 166 $ (95) $ (28) $ 879
2012Fixed income
U.S. government and government agency securities $ 13 $ — $ — $ — $ — $ 13Non-U.S. debt securities 10 (1) 1 (1) 1 10
Real estate Private real estate 113 (2) 2 (3) — 110Real estate commingled/mutual funds 249 13 62 — — 324
Limited partnerships 232 8 11 (20) — 231Other investments 122 7 4 (4) — 129
Total $ 739 $ 25 $ 80 $ (28) $ 1 $ 817
2011Fixed income
U.S. government and government agency securities $ 14 $ (1) $ — $ — $ — $ 13Non-U.S. debt securities 9 — 3 (2) — 10
Real estate Private real estate 110 — 3 — — 113Real estate commingled/mutual funds 215 26 9 (1) — 249
Limited partnerships 230 (6) 13 (5) — 232Other investments 94 1 26 — 1 122
Total $ 672 $ 20 $ 54 $ (8) $ 1 $ 739
Projected Benefit PaymentsBenefit payments projected to be made from the Qualified Pension Plan, Non-U.S. Pension Plans, Nonqualified and Other Pension Plans, and Postretirement Health and Life Plans are presented in the table below.
Projected Benefit Payments
Postretirement Health and Life Plans
(Dollars in millions)Qualified
Pension Plan (1)
Non-U.S.Pension Plans (2)
Nonqualifiedand Other
Pension Plans (2) Net Payments (3)
MedicareSubsidy
2014 $ 927 $ 60 $ 243 $ 142 $ 172015 920 61 245 140 172016 910 64 242 137 172017 903 69 239 132 172018 894 71 235 127 172019 – 2023 4,399 428 1,132 558 76
(1) Benefit payments expected to be made from the plan’s assets.(2) Benefit payments expected to be made from a combination of the plans’ and the Corporation’s assets.(3) Benefit payments (net of retiree contributions) expected to be made from a combination of the plans’ and the Corporation’s assets.
76788ba_financials.indd 247 3/6/14 12:07 PM

248 Bank of America 2013
Defined Contribution PlansThe Corporation maintains qualified defined contribution retirement plans and nonqualified defined contribution retirement plans. As a result of the Merrill Lynch acquisition, the Corporation also maintains the Merrill Lynch 401(k) Savings & Investment Plan, which is closed to new participants, with certain exceptions. The Corporation contributed $1.1 billion, $886 million and $723 million in 2013, 2012 and 2011, respectively, to the qualified defined contribution plans. In connection with the 2012 redesign of the Corporation’s retirement plans, an additional contribution is being made annually to certain of these plans. The expense in 2013 and 2012 related to the additional annual contribution was $410 million and $174 million. At December 31, 2013 and 2012, 235 million shares of the Corporation’s common stock were held by these plans. Payments to the plans for dividends on common stock were $10 million, $10 million and $9 million in 2013, 2012 and 2011, respectively.
Certain non-U.S. employees are covered under defined contribution pension plans that are separately administered in accordance with local laws.
NOTE 18 Stock-based Compensation PlansThe Corporation administers a number of equity compensation plans, including the Key Associate Stock Plan and the Merrill Lynch Employee Stock Compensation Plan. Descriptions of the significant features of the equity compensation plans are below. Under these plans, the Corporation grants stock-based awards, including stock options, restricted stock and restricted stock units (RSUs). Grants in 2013 include RSUs which generally vest in three equal annual installments beginning one year from the grant date, and awards which will vest subject to the attainment of specified performance goals.
For most awards, expense is generally recognized ratably over the vesting period net of estimated forfeitures, unless the employee meets certain retirement eligibility criteria. For awards to employees that meet retirement eligibility criteria, the Corporation records the expense upon grant. For employees that become retirement eligible during the vesting period, the Corporation recognizes expense from the grant date to the date on which the employee becomes retirement eligible, net of estimated forfeitures. The compensation cost for the stock-based plans was $2.3 billion, $2.3 billion and $2.6 billion in 2013, 2012 and 2011, respectively. The related income tax benefit was $842 million, $839 million and $969 million for 2013, 2012 and 2011, respectively.
Key Associate Stock PlanThe Key Associate Stock Plan became effective January 1, 2003. It provides for different types of awards, including stock options, restricted stock and RSUs. As of December 31, 2013, the shareholders had authorized approximately 1.1 billion shares for grant under this plan. Additionally, any shares covered by awards under certain legacy plans that cancel, terminate, expire, lapse or settle in cash after a specified date may be re-granted under the Key Associate Stock Plan.
During 2013, the Corporation issued 183 million RSUs to certain employees under the Key Associate Stock Plan. Certain awards are earned based on the achievement of specified
performance criteria. RSUs may be settled in cash or in shares of common stock depending on the terms of the applicable award. In 2013, two million of these RSUs were authorized to be settled in shares of common stock with the remainder in cash. Certain awards contain clawback provisions which permit the Corporation to cancel all or a portion of the award under specified circumstances. The compensation cost for cash-settled awards and awards subject to certain clawback provisions, which in the aggregate represent substantially all of the awards in 2013, is accrued over the vesting period and adjusted to fair value based upon changes in the share price of the Corporation’s common stock.
From time to time, the Corporation enters into equity total return swaps to hedge a portion of RSUs granted to certain employees as part of their compensation in prior periods to minimize the change in the expense to the Corporation driven by fluctuations in the fair value of the RSUs. Certain of these derivatives are designated as cash flow hedges of unrecognized unvested awards with the changes in fair value of the hedge recorded in accumulated OCI and reclassified into earnings in the same period as the RSUs affect earnings. The remaining derivatives are used to hedge the price risk of cash-settled awards with changes in fair value recorded in personnel expense.
At December 31, 2013, approximately 108 million options were outstanding under this plan. There were no options granted under this plan during 2013, 2012 or 2011.
Other Stock PlansThe Corporation assumed the Merrill Lynch Employee Stock Compensation Plan with the acquisition of Merrill Lynch. Approximately eight million RSUs were granted in 2011 which generally vest in three equal annual installments beginning one year from the grant date. There were no shares granted under this plan during 2013 or 2012. At December 31, 2013, there were approximately two million unvested shares outstanding. The Corporation also assumed, with the acquisition of Merrill Lynch, the obligations of outstanding awards granted under the Merrill Lynch Financial Advisor Capital Accumulation Award Plan (FACAAP). The FACAAP is no longer an active plan and no awards were granted in 2013, 2012 or 2011. Awards still outstanding which were granted in 2003 and thereafter, are generally payable eight years from the grant date in a fixed number of the Corporation’s common shares. At December 31, 2013, there were seven million shares outstanding under this plan.
Restricted Stock/UnitsThe table below presents the status at December 31, 2013 of the share-settled restricted stock/units and changes during 2013.
Stock-settled Restricted Stock/Units
Shares/Units
Weighted-average Grant Date Fair Value
Outstanding at January 1, 2013 147,570,397 $ 13.18Granted 2,405,568 11.80Vested (75,422,919) 14.24Canceled (3,350,295) 12.22
Outstanding at December 31, 2013 71,202,751 $ 12.05
76788ba_financials.indd 248 3/6/14 12:07 PM

Bank of America 2013 249
The table below presents the status at December 31, 2013 of the cash-settled RSUs granted under the Key Associate Stock Plan and changes during 2013.
Cash-settled Restricted Units
Units
Outstanding at January 1, 2013 329,556,468Granted 181,166,560Vested (137,125,114)Canceled (13,669,045)
Outstanding at December 31, 2013 359,928,869
At December 31, 2013, there was an estimated $1.9 billion of total unrecognized compensation cost related to certain share-based compensation awards that is expected to be recognized over a period of up to four years, with a weighted-average period of 1.3 years. The total fair value of restricted stock vested in 2013, 2012 and 2011 was $1.0 billion, $2.9 billion and $1.7 billion, respectively. In 2013, 2012 and 2011 the amount of cash paid to settle equity-based awards for all equity compensation plans was $1.4 billion, $779 million and $489 million, respectively.
Stock OptionsThe table below presents the status of all option plans at December 31, 2013 and changes during 2013. Outstanding options at December 31, 2013 include 108 million options under the Key Associate Stock Plan and 14 million options to employees of predecessor company plans assumed in mergers.
Stock Options
Options
Weighted-average
Exercise Price
Outstanding at January 1, 2013 154,923,623 $ 46.22Forfeited (32,754,932) 38.73
Outstanding at December 31, 2013 122,168,691 48.23Options vested and exercisable at
December 31, 2013 122,168,691 48.23
At December 31, 2013, there was no aggregate intrinsic value of options outstanding, vested and exercisable. The weighted-average remaining contractual term of options outstanding, vested and exercisable was 1.9 years at December 31, 2013. These remaining contractual terms are the same because options have not been granted since 2008 and they generally vest over three years.
NOTE 19 Income TaxesThe components of income tax expense (benefit) for 2013, 2012 and 2011 are presented in the table below.
Income Tax Expense (Benefit)
(Dollars in millions) 2013 2012 2011Current income tax expense (benefit)
U.S. federal $ 180 $ 458 $ (733)U.S. state and local 786 592 393Non-U.S. 513 569 613
Total current expense 1,479 1,619 273Deferred income tax expense (benefit)
U.S. federal 2,056 (3,433) (2,673)U.S. state and local (94) (55) (584)Non-U.S. 1,300 753 1,308
Total deferred expense (benefit) 3,262 (2,735) (1,949)Total income tax expense (benefit) $ 4,741 $ (1,116) $ (1,676)
Total income tax expense (benefit) does not reflect the deferred tax effects of unrealized gains and losses on AFS debt and marketable equity securities, foreign currency translation adjustments, derivatives and employee benefit plan adjustments that are included in accumulated OCI. These tax effects resulted in a benefit of $2.7 billion and $2.9 billion in 2013 and 2011, respectively, and an expense of $1.3 billion in 2012 recorded in accumulated OCI. In addition, total income tax expense (benefit) does not reflect tax effects associated with the Corporation’s employee stock plans which decreased common stock and additional paid-in capital $128 million and $277 million in 2013 and 2012, and increased common stock and additional paid-in capital $19 million in 2011.
76788ba_financials.indd 249 3/6/14 12:07 PM

250 Bank of America 2013
Income tax expense (benefit) for 2013, 2012 and 2011 varied from the amount computed by applying the statutory income tax rate to income (loss) before income taxes. A reconciliation of the expected U.S. federal income tax expense is calculated by applying the federal statutory tax rate of 35 percent to the Corporation’s actual income tax expense (benefit) and the effective tax rates for 2013, 2012 and 2011 are presented in the table below.
Reconciliation of Income Tax Expense (Benefit)
2013 2012 2011(Dollars in millions) Amount Percent Amount Percent Amount PercentExpected U.S. federal income tax expense (benefit) $ 5,660 35.0 % $ 1,075 35.0 % $ (81) 35.0 %Increase (decrease) in taxes resulting from: (0.001)% (0.001)% (0.001)%
State tax expense (benefit), net of federal effect 450 2.8 349 11.4 (124)Non-U.S. tax differential (1) (940) (5.8) (1,968) (64.1) (383)Affordable housing credits/other credits (863) (5.3) (783) (25.5) (800)Tax-exempt income, including dividends (524) (3.2) (576) (18.8) (614)Changes in prior period UTBs, including interest (255) (1.6) (198) (6.4) (239)Non-U.S. statutory rate reductions 1,133 7.0 788 25.7 860Nondeductible expenses 52 0.3 231 7.5 119Goodwill – impairment and other goodwill impacts 52 0.3 — — 1,420Change in federal and non-U.S. valuation allowances 26 0.2 41 1.3 (1,102)Leveraged lease tax differential 26 0.2 83 2.7 121Subsidiary sales and liquidations — — — — (823)Other (76) (0.6) (158) (5.1) (30)
Total income tax expense (benefit) $ 4,741 29.3 % $ (1,116) (36.3)% $ (1,676) n/m(1) Includes in 2012, $1.7 billion income tax benefit attributable to the excess of foreign tax credits recognized in the U.S. upon repatriation of the earnings of certain non-U.S. subsidiaries over the
related U.S. tax liability.n/m = not meaningful
The reconciliation of the beginning unrecognized tax benefits (UTB) balance to the ending balance is presented in the table below.
Reconciliation of the Change in Unrecognized Tax Benefits
(Dollars in millions) 2013 2012 2011Balance, January 1 $ 3,677 $ 4,203 $ 5,169
Increases related to positions taken during the current year 98 352 219Increases related to positions taken during prior years (1) 254 142 879Decreases related to positions taken during prior years (1) (508) (711) (1,669)Settlements (448) (205) (277)Expiration of statute of limitations (5) (104) (118)
Balance, December 31 $ 3,068 $ 3,677 $ 4,203(1) The sum per year of positions taken during prior years differs from the $255 million, $198 million and $239 million in the Reconciliation of Income Tax Expense (Benefit) table due to temporary
items and jurisdictional offsets, as well as the inclusion of interest in the Reconciliation of Income Tax Expense (Benefit) table.
At December 31, 2013, 2012 and 2011, the balance of the Corporation’s UTBs which would, if recognized, affect the Corporation’s effective tax rate was $2.5 billion, $3.1 billion and $3.3 billion, respectively. Included in the UTB balance are some items the recognition of which would not affect the effective tax rate, such as the tax effect of certain temporary differences, the portion of gross state UTBs that would be offset by the tax benefit of the associated federal deduction and the portion of gross non-U.S. UTBs that would be offset by tax reductions in other jurisdictions.
The Corporation files income tax returns in more than 100 state and non-U.S. jurisdictions each year. The IRS and other tax authorities in countries and states in which the Corporation has significant business operations examine tax returns periodically (continuously in some jurisdictions). The Tax Examination Status table summarizes the status of significant examinations (U.S. federal unless otherwise noted) for the Corporation and various subsidiaries as of December 31, 2013.
Tax Examination Status
Years underExamination
Status atDecember 31
2013
Bank of America Corporation – U.S. 2005 – 2009 See belowBank of America Corporation – U.S. 2010 – 2011 Field examinationBank of America Corporation – New York (1) 2004 – 2008 Field examinationMerrill Lynch – U.S. 2004 – 2008 See belowVarious – U.K. 2012 Field examination
(1) All tax years subsequent to the years shown remain open to examination.
During 2013, the Corporation and the IRS arrived at final resolution of the Bank of America Corporation 2001 through 2004 tax years and continued to make progress toward resolving all federal income tax examinations through 2009, including Merrill Lynch. While subject to final agreement, including review by the Joint Committee on Taxation of the U.S. Congress for certain years, the Corporation believes that these examinations may be concluded during 2014.
76788ba_financials.indd 250 3/6/14 12:07 PM

Bank of America 2013 251
Considering all examinations, it is reasonably possible that the UTB balance may decrease by as much as $2.1 billion during the next 12 months, since resolved items will be removed from the balance whether their resolution results in payment or recognition. If such decrease were to occur, it likely would primarily result from outcomes consistent with management expectations.
During 2013 and 2012, the Corporation recognized $127 million and $99 million of expense and, in 2011, a benefit of $168 million for interest and penalties, net-of-tax, in income tax expense (benefit). At December 31, 2013 and 2012, the Corporation’s accrual for interest and penalties that related to income taxes, net of taxes and remittances, was $888 million and $775 million.
Significant components of the Corporation’s net deferred tax assets and liabilities at December 31, 2013 and 2012 are presented in the table below.
Deferred Tax Assets and Liabilities
December 31(Dollars in millions) 2013 2012Deferred tax assets
Net operating loss carryforwards $ 10,967 $ 13,863Tax credit carryforwards 9,689 9,529Accrued expenses 6,749 8,099Allowance for credit losses 6,100 8,463Security, loan and debt valuations 4,264 2,712Employee compensation and retirement benefits 2,729 4,612State income taxes 2,643 2,766Available-for-sale securities 1,918 —Other 722 725
Gross deferred tax assets 45,781 50,769Valuation allowance (1,940) (2,211)
Total deferred tax assets, net of valuationallowance 43,841 48,558
Deferred tax liabilities Equipment lease financing 3,106 3,371Long-term borrowings 3,033 3,215Mortgage servicing rights 1,547 1,986Intangibles 1,529 1,708Fee income 798 901Available-for-sale securities — 2,877Other 1,472 1,462
Gross deferred tax liabilities 11,485 15,520Net deferred tax assets $ 32,356 $ 33,038
The table below summarizes the deferred tax assets and related valuation allowances recognized for the net operating loss (NOL) and tax credit carryforwards at December 31, 2013.
Net Operating Loss and Tax Credit Carryforwards
(Dollars in millions)DeferredTax Asset
ValuationAllowance
NetDeferredTax Asset
First YearExpiring
Net operating losses – U.S. $ 3,061 $ — $ 3,061 After 2027Net operating losses – U.K. 7,417 — 7,417 None (1)
Net operating losses –other non-U.S. 489 (366) 123 Various
Net operating losses – U.S. states (2) 2,039 (1,025) 1,014 Various
General business credits 4,034 — 4,034 After 2027Foreign tax credits 5,655 (271) 5,384 After 2017
(1) The U.K. net operating losses may be carried forward indefinitely.(2) The net operating losses and related valuation allowances for U.S. states before considering
the benefit of federal deductions were $3.1 billion and $1.6 billion.
Management concluded that no valuation allowance was necessary to reduce the U.K. NOL carryforwards and U.S. NOL and general business credit carryforwards since estimated future taxable income will be sufficient to utilize these assets prior to their expiration. The majority of the Corporation’s U.K. net deferred tax assets, which consist primarily of NOLs, are expected to be realized by certain subsidiaries over an extended number of years. Management’s conclusion is supported by recent financial results and forecasts, the reorganization of certain business activities and the indefinite period to carry forward NOLs. However, significant changes to those estimates, such as changes that would be caused by a substantial and prolonged worsening of the condition of Europe’s capital markets, could lead management to reassess its U.K. valuation allowance conclusions.
At December 31, 2013, U.S. federal income taxes had not been provided on $17.0 billion of undistributed earnings of non-U.S. subsidiaries that management has determined have been reinvested for an indefinite period of time. If the Corporation were to record a deferred tax liability associated with these undistributed earnings, the amount would be approximately $4.3 billion at December 31, 2013.
76788ba_financials.indd 251 3/6/14 12:07 PM

252 Bank of America 2013
NOTE 20 Fair Value MeasurementsUnder applicable accounting guidance, fair value is defined as the exchange price that would be received for an asset or paid to transfer a liability (an exit price) in the principal or most advantageous market for the asset or liability in an orderly transaction between market participants on the measurement date. The Corporation determines the fair values of its financial instruments based on the fair value hierarchy established under applicable accounting guidance which requires an entity to maximize the use of observable inputs and minimize the use of unobservable inputs when measuring fair value. There are three levels of inputs used to measure fair value. The Corporation conducts a review of its fair value hierarchy classifications on a quarterly basis. Transfers into or out of fair value hierarchy classifications are made if the significant inputs used in the financial models measuring the fair values of the assets and liabilities became unobservable or observable, respectively, in the current marketplace. These transfers are considered to be effective as of the beginning of the quarter in which they occur. For more information regarding the fair value hierarchy and how the Corporation measures fair value, see Note 1 – Summary of Significant Accounting Principles. The Corporation accounts for certain financial instruments under the fair value option. For additional information, see Note 21 – Fair Value Option.
Valuation Processes and TechniquesThe Corporation has various processes and controls in place to ensure that fair value is reasonably estimated. A model validation policy governs the use and control of valuation models used to estimate fair value. This policy requires review and approval of models by personnel who are independent of the front office, and periodic reassessments of models to ensure that they are continuing to perform as designed. In addition, detailed reviews of trading gains and losses are conducted on a daily basis by personnel who are independent of the front office. A price verification group, which is also independent of the front office, utilizes available market information including executed trades, market prices and market-observable valuation model inputs to ensure that fair values are reasonably estimated. The Corporation performs due diligence procedures over third-party pricing service providers in order to support their use in the valuation process. Where market information is not available to support internal valuations, independent reviews of the valuations are performed and any material exposures are escalated through a management review process.
While the Corporation believes its valuation methods are appropriate and consistent with other market participants, the use of different methodologies or assumptions to determine the fair value of certain financial instruments could result in a different estimate of fair value at the reporting date.
During 2013, there were no changes to the valuation techniques that had, or are expected to have, a material impact on the Corporation’s consolidated financial position or results of operations.
Level 1, 2 and 3 Valuation TechniquesFinancial instruments are considered Level 1 when the valuation is based on quoted prices in active markets for identical assets or liabilities. Level 2 financial instruments are valued using quoted prices for similar assets or liabilities, quoted prices in markets that are not active, or models using inputs that are observable or
can be corroborated by observable market data for substantially the full term of the assets or liabilities. Financial instruments are considered Level 3 when their values are determined using pricing models, discounted cash flow methodologies or similar techniques, and at least one significant model assumption or input is unobservable and when determination of the fair value requires significant management judgment or estimation.
Trading Account Assets and Liabilities and Debt SecuritiesThe fair values of trading account assets and liabilities are primarily based on actively traded markets where prices are based on either direct market quotes or observed transactions. The fair values of debt securities are generally based on quoted market prices or market prices for similar assets. Liquidity is a significant factor in the determination of the fair values of trading account assets and liabilities and debt securities. Market price quotes may not be readily available for some positions, or positions within a market sector where trading activity has slowed significantly or ceased. Some of these instruments are valued using a discounted cash flow model, which estimates the fair value of the securities using internal credit risk, interest rate and prepayment risk models that incorporate management’s best estimate of current key assumptions such as default rates, loss severity and prepayment rates. Principal and interest cash flows are discounted using an observable discount rate for similar instruments with adjustments that management believes a market participant would consider in determining fair value for the specific security. Other instruments are valued using a net asset value approach which considers the value of the underlying securities. Underlying assets are valued using external pricing services, where available, or matrix pricing based on the vintages and ratings. Situations of illiquidity generally are triggered by the market’s perception of credit uncertainty regarding a single company or a specific market sector. In these instances, fair value is determined based on limited available market information and other factors, principally from reviewing the issuer’s financial statements and changes in credit ratings made by one or more rating agencies.
Derivative Assets and LiabilitiesThe fair values of derivative assets and liabilities traded in the OTC market are determined using quantitative models that utilize multiple market inputs including interest rates, prices and indices to generate continuous yield or pricing curves and volatility factors to value the position. The majority of market inputs are actively quoted and can be validated through external sources, including brokers, market transactions and third-party pricing services. When third-party pricing services are used, the methods and assumptions are reviewed by the Corporation. Estimation risk is greater for derivative asset and liability positions that are either option-based or have longer maturity dates where observable market inputs are less readily available, or are unobservable, in which case, quantitative-based extrapolations of rate, price or index scenarios are used in determining fair values. The fair values of derivative assets and liabilities include adjustments for market liquidity, counterparty credit quality and other instrument-specific factors, where appropriate. In addition, the Corporation incorporates within its fair value measurements of OTC derivatives a valuation adjustment to reflect the credit risk associated with the net position. Positions are netted by counterparty, and fair value for net long exposures is adjusted for counterparty credit risk while the fair value for net short exposures is adjusted for the
76788ba_financials.indd 252 3/6/14 12:07 PM
Bank of America 2013 253
Corporation’s own credit risk. An estimate of severity of loss is also used in the determination of fair value, primarily based on market data.
Loans and Loan CommitmentsThe fair values of loans and loan commitments are based on market prices, where available, or discounted cash flow analyses using market-based credit spreads of comparable debt instruments or credit derivatives of the specific borrower or comparable borrowers. Results of discounted cash flow analyses may be adjusted, as appropriate, to reflect other market conditions or the perceived credit risk of the borrower.
Mortgage Servicing RightsThe fair values of MSRs are determined using models that rely on estimates of prepayment rates, the resultant weighted-average lives of the MSRs and the option-adjusted spread (OAS) levels. For more information on MSRs, see Note 23 – Mortgage Servicing Rights.
Loans Held-for-saleThe fair values of LHFS are based on quoted market prices, where available, or are determined by discounting estimated cash flows using interest rates approximating the Corporation’s current origination rates for similar loans adjusted to reflect the inherent credit risk.
Private Equity InvestmentsPrivate equity investments consist of direct investments and fund investments which are initially valued at their transaction price. Thereafter, the fair value of direct investments is based on an assessment of each individual investment using methodologies that include publicly-traded comparables derived by multiplying a key performance metric (e.g., earnings before interest, taxes, depreciation and amortization) of the portfolio company by the relevant valuation multiple observed for comparable companies, acquisition comparables, entry level multiples and discounted cash flow analyses, and are subject to appropriate discounts for lack of liquidity or marketability. After initial recognition, the fair value of fund investments is based on the Corporation’s proportionate interest in the fund’s capital as reported by the respective fund managers.
Securities Financing AgreementsThe fair values of certain reverse repurchase agreements, repurchase agreements and securities borrowed transactions are determined using quantitative models, including discounted cash flow models that require the use of multiple market inputs including interest rates and spreads to generate continuous yield or pricing curves, and volatility factors. The majority of market inputs are actively quoted and can be validated through external sources, including brokers, market transactions and third-party pricing services.
Deposits The fair value of deposits are determined using quantitative models, including discounted cash flow models that require the use of multiple market inputs including interest rates and spreads to generate continuous yield or pricing curves, and volatility factors. The majority of market inputs are actively quoted and can be validated through external sources, including brokers, market transactions and third-party pricing services. The Corporation considers the impact of its own credit spreads in the valuation of these liabilities. The credit risk is determined by reference to observable credit spreads in the secondary cash market.
Short-term Borrowings and Long-term DebtThe Corporation issues structured liabilities that have coupons or repayment terms linked to the performance of debt or equity securities, indices, currencies or commodities. The fair values of these structured liabilities are estimated using quantitative models for the combined derivative and debt portions of the notes. These models incorporate observable and, in some instances, unobservable inputs including security prices, interest rate yield curves, option volatility, currency, commodity or equity rates and correlations among these inputs. The Corporation also considers the impact of its own credit spreads in determining the discount rate used to value these liabilities. The credit spread is determined by reference to observable spreads in the secondary bond market.
Asset-backed Secured FinancingsThe fair values of asset-backed secured financings are based on external broker bids, where available, or are determined by discounting estimated cash flows using interest rates approximating the Corporation’s current origination rates for similar loans adjusted to reflect the inherent credit risk.
76788ba_financials.indd 253 3/6/14 12:07 PM

254 Bank of America 2013
Recurring Fair ValueAssets and liabilities carried at fair value on a recurring basis at December 31, 2013 and 2012, including financial instruments which the Corporation accounts for under the fair value option, are summarized in the following tables.
December 31, 2013 Fair Value Measurements
(Dollars in millions) Level 1 (1) Level 2 (1) Level 3Netting
Adjustments (2)
Assets/Liabilitiesat Fair Value
Assets
Federal funds sold and securities borrowed or purchased underagreements to resell $ — $ 75,614 $ — $ — $ 75,614
Trading account assets:
U.S. government and agency securities (3) 34,222 14,625 — — 48,847
Corporate securities, trading loans and other 1,147 27,746 3,559 — 32,452
Equity securities 41,324 22,741 386 — 64,451
Non-U.S. sovereign debt 24,357 12,399 468 — 37,224
Mortgage trading loans and ABS — 13,388 4,631 — 18,019
Total trading account assets 101,050 90,899 9,044 — 200,993
Derivative assets (4) 2,374 910,602 7,277 (872,758) 47,495
AFS debt securities:
U.S. Treasury and agency securities 6,591 2,363 — — 8,954
Mortgage-backed securities:
Agency — 164,935 — — 164,935
Agency-collateralized mortgage obligations — 22,492 — — 22,492
Non-agency residential — 6,239 — — 6,239
Commercial — 2,480 — — 2,480
Non-U.S. securities 3,698 3,415 107 — 7,220
Corporate/Agency bonds — 873 — — 873
Other taxable securities 20 12,963 3,847 — 16,830
Tax-exempt securities — 5,122 806 — 5,928
Total AFS debt securities 10,309 220,882 4,760 — 235,951
Other debt securities carried at fair value:U.S. Treasury and agency securities 4,062 — — — 4,062
Mortgage-backed securities:Agency — 16,500 — — 16,500
Agency-collateralized mortgage obligations — 218 — — 218
Commercial — 749 — — 749
Non-U.S. securities 7,457 3,858 — — 11,315
Total other debt securities carried at fair value 11,519 21,325 — — 32,844
Loans and leases — 6,985 3,057 — 10,042
Mortgage servicing rights — — 5,042 — 5,042
Loans held-for-sale — 5,727 929 — 6,656
Other assets 14,474 1,912 1,669 — 18,055
Total assets $ 139,726 $ 1,333,946 $ 31,778 $ (872,758) $ 632,692
Liabilities
Interest-bearing deposits in U.S. offices $ — $ 1,899 $ — $ — $ 1,899
Federal funds purchased and securities loaned or sold underagreements to repurchase — 33,684 — — 33,684
Trading account liabilities:
U.S. government and agency securities 26,915 348 — — 27,263
Equity securities 23,874 3,711 — — 27,585
Non-U.S. sovereign debt 20,755 1,387 — — 22,142
Corporate securities and other 518 5,926 35 — 6,479
Total trading account liabilities 72,062 11,372 35 — 83,469
Derivative liabilities (4) 1,968 897,107 7,301 (868,969) 37,407
Short-term borrowings — 1,520 — — 1,520
Accrued expenses and other liabilities 10,130 1,093 10 — 11,233
Long-term debt — 45,045 1,990 — 47,035
Total liabilities $ 84,160 $ 991,720 $ 9,336 $ (868,969) $ 216,247(1) During 2013, $500 million of other assets were transferred from Level 1 to Level 2 primarily due to a restriction that became effective for a private equity investment that was subsequently sold
once the restriction was lifted.(2) Amounts represent the impact of legally enforceable master netting agreements and also cash collateral held or placed with the same counterparties.(3) Includes $17.2 billion of government-sponsored enterprise obligations.(4) For further disaggregation of derivative assets and liabilities, see Note 2 – Derivatives.
76788ba_financials.indd 254 3/6/14 12:07 PM

Bank of America 2013 255
December 31, 2012Fair Value Measurements
(Dollars in millions) Level 1 (1) Level 2 (1) Level 3Netting
Adjustments (2)
Assets/Liabilitiesat Fair Value
Assets
Federal funds sold and securities borrowed or purchased underagreements to resell $ — $ 98,670 $ — $ — $ 98,670
Trading account assets: U.S. government and agency securities (3) 57,655 29,319 — — 86,974Corporate securities, trading loans and other 1,292 32,882 3,726 — 37,900Equity securities 28,144 14,626 545 — 43,315Non-U.S. sovereign debt 29,254 13,139 353 — 42,746Mortgage trading loans and ABS — 11,905 4,935 — 16,840
Total trading account assets 116,345 101,871 9,559 — 227,775Derivative assets (4) 2,997 1,372,398 8,073 (1,329,971) 53,497AFS debt securities:
U.S. Treasury and agency securities 21,514 2,958 — — 24,472Mortgage-backed securities:
Agency — 188,149 — — 188,149Agency-collateralized mortgage obligations — 37,538 — — 37,538Non-agency residential — 9,494 — — 9,494Non-agency commercial — 3,914 10 — 3,924
Non-U.S. securities 2,637 2,981 — — 5,618Corporate/Agency bonds — 1,358 92 — 1,450Other taxable securities 20 8,180 3,928 — 12,128Tax-exempt securities — 3,072 1,061 — 4,133
Total AFS debt securities 24,171 257,644 5,091 — 286,906Other debt securities carried at fair value:
U.S. Treasury and agency securities 491 — — — 491Mortgage-backed securities:
Agency — 13,073 — — 13,073Agency-collateralized mortgage obligations — 929 — — 929
Non-U.S. securities 9,151 300 — — 9,451Total other debt securities carried at fair value 9,642 14,302 — — 23,944Loans and leases — 6,715 2,287 — 9,002Mortgage servicing rights — — 5,716 — 5,716Loans held-for-sale — 8,926 2,733 — 11,659Other assets 18,535 4,826 3,129 — 26,490
Total assets $ 171,690 $ 1,865,352 $ 36,588 $ (1,329,971) $ 743,659Liabilities
Interest-bearing deposits in U.S. offices $ — $ 2,262 $ — $ — $ 2,262
Federal funds purchased and securities loaned or sold underagreements to repurchase — 42,639 — — 42,639
Trading account liabilities: U.S. government and agency securities 22,351 1,079 — — 23,430Equity securities 19,852 2,640 — — 22,492Non-U.S. sovereign debt 18,875 1,369 — — 20,244Corporate securities and other 487 6,870 64 — 7,421
Total trading account liabilities 61,565 11,958 64 — 73,587Derivative liabilities (4) 2,859 1,355,309 6,605 (1,318,757) 46,016Short-term borrowings — 4,074 — — 4,074Accrued expenses and other liabilities 15,457 1,122 15 — 16,594Long-term debt — 46,860 2,301 — 49,161
Total liabilities $ 79,881 $ 1,464,224 $ 8,985 $ (1,318,757) $ 234,333(1) During 2012, $2.0 billion and $350 million of assets and liabilities were transferred from Level 1 to Level 2, and $785 million and $40 million of assets and liabilities were transferred from Level
2 to Level 1. Of the asset transfers from Level 1 to Level 2, $940 million was due to a restriction that became effective for a private equity investment during 2012, while $535 million of the transfers from Level 2 to Level 1 was due to the lapse of this restriction during 2012. The remaining transfers were the result of additional information associated with certain equities, derivative contracts and private equity investments.
(2) Amounts represent the impact of legally enforceable master netting agreements and also cash collateral held or placed with the same counterparties.(3) Includes $30.6 billion of government-sponsored enterprise obligations.(4) For further disaggregation of derivative assets and liabilities, see Note 2 – Derivatives.
76788ba_financials.indd 255 3/6/14 12:07 PM

256 Bank of America 2013
The following tables present a reconciliation of all assets and liabilities measured at fair value on a recurring basis using significant unobservable inputs (Level 3) during 2013, 2012 and 2011, including net realized and unrealized gains (losses) included in earnings and accumulated OCI.
Level 3 – Fair Value Measurements (1)
2013
Gross
(Dollars in millions)
BalanceJanuary 1
2013
Gains(Losses)
in Earnings
Gains(Losses)in OCI Purchases Sales Issuances Settlements
GrossTransfers
intoLevel 3
GrossTransfers
out ofLevel 3
BalanceDecember 31
2013
Trading account assets:
Corporate securities, trading loans andother $ 3,726 $ 242 $ — $ 3,848 $ (3,110) $ 59 $ (651) $ 890 $ (1,445) $ 3,559
Equity securities 545 74 — 96 (175) — (100) 70 (124) 386
Non-U.S. sovereign debt 353 50 — 122 (18) — (36) 2 (5) 468
Mortgage trading loans and ABS 4,935 53 — 2,514 (1,993) — (868) 20 (30) 4,631
Total trading account assets 9,559 419 — 6,580 (5,296) 59 (1,655) 982 (1,604) 9,044
Net derivative assets (2) 1,468 (297) — 824 (1,274) — (1,362) (10) 627 (24)
AFS debt securities:
Commercial MBS 10 — — — — — (10) — — —
Non-U.S. securities — 5 2 1 (1) — — 100 — 107
Corporate/Agency bonds 92 — 4 — — — — — (96) —
Other taxable securities 3,928 9 15 1,055 — — (1,155) — (5) 3,847
Tax-exempt securities 1,061 3 19 — — — (109) — (168) 806
Total AFS debt securities 5,091 17 40 1,056 (1) — (1,274) 100 (269) 4,760
Loans and leases (3, 4) 2,287 98 — 310 (128) 1,252 (757) 19 (24) 3,057
Mortgage servicing rights (4) 5,716 1,941 — — (2,044) 472 (1,043) — — 5,042
Loans held-for-sale (3) 2,733 62 — 8 (402) 4 (1,507) 34 (3) 929
Other assets (5) 3,129 (288) — 46 (383) — (1,019) 239 (55) 1,669
Trading account liabilities – Corporatesecurities and other (64) 10 — 43 (54) (5) — (9) 44 (35)
Accrued expenses and other liabilities (3) (15) 30 — — — (751) 724 (1) 3 (10)
Long-term debt (3) (2,301) 13 — 358 (4) (172) 258 (1,331) 1,189 (1,990)(1) Assets (liabilities). For assets, increase (decrease) to Level 3 and for liabilities, (increase) decrease to Level 3.(2) Net derivatives include derivative assets of $7.3 billion and derivative liabilities of $7.3 billion.(3) Amounts represent instruments that are accounted for under the fair value option.(4) Issuances represent loan originations and mortgage servicing rights retained following securitizations or whole-loan sales.(5) Other assets is primarily comprised of private equity investments and certain long-term fixed-rate margin loans that are accounted for under the fair value option.
During 2013, the transfers into Level 3 included $982 million of trading account assets, $100 million of AFS debt securities, $239 million of other assets and $1.3 billion of long-term debt. Transfers into Level 3 for trading account assets were primarily the result of decreased third-party prices available for certain corporate loans and securities. Transfers into Level 3 for AFS debt securities were primarily due to decreased price observability. Transfers into Level 3 for other assets were primarily due to a lack of independent pricing data for certain receivables. Transfers into Level 3 for long-term debt were primarily due to changes in the impact of unobservable inputs on the value of certain structured liabilities. Transfers occur on a regular basis for these long-term debt instruments due to changes in the impact of unobservable inputs on the value of the embedded derivative in relation to the instrument as a whole.
During 2013, the transfers out of Level 3 included $1.6 billion of trading account assets, $627 million of net derivative assets, $269 million for AFS debt securities and $1.2 billion of long-term debt. Transfers out of Level 3 for trading account assets were primarily the result of increased market liquidity and third-party prices available for certain corporate loans and securities. Transfers out of Level 3 for net derivative assets were primarily due to increased price observability (i.e., market comparables for the referenced instruments) for certain options. Transfers out of Level 3 for AFS debt securities were primarily due to increased market liquidity. Transfers out of Level 3 for long-term debt were primarily due to changes in the impact of unobservable inputs on the value of certain structured liabilities.
76788ba_financials.indd 256 3/6/14 12:07 PM

Bank of America 2013 257
Level 3 – Fair Value Measurements (1)
2012
Gross
(Dollars in millions)
BalanceJanuary 1
2012
Gains(Losses)
in Earnings
Gains(Losses)in OCI Purchases Sales Issuances Settlements
GrossTransfers
intoLevel 3
GrossTransfers
out of Level 3
BalanceDecember 31
2012
Trading account assets:
Corporate securities, trading loans and other (2) $ 6,880 $ 195 $ — $ 2,798 $ (4,556) $ — $ (1,077) $ 436 $ (950) $ 3,726
Equity securities 544 31 — 201 (271) — 27 90 (77) 545Non-U.S. sovereign debt 342 8 — 388 (359) — (5) — (21) 353Mortgage trading loans and ABS (2) 3,689 215 — 2,574 (1,536) — (678) 844 (173) 4,935
Total trading account assets 11,455 449 — 5,961 (6,722) — (1,733) 1,370 (1,221) 9,559Net derivative assets (3) 5,866 (221) — 893 (1,012) — (3,328) (269) (461) 1,468AFS debt securities:
Mortgage-backed securities:Agency 37 — — — — — (4) — (33) —Non-agency residential 860 (69) 19 — (306) — (2) — (502) —Non-agency commercial 40 — — — (24) — (6) — — 10
Corporate/Agency bonds 162 (2) — (2) — — (39) — (27) 92Other taxable securities 4,265 23 26 3,196 (28) — (3,345) — (209) 3,928Tax-exempt securities 2,648 61 20 — (133) — (1,535) — — 1,061
Total AFS debt securities 8,012 13 65 3,194 (491) — (4,931) — (771) 5,091Loans and leases (4, 5) 2,744 334 — 564 (1,520) — (274) 450 (11) 2,287Mortgage servicing rights (5) 7,378 (430) — — (122) 374 (1,484) — — 5,716Loans held-for-sale (4) 3,387 352 — 794 (834) — (414) 80 (632) 2,733Other assets (6) 4,235 (54) — 109 (1,039) 270 (381) — (11) 3,129
Trading account liabilities – Corporatesecurities and other (114) 4 — 116 (136) — 80 (68) 54 (64)
Short-term borrowings (4) — — — — — (232) 232 — — —Accrued expenses and other liabilities (4) (14) (4) — 8 — (9) — — 4 (15)Long-term debt (4) (2,943) (307) — 290 (33) (259) 1,239 (2,040) 1,752 (2,301)
(1) Assets (liabilities). For assets, increase (decrease) to Level 3 and for liabilities, (increase) decrease to Level 3.(2) During 2012, approximately $900 million was reclassified from Trading account assets – Corporate securities, trading loans and other to Trading account assets – Mortgage trading loans and ABS.
In the table above, this reclassification is presented as a sale of Trading account assets – Corporate securities, trading loans and other and as a purchase of Trading account assets – Mortgage trading loans and ABS.
(3) Net derivatives include derivative assets of $8.1 billion and derivative liabilities of $6.6 billion.(4) Amounts represent instruments that are accounted for under the fair value option.(5) Issuances represent loan originations and mortgage servicing rights retained following securitizations or whole-loan sales.(6) Other assets is primarily comprised of net monoline exposure to a single counterparty and private equity investments.
During 2012, the transfers into Level 3 included $1.4 billion of trading account assets, $269 million of net derivative assets, $450 million of loans and leases, and $2.0 billion of long-term debt. Transfers into Level 3 for trading account assets were primarily the result of decreased market liquidity for certain corporate loans and updated information related to certain CLOs. Transfers into Level 3 for net derivative assets primarily related to decreased price observability for certain long-dated equity derivative liabilities due to a lack of independent pricing. Transfers into Level 3 for loans and leases were due to updated information related to certain commercial loans. Transfers into Level 3 for long-term debt were primarily due to changes in the impact of unobservable inputs on the value of certain structured liabilities. Transfers occur on a regular basis for these long-term debt instruments due to changes in the impact of unobservable inputs on the value of the embedded derivative in relation to the instrument as a whole.
During 2012, the transfers out of Level 3 included $1.2 billion of trading account assets, $461 million of net derivative assets, $771 million of AFS debt securities, $632 million of LHFS and $1.8 billion of long-term debt. Transfers out of Level 3 for trading account assets primarily related to increased market liquidity for certain corporate and commercial real estate loans. Transfers out of Level 3 for net derivative assets primarily related to increased price observability (i.e., market comparables for the referenced instruments) for certain total return swaps and foreign exchange swaps. Transfers out of Level 3 for AFS debt securities primarily related to increased price observability for certain non-agency RMBS and ABS. Transfers out of Level 3 for LHFS primarily related to increased observable inputs, primarily liquid comparables. Transfers out of Level 3 for long-term debt were primarily due to changes in the impact of unobservable inputs on the value of certain structured liabilities.
76788ba_financials.indd 257 3/6/14 12:07 PM

258 Bank of America 2013
Level 3 – Fair Value Measurements (1)
2011
Gross
(Dollars in millions)
BalanceJanuary 1
2011Consolidation
of VIEs
Gains(Losses)
in Earnings
Gains(Losses) in OCI Purchases Sales Issuances Settlements
Gross Transfers
into Level 3
Gross Transfers
out ofLevel 3
BalanceDecember 31
2011
Trading account assets:
Corporate securities, tradingloans and other $ 7,751 $ — $ 490 $ — $ 5,683 $ (6,664) $ — $ (1,362) $ 1,695 $ (713) $ 6,880
Equity securities 557 — 49 — 335 (362) — (140) 132 (27) 544Non-U.S. sovereign debt 243 — 87 — 188 (137) — (3) 8 (44) 342Mortgage trading loans and ABS 6,908 — 442 — 2,222 (4,713) — (440) 75 (805) 3,689
Total trading account assets 15,459 — 1,068 — 8,428 (11,876) — (1,945) 1,910 (1,589) 11,455Net derivative assets (2) 7,745 — 5,199 — 1,235 (1,553) — (7,779) 1,199 (180) 5,866AFS debt securities:
Mortgage-backed securities: Agency 4 — — — 14 (11) — — 34 (4) 37
Agency collateralized-mortgageobligations — — — — 56 (56) — — — — —
Non-agency residential 1,468 — (158) 41 11 (307) — (568) 373 — 860Non-agency commercial 19 — — — 15 — — — 6 — 40
Non-U.S. securities 3 — — — — — — — 88 (91) —Corporate/Agency bonds 137 — (12) (8) 304 (17) — — 7 (249) 162Other taxable securities 13,018 — 26 21 3,876 (2,245) — (5,112) 2 (5,321) 4,265Tax-exempt securities 1,224 — 21 (35) 2,862 (92) — (697) 38 (673) 2,648
Total AFS debt securities 15,873 — (123) 19 7,138 (2,728) — (6,377) 548 (6,338) 8,012Loans and leases (3, 4) 3,321 5,194 (55) — 21 (2,644) 3,118 (1,830) 5 (4,386) 2,744Mortgage servicing rights (4) 14,900 — (5,661) — — (896) 1,656 (2,621) — — 7,378Loans held-for-sale (3) 4,140 — 36 — 157 (483) — (961) 565 (67) 3,387Other assets (5) 6,922 — 140 — 1,932 (2,391) — (768) 375 (1,975) 4,235
Trading account liabilities –Corporate securities and other (7) — 4 — 133 (189) — — (65) 10 (114)
Short-term borrowings (3) (706) — (30) — — — — 86 — 650 —
Accrued expenses and other liabilities (3) (828) — 61 — — (2) (9) 3 — 761 (14)
Long-term debt (3) (2,986) — (188) — 520 (72) (520) 838 (2,111) 1,576 (2,943)(1) Assets (liabilities). For assets, increase (decrease) to Level 3 and for liabilities, (increase) decrease to Level 3.(2) Net derivatives include derivative assets of $14.4 billion and derivative liabilities of $8.5 billion.(3) Amounts represent instruments that are accounted for under the fair value option.(4) Issuances represent loan originations and mortgage servicing rights retained following securitizations or whole-loan sales.(5) Other assets is primarily comprised of net monoline exposure to a single counterparty and private equity investments.
During 2011, the transfers into Level 3 included $1.9 billion of trading account assets, $1.2 billion of net derivative assets and $2.1 billion of long-term debt. Transfers into Level 3 for trading account assets were primarily certain CLOs, corporate loans and bonds that were transferred due to decreased market activity. Transfers into Level 3 for net derivative assets were the result of changes in the valuation methodology for certain total return swaps, in addition to increases in certain equity derivatives with significant unobservable inputs. Transfers into Level 3 for long-term debt were primarily due to changes in the impact of unobservable inputs on the value of certain structured liabilities. Transfers occur on a regular basis for these long-term debt instruments due to changes in the impact of unobservable inputs on the value of the embedded derivative in relation to the instrument as a whole.
During 2011, the transfers out of Level 3 included $1.6 billion of trading account assets, $6.3 billion of AFS debt securities, $4.4 billion of loans and leases, $2.0 billion of other assets and $1.6 billion of long-term debt. Transfers out of Level 3 for trading account assets were primarily due to increased price observability on certain RMBS, CMBS and consumer ABS portfolios, as well as certain corporate bond positions due to increased trading volume. Transfers out of Level 3 for AFS debt securities primarily related to auto, credit card and student loan ABS portfolios due to increased trading volume in the secondary market for similar securities. Transfers out of Level 3 for loans and leases were due to increased observable inputs, primarily liquid comparables, for certain corporate loans. Transfers out of Level 3 for other assets were primarily the result of an IPO of an equity investment. Transfers out of Level 3 for long-term debt were primarily due to changes in the impact of unobservable inputs on the value of certain structured liabilities.
76788ba_financials.indd 258 3/6/14 12:07 PM

Bank of America 2013 259
The following tables summarize gains (losses) due to changes in fair value, including both realized and unrealized gains (losses), recorded in earnings for Level 3 assets and liabilities during 2013, 2012 and 2011. These amounts include gains (losses) on loans, LHFS, loan commitments and structured liabilities that are accounted for under the fair value option.
Level 3 – Total Realized and Unrealized Gains (Losses) Included in Earnings
2013
(Dollars in millions)
TradingAccountProfits
(Losses)
MortgageBankingIncome(Loss) (1) Other (2) Total
Trading account assets:
Corporate securities, trading loans and other $ 242 $ — $ — $ 242
Equity securities 74 — — 74
Non-U.S. sovereign debt 50 — — 50
Mortgage trading loans and ABS 53 — — 53
Total trading account assets 419 — — 419
Net derivative assets (1,224) 927 — (297)
AFS debt securities:
Non-U.S. securities — — 5 5
Other taxable securities — — 9 9
Tax-exempt securities — — 3 3
Total AFS debt securities — — 17 17
Loans and leases (3) — (38) 136 98
Mortgage servicing rights — 1,941 — 1,941
Loans held-for-sale (3) — 2 60 62
Other assets — 122 (410) (288)
Trading account liabilities – Corporate securities and other 10 — — 10
Accrued expenses and other liabilities (3) — 30 — 30
Long-term debt (3) 45 — (32) 13
Total $ (750) $ 2,984 $ (229) $ 2,005
2012Trading account assets:
Corporate securities, trading loans and other $ 195 $ — $ — $ 195Equity securities 31 — — 31Non-U.S. sovereign debt 8 — — 8Mortgage trading loans and ABS 215 — — 215
Total trading account assets 449 — — 449Net derivative assets (3,208) 2,987 — (221)AFS debt securities:
Non-agency residential MBS — — (69) (69)Corporate/Agency bonds — — (2) (2)Other taxable securities 2 — 21 23Tax-exempt securities — — 61 61
Total AFS debt securities 2 — 11 13Loans and leases (3) — — 334 334Mortgage servicing rights — (430) — (430)Loans held-for-sale (3) — 148 204 352Other assets — (74) 20 (54)Trading account liabilities – Corporate securities and other 4 — — 4Accrued expenses and other liabilities (3) — — (4) (4)Long-term debt (3) (133) — (174) (307)
Total $ (2,886) $ 2,631 $ 391 $ 136(1) Mortgage banking income (loss) does not reflect the impact of Level 1 and Level 2 hedges on MSRs.(2) Amounts included are primarily recorded in other income (loss). Equity investment gains of $84 million and $97 million recorded on other assets were also included for 2013 and 2012.(3) Amounts represent instruments that are accounted for under the fair value option.
76788ba_financials.indd 259 3/6/14 12:07 PM

260 Bank of America 2013
Level 3 – Total Realized and Unrealized Gains (Losses) Included in Earnings (continued)
2011
(Dollars in millions)
TradingAccountProfits
(Losses)
MortgageBankingIncome(Loss) (1) Other (2) Total
Trading account assets: Corporate securities, trading loans and other $ 490 $ — $ — $ 490Equity securities 49 — — 49Non-U.S. sovereign debt 87 — — 87Mortgage trading loans and ABS 442 — — 442
Total trading account assets 1,068 — — 1,068Net derivative assets 1,516 3,683 — 5,199AFS debt securities:
Non-agency residential MBS — — (158) (158)Corporate/Agency bonds — — (12) (12)Other taxable securities 16 — 10 26Tax-exempt securities (3) — 24 21
Total AFS debt securities 13 — (136) (123)Loans and leases (3) — (13) (42) (55)Mortgage servicing rights — (5,661) — (5,661)Loans held-for-sale (3) — (108) 144 36Other assets — (51) 191 140Trading account liabilities – Corporate securities and other 4 — — 4Short-term borrowings (3) — (30) — (30)Accrued expenses and other liabilities (3) (10) 71 — 61Long-term debt (3) (106) — (82) (188)
Total $ 2,485 $ (2,109) $ 75 $ 451(1) Mortgage banking income (loss) does not reflect the impact of Level 1 and Level 2 hedges on MSRs.(2) Amounts included are primarily recorded in other income (loss). Equity investment gains of $242 million recorded on other assets were also included for 2011.(3) Amounts represent instruments that are accounted for under the fair value option.
76788ba_financials.indd 260 3/6/14 12:07 PM

Bank of America 2013 261
The table below summarizes changes in unrealized gains (losses) recorded in earnings during 2013, 2012 and 2011 for Level 3 assets and liabilities that were still held at December 31, 2013, 2012 and 2011. These amounts include changes in fair value on loans, LHFS, loan commitments and structured liabilities that are accounted for under the fair value option.
Level 3 – Changes in Unrealized Gains (Losses) Relating to Assets and Liabilities Still Held at Reporting Date
2013
(Dollars in millions)
TradingAccountProfits
(Losses)
MortgageBankingIncome(Loss) (1) Other (2) Total
Trading account assets:
Corporate securities, trading loans and other $ (130) $ — $ — $ (130)
Equity securities 40 — — 40
Non-U.S. sovereign debt 80 — — 80
Mortgage trading loans and ABS (174) — — (174)
Total trading account assets (184) — — (184)
Net derivative assets (1,375) 42 — (1,333)
Loans and leases (3) — (34) 152 118
Mortgage servicing rights — 1,541 — 1,541
Loans held-for-sale (3) — 6 57 63
Other assets — 166 14 180
Long-term debt (3) (4) — (32) (36)
Total $ (1,563) $ 1,721 $ 191 $ 349
2012Trading account assets:
Corporate securities, trading loans and other $ (19) $ — $ — $ (19)Equity securities 17 — — 17Non-U.S. sovereign debt 20 — — 20Mortgage trading loans and ABS 36 — — 36
Total trading account assets 54 — — 54Net derivative assets (2,782) 456 — (2,326)AFS debt securities – Other taxable securities 2 — — 2Loans and leases (3) — — 214 214Mortgage servicing rights — (1,100) — (1,100)Loans held-for-sale (3) — 112 168 280Other assets — (71) 50 (21)Trading account liabilities – Corporate securities and other 4 — — 4Accrued expenses and other liabilities (3) — — (2) (2)Long-term debt (3) (136) — (173) (309)
Total $ (2,858) $ (603) $ 257 $ (3,204)
2011Trading account assets:
Corporate securities, trading loans and other $ (86) $ — $ — $ (86)Equity securities (60) — — (60)Non-U.S. sovereign debt 101 — — 101Mortgage trading loans and ABS 30 — — 30
Total trading account assets (15) — — (15)Net derivative assets 1,430 133 — 1,563AFS debt securities:
Non-agency residential MBS — — (195) (195)Corporate/Agency bonds — — (14) (14)Other taxable securities — — 13 13
Total AFS debt securities — — (196) (196)Loans and leases (3) — — 94 94Mortgage servicing rights — (6,958) — (6,958)Loans held-for-sale (3) — (87) 5 (82)Other assets — (53) (772) (825)Trading account liabilities – Corporate securities and other 3 — — 3Long-term debt (3) (107) — (94) (201)
Total $ 1,311 $ (6,965) $ (963) $ (6,617)(1) Mortgage banking income (loss) does not reflect the impact of Level 1 and Level 2 hedges on MSRs.(2) Amounts included are primarily recorded in other income (loss). Equity investment gains of $60 million and $141 million, and losses of $309 million recorded on other assets were also included for
2013, 2012 and 2011, respectively.(3) Amounts represent instruments that are accounted for under the fair value option.
76788ba_financials.indd 261 3/6/14 12:07 PM
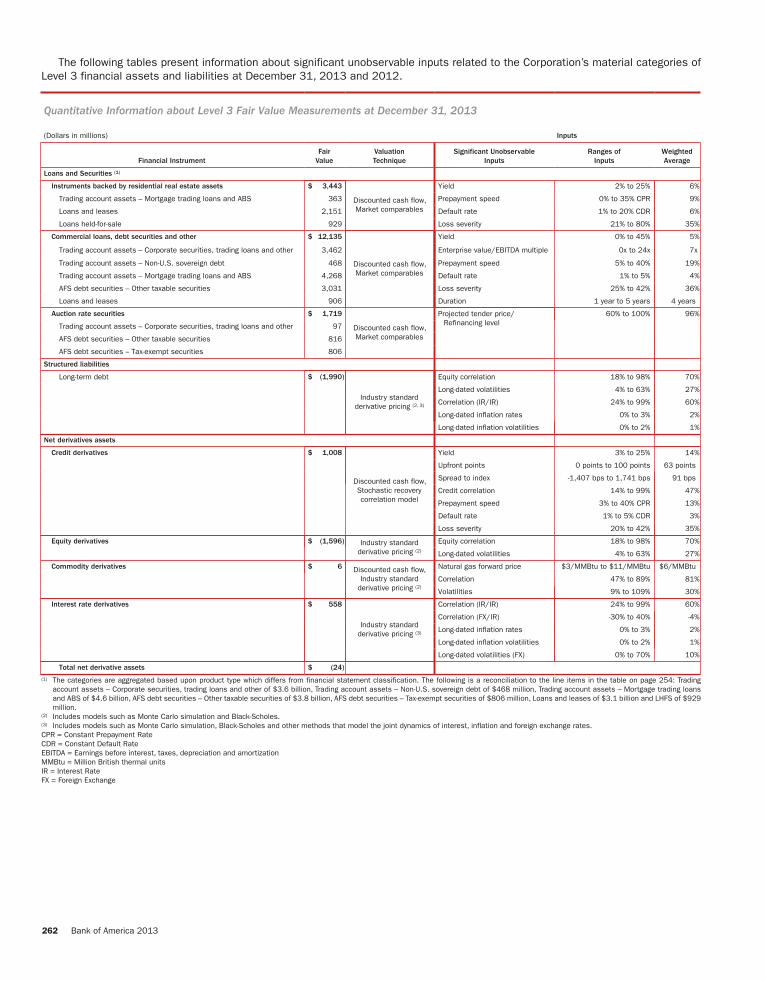
262 Bank of America 2013
The following tables present information about significant unobservable inputs related to the Corporation’s material categories of Level 3 financial assets and liabilities at December 31, 2013 and 2012.
Quantitative Information about Level 3 Fair Value Measurements at December 31, 2013
(Dollars in millions) Inputs
Financial InstrumentFair
ValueValuation Technique
Significant Unobservable Inputs
Ranges of Inputs
WeightedAverage
Loans and Securities (1)
Instruments backed by residential real estate assets $ 3,443
Discounted cash flow,Market comparables
Yield 2% to 25% 6%
Trading account assets – Mortgage trading loans and ABS 363 Prepayment speed 0% to 35% CPR 9%
Loans and leases 2,151 Default rate 1% to 20% CDR 6%
Loans held-for-sale 929 Loss severity 21% to 80% 35%
Commercial loans, debt securities and other $ 12,135
Discounted cash flow,Market comparables
Yield 0% to 45% 5%
Trading account assets – Corporate securities, trading loans and other 3,462 Enterprise value/EBITDA multiple 0x to 24x 7x
Trading account assets – Non-U.S. sovereign debt 468 Prepayment speed 5% to 40% 19%
Trading account assets – Mortgage trading loans and ABS 4,268 Default rate 1% to 5% 4%
AFS debt securities – Other taxable securities 3,031 Loss severity 25% to 42% 36%
Loans and leases 906 Duration 1 year to 5 years 4 years
Auction rate securities $ 1,719
Discounted cash flow,Market comparables
Projected tender price/Refinancing level
60% to 100% 96%
Trading account assets – Corporate securities, trading loans and other 97
AFS debt securities – Other taxable securities 816
AFS debt securities – Tax-exempt securities 806
Structured liabilities
Long-term debt $ (1,990)
Industry standard derivative pricing (2, 3)
Equity correlation 18% to 98% 70%
Long-dated volatilities 4% to 63% 27%
Correlation (IR/IR) 24% to 99% 60%
Long-dated inflation rates 0% to 3% 2%
Long-dated inflation volatilities 0% to 2% 1%
Net derivatives assets
Credit derivatives $ 1,008
Discounted cash flow,Stochastic recoverycorrelation model
Yield 3% to 25% 14%
Upfront points 0 points to 100 points 63 points
Spread to index -1,407 bps to 1,741 bps 91 bps
Credit correlation 14% to 99% 47%
Prepayment speed 3% to 40% CPR 13%
Default rate 1% to 5% CDR 3%
Loss severity 20% to 42% 35%
Equity derivatives $ (1,596) Industry standard derivative pricing (2)
Equity correlation 18% to 98% 70%
Long-dated volatilities 4% to 63% 27%
Commodity derivatives $ 6 Discounted cash flow, Industry standard
derivative pricing (2)
Natural gas forward price $3/MMBtu to $11/MMBtu $6/MMBtu
Correlation 47% to 89% 81%
Volatilities 9% to 109% 30%
Interest rate derivatives $ 558
Industry standard derivative pricing (3)
Correlation (IR/IR) 24% to 99% 60%
Correlation (FX/IR) -30% to 40% -4%
Long-dated inflation rates 0% to 3% 2%
Long-dated inflation volatilities 0% to 2% 1%
Long-dated volatilities (FX) 0% to 70% 10%
Total net derivative assets $ (24)
(1) The categories are aggregated based upon product type which differs from financial statement classification. The following is a reconciliation to the line items in the table on page 254: Trading account assets – Corporate securities, trading loans and other of $3.6 billion, Trading account assets – Non-U.S. sovereign debt of $468 million, Trading account assets – Mortgage trading loans and ABS of $4.6 billion, AFS debt securities – Other taxable securities of $3.8 billion, AFS debt securities – Tax-exempt securities of $806 million, Loans and leases of $3.1 billion and LHFS of $929 million.
(2) Includes models such as Monte Carlo simulation and Black-Scholes.(3) Includes models such as Monte Carlo simulation, Black-Scholes and other methods that model the joint dynamics of interest, inflation and foreign exchange rates.CPR = Constant Prepayment RateCDR = Constant Default RateEBITDA = Earnings before interest, taxes, depreciation and amortizationMMBtu = Million British thermal unitsIR = Interest RateFX = Foreign Exchange
76788ba_financials.indd 262 3/6/14 12:07 PM
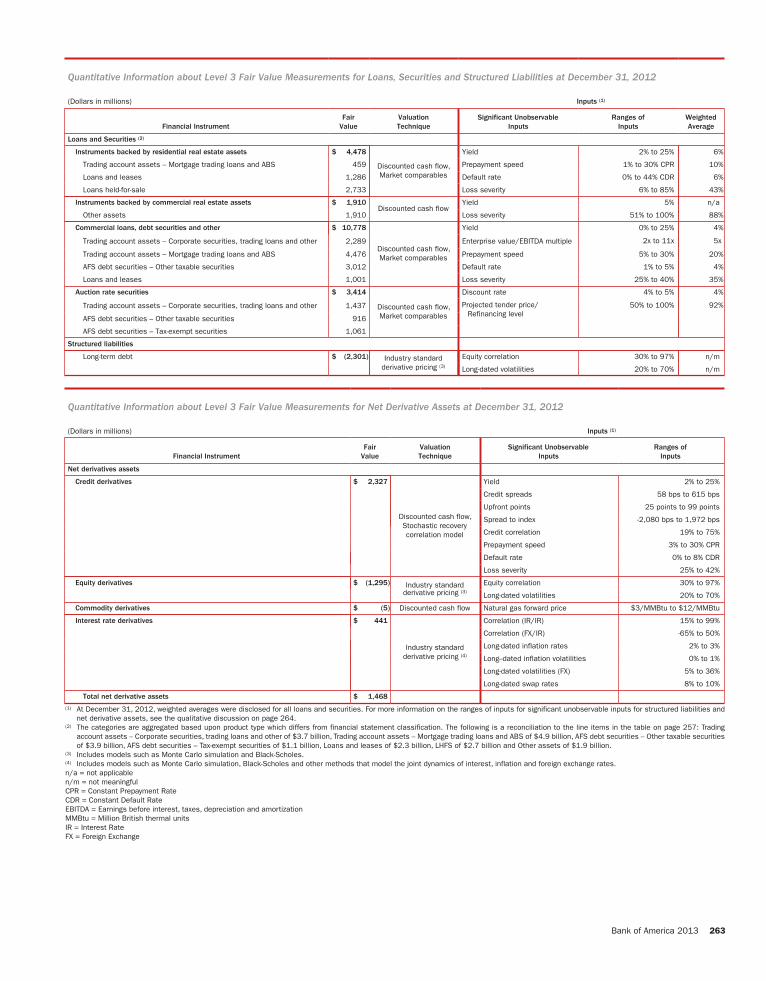
Bank of America 2013 263
Quantitative Information about Level 3 Fair Value Measurements for Loans, Securities and Structured Liabilities at December 31, 2012
(Dollars in millions) Inputs (1)
Financial InstrumentFair
ValueValuationTechnique
Significant UnobservableInputs
Ranges ofInputs
WeightedAverage
Loans and Securities (2)
Instruments backed by residential real estate assets $ 4,478
Discounted cash flow,Market comparables
Yield 2% to 25% 6%
Trading account assets – Mortgage trading loans and ABS 459 Prepayment speed 1% to 30% CPR 10%
Loans and leases 1,286 Default rate 0% to 44% CDR 6%
Loans held-for-sale 2,733 Loss severity 6% to 85% 43%
Instruments backed by commercial real estate assets $ 1,910Discounted cash flow
Yield 5% n/a
Other assets 1,910 Loss severity 51% to 100% 88%
Commercial loans, debt securities and other $ 10,778
Discounted cash flow,Market comparables
Yield 0% to 25% 4%
Trading account assets – Corporate securities, trading loans and other 2,289 Enterprise value/EBITDA multiple 2x to 11x 5x
Trading account assets – Mortgage trading loans and ABS 4,476 Prepayment speed 5% to 30% 20%
AFS debt securities – Other taxable securities 3,012 Default rate 1% to 5% 4%
Loans and leases 1,001 Loss severity 25% to 40% 35%
Auction rate securities $ 3,414
Discounted cash flow,Market comparables
Discount rate 4% to 5% 4%
Trading account assets – Corporate securities, trading loans and other 1,437 Projected tender price/Refinancing level
50% to 100% 92%
AFS debt securities – Other taxable securities 916
AFS debt securities – Tax-exempt securities 1,061
Structured liabilities
Long-term debt $ (2,301) Industry standard derivative pricing (3)
Equity correlation 30% to 97% n/m
Long-dated volatilities 20% to 70% n/m
Quantitative Information about Level 3 Fair Value Measurements for Net Derivative Assets at December 31, 2012
(Dollars in millions) Inputs (1)
Financial InstrumentFair
ValueValuationTechnique
Significant UnobservableInputs
Ranges ofInputs
Net derivatives assets
Credit derivatives $ 2,327
Discounted cash flow,Stochastic recoverycorrelation model
Yield 2% to 25%
Credit spreads 58 bps to 615 bps
Upfront points 25 points to 99 points
Spread to index -2,080 bps to 1,972 bps
Credit correlation 19% to 75%
Prepayment speed 3% to 30% CPR
Default rate 0% to 8% CDR
Loss severity 25% to 42%
Equity derivatives $ (1,295) Industry standard derivative pricing (3)
Equity correlation 30% to 97%
Long-dated volatilities 20% to 70%
Commodity derivatives $ (5) Discounted cash flow Natural gas forward price $3/MMBtu to $12/MMBtu
Interest rate derivatives $ 441
Industry standard derivative pricing (4)
Correlation (IR/IR) 15% to 99%
Correlation (FX/IR) -65% to 50%
Long-dated inflation rates 2% to 3%
Long--dated inflation volatilities 0% to 1%
Long-dated volatilities (FX) 5% to 36%
Long-dated swap rates 8% to 10%
Total net derivative assets $ 1,468
(1) At December 31, 2012, weighted averages were disclosed for all loans and securities. For more information on the ranges of inputs for significant unobservable inputs for structured liabilities and net derivative assets, see the qualitative discussion on page 264.
(2) The categories are aggregated based upon product type which differs from financial statement classification. The following is a reconciliation to the line items in the table on page 257: Trading account assets – Corporate securities, trading loans and other of $3.7 billion, Trading account assets – Mortgage trading loans and ABS of $4.9 billion, AFS debt securities – Other taxable securities of $3.9 billion, AFS debt securities – Tax-exempt securities of $1.1 billion, Loans and leases of $2.3 billion, LHFS of $2.7 billion and Other assets of $1.9 billion.
(3) Includes models such as Monte Carlo simulation and Black-Scholes.(4) Includes models such as Monte Carlo simulation, Black-Scholes and other methods that model the joint dynamics of interest, inflation and foreign exchange rates.n/a = not applicablen/m = not meaningfulCPR = Constant Prepayment RateCDR = Constant Default RateEBITDA = Earnings before interest, taxes, depreciation and amortizationMMBtu = Million British thermal unitsIR = Interest RateFX = Foreign Exchange
76788ba_financials.indd 263 3/6/14 12:07 PM

264 Bank of America 2013
In the tables above, instruments backed by residential and commercial real estate assets include RMBS, CMBS, whole loans, mortgage CDOs and net monoline exposure. Commercial loans, debt securities and other includes corporate CLOs and CDOs, commercial loans and bonds, and securities backed by non-real estate assets. Structured liabilities primarily include equity-linked notes that are accounted for under the fair value option.
In addition to the instruments in the tables above, the Corporation held $767 million and $1.2 billion of instruments at December 31, 2013 and 2012 consisting primarily of certain direct private equity investments and private equity funds that were classified as Level 3 and reported within other assets. Valuations of direct private equity investments are based on the most recent company financial information. Inputs generally include market and acquisition comparables, entry level multiples, as well as other variables. The Corporation selects a valuation methodology (e.g., market comparables) for each investment and, in certain instances, multiple inputs are weighted to derive the most representative value. Discounts are applied as appropriate to consider the lack of liquidity and marketability versus publicly-traded companies. For private equity funds, fair value is determined using the net asset value as provided by the individual fund’s general partner.
The Corporation uses multiple market approaches in valuing certain of its Level 3 financial instruments. For example, market comparables and discounted cash flows are used together. For a given product, such as corporate debt securities, market comparables may be used to estimate some of the unobservable inputs and then these inputs are incorporated into a discounted cash flow model. Therefore, the balances disclosed encompass both of these techniques.
The level of aggregation and diversity within the products disclosed in the tables result in certain ranges of inputs being wide and unevenly distributed across asset and liability categories. At December 31, 2013, weighted averages are disclosed for all loans, securities, structured liabilities and net derivative assets. At December 31, 2012, weighted averages were disclosed for all loans and securities.
For credit derivatives, the range of credit spreads represented positions with varying levels of default risk to the underlying instruments. The lower end of the credit spread range typically
represented shorter-dated instruments and those with better perceived credit risk. The higher end of the range represented longer-dated instruments and those referencing debt issuances that were more likely to be impaired or nonperforming. At December 31, 2012, the majority of inputs were concentrated in the lower end of the range. Similarly, the spread to index could vary significantly based on the risk of the instrument. The spread will be positive for instruments that have a higher risk of default than the index (which is based on a weighted average of its components) and negative for instruments that have a lower risk of default than the index. At December 31, 2012, inputs were distributed evenly throughout the range for spread to index. In addition, for yield and credit correlation, the majority of the inputs were concentrated in the center of the range. Inputs were concentrated in the middle to lower end of the range for upfront points. The range for loss severity reflected exposures that were concentrated in the middle to upper end of the range while the ranges for prepayment speed and default rates reflected exposures that were concentrated in the lower end of the range.
For equity derivatives at December 31, 2012, including those embedded in long-term debt, the range for equity correlation represented exposure primarily concentrated toward the upper end of the range. The range for long-dated volatilities represented exposure primarily concentrated toward the lower end of the range.
For interest rate derivatives, the diversity in the portfolio was reflected in wide ranges of inputs because the variety of currencies and tenors of the transactions required the use of numerous foreign exchange and interest rate curves. Since foreign exchange and interest rate correlations were measured between curves and across the various tenors on the same curve, the range of potential values could include both negative and positive values. For the correlation (IR/IR) range, the exposure represented the valuation of interest rate correlations on less liquid pairings and was concentrated at the upper end of the range at December 31, 2012. For the correlation (FX/IR) range, the exposure was the sensitivity to a broad mix of interest rate and foreign exchange correlations and was distributed evenly throughout the range at December 31, 2012. For long-dated inflation rates and volatilities as well as long-dated volatilities (FX), the inputs were concentrated in the middle of the range.
For more information on the inputs and techniques used in the valuation of MSRs, see Note 23 – Mortgage Servicing Rights.
76788ba_financials.indd 264 3/6/14 12:07 PM

Bank of America 2013 265
Sensitivity of Fair Value Measurements to Changes in Unobservable Inputs
Loans and SecuritiesFor instruments backed by residential real estate assets, commercial real estate assets, and commercial loans, debt securities and other, a significant increase in market yields, default rates, loss severities or duration would result in a significantly lower fair value for long positions. Short positions would be impacted in a directionally opposite way. The impact of changes in prepayment speeds would have differing impacts depending on the seniority of the instrument and, in the case of CLOs, whether prepayments can be reinvested.
For closed-end auction rate securities (ARS), a significant increase in discount rates would result in a significantly lower fair value. For student loan and municipal ARS, a significant increase in projected tender price/refinancing levels would result in a significantly higher fair value.
Structured Liabilities and DerivativesFor credit derivatives, a significant increase in market yield, including spreads to indices, upfront points (i.e., a single upfront payment made by a protection buyer at inception), credit spreads, default rates or loss severities would result in a significantly lower fair value for protection sellers and higher fair value for protection buyers. The impact of changes in prepayment speeds would have differing impacts depending on the seniority of the instrument and, in the case of CLOs, whether prepayments can be reinvested.
Structured credit derivatives, which include tranched portfolio CDS and derivatives with derivative product company (DPC) and monoline counterparties, are impacted by credit correlation,
including default and wrong-way correlation. Default correlation is a parameter that describes the degree of dependence among credit default rates within a credit portfolio that underlies a credit derivative instrument. The sensitivity of this input on the fair value varies depending on the level of subordination of the tranche. For senior tranches that are net purchases of protection, a significant increase in default correlation would result in a significantly higher fair value. Net short protection positions would be impacted in a directionally opposite way. Wrong-way correlation is a parameter that describes the probability that, as exposure to a counterparty increases, the credit quality of the counterparty decreases. A significantly higher degree of wrong-way correlation between a DPC counterparty and underlying derivative exposure would result in a significantly lower fair value.
For equity derivatives, interest rate derivatives and structured liabilities, a significant change in long-dated rates and volatilities and correlation inputs (e.g., the degree of correlation between an equity security and an index, between two different interest rates, or between interest rates and foreign exchange rates) would result in a significant impact to the fair value; however, the magnitude and direction of the impact depends on whether the Corporation is long or short the exposure.
Nonrecurring Fair ValueThe Corporation holds certain assets that are measured at fair value, but only in certain situations (e.g., impairment) and these measurements are referred to herein as nonrecurring. These assets primarily include LHFS, certain loans and leases, and foreclosed properties. The amounts below represent only balances measured at fair value during 2013, 2012 and 2011, and still held as of the reporting date.
Assets Measured at Fair Value on a Nonrecurring Basis
December 31 2013 2012
(Dollars in millions) Level 2 Level 3 Level 2 Level 3Assets
Loans held-for-sale $ 2,138 $ 115 $ 5,692 $ 1,136Loans and leases 18 5,240 21 9,184Foreclosed properties (1) 12 1,258 33 1,918Other assets 88 — 36 12
Gains (Losses)
2013 2012 2011Assets
Loans held-for-sale $ (71) $ (24) $ (188)Loans and leases (2) (1,104) (3,116) (4,813)Foreclosed properties (1) (39) (47) (167)Other assets (20) (16) —
(1) Amounts are included in other assets on the Consolidated Balance Sheet and represent fair value of, and related losses on, foreclosed properties that were written down subsequent to their initial classification as foreclosed properties.
(2) Losses represent charge-offs on real estate-secured loans.
76788ba_financials.indd 265 3/6/14 12:07 PM

266 Bank of America 2013
The table below presents information about significant unobservable inputs related to the Corporation’s nonrecurring Level 3 financial assets and liabilities at December 31, 2013 and 2012.
Quantitative Information about Nonrecurring Level 3 Fair Value Measurements
December 31, 2013(Dollars in millions) Inputs
Financial InstrumentFair
ValueValuation Technique
Significant Unobservable Inputs
Ranges of Inputs
WeightedAverage
Instruments backed by residential real estate assets $ 5,240Market comparables
OREO discount 0% to 19% 8%Loans and leases 5,240 Cost to sell 8% n/a
December 31, 2012Instruments backed by residential real estate assets $ 9,932
Discounted cashflow, Marketcomparables
Yield 3% to 5% 3%Loans held-for-sale 748 Prepayment speed 3% to 30% 15%Loans and leases 9,184 Default rate 0% to 55% 7%
Loss severity 6% to 66% 48%OREO discount 0% to 28% 15%Cost to sell 8% n/a
Instruments backed by commercial real estate assets $ 388 Discounted cashflow
Yield 4% to 13% 6%Loans held-for-sale 388 Loss severity 24% to 88% 53%
n/a = not applicable
Instruments backed by residential real estate assets represent residential mortgages where the loan has been written down to the fair value of the underlying collateral or, in the case of LHFS, are carried at the lower of cost or fair value. In addition to the instruments disclosed in the table above, the Corporation holds foreclosed residential properties where the fair value is based on unadjusted third-party appraisals or broker price opinions. Appraisals are generally conducted every 90 days. Factors considered in determining the fair value include geographic sales trends, the value of comparable surrounding properties as well as the condition of the property.
NOTE 21 Fair Value Option
Loans and Loan CommitmentsThe Corporation elects to account for certain commercial loans and loan commitments that exceed the Corporation’s single name credit risk concentration guidelines under the fair value option. Lending commitments, both funded and unfunded, are actively managed and monitored and, as appropriate, credit risk for these lending relationships may be mitigated through the use of credit derivatives, with the Corporation’s public side credit view and market perspectives determining the size and timing of the hedging activity. These credit derivatives do not meet the requirements for designation as accounting hedges and therefore are carried at fair value with changes in fair value recorded in other income (loss). Electing the fair value option allows the Corporation to carry these loans and loan commitments at fair value, which is more consistent with management’s view of the underlying economics and the manner in which they are managed. In addition, election of the fair value option allows the Corporation to reduce the accounting volatility that would otherwise result from the asymmetry created by accounting for the financial instruments at historical cost and the credit derivatives at fair value. The Corporation also elected the fair value option for certain residential mortgage loans that
were classified as held-for-sale and certain loans held in consolidated VIEs. Of the changes in fair value of these loans, gains of $315 million and $1.2 billion were attributable to changes in borrower-specific credit risk in 2013 and 2012.
Loans Held-for-saleThe Corporation elects to account for residential mortgage LHFS, commercial mortgage LHFS and other LHFS under the fair value option with interest income on these LHFS recorded in other interest income. These loans are actively managed and monitored and, as appropriate, certain market risks of the loans may be mitigated through the use of derivatives. The Corporation has elected not to designate the derivatives as qualifying accounting hedges and therefore they are carried at fair value with changes in fair value recorded in other income (loss). The changes in fair value of the loans are largely offset by changes in the fair value of the derivatives. Of the changes in fair value of these loans, gains of $225 million and $425 million were attributable to changes in borrower-specific credit risk in 2013 and 2012. Election of the fair value option allows the Corporation to reduce the accounting volatility that would otherwise result from the asymmetry created by accounting for the financial instruments at the lower of cost or fair value and the derivatives at fair value. The Corporation has not elected to account for other LHFS under the fair value option primarily because these loans are floating-rate loans that are not hedged using derivative instruments.
Loans Reported as Trading Account AssetsThe Corporation elects to account for certain loans that are held for the purpose of trading and risk-managed on a fair value basis under the fair value option. An immaterial portion of the changes in fair value of these loans was attributable to changes in borrower-specific credit risk in 2013 and 2012.
76788ba_financials.indd 266 3/6/14 12:07 PM

Bank of America 2013 267
Other AssetsThe Corporation elects to account for certain private equity investments that are not in an investment company under the fair value option as this measurement basis is consistent with applicable accounting guidance for similar investments that are in an investment company. The Corporation also elects to account for certain long-term fixed-rate margin loans that are hedged with derivatives under the fair value option. Election of the fair value option allows the Corporation to reduce the accounting volatility that would otherwise result from the asymmetry created by accounting for the financial instruments at historical cost and the derivatives at fair value.
Securities Financing AgreementsThe Corporation elects to account for certain securities financing agreements, including resale and repurchase agreements, under the fair value option based on the tenor of the agreements, which reflects the magnitude of the interest rate risk. The majority of securities financing agreements collateralized by U.S. government securities are not accounted for under the fair value option as these contracts are generally short-dated and therefore the interest rate risk is not significant.
Long-term DepositsThe Corporation elects to account for certain long-term fixed-rate and rate-linked deposits that are hedged with derivatives that do not qualify for hedge accounting under the fair value option. Election of the fair value option allows the Corporation to reduce the accounting volatility that would otherwise result from the
asymmetry created by accounting for the financial instruments at historical cost and the derivatives at fair value. The Corporation did not elect to carry other long-term deposits at fair value because they were not hedged using derivatives.
Short-term BorrowingsThe Corporation elects to account for certain short-term borrowings, primarily short-term structured liabilities, under the fair value option because this debt is risk-managed on a fair value basis.
The Corporation elects to account for certain asset-backed secured financings, which are also classified in short-term borrowings, under the fair value option. Election of the fair value option allows the Corporation to reduce the accounting volatility that would otherwise result from the asymmetry created by accounting for the asset-backed secured financings at historical cost and the corresponding mortgage LHFS securing these financings at fair value.
Long-term DebtThe Corporation elects to account for certain long-term debt, primarily structured liabilities, under the fair value option. This long-term debt is either risk-managed on a fair value basis or the related hedges do not qualify for hedge accounting.
The table below provides information about the fair value carrying amount and the contractual principal outstanding of assets and liabilities accounted for under the fair value option at December 31, 2013 and 2012.
Fair Value Option Elections
December 31 2013 2012
(Dollars in millions)
Fair ValueCarryingAmount
ContractualPrincipal
Outstanding
Fair ValueCarrying
Amount LessUnpaid
Principal
Fair ValueCarryingAmount
ContractualPrincipal
Outstanding
Fair ValueCarrying
Amount LessUnpaid
Principal
Loans reported as trading account assets (1) $ 2,200 $ 4,315 $ (2,115) $ 1,663 $ 2,879 $ (1,216)Trading inventory - other 5,475 n/a n/a 2,170 n/a n/aConsumer and commercial loans 10,042 10,423 (381) 9,002 9,576 (574)Loans held-for-sale 6,656 6,996 (340) 11,659 12,676 (1,017)Securities financing agreements 109,298 109,032 266 141,309 140,791 518Other assets 278 270 8 453 270 183Long-term deposits 1,899 2,115 (216) 2,262 2,046 216Asset-backed secured financings — — — 741 1,176 (435)Unfunded loan commitments 354 n/a n/a 528 n/a n/aShort-term borrowings 1,520 1,520 — 3,333 3,333 —Long-term debt (2, 3) 47,035 46,669 366 49,161 50,792 (1,631)
(1) A significant portion of the loans reported as trading account assets are distressed loans which trade and were purchased at a deep discount to par, and the remainder are loans with a fair value near contractual principal outstanding.
(2) The majority of the difference between the fair value carrying amount and contractual principal outstanding at December 31, 2013 and 2012 relates to the impact of the Corporation’s credit spreads as well as the fair value of the embedded derivative, where applicable.
(3) Includes structured liabilities with a fair value of $40.7 billion and contractual principal outstanding of $39.7 billion at December 31, 2013 compared to $39.3 billion and $39.9 billion at December 31, 2012.
n/a = not applicable
76788ba_financials.indd 267 3/6/14 12:07 PM

268 Bank of America 2013
The table below provides information about where changes in the fair value of assets and liabilities accounted for under the fair value option are included in the Consolidated Statement of Income for 2013, 2012 and 2011.
Gains (Losses) Relating to Assets and Liabilities Accounted for Under the Fair Value Option
2013
(Dollars in millions)
TradingAccountProfits
(Losses)
Mortgage Banking Income (Loss)
Other Income (Loss) Total
Loans reported as trading account assets $ 83 $ — $ — $ 83
Trading inventory - other (1) 1,355 — — 1,355
Consumer and commercial loans (28) (38) 240 174
Loans held-for-sale (2) 7 966 75 1,048
Securities financing agreements (80) — — (80)
Other assets — — (77) (77)
Long-term deposits 30 — 84 114
Asset-backed secured financings — (91) — (91)
Unfunded loan commitments — — 180 180
Short-term borrowings (70) — — (70)
Long-term debt (3) (602) — (649) (1,251)
Total $ 695 $ 837 $ (147) $ 1,385
2012Loans reported as trading account assets $ 232 $ — $ — $ 232Trading inventory - other (1) 659 — — 659Consumer and commercial loans 17 — 542 559Loans held-for-sale (2) 75 3,048 190 3,313Securities financing agreements (90) — — (90)Other assets — — 12 12Long-term deposits — — 29 29Asset-backed secured financings — (180) — (180)Unfunded loan commitments — — 704 704Short-term borrowings 1 — — 1Long-term debt (3) (1,888) — (5,107) (6,995)
Total $ (994) $ 2,868 $ (3,630) $ (1,756)
2011Loans reported as trading account assets $ 73 $ — $ — $ 73Consumer and commercial loans 15 — (275) (260)Loans held-for-sale (2) (20) 4,535 148 4,663Securities financing agreements 127 — — 127Other assets — — 196 196Long-term deposits — — (77) (77)Asset-backed secured financings — (30) — (30)Unfunded loan commitments — — (429) (429)Short-term borrowings 261 — — 261Long-term debt (3) 2,149 — 3,320 5,469
Total $ 2,605 $ 4,505 $ 2,883 $ 9,993(1) The gains in trading account profits (losses) are primarily offset by losses on trading liabilities that hedge these assets.(2) Includes the value of interest rate lock commitments on loans funded, including those already sold during the period.(3) The majority of the net gains (losses) in trading account profits (losses) relate to the embedded derivative in structured liabilities and are offset by gains (losses) on derivatives and securities that
hedge these liabilities. The net gains (losses) in other income (loss) relate to the impact on structured liabilities of changes in the Corporation’s credit spreads.
NOTE 22 Fair Value of Financial InstrumentsThe fair values of financial instruments and their classifications within the fair value hierarchy have been derived using methodologies described in Note 20 – Fair Value Measurements. The following disclosures include financial instruments where only a portion of the ending balance at December 31, 2013 and 2012 was carried at fair value on the Consolidated Balance Sheet.
Short-term Financial InstrumentsThe carrying value of short-term financial instruments, including cash and cash equivalents, time deposits placed and other short-term investments, federal funds sold and purchased, certain
resale and repurchase agreements, customer and other receivables, customer payables (within accrued expenses and other liabilities on the Consolidated Balance Sheet), and short-term borrowings approximates the fair value of these instruments. These financial instruments generally expose the Corporation to limited credit risk and have no stated maturities or have short-term maturities and carry interest rates that approximate market. The Corporation elected to account for certain resale and repurchase agreements under the fair value option.
Under the fair value hierarchy, cash and cash equivalents are classified as Level 1. Time deposits placed and other short-term investments, such as U.S. government securities and short-term
76788ba_financials.indd 268 3/6/14 12:07 PM

Bank of America 2013 269
commercial paper, are classified as Level 1 and Level 2. Federal funds sold and purchased are classified as Level 2. Resale and repurchase agreements are classified as Level 2 because they are generally short-dated and/or variable-rate instruments collateralized by U.S. government or agency securities. Customer and other receivables primarily consist of margin loans, servicing advances and other accounts receivable and are classified as Level 2 and Level 3. Customer payables and short-term borrowings are classified as Level 2.
Held-to-maturity Debt SecuritiesHTM debt securities, which consist of U.S. agency debt securities, are classified as Level 2 using the same methodologies as AFS U.S. agency debt securities. For more information on HTM debt securities, see Note 3 – Securities.
LoansThe fair values for commercial and consumer loans are generally determined by discounting both principal and interest cash flows expected to be collected using a discount rate for similar instruments with adjustments that the Corporation believes a market participant would consider in determining fair value. The Corporation estimates the cash flows expected to be collected using internal credit risk, interest rate and prepayment risk models that incorporate the Corporation’s best estimate of current key assumptions, such as default rates, loss severity and prepayment speeds for the life of the loan. The carrying value of loans is presented net of the applicable allowance for loan losses and excludes leases. The Corporation elected to account for certain commercial loans and residential mortgage loans under the fair value option.
DepositsThe fair value for certain deposits with stated maturities was determined by discounting contractual cash flows using current market rates for instruments with similar maturities. The carrying value of non-U.S. time deposits approximates fair value. For deposits with no stated maturities, the carrying value was considered to approximate fair value and does not take into account the significant value of the cost advantage and stability of the Corporation’s long-term relationships with depositors. The Corporation accounts for certain long-term fixed-rate deposits under the fair value option.
Long-term DebtThe Corporation uses quoted market prices, when available, to estimate fair value for its long-term debt. When quoted market prices are not available, fair value is estimated based on current
market interest rates and credit spreads for debt with similar terms and maturities. The Corporation accounts for certain structured liabilities under the fair value option.
Fair Value of Financial InstrumentsThe carrying values and fair values by fair value hierarchy of certain financial instruments where only a portion of the ending balance was carried at fair value at December 31, 2013 and 2012 are presented in the table below.
Fair Value of Financial Instruments
December 31, 2013
Fair Value
(Dollars in millions)Carrying
Value Level 2 Level 3 Total
Financial assets
Loans $ 885,724 $ 102,564 $ 789,273 $ 891,837
Loans held-for-sale 11,362 8,872 2,613 11,485
Financial liabilities
Deposits 1,119,271 1,119,512 — 1,119,512
Long-term debt 249,674 257,402 1,990 259,392
December 31, 2012Financial assets
Loans $ 859,875 $ 105,119 $ 772,761 $ 877,880Loans held-for-sale 19,413 15,087 4,321 19,408
Financial liabilities Deposits 1,105,261 1,105,669 — 1,105,669Long-term debt 275,585 281,173 2,301 283,474
Commercial Unfunded Lending CommitmentsFair values were generally determined using a discounted cash flow valuation approach which is applied using market-based CDS or internally developed benchmark credit curves. The Corporation accounts for certain loan commitments under the fair value option.
The carrying values and fair values of the Corporation’s commercial unfunded lending commitments were $830 million and $3.7 billion at December 31, 2013, and $1.0 billion and $4.5 billion at December 31, 2012. Commercial unfunded lending commitments are primarily classified as Level 3. The carrying value of these commitments is classified in accrued expenses and other liabilities.
The Corporation does not estimate the fair values of consumer unfunded lending commitments because, in many instances, the Corporation can reduce or cancel these commitments by providing notice to the borrower. For more information on commitments, see Note 12 – Commitments and Contingencies.
76788ba_financials.indd 269 3/6/14 12:07 PM

270 Bank of America 2013
NOTE 23 Mortgage Servicing RightsThe Corporation accounts for consumer MSRs at fair value with changes in fair value recorded in mortgage banking income (loss) in the Consolidated Statement of Income. The Corporation manages the risk in these MSRs with securities including MBS and U.S. Treasuries, as well as certain derivatives such as options and interest rate swaps, which are not designated as accounting hedges. The securities used to manage the risk in the MSRs are classified in other assets with changes in the fair value of the securities and the related interest income recorded in mortgage banking income (loss).
The table below presents activity for residential mortgage and home equity MSRs for 2013 and 2012. Commercial and residential reverse MSRs, which are carried at the lower of cost or market value and accounted for using the amortization method, totaled $10 million and $135 million at December 31, 2013 and 2012, and are not included in the tables in this Note.
Rollforward of Mortgage Servicing Rights
(Dollars in millions) 2013 2012Balance, January 1 $ 5,716 $ 7,378
Additions 472 374Sales (2,044) (122)Amortization of expected cash flows (1) (1,043) (1,484)
Impact of changes in interest rates and other market factors (2) 1,524 (867)
Model and other cash flow assumption changes: (3)
Projected cash flows, primarily due to (increases)decreases in costs to service loans (27) 443
Impact of changes in the Home Price Index (398) (112)Impact of changes to the prepayment model 609 435Other model changes (4) 233 (329)
Balance, December 31 $ 5,042 $ 5,716Mortgage loans serviced for investors (in billions) $ 550 $ 1,045
(1) Represents the net change in fair value of the MSR asset due to the recognition of modeled cash flows.
(2) These amounts reflect the changes in modeled MSR fair value primarily due to observed changes in interest rates, volatility, spreads and the shape of the forward swap curve.
(3) These amounts reflect periodic adjustments to the valuation model to reflect changes in the modeled relationship between inputs and their impact on projected cash flows as well as changes in certain cash flow assumptions such as cost to service and ancillary income per loan.
(4) These amounts include the impact of periodic recalibrations of the model to reflect changes in the relationship between market interest rate spreads and projected cash flows. Also included is a decrease of $497 million for 2012 due to changes in OAS rate inputs.
The Corporation primarily uses an OAS valuation approach which factors in prepayment risk to determine the fair value of MSRs. This approach consists of projecting servicing cash flows under multiple interest rate scenarios and discounting these cash flows using risk-adjusted discount rates. In addition to updating the valuation model for interest, discount and prepayment rates, periodic adjustments are made to recalibrate the valuation model for factors used to project cash flows. The changes to the factors capture the effect of variances related to actual versus estimated servicing proceeds.
The $2.0 billion of MSR sales during 2013 primarily relate to transfers completed under definitive agreements the Corporation entered into during the year to sell certain MSRs. The transfers
of the MSRs occurred in stages throughout 2013, and all of the servicing encompassed by these agreements had been transferred as of December 31, 2013.
Significant economic assumptions in estimating the fair value of MSRs at December 31, 2013 and 2012 are presented below. The change in fair value as a result of changes in OAS rates is included within “Model and other cash flow assumption changes” in the Rollforward of Mortgage Servicing Rights table. The weighted-average life is not an input in the valuation model but is a product of both changes in market rates of interest and changes in model and other cash flow assumptions. The weighted-average life represents the average period of time that the MSRs’ cash flows are expected to be received. Absent other changes, an increase (decrease) to the weighted-average life would generally result in an increase (decrease) in the fair value of the MSRs.
Significant Economic Assumptions
December 31
2013 2012Fixed Adjustable Fixed Adjustable
Weighted-average OAS 3.97% 7.61% 4.00% 6.63%Weighted-average life, in years 5.70 2.86 3.65 2.10
The table below presents the sensitivity of the weighted-average lives and fair value of MSRs to changes in modeled assumptions. These sensitivities are hypothetical and should be used with caution. As the amounts indicate, changes in fair value based on variations in assumptions generally cannot be extrapolated because the relationship of the change in assumption to the change in fair value may not be linear. Also, the effect of a variation in a particular assumption on the fair value of MSRs that continue to be held by the Corporation is calculated without changing any other assumption. In reality, changes in one factor may result in changes in another, which might magnify or counteract the sensitivities. The below sensitivities do not reflect any hedge strategies that may be undertaken to mitigate such risk.
Sensitivity Impacts
December 31, 2013
Change inWeighted-average Lives
(Dollars in millions) Fixed AdjustableChange inFair Value
Prepayment rates Impact of 10% decrease 0.24 years 0.20 years $ 266Impact of 20% decrease 0.51 0.42 558Impact of 10% increase (0.22) (0.17) (244)Impact of 20% increase (0.42) (0.32) (469)
OAS level Impact of 100 bps decrease $ 268Impact of 200 bps decrease 561Impact of 100 bps increase (247)Impact of 200 bps increase (474)
76788ba_financials.indd 270 3/6/14 12:07 PM

Bank of America 2013 271
NOTE 24 Business Segment InformationThe Corporation reports the results of its operations through five business segments: Consumer & Business Banking (CBB), Consumer Real Estate Services (CRES), Global Wealth & Investment Management (GWIM), Global Banking and Global Markets, with the remaining operations recorded in All Other.
Consumer & Business BankingCBB offers a diversified range of credit, banking and investment products and services to consumers and businesses. CBB product offerings include traditional savings accounts, money market savings accounts, CDs and IRAs, noninterest- and interest-bearing checking accounts, investment accounts and products as well as credit and debit cards in the U.S. to consumers and small businesses. Customers and clients have access to a franchise network that stretches coast to coast through 31 states and the District of Columbia. The franchise network includes approximately 5,100 banking centers, 16,300 ATMs, nationwide call centers, and online and mobile platforms. CBB also offers a wide range of lending-related products and services, integrated working capital management and treasury solutions through a network of offices and client relationship teams along with various product partners to U.S.-based companies generally with annual sales of $1 million to $50 million. During 2013, consumer DFS results were moved to CBB from Global Banking to align this business more closely with the Corporation’s consumer lending activity and better serve the needs of its customers. Prior periods were reclassified to conform to current period presentation.
Consumer Real Estate ServicesCRES provides an extensive line of consumer real estate products and services to customers nationwide. CRES products include fixed- and adjustable-rate first-lien mortgage loans for home purchase and refinancing needs, HELOCs and home equity loans. First mortgage products are generally either sold into the secondary mortgage market to investors, while retaining MSRs and the Bank of America customer relationships, or are held on the balance sheet in All Other for ALM purposes. Newly originated HELOCs and home equity loans are retained on the CRES balance sheet. CRES services mortgage loans, including those loans it owns, loans owned by other business segments and All Other, and loans owned by outside investors.
The financial results of the on-balance sheet loans are reported in the business segment that owns the loans or All Other. CRES is not impacted by the Corporation’s first mortgage production retention decisions as CRES is compensated for loans held for ALM purposes on a management accounting basis, with a corresponding offset recorded in All Other, and for servicing loans owned by other business segments and All Other.
Global Wealth & Investment ManagementGWIM provides comprehensive wealth management solutions to a broad base of clients from emerging affluent to ultra high net-worth. These services include investment and brokerage services, estate and financial planning, fiduciary portfolio management, cash and liability management, and specialty asset management. GWIM also provides retirement and benefit plan services, philanthropic management and asset management to individual and institutional clients.
Global BankingGlobal Banking provides a wide range of lending-related products and services, integrated working capital management and treasury solutions to clients, and underwriting and advisory services through the Corporation’s network of offices and client relationship teams. Global Banking’s lending products and services include commercial loans, leases, commitment facilities, trade finance, real estate lending and asset-based lending. Global Banking’s treasury solutions business includes treasury management, foreign exchange and short-term investing options. Global Banking also works with clients to provide investment banking products such as debt and equity underwriting and distribution, and merger-related and other advisory services. The economics of most investment banking and underwriting activities are shared primarily between Global Banking and Global Markets based on the activities performed by each segment. Global Banking clients generally include middle-market companies, commercial real estate firms, auto dealerships, not-for-profit companies, large global corporations, financial institutions and leasing clients. During 2013, the results of consumer DFS, previously reported in Global Banking, were moved into CBB and prior periods have been reclassified to conform to current period presentation.
Global MarketsGlobal Markets offers sales and trading services, including research, to institutional clients across fixed-income, credit, currency, commodity and equity businesses. Global Markets product coverage includes securities and derivative products in both the primary and secondary markets. Global Markets provides market-making, financing, securities clearing, settlement and custody services globally to institutional investor clients in support of their investing and trading activities. Global Markets also works with commercial and corporate clients to provide risk management products using interest rate, equity, credit, currency and commodity derivatives, foreign exchange, fixed-income and mortgage-related products. As a result of market-making activities in these products, Global Markets may be required to manage risk in a broad range of financial products including government securities, equity and equity-linked securities, high-grade and high-yield corporate debt securities, syndicated loans, MBS, commodities and ABS. The economics of most investment banking and underwriting activities are shared primarily between Global Markets and Global Banking based on the activities performed by each segment.
All OtherAll Other consists of ALM activities, equity investments, the international consumer card business, liquidating businesses, residual expense allocations and other. ALM activities encompass the whole-loan residential mortgage portfolio and investment securities, interest rate and foreign currency risk management activities including the residual net interest income allocation, gains/losses on structured liabilities, the impact of certain allocation methodologies and accounting hedge ineffectiveness. The results of certain ALM activities are allocated to the business segments. Additionally, certain residential mortgage loans that are managed by CRES are held in All Other.
76788ba_financials.indd 271 3/6/14 12:07 PM

272 Bank of America 2013
Basis of PresentationThe management accounting and reporting process derives segment and business results by utilizing allocation methodologies for revenue and expense. The net income derived for the businesses is dependent upon revenue and cost allocations using an activity-based costing model, funds transfer pricing, and other methodologies and assumptions management believes are appropriate to reflect the results of the business.
Total revenue, net of interest expense, includes net interest income on a FTE basis and noninterest income. The adjustment of net interest income to a FTE basis results in a corresponding increase in income tax expense. The segment results also reflect certain revenue and expense methodologies that are utilized to determine net income. The net interest income of the businesses includes the results of a funds transfer pricing process that matches assets and liabilities with similar interest rate sensitivity and maturity characteristics. For presentation purposes, in segments where the total of liabilities and equity exceeds assets, which are generally deposit-taking segments, the Corporation allocates assets to match liabilities. Net interest income of the business segments also includes an allocation of net interest income generated by certain of the Corporation’s ALM activities. In addition, the business segments are impacted by the migration of customers and clients and their deposit and loan balances between client-managed businesses, primarily CBB, CRES and GWIM. Subsequent to the date of migration, the associated net
interest income, noninterest income and noninterest expense are recorded in the business to which the customers or clients migrated.
The Corporation’s ALM activities include an overall interest rate risk management strategy that incorporates the use of various derivatives and cash instruments to manage fluctuations in earnings and capital that are caused by interest rate volatility. The Corporation’s goal is to manage interest rate sensitivity so that movements in interest rates do not significantly adversely affect earnings and capital. The results of a majority of the Corporation’s ALM activities are allocated to the business segments and fluctuate based on the performance of the ALM activities. ALM activities include external product pricing decisions including deposit pricing strategies, the effects of the Corporation’s internal funds transfer pricing process and the net effects of other ALM activities.
Certain expenses not directly attributable to a specific business segment are allocated to the segments. The most significant of these expenses include data and item processing costs and certain centralized or shared functions. Data processing costs are allocated to the segments based on equipment usage. Item processing costs are allocated to the segments based on the volume of items processed for each segment. The costs of certain other centralized or shared functions are allocated based on methodologies that reflect utilization.
76788ba_financials.indd 272 3/6/14 12:07 PM

Bank of America 2013 273
The following tables present net income and the components thereto (with net interest income on a FTE basis) for 2013, 2012 and 2011, and total assets at December 31, 2013 and 2012 for each business segment, as well as All Other.
Business Segments
At and for the Year Ended December 31 Total Corporation (1) Consumer & Business Banking Consumer Real Estate Services(Dollars in millions) 2013 2012 2011 2013 2012 2011 2013 2012 2011Net interest income (FTE basis) $ 43,124 $ 41,557 $ 45,588 $ 20,051 $ 19,853 $ 22,249 $ 2,890 $ 2,930 $ 3,209Noninterest income (loss) 46,677 42,678 48,838 9,816 9,937 11,572 4,826 5,821 (6,310)
Total revenue, net of interest expense (FTE basis) 89,801 84,235 94,426 29,867 29,790 33,821 7,716 8,751 (3,101)Provision for credit losses 3,556 8,169 13,410 3,107 4,148 3,677 (156) 1,442 4,523Amortization of intangibles 1,086 1,264 1,509 505 626 759 — — 11Goodwill impairment — — 3,184 — — — — — 2,603Other noninterest expense 68,128 70,829 75,581 15,852 16,369 17,153 16,013 17,190 19,055
Income (loss) before income taxes 17,031 3,973 742 10,403 8,647 12,232 (8,141) (9,881) (29,293)Income tax expense (benefit) (FTE basis) 5,600 (215) (704) 3,815 3,101 4,431 (2,986) (3,442) (9,939)
Net income (loss) $ 11,431 $ 4,188 $ 1,446 $ 6,588 $ 5,546 $ 7,801 $ (5,155) $ (6,439) $ (19,354)Year-end total assets $ 2,102,273 $2,209,974 $ 592,978 $554,915 $ 113,386 $131,059
Global Wealth &
Investment Management Global Banking
2013 2012 2011 2013 2012 2011Net interest income (FTE basis) $ 6,064 $ 5,827 $ 5,885 $ 8,914 $ 8,135 $ 8,233Noninterest income 11,726 10,691 10,610 7,567 7,539 7,361
Total revenue, net of interest expense (FTE basis) 17,790 16,518 16,495 16,481 15,674 15,594Provision for credit losses 56 266 398 1,075 (342) (1,308)Amortization of intangibles 387 410 437 62 79 101Other noninterest expense 12,651 12,311 12,899 7,490 7,540 7,928
Income before income taxes 4,696 3,531 2,761 7,854 8,397 8,873Income tax expense (FTE basis) 1,722 1,286 1,014 2,880 3,053 3,251
Net income $ 2,974 $ 2,245 $ 1,747 $ 4,974 $ 5,344 $ 5,622Year-end total assets $ 274,112 $297,326 $ 379,207 $331,611
Global Markets All Other
2013 2012 2011 2013 2012 2011Net interest income (FTE basis) $ 4,239 $ 3,672 $ 4,068 $ 966 $ 1,140 $ 1,944Noninterest income (loss) 11,819 10,612 11,507 923 (1,922) 14,098
Total revenue, net of interest expense (FTE basis) 16,058 14,284 15,575 1,889 (782) 16,042Provision for credit losses 140 34 (53) (666) 2,621 6,173Amortization of intangibles 65 64 66 67 85 135Goodwill impairment — — — — — 581Other noninterest expense 11,948 11,231 12,824 4,174 6,188 5,722
Income (loss) before income taxes 3,905 2,955 2,738 (1,686) (9,676) 3,431Income tax expense (benefit) (FTE basis) 2,342 1,726 1,669 (2,173) (5,939) (1,130)
Net income (loss) $ 1,563 $ 1,229 $ 1,069 $ 487 $ (3,737) $ 4,561Year-end total assets $ 575,709 $632,263 $ 166,881 $262,800
(1) There were no material intersegment revenues.
76788ba_financials.indd 273 3/6/14 12:07 PM

274 Bank of America 2013
The table below presents a reconciliation of the five business segments’ total revenue, net of interest expense, on a FTE basis, and net income to the Consolidated Statement of Income, and total assets to the Consolidated Balance Sheet. The adjustments presented in the table below include consolidated income, expense and asset amounts not specifically allocated to individual business segments.
Business Segment Reconciliations
(Dollars in millions) 2013 2012 2011Segments’ total revenue, net of interest expense (FTE basis) $ 87,912 $ 85,017 $ 78,384Adjustments:
ALM activities (1) (986) (2,412) 7,576Equity investment income 2,610 1,135 7,105Liquidating businesses and other 265 495 1,361FTE basis adjustment (859) (901) (972)
Consolidated revenue, net of interest expense $ 88,942 $ 83,334 $ 93,454Segments’ net income (loss) $ 10,944 $ 7,925 $ (3,115)Adjustments, net of taxes:
ALM activities (1,207) (4,087) 513Equity investment income 1,644 715 4,476Liquidating businesses and other 50 (365) (26)Merger and restructuring charges — — (402)
Consolidated net income $ 11,431 $ 4,188 $ 1,446
December 31
2013 2012Segments’ total assets $ 1,935,392 $ 1,947,174Adjustments:
ALM activities, including securities portfolio 664,302 655,915Equity investments 2,411 5,508Liquidating businesses and other 70,435 138,974Elimination of segment asset allocations to match liabilities (570,267) (537,597)
Consolidated total assets $ 2,102,273 $ 2,209,974(1) Includes negative fair value adjustments on structured liabilities related to changes in the Corporation’s credit spreads of $649 million and $5.1 billion in 2013 and 2012 compared to positive
adjustments of $3.3 billion in 2011.
76788ba_financials.indd 274 3/6/14 12:07 PM
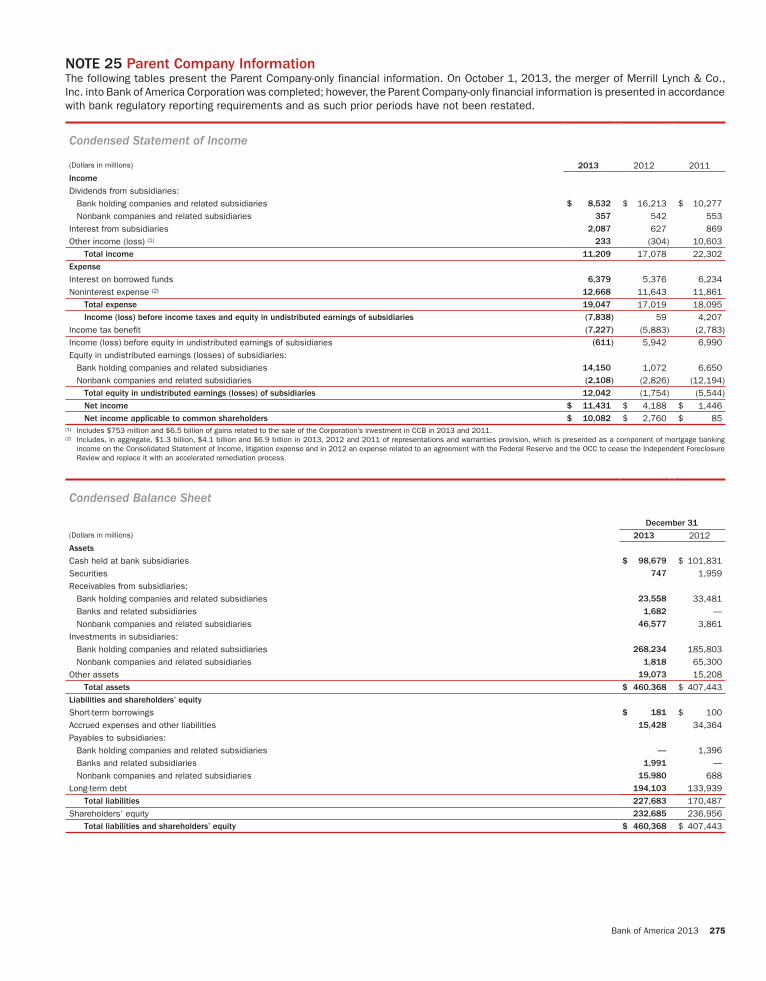
Bank of America 2013 275
NOTE 25 Parent Company InformationThe following tables present the Parent Company-only financial information. On October 1, 2013, the merger of Merrill Lynch & Co., Inc. into Bank of America Corporation was completed; however, the Parent Company-only financial information is presented in accordance with bank regulatory reporting requirements and as such prior periods have not been restated.
Condensed Statement of Income
(Dollars in millions) 2013 2012 2011Income Dividends from subsidiaries:
Bank holding companies and related subsidiaries $ 8,532 $ 16,213 $ 10,277Nonbank companies and related subsidiaries 357 542 553
Interest from subsidiaries 2,087 627 869Other income (loss) (1) 233 (304) 10,603
Total income 11,209 17,078 22,302Expense Interest on borrowed funds 6,379 5,376 6,234Noninterest expense (2) 12,668 11,643 11,861
Total expense 19,047 17,019 18,095Income (loss) before income taxes and equity in undistributed earnings of subsidiaries (7,838) 59 4,207
Income tax benefit (7,227) (5,883) (2,783)Income (loss) before equity in undistributed earnings of subsidiaries (611) 5,942 6,990Equity in undistributed earnings (losses) of subsidiaries:
Bank holding companies and related subsidiaries 14,150 1,072 6,650Nonbank companies and related subsidiaries (2,108) (2,826) (12,194)
Total equity in undistributed earnings (losses) of subsidiaries 12,042 (1,754) (5,544)Net income $ 11,431 $ 4,188 $ 1,446Net income applicable to common shareholders $ 10,082 $ 2,760 $ 85
(1) Includes $753 million and $6.5 billion of gains related to the sale of the Corporation’s investment in CCB in 2013 and 2011.(2) Includes, in aggregate, $1.3 billion, $4.1 billion and $6.9 billion in 2013, 2012 and 2011 of representations and warranties provision, which is presented as a component of mortgage banking
income on the Consolidated Statement of Income, litigation expense and in 2012 an expense related to an agreement with the Federal Reserve and the OCC to cease the Independent Foreclosure Review and replace it with an accelerated remediation process.
Condensed Balance Sheet
December 31(Dollars in millions) 2013 2012Assets Cash held at bank subsidiaries $ 98,679 $ 101,831Securities 747 1,959Receivables from subsidiaries:
Bank holding companies and related subsidiaries 23,558 33,481Banks and related subsidiaries 1,682 —Nonbank companies and related subsidiaries 46,577 3,861
Investments in subsidiaries: Bank holding companies and related subsidiaries 268,234 185,803Nonbank companies and related subsidiaries 1,818 65,300
Other assets 19,073 15,208Total assets $ 460,368 $ 407,443
Liabilities and shareholders’ equity Short-term borrowings $ 181 $ 100Accrued expenses and other liabilities 15,428 34,364Payables to subsidiaries:
Bank holding companies and related subsidiaries — 1,396Banks and related subsidiaries 1,991 —Nonbank companies and related subsidiaries 15,980 688
Long-term debt 194,103 133,939Total liabilities 227,683 170,487
Shareholders’ equity 232,685 236,956Total liabilities and shareholders’ equity $ 460,368 $ 407,443
76788ba_financials.indd 275 3/6/14 12:07 PM

276 Bank of America 2013
Condensed Statement of Cash Flows
(Dollars in millions) 2013 2012 2011Operating activities Net income $ 11,431 $ 4,188 $ 1,446Reconciliation of net income to net cash provided by (used in) operating activities:
Equity in undistributed (earnings) losses of subsidiaries (12,042) 1,754 5,544Other operating activities, net (10,422) (3,432) 6,716
Net cash provided by (used in) operating activities (11,033) 2,510 13,706Investing activities Net sales of securities 459 13 8,444Net payments from subsidiaries 39,336 12,973 5,780Other investing activities, net 3 445 (8)
Net cash provided by investing activities 39,798 13,431 14,216Financing activities Net increase (decrease) in short-term borrowings 178 (616) (13,172)Net increase (decrease) in other advances (14,378) 10,100 (4,449)Proceeds from issuance of long-term debt 30,966 17,176 16,047Retirement of long-term debt (39,320) (63,851) (21,742)Proceeds from issuance of preferred stock and warrants 1,008 667 5,000Redemption of preferred stock (6,461) — —Common stock repurchased (3,220) — —Cash dividends paid (1,677) (1,909) (1,738)Other financing activities, net — (668) (1)
Net cash used in financing activities (32,904) (39,101) (20,055)Net increase (decrease) in cash held at bank subsidiaries (4,139) (23,160) 7,867Cash held at bank subsidiaries at January 1 102,818 124,991 117,124
Cash held at bank subsidiaries at December 31 $ 98,679 $ 101,831 $ 124,991
NOTE 26 Performance by Geographical AreaSince the Corporation’s operations are highly integrated, certain asset, liability, income and expense amounts must be allocated to arrive at total assets, total revenue, net of interest expense, income (loss) before income taxes and net income (loss) by geographic area. The Corporation identifies its geographic performance based on the business unit structure used to manage the capital or expense deployed in the region as applicable. This requires certain judgments related to the allocation of revenue so that revenue can be appropriately matched with the related capital or expense deployed in the region.
December 31 Year Ended December 31
(Dollars in millions) Year Total Assets (1)
Total Revenue, Net of Interest
Expense (2)
Income (Loss) Before Income
TaxesNet Income
(Loss)
U.S. (3) 2013 $ 1,803,243 $ 76,612 $ 13,221 $ 10,588
2012 1,902,946 72,175 1,867 4,116 2011 73,613 (9,261) (3,471)Asia (4) 2013 98,605 4,442 1,382 887
2012 102,492 3,478 353 282 2011 10,890 7,598 4,787Europe, Middle East and Africa 2013 169,708 6,353 1,003 (403)
2012 171,209 6,011 323 (543) 2011 7,320 1,009 (137)Latin America and the Caribbean 2013 30,717 1,535 566 359
2012 33,327 1,670 529 333 2011 1,631 424 267Total Non-U.S. 2013 299,030 12,330 2,951 843
2012 307,028 11,159 1,205 72
2011 19,841 9,031 4,917Total Consolidated 2013 $ 2,102,273 $ 88,942 $ 16,172 $ 11,431
2012 2,209,974 83,334 3,072 4,188
2011 93,454 (230) 1,446(1) Total assets include long-lived assets, which are primarily located in the U.S.(2) There were no material intercompany revenues between geographic regions for any of the periods presented.(3) Includes the Corporation’s Canadian operations, which had total assets of $9.6 billion and $8.3 billion at December 31, 2013 and 2012; total revenue, net of interest expense of $364 million, $317
million and $1.3 billion; income before income taxes of $258 million, $202 million and $621 million; and net income of $199 million, $141 million and $528 million for 2013, 2012 and 2011, respectively.
(4) Amounts include pre-tax gains of $753 million and $6.5 billion ($474 million and $4.1 billion net-of-tax) on the sale of common shares of CCB during 2013 and 2011.
76788ba_financials.indd 276 3/6/14 12:07 PM

Bank of America 2013 277
Disclosure Controls and ProceduresBank of America Corporation and Subsidiaries
As of the end of the period covered by this report and pursuant to Rule 13a-15 of the Securities Exchange Act of 1934 (Exchange Act), Bank of America’s management, including the Chief Executive Officer and Chief Financial Officer, conducted an evaluation of the effectiveness and design of our disclosure controls and procedures (as that term is defined in Rule 13a-15(e) of the Exchange Act). Based upon that evaluation, Bank of America’s Chief Executive Officer and Chief Financial Officer concluded that
Bank of America’s disclosure controls and procedures were effective, as of the end of the period covered by this report, in recording, processing, summarizing and reporting information required to be disclosed by the Corporation in reports that it files or submits under the Exchange Act, within the time periods specified in the Securities and Exchange Commission’s rules and forms.
76788ba_financials.indd 277 3/6/14 12:07 PM

278 Bank of America 2013
Report of Independent Registered Public Accounting FirmBank of America Corporation and Subsidiaries
To the Board of Directors of Bank of America Corporation:We have examined, based on criteria established in Internal Control – Integrated Framework (1992) issued by the Committee of Sponsoring Organizations of the Treadway Commission, Bank of America Corporation’s (the “Corporation”) assertion, included under Item 9A, that the Corporation’s disclosure controls and procedures were effective as of December 31, 2013 (“Management’s Assertion”). Disclosure controls and procedures mean controls and other procedures of an issuer that are designed to ensure that information required to be disclosed by an issuer in reports that it files or submits under the Securities Exchange Act of 1934 is recorded, processed, summarized, and reported within the time periods specified in the Securities and Exchange Commission’s rules and forms, and that information required to be disclosed by an issuer in reports that it files or submits under the Securities Exchange Act of 1934 is accumulated and communicated to the issuer’s management, including its principal executive and principal financial officer, or persons performing similar functions, as appropriate, to allow timely decisions regarding required disclosure. The Corporation’s management is responsible for maintaining effective disclosure controls and procedures and for Management’s Assertion of the effectiveness of its disclosure controls and procedures. Our responsibility is to express an opinion on Management’s Assertion based on our examination.
There are inherent limitations to disclosure controls and procedures. Because of these inherent limitations, effective disclosure controls and procedures can only provide reasonable assurance of achieving the intended objectives. Disclosure controls and procedures may not prevent, or detect and correct, material misstatements, and they may not identify all information relating to the Corporation to be accumulated and communicated to the Corporation’s management to allow timely decisions regarding required disclosures. Also, projections of any evaluation
of effectiveness to future periods are subject to the risk that disclosure controls and procedures may become inadequate because of changes in conditions, or that the degree of compliance with the policies or procedures may deteriorate.
We conducted our examination in accordance with attestation standards established by the Public Company Accounting Oversight Board (United States). Those standards require that we plan and perform the examination to obtain reasonable assurance about whether effective disclosure controls and procedures were maintained in all material respects. Our examination included obtaining an understanding of the Corporation’s disclosure controls and procedures and testing and evaluating the design and operating effectiveness of the Corporation’s disclosure controls and procedures based on the assessed risk. Our examination also included performing such other procedures as we considered necessary in the circumstances. We believe that our examination provides a reasonable basis for our opinion. Our examination was not conducted for the purpose of expressing an opinion, and accordingly we express no opinion, on the accuracy or completeness of the Corporation’s disclosures in its reports, or whether such disclosures comply with the rules and regulations adopted by the Securities and Exchange Commission.
In our opinion, Management’s Assertion that the Corporation’s disclosure controls and procedures were effective as of December 31, 2013 is fairly stated, in all material respects, based on criteria established in Internal Control – Integrated Framework (1992) issued by the Committee of Sponsoring Organizations of the Treadway Commission.
Charlotte, North Carolina February 25, 2014
76788ba_financials.indd 278 3/6/14 12:07 PM

Executive Management Team and Board of DirectorsBank of America Corporation
Executive Management TeamBrian T. Moynihan*
Chief Executive Officer
Catherine P. Bessant
Global Technology and Operations Executive
David C. Darnell*
Co-chief Operating Officer
Anne M. Finucane
Global Strategy and Marketing Officer
Christine P. Katziff
Corporate General Auditor
Terrence P. Laughlin*
Chief Risk Officer
Gary G. Lynch*
Global General Counsel and Head of Compliance and Regulatory Relations
Thomas K. Montag*
Co-chief Operating Officer
Andrea B. Smith
Global Head of Human Resources
Ron D. Sturzenegger
Legacy Asset Servicing Executive
Bruce R. Thompson*
Chief Financial Officer
Board of DirectorsCharles O. Holliday, Jr.
Chairman of the BoardBank of America Corporation
Sharon L. Allen
Former Chairman Deloitte LLP
Susan S. Bies
Former MemberBoard of Governors of the Federal Reserve System
Jack O. Bovender, Jr.
Former Chairman and Chief Executive Officer HCA, Inc.
Frank P. Bramble, Sr.
Former Executive Officer MBNA Corporation
Pierre de Weck
Former Chairman and Global Head of Private Wealth Management Deutsche Bank AG
Arnold W. Donald
President andChief Executive OfficerCarnival Corporation and Carnival plc
Charles K. Gifford
Former ChairmanBank of America Corporation
Linda P. Hudson
CEO Emeritus and Former President and Chief Executive OfficerBAE Systems, Inc.
Monica C. Lozano
Chairman and Chief Executive Officer ImpreMedia, LLC
Thomas J. May
Chairman, President and Chief Executive Officer Northeast Utilities
Brian T. Moynihan
Chief Executive OfficerBank of America Corporation
Lionel L. Nowell, III
Former Senior Vice President and Treasurer PepsiCo, Inc.
Clayton S. Rose
Professor of Management Practice Harvard Business School
R. David Yost
Former Chief Executive Officer AmerisourceBergen Corporation
*Executive Officer
76788ba_financials.indd 279 3/10/14 12:23 PM
Bank of America 2013 279

HeadquartersThe principal executive offices of Bank of America Corporation (the Corporation) are located in the Bank of America Corporate Center, 100 North Tryon Street, Charlotte, NC 28255.
Stock ListingThe Corporation’s common stock is listed on the New York Stock Exchange (NYSE) under the symbol BAC. The Corporation’s common stock is also listed on the London Stock Exchange, and certain shares are listed on the Tokyo Stock Exchange. The stock is typically listed as BankAm in newspapers. As of February 24, 2014, there were 215,755 registered holders of the Corporation’s common stock.
Investor RelationsAnalysts, portfolio managers and other investors seeking additional information about Bank of America stock should contact our Equity Investor Relations group at 1.704.386.5681 or [email protected]. For additional information about Bank of America from a credit perspective, including debt and preferred securities, contact our Fixed Income Investor Relations group at 1.866.607.1234 or [email protected]. Visit the Investor Relations area of the Bank of America website, http://investor.bankofamerica.com, for stock and dividend information, financial news releases, links to Bank of America SEC filings, electronic versions of our annual reports and other items of interest to the Corporation’s shareholders.
CustomersFor assistance with Bank of America products and services, call 1.800.432.1000, or visit the Bank of America website at www.bankofamerica.com. Additional toll-free numbers for specific products and services are listed on our website at www.bankofamerica.com/contact.
News MediaNews media seeking information should visit our online newsroom at www.bankofamerica.com/newsroom for news releases, speeches and other items relating to the Corporation, including a complete list of the Corporation’s media relations specialists grouped by business specialty or geography.
Corporate InformationBank of America Corporation
Annual Report on Form 10-KThe Corporation’s 2013 Annual Report on Form 10-K is available at http://investor.bankofamerica.com. The Corporation also will provide a copy of the 2013 Annual Report on Form 10-K (without exhibits) upon written request addressed to:
Bank of America Corporation Office of the Corporate Secretary NC1-027-20-05Hearst Tower, 214 North Tryon Street Charlotte, NC 28255
Shareholder InquiriesFor inquiries concerning dividend checks, electronic deposit of dividends, dividend reinvestment, tax statements, electronic delivery, transferring ownership, address changes or lost or stolen stock certificates, contact Bank of America Shareholder Services at Computershare Trust Company, N.A. via the Internet at www.computershare.com/bac; call 1.800.642.9855; or write to P.O. Box 43078, Providence, RI 02940-3078. For general shareholder information, contact Bank of America Office of the Corporate Secretary at 1.800.521.3984. Shareholders outside of the United States and Canada may call 1.781.575.2621.
Electronic DeliveryAs part of our commitment to reduce paper consumption by 20% by 2015, we offer electronic methods for customer communications and transactions. In 2013, we delivered more than 445 million digital correspondences through Online Banking and other channels, and continued use of Image ATMs, electronic payments and an employee print reduction program, preventing the emissions of 36,314 metric tons of carbon dioxide equivalent (CO2e). Customers can sign up to receive online statements through their Bank of America or Merrill Lynch account website. In 2012, we adopted the SEC’s Notice and Access rule, which allows certain issuers to inform shareholders of the electronic availability of Proxy materials, including the Annual Report, which significantly reduced the number of printed copies we produce and mail to shareholders. Shareholders still receiving printed copies can join our efforts by electing to receive an electronic copy of the Annual Report and Proxy materials. If you have an account maintained in your name at Computershare Investor Services, you may sign up for this service at www.computershare.com/bac. If your shares are held by a broker, bank or other nominee, you may elect to receive an electronic copy of the Annual Report and Proxy materials online at www.proxyvote.com, or contact your broker.
76788ba_financials.indd 280 3/10/14 12:23 PM
280 Bank of America 2013

Des
ign:
Seq
uel,
New
Yor
k
Bank of America Corporation (“Bank of America”) is a financial holding company that, through its subsidiaries and affiliated companies, provides banking and non-banking financial services. Global Wealth and Investment Management is a division of Bank of America Corporation (“BAC”). Merrill Lynch, Merrill Edge™, U.S. Trust, Bank of America Merrill Lynch and BofA™ Global Capital Management are affiliated subdivisions within Global Wealth and Investment Management. Merrill Lynch Wealth makes available products and services offered by Merrill Lynch, Pierce, Fenner & Smith Incorporated (“MLPF&S”) and other subsidiaries of BAC. Merrill Edge is available through MLPF&S, and consists of the Merrill Edge Advisory Center (investment guidance) and self-directed online investing. U.S. Trust, Bank of America Private Wealth Management operates through Bank of America, N.A., and other subsidiaries of BAC. Bank of America Merrill Lynch is a marketing name for the Retirement and Philanthropic Services businesses of BAC. BofA™ Global Capital Management Group, LLC (“BofA Global Capital Management”), is an asset management division of BAC. BofA Global Capital Management entities furnish investment management services and products for institutional and individual investors.
“Bank of America Merrill Lynch” is the marketing name for the global banking and global markets businesses of Bank of America Corporation. Lending, derivatives, and other commercial banking activities are performed globally by banking affiliates of Bank of America Corporation, including Bank of America, N.A., member FDIC. Securities, strategic advisory, and other investment banking activities are performed globally by investment banking affiliates of Bank of America Corporation (“Investment Banking Affiliates”), including, in the United States, Merrill Lynch, Pierce, Fenner & Smith Incorporated and Merrill Lynch Professional Clearing Corp., both of which are registered broker-dealers and members of SIPC, and, in other jurisdictions, by locally registered entities. Merrill Lynch, Pierce, Fenner & Smith Incorporated and Merrill Lynch Professional Clearing Corp. are registered as futures commission merchants with the CFTC and are members of the NFA.
Case studies are intended to illustrate products and services available at Bank of America and Merrill Lynch. You should not consider these as an endorsement of Merrill Lynch as an investment advisor or as a testimonial about a client’s experiences with us as an investment advisor. Case studies do not necessarily represent the experiences of other clients, nor do they indicate future performance. Investment results may vary. The investment strategies discussed are not appropriate for every investor and should be considered given a person’s investment objectives, financial situation and particular needs. Clients should review with their advisor the terms, conditions and risks involved with specific products and services.
Banking products are provided by Bank of America, N.A., and affiliated banks, members FDIC and wholly owned subsidiaries of BAC.
Investment products offered by Investment Banking Affiliates: Are Not FDIC Insured Are Not Bank Guaranteed May Lose Value
MLPF&S is a registered broker-dealer, member SIPC and a wholly owned subsidiary of BAC.
Please recycle. The annual report is printed on 30% post-consumer waste (PCW) recycled paper.
50Mconsumer and small business relationships in the U.S.
14M+banking customers are now making mobile connections, staying in touch with their finances anytime, anywhere
To our shareholders, In 2013, the earnings power of our company began to shine through more clearly. The strategy we outlined several years ago is driving growth as we better connect the outstanding capabilities of our company for the three groups of customers we serve: people, companies and institutional investors. We are helping our teams to connect more deeply with each other so that we can bring everything to bear that customers and clients need to live their financial lives.
For the year, net income increased to $11.4 billion from $4.2 billion a year ago. These results are some of the best we have seen in recent years and a testament to the work the team is doing every day to win in the marketplace.
Last year, Tier 1 common capital grew by 9 percent, and our regulatory capital measures exceed all long-term requirements. Liquidity and time-to-required funding also strengthened, and long-term debt has been reduced by more than $200 billion from its peak, all of which enabled our company to return more than $3 billion in capital to shareholders last year through common share repurchases. We know this is important to you as shareholders and let me assure you the company is committed to returning excess capital over time through both repurchases and dividends.
For Bank of America, growth means making everyday connections — every day. Here’s how:
Brian T. MoynihanChief Executive Officer
Life’s better when we’re connected
76788ba_cvr.indd 3 3/14/14 1:09 PM

Bank of America Corporation2013 Annual Report
Wherever we do business, our success depends on understanding what’s important to our customers and clients and connecting them to what they need to help make their financial lives better.
Life’s better when we’re connected™
Please recycle
Bank of America Corporation2013 Annual Report00-04-1368B 3/2014
Bank of America Corporation 2013 Annual Report
Mia
mi
Mia
mi
Atla
nta
Atla
nta
San
Fran
cisc
oSa
n Fr
anci
sco
Den
ver
Den
ver
Jack
sonv
ille
Jack
sonv
ille
São
Paul
oSã
o Pa
ulo
São
Paul
oSã
o Pa
ulo
Nas
hvill
eN
ashv
ille
St. L
ouis
St. L
ouis
St. L
ouis
St. L
ouis
Dal
las
Dal
las
Toky
oTo
kyo
76788ba_cvr.indd 3 3/14/14 1:09 PM