ASX_BUB_2020.pdf - AnnualReports.com
62
Bubs Australia Limited and Controlled Entities LIFTING OFF INTO GLOBAL GROWTH FY20 Annual Report ACN 060 094 742 2020 For personal use only
-
Upload
khangminh22 -
Category
Documents
-
view
0 -
download
0
Transcript of ASX_BUB_2020.pdf - AnnualReports.com

Bubs Australia Limited and Controlled Entities
LIFTING OFF INTO GLOBAL GROWTHFY20 Annual Report
ACN 060 094 742
2020
For
per
sona
l use
onl
y

TABLE OFCONTENTS
GENERAL INFORMATIONThe financial statements cover Bubs Australia Limited for the year ended 30 June 2020. The financial statements are presented in Australian dollars, which is the Bubs Australia Limited functional and presentational currency.
Bubs Australia Limited registered office is: 23 Nina Link, Dandenong South VIC 3175 Australia
Bubs Australia Limited principal place of business is: 2-4/6 Tilley Lane, Frenchs Forest NSW 2086 Australia
01
02
03
04
05
04060810121820
2224262830
3234405256
586062646668117
118
FY20 REVIEWFINANCIAL HIGHLIGHTSFROM OUR CHAIRFROM OUR CEOCEO YEAR IN REVIEWBOARD OF DIRECTORSEXECUTIVE LEADERSHIP
OUR BUSINESSBUILDING ON SOLID FOUNDATIONSOUR BRANDSONE BRAND, MULTIPLE FEEDING OCCASIONSOPTIMISED SUPPLY CHAIN
DIRECTOR’S REPORTDIRECTOR’S REPORTREMUNERATION REPORTINDEPENDENT AUDITORS REPORTLEAD AUDITOR’S INDEPENDENCE DECLARATION
FINANCIAL STATEMENTSCONSOLIDATED STATEMENT OF PROFIT OR LOSS AND OTHER COMPREHENSIVE INCOMECONSOLIDATED STATEMENT OF FINANCIAL POSITIONCONSOLIDATED STATEMENT OF CHANGES IN EQUITYCONSOLIDATED STATEMENT OF CASH FLOWSNOTES TO THE FINANCIAL STATEMENTSDIRECTOR’S DECLARATION
OTHER INFORMATION
For
per
sona
l use
onl
y

4 501
FY20REVIEW Financial Highlights
From our Chair
From our CEO
CEO Year in Review
Board of Directors
Executive Leadership
01
For
per
sona
l use
onl
y

FY20 results were driven by the strong performance of Bubs® Infant Formula in all retail channels and regions.
Financial Performance
+69%
+32%
$26m
5x
ASX 300 Bubs Australia
Infant Formula Gross Revenue1 growth pcp
Direct sales to China growth pcp
Cash reserves as at 30 June 2020
Export sales growth pcp to emerging markets outside of China
+32%
55%
Group Gross Revenue1 pcp
Infant Formula Share Group Gross Revenue1
$62mGroup Gross Revenue1
1Gross revenue is a non-IFRS measure. Non-IFRS measures have not been subject to audit or review. Gross revenue represents the revenue recognised without rebates and marketing contribution.
FINANCIAL HIGHLIGHTS
7Bubs Australia Limited and Controlled Entities Annual Report for the year ended 30 June 20206 7
01 FY20 REVIEW Financial HightlightsF
or p
erso
nal u
se o
nly

FROM OUR CHAIR
Executive ChairmanDENNIS LIN
Dear Shareholders,
I am pleased to advise, over the past financial year Bubs has achieved numerous important milestones within our business strategy to deliver a record operating result of $62 million in gross revenue1, up 32% on FY19, with a 24% increase in revenue to $55 million.
Importantly, the COVID-19 mitigation measures that we took on the ground have kept the Bubs family safe and ensured continuity of production as an essential service to meet unexpected sporadic peaks in demand during this difficult period. Our unique and robust business model, along with our collaborative strategic partnerships, meant we were able to mitigate supply chain risks and quickly adapt our China route-to-market strategy in response to shifts in channel dynamics.
During the year we relocated our headquarters to our state-of-the-art Deloraine manufacturing facility in Dandenong South, Victoria, to be close to our farmers, suppliers, and key customers.
As a sign of our growing maturity and long-term investment growth potential, in September 2019 Bubs Australia entered the S&P/ASX 300, a position the Company retained when the ASX Quarterly Index was rebalanced in June 2020 (now ranked 244).
Bubs domestic footprint expanded significantly in the back half of the financial year with our Infant Formula range now retailed in over 2,000 outlets. Domestic revenue accounted for 67% of Group revenue. We have now established an optimal domestic national footprint in both the grocery and pharmacy channels – strongly positioning Bubs as a challenger brand with coverage on par with leading multinational Infant Formula brands.
It is because of this unique position as an Australian children’s nutrition specialist, that we continue to expand the Bubs® brand offering into high margin adjacent categories. As we enter FY21, our hero product innovation; ‘Vita Bubs™’ children’s vitamin and mineral supplements range, will further expand our brand touchpoints across more consumer needs and occasions. With this development, we are also pleased to have further strengthened our strategic equity-linked partnership with Chemist Warehouse, who will be our launch retail partner ranging the new product line in 400 stores from October 2020.
We are confident this step up in our collaboration with one of the largest Chinese owned enterprises in the infant formula industry, coupled with the additional capability to manufacture locally in China, will secure our State Administration for Market Regulation (SAMR) brand registration and provide Bubs with a faster route-to-market with full access to distribute our products in Mother and Baby stores. Bubs intends to withdraw the existing SAMR brand applications previously made by Deloraine, and resubmit differentiated super-premium formulations targeting consumers in tier-one cities.
Importantly, this “Created by Bubs®” strategy also enables Bubs to retain secure and proprietary ownership of our brand production slots and is underpinned by our vertically integrated business model. This provides us with unrivalled proprietary insight into the supply chain process, and the ability to provide 100% Australian premium goat milk. Our “Created by Bubs®” strategy can also be applied to other regulatory jurisdictions in the future.
To that end, the Company has advanced our commitment to regional diversification in FY20 by entering a partnership with Vietnam TVV Service and Trading Company to distribute Bubs® products in Vietnam’s leading Mother and Baby retail chains. The Vietnam market has delivered material growth throughout the year and will remain a key focus for the business.
With representation well established in all major Australian retailers, as well as increasing penetration
Our China strategy has made significant advancements throughout the year, with direct sales delivering a 32% uplift over the full year compared to 2019. We have been pleased to see the continued deepening of our productive relationship with Alibaba through a Master Distribution Agreement with its Centralised Import Procurement (CIP) division for the development, promotion, and distribution of our adult goat dairy products. We are privileged to have this important relationship with Alibaba, and the support and insights of C2 Capital Partners.
Towards the backend of the financial year we experienced the disruption of the macro-environment with the global pandemic limiting inbound Chinese tourists and international students, along with prolonged lead-times and the rising cost of airfreight logistics. Whilst this significantly impacted on personal Daigou shoppers within the domestic retail market, we also saw an accelerated shift in purchasing behaviour across all other channels, indicating Chinese consumer demand for our premium products remains strong.
In response to this shift in channel demand, we continue to invest marketing resources for the future to build customer acquisition and brand equity in our key markets, particularly China. We have focused on redirecting and up-weighting our marketing effort to accelerate the growth of our Cross-Border eCommerce business in China.
Market access to China’s General Trade Channel remains a key objective for our future growth strategy and will undoubtedly provide material upside to the Company’s revenues and profitability. Given the current macro geo-political landscape and increasing regulatory risks, we will look to produce Bubs® Chinese label Goat Infant Formula products in China, utilising our own Australian premium goat milk source. On 24 August 2020, Bubs entered a Memorandum of Understanding to acquire an ownership interest in Beingmate’s facility located in Beihai, China, and secure exclusive use of a SAMR approved brand slot.
This evolution of our China market access strategy is only made possible through our existing strong partnership with Beingmate, a public company listed on the Shenzhen Stock Exchange with a market capitalisation of RMB5.5bn (c.A$1.1bn) and reported revenues for FY19 of RMB2.8bn (c.A$572 million). Beingmate was the first Infant Formula company to obtain certification when the new registration system was established.
into China and Vietnam, we have a strong platform to provide major global growth momentum in FY21 and beyond. Now that we have reached a position of scale and established supply chain security, we will evaluate and enter further new markets which have the highest potential to leverage our unique advantage as a premium children’s nutrition specialist and Australian leader in goat dairy production.
In my first year as Executive Chairman, I would like to thank shareholders and our partners for their unwavering support and my special thanks to the wonderful Bubs family who responded so well to the challenging macro dynamics that confronted all of us on a professional and personal level.
I am confident our competitively advantaged business model is well positioned for continued rapid growth, with a pathway to profitability in the near term. I am looking forward to working with our Leadership Team and Board of Directors to implement the next phase of our growth strategy, including pursuing new markets and product categories, further collaborative strategic partnerships, and evaluating M&A opportunities to support our long-term vision of becoming a major global food business.
“I am more confident than ever that Bubs has achieved the right foundations and initial scale to realising our long-term ambition to becoming a major global food business, spearheaded by the best Australia has to offer in specialised infant nutrition.”
1Gross revenue is a non-IFRS measure. Non-IFRS measures have not been subject to audit or review. Gross revenue represents the revenue recognised without rebates and marketing contribution.
Bubs Australia Limited and Controlled Entities Annual Report for the year ended 30 June 20208 9
01 FY20 REVIEW From Our ChairF
or p
erso
nal u
se o
nly

FROM OUR CEO
“Despite the challenging macro environment, the Bubs family continues to thrive with passion, pace and purpose. We are now ideally positioned to deliver on the next phase of our global growth strategy.”
Dear Shareholders,
2020 will be remembered as the year the COVID-19 global pandemic disrupted life to an unimaginable level, and perhaps changed the relationship between consumers and brands forever.
I am enormously proud of the Bubs family, who remained diligent and agile, overcoming countless operational challenges brought on by evolving market dynamics. Our team continued to thrive - whether working remotely or on the production floor, demonstrating passion, pace and purpose. I am confident that our unique business model, underpinned by supply chain security and manufacturing flexibility, will enable us to continue to navigate COVID-19 impacts into FY21.
Critical progress was made throughout the year on expanding our infant nutrition portfolio and distribution footprint, ensuring we maintained strong growth momentum in our performance. FY20 gross revenue1 increased 32% year-on-year to $62 million, and despite the challenges and disruption caused by COVID-19, second half gross revenue was up 28% over prior year.
It was a mark of our organisational strength, foundational building blocks, and strategic focus that we were able to continue to supply through the sudden demand surges caused by ‘pantry stocking’ in the third quarter, as well as accommodate the shifts in channel demand and the disruption to international logistics that followed.
Despite the obvious challenges that arose from the COVID-19 global pandemic in the second half of the financial year, we achieved an increase in our normalised gross margin2, increasing to 24%, versus 21% in FY19 and 14% in FY18, derived from increased scale, optimised channel and product mix, and improvements to supply chain operational efficiencies. This validates our decision to acquire the Deloraine manufacturing facility in 2019, with further margin improvements expected to be made in FY21.
Infant Formula revenue continued to shine as the most profitable growth engine of the business, up 58% to $30 million in revenue. The Bubs® brand portfolio of products now accounts for 60% of group revenue, versus 49% in FY19.
providing Bubs with widespread access to China’s lucrative Mother and Baby store channel.
Product innovation continued to be an integral component of our growth strategy, as we launched multiple new products and brands in the Adult Goat Dairy sector to cater for differentiated target segments and nutritional needs. We also extended the Bubs® Infant Formula portfolio offering to include Junior Nutrition, catering for 3-12 year olds.
In addition, we are excited to enter the high margin adjacent Vitamin and Mineral Supplements category with the launch of ‘Vita Bubs™’ in October 2020. The significant show of support from our strategic relationship with Chemist Warehouse, now committed to ranging all forty of Bubs® products, is a further testament to our continued success in this channel.
We continue to make digitally-led brand building investment in our Bubs® hero brand in key markets, boosted by the recent appointment of former Miss Universe and new mum, Jennifer Hawkins, as Bubs® Global Brand Ambassador.
It is with this position of strength in our brand reach and relevance, our multi-market manufacturing capabilities and collaborative strategic partnerships, that we are well placed to accelerate domestic and international growth, driving profitability into the near term future.
Group liquidity remains strong with $26 million in cash reserves as at 30 June 2020. We have taken the precaution of increasing our working capacity facility to $10 million with $8 million undrawn.
I would like to take this opportunity to sincerely thank our shareholders, partners, suppliers and the extended Bubs family for their continued support and ongoing belief in Bubs journey to becoming a global food company and category leader in infant nutrition. I look forward to continuing to build our brand-led growth trajectory, as we accelerate our global expansion, creating new generations of happy, healthy bubs.
Our three key markets saw strong growth throughout the year and we have been privileged to have the support from our strategic partners across our key channels and markets, particularly Alibaba and Chemist Warehouse.
We welcomed the step change agreement with Woolworths to carry our entire range of eight Infant Formula products across a targeted selection of its 700 stores from May 2020. In June, further new supply agreements were secured for Bubs Organic® grass-fed cow’s milk formula to be ranged in 482 Coles stores and all 130 Big W stores, as well as the full Bubs® portfolio to be ranged in 52 Baby Bunting stores. This significant increase in distribution footprint led to a 270% increase in Infant Formula gross revenue in domestic retailers in the fourth quarter compared to prior year.
China momentum continued throughout the year, with direct revenue increasing 32% year-on-year to $13 million, representing 23% of Group revenue. Other international markets experienced five-fold growth, accounting for 10% of Group gross revenue, driven largely by the successful launch of Bubs® infant nutrition products in Vietnam.
We continue to work closely in partnership with Alibaba to maximise the China eCommerce opportunity. During the year Bubs® achieved the fastest growing imported brand share across the Alibaba ecosystem, with a 90% uplift in Q4 FY20 Gross Merchandise Value (GMV) pcp.
Post balance date the Company has entered into a Memorandum of Understanding with Bubs Joint Venture partner, Beingmate, to acquire an ownership interest in one of their registered manufacturing facilities in Beihai, China. Beingmate owns the largest Infant Formula portfolio in China, including 51 products across 17 brands, that are all successfully registered with the State Administration for Market Regulation (SAMR), and distributed throughout 30,000 Mother and Baby stores.
Beingmate offer Bubs unparalleled expertise advising on Chinese regulatory compliance and product registration and have an impeccable track record in Food Safety and Quality Assurance. Their Research and Development Centre is a certified post-doctoral research station, making them an ideal partner to co-produce Bubs® Chinese label products in-market. We are confident this will fast track the registration process, ultimately
Chief Executive OfficerKRISTY CARR
1Gross revenue is a non-IFRS measure. Non-IFRS measures have not been subject to audit or review. Gross revenue represents the revenue recognised without rebates and marketing contribution.
2 Normalised gross margin is a non-IFRS measure. Non-IFRS measures have not been subject to audit or review. Normalised gross margin is calculated as (Revenue – Production Costs) / Revenue. Revenue excludes one off discount to CapriLac® old packaging adult powder products ($1.6m)
Bubs Australia Limited and Controlled Entities Annual Report for the year ended 30 June 202010 11
01 FY20 REVIEW From Our CEOF
or p
erso
nal u
se o
nly

Category Performance – Bubs Infant Formula shines as growth engine
Infant formula was the stand out in FY20 performance with a 58% increase in revenue to $30 million, now accounting for 55% of Group revenue, compared to only 43% in FY19. As the growth engine of our business, and most profitable sector of the Group portfolio, Bubs® Infant Formula remains our key driver for brand building investment and long-term sustainable growth profile.
A refreshed range of newly packaged and formulated CapriLac® adult goat milk powder products were successfully launched through Alibaba in the fourth quarter. Our product innovation has led the expansion of our Adult Goat Dairy portfolio across multiple brands to cater for different target segments and functional nutritional needs.
Domestic performance – Strong foothold in all major retailers
Bubs domestic retail footprint expanded significantly in the back half of the financial year with Bubs® Infant Formula coverage more than doubling to over 2,000 retail touchpoints with our domestic market now accounting for 67% of group revenues. Incremental supply agreements with Chemist Warehouse, Woolworths, Coles, Big W and Baby Bunting led to domestic retail gross revenue growth increasing 270% in the fourth quarter compared to the same prior period.
However, overall domestic full-year revenue increased by only 9% on 2019, offset by a second half contraction in the Daigou channel as a result of the COVID-19 pandemic causing a significant reduction in Chinese tourists and students, together with increasing costs and prolonged delivery times for international logistics.
China channel shifts - Accelerating importance of Cross-Border eCommerce
Responding rapidly to channel shifts in consumer demand, increased marketing investment drove Cross-Border eCommerce (CBEC) revenue to China upward, delivering a 32% uplift year-on-year, now representing 23% of our total business. Bubs® was the fastest growing imported brand on the Alibaba ecosystem – up 90% year-on-year.
As well, China direct gross revenue in the fourth quarter were up 26%, further demonstrating Chinese consumer demand for our premium products remains strong.
The successful CapriLac® relaunch also supported our China growth with 170% uplift in Q4 gross revenue compared to Q4 2019.
International expansion – Market diversification
Earlier this financial year we launched Bubs® Infant Formula and organic baby food portfolio in Vietnam with great success, driving a five-fold increase in Export revenue outside of China, contributing 10% of our total Group revenues (up from 2% contribution share in FY19).
Gross margin expansion – Pathway to profitability
Our vertically integrated business model and unique ‘one-step’ production process provided Bubs with supply chain security and agility to respond quickly to changes in demand, particularly during the sudden surge driven by ‘pantry stocking’ across all of our key markets in the third quarter.
This end-to-end control over our supply chain, optimised product assortment towards Infant Formula, improved allocation of our milk pool, together with increased scale delivered an improvement in normalised gross margin1 of three percentage points to 24% in FY20 (compared to 21% FY19 and 14% in FY18).
Infant Formula will continue to be our highest margin product with the full benefit of wholesale list price increases in May 2020 and further supply chain efficiencies to be achieved via implementation of margin improvement initiatives in FY21.
CEO YEAR IN REVIEW
40
35
30
25
20
15
10
5
0
($million)
Bubs® Infant Formula Revenue
FY18
5.0
18.9
29.8
FY19 FY20
+278%
+58%
Revenue by Market
Australia China Other International
10
30
50
20
40
60
($million)
14.1
33.436.5
12.7
5.4
9.6
0.9
2.5
0.3
16.9
43.9
54.6
FY18 FY19 FY20
+501%
+32%
+9% 0.3
0.9
5.4
FY18 FY19 FY20
Other International Revenue
6
5
4
3
2
1
0
($million)
+501%
FY18 FY19 FY20
Normalised Group Gross Margin1
14%21%
24%
Annual Report for the year ended 30 June 2020
01 FY20 REVIEW CEO Year in Review
1 Normalised gross margin is a non-IFRS measure. Non-IFRS measures have not been subject to audit or review. Normalised gross margin is calculated as (Revenue – Production Costs) / Revenue. Revenue excludes one off discount to CapriLac® old packaging adult powder products
12 13
For
per
sona
l use
onl
y

OutlookThe Company anticipates continued benefit from its unique integrated business model and key competitive advantage stemming from Bubs® unrivalled provenance brand story in premium infant nutrition.
We expect Bubs® Infant Formula to be the engine room for accelerated profitable growth across all key channels and markets. To that end, we can see pathways for the Company to an aspirational revenue goal of $400 million and gross margin floor of 40% by 2025.
Looking ahead, the effects of the COVID-19 pandemic will continue to have long-lasting effects on many sectors of the economy, resulting in new ways of doing business and engaging with consumers. Whilst there remains general uncertainty around the long-term disruption of the pandemic, Management and the Board remain optimistic and retain a high level of confidence in the strengths of Bubs business model to continue to navigate these challenges and leverage ongoing opportunities for international growth and product expansion with the support and collaboration of our key strategic partners.
”We continue to focus and invest in our strategic priorities to deliver on our long-term ambition of becoming a major global food company, spearheaded by Australian premium infant nutrition, and underpinned by our domination in Goat Dairy production.”
Post balance date strategic developmentsWhile this report reflects FY20 developments, apart from our trading performance, work has continued on product innovation and laying the groundwork for creating new revenue streams via market access and geographical expansion in FY21.
Vita Bubs™ – entry into Vitamin and Mineral
Supplements category
Among these initiatives is an expansion into the high margin adjacent category of Children’s Vitamin and Mineral Supplements (VMS) with the launch of ‘Vita Bubs™,’ announced in July 2020.
This is a key strategic development as we take advantage of a white space opportunity for a children’s product in the A$2.3bn Australian VMS market, leveraging our unique positioning as an Infant Nutrition and Australian Goat Dairy specialist.
Having already secured brand loyalty and trust with an existing consumer base in what is a highly sensitive and emotional purchase decision tree, the launch of Vita Bubs™ is a natural extension of this trust. We are thrilled to be partnering with Chemist Warehouse, the clear retail leader for this category accounting for over half of all VMS sales. All eight new products will be available in 400 Chemist Warehouse stores from October 2020.
Jennifer Hawkins appointed as Bubs Global Brand
Ambassador
In July 2020, the Company announced the appointment of Jennifer Hawkins, a much-loved Australian icon and new mum herself, as Bubs® Global Brand Ambassador. Jennifer provides strong brand alignment with Bubs® core positioning and values, and will exclusively represent the Bubs® entire product portfolio. She will appear on all media platforms to support consumer awareness, education and ongoing engagement with new parents in all markets, as well as providing strong social influence within her own following of over two million fans.
China in-market manufacturing – Securing and
fast tracking SAMR registration
In August 2020, the Company announced it had entered a Memorandum of Understanding with existing Joint Venture partner Beingmate to locally produce Bubs® Chinese label Goat Milk Infant Formula products in a China registered facility, whilst still utilising Bubs® brand, intellectual property and Australian premium goat milk source.
The milestone agreement would result in Bubs acquiring an ownership interest in one of Beingmate’s five approved facilities located in Beihai, China, providing Bubs with exclusive use of an approved SAMR brand slot and unique proprietary formulation. Beingmate would assist in developing, manufacturing and obtaining the State Administration for Market Regulation (SAMR) registration for Bubs® Chinese label Goat Milk Infant Formula products.
Once registered, the Bubs-Beingmate Joint Venture Company will distribute the products within their existing network of 30,000 Mother and Baby stores. Both parties are confident this manufacturing merger with one of the largest Chinese owned enterprises, coupled with a stake-holding in a domestic facility for local manufacture, will place Bubs in the best possible position to achieve successful brand registration to gain full market access to China’s General Trade Channel in the shortest possible timeframe.
Meanwhile Bubs intends to withdraw existing brand applications previously made by Deloraine and resubmit differentiated premium formulations that adhere to any amendments in the China GB-national food guidelines, expected to be published in the near term.
Each of these two approaches provide the cornerstone for our “Created by Bubs®” market access and global expansion strategy.
Outlook
The Company anticipates continued benefit from its unique integrated business model and key competitive advantage stemming from Bubs® unrivalled provenance brand story in premium infant nutrition.
We expect Bubs® Infant Formula to be the engine room for accelerated profitable growth across all key channels and markets. To that end, we can see pathways for the Company to an aspirational revenue goal of $400 million and gross margin floor of 40% by 2025.
Looking ahead, the effects of the COVID-19 pandemic will continue to have long-lasting effects on many sectors of the economy, resulting in new ways of doing business and engaging with consumers. Whilst there remains general uncertainty around the long-term disruption of the pandemic, Management and the Board remain optimistic and retain a high level of confidence in the strengths of Bubs business model to continue to navigate these challenges and leverage ongoing opportunities for international growth and product expansion with the support and collaboration of our key strategic partners.
01 FY20 REVIEW CEO Year in Review
Concept label only.
Concept label only. Concept label only.
14 15Annual Report for the year ended 30 June 2020
For
per
sona
l use
onl
y

Consumer Behaviour & Consumption Channels
Supply Chain Resilience
Regulatory & Market Access
People & Culture
Significant pantry stocking brought forward demand. Australian domestic consumption from local consumers now returning to pre-COVID levels. Increasing demand evident in China for brands manufactured in China for Chinese babies. Australian consumers also demanding more Australian made products.
Channel shifting towards Cross Border e-Commerce (CBEC) China sales growing and strategic partnership with Alibaba strengthening.
As an essential service, there was no disruption to production or material impact to supply chain over the period.
Fluctuating demand surges managed at Deloraine with ability to rapidly increase production.
Vertical integration model and local procurement policy provided control and flexibility in supply chain.
Temporary closure of borders to Chinese tourists and students, as well as rising cost of airfreight and prolonged delivery lead times has impacted Daigou domestic sales.
China SAMR regulatory process continues to be delayed.
Market access for SAMR brands manufactured and registered in China is continuing and provides most favourable route to market. Opportunity to continue to leverage strategic partnership with Beingmate China via Joint Venture to develop locally approved SAMR Chinese label products.
Additional health and safety measures put in place across production floor and flexible remote working.
Agile and responsive culture enabled quick redeployment of team resources in response to changing channel and marketing dynamics, and acceleration of 24/7 production to fulfil sudden surges in demand driven by pantry stocking.
COVID-19 IMPACT
16 17
01 FY20 REVIEW COVID—19 Impact
Bubs Australia Limited and Controlled Entities Annual Report for the year ended 30 June 2020
For
per
sona
l use
onl
y

The directors present their report together with the consolidated financial statements of Bubs Australia Limited as a consolidated entity consisting of Bubs Australia Limited (the “Company”) and the entities it controlled (“the Group”) for the financial year ended 30 June 2020 and the auditor’s report thereon.
The names of the directors in office at any time during or since the end of the financial year are:
BOARD OFDIRECTORS
Mr Lin focuses on high growth branded businesses that are looking to expand globally, and has been part of Bubs Australia board since its listing. He works closely with the team in creating, setting and executing strategic priorities for the business, especially in relation to international markets and vertical integration. He speaks fluent Chinese Mandarin and Japanese. In addition, Mr Lin is co-founder and chairman of Cortina Capital, an independent private equity fund that focuses on investing in health and wellness brands.
Mr Lin was appointed as a non-executive director of Buderim Group Limited on 3 November 2017 and executive director from 1 July 2020 and a non-executive director of Synertec Corporation Limited on 20 August 2019. Mr Lin was appointed as a non-executive director of Ecargo Holdings Limited on 9 April 2019 and resigned on 30 October 2019. Mr Lin completed his contract with BDO on 30 June 2020.
Executive Chairman GradDipAppFin, CA, Solicitor of the Supreme Court of Queensland – Executive Chairman (appointed 22 October 2019), Chairman and Non – executive Director (resigned 21 October, 2019)
DENNIS LIN
Mrs Carr is the Chief Executive Officer of Bubs Australia Limited and holds a Bachelor of Business Degree (Queensland University of Technology). She has a proven track record of leading and building successful brands and businesses spanning Australia and Asia Pacific over the past 25 years. Kristy’s passion is in creating and developing new business opportunities that not only make a difference in the world we live in today, but also closely identify with emerging global consumer trends. Kristy has lived and worked in Hong Kong for over a decade and travelled extensively throughout Asia for both business and leisure. It is with this experience that she founded Bubs when on maternity leave with her first of three daughters in 2005.
Mrs Carr has not held any other Directorships in publicly listed companies in the past three years.
Managing DirectorBBus (Bachelor Degree of Business) – Managing Director (appointed 22 December 2016)
KRISTYCARR
Director attendance at Board meetings during the year is set out below.
RECORD OF ATTENDANCE AT THE BOARD MEETINGS
Held AttendedD Lin (Resigned as Non-executive Director on
21 October 2019 and appointed as Executive
Chairman on 22 October 2019)
14 14
K Newland Carr (Executive Director) 14 14
M Reynolds (Non-executive Director) 14 14
S Lin (Non-executive Director) 14 14
Mr Reynolds is a Partner at Thomson Geer Lawyers who specialises in capital markets (retail and wholesale), debt capital markets (wholesale) and mergers and acquisitions (public and private) including private equity. He holds a Bachelor of Political Science & Economics (Hons) and a Bachelor of Laws (Hons) and is a member of the Queensland Law Society.
Mr Reynolds was a director in publicly listed G8 Education Limited (ASX: GEM) retiring from the board on the 31st of August 2017.
All directors have been in office since the start of the financial year to the date of this report unless otherwise stated.
Non-Executive Director B.Sc (Hons), LLB (Hons), MQLS - Non-Executive Director (appointed 22 December 2016)
MATTHEW REYNOLDS
Mr Lin has over 25 years of investment, operations and management experience in Asia. He started his career in investment banking at Morgan Stanley in New York. He then joined Goldman Sachs’ Merchant Banking Division in Hong Kong and Tokyo and invested in private equity, real estate and epical situations opportunities. Mr Lin became the President and CEO – Asia of GMAC Commercial Holding Corp., managing a multi-billion dollar portfolio of real estate investments and loans. Thereafter, he co-founded a non-profit organisation, Hands On Tokyo, joined Laureate Education as President and CEO – North Asia and served on the board of two universities in China. Mr Lin has a B.A. in Economics from Harvard College.
Mr Lin has not held any other Directorships in publicly listed companies in Australia in the past three years.
Non-Executive Director (appointed 18 April 2019)
STEVE LIN
Mr Stephenson has been involved in business development for over 30 years including approximately 26 years as Director, Chief Financial Officer and Company Secretary for various listed and unlisted entities in resources, IT, manufacturing, food, wine, hotels and property. Mr Stephenson has been involved in business acquisitions, mergers, initial public offerings, capital raisings, business restructuring as well managing all areas of finance for companies.
Company Secretary MBA, FCPA, FGIA, MAICD, CPA (Canada), CMA (Canada) – Company Secretary (appointed 1 September 2015)
MR JAY STEPHENSON
18 19
01 FY20 REVIEW Board Of Directors
Bubs Australia Limited and Controlled Entities Annual Report for the year ended 30 June 2020
For
per
sona
l use
onl
y

Iris Ren spent 3 years in KPMG’s CFO Advisory division where she specialised in providing IFRS advisory services and transaction support to public and private entities to achieve positive accounting and commercial outcomes. Prior to that, Iris worked for 7 years in the audit and assurance division of BDO and is a current member of the Institute of Chartered Accounts Australia. Iris joined Bubs Australia in February 2018.
Chief Financial Officer
IRIS REN
Kristy Carr has an in-depth knowledge of the infant nutrition category and retail sector, with a proven track record of leading and building successful brands and businesses over the past 20 years. Prior to Bubs®, Kristy held international marketing and business development roles based in Hong Kong. It is with this expertise that Kristy founded Bubs® in 2006 and continues to lead a talented team in delivering on her original vision to make Bubs® a successful global brand.
Mr Lin focuses on high growth branded businesses that are looking to expand globally, and has been part of Bubs Australia board since its listing. He works closely with the team in creating, setting and executing strategic priorities for the business, especially in relation to international markets and vertical integration. He speaks fluent Chinese Mandarin and Japanese. In addition, Mr Lin is co-founder and chairman of Cortina Capital, an independent private equity fund that focuses on investing in health and wellness brands.
Founder CEO
Executive Chairman
KRISTYCARR
DENNIS LIN
EXECUTIVE LEADERSHIP
David Orton has been in FMCG sales and operations for the last 25 years where he held senior roles with Henkel Beauty Care, SC Johnson & Sons and several other multinational firms responsible for overseeing sales and the ultimate profitability of the company. David was appointed as Bubs General Manager Commercial in Jan 2018 responsible for all domestic sales, commercial planning and operations. David joined Bubs Australia in March 2017.
General Manager Commercial and Operations
DAVID ORTON
Vivian has over 20 years’ marketing & commercial experience in senior marketing positions across various consumer goods categories at FMCG multinationals. Vivian is responsible for marketing, brand development and product innovation leadership across all markets. Vivian brings her extensive marketing strategy, consumer insights, brand strategy and product innovation experience. Vivian joined Bubs Australia in July 2019.
General Manager Marketing
VIVIAN ZURLO
Richard Paine has over 25 years manufacturing and management experience in the Australian dairy specialising in the nutritional ingredient and nutraceutical space. He also has broader dairy expertise covering commercial and operational management from milk collection/milk pool through to ‘whole of manufacture’ in both medium size private to larger listed entities. Prior to this, Richard held several senior operational management roles including roles reporting to CEOs. Richard joined Bubs Australia February 2019.
General Manager Dairy Operations
RICHARD PAINE
20 21
01 FY20 REVIEW Executive Leadership
Bubs Australia Limited and Controlled Entities Annual Report for the year ended 30 June 2020
For
per
sona
l use
onl
y
OUR BUSINESS Building on Solid Foundations
Our Brands
One Brand, Multiple Feeding Occasions
Optimised Supply Chain
02
22 23
For
per
sona
l use
onl
y

Building brand equity and
awareness to increase market share in all key
markets.
Bubs is an authentic trusted brand with unique proposition
operating in an attractive high growth market.
Clear market leader in goat dairy production
with supply chain security and scalability.
Ownership of registered manufacturing facility with impeccable R&D, QA and manufacturing
capabilities.
Strategic collaborative partners with industry giants in key markets.
Domestic retail distribution strength
across all major retailers.
Optimise supply chain integration and capability to drive efficiencies
and improve margins.
Drive consumer led innovation
in emerging and adjacent categories.
Accelerate market access into China
via localised manufacturing of
SAMR product.
Rapid growth of global expansion
driving brand equity across all key
markets.
MAXIMISE BRAND EQUITY GROWTH
OPTIMISE GOAT DAIRY LEADERSHIP
DRIVE INNOVATION
LEVERAGE STRATEGIC
PARTNERSHIPS
ACCELERATING GLOBAL REACH
Since listing Bubs has become Australia’s leading producer of goat dairy and one of the fastest growing infant formula brands. Bubs is well positioned to become a major global consumer food business spearheaded by infant nutrition and underpinned by a unique goat dairy supply chain.
BUILDING ON SOLID FOUNDATIONS TO ACCELERATE GLOBAL GROWTH
24 25Bubs Australia Limited and Controlled Entities Annual Report for the year ended 30 June 2020
02 OUR BUSINESS Building on Solid FoundationsF
or p
erso
nal u
se o
nly

Our portfolio of brands is led by Bubs®, our hero brand and the catalyst for value creation across the business.
Our goat dairy specialist brands: CapriLac®, Deloraiane® and Capela® optimise brand equity value conversion from our milk pool.
Bubs Australia Limited and Controlled Entities Annual Report for the year ended 30 June 202026 27
OUR BRANDS
02 OUR BUSINESS Our BrandsF
or p
erso
nal u
se o
nly

Bubs Australia Limited and Controlled Entities Annual Report for the year ended 30 June 2020
Bubs® caters for all feeding occasions throughout a child’s development. Bubs® is a brand driven by it’s core – centered around children’s nutritional needs in key consumption occasions.
JUNIOR NUTRITION
COW INFANT FORMULA
POUCHESCEREAL
SNACKS
1
ONE BRAND, MULTIPLE FEEDING OCCASIONS
GOAT INFANT FORMULA
ONE BRAND, MULTIPLE FEEDING OCCASIONS
02 OUR BUSINESS One Brand, Multiple Feeding Occasions
VITAMIN & MINERAL SUPPLEMENTS
28 29
For
per
sona
l use
onl
y

No.1Australia’s largest
goat dairy producer
Bubs unique vertical integration model continues to be our foundational strength.
UNIQUE SUPPLY CHAIN MODEL
SCALABLE MANUFACTURING
UNDERPINNED BY GOAT DAIRY DOMINANCE
Our secure supply chain integrating farm to production, provides traceability, scalability and flexibility.
100% ownership of Australia Deloraine Dairy, holder of only 1 of 15 CNCA accredited infant formula China manufacturing licences in Australia.
Bubs is the market leader in goat dairy across Australia and owns exclusive access to its goat milk pool.
Bubs Australia Limited and Controlled Entities Annual Report for the year ended 30 June 2020
OPTIMISED SUPPLY CHAIN
02 OUR BUSINESS Optimised Supply Chain
30 31
For
per
sona
l use
onl
y

DIRECTOR’S REPORT Director’s Report
Remuneration Report
Independent Auditors Report
Lead Auditor’s Independence Declaration
03
32 33
For
per
sona
l use
onl
y

REVIEW OF OPERATIONS AND FINANCIAL RESULTS
There was no significant change in the state of affairs of the Group during the financial year.
Top line gross revenues2 for the year were $62 million (up 32% over FY19), while revenue was $55 million (24% upon FY19). Normalised gross margin3 improved to 24% from 21% in FY19.
Our financial result for the year reflects solid underlying growth momentum despite the impact of channel shifts brought on by the COVID-19 global pandemic. Importantly, our distribution costs to revenue ratio remained consistent year-on-year in spite of the disruption to international logistics.
Our employee costs4 to revenue ratio remained consistent year on year, supporting the ability of our organisational capability to sustain continued growth.
The increased inventory position of $30.6 million is in part due to the constrained fourth quarter performance and in part planned increase in inventory coverage to protect our supply chain against ongoing COVID-19 disruption. 53% of inventory is in finished goods.
Throughout the year, we continued to make significant and essential investment in brand marketing, increasing our spend to 18% of revenue, predominantly due to our increasing domestic presence and leveraging China in-market customer acquisition. This is an investment where the benefits will be realised in future years. We expect this marketing investment to revenue ratio to be reduced in FY21. We also invested in channel capacity, new product development across multiple brands and categories, and our end-to-end supply chain. Within this, trade marketing spend increased in line with our expanded distribution footprint across domestic retailers.
On a statutory basis, loss after tax was $7.8m (FY19: $35.5m). Normalised EBITDA loss was $9.1m (FY19: $5.7m loss) adjusted for transactions that are one off in nature, Mergers & Acquisitions in nature and share based payments of the Group.
FINANCIAL PERFORMANCE AND OPEX MANAGEMENT
SIGNIFICANT CHANGES IN THE STATE OF AFFAIRS
2 Gross revenue is a non-IFRS measure. Non-IFRS measures have not been subject to audit or review. Gross revenue represents the revenue recognised without rebates and marketing contribution.
3 Normalised gross margin is a non-IFRS measure. Non-IFRS measures have not been subject to audit or review. Normalised gross margin is calculated as (Revenue – Production Costs) / Revenue. Revenue excludes one off discount to Caprilac old packaging adult powder products ($1.6m).
4 Employee costs exclude share based payments and employee benefit expense – Nulac acquisition.
FY20 FY19
Loss before tax (16,100,700) (35,582,033)
Interest income 317,504 455,554
Finance cost (1,380,255) (893,576)
Depreciation and amortisation (3,730,852) (1,178,954)
EBITDA (11,307,097) (33,965,057)
Profit on disposal of joint ventures - 937,185
Inventories written off1 (450,619) (404,442)
Share based payments 141,049 (1,346,954)
Share based payment expense – Corporate transaction - (20,425,504)
Employee benefit expense - Nulac acquisition - (5,897,633)
Corporate transaction accounting and legal expense (349,209) (897,327)
Discount to Caprilac old packaging adult powder product (1,564,025) -
Employee costs provision - ex CEO - (235,616)
Normalised EBITDA (9,084,293) (5,694,766)
Normalised financial performance for FY20 compares to FY19 in the table below.
Meanwhile, the Group continues to maintain a strong balance sheet and liquidity position with $26 million cash and cash equivalents, and minimal external debt at balance date.
MITIGATING COVID-19 IMPACT – DEMONSTRATING RESILIENCE AND AGILITY
Importantly, throughout this period of growth, we have also been focusing on responsibly operating in the face of the pandemic for six months without incident and believe the risk of enforced factory closure is extremely low given infant formula is the sole source of nutrition for non breastfed babies.
We have implemented additional health and safety measures, including splitting work teams and zones in our Deloraine production facility, to reduce the risk of a major supply disruption and the health and safety of our team remains paramount.
Whilst the second half macro environment was challenging for the industry, with a significant amount of pantry stocking in the third quarter bringing forward sales, the Australian consumer demand is now showing signs of moving back towards normal pre-COVID levels. Meanwhile, a sharp reduction in Chinese students and tourists and increasing outbound shipping costs has triggered a channel shift away from the Daigou channel and towards China’s Cross-border eCommerce platforms.
In light of these factors, the company undertook a deep examination of the potential short and long-term consequences of the pandemic at both the supply chain and manufacturing level, and sales prospects going forward under a range of scenarios based on the duration of restrictions in all key markets. The increased potential for WH&S regulations, likelihood of manufacturing interruption, freight and transport availability and pricing, terms of trade (including receivables management) and the likely rate of recovery of business in affected sales channels, primarily the Daigou channel were also evaluated.
1 Of the $547,873 inventory written off in FY20, $450,619 was due to discontinued products and one off write offs.
DIRECTOR’S REPORT
Bubs Australia Limited and Controlled Entities Annual Report for the year ended 30 June 202034 35
03 DIRECTOR’S REPORTF
or p
erso
nal u
se o
nly
Whilst there has been re-weighting of the Daigou channel throughput toward Cross-Border eCommerce platforms, as future Chinese students and visitors return when international borders open and passenger planes resume, we are optimistic this will in turn have a positive impact on a rebound in the Daigou channel in the long-term. However, it is anticipated short-term growth will be impacted by the downward pressure being experienced in this outbound consumer-to-consumer channel.
The ability to have line of sight on inventory through our channel partners enabled Bubs to sustain and increase our wholesale list price and avoid the push of inventory into the field ahead of end consumer off-take demand, Bubs products have not incurred heavy discounting which has been evident in the category in recent months. Management are focused on a balanced supply and demand ratio, and will continue to be demand-led whilst closely managing the amount of inventory in-market to protect margins and avoid any negative impact to our pricing architecture. This is considered paramount to delivering on our China strategic objectives.
GOING CONCERN
As part of the directors’ consideration of the appropriateness of adopting the going concern basis in preparing the financial statements, a range of scenarios have been reviewed. The assumptions modelled are based on the estimated potential impact of COVID-19 along with our proposed responses over the course of the next 12 months. These include a range of estimated impacts primarily based on length of time various levels of restrictions are in place and the severity of the consequent impact to our relevant distribution channels. For the channels that have adversely impacted by COVID-19 and expected to contribute significant incremental revenue growth to the Group in FY21, we have sensitised the revenue, operating costs and cashflow impact of reduced trading activities. A key judgement applied in the base case scenario is the trading activities back to pre-COVID level in Q3 FY21 for the distribution channels that have been adversely impacted. Under each scenario, mitigating actions are all within management control and can be initiated as they relate to discretionary spend, and do not impact the ability to meet demand. These actions include reduced administration and marketing costs and stopping all non-essential and non-committed capex in the next 12 months. We believe that the risk of enforced factory closure is extremely low as an essential service under Victoria Stage 4 restriction and have implemented additional health and safety measures in our Deloraine factory to reduce the risk of a major supply disruption. In the event of enforced factory closure temporarily, we have enough inventory to meet the end consumer demand. We have assumed no significant structural changes to the business will be needed in any of the scenarios modelled. As at 30 June 2020, the Group balance sheet reflects a net asset position of $132 million and the liquidity of the Group remains strong. We have recently increased NAB working capital facility to $10 million with undrawn balance of $8 million at 30 June 2020. The maturity date of the facility is 21 May 2021. In all scenarios modelled, our liquidity requirements are within the $10 million working capital facility and able to repay the drawdown balance in full before the expiry date. On the basis of these reviews, the directors consider it is appropriate for the going concern basis to be adopted in preparing the financial statements.
PRINCIPAL ACTIVITIES
The Group offers a great range of organic baby food, goat milk infant formula products, the adult goat milk powder products and fresh dairy products. The Group also provides canning services of nutritional dairy products.
ENVIRONMENTAL REGULATIONS
The Group is not aware of any matter which requires disclosure with respect to any significant environmental regulation in respect of its operating activities.
CORPORATE GOVERNANCE
The Group’s corporate governance statement sets out the key features of the Group’s governance framework and practices. The Group has adopted corporate governance policies and practices which are designed to support and promote the responsible management and conduct of the Group. The Group’s corporate governance statement can be found at https://www.asx.com.au/asxpdf/20180606/pdf/43vldgzjlb5bg7.pdf.
EVENTS SUBSEQUENT TO THE END OF THE REPORTING PERIOD
On 24 July 2020, Bubs issued 12,356,627 fully paid ordinary shares to Chemist Warehouse Retail Group upon satisfying its sales performance condition of meeting minimum sales target for the year ended 30 June 2020.
On 24 August 2020, Bubs has entered into a Memorandum of Understanding with Beingmate Co., Ltd under which Bubs has the opportunity to acquire an ownership interest in one of Beingmate’s Infant Formula manufacturing facilities in Beihai China, and obtain Beingmate’s support in securing a State Administration for Market Regulation (SAMR) brand slot, with the objective of producing Bubs® China label Goat Milk Infant Formula using 100% Bubs Australian goat milk. Bubs intends to withdraw the existing SAMR brand applications previously made by Deloraine, and resubmit differentiated super-premium formulations targeting consumers in tier-one cities.
Bubs continues to monitor milk supply in line with projected demand and conduct pricing reviews with suppliers. As part of the FY21 review process, some milk supply agreements have been reset to better align volumes and reduce costs. This restructure included terminating without penalty the guaranteed supply under the CIBUS Australia Milk Supply Agreement from 31 December 2020, and forgoing the call option over CIBUS farms. In addition, the Company entered into a new Milk Supply Agreement with a Victorian supplier who is expected to replace and exceed CIBUS volume over time, thereby better aligning with the Company’s demand profile in the short term whilst safeguarding Bubs provenance positioning and long-term supply chain security, including meeting future demand for SAMR China label products. This replacement in supply partners is expected to significantly improve raw material costs and cashflow management from January 2021.
COVID-19 IMPACT
The COVID-19 pandemic has caused unprecedent social and economic disruption. The Group has to date demonstrated resilience in the face of the COVID-19 pandemic, supported by a strong underlying consumer demand for our products and the focus of the Board and management team on key initiatives, including:
• Continued operation of Deloraine factory as an essential service under Victoria stage 4 restriction;
• The implementation of additional health and safety measures, including splitting work teams and zones in our Deloraine production facility, to reduce the risk of a major supply disruption;
• Working from home arrangement for head office staff;
• Continued close cooperation with our key suppliers;
• Increased levels of safety stock to mitigate future supply chain disruption
Other than the event noted above, no item, transaction or event of a material or unusual nature has arisen in the interval between the end of the financial year and the date of this report, in the opinion of the directors of the Group, that would significantly affect the operations of the Group, the results of those operations, or the state of affairs of the Group, in future financial years.
Bubs Australia Limited and Controlled Entities Annual Report for the year ended 30 June 202036 37
03 DIRECTOR’S REPORTF
or p
erso
nal u
se o
nly

DIVIDENDS
No dividends have been paid or declared since the start of the financial year (2019: Nil).
INDEMNIFICATION AND INSURANCE OF DIRECTORS AND OFFICERS AND AUDITORS
The Group has paid insurance premiums in respect of Directors’ and Officers’ liability insurance for current and past directors and officers. Insurance does not indemnify the Directors and Offices where there is conduct involving lack of good faith.
During the financial year, the Group paid a premium in respect of a contract insuring the Directors’ and Officers’ against a liability incurred as such a Director or executive officer to the extent permitted by the Corporations Act 2001. The contract of insurance prohibits disclosure of the nature of the liability and the amount of the premium. To the extent permitted by law, Bubs has agreed to indemnify its auditors, Deloitte, as part of the terms of its audit engagement agreement against claims by third parties arising from the audit.
The Group has not otherwise, during or since the end of the financial year, except to the extent permitted by law, indemnified or agreed to indemnify an officer or auditor of the Group against a liability incurred as such an officer or auditor.
PROCEEDINGS ON BEHALF OF THE GROUP
No person has applied for leave of court to bring proceedings on behalf of the Group or intervene in any proceedings to which the Group is a party for the purpose of taking responsibility on behalf of the Group for all or part of those proceedings.
The Group was not a party to any such proceedings during the year.
ROUNDING
The financial report is presented in Australian dollars and all values are rounded to the nearest dollar.
GENDER DIVERSITY
The Group has a strong commitment to diversity and recognises the value of attracting and retaining employees with different backgrounds, gender, culture, knowledge, experience and abilities. Diversity contributes to the Group’s business success and benefits individuals, clients, teams, shareholders and stakeholders. The Group’s business policies, practices and behaviours promote diversity and equal opportunity and creates an environment where individual differences are valued and all employees have the opportunity to realise their potential and contribute to the Group’s success.
As at 30 June 2020 As at 30 June 2019
MalePercentage
Male (%)Female
Percentage Female (%)
MalePercentage
Male (%)Female
Percentage Female (%)
Board 3 75% 1 25% 3 75% 1 25%
Senior management 2 50% 2 50% 3 75% 1 25%
Employees 20 61% 13 39% 15 54% 13 46%
Total 25 61% 16 39% 21 58% 15 42%
UNISSUED SHARES UNDER OPTIONS
At the date of this report, unissued shares of the Group under option are:
Expiry Date Exercise Price Number of Shares
19 January 2021 0.10 4,770,810
29 November 2022 0.10 4,770,810
All unissued shares are ordinary shares of the Group.
NON-AUDIT SERVICES
No non-audit services were provided by Deloitte during the year ended 30 June 2020.
Details of amounts paid or payable to the auditor for other assurances services provided during the year are outlined in Note G3 to the financial statements.
A copy of the auditor’s independence declaration as required under Section 307C of the Corporations Act 2001 is attached to this financial report.
Bubs Australia Limited and Controlled Entities Annual Report for the year ended 30 June 202038 39
03 DIRECTOR’S REPORTF
or p
erso
nal u
se o
nly

KEY MANAGEMENT PERSONNEL
The term key management personnel (KMP) refers to those persons having the authority and responsibility for planning, directing and controlling the activities of the Group, directly or indirectly and includes any director of the Group. The disclosures in this report have been audited.
The KMP of the Group for the year ended 30 June 2020 were:
• Dennis Lin (Executive Chairman, appointed on 22 October 2019)
• Matthew Reynolds (Non-executive Director)
• Steve Lin (Non-executive Director)
• Kristy-Lee Newland Carr (Chief Executive Officer and Managing Director)
• Iris Ren (Chief Financial Officer)
• David Orton (General Manager Commercial)
• Richard Paine (General Manager Dairy)
• Anthony Gualdi (Operations Director, resigned on 30 November 2019)
• Vivian Zurlo (General Manager Marketing, appointed on 1 July 2019)
REMUNERATION STRUCTURE
In consultation with external remuneration consultants, the Board seeks to set aggregate compensation at a level that provides the Group with the ability to attract and retain directors and KMP of the highest calibre, whilst incurring a cost that is acceptable to shareholders. The amount of aggregate compensation sought to be approved by shareholders and the manner in which it is apportioned amongst the directors and KMP is reviewed annually. The overall level of executive reward takes into account the performance of the Group over a number of years.
REMUNERATION REPORT (AUDITED)
Employee’s fixed remuneration is based on a matrix of an individual’s skills and experience, their individual performance and their current level of remuneration relative to the market. Fixed remuneration is reviewed on an annual basis, and where appropriate, is adjusted based on consideration of individual performance and market remuneration movement. The overall level of key management personnel reward takes into account the performance of the Group over a number of years. This ensures that the Group attracts, motivates, and retains top talent executives so they can deliver on the Group’s business strategy and contribute to the Group’s ongoing financial performance.
Total fixed remuneration (TFR) comprises of base salary, superannuation in accordance with the statutory rates and allowances. The Board reviews and approves all changes to fixed remuneration.
FIXED REMUNERATION
Short term incentive (STI)
The STI focuses on performance goals which align with the Group’s direction, driving outcomes, differentiating high performance and rewarding delivery over the financial year. STI values are generally calculated as a percentage of fixed remuneration. STI values and performance targets are approved by the Board. For the year ended 30 June 2020, participants may achieve a maximum STI of between 14% and 50% of TFR, with the STI payable up to the maximum subject to achievement of financial targets and specific agreed personal objectives, aligning with the strategic objectives of the Group.
Performance against financial targets is compared with the Group’s budget, and achievement of personal objectives is tracked and discussed through the performance period as part of the Group’s management process.
STI payments are determined and paid annually following the finalisation of audited Group results and are contingent on achievement of Group financial targets and specific agreed personal objectives.
Long term incentives (LTI)
The LTI programs provide the potential for KMPs to receive payment over and above fixed remuneration and short term incentive. These programs are discretionary, appropriate to the results delivered by the Group, and based on the principle of reward for performance.
The purpose of the LTI is to focus the executives’ efforts on the achievement of sustainable long-term shareholder value creation and the long-term financial success of the Group.
The provision of LTI plan awards via options for ordinary shares encourages long-term share exposure for the executives and, therefore, drives behaviours which align with the interests of our shareholders.
The Board believes a three-year performance period provides a reasonable period to align reward with shareholder return and also acts as a vehicle to help retain the KMP, align the business planning cycle, and provide sufficient time for the longer-term performance to be achieved.
VARIABLE REMUNERATION
Bubs Australia Limited and Controlled Entities Annual Report for the year ended 30 June 202040 41
03 DIRECTOR’S REPORT Remuneration Report (Audited)F
or p
erso
nal u
se o
nly

TOTAL FIXED REMUNERATION (TFR)
KMP EXECUTIVES
During the year, the KMP executives of TFR were as follows:
Title Name Annual Base Salary Allowance
Executive Chairman (appointed on 22 October 2019)
Dennis Lin $150,000 Nil
Chief Executive Officer and Managing Director
Kristy Carr $300,000 $6,000
Chief Financial Officer Iris Ren $220,000 Nil
General Manager Commercial David Orton $220,000 Nil
General Manager Dairy Richard Paine $250,000 Nil
General Manager Marketing (appointed on 1 July 2019)
Vivian Zurlo $200,000 Nil
Operations Director (resigned on 30 November 2019)
Anthony Gualdi $200,000 $6,000
GROUP’S FINANCIAL PERFORMANCE
The following table provides details of the relationship between KMP’s TFR and the summary of Group’s financial performance:
2020 2019 2018 2017 2016
Revenue 54,644,952 43,914,853 16,906,256 3,932,298 3,659,328
EBIT Loss (15,037,949) (35,144,011) (66,025,718) (5,078,230) (1,308,057)
Share price at year end
0.925 1.13 0.78 0.25 -
Basic loss per share
0.01 0.08 0.20 0.02 -
Total dividend (cents per share)
- - - - -
SHORT-TERM INCENTIVE PLANS
The FY20 STI awards are set based on achievement against a combination of financial and non-financial KPIs. These are used to ensure a balance between short term financial measures and more strategic non-financial measures which in the medium to longer term will support the growth of the Group.
Performance is measured against the following KPIs:
• Financial – actual results compared to budgeted results for items including revenue, gross margin and normalised EBITDA.
• Business Management – cash generation, capital management, working capital management.
• Business Strategy – development, approval, implementation and achievement.
The following table provides details of the maximum STI that each KMP is entitled to receive:
KMP STISTI
% of TFRPerformance measurement
Dennis Lin - - -
Kristy Carr $150,000 50%100% is measured against
delivery of Business Strategy
Iris Ren $30,000 14%
50% is measured against Business Management and 50% is measured against
Financial
David Orton $80,000 36%100% is measured against
Financial
Richard Paine - - -
Vivian Zurlo - - -
Anthony Gualdi - - -
Bubs Australia Limited and Controlled Entities Annual Report for the year ended 30 June 202042 43
03 DIRECTOR’S REPORT Remuneration Report (Audited)F
or p
erso
nal u
se o
nly
LONG-TERM INCENTIVE PLANS
Each option granted represents a right to receive one fully paid share in the Group once the option vests and is exercised. The number of options and the vesting conditions issued under the LTI Plans are determined by and at the sole discretion of the Board.
EXECUTIVE CHAIRMAN’S FY20 GRANT OF OPTIONS
The FY20 LTI plan awards were divided in 2 tranches and vest subject to the gross revenue and normalised EBITDA performance hurdle calculation in any of a three-year performance period and continuing employment:
• Tranche 1 (2,385,405 options) will vest 3 months after issue and on the achievement of $50,000,000 in gross revenue and $2,000,000 in normalised EBITDA as at the Company’s full year results; and
• Tranche 2 (2,385,405 options) will vest 3 months after issue and on the achievement of $60,000,000 in gross revenue and $4,000,000 in normalised EBITDA as at the Company’s full year results.
The expiry date of the options is 29 November 2022.
The gross revenue and normalised EBITDA performance hurdle was chosen as being a performance measure appropriate to current circumstances of the Group given the Group’s short term objective is to continue to build strong sales momentum and deliver profitable growth.
CEO’S FY18 GRANT OF OPTIONS
The FY18 LTI plan awards were divided in 3 tranches and vest subject to the gross revenue or EBIT performance hurdle calculation over a three-year performance period:
• Tranche 1 (3,578,108 options) will vest on the achievement of $15,000,000 in gross revenue or achievement of $500,000 in EBIT.
• Tranche 2 (2,385,405 options) will vest on the achievement of $30,000,000 in gross revenue and $2,000,000 in EBIT
• Tranche 3 (2,385,405 options) will vest on the achievement of $50,000,000 in gross revenue and $4,000,000 in EBIT.
Performance hurdles must be achieved in any consecutive 12 month period and are not cumulative in nature.
Options in respect of Tranche 1 do not have an explicit service condition and Tranches 2 and 3 have a three-month service condition after the issue date and the continuing employment. The expiry date of the options is 19 January 2021.
The gross revenue or EBIT performance hurdle was chosen as being a performance measure appropriate to current circumstances of the Group, with progress easily tracked against agreed performance targets, encouraging CEO engagement and aligning with shareholder objectives.
Tranche 1 was granted to the Group’s previous CEO Nicholas Simms. The options vested in FY18 and were subsequently cancelled in FY19.
Tranche 2 and 3 options were offered to and accepted by the current CEO Kristy Carr on 29th June 2018 with the value of $0.68 for each option and an exercise price of $0.10. These tranches have not yet vested.
EXECUTIVE CONTRACTS
The remuneration and other terms of employment for KMP executives are covered in formal employment contracts. The Group may terminate an executive immediately for cause, in which case the executive is not entitled to any payment other than the value of total fixed remuneration (and accrued entitlements) up to the termination date.
KMP executiveNotice period by the
GroupNotice period by
ExecutivePayment in lieu of
notice
Kristy Carr (Managing Director) 3 months 3 months Yes
Dennis Lin (Executive Chairman, appointed on 22 October 2019)
3 months 3 months Yes
Kristy Carr (Chief Executive Officer and Managing Director)
3 months 3 months Yes
Iris Ren (Chief Financial Officer) 3 months 3 months Yes
David Orton (General Manager Commercial) 3 months 3 months Yes
Richard Paine (General Manager Dairy) 3 months 3 months Yes
Vivian Zurlo (General Manager Marketing, appointed on 1 July 2019)
3 months 3 months Yes
Anthony Gualdi (Operations Director resigned on 30 November 2019)
3 months 3 months Yes
Bubs Australia Limited and Controlled Entities Annual Report for the year ended 30 June 202044 45
03 DIRECTOR’S REPORT Remuneration Report (Audited)F
or p
erso
nal u
se o
nly

NON-EXECUTIVE DIRECTORS’ REMUNERATION
The Group’s remuneration policy for non-executive directors aims to ensure that the Group can attract and retain suitably qualified and experienced directors having regard to:
• the level of fees paid to non-executive directors of other comparable Australian listed companies;
• the growing size and complexity of the Group’s operations;
• the responsibilities and work requirements of Board members; and
• the skills and diversity of Board members.
Under the ASX Listing Rules, the total amount paid to all non-executive directors in any financial year must not exceed the amount fixed in a general meeting of the Group. This amount is currently $300,000 as determined by Shareholders at the AGM held on 18 November 2009. The Board’s present policy is that all non-executive directors, other than the chairman, be paid $40,000, per annum, exclusive of superannuation in accordance with statutory rates as remuneration for their services as directors.
For FY20, non-executive chairman and directors’ remuneration was as follows:
Title Name Annual remuneration
Non-Executive Chairman (resigned on 21 October 2019) Dennis Lin $150,000
Non-Executive Director Matthew Reynolds $40,000
Non-Executive Director Steve Lin $40,000*
*Steve Lin’s services were remunerated by C2 Capital Partners.
Directors are also reimbursed for travel and other expenses incurred in attending to Board meetings and the Group’s affairs.
COMPANY SECRETARY
Jay Stephenson is contracted on a monthly basis as Company Secretary at a rate of $30,000 per annum.
OTHER RELATED PARTY TRANSACTIONS WITH KMP
Dennis Lin, Executive Chairman, was a strategic advisor in an accounting firm up to 30 June 2020. The Group contracted professional services from the accounting firm to the amount of $39,488 in FY2020 (2019: $181,794), with an outstanding balance at 30 June 2020 of $14,149 (2019: $64,538).
Apart from the details disclosed above, no director or any other related party has entered into any other material contracts with the Group since the end of the previous financial year. All of the above transactions were considered to be on an arms’ length basis.
DETAILS OF THE NATURE AND AMOUNT OF EACH ELEMENT OF THE REMUNERATION
Table A(1): Remuneration for KMP for the year ended 30 June 2020
Short TermPost-
EmploymentOther Long
Term
Salary & fees
$
Annual leave $
Cash bonus
$
Non- monetary
$ (1)
Super- annuation
$
Long service leave
$
Share based payments –
options$
Total$
Perfor- mance related
%
Dennis Lin (2)
2020 99,934 7,998 - - 9,494 252 1,207,997 1,325,678 91%
2019 - - - - - - - -
Kristy Carr
2020 270,000 23,077 150,000 - 25,650 5,251 (1,349,046) (875,068) 137%
2019 285,000 23,077 - 6,000 27,075 18,768 1,346,954 1,706,874 79%
Anthony Gualdi (3)
2020 68,031 6,407 - 2,500 6,463 45,212 - 128,613 0%
2019 190,769 15,385 - 6,000 18,123 4,674 - 234,951 0%
Iris Ren
2020 212,385 16,923 15,000 - 20,177 2,985 - 267,470 6%
2019 137,513 11,170 20,000 - 13,064 824 - 182,571 11%
David Orton
2020 211,538 16,923 10,000 - 20,096 3,140 - 261,697 4%
2019 138,282 11,170 100,000 - 13,137 892 - 263,481 38%
Richard Paine
2020 238,462 19,231 - - 22,654 1,475 - 281,822 0%
2019 89,041 6,849 - - 8,459 98 - 104,447 0%
Vivian Zurlo
2020 194,615 5,385 - - 18,488 695 - 219,183 0%
2019 - - - - - - - -
Total
2020 1,294,965 95,944 175,000 2,500 123,022 59,010 (141,049) 1,609,392
2019 840,605 67,651 120,000 12,000 79,858 25,256 1,346,954 2,492,324
(1) Non-monetary benefits include motor vehicle and travel allowances.
(2) Dennis Lin was appointed as an executive chairman on 22 October 2019.
(3) Anthony Gualdi resigned on 30 November 2019.
Bubs Australia Limited and Controlled Entities Annual Report for the year ended 30 June 202046 47
03 DIRECTOR’S REPORT Remuneration Report (Audited)F
or p
erso
nal u
se o
nly

Table A(2): Remuneration for Non-executive Directors for the year ended 30 June 2020
Short TermPost-
EmploymentOther Long
Term
Salary & fees$
Non- monetary
$
Super- annuation
$
Long service leave
$
Share based payments –
options$
Total$
Perfor- mance related
%
Matthew Reynolds
2020 40,000 - 3,800 - - 43,800 -
2019 40,000 - 3,800 - - 43,800 -
John Gommans
2020 - - - - - - -
2019 31,969 - 3,037 - - 35,006 -
Steve Lin (2)
2020 40,000 - - - - 40,000 -
2019 8,000 - - - - 8,000 -
Dennis Lin (1)
2020 46,027 - 4,373 - - 50,400 -
2019 150,000 - 14,250 - - 164,250 -
Total
2020 126,027 - 8,173 - - 134,200 -
2019 229,969 - 21,087 - - 251,056 -
(1) Dennis Lin resigned as a Non-executive Director on 21 October 2019 and was appointed as an executive chairman on 22 October 2019.
(2) Steve Lin’s services were remunerated by C2 Capital Partners in FY19 and FY20.
FULLY PAID ORDINARY SHARES OF BUBS AUSTRALIA LIMITED
Table B: Movement in the shares of Bubs held, directly, indirectly or beneficially, by each KMP, including their related parties.
At the beginning of
the year
Purchase of shares
Other changeShares
disposedAt the end of
the year
Kristy Carr (1)
2020 16,761,600 - - (3,141,000) 13,620,600
2019 20,761,600 - - (4,000,000) 16,761,600
Anthony Gualdi (2)
2020 12,000,000 - - (2,000,000) 10,000,000
2019 17,676,600 - - (5,676,000) 12,000,000
Steve Lin(3)
2020 - - - - -
2019 - - - - -
Dennis Lin
2020 - - - - -
2019 - - - - -
Matthew Reynolds
2020 - - - - -
2019 - - - - -
John Gommans (4)
2020 - - - - -
2019 19,200,671 - - - 19,200,671
Iris Ren
2020 - - - - -
2019 - - - - -
David Orton
2020 - - - - -
2019 - - - - -
Richard Paine
2020 1,500 - - - 1,500
2019 1,500 - - - 1,500
Vivian Zurlo
2020 - - - - -
2019 - - - - -
[1] Shares are held under Carr Family Pty Limited.
[2] Shares are held under Infant Food Business Pty Limited. Anthony Gualdi resigned on 30 November 2019.
[3] At 30 June 2019 and 30 June 2020, 76,288,510 shares were held by C2 Capital Partners, of which Steve Lin is the Managing Director.
[4] 19,200,671 shares were held by J Gommans on resignation date. At resignation date, J Gommans close family member held 19,200,671 shares as part of the acquisition of Nulac Foods Pty Ltd on 20 December 2017.
Bubs Australia Limited and Controlled Entities Annual Report for the year ended 30 June 202048 49
03 DIRECTOR’S REPORT Remuneration Report (Audited)F
or p
erso
nal u
se o
nly

END OF REMUNERATION REPORT (AUDITED)
This directors’ report is signed in accordance with a resolution of the board of directors:
DENNIS LIN
Dated: 31 August 2020EXECUTIVE CHAIRMANSYDNEY
SHARE BASED PAYMENTS
Table C: Share-based payments granted as remuneration to KMP
Grant date
Number of options granted
Fair Value of options granted
Exercise price per
option
Expiry date
Number vested
Number exercised
Number forfeited
Number cancelled
Number of options held at the end of
the period
Dennis Lin
2020 29/11/2019 4,770,810 $0.9838 $0.10 29/11/2022 - - - - 4,770,810
2019 - - - - - - - - - -
Kristy Carr
2020 - - - - - - - - - 4,770,810
2019 - - - - - - - - - 4,770,810
2018 29/06/2018 4,770,810) $0.6836 $0.10 19/01/2021 - - - - 4,770,810
Nicholas Simms
2020 - - - - - - - - - -
2019 - - - - - - - - 3,578,1082 -
2018 14/12/2017 8,348,918 $0.7106 $0.10 19/01/2021 3,578,1082 - 4,770,8101 - 3,578,108
(1) As a result of her appointment to the position of CEO, tranche 2 and tranche 3 options were offered to and accepted by Kristy Carr in FY18. The tranche 2 and tranche 3 options issued to Nicholas Simms were forfeited.
(2) 3,578,108 options vested in FY18 and were subsequently cancelled in FY19. As such, these options are unable to be exercised.
Bubs Australia Limited and Controlled Entities Annual Report for the year ended 30 June 202050 51
03 DIRECTOR’S REPORT Remuneration Report (Audited)F
or p
erso
nal u
se o
nly

Bubs Australia Limited and Controlled Entities Annual Report for the year ended 30 June 202052 53
03 Independent Auditor ’s ReportF
or p
erso
nal u
se o
nly

Bubs Australia Limited and Controlled Entities Annual Report for the year ended 30 June 202054 55
03 Independent Auditor ’s ReportF
or p
erso
nal u
se o
nly

Annual Report for the year ended 30 June 2020 5756
03 Lead Auditor Independence Declaration
Liability limited by a scheme approved under Professional Standards Legislation.
Member of Deloitte Asia Pacific Limited and the Deloitte organisation.
Dear Board Members
Bubs Australia Limited
In accordance with section 307C of the Corporations Act 2001, I am pleased to provide the following declaration of independence to the directors of Bubs Australia Limited. As lead audit partner for the audit of the financial report of Bubs Australia Limited for the financial year ended 30 June 2020, I declare that to the best of my knowledge and belief, there have been no contraventions of:
(i) the auditor independence requirements of the Corporations Act 2001 in relation to the audit; and
(ii) any applicable code of professional conduct in relation to the audit. Yours faithfully
DELOITTE TOUCHE TOHMATSU
Lian (Andrew) Sun Partner Chartered Accountants
Deloitte Touche Tohmatsu ABN 74 490 121 060 477 Collins Street Melbourne, VIC, 3000 Australia Phone: +61 3 9671 7000 www.deloitte.com.au
31 August 2020 The Board of Directors Bubs Australia Limited 23-29 Nina Link Dandenong South VIC 3175
For
per
sona
l use
onl
y

FINANCIAL STATEMENTS
Consolidated Statement of Profit or Loss
and Other Comprehensive Income
Consolidated Statement of Financial
Position
Consolidated Statement of Changes in
Equity
Consolidated Statement of
Cash Flows
Notes to Financial Statements
Director’s Declaration
Other Information
04
58 59
For
per
sona
l use
onl
y

CONSOLIDATED STATEMENT OF PROFIT OR LOSS AND OTHER COMPREHENSIVE INCOME
Note2020
$2019
$
Revenue B2 54,644,952 43,914,853
Cost of sales B3 (44,276,408) (35,301,918)
Gross Profit 10,368,544 8,612,935
Other Income 377,697 1,238,845
Share of net profits of joint ventures accounted for using the equity method
(272,496) -
Distribution and selling costs (1,885,185) (1,468,069)
Marketing and promotion costs (9,907,735) (4,056,514)
Administrative and other costs B3 (13,369,565) (18,148,377)
Share based payment expense – Corporate transaction - (20,425,504)
Other expenses B3 (349,209) (897,327)
Interest income 317,504 455,554
Finance cost B3 (1,380,255) (893,576)
Loss before tax (16,100,700) (35,582,033)
Income tax benefit B5 8,329,562 72,797
Loss for the year after tax (7,771,138) (35,509,236)
Other comprehensive income
Other comprehensive income that may be reclassified to profit or loss in subsequent periods (net of tax)
Exchange difference on translation of foreign operations (14,177) -
Other comprehensive income, net of tax (14,177) -
Total comprehensive loss for the year (7,785,315) (35,509,236)
Loss per share
Basic (loss) per share (dollars) B4 (0.01) (0.08)
Diluted (loss) per share (dollars) B4 (0.01) (0.08)
The accompanying notes form part of these financial statements.
Bubs Australia Limited and Controlled Entities Annual Report for the year ended 30 June 202060 61
04 FINANCIAL STATEMENTS Consolidated Statement of Profit or Loss and Other Comprehensive IncomeF
or p
erso
nal u
se o
nly

Note30/06/2020
$30/06/2019
$Assets Current Assets Cash and cash equivalents D3 26,025,575 23,291,058 Trade and other receivables C1 6,619,072 15,552,802 Other assets C3 1,654,106 1,636,563 GST receivable C11 956,045 1,946,169 Inventories C2 30,602,156 14,552,400 Total Current Assets 65,856,954 56,978,992
Non-Current Assets
GST receivable C11 255,768 593,477 Plant and equipment C4 4,067,769 4,213,775 Right of use assets C8 2,081,000 -Intangible assets C5 88,504,687 91,782,992 Investment in joint ventures E 743,542 1,030,470Total Non-Current Assets 95,652,766 97,620,714 Total Assets 161,509,720 154,599,706 Liabilities
Current Liabilities
Trade and other payables C6 11,003,580 8,931,497 Contract liabilities C7 67,234 926,382 Lease liabilities C8 422,805 -Borrowings C9 2,000,000 2,000,000 Provisions C10 601,269 2,357,410 Share based payment liability C11 956,045 1,946,169 Employee benefit liability - Nulac acquisition - 6,700,000 Consideration payable - 238,095 Deferred consideration payables C12 4,510,181 5,000,000 Total Current Liabilities 19,561,114 28,099,553
Non-Current Liabilities
Lease liabilities C8 2,166,131 -Provisions C10 148,841 553,949
Share based payment liability C11 255,768 593,477
Deferred consideration payables C12 3,873,573 7,347,062 Deferred tax liabilities B5 3,605,635 12,354,026 Total Non-Current Liabilities 10,049,948 20,848,514 Total Liabilities 29,611,062 48,948,067 Net Assets 131,898,658 105,651,639 Equity Issued capital D5 236,965,360 189,059,150 Share based payments reserve D6 11,005,047 24,878,923 Foreign currency translation reserve (12,210) 1,967 Accumulated losses (116,059,539) (108,288,401)Total Equity 131,898,658 105,651,639
CONSOLIDATED STATEMENT OFFINANCIAL POSITION
The accompanying notes form part of these financial statements.
Bubs Australia Limited and Controlled Entities Annual Report for the year ended 30 June 202062 63
04 FINANCIAL STATEMENTS Consolidated Statement of Financial PositionF
or p
erso
nal u
se o
nly

2020 Issued Capital $
Share Based Payments Reserve
$
Foreign Currency
Translation Reserve
$
Retained Earnings
$
Total equity $
Balance at 1 July 2019 189,059,150 24,878,923 1,967 (108,288,401) 105,651,639
Comprehensive income
Loss for the period - - - (7,771,138) (7,771,138)
Other comprehensive income - - (14,177) - (14,177)
Total comprehensive income - - (14,177) (7,771,138) (7,785,315)
Transactions with owners in their capacity as owners:
Issue of shares D5 48,732,827 - - - 48,732,827
Exercise of options D5 150,655 - - - 150,655
Capital raising costs, net of tax D5 (977,272) - - - (977,272)
Share based payment expense D6 - (141,049) - - (141,049)
Share based payment expense – Corporate transaction
D6 - (13,732,827) - - (13,732,827)
Balance at 30 June 2020 236,965,360 11,005,047 (12,210) (116,059,539) 131,898,658
The accompanying notes form part of these financial statements.
CONSOLIDATED STATEMENT OF CHANGES IN EQUITY
The accompanying notes form part of these financial statements.
2019 Issued Capital $
Share Based Payments Reserve
$
Foreign Currency
Translation Reserve
$
Retained Earnings
$
Total equity $
Balance at 1 July 2019 142,189,264 3,106,465 - (72,779,165) 72,516,564
Comprehensive income
Loss for the period - - - (35,509,236) (35,509,236)
Other comprehensive income - - 1,967 - 1,967
Total comprehensive income - - 1,967 (35,509,236) (35,507,269)
Transactions with owners in their capacity as owners:
Shares issued at acquisition 13,384,615 - - - 13,384,615
Issue of shares 32,738,477 - - - 32,738,477
Exercise of options D5 791,081 - - - 791,081
Capital raising costs, net of tax D5 (44,287) - - - (44,287)
Share based payment expense D6 - 1,346,954 - - 1,346,954
Share based payment expense – Corporate transaction
D6 - 20,425,504 - - 20,425,504
Balance at 30 June 2020 189,059,150 24,878,923 1,967 (108,288,401) 105,651,639
Bubs Australia Limited and Controlled Entities Annual Report for the year ended 30 June 202064 65
04 FINANCIAL STATEMENTS Consolidated Statement of Changes in EquityF
or p
erso
nal u
se o
nly

2020 $
2019 $
Cash flows from operating activities
Receipts from customers 65,487,490 40,061,416
Payments to suppliers and employees (87,444,781) (57,415,513)
Interest received 383,665 369,910
Interest paid (343,452) (174,180)
Net cash used in operating activities (21,917,078) (17,158,367)
Cash flows from investing activities
Purchases of property, plant and equipment (166,861) (82,730)
Proceeds from disposal of property, plant and equipment 864 1,709
Net payments to Deloraine vendors relating to Deloraine acquisition (2,205,073) -
Payments for subsidiaries net of cash acquired - (15,956,865)
Purchases of intangible assets (52,550) -
Payments for interests in associates (1,030,470) -
Net payments to Nulac vendors relating to Nulac Foods acquisition and disposal of joint ventures (5,245,095) (7,950,232)
Proceeds from disposal of Coach House Dairy assets - 500,000
Repayment to a related party - 600,000
Net cash (used in) / from investing activities (8,699,185) (22,888,118)
Cash flows from financing activities
Proceeds from share issue 35,000,000 32,738,477
Exercise of options 150,655 791,081
Capital raising costs (1,396,102) (44,287)
Repayment of the shareholder loan from the Deloraine Dairy vendors (pre-acquisition shareholders) - (8,790,630)
Repayment of lease liabilities (403,773) -
Net cash from financing activities 33,350,780 24,694,641
Net increase in cash and cash equivalents 2,734,517 (15,351,844)
Cash and cash equivalents at the beginning of the financial year 23,291,058 38,642,902
Total cash and cash equivalents at the end of the year
26,025,575 23,291,058
CONSOLIDATED STATEMENT OF CASH FLOWS
The accompanying notes form part of these financial statements.
Bubs Australia Limited and Controlled Entities Annual Report for the year ended 30 June 202066 67
04 FINANCIAL STATEMENTS Consolidated Statement of Cash FlowsF
or p
erso
nal u
se o
nly

The financial statements cover Bubs Australia Limited as a consolidated entity consisting of Bubs Australia Limited and the entities it controlled (“the Group”) for the year ended 30 June 2020. The financial report is presented in Australian dollars, which is Bubs Australia Limited’s functional and presentational currency.
The Group is a for-profit entity that is a listed public company limited by shares, incorporated and domiciled in Australia. A description of the nature
The financial report is a general purpose financial report, which has been prepared in accordance with Australian Accounting Standards and Interpretations issued by the Australian Accounting Standards Board (‘AASB’) and the Corporations Act 2001. These financial statements also comply with International Financial Reporting Standards as issued by the International Accounting Standards Board (‘IASB’).
The financial statements, apart from the cash flow information, have been prepared on an accruals basis and are based on historical costs.
CORPORATE INFORMATION
BASIS OF PREPARATION
BASIS OF PREPARATIONA.
of the Group’s operations and its principal activities is included in the directors’ report, which is not part of the financial report. The annual report was authorised for issue, in accordance with a resolution of directors, on 30 August 2020. The directors have the power to amend and reissue the financial report.
The Group applies AASB 16 Leases for the first time. The nature and effect of the changes as a result of adoption of these new accounting standards are described below.
NOTES TO THE FINANCIAL STATEMENTS
AASB 16 LEASES
AASB 16 Leases supersedes AASB 117 Leases and introduces significant changes to lessee accounting by removing the distinction between operating and finance lease and requiring the recognition of a right-of-use asset and a lease liability at commencement for all leases, except for short-term leases and leases of low value assets when such recognition exemptions are adopted.
The Group has applied AASB 16 using the cumulative catch-up approach which requires the Group to recognise an asset at amount equal to liability at the date of initial application.
The Group’s accounting policy for Leases and impact on adoption is as follows.
Impact of the new definition of a lease
The Group has made use of the practical expedient available on transition to AASB 16 not to reassess whether a contract is or contains a lease. Accordingly, the definition of a lease in accordance with AASB 117 and Interpretation 4 will continue to be applied to those leases entered or changed before 1 July 2019. AASB 16 determines whether a contract contains a lease on the basis of whether the customer has the right to control the use of an identified asset for a period of time in exchange for consideration. The Group applies the definition of a lease and related guidance set out in AASB 16 to all lease contracts entered into or changed on or after 1 July 2019. AASB 16 will not significantly change the scope of contracts that meet the definition of a lease for the Group.
Impact on Lessee Accounting
Applying AASB 16, for all leases, the Group:
• Recognises right-of-use assets and lease liabilities in the consolidated statement of financial position, initially measured at the present value of the future lease payments, with the right-of-use asset adjusted by the amount of any prepaid or accrued lease payments.
• Recognises depreciation of right-of-use assets and interest on lease liabilities in the consolidated statement of profit or loss.
• Separates the total amount of cash paid into a principal portion (presented within financing activities) and interest (presented within financing activities) in the consolidated statement of cash flows.
• Lease incentives (e.g. rent free period) are recognised as part of the measurement of the right-of-use assets and lease liabilities whereas under AASB 117 they resulted in the recognition of a lease incentive, amortised as a reduction of rental expenses on a straight line basis.
Under AASB 16, right-of-use assets are tested for impairment in accordance with AASB 136 Impairment of Assets.
For short-term leases (lease term of 12 months or less) and leases of low-value assets (which includes tablets and
Bubs Australia Limited and Controlled Entities Annual Report for the year ended 30 June 202068 69
04 FINANCIAL STATEMENTS Notes to the Financial StatementsF
or p
erso
nal u
se o
nly

personal computers, small items of office furniture and telephones), the Group has opted to recognise a lease expense on a straight-line basis as permitted by AASB 16. This expense is presented within ‘Administrative and other costs’ in profit or loss.
The Group has used the following practical expedients when applying the cumulative catch-up approach to leases previously classified as operating leases applying AASB 16:
• The Group has applied a single discount rate to a portfolio of leases with reasonably similar characteristics.
• The Group has elected not to recognise right-of-use assets and lease liabilities to leases for which the lease term ends within 12 months of the date of initial application.
Financial impact of initial application of AASB 16
The weighted average lessees incremental borrowing rate applied to lease liabilities recognised in the statement of financial position on 1 July 2019 is 5.35%.
The following table shows the operating lease commitments disclosed applying AASB 117 at 30 June 2019, discounted using the incremental borrowing rate at the date of initial application and the lease liabilities recognised in the statement of financial position at the date of initial application.
$
Operating lease commitments at 30 June 2019 3,522,540
Short-term leases and leases of low-value assets (1,651)
Present value of the lease payments due in periods covered by extension options that are included in the lease term and not previously included in operating lease commitments
23,448
Effect of discounting the above amounts (552,177)
Lease liabilities recognised at 1 July 2019 2,992,160
The Group has recognised right-of-use assets $2,521,038 and lease liabilities $2,992,160 upon transition to AASB 16. The difference represents the lease incentive recognised at 30 June 2019 under AASB 117 Leases.
The preparation of the financial statements requires management to make judgements, estimates and assumptions. The most significant use of judgements and estimates has been applied to the following areas. Refer to the respective notes for additional details.
SIGNIFICANT ACCOUNTING JUDGEMENTS AND ESTIMATES
Reference
Recoverability of intangibles Note C1
Valuation of inventory Note C2
Recoverability of intangibles Note C5
Recognition and recoverability of deferred tax assets
Note B5
Share based payments Note G2
Bubs Australia Limited and Controlled Entities Annual Report for the year ended 30 June 202070 71
04 FINANCIAL STATEMENTS Notes to the Financial StatementsF
or p
erso
nal u
se o
nly

GROUP PERFORMANCEB.
B.1OPERATING SEGMENTS
Operating segments are identified on the basis of internal reports about components of the Group that are regularly reviewed by the chief operating decision maker (the Board) in order to allocate resources to the segment and assess its performance.
The Group had 2 external customers who generated greater than 10 percent of the Group’s revenue at 30 June 2020 amounting to $17,220,404. The Group had 3 external customers who generated greater than 10 percent of the Group’s revenue at 30 June 2019 amounting to $20,926,237.
This section explains the results and performance of the Group for the year, including segment information, earnings per share and taxation.
In FY19 and FY20, the Group had identified a single operating segment being the sale of nutritional food, fresh products, adult powder and providing canning services of nutritional dairy products. Accordingly, the financial information presented in the consolidated statement of profit or loss and other comprehensive income and consolidated statement of financial position was the same as that presented to the chief operating decision maker.
Geographic information
Revenue (by region)2020
$2019
$
Australia 36,540,584 33,392,866
China 12,692,522 9,622,100
Other International 5,411,846 899,887
Total 54,644,952 43,914,853
The revenue information above is based on the locations of the customers.
Set out below is the disaggregation of the Group’s revenue from contracts with customers:
2020$
2019$
Type of goods and services
Sale of Infant Formula 29,845,732 18,936,215
Sale of Baby Organic Food 2,604,513 2,708,393
Sale of Adult Powder 14,378,082 15,611,244
Sale of Fresh Dairy Products 3,449,196 5,939,231
Sale of Raw Materials 2,340,973 337,304
Canning services 2,026,456 382,466
Total revenue from contracts with customers 54,644,952 43,914,853
Sale of products
The Group has identified the following revenue streams by product type:
• Infant Formula
• Baby Organic Food
• Adult Powder
• Fresh Dairy Products
• Raw materials
B.2REVENUE
RECOGNITION AND MEASUREMENT
Under AASB 15 Revenue from Contracts with Customer, revenue is recognised at an amount that reflects the consideration to which an entity expects to be entitled in exchange for transferring goods or services to a customer. The standard requires entities to exercise judgement, taking into consideration all of the relevant facts and circumstances when applying each step of the model to contracts with their customers. The standard also specifies the accounting for the incremental costs of obtaining a contract and the costs directly related to fulfilling a contract and comparatives were not restated.
Bubs Australia Limited and Controlled Entities Annual Report for the year ended 30 June 202072 73
04 FINANCIAL STATEMENTS Notes to the Financial StatementsF
or p
erso
nal u
se o
nly

For all revenue streams, the Group’s contracts with customers for the sale of products include one performance obligation. The Group has concluded that revenue from sale of products should be recognised at the point in time when the products are transferred to the customer, generally on delivery of the products or when the goods are picked up at the Group’s warehouse. The Group recognises revenue from the sale of goods measured at the fair value of the consideration received or receivable, net of returns, volume rebates and marketing contribution.
Rebates and marketing contribution
Rebates and marketing contribution with customers are recognised as a reduction of revenue. Under AASB 15 Revenue from Contracts with Customer, marketing contributions give rise to variable consideration. To estimate the variable consideration to which it is entitled, the Group applies the ‘most likely amount method’ for contracts with marketing contribution. The selected method that best predicts the amount of variable consideration is primarily driven by the marketing contribution agreed with the customers. The Group then applies the requirements on constraining estimates of variable consideration and recognises a refund liability for the expected future rebates.
Canning services
The Group provides the canning services for nutritional dairy products. The Group recognises revenue from the canning services measured at the fair value of the consideration received or receivable. The revenue represents the Group’s right to an amount of consideration that is unconditional. Where the Group controls the promised goods before transferring them to the customers, the Group is a principal and recognises the full amount of goods and canning services as revenue when the production is complete. Where the Group does not control the promised goods and solely provides canning services to the customers, the Group is an agent and recognises the revenue for the canning services when the production is complete.
Where contracts with customers have minimum volume commitments over the term of the agreement and the customer is not able to fulfil minimum volume commitment, the Group is entitled to charge a penalty fee of the shortfall volume. This gives rise to variable consideration. To estimate the variable consideration to which it is entitled, the Group applies the ‘expected value method’.
KEY ESTIMATE AND JUDGEMENT
The Group estimates variable consideration to be included in the transaction price for the sale of products with rebates and market contribution. Determining whether a customer will be likely entitled to a rebate will depend on the customer’s historical rebates entitlement and accumulated purchases to date.
The Group estimates variable consideration to be included in the transaction price of the canning service with minimum volume commitments. The Group estimates the expected volume based on customer forecasts and accumulated purchases to date.
B.3EXPENSES
2020 $
2019 $
Cost of sales
Production costs 42,639,299 34,520,080
Net realisable value adjustments 105,946 36,993
Obsolete inventory provision 983,290 -
Inventories written off 547,873 744,845
Total 44,276,408 35,301,918
Included in administrative and other expenses are the following:
Listing and registry fees 397,964 313,136
Accountancy and legal fees 673,298 493,372
Insurance 485,233 408,667
Travel costs 421,412 672,754
Consultancy fee 214,317 764,843
Occupancy costs 127,698 383,122
Credit losses 17,788 42,150
Depreciation and amortisation 3,730,852 1,178,954
Retainer fee with UphamGo Australia - 429,265
Employee costs
Wages and salaries 5,334,823 4,461,758
Superannuation 443,096 299,294
Share based payments (141,049) 1,346,954
Employee benefit expense – Nulac acquisition - 5,897,633
Total 5,636,870 12,005,639
Other expenses
Corporate transaction accounting expense 349,209 897,327
Total 349,209 897,327
Finance costs
Interest expense 193,703 174,180
Interest expense on lease liabilities 149,860 -
Unwinding of consideration payable 1,036,692 719,396
Total 1,380,255 893,576
Bubs Australia Limited and Controlled Entities Annual Report for the year ended 30 June 202074 75
04 FINANCIAL STATEMENTS Notes to the Financial StatementsF
or p
erso
nal u
se o
nly

B.4LOSS PER SHARE (LPS)
2020 2019
Loss attributable to the Group used in calculating basic and diluted EPS (7,771,138) (35,509,236)
Weighted average number of ordinary shares for basic EPS 538,114,198 455,620,266
Basic LPS (dollars) (0.01) (0.08)
Diluted LPS (dollars)* (0.01) (0.08)
* The Group has granted 9,541,620 options to employees that could potentially dilute basic earnings per share in the future, but were not included in the calculation above because they are anti-dilutive for the period(s) presented.
RECOGNITION AND MEASUREMENT
Basic EPS is calculated as net loss attributable to the group divided by the weighted average number of ordinary shares outstanding during the financial year.
Diluted EPS adjusts the figures used in the determination of basic earnings per share to take into account the after income tax effect of interest and other financing costs associated with dilutive potential ordinary shares and the weighted average number of shares assumed to have been issued for no consideration in relation to dilutive potential ordinary shares.
B.5INCOME TAXES
2020 $
2019 $
Consolidated profit or loss
Income tax benefit
Current tax - -
Deferred tax 8,329,562 72,797
Income tax benefit reported in the statement of profit or loss 8,329,562 72,797
Numerical reconciliation of income tax benefit and tax at the statutory rate
Accounting Loss before income tax benefit 16,100,700 35,582,033
Income tax benefit calculated at 30% (2018: 27.5%) 4,830,210 9,785,059
Tax effect of amounts not taxable in calculating income tax benefit:
Share of profit of joint ventures - 51,552
Allocable cost amount relating to Deloraine acquisition (531,743) -
Share based payments 42,315 (370,412)
Share based payment - Corporate transaction - (5,617,014)
Non-deductible costs (174,108) (31,407)
Employee benefit liability - Nulac acquisition - (1,621,849)
Deferred consideration payable fair value movement (311,008) (197,834)
Income tax losses not recognised - (1,865,952)
Other (347,897) (59,346)
Income tax losses recognised 4,821,793 -
Income tax benefits 8,329,562 72,797
Bubs Australia Limited and Controlled Entities Annual Report for the year ended 30 June 202076 77
04 FINANCIAL STATEMENTS Notes to the Financial StatementsF
or p
erso
nal u
se o
nly

Deferred tax assets/(liabilities) arise from the following
2020 Opening BalanceRecognised in Profit or Loss
Recognised in equity
Closing Balance
Trade and other receivables - 104,828 - 104,828
Inventories 112,392 182,594 - 294,986
Intangible assets (14,770,024) 657,116 - (14,112,908)
Plant and equipment 48,481 61,535 - 110,016
Right of use assets - (624,300) - (624,300)
Lease Liabilities - 776,681 - 776,681
Trade and other payables - 69,433 - 69,433
Provisions - 154,348 - 154,348
Carried forward tax losses1 1,418,030 7,479,070 484,611 9,381,711
Capital raising costs 837,095 - (65,782) 771,313
Allocable cost amount relating to Deloraine acquisition
- (531,743) - (531,743)
(12,354,026) 8,329,562 418,829 (3,605,635)
2019 Opening BalanceRecognised in Profit or Loss
Recognised in equity
Closing Balance
Trade and other receivables (7,355) 7,355 - -
Inventories 64,803 47,589 - 112,392
Intangible assets (2,321,203) (21,998) (12,426,823) (14,770,024)
Capital raising costs 837,095 - - 837,095
Plant and equipment - 48,481 - 48,481
Carried forward tax losses 1,426,660 (8,630) - 1,418,030
- 72,797 (12,426,823) (12,354,026)
1 As at 30 June 2020, deferred tax assets of $9,381,710 (FY19: $1,418,030) relating to tax losses were recognised and expected to be utilised in the foreseeable future.
RECOGNITION AND MEASUREMENT
The income tax expense or benefit for the year is the tax payable on that year’s taxable income based on the applicable income tax rate for each jurisdiction, adjusted by the changes in deferred tax assets and liabilities attributable to temporary differences, unused tax losses and the adjustment recognised for prior years, where applicable.
Deferred tax assets and liabilities are recognised for temporary differences at the tax rates expected to be applied when the assets are recovered or liabilities are settled, based on those tax rates that are enacted or substantively enacted, except for:
When the deferred income tax asset or liability arises from the initial recognition of goodwill or an asset or liability in a transaction that is not a business combination and that, at the time of the transaction, affects neither the accounting nor taxable profits; or
When the taxable temporary difference is associated with interests in subsidiaries, associates or joint ventures, and the timing of the reversal can be controlled and it is probable that the temporary difference will not reverse in the foreseeable future.
Deferred tax assets are recognised for deductible temporary differences and unused tax losses only if it is probable that future taxable amounts will be available to utilise those temporary differences and losses.
Deferred tax assets and liabilities are offset only where there is a legally enforceable right to offset current tax assets against current tax liabilities and deferred tax assets against deferred tax liabilities; and they relate to the same taxable authority on either the same taxable entity or different taxable entities which intend to settle simultaneously.
Bubs Australia Limited and its 100% owned Australian resident subsidiaries formed a tax consolidated group (‘TCG’) and Bubs Australia Limited is the head entity of the tax consolidated group.
Assumptions about the generation of future taxable profits depend on management’s estimates of future cash flows. These depend on estimates of future sales, operating costs, capital expenditure, dividends and other capital management transactions. Judgements are also required about the application of income tax legislation.
Changes in expectations for the future performance of the business may impact the amount of deferred tax assets recoverable and recognised on the statement of financial position and the amount of other tax losses and temporary differences not yet recognised. At 30 June 2020, the Group had nil (2019: $8,988,100) of unrecognised tax losses.
KEY ESTIMATE AND JUDGEMENT
Judgement is required to be made by the group in assessing whether deferred tax assets and certain deferred tax liabilities are recognised on the consolidated statement of financial position. As detailed above, in the year ended 30 June 2020, Bubs has recognised deferred tax assets of $11,553,301 (2019: $94,797) primarily relating to carried forward tax losses and temporary differences impacting the profit or loss. Deferred tax assets are recognised for unused tax losses, unused tax credits and deductible temporary differences, to the extent that it is probable that future taxable profits will be available against which they can be used. Probable is considered more likely than not.
Judgement is required when deferred tax assets are reviewed at each reporting date. Deferred tax assets may be reduced to the extent that it is no longer probable that future taxable profits will be available.
RECOVERY OF DEFERRED TAX ASSETS
Bubs Australia Limited and Controlled Entities Annual Report for the year ended 30 June 202078 79
04 FINANCIAL STATEMENTS Notes to the Financial StatementsF
or p
erso
nal u
se o
nly

OPERATING ASSETS AND LIABILITIES C.This section provides details of the Group’s operating assets, and liabilities incurred as a result of trading activities, used to generate the Group’s performance.
The Group’s exposure to credit risks related to trade and other receivables are disclosed in Note D2 Financial risk management.
C.1TRADE AND OTHER RECEIVABLES
30/06/2020 $
30/06/2019 $
Trade debtors 4,451,294 7,580,552
Allowance for credit losses (10,525) (3,755)
Deferred consideration receivable - 3,493,000
Other receivables 360,515 956,828
Working capital adjustment - 2,794,927
Receivable from associates 1,817,788 731,250
6,619,072 15,552,802
The following table details the risk profile of trade receivables based on the Group’s provision matrix.
TRADE RECEIVABLES - DAYS PAST DUE
30/06/2020 Not past due <30 days 31-60 days 61-90 days 91-120 days >120 days Total
Estimated total gross carrying amount at default
5,723 98 4,704 - - - 10,525
Lifetime ECL 10,525
TRADE RECEIVABLES - DAYS PAST DUE
30/06/2019 Not past due <30 days 31-60 days 61-90 days 91-120 days >120 days Total
Estimated total gross carrying amount at default
2,192 1,152 253 117 41 - 3,755
Lifetime ECL 3,755
RECOGNITION AND MEASUREMENT
The Group initially measures a financial asset at its fair value plus, in the case of a financial asset not at fair value through profit or loss, transaction costs. Trade receivables are measured at the transaction price determined under AASB15 Revenue from Contracts with Customers. Further details are disclosed in Note B2 Revenue.
Financial instruments are subsequently measured at fair value through profit or loss (FVPL), amortised cost, or fair value through other comprehensive income (FVOCI). The classification is based on two criteria: the Group’s business model for managing the assets; and whether the instruments’ contractual cash flows represent ‘solely payments of principal and interest’ on the principal amount outstanding (the ‘SPPI criterion’).
The Group’s trade and other receivables and financial assets are measured at amortised cost that are held within a business model with the objective to hold the financial assets in order to collect contractual cash flows that meet the SPPI criterion.
The Group adopted a forward-looking expected credit loss (ECL) approach for impairment losses for ECLs for financial assets not held at FVPL.
ECLs are based on the difference between the contractual cash flows due in accordance with the contract and all the cash flows that the Group expects to receive. The shortfall is then discounted at an approximation to the asset’s original effective interest rate.
on the Group’s historical credit loss experience, adjusted for forward-looking factors specific to the debtors and the economic environment.
KEY ESTIMATE AND JUDGEMENT
For trade receivables, the Group has applied the standard’s simplified approach and has calculated ECLs based on lifetime expected credit losses. The Group has established a provision matrix that is based
RECOVERY OF DEFERRED TAX ASSETS
Bubs Australia Limited and Controlled Entities Annual Report for the year ended 30 June 202080 81
04 FINANCIAL STATEMENTS Notes to the Financial StatementsF
or p
erso
nal u
se o
nly

RECOGNITION AND MEASUREMENT
The amount of inventory that was written off during the period was $547,873 (2019: $744,845).An adjustment of 105,946 (2019: $36,993) was made on inventories carried at net realisable value. An inventory obsolete provision $983,290 (2019: $nil) was recognised as an expense during the year. $38,849,052 (2019: $30,668,221) inventories were recognised as an expense during the year.
Inventories are valued at the lower of cost and net realisable value. Cost is calculated using weighted average methods. Net realisable value represents the estimated selling price in the ordinary course of business, less estimated costs of completion and the estimated costs necessary to make the sale.
C.2INVENTORIES
KEY ESTIMATES AND JUDGEMENTS
30/06/2020 $
30/06/2019 $
Raw materials 14,266,867 2,624,457
Finished goods at cost 16,335,289 11,927,943
30,602,156 14,552,400
Estimation of net realisable value includes assessment of expected future turnover of inventory held for sale and the expected future selling price of such inventory. Management assessed the recoverability of inventories based on the estimated
RECOVERY OF INVENTORY
ongoing impact from COVID-19 on distribution channels and estimated end consumer demand in FY21. Changes in trading and economic conditions, and changes in country specific regulations, may impact these estimations in future periods.
C.3OTHER ASSETS
30/06/2020 $
30/06/2019$
Prepayments and other assets 497,175 239,219
Deposits paid 586,286 596,939
Inventories paid in advance 187,661 426,717
Security bond 382,985 373,688
1,654,106 1,636,563
RECOGNITION AND MEASUREMENT
Inventories paid in advance
Inventories paid in advance represent payments for purchases of finished goods prior to ownership passing to the Group.
Deposits paid
Deposits paid represent payments to suppliers in relation to goods received or services rendered. These deposits are refundable to the Group.
Security bond
Security bond represents payments to the landlord securing the obligations of the Group under the lease contract of the Deloraine Dairy site.
Bubs Australia Limited and Controlled Entities Annual Report for the year ended 30 June 202082 83
04 FINANCIAL STATEMENTS Notes to the Financial StatementsF
or p
erso
nal u
se o
nly

C.4PLANT AND EQUIPMENT
Building and improvements
$
Production equipment
$
Motor Vehicle$
Office equipment
$
Total $
Cost
As at 1 July 2018 - 73,730 - 45,309 119,039
Additions - 45,777 - 36,950 82,727
Acquisition of a subsidiary 1,371,300 2,707,170 25,000 70,730 4,174,200
Disposals - - - (9,320) (9,320)
As at 30 June 2019 1,371,300 2,826,677 25,000 143,669 4,366,646
Additions 17,570 124,452 - 24,842 166,864
Disposal - (28,652) - (10,194) (38,846)
As at 30 June 2020 1,388,870 2,922,477 25,000 158,317 4,494,664
Accumulated Depreciation
As at 1 July 2018 - (52,062) - (19,672) (71,734)
Depreciation (16,170) (50,102) (416) (22,483) (89,172)
Disposal - - - 8,035 8,035
As at 30 June 2019 (16,170) (102,165) (416) (34,120) (152,871)
Depreciation (81,320) (175,276) (2,083) (34,250) (292,929)
Disposal - 12,143 - 6,762 18,905
As at 30 June 2020 (97,490) (265,298) (2,499) (61,608) (426,895)
Net book value
As at 30 June 2019 1,355,130 2,724,512 24,584 109,549 4,213,775
As at 30 June 2020 1,291,380 2,657,179 22,501 96,709 4,067,769
RECOGNITION AND MEASUREMENT
Plant and equipment are stated at historical cost less accumulated depreciation and impairment. Historical cost includes expenditure that is directly attributable to the acquisition of the items.
Depreciation is calculated on a straight-line basis to write off the net cost of each item of plant and equipment over their expected useful lives as follows:
Building and improvements 17-19 yearsProduction equipment 12-19 yearsMotor Vehicle 10 yearsOffice equipment 2-13 years
The residual values, useful lives and depreciation methods are reviewed, and adjusted if appropriate, at each reporting date.
An item of plant and equipment is derecognised upon disposal or when there is no future economic benefit to the Group. Gains and losses between the carrying amount and the disposal proceeds are taken to profit or loss.
C.5INTANGIBLE ASSETS
Goodwill $
Brand name
$Licence $
Priority right
$
Customer contract/
list $
Recipes $
Patents, trademarks
and software
$
Total $
Cost
As at 1 July 2018
73,690,417 5,091,634 - - 3,765,731 47,740 52,188 82,647,710
Acquisition of a subsidiary
16,924,256 - 38,489,095 - 3,094,033 - 58,444 58,565,828
Addition - - - 1,800,000 - - - 1,800,000
Disposal - (400,000) - - (100,000) - - (500,000)
As at 30 June 2019
90,614,673 4,691,634 38,489,095 1,800,000 6,759,764 47,740 110,632 142,513,538
Addition - - - - - - 52,550 52,550
Disposal - - - - - - - -
As at 30 June 2020
90,614,673 4,691,634 38,489,095 1,800,000 6,759,764 47,740 163,182 142,566,088
Amortisation and impairment
As at 1 July 2018
(49,138,940) - - - (442,687) (46,196) (28,241) (49,656,064)
Amortisation - - (349,901) (300,000) (420,466) (1,544) (17,872) (1,089,783)
Disposal - - - - 15,301 - - 15,301
As at 30 June 2019
(49,138,940) (349,901) (300,000) (847,852) (47,740) (46,113) (50,730,546)
Amortisation - - (1,749,504) (900,000) (648,199) - (33,152) (3,330,855)
Disposal - - - - - - - -
As at 30 June 2020
(49,138,940) (2,099,405) (1,200,000) (1,496,051) (47,740) (79,265) (54,061,401)
Net book value
At 30 June 2019
41,475,733 4,691,634 38,139,194 1,500,000 5,911,912 - 64,519 91,782,992
As at 30 June 2020
41,475,733 4,691,634 36,389,690 600,000 5,263,713 - 83,917 88,504,687
Brand name, customer contract/list, licence, priority right and goodwill are allocated to the following cash generating units (CGUs) for the purposes of impairment testing: Infant Food
Co $1,165,712 (2019: $1,165,712); Nulac Foods $31,218,363 (2019: $32,457,159) and Deloraine Dairy $56,036,695 (2019: $58,095,603).
Bubs Australia Limited and Controlled Entities Annual Report for the year ended 30 June 202084 85
04 FINANCIAL STATEMENTS Notes to the Financial StatementsF
or p
erso
nal u
se o
nly

RECOGNITION AND MEASUREMENT
Intangible assets acquired separately are capitalised at cost and from a business combination are capitalised at fair value as at the date of acquisition. Following initial recognition, the cost model is applied to the class of intangible assets.
Goodwill is recognised on business acquisitions, representing the excess of the fair value of the consideration transferred over the Group’s interest in the net fair value of the identifiable assets, liabilities and contingent liabilities of the business recognised at the date of acquisition. Goodwill is initially recognised as an asset at cost and is subsequently measured at cost less any accumulated impairment losses. For the purposes of impairment testing, goodwill acquired in a business combination is, from the date of acquisition, allocated to the Group’s cash-generating units that are expected to benefit from the synergies of the combination.
Brand names are considered to have an indefinite life and are not amortised. As at 30 June 2018, these assets were tested for impairment.
The licence represents the CNCA (Certification and Accreditation Administration of the People’s Republic of China) licence that Deloraine Dairy currently holds. The licence is amortised on a straight-line basis over the period of the expected benefit, being the finite life of 22 years.
GOODWILL
BRAND NAMES
LICENCE
Customer lists acquired in a business combination are amortised on a straight-line basis over the period of their expected benefit, being their finite life of 10 years.
CUSTOMER CONTRACT/LIST
Priority right represents the priority right of processing and manufacturing goat milk at Uphamgo Australia. The amount is amortised on a straight-line basis over the two year agreement with the commencement date of 28 February 2018.
PRIORITY RIGHT
RECOGNITION AND MEASUREMENT
The Group assesses, at each reporting date, whether there is an indication that an asset may be impaired. If any indication exists, or when annual impairment testing for an asset is required, the Group estimates the asset’s recoverable amount. An asset’s recoverable amount is the higher of an asset’s or CGU’s fair value less costs of disposal and its value in use. The recoverable amount is determined for an individual asset, unless the asset does not generate cash inflows that are largely independent of those from other assets or groups of assets. When the carrying amount of an asset or CGU exceeds its recoverable amount, the asset is considered impaired and is written down to its recoverable amount.
In assessing value in use, the estimated future cash flows are discounted to their present value using a pre-tax discount rate that reflects current market assessments of the time value of money and the risks specific to the asset. In determining fair value less costs of disposal, recent market transactions are taken into account. If no such transactions can be identified, an appropriate valuation model is used. These calculations are corroborated by valuation multiples, quoted share prices for publicly traded companies or other available fair value indicators.
The Group bases its impairment calculation on detailed budgets and forecast calculations, which are prepared separately for each of the Group’s CGUs to which the individual assets are allocated. These budgets and forecast calculations generally cover a period of five years. A long-term growth rate is calculated and applied to project future cash flows after the fifth year.
For the purposes of impairment testing, goodwill and brand names are allocated to the Group’s CGUs which represent the lowest level within the Group at which goodwill and brand names are monitored by internal management and are no higher than an operating segment as follows:
GOODWILL AND BRAND NAMES ALLOCATION
IMPAIRMENT TESTING FOR CASH-GENERATING UNITS (CGUS) INCLUDING GOODWILL
2020 2019
Infant Food Co 1,165,712 1,165,712
Nulac Foods 31,218,363 32,457,159
Deloraine Dairy 56,036,695 58,095,603
88,420,770 91,718,474
Bubs Australia Limited and Controlled Entities Annual Report for the year ended 30 June 202086 87
04 FINANCIAL STATEMENTS Notes to the Financial StatementsF
or p
erso
nal u
se o
nly

KEY ESTIMATES AND JUDGEMENTS
KEY ASSUMPTIONS
Judgements are made with respect to identifying and valuing intangible assets on acquisitions of new businesses. The Group assesses whether goodwill and intangibles with indefinite useful lives are
The recoverable amount of the CGUs to which goodwill and indefinite life brand names were allocated has been determined on a value in use basis using a discounted cash flow approach, and projections based on financial budgets and five-year forward plans approved by the Board.
In light of the current impact of COVID-19 on the Group’s performance in 2HFY20, management has
GOODWILL AND INTANGIBLES
ANNUAL IMPAIRMENT TESTING AT 30 JUNE 2020
impaired at least annually. These calculations involve judgements to estimate the recoverable amount of the cash-generating units to which the goodwill and intangibles with indefinite useful lives are allocated.
reviewed the assumptions applied to the value in use models for goodwill impairment testing and made additional adjustments to the five-year forward plans used in the Group’s impairment testing in order to reflect the estimated impact from COVID-19 based on information available as at 30 June 2020. The value in use models are considered to reflect a base case of cashflows and appropriate discount rate.
2020 2019
CGUs Infant Food Co Nulac FoodsDeloraine
DairyInfant Food Co Nulac Foods
Deloraine Dairy
Discount rate (post tax) 12.90% 11.90% 11.91% 12.90% 11.90% 11.91%
Discount rate (pre tax) 18.50% 17.00% 17.01% 18.50% 17.00% 17.01%
Terminal growth 2.00% 2.00% 2.00% 2.50% 2.50% 2.50%
SENSITIVITY TO CHANGE IN ASSUMPTIONS
The calculation of value in use for the above CGUs is most sensitive to the following assumptions:
• Gross margins
• Discount rates
• Revenue growth during the forecast period
• Growth rates used to extrapolate cash flows beyond the forecast period (terminal growth rate)
Gross margins – Gross margins are based on budgeted margins for FY2020, and conservative estimates for future years, which have been adjusted where appropriate to account for expected future trading conditions. Consideration has been given to the growth profile of each CGU when forecasting future margin returns.
Discount rates – Discount rates represent the risks specific to each CGU, taking into consideration the time value of money and individual risks of the underlying cash flows expected from the CGU being assessed. CGU specific risk is incorporated by applying individual beta factors. The discountrate calculation is based on the specific circumstances of each CGU and its operating segments and is derived from its weighted average cost of capital (WACC). The WACC takes into account both debt and equity. The cost of equity is derived from the expected return on investment by the CGU’s investors. The cost of debt is derived from the interest rate of the CGU’s working capital facility.
The Group has not adjusted the discount rates in light of the current impact of COVID-19 as the Group has incorporated the risk into five-year forward plans and reflected in the value in use models for goodwill impairment testing.
Revenue growth – Revenue projections have been constructed with reference to the FY20 results and five-year forward-looking plans with the earlier years being estimated through specific volume assumptions based on known opportunities, while years thereafter are adjusted for performance trends across the particular regions. In addition, the Group made further adjustments on revenue growth in FY21 to reflect the estimated impact from COVID-19. Lower revenue for the first quarter were assumed in the distribution channel that have been adversely impacted from COVID-19. A gradual return of trading activities is assumed with no return to pre COVID-19 levels until Q3 FY21. Management assesses the reasonableness of the growth assumptions by reviewing the achieved growth of comparable entities in the nutritional products industry.
Terminal growth rate – A terminal growth rate of 2.0% (2019: 2.5%) has been used for future cash flow growth beyond the five-year forecast period for all CGUs. This is a conservative rate when compared to annual growth rates during the forecast period.
The terminal value (being the total value of expected cash flows beyond the forecast period) is discounted to present values using the discount rate specific to each CGU.
As a result of this testing, the recoverable amount of each CGU exceeded its carrying amount and no impairment loss has been recognised on intangible assets that are subject to goodwill impairment testing.
Management has identified that a reasonably possible change in three key assumptions could reduce the headroom of each CGU as showing in the following table. However, it would not result in an impairment.
Impact on headroom
% change Infant Food Co Nulac Foods Deloraine Dairy
Discount rate 1.5% (13,808,595) (6,265,855) (12,316,889)
Budgeted gross revenue growth -5% (21,526,640) (5,274,381) (5,370,753)
Budgeted gross margin -1% (13,122,716) (3,247,141) (3,098,950)
The gross margin would need to adversely change by 4.45% before the recoverable amount of Infant Food Co CGU and Nulac Foods CGU would be equal to the carrying amount. Management has conducted sensitivity review on the forecast revenue, it would not result in an impairment if the revenue of each of the three CGUs is 10% lower than the forecast. No reasonably possible change in discount rate as described above would result in an impairment to any CGUs.
The Group believes that the assumptions adopted in the value in use calculations reflect an appropriate balance between the Group’s experience to date and the uncertainty associated with the COVID-19 pandemic. Whilst the disruption caused by COVID-19 to the business may impact short term results, the expected timing and nature of any such disruptions is not expected to impact the long-term performance of the Group’s business and result of our impairment testing. Accordingly, the Group has concluded that no impairment is required based on current market and economic conditions and expected future performance.
Bubs Australia Limited and Controlled Entities Annual Report for the year ended 30 June 202088 89
04 FINANCIAL STATEMENTS Notes to the Financial StatementsF
or p
erso
nal u
se o
nly

C.6
C.6
TRADE AND OTHER PAYABLES
2020 $
2019 $
Trade payables 7,559,124 4,152,617
Other payables 2,773,565 1,345,667
Customer deposit 609,884 602,743
Priority right payable - 1,800,000
Payable to associates 61,007 1,030,470
11,003,580 8,931,497
RECOGNITION AND MEASUREMENT
TRADE AND OTHER PAYABLES
Trade and other payables are initially recognised at fair value, and subsequently carried at amortised cost due to their short-term nature, and they are not discounted. They represent liabilities recognised when the Group becomes obligated to make future payments resulting from the purchase of goods and services. The amounts are unsecured.The carrying value of trade and other payables approximates their fair value.
CUSTOMER DEPOSIT
Customer deposits are cash considerations received from customers in relation to the packaging service to be provided by the Group after obtaining the approval from the People’s Republic of China on its brand slot application (“SAMR registration”). Deposits are refundable to the customer.
There is no impact on the accounting for the Group’s financial liabilities under AASB 9 Financial Instruments.
As at 30 June 2020, a total of $400,932 PAYG payable, GST payable and FBT payable were deferred to September
2020 as part of the benefits received by the Group during the COVID-19 period.
C.7CONTRACT LIABILITIES
2020 $
2019 $
Contract liabilities 67,234 926,382
67,234 926,382
$27,546 included in contract liabilities at 30 June 2019 was recognised as revenue during the year and $881,236 deposit received pre Deloraine acquisition was refunded
to the customer. No revenue was recognised in the current year that related to performance obligations that were satisfied in the prior year.
C.6
RECOGNITION AND MEASUREMENT
Contract liabilities are obligations to transfer goods or services to a customer for which the Group has received consideration (or an amount of consideration is due) from the customer. If a customer pays consideration before the Group transfers goods or services to the customer, contract liabilities are recognised when the payment is made or the payment is due (whichever is earlier). Income received in advance are recognised as revenue when the Group satisfies the performance obligations under the contract.
Bubs Australia Limited and Controlled Entities Annual Report for the year ended 30 June 202090 91
04 FINANCIAL STATEMENTS Notes to the Financial StatementsF
or p
erso
nal u
se o
nly

C.8LEASES
RIGHT OF USE ASSETS
Buildings $
Equipment $
Total $
Cost
At 1 July 2019 2,444,996 76,042 2,521,038
Additions - - -
At 30 June 2020 2,444,996 76,042 2,521,038
Accumulated depreciation
At 1 July 2019 - - -
Charges for the period 421,805 18,233 440,038
At 30 June 2020 421,805 18,233 440,038
Carrying amount
At 30 June 2020 2,023,191 57,809 2,081,000
The Group leases several assets including buildings and IT equipment. The lease terms range from 1.2 – 5.75 years (2019: 2.2 - 6.75 years).
AMOUNTS RECOGNISED IN PROFIT AND LOSS
30/06/2020 $
Depreciation expense on right-of-use assets 440,038
Interest expense on lease liabilities 149,860
Expense relating to short-term leases 19,812
The total cash outflow for leases amount to $553,633.
RECOGNITION AND MEASUREMENT
Further details are disclosed in Note A.
LEASE LIABILITIES
30/06/2020 $
Current 422,805
Non-current 2,166,131
2,588,936
Maturity analysis
Year 1 550,557
Year 2 532,824
Year 3 499,444
Year 4 502,267
Year 5 512,266
Onwards 393,347
2,990,705
Less unearned interest 401,769
Total 2,588,936
The Group does not face a significant liquidity risk with regard to its lease liabilities. All lease obligations are denominated in Australian dollars.
Bubs Australia Limited and Controlled Entities Annual Report for the year ended 30 June 202092 93
04 FINANCIAL STATEMENTS Notes to the Financial StatementsF
or p
erso
nal u
se o
nly

C.9BORROWINGS
RECOGNITION AND MEASUREMENT
Borrowings are initially recognised at the fair value of the consideration received, net of transaction costs. They are subsequently measured at amortised cost using the effective interest method.The carrying value of borrowings approximates their fair value due to relatively short term maturity.
2020 $
2019 $
Current 2,000,000 2,000,000
2,000,000 2,000,000
The Group has a working capital facility with National Australia Bank. Total limit of the facility is $10 million with
$2 million drawn at 30 June 2020 (2019: $2 million). Bubs Australia Limited is the guarantor of the facility.
C.10PROVISION
RECOGNITION AND MEASUREMENT
ANNUAL LEAVE AND LONG SERVICE LEAVE
Provision is made for benefits accruing to employees in respect of wages and salaries, annual leave and long service leave when it is probable that settlement will be required and they are capable of being measured reliably.
Provisions made in respect of employee benefits expected to be settled within 12 months are measured at their nominal values using the remuneration rate expected to apply at the time of settlement.
Provisions made in respect of employee benefits which are not expected to be settled within 12 months are measured as the present value of the estimated future cash outflows to be made by the Group in respect of services provided by employees up to the reporting date.
SUPPLIER CONTRACT LIABILITY
Deloraine Dairy entered into a manufacturing agreement which has minimum volume commitments over the term of the agreement. Where Deloraine Dairy is not able to fulfil minimum volume commitments, it is required to make production shortfall payments. A provision is raised when production thresholds have not been met.
OTHER PROVISION
An employee costs provision relating to the expected termination settlement with the previous CEO.
2020 $
2019 $
Current
Annual leave and long service leave 365,653 291,870
Lease incentive - 29,924
Supplier contract liability - 1,800,000
Other provision 235,616 235,616
601,269 2,357,410
Non - Current
Long service leave 59,520 25,505
Lease incentive - 441,198
Make good provision 89,321 87,246
148,841 553,949
Bubs Australia Limited and Controlled Entities Annual Report for the year ended 30 June 202094 95
04 FINANCIAL STATEMENTS Notes to the Financial StatementsF
or p
erso
nal u
se o
nly

C.11SHARE BASED PAYMENT LIABILITY
2020 $
2019 $
Current 956,045 1,946,169
Non-Current 255,768 593,477
As part of the Chemist Warehouse transaction the Group engaged in FY19, the Group is required to pay cash for the GST component relating to the shares to be issued to Chemist Warehouse. This has been presented as a share
based payment liability. This amount is expected to be fully recoverable and a corresponding GST receivable has been recorded.
C.12DEFERRED CONSIDERATION
As part of the acquisition of Deloraine Dairy in FY19, a deferred consideration of $15 million is payable in cash over the three year period. The fair value of the deferred consideration is estimated by calculating the present value of future expected cashflow.
A reconciliation of fair value measurement of the deferred consideration payable is provided below:
Balance at 30 June 2019 $12,347,062
Unwinding of the deferred consideration payable recognised in profit or loss in the current period $1,036,692
Deferred consideration paid in the current period ($5,000,000)
Balance at 30 June 2020 $8,383,754
Bubs Australia Limited and Controlled Entities Annual Report for the year ended 30 June 202096 97
04 FINANCIAL STATEMENTS Notes to the Financial StatementsF
or p
erso
nal u
se o
nly
CAPITAL AND FINANCIAL RISK MANAGEMENTD.This section outlines how the Group manages its capital structure and its exposure to financial risk, and provides details of its balance sheet liquidity and access to financing facilities.
The Group’s objectives when managing capital is to safeguard its ability to continue as a going concern so that in due course it can provide returns for stakeholders and maintain an optimum capital structure.
Exposure to credit risk, foreign currency risk and liquidity risk arises in the normal course of the Group’s business.
The Group’s financial risk management processes and procedures seek to minimise the potential adverse impacts that may arise from the unpredictability of financial markets.
Policies and procedures are reviewed periodically to reflect both changes in market conditions and changes in the nature and volume of Group activities.
Credit risk is the risk of financial loss to the Group if a customer or the counterparty to a financial instrument fails to meet its contractual obligations and arises principally from the Group’s receivables from customers.
In order to maintain or adjust the capital structure, the Group manages the level of debt such that it remains prudent and facilitates the execution of the operational plan and provides flexibility for growth.
As at 30 June 2020 there were no derivative financial instruments in place. Specific risk management objectives and policies are set out below.
The Group uses various methods to measure different types of risk exposures. These methods include ageing analysis for credit risk, and sensitivity analysis in the case of foreign exchange risks and equity price risk.
D.1
D.2
CAPITAL MANAGEMENT
FINANCIAL RISK MANAGEMENT
CREDIT RISK MANAGEMENT
Maximum exposures to credit risk at balance date:2020
$2019
$Cash and cash equivalent (counterparty risk) 26,025,575 23,291,058
Trade receivables (customer credit risk) 6,258,557 8,308,047
Deferred consideration receivable - 3,493,000
Working capital adjustment - 2,794,927
Other receivables 360,515 956,828
GST receivable 1,211,813 2,539,646
Deposits paid 586,286 596,939
34,442,746 41,980,445
At balance date, the Group’s bank accounts were held with National Australia Bank Limited and Australia and New Zealand Bank Limited.
The Group’s exposure to customer credit risk is influenced mainly by the individual characteristics of each customer. The majority of sales are to major retailers with established creditworthiness and minimum levels of default.
New customers are analysed individually for creditworthiness, taking into account credit ratings where available, financial position, previous trading experience and other factors.
In monitoring customer credit risk, customers are assessed individually by their debtor ageing profile. Monitoring of receivable balances on an ongoing basis minimises the exposure to bad debts.
The Group is exposed to related party credit risk and other credit risk. In monitoring other credit risk, the related parties and counterparties are analysed
Ageing of trade receivables at the reporting date:
COUNTERPARTY RISK
CUSTOMER CREDIT RISK
OTHER CREDIT RISK
The Group does not have any other concentrations of counterparty credit risk.
There is significant concentration of credit risk within the Group. In FY20, 19% of sales were to one customer (2019: 24% sales to one customer). There is no history of default for this customer.
For trade receivables and contract assets, the Group has applied the standard’s simplified approach and has calculated ECLs based on lifetime expected credit losses.
The Group considers a financial asset in default when internal or external information indicates that the Group is unlikely to receive the outstanding contractual amounts in full before taking into account any credit enhancements held by the Group.
individually for creditworthiness, taking into account credit ratings where available, financial position and other factors.
2020 $
2019 $
Neither past due nor default 4,995,348 3,447,415
Past due but not impaired
Past due up to 30 days 1,203,758 4,747,038
Past due 31 to 60 days 56,241 99,502
Past due 61 to 90 days 3,210 1,039
Past due more than 90 days - 13,053
6,258,557 8,308,047
Bubs Australia Limited and Controlled Entities Annual Report for the year ended 30 June 202098 99
04 FINANCIAL STATEMENTS Notes to the Financial StatementsF
or p
erso
nal u
se o
nly

Market risk is the risk that changes in market prices will affect the Group’s income or the value of its holdings in financial instruments. The Group’s activities expose it primarily to the financial risks of changes in foreign currency exchange rates to the AUD dollar.
MARKET RISK
Market risk exposures are monitored by management on an ongoing basis and there has been no change during the year to the Group’s exposure to market risks or the manner in which it manages and measures risk.
The Group enters into the transactions in Australia, New Zealand, China and Europe and is exposed to currency risk arising from movements in the currencies of those countries against the AUD dollar.
Expressed in AUD dollars, the table below indicates material exposure and sensitivity to movements in exchange rates on
the profit or loss of the Group based on closing exchange rates as at 30 June, applied to the Group’s financial assets/(liabilities) at 30 June.
Exchange rates and assets and liabilities held in foreign currencies will fluctuate over the course of normal operations. The analysis is performed consistently from year to year.
FOREIGN CURRENCY RISK MANAGEMENT
2020 Net exposure on reporting date (Payable)/Receivable
Impact on pre-tax profit / (loss)
Movement on exchange rate$
+10% $
-10% $
NZD (800,571) 72,779 (88,952)
USD 253,428 (23,039) 28,159
RMB 98,332 (8,939) 10,926
Euro 179,782 (23,039) 19,976
Net exposure (269,029) 17,762 (29,891)
Movement in allowance for doubtful debts
2020 $
2019 $
Allowance of doubtful debts
Balance at beginning of the year 3,755 1,266
Amount charged to the statement of profit or loss and other comprehensive income 17,788 42,150
Provision utilised (11,018) (39,661)
Balance at the end of year 10,525 3,755
Liquidity risk is the risk that the Group will be unable to meet its obligations as they fall due. This risk is managed by establishing a target minimum liquidity level, ensuring that ongoing commitments are managed with respect to forecast available cash inflows.
The Group’s main interest rate risk arises from borrowings, which expose the Group to cash flow interest rate risk. The risk is considered immaterial.
Contractual undiscounted maturities of financial liabilities
The Group holds significant cash reserves which enable it to meet its obligations as they fall due, and to support operations in the event of unanticipated external events.The Group has one working capital facility with $2,000,000 (2018: $2,000,000) drawn at 30 June 2020. Total limit of facility is $10,000,000.
INTEREST RISK MANAGEMENT
LIQUIDITY RISK MANAGEMENT
2020 Contractual cashflows
Carrying amount
Total2 months
or less2-12
months1-2 years 2-5 years
More than 5 years
Non-derivative financial liabilities
Lease liability 2,588,936 2,990,705 91,759 458,798 532,824 1,513,977 393,347
Deferred consideration payable
8,383,754 10,000,000 - 5,000,000 5,000,000 - -
Trade and other payables
11,003,580 11,003,580 11,003,580 - - - -
Borrowings 2,000,000 2,000,000 2,000,000 - - - -
Payable to associates 61,007 61,007 61,007 - - - -
24,037,277 26,055,292 13,156,346 5,458,798 5,532,824 1,513,977 393,347
2019 Net exposure on reporting date (Payable)/Receivable
Impact on pre-tax profit / (loss)
Movement on exchange rate$
+10% $
-10% $
NZD (271,771) 24,706 (30,197)
USD 14,761 (1,342) 1,640
RMB 59,414 (5,401) 6,602
Euro 196,045 (17,822) 21,783
Net exposure 1,551 (141) (172)
Bubs Australia Limited and Controlled Entities Annual Report for the year ended 30 June 2020100 101
04 FINANCIAL STATEMENTS Notes to the Financial StatementsF
or p
erso
nal u
se o
nly
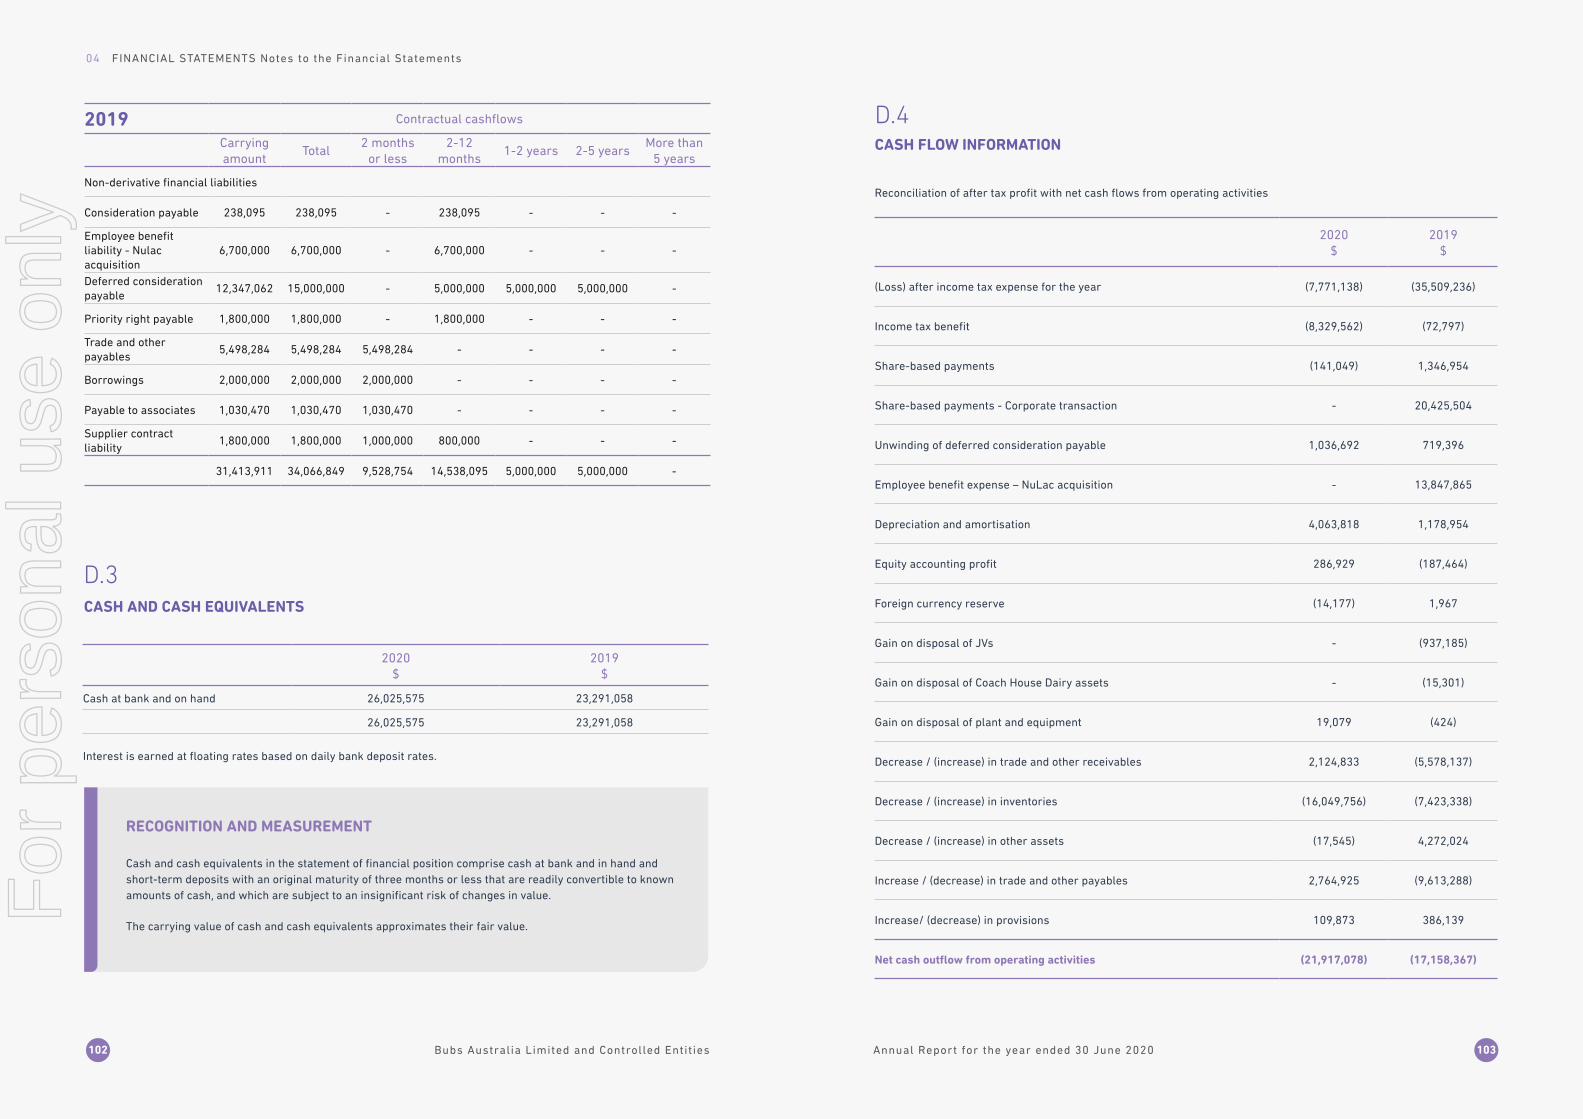
2020
$2019
$
Cash at bank and on hand 26,025,575 23,291,058
26,025,575 23,291,058
Interest is earned at floating rates based on daily bank deposit rates.
D.3CASH AND CASH EQUIVALENTS
RECOGNITION AND MEASUREMENT
Cash and cash equivalents in the statement of financial position comprise cash at bank and in hand and short-term deposits with an original maturity of three months or less that are readily convertible to known amounts of cash, and which are subject to an insignificant risk of changes in value.
The carrying value of cash and cash equivalents approximates their fair value.
2019 Contractual cashflows
Carrying amount
Total2 months
or less2-12
months1-2 years 2-5 years
More than 5 years
Non-derivative financial liabilities
Consideration payable 238,095 238,095 - 238,095 - - -
Employee benefit liability - Nulac acquisition
6,700,000 6,700,000 - 6,700,000 - - -
Deferred consideration payable
12,347,062 15,000,000 - 5,000,000 5,000,000 5,000,000 -
Priority right payable 1,800,000 1,800,000 - 1,800,000 - - -
Trade and other payables
5,498,284 5,498,284 5,498,284 - - - -
Borrowings 2,000,000 2,000,000 2,000,000 - - - -
Payable to associates 1,030,470 1,030,470 1,030,470 - - - -
Supplier contract liability
1,800,000 1,800,000 1,000,000 800,000 - - -
31,413,911 34,066,849 9,528,754 14,538,095 5,000,000 5,000,000 -
D.4CASH FLOW INFORMATION
Reconciliation of after tax profit with net cash flows from operating activities
2020
$2019
$
(Loss) after income tax expense for the year (7,771,138) (35,509,236)
Income tax benefit (8,329,562) (72,797)
Share-based payments (141,049) 1,346,954
Share-based payments - Corporate transaction - 20,425,504
Unwinding of deferred consideration payable 1,036,692 719,396
Employee benefit expense – NuLac acquisition - 13,847,865
Depreciation and amortisation 4,063,818 1,178,954
Equity accounting profit 286,929 (187,464)
Foreign currency reserve (14,177) 1,967
Gain on disposal of JVs - (937,185)
Gain on disposal of Coach House Dairy assets - (15,301)
Gain on disposal of plant and equipment 19,079 (424)
Decrease / (increase) in trade and other receivables 2,124,833 (5,578,137)
Decrease / (increase) in inventories (16,049,756) (7,423,338)
Decrease / (increase) in other assets (17,545) 4,272,024
Increase / (decrease) in trade and other payables 2,764,925 (9,613,288)
Increase/ (decrease) in provisions 109,873 386,139
Net cash outflow from operating activities (21,917,078) (17,158,367)
Bubs Australia Limited and Controlled Entities Annual Report for the year ended 30 June 2020102 103
04 FINANCIAL STATEMENTS Notes to the Financial StatementsF
or p
erso
nal u
se o
nly

D.5SHARE CAPITAL
30/06/2020 30/06/2019
Shares $ Shares $
Movement in share capital
Balance at beginning of the year 509,590,057 189,059,150 436,194,415 142,189,264
Issue of shares as part of acquisition - - 15,384,615 13,384,615
Share based payment expense – Corporate transaction
12,356,627 13,732,827 - -
Exercise of options 1,506,545 150,655 7,910,805 791,081
Placement of shares 31,578,947 30,000,000 - -
Share purchase plan 5,263,158 5,000,000 50,100,222 32,738,477
Share issue transactions costs (net of tax) - (977,272) - (44,287)
Balance at end of year 560,295,334 236,965,360 509,590,057 189,059,150
Fully paid ordinary shares carry one vote per share and carry right to dividends. Fully paid ordinary shares have no par value.
D.6SHARE BASED PAYMENTS RESERVE
30/06/2020
$30/06/2019
$
Balance at the beginning of the year 24,878,923 3,106,465
Share based payment (141,049) 1,346,954
Share based payment – Corporate transaction (13,732,827) 20,425,504
Balance at the end of the year 11,005,047 24,878,923
D.7CONTINGENT LIABILITIES
As at 30 June 2020, there were no material contingent liabilities (2019: $nil).
The equity settled payments reserve is used to record the value of share-based payments. Further details are disclosed in Note G2 Share based payments.
Share based payment – Corporate transaction represents the value of shares that the Group has issued to Chemist Warehouse Retail Group during the period. The value of the shares was transferred to the issued capital with a reduction in the share based payments reserve.
An initial tranche of 2,974,272 fully paid ordinary shares was issued to Chemist Warehouse Retail Group on 2 September 2019 upon Chemist Warehouse stocking the products in accordance with the Heads of Agreement. The second tranche of 9,382,355 fully paid ordinary shares
was issued on 23 December 2019 upon the approval at Bubs’ 2019 AGM.
The third tranches of 12,356,627 fully paid ordinary shares were issued on 24 July 2020 upon satisfying its sales performance condition of meeting minimum sales target for the year ending 30 June 2020.
The remaining 24,713,254 fully paid ordinary shares will be issued in two annual tranches, each of 12,356,627 shares upon the future satisfaction of sales performance targets by Chemist Warehouse relating to the actual sales of Bubs products in Chemist Warehouse stores for the years ending 30 June 2021 and 30 June 2022.
Bubs Australia Limited and Controlled Entities Annual Report for the year ended 30 June 2020104 105
04 FINANCIAL STATEMENTS Notes to the Financial StatementsF
or p
erso
nal u
se o
nly

ASSOCIATESE.On 6 May 2019, the Group and Beingmate Baby & Child Food Co., Ltd (‘Beingmate’) established a joint venture company Bubs Brand Management Shanghai Co. Ltd (‘Bubs Brand Management’). The Group contributed 49% of registered capital RMB 4,900,000 in FY20.
Summarised financial information of the associate are set out below:
30/06/2020
Current assets 3,218,647
Non-current assets 224,674
Current liabilities (1,842,764)
Non-current liabilities (83,124)
Net assets (1,517,433)
Loss for the year ended 30 June 2020
Revenue 6,580,963
Loss before tax (547,628)
Income tax expense (8,487)
Loss for the year (556,115)
Other comprehensive income -
Total comprehensive loss for the year (556,115)
Reconciliation of the above summarised financial information to the carrying amount of the investment in Associate recognised in the consolidated financial statements
Net assets of associate (49%) 1,517,433
Proportion of the Groups ownership interest in the associate (49%) 743,542
Carrying amount of the investment in the associate 743,542
RECOGNITION AND MEASUREMENT
The Group has determined that it does not have joint control of Bubs Brand Management and is therefore outside the scope of AASB 11 Joint Arrangements. As such, The Group’s investment in Bubs Brand Management will be accounted for as an associate under AASB 128 Investments in Associates and Joint Ventures.
The financial results of the associate are used by the Group to apply the equity method. Where associates apply different accounting policies to the Group, adjustment are made upon application of the equity method.
Investments in associates are carried in the consolidated Statement of Financial Position at cost plus post-acquisition changes in the Group’s share of net assets of the associates, less impairment in value. The consolidated Statement of Profit or Loss reflects the Group’s share of the results of operations of the associate.
Where there has been a change in the associates OCI or equity, the Group recognises its share of any changes and discloses this, when applicable in the consolidated Statement of Other Comprehensive Income.
When the Group’s share of losses in an associate equals or exceeds its interest in the associate, including any unsecured long term receivables and loans, the Group does not recognise further losses unless it has incurred obligations or made payments on behalf of the associate.
Bubs Australia Limited and Controlled Entities Annual Report for the year ended 30 June 2020106 107
04 FINANCIAL STATEMENTS Notes to the Financial StatementsF
or p
erso
nal u
se o
nly
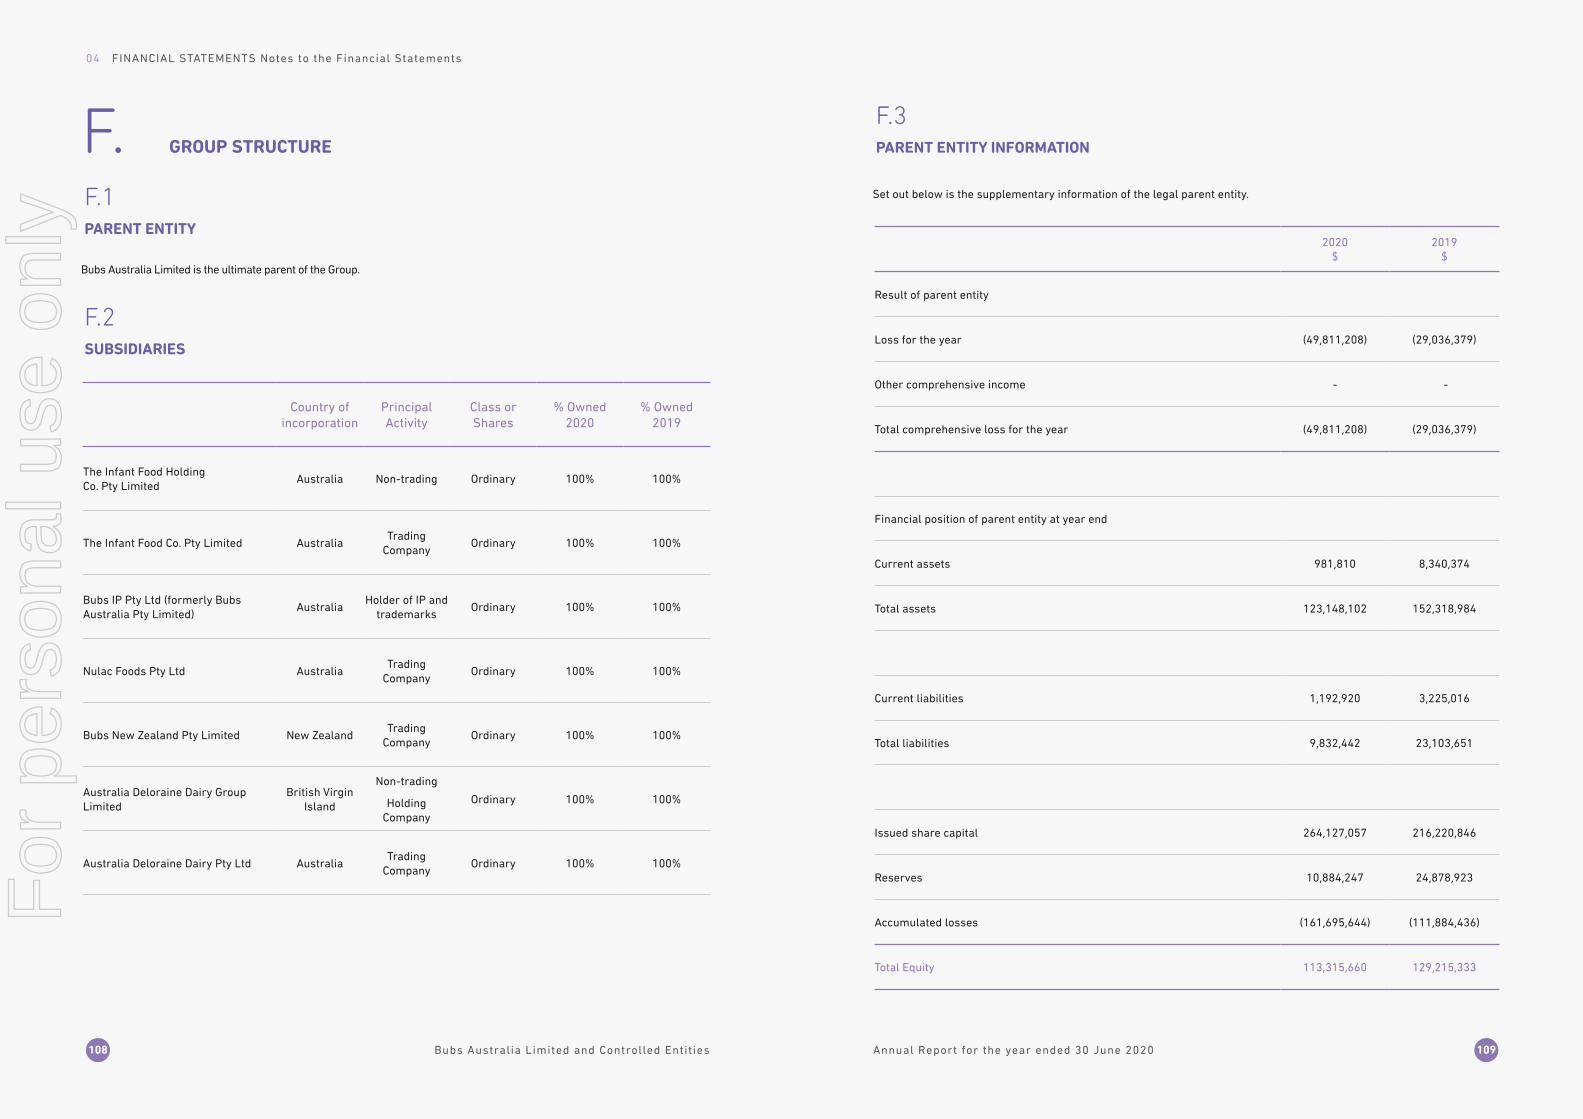
GROUP STRUCTUREF.
Bubs Australia Limited is the ultimate parent of the Group.
F.1
F.2
PARENT ENTITY
SUBSIDIARIES
Country of incorporation
Principal Activity
Class or Shares
% Owned 2020
% Owned 2019
The Infant Food Holding Co. Pty Limited
Australia Non-trading Ordinary 100% 100%
The Infant Food Co. Pty Limited AustraliaTrading
CompanyOrdinary 100% 100%
Bubs IP Pty Ltd (formerly Bubs Australia Pty Limited)
AustraliaHolder of IP and
trademarksOrdinary 100% 100%
Nulac Foods Pty Ltd AustraliaTrading
CompanyOrdinary 100% 100%
Bubs New Zealand Pty Limited New ZealandTrading
CompanyOrdinary 100% 100%
Australia Deloraine Dairy Group Limited
British Virgin Island
Non-trading
Holding Company
Ordinary 100% 100%
Australia Deloraine Dairy Pty Ltd AustraliaTrading
CompanyOrdinary 100% 100%
Set out below is the supplementary information of the legal parent entity.
F.3PARENT ENTITY INFORMATION
2020 $
2019 $
Result of parent entity
Loss for the year (49,811,208) (29,036,379)
Other comprehensive income - -
Total comprehensive loss for the year (49,811,208) (29,036,379)
Financial position of parent entity at year end
Current assets 981,810 8,340,374
Total assets 123,148,102 152,318,984
Current liabilities 1,192,920 3,225,016
Total liabilities 9,832,442 23,103,651
Issued share capital 264,127,057 216,220,846
Reserves 10,884,247 24,878,923
Accumulated losses (161,695,644) (111,884,436)
Total Equity 113,315,660 129,215,333
Bubs Australia Limited and Controlled Entities Annual Report for the year ended 30 June 2020108 109
04 FINANCIAL STATEMENTS Notes to the Financial StatementsF
or p
erso
nal u
se o
nly

Key management personnel are defined as those persons having significant authority and responsibility for planning, directing and controlling the activities of the Group.
Key management personnel compensation:
OTHER DISCLOSURESG.G.1RELATED PARTY TRANSACTIONS
KEY MANAGEMENT PERSONNEL
2020 $
2019 $
Short-term employee benefits 1,694,436 1,270,224
Post-employment benefits 131,195 100,944
Long-term benefits 59,010 25,256
Share-based payments1 (141,049) 1,346,954
Key management personnel disclosures 1,743,592 2,743,378
1 In FY19, a higher probability was applied to vesting conditions of CEO options. Due to the impact of COVID-19, the probability of satisfying those conditions has been significantly reduced which has resulted in a negative balance.
The following table provides details of transactions that were entered into for the relevant financial year.
All of the above transactions were considered to be on an arms’ length basis.
TRANSACTIONS WITH RELATED PARTIES
Sales to related parties
Purchases from related parties
Amounts owed to related parties
Loan to related parties
Amounts owed by related parties
2020 $
2019 $
2020 $
2019 $
2020 $
2019 $
2020 $
2019 $
2020 $
2019 $
KMP of the group
Professional services fee to BDO Australia Ltd
- - 39,488 181,794 14,148 64,538 - - - -
Joint venture in which the parent is a venturer:
Cibus Goats (Australia) Pty Ltd
- - - 5,648,592 - 29,037 - - - -
New Zealand Nutritional Company
- 6,838 - 9,335,643 - - - - - -
UphamGo Australia Pty Ltd
- 110,535 - 7,722,603 - - - - - -
Associate
Bubs Brand Management Shanghai Co. Ltd
6,734,364 - 185,296 - 61,007 - - - 1,817,788 -
Total 6,734,364 117,373 224,784 22,888,632 75,155 93,575 - - 1,817,788 -
Bubs Australia Limited and Controlled Entities Annual Report for the year ended 30 June 2020110 111
04 FINANCIAL STATEMENTS Notes to the Financial StatementsF
or p
erso
nal u
se o
nly

Options on issue at 30 June 2020 are as follows:
Options issued to the current CEO in FY18:
2,385,405: vest 3 months after issue and on the achievement of $30m in gross revenue and $2m in EBIT in any consecutive 12 month period and expire on termination of employment; and
2,385,405: vest 3 months after issue and on the achievement of $50m in gross revenue and $4m in EBIT in any consecutive 12 month period and expire on termination of employment.
The options issued in FY18 expire on 19 January 2021.
Options issued to the Executive Chairman in FY20:
2,385,405: vest 3 months after issue and on the achievement of $50m in gross revenue and $2m in normalised EBITDA as at the Company’s full year results and expire on termination of employment.
2,385,405: vest 3 months after issue and on the achievement of $60m in gross revenue and $4m in normalised EBITDA as at the Company’s full year results and expire on termination of employment.
The options issued in FY20 expire on 29 November 2022.
The fair value of the options granted was measured during the year using the Black-Scholes pricing model, taking into account the terms and conditions upon which the options were granted.
Share based payments expense in relation to options exercisable is as follows:
G.2SHARE BASED PAYMENTS
2020 $
2019 $
Employee options issued to the current CEO (1,349,046) 1,346,954
Employee options issued to the Executive Chairman 1,207,997 -
(141,049) 1,346,954
The movements in the options are as follows:
Options #
Balance at 1 July 2018 17,766,268
Options cancelled during the year (Exercisable at $0.10) (3,578,108)
Options exercised during the year (Exercisable at $0.10) (7,910,805)
Balance at 30 June 2019 6,277,355
Options exercised during the year (Exercisable at $0.10) (1,506,545)
Options granted to the Executive Chairman during the year (Exercisable at $0.10) 4,770,810
Balance at 30 June 2020 9,541,620
The details of the fair value of the options offered to Dennis Lin during the period is as follows:
Employee options
Exercise price ($) 0.10
Share price at date of issue ($) 1.08
Grant date 29-Nov-19
Expected volatility (%) 65%
Expiry date 29-Nov-22
Expected dividends Nil
Risk free interest rate 0.65%
Value per option ($) $0.98
Number of options 2,385,405
Total value of options $2,346,761
RECOGNITION AND MEASUREMENT
The fair value of options granted is recognised as an employee expense with a corresponding increase in equity. The fair value is measured at grant date and spread over the period during which the employees become unconditionally entitled to the options. The fair value of the options granted is measured using the Black-Scholes pricing model, taking into account the terms and conditions upon which the options were granted. The amount recognised as an expense is adjusted over the period to reflect the number of awards for which the related service and non-market vesting conditions are expected to be met but is not adjusted when market performance conditions are not met.
Expected volatility has been based on an evaluation of the historical volatility of the Group’s share price, particularly over the historical period commensurate with the expected term. The expected term of the instruments has been based on historical experience and general option holder behaviour.
Estimating fair value for share-based payment transactions requires determination of the most appropriate valuation model, which depends on the terms and conditions of the grant. This estimate also requires determination of the
most appropriate inputs to the valuation model including the expected life of the share option, volatility and dividend yield and making assumptions about them.
KEY ESTIMATE AND JUDGEMENT
Bubs Australia Limited and Controlled Entities Annual Report for the year ended 30 June 2020112 113
04 FINANCIAL STATEMENTS Notes to the Financial StatementsF
or p
erso
nal u
se o
nly

During the financial year the following fees were paid or payable for services provided by the auditor of the Group:
G.3
G.4
AUDITORS REMUNERATION
SUBSEQUENT EVENTS
2020 $
2019 $
Audit services
Audit or review of the financial statements – Deloitte 245,000 -
Audit or review of the financial statements – Ernst & Young - 434,436
Completion audit of Australia Deloraine Dairy Group at acquisition date – Ernst & Young
- 41,434
Non audit services - -
245,000 475,870
On 24 July 2020, Bubs issued 12,356,627 fully ordinary paid shares to Chemist Warehouse Retail Group upon satisfying of sales performance target for the year ended 30 June 2020. Further details are disclosed in Note D6 Share based payments reserve.
On 24 August 2020, Bubs has entered into a Memorandum of Understanding with Beingmate Co., Ltd under which Bubs has the opportunity to acquire an ownership interest in one of Beingmate’s Infant Formula manufacturing facilities in Beihai China, and obtain Beingmate’s support in securing a State Administration for Market Regulation (SAMR) brand slot, with the objective of producing Bubs® China label Goat Milk Infant Formula using 100% Bubs Australian goat milk. Bubs intends to withdraw the existing SAMR brand applications previously made by Deloraine, and resubmit differentiated super-premium formulations targeting consumers in tier-one cities.
Bubs continues to monitor milk supply in line with projected demand and conduct pricing reviews with suppliers. As part of the FY21 review process, some milk supply agreements have been reset to better align volumes and reduce costs. This restructure included terminating without penalty the guaranteed supply under the CIBUS Australia Milk Supply Agreement from 31 December 2020, and forgoing the call option over CIBUS farms. In addition, the Company entered into a new Milk Supply Agreement with a Victorian supplier who is expected to replace and exceed CIBUS volume over time, thereby better aligning with the Company’s demand profile in the short term whilst safeguarding Bubs provenance positioning and long-term supply chain security, including meeting future demand for SAMR China label products. This replacement in supply partners is expected to significantly improve raw material costs and cashflow management from January 2021.
G.5ACCOUNTING POLICIES AND NEW ACCOUNTING STANDARDS
PRINCIPLES OF CONSOLIDATION
The consolidated financial statements incorporate the assets and liabilities of all subsidiaries of Bubs Australia Limited (‘company’ or ‘parent entity’) as at 30 June 2020 and the results of all subsidiaries for the year then ended. Bubs Australia Limited and its subsidiaries together are referred to in these financial statements as the ‘Group’.
Subsidiaries are all those entities over which the Group has control. The Group controls an entity when the Group is exposed to, or has rights to, variable returns from its involvement with the entity and has the ability to affect those returns through its power to direct the activities of the entity. Subsidiaries are fully consolidated from the date on which control is transferred to the Group. They are deconsolidated from the date that control ceases.
Intercompany transactions, balances and unrealised gains on transactions between entities in the Group are eliminated. Unrealised losses are also eliminated unless the transaction provides evidence of the impairment of the asset transferred. Accounting policies of subsidiaries have been changed where necessary to ensure consistency with the policies adopted by the Group.
The acquisition of subsidiaries is accounted for using the acquisition method of accounting. A change in ownership interest, without the loss of control, is accounted for as an equity transaction, where the difference between the consideration transferred and the book value of the share of the non-controlling interest acquired is recognised directly in equity attributable to the parent.
Where the Group loses control over a subsidiary, it derecognises the assets including goodwill, liabilities and non-controlling interest in the subsidiary together with any cumulative translation differences recognised in equity. The Group recognises the fair value of the consideration received and the fair value of any investment retained together with any gain or loss in profit or loss.
COVID19- IMPACT
The COVID-19 pandemic has caused unprecedent social and economic disruption. The Group has to date demonstrated resilience in the face of the COVID-19 pandemic, supported by a strong underlying consumer demand for our products and the focus of the Board and management team on key initiatives, including:
• Continued operation of Deloraine factory as an essential service under Victoria stage 4 restriction;
• The implementation of additional health and safety measures, including splitting work teams and zones in our Deloraine production facility, to reduce the risk of a major supply disruption;
• Working from home arrangement for head office staff;
• Continued close cooperation with our key suppliers;
• Increased levels of safety stock to mitigate future supply chain disruption
Other than the events stated above, no matter or circumstance has arisen since 30 June 2020 that has significantly affected or could significantly affect the reported results from operations or financial position for the year then ended.
Bubs Australia Limited and Controlled Entities Annual Report for the year ended 30 June 2020114 115
04 FINANCIAL STATEMENTS Notes to the Financial StatementsF
or p
erso
nal u
se o
nly
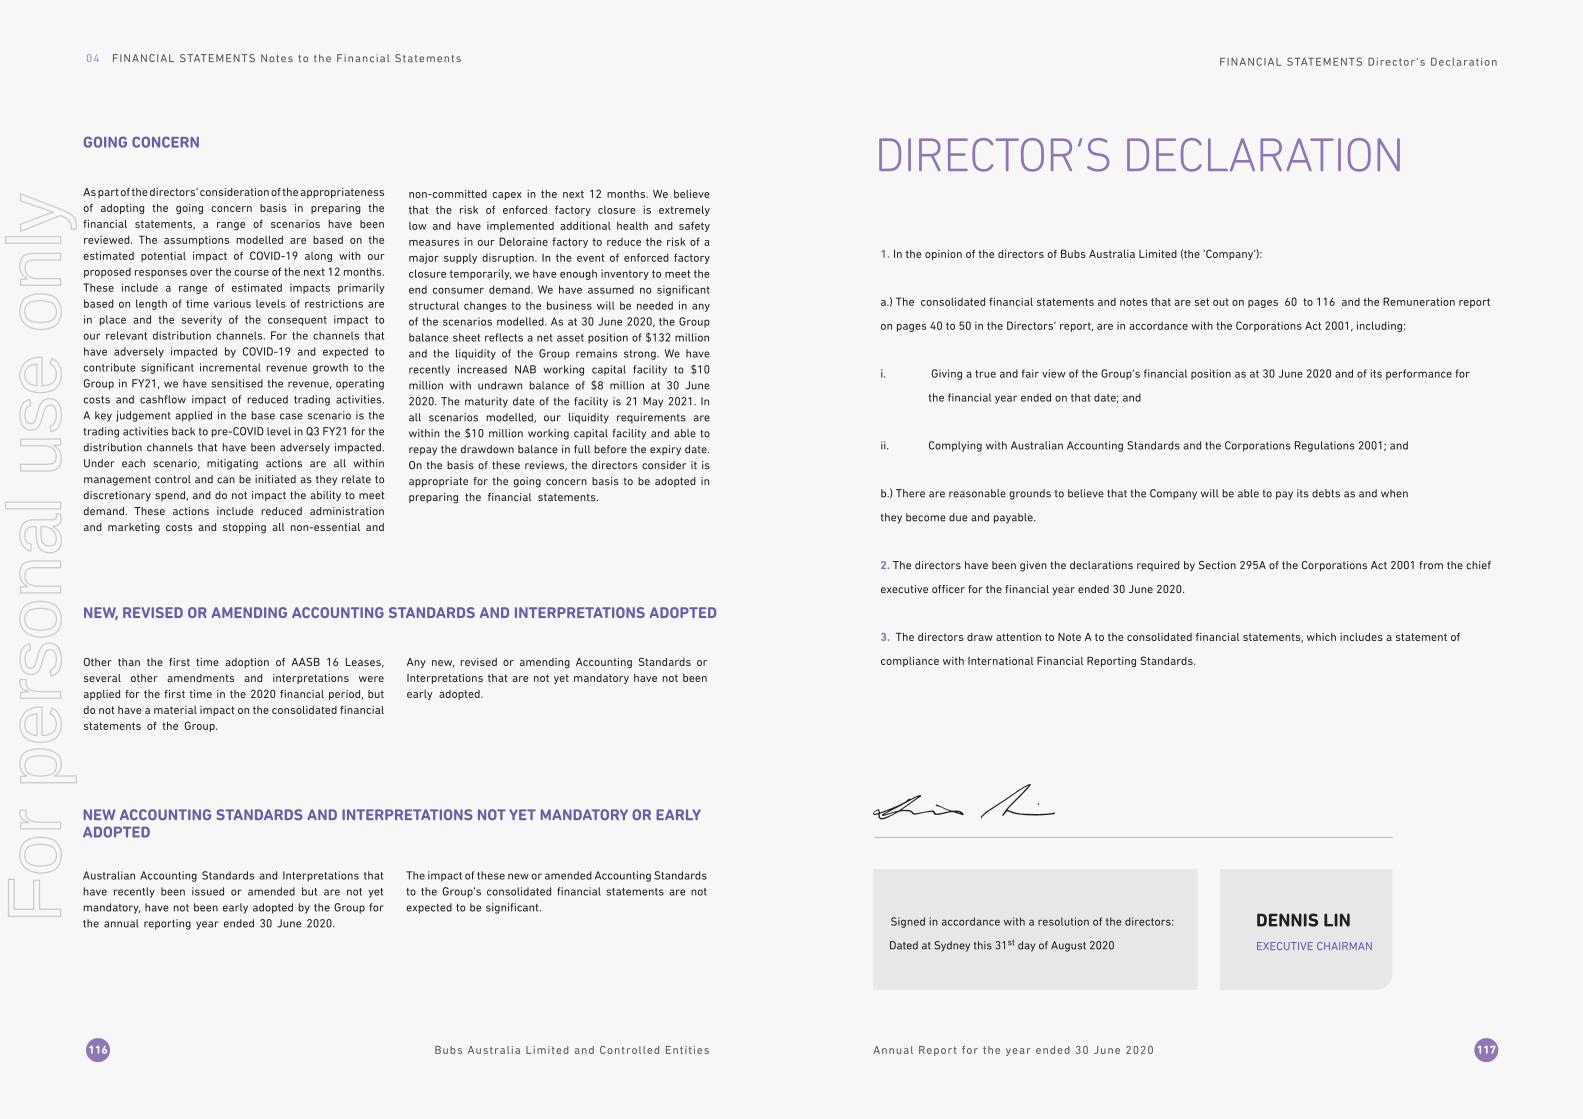
NEW ACCOUNTING STANDARDS AND INTERPRETATIONS NOT YET MANDATORY OR EARLY ADOPTED
Australian Accounting Standards and Interpretations that have recently been issued or amended but are not yet mandatory, have not been early adopted by the Group for the annual reporting year ended 30 June 2020.
The impact of these new or amended Accounting Standards to the Group’s consolidated financial statements are not expected to be significant.
GOING CONCERN
NEW, REVISED OR AMENDING ACCOUNTING STANDARDS AND INTERPRETATIONS ADOPTED
Other than the first time adoption of AASB 16 Leases, several other amendments and interpretations were applied for the first time in the 2020 financial period, but do not have a material impact on the consolidated financial statements of the Group.
As part of the directors’ consideration of the appropriateness of adopting the going concern basis in preparing the financial statements, a range of scenarios have been reviewed. The assumptions modelled are based on the estimated potential impact of COVID-19 along with our proposed responses over the course of the next 12 months. These include a range of estimated impacts primarily based on length of time various levels of restrictions are in place and the severity of the consequent impact to our relevant distribution channels. For the channels that have adversely impacted by COVID-19 and expected to contribute significant incremental revenue growth to the Group in FY21, we have sensitised the revenue, operating costs and cashflow impact of reduced trading activities. A key judgement applied in the base case scenario is the trading activities back to pre-COVID level in Q3 FY21 for the distribution channels that have been adversely impacted. Under each scenario, mitigating actions are all within management control and can be initiated as they relate to discretionary spend, and do not impact the ability to meet demand. These actions include reduced administration and marketing costs and stopping all non-essential and
Any new, revised or amending Accounting Standards or Interpretations that are not yet mandatory have not been early adopted.
non-committed capex in the next 12 months. We believe that the risk of enforced factory closure is extremely low and have implemented additional health and safety measures in our Deloraine factory to reduce the risk of a major supply disruption. In the event of enforced factory closure temporarily, we have enough inventory to meet the end consumer demand. We have assumed no significant structural changes to the business will be needed in any of the scenarios modelled. As at 30 June 2020, the Group balance sheet reflects a net asset position of $132 million and the liquidity of the Group remains strong. We have recently increased NAB working capital facility to $10 million with undrawn balance of $8 million at 30 June 2020. The maturity date of the facility is 21 May 2021. In all scenarios modelled, our liquidity requirements are within the $10 million working capital facility and able to repay the drawdown balance in full before the expiry date. On the basis of these reviews, the directors consider it is appropriate for the going concern basis to be adopted in preparing the financial statements.
Signed in accordance with a resolution of the directors:
Dated at Sydney this 31st day of August 2020 EXECUTIVE CHAIRMAN
DENNIS LIN
DIRECTOR’S DECLARATION
FINANCIAL STATEMENTS Director ’s Declaration
1. In the opinion of the directors of Bubs Australia Limited (the ‘Company’):
a.) The consolidated financial statements and notes that are set out on pages 60 to 116 and the Remuneration report
on pages 40 to 50 in the Directors’ report, are in accordance with the Corporations Act 2001, including:
i. Giving a true and fair view of the Group’s financial position as at 30 June 2020 and of its performance for
the financial year ended on that date; and
ii. Complying with Australian Accounting Standards and the Corporations Regulations 2001; and
b.) There are reasonable grounds to believe that the Company will be able to pay its debts as and when
they become due and payable.
2. The directors have been given the declarations required by Section 295A of the Corporations Act 2001 from the chief
executive officer for the financial year ended 30 June 2020.
3. The directors draw attention to Note A to the consolidated financial statements, which includes a statement of
compliance with International Financial Reporting Standards.
Bubs Australia Limited and Controlled Entities Annual Report for the year ended 30 June 2020116 117
04 FINANCIAL STATEMENTS Notes to the Financial StatementsF
or p
erso
nal u
se o
nly

OTHER INFORMATION
05
118
For
per
sona
l use
onl
y

The following additional information is required by the Australian Securities Exchange in respect of listed public companies.
The voting rights attached to each class of equity security are as follows:
Ordinary shares: each ordinary share is entitled to one vote when a poll is called, otherwise each member present at a meeting or by proxy has one vote on a show of hands
1. SHAREHOLDING AS AT 20 AUGUST 2020
OTHER INFORMATION
Distribution of shareholders
Voting rights
Unmarketable parcels
A
C
B
Range Total holders Units % Units
1 - 10,000 25,751 78,998,333 13.80
10,001 - 20,000 2,979 44,587,192 7.79
20,001 - 30,000 1,191 30,399,674 5.30
30,001 - 40,000 511 18,396,184 3.21
40,001 - 50,000 394 18,463,408 3.22
50,001 Over 1,107 381,867,170 66.68
Rounding 0.00
Total 31,933 572,651,961 100.00
Minimum Parcel Size Holders Units
Minimum $ 500.00 parcel at $ 0.9150 per unit 547 2,538 1,013,637
2. CORPORATE DIRECTORY
The name of the Company Secretary is Jay Richard Stephenson
Registered office23 Nina Link, Dandenong South, VIC 3175 Australia
Registers of securitiesComputer Investor Services Pty Ltd
Stock exchange listingQuotation has been granted for all the ordinary shares of the Company on all member exchanges of the Australian Securities Exchange Limited
Unquoted securitiesOptions over unissued sharesThe Group has 9,541,620 options on issue.
Top 20 shareholders – Ordinary Shares
A
B
C
D
E
D
Rank Name Units % of Units
1. C2 CAPITAL GLOBAL EXPORT-TO-CHINA FUND 76,288,510 13.32
2. CW RETAIL SERVICES PTY LTD 24,713,254 4.32
3. HSBC CUSTODY NOMINEES (AUSTRALIA) LIMITED 22,458,978 3.92
4. CITICORP NOMINEES PTY LIMITED 20,474,568 3.58
5. J P MORGAN NOMINEES AUSTRALIA LIMITED 14,376,358 2.51
6. CARR FAMILY PTY LIMITED <CARR FAMILY A/C> 13,620,600 2.38
7. INFANT FOOD BUSINESS PTY LIMITED <BUBS AUSTRALIA A/C> 10,000,000 1.75
8. MR GONG XU 5,700,00 1.00
9. BNP PARIBAS NOMINEES PTY LTD <IB AU NOMS RETAILCLIENT DRP> 5,018,595 0.88
10. STABLE CHARTER LIMITED 4,615,385 0.81
11. BNP PARIBAS NOMINEES PTY LTD <AGENCY LENDING DRP A/C> 4,524,924 0.79
12. A Z GLOBAL CORPORATION PTY LTD 4,512,911 0.79
13. MS CATHERINE JANE TAYLOR 4,003,612 0.70
14. MR BENJAMIN PAUL LANDON 4,000,270 0.70
15. RHB SECURITIES SINGAPORE PTE LTD <CLIENT A/C> 3,558,000 0.62
16. MR RUPERT ROBIN SOAR 2,772,039 0.48
17. CUSTODIAL SERVICES LIMITED <BENEFICIARIES HOLDING A/C> 2,073,566 0.36
18. NATIONAL NOMINEES LIMITED 2,071,701 0.36
19.MICHEAL WALTER DANIEL + NIGEL GEOFFREY BURTON + MICHAEL MURRAY BENJAMIN
1,800,000 0.31
20.MR DENNIS BARRY STAMP + MS CHRISTINE DIANNE STAMP <TEFER PTY LTD SUPER FUND A/C>
1,520,000 0.27
Totals: Top 20 holders of ORDINARY FULLY PAID SHARES (TOTAL) 228,103,271 39.83
F
Principal office2-4/6 Tilley Lane, Frenchs Forest, NSW, Australia, 2086
Bubs Australia Limited and Controlled Entities Annual Report for the year ended 30 June 2020120 121
05 OTHER INFORMATIONF
or p
erso
nal u
se o
nly

Jay Stephenson Bubs Australia Limited is a company limited by shares, incorporated and domiciled in Australia.
Its registered office is: 23 Nina Link Dandenong South VIC 3175 Australia
Dennis Lin (Resigned as Non-executive Director on 21 October 2019, Appointed as Executive Chairman and Director on 22 October 2019)
Kristy-Lee Newland Carr
Matthew Reynolds
Steve Lin
Computershare Investor Services Pty Limited
Level 2 Reserve Bank Buidling 45 St George’s Terrace Perth WA 6000
Deloitte477 Bourke StreetMelbourne VIC 3000
ASX Code: BUB
DIRECTORS
SHARE REGISTRY AUDITORS AUSTRALIAN SECURITIES EXCHANGE
COMPANY SECRETARY REGISTERED OFFICE AND DOMICILE
CORPORATE DIRECTORY
www.investor.bubsaustralia.com
ASX: BUBBubs Australia
INVESTOR RESOURCE CENTRE
Bubs Australia Limited and Controlled Entities122
05 OTHER INFORMATIONF
or p
erso
nal u
se o
nly