ONEFord - AnnualReports.com
176
ONE Ford ONE Ford Ford Motor Company / 2009 Annual Report
-
Upload
khangminh22 -
Category
Documents
-
view
3 -
download
0
Transcript of ONEFord - AnnualReports.com

One
FordFord
Motor C
omp
any 2009 A
nnual Rep
ortFord Motor CompanyOne American Road
Dearborn, Michigan 48126
www.ford.com
Printed in U.S.A. 10% post-consumer waste paper. Please recycle.
OneFordFord Motor Company / 2009 Annual Report

Ford Motor Company | 2009 Annual Report
ONE FORD: ONE Ford expands on the company’s four-point business plan for achieving success globally. It encourages focus, teamwork and a single global approach, aligning employee efforts toward a common definition of success and optimizing their collective strengths worldwide. The elements of ONE Ford are:
ONE TEAM: ONE Ford emphasizes the importance of working together as one team to achieve automotive leadership, which is measured by the satisfaction of our customers, employees and other essential business partners, such as our dealers, investors, suppliers, unions/councils and communities.
ONE PLAN: The company’s four-point plan consists of: balancing our cost structure with our revenue and market share; accelerating development of new vehicles that customers want and value; financing our plan and rebuilding our balance sheet; and working together to leverage our resources around the world.
ONE GOAL: The goal of ONE Ford is to create an exciting and viable company with profitable growth for all.
Ford Motor Company | 2009 Annual Report 173
´Global Overview*Automotive Brands
Dealers** and
Markets
11,682 dealers
116 markets
1,376 dealers
30 markets
1,780 dealers
19 markets
2,269 dealers
99 marketsCustomer
Assistance1.800.392.3673fordvehicles.comfordowner.comClick on “contact us”
1.800.521.4140lincoln.comlincolnowner.comClick on “contact us”
1.800.392.3673mercuryvehicles.commercuryowner.comClick on “contact us”
Financial Services Customer Services
Operations – Provides a wide variety of dealer and customer financing products and services globally in support of Ford Motor Company vehicle sales
– One of the world’s largest automotive finance companies, with managed receivables of $95 billion at year-end 2009
Genuine Parts and Service– A total service
experience for Ford, Lincoln and Mercury owners available only at Ford and Lincoln Mercury dealerships — designed to deliver customer satisfaction and repeat purchase intent
– Parts engineered to Ford Motor Company specifications
– Technicians trained and certified specifically on Ford, Lincoln and Mercury vehicles
Quick Lane Tire & Auto CenterFord Motor Company’s all-makes quick service brand, successfully occupies a unique niche in the marketplace by offering customers “convenience with confidence.” Convenience comes in the form of all- makes-all-models service capabilities, no-appointment-necessary service while you wait, evening and weekend hours, and competitive prices. Confidence comes in the form of factory-trained technicians and quality Motorcraft parts
Motorcraft PartsNew and remanufactured parts recommended by Ford Motor Company and available in Ford, Lincoln and Mercury franchised dealerships, Ford authorized distributors and thousands of major retail and repair locations
Genuine Ford AccessoriesWide variety of customer accessories designed to personalize Ford, Lincoln and Mercury vehicles
Extended Service BusinessProviding comprehensive vehicle service contract and maintenance programs
Ford Extended Service Plan (ESP)Major customers include Ford, Lincoln and Mercury vehicle dealers, commercial customers and fleets of Ford Motor Company vehicles
Customer Assistance
1.800.727.7000fordcredit.com
Order Genuine Ford parts at: FordParts.com
Locate Quick Lane Tire & Auto Centers at:Quicklane.com
Order Genuine Motorcraft parts at:FordParts.com
Genuine Ford Accessoriesfordaccessories.comlincolnaccessories.commercuryaccessories.com
ESP1.800.521.4144ford-esp.com
* As reported in our public filings, Volvo currently is held for sale.
** Because many of these dealerships distribute more than one of our brands from the same sales location, a single dealership may be counted under more than one brand.
Sales and Revenues (a) 2009 2008Worldwide wholesale unit volumesby automotive segment (in thousands) Ford North America 1,959 2,329 Ford South America 443 435 Ford Europe 1,568 1,820 Ford Asia Pacific Africa 523 464 Volvo 324 359 Jaguar Land Rover – 125Total 4,817 5,532
Sales and revenues (in millions) Automotive $ 105,893 $ 129,165 Financial Services 12,415 15,949Total $ 118,308 $ 145,114
Financial Results (a)Income/(Loss) before income taxes (in millions) Automotive $ 1,212 $ (11,917) Financial Services 1,814 (2,581) Total $ 3,026 $ (14,498)
Amounts Attributable to Ford Motor Company (a)Net income/(loss) (in millions) $ 2,717 $ (14,766) Diluted net income/(loss) per share of Common and Class B Stock $ 0.86 $ (6.50)
Cash and Spending (a)Automotive capital expenditures Amount (in billions) $ 4.5 $ 6.6 As a percentage of Automotive sales 4.2% 5.1%
Automotive cash at year end (in billions) Automotive gross cash (b) $ 25.5 $ 13.4 – Cash net of Automotive debt (8.9) (10.8)
Shareholder ValueDividends per share $ – $ - Total shareholder returns % (c) 337% (66)%
Contents
1 About the Company
2 A Message from the Executive Chairman
2 A Message from the President and CEO
5 Board of Directors and Executives
6 Great Products
10 Strong Business
11 Better World
13 Financial Contents
172 Shareholder Information
173 Global Overview
´Operating Highlights
(a) Data presented includes Jaguar Land Rover for 2008.
(b) Automotive gross cash includes cash and cash equivalents and net marketable securities.
(c) Source: Bowne

Ford Motor Company | 2009 Annual Report 1
´About the CompanyFord Motor Company, a global automotive industry leader based in Dearborn, Michigan, manufactures or distributes automobiles across six continents. With about 198,000 employees and about 90 plants worldwide, the company’s automotive brands include Ford, Lincoln, Mercury and Volvo. The company provides financial services through Ford Motor Credit Company. For more information regarding Ford’s products, please visit www.ford.com.
On the CoverThe next-generation Ford Focus, which made its worldwide debut in January, is part of a new generation of vehicles based on a common platform that will support up to 10 global products, with a projected 2 million units of annual production by 2012. The Focus is designed and developed to exceed the wants and needs of global Focus customers. This stylish new offering will be nearly identical across markets with 80 percent parts commonality. Focus will offer class-leading technologies, premium feature content and precision craftsmanship combined with exceptional fuel economy and a fun-to-drive experience. Production will begin simultaneously in Europe and North America in late 2010, with production in Asia beginning in 2011.
Key products in Ford’s global vehicle line up include: the 2010 F-150 manufactured in Dearborn, Michigan, U.S.A.; the Ford Fiesta manufactured in Cologne, Germany; the 2010 Ford Fusion Sport manufactured in Hermosillo, Mexico; and the Ford Figo, manufactured in Chennai, India.
´Global Growth Plan
Profitable growth for all
Alan Mulally and William Clay Ford, Jr. introduce the next-generation Ford Focus at the 2010 North American International Auto Show in Detroit.
In the summer of 2009, Transit Connect launched in North America as a spacious and fuel-efficient alternative to larger commercial vehicles, offering the maneuverability of a car, the enclosed space of a van and the payload capacity of a full-size pickup. This unique product – already a market leader in Europe – was adapted for North American use with the addition of a proven 2.0-liter engine and four-speed automatic overdrive transmission. The durable powertrain helps Transit Connect deliver fuel economy of 25 mpg highway and 22 city. No other vehicle in North America can match its combination of payload, space and fuel efficiency. Beginning in 2010, Transit Connect Electric will be offered for commercial customers with routine usage over specified routes. Ford also offers a taxi prep package, with clean-burning compressed natural gas or liquefied propane compatibility.
´ Ford Transit Connect
+ + =Asia Pacific Africa
Europe
Large
Medium
Americas
Small

2 Ford Motor Company | 2009 Annual Report
Last year Ford Motor Company continued its transformation in the face of extraordinarily difficult economic conditions. By borrowing all we could ahead of the credit collapse and dramatically cutting our costs we avoided a government bailout. We then went on to achieve one of the greatest financial turnarounds in our history.
Our outstanding progress confirmed we are headed in the right direction, but we know our journey is far from over. We are now fighting our way back to prosperity.
Today the automotive industry is at the intersection of three critical global issues: the economy, energy and the environment. There are concerns about competitiveness and employment, the availability and affordability of fuel, and the impact of CO2 emissions. In response to these concerns, for the first time in a century, some of the most fundamental and enduring elements of the automobile are being radically transformed by new technologies. The key to this transformation, and to success in our business, is continuous improvement and innovation.
We remain intensely focused on growing our business profitably by delivering exciting vehicles that our customers want and value. To do that we want to be a leader in the application of technology that makes our customers’ lives better. That includes developing breakthrough technologies to address the critical global issues that impact us all.
Operating as ONE Ford around the world allows us to fully leverage our resources so that we can introduce new technology at a lower cost and a faster pace. These advanced technologies will help us ensure that every new product we introduce will be a leader in its segment for fuel economy, while providing top quality, safety and value.
We are transforming our company and our products to keep pace with a rapidly changing world. We are proud of our achievements, but also fully aware that in a fiercely competitive global economy there is no room for complacency. The fact that our plan is working will not slow us down – rather, it will inspire us to move faster and farther.
Thank you for your continued support of our efforts.
William Clay Ford, Jr.Executive ChairmanMarch 4, 2010
Ford Motor Company emerged from the challenging business environment of 2009 with the strongest proof yet that our ONE Ford plan is working. We reported full year 2009 net income of $2.7 billion, which was the company’s first full year of positive net income since 2005 and a $17.5 billion improvement over the previous year. We achieved a pre-tax operating profit, excluding special items, of $472 million in 2009, which was a $7.3 billion improvement over 2008. (See page 22 for a listing of special items in 2009 and 2008.)
We still face significant challenges, but by following the ONE Ford plan we put in place three and a half years ago we are forging a path toward profitable growth. Our plan remains unchanged:
•Aggressivelyrestructuretooperateprofitablyatthecurrentlower demand and the changing model mix.
•Acceleratethedevelopmentofhigh-quality,fuel-efficient, safe new products that customers want and value.
•Financeourplanandimproveourbalancesheet.
•Worktogetherasoneteam,leveragingourglobalassets.
ONE Ford helped us achieve profitability and grow our business despite a global recession. In every part of the world we are providing customers with great products, building a stronger business and contributing to a better world.
Great ProductsIn 2007 we created a single global product development organization to maximize economies of scale and share best practices and ideas. That allows us to fully leverage our resources so that we can offer a full range of vehicles with the best quality, fuel-efficiency, safety, smart design and value.
Taking full advantage of our global scale and talent to build products customers want and value is already paying off for us in markets around the world. And within the next four years, all Ford vehicles competing in global product segments will be common in North America, South America, Europe and Asia Pacific Africa.
In 2009 our strong products drove full year market share gains in North America, Europe and South America while maintaining share in the rapidly growing Asia Pacific Africa region.
In the U.S., Ford F-Series was the best-selling truck for the 33rd year in a row in 2009. In the utilities segment, the Ford brand was the top-selling brand of crossovers in the U.S., led by the Ford Escape. Every consumer metric about the Ford brand – including favorable opinion, consideration, shopping and intention to buy – ended the year at record levels. Full-year total market share was 15.3 percent, more than one point higher than 2008, marking the company’s first full-year U.S. market share increase since 1995.
In Canada, Ford was the best-selling brand in 2009, and the Ford F-Series was the best-selling truck for the 44th year in a row. Led by the Fiesta, Focus and Ka, Ford strengthened its position
´�A Message from the Executive Chairman
�́�A Message from the President and CEO
William Clay Ford, Jr. celebrated his 30-year anniversary with Ford Motor Company. Pictured with him are Elena Ford, Director, Global Marketing, Sales and Service Operations and Felicia Fields, Group Vice President, Human Resources and Corporate Services.

Ford Motor Company | 2009 Annual Report 3
as Europe’s second highest-selling brand in 2009. Ford Europe’s market share of 9.1 percent was a half point increase for the year and set an 11-year high.
In South America, Ford Brazil achieved its best ever full-year sales in 2009 by selling 325,000 vehicles, a 15 percent increase over the previous year. Ford Asia Pacific Africa’s sales were up 14 percent in 2009, and set a full-year record. Ford sales in China, up 45 percent, led the increase in the region.
More great products are on the way this year, including the new Ford Fiesta in the U.S., freshened versions of the Ford S-MAX and Galaxy in Europe, and the new Ford Figo in India.
Strong BusinessFord has completed major cost reduction actions over the past four years to substantially restructure its business, including personnel levels, facilities and related costs, and the settlement of the United Auto Workers retiree health care Voluntary Employee Beneficiary Association (VEBA) agreement. We also obtained capital and liquidity ahead of the financial market crisis, which helped us maintain our investments in new products during a difficult economic period.
In 2009, we achieved $5.1 billion in Automotive structural cost reductions, exceeding our target of $4 billion. For the full year, Automotive operating-related cash flow was negative $300 million; an improvement of $19.2 billion over 2008. We finished the year with $25.5 billion in Automotive gross cash, which was up from $23.8 billion at the end of the third quarter of 2009.
Ford Motor Credit Company reported net income of $1.3 billion in 2009, an improvement of $2.8 billion from a net loss of $1.5 billion a year earlier. Contributing to this improvement was the non-recurrence of an impairment charge for operating leases and lower depreciation expense for leased vehicles due to higher resale values.
Our intense focus on improving our cost structure and strengthening our balance sheet will continue going forward. Among other actions, we anticipate completing the sale of Volvo Cars to Zhejiang Geely Holding Group Co. Ltd. in the second quarter of 2010.
´ONE Ford DNA and Global Vehicle Strategy
“Ford knows that customer wants and needs are converging globally, and to that
end, the customer is at the center of the company’s strategy to bring new global
vehicles to market. The next generation of small cars created under the ONE Ford
approach are engineered not just to meet the standards of customers the world
over but to surprise and delight with their high level of feature content. They are
great to look at, great to sit in and great to drive, too.”
- Derrick Kuzak, Ford group vice president, Global Product Development
Ford’s Global Product Strategy is focused on five key areas:
• Driving quality – Building on a dynamic heritage to define a truly engaging driving experience.
• Fuel economy – Delivering on our commitment to be unsurpassed in providing fuel-efficient vehicles, which is becoming increasingly important to customers.
• Technology – The next-generation small cars are loaded with intuitive and intelligent features until now found only in larger, more premium vehicles.
• Safety – Engineering to global safety standards.
• Craftsmanship – Material selection and fit-and-finish take a major step forward. Interior quietness bests the competition and then some.
2011 Ford Fiesta

4 Ford Motor Company | 2009 Annual Report
Better WorldGreat companies are driven by purpose as well as profit.Ford has a proud heritage of improving people’s lives and making their world a better place. We want to build on this heritage by being a good neighbor locally and a trusted corporate citizen globally, operating responsibly and sustainably wherever we do business.
A central element of our efforts is providing affordable fuel economy for millions of customers, not just expensive, low-volume niche vehicles. To do that we have introduced innovative fuel-saving technologies across a wide range of vehicles.
We now have more fuel-saving six-speed transmissions on the road than any other manufacturer. We are also the leading U.S.-based producer of hybrid-electric vehicles, with record sales that were up 72 percent in 2009. The EcoBoost™ engine technology we introduced last year delivers up to 20 percent better fuel economy and will be offered on a wide range of vehicles with projected production reaching half a million annually in North America within 5 years. In that same time period, we will introduce a series of four new electric, next-generation hybrid and plug-in hybrid vehicles that use advanced lithium ion batteries.
In 2009, a U.S. Environmental Protection Agency report showed that Ford Motor Company improved its combined car and truck fuel economy by nearly 20 percent during the 5-year period 2004-2009, almost double the improvement of the next closest competitor.
Giving back to the community also is an important part of our efforts to help build a better world. Ford Motor Company Fund and Community Services, our philanthropic organization, celebrated its 60th anniversary in 2009. Our Ford Volunteer Corps, which was established in 2005, encourages salaried employees to take two work days per year to serve as volunteers. Last year 16,000 Ford employees and retirees volunteered more than 77,000 hours to help people in their local communities.
Looking ForwardWe are more convinced than ever that Ford has the right plan to lead us through near-term economic pressures and continue to deliver profitable growth. We expect to be profitable for the full year in 2010 on a pre-tax basis, excluding special items. That includes full year profitability for our Ford North America and total Automotive operations, with positive Automotive operating-related cash flow.
The entire extended Ford team is absolutely committed to building on our progress and working together as a lean global enterprise focused on delivering great products. By doing that, we will create an exciting and viable company with profitable growth for all.
As always, we thank you for your support of our efforts.
Alan R. MulallyPresident and Chief Executive OfficerMarch 4, 2010
´ Ford’s Senior Management Team
Ford’s senior management team is continuing to implement the company’s ONE Ford global plan. Pictured with the next-generation Ford Focus and the Ford Fiesta, from left to right:
Ray Day, Sue Cischke, Lewis Booth, Mike Bannister, Nick Smither, Mark Fields, Bennie Fowler, Alan Mulally, Derrick Kuzak, Joe Hinrichs, Jim Farley, John Fleming, Tony Brown, Ziad Ojakli, Felicia Fields and David Leitch.

Ford Motor Company | 2009 Annual Report 5
William Clay Ford, Jr.Executive Chairman and Chairman of the Board
Alan R. MulallyPresident and Chief Executive Officer
Michael E. BannisterExecutive Vice President, Chairman and Chief Executive Officer, Ford Motor Credit Company
Lewis W. K. BoothExecutive Vice President and Chief Financial Officer
Mark FieldsExecutive Vice President and President, The Americas
John FlemingChairman, Ford of Europe and Executive Vice President, Manufacturing & Labor Affairs
Thomas K. BrownGroup Vice President, Global Purchasing
Susan M. CischkeGroup Vice President, Sustainability, Environment and Safety Engineering
James Farley, Jr.Group Vice President, Global Marketing and Canada, Mexico & South America
Felicia J. FieldsGroup Vice President, Human Resources and Corporate Services
Bennie W. FowlerGroup Vice President, Quality
Joseph R. HinrichsGroup Vice President, and President, Asia Pacific and Africa
Derrick M. KuzakGroup Vice President, Global Product Development
David G. LeitchGroup Vice President and General Counsel
J MaysGroup Vice President and Chief Creative Officer, Design
Ziad S. OjakliGroup Vice President, Government and Community Relations
Robert L. ShanksVice President and Controller
Nicholas J. SmitherGroup Vice President and Chief Information Officer
Joseph BakajProduct Programs and Product Development, Ford of Europe
Stephen E. BiegunInternational Governmental Affairs
Kenneth M. CzubayU.S. Marketing, Sales & Service
Raymond F. DayCommunications
Robert J. GrazianoChairman and CEO, Ford Motor China
Ken MacfarlaneManufacturing, Ford of Europe
Paul A. MascarenasEngineering
Martin J. MulloyLabor Affairs
Stephen T. OdellPresident and Chief Executive Officer, Volvo Cars
Barb J. SamardzichPowertrain Engineering
Neil M. SchlossTreasurer
Gerhard SchmidtChief Technical Officer, Research and Advanced Engineering
Ingvar SviggumMarketing, Sales and Service, Ford of Europe
James P. TetreaultNorth America Manufacturing
Frederiek ToneyFord Customer Service Division
´�Board of Directors
Stephen G. Butler(1,5)
Kimberly A. Casiano(1,3,5)
Anthony F. Earley, Jr.(2,3,5)
Edsel B. Ford II(3,4)
William Clay Ford, Jr.(3,4)
Richard A. Gephardt(3,5)
Irvine O. Hockaday, Jr.(1,5)
Richard A. Manoogian(2,5)
Ellen R. Marram(2,3,5)
Alan R. Mulally(4)
Dr. Homer A. Neal(3,4,5)
Gerald L. Shaheen(1,5)
John L. Thornton(2,4,5)
William Clay Ford(Director Emeritus)
Committee Memberships(1) Audit (2) Compensation(3) Sustainability (4) Finance (5) Nominating and
Governance
´Board of Directors and Executives*
*As of March 4, 2010
´Executive Officer Group
´Other Vice Presidents

6 Ford Motor Company | 2009 Annual Report
From new small cars offering features normally associated with more expensive vehicles, to highly capable and adaptable crossovers and utilities to Built Ford Tough trucks, Ford is leveraging its global product development strengths and technical expertise to deliver safe, fuel-efficient and fun-to-drive vehicles to customers around the world. Ford is committed to the development and broad availability of vehicles that provide buyers with the best, or among the best, fuel economy in each market segment. While powertrain developments such as EcoBoost™
and PowerShift present opportunities for Ford to improve fuel efficiency without sacrificing performance, subtle innovations like Electric Power Assist Steering, aerodynamic tuning and use of lightweight components contribute to Ford’s commitment to help make fuel economy affordable for millions while reducing Ford’s carbon footprint.
Great Products
´Cars
2011 Ford Fiesta
Ford Figo (left) and Grand C-MAX
2010 Lincoln MKS Next-Generation Ford Focus
A key element of the ONE Ford plan is accelerating development of the products our customers want and value. In North America, this is evident in the reinvigoration and renaissance of several Ford car lines. As the light-vehicle market shifts back to cars, Ford has gained market share with boldly designed, high-quality, fuel-efficient cars that offer unexpected levels of technology, convenience and safety, while rewarding drivers with a fun-to-drive experience.
A new Ford Fusion, Fusion Hybrid, Lincoln MKZ, Mercury Milan and Milan Hybrid debuted in 2009. All-new six-speed transmissions help these stylish midsize sedans deliver improved fuel economy – with both I-4 and V-6 engines – compared to previous models. The Fusion and Milan Hybrids are America’s most fuel-efficient midsize cars, delivering impressive fuel economy figures of 41 mpg city, 36 highway. In 2010, a Lincoln MKZ Hybrid joins the lineup.
The all-new Ford Taurus and Taurus SHO sports sedan debuted, bringing bold technologies, luxurious interior appointments and world-class driving dynamics. Taurus SHO is the first North American Ford-brand application of EcoBoost™, employing two small turbochargers to boost power from its advanced 3.5-liter V-6 to V-8 levels without compromising fuel efficiency.
Lincoln continued its transformation with the addition of the MKS with EcoBoost, attracting new, younger buyers to Ford’s luxury brand.
In Europe and Asia, Fiesta, Ford’s new global small car, introduced an advanced PowerShift six-speed automatic transmission, employing dual internal clutches and six well-spaced gears to keep the 1.6-liter I-4 engine in its most efficient operating range. Fiesta proves small car drivers can enjoy a wide selection of convenience technologies and luxury appointments without sacrificing top fuel efficiency.
Around the world, Ford continues to expand its small car portfolio with a new Focus hatchback and sedan. Developed for sale across global markets, Focus will continue the trend of offering luxury-class safety and convenience features and technologies that will set new small car standards.
In Europe, Ford launched a high-performance Focus RS in addition to new C-MAX and Grand C-MAX family vehicles, while in India the Figo was revealed to bring a new class of drivers into the Ford brand. These stylish new offerings feature Ford DNA design cues and numerous fuel-efficient powertrain alternatives.

Ford Motor Company | 2009 Annual Report 7
For the 33rd year in a row, Ford’s award-winning F-Series is America’s best-selling truck with 2009 sales of 413,625. F-Series outsold its nearest truck rival by more than 97,000 units, the largest margin in three years.
In addition, for the 28th consecutive year, F-Series is once again America’s best-selling vehicle of any type – car, utility or truck.
The F-150 was redesigned inside and out for 2009, and it sets a new benchmark for full-size pickups with a new high-strength, lighter-weight chassis that delivers more class-leading towing and hauling capability and unsurpassed fuel economy.
New to F-Series for 2010 is F-150 Harley-Davidson™ edition and the off-road F-150 SVT Raptor – the winner of the 2009 Truck of Texas award.
When the 2011 F-Series Super Duty hits dealer showrooms in 2010, it will have an all-new Ford-designed, Ford-engineered and Ford-built 6.7-liter Power Stroke® turbocharged V-8 diesel. The new engine will feature best-in-class fuel economy and enable class-leading towing and payload.
Determined to be class-leading in every segment, Ford’s utility vehicle range continues to resonate with customers. And it’s no wonder: From Flex and Edge to Lincoln MKT and MKX, Ford’s family of utility vehicles offer the ultimate in no-compromise utility wrapped in an engaging package.
In the full-size utility segment, both the Ford Flex and Lincoln MKT added an EcoBoost™ engine option – a turbocharged, direct gasoline injection engine to improve fuel efficiency and lower CO2 emissions – paired with a suite of other popular features.
Dramatic freshenings to both the Ford Edge and Lincoln MKX were unveiled in early 2010, showcasing new engines with more power and better fuel economy, class-exclusive features and new sheet metal.
The Ford Explorer also topped the sales charts in the medium utility segment and the Ford Escape finished second in the small utility segment. Escape’s counterpart in Europe, Kuga, helped Ford strengthen its No. 2 position in 2009 with a 9.1 percent market share in its 19 main European markets.
´ Trucks´Utilities
2011 Ford Edge
All-new 6.7-liter V-8 turbocharged Power Stroke diesel engine
2010 Ford Mustang GT, 2010 Ford Taurus SHO and 2010 Ford Fusion Hybrid
Ford Kuga 2010 Ford F-150

8 Ford Motor Company | 2009 Annual Report
The 2010 Ford Fusion bested a field of 23 contenders – including the Toyota Camry and Honda Accord – to win the prestigious MOTOR TREND 2010 Car of the Year® award. The Fusion lineup was praised by MOTOR TREND for its potential to appeal to every type of driver, from the eco-conscious to the sport-minded.
Fusion – America’s most fuel-efficient midsize sedan – set record-breaking sales for 2009, is currently the No. 1-selling domestic car, and ranked among the nation’s top 10-selling vehicles.
Ford sweeps North American Car and Truck of the Year awardsFord Motor Company captured both North American Car of the Year and Truck of the Year awards for the 2010 Ford Fusion Hybrid and 2010 Ford Transit Connect respectively at the 2010 North American International Auto Show. The historic double win marks only the third time in 17 years one manufacturer has taken home both titles.
The 2010 Ford Fusion Hybrid – also honored as one of CAR and DRIVER’s “10Best” Cars for 2010 and one of AUTOMOBILE’s 2010 All-Stars – edged out
finalists including the Buick LaCrosse and the Volkswagen Golf/GTI to win the North American Car of the Year award. Fusion Hybrid sales account for almost 20 percent of total Fusion retail sales, and more than 60 percent of those sales have been to customers coming from import brands – mostly Toyota and Honda.
The 2010 Ford Transit Connect bested finalists including the Chevrolet Equinox and Subaru Outback to win North American Truck of the Year. It is the sixth Ford truck to win the award – the most wins of any automaker in the 17-year history of the program. It also is the second year in a row Ford has earned the award. Last year, the honor went to the 2009 Ford F-150.
´Best-in-Class Results
Mark Fields accepting the 2010 North American Car of the Year and Truck of the Year awards for the 2010 Ford Fusion Hybrid and 2010 Ford Transit Connect.
Along with coveted North American Car and Truck of the Year awards for Fusion Hybrid and Transit Connect, Ford is gaining recognition for its efforts the world over.
Fiesta, already a hit in Europe and Asia, won praise across the globe this past year, a preview, perhaps, of what’s to come when the car makes its North American debut this summer. Fiesta won car of the year awards from Denmark to Greece to Romania in 2009, and in China alone, the small car collected more than 40 accolades.
Kuga, Ford’s small utility sold mainly in Europe, earned praise in Great Britain for its affordability, design, build quality and drive experience. Not to be outdone, Ford’s Galaxy and S-MAX in Europe won a number of accolades, with S-MAX in particular being acclaimed for its excellent driving dynamics and strong residuals.
Ka is the best city car in Croatia, and a favorite among women in Germany. And Ford’s popular Mondeo (Asia Pacific Africa model pictured above) scored high with families and fleet owners from New Zealand to Spain for its robust safety credentials.
If 2009 is any indication, praise for the company’s smart innovations, class-leading safety, cutting-edge design and fuel-efficient solutions will continue to come fast and strong in 2010.
Ford Mondeo

Ford Motor Company | 2009 Annual Report 9
Ford has more U.S. government 5-star crash test ratings than any other brand. Ford’s rapid advancement of crash-avoidance and crash-protection technologies continues to build on its leading safety heritage.
In 2009, Ford introduced Adaptive Cruise Control and Collision Warning with Brake Support, and Blind Spot Information System with Cross Traffic Alert. These technologies help drivers avoid potential collisions by using radar to detect the position of other vehicles and warn the driver with a combination of visual and audio alerts.
Ford announced plans to introduce the world’s first automotive inflatable seat belts, combining attributes of traditional safety belts and air bags to provide an added level of crash protection for rear seat passengers. The device will be an option on the next-generation Ford Explorer that goes into production this year.
The introduction of MyFord driver connect technology heralds a sweeping redesign in the way drivers interact with their vehicles, focused on making the in-vehicle experience smarter, safer and simpler. Featuring rich graphic display screens, user-friendly controls and expanded voice commands, MyFord Touch™ offers drivers increased connectivity while fostering a “hands on the wheel, eyes on the road” approach to keeping in touch.
MyFord leverages the company’s award-winning SYNC® communications system, making additional vehicle controls voice-accessible while refining the voice recognition technology to make it more intuitive than ever. As part of MyFord, SYNC has expanded, allowing users to operate additional features like climate controls and audio and navigation systems without their eyes ever leaving the road. New features like in-car WiFi, HD Radio™ technology and song tagging combined with extensive personalization options help create a rich, custom driving experience for Ford customers.
Making the desirable affordableMyFord represents premium technology, but it will not be exclusive to premium products – the system was engineered from the start to be delivered in affordable, high-volume cars and trucks for everyone around the globe. As new and freshened Ford, Lincoln and Mercury models continue to arrive, all will be outfitted with MyFord driver connect technology. Across different models, different trim levels, even different countries, drivers immediately will know they’re behind the wheel of a Ford vehicle equipped with the technology, safety and convenience features they expect.
´MyFord Touch ´Safety Leadership
Ford’s Adaptive Cruise Control and Collision Warning with Brake Support allows drivers to set the vehicle’s speed and maintain it without using the accelerator pedal, using radar sensors to detect moving vehicles ahead and warn drivers of collision risks.

10 Ford Motor Company | 2009 Annual Report
With Ford working aggressively to improve its balance sheet, major transformations to its manufacturing footprint are taking shape. Rather than relying just on a regional supplier base, Ford is partnering with international suppliers to drive cost efficiencies and establish consistent levels of quality and craftsmanship. When it came time to build the company’s first ONE Ford global product, the next-generation Ford Focus, executives, engineers and plant workers in North America, Europe and Asia gathered in front of huge projection screens to put the car together virtually piece by piece. Focus will be sold in 122 countries, based on the C-platform, with projected production of 2 million vehicles a year by 2012.
The new Galaxy and S-MAX are the first European Ford models to benefit from the company’s global family of turbocharged, direct-injected EcoBoost engines, which deliver impressive fuel economy and low CO2 emissions. The Galaxy and S-MAX are built alongside the Mondeo at Ford of Europe’s Genk facility in Belgium, a highly sophisticated, lean and flexible manufacturing factory that ensures Ford can respond very quickly to changes in customer demand.
In 2009, Ford Motor Credit Company celebrated 50 years as Ford’s global financial services subsidiary, providing focused support of Ford dealers and customers.
Ford Credit’s profits and dividends support development of new cars and trucks.
Strong and enduring dealer relationships are a Ford Credit hallmark, including that with Stuart Powell Ford (above) in Kentucky. Ford and Ford Credit representatives honored Powell (standing third from left) for his 49-year association with Ford Credit.
The drive for customer loyalty began with Ford Credit’s first retail customers, the Indiana couple (seated at left in the photo below). Ford Credit continues to bring customers back to Ford today.
“When Ford formed Ford Credit, we created a global partner dedicated to the sale of Ford cars and trucks – a very smart move,” Ford President and CEO Alan Mulally said. “Ford Credit is more than ever a strategic asset to Ford.”
As Ford introduces a new generation of global products, the company’s ONE Ford strategy is clearly evident in its assembly plants. Taking advantage of global demand means scaling up the company’s manufacturing operations to produce the first of these global products – the next-generation Ford Focus – with universally high levels of craftsmanship, quality and efficiency all around the world. In Wayne, Mich., one of three North American truck plants is being retooled to build fuel-efficient global small cars, and in Chongqing, China, Changan Ford Mazda Automobile broke ground in September for a state-of-the-art and highly flexible passenger car plant scheduled for completion in 2012 as the new home for Focus in China.
Meanwhile, the integrated manufacturing facility in Chennai, India, saw a $550 million expansion to begin production of the new Ford Figo for that country’s vast small car market using environmentally friendlier processes like the three-wet, high-solids paint application.
´ Ford Credit at 50 ´�Global Expansion and Manufacturing
S-MAX Trend 5-seat
Strong Business
Groundbreaking at the Changan Ford Mazda Automobile Plant, Chongqing, China

Ford Motor Company | 2009 Annual Report 11
Worldwide, Ford is delivering advanced powertrains that reinforce its commitment to improving fuel economy without sacrificing the joy of driving. Advances in materials and technology have combined to yield benefits without traditional tradeoffs. Aluminum has replaced iron, resulting in engines that are lighter in weight yet more durable. Precise valvetrain control produces more power using less fuel. And smoother, more efficient six-speeds have eclipsed the four-speed units that were ubiquitous just a few years ago. From the smallest gasoline four-cylinders to the largest turbo-diesels – and the transmissions behind each – a refusal to compromise can be seen throughout the Ford powertrain lineup. A Global Effort, with Global ResultsMore than ever, the driving force for Ford products has its roots in an elite global engineering workforce. Powertrains are designed for worldwide consumption but have the flexibility to be tailored for local market needs. EcoBoost™, which gained immediate North American acceptance, is now beginning its spread to European vehicles. Our global 1.6-liter and 2.0-liter I-4 engines are finding their way into vehicles worldwide utilizing global platforms.
Ford’s commitment to sustainability and the environment is evident in both its product plan and its operational efficiencies.
In 2009, the EPA reported Ford’s fleetwide fuel economy improved nearly 20 percent during the prior five years, almost double its closest competitor. Ford will deliver 30 new powertrains during the next two years to increase fuel efficiency. Work is also underway on four new electrified vehicles, including the Transit Connect Electric, Focus Electric, a plug-in hybrid electric vehicle and a next-generation hybrid.
Sustainability BlueprintEnergy efficiency and resource conservation are critical to running a strong business, and Ford recently earned its fifth consecutive ENERGY STAR Award for Sustained Excellence. Since 2000, Ford’s U.S. facilities have improved energy efficiency by nearly 35 percent through innovative technology solutions, replication of best practices and non-production shutdowns. These successes were shared with Ford’s global operations.
In 2009, Ford became the first automaker to join the CDP Water Disclosure Project, which will establish a water usage reporting protocol and promote conservation of this increasingly scarce resource. From 2000 to 2008, Ford cut its global water use by 56 percent in an effort to affect positive social change and reduce its environmental impact around the world.
´ Ford Powertrain InnovationsBetter World2010 Ford Escape Hybrid and 2010 Ford Fusion Hybrid

12 Ford Motor Company | 2009 Annual Report
Many women, students and elders received care during a medical outreach program, a collaborative effort of the Sanjeevi Medical Health Center, The Rotary Club of Madras South West and Ford of India volunteers. An x-ray machine, donated by Ford volunteers, is the only one functioning in the area.
Celebrating its 15th year of support for the Susan G. Komen for the Cure®, Ford illuminated its World Headquarters pink to show support for breast cancer patients and survivors. Ford’s Warriors in Pink campaign is designed to recognize the strength and courage it takes to deal with the everyday challenges of fighting breast cancer 365 days a year.
The Ford Mobile Food Pantry vehicles were designed to provide much-needed support for food banks to pick up and distribute food to areas where there is not a standard food distribution point. The concept was launched in Detroit and will be expanded to a number of cities across the U.S. The demand for food in the U.S. has increased dramatically and this effort will help to distribute food which otherwise might go to waste and to areas that have no traditional food resource network.
´�Ford Transit Connect Mobile Food Pantry
Over 110 volunteers from Ford of Germany are saving precious historical records from the Cologne Archives. Some records, over 1,000 years old, were buried when 30 km (18.6 miles) of the city Archives collapsed.
Through a MODEL Teams mini-grant, 17,857 pounds of food was purchased, enough groceries to feed 416 households for one month. Ford volunteers sorted, organized and stocked the shelves with the food purchased.
Ford Driving Skills For Life has provided a series of global events focused on advanced, hands-on training from some of the world’s top professional instructors.
´ Ford Motor Company employees, creating a better world
Ford employees around the world continue to build a legacy of community involvement where they live and work. They volunteer their hearts, talents and time to projects that benefit children, adults and families in need. In 2009, they built, planted, cleaned, fed and walked for causes great and small.
Through volunteerism, Ford and its employees are creating a better world, one neighborhood at a time.
Ford Motor Company Fund and Community Services Ford Motor Company Fund and Community Services is committed to creating opportunities that promote philanthropy, volunteerism and cultural diversity for the communities where Ford does business.
Established in 1949 and funded by Ford Motor Company, Ford Motor Company Fund supports initiatives and institutions that foster innovative education, auto-related safety and American heritage and diversity. The Ford Volunteer Corps, established in 2005, continues Ford’s legacy of caring worldwide. Through the Ford Volunteer Corps, Ford employees participated in more than 1,000 volunteer projects in 2009. Those projects were filled by more than 20,000 Ford volunteers, equaling more than 100,000 volunteer hours - the equivalent of $2 million of human resources pumped into communities. During Global Week of Caring, held during September 5-12, 2009, Ford volunteers in 44 countries volunteered on six continents.

Ford Motor Company | 2009 Annual Report 13
Financial Contents*
14 Management’s Discussion and Analysis of Financial
Condition and Results of Operations
69 Quantitative and Qualitative Disclosures About Market Risk
74 Consolidated Statement of Operations
75 Sector Statement of Operations
76 Consolidated Balance Sheet
77 Sector Balance Sheet
78 Consolidated Statement of Cash Flows
79 Sector Statement of Cash Flows
80 Consolidated Statement of Equity
81 Notes to the Financial Statements
165 Report of Independent Registered Public Accounting Firm
167 Selected Financial Data
168 Employment Data
169 Management’s Report on Internal Control Over Financial
Reporting
170 New York Stock Exchange Required Disclosures
171 Stock Performance Graph
* Financial information contained herein (pages 14-171) is excerpted from the Annual Report on Form 10-K for the year ended December 31, 2009 of Ford Motor Company (referred to herein as “Ford”, the “Company”, “we”, “our” or “us”), which is available on our website at www.ford.com.

Management’s Discussion and Analysis of Financial Condition and Results of Operations
14 Ford Motor Company | 2009 Annual Report
OVERVIEW
Generation of Revenue, Income and Cash
Our Automotive sector's revenue, income, and cash are generated primarily from sales of vehicles to our dealers and distributors (i.e., our customers). Vehicles we produce generally are subject to firm orders from our customers and are deemed sold (with the proceeds from such sale recognized in revenue) after they are produced and shipped or delivered to our customers. This is not the case, however, with respect to vehicles produced for sale to daily rental car companies that are subject to a guaranteed repurchase option or vehicles produced for use in our own fleet (including management evaluation vehicles). Vehicles sold to daily rental car companies that are subject to a guaranteed repurchase option are accounted for as operating leases, with lease revenue and profits recognized over the term of the lease. When we sell the returned vehicle at auction, we recognize a gain or loss on the difference, if any, between actual auction value and the projected auction value. In addition, revenue for finished vehicles we sell to customers or vehicle modifiers on consignment is not recognized until the vehicle is sold to the ultimate customer. Therefore, except for the impact of the daily rental units sold subject to a guaranteed repurchase option, those units placed into our own fleet, and those units for which recognition of revenue is otherwise deferred, wholesale volumes to our customers and revenue from such sales are closely linked with our production.
Most of the vehicles sold by us to our dealers and distributors are financed at wholesale by Ford Credit. Upon Ford Credit originating the wholesale receivable related to a dealer's purchase of a vehicle, Ford Credit pays cash to the relevant legal entity in our Automotive sector in payment of the dealer's obligation for the purchase price of the vehicle. The dealer then pays the wholesale finance receivable to Ford Credit when it sells the vehicle to a retail customer.
Our Financial Services sector's revenue is generated primarily from interest on finance receivables, net of certain deferred origination costs that are included as a reduction of financing revenue, and such revenue is recognized over the term of the receivable using the interest method. Also, revenue from operating leases, net of certain deferred origination costs, is recognized on a straight-line basis over the term of the lease. Income is generated to the extent revenues exceed expenses, most of which are interest, depreciation, and operating expenses.
Transactions between our Automotive and Financial Services sectors occur in the ordinary course of business. For example, Ford Credit receives interest supplements and other support cost payments from the Automotive sector in connection with special-rate vehicle financing and leasing programs that we sponsor. Ford Credit records these payments as revenue, and, for contracts purchased prior to 2008, our Automotive sector made the related cash payments, over the expected life of the related finance receivable or operating lease. Effective January 1, 2008, to reduce ongoing Automotive obligations to Ford Credit and to be consistent with general industry practice, we began paying interest supplements and residual value support to Ford Credit on an upfront, lump-sum basis at the time Ford Credit purchases eligible contracts from dealers. See Note 1 of the Notes to the Financial Statements for a more detailed discussion of transactions and payments between our Automotive and Financial Services sectors. The Automotive sector records the estimated costs of marketing incentives, including dealer and retail customer cash payments (e.g., rebates) and costs of special-rate financing and leasing programs, as a reduction to revenue. These reductions to revenue are accrued at the later of the date the related vehicle sales to the dealer are recorded or at the date the incentive program is both approved and communicated. Key Economic Factors and Trends Affecting the Automotive Industry
Global Economic and Financial Market Crisis. Beginning in 2008, the global economy entered a period of very weak economic growth, led by the recession in the United States and followed by declines in other major markets around the world. The financial market crisis set off a series of events that generated conditions more severe than those experienced in several decades. The characteristics of the financial crisis were unique, in part due to the complex structure of housing-related securities that were at the epicenter of the financial market turmoil. A steep housing correction, especially in the U.S. and U.K. markets, along with downward valuations of mortgage-backed and related securities, combined to foster a crisis in confidence. Although several other factors contributed to current economic and financial conditions, the influence of these financial developments was very prominent. The interrelationships among financial markets worldwide ultimately resulted in a synchronous global economic downturn, the effects of which became evident in the fourth quarter of 2008 as major markets around the world all suffered setbacks.

Management’s Discussion and Analysis of Financial Condition and Results of Operations
Ford Motor Company | 2009 Annual Report 15
While the economic outlook is improving, it is rebounding from a very low base and with a range of possible outcomes due to the uncertain financial market environment and dependence upon ongoing policy responses. The consumer and commercial sectors of the global economy appear to be improving, although recovery remains fragile due to continuing tightness in the credit markets, weak labor markets in many countries, and uncertainty regarding the timing and magnitude by which governments and central banks will remove stimulus programs. Although the housing market is stabilizing in the worst hit markets, such as the United States, the United Kingdom, and Spain, challenges remain associated with rising foreclosure rates and excess housing stocks.
In 2009, global industry vehicle sales volume is estimated to have declined to about 64.3 million units, down about
4 million units or 6% from 2008 levels. Global industry sales volume is projected to increase from the depressed 2009 levels, to a range of 65 million units to 75 million units for 2010.
Excess Capacity. According to CSM Worldwide, an automotive research firm, in 2009 the estimated automotive
industry global production capacity for light vehicles (about 86 million units) exceeded global production by about 29 million units. In North America and Europe, the two regions where the majority of revenue and profits are earned in the industry, excess capacity was an estimated 96% and 37%, respectively, with North America in particular driven up from recent rates of around 43% due to the industry conditions in that market last year. According to production capacity data projected by CSM Worldwide, global excess capacity conditions could continue for several years at an average of 21 million units per year during the 2010-2014 period.
Pricing Pressure. Excess capacity, coupled with a proliferation of new products being introduced in key segments by the
industry, will keep pressure on manufacturers' ability to increase prices on their products. In addition, the incremental new U.S. manufacturing capacity of Japanese and Korean manufacturers in recent years has contributed, and is likely to continue to contribute, to pricing pressure in the U.S. market. The reduction of real prices for similarly contented vehicles in the United States has become more pronounced since the late 1990s, and we expect that a challenging pricing environment will continue for some time to come.
Consumer Spending and Credit. Limited ability to increase vehicle prices has been offset in recent years, at least in part, by the long-term trend toward purchase of higher-end, more expensive vehicles and/or vehicles with more features. The current retrenchment in consumer spending is likely to dampen that trend in the near-term. Over the long term, spending on new vehicles is expected to resume its correlation with growth in per capita incomes. Emerging markets also will contribute an increasing share of global industry sales volume and revenue, as growth in wholesales (i.e., volume) will be greatest in emerging markets in the next decade. We believe, however, the mature automotive markets (e.g., North America, Western Europe, and Japan) will retain the largest share of global revenue over the coming decade.
Commodity and Energy Price Increases. Commodity prices have resumed upward movement since early 2009. Despite
weak demand conditions, oil prices increased from around $40 per barrel in January to $80 per barrel in December of 2009. With the global economic outlook improving and financial investment returning to commodity and oil markets, we expect commodity and oil prices to continue trending upward with potentially higher volatility. Higher fuel prices, combined with efforts to achieve environmental policy objectives, are likely to continue to generate demand for more fuel-efficient vehicles.
Currency Exchange Rate Volatility. The ongoing deleveraging in financial markets has generated significant volatility in currencies as well. Recently, the U.S. dollar has gained some ground against the British pound and euro.
Other Economic Factors. The eventual implications of significant fiscal stimulus, including higher government deficits generating potentially higher long-term interest rates, could drive a higher cost of capital over our planning period. Higher interest rates and/or taxes to address the higher deficits may also impede real GDP growth and, therefore, vehicle sales over our planning period.

Management’s Discussion and Analysis of Financial Condition and Results of Operations
16 Ford Motor Company | 2009 Annual Report
Trends and Strategies
We continue to monitor incipient signs of economic recovery following the recent global economic crisis that caused such a sudden and substantial decline in global automotive industry sales volume, and we remain firm in our belief that our continued focus on executing the four pillars of our plan is the right strategy to achieve our objectives.
• Aggressively restructure to operate profitably at the current demand and changing model mix; • Accelerate development of new products our customers want and value; • Finance our plan and improve our balance sheet; and • Work together effectively as one team, leveraging our global assets.
Despite the external economic environment, we have made significant progress in transforming our business: Aggressively Restructure to Operate Profitably
Manufacturing. Our U.S. manufacturing presence includes 10 vehicle assembly plants and 23 powertrain, stamping, and components plants. We have converted one North American assembly plant, and are converting two additional assembly plants, from production of large utilities and trucks to small car production to support what we believe is a permanent shift in consumer preferences to smaller, more fuel-efficient vehicles. In addition, nearly all of our U.S. assembly plants will have flexible body shops by 2012 to enable quick response to changing consumer demands, and nearly half of our transmission and engine plants will be flexible, capable of manufacturing various combinations of transmission and engine families. We have announced plans in North America to close three Ford plants and one ACH plant in the 2010 – 2011 period, as well as consolidating Wayne Assembly Plant into the Michigan Assembly Plant as part of our plan to expand North American production capacity for smaller, more fuel-efficient vehicles. We are exploring our options for our remaining ACH plants, and intend to transition these businesses to the supply base as soon as practicable.
Suppliers. We continue to work to strengthen our supply base in the United States, which represents 80% of our North American purchases. As part of this process, we have been reducing the total number of production suppliers eligible for new product sourcing from 3,300 in 2004 to about 1,600 suppliers in 2009 and 1,500 suppliers in 2010. To date, we have identified specific plans that will take us to about 850 suppliers in the near- to mid-term, with a further reduction to about 750 suppliers targeted. We believe that our efforts at consolidation will result in more business for our major suppliers, which is increasingly important with the decline in industry sales volume. In addition, our move to global vehicle platforms should increase our ability to source to common suppliers for the total global volume of vehicle components, so that a smaller number of suppliers will receive a greater volume of the purchases we make to support our global vehicle platforms.
Dealers. Our dealers are a source of strength in North America and around the world, especially in rural areas and small towns where they represent the face of Ford. At our current and expected future U.S. market share, however, we have too many dealers, particularly in metropolitan areas, which makes it difficult to sustain a healthy and profitable dealer base. To address this overcapacity, we are working with our dealers in efforts to downsize, consolidate and restructure our Ford, Lincoln, and Mercury network in our largest 130 metropolitan market areas in the United States to provide targeted average-year sales for Ford dealers of around 1,500 units and for Lincoln Mercury dealers of around 600 units. This should result in sustainable dealer profits. As part of these efforts, the number of dealers in our Ford, Lincoln and Mercury network in the United States has been reduced from about 4,400 at the end of 2005 to 3,800 at the end of 2008, and to 3,550 at the end of 2009. These efforts, which include funding dealer consolidations to enhance our representation in the marketplace, will continue in the future to reduce further our dealer network to match our sales and dealer sales objectives.
Product Development. In combination with the business improvements being achieved, our One Ford global product development system ("GPDS") allows us to realize efficiencies in capital and engineering costs, to increase revenue, and, in general, to bring to market a broad range of frequently-freshened, highly-acclaimed global vehicles that customers want and value. In addition, GPDS allows us to accelerate to market the number of new products designed to meet shifting consumer preferences, including, for example, preferences for smaller, more fuel-efficient vehicles. In 2010, globally we will deliver substantially more new or freshened product by volume than 2009, bringing to market an unprecedented volume of new products – with class-leading fuel economy, quality, safety and technology.

Management’s Discussion and Analysis of Financial Condition and Results of Operations
Ford Motor Company | 2009 Annual Report 17
Ford Credit. During 2009, Ford Credit eliminated about 1,200 U.S. staff and agency positions within its servicing, sales, and central operations. During 2010, Ford Credit plans to reduce its staffing by about 1,000 positions to improve its cost structure, in response to lower financing volumes resulting from lower automotive industry sales volumes and the transition of Jaguar, Land Rover, Mazda, and Volvo financing to other finance providers. Accelerate Development of New Products Our Customers Want and Value
We are committed to introducing new products that consumers want and value, and we are receiving very positive
reactions from consumers, media, and independent evaluators in response to the products we introduced in 2009. We plan to build on this strength in 2010. Our global product strategy is to serve all meaningful geographic markets with a complete family of products that have best-in-class design, quality, green, safety and smart features. The result of this strategy is to produce vehicles that:
• have bold, emotive exterior designs, • are great to drive, • are great to sit in (with the comfort and convenience of a second home on wheels and exceptional quietness), • provide best-in-class fuel economy as a reason to buy, • are unmistakably a Ford or Lincoln in look, sound and feel, and
• provide an exceptional value.
With GPDS and our global product strategy, we have a global product cycle plan, global product programs, global product "DNA" and a global product development organization. This allows us to simplify, commonize and, hence, reduce the number of vehicle platforms or architectures and parts, as well as to simplify vehicle ordering from the customer's perspective. For example, we have reduced the number of global nameplates from 97 in 2006 to 59 in 2008, with further reductions planned. In 2007, we had 27 different vehicle platforms, with 29% of our total production volume produced from core platforms. In 2012, we plan to have 15 different platforms, with 72% of our total production volume produced from core platforms. With our One Ford GPDS, we are working to make all small- and medium-sized Ford vehicles competing in global segments common in North America, South America, Europe and Asia Pacific Africa by 2013. This will include Fiesta- and Focus-sized small cars, Fusion- and Mondeo-sized mid-size cars and utilities, compact pick-ups, and commercial vans. For example, in 2012, we expect to produce more than 2 million vehicles from our global C-car (Focus-sized) platform and more than 1 million vehicles from our global B-car (Fiesta-sized) platform. The efficiencies resulting from our One Ford GPDS and global product strategies are demonstrated by a 60% reduction in engineering costs and a 40% reduction in capital costs from 2005 to 2008, per typical new vehicle, with ongoing improvements planned.
In addition to these efficiencies, our global product strategies allow us to increase revenue by making our vehicles and their features more attractive to customers. With bold, emotive design, high levels of quality, fuel economy leadership, top safety ratings, innovative technology, greater feature content than competitive models and higher attractive series, we are able to reduce brand discount and increase revenue. In 2009, average per-unit revenue from our vehicles sold in North America increased by $3,300, from $22,800 in 2008 to $26,100 in 2009.
With the cost efficiencies and revenue increases that have been and will in the future be realized from our One Ford GPDS and global product strategy, we believe we can achieve small-car profitability in the North American market as well as other markets, and improve the profitability of all our vehicle lines in all markets.
Following is a discussion of new or future products offered or to be offered by Ford business units and a discussion of
each of the four pillars of our global product strategy:
Ford North America. Ford, Lincoln and Mercury brands collectively increased U.S. overall and retail market share 14 of the last 15 months as of December 2009, and posted the first full-year market share gain since 1995. Our new 2010 Fusion Hybrid was named Motor Trend magazine's Car of the Year and awarded the title of North American Car of the Year at the North American International Auto Show in January 2010. The Ford Fusion, the most fuel-efficient mid-size sedan sold in America, posted a full-year sales record in 2009 with 180,671 units sold. The new Ford Transit Connect was introduced in the second quarter of 2009 and was awarded the 2010 North American Truck of the Year at the North American International Auto Show. The 2011 Ford Fiesta was revealed in North America in the fourth quarter of 2009 as a new offering and will go on sale in the second quarter of 2010. The 2011 Ford Mustang debuted with a new family of V-6 and V-8 engines that deliver best-in-class performance and fuel economy and will arrive in dealerships in spring 2010. Further product introductions are planned, as we plan to substantially increase the amount of new vehicle introductions by volume versus 2009, an aggressive product introduction period. For 2010, these introductions include the all-new Ford Fiesta, Focus, Explorer, Super Duty, Edge, Transit Connect Electric, Lincoln MKX and an all-new small car for Mercury.

Management’s Discussion and Analysis of Financial Condition and Results of Operations
18 Ford Motor Company | 2009 Annual Report
Ford Europe. Based on the strength of its product portfolio, Ford Europe improved its 2009 full-year market share to 9.1% in the 19 European markets we track, a 0.5 percentage point increase versus 2008 and its best market share since 1998. Fiesta was the second best-selling model in Europe in 2009, reaching its best full-year sales since 1996. One year after its debut, more than 600,000 customers have purchased the new Fiesta globally. In 2010, we will continue to build on our product momentum, entering one of the most prolific periods of new product and technology introductions in Ford Europe's history. With 6 vehicle product actions planned for 2010 – including the new Ford C-MAX and Grand C-MAX, and the freshened Ford Galaxy, S-MAX and Focus – Ford Europe is poised to build on the successful introductions of the Ford Ka and Ford Fiesta. An expanded range of fuel-efficient powertrains, including the new EcoBoost 2.0-liter and 1.6-liter engines and further improved TDCi diesel powertrains will be available across the range, together with new technologies and innovations.
Ford South America. We continue to launch new products to meet the needs of our customers in South America. In 2010, we are bringing a flex-fuel version of the European-based Ford Focus to Brazil; nine additional product introductions are planned for the region in 2010. As noted, we also are making our largest-ever investment in Brazil operations over a five-year period, investing R$4 billion in 2011–2015 to accelerate delivery of more fuel-efficient, high-quality vehicles.
Ford Asia Pacific Africa. In 2010, we will see the introduction in Asia Pacific Africa of the all-new Ford Fiesta five-door
and four-door sedan built in Rayong, Thailand. The four-door Fiesta will join its five-door sibling in Australia, New Zealand, South Africa and Taiwan. The new Ford Figo will commence sales in the second quarter in India and later in the year in South Africa. Other product introductions in 2010 include updated core products in key Asia Pacific Africa markets, including China.
Drive Quality. We have made significant strides to improve quality through a renewed commitment that touches every aspect of the vehicle process – from design to manufacturing to product launch – so that quality is designed and built into every vehicle. These efforts have paid off with best-in-class initial quality in the United States according to internal and external quality surveys. We have established a global set of disciplined, standardized processes aimed at making us the world's leader in automotive quality. Through GPDS and a single, global management team, we are leveraging our assets by eliminating duplication, implementing best practices and a systematic approach to quality, and utilizing common components for the advantage of scale. The new integrated approach can be seen in the new Fiesta, our first of this generation of global cars under our One Ford plan. Selling one high-volume version of this vehicle helps us lower capital and engineering costs, reduce defects and improve overall craftsmanship. In North America, we expect to launch our all-new B- and C-cars with best-in-class quality in 2010. In the 2009 J.D. Power Asia Pacific India Vehicle Dependability Study, our models ranked highest in the entry mid-size (Ford Ikon) and SUV (Ford Endeavor) segments. The Ikon also topped J.D. Power Asia Pacific 2009 Initial Quality Study for India. In South America, we are preparing to launch the 2011 EcoSport developed using our extensive quality program based on owner surveys. The cumulative effect of these disciplined, global quality standards has been improved owner satisfaction. We expect that our improved quality discipline will lead to continued improvement in long-term reliability.
Drive Green. We remain committed to our goal to deliver best-in-class or among the best-in-class fuel efficiency in every new vehicle we produce. For example, the 2010 Ford Fusion and Ford Fusion Hybrid, launched last year, are the most fuel-efficient mid-size sedans in the market. The 2011 Ford Fiesta, which will be in showrooms this year, offers a model rated at an EPA-estimated 30 miles per gallon city, 40 miles per gallon highway. The implementation of our new EcoBoost family of gasoline engines is well on its way, with the 3.5-liter engine now available in the Lincoln MKS and MKT and the Ford Taurus SHO and Flex and the I-4 EcoBoost to be introduced in vehicles this year. We will continue to aggressively migrate this technology across our product lineup. By 2013, 90% of Ford's North America nameplates will offer this engine option. By combining direct fuel-injection and turbo boosting, the engines can deliver up to 20% better fuel economy and up to 15% fewer CO2 emissions versus larger-displacement engines, without sacrificing driving performance.
We also are rolling out EcoBoost in Europe, with five models slated to implement this technology in the near-term,
including the Galaxy and S-MAX in 2010. The Ford Europe ECOnetic range of ultra-low CO2 models across all car segments (from B to CD), including commercial vehicle applications, started in 2008 with the Ford Focus ECOnetic, followed by the Fiesta and Transit ECOnetic. Recently, we unveiled the second-generation Focus ECOnetic with further advanced technology and reduced CO2 emissions (below 100 g/km of CO2). In Asia Pacific Africa, we have committed to improving fuel efficiency by up to 20% across our product lineup by 2012 – helped by the introduction of new models, as well as innovative Ford technologies such as Powershift transmissions and EcoBoost. As part of this commitment, we will launch EcoBoost-equipped vehicles in China, Australia, New Zealand and Taiwan in 2010. Also in Australia, by 2011 we will introduce an advanced liquid-injection LPG system for the Ford Falcon, providing customers with the most advanced LPG technology on the market.

Management’s Discussion and Analysis of Financial Condition and Results of Operations
Ford Motor Company | 2009 Annual Report 19
We have developed a sustainability strategy that outlines future technology pathways for our vehicle production in the near-, mid- and long-term. Near-term, we have introduced EcoBoost, doubled the number and volume production of our hybrids and continue to implement fuel-saving technologies such as six-speed transmissions and electric power assist steering in the product lineup. We also have announced an aggressive electric vehicle strategy that will bring at least four new electric vehicles to market in the United States within the next three years. Late this year, the Ford Transit Connect Electric, a small, all-electric commercial van will be introduced to the market, aimed at commercial vehicle owners. Next year, we will begin production of a zero-emission Ford Focus Electric vehicle at our Michigan Assembly Plant. In 2012, we will produce, at that same facility, the next-generation hybrid vehicle and plug-in hybrid. Electric vehicle projects also are underway in Germany and the United Kingdom. We continue to engage in a number of collaborative agreements to address the many challenges that remain for electrified transportation, including battery development, standardization, cost, electric infrastructure and connectivity to the national power grid.
Drive Safe. We are expanding our heritage of leading vehicle safety with both advanced crash protection and crash
avoidance technology. We have the most U.S. government five-star rated vehicles and the most "Top Safety Picks" from the Insurance Institute of Highway Safety of any automaker. We are building on our safety leadership by focusing on three key areas – addressing driver behavior, enhancing crash protection even more and pioneering the next frontier of safety with "active" crash-avoidance technologies. For example, we have introduced a new feature called MyKey to help parents encourage their teenagers to drive more safely and more fuel efficiently, and to increase safety belt usage. MyKey – which debuted on the 2010 Ford Focus and is quickly becoming standard on many other Ford, Lincoln and Mercury models – allows owners to program a key that can limit the vehicle's top speed and audio volume. We also began offering a new advanced crash-avoidance technology, Collision Warning with Brake Support, on certain Ford and Lincoln vehicles in 2009, including the 2010 model-year Ford Taurus. This feature uses radar to detect slowing or stationary vehicles directly ahead and warns the driver with an authoritative beep and a red warning light projected on the windshield. The next-generation Ford Explorer, which goes into production in 2010, will debut the auto industry's first-ever production use of inflatable seat belts, designed to provide additional protection for rear-seat occupants – often children and older passengers who can be more vulnerable to head, chest and neck injuries. We eventually plan to offer inflatable seat belt technology on other vehicles globally.
In Europe, we plan to offer a suite of new safety and driver assistance technology on vehicles sold in the region in 2010 and beyond, including our Blind Spot Information System, Speed Limiter, Active Park Assist, Torque Vectoring Control, Adaptive Cruise Control, Lane Departure Warning, Lane Keeping Aid, Low Speed Collision Mitigation System, Traffic Sign Recognition System, Driver Alert, All-Seat Beltminder and Power Child Locks. Many of these safety features will become available with the introduction of the next-generation C-MAX, Grand C-MAX, Focus and freshened S-MAX and Galaxy.
Drive Smart. We earned our second consecutive invitation to keynote the International Consumer Electronics Show, placing the Company among the world's leading electronics and technology innovators. At the show, our President and Chief Executive Officer Alan Mulally introduced MyFord Touch and the next-generation of SYNC that will redefine the in-car experience with a simpler, safer and smarter way to connect drivers with available technology and their digital lives. MyFord Touch presents a holistic approach to accessing and personalizing vehicle settings and functions using a mix of graphic, touch, and voice user interfaces. MyFord Touch was recognized with CNET's "Best of CES" and Popular Mechanics' "Editor's Choice" awards at the show. MyFord and SYNC are both headed to the European market for upcoming products, including the Focus and C-MAX. Ford also is leading the way in leveraging the growing consumer trend of smartphone applications ("apps") with an innovative approach to control the applications through SYNC. Our application programming interface ("API") brings popular apps such as Pandora internet radio, Stitcher "smart" radio and the Twitter client OpenBeak into the car. These technologies not only provide greater connectivity to vehicle occupants, but importantly also help mitigate driver distraction risks by using the safer means of voice commands to control functions and programs.

Management’s Discussion and Analysis of Financial Condition and Results of Operations
20 Ford Motor Company | 2009 Annual Report
Finance Our Plan and Improve Our Balance Sheet
During 2009, we completed numerous financing transactions designed to provide additional Automotive liquidity and improve our balance sheet. These accomplishments include:
• Negotiated with the UAW to amend the VEBA agreement to provide the option of paying up to approximately 50% of our VEBA obligations in Ford Common Stock, and to smooth payments over the 13-year payment term.
• Reduced Automotive debt by $10.1 billion principal amount, utilizing $2.6 billion in Automotive and Ford Credit cash and 468 million shares of Ford Common Stock, through a number of separate but related transactions, including a cash tender offer to repurchase outstanding debt securities, a cash tender offer to repurchase certain secured term loan debt, and an induced conversion offer with respect to our convertible debt securities maturing 2036.
• Raised $1.6 billion of equity in an underwritten public offering of Ford Common Stock. • Raised $565 million with the completion of an equity distribution program begun in 2008, pursuant to which shares of
Ford Common Stock were issued over time in market transactions. • Entered into a U.S. Department of Energy ("DOE") loan agreement to provide us up to $5.9 billion in loans, at interest
rates generally equivalent to a 10-year U.S. Treasury rate, under the DOE's Advanced Technology Vehicles Manufacturing Incentive Program (the "ATVM Program").
• Issued $2.875 billion of 4.25% Senior Convertible Notes due 2016. • Amended and extended the revolving credit facility under our secured Credit Agreement – reducing the amount of the
revolving credit facility from $10.7 billion to $8.1 billion, extending the maturity date of $7.2 billion of that amount from December 2011 to November 2013 and establishing a new term loan in the amount of $724 million maturing in December 2013.
• Registered an additional $1 billion equity distribution program in November 2009 and commenced sales thereunder in December 2009.
• Completed the UAW VEBA transaction on December 31, 2009 by transferring assets, consisting of cash and marketable securities, notes and warrants valued at $14.8 billion, to the UAW VEBA Trust, thereby discharging our $13.6 billion of UAW retiree health care obligations.
See "Liquidity and Capital Resources" and Note 19 of the Notes to the Financial Statements for additional discussion of financing activities, available liquidity and outstanding debt.
After completion of the important steps described above (discussed further in "Liquidity and Capital Resources" and the Notes to the Financial Statements), we ended 2009 with $34.4 billion in Automotive debt, which is significantly higher than that of our key competitors. As a result, we continue to pursue opportunities to improve our balance sheet – with a key priority being continuous improvement of the underlying business in order to generate operating profits and positive Automotive cash flow with which our debt can be paid down.
We believe that our stable management team, our strong supplier and dealer relationships, the positive acceptance of
our products by customers, and our full pipeline of new products allow us to compete effectively in the global vehicle markets while we reduce our debt to a more competitive level.
Work Together Effectively as One Team
As part of the One Team approach, we have implemented a disciplined business plan process to regularly review our business environment, risks and opportunities, strategy, and plan, and to identify areas of our plan that need special attention while pursuing opportunities to improve our plan. Everyone is included and contributes, openness is encouraged, our leaders are responsible and accountable, we use facts and data to make our decisions, high performance teamwork is a performance criteria – and we follow this process every week, every month, and every quarter, driving continuous improvement. We believe this process gives us a clear picture of our business in real time and the ability to respond quickly and decisively to new issues and changing conditions – as we have done in the face of rapid changes in the market and business environment in 2009.
In addition, we are partnering with and enlisting all of our stakeholders to help us execute our plan to deal with our business realities and create an exciting and viable Ford business going forward. We are reaching out and listening to customers, dealers, employees, the UAW, suppliers, investors, communities, retirees, and federal, state and local governments. Each of these constituencies is a critical part of the success of our business going forward. Realizing our goal of profitable growth for all is as important to these stakeholders as it is to our shareholders.

Management’s Discussion and Analysis of Financial Condition and Results of Operations
Ford Motor Company | 2009 Annual Report 21
RESULTS OF OPERATIONS FULL-YEAR 2009 RESULTS OF OPERATIONS
Our worldwide net income attributable to Ford Motor Company was $2.7 billion or $0.86 per share of Common and Class B Stock in 2009, an improvement of $17.5 billion from a net loss attributable to Ford Motor Company of $14.8 billion or $6.50 per share of Common and Class B Stock in 2008.
Results by business sector are shown below (in millions):
Adjusted for the effect of the change in the accounting standards for convertible debt instruments that, upon conversion, may be settled in cash; see Note 1 of the Notes to the Financial Statements for additional detail
See Note 23 of the Notes to the Financial Statements for disclosure regarding 2009 effective tax rate.Formerly labeled "Minority interests in net income/(loss)," reflects new presentation under standard on accounting for noncontrolling interests, which was effective January 1, 2009. Primarily related to Ford Europe's consolidated 41% owned affiliate, Ford Otosan. The pre-tax results for Ford Otosan were $307 million, $531 million, and $551 million in 2009, 2008, and 2007, respectively. Formerly labeled "Net income/(loss)," reflects new presentation under the standard on accounting for noncontrolling interests, effective January 1, 2009
Income/(Loss) before income taxes includes certain items ("special items") that we have grouped into "Personnel and
Dealer-Related Items" and "Other Items" to provide useful information to investors about the nature of the special items. The first category includes items related to our efforts to match production capacity and cost structure to market demand and changing model mix and therefore helps investors track amounts related to those activities. The second category includes items that we do not generally consider to be indicative of our ongoing operating activities, and therefore allows investors analyzing our pre-tax results to identify certain infrequent significant items that they may wish to exclude when considering the trend of ongoing operating results.

Management’s Discussion and Analysis of Financial Condition and Results of Operations
22 Ford Motor Company | 2009 Annual Report
The following table details special items in each category by segment or business unit (in millions): Personnel and Dealer-Related Items – Automotive Sector: 2009 2008 2007
Ford North America Retiree health care and related charges .................................................................... $ (768) $ 2,583 $ 1,332 Personnel-reduction actions/Other............................................................................. (358) (875) (829) U.S. dealer actions (primarily dealership impairments) ............................................. (139) (219) — Pension curtailment charges ...................................................................................... — — (180) Job Security Benefits/Transition Assistance Plan...................................................... 40 346 80
Total Ford North America......................................................................................... (1,225) 1,835 403Ford South America
Personnel-reduction actions....................................................................................... (20) — —Ford Europe
Personnel-reduction actions/Other............................................................................. (216) (82) (90)Ford Asia Pacific Africa
Personnel-reduction actions/Other............................................................................. (22) (137) (23)Volvo
Personnel-reduction actions/Other............................................................................. (54) (194) (63)U.S. dealer actions ..................................................................................................... (1) (31) —
Total Volvo................................................................................................................ (55) (225) (63)Other Automotive
Return on assets held in Temporary Asset Account ("TAA")..................................... 110 (509) — Total Personnel and Dealer-Related Items – Automotive sector........................... (1,428) 882 227
Other Items: Automotive sector
Ford North America Fixed asset impairment charges ................................................................................ — (5,300) — Gain/(Loss) on sale of ACH plants ............................................................................. — (324) 3 Accelerated depreciation related to AAI acquisition of leased facility........................ — (306) — Supplier settlement/Other........................................................................................... — (202) — Ballard restructuring/Other ......................................................................................... — (70) — Variable marketing – change in business practice * .................................................. — — (1,099)
Total Ford North America......................................................................................... — (6,202) (1,096)Ford Europe
Investment impairment and related charges/Other.................................................... (96) — — Variable marketing – change in business practice * .................................................. — — (120) Plant idling/closure ..................................................................................................... — — (43)
Total Ford Europe .................................................................................................... (96) — (163) Ford Asia Pacific Africa
Variable marketing – change in business practice * .................................................. — — (15) Volvo
Held-for-sale impairment ............................................................................................ (650) — — Goodwill impairment charges ..................................................................................... — — (2,400) Variable marketing – change in business practice * .................................................. — — (87) Held-for-sale cessation of depreciation and related charges/Other........................... 424 — (4)
Total Volvo................................................................................................................ (226) — (2,491)Other Automotive
Liquidation of foreign subsidiary – foreign currency translation impact ......................... (281) — — Initial mark-to-market adjustment on Mazda marketable securities........................... — (80) — Loss from conversion of convertible securities .......................................................... — — (632)Gain from debt securities exchanged for equity......................................................... — 141 120 Net gains from debt reduction actions........................................................................ 4,663 — —
Total Other Automotive ............................................................................................ 4,382 61 (512)Mazda
Loss on sale of Mazda shares.................................................................................... — (121) —Impairment of dealer network goodwill....................................................................... — (214) —
Total Mazda.............................................................................................................. — (335) —Jaguar Land Rover and Aston Martin
Sale-related/Other ...................................................................................................... 3 32 178 Total Other Items – Automotive sector .................................................................. 4,063 (6,444) (4,099)
Financial Services sector DFO Partnership impairment/gain on sale ................................................................. (132) — — Ford Credit net operating lease impairment charge................................................... — (2,086) — Gain from purchase of Ford Holdings debt securities................................................ 51 — —
Total Other Items – Financial Services sector ....................................................... (81) (2,086) — Total ..................................................................................................................... $ 2,554 $ (7,648) $ (3,872)
__________ * * Represents a one-time, non-cash charge related to a change in our business practice for offering and announcing retail variable marketing incentives
to our dealers. See our Annual Report on Form 10-K for the year ended December 31, 2007 for discussion of this change in business practice.

Management’s Discussion and Analysis of Financial Condition and Results of Operations
Ford Motor Company | 2009 Annual Report 23
Included in Provision for/(Benefit from) income taxes are tax benefits of $132 million, $144 million, and $1.5 billion for 2009, 2008, and 2007, respectively, that we consider to be special items. These consist of the tax effects of the pre-tax special items listed above, the impact of changes in tax rate on deferred tax balances, and, in 2007, a $1.5 billion benefit reflecting the change in our deferred tax asset valuation allowance allocated to Income/(Loss) from continuing operations after taking into consideration income from Accumulated other comprehensive income/(loss) when determining whether sufficient future taxable income exists to realize deferred tax assets.
Discussion of Automotive and Financial Services sector results of operations below is on a pre-tax basis. Discussion of overall Automotive cost changes, including structural cost changes (e.g., manufacturing and engineering, pension and OPEB, overhead, etc.), is at constant exchange and excludes special items and discontinued operations. In addition, costs that vary directly with volume, such as material, freight, and warranty costs, are measured at constant volume and mix.

Management’s Discussion and Analysis of Financial Condition and Results of Operations
24 Ford Motor Company | 2009 Annual Report
AUTOMOTIVE SECTOR RESULTS OF OPERATIONS 2009 Compared with 2008
Details by segment or business unit of Income/(Loss) before income taxes are shown below (in millions), with Mazda and Jaguar Land Rover and Aston Martin separated out from "ongoing" subtotals:
__________ * Includes the sales of Mazda6 by our consolidated subsidiary, AAI.

Management’s Discussion and Analysis of Financial Condition and Results of Operations
Ford Motor Company | 2009 Annual Report 25
Details by segment of Automotive revenues ("sales") and wholesale unit volumes are shown below:
Details of Automotive sector market share for selected markets for 2009 and 2008, along with the level of dealer stocks
as of December 31, 2009 and 2008, are shown below:

Management’s Discussion and Analysis of Financial Condition and Results of Operations
26 Ford Motor Company | 2009 Annual Report
Overall Automotive Sector
The improvement in results primarily reflects favorable cost changes ($5.8 billion), favorable net pricing ($5.5 billion), the non-recurrence of fixed asset impairment charges in Ford North America ($5.3 billion), net gains on debt reduction actions ($4.7 billion), and higher returns on the assets held in the TAA (about $900 million). These factors were offset partially by unfavorable volume and mix ($3.7 billion), higher retiree health care and related charges and the non-recurrence of a retiree health care curtailment gain ($3.4 billion), and unfavorable changes in currency exchange ($2.1 billion). The favorable cost changes primarily reflect lower structural costs.
The decrease in revenue primarily reflects lower volumes, the non-recurrence of revenue at Jaguar Land Rover, and unfavorable changes in currency exchange, offset partially by favorable net pricing.
The table below details our Automotive sector 2009 structural cost changes at constant exchange, excluding special items and discontinued operations (in billions):
Ford North America Segment. The improvement in earnings primarily reflects the non-recurrence of fixed asset
impairment charges ($5.3 billion), favorable net pricing ($4 billion), favorable cost changes ($3.7 billion), lower costs associated with personnel-reduction actions (about $500 million), and the non-recurrence of losses on the sale of ACH plants (about $300 million). These factors are offset partially by higher retiree health care and related charges and the non-recurrence of a retiree health care curtailment gain ($3.4 billion), unfavorable changes in currency exchange ($1.2 billion), and unfavorable volume and mix (including lower industry volume, offset partially by favorable mix and higher market share) (about $900 million). The favorable net pricing primarily reflects the success of new products, selective top-line pricing, and a disciplined approach on incentives. The unfavorable changes in currency exchange primarily reflect the non-recurrence of favorable 2008 balance sheet valuations. The favorable cost changes primarily reflect lower structural costs (including lower manufacturing and engineering, pension and OPEB, and spending-related costs) and lower net product costs.
Ford South America Segment. The decrease in earnings primarily reflects unfavorable changes in currency exchange rates and unfavorable cost changes, offset partially by favorable net pricing. The unfavorable cost changes primarily reflect higher net product costs.
Ford Europe Segment. The decline in results primarily reflects unfavorable volume and mix (including lower industry volume and dealer stock, as well as unfavorable product mix due in part to government scrappage programs), unfavorable changes in currency exchange rates, lower earnings due to lower volumes at our consolidated joint ventures, higher costs associated with personnel-reduction actions, and an investment impairment. These factors are offset partially by favorable cost changes and favorable net pricing. The favorable cost changes primarily reflect lower structural costs (including lower manufacturing and engineering, advertising and sales promotions, and spending-related costs).
Ford Asia Pacific Africa Segment. The improvement in earnings is more than explained by favorable net pricing, favorable cost changes, lower costs associated with personnel-reduction actions, and favorable China joint venture profits, offset partially by unfavorable volume and mix and unfavorable changes in currency exchange rates. The favorable cost changes are more than explained by lower structural costs (including lower manufacturing and engineering, advertising and sales promotions, and overhead costs).

Management’s Discussion and Analysis of Financial Condition and Results of Operations
Ford Motor Company | 2009 Annual Report 27
Volvo Segment. The improvement in earnings is more than explained by favorable cost changes, held-for-sale
cessation of depreciation, favorable changes in currency exchange rates, and lower costs associated with personnel-reduction actions, offset partially by a held-for-sale impairment and unfavorable volume and mix. The favorable cost changes primarily reflect lower structural costs (including lower manufacturing and engineering, advertising and sales promotions, and overhead costs) and lower net product costs.
Other Automotive. The improvement in results is more than explained by net gains resulting from debt reduction
actions and higher returns on the assets held in the TAA. Mazda Segment. In the fourth quarter of 2008, we sold a significant portion of our investment in Mazda. Our remaining
ownership interest is treated as a marketable security, with mark-to-market adjustments reported in Other Automotive. Jaguar Land Rover and Aston Martin Segment. During the second quarter of 2008, we sold our Jaguar Land Rover
operations. During the second quarter of 2007, we sold our Aston Martin operations.

Management’s Discussion and Analysis of Financial Condition and Results of Operations
28 Ford Motor Company | 2009 Annual Report
2008 Compared with 2007
Details by segment or business unit of Income/(Loss) before income taxes are shown below (in millions), with Mazda and Jaguar Land Rover and Aston Martin separated out from "ongoing" subtotals:
__________ * Includes the sales of Mazda6 by our consolidated subsidiary, AAI.

Management’s Discussion and Analysis of Financial Condition and Results of Operations
Ford Motor Company | 2009 Annual Report 29
Details by segment of Automotive revenues ("sales") and wholesale unit volumes are shown below:
Details of Automotive sector market share for selected markets for 2008 and 2007, along with the level of dealer stocks
as of December 31, 2008 and 2007, are shown below:

Management’s Discussion and Analysis of Financial Condition and Results of Operations
30 Ford Motor Company | 2009 Annual Report
Overall Automotive Sector
The decline in earnings primarily reflects unfavorable volume and mix ($6.9 billion), fixed asset impairment charges in Ford North America ($5.3 billion), lower returns on our cash portfolio ($1 billion), lower returns on the assets held in the TAA (about $700 million), and unfavorable net pricing (about $700 million). These factors were offset partially by favorable cost changes ($4.3 billion), the non-recurrence of a goodwill impairment charge related to Volvo ($2.4 billion), and favorable retiree health care changes (primarily curtailment gains) ($1.3 billion). The favorable costs changes primarily reflect lower structural costs, offset partially by higher net product costs.
The decrease in revenue is more than explained by lower volumes and lower revenue for Jaguar Land Rover, offset partially by favorable changes in currency exchange.
The table below details our Automotive sector 2008 structural cost changes at constant exchange, excluding special items and discontinued operations (in billions):
Ford North America Segment. The decline in earnings is more than explained by unfavorable volume and mix
($5.4 billion), fixed asset impairment charges ($5.3 billion), and unfavorable net pricing ($1.3 billion), offset partially by favorable cost changes ($3.5 billion), favorable retiree health care changes (primarily curtailment gains) ($1.3 billion), and the non-recurrence of a variable marketing charge related to a business practice change ($1.1 billion). The favorable cost changes are more than explained by lower structural costs (including lower manufacturing and engineering, spending-related, and pension and OPEB costs), offset partially by higher net product costs.
Ford South America Segment. The increase in earnings is more than explained by favorable net pricing, offset partially by unfavorable cost changes, unfavorable volume and mix, and unfavorable changes in currency exchange. The unfavorable cost changes are more than explained by higher net product costs.
Ford Europe Segment. The increase in earnings primarily reflects favorable cost changes, favorable net pricing, and the non-recurrence of a variable marketing charge related to a business practice change, offset partially by unfavorable changes in currency exchange rates and unfavorable volume and mix. The favorable cost changes are more than explained by lower structural costs (including lower pension costs) and lower warranty-related costs.
Ford Asia Pacific Africa Segment. The decline in results primarily reflects unfavorable volume and mix, unfavorable changes in currency exchange rates, and higher costs associated with personnel-reduction actions, offset partially by favorable cost changes and higher net pricing. The favorable cost changes are more than explained by lower structural costs (including lower overhead, spending-related, and advertising and sales promotions costs) and lower net product costs.
Volvo Segment. The improvement in earnings is more than explained by the non-recurrence of a goodwill impairment charge and favorable cost changes. These factors were offset partially by unfavorable volume and mix, mainly in the United States and Europe (largely due to lower industry sales volumes, lower market share, and unfavorable product mix), unfavorable net pricing, and unfavorable changes in currency exchange rates. The favorable cost changes primarily reflects lower structural costs (including lower manufacturing and engineering, overhead, and advertising and sales promotions costs), lower net product costs, and lower warranty-related costs.
Other Automotive. The decline in earnings primarily reflected lower returns on our cash portfolio and lower returns on the assets held in the TAA. These factors were offset partially by the non-recurrence of the conversion of convertible securities, lower interest expense, and favorable mark-to-market adjustments for changes in currency exchange rates on intercompany loans.

Management’s Discussion and Analysis of Financial Condition and Results of Operations
Ford Motor Company | 2009 Annual Report 31
Mazda Segment. In the fourth quarter of 2008, we sold a significant portion of our investment in Mazda. Our remaining ownership interest is treated as marketable securities, with mark-to-market adjustments reported in Other Automotive.
Jaguar Land Rover and Aston Martin Segment. During the second quarter of 2008, we sold our Jaguar Land Rover
operations. During the second quarter of 2007, we sold our Aston Martin operations. FINANCIAL SERVICES SECTOR RESULTS OF OPERATIONS 2009 Compared with 2008
Details of the full-year Financial Services sector Revenues and Income/(Loss) before income taxes for 2009 and 2008 are shown below:
Ford Credit
The improvement in pre-tax results primarily reflected the non-recurrence of the 2008 impairment charge to Ford Credit's North America operations operating lease portfolio for contracts terminating beginning third quarter of 2008 ($2.1 billion), lower depreciation expense for leased vehicles and lower residual losses on returned vehicles due to higher auction values ($1.9 billion), and a lower provision for credit losses primarily related to non-recurrence of higher severity offset partially by higher repossessions (about $800 million). Other factors that explain the improvement in pre-tax results included the non-recurrence of net losses related to market valuation adjustments to derivatives, shown as unallocated risk management in the table below ($367 million), net gains related to unhedged currency exposure primarily from cross-border intercompany lending (about $300 million), lower net operating costs (about $200 million), and higher financing margin primarily attributable to lower borrowing costs (about $100 million). These factors were offset partially by lower volume primarily reflecting lower industry volumes, lower dealer stocks, the impact of divestitures and alternative business arrangements, and changes in currency exchange rates (about $1 billion); the non-recurrence of the gain related to the sale of approximately half of Ford Credit's ownership interest in its Nordic operation (about $100 million), and a valuation allowance for Australian finance receivables sold in 2009 (about $50 million).
Results of Ford Credit's operations and unallocated risk management for 2009 and 2008 are shown below:
________
The improvement in Ford Credit's North America operations pre-tax results primarily reflected non-recurrence of the
impairment charge for operating leases, lower depreciation expense for leased vehicles and lower residual losses on returned vehicles due to higher auction values, a lower provision for credit losses, net gains related to unhedged currency exposure from cross-border intercompany lending, higher financing margin, and lower operating costs. These factors were offset partially by lower volume. The decrease in Ford Credit's International operations pre-tax earnings primarily reflected lower volume, a higher provision for credit losses primarily reflecting losses in Spain and Germany, lower financing margin primarily in Mexico, non-recurrence of a gain related to the sale of approximately half of Ford Credit's ownership interest in its Nordic operations, and a valuation allowance for Australian finance receivables sold in 2009. These factors were offset

Management’s Discussion and Analysis of Financial Condition and Results of Operations
32 Ford Motor Company | 2009 Annual Report
partially by lower operating costs. The change in unallocated risk management income reflected the non-recurrence of net losses related to market valuation adjustments to derivatives primarily related to movements in interest rates.
Ford Credit reviews its business performance from several perspectives, including:
• On-balance sheet basis. Includes the receivables and leases Ford Credit owns and securitized receivables and leases that remain on Ford Credit's balance sheet (includes other structured financings and factoring transactions that have features similar to securitization transactions);
• Securitized off-balance sheet basis. Includes receivables sold in securitization transactions that, when sold, do not remain on Ford Credit's balance sheet;
• Managed basis. Includes on-balance sheet receivables, excluding unearned interest supplements related to finance receivables, and securitized off-balance sheet receivables that Ford Credit continues to service; and
• Serviced basis. Includes managed receivables and leases, and receivables sold in whole-loan sale transactions where Ford Credit retains no interest in the sold receivables, but which it continues to service.
Ford Credit analyzes its financial performance primarily on a managed and on-balance sheet basis. It retains interests
in receivables sold in off-balance sheet securitization transactions and, with respect to subordinated retained interests, Ford Credit has credit risk. As a result, it evaluates credit losses, receivables, and leverage on a managed basis as well as on an on-balance sheet basis. In contrast, Ford Credit does not have the same financial interest in the performance of receivables sold in whole-loan sale transactions, and as a result, Ford Credit generally reviews the performance of its serviced portfolio only to evaluate the effectiveness of its origination and collection activities. To evaluate the performance of these activities, Ford Credit monitors a number of measures, such as delinquencies, repossession statistics, losses on repossessions, and the number of bankruptcy filings.
Ford Credit's net finance receivables and net investment in operating leases are shown below (in billions):
__________

Management’s Discussion and Analysis of Financial Condition and Results of Operations
Ford Motor Company | 2009 Annual Report 33
Receivables decreased from year-end 2008, primarily reflecting lower industry volumes, lower dealer stocks, and the transition of Jaguar, Land Rover, and Mazda financing to other finance providers. In 2009, as part of Ford Credit's commitment to support the sale of Ford, Lincoln, and Mercury brand vehicles, Volvo began to transition its financing to other sources. At December 31, 2009, the Jaguar, Land Rover, and Mazda financing portfolio represented 7% of Ford Credit's managed receivables and the Volvo financing portfolio represented 5% of Ford Credit's managed receivables. These percentages will decline over time.
The following table shows worldwide charge-offs (credit losses net of recoveries), for Ford Credit for the various
categories of financing during the periods indicated. The loss-to-receivables ratios, which equal charge-offs on an annualized basis divided by the average amount of receivables outstanding for the period, excluding the allowance for credit losses and unearned interest supplements related to finance receivables, are shown below for Ford Credit's on-balance sheet and managed portfolios.
Most of Ford Credit's charge-offs are related to retail installment sale and lease contracts. Charge-offs depend on the
number of vehicle repossessions, the unpaid balance outstanding at the time of repossession, the auction price of repossessed vehicles, and other charge-offs. Ford Credit also incurs credit losses on its wholesale loans, but default rates for these receivables historically have been substantially lower than those for retail installment sale and lease contracts.
The decrease in charge-offs from a year ago reflected lower losses in the United States, offset partially by higher losses in Europe. The decrease in charge-offs in the United States reflected lower severity and lower other charge-offs, offset partially by higher repossessions. The increase in charge-offs in Europe primarily reflected higher losses in Spain and Germany. The increase in loss-to-receivables ratios from a year ago primarily reflected a combination of lower average receivables, higher repossessions in the United States, and higher losses in Spain and Germany.
Shown below is an analysis of Ford Credit's allowance for credit losses and its allowance for credit losses as a percentage of end-of-period receivables (finance receivables (excluding unearned interest supplements), and net investment in operating leases, excluding the allowance for credit losses) for its on-balance sheet portfolio for the years ended December 31 (dollar amounts in billions):
The allowance for credit losses is estimated using a combination of models and management judgment, and is based
on such factors as portfolio quality, historical loss performance, and receivable levels. The decrease in Ford Credit's allowance for credit losses primarily reflected the decline in receivables and decrease in charge-offs. At December 31, 2009, Ford Credit's allowance for credit losses included about $215 million, which was based on management's judgment regarding higher retail installment and lease repossession assumptions and higher wholesale and

Management’s Discussion and Analysis of Financial Condition and Results of Operations
34 Ford Motor Company | 2009 Annual Report
dealer loan default assumptions compared with historical trends used in Ford Credit's models. At December 31, 2008, Ford Credit's allowance for credit losses included about $210 million, which was based on management's judgment regarding higher severity assumptions. The credit quality of Ford Credit's retail and lease originations remains high. For additional discussion, see "Critical Accounting Estimates – Allowance for Credit Losses."
In purchasing retail finance and lease contracts, Ford Credit uses a proprietary scoring system that classifies contracts using several factors, such as credit bureau information, credit bureau scores (e.g., FICO score), customer characteristics, and contract characteristics. In addition to Ford Credit's proprietary scoring system, it considers other factors, such as employment history, financial stability, and capacity to pay. As of December 31, 2009, about 5% of the outstanding U.S. retail finance and lease contracts in Ford Credit's serviced portfolio were classified as high risk at contract inception, slightly higher than year-end 2008 of about 4%. This increase primarily reflects a lower percentage of lease contracts in Ford Credit's retail portfolio. Lease contracts generally include shorter average terms and higher average FICO scores compared with retail installment sale contracts.
Residual Risk
Ford Credit is exposed to residual risk on operating leases and similar balloon payment products where the customer may return the financed vehicle to Ford Credit. Residual risk is the possibility that the amount Ford Credit obtains from returned vehicles will be less than its estimate of the expected residual value for the vehicle. Ford Credit estimates the expected residual value by evaluating recent auction values, return volumes for its leased vehicles, industry-wide used vehicle prices, marketing incentive plans, and vehicle quality data. For additional discussion, see "Critical Accounting Estimates – Accumulated Depreciation on Vehicles Subject to Operating Leases."
North America Retail Operating Lease Experience
Ford Credit uses various statistics to monitor its residual risk:
• Placement volume measures the number of leases Ford Credit purchases in a given period; • Termination volume measures the number of vehicles for which the lease has ended in the given period; and
• Return volume reflects the number of vehicles returned to Ford Credit by customers at lease-end.
The following table shows operating lease placement, termination, and return volumes for Ford Credit's North America operations, which accounted for about 98% of its total investment in operating leases at December 31, 2009 (in thousands, except for percentages):
In 2009, placement volumes were down 250,000 units compared with 2008, primarily reflecting changes in our
marketing programs that emphasized retail installment sale contracts, lower industry volumes, and the transition of Jaguar Land Rover and Mazda financing to other providers. Termination volumes increased by 5,000 units compared with last year, reflecting higher placement volumes in 2006 and 2007. Return volumes decreased 13,000 units compared with last year, primarily reflecting lower return rates, consistent with improved auction values relative to Ford Credit's expectations of lease-end values at the time of contract purchase.

Management’s Discussion and Analysis of Financial Condition and Results of Operations
Ford Motor Company | 2009 Annual Report 35
U.S. Ford, Lincoln, and Mercury Brand Retail Operating Lease Experience
The following table shows return volumes for Ford Credit's Ford, Lincoln, and Mercury brand U.S. operating lease portfolio. Also included are auction values at constant fourth quarter 2009 vehicle mix for lease terms comprising 59% of Ford Credit's active Ford, Lincoln, and Mercury brand U.S. operating lease portfolio (in thousands, except for percentages):
In 2009, Ford, Lincoln, and Mercury brand U.S. return volumes were down 9,000 units compared with 2008, primarily
reflecting a lower return rate, down 10 percentage points to 78%, consistent with improved auction values relative to Ford Credit's expectations of lease-end values at the time of contract purchase. Auction values at constant fourth quarter 2009 mix were up $2,360 per unit from 2008 levels for vehicles under 24-month leases, and up $1,350 for vehicles under 36-month leases, primarily reflecting the overall auction value improvement in the used vehicle market. Ford Credit expects future auction values to remain volatile. 2008 Compared with 2007
Details of the full-year Financial Services sector Revenues and Income/(Loss) before income taxes for 2008 and 2007 are shown below:
Ford Credit
The decline in pre-tax results primarily reflected the significant decline in used vehicle auction values during 2008. This decline in auction values contributed to an impairment charge to Ford Credit's North America segment operating lease portfolio ($2.1 billion), a higher provision for credit losses ($1.2 billion), and higher depreciation expense for leased vehicles (about $700 million). Other factors that explain the decrease in pre-tax earnings include lower volume primarily related to lower average receivables (about $300 million), higher net losses related to market valuation adjustments to derivatives (about $200 million), and the non-recurrence of the gain related to the sale of a majority of Ford Credit's interest in AB Volvofinans (about $100 million). These factors were partially offset by higher financing margin primarily attributable to lower borrowing costs (about $200 million), the non-recurrence of costs associated with Ford Credit's North American business transformation initiative (about $200 million), lower expenses primarily reflecting improved operating costs (about $300 million), and a gain related to the sale of approximately half of Ford Credit's ownership interest in its Nordic operation (about $100 million).

Management’s Discussion and Analysis of Financial Condition and Results of Operations
36 Ford Motor Company | 2009 Annual Report
LIQUIDITY AND CAPITAL RESOURCES Automotive Sector
Our industry has been heavily impacted by the global economic crisis that began in 2008, which included a sudden and substantial decline in global industry sales volume. The dramatic decline in industry sales volume, combined with tight credit markets, other economic factors, and the costs associated with transforming our business, put significant pressure on our Automotive liquidity in the first half of 2009. While the economic environment remains uncertain, we believe that our continued focus on delivering on our plan is the right strategy to achieve our objectives. Our Automotive liquidity strategy includes ensuring that we have sufficient funding available with a high degree of certainty throughout the business cycle, with the goal of improving our core Automotive operations so that they generate positive operating-related cash flow.
Gross Cash. Automotive gross cash includes cash and cash equivalents, net marketable securities, and loaned securities. Prior to 2008, we included in Automotive gross cash those assets contained in a VEBA trust which may be used to pre-fund certain types of company-paid benefits for U.S. employees and retirees, that were invested in shorter-duration fixed income investments and could be used within 18 months to pay for benefits ("short-term VEBA assets"). Consistent with our Retiree Health Care Settlement Agreement dated March 28, 2008, in 2008 we reclassified out of our Automotive gross cash calculation the short-term VEBA assets and TAA securities. Gross cash is detailed below as of the dates shown (in billions):
Included in 2009 and 2008 are Ford Credit debt securities that we purchased, which are reflected in the table at a carrying value of $646 million and $492 million, respectively; the estimated fair value of these securities is $656 million and $437 million, respectively. Also included are Mazda marketable securities with a fair value of $447 million and $322 million at December 31, 2009 and 2008, respectively.The purchase or sale of marketable securities for which the cash settlement was not made by period-end and for which there was a payable or receivable recorded on the balance sheet at period-end.
Amount transferred to UAW-Ford TAA that, due to consolidation, was shown in Cash, marketable securities and loaned securities.
Pursuant to the Retiree Health Care Settlement Agreement (see Note 18 of the Notes to the Financial Statements), in January 2008 we contributed $4.6 billion of assets and reduced our Automotive gross cash accordingly.
In managing our business, we classify changes in Automotive gross cash into two categories: operating-related and
other (which includes the impact of certain special items, contributions to funded pension plans, the net effect of the change in the TAA and VEBA on gross cash, certain tax-related transactions, acquisitions and divestitures, capital transactions with the Financial Services sector, dividends paid to shareholders, and other – primarily financing-related). Our key liquidity metrics are operating-related cash flow, which best represents the ability of our Automotive operations to generate cash, and Automotive gross cash. We believe the cash flow analysis reflected in the table below is useful to investors because it includes in operating-related cash flow elements that we consider to be related to our Automotive operating activities (e.g., capital spending) and excludes cash flow elements that we do not consider to be related to the ability of our operations to generate cash. This differs from a cash flow statement presented in accordance with U.S. GAAP and differs from Cash flows from operating activities of continuing operations, the most directly comparable U.S. GAAP financial measure.

Management’s Discussion and Analysis of Financial Condition and Results of Operations
Ford Motor Company | 2009 Annual Report 37
Changes in Automotive gross cash are summarized below (in billions):
Excluding sale proceeds, total change in Automotive gross cash attributable to Jaguar Land Rover operations was $300 million net cash outflow for 2008. Except for up-front subvention payments to Ford Credit, Jaguar Land Rover cash outflows are excluded from each line item of this table and included in Other within "Other changes in gross cash." Primarily expense and payment timing differences for items such as pension and OPEB, marketing, and warranty, as well as additional factors such as the impact of tax payments. Primarily distributions received from Ford Credit, excluding proceeds from Financial Services sector divestitures paid to the Automotive sector.
Shown below is a reconciliation between financial statement Cash flows from operating activities of continuing
operations and operating-related cash flows (calculated as shown in the table above), for the last three years (in billions):
Except as noted (see footnote (b) below), 2008 data exclude Jaguar Land Rover; 2007 includes Jaguar Land Rover. Includes Jaguar Land Rover. Primarily payables and receivables between the Automotive and Financial Services sectors in the normal course of business. For example, vehicle wholesale loans that are made by Ford Credit to Ford-owned dealers.

Management’s Discussion and Analysis of Financial Condition and Results of Operations
38 Ford Motor Company | 2009 Annual Report
Equity and Equity-Linked Issuances. On May 18, 2009, we issued 345 million shares of Ford Common Stock pursuant to a public offering at a price of $4.75 per share, resulting in net proceeds totaling $1.59 billion.
In August 2009, pursuant to an equity distribution agreement with a certain broker-dealer, we issued from time to time
in market transactions 71.6 million shares of Ford Common Stock for an aggregate price of $565 million, and used the proceeds to purchase $556 million principal amount of outstanding Ford Credit debt securities maturing prior to 2011, and pay related accrued interest of $9 million. Pending their maturity, the Ford Credit debt securities are reflected in Automotive gross cash and, when the debt securities mature, their par value will be paid in cash by Ford Credit. For additional detail, see Note 1 of the Notes to the Financial Statements.
In November 2009, we issued $2.875 billion principal amount of 4.25% Senior Convertible Notes due
November 15, 2016 ("2016 Convertible Notes") in a public offering, resulting in net proceeds totaling $2.81 billion. These notes are convertible, under certain circumstances, into Ford Common Stock at a conversion price of approximately $9.30 per share. Upon conversion, we will have the right to deliver, in lieu of shares of Ford Common Stock, cash or a combination of cash and Common Stock. At December 31, 2009 the carrying value of the debt was $2.2 billion (which excludes the equity component of the convertible feature of this note valued at $704 million), reflecting the fair value of the debt obligation at date of issuance.
On December 4, 2009, we entered into another equity distribution agreement with certain broker-dealers pursuant to
which we would offer and sell shares of Ford Common Stock from time to time for an aggregate offering price of up to $1 billion. Sales of Ford Common Stock under this equity distribution agreement are expected to be made over a several-month period by means of ordinary brokers' transactions on the New York Stock Exchange at market prices or as otherwise agreed. Through December 31, 2009 and February 15, 2010, we issued 9.8 million and 41.9 million shares of Ford Common Stock for an aggregate price of $97 million and $470 million, respectively, resulting in net proceeds of $96 million and $466 million, respectively, which will be used for general corporate purposes.
Secured Credit Agreement. Due to concerns about instability in the capital markets and the uncertain state of the global
economy, on February 3, 2009, we borrowed $10.1 billion under the revolving credit facility of the Credit Agreement to ensure access to these funds. As expected, the $890 million commitment of Lehman Commercial Paper Inc. ("LCPI"), one of the lenders under the facility, was not funded because LCPI filed for protection under Chapter 11 of the U.S. Bankruptcy Code on October 5, 2008. LCPI subsequently assigned $110 million of its revolving commitment to other lenders, and $89 million of these assignee lenders' revolving commitments were funded in the third quarter of 2009. On July 10, 2009, we terminated the remaining LCPI commitment of $780 million. We also received an additional $10 million under the revolving credit facility in the third quarter of 2009 for amounts previously committed but not yet received.
As disclosed in our Current Report on Form 8-K dated November 24, 2009, on that date we entered into the Fourth Amendment to the Credit Agreement. Prior to the Fourth Amendment, revolving lenders held commitments totaling $10.7 billion that matured on December 15, 2011. As a result of the Fourth Amendment, lenders now have commitments totaling $7.2 billion in a new revolving facility that matures on November 30, 2013 and such lenders converted $724 million of their previously existing revolving loans to a new term loan that matures on December 15, 2013. The new term loan has the same pricing, maturity, and other terms as the existing term loan, but is not subject to mandatory prepayments as is the existing term loan. Those lenders who agreed to extend the maturity of their revolving commitments had the option to reduce their commitments by up to 25%, and received a 1 percentage point increase in interest rate margins, an increase in quarterly fees, and payment of an upfront fee.
Pursuant to these arrangements, on December 3, 2009, $2.3 billion of the revolving loan was repaid to effect the commitment reductions elected by extending lenders and certain other extending lenders increased their revolving loan commitments by, and funded, an aggregate of $400 million, thereby resulting in a net cash repayment by us of $1.9 billion. Lenders with revolving commitments totaling $886 million elected not to extend those commitments, which will mature on the original maturity date of December 15, 2011.
At December 31, 2009, the revolving credit facility of the Credit Agreement totaled $8.1 billion, of which (i) $7.9 billion
was utilized (including $418 million to support letters of credit), (ii) $7.2 billion matures on November 30, 2013 and (iii) $886 million matures on December 15, 2011. Also on December 31, 2009, the term loans outstanding under the Credit Agreement totaled $5.3 billion.
The borrowings of the Company, the subsidiary borrowers, and the guarantors under the Credit Agreement are secured
by a substantial portion of our domestic Automotive assets (excluding cash). The collateral includes a majority of our principal domestic manufacturing facilities, excluding facilities to be closed, subject to limitations set forth in existing public indentures and other unsecured credit agreements; domestic accounts receivable; domestic inventory; up to $4 billion of

Management’s Discussion and Analysis of Financial Condition and Results of Operations
Ford Motor Company | 2009 Annual Report 39
marketable securities or cash proceeds therefrom; 100% of the stock of our principal domestic subsidiaries, including Ford Credit (but excluding the assets of Ford Credit); certain intercompany notes of Volvo Holding Company Inc. (a holding company for Volvo), and Ford Motor Company of Canada, Limited; 66% to 100% of the stock of all major first tier foreign subsidiaries (including Volvo); and certain domestic intellectual property, including trademarks.
The Credit Agreement requires ongoing compliance with a borrowing base covenant and contains other restrictive
covenants, including a restriction on our ability to pay dividends. The Credit Agreement prohibits the payment of dividends (other than dividends payable solely in stock) on Ford Common and Class B Stock, subject to certain limited exceptions. In addition, the Credit Agreement contains a liquidity covenant requiring us to maintain a minimum of $4 billion in the aggregate of domestic cash, cash equivalents, loaned and marketable securities and short-term VEBA assets and/or availability under the revolving credit facility.
With respect to the borrowing base covenant, we are required to limit the outstanding amount of debt under the Credit
Agreement as well as certain permitted additional indebtedness secured by the collateral described above such that the total debt outstanding does not exceed the value of the collateral as calculated in accordance with the Credit Agreement (the "Borrowing Base value").
The following table provides detail of Borrowing Base values for various categories of collateral (in millions, except
percentages):
As of December 31, 2009, the Borrowing Base value and the total outstanding amount of debt secured by collateral
were $24,563 million and $13,206 million, respectively, compared with $23,183 million and $7,354 million, respectively, at December 31, 2008. This resulted in a collateral coverage ratio of 1.86 to 1 at December 31, 2009, compared with a collateral coverage ratio of 3.15 to 1 at December 31, 2008. The Borrowing Base value increased by $1.3 billion over the corresponding value at December 31, 2008, more than explained by improved equity in Ford Credit and the inclusion of Ford Brasil Ltda. The debt secured by collateral increased by about $6 billion from the amount of debt secured at December 31, 2008, reflecting the (i) $10.1 billion revolving loan advanced to us on February 3, 2009, (ii) repurchase in March 2009 of $2.2 billion principal amount of term loans and (iii) repayment in December 2009 of $1.9 billion principal amount of revolving loans made in connection with the amendment and extension described above. On a basis that assumes the revolving loan facility is fully drawn, the collateral coverage ratio at December 31, 2009 (1.84 to 1) increased from that at December 31, 2008 (1.33 to 1).
In addition to customary payment, representation, bankruptcy, and judgment defaults, the Credit Agreement contains
cross-payment and cross-acceleration defaults with respect to other debt for borrowed money, and a change in control default.

Management’s Discussion and Analysis of Financial Condition and Results of Operations
40 Ford Motor Company | 2009 Annual Report
Other Automotive Credit Facilities.* At December 31, 2009, we had $628 million of other contractually-committed
Automotive credit facilities with financial institutions, including $25 million of worldwide Automotive unsecured credit facilities and $603 million of local credit facilities to foreign Automotive affiliates. Of the $628 million of contractually-committed, $130 million has been utilized. Of the $498 million available for use, $60 million expire in 2010, $65 million expire in 2013, and $373 million expire in 2014.
DOE ATVM Program. As disclosed in our Current Report on Form 8-K dated September 16, 2009 (the "September 2009 Form 8-K Report"), we entered into a Loan Arrangement and Reimbursement Agreement ("Arrangement Agreement") with the DOE, pursuant to which the DOE agreed to (i) arrange a 13-year multi-draw term loan facility (the "Facility") under the ATVM Program in the aggregate principal amount of up to $5.9 billion, (ii) designate us as a borrower under the ATVM Program and (iii) cause Federal Financing Bank to enter into a Note Purchase Agreement (the "Note Purchase Agreement") for the purchase of notes to be issued by us evidencing such loans. The proceeds of advances under the Facility will be used to finance certain costs eligible for financing under the ATVM Program that are incurred through mid-2012. Advances under the Facility may be requested through June 30, 2012. Each advance under the Facility will bear interest at a blended rate based on the Treasury yield curve at the time such advance is borrowed, based on the principal amortization schedule for that advance, with interest payable quarterly in arrears. The principal amount of the loans under the Facility are payable in equal quarterly installments commencing on September 15, 2012 through June 15, 2022. Through December 31, 2009 we have received $1.2 billion in loans under the Facility. For additional details regarding the Arrangement Agreement and the Note Purchase Agreement, refer to Exhibits 10.1 and 10.2 filed with the September 2009 Form 8-K Report.
Net Cash/(Debt). Our Automotive sector net debt calculation is detailed below (in billions):
The change in total debt primarily is explained by the net $7.5 billion draw on our revolving credit facility discussed
above, the two New Notes, totaling $7 billion, issued in connection with the UAW VEBA transaction discussed below, the issuance of $2.875 billion aggregate principal amount of the 2016 Convertible Notes discussed above, and the $10.1 billion of debt reduction actions discussed below.
See Note 19 of the Notes to the Financial Statements for our debt maturity table as of December 31, 2009 and additional debt disclosures.

Management’s Discussion and Analysis of Financial Condition and Results of Operations
Ford Motor Company | 2009 Annual Report 41
Debt Reduction Actions. We undertook the following transactions during the first half of 2009, which reduced our Automotive debt by a total of $10.1 billion principal amount (with a carrying value of $8.5 billion):
• A private market transaction, completed in January 2009, pursuant to which we purchased $165 million principal amount of our outstanding unsecured notes for $37 million in cash.
• A cash tender offer by Ford Credit for our secured term loan under the Credit Agreement, pursuant to which Ford Credit purchased from lenders thereof $2.2 billion principal amount of the secured term loan for an aggregate cost of $1.1 billion (including transaction costs). This transaction settled on March 27, 2009, following which, consistent with previously-announced plans to return capital from Ford Credit to us, Ford Credit distributed the repurchased secured term loan to its immediate parent, Ford Holdings, whereupon the repurchased secured term loan was forgiven.
• A cash tender offer by Ford Credit for our unsecured notes, pursuant to which Ford Credit purchased $3.4 billion principal amount of debt securities for an aggregate cost of $1.1 billion (including transaction costs). This transaction settled on April 8, 2009, following which Ford Credit transferred the repurchased debt securities to us in satisfaction of $1.1 billion of Ford Credit's tax liabilities to us. Approximately $5.6 billion aggregate principal amount of our unsecured notes (including about $100 million of industrial revenue bonds) remains outstanding.
• An exchange offer by us for our 4.25% Senior Convertible Notes due December 15, 2036 ("2036 Convertible Notes"), pursuant to which $4.3 billion principal amount of 2036 Convertible Notes was exchanged for an aggregate of 468 million shares of Ford Common Stock and $344 million in cash ($80 in cash per $1,000 principal amount of 2036 Convertible Notes exchanged). This transaction settled on April 8, 2009. An aggregate principal amount of $579 million of 2036 Convertible Notes remains outstanding with a carrying value of approximately $400 million.
Amendment to UAW Retiree Health Care Settlement Agreement. As disclosed in our Current Report on Form 8-K
dated July 22, 2009 ("July 2009 Form 8-K Report"), on July 23, 2009, we entered into an amendment to the UAW Retiree Health Care Settlement Agreement dated March 28, 2008 (the "Original Settlement Agreement") among and between us, the UAW, and certain class representatives, on behalf of the class of plaintiffs as set forth therein. The Original Settlement Agreement established the UAW Retiree Medical Benefits Trust as a new VEBA trust (the "UAW VEBA Trust") that on December 31, 2009 would assume the obligation to provide retiree health care benefits to eligible active and retired UAW Ford hourly employees and their eligible spouses, surviving spouses and dependents.
Pursuant to the Original Settlement Agreement, in April 2008, we issued to VEBA-F Holdings LLC, a then-wholly owned subsidiary of ours (the "LLC"): (a) $3.3 billion aggregate principal amount of 5.75% Convertible Notes Due January 1, 2013 (the "Convertible Notes"); (b) a $3 billion aggregate principal amount 9.50% Second Lien Term Note Due January 1, 2018 (the "Term Note") and a corresponding guaranty issued by certain subsidiary guarantors (the "Term Note Guaranty"); and (c) a promissory note dated January 5, 2009 in an aggregate principal amount of $2.3 billion, which is equal to the market value of the assets in the TAA held by the LLC on December 31, 2008 (the "TAA Note" and, together with the Convertible Notes, the Term Note and the Term Note Guaranty, the "Old Securities").
The amendment to the Original Settlement Agreement (the "Amended Settlement Agreement"), and the forms of the New Securities, the Exchange Agreement and the Registration Rights Agreement (each as defined below), were filed as exhibits to the July 2009 Form 8-K Report. The Amended Settlement Agreement changed the Original Settlement Agreement to provide for smoothing of payment obligations and to give us the option to use Ford Common Stock to satisfy up to approximately 50% of our future payment obligations to the UAW VEBA Trust.
The Amended Settlement Agreement was approved by the U.S. District Court for the Eastern District of Michigan on November 9, 2009. On December 8, 2009, the U.S. Department of Labor published in the Federal Register a Notice of Proposed Individual Exemption (the "Exemption") that would be retroactive to December 31, 2009 and would, among other things, permit the transfer to the UAW VEBA Trust and allow the UAW VEBA Trust to hold the New Securities (as defined below). This, along with prior discussions with the U.S. Department of Labor, met the condition under the Amended Settlement Agreement of obtaining the Exemption or reasonable assurance of retroactive effect thereof satisfactory to Ford and the UAW VEBA Trust.
On December 11, 2009, in accordance with the Amended Settlement Agreement and pursuant to a Securities Exchange Agreement dated as of December 11, 2009 among us, the LLC and certain subsidiary guarantors (the "Exchange Agreement"), we issued to the LLC in exchange for the Old Securities: (i) an Amortizing Guaranteed Secured Note Maturing June 30, 2022 with an original principal amount of $6.7 billion and with a fair value at December 31, 2009 of about $4.8 billion ("New Note A") excluding a "true-up amount" (described below); (ii) an Amortizing Guaranteed Secured Note Maturing June 30, 2022 with an original principal amount of $6.5 billion and with a fair value at December 31, 2009 of about $4.5 billion ("New Note B" and, together with New Note A, the "New Notes"); (iii) guaranties by certain subsidiary guarantors of the New Notes, limited to an aggregate of $3 billion of obligations thereunder (the "Guaranties") and (iv) warrants to purchase 362,391,305 shares of Ford Common Stock, issued pursuant to a Warrant Agreement (the

Management’s Discussion and Analysis of Financial Condition and Results of Operations
42 Ford Motor Company | 2009 Annual Report
"Warrant Agreement") dated December 11, 2009 between us and the LLC (the "Warrants" and, together with the New Notes and Guaranties, the "New Securities"). The New Notes are secured on second lien basis, to the extent of $3 billion of obligations thereunder, with collateral securing our obligations under the Credit Agreement.
Under New Note B, we have the option, subject to certain conditions, of making each payment in cash, Ford Common Stock, or a combination of cash and Ford Common Stock. Any Ford Common Stock to be delivered in satisfaction of such payment obligation is to be valued based on its volume-weighted average price per share for the 30 trading-day period ending on the second business day prior to the relevant payment date ("30-day VWAP price").
The Warrants, which expire on January 1, 2013, entitle the holder thereof to purchase 362,391,305 shares of Ford
Common Stock at an exercise price of $9.20 per share. Generally, the warrants can be exercised at any time, but the underlying shares cannot be transferred prior to October 1, 2012, unless the closing sale price of Ford Common Stock was above $11.04 for at least 20 trading days in the 30 consecutive trading days ending on the last trading day in the preceding calendar quarter. Upon exercise of the Warrants, the warrant holder has the option to elect to have us settle on a cashless, net share basis (i.e., delivering to the holder shares of Ford Common Stock having a value equal to the "in-the-money" value of the Warrants being exercised).
In addition, on December 11, 2009, we entered into a Securityholder and Registration Rights Agreement with the LLC (the "Registration Rights Agreement"), which provides for certain hedging restrictions, certain sales restrictions relating to the Warrants and shares of Ford Common Stock underlying the Warrants and delivered in payment of New Note B, and customary registration rights relating to the sale of shares of Ford Common Stock received by the UAW VEBA Trust pursuant to our stock payment option under New Note B, as well as the Warrants and shares of Ford Common Stock issued upon the exercise thereof.
As disclosed previously, notwithstanding our option to pay a portion of our obligations to the UAW VEBA Trust in stock in lieu of cash, we will use our discretion in determining which form of payment makes sense at the time of each required payment, balancing liquidity needs and preservation of shareholder value. In making such a determination, we will consider facts and circumstances existing at the time of each required payment, including market and economic conditions, our available liquidity, and the price of Ford Common Stock.
On December 31, 2009, with respect to New Note A, we paid to the LLC the payment due on that date of $1.3 billion, the payment of a true-up amount of $150 million, and a partial prepayment of New Note A in the amount of $500 million. The true-up amount was negotiated as part of the arrangement for us to use during 2009 the cash in the TAA in exchange for a fixed return of 9% per annum plus an amount that represents a hypothetical return on a portfolio of assets invested 70% in the equity markets and 30% in fixed income markets, subject to a cap of $150 million. Because the equity markets performed well in 2009, the true-up amount met the $150 million cap.
Also on December 31, 2009, with respect to New Note B, we paid to the LLC the payment due on that date of $610 million in cash. We decided to make the New Note B payment in cash because the 30-day VWAP price was $9.13 and the December 31, 2009 closing sale price of Ford Common Stock was $10.00 per share.
After giving effect to the payments made on the New Notes on December 31, 2009, the New Notes had a fair value of
$7 billion.
Thereafter, at the close of business on December 31, 2009, we transferred to the UAW VEBA Trust: (i) our ownership interest in the LLC, which was the legal owner of the New Securities and which held cash and marketable securities in its TAA with a value on that date of $619 million, and (ii) the assets in our then-existing internal VEBA trust consisting of cash and marketable securities with a value on December 31, 2009 of $3.5 billion. The transfer by us to the UAW VEBA Trust of the ownership of these assets, including the beneficial ownership of the New Securities, irrevocably settled our obligation, valued at about $13.6 billion on December 31, 2009, to provide retiree health care benefits to eligible active and retired UAW Ford hourly employees and their eligible spouses, surviving spouses and dependents.

Management’s Discussion and Analysis of Financial Condition and Results of Operations
Ford Motor Company | 2009 Annual Report 43
The schedule of remaining payments for each of the New Notes (which reflects the partial prepayment made on New Note A described above), as well as the prepayment amount for each of the New Notes in the event we were to pay the remaining balance in full on the corresponding payment date, is as follows:
Pension Plan Contributions. Our policy for funded plans is to contribute annually, at a minimum, amounts required by
applicable laws and regulations. We do from time to time make contributions beyond those legally required.
In 2009, we made $900 million of cash contributions to our funded pension plans. During 2010, we expect to contribute $1.1 billion to our worldwide funded pension plans from available Automotive cash and cash equivalents. In addition, benefit payments made directly by us for unfunded plans are expected to be about $400 million. Based on current assumptions and regulations, we do not expect to have a legal requirement to fund our major U.S. pension plans in 2010. For a further discussion of our pension plans, see Note 18 of the Notes to the Financial Statements.
Liquidity Sufficiency. One of the four key priorities of our business plan is to finance our plan and improve our balance
sheet. The actions described above are consistent with this priority. Based on our planning assumptions, we believe that we have sufficient liquidity and capital resources to continue to transform our business, invest in new products that customers want and value, pay our debts and obligations as and when they come due, and provide a cushion within the uncertain global economic environment. We will continue to look for opportunities to improve our balance sheet, primarily by working to improve our underlying business to generate positive Automotive operating-related cash flow. Financial Services Sector Ford Credit
Funding Strategy. Ford Credit's funding strategy is to maintain sufficient liquidity to meet short-term funding obligations by having a substantial cash balance and committed funding capacity. As a result of lower long-term senior unsecured credit ratings assigned to Ford Credit over the past few years, its unsecured funding costs have increased over time. While Ford Credit has accessed the unsecured debt market when available, Ford Credit has increased its use of securitization funding as this has been more cost effective than unsecured funding and has allowed Ford Credit access to a broader investor base. Ford Credit plans to meet a significant portion of its 2010 funding requirements through securitization transactions. In addition, Ford Credit has various alternative business arrangements for select products and markets that reduce its funding requirements while allowing Ford Credit to support us (e.g., Ford Credit's partnering in Brazil for retail financing and FCE Bank plc's ("FCE") partnering with various institutions in Europe for full service leasing and retail and wholesale financing). Ford Credit is continuing to explore and execute such alternative business arrangements.
Consistent with the overall market, Ford Credit has been impacted by volatility and disruptions in the asset-backed securitization markets since August 2007. The recent global credit environment has presented many challenges, including reduced access to public and private unsecured and securitization markets, increased credit spreads associated with both asset-backed and unsecured funding, higher renewal costs on its committed liquidity programs, reduced net proceeds from securitization transactions due to greater enhancements, shorter maturities in Ford Credit's public and private securitization transactions in certain circumstances, and reduced capacity to obtain derivatives to manage market risk, including interest rate risk, in Ford Credit's securitization programs.

Management’s Discussion and Analysis of Financial Condition and Results of Operations
44 Ford Motor Company | 2009 Annual Report
While challenges remain, Ford Credit saw improvement in the capital markets in the last three quarters of 2009 evidenced by improvement in market access and credit spreads, including: four unsecured debt issuances in the United States and one in Europe totaling about $5 billion with significantly improved U.S. credit spreads from the first to the most recent; increasingly tighter spreads on Ford Credit's triple-A rated classes of Ford Credit's U.S. retail securitization transactions; a non-TALF public retail securitization transaction in November 2009; two European public retail securitization transactions in the fourth quarter of 2009; Ford Credit's first public wholesale securitization transaction since 2006 in October 2009; a two-year committed lease facility in December 2009; and the sale of over $150 million of subordinated notes from Ford Credit's September 2009 public retail securitization transaction.
Ford Credit's funding plan is subject to risks and uncertainties, many of which are beyond its control, including
disruption in the capital markets for the types of asset-backed securities used in Ford Credit's asset-backed funding, as well as disruption beyond the expiration of the government-sponsored securitization funding programs. Potential impact of industry events on Ford Credit's ability to access debt and derivatives markets or renew its committed liquidity programs in sufficient amounts and at competitive rates represents another risk to Ford Credit's funding plan. As a result, Ford Credit may need to further reduce the amount of finance receivables and operating leases it purchases or originates, thereby reducing its ongoing profits and adversely affecting its ability to support the sale of Ford vehicles.
Funding. Ford Credit requires substantial funding in the normal course of business. Its funding requirements are
driven mainly by the need to: (i) purchase retail installment sale contracts and retail lease contracts to support the sale of Ford products, which are influenced by Ford-sponsored special-rate financing programs that are available exclusively through Ford Credit, (ii) provide wholesale financing and capital financing for Ford dealers, and (iii) repay its debt obligations.
Ford Credit's funding sources include primarily securitization transactions (including other structured financings) and
unsecured debt. Ford Credit issues both short- and long-term debt that is held by both institutional and retail investors, with long-term debt having an original maturity of more than 12 months. Ford Credit sponsors a number of securitization programs that can be structured to provide both short- and long-term funding through institutional investors in the United States and international capital markets.
Ford Credit obtains short-term unsecured funding from the sale of floating rate demand notes under its Ford Interest
Advantage program and by issuing unsecured commercial paper in the United States, Europe, and other international markets. At December 31, 2009, the principal amount outstanding of Ford Interest Advantage notes, which may be redeemed at any time at the option of the holders thereof without restriction, was about $4 billion. At present, all of Ford Credit's short-term credit ratings by nationally recognized statistical rating organizations ("NRSROs") are below the Tier-2 category, and as a result it has limited access to the unsecured commercial paper market and Ford Credit's unsecured commercial paper cannot be held by money market funds. At December 31, 2009, the principal amount outstanding of Ford Credit's unsecured commercial paper was less than $1 million. Ford Credit does not hold reserves specifically to fund the payment of any of its unsecured short-term funding obligations. Instead, Ford Credit maintains multiple sources of liquidity, including cash, cash equivalents, and marketable securities (excluding marketable securities related to insurance activities), unused committed liquidity programs, excess securitizable assets, and committed and uncommitted credit facilities, which should be sufficient for Ford Credit's unsecured short-term funding obligations.
Government-Sponsored Securitization Funding Programs. Government-sponsored securitization funding programs have helped stabilize the asset-backed securitization market. Since the third quarter of 2009, Ford Credit significantly reduced the use of these programs as its access to the public and private securitization and unsecured markets continued to improve.
Commercial Paper Funding Facility ("CPFF"): The CPFF became operational in October 2008 and purchased
unsecured and asset-backed commercial paper from U.S. issuers. In 2008, Ford Credit registered to sell up to $16 billion from its asset-backed commercial paper program ("FCAR") to the CPFF. At December 31, 2008, FCAR had $7 billion of commercial paper outstanding under the CPFF, which represented about 60% of FCAR's outstanding balance. FCAR was able to issue a limited amount of commercial paper to investors during the first half of 2009 and at lower interest rates than under CPFF, but with a relatively short average maturity compared with CPFF and often overnight. FCAR issued a total of $9 billion of commercial paper to the CPFF in 2009, all of which had matured by September 30, 2009. Commercial paper was sold to the CPFF at a price based on the designated benchmark rate, plus a spread of 300 basis points. This represented a significantly higher rate than those that prevailed in the asset-backed commercial paper market before August 2007, when the disruptions in the debt and asset-backed securitization markets began. As a result of improvements in the asset-backed commercial paper market, as well as a reduction in the overall size of FCAR, FCAR is able to issue commercial paper outside the CPFF at prices and average maturities that are close to those that prevailed before August 2007. The CPFF ceased purchasing commercial paper on February 1, 2010.

Management’s Discussion and Analysis of Financial Condition and Results of Operations
Ford Motor Company | 2009 Annual Report 45
Term Asset-Backed Securities Loan Facility ("TALF"): TALF began in March 2009 to make credit available by restoring
liquidity in the asset-backed securitization market. Under TALF, the Federal Reserve Bank of New York ("FRBNY") makes loans to holders of TALF-eligible asset-backed securities. The loans are equal to the market value of the asset-backed securities less a discount. Interest rates on most TALF loans are 100 basis points over the respective term benchmark rate, and discounts vary according to the assets supporting the asset-backed securities. The TALF program revived the asset-backed securitization market by attracting new investors who purchased asset-backed securities, receiving higher spreads on these securities than the spreads they pay on their loans from FRBNY. As investor demand increased due to the liquidity provided by TALF, spreads generally narrowed on Ford Credit's issuances and the percentage of non-TALF investors increased. As the spread on certain asset-backed securities fell below the 100 basis point spread on TALF loans, Ford Credit's TALF-eligible asset-backed securities were purchased almost exclusively by non-TALF investors.
Ford Credit issued $10.3 billion of TALF-eligible asset-backed securities in 2009, of which $2.2 billion amortized during
the year and $8.1 billion was outstanding at December 31, 2009. Ford Credit has also issued a total of $1.3 billion of TALF-eligible asset-backed securities in 2010. The following table summarizes Ford Credit's TALF-eligible issuances including the weighted average spread of the triple-A rated notes over the relevant benchmark rates for securitization transactions:
Ford Credit recently completed two public asset-backed securitization transactions that were not TALF-eligible: a retail
securitization transaction with a weighted average spread of 48 basis points on the triple-A rated notes in November 2009 and a lease securitization transaction with a weighted average spread of 54 basis points on the triple-A rated notes in February 2010. In January 2010, Ford Credit issued about $230 million of non-TALF subordinated wholesale asset-backed securities that were rated double-A and single-A. In February 2010, Ford Credit also issued $250 million of private wholesale asset-backed securities with a maturity of five years compared with the three-year maturity of Ford Credit's previous TALF transactions. Ford Credit does not plan to complete any additional TALF-eligible retail or lease transactions before the expected expiration of TALF on March 31, 2010. Given the recent improvements in the securitization market, and absent further significant market disruptions, Ford Credit has confidence it can obtain funding in the public securitization markets without TALF.
European Central Bank ("ECB") Open Market Operations: FCE is eligible to access liquidity through the ECB’s open
market operations program. This program allows eligible counterparties to use eligible assets (including asset-backed securities) as collateral for short-term liquidity. The present term limitation is three months; however, in the past the term has been as long as one year. The funding efficiency of liquidity provided under this program is typically lower than if the asset-backed securities were placed in the public or private markets because the ECB applies its own market valuation to the collateral and a discount to the original face value of the asset-backed securities. The market valuation and discount vary by the term of the asset, asset type, and jurisdiction of the asset. During the first half of 2009, FCE used the ECB's open market operations program to provide additional liquidity at a time when access to the asset-backed securitization market was limited and costs for such funding were significantly higher than in the past. FCE had $1.8 billion and $1.1 billion of funding through the ECB at December 31, 2009 and 2008, respectively. During the second half of 2009, improvements in the asset-backed securitization market allowed FCE to receive funding from public and private securitization transactions and sell collateral previously posted with the ECB in the secondary markets. Ford Credit expects FCE's utilization of the ECB open market operations program to decline.

Management’s Discussion and Analysis of Financial Condition and Results of Operations
46 Ford Motor Company | 2009 Annual Report
Funding Portfolio. Ford Credit's outstanding debt and off-balance sheet securitization transactions were as follows on the dates indicated (in billions, except for ratios):
__________ (a) Obligations issued in securitization transactions that are payable only out of collections on the underlying securitized assets and related
enhancements. (b) At December 31, 2009, Ford Credit did not have any asset-backed commercial paper sold to the CPFF. At December 31, 2008, includes asset-
backed commercial paper sold to the CPFF of $7 billion. (c) The Ford Interest Advantage program consists of Ford Credit's floating rate demand notes.
At December 31, 2009, unsecured long-term debt (including notes payable within one year) was down about $12 billion
from year-end 2008, primarily reflecting about $18 billion of debt maturities and repurchases, offset partially by about $6 billion of new unsecured public and private long-term debt issuance. Unsecured long-term debt maturities were as follows: 2010 — $7 billion; 2011 — $11 billion; 2012 — $7 billion; and the remainder thereafter. At December 31, 2009, asset-backed long-term debt (including notes payable within one year) was down about $13 billion from year-end 2008, reflecting amortization of asset-backed debt in excess of asset-backed long-term debt issuance.
Funding Plan. The following table illustrates Ford Credit's public and private term funding issuances for 2008 and 2009
and its planned issuances for 2010 (in billions):
__________ * Includes private term debt, securitization transactions, and other term funding; excludes sales to Ford Credit's on-balance sheet asset-backed
commercial paper program.
In 2009, Ford Credit completed about $20 billion of public term funding transactions, including: about $12 billion of retail
asset-backed securitization transactions in the United States, Canada, and Europe; about $2 billion of wholesale asset-backed securitization transactions in the United States; about $1 billion of lease asset-backed securitization transactions in the United States; and about $5 billion of unsecured issuances. In 2009, Ford Credit completed about $11 billion of private term funding transactions (excluding Ford Credit's on-balance sheet asset-backed commercial paper program) in several markets, including about $4 billion in Canada. These private transactions included retail, lease, and wholesale asset-backed securitization transactions.

Management’s Discussion and Analysis of Financial Condition and Results of Operations
Ford Motor Company | 2009 Annual Report 47
In 2009, total issuance was about $11 billion lower than 2008, primarily reflecting lower funding requirements resulting from lower receivables. However, 2009 public issuance was about $7 billion higher than 2008, primarily reflecting the availability of and Ford Credit's preference to issue in the public markets. In 2009, there was a corresponding reduction in reliance on private capacity as Ford Credit lowered its utilization of committed funding programs.
Through February 24, 2010, Ford Credit completed about $4 billion of public term funding transactions, including about $1 billion of retail asset-backed securitization transactions in the United States, Canada, and Europe, about $1 billion for a lease asset-backed securitization transaction in the United States, about $1 billion of wholesale asset-backed securitization transactions in the United States, and about $1 billion of unsecured issuances. Ford Credit also completed about $1 billion of private term funding transactions, primarily reflecting retail and wholesale asset-backed securitization transactions in the United States and Europe.
The cost of securitization transactions and unsecured debt funding is based on a margin or spread over a benchmark interest rate. Spreads are typically measured in basis points. Ford Credit's asset-backed funding and unsecured long-term debt costs are based on spreads over U.S. Treasury securities of similar maturities, a comparable London Interbank Offered Rate ("LIBOR") or other comparable benchmark rates. Ford Credit's floating rate demand notes funding costs are changed depending on market conditions. In addition to enhancing Ford Credit's liquidity, one of the main reasons that Ford Credit has increased its use of securitization transactions as a funding source over the last few years has been that spreads on Ford Credit's securitization transactions have been more stable and lower than those on Ford Credit's unsecured long-term debt funding. Prior to August 2007, Ford Credit's securitized funding spreads (which are based on the creditworthiness of the underlying securitized asset and enhancements) were not volatile, while its unsecured long-term spreads were volatile. Consistent with the overall market, Ford Credit was impacted by volatility in the asset-backed securitization market beginning in the second half of 2007. Ford Credit experienced higher spreads for several of its committed liquidity programs as well as its public and private issuances. During 2009, Ford Credit's spreads on the three-year fixed rate notes offered in its U.S. public retail securitization transactions decreased from 425 basis points to 70 basis points over the relevant benchmark rates from March 2009 to November 2009, respectively. During 2009, Ford Credit's U.S. unsecured long-term debt transaction spreads decreased from 1,006 basis points to 480 basis points over the relevant benchmark rates from June 2009 to December 2009, respectively.
Liquidity. The following table illustrates the various sources of Ford Credit's liquidity as of the dates shown (in billions):
__________
* Excludes marketable securities related to insurance activities.
At December 31, 2009, committed capacity and cash shown above totaled $51.1 billion, of which $39.4 billion could be utilized (after adjusting for capacity in excess of eligible receivables of $6.5 billion and cash required to support on-balance sheet securitization transactions of $5.2 billion). At December 31, 2009, $18.3 billion was utilized, leaving $21.1 billion available for use (including $12.1 billion of cash, cash equivalents, and marketable securities, but excluding marketable securities related to insurance activities and cash and cash equivalents to support on-balance sheet securitization transactions).
At December 31, 2009, Ford Credit's liquidity available for use was lower than year-end 2008 by about $300 million, as debt maturities and cash payments were higher than the impact of lower receivables and new debt issuances. The reduction in liquidity available for use from year-end 2008 also included a $630 million cumulative adjustment, reflected in the first quarter of 2009, to correct for the overstatement of cash and cash equivalents and certain accounts payable that originated in prior periods. Liquidity available for use was 22% of managed receivables. In addition to the $21.1 billion of liquidity available for use, the $6.5 billion of capacity in excess of eligible receivables provides Ford Credit with an alternative for
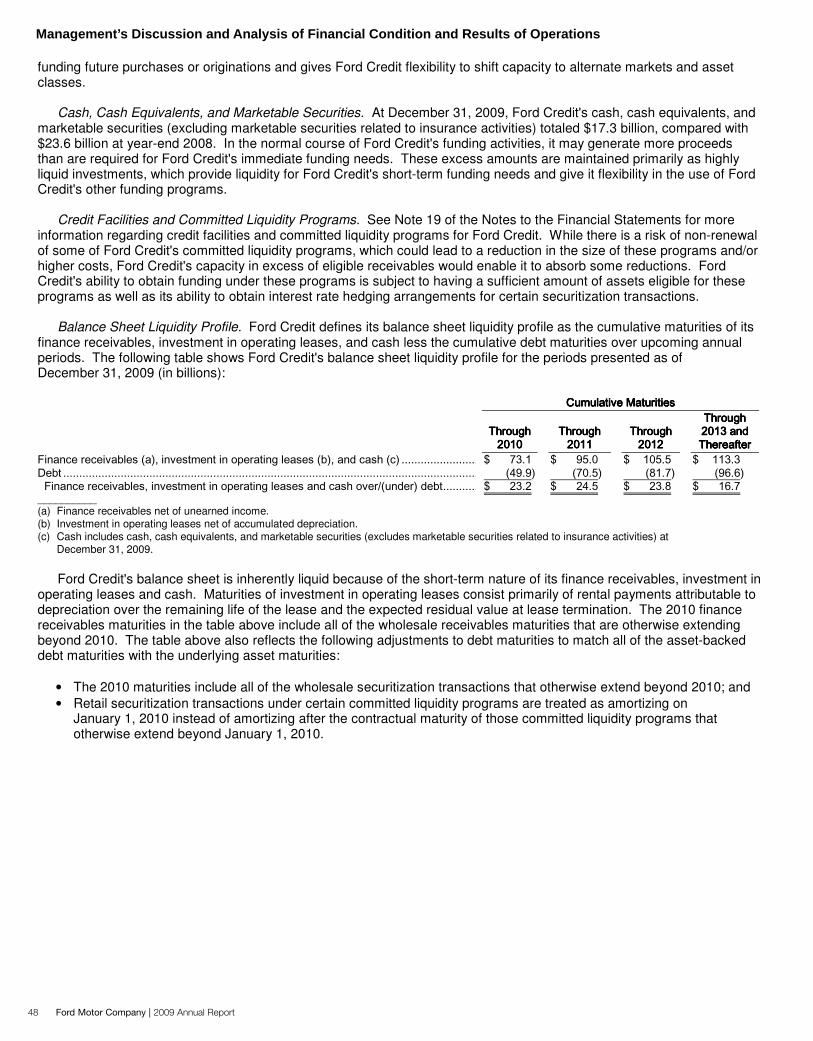
Management’s Discussion and Analysis of Financial Condition and Results of Operations
48 Ford Motor Company | 2009 Annual Report
funding future purchases or originations and gives Ford Credit flexibility to shift capacity to alternate markets and asset classes.
Cash, Cash Equivalents, and Marketable Securities. At December 31, 2009, Ford Credit's cash, cash equivalents, and
marketable securities (excluding marketable securities related to insurance activities) totaled $17.3 billion, compared with $23.6 billion at year-end 2008. In the normal course of Ford Credit's funding activities, it may generate more proceeds than are required for Ford Credit's immediate funding needs. These excess amounts are maintained primarily as highly liquid investments, which provide liquidity for Ford Credit's short-term funding needs and give it flexibility in the use of Ford Credit's other funding programs.
Credit Facilities and Committed Liquidity Programs. See Note 19 of the Notes to the Financial Statements for more information regarding credit facilities and committed liquidity programs for Ford Credit. While there is a risk of non-renewal of some of Ford Credit's committed liquidity programs, which could lead to a reduction in the size of these programs and/or higher costs, Ford Credit's capacity in excess of eligible receivables would enable it to absorb some reductions. Ford Credit's ability to obtain funding under these programs is subject to having a sufficient amount of assets eligible for these programs as well as its ability to obtain interest rate hedging arrangements for certain securitization transactions.
Balance Sheet Liquidity Profile. Ford Credit defines its balance sheet liquidity profile as the cumulative maturities of its finance receivables, investment in operating leases, and cash less the cumulative debt maturities over upcoming annual periods. The following table shows Ford Credit's balance sheet liquidity profile for the periods presented as of December 31, 2009 (in billions):
__________ (a) Finance receivables net of unearned income. (b) Investment in operating leases net of accumulated depreciation. (c) Cash includes cash, cash equivalents, and marketable securities (excludes marketable securities related to insurance activities) at
December 31, 2009.
Ford Credit's balance sheet is inherently liquid because of the short-term nature of its finance receivables, investment in
operating leases and cash. Maturities of investment in operating leases consist primarily of rental payments attributable to depreciation over the remaining life of the lease and the expected residual value at lease termination. The 2010 finance receivables maturities in the table above include all of the wholesale receivables maturities that are otherwise extending beyond 2010. The table above also reflects the following adjustments to debt maturities to match all of the asset-backed debt maturities with the underlying asset maturities:
• The 2010 maturities include all of the wholesale securitization transactions that otherwise extend beyond 2010; and
• Retail securitization transactions under certain committed liquidity programs are treated as amortizing on January 1, 2010 instead of amortizing after the contractual maturity of those committed liquidity programs that otherwise extend beyond January 1, 2010.

Management’s Discussion and Analysis of Financial Condition and Results of Operations
Ford Motor Company | 2009 Annual Report 49
Leverage. Ford Credit uses leverage, or the debt-to-equity ratio, to make various business decisions, including evaluating and establishing pricing for retail, wholesale, and lease financing, and assessing Ford Credit's capital structure. Ford Credit refers to its shareholder's interest as equity. Ford Credit calculates leverage on a financial statement basis and on a managed basis using the following formulas:
__________ (a) Excluding marketable securities related to insurance activities. (b) Primarily related to market valuation adjustments to derivatives due to movements in interest rates. Adjustments to debt are related to designated fair
value hedges and adjustments to equity are related to retained earnings.
The following table illustrates the calculation of Ford Credit's financial statement leverage (in billions, except for ratios):
The following table illustrates the calculation of Ford Credit's managed leverage (in billions, except for ratios):
__________ (a) Excluding marketable securities related to insurance activities. (b) Primarily related to market valuation adjustments to derivatives due to movements in interest rates. Adjustments to debt are related to designated fair
value hedges and adjustments to equity are related to retained earnings.
Ford Credit believes that managed leverage is useful to its investors because it reflects the way Ford Credit manages its business. Ford Credit retains interests in receivables sold in off-balance sheet securitization transactions and, with respect to subordinated retained interests, is exposed to credit risk. Accordingly, Ford Credit evaluates charge-offs, receivables, and leverage on a managed as well as a financial statement basis. Ford Credit also deducts cash and cash equivalents, and marketable securities (excluding marketable securities related to insurance activities) because they generally correspond to excess debt beyond the amount required to support its operations and amounts to support on-balance sheet securitization transactions. Ford Credit makes derivative accounting adjustments to its assets, debt, and equity positions to reflect the impact of interest rate instruments Ford Credit uses in connection with its term-debt issuances and securitization transactions. The derivative accounting adjustments related to these instruments vary over the term of the underlying debt and securitized funding obligations based on changes in market interest rates. Ford Credit generally repays its debt obligations as they mature. As a result, Ford Credit excludes the impact of these derivative accounting adjustments on both the numerator and denominator in order to exclude the interim effects of changes in market interest rates. Ford Credit believes the managed leverage measure provides its investors with meaningful information regarding management's decision-making processes.

Management’s Discussion and Analysis of Financial Condition and Results of Operations
50 Ford Motor Company | 2009 Annual Report
Ford Credit plans its managed leverage by considering prevailing market conditions and the risk characteristics of its business. At December 31, 2009, Ford Credit's managed leverage was 7.3 to 1, compared with 9.9 to 1 a year ago. Ford Credit's managed leverage is significantly below the threshold of 11.5 to 1 set forth in the Amended and Restated Support Agreement with us. In 2009, Ford Credit distributed $1.5 billion to its parent, which included in the first quarter of 2009 a non-cash distribution of about $1.1 billion and in the third quarter of 2009 a cash distribution of $400 million and a non-cash distribution of $31 million for Ford Credit's ownership interest in AB Volvofinans. Securitization Transactions by Ford Credit
Securitization. Ford Credit securitizes finance receivables and net investment in operating leases through a variety of programs, utilizing amortizing, variable funding, and revolving structures. Ford Credit also sells finance receivables in structured financing transactions. Due to the similarities between securitization and structured financing, Ford Credit refers to structured financings as securitization transactions. Ford Credit's securitization programs are targeted to many different investors in both public and private transactions in capital markets worldwide. Ford Credit completed its first securitization transaction in 1988, and regularly securitizes assets, purchased or originated, in the United States, Canada, Mexico, and Europe.
Most of Ford Credit's securitization transactions do not satisfy the requirements for accounting sale treatment, and the
securitized assets and related debt remain on Ford Credit's balance sheet. Some of Ford Credit's securitization transactions, however, do satisfy accounting sale treatment and are not reflected on Ford Credit's balance sheet in the same way as debt funding. All of Ford Credit's securitization transactions since the first quarter of 2007 have been on-balance sheet transactions. Both on- and off-balance sheet securitization transactions have an effect on its financial condition, operating results, and liquidity.
Ford Credit securitizes its assets because the securitization market provides it with a lower cost source of funding
compared with unsecured debt given Ford Credit's present credit ratings, and it diversifies Ford Credit's funding among different markets and investors. In the United States, Ford Credit is generally able to obtain funding in two days for its unutilized capacity in most of its committed liquidity programs. New programs and new transaction structures typically require substantial development time before coming to market.
In a securitization transaction, the securitized assets are generally held by a bankruptcy-remote special purpose entity ("SPE") in order to isolate the securitized assets from the claims of Ford Credit's other creditors and ensure that the cash flows on the securitized assets are available for the benefit of securitization investors. As a result, payments to securitization investors are based on the creditworthiness of the securitized assets and any enhancements, and not on Ford Credit's creditworthiness. Senior asset-backed securities issued by the SPEs generally receive the highest short-term credit ratings and among the highest long-term credit ratings from the rating agencies that rate them.
Securitization SPEs have limited purposes and generally are only permitted to purchase the securitized assets, issue
asset-backed securities, and make payments on the securities. Some SPEs, such as certain trusts that issue securities backed by retail installment sale contracts, only issue a single series of securities and generally are dissolved when those securities have been paid in full. Other SPEs, such as the trusts that issue securities backed by wholesale receivables, issue multiple series of securities from time to time and are not dissolved until the last series of securities is paid in full.
Ford Credit's use of SPEs in its securitization transactions is consistent with conventional practices in the securitization
industry. Ford Credit sponsors the SPEs used in all of its securitization programs with the exception of bank-sponsored conduits. None of Ford Credit's officers, directors, or employees holds any equity interests in its SPEs or receives any direct or indirect compensation from the SPEs. These SPEs do not own Ford Credit's Shares or shares of any of its affiliates.
In order to be eligible for inclusion in a securitization transaction, each asset must satisfy certain eligibility criteria
designed for the specific transaction. For example, for securitization transactions of retail installment sale contracts, the selection criteria may be based on factors such as location of the obligor, contract term, payment schedule, interest rate, financing program, the type of financed vehicle, and whether the contracts are active and in good standing (e.g., when the obligor is not more than 30-days delinquent or bankrupt). Generally, Ford Credit selects the assets to be included in a particular securitization randomly from its entire portfolio of assets that satisfy the applicable eligibility criteria.
Ford Credit provides various forms of credit enhancements to reduce the risk of loss for securitization investors. Credit
enhancements include over-collateralization (when the principal amount of the securitized assets exceeds the principal amount of related asset-backed securities), segregated cash reserve funds, subordinated securities, and excess spread (when interest collections on the securitized assets exceed the related fees and expenses, including interest payments on the related asset-backed securities). Ford Credit may also provide payment enhancements that increase the likelihood of

Management’s Discussion and Analysis of Financial Condition and Results of Operations
Ford Motor Company | 2009 Annual Report 51
the timely payment of interest and the payment of principal at maturity. Payment enhancements include yield supplement arrangements, interest rate swaps, and other hedging arrangements, liquidity facilities, and certain cash deposits.
Ford Credit retains interests in its securitization transactions, including senior and subordinated securities issued by the SPE, rights to cash held for the benefit of the securitization investors (for example, a reserve fund), and residual interests. Residual interests represent the right to receive collections on the securitized assets in excess of amounts needed to pay securitization investors and to pay other transaction participants and expenses. Ford Credit retains credit risk in securitization transactions because its retained interests include the most subordinated interests in the securitized assets and are structured to absorb expected credit losses on the securitized assets before any losses would be experienced by investors. Based on past experience, Ford Credit expects that any losses in the pool of securitized assets would likely be limited to its retained interests.
Ford Credit is engaged as servicer to collect and service the securitized assets. Its servicing duties include collecting payments on the securitized assets and preparing monthly investor reports on the performance of the securitized assets and on amounts of interest and/or principal payments to be made to investors. While servicing securitized assets, Ford Credit applies the same servicing policies and procedures that Ford Credit applies to its owned assets and maintains its normal relationship with its financing customers.
Ford Credit generally has no obligation to repurchase or replace any securitized asset that subsequently becomes delinquent in payment or otherwise is in default. Securitization investors have no recourse to Ford Credit or its other assets for credit losses on the securitized assets and have no right to require Ford Credit to repurchase their investments. Ford Credit does not guarantee any asset-backed securities and has no obligation to provide liquidity or make monetary contributions or contributions of additional assets to its SPEs either due to the performance of the securitized assets or the credit rating of its short-term or long-term debt. However, as the seller and servicer of the securitized assets, Ford Credit is obligated to provide certain kinds of support to its securitization transactions, which are customary in the securitization industry. These obligations include indemnifications, repurchase obligations on assets that do not meet eligibility criteria or that have been materially modified, the mandatory sale of additional assets in revolving transactions, and, in some cases, servicer advances of certain amounts.
Risks to Continued Funding under Securitization Programs. The following securitization programs contain structural features that could prevent Ford Credit from using these sources of funding in certain circumstances:
• Retail Securitization. If the credit enhancement on any asset-backed security held by FCAR is reduced to zero, FCAR may not purchase any additional asset-backed securities or issue additional commercial paper and would wind down its operations. In addition, if credit losses or delinquencies in Ford Credit's portfolio of retail assets exceed specified levels, FCAR is not permitted to purchase additional asset-backed securities for so long as such levels are exceeded.
• Retail Conduits. If credit losses or delinquencies on the pool of assets held by a conduit exceed specified levels, or if the level of over-collateralization or credit enhancements for such pool decreases below a specified level, Ford Credit will not have the right to sell additional pools of assets to that conduit.
• Wholesale Securitization. If the payment rates on wholesale receivables in the securitization trust are lower than specified levels or if there are significant dealer defaults, Ford Credit will be unable to obtain additional funding and any existing funding would begin to amortize.
• Retail Warehouse. If credit losses or delinquencies in Ford Credit's portfolio of retail assets exceed specified levels, Ford Credit will be unable to obtain additional funding from the securitization of retail installment sale contracts through its retail warehouse facility (i.e., a short-term credit facility under which draws are backed by the retail contracts).
• Lease Warehouse. If credit losses or delinquencies in Ford Credit's portfolio of retail lease contracts exceed specified levels, Ford Credit will be unable to obtain additional funding from the securitization of retail lease contracts through its lease warehouse facility (i.e., a credit facility under which draws are backed by the retail lease contracts).
In the past, these features have not limited Ford Credit's ability to use securitization to fund its operations.

Management’s Discussion and Analysis of Financial Condition and Results of Operations
52 Ford Motor Company | 2009 Annual Report
In addition to the specific transaction-related structural features discussed above, Ford Credit's securitization programs may be affected by the following factors: market disruption and volatility, the market capacity for Ford Credit and Ford Credit's sponsored investments, the general demand for the type of assets supporting the asset-backed securities, the availability of committed liquidity facilities, the amount and credit quality of assets available, the performance of assets in its previous securitization transactions, accounting and regulatory changes, and Ford Credit's credit ratings. In addition, a bankruptcy of Ford, Ford Credit, or FCE would cause certain of Ford Credit's funding transactions to amortize and result in a termination of certain liquidity commitments. If, as a result of any of these or other factors, the cost of securitization funding were to increase significantly or funding through securitization transactions were no longer available to Ford Credit, it would have a material adverse impact on Ford Credit's financial condition and results of operations, which could adversely affect its ability to support the sale of Ford vehicles. On-Balance Sheet Arrangements
Most of Ford Credit's securitization transactions do not satisfy the requirements for accounting sale treatment and, therefore, the securitized assets and related debt are included in Ford Credit's financial statements. Ford Credit expects its future securitization transactions to be on-balance sheet. Ford Credit believes on-balance sheet arrangements are more transparent to its investors. Securitized assets are only available to repay the related asset-backed debt and to pay other securitization investors and other participants. These underlying securitized assets are available only for payment of the debt and other obligations issued or arising in the securitization transactions; they are not available to pay Ford Credit's other obligations or the claims of its other creditors. Ford Credit holds the right to the excess cash flows not needed to pay the debt and other obligations issued or arising in each of these securitization transactions. This debt is not Ford Credit's legal obligation or the legal obligation of its other subsidiaries. Assets and associated liabilities related to Ford Credit's on-balance sheet securitization transactions are as follows (in billions):
See Note 19 of the Notes to the Financial Statements for more information regarding on-balance sheet securitization transactions. Off-Balance Sheet Arrangements
We have entered into various arrangements not reflected on our balance sheet that have or are reasonably likely to have a current or future effect on our financial condition, results of operations or liquidity. These include securitizations by Ford Credit in off-balance sheet transactions, variable interest entities ("VIEs") and guarantees. For a discussion of our VIEs and guarantees, see Notes 13 and 31, respectively, of the Notes to the Financial Statements.
Ford Credit has not entered into any off-balance sheet arrangements (off-balance sheet securitization transactions and whole-loan sale transactions, excluding sales of businesses and liquidating portfolios) since the first quarter of 2007, which is consistent with Ford Credit's plan to execute on-balance sheet securitization transactions.
Total Company
Equity/(Deficit). At December 31, 2009, Total equity/(deficit) attributable to Ford Motor Company was negative $7.8 billion, an improvement of $7.9 billion compared with December 31, 2008. The improvement is more than explained by favorable changes in Capital in excess of par value of stock (primarily the various equity issuances ($1.9 billion), the conversion of a portion of the 2036 Convertible Notes ($1.4 billion), the issuance of warrants related to the UAW Amended Settlement Agreement ($1.2 billion), the equity component related to the issuance of the 2016 Convertible Notes (about $700 million), and the debt securities exchanged for equity (about $600 million)); and favorable changes in Retained earnings (primarily related to 2009 net income attributable to Ford ($2.7 billion)).

Management’s Discussion and Analysis of Financial Condition and Results of Operations
Ford Motor Company | 2009 Annual Report 53
Credit Ratings. Our short-term and long-term debt is rated by four credit rating agencies designated as NRSROs by the SEC:
• DBRS Limited ("DBRS"); • Fitch, Inc. ("Fitch"); • Moody's Investors Service, Inc. ("Moody's"); and
• Standard & Poor's Ratings Services, a division of The McGraw-Hill Companies, Inc. ("S&P").
In several markets, locally recognized rating agencies also rate us. A credit rating reflects an assessment by the rating agency of the credit risk associated with a corporate entity or particular securities issued by that entity. Their ratings of us are based on information provided by us and other sources. Credit ratings are not recommendations to buy, sell or hold securities and are subject to revision or withdrawal at any time by the assigning rating agency. Each rating agency may have different criteria for evaluating company risk and, therefore, ratings should be evaluated independently for each rating agency. Lower credit ratings generally result in higher borrowing costs and reduced access to capital markets.
The following rating actions have been taken by these NRSROs since October 1, 2009:
Ford On November 2, 2009, DBRS placed Ford's long-term credit ratings under review with positive implications;
Fitch revised Ford's outlook to positive from stable; and Moody's raised Ford's corporate rating to B3 from Caa1, its senior unsecured rating to Caa1 from Caa2, and its senior secured rating to Ba3 from B1. Moody's outlook for Ford remains stable.
On November 3, 2009, S&P upgraded Ford's corporate rating to B- from CCC+, its senior secured rating to B- from CCC+, and its senior unsecured rating to CCC from CCC-. S&P's ratings outlook for Ford remains stable.
On December 1, 2009, DBRS upgraded Ford's issuer Rating to B(low) from CCC(high) and upgraded Ford's senior secured rating to B(high) from B(low). DBRS' outlook for Ford remains stable. Also on December 1, Fitch Ratings upgraded Ford's senior secured rating to B+ from B, with a positive outlook.
On January 11, 2010, Fitch upgraded Ford's corporate rating to B- from CCC and the senior secured rating to BB- from B+; the outlook remains positive.
Ford Credit On November 2, 2009, DBRS placed Ford Credit's ratings under review with positive implications; Fitch revised Ford Credit's outlook to positive from stable; and Moody's upgraded Ford Credit's senior unsecured rating to B3 from Caa1 while keeping its credit ratings under review for a possible upgrade.
On November 3, 2009, S&P upgraded Ford Credit's senior unsecured rating to B- from CCC+ with a stable outlook.
On December 1, 2009, DBRS upgraded Ford Credit's corporate and senior unsecured ratings to B from B (low) with a stable outlook.
On January 11, 2010, Fitch upgraded Ford Credit's corporate rating to B- from CCC, the senior unsecured rating to B+ from B, and the short-term rating to B from C; the outlook remains positive.
The following chart summarizes certain of the credit ratings and the outlook presently assigned to Ford and Ford Credit
by these four NRSROs:
NRSRO RATINGS
Ford Ford Credit
Issuer Default/ Corporate/
Issuer Rating
Long-Term Senior
Unsecured Senior
Secured Outlook /
Trend
Long-Term Senior
Unsecured Short-Term Unsecured
Outlook / Trend
DBRS B (low) CCC B (high) Stable B R-5 Stable
Fitch B- CC BB- Positive B+ B Positive
Moody's B3 Caa1 Ba3 Stable B3 NP Review
S&P B- CCC B- Stable B- * NR Stable __________
* S&P assigns FCE a long-term senior unsecured rating of B, maintaining a one notch differential versus Ford Credit.

Management’s Discussion and Analysis of Financial Condition and Results of Operations
54 Ford Motor Company | 2009 Annual Report
OUTLOOK
Although a global economic recovery is underway, the economic environment remains uncertain. We believe that in the face of this uncertainty, our One Ford plan – to aggressively restructure our business to operate profitably at current demand and changing model mix, accelerate development of new products customers want and value, finance our plan and improve our balance sheet, and work together effectively as one team to leverage our global resources – provides the right strategy to achieve our objectives. For additional discussion of the economic environment, and discussion and assessment of the risks and opportunities with regard to our planning assumptions, see our "Risk Factors" and "Overview" discussion above, and "Critical Accounting Estimates" discussion below.
Our projection of upcoming vehicle production (including Ford-badged vehicles manufactured by unconsolidated
affiliates and non-Ford-badged vehicles manufactured by Ford or its consolidated affiliates) is as follows (in thousands):
The increase in first quarter 2010 production compared with a year ago reflects strong customer demand for our
products, and the non-recurrence of prior-year dealer stock declines. We expect gradual improvement in global industry sales volume during 2010, but significant uncertainties remain. As a result of the very effective 2009 scrappage programs in Europe, we expect vehicle demand in that region to be lower in 2010, particularly in Germany.
Our planning assumptions for 2010 include the following:
Although we see improvement in leading economic indicators in our major markets and financial markets have
continued to normalize with ongoing policy support, low levels of consumer confidence and continuing labor market weakness present a challenge to the near-term economic outlook (particularly for the United States and Europe). The outlook for consumer spending in the United States and Europe remains weak, with below-trend growth likely in 2010. In addition, our suppliers and dealers have been weakened by the global economic downturn.
Commodity prices have begun to increase with the emergence of initial signs of economic recovery, and we anticipate this trend will continue in 2010. Our business also will continue to be affected by currency volatility.
We experienced significant positive net pricing in 2009; we expect year-over-year improvement in 2010, but this will be a smaller magnitude than in 2009.

Management’s Discussion and Analysis of Financial Condition and Results of Operations
Ford Motor Company | 2009 Annual Report 55
As reported, we have achieved significant structural cost reductions over the past four years; in 2010, we expect
Automotive structural costs to be somewhat higher as we increase production to meet demand.
We expect that full-year 2010 Automotive operating-related cash flow will be positive, though less than the run rate implied by our strong second half 2009 cash flow. Our recent performance was heavily influenced by seasonal factors, including normal year-end inventory reductions, and significant non-recurring factors such as tax refunds and higher production to rebuild depleted dealer stocks.
Capital spending in 2010 is expected to be in the range of $4.5 billion to $5 billion as we continue to focus on our product plan. This planning assumption for capital spending excludes Volvo and joint ventures that are being deconsolidated under the new accounting standard effective January 1, 2010. On a comparable basis, planned 2010 capital spending is about $1 billion higher than our actual 2009 spending.
We have excluded Volvo from our 2010 planning assumptions based on its held-for-sale status. As announced, we have settled on substantive terms for the sale of Volvo to Zhejiang Geely Group Holding Co. Ltd. While some work still remains relating to final documentation, financing and government approvals, we expect to reach a definitive sales agreement in the first quarter of 2010, with closing of the sale likely to occur in the second quarter of 2010.
While deconsolidation of joint ventures pursuant to the new accounting standard will have no effect on Net income/(loss) attributable to Ford Motor Company and is not expected to have a substantial impact on total cash flow, we estimate that the accounting change will reduce our full-year 2010 pre-tax operating results by $350 million to $400 million. Additionally, deconsolidation will reduce Automotive gross cash by about $550 million, and decrease Automotive debt by about $800 million (of which about $500 million is to mature during 2010) compared with December 31, 2009 levels.
Ford Credit expects to be profitable in 2010, but at a reduced level compared with 2009, reflecting lower average receivables and the non-recurrence of certain favorable factors experienced during 2009. At year-end 2010, Ford Credit anticipates managed receivables to be in the range of $80 billion to $90 billion. The projected decline in managed receivables primarily reflects lower industry and financing volumes in 2009 and 2010 compared with prior years, and the effect of transitioning Jaguar, Land Rover, Mazda and some Volvo financing to other providers. Ford Credit expects to pay distributions of about $1.5 billion in 2010. Ford Credit will continue to assess its ability to make future distributions based on its available liquidity and managed leverage objectives.
Based on our planning assumptions, which include continued improvement in U.S. and global industry sales volume during 2010 and beyond, for full-year 2010 we plan to be profitable on a pre-tax basis excluding special items for Ford North America, total Automotive and total company, with positive Automotive operating-related cash flow. We remain on track for full-year 2011 to be solidly profitable on a pre-tax basis excluding special items, with positive Automotive operating-related cash flow.

Management’s Discussion and Analysis of Financial Condition and Results of Operations
56 Ford Motor Company | 2009 Annual Report
Risk Factors
Statements included or incorporated by reference herein may constitute “forward-looking statements” within the meaning of the Private Securities Litigation Reform Act of 1995. Forward-looking statements are based on expectations, forecasts, and assumptions by our management and involve a number of risks, uncertainties, and other factors that could cause actual results to differ materially from those stated, including, without limitation:
• Further declines in industry sales volume, particularly in the United States or Europe, due to financial crisis, deepening
recession, geo-political events, or other factors; • Decline in market share; • Lower-than-anticipated market acceptance of new or existing products; • An increase in or acceleration of market shift beyond our current planning assumptions from sales of trucks, medium- and
large-sized utilities, or other more profitable vehicles, particularly in the United States; • A return to elevated gasoline prices, as well as the potential for volatile prices or reduced availability; • Continued or increased price competition resulting from industry overcapacity, currency fluctuations, or other factors; • Adverse effects from the bankruptcy, insolvency, or government-funded restructuring of, change in ownership or control of, or
alliances entered into by a major competitor; • A prolonged disruption of the debt and securitization markets; • Fluctuations in foreign currency exchange rates, commodity prices, and interest rates; • Economic distress of suppliers that may require us to provide substantial financial support or take other measures to ensure
supplies of components or materials and could increase our costs, affect our liquidity, or cause production disruptions; • Single-source supply of components or materials; • Labor or other constraints on our ability to restructure our business; • Work stoppages at Ford or supplier facilities or other interruptions of production; • Substantial pension and postretirement health care and life insurance liabilities impairing our liquidity or financial condition; • Worse-than-assumed economic and demographic experience for our postretirement benefit plans (e.g., discount rates or
investment returns); • Restriction on use of tax attributes from tax law "ownership change;" • The discovery of defects in vehicles resulting in delays in new model launches, recall campaigns, or increased warranty costs; • Increased safety, emissions, fuel economy, or other regulation resulting in higher costs, cash expenditures, and/or sales
restrictions; • Unusual or significant litigation or governmental investigations arising out of alleged defects in our products, perceived
environmental impacts, or otherwise; • A change in our requirements for parts or materials where we have long-term supply arrangements that commit us to purchase
minimum or fixed quantities of certain parts or materials, or to pay a minimum amount to the seller ("take-or-pay" contracts); • Adverse effects on our results from a decrease in or cessation of government incentives related to capital investments; • Adverse effects on our operations resulting from certain geo-political or other events; • Substantial levels of Automotive indebtedness adversely affecting our financial condition or preventing us from fulfilling our debt
obligations (which may grow because we are able to incur substantially more debt, including additional secured debt); • Failure of financial institutions to fulfill commitments under committed credit facilities; • Inability of Ford Credit to obtain competitive funding; • Inability of Ford Credit to access debt, securitization, or derivative markets around the world at competitive rates or in sufficient
amounts due to credit rating downgrades, market volatility, market disruption, or other factors; • Higher-than-expected credit losses; • Increased competition from banks or other financial institutions seeking to increase their share of financing Ford vehicles; • Collection and servicing problems related to finance receivables and net investment in operating leases; • Lower-than-anticipated residual values or higher-than-expected return volumes for leased vehicles; • New or increased credit, consumer, or data protection or other regulations resulting in higher costs and/or additional financing
restrictions; and • Inability to implement our One Ford plan.
We cannot be certain that any expectation, forecast, or assumption made in preparing forward-looking statements will prove
accurate, or that any projection will be realized. It is to be expected that there may be differences between projected and actual results. Our forward-looking statements speak only as of the date of their initial issuance, and we do not undertake any obligation to update or revise publicly any forward-looking statement, whether as a result of new information, future events or otherwise.

Management’s Discussion and Analysis of Financial Condition and Results of Operations
Ford Motor Company | 2009 Annual Report 57
CRITICAL ACCOUNTING ESTIMATES
We consider an accounting estimate to be critical if: 1) the accounting estimate requires us to make assumptions about matters that were highly uncertain at the time the accounting estimate was made, and 2) changes in the estimate that are reasonably likely to occur from period to period, or use of different estimates that we reasonably could have used in the current period, would have a material impact on our financial condition or results of operations.
Management has discussed the development and selection of these critical accounting estimates with the Audit Committee of our Board of Directors. In addition, there are other items within our financial statements that require estimation, but are not deemed critical as defined above. Changes in estimates used in these and other items could have a material impact on our financial statements. Warranty and Additional Service Actions
Nature of Estimates Required. The estimated warranty and additional service action costs are accrued for each vehicle at the time of sale. Estimates are principally based on assumptions regarding the lifetime warranty costs of each vehicle line and each model year of that vehicle line, where little or no claims experience may exist. In addition, the number and magnitude of additional service actions expected to be approved, and policies related to additional service actions, are taken into consideration. Due to the uncertainty and potential volatility of these estimated factors, changes in our assumptions could materially affect net income.
Assumptions and Approach Used. Our estimate of warranty and additional service action obligations is re-evaluated on a quarterly basis. Experience has shown that initial data for any given model year can be volatile; therefore, our process relies upon long-term historical averages until sufficient data are available. As actual experience becomes available, it is used to modify the historical averages to ensure that the forecast is within the range of likely outcomes. Resulting accruals are then compared with present spending rates to ensure that the balances are adequate to meet expected future obligations.
See Note 31 of the Notes to the Financial Statements for more information regarding costs and assumptions for warranties and additional service actions. Pensions
Nature of Estimates Required. The estimation of our pension obligations, costs, and liabilities requires that we make use of estimates of the present value of the projected future payments to all participants, taking into consideration the likelihood of potential future events such as demographic experience. These assumptions may have an effect on the amount and timing of future contributions.
Assumptions and Approach Used. The assumptions used in developing the required estimates include the following key factors:
• Discount rates. We base the discount rate assumption primarily on the results of a cash flow matching analysis, which matches the future cash outflows for each major plan to a yield curve comprised of high quality bonds specific to the country of the plan. Benefit payments are discounted at the rates on the curve and a single discount rate specific to the plan is determined.
• Expected return on plan assets. The expected return on plan assets assumption reflects historical returns and long-run inputs from a range of advisors for capital market returns, inflation, bond yields, and other variables, adjusted for specific aspects of our investment strategy. The assumption is based on consideration of all inputs, with a focus on long-term trends to avoid short-term market influences. Assumptions are not changed unless structural trends in the underlying economy are identified, our asset strategy changes, or there are significant changes in other inputs.
• Salary growth. The salary growth assumption reflects our long-term actual experience, outlook, and assumed inflation.
• Inflation. Our inflation assumption is based on an evaluation of external market indicators. • Expected contributions. The expected amount and timing of contributions is based on an assessment of minimum
requirements, and additional amounts based on cash availability and other considerations (e.g., funded status, avoidance of regulatory premiums and levies, and tax efficiency).
• Retirement rates. Retirement rates are developed to reflect actual and projected plan experience. • Mortality rates. Mortality rates are developed to reflect actual and projected plan experience.

Management’s Discussion and Analysis of Financial Condition and Results of Operations
58 Ford Motor Company | 2009 Annual Report
Plan obligations and costs are based on existing retirement plan provisions. No assumption is made regarding any
potential future changes to benefit provisions beyond those to which we are presently committed (e.g., in existing labor contracts).
The effects of actual results differing from our assumptions and the effects of changing assumptions are included in unamortized net gains and losses. Unamortized gains and losses are amortized over future periods and, therefore, generally affect our recognized expense in future periods. Amounts are recognized as a component of net expense over the expected future years of service (approximately 12 years for the major U.S. plans). In 2009, the U.S. actual return on assets was 14.4%, which was higher than the expected return of 8.25%. The year-end 2009 weighted average discount rates for the U.S. and non-U.S. plans decreased by 64 and 27 basis points, respectively. These differences resulted in unamortized losses of about $2 billion (excluding Volvo). These losses are only amortized to the extent they exceed 10% of the higher of the market-related value of assets or the projected benefit obligation of the respective plan. For the major U.S. plans, the losses do not exceed this threshold and recognition will begin at a future measurement date.
See Note 18 of the Notes to the Financial Statements for more information regarding costs and assumptions for employee retirement benefits.
Sensitivity Analysis. The December 31, 2009 pension funded status and 2010 expense are affected by year-end 2009 assumptions. These sensitivities may be asymmetric and are specific to the time periods noted. They also may not be additive, so the impact of changing multiple factors simultaneously cannot be calculated by combining the individual sensitivities shown. The effect of the indicated increase/(decrease) in selected factors is shown below (in millions):
The foregoing indicates that changes in the discount rate and return on assets can have a significant effect on the
expense of our pension plans and/or obligation. We cannot predict these changes in discount rates or investment returns and, therefore, cannot reasonably estimate whether adjustments to our expense or obligation in subsequent years will be significant. Other Postretirement Employee Benefits
Nature of Estimates Required. The estimation of our obligations, costs, and liabilities associated with OPEB, primarily retiree health care and life insurance, requires that we make use of estimates of the present value of the projected future payments to all participants, taking into consideration the likelihood of potential future events such as health care cost increases and demographic experience, which may have an effect on the amount and timing of future payments.
Assumptions and Approach Used. The assumptions used in developing the required estimates include the following key factors:
• Discount rates. We base the discount rate assumption primarily on the results of a cash flow matching analysis, which matches the future cash outflows for each plan to a yield curve comprised of high quality bonds specific to the country of the plan. Benefit payments are discounted at the rates on the curve and a single discount rate specific to the plan is determined.
• Health care cost trends. Our health care cost trend assumptions are developed based on historical cost data, the near-term outlook, and an assessment of likely long-term trends.
• Salary growth. The salary growth assumptions reflect our long-term actual experience, outlook and assumed inflation.
• Retirement rates. Retirement rates are developed to reflect actual and projected plan experience. • Mortality rates. Mortality rates are developed to reflect actual and projected plan experience.

Management’s Discussion and Analysis of Financial Condition and Results of Operations
Ford Motor Company | 2009 Annual Report 59
Plan obligations and costs are based on existing retirement plan provisions. No assumption is made regarding any
potential future changes to benefit provisions beyond those to which we are presently committed (e.g., in existing labor contracts).
The effects of actual results differing from our assumptions and the effects of changing assumptions are included in unamortized net gains and losses. Unamortized gains and losses are amortized over future periods and, therefore, generally affect our recognized expense in future periods. The weighted average discount rate used to determine the benefit obligation for U.S. plans at December 31, 2009 was 5.74%, compared with 4.95% (6.37% excluding the UAW retiree health care obligation) at December 31, 2008, resulting in an unamortized loss of about $250 million. This amount is expected to be recognized as a component of net expense over the expected future years of service (approximately 14 years).
See Note 18 of the Notes to the Financial Statements for more information regarding costs and assumptions for other postretirement employee benefits.
Sensitivity Analysis. The effect on U.S. and Canadian plans of a one percentage point increase/(decrease) in the assumed discount rate would be a (decrease)/increase in the postretirement health care benefit expense for 2010 of approximately $(30) million/$40 million, and in the year-end 2009 obligation of approximately $(590) million/$720 million. Impairments of Goodwill and Long-Lived Assets
Nature of Estimates Required – Goodwill. Goodwill is not amortized, but is subject to periodic assessments of impairment. We test goodwill for impairment annually during the fourth quarter, or when events occur or circumstances change that would more likely than not reduce the fair value of the reporting unit below its carrying value. Impairment of goodwill is evaluated using a two step process. The first step involves comparison of the fair value of a reporting unit with its carrying value. If the carrying value of the reporting unit exceeds its fair value, the second step of the process involves comparison of the implied fair value of goodwill with its carrying value. The implied fair value of goodwill is equivalent to the excess of the fair value of a reporting unit over the amounts assigned to its assets and liabilities as if the reporting unit had been acquired in a business combination. If the carrying value of the reporting unit's goodwill exceeds the implied fair value of that goodwill, an impairment loss is recognized in an amount equal to the excess. Restoration of a previously-recognized goodwill impairment loss is not allowed.
Nature of Estimates Required – Held-and-Used Long-Lived Assets. Long-lived asset groups are tested for recoverability when changes in circumstances indicate the carrying value may not be recoverable. Events that trigger a test for recoverability include material adverse changes in projected revenues and expenses, significant underperformance relative to historical and projected future operating results, and significant negative industry or economic trends. When a triggering event occurs, a test for recoverability is performed, comparing projected undiscounted future cash flows to the carrying value of the asset group. If the test for recoverability identifies a possible impairment, the asset group's fair value is measured relying primarily on a discounted cash flow methodology. An impairment charge is recognized for the amount by which the carrying value of the asset group exceeds its estimated fair value. A test for recoverability also is performed when management has committed to a plan to sell or otherwise dispose of an asset group and the plan is expected to be completed within a year. When an impairment loss is recognized for assets to be held and used, the adjusted carrying amount of those assets is depreciated over its remaining useful life. Restoration of a previously-recognized long-lived asset impairment loss is not allowed.

Management’s Discussion and Analysis of Financial Condition and Results of Operations
60 Ford Motor Company | 2009 Annual Report
Nature of Estimates Required – Held-for-Sale Operations. We perform an impairment test on an asset group to be discontinued, held for sale, or otherwise disposed of when management has committed to the action and the action is expected to be completed within one year. We estimate fair value to approximate the expected proceeds to be received. An impairment charge is recognized when the carrying value of the asset group exceeds the estimated fair value less transaction costs.
Automotive Sector
Assumptions and Approach Used. We measure the fair value of a reporting unit or asset group based on market prices (i.e., the amount for which the asset could be sold to a third party), when available. When market prices are not available, we estimate the fair value of the reporting unit or asset group using the income approach and/or the market approach. The income approach uses cash flow projections. Inherent in our development of cash flow projections are assumptions and estimates derived from a review of our operating results, approved business plans, expected growth rates, and cost of capital, similar to those a market participant would use to assess fair value. We also make certain assumptions about future economic conditions and other data. Many of the factors used in assessing fair value are outside the control of management, and these assumptions and estimates may change in future periods.
Changes in assumptions or estimates can materially affect the fair value measurement of a reporting unit or asset group, and therefore can affect the amount of the impairment. The following are key assumptions we use in making cash flow projections:
• Business projections. We make assumptions about the demand for our products in the marketplace. These assumptions drive our planning assumptions for volume, mix, and pricing. We also make assumptions about our cost levels (e.g., capacity utilization, cost performance, etc.). These projections are derived using our internal business plans that are updated at least annually and reviewed by our Board of Directors.
• Long-term growth rate. A growth rate is used to calculate the terminal value of the business, and is added to the present value of the debt-free interim cash flows. The growth rate is the expected rate at which a business unit's earnings stream is projected to grow beyond the planning period.
• Discount rate. When measuring possible impairment, future cash flows are discounted at a rate that is consistent with a weighted-average cost of capital that we anticipate a potential market participant would use. Weighted-average cost of capital is an estimate of the overall risk-adjusted after-tax rate of return required by equity and debt holders of a business enterprise, which is developed with the assistance of external financial advisors.
• Economic projections. Assumptions regarding general economic conditions are included in and affect our assumptions regarding industry sales and pricing estimates for our vehicles. These macro-economic assumptions include, but are not limited to, industry sales volumes, inflation, interest rates, prices of raw materials (i.e., commodities), and foreign currency exchange rates.
The market approach is another method for measuring the fair value of a reporting unit or asset group. This approach relies on the market value (i.e., market capitalization) of companies that are engaged in the same or similar line of business.
Automotive Sector – Goodwill
We had $34 million of Automotive goodwill on our balance sheet at December 31, 2009, all related to Ford of Europe. Volvo goodwill is reflected as part of held-for-sale assets (see Note 24 of the Notes to the Financial Statements for additional detail).
Ford Europe. We performed our annual goodwill testing in the fourth quarter of 2009 and assessed that the carrying
value of our Ford Europe reporting unit at December 31, 2009 did not exceed its fair value. Volvo. As previously disclosed, in the fourth quarter of 2007 we recorded a $2.4 billion impairment of our Volvo
goodwill. We estimated at that time that a 0.5 percentage point decrease in the long-term growth rate would have decreased our fair value estimate by about $250 million. A 0.5 percentage point increase in the discount rate assumption would have decreased the fair value estimate by about $350 million.
In the fourth quarter of 2008, we performed annual goodwill impairment testing for our Volvo reporting unit. We
compared the carrying value of our Volvo reporting unit to its fair value, and concluded that the goodwill was not impaired. We performed this measurement relying primarily on the income approach, applying a discounted cash flow methodology.

Management’s Discussion and Analysis of Financial Condition and Results of Operations
Ford Motor Company | 2009 Annual Report 61
Our valuation was based on an in-use premise which considered a discount rate, after-tax return on sales rate, growth rate, and terminal value consistent with assumptions we believed principal market participants (i.e., other global automotive manufacturers) would use. This methodology produced appropriate valuations for entities we disposed of in recent years; in light of worsening economic conditions, however, we also considered other valuations, including a discounted cash flow analysis using more conservative assumptions than we initially used. This alternative analysis incorporated a significantly higher discount rate, offset partially by a higher growth rate; a much lower after-tax return on sales rate; and a lower terminal value. This alternative analysis reduced the valuation of our Volvo reporting unit by about 50%. Even this more conservative analysis, however, did not support an impairment of Volvo goodwill at year-end 2008. For information regarding 2009 testing, see "Automotive Sector – Held-for-Sale Operations" shown below.
Automotive Sector – Held-and-Used Long-Lived Assets
In 2008, we examined each of our asset groups for triggering events and recorded a pre-tax impairment charge for Ford North America. All other asset groups were found to either have no triggering events or have a carrying value of assets that was recoverable.
Ford North America. Due to rapidly-changing U.S. market conditions in the second quarter of 2008 (discussed in Note 15 of the Notes to the Financial Statements), we tested the long-lived assets of our Ford North America segment and recorded a pre-tax impairment charge of $5.3 billion. The impairment was driven almost entirely by deterioration in projected cash flows for our near-term business plan period, attributable to changes in our business and economic projections as discussed above. Following this impairment, Ford North America had $11 billion of net property recorded in our financial statements as of June 30, 2008.
Sensitivity Analysis. The impairment reflected changes in the assumptions used to measure the fair value of the asset group based on the rapidly-changing market conditions (including changes to our business projections). The most notable changes in our business and economic projections included: (1) a more pronounced and accelerated shift in consumer preferences away from full-size trucks and SUVs to smaller and more fuel-efficient vehicles as a result of higher fuel prices, with a return over time to a level between today's mix and recent levels; (2) lowered U.S. industry demand in the near term, with a return to trend levels as the U.S. economy recovers subsequent to 2010; and (3) higher commodity costs over the business plan period compared with prior projections. For additional discussion of the planning assumptions used, see the "Outlook" discussion in our Quarterly Report on Form 10-Q for the period ended June 30, 2008.
Beyond the business and economic projections discussed above, we also updated our assumptions with regard to long-term growth and discount rates. The long-term growth rate assumption used in our second quarter 2008 testing is similar to that used in our 2006 North America impairment testing, when we last had an impairment of North America fixed assets. This growth rate, however, when applied to lowered business plan period projections, resulted in a less favorable undiscounted long-term outlook. This outlook is consistent with our present projection of lower margins, resulting primarily from the recent shift in consumer preferences discussed above. We estimate that a 0.5 percentage point decrease in the long-term growth rate assumed in our second quarter impairment testing would have decreased the fair value estimate by about $800 million.
The discount rate that we used in our second quarter of 2008 impairment testing was consistent with a weighted-average cost of capital that we estimate a potential market participant would use. This discount rate was lower than that used in our 2006 impairment testing, primarily reflecting the change in long-term outlook discussed above. A 0.5 percentage point increase in the discount rate assumption used in the impairment testing would have decreased the fair value estimate by about $1.4 billion.
During the third quarter of 2008, we experienced a severe deterioration in U.S. credit markets, which adversely affected economic conditions and depressed automotive sales. As a result of this significant adverse change in the U.S. business climate, we again tested the long-lived assets of our Ford North America segment. Using updated business and economic projections, we assessed that the carrying value of our long-lived assets at September 30, 2008 did not exceed their fair value. We used the same long-term growth rate as used in our second quarter testing as we believe that long-term economic conditions have not deteriorated as a result of the present credit crisis. We estimate that a 0.5 percentage point decrease in the long-term growth rate assumed in our third quarter impairment testing would have decreased the fair value estimate by about $800 million. Additionally, we used the same discount rate as used in our second quarter testing. This is based on the assumption that the present credit crisis does not have a material impact on the weighted cost of capital in the medium- to long-term (consistent with our planning horizon). A 0.5 percentage point increase in the discount rate assumption used in the impairment testing would have decreased the fair value estimate by about $1.3 billion.

Management’s Discussion and Analysis of Financial Condition and Results of Operations
62 Ford Motor Company | 2009 Annual Report
We closely examined each of our asset groups for triggering events and most recently tested each of our held-and-
used asset groups in the first quarter of 2009. We assessed that the carrying value of our long-lived assets was recoverable.
In 2010, we have plans to expand our product line-up in the United States to include additional small, more fuel-efficient vehicles to our product portfolio which will more closely match the overall market. Additionally, we continue to align our production capacity with industry sales volume and market share. As our plan progresses, we will be less exposed to rapid changes in vehicle mix and demand, and less susceptible to future impairment of long-lived assets. For further discussion of actions we are taking to respond to changing market conditions, see "Overview" above.
Refer to the Held-for-Sale Operations discussion below for detail regarding our 2009 impairment testing of Volvo.
Automotive Sector – Held-for-Sale Operations
Volvo. As previously disclosed, in recent years we have undertaken efforts to divest non-core assets in order to allow us to focus exclusively on our global Ford brand. Toward that end, in 2007 we sold our interest in Aston Martin; in 2008, we sold our interest in Jaguar Land Rover, and a significant portion of our ownership in Mazda. During the first quarter of 2009, based on our strategic review of Volvo and in light of our goal to focus on the global Ford brand, our Board of Directors committed to actively market Volvo for sale, notwithstanding the current distressed market for automotive-related assets. Accordingly, in the first quarter of 2009 we reported Volvo as held for sale and we ceased depreciation of its long-lived assets in the second quarter of 2009.
Our commitment to actively market Volvo for sale also triggered a held-for-sale impairment test in the first quarter of 2009. We received information from our discussions with potential buyers that provided us a value for Volvo using a market approach, rather than an income approach. We concluded that the information we received from our discussions with potential buyers was more representative of the value of Volvo given the current market conditions, the characteristics of viable market participants, and our anticipation of a more immediate transaction for Volvo. These inputs resulted in a lower value for Volvo than the discounted cash flow method we had previously used.
After considering deferred gains reported in Accumulated other comprehensive income/(loss), we recognized a pre-tax impairment charge of $650 million related to our total investment in Volvo. The impairment was recorded in Automotive cost of sales for the first quarter of 2009.
Had we not committed to actively market Volvo for sale, we would not have been afforded the benefit of the new
information obtained in discussions with potential buyers. Rather, we would have continued to employ an in-use premise to test Volvo's goodwill and long-lived assets, using a discounted cash flow methodology with assumptions similar to those we used at year-end 2008. Such a discounted cash flow methodology would not have resulted in an impairment of goodwill or long-lived assets at March 31, 2009.
See Notes 15, 16 and 24 of the Notes to the Financial Statements for more information regarding impairment of long-
lived assets, goodwill, and held-for-sale operations. Financial Services Sector – Ford Credit North America Investment in Operating Leases
Assumptions and Approach Used. As noted above, we measure the fair value of an asset group based on market prices
(i.e., the amount for which the asset could be sold to a third party), when available. When market prices are not available, we estimate the fair value of the asset group using the income approach. The income approach uses discounted cash flow projections. Ford Credit measures the fair value of its North America operating lease portfolio using the projected cash flow based on the terms of the operating lease contracts. Inherent in the cash flow assumptions are estimates derived from its quarterly operating lease portfolio adequacy study for accumulated depreciation. Many of the factors used in measuring fair value are outside the control of management, and these assumptions and estimates may change in future periods.

Management’s Discussion and Analysis of Financial Condition and Results of Operations
Ford Motor Company | 2009 Annual Report 63
Changes in assumptions or estimates may materially affect the fair value measurement of an asset group, and therefore
may affect the amount of the impairment. The following are key assumptions we use in making cash flow projections for Ford Credit's operating leases:
• Auction values. Ford Credit's projection of the market value of the vehicles when Ford Credit sells them at the end of the lease.
• Return volume. Ford Credit's projection of the number of vehicles that will be returned at lease-end. • Discount rate. Ford Credit's estimation of the discount rate, reflecting hypothetical market assumptions regarding
borrowing rates, credit loss patterns, and residual value risk.
See Notes 15 of the Notes to the Financial Statements for more information regarding impairment of long-lived assets.
Sensitivity Analysis. Higher fuel prices and the weak economic climate in the United States and Canada during the second quarter of 2008 caused a more pronounced and accelerated shift in consumer preferences away from full-size trucks and SUVs to smaller, more fuel-efficient vehicles. This shift in consumer preferences, combined with the weak economic climate, caused a significant reduction in auction values for used full-size trucks and SUVs (as discussed in Note 15 of the Notes to the Financial Statements). Recognizing these rapidly-changing market conditions, Ford Credit tested its U.S. and Canadian investments in operating leases for recoverability. As a result of this testing, Ford Credit concluded that the operating lease portfolio was impaired and we and Ford Credit recorded a pre-tax charge of $2.1 billion in second quarter 2008 financial statements. This charge represents the amount by which the carrying value of certain vehicle lines in Ford Credit's lease portfolio, primarily full-size trucks and SUVs, exceeded their fair value. See "Residual Risk" discussion above for additional information regarding the significant decrease in auction values.
At the time of the impairment, Ford Credit estimated that a one percent decrease in the auction value of the impaired vehicles assumed in the impairment testing would have decreased the fair value estimate by about $50 million. A one percentage point increase in the return rate of the impaired vehicles assumed in the impairment testing would have decreased the fair value estimate by about $30 million. A one percentage point increase in the discount rate assumed in the impairment testing would have decreased the fair value estimate by about $100 million.
Although at this time we do not anticipate additional impairment charges, a deterioration of the business climate would impact the assumptions we use in future impairment testing and could result in additional impairments. Valuation of Deferred Tax Assets
Nature of Estimates Required. Deferred tax assets and liabilities are recognized based on the future tax consequences attributable to temporary differences that exist between the financial statement carrying value of assets and liabilities and their respective tax bases, and operating loss and tax credit carryforwards on a taxing jurisdiction basis. We measure deferred tax assets and liabilities using enacted tax rates that will apply in the years in which we expect the temporary differences to be recovered or paid.
U.S. GAAP standards of accounting for income taxes require a reduction of the carrying amounts of deferred tax assets
by recording a valuation allowance if, based on the available evidence, it is more likely than not (defined as a likelihood of more than 50%) such assets will not be realized. The valuation of deferred tax assets requires judgment in assessing the likely future tax consequences of events that have been recognized in our financial statements or tax returns and future profitability. Our accounting for deferred tax consequences represents our best estimate of those future events. Changes in our current estimates, due to unanticipated events or otherwise, could have a material impact on our financial condition and results of operations.
Assumptions and Approach Used. In assessing the need for a valuation allowance, we consider both positive and
negative evidence related to the likelihood of realization of the deferred tax assets. If, based on the weight of available evidence, it is more likely than not the deferred tax assets will not be realized, we record a valuation allowance. The weight given to the positive and negative evidence is commensurate with the extent to which the evidence may be objectively verified. As such, it is generally difficult for positive evidence regarding projected future taxable income exclusive of reversing taxable temporary differences to outweigh objective negative evidence of recent financial reporting losses. U.S. GAAP states that a cumulative loss in recent years is a significant piece of negative evidence that is difficult to overcome in determining that a valuation allowance is not needed against deferred tax assets.

Management’s Discussion and Analysis of Financial Condition and Results of Operations
64 Ford Motor Company | 2009 Annual Report
This assessment, which is completed on a taxing jurisdiction basis, takes into account a number of types of evidence,
including the following:
• Nature, frequency, and severity of current and cumulative financial reporting losses. A pattern of objectively measured recent financial reporting losses is heavily weighted as a source of negative evidence. In certain circumstances, historical information may not be as relevant due to changed circumstances;
• Sources of future taxable income. Future reversals of existing temporary differences are heavily-weighted sources of objectively verifiable positive evidence. Projections of future taxable income exclusive of reversing temporary differences are a source of positive evidence only when the projections are combined with a history of recent profits and can be reasonably estimated. Otherwise, these projections are considered inherently subjective and generally will not be sufficient to overcome negative evidence that includes relevant cumulative losses in recent years, particularly if the projected future taxable income is dependent on an anticipated turnaround to profitability that has not yet been achieved. In such cases, we generally give these projections of future taxable income no weight for the purposes of our valuation allowance assessment pursuant to U.S. GAAP; and
• Tax planning strategies. If necessary and available, tax planning strategies would be implemented to accelerate taxable amounts to utilize expiring carryforwards. These strategies would be a source of additional positive evidence and, depending on their nature, could be heavily weighted.
See Note 23 of the Notes to the Financial Statements for more information regarding deferred tax assets.
Sensitivity Analysis. In 2006, our net deferred tax position in the United States changed from a net deferred tax liability
position to a net deferred tax asset position. In our assessment of the need for a valuation allowance, we heavily weighted the negative evidence of cumulative financial reporting losses in recent periods and the positive evidence of future reversals of existing temporary differences. Although a sizable portion of our North American losses in recent years were the result of charges incurred for restructuring actions, impairments, and other special items, even without these charges we still would have incurred significant operating losses. Accordingly, we considered our pattern of recent losses to be relevant to our analysis. Considering this pattern of recent relevant losses and the uncertainties associated with projected future taxable income exclusive of reversing temporary differences, we gave no weight to projections showing future U.S. taxable income for purposes of assessing the need for a valuation allowance. As a result of our assessment, we concluded that the net deferred tax assets of our U.S. entities required a full valuation allowance. We also recorded a full valuation allowance on the net deferred tax assets of certain foreign entities, such as Germany, Canada, and Spain, as the realization of these foreign deferred tax assets are reliant upon U.S.-source taxable income.
At December 31, 2006, we reported a $7.3 billion valuation allowance against our deferred tax assets (including $2.7 billion resulting from the adoption of the revised standard on accounting for defined benefit pension and other postretirement benefit plans). During 2007, we recorded an additional valuation allowance of $700 million. Losses during 2008, primarily in the United States, increased the valuation allowance by $9.3 billion to a balance of $17.3 billion at December 31, 2008. The valuation allowance increased by $200 million in 2009, which reflects a $1.1 billion increase related to charges to other comprehensive income, partially offset by a $900 million decrease as a result of operating profits.
A sustained period of profitability in our North America operations is required before we would change our judgment
regarding the need for a full valuation allowance against our net deferred tax assets. Accordingly, although we were profitable in 2009, we continue to record a full valuation allowance against the net deferred tax assets in the United States and foreign entities discussed above. Although the weight of negative evidence related to cumulative losses is decreasing as we deliver on our One Ford plan (discussed in "Overview" and "Outlook" above), we believe that this objectively-measured negative evidence outweighs the subjectively-determined positive evidence and, as such, we currently do not anticipate a change in judgment regarding the need for a full valuation allowance in 2010. The consumption of tax attributes to offset expected operating profits during 2010, however, would reduce the overall level of deferred tax assets subject to valuation allowance.
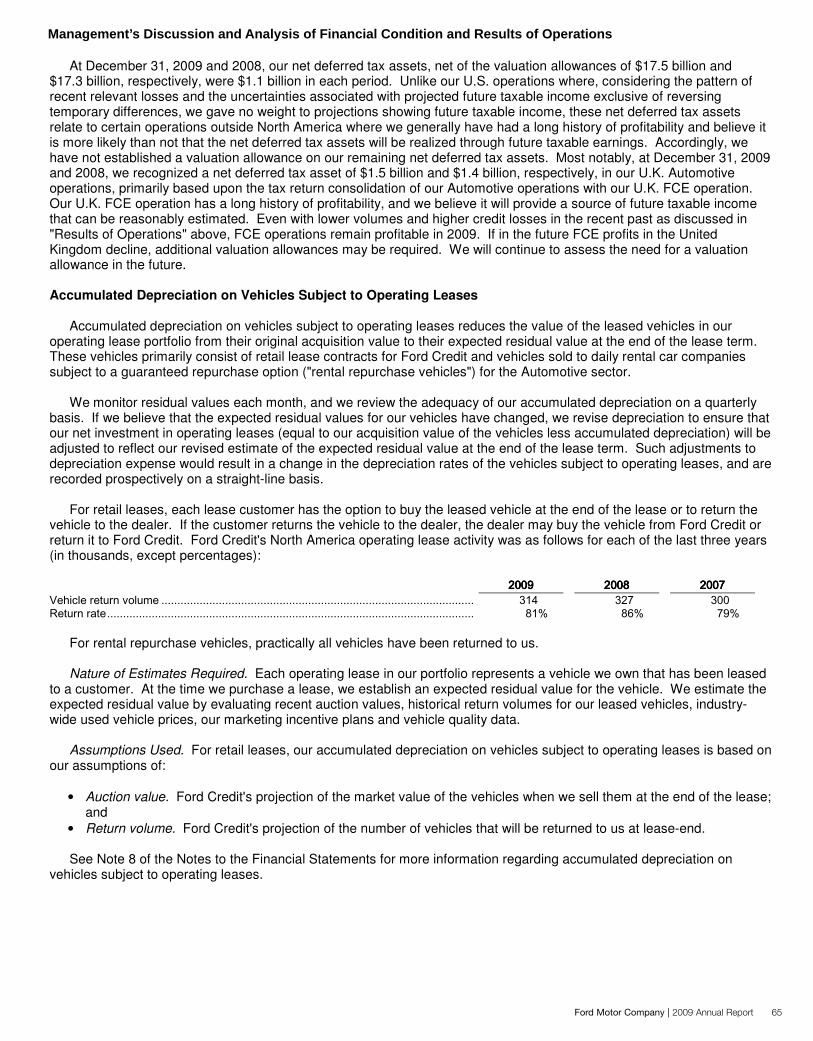
Management’s Discussion and Analysis of Financial Condition and Results of Operations
Ford Motor Company | 2009 Annual Report 65
At December 31, 2009 and 2008, our net deferred tax assets, net of the valuation allowances of $17.5 billion and
$17.3 billion, respectively, were $1.1 billion in each period. Unlike our U.S. operations where, considering the pattern of recent relevant losses and the uncertainties associated with projected future taxable income exclusive of reversing temporary differences, we gave no weight to projections showing future taxable income, these net deferred tax assets relate to certain operations outside North America where we generally have had a long history of profitability and believe it is more likely than not that the net deferred tax assets will be realized through future taxable earnings. Accordingly, we have not established a valuation allowance on our remaining net deferred tax assets. Most notably, at December 31, 2009 and 2008, we recognized a net deferred tax asset of $1.5 billion and $1.4 billion, respectively, in our U.K. Automotive operations, primarily based upon the tax return consolidation of our Automotive operations with our U.K. FCE operation. Our U.K. FCE operation has a long history of profitability, and we believe it will provide a source of future taxable income that can be reasonably estimated. Even with lower volumes and higher credit losses in the recent past as discussed in "Results of Operations" above, FCE operations remain profitable in 2009. If in the future FCE profits in the United Kingdom decline, additional valuation allowances may be required. We will continue to assess the need for a valuation allowance in the future. Accumulated Depreciation on Vehicles Subject to Operating Leases
Accumulated depreciation on vehicles subject to operating leases reduces the value of the leased vehicles in our operating lease portfolio from their original acquisition value to their expected residual value at the end of the lease term. These vehicles primarily consist of retail lease contracts for Ford Credit and vehicles sold to daily rental car companies subject to a guaranteed repurchase option ("rental repurchase vehicles") for the Automotive sector.
We monitor residual values each month, and we review the adequacy of our accumulated depreciation on a quarterly basis. If we believe that the expected residual values for our vehicles have changed, we revise depreciation to ensure that our net investment in operating leases (equal to our acquisition value of the vehicles less accumulated depreciation) will be adjusted to reflect our revised estimate of the expected residual value at the end of the lease term. Such adjustments to depreciation expense would result in a change in the depreciation rates of the vehicles subject to operating leases, and are recorded prospectively on a straight-line basis.
For retail leases, each lease customer has the option to buy the leased vehicle at the end of the lease or to return the vehicle to the dealer. If the customer returns the vehicle to the dealer, the dealer may buy the vehicle from Ford Credit or return it to Ford Credit. Ford Credit's North America operating lease activity was as follows for each of the last three years (in thousands, except percentages):
For rental repurchase vehicles, practically all vehicles have been returned to us. Nature of Estimates Required. Each operating lease in our portfolio represents a vehicle we own that has been leased
to a customer. At the time we purchase a lease, we establish an expected residual value for the vehicle. We estimate the expected residual value by evaluating recent auction values, historical return volumes for our leased vehicles, industry-wide used vehicle prices, our marketing incentive plans and vehicle quality data.
Assumptions Used. For retail leases, our accumulated depreciation on vehicles subject to operating leases is based on
our assumptions of: • Auction value. Ford Credit's projection of the market value of the vehicles when we sell them at the end of the lease;
and • Return volume. Ford Credit's projection of the number of vehicles that will be returned to us at lease-end. See Note 8 of the Notes to the Financial Statements for more information regarding accumulated depreciation on
vehicles subject to operating leases.

Management’s Discussion and Analysis of Financial Condition and Results of Operations
66 Ford Motor Company | 2009 Annual Report
Sensitivity Analysis. For returned vehicles, we face a risk that the amount we obtain from the vehicle sold at auction
will be less than our estimate of the expected residual value for the vehicle. At December 31, 2009, if future auction values for Ford Credit's existing portfolio of operating leases on Ford, Lincoln and Mercury brand vehicles in the United States were to decrease by one percent from its present estimates, the effect would be to increase the depreciation on these vehicles by about $50 million. Similarly, if return volumes for Ford Credit's existing portfolio of operating leases on Ford, Lincoln and Mercury brand vehicles in the United States were to increase by one percent from its present estimates, the effect would be to increase the depreciation on these vehicles by about $7 million. These increases in depreciation would be charged to depreciation expense during the 2010 through 2013 period so that the net investment in operating leases at the end of the lease term for these vehicles is equal to the revised expected residual value. Adjustments to the amount of accumulated depreciation on operating leases will be reflected on our balance sheet as Net investment in operating leases and on the statement of operations in Depreciation, in each case under the Financial Services sector. Allowance for Credit Losses
The allowance for credit losses is Ford Credit's estimate of the probable credit losses inherent in finance receivables and operating leases at the date of the balance sheet. Consistent with its normal practices and policies, Ford Credit assesses the adequacy of its allowance for credit losses quarterly and regularly evaluates the assumptions and models used in establishing the allowance. Because credit losses can vary substantially over time, estimating credit losses requires a number of assumptions about matters that are uncertain.
Nature of Estimates Required. Ford Credit estimates the probable credit losses inherent in finance receivables and operating leases based on several factors.
Retail Installment and Lease Portfolio. The retail installment and lease portfolio is evaluated using a combination of models and management judgment, and is based on factors such as historical trends in credit losses and recoveries (including key metrics such as delinquencies, repossessions, and bankruptcies), the composition of Ford Credit's present portfolio (including vehicle brand, term, risk evaluation, and new/used vehicles), trends in historical and projected used vehicle values, and economic conditions. Estimates from models may not fully reflect losses inherent in the present portfolio, and an element of the allowance for credit losses is established for the imprecision inherent in loan loss models. Reasons for imprecision include changes in economic trends and conditions, portfolio composition and other relevant factors.
Assumptions Used. Ford Credit makes projections of two key assumptions:
• Frequency. The number of finance receivables and operating lease contracts that Ford Credit expects will default over a period of time, measured as repossessions; and
• Loss severity. The expected difference between the amount a customer owes Ford Credit when Ford Credit charges off the finance contract and the amount Ford Credit receives, net of expenses, from selling the repossessed vehicle, including any recoveries from the customer.
Ford Credit uses these assumptions to assist in estimating its allowance for credit losses. See Note 9 of the Notes to
the Financial Statements for more information regarding allowance for credit losses. Sensitivity Analysis. Changes in the assumptions used to derive frequency and severity would affect the allowance for
credit losses. The effect of the indicated increase/decrease in the assumptions is shown below for Ford, Lincoln, and Mercury brand vehicles in the U.S. retail and lease portfolio (in millions):
__________
* Reflects the number of finance receivables and operating lease contracts that Ford Credit expects will default over a period of time relative to the average number of contracts outstanding.

Management’s Discussion and Analysis of Financial Condition and Results of Operations
Ford Motor Company | 2009 Annual Report 67
Wholesale and Dealer Loan Portfolio. The wholesale and dealer loan portfolio is evaluated by segmenting individual loans into risk pools, which are determined by the risk characteristics of the loan (such as the amount of the loan, the nature of collateral, and the financial status of the dealer). The risk pools are analyzed to determine if individual loans are impaired, and an allowance is estimated for the expected loss of these loans.
Changes in Ford Credit's assumptions affect the Provision for credit and insurance losses on our statement of operations and the allowance for credit losses contained within Finance receivables, net and Net investment in operating leases on our balance sheet, in each case under the Financial Services sector. ACCOUNTING STANDARDS ISSUED BUT NOT YET ADOPTED
For information on accounting standards issued but not yet adopted, see Note 3 of the Notes to the Financial
Statements. AGGREGATE CONTRACTUAL OBLIGATIONS
We are party to many contractual obligations involving commitments to make payments to third parties. Most of these are debt obligations incurred by our Financial Services sector. Long-term debt may have fixed or variable interest rates. For long-term debt with variable rate interest, we estimate the future interest payments based on projected market interest rates for various floating-rate benchmarks received from third parties. In addition, as part of our normal business practices, we enter into contracts with suppliers for purchases of certain raw materials, components and services. These arrangements may contain fixed or minimum quantity purchase requirements. We enter into such arrangements to facilitate adequate supply of these materials and services. "Purchase obligations" are defined as off-balance sheet agreements to purchase goods or services that are enforceable and legally binding on the Company and that specify all significant terms.
The table below summarizes our contractual obligations as of December 31, 2009 (in millions):
(a) Amount includes, prior to adjustment noted above, $1,641 million for the Automotive sector and $26.3 billion for the Financial Services sector for the
current portion of long-term debt. See Note 19 of the Notes to the Financial Statements for additional discussion. (b) Automotive sector excludes unamortized debt discounts of $(4,578) million. Financial Services sector excludes unamortized debt discounts of
$(530) million and adjustments of $231 million related to designated fair value hedges of the debt. (c) For the years 2010 – 2013, excludes deferred interest on our Subordinated Convertible Debentures; for all periods, excludes amortization of debt
discounts. (d) Intersector elimination related to Ford's acquisition of Ford Credit debt securities. See Note 1 of the Notes to the Financial Statements for additional
detail.

Management’s Discussion and Analysis of Financial Condition and Results of Operations
68 Ford Motor Company | 2009 Annual Report
The amount of unrecognized tax benefits for 2009 of $1.2 billion (see Note 23 of the Notes to the Financial Statements) is excluded from the table above. Final settlement of a significant portion of these obligations will require bilateral tax agreements among us and various countries, the timing of which cannot be reasonably estimated.
For additional information regarding long-term debt, operating lease obligations, and pension and OPEB obligations and the UAW VEBA Trust, see Notes 19, 8, and 18, respectively, of the Notes to the Financial Statements.

Quantitative and Qualitative Disclosures About Market Risk
Ford Motor Company | 2009 Annual Report 69
OVERVIEW
We are exposed to a variety of market and other risks, including the effects of changes in foreign currency exchange rates, commodity prices, interest rates, as well as risks to availability of funding sources, hazard events, and specific asset risks.
These risks affect our Automotive and Financial Services sectors differently. We monitor and manage these exposures as an integral part of our overall risk management program, which includes regular reports to a central management committee, the Global Risk Management Committee ("GRMC"). The GRMC is chaired by our Chief Financial Officer, and its members include our Treasurer, our Corporate Controller, and other members of senior management.
Our Automotive and Financial Services sectors are exposed to liquidity risk, or the possibility of having to curtail their businesses or being unable to meet present and future financial obligations as they come due because funding sources may be reduced or become unavailable. We maintain plans for sources of funding to ensure liquidity through a variety of economic or business cycles. As discussed in greater detail in "Management's Discussion and Analysis of Financial Condition and Results of Operations" our funding sources include sales of receivables in securitizations and other structured financings, unsecured debt issuances, equity and equity-linked issuances, and bank borrowings.
We are exposed to a variety of insurable risks, such as loss or damage to property, liability claims, and employee injury.
We protect against these risks through a combination of self-insurance and the purchase of commercial insurance designed to protect against events that could generate significant losses.
Direct responsibility for the execution of our market risk management strategies resides with our Treasurer's Office and is governed by written polices and procedures. Separation of duties is maintained between the development and authorization of derivative trades, the transaction of derivatives, and the settlement of cash flows. Regular audits are conducted to ensure that appropriate controls are in place and that they remain effective. In addition, our market risk exposures and our use of derivatives to manage these exposures are approved by the GRMC, and reviewed by the Audit Committee of our Board of Directors.
In accordance with corporate risk management policies, we use derivative instruments, when available, such as forward
contracts, swaps and options that economically hedge certain exposures (foreign currency, commodity, and interest rates). Derivative positions, when available, are used to hedge underlying exposures; we do not use derivative contracts for trading, market-making or speculative purposes. In certain instances, we forgo hedge accounting, which results in unrealized gains and losses that are recognized currently in net income.
The continued deterioration of our derivative capacity in the first half of 2009 resulted in unhedged currency exposure from cross-border intercompany lending during 2009. Total unhedged intercompany loans were about $1.7 billion as of March 31, 2009 and increased to about $5.5 billion as of June 30, 2009. Currency exposure from intercompany loans was substantially hedged at December 31, 2009 through implementation of collateral arrangements with certain counterparties and continued reduction in intercompany loans resulting from local funding actions. For additional information on our derivatives, see Note 26 of the Notes to the Financial Statements.
The market and counterparty risks of our Automotive sector and Ford Credit are discussed and quantified below.

Quantitative and Qualitative Disclosures About Market Risk
70 Ford Motor Company | 2009 Annual Report
AUTOMOTIVE MARKET AND COUNTERPARTY RISK
Our Automotive sector frequently has expenditures and receipts denominated in foreign currencies, including the following: purchases and sales of finished vehicles and production parts, debt and other payables, subsidiary dividends, and investments in foreign operations. These expenditures and receipts create exposures to changes in exchange rates. We also are exposed to changes in prices of commodities used in our Automotive sector and changes in interest rates.
Foreign currency risk and commodity risk are measured and quantified using a model to evaluate the sensitivity of the fair value of currency and commodity derivative instruments with exposure to market risk that assumes instantaneous, parallel shifts in rates and/or prices. For options and instruments with non-linear returns, appropriate models are utilized to determine the impact of shifts in rates and prices.
Foreign Currency Risk. Foreign currency risk is the possibility that our financial results could be better or worse than planned because of changes in currency exchange rates. Accordingly, our normal practice is to use derivative instruments, when available, to hedge our economic exposure with respect to forecasted revenues and costs, assets, liabilities, investments in foreign operations, and firm commitments denominated in foreign currencies. In our hedging actions, we use primarily instruments commonly used by corporations to reduce foreign exchange risk (e.g., forward and option contracts).
The net fair value of foreign exchange forward and option contracts (including adjustments for credit risk) as of
December 31, 2009 was a liability of $26 million compared to a net fair value asset of $249 million as of December 31, 2008. The potential decrease in fair value of foreign exchange forward and option contracts (excluding adjustments for credit risk), assuming a 10% adverse change in the underlying foreign currency exchange rates versus the U.S. dollar, would be approximately $622 million at December 31, 2009 and was $600 million as of December 31, 2008. If adjustments for credit risk were to be included, the decrease would be smaller.
At December 31, 2009, substantially all of our intercompany loans were fully hedged.
Commodity Price Risk. Commodity price risk is the possibility that our financial results could be better or worse than planned because of changes in the prices of commodities used in the production of motor vehicles, such as non-ferrous metals (e.g., aluminum), precious metals (e.g., palladium), ferrous metals (e.g., steel and iron castings), energy (e.g., natural gas and electricity), and plastics/resins (e.g., polypropylene). Steel and resins are two of our largest commodity exposures and are among the most difficult to hedge.
Our normal practice is to use derivative instruments, when available, to hedge the price risk associated with the
purchase of those commodities that we can economically hedge (primarily non-ferrous metals, precious metals and energies). In our hedging actions, we primarily use instruments commonly used by corporations to reduce commodity price risk (e.g., financially settled forward contracts, swaps, and options).
The net fair value of commodity forward and option contracts (including adjustments for credit risk) as of
December 31, 2009 was a liability of $39 million, compared to a liability of $212 million as of December 31, 2008. The potential decrease in fair value of commodity forward and option contracts (excluding adjustments for credit risk), assuming a 10% decrease in the underlying commodity prices, would be approximately $20 million at December 31, 2009, compared with a decrease of $26 million at December 31, 2008. If adjustments for credit risk were to be included, the decrease would be smaller.
In addition, our purchasing organization (with guidance from the GRMC as appropriate) negotiates contracts to ensure continuous supply of raw materials. In some cases, these contracts stipulate minimum purchase amounts and specific prices, and as such, play a role in managing price risk.

Quantitative and Qualitative Disclosures About Market Risk
Ford Motor Company | 2009 Annual Report 71
Interest Rate Risk. Interest rate risk relates to the gain or loss we could incur in our Automotive investment portfolios due to a change in interest rates. Our interest rate sensitivity analysis on the investment portfolios includes cash and cash equivalents and net marketable securities. At December 31, 2009, we had $25.5 billion in our Automotive investment portfolios, compared to $13.4 billion at December 31, 2008. We invest the portfolios in securities of various types and maturities, the value of which are subject to fluctuations in interest rates. The portfolios are classified as trading portfolios and gains and losses (unrealized and realized) are reported in the statement of operations. The investment strategy is based on clearly defined risk and liquidity guidelines to maintain liquidity, minimize risk, and earn a reasonable return on the short-term investment. In 2009, safety of principal was the primary objective in investing our Automotive cash.
At any time, a rise in interest rates could have a material adverse impact on the fair value of our portfolios. Assuming a hypothetical increase in interest rates of one percentage point, the value of our portfolios would be reduced by about $62 million. This compares to $57 million, as calculated as of December 31, 2008. While these are our best estimates of the impact of the specified interest rate scenario, actual results could differ from those projected. The sensitivity analysis presented assumes interest rate changes are instantaneous, parallel shifts in the yield curve. In reality, interest rate changes of this magnitude are rarely instantaneous or parallel.
Counterparty Risk. Counterparty risk relates to the loss we could incur if an obligor or counterparty defaulted on an investment or a derivative contract. We enter into master agreements with counterparties that allow netting of certain exposures in order to manage this risk. Exposures primarily relate to investments in fixed income instruments and derivative contracts used for managing interest rate, foreign currency exchange rate and commodity price risk. We, together with Ford Credit, establish exposure limits for each counterparty to minimize risk and provide counterparty diversification.
Our approach to managing counterparty risk is forward-looking and proactive, allowing us to take risk mitigation actions before risks become losses. We establish exposure limits for both net fair value and future potential exposure, based on our overall risk tolerance and ratings-based historical default probabilities. The exposure limits are lower for lower-rated counterparties and for longer-dated exposures. We use a model to assess our potential exposure, defined at a 95% confidence level. Our exposures are monitored on a regular basis and included in periodic reporting to our Treasurer.
Substantially all of our counterparty exposures are with counterparties that are rated single-A or better. Our guideline for counterparty minimum long-term ratings is BBB-.
For additional information about derivative notional amount and fair value of derivatives, please refer to Note 26 of the Notes to the Financial Statements. FORD CREDIT MARKET RISK
Overview. Ford Credit is exposed to a variety of risks in the normal course of its business activities. In addition to counterparty risk discussed above, Ford Credit is subject to the following additional types of risks that it seeks to identify, assess, monitor, and manage, in accordance with defined policies and procedures:
• Market risk — the possibility that changes in interest and currency exchange rates will adversely affect cash flow and economic value;
• Credit risk — the possibility of loss from a customer’s failure to make payments according to contract terms; • Residual risk — the possibility that the actual proceeds received at lease termination will be lower than projections
or return volumes will be higher than projections; and • Liquidity risk — the possibility that Ford Credit may be unable to meet all of its current and future obligations in a
timely manner.
Each form of risk is uniquely managed in the context of its contribution to Ford Credit's overall global risk. Business decisions are evaluated on a risk-adjusted basis and services are priced consistent with these risks. Credit and residual risks, as well as liquidity risk, are discussed above in "Management's Discussion and Analysis of Financial Condition and Results of Operations." A discussion of Ford Credit's market risks (interest rate risk and foreign currency risk) is included below.

Quantitative and Qualitative Disclosures About Market Risk
72 Ford Motor Company | 2009 Annual Report
Interest Rate Risk. Ford Credit's primary market risk exposure is interest rate risk, and the particular market to which it is most exposed is U.S. dollar LIBOR. Interest rate risk exposure results principally from “re-pricing risk” or differences in the re-pricing characteristics of assets and liabilities. An instrument’s re-pricing period is a term used to describe how an interest rate-sensitive instrument responds to changes in interest rates. It refers to the time it takes an instrument’s interest rate to reflect a change in market interest rates. For fixed-rate instruments, the re-pricing period is equal to the maturity of the instrument’s principal, because the principal is considered to re-price only when re-invested in a new instrument. For a floating-rate instrument, the re-pricing period is the period of time before the interest rate adjusts to the market rate. For instance, a floating-rate loan whose interest rate is reset to a market index annually on December 31 would have a re-pricing period of one year on January 1, regardless of the instrument’s maturity.
Re-pricing risk arises when assets and the related debt have different re-pricing periods, and consequently, respond differently to changes in interest rates. As an example, consider a hypothetical portfolio of fixed-rate assets that is funded with floating-rate debt. If interest rates increase, the interest paid on debt increases while the interest received on assets remains fixed. In this case, the hypothetical portfolio’s cash flows are exposed to changes in interest rates because its assets and debt have a re-pricing mismatch.
Ford Credit's receivables consist primarily of fixed-rate retail installment sale and lease contracts and floating-rate wholesale receivables. Fixed-rate retail installment sale and lease contracts are originated principally with maturities ranging between two and six years and generally require customers to make equal monthly payments over the life of the contract. Wholesale receivables are originated to finance new and used vehicles held in dealers’ inventory and generally require dealers to pay a floating rate.
Funding sources consist primarily of securitizations and short- and long-term unsecured debt. In the case of unsecured term debt, and in an effort to have funds available throughout business cycles, Ford Credit may borrow at terms longer than the terms of their assets, in most instances with up to ten year maturities. These debt instruments are principally fixed-rate and require fixed and equal interest payments over the life of the instrument and a single principal payment at maturity.
Ford Credit is exposed to interest rate risk to the extent that a difference exists between the re-pricing profile of its assets and its debt. Specifically, without derivatives, in the aggregate Ford Credit's assets would re-price more quickly than its debt.
Ford Credit's interest rate risk management objective is to maximize its economic value while limiting the impact of changes in interest rates. Ford Credit achieves this objective by setting an established risk tolerance and staying within the tolerance through the following risk management process.
Ford Credit determines the sensitivity of its economic value to hypothetical changes in interest rates. Ford Credit then enters into interest rate swaps, when available, to economically convert portions of its floating-rate debt to fixed or fixed-rate debt to floating to ensure that the sensitivity of its economic value falls within an established tolerance. As part of its process, Ford Credit also monitors the sensitivity of its pre-tax cash flow using simulation techniques. To measure this sensitivity, Ford Credit calculates the change in expected cash flows to changes in interest rates over a twelve-month horizon. This calculation determines the sensitivity of changes in cash flows associated with the re-pricing characteristics of its interest-rate-sensitive assets, liabilities, and derivative financial instruments under various hypothetical interest rate scenarios including both parallel and non-parallel shifts in the yield curve. This sensitivity calculation does not take into account any future actions Ford Credit may take to reduce the risk profile that arises from a change in interest rates. These quantifications of interest rate risk are reported to the Treasurer regularly (either monthly or quarterly depending on the market).
The process described above is used to measure and manage the interest rate risk of Ford Credit's operations in the United States, Canada, and the United Kingdom, which together represented approximately 80% of its total on-balance sheet finance receivables at December 31, 2009. For its other international affiliates, Ford Credit uses a technique, commonly referred to as "gap analysis," to measure re-pricing mismatch. This process uses re-pricing schedules that group assets, debt, and swaps into discrete time-bands based on their re-pricing characteristics. Ford Credit then enters into interest rate swaps, when available, which effectively change the re-pricing profile of its debt, to ensure that any re-pricing mismatch (between assets and liabilities) existing in a particular time-band falls within an established tolerance.

Quantitative and Qualitative Disclosures About Market Risk
Ford Motor Company | 2009 Annual Report 73
As of December 31, 2009, in the aggregate Ford Credit's assets re-price faster than its debt (including the derivative instruments economically hedging the debt). Other things being equal, this means that during a period of rising interest rates, the interest rates earned on its assets will increase more rapidly than the interest rates paid on its debt, thereby initially increasing Ford Credit's pre-tax cash flow. Correspondingly, during a period of falling interest rates, Ford Credit would expect its pre-tax cash flow to initially decrease.
To provide a quantitative measure of the sensitivity of its pre-tax cash flow to changes in interest rates, Ford Credit uses interest rate scenarios that assume a hypothetical, instantaneous increase or decrease in interest rates of one percentage point across all maturities (a "parallel shift"), as well as a base case that assumes that interest rates remain constant at existing levels. In reality, interest rate changes are rarely instantaneous or parallel and rates could move more or less than the one percentage point assumed in Ford Credit's analysis. As a result, the actual impact to pre-tax cash flow could be higher or lower than the results detailed in the table below. These interest rate scenarios are purely hypothetical and do not represent Ford Credit's view of future interest rate movements.
Pre-tax cash flow sensitivity as of year-end 2009 and 2008 was as follows (in millions):
_____ * Pre-tax cash flow sensitivity given a one percentage point decrease in interest rates requires an assumption of negative interest rates in markets
where existing interest rates are below one percent.
Based on assumptions included in the analysis, sensitivity to a one-percentage point instantaneous increase in interest rates at year-end 2009 was an increase in Ford Credit's pre-tax cash flow over a twelve-month horizon of $27 million compared to a decrease of $28 million at year-end 2008. Correspondingly, the sensitivity to a one-percentage point instantaneous decrease in interest rates at year-end 2009 was a decrease in its pre-tax cash flow over a twelve-month horizon of $27 million compared to an increase of $28 million at year-end 2008. This change primarily results from the decline in Ford Credit's managed receivables and Ford Credit's limited ability to obtain interest rate derivatives.
Foreign Currency Risk. Ford Credit's policy is to minimize exposure to changes in currency exchange rates. To meet funding objectives, Ford Credit borrows in a variety of currencies, principally U.S. dollars and euros. Ford Credit faces exposure to currency exchange rates if a mismatch exists between the currency of receivables and the currency of the debt funding those receivables. When possible, receivables are funded with debt in the same currency, minimizing exposure to exchange rate movements. When a different currency is used, Ford Credit may execute the following foreign currency derivatives to convert substantially all of foreign currency debt obligations to the local country currency of the receivables:
• Foreign currency swap — an agreement to convert non-U.S. dollar long-term debt to U.S. dollar-denominated payments or non-local market debt to local market debt for our international affiliates; or
• Foreign currency forward — an agreement to buy or sell an amount of funds in an agreed currency at a certain time in the future for a certain price.
As a result of this policy, Ford Credit believes its market risk exposure relating to changes in currency exchange rates is insignificant.
While the sensitivity analysis presented is Ford Credit's best estimate of the impacts of the specified assumed interest rate scenarios, its actual results could differ from those projected. The model Ford Credit uses to conduct this analysis is heavily dependent on assumptions. Embedded in the model are assumptions regarding the reinvestment of maturing asset principal, refinancing of maturing debt, replacement of maturing derivatives, exercise of options embedded in debt and derivatives, and predicted repayment of retail installment sale and lease contracts ahead of contractual maturity. Ford Credit's repayment projections ahead of contractual maturity are based on historical experience. If interest rates or other factors change, Ford Credit's actual prepayment experience could be different than projected.
The fair value of Ford Credit's net derivative financial instruments (derivative assets less derivative liabilities) at December 31, 2009 was $683 million, which was $963 million lower than December 31, 2008. The decrease primarily reflects lower derivative notional value. For additional information regarding our Financial Services sector derivatives, see Note 26 of the Notes to the Financial Statements.
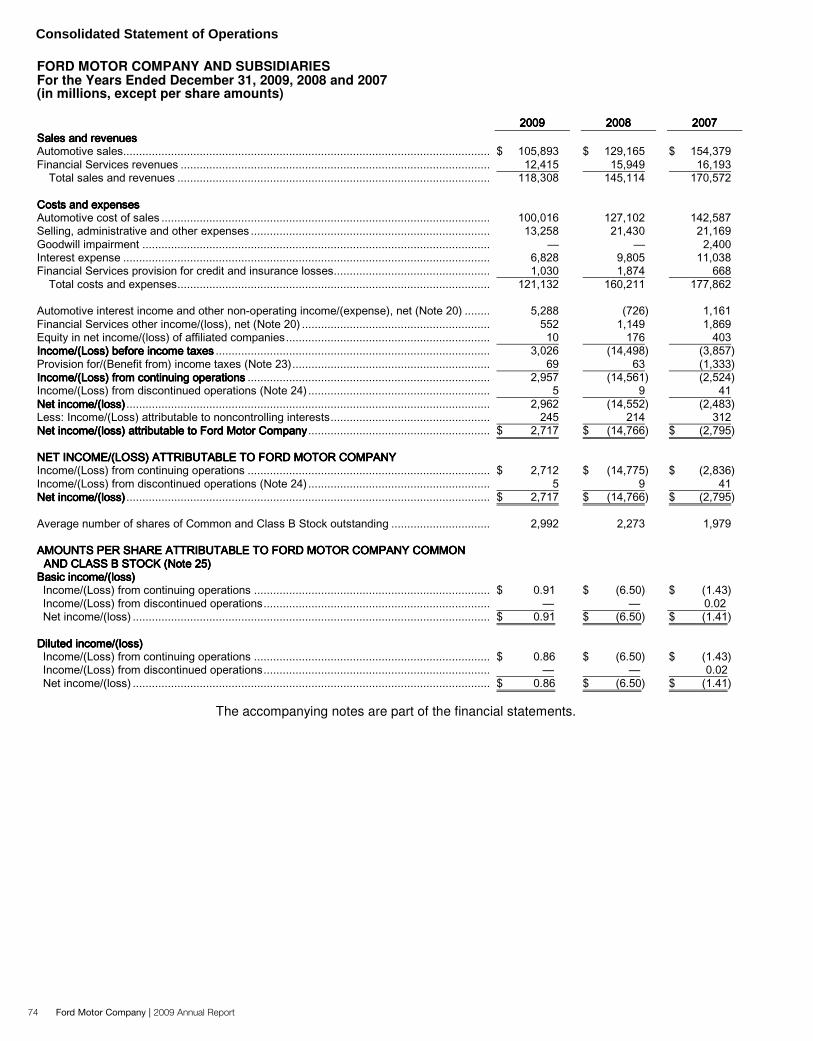
74 Ford Motor Company | 2009 Annual Report
Consolidated Statement of Operations
CONSOLIDATED STATEMENT OF OPERATIONS FORD MOTOR COMPANY AND SUBSIDIARIES For the Years Ended December 31, 2009, 2008 and 2007 (in millions, except per share amounts)
The accompanying notes are part of the financial statements.

Ford Motor Company | 2009 Annual Report 75
Sector Statement of Operations
SECTOR STATEMENT OF OPERATIONS FORD MOTOR COMPANY AND SUBSIDIARIES For the Years Ended December 31, 2009, 2008 and 2007 (in millions, except per share amounts)
The accompanying notes are part of the financial statements.

76 Ford Motor Company | 2009 Annual Report
Consolidated Balance Sheet
CONSOLIDATED BALANCE SHEET FORD MOTOR COMPANY AND SUBSIDIARIES (in millions)
The accompanying notes are part of the financial statements

Ford Motor Company | 2009 Annual Report 77
Sector Balance Sheet
SECTOR BALANCE SHEET FORD MOTOR COMPANY AND SUBSIDIARIES (in millions)
The accompanying notes are part of the financial statements.

78 Ford Motor Company | 2009 Annual Report
Consolidated Statement of Cash Flows
CONSOLIDATED STATEMENT OF CASH FLOWS FORD MOTOR COMPANY AND SUBSIDIARIES For the Years Ended December 31, 2009, 2008 and 2007 (in millions)
The accompanying notes are part of the financial statements.

Ford Motor Company | 2009 Annual Report 79
Sector Statement of Cash Flows
SECTOR STATEMENT OF CASH FLOWS FORD MOTOR COMPANY AND SUBSIDIARIES For the Years Ended December 31, 2009, 2008 and 2007 (in millions)
The accompanying notes are part of the financial statements.

80 Ford Motor Company | 2009 Annual Report
Consolidated Statement of Equity
CONSOLIDATED STATEMENT OF EQUITY FORD MOTOR COMPANY AND SUBSIDIARIES For the Years Ended December 31, 2009, 2008 and 2007 (in millions)
The accompanying notes are part of the financial statements.

Notes to the Financial Statements
Ford Motor Company | 2009 Annual Report 81
Table of Contents
Footnote Page
Note 1 Presentation ....................................................................................................................................... 82
Note 2 Summary of Accounting Policies........................................................................................................ 88
Note 3 Recently Issued Accounting Standards.............................................................................................. 90
Note 4 Fair Value Measurements .................................................................................................................. 91
Note 5 Cash and Restricted Cash ................................................................................................................. 98
Note 6 Marketable and Other Securities........................................................................................................ 98
Note 7 Finance Receivables – Financial Services Sector ............................................................................. 99
Note 8 Net Investment in Operating Leases ................................................................................................ 101
Note 9 Allowance for Credit Losses – Financial Services Sector ................................................................ 102
Note 10 Inventories .......................................................................................................................................... 103
Note 11 Equity in Net Assets of Affiliated Companies ..................................................................................... 103
Note 12 Significant Unconsolidated Affiliates ................................................................................................ 104
Note 13 Variable Interest Entities..................................................................................................................... 105
Note 14 Net Property and Lease Commitments .............................................................................................. 110
Note 15 Impairment of Long-Lived Assets....................................................................................................... 111
Note 16 Goodwill and Other Net Intangible Assets.......................................................................................... 112
Note 17 Accrued Liabilities and Deferred Revenue......................................................................................... 114
Note 18 Retirement Benefits ............................................................................................................................ 115
Note 19 Debt and Commitments...................................................................................................................... 126
Note 20 Other Income/(Loss)........................................................................................................................... 137
Note 21 Share-Based Compensation .............................................................................................................. 137
Note 22 Employee Separation Actions ............................................................................................................ 141
Note 23 Income Taxes ..................................................................................................................................... 142
Note 24 Held-For-Sale Operations, Discontinued Operations, Other Dispositions, and Acquisitions............. 146
Note 25 Capital Stock and Amounts Per Share............................................................................................... 150
Note 26 Derivative Financial Instruments and Hedging Activities ................................................................ 153
Note 27 Operating Cash Flows ........................................................................................................................ 157
Note 28 Segment Information .......................................................................................................................... 158
Note 29 Geographic Information ...................................................................................................................... 162
Note 30 Selected Quarterly Financial Data...................................................................................................... 162
Note 31 Commitments and Contingencies ...................................................................................................... 163

Notes to the Financial Statements
82 Ford Motor Company | 2009 Annual Report
NOTE 1. PRESENTATION
For purposes of this report, "Ford," the "Company," "we," "our," "us" or similar references mean Ford Motor Company and our consolidated subsidiaries and our consolidated variable interest entities ("VIEs") of which we are the primary beneficiary, unless the context requires otherwise.
We prepare our financial statements in accordance with generally accepted accounting principles ("GAAP") in the
United States. We present the financial statements on a consolidated basis and on a sector basis for our Automotive and Financial Services sectors. The additional information provided in the sector statements enables the reader to better understand the operating performance, financial position, cash flows, and liquidity of our two very different businesses. We eliminate all intercompany items and transactions in both the consolidated and sector basis financial statements. In certain circumstances, presentation of these intercompany eliminations or consolidated adjustments differ between the consolidated and sector financial statements. These line items are reconciled below under "Reconciliations between Consolidated and Sector Financial Statements."
The majority of the amounts presented on our balance sheets are based on historical values. However, certain
amounts are shown at fair value. For additional information on fair value, see Note 4. To provide comparative prior-year balance sheets, certain amounts on our December 31, 2008 consolidated and
sector balance sheets and related footnotes have been reclassified for operations held for sale in 2009. All held-for-sale assets and liabilities are excluded from the footnotes unless otherwise noted. For information about our held-for-sale operations, see Note 24.
In the first quarter of 2009, our wholly-owned subsidiary Ford Motor Credit Company LLC ("Ford Credit") recorded a
$630 million cumulative adjustment to correct for the overstatement of Financial Services sector cash and cash equivalents and certain accounts payable that originated in prior periods. The impact on previously-issued annual and interim financial statements was not material.
Subsequent Events. We evaluated the effects of all subsequent events from the end of the fourth quarter through
February 25, 2010, the date we filed our financial statements with the U.S. Securities and Exchange Commission ("SEC").
Adoption of New Accounting Standards Noncontrolling Interests. We adopted the Financial Accounting Standards Board's ("FASB") revised standard on
accounting for noncontrolling interests on January 1, 2009. This standard establishes accounting and reporting requirements for the noncontrolling interest (formerly "minority interest") in a subsidiary and for the deconsolidation of a subsidiary. The standard clarifies that a noncontrolling interest is an ownership interest in a consolidated entity that should be reported as equity in the consolidated financial statements. We have retrospectively applied the presentation and disclosure requirements of this standard for all periods. This requirement changed the presentation of our consolidated and sector statements of operations, our consolidated and sector balance sheets, and our consolidated statement of equity.
Convertible Debt Instruments. We adopted the FASB's new standard on accounting for convertible debt instruments
that may be settled in cash upon conversion (including partial cash settlement) on January 1, 2009. The standard specifies that issuers of convertible debt securities that, upon conversion, may be settled in cash should separately account for the liability and equity components in a manner that will reflect the entity's nonconvertible debt borrowing rate resulting in higher interest expense over the life of the instrument due to amortization of the discount. This standard applies to our 4.25% Senior Convertible Notes due December 15, 2036 ("2036 Convertible Notes") issued in December 2006 and our 4.25% Senior Convertible Notes due December 15, 2016 ("2016 Convertible Notes") issued in November 2009. We have applied retrospectively the standard to all periods presented for the 2036 Convertible Notes.

Notes to the Financial Statements
Ford Motor Company | 2009 Annual Report 83
NOTE 1. PRESENTATION (Continued)
The following financial statement line items from our sector statement of operations and sector balance sheet were affected by implementation of the change in accounting for convertible debt instruments (in millions, except per share information):
__________ (a) "Effect of Change" related to the standard on accounting for convertible debt instruments that includes capitalized charges of $30 million; the
remaining $41 million relates to the assets of Volvo classified as held-for-sale operations (see Note 24 for discussion of Volvo). (b) "Effect of Change" represents the equity component of the 2036 Convertible Notes under the standard on accounting for convertible debt
instruments ($1,864 million), less those amounts previously recorded on conversions prior to adoption of the standard ($65 million).
__________ * "Effect of Change" represents the equity component under the standard on accounting for convertible debt. The net change of $1,799 million in
2008 impacted calendar years 2006 and 2008 by $1,850 million and $(51) million, respectively. The 2006 change impacted the beginning balance of the 2007 equity statement.

Notes to the Financial Statements
84 Ford Motor Company | 2009 Annual Report
NOTE 1. PRESENTATION (Continued) The following shows the effect on the per share amounts attributable to Ford Common and Class B Stock associated
with our 2036 Convertible Notes before and after the adoption of the standard on accounting for convertible debt instruments:
(0.01)
— — —
(0.01)
$ —
— — —
$ —
Trading Securities. Beginning with our statement of cash flows for the year ended December 31, 2008, we changed
the presentation of cash flows to separately disclose the purchases of trading securities and the sale and maturities of trading securities as gross amounts within Cash flows from investing activities of continuing operations instead of Cash flows from operating activities of continuing operations. This change is in response to our election to apply the fair value option to our available-for-sale and held-to-maturity securities on January 1, 2008. Reconciliations between Consolidated and Sector Financial Statements
Deferred Tax Assets and Liabilities. The amount of total assets and total liabilities in our sector balance sheet differ from the amounts in our consolidated balance sheet by $3,040 million and $4,649 million at December 31, 2009 and 2008, respectively. As shown in the table below, the difference is the result of a reclassification for netting of deferred income tax assets and liabilities (in millions):
__________
* Financial Services deferred income tax assets are included in Financial Services other assets on our sector balance sheet.
Debt Reduction Actions During 2008 and 2009, we completed numerous financing transactions designed to improve our balance sheet,
including the repurchase of Automotive and Financial Services debt. The transactions involved, among other things, the repurchase of Automotive sector debt by the Financial Services sector and the repurchase of Financial Services sector debt by the Automotive sector. Because of the intercompany impacts, the transactions have been recorded differently in the consolidated and sector balance sheets. There also are differences in the way the transactions have been recorded in the consolidated and sector statements of cash flows. See the table below for the reconciliation between total sector and consolidated cash flows.

Notes to the Financial Statements
Ford Motor Company | 2009 Annual Report 85
NOTE 1. PRESENTATION (Continued)
Automotive Acquisition of Financial Services Debt. During 2008 and 2009, we issued 159,913,115 shares of Ford Common Stock through an equity distribution agreement and used the proceeds of $1 billion to purchase Ford Credit debt and related interest of $20 million. We recognized a gain on extinguishment of debt of $68 million on the transactions, recorded in Automotive interest income and other non-operating income/(expense), net. Approximately $135 million of the debt purchased has matured, and $267 million was repurchased from us by Ford Credit.
On our consolidated balance sheet, we net the remaining debt purchased by Ford with the outstanding debt of Ford
Credit, reducing our consolidated marketable securities and debt balances by $646 million and $492 million at December 31, 2009 and 2008, respectively. On our sector balance sheet, the acquisition is reported separately as Automotive marketable securities and Financial Services debt as it has not been retired or cancelled by Ford Credit.
Financial Services Acquisition of Automotive Debt. During 2009, the Financial Services sector acquired $2.2 billion
principal amount of Automotive secured term loan and $3.4 billion principal amount of Automotive unsecured debt securities for $2.2 billion of cash. The debt was then distributed to us, whereupon it was forgiven or used in satisfaction of Ford Credit's tax liabilities with us under our tax-sharing agreement. The debt acquired is no longer outstanding. We recorded gains on the extinguishment of debt (net of unamortized discounts, premiums and fees, and transaction costs) of $3.3 billion in Automotive interest income and other non-operating income/(expense), net. See Note 19 for further discussion of these transactions

Notes to the Financial Statements
86 Ford Motor Company | 2009 Annual Report
NOTE 1. PRESENTATION (Continued)
Sector to Consolidated Cash Flow Reconciliation. We present certain cash flows from the wholesale receivables, finance receivables and the debt reduction actions differently on our sector and consolidated statement of cash flows. The reconciliation between total sector and consolidated cash flows is as follows (in millions):
— —
—— —
—— —
— —
__________ (a) In addition to the cash flow from vehicles sold by us, the cash flow from wholesale finance receivables (being reclassified from investing to
operating) includes financing by Ford Credit of used and non-Ford vehicles. 100% of cash flows from wholesale finance receivables have been reclassified for consolidated presentation as the portion of these cash flows from used and non-Ford vehicles is impracticable to separate.
(b) Includes cash flows of finance receivables purchased/collected from certain divisions and subsidiaries of the Automotive sector. (c) See "April 2009 Unsecured Notes Tender Offer" and "2009 Secured Term Loan Actions" within the Automotive section of Note 19 for further
discussion of these transactions. Cash outflows related to these transactions are reported as financing activities on the consolidated statement of cash flows and investing or operating activities on the sector statement of cash flows.
(d) See "Debt Reduction Actions" above for further discussion. Cash outflows related to these transactions are reported as financing activities on the consolidated statement of cash flows and investing activities on the sector statement of cash flows.

Notes to the Financial Statements
Ford Motor Company | 2009 Annual Report 87
NOTE 1. PRESENTATION (Continued)
Certain Transactions Between Automotive and Financial Services Sectors
Intersector transactions occur in the ordinary course of business. We formally documented certain long-standing business practices with Ford Credit, our indirect wholly-owned subsidiary, in a 2001 agreement that was amended in 2006. Additional details on certain transactions and the effect on each sector's balance sheet at December 31 are shown below (in billions):
Additionally, amounts recorded as revenue by the Financial Services sector and billed to the Automotive sector for interest supplements and other support costs for special financing and leasing programs were $3.7 billion, $4.8 billion, and $4.6 billion in 2009, 2008 and 2007, respectively. The Automotive sector had accrued in Accrued liabilities and deferred revenue $1 billion and $2.5 billion for interest supplements at December 31, 2009 and 2008, respectively, and about $180 million and about $450 million for residual-value supplements in the United States and Canada to be paid to Ford Credit over the term of the related finance contracts at December 31, 2009 and 2008, respectively. Liquidity
At December 31, 2009, our Automotive sector had total cash, cash equivalents, and marketable securities of $25.5 billion and full-year operating cash flows from continuing operations of $4.1 billion.
During 2009, we completed numerous financing transactions designed to provide additional Automotive liquidity and improve our balance sheet. These transactions include the Amended Settlement Agreement relating to our hourly retiree health care obligation (discussed in Note 18) (providing us the option to pay up to approximately 50% of VEBA obligations in Ford Common Stock), reduction of Automotive debt by $10.1 billion principal amount, and issuance of $1.6 billion of equity in an underwritten offering of Ford Common Stock and about $700 million through equity distribution agreements. In addition, we entered into a U.S. Department of Energy ("DOE") loan agreement to provide up to $5.9 billion in loans, issued $2.875 billion of 2016 Convertible Notes, and amended and extended the revolving credit facility (discussed in Note 19) thereby extending the maturity date for $7.2 billion of the facility from December 2011 to November 2013.
Although the economic environment for 2010 remains uncertain, we believe that all reasonably possible scenarios, including a decline in 2010 industry sales volumes to levels below our planning assumptions, would not exhaust our presently available liquidity. Therefore, we do not believe that these reasonably possible scenarios cause substantial doubt about our ability to continue as a going concern for the next year.
Accordingly, we have concluded that there is no substantial doubt about our ability to continue as a going concern, and our financial statements have been prepared on a going concern basis.
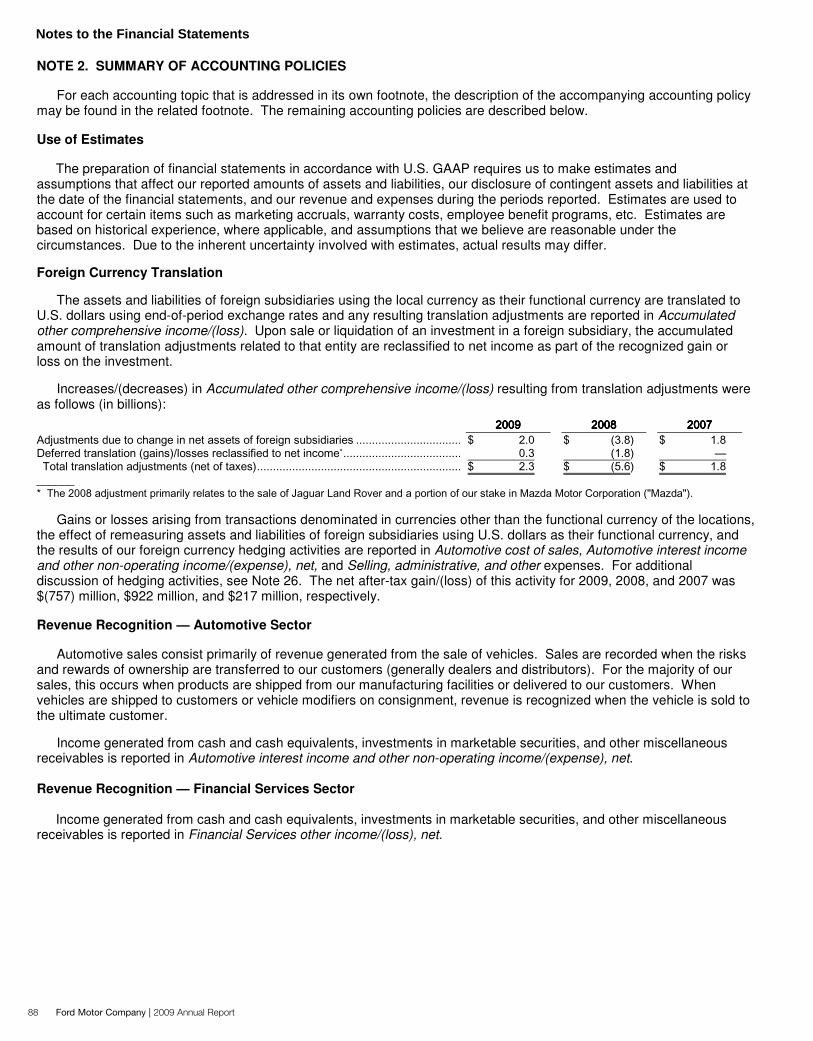
Notes to the Financial Statements
88 Ford Motor Company | 2009 Annual Report
NOTE 2. SUMMARY OF ACCOUNTING POLICIES
For each accounting topic that is addressed in its own footnote, the description of the accompanying accounting policy may be found in the related footnote. The remaining accounting policies are described below. Use of Estimates
The preparation of financial statements in accordance with U.S. GAAP requires us to make estimates and assumptions that affect our reported amounts of assets and liabilities, our disclosure of contingent assets and liabilities at the date of the financial statements, and our revenue and expenses during the periods reported. Estimates are used to account for certain items such as marketing accruals, warranty costs, employee benefit programs, etc. Estimates are based on historical experience, where applicable, and assumptions that we believe are reasonable under the circumstances. Due to the inherent uncertainty involved with estimates, actual results may differ.
Foreign Currency Translation
The assets and liabilities of foreign subsidiaries using the local currency as their functional currency are translated to U.S. dollars using end-of-period exchange rates and any resulting translation adjustments are reported in Accumulated other comprehensive income/(loss). Upon sale or liquidation of an investment in a foreign subsidiary, the accumulated amount of translation adjustments related to that entity are reclassified to net income as part of the recognized gain or loss on the investment.
Increases/(decreases) in Accumulated other comprehensive income/(loss) resulting from translation adjustments were as follows (in billions):
______
Gains or losses arising from transactions denominated in currencies other than the functional currency of the locations, the effect of remeasuring assets and liabilities of foreign subsidiaries using U.S. dollars as their functional currency, and the results of our foreign currency hedging activities are reported in Automotive cost of sales, Automotive interest income and other non-operating income/(expense), net, and Selling, administrative, and other expenses. For additional discussion of hedging activities, see Note 26. The net after-tax gain/(loss) of this activity for 2009, 2008, and 2007 was $(757) million, $922 million, and $217 million, respectively.
Revenue Recognition — Automotive Sector
Automotive sales consist primarily of revenue generated from the sale of vehicles. Sales are recorded when the risks and rewards of ownership are transferred to our customers (generally dealers and distributors). For the majority of our sales, this occurs when products are shipped from our manufacturing facilities or delivered to our customers. When vehicles are shipped to customers or vehicle modifiers on consignment, revenue is recognized when the vehicle is sold to the ultimate customer.
Income generated from cash and cash equivalents, investments in marketable securities, and other miscellaneous receivables is reported in Automotive interest income and other non-operating income/(expense), net.
Revenue Recognition — Financial Services Sector
Income generated from cash and cash equivalents, investments in marketable securities, and other miscellaneous receivables is reported in Financial Services other income/(loss), net.

Notes to the Financial Statements
Ford Motor Company | 2009 Annual Report 89
NOTE 2. SUMMARY OF ACCOUNTING POLICIES (Continued) Marketing Incentives and Interest Supplements
Marketing incentives generally are recognized by the Automotive sector as revenue reductions in Automotive sales. These include customer and dealer cash payments and costs for special financing and leasing programs paid to the Financial Services sector. The revenue reductions are accrued at the later of the date the related vehicle sales to the dealers are recorded or the date the incentive program is both approved and communicated. We generally estimate these accruals using marketing programs that are approved as of the balance sheet date and are expected to be effective at the beginning of the subsequent period. The Financial Services sector identifies payments for special financing and leasing programs as interest supplements or other support costs and recognizes them consistent with the earnings process of the underlying receivable or operating lease.
Supplier Price Adjustments
We frequently negotiate price adjustments with our suppliers throughout a production cycle, even after receiving production material. These price adjustments relate to changes in design specifications or other commercial terms such as economics, productivity, and competitive pricing. We recognize price adjustments when we reach final agreement with our suppliers. In general, we avoid direct price changes in consideration of future business; however, when these occur, our policy is to defer the financial statement impact of any such price change given explicitly in consideration of future business where guaranteed volumes are specified.
Raw Material Arrangements
We negotiate prices for and facilitate the purchase of raw materials on behalf of our suppliers. These raw material arrangements, which take place independently of any purchase orders being issued to our suppliers, are negotiated at arms length and do not involve volume guarantees to either party. When we pass the risks and rewards of ownership to our suppliers, including inventory risk, market price risk, and credit risk for the raw material, we record both the cost of the raw material and the income from the subsequent sale to the supplier in Automotive cost of sales. When we retain the risks and rewards of ownership, we account for the raw material as Inventory on our balance sheet. Government Grants and Loan Incentives
From time to time, we receive grants and loan incentives from domestic and foreign governments. Grants are recorded in the financial statements in accordance with their purpose, either as a reduction of expenses or a reduction of the cost of the capital investment. When recorded as a reduction of expense, grants are recorded as a reduction in Automotive cost of sales. The benefit of grants and loan incentives are recorded when performance is complete and all conditions as specified in the agreement are fulfilled. Selected Other Costs
Freight, engineering, and research and development costs are included in Automotive cost of sales; advertising costs
are included in Selling, administrative and other expenses. Freight costs on goods shipped and advertising costs are expensed as incurred. Engineering, research and development costs are expensed as incurred when performed internally or performed by a supplier when reimbursement is guaranteed. Engineering, research and development, and advertising expenses were as follows (in billions):

Notes to the Financial Statements
90 Ford Motor Company | 2009 Annual Report
NOTE 2. SUMMARY OF ACCOUNTING POLICIES (Continued) Presentation of Sales and Sales-Related Taxes
We collect and remit taxes assessed by different governmental authorities that are both imposed on and concurrent with a revenue-producing transaction between us and our customers. These taxes may include, but are not limited to, sales, use, value-added, and some excise taxes. We report the collection of these taxes on a net basis (excluded from revenues). NOTE 3. RECENTLY ISSUED ACCOUNTING STANDARDS
In June 2009, the FASB issued Statement of Financial Accounting Standards No. 168, The FASB Accounting Standards Codification™ and the Hierarchy of Generally Accepted Accounting Principles - a replacement of FASB Statement No. 162. This standard establishes the FASB Accounting Standards Codification ("Codification") as the single source of authoritative U.S. GAAP, superseding all previously issued authoritative guidance. All references to pre-Codification GAAP in our financial statements are replaced with descriptive titles.
In June 2009, the FASB issued a new accounting standard related to transfers of financial assets. The standard provides greater transparency about transfers of financial assets and a company’s continuing involvement in the transferred financial assets. The standard also removes the concept of a qualifying special-purpose entity from U.S. GAAP, changes the requirements for derecognizing financial assets, and requires additional disclosures about a transferor's continuing involvement with the transferred financial assets and the related risks retained. The standard is effective for us as of January 1, 2010. We do not expect this standard to have a material impact on our financial condition, results of operations, and financial statement disclosures.
In June 2009, the FASB issued a new accounting standard related to the consolidation of VIEs. The standard replaces the quantitative-based risks and rewards calculation with an approach that is primarily qualitative. The standard also requires ongoing reassessments of the appropriateness of consolidation, and additional disclosures about involvement with VIEs. The standard is effective for us as of January 1, 2010. We expect that adoption of this standard will result in the deconsolidation of many of our joint ventures, including Ford Otomotiv Sanayi Anonim Sirketi ("Ford Otosan") reported within our Ford Europe segment results. Although we continue to examine the potential impact of this standard on our financial condition, results of operations, and financial statement disclosures, we anticipate that its adoption will impact Income/(Loss) before income taxes and in particular Ford Europe's pre-tax results (see Note 13 for additional information regarding the financial results of our consolidated VIEs). The standard will have no effect on Net income/(loss) attributable to Ford Motor Company.
In October 2009, the FASB issued amended guidance addressing revenue arrangements with multiple deliverables. The new guidance establishes a selling price hierarchy for determining the selling price of a deliverable, eliminates the residual method of allocation, requires the allocation of arrangement consideration to all deliverables using the relative selling price method, and significantly expands disclosure requirements. The guidance is effective prospectively for revenue arrangements entered into or materially modified in fiscal years beginning on or after June 15, 2010. We are addressing the potential impact of this guidance on our financial condition, results of operations, and financial statement disclosures.
In October 2009, the FASB issued amended guidance addressing revenue arrangements that include both tangible products and software elements. The new guidance amends the scope of the software guidance to exclude tangible products containing both software and nonsoftware components that function together to deliver the tangible product's essential functionality. The guidance also requires entities affected by its amendments to provide the expanded disclosures included within the amended guidance on revenue arrangements with multiple deliverables. The guidance is effective prospectively for revenue arrangements entered into or materially modified in fiscal years beginning on or after June 15, 2010. We are addressing the potential impact of this guidance on our financial condition, results of operations, and financial statement disclosures.

Notes to the Financial Statements
Ford Motor Company | 2009 Annual Report 91
NOTE 4. FAIR VALUE MEASUREMENTS
Certain assets and liabilities are presented on our financial statements at fair value. Assets and liabilities measured at fair value on a recurring basis on our balance sheet include cash equivalents, marketable securities, derivative financial instruments, retained interest in securitized assets, and pension assets. Assets and liabilities measured at fair value on a recurring basis for disclosure only include debt and finance receivables. Fair value of these items are presented together with the related carrying value in Notes 19 and 7, respectively. Assets and liabilities measured at fair value on a non-recurring basis include held-for-sale operations, finance receivables, held-and-used long-lived assets, and equity method investments. Fair Value Measurements
Fair value is the price that would be received to sell an asset or paid to transfer a liability in an orderly transaction
between market participants at the measurement date. The fair value should be based on assumptions that market participants would use, including a consideration of non-performance risk.
In determining fair value, we use various valuation methodologies and prioritize the use of observable inputs. The availability of observable inputs varies by instrument and depends on a variety of factors including the type of instrument, whether the instrument is actively traded, and other characteristics particular to the transaction. For many financial instruments, pricing inputs are readily observable in the market, the valuation methodology used is widely accepted by market participants, and the valuation does not require significant management discretion. For other financial instruments, pricing inputs are less observable in the marketplace and may require management judgment.
We assess the inputs used to measure fair value using a three-tier hierarchy based on the extent to which inputs used in measuring fair value are observable in the market:
• Level 1 – inputs include quoted prices for identical instruments and are the most observable. • Level 2 – inputs include quoted prices for similar assets and observable inputs such as interest rates, currency
exchange rates and yield curves. • Level 3 – inputs are not observable in the market and include management's judgments about the assumptions
market participants would use in pricing the asset or liability. For instruments measured using Level 3 inputs, a reconciliation of the beginning and ending balances is disclosed. Valuation Methodologies
Cash Equivalents – Financial Instruments. Cash and all highly liquid investments with a maturity of 90 days or less at date of purchase are classified as Cash and cash equivalents. We use quoted market prices where available and industry-standard valuation models using market-based inputs when quoted prices are unavailable.
Marketable Securities. Fixed income and equity securities with a maturity date greater than 90 days at the date of purchase are classified as marketable securities. We measure the fair value of these securities using quoted market prices where available and industry-standard valuation models using market-based inputs when quoted prices are unavailable. Where there is limited transparency to valuation inputs, we generally utilize dealer security quotes or standard models using unobservable inputs.
Derivative Financial Instruments. We estimate the fair value of our derivatives using industry-standard valuation
models, including Black-Scholes and Curran's Approximation. These models project future cash flows and discount the future amounts to a present value using market-based expectations for interest rates, foreign exchange rates, and commodity prices, taking into account the contractual terms of the derivative instruments.

Notes to the Financial Statements
92 Ford Motor Company | 2009 Annual Report
NOTE 4. FAIR VALUE MEASUREMENTS (Continued) We include an adjustment for non-performance risk in the recognized measure of fair value of derivative instruments.
The adjustment reflects the full credit default swap ("CDS") spread applied to a net exposure, by counterparty. We use our counterparty's CDS spread when we are in a net asset position and our own CDS spread when we are in a net liability position.
In certain cases, market data are not available and we use management judgment to develop assumptions which are used to determine fair value. This includes situations where there is illiquidity for a particular currency or commodity, or for longer-dated instruments. For longer-dated instruments where observable interest rates or foreign exchange rates are not available for all periods through maturity, we hold the last available data point constant through maturity. For certain commodity contracts, observable market data may be limited and, in those cases, we generally survey brokers and use the average of the surveyed prices in estimating fair value. For securitization interest rate swaps, we use management judgment in estimating timing of cash flows which may vary based on actual repayments of securitized contracts.
Retained Interest in Securitized Assets. Ford Credit estimates the fair value of retained interests using internal
valuation models, market inputs, and its own assumptions in estimating cash flows from the sales of retail receivables. Pension Assets. Pension assets are recorded at fair value, and include fixed income and equity securities, as well as
alternative investments. Fixed income and equity securities may each be combined into commingled fund investments. Commingled funds are valued to reflect the Company's interest in the fund based on the reported year-end net asset value. Alternative investments include investments in private equity and hedge funds, and are valued based on year-end reported net asset value, with adjustments as appropriate for lagged reporting of 1 – 3 months. For pension assets, the balance sheet includes the funded status of the benefit plans, which represents the difference between the benefit obligations and fair value of plan assets. Refer to Note 18 for additional information, including the input hierarchy and Level 3 reconciliation.
Valuation methodologies for debt and finance receivables, for which fair value is measured for disclosure only, can be
found in Note 19 and 7, respectively.
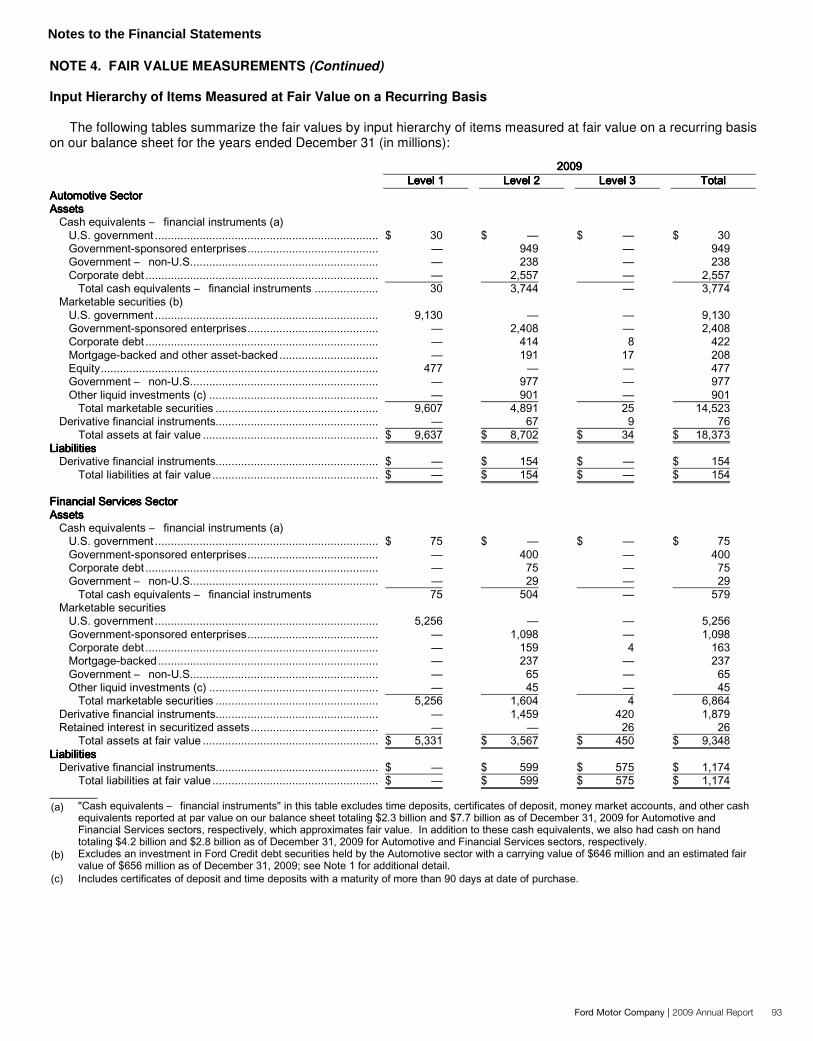
Notes to the Financial Statements
Ford Motor Company | 2009 Annual Report 93
NOTE 4. FAIR VALUE MEASUREMENTS (Continued)
Input Hierarchy of Items Measured at Fair Value on a Recurring Basis The following tables summarize the fair values by input hierarchy of items measured at fair value on a recurring basis
on our balance sheet for the years ended December 31 (in millions):

Notes to the Financial Statements
94 Ford Motor Company | 2009 Annual Report
NOTE 4. FAIR VALUE MEASUREMENTS (Continued)

Notes to the Financial Statements
Ford Motor Company | 2009 Annual Report 95
NOTE 4. FAIR VALUE MEASUREMENTS (Continued) Reconciliation of Changes in Level 3 Balances
The following tables summarize the changes in Level 3 items measured at fair value on a recurring basis on our
balance sheet for the years ended December 31 (in millions):

Notes to the Financial Statements
96 Ford Motor Company | 2009 Annual Report
NOTE 4. FAIR VALUE MEASUREMENTS (Continued) The following tables summarize the realized/unrealized gains/(losses) on Level 3 items by financial statement position
for the period ending December 31 (in millions):

Notes to the Financial Statements
Ford Motor Company | 2009 Annual Report 97
NOTE 4. FAIR VALUE MEASUREMENTS (Continued)
Input Hierarchy of Items Measured at Fair Value on a Non-Recurring Basis
The following tables summarize the fair values by input hierarchy of items measured at fair value on our balance sheet on a non-recurring basis for the years ended December 31 (in millions):

Notes to the Financial Statements
98 Ford Motor Company | 2009 Annual Report
NOTE 5. CASH AND RESTRICTED CASH
Cash and cash equivalents that are restricted as to withdrawal or usage under the terms of certain contractual arrangements are recorded as restricted in Other assets on our consolidated balance sheet. Restricted cash does not include required minimum balances, or cash securing debt raised through securitization transactions ("securitization cash"). See Note 19 for discussion of the minimum balance requirement related to the secured credit agreement that we initially entered into in December 2006, and securitization cash. See Note 13 for additional information regarding Automotive VIEs. For cash and cash equivalents, we review our disbursement accounts and reclassify any aggregate negative balances to a liability account included in Payables on our balance sheet. Restricted Cash
Restricted cash reflected on our balance sheet at December 31 is as follows (in millions):
NOTE 6. MARKETABLE AND OTHER SECURITIES
Ford holds various investments classified as marketable securities including U.S. government and non-U.S. government securities, corporate obligations and equities, and asset-backed securities. Highly-liquid investments with a maturity of 90 days or less at the date of purchase are classified in Cash and cash equivalents. Investment securities with a maturity date greater than 90 days at the date of the security's acquisition are classified as Marketable securities.
Prior to 2008, we classified all marketable securities as trading, available-for-sale or held-to-maturity. The unrealized gains and losses for available-for-sale securities were recorded, net of tax, as a separate component of Accumulated other comprehensive income/(loss) and the unrealized gains and losses for held-to-maturity securities were not recognized. On January 1, 2008, we elected to apply the fair value option and recorded all available-for-sale or held-to-maturity securities as trading securities. This election resulted in a cumulative after-tax increase of about $12 million to the opening balance of Retained earnings. Marketable securities acquired subsequent to January 1, 2008 have been recorded as trading securities.
Trading securities are recorded at fair value with unrealized gains and losses recorded in Automotive interest income
and other non-operating income/(expense), net and Financial Services income/(loss), net. Realized gains and losses are accounted for using the specific identification method. See Note 4 for information on valuation methodologies.
Investments in Marketable Securities
Investments in marketable securities at December 31 were as follows (in millions):
__________

Notes to the Financial Statements
Ford Motor Company | 2009 Annual Report 99
NOTE 6. MARKETABLE AND OTHER SECURITIES (Continued)
Included in Automotive sector trading securities above is our investment in Mazda. The fair value of our investment in Mazda at December 31, 2009 and 2008 was $447 million and $322 million, respectively. See Note 12 for additional information.
The proceeds from maturities and sales of available-for-sale securities in 2007 were as follows (in millions):
Realized gains and losses on sales of available-for-sale securities in 2007 were as follows (in millions):
Other Securities
Investments in entities that we do not control and over which we do not have the ability to exercise significant influence
are recorded at cost and included in Other assets. These cost method investments were as follows (in millions):
__________
NOTE 7. FINANCE RECEIVABLES — FINANCIAL SERVICES SECTOR
Retail finance receivables consist primarily of installment loans and direct financing lease contracts for new and used vehicles with retail customers, daily rental companies, government entities, and fleet customers. Wholesale finance receivables include dealer financing of new and used vehicles in inventory. Other finance receivables consist primarily of real estate, commercial and other collateralized loans, and accrued interest.
Revenue from finance receivables (including direct financing leases) is recognized using the interest method. Certain
origination costs on receivables are deferred and amortized, using the interest method, over the term of the related receivable as a reduction in financing revenue. The accrual of interest on receivables is discontinued at the time a receivable is determined to be uncollectible.
Ford Credit receives interest supplements and other support payments on certain financing transactions under
agreements with Ford and other affiliates. Income is recognized in a manner that is consistent with revenue recognition on the underlying financing contracts over the periods that the related finance receivables are outstanding.

Notes to the Financial Statements
100 Ford Motor Company | 2009 Annual Report
NOTE 7. FINANCE RECEIVABLES — FINANCIAL SERVICES SECTOR (Continued)
Finance Receivables, Net
Finance receivables, net, at December 31, were as follows (in millions):
(1,343)
__________
Finance receivables that originated outside of the United States were $35.4 billion and $43.1 billion at December 31, 2009 and 2008, respectively. At December 31, 2009, finance receivables included $663 million owed by the three customers with the largest receivables balances.
Included in net finance and other receivables at December 31, 2009 and 2008 were $64.4 billion and $73.7 billion, respectively, of finance receivables that secure certain debt obligations. The cash flows generated from collection of these receivables can be used only for payment of the related debt and obligations arising from the transfer; they are not available to pay our other obligations or the claims of our other creditors (see Notes 13 and 19).
The fair value of finance receivables is generally calculated by discounting future cash flows using an estimated discount rate that reflects the current credit, interest rate, and prepayment risks associated with similar types of instruments.
Scheduled maturities of total finance receivables, including minimum lease rentals, are as follows (in millions):
Experience indicates that a portion of the portfolio is repaid before the scheduled maturity dates.
The net investment in direct financing leases at December 31 was as follows (in millions):
The investment in direct financing leases primarily relates to the leasing of vehicles with a term greater than
60 months. Scheduled maturities of minimum lease rentals, as included above, are as follows (in millions):

Notes to the Financial Statements
Ford Motor Company | 2009 Annual Report 101
NOTE 8. NET INVESTMENT IN OPERATING LEASES Net investment in operating leases on our balance sheet consists primarily of lease contracts for vehicles with daily
rental companies, fleet customers, and retail customers. Assets subject to operating leases are depreciated on the straight-line method over the term of the lease to reduce the asset to its estimated residual value. Estimated residual values are based on assumptions for used vehicle prices at lease termination and the number of vehicles that are expected to be returned.
Included in the Automotive sector on our consolidated balance sheet are vehicles sold to daily rental car companies
subject to guaranteed repurchase options. At the time of transfer, the proceeds are recorded as deferred revenue in Accrued liabilities and deferred revenue. At December 31, 2009 and 2008, $2.5 billion and $2.3 billion, respectively, was included in this line item for these vehicles. Also at the time of transfer, the cost of the vehicles is recorded in Other current assets. The difference between the proceeds and the guaranteed repurchase amount is recognized in Automotive sales over an average term of 8 months, using a straight-line method. The difference between the cost of the vehicle and the estimated auction value is depreciated in Automotive cost of sales over the term of the lease.
Net Investment in Operating Leases
The net investment in operating leases at December 31 was as follows (in millions):
__________
Automotive Sector
Included in Net investment in operating leases are vehicles sold to daily rental car companies subject to guaranteed repurchase options. Operating lease depreciation expense (which excludes gains and losses on disposal of assets) was as follows (in millions):
Included in Automotive sales are rents on operating leases. The amount contractually due for minimum rentals on
operating leases is $404 million for 2010. Financial Services Sector
Included in Net investment in operating leases at December 31, 2009 and 2008 were Ford Credit's interests of $10.4 billion and $15.6 billion, respectively, that have been included in securitizations that do not satisfy the requirements for accounting sale treatment. These net investments in operating leases are available only for payment of the debt or other obligations issued or arising in the securitization transactions; they are not available to pay other obligations or the claims of other creditors.

Notes to the Financial Statements
102 Ford Motor Company | 2009 Annual Report
NOTE 8. NET INVESTMENT IN OPERATING LEASES (Continued)
Included in Financial Services revenues are rents on operating leases. The amounts contractually due for minimum rentals on operating leases are as follows (in millions):
Operating lease depreciation expense (which includes gains and losses on disposal of assets) was as follows
(in millions):
NOTE 9. ALLOWANCE FOR CREDIT LOSSES — FINANCIAL SERVICES SECTOR
The allowance for credit losses is our estimate of the probable credit losses inherent in finance receivables and operating leases at the date of the balance sheet. Consistent with our normal practices and policies, we assess the adequacy of our allowance for credit losses quarterly and regularly evaluate the assumptions and models used in establishing the allowance. Because credit losses can vary substantially over time, estimating credit losses requires a number of assumptions about matters that are uncertain.
The allowance for credit losses is estimated using a combination of models and management judgment and is based on factors such as historical trends in credit losses and recoveries (including key metrics such as delinquencies, repossessions, and bankruptcies), the composition of our present portfolio (including vehicle brand, term, risk evaluation, and new/used vehicles), trends in historical and projected used vehicle values and economic conditions. Additions to the allowance for credit losses are made by recording charges to Financial Services provision for credit and insurance losses on our consolidated statement of operations. Finance receivables, investments in direct financing leases, and investments in operating leases are charged to the allowance for credit losses at the earlier of when an account is deemed to be uncollectible or when an account is 120 days delinquent, taking into consideration the financial condition of the borrower or lessee, the value of the collateral, recourse to guarantors and other factors. Recoveries on finance receivables and investments in leases previously charged off as uncollectible are credited to the allowance for credit losses.
Changes in Allowance for Credit Losses
Changes in the allowance for credit losses for finance receivables, investment in direct financing leases, and investment in operating leases were as follows (in millions):
The decrease in allowance for credit losses primarily reflected the decline in receivables and the related charge-offs. At December 31, 2009, Ford Credit's allowance for credit losses included about $215 million that was based on management's judgment regarding higher retail installment and lease repossession assumptions and higher wholesale and dealer loan default assumptions compared with historical trends used in Ford Credit's models. At December 31, 2008, Ford Credit's allowance for credit losses included about $210 million that was based on management's judgment regarding higher severity assumptions. At December 31, 2007, Ford Credit's allowance for credit losses did not include any adjustments for management judgment.

Notes to the Financial Statements
Ford Motor Company | 2009 Annual Report 103
NOTE 10. INVENTORIES
All inventories are stated at the lower of cost or market. Cost for a substantial portion of U.S. inventories is determined on a last-in, first-out ("LIFO") basis. LIFO was used for approximately 28% and 24% of inventories at December 31, 2009 and 2008, respectively. Cost of other inventories is determined on a first-in, first-out ("FIFO") basis.
Inventories at December 31 were as follows (in millions):
At December 31, 2009, inventory quantities were reduced, resulting in a liquidation of LIFO inventory quantities carried at lower costs prevailing in prior years as compared with the cost of 2009 purchases, the effect of which decreased Automotive cost of sales by about $33 million. NOTE 11. EQUITY IN NET ASSETS OF AFFILIATED COMPANIES
We use the equity method of accounting for our investments in entities over which we do not have control or of which we are not the primary beneficiary, but over whose operating and financial policies we are able to exercise significant influence.
Ownership Percentages and Investment Balances
The following table reflects our ownership percentages at December 31, 2009, and balances of equity method investments at December 31, 2009 and 2008 (in millions, except percentages):

Notes to the Financial Statements
104 Ford Motor Company | 2009 Annual Report
NOTE 11. EQUITY IN NET ASSETS OF AFFILIATED COMPANIES (Continued)
We received $152 million, $224 million, and $216 million of dividends from these affiliated companies for the years ended December 31, 2009, 2008, and 2007, respectively. Changes in Equity Method Investments
Getrag America Holdings. In 2009, Getrag America Holdings changed its operating profile from a development stage
enterprise to an operating business. Accordingly, we reconsidered the consolidation analysis and determined this to be a variable interest entity of which we are the primary beneficiary.
DFO Partnership. In March 2009, our Board of Directors approved a potential sale of the Financial Services sector investment in DFO Partnership. DFO Partnership holds a portfolio of "non-core" diversified leveraged lease assets (e.g., railcars, aircraft, and energy facilities). During the first quarter of 2009, an other-than-temporary impairment of the investment in DFO Partnership of $141 million was recorded in Financial Services equity in net income/(loss) of affiliated companies. During the third quarter of 2009, the Financial Services sector completed the sale of its interest in DFO Partnership to a subsidiary of Bank of America. As a result of the sale, a pre-tax gain of $9 million (net of transaction costs) was recognized in Financial Services other income/(loss), net.
NOTE 12. SIGNIFICANT UNCONSOLIDATED AFFILIATES
We are required to measure the impact of all unconsolidated majority-owned subsidiaries and equity-method investments to determine their significance to our financial statements. If the affiliates meet the defined thresholds of significance, certain financial disclosure data is required. Mazda
Mazda was considered to be a significant unconsolidated affiliate in 2007. Presented below is summarized financial information for Mazda for 2008 and 2007.
In November 2008, we sold 278 million shares of Mazda for net proceeds of $532 million. As a result of the transaction,
we recorded a pre-tax loss on the sale of $121 million, net of transaction costs and recognition of foreign currency translation adjustments, in Automotive interest income and other non-operating income/(expense), net. We continue to own 195.5 million shares of Mazda, representing an 11% ownership interest. We no longer have certain management rights we previously held and, as a result, we have deemed that we no longer hold significant influence over Mazda's operating and financial policies. Consequently, we account for our remaining investment of $447 million as of December 31, 2009 as a marketable security.
As a result, we had no equity in net assets of affiliated companies at December 31, 2008 associated with our investment
in Mazda. Our investment in Mazda included $0 of goodwill included in Equity in net assets of affiliated companies at December 31, 2008. Dividends received from Mazda were $27 million and $36 million for the years ended December 31, 2008 and 2007, respectively.
Summarized income statement information from Mazda's published financial statements, prepared in accordance with Japanese GAAP, for the twelve months ended September 30, 2008 and 2007, and summarized balance sheet information from Mazda's published financial statements at September 30, 2008 and 2007 is as follows (in millions):

Notes to the Financial Statements
Ford Motor Company | 2009 Annual Report 105
NOTE 12. SIGNIFICANT UNCONSOLIDATED AFFILIATES (Continued) Included in our Automotive equity in net income/(loss) of affiliated companies was the following income for the years
ended December 31 (in millions):
Ford's share of Mazda's net income/(loss) in the table above represents our share of Mazda's results on a U.S. GAAP
basis. For 2008, our share includes a charge as determined under U.S. GAAP representing the impact on us of a goodwill impairment related to Mazda-owned dealerships in Japan. NOTE 13. VARIABLE INTEREST ENTITIES
A VIE is an entity that either (i) has insufficient equity to permit the entity to finance its activities without additional subordinated financial support or (ii) has equity investors who lack the characteristics of a controlling financial interest. A VIE is consolidated by its primary beneficiary. The primary beneficiary is the entity that absorbs the majority of the risk for the variability in the VIE's assets. A variable interest is a contractual, ownership, or other interest that changes with changes in the fair value of the VIE's net assets.
We use qualitative analysis to determine whether or not we need to consolidate a VIE. We consider the rights and obligations conveyed by variable interests to determine whether we will absorb a majority of a VIE's expected losses, receive a majority of its expected residual returns, or both. If so, we consolidate the VIE.
The liabilities recognized as a result of consolidating these VIEs do not necessarily represent additional claims on our general assets; rather, they represent claims against the specific assets of the consolidated VIEs. Conversely, assets recognized as a result of consolidating these VIEs do not represent additional assets that could be used to satisfy claims against our general assets.
Automotive Sector
VIEs of which we are the primary beneficiary:
We have contractual agreements with the VIEs we consolidate to purchase the majority, and in some cases substantially all, of the entity's output under a cost-plus-margin arrangement and/or volume-dependent pricing. These contractual arrangements may require us to absorb entity losses when production volume targets are not met and/or allow us to receive bonuses when production volume targets are exceeded. Described below are the significant VIEs we consolidated as of December 31, 2009:
AutoAlliance International, Inc. ("AAI") is a 50/50 joint venture with Mazda in North America, engaged in the manufacture of automobiles on behalf of Ford and Mazda, primarily for sale in North America.
First Aquitaine operates a transmission plant in Bordeaux, France which manufactures automatic transmissions for Ford Explorer, Ranger, and Mustang vehicles. During the second quarter of 2009, we transferred legal ownership of First Aquitaine to HZ Holding France. We also entered into a volume-dependent pricing agreement with the new owner to purchase transmissions through the end of the product cycle. As a result, we now consider this entity to be a VIE of which we are the primary beneficiary. See Note 4 for discussion of the impairment of our investment in this plant.
Ford Otosan is a 41/41/18 joint venture in Turkey with the Koc Group of Turkey and public investors. Ford Otosan is a supplier of the Ford Transit Connect model, and an assembly supplier of the Ford Transit van model, both of which we sell primarily in Europe.
Getrag Ford Transmissions GmbH ("GFT") is a 50/50 joint venture with Getrag Deutsche Venture GmbH and Co. KG. and is the primary supplier of manual transmissions for use in our European vehicles.

Notes to the Financial Statements
106 Ford Motor Company | 2009 Annual Report
NOTE 13. VARIABLE INTEREST ENTITIES (Continued) Getrag All Wheel Drive AB is a 40/60 joint venture between Volvo Cars and Getrag Dana Holding GmbH. The joint
venture produces all-wheel-drive components. The assets and liabilities associated with this joint venture that were classified during the first quarter of 2009 as held for sale are shown in the table below and are included in the assets and liabilities of Volvo classified as held-for-sale operations in Note 24.
Pininfarina Sverige, AB is a 40/60 joint venture between Volvo Cars and Pininfarina, S.p.A. The joint venture was established to engineer and manufacture niche vehicles. The assets and liabilities associated with this joint venture that were classified as held for sale during the first quarter of 2009 are shown in the table below and are included in the assets and liabilities of Volvo classified as held-for-sale operations in Note 24.
Tekfor Cologne GmbH ("Tekfor") is a 50/50 joint venture with Neumayer Tekfor GmbH. Tekfor produces transmission
and chassis components for use in our vehicles. During the fourth quarter of 2009, Ford initiated a revolving loan agreement with Tekfor for $12.8 million. This loan is being used by Tekfor to refinance external debt.
We also hold interests in certain dealerships in North America. At December 31, 2009 there were approximately
13 dealerships consolidated as part of our Dealer Development program. We supply and finance the majority of vehicles and parts for these dealerships, and the operators have a contract to buy our equity interest over a period of time. See Note 4 for discussion of the impairment of our investment in these assets.
The total consolidated VIE assets and liabilities reflected on our December 31 balance sheet are as follows (in millions):
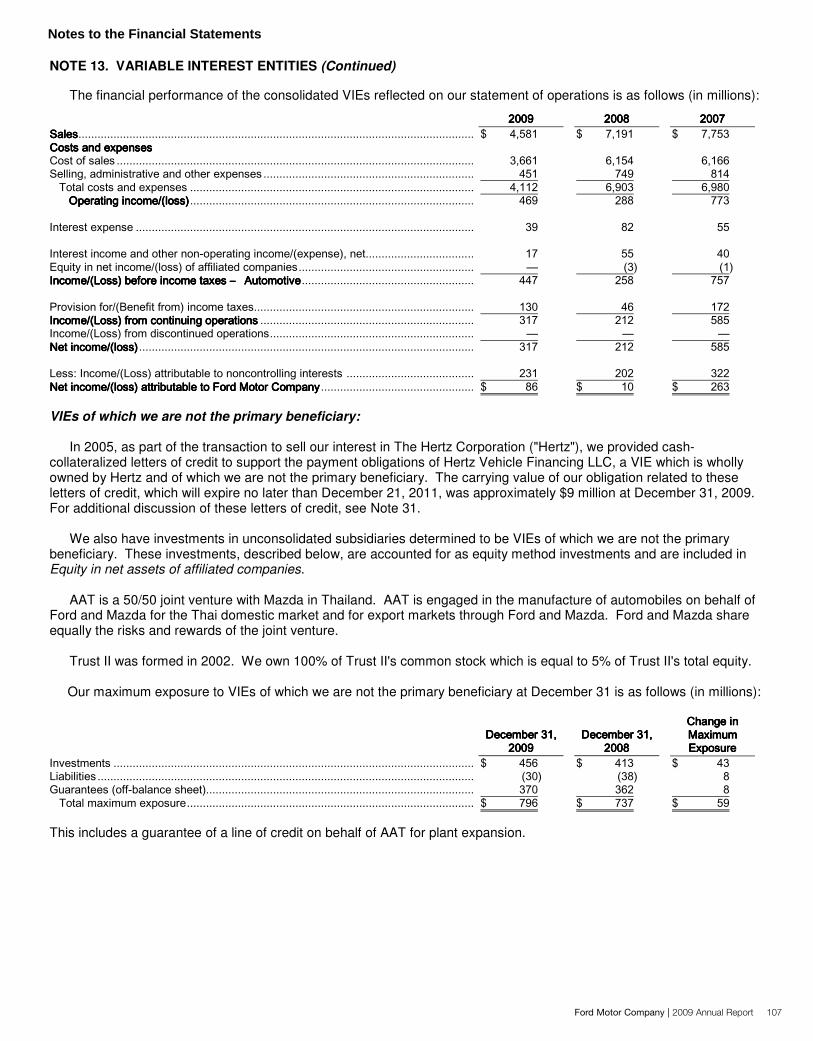
Notes to the Financial Statements
Ford Motor Company | 2009 Annual Report 107
NOTE 13. VARIABLE INTEREST ENTITIES (Continued)
The financial performance of the consolidated VIEs reflected on our statement of operations is as follows (in millions):
VIEs of which we are not the primary beneficiary:
In 2005, as part of the transaction to sell our interest in The Hertz Corporation ("Hertz"), we provided cash-collateralized letters of credit to support the payment obligations of Hertz Vehicle Financing LLC, a VIE which is wholly owned by Hertz and of which we are not the primary beneficiary. The carrying value of our obligation related to these letters of credit, which will expire no later than December 21, 2011, was approximately $9 million at December 31, 2009. For additional discussion of these letters of credit, see Note 31.
We also have investments in unconsolidated subsidiaries determined to be VIEs of which we are not the primary
beneficiary. These investments, described below, are accounted for as equity method investments and are included in Equity in net assets of affiliated companies.
AAT is a 50/50 joint venture with Mazda in Thailand. AAT is engaged in the manufacture of automobiles on behalf of Ford and Mazda for the Thai domestic market and for export markets through Ford and Mazda. Ford and Mazda share equally the risks and rewards of the joint venture.
Trust II was formed in 2002. We own 100% of Trust II's common stock which is equal to 5% of Trust II's total equity.
Our maximum exposure to VIEs of which we are not the primary beneficiary at December 31 is as follows (in millions):
This includes a guarantee of a line of credit on behalf of AAT for plant expansion.

Notes to the Financial Statements
108 Ford Motor Company | 2009 Annual Report
NOTE 13. VARIABLE INTEREST ENTITIES (Continued) Financial Services Sector VIEs of which Ford Credit is the primary beneficiary:
Ford Credit uses special-purpose entities to issue asset-backed securities in transactions to public and private investors, bank conduits, and government-sponsored entities or others who obtain funding from government programs. The asset-backed securities are secured by the expected cash flows from finance receivables and interests in net investments in operating leases. The expected cash flows from these assets have been legally sold but Ford Credit retains interests in its securitization transactions, including senior and subordinated securities issued by VIEs, rights to cash held for the benefit of the securitization investors such as cash reserves, and residual interests. Therefore, the assets continue to be consolidated by Ford Credit.
The VIE transactions create and pass along risks to the variable interest holders, depending on the assets securing the
debt and the specific terms of the transactions. Ford Credit aggregates and analyzes its transactions based on the risk profile of the product and the type of funding
structure, including:
• Retail transactions – consumer credit risk and prepayment risk. • Wholesale transactions – dealer credit risk. • Net investments in operating lease transactions – vehicle residual value risk, consumer credit risk, and
prepayment risk. As residual interest holder, Ford Credit is exposed to underlying residual and credit risk of the collateral, and may be
exposed to interest rate risk. However, this risk is not incremental to the exposure Ford Credit has on the underlying assets. Ford Credit's residual interest in these transactions was $27.2 billion and $18.2 billion at December 31, 2009 and 2008, respectively. The amount of risk absorbed by Ford Credit's residual interests is generally represented by and limited to the amount of overcollaterization of its assets securing the debt and any cash reserves.

Notes to the Financial Statements
Ford Motor Company | 2009 Annual Report 109
NOTE 13. VARIABLE INTEREST ENTITIES (Continued) Ford Credit has no obligation to repurchase or replace any securitized asset that subsequently becomes delinquent in
payment or otherwise is in default. Securitization investors have no recourse to Ford Credit or its other assets for credit losses on the securitized assets, and have no right to require Ford Credit to repurchase the investments. Although not contractually required, Ford Credit regularly supports their wholesale securitization programs by repurchasing receivables of a dealer from the VIEs when the dealer's performance is at risk, which transfers the corresponding risk of loss from the VIE to Ford Credit. In order to continue to fund the wholesale receivables, Ford Credit also may contribute additional cash or wholesale receivables if the collateral falls below the required level. The cash contributions were $0 and $179 million at December 31, 2009 and 2008, respectively, and ranged from $0 to $1.4 billion and $0 to $2.2 billion during 2009 and 2008, respectively. In addition, while not contractually required, Ford Credit may purchase the commercial paper issued by Ford Credit's FCAR Owner Trust retail securitization program.
During 2009, Ford Credit elected to provide additional enhancements or repurchase specific senior or subordinated
notes in order to address market conditions. From time to time, Ford Credit renegotiates the terms of its funding commitments and may reallocate the commitments globally. Ford Credit does not guarantee any asset-backed securities and generally has no obligation to provide liquidity or contribute cash or additional assets to the VIEs. In certain securitization transactions, Ford Credit has dynamic enhancements where Ford Credit is required to support the performance of the securitization transactions by purchasing additional subordinated notes or increasing cash reserves.
VIEs that are exposed to interest rate or currency risk have reduced their exposure by entering into derivatives. In
certain instances, Ford Credit has entered into offsetting derivative transactions with the VIE to protect the VIE from these risks that are not mitigated through derivative transactions between the VIE and its counterparty. See Note 26 for additional information regarding Ford Credit's derivatives.
Finance receivables and net investment in operating leases that secure the debt of the VIE remain on Ford Credit's
balance sheet and therefore are not included in the VIE assets shown in the following table. As of December 31, 2009, the carrying values of the assets were $41.7 billion of retail receivables, $16.5 billion of wholesale receivables, and $10.4 billion of net investment in operating leases. As of December 31, 2008, the carrying values of the assets were $41.9 billion of retail receivables, $19.6 billion of wholesale receivables, and $15.6 billion of net investment in operating leases.
The total consolidated VIE assets and liabilities that support Ford Credit's securitization transactions reflected on our
December 31 balance sheet are as follows (in millions):
Ford Credit's exposure based on the fair value of derivative instruments related to securitization programs at
December 31 is as follows (in millions):

Notes to the Financial Statements
110 Ford Motor Company | 2009 Annual Report
NOTE 13. VARIABLE INTEREST ENTITIES (Continued) The financial performance of the consolidated VIEs that support Ford Credit's securitization transactions reflected in
our statement of operations is as follows (in millions):
VIEs of which Ford Credit is not the primary beneficiary:
Ford Credit has investments in certain joint ventures determined to be VIEs of which it is not the primary beneficiary.
These joint ventures provide consumer and dealer financing in their respective markets. The joint ventures are financed by external debt and additional subordinated interest of the joint venture partners. The risks and rewards associated with Ford Credit's interests in these joint ventures are based primarily on ownership percentages. Ford Credit's investments in these joint ventures are accounted for as equity method investments and are included in Equity in net assets of affiliated companies. Ford Credit's maximum exposure to any potential losses associated with these VIEs is $67 million and $109 million at December 31, 2009 and 2008, respectively. NOTE 14. NET PROPERTY AND LEASE COMMITMENTS Net Property
Net property includes land, buildings and land improvements, machinery and equipment, special tools, and other assets that we use in our normal operations. These assets are recorded at cost, net of accumulated depreciation and impairments. We capitalize new assets when we expect to use the asset for more than one year and the acquisition cost is greater than $2,500. Routine maintenance and repair costs are expensed when incurred.
Included in our carrying value is the estimated cost for legal obligations to retire, abandon, or dispose of the asset. These conditional asset retirement obligations relate to the estimated cost for asbestos abatement and PCB removal.
Property and equipment are depreciated primarily using the straight-line method over the estimated useful life of the asset. Useful lives range from 3 years to 36 years. The estimated useful lives generally are 14.5 years for machinery and equipment, and 30 years for buildings and improvements. Special tools generally are amortized over the expected life of a product program using a straight-line method. If the expected production volumes for major product programs associated with the tools decline significantly, we accelerate the amortization reflecting the rate of decline.
Net property at December 31 was as follows (in millions):
__________

Notes to the Financial Statements
Ford Motor Company | 2009 Annual Report 111
NOTE 14. NET PROPERTY AND LEASE COMMITMENTS (Continued)
Automotive sector property-related expenses for the years ended December 31 were as follows (in millions):
__________
Conditional Asset Retirement Obligations
Asbestos abatement was estimated using site-specific surveys where available and a per/square foot estimate where surveys were unavailable. PCB removal costs were based on historical removal costs per transformer and applied to transformers identified by a PCB transformer global survey we conducted.
The liability for our conditional asset retirement obligations which are recorded in Accrued liabilities and deferred revenue at December 31 was as follows (in millions):
Lease Commitments
We lease land, buildings and equipment under agreements that expire in various years. Minimum rental commitments under non-cancelable operating leases were as follows (in millions):
Rental expense was as follows (in billions):
NOTE 15. IMPAIRMENT OF LONG-LIVED ASSETS We monitor our operating units for conditions that may indicate a potential impairment of long-lived assets. These
conditions include current-period operating losses combined with a history of losses and a projection of continuing losses, and significant negative industry or economic trends. When these conditions exist, we test for impairment. An impairment charge is recognized for the amount by which the carrying value of the asset group exceeds its estimated fair value.
During the second quarter of 2008, higher fuel prices and the weak economic climate in the United States and Canada resulted in a more pronounced and accelerated shift in consumer preferences away from full-size trucks and traditional sport utility vehicles ("SUVs") to smaller, more fuel-efficient vehicles. This shift in consumer preferences combined with lower-than-anticipated U.S. industry demand and greater-than-anticipated escalation of commodity costs resulted in impairment charges related to Ford North America's long-lived assets and Ford Credit's operating lease portfolio.

Notes to the Financial Statements
112 Ford Motor Company | 2009 Annual Report
NOTE 15. IMPAIRMENT OF LONG-LIVED ASSETS (Continued) Automotive Sector
North America Long-Lived Assets. Based upon the financial impact of rapidly-changing U.S. market conditions during
the second quarter of 2008, we projected a decline in net cash flows for the Ford North America segment. As a result, in the second quarter of 2008 we tested the long-lived assets for impairment and recorded in Automotive cost of sales a pre-tax charge of $5.3 billion, representing the amount by which the carrying value of the assets exceeded the estimated fair value. See Note 4 for further discussion of the fair value used in the impairment.
The table below describes the significant components of the second quarter 2008 long-lived asset impairment
(in millions):
Financial Services Sector
Certain Vehicle Line Operating Leases. The shift in consumer preferences combined with a weak economic climate caused a significant reduction in auction values, in particular for used full-size trucks and traditional SUVs. As a result, in the second quarter of 2008 we tested Ford Credit's operating leases in its North America segment for impairment and recorded a pre-tax impairment charge in Selling, administrative and other expenses on our consolidated statement of operations and in Financial Services depreciation on our sector statement of operations of $2.1 billion, representing the amount by which the carrying value of certain vehicle lines in Ford Credit's lease portfolio exceeded the estimated fair value. See Note 4 for further discussion of the fair value used in the impairment. NOTE 16. GOODWILL AND OTHER NET INTANGIBLE ASSETS
Goodwill is subject to impairment testing at least annually or upon a triggering event. Our annual testing of goodwill occurs in the fourth quarter. An impairment charge is recognized for the amount by which the carrying value of the operating segment's goodwill exceeds its implied fair value.
Our intangible assets are comprised primarily of manufacturing and production incentive rights, license and advertising
agreements, patents, customer contracts, technology, and land rights and all are amortized over their determinable lives. Goodwill
In the fourth quarter of 2007, we recorded a goodwill impairment charge of $2.4 billion in Goodwill impairment as a result of our impairment testing of Volvo. Volvo's fair value declined throughout 2007, primarily related to three factors. First, the weakening of the U.S. dollar resulted in lower sales revenues relative to euro and Swedish krona material costs; approximately 25% of Volvo vehicle sales are in the United States. Second, higher gas prices and other factors were causing a shift from larger to smaller vehicle segments in the U.S. and other markets. This resulted in lower-than-planned volumes for new vehicles, especially high-margin SUVs. Third, to encourage sales in the face of lower-than-planned volumes for Volvo vehicles in the U.S. and other markets, we offered higher-than-anticipated marketing incentives on the sale of these vehicles. These higher marketing incentives led to a reduction in revenues and profits. Volvo goodwill was tested for impairment at December 31, 2007 by comparing the carrying value of the Volvo reporting unit to its implied fair value using discounted cash flow and market methods.

Notes to the Financial Statements
Ford Motor Company | 2009 Annual Report 113
NOTE 16. GOODWILL AND OTHER NET INTANGIBLE ASSETS (Continued) The following table summarizes the changes in the carrying amount of goodwill (in millions):
Excluded from the table above is goodwill within Equity in net assets of affiliated companies of $34 million at
December 31, 2009 and 2008. Other Net Intangibles
The components of other net intangible assets at December 31 are as follows (in millions):

Notes to the Financial Statements
114 Ford Motor Company | 2009 Annual Report
NOTE 16. GOODWILL AND OTHER NET INTANGIBLE ASSETS (Continued)
Our manufacturing and production incentive rights were acquired in 2006 and have a useful life of 4 years, our license and advertising agreements have amortization periods of 5 years to 25 years, and our other intangibles have various amortization periods (primarily patents, customer contracts, technology, and land rights).
Pre-tax amortization expense was as follows (in millions):
Amortization for current intangible assets is forecasted to be approximately $80 million to $90 million in 2010 and
$10 million per year thereafter. NOTE 17. ACCRUED LIABILITIES AND DEFERRED REVENUE
Accrued liabilities and deferred revenue at December 31 were as follows (in millions):
__________

Notes to the Financial Statements
Ford Motor Company | 2009 Annual Report 115
NOTE 18. RETIREMENT BENEFITS
We provide pension benefits and OPEB, such as health care and life insurance, to employees in many of our operations around the world. Plan obligations are measured based on the present value of projected future benefit payments for all participants for services rendered to date. The measurement of projected future benefits is dependent on the provisions of each specific plan, demographics of the group covered by the plan, and other key measurement assumptions. For plans that provide benefits dependent on salary assumptions, we include a projection of salary growth in our measurements. No assumption is made regarding any potential future changes to benefit provisions beyond those to which we are presently committed (e.g., in existing labor contracts).
The funded status of the benefit plans, which represents the difference between the benefit obligation and fair value of plan assets, is calculated on a plan-by-plan basis. The net periodic costs of these benefits are recorded in Automotive cost of sales and Selling, administrative and other expenses. The impact of plan amendments and actuarial gains and losses are recorded in Accumulated other comprehensive income/(loss) and generally are amortized as a component of net periodic cost over the remaining service period of our active employees. We record a curtailment loss when an event occurs that significantly reduces the expected years of future service or eliminates the accrual of defined benefits for the future services of a significant number of employees. We record a curtailment gain when a significant number of employees who are entitled to the benefits terminate their employment.
The measurement of the fair value of plan assets, including stocks, bonds and other investments, uses valuation
methodologies and the inputs as described in Note 4. Certain investments within our plan assets do not have a readily determinable fair value; in such instances, we use net asset value per share to measure fair value.
Our contribution policy for funded pension plans is to contribute annually, at a minimum, amounts required by
applicable laws and regulations. We do from time to time make contributions beyond those legally required. In general, our plans are funded, with the main exceptions being certain plans in Germany, and U.S. defined benefit plans for senior management. In such cases, an unfunded liability is recorded.
Employee Retirement and Savings Plans. We have two principal qualified defined benefit retirement plans in the United States. The Ford-UAW Retirement Plan covers hourly employees represented by the UAW, and the General Retirement Plan covers substantially all other Ford employees in the United States hired on or before December 31, 2003. The hourly plan provides noncontributory benefits related to employee service. The salaried plan provides similar noncontributory benefits and contributory benefits related to pay and service. Other U.S. and non-U.S. subsidiaries have separate plans that generally provide similar types of benefits for their employees. We established, effective January 1, 2004, a defined contribution plan covering new salaried U.S. employees hired on or after that date.
Certain of our defined benefit pension plans provide benefits that are not based on salary (e.g., Ford-UAW Retirement Plan, noncontributory portion of the General Retirement Plan, and the Ford Canada retirement plan for hourly employees represented by the National Automobile, Aerospace, Transportation, and General Workers Union of Canada ("CAW")). The salary growth assumption is not applicable to these benefits.
The expense for our worldwide defined contribution plans was $88 million, $159 million, and $136 million in 2009, 2008 and 2007, respectively. This includes the expense for company matching contributions to our primary employee savings plan in the United States of $0, $58 million, and $37 million in 2009, 2008 and 2007, respectively. Company matching contributions for U.S. employees were suspended January 1, 2009 and reinstated effective January 1, 2010.

Notes to the Financial Statements
116 Ford Motor Company | 2009 Annual Report
NOTE 18. RETIREMENT BENEFITS (Continued)
OPEB. We, and certain of our subsidiaries, sponsor plans to provide OPEB for retired employees, primarily certain health care and life insurance benefits. During 2009, the Ford UAW Hospital-Surgical-Medical-Drug-Dental-Vision Program ("H-S-M-D-D-V Program") covered hourly employees represented by the UAW and hired before November 19, 2007. UAW-represented individuals hired after November 19, 2007 are eligible to participate in a separate health care plan that provides defined contributions made by Ford to individual participant accounts.
The Ford Salaried Health Care Plan covers substantially all other Ford employees in the United States hired before June 1, 2001. U.S. salaried employees hired on or after June 1, 2001 are covered by a separate plan that provides for annual company allocations to employee-specific notional accounts to be used to fund postretirement health care benefits. We also provide company-paid postretirement life insurance benefits to U.S. salaried employees hired before January 1, 2004 and all U.S. hourly employees. Our employees may become eligible for benefits when they retire; however, benefits and eligibility rules may be modified from time to time.
Effective August 1, 2008, the Company-paid retiree basic life insurance benefits were capped at $25,000 for eligible existing and future salaried retirees. Salaried employees hired on or after January 1, 2004 are not eligible for retiree basic life insurance. Our obligation decreased by about $850 million and ongoing expense was reduced by about $125 million annually beginning in 2009 as a result of this benefit change. Settlement of UAW Retiree Health Care Obligation
On July 23, 2009, we entered into an amendment to the 2008 UAW Retiree Health Care Settlement Agreement (the "Settlement Agreement"). The Settlement Agreement established a new VEBA trust (the "UAW VEBA Trust") that on December 31, 2009 would assume the obligation to provide retiree health care benefits to eligible active and retired UAW Ford hourly employees and their eligible spouses, surviving spouses and dependents (the "Benefit Group"). The amendment to the Settlement Agreement (the "Amended Settlement Agreement") described below was approved by the U.S. District Court for the Eastern District of Michigan on November 9, 2009. The Amended Settlement Agreement provides for smoothing of payment obligations and provides us the option to use Ford Common Stock to satisfy up to approximately 50% of our future payment obligations to the UAW VEBA Trust.
Pursuant to the Amended Settlement Agreement, on December 31, 2009, we fully settled our UAW postretirement health care obligation, irrevocably transferring our obligation to provide retiree health care for the Benefit Group to the UAW VEBA Trust in exchange for the transfer of certain assets. The trustees of the UAW VEBA Trust have established a new retiree health care plan (the "New Plan") for the Benefit Group that will be responsible for administering these benefits, and the New Plan will be a closed plan.
On December 31, 2009, pursuant to the Amended Settlement Agreement we transferred to the UAW VEBA Trust the
following assets and thereby fully discharged any obligation we had to provide retiree health care benefits to the Benefit Group:
• A non-interest bearing Amortizing Guaranteed Secured Note maturing June 30, 2022 with a par value of $6.7 billion ("New Note A"). The fair value of New Note A at December 31, 2009 was $3.1 billion after a scheduled payment of $1.3 billion, a partial prepayment of $500 million, and payment of a true-up amount of $150 million were made on December 31, 2009;
• A non-interest bearing Amortizing Guaranteed Secured Note maturing June 30, 2022 with a par value of $6.5 billion ("New Note B"). The fair value of New Note B at December 31, 2009 was $3.9 billion after a scheduled payment of $610 million was made on December 31, 2009;
• Warrants that expire on January 1, 2013 to purchase 362,391,305 shares of Ford Common Stock at an exercise price of $9.20 per share. The fair value of the warrants at December 31, 2009 was $1.2 billion;
• Assets of the H-S-M-D-D-V program ("Plan Assets") consisting of cash and marketable securities. The fair value of the Plan Assets at December 31, 2009 was $3.5 billion; and
• Assets in the Temporary Asset Account ("TAA") consisting of cash and marketable securities. The fair value of these assets at December 31, 2009 was $619 million.

Notes to the Financial Statements
Ford Motor Company | 2009 Annual Report 117
NOTE 18. RETIREMENT BENEFITS (Continued)
In addition to the foregoing transfers, we retained an obligation for 2009 retiree health care costs incurred, but not yet reported, which we have estimated to be $71 million as of December 31, 2009. This obligation is recorded in Accrued liabilities and deferred revenue on our consolidated balance sheet.
As a result of the transfer of the foregoing assets, we removed from our balance sheet and transferred to the
UAW VEBA Trust our UAW postretirement health care obligation of about $13.6 billion. Upon settlement, we recognized a net loss of $264 million in Automotive cost of sales, including the effect of a
deferred gain from prior periods of $967 million previously included as a component of Accumulated other comprehensive income/(loss).
A summary of the transaction and related net loss is as follows (in billions):
_______
We computed the fair value of New Note A and New Note B using an income approach that maximized the use of
relevant observable market available data and adjusted for unobservable data that we believe market participants would assume given the specific attributes of the instruments. Significant inputs considered in the fair value measurement included the credit-adjusted yield of our unsecured debt, adjusted for term and liquidity. The principal of New Note A and New Note B, up to a limit of $3 billion, is secured on a second lien basis with the collateral pledged under the secured credit agreement we entered into in December 2006 (see Note 19 for additional discussion). Accordingly, we adjusted the unsecured yields observable in the market to reflect this limited second lien priority within our overall capital structure, considering spreads on credit default swaps based on our secured and unsecured debt. The discount rate of 9.2% and 9.9% used to determine the fair value for New Note A and New Note B, respectively, reflects consideration of the fair value of specific features of the instruments, including prepayment provisions and the option to settle New Note B with Ford Common Stock. The stock settlement option was valued using an industry standard option-pricing model that considered the volatility of our stock and multiple scenarios with assigned probabilities.

Notes to the Financial Statements
118 Ford Motor Company | 2009 Annual Report
NOTE 18. RETIREMENT BENEFITS (Continued)
We measured the fair value of the warrants issued to the UAW VEBA Trust using a Black-Scholes model and an American Options Model (Binomial). Inputs to the fair value measurement included an exercise price of $9.20 per share, and a market price of $10 per share (the closing sale price of Ford Common Stock on December 31, 2009). The fair value of the warrants reflects a risk-free rate based on a three-year U.S. Treasury debt instrument and a 40% volatility assumption which was derived from a historical volatility analysis and present market (implied) volatility assumptions commensurate with the exercise term of the warrants, and adjusted for transfer and registration restrictions of the underlying shares.
We independently validated several of our assumptions by obtaining non-binding quotes regarding volatility, prepayment features, and yields from several financial institutions and published analysts' reports regarding the market outlook for Ford. The UAW Benefit Trust
In 2005, we entered into an agreement with the UAW ("2005 Agreement") and a class of employees and retirees to increase retiree health care cost sharing under the H-S-M-D-D-V Program as part of our overall cost reduction efforts. The 2005 Agreement established an independent Defined Contribution Retiree Health Benefit Trust ("UAW Benefit Trust") which served as a non-Ford sponsored VEBA. The UAW Benefit Trust was used to mitigate the increased cost sharing for the Benefit Group and was accounted for as a separate plan from the H-S-M-D-D-V Program.
Pursuant to the Settlement Agreement, we made a third contribution of $43 million to the UAW Benefit Trust on January 1, 2009. The terms of the 2005 Agreement were superseded by the terms of the Amended Settlement Agreement and the UAW Benefit Trust was terminated on January 4, 2010. Benefit Plans – Expense and Status
The measurement date for all of our worldwide postretirement benefit plans is December 31. Our expense for defined benefit pension and OPEB plans was as follows (in millions):
_______

Notes to the Financial Statements
Ford Motor Company | 2009 Annual Report 119
NOTE 18. RETIREMENT BENEFITS (Continued)
The year-end status of these plans was as follows (dollar amounts in millions):
_______

Notes to the Financial Statements
120 Ford Motor Company | 2009 Annual Report
NOTE 18. RETIREMENT BENEFITS (Continued)
As a result of the Retiree Health Care Settlement Agreement and various personnel-reduction programs (discussed in Note 22), we have recognized curtailments and settlements in the U.S. and Canadian pension and OPEB plans. The financial impact of the curtailments and settlements is reflected in the tables above and is recorded in Automotive cost of sales and Selling, administrative and other expenses.
The amounts in Accumulated other comprehensive income/(loss) that are expected to be recognized as components
of net expense/(income) during the next year are as follows (in millions):
Plan Contributions and Drawdowns
Pension. In 2009, we made $900 million of cash contributions to our funded pension plans. During 2010, we expect to contribute $1.1 billion to our worldwide funded pension plans from available Automotive cash and cash equivalents. In addition, benefit payments made directly by us for unfunded plans are expected to be about $400 million.
Based on current assumptions and regulations, we do not expect to have a legal requirement to fund our major
U.S. pension plans in 2010.

Notes to the Financial Statements
Ford Motor Company | 2009 Annual Report 121
NOTE 18. RETIREMENT BENEFITS (Continued) Estimated Future Benefit Payments
The following table presents estimated future gross benefit payments and subsidy receipts related to the Medicare Prescription Drug Improvement and Modernization Act of 2003 (in millions):
Pension Plan Asset Information
Investment Objective and Strategies. Our investment objectives are to minimize the volatility of the value of our U.S. pension assets relative to U.S. pension liabilities and to ensure assets are sufficient to pay plan benefits. Target asset allocations, which were established in 2007 and which we expect to reach over the next several years, are about 30% public equity investments, 45% fixed income investments, and up to 25% alternative investments (e.g., private equity, real estate, and hedge funds). Our largest non-U.S. plans (Ford U.K. and Ford Canada) have similar target asset allocations and investment objectives and strategies.
Investment strategies and policies for the U.S. plans and the largest non-U.S. plans reflect a balance of risk-reducing
and return-seeking considerations. The objective of minimizing the volatility of assets relative to liabilities is addressed primarily through asset diversification, partial asset – liability matching, and hedging. Assets are broadly diversified across many asset classes to achieve risk-adjusted returns that in total lower asset volatility relative to the liabilities. Our policy to rebalance our investments regularly ensures actual allocations are in line with target allocations as appropriate. The fixed income target asset allocation partially matches the bond-like and long-dated nature of the pension liabilities.
Strategies to address the goal of ensuring sufficient assets to pay benefits include target allocations to a broad array of
asset classes that provide adequate return, diversification and liquidity.
All assets are externally managed and most assets are actively managed. Managers are not permitted to invest outside of the asset class (e.g., fixed income, equity, alternatives) or strategy for which they have been appointed. We use investment guidelines and recurring audits as tools to ensure investment managers invest solely within the investment strategy they have been provided.
Derivatives are permitted for public equity and fixed income investment managers to use as efficient substitutes for
traditional securities and to manage exposure to foreign exchange and interest rate risks. Interest rate and foreign currency derivative instruments are used for the purpose of hedging changes in the fair value of assets that result from interest rate changes and currency fluctuations. Interest rate derivatives also are used to adjust portfolio duration. Derivatives may not be used to leverage or to alter the economic exposure to an asset class outside the scope of the mandate an investment manager has been given. Alternative investment managers are permitted to employ leverage (including through the use of derivatives or other tools) that may alter economic exposure.
Notes to the Financial Statements
122 Ford Motor Company | 2009 Annual Report
NOTE 18. RETIREMENT BENEFITS (Continued) Significant Concentrations of Risk. Significant concentrations of risk in our plan assets relate to equity, interest rate,
and operating risk. In order to ensure assets are sufficient to pay benefits, a portion of plan assets is allocated to equity investments that are expected over time to earn higher returns with more volatility than fixed income investments which more closely match pension liabilities. Within equities, risk is mitigated by constructing a portfolio that is broadly diversified by geography, market capitalization, manager mandate size, investment style and process.
In order to minimize asset volatility relative to the liabilities, a portion of plan assets are allocated to fixed income investments that are exposed to interest rate risk. Rate increases generally will result in a decline in fixed income assets while reducing the present value of the liabilities. Conversely, rate decreases will increase fixed income assets, partially offsetting the related increase in the liabilities.
Operating risks include the risks of inadequate diversification and weak controls. To mitigate these risks, investments are diversified across and within asset classes in support of investment objectives. Policies and practices to address operating risks include ongoing manager oversight (e.g., style adherence, team strength, firm health, and internal risk controls), plan and asset class investment guidelines and instructions that are communicated to managers, and periodic compliance and audit reviews to ensure adherence.
Ford securities comprised less than 5% of the total market value of our assets in major worldwide plans during 2009
and 2008. Expected Long-Term Rate of Return on Assets. The long-term return assumption at year-end 2009 is 8.25% for the
U.S. plans, and 7.75% for the U.K. and Canadian plans, and averages 7.17% for all non-U.S. plans. A generally consistent approach is used worldwide to develop this assumption. This approach considers various sources, primarily inputs from a range of advisors for long-term capital market returns, inflation, bond yields and other variables, adjusted for specific aspects of our investment strategy by plan. Historical returns also are considered where appropriate.
At December 31, 2009, our actual 10-year annual rate of return on pension plan assets was 6.3% for the U.S. plans, 2.6% for the U.K. plans, and 3.4% for the Canadian plans. At December 31, 2008, our actual 10-year annual rate of return on pension plan assets was 6% for the U.S. plans, 3.4% for the U.K. plans, and 3.7% for the Canadian plans.

Notes to the Financial Statements
Ford Motor Company | 2009 Annual Report 123
NOTE 18. RETIREMENT BENEFITS (Continued)
Fair Value of Plan Assets. The fair value of our pension benefits plan assets (including dividends and interest receivables of $267 million and $75 million for U.S. and non-U.S. plans, respectively) at December 31, 2009 by asset category is as follows (in millions):

Notes to the Financial Statements
124 Ford Motor Company | 2009 Annual Report
NOTE 18. RETIREMENT BENEFITS (Continued)

Notes to the Financial Statements
Ford Motor Company | 2009 Annual Report 125
NOTE 18. RETIREMENT BENEFITS (Continued) The following table summarizes the changes in Level 3 pension benefits plan assets measured at fair value on a
recurring basis for the period ended December 31, 2009 (in millions):

Notes to the Financial Statements
126 Ford Motor Company | 2009 Annual Report
NOTE 18. RETIREMENT BENEFITS (Continued)
NOTE 19. DEBT AND COMMITMENTS
Our debt consists of short-term and long-term unsecured debt securities, convertible debt securities, and unsecured
and secured borrowings from banks and other lenders. Debt issuances are placed directly by us or through securities dealers or underwriters and are held by institutional and retail investors. In addition, Ford Credit sponsors securitization programs that provide short-term and long-term asset-backed financing through institutional investors in the U.S. and international capital markets.
Debt is recorded on our balance sheet at par value adjusted for unamortized discount or premium (in addition to adjustments related to debt in designated fair value hedge relationships; see Note 26 for policy detail). Discounts, premiums, and costs directly related to the issuance of debt generally are capitalized and amortized over the life of the debt and are recorded in Interest expense using the interest method. Gains and losses on the extinguishment of debt are recorded in Automotive interest income and other non-operating income/(expense), net and Financial Services other income/(loss), net.
Although we have not elected to mark any of our debt to fair value through earnings, we estimate its fair value for disclosures. The fair value of debt is estimated based on quoted market prices, current market rates for similar debt with approximately the same remaining maturities, or discounted cash flow models utilizing current market rates.

Notes to the Financial Statements
Ford Motor Company | 2009 Annual Report 127
NOTE 19. DEBT AND COMMITMENTS (Continued)
Debt outstanding at December 31 is shown below (in millions, except percentages):
__________

Notes to the Financial Statements
128 Ford Motor Company | 2009 Annual Report
NOTE 19. DEBT AND COMMITMENTS (Continued) The fair value of debt presented above reflects interest accrued but not yet paid. Interest accrued on Automotive
sector debt is reported in Automotive accrued liabilities and deferred revenue and was $352 million and $438 million at December 31, 2009 and 2008, respectively. Interest accrued on Financial Services sector debt is reported in Financial Services other liabilities and deferred income and was $1.1 billion and $1.3 billion at December 31, 2009 and 2008, respectively. The change in the fair value of our debt in 2009 was primarily driven by improvements in the credit markets generally, and an improved market view of Ford specifically.
Maturities
Debt maturities at December 31, 2009 were as follows (in millions):

Notes to the Financial Statements
Ford Motor Company | 2009 Annual Report 129
NOTE 19. DEBT AND COMMITMENTS (Continued) Automotive Sector
Public Unsecured Debt Securities
Our public unsecured debt securities outstanding at December 31 were as follows (in millions):
April 2009 Unsecured Notes Tender Offer. Pursuant to a cash tender offer conducted by Ford Credit, on the
settlement date of April 8, 2009, Ford Credit purchased $3.4 billion principal amount of our public unsecured debt securities for an aggregate cost of $1.1 billion cash (including transaction costs and accrued and unpaid interest payments for such tendered debt securities). Upon settlement, Ford Credit transferred the repurchased debt securities to us in satisfaction of $1.1 billion of its tax liabilities to us. As a result of the transaction, we recorded a pre-tax gain of $2.2 billion (net of unamortized discounts, premiums and fees) in the second quarter of 2009.
Other 2009 Debt Repurchases. In the first quarter of 2009, we repurchased through a private market transaction
$165 million principal amount of our outstanding public unsecured debt securities for $37 million in cash. As a result, we recorded a pre-tax gain of $127 million (net of unamortized discounts, premiums and fees).
2008 Debt for Equity Exchanges. During the first half of 2008, we issued an aggregate of 46,437,906 shares of Ford
Common Stock, par value $0.01 per share, in exchange for $431 million principal amount of our outstanding public unsecured debt securities. As a result of the exchange, we recorded a pre-tax gain of $73 million (net of unamortized discounts, premiums and fees).

Notes to the Financial Statements
130 Ford Motor Company | 2009 Annual Report
NOTE 19. DEBT AND COMMITMENTS (Continued) Convertible Notes
Convertible Notes due December 15, 2036
At December 31, 2009, we had outstanding $579 million of 2036 Convertible Notes that were originally issued in December 2006 with a principal amount of $4.95 billion. The 2036 Convertible Notes pay interest semiannually at a rate of 4.25% per annum. The 2036 Convertible Notes are convertible into shares of Ford Common Stock, based on a conversion rate (subject to adjustment) of 108.6957 shares per $1,000 principal amount of 2036 Convertible Notes (which is equal to a conversion price of $9.20 per share, representing a 25% conversion premium based on the closing price of $7.36 per share on December 6, 2006).
Upon conversion we have the right to deliver, in lieu of shares of Ford Common Stock, cash or a combination of cash
and Ford Common Stock. Holders may require us to purchase all or a portion of the 2036 Convertible Notes for cash on December 20, 2016 and December 15, 2026 or upon a change in control of the Company, or for shares of Ford Common Stock upon a designated event that is not a change in control, in each case for a price equal to 100% of the principal amount of the 2036 Convertible Notes being repurchased plus any accrued and unpaid interest to, but not including, the date of repurchase. We may redeem for cash all or a portion of the 2036 Convertible Notes at our option at any time or from time to time on or after December 20, 2016 at a price equal to 100% of the principal amount of the 2036 Convertible Notes to be redeemed, plus accrued and unpaid interest to, but not including, the redemption date. We also may terminate the conversion rights at any time on or after December 20, 2013 if the closing price of Ford Common Stock exceeds 140% of the then-applicable conversion price for 20 trading days during any consecutive 30-trading day period.
Liability and equity components of our 2036 Convertible Notes at December 31 are summarized as follows (in millions):
We recognized interest cost on our 2036 Convertible Notes as follows (in millions):
The discount on the liability component of the 2036 Convertible Notes will amortize through December 20, 2016, the
first put date. The total effective rate on the liability component was 10.5%. If all $579 million of 2036 Convertible Notes were converted into shares as of December 31, 2009 at a share price of $10.00, the share value would exceed the principal value of debt by $50 million.
April 2009 Conversion Offer. Pursuant to an exchange offer we conducted, on the settlement date for such exchange offer of April 8, 2009, $4.3 billion principal amount of 2036 Convertible Notes was exchanged for an aggregate of 467,909,227 shares of Ford Common Stock, $344 million in cash ($80 in cash per $1,000 principal amount of 2036 Convertible Notes exchanged) and the applicable accrued and unpaid interest on such 2036 Convertible Notes. As a result of the conversion, we recorded a pre-tax gain of $1.2 billion in the second quarter of 2009.
December 2008 Conversion Request. Pursuant to a request for conversion in the fourth quarter of 2008, $67 million
principal amount of 2036 Convertible Notes was exchanged for an aggregate of 7,253,035 shares of Ford Common Stock. As a result of the conversion we retrospectively recorded a pre-tax gain of $29 million.

Notes to the Financial Statements
Ford Motor Company | 2009 Annual Report 131
NOTE 19. DEBT AND COMMITMENTS (Continued)
Convertible Notes due December 15, 2016
On November 9, 2009, we issued $2.875 billion principal of our 2016 Convertible Notes. This issuance included $2.5 billion from the original offering on November 3,
2009 and $375 million from the underwriters option to purchase
additional convertible notes exercised on November 6, 2009 ("Over-Allotment Option"). The 2016 Convertible Notes pay interest semiannually at a rate of 4.25% per annum. The 2016 Convertible Notes are convertible into shares of Ford Common Stock, based on a conversion rate (subject to adjustment) of 107.5269 shares per $1,000 principal amount of 2016 Convertible Notes (which is equal to a conversion price of $9.30 per share, representing a 25% conversion premium based on the closing price of $7.44 per share on November 3, 2009).
Upon conversion, we have the right to deliver, in lieu of shares of Ford Common Stock, cash or a combination of cash and Ford Common Stock. Holders may require us to purchase all or a portion of the 2016 Convertible Notes upon a change in control of the Company, or for shares of Ford Common Stock upon a designated event that is not a change in control, in each case for a price equal to 100% of the principal amount of the 2016 Convertible Notes being repurchased plus any accrued and unpaid interest to, but not including, the date of repurchase. We also may terminate the conversion rights at any time on or after November 20, 2014 if the closing price of Ford Common Stock exceeds 130% of the then-applicable conversion price for 20 trading days during any consecutive 30-trading day period.
Liability and equity components of our 2016 Convertible Notes at December 31 are summarized as follows (in millions):
We recognized interest cost on our 2016 Convertible Notes as follows (in millions):
The discount on the liability components of the 2016 Convertible Notes will amortize through November 16, 2016. The total effective rate on the liability component was 9.2% on the original offering and 8.6% on the Over-Allotment Option. If all $2.9 billion of 2016 Convertible Notes were converted into shares as of December 31, 2009 at a share price of $10.00, the share value would exceed the principal value of debt by $216 million.
Subordinated Convertible Debentures
At December 31, 2009, we had outstanding $3 billion of 6.50% Junior Subordinated Convertible Debentures due 2032 ("Subordinated Convertible Debentures") and $140 million of deferred interest, reported in Automotive long-term debt. The $3 billion of Subordinated Convertible Debentures are due to Trust II, a subsidiary trust, and are the sole assets of Trust II. As of January 15, 2007, the Subordinated Convertible Debentures have become redeemable at our option.
At December 31, 2009, Trust II had outstanding 6.50% Cumulative Convertible Trust Preferred Securities with an aggregate liquidation preference of $2.8 billion ("Trust Preferred Securities"). The Trust Preferred Securities are convertible into shares of Ford Common Stock, based on a conversion rate (subject to adjustment) of 2.8769 shares per $50 principal amount of Trust Preferred Securities (which is equal to a conversion price of $17.38 per share). We guarantee the payment of all distribution and other payments of the Trust Preferred Securities to the extent not paid by Trust II, but only if and to the extent we have made a payment of interest or principal on the Subordinated Convertible Debentures. As announced on March 27, 2009, we elected to defer future interest payments related to the Trust Preferred Securities for up to 5 years. Trust II is not consolidated by us as it is a VIE in which we do not have a significant variable interest and of which we are not the primary beneficiary.

Notes to the Financial Statements
132 Ford Motor Company | 2009 Annual Report
NOTE 19. DEBT AND COMMITMENTS (Continued)
During the first quarter of 2009, pursuant to a request for conversion, we issued an aggregate of 2,437,562 shares of Ford Common Stock, par value $0.01 per share, in exchange for $43 million principal amount of our Subordinated Convertible Debentures.
Secured Term Loan and Revolving Loan
On December 15, 2006, we entered into a secured credit agreement (the "Credit Agreement") which provided for a seven-year, $7 billion term-loan facility and a five-year revolving credit facility of $11.5 billion. Pursuant to our Credit Agreement, at December 31, 2009, we had outstanding:
• $838 million of revolving loans which bear interest of LIBOR plus a margin of 2.25%, maturing on
December 15, 2011; • $6.7 billion of revolving loans which bear interest of LIBOR plus a margin of 3.25%, maturing on
November 30, 2013; and • $5.3 billion of a secured term loan maturing on December 15, 2013. The term loan principal amount amortizes
at a rate of $77 million (1% of original loan) per annum and bears interest at LIBOR plus a margin of 3.00%.
Under the Credit Agreement, we may designate certain of our domestic and foreign subsidiaries, including Ford Credit, as borrowers under the revolving facility. We and certain of our domestic subsidiaries that constitute a substantial portion of our domestic Automotive assets (excluding cash) are guarantors under the Credit Agreement, and future material domestic subsidiaries will become guarantors when formed or acquired.
Collateral. The borrowings of the Company, the subsidiary borrowers, and the guarantors under the Credit Agreement are secured by a substantial portion of our domestic Automotive assets (excluding cash). The collateral includes a majority of our principal domestic manufacturing facilities, excluding facilities to be closed, subject to limitations set forth in existing public indentures and other unsecured credit agreements; domestic accounts receivable; domestic inventory; up to $4 billion of marketable securities or cash proceeds therefrom; 100% of the stock of our principal domestic subsidiaries, including Ford Credit (but excluding the assets of Ford Credit); certain intercompany notes of Volvo Holding Company Inc., a holding company for Volvo, Ford Motor Company of Canada, Limited and Grupo Ford S. de R.L. de C.V. (a Mexican subsidiary); 66% to 100% of the stock of all major first tier foreign subsidiaries (including Volvo); and certain domestic intellectual property, including trademarks.
Covenants. The Credit Agreement requires ongoing compliance with a borrowing base covenant and contains other restrictive covenants, including a restriction on our ability to pay dividends. The Credit Agreement prohibits the payment of dividends (other than dividends payable solely in stock) on Ford Common and Class B Stock, subject to certain limited exceptions. In addition, the Credit Agreement contains a liquidity covenant requiring us to maintain a minimum of $4 billion in the aggregate of domestic cash, cash equivalents, loaned and marketable securities and short-term VEBA assets and/or availability under the revolving credit facility.
With respect to the borrowing base covenant, we are required to limit the outstanding amount of debt under the Credit Agreement as well as certain permitted additional indebtedness secured by the collateral described above such that the total debt outstanding does not exceed the value of the collateral as calculated in accordance with the Credit Agreement.
Events of Default. In addition to customary payment, representation, bankruptcy and judgment defaults, the Credit Agreement contains cross-payment and cross-acceleration defaults with respect to other debt for borrowed money and a change in control default.
2009 Secured Revolver Actions. Due to concerns about instability in the capital markets and the uncertain state of the global economy, on February 3, 2009, we borrowed $10.1 billion under the revolving credit facility of the Credit Agreement to ensure access to these funds. As expected, the $890 million commitment of Lehman Commercial Paper Inc. ("LCPI"), one of the lenders under the facility, was not funded because LCPI filed for protection under Chapter 11 of the U.S. Bankruptcy Code on October 5, 2008. LCPI subsequently assigned $110 million of its revolving commitment to other lenders, and $89 million of these assignee lenders' revolving commitments were funded in the third quarter of 2009. On July 10, 2009, we terminated the remaining LCPI commitment of $780 million.

Notes to the Financial Statements
Ford Motor Company | 2009 Annual Report 133
NOTE 19. DEBT AND COMMITMENTS (Continued) We also received an additional $10 million under the revolving credit facility in the third quarter of 2009 for amounts
previously committed but not yet received. On November 24, 2009, we entered into the Fourth Amendment to the Credit Agreement. Prior to the Fourth
Amendment, revolving lenders held commitments totaling $10.7 billion that matured on December 15, 2011, of which $10.2 billion was drawn. As a result of the Fourth Amendment, revolving lenders have commitments totaling $7.2 billion in a new revolving facility that matures on November 30, 2013. Those lenders who agreed to extend the maturity of their revolving commitments had the option to reduce their commitments by up to 25%, and receive a 1 percentage point increase in interest rate margins, an increase in quarterly fees, and payment of an upfront fee.
Pursuant to these arrangements, on December 3, 2009, $2.3 billion of the existing secured revolver was repaid to effect the commitment reductions elected by extending lenders, while other extending lenders increased their revolving loan commitments by an aggregate of $400 million, resulting in a net cash repayment of $1.9 billion. Extending lenders also converted $724 million of the previously-existing revolving facility into a new term loan. Lenders with revolving commitments totaling $886 million, of which $838 million is drawn, elected not to extend those commitments which will mature on the original maturity date of December 15, 2011.
At December 31, 2009, $7.5 billion of the $8.1 billion combined revolving facilities has been drawn. In addition, $418 million was utilized in the form of Letters of Credit, leaving $154 million available to be drawn.
2009 Secured Term Loan Actions. On March 27, 2009, Ford Credit purchased from term loan lenders under the Credit Agreement $2.2 billion principal amount of the secured term loan for an aggregate cost of $1.1 billion (including transaction costs). Consistent with previously-announced plans to return capital from Ford Credit to us, Ford Credit distributed the repurchased secured term loan to its immediate parent, Ford Holdings, whereupon the debt was forgiven. As a result of this transaction, we recorded a pre-tax gain of $1.1 billion in the first quarter of 2009.
In the third quarter of 2009, Ford Leasing purchased from a term loan lender under the Credit Agreement $45 million
principal amount of the secured term loan for an aggregate cost of $37 million. Ford Holdings elected to receive the $37 million from Ford Leasing as a dividend, whereupon the debt was immediately forgiven. As a result of this transaction, we recorded a pre-tax gain of $8 million.
On December 3, 2009, as described above, $724 million of our secured revolving loan was converted into an additional
secured term loan that matures on December 15, 2013. The new term loan has the same pricing, maturity, and other terms as the existing secured term loan, but is not subject to mandatory prepayments (as defined in the Credit Agreement) as is the existing term loan. Notes Due to UAW VEBA Trust
Pursuant to the Amended Settlement Agreement as described in Note 18, at December 31, 2009 we had outstanding $7 billion in amortizing notes due to the UAW VEBA Trust made up of New Note A and New Note B. New Note A was recorded at a fair value of $3.1 billion ($4.7 billion par value net of $1.6 billion unamortized discount) using an effective yield of 9.2%. New Note B was recorded at a fair value of $3.9 billion ($5.9 billion par value net of $2 billion unamortized discount) using an effective yield of 9.9%. The New Notes mature June 30, 2022, and allow for prepayments that, if paid, are due with the annual scheduled principal payment dates. The New Notes are secured on a second lien basis, limited to the lesser of an aggregate $3 billion or the outstanding principal amount of obligations thereunder, with collateral securing our obligations under the Credit Agreement.
Under New Note B, we have the option, subject to certain conditions, of making each payment in cash, Ford Common Stock, or a combination of cash and Ford Common Stock. Any Ford Common Stock to be delivered in satisfaction of such payment obligation is to be valued based on its volume-weighted average price per share for the 30 trading-day period ending on the second business day prior to the relevant payment date.
Notes to the Financial Statements
134 Ford Motor Company | 2009 Annual Report
NOTE 19. DEBT AND COMMITMENTS (Continued) DOE Loan
Pursuant to the Loan Arrangement and Reimbursement Agreement (the "Arrangement Agreement") with the DOE entered into on September 16, 2009, we have outstanding $1.2 billion in loans as of December 31, 2009. Under the terms of the Arrangement Agreement, the DOE agreed to (i) arrange a 13-year multi-draw term loan facility (the "Facility") under the Advanced Technology Vehicles Manufacturing ("ATVM") Program in the aggregate principal amount of up to $5.9 billion, (ii) designate us as a borrower under the ATVM Program and (iii) cause the Federal Financing Bank ("FFB") to enter into the Note Purchase Agreement (the "Note Purchase Agreement") for the purchase of notes to be issued by us evidencing such loans under the Arrangement Agreement. Loans under the ATVM are made by and through the FFB, an instrumentality of the U.S. government that is under the general supervision of the U.S. Secretary of the Treasury.
The proceeds of advances under the Facility will be used to finance certain costs eligible for financing under the ATVM Program ("Eligible Project Costs") that are incurred through mid-2012 in the implementation of 13 advanced technology vehicle programs approved by the DOE (each, a "Project"). The Arrangement Agreement limits the amount of advances that may be used to fund Eligible Project Costs for each Project, and our ability to finance Eligible Project Costs with respect to a Project is conditioned on us meeting agreed timing milestones and fuel economy targets for that Project.
Maturity, Interest Rate and Amortization. Advances under the Facility may be requested through June 30, 2012, and the loans will mature on June 15, 2022 (the "Maturity Date"). Each advance bears interest at a blended rate based on the Treasury yield curve at the time such advance is borrowed, based on the principal amortization schedule for that advance, with interest payable quarterly in arrears. The principal amount of the loans is payable in equal quarterly installments commencing on September 15, 2012 and continuing through the Maturity Date. Per the Arrangement Agreement, we have the ability to voluntarily prepay all or a portion of any advance under the Facility at a prepayment price based on the Treasury yield curve at the time the prepayment is made. It is intended to replicate the price for such advance that would, if it were purchased by a third party and held to maturity, produce a yield to the third-party purchaser for the period from the date of purchase to the Maturity Date substantially equal to the interest rate that would be set on a loan from the Secretary of Treasury to the FFB to purchase an obligation having a payment schedule identical to the payment schedule of such advance for the period from the intended prepayment date to the Maturity Date.
Collateral. The $5.9 billion commitment is comprised of two loans: (i) a $1.5 billion note secured by a first priority lien on any assets purchased or developed with the proceeds of the loans, and (ii) a $4.4 billion note secured by a junior lien on all of the collateral pledged under our Credit Agreement subordinated solely to (a) prior perfected security interests securing certain indebtedness, letters of credit, cash-management obligations and hedging obligations in an aggregate principal amount not to exceed $19.1 billion as described in the First Amendment to the Arrangement Agreement and (b) certain other permitted liens described in the Arrangement Agreement.
Guarantees. Certain of our subsidiaries that, together with us, hold a substantial portion of the consolidated domestic Automotive assets (excluding cash) and that guarantee the Credit Agreement will guarantee our obligations under the Facility, and future material domestic subsidiaries will become guarantors when formed or acquired.
Affirmative Covenants. The Arrangement Agreement contains affirmative covenants substantially similar to those in the Credit Agreement (including similar baskets and exceptions), as well as certain other affirmative covenants required in connection with the ATVM Program, including compliance with ATVM Program requirements, introduction of advanced technology vehicles to meet or exceed projected overall annual fuel economy improvements and delivery of progress reports and independent auditor reports with respect to the Projects.
Negative Covenants. The Arrangement Agreement contains negative covenants substantially similar to those in the Credit Agreement. The Arrangement Agreement also contains a negative covenant substantially similar to the liquidity covenant in the Credit Agreement requiring that we not permit Available Liquidity (as defined in the Arrangement Agreement) to be less than $4 billion.

Notes to the Financial Statements
Ford Motor Company | 2009 Annual Report 135
NOTE 19. DEBT AND COMMITMENTS (Continued) Events of Default. In addition to customary payment, representation, bankruptcy and judgment defaults, the
Arrangement Agreement contains cross-payment and cross-acceleration defaults with respect to other debt for borrowed money and a change in control default, as well as events of default specific to the facility.
Other Automotive Credit Facilities*
At December 31, 2009, we had $628 million of other contractually-committed Automotive credit facilities with financial institutions, including $25 million of worldwide Automotive unsecured credit facilities and $603 million of local credit facilities to foreign Automotive affiliates. Of the $628 million of contractually-committed, $130 million has been utilized. Of the $498 million available for use, $60 million expire in 2010, $65 million expire in 2013, and $373 million expire in 2014. Financial Services Sector Unsecured Debt
Debt Repurchases. During 2009, through private market transactions, our Financial Services sector repurchased an aggregate of $3.6 billion principal amount of its outstanding notes for $3.5 billion in cash. As a result, our Financial Services sector recorded a pre-tax gain of $67 million (net of unamortized discounts, premiums and fees) in 2009 ($51 million related to Ford Holdings and $16 million related to Ford Credit). Asset-Backed Debt
Ford Credit transfers finance receivables and net investments in operating leases in structured transactions to fund
operations and to maintain liquidity. Each transaction is evaluated to determine whether for accounting purposes the transfer qualifies as a sale of financial assets or a secured borrowing. The majority of Ford Credit's transactions do not meet the criteria for selling and derecognizing financial assets. Accordingly, such transactions are recorded as a secured borrowing and the assets continue to be reported on our financial statements as Finance receivables, net or as Net investment in operating leases.
The following table shows the assets and liabilities related to Ford Credit's secured debt arrangements that are
included in our financial statements for the years ended December 31 (in billions):
Financial Services sector asset-backed debt also includes $97 million and $96 million at December 31, 2009 and
2008, respectively, that is secured by property. _________

Notes to the Financial Statements
136 Ford Motor Company | 2009 Annual Report
NOTE 19. DEBT AND COMMITMENTS (Continued)
Credit Facilities
At December 31, 2009, Ford Credit and its majority-owned subsidiaries, including FCE Bank, plc ("FCE"), had $1.3 billion of contractually-committed unsecured credit facilities with financial institutions, of which $645 million were available for use. Of the credit facilities available for use, $276 million, $308 million, and $61 million expire in 2010, 2011, and 2012, respectively. Of the $1.3 billion of contractually-committed credit facilities, almost all are FCE worldwide credit facilities. The FCE worldwide credit facilities may be used, at FCE's option, by any of FCE's direct or indirect, majority-owned subsidiaries. FCE will guarantee any such borrowings. All of the worldwide credit facilities are free of material adverse change clauses, restrictive financial covenants (for example, debt-to-equity limitations and minimum net worth requirements) and credit rating triggers that could limit Ford Credit's ability to obtain funding.
In addition, at December 31, 2009, Ford Credit had $9.3 billion of contractually-committed liquidity facilities provided by banks to support its FCAR program. Of the $9.3 billion of contractually-committed liquidity facilities, $4.4 billion and $4.9 billion expire in 2010 and 2012, respectively. Utilization of these facilities is subject to conditions specific to the FCAR program and Ford Credit having a sufficient amount of eligible assets for securitization. The FCAR program must be supported by liquidity facilities equal to at least 100% of its outstanding balance. At December 31, 2009, $9.3 billion of FCAR's bank liquidity facilities were available to support FCAR's asset-backed commercial paper, subordinated debt or FCAR's purchase of Ford Credit's asset-backed securities. At December 31, 2009, the outstanding commercial paper balance for the FCAR program was $6.4 billion, of which $1 million was held by Ford Credit.
Committed Liquidity Programs
Ford Credit and its subsidiaries, including FCE, have entered into agreements with a number of bank-sponsored asset-backed commercial paper conduits (“conduits”) and other financial institutions whereby such parties are contractually committed, at Ford Credit's option, to purchase from Ford Credit eligible retail or wholesale assets, or to purchase or make advances under asset-backed securities backed by retail, lease or wholesale assets, for proceeds of up to $23.2 billion at December 31, 2009 ($10.8 billion retail, $8.1 billion wholesale and $4.3 billion supported by various retail, lease or wholesale) of which $7.4 billion are commitments to FCE. These committed liquidity programs have varying maturity dates, with $20.2 billion having maturities within the next twelve months (of which $6.7 billion relates to FCE commitments), and the balance having maturities between March 2011 and December 2011. While there is a risk of non-renewal of some of these committed liquidity programs, which could lead to a reduction in the size of these programs and/or higher costs, Ford Credit's capacity in excess of eligible receivables would enable it to absorb some reductions. Ford Credit's ability to obtain funding under these programs is subject to having a sufficient amount of assets eligible for these programs as well as the ability to obtain interest rate hedging arrangements for securitizations. At December 31, 2009, $11.2 billion of these commitments were in use. These programs are free of material adverse change clauses, restrictive financial covenants and credit rating triggers that could limit Ford Credit's ability to obtain funding. However, the unused portion of these commitments may be terminated if the performance of the underlying assets deteriorates beyond specified levels. Based on Ford Credit's experience and knowledge as servicer of the related assets, it does not expect any of these programs to be terminated due to such events.

Notes to the Financial Statements
Ford Motor Company | 2009 Annual Report 137
NOTE 20. OTHER INCOME/(LOSS)
Automotive Sector
The following table summarizes amounts included in Automotive interest income and other non-operating income/(expense), net (in millions):
Financial Services Sector
The following table summarizes the amounts included in Financial Services other income/(loss), net (in millions):
NOTE 21. SHARE-BASED COMPENSATION
At December 31, 2009, a variety of Ford stock-based compensation grants and awards were outstanding for employees (including officers) and members of the Board of Directors. All stock-based compensation plans are approved by the shareholders.
Included below is information on restricted stock units, stock option awards, and other share-based awards.
We grant performance and time-based restricted stock units to our employees. Restricted stock units awarded in stock
("RSU-stock") provide the recipients with the right to shares of stock after a restriction period. We have stock-based compensation outstanding under two Long-Term Incentive Plans ("LTIP"): the 1998 LTIP and the 2008 LTIP. No further grants may be made under the 1998 LTIP. All outstanding stock-based compensation under the 1998 LTIP continues to be governed by the terms and conditions of the existing agreements for those grants. Grants may continue to be made under the 2008 LTIP through April 2018. Under the 2008 LTIP, 2% of our issued Common Stock as of December 31 becomes available for granting plan awards in the succeeding calendar year. Any unused portion is available for later years. The limit may be increased up to 3% in any year, with a corresponding reduction in shares available for grants in future years. All unused shares from previous years and shares available under the 2% limit were used in 2009, as well as additional shares allocated from increasing the limit above 2%.
The fair value of the awards under the two plans is calculated differently:
1998 LTIP - Fair value is the average of the high and low market price of our Common Stock on the grant date. 2008 LTIP - Fair value is the closing price of our Common Stock on the grant date.

Notes to the Financial Statements
138 Ford Motor Company | 2009 Annual Report
NOTE 21. SHARE-BASED COMPENSATION (Continued) Outstanding RSU-stock are either strictly time-based or a combination of performance and time-based awards.
Expenses associated with RSU-stock are recorded in Selling, administrative, and other expense.
• Time-based RSU-stock issued in 2006 and prior vest at the end of the restriction period and the expense is taken equally over the restriction period.
• Time-based RSU-stock issued in and after 2007 generally have a graded vesting feature whereby one-third of each RSU-stock vests after the first anniversary of the grant date, one-third after the second anniversary, and one-third after the third anniversary. The expense is recognized using the graded vesting method.
• Performance RSU-stock have a performance period (usually 1-3 years) and a restriction period (usually 1-3 years). Compensation expense for performance RSU-stock is not recognized until it is probable and estimable. Expense is then recognized over the performance and restriction periods based on the fair market value of Ford Common Stock at grant date.
We also grant stock options to our employees. We measure the fair value of the majority of our stock options using the Black-Scholes option-pricing model, using historical volatility and our determination of the expected term. The expected term of stock options is the time period that the stock options are expected to be outstanding. Historical data are used to estimate option exercise behaviors and employee termination experience. Based on our assessment of employee groupings and observable behaviors, we determined that a single grouping is appropriate. Generally, 33% of the stock options are exercisable after the first anniversary of the date of grant, 66% after the second anniversary, and 100% after the third anniversary. Stock options expire ten years from the grant date and are expensed in Selling, administrative, and other expenses using a three-year graded vesting methodology.
Upon stock-settled compensation exercises and awards, we issued new shares of Common Stock. We do not expect to repurchase a significant number of shares for treasury stock during 2010. Restricted Stock Units
RSU-stock activity during 2009 was as follows:
Intrinsic value of RSU-stock is measured by applying the closing stock price as of December 31 to the applicable number of units. The fair value and intrinsic value of RSU-stock during 2009, 2008, and 2007 were as follows (in millions, except RSU per unit amounts):
Compensation cost for RSU-stock was as follows (in millions):

Notes to the Financial Statements
Ford Motor Company | 2009 Annual Report 139
NOTE 21. SHARE-BASED COMPENSATION (Continued)
As of December 31, 2009, there was approximately $86 million in unrealized compensation cost related to non-vested RSU-stock. This expense will be recognized over a weighted average period of 1.3 years. Stock Options
Stock option activity was as follows:
The total fair value of options that vested during the years ended December 31 was as follows (in millions):
We have 185 million fully-vested stock options, with a weighted-average exercise price of $15.47 and remaining term
of 3.5 years. We expect 39.2 million stock options (after forfeitures), with a weighted-average exercise price of $3.72 and remaining term of 8.7 years, to vest in the future.
The intrinsic value for vested and unvested options during the years ended December 31 was as follows (in millions):
We received approximately $10 million from the exercise of stock options in 2009. The tax benefit realized was
de minimis. An equivalent of about $10 million in new issues were used to settle exercised options. For options exercised during the years ended December 31, 2009, 2008, and 2007, the difference between the fair value of the common shares issued and their respective exercise price was $2 million, de minimis, and $1 million, respectively.
Compensation cost for stock options was as follows (in millions):

Notes to the Financial Statements
140 Ford Motor Company | 2009 Annual Report
NOTE 21. SHARE-BASED COMPENSATION (Continued) As of December 31, 2009, there was about $15 million in unrealized compensation cost related to non-vested stock
options. This expense will be recognized over a weighted average period of 1.3 years. A summary of the status of our non-vested shares and changes during 2009 follows:
The estimated fair value of stock options at the time of grant using the Black-Scholes option-pricing model was as
follows:
Details on various stock option exercise price ranges are as follows:
Other Share-Based Awards Under the 1998 LTIP and 2008 LTIP, we have granted other share-based awards to select executives and other key
employees, in addition to stock options and restricted stock units. These awards include restricted stock, cash-awarded restricted stock units, performance stock rights, and stock appreciation rights. These awards have various vesting criteria which may include service requirements, individual performance targets, and company-wide performance targets.
Other share-based compensation cost was as follows (in millions):
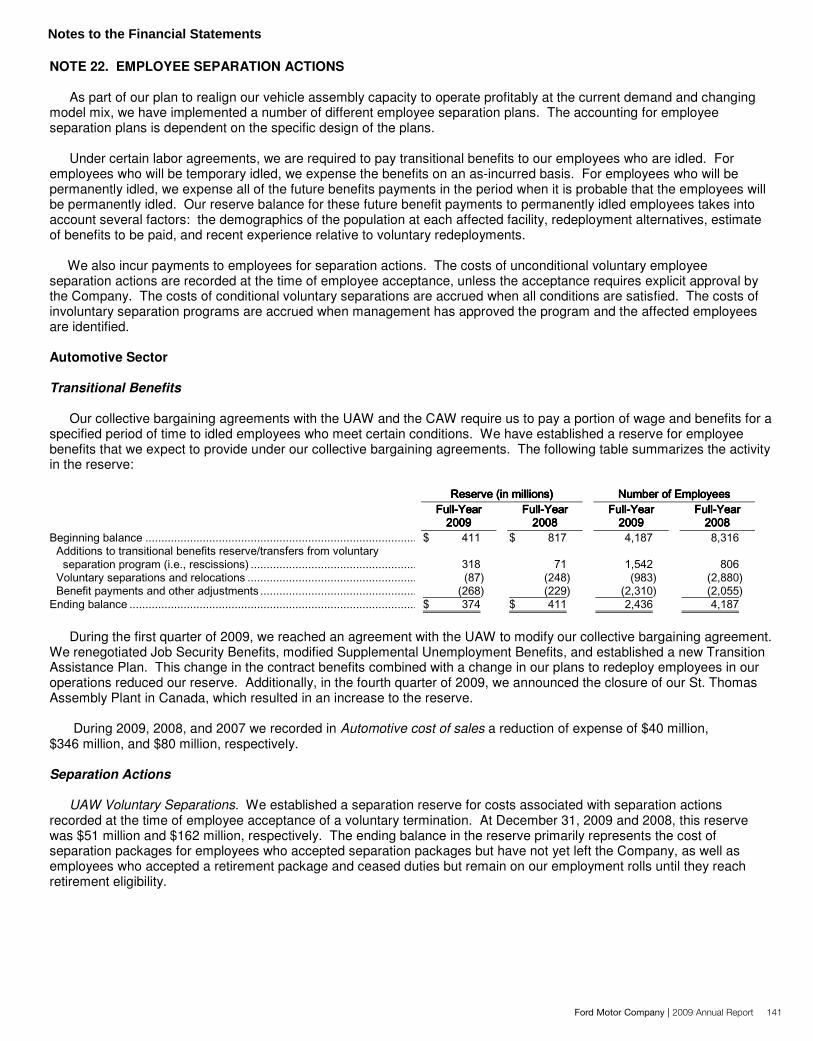
Notes to the Financial Statements
Ford Motor Company | 2009 Annual Report 141
NOTE 22. EMPLOYEE SEPARATION ACTIONS
As part of our plan to realign our vehicle assembly capacity to operate profitably at the current demand and changing
model mix, we have implemented a number of different employee separation plans. The accounting for employee separation plans is dependent on the specific design of the plans.
Under certain labor agreements, we are required to pay transitional benefits to our employees who are idled. For employees who will be temporary idled, we expense the benefits on an as-incurred basis. For employees who will be permanently idled, we expense all of the future benefits payments in the period when it is probable that the employees will be permanently idled. Our reserve balance for these future benefit payments to permanently idled employees takes into account several factors: the demographics of the population at each affected facility, redeployment alternatives, estimate of benefits to be paid, and recent experience relative to voluntary redeployments.
We also incur payments to employees for separation actions. The costs of unconditional voluntary employee
separation actions are recorded at the time of employee acceptance, unless the acceptance requires explicit approval by the Company. The costs of conditional voluntary separations are accrued when all conditions are satisfied. The costs of involuntary separation programs are accrued when management has approved the program and the affected employees are identified.
Automotive Sector
Transitional Benefits
Our collective bargaining agreements with the UAW and the CAW require us to pay a portion of wage and benefits for a specified period of time to idled employees who meet certain conditions. We have established a reserve for employee benefits that we expect to provide under our collective bargaining agreements. The following table summarizes the activity in the reserve:
During the first quarter of 2009, we reached an agreement with the UAW to modify our collective bargaining agreement.
We renegotiated Job Security Benefits, modified Supplemental Unemployment Benefits, and established a new Transition Assistance Plan. This change in the contract benefits combined with a change in our plans to redeploy employees in our operations reduced our reserve. Additionally, in the fourth quarter of 2009, we announced the closure of our St. Thomas Assembly Plant in Canada, which resulted in an increase to the reserve.
During 2009, 2008, and 2007 we recorded in Automotive cost of sales a reduction of expense of $40 million,
$346 million, and $80 million, respectively. Separation Actions
UAW Voluntary Separations. We established a separation reserve for costs associated with separation actions recorded at the time of employee acceptance of a voluntary termination. At December 31, 2009 and 2008, this reserve was $51 million and $162 million, respectively. The ending balance in the reserve primarily represents the cost of separation packages for employees who accepted separation packages but have not yet left the Company, as well as employees who accepted a retirement package and ceased duties but remain on our employment rolls until they reach retirement eligibility.

Notes to the Financial Statements
142 Ford Motor Company | 2009 Annual Report
NOTE 22. EMPLOYEE SEPARATION ACTIONS (Continued) We recorded in Automotive cost of sales pre-tax charges of $122 million and $323 million for 2009 and 2008,
respectively, and recorded a reduction to expense for rescissions of previous acceptances of $298 million for 2007.
Other Employee Separation Actions. The following table shows pre-tax charges for other hourly and salaried employee separation actions, which are recorded in Automotive cost of sales and Selling, administrative and other expenses (in millions):
The charges above exclude costs for pension and OPEB.
Financial Services Sector Separation Actions
In 2009, Ford Credit announced plans to restructure its U.S. operations to meet changing business conditions, including the decline in its receivables. The restructuring affects its servicing, sales, and central operations. In 2009, 2008, and 2007, Ford Credit recognized pre-tax charges of $64 million, $16 million, and $37 million, respectively, in Selling, administrative and other expenses for this and other employee separation actions outside of the United States.
These charges exclude pension costs.
NOTE 23. INCOME TAXES Income Taxes
According to U.S. GAAP, we have elected to recognize accrued interest related to unrecognized tax benefits and tax-related penalties in the Provision for/(Benefit from) income taxes on our consolidated statement of operations. Valuation of Deferred Tax Assets and Liabilities
Deferred tax assets and liabilities are recognized based on the future tax consequences attributable to temporary
differences that exist between the financial statement carrying value of assets and liabilities and their respective tax bases, and operating loss and tax credit carryforwards on a taxing jurisdiction basis. We measure deferred tax assets and liabilities using enacted tax rates that will apply in the years in which we expect the temporary differences to be recovered or paid.
Our accounting for deferred tax consequences represents our best estimate of the likely future tax consequences of events that have been recognized in our financial statements or tax returns and their future probability. In assessing the need for a valuation allowance, we consider both positive and negative evidence related to the likelihood of realization of the deferred tax assets. If, based on the weight of available evidence, it is more likely than not the deferred tax assets will not be realized, we record a valuation allowance.

Notes to the Financial Statements
Ford Motor Company | 2009 Annual Report 143
NOTE 23. INCOME TAXES (Continued) Components of Income Taxes
Components of income taxes excluding discontinued operations, cumulative effects of changes in accounting principles, other comprehensive income, and equity in net results of affiliated companies accounted for after-tax, are as follows:
No provision for deferred taxes has been made on $1.3 billion of unremitted earnings that are permanently invested in
our non-U.S. operating assets. Had these earnings not been permanently reinvested in non-U.S. operations, the U.S. tax consequences of their repatriation would have been insignificant since these earnings were subject to foreign taxes that would offset, as foreign tax credits, substantially all U.S. taxes.
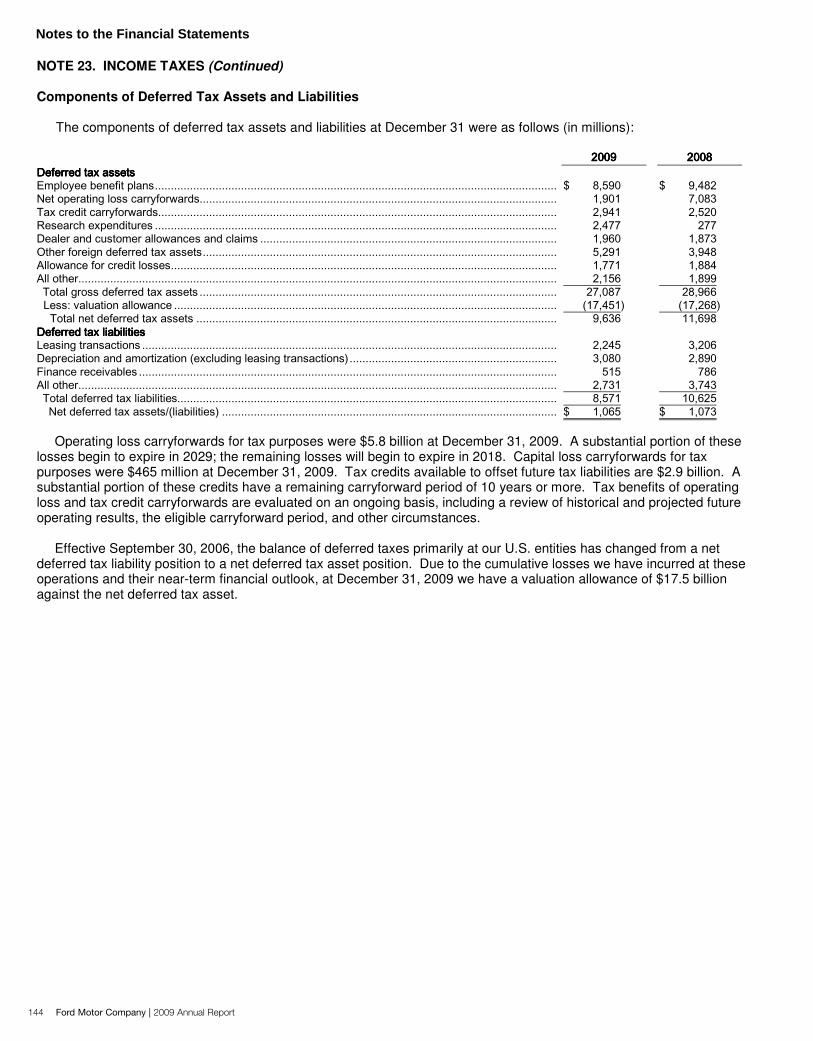
Notes to the Financial Statements
144 Ford Motor Company | 2009 Annual Report
NOTE 23. INCOME TAXES (Continued) Components of Deferred Tax Assets and Liabilities
The components of deferred tax assets and liabilities at December 31 were as follows (in millions):
Operating loss carryforwards for tax purposes were $5.8 billion at December 31, 2009. A substantial portion of these losses begin to expire in 2029; the remaining losses will begin to expire in 2018. Capital loss carryforwards for tax purposes were $465 million at December 31, 2009. Tax credits available to offset future tax liabilities are $2.9 billion. A substantial portion of these credits have a remaining carryforward period of 10 years or more. Tax benefits of operating loss and tax credit carryforwards are evaluated on an ongoing basis, including a review of historical and projected future operating results, the eligible carryforward period, and other circumstances.
Effective September 30, 2006, the balance of deferred taxes primarily at our U.S. entities has changed from a net
deferred tax liability position to a net deferred tax asset position. Due to the cumulative losses we have incurred at these operations and their near-term financial outlook, at December 31, 2009 we have a valuation allowance of $17.5 billion against the net deferred tax asset.

Notes to the Financial Statements
Ford Motor Company | 2009 Annual Report 145
NOTE 23. INCOME TAXES (Continued) Tax Benefits Preservation Plan
On September 11, 2009, our Board of Directors adopted a tax benefit preservation plan designed to preserve shareholder value and the value of certain tax assets including net operating losses, capital losses, and tax credit carryforwards ("Tax Attributes"). At December 31, 2009, we had Tax Attributes that would offset $17 billion of U.S. taxable income. Our ability to use these Tax Attributes would be substantially limited if there were an "ownership change" as defined under Section 382 of the Internal Revenue Code. In general, an ownership change would occur if 5-percent shareholders (as defined under U.S. federal income tax laws) collectively increase their ownership in Ford by more than 50 percentage points over a rolling three-year period.
In connection with the tax benefit preservation plan, our Board of Directors declared a dividend of one preferred share purchase right for each share of Ford Common Stock and Class B Stock outstanding as of the close of business on September 25, 2009. In accordance with the Plan, shares held by any person who acquires, without the approval of our Board of Directors, beneficial ownership of 4.99% or more of outstanding Ford Common Stock (including any ownership interest held by that person's affiliates and associates as defined under the tax benefit preservation plan) could be subject to significant dilution. Other
We adopted the provisions of the accounting standard for uncertainty in income taxes on January 1, 2007. As a result of its implementation, we recorded an increase of $1.3 billion to Retained earnings.
A reconciliation of the beginning and ending amount of unrecognized tax benefits is as follows for the years listed (in millions):
The amount of unrecognized tax benefits at December 31, 2009 and 2008 that would affect the effective tax rate if
recognized was $745 million and $964 million, respectively. The U.S. and Canadian governments have reached agreement on our transfer pricing methodologies. The agreement
covers a number of years and has resulted in a favorable impact to the income tax provision of $196 million in 2009 after the impact of valuation allowances, primarily resulting from the refund of prior Canadian tax payments.
Examinations by tax authorities have been completed through 1999 in Germany, 2001 in Sweden, 2004 in Canada, 2005 in the United States, and 2006 in the United Kingdom. Although examinations have been completed in these jurisdictions, various unresolved transfer pricing disputes exist for years dating back to 1994.
During 2009 and 2008, we recorded in our consolidated statement of operations approximately $54 million and
$69 million in tax related interest income, respectively. As of December 31, 2009 and 2008, we had recorded a net payable of $38 million, and a net receivable of $177 million, respectively, for tax-related interest.

Notes to the Financial Statements
146 Ford Motor Company | 2009 Annual Report
NOTE 24. HELD-FOR-SALE OPERATIONS, DISCONTINUED OPERATIONS, OTHER DISPOSITIONS, AND ACQUISITIONS
We classify disposal groups as held for sale when the sale is probable within one year and the disposal group is available for immediate sale in its present condition. We classify disposal groups as discontinued operations when the criteria to be classified as held for sale have been met and we will not have any significant involvement with the disposal groups after the sale.
We perform an impairment test on disposal groups. An impairment charge is recognized when the carrying value of the disposal group exceeds the estimated fair value, less transaction costs. We estimate fair value under the market approach to approximate the expected proceeds to be received.
We are required by U.S. GAAP to aggregate the assets and liabilities of all held-for-sale disposal groups on the balance sheet for the period in which the disposal group is held for sale. To provide comparative balance sheets, we also aggregate the assets and liabilities for significant held-for-sale disposal groups on the prior-period balance sheet. Automotive Sector Held-for-Sale Operations
Volvo. In the fourth quarter of 2008, we performed annual goodwill impairment testing for our Volvo reporting unit. We compared the carrying value of our Volvo reporting unit to its fair value, and concluded that the goodwill was not impaired. We performed this measurement relying primarily on the income approach, applying a discounted cash flow methodology. Our valuation was based on an in-use premise which considered a discount rate, after-tax return on sales rate, growth rate, and terminal value consistent with assumptions we believed principal market participants (i.e., other global automotive manufacturers) would use. This methodology produced appropriate valuations for entities we disposed of in recent years; in light of worsening economic conditions, however, we also considered other valuations, including a discounted cash flow analysis using more conservative assumptions than we initially used. This alternative analysis incorporated a significantly higher discount rate, offset partially by a higher growth rate; a much lower after-tax return on sales rate; and a lower terminal value. This alternative analysis reduced the valuation of our Volvo reporting unit by about 50%. Even this more conservative analysis, however, did not support an impairment of Volvo goodwill at year end.
As previously disclosed, in recent years we have undertaken efforts to divest non-core assets in order to allow us to focus exclusively on our global Ford brand. Toward that end, in 2007 we sold our interest in Aston Martin; in 2008, we sold our interest in our Jaguar Land Rover operations, and a significant portion of our ownership in Mazda. During the first quarter of 2009, based on our strategic review of Volvo and in light of our goal to focus on the global Ford brand, our Board of Directors committed to actively market Volvo for sale, notwithstanding the current distressed market for automotive-related assets. Accordingly, in the first quarter of 2009 we reported Volvo as held for sale, and we ceased depreciation of its long-lived assets in the second quarter of 2009.
Our commitment to actively market Volvo for sale also triggered a held-for-sale impairment test in the first quarter of 2009. We received information from our discussions with potential buyers that provided us a value for Volvo using a market approach, rather than an income approach. We concluded that the information we received from our discussions with potential buyers was more representative of the value of Volvo given the current market conditions, the characteristics of viable market participants, and our anticipation of a more immediate transaction for Volvo. These inputs resulted in a lower value for Volvo than the discounted cash flow method we had previously used.
After considering deferred gains reported in Accumulated other comprehensive income/(loss), we recognized a pre-tax
impairment charge of $650 million related to our total investment in Volvo. The impairment was recorded in Automotive cost of sales for the first quarter of 2009.
Had we not committed to actively market Volvo for sale, we would not have been afforded the benefit of the new
information obtained in discussions with potential buyers. Rather, we would have continued to employ an in-use premise to test Volvo's goodwill and long-lived assets, using a discounted cash flow methodology with assumptions similar to those we used at year-end 2008.
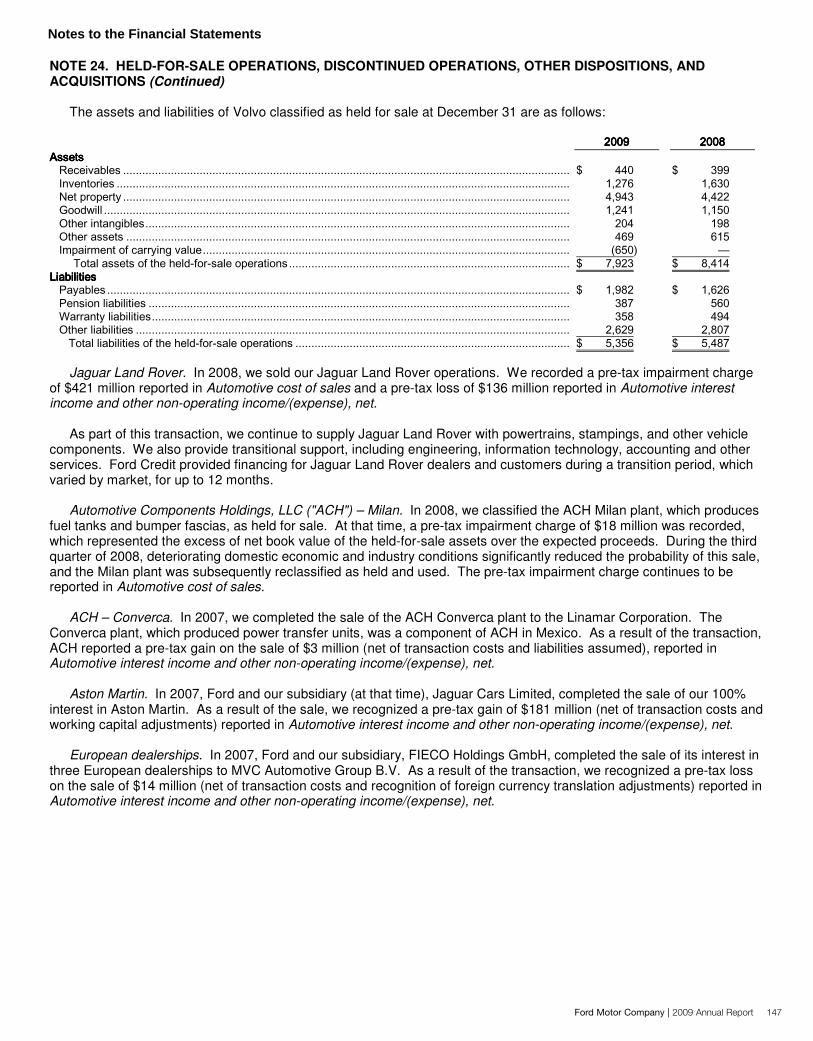
Notes to the Financial Statements
Ford Motor Company | 2009 Annual Report 147
NOTE 24. HELD-FOR-SALE OPERATIONS, DISCONTINUED OPERATIONS, OTHER DISPOSITIONS, AND ACQUISITIONS (Continued)
The assets and liabilities of Volvo classified as held for sale at December 31 are as follows:
Jaguar Land Rover. In 2008, we sold our Jaguar Land Rover operations. We recorded a pre-tax impairment charge
of $421 million reported in Automotive cost of sales and a pre-tax loss of $136 million reported in Automotive interest income and other non-operating income/(expense), net.
As part of this transaction, we continue to supply Jaguar Land Rover with powertrains, stampings, and other vehicle components. We also provide transitional support, including engineering, information technology, accounting and other services. Ford Credit provided financing for Jaguar Land Rover dealers and customers during a transition period, which varied by market, for up to 12 months.
Automotive Components Holdings, LLC ("ACH") – Milan. In 2008, we classified the ACH Milan plant, which produces
fuel tanks and bumper fascias, as held for sale. At that time, a pre-tax impairment charge of $18 million was recorded, which represented the excess of net book value of the held-for-sale assets over the expected proceeds. During the third quarter of 2008, deteriorating domestic economic and industry conditions significantly reduced the probability of this sale, and the Milan plant was subsequently reclassified as held and used. The pre-tax impairment charge continues to be reported in Automotive cost of sales.
ACH – Converca. In 2007, we completed the sale of the ACH Converca plant to the Linamar Corporation. The
Converca plant, which produced power transfer units, was a component of ACH in Mexico. As a result of the transaction, ACH reported a pre-tax gain on the sale of $3 million (net of transaction costs and liabilities assumed), reported in Automotive interest income and other non-operating income/(expense), net.
Aston Martin. In 2007, Ford and our subsidiary (at that time), Jaguar Cars Limited, completed the sale of our 100%
interest in Aston Martin. As a result of the sale, we recognized a pre-tax gain of $181 million (net of transaction costs and working capital adjustments) reported in Automotive interest income and other non-operating income/(expense), net.
European dealerships. In 2007, Ford and our subsidiary, FIECO Holdings GmbH, completed the sale of its interest in three European dealerships to MVC Automotive Group B.V. As a result of the transaction, we recognized a pre-tax loss on the sale of $14 million (net of transaction costs and recognition of foreign currency translation adjustments) reported in Automotive interest income and other non-operating income/(expense), net.

Notes to the Financial Statements
148 Ford Motor Company | 2009 Annual Report
NOTE 24. HELD-FOR-SALE OPERATIONS, DISCONTINUED OPERATIONS, OTHER DISPOSITIONS, AND ACQUISITIONS (Continued) Discontinued Operations
Automotive Protection Corporation ("APCO"). In 2007, we completed the sale of APCO and realized a pre-tax gain of $51 million (net of transaction costs and working capital adjustments), reported in Income/(Loss) from discontinued operations. In the second quarter of 2009, we received additional proceeds related to the settlement of a state and local tax matter that was unresolved at the time of sale and recognized an after-tax gain of $3 million in Income/(Loss) from discontinued operations.
The results of all discontinued Automotive sector operations are as follows (in millions):
Other Dispositions
Progress Ford Sales Limited ("PFS"). In the second quarter of 2009, PFS was liquidated. As a result, we recognized
in Automotive cost of sales a $281 million foreign exchange translation loss previously deferred in Accumulated other comprehensive income/(loss).
NuCellSys. In 2009, we reached an agreement with Daimler AG ("Daimler") to sell our entire ownership interest in
NuCellSys to Daimler. NuCellSys was a joint venture created by Ford and Daimler in 2005 for research into and development and manufacture of fuel cell systems. As a result of the sale, we recognized a loss of $29 million in Automotive interest income and other non-operating income/(expense), net.
ACH – Glass. In 2008, we completed the sale of the ACH glass business to Zeledyne, LLC ("Zeledyne"). As a result
of this transaction, we recognized a pre-tax loss of $285 million reported in Automotive interest income and other non-operating income/(expense), net. During the third quarter of 2008, the sale agreement between Ford and Zeledyne was amended resulting in an additional $19 million pre-tax loss reported in Automotive interest income and other non-operating income/(expense), net. With this, our pre-tax loss was $304 million.
Ballard Power Systems, Inc. ("Ballard"). In 2008, we reached an agreement with Ballard to exchange our entire
ownership interest of 12.9 million shares of Ballard stock for a 30% equity interest in AFCC along with $22 million in cash. AFCC is a joint venture between Ford (30%), Daimler (50.1%) and Ballard (19.9%) that was created for the development of automotive fuel cells. We also have agreed to purchase from Ballard its 19.9% equity interest for $65 million plus interest within five years. As a result of the exchange, we recognized in Automotive cost of sales a pre-tax loss of $70 million. Our investment in AFCC is reported in Equity in net assets of affiliated companies.
Thai-Swedish Assembly Group ("TSA"). In 2008, Ford and our subsidiary, Volvo Car Corporation, completed the sale of TSA to Volvo Holding Sverige, AB (an unrelated company, aka Volvo Truck and Bus (Thailand) Co., Ltd.). Under the terms of the agreement, we sold $14 million of net assets and received $24 million in gross proceeds. We recognized a pre-tax gain of $12 million (including $2 million of foreign currency translation adjustments) in Automotive interest income and other non-operating income/(expense), net.
ACH – El Jarudo. In 2007, we completed the sale of the ACH El Jarudo plant to Cooper-Standard Automotive Inc.
The El Jarudo plant, which produced fuel rails, fuel charging assemblies, and spring lock connectors, was a component of ACH in Mexico. As a result of the sale, we recognized a de minimis pre-tax loss, reported in Automotive interest income and other non-operating income/(expense), net.

Notes to the Financial Statements
Ford Motor Company | 2009 Annual Report 149
NOTE 24. HELD-FOR-SALE OPERATIONS, DISCONTINUED OPERATIONS, OTHER DISPOSITIONS, AND
ACQUISITIONS (Continued)
Acquisitions
ACSA. In 2008, we acquired 72.4% of the shares of ACSA, a Romanian carmaker, from Romania's Authority for State Assets Recovery ("AVAS") for $87 million. In 2009, we increased our ownership percentage to 97.1% and, to date, have invested 250 million into Ford Romania towards the committed spend of 675 million over a four-year period as outlined in the Sale and Purchase Agreement with the Romanian government. We plan to fulfill our outstanding investment obligation of 425 million ($593 million) over the next three years and acquire the remaining minority shareholder's equity interest. Based on the continuing significance of AVAS' control and participation in the operations of ACSA during the four-year investment period, our investment is reflected in Equity in net assets of affiliated companies. We anticipate that we will consolidate the operations upon the cessation of AVAS' control and participation in the operations.
Financial Services Sector
Held-for-Sale Operations Held-for-Sale Finance Receivables. During the third quarter of 2009, Ford Credit reclassified to Assets of held-for-sale
operations $911 million of Ford Credit Australia held-for-investment finance receivables that it no longer had the intent to hold for the foreseeable future or until maturity or payoff. A valuation allowance of $52 million was recorded in Financial Services other income/(loss), net related to these assets. The receivables were sold on October 1, 2009.
Primus Leasing Company Limited ("Primus Thailand"). In March 2009, Ford Credit completed the sale of Primus
Thailand, its operation in Thailand that offered automotive retail and wholesale financing of Ford, Mazda and Volvo vehicles. As a result of the sale, Ford Credit received $165 million in proceeds and recognized a de minimis pre-tax gain in Financial Services other income/(loss), net.
The assets and liabilities of Primus Thailand classified as held for sale at December 31, 2008 are summarized as follows (in millions):
Discontinued Operations Triad Financial Corporation ("Triad"). In 2005, Ford Credit completed the sale of Triad. Ford Credit received
additional proceeds pursuant to a contractual agreement entered into at the closing of the sale, causing Ford Credit to recognize an after-tax gain of $2 million, $9 million and $6 million in 2009, 2008 and 2007, respectively, in Income/(Loss) from discontinued operations.
The results of all discontinued Financial Services sector operations are as follows (in millions):
Notes to the Financial Statements
150 Ford Motor Company | 2009 Annual Report
NOTE 24. HELD-FOR-SALE OPERATIONS, DISCONTINUED OPERATIONS, OTHER DISPOSITIONS, AND ACQUISITIONS (Continued) Other Dispositions
Nordic Operations. In 2008, Ford Credit completed the creation of a joint venture finance company and transferred the majority of its business and assets from Denmark, Finland, Norway, and Sweden into the joint venture. The joint venture will support the sale of Ford vehicles in these markets. As a result of the sale, we reduced Finance receivables, net by $1.7 billion, and recognized a pre-tax gain of $85 million (net of transaction costs and including $35 million of foreign currency translation adjustments) in Financial Services other income/(loss), net. Ford Credit reports its ownership interest in the joint venture as an equity method investment.
PRIMUS Financial Services Inc. ("PRIMUS Japan"). In 2008, Ford Credit completed the sale of 96% of its ownership
interest in PRIMUS Japan, its operation in Japan that offered automotive retail and wholesale financing of Ford and Mazda vehicles. As a result of the sale, we reduced Finance receivables, net by $1.8 billion, reduced Debt by $252 million, and recognized a pre-tax gain of $22 million (net of transaction costs and including $28 million of foreign currency translation adjustments) in Financial Services other income/(loss), net. Ford Credit reports its remaining ownership interest as a cost method investment.
Primus Finance and Leasing, Inc. ("Primus Philippines"). In 2008, Ford Credit completed the sale of its 60%
ownership interest in Primus Philippines, its operation in the Philippines that offered automotive retail and wholesale financing of Ford and Mazda vehicles. Ford Credit also completed the sale of its 40% ownership interest in PFL Holdings, Inc., a holding company in the Philippines that owned the remaining 40% ownership interest in Primus Philippines. As a result of the sale, we recognized a pre-tax gain of $5 million (net of transaction costs and including $1 million of foreign currency translation adjustments) in Financial Services other income/(loss), net.
NOTE 25. CAPITAL STOCK AND AMOUNTS PER SHARE
Capital Stock. All general voting power is vested in the holders of Common Stock and Class B Stock. Holders of our Common Stock have 60% of the general voting power and holders of our Class B Stock are entitled to such number of votes per share as will give them the remaining 40%. Shares of Common Stock and Class B Stock share equally in dividends when and as paid, with stock dividends payable in shares of stock of the class held. As discussed in Note 19, we are restricted in our ability to pay dividends (other than dividends payable in stock) under the terms of the amended Credit Agreement.
If liquidated, each share of Common Stock will be entitled to the first $0.50 available for distribution to holders of
Common Stock and Class B Stock, each share of Class B Stock will be entitled to the next $1.00 so available, each share of Common Stock will be entitled to the next $0.50 so available and each share of Common and Class B Stock will be entitled to an equal amount thereafter.
Earnings Per Share. We calculate earnings per share on a basic and on a diluted basis. Basic earnings per share measures our performance over the reporting period. The numerator of our basic earnings per share calculation is our income/(loss) from continuing operations attributable to Ford Motor Company and the denominator is the average shares outstanding for the period. Diluted earnings per share measures our performance over the reporting period (less restricted and uncommitted ESOP shares), while giving effect to all dilutive potential common shares that were outstanding during the period. The dilutive earnings per share calculation adjusts the basic calculation by the dilutive effect of potential Common Stock (securities such as stock options, warrants, convertible securities, and contingent stock agreements). Each individual type of potential Common Stock is evaluated for its dilutive effect. If a security is determined to be dilutive, income/(loss) from continuing operations attributable to Ford Motor Company is then adjusted by the interest expense, amortization of discount, amortization of fees, and other changes in income or loss that would result from the assumed conversion. The number of average shares outstanding is adjusted by the number of shares this conversion would create. A security that is shown to be antidilutive would not be included in the diluted earnings per share calculation.

Notes to the Financial Statements
Ford Motor Company | 2009 Annual Report 151
NOTE 25. CAPITAL STOCK AND AMOUNTS PER SHARE (Continued) Convertible Securities
As discussed in Note 19, Trust Preferred Securities with an aggregate liquidation preference of $2.8 billion are
outstanding at December 31, 2009. In the first quarter of 2009, holders of 862,889 Trust Preferred Securities with an aggregate liquidation preference of $43 million elected to convert such securities into an aggregate 2,437,562 shares of Ford Common Stock. In the third quarter of 2007, holders of 42,543,071 Trust Preferred Securities with an aggregate liquidation preference of $2.1 billion elected to convert such securities into an aggregate 194,494,157 shares of Ford Common Stock. At the option of the holder, each Trust Preferred Security is convertible, at any time on or before January 15, 2032, into shares of our Common Stock at a rate of 2.8769 shares for each Trust Preferred Security (equivalent to a conversion price of $17.38 per share). Conversion of all shares of such Trust Preferred Securities would result in the issuance of 163 million shares of our Common Stock.
As discussed in Note 19, 2036 Convertible Notes with a principal amount of $579 million are outstanding at
December 31, 2009. In the second quarter of 2009, $4.3 billion principal amount of 2036 Convertible Notes was exchanged for an aggregate of 467,909,227 shares of Ford Common Stock, $344 million in cash ($80 in cash per $1,000 principal amount of 2036 Convertible Notes exchanged) and the applicable accrued and unpaid interest on such 2036 Convertible Notes. In the fourth quarter of 2008, $67 million principal amount of 2036 Convertible Notes was exchanged for an aggregate of 7,253,035 shares of Ford Common Stock. At the option of the holder, each 2036 Convertible Note is convertible at any time on or before December 15, 2036, into shares of Ford Common Stock at a rate of 108.6957 shares per $1,000 principal amount of Convertible Notes (equivalent to a conversion price of $9.20 per share). Conversion of all shares of 2036 Convertible Notes would result in the issuance of 63 million shares of our Common Stock.
As discussed in Note 19, 2016 Convertible Notes with a principal amount of $2.9 billion are outstanding at
December 31, 2009. At the option of the holder, each 2016 Convertible Note is convertible at any time on or before November 16, 2016, into shares of Ford Common Stock at a rate of 107.5269 shares per $1,000 principal amount of 2016 Convertible Note (equivalent to a conversion price of $9.30 per share). Conversion of all shares of 2016 Convertible Notes would result in the issuance of 309 million shares of our Common Stock.
Other Transactions Related to Capital Stock
In the fourth quarter of 2007, we issued an aggregate of 62,000,761 shares of Ford Common Stock in exchange for $567 million principal amount of our public unsecured debt securities.
As described in Note 19, during the first half of 2008, we issued an aggregate of 46,437,906 shares of Ford Common
Stock in exchange for $431 million principal amount of our outstanding public unsecured debt securities. On May 18, 2009, we issued 345,000,000 shares of Ford Common Stock pursuant to a public offering at a price of
$4.75 per share, resulting in total gross proceeds of $1.6 billion. As discussed in Note 1, we issued shares of Ford Common Stock from time to time pursuant to an equity distribution
agreement in market transactions and used the proceeds to purchase outstanding Ford Credit debt securities maturing prior to 2012. In the second half of 2008, we issued 88,325,372 shares of Ford Common Stock resulting in proceeds of $434 million. In the third quarter of 2009, we issued 71,587,743 shares of Ford Common Stock resulting in proceeds of $565 million.
On December 4, 2009, we entered into a new equity distribution agreement with certain broker-dealers pursuant to which we may offer and sell shares of Ford Common Stock from time to time for an aggregate offering price of up to $1 billion. Sales of Ford Common Stock under this equity distribution agreement are expected to be made over a several-month period by means of ordinary brokers’ transactions on the New York Stock Exchange at market prices or as otherwise agreed. Through December 31, 2009 and February 15, 2010, we issued 9,840,429 shares and 41,896,329 shares of Ford Common Stock for an aggregate price of $97 million and $470 million, respectively, resulting in net proceeds of $96 million and $466 million, respectively, which will be used for general corporate purposes.

Notes to the Financial Statements
152 Ford Motor Company | 2009 Annual Report
NOTE 25. CAPITAL STOCK AND AMOUNTS PER SHARE (Continued)
Tax Benefits Preservation Plan
For information regarding our Tax Benefits Preservation Plan, see Note 23.
Warrants
In conjunction with the transfer of assets to the UAW VEBA Trust on December 31, 2009, warrants to purchase 362,391,305 shares of Ford Common Stock at an exercise price of $9.20 per share were issued. The warrants expire on January 1, 2013.
Amounts Per Share Attributable to Ford Motor Company Common and Class B Stock
Basic and diluted income/(loss) per share were calculated using the following (in millions):

Notes to the Financial Statements
Ford Motor Company | 2009 Annual Report 153
NOTE 26. DERIVATIVE FINANCIAL INSTRUMENTS AND HEDGING ACTIVITIES
In the normal course of business, our operations are exposed to global market risks, including the effect of changes in foreign currency exchange rates, certain commodity prices, and interest rates. To manage these risks, we enter into various derivatives contracts. Foreign currency exchange contracts including forwards and options, are used to manage foreign exchange exposure. Commodity contracts including forwards and options are used to manage commodity price risk. Interest rate contracts including swaps, caps, and floors are used to manage the effects of interest rate fluctuations. Cross-currency interest rate swap contracts are used to manage foreign currency and interest rate exposures on foreign-denominated debt. The vast majority of our derivatives are over-the-counter customized derivative transactions and are not exchange-traded. Management reviews our hedging program, derivative positions, and overall risk management strategy on a regular basis. We only enter into transactions that we believe will be highly effective at offsetting the underlying risk.
Consistent with the FASB's new standard on disclosures for derivative instruments and hedging activities effective
January 1, 2009, in this initial year of adoption, we have elected to not present earlier periods for comparative purposes.
Overall Derivative Financial Instruments and Hedge Accounting. All derivatives are recognized on the balance sheet at fair value. To ensure consistency in our treatment of derivative and non-derivative exposures with regard to our master agreements, we do not net our derivative position by counterparty for purposes of balance sheet presentation and disclosure.
We have elected to apply hedge accounting to certain derivatives in both the Automotive and Financial Services
sectors; derivatives that receive designated hedge accounting treatment are documented and evaluated for effectiveness at the time they are designated, as well as throughout the hedge period. Cash flows associated with designated hedges are reported in the same category as the underlying hedged item.
Some derivatives do not qualify for hedge accounting; for others, we elect to not apply hedge accounting. We report changes in the fair value of derivatives not designated as hedging instruments through Automotive cost of sales, Automotive interest income and other non-operating income/(expense), net, or Financial Services other income/(loss), net depending on the sector and underlying exposure. Cash flows associated with non-designated or de-designated derivatives are reported in Net cash (used in)/provided by investing activities in our statements of cash flows.
Cash Flow Hedges. Our Automotive sector has designated certain forward and option contracts as cash flow hedges
of forecasted transactions with exposure to foreign currency exchange and commodity price risks. During the second half of 2008, all foreign exchange forwards and options previously designated as cash flow hedges of forecasted transactions under critical terms match were de-designated and re-designated under the "long-haul" method using regression analysis to assess hedge effectiveness. Since 2007, we have had no commodity derivatives designated as cash flow hedges.
The effective portion of changes in the fair value of cash flow hedges is deferred in Accumulated other comprehensive income/(loss) and is recognized in Automotive cost of sales when the hedged item affects earnings. The ineffective portion is reported currently in Automotive cost of sales. Our policy is to de-designate cash flow hedges prior to the time forecasted transactions are recognized as assets or liabilities on the balance sheet and report subsequent changes in fair value through Automotive cost of sales. If it becomes probable that the originally-forecasted transaction will not occur, the related amount also is reclassified from Accumulated other comprehensive income/(loss) and recognized in earnings. Our cash flow hedges mature within two years or less.
Fair Value Hedges. Our Financial Services sector uses derivatives to reduce the risk of changes in the fair value of liabilities. We have designated certain receive-fixed, pay-float interest rate swaps as fair value hedges of fixed-rate debt under the "long haul" method of assessing effectiveness. The risk being hedged is the risk of changes in the fair value of the hedged debt attributable to changes in the benchmark interest rate. We use regression analysis to assess hedge effectiveness. If the hedge relationship is deemed to be highly effective, we record the changes in the fair value of the hedged debt related to the risk being hedged in Financial Services debt with the offset in Financial Services other income/(loss), net. The change in fair value of the related derivative (excluding accrued interest) also is recorded in Financial Services other income/(loss), net. Hedge ineffectiveness, recorded directly in earnings, is the difference between the two amounts.

Notes to the Financial Statements
154 Ford Motor Company | 2009 Annual Report
NOTE 26. DERIVATIVE FINANCIAL INSTRUMENTS AND HEDGING ACTIVITIES (Continued)
When a derivative is de-designated from a fair value hedge relationship, or when the derivative in a fair value hedge relationship is terminated before maturity, the fair value adjustment to the hedged debt continues to be reported as part of the carrying basis of the item and is amortized over its remaining life.
Net Investment Hedges. We have used foreign currency exchange derivatives to hedge the net assets of certain foreign entities to offset the translation and economic exposures related to our investment in these entities. The effective portion of changes in the value of these derivative instruments is included in Accumulated other comprehensive income/(loss) as a foreign currency translation adjustment until the hedged investment is sold or liquidated. When the investment is sold or liquidated, the effective portion of the hedge is recognized in Automotive interest income and other non-operating income/(expense), net as part of the gain or loss on sale. We have had no active foreign currency derivatives classified as net investment hedges since the first quarter of 2007.
Normal Purchases and Normal Sales Classification. For physical supply contracts that are entered into for the purpose of procuring commodities to be used in production over a reasonable period in the normal course of our business, we have elected to apply the normal purchases and normal sales classification. Income Effect of Derivative Instruments
The following table summarizes by hedge designation the pre-tax gains/(losses) recorded in Other comprehensive income/(loss) ("OCI"), reclassified from Accumulated other comprehensive income/(loss) ("AOCI" ) to income and recognized directly in income (in millions):

Notes to the Financial Statements
Ford Motor Company | 2009 Annual Report 155
NOTE 26. DERIVATIVE FINANCIAL INSTRUMENTS AND HEDGING ACTIVITIES (Continued)
For our Automotive sector, we report in Automotive cost of sales on our consolidated statement of operations gains and losses on cash flow hedges and foreign exchange contracts on operating exposures and commodity contracts not designated as hedging instruments. Gains and losses on foreign exchange contracts on investment portfolios and other contracts not designated as hedging instruments are reported in Automotive interest income and other non-operating income/(expense), net.
For our Financial Services sector, we report net interest settlements and accruals on fair value hedges (which are excluded from the assessment of hedge effectiveness) in Interest expense on our consolidated statement of operations, with the exception of foreign currency revaluation on accrued interest ($2 million gain in 2009) which is reported in Selling, administrative, and other expenses. Ineffectiveness on fair value hedges and gains and losses on interest rate contracts not designated as hedging instruments are reported in Financial Services other income/(loss), net. Gains and losses on foreign exchange and cross currency interest rate swap contracts not designated as hedging instruments are reported in Selling, administrative, and other expenses.
Accumulated Other Comprehensive Income/(Loss) Activity
The following table summarizes activity in Accumulated other comprehensive income/(loss) related to designated cash flow hedges for period ended December 31 (in millions):
We expect to reclassify existing net gains of $1 million from Accumulated other comprehensive income/(loss) to Automotive cost of sales during the next twelve months as the underlying exposures are realized.
Balance Sheet Effect of Derivative Instruments
The following table summarizes the estimated fair value of our derivative financial instruments at December 31, 2009 (in millions):

Notes to the Financial Statements
156 Ford Motor Company | 2009 Annual Report
NOTE 26. DERIVATIVE FINANCIAL INSTRUMENTS AND HEDGING ACTIVITIES (Continued)
In our consolidated balance sheet, we report derivative assets in Other assets, and derivative liabilities in Payables and Accrued liabilities and deferred revenue for Automotive and Financial Services sectors, respectively.
The notional amounts of the derivative financial instruments do not necessarily represent amounts exchanged by the parties and, therefore, are not a direct measure of our exposure to the financial risks described above. The amounts exchanged are calculated by reference to the notional amounts and by other terms of the derivatives, such as interest rates, foreign currency exchange rates or commodity volumes and prices. Counterparty Risk and Collateral
Use of derivatives exposes us to the risk that a counterparty may default on a derivative contract. We establish
exposure limits for each counterparty to minimize this risk and provide counterparty diversification. Substantially all of our derivative exposures are with counterparties that have long-term credit ratings of single-A or better. The aggregate fair value of derivative instruments in asset positions on December 31, 2009 was about $2 billion, representing the maximum loss that we would recognize at that date if all counterparties failed to perform as contracted. We enter into master agreements with counterparties that generally allow for netting of certain exposures; therefore, the actual loss we would recognize if all counterparties failed to perform as contracted would be significantly lower.
We include an adjustment for non-performance risk in the fair value of derivative instruments. At December 31, 2009, our adjustment for non-performance risk relative to a measure based on an unadjusted inter-bank deposit rate (e.g., LIBOR) reduced derivative assets by $0 and $6 million for Automotive and Financial Services sectors, respectively, and reduced derivative liabilities by $1 million and $13 million for Automotive and Financial Services sectors, respectively. See Note 4 for more detail on valuation methodologies.
In the third quarter of 2009, we began posting cash collateral with certain counterparties based on our net position with regard to foreign currency and commodity derivative contracts. As of December 31, 2009, we posted $64 million in cash collateral related to derivative instruments, which is included in restricted cash and reported in Other assets on our consolidated balance sheet.

Notes to the Financial Statements
Ford Motor Company | 2009 Annual Report 157
NOTE 27. OPERATING CASH FLOWS The reconciliation of Net income/(loss) attributable to Ford Motor Company to cash flows from operating activities of
continuing operations is as follows (in millions):

Notes to the Financial Statements
158 Ford Motor Company | 2009 Annual Report
NOTE 27. OPERATING CASH FLOWS (Continued)
Cash paid/(received) for interest and income taxes for continuing operations was as follows (in millions):
NOTE 28. SEGMENT INFORMATION
Our operating activity consists of two operating sectors, Automotive and Financial Services. Segment selection is based on the organizational structure we use to evaluate performance and make decisions on resource allocation, as well as availability and materiality of separate financial results consistent with that structure. Automotive Sector
In 2008, we changed the reporting structure of our Automotive sector to separately disclose the following seven segments: 1) Ford North America, 2) Ford South America, 3) Ford Europe, 4) Ford Asia Pacific Africa, 5) Volvo, 6) Mazda, and 7) Jaguar Land Rover and Aston Martin. Automotive sector prior period information has been reclassified into these seven segments, and is provided for these segments in the table below. Included in each segment described below are the associated costs to design, develop, manufacture, and service vehicles and parts.
Ford North America segment includes primarily the sale of Ford, Lincoln, and Mercury brand vehicles and related service parts in North America (the United States, Canada and Mexico). In the first quarter of 2008, we changed the reporting structure of this segment to include the sale of Mazda6 vehicles by our consolidated subsidiary, AAI (previously included in the results for Ford Asia Pacific Africa). We have reclassified prior period information to reflect this structural change to our segment reporting.

Notes to the Financial Statements
Ford Motor Company | 2009 Annual Report 159
NOTE 28. SEGMENT INFORMATION (Continued) Ford South America segment includes primarily the sale of Ford-brand vehicles and related service parts in South
America. Ford Europe segment includes primarily the sale of Ford-brand vehicles and related service parts in Europe (including
all parts of Turkey and Russia). Ford Asia Pacific Africa segment includes primarily the sale of Ford-brand vehicles and related service parts in the
Asia Pacific region and South Africa. The Volvo segment includes primarily the sale of Volvo-brand vehicles and related service parts throughout the world
(including in North America, South America, Europe, Asia Pacific, and Africa). The Mazda segment includes the equity income/(loss) associated with our investment in Mazda (33.4% of Mazda's
profit after tax before the sale of a portion of our investment in November 2008), as well as certain of our Mazda-related investments. Beginning with the fourth quarter of 2008, our remaining investment in Mazda (approximately 11%) is treated as marketable securities. All mark-to-market adjustments are recorded in Other Automotive.
Prior to the sale of these brands, the Jaguar Land Rover and Aston Martin segment included primarily the sale of
Jaguar Land Rover and Aston Martin vehicles and related service parts throughout the world (including in North America, South America, Europe, Asia Pacific, and Africa). In May 2007 and June 2008, respectively, we completed the sale of Aston Martin and Jaguar Land Rover; sales of Aston Martin and Jaguar Land Rover vehicles and related service parts throughout the world are included within this segment for the period until each brand's respective date of sale.
The Other Automotive component of the Automotive sector consists primarily of centrally-managed net interest expense and related fair market value adjustments.
Transactions among Automotive segments generally are presented on a "where-sold," absolute-cost basis, which
reflects the profit/(loss) on the sale within the segment making the ultimate sale to an external entity. This presentation generally eliminates the effect of legal entity transfer prices within the Automotive sector for vehicles, components, and product engineering. Beginning with the first quarter of 2008, income/(loss) before income taxes on vehicle component sales by Volvo or Jaguar Land Rover to each other or to any other segment and by the Ford-brand segments to either Volvo or Jaguar Land Rover are reflected in the results for the segment making the vehicle component sale.
Financial Services Sector
The Financial Services sector includes the following segments: 1) Ford Credit, and 2) Other Financial Services. Ford Credit provides vehicle-related financing, leasing, and insurance. Other Financial Services includes a variety of businesses including holding companies, real estate, and the financing and leasing of some Volvo vehicles in Europe.

Notes to the Financial Statements
160 Ford Motor Company | 2009 Annual Report
NOTE 28. SEGMENT INFORMATION (Continued)
__________
*

Notes to the Financial Statements
Ford Motor Company | 2009 Annual Report 161
NOTE 28. SEGMENT INFORMATION (Continued)
__________

Notes to the Financial Statements
162 Ford Motor Company | 2009 Annual Report
NOTE 29. GEOGRAPHIC INFORMATION
The following table includes information for both Automotive and Financial Services sectors (in millions):
__________
NOTE 30. SELECTED QUARTERLY FINANCIAL DATA (unaudited)
Certain of the quarterly results identified above include material unusual or infrequently occurring items as follows: The pre-tax loss of $1.6 billion in the first quarter of 2009 includes a $1.1 billion gain (net of transaction costs) related
to Ford Credit's acquisition of $2.2 billion principal amount of our secured term loan for $1.1 billion of cash, a $292 million reduction of expense related to a change in benefits and our ability to redeploy employees, and a $650 million impairment charge related to our total investment in Volvo.

Notes to the Financial Statements
Ford Motor Company | 2009 Annual Report 163
NOTE 30. SELECTED QUARTERLY FINANCIAL DATA (unaudited) (Continued)
The pre-tax income of $2.4 billion in the second quarter of 2009 includes a $2.2 billion gain (net of transaction costs, unamortized discounts, premiums and fees) related to Ford Credit's acquisition of $3.4 billion principal amount of our public unsecured debt securities for $1.1 billion, a $1.2 billion gain related to a conversion offer on our 2036 Convertible Notes, and a $281 million foreign exchange translation loss related to the liquidation of Progress Ford Sales Limited.
The pre-tax income of $1.1 billion in the fourth quarter of 2009 includes a $310 million charge related to the announced
closure of our St. Thomas Assembly Plant in Canada, and a $264 million charge related to the settlement of the UAW retiree health care obligation.
The pre-tax income of $286 million in the first quarter of 2008 includes $340 million in charges related to worldwide
personnel-reduction programs. The pre-tax loss of $9.1 billion in the second quarter of 2008 includes a $5.3 billion impairment charge related to North
America long-lived assets, a $2.1 billion impairment charge related to Ford Credit operating leases in its North America segment, and a $285 million loss related to the sale of our ACH glass business.
The pre-tax loss of $573 million in the third quarter of 2008 includes a $2.6 billion OPEB curtailment gain, a
$344 million reduction of expense primarily related to employees at three ACH plants who were no longer probable to be permanently idled, and a $290 million loss related to returns on the TAA.
The pre-tax loss of $5.2 billion in the fourth quarter of 2008 reflects the sudden and dramatic decline in vehicle industry
sales volume, particularly in the United State and Europe, and a $259 million loss related to returns on the TAA.
NOTE 31. COMMITMENTS AND CONTINGENCIES
Guarantees are recorded at fair value at the inception of the guarantee. Litigation and claims are accrued when losses are deemed probable and reasonably estimable.
Estimated warranty costs and additional service actions are accrued for at the time the vehicle is sold to a dealer,
including costs for basic warranty coverage on vehicles sold, product recalls, and other customer service actions. Fees or premiums for the issuance of extended service plans are recognized in income over the contract period in proportion to the costs expected to be incurred in performing services under the contract.
Guarantees
At December 31, 2009 and 2008, the following guarantees and indemnifications were issued and outstanding: Guarantees related to affiliates and third parties. We guarantee debt and lease obligations of certain joint ventures, as
well as certain financial obligations of outside third parties including suppliers to support our business and economic growth. Expiration dates vary through 2017, and guarantees will terminate on payment and/or cancellation of the obligation. A payment by us would be triggered by failure of the guaranteed party to fulfill its obligation covered by the guarantee. In some circumstances, we are entitled to recover from the third party amounts paid by us under the guarantee. However, our ability to enforce these rights is sometimes stayed until the guaranteed party is paid in full, and may be limited in the event of insolvency of the third party or other circumstances. Maximum potential payments under guarantees total $215 million for 2009 and $206 million for 2008. The carrying value of our recorded liabilities related to guarantees was $30 million and $24 million at December 31, 2009 and 2008, respectively. Our performance risk under these guarantees is reviewed regularly, and has resulted in no changes to our initial valuations.
In December 2005, we completed the sale of Hertz. As part of this transaction, we provided cash-collateralized letters
of credit in an aggregate amount of $200 million to support the asset-backed portion of the buyer's financing for the transaction. Our commitment to provide the letters of credit expires no later than December 21, 2011 and supports the payment obligations of Hertz Vehicle Finance LLC under one or more series of asset-backed notes. The letters of credit can be drawn upon on any date funds allocated to pay interest on the asset-backed notes are insufficient to pay

Notes to the Financial Statements
164 Ford Motor Company | 2009 Annual Report
NOTE 31. COMMITMENTS AND CONTINGENCIES (Continued)
scheduled interest payments, principal amounts due on the legal final maturity date, or when the balance of assets supporting the asset-backed notes is less than the outstanding balance of the asset-backed notes. The carrying value of our deferred gain related to the letters of credit was $9 million and $14 million at December 31, 2009 and 2008, respectively. We believe future performance under these letters of credit is remote.
Indemnifications. In the ordinary course of business, we execute contracts involving indemnifications standard in the industry and indemnifications specific to a transaction, such as the sale of a business. These indemnifications might include claims relating to any of the following: environmental, tax, and shareholder matters; intellectual property rights; power generation contracts; governmental regulations and employment-related matters; dealers, supplier, and other commercial contractual relationships; and financial matters, such as securitizations. Performance under these indemnities generally would be triggered by a breach of terms of the contract or by a third-party claim.
As part of the sale of Jaguar Land Rover, we provided the buyer a customary set of indemnifications, some of which were subject to an aggregate limit of $805 million (which expired June 1, 2009) and some of which (e.g., warranties related to our capacity and authority to enter into the transaction, our ownership of the companies sold and the shares of those companies being free from encumbrances and certain tax covenants) are unlimited in amount. Outstanding claims relating to the $805 million indemnification as well as indemnifications relating to certain warranties described in the preceding sentence continue. We believe that the probability of payment under these claims and indemnifications is remote.
We also are party to numerous indemnifications which do not limit potential payment; therefore, we are unable to estimate a maximum amount of potential future payments that could result from claims made under these indemnities.
Litigation and Claims
Various legal actions, governmental investigations, and proceedings and claims are pending or may be instituted or asserted in the future against us, including but not limited to those arising out of alleged defects in our products; governmental regulations relating to safety, emissions and fuel economy, or other matters; government incentives related to capital investments; tax matters; financial services; employment-related matters; dealer, supplier, and other contractual relationships; intellectual property rights; product warranties; environmental matters; shareholder or investor matters; and financial reporting matters. Certain of the pending legal actions are, or purport to be, class actions. Some of the foregoing matters involve or may involve compensatory, punitive, or antitrust or other treble damage claims in very large amounts, or demands for recall campaigns, environmental remediation programs, sanctions, loss of government incentives, assessments, or other relief, which, if granted, would require very large expenditures.
Litigation is subject to many uncertainties, and the outcome of individual litigated matters is not predictable with assurance. We have established accruals for certain of the matters discussed in the foregoing paragraph where losses are deemed probable and reasonably estimable. It is reasonably possible, however, that some of the matters discussed in the foregoing paragraph for which accruals have not been established could be decided unfavorably to us and could require us to pay damages or make other expenditures in amounts or a range of amounts that cannot be estimated at December 31, 2009. We do not reasonably expect, based on our analysis, that such matters would have a material effect on future financial statements for a particular year, although such an outcome is possible.
Warranty
Included in the warranty cost accruals are costs for basic warranty coverages on vehicles sold. Additional service actions, such as product recalls and other customer service actions, are not included in the warranty reconciliation below, but are also accrued for at the time of sale. Estimates for warranty costs are made based primarily on historical warranty claim experience. Product warranty accruals accounted for in Accrued liabilities and deferred revenue at December 31 were as follows (in millions):

Ford Motor Company | 2009 Annual Report 165
Report of Independent Registered Public Accounting Firm
Report of Independent Registered Public Accounting Firm To the Board of Directors and Stockholders Ford Motor Company: In our opinion, the accompanying consolidated balance sheets and the related consolidated statements of operations, of stockholder's equity and of cash flows present fairly, in all material respects, the financial position of Ford Motor Company and its subsidiaries at December 31, 2009 and December 31, 2008, and the results of their operations and their cash flows for each of the three years in the period ended December 31, 2009 in conformity with accounting principles generally accepted in the United States of America. Also in our opinion, the Company maintained, in all material respects, effective internal control over financial reporting as of December 31, 2009, based on criteria established in Internal Control - Integrated Framework issued by the Committee of Sponsoring Organizations of the Treadway Commission (COSO). The Company's management is responsible for these financial statements, for maintaining effective internal control over financial reporting and for its assessment of the effectiveness of internal control over financial reporting, included in Management's Report on Internal Control Over Financial Reporting in this Annual Report. Our responsibility is to express opinions on these financial statements and on the Company's internal control over financial reporting based on our integrated audits. We conducted our audits in accordance with the standards of the Public Company Accounting Oversight Board (United States). Those standards require that we plan and perform the audits to obtain reasonable assurance about whether the financial statements are free of material misstatement and whether effective internal control over financial reporting was maintained in all material respects. Our audits of the financial statements included examining, on a test basis, evidence supporting the amounts and disclosures in the financial statements, assessing the accounting principles used and significant estimates made by management, and evaluating the overall financial statement presentation. Our audit of internal control over financial reporting included obtaining an understanding of internal control over financial reporting, assessing the risk that a material weakness exists, and testing and evaluating the design and operating effectiveness of internal control based on the assessed risk. Our audits also included performing such other procedures as we considered necessary in the circumstances. We believe that our audits provide a reasonable basis for our opinions. Our audits were conducted for the purpose of forming an opinion on the basic financial statements taken as a whole. The accompanying sector balance sheets and the related sector statements of income and of cash flows are presented for purposes of additional analysis and are not a required part of the basic financial statements. Such information has been subjected to the auditing procedures applied in the audit of the basic financial statements and, in our opinion, are fairly stated in all material respects in relation to the basic financial statements taken as a whole.
As discussed in Note 1 to the consolidated financial statements, the Company changed the manner in which it accounts for noncontrolling interests and convertible debt instruments that may be settled in cash upon conversion (including partial cash settlement) in 2009. As discussed in Note 23 to the consolidated financial statements, the Company changed the manner in which it accounts for uncertain tax positions in 2007. A company’s internal control over financial reporting is a process designed to provide reasonable assurance regarding the reliability of financial reporting and the preparation of financial statements for external purposes in accordance with generally accepted accounting principles. A company’s internal control over financial reporting includes those policies and procedures that (i) pertain to the maintenance of records that, in reasonable detail, accurately and fairly reflect the transactions and dispositions of the assets of the company; (ii) provide reasonable assurance that transactions are recorded as necessary to permit preparation of financial statements in accordance with generally accepted accounting principles, and that receipts and expenditures of the company are being made only in accordance with authorizations of management and directors of the

166 Ford Motor Company | 2009 Annual Report
Report of Independent Registered Public Accounting Firm
company; and (iii) provide reasonable assurance regarding prevention or timely detection of unauthorized acquisition, use, or disposition of the company’s assets that could have a material effect on the financial statements. Because of its inherent limitations, internal control over financial reporting may not prevent or detect misstatements. Also, projections of any evaluation of effectiveness to future periods are subject to the risk that controls may become inadequate because of changes in conditions, or that the degree of compliance with the policies or procedures may deteriorate. PricewaterhouseCoopers LLP Detroit, Michigan February 25, 2010

Ford Motor Company | 2009 Annual Report 167
Selected Financial Data
Selected Financial Data
The following table sets forth selected financial data for each of the last five years (dollar amounts in millions, except for per share amounts).
— — — —
— —— — — —
— —— — — —
— — —
— — —

168 Ford Motor Company | 2009 Annual Report
Employment Data
EMPLOYMENT DATA
The approximate number of individuals employed by us and entities that we consolidated (including entities that we did not control) as of December 31, 2009 and 2008 was as follows (in thousands):
The year-over-year decrease in employment levels primarily reflects our implementation of global personnel-reduction programs. Substantially all of the hourly employees in our Automotive operations are represented by unions and covered by collective
bargaining agreements. In the United States, approximately 99% of these unionized hourly employees in our Automotive sector are represented by the International Union, United Automobile, Aerospace and Agricultural Implement Workers of America ("UAW" or "United Auto Workers"). Approximately two percent of our U.S. salaried employees are represented by unions. Most hourly employees and many non-management salaried employees of our subsidiaries outside of the United States also are represented by unions.
We have entered into collective bargaining agreements with the UAW, and the National Automobile, Aerospace, Transportation and
General Workers Union of Canada ("CAW"). In 2007, we negotiated with the UAW a transformational agreement, enabling us to improve our competitiveness and establishing a Voluntary Employee Benefit Association ("VEBA") trust ("UAW VEBA Trust") to fund our retiree health care obligations.
In March 2009, Ford-UAW membership ratified modifications to the existing collective bargaining agreement that significantly
improved our competitiveness, saving us up to $500 million annually and bringing us near to competitive parity with the U.S. operations of foreign-owned automakers. The operational changes affected wage and benefit provisions, productivity, job security programs, and capacity actions, allowing us to increase manufacturing efficiency and flexibility. In addition, modifications to the UAW VEBA Trust allowed for smoothing of payment obligations and provided us the option to satisfy up to approximately 50% of our future payment
obligations to the UAW VEBA Trust in Ford Common Stock; see "Liquidity and Capital Resources" in "Management's Discussion and Analysis of Financial Condition and Results of Operations" and Note 18 of the Notes to the Financial Statements for additional discussion of the UAW VEBA Trust.
On November 1, 2009, the CAW announced that a majority of its members employed by Ford Canada had voted to ratify modifications to the terms of the existing collective bargaining agreement between Ford Canada and the CAW. The modifications are patterned off of the modifications agreed to by the CAW for its agreements with the Canadian operations of General Motors Company and Chrysler LLC and are expected to result in annual cost savings. The agreement also confirms the end of production at the St. Thomas Assembly Plant in 2011. On November 2, 2009, the UAW announced that a majority of its members employed by Ford had voted against ratification of a tentative agreement that would have further modified the terms of the existing collective bargaining agreement between Ford and the UAW. These latest modifications were designed to closely match the modified collective bargaining agreements between the UAW and our domestic competitors, General Motors and Chrysler. Among the proposed modifications was a provision that would have precluded any strike action relating to improvements in wages and benefits during the negotiation of a new collective bargaining agreement upon expiration of the current agreement, and would have subjected disputes regarding improvements in wages and benefits to binding arbitration, to determine competitiveness based on wages and benefits paid by other automotive manufacturers operating in the United States.
Even with recent modifications, our agreements with the UAW and CAW provide for guaranteed wage and benefit levels for the term of the respective agreements, and a degree of employment security, subject to certain conditions. As a practical matter, these agreements may restrict our ability to close plants and divest businesses during the terms of the agreements. Our collective bargaining agreement with the UAW expires on September 14, 2011; our collective bargaining agreement with the CAW expires on September 14, 2012.

Ford Motor Company | 2009 Annual Report 169
Management’s Report on Internal Control over Financial Reporting
MANAGEMENT'S REPORT ON INTERNAL CONTROL OVER FINANCIAL REPORTING
Our management is responsible for establishing and maintaining adequate internal control over financial reporting, as such term is defined in Exchange Act Rule 13a-15(f). The Company's internal control over financial reporting is a process designed to provide reasonable assurance regarding the reliability of financial reporting and the preparation of financial statements for external purposes in accordance with generally accepted accounting principles.
Because of its inherent limitations, internal control over financial reporting may not prevent or detect misstatements. Also, projections of any evaluation of effectiveness to future periods are subject to the risk that controls may become inadequate because of changes in conditions or because the degree of compliance with policies or procedures may deteriorate.
Under the supervision and with the participation of our management, including our CEO and CFO, we conducted an assessment of the effectiveness of our internal control over financial reporting as of December 31, 2009. The assessment was based on criteria established in the framework Internal Control – Integrated Framework, issued by the Committee of Sponsoring Organizations of the Treadway Commission. Based on this assessment, management concluded that our internal control over financial reporting was effective as of December 31, 2009.
The effectiveness of the Company's internal control over financial reporting as of December 31, 2009 has
been audited by PricewaterhouseCoopers LLP, an independent registered public accounting firm, as stated in its report included herein.

170 Ford Motor Company | 2009 Annual Report
New York Stock Exchange Requited Disclosures
NEW YORK STOCK EXCHANGE REQUIRED DISCLOSURES On June 3, 2009, Ford's Chief Executive Officer certified that he was not aware of any violation by the Company of the New York Stock Exchange Corporate Governance listing standards, other than has been notified to the Exchange pursuant to Section 303A.12 (b), of which there was none. We have filed with the Securities and Exchange Commission, as exhibits to our Annual Report on Form 10-K for the year ended December 31, 2009, our Chief Executive Officer's and Chief Financial Officer's certifications required by Section 302 of the Sarbanes-Oxley Act of 2002.

Ford Motor Company | 2009 Annual Report 171
SEC rules require annual reports to contain a performance graph comparing, over a five-year period, the performance of our common stock against the Standard & Poor’s 500 Stock Index and against either a published industry or line-of-business index or a group of peer issuers. Ford chose the Dow Jones Automobiles & Parts Titans 30 Index as its comparison for the graph. We think this approach is more informative since there are no other publicly-traded, U.S.-based automotive manufacturers.
Stock Performance Graph
$100
$150
$200
$50
$02004 2005 2006 2007 2008 2009
COMPARISON OF CUMULATIVE FIVE YEAR TOTAL RETURN
Total Return To Shareholders(Includes reinvestment of dividends)
Indexed Returns
BasePeriodDec.2004
Years Ending
Dec.2005
Dec.2006
Dec.2007
Dec.2008
Dec.2009Company / Index
FORD MOTOR COMPANY 100 55 55 49 17 73
S&P 500 INDEX 100 105 121 128 81 102
DOW JONES AUTOMOBIlES & PARTS TITANS 30 INDEX
100 114 148 153 89 114

172 Ford Motor Company | 2009 Annual Report
Corporate HeadquartersFord Motor Company One American Road Dearborn, MI 48126 (313) 322-3000
sHareHolder aCCount assistanCeComputershare Trust Company, our transfer agent, maintains the records for our registered stockholders and can help you
with a variety of stockholder-related services. Computershare offers the DirectSERVICE Investment and Stock Purchase Program. This shareholder-paid program provides an alternative to traditional retail brokerage methods of purchasing, holding, and selling Ford Common Stock. You can contact Computershare through the following methods:
Ford Shareholder Services Group Telephone: (800) 279-1237 (U.S. and Canada)c/o Computershare Trust Company, N.A. (781) 575-2732 (International)P.O. Box 43087 Providence, Rhode Island 02940-3087 E-mail: [email protected]
investor informationInvestor information including this report, quarterly financial results, press releases, and various other reports are available
online at www.shareholder.ford.com. Alternatively, individual investors may contact us at:
Ford Motor Company Telephone: (800) 555-5259 (U.S. and Canada)Shareholder Relations (313) 845-8540 (International) One American Road Fax: (313) 845-6073 Dearborn, MI 48126 E-mail: [email protected]
Security analysts and institutional investors may contact:
Ford Motor Company Telephone: (313) 390-4563Investor Relations Fax: (313) 845-6073 One American Road Dearborn, MI 48126 E-mail: [email protected]
stoCk exCHangesFord Common Stock is listed and traded on the New York Stock Exchange in the United States and on stock exchanges in
Belgium, France, Switzerland, and the United Kingdom. Depository shares representing the Convertible Trust Preferred Securities of Ford Motor Company Capital Trust II are listed and traded on the New York Stock Exchange (NYSE) only.
The NYSE trading symbols are as follows:
F Common Stock F.PrS 6.5% Convertible Trust Preferred Securities of Ford Motor Company Capital Trust II
annual meetingThe 2010 Annual Meeting of Shareholders will be held in Wilmington, Delaware on May 13, 2010. A notice of the meeting and
instructions for voting will be mailed to shareholders in advance of the meeting.
This report was printed with paper that has 10% post-consumer waste content. The paper comes from sustainably managed forests, produced by paper mills practicing internationally accepted environmental standards. This paper is recyclable, please recycle.
Shareholder Information
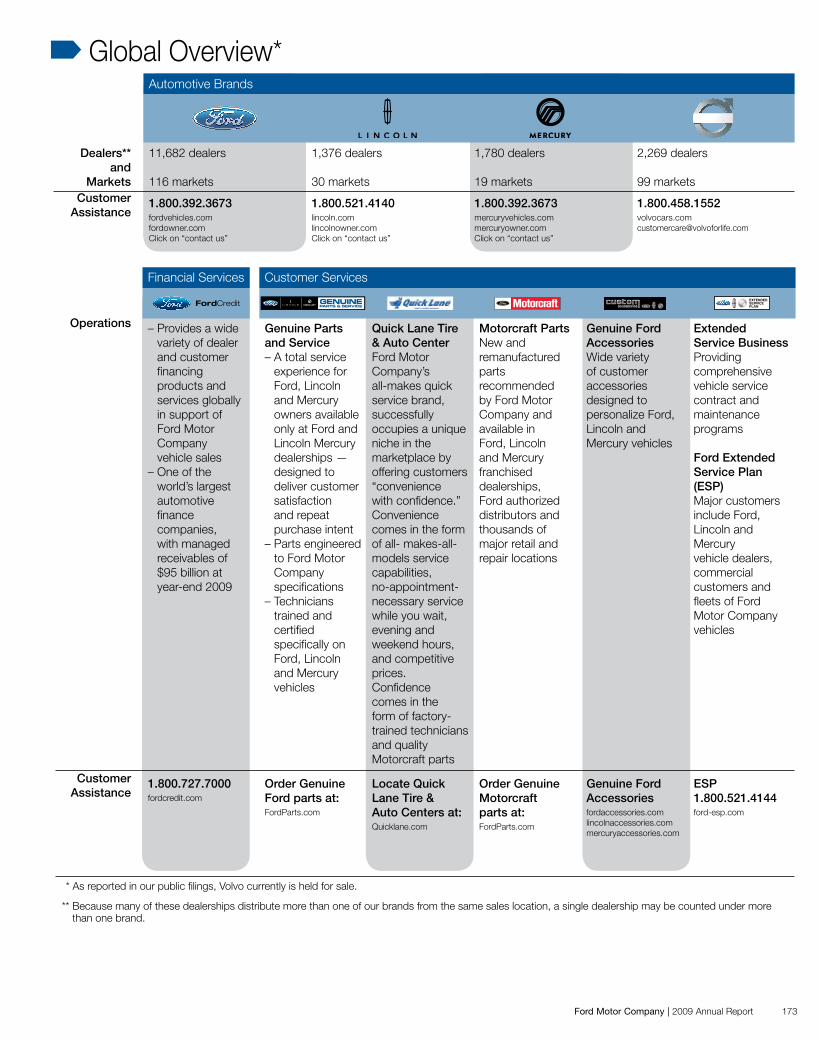
Ford Motor Company | 2009 Annual Report
ONE FORD: ONE Ford expands on the company’s four-point business plan for achieving success globally. It encourages focus, teamwork and a single global approach, aligning employee efforts toward a common definition of success and optimizing their collective strengths worldwide. The elements of ONE Ford are:
ONE TEAM: ONE Ford emphasizes the importance of working together as one team to achieve automotive leadership, which is measured by the satisfaction of our customers, employees and other essential business partners, such as our dealers, investors, suppliers, unions/councils and communities.
ONE PLAN: The company’s four-point plan consists of: balancing our cost structure with our revenue and market share; accelerating development of new vehicles that customers want and value; financing our plan and rebuilding our balance sheet; and working together to leverage our resources around the world.
ONE GOAL: The goal of ONE Ford is to create an exciting and viable company with profitable growth for all.
Ford Motor Company | 2009 Annual Report 173
´Global Overview*Automotive Brands
Dealers** and
Markets
11,682 dealers
116 markets
1,376 dealers
30 markets
1,780 dealers
19 markets
2,269 dealers
99 marketsCustomer
Assistance1.800.392.3673fordvehicles.comfordowner.comClick on “contact us”
1.800.521.4140lincoln.comlincolnowner.comClick on “contact us”
1.800.392.3673mercuryvehicles.commercuryowner.comClick on “contact us”
Financial Services Customer Services
Operations – Provides a wide variety of dealer and customer financing products and services globally in support of Ford Motor Company vehicle sales
– One of the world’s largest automotive finance companies, with managed receivables of $95 billion at year-end 2009
Genuine Parts and Service– A total service
experience for Ford, Lincoln and Mercury owners available only at Ford and Lincoln Mercury dealerships — designed to deliver customer satisfaction and repeat purchase intent
– Parts engineered to Ford Motor Company specifications
– Technicians trained and certified specifically on Ford, Lincoln and Mercury vehicles
Quick Lane Tire & Auto CenterFord Motor Company’s all-makes quick service brand, successfully occupies a unique niche in the marketplace by offering customers “convenience with confidence.” Convenience comes in the form of all- makes-all-models service capabilities, no-appointment-necessary service while you wait, evening and weekend hours, and competitive prices. Confidence comes in the form of factory-trained technicians and quality Motorcraft parts
Motorcraft PartsNew and remanufactured parts recommended by Ford Motor Company and available in Ford, Lincoln and Mercury franchised dealerships, Ford authorized distributors and thousands of major retail and repair locations
Genuine Ford AccessoriesWide variety of customer accessories designed to personalize Ford, Lincoln and Mercury vehicles
Extended Service BusinessProviding comprehensive vehicle service contract and maintenance programs
Ford Extended Service Plan (ESP)Major customers include Ford, Lincoln and Mercury vehicle dealers, commercial customers and fleets of Ford Motor Company vehicles
Customer Assistance
1.800.727.7000fordcredit.com
Order Genuine Ford parts at: FordParts.com
Locate Quick Lane Tire & Auto Centers at:Quicklane.com
Order Genuine Motorcraft parts at:FordParts.com
Genuine Ford Accessoriesfordaccessories.comlincolnaccessories.commercuryaccessories.com
ESP1.800.521.4144ford-esp.com
* As reported in our public filings, Volvo currently is held for sale.
** Because many of these dealerships distribute more than one of our brands from the same sales location, a single dealership may be counted under more than one brand.
Sales and Revenues (a) 2009 2008Worldwide wholesale unit volumesby automotive segment (in thousands) Ford North America 1,959 2,329 Ford South America 443 435 Ford Europe 1,568 1,820 Ford Asia Pacific Africa 523 464 Volvo 324 359 Jaguar Land Rover – 125Total 4,817 5,532
Sales and revenues (in millions) Automotive $ 105,893 $ 129,165 Financial Services 12,415 15,949Total $ 118,308 $ 145,114
Financial Results (a)Income/(Loss) before income taxes (in millions) Automotive $ 1,212 $ (11,917) Financial Services 1,814 (2,581) Total $ 3,026 $ (14,498)
Amounts Attributable to Ford Motor Company (a)Net income/(loss) (in millions) $ 2,717 $ (14,766) Diluted net income/(loss) per share of Common and Class B Stock $ 0.86 $ (6.50)
Cash and Spending (a)Automotive capital expenditures Amount (in billions) $ 4.5 $ 6.6 As a percentage of Automotive sales 4.2% 5.1%
Automotive cash at year end (in billions) Automotive gross cash (b) $ 25.5 $ 13.4 – Cash net of Automotive debt (8.9) (10.8)
Shareholder ValueDividends per share $ – $ - Total shareholder returns % (c) 337% (66)%
Contents
1 About the Company
2 A Message from the Executive Chairman
2 A Message from the President and CEO
5 Board of Directors and Executives
6 Great Products
10 Strong Business
11 Better World
13 Financial Contents
172 Shareholder Information
173 Global Overview
´Operating Highlights
(a) Data presented includes Jaguar Land Rover for 2008.
(b) Automotive gross cash includes cash and cash equivalents and net marketable securities.
(c) Source: Bowne

One
FordFord
Motor C
omp
any 2009 A
nnual Rep
ort
Ford Motor CompanyOne American Road
Dearborn, Michigan 48126
www.ford.com
Printed in U.S.A. 10% post-consumer waste paper. Please recycle.
OneFordFord Motor Company / 2009 Annual Report