Ensign Delivers - AnnualReports.com
100
2012 Ensign Delivers ...because it matters Annual Report
-
Upload
khangminh22 -
Category
Documents
-
view
3 -
download
0
Transcript of Ensign Delivers - AnnualReports.com
2012Ensign Delivers
...because it matters
Annual Report
This is Ensign
Ensign Energy Services Inc. is an industry leader in the delivery of oilfield services in Canada, the
United States and internationally.
We are one of the world’s leading land-based drillers and well servicing providers for crude oil,
natural gas and geothermal wells and are highly skilled in directional drilling.
Since Ensign’s inception in 1987, we have accumulated an extensive equipment fleet characterized
by flexibility and mobility for meeting the challenging demands of our customers.
We have also contributed to advancements in drilling and well servicing through the innovative
use of technology, and have an established reputation for the highest safety standards and
environmental stewardship.
With headquarters in Calgary, Alberta, Canada, Ensign’s shares are listed on the Toronto Stock
Exchange under the trading symbol “ESI”.
1 Ensign Delivers
2 Financial Strength
2 Anywhere in the World
2 Leading Technology and Expertise
5 Financial Highlights
6 Operating Highlights
9 Letter to Shareholders
18 Operations Review
25 Our Sustainability Focus
34 Management’s Discussion and Analysis
58 Operating Divisions Summary
60 Corporate Governance
62 Management’s Report
63 Auditors’ Report
64 Consolidated Financial Statements
69 Notes to the Consolidated Financial Statements
85 Additional Information
85 Share Trading Summary
86 10 Year Financial Information
88 Operating Management
92 Corporate and Field Offices
95 Directors
96 Corporate Information
On the CoverEnsign is one of the world’s leading providers of oilfieldservices. Our proprietary, market-leading Automated DrillRig (“ADR®”) delivers the efficiency our customersdemand and is changing the way the world drills.
Ensign Delivers
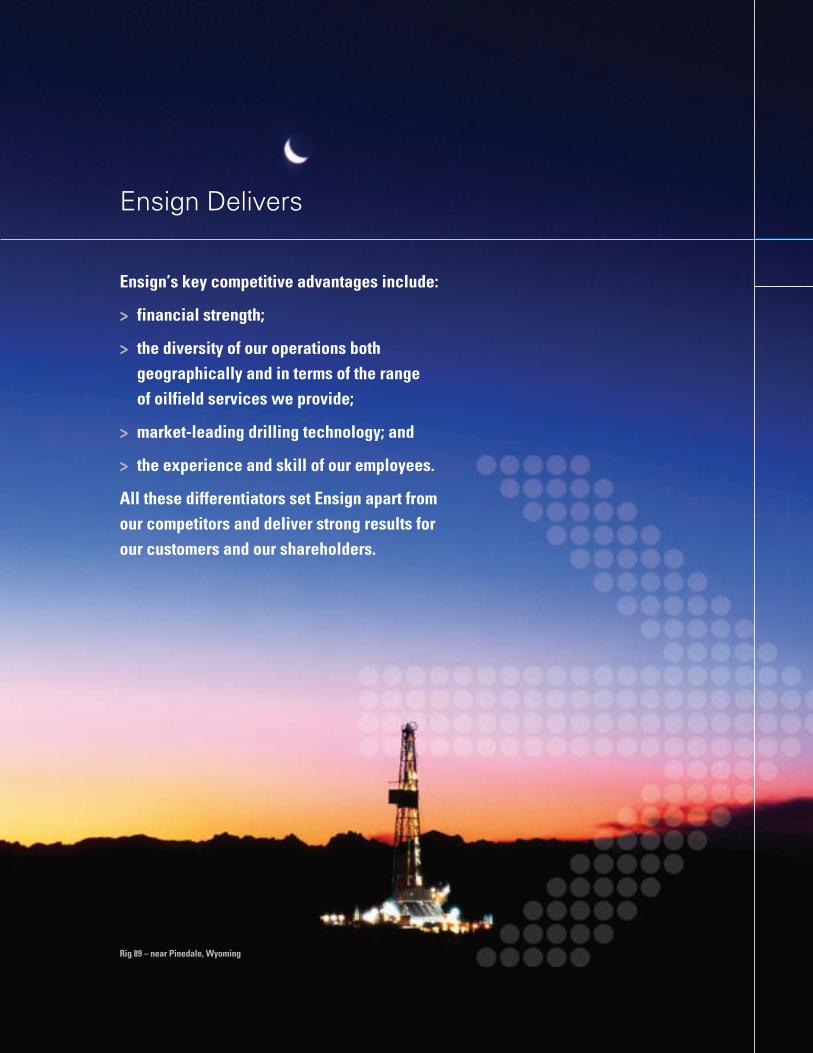
Ensign’s key competitive advantages include:
> financial strength;
> the diversity of our operations both geographically and in terms of the range of oilfield services we provide;
> market-leading drilling technology; and
> the experience and skill of our employees.
All these differentiators set Ensign apart fromour competitors and deliver strong results for our customers and our shareholders.
Rig 89 – near Pinedale, Wyoming

Ensign Delivers
Financial Strength
Ensign Delivers
Anywhere in the World
Dividend rates reflect the 3-for-1 stock split effective May 2001 andthe 2-for-1 stock split effective May 2006.
Ensign Delivers
Leading Technology & Expertise
$0.1000
$0
$0.2000
$0.3000
$0.4000
$0.5000
03 04 05 06 07 08 09 10 11
Annual Dividend Per Share
12
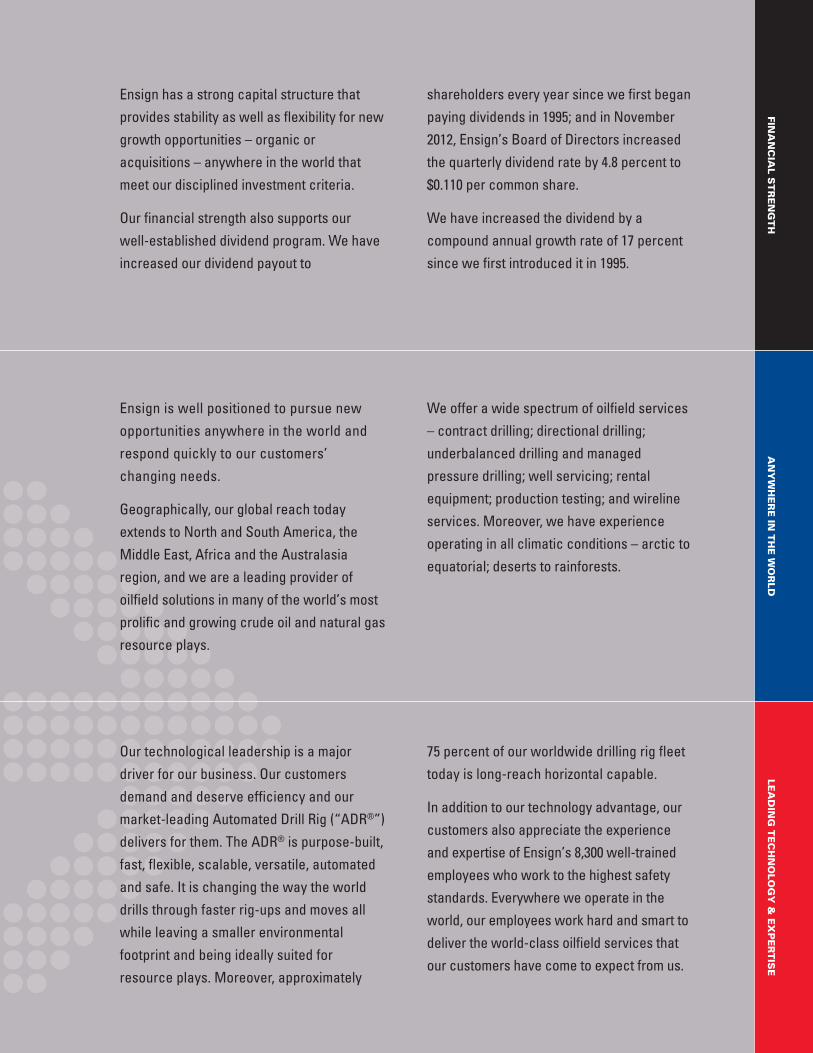
Ensign has a strong capital structure that
provides stability as well as flexibility for new
growth opportunities – organic or
acquisitions – anywhere in the world that
meet our disciplined investment criteria.
Our financial strength also supports our
well-established dividend program. We have
increased our dividend payout to
shareholders every year since we first began
paying dividends in 1995; and in November
2012, Ensign’s Board of Directors increased
the quarterly dividend rate by 4.8 percent to
$0.110 per common share.
We have increased the dividend by a
compound annual growth rate of 17 percent
since we first introduced it in 1995.
FINANCIAL STRENGTH
ANYWHERE IN
THE WORLD
LEADING TECHNOLOGY & EXPERTISE
Our technological leadership is a major
driver for our business. Our customers
demand and deserve efficiency and our
market-leading Automated Drill Rig (“ADR®”)
delivers for them. The ADR® is purpose-built,
fast, flexible, scalable, versatile, automated
and safe. It is changing the way the world
drills through faster rig-ups and moves all
while leaving a smaller environmental
footprint and being ideally suited for
resource plays. Moreover, approximately
75 percent of our worldwide drilling rig fleet
today is long-reach horizontal capable.
In addition to our technology advantage, our
customers also appreciate the experience
and expertise of Ensign’s 8,300 well-trained
employees who work to the highest safety
standards. Everywhere we operate in the
world, our employees work hard and smart to
deliver the world-class oilfield services that
our customers have come to expect from us.
Ensign is well positioned to pursue new
opportunities anywhere in the world and
respond quickly to our customers’
changing needs.
Geographically, our global reach today
extends to North and South America, the
Middle East, Africa and the Australasia
region, and we are a leading provider of
oilfield solutions in many of the world’s most
prolific and growing crude oil and natural gas
resource plays.
We offer a wide spectrum of oilfield services
– contract drilling; directional drilling;
underbalanced drilling and managed
pressure drilling; well servicing; rental
equipment; production testing; and wireline
services. Moreover, we have experience
operating in all climatic conditions – arctic to
equatorial; deserts to rainforests.
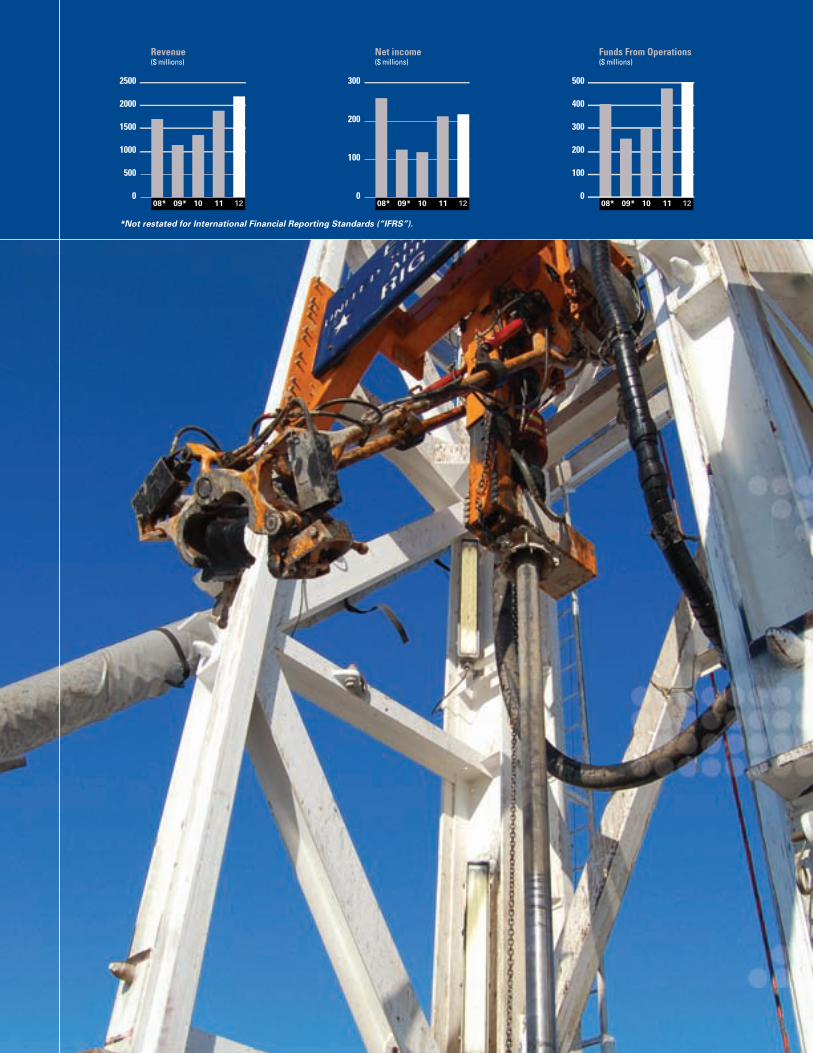
2500
2000
1500
1000
500
0
Revenue($ millions)
11 1208* 09* 10
300
200
100
0
Net income($ millions)
11 1208* 09* 10
500
400
300
200
100
0
Funds From Operations($ millions)
11 1208* 09* 10
*Not restated for International Financial Reporting Standards (“IFRS”).
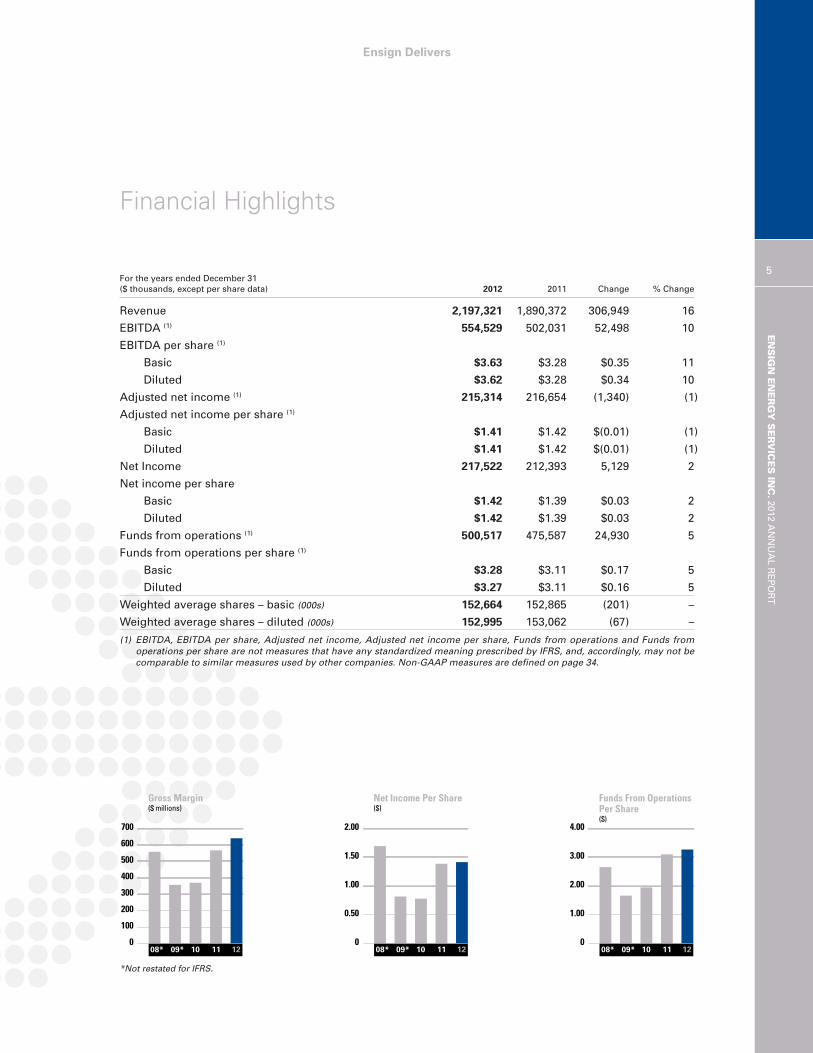
For the years ended December 31($ thousands, except per share data) 2012 2011 Change % Change
Revenue 2,197,321 1,890,372 306,949 16
EBITDA (1) 554,529 502,031 52,498 10
EBITDA per share (1)
Basic $3.63 $3.28 $0.35 11
Diluted $3.62 $3.28 $0.34 10
Adjusted net income (1) 215,314 216,654 (1,340) (1)
Adjusted net income per share (1)
Basic $1.41 $1.42 $(0.01) (1)
Diluted $1.41 $1.42 $(0.01) (1)
Net Income 217,522 212,393 5,129 2
Net income per share
Basic $1.42 $1.39 $0.03 2
Diluted $1.42 $1.39 $0.03 2
Funds from operations (1) 500,517 475,587 24,930 5
Funds from operations per share (1)
Basic $3.28 $3.11 $0.17 5
Diluted $3.27 $3.11 $0.16 5
Weighted average shares – basic (000s) 152,664 152,865 (201) –
Weighted average shares – diluted (000s) 152,995 153,062 (67) –
(1) EBITDA, EBITDA per share, Adjusted net income, Adjusted net income per share, Funds from operations and Funds from operations per share are not measures that have any standardized meaning prescribed by IFRS, and, accordingly, may not becomparable to similar measures used by other companies. Non-GAAP measures are defined on page 34.
5
ENSIGN ENERGY SERVICES IN
C.2012 A
NNUAL R
EPORT
Financial Highlights
Ensign Delivers
*Not restated for IFRS.
700
600
500
400
300
200
100
0
Gross Margin($ millions)
11 1208* 09* 10
2.00
1.50
1.00
0.50
0
Net Income Per Share($)
11 1208* 09* 10
4.00
3.00
2.00
1.00
0
Funds From OperationsPer Share($)
11 1208* 09* 10
Ensign Delivers
6
ENSIGN
ENER
GY SER
VICE
S INC. 2012 ANNUAL REP
ORT
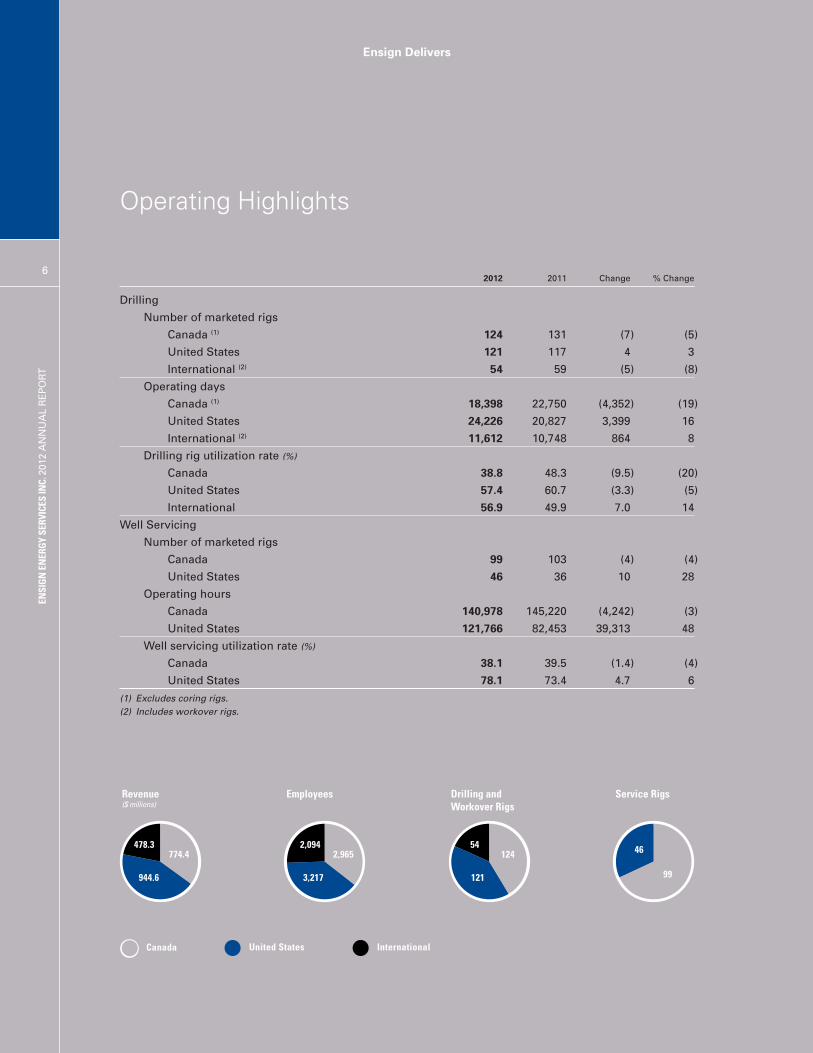
Operating Highlights
2012 2011 Change % Change
Drilling
Number of marketed rigs
Canada (1) 124 131 (7) (5)
United States 121 117 4 3
International (2) 54 59 (5) (8)
Operating days
Canada (1) 18,398 22,750 (4,352) (19)
United States 24,226 20,827 3,399 16
International (2) 11,612 10,748 864 8
Drilling rig utilization rate (%)
Canada 38.8 48.3 (9.5) (20)
United States 57.4 60.7 (3.3) (5)
International 56.9 49.9 7.0 14
Well Servicing
Number of marketed rigs
Canada 99 103 (4) (4)
United States 46 36 10 28
Operating hours
Canada 140,978 145,220 (4,242) (3)
United States 121,766 82,453 39,313 48
Well servicing utilization rate (%)
Canada 38.1 39.5 (1.4) (4)
United States 78.1 73.4 4.7 6
(1) Excludes coring rigs.(2) Includes workover rigs.
Employees
2,0942,965
3,217
Revenue($ millions)
478.3774.4
944.6
Drilling and Workover Rigs
I
54124
121
Service Rigs
99
46
Canada United States International
Ensign Delivers
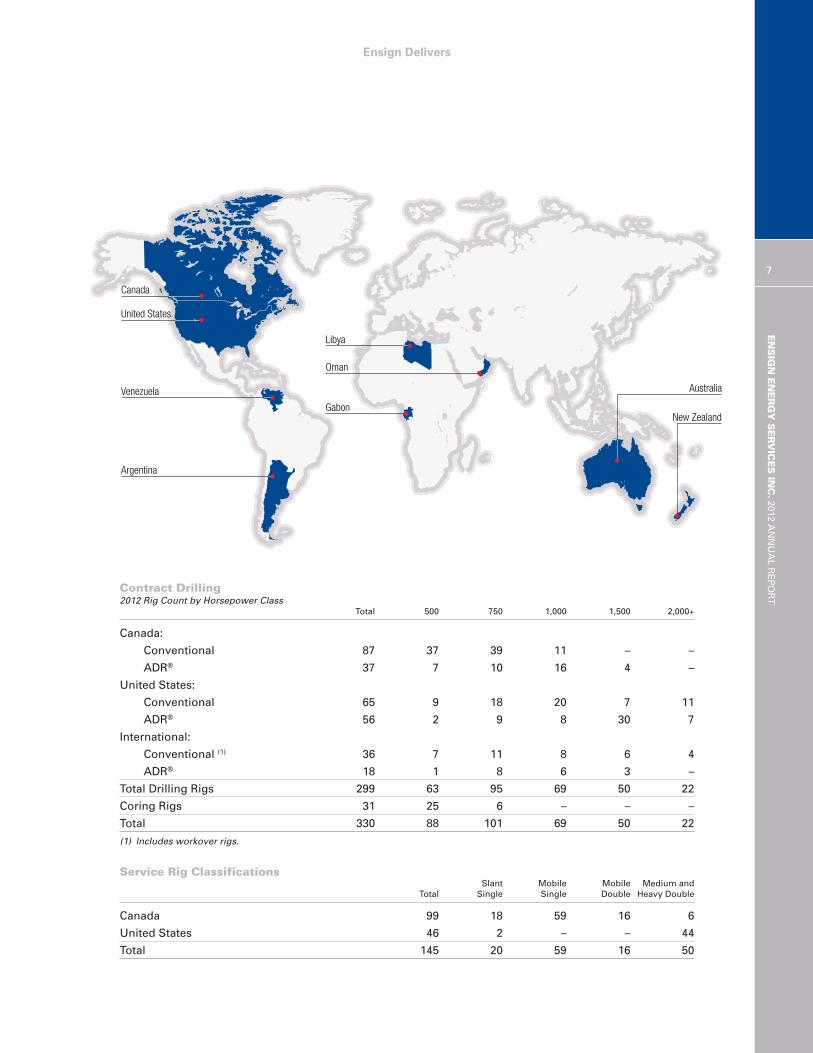
Contract Drilling2012 Rig Count by Horsepower Class
Total 500 750 1,000 1,500 2,000+
Canada:
Conventional 87 37 39 11 – –
ADR® 37 7 10 16 4 –
United States:
Conventional 65 9 18 20 7 11
ADR® 56 2 9 8 30 7
International:
Conventional (1) 36 7 11 8 6 4
ADR® 18 1 8 6 3 –
Total Drilling Rigs 299 63 95 69 50 22
Coring Rigs 31 25 6 – – –
Total 330 88 101 69 50 22
(1) Includes workover rigs.
Service Rig ClassificationsSlant Mobile Mobile Medium and
Total Single Single Double Heavy Double
Canada 99 18 59 16 6
United States 46 2 – – 44
Total 145 20 59 16 50
ENSIGN ENERGY SERVICES IN
C.2012 A
NNUAL R
EPORT
7
Canada
United States
Libya
Australia
Oman
Gabon
Venezuela
Argentina
New Zealand
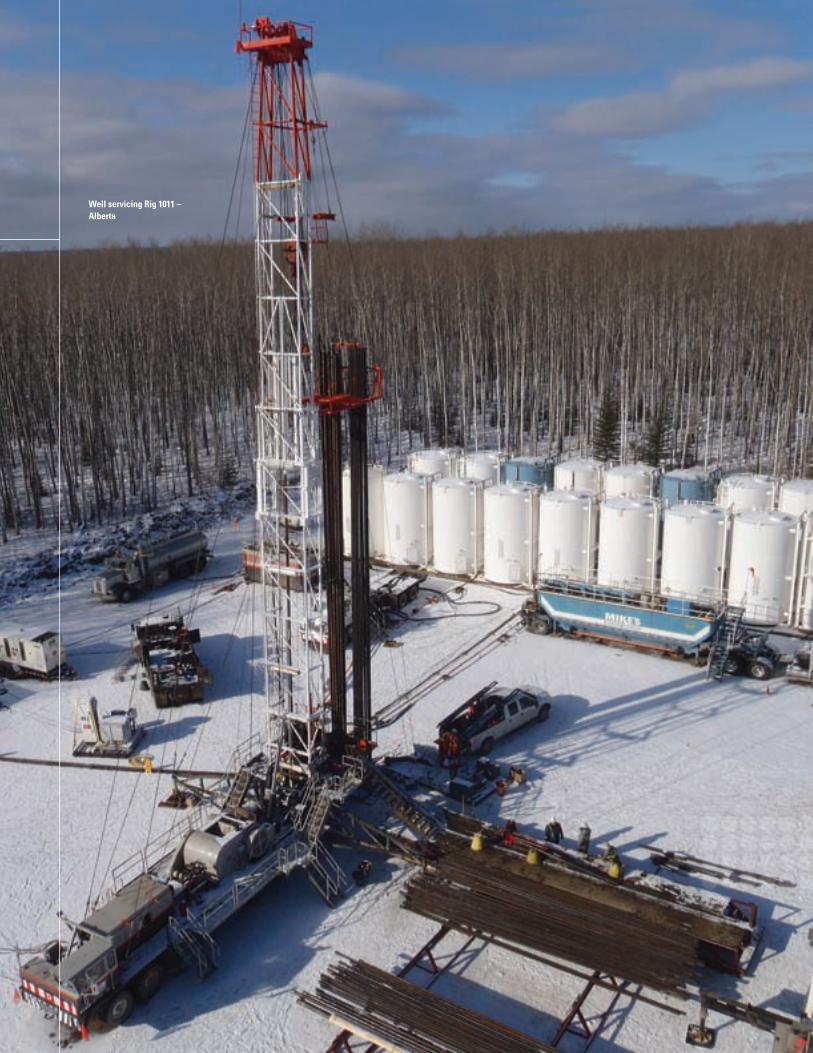
Well servicing Rig 1011 –Alberta

Ensign Delivers
Letter to Shareholders
ENSIGN ENERGY SERVICES IN
C.2012 A
NNUAL R
EPORT
9
Ensign has a long, established
history of annual dividend increases,
and 2012 was no exception.
Dear Fellow Shareholders,
Ensign passed several milestones in
2012 that highlight the Company’s
financial discipline, geographical balance
and technological leadership.
We delivered record revenue of more
than $2 billion and record funds from
operations, while EBITDA and net income
were both up from the prior year.
Also, for the first time in the Company’s
25-year history, our United States
business segment was the largest
contributor to revenues, an achievement
that reflects the strategic investments
we have made in that market over the
past several years. We deployed more of
our market-leading Automated Drill Rigs
(“ADR®”) in the United States and in the
third quarter of 2011, we made the
largest acquisition in Ensign’s history
when we acquired the land drilling
division of Rowan Companies, Inc.
mobile and versatile rigs, many of which
feature high levels of automation and
integrated top drives. Today, ADRs make
up more than one-third of our worldwide
drilling fleet and many of these are under
long-term contract, resulting in a high
utilization rate. Moreover, approximately
75 percent of our rig fleet today is
long-reach horizontal capable, which
puts us in a strong position in the many
North American oil and natural gas
resource plays.
Ensign has a long, established history of
annual dividend increases, and 2012 was
no exception. We declared total
dividends of $0.425 per common share in
2012, up nine percent over fiscal 2011;
and in November 2012, we increased the
quarterly dividend 4.8 percent to $0.110
per common share. Ensign first started
paying a dividend in 1995 and every year
since then we have increased it, for a
compound annual growth rate of
approximately 17 percent.
Delivering results
Ensign delivered these results in what
was a mixed year overall for our
geographical segments. In Canada, the
year started off well, continuing the
demand growth momentum that we saw
throughout 2011. However, as natural
gas prices fell due to a continuing North
American over-supply situation, so did
the cash flows of our customers, which
caused them to delay or defer some of
their capital spending plans and this
(“Rowan Land Drilling”), which is now
operating under the name Ensign US
Southern Drilling LLC (“Ensign US
Southern”). The acquisition of Rowan
Land Drilling has given us a solid
foothold in the very active resource
plays in the southern United States and
raised our profile with the largest energy
producers in the world.
In 2012, we continued to expand the
technical capability of our equipment
fleet, investing in the building and
commissioning of our technologically
superior ADRs and well servicing rigs in
response to continuing customer demand.
During the year, we built and
commissioned six ADRs for our Canadian
fleet; five ADRs and 12 well servicing rigs
for our United States fleet; and two ADRs
for our international fleet, both of which
have been deployed in Australia. Ensign
today has one of the most modern drilling
rig fleets in the industry – highly safe,
Ensign Delivers
resulted in a slowdown in activity in
Canada as the year progressed. The
softening trend in Canada was
counterbalanced by the performance of
both our international segment, where
we saw moderate improvement during
the year, and the aforementioned growth
of our United States segment, where
activity was relatively steady for most of
the year despite the fact that there, too,
lower natural gas prices introduced an
element of uncertainty.
Even with the softening of demand and
prices in some of our operating areas,
Ensign’s revenues rose 16 percent to a
record $2,197.3 million, compared with
$1,890.4 million in 2011. Factors leading
to these record revenues included the
positive impact of adding more ADRs to
our drilling rig fleet, as well as 2012
being the first full year of contributions
from our new operating division, Ensign
US Southern. In 2012, Canada
accounted for 35 percent of revenue
(2011 – 42 percent), the United States
43 percent (2011 – 38 percent) and
international operations 22 percent
(2011 – 20 percent).
Net income also rose in 2012, up two
percent to $217.5 million, compared
with $212.4 million in 2011. Margins
were under pressure in the second half
of the year resulting in lower earnings
growth compared with the growth in
revenue in 2012.
10
ENSIGN ENERGY SERVICES INC.2012 ANNUAL REP
ORT
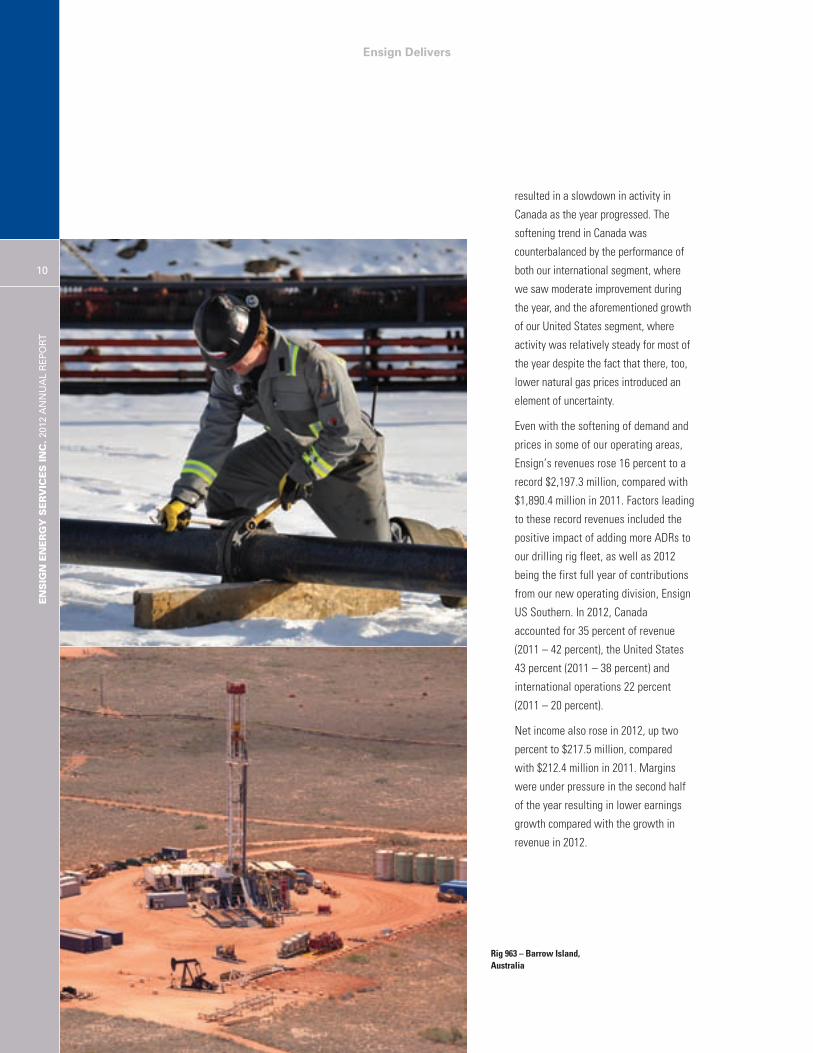
Rig 963 – Barrow Island,Australia
Ensign DeliversLE
TTER TO SHAREHOLD
ERS
11
We recorded our second best year in
terms of EBITDA (defined as earnings
before interest, taxes, depreciation, and
share-based compensation). EBITDA
climbed 10 percent to $554.5 million,
compared with $502.0 million in 2011.
Funds from operations were a record
$500.5 million ($3.28 per share) in
2012, up five percent from $475.6
million ($3.11 per share) in 2011,
providing us with more free cash for
our growth initiatives.
Net capital expenditures, excluding
acquisitions, totalled $306.7 million in
2012, compared with $386.8 million in
2011. The bulk of our growth capital
went towards our new build program
that added 13 new ADRs and 12 new
well servicing rigs in 2012.
As we reported last year, in February
2012, we closed a private placement of
USD $300.0 million in senior unsecured
notes (the “Notes”), consisting of: USD
$100.0 million in five year notes with an
interest rate of 3.43 percent; USD $100.0
million in seven year notes with an
interest rate of 3.97 percent; and USD
$100.0 million in 10 year notes with an
interest rate of 4.54 percent. The Notes
are unsecured and rank equally with
Ensign’s global revolving credit facility.
We used proceeds from the issuance of
the senior unsecured notes, as well as
the Company’s credit facilities and funds
generated from operations, to fully repay
the USD $400.0 million term loan that
Ensign incurred to finance the Company’s
September 2011 acquisition of Rowan
Land Drilling.
Financial discipline is a significant
component of our strategy. Historically,
the Company has operated with little to
no long-term debt. As a result, Ensign
has always had the financial capacity to
pursue new growth opportunities –
organic or acquisitions – anywhere in the
world that meet our disciplined
investment criteria. We expect that
Ensign’s current and future credit
facilities, together with growing funds
from operations, will be sufficient to
support the Company’s growth
initiatives, including our ongoing new
build program.
Geographical performance
In 2012, Ensign benefited from the
diversity of our operations and our
geographical balance, our expansion in
the southern United States, our focus on
being the contractor of choice in all
segments of our business, our customers’
demand for our ADRs and our strong
commitment to safe operations.
Moreover, the Company’s good mix of rig
types, modern equipment fleet (299
drilling rigs, 31 coring rigs and 145 well
servicing rigs as at December 31, 2012),
technological leadership and well-trained
base of personnel continue to stand us in
Ensign Delivers
12
ENSIGN ENERGY SERVICES INC.2012 ANNUAL REP
ORT
good stead and positions us very well for
future challenges and opportunities in
the oil and natural gas market.
We are also continuing to grow our
capabilities in two specialized oilfield
service areas: coring drilling services,
which we provide to oil sands producers
in northern Alberta; and directional
drilling, which we provide to customers
in both the United States and Canada.
Ensign operates one of the largest
coring drilling fleets in Canada,
comprised of 31 specialty drilling rigs.
We also now have 32 directional drilling
kits in the United States and 20
directional drilling kits in Canada. We
will continue to look for opportunities to
expand both of these niche areas as the
market for specialized oilfield services
continues to develop and evolve.
Canada
Following a strong first quarter, activity
levels in the Canadian market in 2012
were decidedly mixed in subsequent
quarters. As the year progressed,
operators delayed or reduced drilling
programs due to decreased levels of cash
flows, regional crude oil price
differentials due to deliverability issues
and continuing uncertainty with respect
to global economic conditions and the
resulting impact on the supply and
demand fundamentals for crude oil and
natural gas.
Ensign’s drilling days in Canada
decreased 19 percent in 2012 over 2011.
Well servicing hours decreased by three
percent in 2012 compared with the prior
year. Ensign’s Canadian ADR® drilling
rigs experienced strong levels of demand
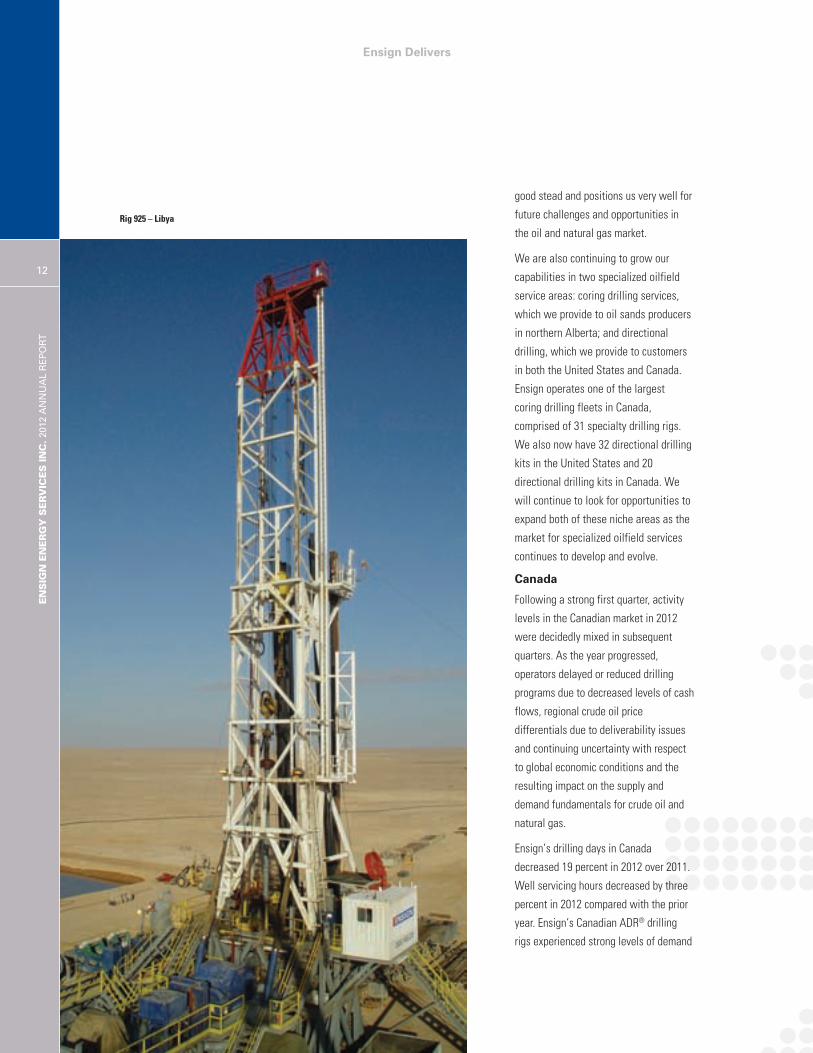
Rig 925 – Libya

Ensign DeliversLE
TTER TO SHAREHOLD
ERS
13
during the year as demand weakness
was directed towards other rig
categories. The addition of six newly
constructed ADRs to our Canadian fleet
in 2012 has further bolstered our
Canadian operations, and we are
currently scheduled to add two new
ADRs and six new well servicing rigs in
Canada during 2013.
The general weakness in the Canadian
market in 2012 resulted in a softening of
rates for certain equipment classes,
resulting in reduced margins compared
to the prior year. Improved, seasonal
levels of demand for the winter drilling
season that started in the fourth quarter
did, however, enable the Company to
improve pricing somewhat; however,
generally weaker market conditions
compared to the prior year means that
we will not be able to attain margins
similar to those experienced in last
year’s winter drilling season.
further eight ADR® drilling rigs and 12
well servicing rigs throughout 2011, and
five ADR® drilling rigs and 12 well
servicing rigs during 2012. As a result,
Ensign’s United States fleet totalled 121
drilling rigs and 46 well servicing rigs at
the start of 2013. An additional four new
ADRs are scheduled to be commissioned
in the United States during 2013 as part
of our new build program.
The expansion of our United States
based drilling business through our 2011
acquisition of Rowan Land Drilling has
been very positive for the Company. We
gained a group of knowledgeable and
experienced employees, as well as a
first-class fleet of newer-style
AC-powered 1500- to 2000-horsepower
drilling rigs that have many of the same
operating characteristics as our own
ADRs. The expansion has opened up the
southern United States market for us and
widened our reach in the region to such
important areas as the Eagle Ford
formation and the emerging Wolfcamp
shale oil play in Texas. With the
acquisition, we also added to our profile
and stature with major Houston-based oil
and natural gas producers, and we are
now seen by them as a land driller that
can provide services in every key
resource play in the United States. In
addition to resource plays in the southern
United States, other strong United States
regions for Ensign in 2012 continued to
be the Bakken formation in North Dakota,
the San Joaquin Basin in California and
the Marcellus formation in Pennsylvania.
In 2012, we also expanded our Chandel
oilfield equipment rentals operation into
Subsequent to year-end, Ensign’s wholly
owned subsidiary Opsco Energy
Industries Ltd. sold its manufacturing
division, which designs and
manufactures customized crude oil and
natural gas production equipment. The
sale of this business did not have a
material effect on the Company and
reflects our intention to focus on oilfield
services, which is our core business.
United States
The expansion of Ensign’s operations in
the southern United States in 2011, as
well as additions to our United States
drilling and well servicing rig fleets,
resulted in strong operating results for
Ensign in the United States in 2012,
despite a softening in the demand for
oilfield services in the latter half of the
year. Ensign’s United States drilling days
increased 16 percent in 2012 over 2011,
while well servicing hours rose 48
percent compared with the prior year.
Our acquisition of Rowan Land Drilling
added 30 drilling rigs to our United
States fleet in the third quarter of 2011,
while our new build program added a
The expansion of our operations in the
southern U.S. in 2011, as well as additions
to our U.S. drilling and well servicing rig
fleets, delivered strong operating results
for Ensign in the U.S. in 2012.
Ensign Delivers
14
ENSIGN ENERGY SERVICES INC.2012 ANNUAL REP
ORT
the United States to serve the Bakken
region in North Dakota, offering our
oilfield customers an inventory of drilling
and completions components.
International
Ensign’s operations in both Latin America
and the Eastern Hemisphere experienced
higher activity levels during 2012 in what
was, overall, a stronger year for our
international division.
Total drilling days for the division
increased eight percent in 2012 over
2011. During 2012, we added two new
ADRs and transferred an ADR® from our
Canadian drilling rig fleet to Australia.
We also moved an additional
2000-horsepower drilling rig from the
United States to Argentina, where
activity has picked up. Additionally, we
redeployed the six drilling rigs we had in
Mexico to west Texas, where we believe
there are better short-term and long-term
opportunities for the equipment.
We also saw continuing strength in the
Venezuelan market; and in Libya, where
operations had been suspended since
February 2011 due to civil unrest, we
resumed operations with the start-up of
one drilling rig in September 2012 and
we expect a second drilling rig will be
operating before the end of the second
quarter of 2013.
At the end of 2012, our international
division had a total of 54 drilling and
workover rigs deployed in seven countries,
with our largest presence being in
Australia where we have 18 drilling and
workover rigs deployed, followed by
Argentina where we have 10 drilling and
workover rigs, Venezuela where we have
eight drilling and workover rigs and Oman
where we have eight drilling rigs.
Ensign is well established in the
international marketplace, and we will
continue to leverage our very good
reputation and the strength of our
technology and experience to grow our
business internationally.
Safety First
Ensign’s number one priority is the
safety of our employees, our customers
and the general public. Under the
umbrella of our Driving to Zero –
Injuries and Incidents safety program,
we are seeing positive trends in our
safety performance and, while we are
pleased with that progress, we are
constantly striving for continual
improvement through a range of
Company-wide programs.
In 2012, we rolled out our
enterprise-wide Global Risk
Management System (“GRMS”), through
which we are capturing, sharing and
reporting key safety data and providing
managers worldwide with the tools and
data they need to make informed, timely
decisions about Health, Safety and
Environment (“HSE”) issues.
Also in 2012, we began beta testing an
enterprise-wide Global Skills Standard
(“GSS”) system, through which we will
capture data about the training,
performance and experience of rig-crew
members around the world. Our goal is to
ensure that, through consistent training
programs, our crews reach a common,
high standard of competency that is
applicable in any jurisdiction in the
world. GSS will help us ensure that
Through our many
safety initiatives,
we are confident we
will achieve increased
worksite safety and
continuing improvement
of Ensign’s safety
performance.
LETTER TO SHAREHOLD
ERS
15
globally we will always have
best-in-class crews – well trained,
efficient and safety-conscious.
To further address rig crew competency
and rig safety, in the spring of 2013 we
will open a world-class training facility in
Nisku, Alberta, near Edmonton, where
we will train both current work crews
and entry-level crews to a higher level.
Out of these and the many other safety
initiatives we are undertaking, we are
confident that we will achieve
increased worksite safety and
continuing improvement of Ensign’s
safety performance.
prices and the lower prices have
negatively impacted the cash flows for
exploration and production companies
and the demand for drilling services.
There is rising concern that a similar fate
may be awaiting growing crude oil
development from resource plays in
North America. Strong global crude oil
prices have been tempered by regional
price differentials in Canada and the
United States primarily resulting from
deliverability issues arising from a lack of
new infrastructure. While the industry
looks for solutions that will aid in
matching supply with demand, the
regional differentials are negatively
Looking Ahead
The success that energy producers have
had drilling natural gas resource plays in
North America coupled with an economic
slowdown in the United States has
resulted in an excess supply of natural
gas in North America. While global
demand and, consequently, the global
pricing for this commodity remains
attractive, North American producers are
currently unable to supply natural gas
into the global market due to
deliverability constraints that do not
appear to be resolvable in the short term.
Natural gas produced in North America
trades at a discount to global commodity
Ensign Delivers
impacting customer cash flows and, if
left unchecked will ultimately result in a
reduction in demand for oilfield services.
The North American oilfield services
industry must adapt to these challenges
in the short term.
Ensign is well positioned to excel in this
challenging environment. The Company
is strong financially and operationally.
Our well established geographic
diversification provides Ensign a degree
of cyclical stability. The combination of
our global footprint and strong capital
structure positions us to pursue both
organic and opportunistic growth
anywhere in the world. We are already
successfully operating in many of the
world’s fastest growing resource plays,
and we have the expertise, knowledge
and flexibility to move equipment from
one play or country to another for the
right customer contracts. Through our
ADR® technology, we are meeting the
technical, safety, environmental, mobility
and versatility requirements of customers
anywhere in the world; and we are
continuing to build new ADRs for key
customers and deploying them under
long-term contracts.
We plan to keep making Ensign better –
building value and delivering results for
all our stakeholders through innovation
and responsible management of our
resources, by focusing on safety and by
delivering the best oilfield services in the
world for our customers.
N. Murray Edwards
Chairman
Robert H. GeddesPresident and Chief Operating Officer
March 14, 2013
In 2013, we expect our international
segment to continue with its steady
growth. However, we are anticipating
and planning for some headwinds in
both Canada and the United States, due
to a continuing oversupply of
conventional drilling equipment,
continuing weak natural gas
fundamentals in North America and
wide pricing differentials in key crude oil
producing regions in both Canada and
the United States.
We will work to ensure that Ensign
continues to thrive through all this by
remaining true to the five pillars of our
strategy – financial discipline;
opportunistic growth; diverse
operations; customer focus; and
commitment to safety.
Acknowledgements
Ensign was proud to mark its 25th
anniversary in 2012. From its roots as a
small Canadian energy services company
founded in March 1987, Ensign has
grown into one of the world’s leaders in
drilling and oilfield services.
Building Ensign into the global player it is
today required vision, hard work,
enthusiasm and determination by
countless individuals. These qualities
still set our team apart today and we
wish to thank Ensign’s 8,300 employees
and our fellow Board members for
delivering their best for our customers
and for our shareholders.
16
ENSIGN ENERGY SERVICES INC.2012 ANNUAL REP
ORT

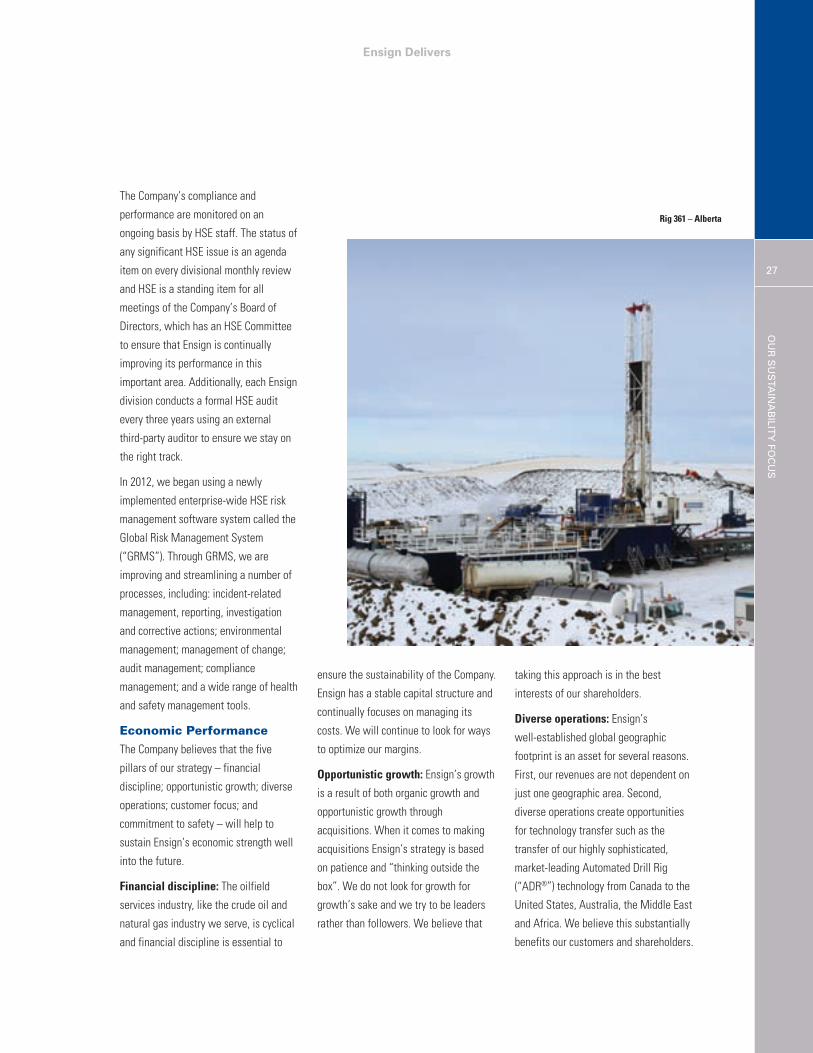
Rig 361 – Alberta
Ensign Delivers
18
ENSIGN ENERGY SERVICES INC.2012 ANNUAL REP
ORT
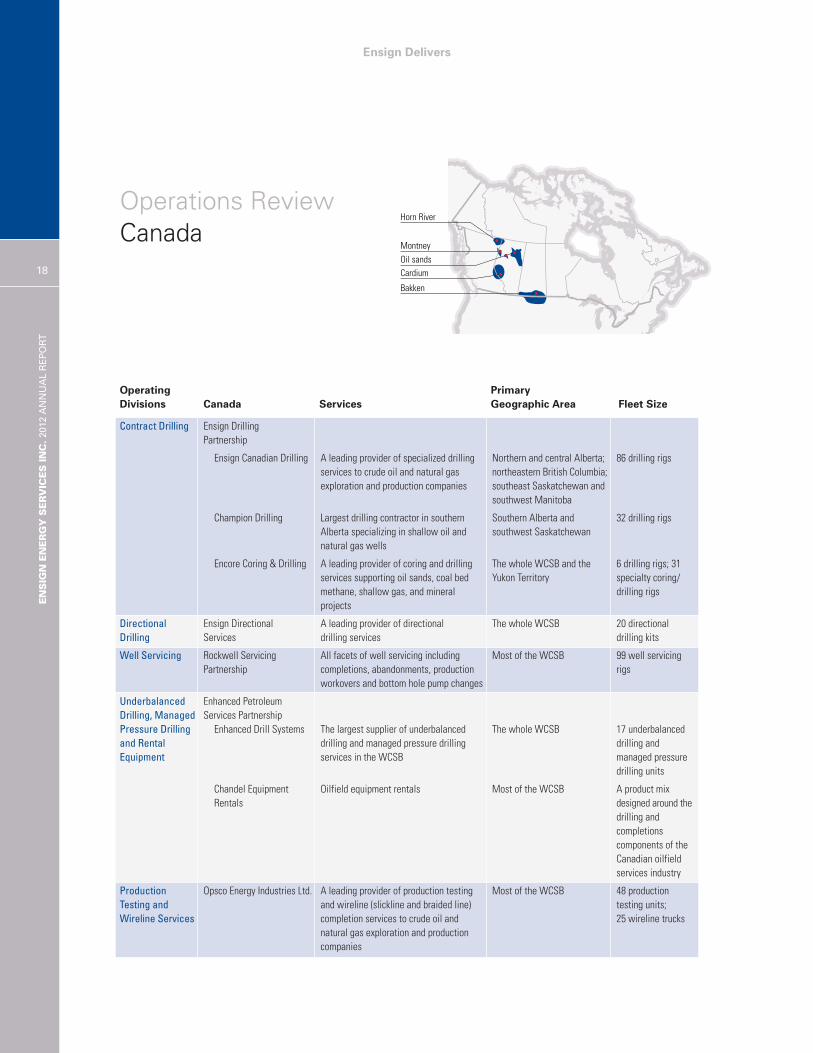
Operations Review Canada
Operating PrimaryDivisions Canada Services Geographic Area Fleet Size
Contract Drilling Ensign DrillingPartnership
Ensign Canadian Drilling A leading provider of specialized drilling Northern and central Alberta; 86 drilling rigsservices to crude oil and natural gas northeastern British Columbia;exploration and production companies southeast Saskatchewan and
southwest Manitoba
Champion Drilling Largest drilling contractor in southern Southern Alberta and 32 drilling rigsAlberta specializing in shallow oil and southwest Saskatchewannatural gas wells
Encore Coring & Drilling A leading provider of coring and drilling The whole WCSB and the 6 drilling rigs; 31services supporting oil sands, coal bed Yukon Territory specialty coring/methane, shallow gas, and mineral drilling rigsprojects
Directional Ensign Directional A leading provider of directional The whole WCSB 20 directionalDrilling Services drilling services drilling kits
Well Servicing Rockwell Servicing All facets of well servicing including Most of the WCSB 99 well servicing Partnership completions, abandonments, production rigs
workovers and bottom hole pump changes
Underbalanced Enhanced PetroleumDrilling, Managed Services PartnershipPressure Drilling Enhanced Drill Systems The largest supplier of underbalanced The whole WCSB 17 underbalancedand Rental drilling and managed pressure drilling drilling and Equipment services in the WCSB managed pressure
drilling units
Chandel Equipment Oilfield equipment rentals Most of the WCSB A product mixRentals designed around the
drilling andcompletions components of the Canadian oilfieldservices industry
Production Opsco Energy Industries Ltd. A leading provider of production testing Most of the WCSB 48 production Testing and and wireline (slickline and braided line) testing units;Wireline Services completion services to crude oil and 25 wireline trucks
natural gas exploration and productioncompanies
Horn River
Oil sands
Montney
Cardium
Bakken
ENSIGN ENERGY SERVICES IN
C.2012 A
NNUAL R
EPORT
19
Ensign Delivers
OverviewEnsign is Canada’s second largestland-based drilling contractor and fourthlargest well servicing contractor.
We provide energy companies engagedin crude oil, natural gas and oil sandsexploration and production with a widerange of oilfield services, including:land-based contract drilling; directionaldrilling; well servicing; underbalanceddrilling; managed pressure drilling;oilfield rentals; wireline services; andproduction testing.
Our geographical reach extends acrossthe Western Canada Sedimentary Basin(“WCSB”) – from southwest Manitoba,throughout Saskatchewan and Alberta tonortheastern British Columbia, theNorthwest Territories and the Yukon.
The major resource plays in the WCSBare key operating areas for us. Theseinclude: Canada’s oil sands in northernAlberta, where we provide coring drillingservices in support of oil sandsdevelopment, slant drilling and wellservicing services for oil sands producers’steam-assisted gravity drainage(“SAGD”) applications; the Montney andHorn River formations in northeasternBritish Columbia where we providedrilling and well servicing services insupport of natural gas development ofthese resource plays; and the Cardiumand Duvernay formations in Alberta andthe Bakken formation in Saskatchewanwhere we have a significant drilling
presence and are also a major provider ofwell servicing services and oilfieldequipment rentals.
2012 HighlightsRevenues
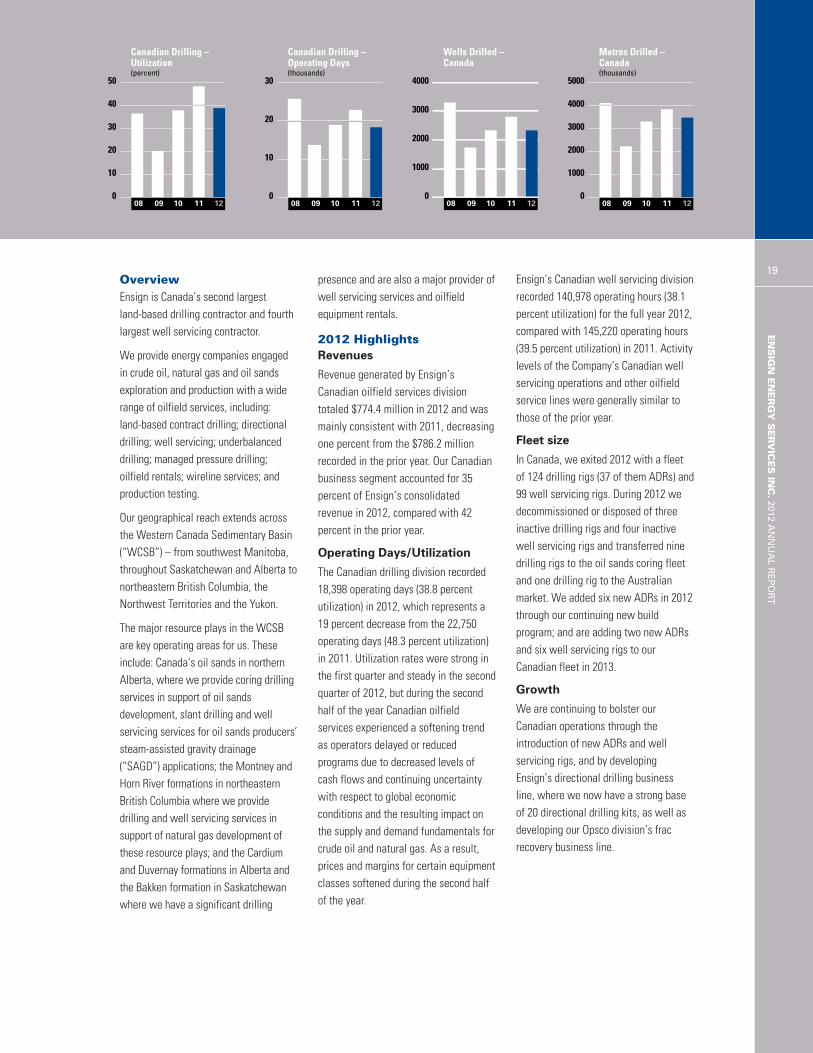
Revenue generated by Ensign’sCanadian oilfield services divisiontotaled $774.4 million in 2012 and wasmainly consistent with 2011, decreasingone percent from the $786.2 millionrecorded in the prior year. Our Canadianbusiness segment accounted for 35percent of Ensign’s consolidatedrevenue in 2012, compared with 42percent in the prior year.
Operating Days/Utilization
The Canadian drilling division recorded18,398 operating days (38.8 percentutilization) in 2012, which represents a19 percent decrease from the 22,750operating days (48.3 percent utilization)in 2011. Utilization rates were strong inthe first quarter and steady in the secondquarter of 2012, but during the secondhalf of the year Canadian oilfieldservices experienced a softening trendas operators delayed or reducedprograms due to decreased levels ofcash flows and continuing uncertaintywith respect to global economicconditions and the resulting impact onthe supply and demand fundamentals forcrude oil and natural gas. As a result,prices and margins for certain equipmentclasses softened during the second halfof the year.
Ensign’s Canadian well servicing divisionrecorded 140,978 operating hours (38.1percent utilization) for the full year 2012,compared with 145,220 operating hours(39.5 percent utilization) in 2011. Activitylevels of the Company’s Canadian wellservicing operations and other oilfieldservice lines were generally similar tothose of the prior year.
Fleet size
In Canada, we exited 2012 with a fleetof 124 drilling rigs (37 of them ADRs) and99 well servicing rigs. During 2012 wedecommissioned or disposed of threeinactive drilling rigs and four inactivewell servicing rigs and transferred ninedrilling rigs to the oil sands coring fleetand one drilling rig to the Australianmarket. We added six new ADRs in 2012through our continuing new buildprogram; and are adding two new ADRsand six well servicing rigs to ourCanadian fleet in 2013.
Growth
We are continuing to bolster ourCanadian operations through theintroduction of new ADRs and wellservicing rigs, and by developingEnsign’s directional drilling businessline, where we now have a strong baseof 20 directional drilling kits, as well asdeveloping our Opsco division’s fracrecovery business line.
50
40
30
20
10
0
Canadian Drilling –Utilization(percent)
11 1208 09 10
30
20
10
0
Canadian Drilling –Operating Days(thousands)
11 1208 09 10
4000
3000
2000
1000
0
Wells Drilled –Canada
11 1208 09 10
5000
4000
3000
2000
1000
011 1208 09 10
Metres Drilled –Canada(thousands)

Ensign Delivers
Operations Review United States
20
ENSIGN ENERGY SERVICES INC.2012 ANNUAL REP
ORT
Operating PrimaryDivisions United States Services Geographic Area Fleet Size
Contract Drilling Ensign United States A leading drilling contractor operating Montana, Wyoming, Colorado, 56 drilling rigs andDrilling Inc. (“Ensign in the Rocky Mountain region, including Utah, North Dakota, South 32 directionalRockies”) directional drilling Dakota, Nebraska, drilling packages
Pennsylvania, Michigan
Ensign United States One of the largest drilling contractors California and Nevada 25 drilling rigsDrilling (California) Inc. operating in California, including (“Ensign California”) directional drilling
Ensign US Southern A premier drilling contractor operating in Texas, Louisiana, Mississippi, 40 drilling rigsDrilling LLC (“Ensign US the southern United States Arkansas, Alabama, OklahomaSouthern”)
Well Servicing Ensign Rockies All facets of well servicing including Rocky Mountain region 14 well Ensign Well Services completions, abandonments, production servicing rigs
workovers and bottom hole pump changes
Ensign California All facets of well servicing including California 32 well Ensign Well Services completions, abandonments, production servicing rigs
workovers and bottom hole pump changes
Rental Equipment Ensign Rocky Mountains Oilfield equipment rentals Rocky Mountain region Ancillary equipment Rocky Mountain used in drilling Oilfield Rentals operations
Ensign California Oilfield equipment rentals California Ancillary equipment West Coast Oilfield used in drilling Rentals operations
Chandel Equipment Rentals Oilfield equipment rentals North Dakota A product mix(U.S.A.) Inc. designed around
the drilling and completionscomponents of theUnited States oilfieldservices industry
Production Opsco Energy Industries Production testing and wireline services Rocky Mountain region, 34 production Testing and (USA) Ltd. Pennsylvania and Texas testing units; oneWireline Services wireline truck
Bakken
Marcellus
Utica
Haynesville
Tuscaloosa
Barnett
Woodford
Piceance
Jonah
San Joaquin Basin
Monterey
Permian
Granite Wash
Eagle Ford
Niobrara
ENSIGN ENERGY SERVICES IN
C.2012 A
NNUAL R
EPORT
21OverviewEnsign United States Drilling Inc., EnsignUnited States Drilling (California) Inc.,and Ensign US Southern Drilling LLCcomprise one of the largest land-baseddrilling contractors in the United States,with a dominant position in the RockyMountain region, California and thesouthern United States region. TheCompany also operates its growingdirectional drilling and well servicingoperations through these entities.
Opsco Energy Industries (USA) Ltd. has a growing presence in providingproduction testing services in the RockyMountain region, the Marcellusformation and Texas resource plays.
Numerous major resource plays in thecontinental United States are importantgeographic areas of operations forEnsign, including: the Bakken formationin North Dakota and Montana, which hasa very large accumulation of recoverablecrude oil; the Eagle Ford formation insouth Texas, which has proven to be oneof the largest onshore hydrocarbondiscoveries in recent years; the emergingWolfcamp shale oil play in west Texas(Permian Basin), which may rival theBakken and Eagle Ford in terms of sizeand potential; the Haynesville shaleformation in east Texas andnorthwestern Louisiana, a fast growingnatural gas production area andestimated to be the largest natural gasfield in the continental United States;the Jonah field, an 85-square-kilometerarea of Wyoming that is estimated tocontain substantial reserves of natural
gas; the Marcellus formation, a growingnatural gas region located in thenorthern Appalachian Basin whichextends through parts of New YorkState, Pennsylvania, Ohio, Maryland,West Virginia and Virginia; and the SanJoaquin basin in California which isbelieved to contain large recoverablereserves of crude oil and natural gas.
2012 HighlightsRevenues
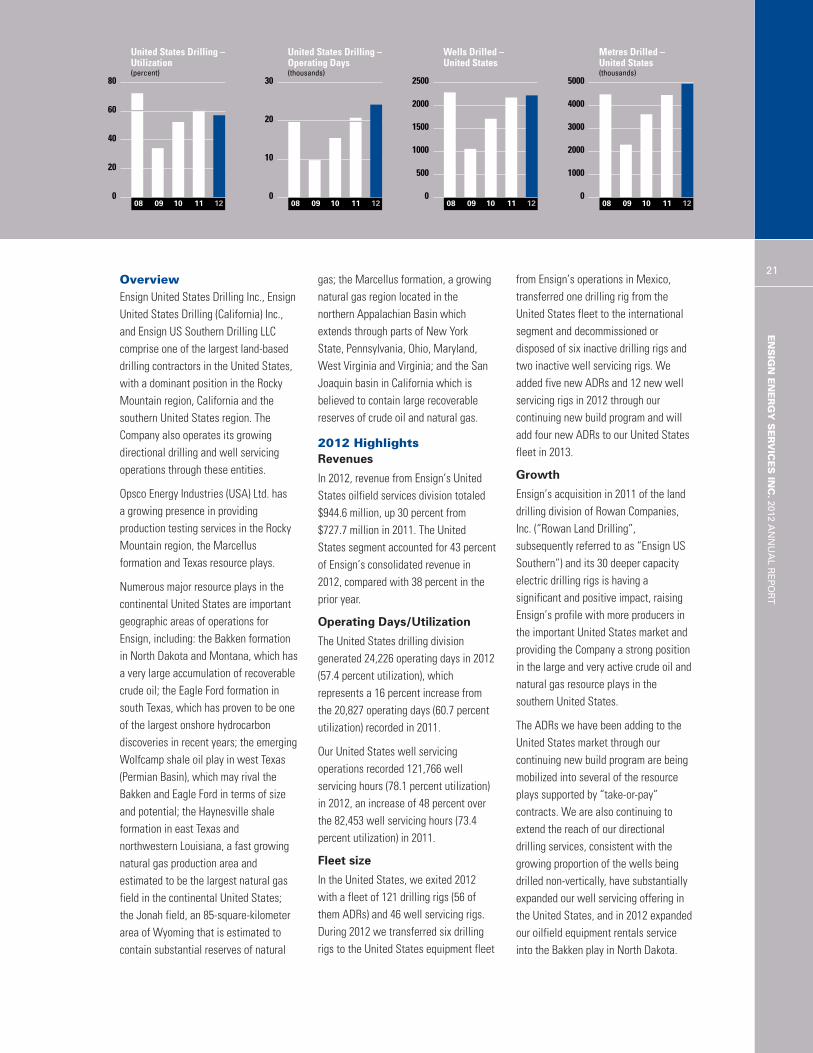
In 2012, revenue from Ensign’s UnitedStates oilfield services division totaled$944.6 million, up 30 percent from$727.7 million in 2011. The UnitedStates segment accounted for 43 percentof Ensign’s consolidated revenue in2012, compared with 38 percent in theprior year.
Operating Days/Utilization
The United States drilling divisiongenerated 24,226 operating days in 2012(57.4 percent utilization), whichrepresents a 16 percent increase fromthe 20,827 operating days (60.7 percentutilization) recorded in 2011.
Our United States well servicingoperations recorded 121,766 wellservicing hours (78.1 percent utilization)in 2012, an increase of 48 percent overthe 82,453 well servicing hours (73.4percent utilization) in 2011.
Fleet size
In the United States, we exited 2012with a fleet of 121 drilling rigs (56 ofthem ADRs) and 46 well servicing rigs.During 2012 we transferred six drillingrigs to the United States equipment fleet
from Ensign’s operations in Mexico,transferred one drilling rig from theUnited States fleet to the internationalsegment and decommissioned ordisposed of six inactive drilling rigs andtwo inactive well servicing rigs. Weadded five new ADRs and 12 new wellservicing rigs in 2012 through ourcontinuing new build program and willadd four new ADRs to our United Statesfleet in 2013.
Growth
Ensign’s acquisition in 2011 of the landdrilling division of Rowan Companies,Inc. (“Rowan Land Drilling”,subsequently referred to as “Ensign USSouthern”) and its 30 deeper capacityelectric drilling rigs is having asignificant and positive impact, raisingEnsign’s profile with more producers inthe important United States market andproviding the Company a strong positionin the large and very active crude oil andnatural gas resource plays in thesouthern United States.
The ADRs we have been adding to theUnited States market through ourcontinuing new build program are beingmobilized into several of the resourceplays supported by “take-or-pay”contracts. We are also continuing toextend the reach of our directionaldrilling services, consistent with thegrowing proportion of the wells beingdrilled non-vertically, have substantiallyexpanded our well servicing offering inthe United States, and in 2012 expandedour oilfield equipment rentals serviceinto the Bakken play in North Dakota.
80
60
40
20
0
United States Drilling –Utilization(percent)
11 1208 09 10
30
20
10
0
United States Drilling –Operating Days(thousands)
11 1208 09 10
2500
2000
1500
1000
500
0
Wells Drilled –United States
11 1208 09 10
5000
4000
3000
2000
1000
0
Metres Drilled –United States(thousands)
11 1208 09 10
Ensign Delivers
22
ENSIGN ENERGY SERVICES INC.2012 ANNUAL REP
ORT
Operations Review International
Operating PrimaryDivisions International Services Geographic Area Fleet Size
Contract Drilling/ Ensign Energy Services Drilling of all forms of hydrocarbon and Australia, New Zealand, 36 drilling/Workover International Limited geothermal wells; shallow to deep well Southeast Asia, the Middle workover rigsServices servicing for oil and natural gas producers East and Africa
Ensign International Drilling of all forms of hydrocarbon wells; Argentina and Venezuela 18 drilling/Energy Services Inc. shallow to deep well servicing for oil and workover rigs
natural gas producers
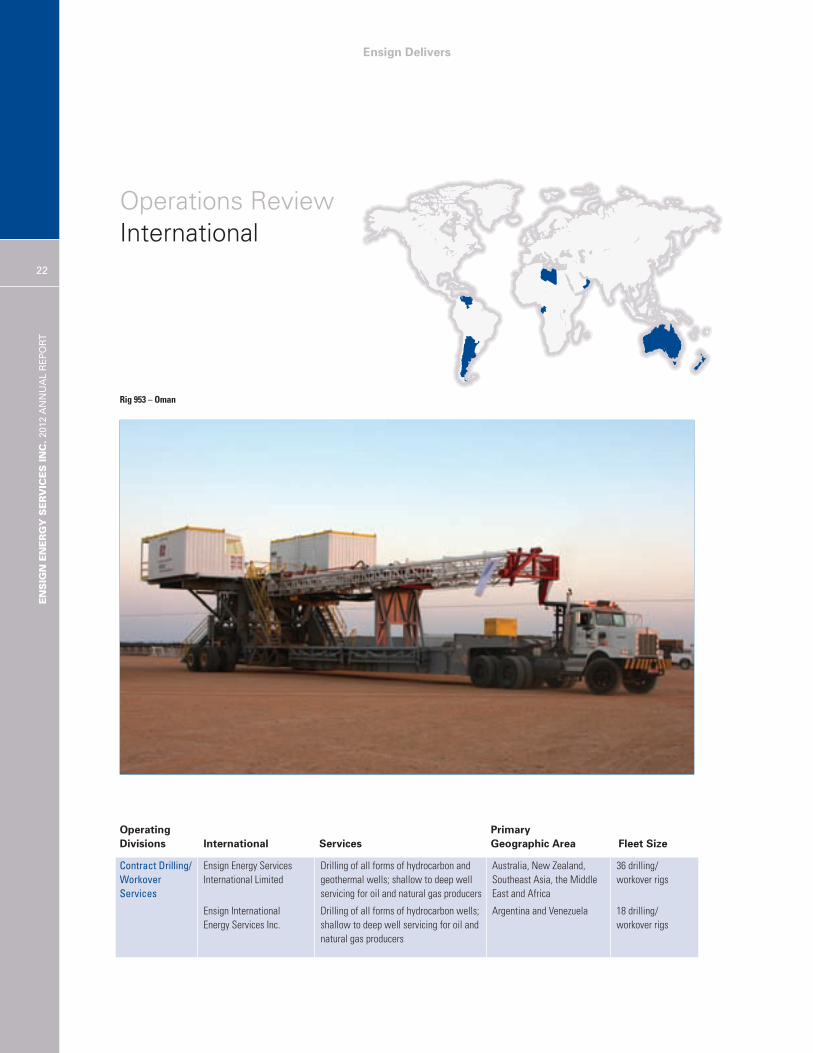
Rig 953 – Oman
ENSIGN ENERGY SERVICES IN
C.2012 A
NNUAL R
EPORT
23OverviewEnsign provides contract drilling servicesin Australia, New Zealand, the MiddleEast, Africa, Venezuela and Argentina.
Ensign Energy Services InternationalLimited (“EESIL”) specializes in thedrilling of all forms of hydrocarbon andgeothermal wells, and oversees ouroperations in Australasia, the MiddleEast and Africa. EESIL is based inAdelaide, Australia.
Ensign International Energy Services Inc.,which is based in Houston, Texas,oversees our operations in Venezuelaand Argentina.
2012 HighlightsRevenues
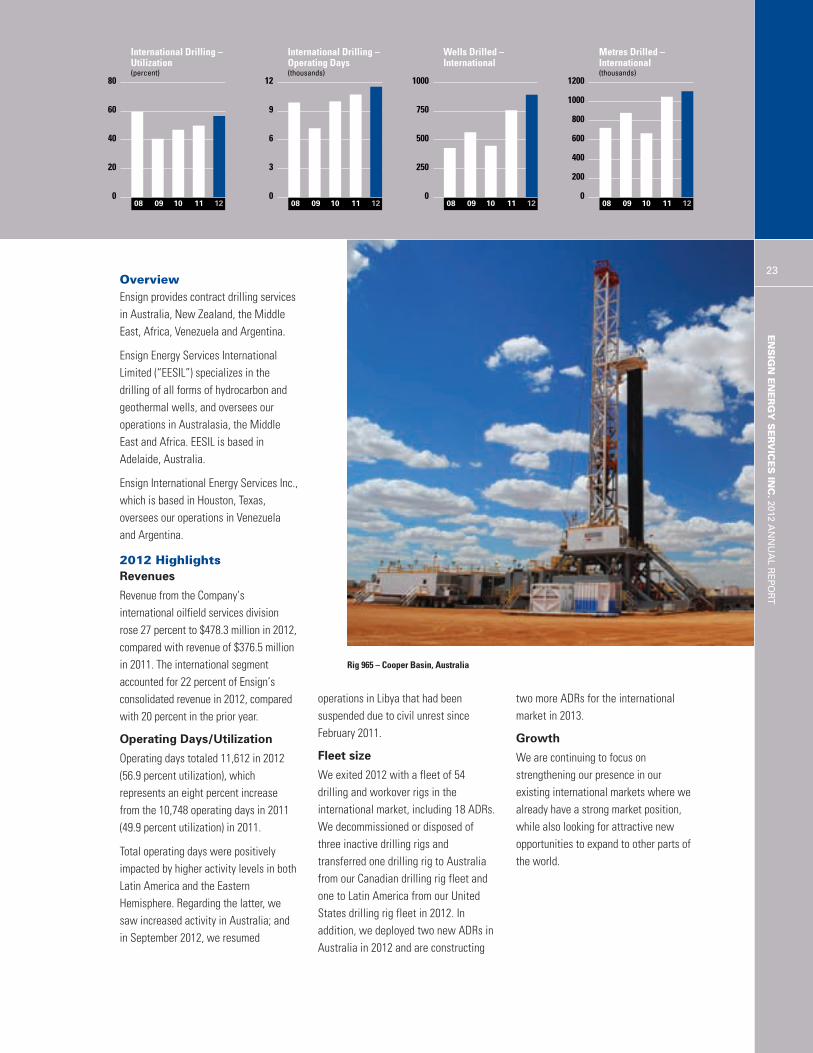
Revenue from the Company’sinternational oilfield services divisionrose 27 percent to $478.3 million in 2012,compared with revenue of $376.5 millionin 2011. The international segmentaccounted for 22 percent of Ensign’sconsolidated revenue in 2012, comparedwith 20 percent in the prior year.
Operating Days/Utilization
Operating days totaled 11,612 in 2012(56.9 percent utilization), whichrepresents an eight percent increasefrom the 10,748 operating days in 2011(49.9 percent utilization) in 2011.
Total operating days were positivelyimpacted by higher activity levels in bothLatin America and the EasternHemisphere. Regarding the latter, wesaw increased activity in Australia; andin September 2012, we resumed
operations in Libya that had beensuspended due to civil unrest sinceFebruary 2011.
Fleet size
We exited 2012 with a fleet of 54drilling and workover rigs in theinternational market, including 18 ADRs.We decommissioned or disposed ofthree inactive drilling rigs andtransferred one drilling rig to Australiafrom our Canadian drilling rig fleet andone to Latin America from our UnitedStates drilling rig fleet in 2012. Inaddition, we deployed two new ADRs inAustralia in 2012 and are constructing
two more ADRs for the internationalmarket in 2013.
Growth
We are continuing to focus onstrengthening our presence in ourexisting international markets where wealready have a strong market position,while also looking for attractive newopportunities to expand to other parts ofthe world.
80
60
40
20
0
International Drilling –Utilization(percent)
11 1208 09 10
12
9
6
3
0
International Drilling –Operating Days(thousands)
11 1208 09 10
1000
750
500
250
0
Wells Drilled –International
11 1208 09 10
1200
1000
800
600
400
200
0
Metres Drilled –International(thousands)
11 1208 09 10
Rig 965 – Cooper Basin, Australia

Well servicing Rig 1307 –Colorado
Ensign DeliversENSIGN ENERGY SERVICES IN
C.2012 A
NNUAL R
EPORT
25
Our Sustainability Focus
We aim to ensure that Ensign will be a
sustainable company that will benefit all
our stakeholders, including our
shareholders, customers, employees and
the communities in which we operate
around the world.
Vision, Mission, Values
Our vision, mission and core values
form the foundation of our
Company-wide corporate social
responsibility (“CSR”) practices.
Our Vision: To grow through
collaborative learning, exploring the
potential of our people and technology,
and creating excellence in who we are,
second to none.
Our Mission: To strive for global
excellence in providing services to the
energy industry worldwide; to distinguish
through our economic, environmental and
social performance, which includes
workplace health and safety.
Code of Integrity, Business
Ethics and Conduct
A formal Code of Integrity, Business
Ethics and Conduct has been developed
by the Company and adopted by the
Board of Directors of Ensign Energy
Services Inc. and its subsidiaries to
ensure that the Company adheres to
ethical standards and obeys all
applicable laws and that its directors,
officers, employees, contractors and
consultants clearly understand what is
required of them in that regard. Full text
of the code is available on our website at
http://www.ensignenergy.com/Documents
/Code_of_Conduct.pdf
Health, Safety and
Environment Policy
Our goal is to protect our people, the
public, our property, and the environment
in which they work and live. This
commitment is in the best interests of
our customers, our employees, and all
other stakeholders. A full text of the
policy is available on the Company’s
website at
http://www.ensignenergy.com/hse/Pages
/default.aspx.
HSE Management System
Ensign’s Health, Safety and
Environmental (“HSE”) Management
System is based on the International Oil
& Gas Producers model, which has many
ourselves through listening, learning and
understanding industry challenges; to
capitalize on strategic and opportunistic
possibilities; to provide services that are
attractive and fair to our customers and
earn their loyalty while also providing
value to our shareholders; and to create
a workplace that protects worker health
and safety with due respect for the
environment, and promote an
atmosphere to grow employee learning
and opportunity in a way that is fulfilling,
recognized and fairly rewarded.
Our Values: Our non-negotiable and
timeless core values are “integrity,
teamwork and learning”.
Our motto – “Performance Excellence –
Second to None” sums up our vision,
mission and core values. We strive to
achieve excellence – second to none –
We strive for continuous improvement
in every aspect of our health, safety and
environmental performance. That is our
promise to our employees, shareholders
and the wider public.
Ensign Delivers
26
ENSIGN ENERGY SERVICES INC.2012 ANNUAL REP
ORT
similarities to ISO standards and helps us
to realize the HSE aspects of our vision,
mission and values. The system’s dual
purpose is to:
1. Establish an international standard for
the way we manage, practice, and
monitor our HSE programs; and
2. Bring our safety programs under one,
Company-wide umbrella.
Ensign aims to: protect our employees;
be the preferred contractor for customers
and the favoured employer in the oilfield
services sector; and lower our costs
associated with HSE incidents through
effective and transparent HSE
management.
Our HSE Management System provides
the framework and processes to
examine the risks to our employees, the
public, our property, and the
environment in which we operate and
determine what actions we need to take
to control these risks.
We will strive for continuous
improvement in every area of our HSE
efforts; this is our promise to our
employees, shareholders and the wider
public. This means continuous
improvement of our standards, systems,
programs, safety performance,
management leadership, and employees’
awareness, knowledge, commitment,
and involvement.
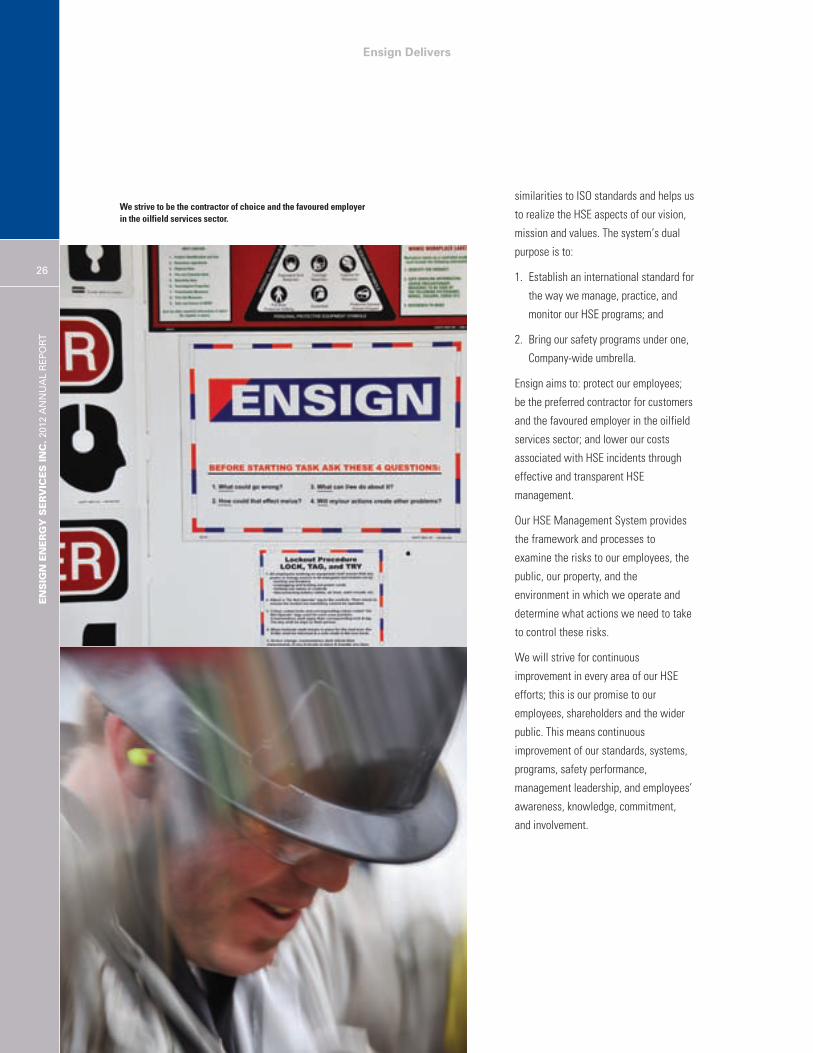
We strive to be the contractor of choice and the favoured employer in the oilfield services sector.
Ensign DeliversOUR SUSTA
INABILIT
Y FO
CUS
27
The Company’s compliance and
performance are monitored on an
ongoing basis by HSE staff. The status of
any significant HSE issue is an agenda
item on every divisional monthly review
and HSE is a standing item for all
meetings of the Company’s Board of
Directors, which has an HSE Committee
to ensure that Ensign is continually
improving its performance in this
important area. Additionally, each Ensign
division conducts a formal HSE audit
every three years using an external
third-party auditor to ensure we stay on
the right track.
In 2012, we began using a newly
implemented enterprise-wide HSE risk
management software system called the
Global Risk Management System
(“GRMS”). Through GRMS, we are
improving and streamlining a number of
processes, including: incident-related
management, reporting, investigation
and corrective actions; environmental
management; management of change;
audit management; compliance
management; and a wide range of health
and safety management tools.
Economic Performance
The Company believes that the five
pillars of our strategy – financial
discipline; opportunistic growth; diverse
operations; customer focus; and
commitment to safety – will help to
sustain Ensign’s economic strength well
into the future.
Financial discipline: The oilfield
services industry, like the crude oil and
natural gas industry we serve, is cyclical
and financial discipline is essential to
taking this approach is in the best
interests of our shareholders.
Diverse operations: Ensign’s
well-established global geographic
footprint is an asset for several reasons.
First, our revenues are not dependent on
just one geographic area. Second,
diverse operations create opportunities
for technology transfer such as the
transfer of our highly sophisticated,
market-leading Automated Drill Rig
(“ADR®”) technology from Canada to the
United States, Australia, the Middle East
and Africa. We believe this substantially
benefits our customers and shareholders.
ensure the sustainability of the Company.
Ensign has a stable capital structure and
continually focuses on managing its
costs. We will continue to look for ways
to optimize our margins.
Opportunistic growth: Ensign’s growth
is a result of both organic growth and
opportunistic growth through
acquisitions. When it comes to making
acquisitions Ensign’s strategy is based
on patience and “thinking outside the
box”. We do not look for growth for
growth’s sake and we try to be leaders
rather than followers. We believe that
Rig 361 – Alberta
Ensign Delivers
28
ENSIGN ENERGY SERVICES INC.2012 ANNUAL REP
ORT
Third, diverse operations benefit our
employees, creating greater
opportunities for them, as well as
stimulating knowledge sharing in areas
such as safety and operational efficiency.
Customer focus:We strive for Ensign to
be the contractor of choice in all
segments of our business. We work
closely with our customers in developing
oilfield services to meet their continually
changing technical requirements and to
improve performance.
Commitment to safety: Our HSE
Management System forms the
foundation of our safety culture along
with our long-standing “Driving to Zero –
Injuries and Incidents” vision. We
believe that a consistent approach will
help achieve our goal of continuously
improving our health, safety and
environmental performance across the
Company and in every jurisdiction we
operate. This benefits all our
stakeholders. We back up this
commitment with Ensign’s Health, Safety
and Environment Policy.
Environmental PerformanceOur Commitment
Ensign aims to be at the forefront of
environmental awareness and solutions
for the benefit of our customers and
other stakeholders.
We actively work to reduce, reuse,
recycle and reclaim materials used in
our operations.
As part of our efforts to innovate and
develop new technologies, we strive to
use environmentally friendly procedures
and materials when providing our services.
While on a well site, the environmental
responsibility generally falls on our
customer, the operating oil and gas
company. Ensign is typically one of many
subcontractors on such sites. Ensign’s
crews are trained in well control that
meets and often exceeds the practices
required by regulation or the industry.
Our performance
We are pleased to report that there have
not been any serious environmental
incidents in the Company’s history.
Diesel fuel
Ensign’s shops and yards have various
quantities of diesel fuel stored in
equipment tanks. These sites are
monitored and checked on an ongoing
basis, and equipment is strategically
located with environmental and safety
concerns in mind.
Reducing engine emissions
For several years, Ensign has pursued a
program of replacing older, less-efficient
engines used on our equipment with
newer engines. The engines we now
purchase represent the latest technology
for achieving fuel efficiency and reduced
emissions. Wherever possible, we select
engines that consume less fuel for a
given power output level.
All incidents that could affect the
environment are dealt with on a timely
basis to ensure that they are properly
contained.
Our divisions have comprehensive
emergency response plans in place that
address environmental concerns.
We take this responsibility very seriously.
We view it as a responsibility to current
and future generations.
Reducing our environmentalfootprint
Ensign aims to use fewer material
resources in order to reduce both our
environmental footprint and input costs.
Our impacts
Our potential impacts occur in the
manufacture, transport and operation of
our drilling rigs and other oilfield services
equipment.
The environmental risks associated
with Ensign’s operations are low.
Except for lubricants, Ensign does not
handle toxic substances.
Our HSE Management System forms
the foundation of our safety culture
along with our long-standing “Driving to
Zero – Injuries and Incidents” vision.
Ensign DeliversOUR SUSTA
INABILIT
Y FO
CUS
29
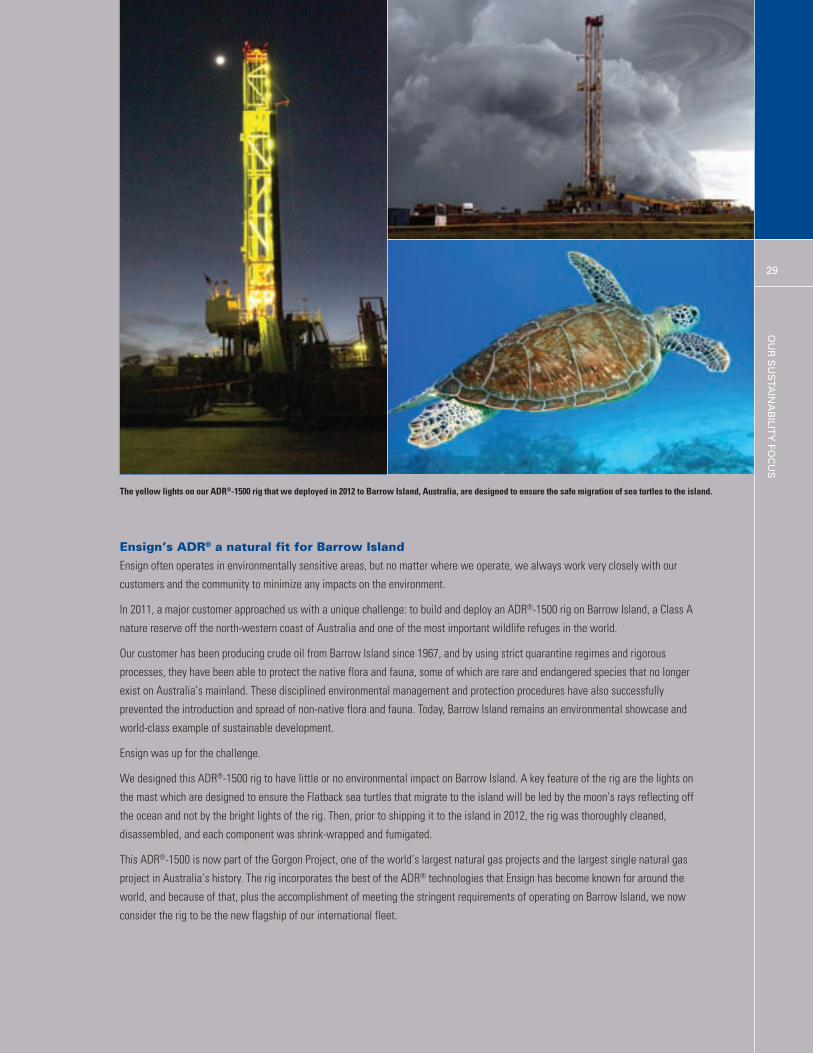
Ensign’s ADR® a natural fit for Barrow Island
Ensign often operates in environmentally sensitive areas, but no matter where we operate, we always work very closely with our
customers and the community to minimize any impacts on the environment.
In 2011, a major customer approached us with a unique challenge: to build and deploy an ADR®-1500 rig on Barrow Island, a Class A
nature reserve off the north-western coast of Australia and one of the most important wildlife refuges in the world.
Our customer has been producing crude oil from Barrow Island since 1967, and by using strict quarantine regimes and rigorous
processes, they have been able to protect the native flora and fauna, some of which are rare and endangered species that no longer
exist on Australia’s mainland. These disciplined environmental management and protection procedures have also successfully
prevented the introduction and spread of non-native flora and fauna. Today, Barrow Island remains an environmental showcase and
world-class example of sustainable development.
Ensign was up for the challenge.
We designed this ADR®-1500 rig to have little or no environmental impact on Barrow Island. A key feature of the rig are the lights on
the mast which are designed to ensure the Flatback sea turtles that migrate to the island will be led by the moon’s rays reflecting off
the ocean and not by the bright lights of the rig. Then, prior to shipping it to the island in 2012, the rig was thoroughly cleaned,
disassembled, and each component was shrink-wrapped and fumigated.
This ADR®-1500 is now part of the Gorgon Project, one of the world’s largest natural gas projects and the largest single natural gas
project in Australia’s history. The rig incorporates the best of the ADR® technologies that Ensign has become known for around the
world, and because of that, plus the accomplishment of meeting the stringent requirements of operating on Barrow Island, we now
consider the rig to be the new flagship of our international fleet.
The yellow lights on our ADR®-1500 rig that we deployed in 2012 to Barrow Island, Australia, are designed to ensure the safe migration of sea turtles to the island.
Ensign Delivers
30
ENSIGN ENERGY SERVICES INC.2012 ANNUAL REP
ORT
We are committed to purchasing new
engines that meet the current North
American emissions standards and meet
or exceed the emissions standards in
various host countries.
Using alternative fuels
We work with our customers to develop
the use of alternative fuels.
In several drilling projects in North
America, we are using LNG or natural
gas sourced from the field to power our
equipment. Doing so results in fewer
emissions as compared with
conventional rig fuel sources, plus it
reduces fossil fuel emissions resulting
from the transport of fuel to the rig site.
As of March 14, 2013, 19 of the rigs in
our Canadian and United States fleet
were running on this cost effective and
clean burning fuel.
To further the application of this
technology throughout our fleet
worldwide, we are currently informing
our customers about the cost savings and
emissions reductions available to them
through the use of alternative fuels.
Increasing drilling efficiency
New drilling rigs, such as our proprietary
ADR®, which we design and assemble
ourselves, use more complex and flexible
designs resulting in a smaller drilling rig
that accomplishes more work. These
more compact drilling rigs move and rig
up in a fraction of the time of older
designs. Our newer rigs also incorporate
drilling systems that reduce the overall
time and energy needed to drill and
complete a well.
Energy Industries Ltd. is designed to
recycle production testing emissions
back into the production line and reduce
or eliminate the flaring of hydrocarbons.
Our global drilling rig fleet includes a
number of “electric” drilling rigs that
allow the “pooling of demand”, which
means dedicated engines are no longer
required and engines can be shut down
when power demand declines.
While the industry as a whole still
operates a large number of older style
mechanical drilling rigs, most newly built
drilling rig designs incorporate
technology that lowers fuel consumption
through more efficient generation and
delivery of power at the rig site, resulting
in reduced emissions.
Recycling
We practice recycling in all of our
locations, and wherever possible, our
shops recycle oils and scrap steel.
A smaller rig design means that we use
less construction material on our new
rigs, which reduces the emissions and
CO2 produced by the manufacturing
process. Whenever practical, we use
low-VOCs (volatile organic compounds)
and lead-free paints to reduce emissions
and minimize pollutants.
The layout and smaller size of our new
drilling rigs means our customers’
wellsites require a smaller footprint,
resulting in less impact on the terrain
and vegetation in the physical
environment in which we operate.
Ensign also constructs its equipment and
trains its people to conduct directional
drilling and multi-bore wells, which
significantly decrease surface impacts by
reducing the number of wellsites.
Many of our drilling operations
incorporate closed drilling fluid systems
that reduce and, in some cases,
eliminate site preparation and clean up.
In addition, the production testing
equipment used by our subsidiary Opsco
The layout and smaller size of our
new drilling rigs allows a smaller
footprint on our customers’ wellsites,
resulting in less impact on the terrain
and vegetation in the physical
environment in which we operate.
Ensign DeliversOUR SUSTA
INABILIT
Y FO
CUS
31
Work in environmentally sensitive areas
Ensign occasionally works in
environmentally sensitive areas. In such
instances, we work closely with our
customers to ensure that any potential
negative impacts of the planned
operation are minimized or eliminated
where possible. As a subcontractor to oil
and gas companies, we fall under their
overall plans and reporting.
Our crews are trained to follow good
environmental and waste management
practices and this is monitored on an
ongoing basis by senior supervisors and
safety staff.
Water usage and handling waste
Water supply and quality issues typically
are the responsibility of our customers,
the operating oil and gas companies.
However, Ensign manages waste to
ensure that any products in use during
the drilling or servicing of a well are
monitored and any spills are addressed
quickly and contained on site.
We have developed the Ensign Closed
Loop Mud System (“CLMS”), which
recycles fresh water used in the drilling
process. The used water-based drilling
fluid is pumped into a vertical cone tank
where the water and solids separate.
The solids are then pumped into a
centrifuge to separate any remaining
water. All the water from both steps is
captured and reused, while the solids are
transferred to a holding tank and
cleaned. After the CLMS process, the
solids are clean enough for farmers to
spread on their land. Our CLMS
eliminates the need for a large holding
pit in the ground and, overall, reduces
the environmental impact and costs of
drill sites.
Social Performance
Ensign is engaged in numerous initiatives
to build and reinforce our health and
safety culture and contribute positively to
the communities in which we work.
Health and SafetyDriving to Zero
Our Driving to Zero vision – which aims
for zero safety incidents, zero injuries,
and zero days off work due to injury –
has helped us achieve improvements in
our safety performance. To support our
vision, Ensign expects its divisions to
meet or exceed the injury rate trends of
their industry peers. Our long-term
objective is to see continued
improvement and have our operating
divisions achieve injury rates recognized
as best in class by major operators.
During the period 2003 to 2012, the
Company as a whole has achieved a
reduction of approximately 76 percent in
the frequency of total recordable
incidents and a reduction of
approximately 66 percent in the
frequency of injuries that resulted in
workers losing time from work.
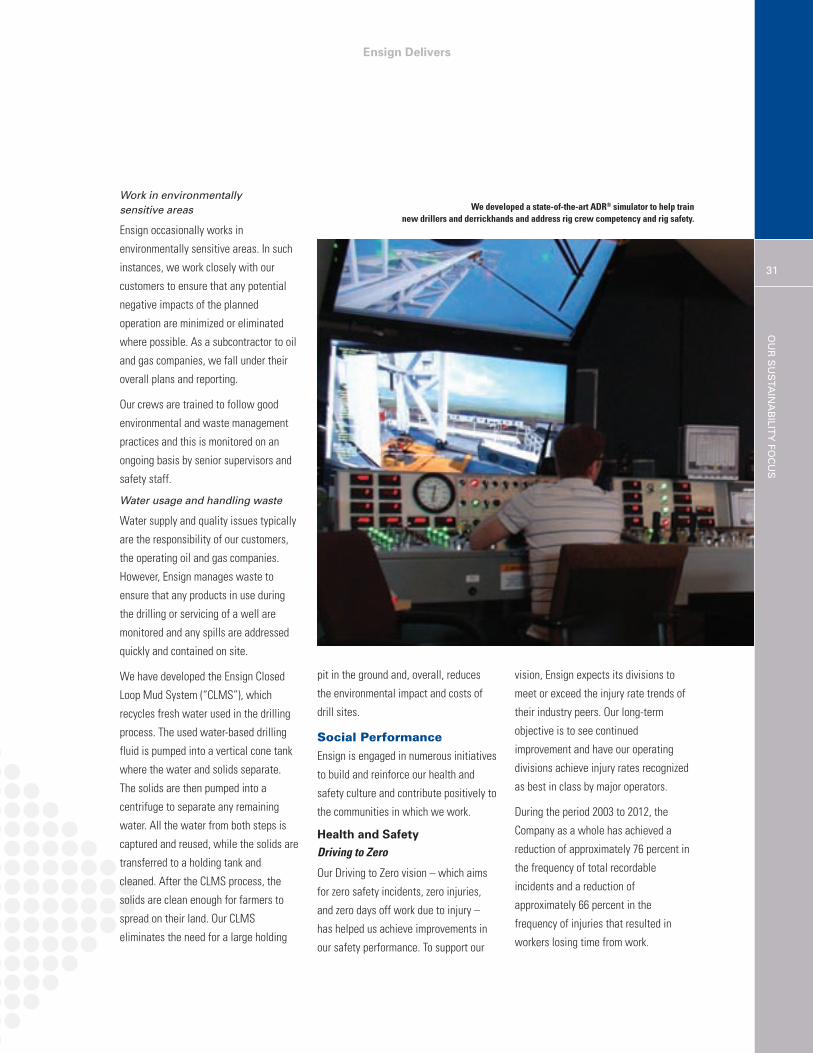
We developed a state-of-the-art ADR® simulator to help train new drillers and derrickhands and address rig crew competency and rig safety.
Ensign Delivers
32
ENSIGN ENERGY SERVICES INC.2012 ANNUAL REP
ORT
Employee training
As a global oilfield services company,
we train our workers to make safety
both on and off the job an everyday
priority. Training starts on the first day
of employment and is reinforced
constantly through job safety analysis
programs, personal injury prevention
training, safety coaching, daily pre-job
safety meetings, and daily work
observation practices.
In 2012, we began beta testing an
enterprise-wide Global Skills Standard
(“GSS”) system, through which we will
capture data about the training,
performance and experience of rig-crew
members around the world to ensure
they receive equivalent levels of
technical and behavioural training so that
our crews reach a common, high
standard of competency that is
applicable in any jurisdiction in the
world. GSS will help us ensure that
globally we will always have
best-in-class crews – well trained,
efficient and safety-conscious.
To help train new drillers and derrick
hands and address rig crew competency
and rig safety, we have developed a
state-of-the-art ADR® simulator.
Operating much like a flight simulator,
our ADR® simulators replicate the actual
experience of operating one of our ADRs,
complete with actual ADR® control
panels and interactive video simulation
of multiple drilling scenarios.
We are also building a world-class
training facility in Nisku, Alberta, near
Edmonton to train both current work
crews and entry-level crews to a higher
level. The facility is scheduled to open in
the spring of 2013.
Another area of focus for Ensign
continues to be driver safety. Ensign
has over 2,000 vehicles globally, and
our divisions are working diligently on
their fleet programs to reduce collision
and ticketing rates from inspections
and thereby protect our employees and
the public.
Safety Stand Down Month
Ensign’s Safety Stand Down Month is a
global initiative designed to reinforce our
commitment to workers’ safety. During
Safety Stand Down Month, which is held
twice a year Company-wide, Ensign’s
senior executives visit job sites in the
field to raise awareness about safety
issues with our frontline workers,
customers and subcontractors.
Our frontline workers – the crews who
work on our rigs and employees who
interact regularly with our customers –
form the largest group in our workforce.
Most of the Company’s recordable
incidents and injuries occur within this
group, particularly among crews working
together for the first time or those who
are new to their job.
In 2012, we held meetings worldwide
under the common theme “Strengthening
Our Safety Foundation” through which
we emphasized that good safety
performance is based on (a) the
systematic use of safety tools, including
pre-job safety meetings, inspections,
observation and coaching; and (b) the
fundamental aspects of our safety
program, including hazard identification
and control, communication, training,
incident reporting and investigation, and
emergency response.
Commitment to communities
We encourage our employees around the
world to support local charities and
participate in the communities where
they live and work.
Being a good corporate citizen means
actively contributing in a number of
ways. We support many different
charities and not-for-profit organizations
in our communities worldwide. We look
for charities that are committed to
positive change.
Ensign Delivers
This Management’s Discussion and Analysis (“MD&A”) for Ensign Energy Services Inc. and all of its subsidiaries and partnerships (the “Company”)
should be read in conjunction with the audited consolidated financial statements and the notes thereto for the year ended December 31, 2012, which
are available on SEDAR at www.sedar.com.
This MD&A and the consolidated financial statements and comparative information have been prepared in accordance with International Financial
Reporting Standards (“IFRS”). All financial measures presented in this MD&A are expressed in Canadian dollars unless otherwise indicated. This MD&A
is dated March 14, 2013. Additional information, including the Company’s Annual Information Form for the year ended December 31, 2011, is available
on SEDAR at www.sedar.com. The Company’s Annual Information Form for the year ended December 31, 2012 is expected to be filed on SEDAR prior
to March 31, 2013.
Advisory Regarding Forward-Looking Statements
Certain statements in this document constitute forward-looking statements or information (collectively referred to herein as “forward-looking
statements”) within the meaning of applicable securities legislation. Forward-looking statements can be identified by the words “believe”, “anticipate”,
“expect”, “plan”, “estimate”, “target”, “continue”, “could”, “intend”, “may”, “potential”, “predict”, “should”, “will”, “objective”, “project”,
“forecast”, “goal”, “guidance”, “outlook”, “effort”, “seeks”, “schedule” or other expressions of a similar nature suggesting future outcome or
statements regarding an outlook. Disclosure related to expected future commodity pricing, revenue rates, equipment utilization or operating activity
levels, operating costs, capital expenditures and other future guidance provided throughout this MD&A, including, but not limited to, the information
provided in the “Outlook” section regarding the general outlook for 2013, the “New Builds” and “Financing Activities” sections regarding the new build
program for 2013 and the “International Oilfield Services” section regarding activities in Libya, constitutes forward-looking statements. These statements
are not guarantees of future performance and are subject to certain risks and the reader should not place undue reliance on these forward-looking
statements as there can be no assurance that the plans, initiatives or expectations upon which they are based will occur.
The forward-looking statements are based on current expectations, estimates and projections about the Company and the industry in which the Company
operates, which speak only as of the date such statements were made or as of the date of the report or document in which they are contained, and are
subject to known and unknown risks, uncertainties and other factors that could cause the actual results, performance or achievements of the Company
to be materially different from any future results, performance or achievements expressed or implied by such forward-looking statements. Such factors
include, among others: general economic and business conditions which will, among other things, impact demand for and market prices of the Company’s
services; volatility of and assumptions regarding crude oil and natural gas prices; fluctuations in currency and interest rates; economic conditions in the
countries and regions in which the Company conducts business; political uncertainty and civil unrest; ability of the Company to implement its business
strategy; impact of competition; the Company’s defense of lawsuits; availability and cost of labor and other equipment, supplies and services; ability of
the Company and its subsidiaries to complete their capital programs; operating hazards and other difficulties inherent in the operation of the Company’s
oilfield services equipment; availability and cost of financing; timing and success of integrating the business and operations of acquired companies;
actions by governmental authorities; government regulations and the expenditures required to comply with them (including safety and environmental
laws and regulations and the impact of climate change initiatives on capital and operating costs); the adequacy of the Company’s provision for taxes;
and other circumstances affecting revenues and expenses.
The Company’s operations and levels of demand for its services have been, and at times in the future may be, affected by political developments and
by national, regional and local laws and regulations such as changes in taxes, royalties and other amounts payable to governments or governmental
agencies and environmental protection regulations. Should one or more of these risks or uncertainties materialize, or should any of the Company’s
assumptions prove incorrect, actual results may vary in material respects from those projected in the forward-looking statements. The impact of any
one factor on a particular forward-looking statement is not determinable with certainty as such factors are interdependent upon other factors, and the
Company’s course of action would depend upon its assessment of the future considering all information then available.
For additional information refer to the “Risks and Uncertainties” section of this MD&A. Readers are cautioned that the foregoing list of important factors
is not exhaustive. Unpredictable or unknown factors not discussed in this report could also have material adverse effects on forward-looking statements.
Although the Company believes that the expectations conveyed by the forward-looking statements are reasonable based on information available to it
on the date such forward-looking statements are made, no assurances can be given as to future results, levels of activity and achievements. Except as
required by law, the Company assumes no obligation to update forward-looking statements should circumstances or the Company’s estimates or
opinions change.
Non-GAAP Measures
This MD&A contains references to EBITDA, EBITDA per share, Adjusted net income, Adjusted net income per share, Funds from operations and Funds
from operations per share. These measures do not have any standardized meaning prescribed by IFRS and accordingly, may not be comparable to
similar measures used by other companies. Non-GAAP measures are defined below.
Management’s Discussion and Analysis
34
ENSIGN ENERGY SERVICES INC.2012 ANNUAL REP
ORT
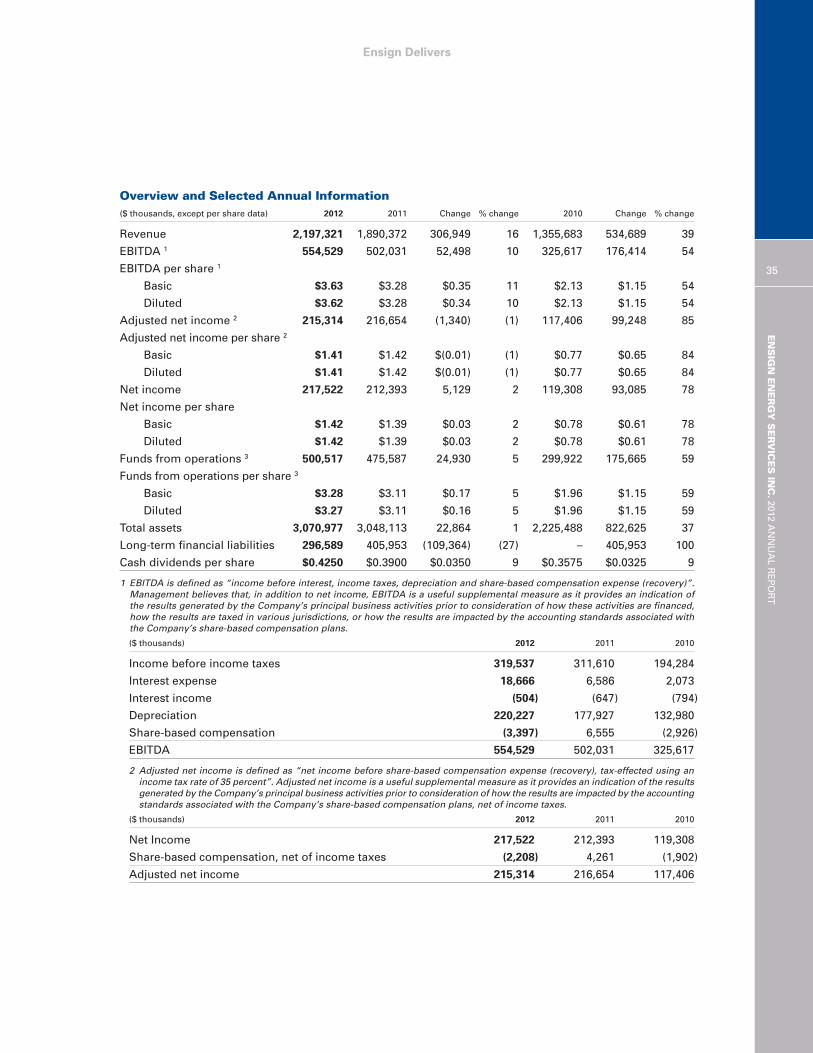
Ensign Delivers
Overview and Selected Annual Information($ thousands, except per share data) 2012 2011 Change % change 2010 Change % change
Revenue 2,197,321 1,890,372 306,949 16 1,355,683 534,689 39
EBITDA 1 554,529 502,031 52,498 10 325,617 176,414 54
EBITDA per share 1
Basic $3.63 $3.28 $0.35 11 $2.13 $1.15 54
Diluted $3.62 $3.28 $0.34 10 $2.13 $1.15 54
Adjusted net income 2 215,314 216,654 (1,340) (1) 117,406 99,248 85
Adjusted net income per share 2
Basic $1.41 $1.42 $(0.01) (1) $0.77 $0.65 84
Diluted $1.41 $1.42 $(0.01) (1) $0.77 $0.65 84
Net income 217,522 212,393 5,129 2 119,308 93,085 78
Net income per share
Basic $1.42 $1.39 $0.03 2 $0.78 $0.61 78
Diluted $1.42 $1.39 $0.03 2 $0.78 $0.61 78
Funds from operations 3 500,517 475,587 24,930 5 299,922 175,665 59
Funds from operations per share 3
Basic $3.28 $3.11 $0.17 5 $1.96 $1.15 59
Diluted $3.27 $3.11 $0.16 5 $1.96 $1.15 59
Total assets 3,070,977 3,048,113 22,864 1 2,225,488 822,625 37
Long-term financial liabilities 296,589 405,953 (109,364) (27) – 405,953 100
Cash dividends per share $0.4250 $0.3900 $0.0350 9 $0.3575 $0.0325 9
1 EBITDA is defined as “income before interest, income taxes, depreciation and share-based compensation expense (recovery)”.Management believes that, in addition to net income, EBITDA is a useful supplemental measure as it provides an indication ofthe results generated by the Company’s principal business activities prior to consideration of how these activities are financed,how the results are taxed in various jurisdictions, or how the results are impacted by the accounting standards associated withthe Company’s share-based compensation plans.
($ thousands) 2012 2011 2010
Income before income taxes 319,537 311,610 194,284
Interest expense 18,666 6,586 2,073
Interest income (504) (647) (794)
Depreciation 220,227 177,927 132,980
Share-based compensation (3,397) 6,555 (2,926)
EBITDA 554,529 502,031 325,617
2 Adjusted net income is defined as “net income before share-based compensation expense (recovery), tax-effected using an income tax rate of 35 percent”. Adjusted net income is a useful supplemental measure as it provides an indication of the resultsgenerated by the Company’s principal business activities prior to consideration of how the results are impacted by the accountingstandards associated with the Company’s share-based compensation plans, net of income taxes.
($ thousands) 2012 2011 2010
Net Income 217,522 212,393 119,308
Share-based compensation, net of income taxes (2,208) 4,261 (1,902)
Adjusted net income 215,314 216,654 117,406
ENSIGN ENERGY SERVICES IN
C.2012 A
NNUAL R
EPORT
35

Ensign Delivers
3 Funds from operations is defined as “cash provided by operating activities before the change in non-cash working capital”.Funds from operations is a measure that provides additional information regarding the Company’s liquidity and its ability togenerate funds to finance its operations. Management utilizes this measure to assess the Company’s ability to finance operatingactivities and capital expenditures.
($ thousands) 2012 2011 2010
Net Income 217,522 212,393 119,308
Non-cash items:
Depreciation 220,227 177,927 132,980
Share-based compensation, net of cash paid 4,363 11,778 (1,907)
Accretion on long-term debt 1,579 1,154 –
Deferred income tax 56,826 72,335 49,541
Funds from operations 500,517 475,587 299,922
Nature of Operations
The Company is in the business of providing oilfield services to the crude oil and natural gas industry in Canada, the
United States and internationally. Oilfield services provided by the Company include drilling and well servicing, oil
sands coring, directional drilling, underbalanced drilling, equipment rentals, transportation, wireline services and
production testing services.
The Company’s Canadian operations span the four western provinces of British Columbia, Alberta, Saskatchewan
and Manitoba and include the Northwest Territories and the Yukon. In the United States, the Company operates
predominantly in the Rocky Mountain and southern regions as well as the states of California, Nevada, North Dakota,
South Dakota, Nebraska, Pennsylvania and Michigan. Internationally, the Company currently operates in Australia,
Argentina, Gabon, Libya, New Zealand, Oman and Venezuela. In addition to these international locations, the
Company has operated in several other countries in the past and may relocate equipment to other regions in the
future depending on bidding opportunities and anticipated levels of future demand.
2012 Compared with 2011
The Company’s revenue of $2,197.3 million for the year ended December 31, 2012 was at record levels, increasing
16 percent over revenue of $1,890.4 million for the prior year. Net income for the year ended December 31, 2012
was $217.5 million ($1.42 per common share), a two percent increase from $212.4 million ($1.39 per common share)
recorded in 2011. Operating earnings, expressed as EBITDA, for 2012 were $554.5 million ($3.63 per common share),
a 10 percent increase from EBITDA of $502.0 million ($3.28 per common share) for the year ended December 31,
2011. Funds from operations were also the highest in the Company’s history, increasing five percent to $500.5 million
($3.28 per common share) from $475.6 million ($3.11 per common share) in the prior year. The Company’s growth
in its United States oilfield services, combined with improved levels of demand in the Company’s international
operations, led to overall increases year-over-year in consolidated operating results.
In 2012 the Company added 13 new Automated Drill Rigs (“ADR®”) to its drilling rig fleet: six in the Canadian
market; five in the United States market; and two in Australia through the new build program. All of the newly
constructed ADRs are subject to long-term contracts. The new build program also added 12 new well servicing
rigs in the United States.
The Company’s operations experienced a strong start in 2012; however, a slowdown in Canadian oilfield services
towards the latter half of the year, as customers reacted to unfavorable price differentials for Canadian commodities,
a continuing over-supply of natural gas and uncertainty in global economic conditions, weakened activity levels and
financial contributions in the last half of the year. The weakness in Canada was somewhat offset by the global
36
ENSIGN ENERGY SERVICES INC.2012 ANNUAL REP
ORT
Ensign Delivers
diversity of the Company’s operations. The Company’s United States operations recorded an increase to revenues
in 2012 compared to the prior year primarily due to the positive impact from the first full year of operations from the
land drilling division of Rowan Companies, Inc. (“Rowan Land Drilling”, subsequently referred to as “Ensign US
Southern”) which was acquired in September 2011. The Company’s international operations experienced higher
activity levels in Latin America and in the eastern hemisphere compared to the prior year. Improvements to operating
results in the Company’s United States and international operations were further increased by the positive
translational impact of a strengthening United States dollar against the Canadian dollar, increasing approximately one
percent during 2012 compared to 2011.
The Company increased its dividend in 2012 with a 4.8 percent fourth quarter increase in the quarterly dividend rate
to $0.110 per common share from the previous quarterly dividend rate of $0.105 per common share. The dividend
has been increased at a 17 percent compound annual growth rate since the Company first paid a dividend in 1995.
The Company issued USD $300.0 million of senior unsecured notes (the “Notes”) in February 2012. The proceeds
from the issuance of the Notes, along with an expanded global revolving credit facility (the “Global Facility”) and
funds generated from operations, were used to repay the USD $400.0 million term loan, incurred to finance the
September 2011 acquisition of Rowan Land Drilling. The Notes consist of: USD $100.0 million in five year notes
with an interest rate of 3.43 percent; USD $100.0 million in seven year notes with an interest rate of 3.97 percent;
and USD $100.0 million in ten year notes with an interest rate of 4.54 percent. The Company also increased its
credit facilities in 2012 resulting in an increase in available borrowings to $164.3 million at December 31, 2012
compared to $10.1 million at December 31, 2011. Changes to the Company’s capital structure during 2012 provide
the Company with a measure of financial stability and support for future growth opportunities.
2011 Compared with 2010
In 2011, improved levels of demand for oilfield services across all of the Company’s segments, combined with the
Company completing the largest acquisition in its history through the third quarter acquisition of Rowan Land Drilling,
contributed to improved financial results when compared to 2010. A consequence of this acquisition was the addition
of long-term debt to the Company’s capital structure. With demand for oilfield services showing signs of recovery
in 2011 revenue rates trended upward, resulting in improvements to the Company’s margins over the prior year.
Partially offsetting the improved levels of operating results was the negative translational impact on the financial
results from the Company’s United States and international operations due to an overall weakening of the United
States dollar against the Canadian dollar. Other challenges in 2011 that negatively impacted consolidated financial
and operating results included geopolitical issues in the Middle East and North Africa and weather setbacks in
Australia during the first half of the year.
Revenue and Oilfield Services Expense($ thousands) 2012 2011 Change % change
Revenue
Canada 774,444 786,158 (11,714) (1)
United States 944,580 727,678 216,902 30
International 478,297 376,536 101,761 27
2,197,321 1,890,372 306,949 16
Oilfield services expense 1,555,509 1,322,926 232,583 18
Gross margin 641,812 567,446 74,366 13
Gross margin percentage (%) 29.2 30.0
MANAGEMENT’S DISCUSSION AND ANALY
SIS
37
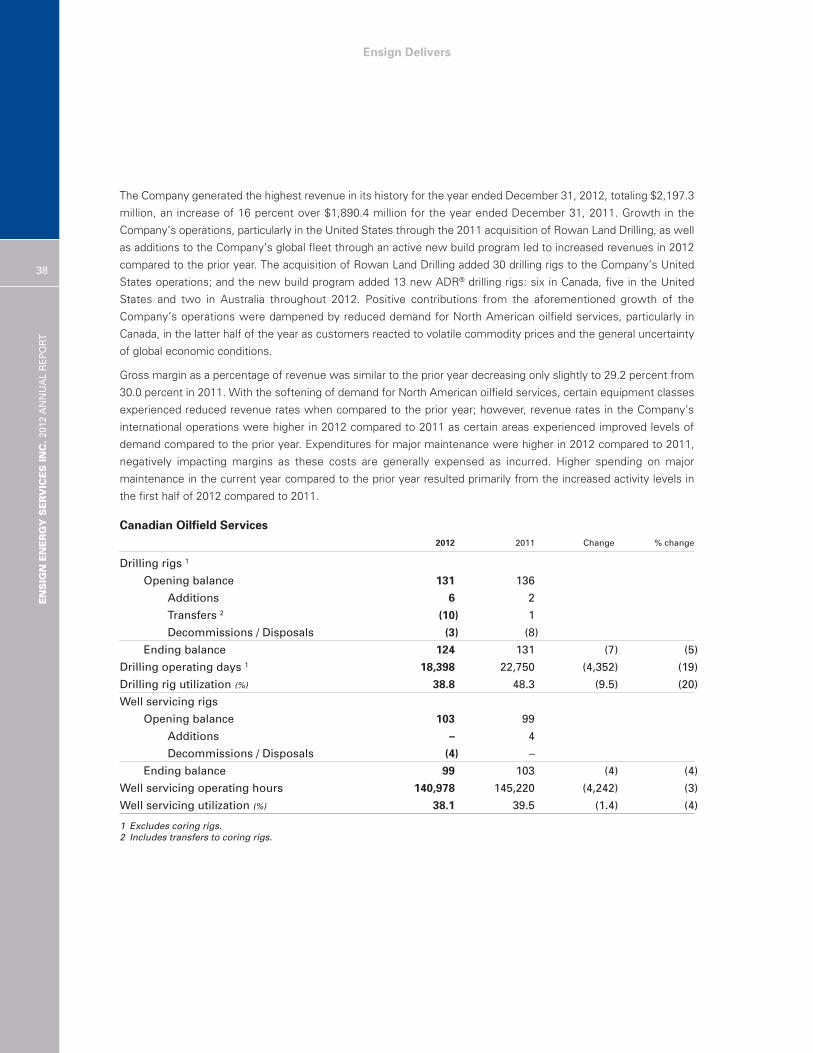
Ensign Delivers
The Company generated the highest revenue in its history for the year ended December 31, 2012, totaling $2,197.3
million, an increase of 16 percent over $1,890.4 million for the year ended December 31, 2011. Growth in the
Company’s operations, particularly in the United States through the 2011 acquisition of Rowan Land Drilling, as well
as additions to the Company’s global fleet through an active new build program led to increased revenues in 2012
compared to the prior year. The acquisition of Rowan Land Drilling added 30 drilling rigs to the Company’s United
States operations; and the new build program added 13 new ADR® drilling rigs: six in Canada, five in the United
States and two in Australia throughout 2012. Positive contributions from the aforementioned growth of the
Company’s operations were dampened by reduced demand for North American oilfield services, particularly in
Canada, in the latter half of the year as customers reacted to volatile commodity prices and the general uncertainty
of global economic conditions.
Gross margin as a percentage of revenue was similar to the prior year decreasing only slightly to 29.2 percent from
30.0 percent in 2011. With the softening of demand for North American oilfield services, certain equipment classes
experienced reduced revenue rates when compared to the prior year; however, revenue rates in the Company’s
international operations were higher in 2012 compared to 2011 as certain areas experienced improved levels of
demand compared to the prior year. Expenditures for major maintenance were higher in 2012 compared to 2011,
negatively impacting margins as these costs are generally expensed as incurred. Higher spending on major
maintenance in the current year compared to the prior year resulted primarily from the increased activity levels in
the first half of 2012 compared to 2011.
Canadian Oilfield Services2012 2011 Change % change
Drilling rigs 1
Opening balance 131 136
Additions 6 2
Transfers 2 (10) 1
Decommissions / Disposals (3) (8)
Ending balance 124 131 (7) (5)
Drilling operating days 1 18,398 22,750 (4,352) (19)
Drilling rig utilization (%) 38.8 48.3 (9.5) (20)
Well servicing rigs
Opening balance 103 99
Additions – 4
Decommissions / Disposals (4) –
Ending balance 99 103 (4) (4)
Well servicing operating hours 140,978 145,220 (4,242) (3)
Well servicing utilization (%) 38.1 39.5 (1.4) (4)
1 Excludes coring rigs.2 Includes transfers to coring rigs.
38
ENSIGN ENERGY SERVICES INC.2012 ANNUAL REP
ORT
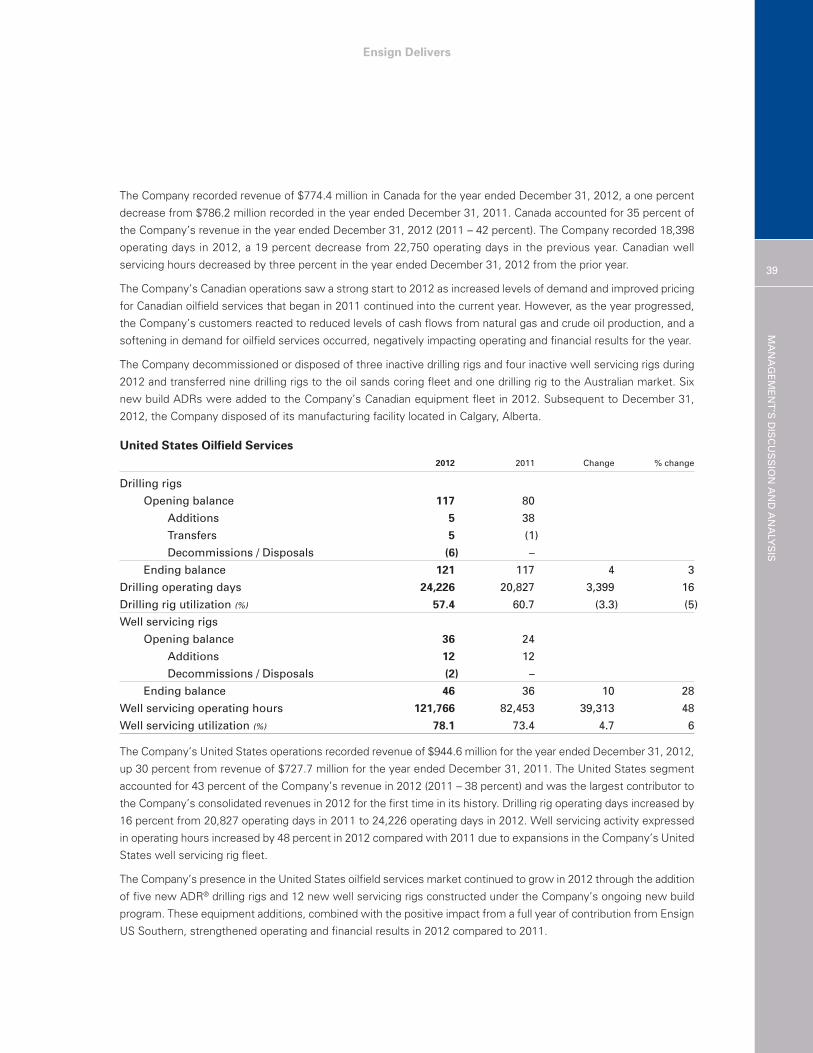
Ensign Delivers
The Company recorded revenue of $774.4 million in Canada for the year ended December 31, 2012, a one percent
decrease from $786.2 million recorded in the year ended December 31, 2011. Canada accounted for 35 percent of
the Company’s revenue in the year ended December 31, 2012 (2011 – 42 percent). The Company recorded 18,398
operating days in 2012, a 19 percent decrease from 22,750 operating days in the previous year. Canadian well
servicing hours decreased by three percent in the year ended December 31, 2012 from the prior year.
The Company’s Canadian operations saw a strong start to 2012 as increased levels of demand and improved pricing
for Canadian oilfield services that began in 2011 continued into the current year. However, as the year progressed,
the Company’s customers reacted to reduced levels of cash flows from natural gas and crude oil production, and a
softening in demand for oilfield services occurred, negatively impacting operating and financial results for the year.
The Company decommissioned or disposed of three inactive drilling rigs and four inactive well servicing rigs during
2012 and transferred nine drilling rigs to the oil sands coring fleet and one drilling rig to the Australian market. Six
new build ADRs were added to the Company’s Canadian equipment fleet in 2012. Subsequent to December 31,
2012, the Company disposed of its manufacturing facility located in Calgary, Alberta.
United States Oilfield Services2012 2011 Change % change
Drilling rigs
Opening balance 117 80
Additions 5 38
Transfers 5 (1)
Decommissions / Disposals (6) –
Ending balance 121 117 4 3
Drilling operating days 24,226 20,827 3,399 16
Drilling rig utilization (%) 57.4 60.7 (3.3) (5)
Well servicing rigs
Opening balance 36 24
Additions 12 12
Decommissions / Disposals (2) –
Ending balance 46 36 10 28
Well servicing operating hours 121,766 82,453 39,313 48
Well servicing utilization (%) 78.1 73.4 4.7 6
The Company’s United States operations recorded revenue of $944.6 million for the year ended December 31, 2012,
up 30 percent from revenue of $727.7 million for the year ended December 31, 2011. The United States segment
accounted for 43 percent of the Company’s revenue in 2012 (2011 – 38 percent) and was the largest contributor to
the Company’s consolidated revenues in 2012 for the first time in its history. Drilling rig operating days increased by
16 percent from 20,827 operating days in 2011 to 24,226 operating days in 2012. Well servicing activity expressed
in operating hours increased by 48 percent in 2012 compared with 2011 due to expansions in the Company’s United
States well servicing rig fleet.
The Company’s presence in the United States oilfield services market continued to grow in 2012 through the addition
of five new ADR® drilling rigs and 12 new well servicing rigs constructed under the Company’s ongoing new build
program. These equipment additions, combined with the positive impact from a full year of contribution from Ensign
US Southern, strengthened operating and financial results in 2012 compared to 2011.
MANAGEMENT’S DISCUSSION AND ANALY
SIS
39
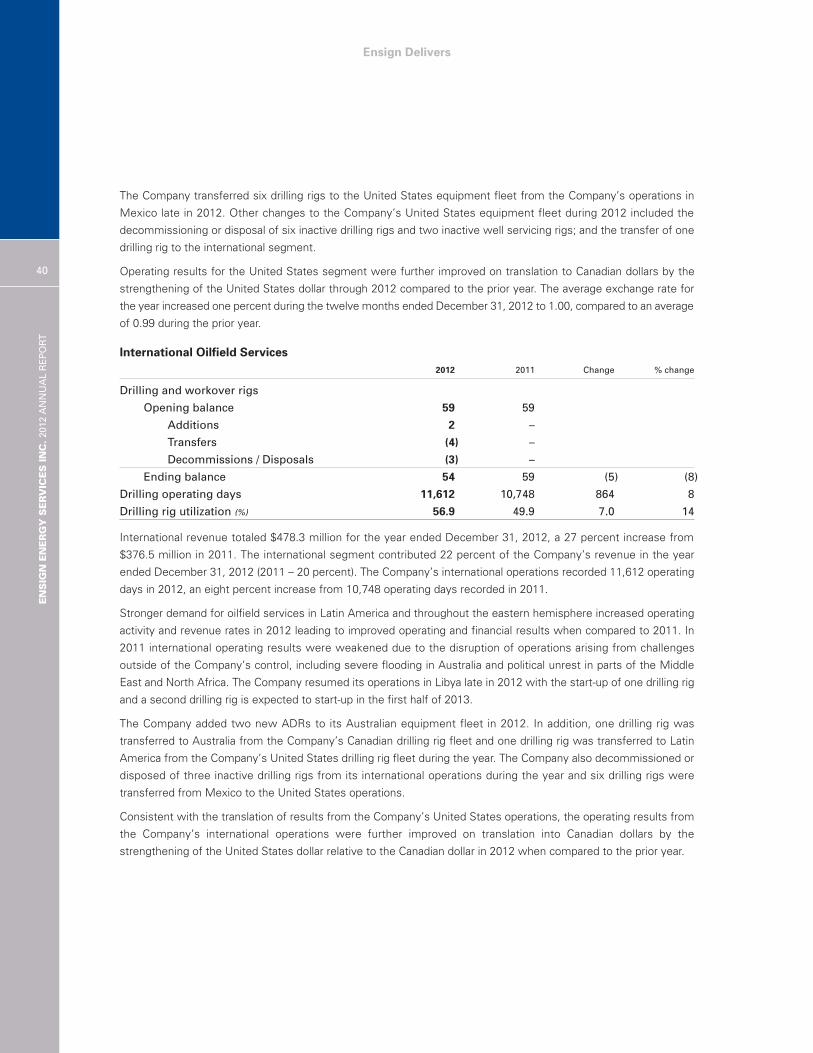
Ensign Delivers
The Company transferred six drilling rigs to the United States equipment fleet from the Company’s operations in
Mexico late in 2012. Other changes to the Company’s United States equipment fleet during 2012 included the
decommissioning or disposal of six inactive drilling rigs and two inactive well servicing rigs; and the transfer of one
drilling rig to the international segment.
Operating results for the United States segment were further improved on translation to Canadian dollars by the
strengthening of the United States dollar through 2012 compared to the prior year. The average exchange rate for
the year increased one percent during the twelve months ended December 31, 2012 to 1.00, compared to an average
of 0.99 during the prior year.
International Oilfield Services2012 2011 Change % change
Drilling and workover rigs
Opening balance 59 59
Additions 2 –
Transfers (4) –
Decommissions / Disposals (3) –
Ending balance 54 59 (5) (8)
Drilling operating days 11,612 10,748 864 8
Drilling rig utilization (%) 56.9 49.9 7.0 14
International revenue totaled $478.3 million for the year ended December 31, 2012, a 27 percent increase from
$376.5 million in 2011. The international segment contributed 22 percent of the Company’s revenue in the year
ended December 31, 2012 (2011 – 20 percent). The Company’s international operations recorded 11,612 operating
days in 2012, an eight percent increase from 10,748 operating days recorded in 2011.
Stronger demand for oilfield services in Latin America and throughout the eastern hemisphere increased operating
activity and revenue rates in 2012 leading to improved operating and financial results when compared to 2011. In
2011 international operating results were weakened due to the disruption of operations arising from challenges
outside of the Company’s control, including severe flooding in Australia and political unrest in parts of the Middle
East and North Africa. The Company resumed its operations in Libya late in 2012 with the start-up of one drilling rig
and a second drilling rig is expected to start-up in the first half of 2013.
The Company added two new ADRs to its Australian equipment fleet in 2012. In addition, one drilling rig was
transferred to Australia from the Company’s Canadian drilling rig fleet and one drilling rig was transferred to Latin
America from the Company’s United States drilling rig fleet during the year. The Company also decommissioned or
disposed of three inactive drilling rigs from its international operations during the year and six drilling rigs were
transferred from Mexico to the United States operations.
Consistent with the translation of results from the Company’s United States operations, the operating results from
the Company’s international operations were further improved on translation into Canadian dollars by the
strengthening of the United States dollar relative to the Canadian dollar in 2012 when compared to the prior year.
40
ENSIGN ENERGY SERVICES INC.2012 ANNUAL REP
ORT
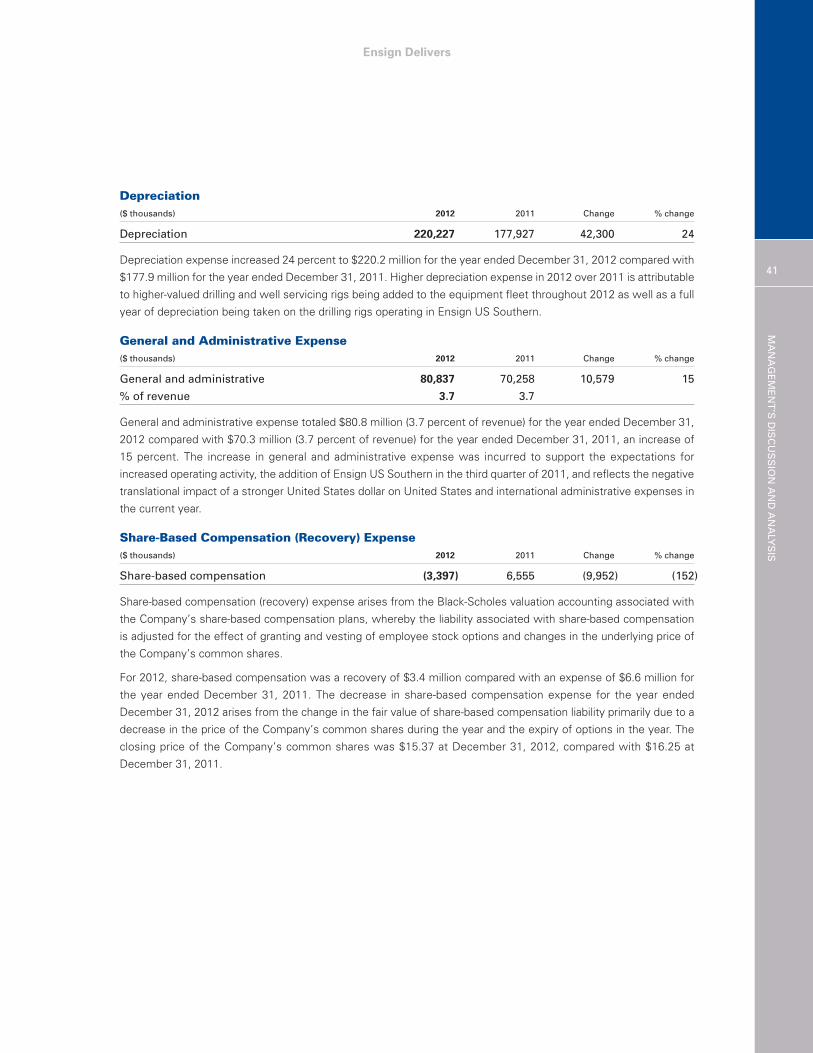
Ensign Delivers
Depreciation($ thousands) 2012 2011 Change % change
Depreciation 220,227 177,927 42,300 24
Depreciation expense increased 24 percent to $220.2 million for the year ended December 31, 2012 compared with
$177.9 million for the year ended December 31, 2011. Higher depreciation expense in 2012 over 2011 is attributable
to higher-valued drilling and well servicing rigs being added to the equipment fleet throughout 2012 as well as a full
year of depreciation being taken on the drilling rigs operating in Ensign US Southern.
General and Administrative Expense($ thousands) 2012 2011 Change % change
General and administrative 80,837 70,258 10,579 15
% of revenue 3.7 3.7
General and administrative expense totaled $80.8 million (3.7 percent of revenue) for the year ended December 31,
2012 compared with $70.3 million (3.7 percent of revenue) for the year ended December 31, 2011, an increase of
15 percent. The increase in general and administrative expense was incurred to support the expectations for
increased operating activity, the addition of Ensign US Southern in the third quarter of 2011, and reflects the negative
translational impact of a stronger United States dollar on United States and international administrative expenses in
the current year.
Share-Based Compensation (Recovery) Expense ($ thousands) 2012 2011 Change % change
Share-based compensation (3,397) 6,555 (9,952) (152)
Share-based compensation (recovery) expense arises from the Black-Scholes valuation accounting associated with
the Company’s share-based compensation plans, whereby the liability associated with share-based compensation
is adjusted for the effect of granting and vesting of employee stock options and changes in the underlying price of
the Company’s common shares.
For 2012, share-based compensation was a recovery of $3.4 million compared with an expense of $6.6 million for
the year ended December 31, 2011. The decrease in share-based compensation expense for the year ended
December 31, 2012 arises from the change in the fair value of share-based compensation liability primarily due to a
decrease in the price of the Company’s common shares during the year and the expiry of options in the year. The
closing price of the Company’s common shares was $15.37 at December 31, 2012, compared with $16.25 at
December 31, 2011.
MANAGEMENT’S DISCUSSION AND ANALY
SIS
41
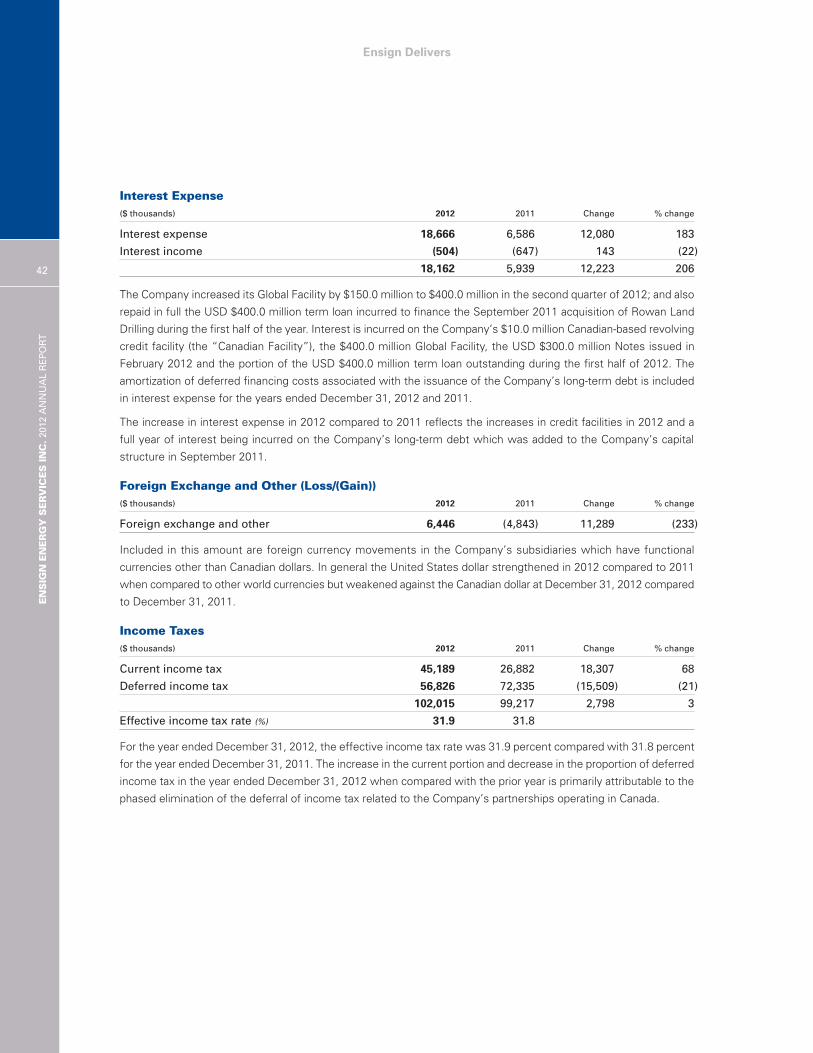
Ensign Delivers
Interest Expense($ thousands) 2012 2011 Change % change
Interest expense 18,666 6,586 12,080 183
Interest income (504) (647) 143 (22)
18,162 5,939 12,223 206
The Company increased its Global Facility by $150.0 million to $400.0 million in the second quarter of 2012; and also
repaid in full the USD $400.0 million term loan incurred to finance the September 2011 acquisition of Rowan Land
Drilling during the first half of the year. Interest is incurred on the Company’s $10.0 million Canadian-based revolving
credit facility (the “Canadian Facility”), the $400.0 million Global Facility, the USD $300.0 million Notes issued in
February 2012 and the portion of the USD $400.0 million term loan outstanding during the first half of 2012. The
amortization of deferred financing costs associated with the issuance of the Company’s long-term debt is included
in interest expense for the years ended December 31, 2012 and 2011.
The increase in interest expense in 2012 compared to 2011 reflects the increases in credit facilities in 2012 and a
full year of interest being incurred on the Company’s long-term debt which was added to the Company’s capital
structure in September 2011.
Foreign Exchange and Other (Loss/(Gain))($ thousands) 2012 2011 Change % change
Foreign exchange and other 6,446 (4,843) 11,289 (233)
Included in this amount are foreign currency movements in the Company’s subsidiaries which have functional
currencies other than Canadian dollars. In general the United States dollar strengthened in 2012 compared to 2011
when compared to other world currencies but weakened against the Canadian dollar at December 31, 2012 compared
to December 31, 2011.
Income Taxes($ thousands) 2012 2011 Change % change
Current income tax 45,189 26,882 18,307 68
Deferred income tax 56,826 72,335 (15,509) (21)
102,015 99,217 2,798 3
Effective income tax rate (%) 31.9 31.8
For the year ended December 31, 2012, the effective income tax rate was 31.9 percent compared with 31.8 percent
for the year ended December 31, 2011. The increase in the current portion and decrease in the proportion of deferred
income tax in the year ended December 31, 2012 when compared with the prior year is primarily attributable to the
phased elimination of the deferral of income tax related to the Company’s partnerships operating in Canada.
42
ENSIGN ENERGY SERVICES INC.2012 ANNUAL REP
ORT
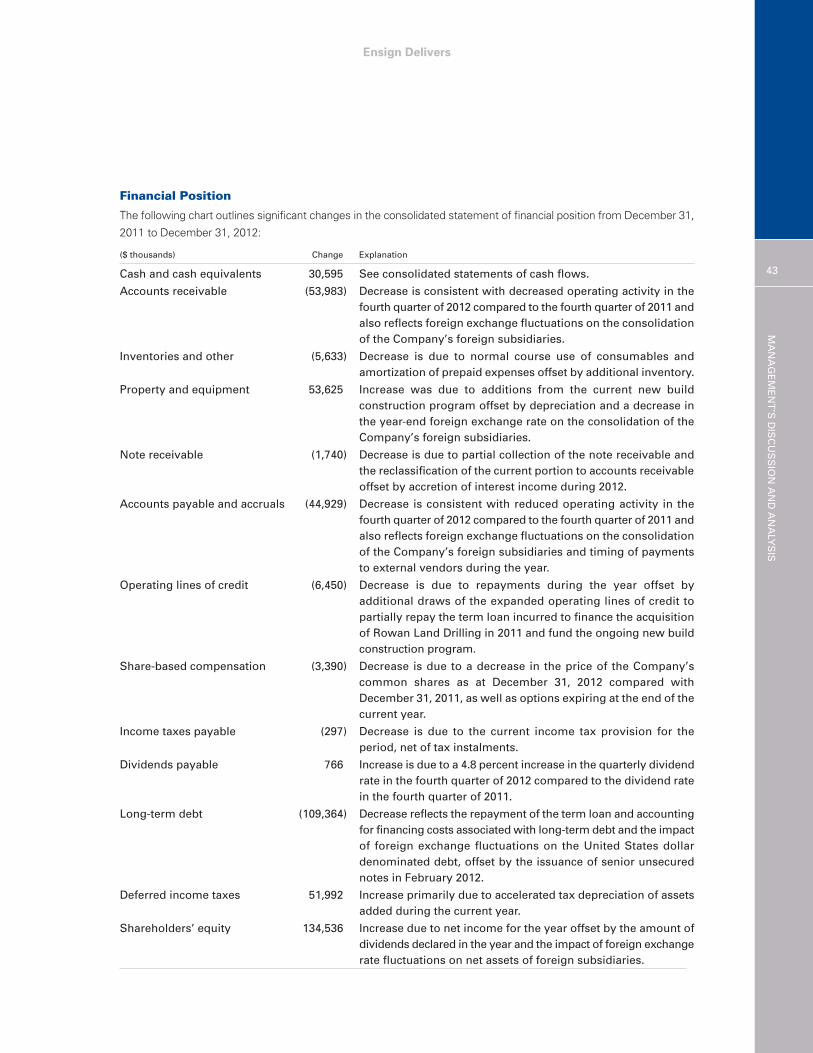
Ensign Delivers
Financial Position
The following chart outlines significant changes in the consolidated statement of financial position from December 31,
2011 to December 31, 2012:
($ thousands) Change Explanation
Cash and cash equivalents 30,595 See consolidated statements of cash flows.
Accounts receivable (53,983) Decrease is consistent with decreased operating activity in thefourth quarter of 2012 compared to the fourth quarter of 2011 andalso reflects foreign exchange fluctuations on the consolidationof the Company’s foreign subsidiaries.
Inventories and other (5,633) Decrease is due to normal course use of consumables and amortization of prepaid expenses offset by additional inventory.
Property and equipment 53,625 Increase was due to additions from the current new build construction program offset by depreciation and a decrease inthe year-end foreign exchange rate on the consolidation of theCompany’s foreign subsidiaries.
Note receivable (1,740) Decrease is due to partial collection of the note receivable andthe reclassification of the current portion to accounts receivableoffset by accretion of interest income during 2012.
Accounts payable and accruals (44,929) Decrease is consistent with reduced operating activity in thefourth quarter of 2012 compared to the fourth quarter of 2011 andalso reflects foreign exchange fluctuations on the consolidationof the Company’s foreign subsidiaries and timing of payments to external vendors during the year.
Operating lines of credit (6,450) Decrease is due to repayments during the year offset by additional draws of the expanded operating lines of credit to partially repay the term loan incurred to finance the acquisitionof Rowan Land Drilling in 2011 and fund the ongoing new build construction program.
Share-based compensation (3,390) Decrease is due to a decrease in the price of the Company’s common shares as at December 31, 2012 compared with December 31, 2011, as well as options expiring at the end of thecurrent year.
Income taxes payable (297) Decrease is due to the current income tax provision for the period, net of tax instalments.
Dividends payable 766 Increase is due to a 4.8 percent increase in the quarterly dividendrate in the fourth quarter of 2012 compared to the dividend rate in the fourth quarter of 2011.
Long-term debt (109,364) Decrease reflects the repayment of the term loan and accountingfor financing costs associated with long-term debt and the impactof foreign exchange fluctuations on the United States dollar denominated debt, offset by the issuance of senior unsecured notes in February 2012.
Deferred income taxes 51,992 Increase primarily due to accelerated tax depreciation of assetsadded during the current year.
Shareholders’ equity 134,536 Increase due to net income for the year offset by the amount ofdividends declared in the year and the impact of foreign exchangerate fluctuations on net assets of foreign subsidiaries.
MANAGEMENT’S DISCUSSION AND ANALY
SIS
43

Ensign Delivers
Funds from Operations and Working Capital($ thousands) 2012 2011 Change % change
Funds from operations 500,517 475,587 24,930 5
Funds from operations per share $3.28 $3.11 $0.17 5
Working capital 13,861 (10,233) 24,094 235
Funds from operations totaled a record $500.5 million ($3.28 per common share) for 2012, an increase of five percent
compared to $475.6 million ($3.11 per common share) generated in 2011. The increase in funds from operations in
2012 compared to 2011 is due to growth of the Company’s operations, particularly in the United States and increased
demand for international oilfield services. The significant factors that may impact the Company’s ability to generate
funds from operations in future periods are outlined in the “Risks and Uncertainties” section of this MD&A.
At December 31, 2012, the Company’s working capital totaled $13.9 million compared to negative working capital
of $10.2 million at December 31, 2011. In 2011 the Company utilized its cash resources to partially fund the
acquisition of Rowan Land Drilling. This resulted in a temporary negative working capital balance in the prior year.
The Company expects the growth in operating results, combined with current and future credit facilities, to fully
support current operating and capital requirements. Existing revolving credit facilities provide for total borrowings of
$410.0 million, of which $164.3 million was available as at December 31, 2012.
Investing Activities($ thousands) 2012 2011 Change % change
Purchase of property and equipment (306,689) (386,833) 80,144 (21)
Acquisition – (497,352) 497,352 (100)
Net change in non-cash working capital (15,040) 31,510 (46,550) (148)
Cash used in investing activities (321,729) (852,675) 530,946 (62)
The Company did not complete any significant acquisitions in 2012. Effective September 1, 2011 the Company
acquired Rowan Land Drilling for USD $510.0 million plus working capital of USD $5.5 million. Rowan Land Drilling
was comprised of 30 deeper capacity electric land drilling rigs in the southern United States. The purchase was funded
with existing cash balances and expanded credit facilities, including an unsecured term loan of USD $400.0 million.
Purchases of property and equipment for the year ended December 31, 2012 totaled $306.7 million (2011 – $386.8
million). The purchases of property and equipment relate primarily to expenditures made pursuant to the Company’s
ongoing new build program. Significant additions as a result of the new build program included:
� Completion of six new ADR® drilling rigs in Canada (three in the first quarter and one in each of the second, third
and fourth quarters);
� Completion of five new ADR® drilling rigs in the United States (two in the first quarter, one in the second quarter
and two in the third quarter);
� Construction of 12 new well servicing rigs in the United States (three in each of the first and second quarters, five
in the third quarter and one in the fourth quarter); and
� Completion of two new ADR® drilling rigs in Australia, both in the third quarter.
44
ENSIGN ENERGY SERVICES INC.2012 ANNUAL REP
ORT

Ensign Delivers
Financing Activities($ thousands) 2012 2011 Change % change
Net (decrease) increase in operating lines of credit (1,398) 73,601 (74,999) (102)
Issue of senior unsecured notes 300,000 – 300,000 –
(Repayment) issue of unsecured term loan (403,279) 390,080 (793,359) (203)
Issue of capital stock 43 – 43 –
Purchase of shares held in trust (8,579) (6,202) (2,377) 38
Deferred financing costs (2,156) (2,078) (78) 4
Dividends (65,116) (59,752) (5,364) 9
Net change in non-cash working capital 3,500 1,371 2,129 155
Cash (used in) provided by financing activities (176,985) 397,020 (574,005) (145)
The Company’s Global Facility was increased by $150.0 million during the second quarter of 2012 to a new limit of
$400.0 million. Additionally, the Company has available a $10.0 million Canadian Facility. The Global Facility is available
to the Company and certain of its wholly-owned subsidiaries, and may be drawn in Canadian, United States or
Australian dollars, up to the equivalent value of $400.0 million Canadian dollars. The amount available under the
Canadian Facility is $10.0 million or the equivalent in United States dollars.
The change in the operating lines of credit for the year ended December 31, 2012 reflects funding for the ongoing
new build program which is anticipated to deliver an additional eight new ADR® drilling rigs and six new well servicing
rigs throughout 2013. As of December 31, 2012, the operating lines of credit are primarily being used to fund the
completion of the most recent new build program and to support international operations.
In February 2012, the Company completed the private placement of USD $300.0 million of senior unsecured notes
(the “Notes”), with the proceeds from the issuance being used to repay a portion of the term loan. The Notes
consist of: USD $100.0 million in five year notes with an interest rate of 3.43 percent and a maturity date of
February 22, 2017; USD $100.0 million in seven year notes with an interest rate of 3.97 percent and a maturity
date of February 22, 2019; and USD $100.0 million in ten year notes with an interest rate of 4.54 percent and a
maturity date of February 22, 2022. The Notes rank equally with the Company’s Global Facility. Proceeds from
the issuance of the Notes in combination with internally generated cash flows and expanded credit facilities were
used to fully repay the USD $400.0 million unsecured term loan incurred in the prior year to partially finance the
acquisition of Rowan Land Drilling. Financing costs associated with the issuance of the Company’s long-term debt
are being deferred and amortized using the effective interest method.
On June 14, 2012 the Company received approval from the Toronto Stock Exchange to acquire for cancellation up to
three percent of the Company’s issued and outstanding common shares under a Normal Course Issuer Bid (the “Bid”).
The Company may purchase up to 4,596,397 common shares for cancellation. The Bid commenced on June 18, 2012
and will terminate on June 17, 2013 or such earlier time as the Bid is completed or terminated at the option of the
Company. As at December 31, 2012, no common shares have been purchased and cancelled pursuant to the Bid.
The Company previously had a Bid that commenced on June 7, 2011 and terminated on June 6, 2012, under which
no common shares were purchased and cancelled.
During the year ended December 31, 2012, the Company declared dividends of $0.4250 per common share, an
increase of nine percent over dividends of $0.3900 per common share declared in 2011. The Company had nominal
receipts from the issuance of common shares in connection with the employee stock option program in 2012
compared to nil in 2011.
MANAGEMENT’S DISCUSSION AND ANALY
SIS
45
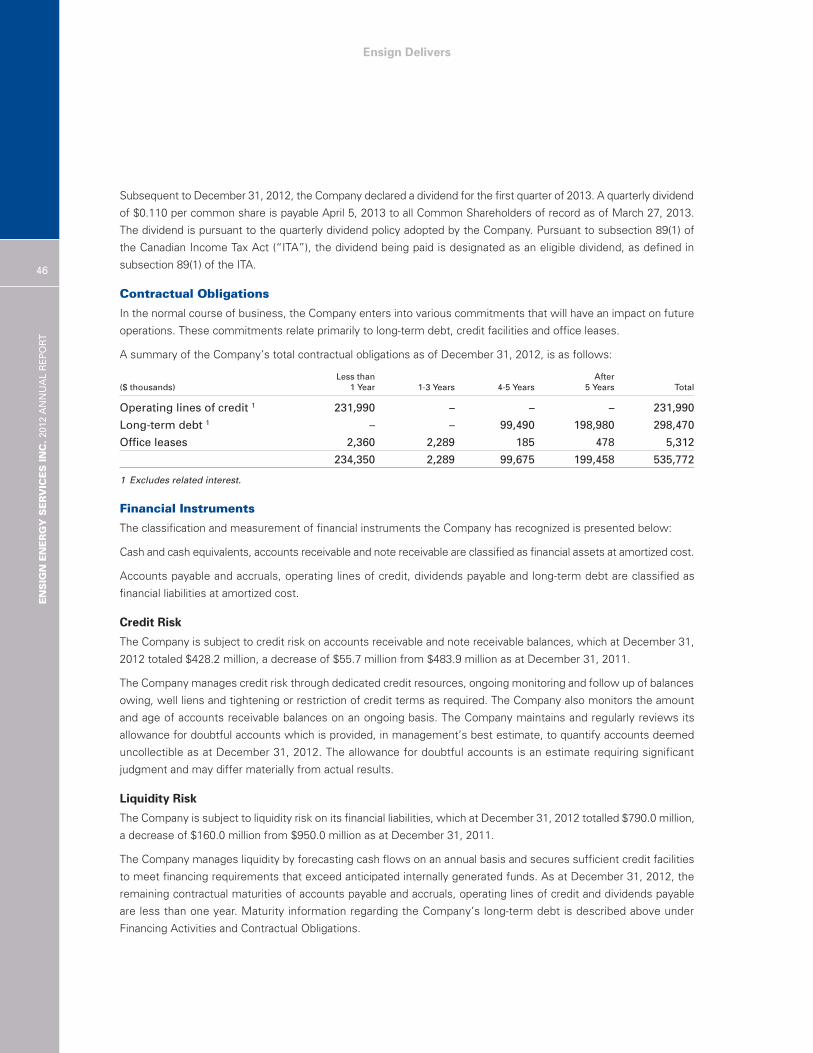
Ensign Delivers
Subsequent to December 31, 2012, the Company declared a dividend for the first quarter of 2013. A quarterly dividend
of $0.110 per common share is payable April 5, 2013 to all Common Shareholders of record as of March 27, 2013.
The dividend is pursuant to the quarterly dividend policy adopted by the Company. Pursuant to subsection 89(1) of
the Canadian Income Tax Act (“ITA”), the dividend being paid is designated as an eligible dividend, as defined in
subsection 89(1) of the ITA.
Contractual Obligations
In the normal course of business, the Company enters into various commitments that will have an impact on future
operations. These commitments relate primarily to long-term debt, credit facilities and office leases.
A summary of the Company’s total contractual obligations as of December 31, 2012, is as follows:
Less than After($ thousands) 1 Year 1-3 Years 4-5 Years 5 Years Total
Operating lines of credit 1 231,990 – – – 231,990
Long-term debt 1 – – 99,490 198,980 298,470
Office leases 2,360 2,289 185 478 5,312
234,350 2,289 99,675 199,458 535,772
1 Excludes related interest.
Financial Instruments
The classification and measurement of financial instruments the Company has recognized is presented below:
Cash and cash equivalents, accounts receivable and note receivable are classified as financial assets at amortized cost.
Accounts payable and accruals, operating lines of credit, dividends payable and long-term debt are classified as
financial liabilities at amortized cost.
Credit Risk
The Company is subject to credit risk on accounts receivable and note receivable balances, which at December 31,
2012 totaled $428.2 million, a decrease of $55.7 million from $483.9 million as at December 31, 2011.
The Company manages credit risk through dedicated credit resources, ongoing monitoring and follow up of balances
owing, well liens and tightening or restriction of credit terms as required. The Company also monitors the amount
and age of accounts receivable balances on an ongoing basis. The Company maintains and regularly reviews its
allowance for doubtful accounts which is provided, in management’s best estimate, to quantify accounts deemed
uncollectible as at December 31, 2012. The allowance for doubtful accounts is an estimate requiring significant
judgment and may differ materially from actual results.
Liquidity Risk
The Company is subject to liquidity risk on its financial liabilities, which at December 31, 2012 totalled $790.0 million,
a decrease of $160.0 million from $950.0 million as at December 31, 2011.
The Company manages liquidity by forecasting cash flows on an annual basis and secures sufficient credit facilities
to meet financing requirements that exceed anticipated internally generated funds. As at December 31, 2012, the
remaining contractual maturities of accounts payable and accruals, operating lines of credit and dividends payable
are less than one year. Maturity information regarding the Company’s long-term debt is described above under
Financing Activities and Contractual Obligations.
46
ENSIGN ENERGY SERVICES INC.2012 ANNUAL REP
ORT
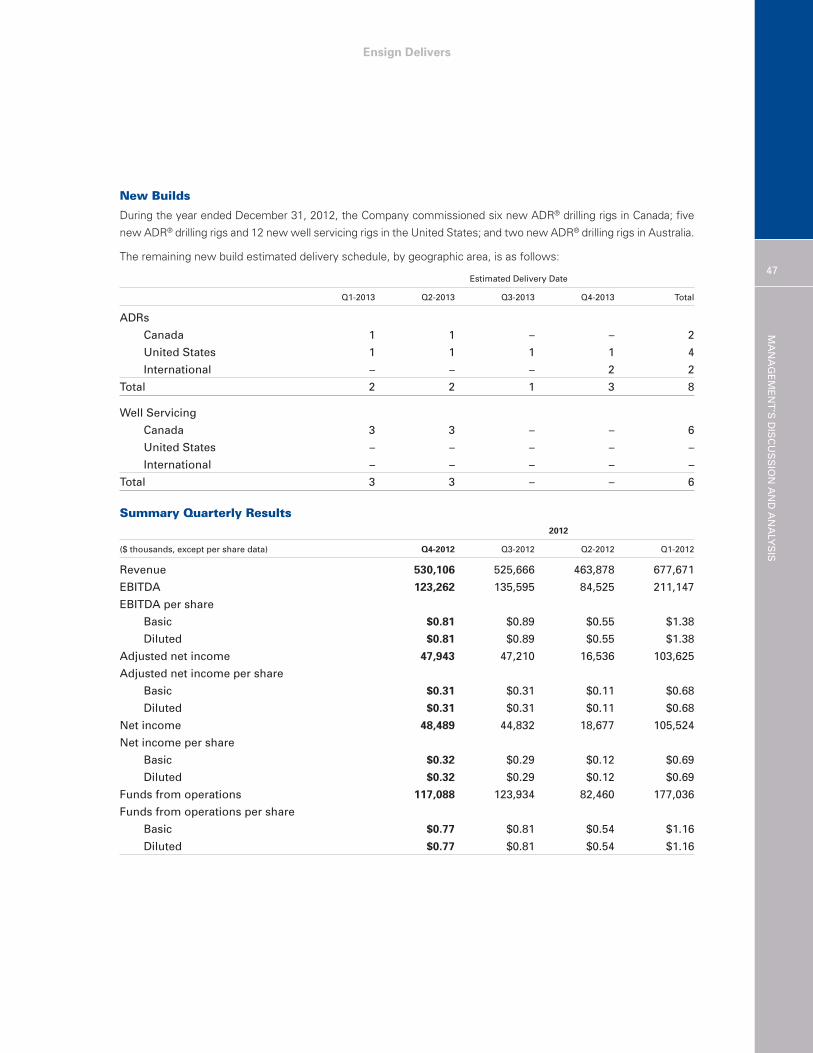
Ensign Delivers
New Builds
During the year ended December 31, 2012, the Company commissioned six new ADR® drilling rigs in Canada; five
new ADR® drilling rigs and 12 new well servicing rigs in the United States; and two new ADR® drilling rigs in Australia.
The remaining new build estimated delivery schedule, by geographic area, is as follows:
Estimated Delivery Date
Q1-2013 Q2-2013 Q3-2013 Q4-2013 Total
ADRs
Canada 1 1 – – 2
United States 1 1 1 1 4
International – – – 2 2
Total 2 2 1 3 8
Well Servicing
Canada 3 3 – – 6
United States – – – – –
International – – – – –
Total 3 3 – – 6
Summary Quarterly Results2012
($ thousands, except per share data) Q4-2012 Q3-2012 Q2-2012 Q1-2012
Revenue 530,106 525,666 463,878 677,671
EBITDA 123,262 135,595 84,525 211,147
EBITDA per share
Basic $0.81 $0.89 $0.55 $1.38
Diluted $0.81 $0.89 $0.55 $1.38
Adjusted net income 47,943 47,210 16,536 103,625
Adjusted net income per share
Basic $0.31 $0.31 $0.11 $0.68
Diluted $0.31 $0.31 $0.11 $0.68
Net income 48,489 44,832 18,677 105,524
Net income per share
Basic $0.32 $0.29 $0.12 $0.69
Diluted $0.32 $0.29 $0.12 $0.69
Funds from operations 117,088 123,934 82,460 177,036
Funds from operations per share
Basic $0.77 $0.81 $0.54 $1.16
Diluted $0.77 $0.81 $0.54 $1.16
MANAGEMENT’S DISCUSSION AND ANALY
SIS
47

Ensign Delivers
2011
Q4-2011 Q3-2011 Q2-2011 Q1-2011
Revenue 577,967 475,749 334,445 502,211
EBITDA 155,167 111,458 65,143 170,263
EBITDA per share
Basic $1.02 $0.73 $0.43 $1.11
Diluted $1.01 $0.73 $0.43 $1.11
Adjusted net income 57,926 52,087 18,941 87,700
Adjusted net income per share
Basic $0.38 $0.34 $0.12 $0.57
Diluted $0.38 $0.34 $0.12 $0.57
Net income 52,640 63,989 16,073 79,691
Net income per share
Basic $0.34 $0.42 $0.11 $0.52
Diluted $0.34 $0.42 $0.11 $0.52
Funds from operations 140,465 114,186 66,395 154,541
Funds from operations per share
Basic $0.92 $0.75 $0.43 $1.01
Diluted $0.92 $0.74 $0.43 $1.01
The seasonal operating environment in Canada impacts the Company’s quarterly results. Financial and operating
results for the Company’s Canadian oilfield services division are generally strongest during the first and fourth quarters
when the Company’s customers conduct the majority of their drilling programs. Utilization rates typically decline
during the second quarter as spring break-up weather conditions hinder mobility of the Company’s equipment. As
the Company expands its operations in the United States and internationally, the seasonal effects on results of
operating in Canada will be mitigated.
The comparability of the Company’s financial results on a quarter-over-quarter basis is impacted by the Black-Scholes
valuation accounting associated with the Company’s share-based compensation plans, which can fluctuate
significantly from quarter to quarter as a result of changes in the valuation inputs. Management utilizes EBITDA and
Adjusted net income to assess results from the Company’s principal business activities prior to the impact of
share-based compensation.
An assessment or comparison of the Company’s quarterly results at any given time requires consideration of crude
oil and natural gas commodity prices. Commodity prices ultimately drive the level of exploration and development
activities carried out by the Company’s customers and the resultant demand for the oilfield services provided by the
Company. In the recent past, North American markets have had greater exposure to natural gas prices while the
international market has been more heavily weighted to crude oil projects.
The variability noted in the Company’s quarterly results for 2012 reflect the softening of demand for oilfield services
in North America, particularly in Canada. Reacting to weak natural gas prices from the continued over supply of the
commodity and continued concerns over the health of the global economy that ultimately determines the demands
for energy, North American customers delayed or reduced their drilling programs in the latter part of the year.
48
ENSIGN ENERGY SERVICES INC.2012 ANNUAL REP
ORT
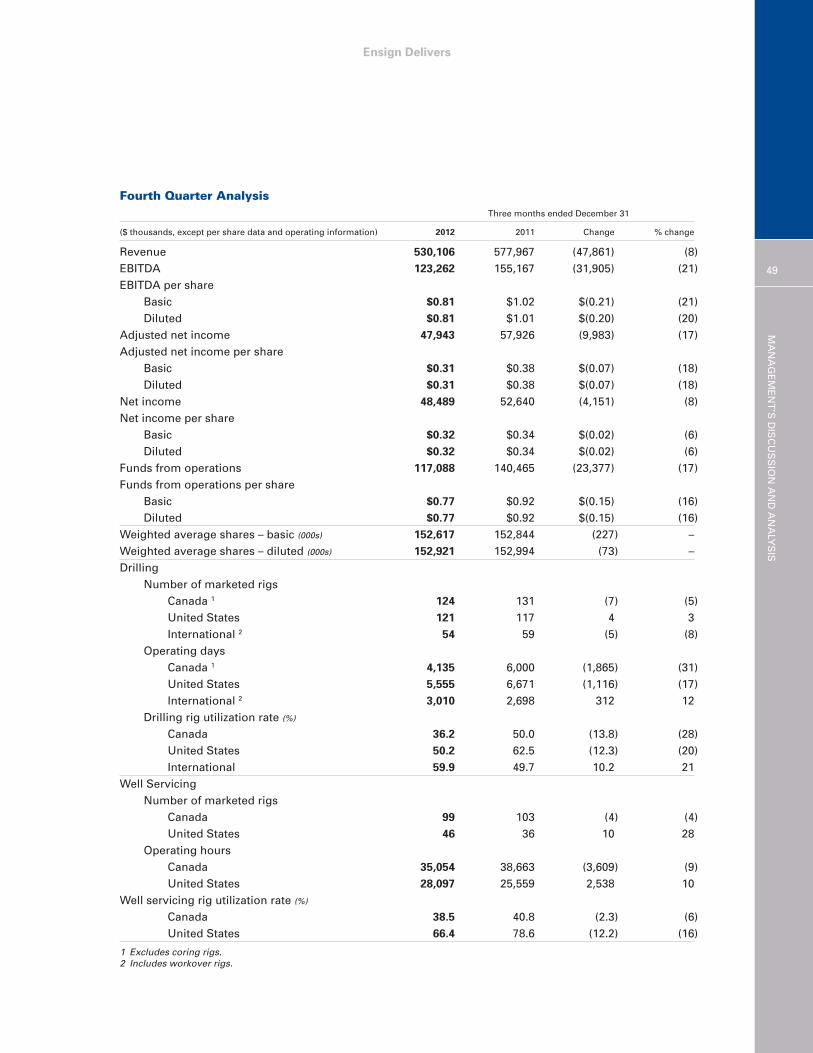
Ensign Delivers
Fourth Quarter AnalysisThree months ended December 31
($ thousands, except per share data and operating information) 2012 2011 Change % change
Revenue 530,106 577,967 (47,861) (8)EBITDA 123,262 155,167 (31,905) (21)EBITDA per share
Basic $0.81 $1.02 $(0.21) (21)Diluted $0.81 $1.01 $(0.20) (20)
Adjusted net income 47,943 57,926 (9,983) (17)Adjusted net income per share
Basic $0.31 $0.38 $(0.07) (18)Diluted $0.31 $0.38 $(0.07) (18)
Net income 48,489 52,640 (4,151) (8)Net income per share
Basic $0.32 $0.34 $(0.02) (6)Diluted $0.32 $0.34 $(0.02) (6)
Funds from operations 117,088 140,465 (23,377) (17)Funds from operations per share
Basic $0.77 $0.92 $(0.15) (16)Diluted $0.77 $0.92 $(0.15) (16)
Weighted average shares – basic (000s) 152,617 152,844 (227) –Weighted average shares – diluted (000s) 152,921 152,994 (73) –Drilling
Number of marketed rigsCanada 1 124 131 (7) (5)United States 121 117 4 3International 2 54 59 (5) (8)
Operating daysCanada 1 4,135 6,000 (1,865) (31)United States 5,555 6,671 (1,116) (17)International 2 3,010 2,698 312 12
Drilling rig utilization rate (%)Canada 36.2 50.0 (13.8) (28)United States 50.2 62.5 (12.3) (20)International 59.9 49.7 10.2 21
Well ServicingNumber of marketed rigs
Canada 99 103 (4) (4)United States 46 36 10 28
Operating hoursCanada 35,054 38,663 (3,609) (9)United States 28,097 25,559 2,538 10
Well servicing rig utilization rate (%)Canada 38.5 40.8 (2.3) (6)United States 66.4 78.6 (12.2) (16)
1 Excludes coring rigs.2 Includes workover rigs.
MANAGEMENT’S DISCUSSION AND ANALY
SIS
49
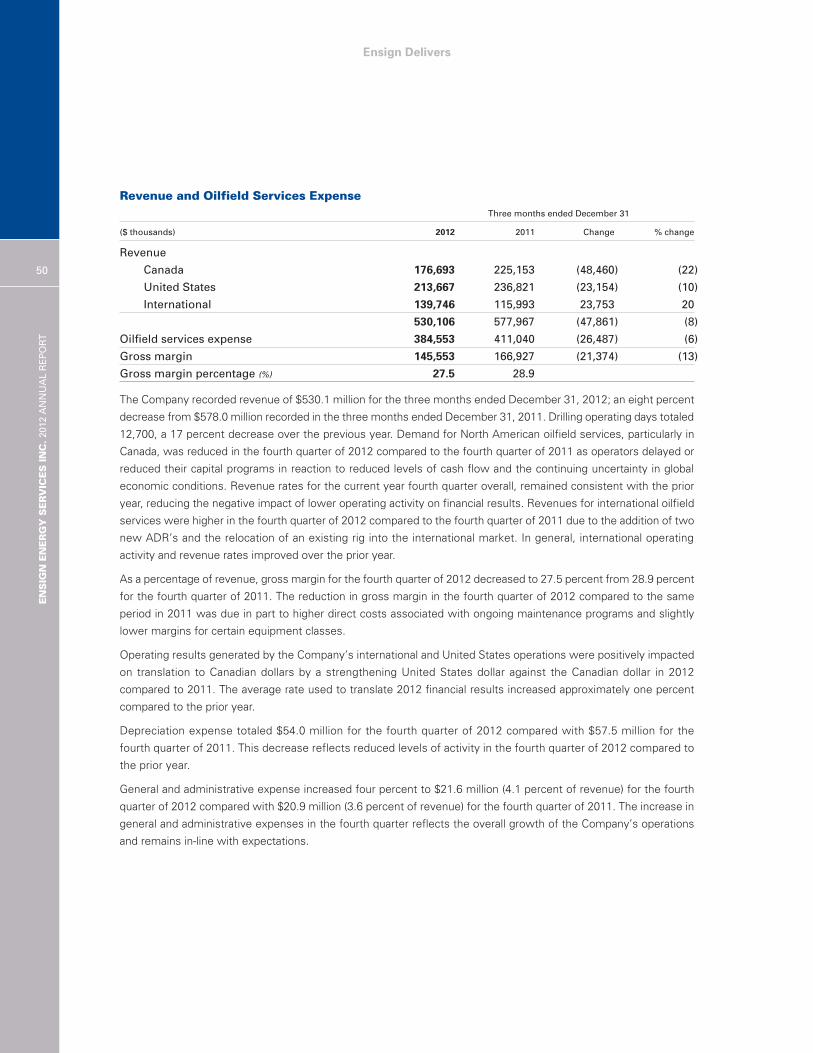
Ensign Delivers
Revenue and Oilfield Services ExpenseThree months ended December 31
($ thousands) 2012 2011 Change % change
Revenue
Canada 176,693 225,153 (48,460) (22)
United States 213,667 236,821 (23,154) (10)
International 139,746 115,993 23,753 20
530,106 577,967 (47,861) (8)
Oilfield services expense 384,553 411,040 (26,487) (6)
Gross margin 145,553 166,927 (21,374) (13)
Gross margin percentage (%) 27.5 28.9
The Company recorded revenue of $530.1 million for the three months ended December 31, 2012; an eight percent
decrease from $578.0 million recorded in the three months ended December 31, 2011. Drilling operating days totaled
12,700, a 17 percent decrease over the previous year. Demand for North American oilfield services, particularly in
Canada, was reduced in the fourth quarter of 2012 compared to the fourth quarter of 2011 as operators delayed or
reduced their capital programs in reaction to reduced levels of cash flow and the continuing uncertainty in global
economic conditions. Revenue rates for the current year fourth quarter overall, remained consistent with the prior
year, reducing the negative impact of lower operating activity on financial results. Revenues for international oilfield
services were higher in the fourth quarter of 2012 compared to the fourth quarter of 2011 due to the addition of two
new ADR’s and the relocation of an existing rig into the international market. In general, international operating
activity and revenue rates improved over the prior year.
As a percentage of revenue, gross margin for the fourth quarter of 2012 decreased to 27.5 percent from 28.9 percent
for the fourth quarter of 2011. The reduction in gross margin in the fourth quarter of 2012 compared to the same
period in 2011 was due in part to higher direct costs associated with ongoing maintenance programs and slightly
lower margins for certain equipment classes.
Operating results generated by the Company’s international and United States operations were positively impacted
on translation to Canadian dollars by a strengthening United States dollar against the Canadian dollar in 2012
compared to 2011. The average rate used to translate 2012 financial results increased approximately one percent
compared to the prior year.
Depreciation expense totaled $54.0 million for the fourth quarter of 2012 compared with $57.5 million for the
fourth quarter of 2011. This decrease reflects reduced levels of activity in the fourth quarter of 2012 compared to
the prior year.
General and administrative expense increased four percent to $21.6 million (4.1 percent of revenue) for the fourth
quarter of 2012 compared with $20.9 million (3.6 percent of revenue) for the fourth quarter of 2011. The increase in
general and administrative expenses in the fourth quarter reflects the overall growth of the Company’s operations
and remains in-line with expectations.
50
ENSIGN ENERGY SERVICES INC.2012 ANNUAL REP
ORT
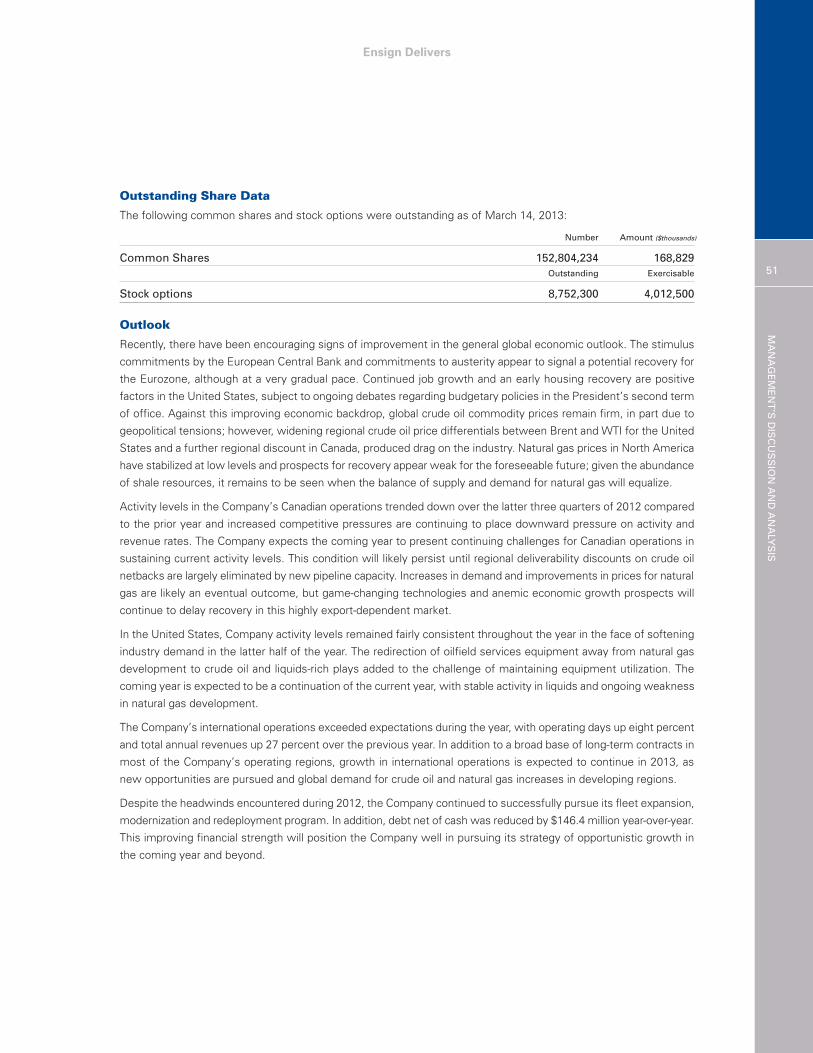
Ensign Delivers
Outstanding Share Data
The following common shares and stock options were outstanding as of March 14, 2013:
Number Amount ($thousands)
Common Shares 152,804,234 168,829Outstanding Exercisable
Stock options 8,752,300 4,012,500
Outlook
Recently, there have been encouraging signs of improvement in the general global economic outlook. The stimulus
commitments by the European Central Bank and commitments to austerity appear to signal a potential recovery for
the Eurozone, although at a very gradual pace. Continued job growth and an early housing recovery are positive
factors in the United States, subject to ongoing debates regarding budgetary policies in the President’s second term
of office. Against this improving economic backdrop, global crude oil commodity prices remain firm, in part due to
geopolitical tensions; however, widening regional crude oil price differentials between Brent and WTI for the United
States and a further regional discount in Canada, produced drag on the industry. Natural gas prices in North America
have stabilized at low levels and prospects for recovery appear weak for the foreseeable future; given the abundance
of shale resources, it remains to be seen when the balance of supply and demand for natural gas will equalize.
Activity levels in the Company’s Canadian operations trended down over the latter three quarters of 2012 compared
to the prior year and increased competitive pressures are continuing to place downward pressure on activity and
revenue rates. The Company expects the coming year to present continuing challenges for Canadian operations in
sustaining current activity levels. This condition will likely persist until regional deliverability discounts on crude oil
netbacks are largely eliminated by new pipeline capacity. Increases in demand and improvements in prices for natural
gas are likely an eventual outcome, but game-changing technologies and anemic economic growth prospects will
continue to delay recovery in this highly export-dependent market.
In the United States, Company activity levels remained fairly consistent throughout the year in the face of softening
industry demand in the latter half of the year. The redirection of oilfield services equipment away from natural gas
development to crude oil and liquids-rich plays added to the challenge of maintaining equipment utilization. The
coming year is expected to be a continuation of the current year, with stable activity in liquids and ongoing weakness
in natural gas development.
The Company’s international operations exceeded expectations during the year, with operating days up eight percent
and total annual revenues up 27 percent over the previous year. In addition to a broad base of long-term contracts in
most of the Company’s operating regions, growth in international operations is expected to continue in 2013, as
new opportunities are pursued and global demand for crude oil and natural gas increases in developing regions.
Despite the headwinds encountered during 2012, the Company continued to successfully pursue its fleet expansion,
modernization and redeployment program. In addition, debt net of cash was reduced by $146.4 million year-over-year.
This improving financial strength will position the Company well in pursuing its strategy of opportunistic growth in
the coming year and beyond.
MANAGEMENT’S DISCUSSION AND ANALY
SIS
51

Ensign Delivers
Critical Accounting Estimates
Management is required to make judgments, assumptions and estimates in applying its accounting policies and
practices, which have a significant impact on the financial results of the Company. These significant accounting
policies involve critical accounting estimates due to complex judgments and assumptions. These estimates,
judgments and assumptions are based on the circumstances that exist at the reporting date and may affect the
reported amounts of income and expenses during the reporting periods and the carrying amounts of assets, liabilities,
accruals, provisions, contingent liabilities, other financial obligations, as well as the determination of fair values.
Property and Equipment
The estimated useful life, residual value and depreciation methods selected are the Company’s best estimate of
such and are based on industry practice, historical experience and other applicable factors. These assumptions and
estimates are subject to change as more experience is obtained or as general market conditions change, both of
which could impact the operations of the Company’s property and equipment.
Impairments
For impairment testing, the assessment of facts and circumstances is a subjective process that often involves a
number of estimates and is subject to interpretation. An impairment is recognized if the carrying value exceeds the
recoverable amount for a cash-generating unit (“CGU”). Property and equipment are aggregated into CGUs based
on their ability to generate largely independent cash flows. The testing of assets or CGUs for impairment, as well as
the assessment of potential impairment reversals, requires that we estimate an asset’s or CGU’s recoverable
amount. The estimate of a recoverable amount requires a number of assumptions and estimates, including expected
market prices, market supply and demand, margins and discount rates. These assumptions and estimates are subject
to change as new information becomes available and changes in any of the assumptions could result in an impairment
of an asset’s or CGU’s carrying value.
Share-based Compensation
Measurement inputs include share price on measurement date, exercise price, expected volatility, expected life,
expected dividends and the risk-free interest rate. Significant estimates and assumptions are used in determining
the expected volatility based on weighted average historic volatility adjusted for changes expected due to publicly
available information, weighted average expected life and expected forfeitures, based on historical experience and
general option holder behavior. Changes to the input assumptions could have a significant impact on the share-based
compensation liability.
Income Taxes
The Company follows the liability method of accounting for income taxes. Under this method, deferred income taxes
are recorded for the effect of any temporary difference between the accounting and income tax basis of an asset or
liability, using the substantively enacted income tax rates. Current income taxes for the current and prior periods are
measured at the amount expected to be recoverable from or payable to the taxation authorities based on the income
tax rates enacted or substantively enacted at the end of the reporting period. The deferred income tax assets and
liabilities are adjusted to reflect changes in enacted or substantively enacted income tax rates that are expected to
apply, with the corresponding adjustment recognized in net income or in shareholders’ equity depending on the item
to which the adjustment relates.
52
ENSIGN ENERGY SERVICES INC.2012 ANNUAL REP
ORT
Ensign Delivers
Tax interpretations, regulations and legislation in the various jurisdictions in which the Company and its subsidiaries
operate are subject to change. As such, income taxes are subject to measurement uncertainty and the
interpretations can impact net income through the income tax expense arising from the changes in deferred income
tax assets or liabilities.
Allowance for Doubtful Accounts
The Company is subject to credit risk on accounts receivable balances and assesses the recoverability of accounts
receivable balances on an ongoing basis. The Company establishes an allowance for estimated losses for uncollectible
accounts as circumstances warrant. The allowance is determined based on customer credit-worthiness, current
economic trends and past experience. Assessing accounts receivable balances for recoverability involves significant
judgment and uncertainty, including estimates of future events. Changes in circumstances underlying these estimates
may result in adjustments to the allowance for doubtful accounts in future periods.
Recent Accounting Pronouncements
A number of new standards, interpretations and amendments to existing standards are not yet effective for the year
ended December 31, 2012 and have not yet been adopted by the Company. The following is a brief summary of the
new standards that may be relevant to the Company, which are effective for annual periods beginning on or after
January 1, 2013 with early adoption permitted, unless otherwise noted. The Company does not plan to adopt these
standards early.
IFRS 10 – Consolidated Financial Statements (“IFRS 10”)
IFRS 10 requires an entity to consolidate an investee when it is exposed, or has rights, to variable returns from its
involvement with the investee and has the ability to affect those returns through its influence over the investee.
Under existing IFRS, consolidation is required when an entity has the power to govern the financial and operating
policies of an entity so as to obtain benefits from its activities. IFRS 10 replaces SIC-12 – Consolidation – Special
Purpose Entities and parts of IAS 27 – Consolidated and Separate Financial Statements. The Company performed a
review of its investees and does not believe adoption of this standard will have a material impact on its consolidated
financial statements.
IFRS 12 – Disclosure of Interests in Other Entities (“IFRS 12”)
IFRS 12 establishes disclosure requirements for interests in other entities, such as joint arrangements, associates,
special purpose vehicles and off balance sheet vehicles. The standard carries forward existing disclosures and also
introduces significant additional disclosure requirements that address the nature of and risks associated with, an
entity’s interests in other entities. The Company is currently assessing the disclosure requirements under IFRS 12
in comparison with existing disclosures.
IFRS 13 – Fair Value Measurement (“IFRS 13”)
IFRS 13 is a comprehensive standard for fair value measurement and disclosure requirements for use across all IFRS
standards. The new standard clarifies that fair value is the price that would be received to sell an asset, or paid to
transfer a liability in an orderly transaction between market participants, at the measurement date. It also establishes
disclosures about fair value measurement. Under existing IFRS, guidance on measuring and disclosing fair value is
dispersed among the specific standards requiring fair value measurements and in many cases does not reflect a
clear measurement basis or consistent disclosures. The Company is currently finalizing its assessment of the impact
of adopting IFRS 13 on its consolidated financial statements but does not expect the adoption of this standard to
have a material impact on its consolidated financial statements.
MANAGEMENT’S DISCUSSION AND ANALY
SIS
53
Ensign Delivers
IFRS 7 – Financial Instruments: Disclosure (“IFRS 7”)
Amendments to IFRS 7 require the disclosure of information that will enable users of the Company’s consolidated
financial statements to evaluate the effect, or potential effect, of offsetting financial assets and financial liabilities,
to the Company’s consolidated statement of financial position. The Company is currently finalizing its assessment
of the impact of adopting IFRS 7 on its consolidated financial statements but does not expect the adoption of
amendments to IFRS 7 to have a material impact on its consolidated financial statements.
IAS 32 – Financial Instruments: Presentation (“IAS 32”)
The amendments to IAS 32 clarify the criteria that should be considered in determining whether an entity has a
legally enforceable right to set off in respect of its financial instruments. Amendments to IAS 32 are effective for
annual periods beginning on or after January 1, 2014 with early adoption permitted. The Company is currently
finalizing its assessment of the impact of adopting IAS 32 on its consolidated financial statements but does not
expect the adoption of amendments to IAS 32 to have a material impact on its consolidated financial statements.
Disclosure Controls and Procedures and Internal Controls over Financial Reporting
The Company’s management, including the President and Chief Operating Officer, and Executive Vice President
Finance and Chief Financial Officer, has reviewed and evaluated the design and operation of both the Company’s
disclosure controls and procedures and the Company’s internal controls over financial reporting (as defined in National
Instrument 52-109 issued by the Canadian securities regulators) as of December 31, 2012.
Management has concluded that, as at December 31, 2012, the Company’s disclosure controls and procedures
were effective and management has also concluded that, as at December 31, 2012, the Company’s internal controls
over financial reporting were effective.
There have been no changes in the Company’s internal controls over financial reporting that occurred during the
period beginning on October 1, 2012 and ended on December 31, 2012 that has materially affected, or is reasonably
likely to materially affect, the Company’s internal controls over financial reporting.
Risks and Uncertainties
Crude Oil and Natural Gas Prices
The most significant factors affecting the business of the Company are crude oil and natural gas commodity prices.
Commodity price levels affect the capital programs of energy exploration and production companies, as the price
they receive for the crude oil and natural gas they produce has a direct impact on the cash flow available to them
and subsequent demand for oilfield services provided by the Company. Crude oil and natural gas prices have been
volatile in recent years, and may continue to be so as weather conditions, government regulations, political and
economic environments, pipeline capacity, storage levels and other factors outside of the Company’s control continue
to influence commodity prices. Demand for the Company’s services in the future will continue to be influenced by
commodity prices and the resultant impact on the cash flow of its customers, and may not be reflective of historical
activity levels.
Competition and Industry Conditions
The oilfield services industry is, and will continue to be, highly competitive. Contract drilling companies compete
primarily on a regional basis and competition may vary significantly from region to region at any particular time. Most
drilling and workover contracts are awarded on the basis of competitive bids, which result in price competition. Many
drilling, workover and well servicing rigs can be moved from one region to another in response to changes in levels
of activity, which can result in an oversupply of rigs in an area. In many markets in which the Company operates, the
54
ENSIGN ENERGY SERVICES INC.2012 ANNUAL REP
ORT
Ensign Delivers
supply of rigs exceeds the demand for rigs, resulting in further price competition. Certain competitors are present in
more than one of the regions in which the Company operates, although no one competitor operates in all of these
areas. In Canada, the Company competes with several firms of varying size. In the United States there are many
competitors with national, regional or local rig operations. Internationally, there are several competitors at each
location where the Company operates and some of those international competitors may be better positioned in
certain markets, allowing them to compete more effectively. There is no assurance that the Company will be able
to continue to compete successfully or that the level of competition and pressure on pricing will not affect the
Company’s margins.
Foreign Operations
The Company provides oilfield services throughout much of North America and internationally in a number of
onshore drilling areas. The Canadian and United States regulatory regimes are stable and, in general, supportive of
energy industry activity. Internationally, the Company’s operations are subject to regulations in various jurisdictions
and support for the oil and natural gas industry can vary in these jurisdictions. In addition, political factors in certain
foreign jurisdictions may be less supportive of stable government regimes and the potential for civil unrest can be
disruptive to the Company’s operations. In general, the Company negotiates long-term service contracts for drilling
services in international areas and these contracts usually include early termination clauses and other clauses for
the Company’s protection.
Operating Risks and Insurance
The Company’s operations are subject to risks inherent in the oilfield services industry. Where available, the Company
carries insurance to cover the risk to its equipment and people, and each year the Company reviews the level of
insurance for adequacy. Although the Company believes its level of insurance coverage to be adequate, there can
be no assurance that the level of insurance carried by the Company will be sufficient to cover all potential liabilities.
Foreign Exchange Exposure
The Company’s consolidated financial statements are presented in Canadian dollars. Operations in countries outside
of Canada result in foreign exchange risk to the Company. The principal foreign exchange risk relates to the conversion
of United States dollar denominated activity to Canadian dollars. The Canada/United States dollar exchange rate at
December 31, 2012, was approximately 0.99 compared with 1.02 at December 31, 2011 and 0.99 at December 31,
2010. Fluctuations in future exchange rates will impact the Canadian dollar equivalent of the results reported by
foreign subsidiaries.
Changes in Laws and Regulations
The Company and its customers are subject to numerous laws and regulations governing its operations and the
exploration and development of crude oil and natural gas, including environmental regulations. Existing and expected
environmental legislation and regulations may increase the costs associated with providing oilfield services, as the
Company may be required to incur additional operating costs or capital expenditures in order to comply with any
new regulations. The costs of complying with increased environmental and other regulatory changes in the future,
such as royalty regime changes, may also have an adverse effect on the cash flows of the Company’s customers
and may dampen demand for oilfield services provided by the Company.
MANAGEMENT’S DISCUSSION AND ANALY
SIS
55
Ensign Delivers
Litigation and Legal Proceedings
From time to time, the Company is subject to litigation and legal proceedings which may include employment, tort,
commercial, and class action suits. Amounts claimed in such suits or actions may be material and accordingly decisions
against the Company could have an adverse effect on the Company’s financial condition or results of operations.
Access to Credit Facilities and Debt Capital Markets
The Company and its customers require reasonable access to credit facilities and debt capital markets as an important
source of liquidity. Global economic events, outside the control of the Company or its customers, may restrict or
reduce the access to credit facilities and debt capital markets. Tightening credit markets may reduce the funds
available to the Company’s customers for paying accounts receivable balances and may also result in reduced levels
of demand for the Company’s services. Additionally, the Company relies on access to credit facilities, along with its
reserves of cash and cash flow from operating activities, to meet its obligations and finance operating activities. The
Company believes it has adequate bank credit facilities to provide liquidity.
New Build Schedule Delays
As customer demand for oilfield service equipment increases, from time to time, the Company may undertake to
increase its fleet through upgrades to rigs or through new construction. These projects are subject to risks of delay
inherent in any large construction project resulting from numerous factors, including but not limited to shortages of
equipment, materials or skilled labor; and unscheduled delays in the delivery of ordered materials and equipment.
Project delays may affect the Company’s ability to meet contractual commitments as well as the timely
commencement of operations of the Company’s drilling rigs following delivery.
Workforce
The Company’s operations are dependent on attracting, developing and maintaining a skilled workforce. During
periods of peak activity levels, the Company may be faced with a lack of personnel to operate its equipment. The
Company is also faced with the challenge of retaining its most experienced employees during periods of low
utilization, while maintaining a cost structure that varies with activity levels. To mitigate these risks, the Company
has developed an employee recruitment and training program, and continues to focus on creating a work environment
that is safe for its employees.
Seasonality and Weather
The Company’s Canadian oilfield services operations are impacted by weather conditions that hinder the Company’s
ability to move heavy equipment. The timing and duration of “spring break-up”, during which time the Company is
prohibited from moving heavy equipment on secondary roads, restricts movement of equipment in and out of certain
areas, thereby negatively impacting equipment utilization levels. Further, the Company’s activities in certain areas in
northern Canada are restricted to winter months when the ground is frozen solid enough to support the Company’s
equipment. This seasonality is reflected in the Company’s operating results, as rig utilization is normally at its lowest
during the second and third quarters of the year. The Company continues to mitigate the impact of Canadian weather
conditions through expansion into markets not subject to the same seasonality and by working with customers in
planning the timing of their drilling programs. In addition, volatility in the weather across all areas of the Company’s
operations can create additional risk and unpredictability in rig utilization rates and operating results.
56
ENSIGN ENERGY SERVICES INC.2012 ANNUAL REP
ORT
Ensign Delivers
Reliance on Key Management Personnel
The success and growth of the Company is dependent upon its key management personnel. The loss of services of
such persons could have a material adverse effect on the business and operations of the Company. No assurance
can be provided that the Company will be able to retain key management members.
Technology
As a result of growing technical demands of resource plays, the Company’s ability to meet customer demands is
dependent on continuous improvement to the performance and efficiency of existing oilfield services equipment.
There can be no assurance that competitors will not achieve technological advantages over the Company. MANAGEMENT’S DISCUSSION AND ANALY
SIS
57
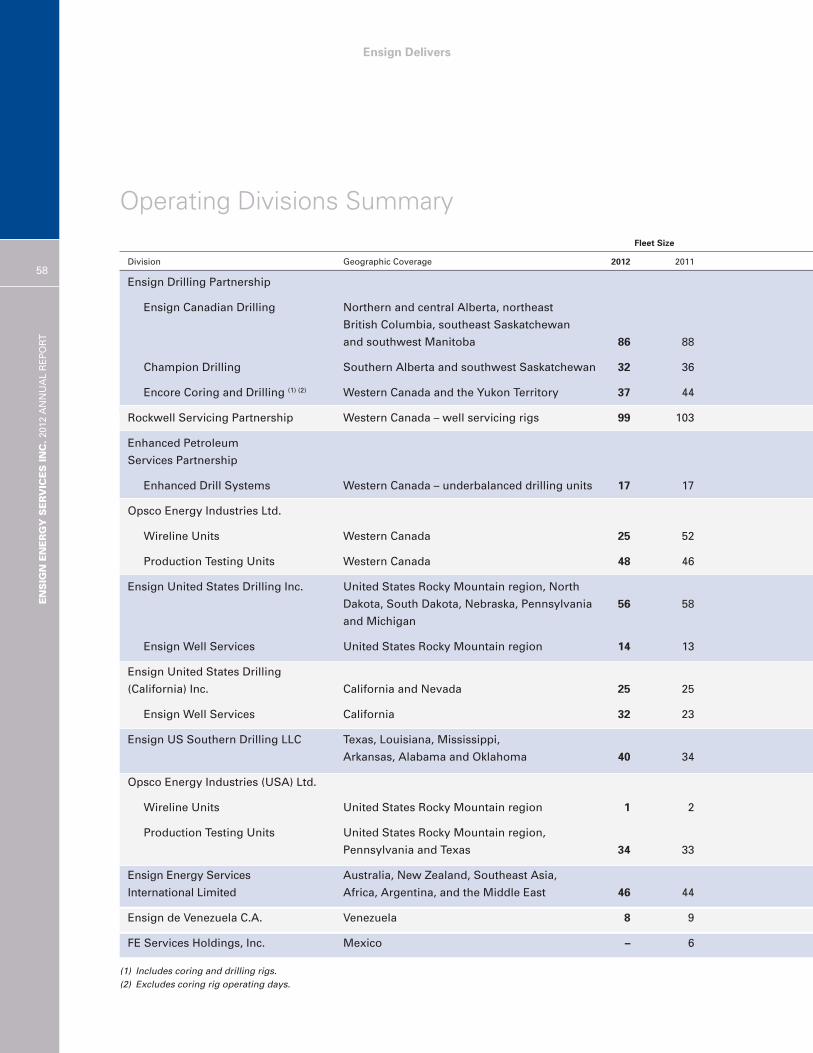
Fleet Size
Division Geographic Coverage 2012 2011
Ensign Drilling Partnership
Ensign Canadian Drilling Northern and central Alberta, northeast
British Columbia, southeast Saskatchewan
and southwest Manitoba 86 88
Champion Drilling Southern Alberta and southwest Saskatchewan 32 36
Encore Coring and Drilling (1) (2) Western Canada and the Yukon Territory 37 44
Rockwell Servicing Partnership Western Canada – well servicing rigs 99 103
Enhanced Petroleum
Services Partnership
Enhanced Drill Systems Western Canada – underbalanced drilling units 17 17
Opsco Energy Industries Ltd.
Wireline Units Western Canada 25 52
Production Testing Units Western Canada 48 46
Ensign United States Drilling Inc. United States Rocky Mountain region, North
Dakota, South Dakota, Nebraska, Pennsylvania 56 58
and Michigan
Ensign Well Services United States Rocky Mountain region 14 13
Ensign United States Drilling
(California) Inc. California and Nevada 25 25
Ensign Well Services California 32 23
Ensign US Southern Drilling LLC Texas, Louisiana, Mississippi,
Arkansas, Alabama and Oklahoma 40 34
Opsco Energy Industries (USA) Ltd.
Wireline Units United States Rocky Mountain region 1 2
Production Testing Units United States Rocky Mountain region,
Pennsylvania and Texas 34 33
Ensign Energy Services Australia, New Zealand, Southeast Asia,
International Limited Africa, Argentina, and the Middle East 46 44
Ensign de Venezuela C.A. Venezuela 8 9
FE Services Holdings, Inc. Mexico – 6
(1) Includes coring and drilling rigs.(2) Excludes coring rig operating days.
Operating Divisions Summary
ENSIGN ENERGY SERVICES INC.2012 ANNUAL REP
ORT
58
Ensign Delivers
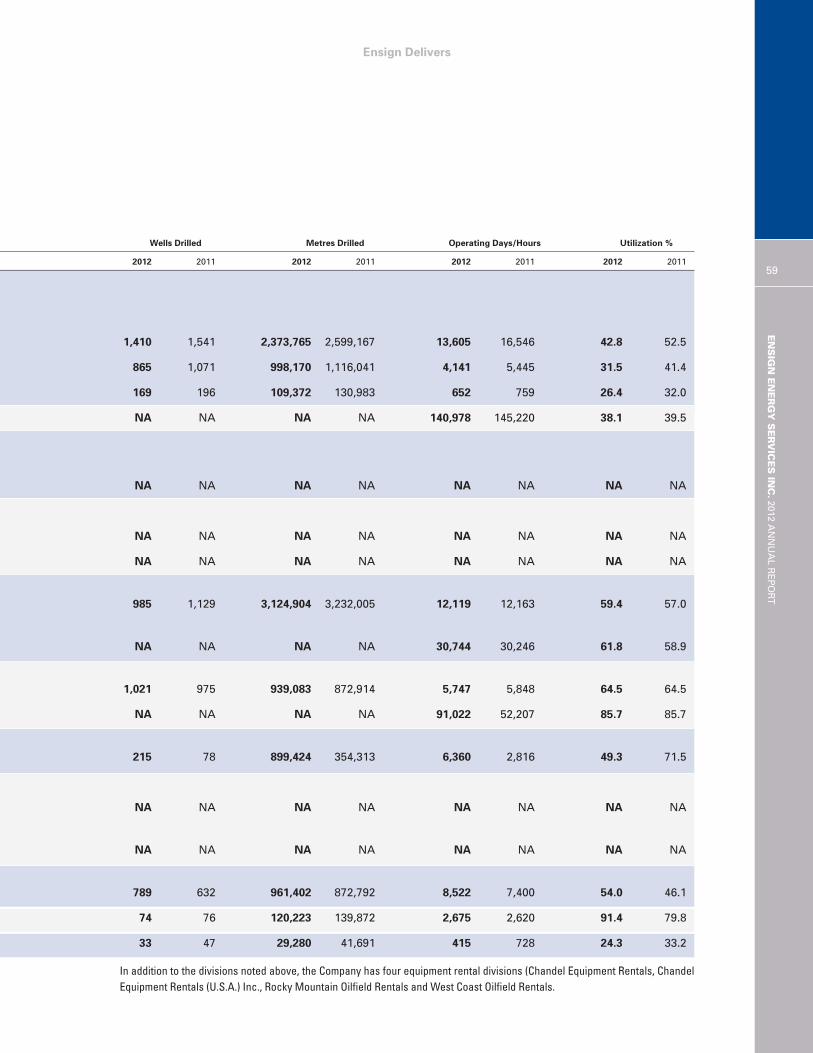
Wells Drilled Metres Drilled Operating Days/Hours Utilization %
2012 2011 2012 2011 2012 2011 2012 2011
1,410 1,541 2,373,765 2,599,167 13,605 16,546 42.8 52.5
865 1,071 998,170 1,116,041 4,141 5,445 31.5 41.4
169 196 109,372 130,983 652 759 26.4 32.0
NA NA NA NA 140,978 145,220 38.1 39.5
NA NA NA NA NA NA NA NA
NA NA NA NA NA NA NA NA
NA NA NA NA NA NA NA NA
985 1,129 3,124,904 3,232,005 12,119 12,163 59.4 57.0
NA NA NA NA 30,744 30,246 61.8 58.9
1,021 975 939,083 872,914 5,747 5,848 64.5 64.5
NA NA NA NA 91,022 52,207 85.7 85.7
215 78 899,424 354,313 6,360 2,816 49.3 71.5
NA NA NA NA NA NA NA NA
NA NA NA NA NA NA NA NA
789 632 961,402 872,792 8,522 7,400 54.0 46.1
74 76 120,223 139,872 2,675 2,620 91.4 79.8
33 47 29,280 41,691 415 728 24.3 33.2
In addition to the divisions noted above, the Company has four equipment rental divisions (Chandel Equipment Rentals, ChandelEquipment Rentals (U.S.A.) Inc., Rocky Mountain Oilfield Rentals and West Coast Oilfield Rentals.
59
ENSIGN ENERGY SERVICES IN
C.2012 A
NNUAL R
EPORT
Ensign Delivers
Ensign Delivers
Corporate Governance
The Company’s Board of Directors exercises overall responsibility for the management and supervision of the affairs
of the Company. This includes the appointment of the Company’s President, approval of compensation for senior
executives and monitoring of the President’s and management’s performance.
The Board of Directors has established procedures that prescribe the requirements governing the approval of
transactions carried out in the course of the Company’s operations, the delegation of authority and the execution of
documents on behalf of the Company.
The Board of Directors reviews and approves the Company’s annual operating budget, ensuring market conditions,
as well as strategic thinking, is properly reflected in the short-term goals of each of the Company’s operating divisions.
The Board of Directors is currently composed of nine directors. Mr. N. Murray Edwards, Mr. Selby Porter and
Mr. Robert H. Geddes, Ensign’s Chairman, Vice Chairman, and President and Chief Operating Officer respectively,
are the only Board members who are also members of the Company’s management. The Board of Directors
annually appoints members to Board committees in the following four areas: Audit, Corporate Governance and
Nominations, Compensation, and Health, Safety and Environment. All of these committees are comprised entirely
of independent directors.
Audit Committee
The Audit Committee has been established to assist the Board in fulfilling its responsibility for oversight of Ensign’s
financial reporting, including oversight of:
1. The preparation, review and disclosure of the Company’s financial statements and other required financial
disclosure materials;
2. The nature and scope of the Company’s annual audit;
3. The independence of the independent auditor;
4. The Company’s internal accounting controls, procedures and practices; and
5. The Company’s financial reporting and accounting systems and procedures.
The Committee recommends, for Board approval, the audited financial statements and other mandatory disclosure
releases containing financial information.
60
ENSIGN ENERGY SERVICES INC.2012 ANNUAL REP
ORT

Ensign Delivers
Corporate Governance and Nominations Committee
The Corporate Governance and Nominations Committee is responsible for assisting the Board with the development
and monitoring of: (i) Ensign’s approach to corporate governance; (ii) the nomination of Directors for appointment to
the Board; (iii) the appointment of Directors to committees of the Board; (iv) the recommendation of remuneration for
the Directors; (v) the evaluation of Directors; (vi) Director education; and (vii) related matters. Specifically this includes:
1. Reviewing Ensign’s corporate governance guidelines and policies, including limitations on the number of boards
on which Directors may sit and policies with respect to director tenure, retirement and succession, and changes
in the primary occupation of a Director; and
2. Reviewing and recommending to the Board for approval, reports concerning the Corporation’s corporate
governance practices as required under applicable securities laws and the rules of any stock exchange on which
the Company’s securities are listed for trading.
Compensation Committee
The Compensation Committee is responsible for assisting the Board in discharging its oversight responsibility
regarding (i) Ensign’s compensation philosophy; and (ii) the retention of key senior management employees with
the skills and expertise needed to enable Ensign to achieve its goals and strategies at fair and competitive
compensation, including appropriate performance incentives. In particular, the Compensation Committee is mandated
to do the following:
1. Review compensation payable to the President and Chief Operating Officer of the Corporation and other executives;
2. Oversee the development, implementation and administration of Ensign’s compensation plans;
3. Review Ensign’s succession planning and implementation progress; and
4. Review executive and director compensation disclosure to be made in the proxy circular prepared in connection
with the Corporation’s annual meeting of shareholders.
Health, Safety and Environment Committee
The Health, Safety and Environment Committee is responsible for oversight and supervision of the policies, standards
and practices of Ensign with respect to health, safety and the environment (“HSE”). Specific responsibilities include:
1. Reviewing, reporting and making recommendations to the Board, on the development and implementation of
policies, standards and practices in the areas of HSE;
2. Assisting Directors to meet their responsibilities in respect of Ensign in carrying out its legal, industry and
community obligations pertaining to the areas of HSE; and
3. Assisting Directors to meet their responsibilities in respect of Ensign maintaining management systems to
implement HSE policies and monitor compliance.
Additional details regarding the Company‘s corporate governance may be found in the “Statement of Corporate
Governance Practices” included in the Information Circular for the Company‘s upcoming Annual Meeting of
Shareholders to be held on May 15, 2013.
ENSIGN ENERGY SERVICES IN
C.2012 A
NNUAL R
EPORT
61
Ensign Delivers
The consolidated financial statements and other information contained in the annual report are the responsibility of the management
of the Company. The consolidated financial statements have been prepared in accordance with International Financial Reporting
Standards consistently applied, using management’s best estimates and judgments, where appropriate.
Preparation of financial statements is an integral part of management’s broader responsibilities for the ongoing operations of the
Company. Management maintains a system of internal accounting controls to ensure that properly approved transactions are
accurately recorded on a timely basis and result in reliable financial statements. The Company’s external auditors are appointed by
the shareholders. They independently perform the necessary tests of the Company’s accounting records and procedures to enable
them to express an opinion as to the fairness of the consolidated financial statements, in conformity with International Financial
Reporting Standards.
The Audit Committee, which is comprised of independent Directors, meets with management and the Company’s external auditors
to review the consolidated financial statements and reports on them to the Board of Directors. The consolidated financial statements
have been approved by the Board of Directors.
Robert H. GeddesPresident and Chief Operating Officer
Glenn DagenaisExecutive Vice President Finance
and Chief Financial Officer
March 14, 2013
62
ENSIGN ENERGY SERVICES INC.2012 ANNUAL REP
ORT
Management’s Report
To the Shareholders of Ensign Energy Services Inc.
We have audited the accompanying consolidated financial statements of Ensign Energy Services Inc. and its subsidiaries, which
comprise the consolidated statements of financial position as at December 31, 2012 and December 31, 2011 and the consolidated
statements of income, comprehensive income, changes in equity and cash flows for the years then ended, and the related notes,
which comprise a summary of significant accounting policies and other explanatory information.
Management’s responsibility for the consolidated financial statementsManagement is responsible for the preparation and fair presentation of these consolidated financial statements in accordance with
International Financial Reporting Standards, and for such internal control as it determines is necessary to enable the preparation of
consolidated financial statements that are free from material misstatement, whether due to fraud or error.
Auditor’s responsibilityOur responsibility is to express an opinion on these consolidated financial statements based on our audit. We conducted our audit
in accordance with Canadian generally accepted auditing standards. Those standards require that we comply with ethical
requirements and plan and perform the audit to obtain reasonable assurance about whether the consolidated financial statements
are free from material misstatement.
An audit involves performing procedures to obtain audit evidence about the amounts and disclosures in the consolidated financial
statements. The procedures selected depend on the auditor’s judgment, including the assessment of the risks of material
misstatement of the consolidated financial statements, whether due to fraud or error. In making those risk assessments, the auditor
considers internal control relevant to the entity’s preparation and fair presentation of the consolidated financial statements in order
to design audit procedures that are appropriate in the circumstances, but not for the purpose of expressing an opinion on the
effectiveness of the entity’s internal control. An audit also includes evaluating the appropriateness of accounting policies used and
the reasonableness of accounting estimates made by management, as well as evaluating the overall presentation of the consolidated
financial statements.
We believe that the audit evidence we have obtained in our audits is sufficient and appropriate to provide a basis for our audit opinion.
OpinionIn our opinion, the consolidated financial statements present fairly, in all material respects, the financial position of Ensign Energy
Services Inc. and its subsidiaries as at December 31, 2012 and December 31, 2011 and their financial performance and their cash
flows for the years then ended in accordance with International Financial Reporting Standards.
Chartered Accountants
March 14, 2013
Calgary, Alberta
Ensign Delivers
Auditors’ Report
ENSIGN ENERGY SERVICES IN
C.2012 A
NNUAL R
EPORT
63
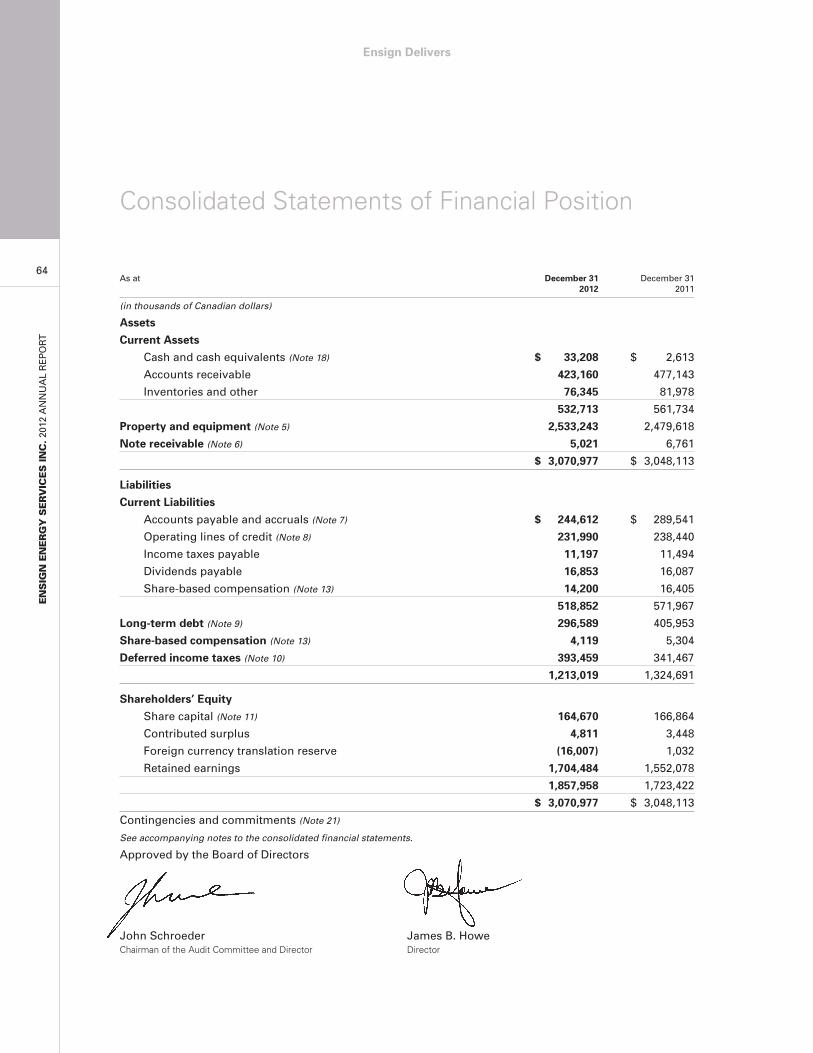
As at December 31 December 312012 2011
(in thousands of Canadian dollars)
Assets
Current Assets
Cash and cash equivalents (Note 18) $ 33,208 $ 2,613
Accounts receivable 423,160 477,143
Inventories and other 76,345 81,978
532,713 561,734
Property and equipment (Note 5) 2,533,243 2,479,618
Note receivable (Note 6) 5,021 6,761
$ 3,070,977 $ 3,048,113
Liabilities
Current Liabilities
Accounts payable and accruals (Note 7) $ 244,612 $ 289,541
Operating lines of credit (Note 8) 231,990 238,440
Income taxes payable 11,197 11,494
Dividends payable 16,853 16,087
Share-based compensation (Note 13) 14,200 16,405
518,852 571,967
Long-term debt (Note 9) 296,589 405,953
Share-based compensation (Note 13) 4,119 5,304
Deferred income taxes (Note 10) 393,459 341,467
1,213,019 1,324,691
Shareholders’ Equity
Share capital (Note 11) 164,670 166,864
Contributed surplus 4,811 3,448
Foreign currency translation reserve (16,007) 1,032
Retained earnings 1,704,484 1,552,078
1,857,958 1,723,422
$ 3,070,977 $ 3,048,113
Contingencies and commitments (Note 21)
See accompanying notes to the consolidated financial statements.
Approved by the Board of Directors
John Schroeder James B. HoweChairman of the Audit Committee and Director Director
Consolidated Statements of Financial Position
ENSIGN ENERGY SERVICES INC.2012 ANNUAL REP
ORT
64
Ensign Delivers
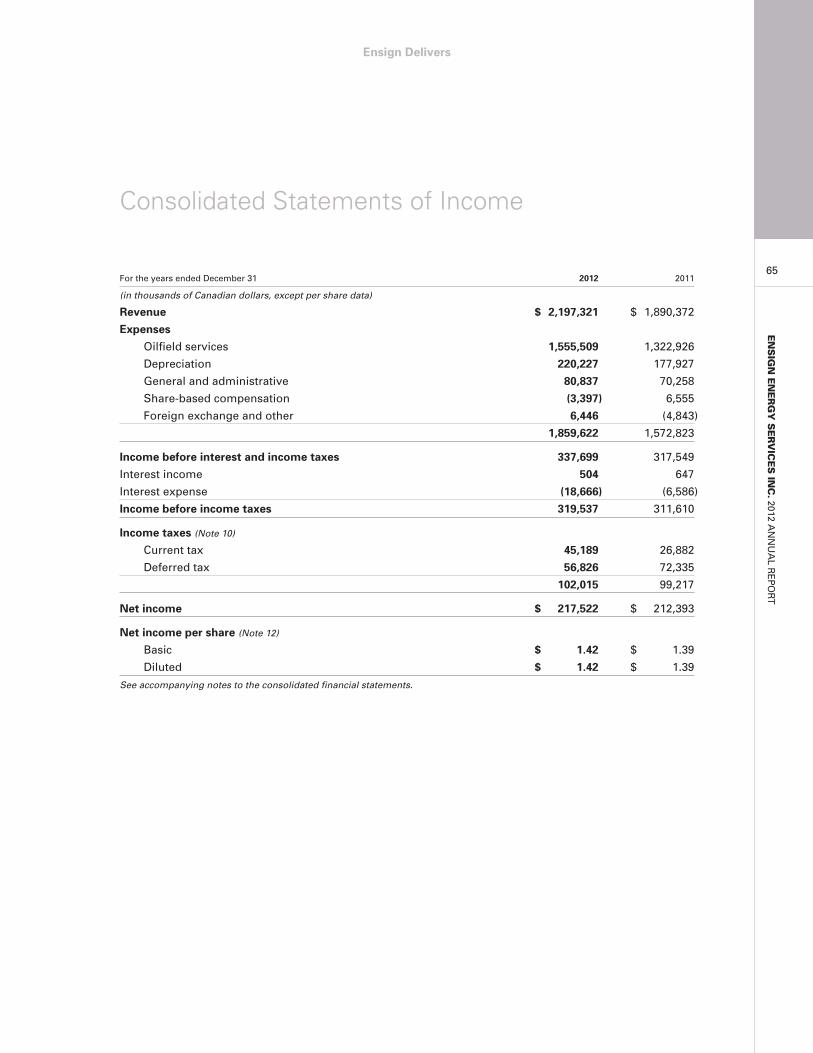
For the years ended December 31 2012 2011
(in thousands of Canadian dollars, except per share data)
Revenue $ 2,197,321 $ 1,890,372
Expenses
Oilfield services 1,555,509 1,322,926
Depreciation 220,227 177,927
General and administrative 80,837 70,258
Share-based compensation (3,397) 6,555
Foreign exchange and other 6,446 (4,843)
1,859,622 1,572,823
Income before interest and income taxes 337,699 317,549
Interest income 504 647
Interest expense (18,666) (6,586)
Income before income taxes 319,537 311,610
Income taxes (Note 10)
Current tax 45,189 26,882
Deferred tax 56,826 72,335
102,015 99,217
Net income $ 217,522 $ 212,393
Net income per share (Note 12)
Basic $ 1.42 $ 1.39
Diluted $ 1.42 $ 1.39
See accompanying notes to the consolidated financial statements.
Consolidated Statements of Income
65
ENSIGN ENERGY SERVICES IN
C.2012 A
NNUAL R
EPORT
Ensign Delivers
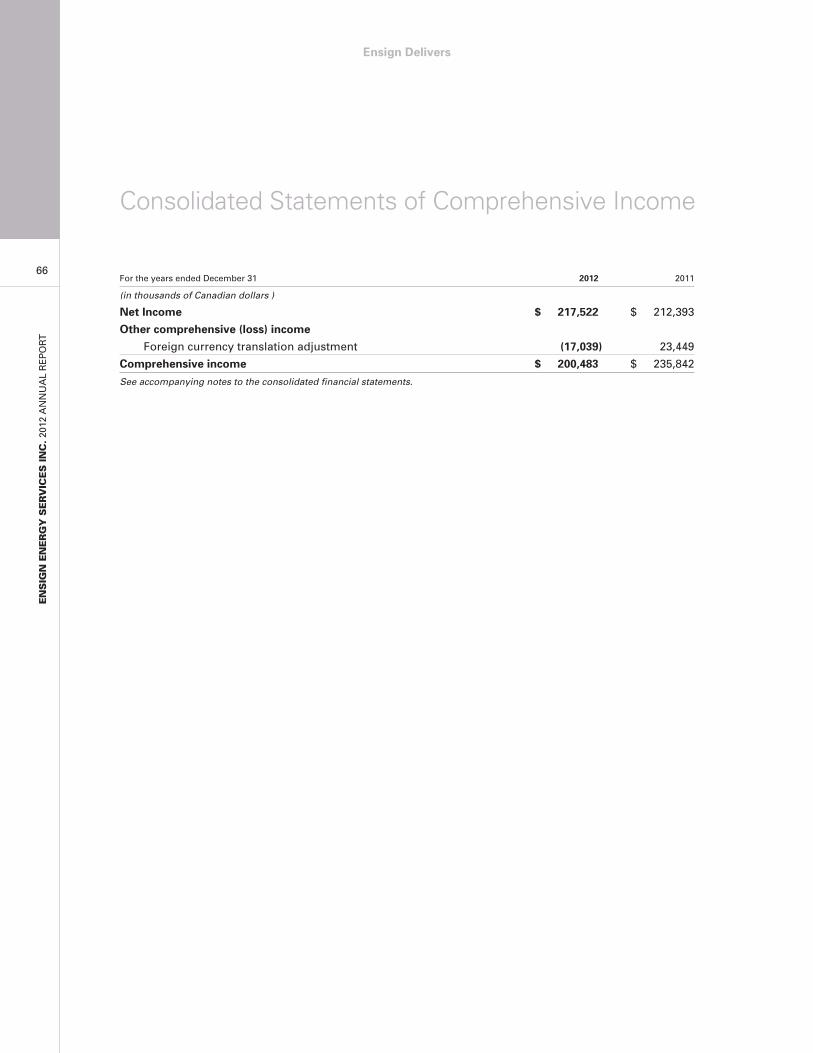
For the years ended December 31 2012 2011
(in thousands of Canadian dollars )
Net Income $ 217,522 $ 212,393
Other comprehensive (loss) income
Foreign currency translation adjustment (17,039) 23,449
Comprehensive income $ 200,483 $ 235,842
See accompanying notes to the consolidated financial statements.
Consolidated Statements of Comprehensive Income
ENSIGN ENERGY SERVICES INC.2012 ANNUAL REP
ORT
66
Ensign Delivers
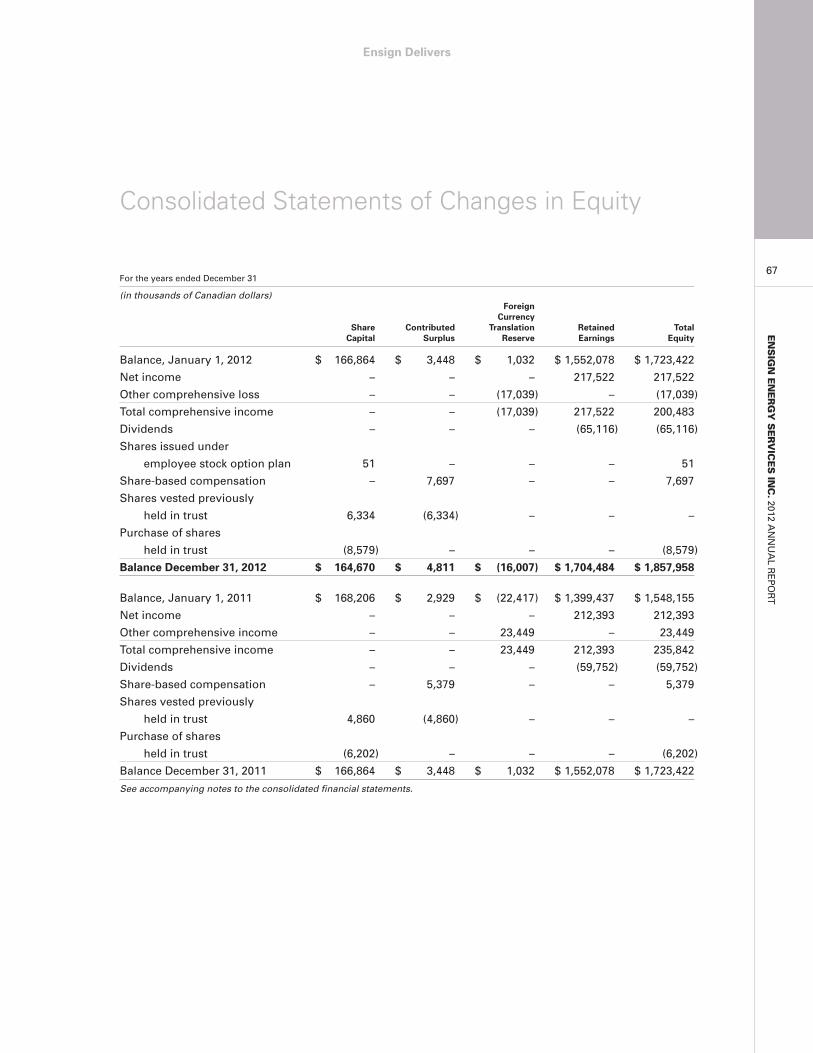
For the years ended December 31
(in thousands of Canadian dollars)Foreign
CurrencyShare Contributed Translation Retained TotalCapital Surplus Reserve Earnings Equity
Balance, January 1, 2012 $ 166,864 $ 3,448 $ 1,032 $ 1,552,078 $ 1,723,422
Net income – – – 217,522 217,522
Other comprehensive loss – – (17,039) – (17,039)
Total comprehensive income – – (17,039) 217,522 200,483
Dividends – – – (65,116) (65,116)
Shares issued under
employee stock option plan 51 – – – 51
Share-based compensation – 7,697 – – 7,697
Shares vested previously
held in trust 6,334 (6,334) – – –
Purchase of shares
held in trust (8,579) – – – (8,579)
Balance December 31, 2012 $ 164,670 $ 4,811 $ (16,007) $ 1,704,484 $ 1,857,958
Balance, January 1, 2011 $ 168,206 $ 2,929 $ (22,417) $ 1,399,437 $ 1,548,155
Net income – – – 212,393 212,393
Other comprehensive income – – 23,449 – 23,449
Total comprehensive income – – 23,449 212,393 235,842
Dividends – – – (59,752) (59,752)
Share-based compensation – 5,379 – – 5,379
Shares vested previously
held in trust 4,860 (4,860) – – –
Purchase of shares
held in trust (6,202) – – – (6,202)
Balance December 31, 2011 $ 166,864 $ 3,448 $ 1,032 $ 1,552,078 $ 1,723,422
See accompanying notes to the consolidated financial statements.
Consolidated Statements of Changes in Equity
67
ENSIGN ENERGY SERVICES IN
C.2012 A
NNUAL R
EPORT
Ensign Delivers
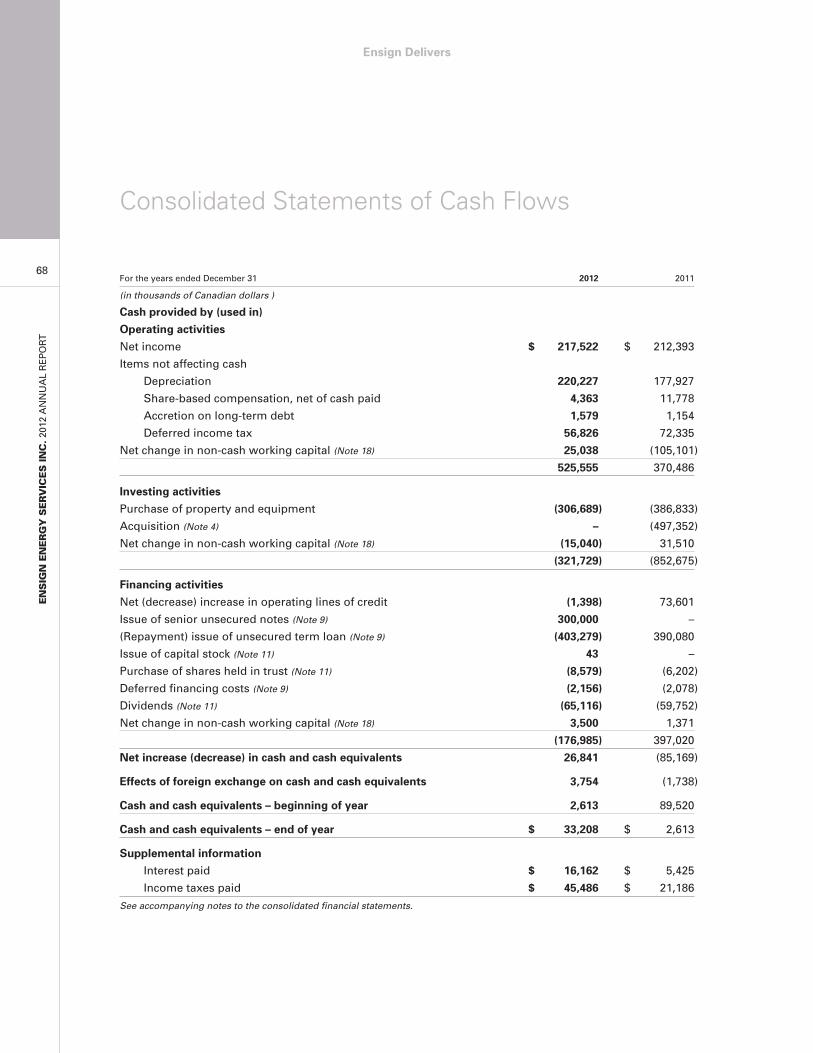
For the years ended December 31 2012 2011
(in thousands of Canadian dollars )
Cash provided by (used in)
Operating activities
Net income $ 217,522 $ 212,393
Items not affecting cash
Depreciation 220,227 177,927
Share-based compensation, net of cash paid 4,363 11,778
Accretion on long-term debt 1,579 1,154
Deferred income tax 56,826 72,335
Net change in non-cash working capital (Note 18) 25,038 (105,101)
525,555 370,486
Investing activities
Purchase of property and equipment (306,689) (386,833)
Acquisition (Note 4) – (497,352)
Net change in non-cash working capital (Note 18) (15,040) 31,510
(321,729) (852,675)
Financing activities
Net (decrease) increase in operating lines of credit (1,398) 73,601
Issue of senior unsecured notes (Note 9) 300,000 –
(Repayment) issue of unsecured term loan (Note 9) (403,279) 390,080
Issue of capital stock (Note 11) 43 –
Purchase of shares held in trust (Note 11) (8,579) (6,202)
Deferred financing costs (Note 9) (2,156) (2,078)
Dividends (Note 11) (65,116) (59,752)
Net change in non-cash working capital (Note 18) 3,500 1,371
(176,985) 397,020
Net increase (decrease) in cash and cash equivalents 26,841 (85,169)
Effects of foreign exchange on cash and cash equivalents 3,754 (1,738)
Cash and cash equivalents – beginning of year 2,613 89,520
Cash and cash equivalents – end of year $ 33,208 $ 2,613
Supplemental information
Interest paid $ 16,162 $ 5,425
Income taxes paid $ 45,486 $ 21,186
See accompanying notes to the consolidated financial statements.
Consolidated Statements of Cash Flows
ENSIGN ENERGY SERVICES INC.2012 ANNUAL REP
ORT
68
Ensign Delivers
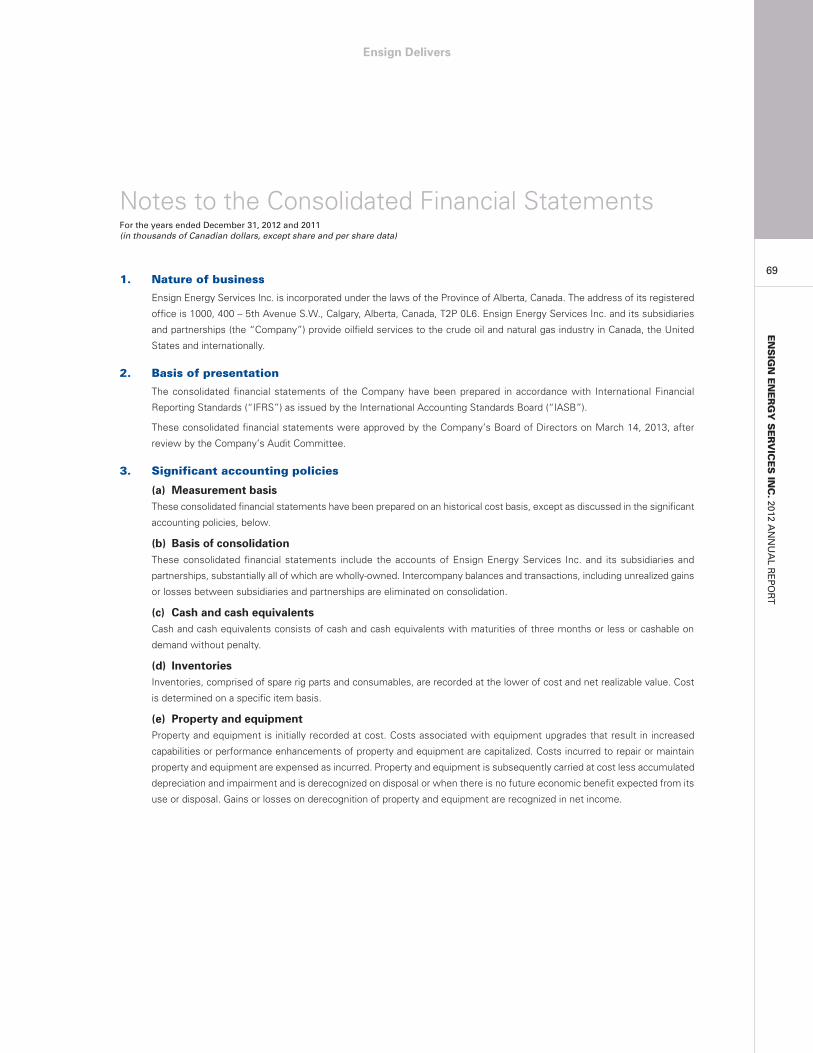
1. Nature of business
Ensign Energy Services Inc. is incorporated under the laws of the Province of Alberta, Canada. The address of its registered
office is 1000, 400 – 5th Avenue S.W., Calgary, Alberta, Canada, T2P 0L6. Ensign Energy Services Inc. and its subsidiaries
and partnerships (the “Company”) provide oilfield services to the crude oil and natural gas industry in Canada, the United
States and internationally.
2. Basis of presentation
The consolidated financial statements of the Company have been prepared in accordance with International Financial
Reporting Standards (“IFRS”) as issued by the International Accounting Standards Board (“IASB”).
These consolidated financial statements were approved by the Company’s Board of Directors on March 14, 2013, after
review by the Company’s Audit Committee.
3. Significant accounting policies
(a) Measurement basisThese consolidated financial statements have been prepared on an historical cost basis, except as discussed in the significant
accounting policies, below.
(b) Basis of consolidationThese consolidated financial statements include the accounts of Ensign Energy Services Inc. and its subsidiaries and
partnerships, substantially all of which are wholly-owned. Intercompany balances and transactions, including unrealized gains
or losses between subsidiaries and partnerships are eliminated on consolidation.
(c) Cash and cash equivalentsCash and cash equivalents consists of cash and cash equivalents with maturities of three months or less or cashable on
demand without penalty.
(d) InventoriesInventories, comprised of spare rig parts and consumables, are recorded at the lower of cost and net realizable value. Cost
is determined on a specific item basis.
(e) Property and equipmentProperty and equipment is initially recorded at cost. Costs associated with equipment upgrades that result in increased
capabilities or performance enhancements of property and equipment are capitalized. Costs incurred to repair or maintain
property and equipment are expensed as incurred. Property and equipment is subsequently carried at cost less accumulated
depreciation and impairment and is derecognized on disposal or when there is no future economic benefit expected from its
use or disposal. Gains or losses on derecognition of property and equipment are recognized in net income.
Notes to the Consolidated Financial StatementsFor the years ended December 31, 2012 and 2011(in thousands of Canadian dollars, except share and per share data)
69
ENSIGN ENERGY SERVICES IN
C.2012 A
NNUAL R
EPORT
Ensign Delivers
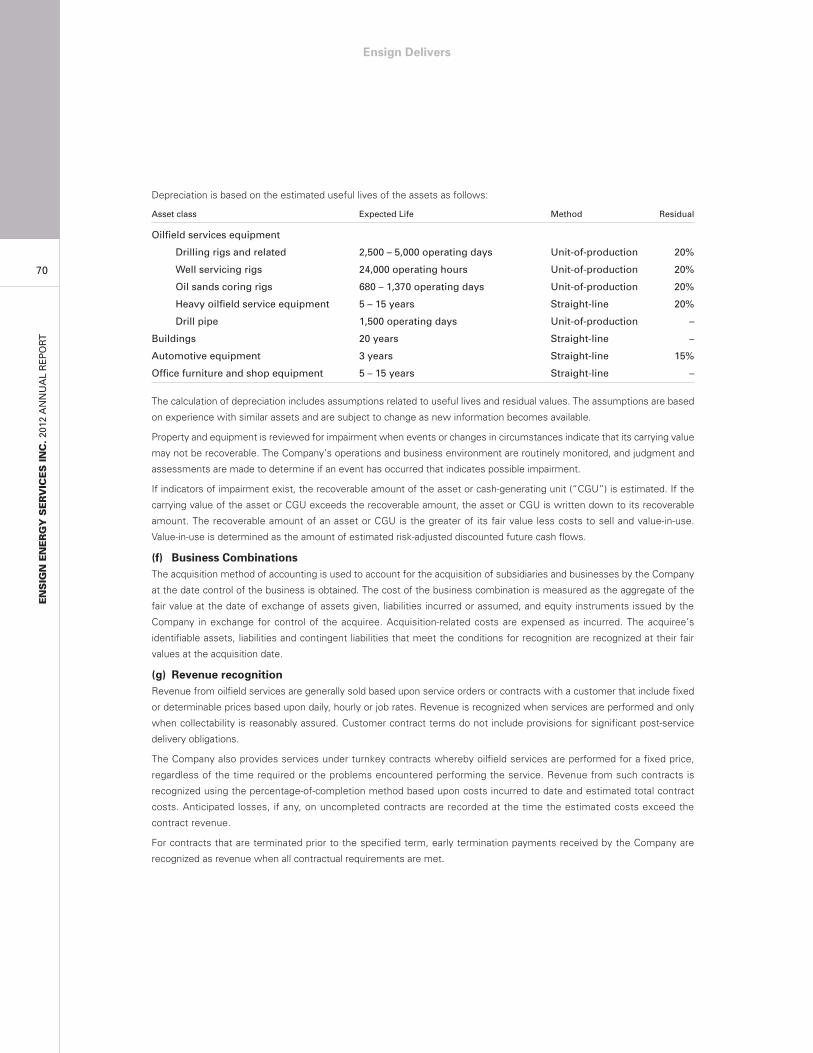
Depreciation is based on the estimated useful lives of the assets as follows:
Asset class Expected Life Method Residual
Oilfield services equipment
Drilling rigs and related 2,500 – 5,000 operating days Unit-of-production 20%
Well servicing rigs 24,000 operating hours Unit-of-production 20%
Oil sands coring rigs 680 – 1,370 operating days Unit-of-production 20%
Heavy oilfield service equipment 5 – 15 years Straight-line 20%
Drill pipe 1,500 operating days Unit-of-production –
Buildings 20 years Straight-line –
Automotive equipment 3 years Straight-line 15%
Office furniture and shop equipment 5 – 15 years Straight-line –
The calculation of depreciation includes assumptions related to useful lives and residual values. The assumptions are based
on experience with similar assets and are subject to change as new information becomes available.
Property and equipment is reviewed for impairment when events or changes in circumstances indicate that its carrying value
may not be recoverable. The Company’s operations and business environment are routinely monitored, and judgment and
assessments are made to determine if an event has occurred that indicates possible impairment.
If indicators of impairment exist, the recoverable amount of the asset or cash-generating unit (“CGU”) is estimated. If the
carrying value of the asset or CGU exceeds the recoverable amount, the asset or CGU is written down to its recoverable
amount. The recoverable amount of an asset or CGU is the greater of its fair value less costs to sell and value-in-use.
Value-in-use is determined as the amount of estimated risk-adjusted discounted future cash flows.
(f) Business CombinationsThe acquisition method of accounting is used to account for the acquisition of subsidiaries and businesses by the Company
at the date control of the business is obtained. The cost of the business combination is measured as the aggregate of the
fair value at the date of exchange of assets given, liabilities incurred or assumed, and equity instruments issued by the
Company in exchange for control of the acquiree. Acquisition-related costs are expensed as incurred. The acquiree’s
identifiable assets, liabilities and contingent liabilities that meet the conditions for recognition are recognized at their fair
values at the acquisition date.
(g) Revenue recognitionRevenue from oilfield services are generally sold based upon service orders or contracts with a customer that include fixed
or determinable prices based upon daily, hourly or job rates. Revenue is recognized when services are performed and only
when collectability is reasonably assured. Customer contract terms do not include provisions for significant post-service
delivery obligations.
The Company also provides services under turnkey contracts whereby oilfield services are performed for a fixed price,
regardless of the time required or the problems encountered performing the service. Revenue from such contracts is
recognized using the percentage-of-completion method based upon costs incurred to date and estimated total contract
costs. Anticipated losses, if any, on uncompleted contracts are recorded at the time the estimated costs exceed the
contract revenue.
For contracts that are terminated prior to the specified term, early termination payments received by the Company are
recognized as revenue when all contractual requirements are met.
ENSIGN ENERGY SERVICES INC.2012 ANNUAL REP
ORT
70
Ensign Delivers
(h) Foreign currency translationThe consolidated financial statements are presented in Canadian dollars which is the Company’s functional currency. Financial
statements of the Company’s United States and international subsidiaries have a functional currency different from Canadian
dollars and are translated to Canadian dollars using the exchange rate in effect at the year-end date for all assets and liabilities,
and at average rates of exchange during the year for revenues and expenses. All changes resulting from these translation
adjustments are recognized in other comprehensive income (loss).
Foreign currency transactions are translated into the functional currency using the exchange rates prevailing at the dates of
the transactions. Foreign exchange gains and losses resulting from the settlement of foreign currency transactions and from
the translation at year-end exchange rates of monetary assets and liabilities denominated in currencies other than an
operation’s functional currency are recognized in the consolidated statement of income.
(i) Borrowing costsInterest and borrowing costs that are directly attributable to the acquisition, construction or production of qualifying assets
are capitalized as part of the cost of those assets. Qualifying assets are those which take a substantial period of time to
prepare for their intended use. Capitalization ceases when substantially all activities necessary to prepare the qualifying asset
for its intended use are complete. All other interest is recognized in the consolidated statement of income in the period in
which it is incurred.
(j) Income taxesThe Company follows the liability method of accounting for income taxes. Under this method, income tax liabilities and assets
are recognized for the estimated tax consequences attributable to differences between the amounts reported in the
consolidated financial statements and their respective tax bases, using enacted or substantively enacted income tax rates.
The effect of a change in income tax rates on deferred income tax liabilities and assets is recognized in income in the period
in which the change is substantively enacted.
Deferred tax assets are recognized to the extent that future taxable income will be available against which temporary
differences can be utilized.
(k) Share-based compensationThe Company has an employee share option plan or equivalent that provides all option holders the right to elect to receive
either common shares or a direct cash payment in exchange for the options exercised; these options are accounted for as
a compound financial instrument, which requires the fair value of the liability component to be determined first and the
residual value, if any, allocated to the equity component. The fair value of the settlement option under cash and shares is the
same; therefore these options are accounted for as cash-settled awards.
The Company has other cash-settled share-based compensation plans. Cash-settled share-based compensation plans are
recognized as compensation expense over the vesting period using fair values with a corresponding increase or decrease in
liabilities. The liability is remeasured at each reporting date and at the settlement date. Any changes in the fair value of the
liability are recognized as share-based compensation expense in the statement of income. The fair value is determined using
the Black-Scholes option pricing model.
The Company has share savings and share bonus plans for employees, as well as a program whereby a portion of the
retainer paid to Directors is in the form of common shares of the Company. Contributions to these plans are recorded as
general and administrative expense over the vesting period. In all cases, any common shares acquired for such plans are
purchased in the open market and administered through trusts until the shares are vested. The share purchase price is
considered the fair value.
71
NOTES TO THE CONSOLID
ATED FIN
ANCIAL S
TATEMENTS
Ensign Delivers
(l) Financial instrumentsFinancial assets and liabilities are recognized on the date the Company becomes party to the contractual provisions of the
instrument. Financial assets are derecognized when the contractual rights to the cash flows from the financial asset expire,
or the Company transfers the rights to receive the contractual cash flows in a transaction in which substantially all of the
risks and rewards of ownership of the financial asset are transferred. Any interest in such transferred financial assets that is
created or retained by the Company is recognized as a separate asset or liability. Financial liabilities are derecognized when
the Company’s contractual obligations are discharged, cancelled or expire.
Financial assets and liabilities are measured at fair value on initial recognition of the instrument. Measurement in subsequent
periods depends on whether the financial assets or liabilities are classified as amortized cost or as fair value through profit
or loss (“FVTPL”).
Transaction costs that are directly attributable to the acquisition or issue of financial assets and financial liabilities, other than
financial assets and financial liabilities at FVTPL, are added to or deducted from the fair value of the financial assets or financial
liabilities, as appropriate, on initial recognition. Transaction costs directly attributable to the acquisition of financial assets or
financial liabilities at FVTPL are recognized immediately in net income.
Financial Assets
A financial asset is classified and measured at amortized cost if it is held within a business model whose objective is to hold
assets in order to collect contractual cash flows and the contractual terms of the financial asset give rise, on specified dates,
to cash flows that are solely payments of principal and interest.
Financial assets other than those qualifying for amortized cost measurement are classified as FVTPL and measured at fair
value with all changes in fair value recognized in net income.
Financial assets that are measured at amortized cost are assessed for impairment on an individual account basis at the end
of each reporting period. Financial assets are considered to be impaired when there is objective evidence that, as a result of
one or more events that occurred after the initial recognition of the financial assets, the estimated future cash flows of the
asset have been affected. An allowance account is used when there is uncertainty surrounding the estimated future cash
flows. When there is objective evidence the impairment will not be reversed the amount originally charged to the allowance
is written off against the carrying amount of the impaired financial asset.
Financial Liabilities
Financial liabilities are classified as FVTPL when the financial liability is either held for trading or it is designated as FVTPL.
Financial liabilities classified as FVTPL are measured at fair value with all changes in fair value recognized in net income with
the exception of changes in fair value attributable to credit risk which are recorded in other comprehensive income.
Financial liabilities that are not held for trading and are not designated as FVTPL are subsequently measured at amortized
cost using the effective interest method. Interest expense that is not capitalized is included in net income.
(m)Critical judgments and accounting estimatesPreparation of the Company’s consolidated financial statements in accordance with IFRS requires management to make
estimates and assumptions that affect the reported amounts of assets, liabilities, income and expenses. Actual results could
differ from those estimates. Estimates and assumptions are continually evaluated and are based on historical experience
and other factors, including expectations of future events that are believed to be reasonable under the circumstances. The
following are the most critical estimates and assumptions used in determining the value of assets and liabilities:
Allowance for doubtful accounts
The Company establishes an allowance for estimated losses for uncollectible accounts. The allowance is determined based
on customer credit-worthiness, current economic trends and past experience. Information regarding the allowance for
doubtful accounts is included in Note 20.
Property and equipment
The calculation of depreciation includes assumptions related to useful lives and residual values. The assumption is based on
experience with similar assets and is subject to change as new information becomes available. In addition, assessing for
indicators of impairment requires judgment.
ENSIGN ENERGY SERVICES INC.2012 ANNUAL REP
ORT
72
Ensign Delivers
Assets are grouped into CGUs based on separately identifiable and largely independent cash inflows and are used for
impairment testing. Estimates of future cash flows used in the evaluation of impairment of assets are made using
management’s forecasts of market prices, market supply and demand, margins, and discount rates. Information regarding
property and equipment is included in Note 5.
Share-based compensation
Measurement inputs include share price on measurement date, exercise price, expected volatility, weighted average expected
life, expected dividends, and risk-free interest rate. Significant estimates and assumptions are used in determining the
expected volatility based on weighted average historic volatility adjusted for changes expected due to publicly available
information, weighted average expected life and expected forfeitures, based on historical experience and general
option-holder behavior. Changes to input assumptions will impact share-based compensation liability and expense. Information
regarding share-based compensation is included in Note 13.
Income taxes
The Company is subject to income taxes in a number of tax jurisdictions. The amount expected to be settled and the actual
outcome and tax rates can change over time, depending on the facts and circumstances. Also, the recognition of deferred
tax assets is based on assumptions about future taxable profits. Changes to these assumptions will impact income tax and
the deferred tax provision. Information regarding income taxes is included in Note 10.
(n) Recent accounting pronouncementsA number of new standards, interpretations and amendments to existing standards are not yet effective for the year ended
December 31, 2012, and have not yet been adopted by the Company. The following is a brief summary of the new standards
that may be relevant to the Company, which are effective for annual periods beginning on or after January 1, 2013 with early
adoption permitted, unless otherwise noted. The Company does not plan to adopt these standards early.
IFRS 10 – Consolidated Financial Statements (“IFRS 10”)IFRS 10 requires an entity to consolidate an investee when it is exposed, or has rights, to variable returns from its involvement
with the investee and has the ability to affect those returns through its influence over the investee. Under existing IFRS,
consolidation is required when an entity has the power to govern the financial and operating policies of an entity so as to
obtain benefits from its activities. IFRS 10 replaces SIC-12 - Consolidation - Special Purpose Entities and parts of IAS 27 -
Consolidated and Separate Financial Statements. The Company performed a review of its investees and does not believe
adoption of this standard will have a material impact on its consolidated financial statements.
IFRS 12 – Disclosure of Interests in Other Entities (“IFRS 12”)IFRS 12 establishes disclosure requirements for interests in other entities, such as joint arrangements, associates, special
purpose vehicles and off balance sheet vehicles. The standard carries forward existing disclosures and also introduces
significant additional disclosure requirements that address the nature of, and risks associated with, an entity’s interests in
other entities. The Company is currently assessing the disclosure requirements under IFRS 12 in comparison with existing
disclosures but does not expect the adoption of this standard to have a material impact on its consolidated financial statements.
IFRS 13 – Fair Value Measurement (“IFRS 13”)IFRS 13 is a comprehensive standard for fair value measurement and disclosure requirements for use across all IFRS standards.
The new standard clarifies that fair value is the price that would be received to sell an asset, or paid to transfer a liability in an
orderly transaction between market participants, at the measurement date. It also establishes disclosures about fair value
measurement. Under existing IFRS, guidance on measuring and disclosing fair value is dispersed among the specific standards
requiring fair value measurements and in many cases does not reflect a clear measurement basis or consistent disclosures.
The Company is currently finalizing its assessment of the impact of adopting IFRS 13 on its consolidated financial statements
but does not expect the adoption of this standard to have a material impact on its consolidated financial statements.
IFRS 7 – Financial Instruments: Disclosure (“IFRS 7”)Amendments to IFRS 7 require the disclosure of information that will enable users of the Company’s consolidated financial
statements to evaluate the effect, or potential effect, of offsetting financial assets and financial liabilities, to the Company’s
consolidated statement of financial position. The Company is currently finalizing its assessment of the impact of adopting
73
NOTES TO THE CONSOLID
ATED FIN
ANCIAL S
TATEMENTS
Ensign Delivers
IFRS 7 on its consolidated financial statements but does not expect the adoption of amendments to IFRS 7 to have a material
impact on its consolidated financial statements.
IAS 32 – Financial Instruments: Presentation (“IAS 32”)The amendments to IAS 32 clarify the criteria that should be considered in determining whether an entity has a legally
enforceable right to set off in respect of its financial instruments. Amendments to IAS 32 are effective for annual periods
beginning on or after January 1, 2014 with early adoption permitted. The Company is currently finalizing its assessment of
the impact of adopting IAS 32 on its consolidated financial statements but does not expect the adoption of amendments to
IAS 32 to have a material impact on its consolidated financial statements.
4. Acquisition
The Company did not complete any significant business acquisitions during the year ended December 31, 2012. On
September 1, 2011 the Company acquired the land drilling division of Rowan Companies, Inc. (“Rowan Land Drilling”), which
owned and operated 30 deeper capacity electric land drilling rigs in the southern United States, for an aggregate purchase
price of USD $510.0 million and USD $5.5 million for working capital. Subsequent to the acquisition, Rowan Land Drilling
was renamed Ensign US Southern Drilling LLC (“Ensign US Southern”).
The acquisition was funded from the Company’s cash resources and available lines of credit, as well as an unsecured term
loan of USD $400.0 million as described in Note 9. As a result of the acquisition, the Company increased its presence in the
southern United States land-based drilling market.
The allocation of the purchase price was determined as follows:
Fair value of net assets at acquisition: Total
Property and equipment $ 497,303
Other assets 49
Trade receivables 11,661
Trade payables (6,326)
Total cash consideration $ 502,687
Acquisition-related costs of $495 have been expensed and included in general and administrative expense in the consolidated
statement of income for the year ended December 31, 2011 and as a reduction in operating cash flows in the consolidated
statement of cash flows for the year ended December 31, 2011.
From the date of the acquisition to December 31, 2011, Ensign US Southern’s contributions to consolidated results of the
Company were revenue of $70,534 and income before income tax of $3,938, which includes depreciation of $17,498. Had
the acquisition of Ensign US Southern occurred on January 1, 2011, consolidated Company revenue for the year ended
December 31, 2011 is estimated to have been $2,017,000. This pro-forma revenue is not necessarily indicative of the revenue
that would actually have been realized had the acquisition occurred on January 1, 2011 and may not be indicative of future
performance. An estimate of operating results from the new operations for the year ended December 31, 2011 as if the
acquisition occurred on January 1, 2011 is not provided as this estimate would be unreliable due to the differences between
accounting principles and methods, assumptions, and overhead structures before and after the acquisition.
ENSIGN ENERGY SERVICES INC.2012 ANNUAL REP
ORT
74
Ensign Delivers
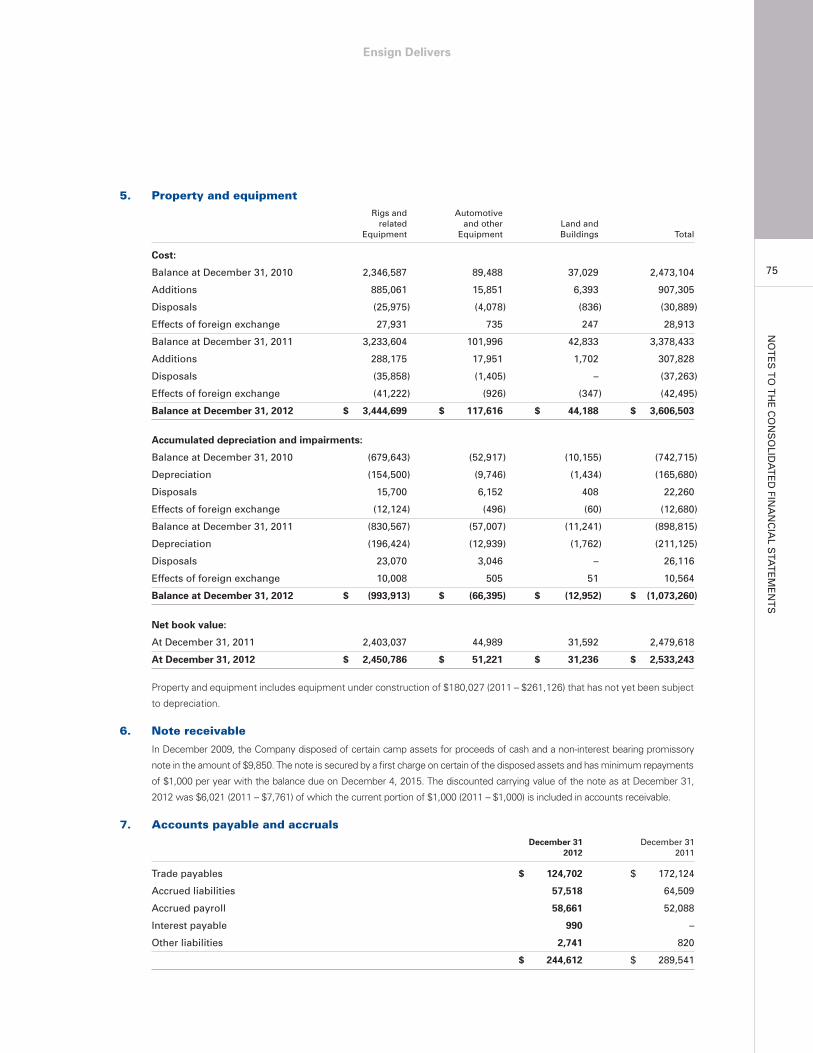
5. Property and equipmentRigs and Automotiverelated and other Land and
Equipment Equipment Buildings Total
Cost:
Balance at December 31, 2010 2,346,587 89,488 37,029 2,473,104
Additions 885,061 15,851 6,393 907,305
Disposals (25,975) (4,078) (836) (30,889)
Effects of foreign exchange 27,931 735 247 28,913
Balance at December 31, 2011 3,233,604 101,996 42,833 3,378,433
Additions 288,175 17,951 1,702 307,828
Disposals (35,858) (1,405) – (37,263)
Effects of foreign exchange (41,222) (926) (347) (42,495)
Balance at December 31, 2012 $ 3,444,699 $ 117,616 $ 44,188 $ 3,606,503
Accumulated depreciation and impairments:
Balance at December 31, 2010 (679,643) (52,917) (10,155) (742,715)
Depreciation (154,500) (9,746) (1,434) (165,680)
Disposals 15,700 6,152 408 22,260
Effects of foreign exchange (12,124) (496) (60) (12,680)
Balance at December 31, 2011 (830,567) (57,007) (11,241) (898,815)
Depreciation (196,424) (12,939) (1,762) (211,125)
Disposals 23,070 3,046 – 26,116
Effects of foreign exchange 10,008 505 51 10,564
Balance at December 31, 2012 $ (993,913) $ (66,395) $ (12,952) $ (1,073,260)
Net book value:
At December 31, 2011 2,403,037 44,989 31,592 2,479,618
At December 31, 2012 $ 2,450,786 $ 51,221 $ 31,236 $ 2,533,243
Property and equipment includes equipment under construction of $180,027 (2011 – $261,126) that has not yet been subject
to depreciation.
6. Note receivable
In December 2009, the Company disposed of certain camp assets for proceeds of cash and a non-interest bearing promissory
note in the amount of $9,850. The note is secured by a first charge on certain of the disposed assets and has minimum repayments
of $1,000 per year with the balance due on December 4, 2015. The discounted carrying value of the note as at December 31,
2012 was $6,021 (2011 – $7,761) of which the current portion of $1,000 (2011 – $1,000) is included in accounts receivable.
7. Accounts payable and accrualsDecember 31 December 31
2012 2011
Trade payables $ 124,702 $ 172,124
Accrued liabilities 57,518 64,509
Accrued payroll 58,661 52,088
Interest payable 990 –
Other liabilities 2,741 820
$ 244,612 $ 289,541
75
NOTES TO THE CONSOLID
ATED FIN
ANCIAL S
TATEMENTS
Ensign Delivers
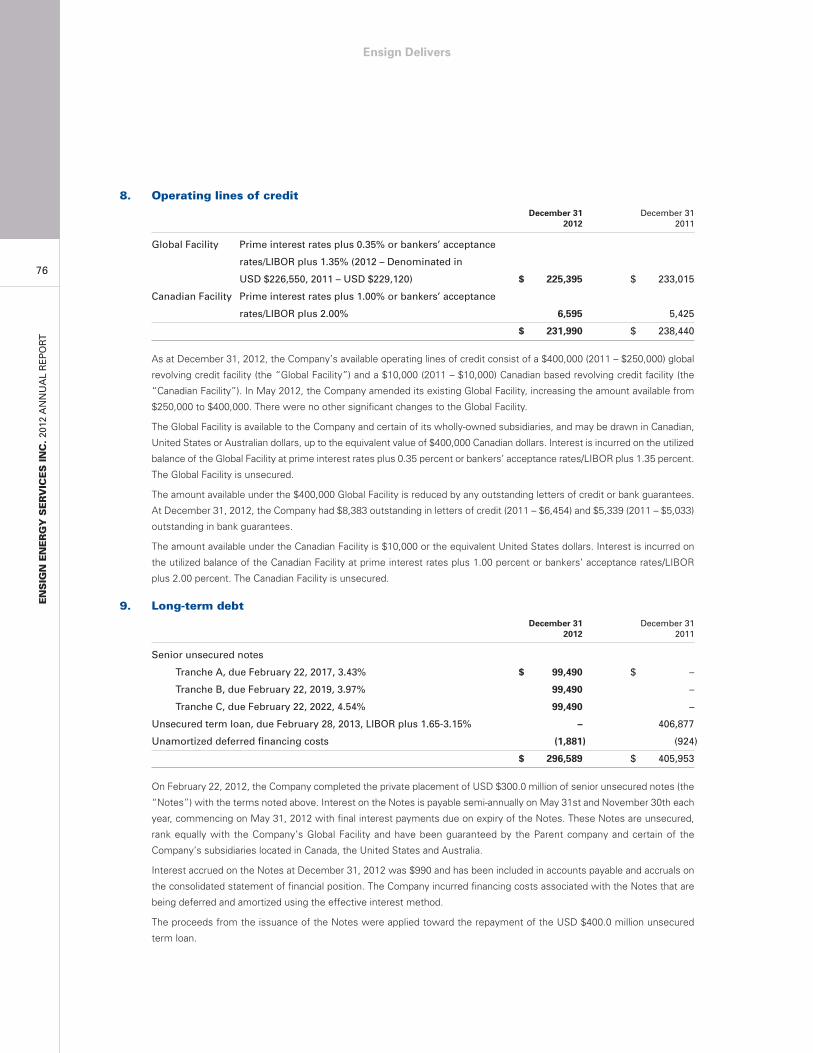
8. Operating lines of creditDecember 31 December 31
2012 2011
Global Facility Prime interest rates plus 0.35% or bankers’ acceptance
rates/LIBOR plus 1.35% (2012 – Denominated in
USD $226,550, 2011 – USD $229,120) $ 225,395 $ 233,015
Canadian Facility Prime interest rates plus 1.00% or bankers’ acceptance
rates/LIBOR plus 2.00% 6,595 5,425
$ 231,990 $ 238,440
As at December 31, 2012, the Company’s available operating lines of credit consist of a $400,000 (2011 – $250,000) global
revolving credit facility (the “Global Facility”) and a $10,000 (2011 – $10,000) Canadian based revolving credit facility (the
“Canadian Facility”). In May 2012, the Company amended its existing Global Facility, increasing the amount available from
$250,000 to $400,000. There were no other significant changes to the Global Facility.
The Global Facility is available to the Company and certain of its wholly-owned subsidiaries, and may be drawn in Canadian,
United States or Australian dollars, up to the equivalent value of $400,000 Canadian dollars. Interest is incurred on the utilized
balance of the Global Facility at prime interest rates plus 0.35 percent or bankers’ acceptance rates/LIBOR plus 1.35 percent.
The Global Facility is unsecured.
The amount available under the $400,000 Global Facility is reduced by any outstanding letters of credit or bank guarantees.
At December 31, 2012, the Company had $8,383 outstanding in letters of credit (2011 – $6,454) and $5,339 (2011 – $5,033)
outstanding in bank guarantees.
The amount available under the Canadian Facility is $10,000 or the equivalent United States dollars. Interest is incurred on
the utilized balance of the Canadian Facility at prime interest rates plus 1.00 percent or bankers’ acceptance rates/LIBOR
plus 2.00 percent. The Canadian Facility is unsecured.
9. Long-term debtDecember 31 December 31
2012 2011
Senior unsecured notes
Tranche A, due February 22, 2017, 3.43% $ 99,490 $ –
Tranche B, due February 22, 2019, 3.97% 99,490 –
Tranche C, due February 22, 2022, 4.54% 99,490 –
Unsecured term loan, due February 28, 2013, LIBOR plus 1.65-3.15% – 406,877
Unamortized deferred financing costs (1,881) (924)
$ 296,589 $ 405,953
On February 22, 2012, the Company completed the private placement of USD $300.0 million of senior unsecured notes (the
“Notes”) with the terms noted above. Interest on the Notes is payable semi-annually on May 31st and November 30th each
year, commencing on May 31, 2012 with final interest payments due on expiry of the Notes. These Notes are unsecured,
rank equally with the Company’s Global Facility and have been guaranteed by the Parent company and certain of the
Company’s subsidiaries located in Canada, the United States and Australia.
Interest accrued on the Notes at December 31, 2012 was $990 and has been included in accounts payable and accruals on
the consolidated statement of financial position. The Company incurred financing costs associated with the Notes that are
being deferred and amortized using the effective interest method.
The proceeds from the issuance of the Notes were applied toward the repayment of the USD $400.0 million unsecured
term loan.
ENSIGN ENERGY SERVICES INC.2012 ANNUAL REP
ORT
76
Ensign Delivers
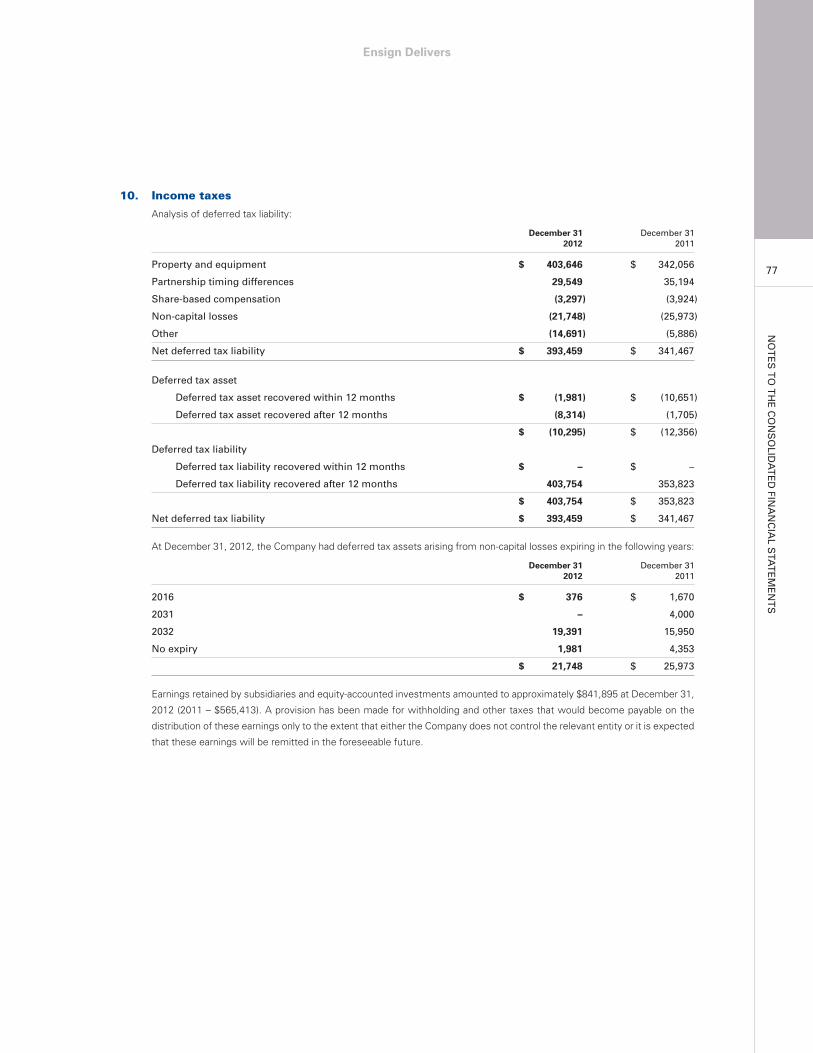
10. Income taxes
Analysis of deferred tax liability:
December 31 December 312012 2011
Property and equipment $ 403,646 $ 342,056
Partnership timing differences 29,549 35,194
Share-based compensation (3,297) (3,924)
Non-capital losses (21,748) (25,973)
Other (14,691) (5,886)
Net deferred tax liability $ 393,459 $ 341,467
Deferred tax asset
Deferred tax asset recovered within 12 months $ (1,981) $ (10,651)
Deferred tax asset recovered after 12 months (8,314) (1,705)
$ (10,295) $ (12,356)
Deferred tax liability
Deferred tax liability recovered within 12 months $ – $ –
Deferred tax liability recovered after 12 months 403,754 353,823
$ 403,754 $ 353,823
Net deferred tax liability $ 393,459 $ 341,467
At December 31, 2012, the Company had deferred tax assets arising from non-capital losses expiring in the following years:
December 31 December 312012 2011
2016 $ 376 $ 1,670
2031 – 4,000
2032 19,391 15,950
No expiry 1,981 4,353
$ 21,748 $ 25,973
Earnings retained by subsidiaries and equity-accounted investments amounted to approximately $841,895 at December 31,
2012 (2011 – $565,413). A provision has been made for withholding and other taxes that would become payable on the
distribution of these earnings only to the extent that either the Company does not control the relevant entity or it is expected
that these earnings will be remitted in the foreseeable future.
77
NOTES TO THE CONSOLID
ATED FIN
ANCIAL S
TATEMENTS
Ensign Delivers
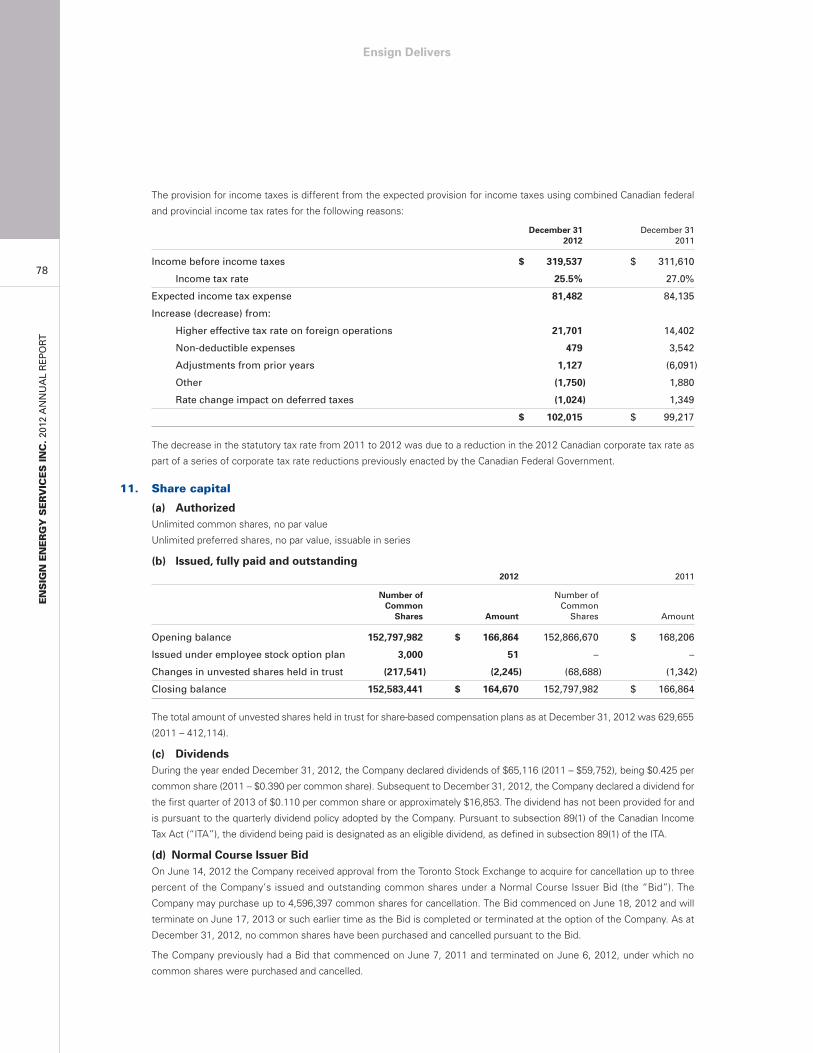
The provision for income taxes is different from the expected provision for income taxes using combined Canadian federal
and provincial income tax rates for the following reasons:
December 31 December 312012 2011
Income before income taxes $ 319,537 $ 311,610
Income tax rate 25.5% 27.0%
Expected income tax expense 81,482 84,135
Increase (decrease) from:
Higher effective tax rate on foreign operations 21,701 14,402
Non-deductible expenses 479 3,542
Adjustments from prior years 1,127 (6,091)
Other (1,750) 1,880
Rate change impact on deferred taxes (1,024) 1,349
$ 102,015 $ 99,217
The decrease in the statutory tax rate from 2011 to 2012 was due to a reduction in the 2012 Canadian corporate tax rate as
part of a series of corporate tax rate reductions previously enacted by the Canadian Federal Government.
11. Share capital
(a) AuthorizedUnlimited common shares, no par value
Unlimited preferred shares, no par value, issuable in series
(b) Issued, fully paid and outstanding2012 2011
Number of Number ofCommon CommonShares Amount Shares Amount
Opening balance 152,797,982 $ 166,864 152,866,670 $ 168,206
Issued under employee stock option plan 3,000 51 – –
Changes in unvested shares held in trust (217,541) (2,245) (68,688) (1,342)
Closing balance 152,583,441 $ 164,670 152,797,982 $ 166,864
The total amount of unvested shares held in trust for share-based compensation plans as at December 31, 2012 was 629,655
(2011 – 412,114).
(c) DividendsDuring the year ended December 31, 2012, the Company declared dividends of $65,116 (2011 – $59,752), being $0.425 per
common share (2011 – $0.390 per common share). Subsequent to December 31, 2012, the Company declared a dividend for
the first quarter of 2013 of $0.110 per common share or approximately $16,853. The dividend has not been provided for and
is pursuant to the quarterly dividend policy adopted by the Company. Pursuant to subsection 89(1) of the Canadian Income
Tax Act (“ITA”), the dividend being paid is designated as an eligible dividend, as defined in subsection 89(1) of the ITA.
(d) Normal Course Issuer BidOn June 14, 2012 the Company received approval from the Toronto Stock Exchange to acquire for cancellation up to three
percent of the Company’s issued and outstanding common shares under a Normal Course Issuer Bid (the “Bid”). The
Company may purchase up to 4,596,397 common shares for cancellation. The Bid commenced on June 18, 2012 and will
terminate on June 17, 2013 or such earlier time as the Bid is completed or terminated at the option of the Company. As at
December 31, 2012, no common shares have been purchased and cancelled pursuant to the Bid.
The Company previously had a Bid that commenced on June 7, 2011 and terminated on June 6, 2012, under which no
common shares were purchased and cancelled.
ENSIGN ENERGY SERVICES INC.2012 ANNUAL REP
ORT
78
Ensign Delivers
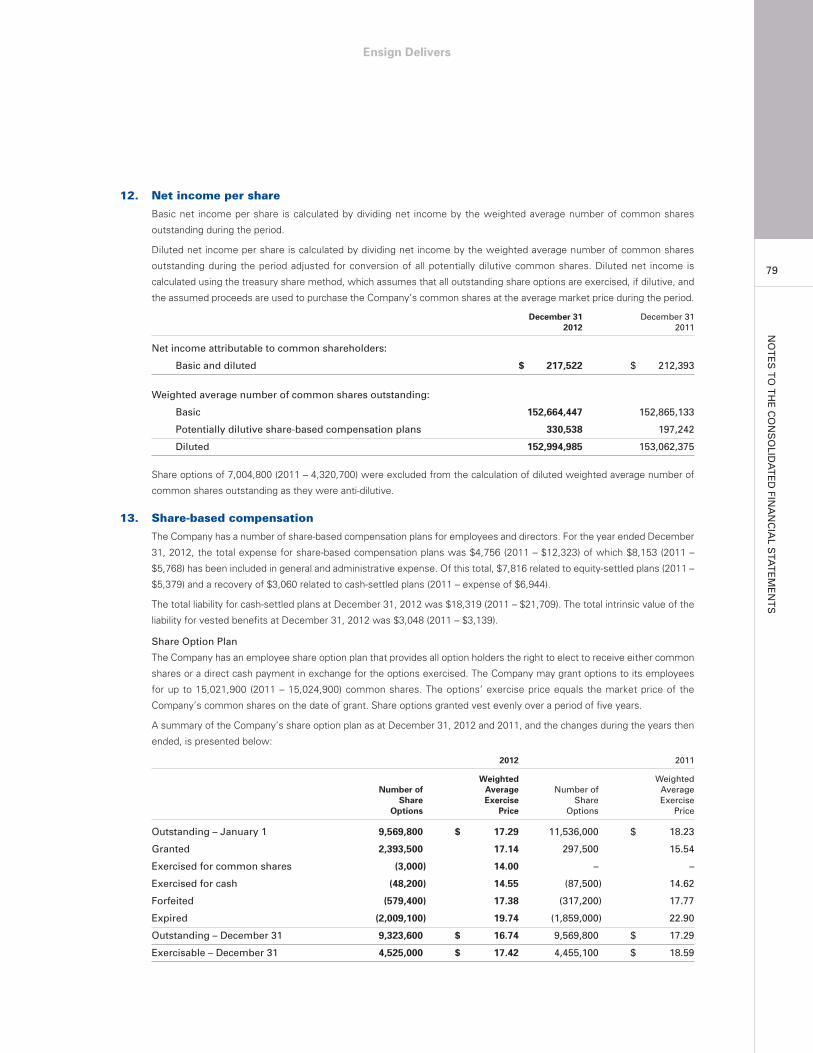
12. Net income per share
Basic net income per share is calculated by dividing net income by the weighted average number of common shares
outstanding during the period.
Diluted net income per share is calculated by dividing net income by the weighted average number of common shares
outstanding during the period adjusted for conversion of all potentially dilutive common shares. Diluted net income is
calculated using the treasury share method, which assumes that all outstanding share options are exercised, if dilutive, and
the assumed proceeds are used to purchase the Company’s common shares at the average market price during the period.
December 31 December 312012 2011
Net income attributable to common shareholders:
Basic and diluted $ 217,522 $ 212,393
Weighted average number of common shares outstanding:
Basic 152,664,447 152,865,133
Potentially dilutive share-based compensation plans 330,538 197,242
Diluted 152,994,985 153,062,375
Share options of 7,004,800 (2011 – 4,320,700) were excluded from the calculation of diluted weighted average number of
common shares outstanding as they were anti-dilutive.
13. Share-based compensation
The Company has a number of share-based compensation plans for employees and directors. For the year ended December
31, 2012, the total expense for share-based compensation plans was $4,756 (2011 – $12,323) of which $8,153 (2011 –
$5,768) has been included in general and administrative expense. Of this total, $7,816 related to equity-settled plans (2011 –
$5,379) and a recovery of $3,060 related to cash-settled plans (2011 – expense of $6,944).
The total liability for cash-settled plans at December 31, 2012 was $18,319 (2011 – $21,709). The total intrinsic value of the
liability for vested benefits at December 31, 2012 was $3,048 (2011 – $3,139).
Share Option Plan
The Company has an employee share option plan that provides all option holders the right to elect to receive either common
shares or a direct cash payment in exchange for the options exercised. The Company may grant options to its employees
for up to 15,021,900 (2011 – 15,024,900) common shares. The options’ exercise price equals the market price of the
Company’s common shares on the date of grant. Share options granted vest evenly over a period of five years.
A summary of the Company’s share option plan as at December 31, 2012 and 2011, and the changes during the years then
ended, is presented below:
2012 2011
Weighted WeightedNumber of Average Number of Average
Share Exercise Share ExerciseOptions Price Options Price
Outstanding – January 1 9,569,800 $ 17.29 11,536,000 $ 18.23
Granted 2,393,500 17.14 297,500 15.54
Exercised for common shares (3,000) 14.00 – –
Exercised for cash (48,200) 14.55 (87,500) 14.62
Forfeited (579,400) 17.38 (317,200) 17.77
Expired (2,009,100) 19.74 (1,859,000) 22.90
Outstanding – December 31 9,323,600 $ 16.74 9,569,800 $ 17.29
Exercisable – December 31 4,525,000 $ 17.42 4,455,100 $ 18.59
79
NOTES TO THE CONSOLID
ATED FIN
ANCIAL S
TATEMENTS
Ensign Delivers
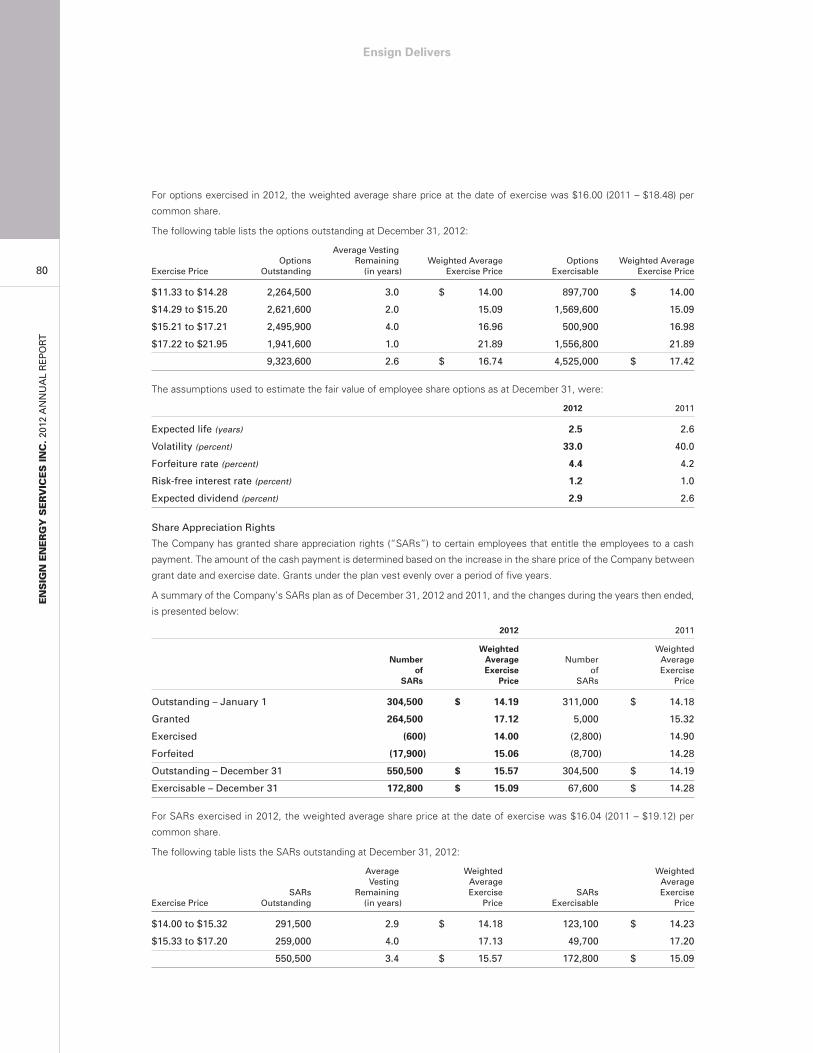
For options exercised in 2012, the weighted average share price at the date of exercise was $16.00 (2011 – $18.48) per
common share.
The following table lists the options outstanding at December 31, 2012:
Average VestingOptions Remaining Weighted Average Options Weighted Average
Exercise Price Outstanding (in years) Exercise Price Exercisable Exercise Price
$11.33 to $14.28 2,264,500 3.0 $ 14.00 897,700 $ 14.00
$14.29 to $15.20 2,621,600 2.0 15.09 1,569,600 15.09
$15.21 to $17.21 2,495,900 4.0 16.96 500,900 16.98
$17.22 to $21.95 1,941,600 1.0 21.89 1,556,800 21.89
9,323,600 2.6 $ 16.74 4,525,000 $ 17.42
The assumptions used to estimate the fair value of employee share options as at December 31, were:
2012 2011
Expected life (years) 2.5 2.6
Volatility (percent) 33.0 40.0
Forfeiture rate (percent) 4.4 4.2
Risk-free interest rate (percent) 1.2 1.0
Expected dividend (percent) 2.9 2.6
Share Appreciation Rights
The Company has granted share appreciation rights (“SARs”) to certain employees that entitle the employees to a cash
payment. The amount of the cash payment is determined based on the increase in the share price of the Company between
grant date and exercise date. Grants under the plan vest evenly over a period of five years.
A summary of the Company’s SARs plan as of December 31, 2012 and 2011, and the changes during the years then ended,
is presented below:
2012 2011
Weighted WeightedNumber Average Number Average
of Exercise of ExerciseSARs Price SARs Price
Outstanding – January 1 304,500 $ 14.19 311,000 $ 14.18
Granted 264,500 17.12 5,000 15.32
Exercised (600) 14.00 (2,800) 14.90
Forfeited (17,900) 15.06 (8,700) 14.28
Outstanding – December 31 550,500 $ 15.57 304,500 $ 14.19
Exercisable – December 31 172,800 $ 15.09 67,600 $ 14.28
For SARs exercised in 2012, the weighted average share price at the date of exercise was $16.04 (2011 – $19.12) per
common share.
The following table lists the SARs outstanding at December 31, 2012:
Average Weighted Weighted Vesting Average Average
SARs Remaining Exercise SARs Exercise Exercise Price Outstanding (in years) Price Exercisable Price
$14.00 to $15.32 291,500 2.9 $ 14.18 123,100 $ 14.23
$15.33 to $17.20 259,000 4.0 17.13 49,700 17.20
550,500 3.4 $ 15.57 172,800 $ 15.09
ENSIGN ENERGY SERVICES INC.2012 ANNUAL REP
ORT
80
Ensign Delivers
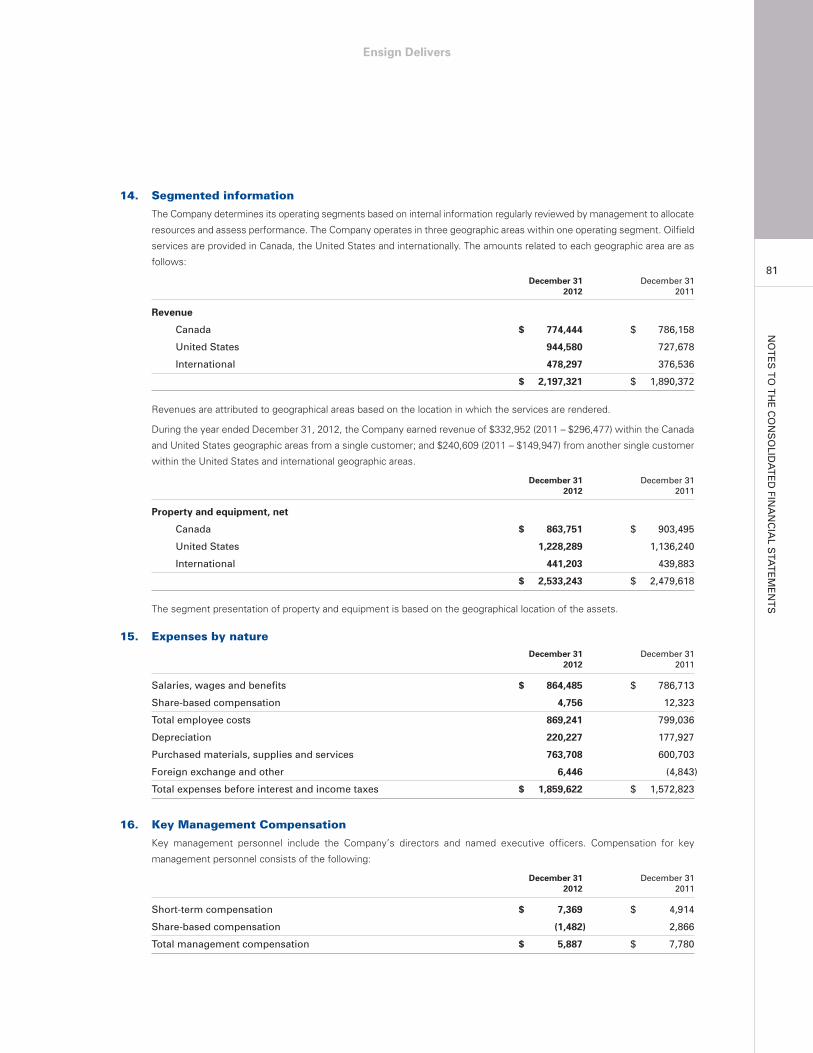
14. Segmented information
The Company determines its operating segments based on internal information regularly reviewed by management to allocate
resources and assess performance. The Company operates in three geographic areas within one operating segment. Oilfield
services are provided in Canada, the United States and internationally. The amounts related to each geographic area are as
follows:
December 31 December 312012 2011
Revenue
Canada $ 774,444 $ 786,158
United States 944,580 727,678
International 478,297 376,536
$ 2,197,321 $ 1,890,372
Revenues are attributed to geographical areas based on the location in which the services are rendered.
During the year ended December 31, 2012, the Company earned revenue of $332,952 (2011 – $296,477) within the Canada
and United States geographic areas from a single customer; and $240,609 (2011 – $149,947) from another single customer
within the United States and international geographic areas.
December 31 December 312012 2011
Property and equipment, net
Canada $ 863,751 $ 903,495
United States 1,228,289 1,136,240
International 441,203 439,883
$ 2,533,243 $ 2,479,618
The segment presentation of property and equipment is based on the geographical location of the assets.
15. Expenses by natureDecember 31 December 31
2012 2011
Salaries, wages and benefits $ 864,485 $ 786,713
Share-based compensation 4,756 12,323
Total employee costs 869,241 799,036
Depreciation 220,227 177,927
Purchased materials, supplies and services 763,708 600,703
Foreign exchange and other 6,446 (4,843)
Total expenses before interest and income taxes $ 1,859,622 $ 1,572,823
16. Key Management Compensation
Key management personnel include the Company’s directors and named executive officers. Compensation for key
management personnel consists of the following:
December 31 December 312012 2011
Short-term compensation $ 7,369 $ 4,914
Share-based compensation (1,482) 2,866
Total management compensation $ 5,887 $ 7,780
81
NOTES TO THE CONSOLID
ATED FIN
ANCIAL S
TATEMENTS
Ensign Delivers
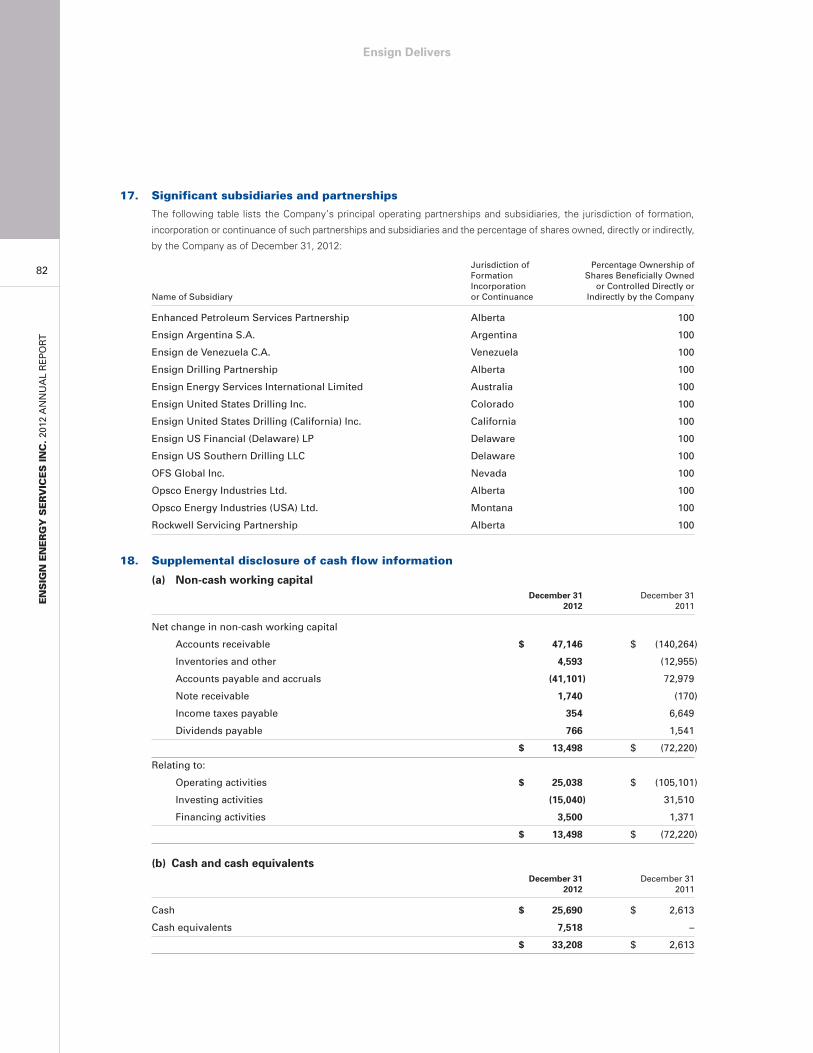
17. Significant subsidiaries and partnerships
The following table lists the Company’s principal operating partnerships and subsidiaries, the jurisdiction of formation,
incorporation or continuance of such partnerships and subsidiaries and the percentage of shares owned, directly or indirectly,
by the Company as of December 31, 2012:
Jurisdiction of Percentage Ownership ofFormation Shares Beneficially OwnedIncorporation or Controlled Directly or
Name of Subsidiary or Continuance Indirectly by the Company
Enhanced Petroleum Services Partnership Alberta 100
Ensign Argentina S.A. Argentina 100
Ensign de Venezuela C.A. Venezuela 100
Ensign Drilling Partnership Alberta 100
Ensign Energy Services International Limited Australia 100
Ensign United States Drilling Inc. Colorado 100
Ensign United States Drilling (California) Inc. California 100
Ensign US Financial (Delaware) LP Delaware 100
Ensign US Southern Drilling LLC Delaware 100
OFS Global Inc. Nevada 100
Opsco Energy Industries Ltd. Alberta 100
Opsco Energy Industries (USA) Ltd. Montana 100
Rockwell Servicing Partnership Alberta 100
18. Supplemental disclosure of cash flow information
(a) Non-cash working capitalDecember 31 December 31
2012 2011
Net change in non-cash working capital
Accounts receivable $ 47,146 $ (140,264)
Inventories and other 4,593 (12,955)
Accounts payable and accruals (41,101) 72,979
Note receivable 1,740 (170)
Income taxes payable 354 6,649
Dividends payable 766 1,541
$ 13,498 $ (72,220)
Relating to:
Operating activities $ 25,038 $ (105,101)
Investing activities (15,040) 31,510
Financing activities 3,500 1,371
$ 13,498 $ (72,220)
(b) Cash and cash equivalentsDecember 31 December 31
2012 2011
Cash $ 25,690 $ 2,613
Cash equivalents 7,518 –
$ 33,208 $ 2,613
ENSIGN ENERGY SERVICES INC.2012 ANNUAL REP
ORT
82
Ensign Delivers
19. Capital management strategy
The Company’s objectives when managing capital are to exercise financial discipline, and to deliver positive returns and
stable dividend streams to its shareholders. The Company continues to be cognizant of the challenges associated with
operating in a cyclical, commodity-based industry and may make future adjustments to its capital management strategy in
light of changing economic conditions.
The Company considers its capital structure to include shareholders’ equity, operating lines of credit and long-term debt. In
order to maintain or adjust its capital structure, the Company may from time to time adjust its capital spending or dividend
policy to manage the level of its borrowings, or may revise the terms of its operating lines of credit to support future growth
initiatives. The Company may consider additional long-term borrowings or equity financing if deemed necessary. As at
December 31, 2012, the balance of the operating lines of credit totaled $231,990 (2011 – $238,440), long-term debt totaled
$296,589 (2011 – $405,953) and shareholders’ equity totaled $1,857,958 (2011 – $1,723,422).
The Company is subject to externally imposed capital requirements associated with its operating lines of credit and long-term
debt, including financial covenants that incorporate shareholders’ equity, earnings, consolidated interest expense and level
of indebtedness. The Company monitors its compliance with these requirements on an ongoing basis and projects future
operating cash flows, capital expenditure levels and dividend payments to assess how these activities may impact compliance
in future periods. As at December 31, 2012, the Company is in compliance with all debt covenants.
20. Financial instruments
Categories of financial instruments
The classification and measurement of financial instruments is presented below:
Cash and cash equivalents, accounts receivable and note receivable are classified as financial assets at amortized cost.
Accounts payable and accruals, operating lines of credit, dividends payable and long-term debt are classified as financial
liabilities at amortized cost.
Fair values
The fair value of cash and cash equivalents, accounts receivable, operating lines of credit, accounts payable and accruals
and dividends payable approximates their carrying value due to the short-term maturity of these financial instruments.
The estimated fair values of the non-interest bearing note receivable and senior unsecured notes have been determined
based on available market information and appropriate valuation methods, including the use of discounted future cash flows
using current rates for similar instruments with similar risks and maturities. The estimated fair values of the note receivable
and senior unsecured notes approximates their carrying values.
Credit risk
Credit risk is the risk of financial loss to the Company if a customer or counterparty to a financial instrument fails to meet its
contractual obligations. Credit risk arises principally from the Company’s accounts receivable balances owing from customers
operating primarily in the oil and natural gas industry in Canada, the United States and internationally. The carrying amount
of accounts receivable and the note receivable represents the maximum credit exposure as at December 31, 2012.
The Company assesses the credit worthiness of its customers on an ongoing basis and establishes credit limits for each
customer based on external credit reports and other publicly available information, internal analysis and historical experience
with the customer. Credit limits are approved by senior management and are reviewed on a regular basis or when changing
economic circumstances dictate. The Company manages credit risk through dedicated credit resources, ongoing monitoring
and follow up of balances owing, well liens, and tightening or restriction of credit terms as required. The Company also
monitors the amount and age of accounts receivable balances on an ongoing basis. During the year ended December 31,
2012, the Company recorded an allowance for doubtful accounts of $1,178 (2011 – $3,844) to provide for balances which,
in management’s best estimate, are deemed uncollectible as at December 31, 2012. The allowance for doubtful accounts
is an estimate requiring significant judgment and may differ materially from actual results.
83
NOTES TO THE CONSOLID
ATED FIN
ANCIAL S
TATEMENTS
Ensign Delivers
Liquidity risk
Liquidity risk is the risk that the Company will not be able to meets its financial obligations as they are due. The Company
manages liquidity by forecasting cash flows on an annual basis and secures sufficient credit facilities to meet financing
requirements that exceed anticipated internally generated funds. As at December 31, 2012, the remaining contractual
maturities of accounts payable and accruals, operating lines of credit and dividends payable are less than one year. Maturity
information regarding the principal and interest on the Company’s long-term debt is as follows:
Less than After1 Year 1-3 Years 4-5 Years 5 Years Total
Senior unsecured notes $ 11,879 23,758 120,613 222,926 $ 379,176
Market risk
Market risk is the risk that changes in market prices, such as foreign exchange rates and interest rates, will affect the
Company’s net income or the value of its financial instruments.
Interest rate risk
The Company is exposed to interest rate risk with respect to its operating lines of credit which bears interest at floating
market rates. For the year ended December 31, 2012, if interest rates applicable to its operating lines of credit had been
0.25 percent higher or lower, with all other variables held constant, income before income taxes would have been $588
lower or higher (2011 – $836).
Foreign currency exchange rate risk
The Company operates internationally and is exposed to foreign exchange risk arising from various currency exposures,
primarily with respect to the United States dollar. The principal foreign exchange risk relates to the conversion of the
Company’s foreign subsidiaries from their functional currencies to Canadian dollars. At December 31, 2012, had the Canadian
dollar weakened or strengthened by $0.01 against the United States dollar, with all other variables held constant, the
Company’s foreign currency translation reserve would have been approximately $9,782 higher or lower (2011 – $9,923) and
income before income taxes would have been $1,765 higher or lower (2011 – $1,543).
The above sensitivities are limited to the impact of changes in the specified variable applied to the items noted above and
do not represent the impact of a change in the variable on the operating results of the Company taken as a whole.
21. Contingencies and Commitments
The Company has provided insurance bonds to certain government agencies in respect of the temporary importation of
equipment into that country. It is not anticipated that any material liabilities will arise from these insurance bonds.
The Company has commitments for office leases, with future minimum payments as follows:
Not later than 1 year $ 2,360
Later than 1 year not later than 5 years 2,474
Later than 5 years 478
The Company leases a number of offices under operating leases. The leases typically run for a period of two to ten years,
with an option to renew the lease after that date. Lease payments are increased throughout the lease term to reflect market
rentals.
For the year ended December 31, 2012, lease payments of $5,415 (2011 – $3,902) were recognized as an expense.
The Company is a party to various disputes and lawsuits in the normal course of its business and believes the ultimate liability
arising from these matters will have no material impact on its consolidated financial statements.
ENSIGN ENERGY SERVICES INC.2012 ANNUAL REP
ORT
84
Ensign Delivers
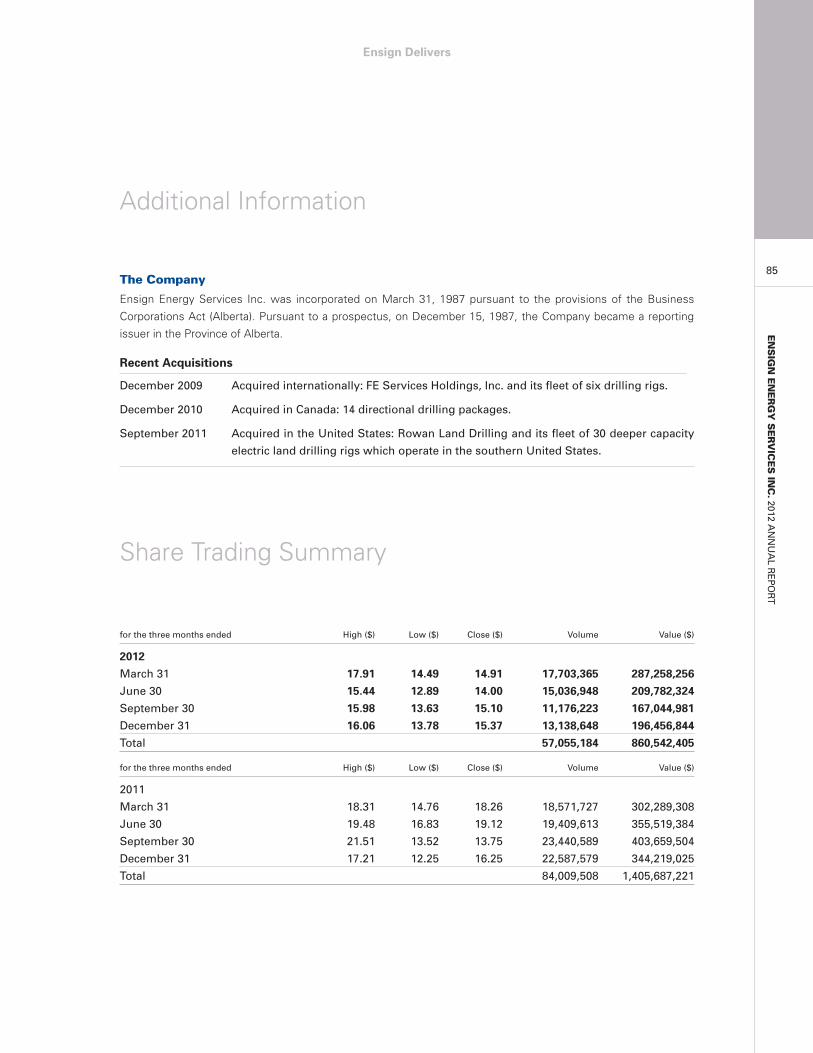
The Company
Ensign Energy Services Inc. was incorporated on March 31, 1987 pursuant to the provisions of the Business
Corporations Act (Alberta). Pursuant to a prospectus, on December 15, 1987, the Company became a reporting
issuer in the Province of Alberta.
Recent Acquisitions
December 2009 Acquired internationally: FE Services Holdings, Inc. and its fleet of six drilling rigs.
December 2010 Acquired in Canada: 14 directional drilling packages.
September 2011 Acquired in the United States: Rowan Land Drilling and its fleet of 30 deeper capacity
electric land drilling rigs which operate in the southern United States.
Additional Information
for the three months ended High ($) Low ($) Close ($) Volume Value ($)
2012
March 31 17.91 14.49 14.91 17,703,365 287,258,256
June 30 15.44 12.89 14.00 15,036,948 209,782,324
September 30 15.98 13.63 15.10 11,176,223 167,044,981
December 31 16.06 13.78 15.37 13,138,648 196,456,844
Total 57,055,184 860,542,405
for the three months ended High ($) Low ($) Close ($) Volume Value ($)
2011
March 31 18.31 14.76 18.26 18,571,727 302,289,308
June 30 19.48 16.83 19.12 19,409,613 355,519,384
September 30 21.51 13.52 13.75 23,440,589 403,659,504
December 31 17.21 12.25 16.25 22,587,579 344,219,025
Total 84,009,508 1,405,687,221
Share Trading Summary
85
ENSIGN ENERGY SERVICES IN
C.2012 A
NNUAL R
EPORT
Ensign Delivers
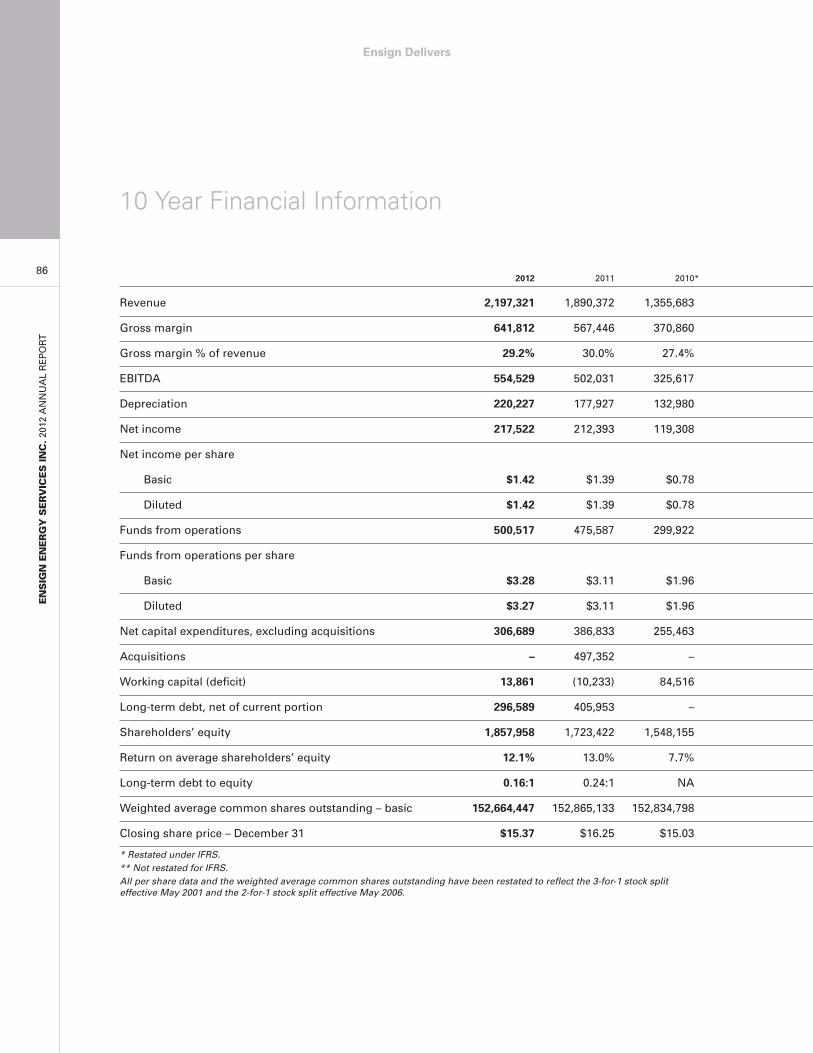
ENSIGN ENERGY SERVICES INC.2012 ANNUAL REP
ORT
2012 2011 2010*
Revenue 2,197,321 1,890,372 1,355,683
Gross margin 641,812 567,446 370,860
Gross margin % of revenue 29.2% 30.0% 27.4%
EBITDA 554,529 502,031 325,617
Depreciation 220,227 177,927 132,980
Net income 217,522 212,393 119,308
Net income per share
Basic $1.42 $1.39 $0.78
Diluted $1.42 $1.39 $0.78
Funds from operations 500,517 475,587 299,922
Funds from operations per share
Basic $3.28 $3.11 $1.96
Diluted $3.27 $3.11 $1.96
Net capital expenditures, excluding acquisitions 306,689 386,833 255,463
Acquisitions – 497,352 –
Working capital (deficit) 13,861 (10,233) 84,516
Long-term debt, net of current portion 296,589 405,953 –
Shareholders’ equity 1,857,958 1,723,422 1,548,155
Return on average shareholders’ equity 12.1% 13.0% 7.7%
Long-term debt to equity 0.16:1 0.24:1 NA
Weighted average common shares outstanding – basic 152,664,447 152,865,133 152,834,798
Closing share price – December 31 $15.37 $16.25 $15.03
* Restated under IFRS.** Not restated for IFRS.All per share data and the weighted average common shares outstanding have been restated to reflect the 3-for-1 stock split effective May 2001 and the 2-for-1 stock split effective May 2006.
10 Year Financial Information
86
Ensign Delivers
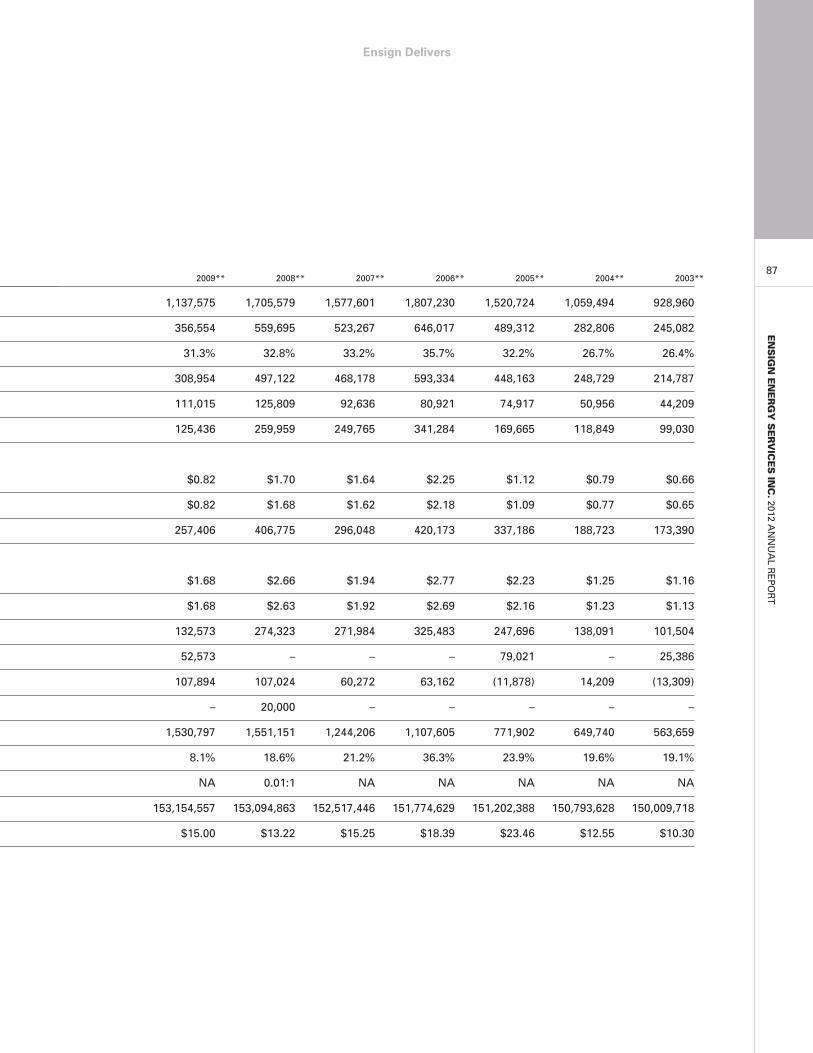
2009** 2008** 2007** 2006** 2005** 2004** 2003**
1,137,575 1,705,579 1,577,601 1,807,230 1,520,724 1,059,494 928,960
356,554 559,695 523,267 646,017 489,312 282,806 245,082
31.3% 32.8% 33.2% 35.7% 32.2% 26.7% 26.4%
308,954 497,122 468,178 593,334 448,163 248,729 214,787
111,015 125,809 92,636 80,921 74,917 50,956 44,209
125,436 259,959 249,765 341,284 169,665 118,849 99,030
$0.82 $1.70 $1.64 $2.25 $1.12 $0.79 $0.66
$0.82 $1.68 $1.62 $2.18 $1.09 $0.77 $0.65
257,406 406,775 296,048 420,173 337,186 188,723 173,390
$1.68 $2.66 $1.94 $2.77 $2.23 $1.25 $1.16
$1.68 $2.63 $1.92 $2.69 $2.16 $1.23 $1.13
132,573 274,323 271,984 325,483 247,696 138,091 101,504
52,573 – – – 79,021 – 25,386
107,894 107,024 60,272 63,162 (11,878) 14,209 (13,309)
– 20,000 – – – – –
1,530,797 1,551,151 1,244,206 1,107,605 771,902 649,740 563,659
8.1% 18.6% 21.2% 36.3% 23.9% 19.6% 19.1%
NA 0.01:1 NA NA NA NA NA
153,154,557 153,094,863 152,517,446 151,774,629 151,202,388 150,793,628 150,009,718
$15.00 $13.22 $15.25 $18.39 $23.46 $12.55 $10.30
87
ENSIGN ENERGY SERVICES IN
C.2012 A
NNUAL R
EPORT
Ensign Delivers
ENSIGN ENERGY SERVICES INC.2012 ANNUAL REP
ORT
Operating Management
Corporate
Randy MutchVice President Strategic Wellsite Technology
Cathy RobinsonVice President Global Human Resources
Jon TraskVice President Global Manufacturingand Supply Chain Management
Michelle BacanekManager, Strategic Sourcing
Reinaldo Fagundez-TiradoManager, International Taxation
Curtis FriesenGeneral Manager, HSE-Global risk Management
Dave FyhnManager Administration
Cindy HamesDirector, Global Strategic Management– Field Resources
Danielle KachanoskiAssistant Controller
Kenneth KalynchukGlobal Asset and Inventory Management
Kimberley ReidCompliance Manager
Trevor RussellManager Treasury and Financial Analysis
Siew-Peng WeldonManager Taxation
Mark YuDirector, Capital Assets
Information Technology
Murray PatonDirector of Information Technology
Stephen PloszManager – Information Services
Kirk SchroterManager – Business Systems
Ron Tolton Manager – Infrastructure
Engineering
Wayne KippSenior Vice President ADR®
Development and Capital Projects
Paul Meade-CliftVice President Engineering
Ron PettapieceVice President, ADR® Development
Sukhdeep GrewalManager, Quality Assurance
Manufacturing
Rod McBethGeneral Manager, Manufacturing –Nisku
Ian BoykoProject Manager
Wayne HansonGeneral Manufacturing Manager –Houston
Paulin KatambaContinuous Improvement Manager
Doug MacLennanFinancial Controller
Scott ParishManufacturing Manager
Procurement
Carl MillsManager Procurement Strategies
Canadian Drilling
Bob ZanussoSenior Vice President, Canadian Drilling
Frank PimiskernVice President, Sales and Marketing
Rick SimontonVice President, Sales and Marketing
Walter HopfHSE Manager
Tino PollockSenior Technical Sales Representative
Kevin TuckerSenior Technical Sales Representative
Oscar AlvarezTechnical Sales Representative
Matt CharronTechnical Sales Representative
Carter DumontTechnical Sales Representative
Jesse HuffmanTechnical Sales Representative
Kris WatkinsTechnical Sales Representative
Angela DafoeManager, Payroll
Jen SpicerManager, Human Resources
Sandi BerubeField Human Resources Manager
Donna ConleyChief Accountant
Robin DalzielBusiness System Manager
David SurridgeTraining Manager
Hank VanDrunenMaintenance Manager
88
Ensign Delivers
Champion Drilling and SE Saskatchewan
Darryl MaserGeneral Manager
Matt SchmitzOperations Manager – Champion
Paul FittonDrilling Superintendent
Todd FritzDrilling Superintendent
Dave GreenDrilling Superintendent
Glen NielsenSafety Coordinator
Rick MannOperations Manager – SASK
Wade BensonDrilling Superintendent – SASK
Brad MayerDrilling Superintendent – SASK
Daniel ShoemakerDrilling Superintendent – SASK
Derek SmithDrilling Superintendent – SASK
Ensign Canadian Drilling
Roch CurrierGeneral Manager
Scott HaggartOperations Manager – Plains
Dale LeitnerOperations Manager – Rockies
Curtis DukDrilling Superintendent
Mark HagenDrilling Superintendent
Ed MattieDrilling Superintendent
Kirby ProsavichDrilling Superintendent
Brian SteevesDrilling Superintendent
Ryan ForsytheEquipment Manager
Mike L’HirondelleTubular Manager
Zol SzirakiTop Drive Superintendent
Jan BadinSafety Manager
Dennis SteinhublField Safety Coordinator
Holly SchmidtField Safety Supervisor
Encore Coring and Drilling
Tom ConnorsVice President, Encore
Glenn ThiessenProject Manager, Oil Sands
Wilf SwanOperation Manager
Frank BeatonDrilling Superintendent
Tom GrossDrilling Superintendent
Darren ToblerDrilling Superintendent
Mike EtienneSales Manager
Ensign Directional Services
Tony VisottoGeneral Manager
Mike GowOperations Manager
Rockwell Servicing
Bryan TothSenior Vice President, Canadian Well Services
William KiddGeneral Manager
Jeff HallwachsSoutheast Area Manager
Cameron BallNorthwest Area Manager
R.J. TothSales Manager
Wayne LawsonSenior Sales Representative
Eric PearsField Sales Representative
Rene LaRouchelleTechnical Sales Representative
Daryl SutherlandTechnical Sales Representative
Tony SorensenField Safety Coordinator
Kevin RudellStation Manager, Ardmore
Kevin DesjarlaisField Superintendent
Daniel EvansField Superintendent
Richard NobertField Superintendent
Jason SikorskiField Superintendent
Kris VopniStation Manager, Brooks
Chad MalischewskiStation Manager, Estevan
Craig SchadField Superintendent
Don HouseStation Manager, Grande Prairie
Shane MorrisField Superintendent
Roger SniderStation Manager, Lloydminster
Miles KosterivaField Superintendent
Jason PollomField Superintendent
Abe ShihinskiStation Manager, Nisku and Red Deer
Doug SomersField Superintendent
Diane MasseyChief Accountant
89
ENSIGN ENERGY SERVICES IN
C.2012 A
NNUAL R
EPORT
Ensign Delivers
ENSIGN ENERGY SERVICES INC.2012 ANNUAL REP
ORT
Opsco Energy Industries
Bob DearVice President and General Manager
Randy ReschkeGeneral Manager, Production Testing
Don KleisingerOperations Manager, Wireline
Jim BucekSafety Coordinator
Ron GallantCanadian Operations Manager, Production Testing
Jeff SchoenhalsSales Manager
Richard KlymokSenior Sales Representative
Peter SchmeilerTraining Manager, Testing Division
Darwin WanvigAsset Manager
Yvonne CoveyChief Accountant
Enhanced Petroleum Services
Jack HoustonVice President and General Manager
Jason DarrowGeneral Manager, Chandel Equipment Rentals
Wilson BorchersStation Manager, Chandel EquipmentRentals – Red Deer
Kevin LauritsenStation Manager, Chandel EquipmentRentals – Oxbow
Fred SlobodianStation Manager, Chandel EquipmentRentals – Whitecourt, Grande Prairie,Edson and Brooks
Robin FinleyGeneral Manager, Enhanced Drill Systems
James DuffOperations Manager, Enhanced Drill Systems
Terrance BotaSafety Coordinator
Yvonne CoveyChief Accountant
Ensign United States Drilling(Northern)
Tom SchledwitzSenior Vice President, United States Operations
Jim McCathronVice President, Operations
Tuss EricksonDirector, Health, Safety and Environment and Human Resources
Frank AmosHealth, Safety and Environment Field Manager
Holli DiamantaraManager, Human Resources
Chris MaxwellStrategic Sourcing Manager
Greg BurtonBusiness Development
Steve HuntFinancial Controller
Jake BickingChief Accountant
Ensign United States Drilling(Rocky Mountain Region)
John StoddardVice President, Directional Support Services
Don EricksonArea Manager
Hugh GibersonArea Manager
Bob HeilArea Manager
Larry SwisherArea Manager
Don MolenSenior Drilling Manager
K.L. TippsSenior Drilling Manager
Ryan HesslerDrilling Manager
Ken KeiserDrilling Manager
Brandon LorenzDrilling Manager
Matthew McEwanDrilling Manager
Tuss Erickson IIIDrilling Engineer
Mel CurtisEquipment Manager
Andy KiddTrucking Manager
Blane StarkeyMaintenance Manager
Ensign United States Drilling(California Region)
Larry LorenzArea Manager
Rick DannisDrilling Manager
Brian WattsDrilling Manager
Kerry FladelandDrilling Superintendent
Don FogleDrilling Superintendent
Stuart SnyderChief Accountant
Ensign United States Drilling(Southern)
Michael NussSenior Vice President
Daniel PattersonVice President and General Manager
Mike PierceSenior Marketing Director
Troy BlackburnArea Manager
David CoxArea Manager
Jackie CraderDrilling Superintendent
Timothy DingmanDrilling Superintendent
James FontenberryDrilling Superintendent
Dale MorganDrilling Superintendent
James OdomDrilling Superintendent
90
Ensign Delivers
OPERATING M
ANAGEMENT
Carlos RamerizDrilling Superintendent
Grant SorrellDrilling Superintendent
Todd Keller Marketing Director
Oscar AcostaTop Drive Manager
William DarbyMechanical and Shop Manager
Tanya HernandezHuman Resources Manager
Jason JensonManager, Health Safety and Environment
Steven SandersElectrical Manager
Luis BonsembianteFinancial Controller
Crystal MilsapsChief Accountant
Ensign Well Services
Bill RoperVice President, Well Services
Graham KlaiberDistrict Manager, California Region
Tim RobelDistrict Manager, Rocky Mountain Region
Opsco Energy Industries (USA)
Chad BrownGeneral Manager
Clay MorrisOperations Manager
Jacob CellmerArea Manager, Rockies
Justin Grimes,Area Manager, South Texas and Appalachia
Rodney NissenTechnical Field Sales Representative
International Oilfield Services –East
Gene GazSenior Vice President, InternationalEast Operations
John BushellVice President, International East Contract and Marketing
Doug LaneOperations Manager – Australia
Geoff PickfordOperations Manager – Middle East andNorth Africa
Gerry WestOperations Manager – Southeast Asia,New Zealand, Gabon and UAE
Dean HillsCountry Manager – Europe
Paul JonesCountry Manager – New Zealand
Ed MilneCountry Manager – Southeast Asia
Adrian NicolescuCountry Manager – Gabon
Travis BeinkeCommercial Manager
Bill BrentzellGeneral Manager – Projects
Andrew SmithCommercial Manager – Corporate
Adam WattsArea Manager, Coal Seam Methaneand Well Servicing Division, Australia
Andrew DolmanFinancial Controller
Kim TuManager, International Accounting
David GrantManager, Health, Safety and Environment
Matt HutchinsSupply Manager
David KerrHuman Resources Manager
International Oilfield Services –West
Michael NussSenior Vice President
Paul ThompsonArea Manager – Latin America
Ricardo Lopez OlacireguiGeneral Manager – Argentina
Eduardo CarbiaOperations Manager – Argentina
Shaun DoupeOperations Manager – Venezuela
Frank HutchinsonOperations Manager – Venezuela
Anthony BelgroveInternational Manager, Procurementand Supply
Mike McClanahanPurchasing Manager
Jorge MicolichBusiness Development Manager
Luis BonsembianteFinancial Controller
91
Ensign Delivers
ENSIGN ENERGY SERVICES INC.2012 ANNUAL REP
ORT
Corporate and Field Offices
Canadian Operations
Ensign Drilling Partnership1000, 400 – 5th Avenue SWCalgary, AB T2P 0L6Telephone: (403) 262-1361Facsimile: (403) 262-8215
Engineering/Manufacturing/Procurementdivisions of Ensign Drilling Partnership2000 – 5th StreetNisku, AB T9E 7X3Telephone: (780) 955-8808Facsimile: (780) 955-7208
Ensign Canadian Drillinga division of Ensign Drilling Partnership2000 – 5th Street Nisku, AB T9E 7X3Telephone: (780) 955-8808Facsimile: (780) 955-7208
Champion Drillinga division of Ensign Drilling Partnership1 Tree RoadP.O. Box 1090Brooks, AB T1R 1B9Telephone: (403) 362-4400Facsimile: (403) 793-8686Toll Free: (888) 362-4499
Ensign Canadian Drilling SASKa division of Ensign Drilling PartnershipOxbow Office#1 Highway 18Box 659Oxbow, SK S0C 2B0Telephone: (306) 483-5132Facsimile: (306) 483-2937Toll Free: (866) 533-6335
Ensign Directional Servicesa division of Ensign Drilling Partnership#14, 10672-46th Street SECalgary, AB T2C 1G1Telephone: (403) 290-1570Facsimile: (403) 287-8104
Encore Coring & Drillinga division of Ensign Drilling Partnership1345 Highfield Crescent SE Calgary, AB T2G 5N2Telephone: (403) 287-0123Facsimile: (403) 243-6158Toll Free: (877) 445-2963Toll Free Fax: (888) 443-5446
Recruitment Centre2001 – 4th StreetNisku, AB T9E 7W6Telephone: (780) 955-6168Toll Free: (888)-367-4460Facsimile: (780) 955-6160
Enhanced Petroleum ServicesPartnership1000, 400 – 5th Avenue SWCalgary, AB T2P 0L6Telephone: (403) 262-1361Facsimile: (403) 262-8215
Enhanced Drill Systemsa division of Enhanced Petroleum Services Partnership1000, 400 – 5th Avenue SWCalgary, AB T2P 0L6Telephone: (403) 262-1361Facsimile: (403) 264-9376
Chandel Equipment Rentalsa division of Enhanced Petroleum Services Partnership1000, 400 – 5th Ave SWCalgary, AB T2P 0L6Telephone: (403) 262-1361Facsimile: (403) 264-9376
Brooks Office1 Tree RoadP.O. Box 1090Brooks, AB T1R 1B9Telephone: (403)793-1138Facsimile: (403) 264-9376
Edson Office#14, 53304RR-170 Mizera subdivisionEdson, ABTelephone: (780) 723-1593Facsimile: (780) 778-6184
Grande Prairie Office14420 – 95 StreetGrande Prairie, AB T8V 7V6Telephone: (780) 518-4907Facsimile: (780) 357-9329
Oxbow Office865 Prospect AvenueHwy 18 East, Box 1079Oxbow, SK S0C 2B0Telephone : (306) 483-2515Facsimile: (306) 483-2815Toll Free: (866) 533-6335
Red Deer OfficeBlindman Industrial Park5398 – 39139 Hwy. 2A Red Deer, AB T4S 2B3 Telephone: (403) 314-1637 Facsimile: (403) 346-3099Toll Free: (877) 677-6500
Whitecourt Office5907 – 45th Avenue Whitecourt, AB T7S 1P2 Telephone: (780) 778-6101 Facsimile: (780) 778-6184Toll Free: (877)478-6101
Rockwell Servicing Partnership1000, 400 – 5th Avenue SWCalgary, AB T2P 0L6Telephone: (403) 265-6361Facsimile: (403) 262-0026
Ardmore OfficeR.R. 440, Hwy 28 Box 355Ardmore, AB T0A 0B0Telephone: (780) 826-6464Facsimile: (780) 826-4305
Brooks OfficeBox 697Brooks, AB T0J 0J0Telephone: (403) 362-3346Facsimile: (403) 362-6069
Estevan OfficeBox 549Estevan, SK S4A 2A5Telephone: (306) 634-5522Facsimile: (306) 634-3238
92
Ensign Delivers

Grande Prairie Office14011 – 97th AvenueGrande Prairie, AB T8V 7B6Telephone: (780) 539-6736Facsimile: (780) 539-1993
Lloydminster Office6302 – 53rd AvenueLloydminster, AB T9V 2E2Telephone: (780) 875-5278Facsimile: (780) 875-6402
Nisku Office2105 - 8th StreetNisku, AB T9E 7Z1 Telephone: (780) 955-7066 Facsimile: (780) 955-7811
Red Deer Office4212-39139, Hwy 2ARed Deer, AB T4S 2A8Telephone: (403) 346-6175Facsimile: (403) 343-6061
Opsco Energy Industries Ltd.1000, 400 – 5th Avenue SWCalgary, AB T2P 0L6Telephone: (403) 265-6361Facsimile: (403) 262-0026
Dawson Creek Office 203, 10504 – 10th StreetDawson Creek, BC. V1G 1X0Telephone: (250) 782-7296Facsimile: (250) 782-9308
Fort St. John Office 8708 – 101st StreetFort St. John, BC V1J 5K5Telephone: (250) 785-3698Facsimile: (250) 785-0461
Grande Prairie Office 14011 – 97th AvenueGrande Prairie, AB T8V 7B6Telephone: (780) 539-0703 (Testing)Telephone: (780) 539-0449 (Wireline)Facsimile: (780) 532-8447
Onoway Office Loomis Drop OffOnoway, AB T0E 1V0Telephone: (780) 967-5446Facsimile: (780) 967-3547
Rainbow Lake Office #10 Del Rio StreetRainbow Lake, AB T0H 2Y0Telephone: (780) 956-2766Facsimile: (780) 956-2769
United States Operations
Ensign United States Drilling Inc.1700 Broadway, Suite 777Denver, CO 80290 USATelephone: (303) 292-1206Toll Free: (866) 866-8739Toll Free Fax: (800) 886-3898
Casper Field OfficeMailing:Box 69 MillsCasper, WY 82644 USAPhysical Address:2100 Seven Mile RoadCasper, WY 82604 USATelephone: (307) 234-2299 or 3563Facsimile: (307) 234-2226
Williston Field OfficeMailing:PO Box 846Williston, ND 58802 USAPhysical Address:5075 – 141st Street N.Williston, ND 58801 USATelephone: (701) 572-0131Facsimile: (701) 572-0447Message Center: (701) 774-0331
Jonah Truckinga division of Ensign United StatesDrilling Inc.22 Wilkens Peak Dr.PO Box 9Rock Springs, WY 82901 USATelephone: (307) 362-1937 or (307)705-1667Facsimile: (307) 705-1175
LaSalle Truckinga division of Ensign United StatesDrilling Inc.Mailing:PO Box 670LaSalle, CO 80645 USAPhysical Address:18287 County Road 394LaSalle, CO 80645 USATelephone: (970) 284-6977Facsimile: (970) 284-6970
Ensign Well Servicesa division of Ensign United StatesDrilling Inc.1700 Broadway, Suite 777Denver, CO 80290 USATelephone: (303) 292-1206Toll Free: (866) 866-8739Toll Free Fax: (800) 886-3898
LaSalle Well Services Field Office24020 WCR 46LaSalle, CO 80645 USATelephone: (303) 659-3109 or (970) 284-6006Facsimile: (303) 659-6842
Ensign Directional Drilling Servicesa division of Ensign United StatesDrilling Inc.1700 Broadway, Suite 777Denver, CO 80290 USATelephone: (303) 292-1206Toll Free: (866) 866-8739Toll Free Fax: (800) 886-3898
Rocky Mountain Oilfield Rentalsa division of Ensign United StatesDrilling Inc.1700 Broadway, Suite 777Denver, CO 80290 USATelephone: (303) 292-1206Toll Free: (866) 866-8739Toll Free Fax: (800) 886-3898
Rocky Mountain Oilfield RentalsField Office200 S 2nd Street, Unit 2LaSalle, CO 80645 USATelephone: (970) 284-6685 or (970) 284-0968Facsimile: (970) 284-6682
Ensign United States Drilling(California) Inc.7001 Charity AvenueBakersfield, CA 93308 USATelephone: (661) 589-0111Toll Free: (800) 443-5925Facsimile: (661) 589-0283
Woodland Field Office 13975 County Road 97FWoodland, CA 95695 USATelephone: (530) 668-1295Facsimile: (530) 668-1254
93
ENSIGN ENERGY SERVICES IN
C.2012 A
NNUAL R
EPORT
Ensign Delivers
ENSIGN ENERGY SERVICES INC.2012 ANNUAL REP
ORT
Ensign California Well ServicesA division of Ensign United StatesDrilling (California) Inc.3701 Fruitvale Ave.Bakersfield, CA 93308 USATelephone: (661) 387-8400Facsimile: (661) 387-8028
California Well Services Field Office17750 State Highway 113Robbins, CA 95676 USATelephone: (530) 738-4028Facsimile: (530) 738-4139
West Coast Oilfield Rentalsa division of Ensign United StatesDrilling (California) Inc.7001 Charity AvenueBakersfield, CA 93308 USATelephone: (661) 589-0111Toll Free: (800) 443-5925Facsimile: (661) 589-0283
Chandel Equipment Rentals (USA) Inc.5075 – 141 Avenue NorthWilliston, ND58801 USATelephone: (888) 488-8933
Ensign US Southern Drilling LLC450 Gears Rd., Suite 777Houston, TX 77065 USATelephone: (281) 872-7770Facsimile: (281) 872-4700
Opsco Energy Industries (USA) Ltd.1700 Broadway, Suite 777Denver, CO 80290 USATelephone: (855) 256-7726Toll Free Fax: (877) 275-5918
Casper Office130 West CollinsCasper, WY 82601 USATelephone: (307) 265-4470Facsimile: (307) 537-3864
South Texas Office 1713 Hwy. 97 EPleasanton, TX. 78064Telephone: (830) 569-4242
Williamsport Office25 West Third Street, Suite 501Williamsport, PA 17701 USATelephone: (570) 601-4079Facsimile: (570) 505-1180
International Operations
Ensign Energy Services International Limited(Eastern Hemisphere Division)15 – 17 Westport RoadEdinburgh NorthSA 5113Australia Telephone: 011 61 8 8255 3011Facsimile: 011 61 8 8252 0272
Gabon OfficeBP 305 GambaGabonTelephone: 011 241 558481Facsimile: 011 241 558044
Jersey Office1 Highview CourtLa Rue de la PointeSt Peter, Jersey JE3 7YETelephone: 44 1534 485851Facsimile: 44 1534 485911
Libya OfficeTajouraBir Elousta MiladPO Box 30555Tripoli GSPLAJTelephone: 011 218 21 369 3212Facsimile: 011 218 21 369 2663
New Zealand OfficeLot 50 De Havilland DriveBell BlockNew Plymouth, New ZealandTelephone: 011 64 6755 1261Facsimile: 011 64 6755 1865
Oman OfficePO Box 137Postal Code 134J. A’ShatiSultanate of OmanTelephone: 011 968 2457 1886Facsimile: 011 968 2457 1840
Perth OfficeSubiaco Business Centre531 Hay StreetSubiaco, WA 6008AustraliaTelephone: 011 61 8 9380 8321Facsimile: 011 61 8 9380 8300
Toowoomba Office461 Greenwattle StreetToowoomba, QLD 4350AustraliaTelephone: 011 61 7 4699 1888Facsimile: 011 61 7 4699 1800
Ensign International EnergyServices Inc.(Latin America Division)450 Gears Rd., Suite 777Houston, TX 77065 USATelephone: (281) 872-7770Facsimile: (281) 872-4700
Ensign de Venezuela C.A.Av. España Ensign Nro. S/NSector Pueblo Nuevo El Tigre, Edo. Anzoategui Venezuela, S.A. 6050Telephone: 011 58 283 500 5000Facsimile: 011 58 283 500 5004
Ensign Argentina S.A.Cerrito 836 Piso 9 C1010AAR Ciudad Autónoma de Buenos AiresArgentina, S.A.Telephone: 011 54 11 4816 0067Facsimile: 011 54 11 4816 5388
Neuquen OfficeParque Industrial Neuquen Manzana 3 – Lotes 16,17,23 y 24Neuquen CapitalArgentina, S.A. 8300Telephone: 011 54 299 448 7048Facsimile: 011 54 299 442 4122Message Center: (701) 774-0331
FE Services Holdings, Inc.450 Gears Rd., Suite 777Houston, TX 77056Telephone: (281) 872-7770Facsimile: (281) 872-4700
OFS Global Inc.5308 Oates Rd.Houston, Texas 77013Telephone: (281) 872-7770Facsimile: (281) 875-8666
94
Ensign Delivers
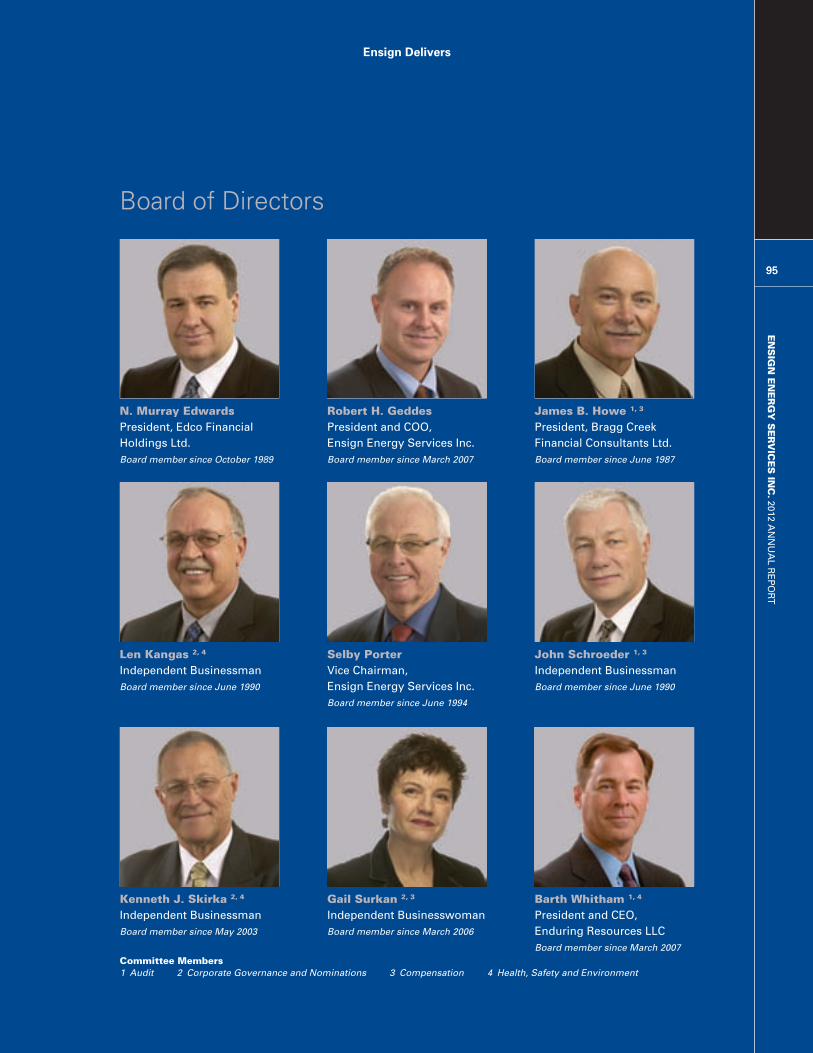
ENSIGN ENERGY SERVICES IN
C.2012 A
NNUAL R
EPORT
95
N. Murray EdwardsPresident, Edco Financial Holdings Ltd.Board member since October 1989
Robert H. GeddesPresident and COO, Ensign Energy Services Inc.Board member since March 2007
James B. Howe 1, 3
President, Bragg Creek Financial Consultants Ltd.Board member since June 1987
Len Kangas 2, 4
Independent BusinessmanBoard member since June 1990
Selby PorterVice Chairman, Ensign Energy Services Inc.Board member since June 1994
John Schroeder 1, 3
Independent BusinessmanBoard member since June 1990
Kenneth J. Skirka 2, 4
Independent BusinessmanBoard member since May 2003
Gail Surkan 2, 3
Independent BusinesswomanBoard member since March 2006
Barth Whitham 1, 4
President and CEO, Enduring Resources LLCBoard member since March 2007
Committee Members1 Audit 2 Corporate Governance and Nominations 3 Compensation 4 Health, Safety and Environment
Board of Directors
95
Ensign Delivers
ENSIGN ENERGY SERVICES INC.2012 ANNUAL REP
ORT
Corporate Information
Corporate Management
N. Murray EdwardsChairman
Selby PorterVice Chairman
Robert H. GeddesPresident and Chief Operating Officer
Ed KautzExecutive Vice President United States and International Operations
Glenn DagenaisExecutive Vice President Financeand Chief Financial Officer
Timothy LemkeVice President Finance
Rob WilmanVice President Health, Safety and Environment
Noel LumsdenCorporate Controller
Suzanne DaviesGeneral Counsel and Corporate Secretary
Head Office1000, 400 – 5th Avenue S.W.Calgary, AB T2P 0L6Telephone: (403) 262-1361Facsimile: (403) 262-8215Email: [email protected]: www.ensignenergy.com
BankersHSBC Bank CanadaRoyal Bank of Canada
Stock Exchange ListingToronto Stock ExchangeSymbol: ESI
AuditorsPricewaterhouseCoopers LLP
Legal CounselBurnet, Duckworth & Palmer LLP
Transfer AgentComputershare Trust Company of Canada
Notice of Annual General MeetingEnsign Energy Services Inc.’s Annual Meeting of Shareholderswill be held on Wednesday, May 15, 2013, at 3 pm MDT at theCalgary Petroleum Club, 319 – 5th
Avenue S.W., Calgary, Alberta. Allshareholders are invited to attend,but if unable, we request the formof proxy be signed and returned.
96
Ensign Delivers
Writing: Fraser Communications Inc.Design and Production: Mike Grant Design Inc.
Printed in Canada by RR Donnelley


www.ensignenergy.com
“Performance Excellence – Second to None”


![1986-12-25 - Newport Harbor Ensign[Icon]](https://static.fdokumen.com/doc/165x107/631b1d25f6a8ee1ff700a4c5/1986-12-25-newport-harbor-ensignicon.jpg)