TSX_DOL_2009.pdf - AnnualReports.com
70
providing great value every day on every dollar Annual Report 2009
-
Upload
khangminh22 -
Category
Documents
-
view
2 -
download
0
Transcript of TSX_DOL_2009.pdf - AnnualReports.com
providing great value every day on every dollar
Annual Report 2009
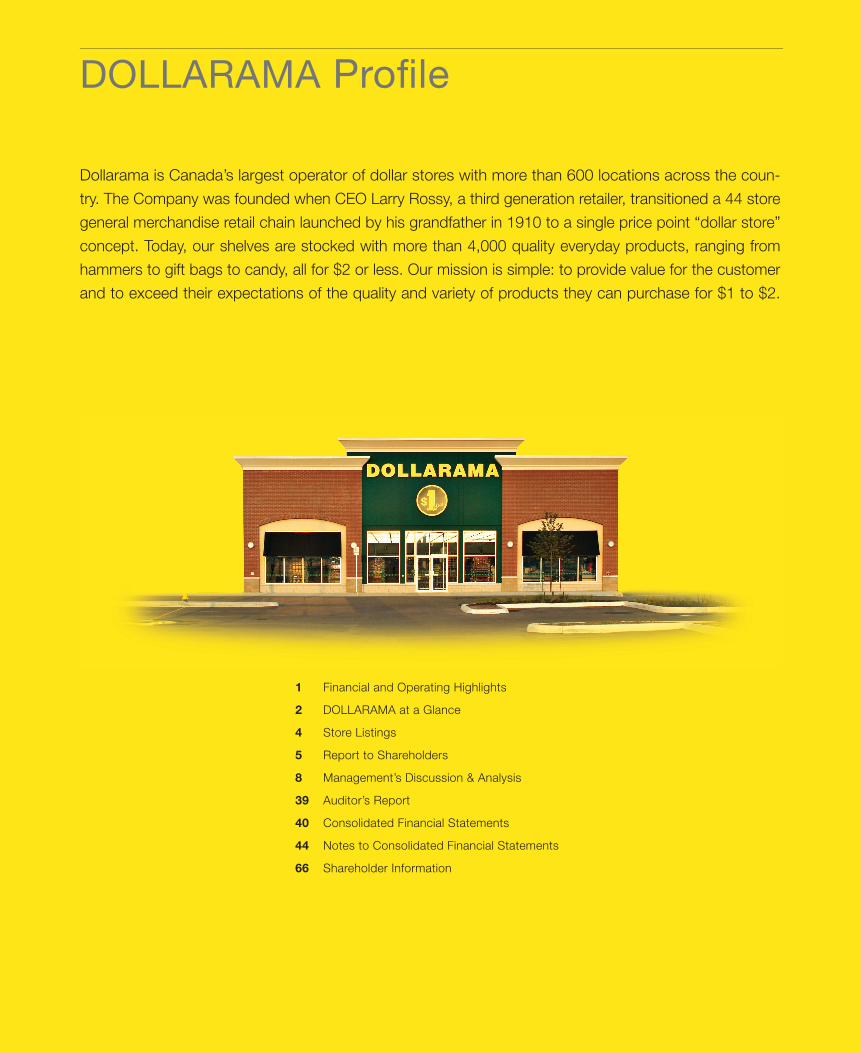
DOLLARAMA Profi le
Dollarama is Canada’s largest operator of dollar stores with more than 600 locations across the coun-
try. The Company was founded when CEO Larry Rossy, a third generation retailer, transitioned a 44 store
general merchandise retail chain launched by his grandfather in 1910 to a single price point “dollar store”
concept. Today, our shelves are stocked with more than 4,000 quality everyday products, ranging from
hammers to gift bags to candy, all for $2 or less. Our mission is simple: to provide value for the customer
and to exceed their expectations of the quality and variety of products they can purchase for $1 to $2.
1 Financial and Operating Highlights
2 DOLLARAMA at a Glance
4 Store Listings
5 Report to Shareholders
8 Management’s Discussion & Analysis
39 Auditor’s Report
40 Consolidated Financial Statements
44 Notes to Consolidated Financial Statements
66 Shareholder Information
1
DO
LL
AR
AM
A IN
C. A
NN
UA
L R
EP
OR
T 2
00
9
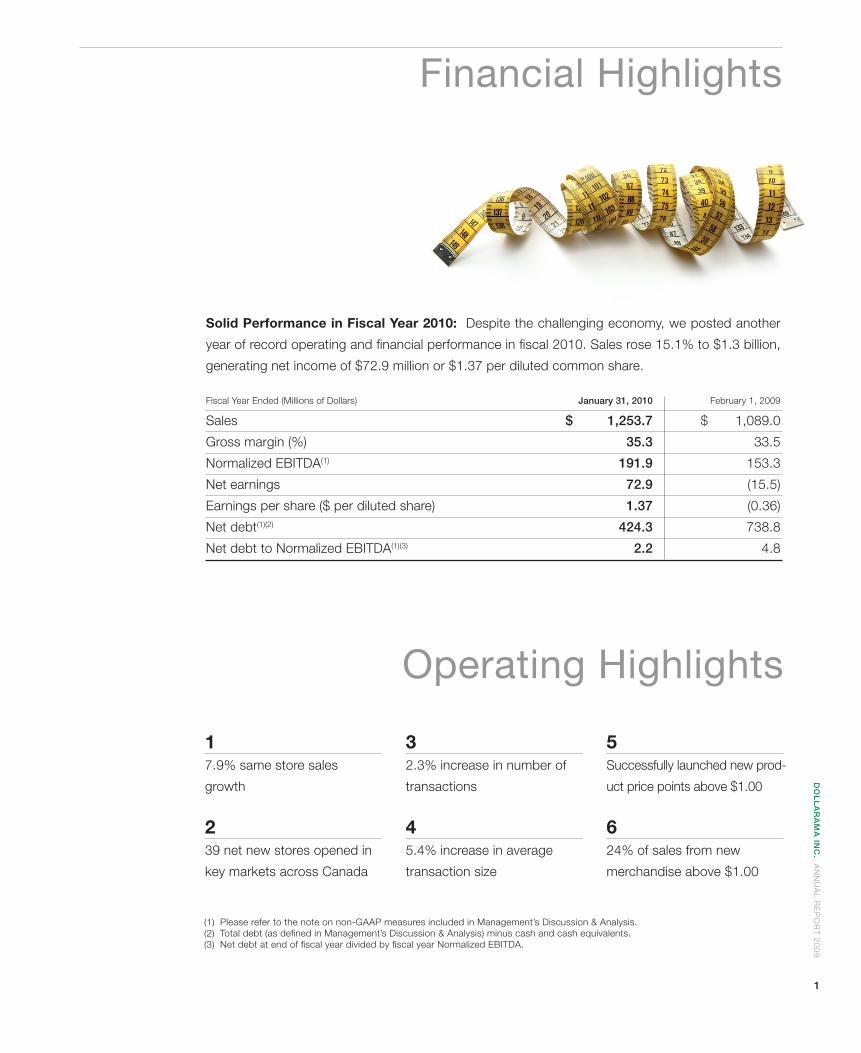
Financial Highlights
Fiscal Year Ended (Millions of Dollars) January 31, 2010 February 1, 2009
Sales $ 1,253.7 $ 1,089.0
Gross margin (%) 35.3 33.5
Normalized EBITDA(1) 191.9 153.3
Net earnings 72.9 (15.5)
Earnings per share ($ per diluted share) 1.37 (0.36)
Net debt(1)(2) 424.3 738.8
Net debt to Normalized EBITDA(1)(3) 2.2 4.8
Solid Performance in Fiscal Year 2010: Despite the challenging economy, we posted another
year of record operating and fi nancial performance in fi scal 2010. Sales rose 15.1% to $1.3 billion,
generating net income of $72.9 million or $1.37 per diluted common share.
Operating Highlights
17.9% same store sales
growth
239 net new stores opened in
key markets across Canada
32.3% increase in number of
transactions
45.4% increase in average
transaction size
5Successfully launched new prod-
uct price points above $1.00
624% of sales from new
merchandise above $1.00
(1) Please refer to the note on non-GAAP measures included in Management’s Discussion & Analysis.(2) Total debt (as defi ned in Management’s Discussion & Analysis) minus cash and cash equivalents.(3) Net debt at end of fi scal year divided by fi scal year Normalized EBITDA.
2
DO
LL
AR
AM
A I
NC
. A
NN
UA
L R
EP
OR
T 2
00
9
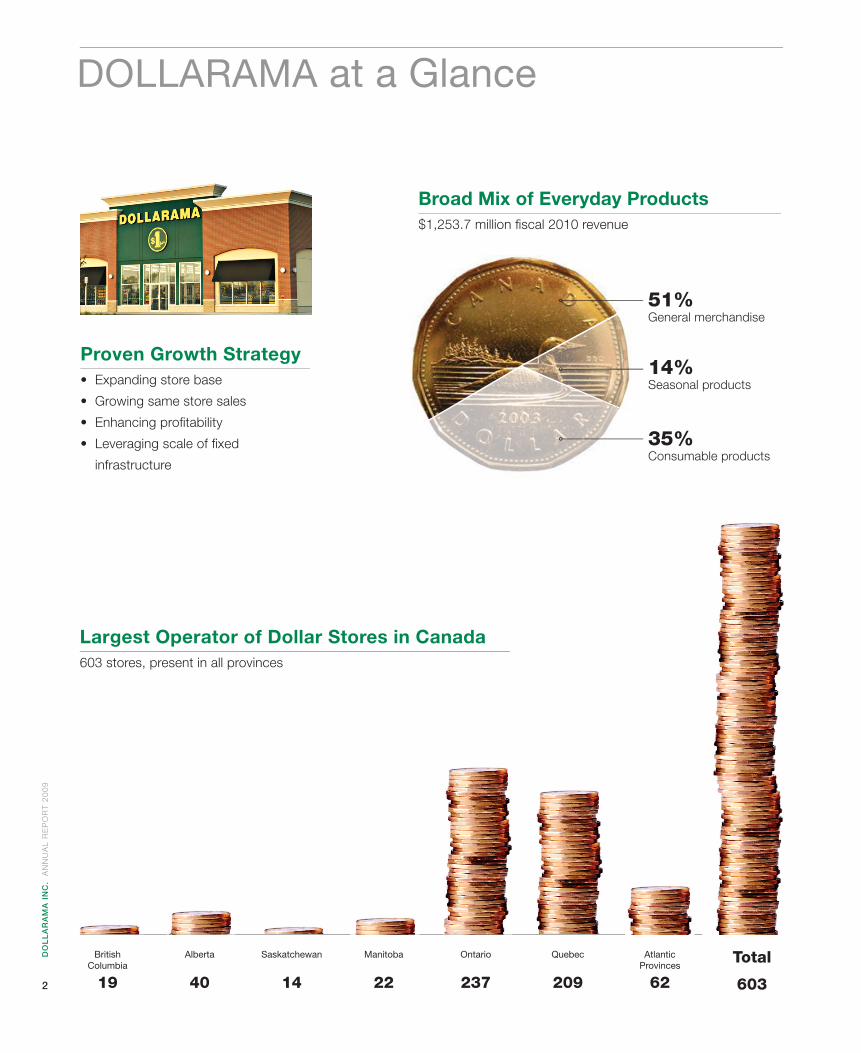
BritishColumbia
19
Alberta
40
Saskatchewan
14
Manitoba
22
Ontario
237
Quebec
209
AtlanticProvinces
62
Total
603
Largest Operator of Dollar Stores in Canada603 stores, present in all provinces
DOLLARAMA at a Glance
Proven Growth Strategy• Expanding store base
• Growing same store sales
• Enhancing profi tability
• Leveraging scale of fi xed
infrastructure
Broad Mix of Everyday Products$1,253.7 million fi scal 2010 revenue
51% General merchandise
14% Seasonal products
35%Consumable products
3
DO
LL
AR
AM
A IN
C. A
NN
UA
L R
EP
OR
T 2
00
9
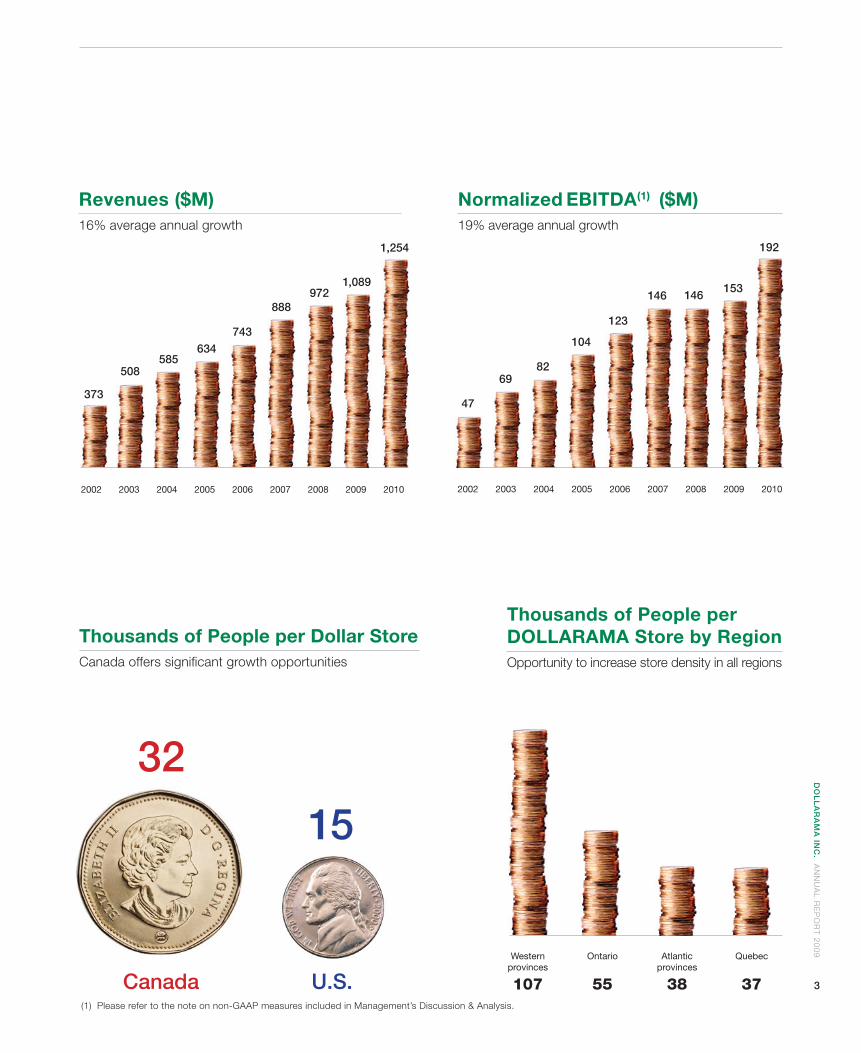
32
15
Canada U.S.
Thousands of People per Dollar StoreCanada offers signifi cant growth opportunities
Thousands of People perDOLLARAMA Store by RegionOpportunity to increase store density in all regions
Normalized EBITDA(1) ($M)19% average annual growth
Revenues ($M)16% average annual growth
2002 2003 2004 2005 2006 2007 2008 2009 2010
47
6982
104
123
146 146153
192
2002 2003 2004 2005 2006 2007 2008 2009 2010
373
508585
634743
888972
1,089
1,254
Western provinces
107
Ontario
55
Atlantic provinces
38
Quebec
37(1) Please refer to the note on non-GAAP measures included in Management’s Discussion & Analysis.
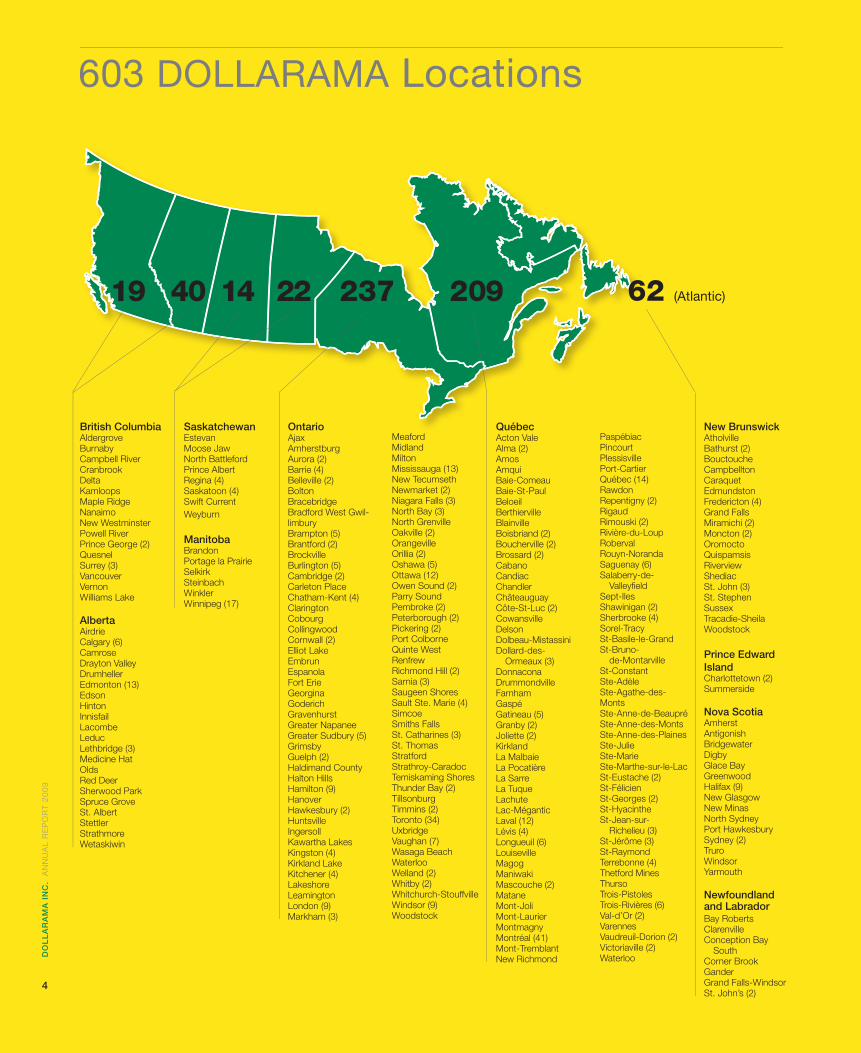
603 DOLLARAMA Locations
19 40 14 22 237 209
British ColumbiaAldergroveBurnabyCampbell RiverCranbrookDeltaKamloopsMaple RidgeNanaimoNew WestminsterPowell RiverPrince George (2)QuesnelSurrey (3)VancouverVernonWilliams Lake
AlbertaAirdrieCalgary (6)CamroseDrayton ValleyDrumhellerEdmonton (13)EdsonHintonInnisfailLacombeLeducLethbridge (3)Medicine HatOldsRed DeerSherwood ParkSpruce GroveSt. AlbertStettlerStrathmoreWetaskiwin
SaskatchewanEstevanMoose JawNorth BattlefordPrince AlbertRegina (4)Saskatoon (4)Swift CurrentWeyburn
ManitobaBrandonPortage la PrairieSelkirkSteinbachWinklerWinnipeg (17)
OntarioAjaxAmherstburgAurora (2)Barrie (4)Belleville (2)BoltonBracebridgeBradford West Gwil-limburyBrampton (5)Brantford (2)BrockvilleBurlington (5)Cambridge (2)Carleton PlaceChatham-Kent (4)ClaringtonCobourgCollingwoodCornwall (2)Elliot LakeEmbrunEspanolaFort ErieGeorginaGoderichGravenhurstGreater NapaneeGreater Sudbury (5)GrimsbyGuelph (2)Haldimand CountyHalton HillsHamilton (9)HanoverHawkesbury (2)HuntsvilleIngersollKawartha LakesKingston (4)Kirkland LakeKitchener (4)LakeshoreLeamingtonLondon (9)Markham (3)
MeafordMidlandMiltonMississauga (13)New TecumsethNewmarket (2)Niagara Falls (3)North Bay (3)North GrenvilleOakville (2)OrangevilleOrillia (2)Oshawa (5)Ottawa (12)Owen Sound (2)Parry SoundPembroke (2)Peterborough (2)Pickering (2)Port ColborneQuinte WestRenfrewRichmond Hill (2)Sarnia (3)Saugeen ShoresSault Ste. Marie (4)SimcoeSmiths FallsSt. Catharines (3)St. ThomasStratfordStrathroy-CaradocTemiskaming ShoresThunder Bay (2)TillsonburgTimmins (2)Toronto (34)UxbridgeVaughan (7)Wasaga BeachWaterlooWelland (2)Whitby (2)Whitchurch-StouffvilleWindsor (9)Woodstock
QuébecActon ValeAlma (2)AmosAmquiBaie-ComeauBaie-St-PaulBeloeilBerthiervilleBlainvilleBoisbriand (2)Boucherville (2)Brossard (2)CabanoCandiacChandlerChâteauguayCôte-St-Luc (2)CowansvilleDelsonDolbeau-MistassiniDollard-des- Ormeaux (3)DonnaconaDrummondvilleFarnhamGaspéGatineau (5)Granby (2)Joliette (2)KirklandLa MalbaieLa PocatièreLa SarreLa TuqueLachuteLac-MéganticLaval (12)Lévis (4)Longueuil (6)LouisevilleMagogManiwakiMascouche (2)MataneMont-JoliMont-LaurierMontmagnyMontréal (41)Mont-TremblantNew Richmond
PaspébiacPincourtPlessisvillePort-CartierQuébec (14)RawdonRepentigny (2)RigaudRimouski (2)Rivière-du-LoupRobervalRouyn-NorandaSaguenay (6)Salaberry-de- Valleyfi eldSept-IlesShawinigan (2)Sherbrooke (4)Sorel-TracySt-Basile-le-GrandSt-Bruno- de-MontarvilleSt-ConstantSte-AdèleSte-Agathe-des-MontsSte-Anne-de-BeaupréSte-Anne-des-MontsSte-Anne-des-PlainesSte-JulieSte-MarieSte-Marthe-sur-le-LacSt-Eustache (2)St-FélicienSt-Georges (2)St-HyacintheSt-Jean-sur- Richelieu (3)St-Jérôme (3)St-RaymondTerrebonne (4)Thetford MinesThursoTrois-PistolesTrois-Rivières (6)Val-d’Or (2)VarennesVaudreuil-Dorion (2)Victoriaville (2)Waterloo
New BrunswickAtholvilleBathurst (2)BouctoucheCampbelltonCaraquetEdmundstonFredericton (4)Grand FallsMiramichi (2)Moncton (2)OromoctoQuispamsisRiverviewShediacSt. John (3)St. StephenSussexTracadie-SheilaWoodstock
Prince Edward IslandCharlottetown (2)Summerside
Nova ScotiaAmherstAntigonishBridgewaterDigbyGlace BayGreenwoodHalifax (9)New GlasgowNew MinasNorth SydneyPort HawkesburySydney (2)TruroWindsorYarmouth
Newfoundlandand LabradorBay RobertsClarenvilleConception Bay SouthCorner BrookGanderGrand Falls-WindsorSt. John’s (2)
62 (Atlantic)
4
DO
LL
AR
AM
A I
NC
. A
NN
UA
L R
EP
OR
T 2
00
9
5
DO
LL
AR
AM
A IN
C. A
NN
UA
L R
EP
OR
T 2
00
9
Report to Shareholders
We are pleased to present our fi rst Annual Report as a publicly-traded company. While we may
be new to the capital markets, Dollarama is a well respected and highly successful name in the
Canadian retail business with an eighteen-year track record of signifi cant growth and increasing
profi tability. Today, Dollarama is Canada’s largest operator of dollar stores with over 600 locations
across the country, and the only truly national chain catering to the needs of consumers in all ten
provinces. With more than four times the number of locations than our nearest competitor, our
industry-leading presence in key urban, suburban and rural markets has resulted in strong brand
awareness and an enviable reputation for value, selection and convenience.
Solid Performance Despite the challenging economy, we generated another year of record operating and fi nancial performance in fi scal 2010. Sales rose 15.1% to $1.3 billion, and Normalized EBIT(1) (prior to non-recurring and IPO-related charges) increased 27.0% to $167 million from $131.4 million in the prior year. Same store sales were up an impressive 7.9%, while we added 39 net new locations to our growing store count during the year. Profi t margins increased due to the active management of our merchandise offering and our team’s continued success in reducing operating costs. A key driver of our growth was the introduction of new products during the year at price points over one dollar. In February 2009, we expanded our assortment to include items offered at select price points between $1.00 and $2.00 so we could continue to provide the quality, freshness and novelty that our customers have come to expect from Dollarama. After a highly successful launch, sales of merchandise priced above $1.00 accounted for approximately 30% of our total revenue in the fourth quarter of fi scal 2010, as customers responded very favourably to the exciting new values that now aug-ment our traditional assortment priced at $1.00. Throughout its history, Dollarama has consistently demonstrated strong growth in revenues and Normalized EBITDA(1), and our solid performance in fi scal 2010 was no exception. Since fi scal 2002, sales have increased 16% on a compound annual basis, while Nor-malized EBITDA(1) has grown at an even higher average annual rate of
19% over this same period. With our strong operating cash fl ow and proceeds from our initial public offering, we signifi cantly reduced our debt balance in fi scal 2010 and we ended the year with a net debt to Normalized EBITDA(1) ratio of 2.2 times.
Compelling Competitive Strengths Our success over the last two decades is primarily the result of a carefully developed and highly differentiated business model that we believe sets us apart from our competitors. First and foremost, we focus relentlessly on our customers, pro-viding great value at low prices and a compelling merchandise offer-ing. A study performed by independent consultants(2) showed that, for every dollar spent at our stores, our customers believe they save equal or greater value. This strong customer value perception is the main reason consumers visit Dollarama time and time again, and it’s at the heart of everything we do. Our attractive merchandise offering is another key advantage. Our stores carry a broad assortment of more than 3,500 active year-round Stock Keeping Units (SKUs), as well as over 600 sea-sonal SKUs at any one time for holidays such as Halloween and Christmas. We supplement our direct-sourced private label mer-chandise with select national brands and focus on offering the best value and selection to meet our customers’ everyday needs. We actively manage our assortment and believe that our mer-chandising strategy contributes to increased store traffi c, repeat
6
DO
LL
AR
AM
A I
NC
. A
NN
UA
L R
EP
OR
T 2
00
9
Report to Shareholders, continued
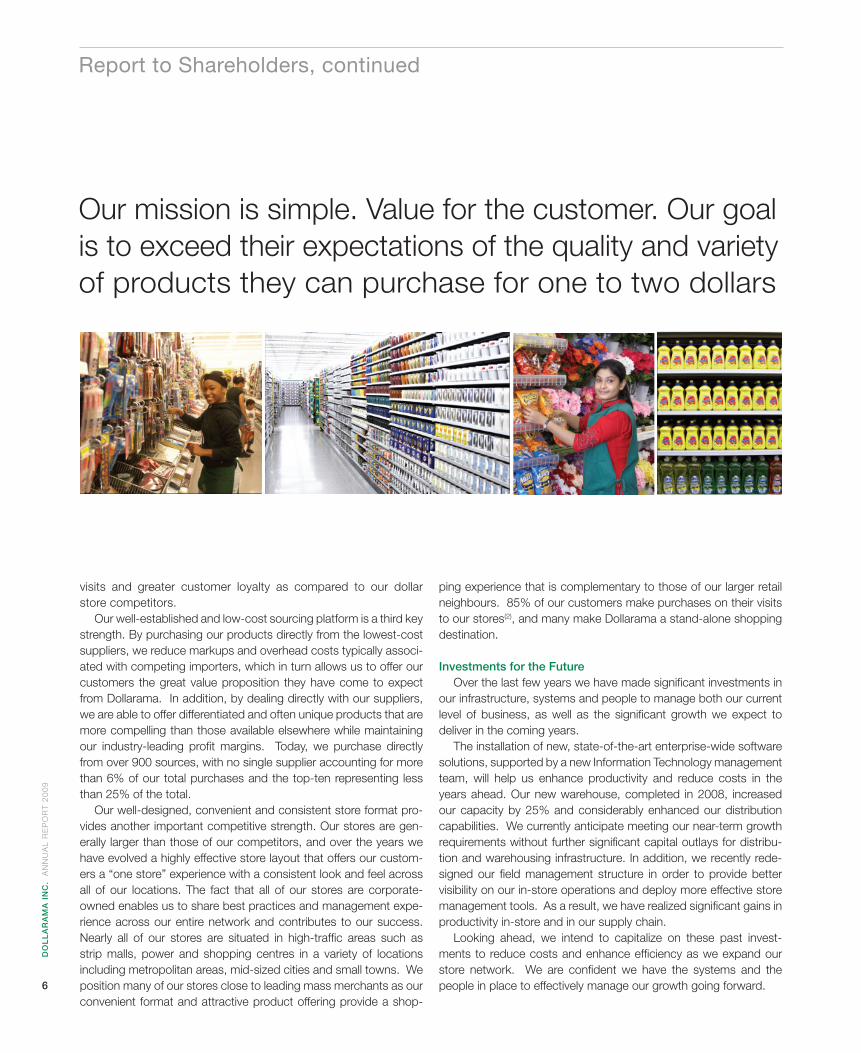
Our mission is simple. Value for the customer. Our goal is to exceed their expectations of the quality and variety of products they can purchase for one to two dollars
visits and greater customer loyalty as compared to our dollar store competitors. Our well-established and low-cost sourcing platform is a third key strength. By purchasing our products directly from the lowest-cost suppliers, we reduce markups and overhead costs typically associ-ated with competing importers, which in turn allows us to offer our customers the great value proposition they have come to expect from Dollarama. In addition, by dealing directly with our suppliers, we are able to offer differentiated and often unique products that are more compelling than those available elsewhere while maintaining our industry-leading profi t margins. Today, we purchase directly from over 900 sources, with no single supplier accounting for more than 6% of our total purchases and the top-ten representing less than 25% of the total. Our well-designed, convenient and consistent store format pro-vides another important competitive strength. Our stores are gen-erally larger than those of our competitors, and over the years we have evolved a highly effective store layout that offers our custom-ers a “one store” experience with a consistent look and feel across all of our locations. The fact that all of our stores are corporate-owned enables us to share best practices and management expe-rience across our entire network and contributes to our success. Nearly all of our stores are situated in high-traffi c areas such as strip malls, power and shopping centres in a variety of locations including metropolitan areas, mid-sized cities and small towns. We position many of our stores close to leading mass merchants as our convenient format and attractive product offering provide a shop-
ping experience that is complementary to those of our larger retail neighbours. 85% of our customers make purchases on their visits to our stores(2), and many make Dollarama a stand-alone shopping destination.
Investments for the Future Over the last few years we have made signifi cant investments in our infrastructure, systems and people to manage both our current level of business, as well as the signifi cant growth we expect to deliver in the coming years. The installation of new, state-of-the-art enterprise-wide software solutions, supported by a new Information Technology management team, will help us enhance productivity and reduce costs in the years ahead. Our new warehouse, completed in 2008, increased our capacity by 25% and considerably enhanced our distribution capabilities. We currently anticipate meeting our near-term growth requirements without further signifi cant capital outlays for distribu-tion and warehousing infrastructure. In addition, we recently rede-signed our fi eld management structure in order to provide better visibility on our in-store operations and deploy more effective store management tools. As a result, we have realized signifi cant gains in productivity in-store and in our supply chain. Looking ahead, we intend to capitalize on these past invest-ments to reduce costs and enhance effi ciency as we expand our store network. We are confi dent we have the systems and the people in place to effectively manage our growth going forward.
7
DO
LL
AR
AM
A IN
C. A
NN
UA
L R
EP
OR
T 2
00
9
Report to Shareholders, continued
A Proven Growth Strategy Since its transition to a dollar store concept in 1992, Dollarama has generated almost twenty years of stable and sustainable growth and increasing profi tability. To maintain this strong track record of performance, we will continue to execute the same proven growth strategies that have contributed to our success in the past. The most important element of our strategy is to further expand our store network. Since our founding, we have grown our store base at a robust compound annual growth rate of 16%. Over the last four years we have opened a total of 205 new stores and have funded these openings exclusively with internally generated cash fl ows. Our expansion model requires low initial capital investment and modest maintenance capital expenditures. Our new stores achieve an average capital payback period of less than two years, and we believe, deliver higher cash fl ows and attractive returns relative to those of our major competitors. Nearly two-thirds of our current store base has been opened, expanded, renovated or re-located within the last six years. The demographics supporting our new store openings are com-pelling. In the United States, there are approximately 15,000 people per dollar store. In Canada, however, the market penetration is only half of that number, with 32,000 people per dollar store. Based solely on our current per capita penetration rate in Quebec, we be-lieve there is presently the potential to expand our store count in Canada to over 900 stores, and our goal is to exploit this oppor-tunity with between thirty and forty new openings per year for the foreseeable future. Our second strategy is to build on our track record of annual
same store sales growth. The launch of our multiple price point strategy in early 2009 has opened up a new world of opportunity for us in this area. With the introduction of additional price points over one dollar and our expanded assortment, our customers now shop Dollarama for new values previously not available under our old single price point model. We expect our new pricing strategy will continue to drive same store sales growth well into the future. And of course, we will continue to execute our private label strategy and provide compelling offerings through our in-house development teams to drive sales productivity.
In closing, we are extremely excited about our future. With strong brand recognition, industry-leading profi tability, our team of dedi-cated people and a proven track record of organic growth, we are well-positioned to deliver increased value for our shareholders for years to come.
Larry RossyChief Executive Offi cer
(1) Please refer to the note on non-GAAP measures included in Management’s Discussion & Analysis.(2) Study dated November 2007 based on a survey of over 3,000 customers.
8
DO
LL
AR
AM
A I
NC
. A
NN
UA
L R
EP
OR
T 2
00
9
The following management’s discussion and analysis (“MD&A”) dated April 8, 2010 is intended to assist
readers in understanding Dollarama Inc. (the “Corporation”), its business environment, strategies, per-
formance and risk factors. It should be read in conjunction with the consolidated fi nancial statements for
the fi scal year ended January 31, 2010 and related notes.
Management’s Discussion & Analysis
Our functional and reporting currency is the Canadian dollar. Finan-cial data has been prepared in conformity with Canadian GAAP. Cer-tain measures used in this MD&A do not have any standardized mean-ing under Canadian GAAP. When used, these measures are defi ned in such terms as to allow the reconciliation to the closest Canadian GAAP measure. It is unlikely that these measures could be compared to similar measures presented by other companies.
All references to “Fiscal 2008” are to the Corporation’s fi scal year ended February 3, 2008, to “Fiscal 2009” are to the Corporation’s fi scal year ended February 1, 2009 and to “Fiscal 2010” are to the Corpora-tion’s fi scal year ended on January 31, 2010.
Formation of the CorporationThe Corporation became a reporting issuer in October 2009. The
Corporation indirectly owns, through its subsidiaries, all of the equity interests in Dollarama L.P. and Dollarama Corporation, which together operate the Dollarama business. Dollarama Inc., together with its con-solidated subsidiaries, are referred to as the “Corporation”, “we”, “us” or “our”.
Forward-Looking StatementsExcept for historical information contained herein, the statements
in this document are forward-looking. Forward-looking statements in-volve known and unknown risks and uncertainties, including those that are described elsewhere in this report. Forward-looking statements are based on estimates and assumptions made by us in light of our experience and perception of historical trends, current conditions and expected future developments, as well as other factors that we believe are appropriate and reasonable in the circumstances, but there can be no assurance that such estimates and assumptions will prove to be correct. Certain assumptions in respect of claim liabilities, employee
future benefi ts, income taxes, goodwill and intangibles are material factors made in preparing forward-looking information and manage-ment’s expectations. Many factors could cause our actual results, level of activity, performance or achievements or future events or devel-opments to differ materially from those expressed or implied by the forward-looking statements, including, without limitation, the following factors set forth in our risk factors section herein: future increases in operating and merchandise costs, inability to refresh our merchandise as often as in the past, increase in the cost or a disruption in the fl ow of imported goods, disruption of distribution infrastructure, current adverse economic conditions, high level of indebtedness, inability to generate suffi cient cash to service all the Corporation’s indebtedness, ability of the Corporation to incur additional indebtedness, signifi cant operating restrictions imposed by our senior secured credit facility (the “Credit Facility”) and our senior fl oating rate deferred interest notes (the “Deferred Interest Notes”) Indenture, interest rate risk associated with variable rate indebtedness, no guarantee that our strategy to introduce products between $1.00 and $2.00 will be successfully sustained, market acceptance of our private brands, inability to increase our ware-house and distribution center capacity in a timely manner, weather conditions or seasonal fl uctuations, competition in the retail industry, dependence on ability to obtain competitive pricing and other terms from our suppliers, inability to renew store, warehouse and distribution center leases or fi nd other locations on favourable terms, disruption in information technology systems, unsuccessful execution of our growth strategy, inability to achieve the anticipated growth in sales and op-erating income, inventory shrinkage, compliance with environmental regulations, failure to attract and retain qualifi ed employees, departure of senior executives, fl uctuation in the value of the Canadian dollar in relation to the U.S. dollar, litigation, product liability claims and product recalls, unexpected costs associated with our current insurance pro-
April 8, 2010
DO
LL
AR
AM
A IN
C. A
NN
UA
L R
EP
OR
T 2
00
9
9
gram, protection of trademarks and other proprietary rights, natural disasters, risks associated with the protection of customers’ credit and debit card data, holding company structure, infl uence by exist-ing shareholders, volatile market price for the common shares of the Corporation (the “Common Shares”), no current plans to pay cash divi-dends and future sales of Common Shares by existing shareholders. These factors are not intended to represent a complete list of the fac-tors that could affect us; however, these factors should be considered carefully. These forward-looking statements describe our expectations as of April 8, 2010 and we have no intention and undertake no obliga-tion to update or revise any forward-looking statements, whether as a result of new information, future events or otherwise, except as re-quired by law. The forward-looking statements contained in this report are expressly qualifi ed by this cautionary statement.
GAAP and Non-GAAP MeasuresUnless otherwise indicated and as hereinafter provided, all fi nan-
cial statement data in this report has been prepared using Canadian generally accepted accounting principles (“GAAP”). Dollarama Inc.’s consolidated fi nancial statements have been prepared in accordance with Canadian GAAP. This report makes reference to certain non-GAAP measures. These non-GAAP measures are not recognized measures under Canadian GAAP, do not have a standardized meaning prescribed by Canadian GAAP and are therefore unlikely to be com-parable to similar measures presented by other companies. Rather, these measures are provided as additional information to complement those Canadian GAAP measures by providing further understanding of the Corporation’s results of operations from management’s per-spective. Accordingly, they should not be considered in isolation nor as a substitute for analysis of our fi nancial information reported under Canadian GAAP. We use non-GAAP measures including EBITDA to provide investors with a supplemental measure of our operating per-formance and thus highlight trends in our core business that may not otherwise be apparent when relying solely on Canadian GAAP fi nancial measures. We also believe that securities analysts, investors and other interested parties frequently use non-GAAP measures in the evaluation of issuers. Our management also uses non-GAAP mea-sures in order to facilitate operating performance comparisons from period to period, prepare annual operating budgets and assess our ability to meet our future debt service, capital expenditure and work-ing capital requirements. Non-GAAP measures are not presentations made in accordance with Canadian GAAP. For example, certain or all of the non-GAAP measures do not refl ect: (a) our cash expenditures, or future requirements for capital expenditures or contractual commit-ments; (b) changes in, or cash requirements for, our working capital needs; (c) the signifi cant interest expense, or the cash requirements necessary to service interest or principal payments on our debt, and; (d) income tax payments that represent a reduction in cash available to us. Although we consider the items excluded in the calculation of non-GAAP measures to be non-recurring and less relevant to evaluate our performance, some of these items may continue to take place and
accordingly may reduce the cash available to us. We refer the reader to “Selected Consolidated Financial Information” for the defi nition and reconciliation of non GAAP measures used and presented by the Cor-poration to the most directly comparable GAAP measures.
We believe that the presentation of the non-GAAP measures de-scribed above is appropriate. However, these Non-GAAP measures have important limitations as analytical tools, and you should not con-sider them in isolation, or as substitutes for analysis of our results as reported under Canadian GAAP. Because of these limitations, we primarily rely on our results as reported in accordance with Canadian GAAP and use the non-GAAP measures only as a supplement. In ad-dition, because other companies may calculate non-GAAP measures differently than we do, they may not be comparable to similarly-titled measures reported by other companies.
Recent EventsPayment of Interest on the Deferred Interest Notes
On December 15, 2009 Dollarama Group Holdings L.P. made a cash payment of interest on the Deferred Interest Notes in the amount of $8.4 million.
Closing of Secondary Offering of Its Common Shares and Con-current Closing of the Over-Allotment Option
On January 28, 2010 the Corporation completed the closing of its previously announced bought deal secondary offering and the concur-rent closing of the over-allotment option pursuant to which its share-holders Bain Dollarama (Luxembourg) One S.à r.l., Stéphane Gonthier and 4411145 Canada Inc., 3339408 Canada Inc. and 9086-6666 Quebec Inc., entities controlled by Larry Rossy, Alan Rossy and Leon-ard Assaly (collectively, the “Selling Shareholders”) sold an aggregate of 13,150,000 Common Shares (of which 1,500,000 were sold pursuant to the partial exercise of the over-allotment option) at a price of $21.50 per share for aggregate gross proceeds of $282,725,000 to the Sell-ing Shareholders. Dollarama did not receive any of the proceeds from this offering.
Board of Directors, Audit Committee and Compensation Com-mittee
On October 16, 2009, Stephen Gunn was appointed to the board of directors of the Corporation as an independent director and chair of the audit committee. Mr. Gunn replaced Younes Zemmouri on the board of directors of the Corporation.
On January 5, 2010, John J. Swidler was appointed as an indepen-dent director and chair of the audit committee of the Corporation. Mr. Swidler replaced Felipe Merry del Val Barbavara de Gravellona on the board of directors of the Corporation and Gregory David on the audit committee. Stephen Gunn remained on the audit committee.
On February 17, 2010, Donald Gray Reid was appointed as an independent director and a member of the audit committee of the Corporation. Mr. Reid replaces Todd Cook who resigned from his po-sition as member of the board of directors, the audit committee and
Management’s Discussion and Analysis April 8, 2010
DO
LL
AR
AM
A I
NC
. A
NN
UA
L R
EP
OR
T 2
00
9
10
the compensation committee of the Corporation. Mr. Gunn, a current independent director and member of the audit committee, was ap-pointed to the compensation committee of the Corporation.
Announcement of the Appointment of the New Chief Financial Offi cer
On March 18, 2010, the Corporation announced the appointment of Michael Ross, CA, as its new Chief Financial Offi cer and Secretary, effective as of April 12, 2010. Michael Ross will replace Nicholas Nomi-cos who will resign from his position as Senior Vice President, Interim Chief Financial Offi cer and Secretary of the Corporation, effective as of April 12, 2010. Mr. Nomicos will remain a member of the Corporation’s board of directors.
OverviewWe are the leading operator of dollar stores in Canada, with 603
Dollarama stores in operation as of January 31, 2010, more than four times the number of stores as our next largest dollar store competitor in Canada. We are the only operator with a signifi cant national presence and are continuing to expand in all Canadian provinces. Our stores average approximately 9,806 square feet and offer a targeted mix of merchandise at compelling values, including private label and nation-ally branded products. We offer a broad range of quality consumer products and general merchandise for everyday use, in addition to seasonal products. Our quality merchandise is sold in individual or multiple units at select fi xed price points between $1.00 and $2.00, with the exception of select candy offered at $0.69. All of our stores are corporate-owned, providing a consistent shopping experience, and nearly all are located in high-traffi c areas such as strip malls and shopping centers in various locations, including metropolitan areas, mid-sized cities, and small towns.
Our strategy is to grow sales, net earnings and cash fl ow by building upon our position as the leading Canadian operator of dollar stores and to offer a compelling value proposition on a wide variety of everyday merchandise to a broad base of customers. We continually strive to maintain and improve the effi ciency of our operations. Our products are sold primarily in individual or multiple units at fi xed prices of $0.69 (for select candy), $1.00, $1.25, $1.50 and $2.00. Prior to February 2009, all our merchandise was sold at a single $1.00 price point, with the exception of select candy offered at lower prices. On February 2, 2009, we introduced additional price points of $1.25, $1.50 and $2.00 which have allowed us to further broaden our product offering.
Key Items in Fiscal Year Ended January 31, 2010• The Corporation became a reporting issuer as a result of its $300.0
million initial public offering (“IPO”) in October 2009. Proceeds from the IPO were used to repay the term loan A outstanding pursuant to the Credit Facility and to redeem the outstanding U.S.$200.0 million principal amount of the 8.875% senior subordinated notes due in 2012 (the “8.875% Subordinated Notes”) on November 17, 2009.
• Sales increased 15.1% in Fiscal 2010 over the prior fi scal year driv-en by the opening of 41 new stores (offset by the temporary closure of two stores) and a 7.9% increase in comparable store sales in the current fi scal year. Comparable store sales growth consisted of a 2.3% increase in the number of transactions and a 5.4% increase in the average transaction size.
• Net earnings increased $88.4 million in Fiscal 2010 as compared to Fiscal 2009 and Normalized EBITDA (as defi ned below) increased 25.2% in Fiscal 2010 to $191.9 million from $153.3 million in Fiscal 2009. EBITDA growth was driven by increased sales and gross margins due to improved product margins and productivity im-provements in distribution and logistics costs.
Factors Affecting Our Results of OperationsSales
We recognize sales at the time the customer tenders payment for and takes possession of the merchandise. All sales are fi nal. Our sales consist of comparable store sales and new store sales. Comparable store sales is a measure of the percentage increase or decrease of the sales of stores open for at least 13 complete fi scal months relative to the same period in the prior year.
We include sales from expanded stores and relocated stores in comparable store sales. The primary drivers of comparable store sales performance are changes in number of transactions and average transaction size. To increase comparable store sales, we focus on of-fering a wide selection of high-quality merchandise at attractive values in well designed, consistent and convenient store formats.
We have historically experienced limited seasonal fl uctuations in sales and expect this trend to continue. We generated 29.0% of Fis-cal 2010 sales during the fourth quarter due to the Christmas selling season.
Our sales are adversely affected by infl ation and other adverse economic developments that affect the level of consumer spending in Canada where we sell our merchandise.
Cost of SalesOur cost of sales consist mainly of merchandise inventory and trans-
portation costs (which are variable and proportional to our sales volume), store occupancy costs, and warehouse and distribution center operat-ing costs. We record vendor rebates consisting of volume purchase rebates, when earned. The rebates are recorded as a reduction of inven-tory purchases at cost, which has the effect of reducing cost of sales. In the past, as a single fi xed-price point dollar store, increases in operating and merchandise costs could negatively impact our operating results because we were not able to pass on cost increases to our customers. Redesigning direct sourced products was the only means to mitigate the impact of increasing unit costs. Although cost increases could still negatively impact our business, with our new multiple price point prod-uct offering effective February 2, 2009, we now have greater fl exibility to react to cost increases on a timely basis. We have historically reduced our cost of sales by shifting more of our sourcing to low-cost foreign
Management’s Discussion and Analysis April 8, 2010
DO
LL
AR
AM
A IN
C. A
NN
UA
L R
EP
OR
T 2
00
9
11
suppliers. For Fiscal 2010, direct overseas sourcing was 53.4% of our purchases compared to 50.4% for the same period in the prior year. While we still source a majority of our overseas products from China, we have been steadily increasing our purchases from other overseas suppliers in the last two fi scal years, including goods sourced directly from India, Indonesia, Thailand, Turkey and Vietnam. As a result, our cost of sales is impacted by the fl uctuation of foreign currencies against the Canadian dollar. In particular, we purchase a majority of our imported merchandise from suppliers in China using U.S. dollars. Therefore, our cost of sales is impacted by the fl uctuation of the Chinese renminbi against the U.S. dollar and the fl uctuation of the U.S. dollar against the Canadian dollar.
While we enter into foreign exchange forward contracts to hedge a signifi cant portion of our exposure to fl uctuations in the value of the U.S. dollar against the Canadian dollar, we do not hedge our exposure to fl uc-tuations in the value of the Chinese renminbi against the U.S. dollar.
Shipping and transportation costs are also a signifi cant component of our cost of sales. When fuel costs increase, shipping and transpor-tation costs increase because the carriers generally pass on such cost increases to the users. Because of the high volatility of fuel costs, it is diffi cult to forecast the fuel surcharges we may incur from our contract carriers as compared to past quarters.
Our occupancy costs are driven by our base rent expense. We be-lieve that we are generally able to negotiate leases at attractive market rates due to the increased consumer traffi c which our stores usually generate in strip malls and shopping centers. We typically enter into leases with base terms of ten years and options to renew for one or more periods of fi ve years each.
General, Administrative and Store Operating ExpensesOur general, administrative and store operating expenses (“SG&A”)
consist of store labour (which is primarily variable and proportional to store sales volume) and store maintenance costs, salaries and related benefi ts of corporate and fi eld management team members, adminis-trative offi ce expenses, professional fees, and other related expenses, all of which are primarily fi xed. Although our average hourly wage rate is higher than the minimum wage, an increase in the mandated mini-mum wage could signifi cantly increase our payroll costs unless we realize offsetting productivity gains and cost reductions. We expect our administrative costs to increase as we build our infrastructure to effectively meet the needs generated by the growth of the Corporation. Since November 2, 2009, general, administrative and store operating expenses no longer include annual management fees of $3.0 million payable to funds advised by Bain Capital Partners, LLC (such funds being referred to in this report as “Bain Capital”) pursuant to its man-agement agreement. This management agreement was terminated in connection with the consummation of the Corporation’s IPO during the third quarter of Fiscal 2010. A one-time fee of $5.0 million was paid to Bain Capital in connection with such termination.
Merchandising StrategyAs part of our ongoing effort to offer more value and higher quality
goods to our customers, on February 2, 2009, we began offering in all our stores an additional assortment of products priced between $1.00 and $2.00. While the majority of products continue to be priced at $1.00, offering products at fi xed price points up to $2.00 has ex-panded our merchandise selection with new items across most cat-egories.
Economic or Industry-Wide Factors Affecting the CorporationWe operate in the value retail industry, which is highly competitive
with respect to price, store location, merchandise quality, assortment and presentation, in-stock consistency, and customer service. We compete with other dollar stores, variety and discount stores and mass merchants operating in Canada. These other retail companies oper-ate stores in many of the areas where we operate and many of them engage in extensive advertising and marketing efforts. Additionally, we compete with a number of companies for prime retail site locations, as well as in attracting and retaining quality employees. We, along with other retail companies, expect continuing pressure resulting from a number of factors including, but not limited to: merchandise costs, recession and instability in the global economy, consumer debt lev-els and buying patterns, adverse economic conditions, interest rates, market volatility, customer preferences, unemployment, labour costs, infl ation, currency exchange fl uctuations, fuel prices, weather patterns, catastrophic events, competitive pressures and insurance costs. Due to current economic conditions, consumer spending could decline because of economic pressures, including unemployment. Reduc-tions in consumer confi dence and spending could have an adverse effect on our sales.
Management’s Discussion and Analysis April 8, 2010
DO
LL
AR
AM
A I
NC
. A
NN
UA
L R
EP
OR
T 2
00
9
12
Management’s Discussion and Analysis April 8, 2010
Fiscal Year Ended
January 31, February 1, February 3, 2010 2009 2008
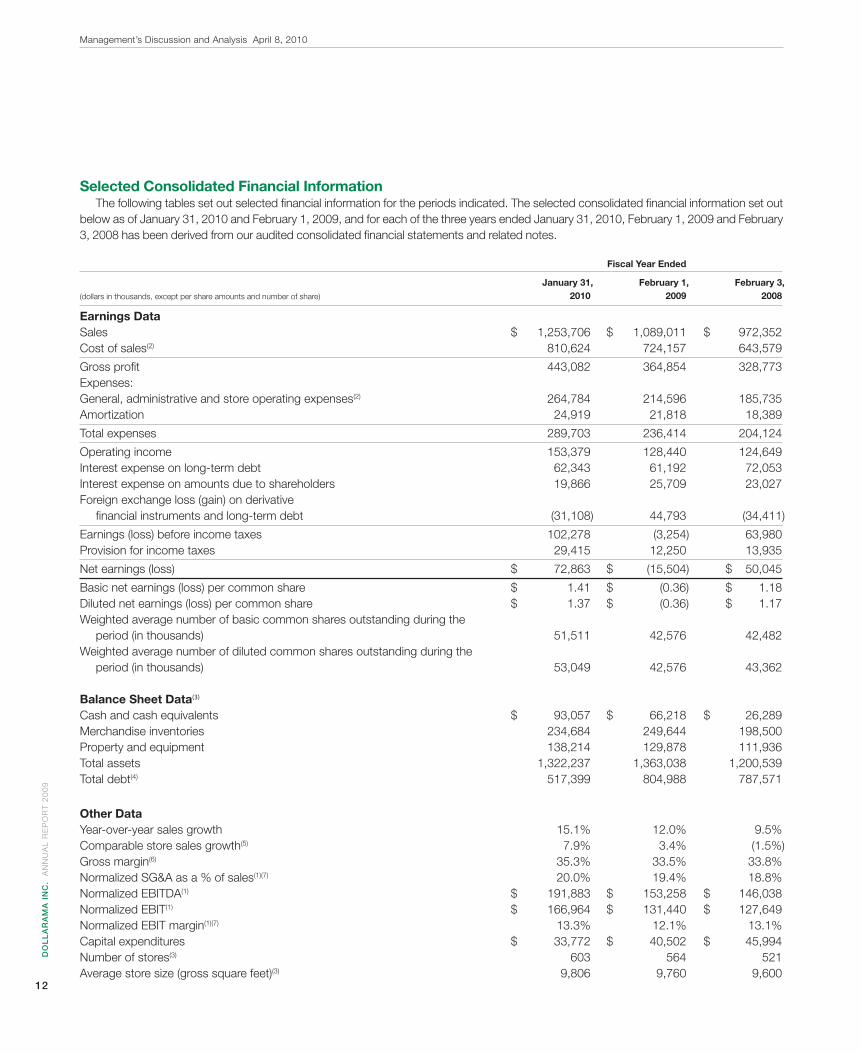
Earnings Data Sales $ 1,253,706 $ 1,089,011 $ 972,352Cost of sales(2) 810,624 724,157 643,579
Gross profi t 443,082 364,854 328,773Expenses: General, administrative and store operating expenses(2) 264,784 214,596 185,735Amortization 24,919 21,818 18,389
Total expenses 289,703 236,414 204,124
Operating income 153,379 128,440 124,649Interest expense on long-term debt 62,343 61,192 72,053Interest expense on amounts due to shareholders 19,866 25,709 23,027Foreign exchange loss (gain) on derivative fi nancial instruments and long-term debt (31,108) 44,793 (34,411)
Earnings (loss) before income taxes 102,278 (3,254) 63,980Provision for income taxes 29,415 12,250 13,935
Net earnings (loss) $ 72,863 $ (15,504) $ 50,045
Basic net earnings (loss) per common share $ 1.41 $ (0.36) $ 1.18Diluted net earnings (loss) per common share $ 1.37 $ (0.36) $ 1.17Weighted average number of basic common shares outstanding during the period (in thousands) 51,511 42,576 42,482Weighted average number of diluted common shares outstanding during the period (in thousands) 53,049 42,576 43,362
Balance Sheet Data(3) Cash and cash equivalents $ 93,057 $ 66,218 $ 26,289Merchandise inventories 234,684 249,644 198,500Property and equipment 138,214 129,878 111,936Total assets 1,322,237 1,363,038 1,200,539Total debt(4) 517,399 804,988 787,571
Other Data Year-over-year sales growth 15.1% 12.0% 9.5%Comparable store sales growth(5) 7.9% 3.4% (1.5%)Gross margin(6) 35.3% 33.5% 33.8%Normalized SG&A as a % of sales(1)(7) 20.0% 19.4% 18.8%Normalized EBITDA(1) $ 191,883 $ 153,258 $ 146,038Normalized EBIT(1) $ 166,964 $ 131,440 $ 127,649Normalized EBIT margin(1)(7) 13.3% 12.1% 13.1%Capital expenditures $ 33,772 $ 40,502 $ 45,994Number of stores(3) 603 564 521Average store size (gross square feet)(3) 9,806 9,760 9,600
(dollars in thousands, except per share amounts and number of share)
Selected Consolidated Financial InformationThe following tables set out selected fi nancial information for the periods indicated. The selected consolidated fi nancial information set out
below as of January 31, 2010 and February 1, 2009, and for each of the three years ended January 31, 2010, February 1, 2009 and February 3, 2008 has been derived from our audited consolidated fi nancial statements and related notes.
DO
LL
AR
AM
A IN
C. A
NN
UA
L R
EP
OR
T 2
00
9
13
Management’s Discussion and Analysis April 8, 2010
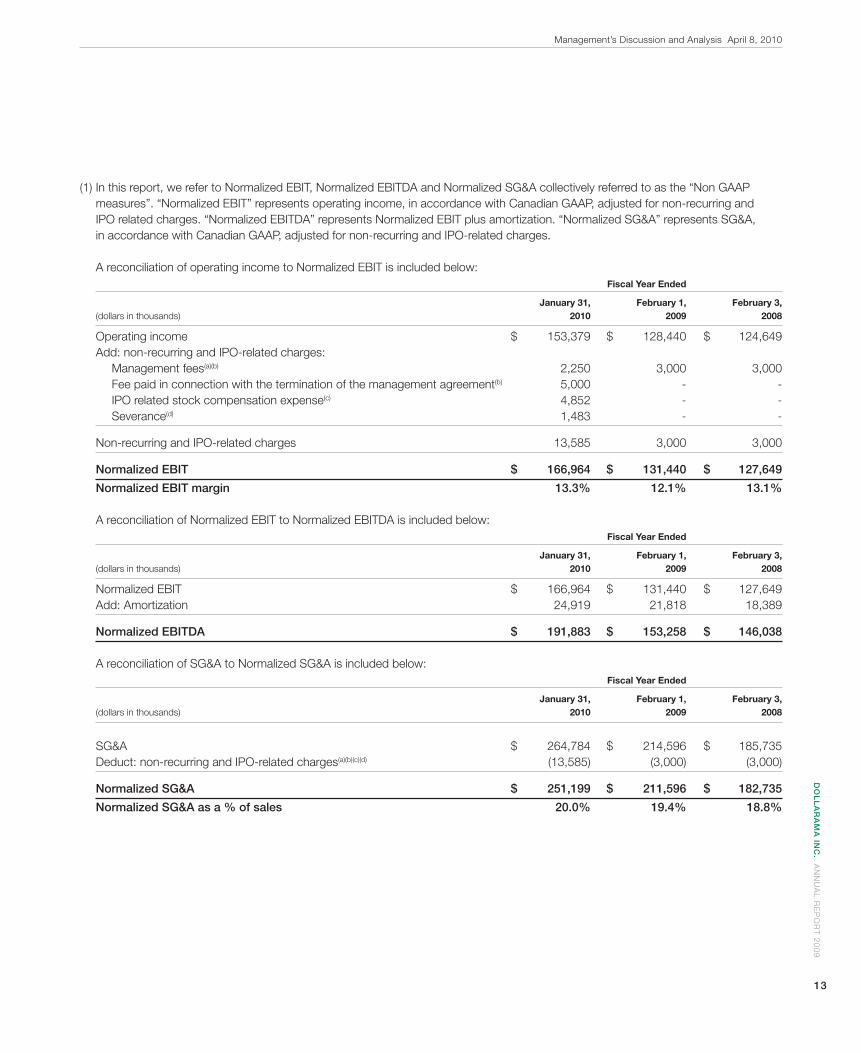
(1) In this report, we refer to Normalized EBIT, Normalized EBITDA and Normalized SG&A collectively referred to as the “Non GAAP measures”. “Normalized EBIT” represents operating income, in accordance with Canadian GAAP, adjusted for non-recurring and IPO related charges. “Normalized EBITDA” represents Normalized EBIT plus amortization. “Normalized SG&A” represents SG&A, in accordance with Canadian GAAP, adjusted for non-recurring and IPO-related charges.
A reconciliation of operating income to Normalized EBIT is included below: Fiscal Year Ended
January 31, February 1, February 3, (dollars in thousands) 2010 2009 2008
Operating income $ 153,379 $ 128,440 $ 124,649 Add: non-recurring and IPO-related charges: Management fees(a)(b) 2,250 3,000 3,000 Fee paid in connection with the termination of the management agreement(b) 5,000 - - IPO related stock compensation expense(c) 4,852 - - Severance(d) 1,483 - -
Non-recurring and IPO-related charges 13,585 3,000 3,000
Normalized EBIT $ 166,964 $ 131,440 $ 127,649
Normalized EBIT margin 13.3% 12.1% 13.1%
A reconciliation of Normalized EBIT to Normalized EBITDA is included below: Fiscal Year Ended
January 31, February 1, February 3, (dollars in thousands) 2010 2009 2008
Normalized EBIT $ 166,964 $ 131,440 $ 127,649 Add: Amortization 24,919 21,818 18,389
Normalized EBITDA $ 191,883 $ 153,258 $ 146,038
A reconciliation of SG&A to Normalized SG&A is included below: Fiscal Year Ended
January 31, February 1, February 3, (dollars in thousands) 2010 2009 2008
SG&A $ 264,784 $ 214,596 $ 185,735 Deduct: non-recurring and IPO-related charges(a)(b)(c)(d) (13,585) (3,000) (3,000)
Normalized SG&A $ 251,199 $ 211,596 $ 182,735
Normalized SG&A as a % of sales 20.0% 19.4% 18.8%
DO
LL
AR
AM
A I
NC
. A
NN
UA
L R
EP
OR
T 2
00
9
14
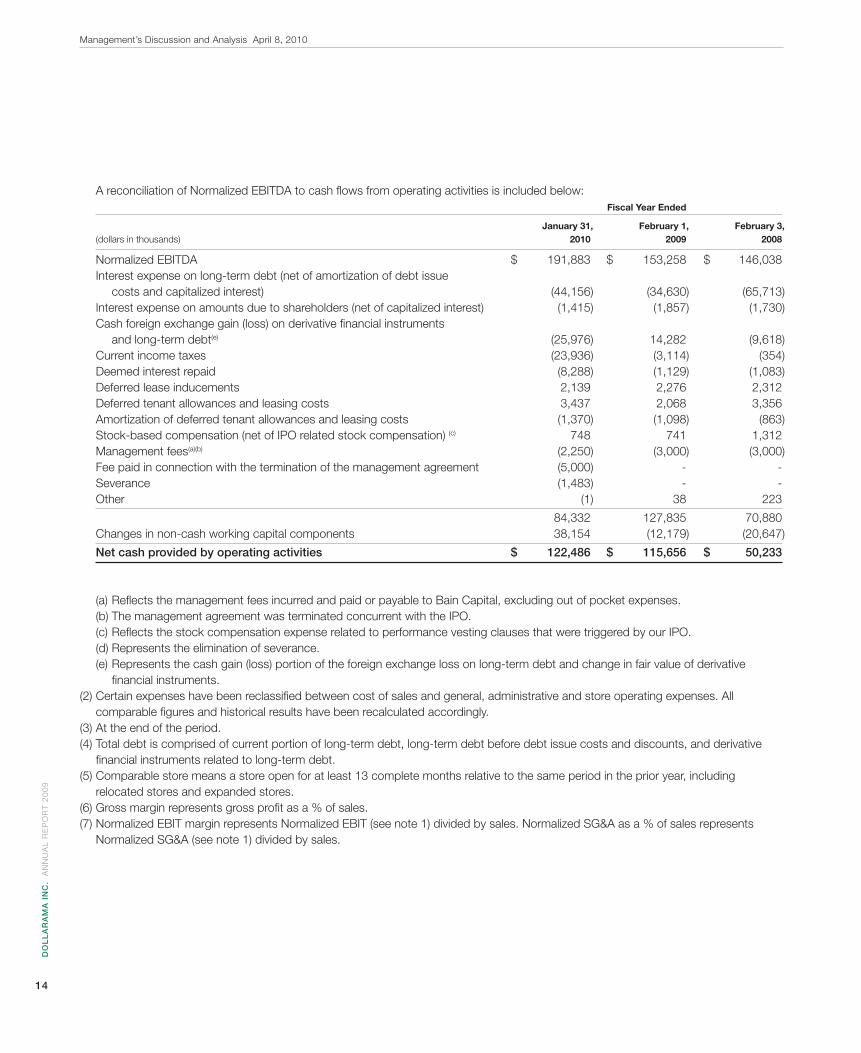
A reconciliation of Normalized EBITDA to cash fl ows from operating activities is included below: Fiscal Year Ended
January 31, February 1, February 3, (dollars in thousands) 2010 2009 2008
Normalized EBITDA $ 191,883 $ 153,258 $ 146,038 Interest expense on long-term debt (net of amortization of debt issue costs and capitalized interest) (44,156) (34,630) (65,713) Interest expense on amounts due to shareholders (net of capitalized interest) (1,415) (1,857) (1,730) Cash foreign exchange gain (loss) on derivative fi nancial instruments and long-term debt(e) (25,976) 14,282 (9,618) Current income taxes (23,936) (3,114) (354) Deemed interest repaid (8,288) (1,129) (1,083) Deferred lease inducements 2,139 2,276 2,312 Deferred tenant allowances and leasing costs 3,437 2,068 3,356 Amortization of deferred tenant allowances and leasing costs (1,370) (1,098) (863) Stock-based compensation (net of IPO related stock compensation) (c) 748 741 1,312 Management fees(a)(b) (2,250) (3,000) (3,000) Fee paid in connection with the termination of the management agreement (5,000) - - Severance (1,483) - - Other (1) 38 223
84,332 127,835 70,880 Changes in non-cash working capital components 38,154 (12,179) (20,647)
Net cash provided by operating activities $ 122,486 $ 115,656 $ 50,233
(a) Refl ects the management fees incurred and paid or payable to Bain Capital, excluding out of pocket expenses. (b) The management agreement was terminated concurrent with the IPO. (c) Refl ects the stock compensation expense related to performance vesting clauses that were triggered by our IPO. (d) Represents the elimination of severance. (e) Represents the cash gain (loss) portion of the foreign exchange loss on long-term debt and change in fair value of derivative fi nancial instruments.(2) Certain expenses have been reclassifi ed between cost of sales and general, administrative and store operating expenses. All comparable fi gures and historical results have been recalculated accordingly.(3) At the end of the period.(4) Total debt is comprised of current portion of long-term debt, long-term debt before debt issue costs and discounts, and derivative fi nancial instruments related to long-term debt.(5) Comparable store means a store open for at least 13 complete months relative to the same period in the prior year, including relocated stores and expanded stores.(6) Gross margin represents gross profi t as a % of sales.(7) Normalized EBIT margin represents Normalized EBIT (see note 1) divided by sales. Normalized SG&A as a % of sales represents Normalized SG&A (see note 1) divided by sales.
Management’s Discussion and Analysis April 8, 2010
DO
LL
AR
AM
A IN
C. A
NN
UA
L R
EP
OR
T 2
00
9
15
Results of OperationsFiscal Year Ended January 31, 2010 Compared to Fiscal Year Ended February 1, 2009
SalesFor Fiscal 2010, we recorded sales of $1,253.7 million, a 15.1%
increase over the prior fi scal year. Comparable store sales rose 7.9%, driven by a 2.3% increase in number of transactions and a 5.4% in-crease in average transaction size.
On February 2, 2009, we introduced our new selection of items at price points of $1.25, $1.50 and $2.00. This introduction was made progressively in the fi rst quarter and the vast majority of our products is still sold at $1.00. We believe the introduction of new price points has positively impacted our sales and resulted in both an improved number of transactions and higher average transaction size. Our total store square footage increased 7.3% from 5.5 million at February 1, 2009 to 5.9 million at January 31, 2010.
Cost of SalesOur cost of sales increased $86.5 million, or 11.9%, from $724.2
million for Fiscal 2009, to $810.6 million for Fiscal 2010. Our gross margin increased to 35.3% of sales as compared to 33.5% of sales for the prior fi scal year, driven by improved product margins associ-ated with the introduction of our multiple price-point strategy and net productivity improvements in distribution and logistics costs.
General, Administrative and Store Operating ExpensesSG&A increased $50.2 million, or 23.4%, from $214.6 million for
Fiscal 2009, to $264.8 million for Fiscal 2010 due to the opening of 39 net new stores since the end of Fiscal 2009, increases in store wage rates, the full-year impact of central infrastructure costs added during the prior fi scal year and the incurrence in Fiscal 2010 of approximately $13.6 million of non-recurring and IPO-related expenses. These non-recurring charges include a $5.0 million fee paid in connection with the termination of our management agreement with Bain Capital, $2.2 mil-lion management fees paid to Bain Capital pursuant to such manage-ment agreement and prior to such termination, stock compensation expense of approximately $4.9 million triggered by the Corporation’s IPO, and severance charges of $1.5 million. Non-recurring charges incurred during Fiscal 2009 consisted of $3.0 million management fees paid to Bain Capital described above.
AmortizationAmortization expense increased $3.1 million, from $21.8 million
for Fiscal 2009, to $24.9 million for Fiscal 2010 due to new store openings.
Interest Expense on Long-Term DebtInterest expense increased $1.2 million, from $61.2 million for Fiscal
2009, to $62.3 million for Fiscal 2010 due primarily to $13.8 million of non-recurring interest expense associated with the early redemption
of debt, partially offset by lower interest costs resulting from the lower outstanding debt balance and lower interest rates on our variable-rate debt. The non-recurring interest charges incurred during Fiscal 2010 include a $3.8 million write-off of debt issue costs associated with the term loan A of the Credit Facility and the 8.875% Subordinated Notes, and $10.0 million in debt repayment premium and expenses associ-ated with the redemption of the 8.875% Subordinated Notes which occurred on November 17, 2009 (the “Redemption Date”).
Interest Expense on Amounts Due to ShareholdersInterest expense on amounts due to shareholders decreased $5.8
million, from $25.7 million for Fiscal 2009, to $19.9 million for Fiscal 2010 due primarily to the conversion of this debt into shares and the repayment of the remaining balance of the amounts due to sharehold-ers on October 16, 2009.
Foreign Exchange Loss (Gain) on Derivative Financial Instruments and Long-Term Debt
Foreign exchange gain on derivative fi nancial instruments and long-term debt increased $75.9 million, from a $44.8 million loss for Fiscal 2009, to a $31.1 million gain for Fiscal 2010 due mainly to the impact of the strengthening of the Canadian dollar relative to the U.S. dollar on our Deferred Interest Notes, which were not hedged until November 2009. The $44.8 million foreign exchange loss on derivative fi nancial instruments and long-term debt in Fiscal 2009 was due primarily to the impact of the weakening of the Canadian dollar relative to the U.S. dollar on our Deferred Interest Notes which were not hedged during Fiscal 2009.
Provision for Income TaxesProvision for income tax increased $17.2 million, from $12.3 mil-
lion for Fiscal 2009 to $29.4 million for Fiscal 2010 due to increased profi tability. The combined statutory provincial and federal tax rate was 31.8% and 32.2%, respectively in Fiscal 2010 and Fiscal 2009. Our effective tax rate is mainly affected by non-deductible accretion value on amounts due to certain shareholders of the Corporation as well as gains and losses on foreign exchange which are only 50% taxable (deductible).
Net EarningsNet earnings increased $88.4 million, from a $15.5 million loss for
Fiscal 2009 to $72.9 million for Fiscal 2010. The increase in net earn-ings was driven mainly by sales growth, higher gross margin dollars, and a foreign exchange gain on our outstanding Deferred Interest Notes, which were not hedged during these periods until November 2009.
Management’s Discussion and Analysis April 8, 2010
DO
LL
AR
AM
A I
NC
. A
NN
UA
L R
EP
OR
T 2
00
9
16
Fiscal Year Ended February 1, 2009 Compared to Fiscal Year Ended February 3, 2008
SalesOur sales increased $116.7 million, or 12.0%, from $972.4 million
for Fiscal 2008, to $1,089.0 million for Fiscal 2009. Comparable store sales increased 3.4% during Fiscal 2009, representing an increase of approximately $10.5 million. The Comparable store sales increase was driven by a 3.9% increase in the average transaction size, offset by a 0.5% decrease in the number of transactions. The remaining por-tion of the sales growth, or $106.2 million, was driven primarily by the incremental full period impact of the 61 stores opened (offset by the temporary closure of three stores) during Fiscal 2008 and the open-ing of 47 new stores (offset by the temporary closure of four stores) in Fiscal 2009. Our total store square footage increased 10.0% from 5.0 million at February 3, 2008 to 5.5 million at February 1, 2009.
Cost of SalesCost of sales increased $80.6 million, or 12.5%, from $643.6 million
for Fiscal 2008, to $724.2 million for Fiscal 2009. Our gross margin decreased to 33.5% for Fiscal 2009 from 33.8% for Fiscal 2008 due primarily to higher transportation costs.
General, Administrative and Store Operating ExpensesSG&A increased $29.1 million, or 15.7%, from $185.5 million for
Fiscal 2008, to $214.6 million for Fiscal 2009. This increase was pri-marily driven by an increase in store labour costs due to the increased number of stores in operation and minimum wage increases. SG&A to support our store network expansion also increased. As a percentage of sales, our SG&A increased from 19.1% for Fiscal 2008 to 19.7% for Fiscal 2009.
AmortizationAmortization expense increased $3.4 million, from $18.4 million for
Fiscal 2008, to $21.8 million for Fiscal 2009. This increase was due to the amortization of property and equipment resulting from the new store openings and the amortization of capitalized software costs as-sociated with our enterprise-wide software system.
Interest Expense on Long-term DebtInterest expense decreased $10.9 million from $72.1 million for Fis-
cal 2008, to $61.2 million for Fiscal 2009, which refl ects the reduced debt outstanding and lower interest rates on variable-rate debt, par-tially offset by the impact of stronger U.S. dollar relative to the Canadian dollar. Average rates for translating U.S. dollars into Canadian dollars were 1.0850 for Fiscal 2009 and 1.0603 for Fiscal 2008.
Interest Expense on Amounts due to ShareholdersInterest expense increased $2.7 million from $23.0 million for Fis-
cal 2008, to $25.7 million for Fiscal 2009, which refl ects the accretion on our previously outstanding junior subordinated notes and Class A, Class B and Class C preferred shares.
Foreign Exchange Loss (Gain) on Derivative Financial Instruments and Long-Term Debt
Foreign exchange loss on derivative fi nancial instruments and long-term debt increased $79.2 million from a $34.4 million gain for Fiscal 2008, to a $44.8 million loss for Fiscal 2009, due mainly to the impact of the strengthening of the U.S. dollar relative to the Canadian dollar on the Deferred Interest Notes which were unhedged during these periods.
Provision for Income TaxesOur effective tax rate is affected by non-deductible accretion value
on preferred shares as well as gains and losses on foreign exchange which are only 50% taxable and valuation allowances taken on any cumulative foreign exchange loss. A reconciliation of our effective in-come tax rate is included in note 17(b) of our audited consolidated fi nancial statements.
Net Earnings (Loss)Net earnings decreased $65.5 million from $50.0 million for Fiscal
2008, to a loss of $15.5 million for Fiscal 2009 as operating income growth in Fiscal 2009 as compared to Fiscal 2008 was more than offset by an unfavourable $79.2 million swing in foreign exchange loss on derivative fi nancial instruments and long-term debt from Fiscal 2008 to Fiscal 2009 due to the impact of the strengthening of the U.S. dollar relative to the Canadian dollar on the Deferred Interest Notes which were unhedged during these periods.
Management’s Discussion and Analysis April 8, 2010
DO
LL
AR
AM
A IN
C. A
NN
UA
L R
EP
OR
T 2
00
9
17
Management’s Discussion and Analysis April 8, 2010
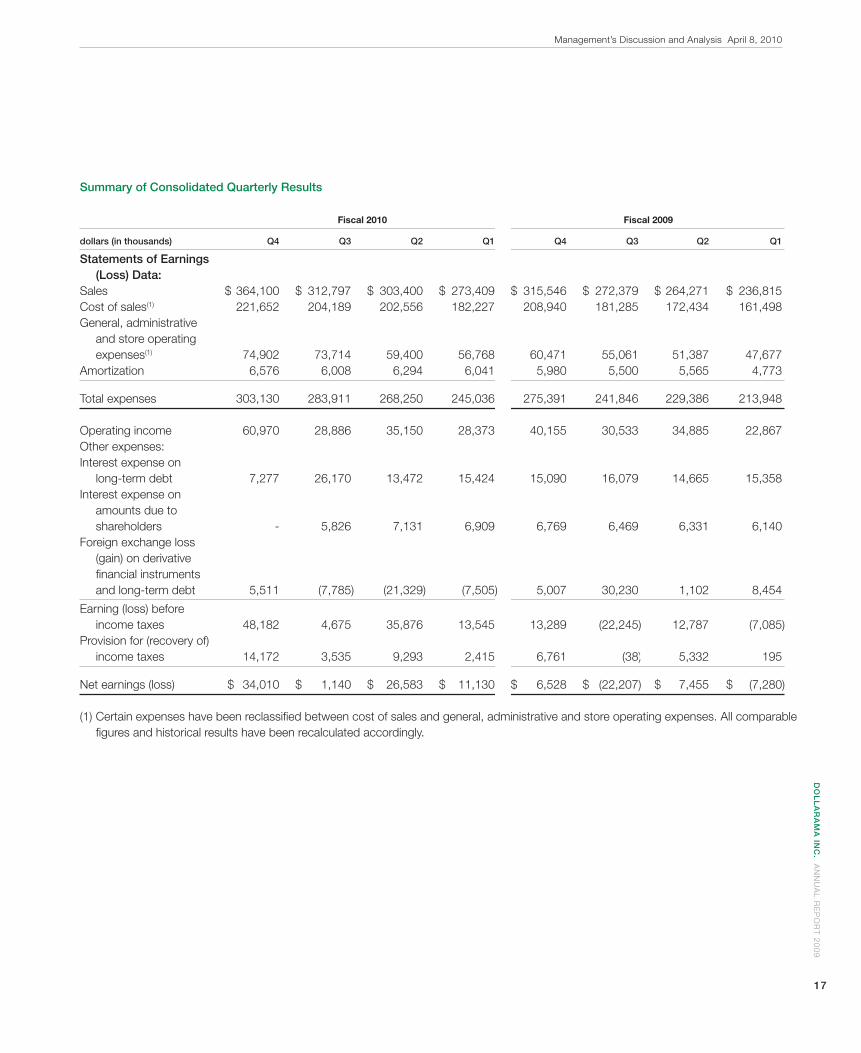
Summary of Consolidated Quarterly Results
Fiscal 2010 Fiscal 2009
dollars (in thousands) Q4 Q3 Q2 Q1 Q4 Q3 Q2 Q1
Statements of Earnings (Loss) Data: Sales $ 364,100 $ 312,797 $ 303,400 $ 273,409 $ 315,546 $ 272,379 $ 264,271 $ 236,815Cost of sales(1) 221,652 204,189 202,556 182,227 208,940 181,285 172,434 161,498General, administrative and store operating expenses(1) 74,902 73,714 59,400 56,768 60,471 55,061 51,387 47,677Amortization 6,576 6,008 6,294 6,041 5,980 5,500 5,565 4,773
Total expenses 303,130 283,911 268,250 245,036 275,391 241,846 229,386 213,948 Operating income 60,970 28,886 35,150 28,373 40,155 30,533 34,885 22,867Other expenses: Interest expense on long-term debt 7,277 26,170 13,472 15,424 15,090 16,079 14,665 15,358Interest expense on amounts due to shareholders - 5,826 7,131 6,909 6,769 6,469 6,331 6,140Foreign exchange loss (gain) on derivative fi nancial instruments and long-term debt 5,511 (7,785) (21,329) (7,505) 5,007 30,230 1,102 8,454
Earning (loss) before income taxes 48,182 4,675 35,876 13,545 13,289 (22,245) 12,787 (7,085)Provision for (recovery of) income taxes 14,172 3,535 9,293 2,415 6,761 (38) 5,332 195
Net earnings (loss) $ 34,010 $ 1,140 $ 26,583 $ 11,130 $ 6,528 $ (22,207) $ 7,455 $ (7,280)
(1) Certain expenses have been reclassifi ed between cost of sales and general, administrative and store operating expenses. All comparable fi gures and historical results have been recalculated accordingly.
DO
LL
AR
AM
A I
NC
. A
NN
UA
L R
EP
OR
T 2
00
9
18
Analysis of Fourth Quarter 2010 Results
SalesSales for the 13 week period ended January 31, 2010 increased
15.4% to $364.1 million from $315.5 million in the corresponding pe-riod in Fiscal 2009.
Fourth quarter sales growth was driven by the opening of 39 net new stores during Fiscal 2010 as well as a 9.3% increase in compa-rable store sales over the fourth quarter of Fiscal 2009. Comparable store sales growth consisted of a 3.3% increase in the number of transactions and a 5.8% increase in the average transaction size.
Cost of SalesOur cost of sales increased $12.7 million, or 6.1%, from $208.9 mil-
lion for the fourth quarter of Fiscal 2009, to $221.7 million for the fourth quarter of Fiscal 2010. Gross margin increased to 39.1% of sales as compared to 33.8% of sales for the same period of Fiscal 2009, due primarily to improved product margins, reduced shrink provision and improved effi ciencies in distribution and transportation costs.
General, Administrative and Store Operating ExpensesSG&A increased 23.9% to $74.9 million for the fourth quarter of
Fiscal 2010 from $60.5 million for the fourth quarter of Fiscal 2009, due primarily to the opening of 39 net new stores since the end of Fiscal 2009, increases in store wage rates and increases in central infrastructure costs.
AmortizationAmortization expense increased $0.6 million, from $6.0 million for
the fourth quarter of Fiscal 2009, to $6.6 million for the fourth quarter of Fiscal 2010 due primarily to new store openings.
Interest Expense on Long-term DebtInterest expense decreased $7.8 million, from $15.1 million for the
fourth quarter of Fiscal 2009, to $7.3 million for the fourth quarter of Fiscal 2010 due primarily to the lower outstanding debt balance and lower interest rates on our variable-rate debt.
Interest Expense on Amounts Due to ShareholdersInterest expense on amounts due to shareholders decreased $6.8
million, from $6.8 million for the fourth quarter of Fiscal 2009, to nil for the fourth quarter of Fiscal 2010 due to the conversion of this debt into shares and the repayment of the remaining balance of the amounts due to shareholders on October 16, 2009.
Foreign Exchange Loss (Gain) on Derivative Financial Instruments and Long-Term Debt
The Corporation recorded a foreign exchange loss on derivative fi nancial instruments and long term debt of $5.5 million in the fourth quarter of Fiscal 2010 due primarily to the loss realized on foreign exchange contracts used to redeem a portion of our 8.875% Sub-
ordinated Notes and those used to make a cash interest payment on our U.S. dollar-denominated Deferred Interest Notes. This $5.5 million foreign exchange loss compares to a foreign exchange loss on derivative fi nancial instruments and long-term debt of $5.0 million recorded during the fourth quarter of Fiscal 2009 driven by the impact of the strengthening of the U.S. dollar relative to the Canadian dollar on our U.S. dollar-denominated Deferred Interest Notes which were not hedged during that period.
Provision for Income TaxesProvision for income tax increased $7.4 million, from $6.8 million for
the fourth quarter of Fiscal 2009 to $14.2 million for the fourth quarter of Fiscal 2010 due to increased profi tability.
Net EarningsNet earnings increased $27.5 million, from $6.5 million for the fourth
quarter of Fiscal 2009 to $34.0 million for the fourth quarter of Fiscal 2010. The increase in net earnings was driven mainly by increases in sales and gross margin as a percentage of sales, reduced interest expense on long-term debt and the elimination of interest on amounts due to shareholders.
Liquidity and Capital ResourcesCash Flows
Cash Flows from Operating ActivitiesCash fl ows provided by operating activities in Fiscal 2010 increased
to $122.5 million as compared to $115.7 million in Fiscal 2009 driven by a $38.2 million reduction in working capital in Fiscal 2010 as com-pared to an increase of $12.2 million in working capital in Fiscal 2009. The change in working capital trend was driven by a reduction in Fis-cal 2010 of merchandise inventory accumulated in the prior year in advance of the launch of our multiple price point merchandise offering and an increase in taxes payable generated in Fiscal 2010.
Cash Flows from Investing ActivitiesDuring Fiscal 2010, cash used for investing activities decreased to
$40.1 million from $49.7 million in Fiscal 2009. Purchases of property and equipment were lower by $6.7 million in Fiscal 2010 due mainly to fewer new store openings and lower capital requirements for our infor-mation systems. There were 41 stores opened (offset by the temporary closure of two stores) in Fiscal 2010 compared to 47 stores opened (offset by the temporary closure of four stores) in Fiscal 2009. In addi-tion, cash used to settle derivative fi nancial instruments in Fiscal 2010 decreased to $6.4 million from $9.4 million in Fiscal 2009. In Fiscal 2010 the Corporation incurred a $6.4 million loss on the early settlement of a derivative fi nancial instrument associated with the modifi cation of a swap agreement to mitigate better the foreign currency risk associated with the outstanding debt following the redemption of the outstanding U.S.$200.0 million principal amount 8.875% Subordinated Notes on November 17, 2009, as compared to a $9.4 million loss incurred in
Management’s Discussion and Analysis April 8, 2010
DO
LL
AR
AM
A IN
C. A
NN
UA
L R
EP
OR
T 2
00
9
19
Fiscal 2009 driven by the settlement of a foreign currency swap agree-ment used to mitigate the foreign exchange risk associated with our previously outstanding 8.875% Subordinated Notes.
Cash Flows from Financing ActivitiesCash used by fi nancing activities in Fiscal 2010 was $55.6 million as
compared to $25.8 million in Fiscal 2009. In Fiscal 2010, the Corpora-tion generated net IPO proceeds of $272.4 million due to the issuance of Common Shares for an aggregate amount of $300.0 million less issuance costs of $27.6 million. The net proceeds of the IPO together with working capital were used to repay the outstanding U.S.$200.0 million principal amount of the 8.875% Senior Subordinated Notes due in 2012, $70.1 million notes owing to certain shareholders of the Corporation, $53.2 million of the principal amount on the term loan A of the Credit Facility, and $2.7 million quarterly scheduled principal repayments of the term loan B of the Credit Facility. During Fiscal 2009, cash used by fi nancing activities were driven primarily by $18.0 million of scheduled quarterly principal repayments on the term loan A of the Credit Facility, a $6.2 million mandatory payment required under the terms of the term loan A of the Credit Facility due to annual consolidated ex-cess cash fl ow generation, and by $2.8 million of scheduled quarterly principal repayments on the term loan B of the Credit Facility, offset by $1.1 million of deemed interest on debt repayment.
LiquidityThe Corporation has historically generated suffi cient operating cash
fl ow to fund its planned growth strategy and debt service requirements. Management anticipates this will continue to be the case given that over the previous three fi scal years, our new stores achieved an aver-age capital payback period of less than two years on the total cash outlay (including capital expenditures and inventory) required to launch a new store. Further, as at January 31, 2010, the Corporation had $93.1 million of cash and cash equivalents on hand and an undrawn revolving credit facility of $73.7 million which provides further fl exibility to meet any unanticipated cash requirements.
Capital ExpendituresCapital expenditures for Fiscal 2010 were $33.8 million, offset by
tenant allowances of $3.6 million as compared to $40.5 million offset by tenant allowances of $2.6 million for Fiscal 2009. The decreased spending in Fiscal 2010 was primarily due to fewer store openings and lower capital requirements for information systems as compared to Fiscal 2009.
Debt and CommitmentsWe are and have historically been signifi cantly leveraged. Our prin-
cipal sources of liquidity have been cash fl ows generated from op-erations and borrowings under the Credit Facility. Our principal cash requirements have been for working capital, capital expenditures and debt service. In connection with the acquisition of the Dollarama busi-ness in 2004 by an entity formed by Bain Capital, we entered into
the Credit Facility, pursuant to which we incurred $120.0 million of borrowings under the term loan A facility and U.S.$201.3 million of borrowings under a term loan B facility ($240.0 million based on the exchange rate on the closing date of the acquisition), and the senior subordinated bridge loan facility, pursuant to which we borrowed an aggregate of $240.0 million.
On August 12, 2005, we issued U.S.$200.0 million 8.875% Sub-ordinated Notes bearing interest at 8.875% per annum payable semi annually and maturing in November 2012. We used the proceeds from the sale of these 8.875% Subordinated Notes, together with additional borrowings under the term loan B of the Credit Facility of U.S.$45.0 million that we incurred pursuant to an amendment to the Credit Facility to (i) repay the outstanding borrowings under the senior subordinated bridge loan facility, (ii) repay a note owing to certain of our shareholders and (iii) pay related fees and expenses. At that time, the outstanding borrowings under the senior subordinated bridge loan including the accrued interest were $240.5 million bearing interest at Canadian Banker’s Acceptance rate plus 8.25% per annum and would have otherwise matured in May 2006.
On December 20, 2006, we issued U.S.$200.0 million Deferred Interest Notes bearing interest at 6-month LIBOR plus 5.75% (increas-ing to 6.25% after two years and 6.75% after three years) per annum, payable semi annually and maturing in November 2012. We used the proceeds from the sale of these notes to make a cash distribution to certain of our shareholders and to pay related fees and expenses.
As of January 31, 2010, we and our subsidiaries had approximate-ly: $250.6 million of senior secured debt outstanding under the Credit Facility; and U.S.$212.2 million ($226.9 million based on the exchange rate on January 31, 2010) of Deferred Interest Notes.
Our ability to make scheduled payments of principal, or to pay the interest on, or to refi nance our indebtedness, or to fund planned capital expenditures will depend on our future performance, which to a certain extent, is subject to general economic, fi nancial, competitive, legislative, regulatory, or other factors that are beyond our control. Based upon the current level of our operations, we believe that cash fl ows from operations, together with borrowings available under the Credit Facility, will be adequate to meet our future liquidity needs. Our assumptions with respect to future liquidity needs may not be correct and funds available to us from the sources described above may not be suffi cient to enable us to service our indebtedness, or cover any shortfall in funding for any unanticipated expenses.
We and our signifi cant shareholders may from time to time seek to retire or purchase our outstanding debt (including publicly issued debt) through cash purchases and/or exchanges, in open market pur-chases, privately negotiated transactions, by tender offer or otherwise. Such repurchases or exchanges, if any, will depend on prevailing mar-ket conditions, liquidity requirements, contractual restrictions and other factors. The amounts involved may be material.
Credit FacilityAs of January 31, 2010, the Credit Facility consisted of a (i)
Management’s Discussion and Analysis April 8, 2010
DO
LL
AR
AM
A I
NC
. A
NN
UA
L R
EP
OR
T 2
00
9
20
U.S.$234.3 million ($250.6 million based on the exchange rate on January 31, 2010) term loan B facility maturing in November 2011, denominated in U.S. dollars; and (ii) $75.0 million revolving credit facility denominated in Canadian dollars and maturing in June 2012, which includes a $25.0 million letter of credit subfacility and a $10.0 million swingline loan subfacility. As of January 31, 2010, there was an ag-gregate $251.9 million outstanding under the Credit Facility, including $1.3 million of letters of credit outstanding under the revolving credit facility. In addition, we may, under certain circumstances and subject to receipt of additional commitments from existing lenders or other eligible institutions, request additional term loan tranches or increases to the revolving loan commitments by an aggregate amount of up to $150.0 million (or the U.S. dollar equivalent thereof).
The interest rates per annum applicable to the loans under the Credit Facility, other than swingline loans, equal an applicable margin percentage plus, at our option, (1) in the case of U.S. dollar denomi-nated loans, (a) a U.S. base rate equal to the greater of (i) the rate of interest per annum equal to the rate which Royal Bank of Canada es-tablishes at its main offi ce in Toronto from time to time as the reference rate of interest for U.S. dollar loans made in Canada and (ii) the federal funds effective rate (converted to a rate based on a 365 or 366 day period, as the case may be) plus 1.0% per annum or (b) the rate per annum equal to the rate determined by Royal Bank of Canada to be the offered rate that appears on the page of the Telerate screen 3750 that displays an average British Bankers Association Interest Settle-ment Rate for deposits in U.S. dollars for an interest period chosen by the applicable borrower of one, two, three, or six months (or, if made available by all applicable lenders, nine or twelve month periods) and (2) in the case of Canadian dollar denominated loans, (a) a Canadian prime rate equal to the greater of (i) the rate of interest per annum equal to the rate which Royal Bank of Canada establishes at its main offi ce in Toronto from time to time as the reference rate for Canadian dollar loans made in Canada and (ii) the rate per annum determined as being the arithmetic average of the rates quoted for bankers’ acceptances for an interest period of one month as listed on the applicable Reuters Screen CDOR (Certifi cate of Deposit Offered Rate) page (plus 0.10% for certain lenders) plus 1.0% per annum or (b) the rate per annum determined as being the arithmetic average of the rates quoted for bankers’ acceptances for the appropriate interest period as listed on the applicable Reuters Screen CDOR (Certifi cate of Deposit Offered Rate) page (plus 0.10% for certain lenders).
The applicable margin percentages for Canadian dollar denomi-nated loans and U.S. dollar denominated loans are subject to adjust-ment based upon the level of the total lease-adjusted leverage ratio. As of January 31, 2010, the applicable margin percentage for 0.75% for Canadian prime rate loans and 1.75% for bankers’ acceptances and the applicable margin percentage was 1.75% for adjusted LI-BOR rate loans and 0.75% for U.S. base rate loans. Swingline loans bear interest at an interest rate equal to the interest rate for Canadian prime rate loans. On the last day of each calendar quarter, we also pay a commitment fee (calculated in arrears) to each revolving credit
lender in respect of any unused commitments under the revolving credit facility, subject to adjustment based upon the level of the total lease-adjusted leverage ratio. As of January 31, 2010, the commitment fee was 0.375%.
The Credit Facility contains various restrictive covenants that, sub-ject to signifi cant exceptions, limit our ability and the ability of our re-stricted subsidiaries, to, among other things: make investments and loans, make capital expenditures, incur, assume, or permit to exist additional indebtedness, guarantees, or liens, engage in mergers, acquisitions, asset sales or sale-leaseback transactions, declare divi-dends, make payments on, or redeem or repurchase equity interests, alter the nature of the business, engage in certain transactions, with affi liates, enter into agreements limiting subsidiary distributions, and prepay, redeem, or repurchase certain indebtedness.
The Credit Facility requires Dollarama Group L.P. (“Group L.P.”) to comply, on a quarterly basis, with certain fi nancial covenants, including a minimum interest coverage ratio test and a maximum lease-adjusted leverage ratio test. As of January 31, 2010, the terms of the Credit Facility required that we maintain a minimum interest coverage ratio of 2.50:1 and a lease-adjusted leverage ratio of no more than 4.50:1. The interest coverage ratio and the lease-adjusted leverage ratio fi nancial covenants are not subject to further adjustments and will be fi xed at 2.50:1 and 4.50:1, respectively, for the remaining term of the Credit Facility. As of January 31, 2010, the Corporation was in compliance with all of its fi nancial covenants.
Subject to exceptions, the Credit Facility requires mandatory pre-payments of or offer to prepay (with the failure to do so constituting an event of default) the loans in the event of certain asset sales or other asset dispositions, issuances of equity securities or debt securities, or if we have annual consolidated excess cash fl ows. The Credit Facility is guaranteed by Dollarama Holdings L.P. (“Holdings L.P.”), Dollarama Group GP Inc. and all of Group L.P.’s existing and future restricted subsidiaries, and is secured by a security interest in substantially all of the existing and future assets of Holdings L.P., Dollarama Group GP Inc, Group L.P. and Group L.P.’s restricted subsidiaries, and a pledge of Group L.P.’s capital stock and the capital stock of each of its sub-sidiaries, subject to certain exceptions agreed upon with the lenders and local law requirements.
On September 22, 2009, we entered into Amendment No. 5 to the Credit Facility which allowed us to enter into a new secured revolving credit facility which replaced our existing secured revolving credit facil-ity on the same terms, except that the new revolving credit facility may have a later maturity date and may have a different interest rate.
On October 21, 2009, we entered into Amendment No. 6 to the Credit Facility. The Amendment No. 6 provides us with a new $75.0 million secured revolving credit facility, which matures in July 2012 and otherwise has the same terms, pricing, covenants, guarantees and security as our existing secured revolving credit facility.
8.875% Subordinated NotesGroup L.P. and Dollarama Corporation issued U.S.$200.0 million
Management’s Discussion and Analysis April 8, 2010
DO
LL
AR
AM
A IN
C. A
NN
UA
L R
EP
OR
T 2
00
9
21
of 8.875% Subordinated Notes due in 2012 on August 12, 2005. On the Redemption Date, Group L.P. and Dollarama Corporation consum-mated the redemption of the outstanding U.S.$200.0 million principle amount of the 8.875% Subordinated Notes in accordance with their terms. The redemption price was 104.438% of the principal amount of the 8.875% Subordinated Notes, plus accrued and unpaid interest to the Redemption Date and was paid from cash on hand and from the net proceeds of the IPO.
Deferred Interest NotesDollarama Group Holdings L.P. (“Holdings”) and Dollarama Group
Holdings Corporation issued U.S.$200.0 million of Deferred Interest Notes on December 20, 2006. As of January 31, 2010, there was U.S.$212.2 million in aggregate principal amount and deferred interest outstanding. The Deferred Interest Notes will mature on August 15, 2012. Interest on the Deferred Interest Notes accrues and is payable semi-annually in arrears on June 15 and December 15 of each year, at a rate per annum equal to 6-month LIBOR plus 6.75% as of December 15, 2009. On each interest payment date, Holdings and Dollarama Group Holdings Corporation may elect to pay interest in cash or de-fer the payment of interest, in which case such interest will become deferred interest and interest shall accrue on such deferred interest for subsequent interest periods. For the payment of interest due on June 15, 2009, Holdings and Dollarama Group Holdings Corporation deferred the payment of interest on the Deferred Interest Notes, which payment represented an amount of U.S.$8.7 million. Interest was also deferred on June 15, 2008 and December 15, 2008. An aggregate amount of U.S.$27.4 million of deferred interest remains outstanding as of January 31, 2010 and will be payable at the latest upon redemp-tion or maturity of the Deferred Interest Notes. Holdings elected to make a cash payment of interest due on December 15, 2009 in the amount of $8.4 million.
The Deferred Interest Notes may be redeemed, in whole or in part, at the following redemption prices (expressed as percentages of prin-cipal amount plus deferred interest), plus accrued and unpaid interest, if any, to the redemption date, if redeemed during periods set forth below:
Year Redemption Price
December 15, 2009 to December 14, 2010 101.00December 15, 2010 and thereafter 100.00
In addition, Holdings and Dollarama Group Holdings Corporation may redeem all of the Deferred Interest Notes at a price equal to 100% of the principal amount plus deferred interest, plus accrued and unpaid interest, if any, if Holdings and Dollarama Group Holdings Corporation become obligated to pay certain tax gross-up amounts. Following a change of control as defi ned in the indenture governing the Deferred Interest Notes (the “Deferred Interest Notes Indenture”), Holdings and Dollarama Group Holdings Corporation will be required to offer to pur-chase all of the Deferred Interest Notes at a purchase price of 101% of their principal amount plus deferred interest, plus accrued and unpaid interest (other than deferred interest), if any, to the date of purchase.
The Deferred Interest Notes Indenture contains certain restrictions on us, including restrictions on Holdings’, Dollarama Group Holdings Corporation’s and their restricted subsidiaries’ ability to make invest-ments and loans, incur indebtedness and issue preferred stock, de-clare dividends, make payments on, or redeem or repurchase equity interests, engage in certain transactions with affi liates, grant liens, sell assets, enter into agreements limiting subsidiary distributions, and engage in certain other activities. The Deferred Interest Notes Inden-ture contains customary affi rmative covenants and events of default, including, but not limited to, non-payment of principal, premium of interest, breach of covenants, cross default and cross acceleration to certain indebtedness, insolvency and bankruptcy events, material judgments and actual or asserted invalidity of the guarantees. Some of these events of default allow for notice and grace periods and are subject to materiality thresholds.
The Deferred Interest Notes constitute senior unsecured obligations of Holdings and Dollarama Group Holdings Corporation. They rank equally in right of payment to all of Holdings’ and Dollarama Group Holdings Corporation’s future unsecured senior indebtedness, senior in right of payment to any of Holdings’ and Dollarama Group Holdings Corporation’s future senior subordinated indebtedness and subordi-nated indebtedness and are effectively subordinated in right of pay-ment to any of Holdings’ and Dollarama Group Holdings Corporation’s future secured debt, to the extent of such security and are structurally subordinated in right of payment to all existing and future debt and other liabilities, including the Credit Facility, trade payables and lease obligations, of Holdings’ subsidiaries. The Deferred Interest Notes are not guaranteed by any of Holdings’ subsidiaries (other than Dollarama Group Holdings Corporation, as the co-issuer of the Deferred Interest Notes).
Management’s Discussion and Analysis April 8, 2010
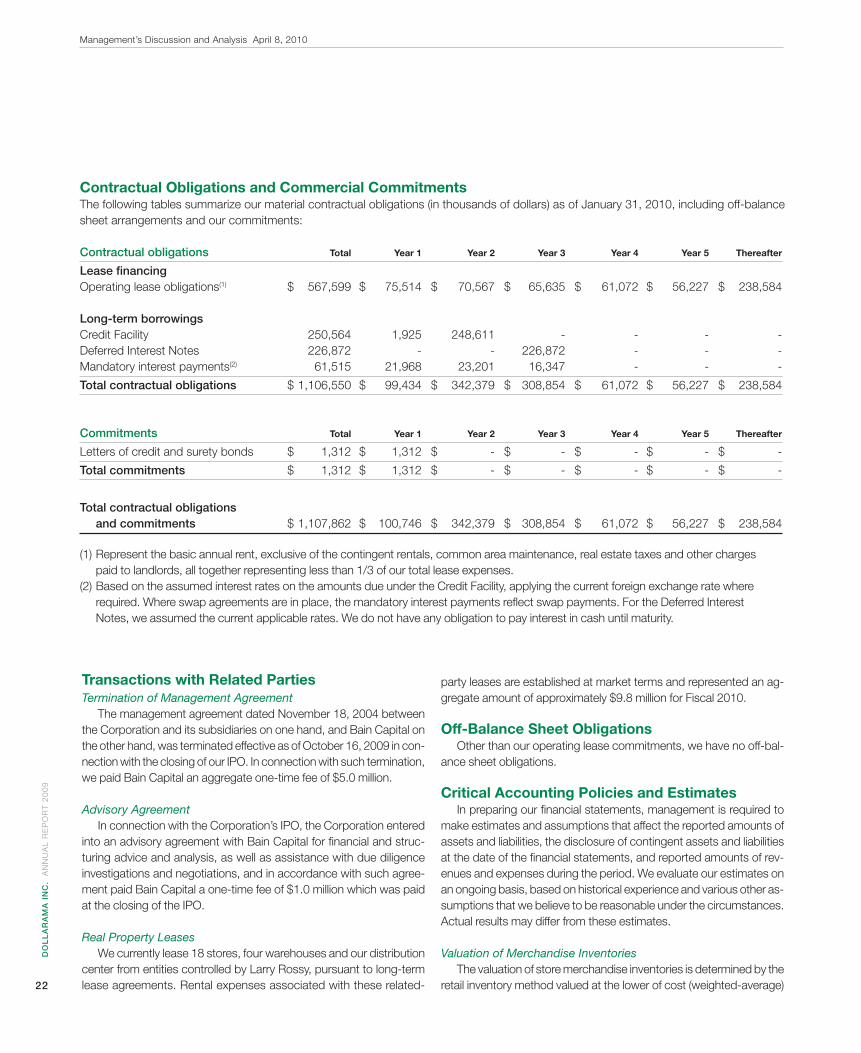
DO
LL
AR
AM
A I
NC
. A
NN
UA
L R
EP
OR
T 2
00
9
22
Transactions with Related PartiesTermination of Management Agreement
The management agreement dated November 18, 2004 between the Corporation and its subsidiaries on one hand, and Bain Capital on the other hand, was terminated effective as of October 16, 2009 in con-nection with the closing of our IPO. In connection with such termination, we paid Bain Capital an aggregate one-time fee of $5.0 million.
Advisory AgreementIn connection with the Corporation’s IPO, the Corporation entered
into an advisory agreement with Bain Capital for fi nancial and struc-turing advice and analysis, as well as assistance with due diligence investigations and negotiations, and in accordance with such agree-ment paid Bain Capital a one-time fee of $1.0 million which was paid at the closing of the IPO.
Real Property LeasesWe currently lease 18 stores, four warehouses and our distribution
center from entities controlled by Larry Rossy, pursuant to long-term lease agreements. Rental expenses associated with these related-
party leases are established at market terms and represented an ag-gregate amount of approximately $9.8 million for Fiscal 2010.
Off-Balance Sheet ObligationsOther than our operating lease commitments, we have no off-bal-
ance sheet obligations.
Critical Accounting Policies and EstimatesIn preparing our fi nancial statements, management is required to
make estimates and assumptions that affect the reported amounts of assets and liabilities, the disclosure of contingent assets and liabilities at the date of the fi nancial statements, and reported amounts of rev-enues and expenses during the period. We evaluate our estimates on an ongoing basis, based on historical experience and various other as-sumptions that we believe to be reasonable under the circumstances. Actual results may differ from these estimates.
Valuation of Merchandise InventoriesThe valuation of store merchandise inventories is determined by the
retail inventory method valued at the lower of cost (weighted-average)
Contractual Obligations and Commercial CommitmentsThe following tables summarize our material contractual obligations (in thousands of dollars) as of January 31, 2010, including off-balance sheet arrangements and our commitments:
Contractual obligations Total Year 1 Year 2 Year 3 Year 4 Year 5 Thereafter
Lease fi nancing Operating lease obligations(1) $ 567,599 $ 75,514 $ 70,567 $ 65,635 $ 61,072 $ 56,227 $ 238,584
Long-term borrowings Credit Facility 250,564 1,925 248,611 - - - -Deferred Interest Notes 226,872 - - 226,872 - - -Mandatory interest payments(2) 61,515 21,968 23,201 16,347 - - -
Total contractual obligations $ 1,106,550 $ 99,434 $ 342,379 $ 308,854 $ 61,072 $ 56,227 $ 238,584
Commitments Total Year 1 Year 2 Year 3 Year 4 Year 5 Thereafter
Letters of credit and surety bonds $ 1,312 $ 1,312 $ - $ - $ - $ - $ -
Total commitments $ 1,312 $ 1,312 $ - $ - $ - $ - $ -
Total contractual obligations and commitments $ 1,107,862 $ 100,746 $ 342,379 $ 308,854 $ 61,072 $ 56,227 $ 238,584
(1) Represent the basic annual rent, exclusive of the contingent rentals, common area maintenance, real estate taxes and other charges paid to landlords, all together representing less than 1/3 of our total lease expenses.(2) Based on the assumed interest rates on the amounts due under the Credit Facility, applying the current foreign exchange rate where required. Where swap agreements are in place, the mandatory interest payments refl ect swap payments. For the Deferred Interest Notes, we assumed the current applicable rates. We do not have any obligation to pay interest in cash until maturity.
Management’s Discussion and Analysis April 8, 2010
DO
LL
AR
AM
A IN
C. A
NN
UA
L R
EP
OR
T 2
00
9
23
or net realizable value. Under the retail inventory method, merchandise inventories are converted to a cost basis by applying an average cost to selling ratio. Merchandise inventories that are at the distribution center or warehouses and inventories that are in-transit from suppliers, are stated at the lower of cost and net realizable value, determined on a weighted-average cost basis. Merchandise inventories include items that have been marked down to management’s best estimate of their net realizable value and are included in cost of sales in the period in which the markdown is determined. We estimate our markdown re-serve based on the consideration of a variety of factors, including but not limited to quantities of slow-moving or carryover seasonal merchan-dise on hand, historical markdown statistics and future merchandising plans. The accuracy of our estimates can be affected by many factors, some of which are outside of our control, including changes in eco-nomic conditions and consumer buying trends. Historically, we have not experienced signifi cant differences in our estimates of markdowns compared with actual results.
Property and EquipmentProperty and equipment are carried at cost. Property and equip-
ment are amortized over the estimated useful lives of the respective assets as follows: (i) on the declining balance method, computer equip-ment and vehicles at 30%; and (ii) on the straight-line method, store and warehouse equipment at eight to ten years, computer software at fi ve years and leasehold improvements at the terms of the leases. Property and equipment are reviewed for impairment whenever events or changes in circumstances indicate that the carrying value of an as-set might not be recoverable.
Goodwill and Trade NameGoodwill and trade name are not subject to amortization and are
tested for impairment annually or more frequently if events or circum-stances indicate that the assets might be impaired. Impairment is identifi ed by comparing the fair value of the reporting unit to which it relates to its carrying value. To the extent the reporting unit’s carrying amount exceeds its fair value, we measure the amount of impairment in a manner similar to that of a purchase price allocation, and any excess of carrying amount over the implied fair value of goodwill is charged to earnings in the period in which the impairment is determined. Future events could cause us to conclude that impairment indicators exist and that goodwill associated with our business is impaired. Any resulting impairment would be charged to net earnings.
Impairment of Long-Lived AssetsLong-lived assets are reviewed for impairment whenever events or
changes in circumstances indicate that the carrying amount of an as-set may not be recoverable. Factors which we consider could trigger an impairment review include, but are not limited to, signifi cant negative industry or economic trends and current, historical or projected losses that demonstrate continuing losses. Impairment is assessed by com-paring the carrying amount of an asset with the expected future net
undiscounted cash fl ows from its use together with its residual value. If such assets are considered to be impaired, the impairment to be recognized is measured by the amount by which the carrying amount of the assets exceeds their fair value. The estimates regarding their fair value include assumptions about future conditions relating to our business, as well as the industry. If actual cash fl ows differ from those projected by management, additional write-offs may be required.
Operating LeasesWe recognize rental expense and inducements received from land-
lords on a straight-line basis over the term of the leases. Any difference between the calculated expense and the amounts actually paid is refl ected as deferred lease inducements on our balance sheet.
Recent Accounting PronouncementsAccounting Changes Implemented
Goodwill and Intangible AssetsCICA 3064 replaces CICA 3062 and establishes standards for the
recognition, measurement and disclosure of goodwill and intangible assets. The provisions relating to the defi nition and initial recognition of intangible assets are equivalent to the corresponding provisions of IAS 38, Intangible Assets. CICA 1000 is amended to clarify criteria for recognition of an asset. CICA 3450 is replaced by guidance in CICA 3064. EIC 27 is no longer applicable for entities that have adopted CICA 3064. AcG 11 is amended to delete references to deferred costs and to provide guidance on development costs as intangible assets under CICA 3064. This new standard is effective for interim and annual fi nancial statements for years beginning on or after October 1, 2008. This Section was adopted as of February 2, 2009 with no impact on the consolidated fi nancial statements.
Accounting ChangesIn June 2009, CICA amended Section 1506, “Accounting Chang-
es”, to exclude from the scope of this section changes in accounting policies upon the complete replacement of an entity’s primary basis of accounting. This amendment is effective for years beginning after July 1, 2009. The adoption of this amendment to Section 1506 had no impact on the consolidated fi nancial statements.
Financial Instruments - DisclosuresIn June 2009, the CICA amended section 3862, “Financial Instru-
ments — Disclosures”, to include additional disclosure requirements about fair value measurement for fi nancial instruments and liquidity risk disclosures. These amendments require a three-level hierarchy that refl ects the signifi cance of the inputs used in making the fair value measurements. Fair value of assets and liabilities included in Level 1 are determined by reference to quoted prices in active markets for identical assets and liabilities. Assets and liabilities in Level 2 include valuations using inputs other than the quoted prices for which all sig-nifi cant inputs are based on observable market data, either directly or
Management’s Discussion and Analysis April 8, 2010
DO
LL
AR
AM
A I
NC
. A
NN
UA
L R
EP
OR
T 2
00
9
24
indirectly. Level 3 valuations are based on inputs that are not based on observable market data. The amendments to Section 3862 ap-ply for annual fi nancial statements relating to fi scal years ending after September 30, 2009.
Future Accounting Changes
Business Combinations, consolidated fi nancial statements and non-controlling interests
CICA Handbook Section 1582, “Business Combinations”; Sec-tion 1601, “Consolidated Financial Statements”; and Section 1602, “Non-controlling Interests”, replace Section 1581, “Business Combi-nations”, and Section 1600, “Consolidated Financial Statements”, and establish a new section for accounting for a non-controlling interest in a subsidiary. These sections provide the Canadian equivalent to International Financial Reporting Standard 3, “Business Combinations (January 2008)”, and IAS 27, “Consolidated and Separate Financial Statements (January 2008)”. Section 1582 is effective for business combinations for which the acquisition date is on or after the fi rst quarter beginning on January 31, 2011 with early adoption permitted. Sections 1601 and 1602 apply to interim and annual consolidated fi nancial statements relating to years beginning on January 20, 2011 with early adoption permitted. The Corporation is assessing the impact of these new standards.
Financial Instruments – Recognition and MeasurementIn June 2009, CICA amended Section 3855, “Financial Instruments –
Recognition and Measurement”, to clarify application of the effective interest rate method after a debt instrument has been impaired. The amendment also clarifi es when an embedded prepayment option is separated from its host debt instrument for accounting purposes. This amendment is effective January 1, 2011, at which time Canadian pub-lic companies will have adopted IFRS. At this point, the Corporation does not intend to adopt this amendment early. The Corporation is currently evaluating the impact of the adoption of this amendment.
International Financial Reporting Standards (“IFRS”)In October 2009, the Accounting Standards Board (“AcSB”) issued
a third and fi nal IFRS Omnibus Exposure Draft confi rming that publicly accounting enterprises will be required to apply IFRS, in full and without modifi cation, for fi nancial periods beginning on January 1, 2011.
The adoption date of January 31, 2011 is the fi rst day of the Cor-poration’s Fiscal 2012 and will require restatement, for comparative purposes, of amounts reported for Fiscal 2011 including the opening balance sheet as at February 1, 2010.
The Corporation has commenced the process to transition from current Canadian GAAP to IFRS. Internal staff has been appointed to lead the conversion project along with sponsorship from the leader-ship team. Resource requirements have been identifi ed and all IFRS requirements will be met with internal employees supplemented with consultants as required. Regular progress reporting to the audit com-
mittee of the Corporation on the status of the IFRS conversion has been implemented along with scheduled training sessions throughout Fiscal 2010. At this time, the Corporation has begun the process of training key personnel, by providing general awareness training on IFRS impacts.
The implementation project of the Corporation consists of three key phases, which in certain cases will be process concurrently as IFRS is applied to specifi c areas from start to fi nish:
Phase 1: Scoping and diagnostic phase:This phase involves performing a high level impact analysis to iden-
tify areas that may be affected by the transition to IFRS. The results of this analysis are priority ranked according to complexity and the amount of time required to assess the impact of changes in transition-ing to IFRS.
Phase 2: Impact analysis and evaluation phase:During this phase, items identifi ed in the diagnostic are addressed
according to the priority levels assigned to them. This phase involves the development of a detailed project plan,
the completion of analyses of the differences between the Corpora-tion’s accounting policies and IFRS to provide a basis for accounting policy recommendations, completion of an IT systems impact analysis and the development of a strategy for dual Canadian GAAP and IFRS reporting during FY11 and changeover to IFRS in FY12, the assess-ment of the impact of accounting and other business process changes on internal controls, the review of compensation arrangements, debt agreements and other contractual arrangements, and the delivery of detailed IFRS training to key fi nance and other personnel.
The conclusion of the impact analysis and evaluation phase will require the audit committee of the Corporation to review and approve all accounting policy choices as proposed by management.
Phase 3: Implementation phase and review phase:In the last phase, we will implement all changes approved in the im-
pact analysis phase and will include changes to information systems, business processes, modifi cation of agreements and training of all staff who are impacted by the conversion.
Current Status of Our IFRS Changeover Plan:The Corporation has completed the scoping and diagnostic phase
and has prepared draft analysis for the impact analysis and evaluation phase. During the fourth quarter of FY10, the Corporation signifi cantly progressed in the design phase of its changeover plan. However, man-agement has not yet fi nalized its analysis of accounting policies choice and impacts on the fi nancial statements, and as such is unable to quantify the impact of adopting IFRS on the fi nancial statements.
We expect to complete the fi nal stages of the design phase of our changeover plan early in FY11. Updates regarding the progress of the IFRS changeover project are provided to the Corporation’s audit committee on a quarterly basis.
Management’s Discussion and Analysis April 8, 2010
DO
LL
AR
AM
A IN
C. A
NN
UA
L R
EP
OR
T 2
00
9
25
The Corporation has identifi ed the areas noted below as those ex-pected to have the most signifi cant impact on our fi nancial statements. These areas do not represent a complete list of expected changes. As we progress further into the implementation phase, and as changes to Canadian GAAP and IFRS standards may occur prior to our change-over date, the differences and impacts described below may be sub-ject to change. We will continue to disclose additional impacts on our fi nancial reporting, including expected quantitative impacts, systems and processes and other areas of our business in future reports as they are determined.
First time adoptionIFRS 1, “First-Time Adoption of International Financial Reporting
Standards” (“IFRS 1”), provides entities adopting IFRS for the fi rst time with a number of optional exemptions and mandatory exceptions in certain areas to the general requirement for full retrospective applica-tion of IFRS.
Management is analyzing the various accounting policy choices available and will implement those determined to be the most appropri-ate for the Corporation which at this time are summarized as follows:
Business CombinationsIFRS 1 generally provides for the business combinations standard
to be applied either retrospectively or prospectively from the date of transition to IFRS (or to restate all business combinations after a select-ed date). Retrospective application would require an entity to restate all prior transactions that meet the defi nition of a business under IFRS.
We will not elect to retrospectively apply IFRS 3 to business com-binations that occurred prior to the transition date, and such business combinations will not be restated. Any goodwill arising on such busi-ness combinations before the transition date will not be adjusted from the carrying amount previously determined under Canadian GAAP as a result of applying these exemptions except as required under IFRS 1.
Property, Plant and Equipment (“PP&E”)IFRS 1 allows an entity to initially measure an item of PP&E and
investment property upon transition to IFRS at fair value as deemed cost (or under certain circumstances using a previous GAAP revalua-tion) as opposed to full retroactive application of the cost model under IFRS. Under this option, fair value as deemed cost will become the new cost amount for qualifying assets at transition.
We will continue to apply the cost model for PP&E and will not restate PP&E to fair value under IFRS. We will use the historical bases under Canadian GAAP as deemed cost under IFRS at the transition date.
Share-Based PaymentsIFRS 1 allows the Corporation an exemption to not apply retrospec-
tively IFRS 2, “Share-Based Payments” requirements to equity instru-ments granted on or before November 2, 2002 or which vested before the Corporation’s transition date to IFRS. Although not expected to
be signifi cant, management is still in the process of assessing the ap-plication of this fi rst time adoption option.
Major differences with current accounting policies
LeasesUnder IFRS there are no bright-line fi nance lease criteria as com-
pared to Canadian GAAP, which may cause certain leases to tenants to be classifi ed as fi nance leases rather than operating leases, as is generally the Corporation’s current treatment under Canadian GAAP.
The Corporation has developed internal methodology (decision tree) using IFRS indicators to assist in lease classifi cation under IFRS. Management is still in the process of fi nalizing its assessment review of the impact of this new accounting policy, however, no signifi cant adjustments are expected.
Grouping of Assets for Impairment PurposesUnder Canadian GAAP, when a long-lived asset does not have
identifi able cash fl ows that are largely independent of those from other assets, that asset must be grouped with other related assets for im-pairment. This is referred to as the asset group.
Under IFRS, asset grouping should be done when an asset does not have identifi able cash infl ows, as opposed to net cash fl ows, that are independent of those from other assets.
Moreover, for goodwill, the grouping should be based on a rationale basis and allocated to the lowest level at which the entity’s manage-ment monitors the performance of its acquisition. This may be an individual CGU or group of CGUs but cannot be larger than a segment. However, the reporting units under Canadian GAAP may not result in assessment at as low a level as the CGU used in IAS 36.
Management has completed its analysis with regard to the above expected differences and concluded that no material adjustment is required.
Impairment of Long-lived AssetsUnder Canadian GAAP, whenever the estimated future cash fl ows
on an undiscounted basis of a property is less than the carrying amount of the property, an impairment loss is measured and recorded based on fair values. Under IFRS, IAS 36 Impairment of Assets (“IAS 36’’) requires an impairment charge to be recognized if the recover-able amount, determined as the higher of the estimated fair value less costs to sell or value in use, is less than carrying amount. The impair-ment charge under IFRS is equal to the amount by which the carrying amount exceeds the recoverable amount.
The difference in testing and determining an impairment may result in more frequent impairment charges, where carrying values of assets may have been supported under Canadian GAAP on an undiscounted cash fl ow basis, but cannot be supported on a discounted cash fl ow basis.
IAS 36 also requires the reversal of any previous impairment losses where circumstances requiring the impairment charge have changed
Management’s Discussion and Analysis April 8, 2010
DO
LL
AR
AM
A I
NC
. A
NN
UA
L R
EP
OR
T 2
00
9
26
and reversed. Canadian GAAP does not permit the reversal of impair-ment losses in any circumstance.
Based on the analysis completed by management, no signifi cant impacts are expected in this area.
Hedges and DerivativesUnder IFRS, hedge effectiveness requirements are more onerous
than under Canadian GAAP. As such, documentation of hedge re-lationships and hedge effectiveness have been reviewed to ensure compliance with IAS 39 requirements, at the transition date.
Moreover, although hedge accounting under Canadian GAAP and IFRS is substantially the same, existing Canadian standards and meth-ods to evaluate retrospective hedge effectiveness are not consistent with IFRS. IFRS does not allow the use of the shortcut method or the critical terms matching method for retrospectively assessing effective-ness for derivative fi nancial instruments. Consequently a new testing methodology has been set up for retrospective testing and has been applied at the transition date. The full extent of the impact of applying IAS 39 requirements cannot be made at this time, pending further review.
Income Taxes – temporary differences on intangible assetsUnder Canadian GAAP, future income taxes are calculated from
temporary differences that are differences between the tax basis of an asset or liability and its carrying amount in the balance sheet. Under the current Income Tax Act (Canada), “eligible capital expenditures” are deductible for tax purposes to the extent of 75 percent of the cost incurred; Section 3465 – Income taxes addresses this specifi c situation and specifi es that for these assets, at any point in time, the tax basis represents the balance in the cumulative eligible capital pool plus 25 percent of the carrying amount.
The defi nition of temporary differences under IFRS is generally con-
sistent with Canadian GAAP. However, IFRS does not provide specifi c guidance in relation to the determination of the tax basis of eligible capital expenditures such as the one described above. As such, the tax basis of these assets, without taking into consideration the 25 percent adjustment of the carrying amount as allowed under Canadian GAAP, should be compared with the carrying amount in the balance sheet to determine the temporary difference relating to these assets. Management is currently fi nalizing the calculation of the potential im-pact related to this issue.
Property, Plant and EquipmentIFRS requires a component approach: each part of an item of PP&E
with a cost that is signifi cant in relation to the total cost of the item must be depreciated separately over its estimated useful life. This may result in additional individual line items in the fi xed assets subledger being depreciated over their useful lives.
Given the nature of the Corporation’s assets, no signifi cant impact is expected in this area.
Share-based PaymentsThere are multiple differences between both GAAP in the measure-
ment principles. For the Corporation, one of the applicable differences is the IFRS requirement to estimate forfeitures at the time of the grant, instead of accounting for as they occur.
The difference has no signifi cant impact at the transition date, but accounting policies will be reviewed consequently.
The following table summarizes the status of our changeover plan based on the recommendations published in October 2008 by the Canadian Performance Reporting Board with regard to the Pre 2011 communications about IFRS conversion.
Management’s Discussion and Analysis April 8, 2010
Key Activity
Identify key differences between IFRS and Canadian GAAP
Evaluate and select ongoing policies
Evaluate and select IFRS 1 choices
Prepare fi nancial statements format
Quantify the effects of change-over to IFRS
Area
Financial statements presentation
Milestones
Senior management sign-off for all items to be completed by the end of Fiscal 2010
Subsequent changes to IFRS will be analyzed and reviewed on a quarterly basis
Status
Completed the identifi cation of IFRS differences
Evaluation and selection of accounting policy alternatives is completed
Preparation of draft of fi nancial statements is under completion
Quantifi cation of impacts are in progress
DO
LL
AR
AM
A IN
C. A
NN
UA
L R
EP
OR
T 2
00
9
27
Management’s Discussion and Analysis April 8, 2010
Key Activity
Identify and address IFRS differences that require changes to fi nancial systems
Evaluate and select methods to address need for parallel processing of 2010 general ledgers and for planning and monitoring purposes
Assess required changes to exist-ing internal control processes and procedures
Design and implement internal controls with respect to one-time changeover adjustments and ongoing changes
For changes to accounting policies and practices identifi ed, assess the disclosure controls and procedures design and effectiveness implications
Provide training to accounting staff, senior executives and board of directors (including audit committee)
Communication of progress on conversion plan to internal and external stakeholders
Identify and assign necessary resources with the requisite expertise for technical analysis and implementation
Assess impacts of IFRS accounting standards on business activities
Identify impact on contractual agreement including fi nancial covenants, employee and management compensation plans
Area
IT systems
Internal control over fi nancial reporting
Training and communication
IFRS impacts on business groups and functions
Milestones
Required fi nancial systems changes and set up of parallel processing to be completed by the end of Fiscal 2010
Assessment of required changes to be completed by the end of Q2 Fiscal 2011
Revision to actual internal controls modifi cations planned for the third quarter of Fiscal 2011
Timely training provided to align with work under transition – train-ing to be substantially completed by the end of Fiscal 2011
Communicate effect of the transition during Fiscal 2011
Procure and assign project resources
Changes to agreement being completed by the end of third quarter Fiscal 2011
Status
Identifi cation of IFRS differences with system impacts is under progress
Selection of parallel processing solution is completed
Implementation of the solution is under progress
Assessment of IFRS impacts on existing internal control process-es and procedures under progress
Revision of actual controls and design of signifi cant process changes will start during Fiscal 2011
General awareness training on IFRS impacts already provided. Detailed training on relevant topics will be provided during Fiscal 2011
Ongoing communication to external stakeholders through disclosures
Periodic status project are presented to senior management and audit committee
Project management continues to identify critical path tasks and resourcing matters
Process of identifying issues will start during the fi rst quarter of Fiscal 2011
DO
LL
AR
AM
A I
NC
. A
NN
UA
L R
EP
OR
T 2
00
9
28
Quantitative And Qualitative Disclosures About Market RiskForeign Exchange Risk
While all of our sales are in Canadian dollars, we have been steadi-ly increasing our purchases of merchandise from low-cost overseas suppliers, including suppliers in China, Brazil, India, Indonesia, Tai-wan, Thailand and Turkey. For Fiscal 2009 and Fiscal 2010 to date, this direct sourcing from foreign suppliers accounted for in excess of 50% of our purchases. Accordingly, our results of operations are impacted by the fl uctuation of foreign currencies against the Cana-dian dollar. In particular, we purchase a majority of our imported mer-chandise from suppliers in China using U.S. dollars. Therefore, our cost of sales is impacted by the fl uctuation of the Chinese renminbi against the U.S. dollar and the fl uctuation of the U.S. dollar against the Canadian dollar.
We use foreign exchange forward contracts to mitigate the risk from fl uctuations in the U.S. dollar relative to the Canadian dollar. The majority of foreign exchange forward contracts are used only for risk management purposes and are designated as hedges of specifi c an-ticipated purchases of merchandise. We estimate that in the absence of our currency risk management program, every $0.01 depreciation in the Canadian dollar relative to U.S. dollar exchange rate results in approximately $2.0 million annual decrease in our operating earnings before taxes. The seasonality of our purchases will affect the quarterly impact of this variation. We periodically examine the derivative fi nancial instruments we use to hedge exposure to foreign currency fl uctuation to ensure that these instruments are highly effective at reducing or modifying foreign exchange risk associated with the hedged item.
In addition, a majority of our debt is in U.S. dollars. Therefore, a downward fl uctuation in the exchange rate of the Canadian dollar ver-sus the U.S. dollar would reduce our funds available to service our U.S. dollar-denominated debt. In absence of foreign exchange hedging of our U.S. dollar-denominated debt, each weakening by one cent of Canadian dollar relative to the U.S. dollar would result in $4.46 million in additional Canadian dollar debt, as well as $0.54 million in additional undiscounted Canadian dollar interest obligations over the remaining life to maturity.
As required by the terms of the Credit Facility, we have entered into foreign currency and interest rate swap agreements with maturities matching those of the underlying debt to minimize our exposure to exchange rate and interest rate fl uctuations in respect of our LIBOR-based U.S. dollar-denominated term loans.
Similarly, we had entered into foreign currency swap agreements to minimize our exposure to exchange rate fl uctuations in respect of our 8.875% Subordinated Notes. Originally, these foreign currency swap agreements qualifi ed for hedge accounting. However, as the Corpora-tion exercised its call option on the 8.875% Subordinated Notes on October 16, 2009, the foreign currency swap agreements no longer qualify for hedge accounting as of that date.
On December 18, 2008, the Corporation entered into new foreign currency and interest rate swap agreements with its lenders to replace
the existing foreign currency and interest rate swap agreements with a maturity date of January 30, 2009. The new currency and interest rate swap does not qualify for hedge accounting.
In addition, the December 18, 2008 swap agreement enables the Corporation to convert the interest rate on the debt from U.S. dollar LIBOR to Canadian bankers’ acceptance rate and fi x the exchange rate on these payments at 1.20. The agreement provides for the Cor-poration to pay interest on the stated notional amount at a variable rate of Canadian bankers’ acceptance rate plus 2.5% (in Canadian dollars) and to receive interest at LIBOR plus 1.75% (in U.S. dollars) with a fi xed U.S./Canadian dollar conversion rate of 1.20.
On November 17, 2009, the Corporation amended an existing for-eign currency and interest rate swap agreement with one of its lenders from a fi xed-for-fi xed rate swap arrangement to a fl oating-for-fl oating rate swap arrangement. The amended agreement provides for the Corpora-tion to pay interest on the stated notional amount at a variable rate of Canadian bankers’ acceptance rate plus 0.3% (in Canadian dollars) and to receive interest at LIBOR (in U.S. dollars) with a fi xed U.S./Canadian dollar conversion rate of 1.15.
On January 26, 2010, the Corporation entered into new foreign cur-rency and interest rate swap agreements with its lenders to replace the existing foreign currency and interest rate swaps with a maturity date of January 29, 2010. The new currency and interest rate swaps do not qualify for hedge accounting.
The January 26, 2010 swap agreements enable the Corporation to convert the interest rate on the debt from U.S. dollar LIBOR to Canadian bankers’ acceptance rate and fi x the exchange rate on these payments at 1.19. The agreements provide for the Corporation to pay interest on the stated notional amount at a variable rate of Canadian bankers’ acceptance rate plus 2.3% (in Canadian dollars) and to receive interest at LIBOR plus 1.75% (in U.S. dollars) with a fi xed U.S./Canadian dollar conversion rate of 1.19.
Interest Rate RiskWe use variable-rate debt to fi nance a portion of our operations and
capital expenditures. These obligations expose us to variability in inter-est payments due to changes in interest rates. We have approximately $250.6 million in term loans outstanding under the Credit Facility based on the exchange rate on January 31, 2010, bearing interest at variable rates. Each quarter point change in interest rates would result in a $0.6 million change in interest expense on such term loans. We also have an existing revolving loan facility which provides for borrowings of up to $75.0 million which bears interest at variable rates. Assuming the entire revolver is drawn, each quarter point change in interest rates would result in a $0.2 million change in interest expense on our existing revolving loan facility.
We also have approximately $226.9 million of Deferred Interest Notes based on the exchange rate on January 31, 2010, bearing inter-est at variable rates. Each quarter point change in interest rates would result in a $0.6 million change in interest expense on the notes.
Management’s Discussion and Analysis April 8, 2010
DO
LL
AR
AM
A IN
C. A
NN
UA
L R
EP
OR
T 2
00
9
29
Financial InstrumentsFair Market Value
We estimate the fair market value of our fi nancial instruments based on current interest rates, foreign currency exchange rate, credit risk, market value and current pricing of fi nancial instruments with similar terms. Unless otherwise disclosed herein, the carrying value of these fi nancial instruments, especially those with current maturities such as cash and cash equivalents, accounts receivable, deposits, accounts payable and accrued expenses, approximates their fair market value.
HedgingWe use derivative fi nancial instruments in the management of our
foreign currency and interest rate exposures. When hedge accounting is used, we document relationships between hedging instruments and hedged items, as well as our risk management objective and strategy for undertaking various hedge transactions. This process includes link-ing derivatives to specifi c assets and liabilities on the balance sheet or to specifi c fi rm commitments or forecasted transactions. We also assess whether the derivatives that are used in hedging transactions are effective in offsetting changes in cash fl ows of hedged items.
Foreign Exchange RisksWe have signifi cant cash fl ows and long-term debt denominated
in U.S. dollars. We use foreign exchange forward contracts and for-eign currency swap agreements to mitigate risks from fl uctuations in exchange rates. Forward contracts and foreign currency swap agree-ments are used for risk management purposes and are designated as hedges of specifi c anticipated purchases.
Interest RisksOur interest rate risk is primarily in relation to our fl oating rate bor-
rowings. We have entered into some swap agreements to exchange U.S. dollar denominated fl oating rate debt to Canadian dollar denomi-nated fl oating rate debt.
OthersIn the event a derivative fi nancial instrument designated as a cash
fl ow hedge is terminated or ceases to be effective prior to maturity, related realized and unrealized gains or losses are deferred under accumulated other comprehensive income (loss) and recognized in earnings in the period in which the underlying original hedged trans-action is recognized. In the event a designated hedged item is sold, extinguished or matures prior to the termination of the related derivative fi nancial instrument, any realized or unrealized gain or loss on such derivative fi nancial instrument is recognized in earnings.
Derivative fi nancial instruments which are not designated as hedges or have ceased to be effective prior to maturity are recorded at their estimated fair values under current assets or liabilities with changes in their estimated fair values recorded in earnings. Estimated fair value is determined using pricing models incorporating current market prices and the contractual prices of the underlying instruments, the time value
of money and yield curves.For a complete description of the fi nancial instruments of the Cor-
poration, please refer to note 10 to our consolidated fi nancial state-ments as of January 31, 2010.
Controls and ProceduresAs of January 31, 2010, we evaluated, with the participation of our
Chief Executive Offi cer and our Interim Chief Financial Offi cer, the effec-tiveness of both our disclosure controls and procedures and our internal control over fi nancial reporting. Based on these evaluations, our Chief Executive Offi cer and our Interim Chief Financial Offi cer concluded that our disclosure controls and procedures and our internal control over fi nancial reporting were effective as of January 31, 2010. In making the evaluation of our internal control over fi nancial reporting, we used the criteria set forth by the Committee of Sponsoring Organizations of the Treadway Commission in Internal Control – Integrated Framework.
There were no changes in our internal control over fi nancial report-ing that occurred during Fiscal 2010 that have materially affected, or are reasonably likely to materially affect our internal control over fi nancial reporting.
Legal ProceedingsWe are from time to time involved in legal proceedings of a nature
considered normal to our business. We believe that none of the litigation in which we are currently involved, individually or in the aggregate, is ma-terial to our consolidated fi nancial condition or results of operations.
Risk Factors
As a dollar store, we are particularly vulnerable to future increases in operating and merchandise costs.
Our ability to provide quality merchandise at low price points is subject to a number of factors that are beyond our control, including merchandise costs, foreign exchange rate fl uctuations, increases in rent and occu-pancy costs, infl ation and increases in labour (including any increases in the minimum wage) and fuel costs, all of which may reduce our profi t-ability and have an adverse impact on our cash fl ows. In the past as a single fi xed price retailer, we were unable to pass cost increases to our customers by increasing the price of our merchandise. As such, we have attempted to offset cost increases in one area of our operations by fi nding cost savings or operating effi ciencies in another.
We believe that our additional fi xed price points of $1.25, $1.50 and $2.00 will give us some fl exibility to address cost increases by adjusting our selling price on certain items. There is, however, no guarantee that our customers will be willing to purchase products at increased prices or that we will be successful in offsetting costs in a meaningful way given the limited range of prices which we offer. Furthermore, there has historically been a time lag before any cost increases could be passed on to our customers. There can be no assurance that we will be able to pass on any cost increases to our customers.
Foreign exchange rate fl uctuations, in particular, have a material im-
Management’s Discussion and Analysis April 8, 2010

DO
LL
AR
AM
A I
NC
. A
NN
UA
L R
EP
OR
T 2
00
9
30
pact on our operating and merchandise costs. This is because while our sales are in Canadian dollars, we have been increasing our purchases of merchandise from low-cost overseas suppliers, principally in China. In Fiscal 2010, direct sourcing from overseas suppliers accounted for more than 53% of our purchases. Our results of operations are particularly sensitive to the fl uctuation of the Chinese renminbi against the U.S. dollar and the fl uctuation of the U.S. dollar against the Canadian dollar because we purchase a majority of our imported merchandise from suppliers in China using U.S. dollars. For example, if the Chinese renminbi were to appreciate against the U.S. dollar, our cost of merchandise purchased in China would increase, which would have a negative impact on our mar-gins, profi tability and cash fl ows. If the U.S. dollar appreciates against the Canadian dollar at the same time, the negative impact would be further exacerbated. We enter into U.S. dollar currency hedging to reduce the risk associated with currency fl uctuations. Currency hedging entails a risk of illiquidity and, to the extent that the U.S. dollar depreciates against the Canadian dollar, the risk of using hedges could result in losses great-er than if the hedging had not been used. Hedging arrangements may have the effect of limiting or reducing the total returns to the Corpora-tion if management’s expectations concerning future events or market conditions prove to be incorrect. In addition, the costs associated with a hedging program may outweigh the benefi ts of the arrangements in such circumstances. Labour shortages may reduce our ability to have a competitive labour cost. Fuel cost increases or surcharges could also increase our transportation costs and therefore impact our profi tability. In addition, infl ation and adverse economic developments in Canada, where we both buy and sell merchandise, and in China and other parts of Asia, where we buy a large portion of our imported merchandise, can have a negative impact on our margins, profi tability and cash fl ows. If we are unable to predict and respond promptly to these or other similar events that may increase our operating and merchandise costs, our results of operations and cash fl ows will be adversely affected.
We may not be able to refresh our merchandise as often as we have done so in the past.
We adjust our merchandise mix periodically based on the results of internal analysis as slow-selling items are discontinued and replaced as warranted. Our success, therefore, depends in large part on our ability to continually fi nd, select and purchase quality merchandise at attrac-tive prices in order to replace underperforming goods. We typically do not enter into long-term contracts for the purchase or development of merchandise and must continually seek out buying opportunities from both our existing suppliers and new sources, for which we compete with other multi-price dollar stores, variety and discount stores and mass merchants. Although we believe that we have strong and long-standing relationships with our suppliers, we may not be successful in maintaining a continuing and increasing supply of quality merchan-dise at attractive prices. If we cannot fi nd or purchase the necessary amount of competitively priced merchandise to replace goods that are outdated or unprofi table, our results of operations and cash fl ows will be adversely affected.
An increase in the cost or a disruption in the fl ow of our imported goods may signifi cantly affect our sales and profi ts and have an adverse impact on our cash fl ows.
One of our key business strategies is to source quality merchandise directly from the lowest cost supplier. As a result, we rely heavily on imported goods, principally from China. Imported goods are gener-ally less expensive than domestic goods and contribute signifi cantly to our favorable profi t margins. Merchandise imported directly from overseas manufacturers and agents accounted for more than 53% of our total purchases during Fiscal 2010. We expect direct imports to continue to account for approximately 45% to 60% of our total purchases. Our imported merchandise could become more expensive or unavailable for a number of reasons, including (a) disruptions in the fl ow of imported goods due to factors such as raw material shortages or an increase in prices, work stoppages, factory closures, suppliers going out of business, infl ation, strikes, and political unrest in foreign countries, (b) problems with oceanic shipping, including shipping con-tainer shortages, (c) economic crises and international disputes, such as China’s claims to sovereignty over Taiwan, (d) increases in the cost of purchasing or shipping foreign merchandise resulting from a failure of Canada to maintain normal trade relations with foreign countries we deal with, (e) import duties, import quotas, and other trade sanctions, and (f) increases in shipping rates imposed by foreign countries we deal with. The development of one or more of these factors could adversely affect our operations in a material way. If imported merchandise be-comes more expensive or unavailable, we may not be able to transition to alternative sources in time to meet our demands. Products from alternative sources may also be of lesser quality and more expensive than those we currently import. A disruption in the fl ow of our imported merchandise or an increase in the cost of those goods due to these or other factors would signifi cantly decrease our sales and profi ts and have an adverse impact on our cash fl ows.
Political and economic instability in the countries in which foreign suppliers are located, the fi nancial instability of suppliers, suppliers’ failure to meet our supplier standards, issues with labour practices of our suppliers or labour problems they may experience (such as strikes), the availability and cost of raw materials to suppliers, mer-chandise quality or safety issues, currency exchange rates, transport availability and cost, infl ation, and other factors relating to our suppliers and the countries in which they are located or from which they import are beyond our control and could have negative implications for us. In addition, the United States’ foreign trade policies, tariffs and other impositions on imported goods, trade sanctions imposed on certain countries, the limitation on the importation of certain types of goods or of goods containing certain materials from other countries and other factors relating to foreign trade are beyond our control. Disruptions due to labour stoppages, strikes or slowdowns, or other disruptions involving our vendors or the transportation and handling industries also may negatively affect our ability to receive merchandise and thus may negatively affect sales. These and other factors affecting our suppliers and our access to products could adversely affect our business and
Management’s Discussion and Analysis April 8, 2010
DO
LL
AR
AM
A IN
C. A
NN
UA
L R
EP
OR
T 2
00
9
31
fi nancial results. As we increase our imports of merchandise from for-eign vendors, the risks associated with foreign imports will increase.
All of our vendors and their products must comply with applicable product safety laws. If we do not have adequate insurance or con-tractual indemnifi cation available, product liability claims relating to products that are recalled, defective or otherwise harmful could have a material adverse effect on our business, reputation and fi nancial results. Our ability to obtain indemnifi cation from foreign suppliers may be hindered by the manufacturers’ lack of understanding of Canadian product liability or other laws, which may make it more likely that we be required to respond to claims or complaints from customers as if we were the manufacturer of the products. This could adversely af-fect our reputation and our litigation expenses could increase, each of which could have an adverse effect on our business, reputation and fi nancial results.
We are dependent upon the smooth functioning of our distribu-tion network.
We must constantly replenish depleted inventory through deliveries of merchandise to our four warehouses, our distribution center and our stores, and from our warehouses and distribution center to our stores by various means of transportation, including shipments by sea, train and truck on the roads and highways of Canada. Long-term disrup-tions to our warehouses and distribution center and to the national and international transportation infrastructure that lead to delays or interruptions of service would adversely affect our business. Similarly, extreme weather conditions can affect the planned receipt of inventory and the distribution of merchandise and may have an adverse effect on our business and fi nancial results.
General economic conditions and volatility in the worldwide economy has adversely affected consumer spending, which may negatively affect our business and fi nancial results.
Current economic conditions or a further deterioration in the Ca-nadian economy may adversely affect the spending of our customers, which would likely result in lower sales than expected on a quarterly or annual basis. Future economic conditions affecting disposable con-sumer income, such as employment levels, consumer debt levels, lack of available credit, business conditions, fuel and energy costs, interest rates, and tax rates, could also adversely affect our business and fi nancial results by reducing consumer spending or causing cus-tomers to shift their spending to other products. We may be sensitive to reductions in consumer spending because we generally have limited fl exibility to reduce our prices to maintain or attract additional sales in an economic downturn.
In addition, current global economic conditions and uncertainties, the potential impact of the current recession, the potential for addi-tional failures or realignments of fi nancial institutions, and the related impact on available credit may affect us and our suppliers and other business partners, landlords, and customers in an adverse manner including, but not limited to, reducing access to liquid funds or credit
(including through the loss of one or more fi nancial institutions that are a part of our revolving credit facility), increasing the cost of credit, limiting our ability to manage interest rate risk, increasing the risk of bankruptcy of our suppliers, landlords or counterparties to or other fi -nancial institutions involved in our credit facilities and our derivative and other contracts, increasing the cost of goods to us, and other impacts which we are unable to fully anticipate. One of our key strategies is to source quality merchandise directly from the lowest cost supplier. Thus supplier plant closures or increases in costs of merchandise due to economic conditions may adversely affect our business and fi nancial results.
Our level of indebtedness could adversely affect our ability to raise additional capital to fund our operations, limit our ability to react to changes in the economy or our industry and prevent us from meeting our debt obligations.
We are highly leveraged. As of January 31, 2010, we had long-term debt excluding fi nancing costs of $477.4 million. On November 17, 2009, we consummated the redemption of the 8.875% Subordinated Notes in accordance with their terms. For a complete description of the redemption of the 8.875% Subordinated Notes, please refer to note 6 in our consolidated fi nancial statements as of January 31, 2010. Our high degree of leverage could have important consequences, includ-ing the following:• a substantial portion of our cash fl ows from operations will be dedi-
cated to the payment of principal and interest on our indebtedness and other fi nancial obligations and will not be available for other purposes, including funding our operations and capital expendi-tures for projects such as a new warehouse or distribution center, new store openings, and future business opportunities
• the debt service requirements of our other indebtedness and lease expense could make it more diffi cult for us to make payments on our debt;
• our ability to obtain additional fi nancing for working capital and general corporate or other purposes may be limited;
• certain of our borrowings, including the Deferred Interest Notes and borrowings under our Credit Facility, are at variable rates of interest, exposing us to the risk of increased interest rates;
• our debt level may limit our fl exibility in planning for, or reacting to, changes in our business and in our industry in general, placing us at a competitive disadvantage compared to our competitors that have less debt; and
• our leverage may make us vulnerable to a downturn in general economic conditions and adverse industry conditions.
We may not be able to generate suffi cient cash to service all of our indebtedness and may be forced to take other actions to sat-isfy our obligations under such indebtedness.
Our ability to make scheduled payments on or to refi nance our debt obligations and to make distributions to enable us to service our debt obligations depends on our fi nancial and operating performance,
Management’s Discussion and Analysis April 8, 2010
DO
LL
AR
AM
A I
NC
. A
NN
UA
L R
EP
OR
T 2
00
9
32
which is subject to prevailing economic and competitive conditions and to certain fi nancial, business, and other factors beyond our con-trol, including fl uctuations in interest rates, market liquidity conditions, increased operating costs, and trends in our industry. If our cash fl ows and capital resources are insuffi cient to fund our debt service obliga-tions, we may be forced to reduce or delay capital expenditures, sell assets, seek additional capital, or restructure or refi nance our indebt-edness. These alternative measures may not be successful and may not permit us to meet our scheduled debt service obligations. In such circumstances, we could face substantial liquidity problems and might be required to dispose of material assets or operations to meet our debt service and other obligations. The Credit Facility restricts the ability of Group L.P. and its restricted subsidiaries, and the Deferred Interest Notes Indenture restricts the ability of Holdings L.P. and its restricted subsidiaries to dispose of assets and restrict the use of the proceeds from asset dispositions. We may not be able to consummate those dispositions or to obtain the proceeds which could be realized from them and these proceeds may not be adequate to meet any debt service obligations then due.
Despite current indebtedness levels, we may still be able to incur substantially more debt, which could further exacerbate the risks described above.
We may be able to incur substantial additional indebtedness in the future. Although the Credit Facility and the Deferred Interest Notes Indenture contain restrictions on the incurrence of additional indebted-ness, such restrictions are subject to a number of qualifi cations and exceptions, and under certain circumstances, indebtedness incurred in compliance with such restrictions could be substantial. In addition, our subsidiaries may, under certain circumstances and subject to re-ceipt of additional commitments from existing lenders or other eligible institutions, request additional term loan tranches or increases to the revolving loan commitments by an aggregate amount of up to $150 million (or the U.S. dollar equivalent thereof). If our current debt levels are increased, the related risks that we now face could intensify.
The terms of the Credit Facility and the Deferred Interest Notes Indenture impose signifi cant operating restrictions, which may prevent us from pursuing certain business opportunities and tak-ing certain actions that may be in our interest.
Our Credit Facility contains various covenants that limit our ability to engage in specifi ed types of transactions. These covenants limit our ability to, among other things:• incur, assume, or guarantee additional debt and issue or sell preferred stock;• pay dividends on, redeem or repurchase our capital stock;• make investments;• make capital expenditures;• create or permit certain liens;• use the proceeds from sales of assets and subsidiary stock;• create or permit restrictions on the ability of our restricted
subsidiaries to pay dividends or make other distributions to us;• enter into transactions with affi liates;• conduct certain business activities;• consolidate or merge or sell all or substantially all of our assets; and• prepay, redeem or repurchase certain indebtedness.
In addition, the Credit Facility also requires Group L.P. to comply on a quarterly basis with certain fi nancial covenants, including a maximum lease-adjusted leverage ratio test and a minimum interest coverage ratio test.
The Deferred Interest Notes Indenture also contains various cov-enants that limit our ability to engage in specifi ed types of transactions. These covenants limit our ability to, among other things:• incur, assume, or guarantee additional debt and issue or sell preferred stock;• pay dividends on, redeem or repurchase our capital stock;• make investments;• create or permit certain liens;• use the proceeds from sales of assets and subsidiary stock;• create or permit restrictions on the ability of our restricted subsidiaries to pay dividends or make other distributions to us;• enter into transactions with affi liates;• conduct certain business activities;• consolidate or merge or sell all or substantially all of our assets; and• prepay, redeem or repurchase certain indebtedness.
Under the Credit Facility, the occurrence of specifi ed change of control events will cause an event of default. Change of control events include if certain “permitted holders” (being funds advised by Bain Capital and certain original management shareholders, unless man-agement shareholders hold more than 30% of the voting stock of Holdings L.P. or more voting stock in Holdings L.P. than Bain Capital, in which case they are not included as permitted holders for this purpose) cease to hold a majority, directly or indirectly, of Holdings L.P.’s voting stock; unless, following such event, (i) no other person or group of per-sons (other than “permitted holders”) becomes the benefi cial owner of more than 35%, directly or indirectly, (or, if higher, the percentage then held by such permitted holders) of Dollarama Holdings L.P.’s voting stock, and, (ii) a majority of Holdings L.P.’s board of directors continues to be directors that were recommended for nomination for election by the Holdings L.P.’s board of directors, in which case such event shall not be considered a change of control.
Under the Deferred Interest Notes Indenture, if specifi ed change of control events occur, we will be required to offer to repurchase all outstanding notes under the applicable indenture at a price equal to 101% of their principal amount plus accrued and unpaid interest, if any. Change of control events include a sale of substantially all of our assets (other than to certain “permitted holders” being Bain Capital and certain original management shareholders, unless management shareholders hold more voting stock of Holdings L.P. or the Corpora-tion than Bain Capital, in which case they are no longer considered
Management’s Discussion and Analysis April 8, 2010
DO
LL
AR
AM
A IN
C. A
NN
UA
L R
EP
OR
T 2
00
9
33
permitted holders), the acquisition by a person or group of persons (other than permitted holders) of at least 50% , directly or indirectly, of the voting power of the Corporation or Holdings L.P. or a majority of the Corporation’s directors ceasing to be directors that were nominated for election, or whose nomination for election was previously approved, by the Corporation’s board of directors. Our failure to repurchase these notes upon a change of control would cause an event of default under the indenture governing the Deferred Interest Notes upon a change of control because we may not have suffi cient fi nancial resources to purchase all of the notes that are tendered upon a change of control. Further, we will be contractually restricted under the terms of our Credit Facility from repurchasing all of the notes tendered by holders upon a change of control. Accordingly, we may not be able to satisfy such obligations to purchase the notes unless we are able to refi nance or obtain waivers under the Credit Facility. Our failure to repurchase these notes upon a change of control would cause an event of default under the indenture governing the Deferred Interest Notes. This may also cause a cross-default under the Credit Facility.
These restrictions may prevent us from taking actions that we be-lieve would be in the best interest of our business, and may make it dif-fi cult for us to successfully execute our business strategy or effectively compete with companies that are not similarly restricted.
Our variable rate indebtedness subjects us to interest rate risk, which could cause our debt service obligations to increase signifi cantly.
A portion of our indebtedness, including our Deferred Interest Notes and the borrowings under the Credit Facility, is at variable rates of interest and exposes us to interest rate risk. If interest rates increase, our debt service obligations on the variable rate indebtedness would increase even though the amount borrowed remained the same, and our net income and cash fl ows would decrease.
There is no guarantee that our strategy to introduce products be-tween the $1.00 and $2.00 dollar price range will continue to be successful.
On February 2, 2009, we introduced additional price points of $1.25, $1.50 and $2.00. We believe that these multiple price points will allow us to offer more value and higher quality goods to our customers. There is, however, no guarantee that our customers will continue to purchase our products priced above the $1.00 price point or that we will be able to continue to offer the same quality and variety of products at the same price-points, which would negatively affect our business and fi nancial results.
Our private brands may not achieve or maintain broad market ac-ceptance.
We carry a substantial number of private brand items. We believe that our success in maintaining broad market acceptance of our pri-vate brands depends on many factors, including pricing, quality and customer perception. We may not achieve or maintain our expected
sales for our private brands. As a result, our business and fi nancial results could be adversely affected.
We may be unable to obtain additional capacity for our ware-house and distribution centers.
We may need additional warehouse and distribution center capac-ity in the coming years following future store openings. However, under our current expansion plan, we believe our existing distribution network currently has the capacity to cost-effectively service more than 150 additional stores. If we are unable to locate sites for new warehouses and distribution centers or unable to launch warehouses or distribution centers on a timely basis, we may not be able to successfully execute our growth strategy.
Our sales may be affected by weather conditions or seasonal fl uctuations.
Weather conditions can affect the timing of consumer spending and have an impact on our retail sales. Moreover, the different holidays like Christmas, Easter, Valentine’s Day and Halloween have a positive impact on our retail sales. Historically, our highest sales results have occurred during the fourth quarter, which includes the holiday selling season. During Fiscal 2010, approximately 29.0% of our sales were generated in the fourth quarter. Accordingly, weather conditions or a failure to anticipate the impact that holidays may have on our op-erations could have an adverse effect on our business and fi nancial results.
Competition in the retail industry could limit our growth opportu-nities and reduce our profi tability.
The retail business is highly competitive. We operate in the value retail industry, which is competitive with respect to price, store location, merchandise quality, assortment and presentation, in stock consis-tency, and customer service. This competitive environment subjects us to the risk of adverse impact to our fi nancial performance because of the lower prices, and thus the lower margins, required to maintain our competitive position. Also, companies operating in our industry (due to customer demographics and other factors) may have limited ability to increase prices in response to increased costs (including, but not limited to, vendor price increases). This limitation may adversely affect our margins and fi nancial performance. We compete for customers, employees, store sites, products and services and in other important aspects of our business with many other local, regional and national retailers. We compete with multi-price dollar stores, variety and dis-count stores and mass merchants. These other competitors com-pete in a variety of ways, including aggressive promotional activities, merchandise selection and availability, services offered to customers, location, store hours, in-store amenities and price. If we fail to respond effectively to competitive pressures and changes in the retail markets, it could adversely affect our business and fi nancial results. Some of our competitors in the retail industry are much larger and have sub-stantially greater resources than we do, and we remain vulnerable to
Management’s Discussion and Analysis April 8, 2010
DO
LL
AR
AM
A I
NC
. A
NN
UA
L R
EP
OR
T 2
00
9
34
the marketing power and high level of consumer recognition of major mass merchants, and to the risk that these mass merchants or others could venture into our market segment in a signifi cant way. In addition, we expect that our expansion plans, as well as the expansion plans of other dollar stores, will increasingly bring us into direct competition with them. Competition may also increase because there are no signifi cant economic barriers to other companies opening dollar stores.
Our business is dependent on our ability to obtain competitive pricing and other terms from our suppliers and the timely receipt of inventory.
We believe that we have good relations with our suppliers and that we are generally able to obtain competitive pricing and other terms from suppliers. However, we buy products on an order-by-order basis and have very few long-term purchase contracts or other assurances of continued product supply or guaranteed product cost. If we fail to maintain good relations with our suppliers, or if our suppliers’ product costs are increased as a result of prolonged or repeated increases in the prices of certain raw materials, we may not be able to obtain attractive pricing, in which case our profi t margins may be reduced and our results of operations may be adversely affected. In addition, if we are unable to receive merchandise from our suppliers on a timely basis because of interruptions in production or other reasons that are beyond our control, our business and fi nancial results may be adversely affected.
We may be unable to renew our store, warehouse and distribution center leases or fi nd other locations or leases on favourable terms. As of January 31, 2010, we leased all our stores from unaffi liated third parties, except 18 of our stores leased from entities controlled by Larry Rossy. Approximately 11%, 9% and 9% of our store leases with third party lessors will expire in Fiscal year 2011, fi scal year 2012, and fi scal year 2013, respectively. As of January 31, 2010, we leased all of our warehouses and our distribution centre from entities controlled by Larry Rossy. Our warehouse leases will expire in fi scal year 2024, respectively, and our distribution centre lease will expire in fi scal year 2024. Unless the terms of our leases are ex-tended, the properties, together with any improvements that we have made, will revert to the property owners upon expiration of the lease terms. As the terms of our leases expire, we may not be able to renew these leases or fi nd alternative store locations that meet our needs on favorable terms or at all. If we are unable to renew a signifi cant number of our expiring leases or to promptly fi nd alterna-tive store locations that meet our needs, our profi tability and cash fl ows may be materially adversely affected. Furthermore, many leas-es provide that the landlord may increase the rent over the term of the lease. Most leases require us to pay a variety of costs such as cost of insurance, taxes, maintenance and utilities. We generally cannot cancel these leases. If an existing or future store is not prof-itable, and we decide to close it, we may nonetheless be committed to perform our obligations under the applicable lease including,
among other things, paying the base rent for the balance of the lease term.
If we experience signifi cant disruptions in our information tech-nology systems, our business and fi nancial results may be ad-versely affected. We depend on our information technology systems for the effi -cient functioning of our business, including accounting, data stor-age, purchasing and inventory management, and store communica-tions systems. Our enterprise-wide software solution enables management to better and more effi ciently conduct our operations and gather, analyze, and assess information across all business seg-ments and geographic locations. However, diffi culties with the hard-ware and software platform could disrupt our operations, including our ability to timely ship and track product orders, project inventory requirements, manage our supply chain, and otherwise adequately service our customers, which would have an adverse effect on our business and fi nancial results. In the event we experience signifi cant disruptions with our information technology system, we may not be able to fi x our systems in an effi cient and timely manner. Accordingly, such events may disrupt or reduce the effi ciency of our entire opera-tion and have a material adverse effect on our results of operations and cash fl ows. Costs associated with potential interruptions to our information systems could be signifi cant.
We may not be able to successfully execute our growth strategy, particularly outside of our core markets of Ontario and Québec.
We have experienced substantial growth during the past several years, opening an average of 43 net new stores per year since fi s-cal year 2002, and we plan to continue to open new stores in the near future. Our ability to successfully execute our growth strategy will depend largely on our ability to successfully open and operate new stores, particularly outside of our traditional core markets of Ontario and Québec, which, in turn, will depend on a number of factors, includ-ing whether we can:• supply an increasing number of stores with the proper mix and
volume of merchandise;• hire, train, and retain an increasing number of qualifi ed employees
at affordable rates of compensation;• locate, lease, build out, and open stores in suitable locations on a
timely basis and on favorable economic terms;• expand into new geographic markets, where we have limited or no
presence;• expand within our traditional core markets of Ontario and Québec,
where new stores may draw sales away from our existing stores;• successfully compete against local competitors; and• build, expand and upgrade warehouses and distribution centers
and internal store support systems in an effi cient, timely and eco-nomical manner.Any failure by us to achieve these goals could adversely affect our
ability to continue to grow.
Management’s Discussion and Analysis April 8, 2010
DO
LL
AR
AM
A IN
C. A
NN
UA
L R
EP
OR
T 2
00
9
35
We may not be able to achieve the anticipated growth in sales and operating income when we open new stores.
If our planned expansion occurs as anticipated, our store base will include a relatively high proportion of stores with relatively short operat-ing histories. Comparable Store sales may be negatively affected when stores are opened or expanded near existing stores. If our new stores on average fail to achieve results comparable to our existing stores, our planned expansion could produce a decrease in our overall sales per square foot and store-level operating margins.
Our profi tability may be negatively affected by inventory shrinkage.We are subject to the risk of inventory loss, administrative or opera-
tor errors, including mislabeling, theft and fraud. We have experienced inventory shrinkage in the past, and we cannot assure you that inci-dences of inventory loss and theft will decrease in the future or that the measures we are taking or the initiatives we implemented will effectively address the problem of inventory shrinkage. Although some level of inventory shrinkage is a necessary and unavoidable cost of doing busi-ness, if we were to experience higher rates of inventory shrinkage or incur increased security costs to combat inventory theft, our business and fi nancial results could be affected adversely.
We are subject to environmental regulations, and compliance with such regulations could require us to make expenditures.
Under various federal, provincial, and local environmental laws and regulations, current or previous owners or occupants of property may become liable for the costs of investigating, removing and monitor-ing any hazardous substances found on the property. These laws and regulations often impose liability without regard to fault.
Certain of the facilities that we occupy have been in operation for many years and, over such time, we and the prior owners or occupants of such properties may have generated and disposed of materials which are or may be considered hazardous. Accordingly, it is possible that additional environmental liabilities may arise in the future as a result of any generation and disposal of such hazardous materials. Although we have not been notifi ed of, and are not aware of, any current envi-ronmental liability, claim, or non-compliance, we could incur costs in the future related to our properties in order to comply with, or address any violations under, environmental laws and regulations.
In the ordinary course of our business, we sometimes use, store, handle or dispose of household products and cleaning supplies that are classifi ed as hazardous materials under various environmental laws and regulations. We cannot predict the environmental laws or regula-tions that may be enacted in the future or how existing or future laws and regulations will be administered or interpreted. Compliance with more stringent laws or regulations, as well as more vigorous enforce-ment policies of the regulatory agencies or stricter interpretations of existing laws and regulations, may require additional expenditures by us which could vary substantially from those currently anticipated.
Failure to attract and retain qualifi ed employees while controlling labour costs, as well as other labour issues, could adversely af-fect our business and fi nancial results.
Our future growth and performance depends on our ability to at-tract, retain and motivate qualifi ed employees, many of whom are in positions with historically high rates of turnover. Our ability to meet our labour needs, while controlling our labour costs, is subject to many external factors, including the competition for and availability of quali-fi ed personnel in a given market, unemployment levels within those markets, prevailing wage rates, minimum wage laws, health and other insurance costs and changes in employment and labour legislation (including changes in the process for our employees to join a union) or other workplace regulation (including changes in entitlement programs such as health insurance and paid leave programs). While we believe we pay our employees fair wages, to the extent a signifi cant portion of our employee base unionizes, or attempts to unionize, our business could be disrupted and, to the extent such attempts are successful, our labour costs could increase. Our ability to pass along labour costs is constrained.
Also, our stores are managed through a network of geographically dispersed management personnel. Our inability to effectively and ef-fi ciently operate our stores, including the ability to control losses result-ing from inventory and cash shrinkage, may negatively affect our sales and/or operating margins.
If we lose the services of our senior executives who possess spe-cialized market knowledge and technical skills, it could reduce our ability to compete, to manage our operations effectively, or to develop new products and services.
Many of our senior executives have extensive experience in our industry and with our business, products, and customers. Since we are managed by a small group of senior executive offi cers, the loss of the technical knowledge, management expertise and knowledge of our operations of one or more members of our core management team, including Larry Rossy, our CEO and the grandson of our founder, Neil Rossy, our Senior Vice President, Merchandising and the son of Larry Rossy, Geoffrey Robillard, our Senior Vice President, Import Divi-sion, and Stéphane Gonthier, our COO, could result in a diversion of management resources, as the remaining members of management would need to cover the duties of any senior executive who leaves us and would need to spend time usually reserved for managing our business to search for, hire and train new members of management. The loss of some or all of our senior executives could negatively affect our ability to develop and pursue our business strategy, which could adversely affect our business and fi nancial results.
Fluctuations in the value of the Canadian dollar in relation to the U.S. dollar may impact our operating and fi nancial results and may affect the comparability of our results between fi nancial periods.
Exchange rate fl uctuations could have an adverse effect on our results of operations and ability to service our U.S. dollar-denominated
Management’s Discussion and Analysis April 8, 2010
DO
LL
AR
AM
A I
NC
. A
NN
UA
L R
EP
OR
T 2
00
9
36
debt. The majority of our debt and over 50% of our purchases are in U.S. dollars while the majority of our sales and operating expenses are in Canadian dollars. Therefore, a fl uctuation in the exchange rate of the Canadian dollar versus the U.S. dollar would affect the cash needed to service our U.S. dollar-denominated debt and the related hedge in-struments and, in addition, our gross margins would be impacted. For the purposes of fi nancial reporting, any change in the value of the Ca-nadian dollar against the U.S. dollar during a given fi nancial reporting period would result in a foreign currency loss or gain on the translation of U.S. dollar denominated debt and our related hedge instruments into Canadian dollars under Canadian generally accepted accounting principles. Consequently, our reported earnings could fl uctuate materi-ally as a result of foreign exchange translation gains or losses and may not be comparable from period to period.
Litigation may adversely affect our business and fi nancial results.Our business is subject to the risk of litigation by employees, cus-
tomers, consumers, suppliers, competitors, shareholders, govern-ment agencies, or others through private actions, class actions, admin-istrative proceedings, regulatory actions or other litigation, including, in the case of administrative proceedings, as a result of reviews by taxation authorities. The outcome of litigation, particularly class action lawsuits, regulatory actions and intellectual property claims, is diffi cult to assess or quantify. Claimants in these types of lawsuits or claims may seek recovery of very large or indeterminate amounts, and the magnitude of the potential loss relating to these lawsuits or claims may remain unknown for substantial periods of time. In addition, certain of these lawsuits or claims, if decided adversely to us or settled by us, may result in liability material to our fi nancial statements as a whole or may negatively affect our operating results if changes to our business operations are required. Also, in connection with the Corporation’s business activities, the Corporation is subject to reviews by taxation authorities. There is no assurance that any such reviews will not result in taxation authorities challenging any of our tax fi lings. The cost to defend future litigation may be signifi cant. There also may be adverse publicity associated with litigation that could negatively affect customer perception of our business, regardless of whether the allegations are valid or whether we are ultimately found liable. As a result, litigation may adversely affect our business and fi nancial results.
We are subject to the risk of product liability claims and product recalls.
The Corporation sells products produced by third party manufac-turers. Some of these products may expose the Corporation to prod-uct liability claims relating to personal injury, death or property damage caused by such products, any may require the Corporation to take actions. One or more of our suppliers might not adhere to product safety requirements or our quality control standards, and we might not identify the defi ciency before merchandise ships to our stores. If our suppliers are unable or unwilling to recall products failing to meet our quality standards, we may be required to remove merchandise
from our shelves or recall those products at a substantial cost to us. Product recalls, withdrawals or replacements may harm the Corpora-tion’s reputation and acceptance of its products by customers, which may adversely affect our business and fi nancial results. Product re-calls, withdrawals, or replacements may also increase the amount of competition that the Corporation faces. Some competitors may attempt to differentiate themselves from the Corporation by claiming that their products are produced in a manner or geographic area that is insulated from the issues that preceded the recalls, withdrawals, or replacements of the Corporation’s products. Although the Corporation maintains liability insurance to mitigate potential claims, the Corpora-tion cannot be certain that its coverage will be adequate for liabilities actually incurred or that insurance will continue to be available on economically reasonable terms or at all. Product liability claims and product recalls, withdrawals or replacements could adversely affect the Corporation’s business and fi nancial results.
Our current insurance program may expose us to unexpected costs and negatively affect our fi nancial results.
Our insurance coverage refl ects deductibles, self-insured reten-tions, limits of liability and similar provisions that we believe are prudent based on the dispersion of our operations. However, there are types of losses we may incur but against which we cannot be insured or which we believe are not economically reasonable to insure, such as losses due to acts of war, employee and certain other crime and some natural disasters. If we incur these losses and they are material, our business could suffer. Certain material events may result in sizable losses for the insurance industry and adversely impact the availability of adequate insurance coverage or result in excessive premium increases. To offset negative insurance market trends, we may elect to self insure, accept higher deductibles or reduce the amount of coverage in response to these market changes. In addition, we self insure a signifi cant por-tion of expected losses under our workers’ compensation, automo-bile liability, general liability and group health insurance programs. Unanticipated changes in any applicable actuarial assumptions and management estimates underlying our recorded liabilities for these losses, including expected increases in medical and indemnity costs, could result in materially different amounts of expense than expected under these programs, which could have an adverse effect on our fi nancial results. Although we continue to maintain property insurance for catastrophic events, we are effectively self-insured for property losses up to the amount of our deductibles. If we experience a greater number of these losses than we anticipate, our fi nancial results could be adversely affected.
We may not be able to protect our trademarks and other propri-etary rights.
We believe that our trademarks and other proprietary rights are important to our success and our competitive position. Accordingly, we protect our trademarks and proprietary rights. However, the actions taken by us may be inadequate to prevent imitation of our products
Management’s Discussion and Analysis April 8, 2010
DO
LL
AR
AM
A IN
C. A
NN
UA
L R
EP
OR
T 2
00
9
37
and concepts by others or to prevent others from claiming violations of their trademarks and proprietary rights by us. In addition, our intellec-tual property rights may not have the value that we believe they have. If we are unsuccessful in protecting our intellectual property rights, or if another party prevails in litigation against us relating to our intellectual property rights, the value and adequacy of our brand recognition could be diminished causing customer confusion and adversely affecting our sales and profi tability and we may incur signifi cant costs and may be required to change certain aspects of our operations.
Natural disasters, unusual weather, pandemic outbreaks, boy-cotts and geo-political events or acts of terrorism could adverse-ly affect our operations and fi nancial results.
The occurrence of one or more natural disasters, such as hur-ricanes and earthquakes, unusually adverse weather, pandemic outbreaks, boycotts and geo-political events, such as civil unrest in countries in which our suppliers are located and acts of terrorism, or similar disruptions could adversely affect our operations and fi nancial results. These events could result in physical damage to one or more of our properties, increases in fuel or other energy prices, the temporary or permanent closure of one or more of our stores or warehouses or distribution centers, delays in opening new stores, the temporary lack of an adequate workforce in a market, the temporary or long-term disruption in the supply of products from some local and overseas suppliers, the temporary disruption in the transport of goods from overseas, delay in the delivery of goods to our warehouses, distribution centers or stores, the temporary reduction in the availability of prod-ucts in our stores and disruption to our information systems. These factors could otherwise disrupt and adversely affect our operations and fi nancial results.
We face risks related to protection of customers’ credit card data. We transmit confi dential credit card information in connection with our credit card pilot project. Third parties may have the technology or know-how to breach the security of this customer information, and our security measures and those of our technology vendors may not effectively prevent others from obtaining improper access to this in-formation. Any security breach could expose us to risks of data loss, litigation and liability and could seriously disrupt our operations and any resulting negative publicity could signifi cantly harm our reputation.
Dollarama Inc. is a holding company.Dollarama Inc. is a holding company and a substantial portion of
its assets are the capital stock of its subsidiaries. As a result, investors in the Corporation are subject to the risks attributable to Dollarama Inc.’s subsidiaries. As a holding company, Dollarama Inc. conducts substantially all of its business through its subsidiaries, which gener-ate substantially all of Dollarama Inc.’s revenues. Consequently, Dol-larama Inc.’s cash fl ows and ability to complete current or desirable future enhancement opportunities are dependent on the earnings of its subsidiaries and the distribution of those earnings to Dollarama Inc.
The ability of these entities to pay dividends and other distributions will depend on their operating results and will be maintained by such companies and contractual restrictions contained in the instruments governing their debt. In the event of a bankruptcy, liquidation or reor-ganization of any of its subsidiaries, holders of indebtedness and trade creditors will generally be entitled to payment of their claims from the assets of those subsidiaries before any assets are made available for distribution to Dollarama Inc.
Infl uence by Existing Shareholders.Based on share ownership as of January 31, 2010, Bain Capital
benefi cially owns or controls, directly or indirectly, 31,740,059 Com-mon Shares, which in the aggregate represents approximately 43.7% of our issued and outstanding Common Shares, Larry Rossy and The Larry and Cookie Rossy Family Foundation benefi cially own or control, in the aggregate, directly or indirectly, 6,347,640 Common Shares, which represent approximately 8.7% of our Common Shares. As a result, if some of these persons or entities act together, they have the ability to control all matters submitted to our shareholders for ap-proval, including without limitation the election and removal of direc-tors, amendments to our articles of incorporation and by-laws and the approval of any business combination. This may delay or prevent an acquisition of the Corporation or cause the market price of our shares to decline. The interests of Bain Capital may not in all cases be aligned with interests of our shareholders. In addition, Bain Capital may have an interest in pursuing acquisitions, divestitures and other transactions that, in the judgment of its management, could enhance its equity investment, even though such transactions might involve risks to our shareholders and may ultimately affect the market price of the Common Shares.
Volatile market price for Common Shares.The market price for Common Shares may be volatile and subject to
wide fl uctuations in response to numerous factors, many of which are beyond the Corporation’s control, including the following:• actual or anticipated fl uctuations in the Corporation’s quarterly
results of operations;• changes in estimates of our future results of operations by us or
securities research analysts;• changes in the economic performance or market valuations of other
companies that investors deem comparable to the Corporation;• addition or departure of the Corporation’s executive offi cers and
other key personnel;• release or other transfer restrictions on outstanding Common
Shares;• sales or perceived sales of additional Common Shares;• signifi cant acquisitions or business combinations, strategic part-
nerships, joint ventures or capital commitments by or involving the Corporation or its competitors; and
• news reports relating to trends, concerns or competitive develop-ments, regulatory changes and other related issues in the Corpora-
Management’s Discussion and Analysis April 8, 2010
DO
LL
AR
AM
A I
NC
. A
NN
UA
L R
EP
OR
T 2
00
9
38
tion’s industry or target markets.Financial markets have recently experienced signifi cant price and
volume fl uctuations that have particularly affected the market prices of equity securities of companies and that have, in many cases, been un-related to the operating performance, underlying asset values or pros-pects of such companies. Accordingly, the market price of the Com-mon Shares may decline even if the Corporation’s operating results, underlying asset values or prospects have not changed. Additionally, these factors, as well as other related factors, may cause decreases in asset values that are deemed to be other than temporary, which may result in impairment losses. As well, certain institutional investors may base their investment decisions on consideration of the Corporation’s environmental, governance and social practices and performance against such institutions’ respective investment guidelines and criteria, and failure to meet such criteria may result in a limited or no investment in the Common Shares by those institutions, which could adversely affect the trading price of the Common Shares. There can be no as-surance that continuing fl uctuations in price and volume will not occur. If such increased levels of volatility and market turmoil continue, the Corporation’s operations could be adversely impacted and the trading price of the Common Shares may be adversely affected.
Because we have no current plans to pay cash dividends on our Common Shares for the foreseeable future, you may not receive any return on investment unless you sell your Common Shares for a price greater than that which you paid for them.
We currently intend to retain future earnings, if any, for future op-eration, expansion and debt repayment and have no current plans to pay any cash dividends for the foreseeable future. Any decision to declare and pay dividends in the future will be made at the discretion of our board of directors and will depend on, among other things, our fi nancial results, cash requirements, contractual restrictions and other factors that our board of directors may deem relevant. In addition, our ability to pay dividends may be limited by covenants of any existing and future outstanding indebtedness we or our subsidiaries incur, including our Credit Facility and the indenture governing the Deferred Interest Notes. As a result, investors may not receive any return on an invest-ment in our Common Shares unless they sell our Common Shares for a price greater than that which they paid for them.
Future Sales of Common Shares by our Existing Shareholders.Based on share ownership as of January 31, 2010, Bain Capital,
Larry Rossy and The Larry and Cookie Rossy Family Foundation, in the aggregate, benefi cially own or control, directly or indirectly, 38,087,699 Common Shares, which in the aggregate represent approximately 52.4% of our outstanding Common Shares. Subject to compliance with applicable securities laws, our offi cers, directors, principal share-holders and their affi liates may sell some or all of their Common Shares in the future. No prediction can be made as to the effect, if any, such future sales of Common Shares will have on the market price of the Common Shares prevailing from time to time. However, the future sale of a substantial number of Common Shares by our offi cers, directors, principal shareholders and their affi liates, or the perception that such sales could occur, could adversely affect prevailing market prices for the Common Shares.
Pursuant to a shareholders agreement entered into between the Corporation, Bain Dollarama (Luxembourg) One S.à r.l. and certain entities controlled by Larry Rossy, Alan Rossy and Leonard Assaly in connection with the closing of the IPO on October 16, 2009, each party is granted certain registration rights.
Additional InformationAdditional information relating to Dollarama Inc. is available on
SEDAR at www.sedar.com.
Common Share Trading InformationThe Common Shares trade on the Toronto Stock Exchange under
the symbol “DOL” and began trading on October 16, 2009. As at January 31, 2010, the Corporation had 72,691,935 Common Shares issued and outstanding. In addition, there were 7,269,193 Common Shares reserved for issuance for the exercise of stock options. Assum-ing exercise of all outstanding stock options, there would have been 75,970,561 Common Shares issued and outstanding on a fully diluted basis as at January 31, 2010.
Management’s Discussion and Analysis April 8, 2010
DO
LL
AR
AM
A IN
C. A
NN
UA
L R
EP
OR
T 2
00
9
39
Auditor’s report
To the Shareholders of Dollarama Inc.We have audited the consolidated balance sheets of Dollarama Inc. as of January 31, 2010 and February 1, 2009 and the consolidated
statements of earnings (loss), shareholders’ equity and cash fl ows for the years ended January 31, 2010 and February 1, 2009. These fi nancial statements are the responsibility of the Corporation’s management. Our responsibility is to express an opinion on these fi nancial statements based on our audits.
We conducted our audits in accordance with Canadian generally accepted auditing standards. Those standards require that we plan and perform an audit to obtain reasonable assurance whether the fi nancial statements are free of material misstatement. An audit includes examining, on a test basis, evidence supporting the amounts and disclosures in the fi nancial statements. An audit also includes assessing the accounting principles used and signifi cant estimates made by management, as well as evaluating the overall fi nancial statement presentation.
In our opinion, these consolidated fi nancial statements present fairly, in all material respects, the fi nancial position of the Corporation as of January 31, 2010 and February 1, 2009 and the results of its operations and its cash fl ows for the years ended January 31, 2010 and February 1, 2009 in accordance with Canadian generally accepted accounting principles.
Montréal, QuebecApril 8, 2010
“PricewaterhouseCoopers” refers to PricewaterhouseCoopers LLP/s.r.l./s.e.n.c.r.l., an Ontario limited liability partnership, or, as the context requires, the
PricewaterhouseCoopers global network or other member fi rms of the network, each of which is a separate legal entity.
April 8, 2010
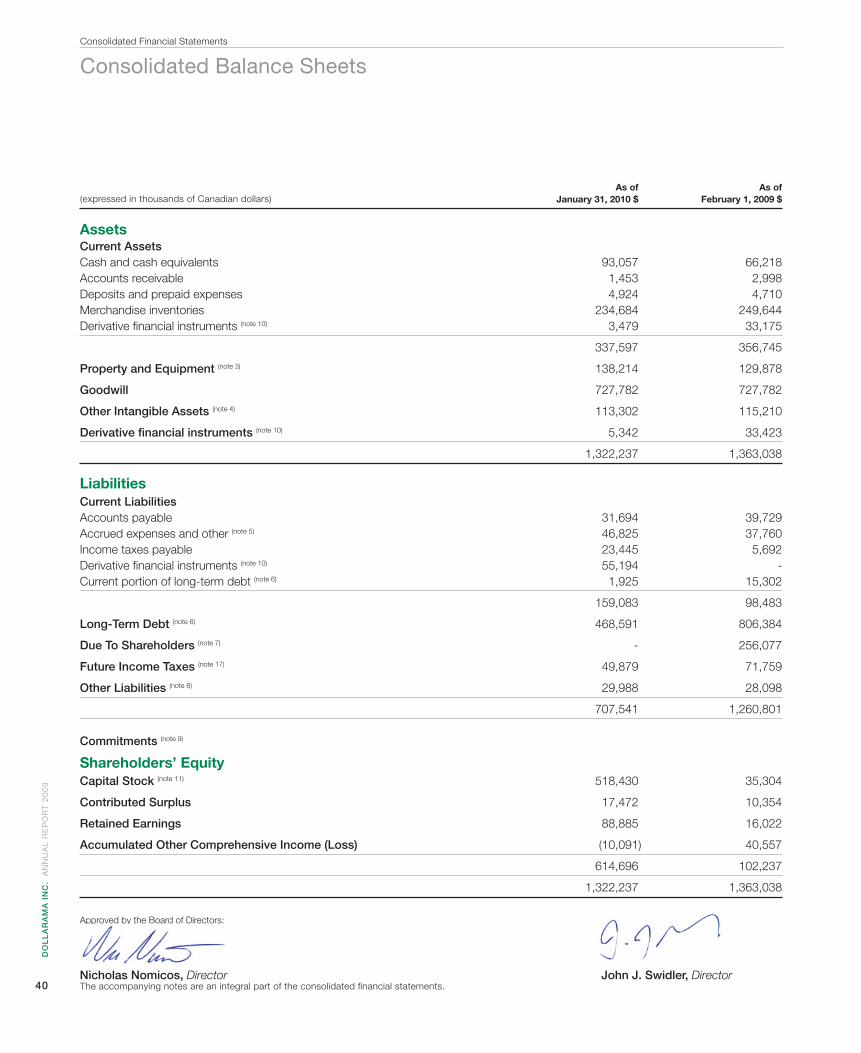
DO
LL
AR
AM
A I
NC
. A
NN
UA
L R
EP
OR
T 2
00
9
40
As of As of January 31, 2010 $ February 1, 2009 $
AssetsCurrent Assets Cash and cash equivalents 93,057 66,218Accounts receivable 1,453 2,998Deposits and prepaid expenses 4,924 4,710Merchandise inventories 234,684 249,644Derivative fi nancial instruments (note 10) 3,479 33,175 337,597 356,745 Property and Equipment (note 3) 138,214 129,878 Goodwill 727,782 727,782 Other Intangible Assets (note 4) 113,302 115,210 Derivative fi nancial instruments (note 10) 5,342 33,423 1,322,237 1,363,038 LiabilitiesCurrent Liabilities Accounts payable 31,694 39,729Accrued expenses and other (note 5) 46,825 37,760Income taxes payable 23,445 5,692Derivative fi nancial instruments (note 10) 55,194 -Current portion of long-term debt (note 6) 1,925 15,302 159,083 98,483 Long-Term Debt (note 6) 468,591 806,384 Due To Shareholders (note 7) - 256,077 Future Income Taxes (note 17) 49,879 71,759 Other Liabilities (note 8) 29,988 28,098 707,541 1,260,801 Commitments (note 9) Shareholders’ EquityCapital Stock (note 11) 518,430 35,304 Contributed Surplus 17,472 10,354 Retained Earnings 88,885 16,022 Accumulated Other Comprehensive Income (Loss) (10,091) 40,557 614,696 102,237 1,322,237 1,363,038
Approved by the Board of Directors:
Nicholas Nomicos, Director John J. Swidler, Director
(expressed in thousands of Canadian dollars)
Consolidated Balance Sheets
The accompanying notes are an integral part of the consolidated fi nancial statements.
Consolidated Financial Statements
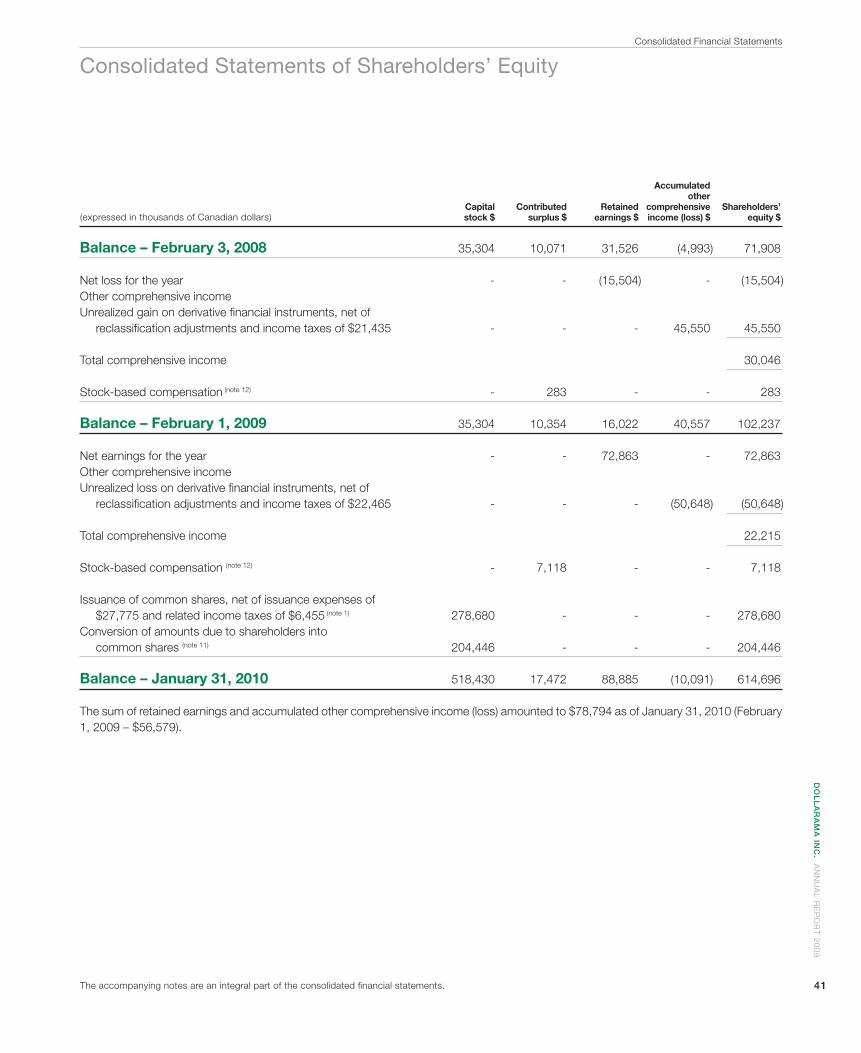
DO
LL
AR
AM
A IN
C. A
NN
UA
L R
EP
OR
T 2
00
9
41
(expressed in thousands of Canadian dollars)
Consolidated Statements of Shareholders’ Equity
Accumulated other Capital Contributed Retained comprehensive Shareholders’ stock $ surplus $ earnings $ income (loss) $ equity $
Balance – February 3, 2008 35,304 10,071 31,526 (4,993) 71,908 Net loss for the year - - (15,504) - (15,504)Other comprehensive income Unrealized gain on derivative fi nancial instruments, net of reclassifi cation adjustments and income taxes of $21,435 - - - 45,550 45,550 Total comprehensive income 30,046 Stock-based compensation (note 12) - 283 - - 283 Balance – February 1, 2009 35,304 10,354 16,022 40,557 102,237 Net earnings for the year - - 72,863 - 72,863Other comprehensive income Unrealized loss on derivative fi nancial instruments, net of reclassifi cation adjustments and income taxes of $22,465 - - - (50,648) (50,648) Total comprehensive income 22,215 Stock-based compensation (note 12) - 7,118 - - 7,118 Issuance of common shares, net of issuance expenses of $27,775 and related income taxes of $6,455 (note 1) 278,680 - - - 278,680Conversion of amounts due to shareholders into common shares (note 11) 204,446 - - - 204,446 Balance – January 31, 2010 518,430 17,472 88,885 (10,091) 614,696
The sum of retained earnings and accumulated other comprehensive income (loss) amounted to $78,794 as of January 31, 2010 (February 1, 2009 – $56,579).
The accompanying notes are an integral part of the consolidated fi nancial statements.
Consolidated Financial Statements
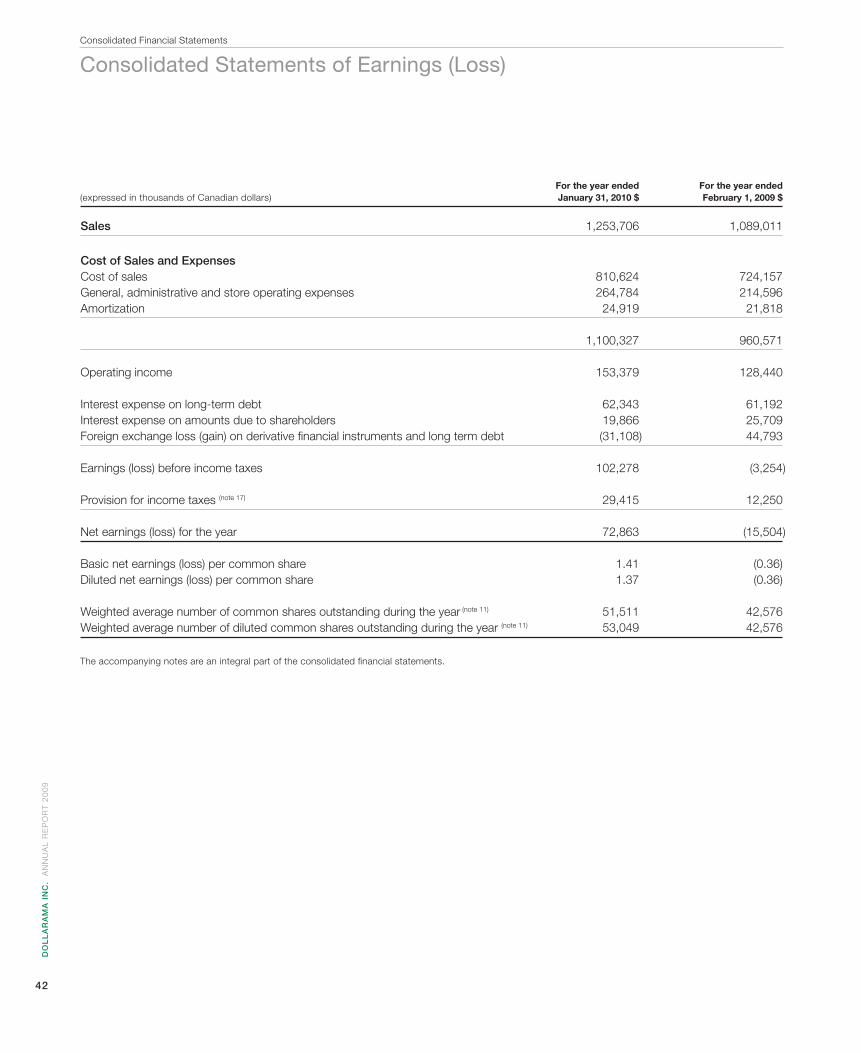
DO
LL
AR
AM
A I
NC
. A
NN
UA
L R
EP
OR
T 2
00
9
42
For the year ended For the year ended January 31, 2010 $ February 1, 2009 $
Sales 1,253,706 1,089,011
Cost of Sales and Expenses Cost of sales 810,624 724,157General, administrative and store operating expenses 264,784 214,596Amortization 24,919 21,818 1,100,327 960,571 Operating income 153,379 128,440 Interest expense on long-term debt 62,343 61,192Interest expense on amounts due to shareholders 19,866 25,709Foreign exchange loss (gain) on derivative fi nancial instruments and long term debt (31,108) 44,793 Earnings (loss) before income taxes 102,278 (3,254) Provision for income taxes (note 17) 29,415 12,250 Net earnings (loss) for the year 72,863 (15,504) Basic net earnings (loss) per common share 1.41 (0.36)Diluted net earnings (loss) per common share 1.37 (0.36) Weighted average number of common shares outstanding during the year (note 11) 51,511 42,576Weighted average number of diluted common shares outstanding during the year (note 11) 53,049 42,576
The accompanying notes are an integral part of the consolidated fi nancial statements.
(expressed in thousands of Canadian dollars)
Consolidated Statements of Earnings (Loss)Consolidated Financial Statements
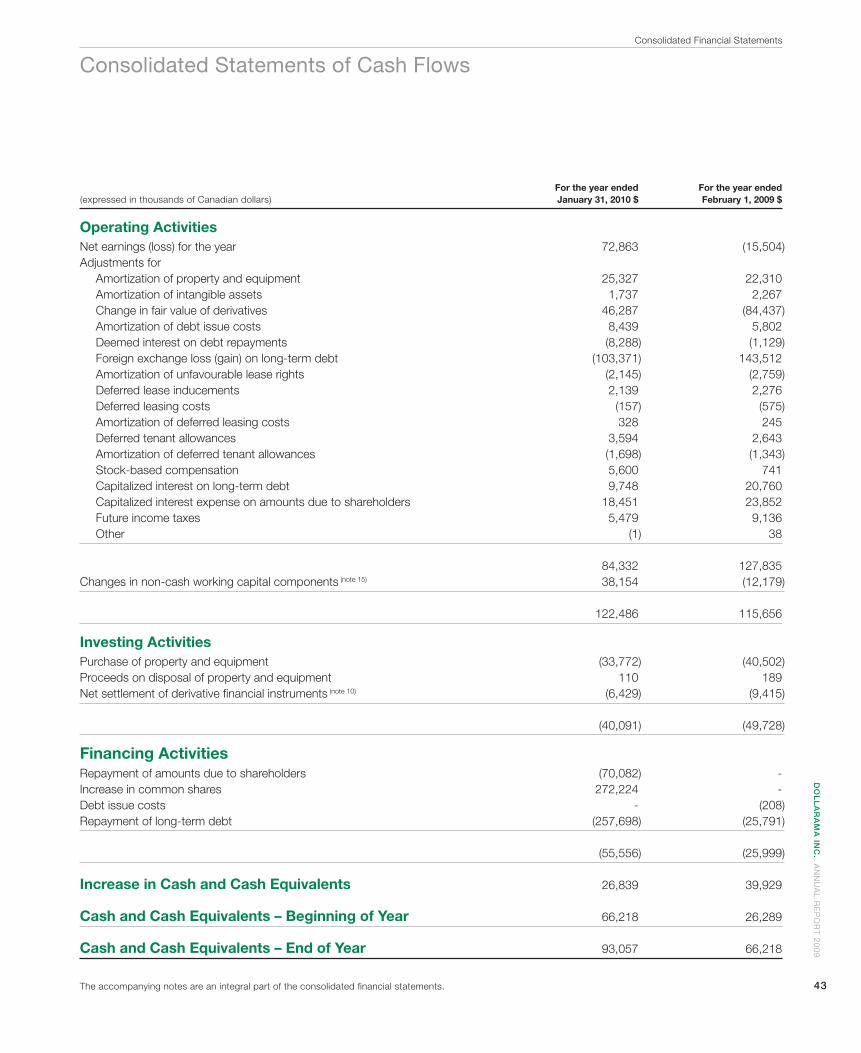
DO
LL
AR
AM
A IN
C. A
NN
UA
L R
EP
OR
T 2
00
9
43
(expressed in thousands of Canadian dollars)
Consolidated Statements of Cash Flows
For the year ended For the year ended January 31, 2010 $ February 1, 2009 $
Operating Activities Net earnings (loss) for the year 72,863 (15,504)Adjustments for Amortization of property and equipment 25,327 22,310 Amortization of intangible assets 1,737 2,267 Change in fair value of derivatives 46,287 (84,437) Amortization of debt issue costs 8,439 5,802 Deemed interest on debt repayments (8,288) (1,129) Foreign exchange loss (gain) on long-term debt (103,371) 143,512 Amortization of unfavourable lease rights (2,145) (2,759) Deferred lease inducements 2,139 2,276 Deferred leasing costs (157) (575) Amortization of deferred leasing costs 328 245 Deferred tenant allowances 3,594 2,643 Amortization of deferred tenant allowances (1,698) (1,343) Stock-based compensation 5,600 741 Capitalized interest on long-term debt 9,748 20,760 Capitalized interest expense on amounts due to shareholders 18,451 23,852 Future income taxes 5,479 9,136 Other (1) 38 84,332 127,835Changes in non-cash working capital components (note 15) 38,154 (12,179) 122,486 115,656 Investing Activities
Purchase of property and equipment (33,772) (40,502)Proceeds on disposal of property and equipment 110 189Net settlement of derivative fi nancial instruments (note 10) (6,429) (9,415) (40,091) (49,728) Financing Activities Repayment of amounts due to shareholders (70,082) -Increase in common shares 272,224 -Debt issue costs - (208)Repayment of long-term debt (257,698) (25,791) (55,556) (25,999) Increase in Cash and Cash Equivalents 26,839 39,929 Cash and Cash Equivalents – Beginning of Year 66,218 26,289 Cash and Cash Equivalents – End of Year 93,057 66,218
Consolidated Financial Statements
The accompanying notes are an integral part of the consolidated fi nancial statements.
DO
LL
AR
AM
A I
NC
. A
NN
UA
L R
EP
OR
T 2
00
9
44
Notes to Consolidated Financial Statements
[ 1 ] Basis of Presentation, Nature of Business, Initial Public Offering and Reorganization
Basis of Presentation and Nature of BusinessDollarama Capital Corporation was formed on October 20, 2004
under the Canada Business Corporations Act. On September 8, 2009, Dollarama Capital Corporation changed its name to Dollarama Inc. (the “Corporation”). The consolidated fi nancial statements have been prepared in accordance with Canadian generally accepted accounting principles (“GAAP”) and refl ect the fi nancial position, results of opera-tions and cash fl ows of the Corporation and its subsidiaries, all of which are wholly owned.
The Corporation operates dollar stores in Canada that sell all items for $2 or less. As of January 31, 2010, its retail operations are car-ried on in every Canadian province. The retail operations’ corporate headquarters, distribution centre and warehouses are located in the Montréal area, Canada. The Corporation manages its business on the basis of one reportable segment.
The signifi cant entities within the legal structure of the Corporation are as follows:
Dollarama Group Holdings L.P. is a co-issuer of the senior subor-dinated deferred interest notes, as further described in
note 6(c).Dollarama Group L.P. has a senior secured credit facility as further
described in note 6(b).Dollarama L.P. and Dollarama Corporation operate the chain of
stores and perform related logistical and administrative support ac-tivities.
Initial Public OfferingOn October 16, 2009, the Corporation completed its initial public
offering by issuing 17,142,857 common shares at a price of $17.50 per common share, resulting in net proceeds of $272,223,983 after deducting the underwriters’ fees and other expenses related to the offering. In addition, certain shareholders of the Corporation granted to the underwriters an over-allotment option, which was fully exercised
to purchase from such shareholders 2,571,428 common shares. The Corporation did not receive any proceeds from the sale of these com-mon shares by the selling shareholders; however, the Corporation has paid the related underwriters’ fees which amounted to $2,700,000.
ReorganizationImmediately before the closing of the initial public offering referred
to above, the Corporation amalgamated with 4513631 Canada Inc., its controlling shareholder. The authorized share capital of the amalgam-ated corporation consists of an unlimited number of common shares and preferred shares.
On amalgamation 4513631 Canada Inc. had no signifi cant liabili-ties other than promissory notes which were paid on the closing of the initial public offering and did not own any signifi cant assets other than the junior subordinated notes, the Class A preferred shares, the Class A common shares and the Class C preferred shares issued by the Corporation.
Upon amalgamation, the junior subordinated notes and all the is-sued and outstanding common and preferred shares of the Corpora-tion and 4513631 Canada Inc. were converted into common shares of Dollarama Inc., and the Corporation assumed the promissory notes referred to above. The promissory notes amounting to $70,082,000 were repaid on October 16, 2009, concurrently with the initial public offering.
[ 2 ] Summary of Signifi cant Accounting Policies
Use of EstimatesThe preparation of fi nancial statements in accordance with Ca-
nadian GAAP requires the use of estimates that affect the reported amounts of assets and liabilities and disclosure of contingent assets and liabilities at the balance sheet date and the reported amounts of revenue and expense items for the reporting period. On an ongoing ba-sis, management reviews its estimates, including those related to the net realizable value of merchandise inventories, useful lives of property and equipment, impairment of long-lived assets and goodwill, income taxes and fair value of fi nancial instruments, based on currently avail-able information. Actual results could differ from those estimates.
Cash and Cash EquivalentsCash and cash equivalents include highly liquid investments with
original maturities from date of purchase of three months or less.
Merchandise InventoriesMerchandise inventories at the distribution centre, warehouses and
stores are stated at the lower of cost and net realizable value. Cost is determined on a weighted average cost basis and is assigned to store inventories using the retail inventory method. Costs of inventory include amounts paid to suppliers, duties and freight into the warehouses as well as costs directly associated with warehousing and distribution.
DOLLARAMA INC.
DOLLARAMA GROUP HOLDINGS L.P.
DOLLARAMA GROUP L.P.
DOLLARAMA L.P. DOLLARAMA CORPORATION
Notes to Consolidated Financial Statements
DO
LL
AR
AM
A IN
C. A
NN
UA
L R
EP
OR
T 2
00
9
45
Property and EquipmentProperty and equipment are carried at cost and amortized over the estimated useful lives of the assets as follows:
Under the declining balance method Computer equipment 30% Vehicles 30%
Under the straight-line method Store and warehouse equipment 8-10 years Computer software 5 years Leasehold improvements Term of lease Goodwill
Goodwill is tested for impairment annually or when events or changes in circumstances indicate that it may be impaired. A Step I impairment test of the goodwill of the Corporation’s reporting unit is ac-complished mainly by determining whether the fair value of the report-ing unit exceeds its net carrying amount as of the assessment date. If the fair value is greater than the net carrying amount, no impairment is necessary. In the event that the net carrying amount of the reporting unit exceeds the sum of the discounted estimated cash fl ows, a Step II impairment test must be performed whereby the fair value of the re-porting unit’s goodwill must be estimated to determine if it is less than its net carrying amount. Fair value of goodwill in the Step II impairment test is estimated in the same way as goodwill was determined at the date of the acquisition in a business combination, that is, the excess of the fair value of the reporting unit over the fair value of the identifi able net assets of the reporting unit. The Corporation conducts its annual impairment test as of the balance sheet date.
Trade NameTrade name is recorded at cost and is not subject to amortization. It
is tested for impairment annually or more frequently if events or circum-stances indicate that it may be impaired. The impairment test consists of a comparison of the fair value, based on discounted estimated cash fl ows related to the trade name, with its carrying amount. If the fair value is greater than the carrying amount, no impairment is necessary. If the carrying amount exceeds the fair value, an impairment loss shall be recognized in an amount equal to that excess. The Corporation conducts its annual impairment test as of the balance sheet date.
Favourable and Unfavourable Lease RightsFavourable and unfavourable lease rights represent the fair value
of lease rights as established on the date of their acquisition or as-sumption and are amortized on a straight-line basis over the terms of the related leases.
Covenants Not to CompeteThe covenants not to compete is amortized on a straight-line basis over the terms of the agreement.
Deferred Leasing InstrumentsDeferred leasing costs and deferred tenant allowances are record-
ed on the balance sheet and amortized using the straight line method over the term of the respective lease.
Debt Issue CostsDebt issue costs are deducted from the carrying value of the re-
lated debt and are accounted for at amortized cost using the effective interest method.
Operating LeasesThe Corporation recognizes rental expense incurred and induce-
ments received from landlords on a straight-line basis over the term of the lease. Any difference between the calculated expense and the amounts actually paid is refl ected as deferred lease inducements in the Corporation’s balance sheet. Contingent rental expense is recog-nized when the achievement of specifi ed sales targets is considered probable.
Impairment of Long-Lived AssetsLong-lived assets are reviewed for impairment whenever events
or changes in circumstances indicate that the carrying amount of an asset may not be recoverable. Impairment is assessed by comparing the carrying amount of an asset with the expected future net undis-counted cash fl ows from its use together with its residual value. If such asset is considered to be impaired, the impairment to be recognized is measured by the amount by which the carrying amount of the asset exceeds its fair value.
Revenue RecognitionThe Corporation recognizes revenue at the time the customer ten-
ders payment for and takes possession of the merchandise. All sales are fi nal.
Cost of SalesThe Corporation includes the cost of merchandise inventories, pro-
curement, warehousing and distribution costs, and certain occupancy costs in its cost of sales.
General, Administrative and Store Operating ExpensesThe Corporation includes store and head offi ce salaries and ben-
efi ts, repairs and maintenance, professional fees, store supplies and other related expenses in general, administrative and store operating expenses.
Notes to Consolidated Financial Statements
DO
LL
AR
AM
A I
NC
. A
NN
UA
L R
EP
OR
T 2
00
9
46
[ 2 ] continued
Pre-Opening CostsCosts associated with the opening of new stores are expensed
as incurred.
Vendor RebatesThe Corporation records vendor rebates, consisting of volume
purchase rebates, when it is probable that they will be received and the amount is reasonably estimable. The rebates are recorded as a reduction of inventory purchases and are refl ected as a reduction of cost of sales.
Advertising CostsThe Corporation expenses advertising costs as incurred. Advertis-
ing costs for the year ended January 31, 2010 amounted to $630,000 (February 1, 2009 – $1,953,000).
Employee Future Benefi tsThe Corporation offers a group defi ned contribution pension plan
to eligible employees whereby it matches an employee’s contributions of up to 3% of the employee’s salary. The pension expense for the year ended January 31, 2010 amounted to $1,132,000 (February 1, 2009 – $1,153,000).
Income TaxesThe Corporation uses the asset and liability method in account-
ing for income taxes. According to this method, future income taxes are determined using the difference between the accounting and tax bases of assets and liabilities. Future income tax assets and liabilities are measured using substantively enacted tax rates in effect in the year in which these temporary differences are expected to be recovered or settled. Future income tax assets are recognized when it is more likely than not that the assets will be realized.
Foreign Currency TransactionsMonetary assets and liabilities denominated in foreign currencies
are translated at year-end exchange rates, while non-monetary assets and liabilities are translated at historical rates. Revenues and expenses are translated at prevailing market rates in the recognition period. The resulting exchange gains or losses are recorded in the consolidated statement of earnings.
Derivative Financial InstrumentsThe Corporation uses derivative fi nancial instruments in the man-
agement of its foreign currency and interest rate exposures.When hedge accounting is used, the Corporation documents re-
lationships between the hedging instruments and the hedged items, as well as its risk management objective and strategy for undertaking various hedge transactions. This process includes linking derivatives to specifi c assets and liabilities on the balance sheet or to specifi c fi rm commitments or forecasted transactions. The Corporation also as-
sesses whether the derivatives that are used in hedging transactions are effective in offsetting changes in cash fl ows of hedged items.
Foreign Exchange Forward Contracts And Foreign Currency Swap Agreements
The Corporation has signifi cant cash fl ows and long term debt denominated in US dollars. It uses foreign exchange forward contracts and foreign currency swap agreements to mitigate risks from fl uctua-tions in exchange rates. All forward contracts and swap agreements are used for risk management purposes. Some forward contracts are designated as cash fl ow hedges of specifi c anticipated transac-tions. Under the cash fl ow hedge model, the fair values of the foreign exchange forward contracts are recorded in “Accumulated other com-prehensive income” and reclassifi ed to the consolidated statement of earnings when the related hedged item is recorded in earnings.
Foreign exchange forward contracts are classifi ed as current assets or liabilities on the consolidated balance sheet.
Interest Rate Swap AgreementsThe Corporation’s interest rate risk is primarily in relation to its fl oat-
ing rate borrowings. The Corporation has entered into swap agree-ments to mitigate this risk.
OthersIn the event a derivative fi nancial instrument designated as a hedge
is terminated or ceases to be effective prior to maturity, related realized and unrealized gains or losses are deferred under assets or liabilities and recognized in earnings in the period in which the underlying original hedged transaction is recognized. In the event a designated hedged item is sold, extinguished or matures prior to the termination of the related derivative fi nancial instrument, any realized or unrealized gain or loss on such derivative fi nancial instrument is recognized in earnings.
Derivative fi nancial instruments which are not designated as hedges or have ceased to be effective prior to maturity are recorded at their estimated fair values under assets or liabilities, with changes in their estimated fair values recorded in earnings.
Stock-Based CompensationThe Corporation has outstanding common shares options.The common shares options are considered equity awards. Accord-
ingly, the Corporation recognizes a compensation expense based on the fair value of the options at the grant date. The options vest in tranches (graded vesting), and accordingly, the expense is recognized using the accelerated expense attribution method over the vesting period.
When the vesting of an award is contingent upon the attainment of performance conditions, the Corporation recognizes the expense based on management’s best estimate of the outcome of the con-ditions and consequently the number of options that are expected to vest. When awards are forfeited because service or performance conditions are not met, any expense previously recorded is reversed in the period of forfeiture.
Notes to Consolidated Financial Statements
DO
LL
AR
AM
A IN
C. A
NN
UA
L R
EP
OR
T 2
00
9
47
Preferred SharesPrior to the reorganization described in note 1, the Corporation had
Class A, B and C preferred shares which were classifi ed as liabilities within the balance sheet line “Due to shareholders” and which were recorded at their redemption value.
Earnings per Common ShareEarnings per common share are determined using the weighted
average number of common shares outstanding during the year. Di-luted earnings per common share are determined using the treasury stock method to evaluate the dilutive effect of stock options, convert-ible instruments and equivalents, when applicable. Under this method, instruments with a dilutive effect, basically when the average market price of a share for the period exceeds the exercise price, are consid-ered to have been exercised at the beginning of the period (or at the time of issuance, if later) and the proceeds received are considered to have been used to redeem common shares at the average market price during the period.
Comparative FiguresTo conform with the basis of presentation adapted in the current
year, certain fi gures previously reported have been reclassifi ed.
Changes in Accounting Policies During The Year
Goodwill and Intangible AssetsCanadian Institute of Chartered Accountants (“CICA”) Handbook
Section 3064, “Goodwill and Intangible Assets”, replaces Section 3062, “Goodwill and Other Intangible Assets”, and establishes stan-dards for the recognition, measurement and disclosure of goodwill and intangible assets. The provisions relating to the defi nition and initial recognition of intangible assets are equivalent to the corresponding provisions of International Accounting Standard (“IAS”) 38, “Intangible Assets”. Section 1000, “Financial Statement Concepts”, has been amended to clarify criteria for recognition of an asset. Section 3450, “Research and Development Costs”, has been replaced by guid-ance in Section 3064. CICA Emerging Issues Committee Abstract 27, “Revenues and Expenditures During the Pre-operating Period”, is no longer applicable for entities that have adopted Section 3064. Accounting Guideline 11, “Enterprises in the Development Stage”, has been amended to delete references to deferred costs and to provide guidance on development costs as intangible assets under Section 3064. This Section was adopted as of February 2, 2009 with no impact on the consolidated fi nancial statements.
Accounting ChangesIn June 2009, the CICA amended Section 1506, “Accounting
Changes”, to exclude from the scope of this Section changes in ac-counting policies upon the complete replacement of an entity’s primary basis of accounting. This amendment is effective for years beginning after July 1, 2009. This amendment was early adopted as of January 31, 2010 with no impact on the consolidated fi nancial statements.
Financial Instruments – DisclosuresIn June 2009, the CICA amended Section 3862, “Financial Instru-
ments – Disclosures”, to include additional disclosure requirements about fair value measurement for fi nancial instruments and liquidity risk disclosures. These amendments require a three-level hierarchy that refl ects the signifi cance of the inputs used in making the fair value measurements. Fair values of assets and liabilities included in Level 1 are determined by reference to quoted prices in active markets for identical assets and liabilities. Assets and liabilities in Level 2 include valuations using inputs other than the quoted prices for which all sig-nifi cant inputs are based on observable market data, either directly or indirectly. Level 3 valuations are based on inputs that are not based on observable market data. The adoption of amended Section 3862 as of January 31, 2010 had no impact on the consolidated fi nancial statements.
Future Accounting Standards Not Yet Applied
Business Combinations, Consolidated Financial Statements and Non-Controlling Interests
CICA Handbook Section 1582, “Business Combinations”; Sec-tion 1601, “Consolidated Financial Statements”; and Section 1602, “Non-controlling Interests”; replace Section 1581, “Business Combi-nations”, and Section 1600, “Consolidated Financial Statements”, and establish a new section for accounting for a non-controlling interest in a subsidiary. These sections provide the Canadian equivalent to International Financial Reporting Standard 3, “Business Combinations (January 2008)”, and IAS 27, “Consolidated and Separate Financial Statements (January 2008)”. Section 1582 is effective for business combinations for which the acquisition date is on or after the fi rst quarter beginning on January 31, 2011 with early adoption permitted. Sections 1601 and 1602 apply to interim and annual consolidated fi nancial statements relating to years beginning on January 31, 2011 with early adoption permitted. The Corporation is assessing the impact of these new standards.
Notes to Consolidated Financial Statements
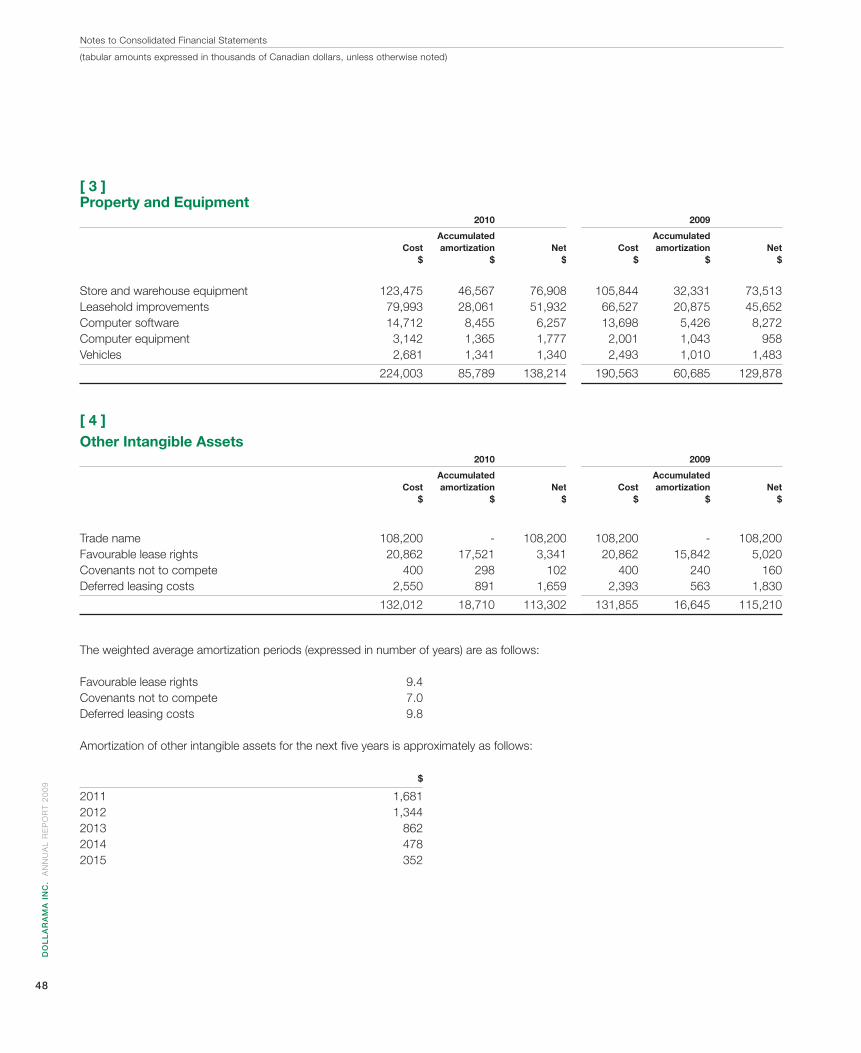
DO
LL
AR
AM
A I
NC
. A
NN
UA
L R
EP
OR
T 2
00
9
48
[ 3 ] Property and Equipment 2010 2009
Accumulated Accumulated Cost amortization Net Cost amortization Net $ $ $ $ $ $
Store and warehouse equipment 123,475 46,567 76,908 105,844 32,331 73,513 Leasehold improvements 79,993 28,061 51,932 66,527 20,875 45,652Computer software 14,712 8,455 6,257 13,698 5,426 8,272Computer equipment 3,142 1,365 1,777 2,001 1,043 958Vehicles 2,681 1,341 1,340 2,493 1,010 1,483
224,003 85,789 138,214 190,563 60,685 129,878
[ 4 ] Other Intangible Assets 2010 2009
Accumulated Accumulated Cost amortization Net Cost amortization Net $ $ $ $ $ $
Trade name 108,200 - 108,200 108,200 - 108,200Favourable lease rights 20,862 17,521 3,341 20,862 15,842 5,020Covenants not to compete 400 298 102 400 240 160Deferred leasing costs 2,550 891 1,659 2,393 563 1,830
132,012 18,710 113,302 131,855 16,645 115,210
The weighted average amortization periods (expressed in number of years) are as follows:
Favourable lease rights 9.4 Covenants not to compete 7.0 Deferred leasing costs 9.8
Amortization of other intangible assets for the next fi ve years is approximately as follows:
$
2011 1,681 2012 1,344 2013 862 2014 478 2015 352
Notes to Consolidated Financial Statements
(tabular amounts expressed in thousands of Canadian dollars, unless otherwise noted)
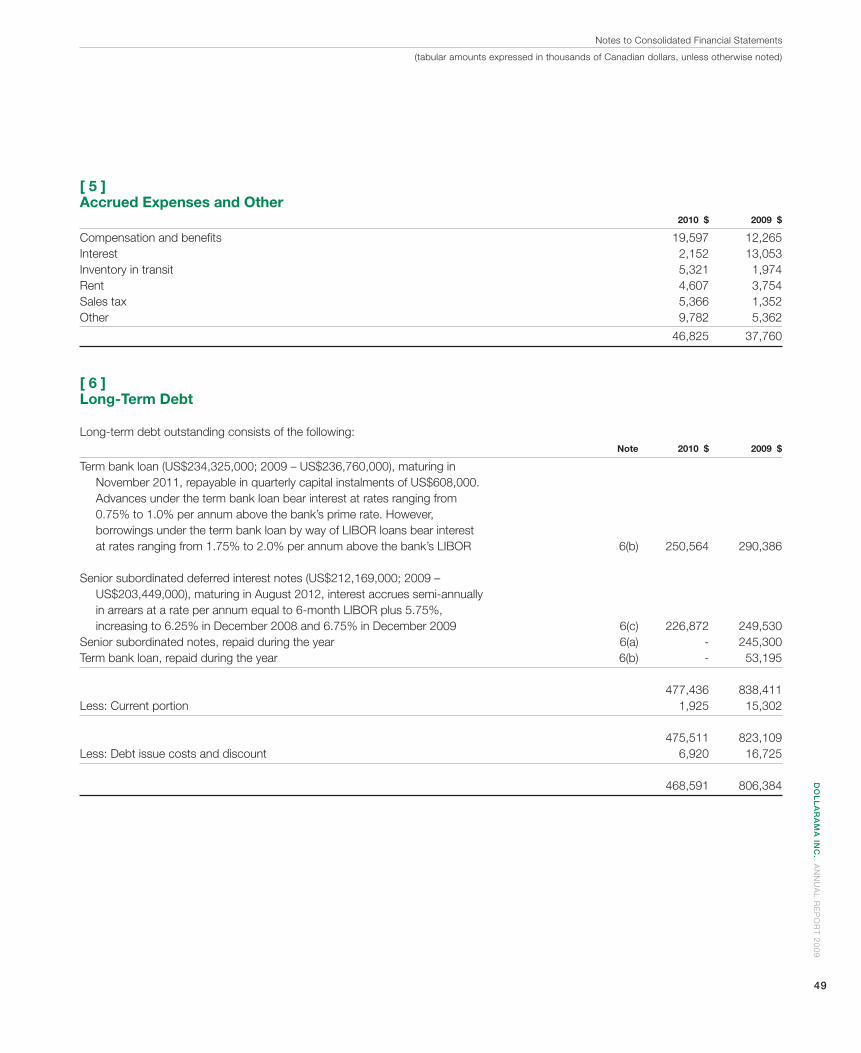
DO
LL
AR
AM
A IN
C. A
NN
UA
L R
EP
OR
T 2
00
9
49
[ 5 ] Accrued Expenses and Other 2010 $ 2009 $
Compensation and benefi ts 19,597 12,265Interest 2,152 13,053Inventory in transit 5,321 1,974Rent 4,607 3,754Sales tax 5,366 1,352Other 9,782 5,362
46,825 37,760
[ 6 ] Long-Term Debt
Long-term debt outstanding consists of the following: Note 2010 $ 2009 $
Term bank loan (US$234,325,000; 2009 – US$236,760,000), maturing in November 2011, repayable in quarterly capital instalments of US$608,000. Advances under the term bank loan bear interest at rates ranging from 0.75% to 1.0% per annum above the bank’s prime rate. However, borrowings under the term bank loan by way of LIBOR loans bear interest at rates ranging from 1.75% to 2.0% per annum above the bank’s LIBOR 6(b) 250,564 290,386
Senior subordinated deferred interest notes (US$212,169,000; 2009 – US$203,449,000), maturing in August 2012, interest accrues semi-annually in arrears at a rate per annum equal to 6-month LIBOR plus 5.75%, increasing to 6.25% in December 2008 and 6.75% in December 2009 6(c) 226,872 249,530Senior subordinated notes, repaid during the year 6(a) - 245,300Term bank loan, repaid during the year 6(b) - 53,195 477,436 838,411Less: Current portion 1,925 15,302 475,511 823,109Less: Debt issue costs and discount 6,920 16,725 468,591 806,384
Notes to Consolidated Financial Statements
(tabular amounts expressed in thousands of Canadian dollars, unless otherwise noted)

DO
LL
AR
AM
A I
NC
. A
NN
UA
L R
EP
OR
T 2
00
9
50
a) Senior subordinated notes (the “Notes”)On November 17, 2009, the Corporation redeemed all of the
issued and outstanding Notes in the aggregate principal amount of US$200,000,000 in accordance with section 5(a) of the Notes and section 3.01(a) of the Indenture at a redemption price equal to 104.438% (US$208,876,000) of the principal amounts of such Notes, plus accrued and unpaid interest up to November 17, 2009. As a result, an additional expense of US$8,876,000 ($9,183,000 using the exchange rate as of the transaction date) has been re-corded as a redemption premium in interest expense.
Prior to their redemption, the Notes were converted into Cana-dian dollars at the foreign exchange rates prevailing at the balance sheet date. As a result, a foreign exchange gain of $35,200,000 was recorded in earnings under “Foreign exchange loss (gain) on derivative fi nancial instruments and long term debt” for the pe-riod of February 2, 2009 to November 17, 2009 (2009 – loss of $46,500,000).
b) Senior secured credit facilityDollarama Group L.P. has a senior secured revolving credit facility
amounting to $75,000,000 and consisting of revolving credit loans, bankers’ acceptances, swing line loans and a letter of credit facility. Borrowings under swing line loans are limited to $10,000,000 and the letter of credit facility is limited to $25,000,000. As of Janu-ary 31, 2010, there were no borrowings under this facility. The senior secured credit facility also includes term bank loans. Bor-rowings under the term bank loans amounted to $250,564,000 as of January 31, 2010 (February 1, 2009 – $343,581,000) and letters of credit issued for the purchase of inventories amounting to $1,312,000 (February 1, 2009 – $2,170,000). Subject to certain exceptions and reductions in the total lease-adjusted leverage ratio, the term bank loans require payment of 100% of net cash proceeds on certain sales of assets, 100% of net cash proceeds on issuance of certain new indebtedness, 50% of net proceeds of a public of-fering or private placement, and 50% of annual excess cash fl ow (as defi ned in the credit agreement).
The term bank loan of US$234,325,000 (February 1, 2009 – US$236,759,000) has been converted into Canadian dollars at foreign exchange rates prevailing at the balance sheet dates and a foreign exchange gain of $36,821,000 (February 1, 2009 – loss of $55,624,000) has been included in the consolidated statements of earnings in “Foreign exchange loss (gain) on derivative fi nancial instruments and long term debt”.
The credit facilities are subject to the customary terms and con-ditions for loans of this nature, including limits on incurring addi-tional indebtedness and granting liens or selling assets without the consent of the lenders. The credit facilities are also subject to the maintenance of a maximum lease adjusted leverage ratio test and a minimum interest coverage ratio test. The credit facilities may, in certain circumstances, restrict Dollarama Group L.P.’s ability to pay distributions, including limiting distributions, unless suffi cient funds
are available for the repayment of indebtedness and the payment of interest expenses and taxes.
Failure to comply with the terms of the credit facilities would entitle the lenders to accelerate all amounts outstanding under the credit facilities, and upon such acceleration, the lenders would be entitled to begin enforcement procedures against the assets of Dollarama Group L.P., including accounts receivable, inventories and equipment. The lender would then be repaid from the proceeds of such enforcement proceedings, using all available assets. Only after such repayment, and the payment of any other secured and unsecured creditors, would the holders of units receive any pro-ceeds from the liquidation of the assets of Dollarama Group L.P. As of January 31, 2010, Dollarama Group L.P. was in compliance with these covenants.
c) Senior subordinated deferred interest notes (the “Deferred Inter- est Notes”)
The Deferred Interest Notes were issued at 99% of face value and are senior unsecured obligations of Dollarama Group Holdings L.P. and Dollarama Group Holdings Corporation and are structurally subordinated in right of payment to all existing and future debt and other liabilities of Dollarama Group Holdings L.P.’s subsidiaries. On each interest payment date, Dollarama Group Holdings L.P. and Dollarama Group Holdings Corporation may elect to pay interest in cash or defer the payment of interest, and interest shall accrue on such deferred interest for subsequent interest periods. Dollarama Group Holdings L.P. and Dollarama Group Holdings Corporation may redeem some or all of the Deferred Interest Notes at the fol-lowing redemption prices (expressed as percentages of principal plus deferred interest) plus accrued and unpaid interest, if any, to the redemption date: Redemption Years commencing price %
December 15, 2009 101.00 December 15, 2010 and thereafter 100.00
Following a change in control, Dollarama Group Holdings L.P. will be required to offer to purchase all Deferred Interest Notes at a price of 101% of their principal amount plus deferred interest plus any accrued and unpaid interest, if any, to the date of the purchase.
The Deferred Interest Notes are subject to the customary cov-enants restricting Dollarama Group Holdings L.P.’s and Dollarama Group Holdings Corporation’s ability to, among other things, incur additional debt, pay dividends and make other restricted payments, create liens, consolidate, merge or enter into business combina-tions, or sell assets.
The Deferred Interest Notes have been translated into Canadian dollars at the foreign exchange rates prevailing at the balance sheet dates and a foreign exchange gain of $31,798,000 (February 1, 2009 – loss of $43,746,000) has been included in the consolidated
Notes to Consolidated Financial Statements
[ 6 ] continued

DO
LL
AR
AM
A IN
C. A
NN
UA
L R
EP
OR
T 2
00
9
51
statements of earnings (loss) in “Foreign exchange loss (gain) on derivative fi nancial instruments and long-term debt.”
d) As collateral for the long-term debt, the Corporation has pledged substantially all of its assets.
e) As of January 31, 2010, the fair value of long-term debt amount-ed to $474,291,000.
The fair value of long-term debt, including the portion due within one year, is principally based on prices obtained on the quoted markets and from a third party broker.
f) Principal repayments on long-term debt due in each of the next three years are approximately as follows:
$
2011 1,925 2012 248,639 2013 226,872
g) As described in (b) and (c) above, certain restrictions exist regard-ing the transfer of funds in the form of loans, advances or cash dividends (defi ned as “Restricted Payments”) to and from Dol-larama Group Holdings L.P. and Dollarama Group L.P. Virtually all operations of the Corporation are conducted through its indirect subsidiary, Dollarama L.P., and consequently, the capacity to make Restricted Payments to the Corporation depends on the capacity of Dollarama Group L.P. and Dollarama Group Holdings L.P. to make Restricted Payments. As of January 31, 2010, the net as-sets of Dollarama Group L.P. amounted to $917.7 million, of which $747.6 million was restricted from payments. Subject to limita-tions imposed by the indenture governing the Deferred Interest Notes, as of January 31, 2010, Dollarama Group Holdings L.P.’s net assets amounted to $691.3 million, of which $619.4 million was restricted from payments.
Notes to Consolidated Financial Statements
[ 7 ] Due to Shareholders
Amounts due to shareholders and number of shares outstanding are as follows:
2010 2009
Number Number of shares $ of shares $
Junior Subordinated Notes n/a - n/a 116,262Class A preferred shares - 20,964,958 32,108Class B preferred shares - 24,681,726 37,802Class C preferred shares - 55,552,551 64,902Accrued interest n/a - n/a 5,003
- 256,077
As described in note 1, as of the date of the closing of the initial public offering, the junior subordinated notes and all the issued and out-standing common and preferred shares of the Corporation (other than the junior subordinated notes and shares held by 4513631 Canada Inc. which have been cancelled for no consideration) and 4513631 Canada Inc. were converted into common shares of
Dollarama Inc., and the Corporation assumed promissory notes in the amount of $70,082,000, which were repaid on October 16, 2009, concurrently with the closing of the initial public offering.
(tabular amounts expressed in thousands of Canadian dollars, unless otherwise noted)
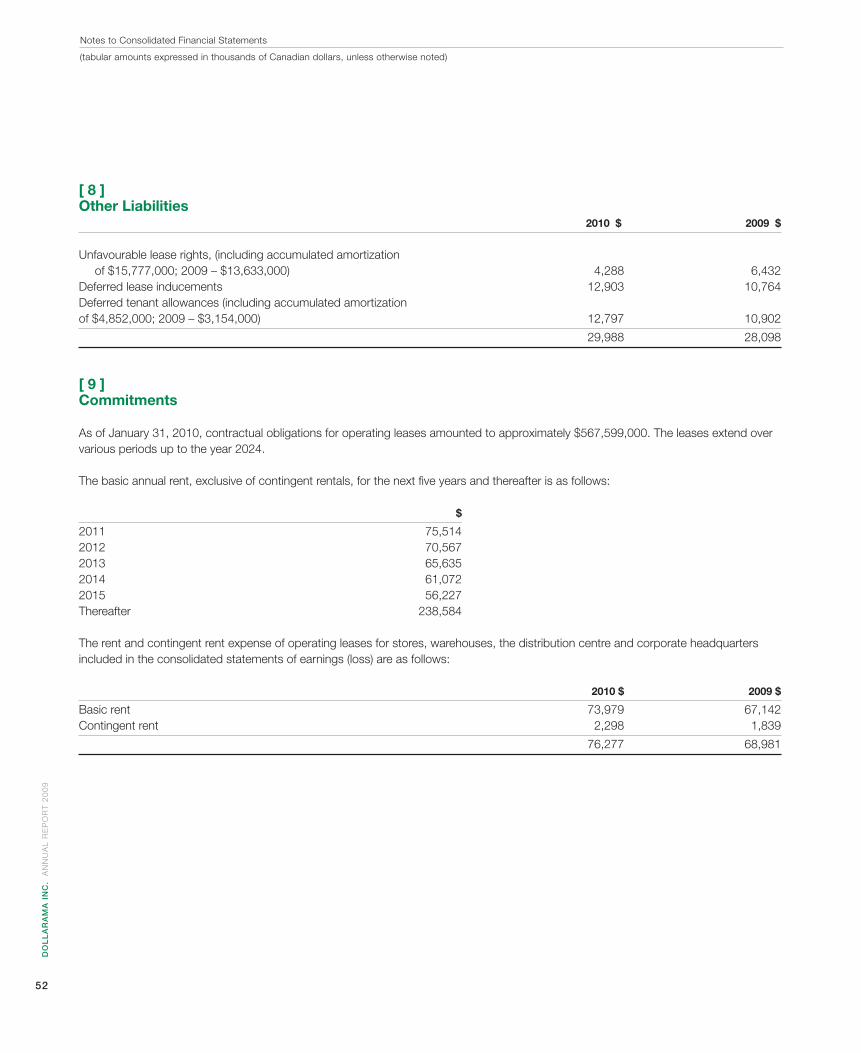
DO
LL
AR
AM
A I
NC
. A
NN
UA
L R
EP
OR
T 2
00
9
52
[ 8 ] Other Liabilities 2010 $ 2009 $
Unfavourable lease rights, (including accumulated amortization of $15,777,000; 2009 – $13,633,000) 4,288 6,432Deferred lease inducements 12,903 10,764Deferred tenant allowances (including accumulated amortization of $4,852,000; 2009 – $3,154,000) 12,797 10,902
29,988 28,098
[ 9 ] Commitments
As of January 31, 2010, contractual obligations for operating leases amounted to approximately $567,599,000. The leases extend over various periods up to the year 2024.
The basic annual rent, exclusive of contingent rentals, for the next fi ve years and thereafter is as follows:
$
2011 75,514 2012 70,567 2013 65,635 2014 61,072 2015 56,227 Thereafter 238,584
The rent and contingent rent expense of operating leases for stores, warehouses, the distribution centre and corporate headquarters included in the consolidated statements of earnings (loss) are as follows:
2010 $ 2009 $
Basic rent 73,979 67,142Contingent rent 2,298 1,839
76,277 68,981
Notes to Consolidated Financial Statements
(tabular amounts expressed in thousands of Canadian dollars, unless otherwise noted)
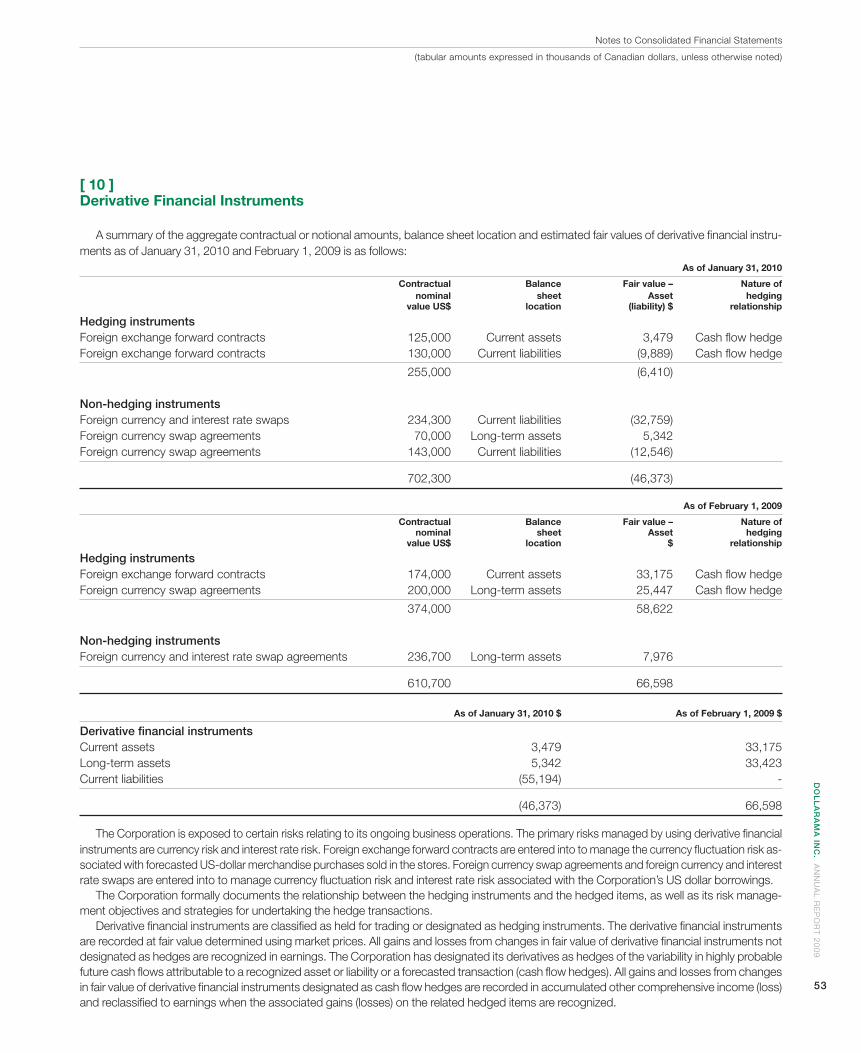
DO
LL
AR
AM
A IN
C. A
NN
UA
L R
EP
OR
T 2
00
9
53
[ 10 ]Derivative Financial Instruments
A summary of the aggregate contractual or notional amounts, balance sheet location and estimated fair values of derivative fi nancial instru-ments as of January 31, 2010 and February 1, 2009 is as follows: As of January 31, 2010
Contractual Balance Fair value – Nature of nominal sheet Asset hedging value US$ location (liability) $ relationship
Hedging instruments Foreign exchange forward contracts 125,000 Current assets 3,479 Cash fl ow hedgeForeign exchange forward contracts 130,000 Current liabilities (9,889) Cash fl ow hedge
255,000 (6,410)
Non-hedging instruments Foreign currency and interest rate swaps 234,300 Current liabilities (32,759) Foreign currency swap agreements 70,000 Long-term assets 5,342 Foreign currency swap agreements 143,000 Current liabilities (12,546)
702,300 (46,373) As of February 1, 2009
Contractual Balance Fair value – Nature of nominal sheet Asset hedging value US$ location $ relationship
Hedging instruments Foreign exchange forward contracts 174,000 Current assets 33,175 Cash fl ow hedgeForeign currency swap agreements 200,000 Long-term assets 25,447 Cash fl ow hedge
374,000 58,622
Non-hedging instruments Foreign currency and interest rate swap agreements 236,700 Long-term assets 7,976
610,700 66,598
As of January 31, 2010 $ As of February 1, 2009 $
Derivative fi nancial instruments Current assets 3,479 33,175Long-term assets 5,342 33,423Current liabilities (55,194) -
(46,373) 66,598
The Corporation is exposed to certain risks relating to its ongoing business operations. The primary risks managed by using derivative fi nancial instruments are currency risk and interest rate risk. Foreign exchange forward contracts are entered into to manage the currency fl uctuation risk as-sociated with forecasted US-dollar merchandise purchases sold in the stores. Foreign currency swap agreements and foreign currency and interest rate swaps are entered into to manage currency fl uctuation risk and interest rate risk associated with the Corporation’s US dollar borrowings.
The Corporation formally documents the relationship between the hedging instruments and the hedged items, as well as its risk manage-ment objectives and strategies for undertaking the hedge transactions.
Derivative fi nancial instruments are classifi ed as held for trading or designated as hedging instruments. The derivative fi nancial instruments are recorded at fair value determined using market prices. All gains and losses from changes in fair value of derivative fi nancial instruments not designated as hedges are recognized in earnings. The Corporation has designated its derivatives as hedges of the variability in highly probable future cash fl ows attributable to a recognized asset or liability or a forecasted transaction (cash fl ow hedges). All gains and losses from changes in fair value of derivative fi nancial instruments designated as cash fl ow hedges are recorded in accumulated other comprehensive income (loss) and reclassifi ed to earnings when the associated gains (losses) on the related hedged items are recognized.
Notes to Consolidated Financial Statements
(tabular amounts expressed in thousands of Canadian dollars, unless otherwise noted)
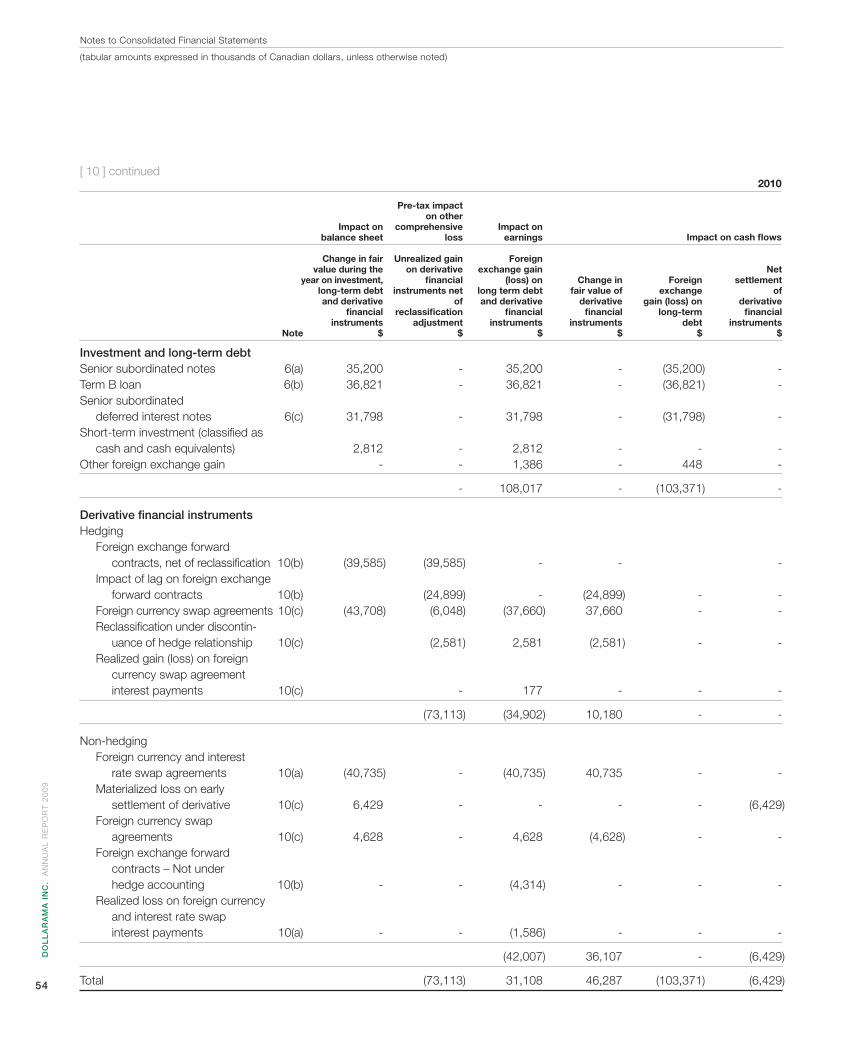
DO
LL
AR
AM
A I
NC
. A
NN
UA
L R
EP
OR
T 2
00
9
54
2010
Impact on cash fl ows
Netsettlement
ofderivative
fi nancialinstruments
$
Investment and long-term debt Senior subordinated notes 6(a) 35,200 - 35,200 - (35,200) -Term B loan 6(b) 36,821 - 36,821 - (36,821) -Senior subordinated deferred interest notes 6(c) 31,798 - 31,798 - (31,798) -Short-term investment (classifi ed as cash and cash equivalents) 2,812 - 2,812 - - -Other foreign exchange gain - - 1,386 - 448 -
- 108,017 - (103,371) - Derivative fi nancial instruments Hedging Foreign exchange forward contracts, net of reclassifi cation 10(b) (39,585) (39,585) - - - Impact of lag on foreign exchange forward contracts 10(b) (24,899) - (24,899) - - Foreign currency swap agreements 10(c) (43,708) (6,048) (37,660) 37,660 - - Reclassifi cation under discontin- uance of hedge relationship 10(c) (2,581) 2,581 (2,581) - - Realized gain (loss) on foreign currency swap agreement interest payments 10(c) - 177 - - -
(73,113) (34,902) 10,180 - - Non-hedging Foreign currency and interest rate swap agreements 10(a) (40,735) - (40,735) 40,735 - - Materialized loss on early settlement of derivative 10(c) 6,429 - - - - (6,429) Foreign currency swap agreements 10(c) 4,628 - 4,628 (4,628) - - Foreign exchange forward contracts – Not under hedge accounting 10(b) - - (4,314) - - - Realized loss on foreign currency and interest rate swap interest payments 10(a) - - (1,586) - - -
(42,007) 36,107 - (6,429)
Total (73,113) 31,108 46,287 (103,371) (6,429)
Notes to Consolidated Financial Statements
(tabular amounts expressed in thousands of Canadian dollars, unless otherwise noted)
Impact onbalance sheet
Change in fairvalue during the
year on investment,long-term debtand derivative
fi nancialinstruments
$
Pre-tax impact on other
comprehensive loss
Unrealized gainon derivative
fi nancialinstruments net
ofreclassifi cation
adjustment$
Impact onearnings
Foreignexchange gain
(loss) onlong term debtand derivative
fi nancialinstruments
$
Change infair value of
derivativefi nancial
instruments$
Foreignexchange
gain (loss) onlong-term
debt$Note
[ 10 ] continued
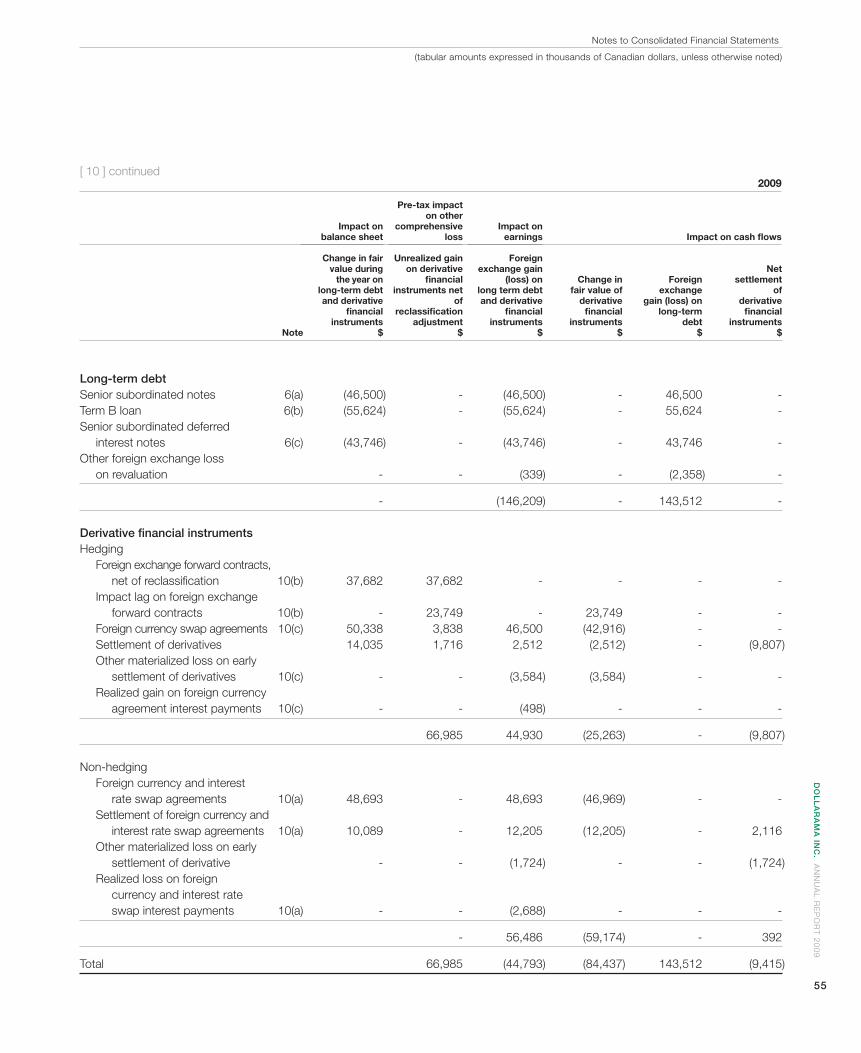
DO
LL
AR
AM
A IN
C. A
NN
UA
L R
EP
OR
T 2
00
9
55
Netsettlement
ofderivative
fi nancialinstruments
$
Long-term debt Senior subordinated notes 6(a) (46,500) - (46,500) - 46,500 -Term B loan 6(b) (55,624) - (55,624) - 55,624 -Senior subordinated deferred interest notes 6(c) (43,746) - (43,746) - 43,746 -Other foreign exchange loss on revaluation - - (339) - (2,358) -
- (146,209) - 143,512 - Derivative fi nancial instruments Hedging Foreign exchange forward contracts, net of reclassifi cation 10(b) 37,682 37,682 - - - - Impact lag on foreign exchange forward contracts 10(b) - 23,749 - 23,749 - - Foreign currency swap agreements 10(c) 50,338 3,838 46,500 (42,916) - - Settlement of derivatives 14,035 1,716 2,512 (2,512) - (9,807) Other materialized loss on early settlement of derivatives 10(c) - - (3,584) (3,584) - - Realized gain on foreign currency agreement interest payments 10(c) - - (498) - - -
66,985 44,930 (25,263) - (9,807) Non-hedging Foreign currency and interest rate swap agreements 10(a) 48,693 - 48,693 (46,969) - - Settlement of foreign currency and interest rate swap agreements 10(a) 10,089 - 12,205 (12,205) - 2,116 Other materialized loss on early settlement of derivative - - (1,724) - - (1,724) Realized loss on foreign currency and interest rate swap interest payments 10(a) - - (2,688) - - -
- 56,486 (59,174) - 392
Total 66,985 (44,793) (84,437) 143,512 (9,415)
Notes to Consolidated Financial Statements
2009
Impact on cash fl owsImpact on
balance sheet
Change in fairvalue during
the year on long-term debtand derivative
fi nancialinstruments
$
Pre-tax impact on other
comprehensive loss
Unrealized gainon derivative
fi nancialinstruments net
ofreclassifi cation
adjustment$
Impact onearnings
Foreignexchange gain
(loss) onlong term debtand derivative
fi nancialinstruments
$
Change infair value of
derivativefi nancial
instruments$
Foreignexchange
gain (loss) onlong-term
debt$Note
[ 10 ] continued
(tabular amounts expressed in thousands of Canadian dollars, unless otherwise noted)
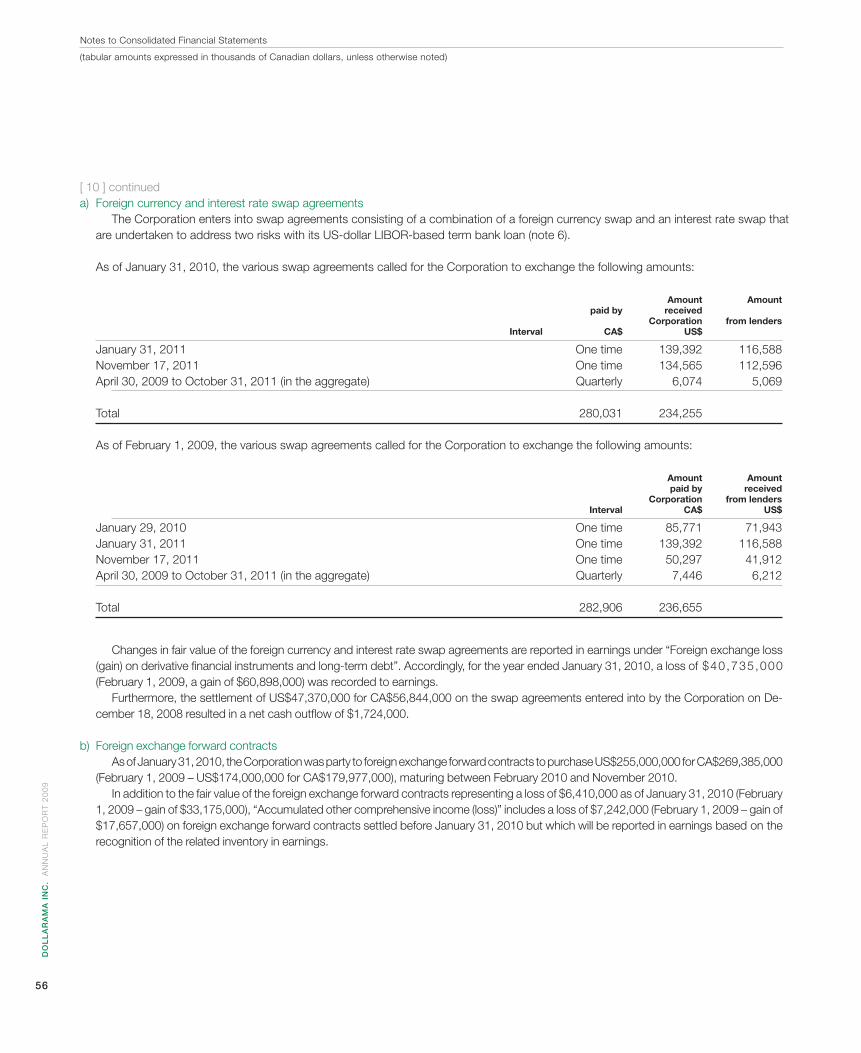
DO
LL
AR
AM
A I
NC
. A
NN
UA
L R
EP
OR
T 2
00
9
56
[ 10 ] continueda) Foreign currency and interest rate swap agreements The Corporation enters into swap agreements consisting of a combination of a foreign currency swap and an interest rate swap that are undertaken to address two risks with its US-dollar LIBOR-based term bank loan (note 6).
As of January 31, 2010, the various swap agreements called for the Corporation to exchange the following amounts:
Amount Amount paid by received Corporation from lenders Interval CA$ US$
January 31, 2011 One time 139,392 116,588 November 17, 2011 One time 134,565 112,596 April 30, 2009 to October 31, 2011 (in the aggregate) Quarterly 6,074 5,069 Total 280,031 234,255
As of February 1, 2009, the various swap agreements called for the Corporation to exchange the following amounts:
Amount Amount paid by received Corporation from lenders Interval CA$ US$
January 29, 2010 One time 85,771 71,943 January 31, 2011 One time 139,392 116,588 November 17, 2011 One time 50,297 41,912 April 30, 2009 to October 31, 2011 (in the aggregate) Quarterly 7,446 6,212 Total 282,906 236,655
Changes in fair value of the foreign currency and interest rate swap agreements are reported in earnings under “Foreign exchange loss (gain) on derivative financial instruments and long-term debt”. Accordingly, for the year ended January 31, 2010, a loss of $40,735,000 (February 1, 2009, a gain of $60,898,000) was recorded to earnings.
Furthermore, the settlement of US$47,370,000 for CA$56,844,000 on the swap agreements entered into by the Corporation on De-cember 18, 2008 resulted in a net cash outfl ow of $1,724,000.
b) Foreign exchange forward contractsAs of January 31, 2010, the Corporation was party to foreign exchange forward contracts to purchase US$255,000,000 for CA$269,385,000
(February 1, 2009 – US$174,000,000 for CA$179,977,000), maturing between February 2010 and November 2010.In addition to the fair value of the foreign exchange forward contracts representing a loss of $6,410,000 as of January 31, 2010 (February
1, 2009 – gain of $33,175,000), “Accumulated other comprehensive income (loss)” includes a loss of $7,242,000 (February 1, 2009 – gain of $17,657,000) on foreign exchange forward contracts settled before January 31, 2010 but which will be reported in earnings based on the recognition of the related inventory in earnings.
Notes to Consolidated Financial Statements
(tabular amounts expressed in thousands of Canadian dollars, unless otherwise noted)
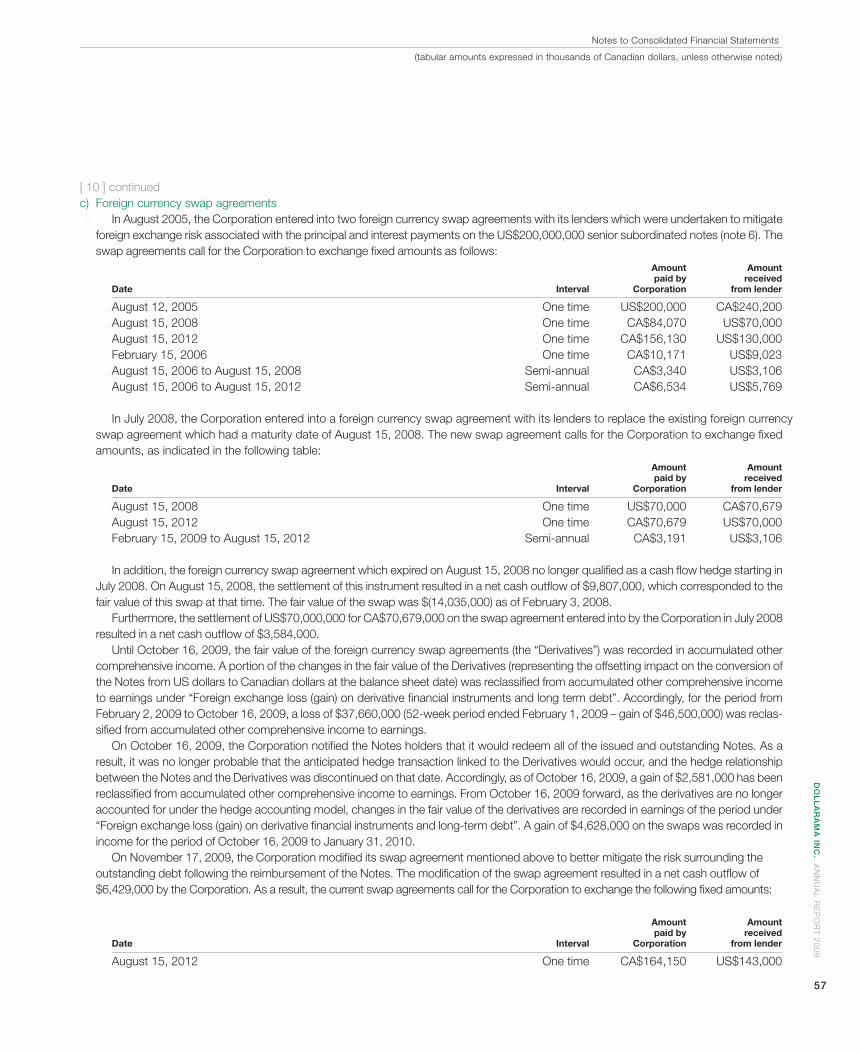
DO
LL
AR
AM
A IN
C. A
NN
UA
L R
EP
OR
T 2
00
9
57
[ 10 ] continuedc) Foreign currency swap agreements
In August 2005, the Corporation entered into two foreign currency swap agreements with its lenders which were undertaken to mitigate foreign exchange risk associated with the principal and interest payments on the US$200,000,000 senior subordinated notes (note 6). The swap agreements call for the Corporation to exchange fi xed amounts as follows:
Amount Amount paid by received Date Interval Corporation from lender
August 12, 2005 One time US$200,000 CA$240,200 August 15, 2008 One time CA$84,070 US$70,000 August 15, 2012 One time CA$156,130 US$130,000 February 15, 2006 One time CA$10,171 US$9,023 August 15, 2006 to August 15, 2008 Semi-annual CA$3,340 US$3,106 August 15, 2006 to August 15, 2012 Semi-annual CA$6,534 US$5,769
In July 2008, the Corporation entered into a foreign currency swap agreement with its lenders to replace the existing foreign currency swap agreement which had a maturity date of August 15, 2008. The new swap agreement calls for the Corporation to exchange fi xed amounts, as indicated in the following table: Amount Amount paid by received Date Interval Corporation from lender
August 15, 2008 One time US$70,000 CA$70,679 August 15, 2012 One time CA$70,679 US$70,000 February 15, 2009 to August 15, 2012 Semi-annual CA$3,191 US$3,106
In addition, the foreign currency swap agreement which expired on August 15, 2008 no longer qualifi ed as a cash fl ow hedge starting in July 2008. On August 15, 2008, the settlement of this instrument resulted in a net cash outfl ow of $9,807,000, which corresponded to the fair value of this swap at that time. The fair value of the swap was $(14,035,000) as of February 3, 2008.
Furthermore, the settlement of US$70,000,000 for CA$70,679,000 on the swap agreement entered into by the Corporation in July 2008 resulted in a net cash outfl ow of $3,584,000.
Until October 16, 2009, the fair value of the foreign currency swap agreements (the “Derivatives”) was recorded in accumulated other comprehensive income. A portion of the changes in the fair value of the Derivatives (representing the offsetting impact on the conversion of the Notes from US dollars to Canadian dollars at the balance sheet date) was reclassifi ed from accumulated other comprehensive income to earnings under “Foreign exchange loss (gain) on derivative fi nancial instruments and long term debt”. Accordingly, for the period from February 2, 2009 to October 16, 2009, a loss of $37,660,000 (52-week period ended February 1, 2009 – gain of $46,500,000) was reclas-sifi ed from accumulated other comprehensive income to earnings.
On October 16, 2009, the Corporation notifi ed the Notes holders that it would redeem all of the issued and outstanding Notes. As a result, it was no longer probable that the anticipated hedge transaction linked to the Derivatives would occur, and the hedge relationship between the Notes and the Derivatives was discontinued on that date. Accordingly, as of October 16, 2009, a gain of $2,581,000 has been reclassifi ed from accumulated other comprehensive income to earnings. From October 16, 2009 forward, as the derivatives are no longer accounted for under the hedge accounting model, changes in the fair value of the derivatives are recorded in earnings of the period under “Foreign exchange loss (gain) on derivative fi nancial instruments and long-term debt”. A gain of $4,628,000 on the swaps was recorded in income for the period of October 16, 2009 to January 31, 2010.
On November 17, 2009, the Corporation modifi ed its swap agreement mentioned above to better mitigate the risk surrounding the outstanding debt following the reimbursement of the Notes. The modifi cation of the swap agreement resulted in a net cash outfl ow of $6,429,000 by the Corporation. As a result, the current swap agreements call for the Corporation to exchange the following fi xed amounts:
Amount Amount paid by received Date Interval Corporation from lender
August 15, 2012 One time CA$164,150 US$143,000
Notes to Consolidated Financial Statements
(tabular amounts expressed in thousands of Canadian dollars, unless otherwise noted)
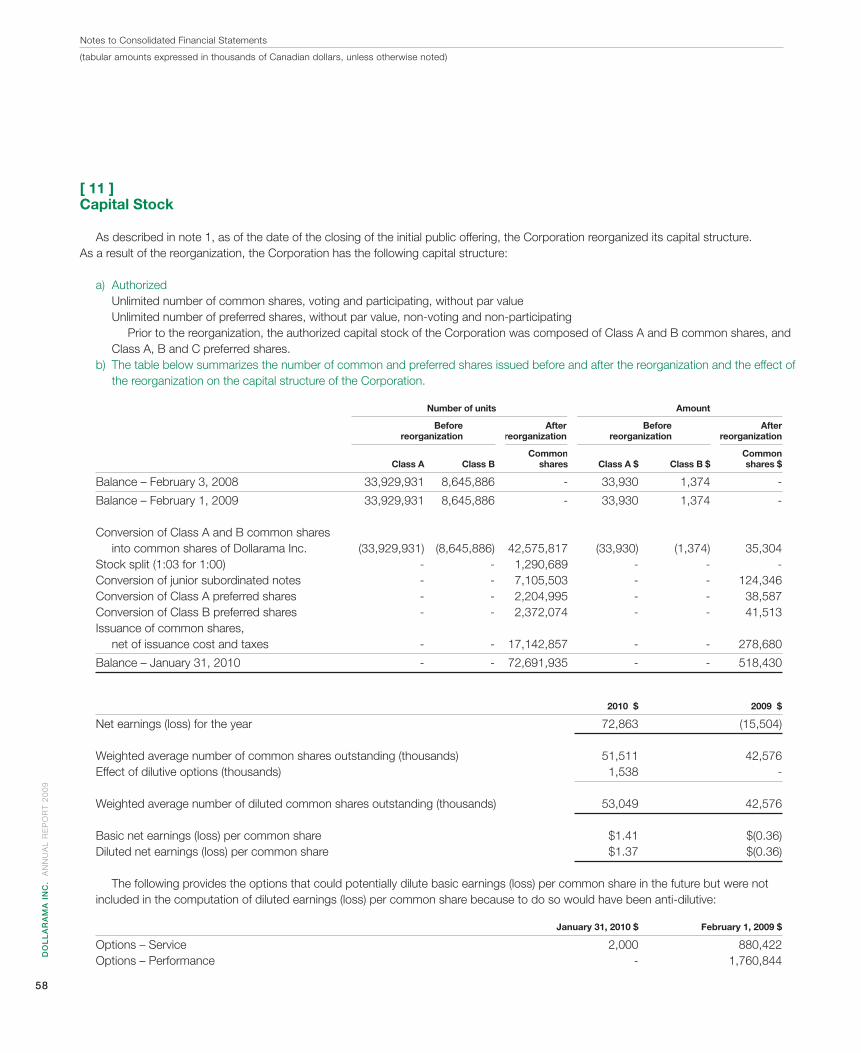
DO
LL
AR
AM
A I
NC
. A
NN
UA
L R
EP
OR
T 2
00
9
58
[ 11 ] Capital Stock
As described in note 1, as of the date of the closing of the initial public offering, the Corporation reorganized its capital structure. As a result of the reorganization, the Corporation has the following capital structure:
a) Authorized Unlimited number of common shares, voting and participating, without par value Unlimited number of preferred shares, without par value, non-voting and non-participating Prior to the reorganization, the authorized capital stock of the Corporation was composed of Class A and B common shares, and Class A, B and C preferred shares. b) The table below summarizes the number of common and preferred shares issued before and after the reorganization and the effect of the reorganization on the capital structure of the Corporation. Number of units Amount
Before After Before After reorganization reorganization reorganization reorganization
Common Common Class A Class B shares Class A $ Class B $ shares $
Balance – February 3, 2008 33,929,931 8,645,886 - 33,930 1,374 -
Balance – February 1, 2009 33,929,931 8,645,886 - 33,930 1,374 - Conversion of Class A and B common shares into common shares of Dollarama Inc. (33,929,931) (8,645,886) 42,575,817 (33,930) (1,374) 35,304 Stock split (1:03 for 1:00) - - 1,290,689 - - - Conversion of junior subordinated notes - - 7,105,503 - - 124,346 Conversion of Class A preferred shares - - 2,204,995 - - 38,587 Conversion of Class B preferred shares - - 2,372,074 - - 41,513 Issuance of common shares, net of issuance cost and taxes - - 17,142,857 - - 278,680
Balance – January 31, 2010 - - 72,691,935 - - 518,430
2010 $ 2009 $
Net earnings (loss) for the year 72,863 (15,504) Weighted average number of common shares outstanding (thousands) 51,511 42,576 Effect of dilutive options (thousands) 1,538 - Weighted average number of diluted common shares outstanding (thousands) 53,049 42,576 Basic net earnings (loss) per common share $1.41 $(0.36) Diluted net earnings (loss) per common share $1.37 $(0.36)
The following provides the options that could potentially dilute basic earnings (loss) per common share in the future but were not included in the computation of diluted earnings (loss) per common share because to do so would have been anti-dilutive:
January 31, 2010 $ February 1, 2009 $
Options – Service 2,000 880,422 Options – Performance - 1,760,844
Notes to Consolidated Financial Statements
(tabular amounts expressed in thousands of Canadian dollars, unless otherwise noted)
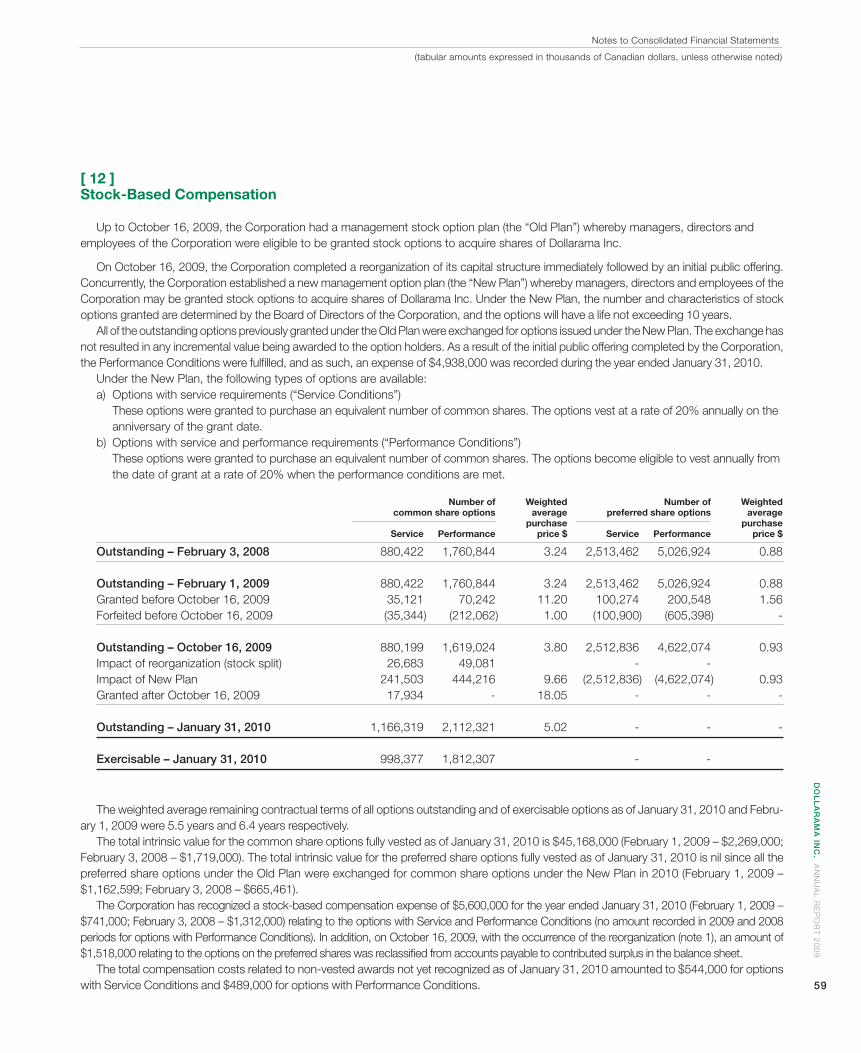
DO
LL
AR
AM
A IN
C. A
NN
UA
L R
EP
OR
T 2
00
9
59
[ 12 ] Stock-Based Compensation
Up to October 16, 2009, the Corporation had a management stock option plan (the “Old Plan”) whereby managers, directors and employees of the Corporation were eligible to be granted stock options to acquire shares of Dollarama Inc.
On October 16, 2009, the Corporation completed a reorganization of its capital structure immediately followed by an initial public offering. Concurrently, the Corporation established a new management option plan (the “New Plan”) whereby managers, directors and employees of the Corporation may be granted stock options to acquire shares of Dollarama Inc. Under the New Plan, the number and characteristics of stock options granted are determined by the Board of Directors of the Corporation, and the options will have a life not exceeding 10 years.
All of the outstanding options previously granted under the Old Plan were exchanged for options issued under the New Plan. The exchange has not resulted in any incremental value being awarded to the option holders. As a result of the initial public offering completed by the Corporation, the Performance Conditions were fulfi lled, and as such, an expense of $4,938,000 was recorded during the year ended January 31, 2010. Under the New Plan, the following types of options are available: a) Options with service requirements (“Service Conditions”) These options were granted to purchase an equivalent number of common shares. The options vest at a rate of 20% annually on the anniversary of the grant date. b) Options with service and performance requirements (“Performance Conditions”) These options were granted to purchase an equivalent number of common shares. The options become eligible to vest annually from the date of grant at a rate of 20% when the performance conditions are met.
Number of Weighted Number of Weighted common share options average preferred share options average purchase purchase Service Performance price $ Service Performance price $
Outstanding – February 3, 2008 880,422 1,760,844 3.24 2,513,462 5,026,924 0.88
Outstanding – February 1, 2009 880,422 1,760,844 3.24 2,513,462 5,026,924 0.88 Granted before October 16, 2009 35,121 70,242 11.20 100,274 200,548 1.56 Forfeited before October 16, 2009 (35,344) (212,062) 1.00 (100,900) (605,398) - Outstanding – October 16, 2009 880,199 1,619,024 3.80 2,512,836 4,622,074 0.93 Impact of reorganization (stock split) 26,683 49,081 - - Impact of New Plan 241,503 444,216 9.66 (2,512,836) (4,622,074) 0.93 Granted after October 16, 2009 17,934 - 18.05 - - - Outstanding – January 31, 2010 1,166,319 2,112,321 5.02 - - - Exercisable – January 31, 2010 998,377 1,812,307 - -
The weighted average remaining contractual terms of all options outstanding and of exercisable options as of January 31, 2010 and Febru-ary 1, 2009 were 5.5 years and 6.4 years respectively.
The total intrinsic value for the common share options fully vested as of January 31, 2010 is $45,168,000 (February 1, 2009 – $2,269,000; February 3, 2008 – $1,719,000). The total intrinsic value for the preferred share options fully vested as of January 31, 2010 is nil since all the preferred share options under the Old Plan were exchanged for common share options under the New Plan in 2010 (February 1, 2009 – $1,162,599; February 3, 2008 – $665,461).
The Corporation has recognized a stock-based compensation expense of $5,600,000 for the year ended January 31, 2010 (February 1, 2009 – $741,000; February 3, 2008 – $1,312,000) relating to the options with Service and Performance Conditions (no amount recorded in 2009 and 2008 periods for options with Performance Conditions). In addition, on October 16, 2009, with the occurrence of the reorganization (note 1), an amount of $1,518,000 relating to the options on the preferred shares was reclassifi ed from accounts payable to contributed surplus in the balance sheet.
The total compensation costs related to non-vested awards not yet recognized as of January 31, 2010 amounted to $544,000 for options with Service Conditions and $489,000 for options with Performance Conditions.
Notes to Consolidated Financial Statements
(tabular amounts expressed in thousands of Canadian dollars, unless otherwise noted)
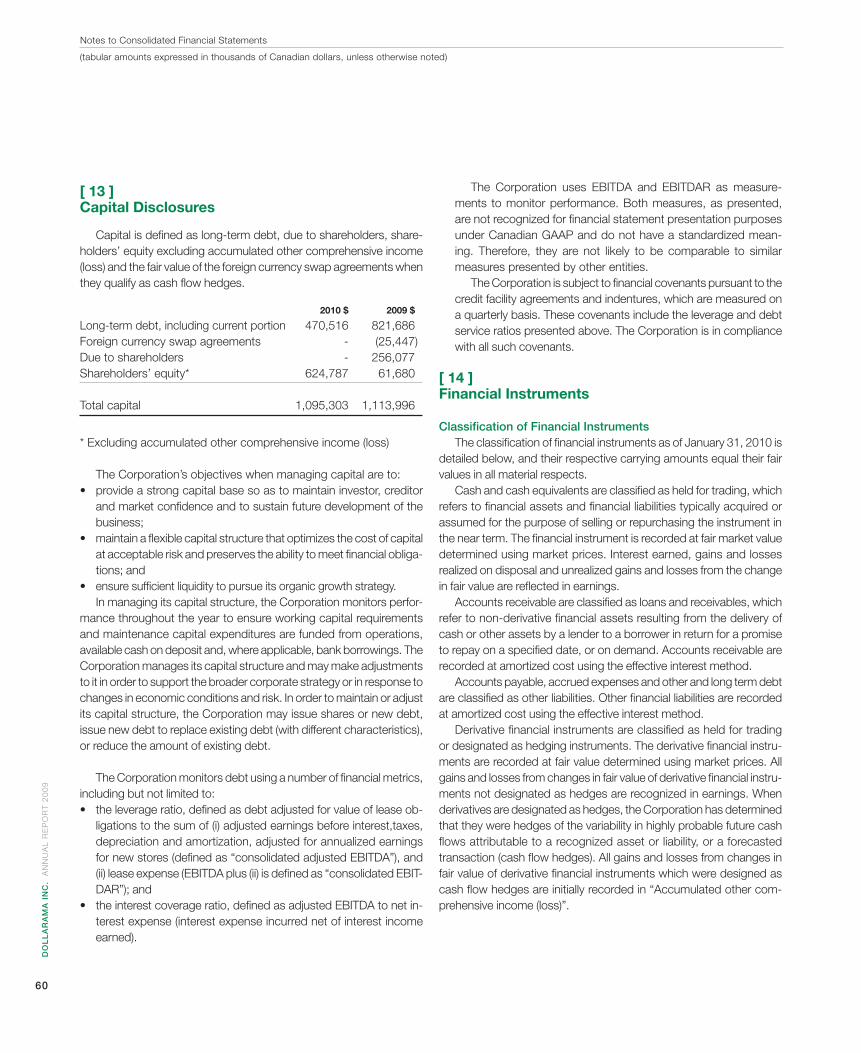
DO
LL
AR
AM
A I
NC
. A
NN
UA
L R
EP
OR
T 2
00
9
60
[ 13 ] Capital Disclosures
Capital is defi ned as long-term debt, due to shareholders, share-holders’ equity excluding accumulated other comprehensive income (loss) and the fair value of the foreign currency swap agreements when they qualify as cash fl ow hedges.
2010 $ 2009 $
Long-term debt, including current portion 470,516 821,686Foreign currency swap agreements - (25,447)Due to shareholders - 256,077Shareholders’ equity* 624,787 61,680 Total capital 1,095,303 1,113,996
* Excluding accumulated other comprehensive income (loss)
The Corporation’s objectives when managing capital are to:• provide a strong capital base so as to maintain investor, creditor
and market confi dence and to sustain future development of the business;
• maintain a fl exible capital structure that optimizes the cost of capital at acceptable risk and preserves the ability to meet fi nancial obliga-tions; and
• ensure suffi cient liquidity to pursue its organic growth strategy.In managing its capital structure, the Corporation monitors perfor-
mance throughout the year to ensure working capital requirements and maintenance capital expenditures are funded from operations, available cash on deposit and, where applicable, bank borrowings. The Corporation manages its capital structure and may make adjustments to it in order to support the broader corporate strategy or in response to changes in economic conditions and risk. In order to maintain or adjust its capital structure, the Corporation may issue shares or new debt, issue new debt to replace existing debt (with different characteristics), or reduce the amount of existing debt.
The Corporation monitors debt using a number of fi nancial metrics, including but not limited to:• the leverage ratio, defi ned as debt adjusted for value of lease ob-
ligations to the sum of (i) adjusted earnings before interest,taxes, depreciation and amortization, adjusted for annualized earnings for new stores (defi ned as “consolidated adjusted EBITDA”), and (ii) lease expense (EBITDA plus (ii) is defi ned as “consolidated EBIT-DAR”); and
• the interest coverage ratio, defi ned as adjusted EBITDA to net in-terest expense (interest expense incurred net of interest income earned).
The Corporation uses EBITDA and EBITDAR as measure-ments to monitor performance. Both measures, as presented, are not recognized for fi nancial statement presentation purposes under Canadian GAAP and do not have a standardized mean-ing. Therefore, they are not likely to be comparable to similar measures presented by other entities.
The Corporation is subject to fi nancial covenants pursuant to the credit facility agreements and indentures, which are measured on a quarterly basis. These covenants include the leverage and debt service ratios presented above. The Corporation is in compliance with all such covenants.
[ 14 ]Financial Instruments
Classifi cation of Financial InstrumentsThe classifi cation of fi nancial instruments as of January 31, 2010 is
detailed below, and their respective carrying amounts equal their fair values in all material respects.
Cash and cash equivalents are classifi ed as held for trading, which refers to fi nancial assets and fi nancial liabilities typically acquired or assumed for the purpose of selling or repurchasing the instrument in the near term. The fi nancial instrument is recorded at fair market value determined using market prices. Interest earned, gains and losses realized on disposal and unrealized gains and losses from the change in fair value are refl ected in earnings.
Accounts receivable are classifi ed as loans and receivables, which refer to non-derivative fi nancial assets resulting from the delivery of cash or other assets by a lender to a borrower in return for a promise to repay on a specifi ed date, or on demand. Accounts receivable are recorded at amortized cost using the effective interest method.
Accounts payable, accrued expenses and other and long term debt are classifi ed as other liabilities. Other fi nancial liabilities are recorded at amortized cost using the effective interest method.
Derivative fi nancial instruments are classifi ed as held for trading or designated as hedging instruments. The derivative fi nancial instru-ments are recorded at fair value determined using market prices. All gains and losses from changes in fair value of derivative fi nancial instru-ments not designated as hedges are recognized in earnings. When derivatives are designated as hedges, the Corporation has determined that they were hedges of the variability in highly probable future cash fl ows attributable to a recognized asset or liability, or a forecasted transaction (cash fl ow hedges). All gains and losses from changes in fair value of derivative fi nancial instruments which were designed as cash fl ow hedges are initially recorded in “Accumulated other com-prehensive income (loss)”.
Notes to Consolidated Financial Statements
(tabular amounts expressed in thousands of Canadian dollars, unless otherwise noted)
DO
LL
AR
AM
A IN
C. A
NN
UA
L R
EP
OR
T 2
00
9
61
Notes to Consolidated Financial Statements
Financial Risk Factors
The Corporation’s activities expose it to a variety of fi nancial risks: market risk (including currency risk, fair value interest rate risk and cash fl ow interest rate risk), credit risk and liquidity risk. The Corporation’s overall risk management program focuses on the unpredictability of the fi nancial market and seeks to minimize potential adverse effects on the Corporation’s fi nancial performance. The Corporation uses derivative fi nancial instruments to hedge certain risk exposures.
Risk management is carried out by the fi nance department under practices approved by the Board of Directors. This department identi-fi es, evaluates and hedges fi nancial risks based on the requirements of the organization. The Board of Directors provides guidance for overall risk management, covering specifi c areas such as foreign exchange risk, interest rate risk, credit risk and the use of derivative fi nancial instruments.
a) Market riski) Currency risk
The Corporation is exposed to foreign exchange risks aris-ing from (1) US dollar-denominated debt and (2) the purchase of imported merchandise using US dollars, which is partially covered by foreign exchange forward contracts.
The Corporation’s risk management policy is to hedge up to 100% of anticipated cash fl ows required for purchases of merchandise in US dollars over the next rolling 12 months.
The Corporation uses foreign exchange forward contracts to manage risks from fl uctuations in the US dollar relative to the Canadian dollar. The majority of forward contracts are used only for risk management purposes and are designated as hedges of specifi c anticipated purchases of merchandise. Upon redesignation or amendment of a foreign exchange for-ward contract, the ineffective portion of such contracts is rec-ognized immediately in earnings. The Corporation estimates that in the absence of its currency risk management program, every $0.01 appreciation in the Canadian dollar relative to the US dollar would result in an increase in earnings before in-come taxes of approximately $2.0 million. The seasonality of the Corporation’s purchases would affect the quarterly im-pact of this variation. The Corporation periodically examines the derivative fi nancial instruments it uses to hedge exposure to foreign currency fl uctuations to ensure that these instru-ments are highly effective at reducing or modifying foreign exchange risk associated with the hedged item.
In addition, a majority of the Corporation’s debt is in US dollars. Therefore, a reduction in the value of the Canadian dollar versus the US dollar would reduce the funds available to service its US dollar-denominated debt. As required by the terms of its senior secured credit facility, the Corporation has entered into swap agreements consisting of foreign currency swaps and an interest rate swap that expire between January 31, 2011 and August 15, 2012, to minimize its exposure to
exchange rate and interest rate fl uctuations in respect of its LIBOR-based US dollar-denominated term loans. The Cor-poration estimates that in the absence of its currency risk management program, every $0.01 appreciation in the Cana-dian dollar relative to the US dollar would result in an increase in earnings before income taxes of $4.8 million.
The Corporation entered into other swap agreements consisting of foreign currency swaps to minimize its exposure to exchange rate fl uctuations in respect of its long-term debt. These swap agreements do not qualify for hedge accounting, and their fair value fl uctuations are reported in the consoli-dated statement of earnings.
ii) Interest rate riskThe Corporation’s interest rate risk arises from long-term
borrowings. Borrowings issued at variable rates expose the Corporation to cash fl ow interest rate risk. Borrowings is-sued at fi xed rates expose the Corporation to fair value inter-est rate risk.
When appropriate, the Corporation analyzes its interest rate risk exposure. Various scenarios are simulated, taking into consideration refi nancing, renewal of existing positions, alternative fi nancing and hedging. Based on these scenarios, the Corporation calculates the impact on earnings of a de-fi ned interest rate shift. It uses variable-rate debt to fi nance a portion of its operations and capital expenditures. These ob-ligations expose it to variability in interest payments due to changes in interest rates. It has approximately $250.6 million in term bank loans outstanding under its senior secured cred-it facility based on the exchange rate on January 31, 2010, bearing interest at variable rates. Each quarter point change in interest rates would result in a $0.6 million change in inter-est expense on such term bank loans.
Dollarama Group Holdings L.P. also has approximately $226.9 million of senior fl oating rate deferred interest notes based on the exchange rate on January 31, 2010, bearing interest at variable rates. Each quarter point change in inter-est rates would result in a $0.6 million change in interest ex-pense on the notes.
b) Credit riskThe Corporation is exposed to credit risk to the extent of non-
payment by counterparties of its fi nancial instruments. The Cor-poration has credit policies covering fi nancial exposures. The maximum exposure to credit risk at the balance sheet date is represented by the carrying value of each fi nancial asset, includ-ing derivative fi nancial instruments. The Corporation mitigates this credit risk by dealing with counterparties which are major fi -nancial institutions that the Corporation anticipates will satisfy their contractual obligations.
(tabular amounts expressed in thousands of Canadian dollars, unless otherwise noted)
DO
LL
AR
AM
A I
NC
. A
NN
UA
L R
EP
OR
T 2
00
9
62
[ 14 ] continued
The Corporation is exposed to credit risk on accounts receiv-
able from its landlords for tenant allowances. In order to reduce this risk, the Corporation retains rent payments until accounts receivable are fully satisfi ed.
c) Liquidity riskLiquidity risk is the risk that the Corporation will not be able to
meet its obligations as they fall due. As of January 31, 2010, the Corporation had available credit facilities of $73.7 million (Febru-ary 1, 2009 – $72.8 million), taking into consideration outstanding letters of credit of $1.3 million (February 1, 2009 – $2.2 million).
The contractual maturities, including interest, of the Corporation’s fi nancial liabilities as of January 31, 2010 are summarized in the following table:
Carrying Contractual Under From 1 to From 2 to amount $ cash fl ows $ 1 year $ 2 years $ 5 years $
Non-Derivative Financial Liabilities Accounts payable 31,694 31,694 31,694 - -Accrued expenses and other 46,825 46,825 46,825 - -Senior subordinated deferred interest notes 226,872 275,913 16,347 16,347 243,219Term bank loan – B 250,564 259,630 5,740 253,890 -
555,955 614,062 100,606 270,237 243,219 Derivative Financial Liabilities Foreign exchange forward contracts 9,889 9,889 9,889 - -Foreign currency and interest trade swap agreements 32,759 32,759 - 32,759 -Foreign currency swap agreements 12,546 12,546 - 12,546 -
55,194 55,194 9,889 45,305 -
Foreign CurrenciesMonetary assets and liabilities denominated in foreign currencies are translated at year-end exchange rates, while non-monetary assets and liabilities are translated at historical rates. Revenues and expenses are translated at prevailing market rates in the recognition period. The resulting exchange gains or losses are recorded in the consolidated statements of earnings.
2010 $ 2009 $
Foreign exchange loss (gain) on derivative fi nancial instruments and long-term debt (31,108) 44,793Foreign exchange loss (gain) included in cost of sales (29,820) 3,723
Aggregate foreign exchange loss (gain) included in net earnings (loss) (60,928) 48,516
Fair Value of Financial InstrumentsThe Corporation adopted the amendments to CICA Section 3862 for these annual consolidated fi nancial statements; comparative disclosures are not required in the year of adoption. The amendments require the use of a fair value hierarchy in order to classify the fair value disclosures related to the Corporation’s fi nancial assets and fi nancial liabilities that are recognized in the balance sheet at fair value.
The fair value hierarchy has the following levels: • Level 1 – quoted market prices in active markets for identical assets or liabilities; • Level 2 – inputs other than quoted market prices included in Level 1 that are observable for the asset or liability, either directly (as prices) or indirectly (derived from prices); and • Level 3 – unobservable inputs such as inputs for the asset or liability that are not based on observable market data. The level in the fair value hierarchy within which the fair value measurement is categorized in its entirety is determined on the basis of the lowest level input that is signifi cant to the fair value measurement in its entirety.
Notes to Consolidated Financial Statements
(tabular amounts expressed in thousands of Canadian dollars, unless otherwise noted)
DO
LL
AR
AM
A IN
C. A
NN
UA
L R
EP
OR
T 2
00
9
63
Notes to Consolidated Financial Statements
The fair value of fi nancial assets and fi nancial liabilities measured in the consolidated balance sheet as of January 31, 2010 are as follows: Quoted prices in active Signifi cant Signifi cant markets for observable observable January 31 identical assets inputs inputs Balance sheet classifi cation and nature 2010 $ (Level 1) $ (Level 2) $ (Level 3) $
Assets Cash and cash equivalents 93,057 93,057 - - Accounts receivable 1,453 - - 1,453 Derivative fi nancial instruments – Current 3,479 - 3,479 - Derivative fi nancial instruments – Non current 5,342 - 5,342 - Liabilities Accounts payable 31,694 - - 31,694 Accrued expenses and other 46,825 - - 46,825 Derivative fi nancial instruments – Current 55,194 - 55,194 -
Fair value measurements of the Corporation’s cash and cash equivalents are classifi ed under Level 1 because such measurements are determined using quoted prices in active markets for identical assets.
Derivative fi nancial instruments include foreign currency and interest rate swap agreements, foreign currency swap agreements and foreign exchange forward contracts. Fair value measurement of the Corporation’s derivative fi nancial instruments are classifi ed under Level 2 because such measurements are determined using published market prices or estimates based on observable inputs such as interest rates, yield curves, and spot and future exchange rates.
Fair value measurements of accounts receivable, accounts payable, and accrued expenses and other are classifi ed under Level 3 because inputs are generally unobservable and refl ect management’s estimates of assumptions that market participants would use in pricing the asset or liability.
[ 15 ] Statement of Cash Flows Information
The changes in non-cash working capital components are as follows:
2010 $ 2009 $
Accounts receivable 1,545 365 Income taxes recoverable - 4,003 Deposits and prepaid expenses (214) 6,809 Merchandise inventories 14,960 (36,131) Accounts payable (6,517) 17,527 Accrued expenses and other 9,065 (5,302) Income taxes payable 19,315 550
38,154 (12,179)
Interest paid by the Corporation for the year ended January 31, 2010 was approximately $41,758,000 (February 1, 2009 – $35,861,000). In-come taxes paid by the Corporation for the year ended January 31, 2010 were approximately $3,956,000 (February 1, 2009 – $3,114,000).
(tabular amounts expressed in thousands of Canadian dollars, unless otherwise noted)
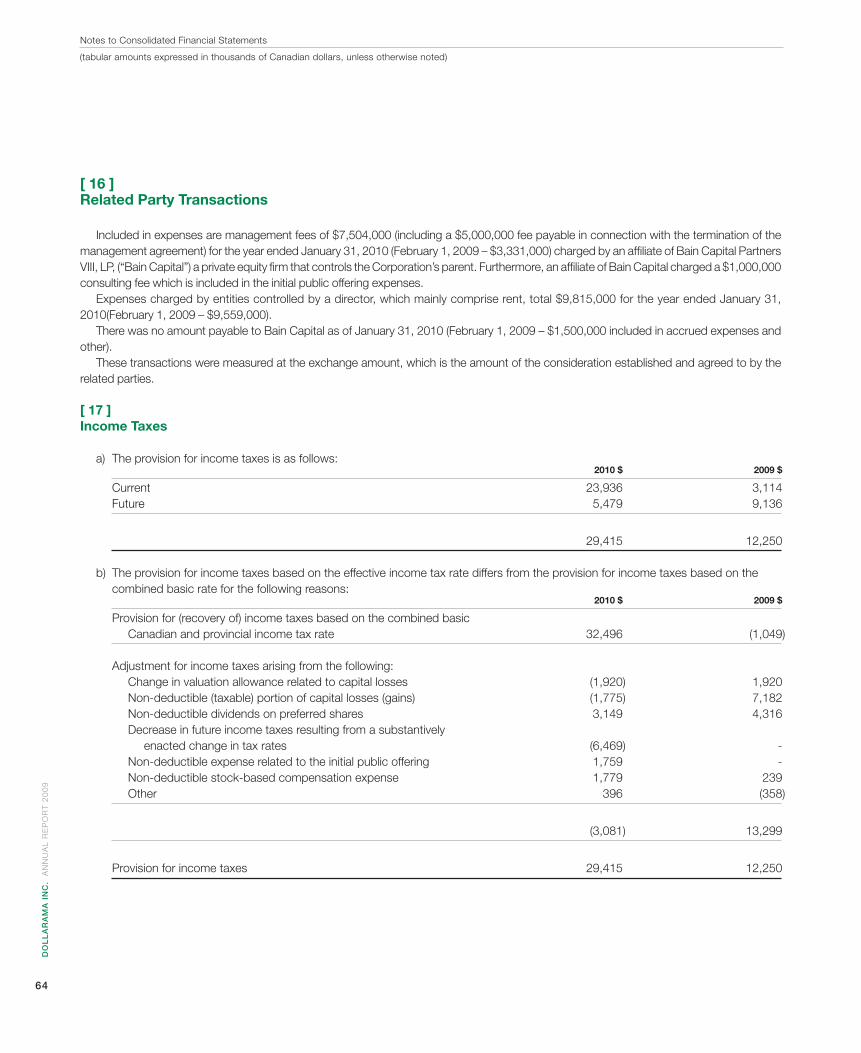
DO
LL
AR
AM
A I
NC
. A
NN
UA
L R
EP
OR
T 2
00
9
64
[ 16 ] Related Party Transactions
Included in expenses are management fees of $7,504,000 (including a $5,000,000 fee payable in connection with the termination of the management agreement) for the year ended January 31, 2010 (February 1, 2009 – $3,331,000) charged by an affi liate of Bain Capital Partners VIII, LP, (“Bain Capital”) a private equity fi rm that controls the Corporation’s parent. Furthermore, an affi liate of Bain Capital charged a $1,000,000 consulting fee which is included in the initial public offering expenses.
Expenses charged by entities controlled by a director, which mainly comprise rent, total $9,815,000 for the year ended January 31, 2010(February 1, 2009 – $9,559,000).
There was no amount payable to Bain Capital as of January 31, 2010 (February 1, 2009 – $1,500,000 included in accrued expenses and other).
These transactions were measured at the exchange amount, which is the amount of the consideration established and agreed to by the related parties.
[ 17 ] Income Taxes
a) The provision for income taxes is as follows: 2010 $ 2009 $
Current 23,936 3,114 Future 5,479 9,136
29,415 12,250
b) The provision for income taxes based on the effective income tax rate differs from the provision for income taxes based on the combined basic rate for the following reasons: 2010 $ 2009 $
Provision for (recovery of) income taxes based on the combined basic Canadian and provincial income tax rate 32,496 (1,049) Adjustment for income taxes arising from the following: Change in valuation allowance related to capital losses (1,920) 1,920 Non-deductible (taxable) portion of capital losses (gains) (1,775) 7,182 Non-deductible dividends on preferred shares 3,149 4,316 Decrease in future income taxes resulting from a substantively enacted change in tax rates (6,469) - Non-deductible expense related to the initial public offering 1,759 - Non-deductible stock-based compensation expense 1,779 239 Other 396 (358)
(3,081) 13,299
Provision for income taxes 29,415 12,250
Notes to Consolidated Financial Statements
(tabular amounts expressed in thousands of Canadian dollars, unless otherwise noted)
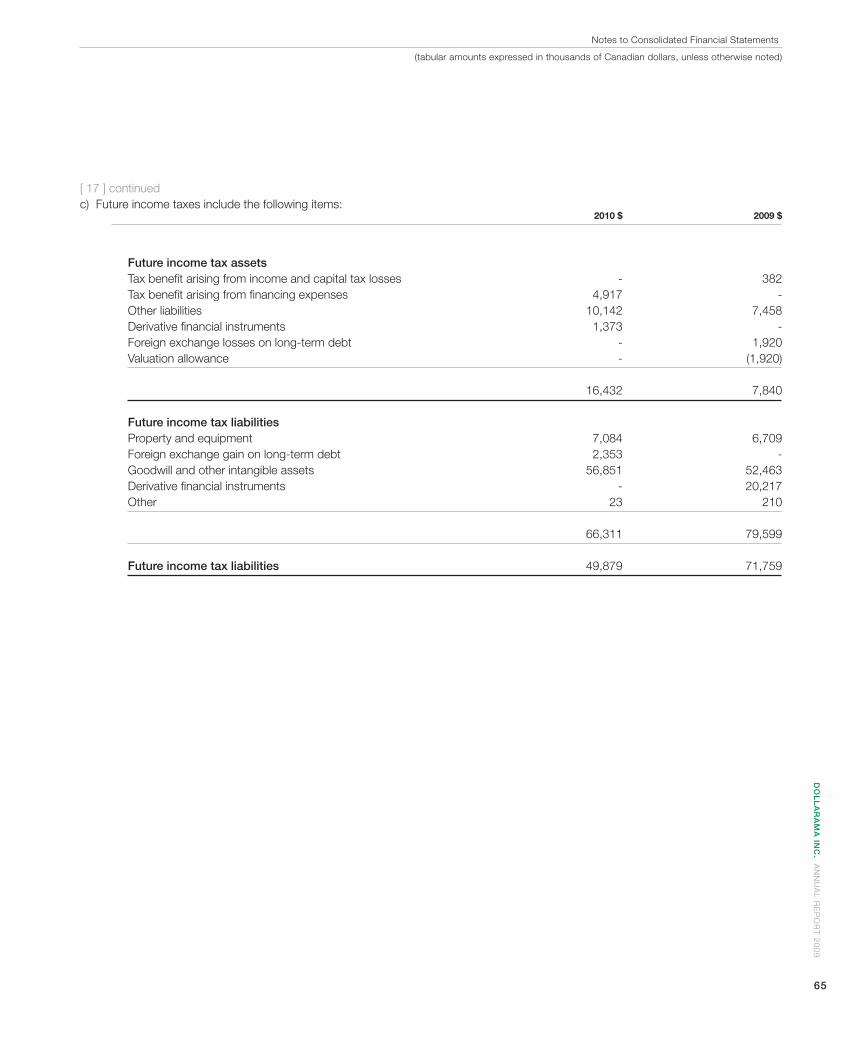
DO
LL
AR
AM
A IN
C. A
NN
UA
L R
EP
OR
T 2
00
9
65
[ 17 ] continuedc) Future income taxes include the following items: 2010 $ 2009 $
Future income tax assets Tax benefi t arising from income and capital tax losses - 382 Tax benefi t arising from fi nancing expenses 4,917 - Other liabilities 10,142 7,458 Derivative fi nancial instruments 1,373 - Foreign exchange losses on long-term debt - 1,920 Valuation allowance - (1,920) 16,432 7,840 Future income tax liabilities Property and equipment 7,084 6,709 Foreign exchange gain on long-term debt 2,353 - Goodwill and other intangible assets 56,851 52,463 Derivative fi nancial instruments - 20,217 Other 23 210
66,311 79,599 Future income tax liabilities 49,879 71,759
Notes to Consolidated Financial Statements
(tabular amounts expressed in thousands of Canadian dollars, unless otherwise noted)
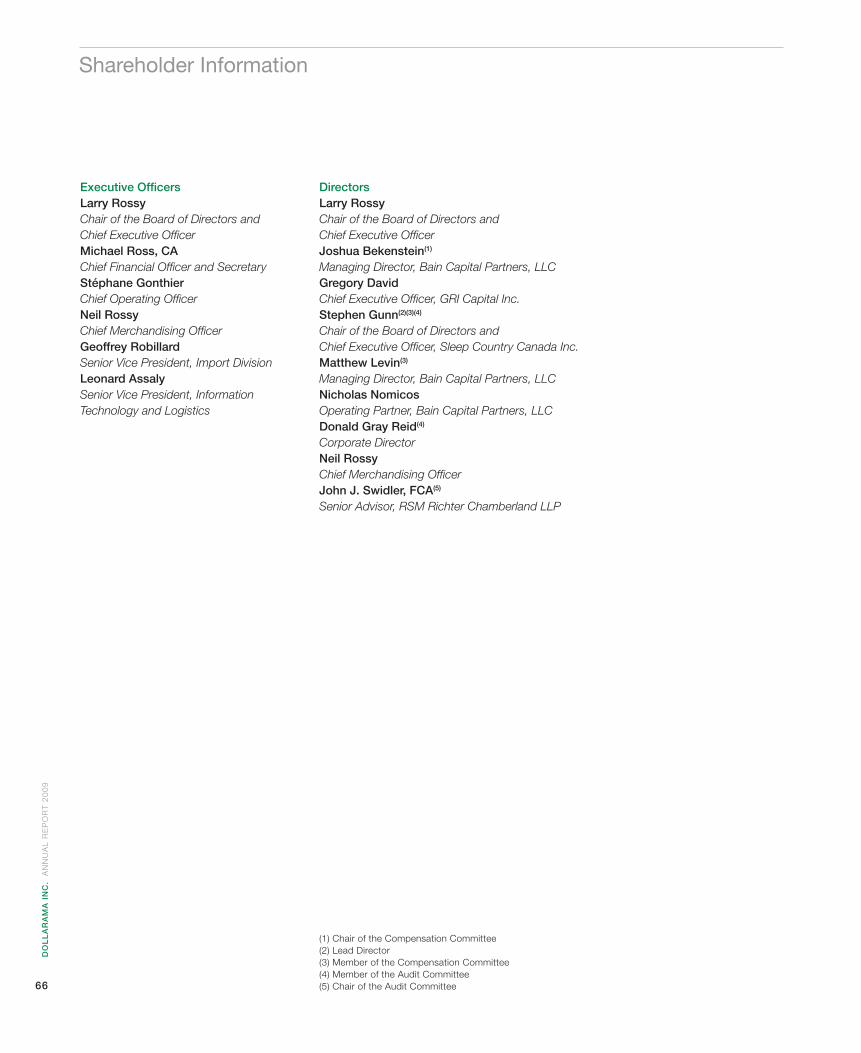
DO
LL
AR
AM
A I
NC
. A
NN
UA
L R
EP
OR
T 2
00
9
66
Executive Offi cers Larry RossyChair of the Board of Directors and Chief Executive Offi cerMichael Ross, CAChief Financial Offi cer and SecretaryStéphane GonthierChief Operating Offi cerNeil RossyChief Merchandising Offi cerGeoffrey RobillardSenior Vice President, Import DivisionLeonard AssalySenior Vice President, Information Technology and Logistics
(1) Chair of the Compensation Committee(2) Lead Director(3) Member of the Compensation Committee(4) Member of the Audit Committee(5) Chair of the Audit Committee
Shareholder Information
Directors Larry RossyChair of the Board of Directors and Chief Executive Offi cerJoshua Bekenstein(1)
Managing Director, Bain Capital Partners, LLCGregory DavidChief Executive Offi cer, GRI Capital Inc.Stephen Gunn(2)(3)(4)
Chair of the Board of Directors and Chief Executive Offi cer, Sleep Country Canada Inc.Matthew Levin(3)
Managing Director, Bain Capital Partners, LLCNicholas NomicosOperating Partner, Bain Capital Partners, LLCDonald Gray Reid(4)
Corporate DirectorNeil RossyChief Merchandising Offi cerJohn J. Swidler, FCA(5)
Senior Advisor, RSM Richter Chamberland LLP
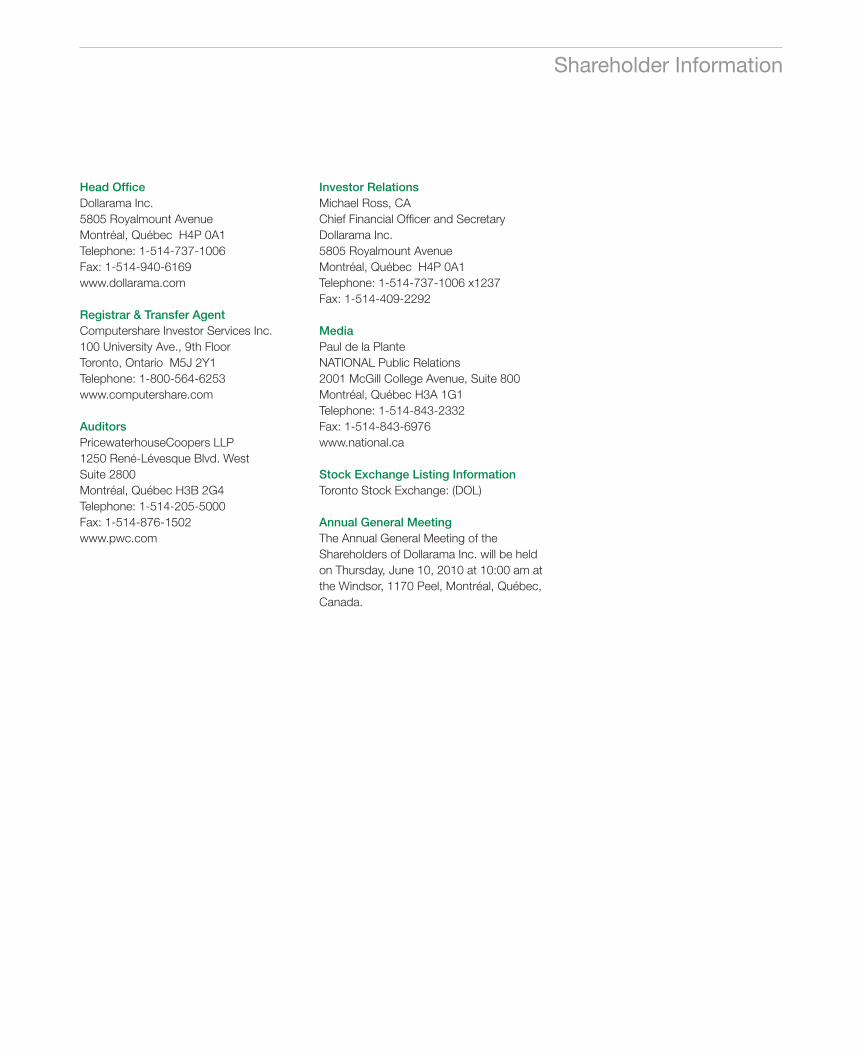
Head Offi ceDollarama Inc.5805 Royalmount AvenueMontréal, Québec H4P 0A1Telephone: 1-514-737-1006Fax: 1-514-940-6169www.dollarama.com
Registrar & Transfer Agent Computershare Investor Services Inc.100 University Ave., 9th FloorToronto, Ontario M5J 2Y1Telephone: 1-800-564-6253www.computershare.com AuditorsPricewaterhouseCoopers LLP1250 René-Lévesque Blvd. West Suite 2800Montréal, Québec H3B 2G4Telephone: 1-514-205-5000Fax: 1-514-876-1502www.pwc.com
Investor RelationsMichael Ross, CAChief Financial Offi cer and SecretaryDollarama Inc.5805 Royalmount AvenueMontréal, Québec H4P 0A1Telephone: 1-514-737-1006 x1237Fax: 1-514-409-2292
MediaPaul de la Plante NATIONAL Public Relations2001 McGill College Avenue, Suite 800Montréal, Québec H3A 1G1Telephone: 1-514-843-2332Fax: 1-514-843-6976www.national.ca Stock Exchange Listing InformationToronto Stock Exchange: (DOL) Annual General MeetingThe Annual General Meeting of the Shareholders of Dollarama Inc. will be held on Thursday, June 10, 2010 at 10:00 am at the Windsor, 1170 Peel, Montréal, Québec, Canada.
Shareholder Information

www.dollarama.com