Evaluation of Shear Capacity of Steel Fiber Reinforced ... - MDPI
Upload
khangminh22Category
view
2download
0
Development of Carbon Fiber Reinforced
Self-Consolidating Concrete Patch for Repair
Applications
by
Mohamed Yakhlaf
A thesis
presented to the University of Waterloo
in fulfillment of the
thesis requirement for the degree of
Master of Applied Science
in
Civil Engineering
Waterloo, Ontario, Canada, 2013
©Mohamed Yakhlaf 2013

ii
Declaration
I hereby declare that I am the sole author of this thesis. This is a true copy of the thesis, including
any required final revisions, as accepted by my examiners.
I understand that my thesis may be made electronically available to the public.

iii
Abstract
Fiber-reinforced self-consolidating concrete is a relatively new material in civil engineering
applications. The purpose of this study is to examine the effects of discrete Pitch-based carbon
fibers on the fresh properties of self-consolidating concrete (SCC). Ten different carbon fiber-
reinforced self-consolidating concrete (CFRSCC) mixtures were produced with two water/binder
(W/B) ratios of 0.35 and 0.4, and 0%, 0.25%, 0.5%, 0.75%, 1% carbon fibers by concrete
volume. Silica fume was used in all concrete mixtures to improve the dispersion of carbon fibers
and the cohesiveness of the SCC. In addition, a high-range water reducer (HRWR) was used to
enhance the workability of the concrete. The flow characteristics of the concrete mixtures were
determined with respect to slump flow, J-ring slump, and T50 slump flow time. The segregation
resistance of the concrete mixtures was evaluated by using the sieve stability test. Visual stability
index (VSI) was also used to assess the segregation resistance of concrete. Hardened properties
such as compressive strength, splitting tensile strength, and fracture energy were evaluated. Test
results revealed that the increased amount of carbon fibers decreased the flowing ability (filling
ability and passing ability). Therefore, a greater HRWR dosage was required to achieve the
targeted flow properties. The hardened test results showed that increasing the carbon fiber
content decreased the compressive strength of the SCC, while the splitting tensile strength of the
SCC was increased. Based on the fresh and hardened properties, two different mixes were
chosen as optimum mixes in respect to the fresh and hardened properties as well as the cost of
producing CFRSCC mixtures. These two mixes were mix M1 (SCC, 0% fibers) and mix M3
(CFRSCC, 0.50% fibers). Eleven RC beams were tested to investigate three different repair
configurations: flexural-top patch, flexural bottom patch and shear span patch. Three different
repair patch materials were used (Sikacrete-08 SCC, M1 SCC, and M3 CFRSCC). The structural
load results showed that the patch repair was most effective (increasing ultimate load and

iv
ductility) as a flexural-top patch and shear-span patch. Using a CFRSCC patch changed the
mode of failure from shear to flexural failure in the shear-span patched beams.

v
Acknowledgments
The author would like to acknowledge Professor Khaled Soudki for his supervision, advice, and
support during my study and research work.
I would like to thank Dr. Safiuddin for his support and help in providing me with considerable
amount of information on this topic. He has specifically instructed me on the proper protocol for
using the laboratory equipment for material testing. I extend my thanks to all technicians:
Richard Morrison, Doug Hirst, and Rob Sluban, and my colleagues in the concrete laboratory at
the University of Waterloo for providing a great work environment. I would also like to extend
my appreciation to Ann at the soil’s laboratory for her support and help to finish the material
tests properly.
I would like to express my gratitude to the High Education Ministry of Libya for giving me this
opportunity to study abroad via their financial support. I am further thankful to Mr. Camron
Monroe from BASF construction Chemicals Canada Ltd. for supplying chemical admixtures.
Last but not least, I would like to thank Mitsubishi Company in USA for partially supplying the
carbon fibers.
The author would like to send a special thanks to Zamiul Haque for his support and help.

vi
Dedication
I would like to dedicate this work to my parents especially my mother who passed away long
time ago but she is still in my heart. I would also like to acknowledge my siblings for their
continuous support and encouragement. And a special thanks to my fiancée, for her
unconditional support and affection, which gave me the strength to finish my tenure. I am further
inclined to dedicate my work to all the Libyan martyrs of 17th
November revolution who brought
freedom to my beloved homeland of Libya.

vii
Table of Contents
DECLARATION ........................................................................................................................... II
ABSTRACT ...................................................................................................................................... III
ACKNOWLEDGMENTS ...................................................................................................................... V
DEDICATION ................................................................................................................................... VI
TABLE OF CONTENTS ..................................................................................................................... VII
LIST OF FIGURES ............................................................................................................................. XI
LIST OF TABLES .......................................................................................................................... XVIII
CHAPTER 1 INTRODUCTION .................................................................................................... 1
1.1 BACKGROUND ...................................................................................................................... 1
1.2 RESEARCH OBJECTIVES AND SCOPE ........................................................................................ 3
1.3 THESIS ORGANIZATION ........................................................................................................... 4
CHAPTER 2 LITERATURE REVIEW ......................................................................................... 6
2.1 SELF-CONSOLIDATING CONCRETE .......................................................................................... 6
2.2 FIBER REINFORCED SELF-CONSOLIDATING CONCRETE ............................................................ 8
2.2.1 Fibers in concrete ........................................................................................................... 8
2.2.1.1 Steel fibers ................................................................................................................ 10
2.2.1.2 Glass fibers................................................................................................................ 11
2.2.1.3 Carbon fibers ............................................................................................................. 11
2.2.2 Fiber reinforced self-consolidating concrete (FRSCC) mix design ............................. 13
2.2.3 Mechanics of crack formation and propagation for SCC and FRSCC ........................ 16
2.3 TESTS FOR SELF-CONSOLIDATING CONCRETE ....................................................................... 17
2.3.1 Tests used for fresh properties ..................................................................................... 17
2.3.1.1 Test for filling ability ................................................................................................ 18
2.3.1.2 Test for passing ability .............................................................................................. 19
2.3.1.3 Test for segregation resistance .................................................................................. 19
2.3.2 Tests for hardened properties ....................................................................................... 20
2.3.2.1 Test for compressive strength ................................................................................... 21
2.3.2.2 Test for tensile strength ............................................................................................. 21
2.3.2.3 Test for flexural strength ........................................................................................... 22

viii
2.4 PREVIOUS STUDIES ON FIBER REINFORCED SELF-CONSOLIDATING CONCRETE (FRSCC) ...... 22
2.4.1 Fresh properties of FRSCC .......................................................................................... 22
2.4.1.1 Filling ability ............................................................................................................. 22
2.4.1.2 Passing ability ........................................................................................................... 23
2.4.1.3 Segregation resistance (Stability) ............................................................................. 24
2.4.2 Hardened properties of FRSCC ................................................................................... 24
2.4.2.1 Compressive strength ................................................................................................ 24
2.4.2.2 Splitting tensile strength ........................................................................................... 25
2.4.2.3 Flexural strength ....................................................................................................... 25
2.5 RESEARCH NEEDS ................................................................................................................. 26
CHAPTER 3 EXPERIMENTAL INVESTIGATION .................................................................. 28
3.1 TESTING OF CONSTITUENT MATERIALS ................................................................................. 28
3.2 DESIGN OF CARBON FIBER REINFORCED SELF-CONSOLIDATING CONCRETE MIXTURES ......... 30
3.2.1 Design approach........................................................................................................... 30
3.2.2 Trial CFRSCC mixtures ............................................................................................... 31
3.2.3 Adjustment of the CFRSCC mixtures.......................................................................... 32
3.3 PREPARATION AND MIXING METHOD .................................................................................... 33
3.4 TESTING OF FRESH CONCRETE PROPERTIES ........................................................................... 35
3.4.1 Filling ability test ......................................................................................................... 35
3.4.2 Passing ability test........................................................................................................ 36
3.4.3 Segregation resistance test ........................................................................................... 37
3.5.3.1 Sieve stability test ..................................................................................................... 37
3.4.3.2 Visual stability index (VSI) ...................................................................................... 39
3.5.5 Test for air content and unit weight ............................................................................. 39
3.5 TESTING OF HARDENED CONCRETE PROPERTIES ................................................................... 40
3.5.1 HARDENED CONCRETE SPECIMENS .................................................................................... 41
3.5.2 Test for compressive strength ...................................................................................... 43
3.5.3 Test for splitting tensile strength.................................................................................. 44
3.5.4 Test for fracture energy ................................................................................................ 45
3.5.5 Scanning electronic micrograph (SEM) ....................................................................... 48
3.6 BEAM TESTS ......................................................................................................................... 49
ix
3.6.1 Design and construction of beams ............................................................................... 50
3.6.2 Repair procedure .......................................................................................................... 54
3.6.3 Instrumentation ............................................................................................................ 56
3.6.4 Test setup and procedure ............................................................................................. 58
CHAPTER 4 FRESH AND HARDENED CFRSCC PROPERTIES........................................... 59
4.1 MATERIALS .......................................................................................................................... 59
4.1.1 Physical properties of coarse aggregates (stone) ......................................................... 60
4.1.2 Grading of coarse aggregate ........................................................................................ 60
4.1.3 Physical properties of fine aggregate (sand) ................................................................ 60
4.1.4 Grading of fine aggregate ............................................................................................ 61
4.1.5 Sand / aggregate ratio................................................................................................... 62
4.2 FRESH PROPERTIES OF CFRSCC MIXTURES ......................................................................... 63
4.2.1 Filling ability ................................................................................................................ 64
4.2.2 Passing ability .............................................................................................................. 67
4.2.3 Segregation index (SI) ................................................................................................. 69
4.2.4 Visual stability ............................................................................................................. 71
4.2.5 Air content and unit weight.......................................................................................... 77
4.3 HARDENED PROPERTIES OF CFRSCC MIXTURES.................................................................. 79
4.3.1 Compressive strength results ....................................................................................... 79
4.3.1.1 Effect of carbon fibers content on compressive strength .......................................... 81
4.3.1.2 Effect of water binder ratio (W/B) on compressive strength .................................... 81
4.3.2 Splitting tensile strength results ................................................................................... 82
4.3.2.1 Effect of carbon fibers content on splitting tensile strength ..................................... 84
4.3.2.2 Effect of water binder ratio (W/B) on splitting tensile strength ............................... 84
4.3.3 Modulus of rupture ...................................................................................................... 85
4.3.4 Load deflection response of CFRSCC mixtures .......................................................... 87
4.3.5 Toughness (fracture energy) and the effect of carbon fibers ....................................... 90
4.3.6 Scanning electron microscope (SEM) ......................................................................... 92
CHAPTER 5 STRUCTURAL PERFORMANCE OF CFRSCC PATCH REPAIRED BEAMS 97
5.1 GENERAL ............................................................................................................................. 97
5.2 EFFECT OF REPAIR MATERIAL ON STRUCTURAL PERFORMANCE OF FLEXURAL BEAMS .......... 97

x
5.2.1 Observed flexural behaviour ........................................................................................ 98
5.2.1.1 Control beam ............................................................................................................. 98
5.2.1.2 Beams repaired in tension zone ................................................................................ 99
5.2.1.3 Beams repaired in compression zone ...................................................................... 102
5.2.2 Load-deflection behaviour ......................................................................................... 104
5.2.3 Load-strain behaviour ................................................................................................ 107
5.2.4 Flexural stiffness ........................................................................................................ 110
5.2.5 Yield load ................................................................................................................... 111
5.2.6 Ultimate load .............................................................................................................. 112
5.2.7 Ductility ..................................................................................................................... 113
5.3 EFFECT OF REPAIR MATERIAL ON STRUCTURAL PERFORMANCE OF SHEAR BEAMS .............. 114
5.3.1 Observed shear behaviour .......................................................................................... 114
5.3.1.1 Control beam ........................................................................................................... 114
5.3.1.2 Repaired beams ....................................................................................................... 115
5.3.2 Load-deflection behaviour ......................................................................................... 117
5.3.3 Load-strain behaviour ................................................................................................ 119
5.3.4 Yield load ................................................................................................................... 124
5.3.5 Ultimate load .............................................................................................................. 125
5.3.6 Ultimate deflection..................................................................................................... 126
CHAPTER 6 CONCLUSIONS AND RECOMMENDATIONS ............................................... 127
6.1 GENERAL ........................................................................................................................... 127
6.2 CONCLUSIONS .................................................................................................................... 128
6.2.1 Fresh and hardened properties tests ........................................................................... 128
6.2.2 Structural load tests .................................................................................................... 129
6.3 RECOMMENDATION OF FUTURE WORK ............................................................................... 131
BIBLIOGRAPHY ....................................................................................................................... 132
APPENDIX A ............................................................................................................................. 142
APPENDIX B ............................................................................................................................. 152

xi
List of Figures
Figure 2.1 Timeline of developing self-consolidating concrete (Douglas 2004) ........................... 6
Figure 2.2 The excess paste theory (Kismi et al. 2012) .................................................................. 7
Figure 2.3 Timeline of using fibers in the concrete mixes (ACI 544.1R 2002) ............................. 8
Figure 2.4 Flow chart of fiber reinforced self consolidating concrete (FRSCC) mix design
(adopted from ACI 211.4R-08 2008).................................................................................... 14
Figure 2.5 The behaviour of single and multiple cracking of the specimens under uniaxial
loading................................................................................................................................... 16
Figure 2.6 Growth of publication on hardened properties for self-consolidating concrete (SCC)
and normal concrete (NC) ..................................................................................................... 20
Figure 3.1 The pan-type revolving mixer ..................................................................................... 34
Figure 3.2 Slump flow apparatus and measurement ..................................................................... 36
Figure 3.3 J-ring slump flow apparatus ........................................................................................ 37
Figure 3.4 Sieve analysis apparatus for aggregate segregation .................................................... 39
Figure 3.5 Air content apparatus ................................................................................................... 40
Figure 3.6 Forms of the cylinders and the prisms ......................................................................... 42
Figure 3.7 The curing process for cylinders, prisms, and beams .................................................. 42
Figure 3.8 The hydraulic compression tester and the grinder machine ........................................ 43
Figure 3.9 The splitting tensile strength test set-up. ..................................................................... 44
Figure 3.10 The flexural strength test set up................................................................................. 46
Figure 3.11 The average net deflection measurements ................................................................. 46
Figure 3.12 Scanning electronic micrographs (SEM) set up ........................................................ 48
Figure 3.13 (a) Specimen geometry and reinforcement details – shear beams (dimension in mm)
............................................................................................................................................... 51
Figure 3.13 (b) Specimen geometry and reinforcement details – flexural beams (dimension in
mm) ....................................................................................................................................... 51
Figure 3.14 Location of patch repair: a) bottom patch, b) top patch, c) shear span patch ............ 52

xii
Figure 3.15 Beams formwork and strain gauges installation ........................................................ 53
Figure 3.16 Beams configuration before repair ............................................................................ 54
Figure 3.17 Constituent materials for SCC mixtures M1 and M3 ................................................ 55
Figure 3.18 The formwork for repairing the beams ...................................................................... 55
Figure 3.19 Patch repair configuration ......................................................................................... 56
Figure 3.20 (a) Schematic of instrumentation - flexural beams .................................................... 57
Figure 3.20 (b) Schematic of instrumentation - shear beams ....................................................... 57
Figure 3.21 The testing frame set up ............................................................................................ 58
Figure 4.1 Coarse aggregate gradation (ASTM C33/C33M-08 2009) ......................................... 61
Figure 4.2 Fine aggregate gradation (OPSS 1002) ....................................................................... 62
Figure 4.3 Relationship between bulk density and sand to aggregates ratio (FA/(CA+FA)). ...... 63
Figure 4.4 Effect of carbon fibers content on the slump of CFRSCC .......................................... 64
Figure 4.5 Effect of carbon fibers content on the slump flow of CFRSCC .................................. 65
Figure 4.6 Effect of carbon fibers content on the T50 slump flow time of CFRSCC .................... 66
Figure 4.7 Effect of carbon fibers content on the J-ring slump of CFRSCC ................................ 67
Figure 4.8 Effect of carbon fibers content on the J-ring slump flow of CFRSCC ....................... 68
Figure 4.9 Effect of carbon fibers content on the blocking index of CFRSCC ............................ 69
Figure 4.10 Effect of carbon fibers content on the segregation index of CFRSCC...................... 70
Figure 4.11 Visual stability index (VSI) of M1 and M6 concrete mixtures ................................. 72
Figure 4.12 Visual stability index (VSI) for M2 and M7 mixtures .............................................. 73
Figure 4.13 Visual stability index (VSI) for M3 and M8 mixtures .............................................. 74
Figure 4.14 Visual stability index (VSI) for M4 and M9 mixtures .............................................. 75
Figure 4.15 Visual stability index (VSI) for M5 and M10 mixtures ............................................ 76
Figure 4.16 Effect of carbon fibers content on the entrapped air content of CFRSCC ................ 78
Figure 4.17 Effect of carbon fibers content on the unit weight of CFRSCC ................................ 78

xiii
Figure 4.18 Effect of carbon fibers content on the compressive strength for mixes with 0.35 W/B
ratio ....................................................................................................................................... 80
Figure 4.19 Effect of carbon fibers content on the compressive strength for mixes with 0.40 W/B
ratio ....................................................................................................................................... 80
Figure 4.20 Effect of water binder ratio (W/B) on compressive strength .................................... 82
Figure 4.21 Effect of carbon fibers content on the splitting tensile strength for mixes with 0.35
W/B ratio ............................................................................................................................... 83
Figure 4.22 Effect of carbon fibers content on the splitting tensile strength for mixes with 0.40
W/B ratio ............................................................................................................................... 83
Figure 4.23 Effect of water binder ratio (W/B) on splitting tensile strength ................................ 85
Figure 4.24 Modulus of rupture for CFRSCC mixtures with 0.35 W/B ratio .............................. 86
Figure 4.25 Modulus of rupture of CFRSCC mixtures with 0.40 W/B ratio................................ 86
Figure 4.26 Load vs. deflection of concrete mixtures of 0.35 W/B ratio .................................... 88
Figure 4.27 Load vs. deflection of concrete mixtures of 0.40 W/B ratio ..................................... 89
Figure 4.28 Toughness of mixtures with 0.35 W/B ratio ............................................................. 90
Figure 4.29 Toughness of mixtures with 0.40 W/B ratio ............................................................. 91
Figure 4.30 Scanning electron micrographs of M1 and M6 mixtures .......................................... 92
Figure 4.31 Scanning electron micrographs of M2 and M7 mixtures .......................................... 93
Figure 4.32 Scanning electron micrographs of M3 and M8 mixtures .......................................... 94
Figure 4.33 Scanning electron micrographs of M4 and M9 mixtures .......................................... 95
Figure 4.34 Scanning electron micrographs of M5 and M10 mixtures ........................................ 96
Figure 5.1 Failure mode for the control beam .............................................................................. 99
Figure 5.2 Failure mode for the bottom-patch repaired beam with Sikacrete-08SCC ............... 100
Figure 5.3 Failure mode for the bottom-patch repaired beam with M1mixture (SCC, no fibers)
............................................................................................................................................. 101
Figure 5.4 Failure mode for the bottom-patch repaired beam with M3 mixture (CFRSCC, 0.50%
fibers) .................................................................................................................................. 101
Figure 5.5 Failure mode for the top-patch repaired beam with Sikacrete-08 SCC..................... 103

xiv
Figure 5.6 Failure mode for the top-patch repaired beam with mix M1 (SCC, no fibers) ......... 103
Figure 5.7 Failure mode for the top-patch repaired beam with mix M3 (CFRSCC, 0.50% fibers)
............................................................................................................................................. 104
Figure 5.8 Load vs. deflection curves of the control and bottom flexural repaired beams ........ 106
Figure 5.9 Load vs. deflection curves of the control and top flexural repaired beams ............... 106
Figure 5.10 Load-strain behaviour of the longitudinal steel for the bottom patch repaired beams
vs. control beam .................................................................................................................. 108
Figure 5.11 Load-strain behaviour of the top concrete for the bottom patch repaired beams vs.
control beam........................................................................................................................ 108
Figure 5.12 Load-strain behaviour of the longitudinal steel for the top patch repaired beams vs.
control beam........................................................................................................................ 109
Figure 5.13 Load-strain behaviour of the top concrete for the top patch repaired beams vs.
control beam........................................................................................................................ 109
Figure 5.14 The yield load of the repaired beams vs. the control beam ..................................... 111
Figure 5.15 The ultimate load of the repaired beams vs. the control beam ................................ 112
Figure 5.16 The ductility the repaired beams vs. control beam .................................................. 113
Figure 5.17 Failure mode of control beam.................................................................................. 115
Figure 5.18 Failure mode of the shear-span repaired beam with Sikacrete-08 SCC .................. 116
Figure 5.19 Failure mode of shear-span repaired beam with mix M1 (SCC, no fibers) ............ 116
Figure 5.20 Failure mode of the shear-span repaired beam with mix M3 (CFRSCC, 0.50% fibers)
............................................................................................................................................. 117
Figure 5.21 Load vs. deflection curves of the control and the shear-span repaired beams ........ 119
Figure 5.22 Load-strain behaviour of the stirrups for the shear-span repaired beams vs. control
beam .................................................................................................................................... 121
Figure 5.23 Load-strain behaviour of the stirrups for the shear-span repaired beams vs. control
beam .................................................................................................................................... 121
Figure 5.24 Stirrups strain profile of control beam..................................................................... 122
Figure 5.25 Stirrups strain profile of shear-span repaired beam with Sikacrete-08 SCC ........... 122

xv
Figure 5.26 Stirrups strain profile of shear-span repaired beam with mix M1 (SCC, 0% fibers)
............................................................................................................................................. 123
Figure 5.27 Stirrups strain profile of shear-span repaired beam with mix M1 (SCC, 0% fibers)
............................................................................................................................................. 123
Figure 5.28 The yield loads for the shear-span repaired beams vs. the control beam ................ 124
Figure 5.29 The ultimate loads for the shear-span repaired beams vs. the control beam ........... 125
Figure 5.30 Deflection for the shear-span repaired beams vs. control beam .............................. 126
Figure B.1 Flexural load vs. deflection curve of the control beam ............................................. 153
Figure B.2 Bottom steel strain curves of the control beam ......................................................... 153
Figure B.3 Concrete compression strain curve of the control beam ........................................... 154
Figure B.4 Flexural load vs. deflection curve of the bottom patch repaired beam with Sikacrete-
08 SCC ................................................................................................................................ 154
Figure B.5 Bottom steel strain curves of the bottom patch repaired beam with Sikacrete-08 SCC
............................................................................................................................................. 155
Figure B.6 Concrete compression strain curve of the bottom patch repaired beam with Sikacrete-
08 SCC ................................................................................................................................ 155
Figure B.7 Flexural load vs. deflection curve of the bottom patch repaired beam with Mix M1
(SCC, 0%fibers) .................................................................................................................. 156
Figure B.8 Bottom steel strain curves of the bottom patch repaired beam with Mix M1 (SCC, 0%
fibers) .................................................................................................................................. 156
Figure B.9 Concrete compression strain curve of the bottom patch repaired beam with Mix M1
(SCC, 0%fibers) .................................................................................................................. 157
Figure B.10 Flexural load vs. deflection curve of the bottom patch repaired beam with Mix M3
(CFRSCC, 0.5%fibers) ....................................................................................................... 157
Figure B.11 Bottom steel strain curves of the bottom patch repaired beam with Mix M3
(CFRSCC, 0.5% fibers) ...................................................................................................... 158
Figure B.12 Concrete compression strain curve of the bottom patch repaired beam with Mix M3
(CFRSCC, 0.5% fibers) ...................................................................................................... 158
Figure B.13 Flexural load vs. deflection curve of the top patch repaired beam with Sikacrete-08
SCC ..................................................................................................................................... 159
Figure B.14 Bottom steel strain curves of the top patch repaired beam with Sikacrete-08 SCC 159

xvi
Figure B.15 Concrete compression strain curve of the top patch repaired beam with Sikacrete-08
SCC ..................................................................................................................................... 160
Figure B.16 Flexural load vs. deflection curve of the top repaired beam with Mix M1 (SCC) 0%
carbon fibers........................................................................................................................ 160
Figure B.17 Bottom steel strain curves of the top patch repaired beam with Mix M1 (SCC,
0%fibers) ............................................................................................................................. 161
Figure B.18 Concrete compression strain curve of the top patch repaired beam with Mix M1
(SCC, 0% fibers) ................................................................................................................. 161
Figure B.19 Flexural load vs. deflection curve of the bottom patch repaired beam with Mix M3
(CFRSCC, 0.5%fibers) ....................................................................................................... 162
Figure B.20 Bottom steel strain curve of the top patch repaired beam with Mix M3 (CFRSCC,
0.5%fibers) .......................................................................................................................... 162
Figure B.21 Concrete compression strain curve of the top patch repaired beam with Mix M3
(CFRSCC, 0.5% fibers) ...................................................................................................... 163
Figure B.22 Shear load vs. deflection curve of the control ........................................................ 164
Figure B.23 Strain curves on the stirrups of the control beam ................................................... 164
Figure B.24 Bottom steel strain curves of the control beam ....................................................... 165
Figure B.25 Concrete compression strain curve of the control beam ......................................... 165
Figure B.26 Shear load vs. deflection curve of the shear-span repaired beam with Sikacrete-08
SCC ..................................................................................................................................... 166
Figure B.27 Strain curves on the stirrups of the shear-span repaired beam with Sikacrete-08 SCC
............................................................................................................................................. 166
Figure B.28 Bottom steel strain curves of the shear-span repaired beam with Sikacrete-08 SCC
............................................................................................................................................. 167
Figure B.29 Concrete compression strain curve of the shear-span repaired beam with Sikacrete-
08 SCC ................................................................................................................................ 167
Figure B.30 Shear load vs. deflection curve of the shear-span repaired beam with Mix M1 (SCC,
0%fibers) ............................................................................................................................. 168
Figure B.31 Strain curves on the stirrups of the shear-span repaired beam with Mix M1 (SCC,
0% fibers) ............................................................................................................................ 168
Figure B.32 Bottom steel strain curves of the shear-span repaired beam with Mix M1 (SCC,
0%fibers) ............................................................................................................................. 169

xvii
Figure B.33 Concrete compression strain curve of the shear-span repaired beam with Mix M1
(SCC, 0%fibers) .................................................................................................................. 169
Figure B.34 Shear load vs. deflection curve of the shear-span repaired beam with Mix M3
(CFRSCC, 0.50%fibers) ..................................................................................................... 170
Figure B.35 Strain curves on the stirrups of the shear-span repaired beam with Mix M3
(CFRSCC, 0.50%fibers) ..................................................................................................... 170
Figure B.36 Bottom steel strain curves of the shear-span repaired beam with Mix M3 (CFRSCC,
0.50%fibers) ........................................................................................................................ 171
Figure B.37 Concrete compression strain curve of the shear-span repaired beam with Mix M3
(CFRSCC, 0.50%fibers) ..................................................................................................... 171

xviii
List of Tables
Table 1.1 Case projects of SCC (Daczko 2012) ............................................................................. 2
Table 1.2 Applications of carbon fiber reinforced concrete (Safiuddin 2010) ............................... 3
Table 2.1 Properties of various fibers (adopted from Kosmatka et al 2008) .................................. 9
Table 2.2 Maximum w/c ratio for high strength concrete ............................................................ 15
Table 2.3 Estimatition of mixing water based on using fine aggregate with 35% voids .............. 15
Table 2.4 Tests for SCC fresh properties and the criteria values set by different institutions ...... 17
Table 3.1 Details of the primary mixture proportions of the carbon fiber reinforced self-
consolidating concrete .......................................................................................................... 32
Table 3.2 Details of adjusted mixture proportions of the carbon fiber reinforced self-
consolidating concrete. ......................................................................................................... 33
Table 3.3 Details of the beam specimens ...................................................................................... 49
Table 3.4 Materials properties for all reinforcing bars (obtained from Harris certificate
reinforcing bar supplier)........................................................................................................ 53
Table 4.1: Physical properties of constituent materials ................................................................ 59
Table 5.1 Summary of flexural test results ................................................................................... 98
Table 5.2 Summary of the flexure stiffness of the flexural beams ............................................. 110
Table 5.1 Summary of shear test results ..................................................................................... 114

1
Chapter 1 Introduction
1.1 Background
Self-consolidating or self-compacting concrete (SCC) is a relatively new and extremely cohesive
concrete that flows under its own weight without the use of vibration. SCC has the ability to fill
all the gaps completely in formwork and go around congested or heavy reinforcement without
segregation and bleeding (El-Dieb et al. 2011). In order for the concrete to be classified as self-
consolidating concrete, the concrete has to fulfill the fresh properties of SCC: which includes
filling ability, passing ability, and segregation resistance. Self-consolidating concrete (SCC) has
been described as “the most revolutionary development in concrete” construction over the last
three decades. Advantages of SCC include the following: faster construction, reduction of site
workers, better and easy finishing, easy placement, good durability, reduction of noise level, and
reduction of pollution. SCC has been developed to compensate for the shortage of skilled labour
in this industry. Thus, it has been rendered efficient and beneficial from both technological and
economic standpoint. SCC can be used in all kinds of applications. Table 1.1 lists some SCC
case projects. For example, SCC can be used in big or small structures, simple or complicated
buildings, horizontal or vertical members, precast or cast-in-place. In the United States,
approximately 40% of precast production uses SCC, while approximately 2-4% of cast-in-place
uses SCC (Daczko 2012). Recently, SCC has been used as a repair material in Canada and
Switzerland since SCC has the capability to flow and fill in the restricted areas (ACI 237R-07
2007, EFNARC 2002).

2
Table 1.1 Case projects of SCC (Daczko 2012)
Location Cast-in-place or
Precast Project Project size (m
3)
Japan Cast-in-place LNG storage tank 12,000
Japan Cast-in-place Water purification plant 200,000
Japan Cast-in-place MMST tunneling 8000
USA Cast-in-place National Museum of the American Indian 23,000
Canada Cast-in-place Reaction Wall, University of Sherbrooke
Korea Cast-in-place Diaphragm wall for inground LNG tank 32,800
Canada Cast-in-place Fill abandoned pump station in mine
USA Cast-in-place LNG storage tank 25,000
Italy Cast-in-place Foundations and slabs for housing 123,000
USA Precast Double tee production
New Zealand Precast Precast beams
Fibers including steel, polypropylene, glass and carbon fibers are being mixed with concrete to
improve and enhance the hardened properties of concrete. The term “fiber reinforced concrete” is
defined by the American Concrete Institute as a concrete containing dispersed, randomly
oriented fibers (ACI 116R-00 2005). Adding fibers in self-consolidating concrete can reduce its
workability and it becomes progressively difficult to achieve self-consolidation. On the other
hand, adding fibers to the self-consolidating concrete may improve the strength and durability of
this type of concrete. Generally, concrete is found to be a brittle material that fractures under
tensile load. Therefore, its mechanical properties can be improved by adding randomly dispersed
fibers. Fibers will reduce the crack opening at the loading stage and create a crack bridging,
which can alter the behaviour of the concrete at failure. Therefore, if self-compacting concrete
with fibers is achieved, then the fibers will play a very important role in the hardened properties.
Carbon fibers have advantages over other fibers in terms of high corrosion resistance, high
tensile strength, and high thermal conductivity. Carbon fiber reinforced concrete has been used

3
in producing different types of structural and non-structural elements. It can also be used to
repair deteriorated concrete in different structures. Table 1.2 presents some examples where
carbon fiber reinforced concrete was used in construction.
Table 1.2 Applications of carbon fiber reinforced concrete (Safiuddin 2010)
Type of
Application Project Project area (m
2)
Partition panel Higashi – Murayama Purification 80
Curtain wall and
parapet wall Suidobashi Building of Tokyo Dental 4,138
Curtain wall Nihonbashi – Honcho Building 1,380
Curtain wall and
louver Shinjuku District Heating Center 5,650
Curtain wall Toshin 24 Omori Building 3,000
Curtain wall Edo – Tokyo Museum 12,000
Curtain wall Tokyo East 21 11,400
Staircase Kariha Atomic Power Plant 108
Formwork of
walls Hamaoka Atomic Power Plant 2,900
Concrete technology always invents new concrete or hybrid concrete that has advantages over its
conventional counterpart. Although concrete with steel, glass, and carbon fibers has been
thoroughly studied, carbon fiber reinforced self-consolidating concrete has not received similar
attention. There is limited information on the fresh and hardened properties of carbon fiber
reinforced self-consolidating concrete and on its application as a repair patch material.
1.2 Research objectives and scope
It is important to note that carbon fiber reinforced concrete has been well researched (Ali 1972 &
Waller 1974). Also, self-consolidating concrete (SCC) incorporating steel and polymer fibers has
been significantly studied (Carlswärd et al. 2010, Yin et al. 2003 and Cunha et al. 2011).
4
However, the use of carbon fibers in SCC has not been studied. Incorporating carbon fibers in
SCC can produce a high quality special concrete known as carbon fiber reinforced self-
consolidating concrete (CFRSCC). CFRSCC offers the benefits of both carbon fibers and SCC.
The objectives of this study are as follows:
To examine the effects of pitch-based carbon fibers on the three key fresh properties
(filling ability, passing ability, and segregation resistance) of SCC.
To investigate the effect of pitch-based carbon fibers on the hardened properties
(compressive strength, splitting tensile strength, and flexural strength) of SCC.
To determine the optimum amount of carbon fibers for CFRSCC.
To investigate the use of CFRSCC as a patch repair in reinforced concrete beams.
In total, ten concrete mixtures were batched. Two W/B ratios were used 0.35 and 0.40. The
carbon fiber content (CF) ranged from 0 to 1%. The HRWR ranged from 1.5 to 8% for mixes
1 to 5 and from 1 to 7% for mixes 5 to 10. Each mix had 18 cylinders of 100mm by 200mm
and 3 prisms of 100mm by 100mm by 300mm. A total of eleven beams were tested in two
groups: The first group consisted of seven beams that were tested in flexure. The second
group consisted of four beams that were tested in shear. The research outcome would be
useful to produce and commercialize CFRSCC as a new repair material for use in concrete
structures.
1.3 Thesis organization
There are six chapters in this thesis as follows:

5
Chapter (1) Introduction: This chapter introduces self-consolidating concrete, and fibers in
concrete. It includes general information, and research objectives and scope of the study.
Chapter (2) Literature review: This chapter reviews the literature on self-consolidating
concrete, fiber reinforced self-consolidating concrete, tests for self-consolidating concrete, and
previous studies on fiber reinforced self-consolidating concrete (FRSCC).
Chapter (3) Experimental investigation: This chapter describes the experimental investigation
on carbon fiber reinforced self-consolidating concrete (CFRSCC). It includes a description of
constituent materials tests, design of carbon fiber reinforced self-consolidating concrete
mixtures, preparation and mixing method, testing of fresh concrete, preparation of hardened
concrete specimens, testing of hardened concrete properties, and the beam specimens fabrication,
and their test setup and procedure.
Chapter (4) Test results and discussion: This chapter presents the test results and discussion of
material fresh and hardened properties. It includes the material test results, the results of the fresh
properties, hardened properties, and optimum mixture of CFRSSC.
Chapter (5) Structural performance: This chapter presents the test results and discussion of
RC beams with patch repair. It includes failure modes, load-deflection, stiffness, ultimate
strength, ultimate deflection, and ductility.
Chapter (5) conclusions and recommendations: This chapter presents the conclusion of this
work, which includes concrete materials and structural beams, and the recommendation of future
work.
6
Chapter 2 Literature Review
This chapter reviews the literature on self-consolidating concrete, fiber reinforced self-
consolidating concrete, tests for self-consolidating concrete, and previous studies on fiber
reinforced self-consolidating concrete (FRSCC).
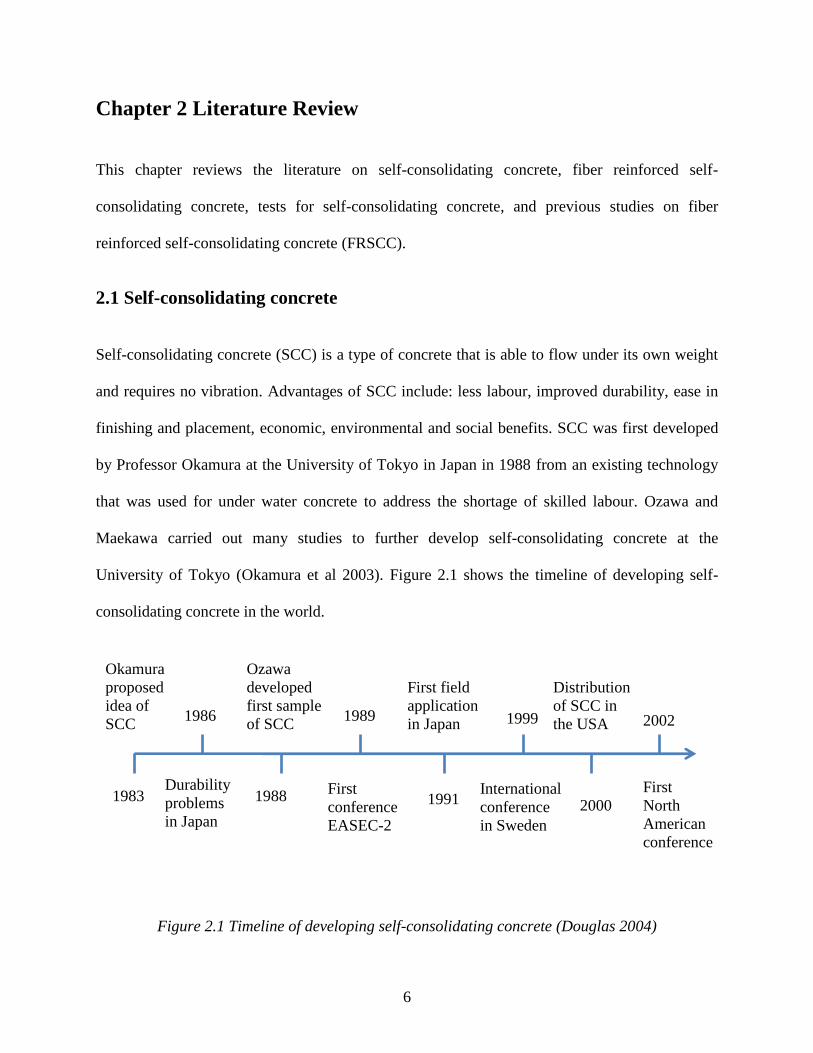
2.1 Self-consolidating concrete
Self-consolidating concrete (SCC) is a type of concrete that is able to flow under its own weight
and requires no vibration. Advantages of SCC include: less labour, improved durability, ease in
finishing and placement, economic, environmental and social benefits. SCC was first developed
by Professor Okamura at the University of Tokyo in Japan in 1988 from an existing technology
that was used for under water concrete to address the shortage of skilled labour. Ozawa and
Maekawa carried out many studies to further develop self-consolidating concrete at the
University of Tokyo (Okamura et al 2003). Figure 2.1 shows the timeline of developing self-
consolidating concrete in the world.
Figure 2.1 Timeline of developing self-consolidating concrete (Douglas 2004)
2002
1983
1986
1988
1989
19
91
1999
20
00
Durability
problems
in Japan
Okamura
proposed
idea of
SCC
Ozawa
developed
first sample
of SCC
First
conference
EASEC-2
First field
application
in Japan
International
conference
in Sweden
Distribution
of SCC in
the USA
First
North
American
conference
2000 1991

7
The three main fresh properties of SCC are filling ability, passing ability, and segregation, which
have to be first obtained and must meet the specified SCC requirements. Filling ability is the
ability of concrete to flow under its own weight and fill the spaces in the formwork. In 1940,
Kennedy proposed the “excess paste theory” as a way to explain the mechanism of concrete
workability as shown in figure 2.5. This theory states that a concrete mixture should have enough
paste to surround the coarse aggregate. This excess paste minimizes the friction among the
aggregates and thus provides better workability.
Figure 2.2 The excess paste theory (Kismi et al. 2012)
Passing ability is the ability of the concrete to pass through tight spaces (e.g. heavy
reinforcement) with no blockage. The passing ability property is affected by the maximum
aggregate size and coarse aggregate volume. Professor Hashimoto from his visualization
experiments showed that the blockage occurred from the contact of the coarse aggregates
(Okamura 1997). In order for the concrete to flow smoothly through narrow spaces the shear
stress should be minimized. It was recommended that in order to reduce the blockage of the
8
concrete, the aggregate content should be reduced and Viscosity-Modifying Admixtures (VMA)
should be added (Okamura 1997 & Okamura et al 1999).
Segregation resistance, or stability, is the ability of the concrete to remain homogeneous after
flowing i.e. no bleeding (Douglas 2004). Bleeding is a special case of segregation in which water
moves upwards and spreads into the concrete surface. Concrete should be stable and cohesive
during the mixing, transporting, casting, and placing process. Concrete is allowed to have
minimum bleeding and segregation. Stability depends on the cohesiveness and viscosity of the
concrete. Reducing mixing water and increasing the amount of fine materials such as cement,
fine aggregate, and powder admixtures will lead to better cohesiveness.
2.2 Fiber reinforced self-consolidating concrete
2.2.1 Fibers in concrete
Fibers are used to reinforce concrete to improve its tensile strength and toughness and reduce
cracking. In the last thirty years, the use of fibers has increased in ready mixed concrete, pre-cast
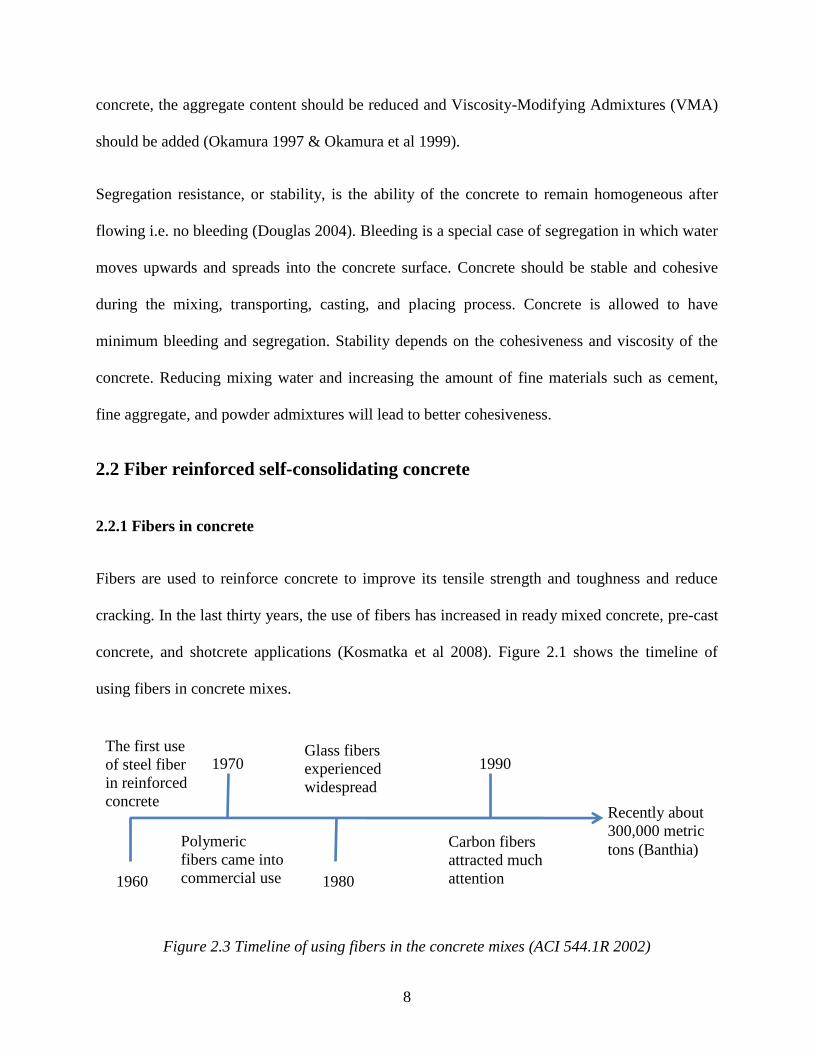
concrete, and shotcrete applications (Kosmatka et al 2008). Figure 2.1 shows the timeline of
using fibers in concrete mixes.
Figure 2.3 Timeline of using fibers in the concrete mixes (ACI 544.1R 2002)
The first use
of steel fiber
in reinforced
concrete
Polymeric
fibers came into
commercial use
Glass fibers
experienced
widespread
Carbon fibers
attracted much
attention 1960
1970
1980
1990
Recently about
300,000 metric
tons (Banthia)

9
About 300,000 metric tons of fibers are used in reinforced concrete industry every year. Steel
fibers are the most common type of fibers (50% of the total used fibers), followed by
polypropylene fibers (20% of total used fibers), then glass fibers (5% of the total used fibers)
finally other types of fibers (25% of the total used fibers).
Extensive research work has been conducted on different type of fibers such as steel fibers, wood
fibers, polypropylene fibers, glass fibers and carbon fibers mixed with concrete (Carlswärd et al.
2010, Yin et al. 2003, Cunha et al. 2010, Srinivasa et al. 2009, and Barluenga et al. 2007).
Previous research indicated that fibers greatly affect the workability of normal and self-
consolidating concrete due to the following factors: the shape of fibers, the stiffness of fibers, the
surface characteristics of fibers, and the deformation of fibers. It was found that the addition of
macro-synthetic fibers led to a decrease in the workability of concrete mixtures. For example, the
addition of 40-50 mm macro-synthetic fibers decreased the slump flow and blockage in the L-
Box test. Table 2.3 presents the properties of various fibers mixed with concrete.
Table 2.1 Properties of various fibers (adopted from Kosmatka et al 2008)
Fiber type
Relative
density
(specific
gravity)
Diameter
(micro-
meter)
Tensile
strength
(MPa)
Modulus of elasticity
(MPa)
Strain at
failure
(%)
Steel 7.80 100-1000 500-2600 210,000 0.5-3.5
Glass 2.54 8-15 2000-4000 72,000 3.0-4.8
Polyethylene 0.96 25-1000 80-600 5,000 12-100
Aramid 1.44 10-12 2000-3100 62,000-120,000 2-3.5
Carbon 1.90 8-9 1800-2600 230,000-380,000 0.5-1.5

10
2.2.1.1 Steel fibers
ACI 544.1R defines steel fibers as short, discrete length steel bars having an aspect ratio (the
length to diameter ratio) from 20 to 100 and diameters from 100 to 1000 µm. The Japanese
Society of Civil Engineers (JSCE) has classified steel fibers based on their cross section: square
cross section, circular section, and crescent section (ACI 544.1R 2002). Adding short steel fibers
to a concrete mixture results in increasing the concrete toughness and controlling crack
propagation. However, steel fibers accelerate the corrosion process, which is a disadvantage in
comparison to other fibers (ACI 544.1R 2002). Self-consolidating concrete (SCC) containing
steel fibers of 0.5% and 0.75% by volume exhibited a reduction in crack widths by around 50%
and 25% compared to plain SCC (Carlswärd et al. 2010). Yin et al. (2003) found that the loads at
crack initiation for specimens with different volume of steel fibers were almost the same.
However, the peak load and the deflection at the peak load increased as the volume of steel fibers
increased. Toughness was improved for the mixture that contained high steel fiber volume (1%)
in comparison to mixtures that have lower dosage of steel fibers (0.25%) (Yin et al. 2003 and
Cunha et al. 2011). The direct tensile strength of concrete with 1.5 percent steel fibers by volume
can increase by about 30 to 40 percent. The shear and torsion strength of concrete with 1% steel
fibers by volume can be increased from 0 to 30 percent. The flexural strength of concrete with
sufficient amount of steel fibers can be improved by 50 to 75 percent. This improvement depends
on length of fibers, specimen’s size, and the test method. The steel fibers improve the ductility of
the concrete, depending on the type and volume of steel fibers present. The pullout of steel fibers
from concrete can be prevented or reduced by using wavy or crimped steel fibers.

11
2.2.1.2 Glass fibers
The first research study on the use of glass fibers in concrete was conducted in early 1960s. The
glass fibers suffered from alkali reactivity that occurs between the glass fibers and the cement
paste. The alkali reactivity led to a reduction in concrete strength, which limited their use in
concrete structures (ACI 544.1R 2002). To over come this issue, new alkali-resistant glass fibers
(AR-glass fibers) were invented with improved long-term durability in concrete. AR-glass fibers
were first introduced in the United Kingdom in 1967 and became the most widely used fibers in
reinforced concrete. Glass fiber reinforced concrete (GFRC) is used in the fabrication of cladding
panels, sandwich panels, integral rib panels, and steel-stud/flex-anchor panels (ACI 544.1R
2002).
Some studies have shown that the modulus of rupture (MOR) for AR-glass fibers decrease after
10 years under normal environmental conditions (ACI 544.1R 2002). The freeze-thaw resistance
also decreases for the AR-glass fibers concrete. A study on polymer glass fiber reinforced
concrete (P-GFRC) revealed that the freeze-thaw resistance was good due to the lower
absorption of glass fibers (ACI 544.1R 2002).
2.2.1.3 Carbon fibers
Since the 1970s many studies have been conducted to investigate the effectiveness of carbon
fibers on the various properties of concrete (Ali 1972, Waller 1974 and Safiuddin 2010). The
addition of carbon fibers to concrete offers significant improvements to the concrete mechanical
properties such as flexural strength and toughness. In addition, impact resistance and fatigue
resistance can be improved if the appropriate amount of carbon fibers is added to the concrete.
Carbon fibers are attractive to engineers due to their low density and thermal conductivity.

12
Carbon fibers can be used to eliminate or reduce drying shrinkage problems as well as reduce
cracking width. Carbon fiber reinforced concrete (CFRC) has been used in many projects
because of its good thermal conductivity, lightweight, and high modulus of elasticity. It has been
also used to produce curtain walls, partition panels, and formwork for walls (Safiuddin 2010).
Two types of carbon fibers are generally used in concrete are continuous high modulus
polyacrylonitrile (PAN-based) carbon fibers and pitch-based carbon fibers. PAN-based carbon
fibers have a very high modulus of elasticity and high tensile strength. They have been mostly
used to produce aerospace and sport equipment. Although PAN-based fibers were the first type
of chopped carbon fibers used in reinforced concrete; they are rarely used in civil engineering
applications due to their high cost.
Pitch-based carbon fibers are used in civil engineering applications because of their lower cost
even though they have a lower modulus of elasticity than PAN-based fibers. Pitch-based carbon
fibers are used in many industrial fields due to their light weight, chemical stability, heat
resistance and abrasion characteristics (JCMA 2010). The use of pitch-based carbon fibers in
plain concrete leads to increases in flexural strength by about 85%, flexural toughness by about
205%, and compressive strength by about 22%. On the other hand, the drying shrinkage of
concrete mixed with pitch-based carbon fibers was decreased by up to 90% and the electrical
resistivity was decreased by up to 83% (Chung et al. 1992 and Chung 1992). These advantages
make pitch-based carbon fibers more attractive for use in SCC. Although many studies were
conducted on the use of pitch-based chopped carbon fibers in concrete, limited research has been
carried out to evaluate SCC with carbon fibers. SCC containing carbon nano-fibers was studied
to investigate its mechanical and electrical properties (Gao et al. 2010). In the present study,
pitch-based chopped carbon fibers will be used to produce SCC. The optimum content of pitch-

13
based carbon fibers will be determined while meeting the performance requirements for the three
key fresh properties of SCC.
2.2.2 Fiber reinforced self-consolidating concrete (FRSCC) mix design
Self-compacting concrete mixture design differs from conventional concrete mixture design.
Development of SCC is basically conducted through trial and error batches, and to date there is
no standard for SCC mix design in the world (Douglas 2004). SCC requires large amounts of
fine materials and small amounts of coarse aggregates. This means more water is required to
produce an SCC mixture. Consequently, dry shrinkage will occur which leads to concrete
cracking. To solve the formation of dry shrinkage cracks in SCC, high range water reducer is
added to the SCC mixture (Brown et al. 2011). Okamura (1993) and Ozawa (1989) applied limits
on aggregate content, lower water binder ratio, and used superplasticizer in their mixture to
produce self-consolidating concrete.
ACI 211.4R-08 (2008) outlines an approach based on the absolute volume method to design high
strength concrete. Nielsson and Wallervik (2003) designed SCC mixture by changing the paste
composition and keeping the aggregate composition the same. For fiber reinforced self-
consolidating concrete (FR-SCC) design, a similar approach is followed. It is assumed that the
fibers are replacing part of the coarse aggregate (ACI 211.4R-08 2008). Figure 2.4 presents the
fiber reinforced self consolidating concrete (FRSCC) mix design outlined in ACI 211.R-08.
Table 2.2 gives the maximum w/c ratio for high strength concrete. Table 2.3 gives estimates for
the mixing water based on a fine aggrgetae content with 35% voids. If the void content is
different from 35% then approach described in ACI 211.4R-08 (2008) should be followed.

14
Figure 2.4 Flow chart of fiber reinforced self consolidating concrete (FRSCC) mix design
(adapted from ACI 211.4R-08 2008)
Change the quantity of HRWR and VMA
and adjust trial mixture proportions
Select w/b ratio (0.26 - 0.46) and slump (25.4 – 50.8 mm) for
concrete with HRWR from Table 2.2 (ACI 211.4R-08 2008)
Select maximum-size aggregate based on required concrete
strength (f’c) (f’c <62, 19 to 25.4; f’c >62MPa, 9.5 to 12.5)
Estimate mixing water from Table 2.3 (ACI 211.4R-08
2008)
Verify the fresh concrete properties (filling
ability, passing ability, and segregation)
Accept as CFRSCC
Perform trial mixtures for FRSCC

15
Table 2.2 Maximum w/c ratio for high strength concrete (ACI 211.4R-08 2008)
Required
average
compressive
strength ƒ’cr
(MPa)
w/c
Maximum-size coarse aggregate (mm)
9.5 12.5 19 25.4
with
HRWR
without
HRWR
with
HRWR
without
HRWR
with
HRWR
without
HRWR
with
HRWR
without
HRWR
48 28-day 0.50 0.42 0.48 0.41 0.45 0.40 0.43 0.39
56-day 0.55 0.46 0.52 0.45 0.48 0.44 0.46 0.43
55 28-day 0.44 0.35 0.42 0.34 0.40 0.33 0.38 0.33
56-day 0.48 0.38 0.45 0.37 0.42 0.36 0.40 0.35
62 28-day 0.38 0.30 0.36 0.29 0.35 0.29 0.34 0.28
56-day 0.42 0.33 0.39 0.32 0.37 0.31 0.36 0.30
69 28-day 0.33 0.26 0.32 0.26 0.31 0.25 0.30 0.25
56-day 0.37 0.29 0.35 0.28 0.33 0.27 0.32 0.26
76 28-day 0.3 - 0.29 - 0.27 - 0.27 -
56-day 0.33 - 0.31 - 0.29 - 0.29 -
83 28-day 0.27 - 0.26 - 0.25 - 0.25 -
56-day 0.30 - 0.28 - 0.27 - 0.26 -
Table 2.3 Estimation of mixing water based on using fine aggregate with 35% voids (ACI
211.4R-08 2008)
Slump (mm)
Mixing water (kg/m3)
Maximum-size coarse aggregate (mm)
9.5 12.5 19 25.4
25.4 to 50.8 184 175 169 166
50.8 to 76 190 184 175 172
76 to 101 196 190 181 178
Entrapped air content 2.5 2 1.5 1

16
2.2.3 Mechanics of crack formation and propagation for SCC and FRSCC
The failure of plain concrete in uniaxial tension is usually governed by a single crack formation.
However, in fiber reinforced concrete (FRC), the fibers will work to resist crack propagation and
provide crack bridging. This crack bridging depends on the effectiveness of the fibers and
number of fibers that contributes to each crack. If the fibers break or pullout during crack
initiation, concrete tension softening occurs and the FRC cannot carry load after the crack
initiates and the load would decrease after the peak point load. However, multiple cracking
occurs if the fibers can sustain load after the first crack initiates, more cracks will appear and
more fibers will contribute to the load transfer for a more ductile behaviour (Vandewalle et al
2002). Figure 2.2 shows the behaviour of single and multiple cracking on a concrete specimen
under uniaxial tensile loading.
a) Single cracking under uniaxial loading b) Multiple cracking under uniaxial loading
Figure 2.5 The behaviour of single and multiple cracking of the specimens under uniaxial
loading (Vandewalle et al 2002)

17
2.3 Tests for self-consolidating concrete
Different standard tests are given by the American Society for Testing and Materials (ASTM)
and European Federation of Supplies of Specialist Construction Chemicals (EFNARC) to assess
SCC fresh and hardened properties.
2.3.1 Tests used for fresh properties
Table 2.4 presents the different tests for SCC fresh properties and the range of the criteria values
that should be satisfied for the fresh properties as set by different institutions.
Table 2.4 Tests for SCC fresh properties and the criteria values set by different institutions
Test name Property Units ASTM ACI EFNARC European
research project “Testing-SCC”
Slump flow Filling ability mm 530-740 450-760 650-800 600-750
T50 slump flow Filling ability Sec. 2-5 2-9 3.5-6
Orimet Filling ability Sec. - 0-5 3-12
V-funnel Filling ability Sec. - 6-12 3-12
J-ring slump
flow (blocking
index)
Passing ability mm 0-50 - 0-10 0.20
L-box Passing ability h2/h1 0.8-1.0 0.8-1.0 0.7-1.0
U-box Passing ability (h2-h1)
mm - 0-30 -
V-funnel at
T5minutes Stability Sec. - 0-3 -
Column
segregation Stability % <10 - -
VSI Stability 0-3 - -
Sieve resistance Stability % - 0-15 0-20
Penetration Stability mm 0-8
18
Tests for fresh properties of SCC are different from those used for conventional concrete. Three
key fresh properties for SCC are filling ability, passing ability, and segregation resistance. To
produce SCC mixtures the three key properties of fresh properties must fulfill the standard
requirements (EFNARC 20002). However, there is no single test method that characterizes all
the fresh properties of SCC (filling ability, passing ability, and stability) at one time. Each
property therefore must be characterized using a different method. The following sections
discuss these test methods.
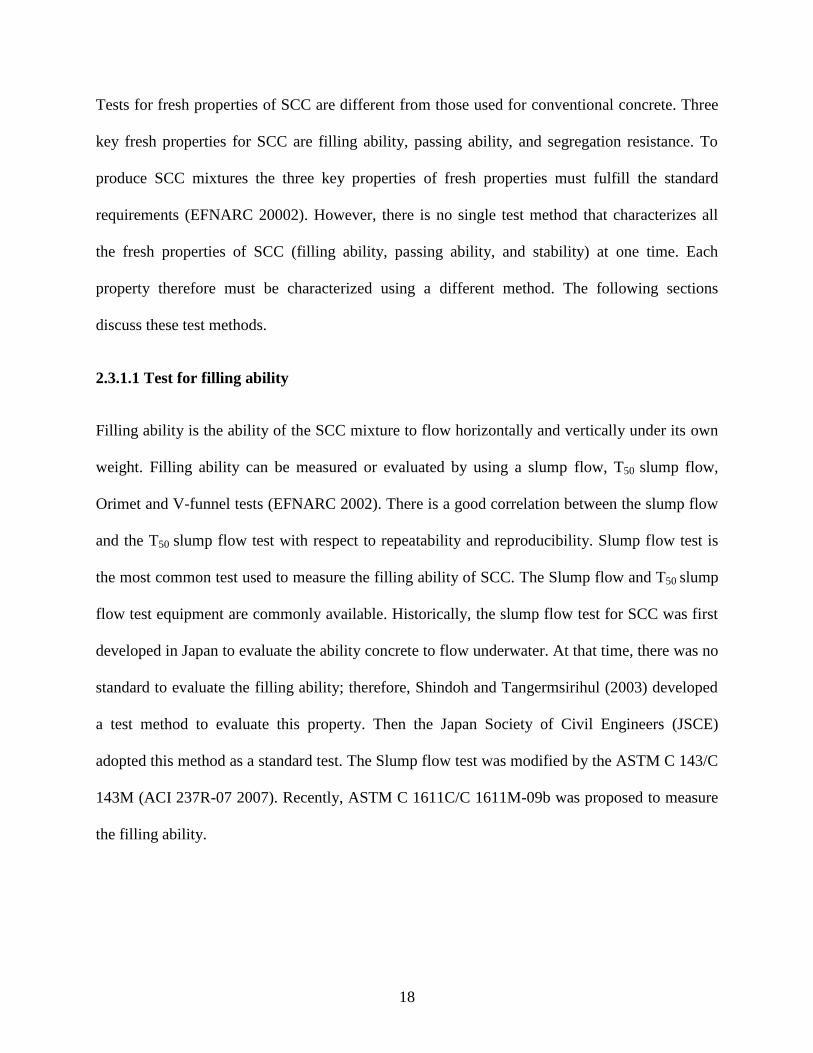
2.3.1.1 Test for filling ability
Filling ability is the ability of the SCC mixture to flow horizontally and vertically under its own
weight. Filling ability can be measured or evaluated by using a slump flow, T50 slump flow,
Orimet and V-funnel tests (EFNARC 2002). There is a good correlation between the slump flow
and the T50 slump flow test with respect to repeatability and reproducibility. Slump flow test is
the most common test used to measure the filling ability of SCC. The Slump flow and T50 slump
flow test equipment are commonly available. Historically, the slump flow test for SCC was first
developed in Japan to evaluate the ability concrete to flow underwater. At that time, there was no
standard to evaluate the filling ability; therefore, Shindoh and Tangermsirihul (2003) developed
a test method to evaluate this property. Then the Japan Society of Civil Engineers (JSCE)
adopted this method as a standard test. The Slump flow test was modified by the ASTM C 143/C
143M (ACI 237R-07 2007). Recently, ASTM C 1611C/C 1611M-09b was proposed to measure
the filling ability.

19
2.3.1.2 Test for passing ability
Passing ability is the ability of the SCC mixture to flow through the limited spaces between re-
bars without blocking. Rebar blocking is defined as the concrete flow through the rebars, the
rebars will restrict the coarse aggregate from flowing smoothly. Passing ability can be evaluated
by using a J-ring slump flow (blocking index), L-box, U-box and V-funnel at T5minutes (EFNARC
2002 and TESTING-SCC 2005). The principle of the J-ring test method is Japanese, but the J-
ring test was developed at the University of Paisley in UK (EFNARC 2002). The J-ring test
indicates the deformability of SCC due to the reinforcement bars blocking (TESTING-SCC
2005). The J-ring can be used with the slump or Orimet test. This combination can bring the
benefit of filling ability and passing ability as they have acceptable correlation.
2.3.1.3 Test for segregation resistance
Segregation resistance or stability is a vital property of SCC. It is defined as the ability of the
concrete to remain consistent and uniform during mixing, transport, and placement. Stability is
determined under two conditions: static and dynamic (Daczko 2012). Dynamic segregation of
concrete can occur during transportation, placing, and casting and it stops when static stability
takes place. The static segregation occurs during the concrete consolidation. SCC mixtures must
have sufficient viscosity, so that concrete can flow easily through restricted spaces and maintain
uniformity without any compactions and have good cohesiveness (Khayat 1999). To improve the
cohesiveness of SCC mixtures, we should reduce the coarse aggregate content, reduce maximum
aggregate size, and increase the amount of carbon fibers. It is important to increase the
cohesiveness to keep the bond between the aggregate and the mortar (Khayat 1999). Three tests
are available to evaluate the stability of concrete “segregation resistance”: settlement column,
20
sieve stability, and penetration. All these tests are convenient for laboratory and site tests
(TESTING-SCC 2005, EFNARC 2002).
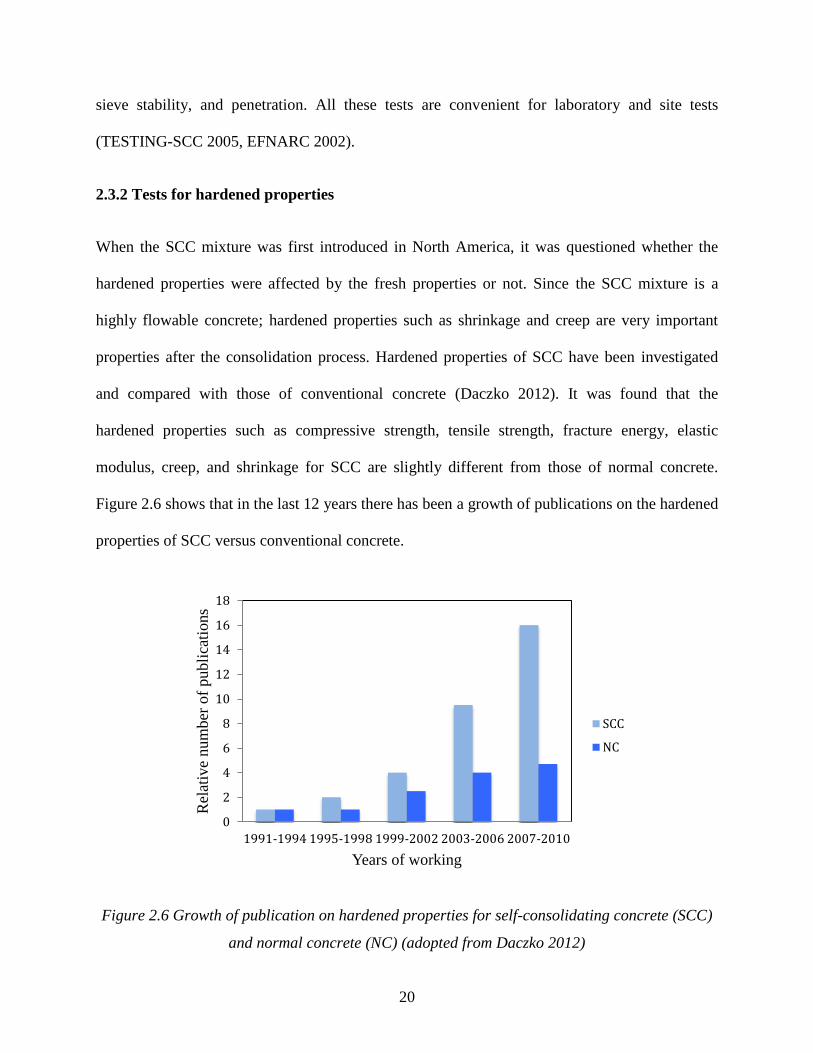
2.3.2 Tests for hardened properties
When the SCC mixture was first introduced in North America, it was questioned whether the
hardened properties were affected by the fresh properties or not. Since the SCC mixture is a
highly flowable concrete; hardened properties such as shrinkage and creep are very important
properties after the consolidation process. Hardened properties of SCC have been investigated
and compared with those of conventional concrete (Daczko 2012). It was found that the
hardened properties such as compressive strength, tensile strength, fracture energy, elastic
modulus, creep, and shrinkage for SCC are slightly different from those of normal concrete.
Figure 2.6 shows that in the last 12 years there has been a growth of publications on the hardened
properties of SCC versus conventional concrete.
Figure 2.6 Growth of publication on hardened properties for self-consolidating concrete (SCC)
and normal concrete (NC) (adopted from Daczko 2012)
0
2
4
6
8
10
12
14
16
18
1991-1994 1995-1998 1999-2002 2003-2006 2007-2010
Rel
ativ
e num
ber
of
publi
cati
ons
Years of working
SCC
NC

21
2.3.2.1 Test for compressive strength
Compressive strength is one of the most important properties for concrete. The compressive
strength is defined as “the measured maximum resistance of a concrete specimen to axial
loading” (Kerkhoff et al. 2002). Compressive strength mainly depends on the water/binder ratio
(w/b), type of cement, cementitious materials, aggregates, the degree of compaction, the age of
the concrete and curing type. Usually, the compressive strength of SCC is higher than 50MPa
(Hela et al 2005). However, adding fibers whether carbon fibers or steel fibers to the concrete are
known to reduce the compressive strength (Aydin 2007). Compressive strength (ƒ’c) is obtained
by dividing the ultimate axial load (P) by the cross sectional area of specimen (A). The ƒ’c can be
calculated for a cylinder as given in the equation below (Douglas 2004):
2.3.2.2 Test for tensile strength
Concrete is weak in tension; therefore, the tensile strength of the concrete is usually ignored in
concrete design. When fibers made from steel, glass, or synthetic materials are added to the
concrete, the tensile strength of the concrete is improved. Fibers typically work as internal
reinforcement in concrete, and can eliminate or reduce a crack from growing (VTRC 10-R8).
Usually, tensile strength ranges from 2 to 5 MPa for normal concrete. The tensile strength can be
calculated by a splitting cylinder test using the formula below:
Equation 2.1
Where:
T= Splitting tensile strength, MPa,

22
P= maximum applied load indicated by the testing machine, N,
l= Length, mm,
d= diameter, mm.
2.3.2.3 Test for flexural strength
The flexural strength of plain or fiber reinforced concrete can be determined using a third point
bending test of a concrete prism to determine the modulus of rupture, ƒr according to CSA
A23.2-8C ASTM C1609/C1609M – 10, as follows:
Equation 2.2
Where:
P= maximum applied load, N,
L= specimen length, mm,
b= width of section, mm,
h= height of section, mm.
2.4 Fiber reinforced self-consolidating concrete (FRSCC)
2.4.1 Fresh properties of FRSCC
2.4.1.1 Filling ability
The filling ability is affected by the increase of fiber amount and fiber length. The workability
decreases when the fiber amount and length are increased. Forgeron and Omer (2010) found that
when the filling capacity, V-funnel, and L-box tests were performed on different SCC mixtures
with 38mm and 50mm fiber lengths, the fiber length played a very important role in SCC filling

23
ability characteristics. It was clear that fiber lengths affected the SCC during concrete moving
around obstacles. Brown et al. (2010) reported that steel fibers with concentrations of 0.4% and
0.6% by volume in the SCC mixtures met the minimum target of slump flow requirement. In the
same study, sufficient stability was not attained in the mixtures with 0.4% and 0.6% by volume
of synthetic fibers and these mixtures were considered as normal fiber reinforced concrete FRC
(not SCC). Nehdi and Ladanchuk (2004) found that in the slump flow of SCC mixtures
containing higher fiber volume were lower than the SCC mixture containing lower fibers
volume. Liao et al. (2010) found that the flowability of normal SCC mixtures was achieved and
the flow diameter was 600mm for all the cases. However, the flowability of self-consilidating
high performance fiber reinforced concrete (SC-HPFRCCs) was not as high as that for the SCC
mixtures; these mixes required slight vibration. El-Dieb and Taha (2012) studied the flow
characteristics and acceptance criteria of fiber-reinforced self-consolidating concrete (FR-SCC).
They found that the maximum polypropylene fiber content that could be added to the SCC
mixtures without affecting the SCC characteristics should be between 1 and 1.3 kg/m3
according
to the V-funel and filling box tests. These ranges were different from those found using a slump
flow test because this test was less affected by inclusion of fibers. In case of SCC mixtures with
steel fibers, the maximum steel fiber factor (Vf×L/D) ranged between 50-100.
2.4.1.2 Passing ability
Grünewald and Walraven (2010) found that the presence of fibers in SCC increased the bar
spacing for non-blocking compared to SCC mixtures with no fibers. The type and content of
fibers affected the bar spacing for non-blocking. Aydin (2007) found that the J-ring test results
did not exhibit any effect of fiber inclusion when the steel fiber content was below 1%. Ding et
al. (2011) and Gencel (2011) found that as the fibers content increased, the J-ring value, which

24
indicates the blocking index, increased. Sahmaran (2004) studied the effect of steel fibers on the
passing ability by using the J-ring slump flow test. He found from that the fiber inclusion did not
affect the blocking index value. Fiber reinforced self-consolidating concrete results from the L-
box test showed that the concrete mixtures can flow in a narrow spacing with out blockage
(Corinaldesi 2004).
2.4.1.3 Segregation resistance (Stability)
Khayat and Roussel (2000) showed that a viscosity-enhancing admixture (VEA) can improve the
stability of self-consolidating concrete with fibers. They compared two different FRSCC
mixtures: The first series of FRSCC mixtures with VEA and less HRWR and the second series of
FRSCC mixtures with no VEA and more HRWR. It was found that FRSCC mixtures with VEA
showed good stability and no segregation. Unlike FRSCC mixtures with VEA, FRSCC mixtures
without VEA exhibited segregation of the aggregates at the edges of the mixtures. El-Chabib
and Nehdi (2006) found that the segregation resistance significantly increased with increasing
the w/c ratio and HRWRA dosage. They also found that the coarse/total aggregate ratio did not
affect the segregation, whereas increasing of the cementitious materials content caused the
segregation to increase for SCC mixtures with high w/c ratio and the segregation slightly
decreased for SCC with low w/c ratio.
2.4.2 Hardened properties of FRSCC
2.4.2.1 Compressive strength
The effect of fibers on the compressive strength of SCC mixtures varies in the published
literature. It was found that fibers do not always decrease the compressive strength of SCC
mixture. Gencel et al. (2011) found that as polypropylene fiber content increased the

25
compressive strength of SCC mixtures increased. Forgeron and Omer (2010) observed that the
fibers had no effect on the compressive strength. As it was observed from their test results, the
compressive strength for SCC with 0% maro-synthetic fibers was 44MPa and SCC with 0.40%
maro-synthetic fibers was 45MPa. Akcay and Tasdemir (2012) found that the fibers did not
significantly affect the compressive strength. The compressive strength was 115MPa for concrete
mixture with 0.75% steel fibers by volume and 118MPa for concrete mixture with 0.75% steel
fibers by volume and 1.5% by volume of steel fibers.
2.4.2.2 Splitting tensile strength
Gencel et al. (2011) found that the splitting tensile strength values increased with increasing fiber
content. However, Sahmaran and Yaman (2005) found that the splitting tensile strength reduced
from 3.4MPa to 3.08MPa due to the reduction of longer hooked ends of steel fibers. Akcay and
Tasdemir (2012) studied the effect of hybrid fibers on the hardened properties of SCC. They
found that the splitting tensile strength did not change when the fiber content was increased.
Mazaheripour et al. (2011) found that the splitting tensile strength increased as the polypropylene
fiber volume increased.
2.4.2.3 Flexural strength
The flexural strength generally increases as the fiber and cement content increase. At 0% fibers
the flexural strength was 3MPa, but at 12kg/m3 the flexural strength increased to about 8MPa
(Gencel et al. 2011). Akcay and Tasdemir (2012) found that the fracture energy increased as the
fiber content increased. The fracture energy (GF) was significantly increased with the increase of
fiber content. In their study, the fracture energy for the reference concrete mixture was 94N/m
while the fracture energy for the concrete mixture with 0.75% of steel fibers was 2248N/m.

26
Mazaheripour et al (2011) studied the effect of fibers on the lightweight SCC and found the
flexural strength increased by about 9% when the polypropylene fiber volume increased.
2.5 Research needs
Based on the current state-of-the art about fiber reinforced self-consolidating concrete, the
following points can be drawn and gaps can be identified:
A considerable amount of research has been undertaken on different fibers such as steel
fibers, glass fibers, and synthetic fibers in concrete. However, use of carbon fibers in
concrete has not been intensively studied.
Carbon fibers have been studied in conjunction with steel fibers and synthetic fibers in
self-consolidating concrete.
The effect of carbon fibers on the fresh properties of self-consolidating concrete (filling
ability, passing ability, and segregation) has not been intensively studied.
Very limited studies have investigated the effect of carbon fibers on the compressive
strength and splitting tensile strength.
The fracture energy of carbon fiber reinforced self-consolidating concrete has not been
studied.
There is no standard or guidelines for mixture proportioning of carbon fiber reinforced
self-consolidating concrete (CFRSCC).
There are no standards to evaluate fresh properties of CFRSCC as it is available for
SCC.

27
Therefore, this research study aims to address the gaps in the state of the art and investigate the
fresh and hardened properties of CFRSCC.

28
Chapter 3 Experimental Investigation
This chapter describes the experimental investigation to assess carbon fiber reinforced self-
consolidating concrete (CFRSCC). It includes a description of constituent material tests, design
of carbon fiber reinforced self-consolidating concrete mixtures, preparation and mixing method,
testing of fresh concrete, preparation of hardened concrete specimens, testing for hardened
concrete properties, the beam specimens fabrication, and their test setup and procedure.
3.1 Testing of constituent materials
Carbon fiber reinforced self-consolidating concrete (CFRSCC) used here was made up of
limestone crushed concrete aggregate, manufactured concrete sand according to OPPS 1002
specification, normal Portland cement (Type I), silica fume, tap water, high-range water reducer
and carbon fibers were used as the components for producing the. This section discusses the
selection and testing of the constituent materials.
Normal Portland cement according to ASTM type I (CSA type 10) was used in this study. The
relative density of the cement was taken from the material supplier sheets. No cement tests were
conducted in this project. Also, silica fume was used in this project as a supplementary material
to replace some of the cement and increase the compressive strength of the concrete. Silica fume
of 10% by binder weight was used in all SCC mixtures.
Locally available limestone crushed concrete aggregates were used. 10mm maximum aggregate
size was chosen based on recommendations in the literature in producing self-consolidating
concrete. The aggregates were tested to obtain the saturated surface dry based relative density,
absorption, and moisture content according to ASTM C127 (2007) and ASTM C566 (2004).

29
These properties are important in the mix design proportion. Also, gradation of the aggregates
was performed by using sieve analysis according to ASTM C136 (2006). Locally manufactured
sand from crushed concrete stone was used. The sand was tested for relative density, absorption,
and moisture content according to ASTM C128 (2007) and ASTM C566 (2004). The gradation
of the concrete sand was evaluated according to ASTM C136 (2006).
The optimum sand/aggregate (S/A) ratio was obtained from the compacted bulk density of the
aggregate blends. The test procedure was according to ASTM C29/C29M (2009). A metal
container was filled with aggregate blends in three layers and each layer was compacted 21
times. The measurement was reported for different S/A ratios. The optimum S/A ratio was
chosen based on the maximum compacted relative density. The S/A ratio is important for the
absolute volume concrete mix design of the self-compacting concrete.
Ten (10) mm pitched based carbon fibers were used in the CFRSCC mixture. The properties of
the carbon fibers were taken from the data material sheets as specified by the supplier.
High range water reducer (HRWR) was used as superplastesizer. It is very important to improve
the workability of self-consolidating concrete. The properties of the HRWR such as relative
density and solid content were adopted from the supplier data material sheets. Tap water was
used in different dosages to obtain the best workability. Tap water was not tested, but its
properties such as total solids and density were adopted from the tap water analysis conducted by
the Regional Municipality of Waterloo (2003). Viscosity modifying admixtures (VMA) were not
used in this project.

30
3.2 Design of carbon fiber reinforced self-consolidating concrete mixtures
3.2.1 Design approach
Carbon fiber reinforced self-consolidating concrete (CFRSCC) mixtures were designed
according to ACI 211.4R-08 (2008). The CFRSCC mixture designs were for non-air-entrained
concrete. The absolute volume method was used to calculate the absolute volume of each SCC
component to occupy one cubic meter of concrete.
A total of ten non-air-entrained self-consolidating concrete mixtures incorporating different
contents of pitch-based carbon fibers were developed in this study. Two mixtures were control
mixes with no fibers and eight mixtures had different percentages of carbon fibers.Two different
water binder ratios of 0.35 and 0.4 were used. These water binder ratios were chosen to achieve
compressive strengths of the CFRSCC mixtures in the range of 50 to 70 MPa and minimum
slumps of 50 to 75 mm with HRWR (ACI 211.4R-08 2008). The maximum coarse aggregate
size was 10 mm. The silica fume content was kept constant at 10% by weight of binder. HRWR
was added to the CFRSCC mixtures to enhance their workability; the HRWR dosages for the
group of 0.35 and 0.4 W/B ratios were 1.5–8.0% and 1.0–7.0%, respectively. Carbon fibers were
added to the self-consolidating concrete to improve its hardened properties. Carbon fibers were
added in different dosages ranging between 0 to 1% by concrete volume. The optimum S/A ratio
of 0.55 was used to design the self-consolidating concrete. This value was obtained from the
compacted bulk density of aggregate blends in section 4.1.5. The water in the mixtures was
adjusted twice: First based on the fine aggregate void content (ACI 211.4R-08, 2008) and later
based on the moisture content and absorption of the aggregates.

31
3.2.2 Trial CFRSCC mixtures
Twenty (20) trial mixtures were done to achieve the optimum fresh properties of CFRSCC
mixtures. The HRWR dosages varied until the CFRSCC fresh properties fulfilled the limits of
SCC set by ASTM standards. In total, ten concrete mixtures were batched using the steps
outlined below. Two W/B ratios were used 0.35 and 0.40. The carbon fiber content (CF) ranged
from 0 to 1%. The HRWR ranged from 1.5 to 8% for mixes 1 to 5 and from 1 to 7% for mixes 5
to 10. The details of the primary mixtures proportions for the CFRSCC mixtures are presented in
Table 3.1. The steps for the primary mixture design are as follows (ACI 211.4R-08 2008):
Select the W/B ratio (0.35 and 0.40).
Select the maximum aggregate size based on compressive strength of 62MPa.
Estimate the mixing water for a slump between 50mm to 75mm.
Calculate the void content of fine aggregate and adjust the mixing water if the void
content is different from 35% (ACI 211.4R-08 2008).
Determine the relative proportions of the coarse and fine aggregate based on the sand
aggregate ratio.
Calculate the quantities of cementitious material (cement and silica fume), carbon fibers,
HRWR, sand, and coarse aggregate.

32
Table 3.1 Details of the primary mixture proportions of the carbon fiber reinforced self-
consolidating concrete
Concrete
Mix
W/B
ratio CF
(% vol.)
CA
(kg)
FA
(kg)
Binder (B)
W
(kg)
CF
(kg)
HRWR C
(kg)
SF
(kg) (% b) (kg)
M1 0.35 0.00 784.2 958.5 432.7 48.1 189.8 0.0 1.50 7.2
M2 0.35 0.25 778.4 951.4 432.7 48.1 189.8 4.7 2.00 9.6
M3 0.35 0.50 767.1 937.6 432.7 48.1 189.8 9.5 3.50 16.8
M4 0.35 0.75 746.4 912.3 432.7 48.1 189.8 14.2 6.70 32.2
M5 0.35 1.00 736.2 899.8 432.7 48.1 189.8 18.9 8.00 38.5
M6 0.40 0.00 811.9 992.3 378.6 42.1 189.8 0.0 1.00 4.2
M7 0.40 0.25 806.7 985.9 378.6 42.1 189.8 4.7 1.45 6.1
M8 0.40 0.50 796.2 973.1 378.6 42.1 189.8 9.5 3.00 12.6
M9 0.40 0.75 783.5 957.6 378.6 42.1 189.8 14.2 5.00 21.0
M10 0.40 1.00 741.7 906.7 378.6 42.1 189.8 18.9 7.00 33.7
CF= Carbon fibers, CA= Coarse aggregate, FA= fine aggregate, C=Cement, SF= Silica fume, W= Water,
HRWR= High range water reducer.
3.2.3 Adjustment of the CFRSCC mixtures
After the trial mixtures were finished for all batches, the optimum dosages for the constituent
materials were adopted as the final CFRSCC mixture. The primary mixture proportions for the
CFRSCC were determined based on the surface-dry saturated relative density of the coarse
aggregates and sand. However, in producing the CFRSCC mixtures, the aggregates were
saturated under laboratory condition; thus, the mixing water used need to be adjusted. The
mixing water was adjusted according to the actual aggregate moisture content and absorption.
Table 3.2 gives the adjusted mixture proportions of the CFRSCC mixtures. Therefore, ten
batches were prepared to cast cylinders and prisms for the hardened properties tests.

33
Table 3.2 Details of adjusted mixture proportions of the carbon fiber reinforced self-
consolidating concrete.
Concrete
Mix
W/B
ratio CF
(% vol.)
CA
(kg)
FA
(kg)
Binder (B)
W
(kg)
CF
(kg)
HRWR C
(kg)
SF
(kg) (% b) (kg)
M1 0.35 0.00 777.4 948.9 432.7 48.1 179.8 0.0 1.50 7.2
M2 0.35 0.25 771.7 941.9 432.7 48.1 178.0 4.7 2.00 9.6
M3 0.35 0.50 760.5 928.2 432.7 48.1 172.9 9.5 3.50 16.8
M4 0.35 0.75 740.0 903.2 432.7 48.1 162.2 14.2 6.70 32.2
M5 0.35 1.00 729.8 890.8 432.7 48.1 157.8 18.9 8.00 38.5
M6 0.40 0.00 804.9 982.5 378.6 42.1 182.4 0.0 1.00 4.2
M7 0.40 0.25 799.7 976.2 378.6 42.1 181.0 4.7 1.45 6.1
M8 0.40 0.50 789.3 963.4 378.6 42.1 176.4 9.5 3.00 12.6
M9 0.40 0.75 776.7 948.1 378.6 42.1 170.5 14.2 5.00 21.0
M10 0.40 1.00 735.3 897.5 378.6 42.1 161.2 18.9 7.00 33.7
CF= Carbon fibers, CA= Coarse aggregate, FA= fine aggregate, C=Cement, SF= Silica fume, W= Water, HRWR=
High range water reducer.
3.3 Preparation and mixing method
The volume of the concrete mixtures was calculated before starting the mixing process. The
batched amount was calculated based on the amount of concrete required to cast cylinders and
prisms while considering the capacity of the pan mixer. The amount of concrete was increased
by 15% to account for losses that might occur during mixing and testing.
The concrete mixtures were prepared using a pan-type revolving mixer of 50L maximum
capacity as shown in Figure 3.1. The coarse and fine aggregates were first charged and mixed
together with a ¼ of the total mixing water for about 60 seconds. Then, the binders, cement and
silica fume, were added with a ¼ of the total mixing water and mixed for about 120 seconds.
After that, the mixing operation was stopped for about 180 seconds and the mixture was covered

34
with wet burlap to prevent loss of water due to evaporation. This was done to ensure that the
aggregates are fully saturated. After the rest time of 180 seconds, for the control mix with no
fibers, the remainder of the mixing water (½ of the total mixing water) with the HRWR dosage
was added into the mixer and the mixture was mixed further for about 180 seconds. The same
sequence was followed for the mixture with fibers, except that the fibers were added before
adding the rest of the mixing water including HRWR dosage. The concrete mixtures were mixed
for a total time of 6 minutes excluding the rest time. Various trial concrete batches were prepared
to obtain the optimum dosage of HRWR for use in the CFRSCC mixtures. The mixture quantity
was 25L for all concrete batches.
Figure 3.1 The pan-type revolving mixer

35
3.4 Testing of fresh concrete properties
Immediately after the completion of mixing, the concrete mixtures were tested for filling ability,
passing ability, segregation resistance, air content, and unit weight or wet density. The test
procedures are discussed below.
3.4.1 Filling ability test
Filling ability is the ability of SCC to flow horizontally and vertically under its self-weight. The
slump flow and T50 slump flow time tests were followed in accordance with ASTM C 1611/C
1611M-09b (2009) to measure the filling ability of SCC.
The slump flow was determined by measuring the diameter of the concrete spread in two
perpendicular directions (D1, D2), where D1 is the largest diameter of the flow patty. The steel
tray was placed on a leveled floor. The mold was lifted upward and the concrete was allowed to
flow. The slump flow measurement was taken after the spread of the concrete completely
stopped. Slump flow values should be in a range between 550 to 800 mm.
T50 slump flow time was also measured for all concretes from the same test; it is the time that the
concrete took to reach a diameter of 50 cm. A stopwatch was used to measure T50. The
stopwatch was started as the mold was lifted upward and the concrete was allowed to flow. Once
the concrete touched the 50-cm diameter circle marked on the base plate, the stopwatch was
stopped and the T50 slump flow time was recorded. T50 slump flow time should be in the range
from 2 to 7 seconds. The apparatus and test measurement of slump flow test are shown in Figure
3.2.
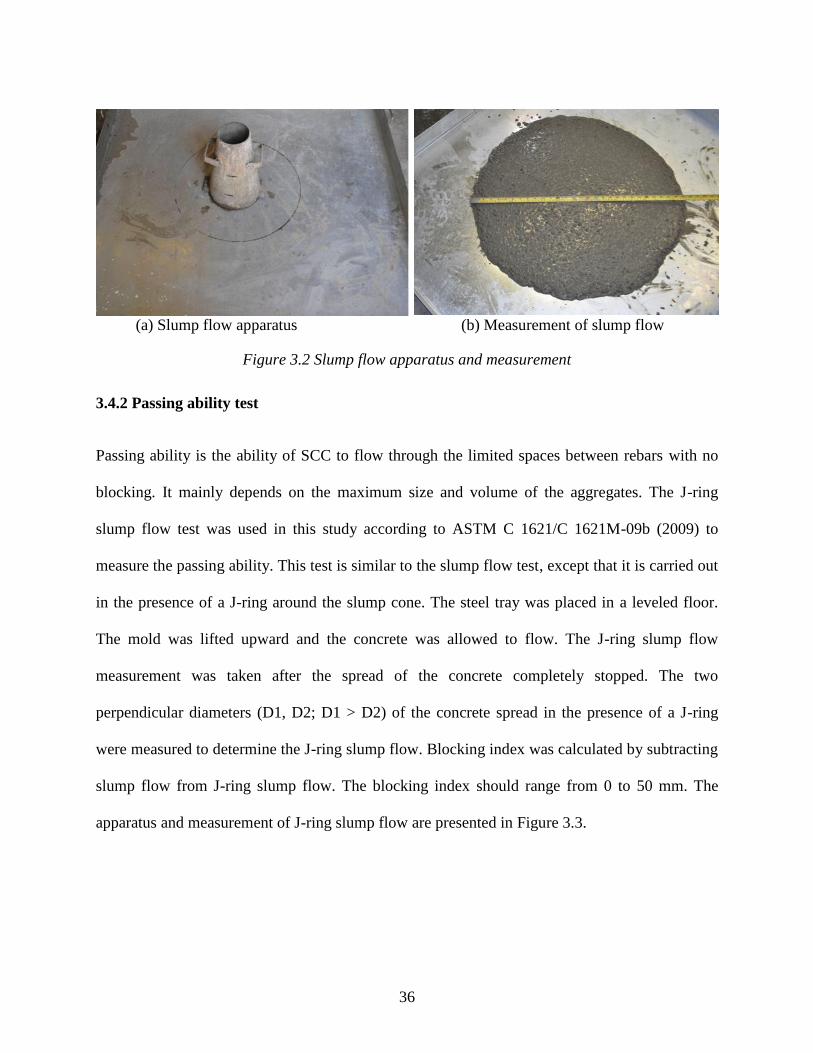
36
(a) Slump flow apparatus (b) Measurement of slump flow
Figure 3.2 Slump flow apparatus and measurement
3.4.2 Passing ability test
Passing ability is the ability of SCC to flow through the limited spaces between rebars with no
blocking. It mainly depends on the maximum size and volume of the aggregates. The J-ring
slump flow test was used in this study according to ASTM C 1621/C 1621M-09b (2009) to
measure the passing ability. This test is similar to the slump flow test, except that it is carried out
in the presence of a J-ring around the slump cone. The steel tray was placed in a leveled floor.
The mold was lifted upward and the concrete was allowed to flow. The J-ring slump flow
measurement was taken after the spread of the concrete completely stopped. The two
perpendicular diameters (D1, D2; D1 > D2) of the concrete spread in the presence of a J-ring
were measured to determine the J-ring slump flow. Blocking index was calculated by subtracting
slump flow from J-ring slump flow. The blocking index should range from 0 to 50 mm. The
apparatus and measurement of J-ring slump flow are presented in Figure 3.3.

37
(a) J-ring slump flow apparatus (b) Measurement of J-ring slump flow
Figure 3.3 J-ring slump flow apparatus
3.4.3 Segregation resistance test
Segregation resistance or stability is a vital property of SCC. It is defined as the ability of the
concrete to remain consistent and uniform during mixing, transport, and placing. Stability affects
the hardened properties such as strength and durability. There are several techniques to measure
the segregation resistance of SCC including column segregation, penetration, and sieve stability
tests. The segregation resistance can also be qualitatively assessed based on visual observations.
In this study, the sieve stability test, which was proposed by Nagataki and Fujiwara (1995) and
given in Safiuddin et al. (2008), was used to quantify the segregation resistance of SCC. In
addition, the segregation resistance of SCC was visually assessed with respect to the visual
stability index (VSI).
3.5.3.1 Sieve stability test
The sieve stability apparatus consisted of a bucket (two liters volume), a sieve (4.75 mm opening
size) attached to a pan, and a stopwatch as shown in Figure 3.4. The test procedure was as
follows: the sieve and pan were weighed separately, the bucket was filled with SCC and the

38
concrete was poured onto the sieve and rested for about 5 minutes to allow some mortar to pass
through the sieve, the sieve/pan with the concrete were weighed, the sieve with the concrete
retained was separated, the pan including the mortar was weighed, the concrete retained on the
sieve was washed to obtain the coarse aggregates in saturated surface dried (SSD) condition;
then the SSD coarse aggregates were weighed, finally the segregation index was determined
using the following equation:
Equation 3.1
Where:
SI= Segregation index (%)
Mp= Mass of the mortar that passed the sieve (kg)
Mc= Mass of the mortar contained in concrete (kg) = Concrete mass – Aggregate mass in SSD
condition
A desirable segregation index (SI) for SCC and CFRSCC should be between 0 to 18 % as
proposed by Nagataki and Fujiwara (1995).

39
Figure 3.4 Sieve analysis apparatus for aggregate segregation
3.4.3.2 Visual stability index (VSI)
Visual stability index (VSI) indicates the bleeding condition and stability (segregation level) of
freshly mixed SCC. ASTM C 1611/C 1611M – 09b (2009) categorizes the visual stability index
for SCC into four groups; these groups are defined below [19]:
a) VSI = 0 refers to highly stable SCC b) VSI = 1 indicates stable SCC
c) VSI = 2 implies unstable SCC d) VSI = 3 infers highly unstable SCC
In this study, the VSI of SCC was determined by observing the visual quality of the concrete mix
in the slump flow test. Each concrete mix was given a VSI value, which indicated the stability of
the CFRSCC. The index value varied from 0 to 3 to describe the degree of concrete stability.
3.5.5 Test for air content and unit weight
The procedure in ASTM C 231/C 231M-09b (2009) standard was followed to determine the air
content of fresh concrete by using type B air meter. The apparatus of the air content was
prepared before the concrete was ready. The bowl was placed in a level base and filled up to the

40
top with the concrete. Then, the bowl was covered and water was pumped into the bowl to
substitute the air with water. Finally, the main air valve was pushed and the air content was read
from the pressure gauge. However, to determine the unit weight a bowl was used to measure the
volume of concrete. The procedure in ASTM C 138/C 138M - 10b (2010) was followed to obtain
the unit weight of each mix. Some exceptions were applied to reflect that the concrete was SCC.
The bowl was weighted with no concrete. Then, it was filled with the concrete and weighted,
then the unit weight was obtained. Figure 3.5 shows the apparatus used for the air content and
unit weight.
Figure 3.5 Air content apparatus
3.5 Testing of hardened concrete properties
This section describes the tests that were carried out to evaluate the hardened concrete properties
of the CFRSCC mixtures. In particular, the compressive strength, splitting tensile strength, and

41
fracture energy tests. The preparation of the hardened concrete specimens and the various tests
that were done are discussed below in details.
3.5.1 Hardened concrete specimens
Twelve concrete cylinders (200 mm diameter × 100 mm length) were used for the compression
strength test, six concrete cylinders (200 mm diameter × 100 mm length) were used for the
splitting tensile strength test, and 3 prisms (100 mm wide × 100 mm deep × 350 mm long) were
used for the fracture energy test. Figure 3.6 (a) and 3.6 (b) shows forms for the cylinders and the
prisms. Once the mold for the cylinders and prisms were prepared and oiled, the concrete was
poured into the mold and filled to the top without any compaction. The concrete in the cylinders
and prisms were screeded to level the top surface and remove any extra concrete. Figure 3.6c
shows the casting of concrete prisms.
(a) The cylinders (100mm × 200mm) (b) The prisms (100mm × 100mm × 350mm)
Figure 3.6 Forms of the cylinders and the prisms

42
(c) Casting of prisms
Figure 3.6 Forms of the cylinders and the prisms (cont’d)
After casting, all the cylinders and prisms were stored in the laboratory. The ASTM C 192/C
192M – 07 (2007) standard was followed for the curing process. Two protocols for curing were
used. The cylinders were cured in a humid room, and the prisms were cured for about one week
by covering them with wet burlap. Figure 4.7 shows the curing processes.
(a) Wet burlap for curing. (b) The humid room for curing
Figure 3.7 The curing process for cylinders, prisms, and beams

43
3.5.2 Test for compressive strength
Compressive strength of the hardened concrete was determined according to ASTM C39/C39M
– 09a (2009). The compressive strength of the concrete cylinders was tested at 3, 7, 14, 28 days.
The concrete cylinders were removed from the molds after two days and placed in a humidity
room. The concrete cylinders were cured until a day before testing. The ends of the cylinders
were ground using a surface grinder to achieve good surface. The cylinders were tested using a
hydraulic compression test machine with a 1500 kN capacity. Figure 3.8 shows the hydraulic
compression tester and the grinder machine. The load was applied onto the concrete cylinders at
a rate of 0.35 to 0.7 mm/min. The maximum load (kN) and the compressive strength (MPa) were
recorded. The average of three test cylinders results was calculated to determine the compression
strength.
(a) The hydraulic compression tester (b) The grinder machine
Figure 3.8 The hydraulic compression tester and the grinder machine

44
3.5.3 Test for splitting tensile strength
The splitting tensile strength of the hardened concrete was measured in accordance to ASTM
C496/C496M – 04 (2004). The cylinders were removed from the molds and cured until day
before testing. The splitting tensile strength was determined at 14 and 28 days. Figure 3.9 shows
the splitting tensile strength test set-up.
Figure 3.9 The splitting tensile strength test set-up.
The length and diameter of the specimens were measured using electronic digital calipers.
Bearing strips were placed at the top and bottom of the specimens to ensure proper straight line
loading as shown in Figure 3.9. Load was applied using the same machine used in the
compressive strength test. The splitting tensile strength was calculated at the ultimate load
capacity using Equation 3.2.
45
Equation 3.2
Where,
T= Splitting tensile strength, MPa,
P= Maximum applied load indicated by the testing machine, N,
l= Length, mm,
d= Diameter, mm.
3.5.4 Test for fracture energy
Fracture energy of the CFRSCC mixtures was determined using prisms tested in flexural under
third-point loading according to ASTM C1609/C1609M – 10 (2010). Three prisms (100 mm
wide × 100 mm deep × 350 mm long) were cast, cured using wet burlap and tested at 28 days. A
closed-loop servo-hydraulic testing system with 100kN capacity was used to perform this test.
The load was applied at a rate of 0.075mm/minute. Two linear variable differential transducers
(LVDTs) were mounted, one on each side of the prism, onto a jig that was clamped to the
specimens. The LVDTs were used to measure the mid-span deflection of the specimens. Figure
3.10 shows flexural strength test set up.

46
Figure 3.10 The flexural strength test set up
Figure 3.11 The average net deflection measurements (ASTM C1609/C1609M – 10 (2010))
Typical data collected included the applied load and mid-span deflection from the two LVDTs as
shown in Figure 3.11. The fracture energy or toughness TD
150 is determined by calculating the
LVDT
Support
Crosshead

47
area under the load-deflection curve up to a net deflection of L/150. The first-peak strength or
“modulus of rupture” is determined from peak load as given in Equation 3.3. The equivalent
flexural strength ratio (RD
T,150) is determined using Equation 3.4.
Equation 3.3
Where,
ƒ1= The first peak strength, MPa,
P1= The peak load, N,
L= The span length, mm,
b= The average width of the specimen, mm,
d= The average depth of the specimen, mm.
Equation 3.4
Where,
= The equivalent flexural strength ratio, %,
= Area under the load vs. net deflection curve 0 to L/150, toughness,
ƒ1= First peak strength, MPa,
b= The average width of the specimen, mm,
d= The average depth of the specimen, mm.

48
3.5.5 Scanning electron micrograph (SEM)
Figure 3.12a shows the scanning electron microscope device. Samples for all mixtures were
prepared from the tested specimens in the fracture energy tests. The samples were cut into 20mm
by 20mm size using a concrete saw. The samples were cleaned and dried. The samples should be
dried in order for the samples to be conductive. The samples were coated using a golden coating
as shown in Figure 3.12b. The samples were then placed inside the scanning microscope. The
SEM images were taken at magnification of 100 micrometer.
a) Scanning electronic microscope b) Golden coating device
c) Samples with and without coating
Figure 3.12 Scanning electronic micrographs (SEM) set up
Not coated sample Coated sample

49
3.6 Beam tests
A total of eleven reinforced concrete beams were designed in accordance to CSA Standard
A23.3-04. Group (1) consisted of four beams designed to study the shear behaviour of reinforced
concrete beams under shear loading; group (2) consisted of seven beams designed to study the
flexural behaviour of reinforced concrete beams under flexural load. The test variables consisted
of the repair materials (SCC (M1), CFRSCC (M3), and Sikacrete-08 SCC), location of repair
(shear, tension, and compression), and loading configuration (flexure, shear) as presented in
Table 3.6.
Table 3.3 Details of the beam specimens
Failure configuration Location of repair Number of specimen Repair material
Shear Shear 4
Control
M1*
M3*
Sikacrete-08 SCC
Flexure
Tension 4
Control
M1
M3
Sikacrete-08 SCC
Compression 3
M1
M3
Sikacrete-08 SCC
M1=Self-consolidating concrete, M3=Self-consolidating concrete with 0.5% by vol. carbon fibers, Sikacrete-08
SCC, * Mixture M1 and M3 was chosen based on the fresh and hardened results.

50
3.6.1 Design and construction of beams
The beams in group (1) shear were 150mm wide × 350mm deep × 2400mm long and the beams
in group (2) flexure were 150mm wide × 300mm deep × 2400mm long. Group (1) beams had 4-
20M longitudinal bars in the tension zone and 2-15M longitudinal bars in the compression zone.
The shear reinforcement consisted of 6 mm diameter closed stirrups spaced at 180 mm in the
repair zone (500mm) and 6mm diameter closed stirrups spaced at 150 mm in the rest of the
beam. This stirrup layout ensures that failure will occur in the repair zone. Group (2) beams had
2-15M longitudinal bars in the tension zone, 2-10M bars in the compression zone and 6 mm
diameter closed stirrups at a spacing of 130 mm. Figure 3.13 shows the beam geometry and
reinforcement layout. Figure 3.14 shows the location of the patch repair in the flexure beams
(tension and compression) and shear beams (shear zone).

51
Figure 3.13 (a) Specimen geometry and reinforcement details – shear beams (dimensions in mm)
Figure 3.13 (b) Specimen geometry and reinforcement details – flexural beams (dimensions in
mm)

52
(a) Flexural beam (tension region patch)
(b) Flexural beam (compression region patch)
(c) Shear beam (shear region patch)
Figure 3.14 Location of patch repair: a) bottom patch, b) top patch, c) shear span patch

53
Table 3.5 presents the steel reinforcement properties, which were provided by Harris certificate
(reinforcing bar supplier). Normal vibrated concrete supplied by Hogg Ready mix was used to
fabricate the beam specimens. The concrete had maximum aggregate size of 19 mm and no
admixtures were used. The specified compressive strength at 28-days was 40MPa.
Table 3.4 Materials properties for all reinforcing bars (obtained from Harris certificate
reinforcing bar supplier)
Material property Φ6mm 10 M 15 M 20 M
Yield strength (MPa) 380 431 487 412
Ultimate strength (MPa) - 574 602 637
Maximum Elongation (%) - 19.5 17.5 15
The formwork was prepared in the laboratory as shown in Figure 3.15a. The formwork was built
in such a way that was convenient to cast and remove the beams. Caging of the reinforcing steel
was done prior to placing them in the formwork.
(a) Beam formwork (b) Strain gauge installation
Figure 3.15 Beams formwork and strain gauges installation
The forms were oiled to ease the removal of the beams after casting. The cages were placed
inside the forms and the concrete cover was fixed using chairs on the bottom and both sides.
Foam was used to make the voids in the beam section where the different repair materials will be

54
applied. Normal vibrated concrete was used to fabricate the beams. The top of each beam was
screeded to remove any extra concrete and ensure good level. The beams were cured for about
two weeks using wet burlap. Then the beams were stripped from the formwork. Figure 3.16
shows the reinforced concrete beams with the repair zone.
Figure 3.16 Beams configuration before repair
3.6.2 Repair procedure
After the beams were cast and cured, the beams were sandblasted to ensure adequate bond
between the existing normal concrete and the repair materials. The beams were repaired using
Sikacrete-08 SCC as a commercial product, mix M1 (SCC), and mix M3 (CFRSCC with 0.5%
by vol. carbon fibers). Mixes M1 and M3 were chosen based on the hardened properties results
and the cost perspective for each mix. Sikacrete-08 SCC comes in a bag of 25 kg. It was mixed
at the concrete laboratory using a handheld mixer. The water was weighed and the Sikacrete-08
SCC was gradually added to the water at the same time the handheld mixer was mixing the
concrete. The mixing process was in accordance to the manufactured specifications. On the other
hand, Mixtures M1 and M3 were developed at the concrete laboratory. Mixtures M1 and M3
were prepared using a pan mixer in the concrete laboratory, for more information refer to section
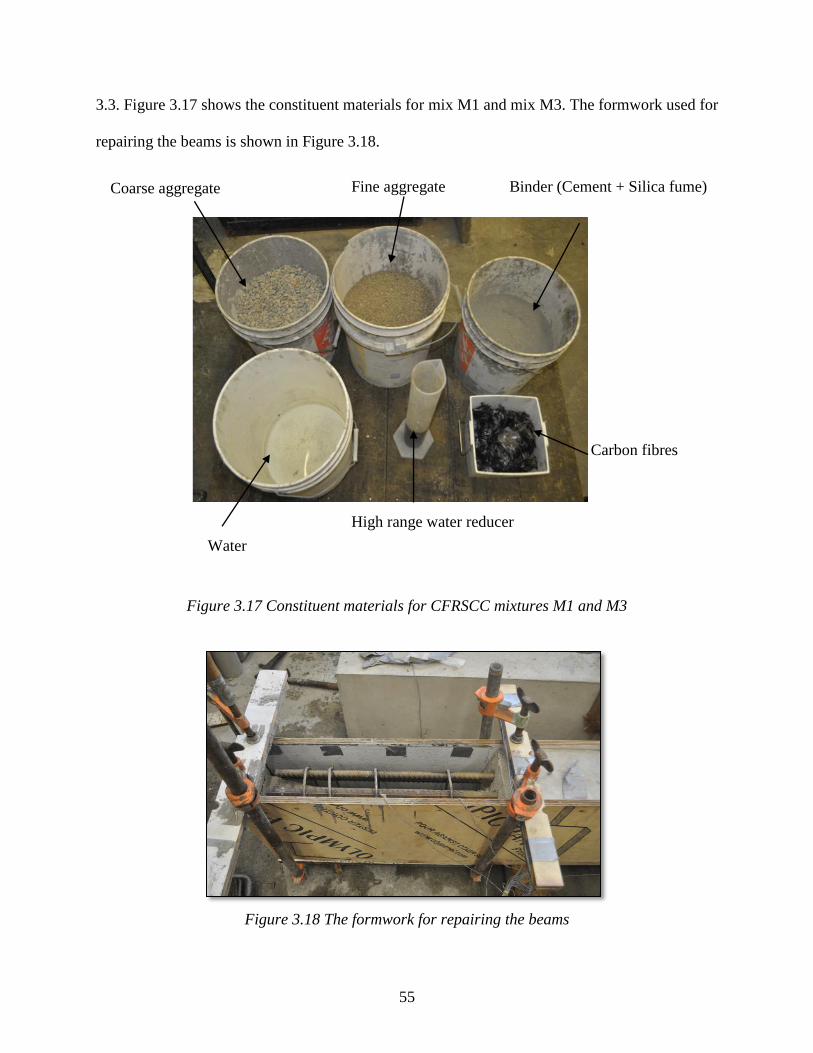
55
3.3. Figure 3.17 shows the constituent materials for mix M1 and mix M3. The formwork used for
repairing the beams is shown in Figure 3.18.
Figure 3.17 Constituent materials for CFRSCC mixtures M1 and M3
Figure 3.18 The formwork for repairing the beams
Coarse aggregate Fine aggregate Binder (Cement + Silica fume)
Water
Carbon fibres
High range water reducer

56
Once the formwork was finished, water was spread on the old concrete to ensure that the old
concrete will not absorb any water from the repair materials. The concrete patch was mixed and
poured in the repaired zones. The repaired zones were cured for about a week using wet burlap.
Figure 3.19 shows the beams after patch repair vs. the control beam.
(a) Control beam (b) Repaired tension zone
(c) Repaired compression zone (d) Repaired shear zone
Figure 3.19 Patch repair configuration
3.6.3 Instrumentation
The load was measured using a load cell mounted on the actuator. A linear variable differential
transformer (LVDT) with a range of 75 mm was mounted in the center of the beam to measure

57
the mid-span deflection. Strain gauges were used to measure the strain in the reinforcement and
concrete. Two concrete strain gauges were placed: one in the repair material and another in the
old concrete. The strain gauges for steel were 5 mm and for concrete were 60 mm. The steel
strain gauges were placed in the middle of the reinforcing steel bars and on the stirrups. The
locations of the strain gauges on the steel rebars were ground then cleaned using a conditioner
and alcoholic isopropylene, and then the strain gauges were mounted using glue. The strain
gauges were calibrated to ensure that they were working before testing. A schematic of
instrumentation is shown in Figure 3.20.
Figure 3.20 (a) Schematic of instrumentation - flexural beams
Figure 3.20 (b) Schematic of instrumentation - shear beams

58
3.6.4 Test setup and procedure
A servo-hydraulic actuator with a capacity of 500 kN was used for the loading test. Figure 3.21
shows the testing frame set-up. Four point loading scenario was chosen to test all the beams. The
beams had a 2100 mm clear span and a constant moment region of 500 mm. The loading points
and support points were marked to ensure that the beam was the right place. Then the beam was
placed in the test frame over the supports. The actuator was controlled by MTS407 controller in
stroke control at a displacement rate of 1.2 mm/min for the flexural test and 0.15 mm/min for the
shear test. All beams were loaded up to failure or when the load dropped by 20% of the
maximum load then the test was stopped. During the test, crack mapping and photos of failure
modes were taken. The strain and LVDTs were measured using an SCXI National Instrument sat
acquisition system and stored on a computer.
Figure 3.21 The testing frame set up
Crosshead
Beam
Spreader
Support

59
Chapter 4 Fresh and Hardened CFRSCC Properties
In this chapter, the test results for the CFRSCC are presented and discussed.
4.1 Materials
Normal (Type I) portland cement, crushed limestone (coarse aggregate, CA), manufactured sand
(fine aggregate, FA), silica fume (SF), HRWR, and tap water (w) were used in this study. The
manufactured sand conformed with the specification OPSS 1002 [18]. Table 1 shows the
physical properties of these materials.
Table 4.1: Physical properties of constituent materials
Material Properties
Normal Portland cement (C) Relative density: 3.15
Crushed limestone coarse aggregate (CA) Maximum aggregate size: 10 mm
Saturated surface-dry based relative density: 2.74
Absorption: 1.13%
Moisture content: 0.393%
Manufactured concrete sand (FA) Relative density : 2.68
Absorption: 1.15%
Moisture content: 0.144%
Pitch-based carbon fibers (CF) Relative density: 1.85
Tensile strength: 1770 MPa
Tensile modulus: 180 MPa
Length: 10 mm
Diameter: 17 μm
High-range water reducer (HRWR) Relative density: 1.064
Solid content: 33%
Silica fume (SF) Relative density: 2.2
Normal tap water (W) Total solids: 430 mg/L
Density at 24 °C: 997.28 kg/m3
60
4.1.1 Physical properties of coarse aggregates (stone)
Table 4.1 shows the test results of the physical properties of the coarse aggregates. The relative
density of the coarse aggregate was determined based on the saturated surface dry condition as
2.74. The relative density for the natural stones should be in the range of 2.4 to 2.9. The
absorption of the stone was 1.13% which is in the acceptable range of 0.5 to 4.5 %. Therefore,
the stone has met the relative density and absorption requirements, so the stone can be used in
the concrete mixture. The absorption of the stone is close to the minimum limits that mean less
water would be added to the concrete.
4.1.2 Grading of coarse aggregate
Figure 4.1 shows the coarse aggregate grading. The sieve analysis was used to determine the
grading. 10 mm was the maximum aggregate size as obtained from Figure 5.1. The coarse
aggregate grading was located in between the ASTM upper and lower limits. The figure shows
that the coarse aggregate is very well graded which leads to fewer voids in the concrete mixture.
4.1.3 Physical properties of fine aggregate (sand)
The sand relative density was 2.68 as seen from Table 4.1. The most natural aggregates relative
density is usually in the range of 2.4 to 2.9. The relative density of the sand is less than the
relative density of the stone, which means that the stone is heavier than the sand. In addition, the
absorption of the sand was 1.15% which is within the acceptable range of 0.2 to 3 %. The value
of 1.15 % is close to the minimum value of the sand which means less water would be absorbed
by the sand during mixing. Evaporable moisture content also was obtained under the lab
condition environment as 0.144 %.

61
0
20
40
60
80
100
1.18 2.36 4.75 9.5 12.5
Per
cen
t p
ass
ing
(%
)
Sieve size (mm)
Figure 4.1 Coarse aggregate gradation (ASTM C33/C33M-08 2009)
4.1.4 Grading of fine aggregate
Figure 4.2 shows the fine aggregate grading. The sieve analysis was used to determine the
grading of fine aggregate. The fine aggregate grading was within the limits of ASTM and the
sand was very well graded which leads to fewer voids. As it is stated in the design and control of
concrete mixture “the amount of fine aggregate passing the 300 μm (No.50) and the 150 μm (No.
100) sieves affect the workability, and bleeding of concrete; therefore, most of the specifications
suggest that the passing aggregate through No.300 sieve should be between 5 to 30%”. As it can
be seen from Figure 4.2 that the amounts of fine aggregates that passed through the No. 300
sieve was 20% which is within the acceptable range.
Upper limit
Lower limit

62
Figure 4.2 Fine aggregate gradation (OPSS 1002)
4.1.5 Sand / aggregate ratio
As can be seen from the Figure 4.3, the bulk density of the aggregate blends increased as the fine
aggregate / coarse + fine aggregate (FA / (CA+FA)) ratio was increased up to 0.55. After this
point the curve started to drop. The bulk density started from 1960 Kg/m3 at 0.35 FA / (CA+FA)
ratio, and it increased to the maximum bulk density of 2050 Kg/m3
at 0.55 FA / (CA+FA) ratio.
After the bulk density reached the maximum value, the curve started to drop until it reached
2030 kg/m3 at 0.65 FA / (CA+FA) ratio. From the curve, it is clear that the optimum sand to
aggregate ratio is 0.55 within the highest bulk density of 2050kg/m3. This means that the
maximum bulk density of 0.55 for the sand to aggregate ratio had less voids than the other bulk
density of blends of aggregate.
0
20
40
60
80
100
0.075 0.15 0.3 0.6 1.18 2.36 4.75 9.5
Per
cen
t p
ass
ing
(%
)
Sieve size (mm)
Upper limit
Lower limit

63
Figure 4.3 Relationship between bulk density and sand to aggregates ratio (FA/(CA+FA)).
4.2 Fresh properties of CFRSCC mixtures
The slump flow, the J-ring slump, and the segregation index were measured simultaneously for
each mixture to determine the filling ability, passing ability, and segregation of the SCC. In
addition, air content and unit weight were determined. The following sections present these
results.
1900
1920
1940
1960
1980
2000
2020
2040
2060
0.35 0.4 0.45 0.5 0.55 0.6 0.65
Bu
lk d
en
sity
(K
g/
m3)
FA/(CA+FA)
Bulk density

64
0
100
200
300
400
500
600
700
800
900
0 0.25 0.5 0.75 1
Slu
mp
flo
w (
mm
)
Carbon fibers (%)
W/B=0.35
W/B=0.40
4.2.1 Filling ability
The filling ability was measured with respect to slump flow and T50 slump flow time. The effect
of carbon fibers on the slump, slump flow and T50 slump flow are plotted in Figures 4.4, 4.5, and
4.6 respectively. The slump for the CFRSCC mixtures was between 250 and 280 mm as shown
in Figure 4.4. These values of the slump are in the range of SCC required values (Ferraris et al.
2000).
Figure 4.4 Effect of carbon fibers content on the slump of CFRSCC
Carbon fibers greatly affected the slump flow for CFRSCC. This is because, as the fiber volume
increases, the interaction between carbon fibers can restrict the flowing ability in SCC (Nehdi et
al. 2004). As shown in Figure 4.5, the slump flow values for the mixtures varied from 550 mm to
745 mm. The slump flow for SCC ranges from 550 mm to 850 mm (Ferraris et al. 2000,
Grünewald et al. 2004 and Schutter 2005). Mixtures M5 and M10 had 1% carbon fibers by
0
50
100
150
200
250
300
0 0.25 0.5 0.75 1
Slu
mp
(m
m)
Carbon fibers (%)
W/B=0.35
W/B=0.40

65
0
100
200
300
400
500
600
700
800
900
0 0.25 0.5 0.75 1
Slu
mp
flo
w (
mm
)
Carbon fibers (%)
W/B=0.35
W/B=0.40
volume which is the highest amount of fibers used in the present study; these two mixtures
successfully fulfilled the slump flow requirements of SCC. However, mixtures M5 and M10
required a higher HRWR dosage than the rest of the mixtures to achieve the target slump flow of
SCC. This is because the flowing ability of the concrete was significantly reduced in these two
mixtures due to the higher volume of carbon fibers. A higher HRWR dosage was needed to
improve the flowing ability of CFRSCC mixtures. Increased HRWR dosage increases the
deformability of concrete to achieve the target flowing ability (EFNARC 2002).
Figure 4.5 Effect of carbon fibers content on the slump flow of CFRSCC
Upper limit Lower limit

66
0
5
10
15
20
25
30
35
0 0.25 0.5 0.75 1
T5
0 s
lum
p f
low
(s)
Carbon fibers (%)
W/B=0.35
W/B=0.40
Mixtures M1 and M6 (0% carbon fibers) showed higher deformability than the other CFRSCC
mixes with respect to T50 slump flow time. Figure 4.6 shows the effect of carbon fibers on the T50
slump flow time. T50 slump flow time increased with higher volume of carbon fibers because the
inclusion of fibers makes CFRSCC mixture more viscous, and thus slows the flow of concrete.
T50 slump flow time for the mixtures without and with carbon fibers varied from 2.4 to 30
seconds. The T50 slump flow time of SCC is typically 2-7 seconds (EFNARC 2002 and Khayat
2000). Hence, the T50 slump flow time results for M9 and M10 mixtures did not meet the
requirements for SCC. HRWR played a very significant role in improving the workability SCC
mixture whereas carbon fibers decreased concrete workability. Therefore, finding the optimum
balance between the amount of carbon fibers and the dosage of HRWR is important for mixtures
to be successful in meeting the requirements for SCC fresh properties.
Figure 4.6 Effect of carbon fibers content on the T50 slump flow time of CFRSCC
Upper limit
Lower limit

67
0
50
100
150
200
250
300
0 0.25 0.5 0.75 1
J-r
ing s
lum
p (
mm
)
Carbon fibers (%)
W/B=0.35
W/B=0.40
4.2.2 Passing ability
The J-ring slump flow test was used to measure the passing ability of the mixtures. As shown in
Figure 4.7, the J-ring slump for CFRSCC varied between 250 to 275 mm. These values of J-ring
slump are similar to the slump values reported by Ferraris et al. (2000). The limits of J-ring
slump for SCC are between 250 and 280 mm.
Figure 4.7 Effect of carbon fibers content on the J-ring slump of CFRSCC
As shown in Figure 4.8, the J-ring slump flow of different CFRSCC mixtures varied from 477.5
to 730 mm. It was generally lower than the slump flow.
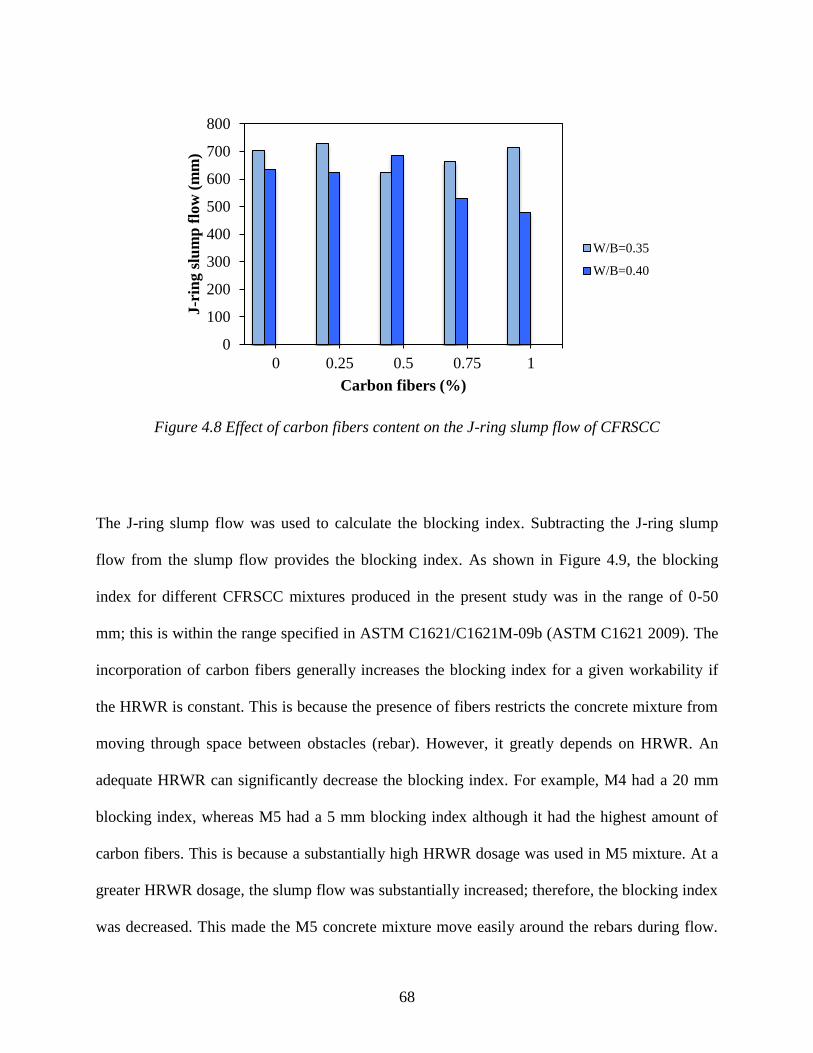
68
0
100
200
300
400
500
600
700
800
0 0.25 0.5 0.75 1
J-r
ing s
lum
p f
low
(m
m)
Carbon fibers (%)
W/B=0.35
W/B=0.40
Figure 4.8 Effect of carbon fibers content on the J-ring slump flow of CFRSCC
The J-ring slump flow was used to calculate the blocking index. Subtracting the J-ring slump
flow from the slump flow provides the blocking index. As shown in Figure 4.9, the blocking
index for different CFRSCC mixtures produced in the present study was in the range of 0-50
mm; this is within the range specified in ASTM C1621/C1621M-09b (ASTM C1621 2009). The
incorporation of carbon fibers generally increases the blocking index for a given workability if
the HRWR is constant. This is because the presence of fibers restricts the concrete mixture from
moving through space between obstacles (rebar). However, it greatly depends on HRWR. An
adequate HRWR can significantly decrease the blocking index. For example, M4 had a 20 mm
blocking index, whereas M5 had a 5 mm blocking index although it had the highest amount of
carbon fibers. This is because a substantially high HRWR dosage was used in M5 mixture. At a
greater HRWR dosage, the slump flow was substantially increased; therefore, the blocking index
was decreased. This made the M5 concrete mixture move easily around the rebars during flow.
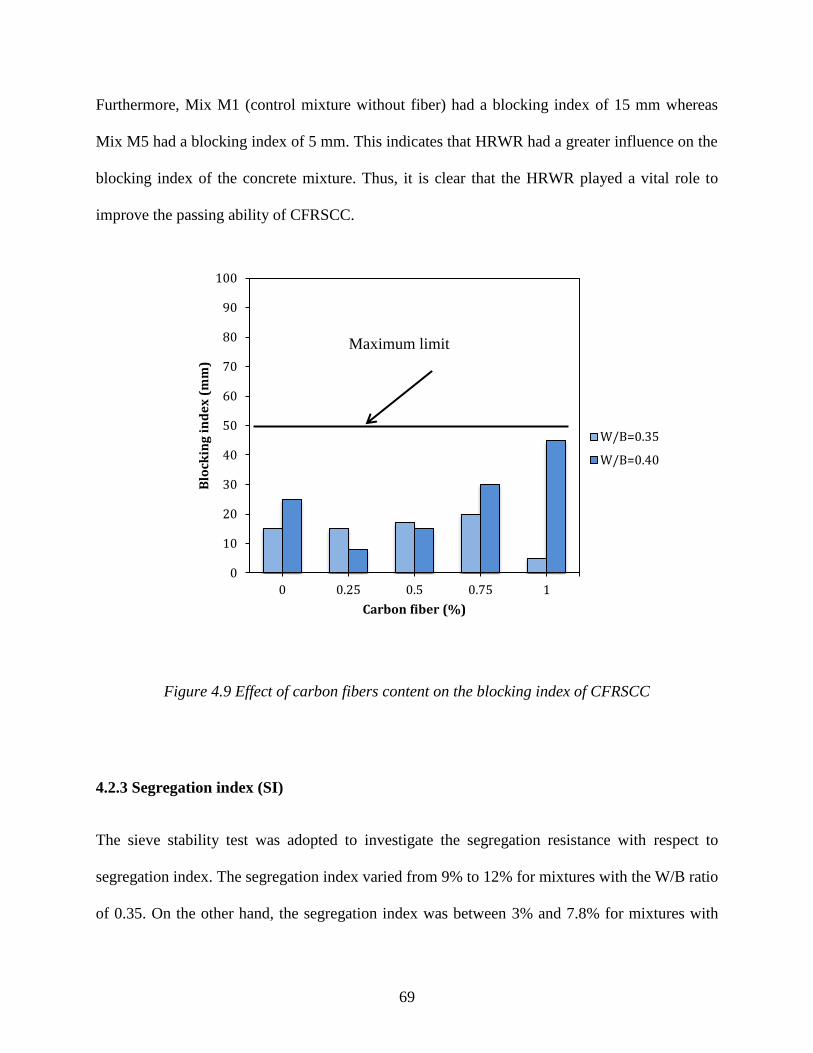
69
0
10
20
30
40
50
60
70
80
90
100
0 0.25 0.5 0.75 1
Blo
ckin
g i
nd
ex
(m
m)
Carbon fiber (%)
W/B=0.35
W/B=0.40
Furthermore, Mix M1 (control mixture without fiber) had a blocking index of 15 mm whereas
Mix M5 had a blocking index of 5 mm. This indicates that HRWR had a greater influence on the
blocking index of the concrete mixture. Thus, it is clear that the HRWR played a vital role to
improve the passing ability of CFRSCC.
Figure 4.9 Effect of carbon fibers content on the blocking index of CFRSCC
4.2.3 Segregation index (SI)
The sieve stability test was adopted to investigate the segregation resistance with respect to
segregation index. The segregation index varied from 9% to 12% for mixtures with the W/B ratio
of 0.35. On the other hand, the segregation index was between 3% and 7.8% for mixtures with
Maximum limit
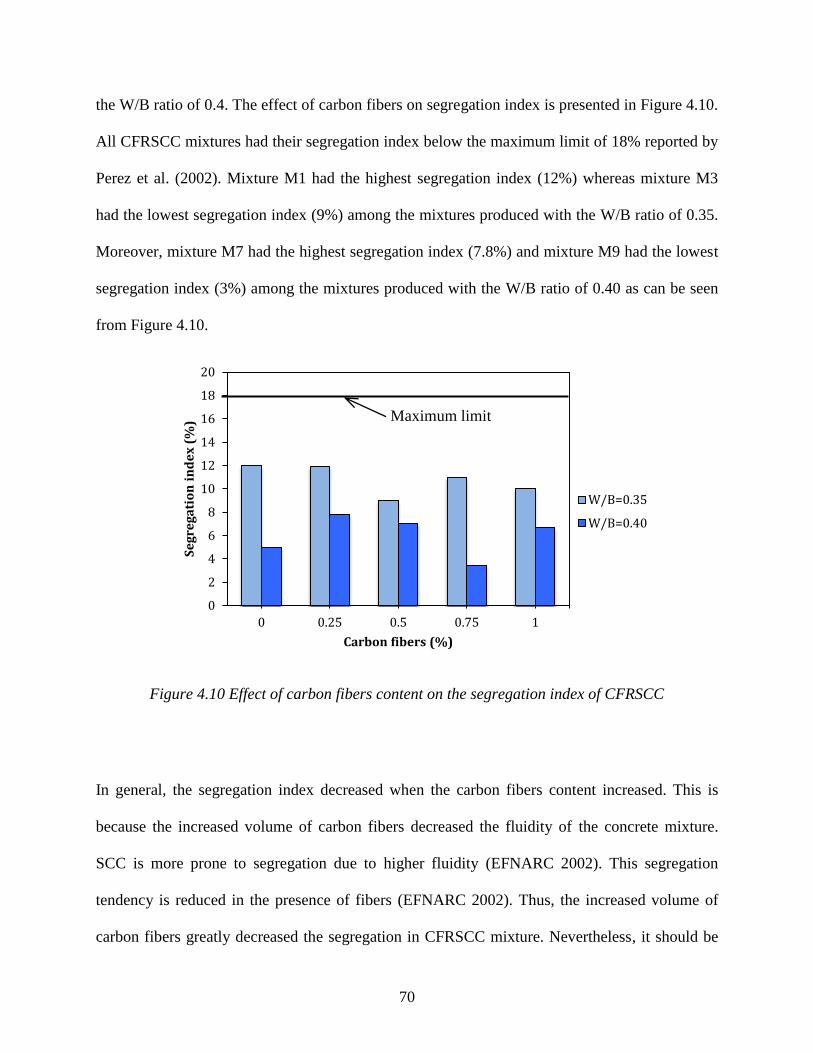
70
0
2
4
6
8
10
12
14
16
18
20
0 0.25 0.5 0.75 1
Se
gre
ga
tio
n i
nd
ex
(%
)
Carbon fibers (%)
W/B=0.35
W/B=0.40
the W/B ratio of 0.4. The effect of carbon fibers on segregation index is presented in Figure 4.10.
All CFRSCC mixtures had their segregation index below the maximum limit of 18% reported by
Perez et al. (2002). Mixture M1 had the highest segregation index (12%) whereas mixture M3
had the lowest segregation index (9%) among the mixtures produced with the W/B ratio of 0.35.
Moreover, mixture M7 had the highest segregation index (7.8%) and mixture M9 had the lowest
segregation index (3%) among the mixtures produced with the W/B ratio of 0.40 as can be seen
from Figure 4.10.
Figure 4.10 Effect of carbon fibers content on the segregation index of CFRSCC
In general, the segregation index decreased when the carbon fibers content increased. This is
because the increased volume of carbon fibers decreased the fluidity of the concrete mixture.
SCC is more prone to segregation due to higher fluidity (EFNARC 2002). This segregation
tendency is reduced in the presence of fibers (EFNARC 2002). Thus, the increased volume of
carbon fibers greatly decreased the segregation in CFRSCC mixture. Nevertheless, it should be
Maximum limit

71
mentioned that HRWR also affected the segregation index of concretes produced in the present
study. HRWR significantly improves the flowing ability of CFRSCC by enhancing its fluidity,
which affects the segregation index. For example, M4 and M5 required a very high dosage of
HRWR, which is 6.7% and 8%, respectively. These high dosages of HRWR increased the
segregation index for these two mixtures. Therefore, the effect of carbon fibers in reducing
segregation index was counter balanced in these two cases in the presence of a higher HRWR
dosage.
4.2.4 Visual stability
Visual stability index (VSI) of CFRSCC mixtures was obtained from the slump flow test. The
photos of slump flow patty for all concrete mixtures are shown in Figures 4.11 to 4.15. The
concrete mixtures were in the highly stable state (VSI = 0) to stable state (VSI = 1). As it can be
seen from Figure 11, mixtures M1 and M6 were homogenous and showed no evidence of
segregation or bleeding; hence, they were highly stable (VSI = 0). Similarly, mixture M5 was
highly stable (VSI = 0), as shown in Figure 15. Also, it can be seen from Figure 12 that mixture
M2 showed very slight bleeding and mixture M7 showed negligible coarse aggregate
concentration at the middle of the flow; therefore, they were designated as the moderately stable
concrete mixtures (VSI = 0.5). Mixtures M8 and M4 were moderately stable with no evidence of
bleeding but with negligible coarse aggregate concentration or a very small mortar halo (VSI =
0.5) whereas mixtures M3, M9, and M10 were stable with slight bleeding as sheen on the surface
and a small mortar halo (VSI = 1), as shown in Figures 13 to 15. In summary, the observation of
the photos of slump flow patty revealed that all mixtures passed the VSI requirements of SCC.

72
a) Mix M1: VSI = 0 (highly stable); no evidence of bleeding, mortar halo, and aggregate piling.
b) Mix M6: VSI = 0 (highly stable); negligible coarse aggregate concentration at the middle of
the flow patty but no evidence of bleeding and mortar halo.
Figure 4.11 Visual stability index (VSI) of M1 and M6 concrete mixtures
M1
W/B: 0.35
CF = 0%
M6
W/B: 0.40
CF = 0%

73
a) Mix M2: VSI = 0.5 (moderately stable); very slight bleeding and a very small mortar halo < 5
mm.
b) Mix M7: VSI = 0.5 (moderately stable); negligible coarse aggregate concentration at the
middle of the flow patty and a very small mortar halo < 5 mm.
Figure 4.12 Visual stability index (VSI) for M2 and M7 mixtures
M2
W/B: 0.35
CF = 0.25%
M7
W/B: 0.40
CF = 0.25%

74
a) Mix M3: VSI = 1 (stable); concrete shows slight bleeding as a sheen on the surface and a
small mortar halo < 10 mm.
b) Mix M8: VSI = 0.5 (moderately stable); no evidence of bleeding and mortar halo mortar but
negligible coarse aggregate concentration at the middle of the flow patty.
Figure 4.13 Visual stability index (VSI) for M3 and M8 mixtures
M3
W/B: 0.35
CF = 0.50%
M8
W/B: 0.40
CF = 0.50%

75
a) Mix M4: VSI = 0.5 (moderately stable); no evidence of bleeding but negligible coarse
aggregate concentration at the middle of the flow patty and a very small mortar halo < 5 mm.
b) Mix M9: VSI = 0.5 (moderately stable); concrete shows very slight bleeding as a sheen on the
surface and a very small mortar halo < 5 mm.
Figure 4.14 Visual stability index (VSI) for M4 and M9 mixtures
M4
W/B: 0.35
CF = 0.75%
M9
W/B: 0.40
CF = 0.75%

76
a) Mix M5: VSI = 0 (highly stable); no evidence of bleeding, mortar halo, and aggregate piling.
b) Mix M10: VSI = 1 (stable); concrete shows very slight bleeding as a sheen on the surface and
a very small mortar halo < 10 mm.
Figure 4.15 Visual stability index (VSI) for M5 and M10 mixtures
M10
W/B: 0.4
CF = 1%
M5
W/B: 0.35
CF = 1%

77
4.2.5 Air content and unit weight
The air content of the CFRSCC mixtures was 1.4 to 3.5%, as shown in Figure 4.16. The concrete
mixtures were designed to be non-air entrained with an entrapped air content of 2% [25]. The air
content results indicate that carbon fibers did not cause any significant air entrapment. This is
attributed to the high flowing ability of the concrete. However, the overall entrapped air content
of the concretes produced with the W/B ratio of 0.35 was relatively low, as compared to the
concretes fabricated with the W/B ratio of 0.40. This is because the concretes with the W/B ratio
of 0.35 possessed a higher flowing ability, as can be seen from Figure 4.5. The increased flowing
ability facilitated the release of entrapped air-voids from concrete.
The unit weights of the CFRSCC mixtures are shown Figure 4.17. The unit weight varied in the
range of 2360 to 2460 kg/m3. The unit weight decreased as the carbon fibers increased; the
reason is that carbon fibers were the lightest component in the concrete mixtures.

78
Figure 4.16 Effect of carbon fibers content on the entrapped air content of CFRSCC
Figure 4.17 Effect of carbon fibers content on the unit weight of CFRSCC
0
1
2
3
4
5
6
7
8
0 0.25 0.5 0.75 1
En
tra
pp
ed
air
co
nte
nt
(%)
Carbon fibers content (%)
W/B=0.35
W/B=0.40
2300
2350
2400
2450
2500
2550
2600
0 0.25 0.5 0.75 1
Un
it w
eig
ht
(kg
/m
3)
Carbon fibers content (%)
W/B=0.35
W/B=0.40

79
4.3 Hardened properties of CFRSCC mixtures
Compressive strength, tensile strength, and flexural strength were evaluated in this research
study. The following sections present the test results.
4.3.1 Compressive strength results
The compressive strength test results for the CFRSCC mixtures after 3, 7, 14, and 28 days are
summarized in Figures 4.18 and 4.19. The compressive strength values are the average results of
three cylinders (dimension 100 mm by 200 mm) and were tested in accordance with ASTM
C39/C39M – 09a. As it can be seen from Figure 4.18, the compressive strength for all mixes
with 0.35 W/B ratio decreased as the carbon fibers increased. This is because the carbon fibers
replaced some of the coarse and fine aggregates. Mix M1 achieved a compressive strength of
95MPa after 28 days, which was the highest compressive strength value while mix M4 had a
compressive strength of 60.2MPa after 28 days, which is the lowest compressive strength as it
can be seen from Figure 4.18. Also, the compressive strength of all mixes with 0.40 W/B ratio
decreased as the carbon fibers increased. The reason behind this reduction was the replacement
between aggregates and carbon fibers. However, the higher W/B ratio led to a reduced
compressive strength of all mixes at 28 days. The highest compressive strength was for mix M6
at 80MPa and the lowest compressive strength was for mix M9 at 39MPa.

80
Figure 4.18 Effect of carbon fiber content on the compressive strength for mixes with 0.35 W/B
ratio
Figure 4.19 Effect of carbon fiber content on the compressive strength for mixes with 0.40 W/B
ratio
0
10
20
30
40
50
60
70
80
90
100
3 days 7 days 14 days 28 days
Co
mp
ress
ive
str
en
gth
(M
Pa
)
Age
M1
M2
M3
M4
M5
0
10
20
30
40
50
60
70
80
90
100
3 days 7 days 14 days 28 days
Co
mp
ress
ive
str
en
gth
(M
Pa
)
Age
M6
M7
M8
M9
M10

81
4.3.1.1 Effect of carbon fiber content on compressive strength
As can be seen from Figures 4.18 and 4.19 the compressive strength decreased as the carbon
fiber content increased. The compressive strength dropped from 90MPa for mix M1 (0% fibers
content) to 64MPa for mix M2 (0.25% fiber content). However, the compressive strength slightly
decreased as the fiber content increased. For instance, mix M2 (0.25% fibers content) had a
compressive strength of 64MPa while mix M5 (1% fibers content) had a compressive strength of
62MPa, which is a negligible reduction in compressive strength. It seems that for the lower W/B
ratio of 0.35 the fiber content had no significant effect on the compressive strength as shown in
Figure 4.18. On the other hand, for mixes M6 to M10, the fiber content had a significant effect
on compressive strength as can be seen from Figure 4.19. The compressive strength decreased as
the fibers content increased. The compressive strength for M6 (0% fibers content) was 80MPa
while the compressive strength for mix M10 (1% fibers content) was 48MPa as it can be seen
from Figure 4.19.
4.3.1.2 Effect of water binder ratio (W/B) on compressive strength
W/B ratio significantly affected the compressive strength. It is clear from Figure 4.20 that as the
W/B ratio decreased the compressive strength increased. The maximum compressive strength of
mixes with W/B ratio of 0.35 with 0% fiber contnet was 95MPa while the maximum
compressive strength of mixes W/B ratio of 0.40 with 0% fiber content was 80MPa. The
compressive strength dropped by 15% as W/B ratio increased from 0.35 to 0.40. The
compressive strength is related to the reduction in porosity of the concrete. The porosity of
CFRSCC mixtures was reduced as the W/B ratio decreased. As evident from Figure 4.16 the
entrapped air for mixes 1 to 5, which had a W/B ratio of 0.35 was lower than that for mixes M6

82
to M10, which had a W/B ratio of 0.40. At the lower W/B ratio, the cement content was lower as
given in Table 3.2. As Safiuddin (2010) stated that the cement content enhanced the bundles of
aggregates and increased the amount of calcium silicate hydrate (C–S–H) that led to a higher
compressive strength.
Figure 4.20 Effect of water binder ratio (W/B) on compressive strength (0% fiber content)
4.3.2 Splitting tensile strength results
The splitting tensile strength for the CFRSCC mixtures is presented in Figures 4.21 and 4.22.
The splitting tensile strength was tested after 14 and 28 days in accordance with ASTM
C496/C496M – 04 standard. The test procedure was explained in section 3.6.3. Figure 4.21
shows that the splitting tensile strength increased as the carbon fibers content increased for
CFRSCC mixes with W/B = 0.35. Mix M1 (0% fibers content) had a tensile strength of 4.20MPa
while Mix M5 (1% fibers content) had a tensile strength of 4.80MPa. The splitting tensile
strength for mix M6 (0% fibers content) was 4.10MPa and the splitting tensile strength for mix
63.4
74.5
86.2
95
45.5
59.3
77 80
0
20
40
60
80
100
3 days 7 days 14 days 28 days
Com
pre
ssiv
e st
ren
gth
(M
Pa
)
Age
W/B=0.35
W/B=0.40

83
M10 (1% fibers content) was 4.70MPa as presented in Figure 4.22 for CFRSCC mixes with W/B
= 0.40. The splitting tensile strength increased up to about 12% at 1% of carbon fibers content.
Figure 4.21 Effect of carbon fibers content on the splitting tensile strength for mixes with 0.35
W/B ratio
Figure 4.22 Effect of carbon fibers content on the splitting tensile strength for mixes with 0.40
W/B ratio
0
1
2
3
4
5
6
0 0.25 0.5 0.75 1
Sp
litt
ing
ten
sile
str
eng
th (
MP
a)
Carbon fiber content (%)
14 days
28 days
0
1
2
3
4
5
6
0 0.25 0.5 0.75 1
Sp
litt
ing
ten
sile
str
ength
(M
Pa)
Carbon fiber content (%)
14 days
28 days

84
4.3.2.1 Effect of carbon fiber content on splitting tensile strength
Figures 4.21 and Figure 4.22 show the effect of carbon fibers on the splitting tensile strength. It
can be seen from Figures 4.21 and 4.22 that as the carbon fibers increased the splitting tensile
strength increased. For example, the splitting tensile strength for mixes M1, M2, and M5 was
4.40MPa, 4.45MPa, and 4.80MPa, respectively. It is discussed that increase in splitting tensile
strength was because the percentage of carbon fibers reduced the crack growing and led to higher
failure loads. Once the load was applied, the cracks started to appear and the concrete cylinder
started to split in two parts. The fibers created a bridge through the split portions of the cylinder
and delayed the splitting of the two parts. The stresses were transferred from the concrete to the
fibers through the fiber bridging.
4.3.2.2 Effect of water binder ratio (W/B) on splitting tensile strength
W/B ratio had no significant effect on the splitting tensile strength as shown in Figure 4.23. The
splitting tensile strength for mix M1 (0% fibers content) was 4.30MPa while the splitting tensile
strength for mix M6 (0% fibers content) was 4.20MPa. Also, the splitting tensile strength for mix
M5 (1% fibers content) was 4.80MPa while the splitting tensile strength for mix M10 (1% fibers
content) was 4.70MPa. The differences in tensile strength between the mixes with W/B ratio =
0.35 and the mixes with W/B ratio = 0.40 was between 0.20 and 0.10MPa. It is clear from Figure
4.23 that the W/B ratio did not significantly affect the splitting tensile strength of CFRSCC
mixes. Since the splitting tensile strength is related to compressive strength; as the W/B ratio
increased the splitting tensile strength decreased.

85
Figure 4.23 Effect of water binder ratio (W/B) on splitting tensile strength
4.3.3 Modulus of rupture
The flexural strength test (modulus of rupture) results for prisms made from the CFRSCC
mixtures are summarized in Figure 4.24 and Figure 4.25. As it can be seen from Figure 4.24, the
modulus of rupture for all mixes with 0.35 W/B ratio ranged between 7.60MPa and 8.05MPa.
Mix M5 (1% fibers content) had the highest modulus of rupture, while mix M3 (0.5% fibers
content) had the lowest modulus of rupture. Carbon fibers increased the modulus of rupture of
the CFRSCC mixtures because they were able to reduce the crack opening. The number of fibers
that crossed the crack or failure surface also affected the modulus of rupture. However, for
CFRSCC mixes with 0.40 W/B ratio, the modulus of rupture ranged between 6.68MPa and
8.40MPa as it can be seen from Figure 4.25. Mix M7 (0.25% fibers content) had the highest
modulus of rupture, while mix M8 (0.5% fibers content) had the lowest modulus of rupture. It is
evident that a carbon fiber content of 0.25% or 0.75% gave the optimum modulus of rupture for
4.19
4.3
4.09
4.2
4
4.05
4.1
4.15
4.2
4.25
4.3
4.35
14 Days 28 Days
Sp
litt
ing
te
nsi
le s
tre
ng
th (
MP
a)
Age
W/B=0.35
W/B=0.40

86
7.7 7.98
7.6 8 8.05
0
1
2
3
4
5
6
7
8
9
10
0 0.25 0.5 0.75 1
Mod
ulu
s o
f ru
ptu
re f
r (M
Pa
)
Fiber content (%)
0.35 W/B
the CFRSCC mixtures with W/B = 0.35 and 0.40. These results are unexpected results; thus,
more specimens and tests are required to justify the results. No trend is absorbed from the test
results.
Figure 4.24 Modulus of rupture for CFRSCC mixtures with 0.35 W/B ratio
Figure 4.25 Modulus of rupture of CFRSCC mixtures with 0.40 W/B ratio
8.29 8.4
6.68
8.15 7.87
0
1
2
3
4
5
6
7
8
9
10
0 0.25 0.5 0.75 1
Mo
du
lus
of
rup
ture
fr
(MP
a)
Fiber content (%)
0.40 W/B

87
4.3.4 Load deflection response of CFRSCC mixtures
Figure 4.26 and Figure 4.27 show the load deflection response for each fracture toughness
specimen. The deflection data were calculated from the average of two LVDTs. The load
deflection curves consisted of a linear curve up to the peak load and then the curve dropped
gradually until the load reached zero. Mix M1 (0% fibers content) had a brittle post-peak
response with maximum mid-span deflection less than 0.4 mm. Mixes M2 to M5 had a slightly
better post-peak response with maximum mid-span deflection less than 0.7 mm. However, the
post-peak response for each mixture with 0.40 W/B ratio was identical with maximum mid-span
deflection of 0.7mm. Most of the mixes did not reach a deflection of 1/150 in accordance to
ASTM C1609 possibly because of the short fibers used. The displacement at the peak load was
identical with mid-span deflections of 0.06mm for all mixes with 0.35 and 0.40 W/B ratio.

88
a) Load vs. net deflection of Mix M1 b) Load vs. deflection of Mix M2
c) Load vs. net deflection of Mix M3 d) Load vs. net deflection of mix M4
e) Load vs. net deflection of Mix M5
Figure 4.26 Load vs. deflection of concrete mixtures of 0.35 W/B ratio
0
5000
10000
15000
20000
25000
0 0.2 0.4 0.6
Axia
l lo
ad
(N
)
Net deflection (mm)
0
5000
10000
15000
20000
25000
0 0.2 0.4 0.6
Axia
l lo
ad
(N
)
Net deflection (mm)
0
5000
10000
15000
20000
25000
0 0.2 0.4 0.6
Axia
l L
oa
d (
N)
Net deflection (mm)
M1 (0% fibers)
W/B = 0.35
0
5000
10000
15000
20000
25000
0 0.2 0.4 0.6
Ax
ial
loa
d (
N)
Net deflection (mm)
0
5000
10000
15000
20000
25000
0 0.2 0.4 0.6
Axia
l lo
ad
(N
)
Net deflection (mm)
M2 (0.25% fibers)
W/B = 0.35
M3 (0.50% fibers)
W/B = 0.35
M4 (0.75% fibers)
W/B = 0.35
M5 (1% fibers)
W/B = 0.35

89
a) Load vs. net deflection of Mix M6 b) Load vs. net deflection of Mix M7
c)
Load vs. net deflection of mix M8 d) Load vs. net deflection of M9
e) Load vs. net deflection of Mix M10
Figure 4.27 Load vs. deflection of concrete mixtures of 0.40 W/B ratio
0
5000
10000
15000
20000
25000
0 0.2 0.4 0.6
Axia
l lo
ad
(N
)
Net deflection (mm)
0
5000
10000
15000
20000
25000
0 0.2 0.4 0.6
Ax
ial
loa
d (
N)
Net deflection (mm)
0
5000
10000
15000
20000
25000
0 0.5 1
Axia
l lo
ad
(N
)
Net deflection (mm)
0
5000
10000
15000
20000
25000
0 0.2 0.4 0.6
Axia
l lo
ad
(N
)
Net deflection (mm)
0
5000
10000
15000
20000
25000
0 0.2 0.4 0.6
Axia
l lo
ad
(N
)
Net deflection (mm)
M6 (0% fibers)
W/B = 0.40
M8 (0.50% fibers)
W/B = 0.40 M8 (0.75% fibers)
W/B = 0.40
M8 (1% fibers)
W/B = 0.40
M7 (0.25% fibers)
W/B = 0.40

90
4.3.5 Toughness (fracture energy) and the effect of carbon fibers
Figure 4.28 and Figure 4.29 show the toughness for each CFRSCC mixture. The toughness is
calculated as the area under the load-deflection curves presented in section 4.3.4. The toughness
of mixes with 0.35 W/B ratio ranged between 3895 N-mm and 2475 N-mm. The carbon fibers
increased the toughness of fracture energy. The carbon fibers helped the concrete mixtures to
absorb more energy as it can be seen from Figure 4.28 and as such mixes with carbon fibers had
improved toughness. Mix M2 (0.25% fibers content) had the highest toughness of 3895 N-mm,
while mix M1 (0%fibers content) had the lowest toughness of 2475 N-mm. Mixes M3 to M5
with carbon fiber content of 0.5% to 1% had similar toughness regardless of the fiber content.
The toughness achieved by these mixes was 31% higher than the control mix (with no fibers),
but 20% lower than the mix with 0.25% fibers. These results suggest that the optimum fiber
content has been reached.
Figure 4.28 Toughness of mixtures with 0.35 W/B ratio
2475
3895
3245 3250 3255
0
500
1000
1500
2000
2500
3000
3500
4000
4500
0 0.25 0.5 0.75 1
To
ug
hn
ess
(N-m
m)
Fiber content (%)
0.35 W/B

91
The toughness values for CFRSCC mixes with 0.40 W/B ratio ranged between 3670 N-mm and
2710 N-mm as seen from Figure 4.29. However, an opposite trend was observed in comparison
to mixes with W/B of 0.35. Mix M6 (0% fibers content) had the highest toughness, while mix
M10 (1%fibers content) had the lowest toughness. It was very hard to achieve the fresh
properties of mix M10; thus, the toughness was affected. However, mix M9 (0.75% fiber
content) had 3400 N-mm. This value was close to the toughness value of mix M6. Therefore, at
higher W/B ratios 0f 0.40, the presence of carbon fibers did not improve the toughness of the
CFRSCC mixtures.
Figure 4.29 Toughness of mixtures with 0.40 W/B ratio
3670 3750
2840
3420
2710
0
500
1000
1500
2000
2500
3000
3500
4000
4500
0 0.25 0.5 0.75 1
Tou
gh
nes
s (N
-mm
)
Fiber content (%)
0.40 W/B

92
4.3.6 Scanning electron microscope (SEM)
The scanning electron micrographs (SEMs) of the fracture surface for the different CFRSCC
fracture energy specimens are shown in Figures 4.30 to 4.34. In these figures, the magnification
used was mostly ×100. Figures 4.30 to 4.34 show the fracture surface of each CFRSCC mixture.
The micrographs exhibited that the carbon fibres were well distributed in each concrete mixture.
a) Mix M1: SEM of fracture surface shows no fibers.
b) Mix M6: SEM of fracture surface shows no fibers.
Figure 4.30 Scanning electron micrographs of M1 and M6 mixtures
M1
W/B: 0.35
CF = 0%
M6
W/B: 0.40
CF = 0%

93
a) Mix M2: SEM of fracture surface shows good distributed fibers.
b) Mix M7: SEM of fracture surface shows good distributed fibers.
Figure 4.31 Scanning electron micrographs of M2 and M7 mixtures
M2
W/B: 0.35
CF = 0.25%
M7
W/B: 0.40
CF = 0.25%

94
a) Mix M3: SEM of fracture surface shows good distributed fibers.
a) Mix M8: SEM of fracture surface shows good distributed fibers.
Figure 4.32 Scanning electron micrographs of M3 and M8 mixtures
M3
W/B: 0.35
CF = 0.50%
M8
W/B: 0.40
CF = 0.50%

95
a) Mix M4: SEM of fracture surface shows good distributed fibers.
b) Mix M9: SEM of fracture surface shows good distributed fibers.
Figure 4.33 Scanning electron micrographs of M4 and M9 mixtures
M4
W/B: 0.35
CF = 0.75%
M9
W/B: 0.40
CF = 0.75%

96
a) Mix M5: SEM of fracture surface shows good distributed fibers.
b) Mix M10: SEM of fracture surface shows good distributed fibers.
Figure 4.34 Scanning electron micrographs of M5 and M10 mixtures
M5
W/B: 0.35
CF = 1%
M10
W/B: 0.40
CF = 1%

97
Chapter 5 Structural Performance of CFRSCC Patch Repaired
Beams
5.1 General
Eleven RC beams were tested to investigate three different repair configurations: a flexural-top
patch, a flexural bottom patch and a shear span patch. Three different repair patch materials were
used. The flexural beams were divided into three groups: the first group had one control beam;
the second group had three beams that were repaired in the compression zone (top patch); and
the third group had three beams that were repaired in the tension zone (bottom patch). The shear
beams had one control beam and three repaired beams that were repaired using three different
patch materials in one shear span. This chapter will present the observed behaviour, failure mode
and load-deflection responses for the different repaired beams.
5.2 Effect of repair material on structural performance of flexural beams
Table 5.1 summarizes the critical stages of the flexural beam results. The individual beam load-
deflection response in terms of the strain in longitudinal reinforcement and strain in top concrete
are shown in Appendix B. The following sections will present and discuss the observed
behaviour, load-deflection behaviour, load-strain behaviour, flexural stiffness, yield load,
ultimate load and ductility for the patch-repaired flexural beams.

98
Table 5.1 Summary of flexural test results
Beam designation
Cracking Yielding Ultimate
Mode of failure Pcr Δcr Py Δy Pu Δu
kN mm kN mm kN mm
Flexural control 23 2 102 8 122 28 Concrete crushing
Fle
xura
l to
p
pat
ch
Sikacrete-08
SCC 23 2 100 10 130 58 Concrete crushing
Mix M1 23 2 103 8 122 43 Concrete crushing
Mix M3 30 2 109 8 130 39 Concrete crushing
Fle
xura
l
bott
om
pat
ch
Sikacrete-08
SCC 23 2 102 9 121 26 Concrete crushing
Mix M1 35 2 103 8 120 34 Concrete crushing
Mix M3 45 2 100 8 115 26 Concrete crushing
5.2.1 Observed flexural behaviour
5.2.1.1 Control beam
The beam was loaded at rate of 1.2mm/min and crack formation was monitored. The first cracks
that appeared were flexural cracks and were located randomly within the constant moment
region at a load of 23kN. As the load increased, the shear cracks started to appear between the
point loading and the support, meanwhile the flexural cracks started to become wider and
extended to the compression zone. As the load continued to increase, the flexural and shear
cracks increased. When the load reached 122kN, which is the ultimate load, the cracks at the
compression zone developed and the concrete crushed. The failure mode of the beam was by
concrete crushing in the compression zone as shown in Figure 5.1.

99
Figure 5.1 Failure mode for the control beam
5.2.1.2 Beams repaired in tension zone
Figures 5.2 to 5.4 show the observed flexural cracks, shear cracks, and the failure mode in the
bottom-patch repaired beams in tension zone. The first cracks that appeared were the flexural
cracks within the constant moment region at loads of 23kN, 23kN and 30kN for bottom-patch
repaired beams with Sikacrete-08 SCC, mix M1 (SCC, no fibers), and mix M3 (CFRSCC, 0.50%
fibers), respectively. Beyond the cracking load, the shear cracks started to appear between the
point loading and the support, meanwhile the flexural cracks became wider and extended to the
compression zone. As the load continued to increase, the flexural and shear cracks increased. For
the beams that were repaired with Sikacrete-08 SCC and mix M1, the cracks propagated in the
repair material itself and between the old concrete and the repair material at the bond line, but for
the beam that was repaired with mix M3 (CFRSCC, 0.5% fibers) the cracks did not appear
between the old concrete and the repair material. The beams failed when the load reached

100
121kN, 120kN, and 115kN for the repaired beams with Sikacrete-08 SCC, mix M1, and mix M3,
respectively. The concrete in the compression zone was crushed and the beams failed.
Figure 5.2 Failure mode for the bottom-patch repaired beam with Sikacrete-08SCC

101
Figure 5.3 Failure mode for the bottom-patch repaired
beam with M1mixture (SCC, no fibers)
Figure 5.4 Failure mode for the bottom-patch repaired beam with M3 mixture (CFRSCC, 0.50%
fibers)
102
5.2.1.3 Beams repaired in compression zone
Figures 5.5 to 5.7 show the observed flexural cracks, shear cracks, and the failure mode in the
top-patch repaired beams in the compression zone. Flexural cracks appeared first within the
constant moment region at loads of 23kN, 35kN, and 45kN for the top-patch repaired beams with
Sikacrete-08 SCC, mix M1 (SCC, 0 fibers), and mix M3 (CFRSCC, 0.50% fibers), respectively.
Then as loading increased, the shear cracks started to appear between the point loading and the
supports, meanwhile the flexural cracks started to become wider and extended to the
compression zone. As the load continued to increase, the flexural and shear cracks increased. For
the beams that were repaired with Sikacrete-08 SCC and mix M1, a big diagonal crack appeared
and extended from the tension zone towards the compression zone as shown in Figures 5.5 and
5.6. The beams failed when the load reached 130kN, 122kN, and 130kN for the repaired beams
with Sikacrete-08 SCC, mix M1, and mix M3, respectively. In all cases, the old concrete crushed
under the point loading and Sikacrete-08 SCC and mix M1 did not crush. Sikacrete-08 SCC and
mix M1 with stood more load and the stresses at these materials were higher than that of the old
concrete. However, the repaired beam with M3 showed no difference from the control
(unrepaired) beam as shown in Figure 5.7. The failure mode of the beams was concrete crushing
in the compression zone.

103
Figure 5.5 Failure mode for the top-patch repaired beam with Sikacrete-08 SCC
Figure 5.6 Failure mode for the top-patch repaired beam with mix M1 (SCC, no fibers)

104
Figure 5.7 Failure mode for the top-patch repaired beam with mix M3 (CFRSCC, 0.50% fibers)
5.2.2 Load-deflection behaviour
Figure 5.8 and Figure 5.9 show the load-deflection curves for beams repaired in tension and
compression zone, respectively. The load-deflection curves exhibited a tri-linear response with
cracking yield and ultimate stage. Initially, the beams were uncracked and as the load was
increased the tension stress in the bottom concrete exceeded the tensile strength of the concrete
and flexural cracks appeared. The load-deflection curve increased linearly with a lesser slope
until the longitudinal reinforcement yielded. After post yielding, the beam continued to resist the
load at a significantly reduced rate with deflection increasing until the ultimate load. After this
load point, the beam failed by concrete crushing; however, the deflection continued to increase
and the load gradually decreased in the post-peak response. Few differences to note about the

105
response of the repaired vs. control beams (Table 5.1). In case of repair in tension zone (bottom
patch), the cracking loads increased with two repair materials (Mix M1 and Mix M3) versus that
of the control beam. The cracking load was not affected in case of repair in compression zone
(top patch) except with mix M3 versus that of the control beam. The deflection at cracking was
the same for all beams. Patch repair slightly affected the yield load when applied as a top patch
(compression zone), but had no effect on yield load when applied as a bottom patch (tension
zone). The deflection at yield was not affected by patch repair. Patch repair had no effect or a
slightly negative effect on the ultimate load when the repair materials were applied as a bottom
patch (tension zone), but had a positive effect with two repairs (Mix M1 and Mix M3) when
applied as a top patch. Deflection at ultimate was significantly improved with top patch versus
the control beam and no effect or slight improvement was evident with bottom patch versus the
control beam.

106
Figure 5.8 Load vs. deflection curves of the control and bottom flexural repaired beams
Figure 5.9 Load vs. deflection curves of the control and top flexural repaired beams
0
20
40
60
80
100
120
140
0 20 40 60 80 100 120
Lo
ad
(k
N)
Deflection (mm)
Control
Bottom repair
Sikacrete-08 SCCBottom repair M1
(SCC)Bottom repair M3
(CFRSCC)
0
20
40
60
80
100
120
140
0 20 40 60 80 100 120
Lo
ad
(k
N)
Deflection (mm)
Control
Top repair
Sikacrete-08 SCC
Top repair M1
(SCC)
Top repair M3
(CFRSCC)
107
5.2.3 Load-strain behaviour
Figures 5.10 to 5.13 show the load-strain curves of the bottom patch repaired beams. The tensile
strain for the bottom longitudinal reinforcement and the compressive strain for the top concrete
are shown respectively in Figure 5.10 and Figure 5.11 for the bottom patch repaired beams. The
strain values were measured at one section at the middle span of the beams. The strain for the
longitudinal steel and concrete increased, as the load increased. The yield strain value for the
longitudinal steel is 2435 microstrain, the yield strain for the stirrup is 1900 microstrain and the
strain value of the concrete crushing is 3500 microstrain. It is evident from Figure 5.10 and
Figure 5.11 that the strain in the longitudinal steel rebar exceeded the yield strain and that the
strain value in the top concrete reached the crushing strain. However, the strain values in the
stirrups did not reach the yield strain. This means that the longitudinal steel rebar resisted the
applied load.
The load-strain behaviour of the longitudinal steel rebar and top concrete of the bottom patch
repaired beams were slightly different from that of the control beam. Figures 5.12 and 5.13 show
the load-strain curves of the steel rebar and concrete of the top patch repaired beams,
respectively. The strain in the longitudinal steel rebar exceeded the yield strain in all the bottom
patch repaired beams and similar to the control beam. It is evident from Figure 5.13 that the
strain values in the top concrete were different than that of the control beam. The strain values of
the top patch repaired beams were higher than that of the control beam. This increase in strain
values means that the patch materials had higher strength than that of the conventional concrete.

108
Figure 5.10 Load-strain behaviour of the longitudinal steel rebar for the bottom patch repaired
beams vs. control beam
Figure 5.11 Load-strain behaviour of the top concrete for the bottom patch repaired beams vs.
control beam
0
20
40
60
80
100
120
140
0 5000 10000 15000 20000 25000 30000 35000
Lo
ad
(k
N)
Micro-strain (µε)
Control
Bottom repair Sikacrete-08 SCC
Bottom repair M1 (SCC, 0% fibers)
Bottom repair M3 (CFRSCC,0.50% fibers)
0
20
40
60
80
100
120
140
-4000 -3500 -3000 -2500 -2000 -1500 -1000 -500 0
Lo
ad
(k
N)
Micro-strain (µε)
Control
Bottom repaire Sikacrete-08 SCC
Bottom repair M1 (SCC, 0% fibers)
Bottom repair M3 (CFRSCC, 0.50% fibers)

109
Figure 5.12 Load-strain behaviour of the longitudinal steel rebar for the top patch repaired
beams vs. control beam
Figure 5.13 Load-strain behaviour of the top concrete for the top patch repaired beams vs.
control beam
0
20
40
60
80
100
120
140
0 5000 10000 15000 20000 25000 30000 35000
Lo
ad
(k
N)
Micro-strain (µε)
Control
Top repair Sikacrete-08 SCC
Top repair M1 (SCC, 0% fibers)
Top repair M3 (CFRSCC,0.50% fibers)
0
20
40
60
80
100
120
140
-4000 -3500 -3000 -2500 -2000 -1500 -1000 -500 0
Lo
ad
(k
N)
Micro-strain (µε)
Control
Top repaire Sikacrete-08 SCC
Top repair M1 (SCC, 0% fibers)
Top repair M3 (CFRSCC, 0.50% fibers)
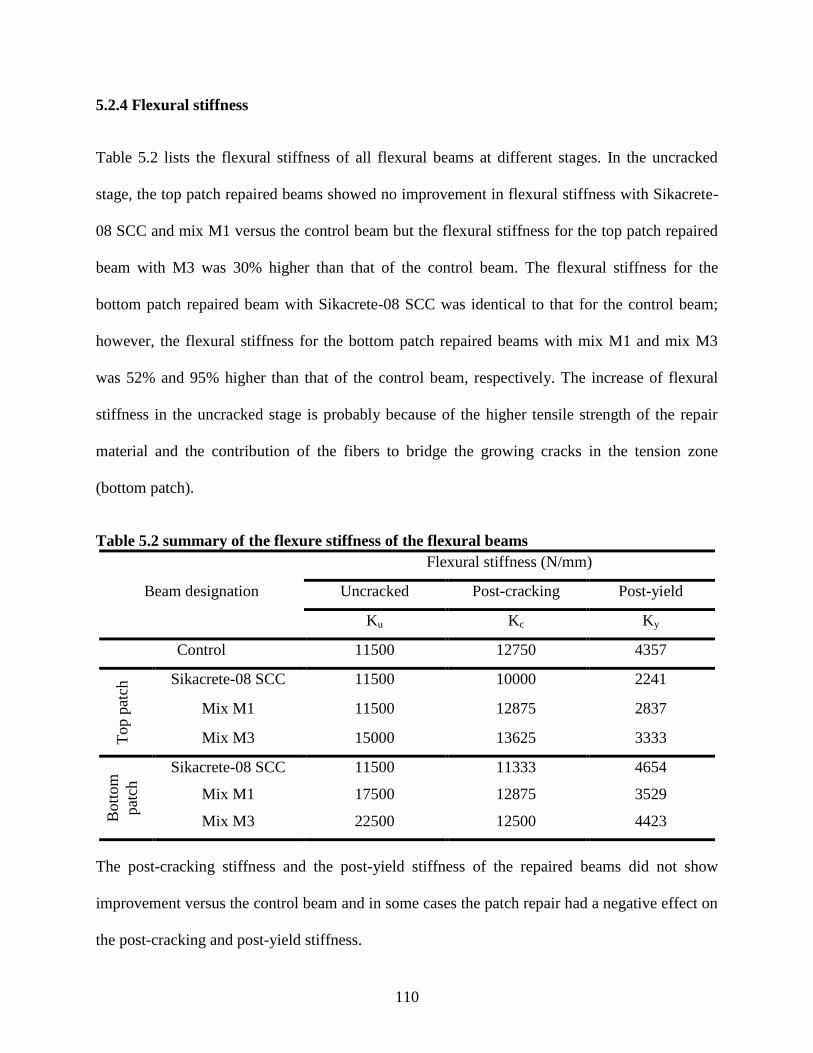
110
5.2.4 Flexural stiffness
Table 5.2 lists the flexural stiffness of all flexural beams at different stages. In the uncracked
stage, the top patch repaired beams showed no improvement in flexural stiffness with Sikacrete-
08 SCC and mix M1 versus the control beam but the flexural stiffness for the top patch repaired
beam with M3 was 30% higher than that of the control beam. The flexural stiffness for the
bottom patch repaired beam with Sikacrete-08 SCC was identical to that for the control beam;
however, the flexural stiffness for the bottom patch repaired beams with mix M1 and mix M3
was 52% and 95% higher than that of the control beam, respectively. The increase of flexural
stiffness in the uncracked stage is probably because of the higher tensile strength of the repair
material and the contribution of the fibers to bridge the growing cracks in the tension zone
(bottom patch).
Table 5.2 summary of the flexure stiffness of the flexural beams
Beam designation
Flexural stiffness (N/mm)
Uncracked Post-cracking Post-yield
Ku Kc Ky
Control 11500 12750 4357
Top p
atch
Sikacrete-08 SCC 11500 10000 2241
Mix M1 11500 12875 2837
Mix M3 15000 13625 3333
Bott
om
pat
ch
Sikacrete-08 SCC 11500 11333 4654
Mix M1 17500 12875 3529
Mix M3 22500 12500 4423
The post-cracking stiffness and the post-yield stiffness of the repaired beams did not show
improvement versus the control beam and in some cases the patch repair had a negative effect on
the post-cracking and post-yield stiffness.

111
5.2.5 Yield load
Figure 5.14 shows a bar chart comparison of the yield load for all flexural beams. The yield
loads for the top patch repaired beams were slightly higher than the control beam. The yield load
for the control beam was 102kN. The yield load for the top patch repaired beams with Sikacrete-
08 SCC, mix M1, and mix M3 were 100kN, 103kN, and 109kN, respectively. The maximum
increase in yield load versus the control was 7% probably due to the high compression strength
of the repair patch. However, the yield loads for the bottom patch repaired beams were same as
the control beam. The yield load for the bottom patch repaired beams with Sikacrete-08 SCC,
mix M1, and mix M3 were 102kN, 103kN, and 100kN, respectively. The repair materials had no
effect on the yield loads for the bottom patch repaired beams.
Figure 5.14 The yield load of the repaired beams vs. the control beam
102 100 103 109
102 103 100
0
20
40
60
80
100
120
140
160
Lo
ad
(k
N)

112
5.2.6 Ultimate load
Figure 5.15 shows a bar chart comparison of the ultimate load for all flexural beams. The
ultimate loads for the top patch repaired beams were slightly higher than the control beam. The
ultimate load for the control beam was 122kN. The ultimate load for the top patch repaired
beams with Sikacrete-08 SCC, mix M1, and mix M3 were 130kN, 122kN, and 130kN,
respectively. Two of the top patch repaired beams had a 6% increase in ultimate load versus the
control probably due to the high compression strength of the repair patch. However, the ultimate
loads for the bottom patch repaired beams were reduced as result of the repair. The ultimate load
for the bottom patch repaired beams with Sikacrete-08 SCC, mix M1, and mix M3 were 121kN,
120kN, and 115kN, respectively. The slight reduction in the ultimate loads was considered
within experimental error.
Figure 5.15 The ultimate load of the repaired beams vs. the control beam
122 130
122 130
121 120 115
0
20
40
60
80
100
120
140
160
Load
(k
N)

113
5.2.7 Ductility
Ductility can be defined as the ultimate deflection divided by the yield deflection. Figure 5.16
shows a bar chart comparison of the ductility for the flexural beams. The ductility for the control
beam was 3.5. The ductility for the top patch repaired beams was 50% higher than that of the
control beam. One of the factors that affect the ductility of RC beams is the compression strain in
the concrete. As it can be seen from the load-strain curves in Appendix B, the compression
strains in the repaired patches were higher than that of the control beam at midspan. Also, the
compressive strength of the repaired material was higher than that of the normal concrete. The
ductility of the bottom patch repaired beams with Sikacrete-08 SCC and mix M3 was not
significantly improved versus the control beam, but the ductility of the bottom patch repaired
beam with M1 was 21% higher than the control beam.
Figure 5.16 The ductility of the repaired beams vs. control beam
3.5
5.8 5.4
4.9
2.8
4.25
3.25
0
1
2
3
4
5
6
7
Du
ctil
ity (
mm
/mm
)

114
5.3 Effect of repair material on structural performance of shear beams
Table 5.3 summarizes the critical stages of the shear beams. The detailed results of the individual
beams (load-deflection and strain responses) are given in Appendix B.
Table 5.1 Summary of shear test results
Beam designation
Cracking Yielding Ultimate
Mode of failure Pcr Δcr Py Δy Pu Δu
kN mm kN mm kN mm
Shea
r zo
ne
pat
ch Control 40 2 190 6.8 270 10 Diagonal tension shear
Sikacrete-08
SCC 45 2 215 7.5 345 14.5 Diagonal tension shear
Mix M1 42 2 220 7.5 320 11.5 Diagonal tension shear
Mix M3 50 2 265 9 355 14.9 Concrete crushing
5.3.1 Observed shear behaviour
5.3.1.1 Control beam
Flexural cracks appeared first and were located in the constant moment region at a load of 40kN.
As the load increased, an inclined crack appeared between the loading point and the support in
one span at a load of 143kN. As the load increased, the shear or inclined crack extended towards
the loading point. As the inclined crack widened in the right side of the beam, the stirrups started
to share the load resistance and the beam continued to carry more load until the concrete crushed.
The failure mode of the control beam was diagonal tension shear by loss of aggregates interlock.
The shear failure is shown in Figure 5.17.

115
Figure 5.17 Failure mode of control beam
5.3.1.2 Repaired beams
The repair was applied on the right side of the beam and the left side of the beam was cast with
additional stirrups to ensure that failure would occur in the right span. The flexural cracks
appeared first and they were located in the constant moment region at loads of 45kN, 42kN, and
50kN for the shear-span repaired beams with Sikacrete-08 SCC, mix M1, and mix M3,
respectively. As the load increased, the shear crack appeared between the loading point and
supports at loads of 143kN, 120kN, and 135kN for the repaired beams with Sikacrete-08 SCC,
mix M1, and mix M3 respectively. As the load was further increased, the shear (inclined) crack
grew and extended towards the loading point. After the appearance of the inclined crack in the
right side of the repaired beam with Sikacrete-08 SCC the stirrups started to share the load
resistance and the beam continued to carry load until the concrete crushed as shown in Figure
5.18. However, the shear-span repaired beam with M1 (SCC, no fibers) showed that the failure
inclined crack appeared in the left side of the beam (control) instead of the patched zone in the

116
right side of the beam. The failure mode of the repaired beam was diagonal tension shear by loss
of aggregates interlock as shown in Figure 5.19.
Figure 5.18 Failure mode of the shear-span repaired beam with Sikacrete-08 SCC
Figure 5.19 Failure mode of shear-span repaired beam with mix M1 (SCC, no fibers)

117
On the other hand, the shear-span failure mode of the repaired beam with mix M3 (CFRSCC,
0.50% fibers) changed from a shear failure (brittle failure) to a flexural failure (ductile failure)
due to the contribution of carbon fibers in resisting the cracks growth in the shear-span as shown
in Figure 5.20. At failure, the flexural load capacity of the beam was 355kN. This result means
that the shear capacity was significantly increased beyond the flexural capacity.
Figure 5.20 Failure mode of the shear-span repaired beam with mix M3 (CFRSCC, 0.50%
fibers)
5.3.2 Load-deflection behaviour
Figure 5.21 shows a comparison the load-deflection curves for the shear-span repaired vs.
control beam. The load deflection behaviour can be divided into three distinct stages: first stage
where the concrete was uncracked up to the appearance of the flexural cracks, the load-deflection
curve was a straight line. Stage two; the concrete was fully cracked and the stiffness of the beam

118
decreased. This stage continued until the diagonal crack appeared. Stage three; the diagonal
crack appeared and more flexural cracks appeared. Upon completion of this last stage, the load
reached its peak value, then noticeably decreasing rapidly afterwards. This drop in the load
occurred because the shear reinforcement was no longer taking more load. It is evident that the
shear-span patch repair increased the ultimate load as well as the deflection at failure. The shape
of the load-deflection curve during the post-peak response was similar with a rapid drop in load
for patch repair with Sikacrete-08 SCC and mix M1 (SCC, no fibers). However, the repaired
beam with mix M3 (CFRSCC, 0.50% fibers) patch exhibited a more ductile flexural failure mode
with a gradual decrease in load. This behaviour is attributed to the presence of the carbon fibers
that helped in bridging in the cracks as evident in the failure mode as shown in Figure 5.21. The
stiffness of the repaired beams was almost identical to that of the control beam during all stages
of loading. The only exception is for repaired beam with mix M3 (CFRSCC, 0.50% fibers)
where the post-peak stiffness was much higher than the rest of the beams (which exhibited no
peak stiffness) because of the change in mode of failure of that beam.

119
Figure 5.21 Load vs. deflection curves of the control and the shear-span repaired beams
5.3.3 Load-strain behaviour
Figures 5.22 and 5.23 show the load-strain curves of the shear-span repaired beams. The strain in
the bottom longitudinal steel rebar, the strain in the stirrups, and the strain in the top concrete are
shown in Figure 5.22 and Figure 5.23. The strain values were measured at the middle span of the
beams. The yield strain for the longitudinal steel rebar is 2060 microstrain, the yield strain for the
stirrup is 1900 microstrain, and the concrete crushing strain is 3500 microstrain. It is evident
from Figure 5.23 that the strain value in the longitudinal steel rebar did not reach the yield and
the strain value in the top concrete did not reach the crushing strain. However, the strain values
in the stirrups exceeded the yield strain for the shear-span repaired beams with Sikacrete-08 SCC
and M1 (SCC, 0% fibers) and the control beam. After the concrete cracked in shear, the
0
50
100
150
200
250
300
350
400
0 5 10 15 20 25 30 35 40 45
Lo
ad
(k
N)
Deflection (mm)
Control
M1 (SCC)
Sikacrete-08 SCC
M3 (CFRSCC)

120
aggregate interlock was lost and the stirrups started to share in the load resistance. It is evident
from Figure 5.23 that the strain values in the longitudinal steel and the top concrete were
identical to that of the control beam. The shear-span repaired beam with M3 (CFRSCC, 0.50%
fibers) showed that the mode of failure changed from a brittle failure to ductile failure. It is
evident that from this beam the strain in longitudinal steel rebar exceeded the yield strain and the
strain value in concrete reached the crushing strain. The stirrups did not reach the yield. Figures
5.24 to 5.27 show the strain profile in the stirrups for the shear-span repaired beams and control
beam. It is evident that strains in the stirrups were very small (less than 500 µɛ) up to cracking.
Once the inclined shear crack occurred, the strains (for stirrups S2 and S3) jumped to values
above 1500 µɛ and continued to increase as loading was increased. In most cases, the peak strain
was measured by S2 which was located at 150 mm from the support. The beam repaired with M3
exhibited lower stirrups strains than the other beams because this beam failed in flexure.
The stirrup strain profiles also showed that the strain value increased, as the distance from the
support increased. This means that the stirrup which was placed close to the support did not
contribute as other stirrups to share in resistance of the diagonal crack whereas the stirrups which
were placed far from the support contributed in resisting diagonal crack.
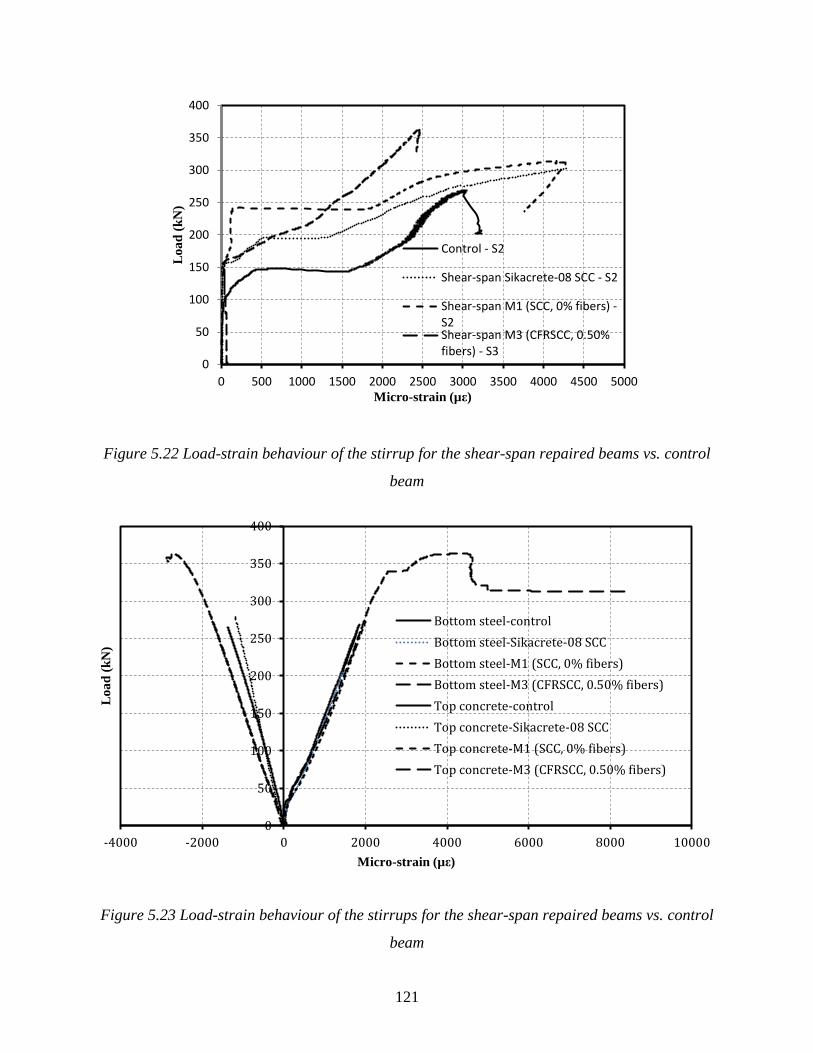
121
Figure 5.22 Load-strain behaviour of the stirrup for the shear-span repaired beams vs. control
beam
Figure 5.23 Load-strain behaviour of the stirrups for the shear-span repaired beams vs. control
beam
0
50
100
150
200
250
300
350
400
0 500 1000 1500 2000 2500 3000 3500 4000 4500 5000
Lo
ad
(k
N)
Micro-strain (µε)
Control - S2
Shear-span Sikacrete-08 SCC - S2
Shear-span M1 (SCC, 0% fibers) -S2Shear-span M3 (CFRSCC, 0.50%fibers) - S3
0
50
100
150
200
250
300
350
400
-4000 -2000 0 2000 4000 6000 8000 10000
Lo
ad
(k
N)
Micro-strain (µε)
Bottom steel-control
Bottom steel-Sikacrete-08 SCC
Bottom steel-M1 (SCC, 0% fibers)
Bottom steel-M3 (CFRSCC, 0.50% fibers)
Top concrete-control
Top concrete-Sikacrete-08 SCC
Top concrete-M1 (SCC, 0% fibers)
Top concrete-M3 (CFRSCC, 0.50% fibers)
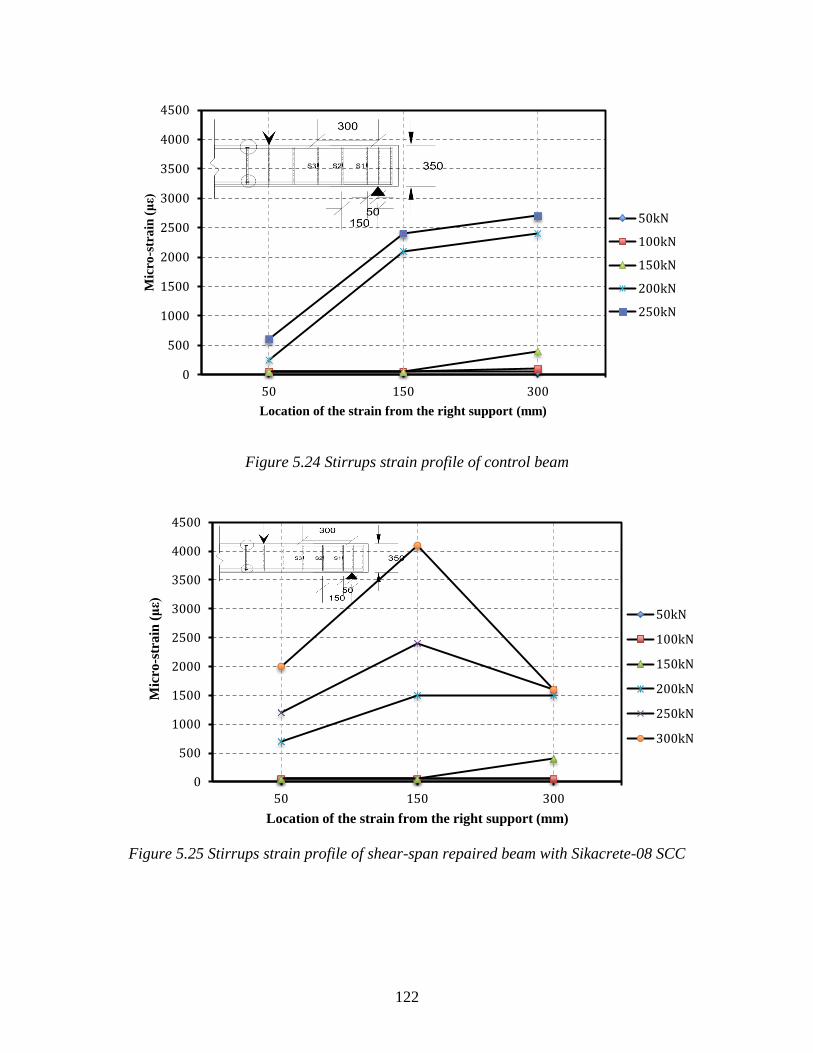
122
0
500
1000
1500
2000
2500
3000
3500
4000
4500
50 150 300
Mic
ro-s
tra
in (με)
Location of the strain from the right support (mm)
50kN
100kN
150kN
200kN
250kN
0
500
1000
1500
2000
2500
3000
3500
4000
4500
50 150 300
Mic
ro-s
train
(με)
Location of the strain from the right support (mm)
50kN
100kN
150kN
200kN
250kN
300kN
Figure 5.24 Stirrups strain profile of control beam
Figure 5.25 Stirrups strain profile of shear-span repaired beam with Sikacrete-08 SCC

123
0
500
1000
1500
2000
2500
3000
3500
4000
4500
50 150 300
Mic
ro-s
tra
in (με)
Location of the strain from the right support (mm)
50kN
100kN
150kN
200kN
250kN
300kN
0
500
1000
1500
2000
2500
3000
3500
4000
4500
50 150 300
Mic
ro-s
tra
in (με)
Location of the strain from the right support (mm)
50kN
100kN
150kN
200kN
250kN
300kN
Figure 5.26 Stirrups strain profile of shear-span repaired beam with mix M1 (SCC, 0% fibers)
Figure 5.27 Stirrups strain profile of shear-span repaired beam with mix M3 (SCC, 0.5% fibers)

124
5.3.4 Yield load
A comparison of the yield loads for the shear-span repaired beams with Sikacrete-08 SCC, mix
M1 (SCC, 0% fibers), and mix M3 (CFRSCC, 0.50% fibers) versus the control beam is shown in
Figure 5.28. It is evident that the yield load increased by about 13%, 16%, and 39.5% for the
repaired beams with Sikacrete-08 SCC, mix M1, and mix M3, respectively. This increase is due
to the contribution of the repair materials, which were stronger than the normal concrete. The
compressive and tensile strengths of the repair materials were higher than that of normal
concrete. Also, carbon fibers played a very important role in controlling the growth of cracks in
the beam repaired with mix M3 (CFRSCC, 0.5% fibers).
Figure 5.28 The yield loads for the shear-span repaired beams vs. the control beam
190
215 220
265
0
50
100
150
200
250
300
Control Shear-span
Sikacrete-08
SCC
Shear-span
M1(SCC,
0%fibers)
Shear-span
M3(CFRSCC,
0.50% fibers)
Yie
ld l
oad
(kN
)

125
5.3.5 Ultimate load
The ultimate loads for the shear-span repaired beams with Sikacrete-08 SCC, mix M1 (SCC, no
fibers), and mix M3 (CFRSCC, 0.50% fibers) are compared with the control beam as shown in
Figure 5.29. The ultimate load increased by about 27.8%, 18.5%, and 31.1% for repaired beams
with Sikacrete-08 SCC, mix M1, and mix M3, respectively. This increase is likely due to the
contribution of repair materials, which had higher compressive and tensile strengths than that of
normal concrete. Also, carbon fibers played very important role in reducing the growth of cracks
and changing failure mode from a brittle to ductile failure for failure for beam repaired with M3
(CFRSCC, 0.5% fibers).
Figure 5.29 The ultimate loads for the shear-span repaired beams vs. the control beam
270
345
320
355
0
50
100
150
200
250
300
350
400
Control Shear-span
Sikacrete-08
SCC
Shear-span
M1(SCC,
0%fibers)
Shear-span
M3(CFRSCC,
0.50% fibers)
Ult
imat
e lo
ad (
kN
)

126
5.3.6 Ultimate deflection
A comparison of the ultimate deflection for the shear-span repaired beams with Sikacrete-08
SCC, mix M1 (SCC, no fibers), and mix M3 (CFRSCC, 0.50% fibers) versus the control beam is
shown in Figure 5.30. It is evident that the ultimate deflection increased by about 40%, 20%, and
200% for the repaired beams with Sikacrete-08 SCC, mix M1, and mix M3, respectively. This
increase is due to the contribution of the repair materials, which were stronger than the normal
concrete. The compressive strengths and tensile strength of the repair materials were higher than
that of normal concrete. Also, carbon fibers played a very important role in reducing controlling
the growth of cracks in the CFRSCC repaired beams.
Figure 5.30 Deflection for the shear-span repaired beams vs. control beam
10
14 12
30
0
5
10
15
20
25
30
35
Control Shear-span
Sikacrete-08
SCC
Shear-span
M1(SCC,
0%fibers)
Shear-span
M3(CFRSCC,
0.50% fibers)
Def
lect
ion (
mm
)

127
Chapter 6 Conclusions and recommendations
6.1 Summary
The main objective of this research was to investigate the effect of carbon fibers on the fresh and
hardened properties of self-consolidating concrete mixtures. The efficiency of CFRSCC as a
patch material was also evaluated in shear and flexural repairs. The experimental research
consisted of concrete materials work and structural performance of repaired RC beams.
Twenty trial mixtures were done to achieve the optimum fresh properties of CFRSCC mixtures.
The HRWR dosages varied until the CFRSCC fresh properties fulfilled the limits of SCC set by
ASTM standards. Ten concrete mixtures were finally batched. Two W/B ratios were used 0.35
and 0.40. The carbon fiber content (CF) ranged from 0 to 1%. The HRWR ranged from 1.5 to
8% for mixes 1 to 5 and from 1 to 7% for mixes 5 to 10.
A total of eleven reinforced concrete beams were tested. Group (1) consisted of four beams
designed to study the behaviour of shear-span patch repair of reinforced concrete beams; group
(2) consisted of seven beams designed to study the behaviour of top patch and bottom patch
repaired reinforced concrete beams. The test variables were: the repair materials (SCC (M1),
CFRSCC (M3), and Sikacrete-08 SCC), location of repair (shear, tension, and compression), and
loading configuration (flexure, shear).

128
6.2 Conclusions
6.2.1 Fresh and hardened properties tests
Based on the test results for the fresh and hardened properties of CFRSCC, the following
conclusions can be made:
SCC with CF can be made to meet the fresh properties.
Carbon fibers affected the filling ability, passing ability, and segregation resistance of
SCC mixtures. HRWR facilitated achieving the target filling ability and passing ability
properties of the SCC mixtures with carbon fibers.
The CFRSCC mixtures with 1% by volume of carbon fibers (mixtures M5 and M10)
required a very high amount of HRWR to improve their fresh properties. The CFRSCC
mixtures with carbon fiber content up to 0.75% and HRWR up to 3% satisfactorily
passed the requirements of SCC.
All CFRSCC mixtures achieved the segregation resistance requirement as their
segregation index was below the maximum limit (18%).
The T50 slump flow time was increased with the increase in carbon fibers content because
the inclusion of fibers slowed the flow of CFRSCC mixtures by making it more viscous.
The blocking index for all SCC mixtures was below the maximum limit of 50 mm
because of their relatively high flowing ability and high segregation resistance.
The visual stability index (VSI) of the freshly mixed CFRSCC mixtures revealed that the
concrete mixtures were highly stable (VSI =0) to stable (VSI =1), thus indicating
excellent and good segregation resistance, as observed from the sieve stability test.

129
The compressive strength of the CFRSCC mixtures decreased as the carbon fibers
increased and the splitting tensile strength of the CFRSCC increased as the carbon fibers
increased.
For mixes with 0.35 W/b ratio achieved higher compressive strength than mixes with 0.4
W/B ratio.
The modulus of rupture for mixes with W/B ratio of 0.35 increased with the increase of
carbon fibers. However, the modulus of rupture for mixes with W/B ratio of 0.40 did not
increase with the increase of carbon fibers. These results were different from those of
mixes with 0.35 W/B ratio.
The toughness or the fracture energy of mixes with 0.35 W/B ratio increased when the
carbon fibers were added.
SEM images of the fracture surface showed that the carbon fibers were well distributed
with the concrete matrix, and no fiber balling occurred.
SEM images revealed that fibers failure was by both fiber pullout and by fiber breakout.
6.2.2 Structural load tests
Conclusions for the structural performance of patch repaired RC beams are as follows:
The patch repair had a more significant effect in shear-span patches versus bottom-patch
and top-patch flexural repairs.
The uncracked flexural stiffness of the top patch repaired beams with Sikacrete-08 SCC
and mix M1 were identical to that for the control beam but the flexural stiffness for the

130
top patch repaired beam with mix M3 was 30% higher than the flexural stiffness of the
control beam.
The flexural stiffness for the bottom patch repaired beam with Sikacrete-08 SCC was
identical to that for the control beam; however, the flexural stiffness for the bottom patch
repaired beams with mix M1 and mix M3 was 52% and 95% higher than that of the
control beam, respectively.
The ultimate loads of the top patch repaired beams were identical or higher than that of
the control beam. The ultimate loads for the bottom patch repaired beams were similar or
slightly lower than that of the control beam.
The ductility for the top patch repaired beams was 50% higher than that of the control
beam. The ductility of the bottom patch repaired beams with Sikacrete-08 SCC and mix
M3 was not improved, but the ductility of the bottom patch repaired beam with M1 was
21% higher than the control beam.
The ultimate load for the shear-span repaired beams with Sikacrete-08 SCC, mix M1, and
mix M3 increased by about 27.8%, 18.5%, and 31.1%, respectively.
All beams had the same type of failure, which is diagonal tension shear by loss of
aggregates interlock, except the shear-span repaired beam with mix M3.
In this study, the repair material M3 (CFRSCC, 0.50% carbon fibers) changed the failure
mode from a shear failure to flexural failure. This is due to the contribution of fibers in
resisting the cracks growth.
Mix M3 is recommended to be sued in the repair application.

131
6.3 Recommendations of future work
Research on other size and type of carbon fibers to produce SCC is required to find
obtained more information.
More hardened properties tests are needed such as impact resistance, freeze and thaw,
and conductivity resistance to find the effect of carbon fibers on the these tests.
Research is needed to investigate the concrete shear resistance (Vc) which means using
CFRSCC on RC beams without stirrups.
Investigate the bond behaviour between the concrete and repair materials M1 and M3
(SCC and CFRSCC).
Investigate the repair materials M1 and M3 on improving repaired corroded RC beams.

132
Bibliography
ACI Committee 211.4R-08. (2008). “Guide for Selecting Proportions for High-Strength
Concrete Using Portland Cement and Other Cementitious Materials”. American concrete
institute, Farmington Hills, USA, pp. 1-29.
ACI Committee 237R-07. (2007). “Self –consolidating concrete”, American concrete institute,
Farmington Hills, USA, pp. 1-30.
Ali A., Majumdar J., and Rayment L. (1972). “Carbon fiber reinforcement of cement,” Cement
and Concrete Research, Vol. 2, No. 2, pp. 201-212.
Aydin, A. (2007). “Self-compatibility of high volume hybrid fiber reinforced concrete,”
Construction and Building Materials, Vol. 21, No. 6, 1149-1154.
ASTM C29/C29M – 09. (2009). “Standard test method for bulk density (“unit weight”) and
voids in aggregate”, Annual book of ASTM standard, American Society for Testing and
Materials, Philadelphia, USA.
ASTM C33/C33M. (2008). “Standard specification for concrete aggregate”, Annual book of
ASTM standard, American Society for Testing and Materials, Philadelphia, USA.
ASTM C127 – 07. (2007). “Standard test method for density, relative density (specific gravity),
and absorption of coarse aggregate”, Annual book of ASTM standard, American Society for
Testing and Materials, Philadelphia, USA.

133
ASTM C128 – 07a. (2007). “Standard test method for density, relative density (specific gravity),
and absorption of fine aggregate”, Annual book of ASTM standard, American Society for Testing
and Materials, Philadelphia, USA.
ASTM C136 – 06. (2006). “Standard test method for sieve analysis of fine and coarse
aggregates”, Annual book of ASTM standard, American Society for Testing and Materials,
Philadelphia, USA.
ASTM C150/C150M – 09. (2009). “Standard specification for portland cement”, Annual book of
ASTM standard, American Society for Testing and Materials, Philadelphia, USA.
ASTM C231/C231M – 09b. (2009) “Standard test method for air content of freshly mixed
concrete by the pressure method”, Annual book of ASTM standard, American Society for Testing
and Materials, Philadelphia, USA.
ASTM C494/C494M – 10. (2010). “Standard specification for chemical admixtures for
concrete”, Annual book of ASTM standard, American Society for Testing and Materials,
Philadelphia, USA.
ASTM C566 – 97. (1997). “Standard test method for total evaporable moisture content of
aggregate by drying”, Annual book of ASTM standard, American Society for Testing and
Materials, Philadelphia, USA.
ASTM C 1116/C 1116M – 09. (2009). “Standard specification for fiber-reinforced concrete”,
Annual book of ASTM standard, American Society for Testing and Materials, Philadelphia, USA.

134
ASTM C1240 – 05. (2005). “Standard specification for silica fume used in cmentitious
mixtures”, Annual book of ASTM standard, American Society for Testing and Materials,
Philadelphia, USA.
ASTM C1611/C 1611M – 09b. (2009). “Standard test method for slump flow of self-
consolidating concrete”, Annual book of ASTM standard, American Society for Testing and
Materials, Philadelphia, USA.
ASTM C1621/C 1621M – 09b. (2009). “Standard test method for passing ability of self-
consolidating concrete by J-ring”, Annual book of ASTM standard, American Society for Testing
and Materials, Philadelphia, USA.
Azam, R. (2010). “Behaviour of shear critical RC beams with corroded longitudinal steel
reinforcement,” Masters of Applied Science Thesis, University of Waterloo, Waterloo, ON,
Canada.
Badawi, M. (2003). “Flexural response of uniform and shear-span corroded RC beams repaired
with CFRP laminates,” Masters of Applied Science Thesis, University of Waterloo, Waterloo,
ON, Canada.
Banthia, N., and Soleimani, S. (2005). “Flexural response of hybrid fiber-reinforced cementitious
composites”. ACI Materials Journal, V. 102, No. 6, pp. 382-389.
Barluenga G., and Hemández-Olivares F. (2007). “Cracking control of concrete modified with
short AR-glass fibers at early age; Experimental results on standard concrete and SCC”. Cement
and Concrete Research, Vol. 37, No. 12, pp. 1624 – 1638.

135
Bharatkumar, B., Narayanan, R., Raghuprasad, B., and Ramachandramurthy, D. (2001). “Mix
proportioning of high performance concrete”. Cement & Concrete Composites, Vol. 23, No. 1,
pp. 71-80.
Brown, M., Ozyildirin, C., and Duke, W. (2010). “Investigation of fiber-reinforced self-
consolidating concrete”. Virginia transportation research council. Charlottesville, Virginia, USA.
Brown, M., Ozyildirim, C., and Duke W. (2010). “Investigation of steel and polymer fiber-
reinforced self-consolidating concrete”. ACI SP-274-5, American Concrete Institute, Farmington
Hills, Michigan, USA, pp. 69-78.
CAN/CSA-A23.3-04, (2004). “Design of concrete structures”. Canadian Standard Association,
Rexdale, Ontario, Canada, 240p.
Carlswärd, J., and Emborg, M. (2010). “Prediction of stress development and cracking in steel
fiber-reinforced self-compacting concrete overlays due to restrained shrinkage”. ACI SP-274-3,
American concrete institute, Farmington Hills, Michigan, USA, pp. 31-50.
Chang C., Ho M., Song G., Mo L., and Li H. (2010) “Improvement of electrical conductivity in
carbon fiber-concrete composites using self-consolidating technology”. Earth and Space 2010:
Engineering, Science, Construction, and Operation in Challenging Environments, Honolulu, pp.
3553-3558.
Chung D. (2000) “Cement reinforced with short carbon fibers: a multifunctional material”.
Composites. Part B., Vol. 31 No. 6-7, pp. 511-526.
Chung D. (1992). “Carbon fiber reinforced concrete”. Strategic highway research program:
National Research Council, University of New York, Buffalo, USA.

136
Chung D., and Chen P. (1993). “Concrete reinforced with up to 0.2 vol% of short carbon fibers”.
Composites, Vol. 24, No. 1, pp. 33-52.
Cunha, V., Barros, J., and Sena-Cruz, J. (2010). “Tensile behavior of steel fiber-reinforced self-
compacting concrete”. ACI SP-274-4, American Concrete Institute, Farmington Hills, Michigan,
USA, pp. 51-68.
Daczko, J. (2012). “Self-consolidating concrete: ch. 4 hardened properties of SCC”. New York,
USA.
De schutter, G. (2005). “Guidelines for testing fresh self-compacting concrete”. European
research project: Measurement of properties of fresh self-compacting concrete. pp. 1-7.
Ding, Y., You, Z., and Jalali, S. (2011). “The composite effect of steel fibers and stirrups on the
shear behaviour of beams using self-consolidating concrete”. Engineering Structures, Vol. 33,
No. 1, pp. 107-117.
Douglas, R. P. (2004). “Properties of self-consolidating concrete containing type F fly ash: with
a verification of the minimum paste volume method,” Masters of Applied Science Thesis,
Northwestern University, USA.
EFNARC. (2002). “Specification and guidelines for self-compacting concrete”. European
Federation of Supplies of Specialist Construction Chemicals, Farnham, Surrey, UK.
Ferraris C. F., Brower L., Ozyildirim C., and Daczko J. (2000). “Workability of self-compacting
concrete”. Preeeding of the PCI/FHWA/FIB international symposium on high performane
concrete. Precast/prestressed Concrete Institute, Chicago, pp. 398-407.

137
Ferrara, L. Prisco, M., and Ozyurt, N. (2010). “Self-consolidating high-performance SFRC: an
example of structural application in Italy”. ACI SP-274-8, American Concrete Institute,
Farmington Hills, Michigan, USA, pp. 109-128.
Forgeron, D., and Omer, A. (2010). “Flow characteristics of macro-synthetic fiber-reinforced
self-consolidating concrete”. ACI SP-274-1, American Concrete Institute, Farmington Hills,
Michigan, USA, pp. 1-14.
Gao D., Mo L., and Peng L. (2010). “Mechanical and electrical properties of carbon-nanofiber
self-consolidating concrete”. Earth and Space 2010: Engineering, Science, Construction, and
Operation in Challenging Environments, Honolulu, pp. 2577-2585.
Gao D., Mo L., and Peng L. (2011). “Electrical resistance of self-consolidating concrete
containing carbon nanofibers”. Journal of Sichuan University (Engineering Science Edition),
Vol. 43, No. 5, pp. 52-58.
Goodier. C. (2003). “Development of self-compacting concrete”. Structures and buildings 156,
Proceeding of the Institution of Civil Engineers, London, SB4, pp. 405-414.
Greenough, T., and Nehdi, M. (2008). “Shear behavior of fiber-reinforced self-consolidating
concrete slender beams”. ACI Materials Journal, V. 105, N0.5, pp. 468-477.
Grünewald, S., and Walraven, J. (2010). “Maximum fiber content and passing ability of self-
consolidating fiber-reinforced concrete”. ACI SP-274-2, American concrete institute, Farmington
Hills, Michigan, USA, pp. 15-30.

138
Grünewald, S., Walraven, J., Emborg, M., Carlswärd, J., and Hedin C. (2004). “Summary report
of workpackage 3.1 Test methods for filling ability of SCC”. Delft University of Technology.
Betongindustri, pp. 1-6.
Hadiwidodo, Y., and Mohd, S., (2005). “Review of testing methods for self compacting
concrete”. International Conference on Construction and Building Technology 2008 – A – (05),
pp. 69-82.
Hitchen, S., Ogin, L., and Smith P. (1995). “Effect of fiber length on fatigue of short carbon
fiber/ epoxy composite”. Composites. Vol. 29, No. 4, pp. 303-308.
Ivorra, S., Garcés, P., Catalá, G., Andión, L., and Zornoza, E. (2009). “Effect of silica fume
particle size on mechanical properties of short carbon fiber reinforced concrete”. Materials and
design, Vol. 31, No. 3, pp. 1553-1558.
Khayat, K. H. (2000). “Optimization and performance of air-entrained, self-consolidating
concrete”. ACI Materials Journal, Vol. 97, No. 5, pp. 526-535.
Khrapko, M. “Self-compacting concrete – a solution for technology hungry concrete
construction”. CBE consultancy Ltd., Finland.
Kosmatka, S., Kerkhoff, B., and Panarese, W. (2002). “Design and control of concrete
mixtures”. 14th
edition, Portland Cement Association, Skokie, Illinois, USA.
Liao, W., Chao, S., Park, S., and Naaman, A. (2006) “Self-consolidating high performance fiber
reinforced concrete”. University of Michigan, USA, 0-10.

139
Liao, W., Chao, S., and Naaman, A. (2010). “Experience with self-consolidating high-
performance fiber-reinforced mortar and concrete”. ACI SP-274-6, American Concrete Institute,
Farmington Hills, Michigan, USA, pp. 79-94.
Mobasher, B., and Destrée, X. (2010). “Design and construction aspects of steel fiber-reinforced
concrete elevated slabs”. ACI SP-274-7, American Concrete Institute, Farmington Hills,
Michigan, USA, pp. 95-108.
Nagataki, S., and Fujiwara, H. (1995). “Self-compacting property of high flowable concrete”.
Proceedings of the second CANMET/ACI international symposium on advances in concrete
technology, SP-154, V.M. Malhotra, ed., American Concrete Institute, Farmington Hills,
Michigan, USA, pp. 301-314.
Nehdi M. and Ladanchuk J. (2004). “Fiber synergy in fiber-reinforced self-consolidating
concrete”. ACI Material Journal, USA, Vol. 101, No. 6, pp. 508-517.
Nehdi, M., Pardhan, M., and Koshowski, S. (2004). “Durability of self-consolidating concrete
incorporating high-volume replacement composite cements”. Cement and Concrete Research,
Vol. 34, No. 11, pp. 2103-2112.
Okamura, H., (1997). “Self-compacting high-performance concrete”. Concrete International,
Farmington Hills, Vol. 19, No. 7, pp. 50-54.
Okamura, H. and Ouchi, M. (1999). “Self-compacting concrete. Development”. Present use and
future. 1st International RILEM symposium on self –compacting concrete, Stockholm, Sweden.
140
Okamura, H., and Ouchi, M. (2003). “Self-compacting concrete”. Journal of Advanced Concrete
Technology, Vol. 1, No. 1, pp. 5-15.
Ouchi, M., Nakamura, S., Osterberg, T., Halberg, S., and Lwin, M. (2003). “Application of self-
compaction in Japan”. Europe and the United State. Federal Highway Administration,
Washington, D.C., U.S.A.
Perez N., Romero H., Hermida G., and Cuellar G. (2002). “Self-compacting concrete on the
search and finding of an optimized design”. Proceeding of the first North Amerian Conference
on the design and use of self-consolidating concrete. Hanley-Wood, LLC, Illinois, USA, pp.
101-107.
Ramachandran V. S. (1995). “Concrete admixtures handbook, Properties, Science, and
Technology: Superplasticizers”. Second edition. Park Ridge, New Jersey, USA, pp. 410-517.
Safiuddin, Md. (2008). “Development of self-consolidating high performance concrete
incorporating rice husk ask”. Ph.D Thesis. University of Waterloo, Waterloo, ON, Canada.
Safiuddin, Md. (2010). “High performance mortar with carbon fibers: Properties and mix
optimization”. Saarbrücken, Germany.
Safiuddin, Md., West, J.S., and Soudki, K. A. (2010). “Flowing ability of self-consolidating
concrete and its binder paste and mortare component incorporating rice husk ash”. NRC research
press, Can. J. Civ. Eng., Vol. 37, No. 3, pp. 401-412.
Schutter, G. (2005). “Measurement of properties of fresh self-compacting concrete”. Guidelines
for testing fresh self-compacting concrete. University of Paisley, UK.

141
Srinivasa Rao P., Vishwanadh G., Sravana P., and Sekhar, T. (2009). “Flexural behaviour of
reinforced concrete beams using self-compacting concrete”. 34th
conference on our world in
concrete & structures, Singapore.
Takefumi S., and Yasunori M. (2003). “Development of combination-type self-consolidating
concrete and evaluation test method”. Journal of Advanced Concrete Technology. Vol. 1, No. 1,
pp. 26-36.
Yin, J., and Wu, Z., S. (2003). “Structural performance of short steel-fiber reinforced concrete
beams with externally bonded FRP sheets”. Construction and Building Materials, pp. 463-470.
Zhang, H., Zhong, Z., and Friedrich, K. (2007). “Effect of fiber length on the wear resistance of
short carbon fiber reinforced epoxy composites”. Composites Science and Technology, Vol. 67,
No. 2, pp. 222-230.

142
Appendix A

143
Flexural design:
Beam length:
L 2400 mm Cover 30 mm
a 800 mm Φ stirrups 6 mm
b 500 mm Φ' 10M
Section properties:
b 150 mm
h 300 mm a/d 3.1
d 256.5 mm
dv 230.85 mm
No. 2
Φ 15 15M
As 353.25 mm2
d' 41 mm
As' 200 mm2
As stirrup 56.52 mm2
Concrete and steel properties:
f'c 40 MPa
fy 400 MPa
Es 200000 MPa
θc 1
θs 1
Calculation of bending moment:
P
82 kN
α β ρ ρ' Kr Kr' Mr Mf=P×a/2 P=Mr×2/a P/2
0.790 0.870 0.00398 0.00520 1.553 1.747 32.57 32.8 81.42 41
ρb 0.0437

144
Calculation of shear:
Simplified method:
β θ Vf Vc S Vr max 0.125×λ×Φ×C×f'c×bw×dv s required Sused Vs Vr
0.21 42 41 45.99 -2321 346.2 173.14 161.60 133.5 86.8 132.8
Shear design:
Beam length:
L 2400 mm Cover 30 mm
a 800 mm a/d 2.7
b 500 mm
Beam Section:
b 150 mm
h 350 mm
d 294 mm
dv 264.6 mm
Φ 20 20M
No. 4 bandeld
As 1256 mm2
d' 40.5 mm
As' 353.25 mm2 2-15M bar
As stirrup 56.52 mm2 6M bar
Concrete and steel properties:
f'c 40 MPa
fy 400 MPa
Es 200000 MPa
θc 1
θs 1

145
Calculation of bending moment:
P 270 kN
α β ρ ρ' Kr Kr' Mr Mf=P×a/2 Pr
0.790 0.870 0.02047 0.00801 7.127 2.763 128.23 108 320.6
ρb 0.0437
Calculation of shear:
Simplified method:
β θ Vf Vc S Vr max S maximum Vs Vr Vf S used
0.21 42 135 52.7 161.39 396.9 198.45 185.22 59.8 112.6 135 180
General method:
Mf Vf εx β θ Vc S Vr max s max s used Vs Vr
72.3 135 0.00081 0.18 34.7 45.3 192.63 396.9 198.45 185.22 180 48.0 93.3
Check:
Pr(flexure)/Pr(shear)
2.85 %
Mr/Vr
1.14 %

146
Design of CFRSCC mixtures:
Sample #1 for W/B of 0.35
Mix Design proportion:
W/B ratio 0.35
Water Weight 189.85
First estimate of water from Table
2.3
Oven Dry Unit Weight 115
Relative Density (dry) 2.65
Void Content % 30.45
The Mixing Water Adjustment -21.56 Kg/m3
The Total Mixing Water Required 168.29 Kg/m3
Binder 480.82 kg
Silica Fume 10% 48.08 kg
Air Entrapped % 2
Cement 432.74
Carbon Fibers % 0
0.0
HRWR 1% of Binder 1.5
7.212 kg
Solids Contents of HRWR (%) 0.330
Sand/Aggregate ratio 0.55
Concrete Component: Coarse Fine Silica Fume Cement Carbon HRWR
Relative Density(SSD) 2.74 2.68 2.2 3.15 1.9 1.064
Absorption(OD) % 1.13 1.15 - - - -
Moisture Content % 0.393 0.144 - - - -
Bulk Density kg/m3 - 1843.14 - - -
Absorption(AD) % 1.264 1.15 - - - -

147
Calculation of concrete mixture:
W/B 0.35
Water Weight 168.29 kg 0.16875 m3
Cement 432.74 kg 0.13775 m3
Silica Fume 48.08 kg 0.02192 m3
HRWR 7.21 kg 0.00680 m3
Carbon 0.00 kg 0.00000 m3
Total 0.3352
FA 0.55*TA/2.68*997.28
CA 0.45*TA/2.74*997.28
The absolute volume of total agg. 1742.6739
FA 958.47 kg
CA 784.20 kg
Adjusted FA 948.92 kg
Adjusted CA 777.43 kg
Adjusted Water 179.77 kg

148
Sample #1 for W/B of 0.40
Mix Design proportion:
W/B ratio 0.40
Water Weight 189.85
First estimate of water from Table
2.3
Oven Dry Unit Weight 115
Relative Density (dry) 2.65
Void Content % 30.45
The Mixing Water Adjustment -21.56 Kg/m3
The Total Mixing Water Required 168.29 Kg/m3
Binder 480.82 kg
Silica Fume 10% 48.08 kg
Air Entrapped % 2
Cement 378.65
Carbon Fibers % 0
0.0
HRWR 1% of Binder 1.00
4.207 kg
Solids Contents of HRWR (%) 0.330
Sand/Aggregate ratio 0.55
Concrete Component: Coarse Fine Silica Fume Cement Carbon HRWR
Relative Density (SSD) 2.74 2.68 2.2 3.15 1.9 1.064
Absorption (OD) % 1.13 1.15 - - - -
Moisture Content % 0.393 0.144 - - - -
Bulk Density kg/m3 - 1843.14 - - -
Absorption (AD) % 1.264 1.15 - - - -
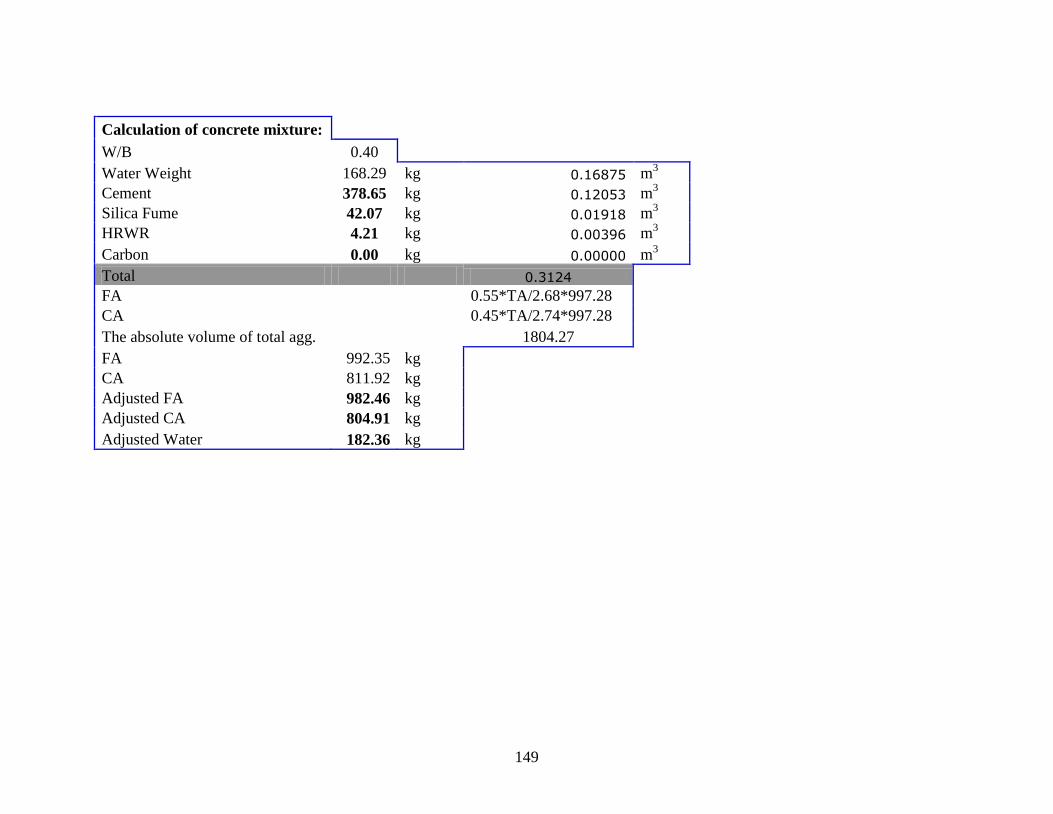
149
Calculation of concrete mixture:
W/B 0.40
Water Weight 168.29 kg 0.16875 m3
Cement 378.65 kg 0.12053 m3
Silica Fume 42.07 kg 0.01918 m3
HRWR 4.21 kg 0.00396 m3
Carbon 0.00 kg 0.00000 m3
Total 0.3124
FA 0.55*TA/2.68*997.28
CA 0.45*TA/2.74*997.28
The absolute volume of total agg. 1804.27
FA 992.35 kg
CA 811.92 kg
Adjusted FA 982.46 kg
Adjusted CA 804.91 kg
Adjusted Water 182.36 kg

150
Calculation of aggregates properties:
Relative Density and Absorption of Fine Aggregates:
Sample ID
Pan.
Wt.(g)
Water
Temp. C
Pycnomete
Wt (g)
Pycnometer
sand Wt. g
SSD Wt
sand
Sand, Water
Pycnometer
Mass of water
Pycnometer
Oven Dry
Wt.Pan (g)
Oven Dry
Wt. (g)
[D] [C] [B] [A]
A 149.48 23 165.9 664 498.1 976.39 664.38 691.66 492.18
B 122.72 22.1 166.73 667.43 333.97 874.32 664.38 452.86 330.14
C 183.57 21.7 165.46 669.24 503.78 979.92 663.68 681.82 498.25
Calculation
Sample BRD SSD
Apparent
S.G.
Absorption
%
A 2.64 2.68 2.73 1.20
B 2.66 2.69 2.75 1.16
C 2.66 2.69 2.74 1.11
Average 2.65 2.69 2.74 1.16
SSD: Surface saturated dry, BRD: Bulk relative density, Apparent S.G: Apparent specific gravity.

151
Relative Density and Absorption of Coarse Aggregates:
Sample
Pan Wt.
(g)
Saturated Surface-Dry
(g)
Weight in Water
(g)
Oven Dry Wt. with Pan
(g)
Oven Dry Wt.
without Pan g
[B] [C] [A]
A 150.06 1623.18 1030.95 1755.38 1605.32
B 152.65 1656.43 1052.12 1790.18 1637.53
C 149.65 1653.94 1051.25 1785.09 1635.44
Calculation
Sample BRD SSD Apparent S.G Absorption %
A 2.71 2.74 2.79 1.11
B 2.71 2.74 2.80 1.15
C 2.71 2.74 2.80 1.13
Average 2.71 2.74 2.80 1.13
SSD: Surface saturated dry, BRD: Bulk relative density, Apparent S.G: Apparent specific gravity.

152
Appendix B

153
Figure B.1 Flexural load vs. deflection curve of the control beam
Figure B.2 Bottom steel strain curves of the control beam
0
20
40
60
80
100
120
140
0 5000 10000 15000 20000 25000 30000 35000
Lo
ad
(k
N)
Micro-strain (µε)
Bottom steel 1
Bottom steel 2
0
20
40
60
80
100
120
140
0 20 40 60 80 100 120
Lo
ad
(k
N)
Deflection (mm)
Control beam

154
Figure B.3 Concrete compression strain curve of the control beam
Figure B.4 Flexural load vs. deflection curve of the bottom patch repaired beam with
Sikacrete-08 SCC
0
20
40
60
80
100
120
140
-4000 -3000 -2000 -1000 0
Lo
ad
(k
N)
Micro-strain (µε)
Concrete
0
20
40
60
80
100
120
140
0 20 40 60 80 100 120
Lo
ad
(k
N)
Deflection (mm)
Bottom repair-Sikacrete-08 SCC

155
Figure B.5 Bottom steel strain curves of the bottom patch repaired beam with Sikacrete-08 SCC
Figure B.6 Concrete compression strain curve of the bottom patch repaired beam with
Sikacrete-08 SCC
0
20
40
60
80
100
120
140
0 5000 10000 15000 20000 25000 30000 35000
Lo
ad
(k
N)
Micro-strain (µε)
Bottom steel 1
Bottom steel 2
0
20
40
60
80
100
120
140
-4000 -3000 -2000 -1000 0
Lo
ad
(K
N)
Micro-strain (µε)
Concrete
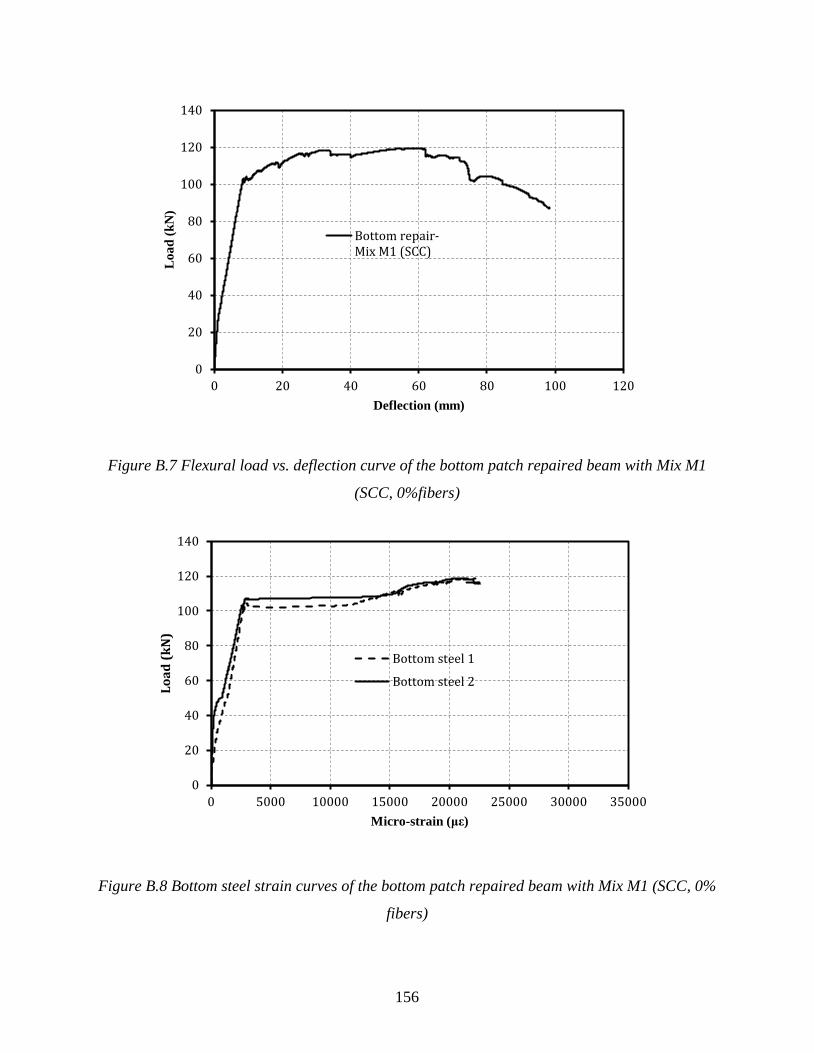
156
Figure B.7 Flexural load vs. deflection curve of the bottom patch repaired beam with Mix M1
(SCC, 0%fibers)
Figure B.8 Bottom steel strain curves of the bottom patch repaired beam with Mix M1 (SCC, 0%
fibers)
0
20
40
60
80
100
120
140
0 20 40 60 80 100 120
Lo
ad
(k
N)
Deflection (mm)
Bottom repair-Mix M1 (SCC)
0
20
40
60
80
100
120
140
0 5000 10000 15000 20000 25000 30000 35000
Lo
ad
(k
N)
Micro-strain (με)
Bottom steel 1
Bottom steel 2

157
Figure B.9 Concrete compression strain curve of the bottom patch repaired beam with Mix M1
(SCC, 0%fibers)
Figure B.10 Flexural load vs. deflection curve of the bottom patch repaired beam with Mix M3
(CFRSCC, 0.5%fibers)
0
20
40
60
80
100
120
140
-4000 -3000 -2000 -1000 0
Lo
ad
(k
N)
Micro-strain (με)
Concrete
0
20
40
60
80
100
120
140
0 20 40 60 80 100 120
Lo
ad
(k
N)
Deflection (mm)
Bottom repair-Mix M3(CFRSCC)

158
Figure B.11 Bottom steel strain curves of the bottom patch repaired beam with Mix M3
(CFRSCC, 0.5% fibers)
Figure B.12 Concrete compression strain curve of the bottom patch repaired beam with Mix M3
(CFRSCC, 0.5% fibers)
0
20
40
60
80
100
120
0 5000 10000 15000 20000 25000 30000 35000
Lo
ad
(k
N)
Micro-strain (με)
Bottom steel 1
Bottom steel 2
0
20
40
60
80
100
120
140
-4000 -3000 -2000 -1000 0
Lo
ad
(k
N)
Micro-strain (με)
Concrete

159
Figure B.13 Flexural load vs. deflection curve of the top patch repaired beam with Sikacrete-08
SCC
Figure B.14 Bottom steel strain curves of the top patch repaired beam with Sikacrete-08 SCC
0
20
40
60
80
100
120
140
0 20 40 60 80 100 120
Lo
ad
(k
N)
Deflection (mm)
Top repairSikacrete-08 SCC
0
20
40
60
80
100
120
140
0 5000 10000 15000 20000 25000 30000 35000
Lo
ad
(k
N)
Micro-strain (µε)
Bottom steel 1
Bottom steel 2

160
Figure B.15 Concrete compression strain curve of the top patch repaired beam with Sikacrete-08
SCC
Figure B.16 Flexural load vs. deflection curve of the top repaired beam with Mix M1 (SCC) 0%
carbon fibers
0
20
40
60
80
100
120
140
-4000 -3000 -2000 -1000 0
Lo
ad
(k
N)
Micro-strain (µε)
Concrete
0
20
40
60
80
100
120
140
0 20 40 60 80 100 120
Laod
(k
N)
Deflection (mm)
Top repair M1…

161
Figure B.17 Bottom steel strain curves of the top patch repaired beam with Mix M1 (SCC,
0%fibers)
Figure B.18 Concrete compression strain curve of the top patch repaired beam with Mix M1
(SCC, 0% fibers)
0
20
40
60
80
100
120
0 5000 10000 15000 20000 25000 30000 35000
Lo
ad
(k
N)
Micro-strain (με)
Bottom steel 1
0
20
40
60
80
100
120
140
-4500 -3500 -2500 -1500 -500
Lo
ad
(k
N)
Micro-strain (με)
Concrete
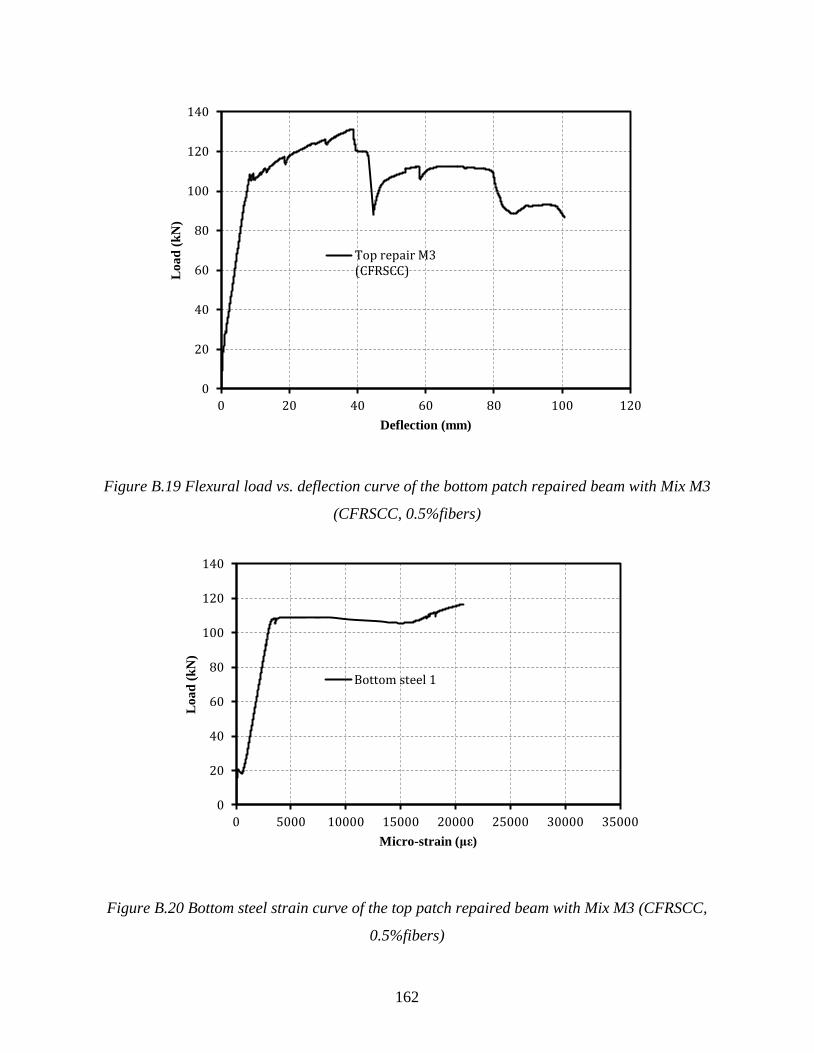
162
Figure B.19 Flexural load vs. deflection curve of the bottom patch repaired beam with Mix M3
(CFRSCC, 0.5%fibers)
Figure B.20 Bottom steel strain curve of the top patch repaired beam with Mix M3 (CFRSCC,
0.5%fibers)
0
20
40
60
80
100
120
140
0 20 40 60 80 100 120
Lo
ad
(k
N)
Deflection (mm)
Top repair M3(CFRSCC)
0
20
40
60
80
100
120
140
0 5000 10000 15000 20000 25000 30000 35000
Lo
ad
(k
N)
Micro-strain (με)
Bottom steel 1

163
Figure B.21 Concrete compression strain curve of the top patch repaired beam with Mix M3
(CFRSCC, 0.5% fibers)
0
20
40
60
80
100
120
140
-4500 -3500 -2500 -1500 -500
Lo
ad
(k
N)
Micro-strain (με)
Concrete

164
Figure B.22 Shear load vs. deflection curve of the control
Figure B.23 Strain curves on the stirrups of the control beam
0
50
100
150
200
250
300
350
400
0 5 10 15 20 25 30 35 40 45
Lo
ad
(k
N)
Deflection (mm)
Control
0
50
100
150
200
250
300
350
400
0 500 1000 1500 2000 2500 3000 3500 4000 4500 5000
Lo
ad
(k
N)
Micro-strain (µε)
S1
S2
S3
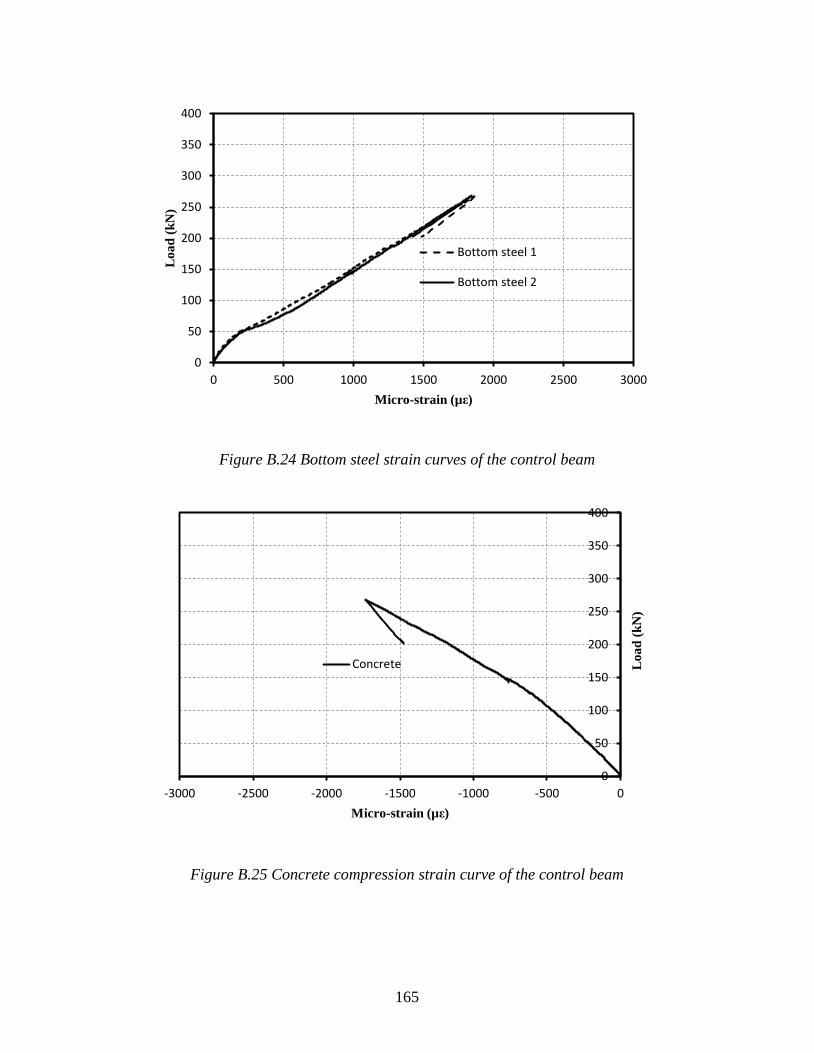
165
Figure B.24 Bottom steel strain curves of the control beam
Figure B.25 Concrete compression strain curve of the control beam
0
50
100
150
200
250
300
350
400
0 500 1000 1500 2000 2500 3000
Lo
ad
(k
N)
Micro-strain (µε)
Bottom steel 1
Bottom steel 2
0
50
100
150
200
250
300
350
400
-3000 -2500 -2000 -1500 -1000 -500 0
Lo
ad
(k
N)
Micro-strain (µε)
Concrete

166
Figure B.26 Shear load vs. deflection curve of the shear-span repaired beam with Sikacrete-08
SCC
Figure B.27 Strain curves on the stirrups of the shear-span repaired beam with Sikacrete-08
SCC
0
50
100
150
200
250
300
350
400
0 5 10 15 20 25 30 35 40 45
Lo
ad
(k
N)
Deflection (mm)
Sikacrete-08 SCC
0
50
100
150
200
250
300
350
400
0 2000 4000 6000 8000 10000 12000 14000
Lo
ad
(k
N)
Micro-strain (µε)
S1
S2
S3

167
Figure B.28 Bottom steel strain curves of the shear-span repaired beam with Sikacrete-08 SCC
Figure B.29 Concrete compression strain curve of the shear-span repaired beam with Sikacrete-
08 SCC
0
50
100
150
200
250
300
350
400
0 500 1000 1500 2000 2500 3000
Lo
ad
(k
N)
Micro-strain (µε)
Bottom steel 1
Bottom steel 2
0
50
100
150
200
250
300
350
400
-3000 -2500 -2000 -1500 -1000 -500 0
Lo
ad
(k
N)
Micro-strain (µε)
Concrete

168
Figure B.30 Shear load vs. deflection curve of the shear-span repaired beam with Mix M1 (SCC,
0%fibers)
Figure B.31 Strain curves on the stirrups of the shear-span repaired beam with Mix M1
(SCC, 0% fibers)
0
50
100
150
200
250
300
350
400
0 5 10 15 20 25 30 35 40 45
Lo
ad
(k
N)
Deflection (mm)
M1 (SCC)
0
50
100
150
200
250
300
350
400
0 1000 2000 3000 4000 5000
Lo
ad
(k
N)
Micro-strain (με)
S1
S2
S3

169
Figure B.32 Bottom steel strain curves of the shear-span repaired beam with Mix M1 (SCC,
0%fibers)
Figure B.33 Concrete compression strain curve of the shear-span repaired beam with Mix M1
(SCC, 0%fibers)
0
50
100
150
200
250
300
350
400
0 500 1000 1500 2000 2500 3000
Lo
ad
(k
N)
Micro-strain (με)
Bottom steel 1
Bottom steel 2
0
50
100
150
200
250
300
350
400
-3000 -2500 -2000 -1500 -1000 -500 0
Lo
ad
(k
N)
Micro-strain (με)
Concrete

170
Figure B.34 Shear load vs. deflection curve of the shear-span repaired beam with Mix M3
(CFRSCC, 0.50%fibers)
Figure B.35 Strain curves on the stirrups of the shear-span repaired beam with Mix M3
(CFRSCC, 0.50%fibers)
0
50
100
150
200
250
300
350
400
0 5 10 15 20 25 30 35 40 45
Lo
ad
(k
N)
Deflection (mm)
M3 (CFRSCC)
0
50
100
150
200
250
300
350
400
0 500 1000 1500 2000 2500 3000
Lo
ad
(k
N)
Micro-strain (με)
S1
S2
S3

171
Figure B.36 Bottom steel strain curves of the shear-span repaired beam with Mix M3 (CFRSCC,
0.50%fibers)
Figure B.37 Concrete compression strain curve of the shear-span repaired beam with Mix M3
(CFRSCC, 0.50%fibers)
0
50
100
150
200
250
300
350
400
0 5000 10000 15000 20000 25000 30000
Lo
ad
(k
N)
Micro-strain (με)
Bottom steel 1
Bottom steel 2
0
50
100
150
200
250
300
350
400
-3500 -3000 -2500 -2000 -1500 -1000 -500 0
Lo
ad
(k
N)
Micro-strain (με)
Concrete
Copyright © 2022 FDOKUMEN