LSE_ULVR_2007.pdf - AnnualReports.com
148
Disclaimer Notes to the Annual Report and Accounts This PDF version of the Unilever Annual Report and Accounts 2007 is an exact copy of the document provided to Unilever’s shareholders. Certain sections of the Unilever Annual Report and Accounts 2007 have been audited. Sections that have been audited are set out on pages 69 to 121, 125 to 126, 128 to 130 and 133 to 135. The auditable part of the report of the Remuneration Committee as set out on page 49 has also been audited. The maintenance and integrity of the Unilever website is the responsibility of the Directors; the work carried out by the auditors does not involve consideration of these matters. Accordingly, the auditors accept no responsibility for any changes that may have occurred to the financial statements since they were initially placed on the website. Legislation in the United Kingdom and the Netherlands governing the preparation and dissemination of financial statements may differ from legislation in other jurisdictions. Disclaimer Except where you are a shareholder, this material is provided for information purposes only and is not, in particular, intended to confer any legal rights on you. This Annual Report and Accounts does not constitute an invitation to invest in Unilever shares. Any decisions you make in reliance on this information are solely your responsibility. The information is given as of the dates specified, is not updated, and any forward-looking statements are made subject to the reservations specified on the final page of the Report. Unilever accepts no responsibility for any information on other websites that may be accessed from this site by hyperlinks.
-
Upload
khangminh22 -
Category
Documents
-
view
1 -
download
0
Transcript of LSE_ULVR_2007.pdf - AnnualReports.com

Disclaimer
Notes to the Annual Report and Accounts This PDF version of the Unilever Annual Report and Accounts 2007 is an exact copy of the document provided to Unilever’s shareholders.
Certain sections of the Unilever Annual Report and Accounts 2007 have been audited. Sections that have been audited are set out on pages 69 to 121, 125 to 126, 128 to 130 and 133 to 135. The auditable part of the report of the Remuneration Committee as set out on page 49 has also been audited.
The maintenance and integrity of the Unilever website is the responsibility of the Directors; the work carried out by the auditors does not involve consideration of these matters. Accordingly, the auditors accept no responsibility for any changes that may have occurred to the financial statements since they were initially placed on the website.
Legislation in the United Kingdom and the Netherlands governing the preparation and dissemination of financial statements may differ from legislation in other jurisdictions.
Disclaimer Except where you are a shareholder, this material is provided for information purposes only and is not, in particular, intended to confer any legal rights on you.
This Annual Report and Accounts does not constitute an invitation to invest in Unilever shares. Any decisions you make in reliance on this information are solely your responsibility.
The information is given as of the dates specified, is not updated, and any forward-looking statements are made subject to the reservations specified on the final page of the Report.
Unilever accepts no responsibility for any information on other websites that may be accessed from this site by hyperlinks.

Un
ileverA
nnual Report and Accounts 2007
Adding Vitality to life
Annual Report and Accounts 2007
Growing as One
Unilever N.V.Weena 455, PO Box 7603000 DK RotterdamThe NetherlandsT +31 (0)10 217 4000F +31 (0)10 217 4798
Commercial Register RotterdamNumber: 24051830
Unilever PLCUnilever House100 Victoria EmbankmentLondon EC4Y 0DYUnited KingdomT +44 (0)20 7822 5252F +44 (0)20 7822 5951
Unilever PLC registered officeUnilever PLCPort Sunlight WirralMerseyside CH62 4ZDUnited Kingdom
Registered in England and WalesCompany Number: 41424
www.unilever.com
8519_ARA_Eng_Cover_10_03_08.inddB B8519_ARA_Eng_Cover_10_03_08.inddB B 11/3/08 08:55:2311/3/08 08:55:23

Unilever Annual Report and Accounts 2007 1
ContentsThe Unilever Group
Report of the DirectorsHighlights 2
Chairman’s statement 3
Group Chief Executive 4
About Unilever 6
Outlook and risks 13
Operating Review – Regions 15
Operating Review – Categories 20
Financial Review 23
Corporate governance 33
Report of the Nomination Committee 48
Report of the Remuneration Committee 49
Report of the Audit Committee 62
Report of the Corporate Responsibility
and Reputation Committee 63
Financial statementsStatement of Directors’ responsibilities 66
Auditors’ reports 67
Consolidated income statement 69
Consolidated statement of recognised
income and expense 69
Consolidated balance sheet 70
Consolidated cash flow statement 71
Notes to the consolidated accounts 72
Financial record 122
Principal group companies and
non-current investments 125
Company accounts 127
Shareholder informationAnalysis of shareholding 137
Exchange controls affecting
security holders 138
Nature of the trading market 139
Dividend record 141
Financial calendar 142
Contact details 142
Website 143
Publications 143
Share registration 143
Index 144
Unilever N.V. (NV) is a public limited company registered in the Netherlands, whichhas listings of shares and depositary receipts for shares on Euronext Amsterdam andof New York Registry Shares on the New York Stock Exchange.
Unilever PLC (PLC) is a public limited company registered in England and Wales which has shares listed on the London Stock Exchange and, as American DepositaryReceipts, on the New York Stock Exchange.
The two parent companies, NV and PLC, together with their group companies,operate as a single economic entity (the Unilever Group, also referred to as Unilever or the Group). NV and PLC and their group companies constitute a single reportingentity for the purposes of presenting consolidated accounts. Accordingly, the accountsof the Unilever Group are presented by both NV and PLC as their respectiveconsolidated accounts.
Basis of reportingOur accounting policies are based on International Financial Reporting Standards(IFRS) as adopted by the European Union (EU), and on United Kingdom and Dutchlaw. They are also in accordance with IFRS as issued by the International AccountingStandards Board (IASB). Certain measures used in our reporting are not defined underIFRS. For further information about these measures, and the reasons why we believethey are important for an understanding of the performance of the business, pleaserefer to the Operating Review on page 15 and the Financial Review on page 29.
The brand names shown in italics in this report are trademarks owned by or licensedto companies within the Unilever Group.
Exchange ratesDetails of key exchange rates used in preparation of these accounts are given on page124, together with Noon Buying Rates in New York for the equivalent dates.
Forward-looking statementsThis document contains certain statements that are neither reported financial resultsnor other historical information. These statements are forward-looking statements,including within the meaning of the United States Private Securities Litigation ReformAct of 1995. For a description of factors that could affect future results, referenceshould be made to the full ‘Cautionary statement’ on the inside back cover.

2 Unilever Annual Report and Accounts 2007
Highlights
Highlights
2007 2006 2005
Turnover (€ million) 40 187 39 642 38 401
Underlying sales growth (%) 5.5 3.8 3.4
Operating profit (€ million) 5 245 5 408 5 074
Operating margin (%) 13.1 13.6 13.2
Earnings per share (euros) 1.32 1.19 1.07
Dividend per NV ordinary share (euros):
Interim 0.25 0.23 0.22
Proposed final 0.50 0.47 0.44
Dividend per PLC ordinary share (pence):
Interim 17.00 15.62 15.04
Proposed final 34.11 32.04 30.09
NotesTurnover, underlying sales growth, operating profit, operating margin and earnings per share are based on continuing operations.Underlying sales growth is not a GAAP measure. In our Financial Review on page 32 we reconcile underlying sales growth with changesin turnover. Dividend figures for each year comprise dividends declared or proposed for that year. Under International FinancialReporting Standards (IFRS) dividends are only recorded against the years in which they become payable. In addition to the dividendsshown above, one-off dividends of €0.26 per NV share and 17.66p per PLC share were paid in December 2006. For further informationand commentary on these measures please refer to the Directors’ Report and the Financial Statements within this Annual Report andAccounts.
Our mission and corporate purposeUnilever’s mission is to add Vitality to life. We meet everyday needs for nutrition, hygiene and personal care with brands that helppeople feel good, look good and get more out of life.
Our deep roots in local cultures and markets around the world give us our strong relationship with consumers and are the foundationfor our future growth. We will bring our wealth of knowledge and international expertise to the service of local consumers – a trulymulti-local multinational. Our long-term success requires a total commitment to exceptional standards of performance and productivity,to working together effectively, and to a willingness to embrace new ideas and learn continuously. To succeed also requires, we believe,the highest standards of corporate behaviour towards everyone we work with, the communities we touch, and the environment onwhich we have an impact. This is our road to sustainable, profitable growth, creating long-term value for our shareholders, our people,and our business partners.

Chairman’s statement
When I joined Unilever in May 2007 I was aware that the UnileverExecutive led by Patrick Cescau was driving a process of sweepingchange aimed at transforming the Group. Since then I havevisited a number of Unilever operations in Asia and Europe. I havemet with many employees and learned a great deal about thebrands which the Group sells and the technology which underpinsthem. I have also spoken to investors to get their perceptions ofthe business.
All of these encounters have confirmed the preconceptions whichI had before joining the Group: Unilever is a business with anextraordinary portfolio of brands, talented people, deep roots indeveloping and emerging markets, a strong commitment tosustainability and a distinctive corporate culture.
The Group’s strong performance in 2007, with higher growth andan improvement in underlying margin, is something about whichthe entire business can feel proud. It is also further validation thatthe strategy being pursued by Patrick and his team is the rightone, and that this strategy is being executed very effectively.
This strategy with its sharp focus on Vitality products, developingmarkets and faster growing product areas like personal care hasdramatically changed the business. The structure is much leanerand simpler. It is enabling Unilever to maximise its considerableadvantages of buying, manufacturing and marketing scale.
Some of the restructuring which has taken place has led to areduction in employee numbers. Decisions which have an impacton employees’ lives and livelihoods are never taken lightly.However, I have been impressed and reassured by the caring andresponsible way in which the Group has executed these changes.
The Boards in 2007Corporate governance in Unilever has undergone radical changein the period since 2004. We continue to ensure that we meetthe highest standards in all the markets in which we operate.
The composition of the Boards themselves has also evolved. Wehave enriched their diversity and experience with three new Non-Executive Directors: Narayana Murthy, Hixonia Nyasulu andGenevieve Berger.
Narayana, co-founder and Chairman of Infosys TechnologiesLimited, brings a deep knowledge of emerging markets andexpertise in IT as well as impressive business leadership skills.Hixonia is a highly experienced Non-Executive Director with SasolLtd. She is also an Advisory Board Member of JP Morgan SouthAfrica and brings first-hand experience of African markets.Genevieve contributes her impressive expertise in research anddevelopment; she is Professor of Biophysics and Medical Imagingat Paris University VI and Chairman of the Advisory Board ‘Health’for the EU Commission for Research.
All three joined our Corporate Responsibility and ReputationCommittee when they took up their posts in May. Theirappointment to this committee, now chaired by Lord Brittan,signals its growing importance and the Group’s commitment tokeeping sustainability at the heart of its activities.
Each of the newcomers was given an extensive programme ofinduction covering key issues facing the business.
In September 2007 we also welcomed Jim Lawrence as our newChief Financial Officer; he will be proposed for election as anExecutive Director at the AGMs in May 2008. Jim, who camefrom General Mills, is a Non-Executive Director of British Airwaysand Avnet. He replaced Rudy Markham who retired in 2007 aftera distinguished career spanning four decades.
Whilst welcoming Jim, we will be saying goodbye to twoDirectors who are leaving. Kees van der Graaf after 32 yearsservice in the business, most recently as President, Europe andRalph Kugler, currently President, Home and Personal Care, whohas served the business for 29 years. On behalf of the Boards Ithank them both for the significant contribution they have madeto our business throughout their careers.
During the year, we also said goodbye to Jean-Cyril Spinetta whostepped down as a member of the Boards and the RemunerationCommittee. I would like to acknowledge his wise counsel andexperience during his term as a Non-Executive Director.
In our Board meetings, we have discussed a wide range of topicsincluding the Group’s annual plan, performance in key marketssuch as Russia and China, organisation and talent, and the role ofscience and technology. We also reviewed and fully agreed theUnilever strategy and the new plans to accelerate change,including portfolio change and business restructuring.
An important part of my role is consistently to evaluate theeffectiveness of the Boards. In 2007 our Senior IndependentDirector and I conducted a formal assessment, includingperformance-related interviews with each Board member. Thefindings were discussed by the Boards and will result in furtherimprovements.
I am proud that we have Boards that are properly equipped togive Patrick and his team all the support that they need.
On a personal note, I find this an exciting time to work forUnilever. The business is doing well and, with its wealth oftalented people, its great global brands and its ambitious businessplans, is on track to do even better. On behalf of the Boards, Iwould like to thank all the Group’s employees around the worldfor all that they have done in 2007. I look forward to serving theUnilever Group to the very best of my ability in the years ahead.
Michael TreschowChairman
Unilever Annual Report and Accounts 2007 3
Report of the Directors

An endorsement of our strategyThese results are testimony to the fact that our strategy offocusing resources on brands, categories and countries with thehighest growth and profit potential is working.
One key area is developing and emerging markets. Over the nextfew years consumer spending in these markets will overtakedeveloped countries in terms of purchasing power parity. Unileverhas an unparalleled footprint in the developing world, as well asan extensive knowledge of local consumers, and a proven abilityto deliver health, hygiene and nutrition products which meet theneeds of populations which are growing in size, wealth andaspiration.
Personal care – another strategic priority – saw continued stronggrowth, at nearly 7%. It continues to be our fastest-growingbusiness, with strong global brands like Dove, Pond’s, Lux andRexona.
Our Vitality mission – to help people feel good, look good andget more out of life – remains central to our strategy, inspiringproducts such as a very low-fat variant of Hellmann’s mayonnaise;Amaze snacks, with nutrients to help support the mentaldevelopment of school-aged children; Lipton Linea slimming teas;and the Dove pro•age range with benefits for mature women.
Of course, our brands must be constantly refreshed to retain theiredge. In 2007, across each of our major categories, growth wasdriven by a combination of innovation – new products and newmixes – and renovation – the strengthening of existing brandsthrough new variants, new packaging or new marketing.
In 2007 we focused on bigger innovations and rolled them outfaster around the world. Clear, a shampoo with superior anti-dandruff active delivery technology, was launched simultaneouslyin several countries, including three of the biggest hair caremarkets in the world – China, Russia and Brazil. We also achieveda better transfer of mixes across continents and cultures, in somecases creating new markets. For example, we successfullylaunched our male deodorant brand Axe in Japan. After just sixmonths it is the leader in its market.
A leaner, fitter businessDuring the year we made significant progress in reshaping theorganisation to create a leaner, more flexible business structure.
Our One Unilever operating model is being implemented in everymajor country. We are now taking this a step further with thecreation of new multi-country organisations – clusters ofneighbouring countries with one central management structure,leveraging regional scale through shared services for functionssuch as HR, IT and Finance. These changes are all part of ouraccelerated programme of restructuring announced last summer.
4 Unilever Annual Report and Accounts 2007
Report of the Directors continued
Group Chief Executive
I am pleased to report on a good year for Unilever – one in whichwe continued to grow competitively, consistently and profitably.With a clear growth strategy and an organisational structure tosupport it, there is growing evidence of improved momentum inour business.
In 2007 underlying sales grew by 5.5% – the third consecutiveyear of accelerating sales growth. At the same time, we achievedan underlying improvement in our operating margin, despitesharply rising commodity costs. Our growth was broad-based,across all our major regions and categories.
In Europe we achieved growth of nearly 3% – up from 1% theyear before. The benefits of all the structural changes we havemade in this region over the past three years are now comingthrough both in terms of growth and underlying margin.
Russia was the star performer – with growth in the high teens –but all our major European businesses grew in 2007.
In the Americas full year growth was 4%. Brazil and Mexicoshowed an improving performance during the year, while the USgrew solidly at 3%.
In Asia Africa we recorded 11% growth. The performance reflectsnot just the vibrancy of these markets but also the high prioritywhich we place on building our business in this part of the world.Once again, India and China were important contributors to oursuccess.
The picture was equally strong across our categories driven bysome great innovations.
Home care had a strong year, fuelled by an excellent performancefrom our laundry business where the Dirt is Good brandsstrengthened still further on the back of innovations like PersilSmall & Mighty. We also had great success in household care withinnovative new variants of brands like Cif and Domestos.
Our Foods category also did very well. Our largest brand Knorrcame close to €4 billion in sales. Lipton tea prospered from aseries of good innovations and so too did ice cream. UnileverFoodsolutions, our global food service business, also turned inanother good performance, confirming the important opportunitythat out-of-home consumption offers us.

Unilever Annual Report and Accounts 2007 5
Report of the Directors continued
Group Chief Executive continued
We further shaped our portfolio through disposals andacquisitions, including the announced sale of Boursin and Lawry’s– brands that offered limited growth potential for Unilever. Wealso announced agreements to acquire the Buavita vitality drinksbrand in Indonesia and – only recently – Inmarko, the leading icecream business in Russia. These transactions accelerate ourstrategy of building leadership positions in fast-growing markets.
This is the right strategy for Unilever but – like any strategy – it isonly as good as the execution. That is why we also continue tobuild our strengths in critical areas such as consumer marketingand customer development. In both cases our progress wasrecognised externally. In marketing, we received a clutch ofawards at the Cannes International Advertising Festival, with Doveand Axe achieving three ‘Grand Prix’ trophies. In customerdevelopment, Unilever was named International Supplier of theYear by Tesco for the second year running.
We are also raising our game in research and development (R&D),recognising the crucial role technology can play in the quality ofour innovations. Underlining the importance of R&D, weappointed our first Chief Technology Officer, Neal Matheson, in2007. Neal leads the development of world class capabilities inscience and technology and champions excellence in all ourinnovation activity.
Of course, some changes required difficult decisions. In Europe,the restructuring is leading to significant job losses. But painful as these decisions have been, they are the right ones for the long-term health of the business.
Keeping sustainability at the heart of UnileverWe believe Unilever can only continue to thrive if we conduct ourbusiness in a sustainable manner.
Integrating social, economic and environmental considerationstherefore sits at the heart of many of our brand strategies. Agreat demonstration of this was the decision to source all of ourtea from sustainable, ethical sources. To support this significantchange, we asked the Rainforest Alliance to start auditing our teasuppliers with immediate effect. The aim is to have all LiptonYellow Label and PG Tips tea bags sold in Western Europecertified by 2010 and all Lipton tea bags sold globally by 2015.
We also set the ambitious target of a further 25% reduction inthe business’s CO2 emissions from energy sources used inproduction by 2012. And we continued to develop ourpartnerships with key retail customers, sharing our sustainabilityexpertise to support them in achieving their goals. Wal-Martresponded by naming us 2007 Supplier of the Year forSustainable Engagement.
The year aheadNotwithstanding some economic uncertainty and the rising costsof many materials, we are confident that Unilever can growconsistently, profitably and competitively in 2008.
The changes we have made in recent years leave Unilever moreresilient and better placed than ever before to meet challengesand respond to opportunities. We have a more flexible, dynamicstructure, an increasingly powerful brand portfolio, anunparalleled footprint in the developing world and – in 2008 –we have another exciting programme of innovations and newproduct launches. Furthermore, we operate in sectors lesssusceptible than others to the effects of an economic downturn:people will always need to eat, wash and clean their homes.
For all these reasons we remain optimistic about the year aheadand confident of making further progress towards our longer-term financial objectives.
On a personal note I would like to thank two members of theUnilever Executive who will leave us in 2008 - Kees van der Graafand Ralph Kugler. They have been valued colleagues over manyyears and I thank them for their contribution. Indeed, I wouldthank the whole of my Executive team, including two greatadditions during the year, Mike Polk and Jim Lawrence, the latterjoining from outside as our new Chief Financial Officer. Thanksalso to my colleagues on the Boards, under our new Chairman,Michael Treschow, and especially to every one of our employeesaround the world for their invaluable contribution to thebusiness's progress in 2007.
Working together, as One Unilever, I am confident that we canlook forward to delivering continued success in 2008.
Patrick CescauGroup Chief Executive

6 Unilever Annual Report and Accounts 2007
Report of the Directors continued
About Unilever
Description of businessUnilever is one of the world’s leading suppliers of fast movingconsumer goods across Foods and Home and Personal Carecategories. Unilever’s portfolio includes some of the world’s bestknown and most loved brands.
Strategy and long-term financial targetsAt the heart of Unilever's strategy is a concentration of resourceson areas where we have leading category and brand positionsand which offer excellent opportunities for profitable growth,especially in personal care, developing and emerging markets andVitality. The focus is primarily on developing the businessorganically, but acquisitions and disposals can also play a role inaccelerating the portfolio development.
To execute this strategy we have reorganised the business tosimplify the organisation and management structure and toimprove capabilities in marketing, customer management, andresearch and development. The result is better allocation ofresources, faster decision-making and a lower cost level. Thistransformation, known as the One Unilever programme, allows usto leverage our scale both globally and locally.
Unilever's long-term ambition is to be in the top third of our peergroup in terms of total shareholder return. We expect underlyingsales growth of 3-5% per annum and an operating margin inexcess of 15% by 2010 after a normal level of restructuringcharges of 0.5 to 1 percent of turnover. Return on invested capitalis targeted to increase over the 2004 base of 11%. Over theperiod 2005 – 2010, we aim to deliver ungeared free cash flow of€25-30 billion. It should be noted that previous and planneddisposals and the additional restructuring plans will have reducedungeared free cash flow by about €2.5 billion over this period,while enhancing the ongoing cash generating capacity of thebusiness.
Key indicators – performance and portfolioThese long-term financial targets determine the scope of our keyfinancial performance indicators. The values for these indicatorsfor the last three reporting years are as follows:
2007 2006 2005
Underlying sales growth (%) 5.5 3.8 3.4Operating margin (%) 13.1 13.6 13.2Ungeared free cash flow (€ billion) 3.8 4.2 4.0Return on invested capital (%) 12.7 14.6 12.5Total shareholder return (ranking) 8 13 14
Underlying sales growth (USG), ungeared free cash flow (UFCF)and return on invested capital (ROIC) are not recognised measuresunder IFRS. The IFRS measure most comparable with USG isturnover. In our Financial Review on page 32 we reconcile USGwith changes in turnover. There is no IFRS measure directlycomparable with either UFCF or ROIC. In our Financial Review wereconcile ROIC to net profit, and UFCF to both net profit and cashflow from operations. The values of turnover, net profit and cashflow from operating activities for the last three reporting years areas follows:
€ million € million € million2007 2006 2005
Turnover 40 187 39 642 38 401Net profit 4 136 5 015 3 975Cash flow from operating activities 5 188 5 574 5 924
In 2007, we set out simultaneously to deliver a higher and moreconsistent level of underlying sales growth in combination with anunderlying improvement in operating margin. Underlying salesgrowth has indeed shown a marked increase to 5.5% in 2007,driven by better innovation rolled out faster to more countriesand better execution in local markets.
We also achieved an underlying improvement in operating marginof 0.2 percentage points in 2007, as the combination of volumeleverage, higher prices, cost savings and mix improvementsuccessfully offset a sharp rise in commodity costs and otherinflation.
Our reported operating margin declined by 0.5 percentage points,due to a significantly higher level of restructuring charges relatedto our plans to accelerate change, which were announced inAugust 2007. These plans aim to deliver a reduction in our annualcost base by around €1.5 billion by the end of 2010, comparedwith our 2006 cost base, through the creation of multi-countryorganisations (MCOs), the closure or streamlining of 50-60factories, and a further reduction in regional and globaloverheads.
Ungeared free cash flow was €3.8 billion, which was €0.4 billionlower than a year earlier, including the effect of the higher cashrestructuring costs and increased capital expenditure. Return oninvested capital was 12.7% in 2007. This represented animprovement from 11.5% in 2006, when adjusted for the profiton the disposal of frozen foods. Before allowing for thisadjustment, return on invested capital in 2006 was 14.6%.
On our three-year average Total Shareholder Return keyperformance measure, which forms part of the basis for topmanagement remuneration, we remained just outside the topthird of our peer group, although we further improved ourposition to the 8th place out of 21 companies.
Further information about these measures, including definitionsand, where appropriate, reconciliation to GAAP measures, can befound in our Financial Review starting on page 29.
In addition to these financial indicators, we track other measuresin support of our strategic goals. We believe that the share of ourbusiness that is generated in developing and emerging (D&E)markets, and the proportion of our turnover that is generated byour top 25 brands are particularly relevant. In the latter contextwe group together brands that have a common consumerproposition and are supported by common innovationprogrammes, although in some cases the brand names may varybetween countries. The results for these measures for the lastthree reporting years are as follows:
2007 2006 2005
Share of turnover in D&E markets (%) 44 42 40Share of turnover in top 25 brands (%) 73 73 72

Unilever Annual Report and Accounts 2007 7
Report of the Directors continued
About Unilever continued
Our D&E businesses continue to show strong growth, in Asia,Africa, Central and Eastern Europe and Latin America, and nowmake up 44% of our total turnover. Our D&E strategy is focusedon leveraging and further strengthening our existing leadingpositions in many D&E markets, such as India and Brazil, as wellas building our brands and business in countries where wecurrently have a relatively smaller presence, notably China andRussia. Our sustained growth is reflecting the strength of our D&Ebusiness model which is characterised by a differentiated portfolioof strong global and regional brands addressing the needs of thedifferent income groups, high quality innovation andcommunication, scale and depth in distribution, and an excellenttrack record and reputation for developing management talent.Our focus on our best global and regional brands, with increasedinvestment in advertising and faster roll-out of innovation, hasresulted in a focused portfolio, with 12 brands having aworldwide turnover in excess of €1 billion and our top 25 brandscollectively delivering 73% of our turnover in 2007.
We also monitor the development of our brands through marketinformation that gives us insights into our leading positions versusour direct competitors. In our section on Operating environmenton page 8 below we indicate the product areas in which we haveleading or key strategic positions.
Key indicators – people and sustainabilityUnilever has for many years recognised the significance of socialand environmental issues as a critical dimension of its operations,and has established many indicators to track its performance inthese areas.
We regard safety as an essential element of a successful andsustainable business and take seriously our responsibility toprovide a safe workplace. We aim to improve continuously thehealth, safety and well-being of everyone working for or onbehalf of Unilever to a standard on a par with the very best of ourpeers. A key measure of our progress in this area is our totalrecordable accident frequency rate which counts all workplaceaccidents except those requiring only simple first aid treatment. In2007 this decreased to 0.26 accidents per 100 000 hours worked,declining from 0.46 in 2004.
We are committed to meeting the needs of customers andconsumers in an environmentally sound and sustainable manner, through continuous improvement in environmentalperformance in all our activities. We exercise the same concernfor the environment wherever we operate and aim to reduce the environmental footprint of our business and brands. Theenvironmental measures that we regard as the most significant inrelation to our business are those relating to the amounts of CO2
from energy that we produce, the water that we consume as partof our production processes, and the amount of waste that wegenerate. We continue to improve our performance across thesemeasures, having reduced our CO2 emissions from energy by33.5%, our water use by 58.6% and our total waste by 69.3%per tonne of production over the period 1995 – 2006. In 2007we set ourselves the further goal of achieving a 25% reduction inCO2 emissions by 2012 (from a 2004 baseline), to give a totalreduction of around 43% since 1995.
The table below shows the results for these indicators for the lastthree years for which independently assured (performed by firmsother than Unilever’s external auditors) data are available:
2006 2005 2004
Total recordable accident frequency rateper 100 000 hours 0.33 0.39 0.46
CO2 from energy per tonne of production (kg) 164.59 171.75 185.67
Water per tonne of production (m3) 3.29 3.52 3.67Total waste per tonne of production (kg) 7.46 8.74 9.79
The type of assurance undertaken has been limited to enquiries ofcompany personnel and analytical procedures together withreview on a sample basis of the operation of processes relating toperformance data noted in the table above. Assurance of thisnature is substantially less in scope than a financial audit and doesnot include detailed sample testing of source data, processes orinternal controls.
A comprehensive review of Unilever’s social and environmentalperformance can be found in our annual SustainableDevelopment Report, available online at www.unilever.comPublished in May 2008, our next Report will contain updated andindependently assured results for 2007 for the measures above, aswell as trend information that demonstrates our consistentperformance over the longer term.
Please refer also to the Corporate responsibility and sustainabilitysection on page 12 which highlights a number of key issues andactivities in this area in 2007. Our Operating Review starting onpage 15 also gives examples of the ways in which our brands areaddressing consumers’ social and environmental concerns.
Ten-year trends in many of the measures described above,together with a range of other indicators, are included in thedocument ‘Unilever Charts’ which can be found on our website atwww.unilever.com/ourcompany/investorcentre/annual_reports
OrganisationThe three building blocks of our organisation are regions,categories and functions.
Three regions – Europe, the Americas and Asia Africa – areresponsible for managing Unilever’s business and local marketoperations in their regions. They are primarily responsible forbuilding relationships with customers, managing supply chainnetworks, and deploying brands and innovations effectively,focused on excellent execution in the marketplace. The regionsare accountable for the delivery of in-year financial resultsincluding growth, profits and cash flow, and in-year developmentof market shares. The Europe region includes our operations inWestern Europe and Central and Eastern Europe, and in 2007accounted for approximately 38% of turnover. The Americasregion includes our operations in North America and LatinAmerica and represented around 33% of turnover. The AsiaAfrica region accounted for 29% of turnover, and includes ouroperations in the Middle East, Africa, South Asia, South East Asia,North East Asia and Australasia.
During 2008 changes will be made to the regional structures.Notably Central and Eastern Europe, will be managed as part ofthe Asia Africa region - further concentrating our focus onemerging markets.

8 Unilever Annual Report and Accounts 2007
Report of the Directors continued
About Unilever continued
Two category teams – Foods and Home and Personal Care – areresponsible for the development of category and brand strategies,the development of brand communication, and the delivery ofrelevant innovation. Categories also lead the strategic direction ofthe supply chain and are accountable for long-term value creationin the business, as measured by longer-term market sharedevelopment, category growth, innovation metrics and brandhealth.
Building on the success of the One Unilever programme, Foodsand Home and Personal Care will be brought together in 2008 in a single category structure.
Five functional teams – Finance, HR, IT, Communications and Legal – are responsible for providing value-adding businesspartnering, strategic support and competitive services to the wholebusiness. They are each organised around the same basic principlesof business partners, shared services and expertise teams.
Since 2005, the One Unilever programme has streamlined our business by creating a single operating company for eachcountry – combining previously separate Foods and Home andPersonal Care operating units into a One Unilever company – andby creating and outsourcing shared services centres for the backoffice operations of our Finance, HR and IT functions. In 2007, weannounced new plans to accelerate change including the creationof multi-country organisations (MCOs) – clusters of countries witha single centralised management and shared functions – andfurther simplification of our regional supply chains.
Operating environmentWe have a wide and diverse set of competitors in our categories.Many competitors also operate on an international scale, whileothers have a narrower regional or local focus.
Competition is a normal part of business. We aim to compete and provide added value to our consumers, customers andshareholders in three ways:
• by continually developing new and improved products thataddress relevant consumer needs and aspirations;
• by rolling out innovations and brand concepts across ourbusinesses around the world; and
• by striving to lower the cost of our sourcing, manufacturingand distribution processes while ensuring the quality of ourproducts.
Our businesses have established strong leadership positions –typically number 1 or number 2 – in the markets in which we areoperating. In Foods, we hold the global number 1 position insavoury and dressings, spreads, tea-based beverages and icecream. In home care, we hold the global number 2 position inlaundry, with a number 1 position in many developing andemerging markets. In personal care, we hold the global number 1position in mass skin care and deodorants, and the number 2position in hair care. In oral care and household care, our strategyis focused on strong regional and local leadership positions inselected makets in Europe, Asia and Latin America.
Unilever’s products are generally sold through our own sales forceas well as through independent brokers, agents and distributorsto chain, wholesale, co-operative and independent groceryaccounts, food service distributors and institutions. Products are
physically distributed through a network of distribution centres,satellite warehouses, company-operated and public storagefacilities, depots and other facilities.
We sell our products in over 150 countries around the world. Inmany countries we manufacture the products that we sell, whilewe also export products to countries where we do not havemanufacturing operations. The chosen manufacturing network isgenerally determined by an optimised regional sourcing strategywhich takes account of requirements for innovation, quality,service, cost and flexibility.
Certain of our businesses, such as ice cream, are subject tosignificant seasonal fluctuations in sales. However, Unileveroperates globally in many different markets and productcategories. No individual element of seasonality is likely to bematerial to the results of the Group as a whole.
Transactions with related parties are conducted in accordancewith agreed transfer pricing policies and include sales to jointventures and associates. Other than those disclosed in this report,there were no related party transactions that were material to theGroup or to the related parties concerned that are required to bereported in 2007 or the two preceding years.
For more information about related party transactions please referalso to note 30 on page 120.
Resources
Our brandsWe have a strong and well differentiated portfolio of global andregional brands, which are positioned to meet the needs andaspirations of our consumers across a variety of price points,segments and channels, allowing us to compete effectively in ourkey categories and countries.
Twelve of our brands have global turnover in excess of €1 billion.These are Knorr, Hellmann’s, Lipton, Becel/Flora (Healthy Heart),Rama/Blue Band (Family Goodness), Wall’s/Algida (Heart brand),Omo, Surf, Dove, Lux, Rexona (including Sure and Degree) andSunsilk (including Seda and Sedal).
We manage our brands under the following four categoryheadings: savoury, dressings and spreads; ice cream andbeverages; personal care; and home care.
Savoury, dressings and spreads includes soups, bouillons, sauces,snacks, mayonnaise, salad dressings, olive oil, margarines, spreadsand cooking products such as liquid margarines, and some frozenfoods. Our key brands here are Knorr, Hellmann’s, Becel/Flora(Healthy Heart), Rama/Blue Band (Family Goodness), Calvé, Wish-Bone, Amora, Ragú and Bertolli.
Ice cream and beverages includes ice cream sold under theinternational Heart brand, including Cornetto, Magnum, Carted’Or and Solero, Wall’s, Kibon, Algida and Ola. Our portfolio alsoincludes Ben & Jerry’s, Breyers, Klondike and Popsicle. Thiscategory also includes tea-based beverages, where our principalbrands are Lipton, Brooke Bond and PG Tips. This group alsoincludes weight management products, principally Slim•Fast, andnutritionally enhanced products sold in developing markets,including Annapurna and AdeS/Adez.

Unilever Annual Report and Accounts 2007 9
Report of the Directors continued
About Unilever continued
Within these groups, we also include sales of our UnileverFoodsolutions, which is a global food service business providingsolutions for professional chefs and caterers.
In Personal Care, six global brands are the core of our business inthe mass skin care, daily hair care and deodorants product areas –Dove, Lux, Rexona (including Sure and Degree), Sunsilk (includingSeda/Sedal), Axe and Pond’s. Other important brands includeSuave, Clear, Lifebuoy and Vaseline, together with Signal andClose Up in oral care.
Our Home Care ranges include laundry products, such as tablets,traditional powders and liquids for washing of clothing by handor machine. Tailored products including soap bars are available forlower-income consumers. Our brands include Omo (‘Dirt is Good’platform), Surf, Comfort, Radiant, Skip and Snuggle. Ourhousehold care products include surface cleaners and bleach, soldunder the Cif, Domestos and Sun/Sunlight brands.
Corporate venture activitiesUnilever has allocated €350 million to its venturing activities inorder to create new business opportunities that have the potentialto help build our core brands and business interests in Foods andHome and Personal Care. These activities include:
• Unilever Ventures, an early-stage business development fundfor businesses from both inside and outside Unilever;
• Langholm Capital, an independent fund investing in privateEuropean companies with above-average longer-term growthprospects; and
• Physic Ventures, an early-stage venture capital fund investing intechnology driven, consumer-directed health, wellness andsustainable living companies.
Our employeesOur One Unilever programme is already streamlining the businessby creating single operating companies for each country andoutsourcing parts of our IT, HR and Finance functions. In 2007 weannounced plans to accelerate our change programme further bydeveloping more multi-country organisations (MCOs) – clusters ofcountries with a single centralised management and sharedfunctions. MCOs reduce duplication and free up resources tofocus on customers and consumers. All regions announced orcontinued to implement MCOs in the year. The newly announcedMCOs include Benelux; Germany, Austria and Switzerland;UK/Ireland; and Central Africa.
Our leaders make diversity a top business priority. Signalling thiscommitment, the Global Diversity Board draws together 15leaders from all business functions and is chaired by Group ChiefExecutive Patrick Cescau. The board focuses on driving thediversity agenda into our business processes and tracking theprogress of diversity initiatives. It also champions new ways ofworking to boost employees’ personal vitality.
The Senior Executive Seminar, our pioneering leadershipdevelopment programme, was led this year by leading businessacademic C K Prahalad. The event brought together 28 of our topleaders to examine key business issues, with a particularly strongexternal focus. They concentrated on developing and emergingmarkets, visiting more than 50 companies and 20 NGOs to gaininsights into global trends and practices for opening upopportunities at the ‘bottom of the economic pyramid’. The
group’s findings have been shared with the Unilever Executive andBoard of Directors, and are helping to shape further our approachin these markets.
Our Standards of Leadership programme is a set of behavioursaimed at ensuring that every manager takes personalresponsibility for delivering Unilever’s agenda through excellencein strategy execution. During the year, the framework was rolledout globally to an enthusiastic response. In Asia the process wasparticularly effective, with managers across 15 countries attendinginteractive workshops. Individuals made personal commitments to‘live the behaviours’ and to model them in their daily workinglives.
We aim to offer our people stimulating ways to broaden theirskills and experience while at the same time giving somethingback to the community. Salvatore Lucia, a Supply Chain Managerfrom Italy, was one of the Unilever specialists seconded to theWorld Food Programme (WFP) as part of their professionaldevelopment. He is helping WFP Ghana deliver its school feedingand nutrition programme – and learning valuable skills to bringback to the business.
We are committed to finding fresh ways of working that improvebusiness effectiveness, enhance work-life balance and benefit theenvironment. We created four ‘Telepresence’ video-conferencingrooms: in Englewood Cliffs, Rotterdam, London and Singapore.Telepresence uses high-definition video screens with life-sizeimages around a single ‘virtual’ table, to replicate as closely aspossible a face-to-face meeting. It is also the first technology ofits kind to be certified by the CarbonNeutral Company. A furthereight rooms will be added in 2008.
Our total employee numbers over the last five years were asfollows:
Year end in thousands 2007 2006 2005 2004 2003
Europe 43 44 49 52 55The Americas 43 45 47 47 50Asia Africa 88 90 110 124 129
Total 174 179 206 223 234
The total reported numbers included approximately 26 000 part-time or seasonal employees in both 2007 and 2006.
DiversityDiversity in Unilever is about inclusion, embracing differences,creating possibilities and growing together for better businessperformance. We embrace diversity in our workforce: this meansgiving full and fair consideration to all applicants and continuingdevelopment to all employees regardless of gender, nationality,race, creed, disability, style or sexuality. Diversity plays a vital rolein ensuring we understand consumers’ needs.
The commitment to diversity is set right at the top of ourbusiness. It is driven by the Global Diversity Board, chaired byGroup Chief Executive Patrick Cescau, who has emphasised that“diversity is critical to our business competitiveness and long-termsustainability”.

10 Unilever Annual Report and Accounts 2007
Report of the Directors continued
About Unilever continued
Unilever is one of the world’s most culturally diverse companies,with 21 different nationalities represented among our top levelgroup of 113 managers worldwide.
In 2007 we worked to embed diversity even more firmly into ourday-to-day business decisions, via our talent management andpeople processes, from appointments to development. As part ofthe Human Resources planning process our businesses units arealso developing specific diversity plans that are aligned to thepriorities and needs of their regions and categories.
We continue to carry out quarterly measurement and tracking ofdiversity against our objectives, using the HR Strategy in Actiontool. Gender remains an important priority and is reviewed by theUnilever Executive team (UEx).
Information technologyUnilever Information Technology is a global function, headed by aglobal Chief Information Officer, with a strategy to delivercompetitive and cost effective IT solutions to support the business.
A common technology framework and standards for architecture,key technologies, processes, information and services allowUnilever to leverage its scale in IT. For example, this approach issupporting the setting up and the operation of regional sharedservices centres for ‘back-office’ operations, notably in Financeand Human Resources, which in some cases are outsourced.
The IT function is a key enabler for the One Unilever change froma multi-local to a globally aligned business through:
• strategic alliances and partnerships with key global suppliers;• improving IT capabilities and processes;• improving overall IT infrastructure and service value; and• strategic outsourcing in selected key areas.
The implementation across the Group of a world-classharmonised ERP system in each region in support of the OneUnilever programme is progressing well. The Americasimplementation has already been completed across the region,while two-thirds of our European business is now on a singleinstance ERP system with full implementation expected to belargely completed by the end of 2008. In Asia Africa, a phasedimplementation towards 2010 has seen the first four countriescompleted in 2007.
Unilever partners with a few major suppliers to develop theminimum number of non-overlapping IT systems needed todeliver the business objectives. This promotes radical simplificationwith flexibility and agility, faster implementation and reducedcosts.
Intellectual propertyWe have a large portfolio of patents and trademarks, and weconduct some of our operations under licences which are basedon patents or trademarks owned or controlled by others. We arenot dependent on any one patent or group of patents. We useour best efforts to protect our brands and technology.
Property, plant and equipmentWe have interests in properties in most of the countries wherethere are Unilever operations. However, none is material in thecontext of the Group as a whole. The properties are usedpredominantly to house production and distribution activities and as offices. There is a mixture of leased and owned propertythroughout the Group. There are no environmental issuesaffecting the properties which would have a material impact upon the Group, and there are no material encumbrances on ourproperties. Any difference between the market value of propertiesheld by the Group and the amount at which they are included inthe balance sheet is not significant. Please refer also to theschedule of principal group companies and non-currentinvestments on page 125 and to details of property, plant andequipment in note 10 on page 88. We currently have no plans toconstruct new facilities or expand or improve our current facilitiesin a manner that is material to the Group.
Laws and regulationUnilever businesses are governed by laws and regulationsdesigned to ensure that products may be safely used for theirintended purpose and that labelling and advertising are truthfuland not misleading. Unilever businesses are further regulated bydata protection and anti-trust legislation. Important regulatorybodies in respect of our businesses include the EuropeanCommission and the US Food and Drug Administration.
We have processes in place to ensure that products, ingredients,manufacturing processes, marketing materials and activitiescomply with the above-mentioned laws and regulations.
Legal proceedingsWe are not involved in any legal or arbitration proceedings whichmight lead to material loss or expenditure in the context of theGroup results. Similarly we do not have any material obligationsunder environmental legislation. None of our Directors or Officersis involved in any legal proceedings which are material as aforesaid.Nonetheless, we comment on certain proceedings below:
Ice cream casesUnilever has businesses in many countries and from time to timethese are subject to investigation by competition and otherregulatory authorities. One such matter under review is our icecream distribution in Europe, specifically the exclusivity for the useof freezer cabinets provided to retailers free-on-loan for the saleof impulse ice cream. In September 2006 the European Court ofJustice in Luxembourg (‘ECJ’) dismissed the appeal by Unilever’sIrish ice cream business, HB Ice Cream, of the 2003 Court of FirstInstance ('CFI') judgment that upheld the European Commission’s1998 decision to ban HB Ice Cream from imposing cabinetexclusivity in Ireland in circumstances where these were the onlycabinets used by the retailer. The ECJ ruling is final as regardsIreland and ends 14 years of legal debate.

Unilever Annual Report and Accounts 2007 11
Report of the Directors continued
About Unilever continued
Unilever has been fully compliant with the ruling in the Irish casesince October 2003, when we lifted cabinet exclusivity fromoutlets that only have HB freezers (Unilever was not ordered toabandon cabinet exclusivity altogether). Parallel proceedingsbetween HB Ice Cream and Masterfoods (re-named Mars) beforethe Irish High Court, which had been deferred pending the ECJruling, were reopened in 2007 at the request of Mars to claimdamages from Unilever. We will resist any claim for compensationfor losses that cannot be directly attributed to the practicesprohibited by the European Commission’s 1998 decision asregards Ireland.
The Commission decision applied only to Ireland. The relevance ofits reasoning to other markets depends on a detailed factualassessment of the effects of cabinet exclusivity in each market.Unilever has given careful consideration to the potentialapplication of the reasoning in the Irish case to its cabinet policiesin other EU countries. The majority of markets are not affected bythis development. However we have taken a number ofcommercial steps to avoid extending the debate further, in theinterest of focusing on our day-to-day business.
Since the ECJ ruling, Mars has nonetheless sought to bring claimsagainst Unilever before authorities and courts in a number ofcountries. Mars’ allegations must be scrutinised in the light ofprevailing national market conditions, this can be a complex andlengthy process. However by 26 October 2007 a civil claim byMars in Germany had already been dismissed by the HamburgRegional Court. Although Mars has appealed this decision, wewill continue vigorously to resist Mars’ claim.
Mars also brought a claim before the Swedish Market Court,which on 25 September 2007 issued an interim order that broadlyreflects Unilever’s current policy as regards the loan of freezercabinets, namely that retail customers in Sweden must be free todecide what products to store in Unilever cabinets where theseare the only cabinets used by the retailer. The Court’s order didnot require material changes beyond those already made byUnilever’s Swedish business, GB Glace. The main proceedingsremain ongoing but the Market Court does not have jurisdictionto make damages awards.
An investigation by the Portuguese competition authority isongoing since March 2007. Portuguese law prevents us fromdisclosing details of this investigation. Unilever engagesproactively with the authority.
In Italy the Consiglio di Stato overturned a 2003 decision by theItalian competition authority (‘ICA’) that responded positively to anotification by Unilever of its policy in relation to outlet exclusivity.The Consiglio di Stato made its decision on 24 July 2007 on thebasis that Unilever’s market position in Italy had not beensufficiently investigated by the ICA. Unilever has always engagedproactively with the ICA and continues to do so to secure aprompt resolution to the outstanding issues.
We cannot exclude that Mars may seek to bring claims in otherjurisdictions, in which case Unilever can be expected to defend itsposition vigorously. We believe that our true strength lies in theappeal and quality of our ice cream brands. By way of illustrationof the point, in the UK since 2000, when cabinet exclusivity waseffectively abandoned by Unilever, there has not been anymaterial change in Unilever’s relevant market share.
Other competition issuesIn 2006 the French competition authorities commenced an inquiryinto potential competition law infringements in France involving anumber of consumer goods companies in the home and personalcare sector, including Unilever France and Lever Fabergé France,both subsidiaries of the Unilever Group. Interviews have beenconducted with present and former members of our staff anddocuments have been supplied to the French authorities. Nostatement of objections or proposals for fines have yet beenlodged against either Unilever France or Lever Fabergé France asthe authorities’ investigation has had to be restarted followingprocedural challenge. Accordingly, the potential financialimplications, if any, of this investigation cannot yet be assessed. Astatement of objections is however expected in the near future.
On 14 March 2007 representatives from the German FederalCartel Office carried out an inspection at the offices of UnileverDeutschland GmbH in Hamburg. The inspection was in relation tothe home and personal care market in Germany. Statements ofobjections have been received by and fines have been imposed onUnilever Deutschland, which currently intends to defend itsposition by way of appeal.
On 25 February 2008, a purported class action lawsuit was filedin the United States of America in the United States District Courtfor the Northern District of Illinois alleging, relying upon theGerman investigation described above, that Unilever N.V., UnileverPLC and Unilever United States, Inc. allegedly conspired withcertain other companies to fix prices of oral, home and personalcare products in the United States. The Unilever parties deny theclaims and intend to defend the action.
Tax cases BrazilDuring 2004 the Federal Supreme Court in Brazil (local acronymSTF) announced a review of certain cases that it had previouslydecided in favour of taxpayers. Because of this action weestablished a provision in 2004 for the potential repayment of sales tax credits in the event that the cases establishingprecedents in our favour are reversed. Since that time we havecontinued to monitor the situation and have made changes as appropriate to the amount provided.
In June 2007, the Supreme Court ruled against the taxpayers inone of these cases. Management believes that the amountprovided in Unilever’s accounts should be sufficient to cover theamount of the tax in question, but industry associations (of whichUnilever is a member) are currently attempting to negotiate asettlement with the Federal Revenue Service to reduce or avoidthe payment of interest and/or penalties on such amounts.Management is optimistic that such negotiations will lead to asettlement, but no assurance can be given that a settlement willbe reached or that the amount of any interest or penalties will becovered by such provision.
Also during 2004 in Brazil, and in common with many otherbusinesses operating in that country, one of our Braziliansubsidiaries received a notice of infringement from the FederalRevenue Service. The notice alleges that a 2001 reorganisation of our local corporate structure was undertaken without validbusiness purpose. If upheld, the notice could result in a tax claimin respect of prior years. The 2001 reorganisation was comparablewith that used by many companies in Brazil and we believe thatthe likelihood of a successful challenge by the tax authorities isremote. While this view is supported by the opinion of outsidecounsel there can be no guarantee of success on the merits.

12 Unilever Annual Report and Accounts 2007
Report of the Directors continued
About Unilever continued
Preference sharesIn 1999, NV issued cumulative preference shares, with a notionalvalue of €6.58 (Fl.14.50), as an alternative to a cash dividend. On24 March 2004, NV announced its intention to convert part(€6.53 – equivalent to Fl.14.40) of the notional value of thepreference shares, in accordance with its Articles of Association,into NV ordinary shares in the first quarter of 2005. Thisconversion took place in February 2005 for a value of €4.55 foreach preference share. In May 2005, NV’s Annual GeneralMeeting decided to cancel the preference shares and cancellationtook effect in July 2005.
In November 2006 NV announced that it had agreed a settlementwith the main parties in a legal dispute over the conversion of thepreference shares. Former preference shareholders who heldpreference shares on 24 March 2004 were entitled to participatein the settlement. These shareholders could apply for thesettlement from 20 January 2007 up to and including 30 June2007. Unilever has paid €304 million in respect of the settlement(further information in note 19 on page 102).
A group of former preference shareholders who had bought theirpreference shares after 24 March 2004 and who are not entitledto the settlement, instituted claims with the Rotterdam DistrictCourt for nullification of the NV Board’s decision to convert thepreference shares and NV’s Annual General Meeting decision tocancel the preference shares. The Rotterdam District Court hasnot yet decided on these claims. They also claim damages in theamount of approximately €81 million. These claims will bevigorously contested.
Corporate responsibility and sustainabilityWe aim to manage and grow our business around the world in aresponsible and sustainable way, creating long-term value for allthose with a stake in our business.
We believe our brands must be at the forefront of delivering oursustainability commitments. The successful brands of the futurewill be those that satisfy both the functional needs of consumersand address their concerns as citizens – including concerns aboutthe environment and social justice.
To enable our brands to integrate social and environmental driversinto their development plans in a structured way, we are rollingout a programme called Brand Imprint. This helps our managersto understand and assess the challenges and opportunities thatsustainability presents for our business. An early example of thepotential of Brand Imprint is our decision to put the sourcing ofall our tea on to a sustainable, ethical basis and to work with theRainforest Alliance to achieve certification for our tea estates.Lipton the world’s largest tea brand, and PG Tips, one of the UK’sleading brands, became the first to carry the Rainforest Alliancelogo, showing that they meet the independent organisation’sstrict sustainability criteria.
Another significant step was taken by our ice cream brand Ben &Jerry’s, which announced plans to invest €2.4 million over the fiveyears 2007-2012 in reducing its impact on climate changethrough initiatives covering every stage of its European productionprocess.
Our ambitions for our brands are underpinned by our Mission andCorporate Purpose and our Code of Business Principles. Theseencapsulate the values and standards by which we expect ouremployees and our business to be judged. We communicate andmonitor these standards actively and any lapses are fullyinvestigated: in 2007 we dismissed 54 people for conduct thatbreached our Code of Business Principles.
To reinforce this commitment and maintain our operationalintegrity, we seek to share these standards with our suppliers andcontractors through our Business Partner Code. This sets outstandards on ten key points of business ethics, labour standards,consumer safety and the environment.
In 2007 we reviewed our sustainability strategies for agriculture(from which about two-thirds of our raw materials come),packaging, water and greenhouse gases to connect them moreclosely to our business objectives.
Our targets in these areas will help us control costs, respond toour customers’ and consumers’ desire to reduce waste and openup avenues for innovation that benefit our consumers, forexample concentrated laundry products such as all Small &Mighty. Small & Mighty’s consumer and environmental benefitswere promoted by Wal-Mart, helping the brand to grow its salesin the US to US $140 million in 2007. Small & Mighty, which usesless water, less packaging and less fuel for transport, has nowlaunched in Europe across the brand portfolio, for example Persil,Surf and Omo.
Many of our major retail customers are focusing on sustainabilityand, by sharing our expertise in this area, we are able tostrengthen our relationships with them and grow our business.For example, the success of our ongoing partnership with Wal-Mart led the world’s largest retailer to name us 2007 Supplier ofthe Year for Sustainable Engagement.
We continue to work in partnership in fields where we cancontribute our expertise. The breadth of our portfolio means weare uniquely placed to share our understanding of how to runeffective programmes to improve both nutrition and hygiene. Forexample, through our partnership with the UN World FoodProgramme we are working to improve the health and nutritionof poor children through school feeding programmes, providingover 15 million school meals to 80 000 children in 2007. With theFDI World Dental Federation we are running projects to improveoral care in 38 countries. In 2007 we contributed €89 million tocommunities through corporate and brand initiatives.
In 2007 the strength of our commitment to sustainabledevelopment was recognised by our ranking as foods producerssector leader of the Dow Jones Sustainability Indexes for the ninthyear running. We were also ranked best in class in the foodproducts sector of the fifth Carbon Disclosure Project (a coalitionof over 315 global investors with combined assets in excess of US $41 trillion) and named in its Climate Disclosure LeadershipIndex in recognition of our efforts to address the challenges ofclimate change.
Further details of the progress we are making to integratesustainability into our day-to-day business operations can befound in our annual Sustainable Development Report, available atwww.unilever.com

The following discussion about outlook and risk managementactivities includes ‘forward-looking’ statements that involve riskand uncertainties. The actual results could differ materially from those projected. See the ‘Cautionary statement’ on the insideback cover.
OutlookOur strategy is to focus our resources on our priority areas ofVitality, personal care, and developing and emerging markets,where we are well placed to achieve sustainable profitable growthwith our brands and strong value creation for our shareholders.This is the basis for our strategic plan which aims to deliverconsistent and competitive underlying sales growth in the 3-5%growth range per annum and an operating margin improving to alevel in excess of 15% by 2010. The underlying sales growthrange is based on market growth of typically around 3-4%, andreflects our ambition to strengthen our leadership positions overtime.
In August 2007, we announced new plans to accelerate changeof Unilever, including a step-up in innovation, plans to shape ourportfolio, and measures to improve our margins, to strengthenand further enhance Unilever’s financial performance.
These plans include the creation of multi-country organisations inall regions, closure or streamlining of 50-60 factories and afurther reduction in global and regional overheads. These changesaim to deliver a reduction in our annual cost base by around €1.5 billion by the end of 2010, compared with our 2006 costbase. The related restructuring charges are estimated to amountto about 2.5% of sales on average per annum in the period2007–2009. For 2010 and beyond, we expect restructuring coststo come down to a ‘normal’ level of 0.5% to 1% of turnover perannum.
We also announced our intention to dispose of brands andbusinesses with a combined turnover in excess of €2 billion,including the sale of our North American laundry business. Thefocus is on brands that do not have a longer-term strategic fitwith our strategy and business model or have a strategicallydisadvantaged position in their particular markets. These value-enhancing disposals are expected to collectively improve theunderlying sales growth rate of our business by around 0.4percentage points and will be neutral to operating margin, afterremoval of uncovered costs.
We also expect to improve our return on invested capital overtime, above the base level of 11% in 2004, and to generateungeared free cash flow of €25-30 billion over the period 2005–2010. It should be noted that previous and planneddisposals and the additional restructuring plans will have reducedungeared free cash flow by about €2.5 billion over this period,while enhancing the ongoing cash generating capacity of thebusiness.
In February 2008 we indicated that in 2008 we expect underlyingsales growth to be towards the upper end of our 3-5% targetrange, and to see a further underlying improvement in operatingmargin. In the three-year period 2005–2007, Unilever generated acumulative ungeared free cash flow of €12 billion, towards the €25-30 billion target for the six-year period 2005–2010.
Risk managementUnilever’s system of risk management is outlined on page 66.Responsibility for establishing a coherent framework for theGroup to manage risk resides with the Boards. The remit of theBoards is outlined on page 33.
Particular risks and uncertainties that could cause actual results tovary from those described in forward-looking statements withinthis document, or which could impact on our ability to meet ourpublished targets, have been identified. Unilever has describedsome mitigating actions it intends to take to address the risks setout below. These actions may not succeed in mitigating theserisks. Additionally, Unilever may not be successful in deployingsome or all of these mitigating actions, which may impairUnilever's profitability or adversely impact its reputation.
Sales and profit growthThe increasingly competitive environment, the furtherconsolidation in the marketplace and continued growth ofdiscounters could adversely impact our rate of sales growth andour profit margins. In the light of this, we will continue to investin selected brands and high growth market areas in an effort todeliver profitable sales growth.
During 2007 we have reinforced our ability to deliver growth bycontinuing to dispose of low growth or non relevant componentsin the category portfolio (i.e. those that do not fit with thestrategy). This we believe has the impact of concentrating brandstrength and therefore reducing the risk of brand equity loss orimpairment in our global brands. It also improves our overallcompetitive position on a global basis by shifting more turnoverweight into high growth-high share business as a percentage ofour total portfolio. We will continue to actively manage ourportfolio with the goal of improving investor returns bystrengthening the competitive position of our business. This, webelieve, will also reduce business risk by minimising the weaknessin our portfolio.
Our continued sales and profit growth depends in large part onour ability to generate and implement a stream of consumer-relevant improvements to our products. The contribution ofinnovation is affected by the level of funding that can be madeavailable, the technical capability of the research anddevelopment functions, and the success of operatingmanagement in rolling out quickly the resulting improvements.Our focus will continue to be on developing our brands in waysthat are distinctive and are relevant for our customers.
We have a number of large global brands, including 12 with anannual turnover greater than €1 billion, which often depend onglobal or regional development and supply chains. Any adverseevent affecting consumer confidence or continuity of supply ofsuch a brand could have an impact in many markets. The carryingvalue of intangible assets associated with our brands is significant,and depends on the future success of those brands. Thereremains a risk that events affecting one or more of our globalbrands could potentially impair the value of those brands.
Unilever Annual Report and Accounts 2007 13
Report of the Directors continued
Outlook and risks

14 Unilever Annual Report and Accounts 2007
Report of the Directors continued
Outlook and risks continued
As the retail market place through which our products aredistributed continues to evolve, our growth and profitability canbe threatened if we do not adapt our strategies and enhance ouroperational capabilities. It is important that we continue to buildand deepen relationships with our customers. Plans to raise oureffectiveness in the trade, where necessary, receive increasingattention at all levels.
Change initiativesThe continuing restructuring of the business which is designed tosimplify our operations and leverage our scale more effectively,includes outsourcing back office support operations, formingmulti-country organisations and converging regional processesand systems. Building on the experiences of 2007, we willcontinue to manage the risks in this area diligently and developclear action plans in an attempt to mitigate these risks. Key to thisis the establishment and maintenance of project managementprocesses to monitor progress against milestones and targetstogether with appropriate communication programmes.
PeopleUnilever’s performance targets require it to have the right calibreof people at all levels. We must compete to obtain capablerecruits for the business, and then train them in the skills andcompetencies that we need to deliver profitable growth. At atime of substantial change in the business there is a particularfocus on creating alignment and energetic leadership.
Corporate reputationUnilever has created a strong corporate reputation over manyyears, and many of our businesses have a high local profile. Thisreputation is underpinned by ensuring that all employees embracethe principles prescribed in our Code of Business Principles.Unilever products carrying our well-known brand names are soldin over 150 countries. Should we fail to meet high product safety,social, environmental and ethical standards in all our operationsand activities, Unilever’s corporate reputation could be damaged,leading to the rejection of our products by consumers, damage toour brands and diversion of management time into rebuilding ourreputation.
Potential economic instabilityAround 44% of Unilever’s turnover comes from the developingand emerging economies. We have long experience in thesemarkets, which are also an important source of our growth. Theseeconomies are typically more volatile than those in the developedworld, and there is a risk of downturns in consumer demand thatwould reduce the sales of our products. We will continue tomonitor closely performance in the most volatile markets andrespond quickly in an effort to protect our business. In cases ofextreme social disruption, protecting our people is always thepriority.
Price and supply of raw materials and commodities contractsWe faced significant increases in the cost of various commoditiesand raw and packing materials throughout the year. We havebeen able to substantially mitigate these through a combinationof price increases, supply chain savings and mix improvements.We see a trend of increasing commodity prices going into 2008.In addition to our ongoing actions to mitigate these risks, andwhere appropriate, we purchase forward contracts for rawmaterials and commodities. Where appropriate, we also usefutures contracts to hedge future price movements, however, theamounts are not material.
Insurance of risksAs a multinational group with diverse product offerings andoperations in around 100 countries, Unilever is subject to varyingdegrees of risk and uncertainty. It does not take out insuranceagainst all risks and retains a significant element of exposure tothose risks against which it does insure. However, it insures itsbusiness assets in each country against insurable risks as it deemsappropriate.
Financial risksIn addition to the above, Unilever is exposed to various specificrisks in connection with its financial operations and results. These include the following:
• the impact of movement in equity markets, interest rates andlife expectancy on net pension liabilities;
• maintenance of group cash flows at an appropriate level;• exposure of debt and cash positions to changes in interest rates;• potential impact of changes in exchange rates on the Group’s
earnings and on the translation of its underlying net assets;• market liquidity and counterparty risks; and• risks associated with the holding of our own shares in
connection with share-based remuneration schemes.
Further information about these, including sensitivity analysis tochanges in certain of the key measures, is given in note 17 onpages 100 and 101 and note 20 on page 105.
Other risksUnilever’s businesses are exposed to varying degrees of risk anduncertainty related to other factors including competitive pricing,consumption levels, physical risks, legislative, fiscal, tax andregulatory developments, terrorism and economic, political, andsocial conditions in the environments where we operate. All ofthese risks could materially affect the Group’s business, ourturnover, operating profit, net profit, net assets and liquidity.There may be risks which are unknown to Unilever or which arecurrently believed to be immaterial.

Unilever Annual Report and Accounts 2007 15
Report of the Directors continued
Operating Review – Regions
Basis of reportingIn this Operating Review we comment on our changes in revenueon the basis of underlying sales growth (USG). This measurereflects the change in revenue at constant rates of exchange,(average exchange rates for the preceding year) excluding theeffects of acquisitions and disposals. It is a measure that providesvaluable additional information on the underlying performance of the business. In particular, it presents the organic growth of our business year on year and is used internally as a core measureof sales performance.
USG is not a measure which is defined under IFRS. It should notbe considered in isolation from, or as a substitute for, financialinformation presented in compliance with IFRS. This measure asreported by us may not be comparable with similarly titledmeasures reported by other companies.
The reconciliation of USG to changes in turnover for each of ourreporting regions is given in the following section, and for theGroup in total on page 32.
The reporting in this section is based on results for continuingoperations. Information about discontinued operations is given innote 27 on page 114.
Europe
2007 compared with 2006€ million € million
2007 2006
Turnover 15 205 15 000Operating profit 1 678 1 903Operating margin 11.0% 12.7%Restructuring, business disposals, impairment charges and one-time gain (2006) on UK pension plans included in operating margin (4.0)% (1.4)%
%Underlying sales growth at constant rates 2.8Effect of acquisitions 0.0Effect of disposals (1.5)Effect of exchange rates 0.0Turnover growth at current rates 1.4
%Operating profit 2007 vs 2006
Change at current rates (11.9)Change at constant rates (11.7)
Turnover at current rates of exchange rose by 1.4%, after theimpact of acquisitions, disposals and exchange rate changes as setout in the table above. Operating profit at current rates ofexchange fell by 11.9%, after including an adverse currencymovement of 0.2%. The underlying performance of the businessafter eliminating these exchange translation effects and theimpact of acquisitions and disposals is discussed below atconstant exchange rates.
The region sustained its improving trend in 2007 with underlyingsales growth of 2.8% for the year. The improvement was drivenby relentless focus on better in-market execution, rejuvenation ofthe quality and value of our core products, and an introduction ofnew innovations. Consumer demand in our categories was steadythroughout the year.
Overall we saw improving trends almost everywhere. Russia wasthe outstanding performer, but all major countries grew in theyear, including the UK, Germany, Italy and the Netherlands. InFrance sales were slightly up in a challenging market.
The operating margin, at 11.0% for the year, reflects a higher netcharge for restructuring, disposals and one-off items comparedwith 2006. Before these items, the operating margin showed anunderlying improvement of 0.9 percentage points, driven bylower overheads as a result of the One Unilever programme andreduced advertising and promotions costs.
We made substantial progress with portfolio development andrestructuring.
At the start of 2008 we completed the expansion of thesuccessful international partnership for Lipton ready-to-drink teawith PepsiCo to include all countries in Europe. We alsocompleted the sale of Boursin, and announced the acquisition ofthe leading Russian ice cream company Inmarko.
We formed four new multi-country organisations and announcedthe streamlining or closure of ten factories. The roll-out of a singleSAP system across the region continues, with two-thirds ofturnover in the region now on stream and full implementationexpected to be largely completed by the end of 2008.
We continued to target innovations mainly at Vitalityopportunities. In ice cream, we introduced Frusì frozen yoghurtwith wholegrain cereals and real fruit pieces and low calorieSolero smoothies. Lipton Linea slimming teas were launched inFrance, Switzerland and Portugal. Growth in Hellmann’s wasboosted by new extra light mayonnaise with citrus fibretechnology.
The new Dove pro•age range of products is building well inEurope as well as elsewhere, and Dove Summer Glow self-tanningand body lotions are now available in most countries. Clear anti-dandruff shampoo was launched in Russia, with good consumerresponse. Small & Mighty concentrated liquid laundry detergentswere launched in seven European countries.

16 Unilever Annual Report and Accounts 2007
Report of the Directors continued
Europe (continued)
2006 compared with 2005€ million € million
2006 2005
Turnover 15 000 14 940Operating profit 1 903 2 064Operating margin 12.7% 13.8%Restructuring, business disposals, impairment charges
and one-time gain (2006) on UK pension plans included in operating margin (1.4)% (0.9)%
%Underlying sales growth at constant rates 1.0Effect of acquisitions 0.1Effect of disposals (0.9)Effect of exchange rates 0.2Turnover growth at current rates 0.4
%Operating profit 2006 vs 2005
Change at current rates (7.7)Change at constant rates (7.9)
Turnover at current rates of exchange rose by 0.4%, after theimpact of acquisitions, disposals and exchange rate changes as set out in the table above. Operating profit at current rates ofexchange fell by 7.7%, after including a favourable currencymovement of 0.2%. The underlying performance of the businessafter eliminating these exchange translation effects and theimpact of acquisitions and disposals is discussed below atconstant exchange rates.
The UK, our largest European business, returned to growth in the year with good results across several foods and personal careranges. Although laundry sales declined, there were promisingsigns of progress in market share with Persil regaining its positionas the country’s leading laundry brand. The Netherlands had astrong year. A pioneer of One Unilever, it benefited fromoperating as a single company. Highlights were rapid growth forLipton, Dove, Rexona and Axe. France remained a difficult marketwith sales lower in spreads, laundry and hair care. Newmanagement was put in place and there was an improvement inthe second half of the year. Sales in Germany held up better in2006. There was good growth for personal care brands but someturnover in Lipton ice tea was lost following changes in rules forbottle returns. Central and Eastern Europe continued to do well,driven by double-digit growth in Russia.
The sale of the majority of our European frozen foods businessesto Permira was successfully completed during the year.
Our 2006 innovation programmes resulted in our Foods brandswholeheartedly embracing the concept of Vitality, with newproducts designed to deliver the health benefits that consumersseek. Rama/Blue Band Idea! – spreads with added nutrients whichare beneficial to children’s mental development – was launched in2006.
Operating Review – Regions continued
A range of Knorr bouillon cubes with selected natural ingredientsand a better, richer taste was rolled out across the region, whileKnorr Vie one-shot fruit and vegetable products became availablein 12 countries. Meanwhile, Latin America’s AdeS drink, a healthyblend of fruit juices and soya, was launched successfully in the UKas AdeZ.
Product launches with clear functional or emotional benefits inHome and Personal Care brands were rolled out rapidly across theregion. A range of new Dove launches included the moisturisingself-tan Dove Summer Glow. Meanwhile in household care, weintroduced Domestos 5x which continues to kill germs even afterseveral flushes and the cleaning power of Cif was applied to aseries of power sprays.
The operating margin, at 12.7%, was 1.1 percentage pointslower than in 2005, with higher net costs for restructuring,disposals and impairments, partially offset by a one-time gain of€120 million from changes to the UK pensions plan. Before theseitems, the operating margin would have been 0.6 percentagepoints lower than in 2005. Margins in Foods were lower than in2005 as we absorbed significant increases in commodity costswhich were only partly compensated by savings programmes.
The Americas
2007 compared with 2006€ million € million
2007 2006
Turnover 13 442 13 779Operating profit 1 971 2 178Operating margin 14.7% 15.8%Restructuring, business disposals, impairment charges
and one-time gain (2006) on US healthcare plans included in operating margin (0.7)% 0.0%
%Underlying sales growth at constant rates 4.1Effect of acquisitions 0.1Effect of disposals (0.6)Effect of exchange rates (5.8)Turnover growth at current rates (2.4)
%Operating profit 2007 vs 2006
Change at current rates (9.5)Change at constant rates (3.4)
Turnover at current rates of exchange fell by 2.4%, after theimpact of acquisitions, disposals and exchange rate changes as setout in the table above. Operating profit at current rates ofexchange fell by 9.5%, after including an adverse currencymovement of 6.1%. The underlying performance of the businessafter eliminating these exchange translation effects and theimpact of acquisitions and disposals is discussed below atconstant exchange rates.

Unilever Annual Report and Accounts 2007 17
Report of the Directors continued
Operating Review – Regions continued
The Americas (continued)
Underlying sales grew by 4.1% in the year, with an increasingcontribution from pricing which was up 2.6% for the year.
In the US, overall consumer demand held up well in ourcategories. Market growth in home care and personal care slowedsomewhat in the second half year, but this was compensated forby robust demand in foods. Our own sales in the US grew solidly,up 3.2% for the year, despite lower sales of ice cream.
Our business in Mexico made good progress in the second half ofthe year and Brazil showed an improved performance in thefourth quarter. Argentina, Andina and Central America performedwell throughout.
The operating margin, at 14.7% for the year, was 1.1 percentagepoints lower than the previous year. Before the impact ofrestructuring, disposals and one-off items, the margin was 0.4percentage points lower than last year. This was due to anincrease in advertising and promotions and the impact ofsubstantial cost increases, which have not yet been fully offset byprice increases and savings programmes.
The One Unilever programme is simplifying operations throughoutthe region. Argentina, Mexico and Brazil all moved to single headoffices in 2007, while the US will follow in early 2008. Sales forceintegration is under way in a number of countries. A single SAPsystem has been implemented in the US, with Latin Americaalready on one system.
We set up a joint venture with Perdigão to develop our heart-health margarine Becel in Brazil and disposed of our local Brazilianmargarine brands. We also announced an agreement for thedisposal of Lawry’s seasonings, while the sale process of the NorthAmerican laundry business is under way.
New varieties of Knorr bouillons and soups in Latin Americafurther advanced the brand’s Vitality credentials. Hellmann’s ‘real’campaign highlights its simple ingredients which are naturally richin Omega 3, in both the US and Latin America. In the US, weintroduced Promise Activ SuperShots, a Vitality shot with addednatural plant sterols, ingredients that are clinically proven to helpactively remove cholesterol as part of a diet low in saturated fatand cholesterol.
Innovation in personal care reflected the more global approach.Clear anti-dandruff shampoo was successfully launched in Brazil,while the Dove pro•age range of skin care, deodorants andshampoos was introduced in the US at the same time as inEurope. In laundry, the Dirt is Good platform continued to buildacross Latin America, now including a variant with built-in fabricsoftener.
2006 compared with 2005€ million € million
2006 2005
Turnover 13 779 13 179Operating profit 2 178 1 719Operating margin 15.8% 13.0%Restructuring, business disposals, impairment charges
and one-time gain (2006) on US healthcare plans included in operating margin 0.0% (3.4)%
%Underlying sales growth at constant rates 3.7Effect of acquisitions 0.1Effect of disposals (0.7)Effect of exchange rates 1.4Turnover growth at current rates 4.6
%Operating profit 2006 vs 2005
Change at current rates 26.7Change at constant rates 25.0
Turnover at current rates of exchange rose by 4.6%, after theimpact of acquisitions, disposals and exchange rate changes as set out in the table above. Operating profit at current rates ofexchange rose by 26.7%, after including a favourable currencymovement of 1.4%. The underlying performance of the businessafter eliminating these exchange translation effects and theimpact of acquisitions and disposals is discussed below atconstant exchange rates.
Sales in Brazil picked up well after a slow start, with very goodinnovation-driven performances in hair, deodorants and laundry.Omo’s brand share was at its highest level for many years.
Sales in Mexico were lower for the year, affected by a combinationof a decline in the traditional retail trade and local low-pricedcompetition. In addition, there were several operational issueswhich have since been addressed. The business returned to growth in the fourth quarter. Elsewhere there was good growth inArgentina, Central America and Venezuela. Taken together, sales inLatin America were ahead by 5.8% with Home and Personal Carebrands continuing to do well. However, there was more modestgrowth in Foods brands due to tough local competition.
New products introduced in the US included Wish-Bone SaladSpritzers with one calorie per spray, further development of theBertolli premium frozen meal range, and Lipton pyramid tea bags.Across the region, new Knorr soups and bouillons catered forlocal tastes. The highly successful AdeS nutritional drink has beenextended with a ‘light’ variant, new fruit flavours and the launchof soymilk in Brazil and Mexico.
We strengthened our hair portfolio with the launch of Sunsilk,improved both the Suave and Dove haircare lines and sold theAquanet and Finesse brands. We had a good sales response to

18 Unilever Annual Report and Accounts 2007
Report of the Directors continued
Operating Review – Regions continued
The Americas (continued)
all Small & Mighty concentrated liquid detergents. These usereduced-size packaging to save water, cardboard and energy inproduction, packaging and transport. They are also easier forconsumers to carry, pour and store. We then applied all Small &Mighty’s product technology to fabric conditioners, creatingSnuggle Exhilarations – a three-times more concentrated premiumsub-range delivering superior fragrance. In Brazil, Omo has beenfurther strengthened with a new top-performance productincluding baby and foam control variants.
The operating margin, at 15.8%, was 2.8 percentage pointshigher than in 2005. There were lower costs for restructuring,disposals and impairments, and a one-time benefit in 2006 of€146 million from changes to US healthcare plans. In 2005 therewas a gain on the sale of an office. Before these items theoperating margin would have been 0.3 percentage points lowerthan the previous year. Innovation-driven marketing mix, pricingand productivity offset high commodity costs. Advertising andpromotions were increased to support major brand launches.
Asia Africa
2007 compared with 2006€ million € million
2007 2006
Turnover 11 540 10 863Operating profit 1 596 1 327Operating margin 13.8% 12.2%Restructuring, business disposals and impairment
charges included in operating margin 1.1% (0.3)%
%Underlying sales growth at constant rates 11.1Effect of acquisitions 0.1Effect of disposals (0.4)Effect of exchange rates (4.0)Turnover growth at current rates 6.2
%Operating profit 2007 vs 2006
Change at current rates 20.2Change at constant rates 27.6
Turnover at current rates of exchange rose by 6.2%, after theimpact of acquisitions, disposals and exchange rate changes as setout in the table above. Operating profit at current rates ofexchange rose by 20.2%, after including an adverse currencymovement of 7.4%. The underlying performance of the businessafter eliminating these exchange translation effects and theimpact of acquisitions and disposals is discussed below atconstant exchange rates.
The strong underlying growth of 11.1% for the year reflects boththe vibrancy of these markets and the high priority we place onbuilding our business in the region. It includes a healthy balanceof volume and price, up by over 7% and 3% respectively.
Growth was consistent throughout the year and was broad-basedacross categories and countries, including established marketssuch as India, Indonesia, the Philippines, South Africa and Turkey,which all grew in double digits; significant product areas such aslaundry and personal wash; and emerging product areas like icecream and deodorants. China remains a key priority and grewstrongly for the third consecutive year.
We drove growth across all income levels, from highly affordablepacks to premium positions. This was supported by new brandsand products that leveraged our global platforms and excellent in-market execution.
The operating margin, at 13.8%, was 1.6 percentage pointshigher than last year. This included the €214 million accountingprofit resulting from the reorganisation of our shareholdings inSouth Africa. Before the effects of this transaction, disposals andrestructuring charges, the operating margin showed an underlyingincrease of 0.2 percentage points. The improvement was drivenby volume growth, pricing actions and savings programmes whichmore than offset higher input costs and increased advertising andpromotions.
We announced the acquisition of the Buavita brand of fruit-basedvitality drinks in Indonesia, which was completed early in January2008.
As part of the One Unilever programme we now have a singleSAP system in place in four countries as the basis for a commonregional platform, while the reorganisation of our shareholdingsin South Africa and Israel facilitates the new organisation.
The new, more global, approach to innovation was evident in the2007 programme. Clear anti-dandruff shampoo was launched inChina, Arabia, Egypt, Pakistan and the Philippines. In Japan, welaunched the Axe brand and Dove pro•age skin care products. Animproved range of Dove shower products was extended to NorthEast Asia, while Lifebuoy soap was launched in South Africa and anew variant brought to India. In laundry, the new Dirt is Goodproduct, packaging and communication were introduced toThailand.
The Moo range of ice creams was extended throughout theregion. Knorr seasonings were rejuvenated with premiumingredients, as in Europe, and in China we launched a new formof Knorr bouillons for preparing thick soups. At the same timenew, more affordable, tubs and sachets are attracting new usersof spreads in several countries.

Unilever Annual Report and Accounts 2007 19
Report of the Directors continued
Asia Africa (continued)
2006 compared with 2005€ million € million
2006 2005
Turnover 10 863 10 282Operating profit 1 327 1 291Operating margin 12.2% 12.6%Restructuring, business disposals and impairment
charges included in operating margin (0.3)% 0.0%
%Underlying sales growth at constant rates 7.7Effect of acquisitions 0.0Effect of disposals (0.8)Effect of exchange rates (1.1)Turnover growth at current rates 5.7
%Operating profit 2006 vs 2005
Change at current rates 2.8Change at constant rates 4.0
Turnover at current rates of exchange rose by 5.7%, after theimpact of acquisitions, disposals and exchange rate changes as set out in the table above. Operating profit at current rates ofexchange rose by 2.8%, after including an adverse currencymovement of 1.2%. The underlying performance of the businessafter eliminating these exchange translation effects and theimpact of acquisitions and disposals is discussed below atconstant exchange rates.
Markets remained buoyant in most of the key countries thoughthere was a slowdown in consumer spending in Thailand.Underlying sales growth of 7.7% was broadly based and ouraggregate market shares remained stable.
India grew well across major sectors. A mix of global, regionaland local brands drove growth, notably Wheel and Surf Excel inlaundry, and Clinic in haircare. A second year of excellent growthin China stemmed from a combination of market growth, betterdistribution and innovations behind global brands such as Omo,Lux and Pond’s, as well as the local toothpaste brand, Zhonghua.
Indonesia sustained good momentum, not only in the large Home and Personal Care ranges but also in Foods as a result of strong performances in ice cream and savoury. Thailand had a disappointing year through weak demand and intensecompetition. A major programme of activities was undertaken tocorrect this.
Australia experienced a much improved performance with sharegains in a number of areas. In Japan, Lux Super Rich – the leadingbrand – performed well despite a major brand launch by acompetitor. However, Dove and Mod’s lost share.
Savoury, ice cream, laundry and household care brands were themain drivers of strong growth in Turkey, while sales in Arabiawere well ahead.
In South Africa, aggressive price promotions by a local competitorhave reduced laundry sales, but there were strong growth andshare gains in Foods.
Innovation was increasingly driven globally and regionally, ratherthan locally. The new Sunsilk range was introduced in most majormarkets, and in laundry the Dirt is Good positioning wasestablished across the region. Pond’s Age Miracle, incorporatingunique technology and designed specifically for Asian skin, waslaunched in four countries. Meanwhile the latest global Axe/Lynxfragrance, Click, was introduced in Australia and New Zealand.
As in the rest of the world, the Foods innovation programmefocused on Vitality. Moo, a wholesome children’s ice cream rangebased on the goodness of milk, was very well received by mothersand children alike and proved successful in South East Asia.Healthy green tea innovations were rolled out extensively, while inSouth Africa marketing for Rama margarine now communicatesthe product’s healthy oils. Addressing the needs of lower incomeconsumers, low-priced Knorr stock cubes – already successful inLatin America – were also introduced in the region.
The operating margin at 12.2% was 0.4 percentage points lowerthan in 2005. Before the impact of restructuring, disposals andimpairments, the operating margin would have been in line withthe previous year. The benefits to margin of strong volumegrowth and savings programmes were fully offset by highercommodity costs and other cost inflation which could not be fullyrecovered in pricing.
Operating Review – Regions continued

20 Unilever Annual Report and Accounts 2007
Report of the Directors continued
Operating Review – Categories
Our brands are household names in many countries around theworld. We create products that appeal to people’s differentpreferences, based on our deep understanding of consumers’varied habits and lifestyles.
Food and nutritionWe aim to provide foods which both taste great and are good foryou, and, in so doing, become the world’s leading food andnutrition business.
To fulfil our goal, we are systematically improving the nutritionalprofile of our product range through our Nutrition EnhancementProgramme. By the end of 2007 we had assessed the nutritionalcomposition of all our products – totalling over 22 000 recipes –and removed a further 2 750 tonnes of saturated fat, 170 tonnesof salt and 5 000 tonnes of sugar. This is in addition to thesubstantial reductions already made by 2006.
We are also committed to ensuring that consumers are able tomake informed choices when buying our products. As well aslisting nutritional information on the back of packaging, we areimplementing the Choices programme, with a front-of-packstamp that identifies products which meet internationallyaccepted dietary advice. In 2007 we continued rolling theprogramme out globally together with other food companies,under the auspices of the Choices International Foundation. Thiswas launched during 2007 and is advised by an independentscientific committee. The stamp can now be found on products inmore than 50 countries around the world. Seewww.choicesinternational.org for more information.
We focus on three key areas of consumer benefit whendeveloping new products: functional foods, lighter options, andnaturalness and authenticity. For example, in 2007 we developedPromise Activ SuperShots, a Vitality shot with added natural plantsterols, ingredients that are clinically proven to help activelyremove cholesterol as part of a diet low in saturated fat andcholesterol.
Meanwhile, Hellmann’s Extra Light uses citrus fibre to create agreat tasting, very low-fat mayonnaise. Because of its low-fatcontent the product has a higher margin – particularly valuable ata time of increasing edible oil costs.
Lipton Green Tea in the US, Lipton Linea slimming teas in Europe,and Lipton Milk Teas in Asia all flourished by exploiting tea’scredentials as a healthy beverage. And a new range of restaurant-quality frozen meals from Bertolli, which are packed with freshvegetables and ready to eat in minutes, was a hit with NorthAmerican consumers.
Health, hygiene and beauty The desire to be clean and healthy and to look good is universal.Our home and personal care brands have promoted health,hygiene and beauty since the late 19th century and continue toplay a vital role in millions of homes around the world today.
In 2007 our household cleaning business had a particularlysuccessful year, with brands such as Cif and Domestos helping itgrow by 9%. From simple soap bars to the most technicallyadvanced concentrated liquids, our laundry brands are alsogrowing fast.
In skin care, the Pond’s brand went from strength to strength inSouth East Asia, China and India, powered in part by the launchof a new anti-ageing range. Vaseline was our fastest-growingglobal skin brand, with underlying sales growth of more than 8%.Vaseline Cocoa Butter range was its most successful launch in theUS in ten years. The brand also announced the Vaseline SkinFund, which is expected to launch in the UK and the US in 2008 –and give 1 million people better access to information aboutmanaging skin complaints.
Our deodorant brands also made good progress in 2007, withAxe and Rexona both achieving double-digit growth. Rexona isthe world’s leading deodorant brand and Axe holds a leadingposition in male deodorants.
Oral Care returned to growth in Europe while continuing itsrobust performance in Indonesia, China and Africa – aided byinnovations such as a combined toothpaste and mouthwash.During the year we announced the extension of our partnershipwith the FDI World Dental Federation, which represents morethan 1 million dentists and we work together with the FDI in oralhealth promotion and education programmes.
Science and technologyWe are proud of our reputation as a world leader in research anddevelopment (R&D). In 2007 we achieved growth across ourcategories both through innovation – new products and newmixes – and through renovation – the strengthening of existingbrands with new variants, packaging or advertising.
We strive to bring innovations to market more swiftly than everbefore. Following the completion of a major reorganisation of ourR&D activities, we have concentrated research and developmentin global and regional centres in order to make the very best useof our resources and create centres which are innovationpowerhouses. We are also increasingly working on fewer, largerscale projects, having carefully chosen those that we think willdeliver the most value to the business either in terms of productsales or margin improvements.

Unilever Annual Report and Accounts 2007 21
Report of the Directors continued
Operating Review – Categories continued
Recent developments include Amaze Brainfood – a range ofnutritious snacks and drinks that are specifically designed tosupport mental development in children. The 2006 launch wasthe result of a €40 million, four-year R&D project. Already sellingwell in Turkey, Amaze is expected to launch in India in 2008.
We have also developed a breakthrough technology that includesthe use of Ice Structuring Proteins (ISP) in ice cream. This enablesa wide range of ice cream innovations, including significantlyhealthier options and better quality ice cream. Ice creams thatcontain ISP are available in a number of countries in the Americasand Asia Africa regions. For Europe, regulatory approval is beingsought under the EC Novel Foods Regulation.
In the kitchen, new Sunlight hand dishwashing liquid keepsworking on the sponge for longer because it turns to gel oncontact with water. Its ultra-concentrated formula uses less waterin the production process and less packaging. It is being rolled outin eight countries. And the environmentally friendly lightweightdesign and fast-drying formulation of our new roll-on deodorant,launched under the Rexona, Axe and Dove brands, also provedpopular with consumers.
This year also saw the simultaneous launch in a number ofcountries of Clear anti-dandruff shampoo with superior anti-dandruff active delivery technology. Its formulation is based onone common ‘chassis’ with add-on refinements for different scalpand hair types.
Brands with missions Our brands have the power to change people’s lives for thebetter.
The second-biggest preventable killer of children in the world isdiarrhoea, and yet simple hand-washing with soap can cutdiarrhoeal diseases significantly. In 2007, in partnership withUNICEF, we piloted an education programme for schoolchildren inUganda highlighting the importance of hand-washing with soap,underpinned by our soap brand Lifebuoy. Coupled with this, theUnilever Marketing Academy helped develop health promotioncampaigns in Kenya, Tanzania and Uganda. During the year thebrand grew by 9%.
Throughout the year, our Goodness of Margarine campaignspread the message in Europe that margarine contains essentialfats and vitamins helpful in maintaining a healthy heart. Theresults were excellent and the campaign is rolling out further in2008.
The Family Goodness spreads brand is raising funds as part of ourthree-year partnership with the World Food Programme (WFP) toprovide nutritious school meals for children living in poverty. Weare also sharing our nutrition and hygiene expertise and helpingWFP develop a school education campaign as well as review theneed for fortified foods.
Meanwhile, a major healthy eating campaign, Knorr Eat Colour,encouraged consumers to eat colourful vegetables, with the helpof a range of new colour-themed products. The campaign wasbased on the insight that vegetables’ bright hues indicate thepresence of different beneficial antioxidants.
The Dove Campaign for Real Beauty made strides in its mission toraise the self-esteem of women. By the end of 2008 the DoveSelf-Esteem Fund aims to have reached 1 million young girls in 20countries through partnerships with organisations such as theEating Disorders Association and Girl Scouts of America. Sales ofDove products are growing rapidly.
Our Dirt is Good positioning – which is used across countries onour main brands including Persil, Omo and Skip – is alsoflourishing. It promotes children’s learning and developmentthrough physical activity – while the brands’ innovativeformulations mean parents don’t need to worry about gettingtheir children’s clothes clean after outdoor play.
Other highlights in 2007Unilever took a historic step in 2007 when it committed to buyingall its tea from sustainable, ethical sources – transforming the teaindustry and improving the crops, income and livelihood of 2million people across three continents. Lipton, the world’s largesttea brand, and PG Tips, one of the UK’s leading brands, becamethe first to carry the Rainforest Alliance logo, showing they meetthe independent organisation’s strict sustainability criteria –covering areas such as wildlife protection, water conservation andfair treatment of workers. The first certified tea was supplied torestaurants and the catering trade in Europe; all Lipton tea bagssold globally are expected to be certified by 2015.
One of our top priorities in 2007 was the simultaneous launch ofClear anti-dandruff shampoo in a number of countries – China,Russia, Brazil (three of the biggest hair care markets in the world),the Philippines, Pakistan, Egypt and Arabia. The brand has aninnovative formula with superior anti-dandruff active deliverytechnology and is our first major Asian hair brand mix to goglobal. Its success shows the power of a centralised, consistentglobal approach to packaging, formulation and marketing. Clearshampoo is now winning consumer preference in all its marketsand there are plans to consolidate growth while continuing itsglobal roll-out in 2008.

Operating Review – Categories continued
Magnum Temptation ice cream offered European consumers theultimate indulgence: a sensual shape containing Madagascanvanilla ice cream, caramel sauce and almond pieces, wrapped inBelgian dark chocolate. It has the highest quantity of ‘addedextras’ ever contained in a Magnum, thanks to new technologywhich involves bringing together two mould halves around thestick. Launched in Italy, Spain, Switzerland and Portugal, MagnumTemptation is the first expression of the brand’s long-term superpremium platform.
European consumers were given a powerful new weapon in thefight against limescale and germs, with the launch of DomestosZero Limescale bleach. Its development was inspired by researchshowing that many more germs are present in toilets withlimescale because germs cluster there, protecting themselves frombeing washed away. Its three-times-thicker formulation helpsDomestos Zero Limescale bleach stick to and destroy limescale,even on vertical surfaces.
Mayonnaise lovers in Latin America responded enthusiastically toa campaign highlighting the health benefits of Hellmann’s Light, avariant of global leader Hellmann’s. The campaign, aired inArgentina, Chile and Brazil, made consumers aware that threespoonfuls of Hellmann’s Light mayonnaise contain the samecalories as one spoonful of olive oil. Underlying sales growth forthe year was outstanding, particularly in Argentina and Brazil.
The newly launched Dove pro•age range proved popular amongwomen aged 50 and over in North America and Europe. Themultimedia campaign, shot by top celebrity photographer AnnieLeibovitz, featured middle-aged women looking natural, gorgeous– and completely naked. The pro•age range does not makeunrealistic anti-ageing promises, but instead meets the specifichair and skin care needs of older consumers.
In Chinese households soup is a part of many people’s daily diet.Knorr Bouillon Gel, launched in China under the Knorr DenseSoup Treasure name, captured the imagination of consumerseager to replicate the nutritional benefits of home-boiled soupwithout the hassle. Made with high-quality fresh ingredients, thegel reverts to dense-textured soup when stirred into boiling water,into which consumers can add their own choice of freshvegetables.
Axe/Lynx, the world’s second-largest deodorant brand, made atriumphant entry into the Japanese market and quickly becamethe country’s top-selling male deodorant. The launch followed anextensive study of the young Japanese male, examining hisattitude towards dating, use of deodorants and purchasing habits.The brand’s range was given a substantial makeover in 2007 toensure packaging and formulations are consistent the world over.
22 Unilever Annual Report and Accounts 2007
Report of the Directors continued

Unilever Annual Report and Accounts 2007 23
Report of the Directors continued
Financial Review
Basis of reportingCertain discussions within this Financial Review include measuresthat are not defined by generally accepted accounting principles(GAAP) such as IFRS. These include Ungeared Free Cash Flow(UFCF), Return on Invested Capital (ROIC), Underlying SalesGrowth (USG), and Net Debt. For further information please referto the section entitled ‘Non-GAAP measures’ on page 29.
The accounting policies that are most significant in connectionwith our financial reporting are set out on pages 27 and 28.
Foreign currency amounts for results and cash flows are translatedfrom underlying local currencies into euros using annual averageexchange rates; balance sheet amounts are translated at year-endrates except for the ordinary capital of the two parent companies.These are translated at the rate referred to in the EqualisationAgreement of 31⁄ 9p = €0.16 (see Corporate governance on page 40).
Results and earnings per shareThe following discussion summarises the results of the Groupduring the years 2007, 2006 and 2005. The figures quoted are ineuros, at current rates of exchange, being the average or year-endrates of each period, unless otherwise stated. Information aboutexchange rates between the euro, pound sterling and US dollar isgiven on page 124.
The results reflected in the consolidated income statement andsupporting notes arise from the Group’s continuing operations. In2007, no disposals qualified to be disclosed as discontinuedoperations. During 2006, we successfully completed the sale ofthe majority of our European frozen foods businesses. The resultsof the businesses disposed of have been presented asdiscontinued operations for 2005, and in 2006 for the period upto the date of sale. During 2005, we completed the sale ofUnilever Cosmetics International (UCI) to Coty Inc., United States.The results of UCI are presented as discontinued operations for2005 for the period up to the date of sale.
€ million € million € million2007 2006 2005
Continuing operations:Turnover 40 187 39 642 38 401Operating profit 5 245 5 408 5 074Net profit 4 056 3 685 3 335
Net profit from discontinued operations 80 1 330 640Net profit – total 4 136 5 015 3 975
€ € €2007 2006 2005
EPS – continuing operations 1.32 1.19 1.07EPS – total 1.35 1.65 1.29
Results for 2007 compared with 2006Turnover for the period increased by 1.4% to €40 187 million.The increase was a consequence of USG of 5.5% in the year,offset by unfavourable currency movements of (3.1)% and theimpact of disposals of (0.9)%. The USG was a result of both priceand volume increases, respectively contributing 1.8% and 3.7%.Operating profit for the year was 3% lower and the operatingmargin at 13.1% was 0.5 percentage points lower than a yearago. The lower margin and operating profit were due to a highernet charge for restructuring, disposals and one-off items. Before
the impact of these items, the operating margin showed anunderlying increase of 0.2 percentage points. Savings and priceincreases more than offset significant increases in product inputcosts. Advertising and promotions as a percentage of sales was inline with last year. An overview of performance by regions isincluded in the Operating Review on pages 15 to 19.
The net charge for restructuring, disposals and one-off items in2007 was €569 million. This was made up of restructuringcharges of €875 million, partly offset by disposal profits of €297 million and other items of €9 million. The disposal profitsinclude €214 million arising from the reorganisation of ourinterests in South Africa and Israel, which was a fair valueeconomic swap that resulted in an accounting profit. Incomparison, the net charge for restructuring, disposals and one-off items in 2006 was €242 million.
Costs of financing net borrowings were 13% lower in the yearwith the impact of movements in the US dollar exchange ratemore than offsetting higher rates. The credit on pensionsfinancing increased to €158 million, reflecting an improvedfunding position of our schemes in 2007 compared with 2006.
The tax rate was 22% for the year, compared with 24% in 2006,and benefited from the favourable settlement of prior year taxaudits. We also benefited from a lower tax charge on disposalsduring 2007.
Our share in net profit from joint ventures increased by 31% inthe year, mainly driven by continuing strong growth in thepartnerships between Lipton and PepsiCo for ready-to-drink tea.
For the full year, net profit from continuing operations grew by10%, while EPS on the same basis grew by 12%.
Net profit, including discontinued operations, was 18% lowerthan prior year, which included the profit on disposal of Europeanfrozen foods businesses in the fourth quarter.
ROIC was 12.7% in 2007. This represented an improvement from11.5% in 2006, adjusted for the profit on disposal of Europeanfrozen foods businesses.
Results for 2006 compared with 2005Turnover for the period increased by 3.2% to €39 642 million.The increase was driven by USG of 3.8%, with contributions fromboth volume and price, as well as favourable currency effects of0.3%. Offsetting the increase was the impact of disposals of(0.8)% in the period.
Operating profit for the period increased by 7% to €5 408 millionwith operating margin increasing to 13.6%, up by 0.4 percentagepoints compared with 2005. This was after charging restructuring,disposals and impairments costs equivalent to 1.3 percentagepoints of sales (compared with 1.5 percentage points in 2005). It also included €266 million of one-off gains from changes to UShealthcare and UK pension plans, equivalent to 0.7 percentagepoints of sales. Before these items, and the profit on the sale ofan office in the US in 2005, the operating margin would havebeen 0.3 percentage points lower than the prior year. Grossmargins held steady during the year, with supply chain savingsprogrammes, pricing action and a positive mix fully offsetting

Financial Review continued
24 Unilever Annual Report and Accounts 2007
Report of the Directors continued
around €600 million of higher input costs. Investment inadvertising and promotions increased by nearly €300 million, from12.8% to 13.1% of sales.
Net finance costs were 18% higher in the year at €721 million.2006 includes the provision of €300 million relating to preferenceshares. The costs of financing net borrowings were lower thanprior year with the benefit of a lower level of debt. Pensionsfinancing, which was a net expense of €53 million in 2005,showed a net income of €41 million in 2006, reflecting a lowergross pension fund deficit.
The tax rate for the year was 24%, compared with 26% in 2005,including the benefits of a better country mix.
Share of net profit from joint ventures was ahead of the prior yeardue to the continued growth in the partnerships between Liptonand PepsiCo for ready-to-drink tea. Share of net profit fromassociates increased significantly compared with the prior year,principally because of the placement of equity by one of ourventure capital fund investments.
Net profit and earnings per share from continuing operationsgrew by 10% and 11% respectively in 2006. Including the profitsof the discontinued operations, net profit and earnings per shareincreased by 26% and 27% respectively.
ROIC increased from 12.5% in 2005 to 14.6% in 2006. Bothyears included significant profits from the sale of discontinuedoperations. Excluding these, ROIC increased from 11.3% to11.5%.
Acquisitions and disposals
2007During 2007, we reached agreement with our partners in SouthAfrica and Israel to exchange respective shareholdings such thatUnilever now own 74.25% of a newly combined South Africanentity and 100% of Unilever Israel. The share swaps were effectedas at 1 October 2007 and as a result we recognised a gain ondisposal of €214 million.
On 1 January 2007, Unilever completed the restructuring of itsPortuguese businesses. The result of the reorganisation is thatUnilever now has a 55% share of the combined Portugueseentity, called Unilever Jerónimo Martins. The combined businessincludes the foods and home and personal care businesses. Theremaining 45% is held by Jerónimo Martins Group. The structureof the agreement is such that there is joint control of the newlyformed entity and therefore it is accounted for by Unilever as ajoint venture.
Other business disposals in 2007 involved the sale of localBrazilian margarine brands. To further develop our heart healthbrand margarine Becel in Brazil we have established a jointventure with Perdigão.
During the year, we announced the disposal of Boursin to LeGroupe Bel for €400 million, and the disposal of Lawry’s andAdolph’s seasoning blends and marinades business to McCormickand Company for US $605 million. Both will be effective during2008 (see note 33 on page 121 for further details). Furthermore,we announced plans to dispose of our North American laundrybusiness, the process for which is ongoing.
In 2007 we purchased minority interests in several countries,including Greece and India.
2006On 4 September 2006, Unilever announced a public offer topurchase all ordinary shares of Elais-Unilever S.A. held by thirdparty shareholders. Elais-Unilever S.A. was reported as a subsidiaryand is Unilever’s main foods business in Greece. The offer pricewas €24.50 per share, with the public offer closing on 25 October2006. A total of 2 234 692 shares were purchased by the end of2006, increasing Unilever’s ownership of Elais-Unilever S.A. to 83.52%. This shareholding was increased to 99.2% as at 31 December 2007.
On 3 November 2006 we announced the completion of the saleof the majority of our frozen foods businesses in Europe to thePermira Funds. Unilever received proceeds of €1.7 billion, andrecorded a profit on disposal of €1.2 billion. The businesses soldincluded operations in Austria, Belgium, France, Germany, Ireland,the Netherlands, Portugal and the United Kingdom.
In 2006 we disposed of various other businesses and brands witha combined turnover of around €280 million, including Mora inthe Netherlands and Belgium, Finesse in North America and Niharin India.
2005There were no material acquisitions during 2005.
On 11 July 2005, we completed the sale of our Prestige fragrancebusiness, UCI, to Coty Inc. of the United States. Unilever receivedUS $800 million in cash, with the opportunity for further deferredpayments contingent upon future sales. Additional payments havebeen made by Coty Inc. since the disposal, and during 2007 werecorded a receivable for the future payments expected.
Business disposals in 2005 included Stanton Oil in the UK andIreland, Dextro in various countries in Europe, Opal in Peru, Karoand Knax in Mexico, spreads and cooking products in Australiaand New Zealand, Crispa, Mentadent, Marmite, Bovril andMaizena in South Africa, frozen pizza in Austria, Biopon inHungary and tea plantations in India. The combined annualturnover of these businesses was approximately €200 million.
In March 2005 Unilever carried out a previous phase of therestructuring of its Portuguese foods business. Before therestructuring Unilever Portugal held an interest in FIMA/VG –Distribuição de Produtos Alimentares, Lda. (FIMA) foods business,a joint venture with Jerónimo Martins Group – in addition to itswholly owned Bestfoods business acquired in 2000. As a result ofthe transaction the two foods businesses – FIMA and UnileverBestfoods Portugal – were unified and the joint venture stakeswere re-balanced so that Unilever held 49% of the combinedfoods business and Jerónimo Martins Group 51%.

Unilever Annual Report and Accounts 2007 25
Report of the Directors continued
Financial Review continued
Dividends and market capitalisation
Dividends per sharePer €0.16 Per 31⁄9p
NV ordinary share PLC ordinary share€ € pence pence
2007 2006 2007 2006
Interim 0.25 0.23 17.00 15.62Final – 0.47 – 32.04Proposed final 0.50 – 34.11 –One-off – 0.26 – 17.66
Final dividends for 2007 are subject to approval at the AnnualGeneral Meetings. If approved, this will bring the total regulardividend to €0.75 per share for NV and 51.11p for PLC, anincrease of 7% excluding the additional one-off payment of €751 million made in 2006. In accordance with IFRS, no provisionfor the amount of this dividend, estimated as €1 427 million, hasbeen recognised in the financial statements for the year ended31 December 2007. The €1.5 billion share buy-back programmeannounced in March 2007 was completed by the end of the year.A further programme of at least €1.5 billion is planned for 2008.
Unilever’s combined market capitalisation at 31 December 2007was €72.5 billion (2006: €60.5 billion).
Balance sheet€ million € million
2007 2006
Goodwill and intangible assets 16 755 17 206Other non-current assets 10 619 10 365Current assets 9 928 9 501Current liabilities (13 559) (13 884)
23 743 23 188
Non-current liabilities 10 924 11 516Shareholders’ equity 12 387 11 230Minority interest 432 442
23 743 23 188
Goodwill and intangibles at 31 December 2007 were €0.5 billionlower than in 2006. The movement was because of currencymovements and acquisition and disposal activity. Property, plantand equipment was at a similar level to last year. The increase inother non-current assets of €0.2 billion is principally explained bythe capital injection in the international Pepsi/Lipton partnershipwhich is extended, effective 1 January 2008, and by the improvedfunding position of our pension funds. This improvement resultsfrom accelerated funding contributions and increases in assetvalues. Inventories and trade receivables show little movementwhen compared with the prior year.
Current liabilities decreased by €0.3 billion compared with 2006.This decrease is because of a €0.3 billion reduction in currentfinancial liabilities, an increase of €0.2 billion in trade payablesand other current liabilities and a decrease of €0.2 billion incurrent tax liabilities.
Non-current liabilities have decreased by €0.6 billion comparedwith 2006. The movement is explained by an increase of €1.1billion in financial liabilities due after more than one year, offsetby a decrease in pensions and post-retirement healthcare liabilitiesof €1.7 billion.
The increase in financial liabilities is because of the refinancingactivity during 2007, offset to some extent by the appreciation ofthe euro against the US dollar, as a significant portion of ourfinancial liabilities are US dollar denominated. The currencydistribution of total financial liabilities was as follows: 53% in USdollars (2006: 69%), and 32% in euros (2006: 24%), theremainder spread across a number of countries.
The funding position of the Group’s main pension arrangementshas improved since the end of 2006 due largely to acceleratedfunding contributions and reduced liabilities from higher discountrates, net of slightly increased inflation and life expectancyassumptions. The overall net liability for all arrangements was€1.1 billion at the end of 2007, a reduction from €3.1 billion at31 December 2006. Funded schemes show an aggregate surplusof €1.2 billion, while unfunded arrangements show a liability of€2.3 billion. During 2007, some previously unfundedarrangements were partially funded with €0.3 billion reported aspart of contributions paid. The movement of the Group’s pensionfunding position has resulted in a release of €0.5 billion of relateddeferred tax asset.
Unilever manages interest rate and currency exposures based onthe net debt position. Taking into account the various crosscurrency swaps and other derivatives, 61% of Unilever’s net debtwas in US dollars (2006: 81%) and 32% in euros (2006: 25%)and ((18)% – financial assets) in sterling (2006: (33)%), with theremainder spread over a large number of other currencies.
Unilever has committed credit facilities in place to support itscommercial paper programmes and for general corporatepurposes. The undrawn committed credit facilities in place at the end of 2007 were: bilateral committed credit facilities totalling US $3.6 billion, bilateral notes commitments totalling US $0.2 billion and bilateral money market commitments totallingUS $1.7 billion. Further details regarding these facilities are givenin note 17 on page 97.
During 2007, a €750 million floating rate bond was issued with amaturity date of 29 May 2009, a US $500 million extendiblefloating rate bond was issued having an initial maturity date of 11 July 2008 and a final maturity date of 11 June 2012 and a€750 million fixed rate 4.625% Eurobond was issued with amaturity of five years. During 2007 Unilever repaid amongstothers the 4.25% €1 000 million euro bonds and the 5% US$650 million bonds.
Total shareholders’ equity has increased by €1.2 billion in the year.Net profit added €3.9 billion and currency and fair value/actuarialgains added €0.2 billion. Dividends paid in the year totalled €2.1 billion and there was an adverse effect of €1.1 billion as aresult of higher treasury stock, explained by the share buy-backprogramme of €1.5 billion and the €(0.4) billion effect of theexercise of share options.
Unilever is satisfied that its financing arrangements are adequateto meet its working capital needs for the foreseeable future.
Unilever’s contractual obligations at the end of 2007 includedcapital expenditure commitments, borrowings, lease commitmentsand other commitments. A summary of certain contractualobligations at 31 December 2007 is provided in the table below.Further details are set out in the following notes to the accounts:note 10 on page 88, note 16 on page 94, note 17 on pages 97to 101 and note 25 on page 112.

26 Unilever Annual Report and Accounts 2007
Report of the Directors continued
Financial Review continued
Contractual obligations at 31 December 2007
€ million € million € million € million € millionDue Due in
within Due in Due in overTotal one year 1-3 years 3-5 years 5 years
Long-term debt 5 851 632 2 367 792 2 060Operating lease
obligations 1 663 363 527 332 441Purchase obligations(a) 299 234 46 17 2Finance leases 520 82 77 48 313Other long-term
commitments 1 454 412 488 404 150
(a) Raw and packaging materials and finished goods.
Off-balance sheet arrangementsIFRS interpretation SIC 12 requires that entities with which wehave relationships are considered for consolidation in theconsolidated accounts based on relative sharing of economic risksand rewards rather than based solely on share ownership andvoting rights. We periodically review our contractualarrangements with potential special purpose entities (SPEs) asdefined by SIC 12. The most recent review has concluded thatthat there are no significant SPE relationships which are notalready appropriately reflected in the accounts. Informationconcerning guarantees given by the Group is stated in note 25 on page 112.
Cash flow€ million € million € million
2007 2006 2005
Net cash flow fromoperating activities 3 876 4 511 4 353
Net cash flow from/(used in) investing activities (623) 1 155 515
Net cash flow from/(used in) financing activities (3 009) (6 572) (4 821)
Net increase/(decrease) in cash and cashequivalents 244 (906) 47
Cash and cash equivalents at 31 December 2007 were €0.2 billion higher than at 31 December 2006. Net cash flowfrom operating activities, at €3.9 billion, was €0.6 billion lowerthan in 2006 because of higher cash costs of restructuring andincreased income tax payments. Income tax paid was €0.2 billionhigher than in 2006 because of the timing of payments. Takingthe last two years together, cash tax paid was at a similar level tothe tax charges in the income statement. There was a furthersmall improvement in working capital.
The movement of €1.8 billion in net cash flow used in investingactivities when compared with 2006 is explained by the decreasein completed disposal activity in the year and a small increase innet capital expenditure. The increase in net capital expenditurewas entirely in Asia Africa, supporting the priority for growth inthe region.
The decrease of €3.6 billion cash used in financing activities from2006 is a consequence of the changes in financial liabilities of€4.6 billion, offset by the impact of the treasury stock movement.The net €1.1 billion movement in treasury stocks reflects the neteffect of share buy-backs of €1.5 billion and the exercise of shareoptions of €(0.4) billion.
At 31 December 2007, the net debt position was €8.3 billion, anincrease of €0.8 billion compared with 2006. The increase is dueto the fact that cash generation was more than offset by theoutflows relating to dividends, share buy-backs and additionalpension funding. We also benefited from the appreciation of theeuro against the US dollar.
Finance and liquidityUnilever aims to be in the top third of a reference group including20 other international consumer goods companies for TotalShareholder Return, as explained on page 32. The Group’sfinancial strategy supports this objective and provides the financialflexibility to meet its strategic and day-to-day needs. The keyelements of the financial strategy are:
• appropriate access to equity and debt capital;• sufficient flexibility for acquisitions that we fund out of current
cash flows;• A1/P1 short-term credit rating;• sufficient resilience against economic turmoil; and• optimal weighted average cost of capital, given the constraints
above.
Unilever aims to concentrate cash in the parent and financecompanies in order to ensure maximum flexibility in meetingchanging business needs. Operating subsidiaries are financedthrough the mix of retained earnings, third-party borrowings andloans from parent and group financing companies that is mostappropriate to the particular country and business concerned.Unilever maintains access to global debt markets through aninfrastructure of short-term debt programmes (principally USdomestic and euro commercial paper programmes) and long-termdebt programmes (principally a US Shelf registration andeuromarket Debt Issuance Programme). Debt in the internationalmarkets is, in general, issued in the name of NV, PLC, UnileverFinance International BV or Unilever Capital Corporation. NV andPLC will normally guarantee such debt where they are not theissuer.
Unilever has been unaffected by the credit issues prevalent insome financial markets and we have been able to raise debt asrequired to fulfil our capital requirements.
TreasuryUnilever Treasury’s role is to ensure that appropriate financing isavailable for all value-creating investments. Additionally, Treasurydelivers financial services to allow operating companies tomanage their financial transactions and exposures in an efficient,timely and low-cost manner.

Unilever Annual Report and Accounts 2007 27
Report of the Directors continued
Financial Review continued
Unilever Treasury operates as a service centre and is governed bypolicies and plans approved by the Boards. In addition to policies,guidelines and exposure limits, a system of authorities andextensive independent reporting covers all major areas of activity.Performance is monitored closely. Reviews are undertaken by thecorporate internal audit function.
The key financial instruments used by Unilever are short- andlong-term borrowings, cash and cash equivalents and certainstraightforward derivative instruments, principally comprisinginterest rate swaps and foreign exchange contracts. Theaccounting for derivative instruments is discussed in note 1 onpage 74. The use of leveraged instruments is not permitted.
Other relevant disclosures are given in notes 15, 16 and 17 onpages 92, 94 and 97.
Unilever Treasury manages a variety of market risks, including theeffects of changes in foreign exchange rates, interest rates andliquidity. Further details of the management of these risks aregiven in note 17 on page 97.
Pensions investment strategyThe Group’s investment strategy in respect of its funded pension plans is implemented within the framework of thevarious statutory requirements of the territories where the plans are based. The Group has developed policy guidelines forthe allocation of assets to different classes with the objective ofcontrolling risk and maintaining the right balance between riskand long-term returns in order to limit the cost to the Group ofthe benefits provided. To achieve this, investments are welldiversified, such that the failure of any single investment wouldnot have a material impact on the overall level of assets. Theplans invest the largest proportion of the assets in equities, whichthe Group believes offer the best returns over the long termcommensurate with an acceptable level of risk. The pension fundsalso have a proportion of assets invested in property, bonds,hedge funds and cash. The majority of the assets are managed bya number of external fund managers with a small proportionmanaged in-house. Unilever has a pooled investment vehicle(Univest) which it believes offers its pension plans around theworld a simplified externally managed investment vehicle toimplement their strategic asset allocation models currently forequities and hedge funds. The aim is to provide a high quality,well diversified risk controlled vehicle.
Significant events after the balance sheet dateEffective 1 January 2008, Unilever and PepsiCo have entered intoan expanded international partnership for the marketing anddistribution of ready-to-drink tea products under the Liptonbrand. The new agreement adds 11 counties to the partnership’sexisting Lipton ready-to-drink tea business – eight in Europe(Germany, Italy, France, Netherlands, Switzerland, Austria, Belgiumand Portugal) as well as Korea, Taiwan and South Africa.
On 5 November 2007, Unilever announced the disposal ofBoursin to Le Groupe Bel for €400 million. The sale was effectiveon 3 January 2008.
On 4 February 2008, we announced that we had reached anagreement to acquire the leading Russian ice cream businessInmarko, for an undisclosed amount. The deal is subject toregulatory approval and is expected to be completed in the firsthalf of 2008.
On 11 February 2008, Unilever announced a share buy-backprogramme of at least €1.5 billion for 2008.
On 21 February 2008, Unilever launched a bond composed oftwo tranches; i) CHF 250 million fixed rate bond which willmature in four years, and ii) CHF 350 million fixed rate bondwhich will mature in seven years. Completion is expected in lateMarch 2008.
On 28 February 2008 Unilever announced a number of changesaffecting its organisation. As a further extension of the OneUnilever programme, Foods and Home and Personal Care will becombined into a single category structure. To reflect our strategicfocus on growth in developing markets, operations in Central andEastern Europe will be managed as part of an enlarged regioncomprising Asia, Africa and Central and Eastern Europe, withWestern Europe becoming a separate region.
A number of Board and senior executive changes wereannounced simultaneously. Kees van der Graaf will step downfrom the Boards of Unilever and from his role as President Europeat the AGMs on 14 and 15 May 2008. Ralph Kugler, PresidentHome and Personal Care, will similarly step down at the AGMs.Harish Manwani, currently President Asia Africa, will lead the newexpanded region. Doug Baillie, previously Chief Executive Officerof Hindustan Unilever, will join the Unilever Executive as PresidentWestern Europe. The roles of President Home and Personal Careand President Foods will be merged under the leadership of VindiBanga, currently President Foods.
Critical accounting policiesThe accounts presented comply in all material respects with IFRSas adopted by the EU and with UK and Dutch law. They are alsoin accordance with IFRS as issued by the International AccountingStandards Board. To prepare these accounts, we are required tomake estimates and assumptions, using judgement based onavailable information, including historical experience. Theseestimates and assumptions are reasonable and are re-evaluatedon an ongoing basis. However, actual amounts and results coulddiffer. Critical accounting policies are those which are mostimportant to the portrayal of Unilever’s financial position andresults of operations. Some of these policies require difficult,subjective or complex judgements from management, the mostimportant being:
Goodwill and intangible assets Impairment reviews in respect of goodwill and indefinite-livedintangible assets are performed at least annually. More regularreviews, and impairment reviews in respect of other assets, areperformed if events indicate that this is necessary. Impairmentreviews are performed by comparing the carrying value of theasset concerned to that asset’s recoverable amount (being thehigher of value in use and fair value less costs to sell). Value in useis a valuation derived from discounted future cash flows. Themost important assumptions when preparing these forecast cashflows are long-term growth rates and discount rates. These arechallenged at least anually and although these are believed to beappropriate, changes in these assumptions could change theoutcomes of the impairment reviews.

28 Unilever Annual Report and Accounts 2007
Report of the Directors continued
Financial Review continued
The most significant balances of goodwill and intangible assetsrelate to the global savoury and dressings sub-product group. We have reviewed the carrying value of this cash generating unitby considering expected future cash flows based on historicalexperience and planned growth rates and margins for thisproduct group. No significant impairment losses have beenidentified in 2007.
Please refer also to note 9 on page 86.
Financial instrumentsFinancial instruments are classified according to the purpose forwhich the instruments were acquired. This gives rise to thefollowing classes: held-to-maturity investments, loans andreceivables, available-for-sale financial assets and financial assetsat fair value through profit or loss. Please refer to note 1 on pages73 and 74 for a description of each of these categories.
Derivative financial instruments are reported at fair value, withchanges in fair values booked through profit or loss unless thederivatives are designated and effective as hedges of future cashflows, in which case the changes are recognised directly in equity.At the time the hedged cash flow results in the recognition of anasset or a liability, the associated gains or losses on the derivativethat had previously been recognised in equity are included in theinitial measurement of the asset or liability. For hedged items thatdo not result in the recognition of an asset or liability, amountsdeferred in equity are recognised in the income statement in thesame period in which the hedged item affects net profit or loss.
Changes in fair value of net investment hedges in relation toforeign subsidiaries are recognised directly in equity.
Pensions and similar obligationsThe assets and liabilities of the plans are recognised at fair valuesin the balance sheet.
Pension accounting requires certain assumptions to be made inorder to value our obligations and to determine the charges to be made to the income statement. These figures are particularlysensitive to assumptions for discount rates, inflation rates,mortality rates and expected long-term rates of return on assets.Information about sensitivity to certain of these assumptions isgiven in note 20 on page 103 and 104.
The following table sets out these assumptions (except formortality rates), as at 31 December 2007, in respect of the fourlargest Unilever pension plans. Further details of assumptions(including mortality rates) made are given in note 20 on pages103 and 104.
% % % %Nether- United
UK lands States Germany
Discount rate 5.8 5.5 5.9 5.5Inflation 3.0 1.9 2.3 1.9Expected long-term rate of return:
Equities 8.0 8.1 7.8 8.1Bonds 5.0 4.7 4.5 4.7Property 6.5 6.6 6.3 6.6Others 6.3 4.1 3.7 5.8
These assumptions are set by reference to market conditions atthe valuation date. Actual experience may differ from theassumptions made. The effects of such differences are recognisedthrough the statement of recognised income and expense.
Demographic assumptions, such as mortality rates, are set havingregard to the latest trends in life expectancy, plan experience andother relevant data. The assumptions are reviewed and updatedas necessary as part of the periodic actuarial valuation of thepension plans. Mortality assumptions for the four largest plans are given in more detail in note 20 on page 104.
ProvisionsProvision is made, amongst other reasons, for legal matters,disputed indirect taxes, employee termination costs andrestructuring where a legal or constructive obligation exists at thebalance sheet date and a reliable estimate can be made of thelikely outcome.
Advertising and promotion costsExpenditure on items such as consumer promotions and tradeadvertising is charged against profit in the year in which it isincurred. At each balance sheet date, we are required to estimatethe part of expenditure incurred but not yet invoiced based onour knowledge of customer, consumer and promotional activity.
Deferred taxFull provision is made for deferred taxation at the rates of taxprevailing at the year end unless future rates have beensubstantively enacted, as detailed in note 12 on page 91.Deferred tax assets are regularly reviewed for recoverability, and avaluation allowance is established to the extent that recoverabilityis not considered likely.

Unilever Annual Report and Accounts 2007 29
Report of the Directors continued
Financial Review continued
Non-GAAP measuresCertain discussions and analyses set out in this Annual Report andAccounts include measures which are not defined by generallyaccepted accounting principles (GAAP) such as IFRS. We believethis information, along with comparable GAAP measurements, isuseful to investors because it provides a basis for measuring ouroperating performance, ability to retire debt and invest in newbusiness opportunities. Our management uses these financialmeasures, along with the most directly comparable GAAPfinancial measures, in evaluating our operating performance andvalue creation. Non-GAAP financial measures should not beconsidered in isolation from, or as a substitute for, financialinformation presented in compliance with GAAP. Non-GAAPfinancial measures as reported by us may not be comparable tosimilarly titled amounts reported by other companies.
In the following sections we set out our definitions of thefollowing non-GAAP measures and provide reconciliations torelevant GAAP measures:
• Ungeared free cash flow;• Return on invested capital;• Underlying sales growth; and• Net debt.
We set out ‘Measures of long-term value creation’ as anintroduction to the following section, in order to explain therelevance of the above measures. At the end of this section wesummarise the impact on Total Shareholder Return (TSR) which isa key metric.
Measures of long-term value creationUnilever’s ambition for the creation of value for shareholders ismeasured by Total Shareholder Return over a rolling three-yearperiod compared with a peer group of 20 other internationalconsumer goods companies.
Unilever believes that the contribution of the business to thisobjective can best be measured and communicated to investorsthrough the following measures:
• The delivery, over time, of Ungeared Free Cash Flow (UFCF),which expresses the translation of profit into cash, and thuslonger-term economic value; and
• The development, over time, of Return on Invested Capital(ROIC), which expresses the returns generated on capitalinvested in the Group.
Unilever communicates progress against these measures annually, and management remuneration is aligned with theseobjectives. The UFCF over a three-year period is incorporated as aperformance element of Unilever’s management incentivescheme.
UFCF and ROIC are non-GAAP measures. We comment on thesein detail here since they are the way in which we communicateour ambition and monitor progress towards our longer-term valuecreation goals and in order to:
• improve transparency for investors;• assist investors in their assessment of the long-term value
of Unilever;• ensure that the measures are fully understood in the light of
how Unilever reviews long-term value creation for shareholders;• properly define the metrics used and confirm their calculation;• share the metrics with all investors at the same time; and• disclose UFCF as it is one of the drivers of management
remuneration and therefore management behaviour.
As investor measures, we believe that there are no GAAPmeasures directly comparable with UFCF and ROIC. However, in the tables on pages 30 and 31, we reconcile each as follows:UFCF to cash flow from operating activities and also to net profit;ROIC to net profit.
CautionUnilever cautions that, while UFCF and ROIC are widely used astools for investment analysis, they are not defined terms underIFRS and therefore their definitions should be carefully reviewedand understood by investors. Investors should be aware that theirapplication may vary in practice and therefore these measuresmay not be fully comparable between companies. In particular:
• We recognise that the usefulness of UFCF and ROIC asindicators of investment value is limited, as such measures are based on historical information;
• UFCF and ROIC measures are not intended to be a substitutefor, or superior to, GAAP measures in the financial statements;
• The fact that ROIC is a ratio inherently limits its use, andmanagement uses ROIC only for the purposes discussed above.The relevance and use of net profit for the year (being the most relevant comparable GAAP measure) is clearly morepervasive; and
• UFCF is not the residual cash available to pay dividends butrepresents cash generated by the business and broadly availableto the providers of finance, both debt and equity.

Financial Review continued
Ungeared free cash flow (UFCF)UFCF expresses the generation of profit by the business and how this is translated into cash, and thus economic value. It is thereforenot used as a liquidity measure within Unilever. The movement in UFCF is used by Unilever to measure progress against our longer-termvalue creation goals as outlined to investors.
UFCF is cash flow from group operating activities, less net capital expenditure, less charges to operating profit for share-basedcompensation and pensions, and less tax (adjusted to reflect an ungeared position and, in 2006, for the impact on profit on sales offrozen foods businesses), but before the financing of pensions.
In 2007, UFCF was €3.8 billion (2006: €4.2 billion; 2005: €4.0 billion). The reconciliation of UFCF to the GAAP measures net profit andcash flow from operating activities is shown below.
The tax charge used in determining UFCF can be either the income statement tax charge or the actual cash taxes paid. Our consistentlyapplied definition uses the income statement tax charge in order to eliminate the impact of volatility due to the variable timing ofpayments around the year end. For 2006 the income statement tax charge on this basis was materially impacted by the tax effect ofnon-cash charges for the provision for preference shares and certain other non-cash items. UFCF for 2007 based on actual cash taxpaid would have been €3.6 billion (2006: €4.5 billion; 2005: €3.7 billion).
€ million € million € millionUngeared free cash flow 2007 2006 2005
Net profit 4 136 5 015 3 975Taxation 1 137 1 332 1 301Share of net profit of joint ventures/associates and other income from non-current investments (191) (144) (55)Net finance costs 252 725 618Depreciation, amortisation and impairment 943 982 1 274Changes in working capital 27 87 193Pensions charges in operating profit less payments (910) (1 038) (532)Movements in provisions less payments 145 107 (230)Elimination of profits on disposals (459) (1 620) (789)Non-cash charge for share-based compensation 118 120 192Other adjustments (10) 8 (23)
Cash flow from operating activities 5 188 5 574 5 924
Less charge for share-based compensation (118) (120) (192)Add back pension payments less pension charges in operating profit 910 1 038 532Less net capital expenditure (983) (934) (813)
Less tax charge adjusted to reflect an ungeared position (1 228) (1 336) (1 440)
Taxation on profit (1 137) (1 332) (1 301)Taxation on profit on sales of frozen foods businesses – 159 –Tax relief on net finance costs (91) (163) (139)
Ungeared free cash flow 3 769 4 222 4 011
30 Unilever Annual Report and Accounts 2007
Report of the Directors continued

Unilever Annual Report and Accounts 2007 31
Report of the Directors continued
Financial Review continued
Return on invested capital (ROIC)ROIC expresses the returns generated on capital invested in the Group. The progression of ROIC is used by Unilever to measureprogress against our longer-term value creation goals outlined to investors.
ROIC is profit after tax but excluding net interest on net debt and impairment of goodwill and indefinite-lived intangible assets both netof tax, divided by average invested capital for the year. Invested capital is the sum of property, plant and equipment and other non-current investments, software and finite-lived intangible assets, working capital, goodwill and indefinite-lived intangible assets at grossbook value and cumulative goodwill written off directly to reserves under an earlier accounting policy.
In 2007, ROIC was 12.7% (2006: 14.6%). The reconciliation of ROIC to the GAAP measure net profit is shown below.
There were no disposals of discontinued operations in 2007; the impact of such disposals in 2006 and 2005 was €1.2 billion and €0.5billion respectively. ROIC is based on total business profit, including profit on such disposals. ROIC excluding this impact in 2007 is12.7% (2006: 11.5%; 2005: 11.3%).
€ million € million € millionReturn on invested capital 2007 2006 2005
Net profit 4 136 5 015 3 975Add back net interest expense net of tax 314 365 424Add back impairment charges net of tax(a) 1 15 245
Profit after tax, before interest and impairment of goodwill and indefinite-lived intangible assets 4 451 5 395 4 644
Year-end positions for invested capital:Property, plant and equipment and other non-current investments 7 276 7 142 7 333Software and finite-lived intangible assets 590 608 642Inventories 3 894 3 796 4 107Trade and other receivables 4 965 4 667 5 185Trade payables and other creditors due within one year (8 545) (8 513) (8 782)Elements of invested capital included in assets and liabilities held for sale 150 15 200Goodwill and indefinite-lived intangible assets at gross book value 20 029 20 705 21 621
Total 28 359 28 420 30 306
Add back cumulative goodwill written off directly to reserves 6 427 6 427 6 870
Year-end invested capital 34 786 34 847 37 176
Average invested capital for the year 35 122 36 850 37 012
Return on average invested capital 12.7% 14.6% 12.5%
Return on average invested capital excluding profit on disposal of discontinued operations 12.7% 11.5% 11.3%
(a) Excluding write-downs of goodwill and indefinite-lived intangible assets taken in connection with business disposals.

Financial Review continued
Underlying sales growth (USG)USG reflects the change in revenue from continuing operations atconstant rates of exchange, excluding the effects of acquisitionsand disposals. It is a measure that provides valuable additionalinformation on the underlying performance of the business. In particular, it presents the organic growth of our business yearon year and is used internally as a core measure of salesperformance.
The reconciliation of USG to changes in the GAAP measureturnover is as follows:
2007 2006vs 2006 vs 2005
Underlying sales growth (%) 5.5 3.8Effect of acquisitions (%) 0.1 0.1Effect of disposals (%) (0.9) (0.8)Effect of exchange rates (%) (3.1) 0.3Turnover growth (%) 1.4 3.2
Net debtNet debt is defined as the excess of total financial liabilities,excluding trade and other payables, over cash, cash equivalentsand financial assets, excluding amounts held for sale. It is ameasure that provides valuable additional information on thesummary presentation of the Group’s net financial liabilities and isa measure in common use elsewhere. The net debt definition inour 2007 reporting has not changed in substance from previousyears, however, the terminology has been updated to correspondwith that appearing on the balance sheet.
The reconciliation of net debt to the GAAP measure total financialliabilities is as follows:
€ million € million2007 2006
Total financial liabilities (9 649) (8 835)
Financial liabilities due within one year (4 166) (4 458)Financial liabilities due after one year (5 483) (4 377)
Cash and cash equivalents as per balance sheet 1 098 1 039
Cash and cash equivalents as per cash flow statement 901 710
Add bank overdrafts deducted therein 197 329
Financial assets 216 273
Net debt (8 335) (7 523)
Total Shareholder Return (TSR)TSR measures the returns received by a shareholder, capturingboth the increase in share price and the value of dividend income(assuming dividends are re-invested). Unilever’s TSR performanceis compared with a peer group of competitors over a three-yearrolling performance period. This period is sensitive enough toreflect changes but long enough to smooth out short-termvolatility. The return is expressed in US dollars, based on theequivalent US dollar share price for NV and PLC. US dollars werechosen to facilitate comparison with companies in Unilever’schosen reference group. The choice of currency affects theabsolute TSR but not the relative ranking.
Unilever’s TSR target is to be in the top third of a reference groupincluding 20 other international consumer goods companies on athree-year rolling basis. At the end of 2006 we were positioned13th, and at the end of 2007 the ranking was 8th. In 2007, the following companies formed the peer group of comparativecompanies:
Avon KraftBeiersdorf LionCadbury Schweppes L’OréalClorox NestléCoca-Cola OrklaColgate PepsiCoDanone Procter & GambleHeinz Reckitt BenckiserKao Sara LeeKimberly-Clark Shiseido
200720062003 2004 2005
7
14
21
Unilever’s position relative to the TSR reference group
The reference group, including Unilever, consists of 21 companies. Unilever’s position isbased on TSR over a three-year rolling period.
32 Unilever Annual Report and Accounts 2007
Report of the Directors continued

Unilever Annual Report and Accounts 2007 33
Report of the Directors continued
Corporate governance
Introduction
Unilever aspires to high standards of corporate governance. We constantly keep our corporate governance arrangementsunder review. NV and PLC are subject to various corporategovernance requirements and best practice codes, the mostrelevant being those in the Netherlands, the United Kingdom and the United States. It is Unilever’s practice to comply, wherepracticable, with the highest level of these codes and respond to developments appropriately.
The Unilever Group Unilever N.V. and Unilever PLC are the two parent companies of the Unilever Group. Together with the group companies, NVand PLC operate effectively as a single economic entity. This isachieved by a series of agreements between NV and PLC (theFoundation Agreements, see page 40), together with specialprovisions in the Articles of Association of NV and PLC. NV andPLC have the same Directors and adopt the same accountingprinciples. Shareholders of both companies receive dividends onan equalised basis. NV and PLC and their group companiesconstitute a single reporting entity for the purposes of presentingconsolidated accounts. Accordingly, the accounts of the UnileverGroup are presented by both NV and PLC as their respectiveconsolidated accounts.
NV and PLC have agreed to co-operate in all areas and ensurethat all group companies act accordingly. NV and PLC are holdingand service companies, and the business activity of Unilever iscarried out by their subsidiaries around the world. Shares in groupcompanies may ultimately be held wholly by either NV or PLC, orjointly by the two companies, in varying proportions.
NV was incorporated under the name Naamlooze VennootschapMargarine Unie in the Netherlands in 1927. Its objects andpurposes are set out in Article 2 of its Articles of Association. PLC was incorporated under the name Lever Brothers Limited inEngland and Wales in 1894. Its objects and purposes can befound in Clause 3 of its Memorandum of Association. The twocompanies have different shareholder constituencies andshareholders cannot convert or exchange the shares of onecompany for shares of the other. NV is listed in Amsterdam andNew York. PLC is listed in London and New York.
Unilever policies The implementation of and compliance with our governancestructure is facilitated through a business-orientated policyframework. Unilever policies are universally applicable within theUnilever Group. They are mandatory and have been developed toensure consistency in key areas within our worldwide operations.They cover operational and functional matters, and govern howwe run our business, in order to comply with applicable laws andregulations.
Unilever policies include: the Code of Business Principles, theCode of Ethics for Senior Financial Officers, the ComplianceManual for the Listing Rules and Disclosure and TransparencyRules (including the Unilever Share Dealing Code), the RiskManagement Policy, the Corporate Pensions Policy and theAccounting and Reporting Policy.
The Code of Business Principles is Unilever’s statement of valuesand represents the standard of conduct we require from all of ouremployees. Our Code of Ethics applies to the senior executive,financial and accounting officers and comprises the standardsprescribed by the US Securities and Exchange Commission (SEC).The Code of Business Principles Hotline is a confidential way foremployees to submit concerns regarding accounting and auditingissues anonymously and handles all alleged violations of the Codeof Business Principles. Copies of the Code of Business Principles,the Code of Ethics and the Share Dealing Code are posted on ourwebsite at www.unilever.com/investorcentre/corpgovernance
Our internal risk management and control systems are describedon pages 13 and 14.
Developments in corporate governance Following his appointment as a Non-Executive Director at theAGMs in May 2007, Unilever appointed its first independent Non-Executive Chairman, Michael Treschow, in succession to AntonyBurgmans who retired as Chairman at those meetings.
In September 2007, the offices of the Joint Secretaries came to anend, and the position of a single Group Secretary was introducedand adopted by the Boards.
The text that follows describes the corporate governancearrangements operating within Unilever and the changesanticipated in 2008. More information on our corporategovernance arrangements is set out in ‘The Governance ofUnilever’, the Boards’ statement of their internal arrangements,which can be found atwww.unilever.com/investorcentre/corpgovernance
The Boards The Boards of NV and PLC comprise the same Directors and havethe same Chairman. This ensures unity of governance andmanagement by ensuring that all matters are considered by theBoards as a single intellect, reaching the same conclusions on thesame set of facts (save where specific local factors apply).
The Boards are one-tier boards, comprising Executive Directorsand, in a majority, Non-Executive Directors. The Boards haveultimate responsibility for the management, general affairs,direction and performance of the business as a whole. Theresponsibility of the Directors is collective, taking into accounttheir respective roles as Executive Directors and Non-ExecutiveDirectors. The Executive Directors have additional responsibilitiesfor the operation of our business as determined by the GroupChief Executive.
Our Directors have set out a number of areas of responsibilitywhich are reserved to themselves and other areas for whichmatters are delegated to the Group Chief Executive andcommittees whose actions are regularly reported to andmonitored by the Boards. These are described on pages 35 to 38.Further details of how our Boards effectively operate as oneboard, govern themselves and delegate their authorities are setout in ‘The Governance of Unilever’, which can be found atwww.unilever.com/investorcentre/corpgovernance

34 Unilever Annual Report and Accounts 2007
Report of the Directors continued
Corporate governance continued
Appointment of Directors Directors are appointed by shareholders at the AGMs. All existingDirectors, unless they are retiring, submit themselves for electionevery year and shareholders can remove any of them by a simplemajority vote.
In order to seek to ensure that NV and PLC have the sameDirectors, the Articles of Association of NV and PLC containprovisions which are designed to ensure that both NV and PLCshareholders are presented with the same candidates for electionas Directors. This is achieved through a nomination procedureoperated by the Boards of NV and PLC through Unilever’sNomination Committee.
Based on the evaluation of the Boards, its Committees and itsindividual members, the Nomination Committee recommends tothe Boards a list of candidates for nomination at the AGMs ofboth NV and of PLC. In addition, since 2006 shareholders havebeen able to nominate Directors for this list although to do sothey must put a resolution to both meetings in line with localrequirements for requisitioning a resolution. In order to ensurethat the Boards remain identical, anyone being elected as aDirector of NV must also be elected as a Director of PLC and viceversa. If an individual fails to be elected to both companies thenhe or she will be unable to take their place on the Boards.
The provisions in the Articles of Association for appointingDirectors cannot be changed without the permission, in the caseof NV, of the holders of the special ordinary shares numbered 1 - 2400 inclusive and, in the case of PLC, of the holders of PLC's deferred stock. The NV special ordinary shares may only betransferred to one or more other holders of such shares. The joint holders of both the NV special ordinary shares and the PLC deferred stock are N.V. Elma and United Holdings Limited, which are joint subsidiaries of NV and PLC. The boards of N.V.Elma and United Holdings Limited comprise the members of theNomination Committee. The Nomination Committee comprisesNon-Executive Directors only.
Board meetings Our Boards meet at least seven times a year to consider importantcorporate events and actions, such as:
• approval of corporate strategy; • approval of the corporate Annual Plan; • review of risks and controls; • authorisation of major transactions; • preparation of the Annual Report and Accounts; • declaration of dividends; • agreement of quarterly results announcements; • convening of shareholders’ meetings; • nominations for Board appointments; • approval of Board remuneration policy; and• review of the functioning of the Boards and their Committees.
The following table shows the attendance of Directors at Boardmeetings for the year ended 31 December 2007. If Directors areunable to attend a meeting, they have the opportunity before themeeting to discuss with the Chairman any agenda items or Boardpapers:
Name Attendance(a)
Antony Burgmans (Chairman to 16 May 2007) 3 of 3Michael Treschow (Chairman from 16 May 2007) 5 of 5Patrick Cescau 8 of 8Kees van der Graaf 7 of 8Ralph Kugler 7 of 8Rudy Markham (to 16 May 2007) 3 of 3Genevieve Berger (from 16 May 2007) 5 of 5Leon Brittan 7 of 8Lynda Chalker (to 16 May 2007) 2 of 3Wim Dik 8 of 8Charles Golden 8 of 8Byron Grote 8 of 8Narayana Murthy (from 16 May 2007) 4 of 5Hixonia Nyasulu (from 16 May 2007) 5 of 5David Simon 8 of 8Jean-Cyril Spinetta (to 14 September 2007) 1 of 6Kees Storm 7 of 8Jeroen van der Veer 6 of 8
(a) Attendance is expressed as number of meetings attended out ofnumber eligible to attend.
Board meetings are normally held either in London or Rotterdam,with at least one off site Board meeting a year. The Chairman isassisted by the Group Secretary, who ensures that the Boards aresupplied with all the information necessary for their deliberations.The Chairman and the Group Secretary involve the SeniorIndependent Director (see page 36) in the arrangements for Boardmeetings.
Board induction and training Upon election, Directors receive a comprehensive Directors’Manual and are briefed thoroughly on their responsibilities andour business. Updates on corporate governance developmentsand investor relations matters are frequent items at Boardmeetings. Ongoing training is provided for Directors by way ofsite visits, presentations, circulated updates, teach-ins and agendaitems at Board or Board committee meetings on, among otherthings, Unilever’s business, corporate governance, regulatorydevelopments, and investor relations matters. In particular, during2007 the Boards were given a presentation by our external legaladvisers on the new directors’ duties under the UK CompaniesAct 2006, which came into force on 1 October 2007. In 2007, aBoard meeting was held in Durban, South Africa which included avisit to our factory operations, certain retail outlets and charitableorganisations supported by Unilever in South Africa.

Unilever Annual Report and Accounts 2007 35
Report of the Directors continued
Corporate governance continued
Board evaluation The evaluation process of our Boards consists of a three-year cyclewith an independent third party evaluation carried out once everythree years and internal evaluations in each of the two years inbetween. The internal evaluations are based on the independentthird party evaluation materials. An independent third partyevaluation was last carried out in 2006. In 2007 our Chairman, inconjunction with the Senior Independent Director, conducted theinternal evaluation process. An extensive questionnaire for allBoard members formed part of the evaluation process. Inaddition, our Chairman conducted a process of evaluating theperformance of each individual Board member, including aninterview with each. A similar process with respect to theperformance of the Chairman was conducted by the SeniorIndependent Director after consulting Board members.
Committees of the Boards evaluate themselves under supervisionof their respective chairmen taking into account the views ofrespective committee members. The results of the evaluationswere discussed by the Boards.
Board support The Group Secretary is available to advise all Directors and ensurethat Board procedures are complied with. The position isappointed and can be removed by the Boards.
A procedure is in place to enable Directors, if they so wish, toseek independent professional advice at Unilever’s expense.
Board changes The current Directors, with their biographies, are shown on page46. All the current Executive Directors held office throughout theyear.
Leon Brittan, Wim Dik, Charles Golden, Byron Grote, DavidSimon, Jean-Cyril Spinetta, Kees Storm and Jeroen van der Veerwere re-elected as Non-Executive Directors of NV and PLC at the2007 AGMs. In addition, Genevieve Berger, Narayana Murthy andHixonia Nyasulu were appointed as Non-Executive Directors, andMichael Treschow became our first independent Non-ExecutiveChairman. Michael Treschow was appointed a member of theNomination Committee in 2007 and, following a change in theUK Combined Code on Corporate Governance, a member of theRemuneration Committee in February 2008.
In 2007, Genevieve Berger, Narayana Murthy and Hixonia Nyasulubecame members of the Corporate Responsibility and ReputationCommittee.
At the 2007 AGMs, Rudy Markham retired as an ExecutiveDirector but remained as Chief Financial Officer until his successor,Jim Lawrence, was appointed on 1 September 2007. LyndaChalker also retired as a Non-Executive Director at the 2007AGMs, and in September 2007 Jean-Cyril Spinetta stepped downas Non-Executive Director due to personal reasons.
At the 2008 AGMs all of the Executive Directors and the Non-Executive Directors will be nominated for re-election, with theexception of Kees van der Graaf and Ralph Kugler, who will bestepping down at the meetings. In addition, Jim Lawrence will beproposed for election as an Executive Director at the 2008 AGMsfollowing his appointment as Chief Financial Officer in September2007. Biographical details for Mr Lawrence are contained in the2008 AGM Notices, and on our website atwww.unilever.com/ourcompany/investorcentre
Chairman and Group Chief Executive Unilever has a separate independent Non-Executive Chairman andGroup Chief Executive. There is a clear division of responsibilitiesbetween their roles. The Chairman is primarily responsible forleadership of the Boards, ensuring their effectiveness and settingtheir agendas. He is also responsible for ensuring that the Boardsreceive accurate, timely and clear information.
The Group Chief Executive has been entrusted, within theparameters set out in the Articles of Association of NV and PLCand ‘The Governance of Unilever’, with all the Boards’ powers,authorities and discretions in relation to the operationalmanagement of Unilever. The Group Chief Executive has theauthority to determine which duties regarding the operationalmanagement of the companies and their business enterprises willbe carried out under his responsibility by one or more ExecutiveDirectors or by one or more other persons. This provides a basisfor the Unilever Executive team (UEx) that is chaired by andreports to the Group Chief Executive. For UEx members’biographies see page 47. For our business structure, please referto ‘About Unilever’ on pages 7 and 8.
Executive Directors All Executive Directors are members of the UEx: Patrick Cescauand, currently, Kees van der Graaf and Ralph Kugler, who willboth be leaving the Boards at the 2008 AGMs. Jim Lawrence will be proposed for election as an Executive Director at thoseAGMs. He is currently a member of UEx in his capacity as ChiefFinancial Officer.
The Executive Directors are full-time employees of Unilever.Information about their remuneration can be found in the reportof the Remuneration Committee and on our website.
The Remuneration Committee takes the view that the entitlementof the Executive Directors to the security of twelve months’ noticeof termination of employment is in line both with the practice ofmany comparable companies and the entitlement of other seniorexecutives within Unilever. It is our policy to set the level ofseverance payments for Directors at no more than one year’ssalary, unless the Boards, at the proposal of the RemunerationCommittee, find this manifestly unreasonable given circumstancesor unless dictated by applicable law.
The Executive Directors submit themselves for re-election at theAGMs each year. The Nomination Committee carefully considerseach nomination for reappointment.
The Directors stop holding executive office on ceasing to beDirectors. Those appointed prior to 2004 retire at the latest by the age of 62. Appointees from 2004 onwards retire at an agebetween 60 and 65, as decided by either them or Unilever.

36 Unilever Annual Report and Accounts 2007
Report of the Directors continued
Corporate governance continued
We do not grant our Executive Directors any personal loans orguarantees.
There are no family relationships between any of our ExecutiveDirectors, other key management personnel or Non-ExecutiveDirectors. None of our Executive Directors are elected orappointed under any arrangement or understanding.
Outside AppointmentsUnilever recognises the benefit to the individual and to the Groupof involvement by Unilever Executives acting as directors of othercompanies outside the Unilever Group, broadening theirexperience and knowledge. The number of outside directorshipsof listed companies is generally limited to one per individual. Inthe case of publicly listed companies approval is required from theChairman. Outside directorships must not involve an excessivecommitment or conflict of interest. Unilever Executives must at alltimes ensure that their time commitment to Unilever takesprecedence over any outside directorship. As of 2008 fees paid inconnection with an outside directorship may be retained by theindividual. This reflects that any outside directorship is for the soleresponsibility of the individual and that Unilever takes noresponsibility in this regard. For Executive Directors’ biographiessee page 46.
Non-Executive Directors The Non-Executive Directors share responsibility for the executionof the Boards’ duties, taking into account their specificresponsibilities, which are essentially supervisory. In particular, they comprise the principal external presence in the governanceof Unilever, and provide a strong independent element. See page 46 for their biographies.
Role and Responsibility The key elements of the role and responsibilities of our Non-Executive Directors are:
• supervision of and advice to the Group Chief Executive; • developing strategy with the Group Chief Executive; • scrutiny of performance; • oversight of controls; • reporting of performance; • remuneration of and succession planning for Executive
Directors; and • governance and compliance.
Our Non-Executive Directors are chosen for their broad andrelevant experience and international outlook, as well as their independence. They form the Audit Committee, theNomination Committee, the Remuneration Committee and in majority the Corporate Responsibility and ReputationCommittee. The roles and membership of these key Boardcommittees are described on pages 37 and 38. The profile set bythe Boards for the Non-Executive Directors and the chart used fororderly succession planning can be seen on our website atwww.unilever.com/investorcentre/corpgovernance
Meetings The Non-Executive Directors meet as a group, without theExecutive Directors present, under the chairmanship of MrTreschow. In 2007 they met three times as a group. In addition,the Non-Executive Directors (including the Chairman) usually meetbefore each Board meeting with the Group Chief Executive andthe Group Secretary.
Senior Independent Director Our Non-Executive Directors have appointed David Simon asSenior Independent Director. He acts as their spokesman. TheSenior Independent Director is consulted by the Chairman on the agenda and arrangements for Board meetings. He is also, in appropriate cases, a point of contact for shareholders andother stakeholders.
Tenure Our Non-Executive Directors submit themselves for re-electioneach year. Their nomination for re-election is subject to continuedgood performance which is evaluated by the Boards, based onthe recommendations of the Nomination Committee. TheNomination Committee carefully considers each nomination forreappointment. The Non-Executive Directors normally serve for amaximum of nine years.
Remuneration The remuneration of the Non-Executive Directors is determined bythe Boards, within the overall limit set by the shareholders at theAGMs in 2007, and it is reported on page 59. Details of theengagement of our Non-Executive Directors can be seen on theUnilever website.
Other appointmentsNon-Executive Directors may serve on boards of other companies,provided they do not involve a conflict of interest or restrict theirability to discharge their duties to Unilever.
Independence Taking into account the role of Non-Executive Directors, which isessentially supervisory, and the fact that they make up the keycommittees of the Boards, it is important that our Non-ExecutiveDirectors can be considered to be independent.
Our definition of ‘independence’ for Directors is set out in ‘The Governance of Unilever’. It is derived from the applicabledefinitions in use in the Netherlands, UK and US. Our currentNon-Executive Directors are considered to be independent ofUnilever. Our Boards reached this conclusion after conducting athorough review of all relevant relationships of the Non-ExecutiveDirectors, and their related or connected persons.
A number of relationships, such as non-executive directorships,exist between various of our Non-Executive Directors andcompanies that provide banking, insurance or financial advisoryservices to Unilever. Our Boards considered in each case thenumber of other companies that also provide or could readilyprovide such services to Unilever, the significance to thosecompanies of the services they provide to Unilever, the roles of the Non-Executive Directors within those companies and the significance of that role to our Non-Executive Directors.

Unilever Annual Report and Accounts 2007 37
Report of the Directors continued
Corporate governance continued
It concluded that none of these relationships threaten theindependence of the Non-Executive Directors concerned. Forexample, the Boards have satisfied themselves that Leon Brittan’sposition at UBS Investment Bank and UBS Securities CompanyLimited does not involve him in any way in its broking relationshipwith Unilever. The Boards have also formed the view that the factthat David Simon is a senior adviser of Morgan StanleyInternational is not material. The Boards have also satisfiedthemselves that the services provided by Paton Tupper Associates(Pty) Limited and Barloworld Limited, of which Hixonia Nyasulu isa director and 12.5% shareholder and director respectively, toUnilever South Africa is not material.
None of our Non-Executive Directors are elected or appointedunder any arrangement or understanding.
Committees
Board committees The Boards have established the committees described below, allformally set up by Board resolution with carefully defined remits.They are made up solely of Non-Executive Directors with theexception of the Corporate Responsibility and ReputationCommittee which currently has an Executive Director as amember, and report regularly to the Boards. For all committees, ifDirectors are unable to attend a meeting, they are given theopportunity before the meeting to discuss with the Chairman ofthe committee any agenda items or committee papers. Allcommittees are provided with sufficient resources to undertaketheir duties. The terms of reference for each committee can befound on our website.
Audit Committee The Audit Committee is comprised only of independent Non-Executive Directors with a minimum requirement of three. It ischaired by Kees Storm, and its other members are Wim Dik,Charles Golden and Byron Grote. The Boards have satisfiedthemselves that all the current members of the Committee arecompetent in financial matters and have recent and relevantexperience and that, for the purposes of the US Sarbanes-OxleyAct of 2002, Kees Storm is the Audit Committee’s financialexpert. The Committee’s meetings are attended, by invitation, bythe Chief Financial Officer, the Chief Legal Officer, the GroupController, the Chief Auditor and our external auditors.
The Audit Committee assists the Boards in fulfilling their oversightresponsibilities in respect of the integrity of Unilever’s financialstatements; risk management and internal control arrangements;compliance with legal and regulatory requirements; theperformance, qualifications and independence of the externalauditors; and the performance of the internal audit function. TheCommittee is directly responsible, subject to local laws regardingshareholder approval, for the nomination, compensation andoversight of the external auditors.
The Audit Committee is fully compliant with the rules regardingaudit committees that are applicable in the Netherlands, UK andUS. The Committee’s responsibilities and powers are fully alignedwith all requirements in the Netherlands, UK and US. The AuditCommittee is supplied with all information necessary for theperformance of its duties by the Chief Auditor, Chief FinancialOfficer, and Group Controller. Both the Chief Auditor and theexternal auditors have direct access to the Audit Committeeseparately from management.
The following table shows the attendance of Directors at AuditCommittee meetings for the year ended 31 December 2007:
Name Attendance(a)
Kees Storm (Chairman) 6 of 7Wim Dik 7 of 7Charles Golden 7 of 7Byron Grote 7 of 7
(a) Attendance is expressed as number of meetings attended out ofnumber eligible to attend.
See page 62 for the Report of the Audit Committee to theshareholders.
Nomination Committee Our Nomination Committee comprises a minimum of threeindependent Non-Executive Directors. It is chaired by David Simonand its other members are Michael Treschow and Jeroen van derVeer. Jean-Cyril Spinetta stepped down from the Committeefollowing his retirement as a Non-Executive Director in September2007. The Committee recommends to the Boards candidates forthe positions of Director. It also has responsibilities for successionplanning and oversight of corporate governance matters. It issupplied with information by the Group Secretary.
The following table shows the attendance of Directors atNomination Committee meetings for the year ended 31December 2007:
Name Attendance(a)
David Simon (Chairman) 6 of 6Antony Burgmans (to 16 May 2007) 3 of 3Jean-Cyril Spinetta (to 14 September 2007) 3 of 4Michael Treschow (from 27 June 2007) 3 of 3Jeroen van der Veer 6 of 6
(a) Attendance is expressed as number of meetings attended out ofnumber eligible to attend.
See page 48 for the Report of the Nomination Committee to shareholders.
Remuneration Committee On 31 December 2007, our Remuneration Committee comprisedtwo independent Non-Executive Directors following Jean-CyrilSpinetta stepping down from the Committee following hisretirement as a Non-Executive Director in September 2007. It ischaired by David Simon and its other member is Jeroen van derVeer. Michael Treschow was appointed as an additional memberof the Committee in February 2008.
The Committee reviews Directors’ remuneration and is responsiblefor the executive share-based incentive plans. It determines,within the parameters set by our shareholders, specificremuneration arrangements for each of the Executive Directors,the remuneration scales and arrangements for Non-ExecutiveDirectors and the remuneration of the tier of managementdirectly below the Boards. The Committee is advised by the GroupSecretary on matters of Corporate Governance.

38 Unilever Annual Report and Accounts 2007
Report of the Directors continued
Corporate governance continued
The following table shows the attendance of Directors atRemuneration Committee meetings for the year ended 31December 2007:
Name Attendance(a)
David Simon (Chairman) 5 of 5Jean-Cyril Spinetta (to 14 September 2007) 1 of 3Jeroen van der Veer 5 of 5
(a) Attendance is expressed as number of meetings attended out ofnumber eligible to attend.
The detailed report of the Remuneration Committee toshareholders on Directors’ remuneration is on pages 49 to 61.
Corporate Responsibility and Reputation Committee The Corporate Responsibility and Reputation Committee currentlycomprises four Non-Executive Directors and one ExecutiveDirector. It is chaired by Leon Brittan and its other members are Genevieve Berger, Narayana Murthy, Hixonia Nyasulu andRalph Kugler. The Committee has responsibility for the oversightof Unilever’s conduct with regard to its corporate and societalobligations and its reputation as a responsible corporate citizen.
The following table shows the attendance of Directors atCorporate Responsibility and Reputation Committee meetings forthe year ended 31 December 2007:
Name Attendance(a)
Leon Brittan (Chairman from 16 May 2007) 3 of 4Lynda Chalker (Chair to 16 May 2007) 2 of 2Genevieve Berger (from 16 May 2007) 2 of 2Antony Burgmans (to 16 May 2007) 0 of 2Wim Dik (to 13 September 2007) 2 of 3Ralph Kugler 4 of 4Narayana Murthy (from 16 May 2007) 2 of 2Hixonia Nyasulu (from 16 May 2007) 2 of 2
(a) Attendance is expressed as number of meetings attended out ofnumber eligible to attend.
See page 63 for the Report of the Corporate Responsibility andReputation Committee to shareholders.
Routine business committees Committees are also set up to conduct routine business as andwhen they are necessary. They comprise any two of the Directorsand certain senior executives and officers. They administer orimplement certain matters previously agreed by our Boards or theGroup Chief Executive. The Group Secretary is responsible for theoperation of these committees.
Disclosure Committee The Boards have set up a Disclosure Committee which isresponsible for helping the Boards ensure that financial and other information that ought to be disclosed publicly is disclosedin a timely manner and that the information that is disclosed is complete and accurate. The Committee comprises the Group Controller, the Group Secretary, the Chief Legal Officer andthe Group Treasurer.
Director matters
Various formal matters The borrowing powers of NV Directors on behalf of NV are notlimited by the Articles of Association of NV. PLC Directors havethe power to borrow on behalf of PLC up to three times theadjusted capital and reserves of PLC, as defined in its Articles ofAssociation, without the approval of shareholders (any exceptionsrequiring an ordinary resolution).
The Articles of Association of NV and PLC do not require Directorsof NV or Directors of PLC to hold shares in NV or PLC. However,the remuneration arrangements applicable to our ExecutiveDirectors require them to build and retain a personal shareholdingin Unilever equal to at least 150% of their annual base pay.
Indemnification Directors’ indemnification, including the terms thereof, is providedfor in Article 19 of NV’s Articles of Association. The power toindemnify Directors is provided for in PLC’s Articles of Association.Deeds of indemnity have been issued to all PLC Directors.Appropriate Directors’ and Officers’ liability insurance is in placefor all Unilever Directors.
Conflicts of interest We attach special importance to avoiding conflicts of interestbetween on the one hand NV and PLC and on the other handtheir Directors. The Boards are responsible for ensuring that thereare rules in place to avoid conflicts of interest by Board members.Conflicts of interest are not understood to include transactionsand other activities between companies in the Unilever Group.
Shareholder matters
Relations with shareholders and other investors We believe it is important both to explain our businessdevelopments and financial results to investors and to understandtheir objectives.
The Chief Financial Officer has lead responsibility for investorrelations, with the active involvement of the Group ChiefExecutive. They are supported by our Investor Relationsdepartment which organises presentations for analysts andinvestors. Such presentations are generally made available on ourwebsite. Briefings on quarterly results are given via teleconferenceand are accessible by telephone or via our website. For furtherinformation visit our website at www.unilever.com/investorcentre
The Boards are regularly briefed on reactions to the quarterlyresults announcements. They, or the relevant Board Committee,are briefed on any issues raised by shareholders that are relevantto their responsibilities.
Our shareholders can, and do, raise issues directly with therelevant Executive Director or the Chairman and, if appropriate, a relevant Non-Executive Director or the Senior IndependentDirector.

Unilever Annual Report and Accounts 2007 39
Report of the Directors continued
Corporate governance continued
Both NV and PLC communicate with their respective shareholdersthrough the AGMs as well as responding to their questions andenquiries during the course of the year. We take the views of ourshareholders into account and, in accordance with all applicablelegislation and regulations, may consult them in an appropriateway before putting major new proposals to our AGMs.
General Meetings of Shareholders The business to be conducted at the AGMs of NV and PLC is setout in the separate Notices of AGM for NV and PLC. It typicallyincludes appointment of Directors, declaration/approval of finaldividend, appointment of external auditors, approval of changesto the Articles of Association, and authorisation for the Boards to allot and repurchase shares, and to restrict pre-emptive rights of shareholders.
At the AGMs, a full account is given of the progress of thebusiness over the last year and there is a review of current issues.Shareholders are encouraged to attend the meetings and askquestions, and the question-and-answer sessions form animportant part of the meetings.
General Meetings of shareholders of NV and PLC are held attimes and places decided by our Boards. NV meetings are held inRotterdam and PLC meetings are held in London on consecutivedays. The notices calling the meetings normally go out more thanthirty days prior to the meetings and include further informationon how to gain access to the AGMs and how to vote by proxy.
We welcome our external auditors to the AGMs and they areentitled to address the meetings.
Electronic CommunicationWe are committed to efforts to establish more effective ways of communication with our shareholders around the AGMs.Electronic communication is becoming an important medium forshareholders, providing ready access to shareholder informationand reports, and for voting purposes.
NV was one of the founders of the Dutch Shareholders’Communication Channel. NV shareholders participating in theDutch Shareholders’ Communication Channel are able to appointelectronically a proxy to vote on their behalf at the NV AGM andNV shareholders who wish to participate should contact theirbank or broker. Shareholders of PLC in the UK can choose toreceive electronic notification that the Annual Review, AnnualReport and Accounts and Notice of AGMs have been publishedon our website, instead of receiving printed copies, and can alsoelectronically appoint a proxy to vote on their behalf at the AGM.
Registration for electronic communication by shareholders of PLCcan be made at www.unilever.com/shareholderservices The UKCompanies Act 2006 contains provisions facilitatingcommunications between companies and their shareholderselectronically. PLC consulted with its shareholders in 2007 to offerthem the opportunity to review their method of receivingshareholder communications in the future.
At the 2007 NV AGM shareholders voted for an amendment tothe NV Articles of Association allowing Unilever to implement theopportunity of electronic communication. Accordingly, the Boardof Directors is now authorised to decide upon the use of thismeans of communication.
Voting rights To be entitled to attend and vote at NV General Meetingsshareholders must hold their NV shares on the record date, whichis set by the Board of NV at a date not more than thirty daysbefore the meeting. Shareholders do not need to block theirshares. NV shareholders can cast one vote for each €0.16 nominalcapital that they hold. This means that they can cast one vote foreach NV ordinary share, or NV New York Registry Share.Shareholders can vote in person or by proxy. Similar arrangementsapply to holders of depositary receipts issued for NV shares andthe holders of NV preference shares (see pages 42 and 43).
PLC shareholders can cast one vote for each 31⁄ 9p nominal capitalthat they hold. Shareholders can vote in person at the meeting orby proxy. This means shareholders can cast one vote for each PLCordinary share, or PLC American Depositary Receipts of shares.Proxies should be submitted at least 48 hours before the GeneralMeeting to the Registrars, whose details can be found on page143.
More information on the exercise of voting rights can be found in NV’s and PLC’s Articles of Association and in the respectiveNotices of Meetings.
Holders of NV New York Registry Shares or PLC AmericanDepositary Receipts of shares will receive a proxy form enablingthem to authorise and instruct ABN AMRO N.V. or Citibank, N.A.respectively to vote on their behalf at the General Meeting of NVor PLC. N.V. Elma and United Holdings Limited (the holders ofNV’s special shares), other group companies of NV which holdordinary or preference shares, and United Holdings Limited, whichowns half of PLC’s deferred stock, are not permitted to vote atGeneral Meetings.
Voting on each of the resolutions contained in the Notice ofAGMs is conducted by poll. The final vote is published at themeetings and the outcome of the votes, including the proxyvotes, is put on Unilever’s website. For each resolution, proxyappointment forms in 2007 provided shareholders with theoption to direct their proxy to vote either for or against theresolution or to withhold their vote. Proxy forms and voting resultannouncements make it clear that a vote withheld is not a vote inlaw, and will not be counted in the calculation of the proportionof votes for and against the resolution voted on.
Shareholder proposed resolutions Shareholders of NV may propose resolutions if they individually ortogether hold 1% of NV’s issued capital in the form of shares ordepositary receipts for shares, or if they individually or togetherhold shares or depositary receipts worth or representing themarket value in shares as set in respect thereto by or pursuant tothe law (currently €50 million). They must submit these requestsat least 60 days before the date of the General Meeting, and therequest will be honoured unless, in the opinion of the Boards, it isagainst a substantive interest of the Company. Shareholders whotogether represent at least 10% of the issued capital of NV canalso requisition Extraordinary General Meetings to deal withspecific resolutions.

40 Unilever Annual Report and Accounts 2007
Report of the Directors continued
Corporate governance continued
The Equalisation Agreement provides that if one company hadlosses, or was unable to pay its preference dividends, the loss orshortfall would be made up out of:
• the current profits of the other company (after it has paid itsown preference shareholders);
• then its own free reserves; and • then the free reserves of the other company.
If either company could not pay its ordinary dividends, we wouldfollow the same procedure, except that the current profits of theother company would only be used after it had paid its ownordinary shareholders and if the Directors thought this moreappropriate than, for example, using its own free reserves.
So far, NV and PLC have always been able to pay their owndividends, so we have never had to follow this procedure. If wedid, the payment from one company to the other would besubject to any United Kingdom and Dutch tax and exchangecontrol laws applicable at that time.
Under the Equalisation Agreement, the two companies arepermitted to pay different dividends in the following exceptionalcircumstances:
• If the average annual sterling/euro exchange rate changed so substantially from one year to the next that to pay equaldividends at the current exchange rates, either NV or PLCwould have to pay a dividend that was unreasonable (that is tosay, substantially larger or smaller in its own currency than thedividend it paid in the previous year); or
• The governments of the Netherlands or the United Kingdomcould in some circumstances place restrictions on theproportion of a company’s profits which can be paid out asdividends. This could mean that in order to pay equal dividendsone company would have to pay out an amount which wouldbreach the limitations in place at the time, or that the othercompany would have to pay a smaller dividend.
In either of these rare cases, NV and PLC could pay differentamounts of dividend if the Boards thought it appropriate. Thecompany paying less than the equalised dividend would put thedifference between the dividends into a reserve: an equalisationreserve in the case of exchange rate fluctuations, or a dividendreserve in the case of a government restriction. The reserveswould be paid out to its shareholders when it became possible orreasonable to do so, which would ensure that the shareholders ofboth companies would ultimately be treated the same.
If both companies were to go into liquidation, NV and PLC wouldeach use any funds available for shareholders to pay the priorclaims of their own preference shareholders. Then they would use any surplus to pay each other’s preference shareholders, ifnecessary. After these claims had been met, they would pay outany equalisation or dividend reserve to their own shareholdersbefore pooling the remaining surplus. This would be distributed to the ordinary shareholders of both companies on an equal basis. If one company were to go into liquidation, we would apply thesame principles as if both had gone into liquidationsimultaneously.
Shareholders who together hold shares representing at least 5%of the total voting rights of PLC, or 100 shareholders who holdon average £100 each in nominal value of PLC capital, can require PLC to propose a resolution at a General Meeting. PLC shareholders holding in aggregate 10% of the issued PLCordinary shares are able to convene a General Meeting of PLC.
Required majorities Resolutions are usually adopted at NV and PLC shareholdermeetings by an absolute majority of votes cast, unless there areother requirements under the applicable laws or NV’s or PLC’sArticles of Association. For example, there are specialrequirements for resolutions relating to the alteration of theArticles of Association, the liquidation of NV or PLC and thealteration of the Equalisation Agreement (see below).
A proposal to alter the Articles of Association of NV can only be made by the Board. A proposal to alter the Memorandum andArticles of Association of PLC can be made either by the Board orby shareholders in the manner permitted under the UKCompanies Acts. Proposals to alter the provisions in the Articles ofAssociation of NV and PLC respectively relating to the unity ofmanagement require the prior approval of meetings of theholders of the NV special shares and the PLC deferred stock. TheArticles of Association of NV and the Memorandum and Articlesof Association of PLC can be found on our website.
Right to hold shares Unilever places no limitations on the right to hold NV and PLCshares.
Foundation Agreements
Equalisation Agreement The Equalisation Agreement makes the economic position of theshareholders of NV and PLC, as far as possible, the same as if theyheld shares in a single company. The Agreement regulates themutual rights of the shareholders of NV and PLC. Under theEqualisation Agreement, NV and PLC must adopt the samefinancial periods and accounting policies. Dividends are paid inaccordance with a formula relating to the nominal values of NV’sand PLC’s issued share capital.
Since the AGMs in 2006 which agreed to split the NV ordinaryshares and to consolidate the PLC ordinary shares, each NVordinary share represents the same underlying economic interestin the Unilever Group as each PLC ordinary share.
We pay ordinary dividends for NV and PLC on the same day. NV and PLC allocate funds for the dividend from their parts of our current profits and free reserves. We pay the same amount on each NV share as on one PLC share calculated at the relevantexchange rate. For interim dividends this exchange rate is theaverage rate for the quarter before we declare the dividend. Forfinal dividends it is the average rate for the year. In arriving at theequalised amount we include any tax payable by the Company inrespect of the dividend, but calculate it before any tax deductibleby the Company from the dividend.

Unilever Annual Report and Accounts 2007 41
Report of the Directors continued
Corporate governance continued
In principle, issues of bonus shares and rights offerings can onlybe made in ordinary shares. Again we would ensure thatshareholders of NV and PLC received shares in equal proportions.The subscription price for one new NV share would have to bethe same, at the prevailing exchange rate, as the price for onenew PLC share. Neither company can issue or reduce capitalwithout the consent of the other.
The Articles of Association of NV establish that any paymentunder the Equalisation Agreement will be credited or debited tothe income statement for the financial year in question.
Under Article 2 of the Articles of Association of NV and Clause 3of the Memorandum of Association of PLC, each company isrequired to carry out the Equalisation Agreement with the other.Both documents state that the Agreement cannot be changed orterminated without the approval of shareholders. For NV, theGeneral Meeting can decide to alter or terminate the EqualisationAgreement at the proposal of the Board. The necessary approvalof the General Meeting is then that at least one half of the totalissued ordinary capital must be represented at an ordinaryshareholders’ meeting, where the majority must vote in favour;and (if they would be disadvantaged or the agreement is to beterminated), at least two-thirds of the total issued preferenceshare capital must be represented at a preference shareholders’meeting, where at least three-quarters of them must vote infavour. For PLC, the necessary approval must be given by theholders of a majority of all issued shares voting at a GeneralMeeting and the holders of the ordinary shares, by a simplemajority voting at a General Meeting where the majority of theordinary shares in issue are represented.
In addition, Article 3 of the PLC Articles of Association states thatPLC’s Board must carry out the Equalisation Agreement and thatthe other provisions of the Articles of Association are subject to it.
We are advised by counsel that these provisions oblige our Boardsto carry out the Equalisation Agreement, unless it is amended orterminated with the required approval of the shareholders of both companies. If the Boards fail to enforce the Agreement,shareholders can compel them to do so under Dutch and UnitedKingdom law.
A copy of the Equalisation Agreement can be found on ourwebsite at www.unilever.com/investorcentre/corpgovernance
The Deed of Mutual Covenants The Deed of Mutual Covenants provides that NV and PLC andtheir respective subsidiary companies shall co-operate in everyway for the purpose of maintaining a common operating policy.They shall exchange all relevant information about their respectivebusinesses – the intention being to create and maintain acommon operating platform for the Unilever Group throughoutthe world. The Deed illustrates some of the information whichmakes up this common platform, such as the mutual exchangeand free use of know-how, patents, trade marks and all othercommercially valuable information. The Deed contains provisionswhich allow the Directors of NV and PLC to take any actions toensure that the dividend-generating capacity of each of NV andPLC is aligned with the economic interests of their respective
shareholders. These provisions also allow assets to be transferredbetween NV and PLC and their associated companies (as definedin the Deed) to ensure that assets are allocated in the mostefficient manner. These arrangements are designed to create abalance between the two parent companies and the fundsgenerated by them, for the benefit of their respective sets of shareholders.
The Agreement for Mutual Guarantees of Borrowing Under the Agreement for Mutual Guarantees of Borrowingbetween NV and PLC, each company will, if asked by the other,guarantee the borrowings of the other. The two companies can also agree jointly to guarantee the borrowings of theirsubsidiaries. These arrangements are used, as a matter of financialpolicy, for certain significant public borrowings. They enablelenders to rely on our combined financial strength.
Share capital matters
Combined earnings per share We calculate earnings per share on a combined basis. Thecalculation is based on the average amount of NV’s and PLC’sordinary share capital in issue during the year.
In our combined earnings per share calculation, we assume thatboth companies will be able to pay their dividends out of theirpart of our profits. This has always been the case in the past, but if we did have to make a payment from one to the other it could result in additional taxes, and reduce our combinedearnings per share.
Further information about the calculation of earnings per share,including the calculation on a diluted basis, can be found in note7 on page 85.
Share capital NV’s issued share capital on 31 December 2007 was made up of:
• €274 356 432 split into 1 714 727 700 ordinary shares of€0.16 each;
• €1 028 568 split into 2 400 ordinary shares numbered 1 to 2 400, known as special shares; and
• €113 599 014 split into several classes (4%, 6% and 7%) ofcumulative preference shares (‘financing preference shares’).
The total number of voting rights attached to NV's outstandingshares is shown hereunder:
Total number of votes % of issued capital
1 714 727 700 ordinary shares 1 714 727 700(a) 70.532 400 special shares 6 428 550 0.26750 000 4% cumulative
preference shares 200 906 250 8.26161 060 6% cumulative
preference shares 431 409 276 17.7529 000 7% cumulative
preference shares 77 678 312 3.20
(a) Of which 81 337 992 shares were held in treasury and 40 958 255 shares were held in connection with share-basedpayments as at 31 December 2007.

42 Unilever Annual Report and Accounts 2007
Report of the Directors continued
Corporate governance continued
NV may issue shares not yet issued and grant rights to subscribefor shares only pursuant to a resolution of the General Meeting of Shareholders or of another corporate body designated for suchpurpose by a resolution of the General Meeting. At the AGM heldon 15 May 2007 the Board of Directors was designated, inaccordance with Articles 96 and 96a of Book 2 of the NetherlandsCivil Code, as the corporate body which is authorised until15 November 2008 to resolve on the issue of – or on the grantingof rights to subscribe for – shares not yet issued and to restrict orexclude the statutory pre-emption rights that accrue toshareholders upon issue of shares, on the understanding that thisauthority is limited to 10% of the issued share capital of theCompany, plus an additional 10% of the issued share capital ofthe Company in connection with or on the occasion of mergersand acquisitions.
At the 2007 AGM the Board of Directors of NV was authorised, in accordance with Article 98 of Book 2 of the Netherlands CivilCode, until 15 November 2008 to cause the Company to buy inits own shares and depositary receipts therefor, within the limitsset by law (10% of the issued share capital), either throughpurchase on a stock exchange or otherwise, at a price, excludingexpenses, not lower than the nominal value of the shares and nothigher than 10% above the average of the closing price of theshares on Eurolist by Euronext Amsterdam for the five businessdays before the day on which the purchase is made.
The above mentioned authorities are renewed annually.
PLC’s issued share capital on 31 December 2007 was made up of:
• £40 760 420 split into 1 310 156 361 ordinary shares of 31⁄ 9peach; and
• £100 000 of deferred stock.
The total number of voting rights attached to PLC’s outstandingshares are shown hereunder:
Total number of votes % of issued capital
1 310 156 361 ordinary shares 1 310 156 361(a) 99.76£100 000 deferred stock 3 214 285 0.24
(a) Of which 11 556 216 shares were held by PLC in treasury and 37 973 522 shares were held by NV group companies or byshare trusts as at 31 December 2007.
The Board of Directors of PLC under sections 80 and 89 of the UKCompanies Act 1985 may, subject to the passing of theappropriate resolutions at a meeting of shareholders, issue shareswithin the limits prescribed within the resolutions. At the 2007AGM the Directors were authorised to issue new shares pursuantto section 80 of that Act, limited to a maximum of £13 450 000nominal value, and pursuant to section 89 of that Act, to disapplypre-emption rights up to approximately 5% of PLC’s issuedordinary share capital. These authorities are renewed annually.
At the 2007 AGM the Board of Directors of PLC was authorisedin accordance with its Articles of Association to make marketpurchases of its ordinary shares within the limits prescribed withinthe resolution until the earlier of the 15 month anniversary afterthe passing of the resolution or the conclusion of the 2008 AGM.
Margarine Union (1930) Limited: Conversion RightsThe first Viscount Leverhulme was the founder of the companywhich became PLC. When he died in 1925, he left in his will alarge number of PLC shares in various trusts.
When the will trusts were varied in 1983, the interests of thebeneficiaries of his will were also preserved. Four classes of specialshares were created in Margarine Union (1930) Limited, asubsidiary of PLC. One of these classes can be converted at theend of the year 2038 into 70 875 000 PLC ordinary shares of31⁄ 9p each. This currently represents 5.4% of PLC’s issued ordinarycapital. These convertible shares replicate the rights which thedescendants of the first Viscount would have had under his will.This class of the special shares only has a right to dividends inspecified circumstances, and no dividends have yet been paid. PLC guarantees the dividend and conversion rights of the special shares.
Foundation Unilever NV Trust OfficeAs at 1 March 2008, around 74.48% of NV’s ordinary shares andaround 33.71% of NV’s 7% cumulative preference shares wereheld by the Foundation Unilever NV Trust Office (StichtingAdministratiekantoor Unilever N.V.), a trust office with a boardindependent from Unilever. As part of its corporate objects, theFoundation issues depositary receipts in exchange for theseshares. These depositary receipts are listed on EuronextAmsterdam, as are the NV ordinary and 7% preference sharesthemselves.
Holders of depositary receipts can under all circumstancesexchange their depositary receipts for the underlying shares (and vice versa).
Holders of depositary receipts are entitled to dividends that arepaid on the underlying shares held by the Foundation.
The members of the board are Mr J H Schraven (Chairman), Mr P P de Koning, Prof Dr L Koopmans and Mr A A Olijslager.Their biographies can be found on the website of the Foundationwww.administratiekantoor-unilever.nl
The Foundation reports periodically, but at least once a year, on its activities.
Voting by holders of depositary receipts Although the depositary receipts themselves do not formally havevoting rights, holders of depositary receipts are in practiceequated with shareholders. Holders of depositary receipts canattend all NV’s General Meetings, either personally or by proxy,and will then automatically, without limitation and under allcircumstances, receive a voting proxy on behalf of the Foundationto vote on the underlying shares.
Holders of depositary receipts not attending a shareholders’meeting and who participate in the Dutch Shareholders’Communication Channel can also issue binding votinginstructions to the Foundation. The Foundation is obliged to follow these instructions. The same applies to all holders of depositary receipts who instruct the Foundation outside the Shareholders’ Communication Channel.

Unilever Annual Report and Accounts 2007 43
Report of the Directors continued
Corporate governance continued
Voting by the Foundation Unilever NV Trust Office Shares for which the Foundation has not granted voting proxiesor for which it has not received voting instructions are voted on by the Foundation in such a way as it deems to be in theinterests of the holders of the depositary receipts. This votingpolicy is laid down in the Conditions of Administration that apply to the depositary receipts. Both the Articles of Associationand the Conditions of Administration can be found on theFoundation’s website.
Specific provisions apply in the event that a meeting of holders ofNV 7% cumulative preference shares is convened.
If a change to shareholders’ rights is proposed, the Foundationwill let shareholders know if it intends to vote, at least 14 days in advance if possible. It will do this by advertising in the press.
Hitherto the majority of votes cast by ordinary shareholders at NV meetings have been cast by the Foundation. Unilever and the Foundation have a policy of actively encouraging holders of depositary receipts to exercise their voting rights in NV meetings.
Unilever considers the arrangements of the Foundationappropriate and in the interest of NV and its shareholders giventhe voting rights attached to the financing preference shares andthe relatively low attendance of the holders of the ordinary sharesin its AGMs.
Foundation Unilever NV Trust Office’s shareholding Foundation NV Trust Office’s shareholding fluctuates daily – itsholdings on 1 March 2008 were:
• NV ordinary shares of €0.16: 1 277 186 652 (74.48%);• NV 7% cumulative preference shares of €428.57: 9 776
(33.71%);• NV 6% cumulative preference shares of €428.57: 5 (0.00%);
and• NV 4% cumulative preference shares of €42.86: 23 (0.00%).
Further information on the Foundation, its arrangements and its activities can be found on its website atwww.administratiekantoor-unilever.nl
Requirements and compliance – general Unilever is subject to corporate governance requirements in theNetherlands, the UK and as a foreign private issuer in the US. In the following section we report on our compliance with thecorporate governance regulations and best practice codesapplicable in the Netherlands and the UK and we also describecompliance with corporate governance regulations in the US.
Our governance arrangements are designed and structured topromote and further the interests of our companies and theirshareholders. The Boards reserve the right, in cases where theydecide such to be conducive to the interests of the companiesand the enterprise connected therewith or our shareholders, todepart from that which is set out in the present and previoussections in relation to our corporate governance. Further changeswill be reported in future Annual Reports and Accounts and,when necessary, through changes to the relevant documentspublished on our website. As appropriate, proposals for changewill be put to our shareholders for approval.
Further information can be found on our website and in ‘TheGovernance of Unilever’, the Boards’ own constitutionaldocument. This describes the terms of reference of our BoardCommittees, including their full responsibilities. It will be kept upto date with changes in our internal constitutional arrangementsthat our Boards may make from time to time and it is available onour website at www.unilever.com/Investorcentre/corpgovernance
Following implementation of the EU Takeover Directive, certaininformation is required to be disclosed in relation to control andshare structures and interests of NV and PLC. Such disclosures,which are not covered elsewhere in this Annual Report, includethe following:
• there are no requirements to obtain the approval of NV or PLC,or of other holders of securities in NV or PLC, for a transfer ofsecurities;
• the Trustees of the PLC employee share trusts may vote orabstain in any way they think fit and in doing so may take intoaccount both financial and non-financial interests of thebeneficiaries of the employee share trusts or their dependents;
• there are no arrangements by which, with NV or PLC's co-operation, financial rights carried by securities are held by aperson other than the holder of securities;
• NV and PLC are not aware of any agreements between holdersof securities which may result in restrictions on the transfer ofsecurities or on voting rights;
• neither NV or PLC are parties to any significant agreementwhich include provisions that take effect, alter or terminatesuch an agreement upon a change of control following atakeover bid; and
• NV and PLC do not have any agreements with any Director oremployee that would provide compensation for loss of office oremployment resulting from a takeover except that most ofUnilever's share schemes contain provisions which operate inthe event of a takeover of Unilever, which provisions may forinstance cause options or awards granted to employees undersuch schemes to vest after a takeover or be exchanged intonew awards for shares in another entity.
Requirements – the Netherlands
General NV is required to state in its Annual Report and Accounts whetherit complies or will comply with the Principles (‘P’) and bestpractice provisions (‘bpp’) of the Dutch Corporate GovernanceCode (the Dutch Code) and, if it does not comply, to explain thereasons for this. As will be clear from the preceding description ofour governance arrangements, NV complies with almost all of theprinciples and best practice provisions of the Dutch Code. Thetext that follows sets out areas of non-compliance, as well ascertain statements that the Dutch Code invites us to make to our shareholders that are not included elsewhere in this AnnualReport and Accounts.

44 Unilever Annual Report and Accounts 2007
Report of the Directors continued
Corporate governance continued
Board and Committee structures NV is a multinational company with activities and shareholderslocated all over the world. It has a one-tier board, consisting ofboth Executive and, as a majority, Non-Executive Directors. We achieve compliance of our board arrangements with theDutch Code, which is for the most part based on the customarytwo-tier structure in the Netherlands, by, as far as is possible andpracticable, applying the provisions of the Dutch Code relating tomembers of a management board to our Executive Directors andthe provisions relating to members of a supervisory board to ourNon-Executive Directors. Management tasks not capable ofdelegation are performed by the Board. Reference is made to Ps IIand III and corresponding bpps. Reference is also made to the UKCombined Code on Corporate Governance, which is fully tailoredto the one-tier board model (see page 33).
Risk management and control Reference is made to pages 13 and 14 where Unilever’s controlframework is described. This incorporates risk management,internal control procedures and disclosure controls andprocedures. Our procedures cover financial, operational, social,strategic and environmental risks and regulatory matters. They arein line with the latest recommendations of ‘Internal Control –Revised Guidance for Directors on the Combined Code’ publishedby the Internal Control Working Party of the Institute ofChartered Accountants in England and Wales in October 2005(‘The Turnbull Guidance’) and in line with the Recommendationsof the Dutch Monitoring Committee. On pages 13 and 14 wehave identified certain specific risks that are areas of focus in2008. Unilever has designed its internal risk management andcontrol systems to provide reasonable (not absolute) assurance toensure compliance with regulatory matters and to safeguardreliability of the financial reporting and its disclosures.
The Board considers that the internal risk management andcontrol systems are appropriate for our business and incompliance with bpp II.1.3.
In bpp II.1.4 the Dutch Code invites our Board to make astatement on our internal risk management and control systems.In its reports, published on 20 December 2005 and 19 December2007, the Dutch Corporate Governance Code MonitoringCommittee has made recommendations concerning theapplication of this best practice provision. In accordance with itsrecommendation and in the light of the above, the Board believesthat, as regards financial reporting risks:
• the risk management and control systems provide reasonableassurance that this Annual Report does not contain anymaterial inaccuracies;
• the risk management and control systems have workedproperly in 2007;
• there are no indications that the risk management and controlsystems will not work properly in 2008;
• no material failings in the risk management and control systemswere discovered in the year under review or the current year upto the date of signing of these accounts;
and, as regards operational, strategic, legislative and regulatory risks:
• no material failings in the risk management and control systemswere discovered in the year under review.
This statement is not a statement in accordance with the requirements of Section 404 of the US Sarbanes-Oxley Act 2002.
Share options and awardsIn line with bpp II.2.2, the awards and grants of shares andoptions to our Executive Directors are in the material cases subjectto performance criteria, as referred to on pages 51 and 52 of theReport of the Remuneration Committee.
Retention period of shares The Dutch Code recommends that shares granted to executivedirectors without a financial consideration must be retained for a period of at least five years (bpp II.2.3). In 2001 we introduced a new remuneration policy with shareholder approval whichrequires our Executive Directors to build and retain a personalshareholding in Unilever equal to at least 150% of their annualbase pay. We believe that this is in line with the spirit of theDutch Code.
Severance pay It is our policy to set the level of severance payments for Directorsat no more than one year’s salary, unless the Board, at theproposal of the Remuneration Committee, finds this manifestlyunreasonable given circumstances or unless otherwise dictated byapplicable law (bpp II.2.7).
Regulations for transactions in securities in othercompanies The Dutch Code recommends that a director shall give periodicnotice of any changes in his holding of securities in other Dutchlisted companies (bpp II.2.6 and bpp III.7.3). We are amultinational company operating all over the world and ourDirectors come from a wide variety of countries. We thereforehave a broader more general requirement for our Directors,requiring them, upon request, to disclose to the complianceofficer their holdings and transactions in securities in any listedcompany.
Conflicts of interest In the event of a (potential) conflict of interest, the provisions ofthe Dutch Code (P II.3 and III.6) are applied. Conflicts of interestare not understood to include transactions and other activitiesbetween companies in the Unilever Group.
Financing preference shares NV issued 4%, 6% and 7% cumulative preference sharesbetween 1927 and 1970. Their voting rights are based on theirnominal value, as prescribed by Dutch law. The Dutch Coderecommends that the voting rights on such shares should, in anyevent when they are newly issued, be based on their economicvalue rather than on their nominal value (bpp IV.1.2). NV agreeswith this principle but cannot unilaterally reduce voting rights ofits outstanding preference shares.
Anti-takeover constructions and control over the company With reference to bpp IV.3.9, NV has no anti-takeoverconstructions, in the sense of constructions that are intendedsolely, or primarily, to block future hostile public offers for itsshares. Nor does NV have any constructions whose specificpurpose is to prevent a bidder, after acquiring 75% of the capital,from appointing or dismissing members of the Board and

Unilever Annual Report and Accounts 2007 45
Report of the Directors continued
Corporate governance continued
subsequently altering the Articles of Association. The acquisitionthrough a public offer of a majority of the shares in a companydoes not under Dutch law preclude in all circumstances thecontinued right of the Board of the company to exercise itspowers.
Provision of information We consider it important to comply with all applicable statutoryregulations on the equal treatment of shareholders and provisionof information and communication with shareholders and otherparties (P IV.2 and P IV.3).
Meetings of analysts and presentations to investors We have extensive procedures for handling relations with andcommunicating with shareholders, investors, analysts and themedia (see description on page 38). The important presentationsand meetings are conducted as far as practicable in accordancewith bpp IV.3.1. Due to their large number and overlap ininformation, some of the less important ones are not announcedin advance, made accessible to everyone or put on our website.
Requirements – the United Kingdom PLC is required, as a company that is incorporated in the UK andlisted on the London Stock Exchange, to state how it has appliedthe principles and how far it has complied with the provisions setout in Section 1 of the 2006 UK Combined Code on CorporateGovernance (‘the Combined Code’).
In the preceding pages we have described how we have appliedthe principles and the provisions in the Combined Code. In 2007,Unilever complied with the Combined Code except in thefollowing areas:
• Since the 2007 AGMs, Michael Treschow has been Unilever’sfirst independent Non-Executive Chairman. His predecessor,Antony Burgmans, was not considered to be independentduring his period as Chairman of Unilever, as he was beforeMay 2005 an Executive Director.
• The Remuneration Committee, following the stepping downfrom that committee by Jean-Cyril Spinetta upon his retirementas a Non-Executive Director of Unilever in September 2007, hashad two independent Non-Executive Directors on itsmembership. Michael Treschow was appointed a member ofthe Remuneration Committee in February 2008. TheCommittee and the Board are currently working to replaceJean-Cyril Spinetta with a new Non-Executive Director.
• Due to the requirement for Unilever to hold two AGMs for itsrespective companies on consecutive days, it may not always bepossible for all Directors, and possibly the Chairmen of theAudit, Remuneration and Nomination Committees, to bepresent at both meetings. The Chairman ensures that a majorityof Directors attend both meetings and that at least onemember of each Committee attends each AGM.
Requirements – the United States Both NV and PLC are listed on the New York Stock Exchange andmust therefore comply with such of the requirements of USlegislation, such as the Sarbanes-Oxley Act of 2002, regulationsenacted under US securities laws and the Listing Standards of theNew York Stock Exchange as are applicable to foreign private
issuers. In some cases the requirements are mandatory and inother cases the obligation is to ’comply or explain’.
We have complied with the requirements concerning corporategovernance that were in force during 2007. Attention is drawn in particular to the remit of the Audit Committee on page 37 and the Report of the Audit Committee on page 62.
Actions already taken to ensure compliance that are notspecifically disclosed elsewhere or otherwise clear from readingthis document include:
• the issuance of a Code of Ethics for senior financial officers; • the issuance of instructions restricting the employment of
former employees of the audit firm; and • the establishment of a policy on reporting requirements under
the US Securities and Exchange Commission (SEC) relating tothe standards of professional conduct for US attorneys.
In each of these cases, existing practices were revised and/ordocumented in such a way as to conform to the newrequirements.
The Code of Ethics applies to the senior executive, financial andaccounting officers and comprises the standards prescribed by theSEC, and a copy has been posted on our website atwww.unilever.com/investorcentre/corpgovernance
The Code of Ethics comprises an extract of the relevant provisionsof Unilever’s Code of Business Principles and the more detailedrules of conduct that implement it. The only amendment to thesepre-existing provisions and rules that was made in preparing theCode of Ethics was made at the request of the Audit Committeeand consisted of a strengthening of the explicit requirement tokeep proper accounting records. No waiver from any provision of the Code of Ethics was granted to any of the persons fallingwithin the scope of the SEC requirement in 2007.
We are required by US securities laws and the Listing Standards of the New York Stock Exchange to have an Audit Committeethat satisfies Rule 10A-3 under the Exchange Act and the ListingStandards of the New York Stock Exchange (NYSE). We are fullycompliant with these requirements. We are also required todisclose any significant ways in which our corporate governancepractices differ from those typically followed by US companieslisted on the NYSE. In addition to the information we have given you in this document about our corporate governancearrangements, further details are provided in ‘The Governance ofUnilever’, which is on our website atwww.unilever.com/investorcentre/corpgovernance
We are fully compliant with the Listing Standards of the New York Stock Exchange applicable to foreign private issuers.Our corporate governance practices do not significantly differfrom those followed by US companies listed on the New YorkStock Exchange.
We also confirm that our shareholders have the opportunity tovote on equity compensation plans.

46 Unilever Annual Report and Accounts 2007
Report of the Directors continued
Chairman
Michael Treschow1,2
Nationality: Swedish. Aged 64. Chairman since May 2007. Chairman,Telefonaktiebolaget L M Ericsson. Non-Executive Director, ABB Group.Board member, Knut and Alice Wallenberg Foundation. Chairman, ABElectrolux 1997-2007 and Confederation of Swedish Enterprise 2004-2007.
Vice-Chairman
The Lord Simon of Highbury CBE3,4,5
Nationality: British. Aged 68. Appointed 2000. Non-Executive Director,Suez Group. Director, CEPS, Belgium. Member of the InternationalAdvisory Council, FITCH, France. Member of the International AdvisoryBoard, Dana Gas Corporation. Senior Advisor, Morgan StanleyInternational. UK Government Minister 1997-1999. Group ChiefExecutive, BP p.l.c. 1992-1995 and Chairman 1995-1997.
Executive Directors
Patrick CescauGroup Chief ExecutiveNationality: French. Aged 59. Group Chief Executive since April 2005.Joined Unilever 1973. Appointed Director 4 May 1999. Previous postsinclude: Chairman, Unilever PLC and Vice-Chairman, Unilever N.V.2004-2005. Foods Director 2001. Financial Director 1999. Controllerand Deputy Financial Director 1998-1999. President, Lipton USA1997-1998. President and CEO, Van den Bergh Foods USA 1995-1997. Chairman, Indonesia 1991-1995. External appointmentsinclude: Non-Executive Director, Pearson plc.
Kees van der GraafPresident EuropeNationality: Dutch. Aged 57. President Europe since April 2005. JoinedUnilever 1976. Appointed Director 12 May 2004. Previous postsinclude: Foods Director 2004, Business Group President, Ice Creamand Frozen Foods 2001. Executive Vice-President, Foods andBeverages Europe 1998. Senior Vice-President, Global Ice Creamcategory 1995. External appointments include: Board member, ECR(Efficient Consumer Response). Member, Supervisory Boards of ANWBClub (Algemene Nederlandse Wielrijdersbond) and ANWB B.V.
Ralph Kugler6
President Home and Personal CareNationality: British. Aged 52. President Home and Personal Care sinceApril 2005. Joined Unilever 1979. Appointed Director 11 May 2005.Previous posts include: President Home and Personal Care Europe2001. Business Group President, Latin America 1999. Chairman,Unilever Thai Holdings 1995. Chairman, Unilever Malaysia 1992.External appointments include: Non-Executive Director,InterContinental Hotels Group PLC.
Non-Executive Directors
Professor Genevieve Berger6
Nationality: French. Aged 53. Appointed 2007. Professor, MedicalUniversity Teaching Hospital, Paris. Member, Technical Committee,Institute of Electrical and Electronics Engineers (IEEE). Chairman,Advisory Board, Health for the European Commission. Director,Biotech and Agri-Food Department 1998-2000 and Director ofTechnology 2000, the French Ministry for Education. Director General,National Centre for Scientific Research (CNRS), France 2000-2003.
The Rt Hon The Lord Brittan of Spennithorne QC, DL7
Nationality: British. Aged 68. Appointed 2000. Vice-Chairman, UBS Investment Bank and Chairman, UBS Limited. Director, UBSSecurities Company Limited. Member, International AdvisoryCommittee of Total. Member, European Commission and Vice-President 1989-1999. Member, UK Government 1979-1986. HomeSecretary 1983-1985 and Secretary of State for Trade and Industry1985-1986.
Professor Wim Dik8
Nationality: Dutch. Aged 69. Appointed 2001. Professor at DelftUniversity of Technology. Chairman, Supervisory Boards of Tele AtlasN.V., Zesko Holding B.V. and Chairman, Advisory Board of SpencerStuart Netherlands. Non-Executive Director, Aviva plc, LogicaCMG plcand Stage Entertainment B.V. Chairman and CEO, Koninklijke PTTNederland (KPN) 1988-1998 and Koninklijke KPN N.V. (Royal DutchTelecom) 1998-2000. Minister for Foreign Trade, Netherlands1981-1982.
Charles Golden8
Nationality: American. Aged 61. Appointed 2006. Executive Vice-President, Chief Financial Officer and Director, Eli Lilly and Company1996-2006. Non-Executive Director, Clarian Health Partners,Hillenbrand Industries, Inc. and Eaton Corporation. Member ofFinance Committee, Indianapolis Museum of Art.
Byron Grote8
Nationality: American/British. Aged 60. Appointed 2006. ChiefFinancial Officer, BP p.l.c.
Narayana Murthy6
Nationality: Indian. Aged 61. Appointed 2007. Chairman, AsiaBusiness Council, Indian Institute of Information Technology andInfosys Technologies Limited. Director, DBS Bank, DBS Group Holdings,Infosys Consulting, Inc., Infosys Technologies (China) CompanyLimited, New Delhi Television Ltd.
Hixonia Nyasulu6
Nationality: South African. Aged 53. Appointed 2007. Non-ExecutiveDirector, Barloworld Ltd, JP Morgan SA, Sasol Ltd and Tongaat-HulettGroup Ltd. Member, Banking Enquiry Panel, South AfricanCompetition Commission.
Kees Storm9
Nationality: Dutch. Aged 65. Appointed 2006. Chairman, ExecutiveBoard, AEGON N.V. 1993-2002. Chairman, Supervisory Board KLMRoyal Dutch Airlines N.V. Board member and Chairman of AuditCommittee, InBev S.A. Board member and Audit Committee member,Baxter International, Inc. Member, Supervisory Board, Pon HoldingsB.V. Member, Supervisory Board, AEGON N.V.
Jeroen van der Veer1,2
Nationality: Dutch. Aged 60. Appointed 2002. Chief Executive Royal Dutch Shell plc. Former Member, Supervisory Board of DeNederlandsche Bank N.V. 2000-2004.
1 Member Nomination Committee2 Member Remuneration Committee3 Chairman Nomination Committee4 Chairman Remuneration Committee5 Senior Independent Director
6 Member Corporate Responsibility and Reputation Committee7 Chairman Corporate Responsibility and Reputation Committee8 Member Audit Committee9 Chairman Audit Committee
Corporate governance Biographical details

Unilever Annual Report and Accounts 2007 47
Report of the Directors continued
Corporate governance Biographical details continued
Unilever Executive (UEx)*
Patrick CescauGroup Chief Executive(see previous details on page 46)
Vindi BangaPresident FoodsNationality: Indian. Aged 53. Appointed President Foods April 2005.Joined Unilever 1977. Previous posts include: Business Group PresidentHome and Personal Care, Asia 2004 in addition to Non-ExecutiveChairman, Hindustan Lever 2004-2005. Chairman and ManagingDirector, Hindustan Lever 2000-2004.
Kees van der GraafPresident Europe(see previous details on page 46)
Ralph KuglerPresident Home and Personal Care(see previous details on page 46)
James Lawrence**Chief Financial OfficerNationality: American. Aged 55. Appointed Chief Financial Officer1 September 2007. External appointments include: Non-ExecutiveDirector, British Airways Plc and Avnet, Inc. Previous posts include:various senior positions at General Mills, Inc. 1998-2007, includingVice Chairman 2006-2007, Executive Vice President-International2000-2006 and Chief Financial Officer 1998-2007, Executive VicePresident and CFO, Northwest Airlines 1996-1998, President andCEO, Pepsi-Cola International (Asia, Middle East, Africa) 1992-1996,and Chairman, LEK Partnership 1983-1992.
Harish ManwaniPresident Asia AfricaNationality: Indian. Aged 54. Appointed President Asia Africa April2005. Joined Unilever 1976. He is also Non-Executive Chairman,Hindustan Lever. Previous posts include: Business Group President,Home and Personal Care, North America 2004. Business GroupPresident, Home and Personal Care, Latin America 2001 and SeniorVice President, Hair Care and Oral Care 2000.
Sandy OggChief Human Resources OfficerNationality: American. Aged 54. Appointed Chief HR Officer April2005. Joined Unilever 2003. Previous posts include: SVP HumanResources, Foods 2003. Prior to joining Unilever he worked forMotorola as SVP, Leadership, Learning and Performance Management.
Michael PolkPresident AmericasNationality: American. Aged 47. Appointed March 2007. Externalappointments include: Director, Grocery Manufacturers of Americaand Food Products Association, GS1, Retail Industry LeadersAssociation, and Yellowstone National Park Foundation. Prior tojoining Unilever he was at Kraft Foods as President, Biscuits andSnacks Sector and President, Asia Pacific Region.
* UEx members are treated as executive officers and senior management for US purposes and key management personnel for IFRSpurposes. All members of the UEx have existing agreements with varying terms, however, all agreements include a notice periodof twelve months. Details of the remuneration paid and share awards are shown in aggregate in note 31 on page 120.
**James Lawrence will be proposed for election as an Executive Director at the 2008 AGMs.

Terms of ReferenceThe Nomination Committee comprises two Independent Non-Executive Directors and the Chairman. It is chaired by DavidSimon, Vice Chairman and Senior Independent Director. Its othermembers are Michael Treschow and Jeroen van der Veer. TheGroup Secretary acts as secretary to the Committee.
The Committee is responsible for drawing up selection criteria andappointment procedures for Directors. Under Unilever’s corporategovernance arrangements all Executive and Non-ExecutiveDirectors offer themselves for election each year at the AnnualGeneral Meetings, unless they are retiring. The NominationCommittee is responsible for recommending candidates fornomination as Executive Directors, including Group ChiefExecutive, and Non-Executive Directors each year. The Committeedoes so on the basis of an evaluation of the Boards, itsCommittees and its individual members. The Committeeperiodically assesses the size and the composition of the Board,and makes proposals for the composition profile of the Board.
After Directors have been appointed by shareholders theCommittee recommends to the Board candidates for election asChairman and Vice-Chairman.
In addition to its responsibility for succession planning within andto the Board, under its Terms of Reference the Committee hasresponsibility for supervising the policy of the Group ChiefExecutive on the selection criteria and appointment proceduresfor senior management.
The Committee keeps oversight of all matters relating tocorporate governance and brings any issues to the attention ofthe Boards. The Committee’s full Terms of Reference and theinformation used by it for succession planning are available onour website www.unilever.com/investorcentre/corpgovernance
Process for the appointment of DirectorsUnilever has formal procedures for evaluation of the Boards, theBoard Committees and the individual Directors. The results of theevaluations are provided to the Committee when it discusses thenominations for election as Directors. All Directors offerthemselves for re-election every year, unless they are retiring.
Where a vacancy arises on the Boards, the Committee seeks theservices of specialist recruitment firms and other external expertsto assist in finding individuals with the appropriate skills andexpertise.
In nominating Directors to the Boards, the Committee follows theagreed Board Profile of potential Non-Executive Directors, whichtakes into account the roles of Non-Executive Directors set out inthe Dutch Corporate Governance Code and the UK CombinedCode on Corporate Governance. Under the terms of theGovernance of Unilever the Boards should comprise a majority ofNon-Executive Directors and the Profile provides that three ofthese have strong financial experience, and staff the AuditCommittee. To represent Unilever’s areas of interest, the Profilealso indicates there should be a strong representation fromDeveloping and Emerging markets as well as from Europe andNorth America. Non-Executives should be independent of Unileverand free from any conflicts of interest.
The Profile looks at diversity in terms of nationality, race, genderand relevant expertise and directs that, wherever possible, theBoards should reflect Unilever’s consumer base. For more detailssee www.unilever.com/investorcentre/corpgovernance
Activities of the Committee during the yearThe Committee met six times in 2007. David Simon and Jeroenvan der Veer attended all meetings. The other Committeemembers attended all meetings that they were eligible to attend,except Jean-Cyril Spinetta who attended three out of fourmeetings he was eligible to attend.
The Committee proposed the nomination of all Directors offeringthemselves for re-election at the 2007 AGMs. In 2007, theCommittee also proposed the nomination of the new Chairman,and three new Non-Executive Directors. These were MichaelTreschow, Genevieve Berger, Narayana Murthy and HixoniaNyasulu respectively.
Michael Treschow is the first person from outside Unilever to holdthe office of Chairman and, following the restructuring of theBoards in recent years, is the first independent, Non-ExecutiveChairman. Michael has been a member of the NominationCommittee since June 2007.
The three new Non-Executive Directors appointed in 2007 werechosen specifically to strengthen the Boards’ knowledge in IT andscience as well as to increase representation from the D&Emarkets and enhance diversity of both background and expertise.All three Non-Executive Directors are members of the CorporateResponsibility and Reputation Committee.
In 2007 an outside executive search firm was engaged to identifycandidates for the role of Chief Financial Officer, following theretirement of Rudy Markham at the 2007 AGMs. Jim Lawrencewas chosen by the Boards, through the selection process, tobecome Chief Financial Officer with effect from 1 September2007, and he will be nominated for election as an ExecutiveDirector at the 2008 AGMs.
Following the appointment of an outside consultant to supportthe 2006 evaluation process, an internal review was undertakenduring 2007 in relation to the evaluation of the Boards, theChairman, the individual Directors and the Board Committeesbased on the completion of a questionnaire.
The Committee discussed general matters of succession planningand talent management with the Group Chief Executive. TheCommittee reviewed and agreed new the terms of appointmentof Non-Executive Directors in line with best practice.
Changes to compositionAntony Burgmans left the Committee when stepping down asChairman in May 2007 and Jean-Cyril Spinetta stepped downwhen he resigned as a Director in September 2007. MichaelTreschow was appointed to the Committee on 27 June 2007. Atall times, the majority of the Nomination Committee consisted ofindependent Non-Executive Directors.
The Board evaluated the performance of the Committee and theCommittee carried out a self assessment of its performance.
David Simon Chairman of the Nomination CommitteeMichael TreschowJeroen van der Veer
Report of the Nomination Committee
48 Unilever Annual Report and Accounts 2007
Report of the Directors continued

Unilever Annual Report and Accounts 2007 49
Report of the Directors continued
Report of the Remuneration Committee
During 2007, the Committee continued to progress on the fivestrategic principles that serve as the platform for Unilever'sapproach to remuneration for the Unilever Executive. Theseprinciples not only pertain to our Executive Directors but to allUnilever's leadership levels. They provide the basis for ourremuneration structure as explained in greater detail in thefollowing pages, and direct that pay should be:
• aligned with shareholders' interests;• robustly linked to performance;• aligned with strategic priorities;• market competitive; and• easy to understand and communicate.
The overriding objective is to ensure that Unilever recruits andretains the best performers, and effectively incentivises them toachieve superior results. It is also our aim to manage the differingelements of total remuneration in a fully integrated manner.
During 2007 these five principles provided the foundation forimportant changes to the level and structure of Unilever’sincentive plans. At our 2007 AGMs, shareholders approved theintroduction of a new share-based incentive plan whichappropriately aligned our programme with our peer companymarket. The Committee also increased the annual incentiveopportunity for Executive Directors while leaving base salary levelsunchanged. Together, these changes have placed a greateremphasis on performance-based rewards relative to fixed pay, andplay a critical role in driving improved business results.
During the second half of 2007, Jim Lawrence was appointed asChief Financial Officer of Unilever. Jim Lawrence’s election to theBoards is subject to shareholders’ approval at the AGMs in May2008. However, in the interests of transparency and goodgovernance, a summary of his remuneration arrangements hasbeen included in this year’s report.
The year 2007 marked a continuation of the Group’s momentumof improved performance. The focus on growth priorities,together with stronger innovation, improved speed to market andbetter in-market execution, has delivered consistent, and webelieve sustainable, growth. Underlying operating margins haveimproved and a strong start was made in implementing anacceleration to the implementation of the One Unileverreorganisation programme.
Based on the performance over 2007 the annual incentive awardswere on average 128% of base salary across the UnileverExecutive team. A Global Performance Share Plan (GPSP) long-term incentive award will vest in 2008 for 121% based on theperformance period 2005 – 2007. The minimum vesting level forthe performance period 2005 – 2007 was in 2005 set at 2% perannum average underlying sales growth (USG) and €12.2 billionungeared free cash flow (UFCF), whereas up to 200% could vestfor USG exceeding 4% per annum and with UFCF more than€13.2 billion. Targets were set before the disposal of EuropeanFrozen Foods and before the disposal of UCI. The targets havebeen adjusted by the impacts of these disposals. A totalshareholder return (TSR) long-term incentive award will also vestin 2008. The vesting was 50% for the performance period 2005to 2007. Unilever ranked 8th within the comparator group ofpeer companies (see page 51).
Over the three years to December 2007 Unilever has created morethan €20 billion of shareholder value. Looking forward to 2008,we expect the Group leadership to deliver improvement againstour longer-term objectives and, as a result, our shareholders andour executives will be duly rewarded.
In September 2007, Jean-Cyril Spinetta stepped down as a Non-Executive Director for personal reasons. We would like to take thisopportunity to thank Jean-Cyril for his contributions to Unileverand our Committee. His wise counsel and experience have beenmost helpful. We wish him all the best for the future. We arecurrently working to replace Jean-Cyril with a new recruit for ourCommittee during 2008.
Michael Treschow was also appointed a member of ourCommittee on 6 February 2008.
David Simon Chairman of the Remuneration CommitteeJeroen van der Veer
Definition of auditable part of the Report of the Remuneration CommitteeIn compliance with the UK Directors’ Remuneration Report Regulation 2002, and under Title 9, Book 2 of the Civil Code in theNetherlands, the auditable part of the report of the Remuneration Committee comprises the ’Aggregate remuneration for ExecutiveDirectors’ on page 53, the ’Remuneration for individual Executive Directors’ on page 53, the ‘Executive Directors’ Global Share IncentivePlan and the ‘Executive Directors’ Global Performance Share Plan’ on page 54, the ’Executive Directors’ conditional share awards underthe TSR Long-Term Incentive Plan’ on page 55, the ‘Executive Directors’ Share Matching Plan’ on page 55, ’Executive Directors’ shareoptions’ on page 56, ’Executive Directors’ pensions’ on page 57, ’Executive Directors’ interests – share capital’ on page 58,‘Non-Executive Directors’ remuneration’ on page 59 and ‘Non-Executive Directors’ interests – share capital’ on page 60.

50 Unilever Annual Report and Accounts 2007
Report of the Directors continued
Remuneration policy
Unilever reward policy table 2007
Element Payment vehicle Value determination Plan objectives/Key drivers
FIXED
Base salary Cash Market median Attraction and retention of high performingexecutives
Pension Cash Directors stay in their home country pension fund Attraction and retention of high performing or an alternative of similar value executivesBonus not pensionable
VARIABLE Indicative levels at face value as % of base pay
Annual incentive Cash (75%) Executive Directors: target 87% (range 0% – 150%) Delivery of trading contribution (Unilever’s Group Chief Executive: target 113% primary internal measure of economic value
Shares (25%) (range of 0% – 200%) added – see page 51) and top-line growth targets
Individual responsibility for key Unilever business objectives
Global Share Shares Grant level for Executive Directors: up to 120% Shareholder return at upper half of peer groupIncentive Plan in 2007 (from 2008 onwards up to 180% (see page 51)
is allowable)Top-line revenue growth as essential to Unilever’s
Grant level for Group Chief Executive: up to 135% long-term value creation(from 2008 onwards up to 200% is allowable)
Ungeared Free Cash Flow as the basic driver of In exceptional circumstances the committee may Unilever’s shareholder returnsexceed the limits
Vesting level: 0% – 200% of grant
Share Matching Shares 25% of annual incentive is paid in shares, Alignment with shareholders’ interestsPlan these shares are matched one for one
A significant proportion of the Executive Directors’ total reward is linked to a number of key measures of Group performance to create alignment with strategy, business priorities, andshareholder value.
The total remuneration package for Executive Directors isintended to be competitive in a global market, with a strongemphasis on performance related pay.
Internal and external comparisons are made with the rewardarrangements for other senior executives within Unilever tosupport consistent application of Unilever’s executive rewardpolicies.
In setting targets for the performance measures, the Committee is guided by what would be required to deliver top thirdshareholder value. This is reflected in both the short-term and long-term performance targets.
Report of the Remuneration Committee continued

Unilever Annual Report and Accounts 2007 51
Report of the Directors continued
Report of the Remuneration Committee continued
Base salaryThe Remuneration Committee reviews base salary levels annually,taking into account external benchmarks within the context ofGroup and individual performance.
The Committee decided not to increase the salaries in 2007 inorder to place more emphasis on performance related pay andless on fixed pay.
Annual incentiveThe annual incentive plan rewards Executive Directors for thedelivery of trading contribution (Unilever’s primary internalmeasure of economic value added) and top-line growth targets,as well as for their individual contribution to Unilever’s businessstrategy.
In 2007 the Remuneration Committee reviewed annual incentivelevels in light of the strategic remuneration principles. Given thedesire to enhance the focus on performance-linked pay and toensure arrangements are market competitive, the Committeedecided to increase annual incentive opportunities. In 2007 theopportunity for Executive Directors was increased to a maximumof 150% of base salary and for the Group Chief Executive up to200%. Up to 120% of salary will be based on Unilever’s businessresults targets (133.3% for Group Chief Executive) and amaximum of 30% of salary will be based on individual businesstargets (66.7% for Group Chief Executive). The target levels arearound 60% of maximum. Aggressive business targets mean thatmaximum levels are only payable for exceptional performance.
The performance criteria for the annual incentive are:
• trading contribution: Unilever’s primary internal measure ofeconomic value added. It is calculated from Trading Result aftera deduction for tax and a charge for asset use. (Trading result is the internal management measure of profit that is the mostconsistent with operating profit). Increases in tradingcontribution reflect the combined impact of top-line growth,margin improvement and capital efficiency gains. It is wellaligned with our objective of a progressive improvement inreturn on invested capital and with shareholder value creation;
• underlying sales growth: focus on the organic growth ofUnilever’s turnover; and
• individual business and leadership targets: tailored to eachindividual’s responsibilities to deliver certain business objectivessupporting the strategy. Individual contribution is assessedagainst robustly set measures and targets to ensure bothobjectivity and ‘stretch’.
Achievement of targets is measured at the end of the year andthe payment takes place the following March. 25% of the annualincentive is delivered to the Executive Directors in the form ofshares in NV and PLC, which are matched by a conditional awardof ‘matching shares’, as further described under the section onlong-term incentives below.
Long-term incentivesAt the 2007 AGM’s, shareholders approved the new UnileverGlobal Share Incentive Plan (GSIP) for employees and ExecutiveDirectors.
The new plan supports the Committee’s strategic remunerationprinciples for executives. The number of shares vesting is linked toimprovements in Unilever’s performance over a three-year period.The plan integrates and replaces two previous long-term plans,the Global Performance Share Plan and TSR Long-Term IncentivePlan, making Unilever’s long-term arrangements simpler andeasier to understand.
The long-term incentive for Executive Directors now consists of two elements, both of which are delivered in shares:
• Global Share Incentive Plan; and• Share Matching Plan (linked to annual incentive).
Executive Directors are required to demonstrate a significantpersonal shareholding commitment to Unilever. Within five yearsof appointment, they are expected to hold shares worth 150% of their annual base salary. This reinforces the link between theexecutives and other shareholders.
Global Share Incentive Plan (GSIP)Under the GSIP, annual awards of shares in NV and PLC aregranted to Executive Directors. The actual number of sharesreceived at vesting after three years depends on the satisfactionof performance conditions.
For the 2007 awards, the vesting of shares is conditional on theachievement of three distinct performance conditions over theperformance period. The performance period is the three-yearperiod which began on 1 January 2007 and ends on 31 December 2009.
The vesting of 40% of the shares in the award is based on acondition measuring Unilever’s relative total shareholder return(TSR) against a comparator group of 20 other companies overthat three-year period. TSR measures the return received by ashareholder, capturing both the increase in share price and thevalue of dividend income (assuming dividends are reinvested). TheTSR results are compared on a single reference currency basis. Noshares (in the portion of the award subject to TSR) will vest ifUnilever is ranked below position 11 of the TSR ranking table overthe three-year period. 50% of the shares will vest if Unilever isranked 11th among the peer group, 100% if ranked 7th, and200% will vest if Unilever is ranked 3rd or above in the table.Straight-line vesting will occur between these points.
The TSR peer group is as follows:
Avon KraftBeiersdorf LionCadbury Schweppes L’OréalClorox NestléCoca-Cola OrklaColgate PepsiCoDanone Procter & GambleHeinz Reckitt BenckiserKao Sara LeeKimberly-Clark Shiseido

52 Unilever Annual Report and Accounts 2007
Report of the Directors continued
The vesting of a further 30% of the shares in the award isconditional on achieving an underlying sales growth target.
The vesting of the final 30% of the shares in the award isconditional on achieving an ungeared free cash flow target whichis the basic driver of the returns that Unilever is able to generatefor shareholders.
Vesting of the business performance-focused parts of an awarddepends on meeting challenging objectives. There will be novesting if performance is below the minimum of the range, 25%vesting for achieving minimum, and 200% vesting only at orsubstantially above the top end of the range.
Performance for each condition will be assessed independentlyfrom the other conditions over the performance period. Shareswill only vest if and to the extent that the respective performanceconditions are satisfied. There will be no re-testing.
Target and actual performance levels will be shown in theRemuneration Report detailing the number of awards that haveactually vested.
Share Matching Plan (linked to the annual incentive)The Share Matching Plan enhances the alignment withshareholders’ interests and supports the retention of keyexecutives. In addition, the necessity to hold the shares for a minimum period of three years supports the shareholdingrequirements.
The Executive Directors receive 25% of their annual incentive in the form of NV and PLC shares. These are matched with anequivalent number of matching shares. The matching shares willvest after three years provided that the underlying shares havebeen retained during this period and the Executive Director hasnot resigned or been dismissed.
The Remuneration Committee considers that there is no need forfurther performance conditions on the vesting of the matchingshares because the number of shares is directly linked to theannual incentive (which is itself subject to demandingperformance conditions). In addition, during the three-yearvesting period the share price of NV and PLC will be influenced bythe performance of Unilever. This, in turn, will affect the ultimatevalue of the matching shares on vesting.
Executive Directors’ pensionsThe policy beginning in 2007 is that new Executive Directors willbe members of the all-employee pension arrangement in theirhome country (or an alternative of similar value) and will payemployee contributions at the same rate as other employees inthat arrangement.
Executive Directors appointed prior to 2007 have a definedbenefit pension of two-thirds of final salary, payable at retirementfrom age 60. Annual incentive is not pensionable except forExecutive Directors appointed prior to the change of policy in2005 (Patrick Cescau, Kees van der Graaf and Rudy Markham
who retired in 2007) for whom annual incentive is pensionable upto a maximum of 20% of base salary.
Other benefits and allowancesExecutive Directors enjoy similar benefits to those enjoyed bymany other employees of Unilever.
Serving as non-executive on the Board of another companySome of the Executive Directors serve as a non-executive on theBoard of another company. In 2007 Unilever required that allremuneration and fees earned from outside directorships are paiddirectly to Unilever.
This policy has been amended in 2008 (see Outside appointmentson page 36).
Arrangements for Jim LawrenceJim Lawrence joined Unilever in September 2007 as ChiefFinancial Officer. He will be proposed for election to the Boards ofNV and PLC at the AGMs in May 2008. Given Unilever’s objectiveof balancing remuneration more clearly towards performancelinked variable pay the agreed package follows this policydirection. His salary in 2007 was set at US $1 100 000 perannum; the maximum annual incentive in 2007 was 150% ofsalary and the grant under the GSIP in 2007 was 49 962 each ofNV shares and PLC shares. He will be in a pension plan similar tothat of Unilever in the USA, which is a defined contribution plan.
To compensate for the forfeiture of incentives from his formeremployer, a cash allowance was paid on appointment of US $1 million (with a pro rata claw back over 3 years) andrestricted shares of 35 565 each of NV and PLC were granted (ataward value US $2.5 million). These will vest one-third after oneyear of service, one-third after two years of service and one-thirdafter 3 years of service.
Jim Lawrence has purchased 295 508 NV shares and 240 000 PLCADRs.
Future developmentsThe Remuneration Committee continues to monitor trends andchanges in the market. It keeps a watching brief on thecontinuing alignment between Unilever’s strategic objectives andthe reward policy for Executive Directors.
From 1 January 2008, the UK all-employee pension plan benefitfor new hires changed from final salary to a combination ofcareer average earnings (up to a limit of £38 000) and definedcontribution above the limit. Existing employees are being giventhe option to move to the new plan or to remain in the previousplan (subject to certain changes including paying higher individualcontributions). The latter impacts the UK-based ExecutiveDirectors Patrick Cescau and Ralph Kugler.
The performance range for the GSIP (Global Share Incentive Plan) 2008 award (performance period 2008 - 2010) will be 4% - 6.4% per annum in respect of average underlying salesgrowth and €10.5 billion - €15.5 billion for cumulative ungearedfree cash flow.
Report of the Remuneration Committee continued

Unilever Annual Report and Accounts 2007 53
Report of the Directors continued
Report of the Remuneration Committee continued
Remuneration information for 2007The following section contains detailed information and commentary on the Executive Directors’ annual remuneration, long-termincentives, pension benefits and share interests in respect of 2007.
Aggregate remuneration for Executive DirectorsThe following table gives details of the aggregate remuneration (including value of the vesting of matching shares and exercise ofoptions) as a group.
2007 2006€ ’000 € ’000
Annual emoluments
Base salary 3 491 4 061Allowances and other payments 221 913Benefits 82 111Performance-related payments (annual incentive) 4 865 2 409
Sub-total of annual emoluments 8 659 7 494Other income arising from vesting/exercise of long-term incentives(a)
Gains on exercise of share options 50 427Vesting of matching shares 230 566Vesting of awards under TSR Long-Term Incentive Plan – –
Total of annual emoluments and other income arising from long-term incentives 8 939 8 487
(a) Includes the gains realised in 2007 following the exercise of share options granted in earlier years and the value of matching shares vestedin 2007.
Comments on base salaryIn 2007, base salary levels were benchmarked against those paid in other major global companies based in Europe, excludingcompanies in the financial sector. The Committee decided not to increase base salaries for 2007 and to place greater emphasis onperformance-based pay.
Comments on annual incentiveThe annual incentive awards for 2007 were subject to achievement of underlying sales growth and trading contribution targets incombination with individual key strategic business targets. The Committee measured the results against the targets set and determinedthe annual incentive amounts for 2007.
Remuneration for individual Executive DirectorsThe following table gives details of the remuneration received in 2007 (including the value of vested share match and optionsexercised) by each Executive Director individually.
Other income arising fromlong-term incentives and
Annual Emoluments 2007 exercise of options in 2007
Allowances Grand GrandBase and other Value of Total Total Option Share total total
salary payments(a) benefits(b) Bonus(c) 2007 2006 gains match TSR/LTIP 2007 2006Name and Base Country € ’000 € ’000 € ’000 € ’000 € ’000 € ’000 € ’000 € ’000 € ’000 € ’000 € ’000
Patrick Cescau (UK)(d) 1 426 129 47 2 346 3 948 2 727 50 63 – 4 061 2 940
Kees van der Graaf (NL) 798 27 9 988 1 822 1 202 – 60 – 1 882 1 287
Ralph Kugler (UK) 861 56 11 1 033 1 961 1 313 – 53 – 2 014 1 414
Rudy Markham (UK)(e) 406 9 15 498 928 1 517 – 54 – 982 2 111
(a) Includes: allowance in lieu of company car; blind trust fees compensation; compensation for loss of net income because part of the salarywas paid in the Netherlands; entertaining allowance and employers’ cost for the all-employee savings plan in the Netherlands. Allallowances are taxable in the country of residence apart from the entertaining allowance which is currently tax free in the Netherlands.
(b) Includes: benefits for company car; housing (for business use) instead of hotel; medical insurance and private use of chauffeur driven cars.Included are benefits that are taxable in the country of residence. In addition, Unilever provides support to Executive Directors in relation tospouse’s travel expenses when travelling together on company business. This amount is capped at 5% of base salary and for 2007 totalled€168 559 (including related taxes payable).
(c) Bonus of the year 2007. Includes: the value of both the cash element and the element paid in shares of NV and PLC. In addition to theelement of the bonus paid in shares each Executive Director is awarded, on a conditional basis, an equivalent number of matching shares.
(d) Group Chief Executive.(e) Rudy Markham stepped down as a Director at the May 2007 AGMs. He retired from Unilever at 31 October 2007. In the table above are
the emoluments for the period January – May 2007. His emoluments for the period June – October were in total: €1 140 000.Figures have been translated into euros using the following exchange rate: €1 = £0.6822 (2006: €1 = £0.6818).

54 Unilever Annual Report and Accounts 2007
Report of the Directors continued
Comments on long-term incentive arrangements• Global Share Incentive Plan
The first award was made in 2007 with a performance period 1 January 2007 to 31 December 2009. Vesting will be in May 2010 (three years after award)
• Global Performance Share PlanThe performance period for the first awards made under the plan ended on 31 December 2007. Vesting will be in May 2008 (threeyears after award).
• TSR PlanIn 2007 the conditional shares awarded in 2004 lapsed. Vesting was based on the TSR performance of Unilever (when ranked againstits defined peer group with competitors) over the three-year performance period which ended 31 December 2006. For this period,Unilever ranked 13th in its peer group and therefore no vesting occurred for this award and the shares lapsed in March 2007.
• Share Matching PlanIn 2007 the matching shares originally granted in 2004 on a conditional basis vested, subject to fulfilment of the retentionconditions.
• Executive Share OptionsThe grants of executive share options made in 2004 became exercisable as from 2007. As the 2004 grant was based on Unilever’sEPS performance, the options at vesting were subject to no further conditions.
Executive Directors’ Global Share Incentive PlanThe Global Share Incentive Plan was approved by shareholders at the 2007 AGMs.
The following conditional shares were granted during 2007 and outstanding at 31 December 2007 under the Global Share Incentive Plan:
Balance ofConditional grant made 22 May 2007 conditional shares at
(Performance period 1 January 2007 to 31 December 2009)(a) 31 December 2007
Share type No. of shares(a) Price at award No. of shares
Patrick Cescau NV 40 505 €22.20 40 505PLC 40 505 1 582.00p 40 505
Kees van der Graaf NV 20 550 €22.20 20 550PLC 20 550 1 582.00p 20 550
Ralph Kugler NV 22 145 €22.20 22 145PLC 22 145 1 582.00p 22 145
Rudy Markham(b) NV – –PLC – –
(a) Each award of performance shares is conditional and vests subject to certain conditions three years after the date of the award.(b) Was not awarded under this new Scheme as he stepped down as a Director at the May 2007 AGMs.
Executive Directors’ Global Performance Share PlanThe following conditional shares were outstanding from grants made in 2005 and 2006.
No new awards from 2007 onwards will be made under this Plan as a new plan was approved by shareholders at the 2007 AGMs andas from 2007 LTI awards will be made only under the new plan.
Balance of Balance ofconditional shares at conditional shares at
1 January 2007 31 December 2007
Share type No. of shares(a) No. of shares(a)
Patrick Cescau NV 18 000 18 000PLC 18 000 18 000
Kees van der Graaf NV 12 000 12 000PLC 12 150 12 150
Ralph Kugler NV 12 000 12 000PLC 12 150 12 150
Rudy Markham NV 12 000 12 000(b)
PLC 12 150 12 150(b)
(a) Each award of performance shares is conditional and vests subject to performance conditions three years after the date of the award. (b) Balance is at May 2007 when he stepped down as an Executive Director.
Report of the Remuneration Committee continued

Unilever Annual Report and Accounts 2007 55
Report of the Directors continued
Report of the Remuneration Committee continued
Executive Directors’ conditional share awards under the TSR Long-Term Incentive PlanThe following conditional shares were outstanding from grants made in 2004 to 2006.
From 2007 onwards no new awards will be made under this Plan as a new plan was approved by shareholders at the 2007 AGMs.From 2007 LTI awards will be made only under the new plan.
Balance of Balance ofconditional Conditional awards conditional
shares lapsed 24 March 2007 shares atat 1 January (Performance period 31 December
2007 2004 to 2006)(a) 2007
OriginalShare No. of No. of price at No. oftype shares shares award shares
Patrick Cescau NV 58 476 (13 863) €18.03 44 613PLC 60 449 (14 391) 1 154.00p 46 058
Kees van der Graaf NV 36 201 (8 319) €18.03 27 882PLC 37 422 (8 634) 1 154.00p 28 788
Ralph Kugler NV 36 201 (8 319) €18.03 27 882PLC 37 422 (8 634) 1 154.00p 28 788
Rudy Markham NV 41 745 (13 863) €18.03 27 882(b)
PLC 43 179 (14 391) 1 154.00p 28 788(b)
(a) The conditional awards made in 2004 lapsed in 2007, based on the TSR performance of Unilever over the three-year performance periodending 31 December 2006. For this period, Unilever ranked 13th in its peer group and therefore no vesting occurred for this award.
(b) Balance is at May 2007 when he stepped down as an Executive Director.
Executive Directors’ Share Matching PlanThe following conditional shares were outstanding, awarded or vested during 2007 under the share matching plan:
Balance of Balance ofconditional conditional
shares shares atat 1 January Conditional shares 31 December
2007 awarded in 2007(a) Shares vested on 24 March 2007(b) 2007
Market OriginalShare No. of No. of Price at No. of price price No. oftype shares shares award shares at vesting at award shares
Patrick Cescau NV 8 778 6 627 €21.33 (1 413) €21.66 €18.03 13 992PLC 8 992 6 627 1 488.00p (1 469) 1 505.11p 1 154.00p 14 150
Kees van der Graaf NV 4 266 2 121(c) €21.33 (1 341) €21.66 €18.03 2 925PLC 4 394 2 121(c) 1 488.00p (1 392) 1 505.11p 1 154.00p 3 002
Ralph Kugler NV 3 831 2 402 €21.33 (1 191) €21.66 €18.03 5 042PLC 3 936 2 402 1 488.00p (1 238) 1 505.11p 1 154.00p 5 100
Rudy Markham NV 4 932 2 830 €21.33 (1 209) €21.66 €18.03 6 553(d)
PLC 5 071 2 830 1 488.00p (1 257) 1 505.11p 1 154.00p 6 644(d)
(a) Each award of matching shares is conditional and vests three years after the date of the award subject to certain conditions. The 2007award was made at grant date 21 March 2007.
(b) The conditional shares awarded on 24 March 2004 (relating to the 2003 performance period) vested on 24 March 2007.(c) Kees van der Graaf (based in the Netherlands) was granted a conditional right to receive at the vesting date a cash amount equal to the
value on that date of 2 121 NV shares and 2 121 PLC shares.(d) Balance is at May 2007 when he stepped down as an Executive Director.
2005 2006 2007
7
14
21
Unilever’s position relative to the TSR reference group
The reference group, including Unilever, consists of 21 companies. Unilever’s position isbased on TSR over a three-year rolling period.

56 Unilever Annual Report and Accounts 2007
Report of the Directors continued
Executive Directors’ share optionsOptions to acquire NV ordinary shares of €0.16 each and options to acquire PLC ordinary shares of 31⁄ 9p each were outstanding, wereexercised or lapsed during 2007. No option awards were made in 2007.
Options outstanding Options outstandingbelow market price above market price
at 31 December 2007 at 31 December 2007Number
Balance of of options Balance of Weighted Weightedoptions at exercised/ options at average average First Final
Share 1 January lapsed 31 December Number exercise Number exercise exercisable expirytype 2007 in 2007 2007 of options price of options price date date
Patrick CescauExecutive Plan NV 269 166 (27 000)(a) 242 166 242 166 €19.50 – – 24/03/02 08/11/15Executive Plan PLC 272 967 (27 000)(b) 245 967 245 967 1 175p – – 24/03/02 08/11/15NL All-Employee Plan NV 750 (150)(c) 600 600 €17.53 – – 02/06/03 17/05/11UK ShareSave Plan PLC 1 374 – 1 374 1 374 1 171p – – 01/10/11 31/03/12
Kees van der GraafExecutive Plan NV 135 450 – 135 450 135 450 €19.70 – – 24/03/02 08/11/15Executive Plan PLC 135 450 – 135 450 135 450 1 203p – – 24/03/02 08/11/15NL All-Employee Plan NV 750 (150)(d) 600 600 €17.53 – – 02/06/03 17/05/11UK ShareSave Plan PLC 1 374 – 1 374 1 374 1 202p – – 01/10/10 31/03/11
Ralph KuglerExecutive Plan NV 176 625 – 176 625 176 625 €19.41 – – 24/03/02 20/03/15Executive Plan PLC 176 625 – 176 625 176 625 1 163p – – 24/03/02 20/03/15NL All-Employee Plan NV 300 – 300 300 €17.59 – – 18/05/05 17/05/11UK ShareSave Plan PLC 1 374 – 1 374 1 374 1 202p – – 01/10/10 31/03/11
Rudy MarkhamExecutive Plan NV 237 150 – 237 150(e) 237 150 €19.67 – – 24/03/02 31/10/09Executive Plan PLC 237 150 – 237 150(e) 237 150 1 212p – – 24/03/02 31/10/09NL All-Employee Plan NV 750 (150)(d) 600(e) 600 €17.53 – – 02/06/03 17/05/11UK ShareSave Plan PLC 1 373 – 1 373(e) 1 373 1 190p – – 01/11/07 30/04/08
(a) Options in respect of 27 000 shares exercised on 1 November 2007 at a market value of €23.24. The options would have expired 7 November 2007 if not exercised before. The options had originally been granted on 8 May 1998 at a price (after taking into account theshare split in May 2006) of €23.10.
(b) Options in respect of 5 355 shares exercised on 8 May 2007 at a market price of 1 658p. Further options in respect of 21 645 sharesexercised on 26 September 2007 at a market price of 1 585p. The options would have expired 7 November 2007 if not exercised before.The options had originally been granted on 8 May 1998 at a price (after taking into account the share consolidation in May 2006) of1 483p.
(c) Options lapsed without value on 12 June 2007.(d) Options exercised on 8 May 2007 at a market value of €23.75. The options had originally been granted on 12 June 2002 at a price (after
taking into account the share split in May 2006) of €22.63.(e) Balances are at May 2007 when he stepped down as a Director. On 2 November 2007, 33 750 options each of NV and PLC were exercised
at €23.64 and 1 725p respectively. The original grant prices were €23.10 and 1 483p. On 27 December 2007, a further 96 750 NV and 164 250 PLC options were exercised at €25.32 and 1 902p. The original grant prices were on average €17.21 and 1 158p.
The term ‘Executive Plan’ refers to options granted under the PLC or NV Executive Option Plans.
The closing market prices of ordinary shares at 31 December 2007 were €25.15 (NV shares) and 1 890p (PLC shares). During 2007 the highestmarket prices were €25.72 and 1 924p respectively, and the lowest market prices were €18.89 and 1 320p respectively.
Report of the Remuneration Committee continued

Unilever Annual Report and Accounts 2007 57
Report of the Directors continued
Report of the Remuneration Committee continued
Comments on pensionsThe Netherlands all-employee pension plan benefit basis was changed from final salary to career average earnings at 31 December2006. This had a small impact on the accrued pension of the Netherlands-based Executive Director.
During 2007, individual contributions paid by Executive Directors in the UK were paid through a salary sacrifice arrangement.
Executive Directors’ pensions(a)
Pension values for the year ended 31 December 2007 are set out below.Movement
Movement in Transfer in transfer Transferaccrued value of value during Individual value of
Accrued pension Accrued accrued 2007 (less contributions accruedpension at during pension at pension at individual made during pension at
Age at 31/12/06(b) 2007(c) 31/12/07(b) 31/12/06(d) contributions)(e) 2007(f) 31/12/07(d)
Name and base country 31/12/07 €’000 pa €’000 pa €’000 pa €’000 €’000 €’000 €’000
Patrick Cescau (UK) 59 1 000 29 1 029 18 662 1 951 4 20 617
Kees van der Graaf (g) (NL) 57 602 37 639 8 098 868 9 8 975
Ralph Kugler (UK) 51 441 (23) 418 6 283 219 – 6 502
Rudy Markham(h) (UK) 61 793 (68) 725 15 909 (1 928) – 13 981
(a) Figures have been translated into euros where necessary using the following exchange rates: 31 December 2007 €1.00 = £0.7342; 31 December 2006 €1.00 = £0.6712; Average for the year ended 31 December 2007 €1.00 = £0.6822.
(b) Based on the Executive Directors’ current pension letters and calculated on a deferred basis using the Executive Directors’ service to 31 December 2006 and 31 December 2007 respectively on the basis that the Executive Directors remain in service until at least age 60 and that the pension payment commences at that time. It includes all pensions provided from Unilever pension plans. In the event that an Executive Director leaves service prior to age 60 and the payment of pension commences earlier than age 60, the pension payable would be on a reduced basis.
(c) Includes the effect of inflation on the accrued pension at 31 December 2006.(d) For the Netherlands-based Executive Director the arrangement is calculated on the basis used by the Unilever Netherlands pension plan
(‘Progress’), as prescribed by the Netherlands Ministry of Social Affairs and Employment. These prescriptions changed on 1 January 2008 asillustrated in footnote (g). For the UK-based Executive Directors’ the arrangement is calculated on the market related basis used by UnileverUnited Kingdom pension plan (UUKPF), in line with the GN11 guidance note published by the Board for Actuarial Standards in the UnitedKingdom.
(e) The movement in transfer value during 2007 of market changes for the UK based Executive Directors together with additional service andthe Executive Directors being one year closer to retirement and exchange rate movements (for pensions denominated in currency other thaneuros). There have been no salary increases in 2007.
(f) Consistent with employees in the current Netherlands pension plan, the rate of individual contributions paid by Kees van der Graaf is 0.5%of pensionable salary between €11 872 and €56 990 and 1% on balance. Consistent with employees in the United Kingdom pension plan,Ralph Kugler’s and Rudy Markham’s contributions are paid through salary sacrifice and at a rate of 5% of pensionable salary (above the UKLower Earnings Limit), and as such no individual contributions are shown above. Patrick Cescau’s contributions on the part of his salary paidin the Netherlands are paid based on the basis of the old Unilever Netherlands pension plan, at 1% above €56 990, and on the part of hissalary paid in the UK are consistent with employees in the Unilever United Kingdom pension plan.
(g) The increase in accrued pension and transfer value during 2007 includes the effect of revaluation on the accrued pension in the UnileverNetherlands pension plan at January 2008. The basis for calculation of the transfer value in the Netherlands as prescribed by theNetherlands Ministry of Social Affairs and Employment changed for accounting periods ending after 1 January 2008. Calculated on this newbasis the transfer value at 31 December 2007 for Kees van der Graaf would be €7 951 000.
(h) Attained age 60 in 2006 and accrued no additional pension. Stepped down as a Director at the 2007 AGMs. The values shown are at 31May 2007, or the period ending on that date, as appropriate. Schedule 7A of the UK Companies Act requires the disclosure of pensionvalues at retirement as he performed qualifying services during 2007. The accrued pension at 31 October 2007 (the date he retired fromUnilever) is unchanged from that shown in the table. The transfer value of the accrued pension at 31 October 2007 was €14 055 000.
The Listing Rules of the Financial Services Authority are different from the Directors’ Remuneration Report Regulations 2002 and require the following disclosures for defined beneffit pension plans which are calculated on an alternative basis to those disclosed in the previous table.
The Dutch Corporate Governance Code requires the disclosure of pension service costs charged to operating profit:Dutch
CorporateListing rules of the Financial Services Authority Governance Code
€’000(a) €’000(b) €’000
Patrick Cescau (UK) (9) (192) 552
Kees van der Graaf (NL) 32 450 249
Ralph Kugler (UK) (1) (14) 294
Rudy Markham (UK) (31) (601) 50(c)
(a) Movement in accrued pension during 2007 (excluding the effect of inflation on the accrued pension at 31 December 2006).(b) Transfer value at 31 December 2007 of the movement in accrued pension during 2007 (excluding the effect of inflation on the accrued
pension at 31 December 2006 and less individual contributions).(c) This includes €28 000 that was incurred up to May 2007 when he left the Board and €22 000 that was incurred subsequently up to
31 October 2007.

58 Unilever Annual Report and Accounts 2007
Report of the Directors continued
Executive Directors’ interests – share capitalThe interests in the share capitals of NV and PLC and their group companies of those who were Executive Directors at 31 December2007 and of their connected persons were as shown in the table below:
Shares held at Shares held atShare type(a) 1 January 2007(b) 31 December 2007(b)
Patrick Cescau(c) NV 85 059 93 099PLC 52 347 65 798
Kees van der Graaf NV 23 157 32 499PLC 16 718 20 339
Ralph Kugler NV 45 396 48 489PLC 20 124 23 366
(a) NV shares are ordinary €0.16 shares and PLC shares are ordinary 31⁄9p shares.(b) Numbers are excluding unvested matching shares.(c) Balances include under NV 38 715 NV New York shares and under PLC 10 220 PLC ADRs.
The Executive Directors, in common with other employees of PLC and its United Kingdom subsidiaries, had beneficial interests in 16 678 871 PLC ordinary shares at 1 January 2007 and 10 920 385 PLC ordinary shares at 31 December 2007, acquired by theUnilever Employee Share Trust (Jersey) for the purpose of satisfying options and vesting of shares under various group share plans(including the PLC Executive Option Plans and the UK Employee ShareSave Plan). Further information, including details of the NV andPLC ordinary shares acquired by certain group companies in connection with other share-based compensation plans, is given in note 29on pages 117 to 119.
The voting rights of the Directors who hold interests in the share capitals of NV and PLC are the same as for other holders of the classof shares indicated. None of the Directors’ or other executive officers’ shareholdings amounts to more than 1% of the issued shares inthat class of share. Except as stated above, all shareholdings are beneficial.
The only changes in the interests of the Executive Directors and their connected persons in NV and PLC ordinary shares between 31December 2007 and 1 March 2008 were that:
• The holding of the Unilever Employee Share Trust (Jersey) has reduced to 10 814 117 PLC ordinary shares; and
• Kees van der Graaf and Ralph Kugler each acquired an additional 14 PLC ordinary shares during January and February as a result ofregular contributions to an employee share investment plan.
Report of the Remuneration Committee continued

Unilever Annual Report and Accounts 2007 59
Report of the Directors continued
Report of the Remuneration Committee continued
Non-Executive Directors
The following section contains detailed information and commentary on the Non-Executive Directors’ annual fees and share interests.The Non-Executive Directors receive fees from both NV and PLC. No other remuneration is given in respect of their non-executive dutiesfrom either NV or PLC, such as annual incentives, share-based incentives or pension benefits.
The level of their fees reflects their commitment and contribution to Unilever. The Chairman’s levels were reviewed and increased withthe appointment of Michael Treschow as Chairman in 2007. No other fee changes have been made since the 2006 AGMs.
Non-Executive Directors’ remunerationThe total fees payable to each Non-Executive Director in 2007 are set out below:
Total fees paid Total fees paidin 2007(a) in 2006(a)
Current Non-Executive Directors €’000 €’000
Michael Treschow(b)(c) 469 n/a
Genevieve Berger(b) 60 n/a
Leon Brittan 97 83
Wim Dik 92 85
Charles Golden 134 89
Byron Grote 90 60
Narayana Murthy(b) 97 n/a
Hixonia Nyasulu(b) 82 n/a
David Simon 131 110
Kees Storm 113 75
Jeroen van der Veer 90 83
Former Non-Executive Directors
Antony Burgmans(d)(e) 246 300
Lynda Chalker(d)(g) 42 94
Jean-Cyril Spinetta(f) 68 60
(a) Covers fees and allowances received from both NV and PLC. Includes fees for travel from outside Europe if applicable.(b) Appointed at the 2007 AGMs. (c) Chairman NV and PLC since the 2007 AGMs.(d) Stepped down at the 2007 AGMs.(e) Chairman until the 2007 AGMs. Total fees include some benefits that occured after retirement.(f) Stepped down in September 2007.(g) Started to work for Unilever under a consultancy agreement as from 1 June 2007 to support Unilever in the African world. Total amount
paid for period June 2007 – December 2007 €85 508.
Please see page 46 for details on committee memberships.

60 Unilever Annual Report and Accounts 2007
Report of the Directors continued
Prior to being a Non-Executive Director Mr Burgmans was awarded shares and options in his capacity as an Executive Director. Mr Burgmans received no further share-based awards in his capacity as Non-Executive Director.
Details of the balance and lapsing under the TSR Long-Term Incentive Plan:
Balance Conditional award lapsed Balance1 January 2007 24 March 2007 May 2007
NV 22 182 (22 182) –PLC 23 024 (23 024) –
Details of the balance and vesting under the Share Matching Plan:
Balance Shares vested Balance1 January 2007 27 March 2007 May 2007
NV 4 569 (1 815) 2 754PLC 4 712 (1 886) 2 826
Details of his outstanding options can be found below:
NumberNumber of of options Balance of Balance Weighted Balance Weighted
options exercised/ options at below average above average First FinalShare granted in lapsed May market exercise market exercise exercisable expirytype 2007 in 2007 2007 price price price price date date(a)
Executive Plan NV 316 800 – 316 800 316 800 €19.10 – – 24/03/02 01/06/09Executive Plan PLC 316 800 – 316 800 316 800 1 163p – – 24/03/02 01/06/09NL All-Employee Plan NV 450 (150)(a) 300 300 €17.47 – – 02/06/03 12/05/09
(a) Exercised 8 May 2007 at market price of €23.75 (originally awarded 12 June 2002 at €22.63).
Non-Executive Directors’ interests – share capitalThe interests in the share capitals of NV and PLC and their group companies of those who were Non-Executive Directors as at 31 December 2007 and had share holdings (including those of their connected persons) were as shown below:
Shares held at Shares held atShare type(a) 1 January 2007(a) 31 December 2007(a)
Michael Treschow NV –(b) 15 000PLC –(b) 15 000
Byron Grote NV NY 3 000 3 000PLC ADRs 1 800 1 800
David Simon NV – –PLC 1 492 1 536
Jeroen van der Veer NV 16 800 16 800PLC – –
(a) NV shares are ordinary €0.16 shares and PLC shares are ordinary 31⁄9p shares.(b) Shareholding is as from date of appointment.
There were no changes in the interests of the Non-Executive Directors and their connected persons in NV and PLC ordinary sharesbetween 31 December 2007 and 1 March 2008.
Report of the Remuneration Committee continued

Unilever Annual Report and Accounts 2007 61
Report of the Directors continued
Report of the Remuneration Committee continued
Additional statutory and other disclosures
The Board evaluated the performance of the Committee and the Committee carried out a self assessment of its performance.
Unilever’s share performance relative to broad-based equity indicesThe UK Companies Act 1985 (schedule 7A) requires us to show Unilever’s relative share performance, based on Total ShareholderReturn, against a holding of shares in a broad-based equity index for the last five years. The Remuneration Committee has decided toshow Unilever’s performance against two indices, namely the FTSE 100 Index, London, and the Euronext AEX Index, Amsterdam asthese are the most generally used indices in the UK and the Netherlands, where we have our principal listings.
Role and responsibilitiesThe Committee is responsible for making proposals to the Boards on the reward policy for Executive Directors. It is also responsible forsetting individual reward packages for Executive Directors and for monitoring and approving all share-based incentive arrangements.The Committee meets at least three times a year and, during 2007, it met on five occasions.
Structure and roleDuring 2007 David Simon served as Chairman of the Committee with Jeroen van der Veer and Jean-Cyril Spinetta as Non-Executivemembers. Jean-Cyril Spinetta stepped down as a Director in September 2007. Michael Treschow was appointed a member of theCommittee on 6 February 2008.
Advice and assistanceThe Committee does not formally retain remuneration consultants. It seeks professional advice from external advisers as and whenrequired. During 2007, the Committee sought advice from Towers Perrin (an independent firm of human resources specialists) onmarket data, reward trends and performance-related pay. Towers Perrin also provides general consultancy advice to Unilever groupcompanies on employee rewards, pension, communications and other human resource matters.
The Group Secretary attends all Committee meetings and advises on matters of corporate governance.
The Group Chief Executive can be invited to attend Committee meetings to provide his own insights to the Committee on businessobjectives and the individual performance of his direct reports. Naturally, he does not attend when his own remuneration is beingdiscussed.
During 2007, the Non-Executive Chairman could, in his role as Chairman of the Boards, also attend meetings.
The Report has been approved by the Boards. Signed on behalf of the Boards by Sven Dumoulin (Group Secretary).
Unilever
AEXDec 2002 Dec 2003 Dec 2004 Dec 2005 Dec 2006 Dec 2007
200
160
180
120
140
100
80
60
Growth in the value of a hypothetical investment over five yearsAEX comparison based on 30 day average values
Unilever
FTSE 100Dec 2002 Dec 2003 Dec 2004 Dec 2005 Dec 2006 Dec 2007
200
160
180
140
120
100
80
60
Five-Year Historical TSR Performance Growth in the value of a hypothetical £100 holding over five yearsFTSE 100 comparison based on 30 trading day average values

Report of the Audit Committee
The role of the Audit Committee is to assist the Unilever Boards infulfilling their oversight responsibilities regarding the integrity ofUnilever’s financial statements, risk management and internalcontrol, compliance with legal and regulatory requirements, theexternal auditors’ performance, qualifications and independence,and the performance of the internal audit function. During theyear ended 31 December 2007 the principal activities of theCommittee were as follows:
Financial statementsThe Committee considered reports from the Chief FinancialOfficer on the quarterly and annual financial statements includingother financial statements and disclosures prior to theirpublication, issues reviewed by the Disclosure Committee, andreviewed the Annual Report and Accounts and Annual Report onForm 20-F prior to publication.
Audit of the Annual AccountsPricewaterhouseCoopers, Unilever’s external auditors, reported indepth to the Committee on the scope and outcome of the annualaudit, including their audit of internal control over financialreporting as required by Section 404 of the US Sarbanes-OxleyAct of 2002. Their reports included accounting matters,governance and control, and accounting developments.
Risk management and internal control arrangementsThe Committee reviewed Unilever's overall approach to riskmanagement and control, and its processes, outcomes anddisclosure, including specifically:
• review of level of disclosure in quarterly financial resultsannouncements;
• review of accounting principles and judgements with respect to financial statements, including the annual impairment reviewof goodwill and intangibles;
• Corporate Audit’s interim and year-end reports on the Status ofRisk Management and Control, and management’s response;
• annual report from the Chief Financial Officer on business risks andpositive assurance on operating controls and corporate policies; anda quarterly review of business risks and safeguards;
• the interim and year-end reports from the Code of BusinessPrinciples Compliance Committee;
• monitoring the resolution of complaints received through theglobal Ethics hotline including procedures for handlingcomplaints and concerns relating to accounting, internal controland auditing matters;
• quarterly review of progress of the application of therequirements under Section 404 of the US Sarbanes-Oxley Actof 2002 with respect to internal controls over financialreporting;
• review of the application of information and communicationtechnology;
• a review of the annual pension report and pensions relatedaccounting and proposals;
• annual review of anti-fraud arrangements;• a review of tax planning policy; and• review of treasury policies, the annual financial plan and
consideration of proposals relating to debt issuance, investmenthedge, dividends and a review of the financial implications ofacquisitions.
External auditors The Audit Committee conducted a formal evaluation of theeffectiveness of the external audit process. The Committee hasapproved the extension of the current external audit contract byone year, and recommended to the Boards the reappointment ofthe external auditors. On the recommendation of the Audit
Committee, the Directors will be proposing the reappointment ofPricewaterhouseCoopers at the AGMs in May 2008 (see pages131 and 136).
Both Unilever and the auditors have for many years had safeguardsin place to avoid the possibility that the auditors’ objectivity and independence could be compromised. The Committeereviewed the report from PricewaterhouseCoopers on the actionsthey take to comply with the professional and regulatoryrequirements and best practice designed to ensure theirindependence from Unilever.
The Committee also reviewed the statutory audit, other audit,tax and other services provided by PricewaterhouseCoopers, andcompliance with Unilever’s policy, which prescribes in detail thetypes of engagements for which the external auditors can andcannot be used:
• statutory audit services – as detailed above, including audit ofsubsidiaries;
• other audit services – work which regulations or agreementswith third parties require the auditors to undertake e.g. inconnection with borrowings and shareholder services;
• other services – statutory auditors may carry out work that theyare best placed to undertake, including internal control reviews;
• acquisition and disposal services – where the auditors are bestplaced to do this work;
• tax services – all significant tax consulting work is put to tender,except where the auditors are best placed to do this; and
• general consulting – external auditors may not tender forgeneral consulting work.
All engagements over €100 000 require specific advance approvalof the Audit Committee Chairman. The overall policy is regularlyreviewed and, where necessary, updated in the light of internaldevelopments, external developments and best practice.
The Committee held independent meetings with the externalauditors during the year.
Internal audit functionThe Committee engaged in discussion and review of theCorporate Audit Department’s audit plan for the year, andapproved its budget and resource requirements.
The Committee carried out a formal evaluation of theperformance of the internal audit function and confirmed thatthey were satisfied with their relationship with the Chief Auditor.
The Committee held independent meetings with the Chief Auditorduring the year.
Audit Committee terms of referenceThe Audit Committee’s terms of reference can be viewed onUnilever’s website at www.unilever.com or supplied on request. In June 2007, the terms of reference were updated to include thereview of ‘other financial statements and disclosures’ prior to theirpublication.
Board Assessment of the Audit CommitteeThe Board evaluated the performance of the Committee and theCommittee carried out a self assessment of its performance.
Kees Storm Chairman of the Audit CommitteeWim DikCharles GoldenByron Grote
62 Unilever Annual Report and Accounts 2007
Report of the Directors continued

Unilever Annual Report and Accounts 2007 63
Report of the Directors continued
Terms of referenceThe Corporate Responsibility and Reputation Committee (CRRC)comprises four independent Non-Executive Directors and oneExecutive Director, the latter being the person who chairsUnilever’s Corporate Responsibility Council.
In May 2007 three new independent members were appointed tothe Committee – Genevieve Berger, Narayana Murthy and HixoniaNyasulu. They replaced Antony Burgmans and Lynda Chalker whoretired. Wim Dik stood down from the Committee in September2007. Leon Brittan replaced Lynda Chalker as Chairman of theCommittee and thanked departing members for their support andthe valuable insights they had contributed to the Group’sthinking.
The Committee has responsibility for overseeing Unilever'sconduct as a responsible corporate citizen. It is also charged withensuring that Unilever’s reputation is protected and enhanced.Inherent in this is the need to identify any external developmentswhich are likely to have an influence upon Unilever’s standing insociety and to bring these to the attention of the executive team.
One of the issues the Committee oversees is that of sustainabledevelopment. In this capacity the Committee is building links withthe Unilever Sustainable Development Group (USDG) – a body offive eminent people who advise on Unilever’s sustainabilitystrategy. To facilitate greater synergy between the two groups,members of the CRRC share the briefings of the USDG and areinvited to join their meetings.
Full details of the Corporate Responsibility and ReputationCommittee’s terms of reference and details of the members of theUnilever Sustainable Development Group are available atwww.unilever.com/investorcentre/corpgovernance
Meetings Committee meetings are held quarterly. In 2007 the Committeediscussed a range of topics including Unilever’s Code of BusinessPrinciples, human rights, its Business Partner Code and supplierassurance, corporate responsibility strategy, reporting andmeasurement. Further details of these discussions are set outbelow.
Code of Business PrinciplesAt its April meeting in Durban, the Committee discussed thepractices of Unilever South Africa in implementing andcommunicating the Code of Business Principles. Committeemembers commended Unilever on its thorough and rigorousapproach to procedures for upholding the principles and itsongoing efforts to maintain awareness of the Code throughdiverse communications channels.
Human rightsThe Committee supported a review of Unilever’s approach tohuman rights. The aim of the review was to ensure that Unilevercontinues to live up to its ethical standards, as defined in theCode of Business Principles, and that effective communicationsand compliance mechanisms are in place. It concluded thatfurther training was needed and that clearer definition of thevarious elements of human rights was required in order toincrease employee awareness and understanding.
Currently, compliance monitoring of Unilever’s human rightsobligations is delivered via the positive assurance process. The
review proposed that this should be complemented by a systemof continuous improvement (akin to the systems Unilever uses forsafety, health and environment), based primarily on self-assessment at site level and supported by periodic external audits.The self-assessment methodology is designed to be consistentwith that used to monitor suppliers’ compliance with our BusinessPartner Code.
Business Partner CodeUnilever’s Business Partner Code is based on its Code of BusinessPrinciples. It makes clear our expectations of suppliers in the areasof health and safety at work, business integrity, labour standards,consumer safety and the environment. Unilever’s supplymanagement is responsible for the roll-out of the Business PartnerCode and for gaining supplier assurance.
As these areas are of increasing concern to both manufacturersand retailers, many companies are launching similar assuranceinitiatives, leading to multiple demands on suppliers to provideevidence of appropriate management policies and compliancewith recognised social, environmental and labour standards.
As both a customer and a supplier, Unilever has a clear interest inavoiding this resource-intensive duplication of effort. To this end,Unilever initiated a collaborative forum with peer fast-movingconsumer goods manufacturers to develop a common approachto supplier evaluation through self-assessment and shared audit.The Committee endorsed Unilever’s commitment to responsiblesourcing and offered suggestions to reinforce communicationaround the Business Partner Code.
Corporate responsibility strategyCommittee members reviewed Unilever’s updated corporateresponsibility strategy, including its CO2 reduction targets. Theimportance of pursuing clear and realistic targets wasemphasised, along with the need to engage retail customers onthis agenda, which is becoming an increasingly important part oftheir business activities. The Committee recommended that theelements of the strategy be reflected clearly in Unilever’s nextsustainable development report. Members also studied the metricsUnilever uses to measure progress in its corporate responsibilityinitiatives and suggested ways in which these should bereinforced.
As part of its watching brief on current issues of concern tosociety, the Committee also received and commented on updateson a range of issues, including Unilever’s approach to biofuels as asource of renewable energy, carbon footprinting, marketing tochildren, the use of ‘size zero’ models in advertising, sustainablesourcing of tea, packaging, and feedback on Unilever’sparticipation in the World Economic Forum at Davos.
Board assessment of the CommitteeThe Board evaluated the performance of the Committee and theCommittee carried out a self assessment of its performance.
More information about Unilever’s corporate responsibilityinitiatives is available at www.unilever.com
Leon Brittan Chairman of the Corporate Responsibility andReputation Committee
Genevieve BergerNarayana MurthyHixonia Nyasulu Ralph Kugler Executive Director
Report of the Corporate Responsibility and Reputation Committee

64 Unilever Annual Report and Accounts 2007
This page has been intentionally left blank

Unilever Annual Report and Accounts 2007 65
Financial statements
Statement of Directors’ responsibilities 66
Auditors’ reports 67
Consolidated income statement 69
Consolidated statement of recognised income and expense 69
Consolidated balance sheet 70
Consolidated cash flow statement 71
Notes to the consolidated accounts 72
1 Accounting information and policies 72
2 Segment information 77
3 Gross profit and operating costs 81
4 Staff costs 82
5 Net ffinance costs 82
6 Taxation 83
7 Combined earnings per share 85
8 Dividends on ordinary capital 86
9 Goodwill and intangible assets 86
10 Property, plant and equipment 88
11 Other non-current assets 90
12 Deferred taxation 91
13 Inventories 91
14 Trade and other receivables 92
15 Cash and cash equivalents and other financial assets 92
16 Financial liabilities 94
17 Financial instruments and treasury risk management 97
18 Trade payables and other liabilities 102
19 Provisions 102
20 Pensions and similar obligations 103
21 Equity 108
22 Share capital 109
23 Other reserves 110
24 Retained profit 111
25 Commitments and contingent liabilities 112
26 Acquisitions and disposals 113
27 Assets held for sale and discontinued operations 114
28 Reconciliation of net profit to cash flow from
operating activities 116
29 Share-based compensation plans 117
30 Related party transactions 120
31 Key management personnel 120
32 Remuneration of auditors 121
33 Events after the balance sheet date 121
Contents
Financial record 122
Principal group companies and non-current investments 125
Company accounts – Unilever N.V. 127
Notes to the company accounts – Unilever N.V. 129
Further statutory and other information – Unilever N.V. 131
Company accounts – Unilever PLC 132
Notes to the company accounts – Unilever PLC 134
Further statutory and other information – Unilever PLC 136

Statement of Directors’ responsibilities
Annual accountsThe Directors are required by Title 9, Book 2 of the Civil Code inthe Netherlands and the United Kingdom Companies Act 1985 to prepare accounts for each financial year which give a true andfair view of the state of affairs of the Unilever Group, and the NVand PLC entities as at the end of the financial year and of theprofit or loss and cash flows for that year.
The Directors consider that, in preparing the accounts, the Groupand the NV and PLC entities have used the most appropriateaccounting policies, consistently applied and supported byreasonable and prudent judgements and estimates, and that allInternational Financial Reporting Standards as adopted by the EUand as issued by the International Accounting Standards Board (inthe case of the consolidated accounts) and United Kingdomaccounting standards (in the case of the parent company accounts)which they consider to be applicable have been followed.
The Directors have responsibility for ensuring that NV and PLCkeep accounting records which disclose with reasonable accuracytheir financial position and which enable the Directors to ensurethat the accounts comply with the relevant legislation. They alsohave a general responsibility for taking such steps as arereasonably open to them to safeguard the assets of the Group,and to prevent and detect fraud and other irregularities.
This statement, which should be read in conjunction with theAuditors’ report, is made with a view to distinguishing forshareholders the respective responsibilities of the Directors and of the auditors in relation to the accounts.
A copy of the financial statements of the Unilever Group isplaced on our website at www.unilever.com/investorcentre Themaintenance and integrity of the website are the responsibility ofthe Directors, and the work carried out by the auditors does notinvolve consideration of these matters. Accordingly, the auditorsaccept no responsibility for any changes that may have occurred to the financial statements since they were initially placed on thewebsite. Legislation in the United Kingdom and the Netherlandsgoverning the preparation and dissemination of financialstatements may differ from legislation in other jurisdictions.
UK law sets out additional responsibilities for the Directors of PLC regarding disclosure of information to auditors. Disclosure in respect of these is made on page 136.
Going concernThe Directors continue to adopt the going concern basisin preparing the accounts. This is because the Directors,after making enquiries and following a review of the Group’sbudget for 2008 and 2009, including cash flows and borrowingfacilities, consider that the Group has adequate resources tocontinue in operation for the foreseeable future.
Internal and disclosure controls and proceduresUnilever has a well-established control framework, which isdocumented and regularly reviewed by the Boards. Thisincorporates risk management, internal control procedures anddisclosure controls and procedures (including the operation of the Disclosure Committee – see page 38) which are designed toprovide reasonable, but not absolute, assurance that assets aresafeguarded, the risks facing the business are being addressedand all information required to be disclosed is reported to theGroup’s senior management, including where appropriate theGroup Chief Executive and Chief Financial Officer, within therequired timeframe.
Our procedures cover financial, operational, social, strategic andenvironmental risks and regulatory matters. The Boards of NV and PLC have also established a clear organisational structure,including delegation of appropriate authorities. The Group’scontrol framework is supported through a Code of BusinessPrinciples, which sets standards of professionalism and integrityfor its operations worldwide, and through an OperationalControls Assessment process, which requires the seniormanagement in each business unit to assess the effectiveness offinancial controls. In our major units financial controls are subjectto a comprehensive risk-based assessment annually with controlsin the remaining units being reviewed over a one- to three-yearcycle.
The Boards have overall responsibility for establishing keyprocedures designed to achieve systems of internal control and disclosure control and for reviewing and evaluating theireffectiveness. The day-to-day responsibility for implementation of these procedures and ongoing monitoring of risk and the effectiveness of controls rests with the Group’s seniormanagement at individual operating company and regional level. Regions review, on an ongoing basis, the risks faced by their group and the related internal control arrangements, andprovide written reports to the Group Chief Executive.
Unilever’s corporate internal audit function plays a key role inproviding an objective view and continuous reassurance of theeffectiveness of the risk management and related control systemsthroughout Unilever to both operating management and theBoards. The Group has an independent Audit Committee, comprised entirely of independent Non-Executive Directors. This Committee meets regularly with the Chief Auditor and the external auditors.
Unilever has a comprehensive budgeting system with an annualbudget approved by the Boards, which is regularly reviewed andupdated. Performance is monitored against budget and theprevious year through monthly and quarterly reporting routines.The Group reports to shareholders quarterly.
Unilever’s system of risk management has been in placethroughout 2007 and up to the date of this report, and complieswith the recommendations of ’Internal Control – RevisedGuidance for Directors on the Combined Code’, published by the Internal Control Working Party of the Institute of CharteredAccountants in England & Wales in October 2005. The Boardshave carried out an annual review of the effectiveness of thesystems of risk management and internal control during 2007 in accordance with this guidance, and have ensured that thenecessary actions have been or are being taken to addressany significant failings arising out of that review.
Based on an evaluation by the Boards, the Group Chief Executiveand the Chief Financial Officer concluded that the design andoperation of the Group’s disclosure controls and procedures as at31 December 2007 were effective, and that subsequently therehave been no significant changes in the Group’s internal controls,or in other factors that could significantly affect those controls.
It is Unilever’s practice to bring acquired companies within theGroup’s governance procedures as soon as is practicable andin any event by the end of the first full year of operation.
Unilever is required by Section 404 of the US Sarbanes-Oxley Act of 2002 to report on the effectiveness of internal control over financial reporting. This requirement will be reported onseparately and will form part of Unilever’s Annual Report on Form 20-F.
66 Unilever Annual Report and Accounts 2007
Financial statements continued

Unilever Annual Report and Accounts 2007 67
Financial statements continued
Auditor’s report Netherlands
Independent auditor’s report to the shareholders of Unilever N.V.
Report on the consolidated accountsWe have audited the consolidated accounts which are part of the Annual Report 2007 of the Unilever Group for the year ended31 December 2007 which comprise the consolidated incomestatement, consolidated balance sheet, consolidated cash flowstatement, consolidated statement of recognised income andexpense and the related notes on pages 69 to 121 and 125 to126. These consolidated accounts have been prepared under theaccounting policies set out in note 1 on pages 72 to 76.
We have reported separately on the company accounts ofUnilever N.V. for the year ended 31 December 2007.
Directors’ responsibilityThe Directors are responsible for the preparation and fairpresentation of the consolidated accounts in accordance withInternational Financial Reporting Standards as adopted by theEuropean Union and as issued by the International AccountingStandards Board and with Part 9 of Book 2 of the NetherlandsCivil Code, and for the preparation of the Report of the Directorsin accordance with Part 9 of Book 2 of the Netherlands CivilCode. This responsibility includes: designing, implementing andmaintaining internal control relevant to the preparation and fairpresentation of the consolidated accounts that are free frommaterial misstatement, whether due to fraud or error; selectingand applying appropriate accounting policies; and makingaccounting estimates that are reasonable in the circumstances.
Auditor’s responsibilityOur responsibility is to express an opinion on the consolidatedaccounts based on our audit. We conducted our audit inaccordance with Dutch law. This law requires that we comply with ethical requirements and plan and perform the audit toobtain reasonable assurance whether the consolidated accountsare free from material misstatement.
An audit involves performing procedures to obtain audit evidenceabout the amounts and disclosures in the consolidated accounts.The procedures selected depend on the auditor’s judgement,including the assessment of the risks of material misstatement of the consolidated accounts, whether due to fraud or error. Inmaking those risk assessments, the auditor considers internalcontrol relevant to the entity’s preparation and fair presentation of the consolidated accounts in order to design audit proceduresthat are appropriate in the circumstances, but not for the purposeof expressing an opinion on the effectiveness of the entity’sinternal control. An audit also includes evaluating theappropriateness of accounting policies used and thereasonableness of accounting estimates made by the Directors, as well as evaluating the overall presentation of the consolidatedaccounts.
We believe that the audit evidence we have obtained is sufficientand appropriate to provide a basis for our audit opinion.
OpinionIn our opinion, the consolidated accounts give a true and fair view of the financial position of the Unilever Group as at 31 December 2007, and of its result and its cash flows for theyear then ended in accordance with International FinancialReporting Standards as adopted by the European Union and asissued by the International Accounting Standards Board and with Part 9 of Book 2 of the Netherlands Civil Code.
Report on other legal and regulatory requirementsPursuant to the legal requirement under 2:393 sub 5 part e of the Netherlands Civil Code, we report, to the extent of ourcompetence, that the Report of the Directors is consistent withthe consolidated accounts as required by 2:391 sub 4 of theNetherlands Civil Code.
Rotterdam, The Netherlands, 10 March 2008PricewaterhouseCoopers Accountants N.V.
Prof Dr J A van Manen RA

68 Unilever Annual Report and Accounts 2007
Financial statements continued
Auditors’ report United Kingdom
Independent auditors’ report to the shareholders ofUnilever PLC on the consolidated accountsWe have audited the consolidated accounts of the Unilever Group for the year ended 31 December 2007 which comprise the consolidated income statement, consolidated balance sheet,consolidated cash flow statement, consolidated statement ofrecognised income and expense and the related notes on pages69 to 121 and 125 to 126. These consolidated accounts havebeen prepared under the accounting policies set out in note 1 onpages 72 to 76.
We have reported separately on the parent company accounts ofUnilever PLC for the year ended 31 December 2007 and on theinformation in the Report of the Remuneration Committee that is described as having been audited.
Respective responsibilities of Directors and auditorsThe Directors’ responsibilities for preparing the consolidatedaccounts in accordance with applicable law and InternationalFinancial Reporting Standards (IFRS) as adopted by the EuropeanUnion and as issued by the International Accounting StandardsBoard are set out in the Statement of Directors’ Responsibilities onpage 66, and on page 136. The Directors are also responsible forpreparing the Annual Report.
Our responsibility is to audit the consolidated accounts inaccordance with relevant legal and regulatory requirements andInternational Standards on Auditing (UK and Ireland). This report,including the opinion, has been prepared for and only for theshareholders of Unilever PLC as a body in accordance with Section 235 of the Companies Act 1985 and for no otherpurpose. We do not, in giving this opinion, accept or assumeresponsibility for any other purpose or to any other person towhom this report is shown or into whose hands it may come save where expressly agreed by our prior consent in writing.
We report to you our opinion as to whether the consolidatedaccounts give a true and fair view and whether the consolidatedaccounts have been properly prepared in accordance with theCompanies Act 1985 and Article 4 of the IAS Regulation. We alsoreport to you whether in our opinion the information given in theDirectors’ Report is consistent with the consolidated accounts.
In addition we report to you if, in our opinion, we have notreceived all the information and explanations we require for our audit, or if information specified by law regarding directors’remuneration and other transactions is not disclosed.
We review whether the Corporate Governance Statementreflects the company’s compliance with the nine provisions of theCombined Code (2006) specified for our review by the ListingRules of the United Kingdom Financial Services Authority, and we report if it does not. We are not required to consider whetherthe Directors’ statements on internal control cover all risks andcontrols, or form an opinion on the effectiveness of the Group’scorporate governance procedures or its risk and controlprocedures.
We read other information contained in the Annual Report andconsider whether it is consistent with the audited consolidatedaccounts. The other information comprises only the Report of the Directors and the Shareholder information. We consider theimplications for our report if we become aware of any apparentmisstatements or material inconsistencies with the consolidatedaccounts. Our responsibilities do not extend to any otherinformation.
Basis of audit opinionWe conducted our audit in accordance with InternationalStandards on Auditing (UK and Ireland) issued by the AuditingPractices Board. An audit includes examination, on a test basis, of evidence relevant to the amounts and disclosures in theconsolidated accounts. It also includes an assessment of thesignificant estimates and judgements made by the Directors in the preparation of the consolidated accounts, and of whether theaccounting policies are appropriate to the Group’s circumstances,consistently applied and adequately disclosed.
We planned and performed our audit so as to obtain all theinformation and explanations which we considered necessary inorder to provide us with sufficient evidence to give reasonableassurance that the consolidated accounts are free from materialmisstatement, whether caused by fraud or other irregularity orerror. In forming our opinion we also evaluated the overalladequacy of the presentation of information in the consolidatedaccounts.
OpinionIn our opinion:
• the consolidated accounts give a true and fair view, inaccordance with IFRS as adopted by the European Union, of the state of the Group’s affairs as at 31 December 2007 and of its profit and cash flows for the year then ended;
• the consolidated accounts have been properly prepared inaccordance with the United Kingdom Companies Act 1985 and Article 4 of the IAS Regulation; and
• the information given in the Report of the Directors isconsistent with the consolidated accounts.
Separate opinion in relation to IFRSAs explained in note 1 to the consolidated accounts, the Group inaddition to complying with its legal obligation to comply with IFRSas adopted by the European Union has also complied with IFRS asissued by the International Accounting Standards Board.
In our opinion the consolidated accounts give a true and fair view, in accordance with IFRS as issued by the InternationalAccounting Standards Board, of the state of the Group’s affairs asat 31 December 2007 and of its profit and cash flows for the yearthen ended.
PricewaterhouseCoopers LLPChartered Accountants and Registered AuditorsLondon, United Kingdom10 March 2008

Unilever Annual Report and Accounts 2007 69
Financial statements continued
Consolidated income statementfor the year ended 31 December
€ million € million € million2007 2006 2005
Continuing operations
Turnover 2 40 187 39 642 38 401
Operating profit 2 5 245 5 408 5 074
After (charging)/crediting:
Restructuring 3 (875) (704) (328)Business disposals, impairments and other 3 306 196 (249)Gain on US healthcare and UK pensions 3 – 266 –
Net finance costs 5 (252) (721) (613)
Finance income 147 128 129Finance costs (550) (590) (689)Preference shares provision (7) (300) –Pensions and similar obligations 158 41 (53)
Share of net profit/(loss) of joint ventures 102 78 47Share of net profit/(loss) of associates 50 36 (25)Other income from non-current investments 11 39 30 33
Profit before taxation 5 184 4 831 4 516Taxation 6 (1 128) (1 146) (1 181)
Net profit from continuing operations 4 056 3 685 3 335Net profit from discontinued operations 27 80 1 330 640
Net profit 4 136 5 015 3 975
Attributable to:Minority interests 248 270 209Shareholders’ equity 3 888 4 745 3 766
Combined earnings per share 7From continuing operationsBasic earnings per share €1.32 €1.19 €1.07Diluted earnings per share €1.28 €1.15 €1.04
From discontinued operationsBasic earnings per share €0.03 €0.46 €0.22Diluted earnings per share €0.03 €0.45 €0.21
From total operationsBasic earnings per share €1.35 €1.65 €1.29Diluted earnings per share €1.31 €1.60 €1.25
References in the consolidated income statement, consolidated statement of recognised income and expense, consolidated cash flow statementand consolidated balance sheet relate to notes on pages 72 to 121, which form an integral part of the consolidated financial statements.
Accounting policies of the Unilever Group are set out in note 1 on pages 72 to 76.
Consolidated statement of recognised income and expensefor the year ended 31 December
€ million € million € million2007 2006 2005
Fair value gains/(losses) net of tax:On cash flow hedges 84 6 14On available-for-sale financial assets 2 15 –
Actuarial gains/(losses) on pension schemes net of tax 542 853 (49)Currency retranslation gains/(losses) net of tax(a) (413) (335) 513
Net income/(expense) recognised directly in equity 215 539 478
Net profit 4 136 5 015 3 975
Total recognised income and expense 21 4 351 5 554 4 453
Attributable to:Minority interests 237 242 249Shareholders’ equity 4 114 5 312 4 204
(a) Includes fair value gains/(losses) on net investment hedges of €(692) million (2006: €(779) million; 2005: €332 million).
Financial statements Unilever Group

Financial statements Unilever Group
Consolidated balance sheetas at 31 December
€ million € million2007 2006
Goodwill 9 12 244 12 425Intangible assets 9 4 511 4 781Property, plant and equipment 10 6 284 6 276Pension asset for funded schemes in surplus 20 2 008 1 697Deferred tax assets 12 1 003 1 266Other non-current assets 11 1 324 1 126
Total non-current assets 27 374 27 571
Inventories 13 3 894 3 796Trade and other current receivables 14 4 194 4 254Current tax assets 367 125Cash and cash equivalents 15 1 098 1 039Other financial assets 15 216 273Assets held for sale 27 159 14
Total current assets 9 928 9 501
Financial liabilities 16 (4 166) (4 458)Trade payables and other current liabilities 18 (8 017) (7 838)Current tax liabilities (395) (579)Provisions 19 (968) (1 009)Liabilities associated with assets held for sale 27 (13) –
Total current liabilities (13 559) (13 884)
Net current assets/(liabilities) (3 631) (4 383)
Total assets less current liabilities 23 743 23 188
Financial liabilities due after one year 16 5 483 4 377Non-current tax liabilities 233 272Pensions and post-retirement healthcare liabilities:
Funded schemes in deficit 20 827 1 379Unfunded schemes 20 2 270 3 398
Provisions 19 694 826Deferred tax liabilities 12 1 213 1 003Other non-current liabilities 204 261
Total non-current liabilities 10 924 11 516
Called up share capital 21 484 484Share premium account 21 153 165Other reserves 21 (3 412) (2 143)Retained profit 21 15 162 12 724
Shareholders’ equity 12 387 11 230Minority interests 21 432 442
Total equity 12 819 11 672
Total capital employed 23 743 23 188
Commitments and contingent liabilities are shown in note 25 on page 112.
These financial statements, together with the Report of the Directors, were approved by the Directors on 10 March 2008.
70 Unilever Annual Report and Accounts 2007
Financial statements continued

Unilever Annual Report and Accounts 2007 71
Financial statements continued
Financial statements Unilever Group
Consolidated cash flow statementfor the year ended 31 December
€ million € million € million2007 2006 2005
Cash flow from operating activities 28 5 188 5 574 5 924Income tax paid (1 312) (1 063) (1 571)
Net cash flow from operating activities 3 876 4 511 4 353
Interest received 146 125 130Purchase of intangible assets (136) (113) (92)Purchase of property, plant and equipment (1 046) (1 013) (914)Disposal of property, plant and equipment 163 192 124Sale and leaseback transactions resulting in operating leases 36 – 69Acquisition of group companies, joint ventures and associates (214) (96) (20)Disposal of group companies, joint ventures and associates 164 1 873 804Acquisition of other non-current investments (50) (90) (50)Disposal of other non-current investments 33 61 83Dividends from joint ventures, associates and other non-current investments 188 120 65(Purchase)/sale of financial assets 93 96 316
Net cash flow from/(used in) investing activities (623) 1 155 515
Dividends paid on ordinary share capital (2 182) (2 602) (1 804)Interest and preference dividends paid (552) (605) (643)Additional financial liabilities 4 283 2 154 3 968Repayment of financial liabilities (2 896) (5 364) (4 795)Sale and leaseback transactions resulting in finance leases 25 2 –Capital element of finance lease rental payments (74) (73) (53)Share buy-back programme (1 500) – (500)Other movements on treasury stock 442 98 (776)Other financing activities (555) (182) (218)
Net cash flow from/(used in) financing activities (3 009) (6 572) (4 821)
Net increase/(decrease) in cash and cash equivalents 244 (906) 47
Cash and cash equivalents at the beginning of the year 710 1 265 1 406
Effect of foreign exchange rate changes (53) 351 (188)
Cash and cash equivalents at the end of the year 15 901 710 1 265
The cash flows of pension funds (other than contributions and other direct payments made by the Group in respect of pensions and similarobligations) are not included in the consolidated cash flow statement. Cash flows relating to discontinued operations included above are set out in note 27 on page 114.

Notes to the consolidated accounts Unilever Group
1 Accounting information and policiesThe accounting policies adopted are the same as those which appliedfor the previous financial year, except as set out below under theheading of ‘Companies legislation and accounting standards’.
UnileverThe two parent companies, NV and PLC, together with their groupcompanies, operate as a single economic entity (the Unilever Group,also referred to as Unilever or the Group). NV and PLC have the sameDirectors and are linked by a series of agreements, including anEqualisation Agreement, which are designed so that the position ofthe shareholders of both companies is as nearly as possible the sameas if they held shares in a single company.
The Equalisation Agreement provides that both companies adopt the same accounting principles and requires as a general rule the dividends and other rights and benefits (including rights onliquidation) attaching to each €0.16 nominal of ordinary share capitalof NV to be equal in value at the relevant rate of exchange to thedividends and other rights and benefits attaching to each 31⁄9pnominal of ordinary share capital of PLC, as if each such unit ofcapital formed part of the ordinary capital of one and the samecompany. For additional information please refer to ‘Corporategovernance’ on page 40.
Basis of consolidationDue to the operational and contractual arrangements referred toabove, NV and PLC form a single reporting entity for the purposes of presenting consolidated accounts. Accordingly, the accounts ofUnilever are presented by both NV and PLC as their respectiveconsolidated accounts. Group companies included in the consolidationare those companies controlled by NV or PLC. Control exists when theGroup has the power to govern the financial and operating policies ofan entity so as to obtain benefits from its activities.
The net assets and results of acquired businesses are included in theconsolidated accounts from their respective dates of acquisition, beingthe date on which the Group obtains control. The results of disposedbusinesses are included in the consolidated accounts up to their dateof disposal, being the date control ceases.
Companies legislation and accounting standardsThe consolidated accounts have been prepared in accordance withInternational Financial Reporting Standards (IFRS) as adopted by the European Union (EU) and in accordance with Book 2 of the CivilCode in the Netherlands and the United Kingdom Companies Acts1985 and 2006. They are also in accordance with IFRS as issued bythe International Accounting Standards Board.
The accounts are prepared under the historical cost convention unlessotherwise indicated.
The accounting policies adopted are consistent with those of theprevious financial year except that the Group has adoptedInternational Financial Reporting Standard 7 ‘Financial Instruments:Disclosures’ and the following IFRIC interpretations with effect from 1 January 2007: IFRIC 7, ‘Applying the Restatement Approach’ underIAS 29 ‘Financial Reporting in Hyperinflationary Economies’; IFRIC 9‘Reassessment of embedded derivatives’; and IFRIC 10 ‘InterimFinancial Reporting and Impairment’. Adoption of IFRS 7 and theseinterpretations did not have a material effect on the financialstatements of the Group.
The Group also applied the amendment to IAS 1 ‘Presentation ofFinancial Statements’ which requires Unilever to make new disclosuresto enable the users of the financial statements to evaluate the Group’sobjectives, policies and processes for managing capital.
In addition, the Group has applied the following changes inpresentation of the financial statements within the balance sheet:
• Finance lease creditors and funding-related derivatives have beenreclassified in order to facilitate the presentation of net debt.Comparatives for 31 December 2006 have been restatedaccordingly; and
• Line items relating to borrowings have been renamed to financialliabilities to align with the requirements of IFRS 7.
Foreign currenciesItems included in the financial statements of group companies aremeasured using the currency of the primary economic environment inwhich each entity operates (its functional currency). The consolidatedfinancial statements are presented in euros. The functional currenciesof NV and PLC are euros and sterling respectively.
Foreign currency transactions are translated into the functionalcurrency using the exchange rates prevailing at the dates of thetransactions. Foreign exchange gains and losses resulting from thesettlement of such transactions and from the translation at year-endexchange rates of monetary assets and liabilities denominated inforeign currencies are recognised in the income statement, exceptwhen deferred in equity as qualifying hedges. Those arising on tradingtransactions are taken to operating profit; those arising on cash,financial assets and financial liabilities are classified as finance incomeor cost.
In preparing the consolidated financial statements, the incomestatement, the cash flow statement and all other movements in assetsand liabilities are translated at annual average rates of exchange. The balance sheet, other than the ordinary share capital of NV andPLC, is translated at year-end rates of exchange. In the case of hyper-inflationary economies, which are those in which inflation exceeds100% cumulatively over a three-year period, the accounts areadjusted to reflect current price levels and remove the influences of inflation before being translated.
The ordinary share capital of NV and PLC is translated in accordancewith the Equalisation Agreement. The difference between theresulting value for PLC and the value derived by applying the year-endrate of exchange is taken to other reserves (see note 23 on page 110).
The effects of exchange rate changes during the year on net assets at the beginning of the year are recorded as a movement inshareholders’ equity, as is the difference between profit of the yearretained at average rates of exchange and at year-end rates ofexchange. For these purposes net assets include loans between groupcompanies and related foreign exchange contracts, if any, for whichsettlement is neither planned nor likely to occur in the foreseeablefuture. Exchange gains/losses on hedges of net assets are alsorecorded as a movement in equity.
Cumulative exchange differences arising since the transition date of 1 January 2004 are reported as a separate component of otherreserves (see note 23 on page 110). In the event of disposal or partdisposal of an interest in a group company either through sale or as a result of a repayment of capital, the cumulative exchange differenceis recognised in the income statement as part of the profit or loss on disposal of group companies.
72 Unilever Annual Report and Accounts 2007
Financial statements continued

Unilever Annual Report and Accounts 2007 73
Financial statements continued
1 Accounting information and policies (continued)Business combinationsBusiness combinations are accounted for using the acquisitionaccounting method. This involves recognising identifiable assets and liabilities of the acquired business at fair value.
Acquisitions of minority interests are accounted for using the parententity method, whereby the difference between the consideration and the book value of the share of the net assets acquired is recognisedas goodwill.
GoodwillGoodwill (being the difference between the fair value of considerationpaid for new interests in group companies, joint ventures andassociates and the fair value of the Group’s share of their netidentifiable assets and contingent liabilities at the date of acquisition)is capitalised. Goodwill is not amortised, but is subject to an annualreview for impairment (or more frequently if necessary). Anyimpairment is charged to the income statement as it arises.
For the purpose of impairment testing, goodwill acquired in abusiness combination is, from the acquisition date, allocated to eachof the Group’s cash generating units, or groups of cash generatingunits, that are expected to benefit from the synergies of thecombination, irrespective of whether other assets or liabilities of theacquired business are assigned to those units or group of units. Eachunit or group of units to which the goodwill is allocated representsthe lowest level within the Group at which the goodwill is monitoredfor internal management purposes, and is not larger than a segmentbased on either the Group’s primary or the Group’s secondaryreporting format.
Intangible assetsOn acquisition of group companies, Unilever recognises anyspecifically identifiable intangible assets separately from goodwill,initially measuring the intangible assets at fair value. Separatelypurchased intangible assets are initially measured at cost. Finite-livedintangible assets mainly comprise patented and non-patentedtechnology, know-how and software. These assets are capitalised and amortised on a straight-line basis in the income statement overthe period of their expected useful lives, or the period of legal rights if shorter, none of which exceeds ten years. Periods in excess of fiveyears are used only where the Directors are satisfied that the life ofthese assets will clearly exceed that period.
Indefinite-lived intangibles are not amortised, but are subject to anannual review for impairment (or more frequently if necessary).
Unilever monitors the level of product development costs against all the criteria set out in IAS 38. These include the requirement toestablish that a flow of economic benefits is probable before costs arecapitalised. For Unilever this is evident only shortly before a product islaunched into the market. The level of costs incurred after thesecriteria have been met is currently insignificant.
Property, plant and equipmentProperty, plant and equipment is stated at cost less depreciation and impairment. Depreciation is provided on a straight-line basis atpercentages of cost based on the expected average useful lives of theassets and their residual values which are reviewed periodically.Estimated useful lives by major class of assets are as follows:
Freehold buildings 40 years(no depreciation on freehold land)Leasehold buildings 40 years*Plant and equipment 2–20 years*or life of lease if less than 40 years
Property, plant and equipment is subject to review for impairmentif triggering events or circumstances indicate that this is necessary.Any impairment is charged to the income statement as it arises.
Other non-current assetsJoint ventures are undertakings in which the Group has an interestand which are jointly controlled by the Group and one or more otherparties. Associates are undertakings in which the Group has aninvestment and can exercise significant influence.
Interests in joint ventures and associates are accounted for using theequity method and are stated in the consolidated balance sheet at cost, adjusted for the movement in the Group’s share of their netassets and liabilities. The Group’s share of the profit or loss after tax of joint ventures and associates is included in the Group’s consolidatedprofit before taxation.
Biological assets are stated at fair value less estimated point-of-sale costs.
Financial instrumentsFinancial instruments are recognised when the Group becomes partyto the contract. They are initially measured at fair value (the transactionprice) adjusted, in the case of instruments not classified as fair valuethrough profit or loss, by directly attributable transaction costs.
Financial assetsMarket purchases and sales of financial assets are recognised usingvalue date accounting. Financial assets, other than those which arefinancial assets at fair value through profit or loss, are initiallyrecognised at fair value plus directly attributable transaction costs. Anyimpairment of a financial asset is charged to the income statement asit arises.
Financial assets are classified according to the purpose for which the investments were acquired. This gives rise to the followingcategories: held-to-maturity investments, loans and receivables,available-for-sale financial assets and financial assets at fair valuethrough profit or loss. Unilever determines the classification of itsinvestments at initial recognition.
Held-to-maturity investmentsHeld-to-maturity investments are non-derivative financial assets withfixed or determinable payments and fixed maturities that managementhas the positive intention and ability to hold to maturity. They areincluded in non-current investments at amortised cost using the effectiveinterest method, less any amounts written off to reflect impairment.
Loans and receivablesLoans and receivables are non-derivative financial assets with fixed or determinable payments that are not quoted in an active market.They arise when the Group provides money, goods or services directlyto a counterparty with no intention of trading the receivable. Loansand receivables are included in trade and other receivables in thebalance sheet at amortised cost.
Short-term loans and receivables are initially measured at originalinvoice amount and subsequently measured after deducting anyprovision for impairment.
Available-for-sale financial assetsAvailable-for-sale financial assets are non-derivative financial assetsthat are either designated in this category or not classified in any ofthe other categories. They are included in non-current assets unlessmanagement intends to dispose of the investment within 12 monthsof the balance sheet date. When securities classified as available-for-sale are sold or impaired, the accumulated fair value adjustmentsrecognised in equity are included in the income statement. Interest onavailable-for-sale securities calculated using the effective interest ratemethod is recognised in the income statement as part of otherincome. Dividends on available-for-sale equity instruments arerecognised in the income statement as part of other income when theGroup’s right to receive payment is established.
Notes to the consolidated accounts Unilever Group

Notes to the consolidated accounts Unilever Group
74 Unilever Annual Report and Accounts 2007
Financial statements continued
1 Accounting information and policies (continued)Financial assets at fair value through profit or lossA financial asset is classified in this category if acquired principally forthe purpose of selling in the short term or if so designated. Derivativesare also classified in this category unless they are designated ashedges. Assets in this category are classified as current assets if theyare either held-for-trading or are expected to be realised within 12months of the balance sheet date. Directly attributable transactioncosts related to the purchase of the assets are expensed as incurred.Gains and losses arising from changes in fair value are included in theincome statement.
Financial liabilitiesFinancial liabilities are recognised initially at fair value, net oftransaction costs incurred. Financial liabilities are subsequently statedat amortised cost unless they are part of a fair value hedgeaccounting relationship; any difference between the amount on initialrecognition and the redemption value is recognised in the incomestatement over the period of the financial liabilities using the effectiveinterest method. Those financial liabilities that are part of a fair valuehedge accounting relationship are also recorded on an amortised costbasis, plus or minus the fair value attributable to the risk beinghedged with a corresponding entry in the income statement.
Short-term financial liabilities are measured at original invoice amount. Borrowing costs are not capitalised as part of property, plant and equipment.
Derivative financial instrumentsDerivatives are measured on the balance sheet at fair value. Theactivities of the Group expose it primarily to the financial risks ofchanges in foreign currency exchange rates and interest rates. TheGroup uses foreign exchange forward contracts, interest rate swapcontracts and forward rate agreements to hedge these exposures. The Group also uses commodity contracts to hedge futurerequirements for certain raw materials, almost always for physicaldelivery. Those contracts that can also be settled in cash are treated as a financial instrument. The Group does not use derivative financialinstruments for speculative purposes. The use of leveragedinstruments is not permitted.
Changes in the fair value of derivative financial instruments that are designated and effective as hedges of future cash flows arerecognised directly in equity, and any ineffective portion is recognisedimmediately in the income statement. If the cash flow hedge of a firmcommitment or forecasted transaction subsequently results in therecognition of a non-financial asset or a liability, then, at the time thenon-financial asset or liability is recognised, the associated gains orlosses on the derivative that had previously been recognised in equityare included in the initial measurement of the non-financial asset orliability. For hedged items that do not result in the recognition of anon-financial asset or a liability, amounts deferred in equity arerecognised in the income statement in the same period in which the hedged item affects net profit or loss.
Hedge accounting is discontinued when the hedging instrument nolonger qualifies for hedge accounting. At that time, any cumulativegain or loss on the hedging instrument recognised in equity isretained in equity until the forecasted transaction occurs. If a hedgedtransaction is no longer expected to occur, the net cumulative gain or loss recognised in equity is transferred to the income statement.
For an effective hedge of an exposure to changes in the fair value of recognised assets and liabilities, the hedged item is adjusted forchanges in fair value attributable to the risk being hedged with the corresponding entry in the income statement. Gains or losses from re-measuring the derivative, or for non-derivatives the foreigncurrency component of its carrying amount, are recognised in theincome statement.
Changes in fair value of net investment hedges in relation to foreignsubsidiaries are recognised directly in equity. Gains and lossesaccumulated in equity are included in the income statement when the foreign operation is partially disposed of or sold.
Changes in the fair value of derivative financial instruments that do not qualify for hedge accounting are recognised in the incomestatement as they arise.
Derivatives embedded in other financial instruments or other hostcontracts are treated as separate derivatives when their risks andcharacteristics are not closely related to those of host contracts andthe host contracts are carried at fair value with unrealised gains or losses reported in the income statement.
The Group also uses commodity contracts to hedge futurerequirements. Those contracts that can also be settled in cash aretreated as financial instruments.
Valuation principlesThe fair values of quoted investments are based on current bid prices.For unlisted and for listed securities where the market for a financialasset is not active the Group establishes fair value using valuationtechniques. These include the use of recent arm’s length transactions,reference to other instruments that are substantially the same anddiscounted cash flow analysis.
Impairment of financial instrumentsAt each balance sheet date the Group assesses whether there isobjective evidence that a financial asset or a group of financial assetsis impaired. In the case of equity securities classified as available-for-sale, a significant or prolonged decline in the fair value of the securitybelow its cost is considered in determining whether the securities areimpaired. If any such evidence exists for available-for-sale financialassets, the cumulative loss – measured as the difference between theacquisition cost and the current fair value, less any impairment loss onthat financial asset previously recognised in profit or loss – is removedfrom equity and recognised in the income statement. Impairmentlosses recognised in the income statement on equity instruments are not subsequently reversed through the income statement.
InventoriesInventories are valued at the lower of weighted average cost and netrealisable value. Cost comprises direct costs and, where appropriate, a proportion of attributable production overheads.
Cash and cash equivalentsFor the purpose of preparation of the cash flow statement, cash andcash equivalents includes cash at bank and in hand, highly liquidinterest bearing securities with original maturities of three months or less, and bank overdrafts.
Pensions and similar obligationsThe operating and financing costs of defined benefit plans arerecognised separately in the income statement. Service costs aresystematically allocated over the service lives of employees, andfinancing costs are recognised in the periods in which they arise. Thecosts of individual events such as past service benefit enhancements,settlements and curtailments are recognised immediately in theincome statement. Variations from expected costs, arising from theexperience of the plans or changes in actuarial assumptions, arerecognised immediately in the statement of recognised income and expense. The assets and liabilities of defined benefit plans are recognised at fair value in the balance sheet.
The charges to the income statement for defined contribution plansare the company contributions payable, and the assets and liabilitiesof such plans are not included in the balance sheet of the Group.
All defined benefit plans are subject to regular actuarial review usingthe projected unit method, either by external consultants or byactuaries employed by Unilever. Group policy is that the mostimportant plans, representing approximately 80% of the definedbenefit liabilities, are formally valued every year; other principal plans,accounting for approximately a further 15% of liabilities, have theirliabilities updated each year. Group policy for the remaining plansrequires a full actuarial valuation at least every three years. Assetvalues for all plans are updated every year.

Unilever Annual Report and Accounts 2007 75
Financial statements continued
1 Accounting information and policies (continued)TaxationIncome tax on the profit or loss for the year comprises current anddeferred tax. Income tax is recognised in the income statement exceptto the extent that it relates to items recognised directly in equity.
Current tax is the expected tax payable on the taxable income for the year, using tax rates enacted or substantively enacted at the balance sheet date, and any adjustments to tax payable in respect of previous years.
Deferred taxation is recognised using the liability method on taxabletemporary differences between the tax base and the accounting base of items included in the balance sheet of the Group. The followingtemporary differences are not provided for: goodwill not deductible fortax purposes, the initial recognition of assets or liabilities that affectneither accounting nor taxable profit, and differences relating toinvestments in subsidiaries to the extent that they will probably notreverse in the forseeable future. The amount of deferred tax provided is based on the expected manner of realisation or settlement of thecarrying amount of assets and liabilities, using tax rates prevailing at theyear end unless future rates have been enacted or substantively enacted.
A deferred tax asset is recognised only to the extent that it is probablethat future taxable profits will be available against which the asset canbe utilised. Deferred tax assets are reduced to the extent that it is nolonger probable that the related tax benefit will be realised.
ProvisionsProvisions are recognised when either a legal or constructiveobligation, as a result of a past event, exists at the balance sheet dateand where the amount of the obligation can be reliably estimated.
Segment informationSegmental information is provided on the basis of geographicalsegments and product categories. The primary format, geographicregions, is based on the management structure of the Group, whichoperates in three geographical regions.
Revenue recognitionTurnover comprises sales of goods and services after deduction ofdiscounts and sales taxes. It does not include sales between groupcompanies. Discounts given by Unilever include rebates, pricereductions and incentives given to customers, promotional couponingand trade communication costs.
Turnover is recognised when the risks and rewards of the underlyingproducts and services have been substantially transferred to thecustomer. Revenue from services is recognised as the services are performed. Interest revenue is recognised as interest accrues using the effective interest method.
Research and market support costsExpenditure on research and market support, such as advertising, is charged to the income statement when incurred.
LeasesLeases are classified as finance leases whenever the terms of the leasetransfer substantially all the risks and rewards of ownership to thelessee. All other leases are classified as operating leases.
Assets held under finance leases are recognised as non-current assetsof the Group at their fair value at the date of commencement of the lease or, if lower, at the present value of the minimum leasepayments. The corresponding liability to the lessor is included in the balance sheet as a finance lease obligation. Lease payments areapportioned between finance charges and reduction of the leaseobligation so as to achieve a constant rate of interest on theremaining balance of the liability. Finance charges are charged directly against income.
A profit or loss is recognised on a sale and leaseback transactionbased on the difference between sales proceeds and the carryingamount of the asset. Where the transaction results in a finance lease,the profit or loss is deferred and amortised over the lease term. Where the transaction results in an operating lease, any profit or loss is recognised immediately with reference to the proceeds of sale and the fair value of the asset.
Lease payments relating to operating leases are charged to theincome statement on a straight-line basis over the lease term.
Share-based paymentsThe economic cost of awarding shares and share options toemployees is reflected by recording a charge in the income statementequivalent to the fair value of the benefit awarded over the vestingperiod. The fair value is determined with reference to option pricingmodels, principally adjusted Black-Scholes models or a multinomialpricing model.
Shares held by employee share trustsThe assets and liabilities of certain PLC trusts, NV and groupcompanies which purchase and hold NV and PLC shares to satisfyoptions granted are included in the consolidated accounts. The book value of shares held is deducted from other reserves, and trusts’borrowings are included in the Group’s liabilities. The costs of thetrusts are included in the results of the Group. These shares areexcluded from the calculation of earnings per share.
Assets held for saleAssets and groups of assets and liabilities which comprise disposalgroups are classified as ‘held for sale’ when all of the following criteriaare met: a decision has been made to sell, the assets are available forsale immediately, the assets are being actively marketed, and a salehas been or is expected to be concluded within twelve months of the balance sheet date. Assets and disposal groups held for saleare valued at the lower of book value or fair value less disposal costs. Assets held for sale are not depreciated.
Critical accounting estimates and judgementsEstimates and judgements are continually evaluated and are based on historical experience and other factors, including expectations of future events that are believed to be reasonable under thecircumstances.
The preparation of financial statements requires management to makeestimates and assumptions concerning the future. The resultingaccounting estimates will, by definition, seldom equal the relatedactual results. The estimates and assumptions that have a significantrisk of causing a material adjustment to the carrying amounts ofassets and liabilities within the next financial year are discussed below.
Income statement presentationOn the face of the income statement, costs and revenues relating to restructuring, business disposals and impairments are disclosed. In addition, individual items judged to be significant are disclosedseparately. These are material in terms of nature and amount. Thesedisclosures are given in order to provide additional information to helpusers better understand financial performance.
Impairment of goodwill and indefinite-lived intangible assetsImpairment reviews in respect of goodwill and intangible assets areperformed at least annually. More regular reviews are performed ifevents indicate that this is necessary. Examples of such triggeringevents would include a significant planned restructuring, a majorchange in market conditions or technology, expectations of futureoperating losses, or negative cash flows.
The recoverable amounts of cash-generating units are determinedbased on the higher of fair value less costs to sell and value-in-usecalculations. These calculations require the use of estimates. Detailsof key assumptions made are set out in note 9 on page 86.
Notes to the consolidated accounts Unilever Group

Notes to the consolidated accounts Unilever Group
76 Unilever Annual Report and Accounts 2007
Financial statements continued
1 Accounting information and policies (continued)Retirement benefitsPension accounting requires certain assumptions to be made in orderto value our obligations and to determine the charges to be made to the income statement. These figures are particularly sensitive toassumptions for discount rates, mortality, inflation rates and expectedlong-term rates of return on assets. Details of assumptions made aregiven in note 20 on pages 103 and 104.
TaxationThe Group is subject to taxes in numerous jurisdictions. Significantjudgement is required in determining worldwide provision for taxes.There are many transactions and calculations during the ordinarycourse of business for which the ultimate tax determination isuncertain. The Group recognises liabilities for anticipated tax auditissues based on estimates of whether additional taxes will be due.Where the final tax outcome of these matters is different from theamounts that were initially recorded, such differences will impact theincome tax and deferred tax provisions in the period in which suchdetermination is made.
ProvisionsProvision is made, among other reasons, for legal matters, disputedindirect taxes, employee termination costs and restructuring where a legal or constructive obligation exists at the balance sheet date anda reliable estimate can be made of the likely outcome. The nature ofthese costs is such that judgement has to be applied to estimate thetiming and amount of cash outflows.
Recent accounting developmentsWe are currently assessing the impact of the following revisedstandards or interpretations. These changes are not expected to havea material impact on the Group’s results of operations, financialposition or disclosures.
• Amendments in IAS 1 ‘Presentation of Financial Statements’(effective from 1 January 2009) requiring information in financialstatements to be aggregated on the basis of shared characteristicsand introducing a statement of comprehensive income.
• Amendments in IAS 23 ‘Borrowing Costs’ (effective from 1 January2009) removing the option for expensing borrowing costs andrequiring mandatory capitalisation of qualifying borrowing costs.
• IFRS 8 'Operating Segments' (effective from 1 January 2009)introduces a management reporting approach to segmentreporting. The information reported would be that whichmanagement uses internally for evaluating the performance ofoperating segments and allocating resources to those segments. Itreplaces disclosure requirements in IAS 14 'Segment Reporting'.
• IFRIC 14 ‘Limit on a defined benefit asset minimum fundingrequirement and their interaction’ (effective from 1 January 2008)clarifies that a pension plan surplus can be recognised only when acompany has the unconditional right to receive the benefits of it,regardless of whether the surplus is immediately available.
• Amendments in IFRS 3 ‘Business Combinations’ and IAS 27‘Consolidated and Separate Financial Statements’ (effective from 1 July 2009) changing and updating the existing requirements orpractice on accounting for partial acquisitions, step acquisitions,acquisition-related costs, contingent consideration and transactionswith non-controlling interests.

Unilever Annual Report and Accounts 2007 77
Financial statements continued
2 Segment informationOur primary reporting segments are geographic, comprising our three operating regions of Europe, The Americas and Asia Africa. The homecountries of the Unilever Group are the Netherlands and the United Kingdom. Turnover for these two countries combined in 2007 was €3 768 million (2006: €3 710 million; 2005: €3 679 million). The combined operating profit in 2007 was €444 million (2006: €555 million; 2005: €648 million). Turnover for the United States for 2007 was €7 120 million (2006: €7 627 million; 2005: €7 550 million). No other countryhad turnover of more than 10% of the Group total.
The analysis of turnover by geographical area is stated on the basis of origin. Turnover on a destination basis would not be materially different.Inter-segment sales between geographical areas and between product areas as on page 79 are not material. Total assets and capital expenditureare based on the location of the assets. Segment results are presented on the basis of operating profit. Segment assets consist primarily ofproperty, plant and equipment, goodwill and other intangible assets, inventories and receivables. Corporate assets consist of current anddeferred tax and pension assets, cash and cash equivalents, and other current or non-current financial assets. Segment liabilities consist primarilyof trade payables and other liabilities. Corporate liabilities include financial liabilities, tax balances payable, provisions and pension and deferredtax liabilities. Capital expenditure comprises additions to property, plant and equipment and intangible assets, including additions resulting fromacquisitions. Other non-cash charges include charges to the income statement during the year in respect of share-based compensation,restructuring and other provisions.
€ million € million € million € millionThe Asia
Analysis by geographical segment Europe Americas Africa Total
2007Turnover 15 205 13 442 11 540 40 187Operating profit 1 678 1 971 1 596 5 245Net finance costs (252)Share of net profit/(loss) of joint ventures 26 74 2 102Share of net profit/(loss) of associates 50 – – 50Other income from non-current investments 39
Profit before taxation 5 184Taxation (1 128)
Net profit from continuing operations 4 056Net profit from discontinued operations 80
Net profit 4 136
2006Turnover 15 000 13 779 10 863 39 642Operating profit 1 903 2 178 1 327 5 408Net finance costs (721)Share of net profit/(loss) of joint ventures 17 60 1 78Share of net profit/(loss) of associates 36 – – 36Other income from non-current investments 30
Profit before taxation 4 831Taxation (1 146)
Net profit from continuing operations 3 685Net profit from discontinued operations 1 330
Net profit 5 015
2005Turnover 14 940 13 179 10 282 38 401Operating profit 2 064 1 719 1 291 5 074Net finance costs (613)Share of net profit/(loss) of joint ventures 11 36 – 47Share of net profit/(loss) of associates (25) 1 (1) (25)Other income from non-current investments 33
Profit before taxation 4 516Taxation (1 181)
Net profit from continuing operations 3 335Net profit from discontinued operations 640
Net profit 3 975
Notes to the consolidated accounts Unilever Group

Notes to the consolidated accounts Unilever Group
78 Unilever Annual Report and Accounts 2007
Financial statements continued
2 Segment information (continued)€ million € million € million € million
The AsiaAnalysis by geographical segment Europe Americas Africa Total
Assets2007Segment assets 14 502 10 867 6 279 31 648Joint ventures/associates 201 11 12 224
Total assets by geographical segment 14 703 10 878 6 291 31 872Corporate assets 5 430
Total assets 37 302
2006Segment assets 14 411 11 548 5 875 31 834Joint ventures/associates 78 16 9 103
Total assets by geographical segment 14 489 11 564 5 884 31 937Corporate assets 5 135
Total assets 37 072
Liabilities2007Segment liabilities 3 964 1 702 2 568 8 234Joint ventures/associates 15 10 5 30
Total liabilities by geographical segment 3 979 1 712 2 573 8 264Corporate liabilities 16 219
Total liabilities 24 483
2006Segment liabilities 4 078 1 790 2 231 8 099Joint ventures/associates 18 11 5 34
Total liabilities by geographical segment 4 096 1 801 2 236 8 133Corporate liabilities 17 267
Total liabilities 25 400
Capital expenditure2007 672 342 411 1 4252006 511 396 294 1 201
Depreciation of property, plant and equipment 2007 (381) (249) (174) (804)2006 (368) (239) (180) (787)2005 (390) (230) (150) (770)
Amortisation of finite-lived intangible assets and software2007 (76) (48) (16) (140)2006 (63) (76) (18) (157)2005 (52) (38) (9) (99)

Unilever Annual Report and Accounts 2007 79
Financial statements continued
Notes to the consolidated accounts Unilever Group
2 Segment information (continued)€ million € million € million € million
The AsiaAnalysis by geographical segment Europe Americas Africa Total
Impairment charges2007Goodwill – – – –Intangible assets – – – –
Total impairment charge – – – –
2006Goodwill (12) – – (12)Intangible assets – (2) – (2)
Total impairment charge (12) (2) – (14)
2005Goodwill – (129) (2) (131)Intangible assets – (241) (10) (251)Other – – (15) (15)
Total impairment charge – (370) (27) (397)
Other non-cash charges2007 (366) (216) (66) (648)2006 (679) (231) (52) (962)2005 (224) (311) (53) (588)
Analysis by product areaAlthough the Group’s operations are managed on a geographical basis, the two Foods and Home and Personal Care categories manage brandswhich we group into our principal product areas; these are secondary reporting segments and are listed below.
Savoury, dressings and spreads – including sales of soups, bouillons, sauces, snacks, mayonnaise, salad dressings, olive oil, margarines andspreads, and cooking products such as liquid margarines.Ice cream and beverages – including sales of ice cream, tea, weight management products, and nutritionally enhanced staples sold indeveloping markets.Personal care – including sales of skin care and hair care products, deodorants and anti-perspirants, and oral care products.Home care and other operations – including sales of home care products, such as laundry powders and liquids, and a wide range of cleaningproducts. To support our consumer brands, we own tea plantations, the results of which are reported within this segment.
€ million € million € million € million € millionHome
Savoury, Ice cream caredressings and Personal and
Analysis by product area and spreads beverages care other Total
2007Turnover 13 988 7 600 11 302 7 297 40 187Operating profit 2 059 809 1 786 591 5 245Net finance costs (252)Share of net profit/(loss) of joint ventures 15 85 1 1 102Share of net profit/(loss) of associates – – – 50 50Other income from non-current investments 39
Profit before taxation 5 184Taxation (1 128)
Net profit from continuing operations 4 056Net profit from discontinued operations 80
Net profit 4 136
2006Turnover 13 767 7 578 11 122 7 175 39 642Operating profit 1 993 900 1 913 602 5 408Net finance costs (721)Share of net profit/(loss) of joint ventures 13 64 1 – 78Share of net profit/(loss) of associates – – – 36 36Other income from non-current investments 30
Profit before taxation 4 831Taxation (1 146)
Net profit from continuing operations 3 685Net profit from discontinued operations 1 330
Net profit 5 015

80 Unilever Annual Report and Accounts 2007
Financial statements continued
Notes to the consolidated accounts Unilever Group
2 Segment information (continued)€ million € million € million € million € million
HomeSavoury, Ice cream care
dressings and Personal andAnalysis by product area and spreads beverages care other Total
2005Turnover 13 557 7 332 10 485 7 027 38 401Operating profit 2 026 609 1 793 646 5 074Net finance costs (613)Share of net profit/(loss) of joint ventures 10 36 1 – 47Share of net profit/(loss) of associates – – – (25) (25)Other income from non-current investments 33
Profit before taxation 4 516Taxation (1 181)
Net profit from continuing operations 3 335Net profit from discontinued operations 640
Net profit 3 975
Assets2007 Segment assets 19 794 4 434 3 752 3 668 31 648Joint ventures/associates 19 134 12 59 224
Total assets by product area 19 813 4 568 3 764 3 727 31 872Corporate assets 5 430
Total assets 37 302
2006 Segment assets 20 435 4 485 3 616 3 298 31 834Joint ventures/associates 29 24 7 43 103
Total assets by product area 20 464 4 509 3 623 3 341 31 937Corporate assets 5 135
Total assets 37 072
Capital expenditure 2007 451 350 383 241 1 4252006 387 327 195 292 1 201

Unilever Annual Report and Accounts 2007 81
Financial statements continued
Notes to the consolidated accounts Unilever Group
3 Gross profit and operating costs€ million € million € million
2007 2006 2005
Turnover 40 187 39 642 38 401Cost of sales (20 558) (20 093) (19 539)
Gross profit 19 629 19 549 18 862Distribution and selling costs (9 489) (9 486) (9 078)Administrative expenses(a) (4 895) (4 655) (4 710)
Operating profit 5 245 5 408 5 074
(a) Includes amortisation of finite-lived intangible assets and impairment of goodwill and intangible assets.
The following items are disclosed on the face of the income statement as separate disclosure provides additional information to users to help them better understand underlying business performance.
€ million € million € million2007 2006 2005
Restructuring (875) (704) (328)Business disposals, impairments and other:
Gain/(loss) on disposals of group companies 297 179 132Impairments – (14) (397)(Provision for)/release of Brazilian sales tax 9 31 16
Gains on US healthcare and UK pensions – 266 –
Restructuring costs are incurred as Unilever continues to simplify the organisation, reorganise operations and support functions and redevelop theportfolio. They primarily relate to redundancy and retirement costs. The significant costs incurred in 2007 are in respect of new multi-countryorganisations announced and several factory closures. Business disposals generate both costs and revenues which are not reflective of underlyingperformance. Impairment charges are primarily recognised for goodwill other than where included in restructuring or as part of business disposals.In 2005 an impairment charge of €363 million was recognised in respect of Slim•Fast.
The gains on US healthcare arose from the introduction of an annual cap on the benefits which each participant can claim. The gain in the UKresulted from reducing deferred pensions where they are taken early.
Other items within operating costs include:€ million € million € million
2007 2006 2005
Staff costs (5 537) (5 355) (5 745)Raw and packaging materials and goods purchased for resale (15 588) (15 655) (15 106)Amortisation of finite-lived intangible assets and software (140) (157) (99)Depreciation of property, plant and equipment (804) (787) (770)Advertising and promotions (5 289) (5 203) (4 918)Exchange gains/(losses): (15) (25) 19
On underlying transactions (10) (10) (6)On covering forward contracts (5) (15) 25
Lease rentals: (477) (451) (421)Minimum operating lease payments (488) (455) (423)Contingent operating lease payments – (3) (3)Less: Sub-lease income relating to operating lease agreements 11 7 5
Total expenditure on research and development in 2007, including costs incurred under some of the headings reported above, was €868 million(2006: €906 million; 2005: €932 million).

82 Unilever Annual Report and Accounts 2007
Financial statements continued
Notes to the consolidated accounts Unilever Group
4 Staff costs€ million € million € million
Staff costs 2007 2006 2005
Remuneration of employees (4 409) (4 377) (4 456)Emoluments of Executive Directors (9) (8) (11)Pensions and other post-employment benefits(a) (321) (132) (384)Social security costs (646) (718) (702)Share-based compensation costs (152) (120) (192)
(5 537) (5 355) (5 745)
(a) In 2006 includes gains of €266 million arising from changes in US post-retirement healthcare plans and UK pension plans.
’000 ’000 ’000Average number of employees during the year 2007 2006 2005
Europe 44 47 51The Americas 44 46 46Asia Africa 87 96 115
175 189 212
5 Net ffinance costs€ million € million € million
Finance costs 2007 2006 2005
Finance costs (550) (590) (689)
Bank loans and overdrafts (62) (93) (90)Bonds and other loans (493) (499) (569)Dividends paid on preference shares (7) (6) (11)Net gain/(loss) on derivatives designated as a fair value hedge for which no hedge accounting is applied: 12 8 (19)
On interest rate swaps (1) (6) (11)On foreign exchange derivatives 538 1 035 (798)Exchange difference on underlying items (525) (1 021) 790
Preference shares provision(a) (7) (300) –Finance income 147 128 129Pensions and similar obligations(b) 158 41 (53)
(252) (721) (613)
(a) For further information please refer to note 19 on page 102.(b) Net finance costs in respect of pensions and similar obligations are analysed in note 20 on page 106.

Unilever Annual Report and Accounts 2007 83
Financial statements continued
Notes to the consolidated accounts Unilever Group
6 Taxation€ million € million € million
Tax charge in income statement 2007 2006 2005
Current taxCurrent year (1 118) (1 171) (1 172)Over/(under) provided in prior years(a) 226 206 107
(892) (965) (1 065)Deferred taxOrigination and reversal of temporary differences (261) (171) (123)Changes in tax rates 21 (15) 2Utilisation of unrecognised losses brought forward 4 5 5
(236) (181) (116)
(1 128) (1 146) (1 181)
(a) Provisions have been released following the favourable settlement of prior year tax audits for amounts provided for tax in prior years in anumber of countries, including the Netherlands, the UK and the US, none of which is individually material.
Europe is considered to be Unilever’s domestic tax base. The reconciliation between the computed weighted average rate of income taxexpense, which is generally applicable to Unilever’s European companies, and the actual rate of taxation charged is as follows:
% % %Reconciliation of effective tax rate 2007 2006 2005
Computed rate of tax(b) 27 30 31Differences due to:Other rates applicable to non-European countries 2 1 –Incentive tax credits (6) (7) (5)Withholding tax on dividends 2 1 2Adjustments to previous years (5) (4) (2)Expenses not deductible for tax purposes 2 2 2Utilisation of previously unrecognised tax losses – – (1)Other – 1 (1)
Effective tax rate 22 24 26
(b) The computed tax rate used is the average of the standard rate of tax applicable in the European countries in which Unilever operates,weighted by the amount of profit before taxation generated in each of those countries.

84 Unilever Annual Report and Accounts 2007
Financial statements continued
Notes to the consolidated accounts Unilever Group
6 Taxation (continued)The following tables analyse profit before taxation and actual taxation charges between those arising in Europe and elsewhere.
€ million € million € million2007 2006 2005
Profit before taxationEuropeParent and group companies 2 332 2 266 2 379Share of net profit/(loss) of joint ventures 26 17 11Share of net profit/(loss) of associates 50 36 (20)
2 408 2 319 2 370Outside EuropeGroup companies 2 700 2 451 2 115Share of net profit/(loss) of joint ventures 76 61 36Share of net profit/(loss) of associates – – (5)
2 776 2 512 2 146
5 184 4 831 4 516
TaxationEuropeParent and group companies:Current taxes payable (208) (359) (414)
Deferred taxation (202) (174) (162)
Accelerated depreciation 27 2 22Pensions (196) (196) (123)Provisions 35 24 (25)Goodwill and intangible assets (59) 4 (48)Other (9) (8) 12
(410) (533) (576)
Outside EuropeGroup companies:Current taxes payable (684) (606) (651)
Deferred taxation (34) (7) 46
Accelerated depreciation 2 25 (40)Pensions (2) (142) 28Provisions 63 16 (78)Goodwill and intangible assets (62) 98 123Other (35) (4) 13
(718) (613) (605)
(1 128) (1 146) (1 181)

Unilever Annual Report and Accounts 2007 85
Financial statements continued
Notes to the consolidated accounts Unilever Group
7 Combined earnings per share€ € €
Combined earnings per share 2007 2006 2005
From continuing operationsBasic earnings per share 1.32 1.19 1.07Diluted earnings per share 1.28 1.15 1.04
From discontinued operationsBasic earnings per share 0.03 0.46 0.22Diluted earnings per share 0.03 0.45 0.21
From total operationsBasic earnings per share 1.35 1.65 1.29Diluted earnings per share 1.31 1.60 1.25
Basis of calculationThe calculations of combined earnings per share are based on the net profit attributable to ordinary capital divided by the average number ofshare units representing the combined ordinary capital of NV and PLC in issue during the year, after deducting shares held as treasury stock.Earnings per share are calculated on the basis of the revised nominal share values which have been applied since 22 May 2006 and whichresulted in a one-to-one equivalence of ordinary shares of NV and PLC as regards their economic interest in the Group. For further informationplease refer to note 22 on page 109.
The calculations of diluted earnings per share are based on: (i) conversion into PLC ordinary shares of the shares in a group company which areconvertible in the year 2038, as described in Corporate governance on page 42; (ii) conversion of the €0.05 NV preference shares, details ofwhich are set out below and in note 16 on page 94; (iii) the effect of share-based compensation plans, details of which are set out in note 29on pages 117 to 119; and (iv) the forward equity contract described in note 29 on page 119.
On 15 February 2005, Unilever converted its €0.05 NV preference shares into ordinary €0.51 NV shares. The conversion was made using sharesalready held by Unilever for the purposes of satisfying the Group’s share-based compensation plans. Unilever bought further ordinary shares inthe market during 2005 to the extent required to restore the hedging position. Until the date of conversion, the €0.05 preference shares werepotentially dilutive for the purposes of the calculation of fully diluted earnings per share, as shown below. At midnight on 13 July 2005 the€0.05 NV preference shares were cancelled.
Millions of share unitsCalculation of average number of share units 2007 2006 2005
Average number of shares: NV 1 714.7 1 714.7 1 714.7PLC 1 310.2 1 310.2 1 310.2
Less shares held by employee share trusts and companies (150.3) (141.6) (111.9)
Combined average number of share units for all bases except diluted earnings per share 2 874.6 2 883.3 2 913.0Add shares issuable in 2038 70.9 70.9 70.9Add shares for conversion – – 7.1Add dilutive effect of share-based compensation plans and forward equity contract 30.6 18.3 16.0
Adjusted combined average number of share units for diluted earnings per share basis 2 976.1 2 972.5 3 007.0
€ million € million € millionCalculation of earnings 2007 2006 2005
For earnings per share from total operations:Net profit attributable to ordinary capital for total operations 3 888 4 745 3 766
For earnings per share from continuing operations:Net profit from continuing operations 4 056 3 685 3 335Minority interest in continuing operations (248) (266) (205)
Net profit attributable to ordinary capital for continuing operations 3 808 3 419 3 130
The numbers of shares included in the calculation of earnings per share is an average for the period. These numbers are influenced by the sharebuy-back programme that we undertook during 2007. During that period the following movements in shares took place:
Millions of share units
Number of shares at 31 December 2006 (net of treasury stock) 2 889.9Net movements in shares under incentive schemes 29.7Share buy-back (66.5)
Number of shares at 31 December 2007 2 853.1
On 11 February 2008, Unilever announced a share buy-back programme of at least €1.5 billion in 2008.

86 Unilever Annual Report and Accounts 2007
Financial statements continued
Notes to the consolidated accounts Unilever Group
8 Dividends on ordinary capital€ million € million € million
Dividends paid on ordinary capital during the year 2007 2006 2005
Final NV dividend for the prior year of €0.47 per share (2006: €0.44; 2005 €0.42) (767) (722) (710)Final PLC dividend for the prior year of 32.04p per share (2006: 30.09p; 2005: 28.49p) (589) (547) (519)Interim NV dividend for the year of €0.25 per share (2006: €0.23; 2005 €0.22) (400) (379) (363)Interim PLC dividend for the year of 17.00p per share (2006: 15.62p; 2005 15.04p) (314) (285) (275)One-off NV dividend of €0.26 per share in 2006 – (428) –One-off PLC dividend of 17.66p per share in 2006 – (323) –
(2 070) (2 684) (1 867)
Of which:NV dividends (1 167) (1 529) (1 073)PLC dividends (903) (1 155) (794)
The proposed final dividends on ordinary capital for the year 2007 have to be approved by shareholders at the Annual General Meetings. Inaccordance with IFRS, no provision for the amount of this dividend, estimated at €1 427 million, has been recognised in the financial statements for the year ended 31 December 2007.
Full details of dividends per share for the years 2003 to 2007 are given on page 141.
9 Goodwill and intangible assets
Indefinite-lived intangible assets principally comprise those trademarks for which there is no foreseeable limit to the period over which they areexpected to generate net cash inflows. These are considered to have an indefinite life, given the strength and durability of our brands and the level of marketing support. Brands that are classified as indefinite have been in the market for many years, and the nature of the industry weoperate in is such that brand obsolescence is not common, if appropriately supported by advertising and marketing spend. Finite-lived intangibleassets, which primarily comprise patented and non-patented technology, know-how, and software, are capitalised and amortised in operatingprofit on a straight-line basis over the period of their expected useful lives, none of which exceeds ten years. The level of amortisation for finite-lived intangible assets is not expected to change materially over the next five years.
€ million € millionAt cost less amortisation and impairment 2007 2006
Goodwill 12 244 12 425Intangible assets: 4 511 4 781
Indefinite-lived intangible assets 3 921 4 174Finite-lived intangible assets 273 343Software 317 264
16 755 17 206
€ million € million € million € million € millionIndefinite- Finite-
lived livedintangible intangible
Movements during 2007 Goodwill assets assets Software Total
Cost1 January 2007 13 454 4 409 642 392 18 897Acquisitions of group companies 334 – – – 334Disposals of group companies (4) (1) – – (5)Change in useful life assumptions – (2) 2 – –Additions – – 3 133 136Disposals – – – (16) (16)Currency retranslation (602) (272) (26) (8) (908)
31 December 2007 13 182 4 134 621 501 18 438
Amortisation and impairment1 January 2007 (1 029) (235) (299) (128) (1 691)Amortisation for the year – – (64) (76) (140)Disposals – – – 16 16Currency retranslation 91 22 15 4 132
31 December 2007 (938) (213) (348) (184) (1 683)
Net book value 31 December 2007 12 244 3 921 273 317 16 755

Unilever Annual Report and Accounts 2007 87
Financial statements continued
Notes to the consolidated accounts Unilever Group
9 Goodwill and intangible assets (continued)€ million € million € million € million € million
Indefinite- Finite-lived lived
intangible intangibleMovements during 2006 Goodwill assets assets Software Total
Cost1 January 2006 14 080 4 713 631 291 19 715Acquisitions of group companies 60 8 1 – 69Disposals of group companies (1) – – – (1)Change in useful life assumptions – (32) 32 – –Additions – – 3 110 113Currency retranslation (685) (280) (25) (9) (999)
31 December 2006 13 454 4 409 642 392 18 897
Amortisation and impairment1 January 2006 (1 117) (263) (215) (65) (1 660)Amortisation for the year – – (94) (63) (157)Impairment (12) – – (2) (14)Currency retranslation 100 28 10 2 140
31 December 2006 (1 029) (235) (299) (128) (1 691)
Net book value 31 December 2006 12 425 4 174 343 264 17 206
There are no significant carrying amounts of goodwill and intangible assets that are allocated across multiple cash generating units (CGUs).
Impairments charges in the yearThere were no impairments in 2007. The impairments charged in 2006 principally related to business disposals that were completed during2007.
In 2006, Slim•Fast was fully integrated into The Americas business as part of the North American beverage operations. As a result of theintegration, Slim•Fast is no longer evaluated on a stand-alone basis but as part of the North American beverage CGU. The 2007 and 2006impairment reviews on this basis did not result in any impairments (2005: €363 million).
Significant CGUsThe goodwill and indefinite-lived intangible assets (predominantly Knorr and Hellmann’s) held in the global savoury and dressings CGU,comprising €11.1 billion (2006: €11.6 billion) and €3.2 billion (2006: €3.4 billion) respectively, are considered significant in comparison to the total carrying amounts of goodwill and indefinite-lived intangible assets at 31 December 2007. No other CGUs are considered significant in this respect.
During 2007, we conducted an impairment review of the carrying value of these assets. Value in use of the global savoury and dressings CGUhas been calculated as the present value of projected future cash flows. A pre-tax discount rate of 10% was used.
The following key assumptions were used in the discounted cash flow projections for the savoury and dressings CGU:
• a longer-term sustainable growth rate of 4%, adjusted for market fade, used to determine an appropriate terminal value multiple; • average near-term nominal growth for the major product groups within the CGU of 4%; and• average operating margins for the major product groups within the CGU ranging from 15% to 18%.
The growth rates and margins used to estimate future performance are based on past performance and our experience of growth rates andmargins achievable in our key markets as a guide. We believe that the assumptions used in estimating the future performance of the savouryand dressings CGU are consistent with past performance.
The projections covered a period of ten years as we believe this to be a suitable timescale over which to review and consider annualperformance before applying a fixed terminal value multiple to the final year cash flows of the detailed projection. Stopping the detailedprojections after five years and applying a terminal value multiple thereafter would not result in a value in use that would cause impairment.
The growth rates used to estimate future performance beyond the periods covered by our annual planning and strategic planning processes donot exceed the long-term average rates of growth for similar products.
We have performed sensitivity analysis around the base case assumptions and have concluded that no reasonably possible changes in keyassumptions would cause the recoverable amount of the global savoury and dressings CGU to be less than the carrying amount.

88 Unilever Annual Report and Accounts 2007
Financial statements continued
Notes to the consolidated accounts Unilever Group
10 Property, plant and equipment€ million € million
At cost less depreciation and impairment 2007 2006
Land and buildings 1 989 1 944Plant and equipment 4 295 4 332
6 284 6 276
Includes freehold land 207 205
Commitments for capital expenditure at 31 December 321 231
€ million € million € millionLand and Plant and
Movements during 2007 buildings equipment Total
Gross1 January 2007 2 992 10 371 13 363Disposals of group companies (12) (142) (154)Additions 346 943 1 289Disposals (98) (429) (527)Currency retranslation (116) (333) (449)Reclassification as held for sale (41) (165) (206)Other adjustments (52) 9 (43)
31 December 2007 3 019 10 254 13 273
Depreciation1 January 2007 (1 048) (6 039) (7 087)Disposals of group companies 8 102 110Depreciation charge for the year (106) (698) (804)Disposals 37 372 409Currency retranslation 36 186 222Reclassification as held for sale 24 114 138Other adjustments 19 4 23
31 December 2007 (1 030) (5 959) (6 989)
Net book value 31 December 2007 1 989 4 295 6 284
Includes payments on account and assets in course of construction 80 542 622

Unilever Annual Report and Accounts 2007 89
Financial statements continued
Notes to the consolidated accounts Unilever Group
10 Property, plant and equipment (continued)€ million € million € millionLand and Plant and
Movements during 2006 buildings equipment Total
Gross1 January 2006 3 014 10 845 13 859Acquisitions of group companies 2 6 8Disposals of group companies (130) (291) (421)Additions 150 921 1 071Disposals (80) (586) (666)Currency retranslation (136) (446) (582)Reclassification as held for sale(a) 95 (69) 26Other adjustments 77 (9) 68
31 December 2006 2 992 10 371 13 363
Depreciation 1 January 2006 (1 020) (6 347) (7 367)Disposals of group companies 50 185 235Depreciation charge for the year(b) (74) (731) (805)Disposals 45 512 557Currency retranslation 38 251 289Reclassification as held for sale(a) (18) 69 51Other adjustments (69) 22 (47)
31 December 2006 (1 048) (6 039) (7 087)
Net book value 31 December 2006 1 944 4 332 6 276
Includes payments on account and assets in course of construction 71 478 549
(a) After reinstating certain assets with gross value of €112 million and accumulated depreciation of €28 million which were previouslyclassified as held for sale.
(b) Includes €(18) million relating to discontinued operations.
Included in the above is property, plant and equipment under a number of finance lease agreements, for which the book values are as follows:
€ million € million € millionPlant and
Net book value Buildings equipment Total
Gross book value 223 342 565Depreciation (16) (204) (220)
31 December 2007 207 138 345
Gross book value 62 369 431Depreciation (20) (201) (221)
31 December 2006 42 168 210

90 Unilever Annual Report and Accounts 2007
Financial statements continued
Notes to the consolidated accounts Unilever Group
11 Other non-current assets€ million € million
2007 2006
Interest in net assets of joint ventures 150 57Interest in net assets of associates 74 46Other non-current financial assets(a): 738 735
Held-to-maturity investments 473 453Loans and receivables 13 13Available-for-sale financial assets 201 257Financial assets at fair value through profit or loss 51 12
Long-term trade and other receivables(b) 187 199Fair value of biological assets 37 36Other non-financial assets 138 53
1 324 1 126
(a) Predominantly consist of investments in a number of companies and financial institutions in India, Europe and the US, including €162 million(2006: €181 million) of assets in a trust to fund benefit obligations in the US (see also note 20 on page 103).
(b) Classified as loans and receivables.
€ million € millionMovements during 2007 and 2006 2007 2006
Joint ventures(c)
1 January 57 67Additions(d) 115 –Dividends received/reductions (122) (85)Share in net profit 102 78Currency retranslation (2) (3)
31 December 150 57
Associates(e)
1 January 12 (20)Acquisitions/(disposals) 31 5Dividends received/reductions (48) (13)Share in net profit 50 36Currency retranslation (1) 4
44 12Of which: Net liabilities of JohnsonDiversey reclassified to provisions 30 34
31 December 74 46
(c) Our principal joint ventures are the FIMA business in Portugal, Pepsi/Lipton International and the Pepsi/Lipton Partnership in the US.(d) In January 2007, the reorganisation of our Portuguese businesses was completed, whereby Unilever now has a 55% share of the combined
Portuguese entity, called Unilever Jerónimo Martins. The structure of the newly formed entity is such that there is joint control and it istherefore accounted for by Unilever as a joint venture. In December 2007 a capital contribution of €103 million was made to Pepsi/LiptonInternational.
(e) Associates primarily comprise our investments in JohnsonDiversey Holdings Inc., Palmci, Langholm Capital Partners and Physic Ventures.Other Unilever Ventures assets (excluding Langholm) are included under ‘Other non-current financial assets’ above.
€ million € millionAnalysis of listed and unlisted investments 2007 2006
Investments listed on a recognised stock exchange 388 402Unlisted investments 350 333
738 735
€ million € million € millionOther income from non-current investments 2007 2006 2005
Income from other non-current investments 19 21 20Profit/(loss) on disposal 20 9 13
39 30 33
The joint ventures and associates have no significant contingent liabilities to which the Group is exposed, and the Group has no significantcontingent liabilities in relation to its interest in the joint ventures and associates.
The Group has no outstanding capital commitments to joint ventures.
Outstanding balances with joint ventures and associates are shown in note 30 on page 120.

Unilever Annual Report and Accounts 2007 91
Financial statements continued
Notes to the consolidated accounts Unilever Group
12 Deferred taxation€ million € million € million € million € million
ReclassificationAs at 1 to liabilities As at 31January Income held for December
Movements during the year 2007 statement(a) Equity(b) disposal 2007
Pensions and similar obligations 714 (198) (316) – 200Provisions 692 93 – 1 786Goodwill and intangible assets (684) (121) 25 – (780)Accelerated tax depreciation (649) 29 20 2 (598)Tax losses 113 (32) 3 – 84Fair value gains (1) (1) (6) – (8)Fair value losses 4 – 4 – 8Share-based payments 92 (26) 35 – 101Other (18) 15 – – (3)
263 (241) (235) 3 (210)
(a) Includes €5 million charge reported under discontinued operations in the income statement.(b) Of the total movement in equity of €235 million, €7 million arises as a result of currency retranslation.
At the balance sheet date, the Group has unused tax losses of €1 471 million and tax credits amounting to €503 million available for offsetagainst future taxable profits. Deferred tax assets have not been recognised in respect of unused tax losses of €1 146 million and tax credits of €503 million, as it is not probable that there will be future taxable profits within the entities against which the losses can be utilised. Themajority of these tax losses and credits arise in tax jurisdictions where they do not expire with the exception of €456 million of state and federal tax losses in the US which expire between now and 2027.
Other deductible temporary differences of €123 million have not been recognised as a deferred tax asset. There is no expiry date for thesedifferences.
At the balance sheet date, the aggregate amount of temporary differences associated with undistributed earnings of subsidiaries for whichdeferred tax liabilities have not been recognised was €1 059 million (2006: €755 million). No liability has been recognised in respect of thesedifferences because the Group is in a position to control the timing of the reversal of the temporary differences, and it is probable that suchdifferences will not reverse in the foreseeable future.
Deferred income tax assets and liabilities are offset when there is a legally enforceable right to set off current tax assets against current taxliabilities and when the deferred income taxes relate to the same fiscal authority. The following amounts, determined after appropriateoffsetting, are shown in the consolidated balance sheet:
€ million € million € million € million € million € millionAssets Assets Liabilities Liabilities Total Total
Deferred tax assets and liabilities 2007 2006 2007 2006 2007 2006
Pensions and similar obligations 514 925 (314) (211) 200 714Provisions 750 670 36 22 786 692Goodwill and intangible assets (223) (194) (557) (490) (780) (684)Accelerated tax depreciation (234) (328) (364) (321) (598) (649)Tax losses 85 112 (1) 1 84 113Fair value gains (3) (1) (5) – (8) (1)Fair value losses 8 4 – – 8 4Share-based payments 101 92 – – 101 92Other 5 (14) (8) (4) (3) (18)
1 003 1 266 (1 213) (1 003) (210) 263
Of which deferred tax to be recovered/(settled) after more than 12 months 484 460 (1 111) (621) (627) (161)
13 Inventories€ million € million
Inventories 2007 2006
Raw materials and consumables 1 406 1 360Finished goods and goods for resale 2 488 2 436
3 894 3 796
Inventories with a value of €101 million (2006: €96 million) are carried at net realisable value, this being lower than cost. During 2007,€177 million (2006: €160 million) was charged to the income statement for damaged, obsolete and lost inventories. In 2007, €25 million (2006: €34 million) was utilised or released to the income statement from inventory provisions taken in earlier years.
In 2007, inventories with a carrying amount of €4 million were pledged as security for certain of the Group’s borrowings (2006: €6 million).

92 Unilever Annual Report and Accounts 2007
Financial statements continued
Notes to the consolidated accounts Unilever Group
14 Trade and other receivables€ million € million
Trade and other receivables 2007 2006
Due within one yearTrade receivables 2 965 3 054Prepayments and accrued income 467 441Other receivables 762 759
4 194 4 254
Credit terms for customers are determined in individual territories. Concentrations of credit risk with respect to trade receivables are limited, dueto the Group’s customer base being large and diverse. Our historical experience of collecting receivables, supported by the level of default, isthat credit risk is low across territories and so trade receivables are considered to be a single class of financial assets. Other receivables compriseloans and receivables of €362 million (2006: €413 million) and other non-financial assets of €400 million (2006: €346 million).
€ million € millionAgeing of trade receivables 2007 2006
Total trade receivables 3 112 3 214Less impairment provision for trade receivables (147) (160)
2 965 3 054
Of which:Not overdue 2 240 2 433Past due less than three months 649 534Past due more than three months but less than six months 85 82Past due more than six months but less than one year 57 53Past due more than one year 81 112Impairment provision for trade receivables (147) (160)
2 965 3 054
€ million € millionImpairment provision for trade and other receivables – movements during the year 2007 2006
1 January 180 258Charged to current year income statement 39 38Reductions/releases (40) (107)Currency retranslation (3) (9)
31 December 176 180
15 Cash and cash equivalents and other financial assets€ million € million
Cash and cash equivalents and other financial assets 2007 2006
Cash and cash equivalentsCash at bank and in hand 507 469Short-term deposits with maturity of less than three months 500 390Other cash equivalents(a): 91 180
1 098 1 039
Other financial assets(b)
Held-to-maturity investments 15 36Loans and receivables 2 9Available-for-sale financial assets 91 171Financial assets at fair value through profit or loss(c) 108 57
216 273
Of which:Listed 41 47Unlisted 175 226
216 273
(a) Other cash equivalents are wholly comprised of available-for-sale financial assets.(b) Other financial assets include government securities, A minus or higher rated money, capital market instruments and derivatives.(c) Financial assets at fair value through profit and loss include derivatives amounting to €78 million (2006: €36 million).

Unilever Annual Report and Accounts 2007 93
Financial statements continued
Notes to the consolidated accounts Unilever Group
15 Cash and cash equivalents and other financial assets (continued)
€ million € million € millionCash and cash equivalents included in the cash flow statement 2007 2006 2005
Cash and cash equivalents as per balance sheet 1 098 1 039 1 529Cash and cash equivalents in businesses held for sale – – 1Bank overdrafts (197) (329) (265)
901 710 1 265
Interest rate profile and currency analysis of financial assetsThe table set out below takes into account the various interest rate swaps and forward foreign currency contracts entered into by the Group,details of which are set out in note 17 on pages 97 to 101.
The interest rate profiles of the Group’s financial assets analysed by principal currency are set out in the table below:
€ million € million € millionFixed Fixed Fixed Floating Floatingrate rate rate rate rate Total
Amount Average Weighted Interestof fixing interest rate average rate for
for following for following fixing followingyear year period year
Assets – 2007Euro 12 4.6% 0.5 years 358 4.5% 370Sterling 541 6.2% 0.7 years 1 250 5.3% 1 791(a)
US dollar – 4 3.4% 4Indian rupee – 205 9.0% 205Brazilian real – 151 11.2% 151Other – 577 7.5% 577
553 2 545 3 098Sterling leg of currency derivatives mainly relating to intra-group loans(a) (1 784)
Total 1 314(b)
Assets – 2006Euro 1 3.1% 0.1 years 243 4.1% 244Sterling 1 549 5.3% 1.0 years 1 196 5.6% 2 745(a)
US dollar – 8 5.4% 8Indian rupee – 403 8.8% 403Brazilian real – 49 13.2% 49Other – 586 6.5% 586
1 550 2 485 4 035Sterling leg of currency derivatives mainly relating to intra-group loans(a) (2 723)
Total 1 312(b)
(a) Includes the sterling leg of the currency derivatives mainly relating to intra-group loans, amounting to €1 784 million for 2007 (2006: €2 723 million). These derivatives create a sterling interest rate exposure. However, to reconcile the assets with the balance sheet,the total value is eliminated again. The other leg of the currency derivatives is shown in note 16 as a liability.
(b) Includes fair value of financial liability-related derivatives amounting to €78 million (2006: €36 million).

94 Unilever Annual Report and Accounts 2007
Financial statements continued
Notes to the consolidated accounts Unilever Group
16 Financial liabilities€ million € million
Financial liabilities 2007 2006
Preference shares 124 124Bank loans and overdrafts 1 212 1 307Bonds and other loans
At amortised cost 7 907 6 561Subject to fair value hedge accounting – 609
Finance lease creditors 311 187Derivatives 95 47
9 649 8 835
All the preference shares and the bank loans and overdrafts are valued at amortised cost.
€ million € millionFinancial liabilities – additional details 2007 2006
The repayments fall due as followsWithin one year:Bank loans and overdrafts 785 743Bonds and other loans 3 239 3 619Finance lease creditors 65 61Derivatives 77 35
Total due within one year 4 166 4 458
After one year but within two years 1 087 448After two years but within three years 1 325 330After three years but within four years 34 1 358After four years but within five years 797 10After five years 2 240 2 231
Total due after more than one year 5 483 4 377
Secured financial liabilities 5 –
Of which secured against property, plant and equipment – –
€ million € million € million € millionIssued,
Number Nominal Number called upof shares value of shares and fully Statutory
authorised Authorised per share issued paid Reserve Total
Preference shares NV as at 31 December 20077% Cumulative Preference 75 000 32 €428.57 29 000 12 1 136% Cumulative Preference(a) 200 000 86 €428.57 161 060 69 4 734% Cumulative Preference 750 000 32 €42.86 750 000 32 2 34Share premium 4 4
150 117 7 124
Preference shares NV as at 31 December 20067% Cumulative Preference 75 000 32 €428.57 29 000 12 1 136% Cumulative Preference(a) 200 000 86 €428.57 161 060 69 4 734% Cumulative Preference 750 000 32 €42.86 750 000 32 2 34Share premium 4 4
150 117 7 124
(a) The 6% cumulative preference shares are traded in the market in units of one tenth of their nominal value.
The 7%, 6% and 4% cumulative preference shares of NV are entitled to dividends at the rates indicated. The 4% preference capital of NV isredeemable at par at the company‘s option either wholly or in part. The other classes of preferential share capital of NV are not unilaterallyredeemable by the company.
At the Annual General Meeting of NV held on 8 May 2006 it was agreed to convert the nominal value of all classes of shares from guilders intoeuros. The 7% and 6% preference shares with a nominal value of Fl.1 000 each, were converted into shares with a nominal value of €428.57each, and the 4% preference shares with a nominal value of Fl.100 each, were converted into shares with a nominal value of €42.86 each. The effect of this was to adjust their reported value, with the difference being held as a statutory reserve.
In order to maintain the same economic rights for the preference shares as before the euro conversion, it was decided that their entitlement todividend and liquidation proceeds remains linked, using the official euro conversion rate, to the amount in Dutch guilders originally paid up onthese shares. The euro conversion did not alter the dividend entitlements of the cumulative preference shares.

Unilever Annual Report and Accounts 2007 95
Financial statements continued
Notes to the consolidated accounts Unilever Group
16 Financial liabilities (continued)Additional detailsDetails of specific bonds and other loans are given below:
€ million € million € million € millionAmortised Fair Amortised Fair
cost value cost value2007 2007(a) 2006 2006(a)
Unilever N.V.4.250% Bonds 2007 (€) – – 505 5005.000% Bonds 2007 (US $) – – 490 –Floating rate note 2009 (€) 750 – – –4.625% Bonds 2012 (€) 747 – – –3.375% Bonds 2015 (€) 747 – 747 –Other – – 7 –
Total Unilever N.V. 2 244 – 1 749 500
Other group companies
NetherlandsCommercial paper (€) 1 526 – 770 –Commercial paper (£) 45 – 532 –Commercial paper (US $) 487 – 236 –Commercial paper (Swiss francs) 29 – 63 –Commercial paper (Canadian $) 12 – – –
United StatesFloating rate extendible note 2009 (US $)(b) 340 – – –7.125% Bonds 2010 (US $) 1 184 – 1 321 –7.000% Bonds 2017 (US $) 99 – 110 –7.250% Bonds 2026 (US $) 195 – 217 –6.625% Bonds 2028 (US $) 149 – 166 –5.900% Bonds 2032 (US $) 668 – 746 –5.600% Bonds 2097 (US $) 62 – 69 –Commercial paper (US $) 732 – 259 –Other 8 – 8 –
Thailand3.300% Bonds 2007 (Thai baht) – – 139 –
South Africa10.200% Bonds 2008 (South African rand) 100 – – 109Commercial paper (South African rand) – – 27 –
Other countries 27 – 149 –
Total other group companies 5 663 – 4 812 109
Total bonds and other loans 7 907 – 6 561 609
(a) Values are based on fair value hedge accounting and do not include a valuation of the credit risk.(b) Of which €292 million will be repaid in 2008.
ReclassificationsDuring 2007, Unilever discontinued fair value hedge accounting for 10.200% Bonds 2008 (South African Rand). On the date the hedge accounting discontinued, the fair value became the new value at amortised cost.

96 Unilever Annual Report and Accounts 2007
Financial statements continued
Notes to the consolidated accounts Unilever Group
16 Financial liabilities (continued)Interest rateThe average interest rate on short-term borrowings in 2007 was 4.5% (2006: 3.6%).
Interest rate profile and currency analysis of financial liabilitiesThe table set out below takes into account the various interest rate swaps and forward foreign currency contracts entered into by the Group,details of which are set out in note 17 on pages 97 to 101. The interest rate profiles of the Group’s financial liabilities analysed by principalcurrency are set out in the table below:
€ million € million € millionFixed Fixed Fixed Floating Floatingrate rate rate rate rate Total
Amount Average Weighted Interestof fixing interest rate average rate for
for following for following fixing followingyear year period year
Liabilities – 2007Euro(c) 2 073 4.3% 5.0 years 980 4.5% 3 053Sterling 168 6.4% 19.8 years 98 5.3% 266US dollar 3 259 6.2% 10.9 years 1 853 3.4% 5 112Swedish krona – 741 4.9% 741Swiss francs – 699 3.1% 699Japanese yen 240 1.0% 1.5 years 99 1.1% 339Thai baht 139 3.5% 0.9 years 43 4.2% 182Australian dollar 3 5.3% 12.0 years 192 7.7% 195Other 90 11.8% 2.5 years 756 6.7% 846
5 972 5 461 11 433Euro leg of currency derivatives mainly relating to intra-group loans(d) (1 784)
Total 9 649(e)
Liabilities – 2006Euro(c) 1 771 3.4% 4.5 years 383 4.1% 2 154Sterling 140 7.8% 20.8 years 143 5.6% 283US dollar 3 444 6.6% 12.2 years 2 687 5.4% 6 131Swedish krona – 830 3.8% 830Swiss francs – 519 2.4% 519Japanese yen 1 4.0% 0.5 years 377 0.8% 378Thai baht 139 3.2% 0.9 years 85 5.2% 224Australian dollar 3 5.3% 12.0 years 387 6.7% 390Other 99 11.9% 3.6 years 550 8.3% 649
5 597 5 961 11 558Euro leg of currency derivatives mainly relating to intra-group loans(d) (2 723)
Total 8 835(e)
(c) Euro financial liabilities include €124 million preference shares that provide for a fixed preference dividend.(d) Includes the euro leg of the currency derivatives mainly relating to intra-group loans, amounting to €1 784 million for 2007 (2006: €2 723
million). These derivatives create an interest rate exposure in euros. However, to reconcile the liability with the balance sheet, the total valueis eliminated again. The other leg of the currency derivatives is shown in note 15 on page 93 as an asset.
(e) Includes finance lease creditors amounting to €311 million (2006: €187 million) and fair value of financial liability-related derivativesamounting to €95 million (2006: €47 million).

Unilever Annual Report and Accounts 2007 97
Financial statements continued
17 Financial instruments and treasury risk managementTreasury Risk ManagementUnilever manages a variety of market risks, including the effects of changes in foreign exchange rates, interest rates, liquidity and counterpartyrisks.
Currency risksBecause of Unilever’s broad operational reach, it is subject to risks from changes in foreign currency values that could affect earnings. As a practicalmatter, it is not feasible to fully hedge these fluctuations. Additionally, Unilever believes that most currencies of major countries in which it operateswill equalise against the euro over time. Unilever does have a foreign exchange policy that requires operating companies to manage trading andfinancial foreign exchange exposures within prescribed limits. This is achieved primarily through the use of forward foreign exchange contracts. Ona case by case basis, depending on potential income statement volatility that can be caused by the fair value movement of the derivative,companies decide whether or not to apply cash flow hedge accounting. Regional groups monitor compliance with this foreign exchange policy. Atthe end of 2007, there was no material exposure from companies holding assets and liabilities other than in their functional currency.
In addition, as Unilever conducts business in many foreign currencies but publishes its financial statements and measures its performance in euros,it is subject to exchange risk due to the effects that exchange rate movements have on the translation of the underlying net assets of its foreignsubsidiaries. Unilever aims to minimise its foreign exchange exposure in operating companies by borrowing in the local currency, except whereinhibited by local regulations, lack of local liquidity or local market conditions. For those countries that in the view of management have asubstantial retranslation risk, Unilever may decide on a case by case basis, taking into account amongst others the impact on the incomestatement, to hedge such net investment. This is achieved through the use of forward foreign exchange contracts on which hedge accounting isapplied. Nevertheless, from time to time, currency revaluations on unhedged investments will trigger exchange translation movements in thebalance sheet.
Interest rate risksUnilever has an interest rate management policy aimed at achieving an optimal balance between fixed and floating rate interest rate exposures onexpected net debt (gross borrowings minus cash and cash equivalents) levels for the next five calendar years. The objective of the policy is tominimise annual interest costs and to reduce volatility. This is achieved by issuing fixed rate long-term debt and by modifying the interest rateexposure of debt and cash positions through the use of interest rate swaps. The fixing levels per calendar year are determined by fixing bands, withminimum and maximum fixing level percentages, decreasing by 10 percentage points per calendar year. The minimum level in the first yearamounts to 50% and the maximum level amounts to 90%. The minimum level is set to avoid unacceptable interest cost volatility and themaximum level is set to prevent over-fixing, recognising that future debt levels can be volatile.
At the end of 2007, interest rates were fixed on approximately 68% of the projected net of cash and financial liability positions for 2008 and 53%for 2009 (compared with 48% for 2007 and 52% for 2008 at the end of 2006).
Liquidity riskA material and sustained shortfall in our cash flow could undermine our credit rating and overall investor confidence and could restrict the Group’sability to raise funds.
Operational cash flow provides the funds to service the financing of financial liabilities and enhance shareholder return. Unilever manages theliquidity requirements by the use of short-term and long-term cash flow forecasts. Unilever maintains access to global debt markets through aninfrastructure of short-term and long-term debt programmes. In addition to this, Unilever has committed credit facilities in place to support itscommercial paper programmes and for general corporate purposes.
Unilever had the following undrawn committed facilities at 31 December 2007:
• revolving 364-day bilateral credit facilities of in aggregate US $3 630 million (2006: US $3 930 million) with a 364-day term out;• revolving 364-day notes commitments of US $200 million (2006: US $200 million) with the ability to issue notes with a maturity up to
364 days; and• 364-day bilateral money market commitments of in aggregate US $1 720 million (2006: US $1 420 million), under which the
underwriting banks agree, subject to certain conditions, to subscribe for notes with maturities of up to three years.
These facilities have been renewed until November 2008.
The revolving five-year bilateral credit facilities of in aggregate US $334 million and a revolving 364-day bilateral credit facility of in aggregate US $333 million matured in November 2007 and were not renewed.
The financial market turbulence and associated illiquidity in credit markets during the second half of 2007 did not impact Unilever’s ability to meetits financing requirements.
Notes to the consolidated accounts Unilever Group

Notes to the consolidated accounts Unilever Group
98 Unilever Annual Report and Accounts 2007
Financial statements continued
17 Financial instruments and treasury risk management (continued)The following table shows Unilever’s contractually agreed (undiscounted) cash flows payable under financial liabilities and derivative assets andliabilities as at the balance sheet date:
€ million € million € million € million € million € millionNet carrying
amount asDue within Due between Due between Due 3 years shown in
Undiscounted cash flows 1 year 1 and 2 years 2 and 3 years and beyond Total balance sheet
2007Non derivative financial liabilities:Financial liabilities excluding related derivatives
and finance lease creditors (4 101) (1 060) (1 314) (2 877) (9 352) (9 243)Interest on financial liabilities (304) (270) (236) (1 916) (2 726)Finance lease creditors including related finance cost (81) (41) (36) (362) (520) (311)Trade payables and other liabilities
excluding social security and sundry taxes(a) (7 643) (204) – – (7 847) (7 847)
(12 129) (1 575) (1 586) (5 155) (20 445)
Derivative financial liabilities:Interest rate derivatives:
Derivative contracts - receipts 6 4 3 2 15Derivative contracts - payments (9) (4) (3) (2) (18)
Foreign exchange derivatives:Derivative contracts - receipts 5 315 22 22 45 5 404Derivative contracts - payments (5 411) (26) (26) (52) (5 515)
(99) (4) (4) (7) (114) (116)(b)
31 December (12 228) (1 579) (1 590) (5 162) (20 559)
2006Non derivative financial liabilities:Financial liabilities excluding related derivatives
and finance lease creditors (4 338) (405) (280) (3 601) (8 624) (8 601)Interest on financial liabilities (328) (234) (219) (2 251) (3 032)Finance lease creditors including related finance cost (71) (68) (22) (135) (296) (187)Trade payables and other liabilities
excluding social security and sundry taxes(a) (7 452) (261) – – (7 713) (7 713)
(12 189) (968) (521) (5 987) (19 665)
Derivative financial liabilities:Interest rate derivatives:
Derivative contracts - receipts 2 – – – 2Derivative contracts - payments (3) (3) (2) (1) (9)
Foreign exchange derivatives:Derivative contracts - receipts 5 272 100 – – 5 372Derivative contracts - payments (5 302) (121) – – (5 423)
(31) (24) (2) (1) (58) (60)(b)
31 December (12 220) (992) (523) (5 988) (19 723)
(a) See note 18 on page 102.(b) Includes financial liability-related derivatives amounting to €(95) million (2006: €(47) million).
Credit risk on banks and received collateralCredit risk related to the use of treasury instruments is managed on a group basis. This risk arises from transactions with banks like cash and cashequivalents, deposits and derivative financial instruments. To reduce the credit risk, Unilever has concentrated its main activities with a limitedgroup of banks that have secure credit ratings. Per bank, individual risk limits are set based on its financial position, credit ratings, past experienceand other factors. The utilisation of credit limits is regularly monitored. To reduce the credit exposures, netting agreements are in place withUnilever’s principal banks that allow Unilever, in case of a default, to net assets and liabilities across transactions. To further reduce Unilever’s creditexposures, Unilever has collateral agreements with Unilever’s principal banks based on which they need to deposit securities and/or cash as acollateral for their obligations in respect of derivative financial instruments. At 31 December 2007 the collateral received by Unilever amounts to€nil (2006: €2 million). At 31 December 2007 there was no significant concentration of credit risk with any single counterparty.

Unilever Annual Report and Accounts 2007 99
Financial statements continued
Notes to the consolidated accounts Unilever Group
17 Financial instruments and treasury risk management (continued)Derivative financial instrumentsThe Group has comprehensive policies in place, approved by the Boards, covering the use of derivative financial instruments. These instruments areused for hedging purposes. The Group has an established system of control in place covering all financial instruments; including policies, guidelines,exposure limits, a system of authorities and independent reporting, that is subject to periodic review by internal audit. Hedge accounting principlesare described in note 1 on page 74. The use of leveraged instruments is not permitted. In the assessment of hedge effectiveness the credit riskelement on the underlying hedged item has been excluded. Hedge ineffectiveness is immaterial.
The Group uses the following types of hedges:• cash flow hedges used to hedge the risk on future foreign currency cash flows, floating interest rate cash flows, and the price risk on future
purchases of raw materials;• fair value hedges used to convert the fixed interest rate on financial liabilities into a floating interest rate; • net investment hedges used to hedge the investment value of our foreign subsidiaries; and • natural hedges used to hedge the risk on exposures that are on the balance sheet. No hedge accounting is applied.
Details of the various types of hedges are given below.
The fair values of forward foreign exchange contracts represent the unrealised gain or loss on revaluation of the contracts at the year-end forwardexchange rates. The fair values of interest rate derivatives are based on the net present value of the anticipated future cash flows.
Cash flow hedgesThe fair values of derivatives hedging the risk on future foreign currency cash flows, floating interest rate cash flows and the price risk on futurepurchases of raw materials amount to €85 million (2006: €9 million) of which €88 million relates to commodity contracts (2006: €5 million),€(10) million to foreign exchange contracts (2006: €2 million) and €7million to interest rate derivatives (2006: €2 million). Of the total fair valueof €85 million, €82 million is due within one year (2006: €7 million).
The following table shows the amounts of cash outflows that are designated as hedged item in the cash flow hedge relations (no cash inflowsare designated as hedged item):
€ million € million € million € million € millionDue Due Due Due Total
within between between between1 year 1-2 years 2-3 years 3-4 years
2007Foreign exchange cash flows (235) – – – (235)Interest rate cash flows (18) (19) (21) – (58)Commodity contracts cash flows (310) (1) – – (311)
2006Foreign exchange cash flows (298) – – – (298)Interest rate cash flows (31) (43) (19) (20) (113)Commodity contracts cash flows (107) – – – (107)
Fair Value hedgesThe fair values of derivatives hedging the fair value interest rate risk on fixed rate debt at 31 December 2007 amounted to €nil million (2006:€5 million) of which €nil million (2006 €5 million) is included under other financial assets.
Net investment hedgesThe following table shows the fair values of derivatives outstanding at year end designated as hedging instruments in hedges of netinvestments in foreign operations:
€ million € million € million € millionAssets Assets Liabilities Liabilities
Fair values of derivatives used as hedges of net investments in foreign entities 2007 2006 2007 2006
CurrentForeign exchange derivatives – 11 337 350
Of the above mentioned fair values, an amount of €nil million (2006: €11 million) is included under other financial assets and €(337) million(2006: €(350) million) is included under financial liabilities.
The impact of exchange rate movements on the fair value of forward exchange contracts used to hedge net investments is recognised inreserves.

100 Unilever Annual Report and Accounts 2007
Financial statements continued
Notes to the consolidated accounts Unilever Group
17 Financial instruments and treasury risk management (continued)Natural hedgesA natural hedge – sometimes known as an economic hedge – is where exposure to a risk is offset, or partly offset, by an opposite exposure tothat same risk. Hedge accounting is not applied to these relationships.
The following table shows the fair value of derivatives outstanding at year end that are natural hedges.
€ million € million € million € millionAssets Assets Liabilities Liabilities
Fair values of natural hedges 2007 2006 2007 2006
CurrentInterest rate derivatives 1 2 3 1Cross currency swaps – – – 6Foreign exchange derivatives 377 371 41 31
378 373 44 38
Non-currentInterest rate derivatives – – – 1Cross currency swaps – – 18 12
– – 18 13
378 373 62 51
Of the fair values disclosed above, the fair value of financial liability-related derivatives at 31 December 2007 amounted to €320 million (2006: €323 million) of which €78 million (2006: €20 million) is included under other financial assets and €242 million (2006: €301 million) isincluded under financial liabilities as a positive amount partly offsetting the €(337) million (2006: €(350) million) included under financialliabilities relating to the fair values of derivatives used as net investment hedges. The remaining balances are shown under trade and otherreceivables and other liabilities.
Sensitivity to not applying hedge accountingDerivatives have to be reported at fair value. Those derivatives used for cash flow hedging and net investment hedging for which we do notapply hedge accounting will cause volatility in the income statement. Such derivatives did not have a material impact on the 2007 incomestatement.
Embedded derivativesIn accordance with IAS 39, 'Financial instruments: Recognition and Measurement', Unilever has reviewed all contracts for embedded derivativesthat are required to be separately accounted for if they do not meet specific requirements set out in the standard; no material embeddedderivatives have been identified.
Fair values of financial assets and financial liabilitiesThe following table summarises the fair values and carrying amounts of the various classes of financial assets and financial liabilities. All tradeand other receivables and trade payables and other liabilities have been excluded from the analysis below and from the interest rate andcurrency profiles in note 15 on page 93 and note 16 on page 96, as their carrying amounts are a reasonable approximation of their fair value,because of their short-term nature.
€ million € million € million € millionFair Fair Carrying Carrying
value value amount amount2007 2006 2007 2006
Financial assetsOther non-current assets 733 748 738 735Cash and cash equivalents 1 098 1 039 1 098 1 039Other financial assets 138 237 138 237Derivatives related to financial liabilities 78 36 78 36
2 047 2 060 2 052 2 047
Financial liabilitiesBank loans and overdrafts (1 212) (1 307) (1 212) (1 307)Bonds and other loans (8 073) (7 402) (7 907) (7 170)Finance lease creditors (313) (192) (311) (187)Preference shares (114) (122) (124) (124)Derivatives related to financial liabilities (95) (47) (95) (47)
(9 807) (9 070) (9 649) (8 835)

Unilever Annual Report and Accounts 2007 101
Financial statements continued
Notes to the consolidated accounts Unilever Group
17 Financial instruments and treasury risk management (continued)The fair values and the carrying amount of listed investments included in financial assets and preference shares included in financial liabilities arebased on their market values. Cash and cash equivalents, other financial assets, bank loans and overdrafts have fair values that approximate totheir carrying amounts because of their short-term nature. The fair values of listed bonds are based on their market value; non-listed bonds andother loans are based on the net present value of the anticipated future cash flows associated with these instruments. Fair values for financelease creditors have been assessed by reference to current market rates for comparable leasing arrangements.
Commodity contractsThe Group uses commodity forward contracts and futures to hedge against price risk in certain commodities. All commodity forward contractsand futures hedge future purchases of raw material. Settlement of these contracts will be in cash or by physical delivery. Those contracts thatwill be settled in cash are reported in the balance sheet at fair value and, to the extent that they are considered as an effective hedge under IAS 39, fair value movements are recognised in the cash flow reserve.
Capital managementThe Group’s financial strategy supports Unilever’s aim to be in the top third of a reference group including 20 other international consumergoods companies for Total Shareholder Return, as explained on page 32. The key elements of the financial strategy are:
• appropriate access to equity and debt markets;• sufficient flexibility for acquisitions that we fund out of current cash flows;• A1/P1 short-term credit rating;• sufficient resilience against economic turmoil; and• optimal weighted average cost of capital, given the constraints above.
For the A1/P1 sort-term credit rating the company monitors the qualitative and quantitative factors utilised by the rating agencies. Thisinformation is publicly available and is updated by the credit rating agencies on a regular basis.
The capital structure of the company is based on management’s judgement of the appropriate balancing of all key elements of its financialstrategy in order to meet the company’s strategic and day-to-day needs. Annually the overall funding plan is presented to the Board forapproval.
Return on Invested Capital is one of Unilever's key performance measures. Within this definition we defined the components of our InvestedCapital. See page 31 for the details of this definition and the calculation of Unilever's Return on Invested Capital.
Income statement sensitivity to changes in foreign exchange ratesThe values of debt, investments and related hedging instruments, denominated in currencies other than the functional currency of the entitiesholding them, are subject to exchange rate movements. The translation risk on the foreign exchange debtors and creditors is excluded from thissensitivity analysis as the risk is considered to be immaterial because positions will remain within prescribed limits (see currency risks on page97).
The remaining foreign exchange positions at 31 December 2007 mainly relate to unhedged US $ loans (total amount at 31 December 2007 US $37 million). A reasonably possible 10% change in rates would lead to a €7 million movement in the income statement (2006: €16 million).
Income statement sensitivity to changes in interest rate Interest rate risks are presented by way of sensitivity analysis. As described on page 97, Unilever has an interest rate management policy aimedat optimising net interest cost and reducing volatility in the income statement. As part of this policy, part of the funds/debt have fixed interestrates and are no longer exposed to changes in the floating rates. The remaining floating part of our funds/debt (see interest rate profile tableson pages 93 for the assets and 96 for the liabilities) is exposed to changes in the floating interest rates.
The analysis below shows the sensitivity of the income statement to a reasonably possible one percentage point change in floating interest rateson a full-year basis.
Sensitivity to a reasonably possible one percentage point change in
floating rates as at 31 December€ million € million
2007 2006
Funds 25 24Debt (55) (59)
Net investment hedges: sensitivity relating to changes in foreign exchange ratesTo reduce the retranslation risk of Unilever's investments in foreign subsidiaries, Unilever uses net investment hedges. The fair values of thesenet investment hedges are subject to exchange rate movements and changes in these fair values are recognised directly in equity and will offsetthe retranslation impact of the related subsidiary.
At 31 December 2007 the nominal value of these net investment hedges amounts to €7.5 billion (2006: €7.6 billion) mainly consisting of US$/€contracts. A reasonably possible 10% change in rates would lead to a fair value movement of €750 million (2006: €760 million). Thismovement would be fully offset by an opposite movement on the retranslation of the book equity of the foreign subsidiary.
Cash flow hedges: sensitivity relating to changes in interest rates and foreign exchange ratesUnilever uses on a limited scale both interest rate and forex cash flow hedges. The fair values of these instruments are subject to changes ininterest rates and exchange rates. Because of the limited use of these instruments and the amount of Unilever's equity, possible changes ininterest rates and exchange rates will not lead to fair value movements that will have a material impact on Unilever's equity.

102 Unilever Annual Report and Accounts 2007
Financial statements continued
Notes to the consolidated accounts Unilever Group
18 Trade payables and other liabilities€ million € million
Trade and other payables 2007 2006
Due within one yearTrade payables 3 690 3 833Accruals 2 970 2 706Social security and sundry taxes 374 386Others 983 913
8 017 7 838
Due after more than one yearAccruals 138 185Others 66 76
204 261
Total trade payables and other liabilities 8 221 8 099
The amounts shown above do not include any creditors due after more than five years. Trade payables and other liabilities are valued at historiccost, which where appropriate, approximates their amortised cost.
19 Provisions€ million € million
Provisions 2007 2006
Due within one yearRestructuring provisions 518 439Preference shares provision 3 300Disputed indirect taxes 269 –Other provisions 178 270
968 1 009
Due after one yearRestructuring provisions 63 53Legal provisions 55 51Disputed indirect taxes 422 560Net liability of associate 30 34Other provisions 124 128
694 826
Total restructuring and other provisions 1 662 1 835
€ million € million € million € million € million € million € millionPreference
Restructuring Legal shares Disputed Net liability OtherMovements during 2007 provisions provisions provision indirect taxes of associate provisions Total
1 January 2007 492 51 300 560 34 398 1 835Disposal of group companies 3 – – – – (37) (34)Income statement:
New charges 457 19 15 161 – 29 681Releases (43) (2) (8) (61) – (59) (173)
Utilisation (312) (10) (304) (11) – (22) (659)Currency retranslation (16) (3) – 42 (4) (7) 12
31 December 2007 581 55 3 691 30 302 1 662
Restructuring provisions primarily relate to early retirement and redundancy costs, the most significant of which relate to the formation of newmulti-country organisations and several factory closures; no projects are individually material. Legal provisions are comprised of many claims, ofwhich none is individually material.
The provision for disputed indirect taxes is comprised of a number of small disputed items. The largest elements of the provision relate todisputes with the Brazilian authorities. Because of the nature of the disputes, the timing of the utilisation of the provisions, and any associatedcash outflows, is uncertain. The majority of the disputed items attract an interest charge. For further information please refer to page 11.
No individual item within the other provisions balance is significant. Unilever expects that the issues relating to these restructuring, legal andother provisions will be substantively resolved over the next five years.

Unilever Annual Report and Accounts 2007 103
Financial statements continued
Notes to the consolidated accounts Unilever Group
20 Pensions and similar obligations
Description of plansIn many countries the Group operates defined benefit pension plans based on employee pensionable remuneration and length of service. The majority of these plans are externally funded. The Group also provides other post-employment benefits, mainly post-employment healthcareplans in the United States. These plans are predominantly unfunded. The Group also operates a number of defined contribution plans, theassets of which are held in external funds.
The majority of the Group’s externally funded plans are established as trusts, foundations or similar entities. The operation of these entities is governed by local regulations and practice in each country, as is the nature of the relationship between the Group and the trustees (orequivalent) and their composition.
Exposure to risksPension assets and liabilities (pre-tax) of €17 253 million and €18 342 million respectively are held on the Group’s balance sheet as at31 December 2007. Movements in equity markets, interest rates, inflation and life expectancy could materially affect the level of surpluses anddeficits in these schemes, and could prompt the need for the Group to make additional pension contributions, or to reduce pensioncontributions, in the future. The key assumptions used to value our pension liabilities are set out below and on page 104.
Investment strategyThe Group’s investment strategy in respect of its funded pension plans is implemented within the framework of the various statutoryrequirements of the territories where the plans are based. The Group has developed policy guidelines for the allocation of assets to differentclasses with the objective of controlling risk and maintaining the right balance between risk and long-term returns in order to limit the cost tothe Group of the benefits provided. To achieve this, investments are well diversified, such that the failure of any single investment would nothave a material impact on the overall level of assets. The plans invest the largest proportion of the assets in equities which the Group believesoffer the best returns over the long term commensurate with an acceptable level of risk. The pension funds also have a proportion of assetsinvested in property, bonds, hedge funds and cash. The majority of assets are managed by a number of external fund managers with a smallproportion managed in-house. Unilever has a pooled investment vehicle (Univest) which it believes offers its pension plans around the world asimplified externally managed investment vehicle to implement their strategic asset allocation models currently for equities and hedge funds.The aim is to provide a high quality, well diversified risk-controlled vehicle.
AssumptionsWith the objective of presenting the assets and liabilities of the pensions and other post-employment benefit plans at their fair value on thebalance sheet, assumptions under IAS 19 are set by reference to market conditions at the valuation date. The actuarial assumptions used tocalculate the benefit obligations vary according to the country in which the plan is situated. The following table shows the assumptions,weighted by liabilities, used to value the principal defined benefit pension plans (which cover approximately 95% of total pension liabilities andplans providing other post-employment benefits) and in addition the expected long-term rates of return on assets, weighted by asset value.
31 December 2007 31 December 2006 31 December 2005 31 December 2004
Principal Other Principal Other Principal Other Principal Otherdefined post- defined post- defined post- defined post-benefit employment benefit employment benefit employment benefit employment
pension benefit pension benefit pension benefit pension benefitplans plans plans plans plans plans plans plans
Discount rate 5.8% 6.1% 5.1% 5.9% 4.6% 5.5% 5.0% 5.7%Inflation 2.6% n/a 2.5% n/a 2.4% n/a 2.4% n/aRate of increase in salaries 3.8% 4.0% 3.7% 4.0% 3.5% 4.0% 3.6% 4.5%Rate of increase for pensions in payment 2.5% n/a 2.3% n/a 2.1% n/a 2.2% n/aRate of increase for pensions in deferment
(where provided) 2.7% n/a 2.7% n/a 2.5% n/a 2.6% n/aLong-term medical cost inflation n/a 5.0% n/a 5.0% n/a 4.8% n/a 4.8%Expected long-term rates of return:
Equities 8.0% 7.8% 7.4% 7.9%Bonds 4.9% 4.9% 4.2% 4.5%Property 6.6% 6.3% 5.8% 6.3%Others 6.3% 6.3% 6.1% 6.1%
Weighted average asset return 7.0% 6.9% 6.4% 6.8%

104 Unilever Annual Report and Accounts 2007
Financial statements continued
Notes to the consolidated accounts Unilever Group
20 Pensions and similar obligations (continued)
The valuations of other post-employment benefit plans generally assume a higher initial level of medical cost inflation, which falls from 9.3% to the long-term rate within the next five years. Assumed healthcare cost trend rates have a significant effect on the amounts reported forhealthcare plans. A one percentage point change in assumed healthcare cost trend rates would have the following effect:
€ million € million1% point 1% point
increase decrease
Effect on total of service and interest cost components 3 (3)Effect on total benefit obligation 29 (26)
The expected rates of return on plan assets were determined, based on actuarial advice, by a process that takes the long-term rates of returnon government bonds available at the balance sheet date and applies to these rates suitable risk premiums that take account of historic marketreturns and current market long-term expectations for each asset class.
For the most important pension plans, representing approximately 80% of all defined benefit plans by liabilities, the assumptions used at 31 December 2007, 2006, 2005 and 2004 were:
United Kingdom NetherlandsAssumptions 2007 2006 2005 2004 2007 2006 2005 2004
Discount rate 5.8% 5.1% 4.7% 5.3% 5.5% 4.6% 4.0% 4.5%Inflation 3.0% 2.9% 2.7% 2.8% 1.9% 1.9% 1.8% 1.8%Rate of increase in salaries 4.5% 4.4% 4.2% 4.3% 2.4% 2.4% 2.3% 2.3%Rate of increase for pensions in payment 3.0% 2.9% 2.7% 2.9% 1.9% 1.9% 1.8% 1.8%Rate of increase for pensions in deferment
(where provided) 3.0% 2.9% 2.7% 2.9% 1.9% 1.9% 1.8% 1.8%Expected long-term rates of return:
Equities 8.0% 8.0% 7.6% 8.0% 8.1% 7.6% 7.0% 7.6%Bonds 5.0% 5.2% 4.5% 5.0% 4.7% 4.4% 3.7% 4.1%Property 6.5% 6.5% 6.1% 6.5% 6.6% 6.1% 5.5% 6.1%Others 6.3% 7.2% 6.7% 7.2% 4.1% 4.0% 3.7% 3.5%
Weighted average asset return 7.2% 7.3% 6.9% 7.3% 6.8% 6.6% 6.0% 6.6%
United States Germany2007 2006 2005 2004 2007 2006 2005 2004
Discount rate 5.9% 5.8% 5.5% 5.7% 5.5% 4.6% 4.0% 4.5%Inflation 2.3% 2.5% 2.4% 2.5% 1.9% 1.9% 1.8% 1.8%Rate of increase in salaries 4.0% 4.0% 4.0% 4.5% 2.8% 2.6% 2.5% 2.5%Rate of increase for pensions in payment 0.0% 0.0% 0.0% 0.0% 1.9% 1.9% 1.8% 1.8%Rate of increase for pensions in deferment
(where provided) 0.0% 0.0% 0.0% 0.0% 0.0% 0.0% 0.0% 0.0%Expected long-term rates of return:
Equities 7.8% 8.3% 8.0% 8.4% 8.1% 7.6% 7.0% 7.6%Bonds 4.5% 5.2% 4.8% 4.7% 4.7% 4.4% 3.7% 4.1%Property 6.3% 6.8% 6.5% 6.9% 6.6% 6.1% 5.5% 6.1%Others 3.7% 4.8% 4.2% 2.1% 5.8% 3.0% 3.7% 3.7%
Weighted average asset return 6.8% 7.4% 7.0% 7.3% 6.5% 5.8% 5.3% 5.7%
Demographic assumptions, such as mortality rates, are set having regard to the latest trends in life expectancy (including expectations for futureimprovements), plan experience and other relevant data. The assumptions are reviewed and updated as necessary as part of the periodicactuarial valuation of the pension plans.
Mortality assumptions for the most important countries are based on the following post-retirement mortality tables: (i) United Kingdom: PNMA 00and PNFA 00 with medium cohort adjustment subject to a minimum annual improvement of 1% and scaling factors of 110% for current malepensioners, 125% for current female pensioners and 105% for future male and female pensioners; (ii) the Netherlands: GBMV (2000–2005) withage set back of four years for males and two years for females; (iii) United States: RP2000 with a projection period of 10–15 years; and (iv)Germany: Heubeck 1998 (Periodentafel) with a scaling factor of 85%.
These tables translate into the following years of life expectancy for current pensioners aged 65:
United UnitedKingdom Netherlands States Germany
Males 21 20 19 18Females 23 22 22 21
With regard to future improvements in life expectancy, in the UK for example, males and females currently aged 45 are assumed to have a lifeexpectancy of 24 years and 26 years respectively on retirement at age 65.
Assumptions for the remaining defined benefit plans vary considerably, depending on the economic conditions of the countries where they are situated.

Unilever Annual Report and Accounts 2007 105
Financial statements continued
Notes to the consolidated accounts Unilever Group
20 Pensions and similar obligations (continued)
Balance sheetThe assets, liabilities and surplus/(deficit) position of the pension and other post-employment benefit plans and the expected rates of return onthe plan assets at the balance sheet date were:
€ million € million % € million € million % € million € million %31 December 2007 31 December 2006 31 December 2005
Other post- Long-term Other post- Long-term Other post- Long-termemployment rates of employment rates of employment rates of
Pension benefit return Pension benefit return Pension benefit returnplans plans expected plans plans expected plans plans expected
Assets of principal plans:Equities 9 957 – 8.0% 10 274 – 7.8% 9 670 – 7.4%Bonds 4 278 – 4.9% 3 946 – 4.9% 3 854 – 4.2%Property 1 381 – 6.6% 1 421 – 6.3% 1 326 – 5.8%Other 1 220 – 6.3% 1 221 – 6.3% 752 – 6.1%
Assets of other plans 404 13 7.5% 403 13 7.3% 387 17 6.9%
17 240 13 17 265 13 15 989 17Present value of liabilities:
Principal plans (16 798) – (18 711) – (19 081) –Other plans (748) (796) (722) (925) (1 059) (1 306)
(17 546) (796) (19 433) (925) (20 140) (1 306)
Aggregate net deficit of the plans (306) (783) (2 168) (912) (4 151) (1 289)Irrecoverable surplus(a) – – – – (141) –
Pension liability net of assets (306) (783) (2 168) (912) (4 292) (1 289)
Of which in respect of
Funded plans in surplus:Liabilities (12 396) – (5 200) – (4 728) –Assets 14 404 – 6 897 – 5 905 –
Aggregate surplus 2 008 – 1 697 – 1 177 –Irrecoverable surplus(a) – – – – (141) –
Pension asset net of liabilities 2 008 – 1 697 – 1 036 –
Funded plans in deficit:Liabilities (3 627) (49) (11 716) (44) (12 444) (72)Assets 2 836 13 10 368 13 10 084 17
Pension liability net of assets (791) (36) (1 348) (31) (2 360) (55)
Unfunded plans:Pension liability (1 523) (747) (2 517) (881) (2 968) (1 234)
(a) A surplus is deemed recoverable to the extent that the Group is able to benefit economically from the surplus.
The constituents of the ‘Principal plans’ and ‘Other plans’ were reviewed in both 2006 and 2007, such that some ‘Other plans’ were moved into ‘Principal plans’ in 2006 and a smaller number of plans were moved out of ‘Principal plans’ into ‘Other plans’ in 2007.
During 2007, a contractual trust arrangement was established in Germany to partially fund previously unfunded pension liabilities. The initialfunding was €300 million whilst the value of the previously unfunded liabilities at 1 January 2007 was approximately €850 million. As aconsequence of this funding, the liabilities have been transferred from unfunded to funded in the table above.
Equity securities include Unilever securities amounting to €32 million (0.2% of total plan assets) and €32 million (0.2% of total plan assets) at 31 December 2007 and 2006 respectively. Property includes property occupied by Unilever amounting to €69 million and €75 million at 31 December 2007 and 2006 respectively.
The pension assets above exclude the assets in a Special Benefits Trust amounting to €162 million (2006: €181 million) to fund pension andsimilar obligations in the US (see also note 11 on page 90).
The sensitivity of the overall pension liabilities to changes in the weighted key financial assumptions are:
Impact onChange in overall
assumption liabilities
Discount rate Increase/decrease by 0.5% Decrease/increase by 6.6%Inflation rate Increase/decrease by 0.5% Increase/decrease by 5.3%

106 Unilever Annual Report and Accounts 2007
Financial statements continued
Notes to the consolidated accounts Unilever Group
20 Pensions and similar obligations (continued)
Income statementThe charge to the income statement comprises:
€ million € million € million2007 2006 2005
Charged to operating profit:Defined benefit pension and other benefit plans
Current service cost (329) (369) (349)Employee contributions 12 13 18Special termination benefits (59) (56) (73)Past service cost 35 293 (12)Settlements/curtailments 72 48 95
Defined contribution plans (52) (61) (63)
Total operating cost (321) (132) (384)
Charged to other finance income/(cost):Interest on retirement benefits (1 013) (977) (984)Expected return on assets 1 171 1 018 931
Total other finance income/(cost) 158 41 (53)
Net impact on the income statement (before tax) (163) (91) (437)
Significant Items on the face of the income statementDuring 2006 we updated certain terms of the defined benefit plan in the UK which resulted in a one-off credit to the income statement in2006 of €120 million. During 2006 a number of initiatives were taken to reduce the cost of post employment healthcare benefits, principally inthe United States, through changes to the design of the plans. As a consequence, a reduction in liability of €146 million was recognised in theincome statement for 2006.
Cash flowGroup cash flow in respect of pensions and similar post employment benefits comprises company contributions paid to funded plans andbenefits paid by the company in respect of unfunded plans. In 2007, the benefits paid in respect of unfunded plans amounted to €280 million(2006: €333 million; 2005: €328 million). Company contributions to funded defined benefit plans are subject to periodic review, taking accountof local legislation. In 2007, contributions to funded defined benefit plans including funding of previously unfunded benefits amounted to €878 million (2006: €758 million; 2005: €508 million). Contributions to defined contribution plans including 401k plans amounted to €52 million (2006: €61 million; 2005: €63 million). In 2007, a €50 million refund of assets was received out of recognised surplus from Finland(2005: €15 million from unrecognised surplus). Total contributions by the Group to funded plans, net of refunds, are currently expected to beabout €235 million in 2008 (2007 Actual: €878 million). In addition, we may make further contributions in 2008 to fund currently unfundedobligations. Benefit payments by the Group in respect of unfunded plans are currently expected to be about €243 million in 2008 (2007 Actual:€280 million).
Statement of recognised income and expenseAmounts recognised in the statement of recognised income and expense:
€ million € million € million € million € millionCumulative
since1 January
2007 2006 2005 2004 2004
Actual return less expected return on pension and other benefit plan assets (236) 533 1 592 369 2 258Experience gains/(losses) arising on pension plan and other benefit plan liabilities 103 51 27 (47) 134Changes in assumptions underlying the present value of the pension and other
benefit plan liabilities 946 474 (1 706) (1 047) (1 333)
Actuarial gain/(loss) 813 1 058 (87) (725) 1 059Change in unrecognised surplus – 142 (41) 2 103Refund of unrecognised assets – – 15 – 15
Net actuarial gain/(loss) recognised in statement of recognised income and expense (before tax) 813 1 200 (113) (723) 1 177

Unilever Annual Report and Accounts 2007 107
Financial statements continued
Notes to the consolidated accounts Unilever Group
20 Pensions and similar obligations (continued)
Reconciliation of change in assets and liabilitiesMovements in assets and liabilities during the year:
€ million € million € million € million € million € millionAssets Assets Assets Liabilities Liabilities Liabilities
2007 2006 2005 2007 2006 2005
1 January 17 278 16 006 13 419 (20 358) (21 446) (18 773)Acquisitions/disposals (3) (63) (3) 5 123 18Current service cost – – – (329) (384) (367)Employee contributions 12 14 19 – – –Special termination benefits – – – (59) (54) (79)Past service costs(b) – – – 35 293 (13)Settlements/curtailments (4) (17) (10) 76 76 105Expected returns on plan assets 1 171 1 021 931 – – –Interest on pension liabilities – – – (1 013) (982) (986)Actuarial gain/(loss) (236) 533 1 592 1 049 525 (1 679)Employer contributions 1 158 1 091 836 – – –Benefit payments (1 247) (1 267) (1 247) 1 247 1 267 1 247Reclassification of benefits(c) (7) 38 39 7 (32) (140)Currency retranslation (869) (78) 430 998 256 (779)
31 December 17 253 17 278 16 006 (18 342) (20 358) (21 446)
(b) The reduction in liabilities in 2006 includes the €266 million reported on the face of the income statement.(c) Certain obligations have been reclassified as employee benefit obligations.
Funded status of plans at the year end€ million € million € million € million
2007 2006 2005 2004
Total assets 17 253 17 278 16 006 13 419Total pension liabilities (18 342) (20 358) (21 446) (18 773)
Net liabilities (1 089) (3 080) (5 440) (5 354)Less unrecognised surplus – – (141) (100)
Pension liabilities net of assets (1 089) (3 080) (5 581) (5 454)
History of experience gains and losses€ million € million € million € million
2007 2006 2005 2004
Actual return less expected return on plan assets (236) 533 1 592 369As % of plan assets at beginning of year (1.4)% 3.3% 11.9% 2.9%
Experience gains/(losses) on plan liabilities 103 51 27 (47)As % of present value of plan liabilities at beginning of year 0.5% 0.2% 0.1% (0.3)%
Changes in actuarial assumptions underlying the present value of the pension benefit and other benefit plan liabilities 946 474 (1 706) (1 047)
As % of present value of plan liabilities at beginning of year 4.6% 2.2% (9.1)% (5.9)%
Total actuarial gain/(loss) 813 1 058 (87) (725)As % of present value of plan liabilities at beginning of year 4.0% 4.9% (0.5)% (4.1)%

108 Unilever Annual Report and Accounts 2007
Financial statements continued
Notes to the consolidated accounts Unilever Group
21 EquityShareholders’ equity Total equity
€ million € million € million € million € million € million € millionCalled up Share Total
share premium Other Retained shareholders’ Minority TotalConsolidated statement of changes in equity capital account reserves profit equity interests equity
1 January 2005 512 158 (2 574) 8 054 6 150 365 6 515Total recognised income and expense for the year – – 379 3 825 4 204 249 4 453Dividends on ordinary capital – – – (1 867) (1 867) – (1 867)Conversion of preference shares – – 1 129 (199) 930 – 930(Purchase)/sale/reduction of treasury stock – – (1 262) – (1 262) – (1 262)Share-based payment credit(a) – – – 186 186 – 186Dividends paid to minority shareholders – – – – – (217) (217)Currency retranslation gains/(losses) net of tax – 4 – – 4 9 13Other movements in equity – – – 16 16 (2) 14
31 December 2005 512 162 (2 328) 10 015 8 361 404 8 765Total recognised income and expense for the year – – (263) 5 575 5 312 242 5 554Dividends on ordinary capital – – – (2 684) (2 684) – (2 684)(Purchase)/sale/reduction of treasury stock(b) – – 403 (285) 118 – 118Share-based payment credit(a) – – – 111 111 – 111Dividends paid to minority shareholders – – – – – (184) (184)Currency retranslation gains/(losses) net of tax (12) 3 14 – 5 (11) (6)Other movements in equity (16) – 31 (8) 7 (9) (2)
31 December 2006 484 165 (2 143) 12 724 11 230 442 11 672Total recognised income and expense for the year – – (314) 4 428 4 114 237 4 351Dividends on ordinary capital – – – (2 070) (2 070) – (2 070)(Purchase)/sale/reduction of treasury stock – – (955) (99) (1 054) – (1 054)Share-based payment credit(a) – – – 140 140 – 140Dividends paid to minority shareholders – – – – – (251) (251)Currency retranslation gains/(losses) net of tax – (12) – – (12) (6) (18)Other movements in equity – – – 39 39 10 49
31 December 2007 484 153 (3 412) 15 162 12 387 432 12 819
(a) The share-based payment credit relates to the reversal of the non-cash charge recorded against operating profit in respect of the fair valueof share options and awards granted to employees.
(b) Includes transfer from treasury stock to retained profit of share settled schemes arising from prior years and differences between exerciseand grant price of share options.

Unilever Annual Report and Accounts 2007 109
Financial statements continued
Notes to the consolidated accounts Unilever Group
22 Share capital€ million € million
Called up share capital 2007 2006
Ordinary share capital of NV 274 274Ordinary share capital of PLC 210 210
484 484
Issued, Issued,Number Nominal Number called up and called up and
of shares Authorised Authorised value of shares fully paid fully paidOrdinary share capital authorised 2007 2006 per share issued 2007 2006
€ million € million € million € million
NV ordinary shares 3 000 000 000 480 480 €0.16 1 714 727 700 274 274NV ordinary shares (shares numbered
1 to 2 400 – ’Special Shares’) 1 1 €428.57 2 400 1 1Internal holdings eliminated
on consolidation (€428.57 shares) – – (1) (1)
481 481 274 274
£ million £ million £ million £ million
PLC ordinary shares 4 377 075 492 136.2 136.2 31⁄9p 1 310 156 361 40.8 40.8PLC deferred stock 100 000 0.1 0.1 £1 stock 100 000 0.1 0.1Internal holding eliminated
on consolidation (£1 stock) – – (0.1) (0.1)
136.3 136.3 40.8 40.8
Euro equivalent in millions (at £1.00 = €5.143) 210 210
For information on the rights of shareholders of NV and PLC and the operation of the Equalisation Agreement, see Corporate governance onpages 40 and 41.
At the Annual General Meetings of NV and PLC held on 8 May and 9 May 2006 respectively, shareholders approved proposals that the NVordinary shares be split in the ratio 3 to 1 and that the PLC ordinary shares be consolidated in the ratio 9 to 20. At the same time, amendmentswere made to NV’s Articles of Association to convert into euros the share capital amounts previously denominated in Dutch guilders. Followingthese changes, which became effective on 22 May 2006, the nominal value of each NV ordinary share is €0.16 and the nominal value of eachPLC ordinary share is 31⁄9p. A nominal dividend of 6% is paid on the deferred stock of PLC, which is not redeemable.
Internal holdingsThe ordinary shares numbered 1 to 2 400 (inclusive) in NV (‘Special Shares’) and deferred stock of PLC are held as to one half of each class byN.V. Elma – a subsidiary of NV – and one half by United Holdings Limited – a subsidiary of PLC. This capital is eliminated on consolidation. Forinformation on the rights related to the aforementioned ordinary shares, see Corporate Governance on pages 39 and 40. The subsidiariesmentioned above have waived their rights to dividends on their ordinary shares in NV.
Share-based compensationThe Group operates a number of share-based compensation plans involving options and awards of ordinary shares of NV and PLC. Full detailsof these plans are given in note 29 on pages 117 to 119.

110 Unilever Annual Report and Accounts 2007
Financial statements continued
Notes to the consolidated accounts Unilever Group
23 Other reserves € million € million € million € million € million € million € million € million € million
NV NV NV PLC PLC PLC Total Total Total2007 2006 2005 2007 2006 2005 2007 2006 2005
Fair value reserves 92 9 (3) 9 7 (2) 101 16 (5)
Cash flow hedges 86 4 (3) (1) (3) (2) 85 1 (5)Available-for-sale financial assets 6 5 – 10 10 – 16 15 –
Currency retranslation of group companies 104 318 548 (204) (19) 35 (100) 299 583Adjustment on translation of PLC’s ordinary
capital at 31⁄ 9p = €0.16 – – – (155) (150) (164) (155) (150) (164)Capital redemption reserve 16 16 – 16 16 16 32 32 16Book value treasury stock (2 741) (1 623) (2 010) (549) (717) (748) (3 290) (2 340) (2 758)
(2 529) (1 280) (1 465) (883) (863) (863) (3 412) (2 143) (2 328)
€ million € millionCash flow hedges – movements during the year 2007 2006
1 January 1 (5)
Additions 74 12Transfers to income statement: 1 (4)
Operating profit 1 (2)Financing – (2)
Transfers to inventories/non-current assets 9 (2)
31 December 85 1
Unilever acquired 68 891 470 ordinary shares of NV and 2 461 202 ordinary shares of PLC through purchases on the stock exchanges during the year. These shares are held as treasury stock as a separate component of other reserves. The total number held at 31 December 2007 is122 296 247 (2006: 70 319 259) NV shares and 49 529 738 (2006: 64 656 456) PLC shares. Of these, 40 958 255 NV shares and 37 973 522PLC shares were held in connection with share-based compensation plans (see note 29 on pages 117 to 119).
€ million € millionTreasury stock – movements during the year 2007 2006
1 January (2 340) (2 758)Purchases and other utilisations (950) 418
31 December (3 290) (2 340)
€ million € millionCurrency retranslation reserve – movements during the year 2007 2006
1 January 299 583Currency retranslation during the year 294 495Movement in net investment hedges (692) (779)Recycled to income statement (1) –
31 December (100) 299

Unilever Annual Report and Accounts 2007 111
Financial statements continued
Notes to the consolidated accounts Unilever Group
24 Retained profit€ million € million € million € million € million € million € million € million € million
NV NV NV PLC PLC PLC Total Total TotalMovements during the year 2007 2006 2005 2007 2006 2005 2007 2006 2005
1 January 8 404 8 721 6 831 4 320 1 294 1 223 12 724 10 015 8 054
Recognised income and expense throughretained profit 2 599 3 727 3 092 1 829 1 848 733 4 428 5 575 3 825
Dividends on ordinary capital (1 167) (1 529) (1 073) (903) (1 155) (794) (2 070) (2 684) (1 867)Conversion of preference shares – – (199) – – – – – (199)Utilisation of treasury stock (53) (217) – (46) (68) – (99) (285) –Share-based compensation credit(a) 90 70 132 50 41 54 140 111 186Adjustment arising from change in structure
of group companies(b) 499 (2 368) (70) (499) 2 368 70 – – –Other movements in retained profit 31 – 8 8 (8) 8 39 (8) 16
31 December 10 403 8 404 8 721 4 759 4 320 1 294 15 162 12 724 10 015
Of which retained by:Parent companies 10 009 9 755 9 463 2 344 2 306 2 145 12 353 12 061 11 608Other group companies 345 (1 294) (668) 2 555 2 006 (837) 2 900 712 (1 505)Joint ventures and associates 49 (57) (74) (140) 8 (14) (91) (49) (88)
10 403 8 404 8 721 4 759 4 320 1 294 15 162 12 724 10 015
(a) The share-based compensation credit relates to the reversal of the non-cash charge recorded against operating profit in respect of the fairvalue of share options and awards granted to employees.
(b) As part of the review of Unilever's corporate structure, and in the light of the constitutional and operational arrangements which enableUnilever N.V. and Unilever PLC to operate as nearly as practicable as a single company, the Directors have been authorised to take anyaction necessary or desirable in order to ensure that the ratio of the dividend generating capacity of PLC to that of NV does not differsubstantially from the ratio of the dividend entitlement of ordinary shareholders in PLC to that of ordinary shareholders in NV. During 2007,Unilever’s shareholding in Unilever Jerónimo Martins in Portugal was transferred from NV to PLC for no consideration. In addition, a part of indirect shareholdings in Unilever US was sold by NV to PLC and the fair value economic swap in South Africa led to further adjustmentsbetween NV and PLC. In 2006, shareholdings in the Unilever companies in Czech Republic, Hungary, Russia and Turkey, as well as a part of indirect shareholdings in Unilever US, were transferred from NV to PLC for no consideration. In addition, part of a dividend which wouldotherwise be due from a Unilever US intermediate company to a company within the NV part of the Group was instead paid to a companywithin the PLC part of the Group. Re-organisations of group companies have produced similar types of adjustments in previous years.
Cumulative goodwill written off directly to reserves prior to the transition to IFRS on 1 January 2004 was €5 199 million for NV and €2 063 million for PLC.

112 Unilever Annual Report and Accounts 2007
Financial statements continued
Notes to the consolidated accounts Unilever Group
25 Commitments and contingent liabilities€ million € million € million € million € million € million
Future Futureminimum minimum
lease Finance Present lease Finance Presentpayments cost value payments cost value
Long-term finance lease commitments 2007 2007 2007 2006 2006 2006
Buildings(a) 410 198 212 137 94 43Plant and machinery 110 11 99 159 15 144
520 209 311 296 109 187
The commitments fall due as follows:Within 1 year 82 17 65 71 10 61Later than 1 year but not later than 5 years 125 59 66 117 25 92Later than 5 years 313 133 180 108 74 34
520 209 311 296 109 187
(a) All leased land is classified as operating leases.
€ million € millionLong-term operating lease commitments 2007 2006
Land and buildings 1 328 1 257Plant and machinery 335 360
1 663 1 617
€ million € million € million € millionOther Other
Operating Operating commit- commit-leases leases ments ments
Operating lease and other commitments fall due as follows 2007 2006 2007 2006
Within 1 year 363 342 646 471Later than 1 year but not later than 5 years 859 875 955 781Later than 5 years 441 400 152 528
1 663 1 617 1 753 1 780
The Group has sublet part of the leased properties under operating leases. Future minimum sublease payments are not significant.
Other commitments principally comprise commitments under contracts to purchase materials and services. They do not include commitmentsfor capital expenditure, which are reported in note 10 on page 88.
The estimated total of our contingent liabilities at 31 December 2007 was €430 million (2006: €439 million). The principal components of thecontingent liabilities relate to legal proceedings, obligations arising under environmental legislation. Guarantees issued by group companies at31 December 2007 amounted to some €81 million (2006: €105 million), Included in this are discounted trade bills with value of €4 million(2006: €23 million). No individual contingent liability is significant. The fair value of guarantees is not material in either 2007 or 2006.
We are not involved in any legal or arbitration proceedings which might lead to material loss or expenditure in the context of the Group results.Similarly we do not have any material obligations under environmental legislation. None of our Directors or Officers is involved in any legalproceedings which are material as aforesaid. Nonetheless, we give further information on pages 10 and 11 about certain current legalproceedings.

Unilever Annual Report and Accounts 2007 113
Financial statements continued
Notes to the consolidated accounts Unilever Group
26 Acquisitions and disposals
2007During 2007 we purchased minority interests in subsidiary companies in Greece and India. We invested in a new venture fund, Physic Ventures,which is accounted for as an associate, and made additional investments in two other venture companies, Spa and Salon International Limitedand Langholm Capital, both of which are accounted for as associates.
With effect from 1 October 2007, Unilever and Remgro Ltd. reached agreement to reorganise their respective shareholdings in the Unileverbusinesses in South Africa and Israel. In the reorganised shareholding Unilever has a majority share in a single South African business and fullyowns the Unilever Israel foods and home and personal care business. As a result of this transaction, Unilever has reported a profit on disposal of€214 million and goodwill of €168 million.
On 1 January 2007, Unilever completed the restructuring of its Portuguese businesses. The result of the reorganisation is that Unilever now hasa 55% share of the combined Portuguese entity, called Unilever Jerónimo Martins. The combined business includes the foods and home andpersonal care businesses. The remaining 45% interest is held by Jerónimo Martins Group. The structure of the agreement is such that there isjoint control of the newly formed entity and so it is accounted for by Unilever as a joint venture.
Other disposals in 2007 included the sale of local Brazilian margarine brands. In addition, to further develop our healthy heart brand margarine,Becel, in Brazil we have established a joint venture with Perdigão. During 2007, we have also announced the disposal of Boursin to Le GroupeBel for €400 million, and the disposal of Lawry’s and Adolph’s seasoning blends and marinades business to McCormick and Company for US $605 million. Both will be effective during 2008. See note 33 on page 121 for further details. Furthermore, we announced plans to disposeof our North American laundry business, the process for which is ongoing.
2006During 2006 we purchased minority interests in subsidiary companies in Greece and Algeria, trademarks in Czech Republic, distribution inTunisia and Vashisti business in India. Also an additional investment into Langholm Capital Partners Fund was made and classified as anacquisition of associates (see note 11 on page 90).
On 3 November 2006, Unilever announced that it had reached a final agreement with Permira Funds to sell the majority of its European frozenfoods business for €1.7 billion. The Unilever businesses being sold in this transaction include the frozen foods operations in Austria, Belgium,France, Germany, Ireland, Netherlands, Portugal and the United Kingdom.
Other disposals in 2006 were Mora in the Netherlands and Belgium, Finesse in the US, Canada and Sweden, Friol in Italy and Nihar andtea plantations in India.
2005The principal disposals in 2005 were Unilever Cosmetics International across the world, Stanton Oil in the UK and Ireland, Dextro in variouscountries in Europe, Opal in Peru, Karo and Knax in Mexico, spreads and cooking products in Australia and New Zealand, Crispa, Mentadent,Marmite, Bovril and Maizena in South Africa, frozen pizza in Austria, Biopon in Hungary and tea plantations in India.
In March 2005 Unilever restructured its Portuguese foods business. Before the restructuring Unilever Portugal held an interest in FIMA/VG –Distribuição de Produtos Alimentares, Lda. (FIMA) foods business, a joint venture with Jerónimo Martins Group, in addition to its wholly ownedBestfoods business acquired in 2000. As a result of the transaction the two foods businesses – FIMA and Unilever Bestfoods Portugal – wereunified and the joint venture stakes were re-balanced so that Unilever holds 49% of the combined foods business and Jerónimo Martins Group51%. During 2006, Unilever signed an agreement with Jerónimo Martins to restructure the ownership of the Portuguese operations effective 1January 2007.
€ million € million € millionDisposals 2007 2006 2005
Goodwill and intangible assets 5 1 150Other non-current assets 44 242 78Current assets 117 354 207Trade creditors and other payables (48) (157) (106)Provisions for liabilities and charges (34) (91) (15)Minority interest 71 – (1)
Net assets sold 155 349 313(Gain)/loss on recycling of currency retranslation on disposal (1) – (5)Profit on sale attributable to Unilever 399 1 528 655
Consideration(a) 553 1 877 963
Cash 168 1 870 845Cash balances of businesses sold (4) – (17)Financial assets, cash deposits and financial liabilities of businesses sold 113 (5) 8Non-cash items and deferred consideration(a) 276 12 26Payment received in prior year – – 101
(a) For 2007, includes €214 million fair value economic swap in South Africa.
The results of disposed businesses are included in the consolidated accounts up to their date of disposal.

114 Unilever Annual Report and Accounts 2007
Financial statements continued
Notes to the consolidated accounts Unilever Group
26 Acquisitions and disposals (continued)
The following table sets out the effect of acquisitions in 2007, 2006 and 2005 on the consolidated balance sheet. The fair values currentlyestablished for all acquisitions made in 2007 are provisional. The goodwill arising on these transactions has been capitalised and is subject to anannual review for impairment (or more frequently if necessary) in accordance with our accounting policies as set out in note 1 on page 72. Anyimpairment is charged to the income statement as it arises. Detailed information relating to goodwill is given in note 9 on pages 86 and 87.
€ million € million € millionAcquisitions 2007 2006 2005
Net assets acquired 94 42 7Goodwill arising in subsidiaries 334 60 13
Consideration 428 102 20
Consideration consisted of €214 million cash, principally relating to acquisitions of minority interest, and €214 million fair value economic swap inSouth Africa.
27 Assets held for sale and discontinued operations
Included under this heading are the results of the majority of Unilever’s European frozen foods businesses following the sale to Permira Funds inNovember 2006 and Unilever Cosmetics International (UCI) following the sale of this business to Coty Inc. in July 2005.
An analysis of the result of discontinued operations, and the result recognised on disposal of discontinued operations is as follows:
€ million € million € millionIncome statement of discontinued operations 2007 2006 2005
Turnover – 1 033 1 501Expenses – (863) (1 253)
Operating profit – 170 248Net finance costs – (3) (6)
Profit before tax – 167 242Taxation – (25) (72)
Profit after taxation – 142 170
Gain/(loss) on disposal of discontinued operations(a) 89 1 349 513Recycling of currency retranslation upon disposal – – 5Taxation arising on disposal (9) (161) (48)
Gain/(loss) after taxation on disposal 80 1 188 470
Net profit from discontinued operations 80 1 330 640
(a) In 2007, a one-off gain of €50 million was recognised for future performance based consideration from the sale of UCI.
€ million € million € millionSegment analysis of discontinued operations 2007 2006 2005
TurnoverEurope – 1 033 1 397The Americas – – 102Asia Africa – – 2
– 1 033 1 501
Foods – 1 033 1 271Personal care – – 230
– 1 033 1 501
Operating profitEurope – 170 227The Americas – – 20Asia Africa – – 1
– 170 248
Foods – 164 226Personal care – 6 22
– 170 248

Unilever Annual Report and Accounts 2007 115
Financial statements continued
27 Assets held for sale and discontinued operations (continued)€ million € million € million
Summary cash flow statement of discontinued operations 2007 2006 2005
Net cash flow from/(used in) operating activities (4) 79 62Net cash flow from/(used in) investing activities 80 1 618 621Net cash flow from/(used in) financing activities – (1) (4)
Net increase/(decrease) in cash and cash equivalents 76 1 696 679
The most significant items included as assets held for sale at 31 December 2007 are:• North American laundry business – disposal process announced 2 August 2007 for completion in 2008.• Boursin business – sale to Le Groupe Bel for €400 million announced on 5 November 2007, completed 3 January 2008.• Lawry’s and Adolph’s branded seasoning blends and marinades business in the US and Canada – sale to McCormick & Company for
US $605 million announced on 14 November 2007, for completion in 2008.
In 2006, various non-current assets were classified as held for sale.
€ million € millionAssets classified as held for sale 2007 2006
Disposal groups held for saleProperty, plant and equipment 66 –Inventories 83 –Trade and other receivables 4 –
153 –
Non-current assets held for saleProperty, plant and equipment 6 14
6 14
€ million € millionLiabilities classified as held for sale (part of disposal groups) 2007 2006
Trade payables and other liabilities (10) –Deferred taxation (3) –
(13) –
Total assets at 31 December 2007 are included in the geographical segments as follows: Europe €31 million; The Americas €127 million; and Asia Africa €1 million.
Notes to the consolidated accounts Unilever Group

28 Reconciliation of net profit to cash flow from operating activities€ million € million € million
Cash flow from operating activities 2007 2006 2005
Net profit 4 136 5 015 3 975Taxation 1 137 1 332 1 301Share of net profit of joint ventures/associates and other income from non-current investments (191) (144) (55)Net finance costs: 252 725 618
Finance income (147) (138) (130)Finance cost 550 602 693Preference shares provision 7 300 –Pensions and similar obligations (158) (39) 55
Operating profit (continuing and discontinued operations) 5 334 6 928 5 839Depreciation, amortisation and impairment 943 982 1 274Changes in working capital: 27 87 193
Inventories (333) (156) (153)Trade and other current receivables (43) (172) (36)Trade payables and other current liabilities 403 415 382
Pensions and similar provisions less payments (910) (1 038) (532)Provisions less payments 145 107 (230)Elimination of (profits)/losses on disposals (459) (1 620) (789)Non-cash charge for share-based compensation 118 120 192Other adjustments (10) 8 (23)
Cash flow from operating activities 5 188 5 574 5 924
The cash flows of pension funds (other than contributions and other direct payments made by the Group in respect of pensions and similarobligations) are not included in the Group cash flow statement.
Major non-cash transactionsDuring 2006 the Group took a provision of €300 million for possible compensation payments relating to the 2005 conversion of preference shares, issued by Unilever N.V. in 1999. See note 19 on page 102 for further details.
During 2007 the Group entered into new finance lease arrangements in respect of equipment with a capital value at inception of the lease of€51 million (2006: €51 million). In addition a lease for €181 million related to the sale and leaseback transaction carried out for the head office building in UK was signed during 2007.
On 15 February 2005 €1 129 million of treasury stock was used in the conversion of the €0.05 preference shares into ordinary NV shares.
Notes to the consolidated accounts Unilever Group
116 Unilever Annual Report and Accounts 2007
Financial statements continued

Notes to the consolidated accounts Unilever Group
Unilever Annual Report and Accounts 2007 117
Financial statements continued
29 Share-based compensation plansAs at 31 December 2007, the Group had share-based compensation plans in the form of Share Option Plans, Performance Share Plans, andOther Plans.
The numbers in this note include those for Executive Directors shown in the report of the Remuneration Committee on pages 49 to 61 and those for key management personnel shown in note 31 on page 120. No awards were made to Executive Directors in 2005, 2006 and 2007 under the North America Performance Share Programme, the Restricted Share Plan or the cash-settled share-based retention plan.Non-Executive Directors do not participate in any of the share-based compensation plans.
The economic fair value of the awards is calculated using option pricing models and the resulting cost is recognised as remuneration costamortised over the vesting period of the grant.
Disclosures, including a description of the method and significant assumptions used to estimate the fair values of options and the weightedaverage information, are given below for each type of plan, for NV, PLC and New York shares on a combined basis.
Unilever will not grant share options in total in respect of Executive Option Plans for more than 5% of its issued ordinary capital, and for allPlans together, for more than 10% of its issued ordinary capital. The Board does not apportion these limits to each plan separately.
The actual remuneration cost charged in each period is shown below, and relates almost wholly to equity settled plans:
€ million € million € millionIncome statement charge 2007 2006 2005
Share option plans (16) (41) (76)Performance share plans (103) (48) (78)Other plans(a) (33) (31) (38)
(152) (120) (192)
(a) The Group also provides a Share Matching Plan, a Restricted Share Plan, TSR-LTIP (no awards after 2006) and a cash-settled share-basedretention plan.
(i) Share Option PlansUnilever has All-Employee Share Option Plans in 15 countries: Austria, Belgium, Denmark, Finland, France, Germany, Ireland, Italy,the Netherlands, Portugal, Spain, Sweden and Switzerland, and with a share save element in South Africa and the United Kingdom. Generallythe vesting periods range between three and five years and the maximum term is five years.
Under the Executive Option Plans options are granted to key employees of the Group on a discretionary basis. The exercise price is the marketprice at the date of grant. The options become exercisable after a three-year period from the date of grant and have a maximum term of tenyears. In view of the introduction of the Global Performance Share Plan in 2005, no further grants were made under the Executive Option Plansafter 2005. The plans consist of the NV, the PLC Plans and the North America Programme which is covered by the Unilever North America 2002Omnibus Equity Compensation Plan.
The fair value per option is estimated using the Black-Scholes option pricing method. The expected option terms are based on historic data.Figures for expected volatility are set with regard to historic volatility over the last six years. The expected dividend yield is based on the dividendyield in the year of grant. Forfeiture rates are set annually with regard to historic forfeiture rates.
Managers working in India can participate in an Executive Option Plan relating to Hindustan Unilever Limited’s shares. As these are neither NVnor PLC shares, no figures for this plan are disclosed in this note, but the fair value costs for 2007 were €1 million (2006: €1 million; 2005: €2 million) and are included in the costs of share option plans in the table above.
A summary of the status of the All-Employee and Executive Option Plans as at 31 December 2007, 2006 and 2005 and changes during theyears ended on these dates is presented below:
2007 2006 2005Weighted Weighted Weighted
average average averageNumber of exercise Number of exercise Number of exercise
options price options price options price
Outstanding at 1 January 96 296 565 €17.58 114 772 471 €18.33 128 972 689 €18.28Granted 2 626 506 €22.10 4 356 278 €17.65 5 878 792 €17.53Exercised (33 535 234) €17.53 (14 380 347) €16.87 (9 464 155) €15.42Forfeited (3 877 793) €18.75 (5 171 316) €19.57 (9 045 452) €19.13Expired (2 815 087) €22.01 (3 280 521) €21.22 (1 569 403) €17.93
Outstanding at 31 December 58 694 957 €17.53 96 296 565 €18.35 114 772 471 €18.42
Exercisable at 31 December 47 975 809 €17.35 71 189 331 €18.57 66 586 233 €18.65
The weighted average market price of the shares at the time of exercise was €23.02 (2006: €19.68; 2005: €18.66).

Notes to the consolidated accounts Unilever Group
118 Unilever Annual Report and Accounts 2007
Financial statements continued
29 Share-based compensation plans (continued)2007 2006 2005
Option value informationFair value per option €4.33 €3.10 €3.12Valuation assumptions:
Expected option term 3.5 years 3.5 years 3.9 yearsExpected volatility 27.5% 27.5% 27.5%Expected dividend yield 3.2% 3.8% 3.6%
Risk-free interest rate 4.6% 3.8% 3.1%
The exercise prices and remaining life of the All-Employee and Executive Option Plans as at 31 December 2007 are as follows:
Options outstanding Options exercisable
Number WeightedRange of outstanding at average remaining Weighted average Number exercisable at Weighted average
exercise prices 31 December 2007 contractual life exercise price 31 December 2007 exercise price
€8.41 – €11.70 1 681 642 3 years €10.98 1 681 642 €10.98€12.40 – €16.97 18 327 615 4 years €14.87 15 633 936 €14.65€17.00 – €24.66 38 685 700 4 years €19.07 30 660 231 €19.07
(ii) Performance Share PlansThe Global Performance Share Plan (GPSP) was introduced in 2005. Under this plan, managers can be awarded conditional shares which will vestthree years later at a level between 0% and 150% (for middle management) or 200% (for higher executives) depending on Unilever’s achievementof set targets for Underlying Sales Growth and Ungeared Free Cash Flow over the three-year performance period. The amount to be paid byparticipants to obtain the shares at vesting is zero.
In 2007 we introduced the Leadership Performance Share Plan (LPSP) under the Global Share Incentive Plan (GSIP) rules. The structure of this Plan iscomparable to the GPSP but the Plan has an additional third performance condition which is based on TSR ranking over the three year period.
North American managers participate in the North American Performance Share Programme, introduced in 2001, that awards Unilever shares ifNorth American company performance targets are met over a three-year period. The amount to be paid to the company by participants to obtainthe shares at vesting is zero.
A summary of the status of the Performance Share Plans as at 31 December 2007, 2006 and 2005 and changes during the years ended on thesedates is presented below:
2007 2006 2005Number of Number of Number of
shares shares shares
Outstanding at 1 January 15 270 180 13 286 992 10 749 007Awarded 6 209 781 6 162 489 6 514 252Vested (3 465 990) (3 057 630) (3 510 939)Forfeited (1 170 202) (1 121 671) (465 328)
Outstanding at 31 December 16 843 769 15 270 180 13 286 992
Exercisable at 31 December – – –
2007 2006 2005
Share award value informationFair value per share award €19.06 €17.22 €17.26

Unilever Annual Report and Accounts 2007 119
Financial statements continued
Notes to the consolidated accounts Unilever Group
29 Share-based compensation plans (continued)Additional informationAs a result of the share-based compensation plans for employees, we are exposed to movements in our own share price. We take a flexibleapproach to the buying of shares to meet these obligations, not automatically buying shares at grant. In 2001, we entered into a contract witha bank for the forward purchase of Unilever shares. This contract was terminated in March 2006.
At 31 December 2007, there were options outstanding to purchase 61 579 485 (2006: 88 937 770) ordinary shares in NV or PLC in respect of share-based compensation plans of NV and its subsidiaries and the North American plans, and 18 296 234 (2006: 29 315 519) ordinaryshares in NV or PLC in respect of share-based compensation plans of PLC and its subsidiaries.
To satisfy the options granted, certain NV group companies hold 68 011 392 (2006: 91 935 752) ordinary shares of NV or PLC, and trusts inJersey and the United Kingdom hold 10 920 385 (2006: 16 678 871) PLC shares. The trustees of these trusts have agreed, until further notice,to waive dividends on these shares, save for the nominal sum of 0.01p per 31⁄9p ordinary share. Shares acquired during 2007 represent 0.2% of the Group’s called up capital. The balance at 31 December 2007 was 2.6% (2006: 3.6%).
The book value of €1 305 million (2006: €1 836 million) of all shares held in respect of share-based compensation plans for both NV and PLC is eliminated on consolidation by deduction from other reserves (see note 23 on page 110). Their market value at 31 December 2007 was €2 008 million (2006: €2 279 million).
At 31 December 2007 the exercise price of nil (2006: 14 989 001) NV and PLC options were above the market price of the shares.
Shares held to satisfy options are accounted for in accordance with IAS 32 and SIC12. All differences between the purchase price of the sharesheld to satisfy options granted and the proceeds received for the shares, whether on exercise or lapse, are charged to reserves. In 2007 thisincludes €nil million (2006: €7 million) for shares held to meet options expiring in the short term which are priced above market value. The basisof the charge to operating profit for the economic value of options granted is discussed on page 117.
Obligations over the following number of shares were granted, exercised, forfeited or expired between 31 December 2007 and 1 March 2008.
Number of shares
Exercised,Granted forfeited or expired
Share Option Plans – 2 104 963Performance Share Plans – 118 881

Notes to the consolidated accounts Unilever Group
120 Unilever Annual Report and Accounts 2007
Financial statements continued
30 Related party transactionsThe following related party balances existed with associate or joint venture businesses at 31 December:
€ million € millionRelated party balances 2007 2006
Trading and other balances due (to)/from joint ventures 157 93Trading balances due (to)/from associates (21) (14)
Joint venturesAs discussed in note 26 on page 113, Unilever completed the restructuring of its Portuguese business as at 1 January 2007. Balances owedby/(to) FIMA and PLI at 31 December 2007 were €258 million and €(101) million (2006: €91 million and €2 million) respectively.
AssociatesFollowing the sale of DiverseyLever, our institutional and industrial cleaning business, to Johnson Professional Holdings Inc. in 2002, Unilever hasa one-third equity stake in the combined JohnsonDiversey business, with an option to exit the business from 2007. This option had a fair valueof zero at 31 December 2007 and 31 December 2006. At 31 December 2007 the outstanding balance payable to JohnsonDiversey HoldingsInc. was €21 million (2006: €14 million). Sales agency fees to JohnsonDiversey were incurred of approximately €67 million in 2007 (2006: €68 million; 2005: €76 million).
Langholm Capital Partners invests in private European companies with above-average longer-term growth prospects. It has invested in: LumeneOY, a Finnish personal care business specialising in natural personal care for fair skins in harsh climates; Dorset Cereals, a UK manufacturer ofcereal products aimed at the healthy eating and luxury niche of the cereals market; Just Retirement, a specialist financial services companybased in the UK, providing customised retirement solution for those in and approaching retirement, and Elvi, a UK retailer of plus-size women’sclothing. During 2007 Langholm placed 30 million shares of the Langholm Fund’s remaining shares in Just Retirement. As a result of sale ofshares, Langholm returned €47 million to Unilever. Langholm remains a majority shareholder of Just Retirement. To build business opportunitiesthat fit our core business interests in Foods and Home and Personal Care, we have committed €97 million to Langholm Capital Partners on atotal of €242 million funds raised. At 31 December 2007, the outstanding balance with Langholm Capital Partners was €36 million (2006: €45 million).
Other related partiesIn September 2006 Harish Manwani, President Asia Africa and a member of the Unilever Executive Team, and his wife purchased an apartmentfrom Hindustan Lever Limited (now Hindustan Unilever Limited), a group company ultimately owned by PLC, for Rs.118 million (€2 042 255).The purchase was made at full market value via an open bidding/tendering process managed by independent property consultants.
31 Key management personnel
Key management personnel are defined as the members of UEx together with the Non-Executive Directors.
€ million € million € millionKey management compensation 2007 2006 2005
Salaries and short-term employee benefits (19) (14) (13)Non-Executive Directors’ fees (2) (1) (1)Post-employment benefits (2) (3) (4)Other long-term benefits (all share-based) (2) (2) (1)Termination payments – – (1)
(25) (20) (20)
Of which:Executive Directors (12) (11) (16)Non-Executive Directors (2) (1) (1)Other (11) (8) (3)
(25) (20) (20)
Details of the remuneration of Directors are given in the auditable part of the report of the Remuneration Committee as defined on page 49.See also note 30 above for information on related party transactions.

32 Remuneration of auditors€ million € million € million
2007 2006 2005
Fees payable to PricewaterhouseCoopers(a) for the audit of the annual accounts of Unilever N.V. and Unilever PLC (5) (6) (4)
Fees payable to PricewaterhouseCoopers(b) for the audit of accounts of subsidiaries of Unilever N.V. and Unilever PLC pursuant to the legislation (17) (20) (11)
Total statutory audit fees(c) (22) (26) (15)
Other services supplied pursuant to such legislation(d) (1) (1) (2)Other services relevant to taxation (2) (2) (3)Services relating to corporate finance transactions(e) (1) (2) (1)All other services(f) (1) (1) (2)
(a) Of which:€1 million was paid to PricewaterhouseCoopers Accountants N.V. (2006: €1 million; 2005: €1 million); and€4 million was paid to PricewaterhouseCoopers LLP (2006: €5 million; 2005: €3 million).
(b) Comprises fees paid to the network of separate and independent member firms of PricewaterhouseCoopers International Limited for auditwork on statutory financial statements and group reporting returns of subsidiary companies.
(c) In addition, €1 million of statutory audit fees were payable to PricewaterhouseCoopers in respect of services supplied to associated pensionschemes (2006: €1 million; 2005: €1 million).
(d) Comprises other audit services, including audit and similar work that regulations or agreements with third parties require the auditors toundertake and other circulars and regulatory reports.
(e) Comprises work in respect of acquisitions and disposals.(f) Comprises other services, including risk management assurance and advisory work and training, that are compatible with
PricewaterhouseCoopers' audit work.
33 Events after the balance sheet date
Effective 1 January 2008, Unilever and PepsiCo have entered into an expanded international partnership for the marketing and distribution onready-to-drink tea products under the Lipton brand. The new agreement adds 11 counties to the partnership’s existing Lipton ready-to drink teabusiness – eight in Europe (Germany, Italy, France, Netherlands, Switzerland, Austria, Belgium and Portugal) as well as Korea, Taiwan and SouthAfrica.
On 5 November 2007, Unilever announced the disposal of Boursin to Le Groupe Bel for €400 million. The sale was effective on 3 January 2008.
On 4 February 2008, we announced that we had reached an agreement to acquire the leading Russian ice cream business Inmarko, for anundisclosed amount. The deal is subject to regulatory approval and is expected to be completed in the first half of 2008.
On 11 February 2008, Unilever announced a share buy-back programme for at least €1.5 billion for 2008.
On 21 February 2008, Unilever launched a bond composed of two tranches; i) CHF 250 million fixed rate bond which will mature in fouryears, and ii) CHF 350 million fixed rate bond which will mature in seven years. Completion is expected in late March 2008.
On 28 February 2008 Unilever announced a number of changes affecting its organisation. As a further extension of the One Unileverprogramme, Foods and Home and Personal Care will be combined into a single category structure. To reflect our strategic focus on growth indeveloping markets, operations in Central and Eastern Europe will be managed as part of an enlarged region comprising Asia, Africa andCentral and Eastern Europe, with Western Europe becoming a separate region.
A number of Board and senior executive changes were announced simultaneously. Kees van der Graaf will step down from the Boards ofUnilever and from his role as President Europe at the AGMs on 14 and 15 May 2008. Ralph Kugler, President Home and Personal Care, willsimilarly step down at the AGMs. Harish Manwani, currently President Asia Africa, will lead the new expanded region. Doug Baillie, previouslyChief Executive Officer of Hindustan Unilever, will join the Unilever Executive as President Western Europe. The roles of President Home andPersonal Care and President Foods will be merged under the leadership of Vindi Banga, currently President Foods.
Unilever Annual Report and Accounts 2007 121
Notes to the consolidated accounts Unilever Group
Financial statements continued

122 Unilever Annual Report and Accounts 2007
Financial statements continued
Financial record Unilever Group
Financial record under IFRS
In the schedules below, figures within the income statement and for earnings per share reflect the classification between continuing anddiscontinued operations, which has applied for our reporting during 2006 and 2007. Figures for 2005 and 2004 also reflect this classification,and therefore differ from those originally published for those years.
€ million € million € million € millionConsolidated income statement 2007 2006 2005 2004
Continuing operations:Turnover 40 187 39 642 38 401 37 168
Operating profit 5 245 5 408 5 074 3 981
Net finance costs (252) (721) (613) (623)Income from non-current investments 191 144 55 95
Profit before taxation 5 184 4 831 4 516 3 453 Taxation (1 128) (1 146) (1 181) (725)
Net profit from continuing operations 4 056 3 685 3 335 2 728 Net profit from discontinued operations 80 1 330 640 213
Net profit 4 136 5 015 3 975 2 941 Attributable to:
Minority interests 248 270 209 186 Shareholders’ equity 3 888 4 745 3 766 2 755
€ € € € Combined earnings per share(a) 2007 2006 2005 2004
Continuing operations:Basic earnings per share 1.32 1.19 1.07 0.87Diluted earnings per share 1.28 1.15 1.04 0.84
Total operations:Basic earnings per share 1.35 1.65 1.29 0.94Diluted earnings per share 1.31 1.60 1.25 0.91
€ million € million € million € millionConsolidated balance sheet 2007 2006 2005 2004
Non-current assets 27 374 27 571 28 358 26 368Current assets 9 928 9 501 11 142 10 490Current liabilities (13 559) (13 884) (15 394) (14 186)
Total assets less current liabilities 23 743 23 188 24 106 22 672
Non-current liabilities 10 924 11 516 15 341 15 043
Shareholders’ equity 12 387 11 230 8 361 7 264Minority interests 432 442 404 365
Total equity 12 819 11 672 8 765 7 629
Total capital employed 23 743 23 188 24 106 22 672
€ million € million € million € millionConsolidated cash flow statement 2007 2006 2005 2004
Net cash flow from operating activities 3 876 4 511 4 353 5 547 Net cash flow from/(used in) investing activities (623) 1 155 515 (120)Net cash flow from/(used in) financing activities (3 009) (6 572) (4 821) (5 938)
Net increase/(decrease) in cash and cash equivalents 244 (906) 47 (511)Cash and cash equivalents at the beginning of the year 710 1 265 1 406 1 428 Effect of foreign exchange rates (53) 351 (188) 489
Cash and cash equivalents at the end of the year 901 710 1 265 1 406
Ratios and other metrics 2007 2006 2005 2004
Operating margin (%) 13.1 13.6 13.2 10.7Net profit margin (%)(b) 9.7 12.0 9.8 7.4Ungeared free cash flow (€ million)(c) 3 769 4 222 4 011 5 346Return on invested capital (%)(d) 12.7 14.6 12.5 10.7Ratio of earnings to fixed charges (times)(e) 8.3 7.5 6.5 5.1
(a) For the basis of the calculations of combined earnings per share see note 7 on page 85.(b) Net profit margin is expressed as net profit attributable to shareholders’ equity as a percentage of turnover from continuing operations.(c) As defined on page 30.(d) As defined on page 31.(e) In the ratio of earnings to fixed charges, earnings consist of net profit from continuing operations excluding net profit or loss of joint
ventures and associates increased by fixed charges, income taxes and dividends received from joint ventures and associates. Fixed chargesconsist of interest payable on debt and a portion of lease costs determined to be representative of interest. This ratio takes no account ofinterest receivable although Unilever’s treasury operations involve both borrowing and depositing funds.

Financial record under IFRS (continued)
€ million € million € million € millionBy geographical area 2007 2006 2005 2004
TurnoverEurope 15 205 15 000 14 940 15 252The Americas 13 442 13 779 13 179 12 296Asia Africa 11 540 10 863 10 282 9 620
40 187 39 642 38 401 37 168
Operating profitEurope 1 678 1 903 2 064 2 045The Americas 1 971 2 178 1 719 896Asia Africa 1 596 1 327 1 291 1 040
5 245 5 408 5 074 3 981
Total assetsEurope 14 703 14 489 15 164 15 586The Americas 10 878 11 564 12 569 11 486Asia Africa 6 291 5 884 6 320 4 369Corporate 5 430 5 135 5 447 5 417
37 302 37 072 39 500 36 858
Capital expenditureEurope 672 511 447 497The Americas 342 396 305 297Asia Africa 411 294 298 305
1 425 1 201 1 050 1 099
€ million € million € million € millionBy operation 2007 2006 2005 2004
TurnoverFoods 21 588 21 345 20 889 20 566Home and Personal Care 18 599 18 297 17 512 16 602
40 187 39 642 38 401 37 168
Operating profitFoods 2 868 2 893 2 635 1 850Home and Personal Care 2 377 2 515 2 439 2 131
5 245 5 408 5 074 3 981
Total assetsFoods 24 381 24 973 26 798 25 382Home and Personal Care 7 491 6 964 7 255 6 059Corporate 5 430 5 135 5 447 5 417
37 302 37 072 39 500 36 858
Capital expenditureFoods 801 714 572 588Home and Personal Care 624 487 478 511
1 425 1 201 1 050 1 099
Unilever Annual Report and Accounts 2007 123
Financial statements continued
Financial record Unilever Group

124 Unilever Annual Report and Accounts 2007
Financial statements continued
Financial record Unilever Group
Exchange rates
The information in the following table is based on exchange rates between euros and US dollars and between euros and sterling. Thesetranslation rates were used in preparation of the accounts:
2007 2006 2005 2004 2003
Year end€1 = US $ 1.471 1.317 1.184 1.366 1.261€1 = £ 0.734 0.671 0.686 0.707 0.708
Annual average€1 = US $ 1.364 1.254 1.244 1.238 1.126€1 = £ 0.682 0.682 0.684 0.678 0.691
Noon Buying Rates in New York for cable transfers in foreign currencies as certified for customs purposes by the Federal Reserve Bank of New York were as follows:
2007 2006 2005 2004 2003
Year end€1 = US $ 1.460 1.320 1.184 1.354 1.260
Annual average€1 = US $ 1.371 1.256 1.245 1.239 1.132
High€1 = US $ 1.486 1.333 1.348 1.363 1.260
Low€1 = US $ 1.290 1.186 1.167 1.180 1.036
High and low exchange rate values for each of the last six months:September October November December January February
2007 2007 2007 2007 2008 2008
High€1 = US $ 1.422 1.447 1.486 1.476 1.488 1.519
Low€1 = US $ 1.361 1.409 1.444 1.434 1.457 1.450
On 1 March 2008, the exchange rates between euros and US dollars and between euros and sterling were as follows: €1.00 = US $1.521 and €1.00 = £0.767.

The companies listed below and on page 126 are those which, in theopinion of the Directors, principally affect the amount of profit andassets shown in the Unilever Group accounts. The Directors considerthat those companies not listed are not significant in relation toUnilever as a whole.
Full information as required by Articles 379 and 414 of Book 2 of theCivil Code in the Netherlands has been filed by Unilever N.V. with theCommercial Registry in Rotterdam.
Particulars of PLC group companies and other significant holdingsas required by the United Kingdom Companies Act 1985 will beannexed to the next Annual Return of Unilever PLC.
Unless otherwise indicated, the companies are incorporated andprincipally operate in the countries under which they are shown.
The aggregate percentage of equity capital directly or indirectly held by NV or PLC is shown in the margin, except where it is 100%. Allthese percentages are rounded down to the nearest whole number.
The percentage of Unilever’s shareholdings held either directly orindirectly by NV and PLC are identified in the tables according to thefollowing code:
NV 100% aPLC 100% bNV 56%; PLC 44% cNV 84%; PLC 16% dNV 19%; PLC 81% eNV 26%; PLC 74% fNV 23%; PLC 77% g
Due to the inclusion of certain partnerships in the consolidatedgroup accounts of Unilever, para 264(b) of the German trade lawgrants an exemption from the duty to prepare individual statutoryfinancial statements and management reports in accordance with therequirements for limited liability companies and to have these auditedand published.
Group companies
% Ownership
ArgentinaUnilever de Argentina S.A. d
AustraliaUnilever Australia Ltd. b
BelgiumUnilever Belgium BVBA/SPRL (Unibel) d
BrazilUnilever Brasil Ltda. d
CanadaUnilever Canada Inc. e
ChileUnilever Chile Home and Personal Care Ltda. d
ChinaUnilever Services (He Fei) Co Limited a
France 99 Unilever France d
Unilever Annual Report and Accounts 2007 125
Financial statements continued
Principal group companies and non-current investments Unilever Group
as at 31 December 2007
Group companies (continued)
% Ownership
GermanyMaizena Grundstücksverwaltungs
GmbH & Co. OHG dPfanni GmbH & Co. OHG Stavenhagen dPfanni Werke Grundstücksverwaltungs
GmbH & Co. OHG dUBG Vermietungs GmbH & Co. OHG dUnilever Deutschland GmbH dUnilever Deutschland Holding GmbH dUnilever Deutschland Immobilien Leasing
GmbH & Co. OHG dWizona IPR GmbH & Co. OHG d
GreeceUnilever Hellas A.E.B.E. a
India52 Hindustan Unilever Ltd. b
Indonesia85 P.T. Unilever Indonesia Tbk a
ItalyUnilever Italia SrL d
Japan Unilever Japan KK a
MexicoUnilever de México S. de R.L. de C.V. d
The NetherlandsMixhold B.V. dUnilever Finance International B.V. aUnilever N.V.(a)
Unilever Nederland B.V. dUNUS Holding B.V. c
PolandUnilever Polska S.A. d
RussiaUnilever Rus g
South Africa74 Unilever South Africa (Pty) Limited f
Spain Unilever España S.A. a
SwedenUnilever Sverige AB a
Switzerland Unilever Supply Chain Company AG aUnilever Schweiz GmbH d
ThailandUnilever Thai Trading Ltd. d
(a) See ‘Basis of consolidation’ in note 1 on page 72.

Group companies (continued)
% Ownership
TurkeyUnilever Sanayi ve Ticaret Türk A.S,. b
United Kingdom Unilever UK Ltd. eUnilever PLC(a)
Unilever UK Holdings Ltd. bUnilever UK & CN Holdings Ltd. e
United States of AmericaConopco, Inc. cUnilever Capital Corporation cUnilever United States, Inc. c
(a) See ‘Basis of consolidation’ in note 1 on page 72
Joint ventures
% Ownership
Portugal55 Unilever Jerónimo Martins, Lda b
United States of America 50 Pepsi/Lipton Partnership c
Associates
% Ownership
Côte d’Ivoire40 Palmci b
United Kingdom40 Langholm Capital Partners L.P. b
United States of America33 JohnsonDiversey Holdings, Inc. a
In addition, we have revenues either from our own operations orthrough agency agreements in the following locations: Abu Dhabi,Algeria, Austria, Bahrain, Bangladesh, Bolivia, Bulgaria, Cambodia,Cameroon, Colombia, Costa Rica, Côte d’Ivoire, Croatia, Cuba,Cyprus, Czech Republic, Democratic Republic of Congo, Denmark,Dominican Republic, Dubai, Ecuador, Egypt, El Salvador, Estonia,Finland, Ghana, Guatemala, Honduras, Hong Kong, Hungary, Iran,Ireland, Israel, Jordan, Kenya, Latvia, Lebanon, Lithuania, Malawi,Malaysia, Morocco, Mozambique, Namibia, Nepal, NetherlandsAntilles, New Zealand, Nicaragua, Niger, Nigeria, Norway, Oman,Pakistan, Palestine, Panama, Paraguay, Peru, Philippines, Portugal,Puerto Rico, Romania, Saudi Arabia, Senegal, Serbia, Singapore,Slovakia, Slovenia, South Korea, Sri Lanka, Sudan, Syria, Taiwan,Tanzania, Trinidad & Tobago, Tunisia, Uganda, Ukraine, United ArabEmirates, Uruguay, Venezuela, Vietnam, Zambia and Zimbabwe.
126 Unilever Annual Report and Accounts 2007
Principal group companies and non-current investments Unilever Group
as at 31 December 2007
Financial statements continued

Company accounts Auditor’s report – Unilever N.V.
Independent auditor’s report to the shareholders ofUnilever N.V.
Report on the company accountsWe have audited the company accounts which are part of theAnnual Report 2007 of Unilever N.V., Rotterdam, for the yearended 31 December 2007 which comprise the balance sheet,income statement and the related notes on pages 128 to 130.These company accounts have been prepared under theaccounting policies set out therein.
We have reported separately on the consolidated accounts of theUnilever Group for the year ended 31 December 2007.
Directors’ responsibilityThe Directors are responsible for the preparation and fairpresentation of the company accounts in accordance with UnitedKingdom accounting standards and with Part 9 of Book 2 of theNetherlands Civil Code, and for the preparation of the Report of the Directors in accordance with Part 9 of Book 2 of theNetherlands Civil Code. This responsibility includes: designing,implementing and maintaining internal control relevant to thepreparation and fair presentation of the company accounts thatare free from material misstatement, whether due to fraud orerror; selecting and applying appropriate accounting policies; and making accounting estimates that are reasonable in the circumstances.
Auditor’s responsibilityOur responsibility is to express an opinion on the companyaccounts based on our audit. We conducted our audit inaccordance with Dutch law. This law requires that we comply with ethical requirements and plan and perform the audit toobtain reasonable assurance whether the company accounts are free from material misstatement.
An audit involves performing procedures to obtain audit evidenceabout the amounts and disclosures in the company accounts. The procedures selected depend on the auditor’s judgement,including the assessment of the risks of material misstatement ofthe company accounts, whether due to fraud or error. In makingthose risk assessments, the auditor considers internal controlrelevant to the entity’s preparation and fair presentation of thecompany accounts in order to design audit procedures that areappropriate in the circumstances, but not for the purpose ofexpressing an opinion on the effectiveness of the entity’s internalcontrol. An audit also includes evaluating the appropriateness ofaccounting policies used and the reasonableness of accountingestimates made by the Directors, as well as evaluating the overallpresentation of the company accounts.
We believe that the audit evidence we have obtained is sufficientand appropriate to provide a basis for our audit opinion.
OpinionIn our opinion, the company accounts give a true and fair view of the financial position of Unilever N.V. as at 31 December 2007,and of its result for the year then ended in accordance withUnited Kingdom accounting standards and with Part 9 of Book 2of the Netherlands Civil Code.
Report on other legal and regulatory requirements Pursuant to the legal requirement under 2:393 sub 5 part e of the Netherlands Civil Code, we report, to the extent of our competence, that the Report of the Directors is consistentwith the company accounts as required by 2:391 sub 4 of the Netherlands Civil Code.
Rotterdam, The Netherlands, 10 March 2008PricewaterhouseCoopers Accountants N.V.
Prof Dr J A van Manen RA
Unilever Annual Report and Accounts 2007 127
Financial statements continued

128 Unilever Annual Report and Accounts 2007
Financial statements continued
Company accounts Unilever N.V.
Balance sheet as at 31 December(after proposed appropriation of profit)
€ million € million2007 2006
Fixed assetsFixed investments 24 423 26 405
Current assetsDebtors 3 215 6 007Cash at bank and in hand 2 7
Total current assets 3 217 6 014Creditors due within one year (17 163) (20 646)
Net current assets/(liabilities) (13 946) (14 632)
Total assets less current liabilities 10 477 11 773
Creditors due after more than one year 2 420 2 451
Provisions for liabilities and charges (excluding pensions and similar obligations) 40 336
Net pension liability for unfunded schemes 134 148
Capital and reserves 7 883 8 838Called up share capital 275 275Share premium account 20 20Legal reserves 16 16Other reserves (2 437) (1 228)Profit retained 10 009 9 755
Total capital employed 10 477 11 773
Profit and loss account for the year ended 31 December€ million € million
2007 2006
Income from fixed investments after taxation 1 508 1 916Other income and expenses (102) (69)
Profit for the year 1 406 1 847
For the information required by Article 392 of Book 2 of the Civil Code in the Netherlands, refer to pages 127 and 131. Pages 129 and 130 arepart of the notes to the Unilever N.V. company accounts.
The company accounts of Unilever N.V. are included in the consolidated accounts of the Unilever Group. Therefore, and in accordance withArticle 402 of Book 2 of the Civil Code in the Netherlands, the profit and loss account only reflects the income from fixed investments aftertaxation and other income and expenses after taxes. The company accounts of Unilever N.V. do not contain a cash flow statement as this isnot required by book 2 of the Civil Code in the Netherlands.
The Board of Directors10 March 2008

Unilever Annual Report and Accounts 2007 129
Financial statements continued
Notes to the company accounts Unilever N.V.
Accounting information and policies
Basis of preparationThe company accounts of Unilever N.V. comply in all material respectswith legislation in the Netherlands. As allowed by Article 362.1 ofBook 2 of the Civil Code in the Netherlands, the company accountsare prepared in accordance with United Kingdom accountingstandards, unless such standards conflict with the Civil Code in the Netherlands which would in such case prevail.
The accounts are prepared under the historical cost convention asmodified by the revaluation of financial assets classified as ‘available-for-sale investments’, ‘financial assets at fair value through profit or loss’, and ‘derivative financial instruments’ in accordance withthe accounting policies set out below which have been consistently applied.
Accounting policiesThe principal accounting policies are as follows:
Fixed investmentsShares in group companies are stated at cost less any amounts writtenoff to reflect a permanent impairment. Any impairment is charged to the profit and loss account as it arises. In accordance with Article385.5 of Book 2 of the Civil Code in the Netherlands, Unilever N.V.shares held by Unilever N.V. subsidiaries are deducted from thecarrying value of those subsidiaries. This differs from the accountingtreatment under UK GAAP, which would require these amounts to beincluded within fixed investments.
Financial instruments and derivative financial instrumentsThe company’s accounting policies under United Kingdom generallyaccepted accounting principles (UK GAAP) namely FRS 25 ‘FinancialInstruments: Presentation’, FRS 26 ‘Financial Instruments:Measurement’ and FRS 29 ‘Financial Instruments: Disclosures’ are thesame as the Unilever Group’s accounting policies under InternationalFinancial Reporting Standards (IFRS) namely IAS 32 ‘FinancialInstruments: Presentation’, IAS 39 ‘Financial Instruments: Recognitionand Measurement’ and IFRS 7 ‘Financial Instruments: Disclosures’. Thepolicies are set out under the heading ‘Financial instruments’ in note 1to the consolidated accounts on pages 73 and 74. NV is taking theexemption for not providing all the financial instruments disclosures,because IFRS 7 disclosures are given in note 17 to the consolidatedaccounts on pages 97 to 101.
Deferred taxationFull provision is made for deferred taxation on all significant timingdifferences arising from the recognition of items for taxation purposesin different periods from those in which they are included in thecompany's accounts. Full provision is made at the rates of taxprevailing at the year end unless future rates have been enacted or substantively enacted. Deferred tax assets and liabilities have not been discounted.
Own shares held Own shares held by the company are accounted for in accordancewith Dutch law and UK GAAP, namely FRS 25 ‘Financial Instruments:Presentation’. All differences between the purchase price of the sharesheld to satisfy options granted and the proceeds received for theshares, whether on exercise or lapse, are charged to reserves.
Retirement benefitsUnilever N.V. has accounted for pensions and similar benefits underthe United Kingdom Financial Reporting Standard 17 'Retirementbenefits' (FRS 17). The operating and financing costs of definedbenefit plans are recognised separately in the profit and loss account;service costs are systematically spread over the service lives ofemployees, and financing costs are recognised in the periods in whichthey arise. Variations from expected costs, arising from the experienceof the plans or changes in actuarial assumptions, are recognisedimmediately in the statement of total recognised gains and losses. Thecosts of individual events such as past service benefit enhancements,settlements and curtailments are recognised immediately in the profitand loss account. The liabilities and, where applicable, the assets ofdefined benefit plans are recognised at fair value in the balance sheet.The charges to the profit and loss account for defined contributionplans are the company contributions payable and the assets of suchplans are not included in the company balance sheet.
DividendsUnder Financial Reporting Standard 21 ‘Events after the Balance SheetDate’ (FRS 21), proposed dividends do not meet the definition of aliability until such time as they have been approved by shareholders atthe Annual General Meeting. Therefore, we do not recognise a liability in any period for dividends that have been proposed but will not beapproved until after the balance sheet date. This holds for externaldividends as well as intra-group dividends paid to the parent company.

130 Unilever Annual Report and Accounts 2007
Financial statements continued
Notes to the company accounts Unilever N.V.
Fixed investments € million € million2007 2006
Shares in group companies 24 428 26 241PLC shares held in connection with
share options 184 375Less NV shares held by group companies (189) (211)
24 423 26 405
Movements during the year:1 January 26 405 11 276PLC shares held in connection
with share options (191) (57)NV shares held by group companies 22 27Additions(a) 4 966 15 342Decreases (6 779) (183)
31 December 24 423 26 405
(a) In 2006 Unilever decided to transfer its group financing activities into a separate financing entity, Unilever Finance International B.V., a 100% subsidiary of NV based in the Netherlands. The transfer was executed as a contribution in kind on issued shares.
Debtors € million € million2007 2006
Loans to group companies 2 262 3 269Other amounts owed by group companies 847 2 288Amounts owed by undertakings in which
the company has a participating interest – 43Taxation 38 –Prepayments and accrued income 12 335Other 56 72
3 215 6 007
Of which due after more than one year 2 250 2 312
Cash at bank and in handAt 31 December 2007 there is no cash at bank and in hand for whichpayment notice is required (2006: nil).
Creditors € million € million2007 2006
Due within one year:Other amounts owed to group companies 15 743 17 244Loans from group companies 1 258 1 248Bonds and other loans – 1 503Taxation and social security 16 48Accruals and deferred income 58 400Other 88 203
17 163 20 646
Due after more than one year:Bonds and other loans 2 244 746Loans from group companies – 1 521Accruals and deferred income 52 60Preference shares(a) 124 124
2 420 2 451
(a) Information on the euro conversion of the preference shares is given in note 16 to the consolidated accounts on page 94.
Creditors due after five years amount to €870 million (2006: €1 630 million) (Article 375.2 of Book 2 of the Civil Code in the Netherlands).
Ordinary share capitalShares numbered 1 to 2 400 are held by a subsidiary of NV and asubsidiary of PLC, each holding 50%. Additionally, 122 296 247 (2006: 72 484 322) €0.16 ordinary shares are held by NV and othergroup companies. Full details as well as information on the euroconversion and subsequent split of ordinary shares are given in note22 to the consolidated accounts on page 109.
Share premium accountThe share premium shown in the balance sheet is not available for theissue of bonus shares or for repayment without incurring withholdingtax payable by the company. This is despite the change in tax law inthe Netherlands, as a result of which dividends received from 2001onwards by individual shareholders who are resident in theNetherlands are no longer taxed.
Other reserves € million € million2007 2006
1 January (1 228) (1 321)Change in own shares held (1 209) 93
31 December (2 437) (1 228)
Profit retained € million € million2007 2006
1 January 9 755 9 463Profit for the year 1 406 1 847Ordinary dividends – final 2005 – (729)Ordinary dividends – interim 2006 – (382)One-off dividend 2006 – (432)Ordinary dividends – final 2006 (775) –Ordinary dividends – interim 2007 (404) –Taxation charge 3 –Fair value adjustments for cash flow hedges – (4)Realised profit/(loss) on shares/certificates held
to meet employee share options 15 (6)Changes in present value of net pension liability 9 (2)
31 December 10 009 9 755
Profit retained shown in the company accounts and the notes theretodiffers from the amount shown in note 24 to the consolidatedaccounts on page 111 mainly because of certain inter-companytransactions which are eliminated in the consolidated accounts.
€ million € million2007 2006
Difference as at 1 January 1 351 742Changes in equity of consolidated participations (3 305) (1 667)Changes in accumulated intercompany results 1 560 2 276
Difference as at 31 December (394) 1 351
Provisions for liabilities and charges (excluding pensionsand similar obligations)
€ million € million2007 2006
Preference shares provision 3 300Deferred taxation and other provisions 37 36
40 336
Of which due within one year 40 332
Contingent liabilitiesContingent liabilities are not expected to give rise to any material loss and include guarantees given for group companies. The estimatedtotal of such liabilities as at 31 December 2007 was some€5 204 million (2006: €4 635 million) of which €3 706 million(2006: €3 203 million) was also guaranteed by PLC. The fair value of such guarantees was not significant in either 2006 or 2007. Theguarantees issued to other companies were immaterial.
NV has issued joint and several liability undertakings, as defined inArticle 403 of Book 2 of the Civil Code in the Netherlands, for almostall Dutch group companies. These written undertakings have beenfiled with the office of the Company Registry in whose area ofjurisdiction the group company concerned has its registered office.

Unilever Annual Report and Accounts 2007 131
Financial statements continued
Further statutory and other information Unilever N.V.
The rules for profit appropriation in the Articles of Association(summary of Article 38)The profit for the year is applied firstly to the reserves required by lawor by the Equalisation Agreement, secondly to cover losses of previousyears, if any, and thirdly to the reserves deemed necessary by theBoard of Directors. Dividends due to the holders of the CumulativePreference Shares, including any arrears in such dividends, are thenpaid; if the profit is insufficient for this purpose, the amount availableis distributed to them in proportion to the dividend percentages oftheir shares. Any profit remaining thereafter shall be distributed tothem in proportion to the dividend percentages of their shares. TheGeneral Meeting can only decide to make distributions from reserveson the basis of a proposal by the Board and in compliance with thelaw and the Equalisation Agreement.
Proposed profit appropriation € million € million2007 2006
Profit for the year (available for distribution) 1 406 1 847Interim dividend already paid (404) (382)One-off dividend 2006 – (432)
To profit retained 1 002 1 033
Post balance sheet eventThe directors propose a final dividend of €0.50 per share (totalling€796 million) out of the profits retained for the year ended 31 December 2007. The dividend will be submitted for formalapproval at the Annual General Meeting to be held on 15 May2008. In accordance with FRS 21, these financial statements donot reflect this dividend payable, which will be accounted for inshareholders’ equity as an appropriation of retained earnings inthe year ended 31 December 2008. During 2007, a final dividendof €0.47 per share (totalling €775 million) was paid in respect ofthe dividend declared for the year ended 31 December 2006.
Special controlling rights under the Articles of AssociationSee note 22 to the consolidated accounts on page 109.
AuditorsA resolution will be proposed at the Annual General Meeting on15 May 2008 for the reappointment of PricewaterhouseCoopersAccountants N.V. as auditors of NV. The present appointment will end at the conclusion of the Annual General Meeting.
Corporate CentreUnilever N.V.Weena 455PO Box 7603000 DK RotterdamThe Netherlands
S H M A DumoulinSecretary of Unilever N.V.10 March 2008

132 Unilever Annual Report and Accounts 2007
Financial statements continued
Company accounts Auditors’ report – Unilever PLC
Independent auditors’ report to the shareholders ofUnilever PLC on the parent company accountsWe have audited the parent company accounts of Unilever PLCfor the year ended 31 December 2007 which comprise thebalance sheet and the related notes. These parent companyaccounts have been prepared under the accounting policies setout therein. We have also audited the information in the Reportof the Remuneration Committee that is described as having been audited.
We have reported separately on the consolidated accounts of theUnilever Group for the year ended 31 December 2007.
Respective responsibilities of Directors and auditorsThe Directors’ responsibilities for preparing the parent companyaccounts in accordance with applicable United Kingdom law andUnited Kingdom accounting standards (United Kingdom GenerallyAccepted Accounting Practice) are set out in the Statement ofDirectors’ Responsibilities on page 66. The Directors are alsoresponsible for preparing the Annual Report, including the Reportof the Remuneration Committee.
Our responsibility is to audit the parent company accounts andthe part of the Report of the Remuneration Committee to beaudited in accordance with relevant legal and regulatoryrequirements and International Standards on Auditing (UK andIreland). This report, including the opinion, has been prepared for and only for the shareholders of Unilever PLC as a body inaccordance with Section 235 of the Companies Act 1985 and forno other purpose. We do not, in giving this opinion, accept orassume responsibility for any other purpose or to any otherperson to whom this report is shown or into whose hands it maycome save where expressly agreed by our prior consent in writing.
We report to you our opinion as to whether the parent companyaccounts give a true and fair view and whether the parentcompany accounts and the part of the Report of theRemuneration Committee to be audited have been properlyprepared in accordance with the Companies Act 1985. We alsoreport to you whether in our opinion the information given in the Report of the Directors is consistent with the parentcompany accounts.
In addition we report to you if, in our opinion, the Company hasnot kept proper accounting records, if we have not received allthe information and explanations we require for our audit, or ifinformation specified by law regarding directors’ remunerationand other transactions is not disclosed.
We read the other information contained in the Annual Reportand consider whether it is consistent with the audited parentcompany accounts. The other information comprises only Reportof the Directors and the Shareholder information. We considerthe implications for our report if we become aware of anyapparent misstatements or material inconsistencies with theparent company accounts. Our responsibilities do not extend to any other information.
Basis of audit opinionWe conducted our audit in accordance with InternationalStandards on Auditing (UK and Ireland) issued by the AuditingPractices Board. An audit includes examination, on a test basis, of evidence relevant to the amounts and disclosures in the parent company accounts and the part of the Report of theRemuneration Committee to be audited. It also includes anassessment of the significant estimates and judgements made by the Directors in the preparation of the parent companyaccounts, and of whether the accounting policies are appropriateto the company’s circumstances, consistently applied andadequately disclosed.
We planned and performed our audit so as to obtain all theinformation and explanations which we considered necessary inorder to provide us with sufficient evidence to give reasonableassurance that the parent company accounts and the part of theReport of the Remuneration Committee to be audited are freefrom material misstatement, whether caused by fraud or otherirregularity or error. In forming our opinion we also evaluated the overall adequacy of the presentation of information in theparent company accounts and the part of the Report of theRemuneration Committee to be audited.
OpinionIn our opinion:
• the parent company accounts give a true and fair view, inaccordance with United Kingdom Generally AcceptedAccounting Practice, of the state of the company’s affairs as at31 December 2007;
• the parent company accounts and the part of the Report of theRemuneration Committee to be audited have been properlyprepared in accordance with the Companies Act 1985; and
• the information given in the Report of the Directors isconsistent with the parent company accounts.
10 March 2008
PricewaterhouseCoopers LLPChartered Accountants and Registered AuditorsLondon, United Kingdom

Unilever Annual Report and Accounts 2007 133
Financial statements continued
Company accounts Unilever PLC
Balance sheet as at 31 December£ million £ million
2007 2006
Fixed assetsIntangible assets 20 23Fixed asset investments 2 294 2 237
Current assetsDebtors due within one year 1 565 134Debtors due after more than one year 3 45
Total current assets 1 568 179Creditors due within one year (2 286) (1 091)
Net current assets/(liabilities) (718) (912)
Total assets less current liabilities 1 596 1 348
Provision for liabilities and charges (excluding pensions and similar obligations) 10 7
Capital and reserves 1 586 1 341
Called up share capital 41 41Share premium account 94 94Capital redemption reserve 11 11Other reserves (281) (353)Profit retained 1 721 1 548
Total capital employed 1 596 1 348
As permitted by Section 230 of the United Kingdom Companies Act 1985, an entity profit and loss account is not included as part of thepublished company accounts for PLC. Under the terms of Financial Reporting Standard 1 (revised 1996) ‘Cash Flow Statements’ (FRS 1) a cashflow statement is not included, as the cash flows are included in the consolidated cash flow statement of the Unilever Group.
On behalf of the Board of Directors
M Treschow ChairmanP Cescau Group Chief Executive
10 March 2008

134 Unilever Annual Report and Accounts 2007
Financial statements continued
Notes to the company accounts Unilever PLC
Accounting information and policies
Basis of preparationThe accounts have been prepared in accordance with applicableUnited Kingdom accounting standards and the United KingdomCompanies Act 1985.
The accounts are prepared under the historical cost convention asmodified by the revaluation of financial assets classified as ‘available-for-sale investments’, ‘financial assets at fair value through profit or loss’,and ‘derivative financial instruments’ in accordance with the accountingpolicies set out below which have been consistently applied.
Accounting policiesThe principal accounting policies are as follows:
Intangible assetsIntangible assets comprise trademarks purchased after 1 January 1998and are amortised in the profit and loss account over their expecteduseful lives of up to a maximum of 20 years. They are subject toreview for impairment in accordance with United Kingdom FinancialReporting Standard 11 ‘Impairment of Fixed Assets and Goodwill’ (FRS 11). Any impairment is charged to the profit and loss account as it arises.
Fixed asset investmentsShares in group companies are stated at cost less any amounts writtenoff to reflect a permanent impairment. Any impairment is charged tothe profit and loss account as it arises.
Financial instruments The company’s accounting policies under United Kingdom generallyaccepted accounting principles (UK GAAP) namely FRS 25 ‘FinancialInstruments: Presentation’, FRS 26 ‘Financial Instruments:Measurement’ and FRS 29 ‘Financial Instruments: Disclosures’ are thesame as the Unilever Group’s accounting policies under InternationalFinancial Reporting Standards (IFRS) namely IAS 32 ‘FinancialInstruments: Presentation’, IAS 39 ‘Financial Instruments: Recognitionand Measurement’ and IFRS 7 ‘Financial Instruments: Disclosures’. Thepolicies are set out under the heading ‘Financial instruments’ in note 1to the consolidated accounts on pages 73 and 74. PLC is taking theexemption for not providing all the financial instruments disclosures,because IFRS 7 disclosures are given in note 17 to the consolidatedaccounts on pages 97 to 101.
Deferred taxationFull provision is made for deferred taxation on all significant timingdifferences arising from the recognition of items for taxation purposesin different periods from those in which they are included in thecompany’s accounts. Full provision is made at the rates of taxprevailing at the year end unless future rates have been enacted or substantively enacted. Deferred tax assets and liabilities have notbeen discounted.
Shares held by employee share trustsShares held to satisfy options are accounted for in accordance withUK GAAP, namely FRS 25 ‘Financial Instruments: Presentation’ andUrgent Issues Task Force abstract 38 ‘Accounting for ESOP Trusts’(UITF 38). All differences between the purchase price of the sharesheld to satisfy options granted and the proceeds received for theshares, whether on exercise or lapse, are charged to other reserves.
DividendsUnder Financial Reporting Standard 21 ‘Events after the Balance SheetDate’ (FRS 21), proposed dividends do not meet the definition of aliability until such time as they have been approved by shareholders at the Annual General Meeting. Therefore, we do not recognise aliability in any period for dividends that have been proposed but willnot be approved until after the balance sheet date. This holds forexternal dividends as well as intra-group dividends paid to the parentcompany.

Unilever Annual Report and Accounts 2007 135
Financial statements continued
Notes to the company accounts Unilever PLC
Fixed asset investments £ million £ million2007 2006
Shares in group companies(a) 2 294 2 237
(a) The only movement in the year is an additional investment in a group company.
Debtors £ million £ million2007 2006
Due within one year:Amounts owed by group companies 1 562 80Amounts owed by undertakings in which
the company has a participating interest 1 28Other 2 26
1 565 134
Due after more than one year:Amounts owed by group companies 3 44Other – 1
3 45
Creditors £ million £ million2007 2006
Due within one year:Amounts owed to group companies 2 162 914Taxation and social security 123 151Other 1 26
2 286 1 091
Provisions for liabilities and charges (excluding pensions andsimilar obligations)
£ million £ million2007 2006
Deferred taxation 10 7
Ordinary share capitalInformation on the consolidation of ordinary shares is given in note 22to the consolidated accounts on page 109.
Other reserves £ million £ million2007 2006
1 January (353) (385)Change in book value of shares 72 32
31 December (281) (353)
Profit retained £ million £ million2007 2006
1 January 1 548 1 466Profit for the year 803 893Final dividend 2005 on ordinary and
deferred shares – (385)Interim dividend 2006 on ordinary and
deferred shares – (200)One-off dividend 2006 – (226)Final dividend 2006 on ordinary and
deferred shares (412) –Interim dividend 2007 on ordinary and
deferred shares (218) –
31 December 1 721 1 548
Contingent liabilitiesContingent liabilities are not expected to give rise to any material lossand include guarantees given for group companies. The estimated totalof such liabilities at 31 December 2007 was some £4 372 million (2006: £3 656 million) of which £2 720 million (2006: £2 150 million)was also guaranteed by NV. The fair value of such guarantees is notsignificant in either 2006 or 2007. The guarantees issued to othercompanies were immaterial.
Remuneration of auditorsThe parent company accounts of Unilever PLC are required to complywith The Companies (Disclosure of Auditor Remuneration) Regulations2005. Auditors’ remuneration in respect of Unilever PLC is includedwithin the disclosures in note 32 on page 121.
Profit appropriation £ million £ million2007 2006
Profit for the year (available for distribution) 803 893Interim dividend already paid (218) (200)One-off dividend 2006 – (226)
To profit retained 585 467
Post balance sheet eventThe directors propose a final dividend of 34.11p per share (totalling £430 million) out of the profits retained for the year ended 31 December 2007. The dividend will be submitted for formalapproval at the Annual General Meeting to be held on 14 May 2008.In accordance with FRS 21, these financial statements do not reflectthis dividend payable, which will be accounted for in shareholders’equity as an appropriation of retained earnings in the year ending 31 December 2008. During 2007, a final dividend of 32.04p per share(totalling £412 million) was paid in respect of the dividend declared forthe year ended 31 December 2006.

136 Unilever Annual Report and Accounts 2007
Financial statements continued
Further statutory and other information Unilever PLC
Employee involvement and communicationUnilever’s UK companies maintain formal processes to inform, consultand involve employees and their representatives. A high proportion ofthe United Kingdom sites are accredited to the Investors in Peoplestandard. Our sites also use tools such as Total ProductiveMaintenance which rely heavily on employee involvement,contribution and commitment.
A European Works Council, embracing employee and managementrepresentatives from countries within Europe, has been in existencefor several years and provides a forum for discussing issues thatextend across national boundaries.
The directors’ reports of the United Kingdom group companiescontain more details about how they have communicated with theiremployees during 2007.
Equal opportunities and diversityThe heads of all operating companies and units in the UK havecommitted their businesses to achieving greater diversity. EveryUnilever company in the United Kingdom has an equal opportunitiespolicy and actively pursues equality of opportunity for all employees.
Our equal opportunities policy is designed, among other things, toensure that people with disabilities, and other under-representedgroups, are given the same training, development and prospects asother employees.
The company carries out regular employee monitoring surveys and hasalso conducted an equal pay audit. The company continues to reviewways in which greater diversity can be achieved in recruitment andselection.
The company continues to put in place policies which promote theachievement of diversity in the business. We have policies on homeworking, flexible working, maternity and paternity leave, child careprovision and career breaks, which help us to meet this objective.
Charitable and other contributionsUnilever collates the cost of its community involvement activities usingthe London Benchmarking Group model. The model recommends the separation of charitable donations, community investment,commercial initiatives in the community and management costsrelating to the programme of activity.
During 2007 UK group companies made a total contribution of £6.6 million, analysed as follows:
• Charitable donations: £1 million.• Community investment: £1.24 million.• Commercial initiatives in the community: £4.1 million.• Management costs: £0.25 million.
No donation or contribution was made or expenditure incurred forpolitical purposes.
Supplier payment policiesIndividual operating companies are responsible for agreeing the terms and conditions under which business transactions with theirsuppliers are conducted. The directors’ reports of the United Kingdomoperating companies give information about their supplier paymentpolicies as required by the UK Companies Act 1985. PLC, as a holdingcompany, does not itself make any relevant payments in this respect.
Auditors and disclosure of information to auditorsA resolution will be proposed at the AGM on 14 May 2008 for the re-appointment of PricewaterhouseCoopers LLP as auditors of PLC.The present appointment will end at the conclusion of the AGM.
To the best of each of the Directors’ knowledge and belief, andhaving made appropriate enquiries of other officers of the UnileverGroup, all information relevant to enabling the auditors to providetheir opinions on PLC’s consolidated and parent company accountshas been provided. Each of the Directors has taken all reasonablesteps to ensure their awareness of any relevant audit information andto establish that the company’s auditors are aware of any suchinformation.
Authority to purchase own sharesAt the AGM of PLC held on 16 May 2007, authority was givenpursuant to Article 64 of the PLC Articles of Association to makemarket purchases of PLC ordinary shares of 31⁄9p each, to a maximumof 290 million shares. This authority will expire at the AGM on 14May 2008, and a resolution will be proposed to renew the authority.
Details of shares purchased by an employee share trust and Unilevergroup companies to satisfy options granted under PLC’s employeeshare schemes are given in the report of the RemunerationCommittee on page 58 and in note 29 to the consolidated accountson pages 117 to 119.
Directors’ report of PLCFor the purposes of Section 234 of the Companies Act 1985, theDirectors’ Report of Unilever PLC for the year ended 31 December2007 comprises this page and the information contained in the reportof the Directors on pages 2 to 63 which includes the Company’sposition on environment and corporate responsibility matters, thereport of the Remuneration Committee in respect of Directors’interests in shares or debentures of the Group on pages 58 and 60,Dividends on page 86, Principal group companies and non-currentinvestments on pages 125 and 126, significant shareholders of PLC asdisclosed on page 137, and financial instruments and treasury riskmanagement on page 97. The information required to be givenpursuant to Section 992 of the UK Companies Act 2006 is coveredelsewhere in this Annual Report.
Business reviewThe UK Companies Act 2006 requires Unilever PLC to set out in thisreport a fair review of the business of the Group during the financialyear ended 31 December 2007 including a description of the principalrisks and uncertainties facing the Group and an analysis of theposition of the Group’s business at the end of the financial year,known as a ‘Business review’.
The information that fulfils the current Business review requirementscan be found on the following pages of this Annual Report which areincorporated into this report by reference:
• a description of the principal risks and uncertainties facing theGroup see pages 13 and 14;
• the development and performance of the Group’s business duringthe year see pages 15 to 32;
• the position of the Group’s business at the end of the year seepages 25, 26 and 70;
• key performance indicators see page 6;• other key indicators see pages 6 and 7;• main trends and factors likely to affect the future development,
performance and position of the Group see pages 13 and 14;• environmental matters and policy, including the impact of the
Group’s business on the environment see page 12; and• employee matters and policy see pages 9, 10 and 136.
In accordance with Section 463 of the UK Companies Act 2006, theDirectors’ responsibility for the Directors’ report and the report of theRemuneration Committee, which responsibility shall be governed byEnglish law, shall be owed only to PLC (to the extent envisaged inSection 463) and not to any other person.
Corporate Centre Unilever PLC Registered OfficeUnilever PLC Port SunlightUnilever House Wirral100 Victoria Embankment Merseyside CH62 4ZDLondon EC4Y 0DY
Unilever PLC RegistrarsComputershare Investor Services PLCThe PavilionsBridgwater RoadBristol BS99 6ZY
By Order of the Board
S H M A Dumoulin
Secretary of Unilever PLC
10 March 2008

Unilever Annual Report and Accounts 2007 137
Shareholder information
Shareholder information
Analysis of shareholding
Significant shareholders of NVAs far as we are aware the only holders of more than 5% (as referred to in the Act on Financial Supervision in the Netherlands) in the NV share capital (apart from the Foundation Unilever NV Trust Office, see page 42 and shares held in treasury by NV, see page 41)are ING Groep N.V. (‘ING’), Fortis Utrecht N.V. (‘Fortis’) and AEGON N.V. (‘AEGON’). We were informed that ING transferred part of itsshareholding in NV to Fortis in July 2007 which is reflected in the information provided below.
The voting rights of such shareholders are the same as for other holders of the class of share indicated. All three shareholders haveeach notified the Netherlands Authority for the Financial Markets (AFM) of their holdings. As at 2 July 2007 ING and Fortis indirectlyheld an interest in the NV issued share capital of 16.94% and 5.10% respectively, and as at 1 November 2006 AEGON indirectly heldan interest of 5.57%. Detailed below are the interests in NV shares provided to the Company by ING, Fortis and AEGON in the secondhalf of 2007. All interests are mainly held in cumulative preference shares.
ING
• 31 171 093 (1.82%) ordinary shares (€4 987 375)• 20 665 (71.26%) 7% cumulative preference shares (€8 856 399)• 74 088 (46.0%) 6% cumulative preference shares (€31 751 894)• 504 440 (67.26%) 4% cumulative preference shares (€21 620 298)
Fortis
• 4 453 850 (0.26%) ordinary shares (€712 616)• 46 000 (28.56%) 6% cumulative preference shares (€19 714 220)
AEGON
• 399 689 (0.02%) ordinary shares (€63 950)• 4 995 (17.22%) 7% cumulative preference shares (€2 140 707)• 29 540 (18.34%) 6% cumulative preference shares (€12 659 957)• 157 106 (20.95%) 4% cumulative preference shares (€6 733 563)
Significant shareholders of PLCThe following table gives notified details of shareholders who held more than 3% of, or 3% of voting rights attributable to, PLC’sshares or deferred stock (excluding treasury shares) on 1 March 2008. The voting rights of such shareholders are the same as for otherholders of the class of share indicated.
Number of ApproximateTitle of class Name of holder shares held % held
Deferred Stock Naamlooze Vennootschap Elma 50 000 50United Holdings Limited 50 000 50
Ordinary shares Trustees of the Leverhulme Trust and the Leverhulme Trade Charities Trust 70 566 764 5
Legal & General Group plc 54 184 916 4Barclays PLC 40 319 254 3
Between 1 January 2005 and 31 December 2007, Barclays PLC, The Capital Group Companies, inc. and Legal & General Group plchave held more than 3% of, or 3% of voting rights attributable to, PLC’s ordinary shares. During this period, and as notified, certain ofthese holdings reduced to below the reporting 3% threshold. The table above sets out the notifiable interest of shares or voting rightsattributable to PLC as at 1 March 2008.

138 Unilever Annual Report and Accounts 2007
Shareholder information continued
Analysis of PLC registered holdingsAt 31 December 2007 PLC had 63 825 ordinary shareholdings.
The following table analyses the registered holdings of PLC’s 31⁄9p ordinary shares at 31 December 2007:
Number TotalNumber of shares of holdings % shares held %
1 – 1 000 41 044 64.31 16 842 627 1.291 001 – 2 500 13 290 20.82 21 198 976 1.622 501 – 5 000 5 262 8.24 18 451 027 1.415 001 – 10 000 2 149 3.37 14 723 218 1.12
10 001 – 25 000 876 1.37 13 019 461 0.9925 001 – 50 000 316 0.50 11 058 969 0.8450 001 – 100 000 214 0.34 15 165 228 1.16
100 001 –1 000 000 513 0.80 175 415 138 13.39Over1 000 000 161 0.25 1 024 281 717 78.18
63 825 100.00 1 310 156 361 100.00
Share purchases during 2007
€ millionOf which, numbers of Maximum value that
shares purchased may yet be purchasedTotal number of Average price as part of publicly as part of publicly
shares purchased paid per share announced plans(a) announced plans
January – – – –February 485 177 €20.37 – 1 500March 7 465 293 €21.13 3 917 782 1 418April 6 600 000 €22.09 6 600 000 1 273May 11 849 090 €22.81 11 195 731 1 018June 7 273 454 €22.10 7 146 817 860July 8 787 712 €23.40 8 787 712 654August 7 092 471 €21.74 7 092 471 500September 6 495 886 €22.19 6 495 886 356October 5 431 376 €21.98 5 431 376 236November 2 501 055 €23.62 2 501 055 177December 7 371 158 €24.11 7 364 282 –
Total 71 352 672 €22.49 66 533 112 –
(a) Shares were also purchased to satisfy commitments to deliver shares under our share-based plans as described in note 29 on page 117 to119.
Exchange controls affecting security holdersThe Netherlands Act on Financial Supervision (Wet op het financieel toezicht (Wft)) came into effect on 1 January 2007. The Wft bringstogether practically all the rules and conditions that applied to the financial markets and their supervision. Under this Act the Ministerof Finance is authorised to issue regulations relating to financial transactions concerning the movement of capital to or from thirdcountries with respect to direct investments, establishment, the performing of financial services, the admission of negotiableinstruments or goods with respect to which regulations have been issued under the Import and Export Act in the interest of theinternational legal system or an arrangement relevant thereto. These regulations may contain a prohibition to perform any of theactions indicated in those regulations without a licence. To date no regulations of this type have been issued which are applicable toUnilever N.V.
There are currently no exchange controls affecting PLC shareholders.
Shareholder information continued

Unilever Annual Report and Accounts 2007 139
Shareholder information continued
Shareholder information continued
Nature of the trading marketThe principal trading markets upon which Unilever shares arelisted are Euronext Amsterdam for NV depositary receipts ofordinary and preference shares and the London Stock Exchangefor PLC ordinary shares. NV ordinary shares mainly trade in theform of depositary receipts for shares.
In the United States, NV ordinary shares and PLC AmericanDepositary Receipts are traded on the New York Stock Exchange.Citibank, N.A. acts for NV and PLC as issuer, transfer agent and,in respect of the American Depositary Receipts, depositary.
There have not been any significant trading suspensions in thepast three years.
At 1 March 2008 there were 6 104 registered holders of NVNew York Registry shares and 790 registered holders of PLCAmerican Depositary Receipts in the United States. We estimatethat approximately 18% of NV’s ordinary shares were held in theUnited States (approximately 21% in 2006), while most holders of PLC ordinary shares are registered in the United Kingdom –approximately 99% in 2007 and in 2006.
NV and PLC are separate companies with separate stock exchangelistings and different shareholders. Shareholders cannot convert or exchange the shares of one for shares of the other and therelative share prices on the various markets can, and do,fluctuate. Each NV ordinary share now represents the sameunderlying economic interest in the Unilever Group as each PLCordinary share (save for exchange rate fluctuations).
If you are a shareholder of NV, you have an interest in a Dutchlegal entity, your dividends will be paid in euros (converted intoUS dollars if you have shares registered in the United States) andyou may be subject to tax in the Netherlands. If you are ashareholder of PLC, your interest is in a UK legal entity, yourdividends will be paid in sterling (converted into US dollars if youhave American Depositary Receipts) and you may be subject toUK tax. Nevertheless, the Equalisation Agreement means that asa shareholder of either company you effectively have an interestin the whole of Unilever. You have largely equal rights over ourcombined net profit and capital reserves as shown in theconsolidated accounts. See Equalisation Agreement on pages 40and 41.
The high and low trading prices for the separate stock exchangelistings are shown in the tables on the following page.

140 Unilever Annual Report and Accounts 2007
Shareholder information continued
Shareholder information continued
Nature of the trading market (continued)
Share prices at 31 December 2007The share price of the ordinary shares at the end of the year were as follows:
NV per €0.16 ordinary share in Amsterdam €25.15
NV per €0.16 ordinary share in New York US $36.46
PLC per 31⁄9p ordinary share in London £18.90
PLC per American Depositary Receipt in New York US $37.42
Monthly high and low prices for the most recent six months:
September October November December January February
NV per €0.16 ordinary share in Amsterdam (in €) High 22.91 23.11 24.62 25.72 25.61 22.46Low 21.42 21.22 22.89 23.57 20.13 20.41
NV per €0.16 ordinary share in New York (in US $) High 31.97 33.21 36.18 37.31 37.18 33.26Low 30.12 30.08 33.24 34.10 29.94 30.16
PLC per 31⁄9p ordinary share in London (in £) High 16.44 16.72 18.09 19.24 19.47 17.17Low 15.36 15.15 16.57 17.32 15.16 15.53
PLC per American Depositary Receipt in New York (in US $) High 32.88 34.38 37.16 38.25 38.02 33.88Low 31.18 31.11 34.46 35.07 29.90 30.46
Quarterly high and low prices for 2007 and 2006
2007 1st 2nd 3rd 4th
NV per €0.16 ordinary share in Amsterdam (in €) High 21.96 23.94 24.64 25.72Low 18.89 21.32 20.70 21.22
NV per €0.16 ordinary share in New York (in US $) High 29.33 32.39 33.73 37.31Low 24.94 28.63 28.11 30.08
PLC per 31⁄9p ordinary share in London (in £) High 15.41 16.74 17.22 19.24Low 13.20 14.95 14.49 15.15
PLC per American Depositary Receipt in New York (in US $) High 30.16 33.31 34.86 38.25Low 25.57 29.64 28.95 31.11
2006 1st 2nd 3rd 4th
NV per €0.16 ordinary share in Amsterdam (in €) High 19.78 19.27 19.59 20.84Low 18.53 16.53 17.26 19.22
NV per €0.16 ordinary share in New York (in US $) High 23.86 24.34 24.90 27.32Low 22.69 20.72 21.74 24.20
PLC per 31⁄9p ordinary share in London (in £) High 13.54 13.16 13.25 14.28Low 12.74 11.25 11.84 12.94
PLC per American Depositary Receipt in New York (in US $) High 23.79 24.31 25.19 27.95Low 22.45 20.66 21.77 24.28
Annual high and low prices
2007 2006 2005 2004 2003
NV per €0.16 ordinary share in Amsterdam (in €) High 25.72 20.84 20.27 19.92 19.98Low 18.89 16.53 16.13 14.80 15.27
NV per €0.16 ordinary share in New York (in US $) High 37.31 27.32 24.02 24.80 21.63Low 24.94 20.72 20.89 18.94 17.65
PLC per 31⁄9p ordinary share in London (in £) High 19.24 14.28 13.39 12.80 13.96Low 13.20 11.25 10.83 9.85 10.56
PLC per American Depositary Receipt in New York (in US $) High 38.25 27.95 23.67 24.17 21.93Low 25.57 20.66 20.34 18.22 17.46

Unilever Annual Report and Accounts 2007 141
Shareholder information continued
Shareholder information continued
Dividend recordOur interim ordinary dividends are normally announced in November and paid in December. Final ordinary dividends are normallyproposed in February and, if approved by shareholders at the Annual General Meetings, paid in June.
The following tables show the dividends paid by NV and PLC for the last five years, expressed in terms of the revised sharedenominations which became effective from 22 May 2006. Dividends have been translated into US dollars at the exchange ratesprevailing on the dates of declaration of the dividend with the exception of the proposed final dividend for 2007 (see below).Differences between the amounts ultimately received by US holders of NV and PLC shares are the result of changes in exchange ratebetween the equalisation of the dividends and the date of payment.
The interim dividend is normally 35% of the previous year’s total normal dividend per share, based on the stronger of our two parentcurrencies over the first nine months of the year. Equalisation of the interim dividend in the other currency takes place at the averageexchange rate of the third quarter. Equalisation of the final dividend takes place at the average exchange rate for the full year.
Final dividends for 2007 are payable on 19 June 2008, subject to approval at the AGMs. For purposes of illustration, the amountspayable in respect of NV New York Registry Shares and PLC ADRs have been translated in the table below at rates of exchange on6 February 2008, which was the day before the date on which the proposed dividends were announced. The actual amounts payablein US dollars will be calculated by reference to the exchange rates on the day on which the dividends are approved (15 May 2008 inthe case of NV and 14 May 2008 in the case of PLC).
The dividend timetable for 2008 is shown on page 142.
NV Dividends2007 2006 2005 2004 2003
Interim dividend per €0.16 (Euros) 0.2500 0.2300 0.2200 0.2100 0.1967Final dividend per €0.16 (Euros) – 0.4700 0.4400 0.4200 0.3833Proposed final dividend per €0.16 (Euros) 0.5000 – – – –One-off dividend per €0.16 (Euros) – 0.2600 – – –
Interim dividend per €0.16 (US Registry) (US dollars) 0.3612 0.2934 0.2638 0.2685 0.2296Final dividend per €0.16 (US Registry) (US dollars) – 0.6363 0.5613 0.5399 0.4545Proposed final dividend per €0.16 (US Registry) (US dollars) 0.7311 – – – –One-off dividend per €0.16 (US Registry) (US dollars) – 0.3316 – – –
PLC Dividends2007 2006 2005 2004 2003
Interim dividend per 31⁄9p (Pounds) 0.1700 0.1562 0.1504 0.1407 0.1369Final dividend per 31⁄9p (Pounds) – 0.3204 0.3009 0.2849 0.2649Proposed final dividend per 31⁄9p (Pounds) 0.3411 – – – –One-off dividend per 31⁄9p (Pounds) – 0.1766 – – –
Interim dividend per 31⁄9p (US Registry) (US dollars) 0.3525 0.2983 0.2655 0.2586 0.2315Final dividend per 31⁄9p (US Registry) (US dollars) – 0.6357 0.5583 0.5366 0.4694Proposed final dividend per 31⁄9p (US Registry) (US dollars) 0.6684 – – – –One-off dividend per 31⁄9p (US Registry) (US dollars) – 0.3372 – – –
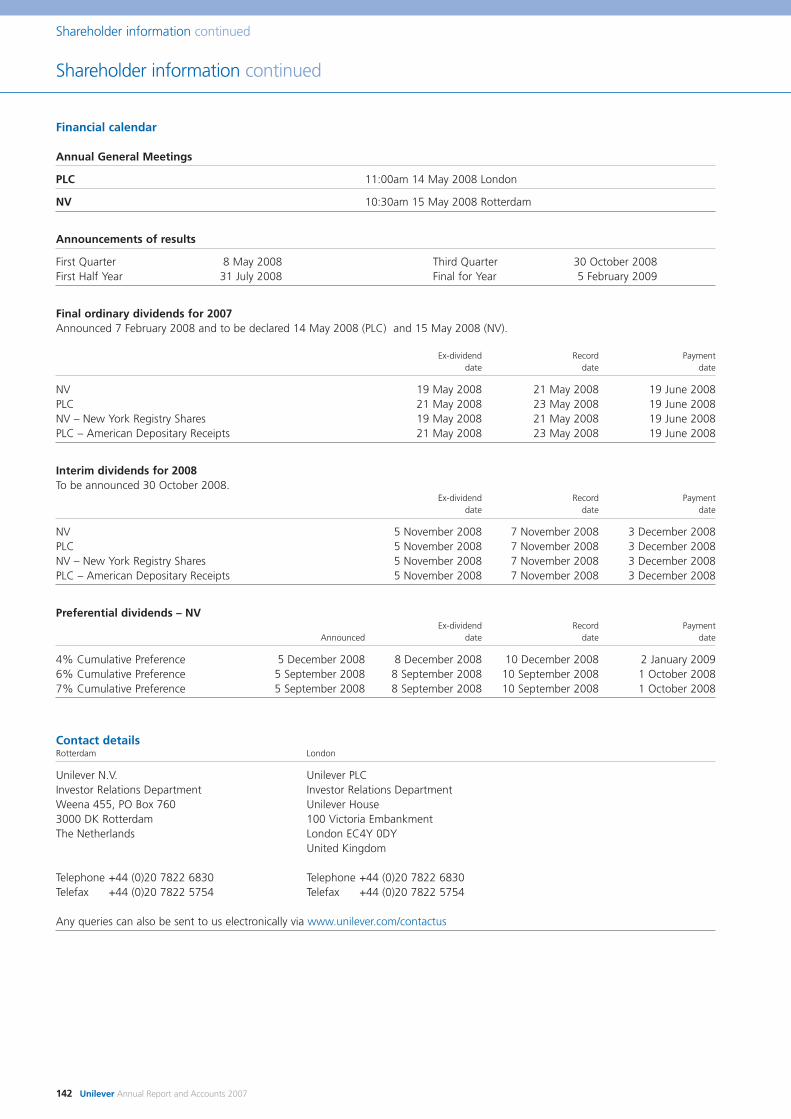
142 Unilever Annual Report and Accounts 2007
Shareholder information continued
Shareholder information continued
Financial calendar
Annual General Meetings
PLC 11:00am 14 May 2008 London
NV 10:30am 15 May 2008 Rotterdam
Announcements of results
First Quarter 8 May 2008 Third Quarter 30 October 2008First Half Year 31 July 2008 Final for Year 5 February 2009
Final ordinary dividends for 2007Announced 7 February 2008 and to be declared 14 May 2008 (PLC) and 15 May 2008 (NV).
Ex-dividend Record Paymentdate date date
NV 19 May 2008 21 May 2008 19 June 2008PLC 21 May 2008 23 May 2008 19 June 2008NV – New York Registry Shares 19 May 2008 21 May 2008 19 June 2008PLC – American Depositary Receipts 21 May 2008 23 May 2008 19 June 2008
Interim dividends for 2008To be announced 30 October 2008.
Ex-dividend Record Paymentdate date date
NV 5 November 2008 7 November 2008 3 December 2008PLC 5 November 2008 7 November 2008 3 December 2008NV – New York Registry Shares 5 November 2008 7 November 2008 3 December 2008PLC – American Depositary Receipts 5 November 2008 7 November 2008 3 December 2008
Preferential dividends – NVEx-dividend Record Payment
Announced date date date
4% Cumulative Preference 5 December 2008 8 December 2008 10 December 2008 2 January 20096% Cumulative Preference 5 September 2008 8 September 2008 10 September 2008 1 October 20087% Cumulative Preference 5 September 2008 8 September 2008 10 September 2008 1 October 2008
Contact detailsRotterdam London
Unilever N.V. Unilever PLCInvestor Relations Department Investor Relations DepartmentWeena 455, PO Box 760 Unilever House3000 DK Rotterdam 100 Victoria EmbankmentThe Netherlands London EC4Y 0DY
United Kingdom
Telephone +44 (0)20 7822 6830 Telephone +44 (0)20 7822 6830Telefax +44 (0)20 7822 5754 Telefax +44 (0)20 7822 5754
Any queries can also be sent to us electronically via www.unilever.com/contactus

Unilever Annual Report and Accounts 2007 143
Shareholder information continued
Shareholder information continued
WebsiteShareholders are encouraged to visit our website www.unilever.com which has a wealth of informationabout Unilever.
There is a section designed specifically for investors at www.unilever.com/investorcentre It includes detailed coverage of the Unilever share price, our quarterly and annual results,performance charts, financial news and investor relationsspeeches and presentations. It also includes conference andinvestor/analyst presentations.
You can also view this year’s and prior years’ Annual Review and Annual Report and Accounts documents at www.unilever.com/investorcentre
PLC shareholders can elect not to receive paper copies of the Annual Review, the Annual Report and Accounts and other shareholder documents by registering atwww.unilever.com/shareholderservices if they prefer to view these on our website.
Share registration
The NetherlandsN.V. Algemeen Nederlands Trustkantoor ANTClaude Debussylaan 241082 MD Amsterdam
Telephone +31 (0)20 522 2555 Telefax +31 (0)20 522 2500Website www.ant-trust.nl/Email [email protected]
UKComputershare Investor Services PLCThe PavilionsBridgwater RoadBristol BS99 6ZY
Telephone +44 (0)870 600 3977Telefax +44 (0)870 703 6119Website www.unilever.com/shareholderservicesEmail [email protected]
USACitibank Shareholder ServicesPO Box 43077Providence RI 02940-3077
Toll free phone (inside US) 888 502 6356Toll phone (outside US) +1 781 575 455Website www.citibank.com/adrEmail [email protected]
PublicationsCopies of the following publications can be accessed directly or ordered through www.unilever.com/investorcentre orwww.unilever.nl/onsbedrijf/beleggers
Unilever Annual Review 2007Including Summary Financial Statement. Available in English orDutch, with financial information in euros, pounds sterling andUS dollars.
Unilever Annual Report and Accounts 2007Available in English or Dutch, with figures in euros. It forms the basis for the Form 20-F that is filed with the United StatesSecurities and Exchange Commission.
Quarterly Results AnnouncementsAvailable in English or Dutch, with figures in euros; supplementsin English, with pounds sterling or US dollar figures, arealso available.

Accounting policies 1, 27-28, 72-76Acquisitions 24, 73, 113Advertising and promotion 28Americas, The 16-18, 77-79Annual General Meetings 39, 142Asia Africa 18-19, 77-79Associates 90, 120Audit Committee 37, 62Auditors 62, 67-68, 121, 127, 132Balance sheet 25, 70Biographical details 46-47Biological assets 90Board committees 37-38Board remuneration 49-61Boards 33Brands 8-9, 21Capital expenditure 78, 80, 88-89Cash 74, 93Cash flow 26, 71, 116Categories 8-9Chairman 3, 35Commitments 112Company accounts, statutory and other information 127-136Competition 8Contingent liabilities 112Corporate governance 33-47Corporate responsibility 12Corporate Responsibility and Reputation Committee 38, 63Deferred tax 28, 91Depreciation 78, 90-91Directors’ responsibilities 66Discontinued operations 114-115Disposals 24, 113-114Distribution 8Diversity 9-10Dividends 25, 86, 141, 142Earnings per share 41, 69, 85Employees 9Equalisation Agreement 40-41Equity 108Europe 15-16, 77-79Exchange rates 1, 23, 72, 124Executive Directors 35-36, 46, 51-58Exports 8Finance and liquidity 26Finance costs and income 82Financial calendar 142Financial instruments 28, 73-74, 97-101Financial liabilities 74, 94-96Financial record 122-124Financial Review 23-32Foods 8, 20-22Functions 8Goodwill 27-28, 73, 86-87Gross profit 81Group Chief Executive 4-5, 35Group structure 1Home and Personal Care 8, 20-22Home care 8, 79-80Ice cream and beverages 8, 79-80Impairment 86-87Income statement 69Information technology 10
Innovation 20-22Intangible assets 27-28, 73, 86-87Intellectual property 10Internal and disclosure controls 66International Financial Reporting Standards (IFRS) 1, 72Inventories 74, 91Joint ventures 90, 120Key management 120Key performance indicators 6-7Laws and regulation 10Leases 75, 112Legal proceedings 10-12Market capitalisation 25Net debt 32Nomination Committee 37, 48Non-Executive Directors 36, 46, 59-60Non-GAAP measures 29, 32Off-balance sheet arrangements 26Operating costs 81Operating profit 77-80Operating Review 15-22Payables 102Pensions and similar obligations 27, 28, 74, 103-107Personal care 8, 79-80Post balance sheet events 27, 121Preference shares and dividends 94, 142Principal group companies 125-126Property, plant and equipment 10, 73, 88-89Provisions 28, 75, 102Receivables 92Regions 7, 15-19Related party transactions 8, 120Remuneration Committee 37, 49-61Research and development 20-21Reserves 110Restructuring 81, 102Retained profit 111Return on invested capital (ROIC) 29, 31Revenue recognition 75Risk management 13-14, 62, 97Savoury, dressings and spreads 8, 79-80Seasonality 8Segment information 75, 77-80Share-based payments 75, 117-119Share capital 41-42, 109Shareholders 38-40, 137-138Share prices 140Share registration 143Staff costs 82Statement of recognised income and expense 69Strategy 6Taxation 76, 83-84Total shareholder return (TSR) 29, 32Treasury 26-27Turnover 77-80Unilever Executive (UEx) 47Unilever Foodsolutions 9Underlying sales growth (USG) 29, 32Ungeared free cash flow (UFCF) 29, 30Ventures 9Voting 39Website 143
144 Unilever Annual Report and Accounts 2007
Index
Shareholder information continued

Designed and produced by Unilever Communications in conjunction with Addison Corporate MarketingTypeset by Pauffley, LondonPrinted by St Ives Westerham Press Ltd. ISO 14001: 2004, FSC certified and CarbonNeutral
This document is printed on Greencoat Plus Velvet which has been independently certified according to the rules of the Forest Stewardship Council (FSC). Greencoat Plus Velvet contains 80% recycled fibre. The manufacturing mill is accredited with the ISO 14001 Environmental Standard. In recognition of its recycled content Greencoat Plus Velvet has also been awarded the NAPM recycled mark. This document is completely recyclable. If you have finished with it and no longer wish to retain it, please pass it on to other interested readers or dispose of it in your recycled paper waste, thank you.
Cautionary statementThis document may contain forward-looking statements, including ‘forward-looking statements’ within the meaning of the United States Private Securities LitigationReform Act of 1995. Words such as ‘expects’, ‘anticipates’, ‘intends’ or the negative of these terms and other similar expressions of future performance or results,including financial objectives to 2010, and their negatives, are intended to identify such forward-looking statements. These forward-looking statements are basedupon current expectations and assumptions regarding anticipated developments and other factors affecting the Group. They are not historical facts, nor are theyguarantees of future performance. Because these forward-looking statements involve risks and uncertainties, there are important factors that could cause actualresults to differ materially from those expressed or implied by these forward-looking statements, including, among others, competitive pricing and activities,consumption levels, costs, the ability to maintain and manage key customer relationships and supply chain sources, currency values, interest rates, the ability tointegrate acquisitions and complete planned divestitures, the ability to complete planned restructuring activities, physical risks, environmental risks, the ability tomanage regulatory, tax and legal matters and resolve pending matters within current estimates, legislative, fiscal and regulatory developments, political, economicand social conditions in the geographic markets where the Group operates and new or changed priorities of the Boards. Further details of potential risks anduncertainties affecting the Group are described in the Group’s filings with the London Stock Exchange, Euronext Amsterdam and the US Securities and ExchangeCommission, including the Annual Report and Accounts on Form 20-F. These forward-looking statements speak only as of the date of this document. Except asrequired by any applicable law or regulation, the Group expressly disclaims any obligation or undertaking to release publicly any updates or revisions to any forward-looking statements contained herein to reflect any change in the Group’s expectations with regard thereto or any change in events, conditions or circumstances onwhich any such statement is based.
This document does not comply with US GAAP and should not therefore be relied upon by readers as such. The Group’s Annual Report on Form 20-F for 2007 isseparately filed with the US Securities and Exchange Commission and is available on our corporate website www.unilever.com In addition, a printed copy of theAnnual Report on Form 20-F is available, free of charge, upon request to Unilever PLC, Investor Relations Department, Unilever House, 100 Victoria Embankment,London EC4Y 0DY, United Kingdom.

Unilever N.V.Weena 455, PO Box 7603000 DK RotterdamThe NetherlandsT +31 (0)10 217 4000F +31 (0)10 217 4798
Commercial Register RotterdamNumber: 24051830
Unilever PLCUnilever House100 Victoria EmbankmentLondon EC4Y 0DYUnited KingdomT +44 (0)20 7822 5252F +44 (0)20 7822 5951
Unilever PLC registered officeUnilever PLCPort Sunlight WirralMerseyside CH62 4ZDUnited Kingdom
Registered in England and WalesCompany Number: 41424
www.unilever.com