
JONES ENERGY - AnnualReports.com
193
JONES ENERGY 2017 ANNUAL REPORT
-
Upload
khangminh22 -
Category
Documents
-
view
0 -
download
0
Transcript of JONES ENERGY - AnnualReports.com

J O N E SE N E R G Y2 0 1 7 A N N U A L R E P O R T
8 07 L A S C I M A S PA R K WAY, S U ITE 35 0
AU S T I N , TE X A S 7874 6

EXECUTIVE OFFICERS
BOARD OF DIRECTORS
CORPORATE INFO
JEFF TANNER Chief Operating Officer & Interim Chief Executive Officer
ROBERT J. BROOKS Executive Vice President & Chief Financial Officer
JONNY JONESChairman
MIKE S. MCCONNELLDirector
ALAN D. BELLDirector
JOHN LOVOIDirector
HALBERT S. WASHBURNDirector
PAUL B. LOYD JR.Director
SCOTT McCARTYDirector
CORPORATE HEADQUARTERS
Jones Energy, Inc. 807 Las Cimas Parkway, Suite 350 Austin, Texas 78746 Phone: 512.328.2953 Fax: 512.328.5394
TRANSFER AGENT
American Stock Transfer and Trust Company 6201 15th Avenue Brooklyn, NY 11219 www.amstock.com
STOCK EXCHANGEClass A common stock traded on the New York Stock Exchange under the symbol: JONE
FORM 10-K
For an additional copy of the Annual Report on Form 10-K, please contact:
JONES ENERGY, INC.
Investor Relations Department Phone: 512.328.2953 Email: [email protected]
WEBSITE ADDRESS www.jonesenergy.com
ANNUAL MEETING
The Annual Meeting for Jones Energy, Inc. shareholders will be held at our corporate headquarters in Austin, Texas, on May 22, 2018.
ABOUT JONES ENERGY
Jones Energy, Inc. (NYSE: JONE) is an Austin, Texas–based independent oil and gas company engaged in the development, production and acquisition of oil and natural gas properties in the Anadarko Basin of Texas and Oklahoma. We have grown rapidly by leveraging our horizontal drilling expertise and low-cost operations to develop our inventory.
OPERATIONS OVERVIEW
TX
OK
AUSTIN
EASTERN ANADARKO BASIN
WESTERN ANADARKO BASIN
KEY LANDFORMATION:
Cleveland
KEY LANDFORMATION:
Woodford Meramec
GROSS DRILLINGLOCATIONS:
5,443
GROSS DRILLINGLOCATIONS:
1,737
NET DRILLING LOCATIONS:
927
NET DRILLING LOCATIONS:
893
DAILYPRODUCTION:
2.8 MBoe/d
DAILYPRODUCTION:
15.2 MBoe/d
TOTAL NETACRES:
22,484
TOTAL NETACRES:
152,191
W E S TE R N A N A DA R KO BA S I N
E A S TE R N A N A DA R KO BA S I N
TOTAL PROVEDRESERVES
104.8 MMBOE
DAILYPRODUCTION
21,332 BOE/D
NET DRILLINGLOCATIONS
1,820
NET ACREAGE
193,569

2 0 1 7 A N N U A L R E P O R T
F O R M 1 0 - K & P R O X Y

JONES ENERGY, INC.
807 Las Cimas Parkway, Suite 350 Austin, Texas 78746
NOTICE OF ANNUAL MEETING OF STOCKHOLDERS To Be Held on May 22, 2018
To the Stockholders of Jones Energy, Inc.:
You are cordially invited to attend the 2018 annual meeting of stockholders of Jones Energy, Inc. This is your notice for the meeting.
TIME AND DATE: 9:30 a.m. Central Time on May 22, 2018
PLACE: Jones Energy, Inc., 807 Las Cimas Parkway, Suite 350, Austin, Texas 78746
PROPOSALS: • To elect two directors to serve as the Class II directors, each for a three-year term; • To approve an amendment to our Amended and Restated Certificate of Incorporation to
permit us to effect a reverse stock split of our Class A common stock and Class B common stock of not less than 1-for-5 and not more than 1-for-20, such ratio and the implementation and timing of such reverse stock split to be determined at the discretion of our board of directors;
• To ratify PricewaterhouseCoopers LLP as independent registered public accounting firm of Jones Energy, Inc. for the fiscal year ending December 31, 2018; and
• To transact such other business as may properly come before the annual meeting and any reconvened meeting following any adjournments or postponements of the meeting.
RECORD DATE: The record date for the annual meeting is March 27, 2018. Only stockholders of record at the close of business on that date may vote at the annual meeting or any adjournment or postponement of the meeting.
PROXY VOTING: YOUR VOTE IS IMPORTANT. Whether or not you expect to attend the annual meeting in person, please submit your proxy or voting instructions over the telephone, the internet or by mail as soon as possible to ensure that your shares are represented at the annual meeting and your vote is properly recorded. Even if you vote by one of these methods, you may still vote in person if you attend the annual meeting. For specific voting information, please see Questions and Answers About the Annual Meeting beginning on page 1 of the Proxy Statement that follows. Even if you plan to attend the meeting, please sign, date and return the enclosed proxy card or submit your proxy using the internet or telephone procedures described on the proxy card.
By Order of the Board of Directors,
Jonny Jones
Founder and Chairman of the Board Austin, Texas April 30, 2018
IMPORTANT NOTICE REGARDING THE AVAILABILITY OF PROXY MATERIALS FOR THE SHAREHOLDER MEETING TO BE HELD MAY 22, 2018
The proxy statement, the form of proxy card and our annual report to stockholders are available at: http://www.viewproxy.com/jonesenergy/2018

TABLE OF CONTENTS
QUESTIONS AND ANSWERS ABOUT THE ANNUAL MEETING . . . . . . . . . . . . . . . . . . . . . . . . . . . . . . . . . . . . . . 1PROPOSAL ONE: ELECTION OF CLASS II DIRECTORS . . . . . . . . . . . . . . . . . . . . . . . . . . . . . . . . . . . . . . . . . . . . . 9BOARD OF DIRECTORS AND CORPORATE GOVERNANCE . . . . . . . . . . . . . . . . . . . . . . . . . . . . . . . . . . . . . . . . . 9
Board Structure . . . . . . . . . . . . . . . . . . . . . . . . . . . . . . . . . . . . . . . . . . . . . . . . . . . . . . . . . . . . . . . . . . . . . . . . . . . . 9Recent Board and Committee Changes . . . . . . . . . . . . . . . . . . . . . . . . . . . . . . . . . . . . . . . . . . . . . . . . . . . . . . . . 9Information about the Directors and Nominees . . . . . . . . . . . . . . . . . . . . . . . . . . . . . . . . . . . . . . . . . . . . . . . . . . 10Business Experience and Qualifications of Directors . . . . . . . . . . . . . . . . . . . . . . . . . . . . . . . . . . . . . . . . . . . . . 10Meetings of the Board . . . . . . . . . . . . . . . . . . . . . . . . . . . . . . . . . . . . . . . . . . . . . . . . . . . . . . . . . . . . . . . . . . . . . . 13Corporate Governance . . . . . . . . . . . . . . . . . . . . . . . . . . . . . . . . . . . . . . . . . . . . . . . . . . . . . . . . . . . . . . . . . . . . . . 13Director Independence . . . . . . . . . . . . . . . . . . . . . . . . . . . . . . . . . . . . . . . . . . . . . . . . . . . . . . . . . . . . . . . . . . . . . . 13Board Committees . . . . . . . . . . . . . . . . . . . . . . . . . . . . . . . . . . . . . . . . . . . . . . . . . . . . . . . . . . . . . . . . . . . . . . . . . 13Compensation Committee Interlocks and Insider Participation . . . . . . . . . . . . . . . . . . . . . . . . . . . . . . . . . . . . . 16Code of Business Conduct and Ethics . . . . . . . . . . . . . . . . . . . . . . . . . . . . . . . . . . . . . . . . . . . . . . . . . . . . . . . . . 16Director Nominations . . . . . . . . . . . . . . . . . . . . . . . . . . . . . . . . . . . . . . . . . . . . . . . . . . . . . . . . . . . . . . . . . . . . . . . 16Contacting the Board, the Chairman and Other Independent Directors . . . . . . . . . . . . . . . . . . . . . . . . . . . . . . . 16Board Leadership and Role in Risk Oversight . . . . . . . . . . . . . . . . . . . . . . . . . . . . . . . . . . . . . . . . . . . . . . . . . . . 17
EXECUTIVE OFFICERS . . . . . . . . . . . . . . . . . . . . . . . . . . . . . . . . . . . . . . . . . . . . . . . . . . . . . . . . . . . . . . . . . . . . . . . . . . 18EXECUTIVE COMPENSATION . . . . . . . . . . . . . . . . . . . . . . . . . . . . . . . . . . . . . . . . . . . . . . . . . . . . . . . . . . . . . . . . . . . . 18
Compensation of Named Executive Officers . . . . . . . . . . . . . . . . . . . . . . . . . . . . . . . . . . . . . . . . . . . . . . . . . . . . 19Amended and Restated Jones Energy, Inc. 2013 Omnibus Incentive Plan . . . . . . . . . . . . . . . . . . . . . . . . . . . . 21Amended and Restated Jones Energy, Inc. 2013 Short Term Incentive Plan . . . . . . . . . . . . . . . . . . . . . . . . . . 21Monarch Equity Plan . . . . . . . . . . . . . . . . . . . . . . . . . . . . . . . . . . . . . . . . . . . . . . . . . . . . . . . . . . . . . . . . . . . . . . . 22Deferred Compensation Plan . . . . . . . . . . . . . . . . . . . . . . . . . . . . . . . . . . . . . . . . . . . . . . . . . . . . . . . . . . . . . . . . . 22Potential Payments Upon Termination or Change in Control . . . . . . . . . . . . . . . . . . . . . . . . . . . . . . . . . . . . . . . 23
DIRECTOR COMPENSATION . . . . . . . . . . . . . . . . . . . . . . . . . . . . . . . . . . . . . . . . . . . . . . . . . . . . . . . . . . . . . . . . . . . . . 24AUDIT COMMITTEE REPORT . . . . . . . . . . . . . . . . . . . . . . . . . . . . . . . . . . . . . . . . . . . . . . . . . . . . . . . . . . . . . . . . . . . . 25CERTAIN RELATIONSHIPS AND RELATED PERSON TRANSACTIONS . . . . . . . . . . . . . . . . . . . . . . . . . . . . . . . 26
IPO Related Agreements . . . . . . . . . . . . . . . . . . . . . . . . . . . . . . . . . . . . . . . . . . . . . . . . . . . . . . . . . . . . . . . . . . . . 26Transactions with Our Executive Officers, Directors and 5% Stockholders . . . . . . . . . . . . . . . . . . . . . . . . . . . 28Procedures for Approval of Related Party Transactions . . . . . . . . . . . . . . . . . . . . . . . . . . . . . . . . . . . . . . . . . . . 30
PRINCIPAL STOCKHOLDERS . . . . . . . . . . . . . . . . . . . . . . . . . . . . . . . . . . . . . . . . . . . . . . . . . . . . . . . . . . . . . . . . . . . . . 31SECTION 16(A) BENEFICIAL OWNERSHIP REPORTING COMPLIANCE . . . . . . . . . . . . . . . . . . . . . . . . . . . . . . 34PROPOSAL TWO: APPROVAL OF REVERSE STOCK SPLIT . . . . . . . . . . . . . . . . . . . . . . . . . . . . . . . . . . . . . . . . . . 35PROPOSAL THREE: RATIFICATION OF INDEPENDENT PUBLIC ACCOUNTING FIRM . . . . . . . . . . . . . . . . . 43PRICE WATERHOUSECOOPERS LLP FEES FOR FISCAL YEARS 2017 AND 2016 . . . . . . . . . . . . . . . . . . . . . . . 43STOCKHOLDER PROPOSALS AND DIRECTOR NOMINATIONS. . . . . . . . . . . . . . . . . . . . . . . . . . . . . . . . . . . . . . 45
Proposals for 2019 Annual Meeting . . . . . . . . . . . . . . . . . . . . . . . . . . . . . . . . . . . . . . . . . . . . . . . . . . . . . . . . . . . 45Nominations for 2019 Annual Meeting . . . . . . . . . . . . . . . . . . . . . . . . . . . . . . . . . . . . . . . . . . . . . . . . . . . . . . . . 45
SOLICITATION AND MAILING OF PROXIES . . . . . . . . . . . . . . . . . . . . . . . . . . . . . . . . . . . . . . . . . . . . . . . . . . . . . . . 46STOCKHOLDER LIST . . . . . . . . . . . . . . . . . . . . . . . . . . . . . . . . . . . . . . . . . . . . . . . . . . . . . . . . . . . . . . . . . . . . . . . . . . . . 46HOUSEHOLDING . . . . . . . . . . . . . . . . . . . . . . . . . . . . . . . . . . . . . . . . . . . . . . . . . . . . . . . . . . . . . . . . . . . . . . . . . . . . . . . . 46WHERE YOU CAN FIND MORE INFORMATION ABOUT US . . . . . . . . . . . . . . . . . . . . . . . . . . . . . . . . . . . . . . . . . 46OTHER MATTERS FOR 2019 ANNUAL MEETING . . . . . . . . . . . . . . . . . . . . . . . . . . . . . . . . . . . . . . . . . . . . . . . . . . . 47APPENDIX A – FORM OF CERTIFICATE OF AMENDMENT TO RESTATED CHARTER . . . . . . . . . . . . . . . . . A-1APPENDIX B – FORM OF PROXY CARD . . . . . . . . . . . . . . . . . . . . . . . . . . . . . . . . . . . . . . . . . . . . . . . . . . . . . . . . . . . B-1

1
JONES ENERGY, INC. 807 Las Cimas Parkway, Suite 350
Austin, Texas 78746
PROXY STATEMENT
2018 Annual Meeting of Stockholders To Be Held on May 22, 2018
The accompanying proxy, mailed together with this proxy statement, is being furnished to you in connection with the solicitation of proxies by and on behalf of the Board of Directors of Jones Energy, Inc. (the “Board”) for use at our 2018 Annual Meeting of Stockholders (the “Annual Meeting”) or at any reconvened meeting after any adjournments or postponements thereof. This proxy statement and accompanying proxy were first mailed to our stockholders on or about April 30, 2018. Unless the context requires otherwise, the terms “Jones Energy,” “the Company,” “our,” “we,” “us” and similar terms refer to Jones Energy, Inc., together with its consolidated subsidiaries.
The Annual Meeting will be held on May 22, 2018, at 9:30 a.m. Central Time, at the Jones Energy, Inc. offices, located at 807 Las Cimas Parkway, Suite 350, Austin, Texas 78746. You can obtain directions to the Annual Meeting by calling our Investor Relations line at 512.493.4834. Only holders of record of shares at the close of business on March 27, 2018 (the “Record Date”) were entitled to notice of, and are entitled to vote at, the Annual Meeting and any reconvened meeting following any adjournments or postponements thereof, unless such adjournment or postponement is for more than 30 days, in which event we will set a new record date.
You can vote your shares at the meeting or by telephone, over the Internet or by completing, signing, dating and returning your proxy in the enclosed envelope.
QUESTIONS AND ANSWERS ABOUT THE ANNUAL MEETING
Questions Answers
Q: What is the purpose of the Annual Meeting?
A: To vote on the following proposals:
• To elect two directors to serve as the Class II directors, each for a three-year term;
• To approve an amendment to our Amended and Restated Certificate of Incorporation (our “Restated Charter”) to permit us to effect a reverse stock split of our Class A common stock (“Class A Shares”) and Class B common stock (“Class B Shares,” and together with the Class A Shares, the “Common Stock”) of not less than 1-for-5 and not more than 1-for-20, such ratio and the implementation and timing of such reverse stock split to be determined at the discretion of our board of directors (the “Reverse Stock Split”);
• To ratify PricewaterhouseCoopers LLP as independent registered public accounting firm of Jones Energy, Inc. for the fiscal year ending December 31, 2018; and
• To transact such other business as may properly come before the annual meeting and any reconvened meeting following any adjournments or postponements of the meeting.

2
Questions Answers
Q: How does the Board recommend I vote on these proposals?
A: The Board recommends a vote:
• FOR the election of Mike S. McConnell and Halbert S. Washburn as Class II directors;
• FOR the approval of the Reverse Stock Split; and
• FOR the ratification of the appointment of
PricewaterhouseCoopers LLP as our independent registered public accounting firm for the fiscal year ending December 31, 2018.
Q: Why did I receive a full set of proxy
materials? A: Pursuant to rules promulgated by the Securities and Exchange
Commission (“SEC”), we have elected to provide access to our proxy materials both by sending you this full set of proxy materials, including a proxy card, and by notifying you of the availability of the proxy material on the Internet. Our Board has made these proxy materials available to you on the Internet on or about April 30, 2018, at: http://www.viewproxy.com/jonesenergy/2018
Q: Who is making this solicitation? A: This proxy for the Annual Meeting is being solicited on behalf of the Board of Jones Energy, Inc.
Q: Who is entitled to vote at the meeting?
A: Stockholders Entitled to Vote: Stockholders who our records show owned shares of our Common Stock (as defined below) as of the close of business on the Record Date may vote at the Annual Meeting. On the Record Date, we had 92,030,282 Class A Shares outstanding and 9,627,821 Class B Shares outstanding. All of the outstanding Class B Shares are owned by affiliates of Metalmark Capital Partners (“Metalmark”) and entities directly or indirectly owned or controlled by Jonny Jones, our Founder and Chairman of the Board, and/or his immediate family (the “Jones Family Entities,” and collectively with Metalmark, the “Pre-IPO Owners”).
Holders of our 8.0% Series A Perpetual Convertible Preferred Stock (the “Series A Preferred Stock”) are not entitled to a vote at the Annual Meeting.
Registered Stockholders: If your shares are registered directly in your name with Jones Energy’s transfer agent, you are considered the holder of record with respect to those shares. As the holder of record, you have the right to grant your voting proxy directly to the individuals listed on the proxy card or to vote in person at the Annual Meeting.
3
Questions Answers
Street Name Stockholders: If your shares are held in a stock brokerage account or by a bank or other nominee, you are considered the beneficial owner of shares held in street name and your broker or nominee is considered the holder of record with respect to those shares. As the beneficial owner, you have the right to direct your broker or nominee how to vote your shares. Beneficial owners are also invited to attend the Annual Meeting. However, since you are not the holder of record, you may not vote your shares in person at the Annual Meeting unless you follow your broker’s procedures for obtaining a legal proxy. Street name stockholders wishing to attend the Annual Meeting in person should also bring proof of ownership, such as a brokerage statement, showing their ownership of stock as of the Record Date.
Q: How can I vote my shares? A: Registered Stockholders: Registered stockholders may vote in person at the Annual Meeting or by one of the following methods:
• By mail. Complete and sign your enclosed proxy card and mail it in the enclosed postage prepaid envelope to Vote Processing, c/o Alliance Advisors LLC, PO Box 2400, Pittsburgh, PA 15230-9762. Alliance Advisors must receive the proxy card not later than May 21, 2018, the day before the annual meeting, for your mailed proxy to be valid and your vote to count. Your shares will be voted according to your instructions. If you return your proxy card but do not specify how you want your shares voted on any particular matter, they will be voted in accordance with the recommendations of our board of directors.
• By telephone. Call 1-866-804-9616, toll free from the United
States, Canada and Puerto Rico, and follow the recorded instructions. You must specify how you want your shares voted and confirm your vote at the end of the call or your telephone vote cannot be completed. Your shares will be voted according to your instructions. You must submit your telephonic proxy before 11:59 p.m., Eastern Daylight Time, on May 21, 2018, the day before the annual meeting, for your telephonic proxy to be valid and your vote to count.
• By internet. Access the secure website registration page through
the internet at www.AALvote.com/JONE. Use the vote control number printed on your enclosed proxy card to access your account and vote your shares. You must specify how you want your shares voted or your Internet vote cannot be completed and you will receive an error message. Your shares will be voted according to your instructions. You must submit your Internet proxy before 11:59 p.m., Eastern Daylight Time, on May 21, 2018, the day before the annual meeting, for your proxy to be validly submitted over the Internet and your vote to count.
Please note that the internet and telephonic voting facilities for
registered stockholders will close at 11:59 p.m. Eastern Daylight Time on May 21, 2018.

4
Questions Answers
Street Name Stockholders: If you hold your shares through a broker, bank or other nominee, you should receive instructions on how to vote your shares from your broker, bank or other nominee. Please follow their instructions carefully. Also, if you wish to vote in person at the Annual Meeting, you must request a legal proxy from the bank, broker or other nominee that holds your shares and present that proxy and proof of identification at the Annual Meeting. Street name stockholders may generally vote by one of the following methods:
• By mail. You will receive instructions from your bank, brokerage firm, or other nominee explaining how you can vote your shares by mail. You should follow those instructions.
• By methods listed on Voting Instruction Card. Please refer to your
voting instruction card or other information provided by your bank, broker, nominee or other holder of record to determine whether you may vote by telephone or electronically on the Internet, and follow the instructions on the voting instruction card or other information provided by the holder of record.
• In person with a proxy from the record holder. A street name
stockholder who wishes to vote at the Annual Meeting will need to obtain a legal proxy from his or her bank, brokerage firm or other nominee. Please consult the voting instruction card provided to you by your bank, broker or other nominee to determine how to obtain a legal proxy in order to vote in person at the Annual Meeting.
Q: Can I attend the meeting in person? A: Yes. You are invited to attend the Annual Meeting if you are a
registered stockholder or a street name stockholder as of the Record Date. In order to enter the Annual Meeting, you must present a form of photo identification acceptable to us, such as a valid driver’s license or passport. Please note that since a street name stockholder is not the holder of record, you may not vote your shares in person at the Annual Meeting unless you follow your broker’s procedures for obtaining a legal proxy.
Q: If I submit a proxy, how will it be voted?
A: When proxies are properly dated, executed and returned, the shares represented by such proxies will be voted at the Annual Meeting in accordance with the instructions of the stockholder. If no specific instructions are given, however, the shares will be voted in accordance with the recommendations of our Board as described above. If any matters not described in the Proxy Statement are properly presented at the Annual Meeting, the proxy holders will use their own judgment to determine how to vote your shares. If the Annual Meeting is adjourned, the proxy holders can vote your shares on the new meeting date as well, unless you have revoked your proxy instructions, as described below under “Can I change my vote?”

5
Questions Answers
Q: Can I change my vote? A: Yes. You may change your vote at any time prior to the vote at the Annual Meeting. To revoke your proxy instructions and change your vote if you are a holder of record, you must (i) attend the Annual Meeting and vote your shares in person, (ii) advise our Corporate Secretary at our principal executive offices (807 Las Cimas Parkway, Suite 350, Austin, Texas 78746) in writing before the proxy holders vote your shares (written notice must be received by May 21, 2018 prior to our business close at 5:30 pm CST), (iii) deliver later dated and signed proxy instructions (which must be received by May 21, 2018 prior to our business close at 5:30 pm CST) or (iv) vote again on a later date on the internet or by telephone (only your latest Internet or telephone proxy submitted prior to 11:59 pm May 21, 2018 will be counted).
Q: What happens if I decide to attend the Annual Meeting, but I have already voted or submitted a proxy covering my shares?
A: You may attend the meeting and vote in person even if you have already voted or submitted a proxy. Please be aware that attendance at the Annual Meeting will not, by itself, revoke a proxy. If a bank, broker or other nominee is the record holder of your shares and you wish to attend the Annual Meeting and vote in person, you must obtain a legal proxy from the holder of record of the shares giving you the right to vote the shares.
Q: What quorum is required for the Annual Meeting?
A: The presence, in person or by proxy, of the holders as of the Record Date of a majority of the voting power of the issued and outstanding Common Stock entitled to vote at the meeting is required for the Annual Meeting to proceed. Withheld votes, abstentions and broker non-votes (which result when a broker holding shares for a beneficial owner has not received timely voting instructions on certain matters from such beneficial owner and when the broker does not otherwise have discretionary power to vote on a particular matter) will count as present for purposes of establishing a quorum on the proposals.
Q: How are votes counted? A: The Class A Shares and Class B Shares are voting together as a single class on all matters described in this Proxy Statement for which your proxy is being solicited. Each share of Common Stock entitles its holder to one vote per share on all matters. There is no cumulative voting.
Q: How many votes are needed to approve each proposal?
A: Election of Class II Directors: Each Class II director is elected by a plurality of the voting power of the Class A Shares and the Class B Shares, voting together as a single class, present and in person or represented by a proxy and entitled to vote on the election of directors. Abstentions and broker non-votes will have no effect on the outcome of the vote.
Approval of Reverse Stock Split: The approval of the Reverse Stock Split requires the affirmative vote of the majority of the voting shares outstanding as of the Record Date. An abstention will have the effect of a vote against the proposal. Brokers have discretion to vote on this matter even without specific voting instructions from the beneficial owner of shares.

6
Questions Answers
Ratification of Independent Registered Public Accounting Firm: The ratification of the appointment of PricewaterhouseCoopers LLP as the Company’s independent registered public accounting firm requires the affirmative vote of the majority of shares cast on the matter. Abstentions shall not be considered as votes cast. Brokers have discretion to vote on this matter even without specific voting instructions from the beneficial owner of shares.
Q: What are broker non-votes? A: Broker non-votes are shares held by brokers that do not have discretionary authority to vote on the matter and have not received voting instructions from their clients. If your broker holds your shares in its name and you do not instruct your broker how to vote, your broker will nevertheless have discretion to vote your shares on our “routine” matters—the Reverse Stock Split and the ratification of the appointment of the Company’s independent registered public accounting firm. Your broker will not have discretion to vote on the election of directors. Broker non-votes do not count for voting purposes, but are considered “present” at the meeting for purposes of determining whether a quorum exists.
Q: Who will tabulate the votes? A: Jones Energy has designated a representative of Alliance Advisors, LLC as the Inspector of Election who will tabulate the votes.
Q: Who pays for the proxy solicitation process?
A: Jones Energy will pay the cost of preparing, assembling, printing, mailing and distributing these proxy materials and soliciting votes. We may, on request, reimburse brokerage firms and other nominees for their expenses in forwarding proxy materials to beneficial owners. In addition to soliciting proxies by mail, we expect that our directors, officers and employees may solicit proxies in person or by telephone or facsimile. None of these individuals will receive any additional or special compensation for doing this, although we will reimburse these individuals for their reasonable out-of-pocket expenses.
Q: May I propose actions for consideration at next year’s annual meeting of stockholders or nominate individuals to serve as directors?
A: Yes. You may present proposals for action at a future meeting or submit nominations for election of directors only if you comply with the requirements of the proxy rules established by the SEC and our amended and restated bylaws (“Bylaws”), as applicable. In order for a stockholder proposal to be included in our proxy statement and form of proxy relating to the meeting for our 2019 Annual Meeting of Stockholders under rules set forth in the Securities Exchange Act of 1934, as amended (the “Exchange Act”), the proposal must be received by us no later than December 30, 2018.

7
Questions Answers
If a stockholder intends to submit a proposal that is not intended to be included in our proxy statement, or a nomination for director for our 2019 Annual Meeting of Stockholders, the stockholder must give us notice in accordance with the requirements set forth in our Bylaws no later than February 21, 2019 and no earlier than January 22, 2019. If the date of the 2019 Annual Meeting is more than 30 days before or more than 70 days after May 22, 2019, notice by the stockholder must be received no earlier than the 120th day prior to the new meeting date and no later than the 90th day prior to the scheduled meeting date or, if less than 100 days’ prior notice or public disclosure of the scheduled meeting date is given or made, the 10th day following the earlier of the date on which the notice of such meeting was mailed to stockholders or the date on which public announcement of the date of the 2019 Annual Meeting is first made by Jones Energy. Our Bylaws require that certain information and acknowledgments with respect to the proposal or the nominee, as applicable, and the stockholder making the proposal or the nomination be set forth in the notice. Our Bylaws have been publicly filed with the SEC and can also be found on our website at www.jonesenergy.com in the Corporate Governance section of our Investor Relations webpage.
Q: What should I do if I get more than one proxy or voting instruction card?
A: Stockholders may receive more than one set of voting materials, these proxy materials and multiple proxy cards or voting instruction cards. For example, stockholders who hold shares in more than one brokerage account may receive separate sets of proxy materials for each brokerage account in which shares are held. Stockholders of record whose shares are registered in more than one name will receive more than one set of proxy materials. You should vote in accordance with all sets of proxy materials you receive relating to our Annual Meeting to ensure that all of your shares are counted.
Q: How do I obtain a separate set of proxy materials or request a single set for my household?
A: We have adopted a procedure approved by the SEC called “householding.” Under this procedure, stockholders who have the same address and last name will receive only one copy of the proxy materials unless one or more of these stockholders notifies us that they wish to continue receiving individual copies. This procedure reduces our printing costs and postage fees. Each stockholder who participates in householding will continue to be able to access or receive a separate proxy card.

8
Questions Answers
If you are a registered stockholder and wish to receive a separate set of proxy materials, please request the additional copy by contacting our transfer agent, American Stock Transfer & Trust Company, LLC, by telephone at 1-888-776-9962 (U.S.) or 1-718-921-8562 (outside the U.S.), or by email at [email protected]. If you hold your shares beneficially and wish to receive a separate set of proxy materials, please contact your bank or broker. If any stockholders in your household wish to receive a separate annual report and a separate proxy statement in the future, they may contact Investor Relations, Jones Energy, Inc., 807 Las Cimas Parkway, Suite 350, Austin, Texas 78746. They may also send an email to Investor Relations at [email protected]. Other stockholders who have multiple accounts in their names or who share an address with other stockholders can authorize us to discontinue mailings of multiple annual reports and proxy statements by contacting Investor Relations.

9
PROPOSAL ONE: ELECTION OF CLASS II DIRECTORS
At the recommendation of the Nominating and Corporate Governance Committee of the Board (the “Nominating Committee”), the Board has nominated the following individuals for election as Class II directors of the Company to serve for a three year term beginning at the Annual Meeting and expiring in 2021 and until either they are re-elected or their successors are elected and qualified:
Mr. Mike S. McConnell
Mr. Halbert S. Washburn
Messrs. McConnell and Washburn are currently serving as directors of the Company. Additional information about the nominees, including biographical information and qualifications, is contained below under the caption “Board of Directors and Corporate Governance—Information about the Directors and Nominees.”
Unless otherwise instructed, the proxy holders will vote the proxies received by them FOR each of Messrs. McConnell and Washburn. If the nominees are unable or decline to serve as a director at the time of the Annual Meeting, the proxies will be voted for another nominee designated by the Board. We are not aware of any reason that a nominee would be unable or unwilling to serve as a director.
THE BOARD UNANIMOUSLY RECOMMENDS THAT STOCKHOLDERS VOTE “FOR” THE ELECTION OF EACH OF MIKE S. MCCONNELL AND HALBERT S. WASHBURN AS CLASS II DIRECTORS.
BOARD OF DIRECTORS AND CORPORATE GOVERNANCE
Board Structure
Our business and affairs are managed under the direction of the Board. Our Restated Charter provides that our Board consist of between one and eleven directors. Our Board currently consists of seven directors. Pursuant to an Amended and Restated Registration Rights and Stockholders Agreement, dated May 2, 2017 (the “Restated Registration Rights and Stockholders Agreement”), Metalmark and the Jones Family Entities are each entitled to nominate two directors for election to the Board. Metalmark is not currently exercising its right to nominate directors for election to the Board, nor are any representatives of Metalmark currently serving on our Board. Jonny Jones and Mike S. McConnell are currently serving as the nominees of the Jones Family Entities. The Restated Registration Rights and Stockholders Agreement also requires the stockholders party thereto to take all necessary actions, including voting their shares of Common Stock, for the election of these nominees. Please see “Certain Relationships and Related Person Transactions—Restated Registration Rights and Stockholders Agreement.”
Our Board is divided into three classes, with one class being elected at each annual meeting of stockholders. Each director serves a three-year term, with termination staggered according to class. Jonny Jones, John Lovoi and Paul Loyd have been assigned to Class I, Mike S. McConnell and Halbert S. Washburn have been assigned to Class II and Alan D. Bell and Scott McCarty have been assigned to Class III. For as long as Metalmark and the Jones Family Entities are entitled to nominate two directors for election to the Board, each of their respective director nominees shall be assigned to a different class.
Recent Board and Committee Changes
Effective February 5, 2018, we expanded the size of our Board from five to seven members and appointed three new directors: Mr. John Lovoi, founder and managing partner of JVL Advisors L.L.C. (“JVL”), one of the Company’s largest shareholders; Mr. Paul B. Loyd Jr., former Chairman and CEO of R&B Falcon Corporation and long-time investor in JVL; and Mr. Scott McCarty, a partner at Q Investments, who joined the board in connection with an agreement entered into between Q Investments and the Company pursuant to which Q Investments has agreed not to

10
nominate a director for the Annual Meeting. In order to accommodate the new directors, Mr. Robb L. Voyles stepped down as a director effective as of February 5, 2018. Messrs. Lovoi and Loyd were designated Class I directors, while Mr. McCarty was designated a Class III director.
In connection with the Board changes, and as further described below, the committees of the Board were modified to consist of the following members:
• Audit Committee: Alan Bell (Chair), Paul B. Loyd Jr. and Halbert S. Washburn;
• Compensation Committee: Halbert S. Washburn (Chair), Alan Bell and John V. Lovoi; and
• Nominating and Corporate Governance Committee: John V. Lovoi (Chair), Scott McCarty and Alan Bell.
Information about the Directors and Nominees
Set forth below is information regarding our directors and the nominees as of April 18, 2018. All of the candidates for election at this meeting are currently serving as our directors.
Name Age Position
Class I Jonny Jones . . . . . . . . . . . . . . . . . . . . . . 58 Founder and Chairman of the Board John Lovoi . . . . . . . . . . . . . . . . . . . . . . . 57 Director Paul Loyd . . . . . . . . . . . . . . . . . . . . . . . . 71 Director Class II Mike S. McConnell . . . . . . . . . . . . . . . . 58 Director Halbert S. Washburn . . . . . . . . . . . . . . . 58 Director Class III Alan D. Bell . . . . . . . . . . . . . . . . . . . . . . 72 Lead Independent Director Scott McCarty . . . . . . . . . . . . . . . . . . . . 44 Director
Business Experience and Qualifications of Directors
Class I Directors (Current Terms Will Expire at the 2020 Annual Meeting)
Jonny Jones has served as Chairman of our board of directors since 2009 and served as the principal executive officer of the Company from 1988 until April 2018. Prior to founding the Company in 1988, Mr. Jones worked for subsidiaries and affiliates of BP plc as a geologist. Mr. Jones is a third generation explorationist with over 30 years of experience in the oil and gas industry focusing on the U.S. mid-continent. Mr. Jones is currently Chairman of the US Oil and Gas Association and serves on the executive committee of the Texas Oil and Gas Association. Mr. Jones is also a member of the Board of Directors for ETX Energy, LLC. He received the Ernst & Young Entrepreneur of the Year 2012 Award for Central Texas. He currently serves on the University of Oklahoma, Mewbourne College of Earth and Energy Board of Advisors. Mr. Jones is a member of the Independent Petroleum Association of America, where he previously served on the Board of Directors. He is also a member of the American Association of Petroleum Geologists. Mr. Jones holds a B.S. in Geology from the University of Oklahoma and an M.A. in Geology from the University of Texas at Austin. Because of his extensive knowledge of the oil and gas industry and our operations developed through his role as our founder, as well as his substantial business, leadership and management experience, we believe that Mr. Jones is a valuable member of our Board.
John Lovoi has served on our board of directors since February 2018. Mr. Lovoi is the Founder and Managing Partner of JVL. JVL is a Houston based asset manager specializing in upstream oil and gas investments and was founded in 2003. As of December 31, 2017, JVL managed approximately $1.5 billion for several institutional investors and high net worth individuals. Mr. Lovoi has approximately 30 years of experience in oil and gas research, investment banking and investments. Prior to forming JVL in 2003, he was the head of Morgan Stanley’s oil and gas investment banking practice. Prior to this role, he served as the head of Morgan Stanley’s oil and gas equity research practice. Mr. Lovoi

11
currently serves as Chairman of the Board for Dril-Quip, Inc (NYSE DRQ), a leading provider of highly engineered offshore drilling products and services. He also serves as Chairman of the Board for Epsilon Energy (TSX EPS-T), an integrated upstream and midstream company in the Marcellus Shale. Mr. Lovoi is a Director with Roan Resources, a leading upstream oil and gas company in the Anadarko Basin and is also a Director of Helix Energy Solutions (NYSE HLX), a leading global provider of well intervention equipment and services to the global offshore oil and gas industry. We believe that Mr. Lovoi’s many years of investing experience, as well as his in-depth knowledge of the oil and gas industry generally, and Jones Energy in particular, provide him with the necessary skills to be a member of the Board of Jones Energy.
Paul Loyd has served on our board of directors since February 2018. Mr. Loyd served as Chairman & CEO of R&B Falcon Corporation, a diversified offshore drilling company. In 2001, R&B Falcon Corporation merged with Transocean Sedco Forex. At that time, Mr. Loyd retired as Chairman and joined the Board of the new company. Prior to his tenure at R&B Falcon Corporation, Mr. Loyd accumulated more than 30 years of experience in the energy and energy services industry. He began his career in 1969 with Reading & Bates Offshore Drilling Company, holding various positions both in the United States and overseas, primarily West Africa, the Middle East and the Far East. He also served with Houston Offshore International, Inc. a domestic offshore drilling company, as Chief Financial Officer, Atwood Oceanics, Inc, an international drilling contractor, as Assistant to the President, Griffin-Alexander, Inc., a domestic drilling contractor, as President, and Chiles-Alexander, Inc., as Chief Executive Officer. Mr. Loyd also founded Carrizo Oil & Gas, Inc. (Nasdaq: CRZO). In addition to the drilling industry, Mr. Loyd served as a consultant to the Central Planning Organization of the Government of Saudi Arabia and assisted in writing the Five Year Plan for 1975 – 1980. Mr. Loyd graduated from Southern Methodist University with a Bachelor of Business Administration in Economics. Cox School of Business honored Mr. Loyd in 2001 with its Distinguished Alumni Award and in 2012 Paul was named an SMU Distinguished Alumni, the highest and most prestigious award the University can bestow upon its alumni. He received his Masters of Business Administration degree from the Harvard Graduate School of Business where he earned honours. We believe that Mr. Loyd’s significant experience, both in the energy industry broadly and in the Company’s specific areas of operation, provides him with the necessary skills to be a valuable member of the Board of Jones Energy.
Class II Directors (Current Terms Will Expire at the 2018 Annual Meeting)
Mike S. McConnell has served as a director since 2009 and served as the President of the Company from 2004 to April 2018. Mr. McConnell has over 30 years of domestic and international energy experience. Prior to joining the company in 2004, he served in senior management positions in a wide variety of areas in the energy business, including as the Chief Executive Officer of the Generation and Production Group for Enron Corp during bankruptcy from 2002 until 2003. He was the Chief Executive Officer of Enron Global Markets, LLC from 2000 until 2001. Prior to these assignments, Mr. McConnell served in the technology area for the company as Vice Chairman and Chief Operating Officer for Enron NetWorks and Chief Executive Officer of Global Technology from 1999 to 2000 and as President of Houston Pipe Line and Louisiana Resources Company from 1997 until 1999. He served as the chairman of the Price Business School Board of Advisors for the University of Oklahoma from 2010 until 2012 and is currently Vice Chairman of the Natural Gas Committee and a Director of the Independent Petroleum Association of America. He has also served on the board of the Oklahoma Independent Petroleum Association since 2016 and the board of Oklahoma Oil and Gas Association since 2017. Mr. McConnell graduated from the University of Oklahoma in 1982 with a B.B.A. in Petroleum Land Management with an emphasis on Law. Because of his wide-ranging experience in the oil and gas industry, including his financial management expertise, we believe Mr. McConnell is a valuable member of our Board.
Halbert S. Washburn has served as a director of the Company since September 2013 and as the Chief Executive Officer of BreitBurn GP, LLC, the general partner of BreitBurn Energy Partners, L.P. (“BreitBurn”), since April 2010. On May 15, 2016, while Mr. Washburn was serving as Chief Executive Officer of BreitBurn GP, LLC, BreitBurn filed a petition for protection under Chapter 11 of the United States Bankruptcy Code. As of the date of this Proxy Statement, BreitBurn has yet to emerge from bankruptcy protection. Prior to these positions, he served as Co-Chief Executive Officer and a director of BreitBurn GP, LLC from March 2006 until April 2010 and was the chairman of the board of directors of BreitBurn GP, LLC from July 2008 to April 2010. Mr. Washburn also currently serves as a director of Pacific Coast Energy Holdings LLC, the indirect owner of Pacific Coast Energy Company LP (“PCEC”), the predecessor to BreitBurn, and is the co-founder and was the Co-Chief Executive Officer of PCEC’s predecessors from

12
1988 to 2012. Since December 2005, Mr. Washburn has served as a member of the board of directors and the compensation committee of Rentech, Inc., a publicly traded alternative fuels company. Mr. Washburn also served on the audit committee of Rentech, Inc. from 2005 until 2012. In June 2011, he was appointed Chairman of the Rentech, Inc. board of directors. From July 2011 to April 2015, Mr. Washburn served on the board of directors of Rentech Nitrogen Partners, L.P., a nitrogen fertilizer company formed by Rentech, Inc. as a publicly traded master limited partnership. He has been a member of the California Independent Petroleum Association since 1995 and served as chairman of the executive committee of the board of directors from 2008 to 2010. He has also served as a board member, including chairman of the board of directors, of the Stanford University Petroleum Investments Committee. Mr. Washburn holds a B.S. degree in Petroleum Engineering from Stanford University. Because of his distinguished career as an executive in the oil and gas industry and his more than 25 years of management experience in the industry, the Board has determined that Mr. Washburn’s experience serving on boards of directors of both public and private companies allows him to provide the company with a variety of perspectives on corporate governance and other issues.
Class III Directors (Current Terms Will Expire at the 2019 Annual Meeting)
Alan D. Bell has served as a director of the Company since July 2013 and has been our Lead Independent Director since February 2018. Mr. Bell is a retired senior audit partner in the energy industry. Prior to his retirement in 2006, Mr. Bell served as the Director of the Southwest Area Energy Practice at Ernst & Young LLP since 1998, after having performed various roles in the firm since joining in 1973. Mr. Bell began his career as a petroleum engineer at Chevron Oil Company from 1969 to 1972. Mr. Bell currently serves as a director and audit committee chair of Approach Resources Inc., an exploration and development company. Mr. Bell is a director of the National Association of Corporate Directors (NACD)—North Texas Chapter. Mr. Bell is a NACD Board Leadership Fellow. Mr. Bell previously served as a director of Dune Energy, Inc. from May 2007 until January 2012, Toreador Resources Corporation from August 2006 until June 2009 and Central Energy GP LLC from November 2013 to December 2015. Mr. Bell also served as the Chief Restructuring Officer of Energy Partners Ltd. from March to September 2009. Mr. Bell was hired by the Board of Directors of Energy Partners to manage daily operations, reduce costs, negotiate a pre-arranged bankruptcy and manage the company during a complex Chapter 11 process. Mr. Bell is a member of the American Institute of Certified Public Accountants, the Texas Society of Certified Public Accountants and the Society of Petroleum Engineers. Mr. Bell earned a Petroleum Engineering degree from the Colorado School of Mines and MBA from Tulane University. We believe that Mr. Bell’s financial and accounting experience and deep technical knowledge as an engineer make him a valuable member of our Board.
Scott McCarty has served on our board of directors since February 2018. Mr. McCarty is a partner at Q Investments, where he manages private equity and distressed investment groups. He joined Q Investments in 2002 and, prior to his current role, served as a portfolio manager. Before joining Q Investments, Mr. McCarty was a captain in the United States Army. Since 2013, Mr. McCarty has served as a Director for Q-TZG Leasing Holding Ltd and for Q-TZG Leasing Hong Kong, Ltd. He also serves as a member of the board of directors and the compensation committee for Vantage Drilling Intl. Mr. McCarty also serves as a director for Gulfmark Offshore, Inc and is a member of their compensation committee and nominating and corporate governance committee. Previously, Mr. McCarty served as a Director and Member of the Compensation Committee for Travelport Worldwide from 2013 – 2014, and as a Director for Envirotest Systems Holdings Corp. from 2007 - 2014. Mr. McCarty graduated with a Bachelors of Science degree from the United States Military Academy at West Point, where he was a Distinguished Cadet and recipient of the General Lee Donne Olvey Award, and earned an Masters of Business Administration from Harvard Business School. We believe that Mr. McCarty’ extensive investing and financial experience and knowledge of our operations provide him with the necessary skills to be a member of our Board.
No family relationship exists among any of the directors, nominees or executive officers. Except as set forth below under “Certain Relationships and Related Party Transactions,” no arrangement or understanding exists between any director, nominee, or executive officer and any other person pursuant to which any director, nominee or executive officer was selected as a director, nominee or executive officer of the Company.

13
Meetings of the Board
The Board met seven times during 2017. Jones Energy’s then-serving directors attended 100 percent of Board and applicable committee meetings during 2017. No director attended less than 75 percent of such meetings. As discussed above, Messrs. Lovoi, McCarty and Loyd joined the Board in February 2018 and are not included in the foregoing calculations.
While the Company has no formal policy regarding director attendance at its annual meeting of stockholders, Jones Energy’s directors are encouraged to attend the Company’s annual meetings. Our board of directors consisted of five members as of the date of the 2017 annual meeting of stockholders (the “2017 Annual Meeting”), and all five of our directors attended the meeting.
The non-management members of the Board regularly hold executive sessions, and the independent directors hold executive sessions at least annually. The Lead Independent Director, currently Alan Bell, presides over any executive session of the Board in which the members of our management are not present.
Corporate Governance
The Board acts as the ultimate decision-making body of the Company and advises and oversees management, who are responsible for the day-to-day operations and management of the Company. In carrying out its responsibilities, the Board reviews and assesses the Company’s long-term strategy and its strategic, competitive and financial performance. The Board has adopted corporate governance guidelines that serve as a flexible framework within which the Board and its committees operate. These guidelines cover a number of areas including the size and composition of the board, board membership criteria and director qualifications, director responsibilities, board agenda, roles of the chairman of the board, chief executive officer and presiding director, meetings of independent directors, committee responsibilities and assignments, board member access to management and independent advisors, director communications with third parties, director compensation, director orientation and continuing education, evaluation of senior management and management succession planning. A copy of our corporate governance guidelines can be found on our website at www.jonesenergy.com in the Corporate Governance section of our Investor Relations webpage.
Director Independence
The Board has affirmatively determined that Messrs. Lovoi, Loyd, Washburn, Bell and McCarty are independent directors under the applicable rules of the New York Stock Exchange (the “NYSE”), and that Messrs. Loyd, Washburn and Bell are also independent directors as such term is defined in Rule 10A-3(b)(1) under the Exchange Act for purposes of their service on the Audit Committee.
Board Committees
The Board has three standing committees: the Audit Committee, the Compensation Committee, and the Nominating Committee. The Board has adopted a written charter for each committee that sets forth the committee’s purpose, composition, authority and responsibilities. Each charter can be found on our website at www.jonesenergy.com in the Corporate Governance section of our Investor Relations webpage.
Audit Committee
The Audit Committee has the authority to, among other things:
• approve and retain the independent registered public accounting firm to conduct the annual audit of our books and records and approve the audit fees to be paid;
• review the independence and performance of the independent registered public accounting firm;

14
• review the proposed scope and results of the audit;
• review and pre-approve the independent registered public accounting firm’s audit and non-audit services rendered;
• review and approve transactions between us and our directors, officers and affiliates;
• oversee internal audit functions and our compliance with legal and regulatory requirements; and
• prepare the report of the audit committee that SEC rules require to be included in our annual meeting proxy statement.
Our Audit Committee is currently comprised of Messrs. Loyd, Washburn and Bell. Mr. Bell serves as chair of the Audit Committee and also qualifies as an “audit committee financial expert” as such term has been defined by the SEC in Item 401(h)(2) of Regulation S-K. During 2017, the Audit Committee was comprised of Messrs. Voyles, Bell and Washburn, with Mr. Bell serving as the chair. Our Board has affirmatively determined that Messrs. Loyd, Washburn and Bell meet the definition of an “independent director” for the purposes of serving on the Audit Committee under applicable SEC and NYSE rules. All members of our Audit Committee meet the requirements for financial literacy under the applicable rules and regulations of the SEC and the NYSE. Members of the Audit Committee are limited to serving on no more than two other public company audit committees, unless expressly approved by the Board after determining that simultaneous service would not impair the ability of such member to effectively serve on the Company’s Audit Committee. Our Audit Committee met four times in 2017.
Compensation Committee
The primary purposes of our Compensation Committee are to, among other things:
• review and recommend the compensation arrangements for officers and other employees;
• establish and review general compensation policies with the objective to attract and retain superior talent, to reward individual performance and to achieve our financial goals; and
• administer our incentive compensation and benefits plans, including our short-term and long-term incentive plans.
The Compensation Committee is delegated all authority of the Board as may be required or advisable to fulfill the purposes of the Compensation Committee. The Compensation Committee may form and delegate some or all of its authority to subcommittees when it deems appropriate. Meetings may, at the discretion of the Compensation Committee, include members of the Company’s management, other members of the Board, consultants or advisors, and such other persons as the Compensation Committee or its chairperson may deem necessary in an informational or advisory capacity.
The Compensation Committee reviews and approves corporate goals and objectives relevant to the compensation of the executive officers, evaluates the executive officers’ performance at least annually in light of those goals and objectives, and determines the executive officers’ compensation level based on this evaluation. In determining the long-term incentive component of the executive officers’ compensation, the Compensation Committee considers the Company’s performance and relative stockholder return, the value of similar incentive awards to executive officers at comparable companies, the awards given to the Company’s executive officers in past years and such other factors as the Compensation Committee deems appropriate and in the best interest of the Company.
Our Board annually considers the performance of our Chief Executive Officer. Meetings to determine the compensation of the Chief Executive Officer must be held in executive session. Meetings to determine the compensation

15
of any officer of the Company, other than the Chief Executive Officer, may be attended by the Chief Executive Officer, but the Chief Executive Officer may not vote on these matters.
The Compensation Committee has the sole authority to retain, amend the engagement with, and terminate any compensation consultant to be used to assist in the evaluation of Chief Executive Officer or officer compensation, including employment contracts and change in control provisions. The Compensation Committee has sole authority to approve the consultant’s fees and other retention terms and has authority to cause the Company to pay the fees and expenses of such consultants. In early 2017, Frederic W. Cook & Co., Inc. (“F.W. Cook”) provided the Compensation Committee with objective and expert analyses, independent advice, and information with respect to executive compensation. F.W. Cook did not provide other consulting services to the Compensation Committee. The Compensation Committee concluded that no conflict of interest exists that would prevent F.W. Cook from independently representing the Compensation Committee. Beginning in July 2017, Meridian Compensation Partners, LLC (“Meridian”) took over this role. Meridian did not provide other consulting services to the Compensation Committee. The Compensation Committee concluded that no conflict of interest exists that would prevent Meridian from independently representing the Compensation Committee.
Our Compensation Committee is currently comprised of Messrs. Lovoi, Washburn and Bell, with Mr. Washburn serving as the chair. Our Board has affirmatively determined that Messrs. Lovoi, Washburn and Bell meet the definition of an “independent director” for the purposes of serving on the Compensation Committee under applicable NYSE rules. Our Compensation Committee met four times in 2017. During 2017, the Compensation Committee was comprised of Messrs. Bell, Myers and Washburn, with Mr. Myers serving as the chair. Effective May 17, 2017, Mr. Myers resigned from his position on the Board and each committee, including the Compensation Committee. Following Mr. Myers’ resignation, Mr. Voyles was appointed to serve as a member of the Compensation Committee and Mr. Washburn was appointed to serve as the chair.
Nominating and Corporate Governance Committee
The primary purposes of our Nominating Committee are to, among other things:
• identify, evaluate and recommend qualified nominees for election to the Board;
• develop, recommend to the Board and oversee a set of corporate governance principles applicable to the Company;
• oversee the evaluation of the Board and management;
• review, recommend and oversee non-employee director compensation; and
• develop and maintain a management succession plan.
In evaluating the suitability of candidates, the Board and the Nominating Committee take into account many factors. These factors may include, among other things, an individual’s character, business experience, qualifications, attributes and skills such as relevant industry knowledge, specific experience with technology, accounting, finance, leadership, operations, strategic planning, and international markets; independence; judgment; integrity; the ability to commit sufficient time and attention to the activities of the Board; diversity of occupational and personal backgrounds on the Board; and the absence of potential conflicts with the Company’s interests.
The Board believes that its membership should reflect a diversity of experience, gender, race, ethnicity and age, and the Nominating Committee’s charter requires that it take into account such diversity in making director recommendations. The Nominating Committee will assess the effectiveness of this approach as part of its annual review of its charter and our Corporate Governance Guidelines. The Nominating Committee will select qualified nominees and review its recommendations with the Board, which will decide whether to invite the nominees to join the Board. When evaluating the suitability of an incumbent director for nomination or re-election, the Board and the Nominating

16
Committee also consider the director’s past performance, including attendance at meetings and participation in and contributions to the activities of the Board.
The Nominating Committee is also responsible for setting and evaluating the compensation of the non-executive members of the Board. For a discussion of director compensation, please see “Director Compensation” below.
Our Nominating Committee is currently comprised of Messrs. Lovoi, Bell and McCarty, with Mr. Lovoi serving as the chair. Our Board has affirmatively determined that Messrs. Lovoi, Bell and McCarty meet the definition of an “independent director” for the purposes of serving on the Nominating Committee under applicable NYSE rules. Our Nominating Committee met one time in 2017. During 2017, the Nominating Committee was comprised of Messrs. Bell, Voyles and Washburn, with Mr. Voyles serving as the chair.
Compensation Committee Interlocks and Insider Participation
None of our officers or employees will be members of the Compensation Committee. None of our executive officers serve on the board of directors or compensation committee of a company that has an executive officer that serves on our Board or Compensation Committee. No member of our Board is an executive officer of a company in which one of our executive officers serves as a member of the board of directors or compensation committee of that company.
Code of Business Conduct and Ethics
We have adopted a code of business conduct and ethics that applies to all of our employees, officers and directors, including those officers responsible for financial reporting. These standards are designed to deter wrongdoing and to promote honest and ethical conduct. The code of business conduct and ethics is available on our website at www.jonesenergy.com in the Corporate Governance section of our Investor Relations webpage. Any waiver of the code for directors or executive officers may be made only by our Board or a Board committee to which the Board has delegated that authority and will be promptly disclosed to our stockholders as required by applicable U.S. federal securities laws and the corporate governance rules of the NYSE. Amendments to the code must be approved by our Board and will be promptly disclosed (other than technical, administrative or non-substantive changes). Any amendments to the code, or any waivers of its requirements, for which disclosure is required, will be disclosed on our website.
Director Nominations
Subject to the rights of Metalmark and the Jones Family Entities to nominate directors to the Board, the Board is responsible for selecting candidates to fill vacancies on the Board and for nominating individuals for election as directors by the stockholders, in each case, based on the recommendation of the Nominating Committee. The Nominating Committee considers recommendations for Board candidates submitted by stockholders using substantially the same criteria it applies to recommendations from the Nominating Committee, current directors or members of management. Stockholders may submit recommendations by providing the person’s name and appropriate background and biographical information in writing to the Nominating Committee at Jones Energy, Inc., Attn: Nominating and Corporate Governance Committee, 807 Las Cimas Parkway, Suite 350, Austin, Texas 78746. Stockholders who want to nominate directors for election at Jones Energy’s next annual meeting of stockholders must follow the procedures described in the Company’s Bylaws, which are available on our website at www.jonesenergy.com in the Corporate Governance section of our Investor Relations webpage.
Contacting the Board, the Chairman and Other Independent Directors
Stockholders or interested parties wishing to communicate directly with our Board, any individual director, the Chairman of the Board, or any non-management or independent directors as a group may do so by writing to them care of Jones Energy’s Corporate Secretary at 807 Las Cimas Parkway, Suite 350, Austin, Texas 78746. The Corporate Secretary will forward appropriate communications. Any concerns reported related to accounting, internal accounting

17
controls or auditing matters will be promptly brought to the attention of the Chair of the Audit Committee as appropriate. For more information on how to contact our Board, please see our Corporate Governance Guidelines located within the Corporate Governance section on the Investor Relations tab of our webpage at www.jonesenergy.com.
Board Leadership and Role in Risk Oversight
Separation of Offices of Chairman of the Board and Chief Executive Officer
Historically, the Nominating Committee believed that Jonny Jones serving as both Chairman of the Board and Chief Executive Officer was the most effective leadership structure for us because it promoted unified leadership and direction for the Company. Recently, it was determined to separate the offices of the Chairman of the Board and Chief Executive Officer in order to permit Jonny Jones to continue to provide his expertise and institutional knowledge to the Board, while appointing a new executive officer with a fresh perspective and experience turning around businesses through difficult financial circumstances to manage the day-to-day affairs of the Company.
Lead Independent Director
Because the Board does not have an independent Chairman, the Board may designate an independent director as the Lead Independent Director. When a Lead Independent Director has been designated, the Lead Independent Director’s exclusive duties are, among other things:
• preside at all meetings of the Board at which the Chairman is not present, including executive sessions of the independent directors;
• serve as the principal liaison between the independent directors and the Chairman;
• communicate to the Chairman and management, as appropriate, any decisions reached, suggestions, views or concerns expressed by independent directors in executive session or outside of Board meetings;
• work with the Chairman to develop and approve Board meeting agendas and schedules and the appropriateness and timeliness of information provided to the Board;
• periodically meet with independent directors to discuss Board and committee performance, effectiveness and composition; and
• if appropriate, and in connection with executive management, be available for consultation and direct communication with major shareholders.
In February 2018, the Board, based on a recommendation from the Nominating Committee, designated Mr. Bell as its Lead Independent Director. This is the first time the Board has designated a Lead Independent Director. The service of the Lead Independent Director complements Mr. Jones’ role as Chairman by, among other things, providing directors, shareholders and other constituents a direct contact to an independent member of the Board. When in office, the Lead Independent Director’s term is one year, but an individual may serve multiple consecutive terms upon recommendation of the Nominating Committee and approval of the Board.
Risk Oversight
The Board provides oversight of our major risk exposures and the steps management has taken to monitor and manage such exposures. The Audit Committee is primarily responsible for oversight of the quality and integrity of the Company’s financial reporting process, internal controls over financial reporting and the Company’s compliance programs. The Compensation Committee is responsible for reviewing compensation-related risks. The Nominating Committee is responsible for oversight of the Company’s corporate governance programs, including the code of ethics

18
and business conduct. Management regularly reports to the Board and its committees on the risks that the Company may face and the steps that management is taking to mitigate those risks.
EXECUTIVE OFFICERS
The executive officers of the Company and their ages and titles as of April 18, 2018 are set forth below.
Name Age Position
Jeff Tanner . . . . . . . . . . . . . . . . . . . . 55 Chief Operating Officer and Interim Chief Executive Officer Robert J. Brooks . . . . . . . . . . . . . . . 55 Executive Vice President, Chief Financial Officer, Secretary and
Treasurer
Each officer shall hold office until such officer’s successor is elected or appointed or until his earlier death, resignation or removal. Set forth below is a description of the backgrounds and business experience of the executive officers of the Company.
Jeff Tanner joined the Company in 2014 and serves as our Chief Operating Officer and Interim Chief Executive Officer. From 2014 until April 2018, Mr. Tanner was the Company’s Executive Vice President—Geosciences and Business Development. Mr. Tanner has approximately 30 years of diverse technical and managerial experience in the oil and gas industry. Prior to joining Jones Energy, Mr. Tanner was Vice President, Exploration for Southwestern Energy. During his career, Mr. Tanner has held a variety of management and technical positions for Laredo Petroleum, Cabot Oil and Gas, and Noble Energy. He began his career with Royal Dutch Shell plc in Houston. Mr. Tanner is a member of the American Association of Petroleum Geologists and the Houston Geological Society. He holds a B.S. in Geology from Texas A&M and an M.S. in Geology from the University of Houston.
Robert J. Brooks joined the Company as our Executive Vice President, Chief Financial Officer, Secretary and Treasurer in 2013. He has over 25 years of corporate finance experience in the oil and gas industry. Mr. Brooks’ prior experience includes investment banking leadership of M&A advisory and capital markets transactions and private equity investments, primarily in the upstream energy sector. Most recently, Mr. Brooks led the energy investment banking efforts at Whiteface Capital LLC from 2012 until 2013 and Focus Capital Group, Inc. from 2010 until 2012. From 2004 until 2010, Mr. Brooks served as the Senior Managing Director and Head of Macquarie Capital’s U.S. Natural Resources investment banking practice, which he founded in 2004. Mr. Brooks also served as President and Board Member of Macquarie Longview Holdings, an E&P company owned and controlled by Macquarie. Prior to Macquarie, Mr. Brooks was a Principal in the Energy Group at Banc of America Securities, and began his investment banking career in the Energy Investment Banking Group at Salomon Brothers. Mr. Brooks holds a B.S. in Mechanical Engineering from the Massachusetts Institute of Technology, or MIT, an M.S. in Mechanical Engineering from Stanford University, and an M.S. in Management from the Sloan School of Management at MIT.
EXECUTIVE COMPENSATION
We are an “emerging growth company,” as defined in the Jumpstart Our Business Startups Act of 2012 (the “JOBS Act”). As an emerging growth company, we have reduced disclosure obligations regarding executive compensation compared to companies that are not emerging growth companies, and we are exempt from the requirement of holding advisory “say-on-pay” votes on executive compensation. Under the JOBS Act, we will remain an emerging growth company until the earliest of (1) the last day of the fiscal year during which we have total annual gross revenues of $1 billion or more; (2) the last day of the fiscal year following the fifth anniversary of the completion of our initial public offering (“IPO”); (3) the date on which we have, during the previous three-year period, issued more than $1 billion in non-convertible debt; and (4) the date on which we are deemed to be a “large accelerated filer” under the Exchange Act. Absent any other factors, we will cease to be an emerging growth company on January 1, 2019.

19
Compensation of Named Executive Officers
The following discussion of compensation arrangements of our named executive officers for 2017 (as set forth in the Summary Compensation Table and defined below) should be read together with the compensation tables and related disclosures set forth below.
2017 Summary Compensation Table
The following tables provide information about the compensation of our named executive officers. In accordance with SEC rules, our named executive officers are the individual who served as our Chief Executive Officer during the entirety of fiscal year 2017 and our two other most highly compensated executive officers who were serving at December 31, 2017.
Name and Principal Position during 2017 Year
Salary ($)
Non-Equity Incentive
Plan Compensation
($)(1)
Stock Awards ($)(2)
All Other Compensation
($)(3) Total
($)
Jonny Jones . . . . . . . . . . . . . . . . . . 2017 $ 515,000 $ 500,000 $ 1,499,999 $ 87,356 $ 2,602,355Chief Executive Officer and
Chairman . . . . . . . . . . . . . . . . 2016 $ 500,000 $ 526,000 $ 1,333,334 $ 126,099 $ 2,485,433Mike S. McConnell . . . . . . . . . . . . 2017 $ 391,400 $ 323,000 $ 749,551 $ 54,837 $ 1,518,788
President and Director . . . . . . . 2016 $ 380,000 $ 339,796 $ 666,266 $ 42,780 $ 1,428,842Robert J. Brooks . . . . . . . . . . . . . . 2017 $ 344,500 $ 315,900 $ 1,077,250 $ 16,200 $ 1,753,850
Executive Vice President and Chief Financial Officer . . . . . 2016 $ 325,000 $ 341,901 $ 511,334 $ 15,900 $ 1,194,135
(1) The amounts reported in this column reflect the amount paid to each executive with respect to performance in 2017
and 2016 under the Amended and Restated Jones Energy, Inc. 2013 Short-Term Incentive Plan.
(2) The amounts in this column represent the aggregate grant date fair value computed in accordance with FASB ASC Topic 718 of restricted stock units and performance share units awarded under the Amended and Restated Jones Energy, Inc. 2013 Omnibus Incentive Plan. The value of performance share units is the value at the grant date based upon the projected outcome of the applicable performance conditions.
(3) The amounts in this column include the following: matching contributions under our 409A savings plan for Messrs. Jones, McConnell, and Brooks; country club association dues for Messrs. Jones and McConnell; payments associated with leasing and the auto insurance policy on the company vehicle for Mr. Jones; and the car allowance provided for McConnell’s vehicle. In 2017, country club association dues paid by the Company totaled $26,054 for Mr. Jones and $13,641 for Mr. McConnell.
Additionally, the 2017 and 2016 amounts for Mr. Jones includes the value of Monarch Natural Gas Holdings, LLC units (“Monarch Units”) that correspond to nominal units representing Monarch Units (“Phantom Units”) forfeited by departing employees. Upon forfeiture the units vested to Mr. Jones pursuant to the Monarch Equity Plan and were valued at $36.63 and $29.93 per unit based upon an analysis of peer company equity values for Monarch Units vested in 2017 and 2016, respectively.
The employment of Messrs. Jones and McConnell with the Company was terminated on April 17, 2018. Mr. Brooks does not have a contractual right to employment by us and may be terminated with or without cause at any time. Messrs. Jones, McConnell, and Brooks entered into agreements with us containing confidentiality, non-competition, non-solicitation and non-disparagement obligations with respect to us that survive beyond their employment with us.

20
Outstanding Equity Awards at 2017 Fiscal Year-End
The following table reflects all unvested outstanding equity awards of our named executive officers as of December 31, 2017.
STOCK AWARDS
Name Grant Date
Number of Units
or Shares of Stock That Have Not
Vested (#)
Market Value of Units or Shares of Stock That Have Not Vested(4)(5)
($)
Equity Incentive Plan Awards:
Number of Unearned
Shares That Have Not
Vested (#)
Equity Incentive Plan Awards:
Payout Value of Unearned
Shares That Have Not
Vested(5) ($)
Jonny Jones . . . . . . . 4/29/2015 43,529(1) $ 47,882 5/27/2016 145,761(1) $ 160,337 5/27/2016 218,638(4) $ 240,502 4/15/2017 415,737(1) $ 457,311 4/15/2017 207,870(4) $ 228,657 Mike S. McConnell . 4/22/2013 30,313(2) $ 33,344 4/29/2015 21,751(1) $ 23,926 5/27/2016 72,838(1) $ 80,122 5/27/2016 109,255(4) $ 120,181 4/15/2017 207,744(1) $ 228,518 4/15/2017 103,873(4) $ 114,260 Robert J. Brooks . . . 6/13/2014 5,675(3) $ 6,243 4/29/2015 16,696(1) $ 18,366 5/27/2016 55,900(1) $ 61,490 5/27/2016 83,849(4) $ 92,234 4/15/2017 159,437(1) $ 175,381 4/15/2017 208,700(3) $ 229,570 4/15/2017 79,719(4) $ 87,691
(1) Represents unvested restricted stock unit awards. Each restricted stock unit represents the contingent right to receive
one Class A Share upon vesting of the unit. Shares vest in three equal installments annually on April 1st. Although not reflected in the table above, which reflects unvested equity awards as of December 31, 2017, outstanding unvested restricted stock unit awards were proportionately adjusted in connection with the Company’s February 15, 2018 dividend on the Company’s 8.0% Series A Perpetual Convertible Preferred Stock paid in Class A Shares, increasing by 0.019796 restricted stock units for each outstanding unvested restricted stock unit on the date of the dividend.
(2) Represents unvested indirectly owned units representing membership interests in JEH LLC (“JEH LLC Units”) and Class B Shares that together, after vesting, are exchangeable on a one-for-one basis for Class A Shares pursuant to the terms of the Exchange Agreement. The unvested indirectly owned JEH LLC Units and Class B Shares vest in five equal installments on each anniversary of the date such JEH LLC Units were granted.
(3) Represents unvested restricted stock unit awards. Each restricted stock unit represents the contingent right to receive one Class A Share upon vesting of the unit. Mr. Brooks’ restricted stock units granted June 13, 2014 vest in four equal installments annually on June 13th and Mr. Brooks’ restricted stock units granted April 15, 2017 vest in five equal installments annually on April 1st.
(4) Represents unvested performance share unit awards based on achieving a target threshold of 100% vesting. Each vested performance share unit is exchangeable for one Class A Share. Upon completion of the three-year performance period ending December 31st of the second year following the year of the grant date, each officer will

21
vest in a number of performance share units. The number of performance share units in which each officer vests will range from 0% to 200% based on the Company’s total shareholder return relative to an industry peer group over the three-year performance period. Although not reflected in the table above, which reflects unvested equity awards as of December 31, 2017, outstanding unvested performance share unit awards were proportionately adjusted in connection with the Company’s February 15, 2018 dividend on the Company’s 8.0% Series A Perpetual Convertible Preferred Stock paid in Class A Shares, increasing by 0.019796 performance share units for each outstanding unvested performance share unit on the date of the dividend.
(5) Reflects the payout values at December 31, 2017 of the unvested awards in the previous column. The payout value is determined by multiplying the number of unvested awards by $1.10, the closing price of a Class A Share on December 29, 2017.
Not included in the table above are performance share units granted on April 29, 2015 that, as of December 31, 2017, were vested and waiting on the Compensation Committee to certify the Company’s total shareholder return calculation. On February 7, 2018, the Compensation Committee certified the vesting of such performance share units at 58.3% of target as a result of the Company’s performance against the pre-selected metrics.
Amended and Restated Jones Energy, Inc. 2013 Omnibus Incentive Plan
Our Board adopted, and our shareholders approved at the 2016 Annual Meeting, the Amended and Restated Jones Energy, Inc. 2013 Omnibus Incentive Plan (the “LTIP”), effective on May 4, 2016. Our LTIP is designed to attract and retain employees, consultants and non-employee directors and to encourage the sense of proprietorship of such individual and to stimulate the active interest of such persons in the development of our success. To accomplish this goal, equity, equity-based and cash awards may be made under the LTIP to employees and consultants of the Company and our affiliates and to our directors.
The LTIP is administered by our Compensation Committee. As of December 31, 2017, there were 3,065,486 Class A Shares available for issuance under the LTIP, all of which may be issued to our employees and directors. The LTIP provides for the issuance of stock options (incentive stock options and nonstatutory stock options), restricted stock, performance awards, restricted stock units, bonus stock awards, stock appreciation rights, dividend equivalents, and cash awards. With respect to equity awards made under the LTIP, no employee may be granted during a single calendar year (i) stock options or stock appreciation rights that are exercisable for more than 1,000,000 shares of our common stock; (ii) performance-based awards settled in our Class A Shares or other stock awards covering or relating to more than 1,000,000 shares of our Class A Shares or (iii) cash awards or performance-based awards settled solely in cash having a grant date value in excess of $5,000,000. No non-employee director may be granted during a single calendar year awards having a value determined on the grant date in excess of $500,000.
Amended and Restated Jones Energy, Inc. 2013 Short-Term Incentive Plan
Our Board adopted, and our shareholders approved at the 2016 Annual Meeting, the Amended and Restated Jones Energy, Inc. 2013 Short Term Incentive Plan (“STIP”), effective on May 4, 2016. Annual cash bonus awards may be made to our employees under the STIP that are based on the achievement of certain business objectives and other criteria established by the Compensation Committee, which is the administrator of the STIP.
Under the STIP, with respect to awards based on the achievement of business objectives, our Compensation Committee establishes objective goals generally no later than 90 days after the commencement of service to which the performance goals relate and prior to the completion of 25% of the performance period, and in any event, while the outcome is substantially uncertain. A performance goal may be based on one or more business criteria that apply to the individual, one or more of our business units, or the company as a whole. Performance goals are based on one or more of the financial or operational factors, as applied to the company or a business unit, as applicable, set forth in the STIP. Prior to the payment of any compensation based on the achievement of the performance goals, the Compensation Committee must certify in writing that applicable performance goals were, in fact, satisfied. The Compensation Committee, in its sole discretion, may decrease the amount payable pursuant to an STIP award, but the Compensation Committee does not have discretion to increase the amount payable to a participant who is a “covered employee” as

22
defined under Code Section 162(m) in a manner inconsistent with the requirements for qualified performance-based compensation under Code Section 162(m). No participant may be granted performance awards that would result in the payment of more than $5,000,000 per plan year.
Monarch Equity Plan
Prior to our IPO, the Board adopted the Monarch Equity Plan to provide for grants of Phantom Units for the benefit of certain officers who performed services for us. As of December 31, 2017, we had granted all 26,192 Phantom Units available for grant under the Monarch Equity Plan, including certain grants of the Phantom Units to our directors and/or executive officers in 2013 as follows: 11,723 Phantom Units were granted to Mike S. McConnell and 1,072 Phantom Units were granted to Robert J. Brooks.
The Phantom Units will vest 20% per year on each of the first, second, third, fourth and fifth anniversary of the grant date, provided that the participant remains in continuous employment with the company through each applicable vesting date. Within 30 days of a vesting date, a participant will receive an assignment of the number of Monarch Units corresponding to the Phantom Units vesting on such date. If a participant’s employment with us terminates for any reason, (i) all unvested Phantom Units will be immediately forfeited by the participant, and the Monarch Units underlying such forfeited Phantom Units will be assigned to Jonny Jones within 30 days following the forfeiture date and (ii) Jonny Jones shall have a call option to purchase any or all of the Monarch Units issued to such participant in respect of vested Phantom Units at the fair market value determined by the Board for Monarch Units as of the most recent valuation date coincident with or immediately preceding the date such call option is exercised.
On March 31, 2016, pursuant to the terms of the Monarch Equity Plan, Jonny Jones received a distribution of Monarch Units having a value of approximately $66,635 in connection with the forfeiture of Phantom Units issued under the Monarch Equity Plan by departing employees.
On July 5, 2017, pursuant to the terms of the Monarch Equity Plan, Jonny Jones received a distribution of Monarch Units having a value of approximately $27,177 in connection with the forfeiture of Phantom Units issued under the Monarch Equity Plan by departing employees.
Deferred Compensation Plan
On October 17, 2013, our Compensation Committee adopted the Jones Energy, LLC Executive Deferral Plan (the “Deferred Compensation Plan”), under which key management or highly compensated employees that are selected by the Compensation Committee may defer receipt of their compensation, including up to 50% of their base salaries and up to 100% of their bonuses, effective as of October 1, 2013. The current eligible employees are Robert J. Brooks and Jeff Tanner.
To participate, eligible employees must make irrevocable deferral elections no later than December 31st (or such earlier date selected by the Compensation Committee) of the year preceding the year during which the election applies. A participant’s compensation deferred under the Deferred Compensation Plan is evidenced in a notional or bookkeeping account established and maintained by the Company. Participant contributions are fully vested at all times and credited with income, expense, gains and losses in accordance with the deemed investment of the participant’s account in the investment funds offered under our 401(k) plan, as elected by the participant. These investment funds are for measurement purposes only, and a participant’s election of any such investment fund is hypothetical and is not an actual investment of his or her Deferred Compensation Plan account in any such investment funds. The Deferred Compensation Plan is an “unfunded” plan for state and federal tax purposes, and participants have the rights of unsecured creditors of the Company with regard to their Deferred Compensation Plan accounts. The Company has established a “rabbi trust” and makes contributions to that trust from time to time that may be used to make payments under the Deferred Compensation Plan. All assets in the rabbi trust remain the property of the Company and subject to the claims of the Company’s creditors; the participants have no rights to the trust funds other than as an unsecured creditor of the Company.
The account balance of a participant will be distributed to the participant in a single lump-sum payment upon the earlier of the 30th day following the date of (i) the participant’s termination of employment for any reason or (ii) the

23
participant’s death or disability (as defined in the Deferred Compensation Plan). Distributions will be made in cash unless the Committee determines other property should be distributed. The foregoing notwithstanding, if a participant is a “specified employee” within the meaning of Section 409A of the Internal Revenue Code, unless the distribution is due to the participant’s death or disability, the participant’s payment will be delayed for 6 months following the participant’s termination date.
Potential Payments Upon Termination or Change in Control
The LTIP provides in the event of death, disability, retirement or change in control (as defined in the LTIP), the Compensation Committee may, in its discretion, accelerate the vesting or exercisability of an award (which acceleration has been provided for in the applicable award agreements for all of our named executive officers), eliminate or make less restrictive any restrictions contained in an award, waive any restriction or other provision of the LTIP or an award or otherwise amend or modify an award in any manner that is, in either case, (1) not materially adverse to the participant, (2) consented to by the participant or (3) as otherwise authorized under the LTIP; provided that the term of an option or SAR may not be extended to greater than 10 years from its original grant date.

24
DIRECTOR COMPENSATION
We believe that attracting and retaining qualified non-employee directors is critical to our future value growth and governance. Our non-employee directors receive:
• an annual cash retainer fee of $75,500; and
• a committee chairperson fee of $20,000 for the chairman of the Audit Committee, and $15,000 for the chairman of each of the Compensation Committee and the Nominating and Corporate Governance Committee; and
• an annual equity award for each non-employee director equal to a number of shares of restricted stock having a value of approximately $135,000 on the date of grant, based on the average closing price of a Class A Share of the Company on the New York Stock Exchange for the ten days preceding the annual meeting of stockholders.
Directors who are also our employees do not receive any additional compensation for their service on our Board. Each director is reimbursed for travel and miscellaneous expenses to attend meetings and activities of our Board or its committees.
2017 Director Compensation Table
The following table sets forth certain information with respect to our non-employee director compensation during the year ended December 31, 2017.
Name
Fees Earned
or Paid in Cash ($)(1)
Restricted Share
Awards ($)(2)
Total ($)
Howard I. Hoffen(3) . . . . . . . . . . . . . . . . . . . . . . . . . . . . $ 30,000 $ ― $ 30,000Gregory D. Myers(3) . . . . . . . . . . . . . . . . . . . . . . . . . . . $ 33,000 $ ― $ 33,000Alan D. Bell . . . . . . . . . . . . . . . . . . . . . . . . . . . . . . . . . . . $ 110,750 $ 135,000 $ 245,750Halbert S. Washburn . . . . . . . . . . . . . . . . . . . . . . . . . . . . $ 89,750 $ 135,000 $ 224,750Robb L. Voyles . . . . . . . . . . . . . . . . . . . . . . . . . . . . . . . . $ 102,750 $ 135,000 $ 237,750
(1) Includes cash retainer, committee meeting fees and committee chair fees. From January 1, 2017 through May 18,
2017, the directors received cash payments of $1,000 for each committee meeting attended. The Nominating and Corporate Governance Committee modified the director compensation structure on May 18, 2017 to remove such committee meeting fees.
(2) Reflects the grant date fair value of the 60,000 shares of restricted Class A Shares awarded to each director on May 18, 2017 under the LTIP, which were subsequently increased by 0.021931 and 0.018867 shares for each unvested share of restricted stock as a result of preferred stock dividends paid in Class A Shares on August 15, 2017 and November 15, 2017, respectively, in accordance with the terms of the original awards. As of December 31, 2017, there were 62,473 shares of restricted Class A Shares held in the name of each director. The restricted Class A Shares vest on May 18, 2018.
(3) Messrs. Hoffen and Myers resigned from the Board on May 17, 2017.

25
AUDIT COMMITTEE REPORT
The information contained in this Audit Committee Report and references in this Proxy Statement to the independence of the Audit Committee members shall not be deemed to be “soliciting material” or to be “filed” with the SEC, nor shall such information be incorporated by reference into any future filing under the Securities Act of 1933, as amended (the “Securities Act”) or the Exchange Act, except to the extent that the Company specifically incorporates such information by reference in such filing.
The Company has determined that all current Audit Committee members are (1) independent, as defined in Section 10A of the Exchange Act, (2) independent under the standards set forth by the NYSE and (3) financially literate. In addition, Mr. Bell qualifies as an audit committee financial expert under the applicable rules promulgated pursuant to the Exchange Act. The Audit Committee is a separately designated standing committee of the Board established in accordance with Section 3(a)(58)(A) of the Exchange Act and operates under a written charter initially approved by the Board on July 10, 2013, which is reviewed annually.
Management is responsible for our system of internal controls and the financial reporting process. The independent accountants are responsible for performing an independent audit of our consolidated financial statements in accordance with auditing standards generally accepted in the United States of America and issuing a report thereon. The Audit Committee is responsible for monitoring (1) the integrity of our financial statements, (2) our compliance with legal and regulatory requirements, and (3) the independence and performance of our auditors.
The Audit Committee has reviewed and discussed with our management and the independent accountants the audited consolidated financial statements in our Annual Report on Form 10-K for the year ended December 31, 2017, including a discussion of the quality, not just the acceptability, of the accounting principles applied, the reasonableness of significant judgments and the clarity of disclosures in the consolidated financial statements. Management represented to the Audit Committee that our consolidated financial statements were prepared in accordance with accounting principles generally accepted in the United States of America. The Audit Committee discussed with the independent accountants matters required to be discussed by the Public Company Accounting Oversight Board’s Auditing Standard No. 16, The Auditor’s Communication With Those Charged With Governance.
Our independent accountants also provided to the Audit Committee the written disclosure required by applicable requirements of the Public Company Accounting Oversight Board regarding independent accountant’s communications with the Audit Committee concerning independence. The Audit Committee discussed with the independent accountants that firm’s independence.
Based on the Audit Committee’s discussions with management and the independent accountants, and the Audit Committee’s review of the representations of management and the report of the independent accountants to the Audit Committee, the Audit Committee recommended that the Board include the audited consolidated financial statements in our Annual Report on Form 10-K for the year ended December 31, 2017 filed with the SEC.
Audit Committee of the Board Mr. Alan D. Bell, Chairman Mr. Halbert S. Washburn, Member Mr. Paul Loyd, Member

26
CERTAIN RELATIONSHIPS AND RELATED PERSON TRANSACTIONS
Each of the related party transactions described below was negotiated on an arm’s length basis. We believe that the terms of such agreements are as favorable as those we could have obtained from parties not related to us.
IPO Related Agreements
In connection with our IPO on July 29, 2013, we entered into various agreements governing the relationship among us, the Pre-IPO Owners, our executive officers and certain of our directors. The following is a description of the material terms of these agreements, which description is qualified in its entirety by reference to the full text of the agreements which are filed with the SEC as exhibits to our periodic reports.
Registration Rights and Stockholders Agreement
In connection with the closing of the IPO, the Company entered into a Registration Rights and Stockholders Agreement with Metalmark and the Jones Family Entities. On May 4, 2017, the Company entered into the Restated Registration Rights and Stockholders Agreement to, among other things, add JVL as a party and to grant JVL certain registration rights. The Restated Registration Rights and Stockholders Agreement grants each of Metalmark and the Jones Family Entities the right to nominate two members of the Board so long as Metalmark or the Jones Family Entities, as applicable, holds not less than 50% of the Common Stock that they held immediately following the IPO and the right to nominate one member of the Board so long as they hold not less than 20% of the Common Stock that they held immediately following the IPO. The Restated Registration Rights and Stockholders Agreement also requires Metalmark and the Jones Family Entities to take all necessary actions, including voting their shares of Common Stock, for the election of these nominees.
In addition, the Restated Registration Rights and Stockholders Agreement contains provisions with respect to demand registration rights and piggy-back registration rights. Pursuant to the Restated Registration Rights and Stockholders Agreement, Metalmark and the Jones Family Entities have the right to require the Company, by written notice, to register the sale of any number of their shares of Common Stock and will each have the right to cause up to three such required or “demand” registrations, with JVL having one such right. The Company is not obligated to effect any demand registration in which the anticipated aggregate offering price included in such offering is equal to or less than $50,000,000 ($25,000,000 where the registration is on a Form S-3). Furthermore, if, at any time, the Company proposes to register an offering of Class A Shares (subject to certain exceptions) for the Company’s own account, then it must give prompt notice to Metalmark, JVL and the Jones Family Entities to allow them to include a specified number of their shares in that registration statement. These registration rights are subject to certain conditions and limitations.
Metalmark has exercised one of its demand registrations, and neither JVL nor the Jones Family Entities have otherwise exercised any of their demand registrations.
Exchange Agreement
In connection with the closing of the IPO, the Company entered into the Exchange Agreement with JEH LLC and the Pre-IPO Owners. Pursuant to the Exchange Agreement, the Pre-IPO Owners and their permitted transferees have the right, subject to the terms of the Exchange Agreement, to exchange their JEH LLC Units (together with a corresponding number of Class B Shares) for Class A Shares on a one-for-one basis, subject to customary conversion rate adjustments for stock splits, stock dividends and reclassifications and other similar transactions.
Tax Receivable Agreement
As described in “Exchange Agreement” above, the Pre-IPO Owners (and their permitted transferees) may exchange their JEH LLC Units (together with a corresponding number of Class B Shares) for Class A Shares (on a one-for-one basis, subject to customary conversion rate adjustments for stock splits, stock dividends and reclassification and other similar transactions). JEH LLC has made an election under Section 754 of the Internal Revenue Code, pursuant to which each future exchange of JEH LLC Units for Class A Shares (as well as any purchase by us of

27
JEH LLC Units for cash) is expected to result in an adjustment to the tax basis of the tangible and intangible assets of JEH LLC, and these adjustments will be allocated to us. The anticipated basis adjustments are expected to increase (for tax purposes) our depreciation, depletion and amortization deductions and may also decrease our gains (or increase our losses) on future dispositions of certain capital assets to the extent tax basis is allocated to those capital assets. Such increased deductions and losses and reduced gains may reduce the amount of tax that we would otherwise be required to pay in the future.
In connection with the closing of the IPO, we entered into the Tax Receivable Agreement with JEH LLC and the Class B shareholders. This agreement generally provides for the payment by us of 85% of the amount of cash savings, if any, in U.S. federal, state and local income tax or franchise tax that we actually realize (or are deemed to realize in certain circumstances) as a result of (i) the tax basis increases resulting from the Class B shareholders’ exchange of JEH Units for Class A Shares (or resulting from a sale of JEH LLC Units to us for cash) and (ii) imputed interest deemed to be paid by us as a result of, and additional tax basis arising from, any payments we make under the Tax Receivable Agreement. In addition, payments we make under the Tax Receivable Agreement will be increased by any interest accrued from the due date (without extensions) of the corresponding tax return.
The payment obligations under the Tax Receivable Agreement are our obligations and not obligations of JEH LLC. For purposes of the Tax Receivable Agreement, cash savings in tax generally are calculated by comparing our actual tax liability to the amount we would have been required to pay had we not been able to utilize any of the tax benefits subject to the Tax Receivable Agreement.
The term of the Tax Receivable Agreement will continue until all such tax benefits have been utilized or expired, unless we exercise our right to terminate the Tax Receivable Agreement, we breach any of our material obligations under the Tax Receivable Agreement (including as a result of our failure to make any payment when due, subject to certain exceptions where we do not have sufficient available cash to make such payment) or certain mergers or other changes of control occur. In any such case, we would be required to make an immediate payment equal to the present value of the anticipated future tax benefits subject to the Tax Receivable Agreement, which calculation of anticipated future tax benefits will be based upon certain assumptions and deemed events set forth in the Tax Receivable Agreement.
The actual increase in tax basis, as well as the amount and timing of any payments under the Tax Receivable Agreement, will vary depending upon a number of factors, including the timing of the exchanges of JEH LLC Units, the price of Class A Shares at the time of each exchange, the extent to which such exchanges are taxable, the amount and timing of the taxable income we generate in the future and the tax rate then applicable, and the portion of our payments under the Tax Receivable Agreement constituting imputed interest or depletable, depreciable or amortizable basis. We expect that the payments that we will be required to make under the Tax Receivable Agreement could be substantial.
As of December 31, 2017, the Company had recorded a Tax Receivable Agreement liability of $61.2 million for the estimated payments that will be made to Class B shareholders who have exchanged JEH LLC Units (and corresponding Class B Shares), after adjusting for the Tax Receivable Agreement liability reduction, along with corresponding deferred tax assets, net of valuation allowance, of $72.3 million as a result of the increase in tax basis generated arising from such exchanges. As of December 31, 2017, the Company had an estimated gross Tax Receivable Agreement liability to Metalmark of $53.0 million, to the Jones Family of $10.7 million, to Mr. McConnell of $1.9 million, and to Mr. Brooks of $0.2 million as a result of exchanges of Class B Shares and JEH LLC Units made to date.
The Company made a payment of $1.6 million of the TRA liability with respect to cash savings that the Company realized on its 2016 tax return as a result of tax attributes arising from prior exchanges in the first quarter of 2018. Of this $1.6 million payment, $1.5 million was paid to Metalmark and $0.1 million was paid to Mr. McConnell. The Company does not anticipate it will realize cash savings on its 2017 tax return as a result of tax attributes arising from prior exchanges, and therefore does not anticipate a payment under the TRA for the 2017 tax year.
Future payments under the Tax Receivable Agreement will not be conditioned upon a holder of rights under the Tax Receivable Agreement having a continued ownership interest in either JEH LLC or us.

28
Transactions with Our Executive Officers, Directors and 5% Stockholders
Monarch Natural Gas Holdings, LLC Natural Gas Sale and Purchase Agreement
On May 7, 2013, the Company entered into a natural gas sale and purchase agreement with Monarch Natural Gas, LLC (“Monarch”), under which Monarch has the first right to gather the natural gas the Company produces from dedicated properties, process the NGLs from this natural gas production and market the processed natural gas and extracted NGLs. Under the Monarch agreement, the Company is paid a specified percentage of the value of the NGLs extracted and sold by Monarch, based on a set liquids recovery percentage, and the amount received from the sale of the residue gas, after deducting a fixed volume for fuel, lost and unaccounted for gas. The Company produced approximately 1.4 MMBoe of natural gas and NGLs for the year ended December 31, 2014, from the properties that became subject to the Monarch agreement. During the year ended December 31, 2014, the Company recognized $37.0 million of revenue associated with the aforementioned natural gas and NGL production. Effective May 1, 2015, the rights to gather natural gas under the sale and purchase agreement transferred from Monarch to Enable Midstream Partners LP, (“Enable”), an unaffiliated third-party. Prior to closing of the transfer of these rights, the Company produced approximately 1.0 MMBoe of natural gas and NGLs for the year ended December 31, 2015 from the properties that became subject to the Monarch agreement for which the Company recognized $10.6 million of revenue. The revenue, for all years mentioned, is recorded in Oil and gas sales on the Company’s Consolidated Statement of Operations. The initial term of the agreement, which remains unchanged by the transfer to Enable, runs for 10 years from the effective date of September 1, 2013.
At the time the Company entered into the 2013 Monarch agreement, Metalmark Capital owned approximately 81% of the outstanding equity interests of Monarch. In addition, Metalmark Capital beneficially owns in excess of five percent of the Company’s outstanding equity interests and two of our former directors, Howard I. Hoffen and Gregory D. Myers, are managing directors of Metalmark Capital and were directors at the time the Company entered into the 2013 Monarch agreement.
In connection with the Company’s entering into the 2013 Monarch agreement, Monarch issued to JEH equity interests in Monarch, having an estimated fair value of $15.0 million, in return for marketing services to be provided throughout the term of the agreement. The Company recorded this amount as deferred revenue which is being amortized on an estimated units-of-production basis commencing in September 2013, the first month of product sales to Monarch. During the years ended December 31, 2017, 2016 and 2015, the Company amortized $1.9 million, $2.4 million, and $2.0 million, respectively, of the deferred revenue balance. This revenue is recorded in Other revenues on the Company’s Consolidated Statement of Operations.
Following the issuance of $15.0 million Monarch equity interests to JEH, JEH assigned $2.4 million of the equity interests to Jonny Jones, the Company’s Chairman of the Board of Directors, and reserved $2.6 million of the equity interests for future distribution through an incentive plan to certain of the Company’s officers, including Mike McConnell and Robert Brooks. The remaining $10.0 million of Monarch equity interests was distributed to certain of the Class B shareholders, which included, among others, Metalmark Capital, the Jones family entities, and certain of the Company’s officers and directors, including Jonny Jones and Mike McConnell. As of December 31, 2017, equity interests in Monarch of $0.4 million are included in Other assets on the Company’s Consolidated Balance Sheet. During the years ended December 31, 2017, 2016 and 2015, equity interests of $0.3 million, $0.6 million, and $0.8 million, respectively, were distributed to management under the incentive plan. The Company recognized expense of $0.4 million, $0.5 million, and $0.5 million during the years ended December 31, 2017, 2016 and 2015, respectively, in connection with the incentive plan.
In September 2014, the Company signed a 10-year oil gathering and transportation agreement with Monarch Oil Pipeline LLC, pursuant to which Monarch Oil Pipeline LLC built, at its expense, a new oil gathering system and connected the gathering system to dedicated Company leases in Texas. At the time the Company entered into the agreement, Metalmark Capital owned the majority of the outstanding equity interests of Monarch Oil Pipeline LLC and/or its parent. The system began service during the fourth quarter of 2015 and provides connectivity to both a regional refinery market as well as the Cushing market hub. The Company incurred gathering fees, which were paid to Monarch Oil Pipeline LLC, of $2.3 million, $2.7 million and $0.4 million associated with the approximately 1.1

29
MMBoe, 1.3 MMBoe and 0.2 MMBoe of oil production transported under the agreement for the years ended December 31, 2017, 2016 and 2015, respectively. These costs are recorded as an offset to Oil and gas sales in the Company’s Consolidated Statement of Operations. The aforementioned production was recognized as Oil and gas sales on the Company’s Consolidated Statement of Operations at the time it was sold to the purchasers, who are unaffiliated third-parties, after passing through the gathering and transportation system. The audit committee of the Board of Directors reviewed and approved the terms of the agreement with Monarch Oil Pipeline LLC.
In May 2015, the Company received a $0.7 million cash distribution associated with its equity interests in Monarch, which was accounted for following the cost method. The initial cash distribution from Monarch was treated as dividend income and is recorded in Other income (expense).
JVL Standstill Agreement
On August 25, 2016, the Company issued 24,150,000 Class A Shares pursuant to an underwritten public offering at $2.77 per share. Affiliates of JVL Advisors, L.L.C. (“JVL”), who owns more than 5% of a class of voting securities of the Company, purchased 9,025,270 Class A Shares in the offering, for gross proceeds to the Company of $25.0 million, before underwriting discounts and commissions of $1.1 million.
Following its purchase in the offering, JVL owned in excess of 15% of our outstanding voting stock. As a result, the Company entered into a letter agreement with JVL (the “JVL Letter Agreement”) in connection with the offering. The JVL Letter Agreement approved, pursuant to Section 203 of the Delaware General Corporation Law (“Section 203”), the purchase of Class A Shares in the offering by JVL. This approval resulted in JVL not being subject to the restrictions on “business combinations” contained in Section 203. In consideration of such approval, JVL agreed that, among other things:
• it will not acquire any material assets of the Company;
• it will not become the owner of more than 19.9% of the Company’s outstanding voting stock (other than as a result of actions taken solely by the Company) without the prior approval of the Company’s independent directors who are not affiliated with JVL; and
• it will not engage in any “business combination” (as defined in the JVL Letter Agreement).
On May 3, 2017, the Company amended and restated its registration rights agreement dated August 29, 2013 (as amended and restated, the “Restated Registration Rights Agreement”) to add JVL as a party in order to facilitate an orderly distribution of JVL’s Class A Shares in the future, a copy of which was filed on the Company’s Current Report on Form 8-K filed with the SEC on May 3, 2017.
Purchases of Senior Secured First Lien Notes
On February 14, 2018, Jones Energy Holdings, LLC and Jones Energy Finance Corp. issued $450.0 million 9.25% senior secured first lien notes due 2023 (the “2023 First Lien Notes”) in an offering exempt from registration under the Securities Act of 1933, as amended, at an offering price equal to 97.526% of par. One or more affiliates of Q Investments, an affiliate of one of our principal stockholders and an affiliate of the employer of Scott McCarty, one of our directors, purchased an aggregate of $45.0 million of the 2023 First Lien Notes at the issue price.

30
Letter Agreement with Q Investments
On February 5, 2018, in connection with the appointment of Scott McCarty to the Board, an affiliate of Q Investments delivered an Acknowledgement and Stipulation pursuant to which Q Investments and its affiliates agreed not to (i) effect, seek or propose (whether publicly or otherwise) to effect or participate in any solicitation of proxies or consents to vote any securities of the Company or any of its subsidiaries, including soliciting consents or taking other action with respect to calling of a special meeting of the stockholders of the Company or any of its subsidiaries or engaging in a withhold vote campaign and (ii) otherwise act, alone or in concert with others, to seek representation on the Board or any governing body of a subsidiary of the Company. The obligations set forth above remain in effect until the day following the Annual Meeting.
Procedures for Approval of Related Party Transactions
A “Related Party Transaction” is a transaction, arrangement or relationship in which we or any of our subsidiaries was, is or will be a participant, the amount of which involved exceeds $120,000, and in which any related person had, has or will have a direct or indirect material interest. A “Related Person” means:
• any person who is, or at any time during the applicable period was, one of our executive officers or one of our directors;
• any person who is known by us to be the beneficial owner of more than 5% of our Class A Shares;
• any immediate family member of any of the foregoing persons, which means any child, stepchild, parent, stepparent, spouse, sibling, mother-in- law, father-in-law, son-in-law, daughter-in-law, brother-in-law or sister-in-law of a director, executive officer or a beneficial owner of more than 5% of our Class A Shares, and any person (other than a tenant or employee) sharing the household of such director, executive officer or beneficial owner of more than 5% of our Class A Shares; and
• any firm, corporation or other entity in which any of the foregoing persons is a partner or principal or in a similar position or in which such person has a 10% or greater beneficial ownership interest.
The Board has adopted a written related party transactions policy, which can be accessed on our website at www.jonesenergy.com in the Corporate Governance Documents tab of the Investor Relations section. Pursuant to this policy, our audit committee will review all material facts of all Related Party Transactions and either approve or disapprove entry into the Related Party Transaction, subject to certain limited exceptions. In determining whether to approve or disapprove entry into a Related Party Transaction, our audit committee shall take into account, among other factors, the following: (1) whether the Related Party Transaction is on terms no less favorable than terms generally available to an unaffiliated third-party under the same or similar circumstances and (2) the extent of the Related Person’s interest in the transaction. Further, the policy requires that all Related Party Transactions required to be disclosed in our filings with the SEC be so disclosed in accordance with applicable laws, rules and regulations.

31
PRINCIPAL STOCKHOLDERS
The following table sets forth information with respect to the beneficial ownership of our Class A Shares and Class B Shares as of March 27, 2018 by:
• each person known by us to be a beneficial owner of more than 5% of the stock;
• each of our named executive officers;
• each of our directors; and
• all of our current directors and executive officers as a group.
Beneficial ownership of shares is determined under rules of the SEC and generally includes any shares over which a person exercises sole or shared voting or investment power. Except as indicated by footnote, and subject to community property laws where applicable, we believe based on the information provided to us that the persons and entities named in the table below have sole voting and investment power with respect to all of our Class A Shares shown as beneficially owned by them. Applicable percentage of beneficial ownership is based on 92,030,282 Class A Shares and 9,627,821 Class B Shares outstanding on March 27, 2018. Unless otherwise indicated, the address for each holder listed below is c/o Jones Energy, Inc., 807 Las Cimas Parkway, Suite 350, Austin, Texas 78746.
Name
Number of Class A Shares
Beneficially Owned(1)
Percent of Class A Shares
BeneficiallyOwned(2)
(%)
Combined Voting
Power(3) (%)
Five Percent Stockholders JVL Advisors, L.L.C.(4) . . . . . . . . . . . . . . . . . . . . . . . . . . . . . . . . . . . . . . . . . . . . 17,868,330 19.4% 17.6% Metalmark Capital Partners(5) . . . . . . . . . . . . . . . . . . . . . . . . . . . . . . . . . . . . . . . 13,109,940 13.6% 12.9% Jones Family Entities(6) . . . . . . . . . . . . . . . . . . . . . . . . . . . . . . . . . . . . . . . . . . . . 12,252,734 12.6% 12.1% Q Global Capital Management, L.P.(7) . . . . . . . . . . . . . . . . . . . . . . . . . . . . . . . . 7,514,819 7.9% 7.2% Fir Tree Capital Management, L.P.(8) . . . . . . . . . . . . . . . . . . . . . . . . . . . . . . . . . 6,143,787 6.7% 6.0% Morgan Stanley Capital Services, LLC(9) . . . . . . . . . . . . . . . . . . . . . . . . . . . . . . 6,094,486 6.6% 6.0%
Directors and Named Executive Officers Jonny Jones(10) . . . . . . . . . . . . . . . . . . . . . . . . . . . . . . . . . . . . . . . . . . . . . . . . . . . 12,252,734 12.6% 12.1% Mike S. McConnell(11) . . . . . . . . . . . . . . . . . . . . . . . . . . . . . . . . . . . . . . . . . . . . . 1,287,674 1.4% 1.3% Robert J. Brooks . . . . . . . . . . . . . . . . . . . . . . . . . . . . . . . . . . . . . . . . . . . . . . . . . . . 177,877 * * Alan D. Bell(12) . . . . . . . . . . . . . . . . . . . . . . . . . . . . . . . . . . . . . . . . . . . . . . . . . . . 122,034 * * Halbert S.Washburn(12) . . . . . . . . . . . . . . . . . . . . . . . . . . . . . . . . . . . . . . . . . . . . 122,034 * * John V. Lovoi(13) . . . . . . . . . . . . . . . . . . . . . . . . . . . . . . . . . . . . . . . . . . . . . . . . . 17,868,330 19.4% 17.6% Paul B. Loyd Jr.(14) . . . . . . . . . . . . . . . . . . . . . . . . . . . . . . . . . . . . . . . . . . . . . . . . ― * * Scott McCarty(15) . . . . . . . . . . . . . . . . . . . . . . . . . . . . . . . . . . . . . . . . . . . . . . . . . ― * *
Directors and current executive officers as a group (nine total) . . . . . . . . . . . 31,325,488 32.1% 30.8%
* Less than one percent (1) Includes Class B Shares owned by certain of these individuals and entities that, subject to the terms of an exchange
agreement (the “Exchange Agreement”), are, together with an equivalent number of JEH LLC Units, exchangeable at any time and from time to time for Class A Shares on a one-for-one basis, subject to equitable adjustments for stock splits, stock dividends and reclassifications. The table assumes all such Class B Shares are fully vested. Also includes shares of Series A Preferred Stock owned by certain of these individuals and entities that are convertible, at the holder’s option at any time, at a rate of 17.0683 Class A Shares for each share of Series A Preferred Stock after adjusting the conversion ratio for the effects of the Special Stock Dividend declared on March 3, 2017, subject to further specified adjustments and limitations as set forth in the certificate of designations for the Series A Preferred

32
Stock. The table assumes all such shares of Series A Preferred Stock are converted for purposes of determining the number of Class A Shares beneficially owned.
(2) The Class A Shares to be issued upon the exchange of Class B Shares that are currently exchangeable pursuant to the terms of the Exchange Agreement or upon the conversion of shares of Series A Preferred Stock pursuant to the terms of the certificate of designations relating to the Series A Preferred Stock are deemed to be outstanding and beneficially owned by the person holding the Class B Shares and/or shares of Series A Preferred Stock for the purpose of computing the percentage of beneficial ownership of Class A Shares for that person and any group of which that person is a member, but are not deemed outstanding for the purpose of computing the percentage of beneficial ownership for any other person. As such, in calculating the percentage of Class A Shares beneficially owned by each person, we have assumed that only such person exchanged Class B Shares and/or converted shares of Series A Preferred Stock for Class A Shares and that no other person made a similar exchange or conversion.
(3) Represents percentage of voting power of the Class A Shares and Class B Shares of Jones Energy voting together as a single class. The Class A Shares to be issued upon the conversion of shares of Series A Preferred Stock pursuant to the terms of the certificate of designations relating to the Series A Preferred Stock are deemed to be outstanding and beneficially owned by the person holding shares of shares of Series A Preferred Stock for the purpose of computing the percentage of beneficial ownership of Class A Shares for that person and any group of which that person is a member, but are not deemed outstanding for the purpose of computing the percentage of beneficial ownership for any other person. As such, in calculating the percentage of Class A Shares beneficially owned by each person, we have assumed that only such person converted shares of Series A Preferred Stock for Class A Shares and that no other person made a similar conversion.
(4) Based on information obtained from the Form 13F filed by JVL Advisors L.L.C. (“JVL”) with the SEC on February 13, 2018. According to this report, JVL’s business address is 10,000 Memorial Drive, Suite 550, Houston, Texas 77024.
(5) Includes Class A Shares and Class B Shares beneficially owned by Metalmark Capital II LLC indirectly through each of MCP II (Cayman) AIF Jones Intermediate LLC, MCP II Jones Intermediate LLC, MCP II (TE) AIF Jones Intermediate LLC, MCP II Co-Investment Jones Intermediate LLC, MCP (C) II Jones Intermediate LLC and MCP II Executive Fund Jones Intermediate LLC (collectively, “Metalmark Capital Partners”). Metalmark Capital Partners’ principal address is 1177 Avenue of the Americas, 40th Floor; New York, NY 10036; Attention: Gregory D. Myers.
(6) Of these shares, 5,424,391 are held by various entities of which Jones Energy Management, LLC or JET 3 GP, LLC is the general partner. Jonny Jones has voting power over all such shares in his capacity as Manager of Jones Energy Management, LLC and Managing Member of JET 3 GP, LLC. Jonny Jones and Jon Rex Jones each indirectly own 50% of Jones Energy Management, LLC. Jonny Jones indirectly owns 100% of JET 3 GP, LLC. Family members or other current or former officers or employees of Jones Energy have direct or indirect ownership interests in the Jones Family Entities and have the right to cause their pro rata portion of the Class B Shares held by the Jones Family Entities to be exchanged for Class A Shares and distributed to them. Jonny Jones disclaims beneficial ownership of the Class B Shares held by the Jones Family Entities except to the extent of his pecuniary interest therein. If all Class B Shares held by the Jones Family Entities were distributed to the individuals or entities that hold direct or indirect ownership interests in them, Jonny Jones would beneficially own 3,335,291 Class B Shares (34.6% of the Class B Shares) and 2,617,751 Class A Shares representing a 5.9% combined voting power. 1,659,039 Class B Shares would be deemed to be beneficially owned by both Jonny Jones and Jon Rex Jones. Indirect ownership of 639,825 of the Class A Shares and 125,026 of the Class B Shares have been pledged from one Jones Family Entity to another for estate planning purposes. Each of the Jones Family Entities party to those pledges is ultimately owned by Jonny Jones. Of the remaining shares, 1,450,005 shares reported in this column are held by a Jones Family Entity in which Jonny Jones has a pecuniary interest but no voting or dispositive power and 2,760,587 shares reported in this column are deemed to be beneficially owned as a result of the irrevocable proxies to vote such Class A Shares granted by Debora Lynn Jones Trust V, Julie Ann Jarvis Trust V, Jon Rex Jones Loyal Trust, and Stephen Martin Jones Trust V. Each of the Jones Family Entities disclaims beneficial ownership of the shares

33
reported herein except to the extent of their pecuniary interests therein. The address for the Jones Family Entities is JRJ Management Company, LLC, 807 Las Cimas Parkway, Suite 245, Austin, TX 78746.
(7) Based on information obtained from the Schedule 13D filed by Q Global Capital Management, L.P., and on behalf of Q5-R5 Trading Ltd. pursuant to an investment management agreement (collectively, “QGCM”) with the SEC on February 14, 2018. Includes 2,669,403 Class A Shares issuable as of March 27, 2018 upon the conversion of 156,395 shares of Series A Preferred Stock beneficially owned by QGCM. In addition to the Class A Shares reported on Schedule 13D are 151,839 Class A Shares received on February 15, 2018 from the Company’s Series A Preferred Stock dividend paid in Class A Shares. According to this report, QGCM’s primary business address is 301 Commerce Street, Suite 3200, Fort Worth, Texas 76102.
(8) Based on information obtained from the Form 13F filed by Fir Tree Capital Management LP (“Fir Tree”) with the SEC on February 14, 2018. According to this report, Fir Tree’s primary business address is 55 West 46th Street, 29th Floor, New York, NY 10036.
(9) Based on information obtained from the Schedule 13G filed by Morgan Stanley and its wholly-owned subsidiary Morgan Stanley Capital Servics LLC with the SEC on February 12, 2018. According to this report, Morgan Stanley shares voting and dispositive power with respect to these shares and its primary business address is 1585 Broadway, New York, NY, 10036.
(10) Of these shares, 5,424,391 are held by various entities of which Jones Energy Management, LLC or JET 3 GP, LLC is the general partner. Jonny Jones has voting power over all such shares in his capacity as Manager of Jones Energy Management, LLC and Managing Member of JET 3 GP, LLC. Jonny Jones and Jon Rex Jones each indirectly own 50% of Jones Energy Management, LLC. Jonny Jones indirectly owns 100% of JET 3 GP, LLC. Family members or other current or former officers or employees of Jones Energy have direct or indirect ownership interests in the Jones Family Entities and have the right to cause their pro rata portion of the Class B Shares held by the Jones Family Entities to be exchanged for Class A Shares and distributed to them. Jonny Jones disclaims beneficial ownership of the Class B Shares held by the Jones Family Entities except to the extent of his pecuniary interest therein. If all Class B Shares held by the Jones Family Entities were distributed to the individuals or entities that hold direct or indirect ownership interests in them, Jonny Jones would beneficially own 3,335,291 Class B Shares (34.6% of the Class B Shares) and 2,617,751 Class A Shares representing a 5.9% combined voting power. 1,659,039 Class B Shares would be deemed to be beneficially owned by both Jonny Jones and Jon Rex Jones. Indirect ownership of 639,825 of the Class A Shares and 125,026 of the Class B Shares have been pledged from one Jones Family Entity to another for estate planning purposes. Each of the Jones Family Entities party to those pledges is ultimately owned by Jonny Jones. Of the remaining shares, 1,450,005 shares reported in this column are held by a Jones Family Entity in which Jonny Jones has a pecuniary interest but no voting or dispositive power and 2,760,587 shares reported in this column are deemed to be beneficially owned as a result of the irrevocable proxies to vote such Class A Shares granted by Debora Lynn Jones Trust V, Julie Ann Jarvis Trust V, Jon Rex Jones Loyal Trust, and Stephen Martin Jones Trust V. Each of the Jones Family Entities disclaims beneficial ownership of the shares reported herein except to the extent of their pecuniary interests therein. The address for the Jones Family Entities is JRJ Management Company, LLC, 807 Las Cimas Parkway, Suite 245, Austin, TX 78746.
(11) Of these shares, 583,326 are currently held by the Jones Family Entities, but Mr. McConnell has the right to cause them to be exchanged for Class A Shares and distributed to himself or entities that he controls. The remaining shares are Class A shares held by himself or an entity in which Mr. McConnell has control.
(12) Messrs. Bell and Washburn were each granted these restricted Class A Shares as compensation for their services as independent directors on our Board, a portion of which has vested as of the date noted above.
(13) Mr. Lovoi is the Managing Partner of JVL and may be deemed to share beneficial ownership of any shares held by JVL.

34
(14) Mr. Loyd is an investor in JVL, but does not have sole or shared voting or dispositive power with respect to any of the shares held by JVL.
(15) Mr. McCarty is a partner at Q Investments, but does not have sole or shared voting or dispositive power with respect to any of the shares held by QGCM.
To our knowledge, except as noted above, no person or entity is the beneficial owner of more than 5% of the voting power of Jones Energy’s stock.
SECTION 16(a) BENEFICIAL OWNERSHIP REPORTING COMPLIANCE
Section 16(a) of the Exchange Act, requires our executive officers, directors, and greater than 10 percent stockholders to file with the SEC certain reports of ownership and changes in ownership of our Common Stock. Based on a review of the copies of such forms received and written representations from certain reporting persons, we believe that all Section 16(a) reports applicable to our executive officers, directors and greater than 10 percent stockholders were timely filed in 2017.
35
PROPOSAL TWO: APPROVAL OF REVERSE STOCK SPLIT
We are seeking stockholder approval for a proposal to adopt an amendment to our Restated Charter to permit us to effect a reverse stock split (the “Reverse Stock Split”) of our issued Class A Shares and Class B Shares by a ratio of not less than 1-for-5 and not more than 1-for-20, such ratio and the implementation and timing of such Reverse Stock Split to be determined at the discretion of our Board.
The form of the amendment to our Restated Charter to effect the Reverse Stock Split is set forth on Appendix A. Approval of the proposal would permit (but not require) our Board to effect the Reverse Stock Split by a ratio of not less than 1-for-5 and not more than 1-for-20, with the exact ratio to be determined by our Board in its sole discretion, provided that the Board must determine to effect the Reverse Stock Split and such amendment must be filed with the Secretary of State of the State of Delaware no later than May 22, 2019. The exact ratio of the Reverse Stock Split will be determined by the Board prior to the effective time of the split and will be publicly announced by the Company prior to the effective time of the split. We believe that enabling our Board to set the ratio of the Reverse Stock Split within the stated range will provide us with the flexibility to implement the Reverse Stock Split in a manner designed to maximize the anticipated benefits for our stockholders. In determining a ratio of the Reverse Stock Split, if any, following the receipt of stockholder approval, our Board may consider, among other things, factors such as:
• the historical trading prices and trading volume of our Class A Shares;
• listing requirements of the NYSE or other applicable exchange or trading venues;
• the number of Class A Shares and Class B Shares outstanding;
• the then-prevailing trading price and trading volume of our Class A Shares and the anticipated or actual impact of the Reverse Stock Split on the trading price and trading volume for our Class A Shares;
• the anticipated impact of a particular ratio on our ability to reduce administrative and transactional costs; and
• prevailing general market and economic conditions.
Our Board reserves the right to not effect a Reverse Stock Split, including any or all proposed ratios for the Reverse Stock Split, if it determines, in its sole discretion, that the Reverse Stock Split is no longer in the best interests of the Company and its stockholders.
Depending on the ratio for the Reverse Stock Split determined by our board of directors, no less than every five and no more than every 20 Class A Shares will be combined into one Class A Share. Pursuant to our Restated Charter, in no event shall the shares of one class be split, divided or combined unless the shares of the other class are proportionately split. As such, an identical number of Class B Shares will be combined into one Class B Share. The amendment to our Restated Charter to effect the Reverse Stock Split will not change the authorized number of shares of common stock or preferred stock of the Company, or the par value of the Company’s common stock or preferred stock. Except for the shares issuable upon the exercise or conversion of outstanding awards under our equity incentive plans and conversion of our preferred stock, we do not currently have any plans, proposals or arrangement to issue any of our authorized but unissued shares of Common Stock.

36
Background and Reasons for the Reverse Stock Split; Potential Consequences of the Reverse Stock Split
On March 23, 2018, we were notified by the NYSE that we were no longer in compliance with the NYSE’s continued listing standards because the average closing price of a Class A Share had fallen below $1.00 per share over a period of 30 consecutive trading days. We have a six-month cure period to regain compliance. Within the cure period, we may regain compliance if the closing price per share is $1.00 or higher on the last trading day of a given month, or at the end of the cure period. Additionally, the 30-day average closing price per share must also be $1.00 or higher. If we are unable to regain compliance, the NYSE may initiate procedures to suspend and delist the Class A Shares. We previously received a similar notice on December 26, 2017 but regained compliance on February 1, 2018.
The Reverse Stock Split proposal is part of our plan to regain compliance with the NYSE stock price continued
listing requirement. If the price of a Class A Share remains below a level sufficient to maintain NYSE listing through market trading, and assuming stockholders have approved the Reverse Stock Split, we may implement the Reverse Stock Split, utilizing a ratio the Board believes will position us to maintain compliance with the NYSE stock price continued listing requirement or another highly visible, well regarded exchange. If we are not able to regain compliance with the continued listing requirement in the applicable time period, the NYSE will provide written notification that our Class A Shares would be subject to delisting from the NYSE.
The Board is submitting the Reverse Stock Split to stockholders for approval with the primary intent of
increasing the price of our Class A Shares to retain our NYSE listing and also to make our Class A Shares more attractive to a broader range of institutional and other investors by restoring our Class A Share price to a normalized level. In addition to increasing the price of our Class A Shares, the Reverse Stock Split would also reduce certain of our costs, such as proxy solicitation fees. Accordingly, for these and other reasons discussed below, we believe that being able to effect the Reverse Stock Split is in the best interests of the Company and its stockholders.
We believe that the Reverse Stock Split, by increasing our stock price, will make our Class A Shares more
attractive to a broader range of institutional and other investors, as we have been advised that the current market price of our Class A Shares may affect its acceptability to certain institutional investors, professional investors and other members of the investing public. Many brokerage houses and institutional investors have internal policies and practices that either prohibit them from investing in low-priced stocks or tend to discourage individual brokers from recommending low-priced stocks to their customers. In addition, some of those policies and practices may function to make the processing of trades in low-priced stocks economically unattractive to brokers. Moreover, because brokers’ commissions on low-priced stocks generally represent a higher percentage of the stock price than commissions on higher-priced stocks, the current average price per Class A Share can result in individual stockholders paying transaction costs representing a higher percentage of their total share value than would be the case if the share price were substantially higher. We believe that the Reverse Stock Split will make our Class A Shares a more attractive and cost effective investment for many investors.
In addition to increasing the price of our Class A Shares, we believe that a Reverse Stock Split will provide the
Company and its stockholders with other benefits. Currently, the fees that we pay to list our shares on the NYSE are based on the number of shares we have outstanding. Also, the fees that we pay for custody and clearing services, the fees that we pay to the SEC to register securities for issuance and the costs of our proxy solicitations are all based on or related to the number of shares being held, cleared or registered, as applicable. Reducing the number of shares that are outstanding and that will be issued in the future may reduce the amount of fees and taxes that we pay to these organizations and agencies, as well as other organizations and agencies that levy charges based on the number of shares rather than the value of the shares.

37
Reducing the number of outstanding Class A Shares through the Reverse Stock Split is intended, absent other factors, to increase the per share market price of our Class A Shares. However, other factors, such as commodity prices for oil and gas, our financial results, market conditions and the market perception of our business may adversely affect the market price of our Class A Shares. As a result, there can be no assurance that the Reverse Stock Split, if completed, will result in the intended benefits described above, that the market price of our Class A Shares will increase following the Reverse Stock Split in proportion to the reduction in the number of shares of our Class A Shares outstanding before the Reverse Stock Split or that the market price of our Class A Shares will not decrease in the future. Accordingly, the total market capitalization of our Class A Shares after the Reverse Stock Split may be lower than the total market capitalization before the Reverse Stock Split.
While we intend to monitor the average closing price of our Class A Shares and consider available options if
the Class A Shares do not trade at a level likely to result in us maintaining compliance, no assurances can be made that we will in fact be able to comply and that our Class A Shares will remain listed on the NYSE. If our Class A Shares are delisted from the NYSE, such delisting could negatively affect the market price of our Class A Shares, reduce the number of investors willing to hold or acquire our Class A Shares, limit our ability to issue additional securities or obtain additional financing in the future, affect our ability to provide equity incentives to our employees, and might negatively impact our reputation and, as a consequence, our business. Procedure for Implementing the Reverse Stock Split
The Reverse Stock Split would become effective upon the filing of a certificate of amendment to our Restated Charter with the Secretary of State of the State of Delaware. The exact timing of the filing of the certificate of amendment that will effect the Reverse Stock Split will be determined by the Board, in its sole discretion, provided that in no event shall the filling of the certificate of amendment effecting the Reverse Stock Split occur after May 22, 2019. Reservation of Right to Abandon Reverse Stock Split
The Board reserves the right, notwithstanding stockholder approval of this Proposal Two and without further action by the stockholders, to elect not to proceed with the Reverse Stock Split if, at any time prior to filing the amendment to our Restated Charter to effect the Reverse Stock Split, or, in the event that the amendment is not effective until a later time, such later time, the Board, in its sole discretion, determines that it is no longer in the Company’s best interests and the best interests of our stockholders to proceed with the Reverse Stock Split. If a certificate of amendment effecting the Reverse Stock Split has not been filed with the Secretary of State of the State of Delaware on or before May 22, 2019, the Board will be deemed to have abandoned the Reverse Stock Split. Effect of the Reverse Stock Split on Holders of Outstanding Common Stock
Depending on the ratio for the Reverse Stock Split determined by the Board, a minimum of every five and a maximum of every 20 Class A Shares will be combined into one new Class A Share. Similarly, an identical number of Class B Shares will be combined into one new Class B Share. As of March 27, 2018, there were 92,030,282 Class A Shares outstanding held by eighteen stockholders of record and 9,627,821 Class B Shares outstanding held by three stockholders of record. Based on the number of shares outstanding as of March 27, 2018, immediately following the Reverse Stock Split the Company would have approximately 18,406,056 Class A Shares and 1,925,564 Class B Shares issued and outstanding if the ratio for the Reverse Stock Split is 1-for-5 and 4,601,514 Class A Shares and 481,391 Class B Shares issued and outstanding if the ratio for the Reverse Stock Split is 1-for-20. Any other ratio selected within such range would result in a number of Class A Shares issued and outstanding of between 18,406,056 and 4,601,514 shares and a number of Class B Shares issued and outstanding of between 1,925,564 and 481,391 shares.

38
The actual number of shares issued and outstanding after giving effect to the Reverse Stock Split, if implemented, will depend on the ratio for the Reverse Stock Split that is ultimately determined by the Board.
The Reverse Stock Split will affect all holders of our Class A Shares uniformly and all holders of our Class B
Shares uniformly and will not affect any stockholder’s percentage ownership interest in the Company, except that, as described below under “—Fractional Shares,” record holders of common stock otherwise entitled to a fractional share as a result of the Reverse Stock Split will receive cash in lieu of such fractional share. In addition, the Reverse Stock Split will not affect any stockholder’s proportionate voting power (subject to the treatment of fractional shares).
The Reverse Stock Split may result in some stockholders owning “odd lots” of less than 100 Class A Shares.
Odd lot shares may be more difficult to sell, and brokerage commissions and other costs of transactions in odd lots may be higher than the costs of transactions in “round lots” of even multiples of 100 shares.
After the effective time of the Reverse Stock Split, our Class A Shares will have a new Committee on Uniform
Securities Identification Procedures (CUSIP) number, which is a number used to identify our equity securities, and stock certificates with the older CUSIP numbers will need to be exchanged for stock certificates with the new CUSIP numbers by following the procedures described below. After the Reverse Stock Split, we will continue to be subject to the periodic reporting and other requirements of the Securities Exchange Act of 1934, as amended. Effect of the Reverse Stock Split on Holders of our Series A Preferred Stock
Each share of Series A Preferred Stock is convertible, at the holder’s option at any time, into approximately 17.0683 Class A Shares, subject to adjustment. If the Board elects to proceed with the Reverse Stock Split, the conversion rate will be adjusted based on a ratio of the number of Class A Shares outstanding immediately after the Reverse Stock Split to the number of Class A Shares outstanding immediately before the Reverse Stock Split, with such adjustment to take effect immediately after 9:00 a.m., New York City time, on the effective date of the Reverse Stock Split. If the Board elects the 1-for-5 ratio and assuming the number of Class A Shares outstanding on the Record Date does not change, the new conversion rate would be 3.4137. If the Board elects the 1-for-20 ratio and assuming the number of Class A Shares outstanding on the Record Date does not change, the new conversion rate would be 0.8534. Any other ratio selected within such range would result in a conversion ratio of between 3.4137 and 0.8534. Authorized Shares of Common Stock
The Reverse Stock Split will not change the number of authorized shares of our Class A Shares or Class B Shares under our Restated Charter. Because the number of issued Class A Shares and Class B Shares will decrease as a result of the Reverse Stock Split, the number of Class A Shares and Class B Shares available for issuance will increase. Currently, we are authorized to issue up to a total of 850,000,000 shares of capital stock, comprising 600,000,000 Class A Shares, 150,000,000 Class B Shares and 100,000,000 shares of preferred stock. Except for the shares issuable upon the exercise or conversion of outstanding awards under our equity incentive plans and conversion of our preferred stock, we do not currently have any plans, proposals or arrangement to issue any of our authorized but unissued shares of Common Stock.
By increasing the number of authorized but unissued shares of common stock, the Reverse Stock Split could, under certain circumstances, have an anti-takeover effect, although this is not the intent of the Board. For example, it may be possible for the Board to delay or impede a takeover or transfer of control of the Company by causing such additional authorized but unissued shares to be issued to holders who might side with the Board in opposing a takeover bid that the Board determines is not in the best interests of the Company or its stockholders. The Reverse Stock Split, therefore, may have the effect of discouraging unsolicited takeover attempts. By potentially discouraging initiation of any such unsolicited takeover attempts the Reverse Stock Split may limit the opportunity for our stockholders to dispose of their shares at the higher price generally available in takeover attempts or that may be available under a merger proposal. The Reverse Stock Split may have the effect of permitting our current management, including the current board of directors, to retain its position, and place it in a better position to resist changes that stockholders may wish to make if they are dissatisfied with the conduct of the Company’s business. However, the Board is not aware of any

39
attempt to take control of the Company and the Board has not approved the Reverse Stock Split with the intent that it be utilized as a type of anti-takeover device. Beneficial Holders of Common Stock (i.e. stockholders who hold in street name)
For purposes of implementing the Reverse Stock Split, we intend to treat shares held by stockholders through a bank, broker, custodian or other nominee in the same manner as registered stockholders whose shares are registered in their names. Banks, brokers, custodians or other nominees will be instructed to effect the Reverse Stock Split for their beneficial holders holding our Common Stock in street name. However, these banks, brokers, custodians or other nominees may have different procedures than registered stockholders for processing the Reverse Stock Split. Stockholders who hold shares of our Common Stock with a bank, broker, custodian or other nominee and who have any questions in this regard are encouraged to contact their banks, brokers, custodians or other nominees. Registered “Book-Entry” Holders of Common Stock (i.e. stockholders that are registered on the transfer agent’s books and records but do not hold stock certificates)
Certain of our registered holders of Common Stock may hold some or all of their shares electronically in book-entry form with the transfer agent. These stockholders do not have stock certificates evidencing their ownership of the common stock. They are, however, provided with a periodic statement reflecting the number of shares registered in their accounts.
Stockholders who hold shares electronically in book-entry form with the transfer agent will not need to take action to receive whole shares of post-Reverse Stock Split Common Stock, because the exchange will be automatic. Exchange of Stock Certificates
If the Reverse Stock Split is effected, stockholders holding certificated shares (i.e., shares represented by one or more physical stock certificates) will be requested to exchange their old stock certificate(s) (“Old Certificate(s)”) for shares held in book-entry form through the Depository Trust Company’s Direct Registration System representing the appropriate number of whole shares of our Common Stock resulting from the Reverse Stock Split. Stockholders of record upon the effective time of the Reverse Stock Split will be furnished the necessary materials and instructions for the surrender and exchange of their Old Certificate(s) at the appropriate time by our transfer agent, American Stock Transfer & Trust Company, LLC. Stockholders will not have to pay any transfer fee or other fee in connection with such exchange. As soon as practicable after the effective time of the Reverse Stock Split, the transfer agent will send a transmittal letter to each stockholder advising such holder of the procedure for surrendering Old Certificate(s) in exchange for new shares held in book-entry form. Your Old Certificate(s) representing pre-split shares cannot be used for either transfers or deliveries. Accordingly, you must exchange your Old Certificate(s) in order to effect transfers or deliveries of your shares.
YOU SHOULD NOT SEND YOUR OLD CERTIFICATES NOW. YOU SHOULD SEND THEM ONLY AFTER YOU RECEIVE THE LETTER OF TRANSMITTAL FROM THE TRANSFER AGENT.
As soon as practicable after the surrender to the transfer agent of any Old Certificate(s), together with a properly completed and duly executed transmittal letter and any other documents the transfer agent may specify, the transfer agent will have its records adjusted to reflect that the shares represented by such Old Certificate(s) are held in book-entry form in the name of such person.
Until surrendered as contemplated herein, a stockholder’s Old Certificate(s) shall be deemed at and after the
effective time of the Reverse Stock Split to represent the number of whole shares of our common stock resulting from the Reverse Stock Split.
Any stockholder whose Old Certificate(s) have been lost, destroyed or stolen will be entitled to new shares in
book-entry form only after complying with the requirements that we and our transfer agent, customarily apply in connection with lost, stolen or destroyed certificates.

40
No service charges, brokerage commissions or transfer taxes shall be payable by any holder of any Old
Certificate, except that if any book-entry shares are to be issued in a name other than that in which the Old Certificate(s) are registered, it will be a condition of such issuance that (1) the person requesting such issuance must pay to us any applicable transfer taxes or establish to our satisfaction that such taxes have been paid or are not payable, (2) the transfer complies with all applicable federal and state securities laws, and (3) the surrendered certificate is properly endorsed and otherwise in proper form for transfer.
Any stockholder who wants to continue holding certificated shares may request new certificate(s) from our
transfer agent. Fractional Shares
Fractional shares will not be issued in connection with the Reverse Stock Split. Stockholders of record and stockholders who hold their shares through a bank, broker, custodian or other nominee who would otherwise hold fractional shares of our Common Stock as a result of the Reverse Stock Split will be entitled to receive cash (without interest and subject to applicable withholding taxes) in lieu of such fractional shares. Each such stockholder will be entitled to receive an amount in cash equal to the fraction of one share to which such stockholder would otherwise be entitled multiplied by the average of the high and low trading prices of our Common Stock on the New York Stock Exchange during regular trading hours for the five trading days immediately preceding the effective time of the Reverse Stock Split.
Stockholders should be aware that, under the escheat laws of the various jurisdictions where stockholders
reside, where we are domiciled and where the funds will be deposited, sums due for fractional interests resulting from the Reverse Stock Split that are not timely claimed after the effective time in accordance with applicable law may be required to be paid to the designated agent for each such jurisdiction. Thereafter, stockholders otherwise entitled to receive such funds may have to seek to obtain them directly from the state to which they were paid. Effect of the Reverse Stock Split on Equity Incentive Plans and Awards
Pursuant to the various instruments governing our then outstanding equity awards, in connection with any Reverse Stock Split, the Board will reduce the number of shares of Common Stock issuable upon the exercise of such awards in proportion to the ratio of the Reverse Stock Split. In connection with such proportionate adjustments, the number of shares of Common Stock issuable upon exercise or conversion of outstanding awards will be rounded down to the nearest whole share and the exercise prices will be rounded up to the nearest cent, and no cash payment will be made in respect of such rounding. Accounting Matters
The amendment to our Restated Charter will not affect the par value of our Common Stock per share, which will remain $0.001 per share. As a result, as of the effective time of the Reverse Stock Split, the stated capital attributable to Common Stock and the additional paid-in capital on our balance sheet will, in total, not change due to the Reverse Stock Split. However, the allocation between the stated capital attributable to Common Stock and the additional paid-in capital on our balance sheet will change because there will be fewer shares of common stock outstanding. The stated capital attributable to Common Stock will decrease, and in turn, the stated capital attributable to the additional paid-in capital will increase. Further, reported per share net income or loss will be higher because there will be fewer shares of common stock outstanding.

41
Material U.S. Federal Income Tax Consequences of the Reverse Stock Split
The following discussion is a summary of the material U.S. federal income tax consequences of the proposed Reverse Stock Split to U.S. Holders of our Common Stock. This discussion is based on the Internal Revenue Code of 1986, as amended (the “Code”), U.S. Treasury Regulations promulgated thereunder, judicial decisions, and published rulings and administrative pronouncements of the U.S. Internal Revenue Service (the “IRS”) in each case in effect as of the date of this proxy statement. These authorities may change or be subject to differing interpretations. Any such change or differing interpretation may be applied retroactively in a manner that could adversely affect a U.S. Holder. We have not sought and will not seek any rulings from the IRS regarding the matters discussed below. There can be no assurance the IRS or a court will not take a contrary position to that discussed below regarding the tax consequences of the proposed Reverse Stock Split.
For purposes of this discussion, a “U.S. Holder” is a beneficial owner of our common stock that, for U.S. federal income tax purposes, is or is treated as:
• an individual who is a citizen or resident of the United States;
• a corporation (or any other entity or arrangement treated as a corporation for U.S. federal income tax purposes) created or organized under the laws of the United States, any state thereof, or the District of Columbia;
• an estate, the income of which is subject to U.S. federal income tax regardless of its source; or
• a trust if (1) its administration is subject to the primary supervision of a court within the United States and all of its substantial decisions are subject to the control of one or more “United States persons” (within the meaning of Section 7701(a)(30) of the Code), or (2) it has a valid election in effect under applicable U.S. Treasury regulations to be treated as a United States person.
This discussion is limited to U.S. Holders who hold our Common Stock as a “capital asset” within the meaning of Section 1221 of the Code (generally, property held for investment). This discussion does not address all U.S. federal income tax consequences relevant to the particular circumstances of a U.S. Holder. In addition, it does not address consequences relevant to U.S. Holders that are subject to special rules, including, without limitation, financial institutions, insurance companies, real estate investment trusts, regulated investment companies, dealers or trades in securities or currencies, stockholders who hold common stock as part of a position in a straddle or as part of a hedging, conversion or integrated transaction for U.S. federal income tax purposes or U.S. Holders that have a functional currency other than the U.S. dollar.
In addition, the following discussion does not address the U.S. federal estate and gift tax, or state, local and non-U.S. tax law consequences of the proposed Reverse Stock Split. Furthermore, the following discussion does not address any tax consequences of transactions effectuated before, after or at the same time as the proposed Reverse Stock Split, whether or not they are in connection with the proposed Reverse Stock Split.
STOCKHOLDERS SHOULD CONSULT THEIR TAX ADVISORS WITH RESPECT TO THE APPLICATION OF THE U.S. FEDERAL INCOME TAX LAWS TO THEIR PARTICULAR SITUATIONS AS WELL AS ANY TAX CONSEQUENCES OF THE PROPOSED REVERSE STOCK SPLIT ARISING UNDER THE U.S. FEDERAL ESTATE OR GIFT TAX LAWS OR UNDER THE LAWS OF ANY STATE, LOCAL OR NON-U.S. TAXING JURISDICTION OR UNDER ANY APPLICABLE INCOME TAX TREATY.
The proposed Reverse Stock Split should constitute a “recapitalization” for U.S. federal income tax purposes pursuant to Section 368(a)(1)(E) of the Code. As a result, a U.S. Holder generally should not recognize gain or loss upon the proposed Reverse Stock Split for U.S. federal income tax purposes, except with respect to cash received in lieu of a fractional share of our common stock, as discussed below. A U.S. Holder’s aggregate adjusted tax basis in the shares of Common Stock held immediately after the proposed Reverse Stock Split should equal the aggregate adjusted tax basis of the shares of Common Stock held immediately before the Reverse Stock Split (reduced by the amount of such basis that is allocated to any fractional share of our Common Stock). The U.S. Holder’s holding period in the shares of Common

42
Stock held immediately after the Reverse Stock Split should include the holding period in the shares of Common Stock held immediately before the Reverse Stock Split. U.S. Treasury Regulations provide detailed rules for allocating the tax basis and holding period among shares of Common Stock which were acquired by a shareholder on different dates and at different prices. U.S. Holders of shares of our Common Stock acquired on different dates and at different prices should consult their tax advisors regarding the allocation of the tax basis and holding period among such shares.
A U.S. Holder that, pursuant to the proposed Reverse Stock Split, receives cash in lieu of a fractional share of our Common Stock should recognize capital gain or loss in an amount equal to the difference, if any, between the amount of cash received and the portion of the U.S. Holder’s aggregate adjusted tax basis in the shares of Common Stock surrendered that is allocated to such fractional share. Such capital gain or loss will be short term if the pre-reverse split shares were held for one year or less at the effective time of the Reverse Stock Split and long term if held for more than one year.
No gain or loss will be recognized by us as a result of the proposed Reverse Stock Split.
Payments of cash made in lieu of a fractional share of our Common Stock may, under certain circumstances, be subject to information reporting and backup withholding. To avoid backup withholding, each holder of our Common Stock that does not otherwise establish an exemption should furnish on applicable Internal Revenue Service forms its taxpayer identification number and comply with the applicable certification procedures.
Backup withholding is not an additional tax and amounts withheld will be allowed as a credit against the holder’s U.S. federal income tax liability and may entitle such holder to a refund, provided the required information is timely furnished to the IRS. Holders of our Common Stock should consult their own tax advisors regarding the application of the information reporting and backup withholding rules to them.
THE BOARD RECOMMENDS THAT THE STOCKHOLDERS VOTE “FOR” THE PROPOSAL TO APPROVE THE AMENDMENT OF OUR RESTATED CHARTER TO EFFECT THE REVERSE STOCK SPLIT DESCRIBED ABOVE.

43
PROPOSAL THREE: RATIFICATION OF INDEPENDENT PUBLIC ACCOUNTING FIRM
The Audit Committee of the Board has determined to engage PricewaterhouseCoopers LLP as our independent registered public accounting firm for the fiscal year ending December 31, 2018. PricewaterhouseCoopers LLP also served as our independent registered public accounting firm for fiscal years ended December 31, 2017 and December 31, 2016.
The Board requests stockholder approval of the following resolution adopted by the Audit Committee and the Board.
“RESOLVED, that PricewaterhouseCoopers LLP is hereby selected as the independent public accounting firm of the Corporation for the year ending December 31, 2018, and such selection be hereby approved and ratified as of the date hereof.”
THE BOARD RECOMMENDS THAT THE STOCKHOLDERS VOTE “FOR” THE PROPOSAL TO RATIFY THE APPOINTMENT OF PRICEWATERHOUSECOOPERS LLP AS JONES ENERGY’S INDEPENDENT REGISTERED PUBLIC ACCOUNTING FIRM FOR 2018.
The affirmative vote of a majority of the voting power of the shares present in person or by proxy and entitled to vote is required for adoption of this proposal. If the appointment is not approved, the adverse vote will be considered as an indication to the Board that it should select another independent registered public accounting firm for the following year. Because of the difficulty and expense of making any substitution of public accountants so long after the beginning of the current year, it is contemplated that the appointment for 2018 will be permitted to stand unless the Audit Committee finds other good reason for making a change.
Representatives of PricewaterhouseCoopers LLP are expected to be present at the Annual Meeting to respond to appropriate questions raised at the Annual Meeting or submitted to them in writing prior to the Annual Meeting. The representatives may also make a statement if they desire to do so.
PRICEWATERHOUSECOOPERS LLP FEES FOR FISCAL YEARS 2017 AND 2016
2017 2016
Audit Fees(1) . . . . . . . . . . . . . . . . . . . . . . . . . . . . . . . . . . . . . . . . . . . $ 1,371,353 $ 1,426,200 Audit-Related Fees(2) . . . . . . . . . . . . . . . . . . . . . . . . . . . . . . . . . . . . 55,400 5,500 Tax Fees(3) . . . . . . . . . . . . . . . . . . . . . . . . . . . . . . . . . . . . . . . . . . . . — — All Other Fees(4). . . . . . . . . . . . . . . . . . . . . . . . . . . . . . . . . . . . . . . . 2,273 2,242 Total: . . . . . . . . . . . . . . . . . . . . . . . . . . . . . . . . . . . . . . . . . . . . . . . . . $ 1,429,026 $ 1,433,942
(1) “Audit Fees” represents fees for professional services provided in connection with the audits of the Jones Energy’s
annual financial statements included in its Annual Reports on Form 10-K and reviews of the interim financial statements. In addition, “Audit Fees” includes work associated with comfort letters issued in conjunction with public filings by Jones Energy.
(2) “Audit-Related Fees” represents fees for professional services rendered in connection with audit work unrelated to the primary financial statements of Jones Energy and its subsidiaries and consultations related to the impact of new accounting pronouncements.
(3) “Tax Fees” represents fees associated with tax services rendered for income tax planning and compliance, and sales, use and excise tax matters.
(4) “All Other Fees” represents other consulting services, including license fees for access to informational databases maintained by PricewaterhouseCoopers LLC. The Audit Committee has concluded that these services are compatible with maintaining PricewaterhouseCoopers LLP’s independence.

44
The charter of the Audit Committee and its pre-approval policy require that the Audit Committee pre-approve all auditing services, internal control-related services and permitted non-audit services (including the fees and terms thereof) to be performed for the Company by PricewaterhouseCoopers LLP, subject to such exceptions for non-audit services as permitted by applicable laws and regulations. The Committee may, when it deems appropriate, form and delegate this authority to a subcommittee consisting of one or more Committee members for purposes of this review and pre-approval. For the years ended December 31, 2017 and 2016, the Audit Committee pre-approved 100% of the services described above opposite the captions “Audit Fees,” “Audit-Related Fees,” “Tax Fees” and “All Other Fees.”

45
STOCKHOLDER PROPOSALS AND DIRECTOR NOMINATIONS
Stockholders may propose matters to be presented at stockholders’ meetings and may also recommend persons for nomination or nominate persons to be directors, subject to the formal procedures that have been established under our Bylaws. Our Bylaws are available in our SEC filings which can be accessed on our website at www.jonesenergy.com under the Corporate Governance tab in the Investor Relations section. Stockholders are urged to review all applicable rules and consult legal counsel before submitting a nomination or proposal to Jones Energy.
Proposals for 2019 Annual Meeting
Pursuant to rules promulgated by the SEC, any proposals of stockholders of our company intended to be presented at the 2019 annual meeting of stockholders and included in our Proxy Statement and form of proxy relating to that meeting must be received at our principal executive offices, 807 Las Cimas Parkway, Suite 350, Austin, Texas 78746, no later than December 30, 2018. Such proposals must be in conformity with all applicable legal provisions, including Rule 14a-8 of the General Rules and Regulations under the Exchange Act.
If you wish to present a stockholder proposal at the 2019 annual meeting of stockholders that is not the subject of a proposal pursuant to Rule 14a-8 of the Exchange Act, you must follow the procedures outlined in Section 2.9(c) of our Bylaws. These procedures include the requirement that your proposal must be delivered to Jones Energy’s Corporate Secretary at the address shown on the cover page of this proxy statement not later than the close of business on the 90th day or earlier than the close of business on the 120th day prior to the first anniversary of the preceding year’s annual meeting. If the date of the annual meeting is more than 30 days before or more than 70 days after such anniversary date, your notice must be delivered not earlier than the close of business on the 120th day prior to such annual meeting and not later than the close of business on the later of the 90th day prior to such annual meeting or the 10th day following the day we publicly announce the date of the 2019 annual meeting of stockholders. For a proposal of business to be considered at the 2019 annual meeting of stockholders, a stockholder’s notice should be properly submitted to our Corporate Secretary at our principal executive offices, 807 Las Cimas Parkway, Suite 350, Austin, Texas 78746, no later than February 21, 2019, but not earlier than January 22, 2019.
Nominations for 2019 Annual Meeting
If you wish to recommend to the Board’s Nominating Committee the nomination of a person for election to the Board, you must follow the procedures outlined in Section 3.5(a) of our Bylaws.
These procedures include the requirement that your nominations must be delivered to Jones Energy’s Corporate Secretary at the address shown on the cover page of this proxy statement not later than the close of business on the 90th day or earlier than the close of business on the 120th day prior to the first anniversary of the preceding year’s annual meeting. If the date of the annual meeting is more than 30 days before or more than 70 days after such anniversary date, your notice must be delivered not earlier than the close of business on the 120th day prior to such annual meeting and not later than the close of business on the later of the 90th day prior to such annual meeting or the 10th day following the day we publicly announce the date of the 2018 annual meeting of stockholders. If the number of directors to be elected to the Board at the 2018 annual meeting of stockholders is increased and there is no prior notice or public disclosure by us naming all of the nominees for director or specifying the size of the increased Board at least 100 days prior to the anniversary date of the Annual Meeting, a stockholder’s notice shall also be considered timely, but only with respect to nominees for any new positions created by such increase, if it shall be delivered to our principal executive offices not later than the close of business on the 10th day following the earlier of the day on which the notice of such meeting was mailed to stockholders of the Corporation or the day on which such public disclosure was made. For a nomination to be considered at the 2019 annual meeting of stockholders, a stockholder’s notice should be properly submitted to our Corporate Secretary at our principal executive offices, 807 Las Cimas Parkway, Suite 350, Austin, Texas 78746, no later than February 21, 2019, but not earlier than January 22, 2019.

46
SOLICITATION AND MAILING OF PROXIES
The expense of preparing, printing and mailing this Proxy Statement and the proxies solicited hereby will be borne by us. In addition to the use of the mail, proxies may be solicited by our representatives in person or by telephone, electronic mail or facsimile transmission. These representatives will not be additionally compensated for such solicitation, but may be reimbursed for out-of-pocket expenses incurred. If undertaken, we expect the expenses of such solicitation by our representatives to be nominal. We will also request brokerage firms, banks, nominees, custodians and fiduciaries to forward proxy materials to the beneficial owners of our shares as of the Record Date and will provide reimbursement for the cost of forwarding the proxy materials in accordance with customary practice.
If a stockholder wishes to give such holder’s proxy to someone other than the names appearing in the proxy card, the names appearing in the proxy card must be crossed out and the name of another individual or individuals (not more than three) inserted. The signed card must be presented at the Annual Meeting by the individual or individuals representing such stockholder.
As a matter of policy, proxies, ballots, and voting tabulations that identify individual stockholders are kept private by us. Such documents are available for examination only by the inspectors of election and certain personnel associated with processing proxy cards and tabulating the vote. The vote of any stockholder is not disclosed except as necessary to meet legal requirements.
STOCKHOLDER LIST
In accordance with the Delaware General Corporation Law, the Company will maintain at its corporate offices in Austin, Texas, a list of the stockholders entitled to vote at the Annual Meeting. The list will be open to the examination of any stockholder, for purposes germane to the Annual Meeting, during ordinary business hours for ten days before the Annual Meeting.
HOUSEHOLDING
The SEC permits a single set of annual reports and proxy statements to be sent to any household at which two or more stockholders reside if they appear to be members of the same family. Each stockholder continues to receive a separate proxy card. This procedure, referred to as householding, reduces the volume of duplicate information stockholders receive and reduces mailing and printing expenses. As a result, if you hold your shares through a broker and you reside at an address at which two or more stockholders reside, you will likely be receiving only one annual report and Proxy Statement unless any stockholder at that address has given the broker contrary instructions. However, if any such beneficial stockholder residing at such an address wishes to receive a separate annual report or Proxy Statement in the future, or if any such beneficial stockholder that receives separate annual reports or Proxy Statements wishes to receive a single annual report or Proxy Statement in the future, that stockholder should contact their broker or send a request to our principal executive offices, 807 Las Cimas Parkway, Suite 350, Austin, Texas 78746, Attn: Corporate Secretary. We will deliver, promptly upon written request to the Corporate Secretary, a separate copy of the 2017 Annual Report and this Proxy Statement to a beneficial stockholder at a shared address to which a single copy of the documents was delivered.
WHERE YOU CAN FIND MORE INFORMATION ABOUT US
We file annual, quarterly and current reports and proxy statements with the SEC. Our SEC filings are available to the public over the internet at the SEC’s website at www.sec.gov. You may also read and copy any document that we file with the SEC at the SEC’s Public Reference Room at 100 F Street, NE, Washington, D.C. 20549. You can call the SEC at 1-800-SEC-0330 for further information on the public reference room and its copy charges. We maintain a website at www.jonesenergy.com, where we post our SEC filings.
You may request copies of our filings, including any documents incorporated by reference in this Proxy Statement as described below, without charge, by calling our Investor Relations representative at 512.493.4834 or write to Investor Relations, 807 Las Cimas Parkway, Suite 350, Austin, Texas 78746.
47
If you would like to request documents from us, please do so at least ten business days before the date of the Annual Meeting in order to receive timely delivery of the documents before the Annual Meeting. If you request any incorporated documents from us, we will mail them to you by first class mail or other equally prompt means within one business day of receipt of your request, provided that we will not mail any exhibits to the information that is incorporated by reference unless such exhibits are specifically incorporated by reference into the information that this Proxy Statement incorporates.
You should rely only on the information contained or incorporated by reference in this Proxy Statement to vote your shares at the Annual Meeting. We have not authorized anyone to provide you with information that is different from what is contained or incorporated by reference in this Proxy Statement.
The information contained in this document or any document incorporated by reference herein speaks only as of the date indicated on the cover of this document or the document incorporated by reference unless the information specifically indicates that another date applies.
OTHER MATTERS FOR 2018 ANNUAL MEETING
As of the date of this Proxy Statement, our Board knows of no matters to be acted upon at the Annual Meeting other than the proposals included in the accompanying notice and described in this Proxy Statement. If any other matter requiring a vote of stockholders arises, including a question of adjourning the Annual Meeting, the persons named as proxies in the accompanying proxy card will have the discretion to vote thereon according to their best judgment of what they consider to be in the best interests of our company. The accompanying proxy card confers discretionary authority to take action with respect to any additional matters that may come before the Annual Meeting or any adjournment or postponement thereof.
By Order of the Board of Directors,
Jonny Jones Founder and Chairman of the Board Austin, Texas April 30, 2018

A-1
APPENDIX A
FORM OF
CERTIFICATE OF AMENDMENT OF
AMENDED AND RESTATED CERTIFICATE OF INCORPORATION
OF JONES ENERGY, INC.
The undersigned officer of Jones Energy, Inc. (the “Corporation”), a corporation organized and existing under and by virtue of the General Corporation Law of the State of Delaware (the “DGCL”), DOES HEREBY CERTIFY as follows:
FIRST: The name of the Corporation is Jones Energy, Inc. SECOND: Upon the filing and effectiveness (the “Effective Time”) pursuant to the DGCL of this certificate of amendment to the amended and restated certificate of incorporation of the Corporation, (i) each [__] shares of the Corporation’s Class A common stock, par value $0.001 per share, issued and outstanding immediately prior to the Effective Time shall be combined into one validly issued, fully paid and non-assessable share of Class A common stock, par value $0.001 per share, and (ii) each [__] shares of the Corporation’s Class B common stock, par value $0.001 per share, issued and outstanding immediately prior to the Effective Time shall be combined into one validly issued, fully paid and non-assessable share of Class B common stock, par value $0.001 per share, in each case, without any further action by the Corporation or the holder thereof, subject to the treatment of fractional share interests as described below (the “Reverse Stock Split”). No certificates representing fractional shares of common stock shall be issued in connection with the Reverse Stock Split. Stockholders who otherwise would be entitled to receive fractional shares of common stock shall be entitled to receive cash (without interest or deduction) from the Corporation’s transfer agent in lieu of such fractional share interests upon the submission of a transmittal letter by a stockholder holding the shares in book-entry form and, where shares are held in certificated form, upon the surrender of the stockholder’s Old Certificates (as defined below), in an amount equal to the proceeds attributable to the sale of such fractional shares following the aggregation and sale by the Corporation’s transfer agent of all fractional shares otherwise issuable. Each certificate that immediately prior to the Effective Time represented shares of common stock (“Old Certificates”) shall thereafter represent that number of shares of common stock into which the shares of common stock represented by the Old Certificate shall have been combined, subject to the elimination of fractional share interests as described above. THIRD: The foregoing amendment was duly adopted in accordance with the provisions of Section 242 of the General Corporation Law of the State of Delaware. FOURTH: The foregoing amendment shall be effective upon filing with the Secretary of State of the State of Delaware.
IN WITNESS WHEREOF, the Corporation has caused this Certificate of Amendment to be signed by its duly authorized officer, this [ ] day of [ ], 2018.
JONES ENERGY, INC.
By: __________________________
Name: Title:

UNITED STATES SECURITIES AND EXCHANGE COMMISSION
Washington, D.C. 20549
FORM 10-K ANNUAL REPORT PURSUANT TO SECTION 13 OR 15(d) OF THE SECURITIES EXCHANGE ACT OF 1934
For the fiscal year ended: December 31, 2017
TRANSITION REPORT PURSUANT TO SECTION 13 OR 15(d) OF THE SECURITIES EXCHANGE ACT OF 1934
For the transition period from to
Commission file number: 001-36006
Jones Energy, Inc. (Exact name of registrant as specified in its charter)
Delaware (State or other jurisdiction of incorporation or organization)
80-0907968 (I.R.S. Employer
Identification No.)
807 Las Cimas Parkway, Suite 350
Austin, Texas 78746 (Address of principal executive offices) (Zip Code)
Tel: (512) 328-2953 Registrant’s telephone number, including area code
Securities registered pursuant to Section 12(b) of the Exchange Act:
Title of class Name of each exchange on which registered
Class A Common Stock, $0.001 par value New York Stock Exchange
Securities registered pursuant to Section 12(g) of the Exchange Act: None
Indicate by check mark if the registrant is a well-known seasoned issuer, as defined in Rule 405 of the Securities Act. Yes No
Indicate by check mark if the registrant is not required to file reports pursuant to Section 13 or 15(d) of the Act. Yes No
Indicate by check mark whether the registrant (1) has filed all reports required to be filed by Section 13 or 15(d) of the Securities Exchange Act of 1934 during the preceding 12 months (or for such shorter period that the registrant was required to file such reports), and (2) has been subject to such filing requirements for the past 90 days. Yes No
Indicate by check mark whether the registrant has submitted electronically and posted on its corporate website, if any, every Interactive Data File required to be submitted and posted pursuant to Rule 405 of Regulation S-T during the preceding 12 months (or for such shorter period that the registrant was required to submit and post such files). Yes No
Indicate by check mark if disclosure of delinquent filers pursuant to Item 405 of Regulation S-K (§ 229.405 of this chapter) is not contained herein, and will not be contained, to the best of registrant’s knowledge, in definitive proxy or information statements incorporated by reference in Part III of this Form 10-K or any amendment to this Form 10-K.
Indicate by check mark whether the registrant is a large accelerated filer, an accelerated filer, a non-accelerated filer, or a smaller reporting company. See the definitions of “large accelerated filer,” “accelerated filer,” “smaller reporting company” and “emerging growth company” in Rule 12b-2 of the Exchange Act.
Large accelerated filer Accelerated filer Non-accelerated filer
(Do not check if a smaller reporting company)
Smaller reporting company
Emerging growth company
If an emerging growth company, indicate by check mark if the registrant has elected not to use the extended transition period for complying with any new or revised financial
accounting standards provided pursuant to Section 13(a) of the Exchange Act.
Indicate by check mark whether the registrant is a shell company (as defined in Rule 12b-2 of the Exchange Act). Yes No
The aggregate market value of the voting and non-voting common stock held by non-affiliates of the registrant computed as of June 30, 2017 (the last business day of the Registrant’s most recently completed second fiscal quarter) based on the closing price of the Class A common stock on the New York Stock Exchange was $102.4 million.
There were 92,030,282 and 9,627,821 shares of the registrant’s Class A and Class B common stock, respectively, outstanding on February 21, 2018.
DOCUMENTS INCORPORATED BY REFERENCE
Portions of the registrant’s definitive proxy statement for the 2018 Annual Meeting of Stockholders, to be filed no later than 120 days after the end of the fiscal year, which we refer to as the Proxy Statement, are incorporated by reference into Part III of this Annual Report on Form 10-K.

i
JONES ENERGY, INC.
TABLE OF CONTENTS
PART 1
Item 1. Business . . . . . . . . . . . . . . . . . . . . . . . . . . . . . . . . . . . . . . . . . . . . . . . . . . . . . . . . . . . . . . . . . . . . . . . . . . . . . . . . . 3Item 1A. Risk Factors . . . . . . . . . . . . . . . . . . . . . . . . . . . . . . . . . . . . . . . . . . . . . . . . . . . . . . . . . . . . . . . . . . . . . . . . . . . . . 23Item 1B. Unresolved Staff Comments . . . . . . . . . . . . . . . . . . . . . . . . . . . . . . . . . . . . . . . . . . . . . . . . . . . . . . . . . . . . . . . . 46Item 2. Properties . . . . . . . . . . . . . . . . . . . . . . . . . . . . . . . . . . . . . . . . . . . . . . . . . . . . . . . . . . . . . . . . . . . . . . . . . . . . . . . . 46Item 3. Legal Proceedings . . . . . . . . . . . . . . . . . . . . . . . . . . . . . . . . . . . . . . . . . . . . . . . . . . . . . . . . . . . . . . . . . . . . . . . . . 46Item 4. Mine Safety Disclosures . . . . . . . . . . . . . . . . . . . . . . . . . . . . . . . . . . . . . . . . . . . . . . . . . . . . . . . . . . . . . . . . . . . . 46
PART II
Item 5. Market for Registrant’s Common Equity, Related Stockholder Matters and Issuer Purchases of Equity Securities . . . . . . . . . . . . . . . . . . . . . . . . . . . . . . . . . . . . . . . . . . . . . . . . . . . . . . . . . . . . . . . . . . . . . . . . . . . . . . . . . . . . . 47
Item 6. Selected Financial Data . . . . . . . . . . . . . . . . . . . . . . . . . . . . . . . . . . . . . . . . . . . . . . . . . . . . . . . . . . . . . . . . . . . . . 49Item 7. Management’s Discussion and Analysis of Financial Condition and Results of Operations . . . . . . . . . . . . . . 53Item 7A. Quantitative and Qualitative Disclosures about Market Risk . . . . . . . . . . . . . . . . . . . . . . . . . . . . . . . . . . . . . . 72Item 8. Financial Statements and Supplementary Data . . . . . . . . . . . . . . . . . . . . . . . . . . . . . . . . . . . . . . . . . . . . . . . . . . 73Item 9. Changes in and Disagreements with Accountants on Accounting and Financial Disclosure . . . . . . . . . . . . . . 73Item 9A. Controls and Procedures . . . . . . . . . . . . . . . . . . . . . . . . . . . . . . . . . . . . . . . . . . . . . . . . . . . . . . . . . . . . . . . . . . . 73Item 9B. Other Information . . . . . . . . . . . . . . . . . . . . . . . . . . . . . . . . . . . . . . . . . . . . . . . . . . . . . . . . . . . . . . . . . . . . . . . . 74
PART III
Item 10. Directors, Executive Officers and Corporate Governance . . . . . . . . . . . . . . . . . . . . . . . . . . . . . . . . . . . . . . . . 75Item 11. Executive Compensation . . . . . . . . . . . . . . . . . . . . . . . . . . . . . . . . . . . . . . . . . . . . . . . . . . . . . . . . . . . . . . . . . . . 75Item 12. Security Ownership of Certain Beneficial Owners and Management and Related Stockholder Matters . . . 75Item 13. Certain Relationships and Related Transactions, and Director Independence . . . . . . . . . . . . . . . . . . . . . . . . . 75Item 14. Principal Accounting Fees and Services . . . . . . . . . . . . . . . . . . . . . . . . . . . . . . . . . . . . . . . . . . . . . . . . . . . . . . . 75
PART IV
Item 15. Exhibit Index . . . . . . . . . . . . . . . . . . . . . . . . . . . . . . . . . . . . . . . . . . . . . . . . . . . . . . . . . . . . . . . . . . . . . . . . . . . . 76Item 16. Form 10-K Summary . . . . . . . . . . . . . . . . . . . . . . . . . . . . . . . . . . . . . . . . . . . . . . . . . . . . . . . . . . . . . . . . . . . . . . 79Signatures. . . . . . . . . . . . . . . . . . . . . . . . . . . . . . . . . . . . . . . . . . . . . . . . . . . . . . . . . . . . . . . . . . . . . . . . . . . . . . . . . . . . . . . 80Financial Statements
Balance Sheets . . . . . . . . . . . . . . . . . . . . . . . . . . . . . . . . . . . . . . . . . . . . . . . . . . . . . . . . . . . . . . . . . . . . . . . . . . . . . . . . . F-3Statements of Operations . . . . . . . . . . . . . . . . . . . . . . . . . . . . . . . . . . . . . . . . . . . . . . . . . . . . . . . . . . . . . . . . . . . . . . . . F-4Statement of Changes in Stockholders’ Equity . . . . . . . . . . . . . . . . . . . . . . . . . . . . . . . . . . . . . . . . . . . . . . . . . . . . . . . F-5Statements of Cash Flows . . . . . . . . . . . . . . . . . . . . . . . . . . . . . . . . . . . . . . . . . . . . . . . . . . . . . . . . . . . . . . . . . . . . . . . . F-6Notes to the Consolidated Financial Statements . . . . . . . . . . . . . . . . . . . . . . . . . . . . . . . . . . . . . . . . . . . . . . . . . . . . . . F-7

1
Cautionary Statement Regarding Forward-Looking Statements
The information in this Annual Report on Form 10-K (the “Annual Report”), includes “forward-looking statements.” All statements, other than statements of historical fact included in this report, regarding our strategy, future operations, financial position, estimated revenues and losses, projected costs, prospects, plans and objectives of management are forward-looking statements. When used in this Annual Report, the words “could,” “should,” “will,” “may,” “believe,” “anticipate,” “intend,” “estimate,” “expect,” “project” and similar expressions are intended to identify forward-looking statements, although not all forward-looking statements contain such identifying words. These forward-looking statements are based on our current expectations and assumptions about future events and are based on currently available information as to the outcome and timing of future events. When considering forward-looking statements, you should keep in mind the risk factors and other cautionary statements described under the heading “Risk Factors” included in this report. These forward-looking statements are based on management’s current belief, based on currently available information, as to the outcome and timing of future events, actions and developments including:
• business strategy;
• estimated current and future net reserves and the present value thereof, and the likelihood of establishing production from such estimates;
• drilling and completion of wells including our identified drilling locations;
• cash flows, liquidity and our leverage;
• financial strategy, capital and operating budgets, projections and operating results;
• future prices and change in prices for oil, natural gas and NGLs;
• customers’ elections to reject ethane and include it as part of the natural gas stream;
• timing and amount of future production of oil and natural gas;
• availability and cost of drilling, completion and production equipment;
• availability and cost of oilfield labor;
• the amount, nature and timing of capital expenditures, including future development costs;
• ability to fund our 2018 capital expenditure budget;
• availability and terms of capital;
• development results from our identified drilling locations;
• ability to generate returns and pursue opportunities;
• marketing of oil, natural gas and NGLs;
• property acquisitions and dispositions and realizing the expected benefits or effects of completed acquisitions and dispositions, including our ability to consummate a “DrillCo” in the Western Anadarko Basin;
• the availability, cost and terms of, and competition for mineral leases and other permits and rights-of-way and our ability to maintain mineral leases;
• costs of developing our properties and conducting other operations, including costs associated with our operations in the Merge area as compared to our operations in the Cleveland play;
• general economic conditions, including the levels of supply and demand for oil, natural gas and NGLs, and the commodity price environment;

2
• competitive conditions in our industry;
• effectiveness and extent of our risk management activities;
• estimates of future potential impairments;
• environmental and endangered species regulations and liabilities;
• counterparty credit risk;
• the extent and effect of any hedging activities engaged in by us;
• the impact of, and changes in, governmental regulation of the oil and natural gas industry, including tax laws and regulations, environmental, health and safety laws and regulations, and laws and regulations with respect to derivatives and hedging activities;
• developments in oil-producing and natural gas-producing countries;
• uncertainty regarding our future operating results;
• weather, including its impact on oil and natural gas demand and weather-related delays on operations;
• changes and uncertainties regarding technology; and
• plans, objectives, expectations and intentions contained in this report that are not historical.
We caution you that these forward-looking statements are subject to all of the risks and uncertainties, most of which are difficult to predict and many of which are beyond our control, incident to the exploration for and development and production of oil and natural gas. These risks include, but are not limited to, commodity price levels and volatility, inflation, the cost of oil field equipment and services, lack of availability of drilling, completion and production equipment and services, environmental risks, drilling and other operating risks, regulatory changes, the uncertainty inherent in estimating oil and natural gas reserves and in projecting future rates of production, cash flow and access to capital, the timing of development expenditures, and the other risks described under “Risk Factors” in this report.
Reserve engineering is a process of estimating underground accumulations of oil and natural gas that cannot be measured in an exact way. The accuracy of any reserve estimate depends on the quality of available data, the interpretation of such data and price and cost assumptions made by reservoir engineers. In addition, the results of drilling, testing and production activities may justify revisions of estimates that were made previously. If significant, such revisions would change the schedule of any further production and development drilling. Accordingly, reserve estimates may differ significantly from the quantities of oil and natural gas that are ultimately recovered.
Should one or more of the risks or uncertainties described in this report occur, or should underlying assumptions prove incorrect, our actual results and plans could differ materially from those expressed in any forward-looking statements.
All forward-looking statements, expressed or implied, included in this report are expressly qualified in their entirety by this cautionary statement. This cautionary statement should also be considered in connection with any subsequent written or oral forward-looking statements that we or persons acting on our behalf may issue.
Except as otherwise required by applicable law, we disclaim any duty to update any forward-looking statements, all of which are expressly qualified by the statements in this section, to reflect events or circumstances after the date of this report.
References
Unless indicated otherwise in this Annual Report or the context requires otherwise, all references to “Jones Energy,” the “Company,” “our company,” “we,” “our” and “us” refer to Jones Energy, Inc. and its subsidiaries, including Jones Energy Holdings, LLC (“JEH”). Jones Energy, Inc. is a holding company whose sole material asset is an equity interest in Jones Energy Holdings, LLC.
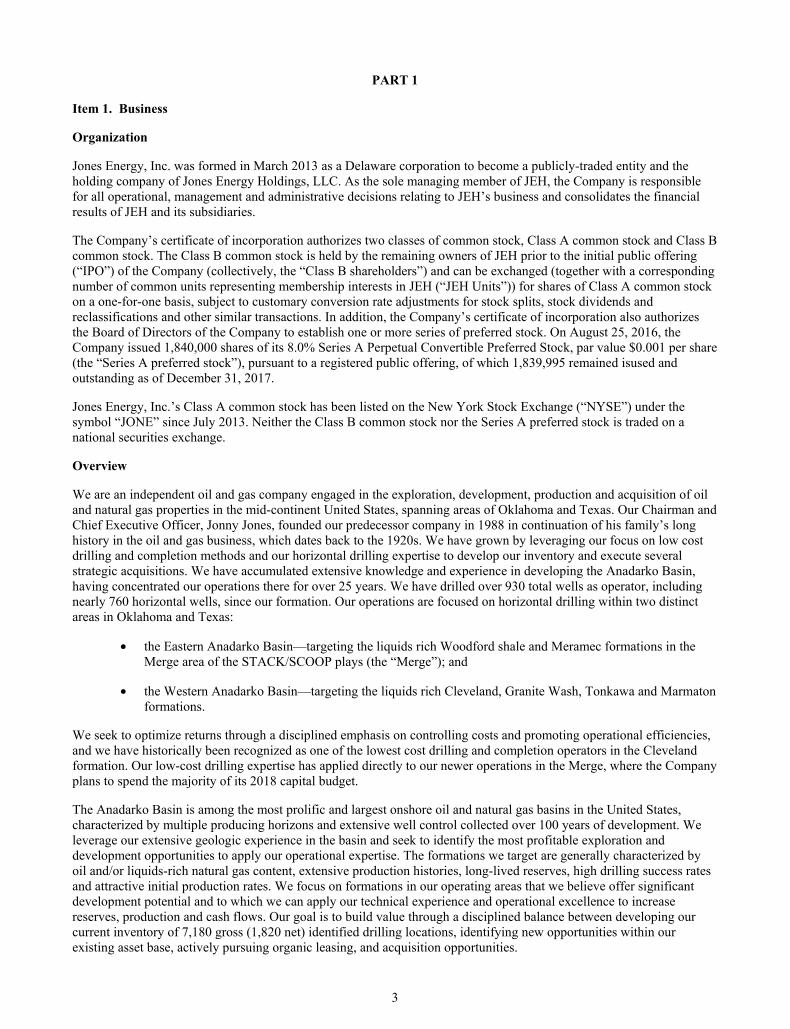
3
PART 1
Item 1. Business
Organization
Jones Energy, Inc. was formed in March 2013 as a Delaware corporation to become a publicly-traded entity and the holding company of Jones Energy Holdings, LLC. As the sole managing member of JEH, the Company is responsible for all operational, management and administrative decisions relating to JEH’s business and consolidates the financial results of JEH and its subsidiaries.
The Company’s certificate of incorporation authorizes two classes of common stock, Class A common stock and Class B common stock. The Class B common stock is held by the remaining owners of JEH prior to the initial public offering (“IPO”) of the Company (collectively, the “Class B shareholders”) and can be exchanged (together with a corresponding number of common units representing membership interests in JEH (“JEH Units”)) for shares of Class A common stock on a one-for-one basis, subject to customary conversion rate adjustments for stock splits, stock dividends and reclassifications and other similar transactions. In addition, the Company’s certificate of incorporation also authorizes the Board of Directors of the Company to establish one or more series of preferred stock. On August 25, 2016, the Company issued 1,840,000 shares of its 8.0% Series A Perpetual Convertible Preferred Stock, par value $0.001 per share (the “Series A preferred stock”), pursuant to a registered public offering, of which 1,839,995 remained isused and outstanding as of December 31, 2017.
Jones Energy, Inc.’s Class A common stock has been listed on the New York Stock Exchange (“NYSE”) under the symbol “JONE” since July 2013. Neither the Class B common stock nor the Series A preferred stock is traded on a national securities exchange.
Overview
We are an independent oil and gas company engaged in the exploration, development, production and acquisition of oil and natural gas properties in the mid-continent United States, spanning areas of Oklahoma and Texas. Our Chairman and Chief Executive Officer, Jonny Jones, founded our predecessor company in 1988 in continuation of his family’s long history in the oil and gas business, which dates back to the 1920s. We have grown by leveraging our focus on low cost drilling and completion methods and our horizontal drilling expertise to develop our inventory and execute several strategic acquisitions. We have accumulated extensive knowledge and experience in developing the Anadarko Basin, having concentrated our operations there for over 25 years. We have drilled over 930 total wells as operator, including nearly 760 horizontal wells, since our formation. Our operations are focused on horizontal drilling within two distinct areas in Oklahoma and Texas:
• the Eastern Anadarko Basin—targeting the liquids rich Woodford shale and Meramec formations in the Merge area of the STACK/SCOOP plays (the “Merge”); and
• the Western Anadarko Basin—targeting the liquids rich Cleveland, Granite Wash, Tonkawa and Marmaton formations.
We seek to optimize returns through a disciplined emphasis on controlling costs and promoting operational efficiencies, and we have historically been recognized as one of the lowest cost drilling and completion operators in the Cleveland formation. Our low-cost drilling expertise has applied directly to our newer operations in the Merge, where the Company plans to spend the majority of its 2018 capital budget.
The Anadarko Basin is among the most prolific and largest onshore oil and natural gas basins in the United States, characterized by multiple producing horizons and extensive well control collected over 100 years of development. We leverage our extensive geologic experience in the basin and seek to identify the most profitable exploration and development opportunities to apply our operational expertise. The formations we target are generally characterized by oil and/or liquids-rich natural gas content, extensive production histories, long-lived reserves, high drilling success rates and attractive initial production rates. We focus on formations in our operating areas that we believe offer significant development potential and to which we can apply our technical experience and operational excellence to increase reserves, production and cash flows. Our goal is to build value through a disciplined balance between developing our current inventory of 7,180 gross (1,820 net) identified drilling locations, identifying new opportunities within our existing asset base, actively pursuing organic leasing, and acquisition opportunities.

4
As of December 31, 2017, our total estimated proved reserves were 104.8 MMBoe, of which 59% were classified as proved developed reserves. Approximately 28% of our total estimated proved reserves as of December 31, 2017 consisted of oil, 32% consisted of NGLs, and 41% consisted of natural gas. As of December 31, 2017, our properties included 1,044 gross producing wells. For the three years ended December 31, 2017, we drilled 168 wells as operator. The following table presents summary reserve, acreage and production data for each of our core operating areas:
Year Ended As of December 31, 2017 December 31, 2017 Estimated Net Average Daily Net Proved Reserves Acreage Production % Oil and Gross Net % Oil and MMBoe NGLs Acreage Acreage MBoe/d NGLs
Western Anadarko (1) . . . . . 76.4 58 % 214,762 152,191 15.2 60 %Eastern Anadarko (2) . . . . . 28.3 64 % 126,839 22,484 2.8 61 %Other . . . . . . . . . . . . . . . . . . 0.1 24 % 33,508 18,894 3.3 35 %
All properties . . . . . . . . . 104.8 59 % 375,109 193,569 21.3 56 %
(1) Western Anadarko includes the Cleveland, Granite Wash, Tonkawa and Marmaton formations. (2) Eastern Anadarko consists of the Merge.
The following table presents summary well and drilling location data for each of our key formations for the date indicated:
As of December 31, 2017 Identified Producing Drilling Wells Locations (1) Gross Net Gross Net
Western Anadarko . . . . . . . . . . . . . . . . . . . . . . . . . . . . . . . . . . . 944 571 1,737 893 Eastern Anadarko . . . . . . . . . . . . . . . . . . . . . . . . . . . . . . . . . . . 69 14 5,443 927 Other . . . . . . . . . . . . . . . . . . . . . . . . . . . . . . . . . . . . . . . . . . . . . 31 6 — —
All properties . . . . . . . . . . . . . . . . . . . . . . . . . . . . . . . . . . . . 1,044 591 7,180 1,820
(1) Our total identified drilling locations include 3,499 gross total proved undeveloped, probable and possible
drilling locations, of which 348 gross locations are associated with proved undeveloped reserves as of December 31, 2017. We have estimated our drilling locations based on well spacing assumptions for the areas in which we operate and other criteria. See “Business—Development of Proved Undeveloped Reserves” and “Business—Drilling Locations” for more information regarding our proved undeveloped reserves and the processes and criteria through which these drilling locations were identified.
Our 2017 capital expenditures totaled $248.0 million (excluding the impact of asset retirement costs, asset disposals and non-cash impairments of oil and gas properties), of which $205.7 million was utilized to drill and complete operated wells. The Company has established an initial capital budget of $150.0 million for 2018, including $134.0 million for drilling and completing wells and $16.0 million for leasing, workovers and other capital projects. The initial budget for 2018 in the Merge is based on estimated ranges of well costs between $5.4 million and $6.1 million per well in the Meramec formation and estimated well costs between $5.5 million and $6.0 million in the Woodford formation. Please see “Item 7. Management’s Discussion and Analysis of Financial Condition and Results of Operations—Liquidity and Capital Resources.”
We expect to fund our 2018 budgeted capital expenditures with cash flow from operations and a portion of the net proceeds from our recent offering of 9.25% senior secured first lien notes due 2023 (the “2023 First Lien Notes”), as well as potential non-strategic asset sales or potentially accessing the debt and/or equity capital markets. In addition, we may, from time to time and subject to our assessment of market conditions, engage in liability management transactions in an effort to reduce indebtedness. Furthermore, we expect to develop all drilling locations classified as proved undeveloped reserves in the year-end reserve report within five years of initial proved reserve booking. We consider projections of future commodity prices when determining our development plan, but many other factors are also considered. Should the commodity price environment or other material factors change significantly from current levels, we will re-evaluate our development plan at that time. If the evaluation results in a shifting of capital expenditures into

5
future periods beyond five years from the initial proved reserve booking, it could potentially lead to a reduction in proved undeveloped reserves.
We have allocated our 2018 capital expenditure budget as follows:
(in millions of dollars)
2018 Capital Expenditure
Budget Drilling and completion Eastern Anadarko, operated . . . . . . . . . . . . . . . . . . . . . . . . . . . . . . . . . . . . . . . $ 108.0 Eastern Anadarko, non-operated . . . . . . . . . . . . . . . . . . . . . . . . . . . . . . . . . . . . 15.0 Western Anadarko . . . . . . . . . . . . . . . . . . . . . . . . . . . . . . . . . . . . . . . . . . . . . . . 11.0 Total drilling and completion . . . . . . . . . . . . . . . . . . . . . . . . . . . . . . . . . . . . . . $ 134.0 Other activities (leasing, pooling, maintenance) . . . . . . . . . . . . . . . . . . . . . . . . . . 16.0 All properties and activities . . . . . . . . . . . . . . . . . . . . . . . . . . . . . . . . . . . . . . . . $ 150.0
Recent Developments
See Note 16, “Subsequent Events,” in the Notes to Consolidated Financial Statements for discussion of recent developments.
Our Operations
Our Area of Operations
We own leasehold interests in oil and natural gas producing properties, as well as in undeveloped acreage, substantially all of which are located in the Anadarko Basin in Oklahoma and Texas. The majority of our interests are in producing properties located in fields characterized by what we believe to be long-lived, predictable production profiles and repeatable development opportunities. Specifically, our properties and wells are located in fields that generally have been developed over a long period of time, typically decades. Given the long productive history of these fields, there is substantial midstream and service infrastructure in place, including natural gas and NGL pipelines and natural gas processing plants. Observing the performance of these fields over many years allows for greater understanding of production and reservoir characteristics, making future performance more predictable. For a discussion of the risks inherent in oil and natural gas production, please read “Risk Factors—Drilling for and producing oil, natural gas and NGLs are high-risk activities with many uncertainties that could adversely affect our business, financial condition or results of operations.”
Nearly 100% of our estimated proved reserves as of December 31, 2017 and approximately 84% of our average daily net production for the year ended December 31, 2017 were located in the Anadarko Basin. The Anadarko Basin is one of the most prolific oil and natural gas producing basins in the United States, covering approximately 50,000 square miles primarily in Oklahoma, but also including the upper Texas Panhandle, southwestern Kansas, and southeastern Colorado.
The Anadarko Basin has an especially well developed interval of productive Pennsylvanian age sedimentary rocks, up to 15,000 feet thick. Our wells in this area produce oil, natural gas and NGLs from various formations at depths from approximately 7,000 feet to 12,000 feet. We drilled 70 gross (58 net) wells as operator in the Anadarko Basin during 2017. Our operations in the Western Anadarko Basin have been primarily focused on the Cleveland formation where we have 671 producing wells. We also have acreage in the Tonkawa, Marmaton, Granite Wash, and various Pennsylvanian-age shale formations located in western Oklahoma and the eastern portion of the Texas Panhandle. Since 2016, we have also been focused on the Woodford and Meramec formations in the Eastern Anadarko Basin.
Our production in the Anadarko Basin is currently derived primarily from the following formations, where we have 1,013 gross (585 net) producing wells and where we have identified 7,180 gross (1,820 net) drilling locations as of December 31, 2017, of which 348 have proved undeveloped reserves attributed to them as of December 31, 2017. See “Drilling Locations” for more information regarding the processes and criteria through which these drilling locations were identified.

6
Western Anadarko Basin.
• Cleveland Formation. Our Cleveland acreage is primarily located in Ochiltree, Lipscomb, Hutchinson, and Hemphill Counties in Texas and Ellis County in Oklahoma. The Cleveland formation ranges from depths of approximately 7,000 feet to 8,800 feet and is characterized by a tight, shaly sand with low permeability that lends itself to improved recovery through enhanced drilling and completion techniques.
As of December 31, 2017, we had 671 gross (482 net) producing wells in the formation with an average working interest of 72%, of which we operated 492 gross (416 net) producing wells. Our Cleveland properties contained 70.4 MMBoe of estimated net proved reserves as of December 31, 2017, 60% of which are oil and NGLs, and generated an average daily net production of 15.2 MBoe/d for the year ended December 31, 2017. We have identified 630 gross (422 net) drilling locations in the Cleveland formation as of December 31, 2017. Of these 630 locations, 194 locations (31%) have proved undeveloped reserves attributed to them as of December 31, 2017.
• Tonkawa Formation. As of December 31, 2017, we identified 279 gross (168 net) drilling locations in the Tonkawa formation primarily in Lipscomb and Hemphill Counties in Texas. In addition, the Tonkawa formation is present in the area of other properties we own located primarily in Ellis and Roger Mills Counties in Oklahoma. The Tonkawa is a horizontal oil formation at depths of approximately 6,000 feet to 8,000 feet and is characterized by fine to very fine-grained shallow marine sandstone, ranging in thickness from 20 feet to 40 feet.
We drilled our first horizontal Tonkawa well in May 2010 and drilled two additional horizontal wells in the formation under a farm-out with Samson Resources that is not part of our current leasehold. During 2014, we drilled six additional test wells in different areas of the Company’s leasehold acreage in the Tonkawa formation. As of December 31, 2017, our Tonkawa properties contained 0.3 MMBoe of estimated net proved reserves.
• Marmaton Formation. As of December 31, 2017, we identified 463 gross (278 net) drilling locations in the Marmaton formation. Our properties in the Marmaton formation are all undeveloped and span three sub- formations: properties located primarily in Ellis County, Oklahoma characterized by fluvio-deltaic sands, properties located primarily in Northeast Ochiltree and Northwest Lipscomb Counties, Texas, characterized by shallow marine sands, and properties located primarily in Ochiltree County, Texas characterized by algal reef complex. The Marmaton sand is a tight, shaly sand with similar reservoir characteristics to the Cleveland. The Marmaton sand ranges in thickness from 40 feet to 80 feet while the reef ranges from 80 feet to 150 feet.
• Granite Wash Formation. Our Granite Wash acreage is primarily located in Roberts, Hemphill and Wheeler Counties in Texas and Roger Mills, Beckham, Custer and Washita Counties in Oklahoma. The Granite Wash spans multiple zones from depths of approximately 9,000 feet to 12,000 feet and is composed of stacked, low permeability, variable lithology alluvial fan deltaic deposits.
As of December 31, 2017, we had 75 gross (20 net) producing wells in the formation with an average working interest of 26%, of which we operated 23 gross (17 net) producing wells. Our Granite Wash properties contained 3.6 MMBoe of estimated net proved reserves as of December 31, 2017, approximately 48% of which are oil and NGLs. We have 362 gross (22 net) remaining drilling locations in the Granite Wash formation as of December 31, 2017.
Eastern Anadarko Basin.
• Merge Woodford Formation. Our Merge Woodford acreage is located in Canadian, Grady and McClain Counties in Oklahoma. The Merge Woodford ranges in depths from approximately 8,500 feet to 13,000 feet and includes various fluids from black oil to gas/condensate. The Merge Woodford formation consists of siliceous, organic-rich shale, and thin bedded carbonates. The low permeability reservoir is naturally fractured with silica-rich brittle layers that are highly conducive to improved recovery from enhanced drilling and completion techniques.

7
Our Merge Woodford properties contained 15.0 MMBoe of estimated net proved reserves as of December 31, 2017, approximately 63% of which are oil and NGLs, and generated an average daily net production of 2.8 MBoe/d for the year ended December 31, 2017. We have identified 3,280 gross (548 net) drilling locations in the Merge Woodford formation as of December 31, 2017. Of these 3,280 locations, 85 locations (3%) have proved undeveloped reserves attributed to them as of December 31, 2017.
• Meramec Formation. Our Meramec acreage is located in Canadian, Grady and McClain Counties in Oklahoma. The Meramec is a horizontal liquid-rich reservoir that ranges in depths from approximately 8,000 feet to 12,500 feet. The reservoir includes various fluids from black oil to gas/condensate. The Meramec formation consist of siltstones, organic-rich shale, and limestones with gradations between rock types. Early results from laterals drilled in various landing points within the Meramec indicate the rock is highly conducive to improved recovery from enhanced drilling and completion techniques.
Our Meramec properties contained 13.3 MMBoe of estimated net proved reserves as of December 31, 2017, approximately 65% of which are oil and NGLs. We have identified 2,163 gross (379 net) drilling locations in the Meramec formation as of December 31, 2017. Of these 2,163 locations, 33 locations (2%) have proved undeveloped reserves attributed to them as of December 31, 2017.
Future Potential Opportunities. Our current leasehold position provides longer term potential exposure to other prospective formations in the Anadarko Basin, including the Atoka, Cherokee, Douglas, Cottage Grove, and Upper and Lower Morrow formations in the Western Anadarko, and the Hunton, Osage, Chester, Caney, and Springer formations in the Eastern Anadarko. The Atoka and Cherokee formations, in particular, have attractive geologic properties, and we may elect to pursue their development in the future.
Arkoma Divestiture
On August 1, 2017, JEH sold its Arkoma Basin properties (the “Arkoma Assets”) for a sale price of $65.0 million, prior to customary effective date adjustments of $7.3 million, and subject to customary post-close adjustments (the “Arkoma Divestiture”). JEH may also receive up to $2.5 million in contingent payments based on natural gas prices. No amounts have been recorded related to this contingent payment as of December 31, 2017.
Drilling Locations
We have identified a total of 7,180 gross (1,820 net) drilling locations on our acreage, all of which are horizontal drilling locations. Of these total identified locations, 2,451 gross locations are attributable to acreage that is currently held by existing production and approximately 348 (5%) are attributable to proved undeveloped reserves as of December 31, 2017. In order to identify drilling locations, we apply geologic screening criteria based on the presence of a minimum threshold of reservoir thickness in a section and then consider the number of sections and the appropriate well density to develop the applicable field. In making these assessments, we include properties in which we hold operated and non-operated interests, as well as redevelopment opportunities. Once we have identified acreage that is prospective for the targeted formations, well placement is determined primarily by the regulatory spacing rules prescribed by the governing body in each of our operating areas. Wells drilled in the Cleveland formation are developed ranging between 128 acre spacing (5 wells per section) and 213-acre spacing (3 wells per section). Wells drilled in the Merge Woodford formation and the Meramec formation are developed on 160-acre spacing (4 wells per section). Wells drilled in the Granite Wash formation are developed on 128-acre or 213-acre spacing. Wells drilled in the Tonkawa and Marmaton formations are developed on 160-acre spacing. We view the risk profiles for the Tonkawa and Marmaton formations as being higher than for our other drilling locations due to relatively less available production data and drilling history.
Our identified drilling locations are scheduled to be drilled over many years. The ultimate timing of the drilling of these locations will be influenced by multiple factors, including oil, natural gas and NGL prices, the availability and cost of capital, drilling, completion and production costs, the availability of drilling services and equipment, drilling results, lease expirations, gathering systems, processing, marketing and pipeline transportation constraints, regulatory approvals and other factors. In addition, a number of our identified drilling locations are associated with joint development agreements, and if we do not meet our obligation to drill the minimum number of wells specified in an agreement, we will lose the right to continue to develop certain acreage covered by that agreement. For a discussion of the risks associated with our drilling program, see “Risk Factors—Our identified drilling locations are scheduled to be drilled over many years, making them susceptible to uncertainties that could materially alter the occurrence or timing of their drilling, which in certain instances could prevent or delay associated expected production. In addition, we may not be

8
able to raise the amount of capital that would be necessary to drill a substantial portion of our identified drilling locations.”
Estimated Proved Reserves
The following table sets forth summary data with respect to our estimated net proved oil, natural gas and NGLs reserves as of December 31, 2017, 2016 and 2015, which are based upon reserve reports of Cawley, Gillespie & Associates, Inc., (“Cawley Gillespie”), our independent reserve engineers. Cawley Gillespie’s reports were prepared in accordance with the rules and regulations of the SEC regarding oil and natural gas reserve reporting in effect during such periods.
As of December 31, 2017 2016 2015
Reserve Data: Estimated proved reserves:
Oil (MBbls) . . . . . . . . . . . . . . . . . . . . . . . . . . . . . . . . . . . . 29,014 23,594 25,408 Natural gas (MMcf) . . . . . . . . . . . . . . . . . . . . . . . . . . . . . . 255,148 283,140 261,596 NGLs (MBbls) . . . . . . . . . . . . . . . . . . . . . . . . . . . . . . . . . . 33,273 34,425 32,649 Total estimated proved reserves (MBoe) (1) . . . . . . . . . . 104,812 105,209 101,657
Estimated proved developed reserves: Oil (MBbls) . . . . . . . . . . . . . . . . . . . . . . . . . . . . . . . . . . . . 15,416 11,471 11,032 Natural gas (MMcf) . . . . . . . . . . . . . . . . . . . . . . . . . . . . . . 159,459 180,293 169,651 NGLs (MBbls) . . . . . . . . . . . . . . . . . . . . . . . . . . . . . . . . . . 20,181 20,941 19,670 Total estimated proved developed reserves (MBoe) (1) . . 62,173 62,461 58,977
Estimated proved undeveloped reserves: Oil (MBbls) . . . . . . . . . . . . . . . . . . . . . . . . . . . . . . . . . . . . 13,598 12,123 14,376 Natural gas (MMcf) . . . . . . . . . . . . . . . . . . . . . . . . . . . . . . 95,689 102,847 91,945 NGLs (MBbls) . . . . . . . . . . . . . . . . . . . . . . . . . . . . . . . . . . 13,092 13,484 12,980
Total estimated proved undeveloped reserves (MBoe) (1) . 42,639 42,748 42,680 Standardized measure (in millions) (2) . . . . . . . . . . . . . . . . . 566 383 465 PV-10 (in millions) (3) . . . . . . . . . . . . . . . . . . . . . . . . . . . . . . $ 627 $ 401 $ 470
(1) One Boe is equal to six Mcf of natural gas or one Bbl of oil or NGLs based on an approximate energy
equivalency. This is a physical correlation and does not reflect a value or price relationship between the commodities.
(2) Standardized measure is calculated in accordance with ASC Topic 932, Extractive Activities—Oil and Gas. (3) PV-10 is a non-GAAP financial measure and generally differs from Standardized Measure, the most
directly comparable GAAP financial measure, because it does not include the effect of income taxes on discounted future net cash flows. Neither PV-10 nor Standardized Measure represents an estimate of the fair market value of our oil and natural gas properties. The oil and gas industry uses PV-10 as a measure to compare the relative size and value of proved reserves held by companies without regard to the specific tax characteristics of such entities. See “Reconciliation of PV-10 to Standardized Measure” below.

9
The following table sets forth the benchmark prices used to determine our estimated proved reserves for the periods indicated.
As of December 31, 2017 2016 2015
Oil, Natural Gas and NGLs Benchmark Prices: Oil (per Bbl) (1) . . . . . . . . . . . . . . . . . . . . . . . . . . . . . . . . . . . . . $ 51.34 $ 42.75 $ 50.25 Natural gas (per MMBtu) (2) . . . . . . . . . . . . . . . . . . . . . . . . . . 2.96 2.46 2.59 NGLs (per Bbl) (3) . . . . . . . . . . . . . . . . . . . . . . . . . . . . . . . . . . . 18.92 17.73 17.63
(1) Benchmark prices for oil reflect the unweighted arithmetic average first-day-of-the-month prices for the
prior 12 months using WTI Cushing posted prices. These prices were utilized in the reserve reports prepared by Cawley Gillespie and in management’s internal estimates and are adjusted by well for content, quality, transportation fees, geographical differentials, marketing bonuses or deductions and other factors affecting the price received at the wellhead. As of December 31, 2017, 2016 and 2015, the average realized prices for oil were $47.45, $38.80 and $45.97 per Bbl, respectively.
(2) Benchmark prices for natural gas in the table above reflect the unweighted arithmetic average first-day-of-the-month prices for the prior 12 months, respectively, using Henry Hub prices. These prices were utilized in the reserve reports prepared by Cawley Gillespie and in management’s internal estimates and are adjusted by well for content, quality, transportation fees, geographical differentials, marketing bonuses or deductions and other factors affecting the price received at the wellhead. As of December 31, 2017, 2016 and 2015, the average realized prices for natural gas were $2.10, $2.19 and $2.37 per MMBtu, respectively.
(3) Prices for NGLs in the table above reflect the average realized prices for the prior 12 months assuming ethane is recovered from the natural gas stream. Benchmark prices for NGLs vary depending on the composition of the NGL basket and current prices for the various components thereof, such as butane, ethane, and propane, among others. Due to declines in ethane prices relative to natural gas prices, beginning in 2012 through the Arkoma Divestiture, purchasers of our Arkoma Woodford production were electing not to recover ethane from the natural gas stream and instead were paying us based on the natural gas price for the ethane left in the gas stream. As a result of the increased energy content associated with the returned ethane and the absence of plant shrinkage, this ethane rejection increased the incremental revenue and volumes that we received for our natural gas product relative to what we would have received if the ethane was separately recovered, but reduced physical barrels of liquid ethane that we sold.
Reserves Sensitivities
Assuming NYMEX strip pricing as of February 21, 2018 through 2022 and keeping pricing flat thereafter, instead of 2017 SEC pricing, and leaving all other parameters unchanged, the Company’s proved reserves would have been 104.9 MMBoe. This alternative pricing scenario is provided only to demonstrate the impact that the current pricing environment may have on reserves volumes. There is no assurance that these prices will actually be realized. The amount of our proved reserves as of December 31, 2017 calculated using SEC pricing is lower than the amount of our proved reserves calculated using current market prices. Using SEC pricing of December 31, 2017, our total estimated proved reserves were 104.8 MMBoe.
Reconciliation of PV-10 to Standardized Measure
PV-10 is derived from the Standardized Measure of discounted future net cash flows, which is the most directly comparable GAAP financial measure. PV-10 is a computation of the Standardized Measure of discounted future net cash flows on a pre-tax basis. PV-10 is equal to the Standardized Measure of discounted future net cash flows at the applicable date, before deducting future income taxes, discounted at 10 percent. We believe that the presentation of PV-10 is relevant and useful to investors because it presents the discounted future net cash flows attributable to our estimated net proved reserves prior to taking into account future corporate income taxes, and it is a useful measure for evaluating the relative monetary significance of our oil and natural gas properties. Further, investors may utilize the measure as a basis for comparison of the relative size and value of our proved reserves to other companies. We use this measure when assessing the potential return on investment related to our oil and natural gas properties. PV-10, however, is not a substitute for the Standardized Measure of discounted future net cash flows. Our PV-10 measure and the

10
Standardized Measure of discounted future net cash flows do not purport to represent the fair value of our oil and natural gas reserves.
The following table provides a reconciliation of the components of the Standardized Measure of discounted future net cash flows to PV-10 at December 31, 2017, 2016 and 2015.
As of December 31, (in millions of dollars) 2017 2016 2015
Standardized measure . . . . . . . . . . . . . . . . . . . . . . . . . . . . . . . . . . . . . . $ 566 $ 383 $ 465 Present value of future income taxes discounted at 10% . . . . . . . . . . 61 18 5 PV-10 . . . . . . . . . . . . . . . . . . . . . . . . . . . . . . . . . . . . . . . . . . . . . . . . . . . $ 627 $ 401 $ 470
Internal Controls
Our proved reserves are estimated at the well or unit level and compiled for reporting purposes by our corporate reservoir engineering staff. We maintain internal evaluations of our reserves in a secure reserve engineering database. The corporate reservoir engineering staff interacts with our internal petroleum engineers and geoscience professionals in each of our operating areas and with operating, accounting and marketing employees to obtain the necessary data for the reserves estimation process. Reserves are reviewed and approved internally by our senior management team on a semi-annual basis. We expect to have our reserve estimates evaluated by Cawley Gillespie, our independent third-party reserve engineers, or another independent reserve engineering firm, at least annually.
Our internal professional staff works closely with Cawley Gillespie to ensure the integrity, accuracy and timeliness of data that is furnished to them for their reserve estimation process. We provide all of the reserve information maintained in our secure reserve engineering database to the external engineers, as well as other pertinent data, such as geologic maps, well logs, production tests, material balance calculations, well performance data, operating procedures and relevant economic criteria. We make all requested information, as well as our pertinent personnel, available to the external engineers as part of their evaluation of our reserves. Various procedures are used to ensure the accuracy of the data provided to our independent petroleum engineers, including review processes. Changes in reserves from the previous report are closely monitored. Reconciliation of reserves from the previous report, which includes an explanation of all significant changes, is reviewed by both the engineering department and management, including our Executive Vice President of Geosciences and Business Development. Our independent petroleum engineers prepare our annual reserves estimates, whereas interim estimates are internally prepared.
Technology Used to Establish Proved Reserves
Under SEC rules, proved reserves are those quantities of oil and natural gas that by analysis of geoscience and engineering data can be estimated with reasonable certainty to be economically producible from a given date forward from known reservoirs, and under existing economic conditions, operating methods and government regulations. The term “reasonable certainty” implies a high degree of confidence that the quantities of oil and natural gas actually recovered will equal or exceed the estimate. Reasonable certainty can be established using techniques that have been proven effective by actual production from projects in the same reservoir or an analogous reservoir or by other evidence using reliable technology that establishes reasonable certainty. Reliable technology is a grouping of one or more technologies (including computational methods) that has been field tested and has been demonstrated to provide reasonably certain results with consistency and repeatability in the formation being evaluated or in an analogous formation.
To establish reasonable certainty with respect to our estimated proved reserves, our internal reserve engineers and Cawley Gillespie employed technologies that have been demonstrated to yield results with consistency and repeatability. The technologies and economic data used in the estimation of our proved reserves include, but are not limited to, electrical logs, radioactivity logs, core analyses, geologic maps and available downhole and production data, seismic data and well test data. Reserves attributable to producing wells with sufficient production history were estimated using appropriate decline curves or other performance relationships. Reserves attributable to producing wells with limited production history and for undeveloped locations were estimated using performance from analogous wells in the surrounding area and geologic data to assess the reservoir continuity. These wells were considered to be analogous based on production performance from the same formation and well completion using similar techniques.

11
Qualifications of Responsible Technical Persons
Internal technical specialist. Jeff Tanner, our Executive Vice President of Geosciences and Business Development, is the technical specialist responsible for overseeing the preparation of our reserves estimates. He has over 30 years of diverse technical and managerial experience in the oil and gas industry. Prior to joining Jones Energy, Mr. Tanner was Vice President, Exploration for Southwestern Energy. During his career, Mr. Tanner has held a variety of management and technical positions for Laredo Petroleum, Cabot Oil and Gas, and Noble Energy. He began his career with Royal Dutch Shell plc in Houston. Mr. Tanner is a member of the American Association of Petroleum Geologists and the Houston Geological Society. He holds a B.S. in Geology from Texas A&M and an M.S. in Geology from the University of Houston.
Cawley Gillespie. Cawley, Gillespie & Associates, Inc. is a Texas Registered Engineering Firm (F-693), made up of independent registered professional engineers and geologists. The firm has provided petroleum consulting services to the oil and gas industry for over 50 years. No director, officer, or key employee of Cawley Gillespie has any financial ownership in us or any of our affiliates. Cawley Gillespie’s compensation for the required investigations and preparation of its report is not contingent upon the results obtained and reported, and Cawley Gillespie has not performed other work for us that would affect its objectivity. The engineering audit presented in the Cawley Gillespie report was supervised by W. Todd Brooker, President at Cawley Gillespie. Mr. Brooker is an experienced reservoir engineer having been a practicing petroleum engineer since 1989. He has more than 25 years of experience in reserves evaluation and joined Cawley Gillespie as a reserve engineer in 1992. He has a Bachelor’s of Science Degree in Petroleum Engineering from the University of Texas at Austin and is a Registered Professional Engineer in the State of Texas (License No. 83462).
Development of Proved Undeveloped Reserves
As of December 31, 2017, none of our proved undeveloped reserves at December 31, 2017 were scheduled to be developed on a date more than five years from the date the reserves were initially booked as proved undeveloped. However, certain of our proved undeveloped reserves are associated with joint development agreements with third parties that include obligations to drill a specified minimum number of wells in a time frame that is shorter than five years. If we do not meet our obligation to drill the minimum number of wells specified in a joint development agreement, we will lose the right to continue to develop the undeveloped acreage covered by the agreement, which in some cases would result in a reduction in our proved undeveloped reserves. Historically, our drilling and development programs were substantially funded from our cash flow from operations and the capital markets. Our expectation is to continue to fund our drilling and development programs primarily from our cash flow from operations and cash on our balance sheet, as well as potential non-strategic asset sales or potentially accessing the public debt and/or equity markets. Based on our current expectations of our cash resources and drilling and development programs, which include drilling of proved undeveloped locations, we believe that we will be able to fund the drilling of our current inventory of proved undeveloped locations in the next five years. For a more detailed discussion of our liquidity position, please read “Management’s Discussion and Analysis of Financial Condition and Results of Operations—Liquidity and Capital Resources.”
Total (MMBoe)
Estimated Proved Undeveloped Reserves December 31, 2015 . . . . . . . . . . . . . . . . . . . . . . . . . . . . . . . . . . . . . . . . . . . . . . . . . . . . . 42.7
Extensions and discoveries . . . . . . . . . . . . . . . . . . . . . . . . . . . . . . . . . . . . . . . . . . . . 2.0 Conversion to proved developed . . . . . . . . . . . . . . . . . . . . . . . . . . . . . . . . . . . . . . . . (5.9)Purchases of minerals in place . . . . . . . . . . . . . . . . . . . . . . . . . . . . . . . . . . . . . . . . . 9.2 Sales of minerals in place . . . . . . . . . . . . . . . . . . . . . . . . . . . . . . . . . . . . . . . . . . . . . — Revisions of previous estimates . . . . . . . . . . . . . . . . . . . . . . . . . . . . . . . . . . . . . . . . (5.3)
December 31, 2016 . . . . . . . . . . . . . . . . . . . . . . . . . . . . . . . . . . . . . . . . . . . . . . . . . . . . . 42.7 Extensions and discoveries . . . . . . . . . . . . . . . . . . . . . . . . . . . . . . . . . . . . . . . . . . . . 13.8 Conversion to proved developed . . . . . . . . . . . . . . . . . . . . . . . . . . . . . . . . . . . . . . . . (6.2)Purchases of minerals in place . . . . . . . . . . . . . . . . . . . . . . . . . . . . . . . . . . . . . . . . . — Sales of minerals in place . . . . . . . . . . . . . . . . . . . . . . . . . . . . . . . . . . . . . . . . . . . . . (1.6)Revisions of previous estimates . . . . . . . . . . . . . . . . . . . . . . . . . . . . . . . . . . . . . . . . (6.1)
December 31, 2017 . . . . . . . . . . . . . . . . . . . . . . . . . . . . . . . . . . . . . . . . . . . . . . . . . . . . . 42.6

12
We have nearly maintained the volume of our proved undeveloped reserves year-over-year, from 42.7 MMBoe as of December 31, 2016 to 42.6 MMBoe as of December 31, 2017. The slight reduction was due to (i) negative revisions of 7.3 MMBoe of proved undeveloped reserves rescheduled outside of five years from their initial booking due to reduced Western Anadarko drilling and (ii) net negative revisions of 3.4 MMBoe due to lease expirations. These were offset by increases due to (iii) additions of 3.4 MMBoe from increased working interest and (iv) additions of 1.2 MMBoe from increased pricing. Proved undeveloped reserves remained constant as a percentage of total reserves at 41% for the years ended December 31, 2017 and 2016. Proved undeveloped reserves decreased as a percentage of total reserves from 42% for the year ended December 31, 2015 to 41% for the year ended December 31, 2016.
For the year ended December 31, 2017, we converted 6.2 MMBoe of proved undeveloped reserves to proved developed reserves or 15% of total proved undeveloped reserves booked at December 31, 2016. Our 2017 capital expenditures totaled $248.0 million (excluding the impact of asset retirement costs, asset disposals and non-cash impairments of oil and gas properties), of which $205.7 million was utilized to drill and complete operated wells, including wells that had no proved undeveloped reserves associated with them prior to drilling. The Company has established an initial capital budget of $150.0 million for 2018, with the majority dedicated to drilling and completion activities. Costs of proved undeveloped reserve development in 2017 do not represent the total costs of these conversions, as additional costs may have been incurred in previous years. Estimated future development costs relating to the development of 2017 year-end proved undeveloped reserves is $400.0 million, all of which is scheduled to be incurred within five years of initial proved reserve booking. All drilling locations classified as proved undeveloped reserves in the year-end reserve report are scheduled to be drilled within five years of initial proved reserve booking.
Operating Data
The following table sets forth summary data regarding production volumes, average prices and average production costs associated with our sale of oil and natural gas for the periods indicated.
Year Ended December 31, 2017 2016 2015
Production and Operating Data: Net Production Volumes:
Oil (MBbls) . . . . . . . . . . . . . . . . . . . . . . . . . . . . . . . . . . . . . 1,964 1,685 2,583 Natural gas (MMcf) . . . . . . . . . . . . . . . . . . . . . . . . . . . . . . . 20,425 18,842 23,839 NGLs (MBbls) . . . . . . . . . . . . . . . . . . . . . . . . . . . . . . . . . . . 2,418 2,204 2,618
Total (MBoe) . . . . . . . . . . . . . . . . . . . . . . . . . . . . . . . . . . . 7,786 7,029 9,174 Average net production (Boe/d) . . . . . . . . . . . . . . . . . . . . 21,332 19,205 25,134
Average Sales Price (1): Oil (per Bbl) . . . . . . . . . . . . . . . . . . . . . . . . . . . . . . . . . . . . . $ 47.46 $ 37.83 $ 44.15 Natural gas (per Mcf) . . . . . . . . . . . . . . . . . . . . . . . . . . . . . 2.07 1.67 1.91 NGLs (per Bbl) . . . . . . . . . . . . . . . . . . . . . . . . . . . . . . . . . . 21.09 13.48 13.36 Combined (per Boe) realized . . . . . . . . . . . . . . . . . . . . . . . 23.94 17.77 21.21
Average Costs per Boe: Lease operating . . . . . . . . . . . . . . . . . . . . . . . . . . . . . . . . . . $ 4.71 $ 4.64 $ 4.47 Production and ad valorem taxes . . . . . . . . . . . . . . . . . . . . 0.88 1.11 1.32 Depreciation, depletion and amortization . . . . . . . . . . . . . 21.48 21.90 22.40 General and administrative (2) . . . . . . . . . . . . . . . . . . . . . . 3.84 4.22 3.64
(1) Prices do not include the effects of derivative cash settlements.
(2) General and administrative includes non-cash compensation of $6.5 million, $8.2 million and $8.0 million for the years ended December 31, 2017, 2016 and 2015, respectively. Excluding non-cash compensation from the above metric results in average cash general and administrative cost per Boe of $3.01, $3.05 and $2.77 for the years ended December 31, 2017, 2016 and 2015, respectively.

13
Drilling Activity
The following table sets forth information with respect to wells drilled during the periods indicated. The information should not be considered indicative of future performance, nor should a correlation be assumed between the number of productive wells drilled, quantities of reserves found or economic value.
Year Ended December 31, 2017 2016 2015 Gross Net Gross Net Gross Net
Development Wells: Productive . . . . . . . . . . . . . . . . . . . . . . . . . . . . . . . . . . . . 68 56 42 37 51 47 Mechanical failure (1) . . . . . . . . . . . . . . . . . . . . . . . . . . — — 3 3 1 1 Dry . . . . . . . . . . . . . . . . . . . . . . . . . . . . . . . . . . . . . . . . . 1 1 — — — —
Exploratory Wells: Productive . . . . . . . . . . . . . . . . . . . . . . . . . . . . . . . . . . . . 1 1 1 1 — — Dry . . . . . . . . . . . . . . . . . . . . . . . . . . . . . . . . . . . . . . . . . — — — — — —
Total Wells: Productive . . . . . . . . . . . . . . . . . . . . . . . . . . . . . . . . . . . . 69 57 43 38 51 47 Mechanical failure (1) . . . . . . . . . . . . . . . . . . . . . . . . . . — — 3 3 1 1 Dry . . . . . . . . . . . . . . . . . . . . . . . . . . . . . . . . . . . . . . . . . 1 1 — — — —
Total . . . . . . . . . . . . . . . . . . . . . . . . . . . . . . . . . . . . . . . 70 58 46 41 52 48
(1) Mechanical failures represent wells drilled during the year indicated which were classified as “Proved
Developed Non-Producing” in the Reserve Report for that year, but are not currently in the process of completion at the end of the year.
For the three years ended December 31, 2017, we had one developmental or exploratory well that was deemed to be a dry well. As of December 31, 2017, there was one exploratory well drilled, but not yet completed. As of December 31, 2017, there were three development wells in the process of drilling and nine wells in the process of completions. For the three years ended December 31, 2017, we drilled 168 gross (147 net) wells as operator with over a 97% success rate.
During the twelve months ended December 31, 2017, we successfully drilled 69 gross proved undeveloped wells and completed 65 gross proved undeveloped wells.
Productive Wells
The following table sets forth our total gross and net productive wells by oil or natural gas classification as of December 31, 2017.
Oil Natural Gas Total Gross Net Gross Net Gross Net
Operated (1) . . . . . . . . . . . . . . . . . . . . . . . . . . . . . . . . 269 223 326 280 595 503 Non-operated . . . . . . . . . . . . . . . . . . . . . . . . . . . . . . . 97 16 352 72 449 88
Total . . . . . . . . . . . . . . . . . . . . . . . . . . . . . . . . . . . 366 239 678 352 1,044 591
(1) Includes wells on which we act as contract operator.
Gross wells are the total number of producing wells in which we own an interest, and net wells are the sum of our fractional working interests owned in gross wells.
Acreage Data
The following table sets forth certain information regarding the developed and undeveloped acreage in which we have an interest as of December 31, 2017 for each of our producing areas. Acreage related to royalty, overriding royalty and

14
other similar interests is excluded from this summary. As of December 31, 2017, approximately 81% of our leasehold acreage was held by existing production.
Developed Acres Undeveloped Acres Total Gross Net Gross Net Gross Net
Western Anadarko . . . . . . . . 184,798 129,859 29,964 22,332 214,762 152,191 Eastern Anadarko . . . . . . . . 31,746 8,665 95,093 13,819 126,839 22,484 Other . . . . . . . . . . . . . . . . . . 33,191 18,887 317 7 33,508 18,894
All properties . . . . . . . . . 249,735 157,411 125,374 36,158 375,109 193,569 Undeveloped Acreage Expirations
The following table sets forth the number of gross and net undeveloped acres as of December 31, 2017 that will expire over the next three years by operating area unless production is established within the spacing units covering the acreage prior to the expiration dates or unless the existing leases are renewed prior to expiration.
Expiring 2018 Expiring 2019 Expiring 2020 Thereafter Gross Net Gross Net Gross Net Gross Net
Western Anadarko . . 17,253 12,777 6,285 5,041 4,456 3,985 1,970 528 Eastern Anadarko . . 35,396 6,715 45,636 5,363 14,061 1,742 — — Other . . . . . . . . . . . . — — 317 7 — — — —
All properties . . . 52,649 19,492 52,238 10,411 18,517 5,727 1,970 528 A majority of the leases comprising the acreage set forth in the table above will expire at the end of their respective primary terms unless operations have commenced or production from the acreage has been established prior to such date, in which event the lease will remain in effect until the cessation of operations or production in commercial quantities. We also have options to extend some of our leases through payment of additional lease bonus payments prior to the expiration of the primary term of the leases. In addition, we may attempt to secure a new lease upon the expiration of certain of our acreage; however, there may be third-party leases that become effective immediately if our leases expire at the end of their respective terms and production has not been established prior to such date. We do not have any of our proved undeveloped reserves as of December 31, 2017 attributed to acreage whose lease expiration date precedes the scheduled initial drilling date. Our leases are mainly fee leases with primary terms of three to five years. We believe that our lease terms are similar to our competitors’ fee lease terms as they relate to both primary term and royalty interests.
Competition
The oil and natural gas industry is highly competitive. We compete with numerous entities, including major domestic and foreign oil companies, other independent oil and natural gas concerns and individual producers and operators. Many of these competitors are large, well-established companies and have financial and other resources substantially greater than ours. As a result, our competitors may be able to pay more for productive oil and natural gas properties and exploratory prospects, as well as evaluate, bid for and purchase a greater number of properties and prospects than our financial or personnel resources permit. Our ability to acquire additional properties and to find and develop reserves will depend on our ability to evaluate and select suitable properties and to consummate transactions in a highly competitive environment. Please read “Risk Factors—We may be unable to compete effectively with larger companies, which may adversely affect our ability to generate sufficient revenues.”
We are also affected by competition for drilling rigs, equipment, services, supplies and qualified personnel. Starting with the downturn in commodity prices in late 2014, the United States onshore oil and natural gas industry experienced a surplus of drilling and completion rigs, equipment, pipe and personnel, due to significantly lower commodity prices. Although this provided a temporary respite from the previous high demand environment, demand for such services and equipment have recently begun to increase as commodity prices have started to recover. If commodity prices continue to increase and exploration and production activity increases, market forces may revert to the previous situation that resulted in delayed development drilling and other exploration activities and caused significant increases in the prices for this equipment and personnel. We are unable to predict when, or if, such changes may occur or how they would affect our development and exploitation programs.

15
Segment Information and Geographic Areas
The Company operates in one industry segment, which is the exploration, development and production of oil and natural gas, and all of its operations are conducted in one geographic area of the United States, as described under “—Our Operations—Our Areas of Operations.”
Oil and Natural Gas Leases
The typical oil and natural gas lease agreement covering our properties provides for the payment of royalties to the mineral owner for all oil and natural gas produced from any wells drilled on the leased premises. The lessor royalties and other leasehold burdens on our properties generally range from 19% to 25%. Our net revenue interests average 55% for our operated leases and 23% including all operated and non-operated leases.
Approximately 81% of our leases (based on net acreage) are held by existing production and do not require lease rental payments.
Marketing and Major Customers
Our oil is generally sold under short-term, extendable and cancellable agreements with unaffiliated purchasers based on published price bulletins reflecting an established field posting price. As a consequence, the prices we receive for oil and liquids move up and down in direct correlation with the oil market as it reacts to supply and demand factors. We do not own any oil or liquids pipelines or other assets for the transportation of those commodities, and transportation costs related to moving oil are deducted from the price received for oil. In September of 2014, we signed a 10-year oil gathering and transportation agreement with Monarch Oil Pipeline LLC, pursuant to which Monarch Oil Pipeline LLC built, at its expense, a new oil gathering system and connected the gathering system to our dedicated leases in Texas. The system began service during the fourth quarter of 2015 and provides connectivity to both a regional refinery market as well as the Cushing market hub. We have reserved capacity of up to 12,000 barrels per day on the system with the potential to increase throughput at a future date.
Our natural gas is sold under both long-term and short-term natural gas purchase agreements. Natural gas produced by us is sold at various delivery points at or near producing wells to natural gas gathering and marketing companies. We receive proceeds from prices that are based on various pipeline indices less any associated fees. On virtually all of our natural gas production, we are paid for the extracted NGLs based on a negotiated percentage of the proceeds that are generated from the customer’s sale of the liquids, or based on other negotiated pricing arrangements. We do not own any natural gas pipelines or other assets for the transportation of natural gas.
During the year ended December 31, 2017, the largest purchasers of our production were Plains Marketing LP (“Plains Marketing”) and ETC Field Services LLC, which accounted for approximately 40% and 22% of consolidated oil and gas sales, respectively. If we were to lose any one of our customers, the loss could temporarily delay production and sale of our oil and natural gas in the related producing region. If we were to lose any single customer, we believe we could identify a substitute customer to purchase the impacted production volumes. However, if one or more of our larger customers ceased purchasing oil or natural gas altogether, the loss of such customer could have a detrimental effect on our production volumes in general and on our ability to find substitute customers to purchase our production volumes. For a discussion of the risks associated with the loss of key customers, please read “Risk factors—Our customer base is concentrated, and the loss of any one of our key customers could, therefore, adversely affect our financial condition and results of operations.”
Seasonality
Generally, but not always, the demand for natural gas decreases during the summer months and increases during the winter months, resulting in seasonal fluctuations in the price we receive for our natural gas production. Seasonal anomalies such as mild winters sometimes lessen this fluctuation.
Title to Properties
Prior to completing an acquisition of producing oil and natural gas properties, we perform title reviews on significant leases, and depending on the materiality of properties, we may obtain a title opinion or review previously obtained title opinions. As a result, title examinations have been obtained on a significant portion of our properties.

16
As is customary in the oil and natural gas industry, we initially conduct only a cursory review of the titles to our properties on which we do not have proved reserves. Prior to the commencement of drilling operations on those properties, we conduct a thorough title examination and perform curative work with respect to material defects. To the extent title opinions or other investigations reflect title defects on those properties, we are typically responsible for curing any title defects at our expense. We generally will not commence drilling operations on a property until we have cured any material title defects on such property.
We conduct a portion of our operations through joint development agreements with third parties. Certain of our joint development agreements include complete-to-earn arrangements, whereby we are assigned title to properties from the third-party after we complete wells. Occasionally, delivery of such assignments may be delayed. Furthermore, certain of our joint development agreements specify that assignments are only to occur when the wells are capable of producing hydrocarbons in paying quantities. These additional conditions to assignment of title may from time to time apply to wells of substantial value.
We believe that we have satisfactory title to all of our material assets. Although title to these properties is subject to encumbrances in some cases, such as customary interests generally retained in connection with the acquisition of real property, customary royalty interests and contract terms and restrictions, liens under operating agreements, liens related to environmental liabilities associated with historical operations, liens for current taxes and other burdens, easements, restrictions and minor encumbrances customary in the oil and natural gas industry, we believe that none of these liens, restrictions, easements, burdens and encumbrances will materially detract from the value of these properties or from our interest in these properties or materially interfere with our use of these properties in the operation of our business. In addition, we believe that we have obtained sufficient rights-of-way grants and permits from public authorities and private parties for us to operate our business in all material respects as described in this Annual Report on Form 10-K.
Regulations
Our operations are substantially affected by federal, state and local laws and regulations. In particular, natural gas production and related operations are, or have been, subject to price controls, taxes and numerous other laws and regulations. All of the jurisdictions in which we own or operate producing oil and natural gas properties have statutory provisions regulating the exploration for and production of oil and natural gas, including provisions related to permits for the drilling of wells, bonding requirements to drill or operate wells, the location of wells, the method of drilling and casing wells, the surface use and restoration of properties upon which wells are drilled, sourcing and disposal of water used in the drilling and completion process, and the abandonment of wells. Our operations are also subject to various conservation laws and regulations. These include the regulation of the size of drilling and spacing units or proration units, the number of wells which may be drilled in an area, and the unitization or pooling of wells, as well as regulations that generally prohibit the venting or flaring of natural gas, and impose certain requirements regarding the ratability or fair apportionment of production from fields and individual wells. The effect of these regulations is to limit the amount of oil and natural gas that we can produce from our wells and limit the number of wells or locations at which we can drill, although we can apply for exceptions to such regulations or to have reductions in well spacing. Moreover, each state generally imposes a production or severance tax with respect to the production and sale of oil, natural gas and NGLs within its jurisdiction.
Failure to comply with applicable laws and regulations can result in substantial penalties. The regulatory burden on the industry increases the cost of doing business and affects profitability. Although we believe we are in substantial compliance with all applicable laws and regulations, such laws and regulations are frequently amended or reinterpreted. Therefore, we are unable to predict the future costs or impact of compliance. Additional proposals and proceedings that affect the oil and natural gas industry are regularly considered by Congress and federal agencies, the states, and the courts. We cannot predict when or whether any such proposals may become effective. Our competitors in the oil and natural gas industry are generally subject to the same regulatory requirements and restrictions that affect our operations.
Environmental Matters and Regulation
Our operations are subject to stringent and complex federal, state and local laws and regulations that govern the protection of the environment, as well as the discharge of materials into the environment. These laws and regulations may, among other things:
• require the acquisition of various permits before drilling commences;

17
• require the installation of pollution control equipment in connection with operations;
• restrict or prohibit our drilling and production activities during periods when such activities might affect protected wildlife;
• place restrictions or regulations upon the types, quantities or concentrations of materials or substances used in our operations;
• restrict the types, quantities or concentrations of various substances that can be released into the environment or used in connection with drilling, production and transportation activities;
• limit or prohibit drilling activities on lands lying within wilderness, wetlands and other protected areas; and
• require remedial measures to mitigate pollution from former and ongoing operations, such as site restoration, pit closure and plugging of abandoned wells.
These laws and regulations may also restrict the rate of oil and natural gas production below the rate that would otherwise be possible. The regulatory burden on the oil and natural gas industry increases the cost of doing business in the industry and consequently affects profitability. Additionally, federal, state and local lawmakers and agencies frequently revise environmental laws and regulations. Such changes could affect costs for environmental compliance, such as waste handling, permitting, or cleanup for the oil and natural gas industry and could have a significant impact on our operating costs.
The following is a summary of some of the existing laws and regulations to which our business operations are subject.
Solid and Hazardous Waste Handling and Releases
The federal Resource Conservation and Recovery Act, or RCRA, and comparable state statutes regulate the generation, transportation, treatment, storage, disposal and cleanup of hazardous and non-hazardous waste. Drilling fluids, produced waters, and most of the other wastes associated with the exploration, development, production and transportation of oil and gas are currently excluded from regulation as hazardous wastes under RCRA. In the course of our operations, however, we generate some industrial wastes, such as paint wastes, waste solvents, and waste oils, which may be regulated as hazardous wastes. Although a substantial amount of the waste generated in our operations are regulated as non-hazardous solid waste rather than hazardous waste, there is no guarantee that the U.S. Environmental Protection Agency, or the EPA, or individual states will not adopt more stringent requirements for the handling of non-hazardous waste. Moreover, it is possible that certain oil and gas exploration and production wastes now classified as non-hazardous could be classified as hazardous wastes in the future. Pursuant to a Consent Decree with environmental groups that filed suit in 2016, EPA must review the exemption of oil and gas exploration and production wastes under RCRA by March 2019 and either determine revisions to the exemption are not necessary or undertake rulemaking to be completed by July 2021. Any repeal or modification of this or similar exemptions in comparable state statutes, would increase the volume of hazardous waste we are required to manage and dispose of, and would cause us, as well as our competitors, to incur increased operating expenses. Any such change could result in an increase in our costs to manage and dispose of waste, which could have a material adverse effect on our results of operations and financial position.
The Comprehensive Environmental Response, Compensation, and Liability Act, or CERCLA, also known as “Superfund,” and comparable state laws and regulations impose liability without regard to fault or legality of the original conduct, on certain classes of persons with respect to the release into the environment of substances designated under CERCLA as hazardous substances. These classes of persons, or so-called potentially responsible parties, or PRPs, include current and past owners or operators of a site where the release occurred and anyone who disposed or arranged for the disposal of a hazardous substance released at a site. Under CERCLA, such persons may be subject to joint and several, strict liability for the costs of cleaning up the hazardous substances released into the environment, for damages to natural resources and for the costs of certain health studies. CERCLA also authorizes the EPA and, in some instances, third parties to take actions in response to threats to public health or the environment and to seek to recover from the PRPs the costs of such action. Many states have adopted comparable or more stringent state statutes. In addition, it is not uncommon for neighboring landowners and other third parties to file claims for personal injury and property damage allegedly caused by the hazardous substances released into the environment.

18
Although CERCLA generally exempts “petroleum” from the definition of hazardous substance, in the course of our operations, we have generated and will generate wastes that may fall within CERCLA’s definition of hazardous substances and may have disposed of these wastes at disposal sites owned and operated by others. We may also be the owner or operator of sites on which hazardous substances have been released. To our knowledge, neither we nor our predecessors have been designated as a PRP by the EPA under CERCLA; we also do not know of any prior owners or operators of our properties that are named as PRPs related to their ownership or operation of such properties. If contamination is discovered at a site on which we are or have been an owner or operator or to which we sent hazardous substances, we could be liable for the costs of investigation and remediation and natural resources damages.
We currently own, lease, or operate numerous properties that have been used for oil and natural gas exploration and production for many years. Although we believe we have utilized operating and waste disposal practices that were standard in the industry at the time, hazardous substances, wastes or hydrocarbons may have been released on or under the properties owned, leased or operated by us, or on or under other locations, including offsite locations, where such substances have been taken for disposal. In addition, some of these properties have been operated by third parties or by previous owners or operators whose treatment and disposal of hazardous substances, wastes, or hydrocarbons were not under our control. These properties and the substances disposed or released on them may be subject to RCRA, CERCLA, and analogous state laws. Spills or other contamination required to be remediated have not required material capital expenditures to date. In the future, we could be required to remediate property, including groundwater, containing or impacted by previously disposed wastes (including wastes disposed or released by prior owners or operators, or property contamination, including groundwater contamination by prior owners or operators) or to perform remedial plugging operations to prevent future or mitigate existing contamination.
Clean Water Act
The federal Water Pollution Control Act, or the Clean Water Act, and analogous state laws impose restrictions and strict controls with respect to the discharge of pollutants, including spills and leaks of produced water and other oil and natural gas wastes, into waters of the United States or waters of the state, both broadly defined terms. The discharge of pollutants into regulated waters is prohibited, except in accordance with the terms of a permit issued by the EPA or an analogous state agency. The Clean Water Act also prohibits the discharge of dredge and fill material in regulated waters, including wetlands, unless authorized by a permit issued by the U.S. Army Corps of Engineers. Federal and state regulatory agencies can impose administrative, civil and criminal penalties, as well as require remedial or mitigation measures, for non-compliance with discharge permits or other requirements of the Clean Water Act and analogous state laws and regulations. In the event of an unauthorized discharge of pollutants, we may be liable for penalties and costs. The EPA and the U.S. Army Corps of Engineers adopted in June 2015 a rule redefining the term “waters of the United States,” which establishes the scope of regulated waters under the Clean Water Act. Pursuant to an Executive Order released February 28, 2017, the agencies are in the process of reviewing the 2015 rule for rescission or revision. In addition, the 2015 rule has been and remains the subject of litigation challenging the rule. A nationwide judicial stay of the 2015 rule is expected to be lifted in February 2018 due to a recent Supreme Court decision addressing whether federal circuit courts or district courts have jurisdiction over challenges to the 2015 rule. The agencies adopted a rule on February 6, 2018 delaying the applicability of this rule nationwide until February 6, 2020, to allow time for the anticipated new rulemaking. The rule delaying applicability of the 2015 rule until 2020, however, has also been challenged in federal courts. Therefore, Texas, Louisiana, and Mississippi have asked a federal district court for a nationwide preliminary injuction of the 2015 rule. The EPA also finalized regulations in 2016 under the Clean Water Act to set a zero-discharge standard for wastewater discharges from hydraulic fracturing and other natural gas production activities to publicly-owned treatment works.
Safe Drinking Water Act
The Safe Drinking Water Act, or SDWA, regulates, among other things, underground injection operations. Congress in the past has considered legislation that would impose additional regulation under the SDWA upon the use of hydraulic fracturing fluids. If similar legislation is enacted in the future, it could impose on our hydraulic fracturing operations permit and financial assurance requirements, requirements that we adhere to construction specifications, fulfill monitoring, reporting and recordkeeping obligations, and meet plugging and abandonment requirements. In addition to subjecting the injection of hydraulic fracturing to the SDWA regulatory and permitting requirements, the previously proposed legislation would have required the disclosure of the chemicals within the hydraulic fluids. In addition, the EPA has taken the position that hydraulic fracturing with fluids containing diesel fuel is subject to the Underground Injection Control program in states in which the EPA is the permitting authority and released permitting guidance on the use of diesel fuel as an additive in hydraulic fracturing fluids. On December 13, 2016, the EPA released a study of the

19
potential adverse effects that hydraulic fracturing may have on water quality and public health, concluding that there is scientific evidence that hydraulic fracturing activities can potentially impact drinking water resources in the United States under some circumstances. A committee of the U.S. House of Representatives conducted its own investigation into hydraulic fracturing practices. The U.S. Department of Energy also studied hydraulic fracturing and provided broad recommendations regarding best practices and other steps to enhance companies’ safety and environmental performance of hydraulic fracturing. Legislation or other new requirements or restrictions regarding hydraulic fracturing could substantially increase compliance costs and the requirements could negatively impact our ability to conduct fracturing activities on our assets.
Other Regulation of Hydraulic Fracturing
On May 19, 2014, the EPA published an advance notice of rulemaking under the Toxic Substances Control Act, to gather information regarding the potential regulation of chemical substances and mixtures used in oil and gas exploration and production. Also, effective June 24, 2015, the Bureau of Land Management, or BLM, adopted rules regarding well stimulation, chemical disclosures, water management, and other requirements for hydraulic fracturing on federal and Indian lands; however these rules were rescinded by rule in December 2017. BLM also adopted rules effective on January 17, 2017 to reduce venting, flaring, and leaks during oil and natural gas production activities on onshore federal and Indian leases. EPA issued a two-year stay of these requirements in December 2017 and on February 13, 2018 announced a rule proposal torescind several requirements and revise others. Effective December 5, 2016, the U.S. National Park Service, or NPS, finalized updates to its regulations governing non-federal oil and gas rights, notably, eliminating exemptions affecting approval requirements for approximately 60% of the oil and gas operations located within the national park system and purporting to adopt under its own authority, the BLM rules on well stimulation invalidated by a district court. This regulation is targeted for agency review for potential rescission or revision purusant to the Executive Order No. 13783 titled “Promoting Energy Independence and Economic Growth” dated March 28, 2017.
Hydraulic fracturing is also subject to regulation at the state and local levels. Several states have proposed or adopted legislative or administrative rules regulating hydraulic fracturing operations. For example, in 2011 the Railroad Commission of Texas adopted the Hydraulic Fracturing Chemical Disclosure Rule. The rule requires public disclosure of chemicals in fluids used in the hydraulic fracturing process for drilling permits issued after February 1, 2012. Additionally, Texas has authorized the Texas Commission on Environmental Quality to suspend water use rights for oil and gas users in the event of serious drought conditions and has imposed more stringent emissions, monitoring, inspection, maintenance, and repair requirements on Barnett Shale operators to minimize Volatile Organic Compound, or VOC, releases. Other states that we operate in, including Oklahoma, have adopted similar chemical disclosure measures.
Some states, including Oklahoma and Texas, also assert the authority to shut down injection wells that are deemed to contribute to induced seismicity, or seismic activity that is caused by human activity. For example, on August 3, 2015, the Oklahoma Corporation Commission (“OKCC”) adopted a plan calling for mandatory reductions in oil and gas wastewater disposal well volumes to address potential induced seismicity in Oklahoma, which was implemented in 2015 and 2016 by ongoing reductions or shut ins of disposal wells. In February 2017, the OKCC issued a directive aimed at limiting the growth in future underground injection disposal rates into the Arbuckle formation in an area with seismicity issues. In December 2016, the OKCC announced seismicity guidelines for hydraulic fracturing operations, under which monitoring results can trigger a pause or suspension of hydraulic fracturing operations to evaluate seismic activity. Please see “Risk Factors—Federal and state legislative and regulatory initiatives relating to hydraulic fracturing and other oil and gas production activities as well as governmental reviews of such activities could result in increased costs, additional operating restrictions or delays, which could adversely affect our production” for a further discussion of state hydraulic fracturing regulation. In addition to state laws, local land use restrictions, such as city ordinances, may restrict or prohibit the performance of well drilling in general and/or hydraulic fracturing in particular.
Oil Pollution Act
The primary federal law related to oil spill liability is the Oil Pollution Act, or the OPA, which amends and augments oil spill provisions of the Clean Water Act and imposes certain duties and liabilities on certain “responsible parties” related to the prevention of oil spills and damages resulting from such spills in or threatening United States waters or adjoining shorelines. For example, operators of certain oil and gas facilities must develop, implement and maintain facility response plans, conduct annual spill training for certain employees and provide varying degrees of financial assurance. A liable “responsible party” includes the owner or operator of a facility, vessel or pipeline that is a source of an oil

20
discharge or that poses the substantial threat of discharge, or in the case of offshore facilities, the lessee or permittee of the area in which a discharging facility is located. OPA assigns strict joint and several liability, without regard to fault, to each liable party for oil removal costs and a variety of public and private damages. Although defenses exist to the liability imposed by OPA, they are limited. In the event of an oil discharge or substantial threat of discharge, we may be liable for costs and damages.
Air Emissions
Our operations may be subject to the Clean Air Act, or CAA, and comparable state and local requirements for the control of emissions from sources of air pollution. Federal and state laws require new and modified sources of air pollutants to obtain permits prior to commencing construction. Major sources of air pollutants are subject to more stringent, federally imposed requirements including additional permits. Federal and state laws designed to control hazardous (toxic) air pollutants, might require installation of additional controls. Administrative enforcement actions for failure to comply strictly with air pollution regulations or permits are generally resolved by payment of monetary fines and correction of any identified deficiencies. Alternatively, regulatory agencies could bring lawsuits for civil penalties or injunctions or require us to forego construction, modification or operation of certain air emission sources.
We may incur expenditures in the future for air pollution control equipment in connection with obtaining or maintaining operating permits and approvals for air emissions. For instance, effective October 15, 2012, final federal rules established new air emission controls for oil and natural gas production and natural gas processing operations, specifically addressing emissions of sulfur dioxide and volatile organic compounds, and hazardous air pollutants frequently associated with oil and natural gas production and processing activities. The rules establish specific requirements regarding emissions from compressors, dehydrators, storage tanks and other production equipment in addition to leak detection requirements for natural gas processing plants. In October 2012, several challenges to the EPA’s rules were filed by various parties, including environmental groups and industry associations. In a January 16, 2013 unopposed motion to hold this litigation in abeyance, the EPA indicated that it may reconsider some aspects of the rules. The case remains in abeyance. The EPA has since made several changes to the rules and has indicated that it may reconsider other aspects of the rules. Depending on the outcome of such judicial proceedings and regulatory actions, the rules may be further modified or rescinded or the EPA may issue new rules. These rules, as well as any modifications to these rules or additional rules, could require a number of modifications to our operations including the installation of new equipment. We have already reported some of our facilities as being subject to these rules and have incurred, and will continue to incur, costs to control emissions, and to satisfy reporting and other administrative requirements associated with these rules. Additionally, federal rules to regulate emissions of methane and volatile organic compounds from new and modified sources in the oil and gas sector and to establish the alternative criteria for aggregating multiple small surface sites into a single source for air-quality permitting purposes became effective on August 2, 2016. This aggregation rule could cause small facilities, on an aggregate basis, to be deemed a major source, thereby triggering more stringent air permitting processes and requirements across the oil and gas industry. Further, in 2015, the EPA adopted a lower national ambient air quality standard for ozone. This lower standard may cause additional areas to be designated as ozone nonattainment areas, causing states to revise their implementation plans to require additional emissions control equipment and to impose more stringent permit requirements on facilities in those areas. EPA anticipates promulgating final area designations under the new standard in the first half of 2018.
Endangered Species and Migratory Birds
The Endangered Species Act, or ESA, restricts activities that may affect endangered or threatened species or their habitats. Pursuant to the ESA, if a species is listed as threatened or endangered, activities adversely affecting that species or its habitat may be considered “take” and may incur liability. Similar protections are offered to migratory birds under the Migratory Bird Treaty Act. Criminal liability has been imposed in some jurisdictions for even an incidental taking of migratory birds, and the federal government recently issued indictments under the Migratory Bird Treaty Act to several oil and gas companies after dead migratory birds were found near reserve pits associated with drilling activities. However, on December 22, 2017, the U.S. Department of the Interior issued a new legal opinion that concludes that the Migratory Bird Treaty Act does not prohibit the accidental or “incidental” taking or killing of migratory birds.
We conduct operations in areas where certain species that are listed as threatened or endangered under the ESA may be present. On March 27, 2014, the U.S. Fish and Wildlife Service listed the Lesser Prairie Chicken as a threatened species under the Endangered Species Act. The designated habitat for the Lesser Prairie Chicken encompasses significant portions of our properties in the Anadarko Basin. On September 1, 2015 a federal district court in Texas vacated the listing of the Lesser Prairie Chicken as a threatened species, holding the Fish and Wildlife Service did not sufficiently

21
account for voluntary range wide conservation efforts being implemented to protect the species. In July 2016, the Lesser Prairie Chicken was removed from the ESA List of Endangered and Threatened Wildlife following the court order. However, as of November 29, 2016, the Fish and Wildlife Service completed initial reviews of a petition filed by environmental groups to list the Lesser Prairie Chicken as endangered and found substantial information that the petitioned action may be warranted. An assessment of the biological status of the Lesser Prairie Chicken began in 2015 and further action remains pending.
In a special rule under ESA Section 4(d) released simultaneously with the decision to list the Lesser Prairie Chicken as threatened, the Fish and Wildlife Service exempted from “take” certain oil and gas and other activities conducted by a participant that could have resulted in an “incidental take” of the Lesser Prairie Chicken as long as the participant was enrolled in, and operating in compliance with, a range-wide conservation plan endorsed by the Fish and Wildlife Service. The range-wide conservation plan also included a Candidate Conservation Agreement with Assurances, or the CCAA, component that provides “take” coverage for properties enrolled into the CCAA before the listing was effective. Prior to the delisting, to mitigate the risk of liability from “incidental takes” of the Lesser Prairie Chicken, we enrolled affected leasehold interests in the CCAA. Given the delisted status of the Lesser Prairie Chicken, Jones may revisit its enrollment in the CCAA.
ESA issues remain dynamic. For example, the designation of previously unidentified endangered or threatened species could cause us to incur additional costs or limit future development activity in the affected areas. On August 23, 2016 an environmental group filed a Notice of Intent to sue the Fish and Wildlife Service for failure to act on 417 petitions to list species as threatened or endangered under the ESA. On November 21, 2016, the Fish and Wildlife Service issued its revised Mitigation Policy, providing a framework and goal to achieve a net gain in conservation outcomes, or at a minimum, no net loss of resources and their values, services, and functions resulting from proposed actions authorized under the ESA; however, this policy is being evaluated by the current administration and the outcome of that review remains unclear. We continue to evaluate the impact of these rules, agency actions, and legal challenges on our operations. The listing under the Endangered Species Act of species in areas that we operate could force us to incur additional costs and delay or otherwise limit or terminate our operations.
National Environmental Policy Act
Oil and natural gas exploration and production activities on federal lands may be subject to the National Environmental Policy Act, or NEPA, which requires federal agencies, including the Department of Interior, to evaluate major agency actions having the potential to significantly impact the environment. In the course of such evaluations, an agency will prepare an Environmental Assessment that assesses the potential direct, indirect and cumulative impacts of a proposed project and, if necessary, will prepare a more detailed Environmental Impact Statement that may be made available for public review and comment. All of our current production activities, as well as any exploration and development plans that may be proposed in the future, on federal lands require governmental permits that are subject to the requirements of NEPA. This process has the potential to delay or impose additional conditions upon the development of oil and natural gas projects.
Climate Change
More stringent laws and regulations relating to climate change and greenhouse gases, or GHGs, may be adopted in the future and could cause us to incur material expenses in complying with them. Both houses of Congress have in the past actively considered, but not passed, legislation to reduce emissions of GHGs. In the absence of comprehensive federal legislation on GHG emission control, the EPA is regulating GHGs as pollutants under the CAA. The EPA has adopted regulations affecting emissions of GHGs from motor vehicles and is also requiring permit review for GHGs from certain stationary sources that emit GHGs at levels above statutory and regulatory thresholds and are otherwise subject to CAA permitting requirements based on emissions of non-GHG regulated air pollutants. We do not believe our operations are currently subject to these permitting requirements, but if our operations become subject to these or other similar requirements, we could incur significant costs to control our emissions and comply with regulatory requirements.
In addition, the EPA has adopted a mandatory GHG emissions reporting program that imposes reporting and monitoring requirements on various types of facilities and industries. In 2010, the EPA issued final rules to expand its existing GHG reporting rule to include onshore oil and natural gas production, processing, transmission, storage, and distribution facilities. The rule requires reporting of GHG emissions by regulated entities to the EPA on an annual basis. In 2015, the EPA added reporting of GHG emissions from gathering and boosting systems, completions and workovers of oil wells using hydraulic fracturing, and blowdowns of natural gas transmission pipelines to the GHG reporting rule. We are

22
currently required to monitor and report GHG emissions under this rule, and operational and/or regulatory changes could increase the burden of compliance with GHG emissions monitoring and reporting requirements.
Because of the lack of any comprehensive legislative program addressing GHGs, there is continuing uncertainty regarding the further development of federal regulation of GHG-emitting sources. Additionally, a number of states, either individually or as part of regional initiatives, have begun taking actions to control and/or reduce GHG emissions primarily through the planned development of GHG emission inventories and/or regional GHG cap and trade programs. Most of these cap and trade programs work by requiring major sources of emissions to acquire and surrender emission allowances. The international, federal, regional and local regulatory initiatives that target GHGs also could adversely affect the marketability of the oil and natural gas we produce. For example, in 2015, the United States participated in the United Nations Conference on Climate Change, which led to the creation of the Paris Agreement. The Paris Agreement entered into force November 4, 2016, and requires countries to review and “represent a progression” in their intended nationally determined contributions, which set GHG emission reduction goals, every five years beginning in 2020. The United States has expressed an intention to withdraw from participation in the Paris Agreement, but some state and local governments have expressed intentions to take GHG-related actions. Due to the uncertainties surrounding the regulation of and other risks associated with GHG emissions, we cannot predict the financial impact of related developments on our operations, however, we do not expect our operations to be affected any differently than other similarly situated domestic competitors.
In addition to legislative and regulatory developments, plaintiffs have brought judicial actions under common law theories against greenhouse gas emitting companies in recent years. For example, environmental advocacy groups filed five nearly identical lawsuits in 2017 seeking to hold a wide variety of companies that produce fossil fuels liable for the alleged impacts of the greenhouse gas emissions attributable to those fuels. The lawsuits primarily assert that the companies’ products have caused a sea level rise that is damaging the plaintiffs. Jones is not a defendant in these cases and we are unable to predict the outcome or potential impact of these cases on the oil and gas industry.
The federal administration also issued a Climate Action Plan in June 2013. Among other things, the Climate Action Plan directs federal agencies to develop a strategy for the reduction of methane emissions, including emissions from the oil and natural gas industry. As previously mentioned, the EPA finalized a rule effective August 2016, setting standards for methane and volatile organic compound emissions from new and modified sources in the oil and gas sector. On November 10, 2016, the EPA issued a final Information Collection Request, or the ICR, that would have required numerous oil and gas companies to provide information regarding methane emissions from existing oil and gas facilities, but on March 2, 2017, EPA withdrew that ICR. The regulatory focus is shifting in the current administration, however, additional GHG regulation of the oil and gas industry remains a possibility. Although it is not possible at this time to predict how legislation or new regulations that may be adopted to address GHG emissions would impact our business, any such future laws and regulations imposing reporting obligations on, or limiting emissions of GHGs from, our equipment and operations could require us to incur costs to reduce emissions of GHGs associated with our operations.
OSHA and Other Laws and Regulation
We are subject to the requirements of the federal Occupational Safety and Health Act, or OSHA, and comparable state statutes. These laws and regulations strictly govern the protection of the health and safety of employees. The OSHA hazard communication standard, the EPA community right-to-know regulations under Title III of CERCLA and similar state statutes require that we organize and/or disclose information about hazardous materials used or produced in our operations and that this information be provided to employees, state and local government authorities and citizens. We believe that we are in substantial compliance with these applicable requirements and with other OSHA and comparable requirements.
We believe that we are in substantial compliance with all existing environmental laws and regulations applicable to our current operations and that our continued compliance with existing requirements will not have a material adverse impact on our financial condition and results of operations. We did not incur any material capital expenditures for remediation or pollution control activities for the years ended December 31, 2017, 2016 or 2015. Additionally, we are not aware of any environmental issues or claims that will require material capital expenditures during 2018 or that will otherwise have a material impact on our financial position or results of operations in the future. However, we cannot assure you that the passage of more stringent laws and regulations in the future will not have a negative impact on our business activities, financial condition or results of operations.

23
Offices
We currently lease approximately 43,000 square feet of office space in Austin, Texas at 807 Las Cimas Parkway, Austin, Texas 78746, where our principal offices are located. The primary lease expires in April 2020. We also lease approximately 9,000 square feet of office space in Oklahoma City, Oklahoma. Additionally, we lease field offices in Oklahoma City, Oklahoma and Canadian, Texas.
Employees
As of December 31, 2017, we had 94 employees, including 31 technical (geosciences, engineering, land), 33 field operations, 26 corporate (finance, accounting, business development, IT, human resources, office management) and 4 management. None of these employees are represented by labor unions or covered by any collective bargaining agreement. We consider our relations with our employees to be satisfactory. From time to time, we utilize the services of independent contractors to perform various field and other services as needed.
Available information
We are required to file annual, quarterly and current reports, proxy statements and other information with the SEC. Our reports filed with the SEC are made available to read and copy at the SEC’s Public Reference Room at 100 F Street, N.E., Washington, D.C., 20549. You may obtain information about the Public Reference Room by contacting the SEC at 1-800-SEC-0330. Reports filed with the SEC are also made available on its website at www.sec.gov.
Our common stock is listed and traded on the New York Stock Exchange under the symbol “JONE.” Our reports, proxy statements and other information filed with the SEC can also be inspected and copied at the New York Stock Exchange, 20 Broad Street, New York, New York 10005.
Through our website, www.jonesenergy.com, you can access, free of charge, electronic copies of all of the documents that we file with the SEC, including our annual reports on Form 10-K, quarterly reports on Form 10-Q and current reports on Form 8-K, as well as any amendments to these reports. Item 1A. Risk Factors
Our business involves a high degree of risk. If any of the following risks, or any risks described elsewhere in this Annual Report on Form 10-K, were actually to occur, our business, financial condition or results of operations could be materially adversely affected and the trading price of our shares could decline resulting in the loss of part or all of your investment. The risks described below are not the only ones facing us. Additional risks not presently known to us or which we currently consider immaterial may also adversely affect us.
Risks Relating to the Oil and Natural Gas Industry and Our Business:
A substantial or extended decline in oil, natural gas or NGL prices would adversely affect our business, financial condition or results of operations and our ability to meet our capital expenditure obligations and financial commitments.
The price we receive for our oil, natural gas and NGLs heavily influences our revenue, profitability, access to capital and future rate of growth. Oil and natural gas are commodities and, therefore, their prices are subject to wide fluctuations in response to relatively minor changes in supply and demand. During the past seven years, the NYMEX WTI oil price has ranged from a low of $26.19 per Bbl in February 2016 to a high of $113.39 per Bbl in April 2011, and was $61.68 as of February 21, 2018. The NYMEX Henry Hub spot market price of gas has ranged from a high of $8.15 per MMBtu in February 2014 to a low of $1.49 in March 2016, and was $2.66 as of February 21, 2018. These markets will likely continue to be volatile in the future, especially given the current geopolitical conditions. The prices we receive for our production and the levels of our production depend on numerous factors beyond our control. These factors include the following:
• regional and worldwide economic conditions impacting the supply and demand for oil, natural gas and NGLs;
• the actions of the Organization of Petroleum Exporting Countries, or OPEC, including whether it meets the reduced output targets it has previously announced or may announce in the future;

24
• the level of production in non-OPEC countries;
• the price and quantity of imports of foreign oil, natural gas and NGLs;
• political conditions regionally, domestically or in other oil and gas-producing regions;
• the level of domestic and global oil and natural gas exploration and production;
• the level of domestic and global oil and natural gas inventories;
• localized supply and demand fundamentals and available pipeline and other oil and gas transportation capacity;
• weather conditions and natural disasters;
• domestic, local and foreign governmental regulations and taxes;
• activities by non-governmental organizations to restrict the exploration, development and production of oil and gas so as to reduce the potential for harm to the environment from such activities, including emissions of carbon dioxide, a greenhouse gas;
• speculation as to the future price of oil, natural gas and NGLs and the speculative trading of oil, natural gas and NGLs;
• trading prices of futures contracts;
• price and availability of competitors’ supplies of oil, natural gas and NGLs;
• technological advances affecting energy consumption;
• the price and availability of alternative fuels; and
• the impact of energy conservation efforts.
NGLs are made up of ethane, propane, isobutane, butane and natural gasoline, all of which have different uses and different pricing characteristics. NGLs comprised 31% of our 2017 production, and we realized an average price of $21.09 per barrel, a 56.5% increase from the average realized price of our 2016 production. An extended decline in NGL prices could materially and adversely affect our future business, financial condition and results of operations.
Substantially all of our production is sold to purchasers under contracts with market-based prices. Lower oil, natural gas and NGL prices will reduce our cash flows and the present value of our reserves. Additionally, prices could reduce our cash flows to a level that would require us to borrow to fund our planned capital budget. Lower oil, natural gas and NGL prices may also reduce the amount of oil, natural gas and NGLs that we can develop and produce economically. Substantial decreases in oil, natural gas and NGL prices could render uneconomic a significant portion of our identified drilling locations. This may result in significant downward adjustments to our estimated proved reserves. As a result, a substantial or extended decline in oil, natural gas or NGL prices may materially and adversely affect our future business, financial condition, results of operations, liquidity or ability to finance planned capital expenditures.
Drilling for and producing oil, natural gas and NGLs are high risk activities with many uncertainties that could adversely affect our business, financial condition or results of operations.
Our future financial condition and results of operations will depend on the success of our exploration, exploitation, development and production activities. Our oil, natural gas and NGLs exploitation, development and production activities are subject to numerous risks beyond our control, including the risk that drilling will not result in commercially viable oil and natural gas production. Our decisions to purchase, explore, develop or otherwise exploit locations or properties will depend in part on the evaluation of information obtained through geophysical and geological analyses, production data and engineering studies, the results of which are often inconclusive or subject to varying interpretations. We cannot assure you that the analogies we draw from available data from other wells, more fully explored prospectus or producing fields will be applicable to our drilling prospects. In addition, our cost of drilling, completing and operating

25
wells is often uncertain before drilling commences, which ultimately results in uncertainty as to when the capital investment required to deploy rigs will create an acceptable return for our shareholders. Further, many factors may curtail, delay or cancel our scheduled drilling projects, including the following:
• delays imposed by or resulting from compliance with regulatory and contractual requirements and related lawsuits, which may include limitations on hydraulic fracturing or the discharge of greenhouse gases;
• pressure or irregularities in geological formations;
• shortages of or delays in obtaining equipment and qualified personnel;
• equipment failures or accidents;
• lack of available gathering facilities or delays in construction of gathering facilities;
• lack of available capacity on interconnecting transmission pipelines;
• fires and blowouts;
• adverse weather conditions, such as hurricanes, blizzards and ice storms;
• environmental hazards, such as natural gas leaks, oil spills, pipeline and tank ruptures, encountering naturally occurring radioactive materials, and unauthorized discharges of brine, well stimulation and completion fluids, toxic gases or other pollutants into the surface or subsurface environment;
• declines in oil, natural gas and NGL prices;
• limited availability of financing at acceptable rates;
• title problems; and
• limitations in the market for oil, natural gas and NGLs.
Part of our strategy involves using some of the latest available horizontal drilling and completion techniques, which involve risks and uncertainties in their application.
Our operations involve utilizing some of the latest drilling and completion techniques as developed by us and our service providers. Risks that we face while drilling include, but are not limited to, the following:
• effectively controlling the level of pressure flowing from particular wells;
• landing our wellbore in the desired drilling zone;
• staying in the desired drilling zone while drilling horizontally through the formation;
• running our casing the entire length of the wellbore; and
• running tools and other equipment consistently through the horizontal wellbore.
Risks that we face while completing our wells include, but are not limited to, the following:
• the ability to effectively fracture stimulate the planned number of stages;
• the ability to run tools the entire length of the wellbore during completion operations; and
• the ability to successfully clean out the wellbore after completion of the final fracture stimulation stage.

26
The results of our drilling in new or emerging formations are more uncertain initially than drilling results in areas that are more developed and have a longer history of established production. Newer or emerging formations and areas have limited or no production history and, consequently, we are more limited in assessing future drilling results in these areas.
The value of our undeveloped acreage could decline if drilling results are unsuccessful.
The success of our horizontal drilling and completion techniques can only be evaluated over time as more wells are drilled and production profiles are established over a sufficiently long time period. If our drilling results are less than anticipated or we are unable to execute our drilling program because of capital constraints, lease expirations, access to gathering systems, declines in oil, natural gas and NGL prices and/or other factors, the return on our investment in these areas may not be as attractive as we anticipate. Further, as a result of any of these developments we could incur material write-downs of our oil and gas properties and the value of our undeveloped acreage could decline in the future.
Our business requires substantial capital expenditures, and we may be unable to obtain needed capital or financing on satisfactory terms or at all.
Our exploration, exploitation, development and acquisition activities require substantial capital expenditures. Our 2017 capital expenditures totaled $248.0 million (excluding the impact of asset retirement costs, asset disposals and non-cash impairments of oil and gas properties), of which $205.7 million was utilized to drill and complete operated wells. The Company has established an initial capital budget of $150.0 million for 2018. Historically, we have funded development and operating activities primarily through a combination of equity capital raised from a private equity partner and public equity offerings, through borrowings under the Revolver, through the issuance of debt securities and through internal operating cash flows. We intend to finance the majority of our capital expenditures predominantly with cash flows from operations. If necessary, we may also access capital through proceeds from potential asset dispositions, cash on hand, borrowings under the Revolver, and the issuance of additional debt and equity securities. Our cash flow from operations and access to capital are subject to a number of variables, including:
• the estimated quantities of our oil, natural gas and NGL reserves;
• the amount of oil, natural gas and NGLs we produce from existing wells;
• the prices at which we sell our production;
• any gains or losses from our hedging activities;
• the costs of developing and producing our oil, natural gas and NGL reserves;
• take-away capacity;
• our ability to acquire, locate and produce new reserves;
• the ability and willingness of banks and other lenders to lend to us; and
• our ability to access the equity and debt capital markets.
If our cash flow from operations is not sufficient to fund our capital expenditure budget, we may have limited ability to obtain the additional capital necessary to conduct our operations at expected levels. The Revolver and the indentures governing our senior notes due 2022, or the 2022 Notes, and senior notes due 2023, or the 2023 Notes, and the 2023 First Lien Notes restrict our ability to obtain new debt financing. We may not be able to obtain debt or equity financing on terms favorable to us, or at all. The failure to obtain additional financing could result in a curtailment of our operations relating to exploration and development of our prospects, which in turn could lead to a decline in our oil, natural gas and NGLs production or reserves, and in some areas a loss of properties.
External financing may be required in the future to fund our growth. We may not be able to obtain additional financing, and financing under the Revolver and through the capital markets may not be available in the future. Without additional capital resources, we may be unable to pursue and consummate acquisition opportunities as they become available, and we may be forced to limit or defer our planned oil, natural gas and NGLs development program, which will adversely affect the recoverability and ultimate value of our oil, natural gas and NGLs properties, in turn negatively affecting our business, financial condition and results of operations.

27
The development of our proved undeveloped reserves in our areas of operation may take longer and may require higher levels of capital expenditures than we currently anticipate. Therefore, our undeveloped reserves may not be ultimately developed or produced by us. In addition, there are no assurances that our proved undeveloped reserves will be converted into producing reserves by us.
Approximately 41% of our total estimated proved reserves were classified as proved undeveloped as of December 31, 2017. Development of these reserves may take longer and require higher levels of capital expenditures than we currently anticipate. In addition, declines in commodity prices could cause us to reevaluate our development plans and delay or cancel development. Delays in the development of our reserves, increases in costs to drill and develop such reserves or sustained periods of low commodity prices will reduce the future net revenues estimated for such reserves and may result in some projects becoming uneconomic. In addition, delays in the development of reserves or lower commodity prices could cause us to have to reclassify our proved reserves as unproved reserves. There is no certainty that we will be able to convert unproved reserves to developed reserves.
Our identified drilling locations are scheduled to be drilled over many years, making them susceptible to uncertainties that could materially alter the occurrence or timing of their drilling, which in certain instances could prevent or delay associated expected production. In addition, we may not be able to raise the amount of capital that would be necessary to drill a substantial portion of our identified drilling locations.
Our management team has identified and scheduled certain drilling locations as an estimation of our future multi-year drilling activities on our existing acreage. These drilling locations represent a significant part of our growth strategy. Our drilling locations are in various stages of evaluation, ranging from a location that is ready to drill to a location that will require substantial additional interpretation. There is no way to predict in advance of drilling and testing whether any particular location will yield oil, natural gas or NGLs in sufficient quantities to recover drilling or completion costs or to be economically viable. Similarly, the use of technologies and the study of producing fields in the same area of producing wells will not enable us to know conclusively prior to drilling whether oil or natural gas will be present or, if present, whether oil or natural gas will be present in sufficient quantities to be economically viable. Even if sufficient quantities of oil or natural gas exist, we may damage the potentially productive hydrocarbon bearing formation or experience mechanical difficulties while drilling or completing the well, resulting in a reduction in production or abandonment of the well. If we drill additional wells that we identify as dry holes in our current and future drilling locations, our drilling success rate may decline and materially harm our business. In addition, our ability to drill and develop these drilling locations depends on a number of uncertainties, including oil, natural gas and NGL prices, the availability and cost of capital, drilling and production costs, the availability of drilling services and equipment, drilling results, lease expirations, gathering systems, marketing and pipeline transportation constraints, regulatory approvals and other factors. Because of the uncertainty inherent in these factors, we do not know if the numerous drilling locations we have identified will ever be drilled or if we will be able to produce oil, natural gas or NGLs from these or any other drilling locations.
Our use of 2D and 3D seismic data is subject to interpretation and may not accurately identify the presence of drilling hazards, including faults, or hydrocarbons, which could adversely affect the results of our drilling operations.
Even when properly used and interpreted, 2D and 3D seismic data and visualization techniques are only tools used to assist geoscientists in identifying subsurface structures and hydrocarbon indicators and do not enable the interpreter to know whether hydrocarbons or drilling hazards such as faults are, in fact, present in those structures. In addition, the use of 3D seismic and other advanced technologies requires greater predrilling expenditures than traditional drilling strategies, and we could incur greater drilling and testing expenses as a result of such expenditures, which may result in a reduction in our returns or losses. As a result, our drilling activities may not be successful or economical, and our overall drilling success rate or our drilling success rate for activities in a particular area could decline.
We often gather 3D seismic data over large areas. Our interpretation of seismic data delineates those portions of an area that we believe are desirable for drilling. Therefore, we may choose not to acquire option or lease rights prior to acquiring seismic data, and, in many cases, we may identify hydrocarbon indicators before seeking option or lease rights in the location. Conversely, we may incur substantial expenditures to acquire and analyze 3D seismic data but not be able to lease attractive locations on acceptable terms.

28
Our hedging strategy may be ineffective in reducing the impact of commodity price volatility from our cash flows or may limit our ability to realize cash flows from commodity price increases, which could result in financial losses or could reduce our income.
To achieve more predictable cash flow and to reduce our exposure to adverse fluctuations in the prices of oil, natural gas and NGLs, we have historically entered into commodity derivative contracts for a significant portion of our oil, natural gas and NGL production that could result in both realized and unrealized hedging losses. The extent of our commodity price exposure is related largely to the effectiveness and scope of our commodity derivative contracts. For example, some of the commodity derivative contracts we utilize are based on quoted market prices, which may differ significantly from the actual prices we realize in our operations for oil, natural gas and NGLs. For the years ending December 31, 2018, 2019, and 2020, approximately 25%, 74%, and 78%, respectively, of our estimated total oil, natural gas and NGL production from proved reserves, based on our reserve report as of December 31, 2017, will not be covered by commodity derivative contracts.
Our policy has been to hedge a significant portion of our estimated oil, natural gas and NGLs production. However, our price hedging strategy and future hedging transactions will be determined at our discretion. We are not under an obligation to hedge a specific portion of our production. The prices at which we hedge our production in the future will be dependent upon commodity prices at the time we enter into these transactions, which may be substantially higher or lower than current oil, natural gas and NGLs prices. Accordingly, our price hedging strategy may not protect us from significant declines in oil, natural gas and NGL prices received for our future production. Conversely, our hedging strategy may limit our ability to realize cash flows from commodity price increases. For example, the estimated mark-to-market value of our commodity price hedges in 2018 and beyond represents a loss of $37.5 million, incorporating strip pricing as of February 21, 2018 but excluding adjustments for credit risk.
In addition, our actual future production may be significantly higher or lower than we estimate at the time we enter into commodity derivative contracts for such period. If the actual amount is higher than we estimate, we will have greater commodity price exposure than we projected. If the actual amount is lower than the notional amount of our commodity derivative contracts, we might be forced to satisfy all or a portion of our commodity derivative contracts without the benefit of the cash flow from our sale or purchase of the underlying physical commodity, substantially diminishing our liquidity. There may be a change in the expected differential between the underlying commodity price in the commodity derivative contract and the actual price received, which may result in payments to our derivative counterparty that are not offset by our receipt of payments for our production in the field.
As a result of these factors, our commodity derivative activities may not be as effective as we intend in reducing the volatility of our cash flows, and in certain circumstances may actually increase the volatility of our cash flows.
Our hedging transactions expose us to counterparty credit risk.
Our hedging transactions expose us to risk of financial loss if a counterparty fails to perform under a derivative contract. Disruptions in the financial markets could lead to sudden changes in a counterparty’s liquidity, which could impair their ability to perform under the terms of the derivative contract. We are unable to predict sudden changes in a counterparty’s creditworthiness or ability to perform. Even if we do accurately predict sudden changes, our ability to negate the risk may be limited depending upon market conditions. Currently our entire hedge portfolio is hedged directly with banks in our credit agreements, thus allowing hedging without any margin requirements.
During periods of falling commodity prices, our hedge receivable positions generally increase, which increases our counterparty credit exposure. If the creditworthiness of our counterparties deteriorates and results in their nonperformance, we could incur a significant loss.
Derivatives legislation and implementing rules could have an adverse effect on our ability to use derivatives to reduce the effect of commodity price risk, interest rate risk and other risks associated with our business.
We use commodity derivatives to manage our commodity price risk. The U.S. Congress adopted comprehensive financial reform legislation that, among other things, expands comprehensive federal oversight and regulation of derivatives and many of the entities that participate in that market. Although the Dodd-Frank Wall Street Reform and Consumer Protection Act, or the Dodd-Frank Act, was enacted on July 21, 2010, the Commodity Futures Trading Commission, or the CFTC, and the SEC, along with certain other regulators, must promulgate final rules and regulations to implement many of its provisions relating to derivatives. While some of these rules have been finalized, some have
29
not. When fully implemented, the law and any new regulations could increase the operational and transactional cost of derivatives contracts and affect the number and/or creditworthiness of available counterparties.
In addition, we may transact with counterparties based in the European Union, Canada or other jurisdictions which, like the U.S., are in the process of implementing regulations to regulate derivatives transactions, some of which are currently in effect and impose operational and transactional costs on our derivatives activities.
Unless we replace our reserves, our reserves and production will naturally decline, which would adversely affect our business, financial condition and results of operations.
Unless we conduct successful exploration, development and acquisition activities or acquire properties containing proved reserves, our proved reserves will decline as those reserves are produced. Producing oil and natural gas reservoirs generally are characterized by declining production rates that vary depending upon reservoir characteristics and other factors. Our future oil, natural gas and NGL reserves and production, and therefore our cash flows and income, are highly dependent on our success in efficiently developing our current reserves and economically finding or acquiring additional recoverable reserves. We may not be able to develop, find or acquire additional reserves to replace our current and future production at acceptable costs. If we are unable to replace our current and future production, the value of our reserves will decrease, and our business, financial condition and results of operations will be adversely affected.
If we do not fulfill our obligation to drill minimum numbers of wells specified in our joint development agreements, we will lose the right to develop the undeveloped acreage associated with the agreement and any proved undeveloped reserves attributable to such undeveloped acreage.
If we do not meet our obligation to drill the minimum number of wells specified in a joint development agreement, we will lose the right to continue to develop the undeveloped acreage covered by the agreement, which would result in the loss of any proved undeveloped reserves attributable to such undeveloped acreage.
Future commodity price declines or downward reserve revisions may result in write-downs of the carrying values of our properties.
Accounting rules require that we periodically review the carrying value of our properties for possible impairment. Based on prevailing commodity prices and specific market factors and circumstances at the time of prospective impairment reviews, and the continuing evaluation of development plans, production data, economics and other factors, we may be required to write down the carrying value of our properties. A write-down constitutes a non-cash charge to earnings. Such impairment may be accompanied by a reduction in proved reserves, thereby increasing future depletion charges per unit of production. We may incur impairment charges and related reductions in proved reserves in the future, which could have a material adverse effect on our results of operations for the periods in which such charges are taken. If commodity prices decline relative to their historical levels, we may incur future impairments to long-lived assets.
Our estimated oil, natural gas and NGLs reserve quantities and future production rates are based on many assumptions that may prove to be inaccurate. Any significant inaccuracies in these reserve estimates or the underlying assumptions will materially affect the quantities and present value of our reserves.
Numerous uncertainties are inherent in estimating quantities of oil, natural gas and NGL reserves. Our estimates of our proved reserve quantities are based upon our reserve report as of December 31, 2017. Reserve estimation is a subjective process of evaluating underground accumulations of oil, natural gas and NGLs that cannot be measured in an exact manner. Reserves that are “proved reserves” are those estimated quantities of oil, natural gas and NGLs that geological and engineering data demonstrate with reasonable certainty are recoverable in future years from known reservoirs under existing economic and operating conditions and that relate to projects for which the extraction of hydrocarbons must have commenced or the operator must be reasonably certain will commence within a reasonable time.
The process of estimating oil, natural gas and NGL reserves is complex, requiring significant decisions and assumptions in the evaluation of available geological, engineering and economic data for each reservoir, and these reports rely upon various assumptions, including assumptions regarding future oil, natural gas and NGL prices, production levels, and operating and development costs. As a result, estimated quantities of proved reserves and projections of future production rates and the timing of development expenditures may prove to be inaccurate. Quantities of proved reserves are estimated based on pricing conditions in existence during the period of assessment and costs at the end of the period of assessment. Changes to oil, natural gas and NGL prices in the markets for such commodities may have the impact of

30
shortening the economic lives of certain fields, because it becomes uneconomic to produce all recoverable reserves on such fields, which reduces proved property reserve estimates.
Over time, we may make material changes to reserve estimates taking into account the results of actual drilling and production. Any significant variance in our assumptions and actual results could greatly affect our estimates of reserves, the economically recoverable quantities of oil, natural gas and NGLs attributable to any particular group of properties, the classifications of reserves based on risk of recovery, and estimates of the future net cash flows. In addition, changes in future production cost assumptions could have a significant effect on our proved reserve quantities.
The standardized measure of discounted future net cash flows from our proved reserves will not necessarily be the same as the current market value of our estimated oil, natural gas and NGL reserves.
You should not assume that the standardized measure of discounted future net cash flows from our proved reserves is the current market value of our estimated oil, natural gas and NGL reserves. In accordance with SEC requirements, we based the discounted future net cash flows from our proved reserves on the 12- month unweighted arithmetic average of the first-day-of-the- month commodities prices for the preceding 12 months without giving effect to derivative transactions. Actual future net cash flows from our oil and natural gas properties will be affected by factors such as:
• commodity price hedging and actual prices we receive for oil, natural gas and NGLs;
• actual cost of development and production expenditures;
• the amount and timing of actual development and production; and
• changes in governmental regulations or taxation.
The timing of both our production and our incurrence of expenses in connection with the development and production of oil and natural gas properties will affect the timing and amount of actual future net revenues from proved reserves, and thus their actual present value. In addition, the 10% discount factor we use when calculating standardized measure may not be the most appropriate discount factor based on interest rates in effect from time to time and risks associated with our company or the oil and natural gas industry in general.
If oil prices decline by $10.00 per Bbl, then our standardized measure as of December 31, 2017 excluding hedging impacts would decrease approximately $163.5 million holding all costs constant. If natural gas prices decline by $1.00 per Mcf, then our standardized measure as of December 31, 2017 excluding hedging impacts would decrease by approximately $98.1 million holding all costs constant.
Over 72% of our estimated proved reserves are located in the Western Anadarko Basin in the Texas Panhandle and Oklahoma; however, our 2018 drilling plan is primarily focused on the development of our assets in the Merge play located in the Eastern Anadarko Basin in Oklahoma. Drilling, exploring for and producing, oil, natural gas and NGLs in a different play than the location of our historical operations subjects us to uncertainties that could adversely affect our business, financial condition or results of operations.
Over 72% of our estimated proved reserves as of December 31, 2017 were located in the Western Anadarko Basin in the Texas Panhandle and Oklahoma, and approximately 71% of our 2017 production was from the Cleveland formation where properties are located in four contiguous counties of Texas and Oklahoma. During the fourth quarter of 2017, however, we released our last remaining rig in the Cleveland formation. In 2018, we plan to target the liquids rich Woodford shale and Meramec formations with our rig program in the Merge. As a result of this change in the area of our significant operations, we may be exposed to the impact of different supply and demand factors, regulations, processing or transportation capacity constraints, availability of equipment, facilities, personnel or services market limitations than we have been exposed to previously in our historical operations in the Western Anadarko Basin. These uncertainties and others inherent in allocating our capital resources to operations in a new geographic area could have a material adverse effect on our financial condition and results of operations.
Our customer base is concentrated, and the loss of any one of our key customers could, therefore, adversely affect our financial condition and results of operations.
Historically, we have been dependent on a few customers for a significant portion of our revenue. For the year ended December 31, 2017 purchases by our top five customers accounted for approximately 40%, 22%, 8%, 6% and 5%,

31
respectively, of our total oil, natural gas and NGL sales. This concentration of customers may increase our overall exposure to credit risk, and customers will likely be similarly affected by changes in economic and industry conditions. To the extent that any of our major purchasers reduces their purchases of oil, natural gas or NGLs or defaults on their obligations to us, our financial condition and results of operations could be adversely affected.
We may be unable to make attractive acquisitions or successfully integrate acquired businesses, and any inability to do so may disrupt our business and hinder our ability to grow.
In the future we may make acquisitions of businesses that complement or expand our current business. We may not be able to identify attractive acquisition opportunities. In addition, increased competition in the areas in which we operate, including the Merge play, may make it more difficult for us to identify or complete acquisitions. Even if we do identify attractive acquisition opportunities, we may not be able to complete the acquisition or do so on commercially acceptable terms.
Any acquisition involves potential risks, including, among other things:
• the validity of our assumptions about estimated proved reserves, future production, commodity prices, revenues, capital expenditures, operating expenses and costs;
• an inability to successfully integrate the assets we acquire;
• an inability to obtain satisfactory title to the assets we acquire;
• a decrease in our liquidity by using a significant portion of our available cash or borrowing capacity to finance acquisitions;
• a significant increase in our interest expense or financial leverage if we incur additional debt to finance acquisitions;
• the assumption of unknown liabilities, losses or costs for which we obtain no or limited indemnity or other recourse;
• the diversion of management’s attention from other business concerns;
• an inability to hire, train or retain qualified personnel to manage and operate our growing assets; and
• the occurrence of other significant changes, such as impairment of oil and natural gas properties, goodwill or other intangible assets, asset devaluation or restructuring charges.
Our decision to acquire a property will depend in part on the evaluation of data obtained from production reports and engineering studies, geophysical and geological analyses and seismic data and other information, the results of which are often inconclusive and subject to various interpretations.
The success of any completed acquisition will depend on our ability to integrate effectively the acquired assets into our existing operations. The process of integrating acquired assets may involve unforeseen difficulties and may require a disproportionate amount of our managerial and financial resources. In addition, even if we successfully integrate an acquisition, it may not be possible to realize the full benefits we may expect in estimated proved reserves, production volume, cost savings from operating synergies or other benefits anticipated from an acquisition or realize these benefits within the expected time frame. Anticipated benefits of an acquisition may be offset by operating losses relating to changes in commodity prices in oil and natural gas industry conditions, risks and uncertainties relating to the exploratory prospects of the combined assets or operations, or an increase in operating or other costs or other difficulties. If we fail to realize the benefits we anticipate from an acquisition, our results of operations may be adversely affected.
Deficiencies of title to our leased interests could significantly affect our financial condition.
It is our practice, in acquiring oil and natural gas leases or undivided interests in oil and natural gas leases or other developed rights, not to incur the expense of retaining lawyers to examine the title to the mineral interest to be acquired. Rather, we rely upon the judgment of oil and natural gas lease brokers or landmen who perform the fieldwork in

32
examining records in the appropriate governmental or county clerk’s office to determine mineral ownership before we acquire an oil and gas lease or other developed rights in a specific mineral interest.
Prior to the drilling of an oil or gas well, it is the normal practice in our industry for the operator of the well to obtain a drilling title opinion from a qualified title attorney to ensure there are no obvious title defects on the property on which the well is to be located. The title attorney would typically research documents that are of record, including liens, taxes and all applicable contracts that burden the property. Frequently, as a result of such examinations, certain curative work must be undertaken to correct defects in the marketability of the title, and such curative work entails expense. Our failure to completely cure any title defects may invalidate our title to the subject property and adversely impact our ability in the future to increase production and reserves. Additionally, because a less strenuous title review is conducted on lands where a well has not yet been scheduled, undeveloped acreage has greater risk of title defects than developed acreage. Any title defects or defects in assignment of leasehold rights in properties in which we hold an interest may adversely impact our ability in the future to increase production and reserves, which could have a material adverse effect on our business, financial condition and results of operations.
We conduct a substantial portion of our operations through joint development agreements with third parties. Certain of our joint development agreements include complete-to-earn arrangements, whereby we are assigned title to properties from the third-party after we complete wells and, in the case of certain counterparties, after completion reports relating to the wells have been approved by regulatory authorities whose approval may be delayed. Furthermore, certain of our joint development agreements specify that assignments are only to occur when the wells are capable of producing hydrocarbons in paying quantities. These additional conditions to assignment of title may from time to time apply to wells of substantial value. If one of our counterparties assigned title to a well in which we had earned an interest (according to our joint development agreement) to a third-party, our title to such a well could be adversely impacted. In addition, if one of our counterparties becomes a debtor in a bankruptcy proceeding, or is placed into receivership, or enters into an assignment for the benefit of creditors, after we had earned ownership of, but before we had received title to, a well, certain creditors of the counterparty may have rights in that well that would rank prior to ours.
Recently enacted tax legislation may impact our ability to fully utilize our interest expense deductions and net operating loss carryovers to fully offset our taxable income in future periods.
Recently enacted legislation commonly known as the Tax Cuts and Jobs Act includes provisions that, beginning in 2018, generally will (i) limit our annual deductions for interest expense to no more than 30% of our “adjusted taxable income” (plus 100% of our business interest income) for the year and (ii) permit us to offset only 80% (rather than 100%) of our taxable income with net operating losses we generate after 2017. Interest expense and net operating losses subject to these limitations may be carried forward by us for use in later years, subject to these limitations. Additionally, the Tax Cuts and Jobs Act repealed the domestic manufacturing tax deduction for oil and gas companies. These tax law changes could have the effect of causing us to incur income tax liability and/or obligations under our Tax Receivable Agreement (the “Tax Receivable Agreement”) sooner than we otherwise would have incurred such liability or, in certain cases, could cause us to incur income tax liability that we might otherwise not have incurred, in the absence of these tax law changes. The Tax Cuts and Jobs Act also includes provisions that, beginning in 2018, reduce the maximum federal corporate income tax rate from 35% to 21% and eliminate the alternative minimum tax, which would lessen any adverse impact of the limitations described in the preceding sentences.
Certain federal income tax deductions currently available with respect to oil and natural gas exploration and development may be eliminated and new taxes may be imposed as a result of future legislation.
From time to time, legislation is introduced that would, if enacted, make significant changes to U.S. tax laws. These proposed changes have included repealing many tax incentives and deductions that are currently used by U.S. oil and gas companies and imposing new fees. Among others, proposed changes have included: elimination of the ability to fully deduct intangible drilling costs in the year incurred; repeal of the percentage depletion deduction for oil and gas properties; repeal of the domestic manufacturing tax deduction for oil and gas companies; increase in the geological and geophysical cost amortization period for independent producers; imposing a per barrel fee on domestically produced oil; and implementation of a fee on non-producing federal oil and gas leases. The recently enacted Tax Cuts and Jobs Act did not include any of these proposals, except for the repeal of the domestic manufacturing tax deduction for oil and gas companies. However, it is possible that such provisions could be proposed in the future. The passage of legislation containing some or all of these provisions or any other similar change in U.S. federal income tax law could eliminate or postpone certain tax deductions that are currently available to us with respect to oil and natural gas exploration and

33
development, and any such change could have a material adverse effect on our business, financial condition and results of operations.
We may be unable to compete effectively with larger companies, which may adversely affect our ability to generate sufficient revenues.
The oil and natural gas industry is intensely competitive, and we compete with other companies that have more resources than us. Many of our larger competitors not only drill for and produce oil and natural gas, but also engage in refining operations and market petroleum and other products on a regional, national or worldwide basis. These companies may have a greater ability to continue drilling activities during periods of low oil, natural gas and NGL prices, to contract for drilling equipment, to secure trained personnel, and to absorb the burden of present and future federal, state, local and other laws and regulations. The oil and natural gas industry has periodically experienced shortages of drilling rigs, equipment, pipe and personnel, which has delayed development drilling and other exploitation activities and has caused significant price increases. Competition for hiring experienced personnel, particularly in the engineering and technical, accounting and financial reporting, tax and land departments continues to be strong. In addition, competition for attractive oil and natural gas producing properties, oil and natural gas companies, and undeveloped leases and drilling rights remains robust. Any inability to compete effectively with larger companies could have a material adverse impact on our financial condition and results of operations.
The oil and natural gas industry is characterized by rapid and significant technological advancements and introductions of new products and services using new technologies. As others use or develop new technologies, we may be placed at a competitive disadvantage or competitive pressures may force us to implement those new technologies at substantial costs. In addition, other oil and natural gas companies may have greater financial, technical, and personnel resources that allow them to enjoy technological advantages and may in the future allow them to implement new technologies before we can. We may not be able to respond to these competitive pressures and implement new technologies on a timely basis or at an acceptable cost. If one or more of the technologies we use now or in the future were to become obsolete or if we are unable to use the most advanced commercially available technology, our business, financial condition and results of operations could be materially adversely affected.
We participate in oil and gas leases with third parties who may not be able to fulfill their commitments to our projects.
We frequently own less than 100% of the working interest in the oil and gas leases on which we conduct operations, and other parties will own the remaining portion of the working interest. Financial risks are inherent in any operation where the cost of drilling, equipping, completing and operating wells is shared by more than one person. We could be held liable for joint activity obligations of other working interest owners, such as nonpayment of costs and liabilities arising from the actions of other working interest owners. In addition, declines in oil, natural gas and NGL prices may increase the likelihood that some of these working interest owners, particularly those that are smaller and less established, are not able to fulfill their joint activity obligations. A partner may be unable or unwilling to pay its share of project costs, and, in some cases, a partner may declare bankruptcy. In the event any of our project partners do not pay their share of such costs, we would likely have to pay those costs, and we may be unsuccessful in any efforts to recover these costs from our partners, which could materially adversely affect our financial position.
The unavailability or high cost of drilling rigs, equipment, supplies, personnel and oil field services as well as fees for the cancellation of such services could adversely affect our ability to execute development and exploitation plans on a timely basis and within budget, and consequently could adversely affect our anticipated cash flow.
We utilize third-party services to maximize the efficiency of our operation. The cost of oil field services typically fluctuates based on demand for those services. We may not be able to contract for such services on a timely basis, or the cost of such services may not remain at a satisfactory or affordable level. Shortages or the high cost of drilling rigs, equipment, supplies or personnel, including hydraulic fracturing equipment, supplies and personnel necessary for horizontal drilling, could delay or adversely affect our development and exploitation operations, which could have a material adverse effect on our financial condition and results of operations.
Our business depends in part on pipelines, transportation and gathering systems and processing facilities owned by others. Any limitation in the availability of those facilities could interfere with our ability to market our oil, natural gas and NGLs production and could harm our business.
The marketability of our oil, natural gas and NGLs production depends in part on the availability, proximity and capacity of pipelines and other transportation methods, such as trucks, gathering systems and processing facilities owned by third

34
parties. The amount of oil, natural gas and NGLs that can be produced and sold is subject to curtailment in certain circumstances, such as pipeline interruptions due to scheduled and unscheduled maintenance, excessive pressure, physical damage or lack of contracted capacity on such systems. Also, the transfer of our oil, natural gas and NGLs on third-party pipelines may be curtailed or delayed if it does not meet the quality specifications of the pipeline owners. Our access to transportation options, including trucks owned by third parties, can also be affected by U.S. federal and state regulation of oil and gas production and transportation, general economic conditions and changes in supply and demand. The curtailments arising from these and similar circumstances may last from a few days to several months. In many cases, we are provided only with limited, if any, notice as to when these circumstances will arise and their duration. Any significant curtailment in gathering system or transportation or processing facility capacity could reduce our ability to market our oil, natural gas and NGLs production and harm our business.
We could experience periods of higher costs if commodity prices continue to rise. These increases could reduce our profitability, cash flow and ability to complete development activities as planned.
Historically, our capital and operating costs have risen during periods of increasing oil, natural gas and NGL prices. These cost increases result from a variety of factors beyond our control, such as increases in the cost of electricity, steel and other raw materials that we and our vendors rely upon; increased demand for labor, services and materials as drilling activity increases; and increased taxes. Decreased levels of drilling activity in the oil and natural gas industry in recent periods have led to declining costs of some drilling equipment, materials and supplies. However, with the recent increase in commodity prices, such costs may rise faster than increases in our revenue, thereby negatively impacting the profitability of our wells. This impact may be magnified to the extent that our ability to participate in the commodity price increases is limited by our derivative activities.
We may incur substantial losses and be subject to substantial liability claims as a result of our oil and natural gas operations. Additionally, we may not be insured for, or our insurance may be inadequate to protect us against, these risks.
We are not insured against all risks. Losses and liabilities arising from uninsured and underinsured events could materially and adversely affect our business, financial condition or results of operations. We may elect not to obtain insurance if we believe that the cost of available insurance is excessive relative to the risks presented. In addition, pollution and environmental risks generally are not fully insurable. Our oil and natural gas exploration and production activities are subject to all of the operating risks associated with drilling for and producing oil and natural gas, including the possibility of:
• environmental hazards, such as uncontrollable flows of oil, natural gas, brine, well fluids, toxic gas or other pollution into the environment, including groundwater contamination;
• adverse weather conditions and natural disasters;
• encountering abnormally pressured formations;
• facility or equipment malfunctions;
• mechanical difficulties, such as stuck oilfield drilling and service tools and casing collapse;
• fires, explosions and ruptures of pipelines;
• personal injuries and death; and
• terrorist attacks targeting oil and natural gas related facilities and infrastructure.
Any of these risks could adversely affect our ability to conduct operations or result in substantial losses to us as a result of:
• injury or loss of life;
• damage to and destruction of property, natural resources and equipment;
• pollution and other environmental damage and associated clean-up responsibilities;

35
• regulatory investigations, penalties or other sanctions;
• suspension of our operations; and
• repair and remediation costs.
We are subject to complex federal, state, local and other laws and regulations that could adversely affect the cost, manner or feasibility of conducting our operations.
Our oil and natural gas exploration and production operations are subject to complex and stringent laws and regulations. In order to conduct our operations in compliance with these laws and regulations, we must obtain and maintain numerous permits, approvals and certificates from various federal, state and local governmental authorities. Failure or delay in obtaining regulatory approvals or drilling permits could have a material adverse effect on our ability to develop our properties, and receipt of drilling permits with onerous conditions could increase our compliance costs. In addition, regulations regarding conservation practices and the protection of correlative rights affect our operations by limiting the quantity of oil, natural gas and NGLs we may produce and sell.
We are subject to federal, state and local laws and regulations as interpreted and enforced by governmental authorities possessing jurisdiction over various aspects of the exploration, production and transportation of oil, natural gas and NGLs, as well as safety matters. Legal requirements are frequently changed and subject to interpretation, and we are unable to predict the ultimate cost of compliance with these requirements or their ultimate effect on our operations. We may be required to make significant expenditures to comply with governmental laws and regulations. The discharge of oil, natural gas, NGLs or other pollutants into the air, soil or water may give rise to significant liabilities on our part to the government, and third parties and may require us to incur substantial costs for remediation.
See “Item 1. Business—Regulations” for a further description of the laws and regulations that affect us.
Our ability to pursue our business strategies may be adversely affected if we incur costs and liabilities due to a failure to comply with environmental regulations or a release of hazardous substances into the environment.
We may incur significant costs and liabilities as a result of environmental requirements applicable to the operation of our wells, gathering systems and other facilities. These costs and liabilities could arise under a wide range of federal, state and local environmental laws and regulations, including, for example:
• the Clean Air Act, or CAA, and comparable state laws and regulations that impose obligations related to air emissions;
• the Clean Water Act and Oil Pollution Act, or OPA, and comparable state laws and regulations that impose obligations related to discharges of pollutants into regulated bodies of water;
• the Resource Conservation and Recovery Act, or RCRA, and comparable state laws that impose requirements for the handling and disposal of waste from our facilities;
• the Comprehensive Environmental Response, Compensation, and Liability Act, or CERCLA, and comparable state laws that regulate the cleanup of hazardous substances that may have been released at properties currently or previously owned or operated by us or at locations to which we have sent waste for disposal;
• the Environmental Protection Agency’s, or the EPA’s, community right to know regulations under the Title III of CERCLA and comparable state laws that require that we organize and/or disclose information about hazardous materials used or produced in our operations;
• the Occupational Safety and Health Act, or OSHA, which establishes workplace standards for the protection of the health and safety of employees, including the implementation of hazard communications programs designed to inform employees about hazardous substances in the workplace, potential harmful effects of these substances, and appropriate control measures;
• the National Environmental Policy Act, or NEPA, which requires federal agencies to evaluate major agency actions having the potential to significantly impact the environment and which may require the

36
preparation of Environmental Assessments and more detailed Environmental Impact Statements that may be made available for public review and comment;
• the Migratory Bird Treaty Act, which implements various treaties and conventions between the United States and certain other nations for the protection of migratory birds and, pursuant to which the taking, killing, or possessing of migratory birds is unlawful without a permit, thereby potentially requiring the implementation of operating restrictions or a temporary, seasonal, or permanent ban on operations in affected areas; and
• the Endangered Species Act, or ESA, and analogous state laws, which seek to ensure that activities do not jeopardize endangered or threatened animals, fish and plant species, nor destroy or modify the critical habitat of such species.
We may incur significant delays, costs and liabilities as a result of federal, state and local environmental, health and safety requirements applicable to exploration, development and production activities. These laws and regulations may require us to obtain a variety of permits or other authorizations governing our air emissions, water discharges, waste disposal, development in regulated wetlands or waters, or other environmental impacts associated with drilling, production and product transportation pipelines or other operations; regulate the sourcing and disposal of water used in the drilling, fracturing and completion processes; limit or prohibit drilling activities in certain areas and on certain lands lying within wilderness, frontier and other protected areas or that contain regulated wetlands or other waters; require remedial action to prevent or mitigate pollution from former operations such as plugging abandoned wells or closing earthen pits; and/or impose substantial liabilities for spills, pollution or failure to comply with regulatory filing requirements. In addition, these laws and regulations are complex, change frequently and have tended to become increasingly stringent over time; however, future changes to environmental laws and regulations remain uncertain. Failure to comply with these laws and regulations may trigger a variety of administrative, civil and criminal enforcement measures, including the assessment of monetary penalties, the imposition of remedial requirements, and the issuance of orders enjoining future operations. Certain environmental statutes, including the RCRA, CERCLA, the federal OPA and analogous state laws and regulations, impose strict joint and several liability for costs required to clean up and restore sites where petroleum or hazardous substances or other waste products have been disposed of or otherwise released. More stringent laws and regulations, including laws related to climate change and greenhouse gases, may be adopted in the future. If there are more expensive and stringent environmental legislation and regulations applied to the oil and natural gas industry, it could result in increased costs of doing business and consequently affect profitability. Moreover, it is not uncommon for neighboring landowners and other third parties to file claims for personal injury and property damage allegedly caused by the release of hazardous substances or other waste products into the environment. We are also subject to many other environmental requirements delineated in “Business—Environmental Matters and Regulation.”
Federal and state legislative and regulatory initiatives relating to hydraulic fracturing and other oil and gas production activities as well as governmental reviews of such activities could result in increased costs, additional operating restrictions or delays, which could adversely affect our production.
Hydraulic fracturing is an important and common practice that is used to stimulate production of natural gas and/or oil from dense subsurface rock formations. The process involves the injection of water, sand and chemicals under pressure into the formation to fracture the surrounding rock and stimulate production. We routinely utilize hydraulic fracturing techniques in our oil and natural gas drilling and completion programs. The process is typically regulated by state oil and natural gas commissions. However, the EPA has asserted federal regulatory authority over certain hydraulic fracturing activities involving diesel under the federal Safe Drinking Water Act, or SDWA, in states where the EPA is the permitting authority and released guidance in February 2014 on regulatory requirements for companies that plan to conduct hydraulic fracturing using diesel in those states. In addition, the EPA issued a notice of rulemaking under the Toxic Substances Control Act relating to chemical substances and mixtures used in oil and gas exploration and production. Congress has also considered legislation to provide for federal regulation of hydraulic fracturing and to require disclosure of the chemicals used in the fracturing process.
Some states, including those in which we operate, have adopted, and other states are considering adopting, regulations that could impose more stringent permitting, disclosure and well construction requirements on hydraulic fracturing operations under certain circumstances. For example, in 2011 Texas adopted the Hydraulic Fracturing Chemical Disclosure Rule, requiring public disclosure of chemicals in fluids used in the hydraulic fracturing process for drilling permits issued after February 1, 2012. In addition, the OKCC has adopted rules prohibiting water pollution resulting

37
from hydraulic fracturing operations and requiring disclosure of chemicals used in hydraulic fracturing. The mandatory disclosure of information regarding the constituents of hydraulic fracturing fluids could make it easier for third parties opposing the hydraulic fracturing process to initiate legal proceedings based upon allegations that specific chemicals used in the fracturing process could adversely affect the environment.
Texas has also authorized the Texas Commission on Environmental Quality to suspend water use rights for oil and gas users in the event of serious drought conditions and has imposed more stringent emissions, monitoring, inspection, maintenance, and repair requirements on Barnett Shale operators to minimize Volatile Organic Compound, or VOC, releases. Also, Louisiana requires operators to minimize releases of gases into the open air after hydraulic fracturing in certain urban areas.
In addition to state laws, local land use restrictions, such as city ordinances, may restrict or prohibit the performance of well drilling in general and/or hydraulic fracturing in particular. If state, local, or municipal legal restrictions are adopted in areas where we are currently conducting operations, or in the future plan to conduct operations, we may incur additional costs to comply with such requirements that may be significant in nature, experience delays or curtailment in the pursuit of exploration, development, or production activities, and perhaps even be precluded from drilling wells.
There are also certain governmental reviews conducted that focus on environmental aspects of hydraulic fracturing practices. The White House Council on Environmental Quality coordinated an administration-wide review of hydraulic fracturing practices, and a committee of the United States House of Representatives has conducted an investigation of hydraulic fracturing practices. Furthermore, a number of federal agencies are analyzing, or have been requested to review, a variety of environmental issues associated with hydraulic fracturing. On December 13, 2016, the EPA released a study of the potential adverse effects that hydraulic fracturing activities (including water acquisition, chemical mixing, well injection, and disposal and reuse) may have on water quality and public health, concluding that there is scientific evidence that hydraulic fracturing activities could impact drinking water resources in the United States under some circumstances.
The EPA finalized a rule prohibiting discharges of wastewater resulting from hydraulic fracturing to publicly-owned treatment works. The EPA is also conducting a study of private wastewater treatment facilities, referred to as centralized waste treatment, or CWT, facilities, accepting oil and gas extraction wastewater and will evaluate whether to revise discharge limits from CWT facilities. In addition, the U.S. Department of Energy’s Natural Gas Subcommittee of the Secretary of Energy Advisory Board conducted a review of hydraulic fracturing issues and practices and made recommendations to better protect the environment from drilling using hydraulic fracturing completion methods. Ongoing or proposed studies, depending on their degree of pursuit and any meaningful results obtained, could spur initiatives to further regulate hydraulic fracturing under the Safe Drinking Water Act, the Toxic Substances Control Act, or other statutory and/or regulatory mechanisms. Executive Order on April 13, 2012 created the Interagency Working Group on Unconventional Natural Gas and Oil, which is charged with coordinating and aligning federal agency research and scientific studies on unconventional oil and natural gas resources.
Also, in 2015, the U.S. Department of the Interior’s Bureau of Land Management, or BLM, adopted rules regarding well stimulation, chemical disclosures and other requirements for hydraulic fracturing on federal and Indian lands; however, these rules were rescinded by rule in December 2017. Effective December 2016, the NPS, finalized updates to its regulations governing non-federal oil and gas rights, affecting various approval exemptions and addressing well stimulation, chemical disclosures and other requirements for hydraulic fracturing. However, this regulation is targeted for agency review for potential rescission or revision pursuant to Executive Order No. 13783 titled “Promoting Energy Independence and Economic Growth,” dated March 28, 2017.
In addition, as discussed further below, state and federal regulatory agencies recently have focused on seismic events potentially associated with oil and gas operations, including injection well disposal and the hydraulic fracturing process.
Further, since 2012, oil and gas operations (production, processing, transmission, storage and distribution) have been subject to regulation under the New Source Performance Standards, or NSPS, and National Emission Standards for Hazardous Air Pollutants, or NESHAPS, programs. The EPA rules also include NSPS standards for completions of hydraulically-fractured gas wells. These standards include the reduced emission completion techniques developed in the EPA’s Natural Gas STAR program along with pit flaring of gas not sent to the gathering line. The standards are applicable to newly drilled and fractured wells as well as existing wells that are refractured. Further, the regulations under NESHAPS include maximum achievable control technology, or MACT, standards for those glycol dehydrators and storage vessels at major sources of hazardous air pollutants not currently subject to MACT standards. In October

38
2012, several challenges to the EPA’s rules were filed by various parties, including environmental groups and industry associations. In a January 16, 2013 unopposed motion to hold this litigation in abeyance, the EPA indicated that it may reconsider some aspects of the rules. The EPA has since reconsidered several aspects of the rules and may continue to make changes. For example in 2015, the EPA finalized a final rule defining “low pressure gas well” and removing “connected in parallel” from the definition of storage vessels in the New Source Performance Standard. Depending on the outcome of such judicial proceedings and regulatory actions, the rules may be further modified or rescinded or the EPA may issue new rules. We have reported some of our facilities as being subject to these rules and have incurred, and will continue to incur, costs to control emissions, and to satisfy reporting and other administrative requirements associated with these rules. We continue to evaluate the effect these rules will have on our business. In addition, the EPA finalized new rules to regulate emissions of methane and volatile organic compounds from new and modified sources in the oil and gas sector effective August 2, 2016. The EPA also finalized a rule regarding the alternative criteria for aggregating multiple small surface sites into a single source for air-quality permitting purposes. This rule could cause small facilities, on an aggregate basis, to be deemed a major source, thereby triggering more stringent air permitting processes and requirements across the oil and gas industry. BLM adopted rules effective on January 17, 2017 to reduce venting, flaring, and leaks during oil and natural gas production activities on onshore federal and Indian leases. EPA issued a two-year stay of these requirements in December 2017 and on February 13, 2018 announced a rule proposal to rescind several requirements and significantly revise others. Increased regulation and attention given to the hydraulic-fracturing process could lead to greater opposition, including litigation, to oil and gas production activities using hydraulic-fracturing techniques. Additional legislation or regulation could also lead to operational delays or increased operating costs in the production of oil and natural gas, including from the developing shale formations, or could make it more difficult to perform hydraulic fracturing. The adoption of any federal, state or local laws or the implementation of regulations regarding hydraulic fracturing could potentially cause a decrease in the completion of new oil and gas wells, increased compliance costs and time, which could adversely affect our financial position, results of operations and cash flows.
Federal and state legislative and regulatory initiatives relating to induced seismicity in connection with oil and gas activities could result in increased costs, additional operating restrictions or delays, and litigation risks which could adversely affect our operations
State and federal regulatory agencies recently have focused on a possible connection between an observed increase in minor seismic activity and tremors and both the operation of injection wells used for oil and gas waste waters and the hydraulic fracturing process. When caused by human activity, such events are called induced seismicity. In some instances, operators of injection wells in the vicinity of minor seismic events have reduced injection volumes or suspended operations, often voluntarily. A 2012 report published by the National Academy of Sciences concluded that only a very small fraction of the tens of thousands of injection wells have been suspected to be, or have been, the likely cause of induced seismicity. However, some state regulatory agencies have modified their regulations to account for induced seismicity. For example, the Texas Railroad Commission rules allow the Commission to modify, suspend, or terminate a permit based on a determination that the permitted injection well activity is likely to be contributing to seismic activity. The OKCC also asserts authority to shut down injection wells that it considers linked to induced seismicity, and has recently taken other steps to regulate injection wells that may contribute to induced seismicity. For example, on August 3, 2015, the OKCC adopted a plan calling for mandatory reductions in oil and gas wastewater disposal well volumes to address potential induced seismicity in Oklahoma; implementation has involved reductions of injection or shut-ins of disposal wells in 2015 and 2016. In February 2017, the OKCC issued a directive aimed at limiting the growth in future underground injection disposal rates into the Arbuckle formation in an area with seismicity issues. In December 2016, the OKCC announced seismicity guidelines for hydraulic fracturing operations, under which monitoring results can trigger a pause or suspension of hydraulic fracturing operations to evaluate seismic activity. Regulatory agencies are continuing to study possible linkage between injection activity and induced seismicity and also possible linkages of induced seismicity to the hydraulic fracturing process. Third-party lawsuits for property damage and other remedies based on allegations of induced seismicity have been brought against other energy companies.
Climate change legislation or regulations restricting emissions of greenhouse gases could result in increased operating costs and reduced demand for the oil, natural gas and NGLs we produce; and actual impacts of climate change like extreme weather conditions could adversely affect our operations.
In December 2009, the EPA officially published its findings that emissions of carbon dioxide, methane and other greenhouse gases, or GHGs, present an endangerment to public health and the environment because emissions of such gases are, according to the EPA, contributing to warming of the earth’s atmosphere and other climatic changes. Based on its findings, the EPA promulgated regulations to restrict emissions of GHGs under existing provisions of the federal

39
Clean Air Act, including one rule that requires a reduction in emissions of GHGs from motor vehicles and another that regulates emissions of GHGs from certain large stationary sources. In addition, on October 30, 2009, the EPA published a final rule requiring the reporting of GHG emissions from specified large GHG emission sources in the United States. On November 9, 2010, the EPA issued final rules to expand its existing GHG reporting rule to include onshore oil and natural gas production, processing, transmission, storage and distribution facilities with reporting of GHG emissions from such facilities required on an annual basis. The first reports were due in 2012 for emissions occurring in 2011. In 2015, the EPA added reporting of GHG emissions from gathering and boosting systems, completions and workovers of oil wells using hydraulic fracturing, and blowdowns of natural gas transmission pipelines to the GHG reporting rule. We are currently required to monitor and report GHG emissions under this rule, and operational and/or regulatory changes could increase the burden of compliance with GHG emissions monitoring and reporting requirements.
As previously mentioned, federal regulations require methane reductions from new or modified oil and gas sources. On November 10, 2016, the EPA issued a final ICR that would have required numerous oil and gas companies to provide information regarding methane emissions from existing oil and gas facilities, but EPA withdrew the ICR on March 2, 2017. The U.S. Congress has from time to time considered adopting legislation to reduce emissions of GHGs and almost one-half of the states have already taken legal measures to reduce emissions of GHGs primarily through the planned development of GHG emission inventories and/or regional GHG cap and trade programs. The adoption of legislation or regulatory programs to reduce emissions of GHGs could require us to incur increased operating costs, such as costs to purchase and operate emissions control systems, to acquire emissions allowances or comply with new regulatory or reporting requirements. Any such legislation or regulatory programs could also increase the cost of consuming, and thereby reduce demand for, the oil, natural gas and NGLs we produce. In addition, international, federal, regional and local regulatory initiatives that target GHGs could adversely affect the marketability of the oil and natural gas we produce. In 2015, the United States participated in the United Nations Conference on Climate Change, which led to the creation of the Paris Agreement. The Paris Agreement came into force on November 4, 2016, requiring, countries to review and “represent a progression” in their intended nationally determined contributions, which set GHG emission reduction goals, every five years beginning in 2020. The United States’ has expressed an intention to withdraw from participation in the Paris Agreement, but some state and local governments have expressed intentions to take GHG-related actions. Due to the uncertainties surrounding the regulation of and other risks associated with GHG emissions, we cannot predict the financial impact of related developments on our operations. To the extent adopted, legislation and regulatory programs to reduce emissions of GHGs could have an adverse effect on our business, financial condition and results of operations.
In addition, there has been public discussion that climate change may be associated with extreme weather conditions such as more intense hurricanes, thunderstorms, tornados and snow or ice storms, as well as rising sea levels. Another possible consequence of climate change is increased volatility in seasonal temperatures. Some studies indicate that climate change could cause some areas to experience temperatures substantially colder than their historical averages. Extreme weather conditions can interfere with our production and increase our costs and damage resulting from extreme weather may not be fully insured. However, at this time we are unable to determine the extent to which climate change may lead to increased storm or weather hazards affecting our operations.
We may face unanticipated water and other waste disposal costs.
We may be subject to regulation that restricts our ability to discharge water produced as part of our oil or gas production operations. Productive zones frequently contain water that must be removed in order for the oil or gas to produce, and our ability to remove and dispose of sufficient quantities of water from the various zones will determine whether we can produce oil or gas in commercial quantities. The produced water currently is transported from the lease and injected into disposal wells. Some states, including Oklahoma and Texas, also assert the authority to shut down disposal wells that are deemed to contribute to induced seismicity, or seismic activity that is caused by human activity. In 2015, the OKCC adopted a plan calling for mandatory reductions in oil and gas wastewater disposal well volumes to address potential induced seismicity in Oklahoma. Further, in February 2017, the OKCC issued a directive aimed at limiting the growth in future underground injection disposal rates into the Arbuckle formation in an area with seismicity issues. The availability of disposal wells with sufficient capacity to receive all of the water produced from our wells may affect our ability to produce our wells. Also, the EPA has prohibited the disposal of wastewater from hydraulic fracturing into publicly owned treatment facilities through a “zero discharge” pretreatment standard. The EPA is also conducting a study of private wastewater treatment facilities, referred to as centralized waste treatment, or CWT, facilities, accepting oil and gas extraction wastewater and will evaluate whether to revise discharge limits from CWT facilities. Therefore, across the oil and gas industry, the cost to transport and dispose of that water, including the cost of complying with regulations concerning water disposal, may increase. This increase may reduce our profitability.

40
If water produced from our projects fails to meet the quality requirements of applicable regulatory agencies, our wells produce water in excess of the applicable volumetric permit limits, the disposal wells fail to meet the requirements of all applicable regulatory agencies, or we are unable to secure access to disposal wells with sufficient capacity to accept all of the produced water, we may have to shut in wells, reduce drilling activities, or upgrade facilities for water handling or treatment. The costs to dispose of this produced water may increase if any of the following occur:
• we cannot obtain future permits from applicable regulatory agencies;
• water of lesser quality or requiring additional treatment is produced;
• our wells produce excess water;
• new laws and regulations require water to be disposed in a different manner; or
• costs to transport the produced water to the disposal wells increase.
We conduct a substantial portion of our operations through farm-outs, areas of mutual interest and other joint development agreements. These agreements subject us to additional risks that could have a material adverse effect on the success of these operations, our financial position and our results of operations.
We conduct a substantial portion of our operations through joint development agreements with third parties, including ExxonMobil. We may also enter into other joint development agreements in the future. These third parties may have obligations that are important to the success of the joint development agreement, such as the obligation to contribute capital or pay carried or other costs associated with the joint development agreement. The performance of these third-party obligations, including the ability of the third parties to satisfy their obligations under these arrangements, is outside our control. If these parties do not satisfy their obligations under these arrangements, our business may be adversely affected.
Our joint development agreements may involve risks not otherwise present when exploring and developing properties directly, including, for example:
• our joint development partners may share certain approval rights over major decisions;
• our joint development partners may not pay their share of the joint development agreement obligations, leaving us liable for their share of joint development liabilities;
• we may incur liabilities as a result of an action taken by our joint development partners;
• our joint development partners may be in a position to take actions contrary to our instructions or requests or contrary to our policies or objectives; and
• disputes between us and our joint development partners may result in delays, litigation or operational impasses.
The risks described above, the failure to continue our joint ventures or to resolve disagreements with our joint development partners could adversely affect our ability to transact the business of such joint development, which would in turn negatively affect our financial condition and results of operations.

41
Risks Relating to Financings and Ownership:
Future sales of our common stock in the public market or the issuance of securities senior to our common stock, or the perception that these sales may occur, could adversely affect the trading price of our common stock and our ability to raise funds in stock offerings.
A large percentage of our shares of common stock are held by a relatively small number of investors. Further, we entered into registration rights agreements with certain of those investors pursuant to which we have filed a registration statement with the SEC to facilitate potential future sales of such shares by them. Sales by us or our stockholders of a substantial number of shares of our common stock in the public markets, or even the perception that these sales might occur, could cause the market price of our Class A common stock to decline or could impair our ability to raise capital through a future sale of, or pay for acquisitions using, our equity securities.
We may issue common stock or other equity securities senior to our common stock in the future for a number of reasons, including to finance acquisitions, to adjust our leverage ratio, and to satisfy our obligations upon the exercise of warrants and options, or for other reasons. We cannot predict the effect, if any, that future sales or issuances of shares of our common stock or other equity securities, or the availability of shares of common stock or such other equity securities for future sale or issuance, will have on the trading price of our common stock.
Increases in interest rates could adversely affect our business.
Our business and operating results can be harmed by factors such as the availability, terms and cost of capital, increases in interest rates or a reduction in credit rating. These changes could cause our cost of doing business to increase, limit our ability to pursue acquisition opportunities, reduce our cash flow available for drilling and place us at a competitive disadvantage. For example, as of February 21, 2018, following the issuance and sale of the 2023 First Lien Notes, we had an unused borrowing capacity of approximately $25.0 million under the Revolver, subject to compliance with financial covenants. The impact of a 1.0% increase in interest rates on an assumed borrowing of the full $50.0 million available under the Revolver would result in increased annual interest expense of approximately $0.5 million and a corresponding decrease in our net income. Recent and continuing disruptions and volatility in the global financial markets may lead to a contraction in credit availability impacting our ability to finance our operations. A significant reduction in our cash flows from operations or the availability of credit could materially and adversely affect our ability to achieve our planned growth and operating results.
Our indebtedness could adversely affect our financial condition. Our annual interest expense is large related to our cash flow.
As of December 31, 2017, we had $770.1 million of total long-term debt obligations, including $211.0 million drawn on the Revolver. As of February 21, 2018, after giving effect to the issuance and sale of the 2023 First Lien Notes, we had approximately $1.0 billion of total long-term debt obligations, including $25.0 million drawn on the Revolver. Our indebtedness may significantly affect our financial flexibility in the future, including by making it more difficult for us to borrow in the future, making us more vulnerable to adverse economic or industry conditions and deterring third parties from material transactions with us. In addition, a reduction in the borrowing base for the Revolver will reduce our liquidity. If such a reduction results in the outstanding amount under the Revolver exceeding the borrowing base, we will be required to repay the deficiency within a short period of time. Our business may not continue to generate sufficient cash flow from operations to repay our indebtedness. If we are unable to generate sufficient cash flow from operations, we may be required to sell assets, to refinance all or a portion of our indebtedness or to obtain additional financing.
The borrowing base under the Revolver will be redetermined at least semi-annually on or about April 1 and October 1 of each year, with such redetermination based primarily on reserve reports using lender commodity price expectations at such time. JEH and the administrative agent (acting at the direction of lenders holding at least 662/3% of the outstanding loans) may each request one unscheduled borrowing base redetermination between each scheduled redetermination. In addition, the lenders may elect to redetermine the borrowing base upon the occurrence of certain defaults under our material operating agreements or upon the cancellation or termination of certain of our joint development agreements. The borrowing base may also be reduced as a result of our issuance of secured or unsecured notes, our termination of material hedging positions or our consummation of significant asset sales. If current low commodity prices continue through such redetermination events, the borrowing base under the Revolver may be reduced.
Certain federal regulatory agencies, including the Office of the Comptroller of the Currency, the Federal Reserve, and the Federal Deposit Insurance Corp., have recently focused on oil and gas lenders’ examinations and ratings of reserve

42
based loans, with a view towards encouraging such lenders to reduce their exposure to potentially substandard loans to oil and gas companies. In April 2014, the Office of the Comptroller of the Currency issued the “Oil and Gas Production Lending” bank examination booklet, which details potential regulatory requirements related to reserve based lending. Whether or not these regulatory agencies are successful in implementing stricter requirements related to reserve based lending, oil and gas lenders may respond to these discussions by taking a more conservative approach in their lending practices, which could adversely impact future borrowing base redeterminations under the Revolver.
For more information on our indebtedness, see “Item 7. Management’s Discussion and Analysis of Financial Condition and Results of Operations—Liquidity and Capital Resources.”
We may be unable to maintain compliance with certain financial ratio covenants of our outstanding indebtedness which could result in an event of default that, if not cured or waived, would have a material adverse effect on our business, financial condition and results of operations.
The Revolver requires us to maintain certain financial ratios, including (i) commencing with the fiscal quarter ending March 31, 2019, a senior secured leverage ratio, consisting of consolidated secured funded debt to EBITDAX, of not greater than 2.25 to 1.00 as of the last day of any fiscal quarter, (ii) a current ratio, consisting of consolidated current assets, including the unused amounts of the total commitments, to consolidated current liabilities, of not less than 1.00 to 1.00 as of the last day of any fiscal quarter, and (iii) commencing with the fiscal quarter ending March 31, 2019, a total leverage ratio, consisting of consolidated debt to EBITDAX, of not greater than 5.25 to 1.00 as of March 31, 2019, 5.00 to 1.00 as of June 30, 2019, 4.75 to 1.00 as of September 30, 2019, 4.50 to 1.00 as of December 31, 2019 and 4.00 to 1.00 as of the last day of each fiscal quarter ending thereafter.
As of December 31, 2017, we were in compliance with our financial covenants. However, we cannot guarantee that we will be able to comply with such terms at all times in the future. Any failure to comply with the conditions and covenants in the Revolver that is not waived by our lenders or otherwise cured could lead to a termination of the Revolver, acceleration of all amounts due under the Revolver, or trigger cross default provisions under other financing arrangements. These restrictions may limit our ability to obtain future financings to withstand a future downturn in our business or the economy in general, or to otherwise conduct necessary corporate activities. We may also be prevented from taking advantage of business opportunities that arise because of the limitations that the restrictive covenants under our indebtedness impose on us.
The Jones family and certain other stockholders control a significant percentage of Jones Energy, Inc.’s voting power and have the ability to take actions that may conflict with your interests.
As of December 31, 2017, the Jones family, Metalmark Capital and affiliates of JVL Advisors, L.L.C. held approximately 44.5% of the combined voting power of Jones Energy, Inc. These stockholders are entitled to act separately in their own respective interests with respect to their ownership interests in Jones Energy, Inc., and collectively have the ability to substantially influence the election of the members of our board of directors, thereby potentially controlling our management and affairs. In addition, they have significant influence over all matters that require approval by our stockholders, including mergers and other material transactions.
If we fail to develop or maintain an effective system of internal controls, we may not be able to report our financial results accurately or prevent fraud, which would likely have a negative impact on the market price of our common stock.
Effective internal controls are necessary for us to provide reliable financial reports, prevent fraud and to operate successfully as a publicly traded company. To comply with the requirements of being a publicly traded company, we may need to implement additional financial and management controls, reporting systems and procedures and hire additional accounting, finance, tax and legal staff. Our efforts to develop and maintain our internal controls may not be successful, and we may be unable to maintain effective controls over our financial processes and reporting in the future or to comply with our obligations under Section 404 of the Sarbanes-Oxley Act of 2002, which we refer to as Section 404. For example, Section 404 requires us, among other things, to annually review and report on the effectiveness of our internal controls over financial reporting. Any failure to develop, implement or maintain effective internal controls or to improve our internal controls could harm our operating results or cause us to fail to meet our reporting obligations. Given the difficulties inherent in the design and operation of internal controls over financial reporting, we can provide no assurance as to our conclusions about the effectiveness of our internal controls, and we may incur significant costs in our efforts to comply with Section 404. If one or more material weaknesses persist or if we fail

43
to establish and maintain effective internal control over financial reporting, our ability to accurately report our financial results could be adversely affected. Ineffective internal controls could also subject us to regulatory scrutiny and a loss of confidence in our reported financial information, which could have an adverse effect on our business.
The loss of senior management or technical personnel could adversely affect our operations.
Our success will depend to a large extent upon the efforts and abilities of our executive officers and key operations personnel. The loss of the services of one or more of these key employees could have a material adverse effect on us. We do not maintain insurance against the loss of any of these individuals. Our business will also be dependent upon our ability to attract and retain qualified personnel. Since the fourth quarter of 2014, the prices of oil, natural gas and NGLs were extremely volatile and declined significantly. Key employees may depart because of uncertainty during times of commodity price volatility. Acquiring and keeping these personnel could prove more difficult or cost substantially more than estimated. This could cause us to incur greater costs, or prevent us from pursuing our development and exploitation strategy as quickly as we would otherwise wish to do.
We currently have no plans to pay regular dividends on our common stock, so you may not receive funds without selling your common stock.
We currently have no plans to pay regular dividends on our Class A common stock. Any payment of dividends in the future will be at the discretion of our board of directors and will depend on, among other things, our earnings, financial condition and business opportunities, the restrictions in our debt agreements, and other considerations that our board of directors deems relevant. Accordingly, you may have to sell some or all of your Class A common stock in order to generate cash flow from your investment.
We will incur corporate income tax liabilities on taxable income allocated to us by JEH with respect to JEH Units we own, which may be substantial. JEH is required to make cash tax distributions under its operating agreement. JEH’s ability to make tax distributions, and our ability to pay taxes and the Tax Receviable Agreement liability may be limited by our structure and available liquidity. To the extent that we incur cash income tax liabilities or JEH is required to make cash tax distributions and cash payments of the Tax Receviable Agreement liability it would impact our liquidity and reduce cash available for other uses.
Under the terms of its operating agreement, JEH is generally required to make quarterly pro rata cash tax distributions to its unitholders (including us) based on income allocated to such unitholders through the end of each relevant quarter, as adjusted to take into account our good faith projections of taxable income or loss for the remainder of the calendar year, to the extent JEH has cash available for such distributions and subject to certain other restrictions described below. During 2016, JEH generated taxable income, resulting in the payment during 2016 of $17.3 million in cash tax distributions to JEH unitholders (other than us). As a result of JEH’s 2016 taxable income (all of which is passed-through and taxed to us and JEH’s other unitholders), during 2017 we made further income tax payments to federal and state taxing authorities of $2.3 million and JEH made further tax distributions to JEH unitholders (other than us) of $0.6 million. During 2017, JEH did not generate taxable income, therefore we did not make any additional tax payments nor did JEH make any additional tax distributions other than those made as a result of 2016 JEH taxable income. Based on our initial 2018 operating budget and information available as of this filing, we do not anticipate that we will be required to make any additional tax payments or that JEH will make any additional tax distributions during 2018. Estimating the tax distributions required under the operating agreement is imprecise by nature, highly uncertain, and dependent upon a variety of factors.
We are classified as a corporation for U.S. federal income tax purposes and, in most states in which JEH does business, for state income tax purposes. Under current law, we are subject to U.S. federal income tax at rates of up to 21%, and to state income tax at rates that vary from state to state, on the net income allocated to us by JEH with respect to the JEH Units we own. We are a holding company with our sole asset consisting of our ownership in JEH and have no independent means of generating revenue. JEH is classified as a partnership for federal income tax purposes and as such is not subject to federal income tax (other than as a withholding agent). Instead, taxable income is allocated to holders of JEH Units, including the JEH Units we own. Under the terms of its operating agreement, JEH is obligated to make tax distributions to holders of its units, including us, subject to the conditions described below. Our ability to cause JEH to make tax distributions, which generally will be pro rata with respect to all outstanding JEH Units, in an amount sufficient to allow us to pay our taxes and make any payments due under the Tax Receivable Agreement, is subject to various factors, including the cash requirements and financial condition of JEH, compliance by JEH or its subsidiaries with restrictions, covenants and financial ratios related to existing or future indebtedness, including under our notes and

44
the Revolver, and other agreements entered into with third parties. As a result, it is possible that Jones Energy, Inc. will not have sufficient cash to pay taxes and make payments under the Tax Receviable Agreement liability.
See “Risk Factors—We will be required to make payments under the Tax Receivable Agreement for certain tax benefits we may receive (or be deemed to receive), and the amounts of such payments could be significant.”
We will be required to make payments under the Tax Receivable Agreement for certain tax benefits we may receive (or be deemed to receive), and the amounts of such payments could be significant.
We entered into the Tax Receivable Agreement with JEH and the Class B shareholders. This agreement generally provides for the payment by us of 85% of the amount of cash savings, if any, in U.S. federal, state and local income tax or franchise tax that we actually realize (or are deemed to realize in certain circumstances) as a result of (i) the tax basis increases resulting from the Class B shareholders’ exchange of JEH Units for shares of Class A common stock (or resulting from a sale of JEH Units to us for cash) and (ii) imputed interest deemed to be paid by us as a result of, and additional tax basis arising from, any payments we make under the Tax Receivable Agreement. In addition, payments we make under the Tax Receivable Agreement will be increased by any interest accrued from the due date (without extensions) of the corresponding tax return.
The payment obligations under the Tax Receivable Agreement are our obligations and not obligations of JEH. For purposes of the Tax Receivable Agreement, cash savings in tax generally are calculated by comparing our actual tax liability to the amount we would have been required to pay had we not been able to utilize any of the tax benefits subject to the Tax Receivable Agreement. Any payments are made within a designated period of time following the filing of the tax return where we utilize such tax benefits to reduce taxes in a given year. The term of the Tax Receivable Agreement will continue until all such tax benefits have been utilized or expired, unless we exercise our right to terminate the Tax Receivable Agreement by making the termination payment specified in the agreement.
The actual increase in tax basis, as well as the amount and timing of any payments under the Tax Receivable Agreement, will vary depending upon a number of factors, including the timing of the exchanges of JEH Units, the price of Class A common stock at the time of each exchange, the extent to which such exchanges are taxable, the amount and timing of the taxable income we generate in the future and the tax rate then applicable, and the portion of our payments under the Tax Receivable Agreement constituting imputed interest or depletable, depreciable or amortizable basis. We expect that the payments that we will be required to make under the Tax Receivable Agreement could be substantial.
The payments under the Tax Receivable Agreement will not be conditioned upon a holder of rights under the Tax Receivable Agreement having a continued ownership interest in either JEH or us.
In certain circumstances including transactions involving a change in control, significant payments under the Tax Receivable Agreement may be accelerated and/or significantly exceed the actual benefits, if any, we realize in respect of the tax attributes subject to the Tax Receivable Agreement.
Under certain circumstances, we could become obligated to make significant payments under our Tax Receivable Agreement that could exceed or represent a substantial portion of our liquidity and market capitalization. These payment obligations could be to persons without significant equity ownership in us at the time such obligation arises. If we elect to terminate the Tax Receivable Agreement early or it is terminated early due to certain mergers or other changes of control, we would be required to make an immediate payment equal to the present value of the anticipated future tax benefits subject to the Tax Receivable Agreement. Such calculation of anticipated future tax benefits will be based upon certain assumptions and deemed events set forth in the Tax Receivable Agreement, including the assumptions that (i) we have sufficient taxable income to fully utilize such benefits, (ii) any JEH Units that the Class B shareholders or their permitted transferees own on the termination date are exchanged for shares of our Class A common stock on the termination date and (iii) the amount of future depletion deductions to which we are entitled is based on recoverable reserves and rates of recovery reflected in the most recent reserve reports and estimates available on the termination date. Any early termination payment may be made significantly in advance of the actual realization, if any, of such future benefits.
In these situations, our obligations under the Tax Receivable Agreement could have a substantial negative impact on our liquidity and could have the effect of delaying, deferring or preventing certain mergers, asset sales, other forms of business combinations or other changes of control due to the additional transaction cost a potential acquirer may attribute to satisfying such obligations. For example, if the Tax Receivable Agreement had been terminated at December 31, 2017, we estimate that the termination payment would be approximately $58.4 million (calculated based on the 21%

45
U.S. federal corporate income tax rate under the recently enacted Tax Cuts and Jobs Act, and applicable state and local income tax rates and using a discount rate equal to LIBOR, plus 100 basis points, applied against the anticipated undiscounted liability and assuming a market value of our Class A common stock equal to $1.10 per share, the closing price on December 29, 2017). The foregoing is merely an estimate and the actual payment could differ materially. There can be no assurance that we will be able to finance our obligations under the Tax Receivable Agreement.
Payments under the Tax Receivable Agreement will be based on the tax reporting positions that we will determine. The holders of rights under the Tax Receivable Agreement will not reimburse us for any payments previously made under the Tax Receivable Agreement if such basis increases or other benefits are subsequently disallowed, except that excess payments made to any Class B shareholder will be netted against payments otherwise to be made, if any, to such Class B shareholder after our determination of such excess. As a result, in such circumstances, we could make payments that are greater than our actual cash tax savings, if any, and may not be able to recoup those payments, which could adversely affect our liquidity. For as long as we are an emerging growth company, we will not be required to comply with certain requirements that apply to other public companies. We continue to qualify as an “emerging growth company” under the Jumpstart Our Business Startups Act, or the JOBS Act. As a result, we may take advantage of certain exemptions from various reporting requirements that are applicable to other public companies that are not emerging growth companies, including not being required to provide an auditor’s attestation report on management’s assessment of the effectiveness of our system of internal control over financial reporting pursuant to Section 404 and reduced disclosure obligations regarding executive compensation in our periodic reports. We will remain an emerging growth company for up to five years from our initial public offering, although we will lose that status sooner if we have more than $1.0 billion of revenues in a fiscal year, have more than $700 million in market value of our Class A common stock held by non-affiliates, or issue more than $1.0 billion of non-convertible debt over a three year period. To the extent that we rely on any of the exemptions available to emerging growth companies, you will receive less information about our executive compensation and internal control over financial reporting than issuers that are not emerging growth companies. We are subject to cyber security risks. A cyber incident could occur and result in information theft, data corruption, operational disruption or financial loss. The oil and gas industry has become increasingly dependent on digital technologies to conduct certain exploration, development, production, processing and distribution activities. For example, we depend on digital technologies to interpret seismic data, manage drilling rigs, production equipment and gathering and transportation systems, conduct reservoir modeling and reserves estimation and process and record financial and operating data. As an oil and natural gas producer, we face various security threats, including cyber security threats. Cyber security attacks in particular are increasing and include, but are not limited to, malicious software, attempts to gain unauthorized access to data, and other electronic security breaches that could lead to disruptions in critical systems, unauthorized release of confidential or otherwise protected information and corruption of data. Although to date we have not experienced any material losses related to cyber security attacks, we may suffer such losses in the future. Moreover, the various procedures and controls we use to monitor and protect against these threats and to mitigate our exposure to such threats may not be sufficient in preventing security threats from materializing. If any of these events were to materialize, they could lead to losses of sensitive information, critical infrastructure, personnel or capabilities essential to our operations and could have a material adverse effect on our reputation, financial position, results of operations or cash flows. Loss of our information and computer systems could adversely affect our business. We are heavily dependent on our information systems and computer based programs, including our well operations information, seismic data, electronic data processing and accounting data. If any of such programs or systems were to fail or create erroneous information in our hardware or software network infrastructure, possible consequences include our loss of communication links, inability to find, produce, process and sell oil, natural gas and NGLs and inability to automatically process commercial transactions or engage in similar automated or computerized business activities. Any such consequence could have a material adverse effect on our business.
46
We were recently out of compliance with the NYSE’s minimum share price requirement and, if we cease to be compliant in the future, we are at risk of the NYSE delisting our Class A common stock, which would have a material adverse effect on our business, financial condition, prospects and liquidity and value of our common stock. Our Class A common stock is currently listed on the NYSE, and the continued listing of our Class A common stock is subject to our compliance with a number of listing standards. On December 26, 2017, we were notified by the NYSE that we were no longer in compliance with the continued listing standards because the average closing price of our Class A common stock had fallen below $1.00 per share over a period of 30 consecutive trading days. While we were notified by the NYSE on February 1, 2018 that we had fully regained compliance with the NYSE’s continued listing standards because the price of the our Class A common stock was above $1.00 per share on the last trading day of January and was on average over $1.00 for the 30 trading days preceding January 31, 2018, if we are unable to maintain compliance the NYSE may initiate procedures to suspend and delist the Class A common stock. If our Class A common stock ultimately were to be delisted for any reason, it could negatively impact us by (i) reducing the liquidity and market price of our Class A common stock; (ii) reducing the number of investors willing to hold or acquire our Class A common stock, which could negatively impact our ability to raise equity financing; (iii) limiting our ability to use a registration statement to offer and sell freely tradeable securities, thereby preventing us from accessing the public capital markets; and (iv) impairing our ability to provide equity incentives to our employees. Item 1B. Unresolved Staff Comments
None. Item 2. Properties
The information required by Item 2. is contained in Item 1. Business. Item 3. Legal Proceedings
We are from time to time subject to, and are presently involved in, litigation or other legal proceedings arising out of the ordinary course of business. None of these legal proceedings are expected to have a material adverse effect on our financial condition, results of operations or cash flow. With respect to these proceedings, our management believes that we will either prevail, have adequate insurance coverage or have established appropriate reserves to cover potential liabilities. Any costs that management estimates may be paid related to these proceedings or claims are accrued when the liability is considered probable and the amount can be reasonably estimated. There can be no assurance, however, as to the ultimate outcome of any of these matters, and if all or substantially all of these legal proceedings were to be determined adversely to us, there could be a material adverse effect on our financial condition, results of operations and cash flow. See Note 15, “Commitments and Contingencies—Litigation,” in the Notes to Consolidated Financial Statements for further discussion. Item 4. Mine Safety Disclosures
Not applicable.

47
Part II
Item 5. Market for Registrant’s Common Equity, Related Stockholder Matters and Issuer Purchases of Equity Securities
Our Class A common stock is listed on the New York Stock Exchange (“NYSE”) under the symbol “JONE.”
The following table sets forth the range of high and low sales prices of our common stock as reported by the NYSE for the periods indicated.
2017 2016 High Low High Low
1st Quarter . . . . . . . . . . . . . . . . . . . . . . . . . . . . . . . . . . . . . . . . $ 5.20 $ 2.20 $ 4.01 $ 1.16 2nd Quarter . . . . . . . . . . . . . . . . . . . . . . . . . . . . . . . . . . . . . . . $ 2.70 $ 1.40 $ 5.30 $ 2.84 3rd Quarter . . . . . . . . . . . . . . . . . . . . . . . . . . . . . . . . . . . . . . . . $ 2.21 $ 0.85 $ 4.49 $ 2.55 4th Quarter . . . . . . . . . . . . . . . . . . . . . . . . . . . . . . . . . . . . . . . . $ 1.90 $ 0.73 $ 5.34 $ 3.35
On February 21, 2018, the last sale price of our Class A common stock, as reported on the NYSE, was $0.92 per share. As of February 21, 2018, there were 92,030,282 shares of Class A common stock outstanding held by approximately nineteen stockholders of record and 9,627,821 shares of Class B common stock outstanding held by approximately three stockholders of record.
On December 26, 2017, we were notified by the NYSE that we were no longer in compliance with the continued listing standards because the average closing price of our Class A common stock had fallen below $1.00 per share over a period of 30 consecutive trading days. On February 1, 2018, we received notice from the NYSE that we had cured our deficiency and fully regained compliance with the NYSE’s continued listing standards as of market close on January 31, 2018 because the price of the our Class A common stock was above $1.00 per share on the last trading day of January and was on average over $1.00 for the 30 trading days preceding January 31, 2018.
Dividend Policy
We have not paid any cash dividends and do not anticipate declaring or paying any cash dividends to holders of our Class A common stock in the foreseeable future. We currently intend to retain future earnings, if any, to finance the growth of our business. Our future dividend policy is within the discretion of our board of directors and will depend upon then existing conditions, including our results of operations, financial condition, capital requirements, investment opportunities, statutory restrictions on our ability to pay dividends and other factors our board of directors may deem relevant. In addition, the Revolver, the 2023 First Lien Notes, the 2022 Notes and the 2023 Notes prohibit us from paying cash dividends.
Issuer Purchases of Equity Securities
None.
Sales of Unregistered Equity Securities
None.
Stock Performance Graph
The following stock performance graph and related information shall not be deemed “soliciting material” or to be “filed” with the SEC, nor shall such information be incorporated by reference into any future filing under the Securities Act of 1933, as amended (the “Securities Act”), or the Securities Exchange Act of 1934, as amended (the “Exchange Act”), except to the extent that we specifically incorporate such information by reference into such a filing. The graph and information is included for historical comparative purposes only and should not be considered indicative of future stock performance.
The graph compares the cumulative total shareholder return to Jones Energy, Inc.’s common stockholders as compared to the cumulative total returns on the Standard & Poor’s 500 index (“the S&P 500 Index”) and the Standard and Poor’s

48
500 Oil & Gas Exploration & Production Index (“S&P 500 O&G E&P Index”) since the time of our IPO. The graph was prepared assuming $100 was invested in our common stock at its initial public offering price of $15.00 per share and invested in the S&P 500 Index and the S&P 500 O&G E&P Index on July 24, 2013 at the closing price on such date and tracked through December 31, 2017.
Securities Authorized for issuance Under Equity Compensation Plans
The following table presents the securities authorized for issuance under the Amended and Restated Jones Energy, Inc. 2013 Omnibus Incentive Plan (the “LTIP”) as of December 31, 2017.
Number of Shares Number of Shares to be Weighted-Average Remaining Available for Issued Upon Exercise of Exercise Price of Future Issuance under Outstanding Options, Outstanding Options, Equity Compensation Plan Category Warrants and Rights Warrants and Rights ($) Plans
Equity compensation plan approved by security holders (1) . . . . — — 3,065,486 (2) Equity compensation plans not approved by security holders . . . . . . . — — — Total . . . . . . . . . . . . . . . — — 3,065,486
(1) Our Amended and Restated 2013 Omnibus Incentive Plan (the “LTIP”) was approved by our board of
directors in May 2016 and took effect on May 4, 2016. The LTIP was also approved by our shareholders at the Annual Meeting of Shareholders on May 4, 2016.
(2) The LTIP may consist of the following components: restricted stock, stock options, performance awards, restricted stock units, stock appreciation rights, cash awards, dividend equivalents, and other share- based awards. The LTIP limits the number of shares that may be delivered pursuant to awards to an aggregate total of 8,340,211 shares of our Class A common stock, as adjusted for the effects of the Special Stock Dividend and the preferred stock dividends paid in shares. Our board of directors had approved total cumulative awards of 5,274,725 shares of restricted Class A common stock under the LTIP as of December 31, 2017, net of forfeitures and other adjustments that return previously awarded shares to the pool of remaining available shares.
$0
$20
$40
$60
$80
$100
$120
$140
$160
24-J
ul-1
3
30-S
ep-1
3
31-D
ec-1
3
31-M
ar-1
4
30-J
un-1
4
30-S
ep-1
4
31-D
ec-1
4
31-M
ar-1
5
30-J
un-1
5
30-S
ep-1
5
31-D
ec-1
5
31-M
ar-1
6
30-J
un-1
6
30-S
ep-1
6
31-D
ec-1
6
31-M
ar-1
7
30-J
un-1
7
29-S
ep-1
7
29-D
ec-1
7
JONE S&P 500 S&P O&G E&P Index

49
Item 6. Selected Financial Data
The following table sets forth selected financial data of Jones Energy, Inc. and its predecessor for the years ended December 31, 2017, 2016, 2015, 2014 and 2013. This information should be read in connection with “Item 7. Management’s Discussion and Analysis of Financial Condition and Results of Operations” and “Item 8. Financial Statements and Supplementary Data” presented elsewhere in this report.
Year Ended December 31, (in thousands except per share data) 2017 2016 2015 2014 2013
Operating revenues Oil and gas sales . . . . . . . . . . . . . . . . . . . . . . . . . . . . . . . . . . . . . . . . . . . . . $ 186,393 $ 124,877 $ 194,555 $ 378,401 $ 258,063 Other revenues . . . . . . . . . . . . . . . . . . . . . . . . . . . . . . . . . . . . . . . . . . . . . . 2,180 2,970 2,844 2,196 1,106
Total operating revenues . . . . . . . . . . . . . . . . . . . . . . . . . . . . . . . . . 188,573 127,847 197,399 380,597 259,169 Operating costs and expenses Lease operating . . . . . . . . . . . . . . . . . . . . . . . . . . . . . . . . . . . . . . . . . . . . . . 36,636 32,640 41,027 37,760 25,129 Production and ad valorem taxes . . . . . . . . . . . . . . . . . . . . . . . . . . . . . . . . . 6,874 7,768 12,130 22,556 15,517 Exploration . . . . . . . . . . . . . . . . . . . . . . . . . . . . . . . . . . . . . . . . . . . . . . . . . 14,145 6,673 6,551 3,453 16,125 Depletion, depreciation and amortization . . . . . . . . . . . . . . . . . . . . . . . . . . . 167,224 153,930 205,498 181,669 114,136 Impairment of oil and gas properties . . . . . . . . . . . . . . . . . . . . . . . . . . . . . . 149,648 — — — — Accretion of ARO liability . . . . . . . . . . . . . . . . . . . . . . . . . . . . . . . . . . . . . 960 1,263 1,087 770 608 General and administrative . . . . . . . . . . . . . . . . . . . . . . . . . . . . . . . . . . . . . 29,892 29,640 33,388 25,763 31,902 Other operating . . . . . . . . . . . . . . . . . . . . . . . . . . . . . . . . . . . . . . . . . . . . . . — 199 4,188 — —
Total operating expenses . . . . . . . . . . . . . . . . . . . . . . . . . . . . . . . . . 405,379 232,113 303,869 271,971 203,417 Operating income (loss) . . . . . . . . . . . . . . . . . . . . . . . . . . . . . . . . . . (216,806) (104,266) (106,470) 108,626 55,752
Other income (expense) Interest expense . . . . . . . . . . . . . . . . . . . . . . . . . . . . . . . . . . . . . . . . . . . . . (51,651) (53,127) (64,458) (41,875) (30,053) Gain on debt extinguishment . . . . . . . . . . . . . . . . . . . . . . . . . . . . . . . . . . . . — 99,530 — — — Net gain (loss) on commodity derivatives . . . . . . . . . . . . . . . . . . . . . . . . . . (17,985) (51,264) 158,753 189,641 (2,566) Other income (expense) . . . . . . . . . . . . . . . . . . . . . . . . . . . . . . . . . . . . . . . . 56,952 536 317 (4,554) (799)
Other income (expense), net . . . . . . . . . . . . . . . . . . . . . . . . . . . . . . . (12,684) (4,325) 94,612 143,212 (33,418) Income (loss) before income tax . . . . . . . . . . . . . . . . . . . . . . . . . . . . (229,490) (108,591) (11,858) 251,838 22,334
Income tax provision Current . . . . . . . . . . . . . . . . . . . . . . . . . . . . . . . . . . . . . . . . . . . . . . (3,585) 3,981 113 53 85 Deferred . . . . . . . . . . . . . . . . . . . . . . . . . . . . . . . . . . . . . . . . . . . . . (47,082) (27,767) (2,894) 26,165 (156) Total income tax provision (benefit) . . . . . . . . . . . . . . . . . . . . . . . . . (50,667) (23,786) (2,781) 26,218 (71)
Net income (loss) . . . . . . . . . . . . . . . . . . . . . . . . . . . . . . . . . . . . . . . . . . . . (178,823) (84,805) (9,077) 225,620 22,405 Net income (loss) attributable to non-controlling interests . . . . . . . . . . . . . . (77,331) (42,253) (6,696) 184,484 24,591 Net income (loss) attributable to controlling interests . . . . . . . . . . . . . . . $ (101,492) $ (42,552) $ (2,381) $ 41,136 $ (2,186) Dividends and accretion on preferred stock . . . . . . . . . . . . . . . . . . . . . . . . . (7,924) (2,669) — — — Net income (loss) attributable to common shareholders . . . . . . . . . . . . . . $ (109,416) $ (45,221) $ (2,381) $ 41,136 $ (2,186) Earnings (loss) per share:
Basic - Net income (loss) attributable to common shareholders . . . . . . $ (1.51) $ (1.04) $ (0.08) $ 3.02 $ (0.16) Diluted - Net income (loss) attributable to common shareholders . . . . . $ (1.51) $ (1.04) $ (0.08) $ 3.02 $ (0.16)
Weighted average Class A shares outstanding: Basic . . . . . . . . . . . . . . . . . . . . . . . . . . . . . . . . . . . . . . . . . . . . . . . . . 72,411 43,506 29,161 13,622 13,593 Diluted . . . . . . . . . . . . . . . . . . . . . . . . . . . . . . . . . . . . . . . . . . . . . . . . 72,411 43,506 29,161 13,630 13,593
Other Supplementary Data: EBITDAX (1) . . . . . . . . . . . . . . . . . . . . . . . . . . . . . . . . . . . . . . . . . . . . $ 186,364 $ 187,955 $ 268,417 $ 303,014 $ 204,997 Adjusted net income (2) . . . . . . . . . . . . . . . . . . . . . . . . . . . . . . . . . . . . . $ (31,126) $ (15,528) $ 2,220 $ 68,824 $ 56,425
(1) EBITDAX is a non-GAAP financial measure. For a definition of EBITDAX and a reconciliation of EBITDAX to
our net income, see “—Non-GAAP Financial Measures” below. (2) Adjusted net income is a non-GAAP financial measure. For a definition of adjusted net income and a reconciliation
of adjusted net income to our net income, see “—Non-GAAP Financial Measures” below.

50
Year Ended December 31, (in thousands of dollars) 2017 2016 2015 2014 2013
Statement of Cash Flow Data Net cash provided by operating activities . . . . $ 59,008 $ 25,700 $ 68,849 $ 265,319 $ 148,528 Net cash (used in) investing activities . . . . . (110,004) (130,862) (168,220) (463,799) (368,232) Net cash provided by financing activities . . . . 35,826 117,911 107,698 188,226 219,798 Net increase (decrease) in cash . . . . . . . . . . . . . . $ (15,170) $ 12,749 $ 8,327 $ (10,254) $ 94
As of December 31, (in thousands of dollars) 2017 2016 2015 2014 2013
Balance Sheet Data Cash and cash equivalents . . . . . . . . . . . $ 19,472 $ 34,642 $ 21,893 $ 13,566 $ 23,820 Other current assets . . . . 85,229 64,680 172,281 230,648 121,725
Total current assets . 104,701 99,322 194,174 244,214 145,545 Property and equipment, net . . . . . . . . 1,599,759 1,746,584 1,639,639 1,642,908 1,300,672 Other long-term assets . 5,603 40,794 101,341 96,363 37,775
Total assets . . . . . . . . $ 1,710,063 $ 1,886,700 $ 1,935,154 $ 1,983,485 $ 1,483,992
Current liabilities . . . . . . $ 166,487 $ 107,807 $ 67,576 $ 229,132 $ 179,623 Long-term debt . . . . . . . 759,316 724,009 837,654 848,636 654,013 Other long-term liabilities . . . . . . . . . . . . 108,585 74,458 93,072 52,367 26,232 Mezzanine equity . . . . . 89,539 88,975 — — — Total stockholders’ / members’ equity . . . . . . 586,136 891,451 936,852 853,350 624,124
Total liabilities and stockholders’ / members’ equity . . . . $ 1,710,063 $ 1,886,700 $ 1,935,154 $ 1,983,485 $ 1,483,992
Non-GAAP financial measures
EBITDAX is a supplemental non-GAAP financial measure that is used by management and external users of our consolidated financial statements, such as industry analysts, investors, lenders and rating agencies.
We define EBITDAX as earnings before interest expense, income taxes, depreciation, depletion and amortization, exploration expense, gains and losses from derivatives less the current period settlements of matured derivative contracts and the other items described below. EBITDAX is not a measure of net income as determined by United States generally accepted accounting principles, or GAAP. Management believes EBITDAX is useful because it allows us to more effectively evaluate our operating performance and compare the results of our operations from period to period and against our peers without regard to our financing methods or capital structure. We exclude the items listed above from net income in arriving at EBITDAX because these amounts can vary substantially from company to company within our industry depending upon accounting methods and book values of assets, capital structures and the method by which the assets were acquired. EBITDAX has limitations as an analytical tool and should not be considered as an alternative to, or more meaningful than, net income as determined in accordance with GAAP or as an indicator of our liquidity. Certain items excluded from EBITDAX are significant components in understanding and assessing a company’s financial performance, such as a company’s cost of capital and tax structure, as well as the historical costs of depreciable assets.

51
Our presentation of EBITDAX should not be construed as an inference that our results will be unaffected by unusual or nonrecurring items. Our computations of EBITDAX may not be comparable to other similarly titled measures of other companies.
The following table sets forth a reconciliation of net income (loss) as determined in accordance with GAAP to EBITDAX for the periods indicated:
Year Ended December 31, (in thousands of dollars) 2017 2016 2015 2014 2013
Reconciliation of net income to EBITDAX Net income (loss) . . . . . . . . . . . . . . . . . . . . . . . . . . . . . . $ (178,823) $ (84,805) $ (9,077) $ 225,620 $ 22,405 Interest expense . . . . . . . . . . . . . . . . . . . . . . . . . . . . . . . . 51,651 53,127 64,458 41,875 30,053 Exploration expense . . . . . . . . . . . . . . . . . . . . . . . . . . . . 14,145 6,673 6,551 3,453 16,125 Income taxes . . . . . . . . . . . . . . . . . . . . . . . . . . . . . . . . . . (50,667) (23,786) (2,781) 26,218 (71) Depreciation and depletion . . . . . . . . . . . . . . . . . . . . . . . 167,224 153,930 205,498 181,669 114,136 Impairment of oil and natural gas properties . . . . . . . . 149,648 — — — — Accretion of ARO liability . . . . . . . . . . . . . . . . . . . . . . . 960 1,263 1,087 770 608 Change in TRA liability . . . . . . . . . . . . . . . . . . . . . . . . . (59,492) (784) (1,984) — — Other non-cash charges . . . . . . . . . . . . . . . . . . . . . . . . . 2,044 1,202 1,023 376 79 Stock compensation expense . . . . . . . . . . . . . . . . . . . . . 6,260 7,425 7,562 4,040 10,838 Deferred and other non-cash compensation
expense . . . . . . . . . . . . . . . . . . . . . . . . . . . . . . . . . . . . . . 208 804 455 758 2,719 Net (gain) loss on derivative contracts . . . . . . . . . . . . . 17,985 51,264 (158,753) (189,641) 2,566 Current period settlements of matured derivative contracts . . . . . . . . . . . . . . . . . . . . . . . . . . . . . . . . . . . . . . 66,851 123,249 149,801 4,476 5,209 Amortization of deferred revenue . . . . . . . . . . . . . . . . . (1,854) (2,384) (1,960) (1,154) (469) (Gain) loss on sale of assets . . . . . . . . . . . . . . . . . . . . . . 127 (14) 3 (297) 78 (Gain) on debt extinguishment . . . . . . . . . . . . . . . . . . . . — (99,530) — — — Stand-by rig costs . . . . . . . . . . . . . . . . . . . . . . . . . . . . . . — — 4,188 — — Financing expenses and other loan fees . . . . . . . . . . . . 97 321 2,346 4,851 721 EBITDAX . . . . . . . . . . . . . . . . . . . . . . . . . . . . . . . . . . . . $ 186,364 $ 187,955 $ 268,417 $ 303,014 $ 204,997
Adjusted Net Income and Adjusted Earnings per Share are supplemental non-GAAP financial measures that are used by management and external users of the Company’s consolidated financial statements. We define Adjusted Net Income as net income excluding the impact of certain non-cash items including gains or losses on commodity derivative instruments not yet settled, impairment of oil and gas properties, non-cash compensation expense, and the other items described below. We define Adjusted Earnings per Share as earnings per share plus that portion of the components of adjusted net income allocated to the controlling interests divided by weighted average shares outstanding. We believe adjusted net income and adjusted earnings per share are useful to investors because they provide readers with a more meaningful measure of our profitability before recording certain items for which the timing or amount cannot be reasonably determined. However, these measures are provided in addition to, not as an alternative for, and should be read in conjunction with, the information contained in our financial statements prepared in accordance with GAAP. Our computations of adjusted net income and adjusted earnings per share may not be comparable to other similarly titled measures of other companies.
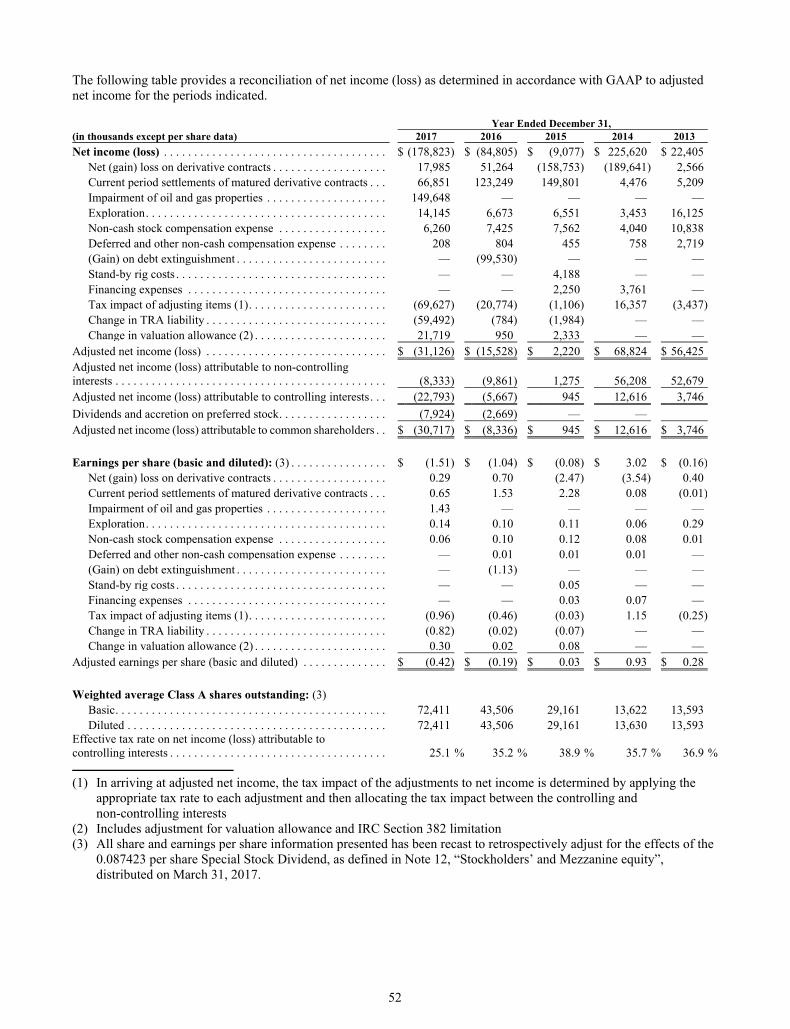
52
The following table provides a reconciliation of net income (loss) as determined in accordance with GAAP to adjusted net income for the periods indicated.
Year Ended December 31, (in thousands except per share data) 2017 2016 2015 2014 2013
Net income (loss) . . . . . . . . . . . . . . . . . . . . . . . . . . . . . . . . . . . . . $ (178,823) $ (84,805) $ (9,077) $ 225,620 $ 22,405 Net (gain) loss on derivative contracts . . . . . . . . . . . . . . . . . . . 17,985 51,264 (158,753) (189,641) 2,566 Current period settlements of matured derivative contracts . . . 66,851 123,249 149,801 4,476 5,209 Impairment of oil and gas properties . . . . . . . . . . . . . . . . . . . . 149,648 — — — — Exploration . . . . . . . . . . . . . . . . . . . . . . . . . . . . . . . . . . . . . . . . 14,145 6,673 6,551 3,453 16,125 Non-cash stock compensation expense . . . . . . . . . . . . . . . . . . 6,260 7,425 7,562 4,040 10,838 Deferred and other non-cash compensation expense . . . . . . . . 208 804 455 758 2,719 (Gain) on debt extinguishment . . . . . . . . . . . . . . . . . . . . . . . . . — (99,530) — — — Stand-by rig costs . . . . . . . . . . . . . . . . . . . . . . . . . . . . . . . . . . . — — 4,188 — — Financing expenses . . . . . . . . . . . . . . . . . . . . . . . . . . . . . . . . . — — 2,250 3,761 — Tax impact of adjusting items (1) . . . . . . . . . . . . . . . . . . . . . . . (69,627) (20,774) (1,106) 16,357 (3,437)Change in TRA liability . . . . . . . . . . . . . . . . . . . . . . . . . . . . . . (59,492) (784) (1,984) — — Change in valuation allowance (2) . . . . . . . . . . . . . . . . . . . . . . 21,719 950 2,333 — —
Adjusted net income (loss) . . . . . . . . . . . . . . . . . . . . . . . . . . . . . . $ (31,126) $ (15,528) $ 2,220 $ 68,824 $ 56,425 Adjusted net income (loss) attributable to non-controlling interests . . . . . . . . . . . . . . . . . . . . . . . . . . . . . . . . . . . . . . . . . . . . . (8,333) (9,861) 1,275 56,208 52,679 Adjusted net income (loss) attributable to controlling interests . . . (22,793) (5,667) 945 12,616 3,746
Dividends and accretion on preferred stock . . . . . . . . . . . . . . . . . . (7,924) (2,669) — — Adjusted net income (loss) attributable to common shareholders . . $ (30,717) $ (8,336) $ 945 $ 12,616 $ 3,746
Earnings per share (basic and diluted): (3) . . . . . . . . . . . . . . . . $ (1.51) $ (1.04) $ (0.08) $ 3.02 $ (0.16)
Net (gain) loss on derivative contracts . . . . . . . . . . . . . . . . . . . 0.29 0.70 (2.47) (3.54) 0.40 Current period settlements of matured derivative contracts . . . 0.65 1.53 2.28 0.08 (0.01)Impairment of oil and gas properties . . . . . . . . . . . . . . . . . . . . 1.43 — — — — Exploration . . . . . . . . . . . . . . . . . . . . . . . . . . . . . . . . . . . . . . . . 0.14 0.10 0.11 0.06 0.29 Non-cash stock compensation expense . . . . . . . . . . . . . . . . . . 0.06 0.10 0.12 0.08 0.01 Deferred and other non-cash compensation expense . . . . . . . . — 0.01 0.01 0.01 — (Gain) on debt extinguishment . . . . . . . . . . . . . . . . . . . . . . . . . — (1.13) — — — Stand-by rig costs . . . . . . . . . . . . . . . . . . . . . . . . . . . . . . . . . . . — — 0.05 — — Financing expenses . . . . . . . . . . . . . . . . . . . . . . . . . . . . . . . . . — — 0.03 0.07 — Tax impact of adjusting items (1) . . . . . . . . . . . . . . . . . . . . . . . (0.96) (0.46) (0.03) 1.15 (0.25)Change in TRA liability . . . . . . . . . . . . . . . . . . . . . . . . . . . . . . (0.82) (0.02) (0.07) — — Change in valuation allowance (2) . . . . . . . . . . . . . . . . . . . . . . 0.30 0.02 0.08 — —
Adjusted earnings per share (basic and diluted) . . . . . . . . . . . . . . $ (0.42) $ (0.19) $ 0.03 $ 0.93 $ 0.28
Weighted average Class A shares outstanding: (3)
Basic . . . . . . . . . . . . . . . . . . . . . . . . . . . . . . . . . . . . . . . . . . . . . 72,411 43,506 29,161 13,622 13,593 Diluted . . . . . . . . . . . . . . . . . . . . . . . . . . . . . . . . . . . . . . . . . . . 72,411 43,506 29,161 13,630 13,593
Effective tax rate on net income (loss) attributable to controlling interests . . . . . . . . . . . . . . . . . . . . . . . . . . . . . . . . . . . . 25.1 % 35.2 % 38.9 % 35.7 % 36.9 %
(1) In arriving at adjusted net income, the tax impact of the adjustments to net income is determined by applying the
appropriate tax rate to each adjustment and then allocating the tax impact between the controlling and non-controlling interests
(2) Includes adjustment for valuation allowance and IRC Section 382 limitation (3) All share and earnings per share information presented has been recast to retrospectively adjust for the effects of the
0.087423 per share Special Stock Dividend, as defined in Note 12, “Stockholders’ and Mezzanine equity”, distributed on March 31, 2017.

53
Item 7. Management’s Discussion and Analysis of Financial Condition and Results of Operations
The following discussion and analysis of our financial condition and results of operations should be read in conjunction with our Consolidated Financial Statements and the Notes to Consolidated Financial Statements appearing elsewhere in this Annual Report on Form 10-K. The following discussion contains “forward-looking statements” that are based on management’s current expectations, estimates and projections about our business and operations, and that involve risks and uncertainties. Our actual results may differ materially from those currently anticipated and expressed in such forward-looking statements as a result of a number of factors, including those we discuss under “Risk Factors,” “Cautionary Statement Regarding Forward- Looking Statements” and elsewhere in this report.
Overview
We are an independent oil and gas company engaged in the exploration, development, production and acquisition of oil and natural gas properties in the mid-continent United States, spanning areas of Oklahoma and Texas. Our Chairman and Chief Executive Officer, Jonny Jones, founded our predecessor company in 1988 in continuation of his family’s long history in the oil and gas business, which dates back to the 1920s. We have grown by leveraging our focus on low-cost drilling and completion methods and our horizontal drilling expertise to develop our inventory and execute several strategic acquisitions. We have accumulated extensive knowledge and experience in developing the Anadarko Basin, having concentrated our operations there for over 25 years. We have drilled over 930 total wells as operator, including nearly 760 horizontal wells, since our formation. Our operations are focused on horizontal drilling within two distinct areas in Oklahoma and Texas:
• the Eastern Anadarko Basin—targeting the liquids rich Woodford shale and Meramec formations in the Merge area of the STACK/SCOOP plays; and
• the Western Anadarko Basin—targeting the liquids rich Cleveland, Granite Wash, Tonkawa and Marmaton formations.
We seek to optimize returns through a disciplined emphasis on controlling costs and promoting operational efficiencies, and we have historically been recognized as one of the lowest-cost drilling and completion operators in the Cleveland formation. Our low-cost drilling expertise has applied directly to our newer operations in the Merge, where the Company plans to spend the majority of its 2018 capital budget.
As of December 31, 2017, our total estimated proved reserves were 104.8 MMBoe, of which 59% were classified as proved developed reserves. Approximately 28% of these total estimated proved reserves consisted of oil, 32% consisted of NGLs, and 41% consisted of natural gas.
2018 Outlook
In 2018, we are focusing the majority of our capital budget and resources on the development of our high-return Merge acreage, where we have an inventory of over 5,443 gross (927 net) operated drilling locations, or over 25 years of drilling inventory at our current two-rig pace. We believe the recognized value of the Merge will continue to improve as we and other operators in the area increase activity and release more production and completions data.
Impact of Pad Drilling
We intend to drill and complete the majority of the wells in our 2018 development program using pad drilling, which is the practice of drilling wells in batches of two or more from the same drilling pad. While pad drilling generally does produce time and cost efficiencies, such as rig mobility time and costs and the sharing of production facilities, it also increases spud-to-production times which results in production delays. For example, on a four-well pad, all four wells on the pad are drilled before completion operations can begin, at which point all four wells must be completed before any of the wells can be turned to production. This process can result in large amounts of production coming online at one time, and will likely cause our development production profile to be less evenly distributed than previous years. While the

54
potential unevenness of our 2018 development production may make near-term forecasting more difficult, we believe the potential capital savings and operational efficiencies of pad drilling are significant.
Commodity Price Hedging
The price we receive for our oil, natural gas and NGLs significantly influences our revenue, profitability, liquidity, access to capital and prospects for future growth. Oil and natural gas are commodities and, therefore, their prices can be subject to wide fluctuations in response to relatively minor changes in supply and demand. We believe these prices will likely continue to be volatile in the future.
Due to the inherent volatility in oil and gas prices, we use commodity derivative instruments such as swaps to hedge price risk associated with a significant portion of our anticipated oil, natural gas and NGL production. These instruments allow us to reduce, but not eliminate, the potential effects of variability in cash flow from operations due to fluctuations in commodity prices. The instruments provide only partial protection against declines in oil and gas prices, and may limit our potential gains from future increases in prices. None of these instruments are used for trading purposes. We do not speculate on commodity prices but rather attempt to hedge physical production by individual hydrocarbon product in order to protect returns. The only counterparties to our derivatives are lenders under the Revolver, and our hedge positions are generally reviewed on a monthly basis. We have not designated any of our derivative contracts as fair value or cash flow hedges. The changes in fair value of the contracts are included in net income. We record such derivative instruments as assets or liabilities in the balance sheet. We do not anticipate any substantial changes in our hedging policy.
Historically, to mitigate the risk associated with commodity price fluctuations, we have maintained a high level of hedges relative to our projected production. During the year ended December 31, 2017, 83% of our total production for oil, natural gas and NGLs was hedged. For the years ending December 31, 2018, 2019, and 2020, approximately 75%, 26%, and 22%, respectively, of our estimated total oil, natural gas and NGL production from proved reserves, based on our reserve report as of December 31, 2017, are hedged by commodity derivative contracts, respectively. As of December 31, 2017, the estimated mark-to-market value of our commodity price hedges in 2018 and beyond was a liability of approximately $41.9 million.

55
Our open positions as of December 31, 2017 were as follows:
Year Ending December 31, 2018 2019 2020
Oil positions (1): Sold swaps:
Hedged volume (MBbl) . . . . . . . . . . . . . . . . . . . . . . . . . . . . 2,364 1,020 660 Weighted average price ($/Bbl) . . . . . . . . . . . . . . . . . . . . . $ 51.08 $ 50.04 $ 50.00
Collars: Hedged volume (MBbl) . . . . . . . . . . . . . . . . . . . . . . . . . . . — 810 — Floor Price ($/Bbl) . . . . . . . . . . . . . . . . . . . . . . . . . . . . . . . $ — $ 48.52 $ — Ceiling Price ($/Bbl) . . . . . . . . . . . . . . . . . . . . . . . . . . . . . . $ — $ 59.64 $ —
Natural gas positions (2): Sold swaps:
Hedged volume (MMcf) . . . . . . . . . . . . . . . . . . . . . . . . . . . 21,810 9,820 8,400 Weighted average price ($/Mcf) . . . . . . . . . . . . . . . . . . . . . $ 2.96 $ 2.83 $ 2.79
Collars: Hedged volume (MMcf) . . . . . . . . . . . . . . . . . . . . . . . . . . . . — 11,890 — Floor Price ($/Mcf) . . . . . . . . . . . . . . . . . . . . . . . . . . . . . . . . $ — $ 2.55 $ — Ceiling Price ($/Mcf) . . . . . . . . . . . . . . . . . . . . . . . . . . . . . . $ — $ 3.19 $ —
NGL positions (3): Swaps:
Hedged volume (MBbl) . . . . . . . . . . . . . . . . . . . . . . . . . . . . 1,665 — — Weighted average price ($/gal) . . . . . . . . . . . . . . . . . . . . . . $ 0.71 $ — $ —
Natural Gas Basis positions (4): Swaps:
Hedged volume (MMcf) . . . . . . . . . . . . . . . . . . . . . . . . . . . 8,000 — — Weighted average price ($/Mcf) . . . . . . . . . . . . . . . . . . . . . $ (0.41) $ — $ —
(1) The oil derivatives are settled based on the month’s average daily NYMEX price of West Texas
Intermediate Light Sweet Crude.
(2) The natural gas derivatives are settled based on the NYMEX natural gas futures price for the calculation period.
(3) The NGL derivatives are settled based on the month’s average daily price of Mont Belvieu and Conway ethane, propane, isobutane, butane and natural gasoline.
(4) The basis swap derivatives are settled based on the differential between the NYMEX natural gas futures price and the ANR Pipeline Co. Oklahoma price, the CenterPoint Energy Gas Transmission Co. East price, the Natural Gas Pipeline Co. of America TexOK zone price, the Northern Natural Gas Co. demarcation price or the Panhandle Eastern Pipe Line Co. Texas/Oklahoma price.
The estimated mark-to-market value of our commodity price hedges in 2018 and beyond was a liability of approximately $37.5 million, incorporating strip pricing as of February 21, 2018 but excluding adjustments for credit risk.

56
The following table summarizes our commodity derivative contracts outstanding as of February 21, 2018:
Fiscal Year Ending December 31, 2018 2019 2020
Oil Hedges Swaps Sold (MBbl) . . . . . . . . . . . . . . . . . . . . . . . . . . . . . . . . . . . . 2,364 1,020 660 Price ($/Bbl) . . . . . . . . . . . . . . . . . . . . . . . . . . . . . . . . . . . . . . . . . $ 51.08 $ 50.04 $ 50.00 Collars (MBbl) . . . . . . . . . . . . . . . . . . . . . . . . . . . . . . . . . . . . . . . — 810 — Floor ($/Bbl) . . . . . . . . . . . . . . . . . . . . . . . . . . . . . . . . . . . . . . . . . $ — $ 48.52 $ — Ceiling ($/Bbl) . . . . . . . . . . . . . . . . . . . . . . . . . . . . . . . . . . . . . . . . $ — $ 59.64 $ — Gas Hedges Swaps Sold (MMcf) . . . . . . . . . . . . . . . . . . . . . . . . . . . . . . . . . . . 21,810 9,820 8,400 Price ($/Mcf) . . . . . . . . . . . . . . . . . . . . . . . . . . . . . . . . . . . . . . . . . $ 2.96 $ 2.83 $ 2.79 Offset Swaps Purchased (MMcf) (1) . . . . . . . . . . . . . . . . . . . . . . 3,620 2,560 — Price ($/Mcf) . . . . . . . . . . . . . . . . . . . . . . . . . . . . . . . . . . . . . . . . . $ 2.84 $ 2.80 $ — Collars (MMcf) . . . . . . . . . . . . . . . . . . . . . . . . . . . . . . . . . . . . . . . — 11,890 — Floor ($/Mcf) . . . . . . . . . . . . . . . . . . . . . . . . . . . . . . . . . . . . . . . . . $ — $ 2.55 $ — Ceiling ($/Mcf) . . . . . . . . . . . . . . . . . . . . . . . . . . . . . . . . . . . . . . . $ — $ 3.19 $ — NGL Swaps (MBbl) Propane . . . . . . . . . . . . . . . . . . . . . . . . . . . . . . . . . . . . . . . . . . . . . 850 — — Iso Butane . . . . . . . . . . . . . . . . . . . . . . . . . . . . . . . . . . . . . . . . . . . 120 — — Butane . . . . . . . . . . . . . . . . . . . . . . . . . . . . . . . . . . . . . . . . . . . . . . 335 — — Natural Gasoline . . . . . . . . . . . . . . . . . . . . . . . . . . . . . . . . . . . . . . 360 — —
Total NGLs (MBbl) . . . . . . . . . . . . . . . . . . . . . . . . . . . . . . . . . 1,665 — —
NGL Swap Prices ($/Gal) Propane . . . . . . . . . . . . . . . . . . . . . . . . . . . . . . . . . . . . . . . . . . . . . $ 0.57 $ — $ — Iso Butane . . . . . . . . . . . . . . . . . . . . . . . . . . . . . . . . . . . . . . . . . . . $ 0.72 $ — $ — Butane . . . . . . . . . . . . . . . . . . . . . . . . . . . . . . . . . . . . . . . . . . . . . . $ 0.69 $ — $ — Natural Gasoline . . . . . . . . . . . . . . . . . . . . . . . . . . . . . . . . . . . . . . $ 1.05 $ — $ — Natural Gas Basis (MMcf) ANR . . . . . . . . . . . . . . . . . . . . . . . . . . . . . . . . . . . . . . . . . . . . . . . 6,000 PEPL . . . . . . . . . . . . . . . . . . . . . . . . . . . . . . . . . . . . . . . . . . . . . . . 2,000 Natural Gas Basis Prices ($/Mcf) ANR . . . . . . . . . . . . . . . . . . . . . . . . . . . . . . . . . . . . . . . . . . . . . . . . $ 0.40 $ — $ — PEPL . . . . . . . . . . . . . . . . . . . . . . . . . . . . . . . . . . . . . . . . . . . . . . . $ 0.45 $ — $ —
Western Anadarko Basin Development Plan
We expect to maintain our leadership and best-in-class operations in the Western Anadarko Basin. In addition to pursuing potential sources of outside development capital to drill in this basin, as discussed below, we are focused on optimizing our existing production from a large and diversified base of 944 gross (571 net) producing wells across approximately 152,000 net acres in the Western Anadarko Basin. Based on our initial capital expenditures budget described above, we expect to drill at least five wells in the Cleveland in 2018.
As previously announced, we are working with Tudor, Pickering, Holt & Co. to evaluate potential drilling joint ventures, or “DrillCo,” financing alternatives, which will enable the continued development of our Western Anadarko properties. If we are able to implement a DrillCo to fund a portion of the continued development of our Western Anadarko

57
properties, we anticipate that we will convey a significant majority of the working interests in certain of our undeveloped properties in the Western Anadarko Basin that are subject to the DrillCo to a third party investor in exchange for the third party investor funding capital expenditures to develop such properties. Upon achieving a specified internal rate of return, the third party investor will re-convey those working interests to us, but retain a small portion for themselves. No definitive Eastern Anadarko Basin development plan agreements to implement a DrillCo have been reached as of the date of this report.
Liability Management
In addition to the offering of 2023 First Lien Notes described in Note 16, “Subsequent Events,” in the Notes to Consolidated Financial Statements, we intend to continue to pursue additional liability management opportunities with the goal of decreasing our leverage and increasing our financial flexibility. For example, we may employ strategies such as repurchases of our 2022 Notes and 2023 Notes at prices significantly below par, or potential exchanges of a portion of our outstanding 2022 Notes or 2023 Notes for newly issued junior lien secured notes. The indenture governing the 2023 First Lien Notes permits us to incur an unlimited amount of junior lien debt, subject to certain conditions and limitations. Any repurchases or exchanges of 2022 Notes or 2023 Notes at a discount generally will cause us to recognize cancellation of debt income for tax purposes.
Reserves Update
The amount of our proved reserves, as estimated based on SEC pricing and definitions, was 104.8 MMBoe as of December 31, 2017, of which 59% were classified as proved developed reserves. This decrease of 0.4%, from 105.2 MMBoe as of December 31, 2016, was primarily due to the divestiture of our Arkoma Assets, offset by reserve extensions in the Merge during 2017.
The Company reviews its proved oil and gas properties for impairment purposes by comparing the expected undiscounted future cash flows at a producing field level to the unamortized capitalized cost of the asset.
Periodic revisions to the estimated reserves and related future cash flows may be necessary as a result of a number of factors, including changes in oil and natural gas prices, reservoir performance, new drilling and completion, purchases, sales and terminations of leases, drilling and operating cost changes, technological advances, new geological or geophysical data or other economic factors. All of these factors are inherently estimates and are inter-dependent. While each variable carries its own degree of uncertainty, some factors, such as oil and natural gas prices, have historically been highly volatile and may be highly volatile in the future. This high degree of volatility causes a high degree of uncertainty associated with the estimation of reserve quantities and estimated future cash flows. Therefore, future results are highly uncertain and subject to potentially significant revisions. Accordingly, reserve estimates are generally different from the quantities of oil and natural gas that are ultimately recovered. We cannot predict the amounts or timing of future reserve revisions, as such revisions could be negatively impacted by:
• Declines in commodity prices or actual realized prices below those assumed for future years;
• Increases in service costs;
• Increases in future global or regional production or decreases in demand;
• Increases in operating costs;
• Reductions in availability of drilling, completion, or other equipment.
If such revisions are significant, they could significantly affect future amortization of capitalized costs and result in an impairment of assets that may be material. Any future impairments are difficult to predict, and although it is not reasonably practicable to quantify the impact of any future impairments at this time, such impairments may be significant.
Capital Expenditures Update
Our 2017 capital expenditures totaled $248.0 million (excluding the impact of asset retirement costs, asset disposals and non-cash impairments of oil and gas properties), of which $205.7 million was utilized to drill and complete operated wells. The Company has established an initial capital budget of $150.0 million for 2018, including $134.0 million for

58
drilling completing wells and $16.0 million for leasing, workovers and other capital projects. We will continue to monitor market conditions and may decide, at a later date, to spend more or less capital for a variety of reasons. Please see “Liquidity and Capital Resources.” All drilling locations classified as proved undeveloped reserves in the year-end reserve report are scheduled to be drilled within five years of initial proved reserve booking.
Basis of Presentation
We consider and report all of our operations as one segment.
Sources of our revenues
We derive our revenue from the production and sale of oil, natural gas and NGLs. Our revenues are a function of oil, natural gas, and NGL production volumes sold and average sales prices received for those volumes. We recognize revenues when the product is delivered at a fixed or determinable price, title has transferred, and collectability is reasonably assured. Our revenues do not include the effects of our hedging activities and may vary substantially from period to period as a result of changes in production volumes or commodity prices.
Principal components of our cost structure
Lease operating expenses. These are daily costs incurred to bring oil and natural gas out of the ground and to the market, together with the daily costs incurred to maintain our producing properties. Such costs also include maintenance, repairs and workover expenses related to our oil and gas properties. Lease operating expenses include both a portion of costs that are fixed in nature, such as infrastructure costs, as well as variable costs resulting from additional well maintenance and production enhancements. As production increases, our average lease operating expense per barrel of oil equivalent is typically reduced because fixed costs do not increase proportionately with production.
Exploration. Exploration expense consists of geological and geophysical costs, seismic costs, amortization of unproved leasehold costs, the costs to drill exploratory wells that do not find proved reserves, and the cost of leases that have been abandoned.
Depreciation, depletion and amortization. Under the successful efforts accounting method that we employ, we capitalize all costs associated with our acquisition, successful exploration, and all development efforts within cost centers classified by producing field. We then systematically expense the costs in each field on a units-of-production basis based on proved oil and natural gas reserve quantities. We calculate depletion on (i) all capitalized costs, other than the cost of investments in unproved properties and major development projects for which proved reserves cannot yet be assigned, less accumulated amortization; and (ii) the estimated plugging and abandonment costs, net of estimated salvage values. We calculate depreciation on the cost of fixed assets related to our well equipment and other fixed assets over the estimated useful lives.
Impairment of oil and gas properties. This is the cost to reduce the carrying value of each field of proved and unproved oil and gas properties to no more than the fair value of the particular field for which impairment recognition is required. We assess our unproved properties periodically for impairment on a property-by-property basis based on remaining lease terms, drilling results or future plans to develop acreage.
Accretion of ARO liability. Accretion of ARO liabilities are related to our obligation for retirement of oil and gas wells and facilities. We record these liabilities when we place the assets in service, using discounted present values of the estimated future obligation. We then record accretion of the liabilities as they approach maturity.
General and administrative. These are costs incurred for overhead, including payroll and benefits for our corporate staff, costs of maintaining our headquarters, costs of managing our production and development operations, audit and other fees for professional services and legal compliance.
Interest. The primary component of this line item is the interest paid to lenders. We finance a portion of our working capital requirements and capital expenditures with borrowings under the Revolver and senior notes. We incur interest expense that is affected by both fluctuations in interest rates and our financing decisions.

59
Results of Operations
The following table summarizes our revenues, expenses and production data for the periods indicated.
(in thousands of dollars except for Year Ended December 31, production, sales price and average cost data) 2017 2016 Change 2016 2015 Change Revenues:
Oil . . . . . . . . . . . . . . . . . . . . . . . . . . . . . . . . . . . . . . . . . . . . $ 93,207 $ 63,736 $ 29,471 $ 63,736 $ 114,029 $ (50,293) Natural gas . . . . . . . . . . . . . . . . . . . . . . . . . . . . . . . . . . . . . . 42,191 31,434 10,757 31,434 45,558 (14,124) NGLs . . . . . . . . . . . . . . . . . . . . . . . . . . . . . . . . . . . . . . . . . . 50,995 29,707 21,288 29,707 34,968 (5,261)
Total oil and gas . . . . . . . . . . . . . . . . . . . . . . . . . . . . . . . . 186,393 124,877 61,516 124,877 194,555 (69,678) Other . . . . . . . . . . . . . . . . . . . . . . . . . . . . . . . . . . . . . . . . . . 2,180 2,970 (790) 2,970 2,844 126
Total operating revenues . . . . . . . . . . . . . . . . . . . . . . . . . 188,573 127,847 60,726 127,847 197,399 (69,552) Costs and expenses:
Lease operating . . . . . . . . . . . . . . . . . . . . . . . . . . . . . . . . . . 36,636 32,640 3,996 32,640 41,027 (8,387) Production and ad valorem taxes . . . . . . . . . . . . . . . . . . . . . . 6,874 7,768 (894) 7,768 12,130 (4,362) Exploration . . . . . . . . . . . . . . . . . . . . . . . . . . . . . . . . . . . . . 14,145 6,673 7,472 6,673 6,551 122 Depletion, depreciation and amortization. . . . . . . . . . . . . . . . 167,224 153,930 13,294 153,930 205,498 (51,568) Impairment of oil and gas properties . . . . . . . . . . . . . . . . . . . 149,648 — 149,648 — — — Accretion of ARO liability . . . . . . . . . . . . . . . . . . . . . . . . . . 960 1,263 (303) 1,263 1,087 176 General and administrative . . . . . . . . . . . . . . . . . . . . . . . . . . 29,892 29,640 252 29,640 33,388 (3,748) Other operating . . . . . . . . . . . . . . . . . . . . . . . . . . . . . . . . . . — 199 (199) 199 4,188 (3,989)
Total costs and expenses . . . . . . . . . . . . . . . . . . . . . . . . . 405,379 232,113 173,266 232,113 303,869 (71,756) Operating income (loss) . . . . . . . . . . . . . . . . . . . . . . . . . (216,806) (104,266) (112,540) (104,266) (106,470) 2,204
Other income (expenses): Interest expense . . . . . . . . . . . . . . . . . . . . . . . . . . . . . . . . . . (51,651) (53,127) 1,476 (53,127) (64,458) 11,331 Gain on debt extinguishment. . . . . . . . . . . . . . . . . . . . . . . . . — 99,530 (99,530) 99,530 — 99,530 Net gain (loss) on commodity derivatives . . . . . . . . . . . . . . . (17,985) (51,264) 33,279 (51,264) 158,753 (210,017) Other income/(expense) . . . . . . . . . . . . . . . . . . . . . . . . . . . . 56,952 536 56,416 536 317 219
Total other income (expense) . . . . . . . . . . . . . . . . . . . . . (12,684) (4,325) (8,359) (4,325) 94,612 (98,937) Income (loss) before income tax . . . . . . . . . . . . . . . . . . . . . . (229,490) (108,591) (120,899) (108,591) (11,858) (96,733)
Income tax provision (benefit) . . . . . . . . . . . . . . . . . . . . . . . . . (50,667) (23,786) (26,881) (23,786) (2,781) (21,005) Net income (loss) . . . . . . . . . . . . . . . . . . . . . . . . . . . . . . . . . . (178,823) (84,805) (94,018) (84,805) (9,077) (75,728) Net income (loss) attributable to non-controlling interests . . . . (77,331) (42,253) (35,078) (42,253) (6,696) (35,557) Net income (loss) attributable to controlling interests . . . . . $ (101,492) $ (42,552) $ (58,940) $ (42,552) $ (2,381) $ (40,171) Dividends and accretion on preferred stock . . . . . . . . . . . . . . . (7,924) (2,669) (5,255) (2,669) — (2,669) Net income (loss) attributable to common shareholders . . . . $ (109,416) $ (45,221) $ (64,195) $ (45,221) $ (2,381) $ (42,840) Net production volumes:
Oil (MBbls) . . . . . . . . . . . . . . . . . . . . . . . . . . . . . . . . . . . . 1,964 1,685 279 1,685 2,583 (898) Natural gas (MMcf) . . . . . . . . . . . . . . . . . . . . . . . . . . . . . . 20,425 18,842 1,583 18,842 23,839 (4,997) NGLs (MBbls) . . . . . . . . . . . . . . . . . . . . . . . . . . . . . . . . . 2,418 2,204 214 2,204 2,618 (414)
Total (MBoe) . . . . . . . . . . . . . . . . . . . . . . . . . . . . . . . . . 7,786 7,029 757 7,029 9,174 (2,145) Average net (Boe/d) . . . . . . . . . . . . . . . . . . . . . . . . . . . . 21,332 19,205 2,127 19,205 25,134 (5,929)
Average sales price, unhedged: Oil (per Bbl), unhedged . . . . . . . . . . . . . . . . . . . . . . . . . . . $ 47.46 $ 37.83 $ 9.63 $ 37.83 44.15 (6.32) Natural gas (per Mcf), unhedged . . . . . . . . . . . . . . . . . . . . 2.07 1.67 0.40 1.67 1.91 (0.24) NGLs (per Bbl), unhedged . . . . . . . . . . . . . . . . . . . . . . . . . 21.09 13.48 7.61 13.48 13.36 0.12
Combined (per Boe), unhedged . . . . . . . . . . . . . . . . . . . . 23.94 17.77 6.17 17.77 21.21 (3.44) Average sales price, hedged:
Oil (per Bbl), hedged . . . . . . . . . . . . . . . . . . . . . . . . . . . . . $ 74.91 $ 84.71 $ (9.80) $ 84.71 76.35 8.36 Natural gas (per Mcf), hedged . . . . . . . . . . . . . . . . . . . . . . 3.50 3.45 0.05 3.45 3.35 0.10 NGLs (per Bbl), hedged . . . . . . . . . . . . . . . . . . . . . . . . . . . 14.30 17.25 (2.95) 17.25 25.73 (8.48)
Combined (per Boe), hedged . . . . . . . . . . . . . . . . . . . . . . 32.53 34.96 (2.43) 34.96 37.54 (2.58) Average costs (per BOE):
Lease operating . . . . . . . . . . . . . . . . . . . . . . . . . . . . . . . . . $ 4.71 $ 4.64 $ 0.07 $ 4.64 4.47 0.17 Production and ad valorem taxes . . . . . . . . . . . . . . . . . . . . 0.88 1.11 (0.23) 1.11 1.32 (0.21) Depletion, depreciation and amortization . . . . . . . . . . . . . . 21.48 21.90 (0.42) 21.90 22.40 (0.50) General and administrative . . . . . . . . . . . . . . . . . . . . . . . . . 3.84 4.22 (0.38) 4.22 3.64 0.58

60
Results of Operations—Year ended December 31, 2017 as compared to year ended December 31, 2016
Operating revenues
Oil and gas sales. Oil and gas sales increased $61.5 million, or 49.2%, to $186.4 million for the year ended December 31, 2017, as compared to $124.9 million for the year ended December 31, 2016. The increase was attributable to the increase in commodity prices ($40.5 million) and the increase in production volumes ($21.0 million). The increase in production volumes was driven by the year-over-year increase in producing wells due to continued drilling activity. The average realized oil price, excluding the effects of commodity derivative instruments, increased from $37.83 per Bbl to $47.46 per Bbl, or 25.5%, year over year. The average realized natural gas price, excluding the effects of commodity derivative instruments, increased from $1.67 per Mcf to $2.07 per Mcf, or 24.0%, year over year. The average realized natural gas liquids price, excluding the effects of commodity derivative instruments, increased from $13.48 per Bbl to $21.09 per Bbl, or 56.5%, year over year. Average daily production increased 11.1% to 21,332 Boe per day for the year ended December 31, 2017 as compared to 19,205 Boe per day for the year ended December 31, 2016.
Costs and expenses
Lease operating. Lease operating expense increased by $4.0 million, or 12.3%, to $36.6 million for the year ended December 31, 2017, as compared to $32.6 million for the year ended December 31, 2016. The increase in lease operating expenses is attributable to the increase in number of producing wells, primarily as a result of our continued drilling program in the Merge area. On a per unit basis, lease operating expense increased $0.07 per Boe, or 1.5%, from $4.64 per Boe in the year ended December 31, 2016 to $4.71 per Boe in the year ended December 31, 2017.
Production and ad valorem taxes. Production and ad valorem taxes decreased by $0.9 million, or 11.5%, to $6.9 million for the year ended December 31, 2017, as compared to $7.8 million for the year ended December 31, 2016. During 2017, the Company's applications for High-Cost Gas Incentive refunds and Low-Producing Gas Incentive refunds in Texas were approved for qualified wells on which taxes were initially paid between October 2012 and April 2017. The Company received net production tax refunds of $3.9 million during the year ended December 31, 2017, which were recorded as a reduction in Production and ad valorem taxes on the Company’s Consolidated Statement of Operations. Production taxes, excluding the impact of these refunds, increased from $5.9 million for the year ended December 31, 2016 to $8.9 million for the year ended December 31, 2017. The increase was attributable to the increase in production volumes. Production tax rates vary between states, products, and production levels; therefore, the overall blended rate is impacted by numerous factors and the mix of producing wells at any given time. Offsetting, estimated ad valorem taxes decreased $0.1 million from $1.9 million for the year ended December 31, 2016 to $1.8 million for the year ended December 31, 2017. The average effective rate excluding the impact of ad valorem taxes decreased from 4.7% for the year ended December 31, 2016 to 2.7% for the year ended December 31, 2017.
Exploration. Exploration expense increased from $6.7 million for the year ended December 31, 2016 to $14.1 million for the year ended December 31, 2017. The Company recognized charges for lease abandonment of $11.0 million during 2017, as compared to $6.3 million during 2016, relating to certain leases that the Company decided during the respective year not to develop and to let lapse. Spending during 2017 primarily related to geological data and seismic processing associated with unproved acreage, focused mainly in the Eastern Anadarko Basin. No exploratory wells resulted in exploration expense during either year.
Depreciation, depletion and amortization. Depreciation, depletion and amortization increased by $13.3 million, or 8.6%, to $167.2 million for the year ended December 31, 2017, as compared to $153.9 million for the year ended December 31, 2016. The increase was primarily the result of capital spending related to our continued drilling program in the Merge area. On a per unit basis, depletion expense decreased $0.42 per Boe, or 1.9%, to $21.48 per Boe for the year ended December 31, 2017 as compared to $21.90 per Boe for the year ended December 31, 2016 due to the year-over-year increase in production and the higher production per unit of capital spending in the Merge area.
Impairment of oil and gas properties. Impairment charges of $149.6 million were recognized during the year ended December 31, 2017. As a result of the Arkoma Divestiture, the Company recognized an impairment charge of $148.0 million during the second quarter of 2017 based on the Company’s negotiated sale price of the Arkoma Basin oil and gas property assets and related liabilities. Additionally, the Company recognized an impairment charge of $1.6 million during the fourth quarter of 2017 related to minor properties, which we are not currently developing. No impairment charges were recognized during the year ended December 31, 2016.

61
General and administrative. General and administrative expenses increased by $0.3 million, or 1.0%, to $29.9 million for the year ended December 31, 2017, as compared to $29.6 million for the year ended December 31, 2016. The increase was driven by professional and support service costs, offset by a reduction in non-cash compensation expense. Non-cash compensation expense decreased $1.7 million from $8.2 million for the year ended December 31, 2016 to $6.5 million for the year ended December 31, 2017. On a per unit basis, general and administrative expenses, excluding non-cash items, decreased from $2.88 per Boe for the year ended December 31, 2016 to $2.75 per Boe for the year ended December 31, 2017.
Interest expense. Interest expense decreased by $1.4 million, or 2.6%, to $51.7 million for the year ended December 31, 2017, as compared to $53.1 million for the year ended December 31, 2016. The decrease was driven by a reduction in the outstanding balance of the 2022 Notes and the 2023 Notes as a result of our debt extinguishments, offset by an increase in borrowings under the Revolver. During the year ended December 31, 2017, borrowings under the Revolver, the 2022 Notes and the 2023 Notes bore interest at a weighted average rate of 3.04%, 6.75% and 9.25%, respectively. Average outstanding balances for the year ended December 31, 2017 were $189.0 million, $409.1 million and $150.0 million under the Revolver, the 2022 Notes and the 2023 Notes, respectively.
Net gain (loss) on commodity derivatives. The net gain (loss) on commodity derivatives was a net loss of $18.0 million for the year ended December 31, 2017, as compared to a net loss of $51.3 million for the year ended December 31, 2016. The decrease was driven by lower average crude oil and natural gas prices ($50.80 per barrel and $2.99 per Mcf, respectively) during the year ended December 31, 2017, as compared to the crude oil and natural gas prices as of December 31, 2016 ($53.75 per barrel and $3.71 per Mcf, respectively). Additionally, the Company unwound its realized 2018 and 2019 hedges resulting in recognized gains of approximately $42.8 million for the year ended December 31, 2017. See Note 7, “Derivative Instruments and Hedging Activities,” for further details.
Other income (expense). Other income (expense) for the year ended December 31, 2017 was net income of $57.0 million, as compared to net income of $0.5 million for the year ended December 31, 2016. Other income (expense) during the year ended December 31, 2017 primarily related to a decrease in the TRA liability as a result of the recently enacted Tax Cuts and Jobs Act, which resulted in income of $59.5 million. See Note 11, “Income Taxes,” for further details on the impact of the enacted tax legislation.
Income taxes. The provision for federal and state income taxes for the year ended December 31, 2017 was a benefit of $50.7 million resulting in a 22.1% effective tax rate as a percentage of our pre-tax book income, as compared to a benefit of $23.8 million with a 21.9% effective tax rate as a percentage of our pre-tax book income for the year ended December 31, 2016. Our effective tax rate is based on the statutory rate applicable to the U.S. and the blended rate of the states in which we conduct business and is adjusted from the enacted rates for the share of net income allocated to the non-controlling interest. The impact of the reduction of the maximum federal tax rate from 35% to 21% on the Company’s effective tax rate was offset by the decrease in percentage of income allocated to the non-controlling interest, subjecting a higher percentage of the Company’s net income to corporate taxes. The other significant item impacting the effective tax rate during the year ended December 31, 2017 was the IRC Section 382 limitation. See Note 11, “Income Taxes,” for further details.
Results of Operations—Year ended December 31, 2016 as compared to year ended December 31, 2015
Operating revenues
Oil and gas sales. Oil and gas sales decreased by $69.7 million, or 35.8%, to $124.9 million for the year ended December 31, 2016, as compared to $194.6 million for the year ended December 31, 2015. The decrease was attributable to decreased production volumes ($47.9 million), as well as the decline in commodity prices ($21.8 million). The decrease in production volumes was driven by the temporary suspension of our drilling program, beginning in the fourth quarter of 2015 and continuing into early 2016. The average realized oil price, excluding the effects of commodity derivative instruments, decreased from $44.15 per Bbl to $37.83 per Bbl, or 14.3%, year over year. The average realized natural gas price, excluding the effects of commodity derivative instruments, decreased from $1.91 per Mcf to $1.67 per Mcf, or 12.6%, year over year. The average realized natural gas liquids price, excluding the effects of commodity derivative instruments, increased from $13.36 per Bbl to $13.48 per Bbl, or 0.9%, year over year. Average daily production decreased 23.6% to 19,205 Boe per day for the year ended December 31, 2016 as compared to 25,134 Boe per day for the year ended December 31, 2015.

62
Costs and expenses
Lease operating. Lease operating expense decreased by $8.4 million, or 20.5%, to $32.6 million for the year ended December 31, 2016, as compared to $41.0 million for the year ended December 31, 2015. The decrease was principally attributable to reduction in post-completion costs driven by a temporary suspension of the drilling program, operational focus on reducing recurring operating expenses, such as optimizing the usage of compressors and rental equipment, and vendor price reductions. Due to the year-over-year decline in production volumes, lease operating expense increased on a per unit basis by $0.17 per Boe or 3.8%, from $4.47 for the year ended December 31, 2015 to $4.64 per Boe, as compared to the year ended December 31, 2016.
Production and ad valorem taxes. Production and ad valorem taxes decreased by $4.3 million, or 35.5%, to $7.8 million for the year ended December 31, 2016, as compared to $12.1 million for the year ended December 31, 2015. The decrease was driven by a $2.6 million (30.6%) reduction in production taxes, which decreased in conjunction with the 35.8% decrease in oil and gas revenue. Production tax rates vary between states, products, and production levels; therefore, the overall blended rate is impacted by numerous factors and the mix of producing wells at any given time. Additionally, estimated ad valorem taxes decreased $1.7 million from $3.6 million for the year ended December 31, 2015 to $1.9 million for the year ended December 31, 2016, reflecting lower property assessments due to lower commodity prices. The average effective rate excluding the impact of ad valorem taxes increased from 4.4% for the year ended December 31, 2015 to 4.7% for the year ended December 31, 2016.
Exploration. Exploration expense increased from $6.6 million for the year ended December 31, 2015 to $6.7 million for the year ended December 31, 2016. The Company recognized charges for lease abandonment of $6.3 million during 2016, as compared to $5.3 million during 2015, relating to certain leases that the Company decided during the respective year not to develop. The remaining spending during 2016 primarily related to geological data and seismic processing associated with unproved acreage. No exploratory wells resulted in exploration expense during either year.
Depreciation, depletion and amortization. Depreciation, depletion and amortization decreased by $51.6 million, or 25.1%, to $153.9 million for the year ended December 31, 2016, as compared to $205.5 million for the year ended December 31, 2015. The decrease was primarily the result of lower production caused by a reduction in capital spending driven by a temporary suspension of the drilling program. On a per unit basis, depletion expense decreased $0.50 per Boe, or 2.2%, to $21.90 per Boe for the year ended December 31, 2016 as compared to $22.40 per Boe for the year ended December 31, 2015.
General and administrative. General and administrative expenses decreased by $3.8 million, or 11.4%, to $29.6 million for the year ended December 31, 2016, as compared to $33.4 million for the year ended December 31, 2015. The decrease in general and administrative expense was primarily attributable to staff and other cost reductions. Non-cash compensation expense increased $0.2 million from $8.0 million for the year ended December 31, 2015 to $8.2 million for the year ended December 31, 2016. On a per unit basis, general and administrative expenses, excluding non-cash items, increased from $2.77 per Boe for the year ended December 31, 2015 to $3.05 per Boe for the year ended December 31, 2016.
Other operating expense. Other operating expense decreased from $4.2 million for the year ended December 31, 2015 to $0.2 million for the year ended December 31, 2016. Expense for the year ended December 31, 2015 represents stand-by rig costs associated with the early termination of drilling rig contracts. There were no similar charges during 2016.
Interest expense. Interest expense decreased by $11.4 million, or 17.7%, to $53.1 million for the year ended December 31, 2016, as compared to $64.5 million for the year ended December 31, 2015. The decrease was driven by a reduction in the outstanding balance of the 2022 Notes and the 2023 Notes as a result of our debt extinguishments. During the year ended December 31, 2016, borrowings under the Revolver, the 2022 Notes and the 2023 Notes bore interest at a weighted average rate of 2.40%, 6.75% and 9.25%, respectively. Average outstanding balances for the year ended December 31, 2016 were $172.3 million, $420.3 million and $166.4 million under the Revolver, the 2022 Notes and the 2023 Notes, respectively.
Gain on debt extinguishment. The gain on debt extinguishment of $99.5 million for the year ended December 31, 2016 was related to the purchase of an aggregate principal amount of $190.9 million of our senior unsecured notes for cash of $84.6 million. The company recognized accelerated amortization of debt issuance costs of $6.7 million associated with the cancellation. See Note 5, “Long-Term Debt,” for further details regarding the debt extinguishment. There were no similar gains during 2015.

63
Net gain (loss) on commodity derivatives. The net gain (loss) on commodity derivatives was a net loss of $51.3 million for the year ended December 31, 2016, as compared to a net gain of $158.8 million for the year ended December 31, 2015. The loss was driven by higher average crude oil and natural gas prices ($43.29 per barrel and $2.52 per Mcf, respectively) during the year ended December 31, 2016, as compared to the crude oil and natural gas prices as of December 31, 2015 ($37.13 per barrel and $2.28 per Mcf, respectively), as well as additional hedging activity during 2016.
Income taxes. The provision for federal and state income taxes for the year ended December 31, 2016 was a benefit of $23.8 million resulting in a 21.9% effective tax rate as a percentage of our pre-tax book income, as compared to a benefit of $2.8 million with a 23.5% effective tax rate as a percentage of our pre-tax book income for the year ended December 31, 2015. Our effective tax rate is based on the statutory rate applicable to the U.S. and the blended rate of the states in which we conduct business and is adjusted from the enacted rates for the share of net income allocated to the non-controlling interest. The change in effective tax rate was primarily due to the percentage of income allocated to the non-controlling interest and the impact of a change in enacted state tax rate during the year ended December 31, 2016.
Liquidity and Capital Resources
Historically, our primary sources of liquidity have been private and public sales of our debt and equity, borrowings under bank credit facilities and cash flows from operations. Our primary use of capital has been for the exploration, development and acquisition of oil and gas properties. As we pursue reserves and production growth, we continually consider which capital resources, including equity and debt financings, are available to meet our future financial obligations, planned capital expenditure activities and liquidity requirements. Our ability to grow proved reserves and production will be highly dependent on the capital resources available to us. We strive to maintain financial flexibility in order to facilitate drilling on our undeveloped acreage positions and permit us to selectively expand our acreage positions. We are likely to be required to generate or raise significant amounts of capital to develop all of our potential drilling locations should we endeavor to do so. In the event our profitability or cash flows are insufficient and other sources of capital we historically have utilized are not available on acceptable terms, we may curtail our capital spending. Our balance sheet at December 31, 2017 reflects a negative working capital balance. We have historically and in the future expect to maintain a negative working capital balance, and we use our Revolver to help manage our working capital.
Availability under the Revolver is subject to a borrowing base, as well as financial covenants. Our borrowing base at December 31, 2017 was $350.0 million of which $211.0 million was utilized leaving an unused capacity of $139.0 million. In connection with the issuance and sale of the 2023 First Lien Notes, the borrowing base was reduced to $50.0 million, of which $25.0 million was utilized. The borrowing base will be re-determined at least semi-annually on or about April 1 and October 1 of each year, with such re-determination based primarily on reserve reports using lender commodity price expectations at such time. Any reduction in the borrowing base will reduce our liquidity, and, if the reduction results in the outstanding amount under our Revolver exceeding the borrowing base, we will be required to repay the deficiency within a short period of time. The financial covenants may further constrain our ability to borrow under our Revolver.
The Company routinely enters into oil and natural gas swap contracts as seller, thus resulting in the Company receiving a fixed price. During 2016 and 2017, the Company realized certain mark-to-market gains associated with oil and natural gas hedges the Company had in place for years 2018 and 2019. The gains were effectively realized by purchasing, as opposed to selling, oil and natural gas swap contracts for the equal volume that was associated with the initial hedge transaction. During the year ended December 31, 2017, the Company unwound its realized 2018 and 2019 hedges resulting in approximately $42.8 million, respectively, of recognized gains which have been included in Net gain (loss) on commodity derivatives on the Company’s Consolidated Statement of Operations.
The amount, timing and allocation of capital expenditures are largely discretionary and within management’s control. If oil and gas prices decline to levels below our acceptable levels or costs increase to levels above our acceptable levels, we may choose to defer some or all of our budgeted capital expenditures until later periods in order to achieve the desired balance between sources and uses of liquidity and to prioritize capital projects that we believe have the highest expected returns and potential to generate near-term cash flow. We may also increase our capital expenditures significantly to take advantage of opportunities we consider to be attractive. We continuously monitor and adjust our projected capital expenditures in response to success or lack of success in drilling activities, changes in prices, availability of financing, drilling and completion costs, industry conditions, the availability of rigs, contractual obligations, internally generated cash flow and other factors both within and outside our control.

64
The following table summarizes our cash flows for the years ended December 31, 2017, 2016 and 2015:
Year Ended December 31, (in thousands of dollars) 2017 2016 2015
Net cash provided by operating activities . . . . . . . . . . . $ 59,008 $ 25,700 $ 68,849 Net cash (used in) investing activities . . . . . . . . . . . . . . (110,004) (130,862) (168,220) Net cash (used in) / provided by financing activities . . 35,826 117,911 107,698 Net increase (decrease) in cash . . . . . . . . . . . . . . . . . . . $ (15,170) $ 12,749 $ 8,327
Cash Flow Provided by Operating Activities
Net cash provided by operating activities was $59.0 million for the year ended December 31, 2017 as compared to cash provided by operating activities of $25.7 million for the year ended December 31, 2016. The increase in operating cash flows was primarily due to the $60.8 million increase in oil and gas revenues for the year ended December 31, 2017 as compared to the year ended December 31, 2016. The increase in revenue was primarily driven by the increase in commodity prices, as well as production volumes.
Net cash provided by operating activities was $25.7 million for the year ended December 31, 2016 as compared to cash provided by operating activities of $68.8 million for the year ended December 31, 2015. The decrease in operating cash flows was primarily due to a $69.7 million decrease in oil and gas revenues for the year ended December 31, 2016 as compared to the year ended December 31, 2015. The decrease in revenue was attributable to decreased production volumes, as well as the decline in commodity prices.
Our operating cash flows are sensitive to a number of variables, the most significant of which is crude oil, NGL, and natural gas prices. For additional information on the impact of changing prices on our financial position, see “Item 7A. Quantitative and Qualitative Disclosures about Market Risk.”
Cash Flow Used in Investing Activities
Net cash used in investing activities was $110.0 million for the year ended December 31, 2017 as compared to cash used in investing activities of $130.9 million for the year ended December 31, 2016. The decrease in investing cash flow was primarily driven by the receipt of proceeds from the sales of non-core assets ($59.6 million increase in receipts) during 2017, as well as reduced capital spending ($19.1 million decrease) as compared to 2016. Offsetting these changes, current period settlements of matured derivative contracts declined ($60.0 million decrease in cash receipts) due to lower strike prices of maturing contracts resulting in a smaller margin between the strike price and the market price upon maturity.
Net cash used in investing activities was $130.9 million for the year ended December 31, 2016 as compared to cash used in investing activities of $168.2 million for the year ended December 31, 2015. The decrease was primarily driven by the reduction in capital expenditures which decreased $46.8 million during the year ended December 31, 2016 as compared to the year ended December 31, 2015 due to a decrease in drilling activity. Partially offsetting the impact of our capital expenditures, cash flows from current period settlements of our commodity derivative instruments resulted in net cash receipts of $132.3 million for the year ended December 31, 2016 as compared to net cash receipts of $144.1 million for the year ended December 31, 2015 driven by the decline in commodity prices.
We expect our 2018 capital expenditures to be approximately $150.0 million, including $134.0 million for drilling and completing wells and $16.0 million for leasing, workovers and other capital projects. Expenditures for development and exploration of oil and gas properties are the primary use of our capital resources. Our capital budget may be adjusted as business conditions warrant. The amount, timing and allocation of capital expenditures is largely discretionary and within our control. If oil and natural gas prices decline or costs increase significantly, we could defer some or all of our budgeted capital expenditures until later periods to prioritize capital projects that we believe have the highest expected returns and potential to generate near-term cash flows. We routinely monitor and adjust our capital expenditures in response to changes in prices, availability of financing, drilling and acquisition costs, industry conditions, the timing of regulatory approvals, the availability of rigs, the degree of success in drilling activities, contractual obligations, internally generated cash flows and other factors both within and outside our control.
65
Cash Flow Provided by Financing Activities
Net cash provided by financing activities was $35.8 million for the year ended December 31, 2017 as compared to net cash provided by financing activities of $117.9 million for the year ended December 31, 2016. The decrease in financing cash flows was primarily due to repayments under the Revolver, net of borrowings, which totaled $33.0 million during 2017 as compared to net borrowings of $68.0 million during 2016. Cash flows provided by financing activities were also impacted by net equity offerings of $8.3 million during 2017 as compared to $153.4 million during 2016. Offsetting these changes, the Company did not engage in the repurchase of our senior unsecured notes during 2017 as compared to cash used toward repurchases of $84.6 million during 2016.
Net cash provided by financing activities was $117.9 million for the year ended December 31, 2016 as compared to net cash provided by financing activities of $107.7 million for the year ended December 31, 2015. The increase in financing cash flows was primarily due to borrowings under the Revolver, net of repayments, which totaled $68.0 million during 2016 compared to net repayments of $250.0 million during 2015. Offsetting this increase, the Company purchased an aggregate principal amount of $190.9 million of our senior unsecured notes for cash of $84.6 million. The Company used cash on hand and borrowings from its Revolver to fund the note purchases. Additionally, we paid cash tax distributions of approximately $17.3 million to Class B shareholders. Cash flows provided by financing activities were also impacted by net equity offerings of $153.4 million.
Senior Unsecured Notes
On April 1, 2014, JEH and Jones Energy Finance Corp., JEH’s wholly owned subsidiary formed for the sole purpose of co-issuing certain of JEH’s debt (collectively, the “Issuers”), sold $500.0 million in aggregate principal amount of the Issuers’ 6.75% senior notes due 2022 (the “2022 Notes”). The Company used the net proceeds from the issuance of the 2022 Notes to repay certain indebtedness and for working capital and general corporate purposes. The 2022 Notes bear interest at a rate of 6.75% per year, payable semi-annually on April 1 and October 1 of each year beginning October 1, 2014. The 2022 Notes were registered in March 2015.
On February 23, 2015, the Issuers sold $250.0 million in aggregate principal amount of 9.25% senior notes due 2023 (the “2023 Notes”) in a private placement to affiliates of GSO Capital Partners LP and Magnetar Capital LLC. The 2023 Notes were issued at a discounted price equal to 94.59% of the principal amount. The Company used the $236.5 million net proceeds from the issuance of the 2023 Notes to repay outstanding borrowings under the Revolver (as defined below) and for working capital and general corporate purposes. The 2023 Notes bear interest at a rate of 9.25% per year, payable semi-annually on March 15 and September 15 of each year beginning September 15, 2015. The 2023 Notes were registered in February 2016.
During 2016, the Company purchased an aggregate principal amount of $190.9 million of its senior unsecured notes through several open-market and privately negotiated purchases. The Company purchased $90.9 million principal amount of its 2022 Notes for $38.1 million, and $100.0 million principal amount of its 2023 Notes for $46.5 million, in each case excluding accrued interest and including any associated fees. The Company used cash on hand and borrowings from its Revolver to fund the note purchases. In conjunction with the extinguishment of this debt, JEH recognized cancellation of debt income of $99.5 million for the twelve months ended December 31, 2016, on a pre-tax basis. This income is recorded in Gain on debt extinguishment on the Company’s Consolidated Statement of Operations. Of the Company’s total repurchases, $20.3 million principal amount of its 2022 Notes were not cancelled and are available for future reissuance, subject to applicable securities laws. No additional purchases were made during 2017.
The 2022 Notes and 2023 Notes are guaranteed on a senior unsecured basis by the Company and by all of its significant subsidiaries. The 2022 Notes and 2023 Notes will be senior in right of payment to any future subordinated indebtedness of the Issuers.
The Company may redeem the 2022 Notes at any time on or after April 1, 2017 and the 2023 Notes at any time on or after March 15, 2018 at a declining redemption price set forth in the respective indentures, plus accrued and unpaid interest.
The indentures governing the 2022 Notes and 2023 Notes are substantially identical and contain covenants that, among other things, limit the ability of the Company to incur additional indebtedness or issue certain preferred stock, pay dividends on capital stock, transfer or sell assets, make investments, create certain liens, enter into agreements that restrict dividends or other payments from the Company’s restricted subsidiaries to the Company, consolidate, merge or transfer all of the Company’s assets, engage in transactions with affiliates or create unrestricted subsidiaries. If at any

66
time when the 2022 Notes or 2023 Notes are rated investment grade and no default or event of default (as defined in the indenture) has occurred and is continuing, many of the foregoing covenants pertaining to the 2022 Notes or 2023 Notes, as applicable, will be suspended. If the ratings on the 2022 Notes or 2023 Notes, as applicable, were to decline subsequently to below investment grade, the suspended covenants would be reinstated.
As of December 31, 2017, the Company was in compliance with the indentures governing the 2022 Notes and 2023 Notes.
Senior Secured First Lien Notes
On February 14, 2018, the Issuers sold $450.0 million of 9.25% senior secured first lien notes due 2023 at an offering price equal to 97.526% of par in an offering exempt from registration under the Securities Act. The 2023 First Lien Notes are senior secured first lien obligations of the Issuers and are guaranteed on a senior secured first lien basis by the Company and each of the existing and future restricted subsidiaries of the Issuers (other than certain immaterial subsidiaries). See Note 16, “Subsequent Events,” in the Notes to Consolidated Financial Statements for more information. Following closing of the offering, we paid down $206.0 million of the Revolver balance. The remaining proceeds will be used for general corporate purposes, including funding capital expenditures.
Other Long-Term Debt
The Company has a Senior Secured Revolving Credit Facility (the “Revolver”) with a syndicate of banks. At the beginning of 2017, the borrowing base under the Revolver was $425.0 million, which was reaffirmed on May 15, 2017 during the semi-annual borrowing base re-determination. Upon closing of the Arkoma Divestiture on August 1, 2017, the Company’s borrowing base was reduced to $375.0 million. Effective November 26, 2017, the borrowing base was further reduced to $350.0 million during the semi-annual borrowing base re-determination. The Company’s oil and gas properties are pledged as collateral to secure its obligations under the Revolver. As of December 31, 2017, the Company had $211.0 million of outstanding borrowings under the Revolver, leaving an unused capacity of $139.0 million. Following the issuance of the 2023 First Lien Notes, the borrowing base was reduced to $50.0 million, of which $25.0 million was outstanding.
On November 26, 2017, the Company entered into an amendment to the Revolver to, among other things (a) modify certain financial ratio covenants, which are more fully described below, (b) reduce the borrowing base to $350.0 million until the next redetermination thereof, (c) increase the margin applicable to borrowings under the Revolver by 0.75% if the total leverage ratio is at or below 4.00 to 1.00 and 1.25% if the total leverage ratio is above 4.00 to 1.00, in each case determined as of the last day of the most recently ended fiscal quarter, (d) add a covenant limiting the ability of JEH and its subsidiaries to repurchase or redeem certain indebtedness prior to maturity thereof, subject to certain exceptions, (e) permit JEH to raise up to $350 million of junior lien debt, subject to covenant compliance and other customary conditions and (f) increase the Company’s hedge limits to permit, at any time, hedging of up to (i) 100% of projected production from proved reserves over the period of 24 months following such time and (ii) 85% of projected production from proved reserves for the subsequent period of 36 months thereafter.
On February 14, 2018, the Company further amended the Revolver in connection with the consummation of the offering of the 2023 First Lien Notes to, among other things, (a) permit the issuance of the 2023 First Lien Notes and additional senior secured notes in an aggregate principal amount, together with the 2023 First Lien Notes, not to exceed $700.0 million, (b) permit the incurrence of liens securing the 2023 First Lien Notes pursuant to the terms of a collateral trust agreement, (c) reduce the borrowing base under the Revolver to $50.0 million and (d) suspend testing of our senior secured leverage ratio until March 31, 2019.
The terms of the Revolver require the Company to make periodic payments of interest on the loans outstanding thereunder, with all outstanding principal and interest under the Revolver due on the maturity date. The Revolver is subject to a borrowing base, which limits the amount of borrowings which may be drawn thereunder. The borrowing base will be re-determined by the lenders at least semi-annually on or about April 1 and October 1 of each year, with such re-determination based primarily on reserve reports using lender commodity price expectations at such time. Any reduction in the borrowing base will reduce our liquidity, and, if the reduction results in the outstanding amount under our Revolver exceeding the borrowing base, we will be required to repay the deficiency within a short period of time.
Interest on the Revolver is calculated, at the Company’s option, at either (a) the London Interbank Offered (“LIBO”) rate for the applicable interest period plus a margin of (i) 2.25% to 3.25% if the Company’s total leverage ratio is less than or equal to 4.00 to 1.00 as of the last day of the previous fiscal quarter or (ii) 2.75% to 3.75% if the Company’s total

67
leverage ratio is greater than 4.00 to 1.00 as of the last day of the previous fiscal quarter, in each case based on the level of borrowing base utilization at such time or (b) the greatest of the federal funds rate plus 0.50%, the one month adjusted LIBO rate plus 1.00%, or the prime rate announced by Wells Fargo Bank, N.A. in effect on such day, in each case plus a margin of (x) 1.25% to 2.25% if the Company’s total leverage ratio is less than or equal to 4.00 to 1.00 as of the last day of the previous fiscal quarter or (y) 1.75% to 2.75% if the Company’s total leverage ratio is greater than 4.00 to 1.00 as of the last day of the previous fiscal quarter, in each case based on the level of borrowing base utilization at such time.
The Revolver contains various covenants that, among other things, limit our ability to:
• incur indebtedness;
• grant liens on our assets;
• pay dividends or distributions or redeem any of our equity interests;
• make certain investments, loans and advances;
• merge into or with or consolidate with any other person, or dispose of all or substantially all of our property to any other person;
• engage in certain asset dispositions;
• enter into transactions with affiliates;
• grant negative pledges or agree to restrict dividends or distributions from subsidiaries;
• allow gas imbalances, take-or-pay or certain other prepayments with respect to oil and gas properties;
• enter into certain derivative arrangements; and
• repurchase or redeem certain indebtedness prior to maturity thereof.
The Revolver also contains a covenant which restricts the ability of Jones Energy, Inc. to (i) hold any assets, (ii) incur, create, assume, or suffer to exist any debt or any other liability or obligation, (iii) create, make or enter into any investment or (iv) engage in any other activity or operation other than, among other exceptions described therein, its ownership of equity interests in JEH and the activities of a passive holding company and assets and operations incidental thereto (including the maintenance of cash and reserves for the payment of operational costs and expenses). Jones Energy, Inc. and its consolidated subsidiaries are subject to certain covenants under the Revolver, including the requirement to maintain the following financial ratios:
• commencing with the fiscal quarter ending March 31, 2019, a senior secured leverage ratio, consisting of consolidated secured funded debt to EBITDAX, of not greater than 2.25 to 1.00 as of the last day of any fiscal quarter;
• commencing with the fiscal quarter ending March 31, 2019, a total leverage ratio, consisting of consolidated debt to EBITDAX, of not greater than (i) 5.25 to 1.00 as of March 31, 2019, (ii) 5.00 to 1.00 as of June 30, 2019, (iii) 4.75 to 1.00 as of September 30, 2019, (iv) 4.50 to 1.00 as of December 31, 2019 and (v) 4.00 to 1.00 as of the last day of each fiscal quarter ending thereafter; and
• a current ratio, consisting of consolidated current assets, including the unused amounts of the total commitments, to consolidated current liabilities, of not less than 1.00 to 1.00 as of the last day of any fiscal quarter.
As of December 31, 2017, our senior secured leverage ratio was approximately 1.18x, our total leverage ratio was approximately 4.29x and our current ratio was approximately 1.85x, as calculated based on the requirements in our indenture. We were in compliance with all terms of our Revolver at December 31, 2017, and we expect to maintain compliance throughout 2018. However, factors including those outside of our control, such as commodity price declines,

68
may prevent us from maintaining compliance with these covenants, at future measurement dates in 2018 and beyond. In the event it were to become necessary, we believe we have the ability to take actions that would prevent us from failing to comply with our covenants, such as paying off and terminating the Revolver. If an event of default exists under the Revolver, the lenders will be able to accelerate the obligations outstanding under the Revolver and exercise other rights and remedies. Our Revolver contains customary events of default, including the occurrence of a change of control, as defined in the Revolver.
Equity Distribution Agreement
On May 24, 2016, the Company and JEH entered into an Equity Distribution Agreement (“Equity Distribution Agreement”) with Citigroup Global Markets Inc. and Wells Fargo Securities, LLC (each, a “Manager” and collectively, the “Managers”). Pursuant to the terms of the Equity Distribution Agreement, the Company may sell from time to time through the Managers, as the Company’s sales agents, or to any Manager as principal for its own account shares of the Company’s Class A common stock having an aggregate offering price of up to $73.0 million. See Note 12, “Stockholders’ and Mezzanine equity” in the Notes to Consolidated Financial Statements for more information.
During the year ended December 31, 2017, the Company sold approximately 3.7 million shares of its Class A common stock under the Equity Distribution Agreement for net proceeds of approximately $8.4 million ($8.7 million gross proceeds, net of approximately $0.3 million in commissions and professional services expenses). The Company used the net proceeds for general corporate purposes. As of December 31, 2017, approximately $62.2 million in aggregate offering proceeds remained available to be issued and sold under the Equity Distribution Agreement.
Off-Balance Sheet Arrangements
At December 31, 2017, we did not have any off-balance sheet arrangements.
Contractual Obligations
The following table summarizes our contractual obligations as of December 31, 2017:
Payments Due by Period Less than (dollars in thousands of dollars) Total 1 Year 1 - 3 Years 4 - 5 Years Thereafter
Long-term debt obligations . . . . $ 770,148 $ — $ 211,000 $ 559,148 $ — Interest expense (1) . . . . . . . . . . . 201,502 47,907 129,925 23,670 — Commodity derivative obligations . . . . . . . . . . . . . . . . . . 45,497 36,709 8,788 — — Operating lease obligations . . . . 3,173 1,300 1,873 — — Total . . . . . . . . . . . . . . . . . . . . . . . $ 1,020,320 $ 85,916 $ 351,586 $ 582,818 $ —
(1) Interest expense is estimated based on the outstanding balance at December 31, 2017 multiplied by the
weighted average interest rate during 2017. Excluded from the table above are the following:
We recognize as a liability an asset retirement obligation, or ARO, associated with the retirement of a tangible long-lived asset in the period in which it is incurred or becomes determinable (as defined by the standard), with an associated increase in the carrying amount of the related long-lived asset. Estimating the future ARO requires management to make estimates and judgments regarding timing and existence of a liability, as well as what constitutes adequate restoration.
The holders of JEH Units, including Jones Energy, Inc., incur U.S. federal, state and local income taxes on their share of any taxable income of JEH. Under the terms of its operating agreement, JEH is generally required to make quarterly pro rata cash tax distributions to its unitholders (including us) based on income allocated to such unitholders through the end of each relevant quarter, as adjusted to take into account good faith projections by the Company of taxable income or loss for the remainder of the calendar year, to the extent JEH has cash available for such distributions and subject to certain other restrictions. This tax distribution is computed based on the estimate of net taxable income of JEH allocated to each holder of JEH Units multiplied by the highest marginal effective rate of federal, state and local income tax applicable to an individual resident in New York, New York, without regard for the federal benefit of the deduction for any state taxes. During 2016, JEH generated taxable income, resulting in the payment during 2016 of $17.3 million in
69
cash tax distributions to JEH unitholders (other than us). As a result of JEH’s 2016 taxable income (all of which is passed-through and taxed to us and JEH’s other unitholders), during 2017 we made further income tax payments to federal and state taxing authorities of $2.3 million and JEH made further tax distributions to JEH unitholders (other than us) of $0.6 million. During 2017, JEH did not generate taxable income, therefore we did not make any additional tax payments nor did JEH make any additional tax distributions other than those made as a result of 2016 JEH taxable income. Based on our initial 2018 operating budget and information available as of this filing, we do not anticipate that we will be required to make any additional tax payments or that JEH will make any additional tax distributions during 2018. Estimating the tax distributions required under the operating agreement is imprecise by nature, highly uncertain, and dependent upon a variety of factors.
The Company entered into the Tax Receivable Agreement with JEH and the Class B shareholders that provides for payment by Jones Energy, Inc. to exchanging Class B shareholders of 85% of the benefits, if any, that Jones Energy, Inc. is deemed to realize as a result of any exchange. As a result of exchanges made prior to December 31, 2017, the Company recorded a TRA liability of $61.2 million. Estimating the timing of payments made under the Tax Receivable Agreement is imprecise by nature, highly uncertain, and dependent upon a variety of factors.
As a result of taxable income allocated from JEH in 2016, we made a payment of the TRA liability of $1.6 million during the first quarter of 2018. See “Management’s Discussion and Analysis of Financial Condition and Results of Operations—Outlook,” and see “Risk Factors—We will be required to make payments under the Tax Receivable Agreement for certain tax benefits we may receive (or be deemed to receive), and the amounts of such payments could be significant.” for further discussion of these items.
Critical Accounting Policies and Estimates
The discussion and analysis of our financial condition and results of operations are based on our consolidated financial statements, which have been prepared in accordance with accounting principles generally accepted in the United States, or GAAP. As used herein, the following acronyms have the following meanings: “FASB” means the Financial Accounting Standards Board; the “Codification” refers to the Accounting Standards Codification, the collected accounting and reporting guidance maintained by the FASB; “ASC” means Accounting Standards Codification and is generally followed by a number indicating a particular section of the Codification; and “ASU” means Accounting Standards Update, followed by an identification number, which are the periodic updates made to the Codification by the FASB.
The preparation of our consolidated financial statements requires us to make estimates and assumptions that affect our reported results of operations and the amount of reported assets, liabilities and proved oil and natural gas reserves. Some accounting policies involve judgments and uncertainties to such an extent that there is reasonable likelihood that materially different amounts could have been reported under different conditions or if different assumptions had been used. Actual results may differ from the estimates and assumptions used in the preparation of our consolidated financial statements. Described below are the most significant policies we apply in preparing our consolidated financial statements, some of which are subject to alternative treatments under GAAP. We also describe the most significant estimates and assumptions we make in applying these policies.
Reserves. Reserve estimates significantly impact depreciation and depletion expense and the calculation of potential impairments of oil and gas properties. Under the SEC rules, proved reserves are those quantities of oil and gas, which, by analysis of geoscience and engineering data, can be estimated with reasonable certainty to be economically producible from a given date forward, from known reservoirs, and under existing economic conditions, operating methods, and government regulations. The term “reasonable certainty” implies a high degree of confidence that the quantities of oil and natural gas actually recovered will equal or exceed the estimate. Reasonable certainty can be established using techniques that have been proven effective by actual production from projects in the same reservoir or an analogous reservoir or by other evidence using reliable technology that establishes reasonable certainty. Reliable technology is a grouping of one or more technologies (including computational methods) that has been field tested and has been demonstrated to provide reasonably certain results with consistency and repeatability in the formation being evaluated or in an analogous formation.
Probable reserves are those additional reserves that are less certain to be recovered than proved reserves but which, together with proved reserves, are as likely as not to be recovered. When deterministic methods are used, it is as likely as not that actual remaining quantities recovered will exceed the sum of estimated proved plus probable reserves. When
70
probabilistic methods are used, there should be at least a 50% probability that the actual quantities recovered will equal or exceed the proved plus probable reserves estimates.
Possible reserves are those additional reserves that are less certain to be recovered than probable reserves. When deterministic methods are used, the total quantities ultimately recovered from a project have a low probability of exceeding proved plus probable plus possible reserves. When probabilistic methods are used, there should be at least a 10% probability that the total quantities ultimately recovered will equal or exceed the proved plus probable plus possible reserves estimates.
Reserves were calculated using an unweighted arithmetic average of commodity prices in effect on the first day of each month within the twelve-month period ending on the date as of which the applicable estimate is presented. These prices were adjusted for quality, transportation fees, geographical differentials, marketing bonuses or deductions and other factors affecting the price received at the wellhead.
Periodic revisions to the estimated reserves and related future cash flows may be necessary as a result of a number of factors, including changes in oil and natural gas prices, reservoir performance, new drilling and completion, purchases, sales and terminations of leases, drilling and operating cost changes, technological advances, new geological or geophysical data or other economic factors. All of these factors are inherently estimates and are inter-dependent. While each variable carries its own degree of uncertainty, some factors, such as oil and natural gas prices, have historically been highly volatile and may be highly volatile in the future. This high degree of volatility causes a high degree of uncertainty associated with the estimation of reserve quantities and estimated future cash flows. Therefore, future results are highly uncertain and subject to potentially significant revisions. Accordingly, reserve estimates are generally different from the quantities of oil and natural gas that are ultimately recovered. We cannot predict the amounts or timing of future reserve revisions, as such revisions could be negatively impacted by:
• Declines in commodity prices or actual realized prices below those assumed for future years;
• Increases in service costs;
• Increases in future global or regional production or decreases in demand;
• Increases in operating costs;
• Reductions in availability of drilling, completion, or other equipment.
If such revisions are significant, they could significantly affect future amortization of capitalized costs and result in an impairment of assets that may be material.
Property and Equipment. Oil and gas producing activities are accounted for using the successful efforts method of accounting. Under the successful efforts method, lease acquisition costs and all development costs, including unsuccessful development wells, are capitalized.
Impairment—The capitalized costs of proved oil and gas properties are reviewed at least annually for impairment, whenever events or changes in circumstances indicate that the carrying amount of a long-lived asset or asset group exceeds its fair market value and is not recoverable. The determination of recoverability is based on comparing the estimated undiscounted future net cash flows from a producing field to the carrying value of the assets. If the future undiscounted cash flows, based on estimates of anticipated production and future oil and natural gas prices and operating costs, are lower than the carrying cost, the carrying cost of the field assets is reduced to fair value. For our proved oil and gas properties, we estimate fair value by discounting the projected future cash flows at an appropriate risk-adjusted discount rate.
Unproved leasehold costs are assessed at least annually to determine whether they have been impaired based upon lease terminations, expected drilling plans, and the impact of any unsuccessful exploratory drilling. Individually significant properties are assessed for impairment on a property-by-property basis, while individually insignificant unproved leasehold costs may be assessed in the aggregate. If unproved leasehold costs are found to be impaired, an impairment allowance is provided and a loss is recognized in the statement of operations.
Sales—Sales of significant portions of a proved field are charged to income as incurred. Gain or loss on the sale is recognized to the extent of the difference between the net proceeds received and the remaining carrying value of the
71
properties sold. Proceeds from the sale of insignificant portions of a larger proved field are accounted for as a recovery of costs, thereby reducing the carrying value of the field until such value reaches zero. For sales of entire working interests in unproved properties, gain or loss is recognized to the extent of the difference between the proceeds received and the net carrying value of the property. Proceeds from sales of partial interests in unproved properties are accounted for as a recovery of costs unless the proceeds exceed the entire cost of the property.
Derivative Financial Instruments. We use derivative contracts to hedge the effects of fluctuations in the prices of oil, natural gas and NGLs. We record such derivative instruments as assets or liabilities in the balance sheet (see Note 7, “Fair Value Measurement,” in the Notes to Consolidated Financial Statements for further information on fair value). Estimating the fair value of derivative financial instruments requires management to make estimates and judgments regarding volatility and counterparty credit risk. We use net presentation of derivative assets and liabilities when such assets and liabilities are with the same counterparty and allowed under the ISDA trading agreement with such counterparty.
We have not designated any of our derivative contracts as fair value or cash flow hedges. The changes in fair value of the contracts are included in net income in the period of the change as “Net gain (loss) on commodity derivatives.”
Share-Based Compensation. We measure and record compensation expense for all share-based payment awards to employees and directors based on estimated grant-date fair values. Compensation costs for share-based awards are recognized over the requisite service period based on the grant-date fair value. Prior to our IPO, we were not publicly traded, and did not have a listed price with which to calculate fair value. We have historically and consistently calculated fair value using combined valuation models including an enterprise valuation approach; an income approach, utilizing future discounted and undiscounted cash flows; and a market approach, taking into consideration peer group analysis of publicly traded companies, and when available, actual cash transactions in our common stock.
Acquisitions. Acquisitions are accounted for as purchases and, accordingly, the results of operations are included in our statement of operations from the closing date of the acquisition. Purchase prices are allocated to acquired assets and assumed liabilities, if any, based on their estimated fair value at the time of the acquisition. We have historically and consistently calculated fair value using combined valuation models including an enterprise valuation approach; an income approach, utilizing future discounted and undiscounted cash flows; and a market approach, taking into consideration peer group analysis of publicly traded companies.
Asset Retirement Obligations. We recognize as a liability an asset retirement obligation, or ARO, associated with the retirement of a tangible long-lived asset in the period in which it is incurred or becomes determinable (as defined by the standard), with an associated increase in the carrying amount of the related long-lived asset. The cost of the tangible asset, including the initially recognized asset retirement cost, is depreciated over the useful life of the asset and accretion expense is recognized over time as the discounted liability is accreted to its expected settlement value. We measure the fair value of the ARO using expected future cash outflows for abandonment discounted generally at our cost of capital at the time of recognition.
Estimating the future ARO requires management to make estimates and judgments regarding timing and existence of a liability, as well as what constitutes adequate restoration. Inherent in the fair value calculation are numerous assumptions and judgments including the ultimate costs, inflation factors, credit adjusted discount rates, timing of settlement and changes in the legal, regulatory, environmental and political environments. To the extent future revisions to these assumptions impact the fair value of the existing ARO liability, a corresponding adjustment is made to the related asset.
Liability under Tax Receivable Agreement. In connection with the IPO, the Company entered into a Tax Receivable Agreement (the “TRA”) which obligates the Company to make payments to certain current and former owners equal to 85% of the applicable cash savings that the Company realizes as a result of tax attributes arising from exchanges of JEH Units and shares of the Company’s Class B common stock held by those owners for shares of the Company’s Class A common stock. The Company will retain the benefit of the remaining 15% of these tax savings.
As a result of exchanges made, the Company accrues the estimated future tax benefits and accounts for this estimated amount as a reduction of deferred tax liabilities on its consolidated balance sheet. The actual amount and timing of payments to be made under the TRA will depend upon a number of factors, including the amount and timing of taxable income generated in the future, changes in future tax rates, the use of loss carryovers, and the portion of the Company’s payments under the TRA constituting imputed interest. To the extent the Company does not realize all of the tax benefits in future years or in the event of a change in future tax rates, this liability may change.

72
Recent Accounting Pronouncements
See Note 2, “Significant Accounting Policies—Recent Accounting Pronouncements” in our Notes to the Consolidated Financial Statements. Item 7A. Quantitative and Qualitative Disclosures about Market Risk
We are exposed to certain market risks that are inherent in our financial statements that arise in the normal course of business. We may enter into derivative instruments to manage or reduce market risk, but do not enter into derivative agreements for speculative purposes.
We do not designate these or future derivative instruments as hedges for accounting purposes. Accordingly, the changes in the fair value of these instruments are recognized currently in earnings.
Commodity price risk and hedges
Our principal market risk exposure is to oil, natural gas and NGL prices, which are inherently volatile. As such, future earnings are subject to change due to fluctuations in such prices. Realized prices are primarily driven by the prevailing prices for oil and regional spot prices for natural gas and NGLs. We have used, and expect to continue to use, oil, natural gas and NGL derivative contracts to reduce our risk of price fluctuations of these commodities. Pursuant to our risk management policy, we engage in these activities as a hedging mechanism against price volatility associated with projected production levels. The fair value of our oil, natural gas and NGL derivative contracts at December 31, 2017 was a net liability of $41.9 million.
For the years ending December 31, 2018, 2019, and 2020, approximately 75%, 26%, and 22%, respectively, of our estimated total oil, natural gas and NGL production from proved reserves, based on our reserve report as of December 31, 2017, are hedged by commodity derivative contracts, respectively. For information regarding the terms of these hedges, please see “—Basis of presentation—Hedging” above. The production hedged thereby is consistent with the assumed drilling schedule and monthly production levels in the December 31, 2017 reserve report prepared by Cawley Gillespie, which is based on prices, costs and other assumptions required by SEC rules. Our actual production will vary from the amounts estimated in this reserve report, perhaps materially. Please read “Risk factors—Our estimated oil and natural gas reserve quantities and future production rates are based on many assumptions that may prove to be inaccurate. Any material inaccuracies in these reserve estimates or the underlying assumptions will materially affect the quantities and present value of our reserves.”
Counterparty and customer credit risk
Joint interest receivables arise from billings to entities that own partial interests in the wells we operate. These entities participate in our wells primarily based on their ownership in leases on which we drill. We are also subject to credit risk due to concentration of our oil and natural gas receivables with several significant customers. The inability or failure of these significant customers to meet their obligations or their insolvency or liquidation may adversely affect our financial results. In addition, our oil and natural gas derivative arrangements expose us to credit risk in the event of nonperformance by counterparties.
While we do not typically require our partners, customers and counterparties to post collateral, we have begun to make cash calls to our partners for their share of future project expenditures. We periodically review, evaluate and assess the credit standing of our partners or customers for oil and gas receivables and the counterparties on our derivative instruments. This evaluation may include reviewing a party’s credit rating, latest financial information and, in the case of a customer with which we have receivables, their historical payment record, and undertaking the due diligence necessary to determine creditworthiness. The counterparties on our derivative instruments currently in place are lenders under the revolving credit facility with investment grade ratings. We are not permitted under the terms of the Revolver to enter into derivative instruments with counterparties outside of the banks who are lenders under the Revolver. As a result, any future derivative instruments will be with these or other lenders under the Revolver who will also likely carry investment grade ratings.
Interest rate risk
We are subject to market risk exposure related to changes in interest rates on our variable rate indebtedness. The terms of the Revolver provide for interest on borrowings at a floating rate equal to prime, LIBOR or federal funds rate plus

73
margins ranging from 0.50% to 2.50% depending on the base rate used and the amount of the loan outstanding in relation to the borrowing base. The base rate margins under the terminated term loan were 6.0-7.0% depending on the base rate used and the amount of the loan outstanding. The terms of our senior notes provide for a fixed interest rate through their respective maturity dates. During the year ended December 31, 2017, borrowings under the Revolver, the 2022 Notes and the 2023 Notes bore interest at a weighted average rate of 3.04%, 6.75% and 9.25%, respectively. Item 8. Financial Statements and Supplementary Data
Our consolidated financial statements and supplementary financial data are included in this Annual Report beginning on page F-1. Item 9. Changes in and Disagreements with Accountants on Accounting and Financial Disclosure
None. Item 9A. Controls and Procedures
Evaluation of Disclosure Controls and Procedures
As required by Rule 13a-15(b) of the Exchange Act, we have evaluated, under the supervision and with the participation of our management, including our principal executive officer and principal financial officer, the effectiveness of the design and operation of our disclosure controls and procedures (as defined in Rules 13a-15(e) and 15d-15(e) under the Exchange Act) as of the end of the period covered by this report. Our disclosure controls and procedures are designed to provide reasonable assurance that the information required to be disclosed by us in reports that we file under the Exchange Act is accumulated and communicated to our management, including our principal executive officer and principal financial officer, as appropriate, to allow timely decisions regarding required disclosure and is recorded, processed, summarized and reported within the time periods specified in the rules and forms of the SEC.
Our management, with the participation of our principal executive officer and principal financial officer, evaluated the effectiveness of the design and operation of our disclosure controls and procedures. Based on that evaluation, our principal executive officer and principal financial officer concluded that as of December 31, 2017, the end of the period covered by this report, our disclosure controls and procedures are effective at a reasonable assurance level.
Management’s Report on Internal Control over Financial Reporting
Our management is responsible for establishing and maintaining adequate internal control over financial reporting (as defined in Rule 13a-15(f) and Rule 15d-15(f) under the Exchange Act). Our internal control over financial reporting is a process designed under the supervision of our principal executive officer and principal financial officer to provide reasonable assurance regarding the reliability of financial reporting and the preparation of our financial statements for external purposes in accordance with generally accepted accounting principles.
Because of its inherent limitations, internal control over financial reporting may not prevent or detect misstatements. Also, projections of any evaluation of effectiveness to future periods are subject to the risk that controls may become inadequate because of changes in conditions, or that the degree of compliance with the policies or procedures may deteriorate.
As of December 31, 2017, our management assessed the effectiveness of our internal control over financial reporting based on the criteria for effective internal control over financial reporting established by the Committee of Sponsoring Organizations of the Treadway Commission (“COSO”) in Internal Control—Integrated Framework (2013). Management’s assessment included an evaluation of the design of our internal control over financial reporting and testing of the operational effectiveness of our internal control over financial reporting. Based on this assessment, management has concluded that, as of December 31, 2017, the Company’s internal control over financial reporting is effective based on those criteria.
Attestation Report of the Registered Public Accounting Firm
This annual report does not include an attestation report of the company’s registered public accounting firm regarding internal control over financial reporting. Pursuant to the JOBS Act, management’s report was not subject to attestation

74
by the company’s registered public accounting firm pursuant to rules of the Securities and Exchange Commission that permit the company to provide only management’s report in this annual report.
Changes in Internal Control over Financial Reporting
There have been no changes in internal control over financial reporting during the quarter ended December 31, 2017 that have materially affected, or are reasonably likely to materially affect, the Company’s internal control over financial reporting. Item 9B. Other Information
None.

75
PART III
Item 10. Directors, Executive Officers and Corporate Governance
The information called for by this Item 10 is incorporated herein by reference to the definitive Proxy Statement to be filed by the registrant pursuant to Regulation 14A of the General Rules and Regulations under the Exchange Act not later than 120 days after the end of the fiscal year covered by this Annual Report on Form 10-K. Item 11. Executive Compensation
The information called for by this Item 11 is incorporated herein by reference to the definitive Proxy Statement to be filed by the registrant pursuant to Regulation 14A of the General Rules and Regulations under the Exchange Act not later than 120 days after the end of the fiscal year covered by this Annual Report on Form 10-K. Item 12. Security Ownership of Certain Beneficial Owners and Management and Related Stockholder Matters
The information called for by this Item 12 is incorporated herein by reference to the definitive Proxy Statement to be filed by the registrant pursuant to Regulation 14A of the General Rules and Regulations under the Exchange Act not later than 120 days after the end of the fiscal year covered by this Annual Report on Form 10-K. Item 13. Certain Relationships and Related Transactions, and Director Independence
The information called for by this Item 13 is incorporated herein by reference to the definitive Proxy Statement to be filed by the registrant pursuant to Regulation 14A of the General Rules and Regulations under the Exchange Act not later than 120 days after the end of the fiscal year covered by this Annual Report on Form 10-K. Item 14. Principal Accounting Fees and Services
The information called for by this Item 14 is incorporated herein by reference to the definitive Proxy Statement to be filed by the registrant pursuant to Regulation 14A of the General Rules and Regulations under the Exchange Act not later than 120 days after the end of the fiscal year covered by this Annual Report on Form 10-K.
76
PART IV
Item 15. Exhibits, Financial Statement Schedules
(a) The following documents are filed as part of this report or incorporated by reference:
(1) Financial Statements. Our consolidated financial statements are included under Part II, Item 8 of this Annual Report. For a listing of these statements and accompanying footnotes, see “Index to Consolidated Financial Statements” on page F-1 of this Annual Report.
(2) Financial Statement Schedules. All schedules have been omitted because they are either not applicable, not required or the information called for therein appears in the consolidated financial statements or notes thereto.
(3) Exhibits. The exhibits required to be filed by this Item 15 are set forth in the Exhibit Index accompanying this Annual Report on Form 10-K.
EXHIBIT INDEX
Exhibit No. Description
2.1
Purchase and Sale Agreement, dated June 22, 2017, between Jones Energy Holdings, LLC and the purchaser party thereto (incorporated by reference to the Quarterly Report on Form 10-Q filed with the Securities and Exchange Commission on August 7, 2017).
3.1
Amended and Restated Certificate of Incorporation of Jones Energy, Inc. (incorporated by reference to Exhibit 3.1 to the Company’s Current Report on Form 8-K filed with the Securities and Exchange Commission on July 30, 2013).
3.2
Amended and Restated Bylaws of Jones Energy, Inc. (incorporated by reference to Exhibit 3.2 to the Company’s Current Report on Form 8-K filed with the Securities and Exchange Commission on July 30, 2013).
3.3
Certificate of Designations of the 8.0% Series A Perpetual Convertible Preferred Stock, filed with the Secretary of State of the State of Delaware and effective August 25, 2016 (including form of stock certificate) (incorporated by reference herein to the Company’s Current Report on Form 8-K filed with the Securities and Exchange Commission on August 26, 2016)
4.1
Form of Class A common stock Certificate (incorporated by reference to Exhibit 4.2 to the Company’s Registration Statement on Form S-1, File No. 333-188896, filed with the Securities and Exchange Commission on June 7, 2013).
4.2
Amended and Restated Registration Rights and Stockholders Agreement, dated May 2, 2017, among Jones Energy, Inc., Jones Energy Holdings, LLC and the other parties thereto (incorporated by reference to the Quarterly Report on Form 10-Q filed with the Securities and Exchange Commission on May 5, 2017).
4.3
Indenture, dated April 1, 2014, among Jones Energy Holdings, LLC, Jones Energy Finance Corp., the Guarantors named therein and Wells Fargo Bank, National Association, as trustee (incorporated by reference to Exhibit 4.1 to the Company’s Current Report on Form 8-K filed with the Securities and Exchange Commission on April 1, 2014).
4.4
Registration Rights Agreement, dated April 1, 2014, among Jones Energy Holdings, LLC, Jones Energy Finance Corp., the Guarantors named therein and Citigroup Global Markets Inc., as the sole representative of the Initial Purchasers named therein (incorporated by reference to Exhibit 4.2 to the Company’s Current Report on Form 8-K filed with the Securities and Exchange Commission on April 1, 2014).
4.5
Indenture, dated February 23, 2015, among Jones Energy Holdings, LLC, Jones Energy Finance Corp., the Guarantors named therein and Wells Fargo Bank, National Association, as trustee (incorporated by reference to Exhibit 4.1 to Jones Energy, Inc.’s Current Report on Form 8-K filed with the Securities and Exchange Commission on February 27, 2015).
4.6
Registration Rights Agreement dated February 23, 2015, among Jones Energy Holdings, LLC, Jones Energy Finance Corp., the Guarantors named therein and the purchasers named therein (incorporated by reference to Exhibit 4.2 to Jones Energy, Inc.’s Current Report on Form 8-K filed with the Securities and Exchange Commission on February 27, 2015).

77
Exhibit No. Description
4.7
Form of certificate for the 8.0% Series A Perpetual Convertible Preferred Stock (included as Exhibit A to Exhibit 3.3)
4.8
Indenture, dated as of February 14, 2018, among Jones Energy Holdings, LLC, Jones Energy Finance Corp., the Guarantors named therein and Wells Fargo Bank, National Association, as trustee (incorporated by reference to Exhibit 4.1 to the Company’s Current Report on Form 8 K filed with the Securities and Exchange Commission on February 16, 2018).
10.1
Fourth Amended and Restated Limited Liability Company Agreement of Jones Energy Holdings, LLC, dated as of August 25, 2016 (incorporated by reference herein to the Company’s Current Report on Form 8-K filed with the Securities and Exchange Commission on August 26, 2016)
10.2
Amendment No. 1 to Fourth Amended and Restated Limited Liability Company Agreement of Jones Energy Holdings, LLC, dated as of September 30, 2016 (incorporated by reference herein to the Company’s Current Report on Form 8-K filed with the Securities and Exchange Commission on October 6, 2016)
10.3
Exchange Agreement, dated as of July 29, 2013, by and among Jones Energy, Inc., Jones Energy Holdings, LLC and the members of Jones Energy Holdings, LLC party thereto (incorporated by reference to Exhibit 10.3 to the Company's Current Report on Form 8-K filed with the Securities and Exchange Commission on July 30, 2013).
10.4
Tax Receivable Agreement, dated as of July 29, 2013, by and among Jones Energy, Inc., Jones Energy Holdings, LLC and the members of Jones Energy Holdings, LLC party thereto (incorporated by reference to Exhibit 10.4 to the Company's Current Report on Form 8-K filed with the Securities and Exchange Commission on July 30, 2013).
10.5 †
Amended and Restated Jones Energy, Inc. 2013 Omnibus Incentive Plan, effective as of May 4, 2016 (incorporated by reference to Appendix A to the Company's Definitive Proxy Statement on Schedule 14A filed with the Securities and Exchange Commission on March 30, 2016).
10.6 †
Amended and Restated Jones Energy, Inc. Short Term Incentive Plan, effective as of May 4, 2016 (incorporated by reference to Appendix B to the Company's Definitive Proxy Statement on Schedule 14A filed with the Securities and Exchange Commission on March 30, 2016).
10.7 †
Form of Director Restricted Stock Award Agreement (incorporated by reference to Exhibit 10.1 to the Company's Current Report on Form 8-K filed with the Securities and Exchange Commission on September 4, 2013).
10.8 †
Form of Employee Restricted Stock Award Agreement (incorporated by reference to Exhibit 10.2 to the Company's Current Report on Form 8-K filed with the Securities and Exchange Commission on May 27, 2014).
10.9 †
Form of Performance Share Unit Award Agreement (formerly referred to as a Performance Unit Award) (incorporated by reference to Exhibit 10.1 to the Company's Current Report on Form 8-K filed with the Securities and Exchange Commission on May 27, 2014).
10.10 †
Jones Energy, LLC Executive Deferral Plan (incorporated by reference to Exhibit 10.1 to the Company's Current Report on Form 8-K filed with the Securities and Exchange Commission on October 23, 2013).
10.11†
Jones Energy Holdings, LLC Monarch Equity Plan (incorporated by reference to Exhibit 10.8 to the Company's Registration Statement on Form S-1, File No. 333-188896, filed on May 28, 2013).
10.12
Form of Indemnification Agreement (incorporated by reference to Exhibit 10.5 to the Company's Registration Statement on Form S-1, File No. 333-188896, filed with the Securities and Exchange Commission on June 7, 2013).
10.13
Credit Agreement, dated as of December 31, 2009, among Jones Energy Holdings, LLC, as borrower, Wells Fargo Bank N.A., as administrative agent, and the lenders party thereto (incorporated by reference to Exhibit 10.9 to the Company's Registration Statement on Form S-1, File No. 333-188896, filed with the Securities and Exchange Commission on May 28, 2013).
10.14
Agreement and Amendment No. 1 to Credit Agreement (First Lien) (incorporated by reference to Exhibit 10.10 to the Company's Registration Statement on Form S-1, File No. 333-188896, filed with the Securities and Exchange Commission on May 28, 2013).
10.15
Master Assignment, Agreement and Amendment No. 2 to Credit Agreement (incorporated by reference to Exhibit 10.11 to the Company's Registration Statement on Form S-1, File No. 333-188896, filed with the Securities and Exchange Commission on May 28, 2013).

78
Exhibit No. Description
10.16
Master Assignment, Agreement and Amendment No. 3 to Credit Agreement (incorporated by reference to Exhibit 10.12 to the Company's Registration Statement on Form S-1, File No. 333-188896, filed with the Securities and Exchange Commission on May 28, 2013).
10.17
Agreement and Amendment No. 4 to Credit Agreement (First Lien) (incorporated by reference to Exhibit 10.13 to the Company's Registration Statement on Form S-1, File No. 333-188896, filed with the Securities and Exchange Commission on May 28, 2013).
10.18
Master Assignment, Agreement and Amendment No. 5 to Credit Agreement (incorporated by reference to Exhibit 10.14 to the Company's Registration Statement on Form S-1, File No. 333-188896, filed with the Securities and Exchange Commission on May 28, 2013).
10.19
Waiver and Amendment No. 6 to Credit Agreement (incorporated by reference to Exhibit 10.15 to the Company's Registration Statement on Form S-1, File No. 333-188896, filed with the Securities and Exchange Commission on May 28, 2013).
10.20
Waiver, Agreement and Amendment No. 7 to Credit Agreement and Amendment to Guarantee and Collateral Agreement (incorporated by reference to Exhibit 10.24 to the Company's Registration Statement on Form S-1, File No. 333-188896, filed with the Securities and Exchange Commission on June 17, 2013).
10.21
Borrowing Base Increase Agreement, dated as of December 18, 2013, among Jones Energy Holdings, LLC, as borrower, certain subsidiaries of Jones Energy Holdings, LLC, as guarantors, Wells Fargo Bank, N.A., as administrative agent, and the lenders party thereto (incorporated by reference to Exhibit 10.19 to the Company's Annual Report on Form 10-K filed with the Securities and Exchange Commission on March 14, 2014).
10.22
Agreement and Amendment No. 8 to Credit Agreement dated as of January 29, 2014, among Jones Energy Holdings, LLC, as borrower, Jones Energy, Inc., Jones Energy, LLC and Nosley Assets, LLC, as guarantors, Wells Fargo Bank, N.A., as administrative agent, and the lenders party thereto (incorporated by reference to Exhibit 10.20 to the Company's Annual Report on Form 10-K filed with the Securities and Exchange Commission on March 14, 2014).
10.23
Master Assignment, Agreement and Amendment No. 9 to Credit Agreement dated as of November 6, 2014, among Jones Energy Holdings, LLC, as borrower, Jones Energy, Inc., Jones Energy, LLC and Nosley Assets, LLC, as guarantors, Wells Fargo Bank, N.A., as administrative agent, and the lenders party thereto (incorporated by reference to Exhibit 10.22 to the Company’s Annual Report on Form 10-K for the year ended December 31, 2015 filed with the Securities and Exchange Commission on March 9, 2016).
10.24
Amendment No. 10 to Credit Agreement dated as of August 1, 2016, among Jones Energy Holdings, LLC, as borrower, Jones Energy, Inc., Jones Energy, LLC and Nosley Assets, LLC, as guarantors, Wells Fargo Bank, N.A., as administrative agent, and the lenders party thereto (incorporated by reference to Exhibit 10.1 to the Company’s Quarterly Report on Form 10-Q for the quarterly period ended September 30, 2016 filed with the Securities and Exchange Commission on November 4, 2016).
10.25
Guarantee and Collateral Agreement, dated as of January 29, 2014, between Jones Energy, Inc., as guarantor, and Wells Fargo Bank, N.A., as administrative agent (incorporated by reference to Exhibit 10.21 to the Company's Annual Report on Form 10-K filed on March 14, 2014).
10.26
Equity Distribution Agreement, dated as of May 24, 2016, by and among the Company, Jones Energy Holdings, LLC and the Managers named therein (incorporated by reference to Exhibit 1.1 to the Company's Current Report on Form 8-K filed on May 25, 2016).
10.27
Amended and Restated Firm Crude Oil Gathering and Transportation Agreement, dated October 23, 2015, by and between Monarch Oil Pipeline, LLC and Jones Energy, LLC (incorporated by reference to Exhibit 10.34 to the Company's Annual Report on Form 10-K filed on March 9, 2016).
10.28
Amended and Restated Gathering and Transportation Services Agreement, dated as of October 23, 2015, by and between Monarch Oil Pipeline, LLC and Jones Energy, LLC (incorporated by reference to Exhibit 10.35 to the Company's Annual Report on Form 10-K filed on March 9, 2016).
10.29
Amendment No. 11 to Credit Agreement dated as of November 26, 2017, among Jones Energy Holdings, LLC, as borrower, Jones Energy, Inc., Jones Energy, LLC and Nosley Assets, LLC, as guarantors, Wells Fargo Bank, N.A., as administrative agent, and the lenders party thereto (incorporated by reference to Exhibit 10.1 to the Company's Current Report on Form 8-K filed on November 27, 2017).

79
Exhibit No. Description
10.30†
Form of Restricted Stock Unit Award Agreement (incorporated by reference to the Quarterly Report on Form 10-Q filed with the Securities and Exchange Commission on May 5, 2017).
10.31†
Form of Performance Share Unit Award Agreement (incorporated by reference to the Quarterly Report on Form 10-Q filed with the Securities and Exchange Commission on May 5, 2017).
10.32†
Form of Performance Unit Award Agreement (incorporated by reference to the Quarterly Report on Form 10-Q filed with the Securities and Exchange Commission on May 5, 2017).
10.33†
Notice to Performance Award Holders (incorporated by reference to Exhibit 99.2 to the Company’s Current Report on Form 8-K filed on February 6, 2018).
10.34
Amended and Restated Collateral Agreement, dated as of February 14, 2018, made by each of the Grantors (as defined therein) in favor of Wells Fargo Bank, National Association (incorporated by reference to Exhibit 10.1 to the Company’s Current Report on Form 8 K filed with the Securities and Exchange Commission on February 16, 2018).
10.35
Amended and Restated Collateral Agreement, dated as of February 14, 2018, made by Jones Energy, Inc. in favor of Wells Fargo Bank, National Association (incorporated by reference to Exhibit 10.2 to the Company’s Current Report on Form 8 K filed with the Securities and Exchange Commission on February 16, 2018).
10.36
Amendment No. 12 to Credit Agreement, dated as of February 14, 2018, among Jones Energy Holdings, LLC, as borrower, Jones Energy, Inc., Jones Energy, LLC and Nosley Assets, LLC, Nosley SCOOP, LLC, Nosley Acquisition, LLC and Jones Energy Finance Corp., as guarantors, Wells Fargo Bank, N.A., as administrative agent, and the lenders party thereto (incorporated by reference to Exhibit 10.3 to the Company's Current Report on Form 8-K filed on February 16, 2018).
21.1* List of Subsidiaries of Jones Energy, Inc. 23.1* Consent of PricewaterhouseCoopers LLP.
23.2* Consent of Cawley Gillespie & Associates, Inc.
31.1* Rule 13a-14(a)/15d-14(a) Certification of Jonny Jones (Principal Executive Officer).
31.2* Rule 13a-14(a)/15d-14(a) Certification of Robert J. Brooks (Principal Financial Officer).
32.1** Section 1350 Certification of Jonny Jones (Principal Executive Officer).
32.2** Section 1350 Certification of Robert J. Brooks (Principal Financial Officer).
99.1
Summary Report of Cawley, Gillespie & Associates, Inc. for reserves as of December 31, 2017 (incorporated by reference to Exhibit 99.3 to the Company’s Current Report on Form 8-K filed on February 5, 2018).
101.INS* XBRL Instance Document. 101.SCH* XBRL Taxonomy Extension Schema Document. 101.CAL* XBRL Taxonomy Extension Calculation Linkbase Document. 101.DEF* XBRL Taxonomy Extension Definition Linkbase Document. 101.LAB* XBRL Taxonomy Extension Label Linkbase Document. 101.PRE* XBRL Taxonomy Extension Presentation Linkbase Document.
* —filed herewith
** — furnished herewith
†—Management contract or compensatory plan or arrangement required to be filed as an exhibit to this 10-K pursuant to Item 15(b).
Item 16. Form 10-K Summary None.

80
SIGNATURES
Pursuant to the requirements of Section 13 or 15(d) of the Securities Exchange Act of 1934, the registrant has duly caused this report to be signed on its behalf by the undersigned, thereunto duly authorized.
JONES ENERGY, INC. (registrant) Date: February 28, 2018 By: /s/ JONNY JONES Name: Jonny Jones Title: Chief Executive Officer
Pursuant to the requirements of the Securities Exchange Act of 1934, this report has been signed below by the following persons on behalf of the registrant and in the capacities and on the dates indicated.
Name Title Date
/s/ JONNY JONES Chairman of the Board of Directors and Chief Jonny Jones Executive Officer (Principal Executive Officer) February 28, 2018
/s/ MIKE S. MCCONNELL
Mike S. McConnell Director and President February 28, 2018
/s/ ROBERT J. BROOKS Executive Vice President and Chief Financial Robert J. Brooks Officer (Principal Accounting and Financial
Officer) February 28, 2018
/s/ HALBERT S. WASHBURN Halbert S. Washburn Director February 28, 2018
/s/ ALAN D. BELL
Alan D. Bell Director February 28, 2018
/s/ JOHN LOVOI John Lovoi Director February 28, 2018
/s/ PAUL B. LOYD JR.
Paul B. Loyd Jr. Director February 28, 2018
/s/ SCOTT MCCARTY Scott McCarty Director February 28, 2018

81
GLOSSARY OF OIL AND NATURAL GAS TERMS
The terms and abbreviations defined in this section are used throughout this Annual Report on Form 10K:
“AMI”—Area of mutual interest, typically referring to a contractually defined area under a joint development agreement whereby parties are subject to mutual participatory rights and restrictions.
“Basin”—A large natural depression on the earth’s surface in which sediments generally brought by water accumulate.
“Bbl”—One stock tank barrel, of 42 U.S. gallons liquid volume, used herein in reference to crude oil, condensate or NGLs.
“Boe”—Barrels of oil equivalent, with 6,000 cubic feet of natural gas being equivalent to one barrel of oil.
“Boe/d”—Barrels of oil equivalent per day.
“British thermal unit (BTU)”—The heat required to raise the temperature of one pound of water by one degree Fahrenheit.
“Completion”—The process of treating a drilled well followed by the installation of permanent equipment for the production of oil or natural gas, or in the case of a dry hole, the reporting of abandonment to the appropriate agency.
“Condensate”—A mixture of hydrocarbons that exists in the gaseous phase at original reservoir temperature and pressure, but that, when produced, is in the liquid phase at surface pressure and temperature.
“Developed acreage”—The number of acres that are allocated or assignable to productive wells or wells capable of production.
“Developed reserves”—Reserves of any category that can be expected to be recovered (i) through existing wells with existing equipment and operating methods or in which the cost of the required equipment is relatively minor compared to the cost of a new well; and (ii) through installed extraction equipment and infrastructure operational at the time of the reserves estimate if the extraction is by means not involving a well.
“Development well”—A well drilled within the proved area of an oil or natural gas reservoir to the depth of a stratigraphic horizon known to be productive.
“Dry hole”—A well found to be incapable of producing hydrocarbons in sufficient quantities to justify completion of the well, such that proceeds from the sale of such production do not exceed production expenses and taxes.
“Economically producible”—A resource which generates revenue that exceeds, or is reasonably expected to exceed, the costs of the operation.
“Exploratory well”—A well drilled to find a new field or to find a new reservoir in a field previously found to be productive of oil.
“Farm-in or farm-out”—An agreement under which the owner of a working interest in an oil or natural gas lease assigns the working interest or a portion of the working interest to another party who desires to drill on the leased acreage. Generally, the assignee is required to drill one or more wells in order to earn its interest in the acreage. The assignor usually retains a royalty or reversionary interest in the lease. The interests received by an assignee is a “farm-in” while the interest transferred by the assignor is a “farm-out.”
“Field”—An area consisting of a single reservoir or multiple reservoirs all grouped on, or related to, the same individual geological structural feature or stratigraphic condition.
“Formation”—A layer of rock which has distinct characteristics that differ from nearby rock.
“Fracture stimulation”—A process whereby fluids mixed with proppants are injected into a wellbore under pressure in order to fracture, or crack open, reservoir rock, thereby allowing oil and/or natural gas trapped in the reservoir rock to travel through the fractures and into the well for production.

82
“Gross acres or gross wells”—The total acres or well, as the case may be, in which a working interest is owned.
“Horizontal drilling”—A drilling technique used in certain formations where a well is drilled vertically to a certain depth and then drilled at a right angle within a specified interval.
“Joint development agreement”—Includes joint venture agreements, farm-in and farm-out agreements, joint operating agreements and similar partnering arrangements.
“MBbl”—One thousand barrels of oil, condensate or NGLs.
“MBoe”—One thousand barrels of oil equivalent, determined using the equivalent of six Mcf of natural gas to one Bbl of crude oil.
“Mcf”—One thousand cubic feet of natural gas.
“MMBoe”—One million barrels of oil equivalent.
“MMBtu”—One million British thermal units.
“MMcf”—One million cubic feet of natural gas.
“Net acres or net wells”—The sum of the fractional working interest owned in gross acres or gross wells. An owner who has 50% interest in 100 acres owns 50 net acres.
“Net revenue interest”—An owner’s interest in the revenues of a well after deducting proceeds allocated to royalty and overriding interests.
“Possible reserves”—Additional reserves that are less certain to be recognized than probable reserves.
“Probable reserves”—Additional reserves that are less certain to be recovered than proved reserves but which, in sum with proved reserves, are as likely as not to be recovered.
“Productive well”—A well that is found to be capable of producing hydrocarbons in sufficient quantities such that proceeds from the sale of the production exceed production expenses and taxes.
“Prospect”—A specific geographic area which, based on supporting geological, geophysical or other data and also preliminary economic analysis using reasonably anticipated prices and costs, is considered to have potential for the discovery of commercial hydrocarbons.
“Proved developed non-producing”—Hydrocarbons in a potentially producing horizon penetrated by a wellbore, the production of which has been postponed pending installation of surface equipment or gathering facilities, or pending the production of hydrocarbons from another formation penetrated by the wellbore. The hydrocarbons are classified as proved but non-producing reserves.
“Proved developed reserves”—Proved reserves that can be expected to be recovered through existing wells and facilities and by existing operating methods.
“Proved reserves”—Reserves of oil and natural gas that have been proved to a high degree of certainty by analysis of the producing history of a reservoir and/or by volumetric analysis of adequate geological and engineering data to be economically producible.
“Proved undeveloped reserves (PUD)”—Proved reserves that are expected to be recovered from new wells on undrilled acreage or from existing wells where a relatively major expenditure is required for recompletion.
“Recompletion”—The process of re-entering an existing wellbore that is either producing or not producing and completing new reservoirs in an attempt to establish or increase existing production.
“Reserves”—Estimated remaining quantities of oil and natural gas and related substances anticipated to be economically producible as of a given date by application of development projects to known accumulations.

83
“Reservoir”—A porous and permeable underground formation containing a natural accumulation of producible oil and/or natural gas that is confined by impermeable rock or water barriers and is individual and separate from other reservoirs.
“Royalty interest”—An interest in an oil and natural gas property entitling the owner to a share of oil or gas production free of production costs.
“Spacing”—The distance between wells producing from the same reservoir. Spacing is often expressed in terms of acres, e.g., 40-acre spacing, and is often established by regulatory agencies.
“Spud”—The commencement of drilling operations of a new well.
“Standardized measure of discounted future net cash flows”—The present value of estimated future net revenues to be generated from the production of proved reserves, determined in accordance with the regulations of the Securities and Exchange Commission, without giving effect to non-property related expenses such as general and administrative expenses, debt service, future income tax expenses or depreciation, depletion and amortization; discounted using an annual discount rate of 10%.
“Trend”—A region of oil and/or natural gas production, the geographic limits of which have not been fully defined, having geological characteristics that have been ascertained through supporting geological, geophysical or other data to contain the potential for oil and/or natural gas reserves in a particular formation or series of formations.
“Unconventional formation”—A term used in the oil and natural gas industry to refer to a formation in which the targeted reservoirs generally fall into one of three categories: (1) tight sands, (2) coal beds, or (3) oil and gas shales. The reservoirs tend to cover large areas and lack the readily apparent traps, seals and discrete hydrocarbon-water boundaries that typically define conventional reservoirs. These reservoirs generally require fracture stimulation treatments or other special recovery processes in order to produce economic flow rates.
“Undeveloped acreage”—Lease acreage on which wells have not been drilled or completed to a point that would permit the production of commercial quantities of oil and natural gas, regardless of whether such acreage contains proved reserves.
“Wellbore”—The hole drilled by the bit that is equipped for oil or gas production on a completed well. Also called well or borehole.
“Working interest”—The right granted to the lessee of a property to explore for and to produce and own oil, gas, or other minerals and receive a share of the production. The working interest owners bear the exploration, development, and operating costs of the property.

F-1
Index to Financial Statements
Report of Independent Registered Public Accounting Firm . . . . . . . . . . . . . . . . . . . . . . . . . . . . . . . . . . . . . . . . . . F-2 Consolidated Financial Statements Balance Sheets . . . . . . . . . . . . . . . . . . . . . . . . . . . . . . . . . . . . . . . . . . . . . . . . . . . . . . . . . . . . . . . . . . . . . . . . . . . . . . . . . . F-3Statements of Operations . . . . . . . . . . . . . . . . . . . . . . . . . . . . . . . . . . . . . . . . . . . . . . . . . . . . . . . . . . . . . . . . . . . . . . . . . F-4Statement of Changes in Stockholders’ Equity . . . . . . . . . . . . . . . . . . . . . . . . . . . . . . . . . . . . . . . . . . . . . . . . . . . . . . . . F-5Statements of Cash Flows . . . . . . . . . . . . . . . . . . . . . . . . . . . . . . . . . . . . . . . . . . . . . . . . . . . . . . . . . . . . . . . . . . . . . . . . . F-6Notes to the Consolidated Financial Statements . . . . . . . . . . . . . . . . . . . . . . . . . . . . . . . . . . . . . . . . . . . . . . . . . . . . . . . F-7Supplemental Information on Oil and Gas Producing Activities (Unaudited) . . . . . . . . . . . . . . . . . . . . . . . . . . . . . . . F-48Supplemental Quarterly Financial Information (Unaudited) . . . . . . . . . . . . . . . . . . . . . . . . . . . . . . . . . . . . . . . . . . . . . F-52

F-2
Report of Independent Registered Public Accounting Firm
To the Board of Directors and Stockholders of Jones Energy, Inc.:
Opinion on the Financial Statements We have audited the accompanying consolidated balance sheets of Jones Energy, Inc. and its subsidiaries as of December 31, 2017 and 2016, and the related consolidated statements of operations, of changes in stockholders’ equity, and of cash flows for each of the three years in the period ended December 31, 2017, including the related notes (collectively referred to as the “consolidated financial statements”). In our opinion, the consolidated financial statements present fairly, in all material respects, the financial position of the Company as of December 31, 2017 and 2016, and the results of their operations and their cash flows for each of the three years in the period ended December 31, 2017 in conformity with accounting principles generally accepted in the United States of America. Basis for Opinion These consolidated financial statements are the responsibility of the Company’s management. Our responsibility is to express an opinion on the Company’s consolidated financial statements based on our audits. We are a public accounting firm registered with the Public Company Accounting Oversight Board (United States) (“PCAOB”) and are required to be independent with respect to the Company in accordance with the U.S. federal securities laws and the applicable rules and regulations of the Securities and Exchange Commission and the PCAOB. We conducted our audits of these consolidated financial statements in accordance with the standards of the PCAOB. Those standards require that we plan and perform the audit to obtain reasonable assurance about whether the consolidated financial statements are free of material misstatement, whether due to error or fraud. The Company is not required to have, nor were we engaged to perform, an audit of its internal control over financial reporting. As part of our audits we are required to obtain an understanding of internal control over financial reporting but not for the purpose of expressing an opinion on the effectiveness of the Company's internal control over financial reporting. Accordingly, we express no such opinion. Our audits included performing procedures to assess the risks of material misstatement of the consolidated financial statements, whether due to error or fraud, and performing procedures that respond to those risks. Such procedures included examining, on a test basis, evidence regarding the amounts and disclosures in the consolidated financial statements. Our audits also included evaluating the accounting principles used and significant estimates made by management, as well as evaluating the overall presentation of the consolidated financial statements. We believe that our audits provide a reasonable basis for our opinion. /s/ PricewaterhouseCoopers LLP
Houston, Texas February 28, 2018 We have served as the Company's auditor since 2011.
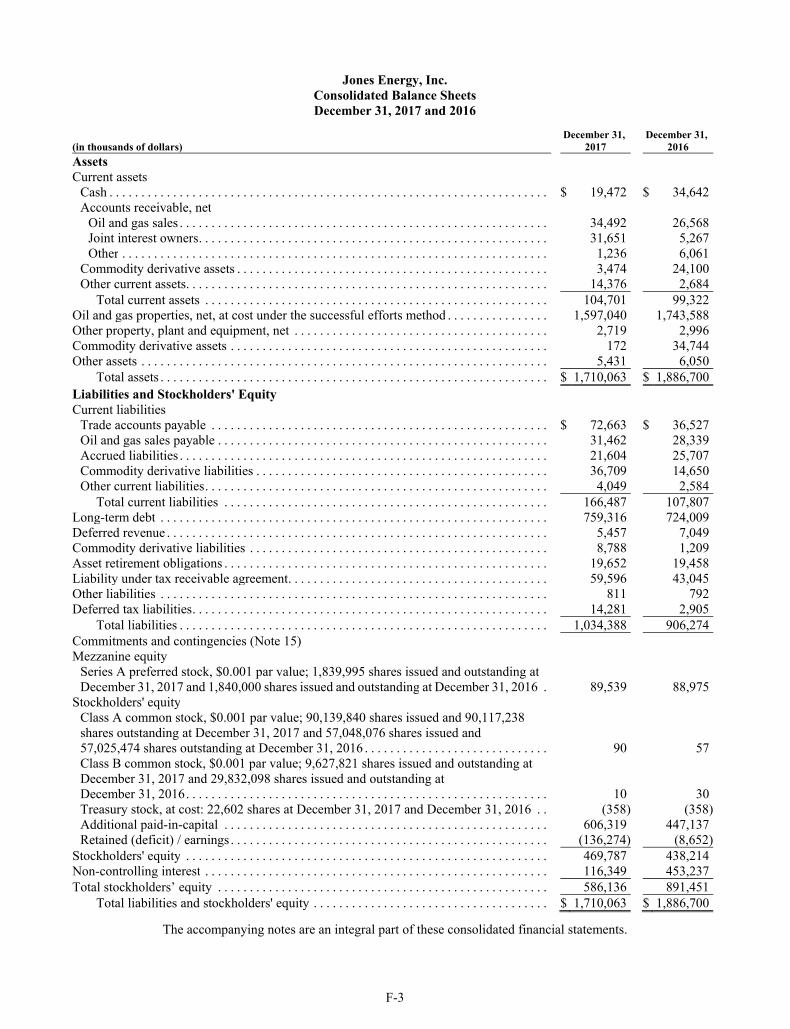
F-3
Jones Energy, Inc. Consolidated Balance Sheets December 31, 2017 and 2016
December 31, December 31, (in thousands of dollars) 2017 2016
Assets Current assets
Cash . . . . . . . . . . . . . . . . . . . . . . . . . . . . . . . . . . . . . . . . . . . . . . . . . . . . . . . . . . . . . . . . . . . . . $ 19,472 $ 34,642 Accounts receivable, net
Oil and gas sales . . . . . . . . . . . . . . . . . . . . . . . . . . . . . . . . . . . . . . . . . . . . . . . . . . . . . . . . . . 34,492 26,568 Joint interest owners . . . . . . . . . . . . . . . . . . . . . . . . . . . . . . . . . . . . . . . . . . . . . . . . . . . . . . . 31,651 5,267 Other . . . . . . . . . . . . . . . . . . . . . . . . . . . . . . . . . . . . . . . . . . . . . . . . . . . . . . . . . . . . . . . . . . . 1,236 6,061
Commodity derivative assets . . . . . . . . . . . . . . . . . . . . . . . . . . . . . . . . . . . . . . . . . . . . . . . . . 3,474 24,100 Other current assets. . . . . . . . . . . . . . . . . . . . . . . . . . . . . . . . . . . . . . . . . . . . . . . . . . . . . . . . . 14,376 2,684
Total current assets . . . . . . . . . . . . . . . . . . . . . . . . . . . . . . . . . . . . . . . . . . . . . . . . . . . . . . 104,701 99,322 Oil and gas properties, net, at cost under the successful efforts method . . . . . . . . . . . . . . . . 1,597,040 1,743,588 Other property, plant and equipment, net . . . . . . . . . . . . . . . . . . . . . . . . . . . . . . . . . . . . . . . . 2,719 2,996 Commodity derivative assets . . . . . . . . . . . . . . . . . . . . . . . . . . . . . . . . . . . . . . . . . . . . . . . . . . 172 34,744 Other assets . . . . . . . . . . . . . . . . . . . . . . . . . . . . . . . . . . . . . . . . . . . . . . . . . . . . . . . . . . . . . . . . 5,431 6,050
Total assets . . . . . . . . . . . . . . . . . . . . . . . . . . . . . . . . . . . . . . . . . . . . . . . . . . . . . . . . . . . . . $ 1,710,063 $ 1,886,700 Liabilities and Stockholders' Equity Current liabilities
Trade accounts payable . . . . . . . . . . . . . . . . . . . . . . . . . . . . . . . . . . . . . . . . . . . . . . . . . . . . . $ 72,663 $ 36,527 Oil and gas sales payable . . . . . . . . . . . . . . . . . . . . . . . . . . . . . . . . . . . . . . . . . . . . . . . . . . . . 31,462 28,339 Accrued liabilities . . . . . . . . . . . . . . . . . . . . . . . . . . . . . . . . . . . . . . . . . . . . . . . . . . . . . . . . . . 21,604 25,707 Commodity derivative liabilities . . . . . . . . . . . . . . . . . . . . . . . . . . . . . . . . . . . . . . . . . . . . . . 36,709 14,650 Other current liabilities . . . . . . . . . . . . . . . . . . . . . . . . . . . . . . . . . . . . . . . . . . . . . . . . . . . . . . 4,049 2,584
Total current liabilities . . . . . . . . . . . . . . . . . . . . . . . . . . . . . . . . . . . . . . . . . . . . . . . . . . . 166,487 107,807 Long-term debt . . . . . . . . . . . . . . . . . . . . . . . . . . . . . . . . . . . . . . . . . . . . . . . . . . . . . . . . . . . . . 759,316 724,009 Deferred revenue . . . . . . . . . . . . . . . . . . . . . . . . . . . . . . . . . . . . . . . . . . . . . . . . . . . . . . . . . . . . 5,457 7,049 Commodity derivative liabilities . . . . . . . . . . . . . . . . . . . . . . . . . . . . . . . . . . . . . . . . . . . . . . . 8,788 1,209 Asset retirement obligations . . . . . . . . . . . . . . . . . . . . . . . . . . . . . . . . . . . . . . . . . . . . . . . . . . . 19,652 19,458 Liability under tax receivable agreement . . . . . . . . . . . . . . . . . . . . . . . . . . . . . . . . . . . . . . . . . 59,596 43,045 Other liabilities . . . . . . . . . . . . . . . . . . . . . . . . . . . . . . . . . . . . . . . . . . . . . . . . . . . . . . . . . . . . . 811 792 Deferred tax liabilities . . . . . . . . . . . . . . . . . . . . . . . . . . . . . . . . . . . . . . . . . . . . . . . . . . . . . . . . 14,281 2,905
Total liabilities . . . . . . . . . . . . . . . . . . . . . . . . . . . . . . . . . . . . . . . . . . . . . . . . . . . . . . . . . . 1,034,388 906,274 Commitments and contingencies (Note 15) Mezzanine equity
Series A preferred stock, $0.001 par value; 1,839,995 shares issued and outstanding at December 31, 2017 and 1,840,000 shares issued and outstanding at December 31, 2016 .
89,539 88,975
Stockholders' equity Class A common stock, $0.001 par value; 90,139,840 shares issued and 90,117,238 shares outstanding at December 31, 2017 and 57,048,076 shares issued and 57,025,474 shares outstanding at December 31, 2016 . . . . . . . . . . . . . . . . . . . . . . . . . . . . .
90 57 Class B common stock, $0.001 par value; 9,627,821 shares issued and outstanding at December 31, 2017 and 29,832,098 shares issued and outstanding at December 31, 2016 . . . . . . . . . . . . . . . . . . . . . . . . . . . . . . . . . . . . . . . . . . . . . . . . . . . . . . . . .
10 30 Treasury stock, at cost: 22,602 shares at December 31, 2017 and December 31, 2016 . . (358) (358) Additional paid-in-capital . . . . . . . . . . . . . . . . . . . . . . . . . . . . . . . . . . . . . . . . . . . . . . . . . . . 606,319 447,137 Retained (deficit) / earnings . . . . . . . . . . . . . . . . . . . . . . . . . . . . . . . . . . . . . . . . . . . . . . . . . . (136,274) (8,652)
Stockholders' equity . . . . . . . . . . . . . . . . . . . . . . . . . . . . . . . . . . . . . . . . . . . . . . . . . . . . . . . . . 469,787 438,214 Non-controlling interest . . . . . . . . . . . . . . . . . . . . . . . . . . . . . . . . . . . . . . . . . . . . . . . . . . . . . . 116,349 453,237 Total stockholders’ equity . . . . . . . . . . . . . . . . . . . . . . . . . . . . . . . . . . . . . . . . . . . . . . . . . . . . 586,136 891,451
Total liabilities and stockholders' equity . . . . . . . . . . . . . . . . . . . . . . . . . . . . . . . . . . . . . $ 1,710,063 $ 1,886,700
The accompanying notes are an integral part of these consolidated financial statements.

F-4
Jones Energy, Inc. Consolidated Statements of Operations
Years Ended December 31, 2017, 2016 and 2015
Year Ended December 31, (in thousands of dollars except per share data) 2017 2016 2015
Operating revenues Oil and gas sales . . . . . . . . . . . . . . . . . . . . . . . . . . . . . . . . . . . . . . . . . . . . . . . . . . $ 186,393 $ 124,877 $ 194,555 Other revenues . . . . . . . . . . . . . . . . . . . . . . . . . . . . . . . . . . . . . . . . . . . . . . . . . . . . 2,180 2,970 2,844 Total operating revenues . . . . . . . . . . . . . . . . . . . . . . . . . . . . . . . . . . . . . . . . . . . . 188,573 127,847 197,399 Operating costs and expenses Lease operating . . . . . . . . . . . . . . . . . . . . . . . . . . . . . . . . . . . . . . . . . . . . . . . . . . . 36,636 32,640 41,027 Production and ad valorem taxes . . . . . . . . . . . . . . . . . . . . . . . . . . . . . . . . . . . . . 6,874 7,768 12,130 Exploration . . . . . . . . . . . . . . . . . . . . . . . . . . . . . . . . . . . . . . . . . . . . . . . . . . . . . . 14,145 6,673 6,551 Depletion, depreciation and amortization . . . . . . . . . . . . . . . . . . . . . . . . . . . . . . 167,224 153,930 205,498 Impairment of oil and gas properties . . . . . . . . . . . . . . . . . . . . . . . . . . . . . . . . . . 149,648 — — Accretion of ARO liability . . . . . . . . . . . . . . . . . . . . . . . . . . . . . . . . . . . . . . . . . . 960 1,263 1,087 General and administrative . . . . . . . . . . . . . . . . . . . . . . . . . . . . . . . . . . . . . . . . . . 29,892 29,640 33,388 Other operating . . . . . . . . . . . . . . . . . . . . . . . . . . . . . . . . . . . . . . . . . . . . . . . . . . . — 199 4,188 Total operating expenses . . . . . . . . . . . . . . . . . . . . . . . . . . . . . . . . . . . . . . . . . . . 405,379 232,113 303,869 Operating income (loss) . . . . . . . . . . . . . . . . . . . . . . . . . . . . . . . . . . . . . . . . . . . . (216,806) (104,266) (106,470) Other income (expense) Interest expense . . . . . . . . . . . . . . . . . . . . . . . . . . . . . . . . . . . . . . . . . . . . . . . . . . . (51,651) (53,127) (64,458) Gain on debt extinguishment . . . . . . . . . . . . . . . . . . . . . . . . . . . . . . . . . . . . . . . . — 99,530 — Net gain (loss) on commodity derivatives . . . . . . . . . . . . . . . . . . . . . . . . . . . . . . (17,985) (51,264) 158,753 Other income (expense) . . . . . . . . . . . . . . . . . . . . . . . . . . . . . . . . . . . . . . . . . . . . 56,952 536 317 Other income (expense), net . . . . . . . . . . . . . . . . . . . . . . . . . . . . . . . . . . . . . . . . . (12,684) (4,325) 94,612 Income (loss) before income tax . . . . . . . . . . . . . . . . . . . . . . . . . . . . . . . . . . . . . (229,490) (108,591) (11,858) Income tax provision (benefit) Current . . . . . . . . . . . . . . . . . . . . . . . . . . . . . . . . . . . . . . . . . . . . . . . . . . . . . . . . . . (3,585) 3,981 113 Deferred . . . . . . . . . . . . . . . . . . . . . . . . . . . . . . . . . . . . . . . . . . . . . . . . . . . . . . . . . (47,082) (27,767) (2,894) Total income tax provision (benefit) . . . . . . . . . . . . . . . . . . . . . . . . . . . . . . . . . . (50,667) (23,786) (2,781) Net income (loss) . . . . . . . . . . . . . . . . . . . . . . . . . . . . . . . . . . . . . . . . . . . . . . . . . (178,823) (84,805) (9,077) Net income (loss) attributable to non-controlling interests . . . . . . . . . . . . . . . . (77,331) (42,253) (6,696) Net income (loss) attributable to controlling interests . . . . . . . . . . . . . . . . . $ (101,492) $ (42,552) $ (2,381) Dividends and accretion on preferred stock . . . . . . . . . . . . . . . . . . . . . . . . . . . . (7,924) (2,669) — Net income (loss) attributable to common shareholders . . . . . . . . . . . . . . . . $ (109,416) $ (45,221) $ (2,381) Earnings (loss) per share (1) : Basic - Net income (loss) attributable to common shareholders . . . . . . . . . . . . $ (1.51) $ (1.04) $ (0.08) Diluted - Net income (loss) attributable to common shareholders. . . . . . . . . . . $ (1.51) $ (1.04) $ (0.08) Weighted average Class A shares outstanding (1) : Basic . . . . . . . . . . . . . . . . . . . . . . . . . . . . . . . . . . . . . . . . . . . . . . . . . . . . . . . . . . . . 72,411 43,506 29,161 Diluted . . . . . . . . . . . . . . . . . . . . . . . . . . . . . . . . . . . . . . . . . . . . . . . . . . . . . . . . . . 72,411 43,506 29,161
(1) All share and earnings per share information presented has been recast to retrospectively adjust for the effects of the
0.087423 per share Special Stock Dividend, as defined in Note 12, “Stockholders’ and Mezzanine equity”, distributed on March 31, 2017.
The accompanying notes are an integral part of these consolidated financial statements.

F-5
Jon
es E
ner
gy, I
nc.
S
tate
men
t of
Cha
nges
in S
tock
hold
ers’
Eq
uit
y Y
ears
En
ded
Dec
emb
er 3
1, 2
017,
201
6 an
d 2
015
Com
mon
Sto
ck
T
reas
ury
Sto
ck
Ad
dit
ion
al
Ret
ain
ed
Tot
al
C
lass
A
C
lass
B
C
lass
A
P
aid
-in
-
(Def
icit
)/
N
on-c
ontr
olli
ng
Sto
ckh
old
ers'
(a
mou
nts
in t
hou
san
ds)
S
har
es
V
alu
e
S
har
es
V
alu
e
Sh
ares
Val
ue
Cap
ital
E
arn
ings
In
tere
st
Eq
uit
y
Bal
ance
at
Dec
emb
er 3
1, 2
014
....
....
....
....
.
12,6
22
$13
36
,719
$
37
23
$ (3
58)
$ 17
8,76
3
$ 38
,950
$
635,
945
$
853,
350
S
ale
of c
omm
on s
tock
...
....
....
....
....
....
..
12,
263
12
—
—
—
—
12
3,18
9
—
—
1
23,2
01
Exc
hang
e of
Cla
ss B
sha
res
for
Cla
ss A
sha
res
...
.
5,4
46
6
(
5,44
6)
(
6)
—
—
54,
209
—
(
92,3
93)
(
38,1
84)
Sto
ck-c
ompe
nsat
ion
expe
nse
...
....
....
....
....
6
7
—
—
—
—
—
7,5
62
—
—
7
,562
V
este
d re
stri
cted
sha
res
....
....
....
....
....
....
1
53
—
—
—
—
—
—
—
—
—
N
et in
com
e (l
oss)
..
....
....
....
....
....
....
..
—
—
—
—
—
—
—
(
2,38
1)
(
6,69
6)
(
9,07
7)
Bal
ance
at
Dec
emb
er 3
1, 2
015
....
....
....
....
.
30,5
51
$31
31
,273
$
31
23
$ (3
58)
$ 36
3,72
3
$ 36
,569
$
536,
856
$
936,
852
S
tock
-com
pens
atio
n ex
pens
e ...
....
....
....
....
.
—
—
—
—
—
—
7,4
25
—
—
7
,425
V
este
d re
stri
cted
sha
res
....
....
....
....
....
....
3
85
—
—
—
—
—
—
—
—
—
D
istr
ibut
ions
pai
d to
JE
H u
nith
olde
rs .
....
....
....
—
—
—
—
—
—
—
—
(
17,3
19)
(
17,3
19)
Sal
e of
com
mon
sto
ck .
....
....
....
....
....
....
2
4,64
8
25
—
—
—
—
65,
421
—
—
65,
446
E
xcha
nge
of C
lass
B s
hare
s fo
r C
lass
A s
hare
s ..
...
1
,441
1
(1,
441)
(1)
—
—
1
0,56
8
—
(24
,047
)
(13
,479
) D
ivid
ends
and
acc
reti
on o
n pr
efer
red
stoc
k ..
....
..
—
—
—
—
—
—
—
(
2,66
9)
—
(2,
669)
N
et in
com
e (l
oss)
..
....
....
....
....
....
....
..
—
—
—
—
—
—
—
(
42,5
52)
(
42,2
53)
(
84,8
05)
Bal
ance
at
Dec
emb
er 3
1, 2
016
....
....
....
....
.
57,0
25
$57
29
,832
$
30
23
$ (3
58)
$ 44
7,13
7
$ (8
,652
) $
453,
237
$
891
,451
C
umul
ativ
e ef
fect
of
adop
tion
of A
SU
201
6-09
...
.
—
—
—
—
—
—
706
(70
6)
—
—
Sto
ck-c
ompe
nsat
ion
expe
nse .
....
....
....
....
...
7
63
1
—
—
—
—
5,7
97
—
—
5
,798
D
istr
ibut
ions
pai
d to
JE
H u
nith
olde
rs .
....
....
....
—
—
—
—
—
—
—
—
(
562)
(56
2)
Sal
e of
com
mon
sto
ck .
....
....
....
....
....
....
3
,716
4
—
—
—
—
8
,329
—
—
8,3
33
Sto
ck d
ivid
ends
on
com
mon
sto
ck .
....
....
....
..
5,0
00
5
—
—
—
—
17,
495
(17
,500
)
—
—
E
xcha
nge
of C
lass
B s
hare
s fo
r C
lass
A s
hare
s ..
...
2
0,20
4
20
(
20,2
04)
(2
0)
—
—
122,
865
—
(
258,
995)
(136
,130
) D
ivid
ends
and
acc
reti
on o
n pr
efer
red
stoc
k ..
....
..
3,4
09
3
—
—
—
—
3,9
90
(
7,92
4)
—
(3,
931)
N
et in
com
e (l
oss)
..
....
....
....
....
....
....
..
—
—
—
—
—
—
—
(1
01,4
92)
(
77,3
31)
(1
78,8
23)
Bal
ance
at
Dec
emb
er 3
1, 2
017
....
....
....
....
.
90,
117
$
90
9,6
28
$ 1
0
23
$
(358
) $
606,
319
$
(136
,274
) $
116
,349
$
586
,136
The
acc
ompa
nyin
g no
tes
are
an in
tegr
al p
art o
f th
ese
cons
olid
ated
fin
anci
al s
tate
men
ts.

F-6
Jones Energy, Inc. Consolidated Statements of Cash Flows
Years Ended December 31, 2017, 2016 and 2015
Year ended December 31, (in thousands of dollars) 2017 2016 2015
Cash flows from operating activities Net income (loss) . . . . . . . . . . . . . . . . . . . . . . . . . . . . . . . . . . . . . . . . . . . . . . . . . . . . . . $ (178,823) $ (84,805) $ (9,077) Adjustments to reconcile net income (loss) to net cash provided by operating activities
Depletion, depreciation, and amortization . . . . . . . . . . . . . . . . . . . . . . . . . . . . . . . . . . . 167,224 153,930 205,498 Exploration (dry hole and lease abandonment) . . . . . . . . . . . . . . . . . . . . . . . . . . . . . . . 11,017 6,261 5,250 Impairment of oil and gas properties . . . . . . . . . . . . . . . . . . . . . . . . . . . . . . . . . . . . . . . 149,648 — — Accretion of ARO liability . . . . . . . . . . . . . . . . . . . . . . . . . . . . . . . . . . . . . . . . . . . . . . 960 1,263 1,087 Amortization of debt issuance costs . . . . . . . . . . . . . . . . . . . . . . . . . . . . . . . . . . . . . . . 3,955 4,060 6,043 Stock compensation expense . . . . . . . . . . . . . . . . . . . . . . . . . . . . . . . . . . . . . . . . . . . . . 6,260 7,425 7,562 Deferred and other non-cash compensation expense . . . . . . . . . . . . . . . . . . . . . . . . . . . 208 804 455 Amortization of deferred revenue . . . . . . . . . . . . . . . . . . . . . . . . . . . . . . . . . . . . . . . . . (1,854) (2,384) (1,960) (Gain) loss on commodity derivatives . . . . . . . . . . . . . . . . . . . . . . . . . . . . . . . . . . . . . . 17,985 51,264 (158,753) (Gain) loss on sales of assets . . . . . . . . . . . . . . . . . . . . . . . . . . . . . . . . . . . . . . . . . . . . . 127 (14) 3 (Gain) on debt extinguishment . . . . . . . . . . . . . . . . . . . . . . . . . . . . . . . . . . . . . . . . . . . — (99,530) — Deferred income tax provision . . . . . . . . . . . . . . . . . . . . . . . . . . . . . . . . . . . . . . . . . . . (47,082) (27,767) (2,892) Change in liability under tax receivable agreement . . . . . . . . . . . . . . . . . . . . . . . . . . . . (59,492) — — Other - net . . . . . . . . . . . . . . . . . . . . . . . . . . . . . . . . . . . . . . . . . . . . . . . . . . . . . . . . . . 2,044 418 (961) Changes in operating assets and liabilities
Accounts receivable . . . . . . . . . . . . . . . . . . . . . . . . . . . . . . . . . . . . . . . . . . . . . . . . . . (34,615) 2,276 64,510 Other assets . . . . . . . . . . . . . . . . . . . . . . . . . . . . . . . . . . . . . . . . . . . . . . . . . . . . . . . . (12,330) (675) (432) Accrued interest expense . . . . . . . . . . . . . . . . . . . . . . . . . . . . . . . . . . . . . . . . . . . . . . (1,422) (4,727) 7,050 Accounts payable and accrued liabilities . . . . . . . . . . . . . . . . . . . . . . . . . . . . . . . . . . 35,198 17,901 (54,534)
Net cash provided by operations . . . . . . . . . . . . . . . . . . . . . . . . . . . . . . . . . . . . . . . 59,008 25,700 68,849 Cash flows from investing activities Additions to oil and gas properties . . . . . . . . . . . . . . . . . . . . . . . . . . . . . . . . . . . . . . . . . . (245,364) (264,462) (311,305) Net adjustments to purchase price of properties acquired . . . . . . . . . . . . . . . . . . . . . . . . . 2,391 — — Proceeds from sales of assets . . . . . . . . . . . . . . . . . . . . . . . . . . . . . . . . . . . . . . . . . . . . . . 61,290 1,645 41 Acquisition of other property, plant and equipment . . . . . . . . . . . . . . . . . . . . . . . . . . . . . (586) (310) (1,101) Current period settlements of matured derivative contracts . . . . . . . . . . . . . . . . . . . . . . . . 72,265 132,265 144,145
Net cash (used in) investing . . . . . . . . . . . . . . . . . . . . . . . . . . . . . . . . . . . . . . . . . . (110,004) (130,862) (168,220) Cash flows from financing activities Proceeds from issuance of long-term debt . . . . . . . . . . . . . . . . . . . . . . . . . . . . . . . . . . . . 162,000 130,000 85,000 Repayment of long-term debt . . . . . . . . . . . . . . . . . . . . . . . . . . . . . . . . . . . . . . . . . . . . . (129,000) (62,000) (335,000) Proceeds from senior notes . . . . . . . . . . . . . . . . . . . . . . . . . . . . . . . . . . . . . . . . . . . . . . . — — 236,475 Purchase of senior notes . . . . . . . . . . . . . . . . . . . . . . . . . . . . . . . . . . . . . . . . . . . . . . . . . — (84,589) — Payment of debt issuance costs . . . . . . . . . . . . . . . . . . . . . . . . . . . . . . . . . . . . . . . . . . . . (1,115) — (1,556) Payment of cash dividends on preferred stock . . . . . . . . . . . . . . . . . . . . . . . . . . . . . . . . . (3,368) (1,615) — Net distributions paid to JEH unitholders . . . . . . . . . . . . . . . . . . . . . . . . . . . . . . . . . . . . . (562) (17,319) — Net payments for share based compensation . . . . . . . . . . . . . . . . . . . . . . . . . . . . . . . . . . . (462) — — Proceeds from sale of common stock . . . . . . . . . . . . . . . . . . . . . . . . . . . . . . . . . . . . . . . . 8,333 65,446 122,779 Proceeds from sale of preferred stock . . . . . . . . . . . . . . . . . . . . . . . . . . . . . . . . . . . . . . . . — 87,988 —
Net cash provided by financing . . . . . . . . . . . . . . . . . . . . . . . . . . . . . . . . . . . . . . . . 35,826 117,911 107,698 Net increase (decrease) in cash . . . . . . . . . . . . . . . . . . . . . . . . . . . . . . . . . . . . . . . . (15,170) 12,749 8,327
Cash Beginning of period. . . . . . . . . . . . . . . . . . . . . . . . . . . . . . . . . . . . . . . . . . . . . . . . . . . . . 34,642 21,893 13,566 End of period . . . . . . . . . . . . . . . . . . . . . . . . . . . . . . . . . . . . . . . . . . . . . . . . . . . . . . . . . $ 19,472 $ 34,642 $ 21,893 Supplemental disclosure of cash flow information Cash paid for interest, net of capitalized interest . . . . . . . . . . . . . . . . . . . . . . . . . . . . . . . . $ 49,101 $ 53,816 $ 52,796 Cash paid for income taxes . . . . . . . . . . . . . . . . . . . . . . . . . . . . . . . . . . . . . . . . . . . . . . . 2,318 — (155) Change in accrued additions to oil and gas properties . . . . . . . . . . . . . . . . . . . . . . . . . . . . 3,921 9,325 (111,210) Asset retirement obligations incurred, including changes in estimate . . . . . . . . . . . . . . . . . 924 (1,276) 6,371
The accompanying notes are an integral part of these consolidated financial statements.

F-7
Jones Energy, Inc.
Notes to the Consolidated Financial Statements
1. Organization and Description of Business
Organization
Jones Energy, Inc. (the “Company”) was formed in March 2013 as a Delaware corporation to become a publicly-traded entity and the holding company of Jones Energy Holdings, LLC (“JEH”). As the sole managing member of JEH, the Company is responsible for all operational, management and administrative decisions relating to JEH’s business and consolidates the financial results of JEH and its subsidiaries.
JEH was formed as a Delaware limited liability company on December 16, 2009 through investments made by the Jones family, certain members of management and through private equity funds managed by Metalmark Capital, among others. JEH acts as a holding company of operating subsidiaries that own and operate assets that are used in the exploration, development, production and acquisition of oil and natural gas properties.
The Company’s certificate of incorporation authorizes two classes of common stock, Class A common stock and Class B common stock. The Class B common stock is held by the remaining owners of JEH prior to the initial public offering (“IPO”) of the Company (collectively, the “Class B shareholders”) and can be exchanged (together with a corresponding number of common units representing membership interests in JEH (“JEH Units”)) for shares of Class A common stock on a one-for-one basis, subject to customary conversion rate adjustments for stock splits, stock dividends and reclassifications and other similar transactions. The Class B common stock has no economic rights but entitles its holders to one vote on all matters to be voted on by the Company’s stockholders generally. As of December 31, 2017, the Company held 90,117,238 JEH Units and all of the preferred units representing membership interests in JEH, and the remaining 9,627,821 JEH Units are held by the Class B shareholders. The Class B shareholders have no voting rights with respect to their economic interest in JEH, resulting in the Company reporting this ownership interest as a non-controlling interest.
The Company’s certificate of incorporation also authorizes the Board of Directors of the Company to establish one or more series of preferred stock. Unless required by law or by any stock exchange on which our common stock is listed, the authorized shares of preferred stock will be available for issuance without further action. Rights and privileges associated with shares of preferred stock are subject to authorization by the Board of Directors of the Company and may differ from those of any and all other series at any time outstanding. On August 25, 2016, the Company issued 1,840,000 shares of its 8.0% Series A Perpetual Convertible Preferred Stock, par value $0.001 per share (the “Series A preferred stock”), pursuant to a registered public offering at $50 per share, of which 1,839,995 remained issued and outstanding as of December 31, 2017. See Note 12, “Stockholders’ and Mezzanine equity”.
Description of Business
The Company is engaged in the exploration, development, production and acquisition of oil and natural gas properties in the mid-continent United States, spanning areas of Oklahoma and Texas. The Company’s assets are located within the Eastern Anadarko Basin, targeting the liquids rich Woodford shale and Meramec formations in the Merge area of the STACK/SCOOP plays, and the Western Anadarko Basin, targeting the liquids rich Cleveland, Granite Wash, Tonkawa and Marmaton formations, and are owned by JEH and its operating subsidiaries. The Company is headquartered in Austin, Texas. 2. Significant Accounting Policies
Basis of Presentation
The accompanying consolidated financial statements have been prepared in accordance with accounting principles generally accepted in the United States of America (“GAAP”) and in accordance with the rules and regulations of the Securities and Exchange Commission. All significant intercompany transactions and balances have been eliminated in consolidation. The Company’s financial position as of December 31, 2017 and 2016 and the financial statements

F-8
reported for each of the three years in the period ended December 31, 2017 include the Company and all of its subsidiaries
Certain prior period amounts have been reclassified to conform to the current presentation.
Segment Information
The Company operates in one industry segment, which is the exploration, development and production of oil and natural gas, and all of its operations are conducted in one geographic area of the United States.
Use of Estimates
In preparing the accompanying financial statements, management has made certain estimates and assumptions that affect the reported amounts of assets and liabilities, disclosure of contingent liabilities, and the reported amounts of revenue and expenses during the reporting period. Actual results could differ from these estimates. Changes in estimates are recorded prospectively.
Significant assumptions are required in the valuation of proved and unproved oil and natural gas reserves, which affect the Company’s estimates of depletion expense, impairment, and the allocation of value in our business combinations. Significant assumptions are also required in the Company’s estimates of the net gain or loss on commodity derivative assets and liabilities, fair value associated with business combinations, and asset retirement obligations (“ARO”).
Cash
Cash and cash equivalents include highly liquid investments with a maturity of three months or less. At times, the amount of cash on deposit in financial institutions exceeds federally insured limits. Management monitors the soundness of the financial institutions it does business with, and believes the Company’s risk is not significant.
Accounts Receivable
Accounts receivable—Oil and gas sales consist of uncollateralized accrued revenues due under normal trade terms, generally requiring payment within 30 to 60 days of production. Accounts receivable—Joint interest owners consist of uncollateralized joint interest owner obligations due within 30 days of the invoice date. Accounts receivable—Other consists at December 31, 2017 and at December 31, 2016 of derivative positions not settled as of the balance sheet date. No interest is charged on past-due balances. The Company routinely assesses the recoverability of all material trade, joint interest and other receivables to determine their collectability, and reduces the carrying amounts by a valuation allowance that reflects management’s best estimate of the amounts that may not be collected. As of December 31, 2017 and 2016, the Company did not have significant allowances for doubtful accounts.
Concentration of Risk
Substantially all of the Company’s accounts receivable are related to the oil and gas industry. This concentration of entities may affect the Company’s overall credit risk in that these entities may be affected similarly by changes in economic and other conditions, including declines in commodity prices. As of December 31, 2017, 71% of Accounts receivable—Oil and gas sales were due from three purchasers and 59% of Accounts receivable-Joint interest owners were due from five working interest owners. As of December 31, 2016, 77% of Accounts receivable—Oil and gas sales were due from four purchasers and 48% of Accounts receivable-Joint interest owners were due from five working interest owners. As of December 31, 2015, 68% of Accounts receivable—Oil and gas sales are due from four purchasers and 80% of Accounts receivable—Joint interest owners are due from five working interest owners. If any or all of these significant counterparties were to fail to pay amounts due to the Company, the Company’s financial position and results of operations could be materially and adversely affected.
Dependence on Major Customers
The Company maintains a portfolio of crude oil and natural gas marketing contracts with large, established refiners and oil and gas purchasers. During the year ended December 31, 2017, the largest purchasers of our production were Plains Marketing LP (“Plains Marketing”) and ETC Field Services LLC, which accounted for approximately 40% and 22% of consolidated oil and gas sales, respectively. During the year ended December 31, 2016, the largest purchasers of our production were Plains Marketing LP (“Plains Marketing”) and ETC Field Services LLC, which accounted for

F-9
approximately 37% and 24% of consolidated oil and gas sales, respectively. During the year ended December 31, 2015, the largest purchasers of our production were Valero Energy Corp. (“Valero”), ETC Field Services LLC, Plains Marketing LP, and NGL Energy Partners LP, which accounted for approximately 18%, 17%, 16%, and 15% of consolidated oil and gas sales, respectively.
Management believes that there are alternative purchasers and that it may be necessary to establish relationships with such new purchasers. However, there can be no assurance that the Company can establish such relationships and that those relationships will result in an increased number of purchasers. Although the Company is exposed to a concentration of credit risk, management believes that all of the Company’s purchasers are credit worthy.
Dependence on Suppliers
The Company’s industry is cyclical, and from time to time, there can be an imbalance between the supply of and demand for drilling rigs, equipment, services, supplies and qualified personnel. During periods of oversupply, there can be financial pressure on suppliers. If the financial pressure leads to work interruptions or stoppages, the Company could be materially and adversely affected. Management believes that there are adequate alternative providers of drilling and completion services although it may become necessary to establish relationships with new contractors. However, there can be no assurance that the Company can establish such relationships and that those relationships will result in increased availability of drilling rigs or other services, or that they could be obtained on the same terms.
Oil and Gas Properties
The Company accounts for its oil and natural gas exploration and production activities under the successful efforts method of accounting.
Costs to acquire mineral interests in oil and natural gas properties are capitalized. Costs to drill and equip development wells and the related asset retirement costs are capitalized. The costs to drill and equip exploratory wells are capitalized pending determination of whether the Company has discovered proved commercial reserves. If proved commercial reserves are not discovered, such drilling costs are charged to expense. In some circumstances, it may be uncertain whether proved commercial reserves have been found when drilling has been completed. Such exploratory well drilling costs may continue to be capitalized if the anticipated reserve quantity is sufficient to justify its completion as a producing well and sufficient progress in assessing the reserves and the economic and operating viability of the project is being made.
The Company capitalizes interest on expenditures for significant exploration and development projects that last more than six months while activities are in progress to bring the assets to their intended use.
On the sale or retirement of a proved field, the cost and related accumulated depletion, depreciation and amortization are eliminated from the field accounts, and the resultant gain or loss is recognized.
Capitalized amounts attributable to proved oil and gas properties are depleted by the unit-of-production method over the life of proved reserves, using the unit conversion ratio of six thousand cubic feet of gas to one barrel of oil equivalent. Depletion of the costs of wells and related equipment and facilities, including capitalized asset retirement costs, net of salvage values, is computed using proved developed reserves. The reserve base used to calculate depreciation, depletion, and amortization for leasehold acquisition costs and the cost to acquire proved properties is the sum of proved developed reserves and proved undeveloped reserves.
The Company reviews its proved oil and natural gas properties, including related wells and equipment, for impairment by comparing expected undiscounted future cash flows at a producing field level to the net capitalized cost of the asset. If the future undiscounted cash flows, based on the Company’s estimate of future commodity prices, operating costs, and production, are lower than the net capitalized cost, the capitalized cost is reduced to fair value. Fair value is calculated by discounting the future cash flows at an appropriate risk-adjusted discount rate.
The Company evaluates its unproved properties for impairment on a property-by-property basis. The Company’s unproved property consists of acquisition costs related to its undeveloped acreage. The Company reviews the unproved property for indicators of impairment based on the Company’s current exploration plans with consideration given to commodity prices, lease expiration dates, results of any drilling and geo science activity during the period, and known information regarding exploration and development activity by other companies on adjacent blocks.

F-10
On the sale of an entire interest in an unproved property, gain or loss on the sale is recognized, taking into consideration the amount of any recorded impairment if the property had been assessed individually. If a partial interest in an unproved property is sold, the amount received is treated as a reduction of the cost of the interest retained.
Other Property, Plant and Equipment
Other property, plant and equipment is depreciated on a straight-line basis over the estimated useful lives of the property, plant and equipment, which range from three years to ten years.
Oil and Gas Sales Payable
Oil and gas sales payable represents amounts collected from purchasers for oil and gas sales, which are due to other revenue interest owners. Generally, the Company is required to remit amounts due under these liabilities within 60 days of receipt.
Accrued Liabilities
Accrued liabilities consisted of the following at December 31, 2017 and 2016:
December 31, December 31, (in thousands of dollars) 2017 2016
Accrued interest . . . . . . . . . . . . . . . . . . . . . . . . . . . . . . . . . . . . . . . . $ 12,109 $ 13,531 Other accrued liabilities . . . . . . . . . . . . . . . . . . . . . . . . . . . . . . . . . . 9,495 12,176 Total accrued liabilities . . . . . . . . . . . . . . . . . . . . . . . . . . . . . . . . . . . $ 21,604 $ 25,707
Commodity Derivatives
The Company records its commodity derivative instruments on the Consolidated Balance Sheet as either an asset or liability measured at its fair value. Changes in the derivative’s fair value are recognized currently in earnings, unless specific hedge accounting criteria are met. During the years ended December 31, 2017, 2016 and 2015, the Company elected not to designate any of its commodity price risk management activities as cash flow or fair value hedges. The changes in the fair values of outstanding financial instruments are recognized as gains or losses in the period of change.
Although the Company does not designate its commodity derivative instruments as cash-flow hedges, management uses those instruments to reduce the Company’s exposure to fluctuations in commodity prices related to its natural gas and oil production. Net gains and losses, at fair value, are included on the Consolidated Balance Sheet as current or noncurrent assets or liabilities based on the anticipated timing of cash settlements under the related contracts. Changes in the fair value of commodity derivative contracts are recorded in earnings as they occur and are included in other income (expense) on the Consolidated Statement of Operations. See Note 7, “Fair Value Measurement,” for disclosure about the fair values of commodity derivative instruments.
Asset Retirement Obligations
The Company's asset retirement obligations ("ARO") consist of future plugging and abandonment expenses on oil and natural gas properties. The Company estimates an ARO for each well in the period in which it is incurred based on estimated present value of plugging and abandonment costs, increased by an inflation factor to the estimated date that the well would be plugged. The resulting liability is recorded by increasing the carrying amount of the related long- lived asset. The liability is then accreted to its then-present value each period and the capitalized cost is depleted over the useful life of the related asset. If the liability is settled for an amount other than the recorded amount, a gain or loss is recognized. The ARO is classified as current or noncurrent based on the expect timing of payments.
Revenue Recognition
Revenues from the sale of crude oil, natural gas, and natural gas liquids are valued at the estimated sales price and recognized when the product is delivered at a fixed or determinable price, title has transferred, collectability is reasonably assured and evidenced by a contract. The Company follows the “sales method” of accounting for its oil and natural gas revenue, so it recognizes revenue on all crude oil, natural gas, and natural gas liquids sold to purchasers. A receivable or liability is recognized only to the extent that the Company has an imbalance on a specific property greater

F-11
than the expected remaining proved reserves. The Company had no significant imbalances as of December 31, 2017, 2016, and 2015.
Income Taxes
The Company records a federal and state income tax liability associated with its status as a corporation. The Company recognizes a tax liability on its share of pre-tax book income, exclusive of the non-controlling interest.
Income taxes are accounted for under the asset and liability method, which requires recognition of deferred tax assets and liabilities for the expected future tax consequences of events that have been included in the financial statements. Under this method, deferred tax assets and liabilities are determined based on the differences between the financial statements and tax basis of assets and liabilities using enacted tax rates in effect for the year in which differences are expected to be recovered or settled pursuant to the provisions of ASC 740—Income Taxes. The effect of a change in tax rates on deferred tax assets and liabilities is recognized in income in the period that includes the enactment date.
On December 22, 2017, the US Congress enacted the Tax Cuts and Jobs Act (Tax Reform Legislation), which made significant changes to US federal income tax law affecting us. See Note 11. “Income Taxes.”
The Company records a valuation allowance if it is deemed more likely than not that all or a portion of its deferred income tax assets will not be realized. In addition, income tax rules and regulations are subject to interpretation and the application of those rules and regulations require judgment by the Company and may be challenged by the taxation authorities. The Company follows a two-step approach for recognizing and measuring tax benefits taken or expected to be taken in a tax return and disclosures regarding uncertainties in income tax positions. Only tax positions that meet the more likely than not recognition threshold are recognized. The Company’s policy is to include any interest and penalties recorded on uncertain tax positions as a component of income tax expense. The Company’s unrecognized tax benefits or related interest and penalties are immaterial.
Comprehensive Income
The Company has no elements of comprehensive income other than net income.
Recent Accounting Pronouncements
Adopted in the current year: In March 2016, the Financial Accounting Standards Board (“FASB”) issued Accounting Standards Update (“ASU”) No. 2016-09, “Compensation—Stock Compensation” (Topic 718). This amendment is intended to simplify the accounting for share-based payment awards to employees, specifically in regard to (1) the income tax consequences, (2) classification of awards as either equity or liabilities, and (3) classification on the statement of cash flows. The amendments are effective for interim and annual reporting periods beginning after December 15, 2016. Therefore, the Company has adopted ASU 2016-09 effective as of January 1, 2017. Upon adoption of ASU 2016-09, the Company elected to change its accounting policy to account for forfeitures as they occur. The change was applied on a modified retrospective basis with a cumulative effect adjustment to retained earnings for forfeitures of $0.7 million as of January 1, 2017. As a result of the valuation allowance against the Company’s deferred tax assets, there was no net adjustment to retained earnings for the change in accounting for unrecognized windfall tax benefits.
In May 2017, the FASB issued ASU 2017-09, “Scope of Modification Accounting” as it relates to “Compensation—Stock Compensation” (Topic 718). This amendment clarifies when changes to the terms or conditions of a share-based payment award must be accounted for as modifications. The new guidance is expected to reduce diversity in practice and result in fewer changes to the terms of an award being accounted for as modifications. Under ASU 2017-09, an entity will not apply modification accounting to a share-based payment award if the award’s fair value, vesting conditions and classification as an equity or liability instrument are the same immediately before and after the change. The amendments are effective for interim and annual reporting periods beginning after December 15, 2017. Early adoption is permitted and the Company chose to early adopt ASU 2017-09 beginning April 1, 2017. The change was applied prospectively to awards modified on or after the adoption date. Adoption did not have a material impact on the financial position, cash flows or results of operations.

F-12
To be adopted in a future period: In May 2014, the FASB issued ASU 2014-09, “Revenue from Contracts with Customers,” which creates a new topic in the Accounting Standards Codification (“ASC”), topic 606, “Revenue from Contracts with Customers.” This standard sets forth a five-step model for determining when and how revenue is recognized. Under the model, an entity will be required to recognize revenue to depict the transfer of goods or services to a customer at an amount reflecting the consideration it expects to receive in exchange for those goods or services. Additional disclosures will be required to describe the nature, amount, timing and uncertainty of revenue and cash flows arising from customer contracts. In August 2015, the FASB issued ASU 2015-14, which deferred the effective date of ASU 2014-09 by one year. The amendments are now effective for interim and annual reporting periods beginning after December 15, 2017 and may be applied on either a full or modified retrospective basis. Early adoption is permitted. During 2017, the Company performed a comparison of our current revenue recognition policies in effect through December 31, 2017 to the new requirements upon adoption of ASU 2014-09 and ASU 2015-14 for each of our revenue categories based upon review of our current contracts by product category and homogenous groupings. Upon completion of the assessment, the analysis of these homogenous groupings did not indicate any material change to our current revenue recognition methodology, although we do expect some changes in presentation of gross revenues and expenses upon adoption of the standard; such costs are currently offset against revenues. The Company adopted ASU 2014-09 and ASU 2015-14 effective as of January 1, 2018 applied on a modified retrospective basis, which did not result in a material cumulative effect adjustment as of the date of adoption. Adoption did not have a material impact on the financial position, cash flows or results of operations. In addition to changes in the presentation of the Company’s Consolidated Statement of Operations, we expect to expand disclosures related to revenue recognition. The Company will continue to further evaluate the effect that the adoption of ASU 2014-09 and ASU 2015-14 will have on our disclosures as we prepare for our first quarter 2018 Form 10-Q filing.
In February 2016, the FASB issued ASU 2016-02, “Leases” (Topic 842). This amendment requires, among other things, that lessees recognize the following for all leases (with the exception of short-term leases) at the commencement date: (1) a lease liability, which is a lessee’s obligation to make lease payments arising from a lease, measured on a discounted basis; and (2) a right-of-use asset, which is an asset that represents the lessee’s right to use, or control the use of, a specified asset for the lease term. Lessees and lessors must apply a modified retrospective transition approach for leases existing at, or entered into after, the beginning of the earliest comparative period presented in the financial statements. The amendments are effective for interim and annual reporting periods beginning after December 15, 2018. Early adoption is permitted. The Company is currently evaluating the impacts of the amendments to our financial statements and accounting practices for leases. We anticipate adoption of ASU 2016-02 effective as of January 1, 2019.
In January 2017, the FASB issued ASU 2017-01, “Business Combinations” (Topic 805). The amendments under this ASU provide guidance to assist entities with evaluating whether transactions should be accounted for as acquisitions (disposals) or business combinations by providing a screen to determine when an integrated set of assets and activities is not a business. The screen requires that when substantially all of the fair value of the gross assets acquired (or disposed of) is concentrated in a single identifiable asset or a group of similar identifiable assets, the set is not a business, therefore reducing the number of transactions that need to be further evaluated for treatment as a business combination. This new guidance is effective for annual periods beginning after December 15, 2017. Early adoption is permitted. The Company adopted ASU 2017-01 effective as of January 1, 2018 applied prospectively, which did not have a material impact on our financial statements; however these amendments could result in the recording of fewer business combinations in future periods. In August 2017, the FASB issued ASU 2017-12, “Derivatives and Hedging” (Topic 815). The amendments in this update apply to any entity that elects to apply hedge accounting in accordance with current GAAP. This standard expands an entity’s ability to apply hedge accounting for nonfinancial and financial risk components and allows for a simplified approach for fair value hedging of interest rate risk. The standard also eliminates the need to separately measure and report hedge ineffectiveness and generally requires the entire change in fair value of a hedging instrument to be presented in the same income statement line as the hedged item. Additionally, the standard simplifies the hedge documentation and effectiveness assessment requirements under the previous guidance. The amendments are effective for interim and annual reporting periods beginning after December 15, 2018. Early adoption is permitted. Historically, the Company has elected not to designate any of its commodity price risk management activities as cash flow or fair value hedges. After concluding our assessment of the amendments in this update, Management has
F-13
determined we will continue not to designate any of our commodity price risk management activities as cash flow or fair value hedges. Therefore, adoption is not expected to have a material impact on the financial position, cash flows or results of operations. We anticipate adoption of ASU 2017-12 effective as of January 1, 2019. 3. Acquisitions and Divestitures
During the three year period ended December 31, 2017, the Company entered into several purchase and sale agreements (as described below). One business combination occurred during the twelve months ended December 31, 2016. However, no business combinations occurred during the twelve months ended December 31, 2017 and 2015. Merge Acquisition
On September 22, 2016, JEH acquired oil and gas properties located in the Merge area of the STACK/SCOOP plays (the “Merge”) in Central Oklahoma (the “Merge Acquisition”) from SCOOP Energy Company, LLC for cash consideration of $134.4 million, net of the final working capital settlement of $2.4 million received in the first quarter of 2017. The oil and gas properties acquired in the Merge Acquisition, on a closed and funded basis, principally consist of 16,975 undeveloped net acres in Canadian, Grady and McClain Counties, Oklahoma. This transaction has been accounted for as an asset acquisition. The Company used proceeds from our equity offerings to fund the purchase. See Note 12, “Stockholders’ and Mezzanine equity”. Anadarko Acquisition
On August 25, 2016, JEH acquired producing and undeveloped oil and gas assets in the Western Anadarko Basin (the “Anadarko Acquisition”) for final consideration of $25.9 million. This transaction was accounted for as a business combination. The Company allocated $32.3 million to “Oil and gas properties,” with $3.0 million allocated to “Unproved” properties, $17.0 million allocated to “Proved” properties, and $12.3 million allocated to “Wells and equipment and related facilities”, based on the respective fair values of the assets acquired. Additionally, the Company allocated $6.4 million to our ARO liability associated with those proved properties. As of December 31, 2017, the measurement-period has closed. The Anadarko Acquisition did not result in a significant impact to revenues or net income and as such, pro forma financial information is not included. The Company funded the Anadarko Acquisition with cash on hand.
The assets acquired in the Anadarko Acquisition included interests in 174 wells, 59% of which were operated by the company, and approximately 25,000 net acres in Lipscomb and Ochiltree Counties in the Texas Panhandle. As of the closing date, the acquired acreage was producing approximately 900 barrels of oil equivalent per day.
Arkoma Divestiture
As of June 30, 2017, the Arkoma Assets and related liabilities (the “Held for sale assets”) were classified as held for sale due to the pending Arkoma Divestiture. Upon the classification change occurring on June 30, 2017, the Company ceased recording depletion on the Held for sale assets. Based on the Company’s sales price, the Company recognized an estimated impairment charge of $148.0 million at June 30, 2017 which has been included in Impairment of oil and gas properties on the Company’s Consolidated Statement of Operations. On August 1, 2017, JEH closed its previously announced agreement to sell its Arkoma Basin properties (the “Arkoma Assets”) for a sale price of $65.0 million, prior to customary effective date adjustments of $7.3 million, and subject to customary post-close adjustments (the “Arkoma Divestiture”). JEH may also receive up to $2.5 million in contingent payments based on natural gas prices. No amounts have been recorded related to this contingent payment as of December 31, 2017.

F-14
4. Properties, Plant and Equipment
Oil and Gas Properties
The Company accounts for its oil and natural gas exploration and production activities under the successful efforts method of accounting. Oil and gas properties consisted of the following at December 31, 2017 and 2016:
December 31, December 31, (in thousands of dollars) 2017 2016
Mineral interests in properties Unproved . . . . . . . . . . . . . . . . . . . . . . . . . . . . . . . . . . . . . . . . . . . $ 164,087 $ 213,153 Proved . . . . . . . . . . . . . . . . . . . . . . . . . . . . . . . . . . . . . . . . . . . . . . 893,246 1,054,683
Wells and equipment and related facilities . . . . . . . . . . . . . . . . . . . 1,434,383 1,395,291 2,491,716 2,663,127 Less: Accumulated depletion and impairment . . . . . . . . . . . . . . . . (894,676) (919,539)
Net oil and gas properties . . . . . . . . . . . . . . . . . . . . . . . . . . . . . $ 1,597,040 $ 1,743,588
There were no exploratory wells drilled during the year ended December 31, 2017 and, as such, no associated costs were capitalized. One exploratory well was drilled during the year ended December 31, 2016, for which associated costs of $1.3 million were capitalized. No exploratory wells resulted in exploration expense during either year.
The Company capitalizes interest on expenditures for significant exploration and development projects that last more than six months while activities are in progress to bring the assets to their intended use. During the year ended December 31, 2017, the Company capitalized $0.4 million associated with such in progress projects. The Company did not capitalize any interest during the year ended December 31, 2016 as no projects lasted more than six months. Costs incurred to maintain wells and related equipment are charged to expense as incurred.
Depletion of oil and gas properties amounted to $166.2 million, $152.7 million, and $204.2 million for the years ended December 31, 2017, 2016, and 2015, respectively.
The Company continues to monitor its proved and unproved properties for impairment. During the year ended December 31, 2017, the Company recognized an impairment charge of $1.6 million related to minor properties, which we are not currently developing. Additionally, as noted in Note 3, “Acquisitions and Divestitures - Arkoma Divestiture,” the Company recognized an impairment charge of $148.0 million during the second quarter of 2017 based on the Company’s negotiated selling price of the Arkoma Basin oil and gas property assets and related liabilities. No impairments of proved or unproved properties were recorded during the years ended December 31, 2016 and 2015.
Other Property, Plant and Equipment
Other property, plant and equipment consisted of the following at December 31, 2017 and 2016:
December 31, December 31, (in thousands of dollars) 2017 2016
Leasehold improvements . . . . . . . . . . . . . . . . . . . . . . . . . . . . . . . . . . . $ 1,186 $ 1,213 Furniture, fixtures, computers and software . . . . . . . . . . . . . . . . . . . . 4,410 4,170 Vehicles . . . . . . . . . . . . . . . . . . . . . . . . . . . . . . . . . . . . . . . . . . . . . . . . . 1,922 1,677 Aircraft . . . . . . . . . . . . . . . . . . . . . . . . . . . . . . . . . . . . . . . . . . . . . . . . . . 910 910 Other . . . . . . . . . . . . . . . . . . . . . . . . . . . . . . . . . . . . . . . . . . . . . . . . . . . 210 284 8,638 8,254 Less: Accumulated depreciation and amortization . . . . . . . . . . . . . . . (5,919) (5,258)
Net other property, plant and equipment . . . . . . . . . . . . . . . . . . . . $ 2,719 $ 2,996
Depreciation and amortization of other property, plant and equipment amounted to $1.0 million, $1.2 million, and $1.3 million during the years ended December 31, 2017, 2016 and 2015, respectively.

F-15
5. Long-Term Debt
Long-term debt consisted of the following at December 31, 2017 and 2016:
(in thousands of dollars) December 31, 2017 December 31, 2016
Revolver . . . . . . . . . . . . . . . . . . . . . . . . . . . . . . . . . . . . . . . . . . $ 211,000 $ 178,000 2022 Notes . . . . . . . . . . . . . . . . . . . . . . . . . . . . . . . . . . . . . . . . 409,148 409,148 2023 Notes . . . . . . . . . . . . . . . . . . . . . . . . . . . . . . . . . . . . . . . . 150,000 150,000 Total principal amount . . . . . . . . . . . . . . . . . . . . . . . . . . . . . . 770,148 737,148
Less: unamortized discount . . . . . . . . . . . . . . . . . . . . . . . . (5,228) (6,240) Less: debt issuance costs, net . . . . . . . . . . . . . . . . . . . . . . (5,604) (6,899)
Total carrying amount . . . . . . . . . . . . . . . . . . . . . . . . . . . . . . . $ 759,316 $ 724,009 Senior Unsecured Notes
On April 1, 2014, JEH and Jones Energy Finance Corp., JEH’s wholly owned subsidiary formed for the sole purpose of co-issuing certain of JEH’s debt (collectively, the “Issuers”), sold $500.0 million in aggregate principal amount of the Issuers’ 6.75% senior notes due 2022 (the “2022 Notes”). The Company used the net proceeds from the issuance of the 2022 Notes to repay certain indebtedness and for working capital and general corporate purposes. The 2022 Notes bear interest at a rate of 6.75% per year, payable semi-annually on April 1 and October 1 of each year beginning October 1, 2014. The 2022 Notes were registered in March 2015. The 2022 Notes mature on April 1, 2022.
On February 23, 2015, the Issuers sold $250.0 million in aggregate principal amount of 9.25% senior notes due 2023 (the “2023 Notes”) in a private placement to affiliates of GSO Capital Partners LP and Magnetar Capital LLC. The 2023 Notes were issued at a discounted price equal to 94.59% of the principal amount. The Company used the $236.5 million net proceeds from the issuance of the 2023 Notes to repay outstanding borrowings under the Revolver (as defined below) and for working capital and general corporate purposes. The 2023 Notes bear interest at a rate of 9.25% per year, payable semi-annually on March 15 and September 15 of each year beginning September 15, 2015. The 2023 Notes were registered in February 2016. The 2023 Notes mature on March 15, 2023.
During 2016, the Company purchased an aggregate principal amount of $190.9 million of its senior unsecured notes through several open-market and privately negotiated purchases. The Company purchased $90.9 million principal amount of its 2022 Notes for $38.1 million, and $100.0 million principal amount of its 2023 Notes for $46.5 million, in each case excluding accrued interest and including any associated fees. The Company used cash on hand and borrowings from its Revolver to fund the note purchases. In conjunction with the extinguishment of this debt, JEH recognized cancellation of debt income of $99.5 million during the year ended December 31, 2016, on a pre-tax basis. This income is recorded in Gain on debt extinguishment on the Company’s Consolidated Statement of Operations. Of the Company’s total repurchases, $20.3 million principal amount of its 2022 Notes were not cancelled and are available for future reissuance, subject to applicable securities laws. No additional purchases were made during 2017.
The 2022 Notes and 2023 Notes are guaranteed on a senior unsecured basis by the Company and by all of its significant subsidiaries. The 2022 Notes and 2023 Notes will be senior in right of payment to any future subordinated indebtedness of the Issuers.
The Company may redeem the 2022 Notes at any time on or after April 1, 2017 and the 2023 Notes at any time on or after March 15, 2018 at a declining redemption price set forth in the respective indentures, plus accrued and unpaid interest.
The indentures governing the 2022 Notes and 2023 Notes are substantially identical and contain covenants that, among other things, limit the ability of the Company to incur additional indebtedness or issue certain preferred stock, pay dividends on capital stock, transfer or sell assets, make investments, create certain liens, enter into agreements that restrict dividends or other payments from the Company’s restricted subsidiaries to the Company, consolidate, merge or transfer all of the Company’s assets, engage in transactions with affiliates or create unrestricted subsidiaries. If at any time when the 2022 Notes or 2023 Notes are rated investment grade and no default or event of default (as defined in the indenture) has occurred and is continuing, many of the foregoing covenants pertaining to the 2022 Notes or 2023 Notes, as applicable, will be suspended. If the ratings on the 2022 Notes or 2023 Notes, as applicable, were to decline subsequently to below investment grade, the suspended covenants would be reinstated.

F-16
As of December 31, 2017, the Company was in compliance with the indentures governing the 2022 Notes and 2023 Notes.
Senior Secured First Lien Notes due 2023
On February 14, 2018, the Issuers sold $450.0 million of 9.25% senior secured first lien notes due 2023 (the “2023 First Lien Notes”) at an offering price equal to 97.526% of par in an offering exempt from registration under the Securities Act. See Note 16, “Subsequent Events.”
Other Long-Term Debt
The Company has a Senior Secured Revolving Credit Facility (the “Revolver”) with a syndicate of banks. At the beginning of 2017, the borrowing base under the Revolver was $425.0 million, which was reaffirmed on May 15, 2017 during the semi-annual borrowing base re-determination. Upon closing of the Arkoma Divestiture on August 1, 2017, the Company’s borrowing base was reduced to $375.0 million. Effective November 26, 2017, the borrowing base was further reduced to $350.0 million during the semi-annual borrowing base re-determination. The Company’s oil and gas properties are pledged as collateral to secure its obligations under the Revolver. The Revolver matures on November 6, 2019.
On November 26, 2017, the Company entered into an amendment to the Revolver to, among other things (a) modify certain financial ratio covenants, which are more fully described below, (b) reduce the borrowing base to $350.0 million until the next redetermination thereof, (c) increase the margin applicable to borrowings under the Revolver by 0.75% if the total leverage ratio is at or below 4.00 to 1.00 and 1.25% if the total leverage ratio is above 4.00 to 1.00, in each case determined as of the last day of the most recently ended fiscal quarter, (d) add a covenant limiting the ability of JEH and its subsidiaries to repurchase or redeem certain indebtedness prior to maturity thereof, subject to certain exceptions, (e) permit JEH to raise up to $350.0 million of junior lien debt, subject to covenant compliance and other customary conditions and (f) increase the Company’s hedge limits to permit, at any time, hedging of up to (i) 100% of projected production from proved reserves over the period of 24 months following such time and (ii) 85% of projected production from proved reserves for the subsequent period of 36 months thereafter.
On February 14, 2018, the Company further amended the Revolver in connection with the offering of the 2023 First Lien Notes. Please see Note 16, “Subsequent Events.”
The terms of the Revolver require the Company to make periodic payments of interest on the loans outstanding thereunder, with all outstanding principal and interest under the Revolver due on the maturity date. The Revolver is subject to a borrowing base, which limits the amount of borrowings which may be drawn thereunder. The borrowing base will be re-determined by the lenders at least semi-annually on or about April 1 and October 1 of each year, with such re-determination based primarily on reserve reports using lender commodity price expectations at such time. Any reduction in the borrowing base will reduce our liquidity, and, if the reduction results in the outstanding amount under our Revolver exceeding the borrowing base, we will be required to repay the deficiency within a short period of time.
Interest on the Revolver is calculated, at the Company’s option, at either (a) the London Interbank Offered (“LIBO”) rate for the applicable interest period plus a margin of (i) 2.25% to 3.25% if the Company’s total leverage ratio is less than or equal to 4.00 to 1.00 as of the last day of the previous fiscal quarter or (ii) 2.75% to 3.75% if the Company’s total leverage ratio is greater than 4.00 to 1.00 as of the last day of the previous fiscal quarter, in each case based on the level of borrowing base utilization at such time or (b) the greatest of the federal funds rate plus 0.50%, the one month adjusted LIBO rate plus 1.00%, or the prime rate announced by Wells Fargo Bank, N.A. in effect on such day, in each case plus a margin of (x) 1.25% to 2.25% if the Company’s total leverage ratio is less than or equal to 4.00 to 1.00 as of the last day of the previous fiscal quarter or (y) 1.75% to 2.75% if the Company’s total leverage ratio is greater than 4.00 to 1.00 as of the last day of the previous fiscal quarter, in each case based on the level of borrowing base utilization at such time. For the year ended December 31, 2017, the average interest rate under the Revolver was 3.04% on an average outstanding balance of $189.0 million. For the year ended December 31, 2016, the average interest rate under the Revolver was 2.40% on an average outstanding balance of $172.3 million.
Total interest and commitment fees under the Revolver were $6.6 million, $5.3 million, and $5.1 million for the years ended December 31, 2017, 2016 and 2015, respectively.

F-17
Jones Energy, Inc. and its consolidated subsidiaries are subject to certain covenants under the Revolver, including the requirement to maintain the following financial ratios:
• commencing with the fiscal quarter ending March 31, 2019, a senior secured leverage ratio, consisting of consolidated secured funded debt to EBITDAX, of not greater than 2.25 to 1.00 as of the last day of any fiscal quarter;
• commencing with the fiscal quarter ending March 31, 2019, a total leverage ratio, consisting of
consolidated debt to EBITDAX, of not greater than (i) 5.25 to 1.00 as of March 31, 2019, (ii) 5.00 to 1.00 as of June 30, 2019, (iii) 4.75 to 1.00 as of September 30, 2019, (iv) 4.50 to 1.00 as of December 31, 2019 and (v) 4.00 to 1.00 as of the last day of each fiscal quarter ending thereafter; and
• a current ratio, consisting of consolidated current assets, including the unused amounts of the total
commitments, to consolidated current liabilities, of not less than 1.00 to 1.00 as of the last day of any fiscal quarter.
As of December 31, 2017, our senior secured leverage ratio was approximately 1.18x, our total leverage ratio was approximately 4.29x and our current ratio was approximately 1.85x, as calculated based on the requirements in our indenture. We were in compliance with all terms of our Revolver at December 31, 2017, and we expect to maintain compliance throughout 2018. However, factors including those outside of our control, such as commodity price declines, may prevent us from maintaining compliance with these covenants, at future measurement dates in 2018 and beyond. In the event it were to become necessary, we believe we have the ability to take actions that would prevent us from failing to comply with our covenants, such as paying off and terminating the Revolver. If an event of default exists under the Revolver, the lenders will be able to accelerate the obligations outstanding under the Revolver and exercise other rights and remedies. Our Revolver contains customary events of default, including the occurrence of a change of control, as defined in the Revolver. 6. Derivative Instruments and Hedging Activities
The Company uses derivative instruments to mitigate volatility in commodity prices. While the use of these instruments limits the downside risk of adverse price changes, their use may also limit future revenues from favorable price changes. Depending on changes in oil and gas futures markets and management’s view of underlying supply and demand trends, we may increase or decrease our hedging positions. The following tables summarize our hedging positions as of December 31, 2017:
Hedging Positions
December 31, 2017 Weighted Final Low High Average Expiration Oil swaps . . . . . . . . . . . . . . . . Exercise price $ 49.70 $ 54.18 $ 50.64 December 2020 Net barrels per month 55,000 216,000 112,333 Natural gas swaps . . . . . . . . . . Exercise price $ 2.76 $ 3.10 $ 2.89 December 2020 Net MMbtu per month 700,000 1,890,000 1,118,889 Natural gas liquids swaps . . . . Exercise price $ 22.89 $ 45.26 $ 29.79 December 2018 Barrels per month 130,000 145,000 138,750 Natural gas basis swaps . . . . . Exercise price $ (0.50) $ (0.30) $ (0.41) October 2018 Net MMbtu per month 800,000 800,000 800,000 Oil collars . . . . . . . . . . . . . . . Puts (floors) $ 45.00 $ 50.00 $ 48.52 December 2019 Calls (ceilings) $ 56.60 $ 61.00 $ 59.64 Net barrels per month 65,000 73,000 67,500 Natural gas collars . . . . . . . . . Puts (floors) $ 2.55 $ 2.55 $ 2.55 December 2019 Calls (ceilings) $ 3.08 $ 3.41 $ 3.19 Net barrels per month 950,000 1,050,000 990,833
The Company recognized net losses on derivative instruments of $18.0 million and $51.3 million for the years ended December 31, 2017 and 2016, respectively. The Company recognized net gains on derivative instruments of $158.8 million for the year ended December 31, 2015.

F-18
The Company routinely enters into oil and natural gas swap contracts as seller, thus resulting in a fixed price. During 2016 and 2017, the Company realized certain mark-to-market gains associated with oil and natural gas hedges the Company had in place for years 2018 and 2019. The gains were effectively realized by purchasing, as opposed to selling, oil and natural gas swap contracts for an equal volume that was associated with the initial hedge transaction. Therefore, as prices fluctuate, the loss (or gain) on any single contract in 2018 and 2019 will be offset by an equal gain (or loss). This essentially left the underlying production open to fluctuations in market prices prior to the point when the Company began to re-hedge the unhedged production. Based on the original contract terms of these purchased swaps, the gains would have been recognized as the hedge contracts mature in 2018 and 2019. However, during the year ended December 31, 2017, the Company unwound all of its realized 2018 and 2019 hedges resulting in approximately $42.8 million, respectively, of recognized gains which have been included in Net gain (loss) on commodity derivatives on the Company’s Consolidated Statement of Operations.
Offsetting Assets and Liabilities
As of December 31, 2017, the counterparties to our commodity derivative contracts consisted of six financial institutions. All of our counterparties or their affiliates are also lenders under the Revolver. We are not generally required to post additional collateral under our derivative agreements.
Our derivative agreements contain set-off provisions that state that in the event of default or early termination, any obligation owed by the defaulting party may be offset against any obligation owed to the defaulting party.
The following table presents information about our commodity derivative contracts that are netted on our Consolidated Balance Sheet as of December 31, 2017 and 2016:
Net Amounts Gross of Assets / Gross Amounts Gross Amounts Amounts Liabilities Not of Recognized Offset in the Presented in Offset in the Assets / Balance the Balance Balance (in thousands of dollars) Liabilities Sheet Sheet Sheet Net Amount
December 31, 2017 Commodity derivative contracts
Assets . . . . . . . . . . . . $ 8,572 $ (4,926) $ 3,646 $ — $ 3,646 Liabilities . . . . . . . . . (50,423) 4,926 (45,497) — (45,497)
December 31, 2016 Commodity derivative contracts
Assets . . . . . . . . . . . . $ 79,649 $ (20,805) $ 58,844 $ — $ 58,844 Liabilities . . . . . . . . . (36,664) 20,805 (15,859) — (15,859)
7. Fair Value Measurement
Fair Value of Financial Instruments
The Company determines fair value amounts using available market information and appropriate valuation methodologies. Fair value is the price that would be received to sell an asset or would be paid to transfer a liability in an orderly transaction between market participants at the measurement date. Considerable judgment is required in interpreting market data to develop the estimates of fair value. The use of different market assumptions and/or estimation methods may have a material effect on the estimated fair value amounts.
The Company enters into a variety of derivative financial instruments, which may include over-the-counter instruments, such as natural gas, crude oil, and natural gas liquid contracts. The Company utilizes valuation techniques that maximize the use of observable inputs, where available. If listed market prices or quotes are not published, fair value is determined based upon a market quote, adjusted by other market-based or independently sourced market data, such as trading volume, historical commodity volatility, and counterparty-specific considerations. These adjustments may include amounts to reflect counterparty credit quality, the time value of money, and the liquidity of the market.

F-19
Counterparty credit valuation adjustments are necessary when the market price of an instrument is not indicative of the fair value as a result of the credit quality of the counterparty. Generally, market quotes assume that all counterparties have low default rates and equal credit quality. Therefore, an adjustment may be necessary to reflect the quality of a specific counterparty to determine the fair value of the instrument. The Company currently has all derivative positions placed and held by members of its lending group, which have high credit quality.
Liquidity valuation adjustments are necessary when the Company is not able to observe a recent market price for financial instruments that trade in less active markets. Exchange traded contracts are valued at market value without making any additional valuation adjustments; therefore, no liquidity reserve is applied.
Valuation Hierarchy
Fair value measurements are grouped into a three-level valuation hierarchy. The valuation hierarchy is based upon the transparency of inputs to the valuation of an asset or liability as of the measurement date. A financial instrument’s categorization within the hierarchy is based upon the input that requires the highest degree of judgment in the determination of the instrument’s fair value. The three levels are defined as follows:
Level 1
Pricing inputs are based on published prices in active markets for identical assets or liabilities as of the reporting date.
Level 2
Pricing inputs include quoted prices for similar assets and liabilities in active markets, and inputs that are observable for the asset or liability, either directly or indirectly, as of the reporting date. Contracts that are not traded on a recognized exchange or are tied to pricing transactions for which forward curve pricing is readily available are classified as Level 2 instruments. These include natural gas, crude oil and some natural gas liquids price swaps and natural gas basis swaps.
Level 3
Pricing inputs include significant inputs that are generally unobservable from objective sources. The Company classifies natural gas liquid swaps and basis swaps for which future pricing is not readily available as Level 3. The Company obtains estimates from independent third parties for its open positions and subjects those to the credit adjustment criteria described above.
The financial instruments carried at fair value as of December 31, 2017 and 2016, by consolidated balance sheet caption and by valuation hierarchy, as described above are as follows:
December 31, 2017 (in thousands of dollars) Fair Value Measurements Using Commodity Price Hedges (Level 1) (Level 2) (Level 3) Total
Current assets . . . . . . . . . . . . . . . . . . . . . . . . . . . . . . $ — $ 3,474 $ — $ 3,474 Long-term assets . . . . . . . . . . . . . . . . . . . . . . . . . . . . — 56 116 172 Current liabilities . . . . . . . . . . . . . . . . . . . . . . . . . . . . — 28,946 7,763 36,709 Long-term liabilities . . . . . . . . . . . . . . . . . . . . . . . . . — 7,860 928 8,788
December 31, 2016 (in thousands of dollars) Fair Value Measurements Using Commodity Price Hedges (Level 1) (Level 2) (Level 3) Total
Current assets . . . . . . . . . . . . . . . . . . . . . . . . . . . . . . . $ — $ 24,100 $ — $ 24,100 Long-term assets (1) . . . . . . . . . . . . . . . . . . . . . . . . . . — 36,384 (1,640) 34,744 Current liabilities . . . . . . . . . . . . . . . . . . . . . . . . . . . . . — 13,636 1,014 14,650 Long-term liabilities . . . . . . . . . . . . . . . . . . . . . . . . . . — 892 317 1,209
(1) Level 3 long-term assets are negative as a result of the netting of our commodity derivatives reflected on
our Consolidated Balance Sheet as of December 31, 2016. Our agreements include set-off provisions, as noted in Note 6, “Derivative Instruments and Hedging Activities - Offsetting Assets and Liabilities”.

F-20
The following table represents quantitative information about Level 3 inputs used in the fair value measurement of the Company’s commodity derivative contracts as of December 31, 2017.
Quantitative Information About Level 3 Fair Value Measurements Fair Value Unobservable Commodity Price Hedges (000’s) Valuation Technique Input Range
Natural gas liquid swaps . .
$ (7,763) Use a discounted cash flow approach using inputs including forward price statements from counterparties
Natural gas liquid futures
$27.93 - $44.00 per barrel
Crude oil collars . . . . . . . .
$ (654) Use a discounted option model approach using inputs including interpolated volatilities for certain settlement months where market volatility quotes were unavailable for the option strike price
Market volatility quotes at the
option strike for certain settlement months in 2019
$45.00 - $61.00 per barrel
Natural gas collars . . . . . .
$ (158) Use a discounted option model approach using inputs including interpolated volatilities for certain settlement months where market volatility quotes were unavailable for the option strike price
Market volatility quotes at the
option strike for certain settlement months in 2019
$2.55 - $3.41 per barrel
Significant increases/decreases in natural gas liquid prices in isolation would result in a significantly lower/higher fair value measurement. The following table presents the changes in the Level 3 financial instruments for the years ended December 31, 2017 and 2016. Changes in fair value of Level 3 instruments represent changes in gains and losses for the periods that are reported in other income (expense). New contracts entered into during the year are generally entered into at no cost with changes in fair value from the date of agreement representing the entire fair value of the instrument. Transfers between levels are evaluated at the end of the reporting period.
The following table summarizes the Company’s commodity derivative contract activity involving Level 3 instruments, by year, is as follows:
(in thousands of dollars)
Balance at December 31, 2015, net . . . . . . . . . . . . . . . . . . . . . . . . . . . . . . . . . . . . . . . $ 1,428 Purchases . . . . . . . . . . . . . . . . . . . . . . . . . . . . . . . . . . . . . . . . . . . . . . . . . . . . . . . . . . (5,208) Settlements . . . . . . . . . . . . . . . . . . . . . . . . . . . . . . . . . . . . . . . . . . . . . . . . . . . . . . . . . (171) Transfers to Level 2 . . . . . . . . . . . . . . . . . . . . . . . . . . . . . . . . . . . . . . . . . . . . . . . . . . — Transfers to Level 3 . . . . . . . . . . . . . . . . . . . . . . . . . . . . . . . . . . . . . . . . . . . . . . . . . . 2,363 Changes in fair value . . . . . . . . . . . . . . . . . . . . . . . . . . . . . . . . . . . . . . . . . . . . . . . . . (1,383)
Balance at December 31, 2016, net . . . . . . . . . . . . . . . . . . . . . . . . . . . . . . . . . . . . . . . $ (2,971) Purchases . . . . . . . . . . . . . . . . . . . . . . . . . . . . . . . . . . . . . . . . . . . . . . . . . . . . . . . . . . (1,236) Settlements . . . . . . . . . . . . . . . . . . . . . . . . . . . . . . . . . . . . . . . . . . . . . . . . . . . . . . . . . 1,606 Transfers to Level 2 . . . . . . . . . . . . . . . . . . . . . . . . . . . . . . . . . . . . . . . . . . . . . . . . . . — Transfers to Level 3 . . . . . . . . . . . . . . . . . . . . . . . . . . . . . . . . . . . . . . . . . . . . . . . . . . (6,527) Changes in fair value . . . . . . . . . . . . . . . . . . . . . . . . . . . . . . . . . . . . . . . . . . . . . . . . . 553
Balance at December 31, 2017, net . . . . . . . . . . . . . . . . . . . . . . . . . . . . . . . . . . . . . . . $ (8,575)

F-21
Assets and Liabilities Measured at Fair Value on a Nonrecurring Basis
The following table provides the fair value of financial instruments that are not recorded at fair value in the consolidated financial statements:
December 31, 2017 December 31, 2016 Principal Principal
(in thousands of dollars) Amount Fair Value Amount Fair Value
Debt: Revolver . . . . . . . . . . . . . . . . . . . . . . . . . . $ 211,000 $ 211,000 $ 178,000 $ 178,000 2022 Notes . . . . . . . . . . . . . . . . . . . . . . . . 409,148 305,404 409,148 393,150 2023 Notes . . . . . . . . . . . . . . . . . . . . . . . . 150,000 114,750 150,000 153,375
The Revolver (as defined in Note 5) is categorized as Level 3 in the valuation hierarchy as the debt is not publicly traded and no observable market exists to determine the fair value; however, the carrying value of the Revolver approximates fair value, as it is subject to short-term floating interest rates that approximate the rates available to the Company for those periods.
The fair value of the 2022 Notes (as defined in Note 5) is based on pricing that is readily available in the public market. Accordingly, the 2022 Notes are classified as Level 1 in the valuation hierarchy as the pricing is based on quoted market prices for the debt securities and is actively traded.
The fair value of the 2023 Notes (as defined in Note 5) is based on indicative pricing that is available in the public market. Accordingly, the 2023 Notes are classified as Level 2 in the valuation hierarchy as the pricing is based on quoted market prices for the debt securities but is not actively traded.
Assets and liabilities acquired in business combinations are recorded at their fair value on the date of acquisition. Significant Level 3 assumptions associated with the calculation of future cash flows used in the analysis of fair value of the oil and gas property acquired include the Company’s estimate of future commodity prices, production costs, development expenditures, production, risk-adjusted discount rates, and other relevant data. Additionally, fair value is used to determine the inception value of the Company’s AROs. The inputs used to determine such fair value are primarily based upon costs incurred historically for similar work, as well as estimates from independent third parties for costs that would be incurred to restore leased property to the contractually stipulated condition. Additions to the Company’s ARO represent a nonrecurring Level 3 measurement. 8. Asset Retirement Obligations
A summary of the Company’s ARO for the years ended December 31, 2017 and 2016 is as follows:
(in thousands of dollars) 2017 2016
ARO liability at beginning of year . . . . . . . . . . . . . . . . . . . . . . . . . . . . . . $ 20,058 $ 20,980 Liabilities incurred (1) . . . . . . . . . . . . . . . . . . . . . . . . . . . . . . . . . . . . . . . . . 1,062 6,947 Accretion of ARO liability . . . . . . . . . . . . . . . . . . . . . . . . . . . . . . . . . . . . . . 960 1,263 Liabilities settled due to sale of related properties . . . . . . . . . . . . . . . . . . . (1,231) (446) Liabilities settled due to plugging and abandonment . . . . . . . . . . . . . . . . . (339) (463) Change in estimate (2) . . . . . . . . . . . . . . . . . . . . . . . . . . . . . . . . . . . . . . . . . (138) (8,223) ARO liability at end of year . . . . . . . . . . . . . . . . . . . . . . . . . . . . . . . . . . . 20,372 20,058 Less: Current portion of ARO at end of year . . . . . . . . . . . . . . . . . . . . . . . (720) (600) Total long-term ARO at end of year . . . . . . . . . . . . . . . . . . . . . . . . . . . . $ 19,652 $ 19,458
(1) The 2016 amount includes $6.4 million related to wells acquired in the Anadarko Acquisition. See Note 3, “Acquisitions and Divestitures—Anadarko Acquisition”. (2) The 2016 amount reflects a reduction in the estimated cost per well, consistent with the decline in actual costs experienced by the Company.

F-22
9. Stock-based Compensation
Management Unit Awards
Effective January 1, 2010, JEH implemented a management incentive plan that provided indirect awards of membership interests in JEH to members of senior management (“Management Units”). These awards had various vesting schedules, and a portion of the Management Units vested in a lump sum at the IPO date. In connection with the IPO, both the vested and unvested Management Units were converted into the right to receive JEH Units and shares of Class B common stock. The JEH Units (together with a corresponding number of shares of Class B common stock) will become exchangeable under this plan into a like number of shares of Class A common stock upon vesting or forfeiture. No new Management Units have been awarded since the IPO and no new JEH Units or shares of Class B common stock are created upon a vesting event. Grants listed below reflect the transfer of JEH Units that occurred upon forfeiture.
The following table summarizes information related to the vesting of Management Units as of December 31, 2017:
Weighted Average Grant Date Fair Value JEH Units per Share
Unvested at December 31, 2016 . . . . . . . . . . . . . . . . . . . . . . . . . 90,762 $ 15.00 Granted . . . . . . . . . . . . . . . . . . . . . . . . . . . . . . . . . . . . . . . . . . . . . 13,066 15.00 Forfeited . . . . . . . . . . . . . . . . . . . . . . . . . . . . . . . . . . . . . . . . . . . . . (13,066) 15.00 Vested . . . . . . . . . . . . . . . . . . . . . . . . . . . . . . . . . . . . . . . . . . . . . . (58,447) 15.00 Unvested at December 31, 2017 . . . . . . . . . . . . . . . . . . . . . . . . . 32,315 $ 15.00
Stock compensation expense associated with the Management Units for the years ended December 31, 2017, 2016 and 2015 was $0.6 million, $1.2 million, and $1.3 million, respectively, and is included in general and administrative expenses on the Company’s Consolidated Statement of Operations. The weighted average grant date fair value of management units was $15.00 per share for the years ended December 31, 2017 and 2016. Unrecognized expense as of December 31, 2017 for all outstanding management units was $0.1 million and will be recognized over a weighted-average remaining period of 0.3 years.
2013 Omnibus Incentive Plan
Under the Amended and Restated Jones Energy, Inc. 2013 Omnibus Incentive Plan (the “LTIP”), established in conjunction with the Company’s IPO and restated on May 4, 2016 following approval by the Company’s stockholders, the Company has reserved a total of 8,340,211 shares of Class A common stock for non-employee director, consultant, and employee stock-based compensation awards, as adjusted for the effects of the Special Stock Dividend and the preferred stock dividends paid in shares, as described in Note 12 “Stockholders’ and Mezzanine equity”.
The Company granted (i) performance share unit and restricted stock unit awards to certain officers and employees and (ii) restricted shares of Class A common stock to the Company’s non-employee directors under the LTIP during 2015, 2016 and 2017. During 2016 and 2017, the Company also granted performance unit awards to certain members of the senior management team under the LTIP.
All share and earnings per share information presented for awards made under the LTIP has been recast to retrospectively adjust for the effects of the 0.087423 per share Special Stock Dividend, as defined in Note 12, “Stockholders’ and Mezzanine equity”, distributed on March 31, 2017.
Restricted Stock Unit Awards
The Company has outstanding restricted stock unit awards granted to certain officers and employees of the Company under the LTIP. The fair value of the restricted stock unit awards is based on the value of the Company’s Class A common stock on the date of grant and is expensed on a straight-line basis over the applicable vesting period, which is typically three years.

F-23
The following table summarizes information related to the total number of units awarded to officers and employees as of December 31, 2017:
Restricted Weighted Average Stock Unit Grant Date Fair Value Awards per Share
Unvested at December 31, 2016 . . . . . . . . . . . . . . . . . . . . . . . 1,359,142 $ 5.60 Adjustment (1) . . . . . . . . . . . . . . . . . . . . . . . . . . . . . . . . . . . . . . 130,871 — Granted . . . . . . . . . . . . . . . . . . . . . . . . . . . . . . . . . . . . . . . . . . . 2,394,290 2.32 Forfeited . . . . . . . . . . . . . . . . . . . . . . . . . . . . . . . . . . . . . . . . . . . (543,803) 3.00 Vested . . . . . . . . . . . . . . . . . . . . . . . . . . . . . . . . . . . . . . . . . . . . (577,729) 6.62 Unvested at December 31, 2017 . . . . . . . . . . . . . . . . . . . . . . . 2,762,771 $ 2.79
(1) Increase of 0.002195 units for each unvested restricted stock unit awards at the time of the Company’s May 15, 2017 preferred stock dividend for the portion of such dividend paid in shares of the Company’s Class A common stock and of 0.021931 units for each unvested restricted stock unit award at the time of the Company’s August 15, 2017 preferred stock dividend paid entirely in shares of the Company’s Class A common stock and of 0.018867 units for each unvested restricted stock unit award at the time of the Company’s November 15, 2017 preferred stock dividend paid entirely in shares of the Company’s Class A common stock, as described in Note 12 “Stockholders’ and Mezzanine equity,” in accordance with the terms of the original awards. This increase is in addition to the adjustment for the effects of the Special Stock Dividend previously disclosed in our Quarterly Report on Form 10-Q for the quarter ended March 31, 2017.
Stock compensation expense associated with the employee restricted stock unit awards for the years ended December 31, 2017, 2016, and 2015 was $3.8 million, $3.0 million, and $3.1 million, respectively, and is included in general and administrative expenses on the Company’s Consolidated Statement of Operations. The weighted average grant date fair value of restricted stock units was $2.32 per share, $3.67 per share, and $8.81 per share for the years ended December 31, 2017, 2016, and 2015, respectively.
Unrecognized expense as of December 31, 2017 for all outstanding restricted stock unit awards was $5.3 million and will be recognized over a weighted-average remaining period of 2.0 years.
Performance Share Unit Awards
The Company has outstanding performance share unit awards granted to certain members of the senior management team of the Company under the LTIP. Prior to the second quarter of 2016, the performance share unit awards were described in the Company’s filings as performance unit awards. During the second quarter of 2016, the Company created a new class of equity award, described below as a performance unit award, that is settled in cash rather than shares of the Company’s Class A common stock. As a result, references to performance unit awards in the Company’s filings prior to the second quarter of 2016 refer to this description of performance share unit awards.
Upon the completion of the applicable three-year performance period, each recipient may vest in a number of performance share units. The percent of awarded performance share units in which each recipient vests at such time, if any, will range from 0% to 200% based on the Company’s total shareholder return relative to an industry peer group over the applicable three-year performance period. Each vested performance share unit is exchangeable for one share of the Company’s Class A common stock. The grant date fair value of the performance share units was determined using a Monte Carlo simulation model, which results in an estimated percentage of performance share units earned. The fair value of the performance share units is expensed on a straight-line basis over the applicable three-year performance period.

F-24
The following table summarizes information related to the total number of performance share units awarded to the senior management team as of December 31, 2017:
Performance Weighted Average Share Unit Grant Date Fair Value Awards per Share
Unvested at December 31, 2016 . . . . . . . . . . . . . . . . . . . . . . . . 942,073 $ 6.25 Adjustment (1) . . . . . . . . . . . . . . . . . . . . . . . . . . . . . . . . . . . . . . . 63,712 — Granted . . . . . . . . . . . . . . . . . . . . . . . . . . . . . . . . . . . . . . . . . . . . 519,562 2.24 Forfeited . . . . . . . . . . . . . . . . . . . . . . . . . . . . . . . . . . . . . . . . . . . . (274,524) 5.29 Vested . . . . . . . . . . . . . . . . . . . . . . . . . . . . . . . . . . . . . . . . . . . . . (293,645) 8.22 Unvested at December 31, 2017 . . . . . . . . . . . . . . . . . . . . . . . . 957,178 $ 4.64
(1) Increase of 0.002195 units for each unvested performance share unit awards at the time of the Company’s May 15, 2017 preferred stock dividend for the portion of such dividend paid in shares of the Company’s Class A common stock and of 0.021931 units for each unvested performance share unit award at the time of the Company’s August 15, 2017 preferred stock dividend paid entirely in shares of the Company’s Class A common stock and of 0.018867 units for each unvested performance share unit award at the time of the Company’s November 15, 2017 preferred stock dividend paid entirely in shares of the Company’s Class A common stock, as described in Note 12 “Stockholders’ and Mezzanine equity,” in accordance with the terms of the original awards. This increase is in addition to the adjustment for the effects of the Special Stock Dividend previously disclosed in our Quarterly Report on Form 10-Q for the quarter ended March 31, 2017.
At the time the performance share units vest, the results of the the Company’s total share return relative to the industry peer group must be certified by the compensation committee of the board of directors before the corresponding shares of Class A common stock are issued. As of December 31, 2017 the 293,645 performance share units that vested during 2017 were awaiting certification by the compensation committee. The Class A shares corresponding to these uncertified awards are not included in the Company’s total outstanding Class A shares reported within stockholder’s equity on the Company’s Consolidated Balance Sheets. The estimated fair value of performance share units vested during the year ended December 31, 2017 was $0.2 million, which will be distributed to recipients during the first quarter of 2018. The fair value of performance share units vested during the year ended December 31, 2016 was $0.8 million, the shares of which were distributed to recipients during the first quarter of 2017. No performance share units vested during the year ended December 31, 2015.
Stock compensation expense associated with the performance share unit awards for the years ended December 31, 2017, 2016, and 2015 was $1.5 million, $2.7 million, and $2.6 million, respectively, and is included in general and administrative expenses on the Company’s Consolidated Statement of Operations. The weighted average grant date fair value of performance share unit awards was $2.24 per share, $4.37 per share, and $9.51 per share for the years ended December 31, 2017, 2016, and 2015, respectively. Unrecognized expense as of December 31, 2017 for all outstanding performance share unit awards was $1.5 million and will be recognized over a weighted-average remaining period of 1.5 years.
The Monte Carlo simulation process is a generally accepted statistical technique used, in this instance, to simulate future stock prices for the Company and the components of the peer group. The simulation uses a risk- neutral framework along with the risk-free rate of return, the volatility of each entity, and the stock price trading correlations of each entity with the other entities in the peer group. A stock price path has been simulated for the Company and the industry peer group and is used to determine the payout percentages and the stock price of the Company’s common stock as of the vesting date. The ending stock price is multiplied by the payout percentage to determine the projected payout, which is then discounted using the risk-free rate of return to the grant date to determine the grant date fair value for that simulation. When enough simulations are generated, the resulting distribution gives a reasonable estimate of the range of future expected stock prices.

F-25
The following assumptions were used for the Monte Carlo simulation model to determine the grant date fair value and associated stock-based compensation expense during the periods presented:
Performance Share Unit Awards 2017 2016 2015
Forecast period (years) . . . . . . . . . . . . . . . . . . . . . . . . . . . . . . . . 2.71 2.60 2.67 Risk-free interest rate . . . . . . . . . . . . . . . . . . . . . . . . . . . . . . . . . 1.34 % 1.00 % 0.79 %Jones stock price volatility . . . . . . . . . . . . . . . . . . . . . . . . . . . . . 78.93 % 71.47 % 52.87 %
The average historical combined volatilities for the Company and the peer group was 39.97%, 70.45%, and 55.13% for the awards made in 2017, 2016, and 2015, respectively. Based on these assumptions, the Monte Carlo simulation model resulted in an expected percentage of performance share units earned of 97.25%, 123.84%, and 101.61% for the 2017, 2016, and 2015 awards, respectively.
Performance Unit Awards
The Company has outstanding performance unit awards, granted initially in 2016, to certain members of the senior management team of the Company under the LTIP. References to performance unit awards in prior filings do not correspond to these newly created performance unit awards. Upon the completion of the applicable three-year performance period, each recipient may vest in a number of performance units. The value of awarded performance units in which each recipient vests at such time, if any, will range from $0.00 to $200.00 per performance unit based on the Company’s total shareholder return relative to an industry peer group over the applicable three-year performance period. For accounting purposes, the performance units are treated as a liability award with the liability being re-measured at the end of each reporting period. Therefore, the expense associated with these awards is subject to volatility until the payout is finally determined at the end of the performance period. The value of the performance units was determined at award using a Monte Carlo simulation model, as of the grant date, which resulted in an estimated final value upon vesting of $0.3 million and $1.1 million for the awards made in 2017 and 2016, respectively, as adjusted for forfeitures. The fair value measured as of December 31, 2017 was $0.1 million and $0.1 million for the awards made in 2017 and 2016, respectively. The following assumptions were used for the Monte Carlo model to determine the grant date fair value and associated stock-based compensation expense of the performance unit awards granted during the periods presented:
Performance Unit Awards 2017 2016
Forecast period (years) . . . . . . . . . . . . . . . . . . . . . . . . . . . . . . . . . . . . . . . . 2.71 2.60 Risk-free interest rate . . . . . . . . . . . . . . . . . . . . . . . . . . . . . . . . . . . . . . . . . 1.34 % 1.00 % Jones stock price volatility . . . . . . . . . . . . . . . . . . . . . . . . . . . . . . . . . . . . . 78.93 % 71.47 %
For the performance units granted during the years ended December 31, 2017 and 2016, the Monte Carlo simulation model resulted in an expected payout of $28.25 per performance unit and $67.38 per performance unit as of the grant date.
Stock compensation expense associated with the performance unit awards was an income position of $0.2 million and expense of $0.3 million for the years ended December 31, 2017 and 2016, respectively, and is included in general and administrative expenses on the Company’s Consolidated Statement of Operations. As of December 31, 2017, $0.1 million of unrecognized compensation expense related to all the performance unit awards, subject to re-measurement and adjustment for the change in estimated final value as of the end of each reporting period, is expected to be recognized over the remaining weighted-average remaining period of 1.4 years.
Restricted Stock Awards
The Company has outstanding restricted stock awards granted to the non-employee members of the Board of Directors of the Company under the LTIP. The restricted stock will vest upon the director serving as a director of the Company for a one-year service period in accordance with the terms of the award. The fair value of the awards was based on the price of the Company’s Class A common stock on the date of grant.

F-26
The following table summarizes information related to the total value of the awards to the Board of Directors as of December 31, 2017:
Weighted Average Restricted Grant Date Fair Value Stock Awards per Share
Unvested at December 31, 2016 . . . . . . . . . . . . . . . . . . . . . . . 152,050 $ 3.68 Adjustment (1) . . . . . . . . . . . . . . . . . . . . . . . . . . . . . . . . . . . . . . 7,749 — Granted . . . . . . . . . . . . . . . . . . . . . . . . . . . . . . . . . . . . . . . . . . . 180,000 2.25 Forfeited . . . . . . . . . . . . . . . . . . . . . . . . . . . . . . . . . . . . . . . . . . . — — Vested . . . . . . . . . . . . . . . . . . . . . . . . . . . . . . . . . . . . . . . . . . . . (152,380) 3.67 Unvested at December 31, 2017 . . . . . . . . . . . . . . . . . . . . . . . 187,419 $ 2.16
(1) Increase of 0.002195 units for each unvested share of restricted stock at the time of the Company’s May 15, 2017 preferred stock dividend for the portion of such dividend paid in shares of the Company’s Class A common stock and of 0.021931 units for each unvested share of restricted stock at the time of the Company’s August 15, 2017 preferred stock dividend paid entirely in shares of the Company’s Class A common stock and of 0.018867 units for each unvested share of restricted stock at the time of the Company’s November 15, 2017 preferred stock dividend paid entirely in shares of the Company’s Class A common stock, as described in Note 12 “Stockholders’ and Mezzanine equity,” in accordance with the terms of the original awards. This increase is in addition to the adjustment for the effects of the Special Stock Dividend previously disclosed in our Quarterly Report on Form 10-Q for the quarter ended March 31, 2017.
Stock compensation expense associated with awards to the members of the Board of Directors for the years ended December 31, 2017, 2016 and 2015 was $0.4 million, $0.6 million, and $0.6 million, respectively, and is included in general and administrative expenses on the Company’s Consolidated Statement of Operations. The weighted average grant date fair value of restricted stock awards was $2.25 per share, $3.68 per share, and $6.71 per share for the years ended December 31, 2017, 2016, and 2015. Unrecognized expense as of December 31, 2017 for all outstanding restricted stock awards was $0.2 million and will be recognized over the remaining vesting period of 0.4 years.
For the years ended December 31, 2017, 2016, and 2015, the Company had an associated tax benefit of $1.6 million, $1.4 million, and $1.1 million, respectively, related to all stock-based compensation, calculated at the federal statutory rate after adjusting for the non-controlling interest. 10. Benefit Plans
The Company maintains a tax-qualified 401(k) savings plan (the “Plan”) for the benefit of employees. The Plan is a defined contribution plan and the Company may match a portion of employee contributions to the Plan.
In addition, since 2013, the Company has maintained a non-qualified deferred compensation plan for the benefit of key employees. The non-qualified deferred compensation plan is an unfunded, account-based plan under which key employees of the Company may elect to defer a portion of their base salary and/or bonus. For the years ended December 31, 2017, 2016, and 2015, our total expense relating to these plans was $0.4 million, $0.4 million, and $0.5 million, respectively. 11. Income Taxes
The Company records federal and state income tax liabilities associated with its status as a corporation. The Company recognizes a tax liability on its share of pre-tax book income, exclusive of the non-controlling interest. JEH is not subject to income tax at the federal level and only recognizes Texas franchise tax expense.
On December 22, 2017, the US Congress enacted the Tax Reform Legislation, which made significant changes to US federal income tax law, including a reduction of the federal corporate tax rate to 21% effective January 1, 2018. We are required to recognize the effect of a rate change on deferred tax assets and liabilities in the period in which the tax rate change is enacted. Therefore, the rate change enacted by the Tax Reform Legislation resulted in the recognition of a tax benefit of $17.2 million along with a benefit from the reduction of the liability under the Tax Receivable Agreement of $59.5 million.

F-27
The Tax Reform Legislation is a comprehensive bill containing other provisions, such as limitations on the deductibility of interest expense and certain executive compensation, that are not expected to materially affect us. The ultimate impact of Tax Reform Legislation may differ from our estimates due to changes in interpretations and assumptions made by us, as well as additional regulatory guidance that may be issued. The impact on our deferred tax assets and liabilities may be adjusted in future periods, as an adjustment to income tax expense or benefit, in the period in which the final amounts are determined.
The following table summarizes the tax provision for the years ended December 31, 2017, 2016, and 2015:
Year Ended December 31, (in thousands of dollars) 2017 2016 2015
Current tax expense (benefit): Federal . . . . . . . . . . . . . . . . . . . . . . . . . . . . . . . . . . . . . . . $ (3,555) $ 3,758 $ — State . . . . . . . . . . . . . . . . . . . . . . . . . . . . . . . . . . . . . . . . . . (30) 223 113
Total current expense (benefit) . . . . . . . . . . . . . . . . . . . . . (3,585) 3,981 113 Deferred tax expense (benefit):
Federal . . . . . . . . . . . . . . . . . . . . . . . . . . . . . . . . . . . . . . . (46,917) (27,245) (1,137) State . . . . . . . . . . . . . . . . . . . . . . . . . . . . . . . . . . . . . . . . . . (165) (522) (1,757)
Total deferred expense (benefit) . . . . . . . . . . . . . . . . . . . . (47,082) (27,767) (2,894) Total tax expense (benefit) . . . . . . . . . . . . . . . . . . . . . . . . . $ (50,667) $ (23,786) $ (2,781) Tax benefit attributable to controlling interests . . . . . . . . . (50,422) (23,263) (1,160) Tax benefit attributable to non-controlling interests . . . . . . (245) (523) (1,621) Total income tax expense (benefit) . . . . . . . . . . . . . . . . . . $ (50,667) $ (23,786) $ (2,781)

F-28
A reconciliation of the Company’s provision for income taxes as reported and the amount computed by multiplying income before taxes, less non-controlling interest, by the U.S. federal statutory rate of 35%:
(in thousands of dollars) 2017 2016 2015
Provision calculated at federal statutory income tax rate:
Net income before taxes . . . . . . . . . . . . . . . . . $ (229,490) $ (108,591) $ (11,858) Statutory rate (1) . . . . . . . . . . . . . . . . . . . . . . . 35 % 35 % 35 % Income tax expense (benefit) computed at statutory rate . . . . . . . . . . . . . . . . . . . . . . . . . . . $ (80,322) $ (38,007) $ (4,150)
Less: Non-controlling interests . . . . . . . . . . . 27,152 14,972 2,911 Income tax expense (benefit) attributable to controlling interests . . . . . . . . . . . . . . . . . . (53,170) (23,035) (1,239)
State and local income taxes, net of federal benefit . . . . . . . . . . . . . . . . . . . . . . . . . . . . . . . . (4,692) (622) (1,011) IRC Section 382 limitation . . . . . . . . . . . . . . . 41,653 — — Reduction of TRA liability . . . . . . . . . . . . . . . — (282) (694) Equity compensation, shortfall . . . . . . . . . . . . — — 338 Change in enacted rate (1) . . . . . . . . . . . . . . . . (38,040) — (650) Change in valuation allowance . . . . . . . . . . . . 4,302 950 2,333 Other . . . . . . . . . . . . . . . . . . . . . . . . . . . . . . . . . (475) (274) (237)
Tax expense (benefit) attributable to controlling interests . . . . . . . . . . . . . . . . . . . (50,422) (23,263) (1,160)
Tax expense attributable to non-controlling interests . . . . . . . . . . . . . . . . . . . . . . . . . . . . . . . (245) (523) (1,621)
Total income tax expense (benefit) . . . . . . $ (50,667) $ (23,786) $ (2,781)
(1) Statutory rate will decrease to 21% for fiscal year 2018. The effect of the rate change on deferred tax assets and liabilities is recognized in the period in which the tax rate change is enacted, which also results in the reduction of the TRA liability.
The Company is subject to federal, state, and local income and franchise taxes. As such, deferred income taxes result from temporary differences between the carrying amounts of assets and liabilities of the Company for financial reporting purposes and the amounts used for income tax purposes. Deferred tax assets and liabilities are measured using enacted tax rates in effect in the years in which those temporary differences are expected to reverse.
In 2017, the United States enacted legislation that reduced the federal corporate tax rate from 35% to 21% for tax years beginning on or after January 1, 2018. The Company is required to recognize the effect of this rate change on its deferred tax assets and liabilities in the period the tax rate change is enacted. We recorded tax benefit of $17.2 million, net of valuation allowance, as a result of revaluing our deferred tax assets and liabilities at the newly enacted rate. The Company also recognized non-taxable income from the reduction of the liability under the Tax Receivable Agreement as a result of remeasuring the liability to reflect the revised federal statutory rate that had an impact on the effective rate of $20.8 million.
In 2015, Texas enacted legislation that reduced the Texas franchise tax rate from 1.0% to 0.75%. We recorded a tax benefit of $1.7 million as a result of revaluing our deferred tax assets and liabilities at the newly enacted rate, of which $1.0 million was attributable to the non-controlling interest.

F-29
Significant components of the Company’s deferred tax assets and deferred tax liabilities consisted of the following:
As of December 31, (in thousands of dollars) 2017 2016
Deferred tax assets Net operating loss . . . . . . . . . . . . . . . . . . . . . . . . . . . . . . . . . . . . . . . . . $ 13,381 $ 8,687 Section 754 election tax basis adjustment . . . . . . . . . . . . . . . . . . . . . 78,623 51,154 Other deferred tax asset . . . . . . . . . . . . . . . . . . . . . . . . . . . . . . . . . . . . 220 —
Total deferred tax assets . . . . . . . . . . . . . . . . . . . . . . . . . . . . . . . . . . 92,224 59,841 Deferred tax liabilities
Investment in consolidated subsidiary JEH . . . . . . . . . . . . . . . . . . . . 93,974 56,888 Noncurrent state deferred tax liability . . . . . . . . . . . . . . . . . . . . . . . . 2,281 2,703
Total deferred tax liabilities . . . . . . . . . . . . . . . . . . . . . . . . . . . . . . . 96,255 59,591 Net deferred tax assets (liabilities) . . . . . . . . . . . . . . . . . . . . . . . . . . . . . . (4,031) 250 Valuation allowance . . . . . . . . . . . . . . . . . . . . . . . . . . . . . . . . . . . . . . . . . (10,250) (3,155)
Net deferred tax assets (liabilities) . . . . . . . . . . . . . . . . . . . . . . . . . . $ (14,281) $ (2,905)
Internal Revenue Code ("IRC") Section 382 limits a corporation’s utilization of federal net operating loss carryforwards and certain other tax attributes on an annual basis following an ownership change of the corporation. The Company has a federal net operating loss carry-forward totaling $53.0 million and state net operating loss carry-forward of $47.4 million, after giving effect to an IRC Section 382 limitation. These federal and state net operating loss carryforwards expire between 2033 and 2037. Net operating losses generated in 2018 and future years will have an indefinite carryforward as a result of Tax Reform Legislation. The tax benefits of carryforwards are recorded as an asset to the extent that management assesses the utilization of such carryforwards to be more likely than not. When the future utilization of some portion of the carryforwards is determined not to be more likely than not, a valuation allowance is provided to reduce the recorded tax benefits from such assets. As of December 31, 2017 and 2016, we had a valuation allowance of $10.2 million and $3.2 million, respectively as a result of management’s assessment of the realizability of federal and state deferred tax assets. Management believes that there will be sufficient future taxable income based on the reversal of temporary differences to enable utilization of substantially all other tax carryforwards.
The Company experienced ownership changes within the meaning of IRC Section 382 during 2017 and 2015 that subject a portion of its federal net operating loss carryforwards to IRC Section 382 limitations. The Company estimates that the IRC Section 382 limitation that applies to the Company’s 2017 ownership change will result in a permanent loss of federal and state deferred tax assets totaling $13.8 net operating loss carryforwards and other tax attributes, as measured at the 21% enacted rate and adjusted for the modified loss carryforward provisions of Tax Reform Legislation. The reduction in state net operating loss carryforwards is off-set by a corresponding $2.4 million adjustment to the valuation allowance.
Separate federal and state income tax returns are filed for Jones Energy, Inc. and Jones Energy Holdings, LLC. JEH’s Texas franchise tax returns are subject to audit for 2013 through 2016. The tax years 2014 through 2016 remain open to examination by the major taxing jurisdictions to which the Company is subject, however net operating losses originating in prior years are subject to examination when utilized. The Internal Revenue Service is currently examining the 2013 federal partnership income tax return for JEH, but has indicated that the audit will be concluded with no change. The Company’s other income tax returns have not been audited by the Internal Revenue Service or any state jurisdiction.
Accounting for uncertainty in income taxes prescribes a recognition threshold and measurement methodology for the financial statement recognition and measurement of a tax position taken or expected to be taken in a tax return. As of December 31, 2017, 2016 and 2015 there was no material liability or expense for the periods then ended recorded for payments of interest and penalties associated with uncertain tax positions or material unrecognized tax positions and the Company’s unrecognized tax benefits were not material.
Tax Receivable Agreement
In connection with the IPO, the Company entered into a Tax Receivable Agreement (the “TRA”) which obligates the Company to make payments to certain current and former owners equal to 85% of the applicable cash savings that the Company realizes as a result of tax attributes arising from exchanges of JEH Units and shares of the Company’s Class B common stock held by those owners for shares of the Company’s Class A common stock. The Company will retain the
F-30
benefit of the remaining 15% of these tax savings. At the time of an exchange, the company records a liability to reflect the future payments under the TRA.
The TRA liability is recorded based upon the projected tax savings at the time of an exchange. As a result of the tax reform legislation, the amount of the TRA liability was remeasured to reflect the reduction of the federal corporate tax rate from 35% to 21%. We recorded a benefit for the reduction of the TRA liability of $59.5 million as a result of the newly enacted rate. The amount is included in other income (expense) on the Company’s Consolidated Statement of Operations.
The actual amount and timing of payments to be made under the TRA will depend upon a number of factors, including the amount and timing of taxable income generated in the future, changes in future tax rates, the use of loss carryovers, and the portion of the Company’s payments under the TRA constituting imputed interest. As of December 31, 2017 and December 31, 2016, the Company had a gross TRA liability of $69.9 million and $45.7 million, respectively. As a result of the valuation allowance recorded against its deferred tax assets associated with prior exchanges, the TRA liability was reduced, as the payment of the TRA liability is dependent upon the realizability of the associated deferred tax assets. As of December 31, 2017 and 2016, the amount of the TRA liability was reduced by $8.7 million, and $2.7 million, respectively, as a result of the valuation allowance recorded against the Company’s deferred tax assets. To the extent the Company does not realize all of the tax benefits in future years or in the event of a change in future tax rates, this liability may change.
As of December 31, 2017, and 2016 the Company had recorded a net TRA liability of $61.2 million and $43.0 million, respectively, for the estimated payments that will be made to the Class B shareholders who have exchanged shares, after adjusting for the TRA liability reduction. As of December 31, 2017, of the $61.2 million net TRA liability, $1.6 million was recorded within other current liabilities on the Company’s Consolidated Balance Sheet. As of December 31, 2017 and 2016 there were corresponding deferred tax assets, net of valuation allowance, of $72.3 million, and $50.6 million, respectively, as a result of the increase in tax basis generated arising from such exchanges.
As of December 31, 2017, the Company had not made any payments under the TRA to Class B shareholders who have exchanged JEH units and Class B common stock for Class A common stock. The Company made a payment of $1.6 million of the TRA liability with respect to cash savings that the Company realized on its 2016 tax return as a result of tax attributes arising from prior exchanges in the first quarter of 2018. The Company does not anticipate it will realize cash savings on its 2017 tax return as a result of tax attributes arising from prior exchanges, and therefore does not anticipate a payment under the TRA for the 2017 tax year.
Cash Tax Distributions The holders of JEH Units, including Jones Energy, Inc., incur U.S. federal, state and local income taxes on their share of any taxable income of JEH. Under the terms of its operating agreement, JEH is generally required to make quarterly pro-rata cash tax distributions to its unitholders (including us) based on income allocated to its unitholders through the end of each relevant quarter, as adjusted to take into account good faith projections by the Company of taxable income or loss for the remainder of the calendar year, to the extent JEH has cash available for such distributions and subject to certain other restrictions. A Special Committee of the Board of Directors comprised solely of directors who do not have a direct or indirect interest in such distribution approved, and JEH made, aggregate cash tax distributions during 2017 and 2016 of $1.7 million and $41.0 million, respectively, (including distributions to us) to its unitholders towards its total 2016 projected tax distribution obligation. Distributions during 2017 were made pro-rata to all members of JEH, and included a $1.1 million payment to the Company and a $0.6 million payment to JEH unitholders other than the Company. Distributions during 2016 were made pro-rata to all members of JEH, and included a $23.7 million payment to the Company and a $17.3 million payment to Class B shareholders. The 2016 tax distributions are the result of taxable income generated by JEH’s operations and debt extinguishment. All tax distributions were paid as a result of JEH’s 2016 taxable income. 12. Stockholders’ and Mezzanine equity
Stockholders’ equity is comprised of two classes of common stock, Class A common stock and Class B common stock. The Class B common stock is held by the owners of JEH prior to the Company’s IPO and can be exchanged (together with a corresponding number of units representing membership interests in JEH Units) for shares of Class A common stock on a one-for-one basis, subject to customary conversion rate adjustments for stock splits, stock dividends and

F-31
reclassifications and other similar transactions. The Class B common stock has no economic rights but entitles its holders to one vote on all matters to be voted on by the Company’s stockholders generally. The Company has classified the Series A preferred stock as mezzanine equity based upon the terms and conditions that contain various redemption and conversion features. For a description of these features, please see below under “— Offering of 8.0% Series A Perpetual Convertible Preferred Stock.” Equity Distribution Agreement On May 24, 2016, the Company and JEH entered into an Equity Distribution Agreement (“Equity Distribution Agreement”) with Citigroup Global Markets Inc. and Wells Fargo Securities, LLC (each, a “Manager” and collectively, the “Managers”). Pursuant to the terms of the Equity Distribution Agreement, the Company may sell from time to time through the Managers, as the Company’s sales agents, the Company’s Class A common stock having an aggregate offering price of up to $73.0 million (the “Class A Shares”). Under the terms of the Equity Distribution Agreement, the Company may also sell Class A Shares from time to time to any Manager as principal for its own account at a price to be agreed upon at the time of sale. Any sale of Class A Shares to a Manager as principal would be pursuant to the terms of a separate terms agreement between the Company and such Manager. Sales of the Class A Shares, if any, will be made by means of ordinary brokers’ transactions, to or through a market maker or directly on or through an electronic communication network, a “dark pool” or any similar market venue, or as otherwise agreed by the Company and one or more of the Managers. During the year ended December 31, 2017, the Company sold approximately 3.7 million Class A Shares under the Equity Distribution Agreement for net proceeds of approximately $8.4 million ($8.7 million gross proceeds, net of approximately $0.3 million in commissions and professional services expenses). The Company used the net proceeds for general corporate purposes. As of December 31, 2017, approximately $62.2 million in aggregate offering proceeds remained available to be issued and sold under the Equity Distribution Agreement. Offering of Class A Common Stock On August 26, 2016, the Company issued 21,000,000 shares of Class A common stock pursuant to an underwritten public offering, and on September 12, 2016 the Company issued an additional 3,150,000 shares of Class A common stock in connection with the exercise of the underwriters’ over-allotment option. The total net proceeds (after underwriters’ discounts and commissions, but before estimated expenses) of the offering, including the exercise of the over-allotment option, was $64.0 million.
Offering of 8.0% Series A Perpetual Convertible Preferred Stock On August 26, 2016, the Company issued 1,840,000 shares of Series A preferred stock pursuant to an underwritten public offering for total net proceeds (after underwriters’ discounts and commissions but before expenses) of $88.3 million.
Holders of Series A preferred stock are entitled to receive, when as and if declared by the Company’s Board of Directors, cumulative dividends at the rate of 8.0% per annum (the “dividend rate”) per share on the $50.00 liquidation preference per share of the Series A Preferred Stock, payable quarterly in arrears on February 15, May 15, August 15 and November 15 of each year, beginning on November 15, 2016. Dividends may be paid in cash or, subject to certain limitations, in Class A common stock, or a combination thereof. Under the terms of the Series A preferred stock, the Company’s ability to declare or pay dividends or make distributions on, or purchase, redeem or otherwise acquire for consideration, shares of the Company’s Class A common stock, or any junior stock or parity stock currently outstanding or issued in the future, will be subject to certain restrictions in the event that the Company does not pay in full or declare and set aside for payment in full all accrued and unpaid dividends on the Series A preferred stock (including certain unpaid excess cash payment amounts excused from payment as a dividend due to restrictions in credit facilities or other indebtedness or legal requirements (“Unpaid Excess Cash Payment Amounts”)). Each share of Series A preferred stock has a liquidation preference of $50.00 per share and is convertible, at the holder’s option at any time, into approximately 17.0683 shares of Class A common stock after adjusting the conversion ratio for

F-32
the effects of the Special Stock Dividend, as defined in Note 12, “Stockholders’ and Mezzanine equity”, (which is equivalent to a conversion price of approximately $2.93 per share after adjusting for the effects of the Special Stock Dividend), subject to specified further adjustments and limitations as set forth in the certificate of designations for the Series A preferred stock. Based on the adjusted conversion rate and the full exercise of the Preferred Stock Underwriters’ over-allotment option, approximately 31.4 million shares of Class A common stock would be issuable upon conversion of all the Series A preferred stock. On or after August 15, 2021, the Company may, at its option, give notice of its election to cause all outstanding shares of Series A preferred stock to be automatically converted into shares of Class A common stock at the conversion rate, if the closing sale price of the Class A common stock equals or exceeds 175% of the conversion price for at least 20 trading days in a period of 30 consecutive trading days. On August 15, 2024 (the “designated redemption date”), each holder of Series A preferred stock may require us to redeem any or all Series A preferred stock held by such holder outstanding on the designated redemption date at a redemption price equal to a liquidation preference of $50.00 per share plus all accrued dividends on the shares up to but excluding the designated redemption date that have not been paid plus any Unpaid Excess Cash Payment Amounts (the “redemption price”). At our option, the redemption price may be paid in cash or, subject to certain limitations, in Class A common stock, or a combination thereof. Except as required by law or the Company’s certificate of incorporation, which includes the certificate of designations for the Series A preferred stock, the holders of Series A preferred stock have no voting rights (other than with respect to certain matters regarding the Series A preferred stock or when dividends payable on the Series A preferred stock have not been paid for an aggregate of six quarterly dividend periods, or more, whether or not consecutive, as provided in the certificate of designations for the Series A preferred stock).
The Series A preferred stock is classified as mezzanine equity on the Company’s Consolidated Balance Sheet and is not listed on a national stock exchange. A summary of the Company’s Mezzanine equity for the year ended December 31, 2017 is as follows:
(in thousands of dollars)
Mezzanine equity at December 31, 2016 . . . . . . . . . . . . . . . . . . . . . . . . . . . . . . $ 88,975 Dividends on preferred stock, net . . . . . . . . . . . . . . . . . . . . . . . . . . . . . . . . . . . . — Accretion on preferred stock . . . . . . . . . . . . . . . . . . . . . . . . . . . . . . . . . . . . . . . . 564 Mezzanine equity at December 31, 2017 . . . . . . . . . . . . . . . . . . . . . . . . . . . . . . $ 89,539
Preferred Stock Dividends On January 19, 2017, the Company’s Board of Directors declared a quarterly cash dividend per share equal to 8.0% based on the liquidation preference of $50.00 per share on an annualized basis, or $1.00 per share, on the Series A preferred stock. This dividend is for the period beginning on the last payment date of November 15, 2016 through February 14, 2017 and was paid in cash on February 15, 2017 to shareholders of record as of February 1, 2017. On April 17, 2017, the Company’s Board of Directors declared a quarterly dividend per share equal to 8.0% based on the liquidation preference of $50.00 per share on an annualized basis, or $1.00 per share, on the Series A preferred stock. On May 15, 2017, the dividend was paid in a combination of cash and the Company’s Class A common stock, with the cash component equal to $0.83 per share and the stock component equal to $0.17 per share. The price per share of the Class A common stock used to determine the number of shares issued was equal to 95% of the average volume-weighted average price per share for each day during the five-consecutive day trading period ending immediately prior to the payment date. This dividend was for the period beginning on the last payment date of February 15, 2017 through May 14, 2017 to shareholders of record as of May 1, 2017. On July 13, 2017, the Company’s Board of Directors declared a quarterly dividend per share equal to 8.0% based on the liquidation preference of $50.00 per share on an annualized basis, or $1.00 per share, on the Series A preferred stock. On August 15, 2017, the dividend was paid entirely in shares of Class A common stock. The price per share of the Class A common stock used to determine the number of shares issued was equal to 95% of the average volume-weighted average price per share for each day during the five-consecutive day trading period ending immediately prior to the payment

F-33
date. This dividend was for the period beginning on the last payment date of May 15, 2017 through August 14, 2017 to shareholders of record as of August 1, 2017. On October 9, 2017, the Company’s Board of Directors declared a quarterly dividend per share equal to 8.0% based on the liquidation preference of $50.00 per share on an annualized basis, or $1.00 per share, on the Series A preferred stock. On November 15, 2017, the dividend was paid entirely in shares of Class A common stock. The price per share of the Class A common stock used to determine the number of shares issued will equal 95% of the average volume-weighted average price per share for each day during the five-consecutive day trading period ending immediately prior to the payment date. This dividend was for the period beginning on the last payment date of August 15, 2017 through November 14, 2017 to shareholders of record as of November 1, 2017 Special Stock Dividend On March 31, 2017, the Company paid a stock dividend (the “Special Stock Dividend”) of 0.087423 shares of the Class A common stock to holders of record as of March 15, 2017. From time-to-time, JEH makes cash distributions to the holders of JEH Units to cover tax obligations that may occur as a result of any net taxable income of JEH allocable to holders of JEH Units. As a holder of JEH Units, the Company has received such cash distributions from JEH in excess of the amount required to satisfy the Company’s associated tax obligations. As a result, the Company used the excess cash of approximately $17.5 million in the aggregate to acquire newly-issued JEH Units from JEH. The Special Stock Dividend was distributed in order to equalize the number of shares of Class A common stock outstanding to the number of JEH Units held by the Company, and the aggregate number of shares of Class A common stock issued in the Special Stock Dividend equaled the number of additional JEH Units the Company purchased from JEH. The Company purchased 4,999,927 JEH Units at a price of $3.50 per share, which is the volume weighted average price per share of the Class A common stock for the five trading days ended February 28, 2017. Immaterial cash payments were made in lieu of fractional shares. The comparative earnings per share information has been recast to retrospectively adjust for the effects of the Special Stock Dividend.
13. Earnings per Share
Basic earnings per share (“EPS”) is computed by dividing net income (loss) attributable to controlling interests by the weighted average number of shares of Class A common stock outstanding during the period. Shares of Class B common stock are not included in the calculation of earnings per share because they are not participating securities and have no economic interest in the Company. Diluted earnings per share takes into account the potential dilutive effect of shares that could be issued by the Company in conjunction with the Series A preferred stock and from stock awards that have been granted to directors and employees. Awards of non-vested shares are considered outstanding as of the respective grant dates for purposes of computing diluted EPS even though the award is contingent upon vesting. For the year ended December 31, 2017, 2,762,738 restricted stock units, and 1,250,822 performance share units, and 31,405,587 shares from the convertible Class A preferred stock were excluded from the calculation as they would have had an anti-dilutive effect. For the year ended December 31, 2016, 1,359,088 restricted stock units, and 1,125,706 performance share units, and 31,405,762 shares from the convertible Class A preferred stock were excluded from the calculation as they would have had an anti-dilutive effect. For the year ended December 31, 2015, 823,446 restricted stock units, and 586,325 performance share units were excluded from the calculation as they would have had an anti-dilutive effect.

F-34
The following is a calculation of the basic and diluted weighted-average number of shares of Class A common stock outstanding and EPS:
Earnings per Share
Year Ended December 31, (in thousands, except per share data) 2017 2016 2015
Income (numerator): Net income (loss) attributable to controlling interests . . . $ (101,492) $ (42,552) $ (2,381) Less: Dividends and accretion on preferred stock . . . . . . (7,924) (2,669) — Net income (loss) attributable to common shareholder . . $ (109,416) $ (45,221) $ (2,381)
Weighted-average shares (denominator): (1) Weighted-average number of shares of Class A common stock - basic . . . . . . . . . . . . . . . . . . . . . . . . . . . . 72,411 43,506 29,161 Weighted-average number of shares of Class A common stock - diluted . . . . . . . . . . . . . . . . . . . . . . . . . . . 72,411 43,506 29,161
Earnings (loss) per share: (1) Basic - Net income (loss) attributable to common shareholders . . . . . . . . . . . . . . . . . . . . . . . . . . . . . . . . . . . . $ (1.51) $ (1.04) $ (0.08) Diluted - Net income (loss) attributable to common shareholders . . . . . . . . . . . . . . . . . . . . . . . . . . . . . . . . . . . . $ (1.51) $ (1.04) $ (0.08)
(1) All share and earnings per share information presented has been recast to retrospectively adjust for the effects of the
0.087423 per share Special Stock Dividend, as defined in Note 12, “Stockholders’ and Mezzanine equity”, distributed on March 31, 2017.
14. Related Parties
Related Party Transactions
Transactions with Our Executive Officers, Directors and 5% Stockholders
Monarch Natural Gas Holdings, LLC Natural Gas Sale and Purchase Agreement On May 7, 2013, the Company entered into a natural gas sale and purchase agreement with Monarch Natural Gas, LLC, (“Monarch”), under which Monarch has the first right to gather the natural gas the Company produces from dedicated properties, process the NGLs from this natural gas production and market the processed natural gas and extracted NGLs. Under the Monarch agreement, the Company is paid a specified percentage of the value of the NGLs extracted and sold by Monarch, based on a set liquids recovery percentage, and the amount received from the sale of the residue gas, after deducting a fixed volume for fuel, lost and unaccounted for gas. The Company produced approximately 1.4 MMBoe of natural gas and NGLs for the year ended December 31, 2014, from the properties that became subject to the Monarch agreement. During the year ended December 31, 2014, the Company recognized $37.0 million of revenue associated with the aforementioned natural gas and NGL production. Effective May 1, 2015, the rights to gather natural gas under the sale and purchase agreement transferred from Monarch to Enable Midstream Partners LP, (“Enable”), an unaffiliated third-party. Prior to closing of the transfer of these rights, the Company produced approximately 1.0 MMBoe of natural gas and NGLs for the year ended December 31, 2015 from the properties that became subject to the Monarch agreement for which the Company recognized $10.6 million of revenue. The revenue, for all years mentioned, is recorded in Oil and gas sales on the Company’s Consolidated Statement of Operations. The initial term of the agreement, which remains unchanged by the transfer to Enable, runs for 10 years from the effective date of September 1, 2013.
At the time the Company entered into the 2013 Monarch agreement, Metalmark Capital owned approximately 81% of the outstanding equity interests of Monarch. In addition, Metalmark Capital beneficially owns in excess of five percent of the Company’s outstanding equity interests and two of our former directors, Howard I. Hoffen and Gregory D. Myers, are managing directors of Metalmark Capital and were directors at the time the Company entered into the 2013 Monarch agreement.
In connection with the Company’s entering into the 2013 Monarch agreement, Monarch issued to JEH equity interests in Monarch, having an estimated fair value of $15.0 million, in return for marketing services to be provided throughout the

F-35
term of the agreement. The Company recorded this amount as deferred revenue which is being amortized on an estimated units-of-production basis commencing in September 2013, the first month of product sales to Monarch. During the years ended December 31, 2017, 2016 and 2015, the Company amortized $1.9 million, $2.4 million, and $2.0 million, respectively, of the deferred revenue balance. This revenue is recorded in Other revenues on the Company’s Consolidated Statement of Operations.
Following the issuance of $15.0 million Monarch equity interests to JEH, JEH assigned $2.4 million of the equity interests to Jonny Jones, the Company’s chief executive officer and chairman of the Board of Directors, and reserved $2.6 million of the equity interests for future distribution through an incentive plan to certain of the Company’s officers, including Mike McConnell and Robert Brooks. The remaining $10.0 million of Monarch equity interests was distributed to certain of the Class B shareholders, which included, among others, Metalmark Capital, the Jones family entities, and certain of the Company’s officers and directors, including Jonny Jones and Mike McConnell. As of December 31, 2017, equity interests in Monarch of $0.4 million are included in Other assets on the Company’s Consolidated Balance Sheet. During the years ended December 31, 2017, 2016 and 2015, equity interests of $0.3 million, $0.6 million, and $0.8 million, respectively, were distributed to management under the incentive plan. The Company recognized expense of $0.4 million, $0.5 million, and $0.5 million during the years ended December 31, 2017, 2016 and 2015, respectively, in connection with the incentive plan.
In September 2014, the Company signed a 10-year oil gathering and transportation agreement with Monarch Oil Pipeline LLC, pursuant to which Monarch Oil Pipeline LLC built, at its expense, a new oil gathering system and connected the gathering system to dedicated Company leases in Texas. At the time the Company entered into the agreement, Metalmark Capital owned the majority of the outstanding equity interests of Monarch Oil Pipeline LLC and/or its parent. The system began service during the fourth quarter of 2015 and provides connectivity to both a regional refinery market as well as the Cushing market hub. The Company incurred gathering fees, which were paid to Monarch Oil Pipeline LLC, of $2.3 million, $2.7 million and $0.4 million associated with the approximately 1.1 MMBoe, 1.3 MMBoe and 0.2 MMBoe of oil production transported under the agreement for the years ended December 31, 2017, 2016 and 2015, respectively. These costs are recorded as an offset to Oil and gas sales in the Company’s Consolidated Statement of Operations. The aforementioned production was recognized as Oil and gas sales on the Company’s Consolidated Statement of Operations at the time it was sold to the purchasers, who are unaffiliated third-parties, after passing through the gathering and transportation system. The audit committee of the Board of Directors reviewed and approved the terms of the agreement with Monarch Oil Pipeline LLC.
In May 2015, the Company received a $0.7 million cash distribution associated with its equity interests in Monarch, which was accounted for following the cost method. The initial cash distribution from Monarch was treated as dividend income and is recorded in Other income (expense).
Purchases of Senior Unsecured Notes On February 29, 2016, JEH and Jones Energy Finance Corp. purchased $50.0 million principal amount of their outstanding 2023 Notes from investment funds managed by Magnetar Capital and its affiliates, which investment funds collectively then owned more than 5% of a class of voting securities of the Company, for approximately $23.3 million excluding accrued interest and including any associated fees. On the same day, JEH and Jones Energy Finance Corp. purchased an additional $50.0 million principal amount of their outstanding 2023 Notes from investment funds managed by Blackstone Group Management L.L.C. and its affiliates, which investment funds collectively then owned more than 5% of a class of voting securities of the Company, for approximately $23.3 million excluding accrued interest and including any associated fees. In conjunction with the extinguishment of this $100.0 million principal amount of debt, JEH recognized cancellation of debt income of $48.3 million on a pre-tax basis. This income is recorded in Gain on debt extinguishment on the Company’s Consolidated Statement of Operations. Issuance of Class A Shares In connection with the August 2016 issuance of Class A common stock pursuant to an underwritten public offering as described in Note 12, “Stockholders’ and Mezzanine equity—Offering of Class A Common Stock,” affiliates of JVL Advisors, L.L.C. (“JVL”), who then owned more than 5% of a class of voting securities of the Company, purchased 9,025,270 shares of Class A common stock, prior to adjustment for the effects of the 0.087423 per share Special Stock Dividend, as defined in Note 12, “Stockholders’ and Mezzanine equity”, in the offering, for gross proceeds to the Company of $25.0 million, before underwriting discounts and commissions of $1.1 million.

F-36
Following its purchase in the offering, JVL owned in excess of 15% of our outstanding voting stock. As a result, the Company entered into a letter agreement with JVL (the “JVL Letter Agreement”) in connection with the offering. The JVL Letter Agreement approved, pursuant to Section 203 of the Delaware General Corporation Law (“Section 203”), the purchase of shares of Class A common stock in the offering by JVL. This approval resulted in JVL not being subject to the restrictions on “business combinations” contained in Section 203. In consideration of such approval, JVL agreed that, among other things:
• it will not acquire any material assets of the Company; • it will not become the owner of more than 19.9% of the Company’s outstanding voting stock (other than as a
result of actions taken solely by the Company) without the prior approval of the Company’s independent directors who are not affiliated with JVL; and
• it will not engage in any “business combination” (as defined in the JVL Letter Agreement). On May 3, 2017, the Company amended and restated its registration rights agreement dated August 29, 2013 (as amended and restated, the “Restated Registration Rights Agreement”) to add JVL as a party in order to facilitate an orderly distribution of JVL’s shares of Class A common stock in the future, a copy of which was filed on the Company’s Current Report on Form 8-K filed with the Securities and Exchange Commission on May 3, 2017. Issuance of Series A Preferred Stock In connection with the August 2016 issuance of Series A preferred stock pursuant to an underwritten public offering as described in Note 12, “Stockholders’ and Mezzanine equity—Offering of 8.0% Series A Perpetual Convertible Preferred Stock,” affiliates of Metalmark, who then owned more than 5% of a class of voting securities of the Company and had two representatives on our Board of Directors, purchased 200,000 shares of Series A preferred stock in the offering, for gross proceeds to the Company of $10.0 million, before underwriting discounts and commissions of $400,000. Amended and Restated Registration Rights and Stockholders Agreement On May 2, 2017, we entered into an Amended and Restated Registration Rights and Stockholders Agreement (the “Restated Agreement”) with certain entities affiliated with the Jones family (the “Jones Family Entities”), Metalmark and JVL. The Restated Agreement amends and restates in its entirety that certain Registration Rights and Stockholders Agreement, dated July 29, 2013 (the “Original Agreement”), by and among the Company, Metalmark and the Jones Family Entities, to, among other things, provide JVL with certain rights, in addition to those rights granted to Metalmark and the Jones Family Entities in the Original Agreement, to require the Company to register the sale of any number of JVL’s shares of Class A common stock. JVL shall have the right to cause no more than one such required or “demand” registration, which shall be requested by a majority in interest of the JVL holders who hold certain equity securities of the Company or securities convertible or exchangeable into equity securities of the Company. The Company is not obligated to affect any demand registration in which the anticipated aggregate offering price included in such offering is equal to or less than $50,000,000 ($25,000,000 where the registration is on a Form S-3). Furthermore, if, at any time, the Company proposes to register an offering of Class A common stock (subject to certain exceptions) for the Company’s own account, then it must give prompt notice to Metalmark, JVL and the Jones Family Entities to allow them to include a specified number of their shares in that registration statement. These registration rights are subject to certain conditions and limitations, including the right of the underwriters to limit the number of shares to be included in a registration and the Company’s right to delay or withdraw a registration statement under certain circumstances. The Company will generally be obligated to pay all registration expenses in connection with the registration obligations, regardless of whether a registration statement is filed or becomes effective. The Restated Agreement also includes customary provisions dealing with indemnification, contribution and allocation of expenses. 15. Commitments and Contingencies
Lease obligations
The Company leases approximately 43,000 square feet of office space in Austin, TX under an operating lease arrangement. We also lease approximately 9,000 square feet of office space in Oklahoma City, Oklahoma. Future

F-37
minimum payments for all noncancellable operating leases extending beyond one year at December 31, 2017 are as follows:
(in thousands of dollars)
Years Ending December 31, 2018 . . . . . . . . . . . . . . . . . . . . . . . . . . . . . . . . . . . . . . . . . . . . . . . . . . . . . . . . . . . . . . . . . $ 1,300 2019 . . . . . . . . . . . . . . . . . . . . . . . . . . . . . . . . . . . . . . . . . . . . . . . . . . . . . . . . . . . . . . . . . 1,311 2020 . . . . . . . . . . . . . . . . . . . . . . . . . . . . . . . . . . . . . . . . . . . . . . . . . . . . . . . . . . . . . . . . . 562 2021 . . . . . . . . . . . . . . . . . . . . . . . . . . . . . . . . . . . . . . . . . . . . . . . . . . . . . . . . . . . . . . . . . — 2022 . . . . . . . . . . . . . . . . . . . . . . . . . . . . . . . . . . . . . . . . . . . . . . . . . . . . . . . . . . . . . . . . . — Thereafter . . . . . . . . . . . . . . . . . . . . . . . . . . . . . . . . . . . . . . . . . . . . . . . . . . . . . . . . . . . . . — $ 3,173
Rent expense under operating leases was $1.8 million, $1.6 million, and $1.6 million for the years ended December 31, 2017, 2016 and 2015, respectively.
Litigation
The Company is subject to legal proceedings and claims that arise in the ordinary course of its business. When applicable, we record accruals for contingencies when it is probable that a liability will be incurred and the amount of loss can be reasonably estimated. While the outcome of lawsuits and other proceedings against us cannot be predicted with certainty, in the opinion of management, individually or in the aggregate, no such lawsuits are expected to have a material effect on our financial position, results of operations, or liquidity.
In an action filed on June 12, 2015 in the 31st District Court of Hemphill County, Texas, Donna Kim Flowers and Mitchell Kirk Flowers v. Jones Energy, LLC f/k/a Jones Energy Limited, LLC f/k/a Jones Energy, Ltd. (Case No. 7225), the Company was sued by Donna Kim Flowers and Mitchell Kirk Flowers (the “plaintiffs”). The plaintiffs own surface rights to property located in Hemphill County, Texas. The mineral rights are leased to third parties, and the Company is the operator of the Oil and Gas Mineral Lease. On May 28, 2010, the plaintiffs and the Company entered into a Surface Use Agreement concerning the Company’s operations on the property, which require the Company to minimize disruption and damage to the plaintiffs’ surface rights. The plaintiffs allege that the Company is in breach of such contract, and seek monetary damages. In June 2016, the Company presented a settlement offer to the plaintiffs. As a result of this settlement offer, the Company accrued $1.5 million related to its estimated obligation under this settlement offer. This accrual was included in accrued liabilities on the Company’s Consolidated Balance Sheet as of December 31, 2016, and the charge was recorded as general and administrative expense on the Company’s Consolidated Statement of Operations during the second quarter of 2016. In June 2017, the Company presented a revised settlement offer to the plaintiffs and the plaintiff accepted. The settlement was paid in cash during June 2017. Upon settlement, the Company recognized an additional charge of $1.4 million which was recorded as general and administrative expense on the Company’s Consolidated Statement of Operations during the second quarter of 2017. 16. Subsequent Events
Preferred Stock Dividend Declared On January 11, 2018, the Company’s Board of Directors declared a quarterly dividend per share equal to 8.0% based on the liquidation preference of $50.00 per share on an annualized basis, or $1.00 per share, on the Series A preferred stock, to be paid entirely in shares of Class A common stock (the “February Preferred Dividend”). The price per share of the Class A common stock used to determine the number of shares issued will equal to 95% of the average volume-weighted average price per share for each day during the five-consecutive day trading period ending immediately prior to the payment date. The February Preferred Dividend will be paid on February 15, 2018 for the period beginning on the last payment date of November 15, 2017 through February 14, 2018 to shareholders of record as of February 1, 2018. Senior Secured First Lien Notes due 2023 On February 14, 2018, JEH and Jones Energy Finance Corp. issued the 2023 First Lien Notes at an offering price equal to 97.526% of par in an offering exempt from registration under the Securities Act. The 2023 First Lien Notes are senior secured first lien obligations of JEH and Jones Energy Finance Corp. and are guaranteed on a senior secured first lien basis by the Company and each of the existing and future restricted subsidiaries of JEH and Jones Energy Finance Corp.

F-38
The Company used the net proceeds from the offering to repay all but $25.0 million of the outstanding borrowings under the Revolver, to fund drilling and completion activities, and for other general corporate purposes.
An affiliate of Q Investments, LP, one of our principal stockholders and an affiliate of Scott McCarty, one of our directors, purchased $45.0 million of 2023 First Lien Notes in the offering.
Amendment of Revolving Credit Facility
In connection with the offering of the 2023 First Lien Notes JEH amended the Revolver to, among other things, (i) permit the issuance of the 2023 First Lien Notes and additional senior secured notes in an aggregate principal amount, together with the notes issued pursuant to this offering, not to exceed $700.0 million, (ii) permit the incurrence of liens securing the 2023 First Lien Notes pursuant to the terms of a collateral trust agreement, (iii) reduce the borrowing base under the Revolver to $50.0 million and (iv) suspend testing of our senior secured leverage ratio until March 31, 2019.
Continued efforts to sell non-core asset
We continue to seek opportunities to reduce leverage through non-core asset sales. However, we have no assurance that we will be successful in closing any such divestitures.
17. Subsidiary Guarantors
The 2022 Notes and the 2023 Notes are guaranteed on a senior unsecured basis by the Company and by all of JEH’s current subsidiaries (except Jones Energy Finance Corp. and two immaterial subsidiaries) and certain future subsidiaries, including any future subsidiaries that guarantee any indebtedness under the Revolver. Each subsidiary guarantor is 100% owned by JEH, and all guarantees are full and unconditional, subject to customary exceptions pursuant to the indentures governing our 2022 Notes and 2023 Notes, as discussed below, and joint and several with all other subsidiary guarantees and the parent guarantee. Any subsidiaries of JEH other than the subsidiary guarantors and Jones Energy Finance Corp. are immaterial.
As of December 31, 2016, the 2022 Notes and the 2023 Notes were guaranteed on a senior unsecured basis by the Company and by all of its significant subsidiaries, other than Nosley SCOOP, LLC and Nosley Acquisition, LLC. These subsidiaries have since become guarantors during the first quarter of 2017 and are therefore presented accordingly in the accompanying condensed consolidated guarantor financial information.
Guarantees of the 2022 Notes and 2023 Notes will be released under certain circumstances, including (i) in connection with any sale or other disposition of (a) all or substantially all of the properties or assets of a guarantor (including by way of merger or consolidation) or (b) all of the capital stock of such guarantor, in each case, to a person that is not the Company or a restricted subsidiary of the Company, (ii) if the Company designates any restricted subsidiary that is a guarantor as an unrestricted subsidiary, (iii) upon legal defeasance, covenant defeasance or satisfaction and discharge of the applicable indenture, or (iv) at such time as such guarantor ceases to guarantee any other indebtedness of the Company or any other guarantor.
The Company is a holding company whose sole material asset is an equity interest in JEH. The Company is the sole managing member of JEH and is responsible for all operational, management and administrative decisions related to JEH’s business. In accordance with JEH’s limited liability company agreement, the Company may not be removed as the sole managing member of JEH.
During the preparation of the condensed consolidating financial information of Jones Energy, Inc. and Subsidiaries in the second quarter of 2017, it was determined that the Issuer Investment in subsidiaries and the related Eliminations at December 31, 2016 as filed in the Company’s 2016 Form 10-K were improperly calculated and understated by $453.2 million. Additionally, it was determined that the Guarantor Subsidiaries Intercompany payable balances and the related Eliminations and the Issuer Intercompany receivable and the related Eliminations at December 31, 2016 as filed in the Company’s 2016 Form 10-K were improperly calculated and overstated by $453.2 million and $80.0 million, respectively. In addition, it was determined that the Issuer Equity interest in income (loss) and the related Eliminations for the year ended December 31, 2016 as filed in the Company’s 2016 Form 10-K were improperly calculated and understated by $42.6 million. It was also determined that the Issuer Adjustments to reconcile net income (loss) to net cash provided by operating activities and the related Eliminations for the year ended December 31, 2016 as filed in the Company’s 2016 Form 10-K were improperly calculated and overstated by $42.6 million. In addition, it was determined that the Issuer Equity interest in income (loss) and the related Eliminations for the year ended December 31, 2015 as filed in the Company’s 2015 Form 10-K were improperly calculated and understated by $9.1 million. Lastly, it was

F-39
determined that the Issuer Adjustments to reconcile net income (loss) to net cash provided by operating activities and the related Eliminations for the year ended December 31, 2015 as filed in the Company’s 2015 Form 10-K were improperly calculated and overstated by $9.1 million.
The errors, which the Company has determined are not material to this disclosure, had no impact on the total assets of the Parent or the Guarantor Subsidiaries and are eliminated upon consolidation, and therefore have no impact on the Company’s consolidated financial condition, results of operations or cash flows.
The Company has revised the Condensed Consolidating Balance Sheets for the Issuer, Guarantor Subsidiaries and Eliminations as of December 31, 2016, the Condensed Consolidating Income Statements for the Issuer and Eliminations for the years ended December 31, 2016 and 2015 and the Condensed Consolidating Statement of Cash Flows for the years ended December 31, 2016 and 2015 to correct for these errors.

F-40
Jones Energy, Inc. Condensed Consolidating Balance Sheet
December 31, 2017
Guarantor Non-Guarantor (in thousands of dollars) JEI (Parent) Issuers Subsidiaries Subsidiaries Eliminations Consolidated Assets Current assets
Cash . . . . . . . . . . . . . . . . . . . . . . . . . . . . $ 5,248 $ 1,180 $ 13,024 $ 20 $ — $ 19,472 Accounts receivable, net
Oil and gas sales . . . . . . . . . . . . . . . . . — — 34,492 — — 34,492 Joint interest owners . . . . . . . . . . . . . . — — 31,651 — — 31,651 Other . . . . . . . . . . . . . . . . . . . . . . . . . . — — 1,236 — — 1,236
Commodity derivative assets . . . . . . . . . — 3,474 — — — 3,474 Other current assets . . . . . . . . . . . . . . . . 1,866 358 12,152 — — 14,376 Intercompany receivable . . . . . . . . . . . . 383,849 1,146,647 — — (1,530,496) —
Total current assets . . . . . . . . . . . . . . 390,963 1,151,659 92,555 20 (1,530,496) 104,701 Oil and gas properties, net, at cost under the successful efforts method . . . . . . . . . . . . — — 1,597,040 — — 1,597,040 Other property, plant and equipment, net . . — — 2,192 527 — 2,719 Commodity derivative assets . . . . . . . . . . . . — 172 — — — 172 Other assets . . . . . . . . . . . . . . . . . . . . . . . . . — 4,427 1,004 — — 5,431 Investment in subsidiaries . . . . . . . . . . . . . . 242,617 116,349 — — (358,966) —
Total assets . . . . . . . . . . . . . . . . . . . . $ 633,580 $ 1,272,607 $ 1,692,791 $ 547 $ (1,889,462) $ 1,710,063 Liabilities and Stockholders’ Equity Current liabilities
Trade accounts payable . . . . . . . . . . . . . $ 138 $ 247 $ 72,278 $ — $ — $ 72,663 Oil and gas sales payable . . . . . . . . . . . . — — 31,462 — — 31,462 Accrued liabilities . . . . . . . . . . . . . . . . . 62 11,363 10,172 7 — 21,604 Commodity derivative liabilities . . . . . . — 36,709 — — — 36,709 Other current liabilities . . . . . . . . . . . . . . 1,606 1,723 720 — — 4,049 Intercompany payable . . . . . . . . . . . . . . — — 1,527,418 3,078 (1,530,496) —
Total current liabilities . . . . . . . . . . . 1,806 50,042 1,642,050 3,085 (1,530,496) 166,487 Long-term debt . . . . . . . . . . . . . . . . . . . . . . — 759,316 — — — 759,316 Deferred revenue . . . . . . . . . . . . . . . . . . . . . — 5,457 — — — 5,457 Commodity derivative liabilities . . . . . . . . . — 8,788 — — — 8,788 Asset retirement obligations . . . . . . . . . . . . — — 19,652 — — 19,652 Liability under tax receivable agreement . . . 59,596 — — — — 59,596 Other liabilities . . . . . . . . . . . . . . . . . . . . . . — 68 743 — — 811 Deferred tax liabilities . . . . . . . . . . . . . . . . . 12,852 1,429 — — — 14,281
Total liabilities . . . . . . . . . . . . . . . . . 74,254 825,100 1,662,445 3,085 (1,530,496) 1,034,388 Mezzanine equity
Series A preferred stock, $0.001 par value; 1,839,995 shares issued and outstanding at December 31, 2017 . . . . . 89,539 — — — — 89,539
Stockholders’/ members' equity (deficit) Members' equity . . . . . . . . . . . . . . . . . . . . . — 447,507 30,346 (2,538) (475,315) —
Class A common stock, $0.001 par value; 90,139,840 shares issued and 90,117,238 shares outstanding at December 31, 2017 . . . . . . . . . . . . . . . . 90 — — — — 90 Class B common stock, $0.001 par value; 9,627,821 shares issued and outstanding at December 31, 2017 . . . . . 10 — — — — 10
Treasury stock, at cost: 22,602 shares at December 31, 2017 . . . . . . . . . . . . . . . . . . . (358) — — — — (358)
Additional paid-in-capital . . . . . . . . . . . . 606,319 — — — — 606,319 Retained earnings (deficit) . . . . . . . . . . . (136,274) — — — — (136,274)
Stockholders' equity (deficit) . . . . . . . . . . . . 469,787 447,507 30,346 (2,538) (475,315) 469,787 Non-controlling interest . . . . . . . . . . . . . . . . — — — — 116,349 116,349
Total stockholders’ equity . . . . . . . . . 469,787 447,507 30,346 (2,538) (358,966) 586,136 Total liabilities and stockholders’ equity . . . . . . . . . . . . . . . . . . . . . . . . $ 633,580 $ 1,272,607 $ 1,692,791 $ 547 $ (1,889,462) $ 1,710,063

F-41
Jones Energy, Inc. Condensed Consolidating Balance Sheet
December 31, 2016
Guarantor Non-Guarantor (in thousands of dollars) JEI (Parent) Issuers Subsidiaries Subsidiaries Eliminations Consolidated Assets Current assets
Cash . . . . . . . . . . . . . . . . . . . . . . . . . . . $ 27,164 $ 1,975 $ 5,483 $ 20 $ — $ 34,642 Accounts receivable, net
Oil and gas sales . . . . . . . . . . . . . . . . — — 26,568 — — 26,568 Joint interest owners . . . . . . . . . . . . . — — 5,267 — — 5,267 Other . . . . . . . . . . . . . . . . . . . . . . . . . — 5,434 627 — — 6,061
Commodity derivative assets . . . . . . . . — 24,100 — — — 24,100 Other current assets . . . . . . . . . . . . . . . — 422 2,262 — — 2,684 Intercompany receivable . . . . . . . . . . . 15,666 1,100,834 — — (1,116,500) —
Total current assets . . . . . . . . . . . . . 42,830 1,132,765 40,207 20 (1,116,500) 99,322 Oil and gas properties, net, at cost under the successful efforts method . . . . . . . . . . . — — 1,743,588 — — 1,743,588 Other property, plant and equipment, net . — — 2,378 618 — 2,996 Commodity derivative assets . . . . . . . . . . . — 34,744 — — — 34,744 Other assets . . . . . . . . . . . . . . . . . . . . . . . . — 5,265 785 — — 6,050 Investment in subsidiaries . . . . . . . . . . . . . 531,363 453,237 — — (984,600) —
Total assets . . . . . . . . . . . . . . . . . . . $ 574,193 $ 1,626,011 $ 1,786,958 $ 638 $ (2,101,100) $ 1,886,700 Liabilities and Stockholders’ Equity Current liabilities
Trade accounts payable . . . . . . . . . . . . $ — $ 13 $ 36,514 $ — $ — $ 36,527 Oil and gas sales payable . . . . . . . . . . . — — 28,339 — — 28,339 Accrued liabilities . . . . . . . . . . . . . . . . 3,874 11,227 10,597 9 — 25,707 Commodity derivative liabilities . . . . . — 14,650 — — — 14,650 Other current liabilities . . . . . . . . . . . . . — 1,984 600 — — 2,584 Intercompany payable . . . . . . . . . . . . . — — 1,113,704 2,796 (1,116,500) —
Total current liabilities . . . . . . . . . . 3,874 27,874 1,189,754 2,805 (1,116,500) 107,807 Long-term debt . . . . . . . . . . . . . . . . . . . . . — 724,009 — — — 724,009 Deferred revenue . . . . . . . . . . . . . . . . . . . . — 7,049 — — — 7,049 Commodity derivative liabilities . . . . . . . . — 1,209 — — — 1,209 Asset retirement obligations . . . . . . . . . . . — — 19,458 — — 19,458 Liability under tax receivable agreement . . 43,045 — — — — 43,045 Other liabilities . . . . . . . . . . . . . . . . . . — 269 523 — — 792 Deferred tax liabilities . . . . . . . . . . . . . . . . 85 2,820 — — — 2,905
Total liabilities . . . . . . . . . . . . . . . . 47,004 763,230 1,209,735 2,805 (1,116,500) 906,274 Mezzanine equity
Series A preferred stock, $0.001 par value; 1,840,000 shares issued and outstanding at December 31, 2016 . . . . 88,975 — — — — 88,975
Stockholders’/ members' equity (deficit) Members' equity . . . . . . . . . . . . . . . . . . . . — 862,781 577,223 (2,167) (1,437,837) —
Class A common stock, $0.001 par value; 57,048,076 shares issued and 57,025,474 shares outstanding at December 31, 2016 . . . . . . . . . . . . . . . 57 — — — — 57 Class B common stock, $0.001 par value; 29,832,098 shares issued and outstanding at December 31, 2016 . . . . 30 — — — — 30
Treasury stock, at cost: 22,602 shares at December 31, 2016 . . . . . . . . . . . . . . . . . . (358) — — — — (358)
Additional paid-in-capital . . . . . . . . . . . 447,137 — — — — 447,137 Retained earnings (deficit) . . . . . . . . . . (8,652) — — — — (8,652)
Stockholders' equity (deficit) . . . . . . . . . . . 438,214 862,781 577,223 (2,167) (1,437,837) 438,214
Non-controlling interest . . . . . . . . . . . . . . . — — — — 453,237 453,237 Total stockholders’ equity . . . . . . . . 438,214 862,781 577,223 (2,167) (984,600) 891,451 Total liabilities and stockholders’ equity . . . . . . . . . . . . . . . . . . . . . . . $ 574,193 $ 1,626,011 $ 1,786,958 $ 638 $ (2,101,100) $ 1,886,700

F-42
Jones Energy, Inc.
Condensed Consolidating Statement of Operations Year Ended December 31, 2017
Guarantor Non-Guarantor (in thousands of dollars) JEI (Parent) Issuers Subsidiaries Subsidiaries Eliminations Consolidated
Operating revenues Oil and gas sales . . . . . . . . . . . . . . . . . . $ — $ — $ 186,393 $ — $ — $ 186,393 Other revenues . . . . . . . . . . . . . . . . . . . . — 1,854 326 — — 2,180 Total operating revenues . . . . . . . . . . . . — 1,854 186,719 — — 188,573 Operating costs and expenses Lease operating . . . . . . . . . . . . . . . . . . . — — 36,636 — — 36,636 Production and ad valorem taxes . . . . . — — 6,874 — — 6,874 Exploration . . . . . . . . . . . . . . . . . . . . . . — — 14,145 — — 14,145 Depletion, depreciation and
amortization . . . . . . . . . . . . . . . . . . . . — — 167,133 91 — 167,224 Impairment of oil and gas properties . . — — 149,648 — — 149,648 Accretion of ARO liability . . . . . . . . . . — — 960 — — 960 General and administrative . . . . . . . . . . 237 10,146 19,226 283 — 29,892 Total operating expenses . . . . . . . . . . . 237 10,146 394,622 374 — 405,379 Operating income (loss) . . . . . . . . . . . . (237) (8,292) (207,903) (374) — (216,806) Other income (expense) Interest expense . . . . . . . . . . . . . . . . . . . — (52,016) 365 — — (51,651) Net gain (loss) on commodity
derivatives . . . . . . . . . . . . . . . . . . . . . . — (17,985) — — — (17,985) Other income (expense) . . . . . . . . . . . . 59,492 (93) (2,447) — — 56,952 Other income (expense), net . . . . . . . . . 59,492 (70,094) (2,082) — — (12,684) Income (loss) before income tax . . . . . 59,255 (78,386) (209,985) (374) — (229,490) Equity interest in income (loss) . . . . . . (211,217) (77,527) — — 288,744 — Income tax provision (benefit) . . . . . . . (50,470) (197) — — — (50,667) Net income (loss) . . . . . . . . . . . . . . . . . (101,492) (155,716) (209,985) (374) 288,744 (178,823) Net income (loss) attributable to
non-controlling interests . . . . . . . . . . — — — — (77,331) (77,331) Net income (loss) attributable to
controlling interests . . . . . . . . . . . . . $ (101,492) $ (155,716) $ (209,985) $ (374) $ 366,075 $ (101,492) Dividends and accretion on preferred
stock . . . . . . . . . . . . . . . . . . . . . . . . . . (7,924) — — — — (7,924) Net income (loss) attributable to
common shareholders . . . . . . . . . . . $ (109,416) $ (155,716) $ (209,985) $ (374) $ 366,075 $ (109,416)

F-43
Jones Energy, Inc. Condensed Consolidating Statement of Operations
Year Ended December 31, 2016
Guarantor Non-Guarantor (in thousands of dollars) JEI (Parent) Issuers Subsidiaries Subsidiaries Eliminations Consolidated
Operating revenues Oil and gas sales . . . . . . . . . . . . . . . . . . $ — $ — $ 124,877 $ — $ — $ 124,877 Other revenues . . . . . . . . . . . . . . . . . . . . — 2,384 586 — — 2,970 Total operating revenues . . . . . . . . . . . . — 2,384 125,463 — — 127,847 Operating costs and expenses Lease operating . . . . . . . . . . . . . . . . . . . — — 32,640 — — 32,640 Production and ad valorem taxes . . . . . — — 7,768 — — 7,768 Exploration . . . . . . . . . . . . . . . . . . . . . . — — 6,673 — — 6,673 Depletion, depreciation and amortization . . . . . . . . . . . . . . . . . . . . . . — — 153,843 87 — 153,930 Accretion of ARO liability . . . . . . . . . . — — 1,263 — — 1,263 General and administrative . . . . . . . . . — 12,028 17,244 368 — 29,640 Other operating . . . . . . . . . . . . . . . . . . . — 199 — 199 Total operating expenses . . . . . . . . . . . — 12,028 219,630 455 — 232,113 Operating income (loss) . . . . . . . . . . . . — (9,644) (94,167) (455) — (104,266) Other income (expense) Interest expense . . . . . . . . . . . . . . . . . . . — (53,080) (47) — — (53,127) Gain on debt extinguishment . . . . . . . . — 99,530 — — — 99,530 Net gain (loss) on commodity derivatives . . . . . . . . . . . . . . . . . . . . . . . — (51,264) — — — (51,264) Other income (expense) . . . . . . . . . . . . 784 (321) 73 — — 536 Other income (expense), net . . . . . . . . . 784 (5,135) 26 — — (4,325) Income (loss) before income tax . . . . . 784 (14,779) (94,141) (455) — (108,591) Equity interest in income (loss) . . . . . . (66,804) (42,571) — — 109,375 — Income tax provision (benefit) . . . . . . . (23,468) (318) — — — (23,786) Net income (loss) . . . . . . . . . . . . . . . . . (42,552) (57,032) (94,141) (455) 109,375 (84,805) Net income (loss) attributable to non-controlling interests . . . . . . . . . . . . — — — — (42,253) (42,253) Net income (loss) attributable to controlling interests . . . . . . . . . . . . . . . $ (42,552) $ (57,032) $ (94,141) $ (455) $ 151,628 $ (42,552) Dividends and accretion on preferred stock . . . . . . . . . . . . . . . . . . . . . . . . . . . . (2,669) — — — — (2,669) Net income (loss) attributable to common shareholders . . . . . . . . . . . . . $ (45,221) $ (57,032) $ (94,141) $ (455) $ 151,628 $ (45,221)

F-44
Jones Energy, Inc.
Condensed Consolidating Statement of Operations Year Ended December 31, 2015
Guarantor Non-Guarantor (in thousands of dollars) JEI (Parent) Issuers Subsidiaries Subsidiaries Eliminations Consolidated
Operating revenues Oil and gas sales . . . . . . . . . . . . . . . . . . $ — $ — $ 194,555 $ — $ — $ 194,555 Other revenues . . . . . . . . . . . . . . . . . . . — 1,960 884 — — 2,844 Total operating revenues . . . . . . . . . . . — 1,960 195,439 — — 197,399 Operating costs and expenses Lease operating . . . . . . . . . . . . . . . . . . . — — 41,027 — — 41,027 Production and ad valorem taxes . . . . — — 12,130 — — 12,130 Exploration . . . . . . . . . . . . . . . . . . . . . . — — 6,551 — — 6,551 Depletion, depreciation and amortization . . . . . . . . . . . . . . . . . . . . . — — 205,407 91 — 205,498 Accretion of ARO liability . . . . . . . . . — — 1,087 — — 1,087 General and administrative . . . . . . . . . — 13,565 19,707 116 — 33,388 Other operating . . . . . . . . . . . . . . . . . . . — — 4,188 — — 4,188 Total operating expenses . . . . . . . . . . . — 13,565 290,097 207 — 303,869 Operating income (loss) . . . . . . . . . . . . — (11,605) (94,658) (207) — (106,470) Other income (expense) Interest expense . . . . . . . . . . . . . . . . . . — (63,160) (1,298) — — (64,458) Net gain (loss) on commodity derivatives . . . . . . . . . . . . . . . . . . . . . . . — 158,753 — — — 158,753 Other income (expense) . . . . . . . . . . . . 1,984 (1,663) (4) — — 317 Other income (expense), net . . . . . . . . 1,984 93,930 (1,302) — — 94,612 Income (loss) before income tax . . . . . 1,984 82,325 (95,960) (207) — (11,858) Equity interest in income (loss) . . . . . . (4,728) (9,114) — — 13,842 — Income tax provision (benefit) . . . . . . . (363) (2,418) — — — (2,781) Net income (loss) . . . . . . . . . . . . . . . . . (2,381) 75,629 (95,960) (207) 13,842 (9,077) Net income (loss) attributable to non-controlling interests . . . . . . . . . . . — — — — (6,696) (6,696) Net income (loss) attributable to controlling interests . . . . . . . . . . . . . . $ (2,381) $ 75,629 $ (95,960) $ (207) $ 20,538 $ (2,381) Dividends and accretion on preferred stock . . . . . . . . . . . . . . . . . . . . . . . . . . . . — — — — — — Net income (loss) attributable to common shareholders . . . . . . . . . . . . . $ (2,381) $ 75,629 $ (95,960) $ (207) $ 20,538 $ (2,381)

F-45
Jones Energy, Inc. Condensed Consolidating Statement of Cash Flows
Year Ended December 31, 2017
Non- Guarantor Guarantor (in thousands of dollars) JEI (Parent) Issuers Subsidiaries Subsidiaries Eliminations Consolidated
Cash flows from operating activities Net income (loss). . . . . . . . . . . . . . . . . . . . . $ (101,492) $ (155,716) $ (209,985) $ (374) $ 288,744 $ (178,823) Adjustments to reconcile net income (loss) to net cash provided by operating activities . . . . . . . . . . . . . . . . . . . . . . . . . . . . 73,536 52,870 399,795 374 (288,744) 237,831
Net cash (used in) / provided by operations . . . . . . . . . . . . . . . . . . . . . . . . (27,956) (102,846) 189,810 — — 59,008
Cash flows from investing activities Additions to oil and gas properties . . . . . . . — — (245,364) — — (245,364) Net adjustments to purchase price of properties acquired . . . . . . . . . . . . . . . . . . . — — 2,391 — — 2,391 Proceeds from sales of assets . . . . . . . . . . . — — 61,290 — — 61,290 Acquisition of other property, plant and equipment . . . . . . . . . . . . . . . . . . . . . . . . . . . — — (586) — — (586) Current period settlements of matured derivative contracts . . . . . . . . . . . . . . . . . . . — 72,265 — — — 72,265
Net cash (used in) / provided by investing . . . . . . . . . . . . . . . . . . . . . . . . . — 72,265 (182,269) — — (110,004)
Cash flows from financing activities Proceeds from issuance of long-term debt . — 162,000 — — — 162,000 Repayment of long-term debt . . . . . . . . . . . — (129,000) — — — (129,000) Payment of debt issuance costs . . . . . . . . . — (1,115) — — — (1,115) Payment of cash dividends on preferred stock . . . . . . . . . . . . . . . . . . . . . . . . . . . . . . . (3,368) — — — — (3,368) Net distributions paid to JEH unitholders . 1,075 (1,637) — — — (562) Net payments for share based compensation . . . . . . . . . . . . . . . . . . . . . . . . — (462) — — — (462) Proceeds from sale of common stock . . . . 8,333 — — — — 8,333
Net cash (used in) / provided by financing . . . . . . . . . . . . . . . . . . . . . . . . . 6,040 29,786 — — — 35,826 Net increase (decrease) in cash . . . . . . . (21,916) (795) 7,541 — — (15,170)
Cash Beginning of period . . . . . . . . . . . . . . . . . . . 27,164 1,975 5,483 20 — 34,642 End of period . . . . . . . . . . . . . . . . . . . . . . . . $ 5,248 $ 1,180 $ 13,024 $ 20 $ — $ 19,472

F-46
Jones Energy, Inc. Condensed Consolidating Statement of Cash Flows
Year Ended December 31, 2016
Non- Guarantor Guarantor (in thousands of dollars) JEI (Parent) Issuers Subsidiaries Subsidiaries Eliminations Consolidated
Cash flows from operating activities Net income (loss) . . . . . . . . . . . . . . . . . . . . . $ (42,552) $ (57,032) $ (94,141) $ (455) $ 109,375 $ (84,805) Adjustments to reconcile net income (loss) to net cash provided by operating activities . . . . . . . . . . . . . . . . . . . . . . . . . . . . (105,877) (28,124) 353,426 455 (109,375) 110,505
Net cash (used in) / provided by operations . . . . . . . . . . . . . . . . . . . . . . . . (148,429) (85,156) 259,285 — — 25,700
Cash flows from investing activities Additions to oil and gas properties . . . . . . . — — (264,462) — — (264,462) Proceeds from sales of assets . . . . . . . . . . . — — 1,645 — — 1,645 Acquisition of other property, plant and equipment . . . . . . . . . . . . . . . . . . . . . . . . . . . — — (310) — — (310) Current period settlements of matured derivative contracts . . . . . . . . . . . . . . . . . . . — 132,265 — — — 132,265
Net cash (used in) / provided by investing . . . . . . . . . . . . . . . . . . . . . . . . . — 132,265 (263,127) — — (130,862)
Cash flows from financing activities Proceeds from issuance of long-term debt . — 130,000 — — — 130,000 Repayment under long-term debt . . . . . . . . — (62,000) — — — (62,000) Purchase of senior notes . . . . . . . . . . . . . . . — (84,589) — — — (84,589) Payment of dividends on preferred stock . (1,615) — — — — (1,615) Net distributions paid to JEH unitholders . 23,674 (40,993) — — — (17,319) Proceeds from sale of common stock . . . . 65,446 — — — — 65,446 Proceeds from sale of preferred stock . . . . 87,988 — — — — 87,988
Net cash (used in) / provided by financing . . . . . . . . . . . . . . . . . . . . . . . . . 175,493 (57,582) — — — 117,911 Net increase (decrease) in cash . . . . . . . 27,064 (10,473) (3,842) — — 12,749
Cash Beginning of period . . . . . . . . . . . . . . . . . . . 100 12,448 9,325 20 — 21,893 End of period . . . . . . . . . . . . . . . . . . . . . . . . $ 27,164 $ 1,975 $ 5,483 $ 20 $ — $ 34,642

F-47
Jones Energy, Inc. Condensed Consolidating Statement of Cash Flows
Year Ended December 31, 2015
Non- Guarantor Guarantor (in thousands of dollars) JEI (Parent) Issuers Subsidiaries Subsidiaries Eliminations Consolidated
Cash flows from operating activities Net income (loss) . . . . . . . . . . . . . . . . . . . . $ (2,381) $ 75,629 $ (95,960) $ (207) $ 13,842 $ (9,077) Adjustments to reconcile net income (loss) to net cash provided by operating activities . . . . . . . . . . . . . . . . . . . . . . . . . . . (120,398) (193,245) 405,214 197 (13,842) 77,926
Net cash (used in) / provided by operations . . . . . . . . . . . . . . . . . . . . . (122,779) (117,616) 309,254 (10) — 68,849
Cash flows from investing activities Additions to oil and gas properties . . . . . . — — (311,305) — — (311,305) Proceeds from sales of assets . . . . . . . . . . — — 41 — — 41 Acquisition of other property, plant and equipment . . . . . . . . . . . . . . . . . . . . . . . . . . — — (1,101) — — (1,101) Current period settlements of matured derivative contracts . . . . . . . . . . . . . . . . . . — 144,145 — — — 144,145
Net cash (used in) / provided by investing . . . . . . . . . . . . . . — 144,145 (312,365) — — (168,220)
Cash flows from financing activities Proceeds from issuance of long-term debt . — 85,000 — — — 85,000 Repayment under long-term debt . . . . . . . — (335,000) — — — (335,000) Proceeds from senior notes . . . . . . . . . . . . . — 236,475 — — — 236,475 Payment of debt issuance costs . . . . . . . . . — (1,556) — — — (1,556) Proceeds from sale of common stock . . . . 122,779 — — — — 122,779
Net cash (used in) / provided by financing . . . . . . . . . . . . . . 122,779 (15,081) — — — 107,698 Net increase (decrease) in cash . . . . . . . — 11,448 (3,111) (10) — 8,327
Cash Beginning of period . . . . . . . . . . . . . . . . . . 100 1,000 12,436 30 — 13,566 End of period . . . . . . . . . . . . . . . . . . . . . . . $ 100 $ 12,448 $ 9,325 $ 20 $ — $ 21,893

F-48
Jones Energy, Inc. Supplemental Information on Oil and Gas Producing Activities (Unaudited)
Geographic Area of Operation
All of our proved reserves are located in the mid-continent United States, spanning areas of Oklahoma and Texas. Therefore, the following disclosures are on a total-company basis.
Costs Incurred
Costs incurred for oil and gas property acquisitions, exploration and development for the last three years are as follows:
(in thousands of dollars) 2017 2016 2015
Property acquisitions: Unproved . . . . . . . . . . . . . . . . . . . . . . . . . . . . . . . . . . . $ 26,110 $ 137,844 $ 4,036 Proved . . . . . . . . . . . . . . . . . . . . . . . . . . . . . . . . . . . . . . 6,887 51,388 —
Exploration . . . . . . . . . . . . . . . . . . . . . . . . . . . . . . . . . . . . 3,129 412 6,551 Development . . . . . . . . . . . . . . . . . . . . . . . . . . . . . . . . . . . 215,040 79,617 202,342
Total costs incurred (1) . . . . . . . . . . . . . . . . . . . . . . . . $ 251,166 $ 269,261 $ 212,929
(1) Excludes the impact of asset retirement costs.
Capitalized Costs
Capitalized costs for our oil and gas properties consisted of the following at the end of each of the following years:
(in thousands of dollars) 2017 2016
Unproved properties . . . . . . . . . . . . . . . . . . . . . . . . . . . . . . . . . . . . . . $ 164,087 $ 213,153 Proved properties . . . . . . . . . . . . . . . . . . . . . . . . . . . . . . . . . . . . . . . . 2,327,629 2,449,974 2,491,716 2,663,127 Accumulated depletion and impairment . . . . . . . . . . . . . . . . . . . . . . (894,676) (919,539) Net capitalized costs . . . . . . . . . . . . . . . . . . . . . . . . . . . . . . . . . . . . . . $ 1,597,040 $ 1,743,588
Reserves
Users of this information should be aware that the process of estimating quantities of proved and proved developed oil and gas reserves (including natural gas liquids) is very complex, requiring significant subjective decisions in the evaluation of all available geological, engineering and economic data for each reservoir. The data for a given reservoir also may change substantially over time as a result of numerous factors, including additional development activity, evolving production history and continual reassessment of the viability of production under varying economic conditions. Consequently, material revisions to existing reserve estimates may occur from time to time.
The following tables set forth the Company’s total proved reserves and the changes in the Company’s total proved reserves. These reserve estimates are based in part on reports prepared by Cawley, Gillespie & Associates, Inc. (“Cawley Gillespie”), independent petroleum engineers, utilizing data compiled by us. In preparing its reports, Cawley Gillespie evaluated properties representing all of the Company’s proved reserves at December 31, 2017, 2016, and 2015. The Company’s proved reserves are located onshore in the United States. There are many uncertainties inherent in estimating proved reserve quantities, and projecting future production rates and the timing of future development expenditures. In addition, reserve estimates of new discoveries are more imprecise than those of properties with production history. Accordingly, these estimates are subject to change as additional information becomes available. Proved reserves are the estimated quantities of natural gas, natural gas liquids and oil that geoscience and engineering data demonstrate with reasonable certainty to be economically producible in future years from known oil and natural gas reservoirs under existing economic conditions, operating methods and government regulations at the end of the respective years. Proved

F-49
developed reserves are those reserves expected to be recovered through existing wells with existing equipment and operating methods.
The following table summarizes changes in estimated proved reserves from December 31, 2014 to December 31, 2017 by commodity type:
Crude Oil NGL Natural Gas Total (MBbls) (MBbls) (MMcf) (MBoe)(1)
Estimated Proved Reserves December 31, 2014 . . . . . . . . . . . . . . . . . . . . . . . . . . 27,683 38,870 292,277 115,266
Extensions and discoveries . . . . . . . . . . . . . . . . . 1,793 1,691 11,793 5,450 Production . . . . . . . . . . . . . . . . . . . . . . . . . . . . . . . (2,582) (2,618) (23,839) (9,174) Purchases of minerals in place . . . . . . . . . . . . . . — — — — Sales of minerals in place . . . . . . . . . . . . . . . . . . — — — — Revisions of previous estimates . . . . . . . . . . . . . (1,486) (5,294) (18,635) (9,885)
December 31, 2015 . . . . . . . . . . . . . . . . . . . . . . . . . . 25,408 32,649 261,596 101,657 Extensions and discoveries . . . . . . . . . . . . . . . . . 774 750 4,767 2,319 Production . . . . . . . . . . . . . . . . . . . . . . . . . . . . . . . (1,690) (2,210) (18,878) (7,046) Purchases of minerals in place . . . . . . . . . . . . . . 2,326 3,829 42,713 13,275 Sales of minerals in place . . . . . . . . . . . . . . . . . . (37) — (1) (37) Revisions of previous estimates . . . . . . . . . . . . . (3,187) (593) (7,057) (4,959)
December 31, 2016 . . . . . . . . . . . . . . . . . . . . . . . . . . 23,594 34,425 283,140 105,209 Extensions and discoveries . . . . . . . . . . . . . . . . . 9,493 8,752 62,514 28,663 Production . . . . . . . . . . . . . . . . . . . . . . . . . . . . . . . (1,964) (2,418) (20,425) (7,786) Purchases of minerals in place . . . . . . . . . . . . . . — — — — Sales of minerals in place . . . . . . . . . . . . . . . . . . (114) (4,442) (54,670) (13,668) Revisions of previous estimates . . . . . . . . . . . . . (1,995) (3,044) (15,411) (7,606)
December 31, 2017 . . . . . . . . . . . . . . . . . . . . . . . . . . 29,014 33,273 255,148 104,812
(1) Barrels of oil equivalent determined using the ratio of six Mcf of natural gas to one Bbl of crude oil or
natural gas liquids.
For the year ended December 31, 2017, the Company added 28,663 MBoe through extensions, which represent the conversion of unproved reserves to proved reserves as a result of our drilling activity during the year, primarily in the Merge area. There were no discoveries of proved reserves. The Company’s estimated proved reserves were reduced by current year production of 7,786 MBoe. The Company had sales of minerals in place of 13,668 MBoe during the year ended December 31, 2017, primarily as a result of the Arkoma Divestiture. No purchases of minerals in place occurred during the year ended December 31, 2017.
For the year ended December 31, 2017, the Company had net negative revisions of 7,606 MBoe, of which 10,730 MBoe was related to Western Anadarko proved undeveloped reserves no longer expected to be developed within five years of first booking or before the lease expired. This was offset by net positive revisions related to commodity pricing of 3,612 Mboe. The remaining net negative revisions of 488 MBoe were primarily related to negative Western Anadarko well performance.
For the year ended December 31, 2016, the Company added 2,319 MBoe through extensions, which represent the conversion of unproved reserves to proved reserves as a result of our drilling activity during the year. There were no discoveries of proved reserves. The Company’s estimated proved reserves were reduced by current year production of 7,046 MBoe. The Company added 13,275 MBoe through the purchases of minerals in place. Purchases were primarily related to leasing and the asset purchases in the Western Anadarko Basin. The Company also had sales of minerals in place of 37 MBoe during the year ended December 31, 2016.
For the year ended December 31, 2016, the Company had net negative revisions of 4,959 MBoe, of which 1,685 MBoe was related to commodity pricing and 4,155 MBoe was related to proved undeveloped reserves revisions. The remaining net positive revisions of 881 MBoe were primarily related to changes in working interest, cost reductions, and production performance enhancements.

F-50
For the year ended December 31, 2015, the Company added 5,450 MBoe through extensions, which represent the conversion of unproved reserves to proved reserves as a result of our drilling activity during the year. There were no discoveries of proved reserves. The Company’s estimated proved reserves were reduced by current year production of 9,174 MBoe. No purchases or sales of minerals in place occurred during the year ended December 31, 2015.
For the year ended December 31, 2015, the Company had net negative revisions of 9,885 MBoe, of which 56,330 MBoe was related to commodity pricing. The remaining net positive revisions of 46,445 MBoe were primarily related to reduced future development costs and production performance improvements.
The following table summarizes estimated proved developed and undeveloped reserves by commodity type as of December 31, 2017, 2016 and 2015:
Crude Oil NGL Natural Gas Total (MBbls) (MBbls) (MMcf) (MBoe)(1)
Estimated Proved Reserves December 31, 2015
Proved developed . . . . . . . . . . . . . . . . . . . . . . . . . 11,032 19,670 169,651 58,977 Proved undeveloped . . . . . . . . . . . . . . . . . . . . . . . 14,376 12,980 91,945 42,680 Total proved reserves . . . . . . . . . . . . . . . . . . . . . . 25,408 32,650 261,596 101,657
December 31, 2016 Proved developed . . . . . . . . . . . . . . . . . . . . . . . . . 11,471 20,941 180,293 62,461 Proved undeveloped . . . . . . . . . . . . . . . . . . . . . . . 12,123 13,484 102,847 42,748 Total proved reserves . . . . . . . . . . . . . . . . . . . . . . 23,594 34,425 283,140 105,209
December 31, 2017 Proved developed . . . . . . . . . . . . . . . . . . . . . . . . . 15,416 20,181 159,459 62,173 Proved undeveloped . . . . . . . . . . . . . . . . . . . . . . . 13,598 13,092 95,690 42,639 Total proved reserves . . . . . . . . . . . . . . . . . . . . . . 29,014 33,273 255,148 104,812
(1) Barrels of oil equivalent determined using the ratio of six Mcf of natural gas to one Bbl of crude oil or
natural gas liquids.
Standardized Measure of Discounted Future Net Cash Flows Relating to Proved Oil and Gas Reserves
The following information was developed utilizing procedures prescribed by FASB Accounting Standards Codification Topic 932, Extractive Industries—Oil and Gas (Topic 932). The “standardized measure of discounted future net cash flows” should not be viewed as representative of the current value of our proved oil and gas reserves. It and the other information contained in the following tables may be useful for certain comparative purposes, but should not be solely relied upon in evaluating the Company or its performance.
In reviewing the information that follows, the following factors should be taken into account:
• future costs and sales prices will probably differ from those required to be used in these calculations;
• actual production rates for future periods may vary significantly from the rates assumed in the calculations;
• future tax rates, deductions and credits are calculated under current laws, which may change in future years;
• a 10% discount rate may not be reasonable relative to risk inherent in realizing future net oil and natural gas revenues.
Under the standardized measure, future cash inflows were estimated by using the average of the historical unweighted first-day-of-the-month prices of oil and natural gas for the prior twelve month periods ended December 31, 2017, 2016, and 2015. Future cash inflows do not reflect the impact of open hedge positions. Future cash inflows were reduced by estimated future development and production costs based on year-end costs in order to arrive at net cash flows. Use of a 10% discount rate, first-day-of-the-month prices and year-end costs are required by ASC 932.

F-51
In general, management does not rely on the following information in making investment and operating decisions. Such decisions are based upon a wide range of factors, including estimates of probable as well as proved reserves and varying price and cost assumptions considered more representative of a range of possible outcomes.
The standardized measure of discounted future net cash flows from the Company’s estimated proved oil and natural gas reserves follows:
(in thousands of dollars) 2017 2016 2015
Future cash inflows . . . . . . . . . . . . . . . . . . . . . . . . . . . $ 2,551,709 $ 2,158,067 $ 2,373,971 Less related future:
Production costs . . . . . . . . . . . . . . . . . . . . . . . . . . (791,302) (798,161) (821,773) Development costs . . . . . . . . . . . . . . . . . . . . . . . . (460,496) (451,790) (483,060) Income tax expenses (1) . . . . . . . . . . . . . . . . . . . (142,196) (46,139) (31,537)
Future net cash flows . . . . . . . . . . . . . . . . . . . . . . . . . 1,157,715 861,977 1,037,601 10% annual discount for estimated timing of cash flows . . . . . . . . . . . . . . . . . . . . . . . . . . . . . . . . . . . . . . . (592,194) (478,498) (572,821) Standardized measure of discounted future net cash flows . . . . . . . . . . . . . . . . . . . . . . . . . . . . . . . . . . $ 565,521 $ 383,479 $ 464,780
(1) The increase in 2017 future income tax expense is due to the increase in future taxable income allocated to
the Company and the limits applicable to the utilization of net operating losses, offset by the decrease in applicable tax rate from 35% to 21% due to the changes in the US Tax Law effective January 1, 2018.
A summary of the changes in the standardized measure of discounted future net cash flows applicable to proved natural gas and crude oil reserves follows:
(in thousands of dollars) 2017 2016 2015
Balance, beginning of period . . . . . . . . . . . . . . . . . . . . $ 383,479 $ 464,780 $ 1,388,096 Net change in sales and transfer prices, net of production expenses . . . . . . . . . . . . . . . . . . . . . . . . . . . 127,748 (90,932) (1,063,248) Changes in estimated future development costs . . . . . (11,838) 32,678 96,408 Sales and transfers of oil and gas produced during the period . . . . . . . . . . . . . . . . . . . . . . . . . . . . . . . . . . . . (145,801) (94,262) (176,301) Net change due to extensions and discoveries . . . . . . 110,752 24 6,236 Net change due to purchases of minerals in place . . . — 18,473 — Net change due to sales of minerals in place . . . . . . . . (51,573) (1,202) — Net change due to revisions in quantity estimates . . . (5,526) (51,237) (153,689) Previously estimated development costs incurred during the period . . . . . . . . . . . . . . . . . . . . . . . . . . . . . . 197,444 73,735 143,560 Net change in income taxes . . . . . . . . . . . . . . . . . . . . . (43,193) (12,824) 108,409 Accretion of discount . . . . . . . . . . . . . . . . . . . . . . . . . . 27,943 37,475 120,047 Other . . . . . . . . . . . . . . . . . . . . . . . . . . . . . . . . . . . . . . . (23,914) 6,771 (4,738) Balance, end of period . . . . . . . . . . . . . . . . . . . . . . . . . $ 565,521 $ 383,479 $ 464,780

F-52
Supplemental Quarterly Financial Information (Unaudited)
Following is a summary of the Company’s results of operations by quarter for the years ended December 31, 2017 and 2016.
2017 First Second Third Fourth Full (in thousands except per share data) Quarter Quarter (1) Quarter Quarter Year
Revenues . . . . . . . . . . . . . . . . . . $ 41,233 $ 48,626 $ 44,202 $ 54,512 $ 188,573 Operating income (loss) . . . . . . (13,507) (172,565) (24,407) (6,327) (216,806)Net income (loss) . . . . . . . . . . . (3,515) (133,978) (82,963) 41,633 (178,823)Net income (loss) attributable to non-controlling interests . . . . (2,128) (51,762) (18,157) (5,284) (77,331)Net income (loss) attributable to controlling interests . . . . . . . (1,387) (82,216) (64,806) 46,917 (101,492)Basic earnings per share . . . . . . $ (0.05) $ (1.39) $ (0.91) $ 0.51 $ (1.51)Diluted earnings per share . . . . $ (0.05) $ (1.39) $ (0.91) $ 0.51 $ (1.51)
________________________________________ (1) The Company has revised the Quarterly Financial Information for the second quarter of 2017 to correct for the error related to the impairment associated with the Arkoma divestiture (as defined in Note 3) as previously discussed in the the Company’s Quarterly Report on Form 10-Q for the quarterly period ended September 30, 2017 filed with the Securities and Exchange Commission on November 8, 2017. This error resulted in a $13.9 million overstatement of the Impairment of oil and gas properties, as well as a $2.3 million understatement of the Liability under the tax receivable agreement.
2016 First Second Third Fourth Full
(in thousands except per share data) Quarter Quarter Quarter Quarter Year
Revenues . . . . . . . . . . . . . . . . . . . . $ 25,858 $ 29,144 $ 33,353 $ 39,492 $ 127,847 Operating income . . . . . . . . . . . . . (34,081) (26,765) (20,564) (22,856) (104,266) Net income (loss) . . . . . . . . . . . . . 48,514 (58,646) (22,429) (52,244) (84,805) Net income (loss) attributable to non-controlling interests . . . . . . . . 29,603 (35,401) (12,576) (23,879) (42,253) Net income (loss) attributable to controlling interests . . . . . . . . . . . . 18,911 (23,245) (9,853) (28,365) (42,552) Basic earnings per share . . . . . . . . $ 0.57 $ (0.69) $ (0.24) $ (0.49) $ (1.04) Diluted earnings per share . . . . . . $ 0.57 $ (0.69) $ (0.24) $ (0.49) $ (1.04)


EXECUTIVE OFFICERS
BOARD OF DIRECTORS
CORPORATE INFO
JEFF TANNER Chief Operating Officer & Interim Chief Executive Officer
ROBERT J. BROOKS Executive Vice President & Chief Financial Officer
JONNY JONESChairman
MIKE S. MCCONNELLDirector
ALAN D. BELLDirector
JOHN LOVOIDirector
HALBERT S. WASHBURNDirector
PAUL B. LOYD JR.Director
SCOTT McCARTYDirector
CORPORATE HEADQUARTERS
Jones Energy, Inc. 807 Las Cimas Parkway, Suite 350 Austin, Texas 78746 Phone: 512.328.2953 Fax: 512.328.5394
TRANSFER AGENT
American Stock Transfer and Trust Company 6201 15th Avenue Brooklyn, NY 11219 www.amstock.com
STOCK EXCHANGEClass A common stock traded on the New York Stock Exchange under the symbol: JONE
FORM 10-K
For an additional copy of the Annual Report on Form 10-K, please contact:
JONES ENERGY, INC.
Investor Relations Department Phone: 512.328.2953 Email: [email protected]
WEBSITE ADDRESS www.jonesenergy.com
ANNUAL MEETING
The Annual Meeting for Jones Energy, Inc. shareholders will be held at our corporate headquarters in Austin, Texas, on May 22, 2018.
ABOUT JONES ENERGY
Jones Energy, Inc. (NYSE: JONE) is an Austin, Texas–based independent oil and gas company engaged in the development, production and acquisition of oil and natural gas properties in the Anadarko Basin of Texas and Oklahoma. We have grown rapidly by leveraging our horizontal drilling expertise and low-cost operations to develop our inventory.
OPERATIONS OVERVIEW
TX
OK
AUSTIN
EASTERN ANADARKO BASIN
WESTERN ANADARKO BASIN
KEY LANDFORMATION:
Cleveland
KEY LANDFORMATION:
Woodford Meramec
GROSS DRILLINGLOCATIONS:
5,443
GROSS DRILLINGLOCATIONS:
1,737
NET DRILLING LOCATIONS:
927
NET DRILLING LOCATIONS:
893
DAILYPRODUCTION:
2.8 MBoe/d
DAILYPRODUCTION:
15.2 MBoe/d
TOTAL NETACRES:
22,484
TOTAL NETACRES:
152,191
W E S TE R N A N A DA R KO BA S I N
E A S TE R N A N A DA R KO BA S I N
TOTAL PROVEDRESERVES
104.8 MMBOE
DAILYPRODUCTION
21,332 BOE/D
NET DRILLINGLOCATIONS
1,820
NET ACREAGE
193,569

J O N E SE N E R G Y2 0 1 7 A N N U A L R E P O R T
8 07 L A S C I M A S PA R K WAY, S U ITE 35 0
AU S T I N , TE X A S 7874 6