Woodward Governor Company - AnnualReports.com
119
CONTROLLING the power of ENERGY Woodward Governor Company | 2008 Annual Report
-
Upload
khangminh22 -
Category
Documents
-
view
0 -
download
0
Transcript of Woodward Governor Company - AnnualReports.com

CONTrOLLING the power of ENErGy
Woodward Governor Company | 2008 Annual Report

Energy is a catalyst for global economic growth.
Woodward’s technologies, through systems and components, focus on Energy Control and
Optimization Solutions for the aerospace, power and process industries, and transportation
markets that we serve.
Our systems manage energy in:
• fLuidS—complete fuel, hydraulic, and air management systems
• mOTiOn—electric and hydraulic actuation systems
• ELECTriCiTy— generation, distribution, protection and control, plus wind turbine and
other renewable power conversion
• COmbuSTiOn—precise fuel injection, ignition, and sensing technologies
We provide systems that maximize energy output while minimizing environmental impact—
controlling the power of energy, whatever the source.
the POwEr of wOODwArD
Financial HighlightsFiscal year ended September 30,
(In thousands except per share amounts and other year-end data) 2008 2007 2006 2005 2004
Operating results
Net sales $ 1,258,204 $ 1,042,337 $ 854,515 $ 827,726 $ 709,805
Net earnings 121,880 98,157 69,900 55,971 31,382
Basic per share amount 1.80 1.43 1.02 0.82 0.46
Diluted per share amount 1.75 1.39 0.99 0.80 0.45
CasH dividends per sHare 0.235 0.215 0.200 0.175 0.160
Year-end FinanCial pOsitiOn
Working capital 369,211 275,611 260,243 241,066 197,524
Total assets 927,017 829,767 735,497 705,466 654,294
Long-term debt, less current portion 33,337 45,150 58,379 72,942 88,452
Shareholders’ equity 629,628 544,431 478,689 432,469 385,861
OtHer Year-end data
Worker members 4,476 4,248 3,731 3,513 3,287
page 1 Woodward Governor Company | 2008 Annual Report
NET SALES(in millions)
0 350 700 1050 1400
’08
’07
’06
’05
’04
0 $350 $700 $1,050 $1,400
NET EARNINGS(in millions)
0 250 500 750 1000 1250
’08
’07
’06
’05
’04
0 $25 $50 $75 $100 $125

page 2 Woodward Governor Company | 2008 Annual Report
Woodward understands the value of
integrated systems.
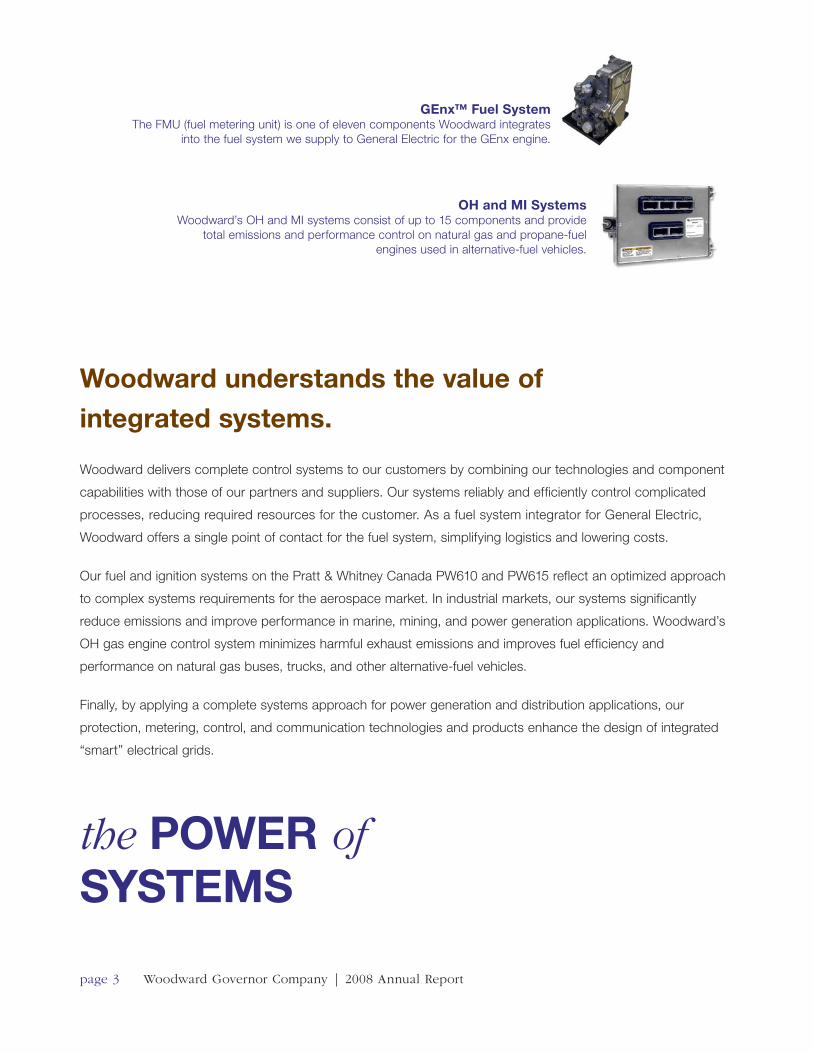
Woodward delivers complete control systems to our customers by combining our technologies and component
capabilities with those of our partners and suppliers. Our systems reliably and efficiently control complicated
processes, reducing required resources for the customer. As a fuel system integrator for General Electric,
Woodward offers a single point of contact for the fuel system, simplifying logistics and lowering costs.
Our fuel and ignition systems on the Pratt & Whitney Canada PW610 and PW615 reflect an optimized approach
to complex systems requirements for the aerospace market. In industrial markets, our systems significantly
reduce emissions and improve performance in marine, mining, and power generation applications. Woodward’s
OH gas engine control system minimizes harmful exhaust emissions and improves fuel efficiency and
performance on natural gas buses, trucks, and other alternative-fuel vehicles.
Finally, by applying a complete systems approach for power generation and distribution applications, our
protection, metering, control, and communication technologies and products enhance the design of integrated
“smart” electrical grids.
genx™ Fuel systemThe FMU (fuel metering unit) is one of eleven components Woodward integrates
into the fuel system we supply to General Electric for the GEnx engine.
OH and Mi systems Woodward’s OH and MI systems consist of up to 15 components and provide
total emissions and performance control on natural gas and propane-fuel engines used in alternative-fuel vehicles.
the pOWer of sYsteMs
page 3 Woodward Governor Company | 2008 Annual Report

page 4 Woodward Governor Company | 2008 Annual Report

COnCYCle® Wind turbine inverter systemsCONCYCLE provides ideal integration of variable speed wind turbine
generators with electrical utility systems.
ion sensing technologyIon sensing technology will be used to control the combustion process to reduce
emissions and increase stability.
Our markets depend on leading-edge technology.
Woodward engineers solve complex problems by applying scientific principles to create innovative designs.
With emission regulations driving the need for more controls, we work seamlessly with customers to offer
superior solutions that reduce emissions, improve fuel efficiency, and enhance performance.
Woodward has leveraged technologies and capabilities across the company to develop aftertreatment control
systems that will enable diesel engines to meet future emission regulations. Woodward is progressing toward
commercialization of ion sensing technology, which will offer improved dynamic performance at a lower cost
than current sensors used in aftertreatment and industrial turbine markets.
In the area of renewable energy, our CONCYCLE wind turbine inverter enables large-scale wind integration
on the electrical grid, meeting local and regional interconnection requirements through the use of highly efficient
patented technology.
the pOWer of innOvatiOn
page 5 Woodward Governor Company | 2008 Annual Report

page 6 Woodward Governor Company | 2008 Annual Report
delivering high-quality products on time is critical
to customer satisfaction.
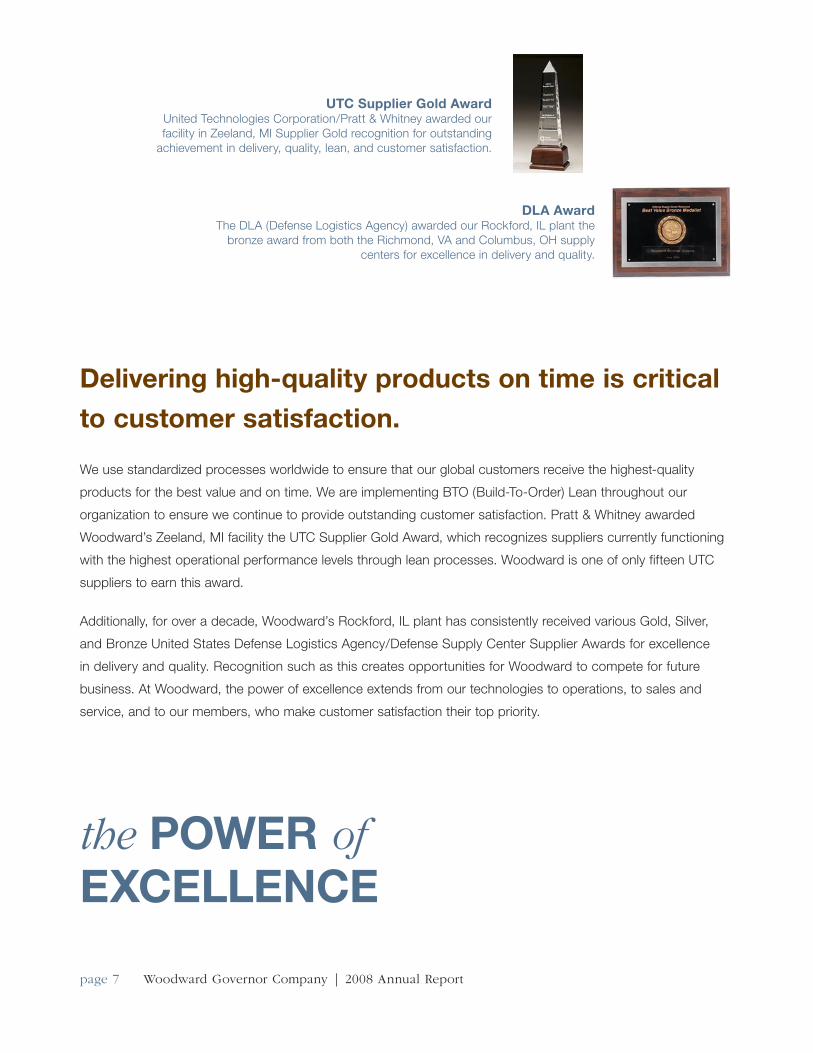
We use standardized processes worldwide to ensure that our global customers receive the highest-quality
products for the best value and on time. We are implementing BTO (Build-To-Order) Lean throughout our
organization to ensure we continue to provide outstanding customer satisfaction. Pratt & Whitney awarded
Woodward’s Zeeland, MI facility the UTC Supplier Gold Award, which recognizes suppliers currently functioning
with the highest operational performance levels through lean processes. Woodward is one of only fifteen UTC
suppliers to earn this award.
Additionally, for over a decade, Woodward’s Rockford, IL plant has consistently received various Gold, Silver,
and Bronze United States Defense Logistics Agency/Defense Supply Center Supplier Awards for excellence
in delivery and quality. Recognition such as this creates opportunities for Woodward to compete for future
business. At Woodward, the power of excellence extends from our technologies to operations, to sales and
service, and to our members, who make customer satisfaction their top priority.
dla awardThe DLA (Defense Logistics Agency) awarded our Rockford, IL plant the
bronze award from both the Richmond, VA and Columbus, OH supply centers for excellence in delivery and quality.
the pOWer of exCellenCe
utC supplier gold awardUnited Technologies Corporation/Pratt & Whitney awarded our facility in Zeeland, MI Supplier Gold recognition for outstanding
achievement in delivery, quality, lean, and customer satisfaction.
page 7 Woodward Governor Company | 2008 Annual Report

the pOWer of presenCe
page 8 Woodward Governor Company | 2008 Annual Report

Our customers are global, and so are their needs.
Woodward knows our customers need to locate in growth areas, so we are right there with them—
designing, manufacturing, and servicing our products. We continue to expand in Poland, China, Korea,
and India, and are establishing offices in the Middle East and Russia. Our global presence allows us to
respond quickly with solutions tailored to the local demands of our customers. Careful consideration of
environmental and cultural differences is key to establishing Woodward as a concerned global citizen.
Our internal teams are comprised of members from multiple locations as well—encouraging fresh ideas,
offering a variety of views on how to meet new challenges, and providing members the opportunity to
have a worldwide impact.
Our plants, offices, and service centers span the globe.
page 9 Woodward Governor Company | 2008 Annual Report

the pOWer of COMMitMent
page 10 Woodward Governor Company | 2008 Annual Report

Woodward products enable customer solutions to
reduce environmental impact.
We believe we must all do our part toward developing long-term solutions for energy availability and
sustainability while maintaining the quality of the environment. Environmental regulations are becoming
increasingly restrictive, and rightly so. Woodward remains committed to designing and manufacturing
products that minimize emissions, increase efficiency, and improve reliability. From development of
aftertreatment control systems to the conversion of wind energy, to safe and dependable electrical
power, Woodward is working to protect the environment by providing our customers with products
unmatched in the marketplace. Woodward is committed to investing in research and development,
as well as other opportunities, in an effort to continue to introduce environmentally sound products.
We help our customers maintain sound environmental practices.
page 11 Woodward Governor Company | 2008 Annual Report
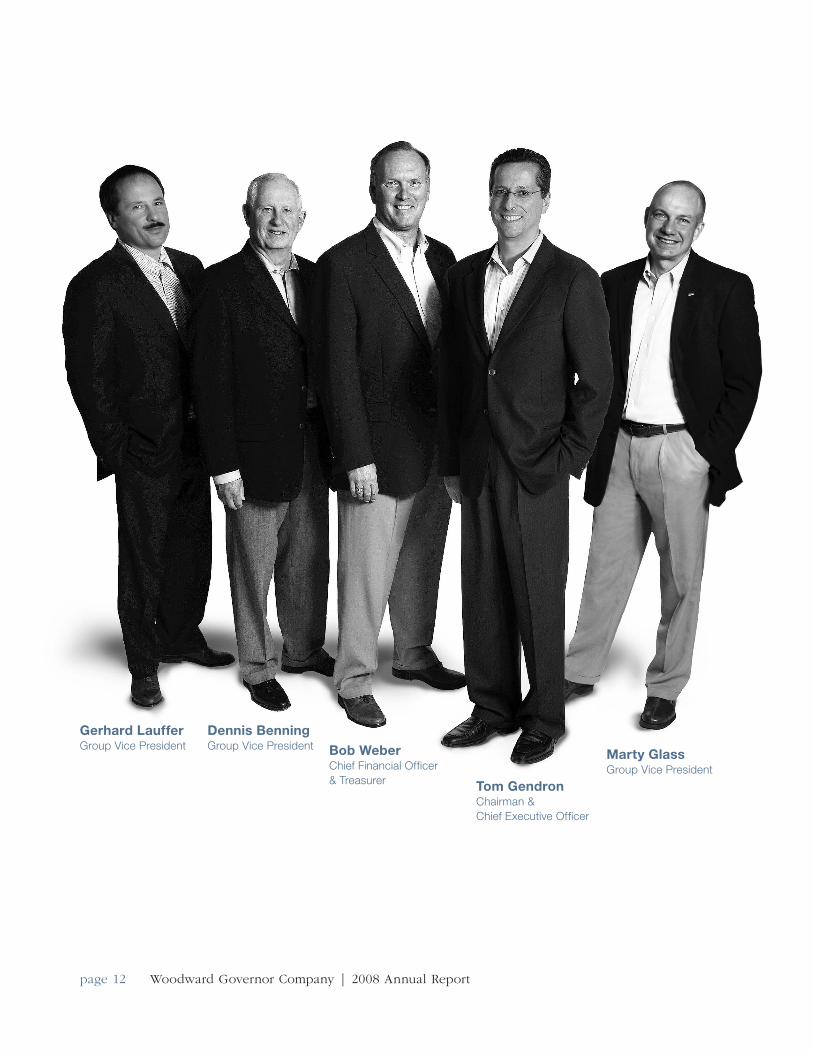
tom gendronChairman & Chief Executive Officer
Bob WeberChief Financial Officer & Treasurer
gerhard laufferGroup Vice President
dennis BenningGroup Vice President
Marty glassGroup Vice President
page 12 Woodward Governor Company | 2008 Annual Report

Dear Shareholders:
For the past five years, our sales and earnings
growth has steadily improved—a direct result of
successfully executing our long-range strategic
initiatives in our strong core markets of aerospace,
power and process industries, and transportation.
Once again, we closed our fiscal year with record
sales and earnings. Sales were up 21 percent over
last year to $1.26 billion and net earnings were $122
million or $1.75 per diluted share.
Our balance sheet and cash flow remained healthy.
We significantly invested in our business to return
value for our shareholders. We raised our dividend,
repurchased over one million shares against our
three-year $200,000,000 stock repurchase program
authorized in September 2007, and executed a two-
for-one stock split.
While our sales and earnings remain strong, we
realize these are uncertain times. We will continue
looking for opportunities to grow and further position
Woodward to capitalize on the increasing global
demand for energy and environmental concerns.
We will achieve our goals by continuing to introduce
systems and components for equipment that
supports global infrastructure development.
We are confident in our balanced portfolio, global
footprint, and strong aftermarket presence. Whether
the economy is in an upward or downward cycle,
we are always mindful of managing our business to
mitigate risks.
KeY aCCOMplisHMents
Our robust strategies, which focus on attractive,
long-term markets, remain on target. By continually
renewing our product portfolio and making strategic
the pOWer of teaMWOrK
page 13 Woodward Governor Company | 2008 Annual Report

acquisitions, we are able to deliver more complete
systems and offer broader support to our global
customers.
In this fiscal year, we signed numerous long-term
supply agreements with our customers that
extended existing business and expanded our
market share. These agreements demonstrate
strength with our foundational customers and
position us to continue winning programs that will
sustain our future.
An agreement with Pratt & Whitney (P&W) secured
our position to supply fuel nozzles on the P&W
PurePower™ engine family, which includes the
PW1000G Geared Turbofan™ and PW800F
advanced turbofan engines. This advanced engine
family will deliver exceptional economic and
environmental benefits for the next generation
commercial aircraft and large business jets.
Additionally, we entered into a long-term supplier
agreement with a key electrical equipment
customer to provide protective relays for the power
generation and distribution market. With growing
customer concern for power quality and security,
the demand is escalating for Woodward power
management controls.
We transitioned successfully from development
to production on several aircraft programs, which
included the GEnx™ fuel system for the Boeing 787
Dreamliner and the control system for the Pratt &
Whitney Canada PW600 engine family for the Cessna
Citation Mustang and Eclipse 500 business jets. Both
programs will contribute to our growth for many years
to come.
In this fiscal year, our sales to existing and new Asian
customers increased significantly for our on-highway
CNG (compressed natural gas) systems. Also, we
were awarded a contract for diesel fuel injection
equipment from a customer in India and introduced
new products that enhance the reliability and improve
the performance of steam turbines used in the power
and process industries.
In the face of uncertain fossil fuel prices and the
increased demand for clean energy, the wind turbine
market has continued to grow at a remarkable rate.
We added a major Chinese wind turbine manufacturer
to our customer base, which contributed to the
doubling of our wind turbine inverter sales. To support
our customers in their expansion plans in North
America and Asia, we announced that we will build
wind turbine inverters in Colorado and enlarge our
operations in China.
We delivered our first fuel control system to General
Electric for the Fighter Engine Team F136 engine, one
of two engines that will power the F-35 Lightning II.
The P&W F135-PW-600 STOVL propulsion system
with Woodward fuel nozzles powered the F-35B
during its first flight test this year. We anticipate
page 14 Woodward Governor Company | 2008 Annual Report
significant production over the next three decades,
making this next generation multi-role strike fighter
program an important part of our future.
Our strategic plan incorporates growth through
acquisitions. We made the largest acquisition in
our history when we purchased MPC Products
Corporation on October 1, 2008. MPC is an industry
leader in the manufacture of high-performance
electromechanical motion control systems primarily
for aerospace applications. Woodward MPC gives
us the opportunity to focus on airframe applications
and forms the basis of a fourth Woodward business
segment—Airframe Systems.
Furthermore, at the start of fiscal year 2009, we
acquired MotoTron Corporation. MotoTron, which
will be integrated into our Engine Systems business
segment, specializes in software tools and processes
for control systems in marine, power generation,
industrial, and other engine equipment applications.
This acquisition particularly strengthens our offerings
to the transportation and power generation markets.
a Clear visiOn
As a company with strong fundamentals, we have a
clear vision and carefully planned long-term strategies.
By remaining focused on our core competencies and
looking to the future by investing in research and
development, we are positioned to introduce the
next generation of systems and components that will
exceed emission regulations, significantly improve
efficiency, and enhance reliability.
We are well situated to respond to economic
uncertainties, and we anticipate continued solid
performance for the next fiscal year. In 2009, we
will concentrate on:
• Delivering sales growth rates above the market
• Leveraging our infrastructure to yield enhanced
margins
• Pursuing acquisitions that enhance our energy
control strategy
• Managing our balance sheet to improve
shareholder returns
• Expanding our portfolio with targeted products
and services
• Enhancing our system capabilities
• Integrating MPC and MotoTron into the Woodward
organization
• Executing key business processes to improve
customer satisfaction and operational efficiency
I want to thank our Board of Directors for their
continued guidance and to welcome Dr. Ronald Sega
to our board. Also, I want to thank our talented and
motivated members, who are the foundation of our
business and experts in their fields. I am confident
in our ability to continue executing our strategies
to deliver excellent performance in our dynamic
markets.
thomas a. gendronChairman & Chief Executive Officer
page 15 Woodward Governor Company | 2008 Annual Report

page 16 Woodward Governor Company | 2008 Annual Report
33% Aerospace
49% Power & Process Industries
18% Transportation
12-MONTH STOCK COMPARISON 10/1/07 to 9/30/08
-30 -20 -10 0 10 20
-30% -20% -10% 0 10% 20%
Woodward 13.0%
S&P 500: (23.7%)
Dow Jones: (21.9%)
NASDAQ: (22.9%)
5-YEAR STOCK PERFORMANCE
Woodward Governor Company S&P Small Cap 600
0
100
200
300
400
500
600
9/03 9/04 9/05 9/06 9/07 9/08
S&P Industrial Machine
0
$100
$200
$300
$400
$500
$600
FisCal 2008 MarKet segMent sales

the Power of Performance
Woodward Governor Company | 2008 Form 10-K
UNITED STATES SECURITIES AND EXCHANGE COMMISSIONWashington, D.C. 20549
Form 10-K
¥ ANNUAL REPORT PURSUANT TO SECTION 13 OR 15(d)OF THE SECURITIES EXCHANGE ACT OF 1934
For the fiscal year ended September 30, 2008
orn TRANSITION REPORT PURSUANT TO SECTION 13 OR 15(d)
OF THE SECURITIES AND EXCHANGE ACT OF 1934
For the transition period from toCommission file number 0-8408
WOODWARD GOVERNOR COMPANY(Exact name of registrant as specified in its charter)
Delaware 36-1984010(State or other jurisdiction ofincorporation or organization)
(I.R.S. EmployerIdentification No.)
1000 East Drake Road,Fort Collins, Colorado
80525(Zip Code)
(Address of principal executive offices)
Registrant’s telephone number, including area code:(970) 482-5811
Securities registered pursuant to Section 12(b) of the Act:Title of Each Class: Name of Each Exchange on Which Registered:
Common stock, par value $.001455 per share NASDAQ Global Select Market
Securities registered pursuant to Section 12(g) of the Act:None
Indicate by check mark if the registrant is a well-known seasoned issuer, as defined in Rule 405 of the Securities Act. Yes ¥ No nIndicate by check mark if the registrant is not required to file reports pursuant to Section 13 or Section 15(d) of the Act. Yes n No ¥Indicate by check mark whether the registrant (1) has filed all reports required to be filed by Section 13 or 15(d) of the Securities Exchange
Act of 1934 during the preceding 12 months (or for such shorter period that the registrant was required to file such reports), and (2) has beensubject to such filing requirements for the past 90 days. Yes ¥ No n
Indicate by check mark if disclosure of delinquent filers pursuant to Item 405 of Regulation S-K is not contained herein, and will not becontained, to the best of registrant’s knowledge, in definitive proxy or information statements incorporated by reference in Part III of thisForm 10-K or any amendment to this Form 10-K. n
Indicate by check mark whether the registrant is a large accelerated filer, an accelerated filer, a non-accelerated filer, or a smaller reportingcompany. See the definitions of “large accelerated filer,” “accelerated filer” and “smaller reporting company” in Rule 12b-2 of the ExchangeAct. (Check one):Large accelerated filer ¥ Accelerated filer n Non-accelerated filer n Smaller reporting company n
(Do not check if a smaller reporting company)Indicate by check mark whether the registrant is a shell company (as defined in Rule 12b-2 of the Act). Yes n No ¥Aggregate market value of registrant’s common stock held by non-affiliates of the registrant, based upon the closing price of a share of the
registrant’s common stock on March 31, 2008 as reported on The NASDAQ Global Select Market on that date: $1,550,848,000. For purposes ofthis calculation, shares of common stock held by (i) persons holding more than 5% of the outstanding shares of stock, (ii) officers and directors ofthe registrant, and (iii) the Woodward Governor Company Profit Sharing Trust, Woodward Governor Company Deferred Shares Trust, or theWoodward Governor Company Charitable Trust, as of March 31, 2008, are excluded in that such persons may be deemed to be affiliates. Thisdetermination is not necessarily conclusive of affiliate status.
Number of shares of the registrant’s common stock outstanding as of November 17, 2008: 67,789,021.DOCUMENTS INCORPORATED BY REFERENCE
Portions of our proxy statement for the 2008 Annual Meeting of Stockholders to be held January 22, 2009, are incorporated by referenceinto Parts II and III of this Form 10-K, to the extent indicated.
TABLE OF CONTENTS
Page
PART IForward Looking Statement . . . . . . . . . . . . . . . . . . . . . . . . . . . . . . . . . . . . . . . . . . . . . . . . . . . . . . . . . 2Item 1. Business . . . . . . . . . . . . . . . . . . . . . . . . . . . . . . . . . . . . . . . . . . . . . . . . . . . . . . . . . . . . . . . 3Item 1A. Risk Factors . . . . . . . . . . . . . . . . . . . . . . . . . . . . . . . . . . . . . . . . . . . . . . . . . . . . . . . . . . . . 9Item 1B. Unresolved Staff Comments . . . . . . . . . . . . . . . . . . . . . . . . . . . . . . . . . . . . . . . . . . . . . . . . . 16Item 2. Properties . . . . . . . . . . . . . . . . . . . . . . . . . . . . . . . . . . . . . . . . . . . . . . . . . . . . . . . . . . . . . . 17Item 3. Legal Proceedings . . . . . . . . . . . . . . . . . . . . . . . . . . . . . . . . . . . . . . . . . . . . . . . . . . . . . . . . 18Item 4. Submission of Matters to a Vote of Security Holders . . . . . . . . . . . . . . . . . . . . . . . . . . . . . . 18
PART IIItem 5. Market for Registrant’s Common Equity, Related Stockholder Matters and Issuer Purchases
of Equity Securities . . . . . . . . . . . . . . . . . . . . . . . . . . . . . . . . . . . . . . . . . . . . . . . . . . . . . . . 19Item 6. Selected Financial Data . . . . . . . . . . . . . . . . . . . . . . . . . . . . . . . . . . . . . . . . . . . . . . . . . . . . 20Item 7. Management’s Discussion and Analysis of Financial Condition and Results of Operations . . . 22Item 7A. Quantitative and Qualitative Disclosures About Market Risk . . . . . . . . . . . . . . . . . . . . . . . . . 43Item 8. Financial Statements and Supplementary Data . . . . . . . . . . . . . . . . . . . . . . . . . . . . . . . . . . . 45Item 9. Changes in and Disagreements with Accountants on Accounting and Financial Disclosure . . . 87Item 9A. Controls and Procedures . . . . . . . . . . . . . . . . . . . . . . . . . . . . . . . . . . . . . . . . . . . . . . . . . . . 87Item 9B. Other Information . . . . . . . . . . . . . . . . . . . . . . . . . . . . . . . . . . . . . . . . . . . . . . . . . . . . . . . . 90
PART IIIItem 10. Directors, Executive Officers and Corporate Governance . . . . . . . . . . . . . . . . . . . . . . . . . . . . 90Item 11. Executive Compensation . . . . . . . . . . . . . . . . . . . . . . . . . . . . . . . . . . . . . . . . . . . . . . . . . . . 90Item 12. Security Ownership of Certain Beneficial Owners and Management and Related Stockholder
Matters . . . . . . . . . . . . . . . . . . . . . . . . . . . . . . . . . . . . . . . . . . . . . . . . . . . . . . . . . . . . . . . . 90Item 13. Certain Relationships and Related Transactions, and Director Independence . . . . . . . . . . . . . 91Item 14. Principal Accounting Fees and Services . . . . . . . . . . . . . . . . . . . . . . . . . . . . . . . . . . . . . . . . 91
PART IVItem 15. Exhibits and Financial Statement Schedules . . . . . . . . . . . . . . . . . . . . . . . . . . . . . . . . . . . . . 92Signatures . . . . . . . . . . . . . . . . . . . . . . . . . . . . . . . . . . . . . . . . . . . . . . . . . . . . . . . . . . . . . . . . . . . . . . 95
1
PART I
Forward Looking Statement
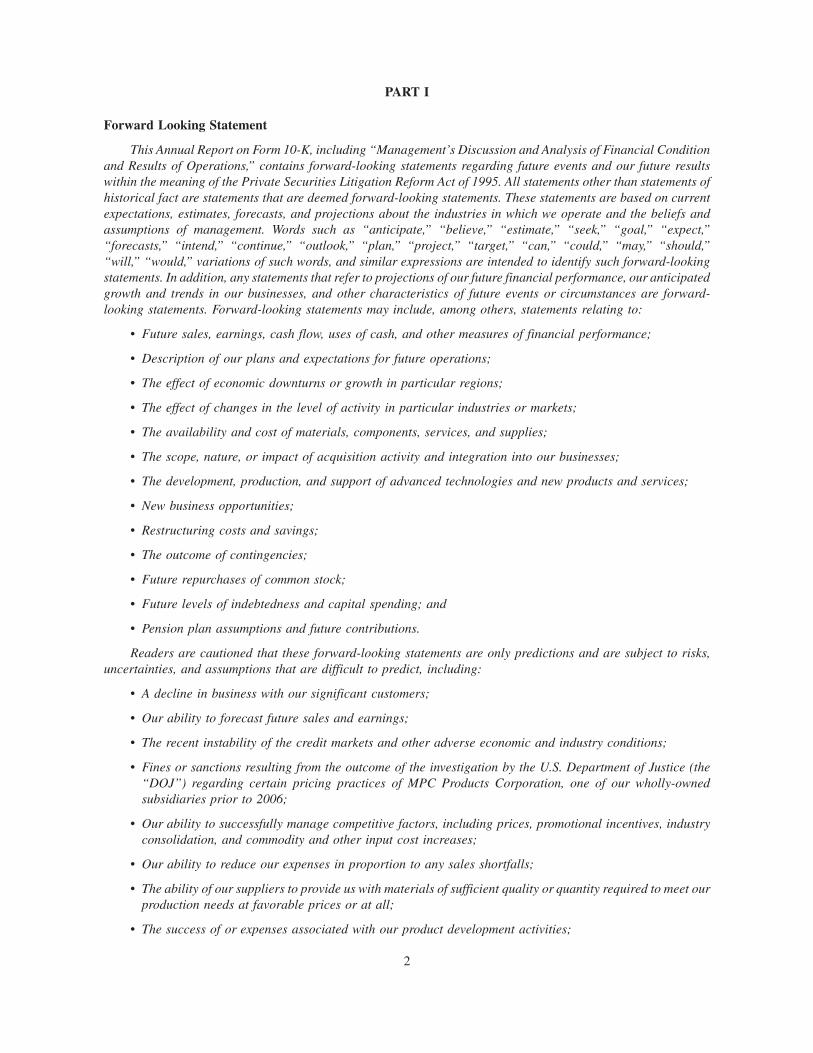
This Annual Report on Form 10-K, including “Management’s Discussion and Analysis of Financial Conditionand Results of Operations,” contains forward-looking statements regarding future events and our future resultswithin the meaning of the Private Securities Litigation Reform Act of 1995. All statements other than statements ofhistorical fact are statements that are deemed forward-looking statements. These statements are based on currentexpectations, estimates, forecasts, and projections about the industries in which we operate and the beliefs andassumptions of management. Words such as “anticipate,” “believe,” “estimate,” “seek,” “goal,” “expect,”“forecasts,” “intend,” “continue,” “outlook,” “plan,” “project,” “target,” “can,” “could,” “may,” “should,”“will,” “would,” variations of such words, and similar expressions are intended to identify such forward-lookingstatements. In addition, any statements that refer to projections of our future financial performance, our anticipatedgrowth and trends in our businesses, and other characteristics of future events or circumstances are forward-looking statements. Forward-looking statements may include, among others, statements relating to:
• Future sales, earnings, cash flow, uses of cash, and other measures of financial performance;
• Description of our plans and expectations for future operations;
• The effect of economic downturns or growth in particular regions;
• The effect of changes in the level of activity in particular industries or markets;
• The availability and cost of materials, components, services, and supplies;
• The scope, nature, or impact of acquisition activity and integration into our businesses;
• The development, production, and support of advanced technologies and new products and services;
• New business opportunities;
• Restructuring costs and savings;
• The outcome of contingencies;
• Future repurchases of common stock;
• Future levels of indebtedness and capital spending; and
• Pension plan assumptions and future contributions.
Readers are cautioned that these forward-looking statements are only predictions and are subject to risks,uncertainties, and assumptions that are difficult to predict, including:
• A decline in business with our significant customers;
• Our ability to forecast future sales and earnings;
• The recent instability of the credit markets and other adverse economic and industry conditions;
• Fines or sanctions resulting from the outcome of the investigation by the U.S. Department of Justice (the“DOJ”) regarding certain pricing practices of MPC Products Corporation, one of our wholly-ownedsubsidiaries prior to 2006;
• Our ability to successfully manage competitive factors, including prices, promotional incentives, industryconsolidation, and commodity and other input cost increases;
• Our ability to reduce our expenses in proportion to any sales shortfalls;
• The ability of our suppliers to provide us with materials of sufficient quality or quantity required to meet ourproduction needs at favorable prices or at all;
• The success of or expenses associated with our product development activities;
2
• Our ability to integrate acquisitions and costs related thereto;
• Our ability to operate our business and pursue business strategies in the light of certain restrictive covenantsin our outstanding debt documents;
• Future impairment charges resulting from changes in the estimates of fair value of reporting units or of long-lived assets;
• Changes in domestic or international tax statutes and future subsidiary results;
• Environmental liabilities related to manufacturing activities;
• Our continued access to a stable workforce and favorable labor relations with our employees;
• Our ability to successfully manage regulatory, tax and legal matters (including product liability, patent andintellectual property matters);and
• Risks from operating internationally, including the impact on reported earnings from fluctuations in foreigncurrency exchange rates.
These factors are representative of the risks, uncertainties, and assumptions that could cause actual outcomesand results to differ materially from what is expressed or forecast in our forward-looking statements. Other factorsare discussed under “Risk Factors” in our SEC filings are incorporated by reference.
Therefore, actual results could differ materially and adversely from those expressed in any forward-lookingstatements. For additional information regarding factors that may affect our actual financial condition and resultsof operations, see the information under the caption “Item 1A. Risk Factors” beginning on page 8 of this AnnualReport on Form 10-K for the year ended September 30, 2008. We undertake no obligation to revise or update anyforward-looking statements for any reason.
Item 1. Business
General
Woodward Governor Company (“Woodward,” the “Company,” “we,” “our,” or “us”) designs, manufactures,and services energy control systems and components for commercial and military aircraft, turbines, reciprocatingengines, and electrical power system equipment. Our innovative fluid energy, combustion control, electrical energy,and motion control systems help customers offer cleaner, more reliable, and more cost-effective equipment.Leading original equipment manufacturers use our products and services in aerospace, power and processindustries, and transportation.
Our strategic focus is Energy Control and Optimization Solutions. The control of energy — fluid energy,combustion, electrical energy, and motion — is a growing requirement in the markets we serve. Our customers lookto us to optimize the efficiency, emissions, and operations of power equipment. Our core technologies leverage wellacross our markets and customer applications, enabling us to develop and integrate cost-effective and state-of-the-art fuel, combustion, fluid, actuation, and electronic systems. We focus primarily on OEMs and equipmentpackagers, partnering with them to bring superior component and system solutions to their demanding applications.
Woodward is headquartered in Fort Collins, Colorado, and serves global markets from locations worldwide.The mailing address for our headquarters is 1000 East Drake Road, Fort Collins, Colorado 80525. Our telephone atthat location is (970) 482-5811, and our website is www.woodward.com.
Products and Services
Woodward strives to be the undisputed leader in the aerospace, power and process industries, and transpor-tation markets that we serve. We help meet global needs for reliable, efficient, low-emission, and high-performanceenergy for diverse applications in challenging environments.
We remain focused on Energy Control and Optimization Solutions for aerospace, power and processindustries, and transportation markets that we serve. We design systems that manage the energy of fluid movement,
3
motion, and electricity. We also convert wind energy into reliable and safe electrical power through invertersystems.
We believe all of our business segments have a significant competitive position within their markets forcomponents and integrated systems. We compete with several other manufacturers, including the in-houseoperations of certain original equipment manufacturers (“OEMs”). We believe our prices, technology, quality,and customer service are highly competitive.
Principal Lines of Business
Woodward operates in the following four business segments:
• Turbine Systems is focused on developing and manufacturing systems and components that provide energycontrol and optimization solutions for the aircraft and industrial gas turbine markets.
• Engine Systems is focused on developing and manufacturing systems and components that provide energycontrol and optimization solutions for the industrial engine and steam turbine markets, which include powergeneration, transportation, and process industries.
• Electrical Power Systems is focused on developing and manufacturing systems and components thatprovide power sensing and energy control systems that improve the security, quality, reliability, andavailability of electrical power networks for industrial markets, which include power generation, powerdistribution, transportation, and process industries.
• Airframe Systems was added October 1, 2008 upon Woodward’s acquisition of all of the outstanding sharesof stock of Techni-Core, Inc. (“Techni-Core”) and all of the outstanding shares of stock of MPC ProductsCorporation (“MPC Products” and, together with Techni-Core, “MPC”). MPC is the leader in the man-ufacture of high-performance electromechanical motion control systems primarily for aerospace applica-tions. Their core competencies in sensing, motors, actuation systems, and electronics will also be applied toWoodward’s aircraft turbine market, industrial turbine market, as well as other industrial markets.
Information about our operations in 2008 and outlook for the future, including certain segment information, isincluded in “Item 7 — Management’s Discussion and Analysis of Financial Condition and Results of Operations.”Additional segment information and certain geographical information are included in Note 20 to the ConsolidatedFinancial Statements in “Item 8 — Financial Statements and Supplementary Data.” Additional information aboutAirframe Systems and the acquisition is included in Note 22 to the Consolidated Financial Statements in “Item 8 —Financial Statements and Supplementary Data.” Other information about our business follows.
Turbine Systems
We provide integrated control systems and control components such as electronics, actuators, valves, fuelsystems, and combustion systems through the Turbine Systems segment to OEMs that manufacture gas turbines foruse in aerospace and industrial power markets. We also sell components as spares or replacements and providerepair and overhaul services to these and other customers.
We primarily sell Turbine Systems’ products and services directly to manufacturers, although we also generatesome aftermarket sales through distributors, dealers, and independent service facilities.
In fiscal 2008, customers exceeding 10% of net external sales in the Turbine Systems segment were GeneralElectric Company (approximately 35%), United Technologies (approximately 16%), and the U.S. government(approximately 10%).
Engine Systems
We provide integrated control systems and control components, such as electronics, actuators, valves, pumps,injectors, and ignition systems through the Engine Systems segment primarily to OEMs that manufacture dieselengines, gas engines, steam turbines, and distributors for use in power generation, marine, transportation, and
4
process applications. We also sell components as spares or replacements and provide repair and overhaul services toOEM customers and equipment operators.
We primarily sell Engine Systems’ products and services directly to our OEM customers. We also sell throughour global channel partners (distributors, dealers, and independent service facilities) to support our OEMs’customers and end users.
In fiscal 2008, Caterpillar exceeded 10% of net external sales in the Engine Systems segment, accounting forapproximately 26% of Engine Systems’ net external sales.
Electrical Power Systems
We provide integrated control systems and electronic control and protection modules through the ElectricalPower Systems segment primarily to OEMs that manufacture electrical power generation, distribution, conversion(predominantly wind power), and grid related quality equipment using digital controls and inverter technologies.Sales are made primarily to OEMs that manufacture generator sets, wind turbines, and switchgear equipment. Wesell components as spares or replacements, and provide other related services to these OEM and other customers.We also provide repair and overhaul services to OEM customers and equipment operators as part of the wind powerside of our business.
We generally sell Electrical Power Systems’ products and services directly to our OEM customers, althoughwe also generate sales to end users through distributors. Our customers demand technological solutions to meettheir needs for security, quality, reliability, and availability of electrical power networks.
In fiscal 2008, customers exceeding 10% of net external sales in the Electrical Power Systems segment wereREpower Systems AG (approximately 24%), Caterpillar (approximately 12%), and Ecotècnia (approximately10%).
Airframe Systems
On October 1, 2008, we added a fourth business segment, Airframe Systems, upon the acquisition of MPC.Airframe Systems provides high-performance electromechanical motion control systems, including sensors,primarily for aerospace applications. The primary product lines include high performance electric motors andsensors, analog and digital control electronics, rotary and linear actuation systems, and flight deck and fly-by-wiresystems for commercial and military aerospace programs. Sales are made primarily OEMs and to tier-one primecontractors. Additional information about Airframe Systems and the acquisition is included in Note 22 to theConsolidated Financial Statements in “Item 8 — Financial Statements and Supplementary Data.”
Customers
Our customers include Caterpillar, Ecotècnia, General Electric, REpower Systems AG, Rolls Royce, theU.S. government, and United Technologies.
Two customers individually accounted for more than 10% of consolidated net sales in each of the years endedSeptember 30, 2008, 2007, and 2006. Sales to General Electric were made by all of our segments and totaledapproximately 17% in fiscal 2008, approximately 20% in fiscal 2007, and approximately 22% in fiscal 2006. Salesto Caterpillar were made by all of our segments and net sales totaled approximately 10% in fiscal 2008,approximately 10% in fiscal 2007, and approximately 11% in fiscal 2006.
5
Backlog
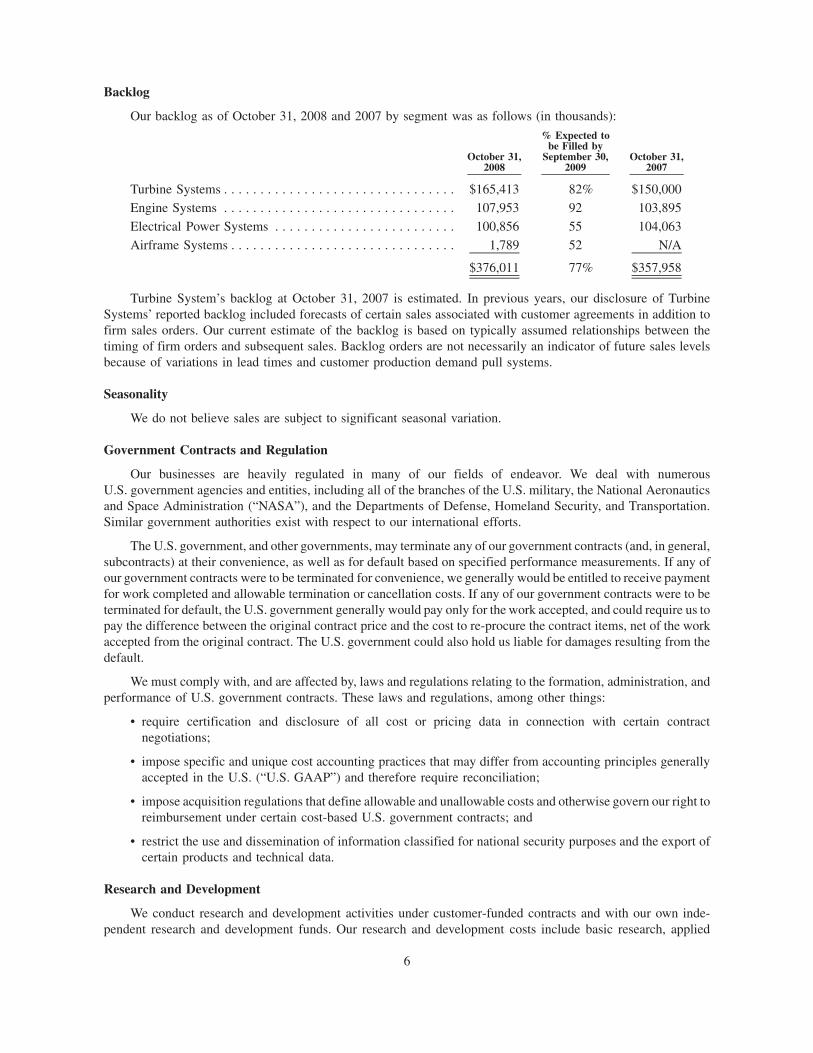
Our backlog as of October 31, 2008 and 2007 by segment was as follows (in thousands):
October 31,2008
% Expected tobe Filled by
September 30,2009
October 31,2007
Turbine Systems . . . . . . . . . . . . . . . . . . . . . . . . . . . . . . . . $165,413 82% $150,000Engine Systems . . . . . . . . . . . . . . . . . . . . . . . . . . . . . . . . 107,953 92 103,895Electrical Power Systems . . . . . . . . . . . . . . . . . . . . . . . . . 100,856 55 104,063Airframe Systems . . . . . . . . . . . . . . . . . . . . . . . . . . . . . . . 1,789 52 N/A
$376,011 77% $357,958
Turbine System’s backlog at October 31, 2007 is estimated. In previous years, our disclosure of TurbineSystems’ reported backlog included forecasts of certain sales associated with customer agreements in addition tofirm sales orders. Our current estimate of the backlog is based on typically assumed relationships between thetiming of firm orders and subsequent sales. Backlog orders are not necessarily an indicator of future sales levelsbecause of variations in lead times and customer production demand pull systems.
Seasonality
We do not believe sales are subject to significant seasonal variation.
Government Contracts and Regulation
Our businesses are heavily regulated in many of our fields of endeavor. We deal with numerousU.S. government agencies and entities, including all of the branches of the U.S. military, the National Aeronauticsand Space Administration (“NASA”), and the Departments of Defense, Homeland Security, and Transportation.Similar government authorities exist with respect to our international efforts.
The U.S. government, and other governments, may terminate any of our government contracts (and, in general,subcontracts) at their convenience, as well as for default based on specified performance measurements. If any ofour government contracts were to be terminated for convenience, we generally would be entitled to receive paymentfor work completed and allowable termination or cancellation costs. If any of our government contracts were to beterminated for default, the U.S. government generally would pay only for the work accepted, and could require us topay the difference between the original contract price and the cost to re-procure the contract items, net of the workaccepted from the original contract. The U.S. government could also hold us liable for damages resulting from thedefault.
We must comply with, and are affected by, laws and regulations relating to the formation, administration, andperformance of U.S. government contracts. These laws and regulations, among other things:
• require certification and disclosure of all cost or pricing data in connection with certain contractnegotiations;
• impose specific and unique cost accounting practices that may differ from accounting principles generallyaccepted in the U.S. (“U.S. GAAP”) and therefore require reconciliation;
• impose acquisition regulations that define allowable and unallowable costs and otherwise govern our right toreimbursement under certain cost-based U.S. government contracts; and
• restrict the use and dissemination of information classified for national security purposes and the export ofcertain products and technical data.
Research and Development
We conduct research and development activities under customer-funded contracts and with our own inde-pendent research and development funds. Our research and development costs include basic research, applied
6
research, development, systems and other concept formulation studies, and bid and proposal efforts related togovernment products and services. Costs related to customer-funded contracts are generally allocated among allcontracts and programs in progress based on the contractual arrangements. Company-sponsored product devel-opment costs not otherwise allocable are charged to expenses when incurred. Under certain arrangements in which acustomer shares in product development costs, our portion of the unreimbursed costs is generally expensed asincurred. Across all our segments, total research and development costs, including costs related to bid and proposalefforts, totaled $73.4 million in fiscal 2008, $65.3 million in fiscal 2007, and $60.0 million in fiscal 2006. See“Research and development costs” in Note 1 to the Consolidated Financial Statements in “Item 8 — FinancialStatements and Supplementary Data.”
Manufacturing
For our segments, our products consist of mechanical, electronic, and electromagnetic components. Mechan-ical components are machined primarily from aluminum, iron, and steel. Generally there are numerous sources forthe raw materials and components used in our products, and they are believed to be sufficiently available to meetexpected requirements. We carry certain finished goods and component parts inventory to meet rapid deliveryrequirements of customers, primarily for aftermarket needs.
Employees
As of October 31, 2008, we employed 5,823 full-time employees of which 1,626 were located outside of theU.S. We consider the relationships with our employees to be positive.
Approximately 1,285 joined Woodward in connection with the acquisition of MPC and 75 employees inconnection with the acquisition of MotoTron Corporation (“MotoTron”) in October 2008. Additional informationabout our acquisitions is included in Note 22 to the Consolidated Financial Statements in “Item 8 — FinancialStatements and Supplementary Data.”
In the U.S., as of October 31, 2008, all of our employees are at-will employees, except certain MPC employeeswho are not executive officers of Woodward and either had pre-existing employment agreements with MPC prior tothe MPC acquisition or were members of the MPC Employees Representative Union. Our at-will employees are notsubject to any type of employment contract or agreement. Our Chief Executive Officer and President and our ChiefFinancial Officer and Treasurer each have a Change in Control Transition Agreement.
Outside of the U.S., we enter into employment contracts and agreements in those countries in which suchrelationships are mandatory or customary. The provisions of these agreements correspond in each case with therequired or customary terms in the subject jurisdiction.
Patents, Intellectual Property, and Licensing
Products for our segments make use of several patents and trademarks of various durations that we believe arecollectively important. However, we do not consider any one patent or trademark material to our business.
Executive Officers of the Registrant
Set forth below is certain information with respect to the current executive officers. There are no familyrelationships between any of the executive officers listed below.
Thomas A. Gendron, Age 47. Chairman of the Board since January 2008; Chief Executive Officer, President,and Director since July 2005; Chief Operating Officer and President from September 2002 through June 2005;Vice President and General Manager of Industrial Controls June 2001 through September 2002; Vice President ofIndustrial Controls April 2000 through May 2001; Director of Global Marketing and Industrial Controls’ BusinessDevelopment February 1999 through March 2000.
Robert F. Weber, Jr., Age 54. Chief Financial Officer and Treasurer since August 2005. Prior to August 2005,Mr. Weber was employed at Motorola, Inc. for 17 years, where he held various positions, including Corporate
7
Vice President and General Manager — EMEA Auto. Prior to this role, Mr. Weber served in a variety of financialpositions at both a corporate and operating unit level with Motorola.
Martin V. Glass, Age 51. Group Vice President, Turbine Systems since September 2007; Vice President ofthe Aircraft Engine Systems Customer Business Segment December 2002 through August 2007; Director of Sales,Marketing, and Engineering February 2000 through December 2002.
Dennis Benning, Age 67. Group Vice President, Airframe Systems since October 2008; GroupVice President, Engine Systems September 2007 through September 2008; Vice President, Center of ExcellenceIndustrial Controls December 2002 through August 2007; General Manager, Center of Excellence IndustrialControls July 2002 through November 2002; Director of Operations, Aircraft Engine Systems January 2002through June 2002.
Gerhard Lauffer, Age 47. Group Vice President, Electrical Power Systems since September 2007;Vice President and General Manager Electronic Controls March 2002 through August 2007; Managing DirectorLeonhard-Reglerbau GmbH 1991 through March 2002 when it was acquired by Woodward.
Chad Preiss, Age 43. Group Vice President, Engine Systems since October 2008; Vice President, Sales,Service, and Marketing, Engine Systems December 2007 through September 2008; and Vice President, IndustrialControls September 2004 through December 2007. Prior to this role, Mr. Preiss served in a variety of engineeringand marketing/sales management roles, including Director of Business Development, since joining Woodward in1988.
A. Christopher Fawzy, Age 39. Vice President, General Counsel and Corporate Secretary since June 2007.Prior to joining Woodward, Mr. Fawzy was employed by Mentor Corporation, a global medical device company. Hejoined Mentor in 2001 and served as Corporate Counsel, then General Counsel in 2003, and was appointed VicePresident, General Counsel and Secretary in 2004.
Information available on Woodward’s Website
Through a link on the Investor Information section of our Website, we make available the following filings assoon as reasonably practicable after they are electronically filed or furnished to the Securities and ExchangeCommission (“SEC”): our Annual Report on Form 10-K, Quarterly Reports on Form 10-Q, Current Reports onForm 8-K, Proxy Statements, and any amendments to those reports filed or furnished pursuant to Section 13(a) or15(d) of the Securities Exchange Act of 1934. Stockholders may obtain, without charge, a single copy ofWoodward’s 2008 Annual Report on Form 10-K upon written request to the Corporate Secretary, WoodwardGovernor Company, 1000 East Drake Road, Fort Collins, Colorado 80525.
8
Item 1A. Risk Factors
Investment in our securities involves risk. An investor or potential investor should consider the riskssummarized in this section when making investment decisions regarding our securities.
Important factors that could individually, or together with one or more other factors, affect our business, resultsof operations, financial condition, and/or cash flows include, but are not limited to, the following:
Company Risks
A decline in business with our significant customers could decrease our consolidated net sales and have amaterial adverse effect on our business, financial condition, results of operations, and cash flows.
We have fewer customers than many other companies with similar sales volumes. For the year endedSeptember 30, 2008, approximately 43% of our consolidated net sales were made to our five largest customers.Sales to our five largest customers represented approximately 47% of our consolidated net sales for the year endedSeptember 30, 2007. Two of those customers individually accounted for more than 10% of consolidated net sales ineach of the years ended September 30, 2008, 2007, and 2006. Turbine Systems, Engine Systems, and ElectricalPower Systems made sales to General Electric Company, and those sales totaled approximately 17% in fiscal 2008,approximately 20% in fiscal 2007, and approximately 22% in fiscal 2006 of our consolidated net sales. TurbineSystems, Engine Systems, and Electrical Power Systems also made sales to Caterpillar Inc. and those sales totaledapproximately 10% in fiscal 2008, approximately 10% in fiscal 2007, and approximately 11% in fiscal 2006 of ourconsolidated net sales. If any of our significant customers were to change suppliers, in-source production,experience difficulties in the markets in which they participate, or otherwise reduce purchases from us, ourconsolidated net sales could decrease significantly, which could have a material adverse effect on our business,financial condition, results of operations, and cash flows.
Our future sales and earnings could vary materially from our projections.
Our sales forecast is based on management’s best estimate of various factors and information deemed relevant,including, among others, customer and third-party forecasts of sales volumes and purchase requirements in ourmarkets. Each of these factors is subjective and could be overstated. In addition, general business and economicconditions and industry-specific business and economic conditions, including a continuation of the currenteconomic slowdown or further deterioration of economic conditions in the U.S. and internationally, could resultin sales that are lower than forecast. Accordingly, our ability to forecast the timing and amount of specific sales islimited, and our future sales and earnings could vary materially from our projections. The difficulty in forecastingdemand increases the challenge in anticipating our inventory requirements, which may cause us to over-producefinished goods and could result in inventory write-offs, or could cause us to under-produce finished goods. Any suchover-production or under-production could have a material adverse effect on our business, financial condition,results of operations, and cash flows.
The recent instability of the financial markets and adverse economic conditions could have a materialadverse effect on the ability of our customers to perform their obligations to us and on demand for ourproducts and services.
Recently, there has been widespread concern over the instability of the financial markets and their influence onthe global economy. As a result of the credit market crisis and other economic challenges currently affecting theglobal economy, our current or potential future customers may experience serious cash flow problems and as aresult, may modify, delay, or cancel plans to purchase our products. Additionally, if customers are not successful ingenerating sufficient revenue or are precluded from securing financing, they may not be able to pay, or may delaypayment of, accounts receivable that are owed to us. Any inability of current and/or potential customers to pay us forour products may adversely affect our earnings and cash flows.
In addition, demand for our products and services is significantly affected by the general economic envi-ronment. During periods of slowing economic activity, such as the recent tightening of the credit markets, a globalslowdown in spending on infrastructure development may occur in the markets in which we operate, and customers
9
may reduce their purchases of our products and services. As a result, any significant economic downturn, includingthe current economic downturn and the adverse conditions in the credit markets, could have a material adverseeffect on customer demand.
There can be no assurance that the current economic slowdown or further deterioration of economic conditionsin the U.S. as well as internationally will not have a material adverse effect our business, financial condition, resultsof operations, and cash flows.
If funding is not available to us when needed, or is available only on unfavorable terms, we may beunable to implement our business plans, complete acquisitions, or otherwise take advantage of businessopportunities or respond to competitive pressures.
Global financial markets and economic conditions have been, and continue to be, disrupted and volatile. Thedebt and equity capital markets have been distressed. These issues, along with significant write-offs in the financialservices sector, the repricing of credit risk, and the current weak economic conditions have made, and will likelycontinue to make, it difficult to obtain funding. In addition, as a result of concerns about the stability of financialmarkets generally and the solvency of counterparties specifically, the cost of obtaining money from the creditmarkets has generally increased as many lenders and institutional investors have increased interest rates, enactedtighter lending standards, refused to refinance existing debt at maturity either at all or on terms similar to our currentdebt and reduced and, in some cases, ceased to provide funding to borrowers. Due to these factors, we cannot becertain that funding will be available if needed and to the extent required, on acceptable terms. If funding is notavailable when needed, or is available only on unfavorable terms, we may be unable to implement our businessplans, complete acquisitions, or otherwise take advantage of business opportunities or respond to competitivepressures, any of which could have a material adverse effect on our business, financial condition, results ofoperations, and cash flows.
Many of our expenses may not be able to be reduced in proportion to a sales shortfall.
Some of our expenses are relatively fixed in relation to changes in sales volumes and are difficult to adjust inthe short term. Some of these expenses are related to past capital expenditures or business acquisitions in the form ofdepreciation and amortization expense. Others are related to expenditures driven by levels of business activity otherthan the level of sales, including manufacturing overhead. As a result, we might be unable to reduce expenses in atimely manner to compensate for a reduction in sales, which could have a material adverse effect on our business,financial condition, results of operations, and cash flows.
Suppliers may be unable to provide us with materials of sufficient quality or quantity required to meetour production needs at favorable prices or at all.
We are dependent upon suppliers for parts and raw materials used in the manufacture of components that wesell to our customers. We may experience an increase in costs for parts or materials that we source from oursuppliers, or we may experience a shortage of materials for various reasons, such as the loss of a significant supplier,high overall demand creating shortages in parts and supplies we use, or financial distress, work stoppages, naturaldisasters, or production difficulties that may affect one or more of our suppliers. Our customers rely on us to provideon-time delivery and have certain rights if our delivery standards are not maintained. A significant increase in oursupply costs, or a protracted interruption of supplies for any reason, could result in the delay of one or more of ourcustomer contracts or could damage our reputation and relationships with customers. Any of these events couldhave a material adverse effect on our business, financial condition, results of operations, and cash flows.
Subcontractors may fail to perform contractual obligations.
We frequently subcontract portions of work due under contracts with our customers and are dependent on thecontinued availability and satisfactory performance by these subcontractors. Nonperformance or underperformanceby subcontractors may materially impact our ability to perform obligations to our customers. A subcontractor’sfailure to perform could result in a customer terminating our contract for default, expose us to liability, andsubstantially impair our ability to compete for future contracts and orders, and we may not be able to enforce fully
10
all of our rights under these agreements, including any rights to indemnification. Any of these events could have amaterial adverse effect on our business, financial condition, results of operations, and cash flows.
Our product development activities may not be successful or may be more costly than currentlyanticipated.
Our business involves a significant level of product development activities, generally in connection with ourcustomers’ own development activities. Industry standards, customer expectations, or other products may emergethat could render one or more of our products or services less desirable or obsolete. Maintaining our market positionwill require continued investment in research and development. During an economic downturn, including thecurrent one, we may need to maintain our investment in research and development, which may limit our ability toreduce these expenses in proportion to a sales shortfall. If these activities are not as successful as currentlyanticipated, or if they are more costly than currently anticipated, future sales and/or earnings could be lower thanexpected, which could have a material adverse effect on our business, financial condition, results of operations, andcash flows.
Activities necessary to integrate acquisitions may result in costs in excess of current expectations or beless successful than anticipated.
We completed two business acquisitions in October 2008, and we may acquire other businesses in the future.The success of these transactions will depend, among other things, on our ability to integrate assets and personnelacquired in these transactions and to apply our internal controls processes to these acquired businesses. Theintegration of these acquisitions may require significant attention from our management, and the diversion ofmanagement’s attention and resources could have a material adverse effect on our ability to manage our business.Furthermore, we may not realize the degree or timing of benefits we anticipate when we first enter into a transaction.If actual integration costs are higher than amounts assumed or we are unable to integrate the assets and personnelacquired in an acquisition as anticipated, or if we are unable to fully benefit from anticipated synergies, ourbusiness, financial condition, results of operations, and cash flows could be materially adversely affected.
Certain restrictive covenants limit our ability to operate our business and to pursue our businessstrategies, and if we fail to comply with these covenants, it could result in an acceleration of paymentsfor our outstanding indebtedness.
Our existing term loan credit agreement, revolving credit agreement, and note purchase agreements governingour outstanding senior notes contain covenants that limit or restrict our ability to finance future operations or capitalneeds, to respond to changing business and economic conditions, or to engage in other transactions or businessactivities that may impact our growth or otherwise be important to us. These agreements limit or restrict, amongother things, our ability and the ability of our subsidiaries to:
• incur additional indebtedness;
• pay dividends or make distributions on our capital stock or certain other restricted payments or investments;
• purchase or redeem stock;
• issue stock of our subsidiaries;
• make investments and extend credit;
• engage in transactions with affiliates;
• transfer and sell assets;
• effect a consolidation or merger or sell, transfer, lease, or otherwise dispose of all or substantially all of ourassets; and
• create liens on our assets to secure debt.
11
The agreements also impose financial covenants on us and our subsidiaries that require us to maintain certainleverage ratios and minimum levels of consolidated net worth. In addition, certain of these agreements require us torepay outstanding borrowings with portions of the proceeds we receive from certain sales of property or assets andspecified future debt offerings. Our ability to comply with these provisions may be affected by events beyond ourcontrol.
Any breach of these covenants could cause a default under these agreements and other debt, which couldrestrict our ability to borrow under the revolving credit agreement. If there were an event of default under certainprovisions of our debt instruments that was not cured or waived, the holders of the defaulted debt would be able tocause all amounts outstanding with respect to the debt instrument to be due and payable immediately. Our assets andcash flow may not be sufficient to fully repay borrowings under our outstanding debt instruments if acceleratedupon an event of default. If we are unable to repay, refinance, or restructure our indebtedness as required, or amendthe covenants contained in these agreements, the lenders or noteholders may be entitled to institute foreclosureproceedings against our assets. Any of these events could have a material adverse effect on our business, financialcondition, results of operations, and cash flows.
Changes in the estimates of fair value of reporting units or of long-lived assets may result in futureimpairment charges, which could have a material adverse effect on our business, financial condition,results of operations, and cash flows.
Over time, the fair values of long-lived assets change. We test goodwill for impairment at least annually, andmore often if circumstances require. Future goodwill impairment charges may occur if estimates of fair valuesdecrease, which would reduce future earnings. We also test property, plant, and equipment and other intangibles forimpairment whenever events or changes in circumstances indicate that the carrying value may not be recoverable.Future asset impairment charges may occur if asset utilization declines, if customer demand decreases, or for anumber of other reasons, which would reduce future earnings. Any such impairment charges could have a materialadverse effect on our business, financial condition, results of operations, and cash flows.
Future subsidiary results or changes in domestic or international tax statutes may change the amount ofvaluation allowances provided for deferred income tax assets.
We establish valuation allowances to reflect the estimated amount of deferred tax assets that might not berealized. The underlying analysis is performed for individual tax jurisdictions, generally at a subsidiary level. Futuresubsidiary results, actual or forecasted, as well as changes to the relevant tax statutes, could change the outcome ofour analysis and change the amount of valuation allowances provided for deferred income tax assets, which couldhave a material adverse effect on our financial condition, results of operations, and cash flows.
Manufacturing activities may result in future environmental liabilities.
We use hazardous materials and/or regulated materials in our manufacturing operations. We also own and mayacquire facilities that were formerly owned and operated by others that used such materials. The risk that asignificant release of regulated materials has occurred in the past or will occur in the future cannot be completelyeliminated or prevented. As a result, we are subject to a substantial number of costly regulations. In particular, weare required to comply with increasingly stringent requirements of federal, state, and local environmental,occupational health and safety laws and regulations in the U.S., the European Union, and other territories,including those governing emissions to air, discharges to water, noise and odor emissions, the generation, handling,storage, transportation, treatment and disposal of waste materials, and the cleanup of contaminated properties andhuman health and safety. Compliance with these laws and regulations results in ongoing costs. We cannot be certainthat we have been, or will at all times be, in complete compliance with all environmental requirements, or that wewill not incur additional material costs or liabilities in connection with these requirements. As a result, we may incurmaterial costs or liabilities or be required to need to undertake future environmental remediation activities thatcould have a material adverse effect on our business, financial condition, results of operations, and cash flows.
12
Our performance depends on continued access to a stable workforce and on favorable labor relations withour employees.
Competition for technical personnel in the industry in which we compete is intense. Our future successdepends in part on our continued ability to hire, train, assimilate, and retain qualified personnel. There is noassurance that we will continue to be successful in recruiting qualified employees in the future. In addition, laborunrest at a customer facility can cause a reduction in demand or a deferral of orders. Any significant increases inlabor costs, deterioration of employee relations, slowdowns or work stoppages at any of our locations, whether dueto employee turnover, changes in availability of qualified technical personnel, or otherwise, could have a materialadverse effect on our business, our relationships with customers, and our financial condition, results of operations,and cash flows.
Our intellectual property rights may not be sufficient to protect all our products or technologies.
Our success depends in part on our ability to obtain patents or rights to patents, protect trade secrets, operatewithout infringing upon the proprietary rights of others, and prevent others from infringing on our patents,trademarks, and other intellectual property rights. We will be able to protect our intellectual property fromunauthorized use by third parties only to the extent that it is covered by valid and enforceable patents, trademarks, orlicenses. Patent protection generally involves complex legal and factual questions and, therefore, enforceability ofpatent rights cannot be predicted with certainty; thus, any patents that we own or license from others may notprovide us with adequate protection against competitors. Moreover, the laws of certain foreign countries do notrecognize intellectual property rights or protect them to the same extent as do the laws of the U.S. If we infringe onthe proprietary rights of others or if we are unable to sufficiently protect our proprietary rights, our business,financial condition, results of operations, and cash flows could be materially adversely affected.
If third parties claim we are infringing their intellectual property rights, we could face significantlitigation, indemnification, or licensing expenses or be prevented from marketing our products.
Our commercial success depends significantly on our ability to operate without infringing the patents and otherproprietary rights of others. However, regardless of our intent, our current or future technologies may infringe uponthe patents or violate other proprietary rights of third parties. In the event of such infringement or violation, we mayface expensive litigation or indemnification obligations and may be prevented from selling existing products andpursuing product development or commercialization, which could have an adverse affect on our business, financialcondition, results of operations, and cash flows.
Product liability claims, product recalls or other liabilities associated with the products and services weprovide may force us to pay substantial damage awards and other expenses that could exceed our accru-als and insurance coverage.
The manufacture and sale of our products and the services we provide expose us to risk of product liability andother tort claims. Both currently and in the past, we have had a number of product liability claims relating to ourproducts, and we will likely be subject to additional product liability claims in the future for both past and currentproducts, some of which may have a material adverse effect on our business, financial condition, and results ofoperations. We also provide certain services to our customers and are subject to claims with respect to the servicesprovided. In providing such services, we may rely on subcontractors to perform all or a portion of the contractedservices. It is possible that we could be liable to our customers for work performed by a subcontractor. While webelieve that we have appropriate insurance coverage available to us related to any such claims, our insurance maynot cover all liabilities or be available in the future at a cost acceptable to us. If a product liability or other claim orseries of claims, including class action claims, is brought against us for liabilities that are not covered by insuranceor for which third-party indemnification is not available, such claim could have a material adverse effect on ourbusiness, financial condition, results of operations, and cash flows.
13
Fines or sanctions resulting from the investigation by the DOJ regarding MPC pricing policies couldhave a material adverse effect on Woodward.
MPC, one of our newly acquired subsidiaries, is subject to an investigation by the DOJ regarding certain of itspricing practices prior to 2006 related to government contracts. MPC and the U.S. Attorney for the Northern Districtof Illinois have reached a settlement in principle and are in the process of finalizing and obtaining approvals withinthe DOJ. Final disposition will be subject to acceptance and approval by the U.S. District Court. It is anticipated thatany settlement of the matter would involve the payment of monetary fines and other amounts by MPC. MPC is alsoin the process of working with the U.S. Department of Defense to resolve any administrative matters that may ariseout of the investigation. There can be no assurance as to the resolution of these matters. The purchase price for MPCreflects the amount agreed to in principle by MPC with the U.S. Attorney. Any resulting fines or other sanctionsbeyond this amount could have a material adverse effect on our business, financial condition, results of operations,and cash flows.
Amounts accrued for contingencies may be inadequate to cover the amount of loss when the matters areultimately resolved.
In addition to intellectual property and product liability matters, we are currently involved or may becomeinvolved in pending or threatened litigation or other legal proceedings regarding employment or other contractualmatters arising in the ordinary course of business. We accrue for known individual matters that we believe are likelyto result in a loss when ultimately resolved using estimates of the most likely amount of loss. There may beadditional losses that have not been accrued, which could have a material adverse effect on our business, financialcondition, results of operations, and cash flows.
Changes in the legal environment in which we operate may affect future sales and expenses.
We operate in a number of countries and are affected by a variety of laws and regulations, including foreigninvestment, employment, import, export, business acquisitions, environmental and taxation matters, land use rights,property, and other matters. Our ability to operate in these countries may be materially adversely affected byunexpected changes in such laws and regulations.
Operations and suppliers may be subject to physical and other risks that could disrupt production.
Our operations include principal facilities in China, Germany, Scotland, and Poland as well as the U.S. Inaddition, we operate sales and service facilities in Brazil, India, Japan, the Netherlands, and the United Kingdom.We also have suppliers for materials and parts inside and outside the U.S. Our operations and sources of supplycould be disrupted by a natural disaster, war, political unrest, terrorist activity, public health concerns, or otherunforeseen events, which could cause significant delays in the shipment of products and the provision of servicesand could cause the loss of sales and customers. Accordingly, disruption of our operations or the operations of asignificant supplier could have a material adverse effect on our business, financial condition, results of operations,and cash flows.
We have significant investments in foreign entities and have significant sales and purchases in foreigndenominated currencies creating exposure to foreign currency exchange rate fluctuations.
We have significant investments outside the U.S. Further, we have sales and purchases of raw materials andfinished goods in foreign denominated currencies. Accordingly, we have exposure to fluctuations in foreigncurrency exchange rates relative to the U.S. dollar. Foreign currency exchange rate risk is reduced through severalmeans, including the maintenance of local production facilities in the markets served, invoicing of customers in thesame currency as the source of the products, prompt settlement of inter-company balances utilizing a global nettingsystem, and limited use of foreign currency denominated debt. Despite these measures, foreign currency ratefluctuations could have a material adverse effect on our international operations or on our business, financialcondition, results of operations, and cash flows.
14
Changes in assumptions may increase the amount of retirement pension and healthcare benefit obliga-tions and related expense.
Accounting for retirement pension and healthcare benefit obligations and related expense requires the use ofassumptions, including a weighted-average discount rate, an expected long-term rate of return on assets, and a nethealthcare cost trend rate, among others. Benefit obligations and benefit costs are sensitive to changes in theseassumptions. As a result, assumption changes could result in increases in our obligation amounts and expenses.Significant increases in the amount of retirement pension and healthcare benefit obligations and related expensecould have a material adverse affect on our business, financial condition, results of operations, and cash flows.
Industry Risks
Competitors may develop breakthrough technologies that are adopted by our customers.
Many of the components and systems we sell are used in harsh environments with stringent emissionsstandards. The technological expertise we have developed and maintained could become less valuable if acompetitor were to develop a breakthrough technology that would allow them to match or exceed the performanceof existing technologies at a lower cost. If we are unable to develop competitive technologies, future sales orearnings could be lower than expected, which could have a material adverse effect on our business, financialcondition, results of operations, and cash flows.
Industry consolidation trends could reduce our sales opportunities, decrease sales prices, and drive downdemand for our product.
There has been consolidation and there may be further consolidation in the aerospace, power, and processindustries. The consolidation in these industries has resulted in customers with vertically integrated operations,including increased in-sourcing capabilities, which may result in economies of scale for those companies. If ourcustomers continue to seek to control more aspects of vertically integrated projects, cost pressures resulting infurther integration or industry consolidation could reduce our sales opportunities, decrease sales prices, and drivedown demand for our products, which could have a material adverse effect on our business, financial condition,results of operations, and cash flows.
Changes in competitor strategies may reduce the demand for our products.
Companies compete on the basis of providing products that meet the needs of customers, as well as on the basisof price, quality, and customer service. Changes in competitive conditions, including the availability of newproducts and services, the introduction of new channels of distribution, and changes in OEM and aftermarketpricing, could adversely affect future sales, which could have a material adverse effect on our business, financialcondition, results of operations, and cash flows.
Unforeseen events may occur that significantly reduce commercial airline travel.
Our Turbine Systems segment accounted for 46% of our external sales in 2008, with the majority of sales tiedto commercial aviation. Certain events, such as the terrorist actions of 2001, have had a notable negative effect onpassenger flight miles in the past and the airlines’ revenues. Currently, increases in fuel costs, high labor costs, andheightened competition from low cost carriers have adversely affected the financial condition of some commercialairlines. In addition, the current economic downturn has led to a general reduction in air travel, and any furtherdeterioration of economic conditions in the U.S. and internationally could lead to additional reductions in air travel.Market demand for our components and systems could be materially adversely affected by such reductions incommercial airline travel and commercial airlines’ financial difficulties, which could have a material adverse affecton our business, financial condition, results of operations, and cash flows.
Increasing emission standards that drive certain product sales may be eased or delayed.
We sell components and systems that have been designed to meet demanding emission standards, includingstandards that have not yet been implemented but are intended to be soon. If these emission standards are eased, ourfuture sales could be lower as potential customers select alternative products or delay adoption of our products,which would have a material adverse affect on our business, financial condition, results of operations, and cashflows.
15
Natural gas prices may increase significantly and disproportionately to other sources of fuels used forpower generation.
Commercial producers of electricity use many of our components and systems, most predominately in theirpower plants that use natural gas as their fuel source. Commercial producers of electricity are often in a position tomanage the use of different power plant facilities and make decisions based on operating costs. Compared to othersources of fuels used for power generation, natural gas prices have increased slower than fuel oil, but about the sameas coal. This increase in natural gas prices and any future increases could decrease the use of our components andsystems, which could have a material adverse affect on our business, financial condition, results of operations, andcash flows.
The U.S. government may reduce defense funding or the mix of programs to which such funding isallocated.
A portion of our sales of components and systems is to the U.S. government, primarily in the aerospace market.The level of U.S. defense spending is subject to periodic congressional appropriation actions, which is subject tochange at any time. The mix of programs to which such funding is allocated is also uncertain, and we can provide noassurance that an increase in defense spending will be allocated to programs that would benefit our business. If theamount of spending was to decrease, or there was a shift from certain aerospace programs to other programs, oursales could decrease, which could have a material adverse effect on our business, financial condition, results ofoperations, and cash flows.
Changes in foreign currency exchange rates or in interest rates may reduce the demand for our products.
A significant portion of our business is conducted in currencies other than the U.S. dollar which exposes us tomovements in foreign currency exchange rates. These exposures may change over time as our business and businesspractices evolve, and they could have a material adverse effect on our financial results and cash flows. An increasein the value of the U.S. dollar could increase the real cost to our customers of our products in those markets outsidethe U.S. where we sell in dollars, and a weakened dollar could increase the cost of local operating expenses andprocurement of raw materials to the extent that we must purchase components in foreign currencies. Continuedinstability in the worldwide financial markets could impact our ability to effectively manage our foreign currencyexchange rate fluctuation risk, which could negatively impact our business, financial condition, results ofoperations, and cash flows.
Investment Risks
The historic market price of our common stock may not be indicative of future market prices.
The market price of our common stock changes over time. Stock markets in general have experiencedsignificant price and volume volatility over the past year. The trading price of our common stock ranged from a lowof $24.50 per share to a high of $48.62 per share in fiscal 2008. The market price and volume of trading of ourcommon stock may continue to be subject to significant fluctuations due not only to general stock marketconditions, but also to factors such as general conditions in the aerospace industry or a change in sentiment in themarket regarding our operations or business prospects. As a result, the market price of our common stock mayfluctuate or decline significantly in the future.
The typical trading volume of our common stock may affect an investor’s ability to sell significant stockholdings in the future without negatively affecting stock price.
We currently have approximately 68 million shares of common stock outstanding. While the level of tradingactivity will vary by day, the typical trading level represents only a small percentage of total shares of stockoutstanding. As a result, a seller who a significant number of shares of stock in a short period of time couldnegatively affect our share price.
Item 1B. Unresolved Staff Comments
None.
16
Item 2. Properties
Our principal plants are as follows:
United States
Fort Collins, Colorado — Turbine Systems, Engine Systems, and Electrical Power Systems manufacturing,engineering, and corporate headquarters
Loveland, Colorado — Turbine Systems and Engine Systems manufacturing and partially leased to a third partyRockford, Illinois — Turbine Systems manufacturing and engineeringRockton, Illinois — Turbine Systems manufacturing and repair and overhaulZeeland, Michigan — Turbine Systems manufacturing and engineeringGreenville, South Carolina (leased) — Turbine Systems manufacturing and engineering
Other Countries
Suzhou, Peoples’ Republic of China (leased) — Engine Systems manufacturingAken, Germany (leased) — Engine Systems manufacturing and engineeringKempen, Germany — Electrical Power Systems manufacturing and engineeringStuttgart, Germany (leased) — Electrical Power Systems manufacturing and engineeringPrestwick, Scotland, United Kingdom (leased) — Turbine Systems repair and overhaulTianjin, Peoples’ Republic of China (leased) — Engine Systems manufacturingKrakow, Poland (leased) — Electrical Power Systems manufacturing and engineering
In connection with the MPC acquisition, Woodward assumed leases on approximately 450,000 square feet ofmanufacturing and office space in Skokie and Niles, Illinois. In connection with the acquisition of MotoTron,Woodward assumed office leases in Ann Arbor, Michigan and Columbus, Indiana and established a lease for anoffice facility in Oshkosh, Wisconsin. Additional information about these acquisitions is included in Note 22 to theConsolidated Financial Statements in “Item 8 — Financial Statements and Supplementary Data.”
In addition to the principal plants listed above, we own or lease other facilities in Brazil, India, Japan, theNetherlands, and the United Kingdom which are used primarily for sales and service activities.
Our principal plants are suitable and adequate for the manufacturing and other activities performed at thoseplants, and we believe our utilization levels are generally high. However, with continuing advancements inmanufacturing technology and operational improvements, we believe we can continue to increase productionwithout significant capital expenditures for expansion, retooling, or acquisition of additional plants.
We anticipate growth in capacity in the following locations during fiscal 2009: Loveland, Colorado, Tianjin,China, and Krakow, Poland.
17
Item 3. Legal Proceedings
We are currently involved in pending or threatened litigation or other legal proceedings regarding employ-ment, product liability, and contractual matters arising from the normal course of business. We have accrued forindividual matters that we believe are likely to result in a loss when ultimately resolved using estimates of the mostlikely amount of loss. There are also individual matters where management believes the likelihood of a loss whenultimately resolved is less than likely but more than remote, which were not accrued. While it is possible that therecould be additional losses that have not been accrued, we currently believe the possible additional loss in the eventof an unfavorable resolution of each matter is less than $10,000 in the aggregate.
Specifically, MPC, one of our newly acquired subsidiaries, is subject to an investigation by the DOJ regardingcertain of its pricing practices related to government contracts prior to 2006. MPC and the U.S. Attorney for theNorthern District of Illinois have reached a settlement in principle and are in the process of finalizing and obtainingapprovals within the DOJ. Final disposition will be subject to acceptance and approval by the U.S. District Court. Itis anticipated that any settlement of the matter would involve the payment of monetary fines and other amounts byMPC. MPC is also in the process of working with the U.S. Department of Defense to resolve any administrativematters that may arise out of the investigation. There can be no assurance as to the resolution of these matters. Thepurchase price for MPC reflects the amount agreed to in principle by MPC with the U.S. Attorney. Any resultingfines or other sanctions beyond this amount could have a material negative impact on Woodward.
We currently do not have any administrative or judicial proceedings arising under any Federal, State, or localprovisions regulating the discharge of materials into the environment or primarily for the purpose of protecting theenvironment.
Woodward does not recognize contingencies that might result in a gain until such contingencies are resolvedand the related amounts are realized.
In the event of a change in control of the Company, Woodward may be required to pay termination benefits tocertain executive officers.
Item 4. Submission of Matters to a Vote of Security Holders
There were no matters submitted to a vote of security holders during the fourth quarter of fiscal 2008.
18
PART II
Item 5. Market for Registrant’s Common Equity, Related Stockholder Matters and Issuer Purchases ofEquity Securities
Our common stock is listed on The NASDAQ Global Select Market and at November 17, 2008, there wereapproximately 1,380 holders of record. Cash dividends were declared quarterly during 2008 and 2007. The amountof cash dividends per share and the high and low sales price per share for our common stock for each fiscal quarter in2008 and 2007 are included in the Note 21 to the Consolidated Financial Statements in “Item 8 — FinancialStatements and Supplementary Data.”
(a) Recent Sales of Unregistered Securities
Sales of common stock issued from treasury stock to one of the company’s directors during the fourth quarterof 2008 consisted of the following (dollars in thousands):
TotalShares
PurchasedConsideration
Received
July 1, 2008 through July 31, 2008. . . . . . . . . . . . . . . . . . . . . . . . . . . . . . 209 $ 9August 1, 2008 through August 31, 2008 . . . . . . . . . . . . . . . . . . . . . . . . . — —September 1, 2008 through September 30, 2008 . . . . . . . . . . . . . . . . . . . . — —
The securities were sold in reliance upon the exemption contained in Section 4(2) of the Securities Act of 1933.
(b) Issuer Purchases of Equity Securities
Period
Total Numberof SharesPurchased
Average PricePaid Per
Share
Total Numberof Shares
Purchased asPart of
Publicly AnnouncedPlans or
Programs
Maximum Number(or Approximate
Dollar Value)of Shares that
May YetBe Purchased
Under thePlans or
Programs(1)(Dollars in thousands)
July 1, 2008 through July 31,2008 . . . . . . . . . . . . . . . . . . — $ — — $168,075
August 1, 2008 throughAugust 31, 2008(2) . . . . . . . — $ — — $168,075
September 1, 2008 throughSeptember 30, 2008(3)(4) . . 554 $43.30 — $168,075
(1) During September 2007, the Board of Directors authorized a stock repurchase program of up to $200 million ofour outstanding shares of common stock on the open market or privately negotiated transactions over a three-year period that will end in October 2010. During the first half of fiscal year 2008, $31,925 was spent from thisallocated pool for repurchase of stock.
(2) Does not include 21,265 shares acquired as part of the exercise of stock options in August 2008.
(3) Does not include 2,677 shares acquired as part of the exercise of stock options in September 2008.
(4) We purchased 554 shares on the open market related to the reinvestment of dividends for shares of treasurystock held for deferred compensation in September 2008.
The information required by this item relating to securities authorized for issuance under equity plans isincluded under the caption “Executive Compensation — Equity Compensation Plan Information” in our ProxyStatement for the 2008 Annual Meeting of Stockholders to be held January 22, 2009 and is incorporated herein byreference.
19

Item 6. Selected Financial Data
The following selected financial data should be read in conjunction with the Consolidated Financial State-ments and related notes which appear in “Item 8 — Financial Statements and Supplementary Data” of this AnnualReport.
2008 2007 2006 2005 2004Year Ended September 30,
(In thousands except per share amounts)
Net sales . . . . . . . . . . . . . . . . . . . . . . . . . . . . . $1,258,204 1,042,337 854,515 827,726 709,805Net Earnings(1)(2)(4) . . . . . . . . . . . . . . . . . . $ 121,880 98,157 69,900 55,971 31,382
Earnings per share(3):Basic . . . . . . . . . . . . . . . . . . . . . . . . . . . . . . $ 1.80 1.43 1.02 0.82 0.46Diluted . . . . . . . . . . . . . . . . . . . . . . . . . . . . $ 1.75 1.39 0.99 0.80 0.45Cash dividends per share . . . . . . . . . . . . . . . $ 0.235 0.215 0.200 0.175 0.160
Income taxes . . . . . . . . . . . . . . . . . . . . . . . . . . $ 60,030 33,831 14,597 23,137 17,910Interest expense . . . . . . . . . . . . . . . . . . . . . . . . $ 3,834 4,527 5,089 5,814 5,332Interest income . . . . . . . . . . . . . . . . . . . . . . . . $ 2,120 3,604 2,750 2,159 1,095Depreciation expense . . . . . . . . . . . . . . . . . . . . $ 28,620 25,428 22,064 24,451 25,856Amortization expense . . . . . . . . . . . . . . . . . . . $ 6,830 7,496 6,953 7,087 6,905Capital expenditures . . . . . . . . . . . . . . . . . . . . $ 41,099 31,984 31,713 26,615 18,698Weighted-average shares outstanding:
Basic shares outstanding . . . . . . . . . . . . . . . 67,564 68,489 68,702 68,400 67,716Diluted shares outstanding . . . . . . . . . . . . . . 69,560 70,487 70,382 70,254 69,390
2008 2007 2006 2005 2004At September 30,
(Dollars in thousands)
Working capital . . . . . . . . . . . . . . . . . . . . . . . . $ 369,211 275,611 260,243 241,066 197,524Total assets . . . . . . . . . . . . . . . . . . . . . . . . . . . $ 927,017 829,767 735,497 705,466 654,294Long-term debt, less current portion . . . . . . . . . $ 33,337 45,150 58,379 72,942 88,452Total debt . . . . . . . . . . . . . . . . . . . . . . . . . . . . $ 48,928 66,586 73,515 95,787 95,241Total liabilities . . . . . . . . . . . . . . . . . . . . . . . . $ 297,389 285,336 256,808 272,997 268,433Stockholders’ equity . . . . . . . . . . . . . . . . . . . . $ 629,628 544,431 478,689 432,469 385,861Full-time worker members . . . . . . . . . . . . . . . . 4,476 4,248 3,731 3,513 3,287Registered stockholder members . . . . . . . . . . . 1,358 1,229 1,442 1,448 1,529
Notes:
1. Net earnings for fiscal 2007 included two tax adjustments, a favorable resolution of issues with tax authoritiesresulting in a reduction of net tax expense of $13.3 million and a reduction in deferred tax assets resulting in atax expense of $3.0 million due to a decrease in the German statutory income tax rate. These adjustmentsincreased net earnings by $10.3 million, or $0.15 per basic share and $0.15 per diluted share.
2. Net earnings for fiscal 2006 included a deferred tax asset valuation allowance change that increased netearnings by $13.7 million, or $0.20 per basic share and $0.19 per diluted share.
3. Per share amounts have been updated from amounts reported prior to February 1, 2008 to reflect the effect of atwo-for-one stock split and prior to February 1, 2006 to reflect the effect of a three-for-one stock split.
4. Accounting for stock-based compensation changed to the fair value method from the intrinsic value methodbeginning in the first quarter of fiscal 2006, concurrent with the adoption on October 1, 2005 of Statement ofFinancial Accounting Standards 123R, “Share-Based Payments.” The following presents a reconciliation ofreported net earnings and per share information to pro forma net earnings and per share information that would
20
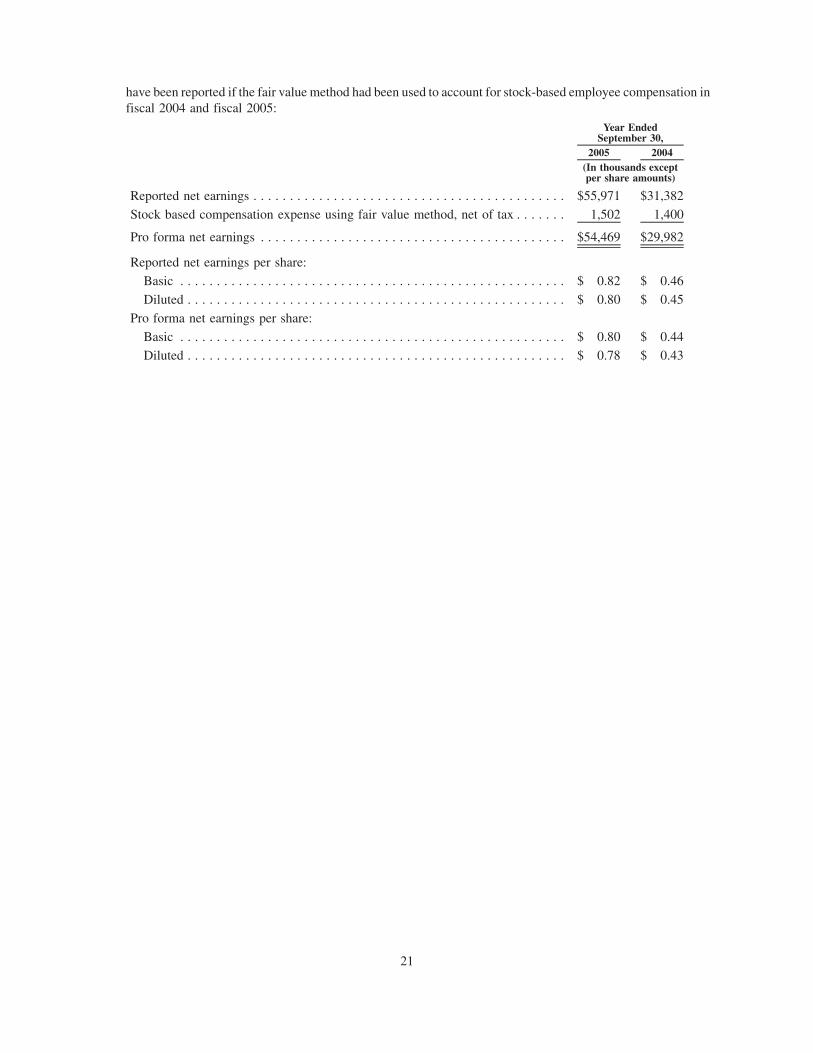
have been reported if the fair value method had been used to account for stock-based employee compensation infiscal 2004 and fiscal 2005:
2005 2004
Year EndedSeptember 30,
(In thousands exceptper share amounts)
Reported net earnings . . . . . . . . . . . . . . . . . . . . . . . . . . . . . . . . . . . . . . . . . . . $55,971 $31,382Stock based compensation expense using fair value method, net of tax . . . . . . . 1,502 1,400
Pro forma net earnings . . . . . . . . . . . . . . . . . . . . . . . . . . . . . . . . . . . . . . . . . . $54,469 $29,982
Reported net earnings per share:Basic . . . . . . . . . . . . . . . . . . . . . . . . . . . . . . . . . . . . . . . . . . . . . . . . . . . . . $ 0.82 $ 0.46Diluted . . . . . . . . . . . . . . . . . . . . . . . . . . . . . . . . . . . . . . . . . . . . . . . . . . . . $ 0.80 $ 0.45
Pro forma net earnings per share:Basic . . . . . . . . . . . . . . . . . . . . . . . . . . . . . . . . . . . . . . . . . . . . . . . . . . . . . $ 0.80 $ 0.44Diluted . . . . . . . . . . . . . . . . . . . . . . . . . . . . . . . . . . . . . . . . . . . . . . . . . . . . $ 0.78 $ 0.43
21
Item 7. Management’s Discussion and Analysis of Financial Condition and Results of Operations
OVERVIEW
Woodward designs, manufactures, and services energy control systems and components for commercial andmilitary aircraft, turbines, reciprocating engines, and electrical power system equipment. Our innovative fluidenergy, combustion control, electrical energy, and motion control systems help customers offer cleaner, morereliable, and more cost-effective equipment. Leading original equipment manufacturers use our products andservices in aerospace, power and process industries, and transportation.
Our strategic focus is Energy Control and Optimization Solutions. The control of energy — fluid energy,combustion, electrical energy, and motion — is a growing requirement in the markets we serve. Our customers look tous to optimize the efficiency, emissions, and operations of power equipment. Our core technologies leverage wellacross our markets and customer applications, enabling us to develop and integrate cost-effective and state-of-the-artfuel, combustion, fluid, actuation, and electronic systems. We focus primarily on OEMs and equipment packagers,partnering with them to bring superior component and system solutions to their demanding applications.
We have three business segments — Turbine Systems, Engine Systems, and Electrical Power Systems.Turbine Systems is focused on systems and components that provide energy control and optimization solutionsfor the aircraft and industrial gas turbine markets. Engine Systems is focused on systems and components thatprovide energy control and optimization solutions for the industrial engine and steam turbine markets, whichinclude power generation, transportation, and process industries. Electrical Power Systems is focused on systemsand components that provide power sensing and energy control systems to improve the security, quality, reliability,and availability of electrical power networks for industrial markets, which include power generation, powerdistribution, transportation, and process industries.
On October 1, 2008, we acquired MPC in a transaction valued at approximately $383 million. MPC is aprivately-held company headquartered in Skokie, Illinois. MPC’s products include high performance motors andsensors, analog and digital control electronics, rotary and linear actuation systems, and flight deck and fly-by-wiresystems. MPC’s products are used in both commercial and military aerospace programs. MPC’s customer listincludes airframers such as Boeing and Airbus, as well as tier-one suppliers, such as Raytheon and Honeywell. MPCwill form our fourth business segment, Airframe Systems. This segment allows us to focus on the airframeapplications of both MPC’s and Woodward’s technologies and products. We are also evaluating opportunities toleverage MPC’s competencies into our traditional market niches. Additional information about Airframe Systemsand the acquisition is included in Note 22 to the Consolidated Financial Statements in “Item 8 — FinancialStatements and Supplementary Data.”
We use segment information internally to assess the performance of each segment and to make decisions on theallocation of resources.
Our sales have increased at an annual rate of 15% from fiscal 2004 to fiscal 2008. Our earnings have increasedat an annual rate of 40% from fiscal 2004 to fiscal 2008. In 2008, we achieved record sales of $1.26 billion and ournet earnings were $121.9 million. Our markets showed continued strength through fiscal 2008 and we were wellpositioned to capture the opportunities presented in each of our segments.
We took advantage of two continuing trends in our markets — the increasing global need for both energyefficiency and emissions reductions, where our products meet customer expectations by providing superiorperformance. At September 30, 2008, our total assets were approximately $927.0 million, including $109.9 millionin cash, and our total debt was approximately $48.9 million. As discussed in Note 22 to the Consolidated FinancialStatements in “Item 8 — Financial Statements and Supplementary Data,” an aggregate $400.0 million of additionaldebt was issued on October 1, 2008 and October 30, 2008, a substantial portion of which was used to finance theMPC acquisition. We are well positioned to fund expanded research and development and to explore otherinvestment opportunities consistent with our focused strategies.
In the sections that follow, we are providing information to help you better understand our critical accountingestimates and market risks, our results of operations and financial condition, and the effects of recent accountingpronouncements.
22
CRITICAL ACCOUNTING ESTIMATES
The preparation of financial statements and related disclosures in conformity with accounting principlesgenerally accepted in the U.S. (“U.S.GAAP”) requires us to make judgments, assumptions, and estimates that affectthe amounts reported in the Consolidated Financial Statements and accompanying notes. Note 1 to the ConsolidatedFinancial Statements describes the significant accounting policies and methods used in the preparation of theConsolidated Financial Statements. The accounting positions described below are significantly affected by criticalaccounting estimates. Such accounting positions require significant judgments, assumptions, and estimates to beused in the preparation of the Consolidated Financial Statements, and actual results could differ materially from theamounts reported based on variability in factors affecting these estimates.
Our management has discussed the development and selection of these critical accounting estimates with theaudit committee of our board of directors, and the audit committee has reviewed our disclosures to it in thisManagement’s Discussion and Analysis.
Inventory
Inventories are valued at the lower of cost or market, with cost being determined on a first-in, first-out basis.Customer-specific information and contractual terms are considered when evaluating lower of cost or marketconsiderations. The carrying value of inventory as of September 30, 2008 was $208.3 million. If economicconditions or other factors significantly reduce future customer demand for our products from forecast levels, thenfuture adjustments to the carrying value of inventory may become necessary. We attempt to maintain inventoryquantities to levels considered necessary to fill expected orders in a reasonable time frame, which we believemitigates our exposure to future inventory carrying cost adjustments.
Post-retirement benefits
The Company provides various benefits to certain employees through defined benefit plans and retirementhealthcare benefit plans. For financial reporting purposes, net periodic benefits expense and related obligations arecalculated using a number of significant actuarial assumptions, including anticipated discount rates, rates ofcompensation increases, long-term return on defined benefit plan investments, and anticipated healthcare costincreases. Changes in net periodic expense may occur in the future due to changes in these assumptions.
Estimates of the value of post-retirement benefit obligations, and related net periodic benefits expense, aredependent on actuarial assumptions including future interest rates, compensation rates, healthcare cost trends, andreturns on defined benefit plan investments. Variances from our year end estimates for these variables couldmaterially affect our recognized post-retirement benefit obligation liabilities. On a near-term basis, such changesare unlikely to have a material impact on reported earnings, since such adjustments are recorded to othercomprehensive income and recognized into expense over a number of years. Significant changes in estimatescould, however, materially affect the carrying amounts of projected benefit obligation liabilities, which could affectloan covenant compliance and future borrowing capacity. As of September 30, 2008, the projected benefitobligation of all of our post-retirement benefit plans was $101.1 million. In light of recent global economicinstability, management considers the likelihood that such assumptions may change significantly in future periodsto be greater than in recent years.
Reviews for impairment of goodwill
At September 30, 2008, we had $139.6 million of goodwill, or 15% of total assets. We test goodwill forimpairment at least annually, during the second quarter, and whenever events occur or circumstances change thatindicate there may be an impairment. These events or circumstances could include a significant adverse change inthe business climate, poor indicators of operating performance, or a sale or disposition of a significant reportingunit.
We test goodwill for impairment at the reporting unit level. Our reporting units are our operating segments.Testing goodwill for impairment requires us to determine the amount of goodwill associated with reporting units,estimate fair values of those reporting units, and determine their carrying values. These processes are subjective and
23
require significant estimates. These estimates include judgments about future cash flows that are dependent oninternal forecasts, long-term growth rates, allocations of commonly shared assets, and estimates of weighted-average cost of capital used to discount future cash flows. Changes in these estimates and assumptions couldmaterially affect the results of our reviews for impairment of goodwill.
Our impairment analysis is partially dependent upon future cash flow projections for our operating segments,discounted at appropriate interest rates. If future sales are significantly impacted by changes in the overall economy,negatively affecting future cash flows, or if interest rates change significantly from current levels, then theimpairment assessment could be effected, which could materially impact our results of operations and financialposition. Management believes that changes in future cash flows and/or interest rates of significant magnitude toresult in a future impairment charge against goodwill recorded as of September 30, 2008 are unlikely.
Income taxes
We are subject to income taxes in the U.S. and numerous foreign jurisdictions. Significant judgment is requiredin evaluating our tax positions and determining our provision for income taxes.
During the ordinary course of business, there are many transactions and calculations for which the ultimate taxdetermination is uncertain. We establish reserves for tax-related uncertainties based on estimates of whether, andthe extent to which, additional taxes will be due. The reserves are established when we believe that certain positionsare likely to be challenged and may not be fully sustained on review by tax authorities. We adjust these reserves inlight of changing facts and circumstances, such as the closing of a tax audit or refinement of an estimate. Althoughwe believe our reserves are reasonable, no assurance can be given that the final outcome of these matters will not bedifferent from that which is reflected in our historical income tax provisions and accruals. To the extent that the finaltax outcome of these matters is different than the amounts recorded, such differences will impact the provision forincome taxes. The provision for income taxes includes the impact of reserve provisions and changes to reserves thatare considered appropriate. As of September 30, 2008, unrecognized net tax benefits for which recognition has beendeferred following the guidance of FIN 48 was $22.6 million.
Significant judgment is also required in determining any valuation allowance recorded against deferred taxassets. In assessing the need for a valuation allowance, we consider all available evidence including past operatingresults, estimates of future taxable income, and the feasibility of tax planning strategies. In the event that we changeour determination as to the amount of deferred tax assets that can be realized, we will adjust our valuation allowancewith a corresponding impact to the provision for income taxes in the period in which such determination is made. Asof September 30, 2008, our valuation allowance was $0.1 million.
Our effective tax rates differ from the statutory rate primarily due to the tax impact of foreign operations,adjustments of valuation allowances, research tax credits, state taxes, and tax audit settlements.
Our provision for income taxes is subject to volatility and could be affected by the following: earnings that aredifferent than anticipated in countries which have lower or higher tax rates; changes in the valuation of our deferredtax assets and liabilities; transfer pricing adjustments; tax effects of stock-based compensation; costs or benefitsrelated to intercompany restructurings; or changes in tax laws, regulations, and accounting principles, includingaccounting for uncertain tax positions, or interpretations thereof. In addition, we are subject to examination of ourincome tax returns by the Internal Revenue Service and other tax authorities. We regularly assess the likelihood ofadverse outcomes resulting from these examinations to determine the adequacy of our provision for income taxes.
There can be no assurance that the outcomes from these examinations will not have an effect on our operatingresults and financial condition.
24
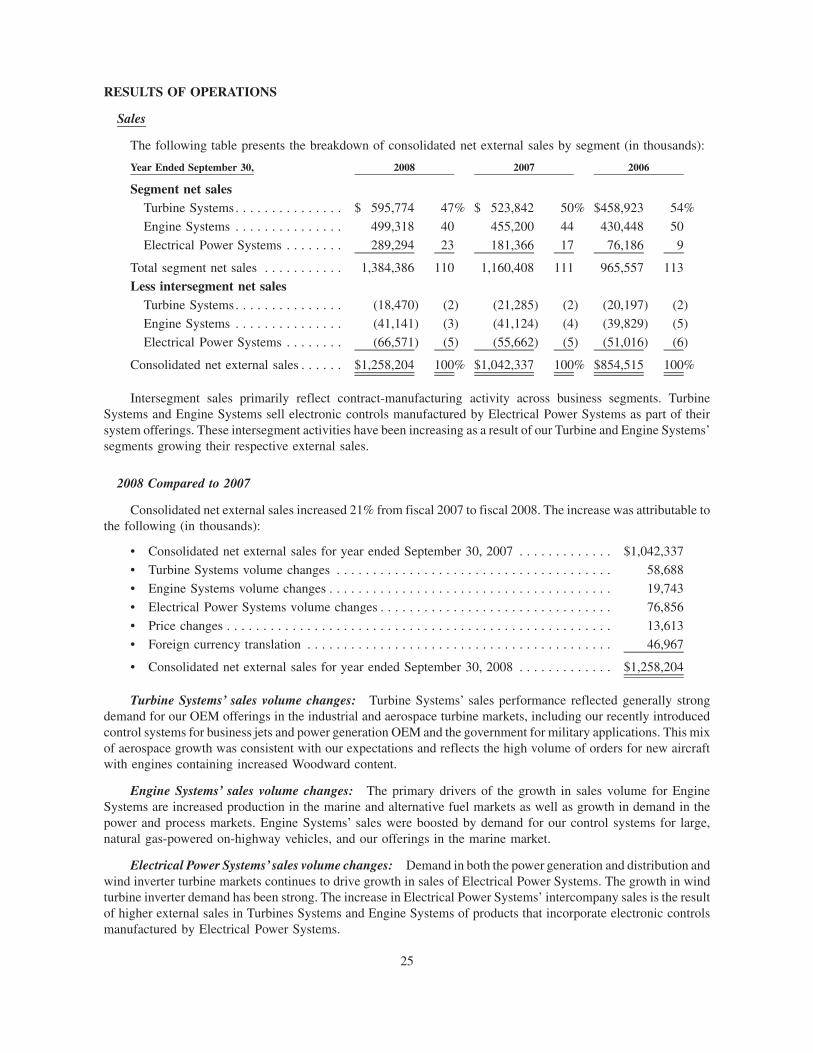
RESULTS OF OPERATIONS
Sales
The following table presents the breakdown of consolidated net external sales by segment (in thousands):
Year Ended September 30, 2008 2007 2006
Segment net salesTurbine Systems. . . . . . . . . . . . . . . $ 595,774 47% $ 523,842 50% $458,923 54%Engine Systems . . . . . . . . . . . . . . . 499,318 40 455,200 44 430,448 50Electrical Power Systems . . . . . . . . 289,294 23 181,366 17 76,186 9
Total segment net sales . . . . . . . . . . . 1,384,386 110 1,160,408 111 965,557 113Less intersegment net sales
Turbine Systems. . . . . . . . . . . . . . . (18,470) (2) (21,285) (2) (20,197) (2)Engine Systems . . . . . . . . . . . . . . . (41,141) (3) (41,124) (4) (39,829) (5)Electrical Power Systems . . . . . . . . (66,571) (5) (55,662) (5) (51,016) (6)
Consolidated net external sales . . . . . . $1,258,204 100% $1,042,337 100% $854,515 100%
Intersegment sales primarily reflect contract-manufacturing activity across business segments. TurbineSystems and Engine Systems sell electronic controls manufactured by Electrical Power Systems as part of theirsystem offerings. These intersegment activities have been increasing as a result of our Turbine and Engine Systems’segments growing their respective external sales.
2008 Compared to 2007
Consolidated net external sales increased 21% from fiscal 2007 to fiscal 2008. The increase was attributable tothe following (in thousands):
• Consolidated net external sales for year ended September 30, 2007 . . . . . . . . . . . . . $1,042,337• Turbine Systems volume changes . . . . . . . . . . . . . . . . . . . . . . . . . . . . . . . . . . . . . . 58,688• Engine Systems volume changes . . . . . . . . . . . . . . . . . . . . . . . . . . . . . . . . . . . . . . . 19,743• Electrical Power Systems volume changes . . . . . . . . . . . . . . . . . . . . . . . . . . . . . . . . 76,856• Price changes . . . . . . . . . . . . . . . . . . . . . . . . . . . . . . . . . . . . . . . . . . . . . . . . . . . . . 13,613• Foreign currency translation . . . . . . . . . . . . . . . . . . . . . . . . . . . . . . . . . . . . . . . . . . 46,967
• Consolidated net external sales for year ended September 30, 2008 . . . . . . . . . . . . . $1,258,204
Turbine Systems’ sales volume changes: Turbine Systems’ sales performance reflected generally strongdemand for our OEM offerings in the industrial and aerospace turbine markets, including our recently introducedcontrol systems for business jets and power generation OEM and the government for military applications. This mixof aerospace growth was consistent with our expectations and reflects the high volume of orders for new aircraftwith engines containing increased Woodward content.
Engine Systems’ sales volume changes: The primary drivers of the growth in sales volume for EngineSystems are increased production in the marine and alternative fuel markets as well as growth in demand in thepower and process markets. Engine Systems’ sales were boosted by demand for our control systems for large,natural gas-powered on-highway vehicles, and our offerings in the marine market.
Electrical Power Systems’sales volume changes: Demand in both the power generation and distribution andwind inverter turbine markets continues to drive growth in sales of Electrical Power Systems. The growth in windturbine inverter demand has been strong. The increase in Electrical Power Systems’ intercompany sales is the resultof higher external sales in Turbines Systems and Engine Systems of products that incorporate electronic controlsmanufactured by Electrical Power Systems.
25
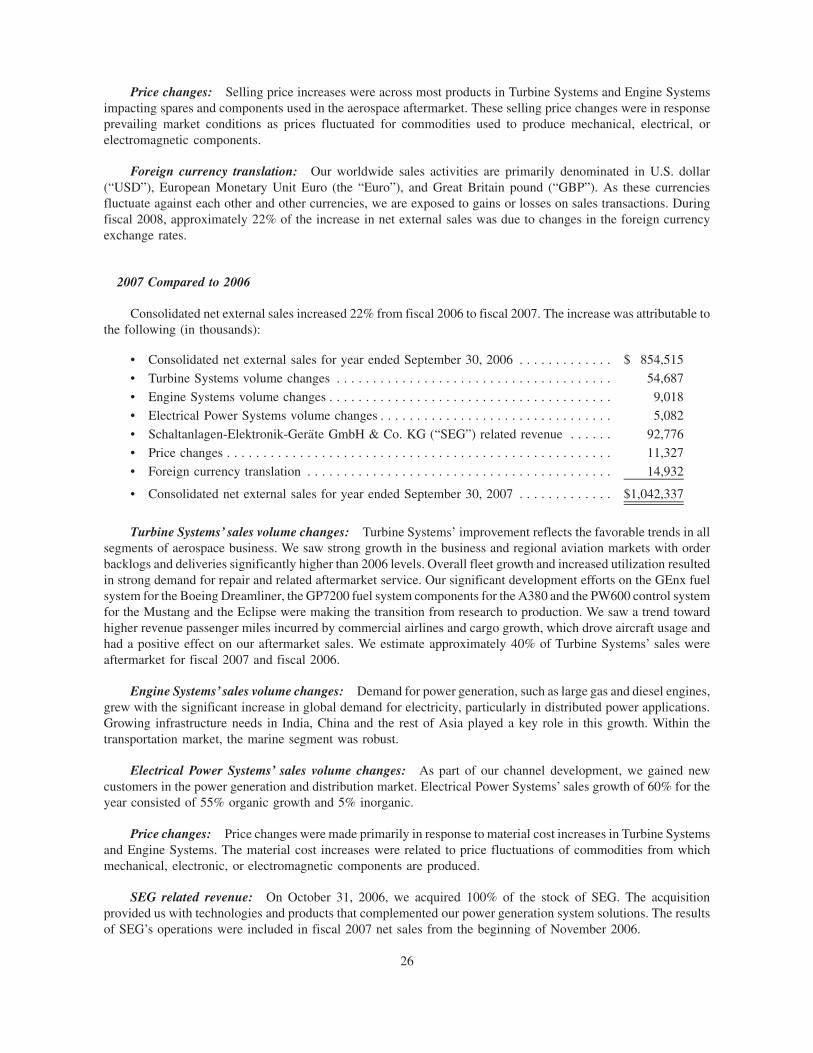
Price changes: Selling price increases were across most products in Turbine Systems and Engine Systemsimpacting spares and components used in the aerospace aftermarket. These selling price changes were in responseprevailing market conditions as prices fluctuated for commodities used to produce mechanical, electrical, orelectromagnetic components.
Foreign currency translation: Our worldwide sales activities are primarily denominated in U.S. dollar(“USD”), European Monetary Unit Euro (the “Euro”), and Great Britain pound (“GBP”). As these currenciesfluctuate against each other and other currencies, we are exposed to gains or losses on sales transactions. Duringfiscal 2008, approximately 22% of the increase in net external sales was due to changes in the foreign currencyexchange rates.
2007 Compared to 2006
Consolidated net external sales increased 22% from fiscal 2006 to fiscal 2007. The increase was attributable tothe following (in thousands):
• Consolidated net external sales for year ended September 30, 2006 . . . . . . . . . . . . . $ 854,515• Turbine Systems volume changes . . . . . . . . . . . . . . . . . . . . . . . . . . . . . . . . . . . . . . 54,687• Engine Systems volume changes . . . . . . . . . . . . . . . . . . . . . . . . . . . . . . . . . . . . . . . 9,018• Electrical Power Systems volume changes . . . . . . . . . . . . . . . . . . . . . . . . . . . . . . . . 5,082• Schaltanlagen-Elektronik-Gerate GmbH & Co. KG (“SEG”) related revenue . . . . . . 92,776• Price changes . . . . . . . . . . . . . . . . . . . . . . . . . . . . . . . . . . . . . . . . . . . . . . . . . . . . . 11,327• Foreign currency translation . . . . . . . . . . . . . . . . . . . . . . . . . . . . . . . . . . . . . . . . . . 14,932
• Consolidated net external sales for year ended September 30, 2007 . . . . . . . . . . . . . $1,042,337
Turbine Systems’ sales volume changes: Turbine Systems’ improvement reflects the favorable trends in allsegments of aerospace business. We saw strong growth in the business and regional aviation markets with orderbacklogs and deliveries significantly higher than 2006 levels. Overall fleet growth and increased utilization resultedin strong demand for repair and related aftermarket service. Our significant development efforts on the GEnx fuelsystem for the Boeing Dreamliner, the GP7200 fuel system components for the A380 and the PW600 control systemfor the Mustang and the Eclipse were making the transition from research to production. We saw a trend towardhigher revenue passenger miles incurred by commercial airlines and cargo growth, which drove aircraft usage andhad a positive effect on our aftermarket sales. We estimate approximately 40% of Turbine Systems’ sales wereaftermarket for fiscal 2007 and fiscal 2006.
Engine Systems’ sales volume changes: Demand for power generation, such as large gas and diesel engines,grew with the significant increase in global demand for electricity, particularly in distributed power applications.Growing infrastructure needs in India, China and the rest of Asia played a key role in this growth. Within thetransportation market, the marine segment was robust.
Electrical Power Systems’ sales volume changes: As part of our channel development, we gained newcustomers in the power generation and distribution market. Electrical Power Systems’ sales growth of 60% for theyear consisted of 55% organic growth and 5% inorganic.
Price changes: Price changes were made primarily in response to material cost increases in Turbine Systemsand Engine Systems. The material cost increases were related to price fluctuations of commodities from whichmechanical, electronic, or electromagnetic components are produced.
SEG related revenue: On October 31, 2006, we acquired 100% of the stock of SEG. The acquisitionprovided us with technologies and products that complemented our power generation system solutions. The resultsof SEG’s operations were included in fiscal 2007 net sales from the beginning of November 2006.
26
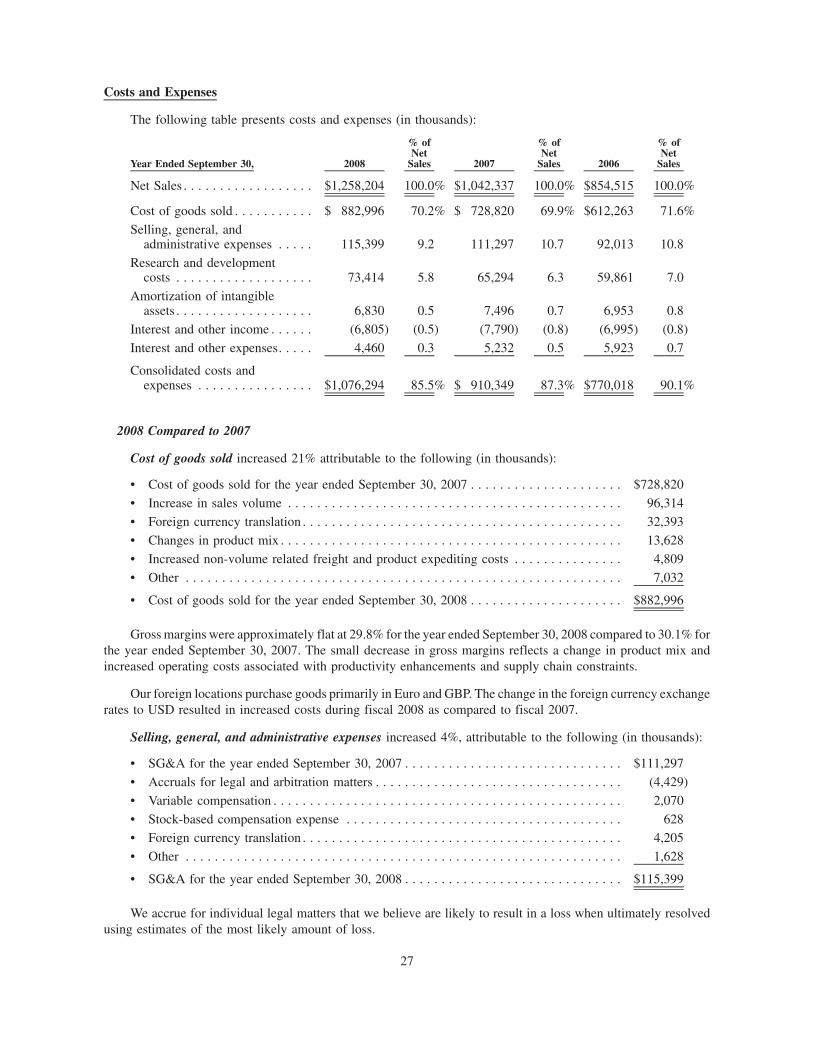
Costs and Expenses
The following table presents costs and expenses (in thousands):
Year Ended September 30, 2008
% ofNet
Sales 2007
% ofNet
Sales 2006
% ofNet
Sales
Net Sales . . . . . . . . . . . . . . . . . . $1,258,204 100.0% $1,042,337 100.0% $854,515 100.0%
Cost of goods sold . . . . . . . . . . . $ 882,996 70.2% $ 728,820 69.9% $612,263 71.6%Selling, general, and
administrative expenses . . . . . 115,399 9.2 111,297 10.7 92,013 10.8Research and development
costs . . . . . . . . . . . . . . . . . . . 73,414 5.8 65,294 6.3 59,861 7.0Amortization of intangible
assets . . . . . . . . . . . . . . . . . . . 6,830 0.5 7,496 0.7 6,953 0.8Interest and other income . . . . . . (6,805) (0.5) (7,790) (0.8) (6,995) (0.8)Interest and other expenses. . . . . 4,460 0.3 5,232 0.5 5,923 0.7
Consolidated costs andexpenses . . . . . . . . . . . . . . . . $1,076,294 85.5% $ 910,349 87.3% $770,018 90.1%
2008 Compared to 2007
Cost of goods sold increased 21% attributable to the following (in thousands):
• Cost of goods sold for the year ended September 30, 2007 . . . . . . . . . . . . . . . . . . . . . $728,820• Increase in sales volume . . . . . . . . . . . . . . . . . . . . . . . . . . . . . . . . . . . . . . . . . . . . . . 96,314• Foreign currency translation . . . . . . . . . . . . . . . . . . . . . . . . . . . . . . . . . . . . . . . . . . . . 32,393• Changes in product mix . . . . . . . . . . . . . . . . . . . . . . . . . . . . . . . . . . . . . . . . . . . . . . . 13,628• Increased non-volume related freight and product expediting costs . . . . . . . . . . . . . . . 4,809• Other . . . . . . . . . . . . . . . . . . . . . . . . . . . . . . . . . . . . . . . . . . . . . . . . . . . . . . . . . . . . 7,032
• Cost of goods sold for the year ended September 30, 2008 . . . . . . . . . . . . . . . . . . . . . $882,996
Gross margins were approximately flat at 29.8% for the year ended September 30, 2008 compared to 30.1% forthe year ended September 30, 2007. The small decrease in gross margins reflects a change in product mix andincreased operating costs associated with productivity enhancements and supply chain constraints.
Our foreign locations purchase goods primarily in Euro and GBP. The change in the foreign currency exchangerates to USD resulted in increased costs during fiscal 2008 as compared to fiscal 2007.
Selling, general, and administrative expenses increased 4%, attributable to the following (in thousands):
• SG&A for the year ended September 30, 2007 . . . . . . . . . . . . . . . . . . . . . . . . . . . . . . $111,297• Accruals for legal and arbitration matters . . . . . . . . . . . . . . . . . . . . . . . . . . . . . . . . . . (4,429)• Variable compensation . . . . . . . . . . . . . . . . . . . . . . . . . . . . . . . . . . . . . . . . . . . . . . . . 2,070• Stock-based compensation expense . . . . . . . . . . . . . . . . . . . . . . . . . . . . . . . . . . . . . . 628• Foreign currency translation . . . . . . . . . . . . . . . . . . . . . . . . . . . . . . . . . . . . . . . . . . . . 4,205• Other . . . . . . . . . . . . . . . . . . . . . . . . . . . . . . . . . . . . . . . . . . . . . . . . . . . . . . . . . . . . 1,628
• SG&A for the year ended September 30, 2008 . . . . . . . . . . . . . . . . . . . . . . . . . . . . . . $115,399
We accrue for individual legal matters that we believe are likely to result in a loss when ultimately resolvedusing estimates of the most likely amount of loss.
27
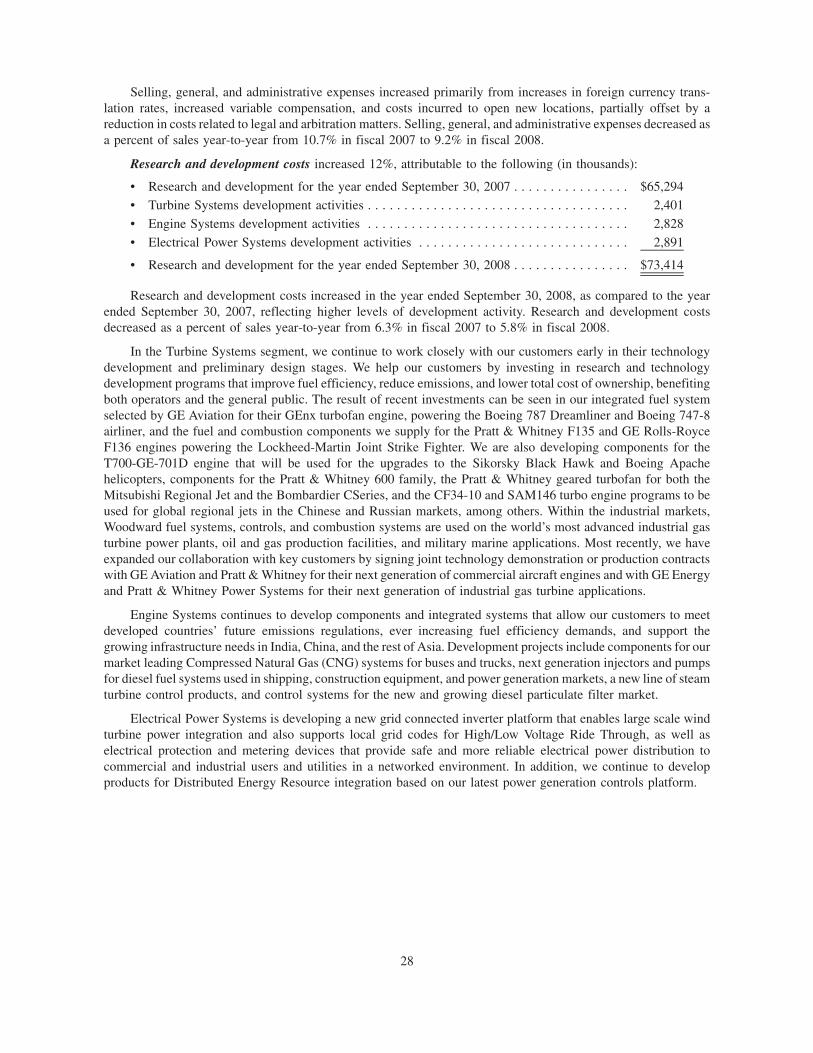
Selling, general, and administrative expenses increased primarily from increases in foreign currency trans-lation rates, increased variable compensation, and costs incurred to open new locations, partially offset by areduction in costs related to legal and arbitration matters. Selling, general, and administrative expenses decreased asa percent of sales year-to-year from 10.7% in fiscal 2007 to 9.2% in fiscal 2008.
Research and development costs increased 12%, attributable to the following (in thousands):
• Research and development for the year ended September 30, 2007 . . . . . . . . . . . . . . . . $65,294• Turbine Systems development activities . . . . . . . . . . . . . . . . . . . . . . . . . . . . . . . . . . . . 2,401• Engine Systems development activities . . . . . . . . . . . . . . . . . . . . . . . . . . . . . . . . . . . . 2,828• Electrical Power Systems development activities . . . . . . . . . . . . . . . . . . . . . . . . . . . . . 2,891
• Research and development for the year ended September 30, 2008 . . . . . . . . . . . . . . . . $73,414
Research and development costs increased in the year ended September 30, 2008, as compared to the yearended September 30, 2007, reflecting higher levels of development activity. Research and development costsdecreased as a percent of sales year-to-year from 6.3% in fiscal 2007 to 5.8% in fiscal 2008.
In the Turbine Systems segment, we continue to work closely with our customers early in their technologydevelopment and preliminary design stages. We help our customers by investing in research and technologydevelopment programs that improve fuel efficiency, reduce emissions, and lower total cost of ownership, benefitingboth operators and the general public. The result of recent investments can be seen in our integrated fuel systemselected by GE Aviation for their GEnx turbofan engine, powering the Boeing 787 Dreamliner and Boeing 747-8airliner, and the fuel and combustion components we supply for the Pratt & Whitney F135 and GE Rolls-RoyceF136 engines powering the Lockheed-Martin Joint Strike Fighter. We are also developing components for theT700-GE-701D engine that will be used for the upgrades to the Sikorsky Black Hawk and Boeing Apachehelicopters, components for the Pratt & Whitney 600 family, the Pratt & Whitney geared turbofan for both theMitsubishi Regional Jet and the Bombardier CSeries, and the CF34-10 and SAM146 turbo engine programs to beused for global regional jets in the Chinese and Russian markets, among others. Within the industrial markets,Woodward fuel systems, controls, and combustion systems are used on the world’s most advanced industrial gasturbine power plants, oil and gas production facilities, and military marine applications. Most recently, we haveexpanded our collaboration with key customers by signing joint technology demonstration or production contractswith GE Aviation and Pratt & Whitney for their next generation of commercial aircraft engines and with GE Energyand Pratt & Whitney Power Systems for their next generation of industrial gas turbine applications.
Engine Systems continues to develop components and integrated systems that allow our customers to meetdeveloped countries’ future emissions regulations, ever increasing fuel efficiency demands, and support thegrowing infrastructure needs in India, China, and the rest of Asia. Development projects include components for ourmarket leading Compressed Natural Gas (CNG) systems for buses and trucks, next generation injectors and pumpsfor diesel fuel systems used in shipping, construction equipment, and power generation markets, a new line of steamturbine control products, and control systems for the new and growing diesel particulate filter market.
Electrical Power Systems is developing a new grid connected inverter platform that enables large scale windturbine power integration and also supports local grid codes for High/Low Voltage Ride Through, as well aselectrical protection and metering devices that provide safe and more reliable electrical power distribution tocommercial and industrial users and utilities in a networked environment. In addition, we continue to developproducts for Distributed Energy Resource integration based on our latest power generation controls platform.
28
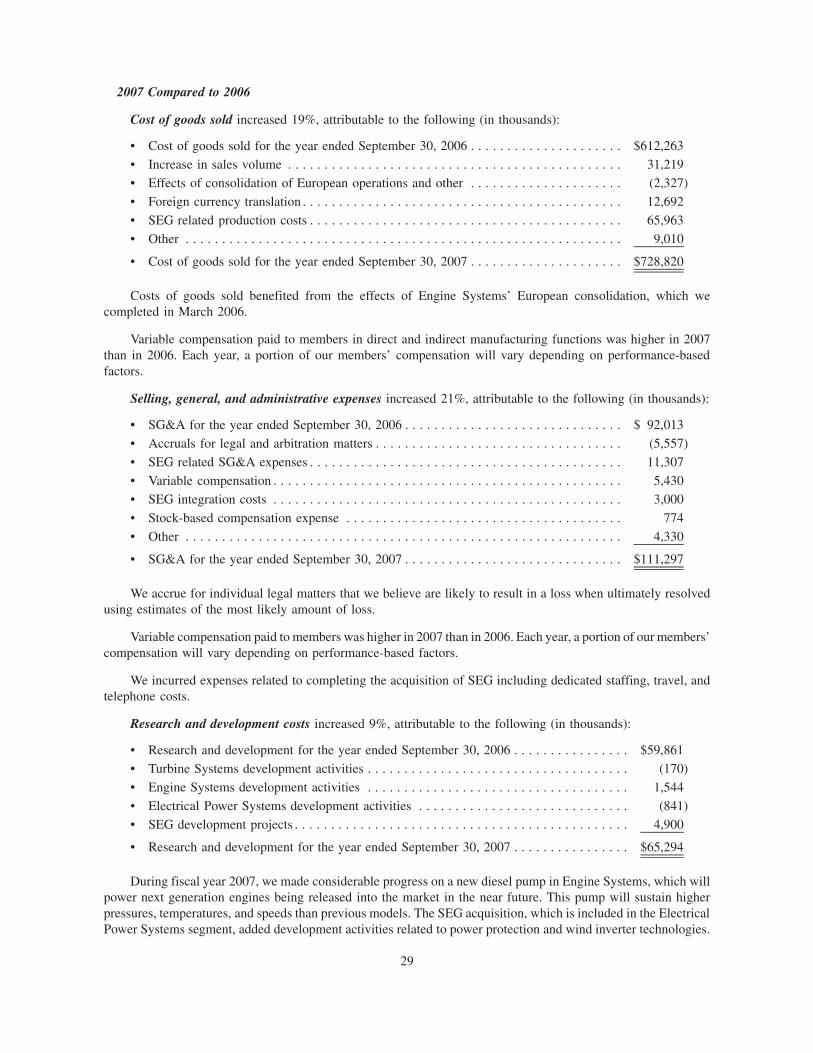
2007 Compared to 2006
Cost of goods sold increased 19%, attributable to the following (in thousands):
• Cost of goods sold for the year ended September 30, 2006 . . . . . . . . . . . . . . . . . . . . . $612,263• Increase in sales volume . . . . . . . . . . . . . . . . . . . . . . . . . . . . . . . . . . . . . . . . . . . . . . 31,219• Effects of consolidation of European operations and other . . . . . . . . . . . . . . . . . . . . . (2,327)• Foreign currency translation . . . . . . . . . . . . . . . . . . . . . . . . . . . . . . . . . . . . . . . . . . . . 12,692• SEG related production costs . . . . . . . . . . . . . . . . . . . . . . . . . . . . . . . . . . . . . . . . . . . 65,963• Other . . . . . . . . . . . . . . . . . . . . . . . . . . . . . . . . . . . . . . . . . . . . . . . . . . . . . . . . . . . . 9,010
• Cost of goods sold for the year ended September 30, 2007 . . . . . . . . . . . . . . . . . . . . . $728,820
Costs of goods sold benefited from the effects of Engine Systems’ European consolidation, which wecompleted in March 2006.
Variable compensation paid to members in direct and indirect manufacturing functions was higher in 2007than in 2006. Each year, a portion of our members’ compensation will vary depending on performance-basedfactors.
Selling, general, and administrative expenses increased 21%, attributable to the following (in thousands):
• SG&A for the year ended September 30, 2006 . . . . . . . . . . . . . . . . . . . . . . . . . . . . . . $ 92,013• Accruals for legal and arbitration matters . . . . . . . . . . . . . . . . . . . . . . . . . . . . . . . . . . (5,557)• SEG related SG&A expenses . . . . . . . . . . . . . . . . . . . . . . . . . . . . . . . . . . . . . . . . . . . 11,307• Variable compensation . . . . . . . . . . . . . . . . . . . . . . . . . . . . . . . . . . . . . . . . . . . . . . . . 5,430• SEG integration costs . . . . . . . . . . . . . . . . . . . . . . . . . . . . . . . . . . . . . . . . . . . . . . . . 3,000• Stock-based compensation expense . . . . . . . . . . . . . . . . . . . . . . . . . . . . . . . . . . . . . . 774• Other . . . . . . . . . . . . . . . . . . . . . . . . . . . . . . . . . . . . . . . . . . . . . . . . . . . . . . . . . . . . 4,330
• SG&A for the year ended September 30, 2007 . . . . . . . . . . . . . . . . . . . . . . . . . . . . . . $111,297
We accrue for individual legal matters that we believe are likely to result in a loss when ultimately resolvedusing estimates of the most likely amount of loss.
Variable compensation paid to members was higher in 2007 than in 2006. Each year, a portion of our members’compensation will vary depending on performance-based factors.
We incurred expenses related to completing the acquisition of SEG including dedicated staffing, travel, andtelephone costs.
Research and development costs increased 9%, attributable to the following (in thousands):
• Research and development for the year ended September 30, 2006 . . . . . . . . . . . . . . . . $59,861• Turbine Systems development activities . . . . . . . . . . . . . . . . . . . . . . . . . . . . . . . . . . . . (170)• Engine Systems development activities . . . . . . . . . . . . . . . . . . . . . . . . . . . . . . . . . . . . 1,544• Electrical Power Systems development activities . . . . . . . . . . . . . . . . . . . . . . . . . . . . . (841)• SEG development projects . . . . . . . . . . . . . . . . . . . . . . . . . . . . . . . . . . . . . . . . . . . . . . 4,900
• Research and development for the year ended September 30, 2007 . . . . . . . . . . . . . . . . $65,294
During fiscal year 2007, we made considerable progress on a new diesel pump in Engine Systems, which willpower next generation engines being released into the market in the near future. This pump will sustain higherpressures, temperatures, and speeds than previous models. The SEG acquisition, which is included in the ElectricalPower Systems segment, added development activities related to power protection and wind inverter technologies.
29
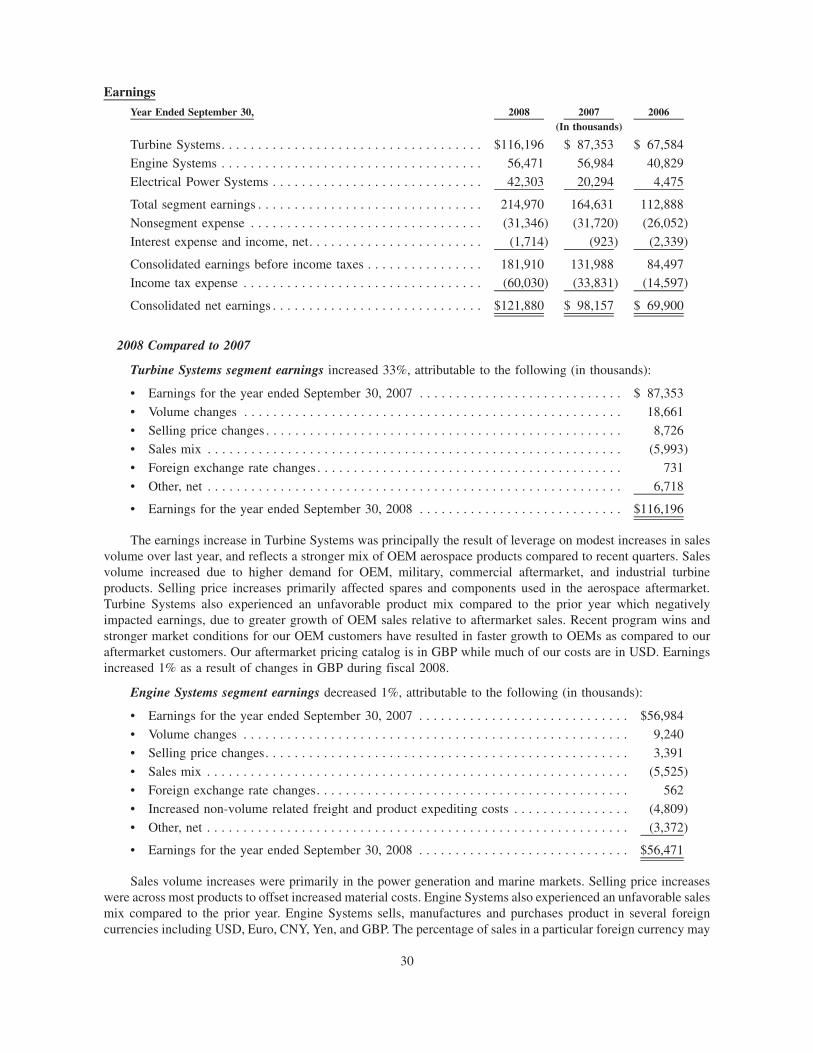
EarningsYear Ended September 30, 2008 2007 2006
(In thousands)
Turbine Systems. . . . . . . . . . . . . . . . . . . . . . . . . . . . . . . . . . . . $116,196 $ 87,353 $ 67,584Engine Systems . . . . . . . . . . . . . . . . . . . . . . . . . . . . . . . . . . . . 56,471 56,984 40,829Electrical Power Systems . . . . . . . . . . . . . . . . . . . . . . . . . . . . . 42,303 20,294 4,475
Total segment earnings . . . . . . . . . . . . . . . . . . . . . . . . . . . . . . . 214,970 164,631 112,888Nonsegment expense . . . . . . . . . . . . . . . . . . . . . . . . . . . . . . . . (31,346) (31,720) (26,052)Interest expense and income, net. . . . . . . . . . . . . . . . . . . . . . . . (1,714) (923) (2,339)
Consolidated earnings before income taxes . . . . . . . . . . . . . . . . 181,910 131,988 84,497Income tax expense . . . . . . . . . . . . . . . . . . . . . . . . . . . . . . . . . (60,030) (33,831) (14,597)
Consolidated net earnings . . . . . . . . . . . . . . . . . . . . . . . . . . . . . $121,880 $ 98,157 $ 69,900
2008 Compared to 2007
Turbine Systems segment earnings increased 33%, attributable to the following (in thousands):
• Earnings for the year ended September 30, 2007 . . . . . . . . . . . . . . . . . . . . . . . . . . . . $ 87,353• Volume changes . . . . . . . . . . . . . . . . . . . . . . . . . . . . . . . . . . . . . . . . . . . . . . . . . . . . 18,661• Selling price changes . . . . . . . . . . . . . . . . . . . . . . . . . . . . . . . . . . . . . . . . . . . . . . . . . 8,726• Sales mix . . . . . . . . . . . . . . . . . . . . . . . . . . . . . . . . . . . . . . . . . . . . . . . . . . . . . . . . . (5,993)• Foreign exchange rate changes . . . . . . . . . . . . . . . . . . . . . . . . . . . . . . . . . . . . . . . . . . 731• Other, net . . . . . . . . . . . . . . . . . . . . . . . . . . . . . . . . . . . . . . . . . . . . . . . . . . . . . . . . . 6,718
• Earnings for the year ended September 30, 2008 . . . . . . . . . . . . . . . . . . . . . . . . . . . . $116,196
The earnings increase in Turbine Systems was principally the result of leverage on modest increases in salesvolume over last year, and reflects a stronger mix of OEM aerospace products compared to recent quarters. Salesvolume increased due to higher demand for OEM, military, commercial aftermarket, and industrial turbineproducts. Selling price increases primarily affected spares and components used in the aerospace aftermarket.Turbine Systems also experienced an unfavorable product mix compared to the prior year which negativelyimpacted earnings, due to greater growth of OEM sales relative to aftermarket sales. Recent program wins andstronger market conditions for our OEM customers have resulted in faster growth to OEMs as compared to ouraftermarket customers. Our aftermarket pricing catalog is in GBP while much of our costs are in USD. Earningsincreased 1% as a result of changes in GBP during fiscal 2008.
Engine Systems segment earnings decreased 1%, attributable to the following (in thousands):
• Earnings for the year ended September 30, 2007 . . . . . . . . . . . . . . . . . . . . . . . . . . . . . $56,984• Volume changes . . . . . . . . . . . . . . . . . . . . . . . . . . . . . . . . . . . . . . . . . . . . . . . . . . . . . 9,240• Selling price changes. . . . . . . . . . . . . . . . . . . . . . . . . . . . . . . . . . . . . . . . . . . . . . . . . . 3,391• Sales mix . . . . . . . . . . . . . . . . . . . . . . . . . . . . . . . . . . . . . . . . . . . . . . . . . . . . . . . . . . (5,525)• Foreign exchange rate changes. . . . . . . . . . . . . . . . . . . . . . . . . . . . . . . . . . . . . . . . . . . 562• Increased non-volume related freight and product expediting costs . . . . . . . . . . . . . . . . (4,809)• Other, net . . . . . . . . . . . . . . . . . . . . . . . . . . . . . . . . . . . . . . . . . . . . . . . . . . . . . . . . . . (3,372)
• Earnings for the year ended September 30, 2008 . . . . . . . . . . . . . . . . . . . . . . . . . . . . . $56,471
Sales volume increases were primarily in the power generation and marine markets. Selling price increaseswere across most products to offset increased material costs. Engine Systems also experienced an unfavorable salesmix compared to the prior year. Engine Systems sells, manufactures and purchases product in several foreigncurrencies including USD, Euro, CNY, Yen, and GBP. The percentage of sales in a particular foreign currency may
30
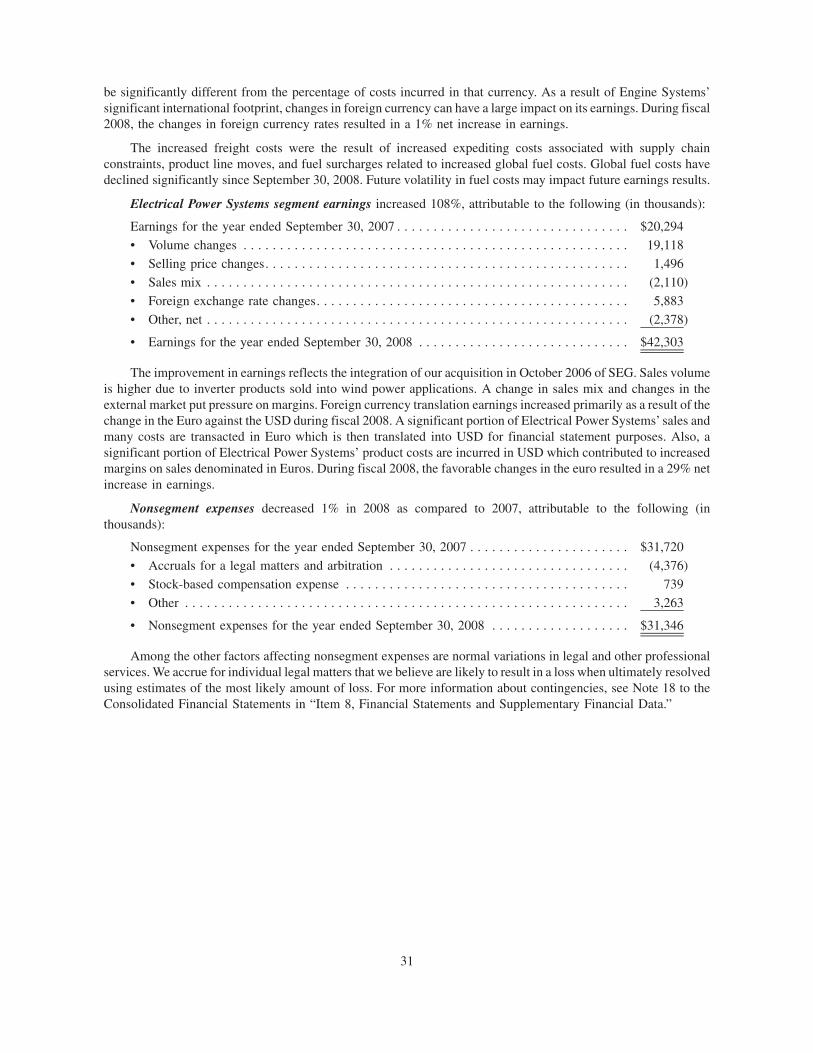
be significantly different from the percentage of costs incurred in that currency. As a result of Engine Systems’significant international footprint, changes in foreign currency can have a large impact on its earnings. During fiscal2008, the changes in foreign currency rates resulted in a 1% net increase in earnings.
The increased freight costs were the result of increased expediting costs associated with supply chainconstraints, product line moves, and fuel surcharges related to increased global fuel costs. Global fuel costs havedeclined significantly since September 30, 2008. Future volatility in fuel costs may impact future earnings results.
Electrical Power Systems segment earnings increased 108%, attributable to the following (in thousands):
Earnings for the year ended September 30, 2007 . . . . . . . . . . . . . . . . . . . . . . . . . . . . . . . . $20,294• Volume changes . . . . . . . . . . . . . . . . . . . . . . . . . . . . . . . . . . . . . . . . . . . . . . . . . . . . . 19,118• Selling price changes. . . . . . . . . . . . . . . . . . . . . . . . . . . . . . . . . . . . . . . . . . . . . . . . . . 1,496• Sales mix . . . . . . . . . . . . . . . . . . . . . . . . . . . . . . . . . . . . . . . . . . . . . . . . . . . . . . . . . . (2,110)• Foreign exchange rate changes. . . . . . . . . . . . . . . . . . . . . . . . . . . . . . . . . . . . . . . . . . . 5,883• Other, net . . . . . . . . . . . . . . . . . . . . . . . . . . . . . . . . . . . . . . . . . . . . . . . . . . . . . . . . . . (2,378)
• Earnings for the year ended September 30, 2008 . . . . . . . . . . . . . . . . . . . . . . . . . . . . . $42,303
The improvement in earnings reflects the integration of our acquisition in October 2006 of SEG. Sales volumeis higher due to inverter products sold into wind power applications. A change in sales mix and changes in theexternal market put pressure on margins. Foreign currency translation earnings increased primarily as a result of thechange in the Euro against the USD during fiscal 2008. A significant portion of Electrical Power Systems’ sales andmany costs are transacted in Euro which is then translated into USD for financial statement purposes. Also, asignificant portion of Electrical Power Systems’ product costs are incurred in USD which contributed to increasedmargins on sales denominated in Euros. During fiscal 2008, the favorable changes in the euro resulted in a 29% netincrease in earnings.
Nonsegment expenses decreased 1% in 2008 as compared to 2007, attributable to the following (inthousands):
Nonsegment expenses for the year ended September 30, 2007 . . . . . . . . . . . . . . . . . . . . . . $31,720• Accruals for a legal matters and arbitration . . . . . . . . . . . . . . . . . . . . . . . . . . . . . . . . . (4,376)• Stock-based compensation expense . . . . . . . . . . . . . . . . . . . . . . . . . . . . . . . . . . . . . . . 739• Other . . . . . . . . . . . . . . . . . . . . . . . . . . . . . . . . . . . . . . . . . . . . . . . . . . . . . . . . . . . . . 3,263
• Nonsegment expenses for the year ended September 30, 2008 . . . . . . . . . . . . . . . . . . . $31,346
Among the other factors affecting nonsegment expenses are normal variations in legal and other professionalservices. We accrue for individual legal matters that we believe are likely to result in a loss when ultimately resolvedusing estimates of the most likely amount of loss. For more information about contingencies, see Note 18 to theConsolidated Financial Statements in “Item 8, Financial Statements and Supplementary Financial Data.”
31
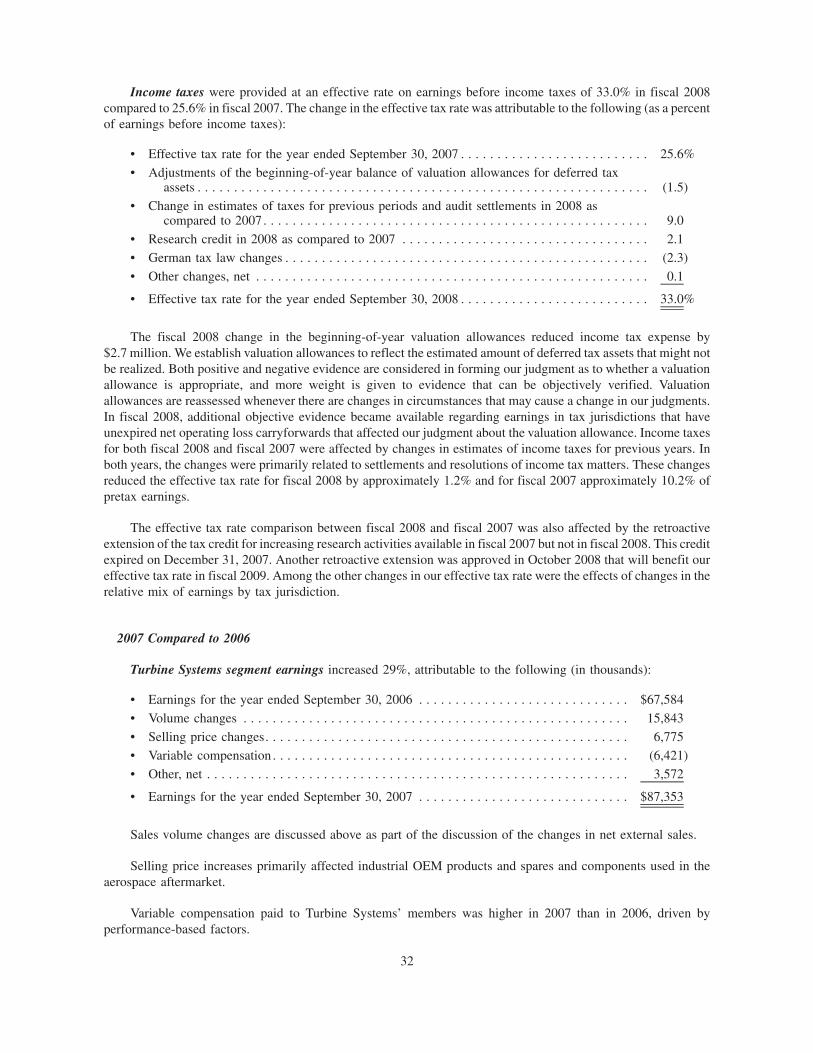
Income taxes were provided at an effective rate on earnings before income taxes of 33.0% in fiscal 2008compared to 25.6% in fiscal 2007. The change in the effective tax rate was attributable to the following (as a percentof earnings before income taxes):
• Effective tax rate for the year ended September 30, 2007 . . . . . . . . . . . . . . . . . . . . . . . . . . 25.6%• Adjustments of the beginning-of-year balance of valuation allowances for deferred tax
assets . . . . . . . . . . . . . . . . . . . . . . . . . . . . . . . . . . . . . . . . . . . . . . . . . . . . . . . . . . . . . . (1.5)• Change in estimates of taxes for previous periods and audit settlements in 2008 as
compared to 2007 . . . . . . . . . . . . . . . . . . . . . . . . . . . . . . . . . . . . . . . . . . . . . . . . . . . . . 9.0• Research credit in 2008 as compared to 2007 . . . . . . . . . . . . . . . . . . . . . . . . . . . . . . . . . . 2.1• German tax law changes . . . . . . . . . . . . . . . . . . . . . . . . . . . . . . . . . . . . . . . . . . . . . . . . . . (2.3)• Other changes, net . . . . . . . . . . . . . . . . . . . . . . . . . . . . . . . . . . . . . . . . . . . . . . . . . . . . . . 0.1
• Effective tax rate for the year ended September 30, 2008 . . . . . . . . . . . . . . . . . . . . . . . . . . 33.0%
The fiscal 2008 change in the beginning-of-year valuation allowances reduced income tax expense by$2.7 million. We establish valuation allowances to reflect the estimated amount of deferred tax assets that might notbe realized. Both positive and negative evidence are considered in forming our judgment as to whether a valuationallowance is appropriate, and more weight is given to evidence that can be objectively verified. Valuationallowances are reassessed whenever there are changes in circumstances that may cause a change in our judgments.In fiscal 2008, additional objective evidence became available regarding earnings in tax jurisdictions that haveunexpired net operating loss carryforwards that affected our judgment about the valuation allowance. Income taxesfor both fiscal 2008 and fiscal 2007 were affected by changes in estimates of income taxes for previous years. Inboth years, the changes were primarily related to settlements and resolutions of income tax matters. These changesreduced the effective tax rate for fiscal 2008 by approximately 1.2% and for fiscal 2007 approximately 10.2% ofpretax earnings.
The effective tax rate comparison between fiscal 2008 and fiscal 2007 was also affected by the retroactiveextension of the tax credit for increasing research activities available in fiscal 2007 but not in fiscal 2008. This creditexpired on December 31, 2007. Another retroactive extension was approved in October 2008 that will benefit oureffective tax rate in fiscal 2009. Among the other changes in our effective tax rate were the effects of changes in therelative mix of earnings by tax jurisdiction.
2007 Compared to 2006
Turbine Systems segment earnings increased 29%, attributable to the following (in thousands):
• Earnings for the year ended September 30, 2006 . . . . . . . . . . . . . . . . . . . . . . . . . . . . . $67,584• Volume changes . . . . . . . . . . . . . . . . . . . . . . . . . . . . . . . . . . . . . . . . . . . . . . . . . . . . . 15,843• Selling price changes. . . . . . . . . . . . . . . . . . . . . . . . . . . . . . . . . . . . . . . . . . . . . . . . . . 6,775• Variable compensation . . . . . . . . . . . . . . . . . . . . . . . . . . . . . . . . . . . . . . . . . . . . . . . . . (6,421)• Other, net . . . . . . . . . . . . . . . . . . . . . . . . . . . . . . . . . . . . . . . . . . . . . . . . . . . . . . . . . . 3,572
• Earnings for the year ended September 30, 2007 . . . . . . . . . . . . . . . . . . . . . . . . . . . . . $87,353
Sales volume changes are discussed above as part of the discussion of the changes in net external sales.
Selling price increases primarily affected industrial OEM products and spares and components used in theaerospace aftermarket.
Variable compensation paid to Turbine Systems’ members was higher in 2007 than in 2006, driven byperformance-based factors.
32
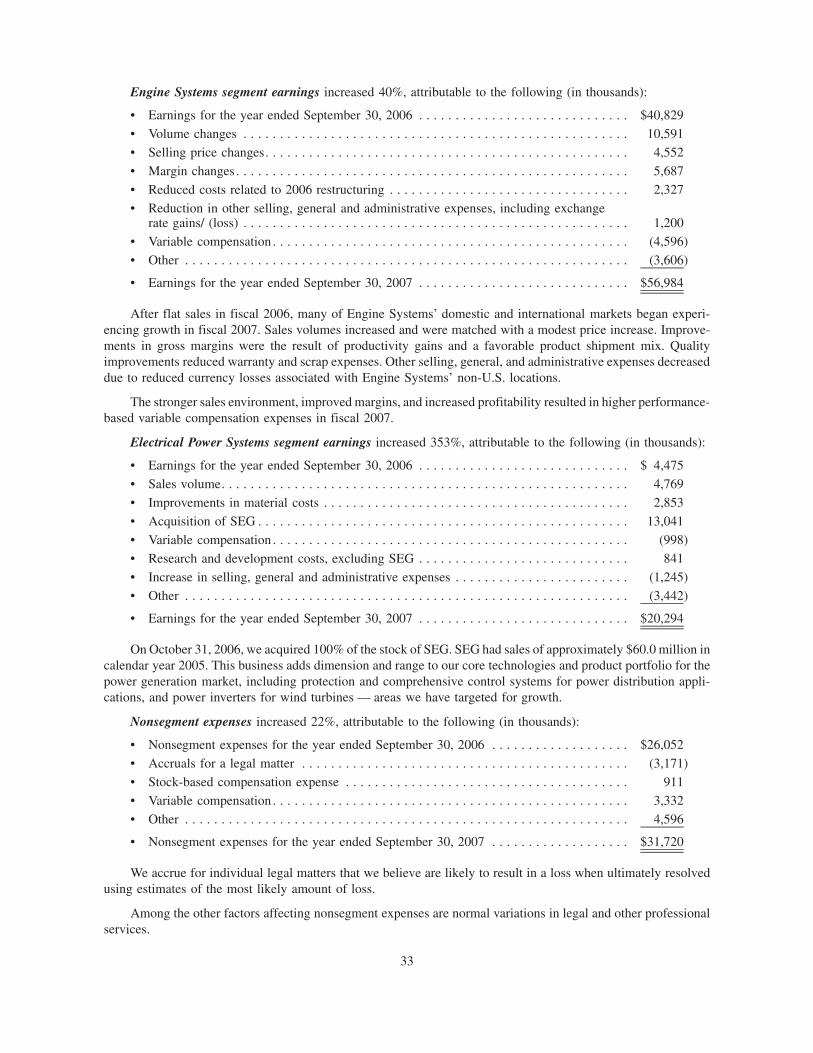
Engine Systems segment earnings increased 40%, attributable to the following (in thousands):
• Earnings for the year ended September 30, 2006 . . . . . . . . . . . . . . . . . . . . . . . . . . . . . $40,829• Volume changes . . . . . . . . . . . . . . . . . . . . . . . . . . . . . . . . . . . . . . . . . . . . . . . . . . . . . 10,591• Selling price changes. . . . . . . . . . . . . . . . . . . . . . . . . . . . . . . . . . . . . . . . . . . . . . . . . . 4,552• Margin changes . . . . . . . . . . . . . . . . . . . . . . . . . . . . . . . . . . . . . . . . . . . . . . . . . . . . . . 5,687• Reduced costs related to 2006 restructuring . . . . . . . . . . . . . . . . . . . . . . . . . . . . . . . . . 2,327• Reduction in other selling, general and administrative expenses, including exchange
rate gains/ (loss) . . . . . . . . . . . . . . . . . . . . . . . . . . . . . . . . . . . . . . . . . . . . . . . . . . . . . 1,200• Variable compensation . . . . . . . . . . . . . . . . . . . . . . . . . . . . . . . . . . . . . . . . . . . . . . . . . (4,596)• Other . . . . . . . . . . . . . . . . . . . . . . . . . . . . . . . . . . . . . . . . . . . . . . . . . . . . . . . . . . . . . (3,606)
• Earnings for the year ended September 30, 2007 . . . . . . . . . . . . . . . . . . . . . . . . . . . . . $56,984
After flat sales in fiscal 2006, many of Engine Systems’ domestic and international markets began experi-encing growth in fiscal 2007. Sales volumes increased and were matched with a modest price increase. Improve-ments in gross margins were the result of productivity gains and a favorable product shipment mix. Qualityimprovements reduced warranty and scrap expenses. Other selling, general, and administrative expenses decreaseddue to reduced currency losses associated with Engine Systems’ non-U.S. locations.
The stronger sales environment, improved margins, and increased profitability resulted in higher performance-based variable compensation expenses in fiscal 2007.
Electrical Power Systems segment earnings increased 353%, attributable to the following (in thousands):
• Earnings for the year ended September 30, 2006 . . . . . . . . . . . . . . . . . . . . . . . . . . . . . $ 4,475• Sales volume. . . . . . . . . . . . . . . . . . . . . . . . . . . . . . . . . . . . . . . . . . . . . . . . . . . . . . . . 4,769• Improvements in material costs . . . . . . . . . . . . . . . . . . . . . . . . . . . . . . . . . . . . . . . . . . 2,853• Acquisition of SEG . . . . . . . . . . . . . . . . . . . . . . . . . . . . . . . . . . . . . . . . . . . . . . . . . . . 13,041• Variable compensation . . . . . . . . . . . . . . . . . . . . . . . . . . . . . . . . . . . . . . . . . . . . . . . . . (998)• Research and development costs, excluding SEG . . . . . . . . . . . . . . . . . . . . . . . . . . . . . 841• Increase in selling, general and administrative expenses . . . . . . . . . . . . . . . . . . . . . . . . (1,245)• Other . . . . . . . . . . . . . . . . . . . . . . . . . . . . . . . . . . . . . . . . . . . . . . . . . . . . . . . . . . . . . (3,442)
• Earnings for the year ended September 30, 2007 . . . . . . . . . . . . . . . . . . . . . . . . . . . . . $20,294
On October 31, 2006, we acquired 100% of the stock of SEG. SEG had sales of approximately $60.0 million incalendar year 2005. This business adds dimension and range to our core technologies and product portfolio for thepower generation market, including protection and comprehensive control systems for power distribution appli-cations, and power inverters for wind turbines — areas we have targeted for growth.
Nonsegment expenses increased 22%, attributable to the following (in thousands):
• Nonsegment expenses for the year ended September 30, 2006 . . . . . . . . . . . . . . . . . . . $26,052• Accruals for a legal matter . . . . . . . . . . . . . . . . . . . . . . . . . . . . . . . . . . . . . . . . . . . . . (3,171)• Stock-based compensation expense . . . . . . . . . . . . . . . . . . . . . . . . . . . . . . . . . . . . . . . 911• Variable compensation . . . . . . . . . . . . . . . . . . . . . . . . . . . . . . . . . . . . . . . . . . . . . . . . . 3,332• Other . . . . . . . . . . . . . . . . . . . . . . . . . . . . . . . . . . . . . . . . . . . . . . . . . . . . . . . . . . . . . 4,596
• Nonsegment expenses for the year ended September 30, 2007 . . . . . . . . . . . . . . . . . . . $31,720
We accrue for individual legal matters that we believe are likely to result in a loss when ultimately resolvedusing estimates of the most likely amount of loss.
Among the other factors affecting nonsegment expenses are normal variations in legal and other professionalservices.
33
Income taxes were provided at an effective rate on earnings before income taxes of 25.6% in fiscal 2007compared to 17.3% in 2006. The change in the effective tax rate was attributable to the following (as a percent ofearnings before income taxes):
• Effective tax rate for the year ended September 30, 2006 . . . . . . . . . . . . . . . . . . . . . . . . . . 17.3%• Adjustments of the beginning-of-year balance of valuation allowances for deferred tax
assets . . . . . . . . . . . . . . . . . . . . . . . . . . . . . . . . . . . . . . . . . . . . . . . . . . . . . . . . . . . . . . 16.2• Change in estimates of taxes for previous periods and audit settlements in 2007 as
compared to 2006 . . . . . . . . . . . . . . . . . . . . . . . . . . . . . . . . . . . . . . . . . . . . . . . . . . . . . (8.9)• Research credit in 2007 as compared to 2006 . . . . . . . . . . . . . . . . . . . . . . . . . . . . . . . . . . (1.5)• Change in German income tax rate . . . . . . . . . . . . . . . . . . . . . . . . . . . . . . . . . . . . . . . . . . 2.3• Other changes, net . . . . . . . . . . . . . . . . . . . . . . . . . . . . . . . . . . . . . . . . . . . . . . . . . . . . . . 0.2
• Effective tax rate for the year ended September 30, 2007 . . . . . . . . . . . . . . . . . . . . . . . . . . 25.6%
The fiscal 2006 change in the beginning-of-year valuation allowances reduced income tax expense by$13.7 million. Exclusive of this item, the effective tax rate for fiscal 2006 was 33.5%. We establish valuationallowances to reflect the estimated amount of deferred tax assets that might not be realized. Both positive andnegative evidence are considered in forming our judgment as to whether a valuation allowance is appropriate, andmore weight is given to evidence that can be objectively verified. Valuation allowances are reassessed wheneverthere are changes in circumstances that may cause a change in our judgments. In fiscal 2006 and fiscal 2007,additional objective evidence became available regarding earnings in tax jurisdictions that have unexpired netoperating loss carryforwards that affected our judgment about the valuation allowance.
Income taxes for both fiscal 2007 and fiscal 2006 were affected by changes in estimates of income taxes forprevious years. In 2007, the changes were primarily related to the settlement of income tax audits. These changesreduced the effective tax rate for fiscal 2007 by approximately 10.2% of pretax earnings. In fiscal 2006, the changeswere primarily related to the favorable resolution of certain tax matters. These changes reduced the effective tax ratefor fiscal 2006 by approximately 1.3% of pretax earnings.
The effective tax rate comparison between fiscal 2007 and fiscal 2006 was also affected by the extension of thetax credit for increasing research activities. This credit expired on December 31, 2005 but was retroactivelyreinstated in December 2006, and we recognized a benefit to our effective tax rate for fiscal 2007 reflecting theextension.
Among the other changes in our effective tax rate were the effects of changes in the amounts of extraterritorialincome exclusion and the effects of changes in the relative mix of earnings by tax jurisdiction.
Outlook
The economy over the last several months has been significantly impacted by financial institution credit crisesultimately impacting the broader credit markets and the financing available to many companies, both in the U.S. andabroad. More significantly to Woodward, at the moment, the rapid weakening of the Euro and the GBP coupled withour continuing growth in Europe is having a pronounced impact on our outlook for 2009.
Preparation for the impacts of market fluctuations has been a strategic objective for a number of years andWoodward is well positioned to maintain liquidity and relative profitability in the event of potential sales declines.We have been investing more broadly both regionally and across our markets to reduce specific risk with respect toany one economy or market. Our focus on energy control and optimization across a wide range of applications andresources mitigates fluctuations in any one area. Further, our products are key components of critical infrastructureprojects where government funding may supplement private financing. We are focusing on our core competenciesto better serve our customers, driving improvements in the cash conversion cycle, reducing operating costs in manyareas, and have locked in favorable long-term financing.
At this time, our order volumes indicate a modest increase in sales volumes in 2009. However, the significanteffects of rapidly weakened European currencies may offset this increase and we now anticipate organic sales to beflat to slightly up.
34
FINANCIAL CONDITION, LIQUIDITY, AND CAPITAL RESOURCES
Assets(In Thousands) at September 30, 2008 2007
Turbine Systems . . . . . . . . . . . . . . . . . . . . . . . . . . . . . . . . . . . . . . . . . . . . . $371,275 $330,969Engine Systems. . . . . . . . . . . . . . . . . . . . . . . . . . . . . . . . . . . . . . . . . . . . . . 242,350 250,908Electrical Power Systems. . . . . . . . . . . . . . . . . . . . . . . . . . . . . . . . . . . . . . . 133,928 109,674Nonsegment assets . . . . . . . . . . . . . . . . . . . . . . . . . . . . . . . . . . . . . . . . . . . 179,464 138,216
Consolidated total assets . . . . . . . . . . . . . . . . . . . . . . . . . . . . . . . . . . . . . . . $927,017 $829,767
Turbine Systems segment assets increased primarily due to increases in accounts receivable and inventory inresponse to increases in sales volume. In addition, property, plant, and equipment increased due to equipmentpurchases and the modernization of the segment’s largest manufacturing facility. We plan to begin construction of astate-of-the-art test facility for aircraft engine fuel and control systems in Rockford, Illinois, on which we expect toinvest approximately $25.0 million within the next two years.
Engine Systems segment assets decreased primarily due to decreases in accounts receivable, property, plantand equipment, and intangible assets. Accounts receivable decreased as a result of an improvement in themanagement of accounts receivable. The decreases in property, plant, and equipment and intangible assets weredue to normal depreciation and amortization, as well as transfer of certain assets to other segments or nonsegmentuse. These decreases were offset by an increase in inventory in response to increases in sales volume.
Electrical Power Systems segment assets increased primarily as a result of increases in accounts receivableand inventory in response to increases in sales volume and purchases of property, plant, and equipment.
Nonsegment assets increased primarily because of an increase in cash and cash equivalents related to increasesin sales volume offset by the repurchase of common stock. Changes in cash are discussed more fully in a separatesection of this Management’s Discussion and Analysis.
Other Balance Sheet Measures(In Thousands) at September 30, 2008 2007
Working capital . . . . . . . . . . . . . . . . . . . . . . . . . . . . . . . . . . . . . . . . . . . . . . $369,211 $275,611Long-term debt, less current portion. . . . . . . . . . . . . . . . . . . . . . . . . . . . . . . 33,337 45,150Other liabilities . . . . . . . . . . . . . . . . . . . . . . . . . . . . . . . . . . . . . . . . . . . . . . 67,695 57,404Stockholders’ equity . . . . . . . . . . . . . . . . . . . . . . . . . . . . . . . . . . . . . . . . . . 629,628 544,431
Working capital (current assets less current liabilities) increased at September 30, 2008 from September 30,2007 primarily as a result of an increase in sales volume which led to an increase in inventories and accountsreceivable, and a decrease in short-term borrowings, partially offset by an increase in accounts payable and accruedliabilities.
As discussed in Note 22 to the Consolidated Financial Statements in “Item 8 — Financial Statements andSupplementary Data,” on October 1, 2008, we completed the acquisition of MPC in a transaction valued atapproximately $383.0 million.
On October 6, 2008, we completed the acquisition of the outstanding capital stock of MotoTron and theintellectual property assets owned by its parent company, Brunswick Corporation, that are used in connection withthe MotoTron business for approximately $17.0 million.
The October 2008 acquisitions of MPC and MotoTron, including the repayment of certain obligationsassociated with these acquisitions, were primarily financed with a total of $400.0 million of debt issued onOctober 1, 2008 and October 30, 2008, as discussed below.
Long-term debt, less current portion decreased as a result of payments made during the period. As ofSeptember 30, 2008, we had a revolving line of credit facility with a syndicate of U.S. banks totaling $225.0 million,
35
with an option to increase the amount of the line to $350.0 million. In addition, we have other line of credit facilities,which are generally reviewed annually for renewal, which totaled $19.9 million at both September 30, 2008 and2007.
Also, we have additional short-term borrowing capabilities tied to net amounts on deposit at certain foreignfinancial institutions under which $4.0 million had been advanced as of September 30, 2008 and $5.5 million hadbeen advanced as of September 30, 2007. The total amount of borrowings under all facilities was $4.0 million atSeptember 30, 2008 and $5.5 million at September 30, 2007. The weighted-average interest rate for outstandingborrowings under these line of credit facilities, which were at rates significantly lower than those typical in the U.S.,was 3.0% September 30, 2008 and 3.8% at September 30, 2007.
Provisions of debt agreements include covenants customary to such agreements that require us to maintainspecified minimum or maximum financial measures and place limitations on various investing and financingactivities. The agreements also permit the lenders to accelerate repayment requirements in the event of a materialadverse event. Our most restrictive covenants require us to maintain a minimum consolidated net worth, amaximum consolidated debt to consolidated operating cash flow ratio, and a maximum consolidated debt toearnings before income taxes, depreciation, and amortization (“EBITDA”) ratio, as defined in the agreements. Wewere in compliance with all covenants at September 30, 2008.
Term Loan Credit Agreement
As discussed in Note 22 to the Consolidated Financial Statements in “Item 8 — Financial Statements andSupplementary Data,” On October 1, 2008, we entered into a Term Loan Credit Agreement (the “Term Loan CreditAgreement”). The Term Loan Credit Agreement provides for a $150.0 million unsecured term loan facility, andmay be expanded by up to $50.0 million of additional indebtedness from time to time, subject to the our compliancewith certain conditions and the lenders’ participation. The Term Loan Credit Agreement generally bears interest atLIBOR plus 1.00% to 2.25%, requires quarterly principal payments of $1,875 beginning in March, 2009, andmatures in October 2013.
The Term Loan Credit Agreement contains customary terms and conditions, including, among others,covenants that place limits on our ability to incur liens on assets, incur additional debt (including a leverage orcoverage based maintenance test), transfer or sell our assets, merge or consolidate with other persons, make capitalexpenditures, make certain investments, make certain restricted payments and enter into material transactions withaffiliates. The Term Loan Credit Agreement contains financial covenants requiring that (a) our ratio of consolidatednet debt to EBITDA not exceed 3.5 to 1.0 and (b) we have a minimum consolidated net worth of $400.0 million plus50% of net income for any fiscal year and 50% of the net proceeds of certain issuances of capital stock, in each caseon a rolling four quarter basis. The Term Loan Credit Agreement also contains events of default customary for suchfinancings, the occurrence of which would permit the lenders to accelerate the amounts due.
Our obligations under the Term Loan Credit Agreement are guaranteed by Woodward FST, Inc., our whollyowned subsidiary (“Woodward FST”).
A portion of the proceeds from the Term Loan Credit Agreement was used to finance the MPC acquisition.
Note Purchase Agreement
On October 1, 2008, we entered into a Note Purchase Agreement (the “Note Purchase Agreement”) relating tothe sale by Woodward of an aggregate principal amount of $250.0 million comprised of (a) $100.0 millionaggregate principal amount of Series B Senior Notes due October 1, 2013 (the “Series B Notes”), (b) $50.0 millionaggregate principal amount of Series C Senior Notes due October 1, 2015 (the “Series C Notes”) and (c) $100.0 mil-lion aggregate principal amount of Series D Senior Notes due October 1, 2018 (the “Series D Notes” and, togetherwith the Series B Notes and Series C Notes, the “Notes”) in a series of private placement transactions. On October 1,2008, $200.0 million aggregate principal amount of Notes were sold, comprised of $80.0 million aggregateprincipal amount of the Series B Notes, $40.0 million aggregate principal amount of the Series C Notes and$80.0 million aggregate principal amount of the Series D Notes. In connection with the Note Purchase Agreemententered into on October 1, 2008, we issued an additional $50.0 million aggregate principal amount of Notes with
36
similar maturities and interest rates on October 30, 2008. The Notes issued in the private placement have not beenregistered under the Securities Act of 1933 and may not be offered or sold in the U.S. absent registration or anapplicable exemption from registration requirements.
The Series B Notes have a maturity date of October 1, 2013 and generally bear interest at a rate of 5.63% perannum. The Series C Notes have a maturity date of October 1, 2015 and generally bear interest at a rate of 5.92% perannum. The Series D Notes have a maturity date of October 1, 2018 and generally bear interest at a rate of 6.39% perannum. Under certain circumstances, the interest rate on each series of Notes is subject to increase if our leverageratio of consolidated net debt to consolidated EBITDA increases beyond 3.5 to 1.0. Interest on the Notes is payablesemi-annually on April 1 and October 1 of each year until all principal is paid. Interest payments commence onApril 1, 2009.
Our obligations under the Note Purchase Agreement and the Notes rank equal in right of payment with all ofour other unsecured unsubordinated debt, including our outstanding debt under the Term Loan Credit Agreement.
The Note Purchase Agreement contains restrictive covenants customary for such financings, including, amongother things, covenants that place limits on our ability to incur liens on assets, incur additional debt (including aleverage or coverage based maintenance test), transfer or sell our assets, merge or consolidate with other persons,and enter into material transactions with affiliates. The Note Purchase Agreement also contains events of defaultcustomary for such financings, the occurrence of which would permit the Purchasers of the Notes to accelerate theamounts due.
The Note Purchase Agreement contains financial covenants requiring that our (a) ratio of consolidated net debtto consolidated EBITDA not exceed 4.0 to 1.0 during any material acquisition period, or 3.5 to 1.0 at any other timeon a rolling four quarter basis, and (b) consolidated net worth at any time equal or exceed $425.0 million plus 50%of consolidated net earnings for each fiscal year beginning with the fiscal year ending September 30, 2008.Additionally, under the Note Purchase Agreement, we may not permit the aggregate amount of priority debt to atany time exceed 20% of our consolidated net worth at the end of the then most recently ended fiscal quarter.
We are permitted at any time, at our option, to prepay all — any part of — the then outstanding principalamount of any series of the Notes at 100% of the principal amount of the series of Notes to be prepaid (but, in thecase of partial prepayment, not less than $1.0 million), together with interest accrued on such amount to be prepaidto the date of payment, plus any applicable make-whole amount. The make-whole amount is computed bydiscounting the remaining scheduled payments of interest and principal of the Notes being prepaid at a discount rateequal to the sum of 50 basis points and the yield to maturity of U.S. treasury securities having a maturity equal to theremaining average life of the Notes being prepaid.
A portion of the proceeds from the issuance of the Notes was used to finance the MPC acquisition.
Commitments and contingencies at September 30, 2008, include various matters arising from the normalcourse of business. See previous discussion in Item 3. “Legal Proceedings” and Note 18 to the ConsolidatedFinancial Statements in Item 8 — “Financial Statements and Supplementary Data.”
Stockholders’ equity at September 30, 2008, increased 16% over the prior fiscal year. Increases due to netearnings, sales of treasury stock, and income tax benefits from the exercise of stock options by employees duringfiscal 2008 were partially offset by cash dividend payments and purchases of treasury stock.
In July 2006, the Board of Directors authorized the repurchase of up to $50.0 million of our outstanding sharesof common stock on the open market or in privately negotiated transactions over a three-year period (the “2006Authorization”). During fiscal year 2007, we purchased $38.6 million of our common stock under the 2006Authorization. Pursuant to the 2006 Authorization, in August 2007, we entered into an agreement with J.P. MorganChase Bank whereby we purchased approximately 989,000 common stock shares in exchange for $31.1 million atan average price of $31.47 per common share. This arrangement with J.P. Morgan Chase Bank completed the stockrepurchase program previously authorized in July 2006.
During September 2007, the Board of Directors authorized a new stock repurchase of up to $200.0 million ofour outstanding shares of common stock on the open market or in privately negotiated transactions over a three-yearperiod that will end in October 2010 (the “2007 Authorization”).
37
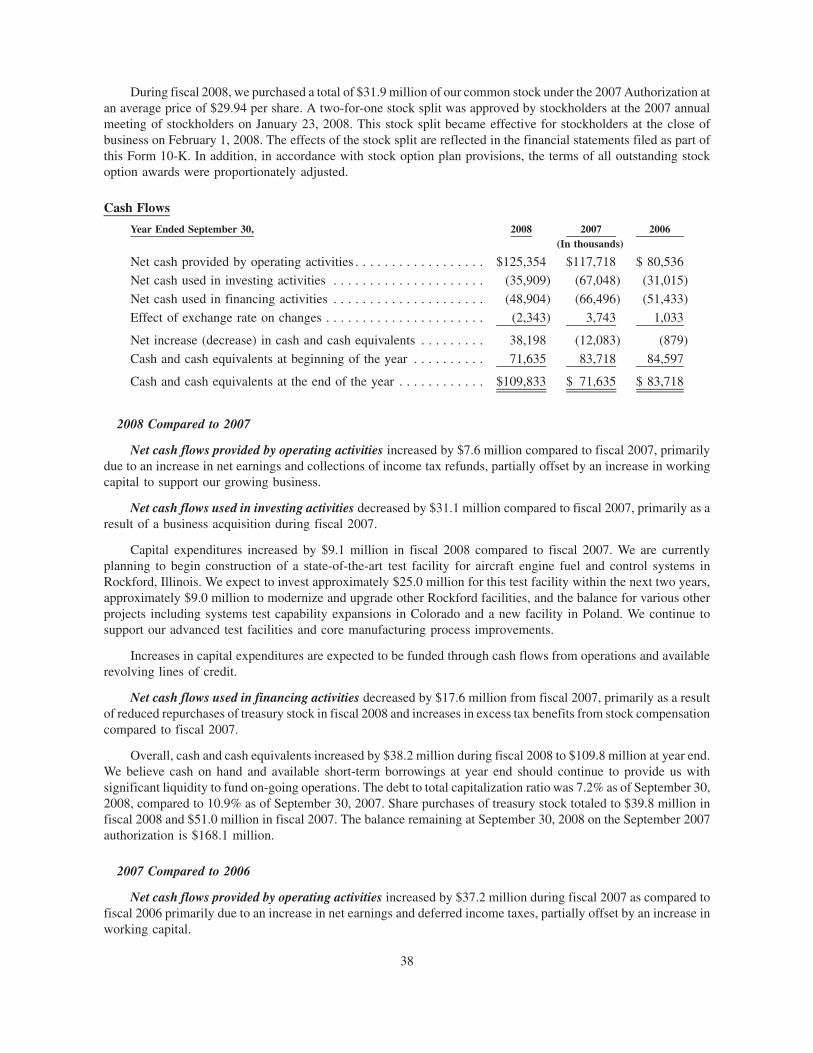
During fiscal 2008, we purchased a total of $31.9 million of our common stock under the 2007 Authorization atan average price of $29.94 per share. A two-for-one stock split was approved by stockholders at the 2007 annualmeeting of stockholders on January 23, 2008. This stock split became effective for stockholders at the close ofbusiness on February 1, 2008. The effects of the stock split are reflected in the financial statements filed as part ofthis Form 10-K. In addition, in accordance with stock option plan provisions, the terms of all outstanding stockoption awards were proportionately adjusted.
Cash Flows
Year Ended September 30, 2008 2007 2006(In thousands)
Net cash provided by operating activities . . . . . . . . . . . . . . . . . . $125,354 $117,718 $ 80,536Net cash used in investing activities . . . . . . . . . . . . . . . . . . . . . (35,909) (67,048) (31,015)Net cash used in financing activities . . . . . . . . . . . . . . . . . . . . . (48,904) (66,496) (51,433)Effect of exchange rate on changes . . . . . . . . . . . . . . . . . . . . . . (2,343) 3,743 1,033
Net increase (decrease) in cash and cash equivalents . . . . . . . . . 38,198 (12,083) (879)Cash and cash equivalents at beginning of the year . . . . . . . . . . 71,635 83,718 84,597
Cash and cash equivalents at the end of the year . . . . . . . . . . . . $109,833 $ 71,635 $ 83,718
2008 Compared to 2007
Net cash flows provided by operating activities increased by $7.6 million compared to fiscal 2007, primarilydue to an increase in net earnings and collections of income tax refunds, partially offset by an increase in workingcapital to support our growing business.
Net cash flows used in investing activities decreased by $31.1 million compared to fiscal 2007, primarily as aresult of a business acquisition during fiscal 2007.
Capital expenditures increased by $9.1 million in fiscal 2008 compared to fiscal 2007. We are currentlyplanning to begin construction of a state-of-the-art test facility for aircraft engine fuel and control systems inRockford, Illinois. We expect to invest approximately $25.0 million for this test facility within the next two years,approximately $9.0 million to modernize and upgrade other Rockford facilities, and the balance for various otherprojects including systems test capability expansions in Colorado and a new facility in Poland. We continue tosupport our advanced test facilities and core manufacturing process improvements.
Increases in capital expenditures are expected to be funded through cash flows from operations and availablerevolving lines of credit.
Net cash flows used in financing activities decreased by $17.6 million from fiscal 2007, primarily as a resultof reduced repurchases of treasury stock in fiscal 2008 and increases in excess tax benefits from stock compensationcompared to fiscal 2007.
Overall, cash and cash equivalents increased by $38.2 million during fiscal 2008 to $109.8 million at year end.We believe cash on hand and available short-term borrowings at year end should continue to provide us withsignificant liquidity to fund on-going operations. The debt to total capitalization ratio was 7.2% as of September 30,2008, compared to 10.9% as of September 30, 2007. Share purchases of treasury stock totaled to $39.8 million infiscal 2008 and $51.0 million in fiscal 2007. The balance remaining at September 30, 2008 on the September 2007authorization is $168.1 million.
2007 Compared to 2006
Net cash flows provided by operating activities increased by $37.2 million during fiscal 2007 as compared tofiscal 2006 primarily due to an increase in net earnings and deferred income taxes, partially offset by an increase inworking capital.
38
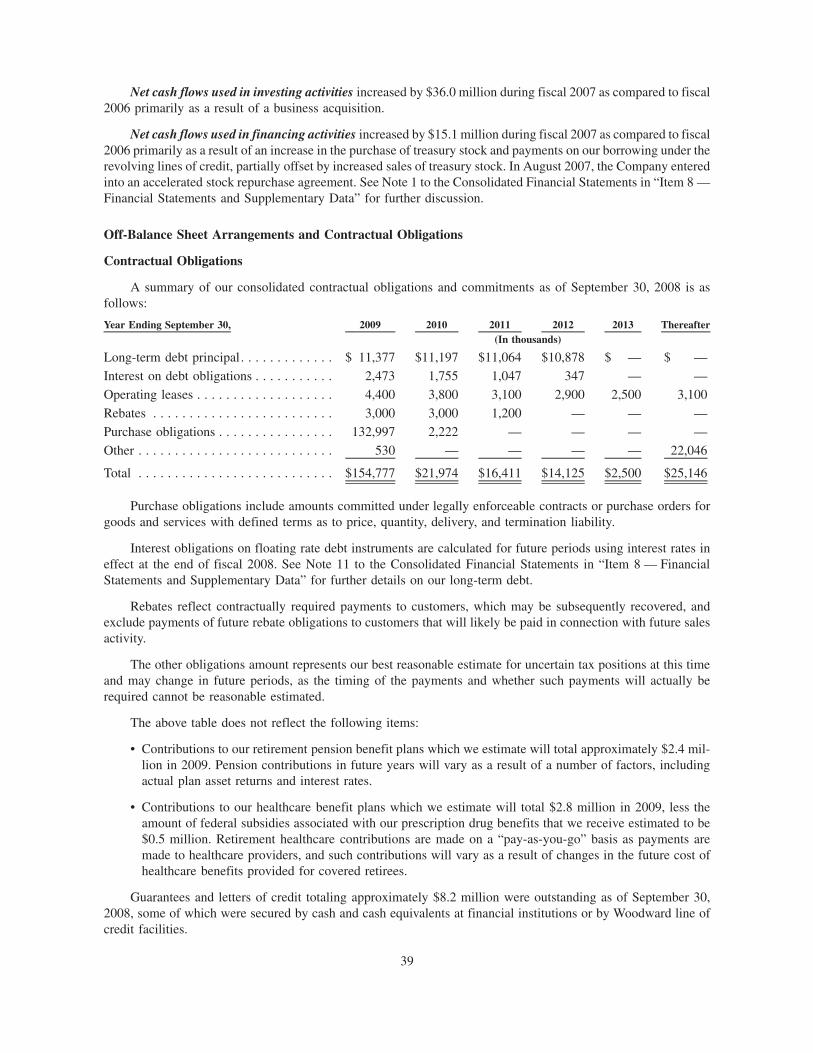
Net cash flows used in investing activities increased by $36.0 million during fiscal 2007 as compared to fiscal2006 primarily as a result of a business acquisition.
Net cash flows used in financing activities increased by $15.1 million during fiscal 2007 as compared to fiscal2006 primarily as a result of an increase in the purchase of treasury stock and payments on our borrowing under therevolving lines of credit, partially offset by increased sales of treasury stock. In August 2007, the Company enteredinto an accelerated stock repurchase agreement. See Note 1 to the Consolidated Financial Statements in “Item 8 —Financial Statements and Supplementary Data” for further discussion.
Off-Balance Sheet Arrangements and Contractual Obligations
Contractual Obligations
A summary of our consolidated contractual obligations and commitments as of September 30, 2008 is asfollows:
Year Ending September 30, 2009 2010 2011 2012 2013 Thereafter(In thousands)
Long-term debt principal. . . . . . . . . . . . . $ 11,377 $11,197 $11,064 $10,878 $ — $ —Interest on debt obligations . . . . . . . . . . . 2,473 1,755 1,047 347 — —Operating leases . . . . . . . . . . . . . . . . . . . 4,400 3,800 3,100 2,900 2,500 3,100Rebates . . . . . . . . . . . . . . . . . . . . . . . . . 3,000 3,000 1,200 — — —Purchase obligations . . . . . . . . . . . . . . . . 132,997 2,222 — — — —Other . . . . . . . . . . . . . . . . . . . . . . . . . . . 530 — — — — 22,046
Total . . . . . . . . . . . . . . . . . . . . . . . . . . . $154,777 $21,974 $16,411 $14,125 $2,500 $25,146
Purchase obligations include amounts committed under legally enforceable contracts or purchase orders forgoods and services with defined terms as to price, quantity, delivery, and termination liability.
Interest obligations on floating rate debt instruments are calculated for future periods using interest rates ineffect at the end of fiscal 2008. See Note 11 to the Consolidated Financial Statements in “Item 8 — FinancialStatements and Supplementary Data” for further details on our long-term debt.
Rebates reflect contractually required payments to customers, which may be subsequently recovered, andexclude payments of future rebate obligations to customers that will likely be paid in connection with future salesactivity.
The other obligations amount represents our best reasonable estimate for uncertain tax positions at this timeand may change in future periods, as the timing of the payments and whether such payments will actually berequired cannot be reasonable estimated.
The above table does not reflect the following items:
• Contributions to our retirement pension benefit plans which we estimate will total approximately $2.4 mil-lion in 2009. Pension contributions in future years will vary as a result of a number of factors, includingactual plan asset returns and interest rates.
• Contributions to our healthcare benefit plans which we estimate will total $2.8 million in 2009, less theamount of federal subsidies associated with our prescription drug benefits that we receive estimated to be$0.5 million. Retirement healthcare contributions are made on a “pay-as-you-go” basis as payments aremade to healthcare providers, and such contributions will vary as a result of changes in the future cost ofhealthcare benefits provided for covered retirees.
Guarantees and letters of credit totaling approximately $8.2 million were outstanding as of September 30,2008, some of which were secured by cash and cash equivalents at financial institutions or by Woodward line ofcredit facilities.
39
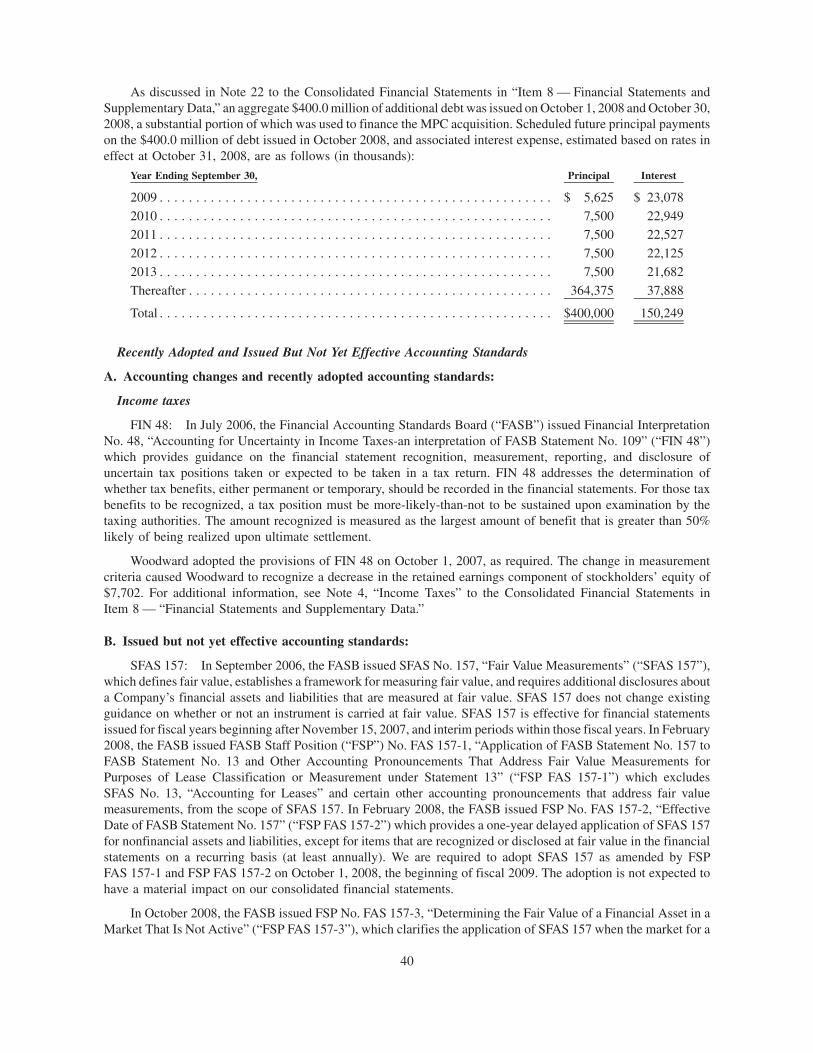
As discussed in Note 22 to the Consolidated Financial Statements in “Item 8 — Financial Statements andSupplementary Data,” an aggregate $400.0 million of additional debt was issued on October 1, 2008 and October 30,2008, a substantial portion of which was used to finance the MPC acquisition. Scheduled future principal paymentson the $400.0 million of debt issued in October 2008, and associated interest expense, estimated based on rates ineffect at October 31, 2008, are as follows (in thousands):
Year Ending September 30, Principal Interest
2009 . . . . . . . . . . . . . . . . . . . . . . . . . . . . . . . . . . . . . . . . . . . . . . . . . . . . . . $ 5,625 $ 23,0782010 . . . . . . . . . . . . . . . . . . . . . . . . . . . . . . . . . . . . . . . . . . . . . . . . . . . . . . 7,500 22,9492011 . . . . . . . . . . . . . . . . . . . . . . . . . . . . . . . . . . . . . . . . . . . . . . . . . . . . . . 7,500 22,5272012 . . . . . . . . . . . . . . . . . . . . . . . . . . . . . . . . . . . . . . . . . . . . . . . . . . . . . . 7,500 22,1252013 . . . . . . . . . . . . . . . . . . . . . . . . . . . . . . . . . . . . . . . . . . . . . . . . . . . . . . 7,500 21,682Thereafter . . . . . . . . . . . . . . . . . . . . . . . . . . . . . . . . . . . . . . . . . . . . . . . . . . 364,375 37,888
Total . . . . . . . . . . . . . . . . . . . . . . . . . . . . . . . . . . . . . . . . . . . . . . . . . . . . . . $400,000 150,249
Recently Adopted and Issued But Not Yet Effective Accounting Standards
A. Accounting changes and recently adopted accounting standards:
Income taxes
FIN 48: In July 2006, the Financial Accounting Standards Board (“FASB”) issued Financial InterpretationNo. 48, “Accounting for Uncertainty in Income Taxes-an interpretation of FASB Statement No. 109” (“FIN 48”)which provides guidance on the financial statement recognition, measurement, reporting, and disclosure ofuncertain tax positions taken or expected to be taken in a tax return. FIN 48 addresses the determination ofwhether tax benefits, either permanent or temporary, should be recorded in the financial statements. For those taxbenefits to be recognized, a tax position must be more-likely-than-not to be sustained upon examination by thetaxing authorities. The amount recognized is measured as the largest amount of benefit that is greater than 50%likely of being realized upon ultimate settlement.
Woodward adopted the provisions of FIN 48 on October 1, 2007, as required. The change in measurementcriteria caused Woodward to recognize a decrease in the retained earnings component of stockholders’ equity of$7,702. For additional information, see Note 4, “Income Taxes” to the Consolidated Financial Statements inItem 8 — “Financial Statements and Supplementary Data.”
B. Issued but not yet effective accounting standards:
SFAS 157: In September 2006, the FASB issued SFAS No. 157, “Fair Value Measurements” (“SFAS 157”),which defines fair value, establishes a framework for measuring fair value, and requires additional disclosures abouta Company’s financial assets and liabilities that are measured at fair value. SFAS 157 does not change existingguidance on whether or not an instrument is carried at fair value. SFAS 157 is effective for financial statementsissued for fiscal years beginning after November 15, 2007, and interim periods within those fiscal years. In February2008, the FASB issued FASB Staff Position (“FSP”) No. FAS 157-1, “Application of FASB Statement No. 157 toFASB Statement No. 13 and Other Accounting Pronouncements That Address Fair Value Measurements forPurposes of Lease Classification or Measurement under Statement 13” (“FSP FAS 157-1”) which excludesSFAS No. 13, “Accounting for Leases” and certain other accounting pronouncements that address fair valuemeasurements, from the scope of SFAS 157. In February 2008, the FASB issued FSP No. FAS 157-2, “EffectiveDate of FASB Statement No. 157” (“FSP FAS 157-2”) which provides a one-year delayed application of SFAS 157for nonfinancial assets and liabilities, except for items that are recognized or disclosed at fair value in the financialstatements on a recurring basis (at least annually). We are required to adopt SFAS 157 as amended by FSPFAS 157-1 and FSP FAS 157-2 on October 1, 2008, the beginning of fiscal 2009. The adoption is not expected tohave a material impact on our consolidated financial statements.
In October 2008, the FASB issued FSP No. FAS 157-3, “Determining the Fair Value of a Financial Asset in aMarket That Is Not Active” (“FSP FAS 157-3”), which clarifies the application of SFAS 157 when the market for a
40
financial asset is inactive. Specifically, FSP FAS 157-3 clarifies how (1) management’s internal assumptions shouldbe considered in measuring fair value when observable data are not present, (2) observable market information froman inactive market should be taken into account, and (3) the use of broker quotes or pricing services should beconsidered in assessing the relevance of observable and unobservable data to measure fair value. The guidance inFSP FAS 157-3 is effective immediately and will apply to us upon adoption of SFAS 157.
SFAS 159: In February 2007, the FASB issued SFAS No. 159, “The Fair Value Option for Financial Assetsand Financial Liabilities — Including an Amendment of FASB Statement No. 115” (“SFAS 159”). SFAS 159 isexpected to expand the use of fair value accounting but does not affect existing standards which require certainassets or liabilities to be carried at fair value. The objective of SFAS 159 is to improve financial reporting byproviding companies with the opportunity to mitigate volatility in reported earnings caused by measuring relatedassets and liabilities differently without having to apply complex hedge accounting provisions. Under SFAS 159, acompany may choose, at specified election dates, to measure eligible items at fair value and report unrealized gainsand losses on items for which the fair value option has been elected in earnings at each subsequent reporting date.SFAS 159 is effective for financial statements issued for fiscal years beginning after November 15, 2007, andinterim periods within those fiscal years. As a result, SFAS 159 is effective for us in the first quarter of fiscal 2009.We do not plan to apply SFAS 159.
EITF 07-3: In June 2007, the Emerging Issues Task Force (“EITF”) issued EITF 07-3, “Accounting forNonrefundable Advance Payments for Goods or Services to Be Used in Future Research and DevelopmentActivities” (“EITF 07-3”). EITF 07-3 addresses the diversity that exists with respect to the accounting for the non-refundable portion of a payment made by a research and development entity for future research and developmentactivities. The EITF concluded that an entity must defer and capitalize non-refundable advance payments made forresearch and development activities, and expense these amounts as the related goods are delivered or the relatedservices are performed. EITF 07-3 is effective for interim or annual reporting periods in fiscal years beginning afterDecember 15, 2007 (fiscal 2009 for us). We do not expect the adoption of EITF 07-03 to have a material impact onour consolidated financial statements.
EITF 07-1: In November 2007, the EITF issued EITF 07-1, “Accounting for Collaborative Arrangements”(“EITF 07-1”). EITF 07-1, which will be applied retrospectively, requires expanded disclosures for contractualarrangements with third parties that involve joint operating activities and may require reclassifications to previouslyissued financial statements. EITF 07-1 is effective for interim or annual reporting periods beginning afterDecember 15, 2008 (fiscal 2010 for us). We are currently evaluating the impact EITF 07-1 may have on ourconsolidated financial statements.
SFAS 141(R): In December 2007, the FASB issued SFAS No. 141 (Revised) “Business Combinations”(“SFAS 141(R)”). SFAS 141(R) is intended to improve, simplify, and converge internationally the accounting forbusiness combinations. Under SFAS 141(R), an acquiring entity in a business combination must recognize theassets acquired, liabilities assumed, and any noncontrolling interest in the acquired entity at the acquisition date fairvalues, with limited exceptions. In addition, SFAS 141(R) requires the acquirer to disclose all information thatinvestors and other users need to evaluate and understand the nature and financial impact of the businesscombination. SFAS 141(R) applies prospectively to business combinations for which the acquisition date is onor after the beginning of the first annual reporting period on or after December 15, 2008. Earlier adoption isprohibited. Accordingly, we will record and disclose business combinations under the revised standard beginningOctober 1, 2009.
SFAS 160: In December 2007, the FASB issued SFAS No. 160, “Noncontrolling Interests in ConsolidatedFinancial Statements — an Amendment of Accounting Research Bulletin (“ARB”) 51,” (“SFAS 160”). Thisstatement amends ARB 51 to establish accounting and reporting standards for the noncontrolling interest (minorityinterest) in a subsidiary and for the deconsolidation of a subsidiary. SFAS 160 establishes accounting and reportingstandards that require (i) noncontrolling interests to be reported as a component of equity, (ii) changes in a parent’sownership interest while the parent retains its controlling interest be accounted for as equity transactions, and(iii) any retained noncontrolling equity investment upon the deconsolidation of a subsidiary be initially measured atfair value. SFAS 160 is to be applied prospectively to business combinations consummated on or after the beginningof the first annual reporting period on or after December 15, 2008. SFAS 160 is effective for fiscal years beginning
41
after December 15, 2008. As a result, SFAS 160 is effective for us in the first quarter of fiscal 2010. We are currentlyevaluating the impact SFAS 160 may have on our consolidated financial statements.
SFAS 161: In March 2008, the FASB issued SFAS No. 161, “Disclosures About Derivative Instruments andHedging Activities” (“SFAS 161”). SFAS 161 is intended to improve financial reporting about derivativeinstruments and hedging activities by requiring enhanced disclosures to enable investors to better understandtheir effects on an entity’s financial position, financial performance, and cash flows. The new standard is effectivefor financial statements issued for fiscal years and interim periods beginning after November 15, 2008 (fiscal 2010for us). We are currently assessing the impact that SFAS 161 may have on our consolidated financial statements.
FSP FAS 142-3: In April 2008, the FASB issued FSP No. FAS 142-3, “Determination of the Useful Life ofIntangible Assets” (“FSP FAS 142-3”), which improves the consistency of the useful life of a recognized intangibleasset among various pronouncements. FSP FAS 142-3 is effective for fiscal years beginning after December 15,2008 (fiscal 2010 for us). We are currently assessing the impact that FSP FAS 142-3 may have on consolidatedfinancial statements.
SFAS 162: In May 2008, the FASB issued SFAS No. 162, “The Hierarchy of Generally AcceptedAccounting Principles” (“SFAS 162”). The new standard is intended to improve financial reporting by identifyinga consistent framework, or hierarchy, for selecting accounting principles to be used in preparing financialstatements that are presented in conformity with U.S. GAAP for nongovernmental entities. The new standardis effective 60 days following the Security and Exchange Commission’s approval of the Public CompanyAccounting Oversight Board amendments to AU Section 411, “The Meaning of Present Fairly in Conformitywith Generally Accepted Accounting Principles.” We are currently assessing the impact that SFAS 162 may have onour consolidated financial statements.
FSP EITF 03-6-1: In June 2008, the FASB issued FASB Staff Position No. EITF 03-6-1, “DeterminingWhether Instruments Granted in Stock-Based Payment Transactions are Participating Securities” (“FSP EITF 03-6-1”). The FSP addresses whether instruments granted in stock-based payment transactions are participatingsecurities prior to vesting and, therefore, need to be included in the earnings allocation in computing earningsper share under the two-class method described in paragraphs 60 and 61 of SFAS No. 128, “Earnings Per Share.”The new FSP is effective for financial statements issued for fiscal years beginning after December 15, 2008 andinterim periods within those years (fiscal 2010 for us). Early application is not permitted. Our unvested options arenot eligible to receive dividends; therefore, FSP EITF 03-06-1 will not have any impact on our consolidatedfinancial statements.
FSP FAS 133-1: In September 2008, the FASB issued FSP No. FAS 133-1 “Disclosures about CreditDerivatives and Certain Guarantees: An Amendment of FASB Statement No. 133 (“FSP FAS 133-1”) and FASBInterpretation No. 45; and Clarification of the Effective Date of FASB Statement No. 161.” This FSP amendsSFAS No. 133 to require disclosures by sellers of credit derivatives, including credit derivatives embedded in ahybrid instrument. This FSP also amends FIN No. 45 to require an additional disclosure about the current status ofthe payment/performance risk of a guarantee. Further, this FSP clarifies the FASB’s intent about the effective date ofSFAS No. 161. This FSP is effective for fiscal years ending after November 15, 2008. We expect to adopt this FSPfor periods ending on and after December 31, 2008. We are currently assessing the impact that FSP FAS 133-1 mayhave on our consolidated financial statements.
Recent Market Events
Current market conditions and economic events have significantly impacted the financial condition, liquidityand outlook for a wide range of companies, including many companies outside the financial services sectors. Wehave considered the potential impact of such conditions and events as it relates to currently reported financial resultsof operations and liquidity, including consideration of the possible impact of other than temporary impairment,auction rate securities, and counterparty credit risk and hedge accounting. We do not believe that current marketconditions and economic events have significantly impacted our results of operations or current liquidity, nor do webelieve that, based on our current investment policies and contractual relationships, we are subject to greater riskfrom such factors than applies to other companies of similar size and market breadth.
42
Financing Arrangements
Payments on our senior notes outstanding as of September 30, 2008, totaling $44.5 million, are due from fiscal2009 through fiscal 2012. Payments on our senior notes issued on October 1 and October 30, 2008 are due in fiscal2009 through fiscal 2019. Also, we have a $225.0 million line of credit facility that includes an option to increase theamount of the line up to $350.0 million, subject to our compliance with certain conditions and the participation ofthe lenders that does not expire until October 2012.
As described in Note 22 to the Consolidated Financial Statements in “Item 8 — Financial Statements andSupplementary Data,” we entered into a Term Loan Credit Agreement on October 1, 2008 that provides for a$150.0 million unsecured term loan facility, and may be expanded by up to $50.0 million of additional indebtedness,subject to our compliance with certain conditions and the participation of the lenders. On October 1, 2008, we alsoentered into a Note Purchase Agreement relating to our sale of an aggregate principal amount of $250.0 millioncomprised of (a) $100.0 million aggregate principal amount of Series B Notes due October 1, 2013, (b) $50.0 millionaggregate principal amount of Series C Notes due October 1, 2015 and (c) $100.0 million aggregate principalamount of Series D Notes due October 1, 2018. On October 1, 2008, $200.0 million aggregate principal amount ofNotes were sold, comprised of $80.0 million aggregate principal amount of the Series B Notes, $40.0 millionaggregate principal amount of the Series C Notes, and $80.0 million aggregate principal amount of the Series DNotes. On October 30, 2008, we issued an additional $50.0 million aggregate principal amount of Notes withsimilar maturities and interest rates.
It is possible that business acquisitions could be made in the future that would require amendments to existingdebt agreements and the need to obtain additional financing.
Outlook
The economy over the last several months has been buffeted with financial institution credit crises ultimatelyimpacting the broader credit markets and the financing available to many companies, both in the U.S. and abroad.Preparation for the impacts of market fluctuations has been a strategic objective for a number of years andWoodward is better positioned at this time to maintain liquidity and relative profitability in the face of potentialsales declines than in the past. Future cash flows from operations and available revolving lines of credit are expectedto be adequate to meet our cash requirements over the next twelve months.
Item 7A. Quantitative and Qualitative Disclosures About Market Risk
Market Risk and Risk Management
In the normal course of business, we have exposures to interest rate risk from our long-term debt, foreignexchange rate risk related to our foreign operations, and foreign currency transactions. We are also exposed tovarious market risks that arise from transactions entered into in the normal course of business related to items suchas the cost of raw materials and changes in inflation. Certain contractual relationships with customers and vendorsmitigate risks from changes in raw material costs and currency exchange rate changes that arise from normalpurchasing and normal sales activities.
Interest Rate Exposure
Derivative instruments utilized by us are viewed as risk management tools, involve little complexity, and arenot used for trading or speculative purposes. To manage interest rate risk related to the $400 million of long-termdebt issued in October 2008, we used a treasury lock which locked in interest rates on future debt. The treasury lockagreement was designated as a cash flow hedge against interest rate risk on a portion of the debt issued in October2008.
A portion of our long-term debt is sensitive to changes in interest rates. We monitor trends in interest rates as abasis for determining whether to enter into fixed rate or variable rate debt agreements, the duration of suchagreements, and whether to use hedging strategies. Our primary objective is to minimize our long-term costs ofborrowing. At September 30, 2008, our long-term debt consisted of variable and fixed rate agreements. As
43
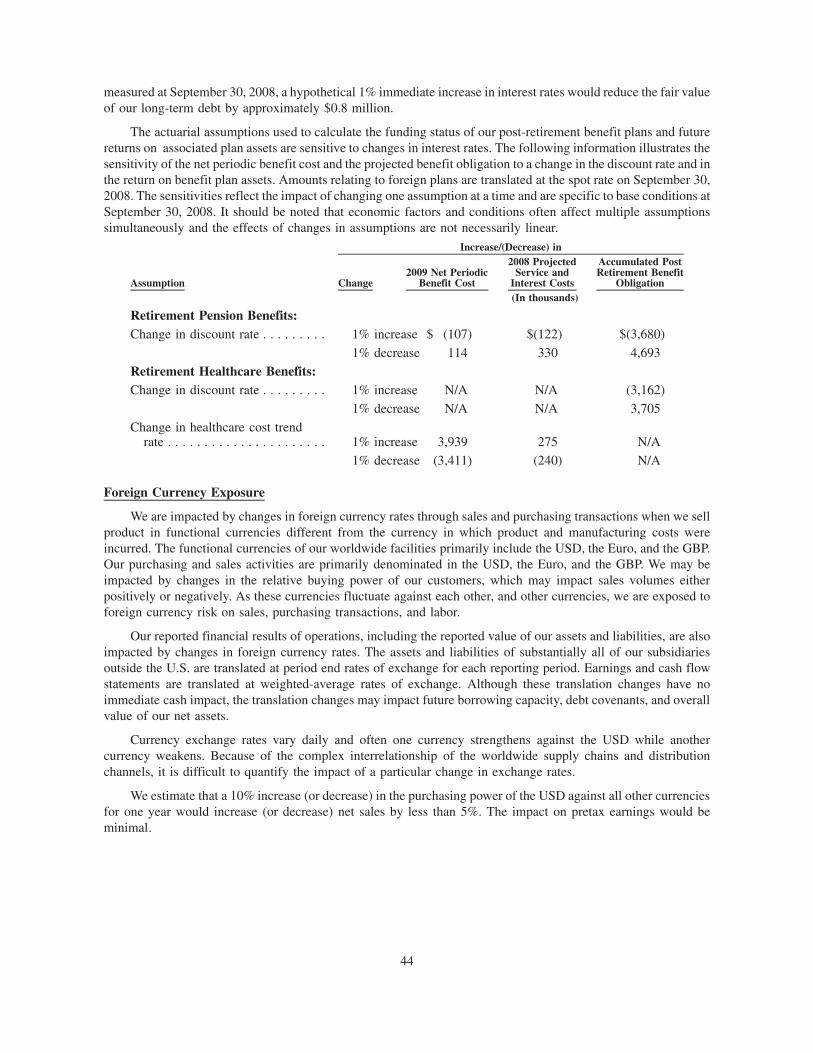
measured at September 30, 2008, a hypothetical 1% immediate increase in interest rates would reduce the fair valueof our long-term debt by approximately $0.8 million.
The actuarial assumptions used to calculate the funding status of our post-retirement benefit plans and futurereturns on associated plan assets are sensitive to changes in interest rates. The following information illustrates thesensitivity of the net periodic benefit cost and the projected benefit obligation to a change in the discount rate and inthe return on benefit plan assets. Amounts relating to foreign plans are translated at the spot rate on September 30,2008. The sensitivities reflect the impact of changing one assumption at a time and are specific to base conditions atSeptember 30, 2008. It should be noted that economic factors and conditions often affect multiple assumptionssimultaneously and the effects of changes in assumptions are not necessarily linear.
Assumption Change2009 Net Periodic
Benefit Cost
2008 ProjectedService and
Interest Costs
Accumulated PostRetirement Benefit
Obligation
Increase/(Decrease) in
(In thousands)
Retirement Pension Benefits:Change in discount rate . . . . . . . . . 1% increase $ (107) $(122) $(3,680)
1% decrease 114 330 4,693Retirement Healthcare Benefits:Change in discount rate . . . . . . . . . 1% increase N/A N/A (3,162)
1% decrease N/A N/A 3,705Change in healthcare cost trend
rate . . . . . . . . . . . . . . . . . . . . . . 1% increase 3,939 275 N/A1% decrease (3,411) (240) N/A
Foreign Currency Exposure
We are impacted by changes in foreign currency rates through sales and purchasing transactions when we sellproduct in functional currencies different from the currency in which product and manufacturing costs wereincurred. The functional currencies of our worldwide facilities primarily include the USD, the Euro, and the GBP.Our purchasing and sales activities are primarily denominated in the USD, the Euro, and the GBP. We may beimpacted by changes in the relative buying power of our customers, which may impact sales volumes eitherpositively or negatively. As these currencies fluctuate against each other, and other currencies, we are exposed toforeign currency risk on sales, purchasing transactions, and labor.
Our reported financial results of operations, including the reported value of our assets and liabilities, are alsoimpacted by changes in foreign currency rates. The assets and liabilities of substantially all of our subsidiariesoutside the U.S. are translated at period end rates of exchange for each reporting period. Earnings and cash flowstatements are translated at weighted-average rates of exchange. Although these translation changes have noimmediate cash impact, the translation changes may impact future borrowing capacity, debt covenants, and overallvalue of our net assets.
Currency exchange rates vary daily and often one currency strengthens against the USD while anothercurrency weakens. Because of the complex interrelationship of the worldwide supply chains and distributionchannels, it is difficult to quantify the impact of a particular change in exchange rates.
We estimate that a 10% increase (or decrease) in the purchasing power of the USD against all other currenciesfor one year would increase (or decrease) net sales by less than 5%. The impact on pretax earnings would beminimal.
44
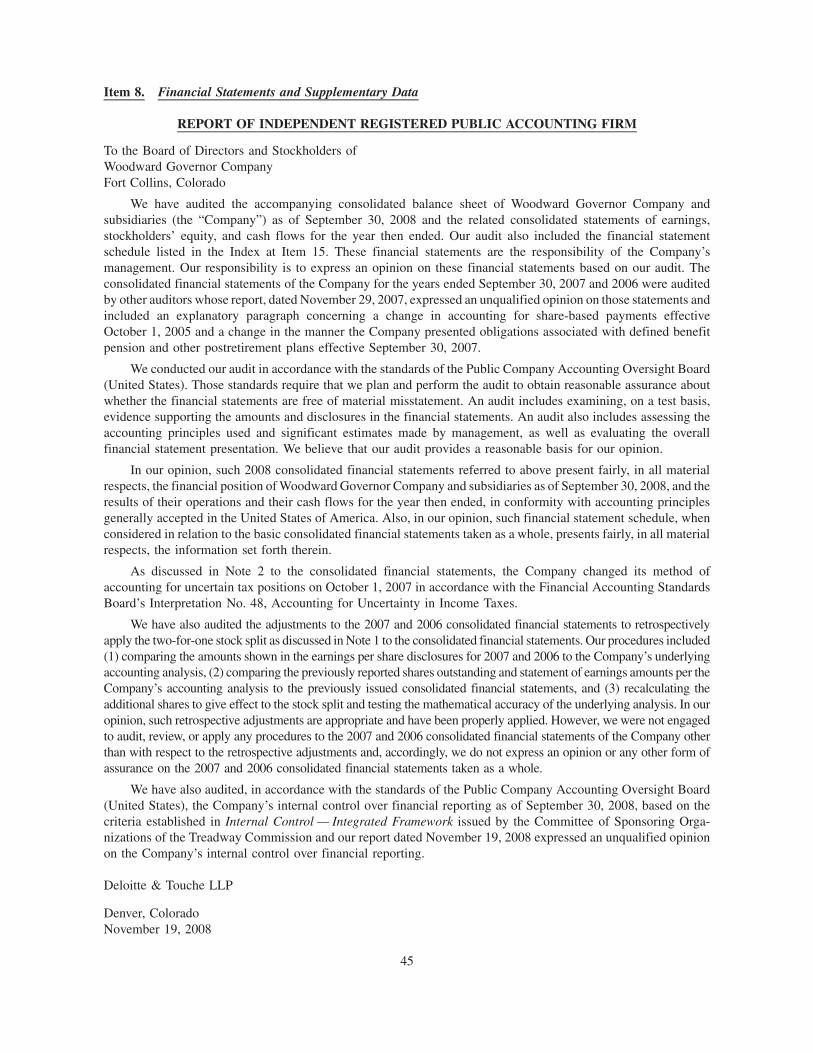
Item 8. Financial Statements and Supplementary Data
REPORT OF INDEPENDENT REGISTERED PUBLIC ACCOUNTING FIRM
To the Board of Directors and Stockholders ofWoodward Governor CompanyFort Collins, Colorado
We have audited the accompanying consolidated balance sheet of Woodward Governor Company andsubsidiaries (the “Company”) as of September 30, 2008 and the related consolidated statements of earnings,stockholders’ equity, and cash flows for the year then ended. Our audit also included the financial statementschedule listed in the Index at Item 15. These financial statements are the responsibility of the Company’smanagement. Our responsibility is to express an opinion on these financial statements based on our audit. Theconsolidated financial statements of the Company for the years ended September 30, 2007 and 2006 were auditedby other auditors whose report, dated November 29, 2007, expressed an unqualified opinion on those statements andincluded an explanatory paragraph concerning a change in accounting for share-based payments effectiveOctober 1, 2005 and a change in the manner the Company presented obligations associated with defined benefitpension and other postretirement plans effective September 30, 2007.
We conducted our audit in accordance with the standards of the Public Company Accounting Oversight Board(United States). Those standards require that we plan and perform the audit to obtain reasonable assurance aboutwhether the financial statements are free of material misstatement. An audit includes examining, on a test basis,evidence supporting the amounts and disclosures in the financial statements. An audit also includes assessing theaccounting principles used and significant estimates made by management, as well as evaluating the overallfinancial statement presentation. We believe that our audit provides a reasonable basis for our opinion.
In our opinion, such 2008 consolidated financial statements referred to above present fairly, in all materialrespects, the financial position of Woodward Governor Company and subsidiaries as of September 30, 2008, and theresults of their operations and their cash flows for the year then ended, in conformity with accounting principlesgenerally accepted in the United States of America. Also, in our opinion, such financial statement schedule, whenconsidered in relation to the basic consolidated financial statements taken as a whole, presents fairly, in all materialrespects, the information set forth therein.
As discussed in Note 2 to the consolidated financial statements, the Company changed its method ofaccounting for uncertain tax positions on October 1, 2007 in accordance with the Financial Accounting StandardsBoard’s Interpretation No. 48, Accounting for Uncertainty in Income Taxes.
We have also audited the adjustments to the 2007 and 2006 consolidated financial statements to retrospectivelyapply the two-for-one stock split as discussed in Note 1 to the consolidated financial statements. Our procedures included(1) comparing the amounts shown in the earnings per share disclosures for 2007 and 2006 to the Company’s underlyingaccounting analysis, (2) comparing the previously reported shares outstanding and statement of earnings amounts per theCompany’s accounting analysis to the previously issued consolidated financial statements, and (3) recalculating theadditional shares to give effect to the stock split and testing the mathematical accuracy of the underlying analysis. In ouropinion, such retrospective adjustments are appropriate and have been properly applied. However, we were not engagedto audit, review, or apply any procedures to the 2007 and 2006 consolidated financial statements of the Company otherthan with respect to the retrospective adjustments and, accordingly, we do not express an opinion or any other form ofassurance on the 2007 and 2006 consolidated financial statements taken as a whole.
We have also audited, in accordance with the standards of the Public Company Accounting Oversight Board(United States), the Company’s internal control over financial reporting as of September 30, 2008, based on thecriteria established in Internal Control — Integrated Framework issued by the Committee of Sponsoring Orga-nizations of the Treadway Commission and our report dated November 19, 2008 expressed an unqualified opinionon the Company’s internal control over financial reporting.
Deloitte & Touche LLP
Denver, ColoradoNovember 19, 2008
45
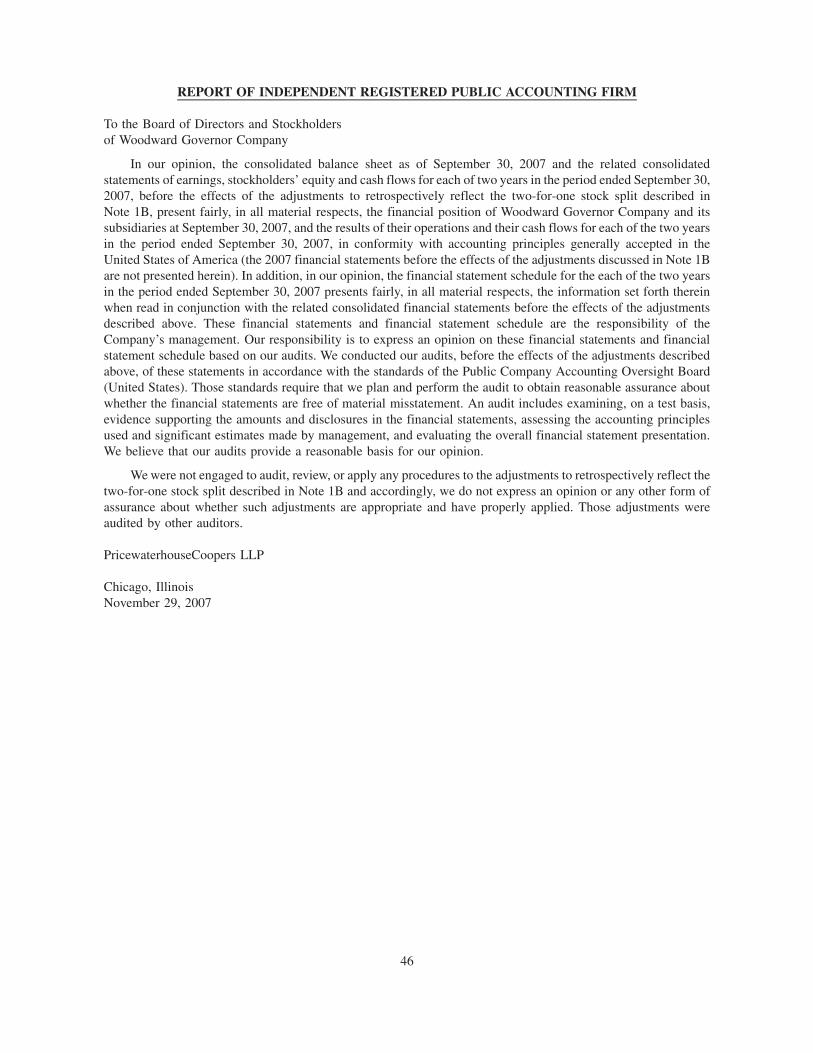
REPORT OF INDEPENDENT REGISTERED PUBLIC ACCOUNTING FIRM
To the Board of Directors and Stockholdersof Woodward Governor Company
In our opinion, the consolidated balance sheet as of September 30, 2007 and the related consolidatedstatements of earnings, stockholders’ equity and cash flows for each of two years in the period ended September 30,2007, before the effects of the adjustments to retrospectively reflect the two-for-one stock split described inNote 1B, present fairly, in all material respects, the financial position of Woodward Governor Company and itssubsidiaries at September 30, 2007, and the results of their operations and their cash flows for each of the two yearsin the period ended September 30, 2007, in conformity with accounting principles generally accepted in theUnited States of America (the 2007 financial statements before the effects of the adjustments discussed in Note 1Bare not presented herein). In addition, in our opinion, the financial statement schedule for the each of the two yearsin the period ended September 30, 2007 presents fairly, in all material respects, the information set forth thereinwhen read in conjunction with the related consolidated financial statements before the effects of the adjustmentsdescribed above. These financial statements and financial statement schedule are the responsibility of theCompany’s management. Our responsibility is to express an opinion on these financial statements and financialstatement schedule based on our audits. We conducted our audits, before the effects of the adjustments describedabove, of these statements in accordance with the standards of the Public Company Accounting Oversight Board(United States). Those standards require that we plan and perform the audit to obtain reasonable assurance aboutwhether the financial statements are free of material misstatement. An audit includes examining, on a test basis,evidence supporting the amounts and disclosures in the financial statements, assessing the accounting principlesused and significant estimates made by management, and evaluating the overall financial statement presentation.We believe that our audits provide a reasonable basis for our opinion.
We were not engaged to audit, review, or apply any procedures to the adjustments to retrospectively reflect thetwo-for-one stock split described in Note 1B and accordingly, we do not express an opinion or any other form ofassurance about whether such adjustments are appropriate and have properly applied. Those adjustments wereaudited by other auditors.
PricewaterhouseCoopers LLP
Chicago, IllinoisNovember 29, 2007
46
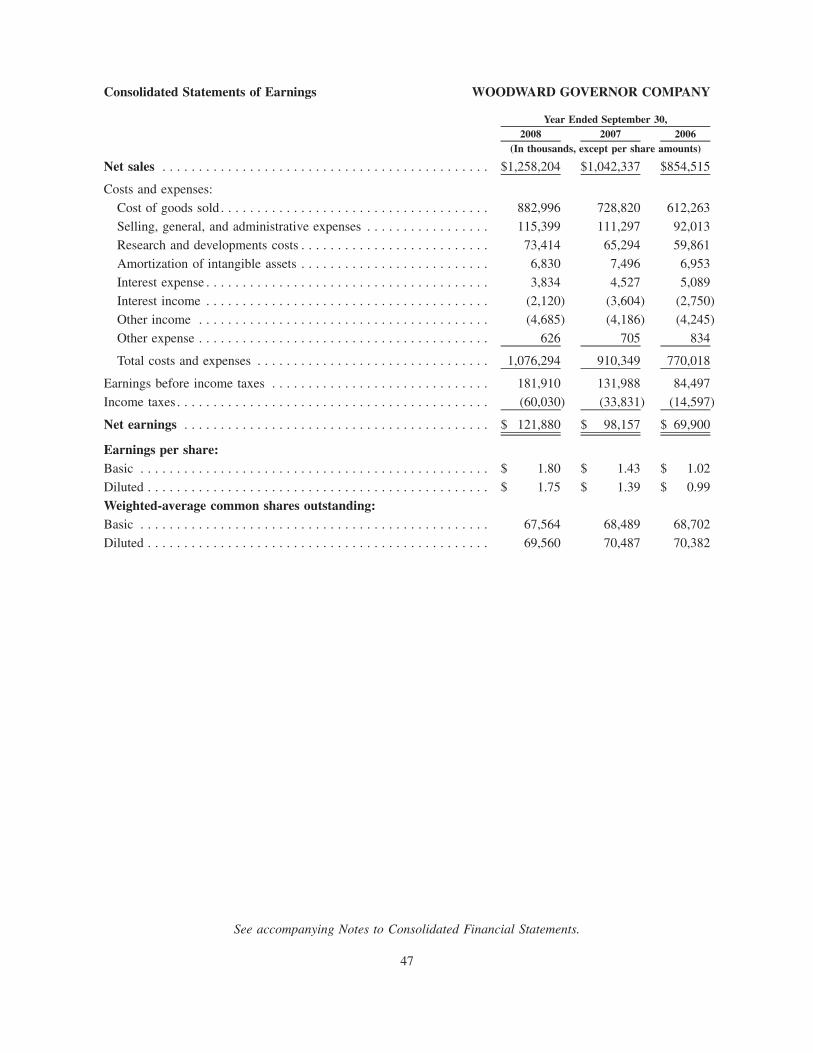
Consolidated Statements of Earnings WOODWARD GOVERNOR COMPANY
2008 2007 2006Year Ended September 30,
(In thousands, except per share amounts)
Net sales . . . . . . . . . . . . . . . . . . . . . . . . . . . . . . . . . . . . . . . . . . . . . $1,258,204 $1,042,337 $854,515
Costs and expenses:Cost of goods sold . . . . . . . . . . . . . . . . . . . . . . . . . . . . . . . . . . . . . 882,996 728,820 612,263Selling, general, and administrative expenses . . . . . . . . . . . . . . . . . 115,399 111,297 92,013Research and developments costs . . . . . . . . . . . . . . . . . . . . . . . . . . 73,414 65,294 59,861Amortization of intangible assets . . . . . . . . . . . . . . . . . . . . . . . . . . 6,830 7,496 6,953Interest expense . . . . . . . . . . . . . . . . . . . . . . . . . . . . . . . . . . . . . . . 3,834 4,527 5,089Interest income . . . . . . . . . . . . . . . . . . . . . . . . . . . . . . . . . . . . . . . (2,120) (3,604) (2,750)Other income . . . . . . . . . . . . . . . . . . . . . . . . . . . . . . . . . . . . . . . . (4,685) (4,186) (4,245)Other expense . . . . . . . . . . . . . . . . . . . . . . . . . . . . . . . . . . . . . . . . 626 705 834
Total costs and expenses . . . . . . . . . . . . . . . . . . . . . . . . . . . . . . . . 1,076,294 910,349 770,018
Earnings before income taxes . . . . . . . . . . . . . . . . . . . . . . . . . . . . . . 181,910 131,988 84,497Income taxes . . . . . . . . . . . . . . . . . . . . . . . . . . . . . . . . . . . . . . . . . . . (60,030) (33,831) (14,597)
Net earnings . . . . . . . . . . . . . . . . . . . . . . . . . . . . . . . . . . . . . . . . . . $ 121,880 $ 98,157 $ 69,900
Earnings per share:Basic . . . . . . . . . . . . . . . . . . . . . . . . . . . . . . . . . . . . . . . . . . . . . . . . $ 1.80 $ 1.43 $ 1.02Diluted . . . . . . . . . . . . . . . . . . . . . . . . . . . . . . . . . . . . . . . . . . . . . . . $ 1.75 $ 1.39 $ 0.99Weighted-average common shares outstanding:Basic . . . . . . . . . . . . . . . . . . . . . . . . . . . . . . . . . . . . . . . . . . . . . . . . 67,564 68,489 68,702Diluted . . . . . . . . . . . . . . . . . . . . . . . . . . . . . . . . . . . . . . . . . . . . . . . 69,560 70,487 70,382
See accompanying Notes to Consolidated Financial Statements.
47
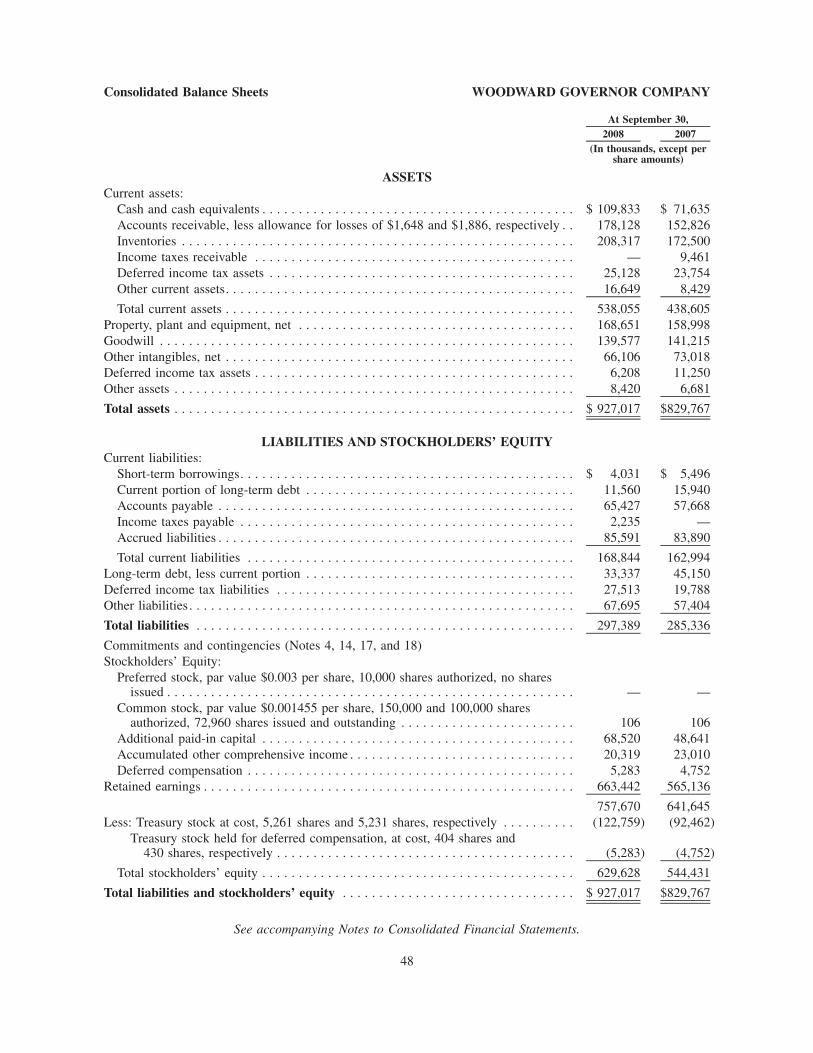
Consolidated Balance Sheets WOODWARD GOVERNOR COMPANY
2008 2007At September 30,
(In thousands, except pershare amounts)
ASSETSCurrent assets:
Cash and cash equivalents . . . . . . . . . . . . . . . . . . . . . . . . . . . . . . . . . . . . . . . . . . . $ 109,833 $ 71,635Accounts receivable, less allowance for losses of $1,648 and $1,886, respectively . . 178,128 152,826Inventories . . . . . . . . . . . . . . . . . . . . . . . . . . . . . . . . . . . . . . . . . . . . . . . . . . . . . . 208,317 172,500Income taxes receivable . . . . . . . . . . . . . . . . . . . . . . . . . . . . . . . . . . . . . . . . . . . . — 9,461Deferred income tax assets . . . . . . . . . . . . . . . . . . . . . . . . . . . . . . . . . . . . . . . . . . 25,128 23,754Other current assets. . . . . . . . . . . . . . . . . . . . . . . . . . . . . . . . . . . . . . . . . . . . . . . . 16,649 8,429
Total current assets . . . . . . . . . . . . . . . . . . . . . . . . . . . . . . . . . . . . . . . . . . . . . . . . 538,055 438,605Property, plant and equipment, net . . . . . . . . . . . . . . . . . . . . . . . . . . . . . . . . . . . . . . 168,651 158,998Goodwill . . . . . . . . . . . . . . . . . . . . . . . . . . . . . . . . . . . . . . . . . . . . . . . . . . . . . . . . . 139,577 141,215Other intangibles, net . . . . . . . . . . . . . . . . . . . . . . . . . . . . . . . . . . . . . . . . . . . . . . . . 66,106 73,018Deferred income tax assets . . . . . . . . . . . . . . . . . . . . . . . . . . . . . . . . . . . . . . . . . . . . 6,208 11,250Other assets . . . . . . . . . . . . . . . . . . . . . . . . . . . . . . . . . . . . . . . . . . . . . . . . . . . . . . . 8,420 6,681
Total assets . . . . . . . . . . . . . . . . . . . . . . . . . . . . . . . . . . . . . . . . . . . . . . . . . . . . . . . $ 927,017 $829,767
LIABILITIES AND STOCKHOLDERS’ EQUITYCurrent liabilities:
Short-term borrowings. . . . . . . . . . . . . . . . . . . . . . . . . . . . . . . . . . . . . . . . . . . . . . $ 4,031 $ 5,496Current portion of long-term debt . . . . . . . . . . . . . . . . . . . . . . . . . . . . . . . . . . . . . 11,560 15,940Accounts payable . . . . . . . . . . . . . . . . . . . . . . . . . . . . . . . . . . . . . . . . . . . . . . . . . 65,427 57,668Income taxes payable . . . . . . . . . . . . . . . . . . . . . . . . . . . . . . . . . . . . . . . . . . . . . . 2,235 —Accrued liabilities . . . . . . . . . . . . . . . . . . . . . . . . . . . . . . . . . . . . . . . . . . . . . . . . . 85,591 83,890
Total current liabilities . . . . . . . . . . . . . . . . . . . . . . . . . . . . . . . . . . . . . . . . . . . . . 168,844 162,994Long-term debt, less current portion . . . . . . . . . . . . . . . . . . . . . . . . . . . . . . . . . . . . . 33,337 45,150Deferred income tax liabilities . . . . . . . . . . . . . . . . . . . . . . . . . . . . . . . . . . . . . . . . . 27,513 19,788Other liabilities. . . . . . . . . . . . . . . . . . . . . . . . . . . . . . . . . . . . . . . . . . . . . . . . . . . . . 67,695 57,404
Total liabilities . . . . . . . . . . . . . . . . . . . . . . . . . . . . . . . . . . . . . . . . . . . . . . . . . . . . 297,389 285,336
Commitments and contingencies (Notes 4, 14, 17, and 18)Stockholders’ Equity:
Preferred stock, par value $0.003 per share, 10,000 shares authorized, no sharesissued . . . . . . . . . . . . . . . . . . . . . . . . . . . . . . . . . . . . . . . . . . . . . . . . . . . . . . . . — —
Common stock, par value $0.001455 per share, 150,000 and 100,000 sharesauthorized, 72,960 shares issued and outstanding . . . . . . . . . . . . . . . . . . . . . . . . 106 106
Additional paid-in capital . . . . . . . . . . . . . . . . . . . . . . . . . . . . . . . . . . . . . . . . . . . 68,520 48,641Accumulated other comprehensive income . . . . . . . . . . . . . . . . . . . . . . . . . . . . . . . 20,319 23,010Deferred compensation . . . . . . . . . . . . . . . . . . . . . . . . . . . . . . . . . . . . . . . . . . . . . 5,283 4,752
Retained earnings . . . . . . . . . . . . . . . . . . . . . . . . . . . . . . . . . . . . . . . . . . . . . . . . . . . 663,442 565,136
757,670 641,645Less: Treasury stock at cost, 5,261 shares and 5,231 shares, respectively . . . . . . . . . . (122,759) (92,462)
Treasury stock held for deferred compensation, at cost, 404 shares and430 shares, respectively . . . . . . . . . . . . . . . . . . . . . . . . . . . . . . . . . . . . . . . . . (5,283) (4,752)
Total stockholders’ equity . . . . . . . . . . . . . . . . . . . . . . . . . . . . . . . . . . . . . . . . . . . 629,628 544,431
Total liabilities and stockholders’ equity . . . . . . . . . . . . . . . . . . . . . . . . . . . . . . . . $ 927,017 $829,767
See accompanying Notes to Consolidated Financial Statements.
48
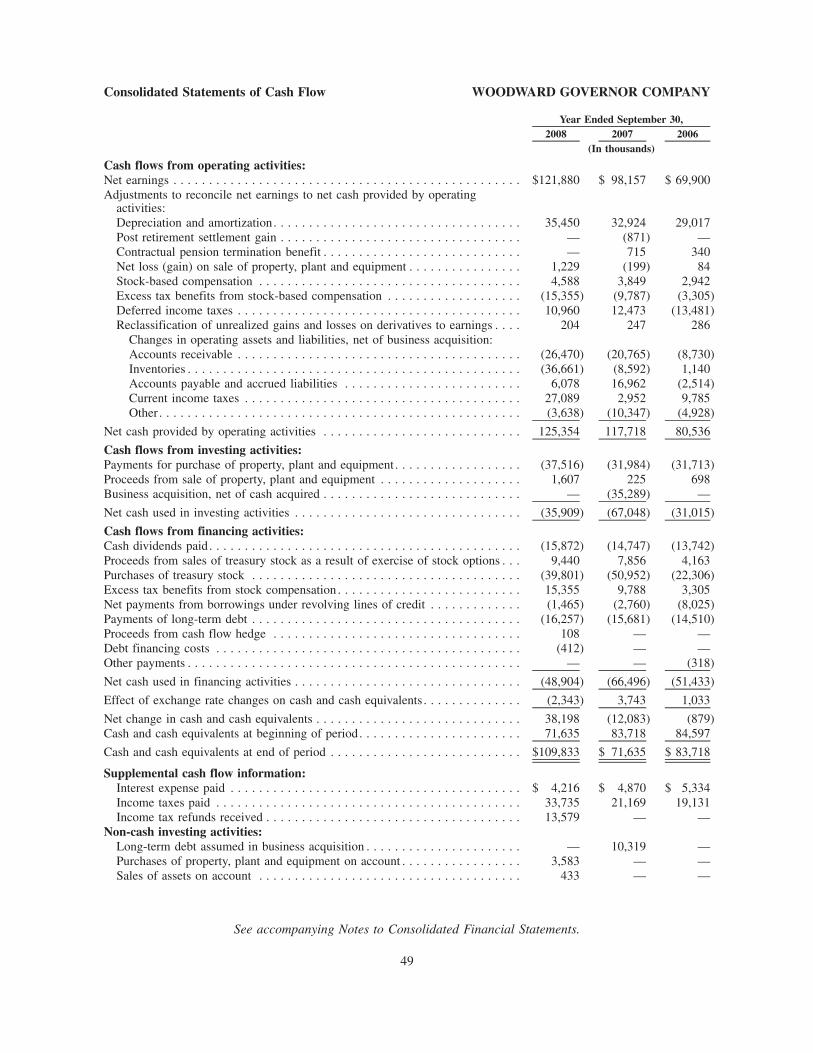
Consolidated Statements of Cash Flow WOODWARD GOVERNOR COMPANY
2008 2007 2006Year Ended September 30,
(In thousands)
Cash flows from operating activities:Net earnings . . . . . . . . . . . . . . . . . . . . . . . . . . . . . . . . . . . . . . . . . . . . . . . . . $121,880 $ 98,157 $ 69,900Adjustments to reconcile net earnings to net cash provided by operating
activities:Depreciation and amortization. . . . . . . . . . . . . . . . . . . . . . . . . . . . . . . . . . . 35,450 32,924 29,017Post retirement settlement gain . . . . . . . . . . . . . . . . . . . . . . . . . . . . . . . . . . — (871) —Contractual pension termination benefit . . . . . . . . . . . . . . . . . . . . . . . . . . . . — 715 340Net loss (gain) on sale of property, plant and equipment . . . . . . . . . . . . . . . . 1,229 (199) 84Stock-based compensation . . . . . . . . . . . . . . . . . . . . . . . . . . . . . . . . . . . . . 4,588 3,849 2,942Excess tax benefits from stock-based compensation . . . . . . . . . . . . . . . . . . . (15,355) (9,787) (3,305)Deferred income taxes . . . . . . . . . . . . . . . . . . . . . . . . . . . . . . . . . . . . . . . . 10,960 12,473 (13,481)Reclassification of unrealized gains and losses on derivatives to earnings . . . . 204 247 286
Changes in operating assets and liabilities, net of business acquisition:Accounts receivable . . . . . . . . . . . . . . . . . . . . . . . . . . . . . . . . . . . . . . . . (26,470) (20,765) (8,730)Inventories . . . . . . . . . . . . . . . . . . . . . . . . . . . . . . . . . . . . . . . . . . . . . . . (36,661) (8,592) 1,140Accounts payable and accrued liabilities . . . . . . . . . . . . . . . . . . . . . . . . . 6,078 16,962 (2,514)Current income taxes . . . . . . . . . . . . . . . . . . . . . . . . . . . . . . . . . . . . . . . 27,089 2,952 9,785Other . . . . . . . . . . . . . . . . . . . . . . . . . . . . . . . . . . . . . . . . . . . . . . . . . . . (3,638) (10,347) (4,928)
Net cash provided by operating activities . . . . . . . . . . . . . . . . . . . . . . . . . . . . 125,354 117,718 80,536
Cash flows from investing activities:Payments for purchase of property, plant and equipment. . . . . . . . . . . . . . . . . . (37,516) (31,984) (31,713)Proceeds from sale of property, plant and equipment . . . . . . . . . . . . . . . . . . . . 1,607 225 698Business acquisition, net of cash acquired . . . . . . . . . . . . . . . . . . . . . . . . . . . . — (35,289) —
Net cash used in investing activities . . . . . . . . . . . . . . . . . . . . . . . . . . . . . . . . (35,909) (67,048) (31,015)
Cash flows from financing activities:Cash dividends paid. . . . . . . . . . . . . . . . . . . . . . . . . . . . . . . . . . . . . . . . . . . . (15,872) (14,747) (13,742)Proceeds from sales of treasury stock as a result of exercise of stock options . . . 9,440 7,856 4,163Purchases of treasury stock . . . . . . . . . . . . . . . . . . . . . . . . . . . . . . . . . . . . . . (39,801) (50,952) (22,306)Excess tax benefits from stock compensation . . . . . . . . . . . . . . . . . . . . . . . . . . 15,355 9,788 3,305Net payments from borrowings under revolving lines of credit . . . . . . . . . . . . . (1,465) (2,760) (8,025)Payments of long-term debt . . . . . . . . . . . . . . . . . . . . . . . . . . . . . . . . . . . . . . (16,257) (15,681) (14,510)Proceeds from cash flow hedge . . . . . . . . . . . . . . . . . . . . . . . . . . . . . . . . . . . 108 — —Debt financing costs . . . . . . . . . . . . . . . . . . . . . . . . . . . . . . . . . . . . . . . . . . . (412) — —Other payments . . . . . . . . . . . . . . . . . . . . . . . . . . . . . . . . . . . . . . . . . . . . . . . — — (318)
Net cash used in financing activities . . . . . . . . . . . . . . . . . . . . . . . . . . . . . . . . (48,904) (66,496) (51,433)
Effect of exchange rate changes on cash and cash equivalents . . . . . . . . . . . . . . (2,343) 3,743 1,033
Net change in cash and cash equivalents . . . . . . . . . . . . . . . . . . . . . . . . . . . . . 38,198 (12,083) (879)Cash and cash equivalents at beginning of period. . . . . . . . . . . . . . . . . . . . . . . 71,635 83,718 84,597
Cash and cash equivalents at end of period . . . . . . . . . . . . . . . . . . . . . . . . . . . $109,833 $ 71,635 $ 83,718
Supplemental cash flow information:Interest expense paid . . . . . . . . . . . . . . . . . . . . . . . . . . . . . . . . . . . . . . . . . $ 4,216 $ 4,870 $ 5,334Income taxes paid . . . . . . . . . . . . . . . . . . . . . . . . . . . . . . . . . . . . . . . . . . . 33,735 21,169 19,131Income tax refunds received . . . . . . . . . . . . . . . . . . . . . . . . . . . . . . . . . . . . 13,579 — —
Non-cash investing activities:Long-term debt assumed in business acquisition . . . . . . . . . . . . . . . . . . . . . . — 10,319 —Purchases of property, plant and equipment on account . . . . . . . . . . . . . . . . . 3,583 — —Sales of assets on account . . . . . . . . . . . . . . . . . . . . . . . . . . . . . . . . . . . . . 433 — —
See accompanying Notes to Consolidated Financial Statements.
49
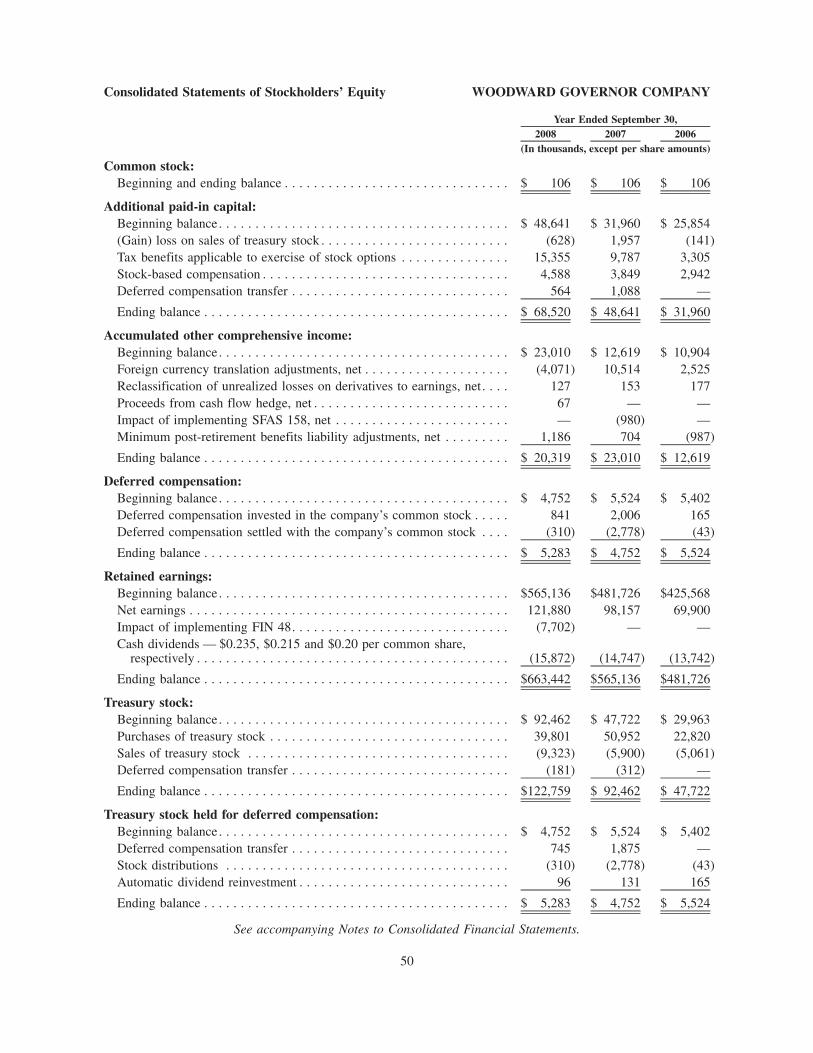
Consolidated Statements of Stockholders’ Equity WOODWARD GOVERNOR COMPANY
2008 2007 2006Year Ended September 30,
(In thousands, except per share amounts)
Common stock:Beginning and ending balance . . . . . . . . . . . . . . . . . . . . . . . . . . . . . . . $ 106 $ 106 $ 106
Additional paid-in capital:Beginning balance. . . . . . . . . . . . . . . . . . . . . . . . . . . . . . . . . . . . . . . . $ 48,641 $ 31,960 $ 25,854(Gain) loss on sales of treasury stock . . . . . . . . . . . . . . . . . . . . . . . . . . (628) 1,957 (141)Tax benefits applicable to exercise of stock options . . . . . . . . . . . . . . . 15,355 9,787 3,305Stock-based compensation . . . . . . . . . . . . . . . . . . . . . . . . . . . . . . . . . . 4,588 3,849 2,942Deferred compensation transfer . . . . . . . . . . . . . . . . . . . . . . . . . . . . . . 564 1,088 —
Ending balance . . . . . . . . . . . . . . . . . . . . . . . . . . . . . . . . . . . . . . . . . . $ 68,520 $ 48,641 $ 31,960
Accumulated other comprehensive income:Beginning balance. . . . . . . . . . . . . . . . . . . . . . . . . . . . . . . . . . . . . . . . $ 23,010 $ 12,619 $ 10,904Foreign currency translation adjustments, net . . . . . . . . . . . . . . . . . . . . (4,071) 10,514 2,525Reclassification of unrealized losses on derivatives to earnings, net. . . . 127 153 177Proceeds from cash flow hedge, net . . . . . . . . . . . . . . . . . . . . . . . . . . . 67 — —Impact of implementing SFAS 158, net . . . . . . . . . . . . . . . . . . . . . . . . — (980) —Minimum post-retirement benefits liability adjustments, net . . . . . . . . . 1,186 704 (987)
Ending balance . . . . . . . . . . . . . . . . . . . . . . . . . . . . . . . . . . . . . . . . . . $ 20,319 $ 23,010 $ 12,619
Deferred compensation:Beginning balance. . . . . . . . . . . . . . . . . . . . . . . . . . . . . . . . . . . . . . . . $ 4,752 $ 5,524 $ 5,402Deferred compensation invested in the company’s common stock . . . . . 841 2,006 165Deferred compensation settled with the company’s common stock . . . . (310) (2,778) (43)
Ending balance . . . . . . . . . . . . . . . . . . . . . . . . . . . . . . . . . . . . . . . . . . $ 5,283 $ 4,752 $ 5,524
Retained earnings:Beginning balance. . . . . . . . . . . . . . . . . . . . . . . . . . . . . . . . . . . . . . . . $565,136 $481,726 $425,568Net earnings . . . . . . . . . . . . . . . . . . . . . . . . . . . . . . . . . . . . . . . . . . . . 121,880 98,157 69,900Impact of implementing FIN 48. . . . . . . . . . . . . . . . . . . . . . . . . . . . . . (7,702) — —Cash dividends — $0.235, $0.215 and $0.20 per common share,
respectively . . . . . . . . . . . . . . . . . . . . . . . . . . . . . . . . . . . . . . . . . . . (15,872) (14,747) (13,742)
Ending balance . . . . . . . . . . . . . . . . . . . . . . . . . . . . . . . . . . . . . . . . . . $663,442 $565,136 $481,726
Treasury stock:Beginning balance. . . . . . . . . . . . . . . . . . . . . . . . . . . . . . . . . . . . . . . . $ 92,462 $ 47,722 $ 29,963Purchases of treasury stock . . . . . . . . . . . . . . . . . . . . . . . . . . . . . . . . . 39,801 50,952 22,820Sales of treasury stock . . . . . . . . . . . . . . . . . . . . . . . . . . . . . . . . . . . . (9,323) (5,900) (5,061)Deferred compensation transfer . . . . . . . . . . . . . . . . . . . . . . . . . . . . . . (181) (312) —
Ending balance . . . . . . . . . . . . . . . . . . . . . . . . . . . . . . . . . . . . . . . . . . $122,759 $ 92,462 $ 47,722
Treasury stock held for deferred compensation:Beginning balance. . . . . . . . . . . . . . . . . . . . . . . . . . . . . . . . . . . . . . . . $ 4,752 $ 5,524 $ 5,402Deferred compensation transfer . . . . . . . . . . . . . . . . . . . . . . . . . . . . . . 745 1,875 —Stock distributions . . . . . . . . . . . . . . . . . . . . . . . . . . . . . . . . . . . . . . . (310) (2,778) (43)Automatic dividend reinvestment . . . . . . . . . . . . . . . . . . . . . . . . . . . . . 96 131 165
Ending balance . . . . . . . . . . . . . . . . . . . . . . . . . . . . . . . . . . . . . . . . . . $ 5,283 $ 4,752 $ 5,524
See accompanying Notes to Consolidated Financial Statements.
50
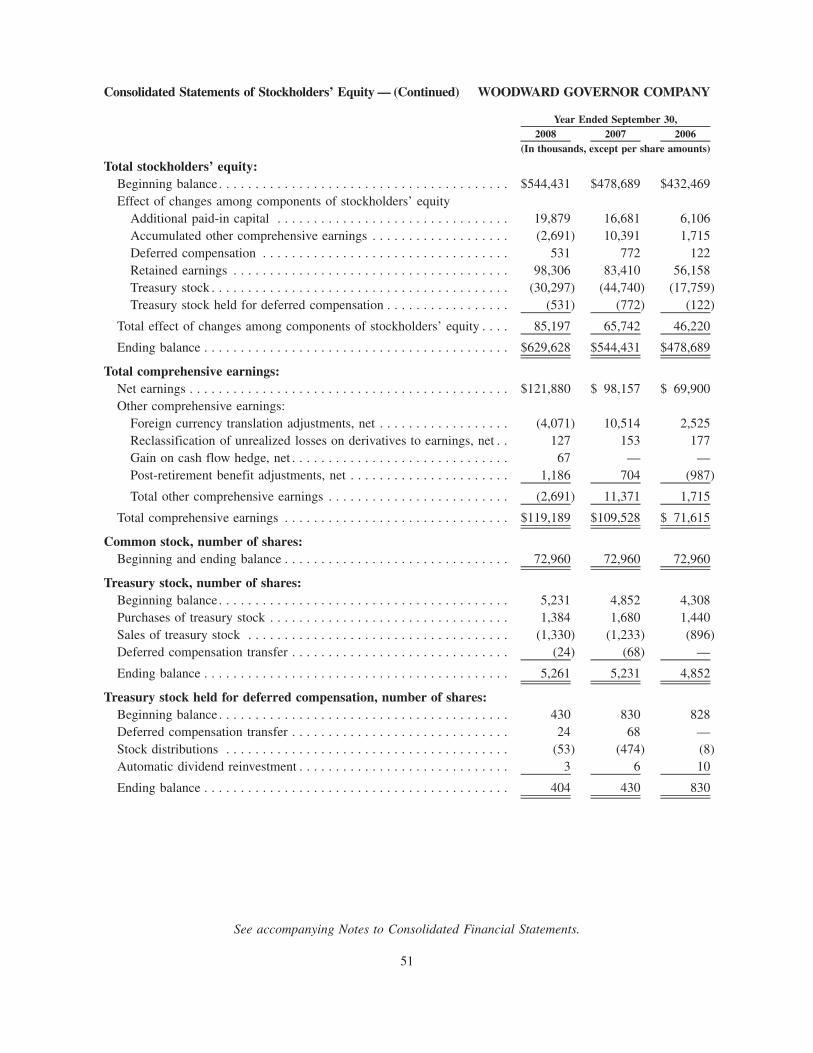
Consolidated Statements of Stockholders’ Equity — (Continued) WOODWARD GOVERNOR COMPANY
2008 2007 2006Year Ended September 30,
(In thousands, except per share amounts)
Total stockholders’ equity:Beginning balance. . . . . . . . . . . . . . . . . . . . . . . . . . . . . . . . . . . . . . . . $544,431 $478,689 $432,469Effect of changes among components of stockholders’ equity
Additional paid-in capital . . . . . . . . . . . . . . . . . . . . . . . . . . . . . . . . 19,879 16,681 6,106Accumulated other comprehensive earnings . . . . . . . . . . . . . . . . . . . (2,691) 10,391 1,715Deferred compensation . . . . . . . . . . . . . . . . . . . . . . . . . . . . . . . . . . 531 772 122Retained earnings . . . . . . . . . . . . . . . . . . . . . . . . . . . . . . . . . . . . . . 98,306 83,410 56,158Treasury stock . . . . . . . . . . . . . . . . . . . . . . . . . . . . . . . . . . . . . . . . . (30,297) (44,740) (17,759)Treasury stock held for deferred compensation . . . . . . . . . . . . . . . . . (531) (772) (122)
Total effect of changes among components of stockholders’ equity . . . . 85,197 65,742 46,220
Ending balance . . . . . . . . . . . . . . . . . . . . . . . . . . . . . . . . . . . . . . . . . . $629,628 $544,431 $478,689
Total comprehensive earnings:Net earnings . . . . . . . . . . . . . . . . . . . . . . . . . . . . . . . . . . . . . . . . . . . . $121,880 $ 98,157 $ 69,900Other comprehensive earnings:
Foreign currency translation adjustments, net . . . . . . . . . . . . . . . . . . (4,071) 10,514 2,525Reclassification of unrealized losses on derivatives to earnings, net . . 127 153 177Gain on cash flow hedge, net . . . . . . . . . . . . . . . . . . . . . . . . . . . . . . 67 — —Post-retirement benefit adjustments, net . . . . . . . . . . . . . . . . . . . . . . 1,186 704 (987)
Total other comprehensive earnings . . . . . . . . . . . . . . . . . . . . . . . . . (2,691) 11,371 1,715
Total comprehensive earnings . . . . . . . . . . . . . . . . . . . . . . . . . . . . . . . $119,189 $109,528 $ 71,615
Common stock, number of shares:Beginning and ending balance . . . . . . . . . . . . . . . . . . . . . . . . . . . . . . . 72,960 72,960 72,960
Treasury stock, number of shares:Beginning balance. . . . . . . . . . . . . . . . . . . . . . . . . . . . . . . . . . . . . . . . 5,231 4,852 4,308Purchases of treasury stock . . . . . . . . . . . . . . . . . . . . . . . . . . . . . . . . . 1,384 1,680 1,440Sales of treasury stock . . . . . . . . . . . . . . . . . . . . . . . . . . . . . . . . . . . . (1,330) (1,233) (896)Deferred compensation transfer . . . . . . . . . . . . . . . . . . . . . . . . . . . . . . (24) (68) —
Ending balance . . . . . . . . . . . . . . . . . . . . . . . . . . . . . . . . . . . . . . . . . . 5,261 5,231 4,852
Treasury stock held for deferred compensation, number of shares:Beginning balance. . . . . . . . . . . . . . . . . . . . . . . . . . . . . . . . . . . . . . . . 430 830 828Deferred compensation transfer . . . . . . . . . . . . . . . . . . . . . . . . . . . . . . 24 68 —Stock distributions . . . . . . . . . . . . . . . . . . . . . . . . . . . . . . . . . . . . . . . (53) (474) (8)Automatic dividend reinvestment . . . . . . . . . . . . . . . . . . . . . . . . . . . . . 3 6 10
Ending balance . . . . . . . . . . . . . . . . . . . . . . . . . . . . . . . . . . . . . . . . . . 404 430 830
See accompanying Notes to Consolidated Financial Statements.
51
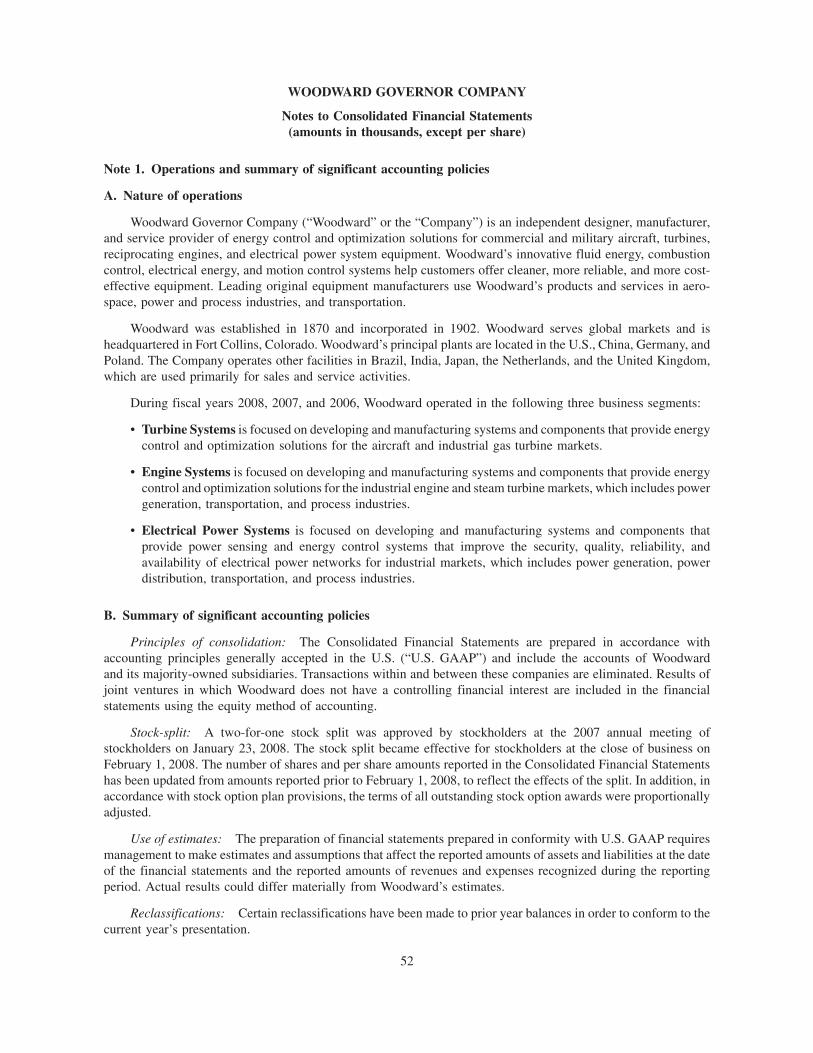
WOODWARD GOVERNOR COMPANY
Notes to Consolidated Financial Statements(amounts in thousands, except per share)
Note 1. Operations and summary of significant accounting policies
A. Nature of operations
Woodward Governor Company (“Woodward” or the “Company”) is an independent designer, manufacturer,and service provider of energy control and optimization solutions for commercial and military aircraft, turbines,reciprocating engines, and electrical power system equipment. Woodward’s innovative fluid energy, combustioncontrol, electrical energy, and motion control systems help customers offer cleaner, more reliable, and more cost-effective equipment. Leading original equipment manufacturers use Woodward’s products and services in aero-space, power and process industries, and transportation.
Woodward was established in 1870 and incorporated in 1902. Woodward serves global markets and isheadquartered in Fort Collins, Colorado. Woodward’s principal plants are located in the U.S., China, Germany, andPoland. The Company operates other facilities in Brazil, India, Japan, the Netherlands, and the United Kingdom,which are used primarily for sales and service activities.
During fiscal years 2008, 2007, and 2006, Woodward operated in the following three business segments:
• Turbine Systems is focused on developing and manufacturing systems and components that provide energycontrol and optimization solutions for the aircraft and industrial gas turbine markets.
• Engine Systems is focused on developing and manufacturing systems and components that provide energycontrol and optimization solutions for the industrial engine and steam turbine markets, which includes powergeneration, transportation, and process industries.
• Electrical Power Systems is focused on developing and manufacturing systems and components thatprovide power sensing and energy control systems that improve the security, quality, reliability, andavailability of electrical power networks for industrial markets, which includes power generation, powerdistribution, transportation, and process industries.
B. Summary of significant accounting policies
Principles of consolidation: The Consolidated Financial Statements are prepared in accordance withaccounting principles generally accepted in the U.S. (“U.S. GAAP”) and include the accounts of Woodwardand its majority-owned subsidiaries. Transactions within and between these companies are eliminated. Results ofjoint ventures in which Woodward does not have a controlling financial interest are included in the financialstatements using the equity method of accounting.
Stock-split: A two-for-one stock split was approved by stockholders at the 2007 annual meeting ofstockholders on January 23, 2008. The stock split became effective for stockholders at the close of business onFebruary 1, 2008. The number of shares and per share amounts reported in the Consolidated Financial Statementshas been updated from amounts reported prior to February 1, 2008, to reflect the effects of the split. In addition, inaccordance with stock option plan provisions, the terms of all outstanding stock option awards were proportionallyadjusted.
Use of estimates: The preparation of financial statements prepared in conformity with U.S. GAAP requiresmanagement to make estimates and assumptions that affect the reported amounts of assets and liabilities at the dateof the financial statements and the reported amounts of revenues and expenses recognized during the reportingperiod. Actual results could differ materially from Woodward’s estimates.
Reclassifications: Certain reclassifications have been made to prior year balances in order to conform to thecurrent year’s presentation.
52
Foreign currency: The assets and liabilities of substantially all subsidiaries outside the U.S. are translated atyear-end rates of exchange, and earnings and cash flow statements are translated at weighted-average rates ofexchange. Translation adjustments are accumulated with other comprehensive earnings as a separate component ofstockholders’ equity and are presented net of tax effects in the Consolidated Statements of Stockholders’ Equity.The effects of changes in exchange rates on loans between consolidated subsidiaries that are not expected to berepaid in the foreseeable future are also accumulated with other comprehensive earnings.
The Company is exposed to market risks related to fluctuations in foreign exchange rates because some salestransactions, and the assets and liabilities of its domestic and foreign subsidiaries, are denominated in foreigncurrencies. Selling, general, and administrative expenses include net foreign currency transaction losses of $1,454in 2008, $249 in 2007 and $903 in 2006.
Revenue recognition: The provisions of Staff Accounting Bulletin No. 104 and all other related interpre-tations have been applied. Sales are generally recognized when delivery of product has occurred or services havebeen rendered and there is persuasive evidence of a sales arrangement, selling prices are fixed or determinable, andcollectability from the customer is reasonably assured. Revenue from sales arrangements with multiple deliverablesare recognized when there is pervasive evidence of a sales arrangement for each individual deliverable.
Product delivery is generally considered to have occurred when the customer has taken title and assumed therisks and rewards of ownership of the products. In countries whose laws provide for retention of some form of titleby sellers enabling recovery of goods in the event of customer default on payment, product delivery is considered tohave occurred when the customer has assumed the risks and rewards of ownership of the products. Most of the salesare made directly to customers that use Woodward products, although products are also sold to distributors, dealers,and independent service facilities. Sales terms for distributors, dealers, and independent service facilities aresubstantially similar to Woodward’s sales terms for direct customers.
Customer Rebates: Woodward sometimes agrees to make rebate payments to customers related to antic-ipated sales activity. Payments made to customers are accounted for as a reduction of revenue unless they are madein exchange for identifiable goods or services with fair values that can be reasonably estimated. These reductions inrevenues are recognized immediately to the extent that the payments cannot be attributed to anticipated future sales,and are recognized in future periods to the extent that the payments relate to future sales, based on the specific factsand circumstances underlying each payment. Payments that are probable and can be reasonably estimated areaccrued at expected rates based on anticipated sale activity.
Stock-based compensation: The provisions of Statement of Financial Accounting Standards (“SFAS”)No. 123R, “Share-Based Payment” (“SFAS 123R”) requiring that compensation cost relating to stock-basedpayment awards made to employees and directors be recognized in the financial statements have been applied. Non-qualified stock option awards are issued under Woodward’s stock-based compensation plans. The cost for suchawards is measured at the grant date based on the fair value of the award. Historical company information is theprimary basis for selection of the expected term, expected volatility, and expected dividend yield assumptions usedto estimate the fair value of the options on the date of grant.
The portion of the award that is ultimately expected to vest is recognized as expense over the requisite serviceperiods, which is generally the vesting period of the awards.
SFAS 123R requires forfeitures to be estimated at the time of the grant in order to estimate the portion of theaward that will ultimately vest. The estimate is based on Woodward’s historical rates of forfeitures and is updatedperiodically.
Research and development costs: Expenditures related to new product development activities are expensedwhen incurred and are separately reported in the Consolidated Statements of Earnings.
53
WOODWARD GOVERNOR COMPANY
Notes to Consolidated Financial Statements — (Continued)(amounts in thousands, except per share)
Income taxes: Deferred income taxes are provided for the temporary differences between the financialreporting basis and the tax basis of Woodward’s assets and liabilities. Woodward provides for taxes that may bepayable if undistributed earnings of overseas subsidiaries were to be remitted to the U.S., except for those earningsthat it considers to be permanently reinvested.
Cash equivalents: Highly liquid investments purchased with an original maturity of three months or less areconsidered to be cash equivalents.
Cash and cash equivalents are maintained with several financial institutions. Generally, these deposits may beredeemed upon demand and are maintained with financial institutions with reputable credit and therefore bearminimal credit risk. Woodward holds cash and cash equivalents at financial institutions in excess of amountscovered by federal depository insurance.
Accounts receivable: Virtually all Woodward’s sales are made on credit and result in accounts receivable,which are recorded at the amount invoiced. In the normal course of business, not all accounts receivable arecollected and, therefore, an allowance for losses of accounts receivable is provided equal to the amount thatWoodward believes ultimately will not be collected. Customer-specific information is considered related todelinquent accounts, past loss experience, and current economic conditions in establishing the amount of itsallowance. Accounts receivable losses are deducted from the allowance and the related accounts receivablebalances are written off when the receivables are deemed uncollectible. Recoveries of accounts receivablepreviously written off are recognized when received.
Inventories: Inventories are valued at the lower of cost or market, with cost being determined on a first-in,first-out basis. Component parts include items that can be sold separately as finished goods or included in themanufacture of other products.
Property, plant, and equipment: Property, plant, and equipment are recorded at cost and are depreciated overthe estimated useful lives of the assets, ranging from five to 40 years for buildings and improvements and three tofifteen years for machinery and equipment. Assets are depreciated using the straight-line method. Assets are testedfor recoverability whenever events or circumstances indicate the carrying value may not be recoverable.
Purchase Accounting: The provisions of SFAS No. 141, “Business Combinations” and related interpreta-tions have been applied. Business combinations are accounted for using the purchase method of accounting. Underthe purchase method, assets and liabilities are recorded at their fair values as of the acquisition date, includingintangible assets. Acquisition costs in excess of amounts assigned to assets acquired and liabilities assumed arerecorded as goodwill.
Goodwill: Woodward tests goodwill on the reporting unit level on an annual basis and more often if an eventoccurs or circumstances change that would more likely than not reduce the fair value of a reporting unit below itscarrying amount. The impairment test consist of comparing the fair value of the reporting unit, determined usingdiscounted cash flows, with its carrying amount including goodwill, and, if the carrying amount of the reporting unitexceeds its fair value, comparing the implied value of goodwill with its carrying amount. If the carrying amount ofgoodwill exceeds the implied fair value of goodwill, an impairment loss would be recognized to reduce the carryingamount to its implied fair value. There was no impairment charge recorded in fiscal 2008, fiscal 2007, or fiscal 2006.
Other intangibles: Other intangibles are recognized apart from goodwill whenever an acquired intangibleasset arises from contractual or other legal rights, or whenever it is capable of being separated or divided from theacquired entity and sold, transferred, licensed, rented, or exchanged, either individually or in combination with arelated contract, asset, or liability. All of Woodward’s intangibles have an estimated useful life and are beingamortized. Impairment losses are recognized if the carrying amount of an intangible exceeds its fair value.
54
WOODWARD GOVERNOR COMPANY
Notes to Consolidated Financial Statements — (Continued)(amounts in thousands, except per share)
Estimated lives over which intangible assets are amortized, on a straight line basis, at September 30, 2008 wereas follows:
Customer relationships . . . . . . . . . . . . . . . . . . . . . . . . . . . . . . . . . . . . . . . . . . . . . . . 10 - 30 yearsIntellectual property . . . . . . . . . . . . . . . . . . . . . . . . . . . . . . . . . . . . . . . . . . . . . . . . . 15 yearsProcess technology . . . . . . . . . . . . . . . . . . . . . . . . . . . . . . . . . . . . . . . . . . . . . . . . . . 8 - 30 yearsPatents . . . . . . . . . . . . . . . . . . . . . . . . . . . . . . . . . . . . . . . . . . . . . . . . . . . . . . . . . . . 10 - 14 yearsOther intangibles . . . . . . . . . . . . . . . . . . . . . . . . . . . . . . . . . . . . . . . . . . . . . . . . . . . 15 years
Deferred compensation: Deferred compensation obligations will be settled either by delivery of a fixednumber of shares of Woodward’s common stock (in accordance with certain eligible members’ irrevocableelections) or in cash. Woodward has contributed shares of its common stock into a trust established for the futuresettlement of deferred compensation obligations that are payable in shares of Woodward’s common stock. Commonstock held by the trust is reflected in the Consolidated Balance Sheet as treasury stock held for deferredcompensation and the related deferred compensation obligation is reflected as a separate component of equityin amounts equal to the fair value of the common stock at the dates of contribution. These accounts are not adjustedfor subsequent changes in fair value of the common stock. Deferred compensation obligations that will be settled incash are accounted for on an accrual basis in accordance with the terms of the underlying contract and are reflectedin the Consolidated Balance Sheet as an accrued liability.
Investments: Woodward holds marketable equity securities related to its deferred compensation program. Inaccordance with SFAS No. 115, “Accounting for Certain Investments in Debt and Equity Securities” and based onWoodward’s intentions regarding these instruments, marketable equity securities are classified as trading securities.The trading securities are reported at fair value, with realized gains and losses recognized in earnings. The tradingsecurities are included in “Other current assets.” The associated obligation to provide benefits is included in “Otherliabilities.”
Derivatives: The Company is exposed to various market risks that arise from transactions entered into in thenormal course of business. The Company utilizes derivative instruments such as treasury lock agreements to lock infixed rates on future debt issuances that qualify as cash flow or fair value hedges to mitigate the risk of variability incash flows related to future interest payments attributable to changes in the designated benchmark rate. TheCompany complies with SFAS Nos. 133, 137, 138 and 149 (collectively “SFAS 133”) pertaining to the accountingfor these derivatives and hedging activities which require all such interest rate hedge instruments to be recorded onthe balance sheet at fair value. Cash flows related to the instrument designated as a qualifying hedge are reflected inthe accompanying Consolidated Statements of Cash Flows in the same categories as the cash flows from the itemsbeing hedged. Accordingly, cash flows relating to the settlement of interest rate derivatives hedging the forecastedissuance of debt have been reflected upon settlement as a component of financing cash flows. The resulting gain orloss from such settlement is deferred to other comprehensive income and reclassified to interest expense over theterm of the underlying debt. This reclassification of the deferred gains and losses impacts the interest expenserecognized on the underlying debt that was hedged and is therefore reflected as a component of operating cash flowsin periods subsequent to settlement. The periodic settlement of interest rate derivatives hedging outstandingvariable rate debt is recorded as an adjustment to interest expense and is therefore reflected as a component ofoperating cash flows.
Post-retirement benefits: The Company provides various benefits to certain employees through definedbenefit plans and retirement healthcare benefit plans. For financial reporting purposes, net periodic benefits expenseand related obligations are calculated using a number of significant actuarial assumptions. Changes in net periodicexpense may occur in the future due to changes in these assumptions.
55
WOODWARD GOVERNOR COMPANY
Notes to Consolidated Financial Statements — (Continued)(amounts in thousands, except per share)

The weighted average actuarial assumptions used in measuring the net periodic benefit cost and planobligations of retirement pension benefits were as follows:
2008 2007 2006 2008 2007 2006United States Other Countries
Year Ended September 30,
Weighted-average assumptions used to determine benefitobligation at September 30:
Discount rate . . . . . . . . . . . . . . . . . . . . . . . . . . . . . . . . . . . . . . 6.5% 6.1% 5.6% 4.7% 4.8% 4.4%Rate of compensation increase . . . . . . . . . . . . . . . . . . . . . . . . . . N/A N/A 4.5 3.7 3.8 3.4Weighted-average assumptions used to determine net periodic
benefit cost for years ended September 30:Discount rate . . . . . . . . . . . . . . . . . . . . . . . . . . . . . . . . . . . . . . 6.1 5.6 5.3 5.7 4.4 4.1Rate of compensation increase . . . . . . . . . . . . . . . . . . . . . . . . . . N/A N/A 4.5 3.7 3.8 3.2Long-term rate of return on plan assets . . . . . . . . . . . . . . . . . . . . 7.5 8.0 8.0 5.6 5.8 5.6
The discount rate assumption is intended to reflect the rate at which the retirement benefits could be effectivelysettled based upon the assumed timing of the benefit payments. In the U.S., Woodward used a bond portfoliomatching analysis based on recently traded, non-callable bonds rated AA- or better by Standard & Poors, whichhave at least $25.0 million outstanding. In the United Kingdom, Woodward used the AA corporate bond index(applicable for bonds over 15 years) and government bond yields (for bonds over 15 years) to determine a blendedrate to use as the benchmark. In Japan, Woodward used AA-rated corporate bond yields (for bonds of 12.5 years) asthe benchmark. Woodward’s assumed rates do not differ significantly from any of these benchmarks.
The investment objectives for the pension plan assets are designed to generate returns that will enable thepension plans to meet their future obligations. The precise amount for which these obligations will be settleddepends on future events, including the life expectancy of the plan participants. These obligations are estimatedusing actuarial assumptions, based on the current economic environment. The strategy balances the requirements togenerate returns, using the higher-returning assets such as equity securities with the need to control risk in thepension plan with less volatile assets, such as fixed-income securities. Risks include, among others, the likelihoodof the pension plans becoming underfunded, thereby increasing their dependence on contributions from Woodward.The assets are managed by professional investment firms and performance is evaluated against specific bench-marks. In the U.S., assets are primarily invested in broadly diversified passive vehicles.
The weighted average actuarial assumptions used in measuring the net periodic benefit cost and planobligations of retirement healthcare benefits follows:
2008 2007 2006
Year EndedSeptember 30,
Weighted-average discount rate assumptions used to determine benefit obligation atSeptember 30 . . . . . . . . . . . . . . . . . . . . . . . . . . . . . . . . . . . . . . . . . . . . . . . . . . . . . 6.5% 6.1% 5.6%
Weighted-average discount rate assumptions used to determine net periodic benefit costfor years ended September 30 . . . . . . . . . . . . . . . . . . . . . . . . . . . . . . . . . . . . . . . . . 6.1% 5.6% 5.3%
The discount rate assumption is intended to reflect the rate at which the retirement benefits could be effectivelysettled based upon the assumed timing of the benefit payments. In the U.S., Woodward used a bond portfoliomatching analysis based on recently traded, non-callable bonds rated AA- or better by Standard & Poors, whichhave at least $25.0 million outstanding. In the United Kingdom, Woodward used the AA corporate bond index(applicable for bonds over 15 years) and government bond yields (for bonds over 15 years) to determine a blendedrate to use as the benchmark. Woodward’s assumed rates do not differ significantly from any of these benchmarks.
56
WOODWARD GOVERNOR COMPANY
Notes to Consolidated Financial Statements — (Continued)(amounts in thousands, except per share)
For retirement healthcare benefits, Woodward assumed net healthcare cost trend rates of 8.0% in 2009,decreasing gradually to 5.0% in 2011, and remaining at 5.0% thereafter. A 1.0% increase in assumed healthcare costtrend rates would have increased the total of the service and interest cost components by approximately $275 andincreased the benefit obligation at the end of the year by approximately $3,939 in 2008. Likewise, a 1.0% decreasein the assumed rates would have decreased the total of service and interest cost components by $240 and decreasedthe benefit obligation by approximately $3,411 in 2008.
Stockholders’ equity: In July 2006, the Board of Directors authorized the repurchase of up to $50,000 ofWoodward’s outstanding shares of common stock on the open market or in privately negotiated transactions over athree-year period (the “2006 Authorization”). During fiscal 2007, Woodward purchased $38,649 of its commonstock under the 2006 Authorization. The 2006 Authorization is closed.
In September 2007, the Board of Directors authorized a new stock repurchase of up to $200,000 ofWoodward’s outstanding shares of common stock on the open market or in privately negotiated transactions overa three-year period that will end in October 2010 (the “2007 Authorization”). During fiscal 2008, Woodwardpurchased a total of $31,925 of its common stock under the 2007 Authorization.
Advertising Costs: Woodward expenses all advertising costs as incurred and they are classified withinselling, general, and administrative expenses. Advertising costs were not material for all years presented.
Shipping and Handling Costs: Product freight costs are included in cost of goods sold.
Note 2. Recently adopted and issued but not yet effective accounting standards
A. Accounting changes and recently adopted accounting standards:
Income taxes
FIN 48: In July 2006, the Financial Accounting Standards Board (“FASB”) issued Financial InterpretationNo. 48, “Accounting for Uncertainty in Income Taxes-an interpretation of FASB Statement No. 109” (“FIN 48”)which provides guidance on the financial statement recognition, measurement, reporting, and disclosure ofuncertain tax positions taken or expected to be taken in a tax return. FIN 48 addresses the determination ofwhether tax benefits, either permanent or temporary, should be recorded in the financial statements. For those taxbenefits to be recognized, a tax position must be more-likely-than-not to be sustained upon examination by thetaxing authorities. The amount recognized is measured as the largest amount of benefit that is greater than 50%likely of being realized upon ultimate settlement.
Woodward adopted the provisions of FIN 48 on October 1, 2007, as required. The change in measurementcriteria caused Woodward to recognize a decrease in the retained earnings component of stockholders’ equity of$7,702. For additional information, see Note 4, “Income Taxes.”
B. Issued but not yet effective accounting standards:
SFAS 157: In September 2006, the FASB issued SFAS No. 157, “Fair Value Measurements” (“SFAS 157”),which defines fair value, establishes a framework for measuring fair value, and requires additional disclosures abouta Company’s financial assets and liabilities that are measured at fair value. SFAS 157 does not change existingguidance on whether or not an instrument is carried at fair value. SFAS 157 is effective for financial statementsissued for fiscal years beginning after November 15, 2007, and interim periods within those fiscal years. In February2008, the FASB issued FASB Staff Position (“FSP”) No. FAS 157-1, “Application of FASB Statement No. 157 toFASB Statement No. 13 and Other Accounting Pronouncements That Address Fair Value Measurements forPurposes of Lease Classification or Measurement under Statement 13” (“FSP FAS 157-1”) which excludesSFAS No. 13, “Accounting for Leases” and certain other accounting pronouncements that address fair valuemeasurements, from the scope of SFAS 157. In February 2008, the FASB issued FSP No. FAS 157-2, “Effective
57
WOODWARD GOVERNOR COMPANY
Notes to Consolidated Financial Statements — (Continued)(amounts in thousands, except per share)
Date of FASB Statement No. 157” (“FSP FAS 157-2”) which provides a one-year delayed application of SFAS 157for nonfinancial assets and liabilities, except for items that are recognized or disclosed at fair value in the financialstatements on a recurring basis (at least annually). Woodward is required to adopt SFAS 157 as amended by FSPFAS 157-1 and FSP FAS 157-2 on October 1, 2008, the beginning of fiscal 2009. The adoption is not expected tohave a material impact on the consolidated financial statements.
In October 2008, the FASB issued FSP No. FAS 157-3, “Determining the Fair Value of a Financial Asset in aMarket That Is Not Active” (“FSP FAS 157-3”), which clarifies the application of SFAS 157 when the market for afinancial asset is inactive. Specifically, FSP FAS 157-3 clarifies how (1) management’s internal assumptions shouldbe considered in measuring fair value when observable data are not present, (2) observable market information froman inactive market should be taken into account, and (3) the use of broker quotes or pricing services should beconsidered in assessing the relevance of observable and unobservable data to measure fair value. The guidance inFSP FAS 157-3 is effective immediately and will apply to the Company upon adoption of SFAS 157.
SFAS 159: In February 2007, the FASB issued SFAS No. 159, “The Fair Value Option for Financial Assetsand Financial Liabilities — Including an Amendment of FASB Statement No. 115” (“SFAS 159”). SFAS 159 isexpected to expand the use of fair value accounting but does not affect existing standards that require certain assetsor liabilities to be carried at fair value. The objective of SFAS 159 is to improve financial reporting by providingcompanies with the opportunity to mitigate volatility in reported earnings caused by measuring related assets andliabilities differently without having to apply complex hedge accounting provisions. Under SFAS 159, a companymay choose, at specified election dates, to measure eligible items at fair value and report unrealized gains and losseson items for which the fair value option has been elected in earnings at each subsequent reporting date. SFAS 159 iseffective for financial statements issued for fiscal years beginning after November 15, 2007, and interim periodswithin those fiscal years. As a result, SFAS 159 is effective for Woodward in the first quarter of fiscal 2009.Woodward does not plan to apply SFAS 159.
EITF 07-3: In June 2007, the Emerging Issues Task Force (“EITF”) issued EITF 07-3, “Accounting forNonrefundable Advance Payments for Goods or Services to Be Used in Future Research and DevelopmentActivities” (“EITF 07-3”). EITF 07-3 addresses the diversity that exists with respect to the accounting for the non-refundable portion of a payment made by a research and development entity for future research and developmentactivities. The EITF concluded that an entity must defer and capitalize non-refundable advance payments made forresearch and development activities, and expense these amounts as the related goods are delivered or the relatedservices are performed. EITF 07-3 is effective for interim or annual reporting periods in fiscal years beginning afterDecember 15, 2007 (fiscal 2009 for Woodward). Woodward does not expect the adoption of EITF 07-03 to have amaterial impact on its consolidated financial statements.
EITF 07-1: In November 2007, the EITF issued EITF 07-1, “Accounting for Collaborative Arrangements”(“EITF 07-1”). EITF 07-1, which will be applied retrospectively, requires expanded disclosures for contractualarrangements with third parties that involve joint operating activities and may require reclassifications to previouslyissued financial statements. EITF 07-1 is effective for interim or annual reporting periods beginning afterDecember 15, 2008 (fiscal 2010 for Woodward). Woodward is currently evaluating the impact EITF 07-1 mayhave on consolidated financial statements.
SFAS 141(R): In December 2007, the FASB issued SFAS No. 141 (Revised) “Business Combinations”(“SFAS 141(R)”). SFAS 141(R) is intended to improve, simplify, and converge internationally the accounting forbusiness combinations. Under SFAS 141(R), an acquiring entity in a business combination must recognize theassets acquired, liabilities assumed, and any noncontrolling interest in the acquired entity at the acquisition date fairvalues, with limited exceptions. In addition, SFAS 141(R) requires the acquirer to disclose all information thatinvestors and other users need to evaluate and understand the nature and financial impact of the businesscombination. SFAS 141(R) applies prospectively to business combinations for which the acquisition date is onor after the beginning of the first annual reporting period on or after December 15, 2008. Earlier adoption is
58
WOODWARD GOVERNOR COMPANY
Notes to Consolidated Financial Statements — (Continued)(amounts in thousands, except per share)
prohibited. Accordingly, Woodward will record and disclose business combinations under the revised standardbeginning October 1, 2009.
SFAS 160: In December 2007, the FASB issued SFAS No. 160, “Noncontrolling Interests in ConsolidatedFinancial Statements — an Amendment of Accounting Research Bulletin (“ARB”) 51,” (“SFAS 160”). Thisstatement amends ARB 51 to establish accounting and reporting standards for the noncontrolling interest (minorityinterest) in a subsidiary and for the deconsolidation of a subsidiary. SFAS 160 establishes accounting and reportingstandards that require (i) noncontrolling interests to be reported as a component of equity, (ii) changes in a parent’sownership interest while the parent retains its controlling interest be accounted for as equity transactions, and(iii) any retained noncontrolling equity investment upon the deconsolidation of a subsidiary be initially measured atfair value. SFAS 160 is to be applied prospectively to business combinations consummated on or after the beginningof the first annual reporting period on or after December 15, 2008. SFAS 160 is effective for fiscal years beginningafter December 15, 2008. As a result, SFAS 160 is effective for Woodward in the first quarter of fiscal 2010.Woodward is currently evaluating the impact SFAS 160 may have on its consolidated financial statements.
SFAS 161: In March 2008, the FASB issued SFAS No. 161, “Disclosures About Derivative Instruments andHedging Activities” (“SFAS 161”). SFAS 161 is intended to improve financial reporting about derivativeinstruments and hedging activities by requiring enhanced disclosures to enable investors to better understandtheir effects on an entity’s financial position, financial performance, and cash flows. The new standard is effectivefor financial statements issued for fiscal years and interim periods beginning after November 15, 2008 (fiscal 2010for Woodward). Woodward is currently assessing the impact that SFAS 161 may have on its consolidated financialstatements.
FSP FAS 142-3: In April 2008, the FASB issued FSP No. FAS 142-3, “Determination of the Useful Life ofIntangible Assets” (“FSP FAS 142-3”), which improves the consistency of the useful life of a recognized intangibleasset among various pronouncements. FSP FAS 142-3 is effective for fiscal years beginning after December 15,2008 (fiscal 2010 for Woodward). Woodward is currently assessing the impact that FSP FAS 142-3 may have on itsconsolidated financial statements.
SFAS 162: In May 2008, the FASB issued SFAS No. 162, “The Hierarchy of Generally AcceptedAccounting Principles” (“SFAS 162”). The new standard is intended to improve financial reporting by identifyinga consistent framework, or hierarchy, for selecting accounting principles to be used in preparing financialstatements that are presented in conformity with U.S. GAAP for nongovernmental entities. The new standardis effective 60 days following the Security and Exchange Commission’s approval of the Public CompanyAccounting Oversight Board amendments to AU Section 411, “The Meaning of Present Fairly in Conformitywith Generally Accepted Accounting Principles.” Woodward is currently assessing the impact that SFAS 162 mayhave on its consolidated financial statements.
FSP EITF 03-6-1: In June 2008, the FASB issued FASB Staff Position No. EITF 03-6-1, “DeterminingWhether Instruments Granted in Share-Based Payment Transactions are Participating Securities” (“FSPEITF 03-6-1”). The FSP addresses whether instruments granted in stock-based payment transactions are partic-ipating securities prior to vesting and, therefore, need to be included in the earnings allocation in computingearnings per share under the two-class method described in paragraphs 60 and 61 of SFAS No. 128, “Earnings PerShare.” The new FSP is effective for financial statements issued for fiscal years beginning after December 15, 2008and interim periods within those years (fiscal 2010 for Woodward). Early application is not permitted. Woodward’sunvested options are not eligible to receive dividends; therefore, FSP EITF 03-06-1 will not have any impact on itsconsolidated financial statements.
FSP SFAS 133-1: In September 2008, the FASB issued FSP No. FAS 133-1 “Disclosures about CreditDerivatives and Certain Guarantees: An Amendment of FASB Statement No. 133 (“FSP FAS 133-1”) and FASBInterpretation No. 45; and Clarification of the Effective Date of FASB Statement No. 161”. This FSP amends
59
WOODWARD GOVERNOR COMPANY
Notes to Consolidated Financial Statements — (Continued)(amounts in thousands, except per share)
SFAS No. 133 to require disclosures by sellers of credit derivatives, including credit derivatives embedded in ahybrid instrument. This FSP also amends FIN No. 45 to require an additional disclosure about the current status ofthe payment/performance risk of a guarantee. Further, this FSP clarifies the FASB’s intent about the effective date ofSFAS No. 161. This FSP is effective for fiscal years ending after November 15, 2008. Woodward expects to adoptthis FSP for periods ending on and after December 31, 2008. Woodward is currently assessing the impact that FSPNo. FAS 133-1 may have on its consolidated financial statements.
Note 3. Business acquisitions
On October 31, 2006, Woodward acquired 100 percent of the stock of Schaltanlagen-Elektronik-GerateGmbH & Co. KG (“SEG”), and a related receivable from SEG that was held by one of the sellers, for $35,289,including $10,319 of assumed debt obligations. The transaction was financed with available cash. The acquisitionprovides Woodward with technologies and products that complement its power generation system solutions.Headquartered in Kempen, Germany, SEG designs and manufactures a wide range of protection and comprehensivecontrol systems for power generation and distribution applications, power inverters for wind turbines, and completeelectrical systems for gas and diesel engine based power stations.
As part of the acquisition, Woodward implemented a plan to exit from a project-based segment of the business.Costs related to exiting this line of business have been accrued as business termination costs, including involuntaryemployee termination benefits and relocation costs. Due to changes in the market, Woodward no longer expects toexit from the project-based segment of the business. Woodward estimates that the implementation of the remainingrestructuring to this business will be completed in fiscal year 2009.
Accrued termination costs, October 1, 2006 . . . . . . . . . . . . . . . . . . . . . . . . . . . . . . . . . . . . $1,753Payments . . . . . . . . . . . . . . . . . . . . . . . . . . . . . . . . . . . . . . . . . . . . . . . . . . . . . . . . . . . . . . (448)Foreign currency translation . . . . . . . . . . . . . . . . . . . . . . . . . . . . . . . . . . . . . . . . . . . . . . . . 218
Accrued termination costs, September 30, 2007 . . . . . . . . . . . . . . . . . . . . . . . . . . . . . . . . . 1,523Payments . . . . . . . . . . . . . . . . . . . . . . . . . . . . . . . . . . . . . . . . . . . . . . . . . . . . . . . . . . . . . . (128)Changes in estimates . . . . . . . . . . . . . . . . . . . . . . . . . . . . . . . . . . . . . . . . . . . . . . . . . . . . . (599)Foreign currency translation . . . . . . . . . . . . . . . . . . . . . . . . . . . . . . . . . . . . . . . . . . . . . . . . 5
Accrued termination costs, September 30, 2008 . . . . . . . . . . . . . . . . . . . . . . . . . . . . . . . . . $ 801
The results of SEG’s operations are included in Woodward’s Consolidated Statements of Earnings from thebeginning of November 2006. If the acquisition had been completed on October 1, 2006, Woodward’s net sales andnet earnings for the fiscal year ended September 30, 2007 would not have been materially different from amountsreported in the Consolidated Statements of Earnings.
Note 4. Income taxes
Income taxes consisted of the following:Year Ended September 30, 2008 2007 2006
Current:Federal . . . . . . . . . . . . . . . . . . . . . . . . . . . . . . . . . . . . . . . . . . . $26,689 $ 6,204 $ 21,117State. . . . . . . . . . . . . . . . . . . . . . . . . . . . . . . . . . . . . . . . . . . . . 4,080 3,416 3,223Foreign. . . . . . . . . . . . . . . . . . . . . . . . . . . . . . . . . . . . . . . . . . . 17,583 10,465 3,994
Deferred. . . . . . . . . . . . . . . . . . . . . . . . . . . . . . . . . . . . . . . . . . . . 11,678 13,746 (13,737)
$60,030 $33,831 $ 14,597
60
WOODWARD GOVERNOR COMPANY
Notes to Consolidated Financial Statements — (Continued)(amounts in thousands, except per share)
Earnings before income taxes by geographical area consisted of the following:
Year Ended September 30, 2008 2007 2006
United States . . . . . . . . . . . . . . . . . . . . . . . . . . . . . . . . . . . . . . . $ 96,934 $ 93,818 $70,037Germany . . . . . . . . . . . . . . . . . . . . . . . . . . . . . . . . . . . . . . . . . . 46,239 22,012 5,991Other countries . . . . . . . . . . . . . . . . . . . . . . . . . . . . . . . . . . . . . 38,737 16,158 8,469
$181,910 $131,988 $84,497
Deferred income taxes presented in the Consolidated Balance Sheets are related to the following:
At September 30, 2008 2007
Deferred tax assets:Retirement healthcare and early retirement benefits . . . . . . . . . . . . . . . . . . $ 14,528 $ 16,913Foreign net operating loss carryforwards . . . . . . . . . . . . . . . . . . . . . . . . . . 4,579 11,007Inventory . . . . . . . . . . . . . . . . . . . . . . . . . . . . . . . . . . . . . . . . . . . . . . . . . 14,828 14,491Other . . . . . . . . . . . . . . . . . . . . . . . . . . . . . . . . . . . . . . . . . . . . . . . . . . . . 20,637 23,744Valuation allowance . . . . . . . . . . . . . . . . . . . . . . . . . . . . . . . . . . . . . . . . . (129) (2,596)
Total deferred tax assets, net of valuation allowance . . . . . . . . . . . . . . . . . 54,443 63,559
Deferred tax liabilities:Intangibles — net . . . . . . . . . . . . . . . . . . . . . . . . . . . . . . . . . . . . . . . . . . . (33,354) (29,761)Other . . . . . . . . . . . . . . . . . . . . . . . . . . . . . . . . . . . . . . . . . . . . . . . . . . . . (17,266) (18,582)
Total deferred tax liabilities . . . . . . . . . . . . . . . . . . . . . . . . . . . . . . . . . . . . (50,620) (48,343)
Net deferred tax assets . . . . . . . . . . . . . . . . . . . . . . . . . . . . . . . . . . . . . . . . . $ 3,823 $ 15,216
The foreign net operating loss carryforwards as of September 30, 2008 may be carried forward indefinitely.
At September 30, 2008, Woodward has not provided for taxes on undistributed foreign earnings of $32,642that it considers permanently reinvested. These earnings could become subject to income taxes if they are remittedas dividends, are loaned to Woodward, or if it sells its stock in the subsidiaries. However, the Company believes thatforeign tax credits would largely offset any income tax that might otherwise be due.
The changes in the valuation allowance were as follows:
Year Ended September 30, 2008 2007 2006
Beginning balance . . . . . . . . . . . . . . . . . . . . . . . . . . . . . . . . . . . . . $(2,596) $(2,566) $(17,769)Change in valuation allowance that existed at the beginning of the
year . . . . . . . . . . . . . . . . . . . . . . . . . . . . . . . . . . . . . . . . . . . . . . 2,689 (116) 13,710Current activity related to deferred items . . . . . . . . . . . . . . . . . . . . (222) (302) —Foreign net operating loss carryforward . . . . . . . . . . . . . . . . . . . . . — 388 1,493
Ending balance . . . . . . . . . . . . . . . . . . . . . . . . . . . . . . . . . . . . . . . $ (129) $(2,596) $ (2,566)
Deferred tax assets are reduced by a valuation allowance if, based on the weight of available evidence, it ismore likely than not that some portion or all of the deferred tax assets will not be realized. Both positive andnegative evidence are considered in forming Woodward’s judgment as to whether a valuation allowance isappropriate, and more weight is given to evidence that can be objectively verified. Valuation allowances arereassessed whenever there are changes in circumstances that may cause a change in judgment. In fiscal 2008, 2007,
61
WOODWARD GOVERNOR COMPANY
Notes to Consolidated Financial Statements — (Continued)(amounts in thousands, except per share)
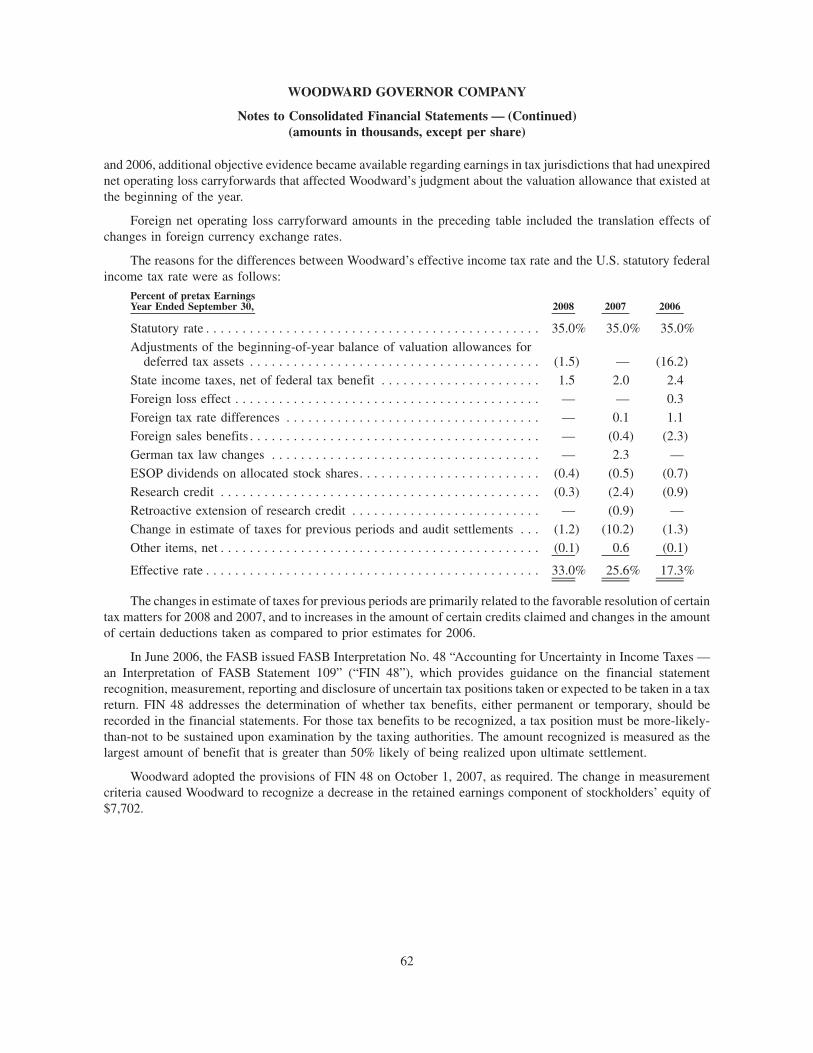
and 2006, additional objective evidence became available regarding earnings in tax jurisdictions that had unexpirednet operating loss carryforwards that affected Woodward’s judgment about the valuation allowance that existed atthe beginning of the year.
Foreign net operating loss carryforward amounts in the preceding table included the translation effects ofchanges in foreign currency exchange rates.
The reasons for the differences between Woodward’s effective income tax rate and the U.S. statutory federalincome tax rate were as follows:
Percent of pretax EarningsYear Ended September 30, 2008 2007 2006
Statutory rate . . . . . . . . . . . . . . . . . . . . . . . . . . . . . . . . . . . . . . . . . . . . . . 35.0% 35.0% 35.0%Adjustments of the beginning-of-year balance of valuation allowances for
deferred tax assets . . . . . . . . . . . . . . . . . . . . . . . . . . . . . . . . . . . . . . . . (1.5) — (16.2)State income taxes, net of federal tax benefit . . . . . . . . . . . . . . . . . . . . . . 1.5 2.0 2.4Foreign loss effect . . . . . . . . . . . . . . . . . . . . . . . . . . . . . . . . . . . . . . . . . . — — 0.3Foreign tax rate differences . . . . . . . . . . . . . . . . . . . . . . . . . . . . . . . . . . . — 0.1 1.1Foreign sales benefits . . . . . . . . . . . . . . . . . . . . . . . . . . . . . . . . . . . . . . . . — (0.4) (2.3)German tax law changes . . . . . . . . . . . . . . . . . . . . . . . . . . . . . . . . . . . . . — 2.3 —ESOP dividends on allocated stock shares. . . . . . . . . . . . . . . . . . . . . . . . . (0.4) (0.5) (0.7)Research credit . . . . . . . . . . . . . . . . . . . . . . . . . . . . . . . . . . . . . . . . . . . . (0.3) (2.4) (0.9)Retroactive extension of research credit . . . . . . . . . . . . . . . . . . . . . . . . . . — (0.9) —Change in estimate of taxes for previous periods and audit settlements . . . (1.2) (10.2) (1.3)Other items, net . . . . . . . . . . . . . . . . . . . . . . . . . . . . . . . . . . . . . . . . . . . . (0.1) 0.6 (0.1)
Effective rate . . . . . . . . . . . . . . . . . . . . . . . . . . . . . . . . . . . . . . . . . . . . . . 33.0% 25.6% 17.3%
The changes in estimate of taxes for previous periods are primarily related to the favorable resolution of certaintax matters for 2008 and 2007, and to increases in the amount of certain credits claimed and changes in the amountof certain deductions taken as compared to prior estimates for 2006.
In June 2006, the FASB issued FASB Interpretation No. 48 “Accounting for Uncertainty in Income Taxes —an Interpretation of FASB Statement 109” (“FIN 48”), which provides guidance on the financial statementrecognition, measurement, reporting and disclosure of uncertain tax positions taken or expected to be taken in a taxreturn. FIN 48 addresses the determination of whether tax benefits, either permanent or temporary, should berecorded in the financial statements. For those tax benefits to be recognized, a tax position must be more-likely-than-not to be sustained upon examination by the taxing authorities. The amount recognized is measured as thelargest amount of benefit that is greater than 50% likely of being realized upon ultimate settlement.
Woodward adopted the provisions of FIN 48 on October 1, 2007, as required. The change in measurementcriteria caused Woodward to recognize a decrease in the retained earnings component of stockholders’ equity of$7,702.
62
WOODWARD GOVERNOR COMPANY
Notes to Consolidated Financial Statements — (Continued)(amounts in thousands, except per share)
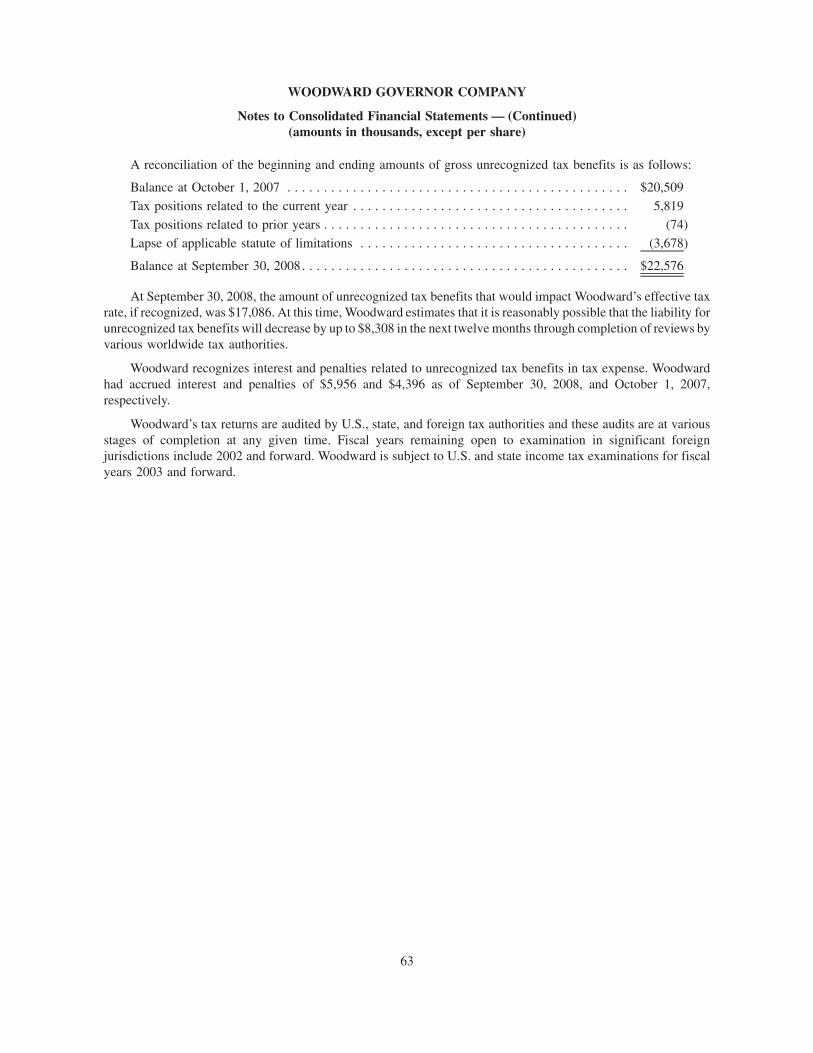
A reconciliation of the beginning and ending amounts of gross unrecognized tax benefits is as follows:
Balance at October 1, 2007 . . . . . . . . . . . . . . . . . . . . . . . . . . . . . . . . . . . . . . . . . . . . . . . $20,509Tax positions related to the current year . . . . . . . . . . . . . . . . . . . . . . . . . . . . . . . . . . . . . . 5,819Tax positions related to prior years . . . . . . . . . . . . . . . . . . . . . . . . . . . . . . . . . . . . . . . . . . (74)Lapse of applicable statute of limitations . . . . . . . . . . . . . . . . . . . . . . . . . . . . . . . . . . . . . (3,678)
Balance at September 30, 2008. . . . . . . . . . . . . . . . . . . . . . . . . . . . . . . . . . . . . . . . . . . . . $22,576
At September 30, 2008, the amount of unrecognized tax benefits that would impact Woodward’s effective taxrate, if recognized, was $17,086. At this time, Woodward estimates that it is reasonably possible that the liability forunrecognized tax benefits will decrease by up to $8,308 in the next twelve months through completion of reviews byvarious worldwide tax authorities.
Woodward recognizes interest and penalties related to unrecognized tax benefits in tax expense. Woodwardhad accrued interest and penalties of $5,956 and $4,396 as of September 30, 2008, and October 1, 2007,respectively.
Woodward’s tax returns are audited by U.S., state, and foreign tax authorities and these audits are at variousstages of completion at any given time. Fiscal years remaining open to examination in significant foreignjurisdictions include 2002 and forward. Woodward is subject to U.S. and state income tax examinations for fiscalyears 2003 and forward.
63
WOODWARD GOVERNOR COMPANY
Notes to Consolidated Financial Statements — (Continued)(amounts in thousands, except per share)
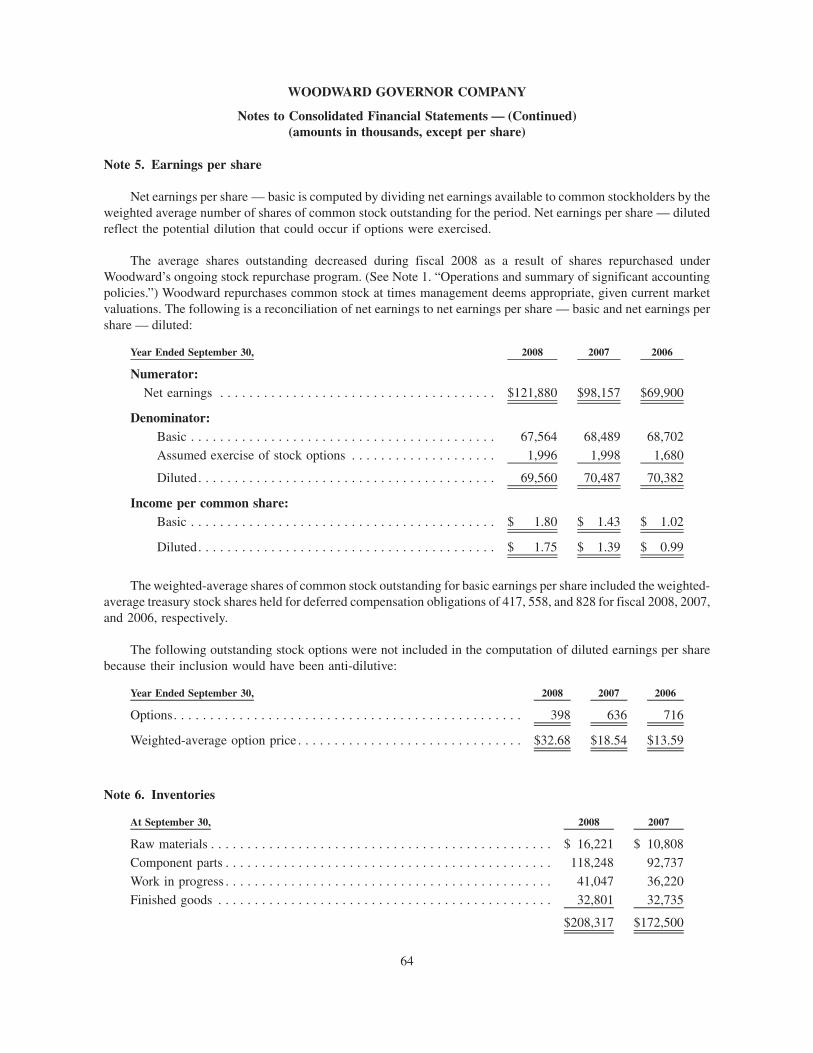
Note 5. Earnings per share
Net earnings per share — basic is computed by dividing net earnings available to common stockholders by theweighted average number of shares of common stock outstanding for the period. Net earnings per share — dilutedreflect the potential dilution that could occur if options were exercised.
The average shares outstanding decreased during fiscal 2008 as a result of shares repurchased underWoodward’s ongoing stock repurchase program. (See Note 1. “Operations and summary of significant accountingpolicies.”) Woodward repurchases common stock at times management deems appropriate, given current marketvaluations. The following is a reconciliation of net earnings to net earnings per share — basic and net earnings pershare — diluted:
Year Ended September 30, 2008 2007 2006
Numerator:Net earnings . . . . . . . . . . . . . . . . . . . . . . . . . . . . . . . . . . . . . . $121,880 $98,157 $69,900
Denominator:Basic . . . . . . . . . . . . . . . . . . . . . . . . . . . . . . . . . . . . . . . . . . 67,564 68,489 68,702Assumed exercise of stock options . . . . . . . . . . . . . . . . . . . . 1,996 1,998 1,680
Diluted. . . . . . . . . . . . . . . . . . . . . . . . . . . . . . . . . . . . . . . . . 69,560 70,487 70,382
Income per common share:Basic . . . . . . . . . . . . . . . . . . . . . . . . . . . . . . . . . . . . . . . . . . $ 1.80 $ 1.43 $ 1.02
Diluted. . . . . . . . . . . . . . . . . . . . . . . . . . . . . . . . . . . . . . . . . $ 1.75 $ 1.39 $ 0.99
The weighted-average shares of common stock outstanding for basic earnings per share included the weighted-average treasury stock shares held for deferred compensation obligations of 417, 558, and 828 for fiscal 2008, 2007,and 2006, respectively.
The following outstanding stock options were not included in the computation of diluted earnings per sharebecause their inclusion would have been anti-dilutive:
Year Ended September 30, 2008 2007 2006
Options. . . . . . . . . . . . . . . . . . . . . . . . . . . . . . . . . . . . . . . . . . . . . . . . 398 636 716
Weighted-average option price . . . . . . . . . . . . . . . . . . . . . . . . . . . . . . . $32.68 $18.54 $13.59
Note 6. Inventories
At September 30, 2008 2007
Raw materials . . . . . . . . . . . . . . . . . . . . . . . . . . . . . . . . . . . . . . . . . . . . . . . $ 16,221 $ 10,808Component parts . . . . . . . . . . . . . . . . . . . . . . . . . . . . . . . . . . . . . . . . . . . . . 118,248 92,737Work in progress . . . . . . . . . . . . . . . . . . . . . . . . . . . . . . . . . . . . . . . . . . . . . 41,047 36,220Finished goods . . . . . . . . . . . . . . . . . . . . . . . . . . . . . . . . . . . . . . . . . . . . . . 32,801 32,735
$208,317 $172,500
64
WOODWARD GOVERNOR COMPANY
Notes to Consolidated Financial Statements — (Continued)(amounts in thousands, except per share)
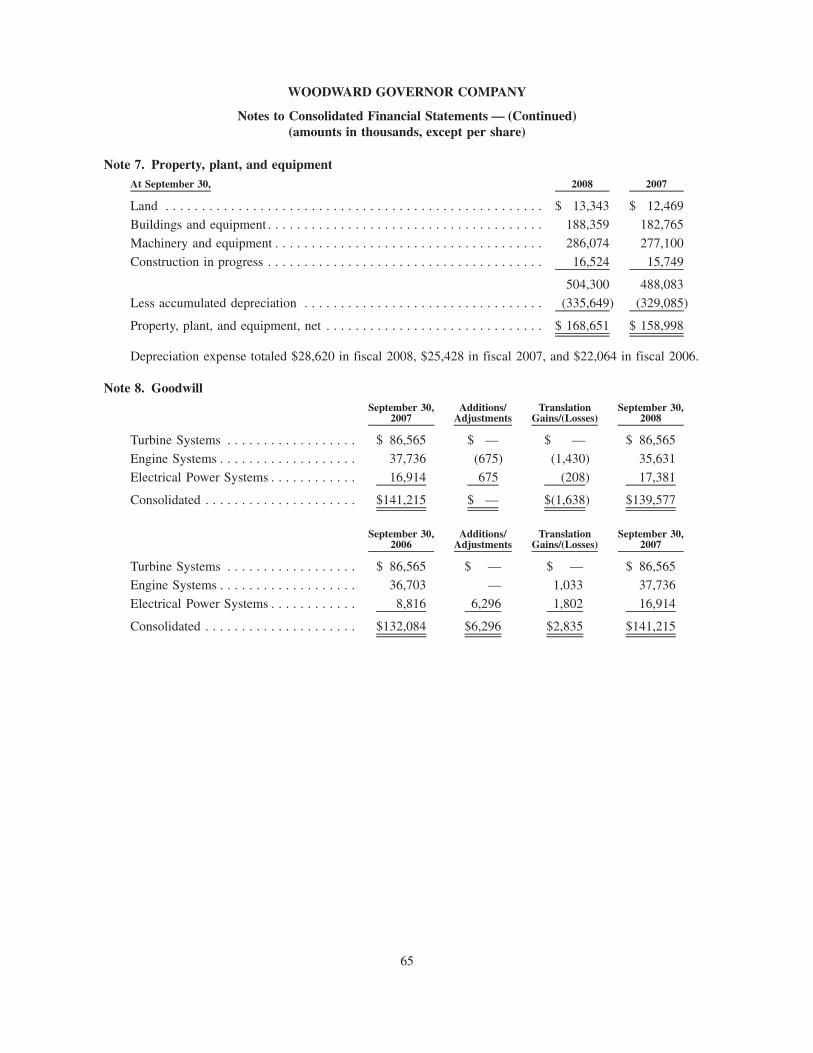
Note 7. Property, plant, and equipmentAt September 30, 2008 2007
Land . . . . . . . . . . . . . . . . . . . . . . . . . . . . . . . . . . . . . . . . . . . . . . . . . . . . $ 13,343 $ 12,469Buildings and equipment . . . . . . . . . . . . . . . . . . . . . . . . . . . . . . . . . . . . . . 188,359 182,765Machinery and equipment . . . . . . . . . . . . . . . . . . . . . . . . . . . . . . . . . . . . . 286,074 277,100Construction in progress . . . . . . . . . . . . . . . . . . . . . . . . . . . . . . . . . . . . . . 16,524 15,749
504,300 488,083Less accumulated depreciation . . . . . . . . . . . . . . . . . . . . . . . . . . . . . . . . . (335,649) (329,085)
Property, plant, and equipment, net . . . . . . . . . . . . . . . . . . . . . . . . . . . . . . $ 168,651 $ 158,998
Depreciation expense totaled $28,620 in fiscal 2008, $25,428 in fiscal 2007, and $22,064 in fiscal 2006.
Note 8. GoodwillSeptember 30,
2007Additions/
AdjustmentsTranslation
Gains/(Losses)September 30,
2008
Turbine Systems . . . . . . . . . . . . . . . . . . $ 86,565 $ — $ — $ 86,565Engine Systems . . . . . . . . . . . . . . . . . . . 37,736 (675) (1,430) 35,631Electrical Power Systems . . . . . . . . . . . . 16,914 675 (208) 17,381
Consolidated . . . . . . . . . . . . . . . . . . . . . $141,215 $ — $(1,638) $139,577
September 30,2006
Additions/Adjustments
TranslationGains/(Losses)
September 30,2007
Turbine Systems . . . . . . . . . . . . . . . . . . $ 86,565 $ — $ — $ 86,565Engine Systems . . . . . . . . . . . . . . . . . . . 36,703 — 1,033 37,736Electrical Power Systems . . . . . . . . . . . . 8,816 6,296 1,802 16,914
Consolidated . . . . . . . . . . . . . . . . . . . . . $132,084 $6,296 $2,835 $141,215
65
WOODWARD GOVERNOR COMPANY
Notes to Consolidated Financial Statements — (Continued)(amounts in thousands, except per share)
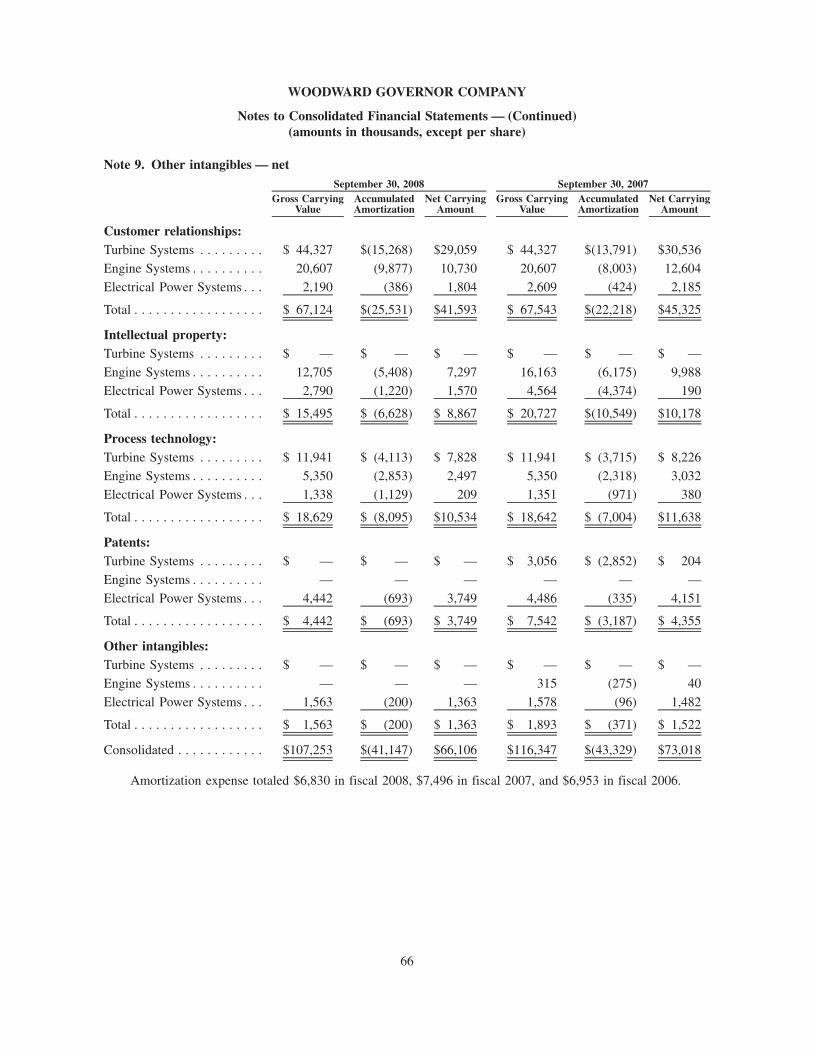
Note 9. Other intangibles — net
Gross CarryingValue
AccumulatedAmortization
Net CarryingAmount
Gross CarryingValue
AccumulatedAmortization
Net CarryingAmount
September 30, 2008 September 30, 2007
Customer relationships:Turbine Systems . . . . . . . . . $ 44,327 $(15,268) $29,059 $ 44,327 $(13,791) $30,536Engine Systems . . . . . . . . . . 20,607 (9,877) 10,730 20,607 (8,003) 12,604Electrical Power Systems . . . 2,190 (386) 1,804 2,609 (424) 2,185
Total . . . . . . . . . . . . . . . . . . $ 67,124 $(25,531) $41,593 $ 67,543 $(22,218) $45,325
Intellectual property:Turbine Systems . . . . . . . . . $ — $ — $ — $ — $ — $ —Engine Systems . . . . . . . . . . 12,705 (5,408) 7,297 16,163 (6,175) 9,988Electrical Power Systems . . . 2,790 (1,220) 1,570 4,564 (4,374) 190
Total . . . . . . . . . . . . . . . . . . $ 15,495 $ (6,628) $ 8,867 $ 20,727 $(10,549) $10,178
Process technology:Turbine Systems . . . . . . . . . $ 11,941 $ (4,113) $ 7,828 $ 11,941 $ (3,715) $ 8,226Engine Systems . . . . . . . . . . 5,350 (2,853) 2,497 5,350 (2,318) 3,032Electrical Power Systems . . . 1,338 (1,129) 209 1,351 (971) 380
Total . . . . . . . . . . . . . . . . . . $ 18,629 $ (8,095) $10,534 $ 18,642 $ (7,004) $11,638
Patents:Turbine Systems . . . . . . . . . $ — $ — $ — $ 3,056 $ (2,852) $ 204Engine Systems . . . . . . . . . . — — — — — —Electrical Power Systems . . . 4,442 (693) 3,749 4,486 (335) 4,151
Total . . . . . . . . . . . . . . . . . . $ 4,442 $ (693) $ 3,749 $ 7,542 $ (3,187) $ 4,355
Other intangibles:Turbine Systems . . . . . . . . . $ — $ — $ — $ — $ — $ —Engine Systems . . . . . . . . . . — — — 315 (275) 40Electrical Power Systems . . . 1,563 (200) 1,363 1,578 (96) 1,482
Total . . . . . . . . . . . . . . . . . . $ 1,563 $ (200) $ 1,363 $ 1,893 $ (371) $ 1,522
Consolidated . . . . . . . . . . . . $107,253 $(41,147) $66,106 $116,347 $(43,329) $73,018
Amortization expense totaled $6,830 in fiscal 2008, $7,496 in fiscal 2007, and $6,953 in fiscal 2006.
66
WOODWARD GOVERNOR COMPANY
Notes to Consolidated Financial Statements — (Continued)(amounts in thousands, except per share)
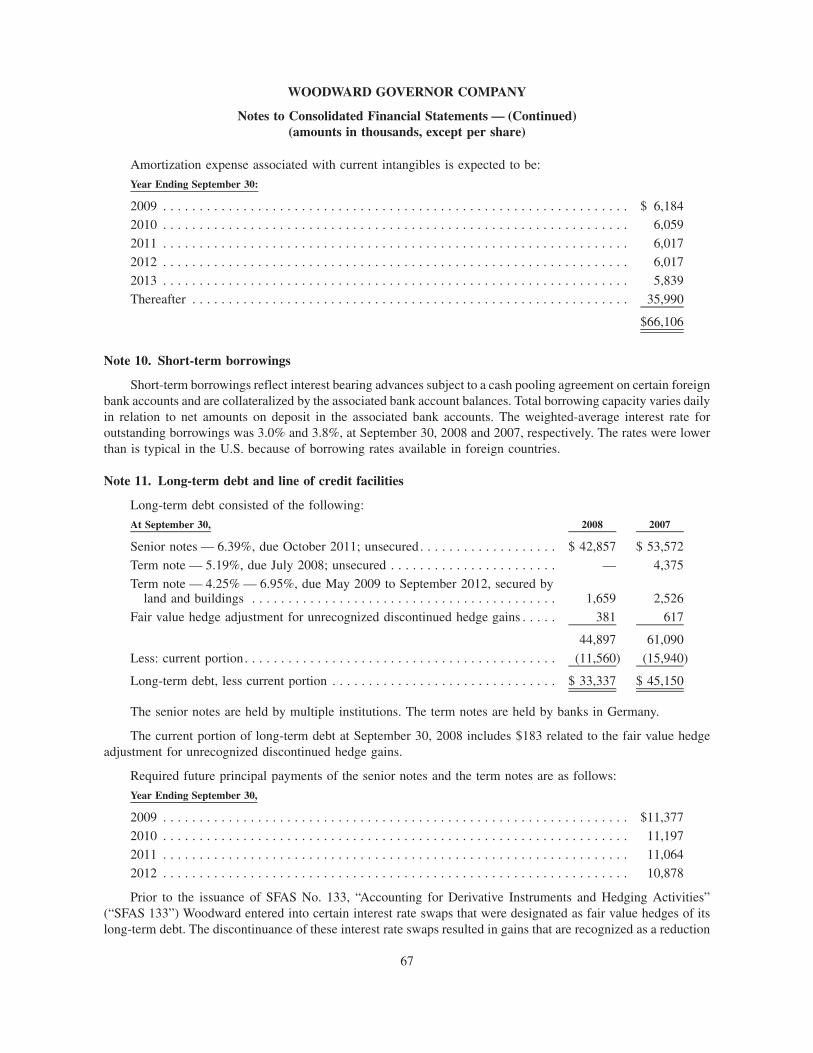
Amortization expense associated with current intangibles is expected to be:Year Ending September 30:
2009 . . . . . . . . . . . . . . . . . . . . . . . . . . . . . . . . . . . . . . . . . . . . . . . . . . . . . . . . . . . . . . . . $ 6,1842010 . . . . . . . . . . . . . . . . . . . . . . . . . . . . . . . . . . . . . . . . . . . . . . . . . . . . . . . . . . . . . . . . 6,0592011 . . . . . . . . . . . . . . . . . . . . . . . . . . . . . . . . . . . . . . . . . . . . . . . . . . . . . . . . . . . . . . . . 6,0172012 . . . . . . . . . . . . . . . . . . . . . . . . . . . . . . . . . . . . . . . . . . . . . . . . . . . . . . . . . . . . . . . . 6,0172013 . . . . . . . . . . . . . . . . . . . . . . . . . . . . . . . . . . . . . . . . . . . . . . . . . . . . . . . . . . . . . . . . 5,839Thereafter . . . . . . . . . . . . . . . . . . . . . . . . . . . . . . . . . . . . . . . . . . . . . . . . . . . . . . . . . . . . 35,990
$66,106
Note 10. Short-term borrowings
Short-term borrowings reflect interest bearing advances subject to a cash pooling agreement on certain foreignbank accounts and are collateralized by the associated bank account balances. Total borrowing capacity varies dailyin relation to net amounts on deposit in the associated bank accounts. The weighted-average interest rate foroutstanding borrowings was 3.0% and 3.8%, at September 30, 2008 and 2007, respectively. The rates were lowerthan is typical in the U.S. because of borrowing rates available in foreign countries.
Note 11. Long-term debt and line of credit facilities
Long-term debt consisted of the following:At September 30, 2008 2007
Senior notes — 6.39%, due October 2011; unsecured . . . . . . . . . . . . . . . . . . . $ 42,857 $ 53,572Term note — 5.19%, due July 2008; unsecured . . . . . . . . . . . . . . . . . . . . . . . — 4,375Term note — 4.25% — 6.95%, due May 2009 to September 2012, secured by
land and buildings . . . . . . . . . . . . . . . . . . . . . . . . . . . . . . . . . . . . . . . . . . 1,659 2,526Fair value hedge adjustment for unrecognized discontinued hedge gains . . . . . 381 617
44,897 61,090Less: current portion. . . . . . . . . . . . . . . . . . . . . . . . . . . . . . . . . . . . . . . . . . . (11,560) (15,940)
Long-term debt, less current portion . . . . . . . . . . . . . . . . . . . . . . . . . . . . . . . $ 33,337 $ 45,150
The senior notes are held by multiple institutions. The term notes are held by banks in Germany.
The current portion of long-term debt at September 30, 2008 includes $183 related to the fair value hedgeadjustment for unrecognized discontinued hedge gains.
Required future principal payments of the senior notes and the term notes are as follows:Year Ending September 30,
2009 . . . . . . . . . . . . . . . . . . . . . . . . . . . . . . . . . . . . . . . . . . . . . . . . . . . . . . . . . . . . . . . . $11,3772010 . . . . . . . . . . . . . . . . . . . . . . . . . . . . . . . . . . . . . . . . . . . . . . . . . . . . . . . . . . . . . . . . 11,1972011 . . . . . . . . . . . . . . . . . . . . . . . . . . . . . . . . . . . . . . . . . . . . . . . . . . . . . . . . . . . . . . . . 11,0642012 . . . . . . . . . . . . . . . . . . . . . . . . . . . . . . . . . . . . . . . . . . . . . . . . . . . . . . . . . . . . . . . . 10,878
Prior to the issuance of SFAS No. 133, “Accounting for Derivative Instruments and Hedging Activities”(“SFAS 133”) Woodward entered into certain interest rate swaps that were designated as fair value hedges of itslong-term debt. The discontinuance of these interest rate swaps resulted in gains that are recognized as a reduction
67
WOODWARD GOVERNOR COMPANY
Notes to Consolidated Financial Statements — (Continued)(amounts in thousands, except per share)
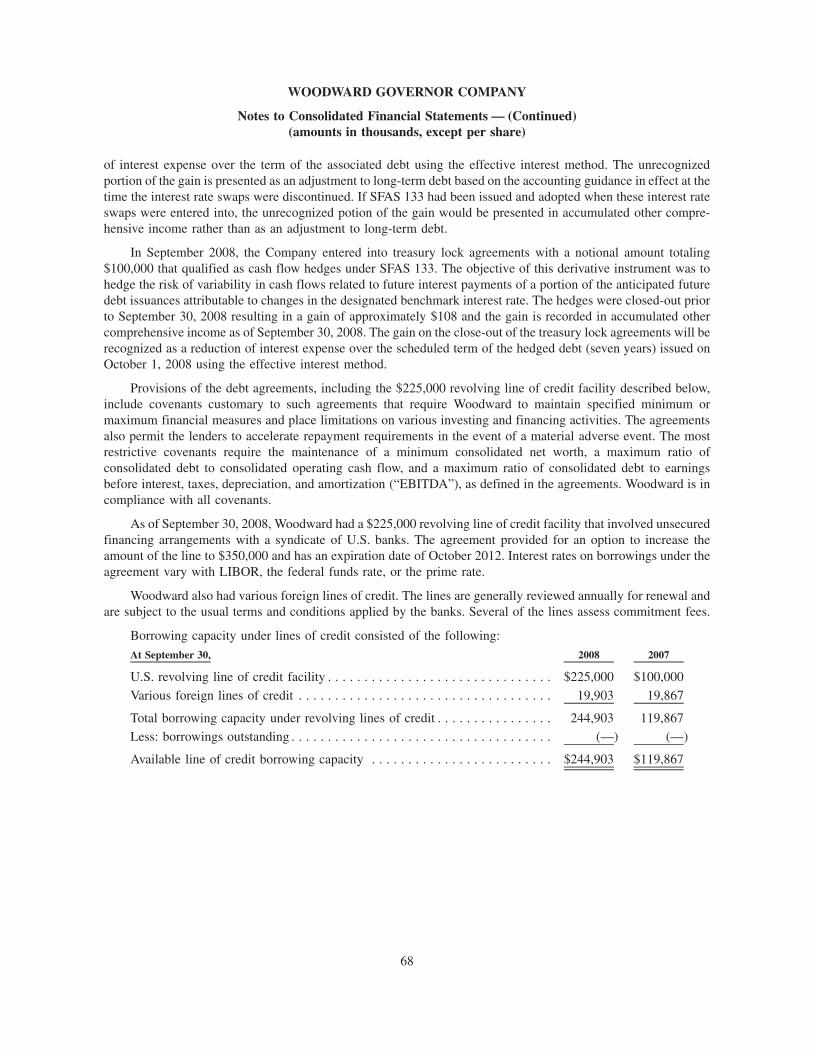
of interest expense over the term of the associated debt using the effective interest method. The unrecognizedportion of the gain is presented as an adjustment to long-term debt based on the accounting guidance in effect at thetime the interest rate swaps were discontinued. If SFAS 133 had been issued and adopted when these interest rateswaps were entered into, the unrecognized potion of the gain would be presented in accumulated other compre-hensive income rather than as an adjustment to long-term debt.
In September 2008, the Company entered into treasury lock agreements with a notional amount totaling$100,000 that qualified as cash flow hedges under SFAS 133. The objective of this derivative instrument was tohedge the risk of variability in cash flows related to future interest payments of a portion of the anticipated futuredebt issuances attributable to changes in the designated benchmark interest rate. The hedges were closed-out priorto September 30, 2008 resulting in a gain of approximately $108 and the gain is recorded in accumulated othercomprehensive income as of September 30, 2008. The gain on the close-out of the treasury lock agreements will berecognized as a reduction of interest expense over the scheduled term of the hedged debt (seven years) issued onOctober 1, 2008 using the effective interest method.
Provisions of the debt agreements, including the $225,000 revolving line of credit facility described below,include covenants customary to such agreements that require Woodward to maintain specified minimum ormaximum financial measures and place limitations on various investing and financing activities. The agreementsalso permit the lenders to accelerate repayment requirements in the event of a material adverse event. The mostrestrictive covenants require the maintenance of a minimum consolidated net worth, a maximum ratio ofconsolidated debt to consolidated operating cash flow, and a maximum ratio of consolidated debt to earningsbefore interest, taxes, depreciation, and amortization (“EBITDA”), as defined in the agreements. Woodward is incompliance with all covenants.
As of September 30, 2008, Woodward had a $225,000 revolving line of credit facility that involved unsecuredfinancing arrangements with a syndicate of U.S. banks. The agreement provided for an option to increase theamount of the line to $350,000 and has an expiration date of October 2012. Interest rates on borrowings under theagreement vary with LIBOR, the federal funds rate, or the prime rate.
Woodward also had various foreign lines of credit. The lines are generally reviewed annually for renewal andare subject to the usual terms and conditions applied by the banks. Several of the lines assess commitment fees.
Borrowing capacity under lines of credit consisted of the following:At September 30, 2008 2007
U.S. revolving line of credit facility . . . . . . . . . . . . . . . . . . . . . . . . . . . . . . . $225,000 $100,000Various foreign lines of credit . . . . . . . . . . . . . . . . . . . . . . . . . . . . . . . . . . . 19,903 19,867
Total borrowing capacity under revolving lines of credit . . . . . . . . . . . . . . . . 244,903 119,867Less: borrowings outstanding . . . . . . . . . . . . . . . . . . . . . . . . . . . . . . . . . . . . (—) (—)
Available line of credit borrowing capacity . . . . . . . . . . . . . . . . . . . . . . . . . $244,903 $119,867
68
WOODWARD GOVERNOR COMPANY
Notes to Consolidated Financial Statements — (Continued)(amounts in thousands, except per share)
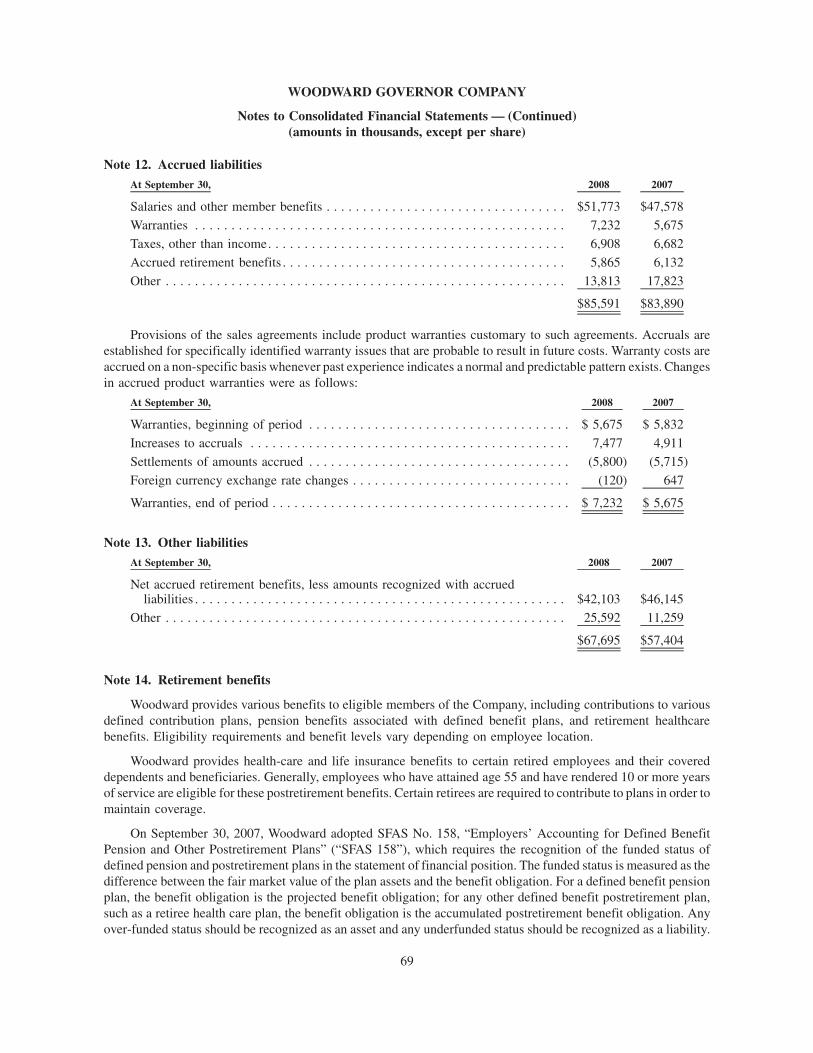
Note 12. Accrued liabilitiesAt September 30, 2008 2007
Salaries and other member benefits . . . . . . . . . . . . . . . . . . . . . . . . . . . . . . . . . $51,773 $47,578Warranties . . . . . . . . . . . . . . . . . . . . . . . . . . . . . . . . . . . . . . . . . . . . . . . . . . . 7,232 5,675Taxes, other than income. . . . . . . . . . . . . . . . . . . . . . . . . . . . . . . . . . . . . . . . . 6,908 6,682Accrued retirement benefits . . . . . . . . . . . . . . . . . . . . . . . . . . . . . . . . . . . . . . . 5,865 6,132Other . . . . . . . . . . . . . . . . . . . . . . . . . . . . . . . . . . . . . . . . . . . . . . . . . . . . . . . 13,813 17,823
$85,591 $83,890
Provisions of the sales agreements include product warranties customary to such agreements. Accruals areestablished for specifically identified warranty issues that are probable to result in future costs. Warranty costs areaccrued on a non-specific basis whenever past experience indicates a normal and predictable pattern exists. Changesin accrued product warranties were as follows:
At September 30, 2008 2007
Warranties, beginning of period . . . . . . . . . . . . . . . . . . . . . . . . . . . . . . . . . . . . $ 5,675 $ 5,832Increases to accruals . . . . . . . . . . . . . . . . . . . . . . . . . . . . . . . . . . . . . . . . . . . . 7,477 4,911Settlements of amounts accrued . . . . . . . . . . . . . . . . . . . . . . . . . . . . . . . . . . . . (5,800) (5,715)Foreign currency exchange rate changes . . . . . . . . . . . . . . . . . . . . . . . . . . . . . . (120) 647
Warranties, end of period . . . . . . . . . . . . . . . . . . . . . . . . . . . . . . . . . . . . . . . . . $ 7,232 $ 5,675
Note 13. Other liabilitiesAt September 30, 2008 2007
Net accrued retirement benefits, less amounts recognized with accruedliabilities . . . . . . . . . . . . . . . . . . . . . . . . . . . . . . . . . . . . . . . . . . . . . . . . . . . $42,103 $46,145
Other . . . . . . . . . . . . . . . . . . . . . . . . . . . . . . . . . . . . . . . . . . . . . . . . . . . . . . . 25,592 11,259
$67,695 $57,404
Note 14. Retirement benefits
Woodward provides various benefits to eligible members of the Company, including contributions to variousdefined contribution plans, pension benefits associated with defined benefit plans, and retirement healthcarebenefits. Eligibility requirements and benefit levels vary depending on employee location.
Woodward provides health-care and life insurance benefits to certain retired employees and their covereddependents and beneficiaries. Generally, employees who have attained age 55 and have rendered 10 or more yearsof service are eligible for these postretirement benefits. Certain retirees are required to contribute to plans in order tomaintain coverage.
On September 30, 2007, Woodward adopted SFAS No. 158, “Employers’ Accounting for Defined BenefitPension and Other Postretirement Plans” (“SFAS 158”), which requires the recognition of the funded status ofdefined pension and postretirement plans in the statement of financial position. The funded status is measured as thedifference between the fair market value of the plan assets and the benefit obligation. For a defined benefit pensionplan, the benefit obligation is the projected benefit obligation; for any other defined benefit postretirement plan,such as a retiree health care plan, the benefit obligation is the accumulated postretirement benefit obligation. Anyover-funded status should be recognized as an asset and any underfunded status should be recognized as a liability.
69
WOODWARD GOVERNOR COMPANY
Notes to Consolidated Financial Statements — (Continued)(amounts in thousands, except per share)
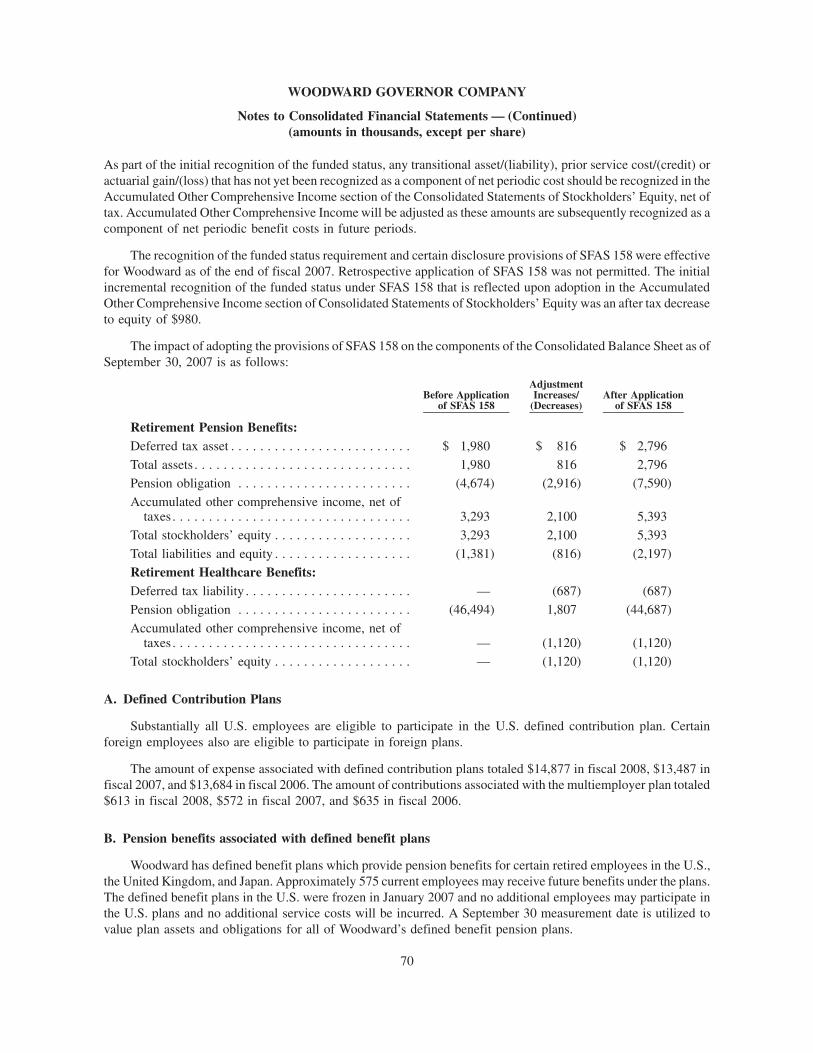
As part of the initial recognition of the funded status, any transitional asset/(liability), prior service cost/(credit) oractuarial gain/(loss) that has not yet been recognized as a component of net periodic cost should be recognized in theAccumulated Other Comprehensive Income section of the Consolidated Statements of Stockholders’ Equity, net oftax. Accumulated Other Comprehensive Income will be adjusted as these amounts are subsequently recognized as acomponent of net periodic benefit costs in future periods.
The recognition of the funded status requirement and certain disclosure provisions of SFAS 158 were effectivefor Woodward as of the end of fiscal 2007. Retrospective application of SFAS 158 was not permitted. The initialincremental recognition of the funded status under SFAS 158 that is reflected upon adoption in the AccumulatedOther Comprehensive Income section of Consolidated Statements of Stockholders’ Equity was an after tax decreaseto equity of $980.
The impact of adopting the provisions of SFAS 158 on the components of the Consolidated Balance Sheet as ofSeptember 30, 2007 is as follows:
Before Applicationof SFAS 158
AdjustmentIncreases/
(Decreases)After Application
of SFAS 158
Retirement Pension Benefits:Deferred tax asset . . . . . . . . . . . . . . . . . . . . . . . . . $ 1,980 $ 816 $ 2,796Total assets . . . . . . . . . . . . . . . . . . . . . . . . . . . . . . 1,980 816 2,796Pension obligation . . . . . . . . . . . . . . . . . . . . . . . . (4,674) (2,916) (7,590)Accumulated other comprehensive income, net of
taxes . . . . . . . . . . . . . . . . . . . . . . . . . . . . . . . . . 3,293 2,100 5,393Total stockholders’ equity . . . . . . . . . . . . . . . . . . . 3,293 2,100 5,393Total liabilities and equity . . . . . . . . . . . . . . . . . . . (1,381) (816) (2,197)Retirement Healthcare Benefits:Deferred tax liability . . . . . . . . . . . . . . . . . . . . . . . — (687) (687)Pension obligation . . . . . . . . . . . . . . . . . . . . . . . . (46,494) 1,807 (44,687)Accumulated other comprehensive income, net of
taxes . . . . . . . . . . . . . . . . . . . . . . . . . . . . . . . . . — (1,120) (1,120)Total stockholders’ equity . . . . . . . . . . . . . . . . . . . — (1,120) (1,120)
A. Defined Contribution Plans
Substantially all U.S. employees are eligible to participate in the U.S. defined contribution plan. Certainforeign employees also are eligible to participate in foreign plans.
The amount of expense associated with defined contribution plans totaled $14,877 in fiscal 2008, $13,487 infiscal 2007, and $13,684 in fiscal 2006. The amount of contributions associated with the multiemployer plan totaled$613 in fiscal 2008, $572 in fiscal 2007, and $635 in fiscal 2006.
B. Pension benefits associated with defined benefit plans
Woodward has defined benefit plans which provide pension benefits for certain retired employees in the U.S.,the United Kingdom, and Japan. Approximately 575 current employees may receive future benefits under the plans.The defined benefit plans in the U.S. were frozen in January 2007 and no additional employees may participate inthe U.S. plans and no additional service costs will be incurred. A September 30 measurement date is utilized tovalue plan assets and obligations for all of Woodward’s defined benefit pension plans.
70
WOODWARD GOVERNOR COMPANY
Notes to Consolidated Financial Statements — (Continued)(amounts in thousands, except per share)
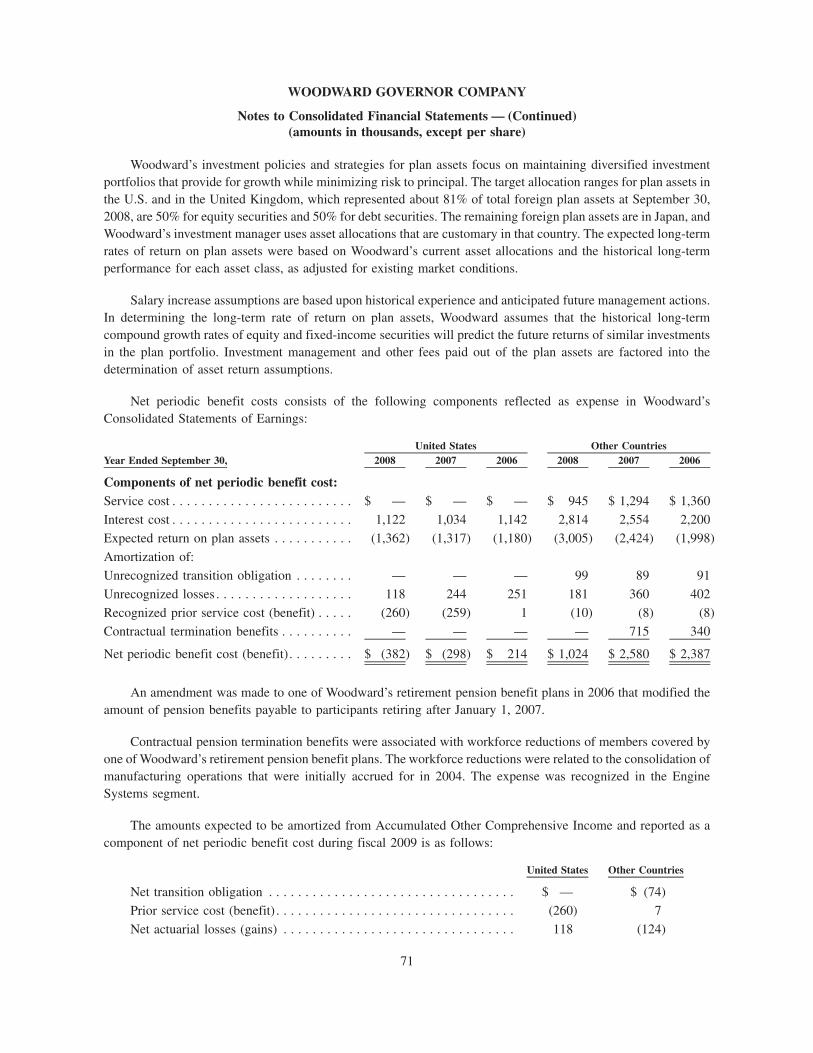
Woodward’s investment policies and strategies for plan assets focus on maintaining diversified investmentportfolios that provide for growth while minimizing risk to principal. The target allocation ranges for plan assets inthe U.S. and in the United Kingdom, which represented about 81% of total foreign plan assets at September 30,2008, are 50% for equity securities and 50% for debt securities. The remaining foreign plan assets are in Japan, andWoodward’s investment manager uses asset allocations that are customary in that country. The expected long-termrates of return on plan assets were based on Woodward’s current asset allocations and the historical long-termperformance for each asset class, as adjusted for existing market conditions.
Salary increase assumptions are based upon historical experience and anticipated future management actions.In determining the long-term rate of return on plan assets, Woodward assumes that the historical long-termcompound growth rates of equity and fixed-income securities will predict the future returns of similar investmentsin the plan portfolio. Investment management and other fees paid out of the plan assets are factored into thedetermination of asset return assumptions.
Net periodic benefit costs consists of the following components reflected as expense in Woodward’sConsolidated Statements of Earnings:
Year Ended September 30, 2008 2007 2006 2008 2007 2006United States Other Countries
Components of net periodic benefit cost:Service cost . . . . . . . . . . . . . . . . . . . . . . . . . $ — $ — $ — $ 945 $ 1,294 $ 1,360Interest cost . . . . . . . . . . . . . . . . . . . . . . . . . 1,122 1,034 1,142 2,814 2,554 2,200Expected return on plan assets . . . . . . . . . . . (1,362) (1,317) (1,180) (3,005) (2,424) (1,998)Amortization of:Unrecognized transition obligation . . . . . . . . — — — 99 89 91Unrecognized losses . . . . . . . . . . . . . . . . . . . 118 244 251 181 360 402Recognized prior service cost (benefit) . . . . . (260) (259) 1 (10) (8) (8)Contractual termination benefits . . . . . . . . . . — — — — 715 340
Net periodic benefit cost (benefit). . . . . . . . . $ (382) $ (298) $ 214 $ 1,024 $ 2,580 $ 2,387
An amendment was made to one of Woodward’s retirement pension benefit plans in 2006 that modified theamount of pension benefits payable to participants retiring after January 1, 2007.
Contractual pension termination benefits were associated with workforce reductions of members covered byone of Woodward’s retirement pension benefit plans. The workforce reductions were related to the consolidation ofmanufacturing operations that were initially accrued for in 2004. The expense was recognized in the EngineSystems segment.
The amounts expected to be amortized from Accumulated Other Comprehensive Income and reported as acomponent of net periodic benefit cost during fiscal 2009 is as follows:
United States Other Countries
Net transition obligation . . . . . . . . . . . . . . . . . . . . . . . . . . . . . . . . . . $ — $ (74)Prior service cost (benefit) . . . . . . . . . . . . . . . . . . . . . . . . . . . . . . . . . (260) 7Net actuarial losses (gains) . . . . . . . . . . . . . . . . . . . . . . . . . . . . . . . . 118 (124)
71
WOODWARD GOVERNOR COMPANY
Notes to Consolidated Financial Statements — (Continued)(amounts in thousands, except per share)
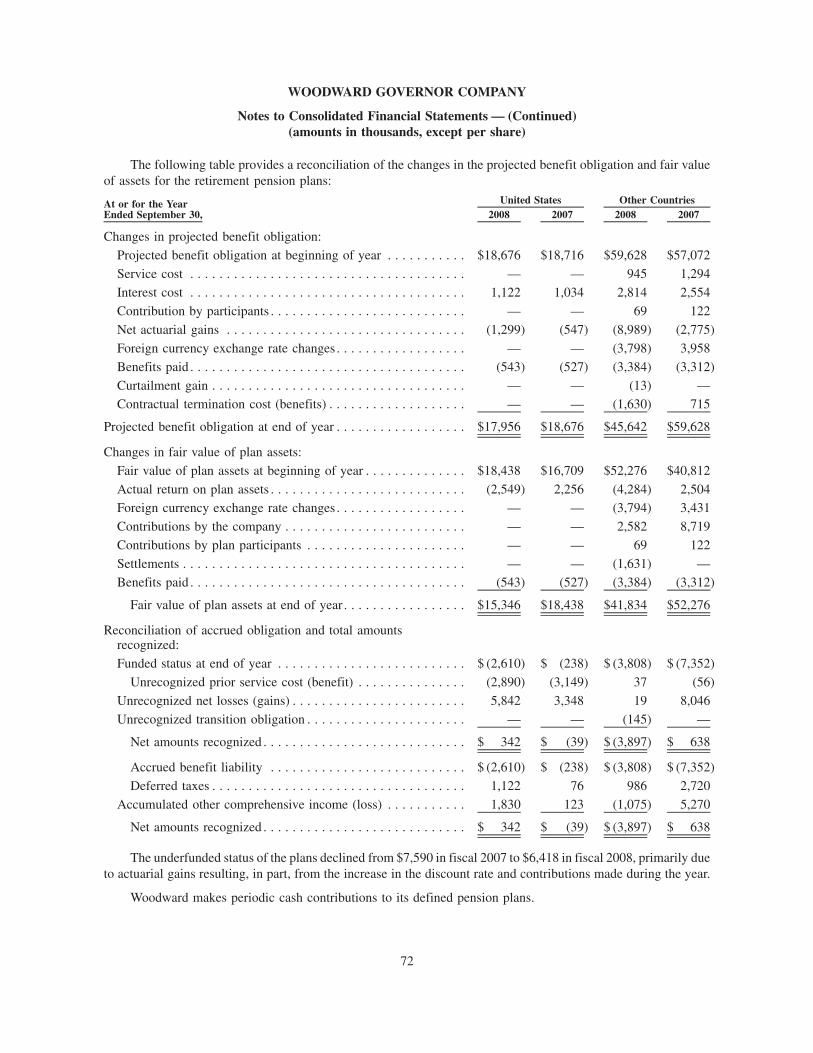
The following table provides a reconciliation of the changes in the projected benefit obligation and fair valueof assets for the retirement pension plans:
At or for the YearEnded September 30, 2008 2007 2008 2007
United States Other Countries
Changes in projected benefit obligation:Projected benefit obligation at beginning of year . . . . . . . . . . . $18,676 $18,716 $59,628 $57,072Service cost . . . . . . . . . . . . . . . . . . . . . . . . . . . . . . . . . . . . . . — — 945 1,294Interest cost . . . . . . . . . . . . . . . . . . . . . . . . . . . . . . . . . . . . . . 1,122 1,034 2,814 2,554Contribution by participants . . . . . . . . . . . . . . . . . . . . . . . . . . . — — 69 122Net actuarial gains . . . . . . . . . . . . . . . . . . . . . . . . . . . . . . . . . (1,299) (547) (8,989) (2,775)Foreign currency exchange rate changes . . . . . . . . . . . . . . . . . . — — (3,798) 3,958Benefits paid . . . . . . . . . . . . . . . . . . . . . . . . . . . . . . . . . . . . . . (543) (527) (3,384) (3,312)Curtailment gain . . . . . . . . . . . . . . . . . . . . . . . . . . . . . . . . . . . — — (13) —Contractual termination cost (benefits) . . . . . . . . . . . . . . . . . . . — — (1,630) 715
Projected benefit obligation at end of year . . . . . . . . . . . . . . . . . . $17,956 $18,676 $45,642 $59,628
Changes in fair value of plan assets:Fair value of plan assets at beginning of year . . . . . . . . . . . . . . $18,438 $16,709 $52,276 $40,812Actual return on plan assets . . . . . . . . . . . . . . . . . . . . . . . . . . . (2,549) 2,256 (4,284) 2,504Foreign currency exchange rate changes . . . . . . . . . . . . . . . . . . — — (3,794) 3,431Contributions by the company . . . . . . . . . . . . . . . . . . . . . . . . . — — 2,582 8,719Contributions by plan participants . . . . . . . . . . . . . . . . . . . . . . — — 69 122Settlements . . . . . . . . . . . . . . . . . . . . . . . . . . . . . . . . . . . . . . . — — (1,631) —Benefits paid . . . . . . . . . . . . . . . . . . . . . . . . . . . . . . . . . . . . . . (543) (527) (3,384) (3,312)
Fair value of plan assets at end of year . . . . . . . . . . . . . . . . . $15,346 $18,438 $41,834 $52,276
Reconciliation of accrued obligation and total amountsrecognized:Funded status at end of year . . . . . . . . . . . . . . . . . . . . . . . . . . $ (2,610) $ (238) $ (3,808) $ (7,352)
Unrecognized prior service cost (benefit) . . . . . . . . . . . . . . . (2,890) (3,149) 37 (56)Unrecognized net losses (gains) . . . . . . . . . . . . . . . . . . . . . . . . 5,842 3,348 19 8,046Unrecognized transition obligation . . . . . . . . . . . . . . . . . . . . . . — — (145) —
Net amounts recognized . . . . . . . . . . . . . . . . . . . . . . . . . . . . $ 342 $ (39) $ (3,897) $ 638
Accrued benefit liability . . . . . . . . . . . . . . . . . . . . . . . . . . . $ (2,610) $ (238) $ (3,808) $ (7,352)Deferred taxes . . . . . . . . . . . . . . . . . . . . . . . . . . . . . . . . . . . 1,122 76 986 2,720
Accumulated other comprehensive income (loss) . . . . . . . . . . . 1,830 123 (1,075) 5,270
Net amounts recognized . . . . . . . . . . . . . . . . . . . . . . . . . . . . $ 342 $ (39) $ (3,897) $ 638
The underfunded status of the plans declined from $7,590 in fiscal 2007 to $6,418 in fiscal 2008, primarily dueto actuarial gains resulting, in part, from the increase in the discount rate and contributions made during the year.
Woodward makes periodic cash contributions to its defined pension plans.
72
WOODWARD GOVERNOR COMPANY
Notes to Consolidated Financial Statements — (Continued)(amounts in thousands, except per share)

The accumulated benefit obligation is the present value of pension benefits (whether vested or unvested)attributed to employee service rendered before the measurement date and based on employee service andcompensation prior to that date. The accumulated benefit obligation differs from the projected benefit obligationin that it includes no assumption about future compensation levels. The projected benefit obligation, accumulatedbenefit obligation and fair value of plan assets for pension plans with accumulated benefit obligations in excess ofplan assets were as follow, at or for the year ended September 30:
2008 2007 2008 2007United States Other Countries
Projected benefit obligation . . . . . . . . . . . . . . . . . . . $(17,956) $(18,676) $(45,642) $(59,628)Accumulated benefit obligation . . . . . . . . . . . . . . . . (17,956) (18,676) (43,497) (56,097)Fair value of plan assets . . . . . . . . . . . . . . . . . . . . . 15,346 18,438 41,834 52,276
The allocation of pension plan assets as of the respective measurement dates is as follows at September 30:
2008 2007 2008 2007United States
OtherCountries
Equity securities . . . . . . . . . . . . . . . . . . . . . . . . . . . . . . . . . . . . . . . . . . 52% 60% 42% 44%Debt securities . . . . . . . . . . . . . . . . . . . . . . . . . . . . . . . . . . . . . . . . . . . 48% 40% 58% 38%Insurance contracts . . . . . . . . . . . . . . . . . . . . . . . . . . . . . . . . . . . . . . . . — — — 5%Other . . . . . . . . . . . . . . . . . . . . . . . . . . . . . . . . . . . . . . . . . . . . . . . . . . — — — 13%
100% 100% 100% 100%
Pension assets at September 30, 2008 and 2007 do not include any direct investment in Woodward’s equitysecurities.
Substantially all pension benefit payments are made from assets of the pension plans. Using foreign exchangerates as of September 30, 2008 and expected future service, it is anticipated that the future benefit payments will beas follows:
Year Ending September 30, United StatesOther
Countries
2009 . . . . . . . . . . . . . . . . . . . . . . . . . . . . . . . . . . . . . . . . . . . . . . . . . . . . . $ 604 $ 2,8232010 . . . . . . . . . . . . . . . . . . . . . . . . . . . . . . . . . . . . . . . . . . . . . . . . . . . . . 656 2,9222011 . . . . . . . . . . . . . . . . . . . . . . . . . . . . . . . . . . . . . . . . . . . . . . . . . . . . . 737 3,1552012 . . . . . . . . . . . . . . . . . . . . . . . . . . . . . . . . . . . . . . . . . . . . . . . . . . . . . 829 3,0322013 . . . . . . . . . . . . . . . . . . . . . . . . . . . . . . . . . . . . . . . . . . . . . . . . . . . . . 922 3,2282014 - 2018 . . . . . . . . . . . . . . . . . . . . . . . . . . . . . . . . . . . . . . . . . . . . . . . . 6,240 17,043
Woodward expects its contributions for retirement pension benefits will be $0 in the United States and $2,426in other countries in 2009.
C. Retirement healthcare benefit plans
Woodward has retirement healthcare benefit plans in the U.S. and the United Kingdom that provideshealthcare benefits for approximately 1,100 retired employees and may provide future benefits to approximately140 active employees, upon retirement. Benefits include the option to elect company provided healthcare insurancebenefits to age 65 and a Medicare supplemental plan after age 65. The retirement healthcare benefit plans were
73
WOODWARD GOVERNOR COMPANY
Notes to Consolidated Financial Statements — (Continued)(amounts in thousands, except per share)
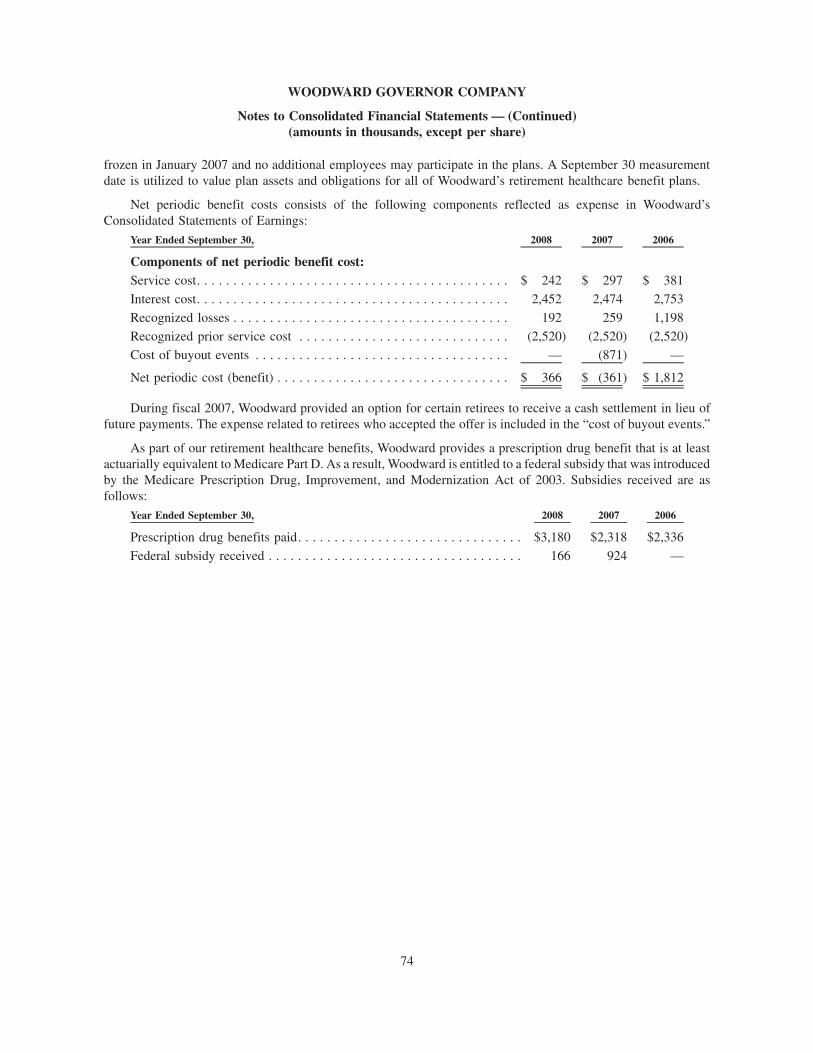
frozen in January 2007 and no additional employees may participate in the plans. A September 30 measurementdate is utilized to value plan assets and obligations for all of Woodward’s retirement healthcare benefit plans.
Net periodic benefit costs consists of the following components reflected as expense in Woodward’sConsolidated Statements of Earnings:
Year Ended September 30, 2008 2007 2006
Components of net periodic benefit cost:Service cost. . . . . . . . . . . . . . . . . . . . . . . . . . . . . . . . . . . . . . . . . . . $ 242 $ 297 $ 381Interest cost. . . . . . . . . . . . . . . . . . . . . . . . . . . . . . . . . . . . . . . . . . . 2,452 2,474 2,753Recognized losses . . . . . . . . . . . . . . . . . . . . . . . . . . . . . . . . . . . . . . 192 259 1,198Recognized prior service cost . . . . . . . . . . . . . . . . . . . . . . . . . . . . . (2,520) (2,520) (2,520)Cost of buyout events . . . . . . . . . . . . . . . . . . . . . . . . . . . . . . . . . . . — (871) —
Net periodic cost (benefit) . . . . . . . . . . . . . . . . . . . . . . . . . . . . . . . . $ 366 $ (361) $ 1,812
During fiscal 2007, Woodward provided an option for certain retirees to receive a cash settlement in lieu offuture payments. The expense related to retirees who accepted the offer is included in the “cost of buyout events.”
As part of our retirement healthcare benefits, Woodward provides a prescription drug benefit that is at leastactuarially equivalent to Medicare Part D. As a result, Woodward is entitled to a federal subsidy that was introducedby the Medicare Prescription Drug, Improvement, and Modernization Act of 2003. Subsidies received are asfollows:
Year Ended September 30, 2008 2007 2006
Prescription drug benefits paid. . . . . . . . . . . . . . . . . . . . . . . . . . . . . . . $3,180 $2,318 $2,336Federal subsidy received . . . . . . . . . . . . . . . . . . . . . . . . . . . . . . . . . . . 166 924 —
74
WOODWARD GOVERNOR COMPANY
Notes to Consolidated Financial Statements — (Continued)(amounts in thousands, except per share)
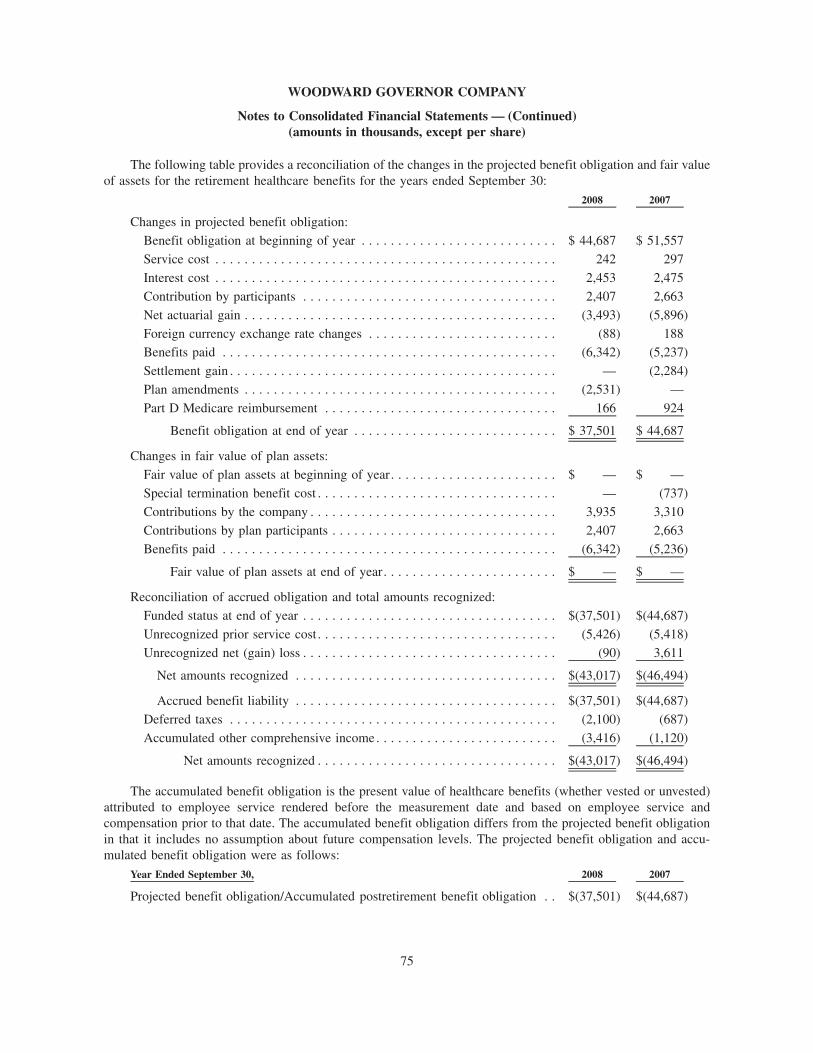
The following table provides a reconciliation of the changes in the projected benefit obligation and fair valueof assets for the retirement healthcare benefits for the years ended September 30:
2008 2007
Changes in projected benefit obligation:Benefit obligation at beginning of year . . . . . . . . . . . . . . . . . . . . . . . . . . . $ 44,687 $ 51,557Service cost . . . . . . . . . . . . . . . . . . . . . . . . . . . . . . . . . . . . . . . . . . . . . . . 242 297Interest cost . . . . . . . . . . . . . . . . . . . . . . . . . . . . . . . . . . . . . . . . . . . . . . . 2,453 2,475Contribution by participants . . . . . . . . . . . . . . . . . . . . . . . . . . . . . . . . . . . 2,407 2,663Net actuarial gain . . . . . . . . . . . . . . . . . . . . . . . . . . . . . . . . . . . . . . . . . . . (3,493) (5,896)Foreign currency exchange rate changes . . . . . . . . . . . . . . . . . . . . . . . . . . (88) 188Benefits paid . . . . . . . . . . . . . . . . . . . . . . . . . . . . . . . . . . . . . . . . . . . . . . (6,342) (5,237)Settlement gain . . . . . . . . . . . . . . . . . . . . . . . . . . . . . . . . . . . . . . . . . . . . . — (2,284)Plan amendments . . . . . . . . . . . . . . . . . . . . . . . . . . . . . . . . . . . . . . . . . . . (2,531) —Part D Medicare reimbursement . . . . . . . . . . . . . . . . . . . . . . . . . . . . . . . . 166 924
Benefit obligation at end of year . . . . . . . . . . . . . . . . . . . . . . . . . . . . $ 37,501 $ 44,687
Changes in fair value of plan assets:Fair value of plan assets at beginning of year. . . . . . . . . . . . . . . . . . . . . . . $ — $ —Special termination benefit cost . . . . . . . . . . . . . . . . . . . . . . . . . . . . . . . . . — (737)Contributions by the company . . . . . . . . . . . . . . . . . . . . . . . . . . . . . . . . . . 3,935 3,310Contributions by plan participants . . . . . . . . . . . . . . . . . . . . . . . . . . . . . . . 2,407 2,663Benefits paid . . . . . . . . . . . . . . . . . . . . . . . . . . . . . . . . . . . . . . . . . . . . . . (6,342) (5,236)
Fair value of plan assets at end of year. . . . . . . . . . . . . . . . . . . . . . . . $ — $ —
Reconciliation of accrued obligation and total amounts recognized:Funded status at end of year . . . . . . . . . . . . . . . . . . . . . . . . . . . . . . . . . . . $(37,501) $(44,687)Unrecognized prior service cost . . . . . . . . . . . . . . . . . . . . . . . . . . . . . . . . . (5,426) (5,418)Unrecognized net (gain) loss . . . . . . . . . . . . . . . . . . . . . . . . . . . . . . . . . . . (90) 3,611
Net amounts recognized . . . . . . . . . . . . . . . . . . . . . . . . . . . . . . . . . . . . $(43,017) $(46,494)
Accrued benefit liability . . . . . . . . . . . . . . . . . . . . . . . . . . . . . . . . . . . . $(37,501) $(44,687)Deferred taxes . . . . . . . . . . . . . . . . . . . . . . . . . . . . . . . . . . . . . . . . . . . . . (2,100) (687)Accumulated other comprehensive income. . . . . . . . . . . . . . . . . . . . . . . . . (3,416) (1,120)
Net amounts recognized . . . . . . . . . . . . . . . . . . . . . . . . . . . . . . . . . $(43,017) $(46,494)
The accumulated benefit obligation is the present value of healthcare benefits (whether vested or unvested)attributed to employee service rendered before the measurement date and based on employee service andcompensation prior to that date. The accumulated benefit obligation differs from the projected benefit obligationin that it includes no assumption about future compensation levels. The projected benefit obligation and accu-mulated benefit obligation were as follows:
Year Ended September 30, 2008 2007
Projected benefit obligation/Accumulated postretirement benefit obligation . . $(37,501) $(44,687)
75
WOODWARD GOVERNOR COMPANY
Notes to Consolidated Financial Statements — (Continued)(amounts in thousands, except per share)
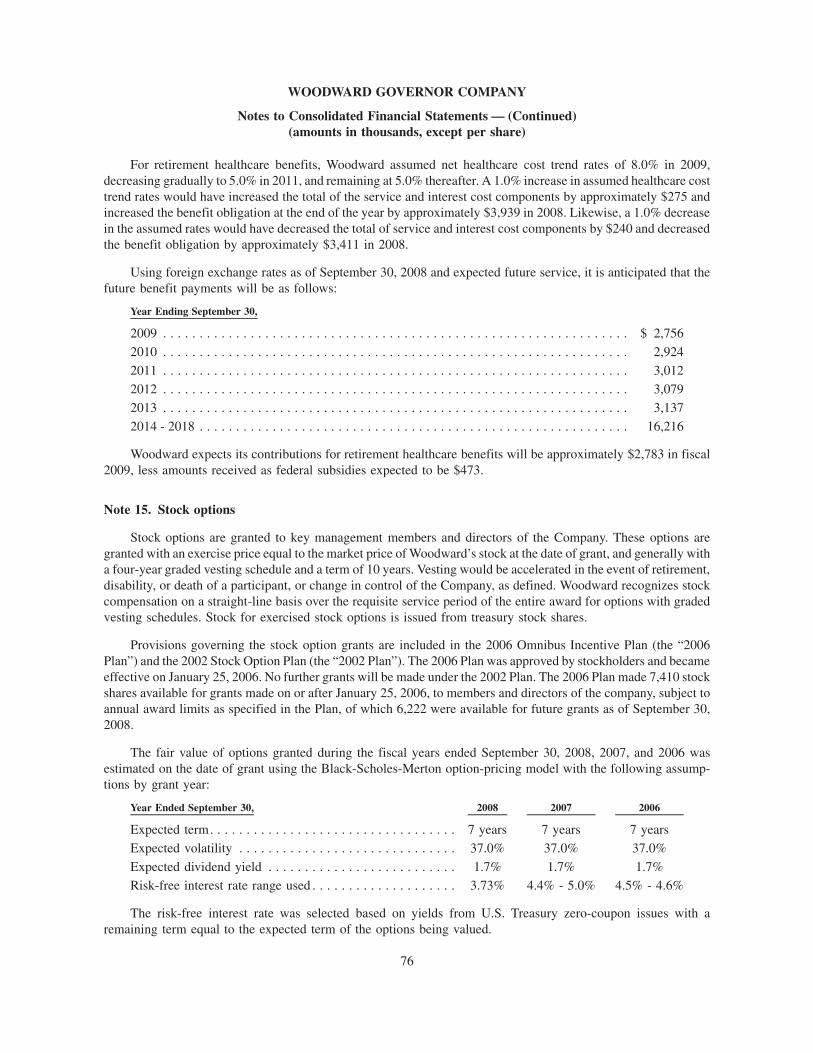
For retirement healthcare benefits, Woodward assumed net healthcare cost trend rates of 8.0% in 2009,decreasing gradually to 5.0% in 2011, and remaining at 5.0% thereafter. A 1.0% increase in assumed healthcare costtrend rates would have increased the total of the service and interest cost components by approximately $275 andincreased the benefit obligation at the end of the year by approximately $3,939 in 2008. Likewise, a 1.0% decreasein the assumed rates would have decreased the total of service and interest cost components by $240 and decreasedthe benefit obligation by approximately $3,411 in 2008.
Using foreign exchange rates as of September 30, 2008 and expected future service, it is anticipated that thefuture benefit payments will be as follows:
Year Ending September 30,
2009 . . . . . . . . . . . . . . . . . . . . . . . . . . . . . . . . . . . . . . . . . . . . . . . . . . . . . . . . . . . . . . . . $ 2,7562010 . . . . . . . . . . . . . . . . . . . . . . . . . . . . . . . . . . . . . . . . . . . . . . . . . . . . . . . . . . . . . . . . 2,9242011 . . . . . . . . . . . . . . . . . . . . . . . . . . . . . . . . . . . . . . . . . . . . . . . . . . . . . . . . . . . . . . . . 3,0122012 . . . . . . . . . . . . . . . . . . . . . . . . . . . . . . . . . . . . . . . . . . . . . . . . . . . . . . . . . . . . . . . . 3,0792013 . . . . . . . . . . . . . . . . . . . . . . . . . . . . . . . . . . . . . . . . . . . . . . . . . . . . . . . . . . . . . . . . 3,1372014 - 2018 . . . . . . . . . . . . . . . . . . . . . . . . . . . . . . . . . . . . . . . . . . . . . . . . . . . . . . . . . . . 16,216
Woodward expects its contributions for retirement healthcare benefits will be approximately $2,783 in fiscal2009, less amounts received as federal subsidies expected to be $473.
Note 15. Stock options
Stock options are granted to key management members and directors of the Company. These options aregranted with an exercise price equal to the market price of Woodward’s stock at the date of grant, and generally witha four-year graded vesting schedule and a term of 10 years. Vesting would be accelerated in the event of retirement,disability, or death of a participant, or change in control of the Company, as defined. Woodward recognizes stockcompensation on a straight-line basis over the requisite service period of the entire award for options with gradedvesting schedules. Stock for exercised stock options is issued from treasury stock shares.
Provisions governing the stock option grants are included in the 2006 Omnibus Incentive Plan (the “2006Plan”) and the 2002 Stock Option Plan (the “2002 Plan”). The 2006 Plan was approved by stockholders and becameeffective on January 25, 2006. No further grants will be made under the 2002 Plan. The 2006 Plan made 7,410 stockshares available for grants made on or after January 25, 2006, to members and directors of the company, subject toannual award limits as specified in the Plan, of which 6,222 were available for future grants as of September 30,2008.
The fair value of options granted during the fiscal years ended September 30, 2008, 2007, and 2006 wasestimated on the date of grant using the Black-Scholes-Merton option-pricing model with the following assump-tions by grant year:
Year Ended September 30, 2008 2007 2006
Expected term. . . . . . . . . . . . . . . . . . . . . . . . . . . . . . . . . . 7 years 7 years 7 yearsExpected volatility . . . . . . . . . . . . . . . . . . . . . . . . . . . . . . 37.0% 37.0% 37.0%Expected dividend yield . . . . . . . . . . . . . . . . . . . . . . . . . . 1.7% 1.7% 1.7%Risk-free interest rate range used . . . . . . . . . . . . . . . . . . . . 3.73% 4.4% - 5.0% 4.5% - 4.6%
The risk-free interest rate was selected based on yields from U.S. Treasury zero-coupon issues with aremaining term equal to the expected term of the options being valued.
76
WOODWARD GOVERNOR COMPANY
Notes to Consolidated Financial Statements — (Continued)(amounts in thousands, except per share)
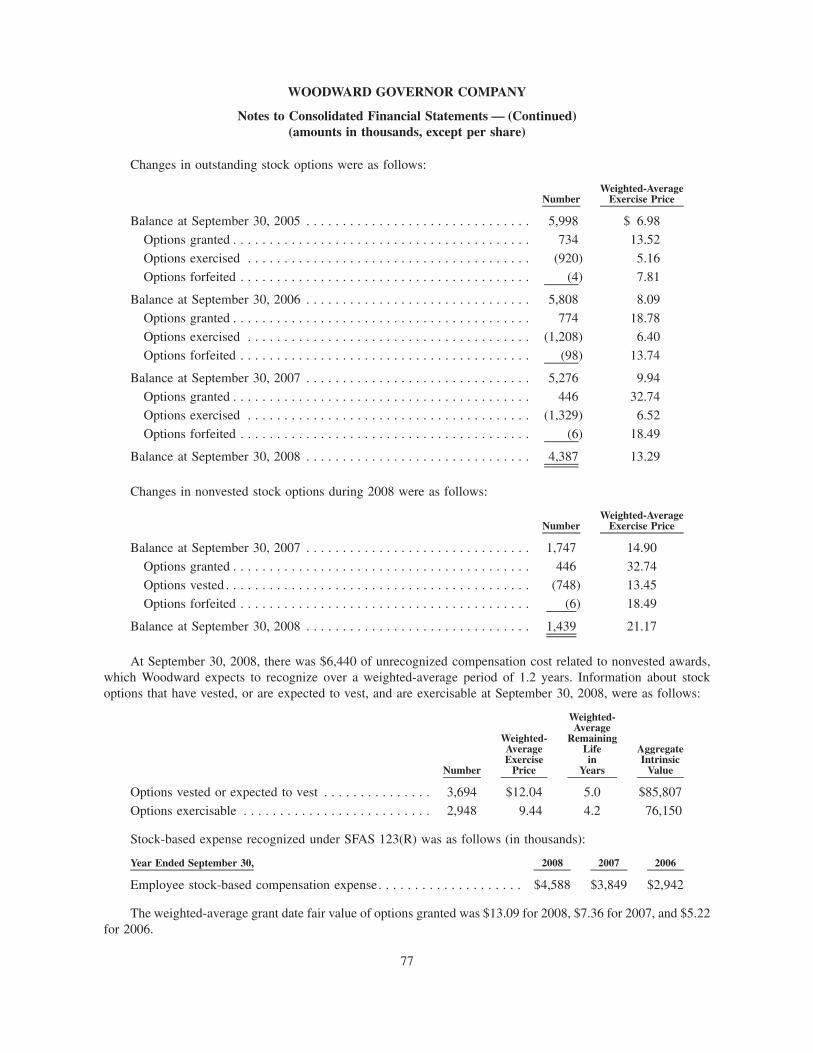
Changes in outstanding stock options were as follows:
NumberWeighted-Average
Exercise Price
Balance at September 30, 2005 . . . . . . . . . . . . . . . . . . . . . . . . . . . . . . . 5,998 $ 6.98Options granted . . . . . . . . . . . . . . . . . . . . . . . . . . . . . . . . . . . . . . . . . 734 13.52Options exercised . . . . . . . . . . . . . . . . . . . . . . . . . . . . . . . . . . . . . . . (920) 5.16Options forfeited . . . . . . . . . . . . . . . . . . . . . . . . . . . . . . . . . . . . . . . . (4) 7.81
Balance at September 30, 2006 . . . . . . . . . . . . . . . . . . . . . . . . . . . . . . . 5,808 8.09Options granted . . . . . . . . . . . . . . . . . . . . . . . . . . . . . . . . . . . . . . . . . 774 18.78Options exercised . . . . . . . . . . . . . . . . . . . . . . . . . . . . . . . . . . . . . . . (1,208) 6.40Options forfeited . . . . . . . . . . . . . . . . . . . . . . . . . . . . . . . . . . . . . . . . (98) 13.74
Balance at September 30, 2007 . . . . . . . . . . . . . . . . . . . . . . . . . . . . . . . 5,276 9.94Options granted . . . . . . . . . . . . . . . . . . . . . . . . . . . . . . . . . . . . . . . . . 446 32.74Options exercised . . . . . . . . . . . . . . . . . . . . . . . . . . . . . . . . . . . . . . . (1,329) 6.52Options forfeited . . . . . . . . . . . . . . . . . . . . . . . . . . . . . . . . . . . . . . . . (6) 18.49
Balance at September 30, 2008 . . . . . . . . . . . . . . . . . . . . . . . . . . . . . . . 4,387 13.29
Changes in nonvested stock options during 2008 were as follows:
NumberWeighted-Average
Exercise Price
Balance at September 30, 2007 . . . . . . . . . . . . . . . . . . . . . . . . . . . . . . . 1,747 14.90Options granted . . . . . . . . . . . . . . . . . . . . . . . . . . . . . . . . . . . . . . . . . 446 32.74Options vested . . . . . . . . . . . . . . . . . . . . . . . . . . . . . . . . . . . . . . . . . . (748) 13.45Options forfeited . . . . . . . . . . . . . . . . . . . . . . . . . . . . . . . . . . . . . . . . (6) 18.49
Balance at September 30, 2008 . . . . . . . . . . . . . . . . . . . . . . . . . . . . . . . 1,439 21.17
At September 30, 2008, there was $6,440 of unrecognized compensation cost related to nonvested awards,which Woodward expects to recognize over a weighted-average period of 1.2 years. Information about stockoptions that have vested, or are expected to vest, and are exercisable at September 30, 2008, were as follows:
Number
Weighted-AverageExercise
Price
Weighted-Average
RemainingLifein
Years
AggregateIntrinsic
Value
Options vested or expected to vest . . . . . . . . . . . . . . . 3,694 $12.04 5.0 $85,807Options exercisable . . . . . . . . . . . . . . . . . . . . . . . . . . 2,948 9.44 4.2 76,150
Stock-based expense recognized under SFAS 123(R) was as follows (in thousands):
Year Ended September 30, 2008 2007 2006
Employee stock-based compensation expense. . . . . . . . . . . . . . . . . . . . $4,588 $3,849 $2,942
The weighted-average grant date fair value of options granted was $13.09 for 2008, $7.36 for 2007, and $5.22for 2006.
77
WOODWARD GOVERNOR COMPANY
Notes to Consolidated Financial Statements — (Continued)(amounts in thousands, except per share)
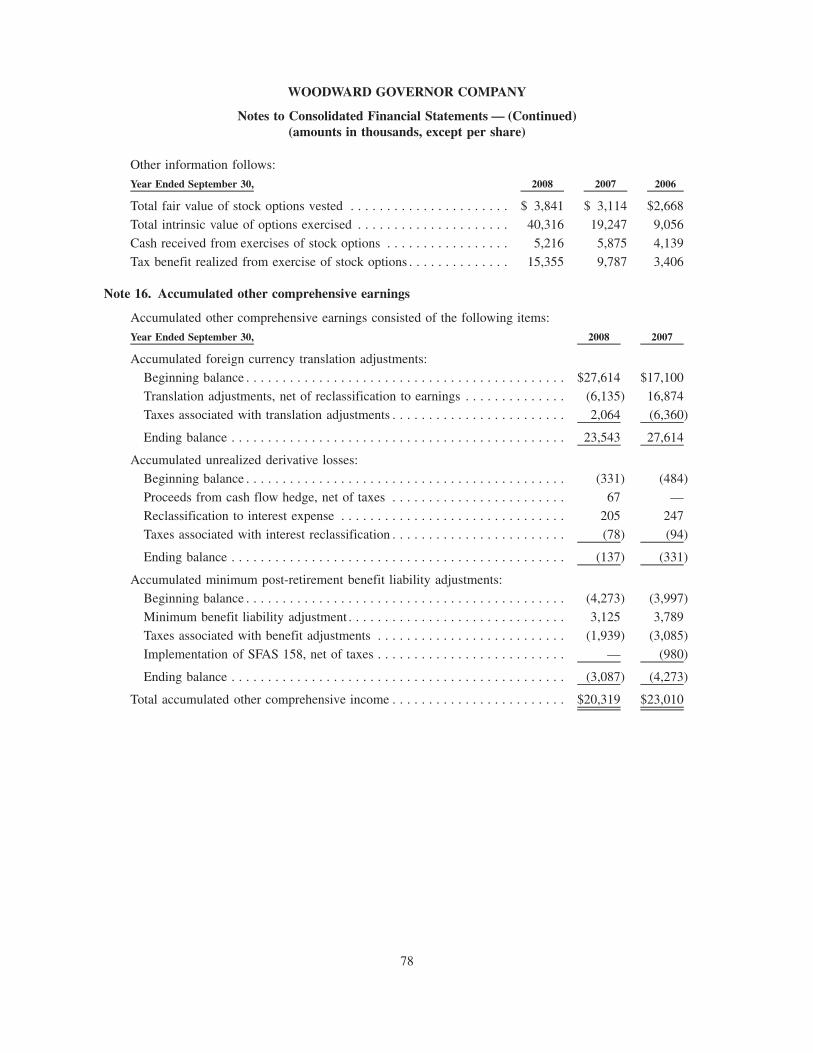
Other information follows:Year Ended September 30, 2008 2007 2006
Total fair value of stock options vested . . . . . . . . . . . . . . . . . . . . . . $ 3,841 $ 3,114 $2,668Total intrinsic value of options exercised . . . . . . . . . . . . . . . . . . . . . 40,316 19,247 9,056Cash received from exercises of stock options . . . . . . . . . . . . . . . . . 5,216 5,875 4,139Tax benefit realized from exercise of stock options . . . . . . . . . . . . . . 15,355 9,787 3,406
Note 16. Accumulated other comprehensive earnings
Accumulated other comprehensive earnings consisted of the following items:Year Ended September 30, 2008 2007
Accumulated foreign currency translation adjustments:Beginning balance . . . . . . . . . . . . . . . . . . . . . . . . . . . . . . . . . . . . . . . . . . . . $27,614 $17,100Translation adjustments, net of reclassification to earnings . . . . . . . . . . . . . . (6,135) 16,874Taxes associated with translation adjustments . . . . . . . . . . . . . . . . . . . . . . . . 2,064 (6,360)
Ending balance . . . . . . . . . . . . . . . . . . . . . . . . . . . . . . . . . . . . . . . . . . . . . . 23,543 27,614
Accumulated unrealized derivative losses:Beginning balance . . . . . . . . . . . . . . . . . . . . . . . . . . . . . . . . . . . . . . . . . . . . (331) (484)Proceeds from cash flow hedge, net of taxes . . . . . . . . . . . . . . . . . . . . . . . . 67 —Reclassification to interest expense . . . . . . . . . . . . . . . . . . . . . . . . . . . . . . . 205 247Taxes associated with interest reclassification . . . . . . . . . . . . . . . . . . . . . . . . (78) (94)
Ending balance . . . . . . . . . . . . . . . . . . . . . . . . . . . . . . . . . . . . . . . . . . . . . . (137) (331)
Accumulated minimum post-retirement benefit liability adjustments:Beginning balance . . . . . . . . . . . . . . . . . . . . . . . . . . . . . . . . . . . . . . . . . . . . (4,273) (3,997)Minimum benefit liability adjustment . . . . . . . . . . . . . . . . . . . . . . . . . . . . . . 3,125 3,789Taxes associated with benefit adjustments . . . . . . . . . . . . . . . . . . . . . . . . . . (1,939) (3,085)Implementation of SFAS 158, net of taxes . . . . . . . . . . . . . . . . . . . . . . . . . . — (980)
Ending balance . . . . . . . . . . . . . . . . . . . . . . . . . . . . . . . . . . . . . . . . . . . . . . (3,087) (4,273)
Total accumulated other comprehensive income . . . . . . . . . . . . . . . . . . . . . . . . $20,319 $23,010
78
WOODWARD GOVERNOR COMPANY
Notes to Consolidated Financial Statements — (Continued)(amounts in thousands, except per share)
Note 17. Commitments and guarantees
Woodward has entered into operating leases for certain facilities and equipment with terms in excess of oneyear under agreements that expire at various dates. Some leases require the payment of property taxes, insurance,and maintenance costs in addition to rental payments. Future minimum rental payments required under these leasesare as follows:
Year Ending September 30,
2009 . . . . . . . . . . . . . . . . . . . . . . . . . . . . . . . . . . . . . . . . . . . . . . . . . . . . . . . . . . . . . . . . . $4,4002010 . . . . . . . . . . . . . . . . . . . . . . . . . . . . . . . . . . . . . . . . . . . . . . . . . . . . . . . . . . . . . . . . . 3,8002011 . . . . . . . . . . . . . . . . . . . . . . . . . . . . . . . . . . . . . . . . . . . . . . . . . . . . . . . . . . . . . . . . . 3,1002012 . . . . . . . . . . . . . . . . . . . . . . . . . . . . . . . . . . . . . . . . . . . . . . . . . . . . . . . . . . . . . . . . . 2,9002013 . . . . . . . . . . . . . . . . . . . . . . . . . . . . . . . . . . . . . . . . . . . . . . . . . . . . . . . . . . . . . . . . . 2,500Thereafter . . . . . . . . . . . . . . . . . . . . . . . . . . . . . . . . . . . . . . . . . . . . . . . . . . . . . . . . . . . . . 3,100
Rent expense for all operating leases totaled $6,503 in fiscal 2008, $5,524 in fiscal 2007, and $4,610 in fiscal2006.
Woodward enters into unconditional purchase obligation arrangements (i.e., issuance of purchase orders,obligations to transfer funds in the future for fixed or minimum quantities of goods or services at fixed or minimumprices, such as “take-or-pay” contracts) in the normal course of business to ensure that adequate levels of sourcedproduct are available to Woodward. Future minimum unconditional purchase obligations are as follows:
Year Ending September 30,
2009 . . . . . . . . . . . . . . . . . . . . . . . . . . . . . . . . . . . . . . . . . . . . . . . . . . . . . . . . . . . . . . . $132,9772010 . . . . . . . . . . . . . . . . . . . . . . . . . . . . . . . . . . . . . . . . . . . . . . . . . . . . . . . . . . . . . . . 2,222
Guarantees and letters of credit totaling approximately $8,200 were outstanding as of September 30, 2008,some of which were secured by cash and cash equivalents at financial institutions or by Woodward line of creditfacilities.
Note 18. Contingencies
Woodward is currently involved in pending or threatened litigation or other legal proceedings regardingemployment, product liability, and contractual matters arising from the normal course of business. The Companyhas accrued for individual matters that it believes are likely to result in a loss when ultimately resolved using estimatesof the most likely amount of loss. There are also individual matters that management believes the likelihood of a losswhen ultimately resolved is less than likely but more than remote, which were not accrued. While it is possible thatthere could be additional losses that have not been accrued, management currently believes the possible additional lossin the event of an unfavorable resolution of each matter is less than $10.0 million in the aggregate.
MPC Products Corporation (“MPC”), which was acquired by Woodward on October 1, 2008, as described inNote 22, “Subsequent Events,” is subject to an investigation by the U.S. Department of Justice (the “DOJ”)regarding certain of its pricing practices prior to 2006 related to government contracts. MPC and the U.S. Attorneyfor the Northern District of Illinois have reached a settlement in principle and are in the process of finalizing andobtaining approvals within the DOJ. Final disposition will be subject to acceptance and approval by the U.S. DistrictCourt. It is anticipated that any settlement of the matter would involve the payment of monetary fines and otheramounts by MPC. MPC is also in the process of working with the U.S. Department of Defense to resolve anyadministrative matters that may arise out of the investigation. There can be no assurance as to the resolution of thesematters. The purchase price for MPC reflects the amount agreed to in principle by MPC with the U.S. Attorney. Anyresulting fines or other sanctions beyond this amount could have a material negative impact on Woodward.
79
WOODWARD GOVERNOR COMPANY
Notes to Consolidated Financial Statements — (Continued)(amounts in thousands, except per share)
Woodward currently does not have any administrative or judicial proceedings arising under any Federal, State,or local provisions regulating the discharge of materials into the environment or primarily for the purpose ofprotecting the environment.
Woodward does not recognize contingencies that might result in a gain until such contingencies are resolvedand the related amounts are realized.
In the event of a change in control of the Company, Woodward may be required to pay termination benefits tocertain executive officers.
Note 19. Financial instruments
The estimated fair values of Woodward’s financial instruments were as follows:
EstimatedFair Value
CarryingCost
EstimatedFair Value
CarryingCost
2008 2007At September 30,
Cash and cash equivalents . . . . . . . . . . . . . . . . . . . $109,833 $109,833 $ 71,635 $ 71,635Investments in deferred compensation program . . . . 3,931 3,931 — —Short-term borrowings . . . . . . . . . . . . . . . . . . . . . . (4,031) (4,031) (5,496) (5,496)Long-term debt, including current portion . . . . . . . . (44,836) (44,516) (60,473) (60,473)Obligations for deferred compensation program . . . (3,931) (3,931) — —
The fair values of cash and cash equivalents and short-term borrowings at variable interest rates are assumed tobe equal to their carrying amounts. Cash and cash equivalents have short-term maturities and short-term borrowingshave short-term maturities and market interest rates.
Investments and obligations related to the deferred compensation program used to provide deferred com-pensation benefits to certain employees are assumed to be equal to their carrying amounts since both the asset andthe liability are marked to market value each reporting period.
The fair value of long-term debt at fixed interest rates was estimated based on a model that discounted futureprincipal and interest payments at interest rates available to the Company at the end of the year for similar debt ofthe same maturity. The weighted-average interest rates used to estimate the fair value of long-term debt at fixedinterest rates were 6.0% at September 30, 2008, and 6.3% at September 30, 2007.
Note 20. Segment information:
During fiscal years 2008, 2007 and 2006, Woodward operated in the following three business segments:
• Turbine Systems is focused on developing and manufacturing systems and components that provide energycontrol and optimization solutions for the aircraft and industrial gas turbine markets.
• Engine Systems is focused on developing and manufacturing systems and components that provide energycontrol and optimization solutions for industrial markets, which includes power generation, transportation,and process industries.
• Electrical Power Systems is focused on developing and manufacturing systems and components thatprovide power sensing and energy control systems that improve the security, quality, reliability, andavailability of electrical power networks for industrial markets, which includes power generation, powerdistribution, transportation, and process industries.
80
WOODWARD GOVERNOR COMPANY
Notes to Consolidated Financial Statements — (Continued)(amounts in thousands, except per share)
On October 1, 2008, Woodward completed the acquisition of MPC and Techni-Core, Inc. (“Techni-Core”)which formed the basis for its fourth business segment — Airframe Systems. Additional information aboutAirframe Systems and the acquisition is included in Note 22, “Subsequent Events.”
• Airframe Systems is focused is focused on developing and manufacturing high-performance electrome-chanical motion control systems, including sensors, primarily for aerospace applications.
The accounting policies of the segments are the same as those described in Note 1, “Operations and summaryof significant accounting policies.” Intersegment sales and transfers are made at established intersegment sellingprices generally intended to approximate selling prices to unrelated parties. The determination of segment earningsdoes not reflect allocations of certain corporate expenses, which are designated as nonsegment expenses, and isbefore interest expense, interest income, and income taxes.
Segment assets consist of accounts receivable, inventories, property, plant, and equipment — net, goodwill,and other intangibles — net.
Summarized financial information for Woodward’s segments follows:At or for the Year Ended September 30, 2008 2007 2006
Segment net sales:Turbine Systems
External net sales . . . . . . . . . . . . . . . . . . . . . . . . . . . . $ 577,304 $ 502,557 $438,726Intersegment sales . . . . . . . . . . . . . . . . . . . . . . . . . . . . 18,470 21,285 20,197
Total segment net sales . . . . . . . . . . . . . . . . . . . . . . . . 595,774 523,842 458,923Engine Systems
External net sales . . . . . . . . . . . . . . . . . . . . . . . . . . . . 458,177 414,076 390,619Intersegment sales . . . . . . . . . . . . . . . . . . . . . . . . . . . . 41,141 41,124 39,829
Total segment net sales . . . . . . . . . . . . . . . . . . . . . . . . 499,318 455,200 430,448Electrical Power Systems
External net sales . . . . . . . . . . . . . . . . . . . . . . . . . . . . 222,723 125,704 25,170Intersegment sales . . . . . . . . . . . . . . . . . . . . . . . . . . . . 66,571 55,662 51,016
Total segment net sales . . . . . . . . . . . . . . . . . . . . . . . . 289,294 181,366 76,186Consolidated
External net sales . . . . . . . . . . . . . . . . . . . . . . . . . . . . 1,258,204 1,042,337 854,515Intersegment sales . . . . . . . . . . . . . . . . . . . . . . . . . . . . 126,182 118,071 111,042
Total segment net sales . . . . . . . . . . . . . . . . . . . . . . . . $1,384,386 $1,160,408 $965,557
Segment earnings:Turbine Systems . . . . . . . . . . . . . . . . . . . . . . . . . . . . . . . $ 116,196 $ 87,353 $ 67,584Engine Systems . . . . . . . . . . . . . . . . . . . . . . . . . . . . . . . 56,471 56,984 40,829Electrical Power Systems . . . . . . . . . . . . . . . . . . . . . . . . 42,303 20,294 4,475
Total segment earnings . . . . . . . . . . . . . . . . . . . . . . . . . . 214,970 164,631 112,888Nonsegment expenses . . . . . . . . . . . . . . . . . . . . . . . . . . . (31,346) (31,720) (26,052)Interest expense and income, net . . . . . . . . . . . . . . . . . . . (1,714) (923) (2,339)
Consolidated earnings before income taxes . . . . . . . . . . . $ 181,910 $ 131,988 $ 84,497
81
WOODWARD GOVERNOR COMPANY
Notes to Consolidated Financial Statements — (Continued)(amounts in thousands, except per share)
At or for the Year Ended September 30, 2008 2007 2006
Segment assets:Turbine Systems . . . . . . . . . . . . . . . . . . . . . . . . . . . . . . . $ 371,275 $ 330,969 $317,688Engine Systems . . . . . . . . . . . . . . . . . . . . . . . . . . . . . . . 242,350 250,908 231,485Electrical Power Systems . . . . . . . . . . . . . . . . . . . . . . . . 133,928 109,674 40,672
Total segment assets . . . . . . . . . . . . . . . . . . . . . . . . . . . . 747,553 691,551 589,845Unallocated corporate property, plant and equipment,
net . . . . . . . . . . . . . . . . . . . . . . . . . . . . . . . . . . . . . . . 13,226 6,651 4,577Other unallocated assets . . . . . . . . . . . . . . . . . . . . . . . . . 166,238 131,565 141,075
Consolidated total assets . . . . . . . . . . . . . . . . . . . . . . . . . $ 927,017 $ 829,767 $735,497
Segment depreciation and amortization:Turbine Systems . . . . . . . . . . . . . . . . . . . . . . . . . . . . . . . $ 14,586 $ 12,133 $ 14,764Engine Systems . . . . . . . . . . . . . . . . . . . . . . . . . . . . . . . 13,034 14,271 12,148Electrical Power Systems . . . . . . . . . . . . . . . . . . . . . . . . 6,002 5,572 1,455
Total segment depreciation and amortization . . . . . . . . . . 33,622 31,976 28,367Unallocated corporate amounts . . . . . . . . . . . . . . . . . . . . 1,828 948 650
Consolidated depreciation and amortization . . . . . . . . . . . $ 35,450 $ 32,924 $ 29,017
Segment capital expenditures:Turbine Systems . . . . . . . . . . . . . . . . . . . . . . . . . . . . . . . $ 17,710 $ 12,490 $ 14,540Engine Systems . . . . . . . . . . . . . . . . . . . . . . . . . . . . . . . 14,817 13,164 14,098Electrical Power Systems . . . . . . . . . . . . . . . . . . . . . . . . 4,531 5,124 2,098
Total segment capital expenditures . . . . . . . . . . . . . . . . . . 37,058 30,778 30,736Unallocated corporate amounts . . . . . . . . . . . . . . . . . . . . 4,041 1,206 977
Consolidated capital expenditures . . . . . . . . . . . . . . . . . . $ 41,099 $ 31,984 $ 31,713
Two customers individually accounted for more than 10% of consolidated net sales in each of the fiscal years2006 through 2008. Sales to the first customer were made by all of Woodward’s segments and totaled approximately17%, 20%, and 22% of sales during the years ended September 30, 2008, 2007, and 2006, respectively. Sales to thesecond customer were made by all of Woodward’s segments and totaled approximately 10%, 10%, and 11% of salesduring the years ended September 30, 2008, 2007, and 2006, respectively.
One customer accounted for more than 10% of accounts receivable as of September 30, 2008 and 2007.Accounts receivable from this customer totaled approximately 20% and 21% of accounts receivable at Septem-ber 30, 2008 and 2007, respectively.
82
WOODWARD GOVERNOR COMPANY
Notes to Consolidated Financial Statements — (Continued)(amounts in thousands, except per share)

External net sales by geographical area, as determined by the location of the customer invoiced, were asfollows:
Year Ended September 30, 2008 2007 2006
External net sales:United States . . . . . . . . . . . . . . . . . . . . . . . . . . . . . . . . . . . $ 528,318 $ 494,237 $449,617Europe . . . . . . . . . . . . . . . . . . . . . . . . . . . . . . . . . . . . . . . . 433,101 340,292 226,039Asia . . . . . . . . . . . . . . . . . . . . . . . . . . . . . . . . . . . . . . . . . . 198,086 133,738 123,639Other countries . . . . . . . . . . . . . . . . . . . . . . . . . . . . . . . . . . 98,699 74,070 55,220
Consolidated external net sales . . . . . . . . . . . . . . . . . . . . . . $1,258,204 $1,042,337 $854,515
Property, plant, and equipment — net by geographical area, as determined by the physical location of theassets, were as follows:
At September 30, 2008 2007
United States. . . . . . . . . . . . . . . . . . . . . . . . . . . . . . . . . . . . . . . . . . . . . . . . $108,897 $100,336Germany . . . . . . . . . . . . . . . . . . . . . . . . . . . . . . . . . . . . . . . . . . . . . . . . . . . 37,427 36,544Other countries . . . . . . . . . . . . . . . . . . . . . . . . . . . . . . . . . . . . . . . . . . . . . . 22,327 22,118
Consolidated total property, plant, and equipment, net . . . . . . . . . . . . . . . . . $168,651 $158,998
Note 21. Supplementary financial data (Unaudited)
First Second Third Fourth2008 Fiscal Quarters
Net sales. . . . . . . . . . . . . . . . . . . . . . . . . . . . . . . . $272,063 $305,753 $329,847 $350,541Gross profit(1) . . . . . . . . . . . . . . . . . . . . . . . . . . . 81,233 95,376 97,892 100,707Earnings before income taxes . . . . . . . . . . . . . . . . 38,488 43,648 49,096 50,678Net earnings . . . . . . . . . . . . . . . . . . . . . . . . . . . . . 25,325 29,714 32,414 34,427Earnings per share:
Basic . . . . . . . . . . . . . . . . . . . . . . . . . . . . . . . . 0.37 0.44 0.48 0.51Diluted . . . . . . . . . . . . . . . . . . . . . . . . . . . . . . . 0.36 0.43 0.47 0.50
Cash dividends per share . . . . . . . . . . . . . . . . . . . . 0.055 0.060 0.060 0.060Common stock price per share(2):
High . . . . . . . . . . . . . . . . . . . . . . . . . . . . . . . . . 36.22 34.52 42.77 48.62Low . . . . . . . . . . . . . . . . . . . . . . . . . . . . . . . . . 29.69 24.50 26.27 33.00Close . . . . . . . . . . . . . . . . . . . . . . . . . . . . . . . . 33.98 26.72 35.66 35.27
83
WOODWARD GOVERNOR COMPANY
Notes to Consolidated Financial Statements — (Continued)(amounts in thousands, except per share)
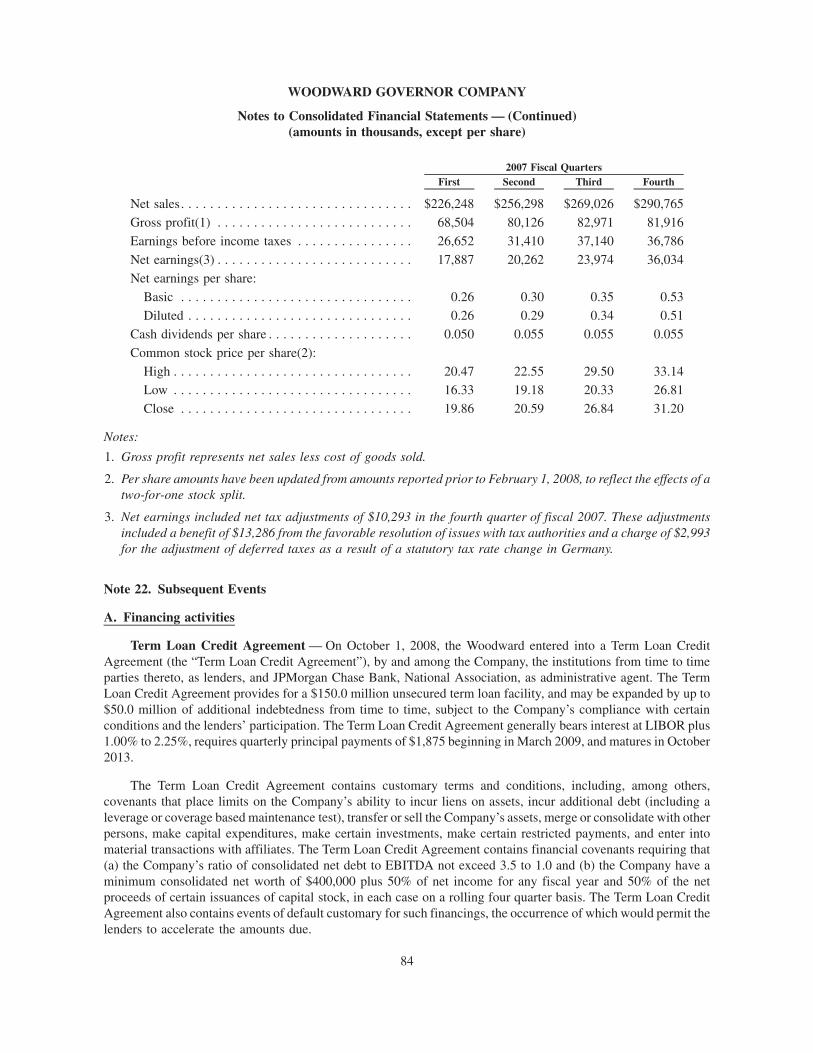
First Second Third Fourth2007 Fiscal Quarters
Net sales. . . . . . . . . . . . . . . . . . . . . . . . . . . . . . . . $226,248 $256,298 $269,026 $290,765Gross profit(1) . . . . . . . . . . . . . . . . . . . . . . . . . . . 68,504 80,126 82,971 81,916Earnings before income taxes . . . . . . . . . . . . . . . . 26,652 31,410 37,140 36,786Net earnings(3) . . . . . . . . . . . . . . . . . . . . . . . . . . . 17,887 20,262 23,974 36,034Net earnings per share:
Basic . . . . . . . . . . . . . . . . . . . . . . . . . . . . . . . . 0.26 0.30 0.35 0.53Diluted . . . . . . . . . . . . . . . . . . . . . . . . . . . . . . . 0.26 0.29 0.34 0.51
Cash dividends per share . . . . . . . . . . . . . . . . . . . . 0.050 0.055 0.055 0.055Common stock price per share(2):
High . . . . . . . . . . . . . . . . . . . . . . . . . . . . . . . . . 20.47 22.55 29.50 33.14Low . . . . . . . . . . . . . . . . . . . . . . . . . . . . . . . . . 16.33 19.18 20.33 26.81Close . . . . . . . . . . . . . . . . . . . . . . . . . . . . . . . . 19.86 20.59 26.84 31.20
Notes:
1. Gross profit represents net sales less cost of goods sold.
2. Per share amounts have been updated from amounts reported prior to February 1, 2008, to reflect the effects of atwo-for-one stock split.
3. Net earnings included net tax adjustments of $10,293 in the fourth quarter of fiscal 2007. These adjustmentsincluded a benefit of $13,286 from the favorable resolution of issues with tax authorities and a charge of $2,993for the adjustment of deferred taxes as a result of a statutory tax rate change in Germany.
Note 22. Subsequent Events
A. Financing activities
Term Loan Credit Agreement — On October 1, 2008, the Woodward entered into a Term Loan CreditAgreement (the “Term Loan Credit Agreement”), by and among the Company, the institutions from time to timeparties thereto, as lenders, and JPMorgan Chase Bank, National Association, as administrative agent. The TermLoan Credit Agreement provides for a $150.0 million unsecured term loan facility, and may be expanded by up to$50.0 million of additional indebtedness from time to time, subject to the Company’s compliance with certainconditions and the lenders’ participation. The Term Loan Credit Agreement generally bears interest at LIBOR plus1.00% to 2.25%, requires quarterly principal payments of $1,875 beginning in March 2009, and matures in October2013.
The Term Loan Credit Agreement contains customary terms and conditions, including, among others,covenants that place limits on the Company’s ability to incur liens on assets, incur additional debt (including aleverage or coverage based maintenance test), transfer or sell the Company’s assets, merge or consolidate with otherpersons, make capital expenditures, make certain investments, make certain restricted payments, and enter intomaterial transactions with affiliates. The Term Loan Credit Agreement contains financial covenants requiring that(a) the Company’s ratio of consolidated net debt to EBITDA not exceed 3.5 to 1.0 and (b) the Company have aminimum consolidated net worth of $400,000 plus 50% of net income for any fiscal year and 50% of the netproceeds of certain issuances of capital stock, in each case on a rolling four quarter basis. The Term Loan CreditAgreement also contains events of default customary for such financings, the occurrence of which would permit thelenders to accelerate the amounts due.
84
WOODWARD GOVERNOR COMPANY
Notes to Consolidated Financial Statements — (Continued)(amounts in thousands, except per share)
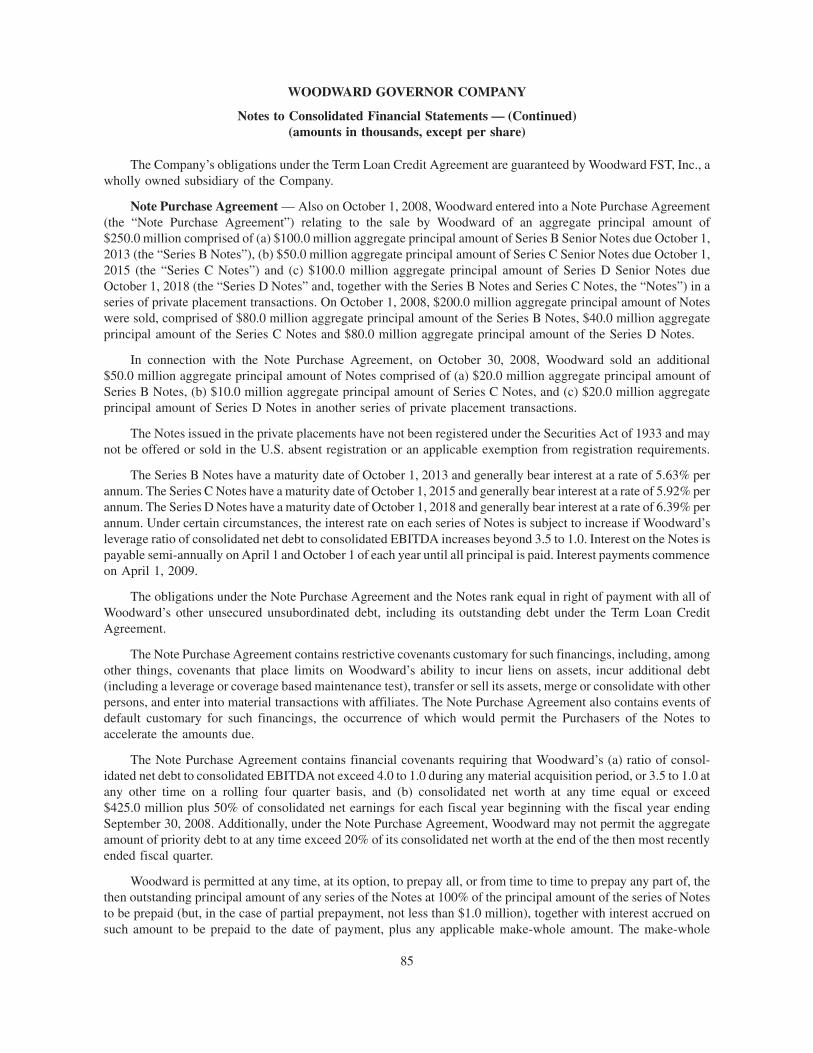
The Company’s obligations under the Term Loan Credit Agreement are guaranteed by Woodward FST, Inc., awholly owned subsidiary of the Company.
Note Purchase Agreement — Also on October 1, 2008, Woodward entered into a Note Purchase Agreement(the “Note Purchase Agreement”) relating to the sale by Woodward of an aggregate principal amount of$250.0 million comprised of (a) $100.0 million aggregate principal amount of Series B Senior Notes due October 1,2013 (the “Series B Notes”), (b) $50.0 million aggregate principal amount of Series C Senior Notes due October 1,2015 (the “Series C Notes”) and (c) $100.0 million aggregate principal amount of Series D Senior Notes dueOctober 1, 2018 (the “Series D Notes” and, together with the Series B Notes and Series C Notes, the “Notes”) in aseries of private placement transactions. On October 1, 2008, $200.0 million aggregate principal amount of Noteswere sold, comprised of $80.0 million aggregate principal amount of the Series B Notes, $40.0 million aggregateprincipal amount of the Series C Notes and $80.0 million aggregate principal amount of the Series D Notes.
In connection with the Note Purchase Agreement, on October 30, 2008, Woodward sold an additional$50.0 million aggregate principal amount of Notes comprised of (a) $20.0 million aggregate principal amount ofSeries B Notes, (b) $10.0 million aggregate principal amount of Series C Notes, and (c) $20.0 million aggregateprincipal amount of Series D Notes in another series of private placement transactions.
The Notes issued in the private placements have not been registered under the Securities Act of 1933 and maynot be offered or sold in the U.S. absent registration or an applicable exemption from registration requirements.
The Series B Notes have a maturity date of October 1, 2013 and generally bear interest at a rate of 5.63% perannum. The Series C Notes have a maturity date of October 1, 2015 and generally bear interest at a rate of 5.92% perannum. The Series D Notes have a maturity date of October 1, 2018 and generally bear interest at a rate of 6.39% perannum. Under certain circumstances, the interest rate on each series of Notes is subject to increase if Woodward’sleverage ratio of consolidated net debt to consolidated EBITDA increases beyond 3.5 to 1.0. Interest on the Notes ispayable semi-annually on April 1 and October 1 of each year until all principal is paid. Interest payments commenceon April 1, 2009.
The obligations under the Note Purchase Agreement and the Notes rank equal in right of payment with all ofWoodward’s other unsecured unsubordinated debt, including its outstanding debt under the Term Loan CreditAgreement.
The Note Purchase Agreement contains restrictive covenants customary for such financings, including, amongother things, covenants that place limits on Woodward’s ability to incur liens on assets, incur additional debt(including a leverage or coverage based maintenance test), transfer or sell its assets, merge or consolidate with otherpersons, and enter into material transactions with affiliates. The Note Purchase Agreement also contains events ofdefault customary for such financings, the occurrence of which would permit the Purchasers of the Notes toaccelerate the amounts due.
The Note Purchase Agreement contains financial covenants requiring that Woodward’s (a) ratio of consol-idated net debt to consolidated EBITDA not exceed 4.0 to 1.0 during any material acquisition period, or 3.5 to 1.0 atany other time on a rolling four quarter basis, and (b) consolidated net worth at any time equal or exceed$425.0 million plus 50% of consolidated net earnings for each fiscal year beginning with the fiscal year endingSeptember 30, 2008. Additionally, under the Note Purchase Agreement, Woodward may not permit the aggregateamount of priority debt to at any time exceed 20% of its consolidated net worth at the end of the then most recentlyended fiscal quarter.
Woodward is permitted at any time, at its option, to prepay all, or from time to time to prepay any part of, thethen outstanding principal amount of any series of the Notes at 100% of the principal amount of the series of Notesto be prepaid (but, in the case of partial prepayment, not less than $1.0 million), together with interest accrued onsuch amount to be prepaid to the date of payment, plus any applicable make-whole amount. The make-whole
85
WOODWARD GOVERNOR COMPANY
Notes to Consolidated Financial Statements — (Continued)(amounts in thousands, except per share)
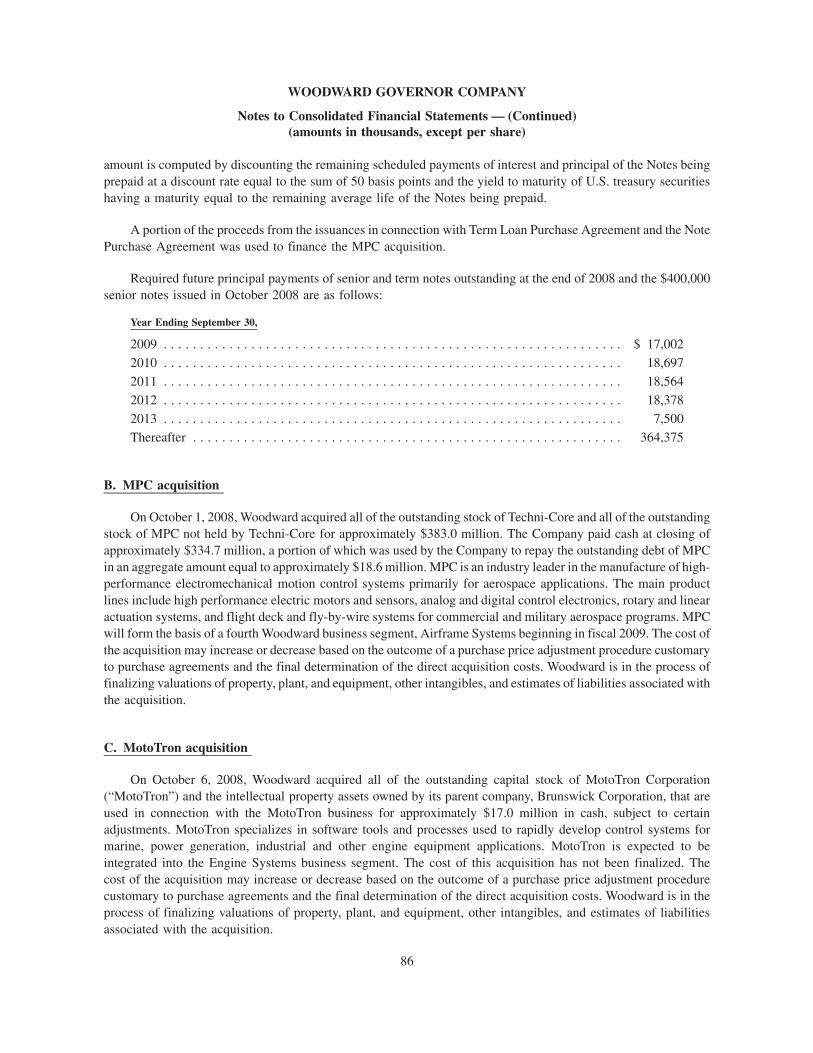
amount is computed by discounting the remaining scheduled payments of interest and principal of the Notes beingprepaid at a discount rate equal to the sum of 50 basis points and the yield to maturity of U.S. treasury securitieshaving a maturity equal to the remaining average life of the Notes being prepaid.
A portion of the proceeds from the issuances in connection with Term Loan Purchase Agreement and the NotePurchase Agreement was used to finance the MPC acquisition.
Required future principal payments of senior and term notes outstanding at the end of 2008 and the $400,000senior notes issued in October 2008 are as follows:
Year Ending September 30,
2009 . . . . . . . . . . . . . . . . . . . . . . . . . . . . . . . . . . . . . . . . . . . . . . . . . . . . . . . . . . . . . . . $ 17,0022010 . . . . . . . . . . . . . . . . . . . . . . . . . . . . . . . . . . . . . . . . . . . . . . . . . . . . . . . . . . . . . . . 18,6972011 . . . . . . . . . . . . . . . . . . . . . . . . . . . . . . . . . . . . . . . . . . . . . . . . . . . . . . . . . . . . . . . 18,5642012 . . . . . . . . . . . . . . . . . . . . . . . . . . . . . . . . . . . . . . . . . . . . . . . . . . . . . . . . . . . . . . . 18,3782013 . . . . . . . . . . . . . . . . . . . . . . . . . . . . . . . . . . . . . . . . . . . . . . . . . . . . . . . . . . . . . . . 7,500Thereafter . . . . . . . . . . . . . . . . . . . . . . . . . . . . . . . . . . . . . . . . . . . . . . . . . . . . . . . . . . . 364,375
B. MPC acquisition
On October 1, 2008, Woodward acquired all of the outstanding stock of Techni-Core and all of the outstandingstock of MPC not held by Techni-Core for approximately $383.0 million. The Company paid cash at closing ofapproximately $334.7 million, a portion of which was used by the Company to repay the outstanding debt of MPCin an aggregate amount equal to approximately $18.6 million. MPC is an industry leader in the manufacture of high-performance electromechanical motion control systems primarily for aerospace applications. The main productlines include high performance electric motors and sensors, analog and digital control electronics, rotary and linearactuation systems, and flight deck and fly-by-wire systems for commercial and military aerospace programs. MPCwill form the basis of a fourth Woodward business segment, Airframe Systems beginning in fiscal 2009. The cost ofthe acquisition may increase or decrease based on the outcome of a purchase price adjustment procedure customaryto purchase agreements and the final determination of the direct acquisition costs. Woodward is in the process offinalizing valuations of property, plant, and equipment, other intangibles, and estimates of liabilities associated withthe acquisition.
C. MotoTron acquisition
On October 6, 2008, Woodward acquired all of the outstanding capital stock of MotoTron Corporation(“MotoTron”) and the intellectual property assets owned by its parent company, Brunswick Corporation, that areused in connection with the MotoTron business for approximately $17.0 million in cash, subject to certainadjustments. MotoTron specializes in software tools and processes used to rapidly develop control systems formarine, power generation, industrial and other engine equipment applications. MotoTron is expected to beintegrated into the Engine Systems business segment. The cost of this acquisition has not been finalized. Thecost of the acquisition may increase or decrease based on the outcome of a purchase price adjustment procedurecustomary to purchase agreements and the final determination of the direct acquisition costs. Woodward is in theprocess of finalizing valuations of property, plant, and equipment, other intangibles, and estimates of liabilitiesassociated with the acquisition.
86
WOODWARD GOVERNOR COMPANY
Notes to Consolidated Financial Statements — (Continued)(amounts in thousands, except per share)
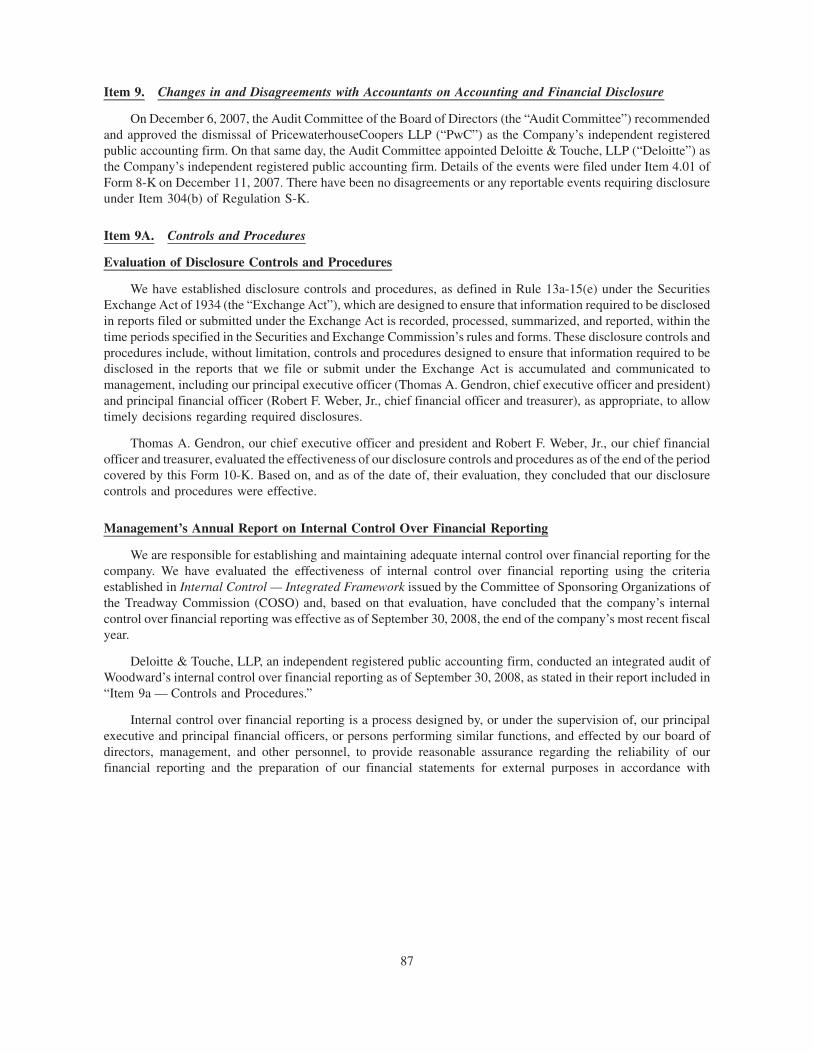
Item 9. Changes in and Disagreements with Accountants on Accounting and Financial Disclosure
On December 6, 2007, the Audit Committee of the Board of Directors (the “Audit Committee”) recommendedand approved the dismissal of PricewaterhouseCoopers LLP (“PwC”) as the Company’s independent registeredpublic accounting firm. On that same day, the Audit Committee appointed Deloitte & Touche, LLP (“Deloitte”) asthe Company’s independent registered public accounting firm. Details of the events were filed under Item 4.01 ofForm 8-K on December 11, 2007. There have been no disagreements or any reportable events requiring disclosureunder Item 304(b) of Regulation S-K.
Item 9A. Controls and Procedures
Evaluation of Disclosure Controls and Procedures
We have established disclosure controls and procedures, as defined in Rule 13a-15(e) under the SecuritiesExchange Act of 1934 (the “Exchange Act”), which are designed to ensure that information required to be disclosedin reports filed or submitted under the Exchange Act is recorded, processed, summarized, and reported, within thetime periods specified in the Securities and Exchange Commission’s rules and forms. These disclosure controls andprocedures include, without limitation, controls and procedures designed to ensure that information required to bedisclosed in the reports that we file or submit under the Exchange Act is accumulated and communicated tomanagement, including our principal executive officer (Thomas A. Gendron, chief executive officer and president)and principal financial officer (Robert F. Weber, Jr., chief financial officer and treasurer), as appropriate, to allowtimely decisions regarding required disclosures.
Thomas A. Gendron, our chief executive officer and president and Robert F. Weber, Jr., our chief financialofficer and treasurer, evaluated the effectiveness of our disclosure controls and procedures as of the end of the periodcovered by this Form 10-K. Based on, and as of the date of, their evaluation, they concluded that our disclosurecontrols and procedures were effective.
Management’s Annual Report on Internal Control Over Financial Reporting
We are responsible for establishing and maintaining adequate internal control over financial reporting for thecompany. We have evaluated the effectiveness of internal control over financial reporting using the criteriaestablished in Internal Control — Integrated Framework issued by the Committee of Sponsoring Organizations ofthe Treadway Commission (COSO) and, based on that evaluation, have concluded that the company’s internalcontrol over financial reporting was effective as of September 30, 2008, the end of the company’s most recent fiscalyear.
Deloitte & Touche, LLP, an independent registered public accounting firm, conducted an integrated audit ofWoodward’s internal control over financial reporting as of September 30, 2008, as stated in their report included in“Item 9a — Controls and Procedures.”
Internal control over financial reporting is a process designed by, or under the supervision of, our principalexecutive and principal financial officers, or persons performing similar functions, and effected by our board ofdirectors, management, and other personnel, to provide reasonable assurance regarding the reliability of ourfinancial reporting and the preparation of our financial statements for external purposes in accordance with
87
generally accepted accounting principles. Internal control over financial reporting includes those policies andprocedures that:
• Pertain to the maintenance of records that, in reasonable detail, accurately and fairly reflect the transactionsand dispositions of the assets of the Company;
• Provide reasonable assurance that transactions are recorded as necessary to permit preparation of financialstatements in accordance with generally accepted accounting principles, and that receipts and expendituresof the Company are being made only in accordance with authorization of management and directors of thecompany; and
• Provide reasonable assurance regarding prevention or timely detection of unauthorized acquisition, use ordisposition of the Company’s assets that could have a material effect on the financial statements.
Changes in Internal Control Over Financial Reporting
There has been no change in our internal control over financial reporting during the fourth fiscal quartercovered by this Form 10-K that has materially affected, or is reasonably likely to materially affect, our internalcontrol over financial reporting.
88
REPORT OF INDEPENDENT REGISTERED PUBLIC ACCOUNTING FIRM
To the Board of Directors and Stockholders ofWoodward Governor CompanyFort Collins, Colorado
We have audited the internal control over financial reporting of Woodward Governor Company and subsid-iaries (the “Company”) as of September 30, 2008, based on criteria established in Internal Control — IntegratedFramework issued by the Committee of Sponsoring Organizations of the Treadway Commission. The Company’smanagement is responsible for maintaining effective internal control over financial reporting and for its assessmentof the effectiveness of internal control over financial reporting, included in the accompanying Management’sAnnual Report on Internal Control Over Financial Reporting. Our responsibility is to express an opinion on theCompany’s internal control over financial reporting based on our audit.
We conducted our audit in accordance with the standards of the Public Company Accounting Oversight Board(United States). Those standards require that we plan and perform the audit to obtain reasonable assurance aboutwhether effective internal control over financial reporting was maintained in all material respects. Our auditincluded obtaining an understanding of internal control over financial reporting, assessing the risk that a materialweakness exists, testing and evaluating the design and operating effectiveness of internal control based on theassessed risk, and performing such other procedures as we considered necessary in the circumstances. We believethat our audit provides a reasonable basis for our opinion.
A company’s internal control over financial reporting is a process designed by, or under the supervision of, thecompany’s principal executive and principal financial officers, or persons performing similar functions, andeffected by the company’s board of directors, management, and other personnel to provide reasonable assuranceregarding the reliability of financial reporting and the preparation of financial statements for external purposes inaccordance with generally accepted accounting principles. A company’s internal control over financial reportingincludes those policies and procedures that (1) pertain to the maintenance of records that, in reasonable detail,accurately and fairly reflect the transactions and dispositions of the assets of the company; (2) provide reasonableassurance that transactions are recorded as necessary to permit preparation of financial statements in accordancewith generally accepted accounting principles, and that receipts and expenditures of the company are being madeonly in accordance with authorizations of management and directors of the company; and (3) provide reasonableassurance regarding prevention or timely detection of unauthorized acquisition, use, or disposition of the company’sassets that could have a material effect on the financial statements.
Because of the inherent limitations of internal control over financial reporting, including the possibility ofcollusion or improper management override of controls, material misstatements due to error or fraud may not beprevented or detected on a timely basis. Also, projections of any evaluation of the effectiveness of the internalcontrol over financial reporting to future periods are subject to the risk that the controls may become inadequatebecause of changes in conditions, or that the degree of compliance with the policies or procedures may deteriorate.
In our opinion, the Company maintained, in all material respects, effective internal control over financialreporting as of September 30, 2008, based on the criteria established in Internal Control — Integrated Frameworkissued by the Committee of Sponsoring Organizations of the Treadway Commission.
We have also audited, in accordance with the standards of the Public Company Accounting Oversight Board(United States), the consolidated financial statements and financial statement schedule as of and for the year endedSeptember 30, 2008 of the Company and our report dated November 19, 2008 expressed an unqualified opinion onthose financial statements and financial statement schedule and included an explanatory paragraph regarding theCompany’s adoption of the Financial Accounting Standards Board’s Interpretation No. 48, Accounting forUncertainty in Income Taxes.
Deloitte & Touche, LLP
Denver, ColoradoNovember 19, 2008
89
Item 9B. Other Information
There is no information required to be disclosed in a report on Form 8-K during the fourth quarter of 2008 thatwas not reported on Form 8-K.
PART III
Item 10. Directors, Executive Officers and Corporate Governance
The information required by this item relating to our directors and nominees, regarding compliance withSection 16(a) of the Securities Act of 1934, and regarding our Audit Committee is included under the captions“Board of Directors,” “Board Meetings and Committees — Audit Committee” (including information with respectto audit committee financial experts), “Stock Ownership of Management,” and “Section 16(a) Beneficial Own-ership Reporting Compliance” in our Proxy Statement related to the 2008 Annual Meeting of Stockholders to beheld January 22, 2009 and is incorporated herein by reference.
The information required by this item relating to our executive officers is included under the caption“Executive Officers of the Registrant” in Item 1 of this report.
We have adopted a code of ethics that applies to our principal executive officer and our principal financial andaccounting officer. This code of ethics is posted on our Website. The Internet address for our Website iswww.woodward.com, and the code of ethics may be found from our main Web page by clicking first on “InvestorInformation” and then on “Corporate Governance,” and finally on “Woodward Codes of Business Conduct andEthics.”
We intend to satisfy any disclosure requirement under Item 5.05 of Form 8-K regarding an amendment to, orwaiver from, a provision of this code of ethics by posting such information to our Website, at the address andlocation specified above.
Item 11. Executive Compensation
Information regarding executive compensation is under the captions “Board Meetings and Committees —Director Compensation,” “Compensation Committee Report on Compensation Discussion and Analysis,” “Com-pensation Committee Interlocks and Insider Participation,” and “Executive Compensation” in our Proxy Statementfor the 2008 Annual Meeting of Stockholders to be held January 22, 2009, and is incorporated herein by reference,except the section captioned “Compensation Committee Report on Compensation Discussion and Analysis” ishereby “furnished” and not “filed” with this annual report on Form 10-K.
Item 12. Security Ownership of Certain Beneficial Owners and Management and Related StockholderMatters
Information regarding security ownership of certain beneficial owners and management and related stock-holder matters is under the tables captioned “Stock Ownership of Management,” “Persons Owning More than FivePercent of Woodward Stock,” and “Executive Compensation — Equity Compensation Plan Information (as ofSeptember 30, 2008),” in our Proxy Statement for the 2008 Annual Meeting of Stockholders to be held January 22,2009, and is incorporated herein by reference.
90
Item 13. Certain Relationships and Related Transactions, and Director Independence
The information set forth under “Board Meetings and Committees — Related Person Transactions Policiesand Procedures,” “Board of Directors” and “Audit Committee Report to Stockholders” in our Proxy Statement forthe 2008 Annual Meeting of the Stockholders to be held January 22, 2009 is incorporated herein by reference exceptthe section captioned “Audit Committee Report” is hereby “furnished” and not “filed” with this annual report onForm 10-K.
Item 14. Principal Accounting Fees and Services
Information regarding principal accounting fees and services is under the captions “Audit Committee Report toStockholders — Audit Committee’s Policy on Pre-Approval of Services Provided by Independent RegisteredPublic Accounting Firm and — Fees Paid to Deloitte and Touche, LLP and PricewaterhouseCoopers LLP” in ourProxy Statement for the 2008 Annual Meeting of Stockholders to be held January 22, 2009, and is incorporatedherein by reference.
91
PART IV
Item 15. Exhibits and Financial Statement Schedules
(a) (1) Consolidated Financial Statements:Page Numberin Form 10-K
Report of Independent Registered Public Accounting Firm . . . . . . . . . . . . . . . . . . . 45Consolidated Statements of Earnings for the years ended September 30, 2008, 2007,
and 2006 . . . . . . . . . . . . . . . . . . . . . . . . . . . . . . . . . . . . . . . . . . . . . . . . . . . . . . 47Consolidated Balance Sheets at September 30, 2008 and 2007. . . . . . . . . . . . . . . . . 48Consolidated Statements of Cash Flows for the years ended September 30, 2008,
2007, and 2006 . . . . . . . . . . . . . . . . . . . . . . . . . . . . . . . . . . . . . . . . . . . . . . . . . 49Consolidated Statements of Stockholders’ Equity for the years ended September 30,
2008, 2007, and 2006 . . . . . . . . . . . . . . . . . . . . . . . . . . . . . . . . . . . . . . . . . . . . . 50Notes to Consolidated Financial Statements . . . . . . . . . . . . . . . . . . . . . . . . . . . . . . 52
(a) (2) Consolidated Financial Statement Schedules —
Valuation and Qualifying Accounts . . . . . . . . . . . . . . . . . . . . . . . . . . . . . . . . . . . 97
Financial statements and schedules other than those listed above are omitted for the reason that they are notapplicable, are not required, or the information is included in the financial statements or the footnotes.
(a) (3) Exhibits Filed as Part of This Report:
2.1 Stock Purchase Agreement, dated August 19, 2008, by and among Woodward GovernorCompany, MPC Products Corporation, Techni-Core, Inc., The Successor Trustees of theJoseph M. Roberti Revocable Trust dated December 29, 1992, Maribeth Gentry, as SuccessorTrustee of the Vincent V. Roberti Revocable Trust dated April 4, 1991 and the individuals andentities named in Schedule I thereto filed as an Exhibit 10.1 to Current Report on Form 8-K,dated August 21, 2008 and incorporated herein by reference.
2.2 Amendment No. 1, dated October 1, 2008, to the Stock Purchase Agreement, dated August 19,2008, by and among Woodward Governor Company, MPC Products Corporation, Techni-Core,Inc., The Successor Trustees of the Joseph M. Roberti Revocable Trust dated December 29,1992, Maribeth Gentry, as Successor Trustee of the Vincent V. Roberti Revocable Trust datedApril 4, 1991 and the individuals and entities named in Schedule I thereto, filed as Exhibit 10.6to Current Report on Form 8-K filed October 7, 2008 and incorporated herein by reference.
3(i)(a) Restated Certificate of Incorporation, as amended October 3, 2007, filed as an exhibit3(i)(b) Restated Certificate of Incorporation, as amended January 23, 2008, filed as an exhibit3(ii) Amended and Restated Bylaws, filed as an Exhibit 3.1 to Current Report on Form 8-K, dated
January 29, 2008 and incorporated herein by reference4.1 Note Purchase Agreement dated October 15, 2001, filed as Exhibit 4 to Form 10-Q for the three
months ended December 31, 2001 and incorporated herein by reference10.1 Long-Term Management Incentive Compensation Plan, filed as Exhibit 10(c) to Form 10-K for
the year ended September 30, 2000 and incorporated herein by reference10.2 Annual Management Incentive Compensation Plan, filed as Exhibit 10(d) to Form 10-K for the
year ended September 30, 2000 and incorporated herein by reference10.3 2002 Stock Option Plan, effective January 1, 2002 filed as Exhibit 10 (iii) to Form 10-Q for the
three months ended March 31, 2002 and incorporated herein by reference10.4 Executive Benefit Plan (non-qualified deferred compensation plan), filed as Exhibit 10(e) to
Form 10-K for the year ended September 30, 2002 and incorporated herein by reference10.5 Form of Outside Director Stock Purchase Agreement with James L. Rulseh, filed as
Exhibit 10(j) to Form 10-K for the year ended September 30, 2002 and incorporated hereinby reference
92
10.6 Form of Transitional Compensation Agreement with Thomas A. Gendron filed as Exhibit 10 toForm 10-Q for the three months ended December 31, 2002 and incorporated herein byreference
10.7 Summary of Non-Employee Director Meeting Fees and Compensation, filed as an exhibit10.8 Material Definitive Agreement with Thomas A. Gendron, filed on Form 8-K filed August 1,
2005 and incorporated herein by reference10.9 Material Definitive Agreement with Robert F. Weber, Jr., filed on Form 8-K filed August 24,
2005 and incorporated herein by reference10.10 2006 Omnibus Incentive Plan, effective January 25, 2006, filed as Exhibit 4.1 to Registration
Statement on Form S-8 effective April 28, 2006 and incorporated herein by reference10.11 Form of Transitional Compensation Agreement with Robert F. Weber, Jr., dated August 22,
2005, filed as exhibit 10.11 to Form 10-K for the year ended September 30, 2005 andincorporated herein by reference
10.12 Material Definitive Agreement with A. Christopher Fawzy, filed as Exhibit 10.12 to Form 10-Qfor the nine months ended June 30, 2007 and incorporated herein by reference
10.13 Amended Executive Benefit Plan, filed as Exhibit 10.13 to Form 10-K for the year endedSeptember 30, 2007 and incorporated herein by reference
10.14 Form of Non-Qualified Stock Option Agreement filed as Exhibit 99.2 to Current Report onForm 8-K, dated November 16, 2007 and incorporated herein by reference
10.15 Second Amended and Restated Credit Agreement, filed as Exhibit 99.1 to Current Report onForm 8-K, dated October 25, 2007 and incorporated herein by reference
10.16 Summary of Executive Officer Compensation, filed as an exhibit10.17 Dennis Benning Post Retirement Relocation Agreement, filed as Exhibit 10.17 to Form 10-K
for the year ended September 30, 2007 and incorporated herein by reference10.18 Dennis Benning Promotion Letter dated October 1, 2008, filed as an exhibit10.19 Chad Preiss Promotion Letter dated October 1, 2008, filed as an exhibit10.20 Term Loan Credit Agreement, dated October 1, 2008, by and among Woodward Governor
Company, the institutions from time to time parties thereto as lenders and JPMorgan ChaseBank, National Association, as administrative agent, filed as Exhibit 10.1 to Current Report onForm 8-K filed October 7, 2008 and incorporated herein by reference.
10.21 Note Purchase Agreement, dated October 1, 2008, by and among Woodward GovernorCompany and the purchasers named therein, filed as Exhibit 10.2 to Current Report onForm 8-K filed October 7, 2008 and incorporated herein by reference.
10.22 Amendment No. 1, dated October 1, 2008, to the Note Purchase Agreement, dated as ofOctober 15, 2001 by and among Woodward Governor Company and the purchasers namedtherein, filed as Exhibit 10.3 to Current Report on Form 8-K filed October 7, 2008 andincorporated herein by reference.
10.23 Amendment No. 2 and Consent, dated October 1, 2008, to the Second Amended and RestatedCredit Agreement, dated as of October 25, 2007, by and among Woodward GovernorCompany, certain foreign subsidiary borrowers of Woodward Governor Company fromtime to time parties thereto, the institutions from time to time parties thereto, as lenders,JPMorgan Chase Bank, National Association, as administrative agent, Wachovia Bank N.A.and Wells Fargo Bank N.A., as syndication agents, and Deutsche Bank Securities Inc., asdocumentation agent, filed as Exhibit 10.4 to Current Report on Form 8-K filed October 7,2008 and incorporated herein by reference.
11 Statement on computation of earnings per share, included in Note 5 of Notes to ConsolidatedFinancial Statements
14 Code of Ethics filed as Exhibit 14 to Form 10-K for the year ended September 30, 2003 andincorporated herein by reference
21 Subsidiaries, filed as an exhibit23(i) Consent of current Independent Registered Public Accounting Firm, filed as an exhibit
93

23(ii) Consent of prior Independent Registered Public Accounting Firm, filed as an exhibit31(i) Rule 13a-14(a)/15d-14(a) certification of Thomas A. Gendron, filed as an exhibit31(ii) Rule 13a-14(a)/15d-14(a) certification of Robert F. Weber, Jr., filed as an exhibit32(i) Section 1350 certifications, filed as an exhibit
94
SIGNATURES
Pursuant to the requirements of Section 13 or 15(d) of the Securities Exchange Act of 1934, the registrant hasduly caused this report to be signed on its behalf by the undersigned, thereunto duly authorized.
WOODWARD GOVERNOR COMPANY
/s/ THOMAS A. GENDRON
Thomas A. GendronChairman of the Board,
Chief Executive Officer, and President(Principal Executive Officer)
Date: November 19, 2008
/s/ ROBERT F. WEBER, JR.
Robert F. Weber, Jr.Chief Financial Officer, Treasurer
(Principal Financial and Accounting Officer)
Date: November 19, 2008
Pursuant to the requirements of the Securities Exchange Act of 1934, this report has been signed below by thefollowing persons on behalf of the registrant and in the capacities and on the dates indicated.
Signature Title Date
/s/ JOHN D. COHN
John D. CohnDirector November 19, 2008
/s/ PAUL DONOVAN
Paul DonovanDirector November 19, 2008
/s/ THOMAS A. GENDRON
Thomas A. GendronChairman of the Board
and DirectorNovember 19, 2008
/s/ JOHN A. HALBROOK
John A. HalbrookDirector November 19, 2008
/s/ MICHAEL H. JOYCE
Michael H. JoyceDirector November 19, 2008
/s/ MARY L. PETROVICH
Mary L. PetrovichDirector November 19, 2008
/s/ LARRY E. RITTENBERG
Larry E. RittenbergDirector November 19, 2008
95
Signature Title Date
/s/ JAMES R. RULSEH
James R. RulsehDirector November 19, 2008
/s/ DR. RONALD SEGA
Dr. Ronald SegaDirector November 19, 2008
/s/ MICHAEL T. YONKER
Michael T. YonkerDirector November 19, 2008
96
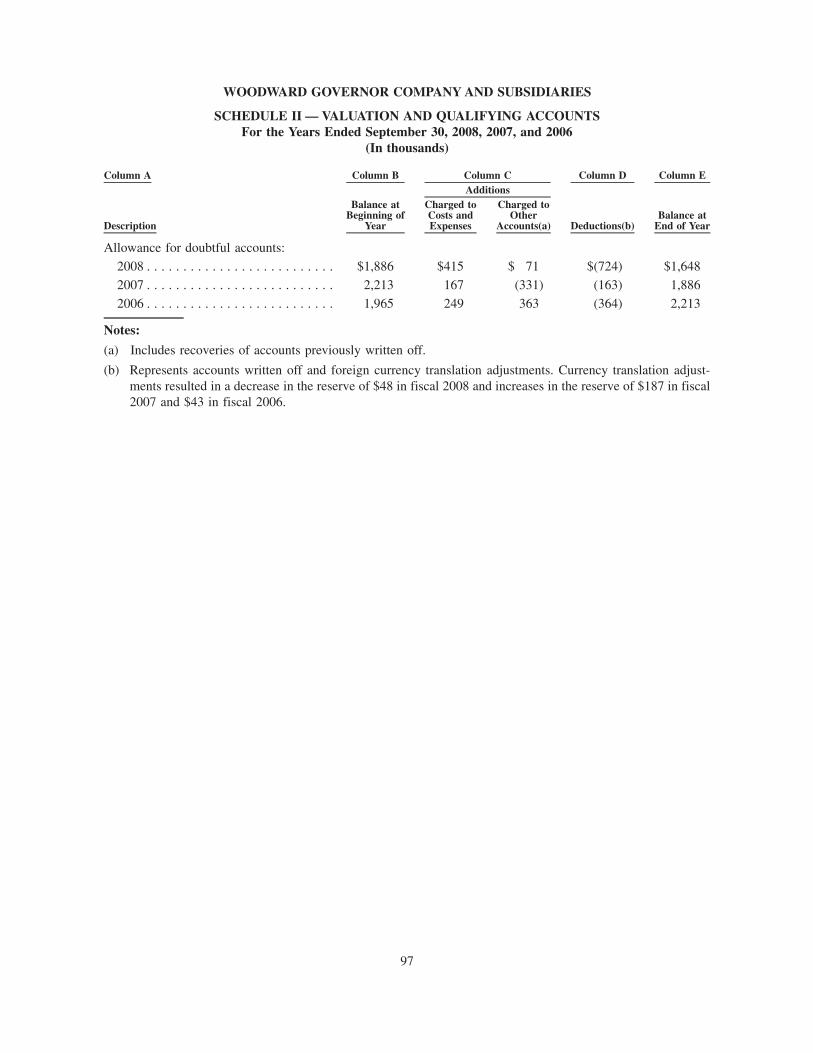
WOODWARD GOVERNOR COMPANY AND SUBSIDIARIES
SCHEDULE II — VALUATION AND QUALIFYING ACCOUNTSFor the Years Ended September 30, 2008, 2007, and 2006
(In thousands)
Description
Balance atBeginning of
Year
Charged toCosts andExpenses
Charged toOther
Accounts(a) Deductions(b)Balance at
End of Year
AdditionsColumn A Column B Column C Column D Column E
Allowance for doubtful accounts:2008 . . . . . . . . . . . . . . . . . . . . . . . . . . $1,886 $415 $ 71 $(724) $1,6482007 . . . . . . . . . . . . . . . . . . . . . . . . . . 2,213 167 (331) (163) 1,8862006 . . . . . . . . . . . . . . . . . . . . . . . . . . 1,965 249 363 (364) 2,213
Notes:(a) Includes recoveries of accounts previously written off.
(b) Represents accounts written off and foreign currency translation adjustments. Currency translation adjust-ments resulted in a decrease in the reserve of $48 in fiscal 2008 and increases in the reserve of $187 in fiscal2007 and $43 in fiscal 2006.
97

OFFICErS
ThOmaS a. GEndrOn Chairman of the Board, Chief Executive Officer, and President
rObErT f. WEbEr, Jr. Chief Financial Officer and Treasurer
dEnniS m. bEnninG Group Vice President, Airframe Systems (Prior to October 1, 2008, Group Vice President, Engine Systems)
marTin V. GLaSS Group Vice President, Turbine Systems
GErhard LauffEr Group Vice President, Electrical Power Systems
Chad r. PrEiSS Group Vice President, Engine Systems (Prior to October 1, 2008, Vice President, Sales, Service and Marketing, Engine Systems)
a. ChriSTOPhEr faWzy Vice President, General Counsel and Corporate Secretary
STEVEn J. mEyEr Vice President, Human Resources
DIrECTOrS
JOhn d. COhn Senior Vice President, Strategic Development and Communications rockwell automation, inc.
PauL dOnOVan Retired Executive Vice President and Chief Financial Officer Wisconsin Energy Corporation
ThOmaS a. GEndrOn Chairman of the Board, Chief Executive Officer, and President Woodward Governor Company
JOhn a. haLbrOOk Retired Chief Executive Officer Woodward Governor Company
miChaEL h. JOyCE Retired President and Chief Operating Officer Twin disc, inc.
mary L. PETrOViCh Chief Executive Officer axleTech international
Larry E. riTTEnbErG Ernst & Young Professor of Accounting & Information Systems university of Wisconsin
JamES r. ruLSEh Regional Vice President Americas modine manufacturing Company
dr. rOnaLd m. SEGa Vice President, Energy, Environment, and Applied Research Colorado State university research foundation
miChaEL T. yOnkEr Retired President and Chief Executive Officer, Portec, inc.
OFFICEr AND INVESTOr INFOrMATION
INVESTOr INFOrMATION
WOOdWard GOVErnOr COmPany Corporate headquarters 1000 East drake road P.O. box 1519 fort Collins, CO 80522-1519 1-970-482-5811 www.woodward.com
TranSfEr aGEnT and rEGiSTrar american Stock Transfer & Trust Company Shareholder Services 59 maiden Lane Plaza Level new york, ny 10038 1-800-937-5449
SharEhOLdEr aCCOunT aSSiSTanCE Shareholders who wish to change the address or ownership of stock, report lost certificates, eliminate duplicate mailings, or for other account registration
procedures and assistance, should contact the Transfer agent at the address or phone number listed.
diVidEnd rEinVESTmEnT PLan and dirECT dEPOSiT Of diVidEndS Woodward offers shareholders of record a convenient dividend reinvestment and direct Stock Purchase and Sale Plan. Through this Plan, shareholders have options to purchase or sell shares of Woodward stock, have their dividends automatically reinvested in Woodward common stock, and to make periodic supplemental cash payments to purchase additional shares.
for further information and an authorization form, contact the Transfer agent at the address or phone number on this page.
annuaL mEETinG January 22, 2009, at 1:00 p.m. hilton university Park 425 W. Prospect road fort Collins, CO 80526
STOCk ExChanGE nasdaq national market Ticker Symbol: WGOV SEC filings are available on our website at www.woodward.com
EquaL OPPOrTuniTy EmPLOyEr STaTEmEnT
it is Woodward’s policy to provide equal
employment opportunity for all qualified
members and applicants without regard to
race, color, religion, age, sex, national origin,
disability, veteran’s or marital status, or other
protected class, and to base all employment
decisions so as to further this principle of equal
employment opportunity..De
sig
ned
by
Cur
ran
& C
onn
ors
, Inc
. / w
ww
.cur
ran
-co
nno
rs.c
om
Our Vision
Woodward sets the global standard for Energy
Control and Optimization Solutions. Our
success is enabled by our members and
measured by the satisfaction of our customers
and the return to our shareholders.
Woodward Governor Company1000 East Drake Road P.O. Box 1519 Fort Collins, Colorado 80522-1519 USA 970-482-5811
www.woodward.com
Business Description
Woodward is an independent designer,
manufacturer, and service provider of energy
control and optimization solutions for
commercial and military aircraft, turbines,
reciprocating engines, and electrical power
system equipment. The company’s innovative
fluid energy, combustion control, electrical
energy, and motion control systems help
customers offer cleaner, more reliable, and
more cost-effective equipment. Leading
original equipment manufacturers use our
products and services in aerospace, power
and process industries, and transportation.