WPP Annual Report 2006 - AnnualReports.com
192
Annual Report & Accounts 2006
-
Upload
khangminh22 -
Category
Documents
-
view
2 -
download
0
Transcript of WPP Annual Report 2006 - AnnualReports.com

Annual Report & Accounts 2006
AdvertisingMedia Investment Management
Information, Insight & ConsultancyPublic Relations & Public Affairs
Branding & IdentityHealthcare Communications
Direct, Digital, Promotion & Relationship MarketingSpecialist Communications
27 Farm StreetLondon W1J 5RJ
Telephone +44 (0)20 7408 2204Fax +44 (0)20 7493 6819
125 Park AvenueNew York NY 10017-5529
Telephone +1 (212) 632 2200Fax +1 (212) 632 2222
www.wpp.com
Annual R
eport & A
ccounts 2006
8310_AR06_(00)+spine_130507_JL.i1 18310_AR06_(00)+spine_130507_JL.i1 1 17/5/07 01:03:3017/5/07 01:03:30

WPP ANNUAL REPORT 2006
Contents What we thinkThe Advertising & Marketing Services Industry:China and the internet by Sir Martin Sorrell 72In Praise of Interior Decorators (Or at Least Some of Them) by Jeremy Bullmore 95
Who runs WPPBoard of Directors 98Senior offi cers and advisors to the Board 101
How we behaveDirectors’ reportReview of the Company’s governance and the Nomination Committee 103
Review of the Audit Committee 105Review of the Compensation Committee 106The Board of Directors 107Committee meetings 107Share owner relations 108Internal control 108Sarbanes-Oxley s404 109Going concern 109Responsibilities in respect of the preparation of fi nancial statements 110
Substantial share ownership 110Election of directors 110Profi ts and dividends 110Parent company charitable donations 110Group activities 111Share capital 111Authority for purchase of own shares 111Supplier payment policy 111Auditors 111Corporate responsibilityBusiness impact 112Signifi cant issues 112How we manage corporate responsibility riskand opportunity 112
Corporate responsibility goals 112Progress in 2006 113The impact of our work 113Marketing ethics 113WPP as an employer 114Environment 115WPP’s carbon footprint 116Supply chain 116Social investment 117Pro bono work 117
The fast readAbout WPP 2A six-minute read 3
Who we areOur companies and associates 10
Why we existWhy we exist 12Our mission 13
How we’re doingFinancial summary 15Letter to share owners 18Reports from our operating brands 27Ogilvy & Mather Worldwide 28JWT 33Young & Rubicam Brands 35Grey Global Group 42The Voluntarily United Group of Creative Agencies 45BatesAsia 141 46GroupM 47MediaCom 49Mediaedge:cia 51MindShare 52The Kantar Group 54Public Relations & Public Affairs: overview 59Hill & Knowlton 60Burson-Marsteller 38Ogilvy Public Relations Worldwide 30Cohn & Wolfe 61GCI Group 62B to D Group 63Enterprise IG 64Fitch 66CommonHealth 67Sudler & Hennessey 40Ogilvy Healthworld 31Grey Healthcare 44Specialist Communications 69
8310_AR06_(01)v10_160507_AT.inddC2 C2 17/5/07 17:46:23
WPP ANNUAL REPORT 2006
About the artists
Manny LingCalligrapherHong Kong-born calligrapher who practises in both eastern and western traditions.
Feng FengArtistThe paintings in this Report are the work of Feng Feng, a Beijing-based artist and poet with an established reputation in China and beyond.
Born in 1956, Feng Feng, like so many artists, joined the army during the cultural revolution. In 1984 he graduated from Tianjin University with a degree in architecture followed by several years working as a journalist. Throughout this period, he never abandoned painting.
Feng Feng’s technique combines acrylic paint with secret ingredients which he refuses to disclose. There are many layers to his work – he may use up to a hundred combinations of colour before achieving his precise intention. The three-dimensional effect of his work is achieved by employing a unique process involving the use of ancient Chinese woodblock plates and coins. These are pressed against the back of the canvas – and then heat is applied until the desired texture develops.
His skill in blending traditional Chinese historical reference with modern abstract painting creates a strong link between past and present. The more you look at Feng Feng’s work, the more you see.
WPP, a global company with a fruitful long-term business relationship with China, takes great pleasure in embracing Feng Feng’s work. It would not have been possible without the endlessly helpful cooperation of his representatives at the ArtSceneChina Gallery in Shanghai, to whom we express our gratitude.
This Report uses paper manufactured from 100% recycled de-inked post
consumer waste. All by-products from both the pulp and paper production
are used for a variety of things including fertiliser, cement production and
energy for heating the local community.
8310_AR06_(10)v4_160507_AT.indd 189 22/5/07 09:01:418310_AR06_(00)+spine_130507_JL.i2 28310_AR06_(00)+spine_130507_JL.i2 2 22/5/07 09:06:1522/5/07 09:06:15

WPP ANNUAL REPORT 2006
How we’re rewardedCompensation Committee report on behalf of the Board
Introduction 1192006 highlights 119Remit of the Compensation Committee 119Composition of the Compensation Committee 120Advisors to Compensation Committee 120Principles of remuneration 120Performance 121Alignment to share owner interests 121WPP Share Incentive Scheme dilution 121Key elements of short- and long-term remuneration 122Policy on directors’ service contracts, notice periods and termination payments 123
Performance graph 123Elements of remuneration 123Retirement benefi ts 125Directors’ remuneration 126Directors’ interests 127
Operating & fi nancial reviewCompetitive performance 131Geographic performance 132Sector performance 133Review of operations 135Group fi nancial performance 135Operating margins 136Like-for-like performance 136Headcount 136Acquisitions and start-ups 136Parent company initiatives 137Treasury activities 137Cash fl ow and balance sheet 138Pensions funding 139Future prospects 139
Our 2006 fi nancial statementsAccounting policies 143Consolidated income statement 149Consolidated cash fl ow statement 150Consolidated statement of recognised income and expense 151
Consolidated balance sheet 152Notes to the consolidated fi nancial statements 153Company balance sheet 173Notes to the Company balance sheet 174Reconciliation to US Accounting Principles 175Notes to the Reconciliation to US Accounting Principles 176
Independent auditors’ report 179Five-year summary 181Financial glossary 182
About share ownershipInformation for share ownersShare owners’ register 185Analysis of shareholdings at 31 December 2006 185Dividends 186American Depositary Receipts (ADRs) 186Financial calendar 187Share price 187Access numbers/Ticker symbols 187Online information 187Registrar and transfer offi ce 187American Depositary Receipts (ADRs) offi ce 187WPP registered offi ce 187Tax information 187
Where to fi nd usContact points 188WPP offi ces 188Investor relations 188Media relations 188Group information 188
Current and historical fi nancial information, including trading statements, news releases and presentations are available online at www.wpp.com
You can sign up to receive WPP news by e-mail at www.wpp.com/ewire
Contents .

WPP ANNUAL REPORT 2006
Who we areWPP is one of the world’s most comprehensive marketing communications groups. It comprises leading companies in all these disciplines:
• Advertising• Media Investment Management• Information, Insight & Consultancy• Public Relations & Public Affairs• Branding & Identity• Healthcare Communications• Direct, Digital, Promotion
& Relationship Marketing• Specialist Communications
There are more than 100 companies within the Group – and each is a distinctive brand in its own right. Each has its own identity, commands its own loyalty, and is committed to its own, specialist expertise. That is their individual strength. Clients seek their talent and their experience on a brand-by-brand basis. Between them, our companies work with over 340 of the Fortune Global 500, over one-half of the NASDAQ 100 and over 30 of the Fortune e-50.
It is also of increasing value to clients that WPP companies can work together, as increasingly they do: providing a tailor-made range of communications services, centrally integrated. Over 400 clients are now served in three distinct disciplines. More than 280 clients are served in four disciplines and these clients account for over 57% of Group revenues. Group companies now work with nearly 230 clients across six or more countries.
Collectively, 100,000* people work for WPP companies; out of 2,000 offi ces in 106 countries.
Our companies and their websites are listed on pages 10 and 11.
* Including associates.
The fast readFor a quick, pre-digested, highly-compressed version of this Annual Report: read the next fi ve pages.
The full story starts on page 8. Please read that, too.
The fast read

WPP ANNUAL REPORT 2006
Why we exist
Our mission
To develop and manage talent;to apply that talent,throughout the world,for the benefi t of clients;to do so in partnership;to do so with profi t.
Within the WPP Group, our clients have access to companies with all the necessary marketing and communications skills; companies with strong and distinctive cultures of their own; famous names, many of them.
WPP, the parent company, complements these companies in three distinct ways.
First, it relieves them of much administrative work. Financial matters (such as planning, budgeting, reporting, control, treasury, tax, mergers, acquisitions, investor relations, legal affairs and internal audit) are co-ordinated centrally. For the operating companies, every administrative hour saved is an extra hour to be devoted to the pursuit of professional excellence.
Secondly, the parent company encourages and enables operating companies of different disciplines to work together for the benefi t of clients. Such collaborations have the additional benefi t of enhancing the job satisfaction of our people. The parent company also plays an across-the-Group role in the following functions: the management of talent, including recruitment and training; in property management; and in procurement, information technology and knowledge sharing.
And, fi nally, WPP itself can function as the 21st century equivalent of the full-service agency. For some clients, predominantly those with a vast geographical spread and a need for marketing services ranging from advertising through design and website construction to research and internal communications, WPP can act as a portal to provide a single point of contact and accountability.
Read more about our role on page 13.
What we think
The Advertising & Marketing Services Industry: China and the internet by Sir Martin Sorrell
2006 was WPP’s best year ever, measured by all metrics. This year will be even stronger as the platform for 2008 – a blockbuster 12 months that will see the US presidential elections, the Beijing Olympics and the European Football Championships.
In the longer term, our industry will be bolstered by globalisation and the continued growth of China and India in particular, along with other parts of Asia Pacifi c, Latin America, Africa, the Middle East, and Central and Eastern Europe.
Manufacturing overcapacity will demand more innovation, stronger brands and greater differentiation – all areas in which we excel. The digital technologies will also provide big opportunities as the media landscape fragments and consumers’ habits evolve. Equally, the demand for internal alignment in big companies and thus the need for internal communications – combined with growing retail concentration and the rapid increase in the signifi cance of corporate responsibility – will underline the importance of the advertising business.
The issues of government extravagance, consolidation among clients, media owners and agencies, along with increasing trade and price promotion, fees, procurement and outsourcing, media fragmentation and super-agencies all bring opportunities as well as threats.
Sir Martin Sorrell’s article begins on page 73.
In Praise of Interior Decorators (Or at Least Some of Them) by Jeremy Bullmore
“I don’t know much about interior decorators and have never directly employed one. But it seems to me, at least from observation, that they belong to one of two categories. There are those that work from the outside in; and there are those that work from the inside out.”
Jeremy Bullmore’s essay can be read in full on pages 95 to 97.
The fast read .

WPP ANNUAL REPORT 2006
How we’re doing
2006 results
Our twenty-fi rst year was a record one. Our results for 2006 refl ect the continued, steady strength of the world economy positively impacting almost all disciplines and geographies.
Revenues were up almost 10% to £5.9 billion. Operating margin was up 0.5 margin points to 14.5%. Headline PBIT (before goodwill impairment/write-downs, amortisation and impairment of acquired intangible assets, share of exceptional gains of associates, interest, tax and investment gains and write-downs) was up almost 14% to £859 million.
Headline profi t before tax was up over 14% to £766 million. Reported profi t before tax was up over 15% to £682 million. Headline diluted earnings per share were up almost 17% to 42.0p and reported diluted earnings per share up over 18% to 35.2p.
Total share owner return improved, with your share price rising by almost 10% to 690.5p over the year and dividends rising 20% to 11.21p. The share price has advanced a further 9% to 757.5p at the time of writing.
Based on constant currency comparisons, on a like-for-like basis, revenues were up 5.4% for the year, up 5.0% in the fi rst half and accelerating to 5.7% in the second half. This appears to have been at or above the growth in the worldwide market, with the Group maintaining or increasing market share.
Sector and geographic performance
By discipline, our Media Investment Management businesses led the way, along with direct, internet and interactive-related activities and Healthcare Communications. Advertising, Information, Insight & Consultancy, Branding & Identity and Specialist Communications, showed consistent growth. Public Relations & Public Affairs also continued to show signifi cant improvement.
Marketing services contributed 52% of our revenues in 2006. Advertising and Media Investment Management comprised 48%.
By geography, Asia Pacifi c, Africa and the Middle East, Latin America and Central and Eastern Europe led the way. Western Continental Europe, although relatively more diffi cult, improved in the year. Markets outside North America represented over 60% of our revenues, a similar level to 2005.
Our long-term objectives are:
• To increase the combined geographic share of revenues of Asia Pacifi c, Latin America, Africa and the Middle East, and Central and Eastern Europe, from around 20% to one-third;
• To increase the share of revenues of marketing services from 52% to two-thirds;
• To increase the share of more measurable marketing services – such as Information, Insight & Consultancy, and direct, interactive and internet – from around one-third of our revenues to 50%.
Financial summary*
2006 2005 Change %
Billings £30,141m £26,674m +13.0
Revenue £5,908m £5,374m +9.9
Headline EBITDA1 £1,002m £877m +14.3
Headline operating profi t1 £822m £721m +14.0
Reported operating profi t £742m £653m +13.6
Headline PBIT1 £859m £755m +13.8
Headline PBIT margin 14.5% 14.0% +0.5
Headline PBT1 £766m £669m +14.5
Reported PBT £682m £592m +15.2
Headline diluted earnings per share1,3 42.0p 36.0p +16.7
Headline diluted earnings per ADR1,2,3 $3.87 $3.27 +18.3
Ordinary dividend per share 11.21p 9.34p +20.0
Ordinary dividend per ADR2 $1.03 $0.85 +21.2
Net debt at year-end £815m £804m +1.4
Average net debt4 £1,214m £1,212m +0.2
Ordinary share price at year-end 690.5p 629.0p +9.8
ADR price at year-end $67.78 $54.00 +25.5
Market capitalisation at year-end £8,566m £7,881m +8.7
At 10 May 2007
Ordinary share price 757.5p
ADR price $74.29
Market capitalisation £9,320m
Notes* The fi nancial statements have been prepared under IFRS (International Financial Reporting
Standards, incorporating International Accounting Standards).1 The calculation of ‘headline’ measurements of performance (including Headline EBITDA, Headline
operating profi t, Headline PBIT, Headline PBT and Headline earnings) is shown in note 32 of the fi nancial statements.
2 One American Depositary Receipt represents fi ve ordinary shares. These fi gures have been translated for convenience purposes only using the income statement exchange rates shown on page 149. This conversion should not be construed as a representation that the pound sterling amounts actually represent, or could be converted into, US dollars at the rates indicated.
3 Earnings per share is calculated in note 9 of the fi nancial statements.4 Average net debt is defi ned on page 182.
The fast read

WPP ANNUAL REPORT 2006
Cash fl ow
The objective introduced in 2003 of covering outgoings by free cash fl ow was achieved. We now generate over $1 billion per annum of cash fl ow – available for enhancing share owner value through capital expenditure, acquisitions, dividends and share buy-backs.
Future objectives
We will continue to focus on our key objectives – improving operating profi ts and margins, increasing cost fl exibility, using free cash fl ow to enhance share owner value and improve return on capital employed, continuing to develop the role of the parent company in adding value to our clients and people, developing our portfolio in high-revenue growth areas, both geographically and functionally, and improving our creative quality and capabilities.
Outlook
Worldwide economic conditions seem set to continue to show steady growth in 2007, although concerns remain over the Middle East, oil and commodity prices and the twin defi cits of the US economy.
Although growth in the world economy continues to be led by Asia Pacifi c, Latin America, Africa and the Middle East, Russia and the CIS countries, even Western Continental Europe may continue the improvement seen in the second half of 2006 together with the UK, where growth in the second half of 2006 was double that of the fi rst half.
2007 should benefi t from the build-up to the US Presidential elections and the Beijing Olympics in 2008, which, as a maxi-quadrennial year, should be a very strong one, buoyed by heavy US political advertising and the European Football Championships.
Our letter to share owners starts on page 18.
Our 2006 operating & fi nancial review and fi nancial statements are presented in full on pages 130 to 183 and at www.wpp.com/investor
Notes1 Percentages are calculated on a constant currency basis. See defi nition on page 182.2 Headline PBIT: The calculation of Headline PBIT is set out in note 32 of the fi nancial statements.
• North America 39
• UK 14
• Continental Europe 26
• Asia Pacific, Latin America, Africa & Middle East 21
2006 revenue1 by geography %
• North America 46
• UK 11
• Continental Europe 22
• Asia Pacific, Latin America, Africa & Middle East 21
2006 Headline PBIT1,2 by geography %
• Advertising and Media Investment Management 48
• Information, Insight & Consultancy 15
• Public Relations & Public Affairs 10
• Branding & Identity, Healthcare and Specialist Communications 27
2006 revenue1 by sector %
• Advertising and Media Investment Management 52
• Information, Insight & Consultancy 12
• Public Relations & Public Affairs 10
• Branding & Identity, Healthcare and Specialist Communications 26
2006 Headline PBIT1,2 by sector %
The fast read .

WPP ANNUAL REPORT 2006
Who runs WPP
Non-executive chairman
Philip LaderChairman of the Nomination CommitteeMember of the Compensation Committee
Executive directors
Sir Martin SorrellChief executive
Paul RichardsonFinance director
Mark ReadStrategy director
Non-executive directors
Colin Day
Esther DysonMember of the Compensation CommitteeMember of the Audit Committee
Orit Gadiesh
David KomanskyMember of the Nomination Committee
Christopher MackenzieMember of the Compensation CommitteeMember of the Nomination Committee
Stanley (Bud) MortenMember of the Audit CommitteeSenior independent director
Koichiro Naganuma
Lubna Olayan
John Quelch
Jeffrey Rosen Chairman of the Compensation CommitteeMember of the Audit Committee
Paul SpencerChairman of the Audit Committee
Members of the Advisory Board
Jeremy Bullmore
John Jackson
Company Secretary
Marie Capes
Directors’ biographies appear on pages 98 to 100.
How we behave
Corporate governance
The Board of Directors as a whole is collectively accountable to the Company’s share owners for good corporate governance and is committed to achieving compliance with the principles of corporate governance set out in the Combined Code.
Our goal is to comply with relevant laws, regulations, and guidelines such as the Combined Code, the US Sarbanes-Oxley Act 2002, the NASDAQ rules, the new UK Companies Act 2006, and where possible and practicable, with the guidelines issued by Institutional Investments and their representative bodies.
WPP operates a system of internal control, which is maintained and reviewed in accordance with the Combined Code and the guidance in the Turnbull Report as well as the relevant provisions of the Securities Exchange Act 1934 as they currently apply to the Company. In the opinion of the Board, the Company has complied throughout the year with the Combined Code, the Turnbull Report and also with the relevant provisions of the Securities Exchange Act 1934.
Corporate responsibility
Paul Richardson is the Board director responsible for assessing corporate responsibility practices in 2006. He chairs WPP’s Corporate Responsibility Committee which advises on policy, monitors emerging issues and co-ordinates communication among Group companies.
WPP’s fi ve most signifi cant corporate responsibility issues are:
• The social and environmental impact of our work for clients.
• The impact of our work, including marketing ethics, compliance with marketing standards, protection of consumer privacy, social and cause-related marketing.
• Employment, including diversity and equal opportunities, business ethics, employee development, remuneration, communication and health and safety. In 2006, WPP invested £38.2 million in training and wellbeing across the Group.
• Social investment, including pro bono work, donations to charity and employee volunteering. In 2006, our total social investment was worth £24.9 million, equivalent to 0.42% of revenue (3.7% of reported profi t before tax). This includes £21.0 million in pro bono work (based on the fees the benefi ting organisations would have paid for our work) and £3.9 million in donations.
• Climate change, including the emissions from energy used in our offi ces and during business travel.
Full details of our governance policies and practices, and our corporate responsibility activities, can be found on pages 103 to 117.
The fast read

WPP ANNUAL REPORT 2006
How we’re rewarded
Executive remuneration policy is set by WPP’s Compensation Committee and is governed by three guiding principles:
• Competitiveness
• Performance
• Alignment to share owner interests
During 2006, the Compensation Committee continued to implement the changes determined by the review of the Group’s compensation policy in 2005.
The committee is mindful of the need to maintain competitive levels of compensation with a large element dependent on performance and comprising shares as well as cash, so as to align the interests of executives with those of share owners.
This is achieved by making:
• Single-year performance awards delivered as restricted stock awards and vesting two years after the end of the one-year performance period.
• Similarly, at the parent company level grants of Executive Share Awards, also vesting two years after the end of the one-year performance period.
• Awards of stock made on an annual basis to WPP Leaders, Partners and High Potential Groups in the form of restricted stock which vest three years after grant.
• To those key executives (including executive directors) whose contributions transcend their day-to-day role, grants under the co-investment LEAP Plan resulting in the award of matching shares, dependent on performance, after a fi ve-year performance period.
Our directors’ remuneration and interests are set out on pages 126 to 129. A full report from the Compensation Committee starts on page 119.
About share ownership
WPP is quoted on the London Stock Exchange and NASDAQ in New York.
Analysis of shareholdings
Issued share capital as at 31 December 2006: 1,240,605,187 ordinary shares, owned by 10,278 share owners.
Substantial share ownership
As at 10 May 2007, the Company is aware of the following interests of 3% or more in the issued ordinary share capital:
MFS Investment Management 4.76%
Legal & General 4.40%
WPP ESOPs 4.17%
The disclosed interests of all of the above refer to the respective combined holdings of those entities and to interests associated with them. The Company has not been notifi ed of any other holdings of ordinary share capital of 3% or more.
Share owner relations
WPP has a well-developed continuous program to address the needs of share owners, investment institutions and analysts, supplying a regular fl ow of information about the company, its strategy, performance and competitive position.
WPP’s website, www.wpp.com, provides current and historical fi nancial information including trading statements, news releases and presentations.
More information relating to share ownership can be found on pages 185 to 187.
• Institutional investors 95
• Employees 4
• Other individuals 1
Share owners by type %
• UK 40
• US 46
• Asia Pacific, Latin America, Africa & Middle East and Continental Europe 14
Share owners by geography %
The fast read .

WPP ANNUAL REPORT 2006
Who we are
Who we are

WPP ANNUAL REPORT 2006
EWABespoke Communications
Who we are .

WPP ANNUAL REPORT 2006
Advertising
ADK1
www.adk.jpBatesAsia 141www.batesasia.comBrandBuzz■
www.brandbuzz.comClemmow Hornby Inge1
www.chiadvertising.comDentsu Y&R1,2,■
www.yandr comDiamond Ogilvywww.diamond.co.krGrey Worldwide◆
www.greyglobalgroup.comLG Ad1
www.lgad.co.krJWTwww.jwt.comMarsteller Advertising■
www.marsteller.comOgilvy & Mather Worldwidewww.ogilvy.comRed CellSoho Squarewww.sohosq.comTAPSAwww.tapsa.esThe Voluntarily United Group of Creative Agencieswww.group-united.comY&R■
www.yandr.com
Media Investment Management
GroupM:MAXUSwww.maxusglobal.comMediaComwww.mediacom.comMediaedge:ciawww.mecglobal.comMindSharewww.mindshareworld.comOutriderwww.outrider.comOther media agenciesKinetic Worldwide2
www.kineticww.comKR Media1
Information, Insight & Consultancy
The Kantar Group:www.kantargroup.comAdded Value Groupwww.added-value.com
BPRIwww.bprigroup.comCannondale Associateswww.cannondaleassoc.comCatalyst◆
www.catalystsearchmarketing.comCenter Partnerswww.centerpartners.comFocalyst2
www.focalyst.comGlendinningwww.glendinning.comHenley Centre HeadlightVisionwww.hchlv.comIMRB Internationalwww.imrbint.comJapan Kantar Researchwww.jp.kantargroup.comKantar Operationswww.kantaroperations.comKMR Groupwww.kmr-group.com– AGBNielsen Media Research2
www.agbgroup.com– BMRB International www.bmrb.co.uk– IBOPE Media Information1
www.ibope.com.br– Marktest1
– Mediafax www.mediafax-pr.comLightspeed Researchwww.lightspeedresearch.comManagement Ventureswww.mventures.comMattson Jack Groupwww.mattsonjack.comMillward Brownwww.millwardbrown.comResearch Internationalwww.research-int.comRMS Instorewww.rms-uk.comZiment Groupwww.zimentgroup.comOther marketing consultanciesEverystonewww.everystonegroup.comohalwww.ohal-group.com
Public Relations & Public Affairs
BKSH■
www.bksh.comBlanc & Otuswww.blancandotus.comBuchanan Communicationswww.buchanan.uk.com
Burson-Marsteller■
www.bm.comChime Communications PLC1
www.chime.plc.ukClarion Communicationswww.clarioncomms.co.ukCohn & Wolfe■
www.cohnwolfe.comDewey Square Groupwww.deweysquare.comFinsburywww.fi nsbury.comGCI Group◆
www.gcigroup.comHill & Knowltonwww.hillandknowlton.comOgilvy Government Relationswww.ogilvypr.comOgilvy Public Relations Worldwidewww.ogilvypr.comPenn, Schoen & Berland■
www.psbsurveys.comPublic Strategieswww.pstrategies.comQuinn Gillespiewww.quinngillespie.comRobinson Lerer & Montgomery■
www.rlmnet.comTimmons and Companywww.timmonsandcompany.comWexler & Walker Public Policy Associateswww.wexlergroup.com
Branding & Identity
Addison Corporate Marketing•www.addison.co.ukBDGMcCollwww.bdg-mccoll.comBDGworkfutureswww.bdgworkfutures.comColey Porter Bellwww.cpb.co.ukDovetailwww.dovetailfurniture.comEnterprise IG•www.enterpriseig.comFitchwww.fi tchww.comLambie-Nairn•www.lambie-nairn.comLandor Associates■•www.landor.comThe Partners•www.thepartners.co.ukVBAT•www.vbat.nlWarwickswww.warwicks-uk.com
Our companies & associates
Who we are
Who we are

WPP ANNUAL REPORT 2006
Healthcare Communications
CommonHealthwww.commonhealth.comFeinstein Kean Healthcarewww.fkhealth.comGrey Healthcare Group◆
www.ghgroup.comOgilvy Healthworldwww.ogilvyhealthworld.comSudler & Hennessey■
www.sudler.com
Direct, Digital, Promotion & Relationship Marketing
A. Eicoff & Cowww.eicoff.comBridge Worldwidewww.bridgeworldwide.comBrierley & Partners1
www.brierley.comDialogue Marketingwww.dialmkg.comDigitwww.digitlondon.comEinson Freemanwww.einsonfreeman.comEWAwww.ewa.ltd.ukFullSIX 3
www.fullsix.comGood Technology■
www.goodtechnology.comGrass Roots1
www.grg.comG2◆
www.g2.com– G2 Branding & Design– G2 Interactive– G2 Direct & Digital– G2 Promotional MarketingHeadcount Worldwide Field Marketingwww.headcount.co.ukHigh Co1
www.highco.fr KnowledgeBase Marketing■
www.knowledgebasemarketing.comMando Brand Assurancewww.mando.co.ukMaxx Marketingwww.maxx-marketing.comOgilvyActionwww.ogilvyaction.comOgilvyOne Worldwidewww.ogilvy.comRMG Connectwww.rmgconnect.comRTC Relationship Marketing■
www.rtcrm.com
Studiocom■
www.studiocom.comsyzygy1
www.syzygy.netVML■
www.vml.comWunderman■
www.wunderman.comZAAZ■
www.zaaz.com141 Worldwidewww.141worldwide.com
Specialist Communications
Corporate/B2BBrouillardwww.brouillard.comOgilvy Primary Contactwww.primary.co.ukCustom mediaForwardwww.theforwardgroup.comSpafaxwww.spafax.comDemographic marketingThe Bravo Group■
www.thebravogroupyr.comKang & Lee■
www.kanglee.comMosaicaMDUniWorld1
www.uniworldgroup.comWINGLATINO◆
www.winglatino.comEmployer branding/recruitmentJWT Specialized Communicationswww.jwtworks.comEvent/face-to-face marketingMJMwww.mjmcreative.comPCI Fitchwww.fi tch.comThe Event Unionwww.theeventunion.com– Pro Deo www.prodeo.com– facts + fi ction www.factsfi ction.deFoodservice marketingThe Food Groupwww.thefoodgroup.comSports marketingGlobal Sportnetwww.globalsportnet.com141 Sports Entertainmentwww.ogilvyaction.com Performance SportEntwww.performance-worldwide.comPRISM Groupwww.prismteam.com
Entertainment marketingAlliance◆
www.alliance-agency.comYouth marketingThe Geppetto Groupwww.geppettogroup.comG Whiz◆
www.thinkgwhiz.comReal estate marketingPacewww.paceadv.comTechnology marketingBanner Corporation■
www.b1.comMedia & production servicesClockwork Capital1
www.clockworkcapital.comThe Farm Groupwww.farmpost.co.uk MEDIAPRO Group3
www.mediapro.esMetro Groupwww.metrobroadcast.co.uk
WPP Digital partner companies
iconmobile1
www.iconmobile.mobiJumpTap3
www.jumptap.comLiveWorld3
www.liveworld.commMetrics3
www.mmetrics.comSpot Runner3
www.spotrunner.comVideoEgg3
www.videoegg.comVisible Technologies1
www.visibletechnologies.comVisible World3
www.visibleworld.comWildTangent3
www.wildtangent.com
WPP knowledge communities
The [email protected] [email protected]
Key
1 Associate2 Joint venture3 Investment■ A Young & Rubicam Brands company• A member of B to D Group ◆ A Grey Global Group company
As at May 2007
Who we areOur companies & associates
Who we are .

WPP ANNUAL REPORT 2006Why we exist

WPP ANNUAL REPORT 2006
etween them, WPP companies have tens of thousands of individual clients. They range from Fortune 500 global giants through single-nation start-ups to the smallest of specialist charities. Diverse as they are, they have one thing in common: in pursuing their objectives, they face formidable competition.
Growing affl uence in many parts of the world – combined with over-capacity and over-supply in almost every signifi cant consumer market – have put more and more power into the hands of consumers, accelerated by technology.
As always, if they are to succeed – or even to survive with profi t – every competitive company needs an intrinsically appealing product or service. But that, though it remains the most fundamental of requirements, is no longer enough. Just as competitive costermongers arrange their apples in appealing displays and polish them lovingly to catch their customers’ eyes, so all companies need to display their wares compellingly.
They need access to high-quality information, strategic advice and specialist communications skills. And it’s in the nature of specialist and creative talent that it is unlikely to fl ourish within the confi nes of a manufacturing or service company. People with specialist talents work best – and contribute more – when recruited, trained and inspired by specialist companies.
Within the WPP Group, our clients have access to companies with all the necessary marketing and communications skills; companies with strong and distinctive cultures of their own; famous names, many of them.
WPP, the parent company, complements these companies in three distinct ways.
First, it relieves them of much administrative work. Financial matters (such as planning, budgeting, reporting, control, treasury, tax, mergers, acquisitions, investor relations, legal affairs and internal audit) are co-ordinated centrally. For the operating companies, every administrative hour saved is an extra hour to be devoted to the pursuit of professional excellence.
Secondly, the parent company encourages and enables operating companies of different disciplines to work together for the benefi t of clients. Such collaborations have the additional benefi t of enhancing the job satisfaction of our people. The parent company also plays an across-the-Group role in the following functions: the management of talent, including recruitment and training; in property management; and in procurement, information technology and knowledge sharing.
And fi nally – a relatively recent development, this – WPP itself can function as the 21st century equivalent of the full-service agency. For some clients, predominantly those with a vast geographical spread and a need for marketing services ranging from advertising through design and website construction to research and internal communications, WPP can act as a portal to provide a single point of contact and accountability.
No two clients are structured in precisely the same way. Within WPP’s operating companies, teams can be tailor-made to match any and all.
Why we exist
Why we exist .
Our missionTo develop and manage talent; to apply that talent, throughout the world, for the benefi t of clients;to do so in partnership;to do so with profi t.

WPP ANNUAL REPORT 2006How we’re doing

Our twenty-fi rst year was a record one. All the key measures were better, refl ecting the continuing strength and growth of our operating brands.
2006 2005 Change %Billings £30,141m £26,674m +13.0Revenue £5,908m £5,374m +9.9Headline EBITDA1 £1,002m £877m +14.3Headline operating profi t1 £822m £721m +14.0Reported operating profi t £742m £653m +13.6Headline PBIT1 £859m £755m +13.8Headline PBIT margin 14.5% 14.0% +0.5Headline PBT1 £766m £669m +14.5Reported PBT £682m £592m +15.2Headline diluted earnings per share1,3 42.0p 36.0p +16.7Headline diluted earnings per ADR1,2,3 $3.87 $3.27 +18.3Ordinary dividend per share 11.21p 9.34p +20.0Ordinary dividend per ADR2 $1.03 $0.85 +21.2Net debt at year-end £815m £804m +1.4Average net debt4 £1,214m £1,212m +0.2Ordinary share price at year-end 690.5p 629.0p +9.8ADR price at year-end $67.78 $54.00 +25.5Market capitalisation at year-end £8,566m £7,881m +8.7
At 10 May 2007Ordinary share price 757.5pADR price $74.29Market capitalisation £9,320m
Notes* The fi nancial statements have been prepared under IFRS (International Financial Reporting Standards, incorporating International Accounting Standards).
1 The calculation of ‘headline’ measurements of performance (including Headline EBITDA, Headline operating profi t, Headline PBIT, Headline PBT and Headline earnings) is shown in note 32 of the fi nancial statements.
2 One American Depositary Receipt represents fi ve ordinary shares. These fi gures have been translated for convenience purposes only using the income statement exchange rates shown on page 149. This conversion should not be construed as a representation that the pound sterling amounts actually represent, or could be converted into, US dollars at the rates indicated.
3 Earnings per share is calculated in note 9 of the fi nancial statements.
4 Average net debt is defi ned on page 182.
WPP ANNUAL REPORT 2006
How we’re doingFinancial summary*
How we’re doing .

3,908 4,106 4,300 5,374
02 03 04 05
5,908
06
Revenue1 £m
42.015
129
6
3
0
23.8 29.0 27.9 36.0Dividends per share p
02 03 04 05 06
Headline diluted earnings per share1,2 p
85920
1612
8
4
0
468 534 560 755Headline PBIT1,2 margin %
02 03 04 05 06
Headline PBIT1,2 £m
1,002574 661 664 877
02 03 04 05 06
Headline EBITDA1,2 £m
150
100
50
0
31 Dec 01 31 Dec 02 31 Dec 03 31 Dec 04 31 Dec 05 31 Dec 06Jan-
Apr 07
WPP
FTSE100
Omnicom
Interpublic
WPP total return to share owners relative to relevant comparators rebased to 31 December 2001
10.4121086420
6.8 7.5 8.5 9.1Weighted average cost of
capital (WACC)
02 03 04 05 06
After tax return on average capital employed1,3 %
WPP ANNUAL REPORT 2006
How we’re doingFinancial summary
Information for 2002 and 2003 is on a UK GAAP basis, as previously reported in those years. Figures for 2004, 2005 and 2006 are presented in accordance with IFRS.
Notes1 Figures for 2006, 2005 and 2004 have been prepared in accordance with IFRS (International
Financial Reporting Standards, incorporating International Accounting Standards), which the Group adopted in 2005. Figures for prior years have been prepared under UK GAAP, as previously disclosed in the Group’s Annual Report and Accounts for those years.
2 The calculation of ‘headline’ measurements of performance (including Headline EBITDA, Headline PBIT and Headline earnings) is shown in note 32 of the fi nancial statements.
3 Calculated gross of goodwill and using profi t after taxation before goodwill impairment and other goodwill write-downs, gains/losses arising from the revaluation of fi nancial instruments, amortisation and impairment of acquired intangible assets, share of exceptional gains of associates, and investment gains and write-downs.
How we’re doing

– – 404 332
2011 2012 2013 2014
450 489 – –
2007 2008 2009 2010
– 77
2015 2016+
Debt maturity6 £m
1,21410
86
4
2
0
1,537 1,480 1,083 1,212Net interest4 cover
on Headline PBIT1,3
02 03 04 05 06
Average net debt1,5 £m and interest cover multiples
• North America 39
• UK 14
• Continental Europe 26
• Asia Pacific, Latin America, Africa & Middle East 21
2006 revenue2 by geography %
• North America 46
• UK 11
• Continental Europe 22
• Asia Pacific, Latin America, Africa & Middle East 21
2006 Headline PBIT2,3 by geography %
• Advertising and Media Investment Management 48
• Information, Insight & Consultancy 15
• Public Relations & Public Affairs 10
• Branding & Identity, Healthcare and Specialist Communications 27
2006 revenue2 by sector %
• Advertising and Media Investment Management 52
• Information, Insight & Consultancy 12
• Public Relations & Public Affairs 10
• Branding & Identity, Healthcare and Specialist Communications 26
2006 Headline PBIT2,3 by sector %
WPP ANNUAL REPORT 2006
How we’re doingFinancial summary
Information for 2002 and 2003 is on a UK GAAP basis, as previously reported in those years. Figures for 2004, 2005 and 2006 are presented in accordance with IFRS.
Notes1 Figures for 2006, 2005 and 2004 have been prepared in accordance with IFRS (International
Financial Reporting Standards, incorporating International Accounting Standards), which the Group adopted in 2005. Figures for prior years have been prepared under UK GAAP, as previously disclosed in the Group’s Annual Report and Accounts for those years.
2 Percentages are calculated on a constant currency basis. See defi nition on page 182.
3 The calculation of Headline PBIT is set out in note 32 of the fi nancial statements.
4 Interest in 2006 and 2005 excludes fi nance costs arising from the revaluation of fi nancial instruments.
5 Average net debt includes amounts drawn down in each year on the Group’s working capital facility (the advance of cash fi nancing against which certain trade debts have been assigned). This facility was repaid and cancelled on 31 August 2005.
6 Includes corporate bonds, convertible bonds and bank loans payable at par value, excluding any redemption premium due, by due date.
How we’re doing .

WPP ANNUAL REPORT 2006
Letter to share owners
Dear share owner
PP’s twenty-fi rst year was a model year, our best yet, with key measures exceeding any previous year. Our performance conformed closely to the fi nancial model we have developed, with revenues rising 10% and profi ts 15%.
Most importantly, total share owner return improved, with your share price rising by
almost 10% to 690.5p over the year and dividends rising 20% to 11.21p. Pleasingly, your share price has advanced a further 9% to 757.5p at the time of writing.
Billings were up 13% to £30.1 billion. Revenues were up almost 10% to £5.9 billion. Operating margin was up half a margin point to 14.5%. Headline EBITDA (or headline earnings before interest, taxes, depreciation and amortisation, which is a key metric that private equity fi rms use for valuing companies) crossed £1 billion for the fi rst time. Headline PBIT – that is profi t before goodwill impairment/write-downs, amortisation and impairment of acquired intangible assets, share of exceptional gains of associates, interest, tax and investment gains and write-downs (what a mouthful!) – was up almost 14% to £859 million. Headline profit before tax was up over 14% to £766 million.
Profit before tax was up over 15% to £682 million. Headline diluted earnings per share were up almost 17% to 42.0p and reported diluted earnings per share up over 18% to 35.2p.
These results reflect faster growth in almost all regions – North America, Continental Europe, Asia Pacific, Latin America, Africa and the Middle East – the slower growth area being the UK. Similarly, growth was encouraging across all communications services sectors – Advertising, Media Investment Management, Information, Insight & Consultancy, Public Relations & Public Affairs, Branding & Identity, Healthcare and Specialist Communications. As in 2004 and 2005, we were firing on all cylinders.
These results also reflected continued improvement in productivity, with like-for-like revenues up 5.4% and average headcount on the same basis up 3.6%. Liquidity was steady, with average net debt fl at on a reported basis and up only £121 million (at 2006 exchange rates), with a net cash infl ow of £123 million. Operating margins improved significantly, too, to record levels – up one half
of a margin point after incentives and 0.4 margin points before incentives.
The rest of this letter to you is based on constant currency comparisons, which are more meaningful, given currency movements. On a like-for-like basis revenues were up 5.4% for the year, up 5.0% in the first half and 5.7% in the second half. This appears to have been above the growth in the worldwide market, with the Group increasing market share.
Revenue growth was also consistently strong in successive quarters, on a like-for-like basis up 4.8%, 5.1%, 4.1% in the fi rst three quarters, accelerating to 7.2% in the fourth quarter, the Company’s fi rst $3 billion quarter. The momentum was maintained in the first quarter of 2007, with like-for-like revenues up 4.3% and gross margin up 4.5%. Our like-for-like revenue objective for 2007 remains 4-5%, well in line with, or above, forecasts for the advertising and marketing services industry and worldwide GNP growth.
Media Investment Management again leads growth
By discipline, Media Investment Management led the way, together with Healthcare and Specialist Communications, the latter particularly in direct, internet and interactive. Advertising, Information, Insight & Consultancy, and Branding & Identity also registered good performances. Public Relations & Public Affairs again registered its strongest year since 2000, buoyed by the infl uence of social networking and blogging on the internet. Marketing services rose to over 52% of our revenues in 2006, due to strong growth in Public Relations & Public Affairs and Branding & Identity, Healthcare and Specialist Communications. We are no longer purely an advertising agency.
By geography, Asia Pacific, Africa and the Middle East, Latin America and Central and Eastern Europe led the way. The only laggard was the UK, with even France, Germany and Italy showing some improvement, to some extent due to easier comparatives. As a result, markets outside North America now account for over 60% of our revenues, as compared to 58% in 2003 and 56% in 2002. The influence of the faster-growing markets outside North America is increasing rapidly.
How we’re doing
How we’re doing

WPP ANNUAL REPORT 2006
Profi ts up; cash fl ow strong
Headline PBIT margins rose to 14.5% from 14.0%, in line with our objective. This was particularly encouraging, as our income statement reflected our largest-ever incentive pools for record performance. Pre-incentive headline PBIT margins rose by 0.4 margin points to 18.7% from 18.3%. Incentive payments rose to £247 million, or more than four margin points, from £228 million in 2005. Total incentive payments (including share-based payments) were more than 23% of headline operating profits before bonuses, taxes and income from associates. Our objective remains to pay out approximately 20% at maximum and 15% at target, excluding share option costs. Variable staff costs (freelance, consultants and incentive payments, including share option charges) now account for 7.7% of revenues, almost the same as the peak of 7.8% in 2004. This provides a useful shock absorber for operating margins, should revenues again come under pressure.
As a result of all this, headline PBIT rose to £859 million, well over $1 billion for the third year in a row, up almost 16% in constant currencies. Although 2006 was a strong year, some of our first-generation businesses continued to suffer, and a non-cash impairment charge reflecting accelerated amortisation of goodwill of almost £36 million was taken, compared to £46 million in 2005. Pre-tax profits, therefore, rose by over 15% to £682 million, more than $1 billion for the second time, and diluted headline earnings per share by almost 17% to 42p.
Free cash flow was up strongly at £716 million, compared to £561 million in 2005. Excluding the cash payment for Grey in 2005, for the third year in a row, we more than achieved our recently introduced cash flow objective of covering all acquisition payments and share re-purchases, and managed to cover dividend payments, too.
Liquidity improved as well, and your Company remains comfortably geared. Net debt averaged £1.214 billion – up £121 million (at 2006 exchange rates). In the first quarter of 2007, liquidity has continued to strengthen, with average net debt only up £39 million to £1.029 billion (at 2007 exchange rates) compared with the same period in 2006. Headline interest cover in 2006 was over nine times. Analysts appear comfortable with average net debt levels of more than twice EBITDA, or over £2 billion, versus our current levels of approximately £1.2 billion.
Industry prospects
In theory, 2006 should have been a stronger year, with the Turin Winter Olympics, the FIFA World Cup in Germany and the US Congressional elections stimulating growth. So it proved to be, as clients also realised, that like-for-like growth could be stimulated by increased spending on differentiation of products and services, as in 2005. The industry will probably grow at 4% in 2007, a similar level to 2006, with marketing services outpacing advertising, driven primarily by growth in direct, interactive and internet marketing.
2007 should again be a good year, reflecting the build-up to the Beijing Olympics and the 2008 US Presidential election, in which both parties are expected to have well-financed, multi-candidate fields. In fact there is already evidence that the campaign is starting early and will be a long, expensive one. 2007 should see growth similar to 2006 or slightly stronger growth, with 2008 escalating to 5-6%. 2008 should be a blockbuster year, not only because of the Summer Olympics and the US elections, but also with the European Football Championship in Austria and Switzerland. Spending beyond one’s means may finally catch up with the US economy in 2009 and result in a global slow-down.
2006 was an excellent year; 2007, we believe, can see WPP strengthen more. The Company continues to be in its most robust position since 2000. Revenue growth, cost management, productivity, liquidity and balance sheet strength all continued to improve over last year and continue to do so in 2007. Most importantly, our talent base continues to strengthen, particularly as we invest in increasing headcount in 2006 and in 2007.
As for 2007 and beyond, there are two principal concerns: America’s twin deficits, and Western Europe’s stagnation. How long growth can continue when the US government continues to run current account and fiscal deficits remains to be seen. The American consumer remains sluggish, and chairmen and CEOs do not seem willing as yet to raise corporate capital spending consistently to bolster the economy, which – in our view – remains patchy.
The 2000 recession was stimulated by a sharp decline in corporate capital spending, which was then ameliorated by stronger consumer spending. The reverse has not happened yet, notwithstanding the strength in corporate profitability, liquidity and margins. Profits as a proportion of GNP are at a 50-year high. At the same time, inflation stimulated by commodity price inflation, in oil and steel in particular, has returned, and the dollar has weakened. Perhaps this is an old-fashioned approach, but operating beyond ones means
How we’re doingLetter to share owners
How we’re doing .

WPP ANNUAL REPORT 2006
Grey delivers
Grey, which accounts for about 15% of the enlarged Company, has now been fully integrated and has brought to the Group important strategic assets and strong people. It has a powerful planning and account handling advertising agency led by Jim Heekin, with relationships with major multinational clients of WPP. And it is now raising its levels of creativity.
Its strong Media Investment Management capability, led by Alexander Schmidt-Vogel, is now fully integrated into GroupM, winning large accounts using GroupM networks and planning and research tools. Its public relations capability, led by Jeff Hunt, is now co-ordinating and co-operating with Cohn & Wolfe, led by Donna Imperato. Its very strong healthcare capability, probably our fastest growing, is run by Lynn O’Connor Vos. Its strong direct, sales promotion, interactive and internet capability, now uniformly branded G2, is led by Joe Celia.
Geographic strengths include the US and Europe (including Eastern Europe) in particular, with interesting bases in Asia Pacific, Latin America, Africa and the Middle East, which are being built up further, organically and by acquisition. Grey also presents big opportunities to build on existing common client opportunities, and explore new relationships.
Margin objectives
Our 2007 budgets indicate organic revenue growth of 4%, equally balanced between first and second halves, and skewed to greater growth in marketing services. Operating margins are projected to reach 15.0%. The margin objective for 2008 is 15.5% and in 2009 we will aim for 16.0%.
2007 should be an even better year for the industry, stimulated by anticipation of the Beijing Olympics and US Presidential election in 2008. In February, when we announced our results for 2006, we gave guidance on life beyond 15%, to 15.5% in 2008 and 16.0% in 2009 and how we might improve further our margin to 19%, or 20% under 2004 UK GAAP. This is not so outrageous as some believe, given that our best performing companies in each services sector already perform at a combined Group margin of 17%.
Our top priorities
Our reason for being, the justification for WPP’s existence, continues to be to add value to our clients’ businesses and our people’s careers. Our goal remains to be the world’s most successful provider of communications services to multinational and local companies. To that end, we have three top strategic priorities.
How we’re doingLetter to share owners
seems perilous to us. And a country’s currency, we think, comes close to representing its ‘stock price’.
Our second worry is that Western Europe continues to stagnate, although there have been signs of improvement. France, Germany, Italy and, to a lesser extent the UK, resemble a mature company in a mature industry. There is little top-line growth. With healthcare and pension costs becoming an increasing burden, unless relative interest rates decline and growth is stimulated by further broadening of the European Union, for example by the early entry of Turkey or by more liberal corporate and social tax policies, Western Europe may be trapped in a sluggish, lack-of-growth scenario, falling further behind the US and Asia Pacific. Social and structural costs are significant elements of this concern. The recent extension of transfer of undertakings legislation in the EU (‘TUPE’), for example, represents another burden to bear. In certain circumstances, it is possible that having won an account, the winning agency would have to take on the losing team or pay severance.
Despite these issues, there is evidence – particularly in 2005, 2006 and the early part of 2007 – of a growing focus on top-line growth. Given a low-inflationary environment, limited pricing power and more concentrated retail distribution, clients are increasingly coming to the view that there is only one way to compete – through innovation and branding. Promote on price and you create commodities. Innovate and differentiate, you create brands and the right to demand a premium from the consumer.
There is a growing realisation that cutting costs alone will not deliver growth targets promised to Wall Street and the City of London. There is a limit to cost reduction, but no ceiling on top-line growth – at least until you reach 100% market share. Further reinforcing this trend, strategic advisors, such as management consultants like McKinsey, counsel a switch in focus from costs to revenues. Corporate strategic plans are increasingly concentrating on managing for growth, instead of managing for value.
Finally, managements are just plain tired of grappling with debilitating cost-management programs. For the past three or four years, there has been an inexorable focus on cost. It is much more fun to focus on growth – perhaps this partially explains the recent surge in merger and acquisition activity.
How we’re doing

WPP ANNUAL REPORT 2006 How we’re doing .
First, in the short term, having weathered the internet bust successfully, we need to build on the solid base we have established. Our people are stronger: they are better resourced, motivated and incentivised than when we exited the last recession in the early 1990s.
The Company is also more profitable, more liquid, less leveraged and better structured. In the most recent economic cycle, margins peaked at 14.5% and bottomed at 12.3%, as opposed to 10.5% and 5.6% the previous time.
Second, in the medium term, to build upon the successful base we have established with the acquisitions of Young & Rubicam Brands and Grey. At Grey, the new management structure is now in place and the planned integration is now completed. At Young & Rubicam Brands, our plans are also largely implemented, the one remaining task being to continue to strengthen the Y&R advertising agency.
Our third priority, in the long term or over the next five to 10 years, is to increase the combined geographic share of revenues of Asia Pacific, Latin America, Africa and the Middle East, and Central and Eastern Europe, from around 20% to one-third. We shall also aim to increase the share of revenues of marketing services from 52% to two-thirds; and to increase the share of more measurable marketing services – such as Information, Insight & Consultancy, and direct, interactive and internet – from around one-third of our revenues to 50%.
Our six objectives
Our six objectives remain as follows: First, to continue to raise operating margins to the levels of the best-performing competition.
15.0% (under 2004 UK GAAP) has already been achieved. 20%, or 19% under IFRS, is much
tougher, but not out of the question. BBDO, Dentsu and McCann have done so historically, although the pressure became too great in some instances.
Second, to continue to increase flexibility in the cost structure. Great strides were made in 2005 and 2006 on this. Peak flexibility historically was in 2000, at 6.6% of revenues in variable staff
costs. Now at 7.7% in 2006, 7.6% in 2005 and 7.8% in 2004, we have seen new peaks; and once again we have a sufficient ‘shock absorber’ in our cost structure, if revenue growth weakens.
Third, to improve total share owner return by maximising the return on investment on the Company’s £700 million (or over $1 billion) free cash flow. There are broadly three alternative
uses of funds:
• Capital expenditure, which usually approximates the depreciation cost. Pressure here has eased as technology pricing has fallen, although we are investing more in real estate, particularly in the US, to secure greater efficiencies.
How we’re doingLetter to share owners
2007 should be an even better year for the industry, stimulated by anticipation of the Beijing Olympics and US Presidential election in 2008
We have been the only FTSE 100 company to increase its dividend by 20% per annum over the past 10 years

WPP ANNUAL REPORT 2006
• Mergers and acquisitions, which have historically taken the lion’s share of free cash flow. Here we have raised the hurdle rate on capital utilised so that our return on capital employed may be increased. Even so, there are still interesting opportunities, particularly outside the US, where pricing remains lower and where there is a closer fit with the Company’s strategic objectives. Private transactions remain more attractively priced at single-digit price-earnings multiples. Happily, return on capital from Grey exceeded our cost of capital in the first and second year, and the return from Young & Rubicam Brands, although still below the cost of capital, is rising satisfactorily.
• Dividends or share buy-backs. We have been the only FTSE 100 company to increase its dividend by 20% per annum over the past 10 years. Given dividend cover of more than four times headline earnings and a dividend yield of just over 1%, we can continue to increase the dividend. However, a rolling share buy-back program appears to offer a more significant benefit to total share owner returns, and we have boosted the target level of the share buy-back program from 2-3% of the outstanding share capital to 4-5%. In the first quarter of 2007, we were buying back shares at an annualised rate of over 4%.
Fourth, we will continue to enhance the contribution of the parent company. WPP is not just a holding company focused on planning, budgeting, reporting and financial issues, but a
parent company that can add value to our clients and our people. We will continue to do this through a limited group of 250 or so people at the centre in London, New York, Hong Kong and Shanghai. This does not mean that we seek to diminish the strength of our operating brands. Our objective is to maximise the added value for our clients with their businesses and our people with their careers.
Many of our initiatives are possible because of the scale on which we now operate. In the optimum use of property, in information technology and in procurement generally, we are able to achieve efficiencies that would be beyond the reach of any individual operating company. But it is also clear that there is an increasing requirement for the centre to complement the operating companies in professional development and client co-ordination.
It is a relatively recent development for certain multinational marketing companies, when looking to satisfy their global communications needs, to make their initial approach not to operating companies but directly to parent companies. Such assignments present major, and increasingly frequent, opportunities for the few groups of our size. It is absolutely essential that we have the professional resources and the practice development capability to serve such clients comprehensively, actively and creatively.
All our clients, whether global, multinational or local, continue to focus on the quality of our thinking, co-ordination of communications, and price. In response, we focus on talent, structure and incentives.
Our objective is to maximise the added value for our clients with their businesses and our people with their careers
Our recruiting efforts throughout 2006 were dedicated and especially fruitful as we successfully targeted and attracted top talent within and beyond our industry, often competing with investment banking, management consulting and private equity offers
How we’re doingLetter to share owners
How we’re doing

WPP ANNUAL REPORT 2006
People, people, people
Talent and its management therefore remain the lynchpin of our reason for existence: that is what our clients pay us for. Development of our people and the way we manage that talent is a critical driver of performance; and on that critical dimension, we continue to make significant progress. In the creation of extremely attractive working environments, with highly competitive incentives, we increasingly differentiate ourselves from our competitors and improve the attraction of WPP companies as destinations for talent.
Our quarterly reviews with the operating companies have been restructured, consequently, to give more time and attention to talent and to clients. Our recruiting efforts throughout 2006 were dedicated and especially fruitful as we successfully targeted and attracted top talent within and beyond our industry, often competing with investment banking, management consulting and private equity offers. The war for talent is fierce, and there is more to be done.
The blueprint for our executive development curriculum has been completed, and our new client leadership training program has been successfully introduced. The parent company and each of our operating companies installed its own approach to performance assessment and succession planning, aimed at developing the careers of their people, improving the quality of feedback, coaching and mentoring they receive and providing for orderly succession. We continued to scrutinise and modify our compensation practices: both to offer competitive and justly-based rewards to our existing people and to attract outstanding talent from elsewhere. For the first time Grey was included in our performance and assessment approach in 2005 and 2006. Our incentives assessment and rewards methodology have been enthusiastically received.
A communications services company must be a model of excellent external and internal communications. To that end, we are broadening the understanding of the Group’s vast resources through a raft of regular communications: our FactFiles profiling Group resources/companies/products; our monthly public online news bulletin, e.wire;our award-winning global newspaper, The WIRE; our annual Atticus Journal of original marketing thinking; and our annual Corporate Responsibility Report. We are focusing increasingly on online communications following a comprehensive redevelopment of the WPP intranet and Group website (www.wpp.com).
In property management, we continue to improve the return on our investment in real estate through the award-winning WPP Space Program, with planned investment in property databases and systems, innovative design and continuous review of key locations. Better use of space has enabled us to hold like-for-like increase in square footage in our portfolio to less than 3% over the last two years, while for the same period like-for-like revenue has increased by over 11%. As a result, square footage per head is down
almost 5%, from 248 sq ft in 2004 to 236 sq ft in 2006, and the ratio of establishment cost to revenue has reduced from 7.6% in 2004 to 7.1% in 2006, equivalent to a saving of £29 million. We have effectively achieved the medium-term objective of a 7% establishment cost-to-revenue ratio set in 2002, when the same ratio was 8.4%.
We have shed the surplus space taken on in recent acquisitions, and our future priority in managing the property portfolio of approximately 18 million sq ft worldwide is to ensure that the growth in additional square footage is less than the growth in revenues and headcount. Our new objective is to achieve greater space utilisation to more than offset the impact of the current surge in commercial property rentals worldwide.
In procurement, we have set ourselves the goal of becoming the undisputed leader of procurement practice in the global advertising and marketing services industry. With intensified internal training in this area, we have focused on our major markets and categories more favourable for global, regional or country contracts such as IT, telecoms, facilities, travel, professional services and production. This program’s success has been demonstrated by improvement of the non-staff costs to revenue ratio in recent years.
In Information Technology, we continue to integrate core infrastructure support across our offices. As with our earlier acquisition of Cordiant, Grey operations have been quickly integrated into our IT platform, which has allowed the operating companies to concentrate on client-related IT systems development. Convergence of transmission of electronic data, internet, wireless, IP and traditional voice telephony presents us with a further opportunity to standardise our approach to technology at the regional, if not global level, and to take advantage of current overcapacity in many of these sectors.
Finally, in practice development we continue to develop horizontal initiatives in a focused set of high-potential areas across our vertical operating brands: in media investment management, healthcare, privatisation, new technologies, new faster-growing markets, internal communications, retail, entertainment and media, financial services, and hi-tech and telecommunications. Specifically, we continue to invest in sharing insights and developing initiatives through The Channel (in media and research) and The Store (in distribution and retail).
In key geographic markets we are increasingly co-ordinating our activities through WPP Country Managers. We continue to believe that increasing co-ordination is required between our brands at the country and global levels, as the arguments for investment in regional
How we’re doingLetter to share owners
How we’re doing .
WPP ANNUAL REPORT 2006
management become weaker. As our recent experience in Italy demonstrated, however, the activities of Country Managers must be closely aligned and monitored. In addition, we are appointing an increasing number of WPP Global Client Leaders to co-ordinate our efforts on behalf of clients and to ensure they get maximum benefit from their relationships with WPP operating brands.
Furthermore, we continue to encourage internal strategic alliances and promote co-operation. Practice development initiatives have thereby been reinforced in such areas as healthcare, internal communications and media and entertainment. This has been especially important to manage our portfolio of direct investments in new media, under the re-branded WPP Digital.
All these initiatives are designed to ensure that we, the parent company, really do (and are perceived to) inspire, motivate, coach, encourage, support and incentivise our operating companies to achieve their strategic and operational goals.
Growing our revenues
Fifth, as we move up the margin curve, we intend to place greater emphasis on revenue growth. One legitimate criticism of our performance against the best-performing competition is our comparative
level of organic revenue growth. 2000 was a bumper year but unsustainable. In 2001, we disappointingly moved back into the middle of the pack. But there was a significant revival in 2002 and 2003, when we were one of only two of the major companies that showed revenue growth. 2004 was punctuated with a number of high-profile wins, resulting in the second strongest organic growth performance in the industry, and 2005 and 2006 saw strong growth again among the leaders in the industry.
Our practice development activities are also aimed at helping us position our portfolio in the faster-growing functional and geographic areas. So far in 2007, the Group has made acquisitions or increased equity interests in Advertising and Media Investment Management in the US, France, Germany, the Netherlands, Russia, Brazil, Colombia, Australia and China; in Information, Insight & Consultancy in the US and the UK; in direct, internet and interactive in the US and Mexico.
These acquisitions continue to move us forward to our aforementioned strategic priorities; expanding the market shares of our businesses in Asia Pacific, Latin America, Africa and the Middle East to one-third; in marketing services to two-thirds; and in Information, Insight & Consultancy, direct and interactive, to one-half.
We will expand our strong networks – Ogilvy & Mather, JWT, Y&R, Grey, United, BatesAsia 141, MindShare, Mediaedge:cia, MediaCom, Research International, Millward Brown, KMR, Hill & Knowlton, Ogilvy Public Relations Worldwide, Burson-Marsteller, Cohn & Wolfe, GCI, OgilvyOne, Wunderman, OgilvyAction, G2, CommonHealth, Sudler & Hennessey, Ogilvy Healthworld, Grey Healthcare, Enterprise IG, Landor and Fitch – in high-growth markets or where their market share is insufficient.
In 2006, we strengthened our position in Advertising and Media Investment Management in the US, the UK, the Netherlands, Germany, South Africa, Israel, China, Singapore, New Zealand and Brazil; in Information, Insight & Consultancy in the US, Spain, Argentina, Hong Kong and China; in Public Relations & Public Affairs in the US, Canada and India; in Branding & Identity in India; in Healthcare Communications in the US, the Netherlands, Spain and Switzerland and in direct, internet and interactive in the US, Germany, China and Korea.
We will also enhance our leadership position in Information, Insight & Consultancy by further development of our key brands with particular emphasis on North America, Asia Pacific and Latin America. We will accelerate our growth of panels and have established a Kantar-wide operational capability. We will reinforce our growing position in media research through KMR, which includes our investments in television audience research through IBOPE, AGBNielsen Media Research and Marktest, which, combined, are the market leaders outside North America. We will also continue to accelerate development of our retail and healthcare offers.
In addition, we will reinforce our worldwide strength in direct and interactive marketing and research through our traditional channels such as OgilvyOne, Wunderman, G2, RMG Connect, Blanc & Otus and Lightspeed. Although the early 2000-2001 compressions in financial valuations initially offered significant opportunities, we will now also invest directly in the new channels through start-ups, particularly as US valuations in search, for example, have become prohibitive. Other opportunities will be sought to enhance our online capabilities.
Lastly, we will continue to develop our specialist expertise in areas such as healthcare, retail and interactive and to identify new high-growth areas.
Creativity remains paramount
Our sixth objective is to improve still further the quality of our creative output. Despite the growing importance of co-ordinated communications and price effectiveness, the quality of the work remains
and will remain paramount. If you drew a graph plotting creative awards (as a proxy for creativity) against margins for any group of agencies, there would be a very strong correlation. The more awards, the stronger the margins.
How we’re doingLetter to share owners
How we’re doing
WPP ANNUAL REPORT 2006
The client’s procurement department fades into the background when the work is strong. Of the three things we do – strategic thinking, creative execution and co-ordination – creative execution is undoubtedly the most important, and that means creativity in its broadest sense.
Clients look for creative thinking and output not just from advertising agencies, public relations and design companies, but also from our Media Investment Management companies, MindShare, Mediaedge:cia, MAXUS and MediaCom, and our research companies. Millward Brown remains arguably one of our most creative brands. Witness the BrandZ™ Top 100 Most Powerful Brands Study in the Financial Times.
We will achieve this objective by stepping up our training and development programs; by recruiting the finest external talent; by celebrating and rewarding outstanding creative success tangibly and intangibly; by acquiring strong creative companies; and by encouraging, monitoring and promoting our companies’ achievements in winning creative awards. For additional leadership in this regard, Robyn Putter, in addition to serving as worldwide creative director at Ogilvy, has taken on the additional role of WPP’s worldwide creative head.
We are committed to achieving these objectives as a substantively responsible corporate citizen of the world at large and the communities in which we operate.
The future
A colossal amount remains to be done – challenging our clients, and therefore us. It seems certain that once these objectives are achieved, they will be replaced by new ones.
As companies grow in size, most chairmen and CEOs become concerned that their organisations may become flabby, slow to respond, bureaucratic and sclerotic.
Any sensible business leader aggressively resists this phenomenon; we all seek the benefits of size and scale without sacrificing the suppleness and energy of a smaller firm. And, for the first time, new technologies now make this possible on a global platform.
WPP wants the scale and resources of the largest firm together with the heart and mind of a small one.
As a parent company, we continue to develop practical principles and policies for our companies’ charitable giving and services to the environment, education, the arts and healthcare based on best-practice guidelines. We conservatively calculate that the WPP organisation contributed an estimated £24.9 million worth of time, skills, materials and money to social and community causes in 2006. A summary of the Group’s approach to corporate responsibility can be found on pages 112 to 117.
And fi nally…
Great consumer goods companies never forget one fundamental and sobering truth.
However big they become, however impressive their market capitalisation and their ranking in the Fortune 500, their continued success is dependent not simply on top-down management but crucially on bottom-up marketing. Only if tens of millions of individuals, day-by-day, week-by-week, continue to choose that tube of toothpaste, those cheese slices, that pack of pain killer, that breakfast cereal – only then will even the greatest of companies survive and prosper.
Exactly the same sobering truth applies to WPP. 2006 was an extremely good year for the Company and this Report describes and analyses our results in considerable detail. But we never forget that those results are made up of tens of thousands of smaller results, from more than 100 companies in more than 100 countries around the world; and that we, too, are dependent for our success on the day-to-day, week-by-week invention and delivery of tens of thousands of handmade artefacts on behalf of our clients; strategic plans, research analyses and all forms of marketing communications – each one the product of creative minds and each one crafted to meet unique and specifi c client needs.
As reported, the single fi gure for Group profi t before tax in 2006 was £682 million. If it were possible to carry out a complete dissection of that single fi gure, we would fi nd that it was made up of the contributions of no fewer than 100,000 individuals. These are the people our clients respect and value; it is their work and their talent that continue to fuel the Group’s progress; and it gives us great pleasure, on behalf of all our share owners, to end this letter by expressing our gratitude to them for their remarkable achievements.
Philip LaderChairman
Sir Martin SorrellGroup chief executive
* This letter to share owners should be read in conjunction with and as part of the management report set out in the section headed Directors’ report on pages 103 to 117. The statements made in the footnote to the Review of operations on page 141 apply equally to this letter to share owners.
How we’re doingLetter to share owners
How we’re doing .

WPP ANNUAL REPORT 2006How we’re doing
WPP ANNUAL REPORT 2006
Reports from our operating brands
Agency networks P28-46Media Investment Management P47-53Information, Insight & Consultancy P54-58Public Relations & Public Affairs P59-62Branding & Identity P63-66Healthcare Communications P67-68Specialist Communications P69-71
How we’re doing .

WPP ANNUAL REPORT 2006
Agency networks
This was not surprising. We have aggressively taken a leadership position in the new media, as evidenced by the vitality of our ongoing digital summit series, Verge. Digital is evolving so fast that our capability and leadership in this area is crucial for our clients today.
In 2006 we also took steps to strengthen our leadership position in several key markets that we have identifi ed as sources for the highest potential growth. We expanded operations in China to the next tier of key cities and added capability with acquisitions in internet and real estate marketing (an area of huge growth). We consolidated two operations in Korea to form the Diamond Ogilvy Group, creating a market leader. We focused on growing Central Europe as a sub-region by strengthening creative and management resources. The challenges in those markets are signifi cant, but so are the opportunities. Our leadership there has been particularly adept in setting up second agency units to handle confl icts, readying us for rapid growth going forward.
The investment in our network yielded a strong year in client acquisition. Johnson & Johnson tapped us to lead their Olympic sponsorship program in China. Panasonic tapped Ogilvy Latina as its region-wide agency.
How we’re doing
Ogilvy & Mather Worldwide
OgilvyOne Worldwide
Ogilvy Public Relations Worldwide
Ogilvy Healthworld
OgilvyAction
Report by Shelly Lazarus (right)
Chairman and chief executive offi cerOgilvy & Mather Worldwide
e live in interesting times. You cannot look at any part of our business without seeing tremendous change. The massively expanding number of ways that we can connect, coupled with the fact that the consumer is fi rmly in control, places a deep premium on innovation, fresh thinking and ideas. For this reason I am
deeply appreciative of how our entire company has adapted with new ways of working, award-winning creativity, and excellent fi nancial performance.
The valuable lesson our long experience in integrated communications (what we call 360 Degree Brand Stewardship®) has taught us is that success is not a question of media, technology, or even integration. It’s about the idea. Our best work is always founded on a compelling brand idea (we might even say a brand “ideal”). We think focusing on big ideas gives greatest value to clients and best assures our fi nancial growth and success. Think Dove (Campaign for Real Beauty), American Express (My life. My card.), IBM (Innovation That Matters), BP (Beyond Petroleum), Motorola (Moto), and Cisco (The Human Network).
We continue to redefi ne advertising in the broadest possible terms and are working in intra-disciplinary creative teams to deliver. For example, in New York and London, the creative departments from advertising, direct and interactive have been combined; a positive trend that acknowledges the lack of boundaries and hierarchy in media today. This is the future of advertising.
2006 was a year of signifi cant growth. OgilvyOne and OgilvyInteractive – at the center of the digital revolution – turned in extremely strong performances.
How we’re doing

WPP ANNUAL REPORT 2006
Avis, Chiquita Brands and easyJet came into Ogilvy Europe. Other new clients included AIG, Foster’s Beer, Nestlé Nutrition, Malaysian Airlines and Intel (a big global win for Ogilvy Public Relations). Most importantly – because this is always the measure of network strength – we continued to grow with existing clients such as American Express, BAT, BP, Cisco, Coca-Cola, Kodak, Kraft, Merck, Motorola, Unilever and Yahoo!, among others.
Our success with existing clients is a direct result of our commitment to superior client management through the Global Brand Community. Our global clients – who represent more than 50% of our income – have high expectations and a unique set of needs. They require partners who understand their business profoundly and know how to drive ideas around the world. The people who lead these global accounts set a standard of practice that infl uences our client engagements everywhere.
Awards are another measure of success and a sign of our creative vitality. I am particularly proud of how consistently we win at the major awards shows and how widely the honors are distributed.
We won signifi cant recognition at Cannes (37), the Clios (13), DMA ECHO (seven including the Diamond Best
in Show), The London International Awards (6), NY ADDY (42), NY Festivals (23), and The One Show (12). We were major winners at the Effi es in many markets including India, Mexico, El Salvador and in the US where Ogilvy won 10, including the Grand Effi e for Dove’s Campaign for Real Beauty. This is an astounding achievement since Dove also won the Grand Prix at the Euro Effi es two years ago – the fi rst time any campaign has won that honor on two continents. The Dove campaign was also named Global Campaign of the Year by AdvertisingAge, and BusinessWeek named it Best in Class in their annual ad roundup. Dove is a big idea in action.
We also had a full share of Agency of the Year honors. Winners include Ogilvy & Mather Asia Pacifi c (as both network of the year and creative agency of the year), Argentina, Germany, Johannesburg, Hong Kong, Singapore, Mexico, and India, with India being named most creative agency for the tenth time in 11 years. OgilvyOne Worldwide was named top company in both the direct and digital marketing categories by the prestigious Won Report.Ogilvy PR was named the top network by PRWeek. Ogilvy North America was named large agency of the year by BtoB Magazine and was inducted into American Business Media’s Creative Excellence in Business Advertising Hall of Fame.
2006 was also a year marked by a number of major initiatives that enrich our 360 offering.
We combined all of Ogilvy’s sales promotion and retail companies into one global unit called OgilvyAction. OgilvyAction seeks to transform consumer behavior along the path to purchase – what it calls The Last Mile – with meaningful points of contact.
Neo@Ogilvy, our digital, direct response and search marketing media group, became truly global this year. Neo won Kodak’s global 360 media account and was named by The Wall Street Journal as one of the “fi ve dynamic agencies to watch in 2007.” No doubt, digital media planning will take an increasingly central role in how we deliver for our clients.
We established a Branded Content and Entertainment practice which is a growing area of intense activity both online and in traditional entertainment channels. This is no longer a sideliner to the main event. Now our brands can bethe event; they can be in the game, literally, fi guratively or virtually. Imagination is the only limit to the possibilities.
Other Ogilvy units experienced their fair share of growth and success as well in 2006. Ogilvy PR continued its pattern of strong growth, while becoming more essential to our 360 Degree Branding proposition. PR has always been an important discipline, but in the age of the internet, which offers instant fame – or infamy – PR is absolutely vital to building and protecting brands.
How we’re doingAgency networks
How we’re doing .

WPP ANNUAL REPORT 2006
Ogilvy Healthworld, one of the preeminent global healthcare communications networks, is benefi ting from the growth that the healthcare and pharmaceutical industries are enjoying. Its reach, coupled with Ogilvy’s network and 360 practice, has strengthened existing client relationships with such industry leaders as Allergan, Merck and Wyeth.
As a company, we spent a great deal of time last year talking about the value of ideas and our role in fostering them. In a cluttered world, ideas are what cut through. Ideas are the great organizing principles. With more moving parts, more options, more opportunities, the only thing that will matter for our clients is to be able to get to a big idea, and that is the one thing that clients cannot do for themselves. We already have the people, the creative minds, the renegade thinkers, the artisans, poets and inventors on hand. The question is what can we do to make the most of this asset? How can we truly be an ideas-driven company?
This year we will be exploring new ways of working that we hope will answer that challenge. I can assure you of one thing: we will start with David Ogilvy’s famous words, written on the walls in virtually every offi ce in the network. “Raise your sights. Blaze new trails. Compete with the immortals.” That’s a good starting place.
OgilvyOne Worldwide
Report by Brian FetherstonhaughChairman and chief executive offi cer
2006 was another solid and successful year for OgilvyOne Worldwide. At the beginning of the year, we set ambitious targets for ourselves in terms of revenue growth, creative reputation and digital thought leadership. We delivered on all three fronts.
Our revenues grew steadily in 2006 on top of two record growth years. We won signifi cant new client assignments in every region of the world, including major victories in categories such as entertainment and leisure, publishing, fi nancial services, insurance, consumer packaged goods, airlines, hotels and telecommunications.
Our creative accomplishments in 2006 exceeded our expectations. We won 595 local and international awards, topping 2005’s stellar total by 20%. For the second year in a row, we were named the top agency network for both direct and digital marketing by the Won Report and theCyber Won Report.
In addition to our top performances at Cannes, the Effi es, Caples, The One Show, The Clios and D&AD, we also turned in another outstanding showing at the
DMA ECHO awards in October, winning fi ve Golds, one Silver and the Diamond Best in Show award.
The digital transformation of marketing communications continues to command media and industry attention. At OgilvyOne, we are uniquely positioned to help our clients navigate and win in the new digital marketing age.
Verge, the OgilvyOne digital summit series, is an integral part of our digital thought leadership strategy. In 2006, there were Verge events in Mumbai, Madrid, Seoul, Prague and New York. The fl agship New York event took place in November and had a record attendance of around 700 including clients, media and many bloggers. It was webcast via Truffl es, our intranet, and was accessed by 3,500 employees worldwide.
Already in 2007, Verge events have been held in Tokyo and Toronto with planning underway for summits in São Paulo, Dubai, London and New York once again towards the end of the year. We’ve also stepped up Vergeevents tailored to individual clients. These smaller and more focused events enable us to shape content exclusively to the needs of particular client audiences, and to present specifi c recommendations for immediate implementation.
The launch of Neo@Ogilvy, our digital, direct response and search marketing media division, in early 2006 has been a key driver of our growth. Neo rounds out our truly integrated digital marketing offering. It’s no surprise that The Wall Street Journal named Neo@Ogilvy as one of the “fi ve dynamic agencies to watch in 2007.”
We anticipate continued strong growth this year, fueled by an aggressive acquisition strategy, especially in search marketing capabilities. We recently announced our fi rst acquisition in this area – Global Strategies International (GSI), a leading search marketing consultancy. The integration of Neo@Ogilvy and GSI creates an immediate marketplace advantage for clients as they embrace all types of search as a superior way to connect consumers with their brands.
Our focus for 2007 will continue to be on growth. Building on our momentum from the past two years, we are already off to a strong start.
Ogilvy Public Relations Worldwide
Report by Marcia SilvermanChief executive offi cer
If you want to know how well an agency does its job, ask a client – or a potential client. So Ogilvy PR was deeply gratifi ed by the results of the 2006 Agency Excellence Survey conducted by PRWeek last July. In fi ve key categories, as rated by 600 clients, we came in fi rst, including Who Would You Likely Hire in a Crisis and Who Would You Hire as Your Next Agency.
How we’re doingAgency networks
How we’re doing

WPP ANNUAL REPORT 2006
It took a lot of hard work by hundreds of top professionals to achieve these rankings. Just as importantly, it took clients who share our understanding of how mature digital technologies have fundamentally transformed communications.
Only one year after its launch, our 360 Digital Infl uence interactive offering has helped clients manage this transformation by creating comprehensive strategies to engage customers or constituents in direct conversation. For Snap-on Diagnostics, we launched a broadband TV channel where automotive technicians can access training videos at any time. Other clients who have looked to us for digital expertise include BP, Intel and Unilever.
In this world where consumers are now “always on,” Ogilvy PR enjoyed continued global expansion of client engagements throughout 2006, as companies looked to us to help build market share worldwide.
In China, we added Bausch & Lomb, Intel and United Airlines to a roster that includes American Express, Ford, IBM and UPS. We now have more than 300 professionals in our offi ces in Beijing, Shanghai and Guangzhou. Our presence in the rest of Asia continued growing in importance, as we launched the Dove Campaign for Real Beauty for Unilever in 12 nations, including China, Indonesia, Malaysia and the Philippines.
The year was also marked by steady growth in Europe. Acquisition of the agency CPZ gave us a strong presence in Germany, while we inaugurated health and sports marketing disciplines in Ireland and were named Agency of the Year in Eastern Europe in the European Consultancy Report Card 2006 from The Holmes Report.
Unilever rewarded our Consumer Marketing Practice by adding its Bertolli and Knorr brands to our portfolio, complementing our work for Lipton, Promise, Slim•fast and Hellmann’s. Johnson & Johnson expanded our work for Johnson’s Baby to Europe and China, while naming us agency of record for its KY personal products. Yum! Brands looked to us for crisis management during the Taco Bell e.coli outbreak, while we achieved broad positive coverage for its KFC unit’s move to stop using trans fats. Other Consumer Marketing wins included Quaker and Fox Mobile Entertainment.
Our Health Care practice added a new anchor client in 2006, winning the AstraZeneca respiratory franchise, while growing our work for oncology therapies from Bristol-Meyers Squibb. And the Social Marketing practice continued its vital work in women’s health with the fi fth year of The Heart Truth campaign for the National Heart, Lung and Blood Institute. Models for the Red Dress Collection during Fashion Week included Emmylou Harris, Lindsay Lohan and Broadway legend Elaine Stritch.
Our Technology Practice continued to grow, adding global clients such as Hitachi Data Systems, Intel and Satyam Computer Services, all while working seamlessly with other practices, such as Digital Infl uence, Corporate, Consumer Marketing and Financial Communications.
Looking ahead, 2007 will mark a serious commitment to Latin America, as we open offi ces in Mexico City and São Paulo, Brazil. In these nations, as elsewhere, we will fi nd success by stimulating a dialogue with customers that focuses on engaging, not talking at, our target audience.
Ogilvy Healthworld
Report by Steve GirgentiChief executive offi cer
As the size and complexity of the healthcare category continues to increase dramatically around the world, Ogilvy Healthworld has been able to leverage its unmatched geographic reach (53 offi ces in 33 countries), market expertise and strategic alignment with parent Ogilvy Worldwide. We offer a full array of For the Life of the Brand™ services: from early-stage work in medical education, global PR and clinical trial recruitment to professional communications, direct-to-consumer and patient programs, and relationship marketing.
2006 was an eventful year for our US operations. From the New York hub, the US operations directed a broad array of global assignments for clients such as Amgen, AstraZeneca, Johnson & Johnson, Lilly, Merck, Pfi zer, Roche and Wyeth. In particular, we grew our existing relationships by winning Allergan’s breast implant business, Merck’s Januvia, Medtronic and Du Puy Spine, and Wyeth’s Lybrel and Prestiq. These successes gave added meaning to the company’s twentieth anniversary celebration of its founding, when it was launched as Girgenti, Hughes, Butler and McDowell.
In Europe, we are driving the pan-European launches of Champix for Pfi zer and Sprycel for BMS. Additional European assignments include wins from Schering Dermatology, MTM, Almirall, Janssen pain portfolio, and the Schering World Contraception Day. Further fueling growth in Europe is our recent partnership with WPP sister company CommonHealth. The Ogilvy Healthworld network is being used by its US-based global clients who require marketing programs in Europe. This partnership will soon expand to other regions of the world.
In Asia Pacifi c, Australia enjoyed strong growth last year, with 11 new clients and is now the No.5 healthcare specialist in the country. In India, Ogilvy Healthworld is the market leader and experiencing healthy expansion. In Singapore, recent regional wins include projects with Schering AG, BMS and Pfi zer. Expansion strategies in
How we’re doingAgency networks
How we’re doing .
WPP ANNUAL REPORT 2006
How we’re doingAgency networks
Japan, China, Korea, Taiwan, Thailand, Hong Kong and the Philippines include a variety of approaches that leverage resources from the Ogilvy network along with a mix of joint ventures and acquisitions.
In Latin America, the offi ce in Mexico City has experienced positive growth following the arrival of new management. Important wins at Boehringer Ingelheim, Pfi zer and Stiefel have been highlights of 2006. Argentina also has new leadership, and Brazil continues to expand.
As proud as we are of this strong showing, we know the issues and opportunities surrounding the healthcare industry are dynamic and evolving. Size and technical capabilities alone are not enough. The key to continued success is to bring innovation and fresh ideas into the communication conversation with our clients. Clients everywhere want big ideas; healthcare is no different, and we will continue to deliver.
OgilvyAction
Report by Rick RothChief executive offi cer
2006 was a year of important developments for the newly-named activation arm of Ogilvy. We made signifi cant progress against our strategic goals through a time of industry evolution, business challenges and internal realignment.
The identity of our company was perhaps the biggest development. It became abundantly clear that for us to go to market as part of the Ogilvy 360 Degree promise, we needed an Ogilvy name. Ogilvy clients are demanding more and more of the services we offer and they want those services from the Ogilvy brand. As OgilvyAction we deliver to them seamlessly, and now, quite naturally alongside OgilvyOne, Ogilvy PR, OgilvyInteractive and Ogilvy Healthworld.
We delivered high revenue growth in the Ogilvy network. Our focus on driving top-line business resulted in impressive year-over-year performance. Our investments in people and services are generating big opportunities for us – opportunities we are confi dent will bring strong returns going forward.
Everything we do is focused on helping our clients win in what we call The Last Mile. There isn’t a day that goes by when marketers aren’t searching for new ways to physically connect with their consumers to infl uence how they act as they approach a purchase decision. Our fi eld and event marketing discipline has become the fastest-growing
part of our company. These services are at the center of our brand experience work, and we are committed to delivering best-in-class capability.
Our suite of services has increasing relevance in today’s market. Complementing our core services of experiential, promotional, shopper and customer marketing, we offer digital capabilities, sports and entertainment marketing and retail design. In markets where our presence is developing, we are growing both organically and with new partnerships. This commitment extends to markets targeted for further development, particularly Brazil, Russia, India and China.
We believe fi rmly that the most successful marketing programs today will have placed critical emphasis on the trade customer. Many of our clients have embraced this point of view, and we are receiving strong support to expand our customer marketing capability in all markets.
We have made considerable progress building awareness of our company, understanding of the role we play, and how to optimally engage an activation agency in developing true media-neutral plans. Our focus has been on building business through partnerships with our Ogilvy brethren, particularly those in our Global Brand Community, driving worldwide client relationships. The good news is that we have made solid progress across shared clients like American Express, BAT, Kodak, Kraft, Motorola, Nestlé and Unilever. The better news is that we have merely scratched the surface. While we nurture a growing independent business, we see tremendous upside in penetrating the Ogilvy client portfolio.
In the fi rst week of 2007, we launched OgilvyAction. Our clients applauded, our people celebrated, the industry immediately understood. We are Ogilvy but we are a unique part of Ogilvy. We are a company made up of high-energy entrepreneurial people focused on infl uencing how the consumer behaves in The Last Mile. In the famous words of David Ogilvy, “We sell or else.”
How we’re doing

WPP ANNUAL REPORT 2006
t JWT, we always approach the future with equal parts, reverence and wild anticipation. Innovation is our lifeblood, and has been throughout our rich history of fi rsts: we were the fi rst agency to establish research and account planning departments; the fi rst to create ads that used sex appeal and celebrity endorsements;
the fi rst to develop a commercial television program; and the fi rst to buy a TV roadblock.
As we have done throughout our history, today we are turning what could be perceived as challenges – new media platforms, disparate consumption patterns and confl icting demands on consumer time – into opportunities.
The digital domain is one of those huge opportunities. For us, it’s all about taking our clients confi dently and passionately into the future by tapping into the limitless
potential of what we call “digitivity” – the point where digital meets creativity meets connectivity.
We’ve done it for clients such as Ford. Last year, we created an online documentary series, Bold Moves: The Future of Ford, that allows the world to witness the inner workings of the auto maker as it rebuilds its North American business. Digital was integral to the campaign in that it allowed the automaker to communicate its ongoing story in a journalistic manner – what we’ve termed “brand journalism” – and gave stakeholders a way to respond. The site FordBoldMoves.com, where the documentary lives, includes point-counterpoint editorials and an area for e-conversations around each topic.
Most important, the work for Ford represents not just an advertising idea but an idea that people can participate in. That’s what we do, bigger and better than any other network. We’ve always been an agency famous for big, populist campaigns. And we still are: Bold Moves for Ford; Clearly Smirnoff for the Diageo brand; Play with Beauty for Unilever’s Lux.
So how is a global network such as ours better enabled to deliver these solutions? First and foremost is the key issue of pure resource. Our size and breadth simply allows us to bring greater capability – in terms of people, places and creative talent – to solving global client problems.
To be clear, this element goes way beyond pins on a map. Indeed, if that were our only advantage, we’d quickly be trumped by local capabilities, individual market agendas and the like. What I’m talking about here is
How we’re doingAgency networks
JWT
Report by Bob Jeffrey (above)
Chairman and chief executive offi cer, WorldwideJWT
How we’re doing .

WPP ANNUAL REPORT 2006
How we’re doingAgency networks
the ability to deploy the very best global thinkers at our disposal and to marry them with colleagues in the trenches in far-fl ung regions, and the ability to generate success for our client with whatever is required – whether it’s a single global answer, the nuanced “glocal” solution or a completely tailored solution based on the unique needs of a marketplace. Our success with HSBC, for example, is predicated on each of these factors in the markets in which we serve HSBC around the globe.
Increasingly, our clients and the industry at large are recognizing the strengths of our solutions. Under the leadership of our worldwide chief creative offi cer, Craig Davis, we continue to see year-over-year improvement in our creative product.
Last year, the JWT group won 35 Lions at the Cannes International Advertising Festival, up from 17 in 2005 and fi ve the year before. Belying our TV-centric past, we won Lions in Television, Radio, Press, Outdoor, Media, Cyber, Promotion and Direct. And, in a resounding statement that big ideas and big business belong together, 23 of our clients were represented by our winning work, including Nestlé, Vodafone, Cadbury, Smirnoff, Pfi zer, HSBC, Unilever, Levi’s, Nike, Kimberly-Clark, Wilkinson Sword, Ford, Mazda and JetBlue.
This performance helped JWT rocket up the Gunn Report in 2006 – from ninth place to fourth place. To quote directly from the report, which honors the world’s best advertising by combining the winners’ lists from all of the major local, regional and global ad festivals: “Undoubtedly the biggest jump we have seen in the top half of the table in the eight-year history of the Gunn Report.”
At the core of these honored ideas are actionable insights. At JWT, we have always considered ourselves anthropologists fi rst, advertising people second. Reaffi rming our commitment to consumer understanding, last October we tapped Guy Murphy to become our global planning director. Murphy, who previously spent 14 years at BBH as planning director in both London and Singapore and, most recently, as deputy chairman, is building upon our legacy in planning (in 1968, our very own Stephen King founded the discipline) and casting it in a modern way to inspire great business-building creative ideas.
Ideas such as the one we created last year for the Diamond Trading Company. The idea was based on the insight that, just as diamonds stand the test of time – battling through the elements to be with us today stronger than ever – so too do relationships. Working from this insight, we developed Journey Diamond Jewelry, a piece with four or more diamonds of increasing size – from smallest to largest – that symbolizes the strengthening of a couple’s love over time. Since the launch of the concept
in the US, more than one million Journey pieces have been sold, generating over $829 million in sales. More signifi cant, US jewelry retailers considered the Journey concept to be the driving force in the market during a Christmas season that faced very strong competition from the electronics sector.
In providing a steady stream of insights, we look to move our clients’ businesses – and ultimately ours – forward. Through new ideas, new ways of communications, new product lines, new innovations.
We also intend to move forward by investing in high-growth markets. In doing so, we will help our multinational clients succeed by understanding and embracing the dramatically different cultural and operational landscapes. We are well positioned to do this, as the BRIC markets are home to some of our most noteworthy talent and work.
In 2006, JWT Brazil won six Cannes Lions, helping to make our network the highest-rated ad agency in Latin America at the awards festival. In Russia, we have an active and vibrant partnership, JWT/RAVI CIS.
As one of India’s largest and oldest advertising agencies (we opened there in 1929), we understand the country’s complexities and have the ability to bridge what’s now and what’s next. And, in China, we are helping clients take advantage of the country’s growing middle class and its purchasing power in the lead-up to the 2008 Beijing Olympics and well beyond.
Just as having a signifi cant presence in the high-growth markets is imperative, so too is having a best-in-class integrated offering worldwide. This is consistent with the rationale behind our relaunch in 2005, when we called for big, bold, innovative brand ideas that can live everywhere. It also reinforces why, in 2004, we launched RMG Connect as a global CRM network, which is meant to support JWT in its non-traditional efforts, as well as compete on its own credentials.
At JWT, we create ideas for our clients that people want to spend time with. So, it only goes to reason that we plan to commit more of our time, talent and resources to identifying where people are spending more of their time and developing ideas that will reach them there, be it the web, their mobile devices, their video games or the next media platform of the future. For our main ambition is this: ensuring our clients’ success. Our clients’ success is at the heart of everything we do – and why we strive for a constant state of evolution in today’s rapidly changing, consumer-controlled world.
How we’re doing

WPP ANNUAL REPORT 2006
t is truly a pleasure to return to Young & Rubicam Brands after six years. Although much has changed, its core values, culture and sense of tradition are as strong as ever. Most importantly, Young & Rubicam Brands’ reason for being – to give clients the full range of marketing disciplines from a group of
companies practiced at working together collaboratively – has never been more timely. Thirty years ago, Young & Rubicam Brands led the industry in pioneering integrated communications.
Today, in a dramatically changed environment, we are challenging ourselves to help redefi ne our industry, once again, for these times.
Young & Rubicam Brands has always believed in the importance of sustaining the integrity of its individual brands, while fostering a culture and structure that makes it easy and desirable to collaborate.
We have some iconic brands, and it is our job to make sure that we are focused on the future together.
2006 showed much evidence that we are moving forward. Hamish McLennan took over as CEO of Y&R in August 2006. Y&R is already responding to the strong leadership that is his hallmark. His focus on new business,
How we’re doingAgency networks
Young & Rubicam Brands
Y&R
Wunderman
VML
Burson-Marsteller
Landor Associates
Sudler & Hennessey
The Bravo Group
Cohn & Wolfe
Robinson Lerer & Montgomery
BrandBuzz
Report by Peter Stringham (left)
Global chief executive offi cerYoung & Rubicam Brands
How we’re doing .

WPP ANNUAL REPORT 2006
his high standards for creative product and his immediate attention to Y&R’s offering is bringing new energy and enthusiasm to every part of the agency.
The team at Wunderman, led by Daniel Morel, have continued to build on the solid base they laid in 2005, especially driven by the accelerated growth of data and online as not only future, but current, drivers of their growth.
In his second year of leadership at Burson-Marsteller, Mark Penn saw continued improvement in profi tability and revenue growth. His emphasis on four core strategies – digital, integrated, global and strategic – are shaping their offering to great results.
Landor Associates had another record-breaking year, sustaining its leadership position in brand consulting. A new generation of leadership stepped up from within the company, most notably Charlie Wrench taking on the CEO role.
Cohn & Wolfe, under the leadership of Donna Imperato, had another strong year. For the fi rst time, the agency expanded to Asia and, through a new partnership with GCI, can help clients more broadly in the Americas, across Europe and Asia. New practices in green marketing and digital helped to contribute to the top and bottom line.
Sudler & Hennessey, led by Jed Beitler, continued to deepen its relationships with some of the world’s most prestigious pharmaceutical companies. 2006 saw important expansion into 16 new European markets and a new operation in Mexico City.
In 2006, Eddie Gonzalez, who also runs Y&R Latin America, took over leadership of The Bravo Group. Eddie presided over a restructuring of the agency, which is now positioned to capitalize on the enormous growth of the Hispanic market in the US.
Robinson Lerer & Montgomery remains an incredible powerhouse for strategic communications counsel and services. BrandBuzz, which began as a “lab” for channel-neutral marketing, continues to build its roster of clients.
And, fi nally, marketing technology company VML has become a critical part of Y&R Brands since joining in 2005. Initially working closely with Wunderman, they have been repositioned to work directly with all of our companies and clients. This change refl ects the evolution of the digital world into a fundamental part of the media mix.
In 2007, a key objective will be to reinvigorate our ability to build key global client relationships across the Young & Rubicam Brands. While our individual companies have been successful at growing their own businesses, we need to retool the way the companies collaborate. This will be critical to returning Young & Rubicam Brands to the top of the industry.
Finally, we will look to expand and enhance the capabilities of BrandAsset® Valuator, our proprietary brand management tool, which has been a point of differentiation and value for our clients and us since its introduction. BAV is constantly uncovering new relationships between consumers and brands and gives our clients a set of metrics that inform and inspire all of the work we do at Young & Rubicam Brands.
Y&R
Hamish McLennanGlobal chief executive offi cer
In August 2006, I stepped into the role as Global CEO from my previous one as head of our Australia and New Zealand network. Having been a member of Y&R’s global network for fi ve years already, I came to my new responsibilities with a healthy respect for our global network, an understanding of our culture, as well as with ideas on how we need to address the challenges our clients are facing in the short and long term.
2006 has borne out the merits of our regional structure. EMEA achieved its best overall business performance since 2000 and Australia and New Zealand pulled another strong year. Our agencies in India have burgeoning growth. Latin America is growing in critical markets and North America, now stabilized, is beginning its resurgence. New York’s performance on global business is strong; we remain focused on bringing the agency back to its national prominence. Asia had its best fi nancial performance in its history.
These results are, in no small part, owing to the leadership of Massimo Costa in EMEA; of Matt McGrath in Australia and New Zealand; of Arun Nanda, in India; of Eddie Gonzalez in Latin America; and Ambar Brahmachary, who joined Y&R Asia last year with an incredible roster of accomplishments to his name.
We recharged our emphasis on global clients, the bedrock of our business, by installing Gord McLean as Y&R’s global managing partner, responsible for building and delivering all the benefi ts of a fi nely-tuned global network to our clients. Our ability to help our global clients is refl ected in increased assignments from clients including Colgate, Land Rover, Bacardi, Hilton Hotels, Miller Brewing Company, Danone, Xerox and Campbell’s and with new global wins, like Palm and LG Electronics.
In 2006, we began to roll out our new strategic process, based on a critical fi nding we have made in our proprietary BrandAsset Valuator that brands have a quantifi able value we call Energy™. Energy is tied to a brand’s momentum, works to boost differentiation and relevance, and is also tied to stronger enterprise value. Our unique ability to identify, create and measure Energy™ in brands gives Y&R a strong competitive asset going forward.
How we’re doingAgency networks
How we’re doing

WPP ANNUAL REPORT 2006
We are making digital an intrinsic part of what we do everywhere in the world, rolling out Y&R Australia’s model of embedded digital operations, and stepping up our acquisition strategy.
We had a good new business record in nearly every corner. In EMEA, we had 200 client wins, including pan-regional clients like BT Business, Pharmaton and Novotel. Y&R Milan was the top new business winner in its market. France’s new business wins contributed to a signifi cant turnaround in that market.
In Australia and New Zealand, Y&R won T3 and eight Federal and State government projects, Bank of New Zealand, Tower Insurance, Arnotts National Foods, Westpac, as well as new business from Suncorp, CUB and Telstra.
In Asia, Y&R won Sony Electronics Asia and Middle East, Discovery Channel Asia, Taj Hotels Worldwide and the major strategic planning business for Asia Pacifi c Breweries worldwide. Latin America added Hershey’s, Caterpillar, Goodyear, Nokia and Brazil’s largest internet provider, UOL. In North America, Palm and LG Electronics were added in the last quarter of 2006.
New talent, new capabilities, better strategies have helped us improve our creative product and public recognition of it. In the UK, RKCR/Y&R’s work for Marks & Spencer has gained universal press acclaim and just about every award – culminating in being named UK Agency of the Year – for achieving one of the most remarkable turnarounds in retail history.
We had six other agencies that were named Agency of the Year, including Y&R Israel for the seventh consecutive year in a row. GPY&R Melbourne, whose “Big Ad” was one of the most talked about pieces of creative at Cannes, was Agency of the Year in its market and ranked No.14 in the prestigious Gunn Report. Y&R Argentina, which also ranked among the top 20 agencies in Gunn, is one of the agencies leading Y&R Latin America’s ascendancy to creative leadership in the region. Y&R Malaysia was the Grand Prix winner at the Golden Kancil awards, and Singapore, the Philippines and China won awards at both national and international competitions. Our agency in India is the most exciting creative hot shop in India, and proved its mettle with 60 awards national and internationally, including both Gold and Silver awards at Cannes.
Importantly, our creative palette is becoming more and more diverse – from Bluetooth messaging for Land Rover, to the hugely successful viral “Stand Up” campaign we created for the United Nations millennium campaign, to the interactive work we are doing for Telstra. All of our agencies are redefi ning what advertising means today.
Wunderman
Daniel MorelChairman and chief executive offi cer
2006 was marked by an insatiable demand for all things digital. There is no question the web is the marketing hub. Mainstream press reported on every aspect of its explosive rise. Clients shifted signifi cant budgets to online initiatives.
With half of Wunderman’s activities online, we are building one of the world’s most powerful digital marketing services networks. In 2006, Wunderman ranked among AdWeek’s top Interactive agencies and an independent research fi rm cited Wunderman as a “Strong Performer” in The Forrester Wave™.
As part of our aggressive strategy to add depth to our digital offering, Wunderman acquired four agencies. Seattle-based ZAAZ, a web analytics and interactive agency, complements Wunderman’s relationship marketing and data analytics competencies with a robust data-driven, digital offering. Shaw Wunderman, the result of our acquisition of Shaw Marketing Group, extends our digital expertise to the spirits and consumer packaged goods sectors. In Asia, Wunderman acquired ComHaus Korea and SRP Corporation, forming Wunderman Korea, to serve Microsoft.
Our digital solutions emphasize what happens after customers click through to their digital destinations. This year, Wunderman introduced After The Click™,an exclusive online service offering that increases online performance by as much as 35%.
Wunderman continues to infuse the network with creative talent. Wunderman named Steve Harrison the agency’s fi rst ever worldwide creative director. Key offi ces also added creative talent including New York, San Francisco, Mexico, Brazil, Austria, Germany, Spain and Australia. The Wunderman network was recognized with nearly 300 awards and offi ces in Argentina, Canada, France, Mexico and Portugal were rated tops in their respective markets. In Europe’s D-A-C-H region (Germany, Austria and Switzerland), Wunderman ranked No.2 for creativity. In the UK, Campaign named Steve Harrison the No.1 Creative Director in Direct.
Our client roster continues to expand. The Wunderman network added more than 10 new agency of record (AOR) relationships, including adidas, Caterpillar, Diageo, Kraft Foods, monster.com, Rogers Communications, Goodyear Tire and Rubber Company. These new clients join our long-standing global clients
How we’re doingAgency networks
How we’re doing .
WPP ANNUAL REPORT 2006
such as Ford, Microsoft, Citibank, HP, Telefonica, Burger King and Lufthansa.
2007 is off to a strong start with digital AOR wins for LexisNexis and Nationwide, new brand business from AstraZeneca and Abbott, and signifi cant assignments in Europe from Bridgestone and the Spanish Army. We remain confi dent in our future and steadfast in our commitment to digital leadership.
VML
Matt AnthonyChief executive offi cer
VML strengthened its position in 2006 as one of the world’s leading marketing technology companies. Highlights of VML’s award-winning work in 2006 included the redesign of burgerking.com, Sprint’s Power Vision Hook-up campaign, multiple online marketing campaigns across the family of brands for both Colgate-Palmolive and Microsoft, and record-setting online sales performance for Intuit’s Turbo Tax, tax preparation software.
VML’s leadership in enterprise web development was demonstrated for brands like adidas, where we integrated emerging technology with e-marketing to improve brand positioning, and delivered a company-wide online product catalog, localized for 26 countries in 10 languages. VML also launched its global redesign and new technology infrastructure for parent company WPP’s public web site and Group-wide intranet.
VML’s roster of leading client brands grew across industries and geographies, with major new wins such as Cadbury-Schweppes, Diageo, Embarq, Hallmark Cards, Shure Electronics, SunTrust Financial, TransAmerica Retirement Management and General Electric.
The agency expanded its global footprint, including the acquisitions of Good Technology in the UK and Studiocom in the Americas. 2006 also brought signifi cant advances in VML’s proprietary technology solutions, including the optimization of its web reputation tool, SEER.
Burson-Marsteller
Mark PennWorldwide chief executive offi cer
In 2006 we established DIGS as our organizing principles: Digital, Integrated, Global and Strategic.
Digital is about enhancing our ability to manage the changing nature of communications and media and the need to help our clients manage their digital image with new products and tools. In 2006, we had real success in introducing these new capabilities to clients and we entered into a number of alliances to enhance our capabilities like digital content management and distribution.
We challenged ourselves to become more digital internally, adding new talent around the world and embarking upon on a global training program so that everyone would feel as comfortable in the digital space as anywhere else.
We are growing our existing client relationships and winning new clients with an integrated arsenal of products, services and capabilities. We feel our capabilities, including research, lobbying and grassroots, help us offer our clients a unique package that addresses their needs in a challenging communications environment.
We are further aligning ourselves globally to take advantage of one of our greatest differentiators: the fact that we are a truly global network with a single culture and heritage. This is best embodied in our Key Client Relationship (KCR) program. The KCR promise is about a single point of global accountability and an absolute commitment to deliver with the best people across time zones and practices. In 2006, we took steps to optimize our program and drive exponential growth.
And, in being strategic, we are leveraging our research capabilities with compelling, economically viable ideas, products and services. A Knowledge Development team, working with Penn, Schoen & Berland Associates (our strategic research and polling fi rm), was formed to create primary research platforms and offer our clients consultative services from a knowledge-based position of strength. Our fi rst example of this was the release of the Global Issues Index. At the same time, our team streamlined our secondary research resources to free our analysts to devote their time to “insights” rather than “data gathering”.
The power of our DIGS approach was refl ected in our fi nancial results. The US had the strongest year-over-year performance in many years and around the world we had double-digit revenue growth in many markets.
How we’re doingAgency networks
How we’re doing

WPP ANNUAL REPORT 2006
Going forward, we will continue our dedication to DIGS both internally and also begin to drive it externally. We are developing a suite of digital products that clients anywhere can use and we will enter into more alliances. We will provide our clients with new ways to use our integrated and strategic services, including micro-targeting and 35,000 foot thinking. We will continue to put down stakes in emerging markets. We will continue our devotion to learning and career development, introducing new programs and creating opportunities for our high potential performers. And we will use our greater technological connectivity to create an even stronger, global Burson-Marsteller community.
Landor Associates
Charlie WrenchChief executive offi cer
With another record-breaking year in 2006, Landor continued its commitment to delivering brand-led business transformation. Through enhancements to our leadership team, expansion into new territories and advancement of our expertise, Landor strengthened its offer in the brand consulting market.
From an organizational perspective, 2006 was a year of considerable change as a new generation of passionate and dedicated Landor leaders was elevated from within the company. Most notably, Phil Duncan was appointed president, Europe and Middle East and Michael Ip was appointed president, Greater China and South East Asia; Mary Zalla was promoted to managing director, Cincinnati and Chicago; Monica Magana to managing director, Mexico City; Monica Au to managing director, Hong Kong; and I took over as chief executive offi cer, working alongside Craig Branigan, who now serves as chairman of Landor and CEO of B to D Group. On top of this, 44 Landorians took the opportunity to expand their perspective on the world by transferring to new offi ces, enabling us to move energy and ideas fl uidly across the globe.
Our global presence continued to expand as well. In a signifi cant step toward advancing Landor’s strength in Greater China, a new Beijing offi ce was established to work in partnership with our Hong Kong and Shanghai offi ces. We also leveraged several of our Key Client Relationships (KCRs) into new territories, expanded our new client portfolio in India, Russia, Eastern Europe and Brazil and began grooming talent for future relocation to our emerging market offi ces.
We also continued to invest in the development of our expertise areas. Illustrating the progress of Landor’s innovation offer, Procter & Gamble embraced our Innoweek and Innoday approach as one of their best practice methodologies. P&G now joins Diageo, PepsiCo, PMI, Coors, Entenmann’s, Danone and Kraft as companies that count Landor as an innovation partner. We also continued to invest in several key hires to drive our Brand Engagement practice, resulting in assignments from Citi, ITT and Akzo Nobel among others. And our worldwide disciplines of Digital Branding, Brand Environments, Naming and Airlines were all invigorated by signifi cant wins and enhanced investment.
On the new business front, 2006 was exceptionally strong. Notably, we fi nished the year with a remarkable demonstration of cross-offi ce partnership, winning a tough competition to be Verizon Wireless’s exclusive branding partner. The addition of Wireless to our existing landline business positions Verizon as a new key client. Additional new business wins included Jet Airways, The PGA, Capital One, Brocade and Etihad Airlines.
The quality of our strategic and creative work was again recognized and awarded in the external marketplace in 2006. We entered the year as Marketingmagazine’s Design Agency of the Year and went on to win the GRAMIA award for Packaging Agency of the Year for the second year running. We won a CiB Award of Excellence for our BDO Brand Engagement program, and both Landornet and Landor.com received top web awards. Additionally, we sponsored the EconomistBranding Conferences in New York and Shanghai, repeated our Breakaway Brands Study in Fortune magazine, and published the successful industry tome, BrandSimple.
In the year ahead, we remain committed to advancing our strategic and creative capabilities, building a cohesive Landor culture across geographies and delivering irrefutable impact on our clients’ businesses through the generation of spectacular insights, ideas and creativity.
How we’re doingAgency networks
How we’re doing .

WPP ANNUAL REPORT 2006
How we’re doingAgency networks
Sudler & Hennessey
Jed BeitlerChairman and chief executive offi cer
In 2006, the Sudler & Hennessey network continued its heritage of service, creativity and delivery in the health and healthcare industries.
We increased our relationships with key pharmaceutical and consumer healthcare clients, including Pfi zer, Boehringer Ingelheim, AstraZeneca and J&J companies; welcomed new client relationships, including Cubist, Novartis, Baxter and Schwarz; expanded its presence in Europe, Asia, Latin America and the Middle East; and established new partnerships within the WPP network.
2006 was also another year of triumph for our network’s creative efforts with two Gold and four Silver Awards at the Rx Club; two Gold Awards at the Comprix Awards in Germany, Best in Class Awards at both the US MM&M Awards and the UK PMEA Awards, as well as numerous Awards of Excellence and Finalist Certifi cates at the Globals as well as the aforementioned ceremonies.
We are fortunate to have very strong senior managers to oversee our global operations. Louisa Holland was promoted to president and chief operating offi cer of all of our US operations. Massimo Vergnano returned as chairman of S&H EMEA. Rob Rogers is president of S&H Asia/Pacifi c (in addition to his role as chief creative offi cer for S&H New York). David McLean is chairman, Asia/Pacifi c. Bruno Stucchi is global creative director. Ellen Goldman is chief fi nancial offi cer and chief operating offi cer for S&H Worldwide.
In 2006, the S&H network, in partnership with Y&R Brands companies, established offi ces in Lisbon, Madrid, Helsinki, Copenhagen, Stockholm, Warsaw, Prague, Bratislava, Budapest, Bucharest, Athens, Istanbul, Vienna, Johannesburg, Geneva and Zurich. This is in addition to our European offi ces in London, Cambridge, Paris, Frankfurt, Milan, and Barcelona. We also started a new operation in Mexico City, and partnered with WPP and Y&R Brands companies in the Latin American region for both pharma and consumer brands clients.
The Bravo Group
Eddie GonzalezChairman and chief executive offi cer
2006 was a pivotal year for The Bravo Group, with a turnaround in management and new business wins, along with strong synergies created by the aligning of competencies from different offi ces.
In July I became chairman and CEO of The Bravo Group, in addition to my role as CEO of Y&R Latin America, and undertook some major restructuring and positioning to capitalize on the growth of the Hispanic market.
MEC Bravo was created by combining Bravo’s media planning and buying capabilities with sister company Mediaedge:cia to provide a new offer which includes access to consumer insight and ROI, communications planning, media planning and buying, interaction, retail consultancy, sponsorship consultancy and activation and branded content and entertainment marketing services.
Bravo Miami strengthened its operations by maximizing the synergies of the Young & Rubicam and Wunderman resources in Miami.
Bravo attracted top talent, notably Julio Arrieta as SVP/managing partner of BravoWest; Ana Franco as group account director; Monica Gutierrez as experiential director; Carla Tesak as creative director, and Tony Sarroca as chief creative offi cer.
Bravo ended the year on a high note with additional business from existing clients including Microsoft and AstraZeneca and new business wins from Wrigley’s and HP.
How we’re doing

WPP ANNUAL REPORT 2006
Cohn & Wolfe
Donna ImperatoChief executive offi cer
Cohn & Wolfe had another stellar year in 2006, with signifi cant growth on the top and bottom lines. Our reputation for brand-building public relations in each practice area – Consumer, Healthcare, Corporate and Technology – opened many doors as clients seek innovative ways to build brands through a multitude of media.
For Cohn & Wolfe’s full report, see page 61.
Robinson Lerer & Montgomery
Linda RobinsonChairman
In its twenty-fi rst year, Robinson Lerer & Montgomery, a New York-based strategic communications company, once again produced outstanding work for its clients and turned in excellent fi nancial results. In working with a roster of new and ongoing clients, RLM continued to build its reputation for the highest-quality strategic communications advice and services to corporate boards and senior managements. The fi rm undertook key assignments in support of reputation-building programs, crisis management, corporate campaigns, fi nancial transactions, restructurings and reorganizations, governance issues, CEO transitions, regulatory and public policy issues, and strategic marketing programs.
Among many high-profi le projects for RLM during 2006 were major transactions in the fi nancial services, technology, retail and real estate sectors; a comprehensive corporate repositioning for a leading internet company; work with prominent fi nancial services and healthcare companies on management transitions; and assistance to various clients in managing options backdating and other accounting issues, and implementing new best practices in governance.
BrandBuzz
Mike ReesePresident
In 2006, BrandBuzz once again demonstrated strong revenue and profi t growth, driven by gains from within its current client base and continued success on the new business front.
We successfully retained the US portion of the LG Electronics business and, in the process, expanded this client assignment across all of North America. We also grew our relationship with Sanford Brands to include several international assignments.
On the new business front, BrandBuzz landed several major new pieces of business including Citizens Communications, Lord & Taylor, Cointreau and Genfoot.
Most importantly, our work and thinking continued to be recognized in 2006. We won our second Effi e award in as many years for our LG Mobile Phone client. We also received client accolades and strong in-market performance for the work done for Dymo, Nets, LG and MSN.
Finally, we rounded out our media-neutral offering by adding econometric modeling capabilities to help us further evaluate, inform and enhance the media-neutral solutions we provide our clients.
How we’re doingAgency networks
How we’re doing .

WPP ANNUAL REPORT 2006
n 2006, Grey Global Group underwent the most signifi cant transition in its 90-year history. We completed our fi rst full year as a WPP agency, installed a new management team and took decisive actions to sharpen Grey’s competitiveness in the new communications landscape.
Grey grew in both revenue and profi ts, our major client partnerships remained dynamic and growing and the quality and perception of our creative product in every discipline improved considerably. Importantly, we engineered major changes for the future while meeting, or exceeding, all our performance benchmarks.
At year end, Edward H. Meyer retired, capping an illustrious 50-year tenure at Grey, including three decades as CEO, having built the company into one of the world’s top marketing organizations and overseen our merger with WPP. He has our thanks and best wishes on a remarkable career.
In January, I became chairman and CEO of Grey Global Group and remain CEO of Grey Worldwide, our global advertising network. We created a new senior management structure for the group which places creativity and total communications at the very top of our company. Joe Celia was named vice chairman, overseeing our mandate to deliver total communications. He continues to lead G2, our global network of premier specialized communications companies. Tim Mellors was named vice chairman, chief creative offi cer. He is responsible for Grey’s creative product globally, underscoring the critical importance we place on superlative creativity working in concert across all communications channels.
Grey forged a powerful total communications offering in response to the needs of our major clients for big ideas that resonate across communications channels. This new architecture pairs the creative expertise of Grey Worldwide with the activation marketing expertise of G2. A key component of this offering is a new, proprietary global strategic planning model, Brand Acceleration, that ensures the quality of our ideas and the optimum impact of our communications plan. Today, all Grey disciplines share a common strategic framework, tools and language to create seamless communications across channels. Our increasing roster of shared clients across disciplines underscores the promise and potential of this new direction.
As the convergence of media and technology and the emergence of the empowered consumer continue at warp speed, we see tremendous opportunity ahead. Here is how Grey Global Group companies are seizing the initiative.
Grey Global Group
Grey Worldwide
G2
Grey Healthcare Group
GCI Group
Report by Jim Heekin (above)
Chairman and chief executive offi cerGrey Global Group
How we’re doingAgency networks
How we’re doing

WPP ANNUAL REPORT 2006
How we’re doingAgency networks
Grey Worldwide (Advertising)
Last year, we introduced a new agency platform, Grey Brand Acceleration, across our global network. This will accelerate both our transformation to a more collaborative and creative culture and the potential of our clients’ brands through powerful creative ideas.
Grey recommitted itself to best-in-class creativity by establishing a Worldwide Creative Council and through the recruitment of top talent. New creative directors were named in the US, Brazil, the Netherlands, Denmark, Spain, Turkey, Finland, South Africa and China. Globally, Grey doubled its 2005 wins with 10 Cannes Lions and rose four places in the Gunn Report.
Grey North America has doubled its award performance in the past two years. Grey New York swept the Addys in 2006 with 22 Gold, 11 Silver and Best of Show for Nokia. It also won a Clio and an Emmy and received the second highest number of AdAge“Commercials of the Week.”
Grey EMEA tripled its awards in 2006 over 2005 and became the fi rst agency to win the Euro Effi es’ Agency of the Year honor twice. It also had a distinguished performance at the Eurobest and Epica Awards. Grey Asia-Pacifi c won more awards in 2006 than in any of the last fi ve years and Grey Latin America has begun to enter and win important competitions.
The foundation of Grey is our long-standing relationships with global clients and we expanded the business of 18 of our top 20 clients. The agency’s vitality was represented in the new assignments we received from Procter & Gamble, GlaxoSmithKline, 3M, BAT, Darden Restaurants, Diageo, Nokia and Volkswagen around the world.
We were proud to win such clients/brands as SanDisk, Darden’s Smokey Bones Grill, Diageo’s Tanqueray 10 and Rang Pur Gin, Wyeth’s Dimetapp, Allergan’s Juvederm and Wellpoint in the US; Morgan Stanley in the UK; Deutsche Bank in Germany; China Mobile and Lehman Brothers in Asia; Coca-Cola and Ocean Spray in Latin America. We have had some important wins in 2007 from Eli Lilly, GlaxoSmithKline, Procter & Gamble and Terlato Wines International.
We strengthened our global leadership with the appointment of several top-fl ight professionals last year: Scott Hollingsworth joined us as regional director, Grey Latin America; Tamara Ingram became executive managing director of the global Procter & Gamble business, retaining her role as leader of Team P&G; Steve Lin became president and CEO, Grey Greater China; Chris Rich was appointed chief growth offi cer, Grey Worldwide and Owen Dougherty became chief communications offi cer of the group.
We have put our company on the path to positive change. All of our employees are energized to lead professionally by constantly pursuing new ideas and new creative solutions to the challenges faced by our clients and the marketplace at large.
G2 (Activation Marketing)
Report by Joe CeliaVice chairman, Grey Global Group Chairman and chief executive offi cer, G2 Worldwide
2006 was a milestone year for G2. We unifi ed our expertise in direct marketing, interactive, shopper marketing and branding and design, under a single, distinct brand dedicated to activation marketing. By the close of the year, the G2 network extended to 43 countries and 86 offi ces.
The global alignment of our agencies as G2 enabled us to fi eld a more consistent and powerful offer. Our clients want to work with global agencies that combine deep specialist expertise with a multidisciplinary capability to optimize their brand communications across multiple channels. The G2 network is designed to meet all of these needs.
We expanded assignments across our global network with all of our key clients including BAT, Coca-Cola, Nokia, Pfi zer and Procter & Gamble.
G2 also added a number of new brands to our client roster. In North America, we won assignments from Campbell’s, Canon, Discover Card, MGM/Mirage, Procter & Gamble and Shell. Our Latin American group secured new work from major brands including Nestlé and Gerber. In Europe, our French offi ce was awarded a major digital assignment from SNCF (the French national railway network). Our UK operation experienced notable growth with wins from Swatch’s Bijoux Jewelry, ECCO, Nescafé and The Royal Mail. Germany began a new relationship with Masterfoods working for their Pedigree brand. In Asia Pacifi c, we added Duracell and Gillette to our client roster in Korea, and, in China, Microsoft China, Nokia China, Skoda and Deutsche Bank. Our Australian operation was engaged to work with Sara Lee and Research in Motion.
In 2006, G2’s work continued to be recognized throughout the world with hundreds of awards across all disciplines thanks to the talent that resides in our global network. It was also a year in which we recognized proven leaders with broader responsibility and welcomed new industry talent.
Peter Thompson became CEO for our agency network in Europe, Middle East and Africa. Jonathan Dodd took up
How we’re doing .

WPP ANNUAL REPORT 2006
How we’re doingAgency networks
the post of G2’s director of global strategy. Larry Kimmel expanded his duties as chairman and CEO of G2 Direct & Digital in North America and became regional director in Latin America. Tony Ip was promoted to lead our G2 China operation. John Paulson joined us as the new president for our G2 Interactive unit in North America. Masahiro Saito joined us to lead our G2 Japan operation.
We continue to invest in the capabilities and technologies that will enable us to maintain our position as a strategic and creative thought-leader in digital marketing. And, as retail continues to increase in signifi cance for brand manufacturers, G2 will focus on the development of our shopper marketing practice, building on our best-in-class expertise and work with world-class FMCG brand owners and retailers.
As we enter 2007, we are poised for greater success with the right people, resources and structure in place. We welcome the challenges that lie ahead.
Grey Healthcare Group
Report by Lynn O’Connor VosPresident and chief executive offi cer
Grey Healthcare Group (GHG), one of the world’s leading healthcare marketing companies, achieved double-digit growth for the tenth year in a row in 2006. Our total offer now includes a broad array of integrated pharmaceutical marketing tools: strategic services, branding and consulting, online and offl ine professional and consumer advertising, medical education, access management, search optimization, medical illustration, contract sales and sales training expertise.
Last year, GHG Advertising launched Pfi zer’s Exubera globally as well as Bifeprunox, a tri-promotion with Wyeth, Solvay and Lundbeck, and Wyeth’s Lybrel. GHG Advertising Europe gained several major assignments, opened a new offi ce, and refi ned new techniques in pan-European consumer marketing and patient compliance. Summit Grey opened several new offi ces with both digital and oncology focuses.
GHG also expanded the oncology and specialty pharma capabilities of its medical education companies, US-based Phase Five Communications and International Meetings & Science, and both achieved dynamic growth. GHG’s European medical education companies also had an extremely strong year. Specialty medical education
companies DarwinGrey and s&kGrey had the greatest growth within the medical education network worldwide.
To meet the demands of the changing communications landscape, many GHG acquisitions and innovations had a strong technology focus. We:
• Established Access Strategies and Managed Care, which brings sophisticated methodologies and tactics for gaining entry and favorable placement on healthcare formularies.
• Expanded Acute and Specialty Care, adding substantial high-science assignments.
• Acquired Catalyst on-line, the leading pharma search optimization fi rm, serving such blue-chip clients as P&G and Pfi zer.
• Purchased Madrid-based advertising agency Comunicacion y Servicio Consultores as part of our pan-European expansion.
• Added Newton Grey to our group of contract sales and sales training companies, which include Summit Grey and OnCall.
• Focused on biologics and acquired Vogel-Farina, marketers skilled in complex specialty pharmaceuticals.
• Opened Summit Grey Europe and Summit Grey Freiberg, new EU-based multichannel/digital specialists.
Our pro bono work won the prestigious Corporate Achievement award for www.uLifeline.com, the Jed Foundation’s website, dedicated to the mental health of college-age students and the prevention of suicide. GHG also won numerous awards for our groundbreaking work for the Helen Keller Foundation.
We continue to marshal every company and resource in our expanding network to align our clients closer to physicians, payers, patients, and consumers and to improve health outcomes.
GCI Group
Report by Jeff HuntChief executive offi cer
2006 was a strong year for GCI Group with a focus on delivering measurable impact, world-class creative and digital media expertise – all of which contributed to some of the most highly-contested new business wins in the industry.
For GCI’s full report, see page 62.
How we’re doing

WPP ANNUAL REPORT 2006
How we’re doingAgency networks
The Voluntarily United Group of Creative Agencies (United)
Report by Andy Berlin (above)
Chief executive offi cerand Laurence MellmanChief operating offi cer
he year 2006 was one of re-engineering and rebuilding for the United Group, with notable performances from several United companies. Senora Rushmore United in Madrid posted another banner year, adding impressive new business gains based on work now admired globally. The company grew in every
respect and, in the 2006 annual Spanish advertising industry survey, was voted the most creative Spanish agency, the most admired Spanish agency and the agency that most respondents would like to work for.
In New York, Berlin Cameron United, under Ewen Cameron’s leadership, capitalized on its late-2005 win of Heineken Premium Lite, helping the launch of this new brand extension to become the US beer industry’s biggest 2006 marketing success. And, at the time of going to press, we can report that Berlin Cameron has also won Heineken US’s main brand. In addition, Berlin Cameron United won new assignments from Fiat, LVMH, Vitamin Water and Ask.com.
New business wins from blue chip clients such as Coca-Cola and Vodafone transformed several of our offi ces, including our start-up offi ce in Buenos Aires, WM United, and revitalized offi ces in Norway (BTS United) and Italy (1861 United).
United in Paris restructured its management and added new clients. Cole & Weber United in Seattle brought in a highly-regarded executive creative director, Todd Grant. We are working closely with management in Antwerp to strengthen the agency there. In London, we made disappointing progress. As a result, we have recently announced that the remaining clients and a number of key staff will be transferring to Grey London. In due course we will look to re-enter the London market.
The transition from Red Cell into United continued through the year with some of the Red Cell offi ces moving into other Group networks.
Efforts are now focused on growth and we expect prospects and performance to improve for the United Group as a whole through 2007.
As we go to press, the International Olympic Committee in Lausanne, Switzerland announced that it has appointed United for the creative development and implementation of its global integrated marketing communications campaign, following a hotly-contested competition.
How we’re doing .

WPP ANNUAL REPORT 2006
How we’re doingAgency networks
Hall of Fame. In China, BatesAsia won awards for Heineken, from CASBAA, China 4As and China Advertising Awards. 141 became the region’s most awarded activation unit, dominating the Promotion Marketing Awards Asia (PMAA) with 11 Golds and fi ve Best in Country awards.
A new business highlight was winning the prestigious international assignment for Heineken Rugby World Cup in a pitch against the world’s best agencies. This is just one piece of evidence that our locally-produced work is appreciated globally. We also deepened our 18-year relationship with HSBC, winning all product assignments in Hong Kong and HSBC Direct in Taiwan, and being appointed the agency of record in the Philippines. Other important wins included AIG in India and Taiwan, Cheung Kong and Macau Studio City in Hong Kong, and Visa across the region.
In 2007, as the only Asia-devoted network of size, BatesAsia 141 aims to be as responsive as possible to demands of business in this changing and fast-growing region – building sustainable brands with global ambition and potential.
he year 2006 was one of great positive change for BatesAsia 141. We stepped up BatesAsia’s integration with 141, our team of brand activation specialists. BatesAsia and 141 work collaboratively to drive change from the brand down and from the street up. We also embedded digital into our standard
offerings, to embrace the biggest change in our industry.Internally, we made our Change Point Planning an
even more robust process for developing ideas for both BatesAsia and 141, through our framework I.D.E.A.S.
To help clients understand and leverage change, we ran Change Panels in China, India, Japan and Singapore, covering hot issues ranging from animation fans and convenience stores in Japan, to what constitutes beauty in India today, and how the digital wave is transforming the lives of Singaporeans.
In China, we acquired a majority share in West China’s largest agency in Chengdu, Apex, to form BatesApex. In India, we have agreed to acquire a majority stake in Sercon, the country’s second largest activation unit, to create 141 Sercon. We also completed our merger with David in Beijing, India, Indonesia and Taiwan.
In Hong Kong, BatesAsia Hong Kong acquired local PR agency, Beyond Communications, to complete our integrated offerings for top local and international brands including Cheung Kong and HSBC.
One of the region’s most entrepreneurial agency leaders, Digby Richards, joined us as chief operating offi cer and will partner me in managing all aspects of the network. Other senior hires included Judd Labarthe, chief strategy offi cer, and Steve Llewellynn, executive creative director, 141.
In 2006, we dominated in the region’s industry awards. BatesAsia Singapore picked up the most awards at the Creative Circle with the most number of Golds. Executive creative director Rob Gaxiola won Creative Director of the Year, awarded by the Singapore Advertising
BatesAsia 141
Report by Jeffrey Yu (right)
PresidentBatesAsia 141
How we’re doing

WPP ANNUAL REPORT 2006
How we’re doing
Media Investment Management
roupM is WPP’s global media investment management operation. It serves as the parent company to WPP media agencies including MAXUS, MediaCom, Mediaedge:cia and MindShare.
Our primary purpose is to maximize the performance of WPP’s media communications agencies on behalf of our clients,
our share owners and our people by operating as a parent and collaborator in performance-enhancing activities such as trading, content creation, sports, digital, fi nance, proprietary tool development and other business-critical capabilities. The agencies that comprise GroupM are all global operations in their own right with leading market positions.
The focus of GroupM is the intelligent application of physical and intellectual scale to benefi t trading, innovation and new communication services, to bring unfair competitive advantage to our clients and our companies.
In 2006, RECMA (the independent organization that measures scale and capabilities in the media sector) has again ranked GroupM as the world leader in scale as well as vitality and momentum – a refl ection of our industry-leading rate of growth.
Our capabilities include business science, consumer insight, communications and media strategy, tactical planning, trading, interactions, content development and sports and entertainment marketing.
We had another outstanding year in 2006 by any measure. We enjoyed signifi cant double-digit growth in total as each of our agencies delivered outstanding performances. The following reports by our individual agencies spell out our record of existing client retention and new business acquisition.
GroupM
MediaCom
Mediaedge:cia
MindShare
Report by Irwin Gotlieb (below)
Chief executive offi cerGroupM
How we’re doing .

WPP ANNUAL REPORT 2006
Our people deserve great credit for delivering exceptional value to their clients – who include some of the world’s most sophisticated marketers. By working in partnership with our clients, we are leading the way in new thinking.
GroupM is a pioneer, and pioneers are aggressive in imposing change on their organizations to bring improvement to the business. We have a real passion to shape a better future; this passion has driven our organization since GroupM’s creation in 2003. We continue to be just as restless as we push to take advantage of the market leadership we have created for ourselves.
In 2006 we reinforced our management infrastructure so that we can more aggressively implement our strategies. Rupert Day was elevated to chief operating offi cer of the group. We built regional infrastructure with Kelly Clark and Dominic Grainger assuming leadership in EMEA, John Steedman in Asia Pacifi c and David Byles in Latin America. We have also now implemented consolidated leadership and structures in almost every market in which we operate.
Last year, we also went public with This Year Next Year, our ongoing publication of unique media marketplace data and forecasts. This has been very well received in both the fi nancial and media communities, and has reinforced our eminence in knowledge- and thought-leadership. We’ve just begun and will be expanding our offer over the next 12 months.
Our business today is approaching a signifi cant infl ection point. As ‘new media’ begins to mature and traditional media moves towards ubiquitous digital delivery, the capabilities of each medium will undergo positive transformation. With digital delivery of both media and messaging, we can begin to exploit the potential of addressability, target refi nement, telescoping, census level measurement and response capabilities.
We didn’t build our scale for bragging rights. In the past, we built scale to develop leverage and unparalleled marketplace knowledge and insight, as well as strong relationships with our media partners. In the developing digital world, the greatest benefi t of scale is the ability to capture data from a signifi cant percentage of the world’s communication fl ow. We are in a unique position to aggregate and mine the data that derives from that fl ow and it will surely provide both our clients and ourselves with signifi cant competitive advantage.
At the same time, we are shaping the future of media. We are positioning GroupM to ensure that our increasingly deep and sophisticated knowledge of the digital arena will defi ne how clients reach and engage with consumers. This intelligence will also infl uence how our clients form deeper and more effective relationships with consumers in the
How we’re doingMedia Investment Management
future. Our base of knowledge is substantially amplifi ed through a collaboration with our Kantar colleagues on insights, effectiveness metrics and data management.
Last year, we said “GroupM is fast emerging as an industry shaper”. We feel even more confi dent today and can say that GroupM has proven itself to be the shaper of our industry. The exceptional performance of our 14,000 people across the world deserves great credit and acknowledgement. Our mission continues to be to provide an extraordinary place where their talents and aspirations can fl ourish and lead to great value for our clients and our stakeholders.
How we’re doing

WPP ANNUAL REPORT 2006
How we’re doingMedia Investment Management
MediaCom
Report by Alexander Schmidt-Vogel (left)
Chairman and chief executive offi cerMediaCom
ediaCom experienced a “watershed year” in 2005 that marked historical change for our global agency network as we became part of the WPP and GroupM families. This was the year in which MediaCom planted the seeds for further development. Our investments in talent, tools and geographical expansion, and
new initiatives in all areas of MediaCom’s business and working processes, were the seeds we sowed to grow our global agency network.
2006 saw MediaCom harvesting the direct results of that landmark year. New business wins and expanded client relationships attested to the strong return of our 2005 investments. And initiatives started in 2005, such as our unique planning and implementation tool, Real World Architecture, gave our current and new clients a leg up on their competition during 2006. We continued to build on and expand them throughout the year.
Our confi dent growth was evident in all areas of our business and within our organization in 2006, and resulted in MediaCom’s best year ever with fi rm two-digit growth. RECMA noted MediaCom’s robust growth in billings by naming us the second fastest-growing global agency network for billings in 2006 vs. 2005, and the third fastest-growing agency in 2006 vs. 2005. In particular markets, such as China, Russia and Australia, this growth was especially evident, with new business wins and strong local teams pushing MediaCom to local success. And local offi ces were inundated with awards for their consistent high quality of work with, for example, South Africa being named Media Agency of the Year by both the Financial Mail and Finance Week.
Globally, MediaCom saw major wins from clients such as Volkswagen, Procter & Gamble, Nokia, Unicredit and Danone in 2006. We are very proud of the Volkswagen win: the assignment of Volkswagen’s global account was the direct outcome of the strong results we have achieved
How we’re doing .

WPP ANNUAL REPORT 2006
How we’re doingMedia Investment Management
for VW in numerous local markets over a number of years. In fact, many of our 2006 major wins derived from clients with whom we’ve had long-term relationships: an attest to MediaCom’s ability to grow clients’ business and the relationships with their consumers.
To ensure that we can serve our clients everywhere they are, 2006 also saw MediaCom completing the construction of our network in key regions such as Asia Pacifi c and Latin America, with targeted investments in regional and local personnel as well as in local capabilities. These investments are already bringing about a number of positive changes. In Asia Pacifi c, for example, MediaCom was one of the fastest-growing media agency networks in 2006, and both Asia Pacifi c and Latin America saw MediaCom winning numerous key accounts on both a regional and local level.
Our local offi ces are supported by a robust international team and a set of global tools. In 2006, we continued to invest in these worldwide assets. We strengthened our global talent resources in areas such as ROI, consumer insights, research and business development. We expanded our global tool palette by introducing new processes and systems within our Real World Architecture family.
MediaCom’s strength, and the powerful advantage we give to our clients, is based on our philosophy: People First >> Better Results. Our clients value our commitment to look at their customers as individuals, and not just as consumers. When we launched this tagline in 2004, we were alone in recognizing “people” and not just “consumers” as the key to successful media investment. Today, the industry is abuzz with talk about the need to look at consumers as people – a fact we recognized years ago.
At MediaCom, our philosophy stands substantially backed by tools and systems that make both “people fi rst” and “better results” come alive. Our Real World Architecture is based on this unwavering focus on people at all stages of our media investment management, and on achieving real brand success via sales.
In 2007, MediaCom is again well positioned for growth. In the fi rst few months of 2007, we are already seeing improved revenue versus our record-breaking year in 2006, through both expanding services to current clients and winning major new clients. We are confi dent that the building blocks set in 2006 have placed us in an opportune position to continue this growth, and we look forward to an even more successful 2007.
How we’re doing

WPP ANNUAL REPORT 2006
How we’re doingMedia Investment Management
Mediaedge:cia
Report by Charles Courtier (left)
Chief executive offi cerMediaedge:cia
ediaedge:cia (MEC) came into 2006 in a confi dent mood and that confi dence was rewarded at the end of the year when we were named Global Media Agency of the Year, not once but twice, by AdvertisingAge and Adweek.
After a banner year in 2005, which saw our best ever series of new business wins across
the network since the creation of the company, we delivered double-digit growth again. MEC continues to grow in both size and in the breadth and depth of our capabilities, which in turn adds to and exploits GroupM’s physical and intellectual scale around the world.
MEC moved into the No.1 position in RECMA’s Pitches and Competitiveness Report, issued in November 2006, and was quoted as “taking a clear leadership position in 2006.” Our ranking is a testament to our excellent new business gains around the network and the teams that have worked relentlessly for MEC to be acknowledged as the global network leader. It’s a satisfying achievement.
In 2006 we completed the global consolidation of the Campbell Soup Company and Ikea accounts. We won Monster.com across Europe; Telecom Italia in Italy, Germany and France and Schick Energizer across Asia Pacifi c and the Middle East. Major wins in local markets that really “moved the dial” were Colgate-Palmolive and Wrigley in China, Danone in the UK, Red Bull in Mexico and DreamWorks SKG in the US.
This achievement and confi dence stems from our ability to defi ne the changes taking place in our market, to adapt our business model accordingly and, in so doing, stay one step ahead of the competition.
By placing the consumer at the heart of our business we successfully repositioned MEC’s offering in which consumers’ Active Engagement with clients’ brands and communications channels has become the core objective. That is the future of how we deliver and that’s why the investment in the diversifi cation of our business continues
How we’re doing .

WPP ANNUAL REPORT 2006
How we’re doingMedia Investment Management
and is increasingly where our growth is coming from. Our business model has expanded to include capabilities dedicated to retail communications, the Hispanic audience, content creation and community activation.
Consumer empowerment continues to be driven by the digital world. MEC invests heavily in human and technical resources, allowing us to respond to the opportunity that new media channels represent. MEC Interaction (our digital, direct and search offer) is increasingly the centre of our business globally and the fastest-growing part of MEC. We focus on a highly integrated offer as this is how consumers interact with media and entertainment.
In 2006, we increased the consistent breadth and depth of the MEC offer around the world, and with it the continued development and management of talent throughout the agency. Our global process MEC Navigatorcontinues to enhance our communications planning and implementation offer, bringing major benefi ts to our client partners, around the network:
• An approach that truly locks ideas and investment return together to deliver more differentiated communications solutions for our clients’ commercial benefi t.
• Fosters new behaviours internally at MEC as well as externally with client and other agency partners.
• Not overly reliant on tools and studies, but prompts their use at the most appropriate and relevant times. The focus is very much on outcome and how information can be used to develop more insightful strategy and implementation.
This commitment to communications planning and implementation is visible across the entire network. The work we do for our clients has won multiple awards around the world, contributing to our success locally and helping to strengthen our brand through industry recognition across the regions.
MEC had another great year in 2006. We are focused and committed to achieving even more success for our client partners and for ourselves in 2007.
he year 2006 proved to be another great year for MindShare. Not just for our people but also for the growing relationships with our clients and partners around the world.
Since we started the company in 1997 our greatest competitive advantages have been the strength and unity
of our global network and the collaborative behaviour of our agencies and people. This has never been more important than today because clients are demanding the apparent contradiction of specialist advice, but from an integrated team. And they want this globally. They need expert specialists to guide them through the bewildering new opportunities, but they need this to be delivered in a coherent and integrated fashion, from a variety of partners who otherwise spend much of their time competing with each other. So we need to be strong, diverse, global, and collaborative.
With this in mind we wrote last year of the need to further diversify our services and to move much further upstream. Clients want us to develop a much more strategic service but still based on extremely robust execution. In many markets we are now able to lean heavily on GroupM resources to ensure that the execution of plans is faultless, thus allowing us to make the journey upstream strategically.
2006 therefore saw an unprecedented number of changes in MindShare’s management teams as many of our most senior managers went into other senior positions in the Group. This allowed us both to promote new managers from within and to bring in new, fresh specialist talent from outside to refl ect our new diverse business model. It is interesting to note that none of this new external leadership was recruited from direct competitors. Rather it has been from specialist digital fi rms, content providers, research agencies, clients, advertising agencies, sponsorship consultancies and management consultancies.
MindShare
Report by Dominic Proctor (right)
Chief executive offi cerMindShare
How we’re doing

WPP ANNUAL REPORT 2006
This deliberate policy refl ects the need to have our more diversifi ed company populated by more diversifi ed leadership.
So there was much change in 2006, but change made at a time when we still have great momentum, and at a time when our service offering is underpinned by the enormous strength of GroupM.
Our developing strategy mirrors the changes taking place elsewhere in different companies and therefore sometimes brings us into confl ict with new types of competitor as we move more into the centre of the stage. Rather than just competing with other media agencies, we now come up against specialist agencies in digital, content, ROI and sponsorship. We come up against management consultants, specialist divisions of advertising agencies, studios and occasionally even media owners. This again requires us fi rst to be strong in all the new specialist areas but then to collaborate with other members of the client’s chosen team.
It is certainly the case that the lines between the ambitions and offerings of our clients’ marketing services partners are blurring. We regard this as a good thing as we
believe that media agencies are perfectly positioned to help fi nd order within the chaos of the new digital revolution. This revolution will change everything as all media becomes addressable and all media becomes avoidable. We will be taking a big stake in this new media economy.
2006 saw MindShare’s ninth consecutive year of double-digit growth as we increased our business with key clients. We continued to expand our agency network by opening new offi ces and growing our population to 5,700. We won many awards in many countries (and we send congratulations to our sister agency MEC for winning ‘Global Agency of the Year’). 2007 sees our tenth birthday and it is hard to fi nd any reason why we cannot continue to develop the business successfully if we stick to our new strategy. It defi nitely remains an exciting and rewarding time to be part of MindShare’s success.
All thanks must go to our people, to our clients and to our other partners (even if we sometimes compete!).
How we’re doingMedia Investment Management
How we’re doing .

WPP ANNUAL REPORT 2006
Information, Insight & Consultancy
How we’re doing
How we’re doing

WPP ANNUAL REPORT 2006
How we’re doingInformation, Insight & Consultancy
s anyone who has followed our industry in recent months knows, there has been a wide variation in the performance of the leading players. Maybe this should not come as a surprise. The strategies of the leading players differ and as always, any strategy is only as good as the degree and consistency with which it is executed. Against
this background our stakeholders – employees, clients, WPP and its share owners – had reasons to be satisfi ed with our progress in 2006.
Our fi nancial performance was good. On a constant currency basis, revenues grew over 11%, with like-for-like revenues up over 4%. Headline PBIT margins increased from 10.3% to 11.1%. Our margin performance was excellent in the light of increased price competition and procurement initiatives from clients and the fact that our margins are at higher levels than all of our major competitors in ad-hoc research (TNS, Ipsos, Synovate and NOP) and increased again by more than anyone else in the industry. However, there is still signifi cant opportunity for more margin improvement by addressing under-performing units, by developing more “must-have offers” and improving revenue growth to satisfactory levels.
Our shift to internet-based research is lowering our prices and, therefore, our revenue growth but this cannot and should not be an excuse. Our good fourth quarter performance was helped by continued superb performance in the US and Latin America and stabilisation in the UK; we must aim to continue to gain share in the way that we did in the last few months of 2006. It was particularly pleasing to see so much revenue growth and client impact coming from two areas: where we have Kantar-wide account directors located in our clients’ HQs, whose job it is to anticipate client issues and ensure that the best of Kantar is delivered to them at appropriate times; and on accounts where different Kantar businesses combine to offer clients something which they could not have done alone.
The Kantar Group
Report by Eric Salama (left)
Chairman and chief executive offi cerThe Kantar Group
How we’re doing .

WPP ANNUAL REPORT 2006
How we’re doingInformation, Insight & Consultancy
Financial performance aside, we also made some important structural changes, our clients experienced more innovation and consistency in delivery than ever before, our people benefi ted from greater investment in development, training and focus on their careers than ever before, we recruited some fantastic people from diverse backgrounds, made some good acquisitions and have further strengthened our operational base. And, in order to ensure balanced growth going forward, we have put in place a worldwide system for benchmarking and measuring our progress against three key criteria – fi nancial (overall and vs competitors), employee satisfaction and client satisfaction.
What do our clients need?
Any discussion of strategic progress and achievement must begin with an understanding of what our clients need to succeed. The good news is that clients recognise the need for better and more usable insights as a key component of their growth strategy. But with that recognition comes a dissatisfaction with traditional ways of doing things.
Some of what they need is not new. They are, and have been for some time, looking for
scalable offers, more-for-less, more proactive partners, actionable insights not just data. As media has fragmented and content become more important, they have sought to better understand what media are driving preference and demand for their brands and how best to allocate their spend. And, as trade issues have come to the fore, they have put a bigger emphasis on shopper, in-store issues and multi-channel strategies.
But there is no doubt that these agendas are sweeping through clients at a faster pace and are manifested by a growing number of clients who want to consolidate their rosters and engage in a debate about how they are structured, how they work with outside partners and how they help their own research and insight departments add more value to their business. We are seeing CFOs who want ROI tools and clients who are shifting their research budgets to shopper-related issues.
This debate has reached the highest levels of organizations. AG Lafl ey, the CEO of Procter & Gamble, has been vocal in explaining his view that consumer is king, that we are scrambling to keep up with bottom-up approaches to brand building, that marketers need to let go in order to stay in touch and that as an example, traditional focus groups are inferior to immersing yourself in the lives of your consumers. We don’t think he is right about the latter (we think it is about combining approaches) but we need to be more vocal and demonstrate how.
Clients are also discovering new needs. Somewhat ironically, given globalisation, the key
competitors for many of our global multinational clients are increasingly local. Local retailers, regional oil players such as Caltex and Petronas, Mac (a local detergent brand in South Africa) and local Chinese mobile handset manufacturers are all examples of companies who have taken share from well-established multinationals. Rolling out global research tools cannot come at the expense of understanding local consumers and local competitors.
And, while we have done a good job in moving our work to the web (over 75% of our work in the US is done this way), we and our clients are facing a range of serious issues related to data collection – everything from respondent fatigue issues which are driving respondent rates down to privacy issues (in Germany there is a court case looming which would prevent people from being approached to respond to a research interview unless they had given prior agreement).
These issues are in addition to the inevitable impact which technology and societal changes will have on the way we have to access respondents and engage with them. Understanding consumers and predicting their behaviour will inevitably involve a greater use of technology and a more consumer-centric, less siloed approach.
Our strategy
All of this leads us to a simple strategy which we have been pursuing for over four years:
• Innovate our offer and make it relevant to contemporary client needs, deliver genuinely usable insights simply and without over-engineering. Make it “must have”.
• Develop the skills and capabilities of our people and bring in people from outside the industry who have skills we don’t possess. Recognise that we cannot succeed with clients unless we have the best talent pool in the industry, appropriately engaged and focused.
• Develop a single Kantar operational infrastructure as a way of dealing with privacy, web, and data collection issues while taking cost out of the system for the benefi t of clients.
• Keep our multi-branded structure in order to keep the specialists which our clients want and the cultures which our people desire while developing cross-company mechanisms to ensure that clients get the best of Kantar.
Against this strategy, how are we doing?
How we’re doing
WPP ANNUAL REPORT 2006
How we’re doingInformation, Insight & Consultancy
developing a range of e-learning solutions to facilitate more scalable effi cient education of client sales teams.
• Millward Brown has developed 360Link and Dynamic Tracking as ways of testing advertising ideas and of measuring the impact which different media have on the strength of brands. Its Optimor unit offers a valuable service to clients in a range of brand building, licensing, sale and acquisition units in translating a range of marketing actions and behaviours into fi nancial impacts. Dynamic Logic leads the way in internet-based evaluation.
• In healthcare, we have developed and launched a range of syndicated services which offer clients unique insights at affordable prices. These include: Cancer !mpact from Mattson Jack; new ways of accessing the National Health and Wellness Study from Ziment; and Mars Medical as a media tool from Kantar Media Research; all of which have resonated well with clients.
• Kantar Operations is rolling out a suite of new products and technologies around data processing, scripting, coding and estimating.
It is not simply by doing things better that we innovate. We also have to do things differently. As I said last year, “Research International, Added Value and Henley Centre HeadlightVision have made use of innovative presentation approaches including video and live acting to make insights come alive in the minds and hearts of clients; we have pioneered the use of creative briefs in research as a way of keeping ourselves and our clients focused on what is really important in any given project.” This continued into 2006 with the likes of Added Value and Research International combining with sister creative agencies, such as Ideo, Fitch, 141 and G2, to deliver a mixture of insight and creativity that clients love.
Our people
We tell our clients that their brands are built through the quality of the interactions which they have with their customers – and it is no different for us. We have thousands of people and they each have hundreds, if not thousands, of interactions with our clients. Each one of those is an opportunity to understand the client better, to provoke, help, inspire. Seen through that perspective, the emphasis we put on training and development, on individual career focus, on improving the quality of our leadership capabilities, on bringing in people with talents and skills which we do not have enough of, is a necessity.
Our structure
We have begun to translate our global presence into genuine global advantage. Four strands illustrate this:
• In Japan we have merged our businesses to create Japan Kantar Research (JKR), a response to a unique market situation. In creating one of the top three businesses in the market, merging and streamlining our offer and appointing Masanori Miyajima as our incoming CEO, we believe that we will be able to focus more than before on the needs of local clients – Japanese and multinational – and deliver to them.
• We are running global client relationships and functions from parts of the world where we have top talent and can do so at lower cost to clients. For example, Research International is running the Shell and Reckitt Benckiser global relationships from Singapore, our worldwide BAT relationship is being led by IMRB in Kolkatta, while much of the process re-engineering for Coke’s innovation work is being handled by Research International in South Africa.
• Chris Robinson and his global Kantar human resources team have relocated to Singapore. We already employ 3,000+ people in Asia and we are recruiting over 1,000 people a year. How else can we ensure that we become the magnet for talent in Asia that we must become if we are to thrive in that region?
• Kantar Operations has established its Indian hub, with over 300 coders and data processors helping us reduce costs while maintaining the quality we expect.
Our offer
We have continued to place a premium on innovation. Some innovation comes from the acquisitions we have made. All Global is merging with Web Survey to create the biggest physician online panel in US/Europe. Ultimate Consumer panel has been acquired by Lightspeed and allows clients to gain better insights through the merging of actual behavioural data on how people manage their fi nancial affairs with attitudinal research. Foresight and Lightspeed will be able to help clients track employee satisfaction globally and cost effectively.
But the majority of innovation has got to come from our existing businesses and offers. There have been some notable highlights:
• AGBNMR has continued to roll out its digital TV ratings offer, measuring more homes with digital PVRs than anyone else in the world.
• Cannondale has co-developed iCUBE™ with fi ve of its major clients, a unique tool which combines panel data with frequent shopper card data and gives clients a powerful way of segmenting consumers and launching products successfully.
• Management Ventures has revamped its web offering making it easy for clients to access retailer insights from around the world in the way that suits them, while
How we’re doing .

WPP ANNUAL REPORT 2006
As we say in our recently launched Kantar Manifesto, “We value and develop passionate people who are a source of inspiration, knowledge and growth… and we cannot succeed unless we provide a stimulating environment where talent thrives.” Our training and development program touches thousands of people a year; our talent reviews are taken as seriously as our fi nancial reviews and are designed to align corporate and individual needs. The net result is that employee satisfaction and engagement scores are rising – though still not as consistently and as fast as we want – and that client impact is increasing.
We must also recognise the need to bring in people from outside as a way of bringing fresh ideas and new ways of looking at things, of challenging ourselves and of building capabilities we need but don’t have.
In this respect we have made exceptional progress with people such as Sue Elms (from Carat), David Day (from Nielsen NetRatings) Mike Skypala (from DunnHumby), Matthew Graham-Hyde (from UBM) and Paul Rodrigues (from Ogilvy). Equally pleasing has been the movement of talented people from one Kantar company to another (such as Nadim Sadek from SadekWynbergMillwardBrown to Research International) and the smooth succession which we have seen in many companies (eg Lynnette Cooke into the Ziment CEO role and Eileen Campbell into the Millward Brown CEO role).
Some thoughts in closing
We deliver outstanding work to many clients some of the time and to some clients most of the time. Our aim must be to achieve those standards for most clients most of the time.
To do so we must reward people and companies who put the interests of their clients at the centre of their world, who develop talent and who act as role models, who innovate and who succeed fi nancially. This year’s Kantar award winners – Millward Brown North America (together with their operational partners, Kantar Operations and Lightspeed), Cannondale, Ziment, RI South Africa, MB South Africa, MB Columbia, Added Value US and Added Value Germany – achieved that and we applaud them. But to be really successful we must also learn from them. Our culture is not political or ego-driven but nor is it as learning-oriented as it could be. None of us can improve without analyzing things that go right and go wrong, learning the lessons, documenting and circulating them.
And, fi nally, we are a business and we do not shy away from tough decisions. But we also spend a lot of time with colleagues whom we grow very fond of and there are
times during the year when something happens which puts things in perspective.
Tom Deierlein is a US reservist who volunteered for duty in Iraq. He was badly wounded and spent a year recuperating in hospital. He also happens to be COO of Dynamic Logic and someone who is very special to his colleagues. Thankfully, he has recently returned to work.
Sue Gardiner touched the lives of many people in Millward Brown, Kantar and our clients. She ran MB’s Unilever relationship for many years and was instrumental in developing MB UK. She was argumentative, stubborn, fun, passionate and a positive infl uence on all around her. She died at the end of 2006 after a short illness and is much missed.
As our ambition for our business and our desire to succeed increases, let us never lose sight of the very human nature of our business.
How we’re doingInformation, Insight & Consultancy
How we’re doing
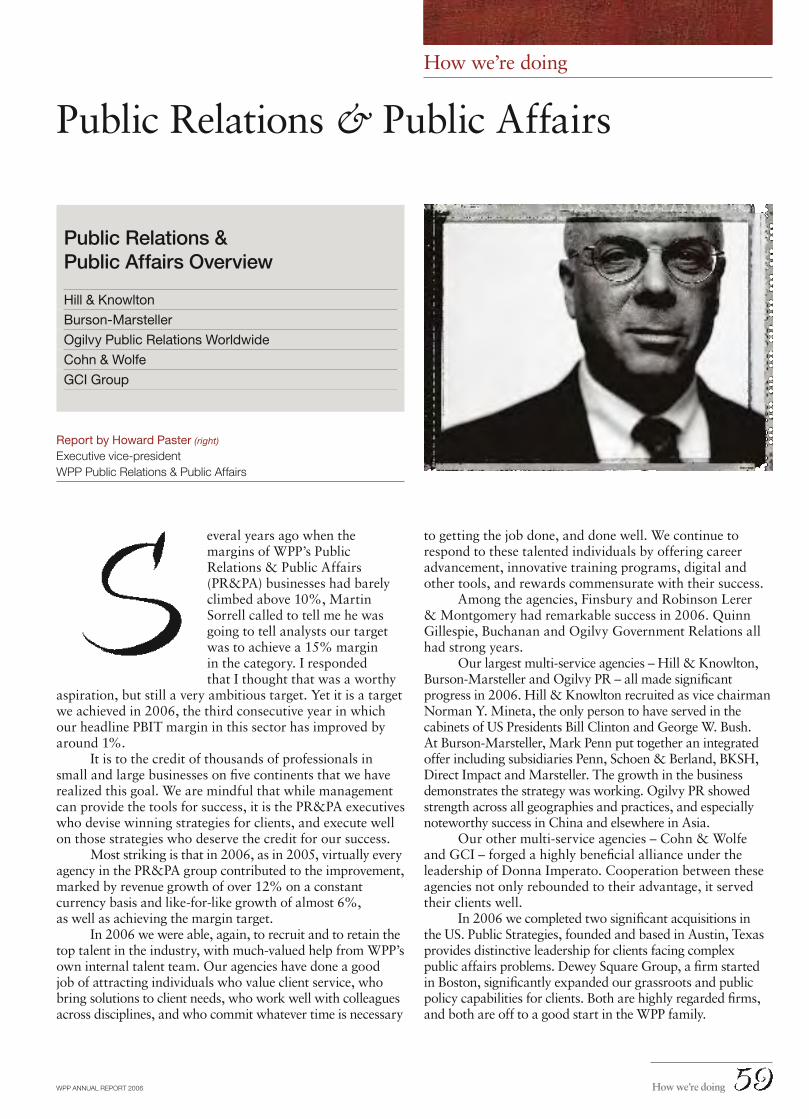
WPP ANNUAL REPORT 2006
How we’re doing
Public Relations & Public Affairs
Public Relations & Public Affairs Overview
Hill & Knowlton
Burson-Marsteller
Ogilvy Public Relations Worldwide
Cohn & Wolfe
GCI Group
Report by Howard Paster (right)
Executive vice-president WPP Public Relations & Public Affairs
to getting the job done, and done well. We continue to respond to these talented individuals by offering career advancement, innovative training programs, digital and other tools, and rewards commensurate with their success.
Among the agencies, Finsbury and Robinson Lerer & Montgomery had remarkable success in 2006. Quinn Gillespie, Buchanan and Ogilvy Government Relations all had strong years.
Our largest multi-service agencies – Hill & Knowlton, Burson-Marsteller and Ogilvy PR – all made signifi cant progress in 2006. Hill & Knowlton recruited as vice chairman Norman Y. Mineta, the only person to have served in the cabinets of US Presidents Bill Clinton and George W. Bush. At Burson-Marsteller, Mark Penn put together an integrated offer including subsidiaries Penn, Schoen & Berland, BKSH, Direct Impact and Marsteller. The growth in the business demonstrates the strategy was working. Ogilvy PR showed strength across all geographies and practices, and especially noteworthy success in China and elsewhere in Asia.
Our other multi-service agencies – Cohn & Wolfe and GCI – forged a highly benefi cial alliance under the leadership of Donna Imperato. Cooperation between these agencies not only rebounded to their advantage, it served their clients well.
In 2006 we completed two signifi cant acquisitions in the US. Public Strategies, founded and based in Austin, Texas provides distinctive leadership for clients facing complex public affairs problems. Dewey Square Group, a fi rm started in Boston, signifi cantly expanded our grassroots and public policy capabilities for clients. Both are highly regarded fi rms, and both are off to a good start in the WPP family.
everal years ago when the margins of WPP’s Public Relations & Public Affairs (PR&PA) businesses had barely climbed above 10%, Martin Sorrell called to tell me he was going to tell analysts our target was to achieve a 15% margin in the category. I responded that I thought that was a worthy
aspiration, but still a very ambitious target. Yet it is a target we achieved in 2006, the third consecutive year in which our headline PBIT margin in this sector has improved by around 1%.
It is to the credit of thousands of professionals in small and large businesses on fi ve continents that we have realized this goal. We are mindful that while management can provide the tools for success, it is the PR&PA executives who devise winning strategies for clients, and execute well on those strategies who deserve the credit for our success.
Most striking is that in 2006, as in 2005, virtually every agency in the PR&PA group contributed to the improvement, marked by revenue growth of over 12% on a constant currency basis and like-for-like growth of almost 6%, as well as achieving the margin target.
In 2006 we were able, again, to recruit and to retain the top talent in the industry, with much-valued help from WPP’s own internal talent team. Our agencies have done a good job of attracting individuals who value client service, who bring solutions to client needs, who work well with colleagues across disciplines, and who commit whatever time is necessary
How we’re doing .
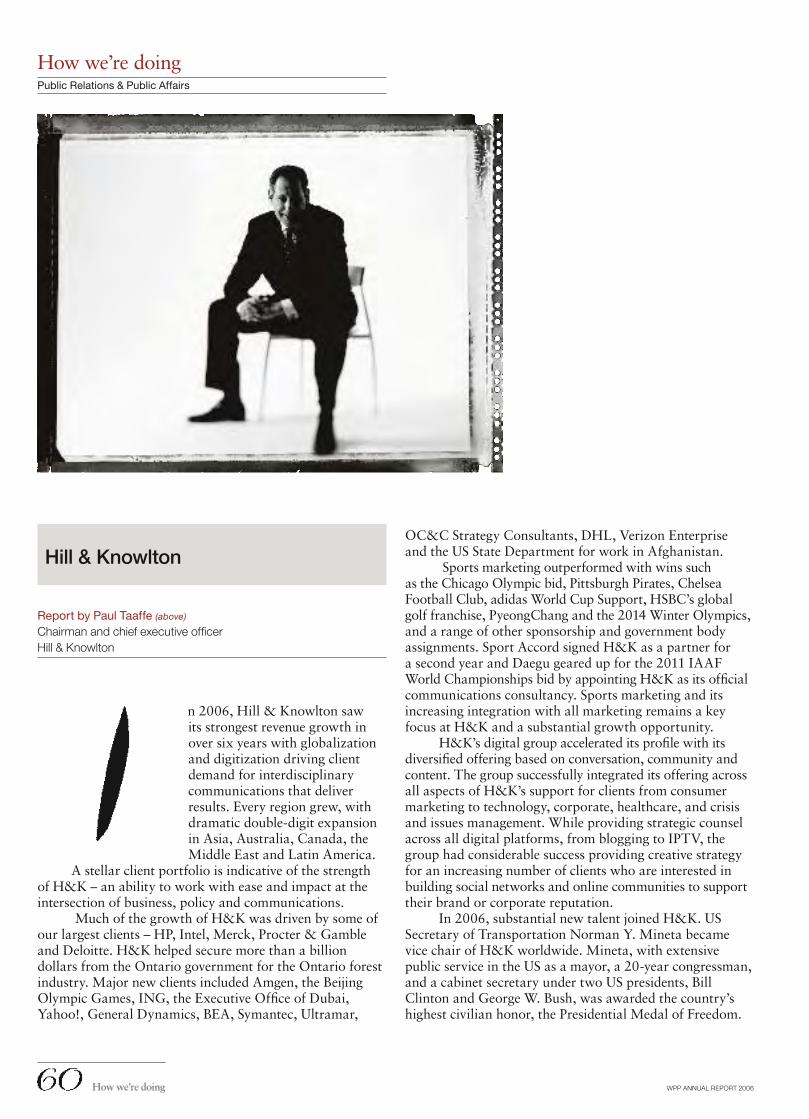
WPP ANNUAL REPORT 2006
n 2006, Hill & Knowlton saw its strongest revenue growth in over six years with globalization and digitization driving client demand for interdisciplinary communications that deliver results. Every region grew, with dramatic double-digit expansion in Asia, Australia, Canada, the Middle East and Latin America.
A stellar client portfolio is indicative of the strength of H&K – an ability to work with ease and impact at the intersection of business, policy and communications.
Much of the growth of H&K was driven by some of our largest clients – HP, Intel, Merck, Procter & Gamble and Deloitte. H&K helped secure more than a billion dollars from the Ontario government for the Ontario forest industry. Major new clients included Amgen, the Beijing Olympic Games, ING, the Executive Offi ce of Dubai, Yahoo!, General Dynamics, BEA, Symantec, Ultramar,
How we’re doingPublic Relations & Public Affairs
Hill & Knowlton
Report by Paul Taaffe (above)
Chairman and chief executive offi cerHill & Knowlton
OC&C Strategy Consultants, DHL, Verizon Enterprise and the US State Department for work in Afghanistan.
Sports marketing outperformed with wins such as the Chicago Olympic bid, Pittsburgh Pirates, Chelsea Football Club, adidas World Cup Support, HSBC’s global golf franchise, PyeongChang and the 2014 Winter Olympics, and a range of other sponsorship and government body assignments. Sport Accord signed H&K as a partner for a second year and Daegu geared up for the 2011 IAAF World Championships bid by appointing H&K as its offi cial communications consultancy. Sports marketing and its increasing integration with all marketing remains a key focus at H&K and a substantial growth opportunity.
H&K’s digital group accelerated its profi le with its diversifi ed offering based on conversation, community and content. The group successfully integrated its offering across all aspects of H&K’s support for clients from consumer marketing to technology, corporate, healthcare, and crisis and issues management. While providing strategic counsel across all digital platforms, from blogging to IPTV, the group had considerable success providing creative strategy for an increasing number of clients who are interested in building social networks and online communities to support their brand or corporate reputation.
In 2006, substantial new talent joined H&K. US Secretary of Transportation Norman Y. Mineta became vice chair of H&K worldwide. Mineta, with extensive public service in the US as a mayor, a 20-year congressman, and a cabinet secretary under two US presidents, Bill Clinton and George W. Bush, was awarded the country’s highest civilian honor, the Presidential Medal of Freedom.
How we’re doing

WPP ANNUAL REPORT 2006
How we’re doingPublic Relations & Public Affairs
In addition, AnnaMaria DeSalva joined as global head of healthcare, Joe Paluska was appointed global head of technology, Sally Costerton was named CEO of H&K London, Goldy Hyder was named head of H&K Ottawa and Bo Albertson joined H&K to lead Sweden.
H&K continued to work to differentiate itself and, as client needs changed and became more complex and more transnational, we were recognized as an agency of choice across the globe. In 2006, we boosted our leadership in the communications category by launching an innovative solution called Infl uencer Network Analysis (INA) that uses software to discover infl uential commentators and then maps the relationships between them. This is fast becoming a major client planning tool.
We continued to make a real difference in our clients’ business by being outcomes- and ROI-focused. We rolled out a signifi cant upgrade to Compass, our proprietary account planning system that ensures each client a more rigorous analysis by understanding the drivers behind each challenge or opportunity and defi ning more clearly the required outcomes and relevant metrics.
Wexler & Walker Public Policy Associates had a successful year on behalf of its clients, most notably with the passage at the end of the US 109th Congress of legislation to reform the US Postal Service, a long-sought goal of a coalition of major companies and associations representing fi rst class and small volume mailers.
The fi rm grew its homeland security practice while strengthening its telecommunications and energy practices in 2006, and further diversifi ed its highly-regarded work in the transportation sector. Passage of the Pension Protection Act of 2006 helped ensure the solvency of American Airlines’ 90,000 employees’ retirement plan. In healthcare, Wexler retained its work on behalf of UnitedHealthcare as it purchased former client, Pacifi Care, and introduced a new policy effort on behalf of Wyeth. For IMS Health, Wexler developed and initiated the launch of an issue advocacy campaign in preparation for an extensive policy campaign in 2007.
The year was marked by signifi cant movement at Blanc & Otus, H&K’s stand-alone technology company. B&O welcomed a new CEO, Mark Hampton, bringing 15 years of broad technology industry PR experience to the role. Hampton was joined at year-end by ex-Dataquest analyst and technology PR specialist Anna Leonard as the new general manager of the San Francisco offi ce.
B&O continued to develop its consumer technology practice by adding hot new clients such as Facebook, Opera Software and Burnlounge to a client roster that includes Universal Electronics, the Blu-ray Disc Association and LG Electronics.
The year saw the rapid development of B&O’s clean tech practice with signifi cant work undertaken for clients including The Green Grid, TechTurn, SunPower and the California Clean Energy Fund. The growth in these two practices built on B&O’s traditional strong foundation in enterprise technology that continued with signifi cant engagements with clients such as Computer Associates, Verizon Business and Hyperion.
Prestigious awards continued to highlight H&K as a leader in communications. H&K Canada was named a Top 100 Employer for the fi fth time by Mediacorp Canada Inc. It also won a Silver Award of Excellence for Quality from the National Quality Institute. Hill & Knowlton Europe, Middle East and Africa was named best multinational company in the 2006 International Business Awards and best international consultancy to work for in the 2006 Holmes ReportConsultancy Survey. Hill & Knowlton Beijing was named Consultancy of the Year in the Asia Pacifi c PR Awards.
Hill & Knowlton continued to support many pro bono causes during the year. Through the charitable John Hill Foundation as well as its work with Ashoka, Darfur, New Orleans, terre des hommes, the House of St Barnabas and the Arab Children Health Congress 2007 plus many more, H&K and its worldwide staff continue to commit itself to socially responsible endeavors around the world.
Cohn & Wolfe
Donna ImperatoChief executive offi cer
Cohn & Wolfe had another stellar year in 2006, with signifi cant growth on the top and bottom lines. Our reputation for brand-building public relations in each practice area – Consumer, Healthcare, Corporate and Technology – opened many doors as clients seek innovative ways to build brands through a multitude of media. As stated in the industry’s leading publication, The Holmes Report, “Cohn & Wolfe specializes uniquely among the larger agencies in big brand-building ideas and is increasingly capable of delivering the kind of creative concepts that can be leveraged across the entire marketing mix.” In 2006, we added many new big-brand clients to our roster, including Panasonic, Merck, Hilton International, Barclays, Asti Spumante and a multitude of digital clients including Joost and Yahoo!
The agency’s heritage in creativity allowed us to adapt easily to the digital world. Cohn & Wolfe offers a wide range of digital services including social networking, text messaging, viral videos, podcasts, tag marketing and search engine strategies for clients such as Diageo, Colgate-Palmolive, American Express and Taco Bell.Notably, we won Best New Media Campaign for O2 in
How we’re doing .

WPP ANNUAL REPORT 2006
How we’re doingPublic Relations & Public Affairs
2006 as well as two prestigious awards from the Society of New Communication Research for “active listening” and “product launch” programs.
We’re also building a strong “green” practice with environmental specialists in Europe and the US. The practice focuses on sustainable business, alternative energies and environmental strategies. It allows clients to demonstrate corporate social responsibility through a green program utilizing the integrated research, media channels, grassroots, viral and social media campaigns that are employed in the practice. Cohn & Wolfe has served a number of clients in the environmental arena, including Ford Motor Company, sister company Landor Associates and several global energy companies.
In 2006, Cohn & Wolfe entered Asia with our fi rst offi ce in Shanghai. We have added Ford, Rolex, Kellogg and Hilton to our roster in this region. In addition, through our partnership with sister agency GCI, we now offer an expanded reach in the US, Western and Eastern Europe, Asia and Latin America.
What makes Cohn & Wolfe most successful, though, is the highly motivated team that services our clients. Cohn & Wolfe consistently ranks as a top fi ve Best Agency To Work For in the industry’s largest independent survey on employee morale from The Holmes Report. We were ranked as a top fi ve public relations fi rm in 2006 in the industry’s largest independent client satisfaction survey, the PRWeek Agency Excellence Survey.
GCI Group
Report by Jeff HuntChief executive offi cer
2006 was a strong year for GCI Group with a focus on delivering measurable impact, world-class creative and digital media expertise – all of which contributed to some of the most highly-contested new business wins in the industry.
Among the new clients added to our roster were Nike, Citigroup, MetLife, Genentech, Berlex/Schering, Darden Restaurant Group (the world’s largest restaurant group), Sony and Garmin. This momentum was also fueled by key hires in GCI’s digital media, creative and corporate practices. GCI Healthcare remains one of the most competitive and leading-edge practices in the public
relations industry with clients such as Merck, Eli Lilly, Bayer, Forest Labs, Boehringer Ingelheim and Medtronic.
GCI’s commitment to helping clients navigate the digital media revolution brought the global expansion of our digital media practice and signifi cant incremental growth with such clients as Dell, RadioShack, P&G and Nike. The agency also formalized a global network of creative experts, referred to as the Imagination Board, who are enhancing our “media neutral” approach to creative ideation.
In addition, the agency launched interactive entertainment, sports marketing and sustainability specialties to capitalize on its expertise and client experience in these areas. GCI maintained its market leader position in the Nordics, and the London offi ce continues its revitalization under new leadership. The agency routinely participates in cross-WPP pitches, such as Berlex/Schering.
GCI’s success in 2006 can be attributed to the cohesiveness of a senior management team that is effectively enforcing our strategic priorities for growth and its culture of high performance and collegiality.
Burson-Marsteller
Burson-Marsteller saw continued improvement in profi tability and revenue growth. Its emphasis on four core strategies – digital, integrated, global and strategic – are shaping its offering to great results.
For Burson-Marsteller’s full report, see page 38.
Ogilvy Public Relations Worldwide
Ogilvy PR enjoyed continued global expansion of client engagements throughout 2006, as companies looked to us to help build market share worldwide.
For Ogilvy PR’s full report, see page 30.
How we’re doing

WPP ANNUAL REPORT 2006
How we’re doing
Branding & Identity
n its fi rst full year as WPP’s branding and design group, B to D Group met with notable success. Led by CFO Robert Horjus and myself, the group as a whole experienced added growth and stability, while the individual companies benefi ted from an exchange of top talent and resources, the sharing of new
business prospects and the opportunity to collaborate in order to serve clients better.
Landor achieved another record-breaking year in 2006. A new generation of leaders, led by CEO Charlie Wrench, assumed the reins, driving Landor’s strategic and creative capabilities through added investment and strengthening Landor’s global network, most notably through the addition of a Beijing offi ce.
Enterprise IG, led by CEO Simon Bolton, delivered a strong performance in 2006. The company strengthened its offering and expanded its footprint via the addition of strategic marketing consultancy, Everystone, and Indian design agency, Ray+Keshavan.
VBAT achieved a solid performance in 2006 despite challenges in its native Dutch market. Led by chairman Eugene Bay and CEO Bob van der Lee, the company deepened its commitment to delivering a truly integrated brand development offer. Heineken and ING remained two of VBAT’s top clients in 2006, in addition to supermarket chain, Laurus/Super de Boer, and premium food supplier, Wessanen. New 2006 additions to VBAT’s client list included Ahold, Intergamma, Vrumona and Dutch railroad company, Nederlandse Spoorwegen.
Addison had an outstanding year, furthering its reputation as one of the world’s leading corporate reporting consultancies. Addison won a greater range of awards than any other agency in their fi eld this year and a greater number than any other year in Addison’s 28-year history. Under the strong leadership of CEO Tom Robinson, Addison amassed a broader client base than its competitors, thanks in part to its differentiated position as a strategic advisor across the full
B to D Group
Report by Craig Branigan (left)
Chairman and chief executive offi cerB to D Group
How we’re doing .
WPP ANNUAL REPORT 2006
range of corporate communications. On the new business front, Addison added Swiss Re, Azko Nobel and Deutsche Post to an already impressive roster that includes clients Anglo American, AstraZeneca, Heineken, ING, Vodafone and WPP.
While 2006 began with a challenging start for Lambie-Nairn, the company secured a number of solid wins by year end with companies such as BBC News, Bloomberg, Skai Greece, AVIVA and Hotels.com. Lambie-Nairn also continued to deliver effectively as brand guardian for mobile service provider, O2, securing a Gold in the prestigious IPA Effectiveness Awards for their work on the brand. Additionally, Lambie-Nairn successfully led the efforts to rebrand Telefonica’s Czech Republic and Slovakia businesses under the O2 brand following Telefonica’s recent acquisition of O2.
Finally, 2006 was also a successful year for The Partners as the company continued to translate recent momentum into sustainable growth. The Partners was highly recognized for its outstanding work, winning more creative awards than any other UK fi rm in the year, including Best Identity in the Design Week awards and a D&AD Yellow Pencil. Led by CEO Jim Prior, The Partners successfully diversifi ed its client base and established several signifi cant on-going client relationships most notably with AstraZeneca. New client wins included Hilton Hotels, Liverpool Victoria and Schroders Investment Management.
In the year ahead, B to D Group will continue to serve as a catalyst for top- and bottom-line growth by continuing to leverage the strengths of each individual company to address the changing needs of our clients even more effectively.
Enterprise IG
Report by Simon Bolton (right)
Worldwide chief executive offi cerEnterprise IG
nterprise IG’s business performance improved signifi cantly during 2006, with healthy revenue growth and operating margin improvement. It was within this encouraging commercial context that our strategic vision for the network took fi rm root.
We are in the process of turning Enterprise IG into a stronger and more seamless network. We are aligning our global offer and process and focusing on building our reputation as ‘Master Brand Builders’. Growth has come from three main sources: new business; existing client relationship development; and further geographic expansion of our network, which now comprises 24 offi ces in 21 countries.
Across this network we offer a diverse range of services. However, they all share a common belief that we are in the business to deliver brand-driven business growth for clients. The topic of brand has never been more closely aligned with our clients’ business performance; we see the need for the brand challenge to sit at the heart of the commercial agenda.
This was part of the proposition that helped Enterprise IG to win signifi cant new clients in 2006, including Deutsche Post, Emaar Properties, HP and Schroders. These are all major multinational clients that have engaged Enterprise IG to support an international brand development agenda.
We also developed our relationships with a number of existing clients, including Pernod Ricard in France and the US, RBS in Ireland and the UK, Unilever in Germany and Cofco in China.
There were major developments in Asia Pacifi c. We reached an agreement with our joint venture partner, Ogilvy, that the network would come under the full management of Enterprise IG (with all other elements of the JV unchanged). This has led to us developing the regional network even further. We opened two new offi ces in Beijing and Jakarta to service the growing needs of
How we’re doingBranding & Identity
How we’re doing

WPP ANNUAL REPORT 2006
How we’re doingBranding & Identity
clients in these fast-developing markets. In November, we announced the acquisition of Ray+Keshavan (R+K) based in Bangalore, India. Led by the founder and creative director, Sujata Keshavan, R+K is recognized to be one of the fi nest branding agencies in the sub-continent, handling a fi rst-class blend of local and multinational business.
We also developed our strategic proposition by bringing the London-based marketing consulting group, Everystone, under the wing of Enterprise IG. Everystone is an experienced group of marketing strategists that work closely with clients to determine and develop accountable marketing plans. Led by Rosi McMurray, Everystone works with clients such as Ernst & Young, HSBC and Old Mutual.
On the talent front, we made a number of key moves. Terry Tyrrell (one of the original founders of the London agency) was promoted to worldwide chairman, with specifi c responsibility for a number of key clients. Crispin Jameson (formerly CEO of Everystone) joined as the worldwide strategy director in December. And at the time of going to press, we were able to announce that Julia Rice (formerly of MTV) will join as the worldwide HR director, responsible for recruiting and retaining talent.
During the year we made signifi cant strides with our creative product, and this was recognized with a number of prestigious awards. However, our quest is to continue to
raise the creative bar and with this in mind we hired Wally Krantz as the executive creative director for our New York operation. We have also formed the Worldwide Creative Council which is charged with the task of attracting and managing creative talent as well as the responsibility for improving creative standards.
I am confi dent that, as Enterprise IG embraces 2007, we have the strategy in place for the network to continue its ambitious growth path.
How we’re doing .

WPP ANNUAL REPORT 2006
Fitch
Report by Rodney Fitch (above)
ChairmanFitch
006 was another good year for Fitch, with most of our studios performing well and some exceptionally so. From a loss-making position in 2003, we have enjoyed three successful years, with last year our best yet. We have continued to work with valued existing clients such as Vodafone, HSBC, BAT, Liz
Claiborne and GE, while growing our involvement with newer clients such as Nokia and Colgate. 2007 has started well, nowhere more so than in our most recent studio in Mumbai, which has already attracted considerable new business, particularly in retail design.
But behind good numbers stands good work and behind good work stand good people; our associates and clients. So it is with great pride and gratitude that I take this opportunity to publicly honour both.
During a typical year, Fitch will tackle hundreds of projects for dozens of clients but, whether large or small,
existing or new, our global studios bring equal amounts of enthusiasm and commitment to a wide range of challenges across our core disciplines of consumer environments, brand communications, trends and insights and industrial design. Notable among last year’s projects:
• In retail environments we enjoyed huge success with Central Foods in Bangkok. Our work in creating state-of-the-art grocery retailing helped win our client the accolades of Best Food Store in Asia and “the world’s third best food retailer” (behind Wholefoods, but ahead of Tesco and Dean & DeLuca!).
• The opening last December of the Asia Games, the largest sporting event in Asia, saw the culmination of three years’ work creating a superb award-winning brand communication and identity program. A world-class program that was thoroughly grounded by traditional Arab visual culture.
• Our industrial design studios in the US collaborated on a brief from GE, which saw us helping to develop for General Motors the Volt concept car, revealed at the Detroit Motor Show as the car of the future. This work was much applauded being voted “best concept car in show” and “the most signifi cant development in the US auto industry of the past 20 years.”
• We are not only creators but also thinkers. Our insightful study into changing consumer attitudes towards brands was published as Generous Brands. This paper was publicly endorsed by Jim Stenghal, CMO of P&G, as a framework for future brand engagement.
Just four examples among many. As long as we continue to create programs of this quality for our clients, so shall our reputation underpin our performance.
How we’re doingBranding & Identity
How we’re doing

WPP ANNUAL REPORT 2006
Healthcare Communications
How we’re doing
ommonHealth’s many accomplishments in 2006 have positioned us well for a strong 2007… and beyond. From the creation of a more formal global presence, to the execution of a signifi cant offi ce consolidation project, from the refi nement of our management and operating structures, to the expansion of
our proprietary tools and techniques – we are a bigger, more creative, collaborative and coordinated force in healthcare marketing than ever before.
With strength now in 15 worldwide operating divisions, CommonHealth enjoys an expansive client roster and a signifi cant presence in virtually every therapeutic category, marketing discipline, media channel and audience sector. Our organizational structure allows us to offer clients individual, specialized skills or a strategically coordinated mix of services, giving us both fl exibility and critical mass in the vital, yet ever-changing healthcare marketplace.
Specifi c progress in 2006:
• Proving the cliché with change comes opportunity,we pitched, won and earned more new business than in any prior year, further diversifying our client base and expanding our footprint in this highly competitive arena. We are now proud to name 14 of the top 15 pharmaceutical manufacturers as valued clients.
• In response to the continued globalization of the healthcare market and client base, we launched a more formalized worldwide presence in partnership with our WPP sister company, Ogilvy Healthworld. We now boast dedicated agency hubs in London and Paris with additional offi ces already in development.
• With an eye towards better leverage of our talent, improved operating effi ciencies and stronger cross-company collaboration, we successfully completed the consolidation of 12 of our 13 US-based operating divisions into one, multi-tenant offi ce campus.
CommonHealth
Report by Matt Giegerich (right)
President and chief executive offi cer CommonHealth
• In fact, our network of talent became more connected and collaborative than ever before, with a solid three-quarters of our clients’ brands working with two or more CommonHealth service divisions – a sure sign that our fully integrated business model adds value.
• Greatly advancing our industry-wide reputation, CommonHealth garnered signifi cant critical acclaim with a record 72 industry awards – all acknowledging creative excellence in healthcare communications.
• We increasingly organized the business around our proprietary suite of “reality-based” insight tools and techniques, allowing us to assemble accurate, actionable insights for our clients’ brands – on a depth and scale to which none of our competitors can compare.
• Based on one of our proprietary insight-mining tools, we publicly released the fi ndings of our study on the effects of direct-to-consumer (DTC) advertising on patient/physician dialogue. The surprising results of this study commanded the attention of the FDA and were subsequently submitted
How we’re doing .

WPP ANNUAL REPORT 2006
How we’re doingHealthcare Communications
to the federal register for consideration as the future of DTC advertising protocols are debated.
As we look forward into the ever-churning, yet ever-critical healthcare marketplace, we continue to see enormous need for communications campaigns that infl uence wellness, drive disease and brand awareness and education, and improve diagnosis, prescribing, compliance and adherence. And, with great reverence for the inherent importance of our marketplace charter, CommonHealth is committed to continuing as a leader in the healthcare marketing industry – and to the passionate support of our newly-revealed mission: Compelling communications. Bigger brands. Better healthcare.
Grey Healthcare Group
Grey Healthcare Group, one of the world’s leading healthcare marketing companies, achieved double-digit growth for the tenth year in a row in 2006.
For Grey Healthcare’s full report, see page 44.
Ogilvy Healthworld
As the size and complexity of the healthcare category continues to increase dramatically around the world, Ogilvy Healthworld has been able to leverage its unmatched geographic reach, market expertise and strategic alignment with parent Ogilvy Worldwide.
For Ogilvy Healthworld’s full report, see page 31.
Sudler & Hennessey
In 2006, the Sudler & Hennessey network continued its heritage of service, creativity and delivery in the health and healthcare industries.
For Sudler & Hennessey’s full report, see page 40.
How we’re doing

WPP ANNUAL REPORT 2006
How we’re doing
Specialist Communications
Specialist Communications
Report by Mary Ellen Howe (below)
Chief operating offi cer Specialist Communications, North Americaand Andrew Scott (overleaf)
Chief operating offi cerInternational Specialist Communications
pecialist Communications represent a group of companies that provide clients with unique marketing capabilities, specialized industry expertise, and deep knowledge of particular audience segments. In some cases, these businesses eventually choose to affi liate with one of the major networks. In other instances the
businesses prefer to maximize opportunities by remaining independent. Occasionally, businesses join Specialist Communications when it is no longer appropriate to affi liate with a network for confl ict or strategic reasons. Our mission is to assist individual operating company managements to develop their full potential.
Direct, promotion, digital and interactive marketing
Bridge Worldwide, a US Top 50 digital and relationship marketing agency, successfully completed its fi rst year with WPP, posting strong organic growth with long-time Fortune 100 clients such as Procter & Gamble, that are increasingly taking advantage of the digital and relationship marketing space. Part of this growth stems from Bridge’s initiatives leveraging next-generation digital experiences such as RSS, podcasts, blogs, IM, lifecoaching services, branded social networking environments, and mobile initiatives.
Bridge was also awarded several new brand relationships fi lling out the agency’s consumer packaged goods portfolio, including ConAgra Foods (Healthy Choice, Hunts, Orville Redenbacher, Chef Boyardee, Hebrew National and La Choy) as well as two new brands at P&G (Fixodent and Glide). Other digital wins include expansion into new categories such as automotive (Federal-Mogul) and fi nancial services (US Bancorp).
Healthcare remains a key focus with three signifi cant quantifi able initiatives addressing the American obesity epidemic – the consumer program tackling morbid obesity for J&J’s BariatricEdge brand (www.bariatricedge.com); a lifestyle compliance program for Abbott’s diabetic nutrition brand, Glucerna (www.diabetescontrolforlife.com); and a healthy eating and lifestyle program in partnership with the American Heart Association for ConAgra Food’s Healthy Choice brand (www.startmakingchoices.com).
Bridge’s creative reputation also had a solid year, winning more than 40 awards in the digital and healthcare space including two Best of Shows at the WebAwards and seven Best of Industry at the Internet Advertising Competition. One of those Bests captured a perfect score
How we’re doing .

WPP ANNUAL REPORT 2006
How we’re doingSpecialist Communications
and culminated in them winning the British Video Association Agency of the Year Award in early 2007.
Warwicks’ focus on automotive clients saw it add Triumph Motorcycles to its client roster during 2006 to provide global creative design, production and advertising services. Work continued for clients such as Jaguar, Land Rover, Aston Martin, Peugeot, LTI (manufacturer of the black cab) and tractor manufacturer, AGCO.
Custom media
Forward saw growth from existing clients including Patek Philippe and B&Q, the latter’s expansion due to the development and launch of new projects. Additionally, Tesco rationalised its agencies, awarding a further Club to Forward. Work in North America for the Sears Holdings Corporation grew with further business development in consultancy and online content for Kmart. The agency also enjoyed considerable uplift in the provision of online content through successful cross-promotion to Ford, B&Q and Barclays – a trend that is expected to continue.
Spafax had an exciting year in 2006, delivering new interactive and on-demand entertainment and media projects for clients including British Airways, Singapore Airlines, American Airlines, US Airways, Virgin America, Qantas, Emirates, Qatar and Air Canada. Following the acquisition and merger with DMX Infl ight, the company further developed its technical and digital infrastructure with the creation of a successful digital video-encoding facility, as well as additional capacity in audio replication. Its custom media division received a number of awards including enRoute being named Best Travel Magazine 2007 by the North American Travel Journalists.
Demographic and sector marketing
In real estate marketing, the general malaise and over-supply that plagued much of the US for most of 2006 proved benefi cial to Pace. Although both builders and buyers were tentative, Pace was able to substantially increase its billings, as both new and old clients turned to the fi rm for its well-established reputation for quick and effective solutions to diffi cult and changing market conditions. Continued expansion into new geographic markets, a strong showing at The National Association of Homebuilders annual convention, and a growing list of new and established clients, helped Pace exceed performance expectations.
Youth and young adult marketing fi rm Geppettointroduced the Wal-Mart brand to America’s youth via an integrated communications plan. It also created a Gold Reggie-winning youth program to launch Listerine’s Agent Cool Blue, saw Samsung launch the K5 MP3 player it helped create, developed a pipeline of new youth products for Nestlé and Pepsi, and authored ground-breaking new research on young adults and global teen culture.
for P&G’s Noxzema brand (www.noxzema.com). Bridge was honored for its company culture as well, being named the No.9 Best Place to Work in America by the Great Place to Work Institute (the same survey company that ranks the Fortune 100).
Live media and events fi rm MJM saw a year of strong performance and growth for its core offerings. Important projects for long-standing clients like Pfi zer, AstraZeneca, IBM, Canon, Deloitte and GlaxoSmithKline were delivered from Cape Town to Mexico City as well as across Europe and the US. New capabilities and talent added to the teams in London, Detroit and the Mid-Atlantic Region also resulted in highly innovative face-to-face programs. These included fi eld-marketing campaigns for HSBC and a ground-breaking training program for Fortnum & Mason in the UK; brand-building initiatives for Ford; and the sensational Red Bull Air Race held over San Francisco Bay, which was seen by nearly half a million people.
EWA recorded another record year in 2006, providing outsourced data and relationship management services. Growth was boosted by new business wins from Reebok, English Partnerships and COI, together with additional work for existing clients including the Department of Health and the Training & Development Agency for schools.
Mando Brand Assurance’s growth in 2006 culminated in the opening of offi ces in Frankfurt and Toronto. Major promotional campaigns won during 2006 included Unilever’s Lynx (Axe), Peperami and Persil brands. Global brands Coca-Cola and iTunes formed a joint contract with Mando to manage a major on-pack promotion.
Einson Freeman, a full-service consumer promotion agency, continued to score victories on the awards circuit, including completion of a coveted “Triple Crown” (Reggie, Pro and Globe Awards) for its Purell/National Geographic Kids tie-in. The agency began signifi cant new projects and relationships with WPP network clients including Unilever, HSBC, IBM and Lenovo. In addition, Einson continues to work closely as part of integrated teams with many sister agencies: OgilvyAction, JWT and Mediaedge:cia among others.
Headcount continued to grow its client base during 2006. Activity included working with Unilever in their launch of AdeZ, 2006 World Cup events were organised for Virgin Mobile and Mastercard, and the relationship with Warner Home Video saw Headcount being a part of the launch of major titles such as Harry Potter and Superman,
How we’re doing

WPP ANNUAL REPORT 2006
How we’re doingSpecialist Communications
The Food Group launched a culinary nutrition practice, Nutrition + Culinary Consultants, further strengthening its leadership role in the food industry. NCC will provide credible nutrition services to all facets of the food, beverage, and wellness category with its staff of registered dieticians and executive chefs. Additionally, The Food Group continues to work with some of the leading foodservice manufacturers in the nation including Kraft, TABASCO, Dannon, and the Florida Department of Citrus as well as leading international foodservice appliance manufacturer Electrolux. Notable 2006 wins included assignments with PepsiCo and Dannon USA.
BDG McColl, Edinburgh-based architects and interior designers had another successful year with ongoing work for BP’s North Sea Headquarters and the new Veterinary School for the University of Edinburgh. Other projects included the strategic reorganisation and space planning of the City of Edinburgh’s core estate accommodating 3,000 staff, further work with Numico in Poland, and the delivery of Rabobank’s offi ces in the Netherlands.
BDGworkfutures continued to develop its offer within the corporate property strategy and design sector. Ongoing relationships with major companies including AON, Barclays, IBM, Honeywell and various government departments were complemented by additions of new key accounts including Network Rail and Siemens UK.
Dovetail had a successful year and continued to develop its relationships within the architectural and design communities. During 2006 it supplied offi ce furniture to Hammerson, Lloyds Bank, Swiss Re, and UBS, among others. Prospects are promising for 2007 with the appointment to manage the installation of new furniture for Deloitte’s London campus.
Sports marketing
PRISM carried out sponsorship assignments with the Winter Olympics, NASCAR, MotoGP, NFL and Asian Marathon races. On the Formula One circuit, clients included i-mode and Shell; PRISM created an award-winning viral campaign for Shell, featuring Michael Schumacher. PRISM’s sponsorship consultancy business continued to expand with new assignments from Coke, AT&T and FSP sports, which augmented existing assignments from Volvo, Visa, Standard Chartered, Ford and Samsung.
Global Sportnet had a strong year in 2006 due to the strong performance of its core football media rights business. It continued to develop its offering beyond football rights into a full-service sports marketing agency, and grew its geographical presence in Singapore and Dubai.
Media and fi lm production services
Metro demonstrated the breadth of its service offering to produce web broadcasts for GSK, incorporating the design and staging of live events, streaming of web-broadcast and design of web portals. The events unit developed its roadshow business with graduate recruitment events for a number of blue-chip clients and corporate branding exhibitions. The broadcast service unit continues to offer end-to-end High Defi nition production services, media digitisation and web-streaming services.
The Farm Group continued to be a major supplier of post production services to the main producers of prime-time terrestrial television in the UK. Recent work has included dramas such as The Trials of Tony Blair,Shameless and Wild at Heart; entertainment shows including X Factor, Deal or No Deal, and Friday Night with Jonathan Ross as well as music projects for Madonna, Robbie Williams, Kylie Minogue and Oasis.
How we’re doing .

WPP ANNUAL REPORT 2006What we think

WPP ANNUAL REPORT 2006
What we thinkThe Advertising & Marketing Services Industry: China and the internet WPP CEO Sir Martin Sorrell reports
s expected, 2006 was a strong year. It was a ‘mini-quadrennial’ – boosted by political spending around the mid-term Congressional elections in the US (bigger than expected, at around $1.6 billion), the Winter Olympics in Turin (somewhat disappointing) and soccer’s World Cup in Germany (better than expected). 2006 followed
a stronger than expected 2005, all of which maintained the strong recovery from the internet bust of 2000. In theory, 2005 should have been the weakest year of the four-year cycle to 2008, with no big events to boost advertising and marketing services spending. Following on, 2006 was WPP’s best year ever – measured by all metrics. It achieved record billings, revenues, gross margin and operating margins of 14.5%. 2007 has already shown more improvement. It should be an even better year with continued growth in the US, Asia Pacifi c, Latin America, and Central and Eastern Europe, buttressed by a mild recovery in Western Continental Europe and even Britain. The rapid changes in technology continue to be an opportunity. But if we do not respond quickly, they will become a threat.
What we think .
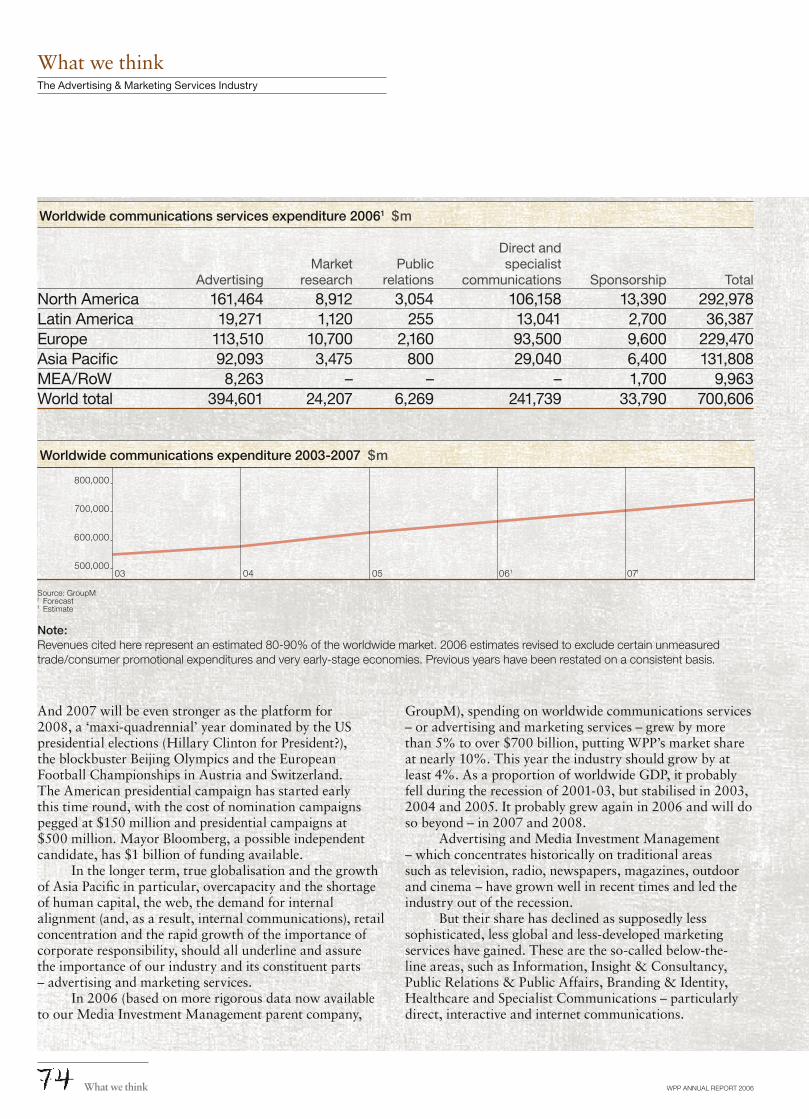
WPP ANNUAL REPORT 2006
What we thinkThe Advertising & Marketing Services Industry
Worldwide communications services expenditure 20061 $m
Direct and Market Public specialist Advertising research relations communications Sponsorship Total
North America 161,464 8,912 3,054 106,158 13,390 292,978Latin America 19,271 1,120 255 13,041 2,700 36,387Europe 113,510 10,700 2,160 93,500 9,600 229,470Asia Pacifi c 92,093 3,475 800 29,040 6,400 131,808MEA/RoW 8,263 – – – 1,700 9,963World total 394,601 24,207 6,269 241,739 33,790 700,606
And 2007 will be even stronger as the platform for 2008, a ‘maxi-quadrennial’ year dominated by the US presidential elections (Hillary Clinton for President?), the blockbuster Beijing Olympics and the European Football Championships in Austria and Switzerland. The American presidential campaign has started early this time round, with the cost of nomination campaigns pegged at $150 million and presidential campaigns at $500 million. Mayor Bloomberg, a possible independent candidate, has $1 billion of funding available.
In the longer term, true globalisation and the growth of Asia Pacifi c in particular, overcapacity and the shortage of human capital, the web, the demand for internal alignment (and, as a result, internal communications), retail concentration and the rapid growth of the importance of corporate responsibility, should all underline and assure the importance of our industry and its constituent parts – advertising and marketing services.
In 2006 (based on more rigorous data now available to our Media Investment Management parent company,
GroupM), spending on worldwide communications services – or advertising and marketing services – grew by more than 5% to over $700 billion, putting WPP’s market share at nearly 10%. This year the industry should grow by at least 4%. As a proportion of worldwide GDP, it probably fell during the recession of 2001-03, but stabilised in 2003, 2004 and 2005. It probably grew again in 2006 and will do so beyond – in 2007 and 2008.
Advertising and Media Investment Management – which concentrates historically on traditional areas such as television, radio, newspapers, magazines, outdoor and cinema – have grown well in recent times and led the industry out of the recession.
But their share has declined as supposedly less sophisticated, less global and less-developed marketing services have gained. These are the so-called below-the-line areas, such as Information, Insight & Consultancy, Public Relations & Public Affairs, Branding & Identity, Healthcare and Specialist Communications – particularly direct, interactive and internet communications.
03 04 05 07f061500,000
600,000
700,000
800,000
Worldwide communications expenditure 2003-2007 $m
Source: GroupMf Forecast1 Estimate
Note:Revenues cited here represent an estimated 80-90% of the worldwide market. 2006 estimates revised to exclude certain unmeasuredtrade/consumer promotional expenditures and very early-stage economies. Previous years have been restated on a consistent basis.
What we think

WPP ANNUAL REPORT 2006
What we thinkThe Advertising & Marketing Services Industry
Clients still need reach. In the US, for example, primetime network television used to reach 90% of households. A few years ago it was 50%; today it is perhaps only 33%. There are, of course, still programs with signifi cant global or national reach, such as the Super Bowl, the Academy Awards, the Olympic Games or the World Cup. The World Cup fi nal reaches about 500 million people, the Olympics 400 million, the Super Bowl 90 million and the Academy Awards around 30 million.
The largest live event audience, however, is for the Chinese New Year Gala on CCTV in China, Asia and elsewhere, watched by one billion people. These events remain in relatively fi xed supply with the pools of money chasing them stable or growing. Their prices are bid up as a result. That is why a 30-second Super Bowl advert costs $2.6 million and an Academy Awards slot $1.6 million.
This is not a situation that can last, particularly when signifi cant segments of the population seem to go missing. For instance, US audience ratings indicate that young men have disappeared on Monday nights – perhaps gaming on the internet or watching out-of-home in bars. Equally, housewives have defected from soap operas. Recent changes in Nielsen and our own AGBNielsen Media Research and IBOPE technology now include out-of-home and internet audience fi gures, too.
Moreover, media fragmentation has increased signifi cantly, as the old media become more sophisticated and the new media proliferate. Technology has improved the effectiveness and development of cable and satellite television, newspapers and periodicals, radio and outdoor, while spawning new media in direct, interactive and the internet. Many of these new media are more measurable and more targeted.
At the same time, media consumption habits are changing with every generation. Look at what a four-year-old can do with a computer in a few hours or what bloggers and hackers do with a clear conscience and different value systems. Decision-makers in media owners and agencies tend to be in their fi fties and sixties; their sons and daughters and grandchildren are shifting in ever greater numbers to multi-tasking on the web, personal video recorders (PVRs), video-on-demand, iPods, video iPods, iPhones, mobiles, podcasts and internet games.
Many leading executives are in denial. They believe – or hope – that such changes will not happen on their watch. Yet I know that my own consumption habits have altered radically over the past few years – more daily newspapers, fewer periodicals. More cable and satellite television, less network. More web surfi ng and BlackBerry® e-mail. More continuous streaming of CNBC or Bloomberg. I am less willing to wait for detailed analysis in weeklies or
Marketing services: the growth goes on
Marketing services have grown more quickly for two reasons. First, network television pricing has risen faster than infl ation, to the disquiet of big advertisers. Procter & Gamble, the world’s biggest advertiser, Unilever, Coca-Cola and American Express have all registered voluble protests in recent times. They are sick and tired of paying more for less.
In 2003, in the upfront network buying season, cost per thousand rose by an estimated 15-22% against an expected 7-12% – this against general price infl ation of 3%. In 2004, upfront pricing continued to outpace infl ation, cost per thousand rising by 6-7%. 2005 saw more softening, but prices still grew faster than infl ation at around 4-5%. NBC was particularly hit hard – dropping $900 million in revenues, with pricing, programming and late bargaining issues combining to cause signifi cant issues. Although the pressures on network television intensifi ed in 2006, network cost per thousand probably rose by 4-5%, still faster than general price infl ation of 3%.
I know that my own consumption habits have altered radically over the past few years – more daily newspapers, fewer periodicals. More cable and satellite television, less network. More web surfi ng and BlackBerry® e-mail
The analogy is to imagine what would happen in the car industry, if the price of steel rose consistently by 10% against general price infl ation of 3%. Manufacturers would use less steel or fi nd a substitute. That is what is happening in our industry, too. Marketing services and other traditional media such as radio, outdoor and cinema advertising are becoming more acceptable substitutes.
Network television will, however, remain an important medium. It will not disappear. If we were starting a multinational packaged goods company from scratch, we would still use network television to reach the largest number of people in the shortest time at the lowest cost.
What we think .

WPP ANNUAL REPORT 2006
What we thinkThe Advertising & Marketing Services Industry
World 2001 2002 2003 2004 2005 2006f 2007f
Television -68 85 42 51 38 50 50
Radio -28 24 11 4 5 6 4
Newspapers -84 -6 18 19 14 5 6
Magazines -37 -7 12 11 15 4 5
Cinema 1 4 1 0 1 1 1
Outdoor 11 2 4 4 6 7 7
Internet 104 -2 12 11 22 27 28
North America
Television -118 56 25 51 17 46 46
Radio -18 23 10 0 1 5 5
Newspapers -69 18 27 16 12 -2 -3
Magazines -55 7 24 18 36 -2 1
Cinema 0 3 1 1 2 2 2
Outdoor 0 0 3 4 8 7 7
Internet 161 -7 11 10 25 44 41
Latin America
Television 11 -51 35 67 52 57 68
Radio -75 -11 43 12 14 12 2
Newspapers -27 -21 5 10 18 16 12
Magazines -7 -16 3 7 11 6 4
Cinema 0 0 0 1 0 0 0
Outdoor -2 -2 9 2 3 4 3
Internet 0 0 4 1 2 5 10
Western Europe
Television -49 -5 -84 40 30 23 28
Radio 0 -2 -35 8 7 3 4
Newspapers -72 -62 84 24 13 -13 1
Magazines -1 -37 55 8 7 13 9
Cinema 3 0 -3 0 0 -1 0
Outdoor 18 -1 -26 3 6 9 6
Internet 1 5 -92 18 37 65 51
Central and Eastern Europe
Television 58 61 49 44 48 53 59
Radio 4 2 6 10 4 5 5
Newspapers 14 15 18 24 12 13 11
Magazines 9 6 10 9 18 11 9
Cinema 1 0 2 1 1 2 2
Outdoor 13 14 13 10 13 13 9
Internet 1 1 2 2 3 4 5
Asia Pacifi c (all) 2001 2002 2003 2004 2005 2006f 2007f
Television 220 98 67 59 55 59 58
Radio -8 -1 2 2 1 6 3
Newspapers -145 -18 17 17 9 5 9
Magazines -38 1 3 3 5 2 2
Cinema 0 0 0 0 1 0 0
Outdoor 33 2 -1 5 2 7 7
Internet 37 19 11 13 26 21 21
North Asia (China, Hong Kong, Korea, Taiwan)
Television 75 62 73 71 75 75 75
Radio -3 2 0 1 0 9 3
Newspapers 5 24 16 11 7 1 6
Magazines 4 3 3 4 6 1 3
Cinema 1 0 0 0 0 0 0
Outdoor 19 7 2 6 0 6 6
Internet 0 3 6 7 12 8 7
ASEAN (Indonesia, Malaysia, Philippines, Singapore, Thailand)
Television 62 68 57 56 68 74 68
Radio 22 8 9 4 5 6 7
Newspapers -9 21 18 29 13 9 16
Magazines 14 1 6 4 4 4 2
Cinema 1 0 1 1 2 1 1
Outdoor 4 1 10 5 5 4 4
Internet 6 0 1 1 2 2 2
Middle East & Africa
Television 45 66 60 42 13 44 42
Radio 12 4 3 6 10 5 7
Newspapers 28 16 25 43 54 44 38
Magazines 7 5 5 5 10 7 7
Cinema -1 1 1 1 2 -2 -1
Outdoor 9 8 6 3 7 0 6
Internet 1 0 0 0 4 2 1
Source: GroupMf: Forecast* Seven main media excluding ‘Other’
Percentage contribution to growth by media* in major markets %TV still dominates in faster-growing markets/internet strong in mature markets
What we think

WPP ANNUAL REPORT 2006
What we thinkThe Advertising & Marketing Services Industry
fortnightlies. I want news, together with commentary now. Why should I wait for 10 days or so for in-depth analysis of the Procter/Gillette merger announced on a Thursday night? Although, in contradiction, The Economist still seems to strengthen, having passed one million circulation, and women seem to be increasing their magazine readership.
Similarly, the US has hitherto accounted for about half of worldwide advertising and marketing services spending, with the most prominent non-American markets being Japan, Germany, the UK, France, Italy and Spain.
That is changing. Asia Pacifi c, Latin America, Africa, the Middle East, and Central and Eastern Europe are becoming more and more signifi cant, as multinational corporations build their businesses where populations are large and growing faster. In 2006, Russia was WPP’s fastest-growing country at 40% and the Middle East one of the fastest-growing areas at 25%. And the ‘neo-BRICs’ of Pakistan with a population of 165 million, Vietnam with a population of 85 million and Indonesia with more than 230 million (of which 200 million are Muslims) all growing faster and becoming more infl uential in 2006.
Non-US markets will be increasingly important. Extrapolate WPP’s current revenues in the BRIC countries (Brazil, Russia, India and China) or BRICI (including Indonesia) at the rates of GDP growth predicted in recently published Goldman Sachs research and assume moderate rises in advertising to GDP ratios.
Increasingly, the marketing world is becoming two-paced or even three-paced, geographically and functionally
The result is that Asia Pacifi c, Latin America, Africa, the Middle East, and Central and Eastern Europe will take a growing share of our business: possibly 38% by 2015, excluding acquisitions. Perhaps we should look at our activities on a network television and non-network television basis, and a US and non-US basis.
Increasingly, the marketing world is becoming two-paced or even three-paced, geographically and functionally. Asia Pacifi c, Africa and the Middle East and Central and Eastern Europe are outpacing the US and the US outpacing Western Europe; the internet and other new technologies are outpacing network television, newspapers and periodicals.
WPP was founded some 20 years ago by two people in one room to try to capitalise on these two trends and provide co-ordinated advertising and marketing services throughout the world.
Politics and events set the pace
We were spoiled in the 1990s. All you had to do was go into the offi ce. With a tightly controlled Rubin/Greenspan US economy and Friedmanite economics driving the global economy, life was relatively easy – despite the world’s second-largest economic engine, Japan, being out of order for 12 years or so. Strong growth, low infl ation and high, but not full levels of employment, drove a 10-year bull market, such as we have not seen since the 1920s.
The speculative blowout around the internet was perhaps inevitable and, given its size, a lengthy correction was necessary. Overall, the past six or so years have had their share of pain. After growing consistently through the 1990s, culminating in organic growth of 15% in 2000 (20% using
Top global marketers* spending by regionby measured media bought in 2005 and 2004 $m
Region 2005 2004 % change
Africa 687 552 24.5
Asia 15,568 14,351 8.5
Europe 30,178 28,242 6.9
Latin America 2,163 1,926 12.3
Middle East 366 273 33.9
Canada 1,848 1,765 4.7
US 47,462 46,929 1.1
Total worldwide 98,273 94,038 4.5
Source: AdvertisingAge
• Africa 0.7
• Asia 15.8
• Europe 30.7
• Latin America 2.2
• Middle East 0.4
• Canada 1.9
• US 48.3
Total worldwide 100
Source: AdvertisingAge* As defined by AdvertisingAge
Total global marketers* spending by region % total by measured media bought in 2005
What we think .

WPP ANNUAL REPORT 2006
the yardstick of our competitors), WPP shrank or fl attened, on a like-for-like basis, in 2001 and 2002. It resumed modest growth in 2003 and 2004 and demonstrated stronger, more broad-based growth in 2005 and 2006.
Ten fat years, three lean ones and a return to the same modest nominal growth in a lower infl ationary environment in the last four – mostly due to quadrennial events in two of the last four years and perhaps a growing acknowledgement of the importance of innovation and branding particularly in the last two.
It seems our business is becoming increasingly event-driven, particularly by political events and the political cycle. President Bush wanted a strong economic background to his re-election, as did Prime Minister Blair in 2005. President Bush will want the same for his Republican nominee in
2008 and Chancellor Brown will want the same for his fi rst electoral campaign as Prime Minister in three years. His last two budgets were models of early-term caution.
Fiscal over-stimulation, the dark cloud over America
The US economy was in a political cycle in 2004, as the government used fi scal spending to stimulate the economy. Rates of growth in US government spending were back to where they were 35 years ago at the height of the Vietnam War. In 2005, the tragedy of Katrina and the continuing demands of the wars in Afghanistan and Iraq continued to fuel the government spending spree. In 2006 the confl ict in Iraq continued the acceleration in government spending.
It is no accident that governments in many countries are the largest advertising spenders: ministries use marketing spending to reinforce their policies and build electoral popularity. The problem is that the US economy is almost entering another Reagan era with huge fi scal defi cits, a weak dollar, trade imbalances and the threat of infl ation. Isn’t the country’s currency really its stock price?
Perhaps for political reasons, President Bush has failed to deal with the twin fi scal and trade defi cits, and the dollar has weakened. He has not chosen to raise taxes and Chairman Bernanke has not hiked interest rates even further. To date, any caution has hit the business-to-business arena, leaving the increasingly indebted consumer relatively untouched. Spending has been stimulated by negative real interest rates and discounting. But there have been recent signs of consumer weakness on both sides of the Atlantic.
The issue remains whether increased corporate profi tability and liquidity will stimulate a capital expenditure-led increase in activity, as the consumer is hit by monetary correction. 2005, 2006 and early 2007 have so far seen a relatively soft landing, with a mild softening in the US in the fi rst quarter of 2007. Corporate capital spending, however, remains sluggish; not fi lling the void caused by more sensitive debt-ridden consumers and reduced consumer spending.
We are still in a Sarbanes-Oxley, Eliot Spitzer-dominated world, where CEOs last on average fewer than four years and CMOs fewer than two, and are constantly pressurised to return cash to share owners and hedge funds – themselves pre-occupied by short-term performance targets. Hedge funds account for more than half of trading volumes on both sides of the Atlantic and even so-called long funds have quarterly performance targets. Perhaps that is not an environment where anybody wants to take risks or focus on the long term. Why take chances and be fi red? Continue to receive substantial compensation, until
What we thinkThe Advertising & Marketing Services Industry
Media growth indices relative to GDP growth
Media: GDP growth rate parity = 100 2005 2006f 2007f
North America 73 75 76
US 71 72 75
Latin America 194 228 144
Brazil 282 339 187
Western Europe 115 61 92
Central and Eastern Europe 80 94 89
Russia 90 98 88
Asia Pacifi c (all) 124 140 127
India 69 86 74
North Asia 123 163 160
China 133 212 193
ASEAN 100 111 117
Middle East & Africa 54 48 68
World 90 91 94
Source: GroupMf: Forecast
Principal sources of annual media growth
Absolute contribution in % 2005 2006f 2007f
North America 24 23 20
US 21 20 18
Latin America 14 16 10
Brazil 10 10 6
Western Europe 20 13 20
Central and Eastern Europe 10 11 11
Russia 7 6 5
Asia Pacifi c (all) 28 35 36
North Asia 16 23 21
China 14 21 18
ASEAN 3 4 4
Middle East & Africa 4 2 3
What we think

WPP ANNUAL REPORT 2006
What we thinkThe Advertising & Marketing Services Industry
you retire in three or four years. Or explore the seemingly safer haven of private equity, rapidly becoming the largest employer in the mature economies, where diffi cult decisions can be taken and risks explored in private and quietly.
No end to consolidation
In parallel with this short-term weakness, other pressures persist. Consolidation continues apace. Among clients, Procter takes Wella and Gillette, Interbrew takes AmBev, Telefonica takes Bell South’s Latin American interests, Cingular takes AT&T Wireless, MCI chooses Verizon, Pernod Ricard takes Allied Domecq, AT&T takes Bell South, NewsCorp bids for Dow Jones, Google takes DoubleClick, Yahoo! takes Right Media. And this at a time when merger and acquisition activity has been at lower levels, although there is a sharp acceleration now and perhaps signs, yet again, of irrational exuberance.
Consolidation among media owners also continues unabated. NewsCorp takes and disposes of DirecTV, Comcast tried to take Disney, Carlton and Granada merge to monopolise ITV, and BSkyB takes a blocking stake. Legislation favours more consolidation in the US and the UK. Even in Brazil, which has been fi ercely protectionist, you can buy 30% of Globo or Editora Abril. And in Australia, recently introduced legislation relaxing media ownership rules has triggered a media asset bidding frenzy. Germany allows foreign ownership of TV channels. Italy concentrates further through the Gasparri Bill.
Clients and media owners are not alone. Retail consolidates, too. Morrison takes Safeway; Boots and Alliance both merge and privatise shortly thereafter. In Latin America, Wal-Mart enters the North East of Brazil
4.0450
4030
20
10
0
1.291.96 1.49 2.20 2.98• Deal value $ trillion
Deal volume 000s
0201 03 04 05 06
Announced global M&A activity 2006
Source: Thomson Financial March 2007
Top 10 M&As: technology, media and entertainment Deals announced/completed in 2006
Target/issuer Buyer/investor Total transaction value $bn
America Telecom SA de CV America Movil 40.2
Clear Channel Communications Inc Bain Capital; Thomas H Lee Partners 27.8
Cablevision Systems Corp N/A 20.9
Lucent Technologies Inc Alcatel-Lucent 18.8
Freescale Semiconductor Inc AIG Global Investment Group; Permira Advisors; The Blackstone Group; Private Equity Group;
The Carlyle Group; TPG 18.4
Vodafone KK Softbank Corp 17.0
Univision Communications Inc Madison Dearborn Partners; Providence Equity Partners; Saban Capital Group; Thomas H Lee Partners 13.7
The Nielsen Company AlpInvest Partners; Hellman & Friedman; Kohlberg Kravis Roberts; The Blackstone Group;
Private Equity Group; The Carlyle Group: Thomas H Lee Partners 12.8
DirecTV Group Inc Liberty Media Interactive 11.2
Pixar Walt Disney Co 7.6
Sources: CapitalIQ, PricewaterhouseCoopers, WPP
by acquiring part of Ahold’s interests, Lider consumes Carrefour, Jumbo buys Disco in Argentina, and rumours surround Wal-Mart and Carrefour, Home Depot and Kingfi sher, and Best Buy and Carphone Warehouse. In line with the laws of big numbers, the challenge to Wal-Mart, Tesco and Home Depot will be how they can successfully manage expansion outside their home markets. Tesco already has over half its square footage outside the UK and has sent out its UK managing director to the West Coast to manage its US expansion as Fresh ’n Easy. It will not be easy; the demands are different and the model will be signifi cantly based on rehabilitating blighted areas on the West Coast. But early signs are promising.
As a result, it is no surprise that agencies are also consolidating. Certainly in the one area where there are big economies of scale – media buying – consolidation is signifi cant. To negotiate with a Rupert Murdoch, Sumner Redstone, Mel Karmazin, Michael Eisner, Bob Iger or Bob Wright or Jeff Zucker, larger scale is essential.
Media planning or buying, or what we call Media Investment Management, is one of WPP’s fastest-growing businesses, driven by clients looking for media-buying effi ciencies – rather than reductions in
What we think .

WPP ANNUAL REPORT 2006
agency’s commissions. Like-for-like growth for the last three and a quarter years has remained around 14%, against overall WPP like-for-like growth of 5-6%. Often savings on gross media budgets of 5-10% are achievable.
Media savings are driving client centralisations and are a quick kill in showing effi ciencies, as Nestlé and Unilever have shown. The traditional media owners are not only having to fend off disintermediation by new technologies, but the pricing pressure from signifi cant consolidation of media budgets.
But even on the creative side, voracious procurement departments and ill-judged price competition by agencies themselves are driving consolidation (the $100 million pitch win headline in AdAge or Campaign is more satisfying than real revenue).
Discounting – a zero-sum game
In a low-infl ation, over-capacity market with little or no pricing power, many manufacturers have turned to price promotion and discounting. The best example is the car and truck industry. General Motors still seems to believe it has a balance sheet advantage over its competitors, particularly in Detroit. Why else would it introduce heavily price-based competition such as fi ve-year zero-coupon fi nancing or discounts of $4,000 to $5,000 a unit.
Probably, the most extreme case was Hyundai in Korea offering negative interest rates on fi nancing – a form of cash giveback. One dealer in America offered a buy-one, get-one-free deal on sports utility vehicles (SUVs). Luckily, it was a failure. If you give cars away it is only to be expected that consumers buy them. No surprise, then, that the American auto market has remained at 16 or 17 million units in this environment, or that housing markets and house prices show similar buoyancy, when fi xed-term money is being given away at such low interest rates, despite the shudders in the sub-prime markets.
The problem is that consumers become used to such discounting and wait for new car or truck introductions and the discounting that goes with them. The auto manufacturers face profi tless prosperity and break-even economics at full capacity. Hence the decision by Dieter Zetsche at DaimlerChrysler to dispose of Chrysler (what will private equity do on branding?), and the strategies of General Motors and Ford to cut capacity. Interestingly, the Japanese and Korean manufacturers, and some German ones too, have tended to resist excessive discounting, offering lower levels of $1,000 or $2,000. Instead, they concentrate on design, new products and branding to build a price premium. If you focus on price, you build commodities.
If you focus on innovation and differentiation, you earn a price premium and build brands. This seems to be the approach of Alan Mulally at Ford, as he brings a laser-like focus on the Blue Oval.
Conclusive evidence of the inadvisability of discounting came when General Motors had to lower its earnings forecast for 2005 by 80%. Recent comments and actions by General Motors do indicate a slight difference in approach and a shift to more focus on product. Further competition from the Chinese and Indians (Tata) will ram the point home more. The Geely Chinese four-door, fi ve-seat car will be introduced into America in 2008, at under $10,000. Price promotion just does not work. The product is key.
A similarly unfortunate trend is occurring in the food industry. Packaged goods companies continue to try to build share by discounting and price competition, particularly as distribution concentrates. They pay higher trade discounts and slotting allowances, and fund increased promotional activity.
Just like the media owners, the food manufacturers are being squeezed by a second factor – obesity. Diabetes is a pandemic and diabesity is becoming a huge area of public concern. Increasingly, commodity-like food companies are not in a strong position.
Media savings are driving client centralisations and are a quick kill in showing effi ciencies, as Nestlé and Unilever have shown
Interestingly, there is not the same phenomenon in the health-based or wellbeing segments of the packaged goods industry. Here, companies are more focused on product innovation, research and development or science, along with branding to build stronger market shares. As a result, brands and margins are more robust, and volumes greater.
Recent accounting changes in the US did force companies to show gross and net sales, at least temporarily. As a result, more data are available on the balance between advertising and promotional spending. Many CEOs know what they spend on advertising, but not on trade promotion. Often the latter exceeds the former, even in heavy-spending above-the-line companies.
It may well be that manufacturers will seek to cut trade spending and boost brand spending, particularly at a time when the trade is consolidating at such a rapid rate. Bribing customers for distribution is a recipe for ruin.
What we thinkThe Advertising & Marketing Services Industry
What we think

WPP ANNUAL REPORT 2006
Fees, outsourcing and procurement bring opportunities
The days of 15% gross commissions – 17.65% on cost – are long gone. Commission levels have receded to around 12% gross for full service, including media planning and buying, or, as we put it, Media Investment Management. Production commissions have largely been reduced or eliminated, although there are interesting procurement opportunities for agencies themselves in television production, as we have seen in Australia.
While commissions persist, fees are becoming more popular with clients, although that momentum seems to have slowed recently. They now represent at least 75% of our business. Usually time-based, with incentives, they are used almost exclusively in our marketing services business, which accounts for 52% of our revenues. In advertising, they account for over half of our business.
Fees have a number of advantages and on balance we prefer them. They are not seasonal, in a business where spending tends to be concentrated in the second and fourth quarters. January has become a profi table month. If clients cut or do not spend or continually re-brief us, we still get paid.
Finally, when fee-driven, we tend to plan our annual business better. Fees have also tended to dampen volatility in our operating margins. In the most recent cycle, our margins peaked at 14.5% and bottomed at 12.3%. In this cycle they have already reached 15.5% (‘old’ UK GAAP basis). In the previous cycle in the early nineties, they peaked at 10.5% and bottomed at 5.6%.
I cannot remember a time, in the 30 or so years I have been in the industry, when clients have been so focused on cost, although in 2004, 2005 and 2006 there were signs of a growing focus on top-line growth, and innovation and branding. Given overcapacity, low infl ation and lack of pricing power, and high management turnover, that is perhaps understandable
However, the question remains whether the procurement process can successfully purchase creative services in the way door handles or widgets are bought. The emphasis on procurement seemed to start in the pharmaceutical industry and then moved elsewhere. It may work in media buying, where there are economies of scale, but not necessarily in media planning or other creative areas.
It is true we must improve our processes and eliminate waste, but can you buy ideas or our people’s creativity in such a mechanical way? Increasingly, pressure on price will drive our best creative resources to clients and categories where their services are appreciated and rewarded appropriately. Many marketing clients still appreciate that great advertising ideas and copy
What we thinkThe Advertising & Marketing Services Industry
Top global marketers* spending by category by measured media bought in 2005 and 2004 $m
% % AdvertiserCategory 2005 2004 change total count
Automotive 22,761 22,242 2.3 23.2 17
Personal care 19,491 18,086 7.8 19.8 11
Entertainment & media 11,029 10,903 1.1 11.2 10
Food 8,129 8,010 1.5 8.3 8
Drugs 7,470 7,448 0.3 7.6 9
Soft drinks 3,971 3,394 17.0 4.0 3
Restaurants 3,349 3,221 4.0 3.4 4
Computers 3,106 2,962 4.9 3.2 4
Telephone 3,104 2,412 28.7 3.2 3
Financial 3,000 2,737 9.6 3.1 5
Cleaners 2,626 2,428 8.2 2.7 3
Beer, wine & liquor 2,384 2,396 -0.5 2.4 6
Electronics & imaging 2,278 2,355 -3.3 2.3 3
Retail 2,176 2,125 2.4 2.2 5
Electronics 1,306 1,322 -1.3 1.3 4
Candy 1,109 1,018 9.0 1.1 2
Toys 703 662 6.2 0.7 2
Athletic apparel 283 319 -11.1 0.3 1
Source: AdvertisingAge* As defi ned by AdvertisingAge
BrandZ™ Top 100 Most Powerful Brands 2006Year-on-year brand value growth by category*
Category Brand value growth
Fast food 22%
Luxury 20%
Motor fuel 15%
Personal care 15%
Tech 14%
Financial institutions 10%
Retail 10%
Coffee 8%
Beer 8%
Mineral water 7%
Soft drinks 4%
Apparel 3%
Cars 3%
Mobile operators -2%
Source: Millward Brown Optimor* Excluding restatements; like for like (value of all brands in scope in each category compared with
their 2005 value).
What we think .

WPP ANNUAL REPORT 2006
have improved their offerings through better marketing and research.
Few traditional media owners have managed to deal with the disintermediation by new technologies. Take Craigslist, for example. Established in 1995 by Craig Newmark, the site provides largely free classifi ed advertising to millions of users across the globe. The result – a massive reduction in classifi ed advertising revenues for the traditional players (it is estimated that Craigslist costs San Francisco Bay area newspapers up to $65 million per year in employment advertising alone).
The response from traditional classifi ed advertisers – to produce their own free classifi ed sites. The effect – a permanent reduction in classifi ed advertising revenues, as established classifi ed media owners justify their activities on the basis of cannibalisation. If they don’t eat their own children, someone else will. After all, the internet is probably the most democratic phenomenon we have seen: free information or nearly free information breaking the tyranny or monopoly of distance.
Few newspaper or periodical publishers have mastered the connection with the new internet platforms. Hence Rupert Murdoch’s recent conferences with his editors, as well as his decision to re-examine NewsCorp’s new media approach, with McKinsey engaged to look at it, and his rapid and successful purchases of internet assets such as MySpace.
Similar initiatives have come from network television: NBC owned by GE with iVillage and ITV in the UK with Friends Reunited. Others such as the The New York Timeshave made similar moves, but none seem to have been able to replace the lost revenues by new ones. And will NBC still be a part of GE in one or two years? Will it be sold or spun-off? Will it merge with Yahoo!? It’s diffi cult to be just in the network television business; you have to be in the communications business. Not dissimilar to the late Professor Theodore Levitt’s analysis of the horse and buggy in the context of the transportation industry.
Perhaps the mistake was not to charge for content on the web in the fi rst place. It is easier to take the consumer down in price, rather than up. If you do not charge for content as strong as Condé Nast’s Vogue, for example, when can you? Maybe the internet has resulted in a permanent reduction in the revenues and profi tability of traditional media owners?
As a result, clients are re-examining the relative levels of their advertising and marketing services investment. Does it make sense to shift their portfolio of media investment away from network television to cable, satellite, radio, outdoor, cinema, direct, public relations, interactive,
What we thinkThe Advertising & Marketing Services Industry
deliver outstanding results. Reducing marketing costs indiscriminately, particularly in industries with heavy fi xed production costs, will only result in having to spread those costs over fewer unit sales.
The procurement process seems to be based on the idea that what we provide is low value-added, and that, because we are dependent on signifi cant revenues from large clients, we can be squeezed. This thinking may be fl awed. First, what we do is critical. There is a limit to how far costs can be reduced; but there is almost no limit (apart from 100% market share) to how far you can grow revenues. Second, in an increasingly undifferentiated world, what we do – differentiate products and services, tangibly and intangibly – is becoming more and more important, particularly in the slower-growth markets of the US and Western Europe, where overcapacity, commoditisation and retail concentration are more pressing issues.
Finally, growing consolidation in our industry is reducing the available resources for clients. It is ever more diffi cult to fi nd co-ordinated resources that can deliver what they require, particularly if the client is an international, multinational or global company. Smaller, country- or city-based operations cannot offer the depth of coverage or breadth of resources.
One interesting recent development is the growing interest in outsourcing parts or all of the marketing function. Clearly this is an opportunity for us and is being driven by CEOs’ focus on costs and their analysis of their investment in marketing services. Instead of concentrating solely on amounts spent outside the organisation, closer examination is being made of amounts spent inside the company. WPP has become involved recently in outsourcing projects in the car and internet services industries.
In a number of other areas, including advertising, direct marketing and research, there is interest in what can be done in outsourcing costs. Clearly this tends to make internal marketing departments more defensive about their functions.
Creativity is still key as media fragments
Another signifi cant short-term pressure is media fragmentation. This has been driven by television price infl ation and falling audiences, as media consumption habits change. Developing technologies have given birth to new media such as personal computers, the internet and interactivity. They have also altered the economics of traditional media such as newspapers and magazines, while minority media such as radio, outdoor and cinema
What we think

WPP ANNUAL REPORT 2006
internet or whatever? The econometric analysis of media investment is becoming increasingly important. How much should we spend and through which media, have become the critical questions – the Holy Grail of advertising. The answer to which is half of advertising is wasted.
Developing technologies have altered the economics of traditional media such as newspapers and magazines, while minority media such as radio, outdoor and cinema have improved their offerings
Among the latest media innovations are PVRs, which enable viewers to download television programs on to a hard disk. The PVR enables you to build your own television channel, recording programs for screening when you want to see them, and to build a library, as an Apple iPod does with music. A PVR also allows you to time-shift programs as you watch, stopping for breaks whenever you wish. It cannot be long before they are standard equipment in television sets.
What has made observers particularly excited about the PVR is its ability to fast-forward or skip commercials. Market research in the US indicates that consumers like to fast-forward advertisements – though they stop at beer commercials for fun and car commercials for information. We could do most of this previously with television video recorders, of course, and the key question remains the amount of time viewers will continue to devote to television viewing. In some PVRs, the skip button has been omitted and fast-forward speeds are limited. In others, little boxes on the PVR screen will contain details of the ads being fast-forwarded.
Whatever the outcome, such devices will exert more pressure on network television and on agencies to develop stronger programming and sponsorship opportunities, along with even more creative advertising ideas. The same will be true of video-on-demand, another new and fast-developing technology. The premium on creativity will grow.
Super-agencies continue
Formed initially in response to the pressures of consolidation and to house confl icting accounts, the super-agencies – or what we at WPP prefer to call the parent companies – really represent the full-service agencies of the 21st century.
In the 1960s if you visited, for example, JWT in Berkeley Square, London, you would fi nd a creative department, a marketing department, an account handling department, a media department and a public relations department. There would be a merchandising department, a direct mail department, a packaging department, a production department, an experimental fi lm department, a market research department and a conference department. Even a home economics department with two fully equipped kitchens – plus an operations research department designing a factory for Mr Kipling’s Cakes. Long before the phrase ‘integrated communications’ came into common use, integrated communications were exactly what such full-service agencies provided.
Over time – and as a result of two pressures – these departments became unbundled. Clients sought to reduce costs – and the media and craft specialists within agencies, feeling under-recognised as members of a mother agency’s department, looked for greater recognition and reward in free-standing, specialist companies of their own.
Importantly, this involved a split between the creative agency and the media agency, reducing costs from approximately 15% of gross media costs to about 12%. Good media people left and started independents such as Carat, Media Planning Group, CIA and Western International, which grew organically and by acquisition.
The same pattern was seen among packaging, merchandising, PR and other specialist skills. Many such companies have now been reabsorbed into the super-agencies, but in an inter-dependent or autonomous form. Strong media or marketing services functional specialists do not like, understandably, to be subsumed under advertising professionals.
As the new specialist media investment management agencies have grown in power, new media technologies have developed and the media agencies have developed strong client relationships. The creative agencies have become increasingly discomforted and called for re-integration. This is not possible, in our view. The toothpaste is out of the tube.
Media agencies have declared UDI and gained their independence. They will not report again to account, planning or creative management. If clients want better co-ordination between creative and media agency, which in some cases needs to be improved, the best way to do it is
What we thinkThe Advertising & Marketing Services Industry
What we think .
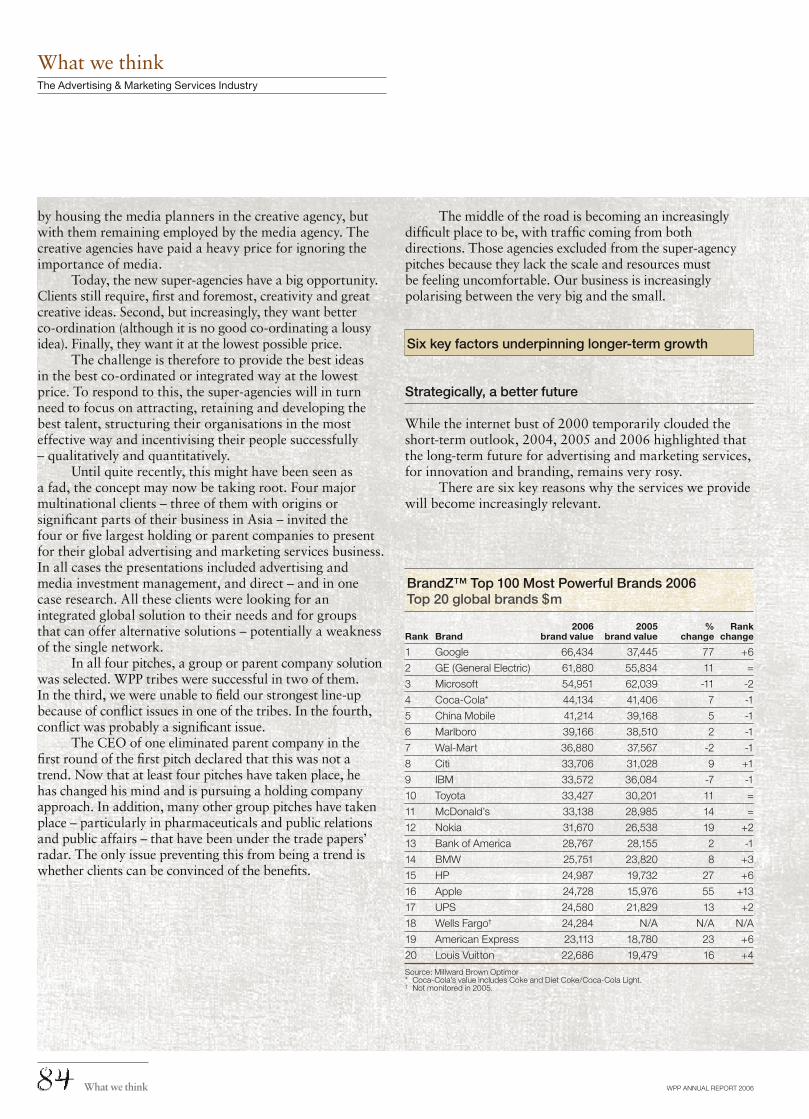
WPP ANNUAL REPORT 2006
by housing the media planners in the creative agency, but with them remaining employed by the media agency. The creative agencies have paid a heavy price for ignoring the importance of media.
Today, the new super-agencies have a big opportunity. Clients still require, fi rst and foremost, creativity and great creative ideas. Second, but increasingly, they want better co-ordination (although it is no good co-ordinating a lousy idea). Finally, they want it at the lowest possible price.
The challenge is therefore to provide the best ideas in the best co-ordinated or integrated way at the lowest price. To respond to this, the super-agencies will in turn need to focus on attracting, retaining and developing the best talent, structuring their organisations in the most effective way and incentivising their people successfully – qualitatively and quantitatively.
Until quite recently, this might have been seen as a fad, the concept may now be taking root. Four major multinational clients – three of them with origins or signifi cant parts of their business in Asia – invited the four or fi ve largest holding or parent companies to present for their global advertising and marketing services business. In all cases the presentations included advertising and media investment management, and direct – and in one case research. All these clients were looking for an integrated global solution to their needs and for groups that can offer alternative solutions – potentially a weakness of the single network.
In all four pitches, a group or parent company solution was selected. WPP tribes were successful in two of them. In the third, we were unable to fi eld our strongest line-up because of confl ict issues in one of the tribes. In the fourth, confl ict was probably a signifi cant issue.
The CEO of one eliminated parent company in the fi rst round of the fi rst pitch declared that this was not a trend. Now that at least four pitches have taken place, he has changed his mind and is pursuing a holding company approach. In addition, many other group pitches have taken place – particularly in pharmaceuticals and public relations and public affairs – that have been under the trade papers’ radar. The only issue preventing this from being a trend is whether clients can be convinced of the benefi ts.
The middle of the road is becoming an increasingly diffi cult place to be, with traffi c coming from both directions. Those agencies excluded from the super-agency pitches because they lack the scale and resources must be feeling uncomfortable. Our business is increasingly polarising between the very big and the small.
Six key factors underpinning longer-term growth
Strategically, a better future
While the internet bust of 2000 temporarily clouded the short-term outlook, 2004, 2005 and 2006 highlighted that the long-term future for advertising and marketing services, for innovation and branding, remains very rosy.
There are six key reasons why the services we provide will become increasingly relevant.
What we thinkThe Advertising & Marketing Services Industry
BrandZ™ Top 100 Most Powerful Brands 2006Top 20 global brands $m
2006 2005 % RankRank Brand brand value brand value change change
1 Google 66,434 37,445 77 +6
2 GE (General Electric) 61,880 55,834 11 =
3 Microsoft 54,951 62,039 -11 -2
4 Coca-Cola* 44,134 41,406 7 -1
5 China Mobile 41,214 39,168 5 -1
6 Marlboro 39,166 38,510 2 -1
7 Wal-Mart 36,880 37,567 -2 -1
8 Citi 33,706 31,028 9 +1
9 IBM 33,572 36,084 -7 -1
10 Toyota 33,427 30,201 11 =
11 McDonald’s 33,138 28,985 14 =
12 Nokia 31,670 26,538 19 +2
13 Bank of America 28,767 28,155 2 -1
14 BMW 25,751 23,820 8 +3
15 HP 24,987 19,732 27 +6
16 Apple 24,728 15,976 55 +13
17 UPS 24,580 21,829 13 +2
18 Wells Fargo† 24,284 N/A N/A N/A
19 American Express 23,113 18,780 23 +6
20 Louis Vuitton 22,686 19,479 16 +4
Source: Millward Brown Optimor* Coca-Cola’s value includes Coke and Diet Coke/Coca-Cola Light.† Not monitored in 2005.
What we think

WPP ANNUAL REPORT 2006
Globalisation or Americanisation
Commercial life has not worked out as Professor Theodore Levitt predicted some 22 years ago in the Harvard Business Review. The world has not been globalised to the extent he forecast, where consumers
around the world consumed similar products, marketed in the same way everywhere. Indeed, Levitt admitted as much in an interview to celebrate the 20th anniversary of his article. He was exaggerating to make a point.
Truly global products only account for around 10-15% of our worldwide revenues. Consumers are probably more interesting for their differences than their similarities. Recent political developments support this – the collapse of the Soviet Union, Yugoslavia, devolution in Scotland and Wales, and Basque nationalism. Indeed, the European Union is really a supply-side led phenomenon, harmonising
production and distribution, rather than demand. On January 1, 1993, a Euro consumer was not born.
What has been going on may well not be the globalisation of world markets, but their Americanisation. Not in the sense that upsets the French or the Germans and results in the banning of Americanisms from French commercial language, an objection to the cultural imperialism of Coke, the Golden Arches or Mickey Mouse. More in the sense of the power and leadership of the US. In most industries, including our own, the US accounts for almost half of the world market. And given the prominence of US-based multinationals, you could argue that almost two-thirds of the advertising and marketing services market is controlled or infl uenced from there. If you want to build a worldwide brand you have to establish a big presence in the world’s largest market – the US.
At WPP, 22 of our top 40 clients are headquartered in the US, 17 in Europe and one in Asia Pacifi c. Moreover, they are almost all located in the north-east corridor created by Chicago, Detroit, New York and Washington. Failure to understand the importance of North America
What we thinkThe Advertising & Marketing Services Industry
Top global marketers 2005 Ranked by total worldwide measured ad spending*
Worldwide US measured Rank advertising spend $m media spending $m Spend by region $m
% % Latin2005 2004 Advertiser Headquarters 2005 2004 change 2005 2004 change Asia Europe America
1 1 Procter & Gamble Co. Cincinnati, US 8,190 7,982 2.6 3,410 3,535 -3.5 1,743 2,553 216
2 3 Unilever London/Rotterdam 4,272 3,504 21.9 761 573 32.7 1,048 2,107 227
3 2 General Motors Corp. Detroit 4,173 3,854 8.3 3,004 2,805 7.1 138 800 92
4 6 Toyota Motor Corp. Toyota City, Japan 2,800 2,589 8.1 1,076 1,107 -2.8 1,096 511 19
5 5 L’Oreal Clichy, France 2,773 2,608 6.3 794 769 3.2 236 1,633 35
6 4 Ford Motor Co. Dearborn, US 2,645 2,624 0.8 1,583 1,574 0.6 108 801 69
7 7 Time Warner New York 2,479 2,504 -1.0 2,061 2,008 2.7 91 272 20
8 8 DaimlerChrysler Auburn Hills, US/
Stuttgart, Germany 2,104 2,343 -10.2 1,590 1,826 -12.9 46 375 32
9 11 Nestlé Vevey, Switzerland 2,033 1,967 3.3 561 524 7.1 274 1,048 105
10 10 Johnson & Johnson New Brunswick, US 1,968 1,971 -0.1 1,386 1,408 -1.5 190 324 17
11 13 Honda Motor Co. Tokyo 1,854 1,644 12.7 861 794 8.4 781 159 13
12 9 Walt Disney Co. Burbank, US 1,813 1,984 -8.6 1,413 1,493 -5.4 117 245 1
13 12 Nissan Motor Co. Tokyo 1,778 1,861 -4.5 1,023 1,108 -7.6 488 173 30
14 16 Coca-Cola Co. Atlanta 1,752 1,526 14.8 471 414 13.8 421 660 119
15 14 Altria Group New York 1,690 1,643 2.8 1,189 1,095 8.5 43 404 11
16 20 PepsiCo Purchase, US 1,644 1,332 23.5 1,129 911 24.0 150 210 91
17 21 GlaxoSmithKline Brentford, UK 1,610 1,286 25.2 1,163 891 30.4 102 282 33
18 15 Sony Corp. Tokyo 1,607 1,576 2.0 996 936 6.4 259 275 11
19 17 McDonald’s Corp. Oak Brook, US 1,554 1,469 5.8 765 704 8.5 312 394 27
20 18 Volkswagen Wolfsburg, Germany 1,547 1,430 8.2 425 423 0.3 29 1,009 48
Source: AdvertisingAge* From Nielsen Media Research, TNS Media Intelligence, Ibope, Parc and others.
What we think .

WPP ANNUAL REPORT 2006
can be life-threatening. Take the case of the investment banking industry. Fifteen to 20 years ago, strong brands in Europe included SG Warburg, Morgan Grenfell, Schroders and Flemings. Today they have virtually disappeared. Large American banks like Goldman Sachs, Morgan Stanley, Merrill Lynch, Citigroup and Lehmans dominate the industry.
While strong European talent might have had misgivings about working in American multinationals a few years ago, today these businesses are more sensitively run and offer much more interesting, intellectually stimulating, global opportunities and challenges. The European-based businesses that remain, such as Deutsche Bank, UBS and Credit Suisse, still face the challenge of establishing a good market position in the US.
No self-respecting multinational company bent on expanding into China or national company seeking to grow inside or outside China will miss out on the branding opportunity presented by the Olympics in Beijing
Neither is it easy to fi nd European-based global companies. BP and Shell certainly get it, as do Unilever and Nestlé. So does DaimlerChrysler, although Jurgen Schrempp’s strategy is being dismantled. Vodafone, GlaxoSmithKline, AstraZeneca, L’Oreal and Sanofi are other good examples, although doubts in some cases remain. There are not many more.
American strength is based on three factors. First, the size and power of the American market; more than 300 million people in a relatively homogeneous market. Despite the European Union being almost twice the size, it is much more heterogeneous. Second, the power and size of US capital markets. If you want to raise debt or equity capital, America still is the cheapest place to go, although more detailed disclosure requirements are discouraging some. Finally, because of its strength in technology. It is hard to think of many areas where it does not lead. Third-generation mobile phone technology is one, but given the prices European companies paid for the privilege, the distinction is a dubious one.
At times in history, when a country or empire seemed to have total political, social or economic hegemony, things changed and the vacuum was fi lled by another power. At this point, it may well be China that takes this role, in the context of the growth of Asia Pacifi c.
In fact, we may now be witnessing a change from Americanisation to globalisation. In Davos this year and last year, the Chinese and Indians exhibited a larger degree of self-reliance and independence. Both no longer seem to be relying on handouts or support. Both economies have reached or are reaching a size and rate of growth that may be self-sustaining and certainly more independent of a US base and infl uence.
On my most recent trip to Shanghai and Beijing in April 2007, it seemed that many Chinese companies with both national and overseas ambitions were becoming much more confi dent and less over-awed by the capabilities of Western competition. The listening and learning approach has paid off. But we will probably still rely on the strength of the US and if the US sneezes, we all catch cold.
However, increasingly we will see the growth of Asian-based multinationals. Not only the Japanese-based multinationals like Sony or Mitsubishi, or the South Korean-based chaebols such as Samsung, LG or Hyundai (the Samsung of the car industry). But the Chinese multinationals such as Lenovo, Haier, Konka, Bird, Bright Dairy, China Mobile, China Unicom and CNOOC (they will come again). And the Indian multinationals such as the two Reliances, Tata, Wipro and Infosys. The latter’s headcount is up from 15,000 to 60,000 in the past four years. It plans to increase by 50,000 more in the next two years. The CEO of Infosys tells me he receives 1.3 to 1.4 million applications for jobs each year.
China will increasingly become a service-based economy. In 2005, the mayor of Shanghai called for the 55 CEOs on his International Business Leaders Advisory Council to advise on how to build Shanghai into the world’s leading services centre. Last year the focus was on innovation. Similarly, India will seek to be a manufacturing centre for the world and not just focused on services. Who would have thought that Ratan Tata would buy Corus, the re-named (by one of our Branding & Identity companies) British Steel, or that the underbidder would be a Brazilian company.
China and India: a different world
It is diffi cult for those of us in the West to comprehend the scale of Asia Pacifi c’s potential development. China is not just one country; it consists of more than 30 provinces, with so many languages and dialects that Mao Tse Tung
What we thinkThe Advertising & Marketing Services Industry
What we think

WPP ANNUAL REPORT 2006
needed an interpreter. The population may well be closer to 1.5 billion rather than 1.3 billion. The Chinese government seems to consistently underestimate its statistics, like those for GDP growth. But it is still equivalent to four or fi ve Americas.
It is true also that currently only 150-200 million Chinese can afford the goods and services we are trying to market to them. However, this is already equivalent to over half an America and this is a dynamic situation, one that will change rapidly in the coming years. Already there are almost 500 million mobile phone subscribers in China, 300 million of which subscribe to one company, China Mobile (one of the top fi ve most valuable world brands) – equivalent to the total population of the US. Furthermore, India – itself equivalent to three to four Americas – seems to have been stimulated into more rapid growth, driven perhaps by neighbourhood envy and the Chinese model of state-directed capitalism – although they bill themselves as the world’s fastest-growing democracy.
Do not underestimate the potential of the region as rapprochement spreads even to cricket, with the Indian-Pakistani test and one-day series representing as important a political, economic and social signal as the Beijing Olympics. Or look at the dog-fi ght for Hutchison Essar, which Vodafone won, in a market growing at fi ve million subscribers per month, just like China.
Asia Pacifi c will dominate again. This really is back to the future. In 1820, China and India generated around 49% of worldwide GDP. In the early 19th century, Meissen and Wedgwood were dismantling the high-quality, high-price Chinese porcelain industry, with similar quality but low-priced porcelain. It is the exact reverse today. In 2025, these two countries are forecast to be headed for the same level of world GDP, having bottomed out at 8% in 1973.
What we thinkThe Advertising & Marketing Services Industry
Currently, China and India represent over one-third of the world’s population. Asia Pacifi c represents one-half. By 2014, Asia Pacifi c will represent over two-thirds. Greater China is already WPP’s fourth largest market in which we have a strong 15% share. In India, our market share is almost 50%, with a 25% share in South Korea. In Japan, it is almost 10%, behind the dominating Dentsu and Hakuhodo DY Group. In Indonesia we are ranked number one, with the lion’s share of the market.
China’s development has been rapid and will continue. The Chinese government is conscious of potential overheating and an imbalance in regional rates of development between the coastal regions and the hinterland. There has already been a very soft-landing slowdown in growth, presenting more opportunity for investment. 2008 represents a huge opportunity. No self-respecting multinational company bent on expanding into China or national company seeking to grow inside or outside China will miss out on the branding opportunity presented by the Olympics in Beijing.
The Chinese government is already committed to $45 billion of investment around the Games (the UK government will probably invest $10 billion in London 2012), in a year that will also be stimulated by the US presidential election. 2008 should be a whopper. And it will not end there. The Municipality of Shanghai will be investing $3 billion in Expo 2010. And there will be the Asian Games, in Guangzhou, again in 2010.
Watch out for growing Chinese military infl uence. Recent economic contact with Fidel Castro in Cuba counterbalances Taiwanese tensions. Chinese investment in Galileo’s GPS systems drew a coruscating response from the Pentagon. Beijing will not be prepared to rely on America to defend its vital and growing energy supply interests in the
GDP (market exchange rates) 2005
US
Japan
Germany
China
Britain
France
Italy
Canada
Spain
Brazil
0 20 40 60 80 100GDP (PPP†) 2005
US
China
Japan
India
Germany
Britain
France
Italy
Brazil
Russia
0 20 40 60 80 100GDP* forecast 2040
China
US
India
Japan
Mexico
Russia
Brazil
Germany
Britain
France
0 20 40 60 80 100
Sources: IMF, Goldman Sachs* Market exchange rate† Purchasing-power parity (PPP) assumes exchange rates which value currencies at rates such that each currency will buy an equal basket of goods.
World’s 10 biggest economies US=100
What we think .

WPP ANNUAL REPORT 2006
Middle East and Russia. It is busily building trade bridges throughout the oil- and energy-producing areas of the world, particularly in Latin America and Africa.
China is changing the political dynamics of Africa, in particular. Increasingly, Africa is the continent of opportunity, rather than the continent of war, disease and poverty. President Gadaffi ’s volte face has energised North Africa and Egypt, and China’s focus has drawn the attention of Western governments seeking to curry favour, too.
The other challenge to American dominance may well come from the Muslim world. Already, Muslims number 1.5 billion people or a quarter of the world’s population. By 2014, they will account for 2.1 billion or 30% of the projected world’s population. The recent struggles in Afghanistan and Iraq, and possible action against Iran, really only continue the confl icts of the 1950s in Suez, the oil price increases of the 1970s and the invasion of Kuwait in the 1990s. Westerners have made little attempt to understand the Muslim mind and assume they have the same value systems and beliefs. They are different and it will be increasingly necessary to make a serious and sincere attempt to understand them.
These events may demand new thinking from the world’s multinational companies. As US-centric companies, for example, seek to develop their businesses and extend their reach into more heterogeneous markets, it may well be that the balance of organisations will shift. There will continue to be a focus on global, max or core brands, with sales of more than $1 billion, particularly to counterbalance the power of global retailers and as companies become less dependent on the US markets. Coca-Cola’s geographic coverage of a third in North America, a third in Europe and a third in Asia Pacifi c and Latin America will become more the norm, rather than Pepsi-Cola’s 59% in the US.
The end of regional management?
However, given this geographic expansion, there will also be a need to develop more sensitive, local organisations that respond to national opportunities and challenges more readily. The past 10 to 15 years have seen, quite rightly, a diminution of power of country managers, as companies sought to reduce needless duplication and stimulate the sharing of knowledge. Eradicating geographic silos and fi efdoms made sense. But as country-based organisations have become more complex and sizeable, there may be a need to develop more focus at a country level.
Several clients have started to re-build country organisations and re-appoint country managers or ambassadors, particularly as their organisations become
What we thinkThe Advertising & Marketing Services Industry
Top advertising categories 2005 US $m
0
5
10
-5
-10
15
2,000 10,0004,000 6,000 8,000 12,0000
2005 USD m
-20
-15
Telecom
Financialservices
Restaurants
Travel &tourism
Autodomestic
RetailotherPersonal
care
Miscservices
Directresponse
YOY%
Average
Autonon-domestic
Top advertising categories 2005 UK £m
YOY%
15
10
5
0
-5
-10
-15 2000
2005 GBP m
400 600 800 1,000 1,200 1,400 1,600
Finance
Retail
Motors
Cosmetics& toiletries
Food
Mail order
Entertainment & media
Transport & travel
Governmentetc
Telecoms
YOY%
Average
What we think
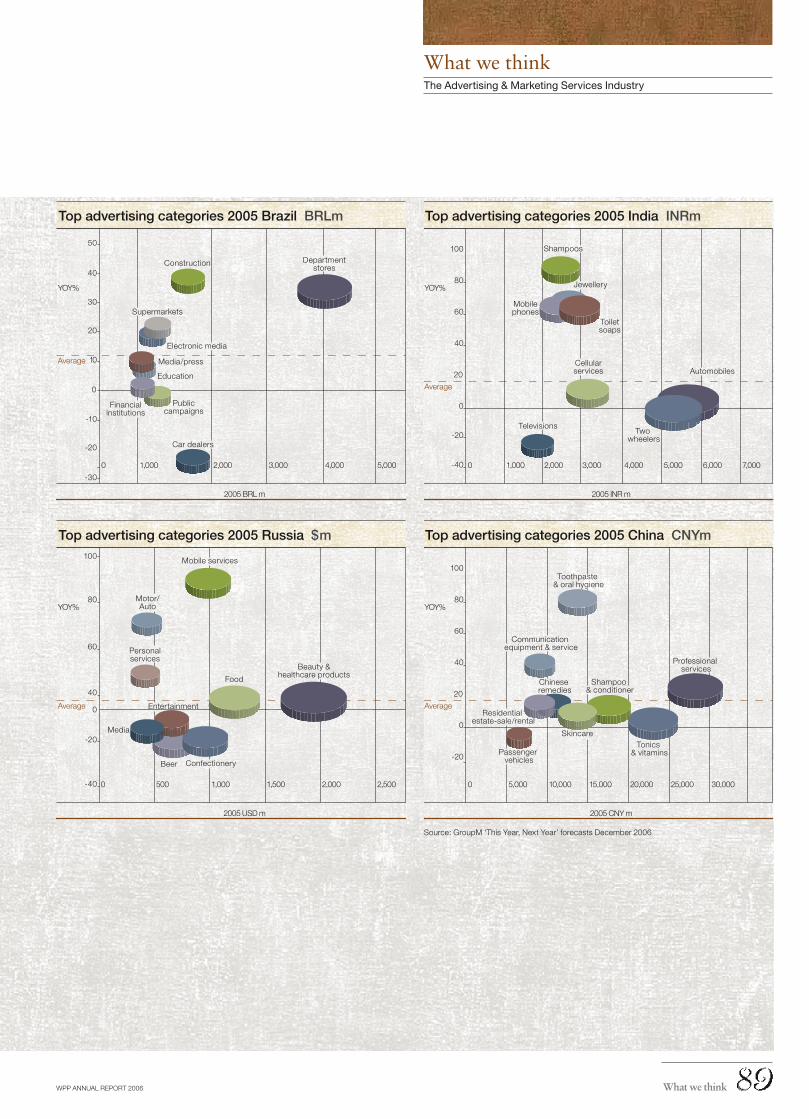
WPP ANNUAL REPORT 2006
What we thinkThe Advertising & Marketing Services Industry
Source: GroupM ‘This Year, Next Year’ forecasts December 2006
Top advertising categories 2005 Brazil BRLm
50
40
30
20
10
0
1,000 2,000 3,000 4,000 5,0000
2005 BRL m
-20
-10
-30
Publiccampaigns
Car dealers
Construction
Media/press
Education
Electronic media
Supermarkets
Financialinstitutions
Departmentstores
YOY%
Average
Top advertising categories 2005 Russia $m100
80
60
40
2,5002,0001,5001,0005000
2005 USD m
0
-20
-40
Beer
Mobile services
Media
Personalservices
Food
Beauty &healthcare products
Confectionery
Entertainment
Motor/AutoYOY%
Average
Top advertising categories 2005 India INRm
100
80
60
40
20
1,000 2,000 3,000 4,000 5,000 6,000 7,0000
2005 INR m
0
-20
-40
Mobilephones
Toiletsoaps
Automobiles
Televisions
Shampoos
Jewellery
Cellularservices
Two wheelers
YOY%
Average
Top advertising categories 2005 China CNYm
100
80
60
40
20
5,0000
2005 CNY m
10,000 15,000 20,000 25,000 30,000
0
-20
Tonics & vitamins
Professional services
Residential estate-sale/rental
Shampoo & conditioner
Toothpaste & oral hygiene
Skincare
Communication equipment & service
Passenger vehicles
Chinese remedies
YOY%
Average
What we think .

WPP ANNUAL REPORT 2006
What we thinkThe Advertising & Marketing Services Industry
more complex at a country level and they need to build governmental or academic infl uence.
As a result, regional management has been scrutinised. With the development of technology and communications, organisational span-breakers may not be so necessary. In addition, given the complexity of regional tasks, regional managers become glorifi ed fi nancial directors. The average agency regional director in Europe, for example, may have to cover 100 offi ces in a 250-day working year. It is diffi cult to add signifi cant value while spending an average of one to two days in each offi ce a year, even if he or she travelled all year.
At WPP, we are experimenting with two new organisational responses. First, Global Client Leaders to manage big clients across WPP on a worldwide basis. Second, WPP Country Managers focusing on three key issues – people, local clients and acquisitions. Both responses cause angst to our operating company or tribal leaders who continue to have primary organisational control. Both cut across the traditional organisational structures. Both demand new ways of working together, denying turf, territory and ego. Both raise questions about motives, methods and values. But both are necessary, responding to client needs and developments.
Organisations are becoming more and more networked, less and less pyramidic. Perhaps the 21st century is not for tidy minds.
Too many cars, not enough talent
The single biggest long-term issue facing our clients in most industries is overcapacity. In fact, it is diffi cult to fi nd many cases where the opposite is true; tequila, perhaps, where it takes seven years to grow the herb, or
high fashion companies like Rolex or Hermes where supply is limited. It is also true that commodity-based industries, such as oil and steel, no longer face overcapacity issues, being overwhelmed by Indian and Chinese demand. But most industries face situations similar to the car and truck industry, where companies can make 80 million units and consumers consume 60 million.
Overcapacity issues are particularly diffi cult to deal with in politically-sensitive industries like automobiles. Governments are not enthusiastic about shutting down capacity and increasing unemployment. They also like to increase capacity by offering inducements to locate new
production facilities in development regions. Thus the best thing for the European car industry would probably have been for GM to absorb Fiat’s production capability. But Silvio Berlusconi, then Italy’s Prime Minister, could not countenance more unemployment in the Mezzogiorno. The same issue faced the British government with Rover particularly during an election, resulting in subsidising workers to stay in work during the campaign.
The critical issue in the 19th and 20th centuries was how to produce goods and services, and to make sure they reached the consumer. In the 21st century, it is convincing the consumer to purchase products, services or brands in the fi rst place.
In such circumstances differentiation becomes critically important, and differentiation is what our business is about. Historically, maintaining technical or product differences was easier. Today keeping a technological lead is diffi cult. Product life cycles are being shortened and brand cycles lengthened. Again, an example from the car industry; less than a decade ago it took fi ve years to design, produce and market a car. Today, it can be done in 18 months. Led by the aggressive Japanese, South Korean and German manufacturers, the Americans have followed. In the future, the Chinese and Indian manufacturers will stimulate further response.
Intangible differentiation is, then, becoming more important. Psychological, lifestyle and emotional differences are signifi cant. The suit or dress you wear, the car you drive, the holidays you take, how you spend your leisure time – all say a lot about your personality and preferences. Some fi nd such intangible appeal immoral or at least unsavoury. Preying on people’s vulnerabilities, it is said, is unethical. However, we believe that fulfi lling people’s desires or dreams is almost always justifi able and satisfying for the consumer – and it is a key role for the advertising and marketing services industry.
While there is certainly too much production and capacity in general, what specifi c resource in the 21st century is in ever shorter supply? The answer is human capital. Every demographic statistic points to a reduction. The slowing birth rate, declining marriage rates, higher divorce rates, the cost of divorce, more single parent families, smaller families, ageing populations – all these factors are reducing the supply of talent. Even countries with strong, younger demographics, such as Mexico, will face similar situations by 2020. There are examples of government campaigns trying to stimulate the birth rate. Western Europe and Japan face signifi cant economic growth issues as a result of the declining proportion of young people and an overall population decline. The newly elected Prime Minister Abe of Japan wanted to stimulate the Japanese birth rate, as one
What we think

WPP ANNUAL REPORT 2006
share, rather than on operating profi ts, margins, earnings per share and return on capital employed.
Finally, the internet and new media companies still steal your people. After the bankruptcies and failures, many young people returned to the more traditional businesses they had left. WPP lost a number of such bright talents and later welcomed some back to the fold. I conducted a number of so-called re-entry interviews, and hoped to see and hear that the returnees were relieved to have their jobs back. Far from it: few grovelled. Instead they admitted that given the opportunity again, they would take it or seize a similar one.
And recently, in the last year or two, with the emergence of the second internet boom, the so-called Web 2.0, it is clear there is another wave of interest among bright, young people over new technologies and attractive opportunities at new technology companies.
Clearly, the age of apprenticeship inside large corporations is fi nished. It was weakened by the corporate downsizing of the 1980s and 1990s, and the fi nal nail in the coffi n was the internet boom of the late 1990s. Young, bright talent will always seek out new, fl exible, un-bureaucratic, responsive companies. Staying with one company for 40 years or so – as my father did and my mother and father advised me to do – no longer seems the best career choice. However, some recent polling and attitudinal analysis in the UK show younger people want a better work-life balance. Hedge funds, for instance, are more attractive than investment banks, offering fi xed work times and not demanding all-night toil.
Google: friend or foe, frienemy or froe?
After Microsoft, who becomes the Dark Star? To some, Google fi ts the bill. It has a market capitalisation, despite recent volatility, of approximately $150 billion, revenues of $11 billion, approximately 12,200 people and growing strongly, in 42 offi ces. The stock markets are saying something about their valuation in relation to our own $19 billion valuation, with approximately the same $11 billion of revenues (for a fl eeting moment), 82,000 people (excluding associates) in 2,000 offi ces.
Put together the four largest communications services parent or holding companies, in market capitalisation order – WPP, Omnicom, Publicis and IPG. You will have about $35 billion of revenues and about a $50 billion market capitalisation – three times the revenue of Google, but only a third the market value. To the CFO of Google, the laws of large numbers may start to operate at $5 billion dollars of revenues, but Google’s success is clear and its economic power substantial.
What we thinkThe Advertising & Marketing Services Industry
way of strengthening the economic growth rate, during his election campaign. That is one of the reasons why the rapid inclusion of Turkey into the EU is so important: another source of population growth, as well as immigrants to stimulate economic growth and access to the Muslim world.
All this points to the growing importance of attracting, recruiting, developing, training, motivating, incentivising and retaining human capital. In a less differentiated world, it will become more and more important for companies to stand out through the quality and responsiveness of their people. Making sure that your people buy into your strategy and structure will be increasingly important. Living the brand – operationally – will be critical.
Web 2.0 and the future
Since the dotcom implosion of 2000 it had become fashionable to dismiss the web. However, WPP’s smarter clients and those who missed out on opportunities in the 1990s have taken advantage of depressed values and a contrarian position. Web activity, broadly
defi ned, currently accounts for more than $2 billion of WPP’s revenues, or around 20%. It is growing rapidly.
There seem to be three reasons why. First, there is still the threat of disintermediation. A horrible word; perhaps some explanation is needed. Let’s take an example from our own business.
More than $2 billion of WPP’s revenues comes from market research. Traditionally, research has been done on the phone and through the post. The process is long and cumbersome. A questionnaire has to be designed, distributed and fi lled in by consumers or interviewers. Then data is collected, analysed and conclusions developed. It can all take three to six months. Many CEOs despair that by the time the solution has been identifi ed, the problem has changed. Using the internet, however, the research process can be transformed and responses obtained almost instantly. WPP’s Lightspeed panel interrogates more than 17 million consumers globally and can deliver answers inside 24 hours.
Second, you continue to be disintermediated by lower-cost business models that are evaluated by investing institutions in new and different ways. Despite the relatively recent vicious compression in valuations and consequent losses, the fi nanciers of new media and technology companies still focus on sales, sales growth and market
What we think .

WPP ANNUAL REPORT 2006
What we thinkThe Advertising & Marketing Services Industry
Last year, it made Rupert Murdoch’s purchase of MySpace a stunning success with a $300 million per annum, three-year deal for internet revenues. This against a purchase price of around $580 million. And then it overcame its lack of success with video by buying YouTube for $1.65 billion, despite little or no revenues and a bunch of copyright law suits, part of which were solved by making three music companies momentarily YouTube share owners and $50 million richer on the morning of the sale. Finally, it gave Warren Hellman and Hellman & Friedman a 800-900% return over two years on DoubleClick, paying over $3 billion or 10 times revenues or 30 times EBITDA. Entry to the fi rst round of the auction was 13-14 times EBITDA, which we could not reach.
It seems that this last transaction will fi nally awake the dragon. Stand by for a heavy Microsoft response, not only on regulatory fronts, but from transactions, too. Through DoubleClick, Google may control more than 80% of targeted and contextual internet advertising, along with much valuable client and publisher data. Current rumours surround more consolidation around Yahoo!, Aquantive and others. Already, Yahoo! has paid an infi nite EBITDA multiple for Right Media. Sane strategic moves or irrational exuberance?
All in all, Google is opening up the attack on many fronts. Perhaps too many, particularly when you consider the other fronts they are fi ghting on, such as book publishing. One gets the impression they are throwing a lot of mud against the wall to see if any sticks. Yahoo! has a different approach, working through its agency partners and believing in the power of people, rather than Google’s greater focus and belief in technology.
Technology and the data it provides are becoming more important components to succeed in the new technology-based media. We are already investing through WPP Digital, GroupM, Kantar and our direct and interactive businesses, such as Wunderman, OgilvyOne, G2 and RMG Connect.
With suffi cient investment, we can reproduce any of the media planning and buying technology developed and have already accessed search revenues effectively. Unlike the media owners, we are not investing in a single technology or making technological bets. We are purveyors of media investment alternatives and, as long as we are not excluded from any single, powerful technology and have the talent to analyse the media alternatives, we will remain relevant and valuable to our clients. Unlike media owners, who unless they cover the media waterfront, are exposed to one technology or another.
So is Google friend or foe, frienemy or froe? On the amicable side, we, for example, are its largest agency customer, spending more than $200 million last year. That tells you a little about the nature of Google’s business. Normally our media market share, according to RECMA, the independent organisation that measures scale and capabilities in the media sector, is around 25%. With Google it is around 2%, indicating a long tail and a heavy business-to-business connection. In any event, Google wants to work with us on building relationships with our 50 biggest clients and it is offering incentive programs for us to buy more. We have also run joint seminars on both sides of the Atlantic, for some of our largest and most important clients, to try to build mutual relationships.
On the less friendly side, CEO Eric Schmidt says Google is targeting the advertising sector.
Google is probably a frienemy or froe. Short-term friend, long-term foe. Although after GoogleClick, the short term got shorter and the long term nearer
Google has already taken several initiatives. It has run an experiment: wholesale purchasing print media and retailing the space in smaller amounts to clients. It has hired creative people to write ads. It has approached US clients directly to see if it can set up a direct, electronic media-buying exchange. It is looking at electronic media planning and buying models, which can be accessed through the web. It purchased dMarc, a radio internet-based company for $100 million down and a three-year mother-of-all earnouts possibly worth $1.1 billion, although the principals have now left. It has recently signed deals with Clear Channel in radio and Echo Star in TV that make clear its desire to move into traditional media.
Google has also concluded its billion-dollar deal with AOL, and Time-Warner has indicated in internal memos that it plans to co-operate with Google in television, print and other media. The opportunity exists, although it is doubtful if the traditional Time-Warner operating company verticals will be easily persuaded to give up on digital expansion and opportunities to meet their budgets and targets. It also offers, through Google Analytics, a free analytical service.
What we think
WPP ANNUAL REPORT 2006
In summary, Google is probably a frienemy or froe. Short-term friend, long-term foe. Although after GoogleClick, the short term got shorter and the long term nearer.
Warren Buffett used to say in the 1970s, when he invested directly in IPG and Ogilvy, that agencies represented a royalty on the international growth of US-based multinationals. Perhaps today, parent company investment also represents a royalty on the growth of new media technologies.
Internal alignment drives success
Given the scale of strategic and structural change going on inside most companies, one of the most important challenges facing CEOs is to communicate that change internally. Internal communication to secure internal
alignment is, perhaps, a polite way of putting it. Probably the biggest block to progress for our clients – and perhaps ourselves – is internal politics. Turf, territory and ego prevent productive change. If the chairmen or CEOs of our clients saw what we saw, they would be horrifi ed. If they and we devoted 50% of the time that they or we spent on internal politics on the consumer, client or competition, they and we would be considerably more successful.
You could argue that most of the communication we co-ordinate is aimed at internal audiences rather than external ones. Some people, such as Allan Leighton when he was at Asda, have maintained that ensuring your internal constituencies are on side is often more important than external ones. Only when internal communications are working can your company talk positively to customers, suppliers, potential customers, potential employees, journalists, analysts, investors, government and NGOs.
Building such virtuous circles in a uni-branded company is one thing. Inside a multi-branded company such as WPP, which has grown by acquisition, our tribes operate independently to deal with dis-economies of scale and client confl ict. It is far more complicated. Trying to ensure almost 100,000 people face in the same direction at the same time is not easy. On the other hand, once achieved, internal unison and common focus make up a very powerful army.
It may not be fashionable to talk about charismatic or strong CEO leadership; the focus is more on the CEO as coach, mentor or team leader. But our experience is that the most successful companies with which we work are where the CEO understands the importance of the brand, has a
strong vision and implements through a strong CMO. After all, at long last, it is understood that all business strategy is really marketing strategy, starting with the consumer and working backwards from there.
Most of our companies develop internal communications through Advertising, Media Investment Management, Information, Insight & Consultancy, Public Relations & Public Affairs, Branding & Identity, and Healthcare and Specialist Communications. However, no single operating entity exists within WPP to execute internal communications on a worldwide basis. Still an opportunity for the future.
Continuing retail concentration
Whenever we ask CEOs what keeps them awake at night or worries them when they get up in the morning, they almost always give the same answer: distribution. Some 18% of Procter & Gamble’s worldwide sales (pre-Gillette) go through
Wal-Mart. The fi gure is probably 25-30% of US sales. Henkel bought Dial Corp, 30% of whose sales go through Wal-Mart. Clorox, another Henkel-connected company, sells 30% of its US products through Wal-Mart.
One of WPP’s media partners sells 10% of its cover sales through Wal-Mart. To the media owner, this is life or death. To Wal-Mart it is a rounding error and the province of the third or fourth level of procurement, making the publisher’s life a misery. More people visit Wal-Mart in the US in a week than go to church on a Sunday. Indeed, some say Wal-Mart is the new religion. Wal-Mart, with $344 billion of sales, is the seventh largest ‘country’ by retail sales. Wal-Mart accounts for 8.7% of US retail sales, Tesco for 12.8% of UK retail sales. Both account for 30% of grocery sales in their domestic markets.
Infl uence over and control of distribution is not a new issue. After all, advertising was developed in the 19th century by manufacturers to appeal over the heads of wholesalers or retailers direct to consumers. Increasing retail concentration – not only in the US but also in Europe and Latin America – will only emphasise the importance of focusing on product innovation and branding, along with better understanding of point-of-purchase consumer behaviour and emphasis on packaging, display and retail design. After all, as a senior Asia Pacifi c Procter & Gamble executive said recently, depending on which P&G brand you are talking about, something between 30% and 80%
What we thinkThe Advertising & Marketing Services Industry
What we think .

WPP ANNUAL REPORT 2006
of purchasing decisions are made at the point of sale. Procter calls it “the fi rst moment of truth”.
WPP believes an understanding of distribution and retail is essential and it is one of our core practice development areas. The Store, our virtual retail agency, links more than 900 professionals working on retail business and issues around the world, updating them on the latest developments and trends – subject to client confi dentiality. Management Ventures – with more than 50 global retail analysts – along with Cannondale and Glendinning Associates, both experts in channel management, supplement and consolidate our knowledge of global retailing.
In addition, OgilvyAction gives the Group an even broader distribution offer with its focus on product categories that have been denied access to traditional media.
Corporate responsibility: a no-brainer?
If you are in the business of building brands, products, services or corporate brands in the long term, corporate responsibility is surely a given. If you want to build long-term profi tability, you would ignore
the environment, society, government, NGOs or the press at your peril. Only if you were in business for a quick buck or short-term profi t would you ignore these constituencies. Many companies have made an increasingly important virtue and value out of positioning their corporate brand, goods or services as corporately responsible. BP in the oil and energy industry, HSBC in banking and Wal-Mart and M&S in retail are good examples.
However, three events in the last year or so have heightened the importance and signifi cance of CR or Global Corporate Citizenship and made them very fashionable. First, the deal between Warren Buffett and Bill Gates, to absorb Microsoft stock into Berkshire Hathaway to enable the Gates Foundation to do even greater charitable work. Second, the decision by Sir Richard Branson, at the second Clinton Global Initiative in New York, to donate up to $3 billion in profi ts from his Virgin companies to good causes. And fi nally, the decision by James Murdoch at BSkyB and his father Rupert Murdoch at NewsCorp to espouse carbon neutrality – along with Al Gore’s fi lm An Inconvenient Truth – have driven the agenda on carbon neutrality.
All of these events have made it fashionable for chairmen and CEOs to embrace corporate responsibility – and embarrassing for them if they do not.
What we thinkThe Advertising & Marketing Services Industry
Many companies have made an increasingly important virtue and value out of positioning their corporate brand, goods or services as corporately responsible
Conclusion
With recessionary forces abating in 2003 and secular and quadrennial forces driving the industry to new highs in 2004, 2005 and 2006, the short-term picture for the communications services industry has improved. The next quadrennial cycle of 2005-2008 is shaping up to be even stronger.
The immediate issues of government overspending, consolidation among clients, media owners, retail and agencies, increasing trade and price promotion, fees, procurement and outsourcing, media fragmentation and super-agencies all bring opportunities as well as threats. 2007 should show more improvement.
In the longer term, the new true globalisation and the growth of Asia Pacifi c, overcapacity and the shortage of human capital, the web, the demand for internal communications, retail concentration and global corporate citizenship should together underline and assure the importance of our industry and its constituent parts, advertising and marketing services. The latter as a proportion of GDP will burst through the cyclical high established at the peak of the internet boom in 2000.
* Information in this section is part of the management report set out in the section headed Directors’ report on pages 103 to 106.
What we think

By Jeremy BullmoreMember of WPP Advisory Board
WPP ANNUAL REPORT 2006
What we think
In Praise of Interior Decorators(Or at Least Some of Them)
What we think .

WPP ANNUAL REPORT 2006
What we thinkIn Praise of Interior Decorators
don’t know much about interior decorators and have never directly employed one. But it seems to me, at least from observation, that they belong to one of two categories. There are those that work from the outside in; and there are those that work from the inside out.
Those in the fi rst category, as you’d expect, start with the outside world of design. They’ve made it their business to know everything there is to know about the latest fabrics, furniture, lighting, colours, textures and sophisticated sound systems. With exceptional skill, they make a hundred different selections from this bewildering menu of alternatives and turn them into a single, coherent, artistic creation. It’s state-of-the-art stuff, the ultimate in contemporary chic, and the client is usually delighted.
By contrast, those who work from the inside out, start with the client. They study the client, listen to the client, observe what the client has chosen to live with before. With immense sensitivity and diligence, they acquire an instinctive feel for the client. Only then do they go outside; do they consciously turn to the wide world of design – and make their selections not just to live in harmony with one another but to refl ect and project their client’s singular tastes and character. They know that their client is one of a kind; so if their design is to be a perfect complement, then it, too, must be one of a kind. It may or may not be the ultimate in fashionable chic; but when it’s right, the client is not only delighted but also wholly comfortable: still the same person but even more so.
Interior decorators who work from the outside in may win more awards; and will certainly win more commissions from international hotel chains and service apartments. But those who work from the inside out do the more diffi cult job, the more admirable job and the more selfl ess job. When visitors fi rst see their work, they don’t exclaim, “Oh my, Priscilla, you must give me the name of your designer!” They say, “Oh, wow, Priscilla – what a wonderful room!” It is the client whose reputation is fi rst to benefi t; and only then, vicariously, that of the designer.
If my amateur analysis is even half-way right, all this, of course, has a great many lessons for brands.
A product without a distinctive identity, a face, a style, an attitude to life remains just that: a product. If a brand is to become successful, and remain successful, its appeal must be unique. It must of course work, it must do what it promises to do: because a brand’s function is its fi rst and most critical statement to the world. But beyond that, it needs clothes – and someone has to choose them. So brands, too, have need of skilled designers; exterior designers, as it were. These are often the advertising agencies, design companies and brand identity consultants that are called upon for expert advice. And the best exterior designers, like their interior equivalents, work not from the outside in but from the inside out.
Brand charisma
From the largest industrial company to the smallest bar of confectionery, all brands have incipient characters. Some may be weak, ill-defi ned, and inconsistent; these are the struggling brands, over-dependent on price and promotion. The strong brands, the profi table brands, the brands that can weather troubled times to survive and prosper again: these are the brands that consistently deliver what the customer wants and that have the proudest, most appealing personalities. Brands, too, can have a kind of charisma. The best brand owners know all this and so do their best advisers. When choosing a wardrobe for a brand, they don’t simply pluck that season’s fashions from the rail: they start from the inside. They study the brand and the brand’s competitors; they study those who use the brand and those who used to use the brand and those who never have. They observe very carefully indeed – with all their senses – and with immense sensitivity and diligence, they acquire an instinctive feeling for the brand’s personality.
Only then do they go outside; do they consciously turn to the wide world of words and ideas and images and music and colour – and make their selections not just to live in harmony with one another but to refl ect and project that brand’s specifi c strengths and character. They know that their brand is one of a kind; so, if their design is to be a perfect fi t for that brand, then it, too, must be one of a kind.
All of this, of course, in different words and different ways, has been said many times before. It’s hard to disagree with such an analysis; commonsense and personal observation both support it. The hard bit comes when trying to do something about it.
What we think

WPP ANNUAL REPORT 2006
What we thinkIn Praise of Interior Decorators
Because the uncomfortable fact remains that the identifi cation, creation and maintenance of brand personality – even in these metric-conscious times – is ultimately dependent on the disciplined imagination and insights of talented individuals. You can’t tap in 25 calibrated brand characteristics, in rank order of salience, and print out a full-colour, three-dimensional portrait of a brand’s persona.
Founders of successful companies tend to have an almost infallible instinct for what is appropriate for their company: from the decor of their offi ces, through key product characteristics down to the sign in the visitors’ car park. There’s a picture in their heads against which any suggestion can be instantly checked: true to brand – or not true to brand. It’s a facility analogous to perfect pitch. And because they’re the founders, people will quite properly defer to their judgements; not for them those fruitless attempts to quantify feeling.
Romance and theatre
In February 2007, a remarkable memo appeared on the website starbucksgossip.com. It’s been confi rmed as authentic and was the text of a message sent by the founder and chairman of Starbucks Corp., Howard Schultz, to his top executives. He wrote: “Over the past 10 years, in order to achieve the growth, development, and scale necessary to go from less than 1,000 stores to 13,000 stores and beyond, we have had to make a series of decisions that, in retrospect, have lead to the watering down of the Starbucks experience.”
Originally, Starbucks had all its baristas pull espresso shots by hand. Then, in the interests of consistency and speed of service, they switched to automatic espresso machines. And in doing so, wrote Mr Schultz, “We overlooked the fact that we would remove much of the romance and theatre.”
Again in the interests of effi ciency, they adopted fl avour-locked packaging: no longer did they scoop fresh beans from bins and grind them in front of customers. Wrote Mr Shultz: “We achieved fresh roasted bagged coffee, but at what cost? The loss of aroma – perhaps the most powerful non-verbal signal we had in our stores.”
With hindsight, he said, the outcome of these and many other well-intentioned changes was, “stores that no longer have the soul of the past.”
‘Romance’… ‘theatre’… ‘soul’: these are words that seldom appear in respectable, rigorous marketing documents. They sound fl aky, subjective, immeasurable.
The decisions that led to the loss of romance, theatre and soul at Starbucks were undoubtedly based on serious analysis. Economies of time and cost would have been scrupulously identifi ed and numbers would have been attached. The bottom line would have been mentioned more than once. Had any underling, or outside adviser, voiced instinctive apprehension – and maybe even murmured about the potential loss of romance, theatre or soul – they would have been challenging hard fact with subjective, baseless sentiment. No chance. It took the courageous Mr Schultz, founder and chairman, to concede the error; and even then, since the company had continued to grow and prosper, he was probably relying more on his instinctive sense of rightness than on any new data.
It wasn’t, of course, a mistake for Starbucks to calculate the benefi ts they could enjoy by switching to automated espresso delivery. But it was a one-dimensional, outside-in analysis – and should have been checked against an inside-out understanding of the brand: its culture, its personality, its soul – all those dodgy, fl aky words that we fl inch from using in case we’re thought to be impractical romantics.
Unfortunately, when conceiving, describing and recommending a desired brand character, such words have to be used. They will always seem feeble and inadequate; they will always be easy targets for the sceptical. The wise client will forgive their use because they’re striving to do the impossible: to make mere words evoke a rich complexity of fact and feeling that can in the end be fully appreciated only when it’s been fully realised. The rewards for such trust can be priceless.
But, still, of course, the client must beware. There is always a place for healthy scepticism. Such trust must be earned.
Brand designers who work from the outside in – who are content to apply the all-purpose fashionable with a blithe disregard for the singular brand – do their trade and their clients no service at all. Like interior decorators, the only ones to deserve real respect are those who work from the inside out: who have a feel for each brand as informed and as instinctive as that of Howard Schultz for the remarkable company he gave birth to.
What we think .

WPP ANNUAL REPORT 2006
Board of Directors
Philip Lader Non-executive chairman Age 61
Philip Lader was appointed chairman in 2001. The US Ambassador to the Court of St James’s from 1997 to 2001, he previously served in several senior executive roles in the US Government, including as a Member of the President’s Cabinet and as White House Deputy Chief of Staff. Before entering government service, he was executive vice president of the company managing the late Sir James Goldsmith’s US holdings and president of both a prominent American real estate company and universities in the US and Australia. A lawyer, he is also a Senior Advisor to Morgan Stanley, a member of the Council of Lloyd’s (insurance market), a director of RAND, Marathon Oil, Rusal, AES Corporations and Songbird Estates plc (Canary Wharf), a trustee of the Smithsonian Museum of American History and a member of the Council on Foreign Relations.
Sir Martin Sorrell Chief executive Age 62
Sir Martin Sorrell joined WPP in 1986 as a director, becoming Group chief executive in the same year. He is a non-executive director of Formula One • [email protected]
Paul Richardson Finance director Age 49
Paul Richardson became Group fi nance director of WPP in 1996 after four years with the Company as director of treasury. He is responsible for the Group’s worldwide functions in fi nance, information technology, procurement, property, treasury, internal audit and corporate responsibility. He is also the Country Manager for Italy. Previously he spent six years with the central fi nancial team of Hanson PLC. He is a chartered accountant and member of the Association of Corporate Treasurers. He is a non-executive director of Chime Communications PLC and STW Communications Group Limited in Australia, both of which are companies associated with the Group • [email protected]
Members of the Board of Directors
Philip LaderNon-executive chairman and chairman of the Nomination Committee
Sir Martin SorrellChief executive
Paul RichardsonFinance director
Mark ReadStrategy director
Colin DayNon-executive
Esther DysonNon-executive
Orit GadieshNon-executive
David KomanskyNon-executive
Christopher MackenzieNon-executive
Stanley (Bud) MortenNon-executive: senior independent director
Koichiro NaganumaNon-executive
Lubna OlayanNon-executive
John QuelchNon-executive
Jeffrey RosenNon-executive: chairman of the Compensation Committee
Paul SpencerNon-executive: chairman of the Audit Committee
Members of the Advisory Board
Jeremy Bullmore
John Jackson
Company Secretary
Marie Capes
Who runs WPP
Who runs WPP
WPP ANNUAL REPORT 2006
Mark Read Strategy director Age 40
Mark Read was appointed a director in March 2005. He has been WPP’s director of strategy since 2002 and is also CEO of WPP Digital. He is a member of the Supervisory Board of HighCo. He worked at WPP between 1989 and 1995 in both parent company and operating company roles. Prior to rejoining WPP in 2002, he was a principal at the consultancy fi rm of Booz-Allen & Hamilton and founded and developed the company WebRewards in the UK • [email protected]
Colin Day Non-executive director Age 51
Colin Day was appointed a non-executive director in July 2005. He is group fi nance director of Reckitt Benckiser plc, having been appointed to its board in September 2000. Prior to joining Reckitt Benckiser he was group fi nance director of Aegis Group plc and previously held a number of senior fi nance positions with ABB Group plc and De La Rue Group plc. He was a non-executive director of Imperial Tobacco plc until February 2007 and of easyJet plc until 30 September 2005.
Esther Dyson Non-executive director Age 55
Esther Dyson was appointed a director in 1999. In 2004 she sold her 21-year-old company, EDventure Holdings, to CNET Networks, the US-based interactive media company. She left CNET at the end of 2006 and now operates as an independent investor and entrepreneur, again under the name of EDventure. She is an acknowledged deep thinker in the information technology industry, and has been highly infl uential for the past 20 years on the basis of her insights into online/information technology markets worldwide, including the emerging markets of Central and Eastern Europe and Asia. An active investor as well as an analyst/observer, she recently participated in the sale of Flickr to Yahoo! and of Medstory to Microsoft. She sits on the boards of other IT start-ups including Boxbe (US), Eventful.com (US), Meetup Inc. (US), Midentity (UK), NewspaperDirect (Canada), CVO Group (Hungary) and Yandex (Russia). She sat on the consumer advisory board of Orbitz until its sale to Cendant. She is also active in public affairs and was founding chairman of ICANN, the domain name policy agency, from 1998 to 2000. She currently sits on the board of the Sunlight Foundation, which advocates transparency in government and is pushing US legislators to publish their daily diaries.
Orit Gadiesh Non-executive director Age 56
Orit Gadiesh was appointed a director in April 2004. She is chairman of Bain & Company, Inc. and a world-renowned expert on management and corporate strategy. She holds an MBA from Harvard Business School and was a Baker Scholar. She is a member of the International Advisory Board at Haute Ecole Commerciale in France. She is a member of the Foundation Board for the World Economic Forum, and on the Board of Directors of The Peres Institute for Peace. She is a member of the Council on Foreign Relations, a trustee for Eisenhower Fellowships and a member of the Business Committee of the Metropolitan Museum of Art, New York.
David H Komansky Non-executive director Age 68
David Komansky was appointed a director in January 2003. He was chairman of the Board of Merrill Lynch & Co, Inc, serving until his retirement on 28 April 2003. He served as chief executive offi cer from 1996 to 2002, having begun his career at Merrill Lynch in 1968. Among many professional affi liations, he serves as a director of Black Rock, Inc. and as a member of the International Advisory Board of the British American Business Council. Active in many civic and charitable organisations, he serves on the Board of the New York Presbyterian Hospital.
Christopher Mackenzie Non-executive director Age 52
Christopher Mackenzie was appointed a director in 2000. He is chief executive of Equilibrium, a London-based investor group. He is also a board member of the Abdul Latif Jameel Group, KazMunaiGas Exploration & Production JSC and Champagne Jacquesson et Fils S.A. He served as the chief executive of fi nancial service groups including Brunswick Capital in Russia, Trizec Propertiesin the US and GE Capital Europe.
Who runs WPPBoard of Directors
Who runs WPP .

WPP ANNUAL REPORT 2006
Who runs WPPBoard of Directors
Stanley (Bud) Morten Non-executive director Age 63
Bud Morten was appointed a director in 1991. He is a consultant and private investor. He is currently the Independent Consultant to Citigroup/Smith Barney with responsibility for its independent research requirements. Previously he was the chief operating offi cer of Punk, Ziegel & Co, a New York investment banking fi rm with a focus on the healthcare and technology industries. Before that he was the managing director of the equity division of Wertheim Schroder & Co, Inc. in New York. He is a former non-executive director of Register.com, which was sold to a private equity fi rm in November 2005 and is no longer a public company. He is also a non-executive director of The Motley Fool, Inc., which is a private company.
Koichiro Naganuma Non-executive director Age 62
Koichiro Naganuma was appointed a director in February 2004. He is president and group chief operating offi cer of Asatsu-DK, also known as ADK. Joining the agency in 1981, he began his career with the account service of global clients in the agency. His mandate thereafter expanded to the total operation of the group. He replaced ADK Chairman Masao Inagaki on the Board who retired upon the appointment of Mr Naganuma. ADK is Japan’s third largest advertising and communications company, and ninth largest in the world. WPP took a 20% interest in ADK in 1998.
Lubna Olayan Non-executive director Age 51
Lubna Olayan was appointed a director in March 2005. Ms Olayan is the deputy chairman and chief executive offi cer of the Olayan Financing Company, a subsidiary and the holding entity for the Olayan Group’s operations in the Kingdom of Saudi Arabia and the Middle East. Ms Olayan is a Board Member of Saudi Hollandi Bank, a publicly listed company in Saudi Arabia and a member of the International Business Council of the World Economic Forum and the International Advisory Board of the Council on Foreign Relations. She is a member of the Board of Directors of INSEAD. In October 2006, Ms Olayan joined the International Advisory Board of Rolls Royce.
John Quelch Non-executive director Age 55
John Quelch was appointed a director in 1988. He is Senior Associate Dean and Lincoln Filene Professor of Business Administration at Harvard Business School. Between 1998 and 2001 he was Dean of the London Business School. He also serves as chairman of the Massachusetts Port Authority. Professor Quelch’s writings focus on global business practice in emerging as well as developed markets, international marketing and the role of the multinational corporation and the nation state. He is a non-executive director of Gentiva Health Services Inc, Inverness Medical Innovations, Inc. and Pepsi Bottling Group Inc. He served previously on the boards of Blue Circle Industries plc, easyJet plc, Pentland Group plc and Reebok International Limited.
Jeffrey A. Rosen Non-executive director Age 59
Jeffrey Rosen was appointed a director in December 2004. He is a deputy chairman and managing director of Lazard. He has over 30 years’ experience in international investment banking and corporate fi nance. He is a member of the Council on Foreign Relations and is President of the Board of Trustees of the International Center of Photography in New York.
Paul Spencer Non-executive director Age 57
Paul Spencer was appointed a director in April 2004. He is a fi nancier with 20 years’ experience in the fi nancial management of a number of blue chip companies, including British Leyland PLC, Rolls-Royce PLC, Hanson PLC and Royal & Sun Alliance PLC. He served as UK chief executive of Royal & Sun Alliance PLC between 1999 and 2002. He is the chairman of State Street Managed Pension Funds Ltd. He is also chairman of the Association of Corporate Treasurers’ Advisory Board, NS&I (National Savings), the UK government-owned retail savings institution, and Sovereign Reversions Group plc. He is also a non-executive director of Resolution Life Group plc and Nipponkoa Insurance (Europe) Ltd. Paul is a governor of Motability, a UK charity for the disabled.
Who runs WPP

WPP ANNUAL REPORT 2006
Strategic thinking, creativity, client co-ordination, and operationsP DartT PiliguianR PutterJ SteelL ReissS Spirit
Corporate and geographical developmentA G B ScottY K Leong L Maerov A NewmanS Spence
Branding & Identity, Healthcare and Specialist Communications servicesJ F ZweigM E Howe
Human resourcesM LinaughA JacksonF Illingworth
PropertyE BauchnerB MacAfferW Vornehm
ProcurementT KinnairdV ChimientiM VargasP Permanne
Information technologyD A S NicollS BlackburnA GarlickJ HollanderS O’Byrne
Knowledge communitiesD Muir
Financial control and management reportingD BarkerC SweetlandN DouglasS WintersK GillS Neish
TreasuryP DelaneyT LobeneJ DurcanR PearlrothJ Yuen
Internal auditP StanleyS WhitworthP Johnston
TaxR AzoulayT O NeumanK FarewellS Woodhouse
Investor relationsC SweetlandF Butera
Corporate communicationsF McEwanV Edwards (corporate responsibility)K McCormack
LegalA J HarrisM PoveyF BahrampourJ Calow
Investment bankersGoldman Sachs International LtdPeterborough Court133 Fleet Street London EC4A 2BB
HSBC8 Canada SquareLondon E14 5HQ
Merrill Lynch International2 King Edward StreetLondon EC1A 1HQ
Morgan Stanley & Co Limited25 Cabot SquareCanary WharfLondon E14 4QA
CitigroupCitigroup Centre33 Canada SquareCanary WharfLondon E14 5LB
Legal advisorsAllen & Overy LLPOne New ChangeLondon EC4M 9QQ
Davis & Gilbert LLP1740 BroadwayNew York NY 10019
Freshfi elds Bruckhaus Deringer65 Fleet StreetLondon EC4Y 1HS
Fried, Frank, Harris, Shriver & Jacobson LLP1 New York PlazaNew York NY 10004
Hammonds7 Devonshire SquareCutlers GardensLondon EC2M 4YH
StockbrokersMerrill Lynch International Corporate Broking2 King Edward StreetLondon EC1A 1HQ
Auditors and accountancy advisorsDeloitte & Touche LLP180 StrandLondon WC2R 1BL
Ernst & Young LLP1 More London PlaceLondon SE1 2AF
KPMG LLP1 Puddle DockLondon EC4V 3DS
PricewaterhouseCoopers LLPSouthwark Towers32 London Bridge StreetLondon SE1 9SY
Remuneration consultantsTowers Perrin71 High HolbornLondon WC1V 6TP
Property advisorsFulcrum Corporate The Pumphouse13-16 Jacob’s Well MewsLondon W1U 3DY
James Andrew International72/75 Marylebone High StreetLondon W1M 3AR
Jones Lang LaSalle22 Hanover SquareLondon W1A 2BN
CB Richard Ellis200 Park AvenueNew YorkNY 101166
Senior offi cers & advisors to the Board
Who runs WPP
Who runs WPP .

WPP ANNUAL REPORT 2006How we behave

WPP ANNUAL REPORT 2006
How we behaveDirectors’ report*
Once again, this year the Directors’ report includes reviews from the chairmen of three Board committees; Philip Lader, as chairman of the Company and its Nomination Committee; Paul Spencer, as chairman of the Audit Committee, and Jeffrey Rosen, as chairman of the Compensation Committee. It also contains an analysis of the Company’s compliance with statutory and regulatory requirements.
Review of the Company’s governance and the Nomination Committee
Dear share ownerContinuing to emphasise excellence in corporate governance while sustaining the entrepreneurial character of this Company and incentivising its people continues to be fundamental to its performance. I hope that this is apparent to share owners, given your Company’s fi nancial performance, growth and innovation as recorded in this Report.
Signifi cant changes were made to the Board and the committees in 2004 and 2005, as discussed in last year’s Annual Report and Accounts. 2006, therefore, focused on the day-to-day work of the Board and the ever-increasing work of its committees. Central were our constructive assessment of management performance, support to key executives in their management of critical issues, and endorsement of initiatives to seize major opportunities.
During 2006, the Board – and I, as chairman – once again undertook a thorough assessment process, including detailed one-on-one discussions with each director, followed by a full review by the Board as a whole. I was separately assessed by the senior independent director and the remaining non-executive directors. This Board is comprised of knowledgeable, independent-minded individuals of considerable standing. Yet, however well-informed and engaged we might be, individually and collectively, we are striving to learn and benefi t from the best governance practices of other public companies and to improve our own performance.
Report by Philip Lader (above)
Chairman of the Company and chairman of the Nomination Committee
* The Directors’ report has been prepared in accordance with English law and where applicable, the Disclosure and Transparency Rules and any liability in relation to the Directors’ report, the report of the Compensation Committee and the fi nancial statements is governed by English law.
How we behave .

WPP ANNUAL REPORT 2006
Similarly, the Board does not view my role as non-executive chairman to compromise my independence. While I am chairman of the Company and a senior advisor to Morgan Stanley, I intend to continue as chairman of the Nomination Committee and as a member of the Compensation Committee to ensure continuity in their work.
In dealing, with a variety of complex issues this past year, your Board has employed tough-minded, commercial judgement based on wide experience in its members’ respective fi elds. They have sought to achieve the proper balance between rendering appropriate corporate governance oversight and championing the entrepreneurial spirit that has built WPP into the leading global enterprise it is. I thank my Board colleagues for their dedication and considerable efforts. Our colleague Howard Paster, who had already made known his decision to relinquish his full time executive responsibilities, did not therefore stand for re-election to the Board in 2006. For three years, Howard brought wisdom and expert counsel to our Board meetings; and we are delighted to record our gratitude to him. The Group is fortunate indeed in that we continue to benefi t from his experience and advice.
Throughout the past year, the Group’s executives have continued to deal – in addition to their central client and competitive challenges – with ever-increasing legislative and regulatory requirements, particularly in the US and the UK. Management’s performance in both regards warrants both our admiration and our appreciation.
However diligent and assertive your directors and management have been in 2006 and continue to be, let us never forget that clients – old and new, large and small, all necessarily demanding – make this business possible.
And fundamental to the remarkable story behind this year’s Report to you are the 100,000 people of WPP, their abilities, their energies and their tenacity.
Philip Lader15 May 2007
How we behaveDirector’s report
Share owners should be particularly interested in our Board’s rigorous talent management and succession-planning process. Annually, and for the last fi ve years, more than 100 senior managers and ‘rising stars’ of the parent and operating companies, including the Group chief executive, are reviewed by the non-executive directors. In this process individual strengths and developmental needs are considered in depth, and potential successors for senior positions are identifi ed. The non-executive directors and Group chief executive had a candid, specifi c discussion of potential internal and external candidates to succeed him in the event of his retirement or other events, but public discussion of this subject would only foster speculation and unhealthy competition. The best interests of the Group require, consequently, that those deliberations and our conclusions be kept strictly confi dential.
The Nomination Committee, of which I am also the chairman, has particularly been involved in assessment and succession-planning processes. During the year, the committee met three times formally and held a number of informal discussions. These sessions were attended in whole or in part by the Group chief executive, the Company Secretary and the chief talent offi cer.
It continues to be your Company’s policy to comply fully with all relevant laws and regulations, including the Combined Code, the US Sarbanes-Oxley requirements, the NASDAQ rules, the new UK Companies Act 2006 and, where possible and practicable, with guidelines issued by institutional investors and their representative bodies.
To this end, WPP executives and advisors again devoted substantial time and resource throughout 2006. In the year ended 31 December 2006, in the opinion of the Board, WPP has again been in compliance with provisions of the Combined Code on Corporate Governance, among other relevant benchmarks, and continues to be so.
The Board’s views on ‘independence’ of non-executive directors have been explained in previous years’ Report and Accounts. Let me re-iterate, nonetheless, that independence, in our opinion, should be determined not by an arbitrary standard, but on a case-by-case basis, with full disclosure to share owners of any appearance of confl ict with published guidelines.
The Board continues to disagree, for example, with the notion that directors who have served for more than nine years should, for this reason alone, no longer be considered “independent”. A global and especially complex business of WPP’s scale benefi ts enormously from the seasoned judgement and institutional knowledge of long-term directors who continue to be actively engaged in the Group’s governance.
How we behave

WPP ANNUAL REPORT 2006
How we behaveDirector’s report
of the Companies Act 2006 and the Disclosure Transparency Rules – so as to enable the directors to sign off on their responsibilities of disclosure to the auditors;
• the review and appointment of the external auditors and approval of their remuneration and terms of engagement;
• monitoring the external auditors’ independence, objectivity and effectiveness, taking into account relevant global professional and regulatory requirements;
• the approval and monitoring of the policy for the engagement of the external auditors in relation to the supply of permissible non-audit services (including taxation), taking into account relevant ethical and regulatory requirements. WPP’s policy regarding non-audit services that may be provided by the Group’s auditors, Deloitte, prohibits certain categories of work in line with relevant guidance on independence, such as ethical standards issued by the Auditory Practices Board and the Sarbanes-Oxley Act. Other categories of work may be provided by the auditors if it is appropriate for them to do so. The provision of such services and associated fees are pre-approved by the Audit Committee, although some specifi ed categories of work may be delegated to the director of internal audit for pre-approval. All fees are summarised periodically for the committee in order to assess the aggregate value of non-audit fees against audit fees. The value of fees for 2006 is shown in note 3 on page 155;
• monitoring accounting and legal reporting requirements, including all relevant regulations of the UK Listing Authority, the SEC, and NASDAQ with which the Company must comply;
• in conjunction with Paul Richardson, the director responsible for corporate responsibility in 2006, ensuring systems are in place to monitor social, environmental and ethical issues which may affect the Group (other than issues which fall within the remit of the Compensation Committee); and
• maintaining established procedures for the receipt and treatment of concerns including accounting, audit and internal audit matters, with confi dential and anonymous submissions by employees of concerns relating to those issues.
I would like to thank Bud Morten, Jeffrey Rosen, Esther Dyson, Philip Lader, Paul Richardson and a number of parent company executives for their continued assistance throughout the year.
Paul Spencer15 May 2007
Review of the Audit Committee
Report by Paul SpencerChairman of the Audit Committee
Dear share ownerMy colleagues on the committee during 2006 were Bud Morten, Jeffrey Rosen and Esther Dyson. Esther Dyson was appointed in May 2006.
Meetings of the committee, of which there were 10 during 2006, were also attended, in whole or in part, by the auditors, the chairman of the Company, the Group fi nance director, the director of internal audit, the Company Secretary and a representative of the legal department. Furthermore, the committee received presentations from parent company department heads, such as taxation and treasury.
The committee’s terms of reference, which are regularly reviewed by the committee, are available for inspection on the Company’s website at www.wpp.com and are on display prior to and at all general meetings of the Company.
During 2006, the committee and its members were formally assessed by the chairman of the Company for their technical suitability to be members of the committee and also for the committee’s overall effectiveness.
2006 has been another important year, especially given WPP’s obligation to report with effect from the end of 2006 on the compliance of its internal controls with the requirements established by the SEC pursuant to section 404 of the Sarbanes-Oxley Act (SOX).
Much of the work by the committee and several Group executives has revolved around satisfying the requirement to be SOX-compliant by the year-end and in this respect the committee is indebted to the work and expertise of our director of internal audit, Paul Stanley, and his team.
Other work carried out by the committee in 2006 under its terms of reference included:
• monitoring the integrity of the Company’s fi nancial statements and reviewing signifi cant fi nancial reporting judgements;
• reviewing internal fi nancial control and internal audit activities;
• assisting the Board in meeting its responsibilities in respect of the review and reporting on the systems and key elements of risk management as they affect all of the Group’s operations;
• advising the Board on all relevant matters concerning its disclosure obligations – particularly in the light of provisions
How we behave .

WPP ANNUAL REPORT 2006
How we behaveDirector’s report
Review of the Compensation Committee
Report by Jeffrey RosenChairman of the Compensation Committee
Dear share ownerThis is my fi rst report to you as chairman of the committee since assuming this responsibility in the middle of 2006. I am grateful to Bud Morten, my predecessor, for ensuring a smooth transition through his continued availability and expertise. Bud has made an immense contribution as chairman of the committee over a number of years. I commend and thank him for this on your behalf and on behalf of the committee.
During 2006 the committee continued to implement the changes determined by the review of the Group’s compensation policy in 2005.
We were, and continue to be, mindful of the need to maintain competitive levels of compensation at all levels in the Company, in a marketplace where talent is at a premium and where compensation levels attract considerable attention. Our work during the year included:
• a review of the total compensation packages of the Group’s most senior executives relative to the marketplace benchmarks;
• the approval of bonuses for senior executives throughout the Group;
• a review of the remuneration for non-executive directors of the Group, including the chairman, which was supported by advice from Towers Perrin, and making recommendations to the Board;
• a review of the total compensation packages of WPP’s executive directors to evaluate their appropriateness in various circumstances, including termination of employment;
• consideration of possible amendments to the LEAP program in respect of future awards under that plan; and
• a review of the impact of recent changes in age discrimination legislation in the UK and pension requirements in the US.
During 2006, the committee held nine formal meetings and had many informal discussions. Committee meetings are frequently attended, in whole or in part, by the Group chief executive, the chief talent offi cer, the director of compensation and benefi ts, and the Company Secretary. We also received advice from senior executives and from those external advisors referred to in the Report of the Compensation Committee on page 120.
My thanks and appreciation go to my colleagues on the committee, Philip Lader, Christopher Mackenzie and Esther Dyson, for their thoughtful contributions and for their support to me during the year. I am also indebted to Mark Linaugh, chief talent offi cer, and Adrian Jackson, director of compensation and benefi ts, for the hard work and attention to detail which they bring to our committee’s deliberations. Our effectiveness as a committee relies on their capable assistance.
Jeffrey Rosen15 May 2007
How we behave

WPP ANNUAL REPORT 2006
How we behave
The Board of Directors
The Board is collectively responsible for promoting the success of the Company by directing and supervising the Company’s policy and strategy and is responsible to share owners for the Group’s fi nancial and operational performance. Responsibility for the development and implementation of Group policy and strategy and for day-to-day management issues is delegated by the Board to the Group chief executive and other executive directors.
For the year under review, Philip Lader continued as chairman of the Board, responsible for the leadership of the Board. Sir Martin Sorrell, as the Group chief executive, continued to be responsible for the development and implementation of policy and strategy and for the day-to-day operations of the Group. The biographies of the current Board members appear on pages 98 to 100.
All directors are fully briefed on important developments in the various business activities which the Group carries out worldwide and regularly receive extensive information concerning the Group’s operations, fi nances, risk factors and its people, enabling them to fulfi l their duties and obligations as directors. The directors are also frequently advised on regulatory and best practice requirements which affect the Group’s businesses on a global basis, but particularly in the US and the UK.
During 2006, the Board met six times formally and held a number of ad hoc meetings throughout the year. With the exception of Colin Day, David Komansky, Christopher Mackenzie and John Quelch (each absent for one meeting), and also with the exception of Koichiro Naganuma who was only able to attend one meeting, there was full attendance at all formal meetings of the Board during 2006.
The Board consists of 15 directors of whom three are executive and 11 plus the chairman are non-executive. The Board considers that nine of the 11 non-executive directors, in addition to the chairman, are independent, with John Quelch and Koichiro Naganuma being the only non-executive directors considered by the Board to be not independent.
The shareholdings of non-executive directors are set out on page 127. Non-executive directors do not participate in the Company’s pension or share option or other incentive plans, but may receive a part of their fees in ordinary shares of the Company and may participate in the Company’s deferred compensation program.
The Board considers that the non-executive directors’ remuneration conforms with the requirements of the Combined Code.
The fees payable to non-executive directors represent compensation in connection with Board and Board committee meetings, and where appropriate for devoting additional time and expertise for the benefi t of the Group in a wider capacity.
Details of directors’ remuneration and service contracts form part of the report of the Compensation Committee which commences on page 119.
As a matter of policy the Company requires all directors to submit themselves for re-election by share owners at least every three years or every year in the case of those directors who held offi ce for more than nine years or who are 70 years of age or over.
The Board recommends that share owners vote in favour of the Resolutions to re-elect the relevant directors, namely Philip Lader, Esther Dyson, Stanley (Bud) Morten, John Quelch and Paul Richardson and sets out their reasons for this recommendation in the Appendix to the Notice of the Annual General Meeting.
Committee meetings
The attendance of non-executive directors at meetings of the committees of the Board during 2006 was as follows:
Nomination Audit Compensation Committee Committee Committee
Philip Lader 3 n/a 9
Bud Morten1 2 10 4
Christopher Mackenzie 2 n/a 8
Jeffrey Rosen2 n/a 10 5
Paul Spencer n/a 10 n/a
Esther Dyson3 n/a 5 5
David Komansky4 2 n/a n/a1 Retired from Compensation and Nomination Committees on 27 June 2006.2 Appointed to Compensation Committee on 27 June 2006 and Audit Committee on 4 May 2006.3 Appointed to Compensation Committee on 4 May 2006 and Audit Committee on 14 May 2006.4 Appointed to Nomination Committee on 4 May 2006.
During 2006, the Corporate Responsibility Committee, chaired by Paul Richardson, met once on a formal basis and had many informal discussions. Their report for 2006 commences on page 112.
The Disclosure Committee is comprised of senior executives in the parent company, namely Group fi nancial reporting, internal audit, treasury, legal, tax, human resource and investor relations departments. The purpose of the Disclosure Committee is to add further assurance to the Board and its committees in relation to the content of major fi nancial public statements (including the Annual Report and Accounts). The committee has been instrumental in relation to this Annual Report and Accounts in advising the Audit Committee and the Board on the disclosure aspects of the Companies Act 2006 and the Disclosure and Transparency Rules so as to enable the Board to comply with all relevant provisions. During 2006, it met four times.
How we behave .

WPP ANNUAL REPORT 2006
Share owner relations
The relationship with share owners, potential share owners and investment analysts is given the highest priority by the Company.
The Company has a well-developed and continuous program to address the needs of share owners, investment institutions and analysts for a regular fl ow of information about the Company, its strategy, performance and competitive position. Given the wide geographic distribution of the Company’s current and potential share owners, this programme includes regular visits to investors, particularly by the Group chief executive, the Group fi nance director, the deputy Group fi nance director and the head of investor relations, in the UK, Continental Europe and the major fi nancial centres in North America and also in Asia Pacifi c and Latin America. The Company provides a quarterly trading update at the end of the fi rst and third quarters and at the Annual General Meeting currently held in June each year, in addition to semi-annual reporting required in the UK.
The Company ensures that it has a proper dialogue with share owners and their representative bodies in relation to remuneration and corporate governance matters as and when appropriate.
WPP’s website, www.wpp.com, provides current and historical fi nancial information, including trading statements, news releases and presentations.
Internal control
WPP operates a system of internal control, which is maintained and reviewed in accordance with the Combined Code and the guidance in the Turnbull Report as well as Rules 13a-14 and 15 of the Securities Exchange Act 1934 as they currently apply to the Company. In the opinion of the Board, the Company has complied throughout the year with the Turnbull Report and has also complied with the relevant provisions of the Securities Exchange Act 1934.
The Board (which receives advice from the Audit Committee) has overall responsibility for the system of internal control and risk management in the Group and has reviewed the effectiveness of the system during the year. In the context of the scope and complexity of this system, the Board can only give reasonable, not absolute, assurance against material misstatement or loss.
The principal elements of internal control are described below.
Control environment
The quality and competence of our people, their integrity, ethics and behaviour are all vital to the maintenance of the Group’s system of internal control.
The Code of Business Conduct (which is regularly reviewed by the Audit Committee and the Board) sets out the principal obligations of all employees. Directors and senior executives throughout the Group are required each year to certify their compliance with this Code. The WPP Policy Book (which also is regularly updated) includes the Code of Business Conduct and human resource practices as well as guidance on practices in many operational areas. Breaches or alleged breaches of this Code of Conduct are investigated by the director of internal audit and the Group general counsel.
Furthermore, the Group has an independently operated helpline, Right to Speak, for the reporting of issues that employees feel unable to raise locally. A number of issues have been raised during 2006 through this helpline, all of which have been investigated.
Risk assessment
Risk monitoring of all of the Group’s operations throughout the world is given the highest priority by the Group chief executive, the Group fi nance director, the chairman of the Audit Committee and the Board, as it is essential to the creation and protection of share owner value and the development of the careers of our people. The Board realises that WPP is a service company and its ongoing prosperity depends on being able to continue to provide a quality service to its existing and potential clients in a creative, effi cient and economic way.
At each Board meeting, the Group chief executive presents a Brand Check review of each of the business’ operations, incorporating a risk monitor, providing feedback on the business risks and details of any change in the risk profi le since the last Board meeting.
The Brand Check covers such issues as:
• changes in political security;
• the possibility of the loss of major business (eg as a result of a change of senior management at a major client);
• loss of a key executive of the Group;
• introduction of new legislation in an important market;
• change in accounting or corporate governance practice.Each operating group undertakes monthly and
quarterly procedures and day-to-day management activities to review their operations and business risks. These are formally communicated to the Group chief executive, other
How we behaveThe Board of Directors
How we behave

WPP ANNUAL REPORT 2006
How we behaveThe Board of Directors
executive directors and senior executives in quarterly review meetings and, in turn, to the Board.
The Board is fi rmly of the opinion that the monitoring of risk is strongly embedded in the culture of the Company and of the operating companies, in a manner which the Board considers goes beyond the Turnbull recommendations and the requirements of Rules 13a-14 and 15 of the Securities Exchange Act 1934.
Control activities and monitoring
Policies and procedures for all operating companies are set out and communicated in the WPP Policy Book, internal control bulletins and accounting guidelines. The application of these policies and procedures is monitored within the individual businesses and by the Company’s director of internal audit and the Group general counsel.
Operating companies are required to maintain and update documentation of their internal controls and processes. This documentation incorporates an analysis of business risks (a summary of which was considered by the Audit Committee), detailed control activities and monitoring, together with controls over security of data and the provision of timely and reliable information to management. IT and fi nancial controls are also included.
The internal audit department carried out reviews and testing of the documentation and the relevant controls for a majority of the Group during 2006, the results of which were reported to the Audit Committee.
Financial reporting
Each operating company annually updates a three-year strategic plan which incorporates fi nancial objectives. These are reviewed by the parent company’s management and are agreed with the chief executive of the relevant operating company.
The Group operates a rigorous procedure for the development of operating company budgets which build up the Group’s budget. During the fi nal quarter of each fi nancial year, operating companies prepare detailed budgets for the following year for review by the parent company. The Group’s budget is reviewed by the Board before being adopted formally. Operating company results are reported monthly and are reviewed locally, regionally and globally by the business groups and by Group management on a consolidated basis and ultimately by the Board. The results are compared to budget and the previous year, with full-year forecasts prepared and updated quarterly throughout the year. The Company reports to share owners four times a year.
At each year-end, all operating companies supply their full-year fi nancial results with such additional information as is appropriate. This information is consolidated to allow the Group to present the necessary disclosures for UK and US GAAP reporting and International Financial Reporting Standards (IFRS) including International Accounting Standards (IAS).
The Disclosure Committee gives further assurance that publicly-released information, including this Annual Report, is free from material omission or misstatement.
Sarbanes-Oxley s404
As has been reported in previous years, the Group has had plans in place for the necessary testing of its fi nancial controls over fi nancial reporting in order for WPP to report in accordance with s404 of the Sarbanes-Oxley Act, effective for WPP for the fi rst time for the 2006 year end. A substantial amount of this testing has now been conducted in accordance with our plans.
These plans are designed to enable us to report on s404 in respect of the disclosures in the 20-F fi ling (our year-end fi nancial statements to be fi led in the US) and, consistent with these plans, we have not yet undertaken all the necessary procedures.
We confi rm, however, that we will report on s404 in the 2006 20-F within the required time limits.
Going concern
UK company law requires the directors to consider whether it is appropriate to adopt the fi nancial statements on the basis that the Company and the Group are going concerns. As part of its normal business practice, the Group prepares annual and longer-term plans and in reviewing this information and in particular the 2007 three-year plan and budget the directors believe that the Company and the Group have adequate resources for the foreseeable future. Therefore the Company and the Group continue to adopt the going concern basis in preparing the fi nancial statements.
How we behave .

WPP ANNUAL REPORT 2006
Responsibilities in respect of the preparation of fi nancial statements
UK company law also requires the directors to prepare fi nancial statements for each fi nancial year which give a true and fair view of the state of affairs of the Company and the Group as at the end of the fi nancial year and of the profi t or loss of the Group for that year. In preparing those fi nancial statements, the directors are required to:
• select suitable accounting policies and then apply them consistently;
• make judgments and estimates that are reasonable and prudent; and
• state whether applicable accounting standards have been followed, subject to any material departures disclosed and explained in the fi nancial statements.
The directors are responsible for keeping proper accounting records which disclose with reasonable accuracy at all times the fi nancial position of the Company and enable them to ensure that the fi nancial statements comply with the Companies Act 1985. They are also responsible for safeguarding the assets of the Company and consequently for taking all possible steps for the prevention and detection of fraud and other irregularities.
In addition and in accordance with the Companies Act 2006 and the Disclosure and Transparency Rules the directors confi rm that so far as they are aware, there exists no relevant audit information of which the Company’s auditors are unaware and that each director has taken all the steps that he or she ought to have taken, as a director, in order to make himself or herself aware of any relevant audit information and to establish that the Company’s auditors are aware of that information.
The following information, together with the letters from the Chairman of the Nomination, Audit and Compensation Committees, the statements regarding directors’ responsibilities and statement of going concern set out above and the directors’ remuneration and interests in the share capital of the Company set out on pages 126 to 129, are included in the Directors’ report, which also includes the sections “Letter to share owners”, “What we think” and “Operating and Financial Review”.
Substantial share ownership
As at 10 May 2007, the Company is aware of the following interests of 3% or more in the issued ordinary share capital:
MFS Investment Management 4.76%
Legal & General 4.40%
WPP ESOPs* 4.17%
* The trustees of the ESOPs are entirely independent. It is the Company’s intention that the total number of shares held in the ESOPs at any one time is such as may be required to satisfy outstanding incentive plan share awards (but allowing for a contingency element, eg to deal with hirings in the course of a year). The number of shares held in the ESOPs as at 31 December 2006 was 51,134,155. The ordinary shares and ADRs held in the ESOPs did not receive the interim and fi nal dividend paid in 2006 as they waived their respective rights.
The disclosed interests of all of the above refer to the respective combined holdings of those entities and to interests associated with them.
The Company has not been notifi ed of any other holdings of ordinary share capital of 3% or more.
Election of directors
Details of the directors who submit themselves for re-election to the Board are set out in the Notice of Annual General Meeting.
Profi ts and dividends
The profi t before tax for the year was £682.0 million (2005: £592.0 million). The directors recommend a fi nal ordinary dividend of 7.61p (2005: 6.34p) per share to be paid on 9 July 2007 to share owners on the register at 8 June 2007 which, together with the interim ordinary dividend of 3.6p (2005: 3.0p) per share paid on 13 November 2006, makes a total of 11.21p for the year (2005: 9.34p).
Parent company charitable donations
The Company made charitable donations of £238,000 (2005: £379,000). In total WPP companies together with the parent company made an estimated £3.9 million of charitable donations in 2006. More detailed information regarding the Group’s support of charities is set out in the section dealing with corporate responsibility on pages 112 to 117.
It is the Company’s policy not to make payments for political purposes.
How we behaveThe Board of Directors
How we behave

WPP ANNUAL REPORT 2006
How we behaveThe Board of Directors
Group activities
The principal activity of the Group continues to be the provision of communications services worldwide. The Company acts only as a parent company and does not trade.
Share capital
Details of share capital movements are given in note 27 on pages 167 to 169.
Authority for purchase of own shares
At the Annual General Meeting in 2006 share owners passed a special resolution authorising the Company, in accordance with its Articles of Association, to purchase up to 125,022,397 of its own shares in the market. In the year under review, 38.9 million shares (of which 33.2 million were cancelled) were purchased at an average price of £6.64 per share.
Supplier payment policy
The Company has no trade creditors because it is a parent company and does not generate trading revenues. Accordingly, no disclosure can be made of year-end trade creditor days. However, the Group’s policy is to settle the terms of payment with suppliers when agreeing the terms of each transaction, and to ensure that suppliers are made aware of the terms of payment and to abide by the terms of payment. The average trade creditors for the Group, expressed as a number of days, were 48 (2005: 49).
Auditors
The directors will propose a resolution at the AGM to re-appoint Deloitte & Touche LLP as auditors.
By Order of the Board:
M W CapesCompany Secretary15 May 2007
* The sections headed “Letter to share owners”, “What we think” and “Operating & fi nancial review” should be read in conjunction with and as part of the section headed Directors’ report.
How we behave .

WPP ANNUAL REPORT 2006
Corporate responsibility
Business impact
Corporate responsibility is of growing relevance to WPP’s business. In several of our key markets there is increasing consumer, media and governmental interest in environmental and social issues. Our multinational and leading national clients are engaging with subjects from climate change and labour standards to healthy eating and poverty in the developing world.
We believe that WPP is well placed to capitalise on opportunities created by the corporate response to social and environmental change. Our businesses are increasingly supporting clients to develop and promote products that meet consumer demand for environmentally friendly or ethically-conscious products. Our Corporate Responsibility Policy and Report are becoming progressively more relevant when competing for new business.
WPP share owners continue to show interest in our corporate responsibility practices and we aim to respond constructively to their requests for information. WPP is included in the Dow Jones Sustainability Index and the FTSE4Good Index.
Signifi cant issues
We focus our efforts on the issues we have identifi ed as being most material (relevant and signifi cant) to WPP. In 2006 we revised our assessment in light of increased global attention to climate change. We consider fi ve corporate responsibility issues to be of signifi cance to WPP:
• The social and environmental impact of our work for clients.
• Marketing ethics, compliance with marketing standards, and protection of consumer privacy.
• Employment, including diversity and equal opportunities, business ethics, employee development, remuneration, communication, and health and safety.
• Social investment, including pro bono work, donations to charity and employee volunteering.
• Climate change, including the emissions from energy used in our offi ces and during business travel.
How we manage corporate responsibility risk and opportunity
Paul Richardson is the Board director responsible for assessing corporate responsibility risks. He chairs WPP’s Corporate Responsibility Committee, established in 2003.
The committee is made up of senior representatives from WPP’s major business categories. It identifi es and assesses signifi cant corporate responsibility risks and opportunities for the business. In support of WPP’s corporate responsibility activities, the Group’s operating companies have each nominated a corporate responsibility representative responsible for compiling and reporting data to the parent company and co-ordinating activity within the operating companies.
Paul Richardson provides an annual assessment of corporate responsibility risks and performance to the Audit Committee. This is in addition to the business and fi nancial reporting risks process described on pages 108 and 109.
WPP’s Corporate Responsibility Policy and our Code of Business Conduct provide guidance for our people on a wide range of ethical, social and environmental subjects. Both documents are publicly available on our website www.wpp.com.
We have established an initial set of key performance indicators (KPIs) in our Corporate Responsibility Reports. These relate to marketing ethics, employment, social investment and climate change.
Corporate responsibility goals
We have two ongoing corporate responsibility goals:
• Contribution to society – Undertake pro bono work and make donations to charity to a value of 0.4% of revenue.
• Marketing ethics – Comply with all laws and industry codes governing marketing material.
Achieving our goals requires co-ordinated effort across fi ve continents and communication with over 2,000 offi ces. This year we met our goal to contribute 0.4% of revenue to charity. On our marketing ethics, among the thousands of advertisements prepared by WPP companies, we identifi ed 23 infringements of marketing codes in seven countries.
In 2007, we will establish new goals for reducing our carbon footprint.
How we behave
How we behave
WPP ANNUAL REPORT 2006
How we behaveCorporate responsibility
Progress in 2006
We will publish our fi fth Corporate Responsibility Report in 2007. This will provide a detailed and objective account of how we are implementing WPP’s Corporate Responsibility Policy across our businesses. A summary of our progress is provided below.
Corporate responsibility information is collected via an internal survey of our businesses. This survey is conducted annually and signed off by the CEO for each operating company. The results are collated and validated by our audit function.
The impact of our work
The work our companies produce is a signifi cant part of our corporate responsibility performance. Supporting clients by marketing products that offer environmental and social benefi ts is key. In addition, WPP businesses work for governments producing campaigns to raise public awareness of issues such as climate change, the importance of health and well-being and the dangers associated with illegal drugs.
Corporate responsibility in our client work
New products, for example those that reduce society’s impact on climate change, require new marketing approaches to succeed. Our companies’ commercial and creative abilities will play a role in promoting the sustainable consumption patterns of the future. In our Corporate Responsibility Report we profi le campaigns for clients which contain work with an environmental or social dimension. This work is indicative of a trend emerging in many markets around the world.
Social marketing
WPP companies undertake work for clients (frequently government agencies) where the objective is to advance a social or environmental cause. These campaigns typically provide public health information, raise awareness of environmental issues or address public safety. Examples of social marketing campaigns by WPP agencies in 2006 are included in our Corporate Responsibility Report.
Cause-related marketing
Cause-related marketing links brands to charities, usually through a donation for every product purchased. Executed sensitively, these campaigns benefi t both brand and charity. Many WPP companies work on cause-related marketing. Examples from 2006 are included in our Corporate Responsibility Report.
Marketing ethics
As a minimum our businesses are expected to comply with all laws, regulations and codes of marketing practice. Our Code of Business Conduct states that we will not knowingly create work which contains statements, suggestions or images offensive to general public decency and will give appropriate consideration to the impact of our work on minority segments of the population, whether that minority be by race, religion, national origin, colour, gender, sex or sexual orientation, gender identity or expression, age or disability.
Supporting marketing standards
Many professionals from within WPP companies play an important part in developing and revising industry codes in sensitive areas such as advertising to children and the marketing of food and pharmaceutical products.
Complaints
Most of the campaigns we produce for clients do not cause complaint, but occasionally complaints do occur relating to matters of taste or fact. In most countries these are arbitrated by government or industry organisations. We have started to track the number of global complaints although our data is still incomplete. In 2006 among the many thousands of advertisements prepared by WPP companies we identifi ed some 23 infringements of marketing codes in seven countries.
Privacy
Privacy is an important issue for our market research and direct marketing companies as they hold and use consumer data. Our operating companies comply with national data protection laws and marketing codes of practice such as the UK Data Protection Act and the EU Data Protection Directive.
How we behave .
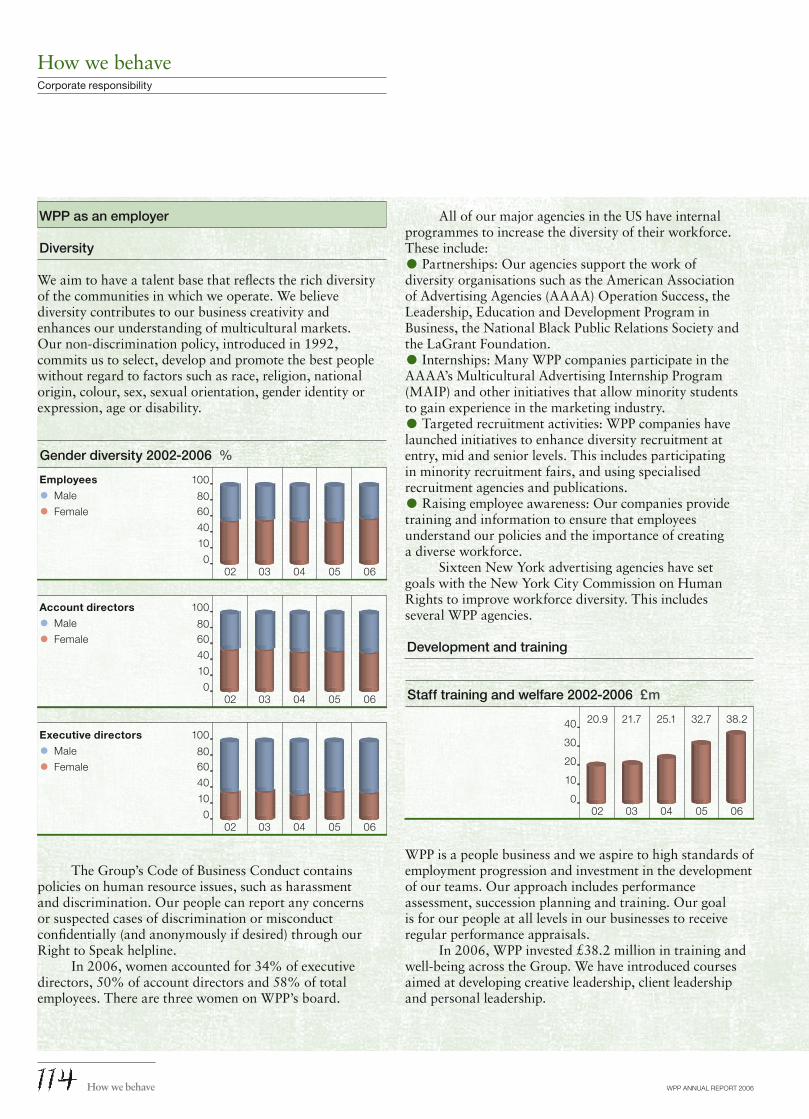
WPP ANNUAL REPORT 2006
WPP as an employer
Diversity
We aim to have a talent base that refl ects the rich diversity of the communities in which we operate. We believe diversity contributes to our business creativity and enhances our understanding of multicultural markets. Our non-discrimination policy, introduced in 1992, commits us to select, develop and promote the best people without regard to factors such as race, religion, national origin, colour, sex, sexual orientation, gender identity or expression, age or disability.
02 03 04 05 06
02 03 04 05 06
02 03 04 05 06
100
8060
40
10
0
100
8060
40
10
0
100
8060
40
10
0
Employees
• Male
• Female
Account directors
• Male
• Female
Executive directors
• Male
• Female
Gender diversity 2002-2006 %
The Group’s Code of Business Conduct contains policies on human resource issues, such as harassment and discrimination. Our people can report any concerns or suspected cases of discrimination or misconduct confi dentially (and anonymously if desired) through our Right to Speak helpline.
In 2006, women accounted for 34% of executive directors, 50% of account directors and 58% of total employees. There are three women on WPP’s board.
All of our major agencies in the US have internal programmes to increase the diversity of their workforce. These include:
• Partnerships: Our agencies support the work of diversity organisations such as the American Association of Advertising Agencies (AAAA) Operation Success, the Leadership, Education and Development Program in Business, the National Black Public Relations Society and the LaGrant Foundation.
• Internships: Many WPP companies participate in the AAAA’s Multicultural Advertising Internship Program (MAIP) and other initiatives that allow minority students to gain experience in the marketing industry.
• Targeted recruitment activities: WPP companies have launched initiatives to enhance diversity recruitment at entry, mid and senior levels. This includes participating in minority recruitment fairs, and using specialised recruitment agencies and publications.
• Raising employee awareness: Our companies provide training and information to ensure that employees understand our policies and the importance of creating a diverse workforce.
Sixteen New York advertising agencies have set goals with the New York City Commission on Human Rights to improve workforce diversity. This includes several WPP agencies.
Development and training
20.9 21.7 25.1 32.7
02 03 04 05
38.2
06
40
30
20
10
0
Staff training and welfare 2002-2006 £m
WPP is a people business and we aspire to high standards of employment progression and investment in the development of our teams. Our approach includes performance assessment, succession planning and training. Our goal is for our people at all levels in our businesses to receive regular performance appraisals.
In 2006, WPP invested £38.2 million in training and well-being across the Group. We have introduced courses aimed at developing creative leadership, client leadership and personal leadership.
How we behaveCorporate responsibility
How we behave

WPP ANNUAL REPORT 2006
Our operating companies also run a range of training courses covering all aspects of agency business and creative skills. For example, many agencies in the UK are accredited as Investors in People including Coley Porter Bell, EWA Bespoke Communications, Headcount and Ogilvy Healthworld. This is a UK standard of good practice for training and development.
Employee share ownership
Share ownership gives our people a fi nancial stake in the Company and a share in its success. WPP’s Worldwide Ownership Plan, introduced in 1997, has granted share options to over 64,095 of our people. Details of this plan and other executive stock options can be found on page 122.
Communication
With 100,000 people in 106 countries strong internal communication is essential. Some examples are:
• Distribution of the Annual Report and Accounts, the Navigator company handbook, the Atticus Journal,The WIRE (WPP’s global newspaper), and regular FactFiles to all companies worldwide.
• A monthly online news bulletin – e.wire.
• Regular communication on Group initiatives such as the Worldwide Partnership Program, BRANDZ, the Atticus Awards, the WPP Marketing Fellowship Program and professional development workshops.
• Periodic reports from Sir Martin Sorrell to participants in LEAP and to the Leaders, Partners and High Potential groups.
• WPP’s website, Group intranet site and professional knowledge communities.
• Formal and informal meetings at operating company level.
• Our annual Corporate Responsibility Report is widely distributed across WPP and is available on our intranet and website.
Health and wellbeing
We aim to identify and reduce health risks, provide a safe workplace and promote employee wellbeing. This contributes to productivity and reduces absence from work. We focus on issues relevant to our offi ce environments, such as stress management and good practice in workstation design and use.
Our agencies seek to create an environment where people feel able to discuss any issues, including stress, with their manager or human resources department. Our companies also assess the risk of work-related stress through regular staff surveys and by monitoring issues raised via our Right to Speak helpline, Employee Assistance Programs and during exit interviews.
Initiatives to combat workplace stress vary by company but include:
• Employee Assistance Programs – a source of confi dential advice, support and counselling.
• Flexible benefi t programs, including subsidised childcare.
• Flexible work arrangements enabling people to work part-time or from home.
• Medical checks and health screening.
• Training on stress and time management.
Employee external appointments
The Company recognises that its directors and senior executives may be invited to become non-executive directors of other companies and that such exposure may be benefi cial to the Group. Consequently, executives are allowed to accept non-executive appointments with non-competing companies subject to obtaining the approval of the Group chief executive in the case of senior executives and the approval of the Nomination Committee in the case of executive directors. Any fees receivable out of such appointments are retained by the individuals concerned.
Environment
Our Corporate Responsibility Policy commits us to minimise our impact on the environment. Climate change is the most important environmental issue for our company.
Our response to climate change is important to our people and our clients. Many of the companies we work for are leaders on this issue. They frequently request evidence of our approach to the environment and corporate responsibility during pitches. WPP companies are increasingly advising clients on their response to climate change in research, product development and marketing. To do this well, we need to show leadership by reducing our own climate change impact.
We are reviewing our approach to this issue and will shortly be announcing a new climate change strategy for WPP.
How we behaveCorporate responsibility
How we behave .

WPP ANNUAL REPORT 2006
Energy and climate change
The amount of carbon that WPP emits – our carbon footprint – is about 260,000 tonnes of CO2.
The Group’s total carbon footprint has been calculated by extrapolating offi ce energy and business fl ight data reported by our major companies. This extrapolation covers all WPP companies excluding associates (companies in which we have a minority shareholding). This represents the footprint of the average number of staff employed by the Group being 77,686 people.
WPP’s carbon footprint
CO2 emissions (tonnes)
Offi ce energy use 144,354
Air travel 81,733
Other 33,913
Total 260,000
Our fi gures have been reviewed by the Edinburgh Centre of Carbon Management (ECCM) and include all Greenhouse Gas Emissions (GHGs) in accordance with the WBCSD Protocol (www.ghgprotocol.org).
Paper use
We encourage offi ces to purchase paper with recycled content.
In most of our larger markets, WPP procurement identifi es preferred paper suppliers which our agencies are encouraged to use. Many of our preferred suppliers across our major markets now provide paper and paper products with recycled content.
Recycling
Our data suggests that more than half of WPP offi ces recycle waste paper. Other materials recycled include toner printer cartridges (over a third of offi ces), old computer equipment (around a quarter) and plastic (almost a fi fth).
We have launched a program to ensure that all obsolete IT equipment from WPP companies worldwide is disposed of in an environmentally-sensitive way.
Supply chain
We recognise the potential impact of our purchasing decisions on the environment and also the need to consider the labour standards associated with manufacturing in certain product sectors.
Our corporate responsibility supply vision for WPP states that: “Across all of our spend, we want to do business with suppliers that meet high standards on the environment and employment practices. We are committed to managing corporate responsibility risks in our supply chain, both for ourselves and our clients.”
We have added ethical and environmental criteria to WPP’s Procurement Policy. This includes a simple fi ve-point questionnaire which we use during supplier selection to help us assess whether supplier companies are managing corporate responsibility issues.
In April 2006 we held a pilot corporate responsibility workshop in the UK for eight suppliers to explain our approach to corporate responsibility and our expectations of suppliers. We selected suppliers that provide products and services which we purchase for clients including print, TV post production and promotions companies. We are following up with each supplier individually to agree an action plan for improving corporate responsibility management by the end of 2007.
During 2007, we plan to hold a second supplier corporate responsibility workshop in the UK with a group of print suppliers.
How we behaveCorporate responsibility
How we behave

WPP ANNUAL REPORT 2006
Social investment
In 2006, our social investment was worth £24.9 million ($45.9 million), in total, compared with £17.3 million in 2005. This is equivalent to 0.42% of our total revenue (meeting our annual ongoing target) and 3.7% of reported profi t before tax. It includes £21 million worth of pro bono work – this is calculated based on the fees the organisations would have paid for our work. We also donated £3.9 million in cash grants to charitable causes across the world.
The value of our social investment for pro bono work has increased partly due to improvements in our data collection systems.
WPP came fourth in the UK Guardian newspaper’s Giving List 2006 (based on 2005 data) that ranks FTSE 100 companies by the value of their social investment.
30
20151050
25• Pro bono work
• Charitable donations
0201 03 04 05 06
Social investment 2001-2006 £m
• Local community 30
• Education 10
• Health 38
• Environment 4
• Arts 4
• Alcohol abuse 1
• Other 13
Pro bono work 2006 %
Pro bono work
WPP companies have a history of supporting charities on a pro bono basis. The donation of our time and skills at no cost or minimal cost is worth much more than an equivalent cash donation. This is because the work we undertake for charities helps them recruit members, raise funds and advance causes. The net benefi t to the charity is usually many times the value of our input.
How we behaveCorporate responsibility
For example, in 2006 two WPP agencies took part in the Global Media AIDS Initiative. Each agency created a pro bono TV advertising spot to raise awareness of HIV/AIDS, 25 years after the disease was fi rst diagnosed. Each advertisement tackled an issue that contributes to the spread of HIV, including unsafe sex, stigma and gender inequality. The campaign was made available rights-free to media outlets around the world so as to reach the widest audience possible.
WPP the parent company
The Company focuses its support on education, young people and the arts. In the UK, WPP supports a range of organisations including: the Royal College of Art annual illustration competition and Hardship Fund; two bursary awards for D&AD, the professional association for design and advertising; and the National Portrait Gallery and Natural History Museum. We are a corporate member of the Media Trust which provides training and communications services for the voluntary sector.
Many senior WPP executives also give pro bono advice and support. Sir Martin Sorrell is an active participant in programs at the following international business schools: London Business School; IESE, Spain; Indian Business School; Harvard Business School and Boston University.
A donation from WPP has paid for a library to be built at the Lower Basic School in Sanyang village, Gambia. This has been stocked by books donated from across WPP companies. WPP is also supporting a regional health clinic at Medina Salaam, paying for a community nurse, the purchase of drugs and equipment, and the installation of solar panels.
Employee volunteering
Many of our people give their time and expertise as volunteers to support good causes in their local communities. We encourage this because it benefi ts the charity and our people.
For example, MediaCom Russia’s ‘good deeds’ program supports local orphanages in Moscow. The company and its employees contribute money, which is used to buy children’s books, games and clothes. Once a quarter, employees are given time to deliver the goods and spend time with the children.
How we behave .

WPP ANNUAL REPORT 2006How we’re rewarded
WPP ANNUAL REPORT 2006
How we’re rewardedCompensation Committee report on behalf of the Board
his report is made by the Board, prepared on its behalf and for its approval by the Compensation Committee.
The report provides the Company’s statement of how it has applied the principles of good governance set out in the Combined Code and Schedule 7A to the Companies Act in respect
of compensation matters. The report of the auditors on the fi nancial statements
set out on pages 179 and 180 confi rms that the scope of their report covers, where required, the disclosures contained in or referred to in this report that are specifi ed for their audit by the UK Listing Authority and under the Companies Act.
Details of each individual director’s remuneration and of their benefi cial holdings of the Company’s shares and share awards are set out on pages 126 and 127.
The Company is required to submit the Compensation Committee report for share owner approval at the Annual General Meeting (AGM) convened for 26 June 2007 and the appropriate resolution is set out as resolution 12 in the Notice of Annual General Meeting accompanying the Annual Report and Accounts.
2006 highlights
During the year the most signifi cant issues addressed by the committee were:
• A review of the total compensation packages of the Group’s most senior executives relative to the market place benchmarks.
• The approval of bonuses for senior executives throughout the Group.
• A review of the remuneration for non-executive directors of the Group, including the chairman, which was supported by advice from Towers Perrin, and making recommendations to the Board.
• A review of the total compensation packages of WPP’s executive directors to evaluate their appropriateness in various circumstances, including termination of employment.
• Consideration of possible amendments to the LEAP programme in respect of future awards under that plan.
• A review of the impact of recent changes in age discrimination legislation in the UK and pension requirements in the US.
Remit of the Compensation Committee
Under its terms of reference the committee is responsible for:
• Reviewing and approving the remuneration and terms of employment (including any termination arrangements) of executive directors and senior executives of the Company and of directors and senior executives of the operating companies.
• Reviewing the Group’s incentive policy and compensation plans.
• Monitoring the vesting of awards under all incentive plans.
• Reviewing systems implemented throughout the Group to deal with matters such as employee harassment and discrimination.
• Appointing and reviewing the performance of external advisors to the committee and to the Company in relation to executive remuneration and human resource activities.
How we’re rewarded .
WPP ANNUAL REPORT 2006
Composition of the Compensation Committee
During 2006, the Compensation Committee comprised the following who took decisions in respect of the year:
• Jeffrey Rosen (chairman of the committee): appointed to the committee as chairman on 27 June 2006;
• S W Morten: retired on 27 June 2006;
• P Lader;
• C Mackenzie; and
• Esther Dyson: appointed on 4 May 2006. No member of the committee has any personal
fi nancial interest (other than as a share owner as disclosed on page 127) in the matters to be decided by the committee, potential confl icts of interest arising from cross-directorships or day-to-day involvement in running the Group’s businesses.
The terms of reference for the Compensation Committee are available on the Company’s website and will be on display as set out in the Notice of Annual General Meeting.
Advisors to the Compensation Committee
The Compensation Committee regularly consults with Group executives, particularly the Group chief executive (who was not present when matters relating to his own compensation or contracts were discussed and decided), the chief talent offi cer and the director of compensation and benefi ts. During the year, the committee received material assistance from Towers Perrin. Advice was also received from Hammonds solicitors on legal and governance issues relating to compensation and benefi ts which arose during the course of the year. Hammonds provide legal advice on a range of matters to the Group.
During 2006, advice in relation to the remuneration of the chairman of the Company and the non-executive directors was provided by Towers Perrin to the committee which advice was then passed to the Board for review and determination.
Advice is received by the committee on issues including the following:
• analysis of competitive compensation practices and determination of competitive positioning;
• base salary levels;
• annual and long-term incentive plans and awards including awards made under LEAP;
• policy relating to WPP share ownership;
• pensions and executive benefi ts;
• changes in accounting, taxation, legal and regulatory practices;
• governance issues relating to compensation and the role of the committee; and
• policies for preventing employee harassment and discrimination.
Principles of remuneration
All executive compensation at WPP is governed by three guiding principles:
• competitiveness;
• performance; and
• alignment to share owner interests.
Competitiveness
Compensation packages for Group executives are reviewed on a regular basis (on average every 24 months). When reviewing an executive’s package the committee usually consults with the Group chief executive and the Group chief talent offi cer.
In making its assessments, the committee considers individual and business unit performance, level of experience and scope of responsibility. It also takes into account the overall value of the package, including both fi xed and variable elements, and focuses on the ‘on-target’ level of remuneration. The competitiveness of this total package is then reviewed in relation to the most appropriate benchmarks.
For example, for the Group chief executive three separate benchmarks for remuneration opportunities are used:
• the most senior executive position in the Company’s closest industry comparators;
• the CEO position in companies of comparable size and complexity in the UK; and
• the CEO position in public companies of comparable size and complexity in the US.
The same approach is taken for the other senior executives, including executive directors. The Compensation Committee considers data from the latest industry surveys covering the senior positions in WPP’s operating companies. WPP participates in the leading global surveys of executive remuneration in the advertising, market research, healthcare, public relations and public affairs sectors. In addition, for heads of operating companies the committee considers public disclosures for similar positions in listed companies of comparable size and complexity in the relevant sector.
How we’re rewardedCompensation Committee report on behalf of the Board
How we’re rewarded

WPP ANNUAL REPORT 2006
Performance
All remuneration packages for senior executives, including executive directors, have a signifi cant element which is variable and dependent on performance as can be seen from the chart below.
0 20 40 60 80 100
Sir Martin Sorrell
Paul Richardson
Mark Read
• Fixed • Variable
Performance %
Notesi) Fixed compensation comprises salary, pension contributions and other benefi ts as disclosed in
the table on page 126.ii) Variable compensation comprises short-term incentive plans and the value of Executive Share
Awards which are also disclosed in the table on page 126 along with the expected value of the Renewed LEAP award granted in 2006 referred to in the table on page 129.
iii) Howard Paster was also an executive director during 2006 but retired on 27 June 2006.
Alignment to share owner interests
WPP is committed to aligning executive performance and reward with share owner interests. This is achieved by providing signifi cant opportunities for executives to acquire WPP stock, by using performance measures that are linked to the creation of share owner value and by operating share ownership goals for the most senior executives.
Many of our incentive plans pay out wholly or partially in WPP stock. As can be seen below, over half of the compensation package of the executive directors was delivered in shares during 2006.
0 20 40 60 80 100
Sir Martin Sorrell
Paul Richardson
Mark Read
• Cash • Shares
Alignment to share owner interests %
Notesi) Cash compensation comprises salary, pension contributions, short-term incentive plans and
other benefi ts as disclosed in the table on page 126.ii) Share-based compensation comprises the value of Executive Share Awards which are also
disclosed in the table on page 126 along with the expected value of the Renewed LEAP awards granted in 2006 referred to in the table on page 129.
iii) Howard Paster was also an executive director during 2006 but retired on 27 June 2006.
The Compensation Committee continues to believe that Total Shareholder Return (TSR) relative to a group of key comparators is the most appropriate measure for determining long-term performance-based rewards for Group executive directors, as it most closely aligns reward with the delivery of share owner value. For this reason TSR is the sole measure of performance used for Renewed LEAP.
WPP has encouraged share ownership for its most senior executives, including executive directors, for many years. For executive directors this is achieved through participation in Renewed LEAP. Other WPP Leaders (approximately 200 people) are expected to own 40,000 WPP ordinary shares.
There is also a need to ensure that share owner value is not diminished through the issue of new shares to satisfy incentive awards. The dilution, as at 15 May 2007, was well below the 10% level acceptable to the ABI. It is intended that Renewed LEAP awards, the Performance Share Awards, the Executive Share Awards and Restricted Stock Plan awards will all be satisfi ed with purchased shares held in the employee share ownership plans (ESOPs).
6.65.4 6.0 7.2•• WPP
ABI Limit
03 04
4.5
02468
10
02 05 06
WPP Share Incentive Scheme dilution for 2002 to 2006 %
How we’re rewardedCompensation Committee report on behalf of the Board
How we’re rewarded .

WPP ANNUAL REPORT 2006
How we’re rewardedCompensation Committee report on behalf of the Board
Objective Participation Performance period
Conditions
Annual
Base salary1 To maintain package competitiveness at all levels within the Group.
All employees. n/a Not applicable. But salary levels are determined taking a number of relevant factors into account, including individual and business unit performance, level of experience, scope of responsibility and the competitiveness of total remuneration.
Cash bonus To incentivise delivery of value at all levels within the Group.
Approximately 10% of employees are eligible to receive a performance bonus.
1 year Achievement of challenging performance goals (fi nancial and non-fi nancial) at the individual and business unit level.
Performance share awards2
To incentivise delivery of value and to align with interests of share owners.
Key operating company executives.
1 year Achievement of challenging performance goals (fi nancial and non-fi nancial) at operating company level. Further two-year retention period.
Executive share awards2
To incentivise delivery of value and to align with interests of share owners.
Key parent company executives and executive directors.
1 year Achievement of individual annual bonus objectives. Further two-year retention period.
Long-Term
WWOP3 To develop a stronger ownership culture. Employees with two years’ employment. Not offered to those participating in other share programs or to executive directors.
3 years None.
Renewed LEAP
To incentivise long-term performance of the most senior executives against the TSR of key comparators and maximise alignment with share owner interests through a high level of personal fi nancial commitment.
Participation offered only to those key executives (currently less than 20 people) whose contributions transcend their day-to-day role, including executive directors.
5 years Relative TSR performance against a group of key communication services comparator companies, subject to a fairness review by the Compensation Committee.
Restricted Stock Plan
To encourage a share ownership culture and long-term retention as well as supporting recruitment.
Directors and senior executives of the operating companies and senior executives of the parent company.
n/a Typically 3-year retention period.
Executive Stock Option Plan
To provide a tool to promote retention and recruitment.
Occasional use only to deal with special situations.
3 years Conditions are determined at the time of grant of the award.
NotesThis table does not include details of previous plans, such as operating company LTIPS and PSP which are no longer used for regular grants of new awards.1 Base salary is the only pensionable element of remuneration.2 Awards are granted under the Restricted Stock Plan.3 Since its fi rst adoption in 1997, grants have been made annually under this plan and as at 31 December 2006 options under this plan had been granted to
over 56,000 employees for approximately 27 million ordinary shares of the Company.
Key elements of short- and long-term remuneration
How we’re rewarded

WPP ANNUAL REPORT 2006
How we’re rewardedCompensation Committee report on behalf of the Board
Policy on directors’ service contracts, notice periods and termination payments
The Company’s policy on the duration of directors’ service contracts is that none of the contracts of parent company executive directors contain liquidated damages provisions. There were no payments in 2006 in respect of termination of employment of any executive director. The notice periods for directors are as follows:
Executive director Contract/effective date Notice period
Sir Martin Sorrell 1 April 2005 “At will”
Paul Richardson 1 January 2005 12 months
Mark Read 9 September 2002 6 months
Non-executive director* Contract date
Philip Lader 26 February 2001
Colin Day 25 July 2005
Esther Dyson 29 June 1999
Orit Gadiesh 28 April 2004
David Komansky 28 January 2003
Bud Morten 2 December 1991
Lubna Olayan 18 March 2005
John Quelch 10 July 1991
Koichiro Naganuma 23 January 2004
Christopher Mackenzie 14 March 2000
Jeffrey Rosen 20 December 2004
Paul Spencer 28 April 2004
Notes* The notice period applicable to all non-executive directors is two months.
During 2006, the committee reviewed in detail the fi nancial impact of a termination of employment of each of the executive directors.
150
100
50
031 Dec
0131 Dec
0231 Dec
0331 Dec
0431 Dec
0531 Dec
06Jan-
Apr 07
WPP
FTSE100
Omnicom
Interpublic
Performance graph WPP total return to share owners relative to relevant comparators rebased to 31 December 2001
For share owners’ information, the Company’s TSR for the period from 31 December 2001 to April 2007 is shown on this graph. The FTSE 100 is the Index the Board considers most relevant for the purpose of comparison and Interpublic and Omnicom are shown as these are the companies with whose performance that of the Company is most commonly compared.
Elements of remuneration
The principal elements of WPP executive remuneration were fully reviewed in 2005 and currently comprise the following:
• Base salaries (fi xed);
• Annual incentives (variable); and
• Long-term incentives (variable).Pension contributions, life assurance, health and disability, and other benefi ts are also provided.
Base salary
The Compensation Committee believes that base salary is only one element of compensation and therefore should only be reviewed in the context of the total compensation being provided to an executive.
During 2006, the committee approved an increase to Mark Read’s base salary from £225,000 to £275,000. The implementation of this was deferred until 1 January 2007.
With effect from 1 January 2007 Sir Martin Sorrell’s base salary has been increased from £840,000 to £1,000,000. This is the fi rst increase to Sir Martin’s base salary since September 1999.
Annual cash bonus
The annual cash bonus is paid under plans established for each operating company as well as the parent company. Challenging performance goals are established and these must be achieved before any bonus becomes payable.
Each executive’s annual incentive opportunity is defi ned at a ‘target’ level for the full achievement of objectives. Higher awards may be paid for outstanding performance in excess of target.
The target level for Sir Martin Sorrell is 100% of base salary with a maximum of up to 200%. For Paul Richardson the target is 80% with a maximum of up to 120% and for Mark Read the target is 50% with a maximum of up to 75% of base salary.
In the case of the Group chief executive and other parent company directors, the annual cash bonus is based on Group and individual performance:
• one-third is based on Group fi nancial results. This goal is common for all executive directors including the Group chief executive (for 2006 the Group’s fi nancial results were very strong, with Headline PBIT increasing by almost 14% to £859 million, Headline PBIT margin increasing from 14.0% to 14.5% and Headline diluted earnings per share up almost 17% to 42.0 pence per share.);
How we’re rewarded .

WPP ANNUAL REPORT 2006
How we’re rewardedCompensation Committee report on behalf of the Board
• one-third is based on individual strategic objectives determined prospectively by the committee at the commencement of each year. In the case of the Group chief executive this related to the relative fi nancial performance of WPP against its peer group. For 2006 WPP outperformed the peer group both in terms of EPS growth and margin improvement; and
• one-third is based on the achievement by the individual director of key business objectives assessed by the committee at the end of each year. Key business objectives in 2006 for the Group chief executive included (amongst others) developing and enhancing the strategic position of the Group and Group companies in developed and fast-growing geographies; implementing business and strategic initiatives in response to the transition from traditional forms of advertising and media delivery to new forms more infl uenced by the increasing importance of digital media; arranging, and continuing to monitor and develop candidates for leadership succession for a number of specifi c key operating company and parent company roles; and intensifying collaboration among business leaders and the process of cross-selling between Group companies, including co-ordination on client initiatives.
As a percentage of base salary, the target, maximum and actual bonuses for 2006 paid to executive directors were as follows:
Target Maximum Actual
Sir Martin Sorrell 100 200 192
Paul Richardson 80 120 111
Mark Read* 50 75 65**
Note* In 2006, Mark Read elected to defer 40% of his bonus.** Calculated by reference to a base salary of £275,000.
In some countries an opportunity exists to defer part of the annual bonus for four years in the form of WPP shares. At the end of the deferral period a 25% match is applied to the original shares, subject to continuous employment.
Share awards
Following the policy review undertaken in 2005, the operating company LTIPs were replaced by PSAs. This has considerably simplifi ed the measurement of performance while at the same time increasing retention by ensuring a greater percentage of the bonus pool is paid in shares.
At the parent company the comparable change meant that no further awards were granted under the Performance Share Plan and instead ESAs are used to reward executive directors for performance over a single year. Performance under these awards is against the same measures currently used to determine the annual bonus payment, but in this case delivered entirely in the form of shares with a further two-year retention period.
Awards are not pensionable and will be satisfi ed out of one of the Company’s ESOPs and not out of a new issue of WPP or treasury shares.
As a percentage of base salary, the target, maximum and actual awards for 2006 to executive directors were as follows:
Target Maximum Actual
Sir Martin Sorrell 67 100 97
Paul Richardson 100 133 125
Mark Read 67 100 87*
* Calculated by reference to a base salary of £275,000.
Renewed Leadership Equity Acquisition Plan (‘Renewed LEAP’)
2006 was the third year of operation for Renewed LEAP and awards were once again granted to the Group’s key executives.
Under Renewed LEAP, participants have to commit to acquire and retain WPP shares (‘investment shares’) in order to have the opportunity to earn additional WPP shares (‘matching shares’). The number of matching shares which a participant can receive at the end of the investment and performance period depends on the performance (based on TSR) of the Company measured over fi ve fi nancial years (four years in the case of awards made in 2004).
However, the Compensation Committee also acknowledges that TSR may not always refl ect the true performance of the Company and in performing its ‘fairness review’ the committee may in exceptional circumstances decide to vary the number of matching shares that will vest. Factors that the committee will consider in its fairness review of any awards will include various measures of the Group’s fi nancial performance, such as growth in revenues and in earnings per share.
How we’re rewarded

WPP ANNUAL REPORT 2006
How we’re rewardedCompensation Committee report on behalf of the Board
For awards made in 2005 and 2006 the vesting schedule is as follows:
Rank compared to peer group* Number of matching shares
1 5
2 5
3 4.5
4 3.5
5 2.5
Median 1.5
Below median 0**
Notes* For actual performance between these positions the match is calculated on a pro rata basis.** Participants in their fi rst year of LEAP receive a half share match for performance below median.
For awards made in 2004 the vesting schedule is as follows:
Rank compared to peer group* Number of matching shares
1 4
2 4
3 3.6
4 2.8
5 2
6 1.6
Median 1.2
Below median 0**
Notes* For actual performance between these positions the match is calculated on a pro rata basis.** Participants in their fi rst year of LEAP, receive a half share match for performance below median.
The comparator companies for the awards made in 2006 were:
Omnicom Gfk
Interpublic Aegis
Publicis Taylor Nelson Sofres
Havas Dentsu
Ipsos Arbitron
Retirement benefi ts
All pension coverage for the Company’s executive directors is currently on a defi ned contribution basis and only base salary is pensionable under any Company retirement plan. Details of pension contributions for the period under review in respect of executive directors are set out on page 126.
The form and level of Company sponsored retirement programs varies depending on historical practices and local market considerations. The level of retirement benefi ts is regularly considered when reviewing total executive remuneration levels.
How we’re rewarded .

WPP ANNUAL REPORT 2006
Directors’ remuneration*
* Information that has been audited
The compensation of all executive directors is determined by the Compensation Committee which is comprised wholly of non-executive directors whom the Company considers to be independent. The Compensation Committee is advised by independent remuneration consultants as well as by Group executives as referred to in the Report of the Compensation Committee on page 120. The information in this section (pages 126 to 129) forms the part of the Report of the Compensation Committee that is subject to audit.
The compensation of the chairman and non-executive directors is determined by the Board which is similarly advised.The components of executive directors’ remuneration and the principles on which these are established are described
in the Report of the Compensation Committee which commences on page 119.Remuneration of the directors who were directors during the year ended 31 December 2006 is set out in the table
below. All amounts shown constitute the total amounts which the respective director received during 2006 and for the annual bonus and awards of ESA’s in respect of 2006 but received in 2007. No compensation payments for loss of offi ce have been made during 2006 to any individuals who have been directors of the Company.
Short-term incentive Total annual Pension plans remuneration contributions
Salary Other (annual Value 2006 2005 2006 2005 and fees benefi ts1 bonus)2 of ESA8 Total Total Total TotalChairman Location £000 £000 £000 £000 £000 £000 £000 £000
P Lader3 USA 213 – – – 213 216 – –
Executive directors
Sir Martin Sorrell3,4,10 UK 832 34 1,613 815 3,294 3,278 337 343
H Paster3,6 USA 190 19 – – 209 1,035 15 19
M Read UK 225 1 180 240 646 551 23 17
P W G Richardson3,5 USA 447 98 501 566 1,612 1,490 90 90
Non-executive directors
C Day UK 50 – – – 50 22 – –
E Dyson3 USA 56 – – – 56 51 – –
O Gadiesh3 USA 50 – – – 50 51 – –
D Komansky3 USA 51 – – – 51 51 – –
C Mackenzie UK 54 – – – 54 54 – –
S W Morten3 USA 63 – – – 63 65 – –
K Naganuma9 Japan – – – – – – – –
L Olayan KSA 50 – – – 50 40 – –
J A Quelch3,7 USA 87 52 – – 139 139 – –
J Rosen3 USA 60 – – – 60 54 – –
P Spencer UK 60 – – – 60 60 – –
Total remuneration 2,488 204 2,294 1,621 6,607 7,157 465 469
Notes1 Other benefi ts include items such as healthcare, life assurance and allowances for cars and housing.2 Amounts paid in 2007 in respect of bonus entitlements for 2006.3 All amounts payable in US dollars have been converted into pounds sterling at $1.8432 to £1. The amounts paid to Sir Martin Sorrell and Paul Richardson were paid part in US dollars and part in pounds
sterling. This can give rise to small fl uctuations year-on-year.4 The amount of salary and fees comprise the aggregate of salary/fees paid under the UK Agreement and the salary paid under the US Agreement.5 Neither Paul Richardson nor the Company received any payment from Chime Communications PLC or STW Communications Group Limited in respect of his non-executive directorships in those
companies.6 Howard Paster retired from the Board in June 2006.7 In addition to fees paid to John Quelch in 2006 as a non-executive director of the Company additional fees were received by him of £37,000.8 Shares under these awards are deferred for two years.9 Mr Naganuma received no remuneration from the Company given his executive position with Asatsu DK.10 During 2006 an amount of approximately £193,000 was paid to Sir Martin Sorrell in respect of tax liabilities incurred by him on expenditure on various items considered by the UK Tax authorities as benefi ts
in kind but which the committee consider to be essential to his ability to deliver his services successfully to the Group.
How we’re rewarded
How we’re rewarded

WPP ANNUAL REPORT 2006
How we’re rewarded
Directors’ interests
Ordinary shares
Directors’ interests in the Company’s share capital, all of which were benefi cial, were as follows1:
Movement Shares acquired during At 31 Dec Shares acquired
At 1 Jan through long-term 2006 2006 through long-term Other 15 May 2007 2006 or incentive plan inc. shares or earlier incentive plan movements or earlier appointment awards in 20062
purchased retirement or awards in 20072 since retirement or
date Vested (sold) in 2006 resignation Vested (sold) 31 Dec 2006 resignation
C Day 5,240 – – – 5,240 – – – 5,240
E Dyson 35,000 – – – 35,000 – – – 35,000
O Gadiesh – – – – – – – – –
D Komansky 10,000 – – – 10,000 – – – 10,000
P Lader 11,950 – – – 11,950 – – – 11,950
C Mackenzie 30,000 – – – 30,000 – – – 30,000
S W Morten 20,000 – – – 20,000 – – – 20,000
K Naganuma6 – – – – – – – – –
L Olayan – – – – – – – – –
H Paster3,4,5,7 418,004 – – (171,367) 246,637 n/a n/a n/a n/a
J A Quelch 12,000 – – – 12,000 – – – 12,000
M Read3,5,7 3,000 5,664 – 14,406 23,070 8,746 (3,594) – 28,222
P W G Richardson3,5,7,8 226,176 4,402 (4,402) (38,000) 188,176 52,454 (26,280) – 214,350
J Rosen – – – 5,000 5,000 – – – 5,000
P Spencer 10,000 – – – 10,000 – – – 10,000
Sir Martin Sorrell3,5,7,9 13,633,028 11,373 – – 13,644,401 97,914 – – 13,742,315
Notes1 Save as disclosed above and in the Report of the Compensation Committee, no director had any interest in any contract of signifi cance with the Group during the year.2 Further details of long-term incentive plans are given in the notes on pages 128 and 129.3 Each executive director has a technical interest as an employee and potential benefi ciary in shares in the Company held under the ESOPs. As at 31 December 2006, the Company’s ESOPs held in total
51,134,155 shares in the Company (2005: 53,297,356 shares). 4 Howard Paster retired from the Board in June 2006.5 The above interests do not include the unvested interests of the executive directors in the Performance Share Plan or Restricted Stock Plan.6 K Naganuma is a director of Asatsu-DK, which at 15 May 2007 was interested in 31,295,646 shares representing 2.5% of the issued share capital of the Company.7 In respect of Sir Martin Sorrell, Howard Paster, Paul Richardson and Mark Read the above interests include investment shares committed to the 2004, 2005 and 2006 awards under Renewed LEAP,
but do not include matching shares, if any.8 Paul Richardson sold 38,000 shares on 24 April 2006 at a price of £7.01 per share to fi nance personal commitments.9 Included for Sir Martin Sorrell are 4,691,392 shares in respect of the Capital Investment Plan part of which vested in September 2004 and in respect of which 987,742 shares are vested but have not
yet been exercised and Sir Martin Sorrell deferred a further 2,649,208 shares until 1 October 2008, which are the shares comprised in the UK and US Deferred Stock Unit Agreements.
How we’re rewarded .
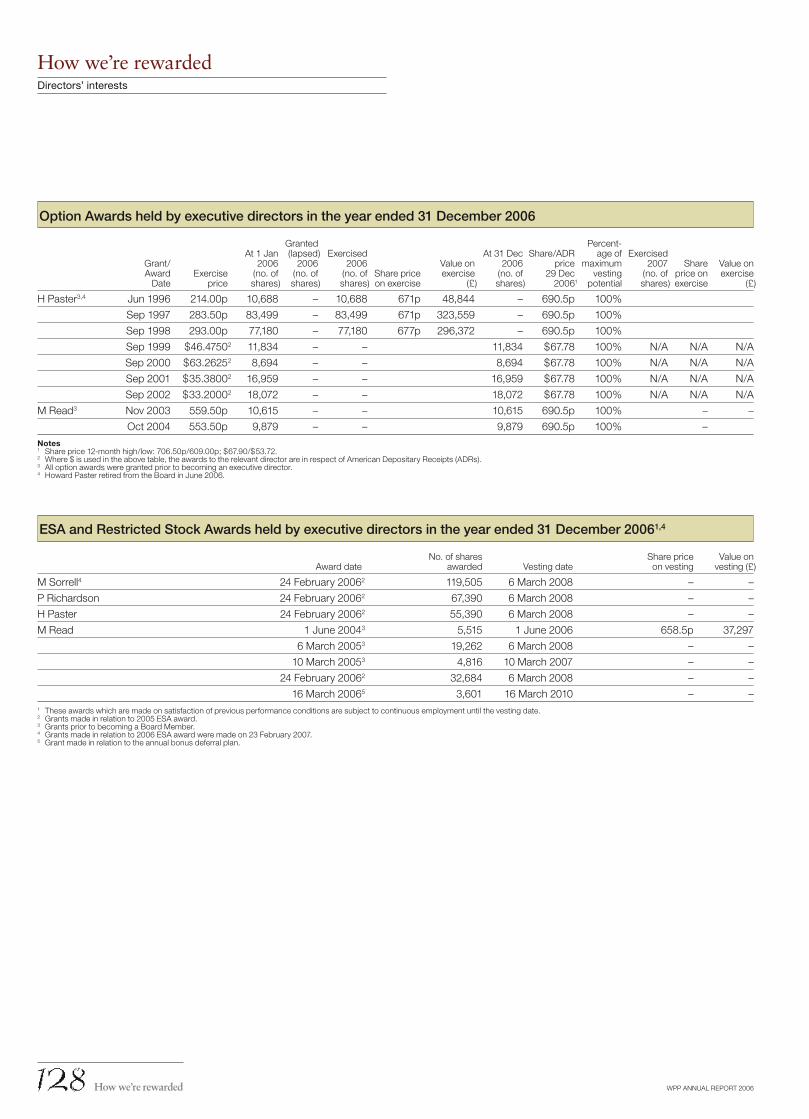
WPP ANNUAL REPORT 2006
Option Awards held by executive directors in the year ended 31 December 2006
Granted Percent- At 1 Jan (lapsed) Exercised At 31 Dec Share/ADR age of Exercised Grant/ 2006 2006 2006 Value on 2006 price maximum 2007 Share Value on Award Exercise (no. of (no. of (no. of Share price exercise (no. of 29 Dec vesting (no. of price on exercise Date price shares) shares) shares) on exercise (£) shares) 20061 potential shares) exercise (£)
H Paster3,4 Jun 1996 214.00p 10,688 – 10,688 671p 48,844 – 690.5p 100%
Sep 1997 283.50p 83,499 – 83,499 671p 323,559 – 690.5p 100%
Sep 1998 293.00p 77,180 – 77,180 677p 296,372 – 690.5p 100%
Sep 1999 $46.4750 2 11,834 – – 11,834 $67.78 100% N/A N/A N/A
Sep 2000 $63.2625 2 8,694 – – 8,694 $67.78 100% N/A N/A N/A
Sep 2001 $35.3800 2 16,959 – – 16,959 $67.78 100% N/A N/A N/A
Sep 2002 $33.2000 2 18,072 – – 18,072 $67.78 100% N/A N/A N/A
M Read3 Nov 2003 559.50p 10,615 – – 10,615 690.5p 100% – –
Oct 2004 553.50p 9,879 – – 9,879 690.5p 100% –
Notes1 Share price 12-month high/low: 706.50p/609.00p; $67.90/$53.72. 2 Where $ is used in the above table, the awards to the relevant director are in respect of American Depositary Receipts (ADRs).3 All option awards were granted prior to becoming an executive director.4 Howard Paster retired from the Board in June 2006.
ESA and Restricted Stock Awards held by executive directors in the year ended 31 December 20061,4
No. of shares Share price Value on Award date awarded Vesting date on vesting vesting (£)
M Sorrell4 24 February 20062 119,505 6 March 2008 – –
P Richardson 24 February 20062 67,390 6 March 2008 – –
H Paster 24 February 20062 55,390 6 March 2008 – –
M Read 1 June 20043 5,515 1 June 2006 658.5p 37,297
6 March 20053 19,262 6 March 2008 – –
10 March 20053 4,816 10 March 2007 – –
24 February 20062 32,684 6 March 2008 – –
16 March 20065 3,601 16 March 2010 – –1 These awards which are made on satisfaction of previous performance conditions are subject to continuous employment until the vesting date.2 Grants made in relation to 2005 ESA award.3 Grants prior to becoming a Board Member.4 Grants made in relation to 2006 ESA award were made on 23 February 2007.5 Grant made in relation to the annual bonus deferral plan.
How we’re rewardedDirectors’ interests
How we’re rewarded
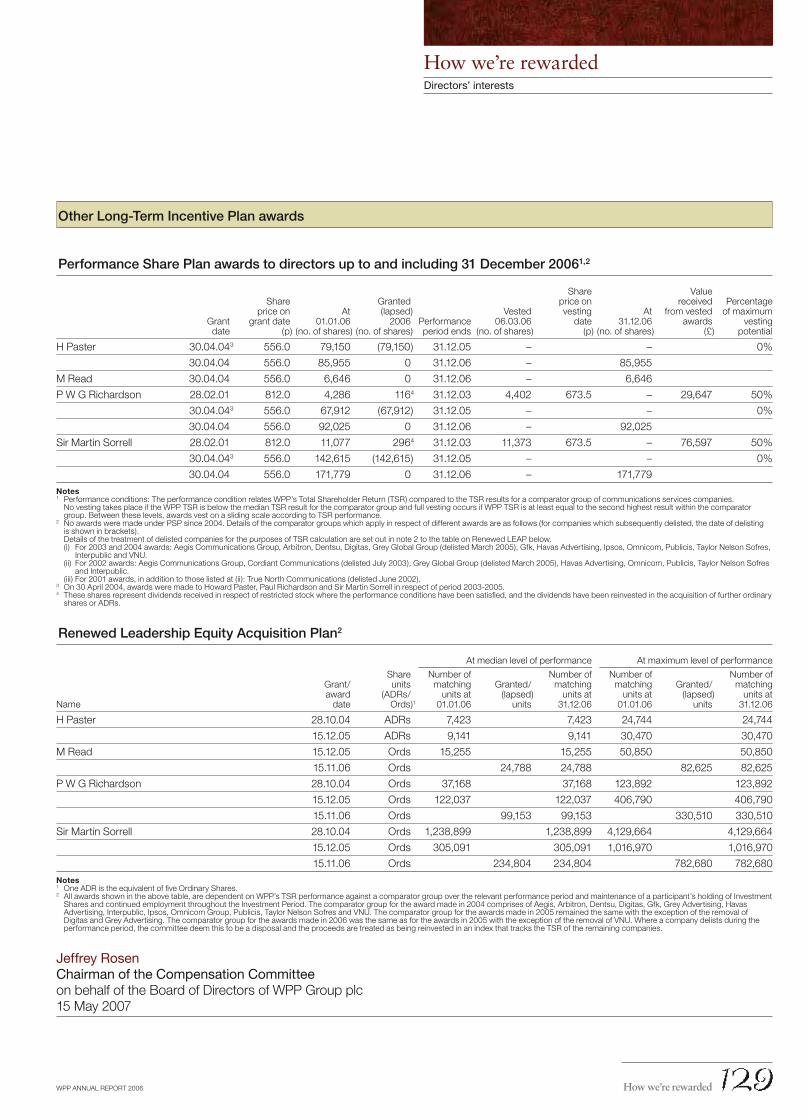
WPP ANNUAL REPORT 2006
How we’re rewardedDirectors’ interests
Other Long-Term Incentive Plan awards
Performance Share Plan awards to directors up to and including 31 December 20061,2
Share Value Share Granted price on received Percentage price on At (lapsed) Vested vesting At from vested of maximum Grant grant date 01.01.06 2006 Performance 06.03.06 date 31.12.06 awards vesting date (p) (no. of shares) (no. of shares) period ends (no. of shares) (p) (no. of shares) (£) potential
H Paster 30.04.043 556.0 79,150 (79,150) 31.12.05 – – 0%
30.04.04 556.0 85,955 0 31.12.06 – 85,955
M Read 30.04.04 556.0 6,646 0 31.12.06 – 6,646
P W G Richardson 28.02.01 812.0 4,286 1164 31.12.03 4,402 673.5 – 29,647 50%
30.04.043 556.0 67,912 (67,912) 31.12.05 – – 0%
30.04.04 556.0 92,025 0 31.12.06 – 92,025
Sir Martin Sorrell 28.02.01 812.0 11,077 2964 31.12.03 11,373 673.5 – 76,597 50%
30.04.043 556.0 142,615 (142,615) 31.12.05 – – 0%
30.04.04 556.0 171,779 0 31.12.06 – 171,779
Notes1 Performance conditions: The performance condition relates WPP’s Total Shareholder Return (TSR) compared to the TSR results for a comparator group of communications services companies.
No vesting takes place if the WPP TSR is below the median TSR result for the comparator group and full vesting occurs if WPP TSR is at least equal to the second highest result within the comparator group. Between these levels, awards vest on a sliding scale according to TSR performance.
2 No awards were made under PSP since 2004. Details of the comparator groups which apply in respect of different awards are as follows (for companies which subsequently delisted, the date of delisting is shown in brackets).
Details of the treatment of delisted companies for the purposes of TSR calculation are set out in note 2 to the table on Renewed LEAP below. (i) For 2003 and 2004 awards: Aegis Communications Group, Arbitron, Dentsu, Digitas, Grey Global Group (delisted March 2005), Gfk, Havas Advertising, Ipsos, Omnicom, Publicis, Taylor Nelson Sofres,
Interpublic and VNU. (ii) For 2002 awards: Aegis Communications Group, Cordiant Communications (delisted July 2003), Grey Global Group (delisted March 2005), Havas Advertising, Omnicom, Publicis, Taylor Nelson Sofres
and Interpublic. (iii) For 2001 awards, in addition to those listed at (ii): True North Communications (delisted June 2002).3 On 30 April 2004, awards were made to Howard Paster, Paul Richardson and Sir Martin Sorrell in respect of period 2003-2005.4 These shares represent dividends received in respect of restricted stock where the performance conditions have been satisfi ed, and the dividends have been reinvested in the acquisition of further ordinary
shares or ADRs.
Renewed Leadership Equity Acquisition Plan2
At median level of performance At maximum level of performance
Share Number of Number of Number of Number of Grant/ units matching Granted/ matching matching Granted/ matching award (ADRs/ units at (lapsed) units at units at (lapsed) units atName date Ords)1 01.01.06 units 31.12.06 01.01.06 units 31.12.06
H Paster 28.10.04 ADRs 7,423 7,423 24,744 24,744
15.12.05 ADRs 9,141 9,141 30,470 30,470
M Read 15.12.05 Ords 15,255 15,255 50,850 50,850
15.11.06 Ords 24,788 24,788 82,625 82,625
P W G Richardson 28.10.04 Ords 37,168 37,168 123,892 123,892
15.12.05 Ords 122,037 122,037 406,790 406,790
15.11.06 Ords 99,153 99,153 330,510 330,510
Sir Martin Sorrell 28.10.04 Ords 1,238,899 1,238,899 4,129,664 4,129,664
15.12.05 Ords 305,091 305,091 1,016,970 1,016,970
15.11.06 Ords 234,804 234,804 782,680 782,680
Notes1 One ADR is the equivalent of fi ve Ordinary Shares.2 All awards shown in the above table, are dependent on WPP’s TSR performance against a comparator group over the relevant performance period and maintenance of a participant’s holding of Investment
Shares and continued employment throughout the Investment Period. The comparator group for the award made in 2004 comprises of Aegis, Arbitron, Dentsu, Digitas, Gfk, Grey Advertising, Havas Advertising, Interpublic, Ipsos, Omnicom Group, Publicis, Taylor Nelson Sofres and VNU. The comparator group for the awards made in 2005 remained the same with the exception of the removal of Digitas and Grey Advertising. The comparator group for the awards made in 2006 was the same as for the awards in 2005 with the exception of the removal of VNU. Where a company delists during the performance period, the committee deem this to be a disposal and the proceeds are treated as being reinvested in an index that tracks the TSR of the remaining companies.
Jeffrey RosenChairman of the Compensation Committeeon behalf of the Board of Directors of WPP Group plc 15 May 2007
How we’re rewarded .

WPP ANNUAL REPORT 2006Operating & fi nancial review

WPP ANNUAL REPORT 2006
Operating & fi nancial reviewCompetitive performance
ur Media Investment Management businesses continued to show strong growth along with direct, internet and interactive and Specialist Communications. Direct and digitally-related activities now account for over 20% of the Group’s revenues, which are running at the rate of over $11 billion per annum.
Brand advertising, particularly in the new faster growing markets, along with Information, Insight & Consultancy and Branding & Identity, Healthcare and Specialist Communications, show consistent growth. Public Relations & Public Affairs also continues to show signifi cant improvement over last year, following a strong year in 2005. The new technologies have demonstrated the power of editorial publicity through fast-growing new applications of new technology such as MySpace, YouTube, Facebook, Flickr and Second Life. Media Investment Management and Information, Insight & Consultancy combined, grew by 10% in the year on a like-for-like basis, well ahead of independent competitors.
Estimated net new billings of £3.562 billion ($6.411 billion) were won last year, refl ecting in part strong media investment management new business. The Group was ranked second in the two major new business surveys for 2006.
In these circumstances, there is no reason to believe that the Group cannot achieve margin targets of 15.5% in 2008 and 16.0% in 2009. Budgets for 2007 include the operating margin target of 15.0% previously set for 2007. Neither is there any reason why operating margins could not be improved beyond these levels by continuing to focus on revenue growth and careful husbandry of costs. Our ultimate objective continues to be to achieve a 19% margin over a period of time and to continue to improve the return on capital employed.
79.6
75.8
68.4
93.780.0
76.0
68.4
96.4
05
05
05
0506
06
06
06
WPP
Advertising and Media Investment Management
Omnicom1
IPG1
Revenue per head2 £000
0.2
14.0
15.5
13.32.8
14.5
15.8
13.4
05
05
05
0506
06
06
06
WPP
Advertising and Media Investment Management
Omnicom1
IPG1
Headline PBIT3 margins %
Notes1 The fi gures above for Omnicom and IPG (The Interpublic Group) have been derived from their
respective 10-K fi lings with the SEC. As both these companies report under US GAAP, the above fi gures should be read as indicative of their fi nancial performance as they are not directly comparable with WPP’s IFRS reporting. Additionally, adjustments have been made to conform the reported results of these companies to a presentation that is comparable – as far as the information disclosed in the Company’s 10-K fi lings allows – to that of WPP.
2 Revenue per head has been calculated as reported revenue divided by the average number of employees in the relevant year. For Omnicom and IPG, who do not report average headcount in their 10-K fi lings, it has been estimated as the average of opening and closing headcount for the year. Additionally, revenue for these US dollar-reporting companies has been converted into sterling using the average exchange rates shown on page 149.
3 The calculation of Headline PBIT is set out in note 32 of the fi nancial statements.
Operating & fi nancial review .

WPP ANNUAL REPORT 2006
Geographic performance
he pattern of revenue growth varied by region.
The US continues to surprise positively, with like-for-like growth of 4.6%, up slightly on the fi rst half. Latin America remained one of the fastest-growing regions, as it was in 2004 and 2005.
Asia Pacifi c remained strong across the region, with Mainland China and India fastest growing, with like-for-like growth rates of 23% and 19% respectively.
Western Continental Europe, although relatively more diffi cult, improved slightly in the second half. The UK was stronger in the latter half of the year, refl ecting some improvement in the media economy, particularly in the fourth quarter.
As seen in the fi rst half, rates of growth in Europe continue to be two-paced, with Western Continental Europe remaining softer and Central and Eastern Europe, Russia and the other CIS countries, in particular, more buoyant.
Of the big fi ve Western European markets, Spain remains a standout growth market, although the UK, France, Germany and Italy all began to show some renewed signs of life.
Operating & fi nancial review
• North America
• UK
• Continental Europe
• Asia Pacific, Latin America, Africa & Middle East
020
03 04 05 06
6,000
5,000
4,000
3,000
2,000
1,000
Revenue by geography £m
Notes1 See definition on page 182.2 The calculation of Headline PBIT is set out in note 32 of the financial statements.
27.4
25.9
10.9
23.018.3
10.3
6.0
9.0
05
05
05
0506
06
06
06
North America
UK
Continental Europe
Asia Pacific, Latin America, Africa & Middle East
Constant currency1 revenue growth %
13.7
16.6
10.5
12.514.5
17.0
11.4
12.7
05
05
05
0506
06
06
06
North America
UK
Continental Europe
Asia Pacific, Latin America, Africa & Middle East
Headline PBIT2 margins by geography %
Operating & fi nancial review

WPP ANNUAL REPORT 2006
Operating & fi nancial review
Sector performance
Advertising and Media Investment Management
n constant currencies, Advertising and Media Investment Management revenue grew by over 8%. Like-for-like revenue growth was over 4%. The combined operating margin of this sector is almost 16%.
In 2006, Ogilvy & Mather Worldwide generated estimated net new billings of £187 million ($336 million), JWT £155 million
($279 million), Y&R Advertising £111 million ($200 million) and Grey Worldwide £130 million ($235 million).
Also in 2006, GroupM, the Group’s Media Investment Management company, which includes MindShare, Mediaedge:cia, MediaCom and MAXUS, generated estimated net new billings of £2.423 billion ($4.361 billion).
The Group was ranked fi rst and second respectively in the Gunn Report awards rankings for media and creative in 2006.
Information, Insight & Consultancy
On a constant currency basis Information, Insight & Consultancy revenues grew over 11%, with like-for-like revenues up over 4%. Gross margin grew by over 6% on a like-for-like basis. Overall margins improved by 0.8 margin points to 11.1%.
Strong performances were recorded by Millward Brown (Millward Brown, Greenfi eld Consulting Group and Dynamic Logic in the US, IMS in Ireland, MFR in France, Germany, Hungary, Turkey, Impact in South Africa, ACSR in China, Japan, Korea, Mexico, Brazil and Colombia); BMRB International in the UK, KMR Group; Research International (in Belgium, Germany, Spain, SIFO in Sweden, Poland, South Africa, Mexico, China, Malaysia, Indonesia, Singapore and Australia); Center Partners and Ziment in the US; IMRB in India; Lightspeed Research in the US and the UK; Icon Added Value in Germany, South Africa and China; Management Ventures and Cannondale Associates in the US, BPRI in the UK and Glendinning in the US and the UK.
• Advertising and Media Investment Management
• Information, Insight & Consultancy
• Public Relations & Public Affairs
• Branding & Identity, Healthcare and Specialist Communications
020
03 04 05 06
6,000
5,000
4,000
3,000
2,000
1,000
Revenue by sector £m
Notes1 See definition on page 182.2 The calculation of Headline PBIT is set out in note 32 of the financial statements.
24.7
28.6
7.3
18.714.6
8.5
11.2
12.4
05
05
05
0506
06
06
06
Advertising and Media Investment Management
Information, Insight & Consultancy
Public Relations & Public Affairs
Branding & Identity, Healthcare and Specialist Communications
Constant currency1 revenue growth %
13.6
15.5
10.3
14.114.1
15.8
11.1
15.0
05
05
05
0506
06
06
06
Advertising and Media Investment Management
Information, Insight & Consultancy
Public Relations & Public Affairs
Branding & Identity, Healthcare and Specialist Communications
Headline PBIT2 margins by sector
Operating & fi nancial review .

WPP ANNUAL REPORT 2006
Public Relations & Public Affairs
Public Relations & Public Affairs continued its strong growth with constant currency growth of over 12% and like-for-like growth of almost 6%. Particularly strong were Ogilvy Public Relations Worldwide, Hill & Knowlton, Burson-Marsteller, Cohn & Wolfe, Finsbury and Buchanan.
Operating margins continued to improve and are now over 15.0%, an improvement of 0.9 margin points over the previous year.
Branding & Identity, Healthcare and Specialist Communications
The Group’s Branding & Identity, Healthcare and Specialist Communications revenues rose by over 14%. Like-for-like revenues rose by almost 8%. Operating margins were up 0.5 margin points. The Group’s healthcare and direct, internet and interactive businesses showed particularly strong revenue growth.
Several companies performed particularly well:
• in Branding & Identity – Landor Associates in New York and Chicago in the US, Germany, Spain, Dubai, Japan, Greater China and Australia; Enterprise IG in the US, the UK, France and Brindfors in Sweden; Fitch in Phoenix and Columbus in the US, the UK and Qatar.
• in Healthcare Communications – Sudler & Hennessey in New York and HealthAnswers Education in the US, Transart in the UK, Germany, Italy, Sydney in Australia and India; Grey Healthcare Group in the US, the UK, France and Germany; in Ogilvy Healthworld in the US, Canada, France, Italy and the Netherlands, Mexico and Australia.
• in promotion and direct marketing – OgilvyOne (in New York, Minneapolis, San Francisco, Leopard and Neo@Ogilvy in the US, Canada, Germany, France, the Netherlands, Portugal, Italy, Brazil, Argentina, Malaysia, Singapore, Greater China, India and Korea); 141 Worldwide (in Boomerang in the US, the UK, Chile, Japan, Malaysia and the Philippines); Wunderman (in Seattle, RTC, KBM, Fortelligent, Studiocom and ZAAZ in the US, Canada, Burrows and Good Technology in the UK, Greece, South Africa, Argentina, Chile and Brazil); RMG Connect (in Canada, France, Italy, Spain, Germany, Brazil, Mexico, India and Singapore); G2 (in the US, MDS in the UK, France, Denmark, Sweden, Brazil, Argentina, Colombia and Korea).
• in specialist marketing resources – VML, Bridge, MJM, Pace and The Food Group in the US; EWA, the Forward Group, Mando, BDGworkfutures, Dovetail and Headcount in the UK and Global Sportnet in Germany.
Manufacturing
Revenues and profi ts at Wire & Plastic Products, the original manufacturing company on which WPP was founded and which now accounts for less than 1% of the Group’s revenues, were down.
Operating & fi nancial reviewSector performance
Operating & fi nancial review

WPP ANNUAL REPORT 2006
Operating & fi nancial review
Review of operations
he Group’s fi nancial performance in the year more than mirrored the continuing steady strength in economic conditions across the globe, with even the weakest geographical region, Western Europe, picking up in the second half.
2006, a mid-year of the quadrennial 2005-2008 cycle, was
strong, to some extent refl ecting the positive impact of events such as the winter Olympics in Turin, the FIFA World Cup in Germany and the mid-term congressionals in the US. Three geographical growth speeds remain though – fastest growth in Asia Pacifi c, Latin America, Africa, the Middle East and Central and Eastern Europe; a surprisingly steady speed in the US; and a slower speed in Western Europe.
2006 also marked continued client focus on top-line growth, as corporate profi tability, margins and liquidity continued to improve signifi cantly. Corporate profi tability remains at historically high levels on both sides of the Atlantic. This resulted in continued high levels of new business activity.
Network television price infl ation and declining audiences, fragmentation of traditional media and rapid development of new technologies continued to drive experimentation by our clients in new media and non-traditional alternatives. 1998 was really the fi rst year when WPP’s marketing services activities represented over 50% of Group revenue. By 2004, these activities represented almost 54% of Group revenue. In 2005, they represented 52%, as Media Investment Management was again the fastest-growing part of our business, following major success in winning media planning and buying consolidations, and refl ected the fi rst-time inclusion of Grey Worldwide and MediaCom. In 2006, the underlying relative strength of the inaptly named ‘below-the-line’ services re-asserted itself, as marketing services grew to 52.5% of revenues. In addition, in 2006, our narrowly defi ned internet-related revenue was almost $1 billion or over 9% of our worldwide reported revenue. This is more than the 6-7% for online media’s share of total advertising spend both in the US and worldwide. The new media continue to build their share of client spending.
Group fi nancial performance
Billings were up 13.0% at £30.141 billion, around $56 billion.
Reportable revenue was up 9.9% to £5.908 billion. Revenue, including 100% of associates, is estimated to total over £7.010 billion.
Headline earnings before interest, depreciation and amortisation (EBITDA) was up 14.2% to £1.002 billion and up 16.0% in constant currencies. Headline PBIT 13.8% to £859.0 million from £754.8 million and up 15.7% in constant currencies. Reported profi t before interest and tax was up 14.0% to £782.7 million from £686.7 million and up 15.9% in constant currencies.
Net fi nance costs (excluding the revaluation of fi nancial instruments) were £92.7 million up from £85.8 million last year, an increase of £6.9 million, largely refl ecting higher interest rates, offset by the impact of improved liquidity as a result of a reduction in average working capital.
Headline profi t before tax was up 14.5% to £766.3 million from £669.0 million and up 16.8% in constant currencies.
Reported profi t before tax rose by 15.2% to £682.0 million, and by 17.6% in constant currencies.
The Group’s tax rate on headline profi ts was 26.0%, a reduction of 3.0 percentage points over 2005. This refl ects the continuing positive impact of the Group’s tax planning initiatives, particularly in relation to Grey which had a tax rate on acquisition in excess of 45%.
Diluted headline earnings per share were up 16.7% at 42.0p. In constant currency, earnings per share on the same basis were up 18.9%. Diluted earnings per share on a reported basis rose by 18.5% to 35.2p and by 21.0% in constant currencies.
The Board recommends an increase of 20% in the fi nal dividend to 7.61p per share, making a total of 11.21p per share for 2006, a 20% increase over 2005. The record date for this dividend is 8 June 2007, payable on 9 July 2007. The dividend paid in 2006 was over four times covered by headline earnings.
Operating & fi nancial review .

WPP ANNUAL REPORT 2006
Operating & fi nancial reviewReview of operations
Operating margins
Headline operating margin (including income from associates) increased 0.5 margin points to a record 14.5% from 14.0%, in line with the revised target set in February 2006.
Reported operating costs together with direct costs (but excluding goodwill impairment, amortisation of acquired intangibles and gains on disposal of investments), rose by 9.3% and by 10.1% in constant currency. Like-for-like total operating and direct costs rose 4.3%. Reported staff costs, excluding incentives (which includes the cost of share-based compensation), were up 9.1%. Incentive payments (including the cost of share-based compensation) totalled £246.9 million (£227.6 million in 2005), an increase of 8.4%, which represents 23.1% (24.0% in 2005) of headline operating profi t before bonuses, taxes and income from associates. Before these incentive payments, operating margins increased by 0.4 margin points to 18.7% from 18.3%. On a reported basis, the Group’s staff cost to revenue ratio improved 0.5 margin points to 58.8% compared with 59.3% in 2005.
Part of the Group’s strategy is to continue to increase variable staff costs as a proportion of total staff costs and revenue, as this provides fl exibility to deal with volatility in revenues. Through the cyclical upswing of the 1990s, variable staff costs as a proportion of total staff costs increased, reaching a peak of 12.1% in 2000. The impact of the recession in 2001 and 2002 was to reduce this ratio to 9.2% and variable staff costs as a proportion of revenue to 5.3% (calculated under 2004 UK GAAP). In 2004, following the signifi cant improvement in pre-bonus operating profi t and incentives, variable staff costs as a proportion of staff costs increased further. There was a slight deterioration in 2005, with the ratio declining slightly by 0.4 percentage points, to 12.8% (under IFRS – which includes 1.0 percentage points attributable to share-based compensation), but in 2006 the ratio strengthened again to 13.0%.
The task of improving property utilisation continues to be a priority with a portfolio of approximately 18.4 million square feet worldwide. In December 2002, establishment costs as a percentage of revenue was 8.4%, with a goal of reducing this ratio to 7.0% in the medium term. At the end of 2004 the establishment cost-to-revenue ratio reduced to 7.6% and by December 2005 this ratio improved further to 7.2%, driven by better utilisation and higher revenues. In 2006 further improvements were made and this ratio reduced slightly to 7.1%.
Like-for-like performance
On a constant currency basis, revenue was up 10.9% and gross margin up 10.3%. Like-for-like revenues, excluding the impact of acquisitions and on a constant currency basis, were up 5.4%. On the same basis, gross margin was up 5.7%. Like-for-like revenues were up 5.0% in the fi rst half of 2006 and up 5.7% in the second half, continuing the strong organic growth of 5.5% in 2005, with the fourth quarter of 2006 accelerating to 7.2%. The fourth quarter was the Company’s fi rst $3 billion revenue quarter.
Headcount
The number of people in the Group averaged 77,686 against 70,936 in 2005, an increase of 9.5%. On a like-for-like basis, average headcount was up to 77,686 from 74,971, an increase of 3.6%. At the end of 2006, staff numbers were 79,352 compared with 76,532 at the end of 2005 on a like-for-like basis, an increase of 3.7%.
Acquisitions and start-ups
In 2006, the Group continued to make small to medium-sized acquisitions and/or investments in high-growth geographical or functional areas. The net initial cost of all acquisitions was £112 million in cash, in Advertising and Media Investment Management in the US, the UK, the Netherlands, Germany, South Africa, Israel, China, Singapore, New Zealand and Brazil; in Information, Insight & Consultancy in the US, Spain, Argentina, Hong Kong and China; in Public Relations & Public Affairs in the US, Canada and India; in Branding & Identity in India; in Healthcare in the US, the Netherlands, Spain and Switzerland and in direct, internet & interactive in the US, Germany, China and Korea.
Operating & fi nancial review
WPP ANNUAL REPORT 2006
Operating & fi nancial reviewReview of operations
Parent company initiatives
Increasingly, WPP is concentrating on its mission of the “management of the imagination”, and ensuring it is a big company with the heart and mind of a small one. To aid the achievement of this objective and to develop the benefi ts of membership in the Group both for clients and for our people, the parent company continues to develop its activities in the areas of human resources, property, procurement, information technology and practice development. Ten practice areas which span all our brands have been developed initially in media investment management, healthcare, privatisation, new technologies, new faster growing markets, internal communications, retail, entertainment and media, fi nancial services and hi-tech and telecommunications.
Treasury activities
Treasury activity is managed centrally, from the parent company’s London, New York and Hong Kong offi ces, and is principally concerned with the monitoring of working capital, managing external and internal funding requirements and the monitoring and management of fi nancial market risks, in particular interest rate and foreign exchange exposures.
The treasury operation is not a profi t centre and its activities are carried out in accordance with policies approved by the Board of directors and subject to regular review and audit.
The Group’s interest rate management policy recognises that fi xing rates on all its debt eliminates the possibility of benefi ting from rate reductions and similarly, having all its debt at fl oating rates unduly exposes the Group to increases in rates.
Its principal borrowing currencies are US dollars, pounds sterling and euros. Borrowings in these currencies
represented 96.0% of the Group’s gross indebtedness at 31 December 2006 (at $1,089 million, £146 million and €1,482 million) and 98.1% of the Group’s average gross debt during the course of 2006 (at $2,289 million, £301 million and €952 million). Including the effect of interest rate and cross-currency swaps, 87.0% of the year-end US dollar net debt is at fi xed rates averaging 5.18% for an average period of 120 months; and 5.7% of the euro net debt is at fi xed rates averaging 8.85% for an average period of 36 months.
Other than fi xed rate debt, the Group’s other fi xed rates are achieved principally through interest rate swaps with the Group’s bankers. The Group also uses forward rate agreements and interest rate caps to manage exposure to interest rate changes. At 31 December 2006, no forward rate agreements or interest rate caps were outstanding.
These interest rate derivatives are used only to hedge exposures to interest rate movements arising from the Group’s borrowing and surplus cash balances arising from its commercial activities and are not traded independently. Payments made under these instruments are accounted for on an accruals basis.
Two new fi nancings were completed during the year. A US commercial paper program was launched in September. This program allows for issues of short-term promissory notes up to a maximum of $1,400 million. Issue proceeds are used to fund the Group’s short-term working capital requirements and other corporate activities. A €600 million 4.375% seven-year bond was issued in December 2006.
Proceeds from this bond have been used to repay the £450 million 2% convertible bonds due in April 2007. Since the end of the year the Group also completed the issue of a £400 million 6% 10-year bond, the proceeds from which also helped repay the convertible bonds.
An analysis of the debt and fi xed-rate maturities is shown in note 10 of the fi nancial statements on pages 157 and 158.
The Group manages liquidity risk by ensuring continuity and fl exibility of funding even in diffi cult market conditions. Undrawn committed borrowing facilities are maintained in excess of peak net-borrowing levels and debt maturities are closely monitored.
Targets for average net debt are set on an annual basis and, to assist in meeting this, working capital targets are set for all the Group’s major operations.
The Group’s signifi cant international operations give rise to an exposure to changes in foreign exchange rates. The Group seeks to mitigate the effect of these structural
Operating & fi nancial review .

WPP ANNUAL REPORT 2006
currency exposures by borrowing in the same currencies as the operating (or ‘functional’) currencies of its main operating units. The majority of the Group’s debt is therefore denominated in US dollars and euros, as these are the predominant currencies of revenues.
The Group’s operations conduct the majority of their activities in their own local currency and consequently the Group has no signifi cant transactional foreign exchange exposures. Any signifi cant cross-border trading exposures are hedged by the use of forward foreign-exchange contracts. There were no such material contracts in place at 31 December 2006. No speculative foreign exchange trading is undertaken.
Cash fl ow and balance sheet
As at 31 December 2006, the Group’s net debt increased slightly to £815 million compared with £804 million at 31 December 2005. Net debt averaged £1,214 million in 2006, fl at against 2005 (up £121 million at 2006 exchange rates). With an equity market capitalisation at 31 March 2007 of approximately £9.5 billion and average net debt in the fi rst quarter of 2007 of £1.0 billion, this would give a total enterprise value of approximately £10.5 billion, market values which lead the industry.
Cash fl ow strengthened as a result of improved working capital management and cash fl ow from operations. In 2006, headline operating profi t before non-cash-based incentive plans was £893 million, capital expenditure £185 million, depreciation £143 million, tax paid £162 million, interest and similar charges paid £58 million and other net cash infl ows of £85 million. Free cash fl ow available for debt repayment, acquisitions, share buy-backs and dividends was therefore £716 million. This free cash fl ow was partially absorbed by £216 million in net acquisition payments and investments, share repurchases and cancellations of £258 million and dividends of £119 million. This resulted in a net infl ow of £123 million, well in excess of the objective introduced in 2003 of covering outgoings by free cash fl ow.
Your Board continues to examine ways of deploying its EBITDA of over £1 billion (over $1.9 billion) and substantial cash fl ow of over £700 million (over $1.3 billion) per annum to enhance share owner value. As necessary capital expenditure, spent mainly on information technology and property, is expected to remain approximately equal to the depreciation charge in the long term, the Company has concentrated on examining potential acquisitions and
Operating & fi nancial reviewReview of operations
OutInCash in
• Depreciation 143
• Goodwill/acquired intangibles impairment and amortisation 88
• Charges for non-cash share-based incentive plans 71
• Other 85
• Operating profit 742
Cash out
• Gains on disposal of investments 8
• Net interest 58
• Capital expenditure 185
• Tax 162
2006 Cash flow £m Free cash flow1 £716m
OutInCash in
• Depreciation 122
• Goodwill/acquired intangibles impairment and amortisation 72
• Charges for non-cash share-based incentive plans 69
• Other 16
• Operating profit 653
Cash out
• Gains on disposal of investments 4
• Net interest 60
• Capital expenditure 171
• Tax 136
2005 Cash flow £m Free cash flow1 £561m
OutInCash in
• Depreciation 103
• Goodwill/acquired intangibles impairment and amortisation 53
• Charges for non-cash share-based incentive plans 59
• Other 23
• Operating profit 476
Cash out
• Gains on disposal of investments 3
• Net interest 51
• Capital expenditure 96
• Tax 101
2004 Cash flow £m Free cash flow1 £463m
Note1 The calculation of free cash fl ow is set out in note 32 of the fi nancial statements.
Operating & fi nancial review

WPP ANNUAL REPORT 2006
Operating & fi nancial reviewReview of operations
on returning excess capital to share owners in the form of dividends and/or share buy-backs.
As outlined in the Group’s 2006 Interim Announcement, the Group carried out a review of its share repurchase program earlier in 2006 with the aim of increasing the buy-back of shares to 2-3% of its share capital each year, as compared with 1-2% historically. Consistent with this objective, in 2006, 38.874 million ordinary shares were purchased, equivalent to 3.1% of the share capital, including 5.717 million ordinary shares acquired by the WPP ESOP in connection with restricted stock awards. These shares were acquired at an average price of £6.64 per share and total cost of £258.2 million. Of these shares, 33.157 million were purchased in the market and subsequently cancelled. Such annual rolling share repurchases are believed to have a more signifi cant impact in improving share owner value than sporadic buy-backs.
Following a further recent review of the Company’s capital structure with its fi nancial advisers, your Board has decided to further increase the target percentage for rolling share buy-backs on the open market, from 2-3% of its share capital each year, or approximately £200-300 million, to 4-5%, or approximately £400-500 million in each of 2007 and 2008, when market conditions are appropriate.
As noted above, your Board has also decided to increase the fi nal dividend by 20% to 7.61p per share, taking the full-year dividend to 11.21p per share.
As at 31 December 2006, net assets of £3,918 million compared with £3,986 million in 2005.
Pensions funding
The Group’s pension defi cit was £186.6 million as at 31 December 2006, compared to £231.4 million as at 31 December 2005. The pension defi cit decrease is due to increased employer contributions across all regions and in the US, asset returns in excess of expected returns and the impact of currency translation.
Most of the Group’s pension scheme assets are held by its schemes in the UK and North America. In the UK, the forecasted weighted average return on assets increased from 5.2% as at 31 December 2005 to 5.6% as at 31 December 2006, and in North America, the forecasted weighted average return increased from 6.7% to 6.8%, principally due to increases in expected rates of return on corporate bonds and insured annuities.
Contributions to funded schemes are determined in line with local conditions and practices. Certain
contributions in respect of unfunded schemes are paid as they fall due.
In 2006 the Group implemented a funding strategy under which we expect to fully eliminate the defi cit for funded schemes by 31 December 2010. Employer contributions in 2006 were £48.6 million (2005: £35.6 million) and are expected to be £50.0 million in 2007.
Future prospects
Including associates, the Group has approximately 100,000 full-time people in over 2,000 offi ces in 106 countries. It services over 340 of the Fortune Global 500 companies, over one-half of the Nasdaq 100, over 30 of the Fortune e-50, and approximately 400 national or multi-national clients in three disciplines. More than 280 clients are served in four disciplines and these clients account for over 57% of Group revenues. The Group also works with nearly 230 clients in six or more countries.
These statistics refl ect the increasing opportunities for developing client relationships between activities nationally, internationally and by function. The Group estimates that over 35% of new assignments in the year were generated through the joint development of opportunities by two or more Group companies. New integration mechanisms, sensitive to global and local opportunities, including WPP Global Client Leaders and Country Managers, continue to be developed. There is an increasing number of major client creative and integration opportunities at a Group level.
The world economy continued to grow in 2006, after the recovery in both 2003 and 2004, driven by the US, Asia Pacifi c, Latin America, the Middle East, Russia and the other CIS countries. As a result, your Company has performed at record levels. In addition, Africa also showed signifi cant signs of growth, no doubt stimulated by Chinese interest and investment and is becoming a continent of opportunity. The FIFA World Cup in South Africa in 2010 will have a signifi cant impact in focusing further attention on the African continent. While like-for-like revenues have grown beyond market expectations, like-for-like average headcount has grown less.
Following this productivity improvement, the Group’s margins at both the pre- and post-incentive levels have improved. In addition, given improved levels of operating profi t and margin, incentive pools and variable staff costs are now at record levels. This will improve operational gearing and fl exibility in 2007 and beyond.
Operating & fi nancial review .

WPP ANNUAL REPORT 2006
As usual, the budgets for 2007 have been prepared on a prudent basis, largely excluding new business, particularly in advertising and media investment management. They predict improvements in like-for-like revenues in the range of 4.0-4.5%, with balanced growth in the fi rst and second half of the year. They also indicate marketing services revenues growing faster than advertising and media investment management.
In the fi rst quarter of 2007 reportable revenues were £1.366 billion, down 0.7%, principally refl ecting the 11% decline in the US dollar against sterling. In constant currencies, fi rst-quarter revenues were up 6.3%. On a like-for-like basis, excluding acquisitions and currency, revenues were up 4.3%. On the same basis, gross margin was up 4.6%.
Net new business billings of £516 million ($1,007 million) were won during the fi rst quarter of 2007.
Net debt at 31 March 2007 was £1,309 million, compared with £1,133 million at 31 March 2006 (at constant exchange rates). Average net debt in the fi rst quarter of 2007 was £1,029 million, compared to £990 million in 2006, at 2007 exchange rates. In the 12 months to 31 March 2007, the Group’s free cash fl ow was £817 million. Over the same period, the Group’s capital expenditure, acquisitions, share repurchases and dividends were £741 million.
Worldwide economic conditions seem set to continue to show steady growth in 2007, although concerns remain over the Middle East, oil and commodity prices and the twin defi cits of the US economy. This year’s prospects, therefore, again look good, with worldwide advertising and marketing services spending set to rise by at least 4% with your Company expected to grow at 4-5% and therefore increasing share.
Although growth in the world economy continues to be led by Asia Pacifi c, Latin America, Africa and the Middle East, Russia and the other CIS countries, even Western Continental Europe may continue the improvement seen in the second half of 2006 together with the UK, where growth in the second half of 2006 was almost double that of the fi rst half.
2007 should also benefi t from the build-up to the US Presidential elections and the Beijing Olympics in 2008, which, as a maxi-quadrennial year, should be a very strong one, buoyed by heavy US political advertising and the European Football Championships.
In the short-term, growth in advertising and marketing services expenditure may remain in low to medium single-digit territory, given the low infl ationary environment, concentrating distribution and consequent lack of pricing power. In this climate, procurement pressure continues (but not in new media) and the signifi cant proportion of fee remuneration dampens revenue growth on cyclical upturns (and moderates on downturns).
However, there continue to be signifi cant opportunities in the area of outsourcing clients’ marketing activities, consolidating clients’ budgets and capitalising on competitive weaknesses. In addition, spending amongst the packaged goods, pharmaceutical, oil and energy, government (the government continues to be one of the largest advertisers in the UK market) and price-value retail sectors, which remained relatively resilient in the recession of 2001 and 2002, have been buttressed by increased activity in previously recession-affected sectors like technology, fi nancial services, media and entertainment and telecommunications.
In the long term, the outlook appears very favourable. Overcapacity of production in most sectors and the shortage of human capital, the developments in new technologies and media, the growth in importance of internal communications, the continued strength of the US economy, the need to infl uence distribution, and the new focus on corporate responsibility issues such as climate change, underpin the need for our clients to continue to differentiate their products and services both tangibly and intangibly.
Moreover, the continuing growth of BRICs (Brazil, Russia, India and China) and other faster-growing geographical markets, will add signifi cant opportunities in Asia Pacifi c, Latin America, Africa and the Middle East and Central and Eastern Europe – along with the growth of ‘new-BRICs’ such as Vietnam, Pakistan, Indonesia and Bangladesh. Advertising and marketing services expenditure as a proportion of gross national product should resume its growth and burst through the cyclical high established in 2000.
Operating & fi nancial reviewReview of operations
Operating & fi nancial review

WPP ANNUAL REPORT 2006
Operating & fi nancial reviewReview of operations
Given these short- and long-term trends, your Company has three strategic priorities. In the short term, having weathered the recession, to capitalise on the 2004 to 2006 up-turn; in the medium term, to continue to successfully integrate acquired companies; and fi nally, in the long term, to continue to develop its businesses in the faster-growing geographical areas of Asia Pacifi c, Latin America, Africa and the Middle East, and Central and Eastern Europe and in the faster-growing functional areas of marketing services, particularly direct, internet, interactive and market research.
Incentive plans for 2007 will again focus more on operating profi t growth than historically, in order to stimulate top-line growth, although objectives will continue to include operating margin improvement, improvement in staff costs-to-revenue ratios and qualitative Group objectives, including co-ordination, talent management and succession planning.
Paul RichardsonGroup fi nance director
In connection with the provisions of the Private Securities Litigation Reform Act of 1995 (the ‘Reform Act’), the Company may include forward-looking statements (as defi ned in the Reform Act) in oral or written public statements issued by or on behalf of the Company. These forward-looking statements may include, among other things, plans, objectives, projections and anticipated future economic performance based on assumptions and the like that are subject to risks and uncertainties. As such, actual results or outcomes may differ materially from those discussed in the forward-looking statements. Important factors which may cause actual results to differ include but are not limited to: the unanticipated loss of a material client or key personnel, delays or reductions in client advertising budgets, shifts in industry rates of compensation, government compliance costs or litigation, natural disasters or acts of terrorism, the Company’s exposure to changes in the values of other major currencies (because a substantial portion of its revenues are derived and costs incurred outside of the UK) and the overall level of economic activity in the Company’s major markets (which varies depending on, among other things, regional, national and international political and economic conditions and government regulations in the world’s advertising markets). In light of these and other uncertainties, the forward-looking statements included in this document should not be regarded as a representation by the Company that the Company’s plans and objectives will be achieved. The Company undertakes no obligation to update or revise any such forward-looking statements, whether as a result of new information, future events or otherwise.
* Information in this section should be read in conjunction with and as part of the management report set out in the section headed Directors’ report on pages 103 to 117.
Operating & fi nancial review .

WPP ANNUAL REPORT 2006Our 2006 fi nancial statements

WPP ANNUAL REPORT 2006
Our 2006 fi nancial statementsAccounting policies
he consolidated fi nancial statements of WPP Group plc (the Group) for the year ended 31 December 2006 have been prepared in accordance with International Financial Reporting Standards (IFRS) as adopted by the European Union as they apply to the fi nancial statements of the Group for
the year ended 31 December 2006. The Group’s fi nancial statements are also consistent
with International Financial Reporting Standards as issued by the International Accounting Standards Board.
Basis of preparation
The fi nancial statements have been prepared under the historical cost convention, except for the revaluation of certain fi nancial instruments. The principal accounting policies are set out below.
Basis of consolidation
The consolidated fi nancial statements include the results of the Company and all its subsidiary undertakings made up to the same accounting date. All intra-Group balances, transactions, income and expenses are eliminated in full on consolidation. The results of subsidiary undertakings acquired or disposed of during the period are included or excluded from the income statement from the effective date of acquisition or disposal.
Goodwill and other intangible assets
Intangible assets comprise goodwill, certain acquired separable corporate brand names, customer relationships and capitalised computer software not integral to a related item of hardware.
Goodwill represents the excess of fair value attributed to investments in businesses or subsidiary undertakings over the fair value of the underlying net assets, including intangible assets, at the date of their acquisition. Goodwill arising on our acquisitions result from the fact our acquisitions are aimed at helping us position our portfolio in the faster-growing functional and geographic areas. These acquisitions complement and give rise to synergies with our existing portfolio of businesses, and bring skilled staff to deliver services to our clients. Goodwill arising on acquisitions before the date of transition to IFRS (1 January 2004) has been retained at the previous UK GAAP amounts subject to being tested for impairment. Goodwill written off to reserves under UK GAAP prior to 1998 has not been reinstated and is not included in determining any subsequent profi t or loss on disposal.
The Group has taken the option as permitted by IFRS 1 to apply IAS 21 (the effects of changes in foreign exchange rates) retrospectively to fair value adjustments and goodwill arising in all business combinations that occurred before the date of transition to IFRS.
Goodwill impairment reviews are undertaken annually or more frequently if events or changes in circumstances indicate a potential impairment. The carrying value of goodwill is compared to the net present value of future cashfl ows derived from the underlying assets using a projection period of up to fi ve years for each cash-generating unit. After the projection period a steady or declining growth rate representing an appropriate long-term growth rate for the industry is applied. Any impairment is recognised immediately as an expense and is not subsequently reversed.
Corporate brand names acquired as part of acquisitions of business are capitalised separately from goodwill as intangible assets if their value can be measured
Our 2006 fi nancial statements

Our 2006 fi nancial statementsAccounting policies
WPP ANNUAL REPORT 2006
line basis over its estimated useful life, as follows:
• Freehold buildings – 50 years
• Leasehold land and buildings – over the term of the lease or life of the asset, if shorter
• Fixtures, fi ttings and equipment – 3-10 years
• Computer equipment – 3-5 years
Interests in associates
The Group’s share of the profi ts less losses of associate undertakings net of tax, interest and minority interest is included in the consolidated income statement and the Group’s share of net assets is shown within interests in associates in the consolidated balance sheet. The Group’s share of the profi ts less losses and net assets is based on current information produced by the undertakings, adjusted to conform with the accounting policies of the Group.
The Group assesses the carrying value of its associate undertakings to determine if any impairment has occurred. Where this indicates that an investment may be impaired, the Group applies the requirements of IAS 36 in assessing the carrying amount of the investment. This process includes comparing its recoverable amount with its carrying value.
The Group accounts for joint venture investments under the equity method which is consistent with the Group’s treatment of associates.
Other investments
Other investments are designated as ‘available for sale’ and are shown at fair value with any movements in fair value taken to equity.
On disposal of the security the cumulative gain or loss previously recognised in equity is included in the profi t or loss for the year. Impairment losses recognised in profi t or loss for equity investments classifi ed as ‘available for sale’ are not subsequently reversed through profi t or loss.
Inventory and work in progress
Work in progress is valued at cost or on a percentage of completion basis where appropriate. Cost includes outlays incurred on behalf of clients and an appropriate proportion of directly attributable costs and overheads on incomplete assignments. Provision is made for irrecoverable costs where appropriate. Inventory is stated at the lower of cost and net realisable value.
reliably on initial recognition and it is probable that the expected future economic benefi ts that are attributable to the asset will fl ow to the Group.
Certain corporate brands of the Group are considered to have an indefi nite economic life because of the institutional nature of the corporate brand names, their proven ability to maintain market leadership and profi table operations over long periods of time and the Group’s commitment to develop and enhance their value. The carrying value of these intangible assets is reviewed at least annually for impairment and adjusted to the recoverable amount if required.
Amortisation is provided at rates calculated to write off the cost less estimated residual value of each asset on a straight-line basis over its estimated useful life as follows:Acquired intangibles
• Brand names – 10-20 years
• Customer related intangibles – 3-10 years
• Other proprietary tools – 3-10 yearsOther
• Other (including capitalised computer software) – 3-5 years
Contingent consideration
Future anticipated payments to vendors in respect of contingent consideration (earnouts) are based on the directors’ best estimates of future obligations, which are dependent on the future performance of the interests acquired and assume the operating companies improve profi ts in line with directors’ estimates. When earnouts are to be settled by cash consideration, the fair value of the consideration is obtained by discounting to present value the amounts expected to be payable in the future. The resulting interest charge is included within fi nance costs.
Property, plant and equipment
Property, plant and equipment are shown at cost less accumulated depreciation and any provision for impairment with the exception of freehold land which is not depreciated. The Group assesses the carrying value of its property, plant and equipment to determine if any impairment has occurred. Where this indicates that an asset may be impaired, the Group applies the requirements of IAS 36 in assessing the carrying amount of the assets. This process includes comparing its recoverable amount with its carrying value. Depreciation is provided at rates calculated to write off the cost less estimated residual value of each asset on a straight-
Our 2006 fi nancial statements

WPP ANNUAL REPORT 2006
Trade receivables
Trade receivables are stated net of provisions for bad and doubtful debts.
Financial instruments
The Group has taken advantage of the exemption available under IFRS 1 not to apply IAS 32 (Financial Instruments: Disclosure and Presentation) and IAS 39 (Financial Instruments: Recognition and Measurement) in respect of the year ended 31 December 2004. UK GAAP has continued to be applied to fi nancial instruments in that year. As the Group adopted IAS 32 and IAS 39 with effect from 1 January 2005, the balance sheet was restated at that date in accordance with the requirements of these standards.
The accounting policy under UK GAAP for the year ended 31 December 2004 is disclosed in note 26.
The accounting policy under IFRS for the years ended 31 December 2006 and 2005 is as follows:
Foreign currency and interest rate hedging
The Group’s policy on Interest Rate and Foreign Exchange Rate Management sets out the instruments and methods available to hedge interest and currency risk exposures and the control procedures in place to ensure effectiveness.
The Group uses derivative fi nancial instruments to reduce exposure to foreign exchange risk and interest rate movements. The Group does not hold or issue derivative fi nancial instruments for speculative purposes.
Derivatives are initially recognised at fair value at the date a derivative contract is entered into and are subsequently remeasured to their fair value at each balance sheet date. The resulting gain or loss is recognised in profi t or loss immediately unless the derivative is designated and effective as a hedging instrument, in which event the timing of the recognition in profi t or loss depends on the nature of the hedge relationship.
At the inception of the hedge relationship the entity documents the relationship between the hedging instrument and hedged item, along with its risk management objectives and its strategy for undertaking various hedge transactions. Furthermore, at the inception of the hedge and on an ongoing basis, the Group documents whether the hedging instrument that is used in a hedging relationship is highly effective in offsetting changes in fair values or cash fl ows of the hedged item.
Note 26 contains details of the fair values of the derivative instruments used for hedging purposes.
Changes in the fair value of derivatives that are designated and qualify as fair value hedges are recorded in profi t or loss immediately, together with any changes in the fair value of the hedged item that is attributable to the hedged risk.
The effective portion of changes in the fair value of derivatives that are designated and qualify as cash fl ow hedges are deferred in equity. The gain or loss relating to the ineffective portion is recognised immediately in profi t or loss. Amounts deferred in equity are recycled in profi t or loss in the periods when the hedged item is recognised in profi t or loss. However, when the forecast transaction that is hedged results in the recognition of a non-fi nancial asset or a non-fi nancial liability, the gains and losses previously deferred in equity are transferred from equity and included in the initial measurement of the cost of the asset or liability.
Hedge accounting is discontinued when the hedging instrument expires or is sold, terminated, or exercised, or no longer qualifi es for hedge accounting. At that time, any cumulative gain or loss on the hedging instrument recognised in equity is retained in equity until the forecasted transaction occurs. If a hedged transaction is no longer expected to occur, the net cumulative gain or loss recognised in equity is transferred to net profi t or loss for the period.
Derivatives embedded in other fi nancial instruments or other host contracts are treated as separate derivatives when their risks and characteristics are not closely related to those of host contracts and the host contracts are not carried at fair value with unrealised gains or losses reported in the income statement.
Liabilities in respect of option agreements
Option agreements that allow the Group’s equity partners to require the Group to purchase a minority interest are treated as derivatives over equity instruments and are recorded in the balance sheet at fair value and the valuation is remeasured at each period end. Fair value is based on the present value of expected cash outfl ows and the movement in the fair value is recognised as income or expense within fi nance costs in the income statement.
Derecognition of fi nancial liabilities
In accordance with IAS 39, a fi nancial liability of the Group is only released to the income statement when the underlying legal obligation is extinguished.
Our 2006 fi nancial statementsAccounting policies
Our 2006 fi nancial statements

Our 2006 fi nancial statementsAccounting policies
WPP ANNUAL REPORT 2006
Convertible debt
Convertible debt is assessed according to the substance of the contractual arrangements and is classifi ed into liability and equity elements on the basis of the initial fair value of the liability element. The difference between this fi gure and the cash received is classifi ed as equity.
The income statement charge for the fi nance cost will be spread evenly over the term of the convertible debt so that at redemption the liability equals the redemption value.
Bank borrowings
Other interest-bearing bank loans and overdrafts are recorded at the proceeds received, net of direct issue costs.
Borrowing costs
Finance costs of borrowing are recognised in the income statement over the term of those borrowings.
Revenue recognition
Revenue comprises commission and fees earned in respect of amounts billed. Direct costs include fees paid to external suppliers where they are retained to perform part or all of a specifi c project for a client and the resulting expenditure is directly attributable to the revenue earned. Revenue is stated exclusive of VAT, sales taxes and trade discounts.
Advertising and Media Investment Management
Revenue is typically derived from commissions on media placements and fees for advertising services. Revenue may consist of various arrangements involving commissions, fees, incentive-based revenue or a combination of the three, as agreed upon with each client.
Revenue is recognised when the service is performed, in accordance with the terms of the contractual arrangement. Incentive-based revenue typically comprises both quantitative and qualitative elements; on the element related to quantitative targets, revenue is recognised when the quantitative targets have been achieved; on the element related to qualitative targets, revenue is recognised when the incentive is received/receivable.
Information, Insight & Consultancy
Revenue recognised in proportion to the level of service performed for market research contracts is based on proportional performance. In assessing contract performance, both input and output criteria are reviewed. Costs incurred are used as an objective input measure of performance. The primary input of all work performed under these arrangements is labour. As a result of the relationship between labour and cost, there is normally a direct relationship between costs incurred and the proportion of the contract performed to date. Costs incurred as a proportion of expected total costs is used as an initial proportional performance measure. This indicative proportional performance measure is always subsequently validated against other more subjective criteria (i.e. relevant output measures) such as the percentage of interviews completed, percentage of reports delivered to a client and the achievement of any project milestones stipulated in the contract. In the event of divergence between the objective and more subjective measures, the more subjective measures take precedence since these are output measures.
While most of the studies provided in connection with the Group’s market research contracts are undertaken in response to an individual client’s or group of clients’ specifi cations, in certain instances a study may be developed as an off-the-shelf product offering sold to a broad client base. For these transactions, revenue is recognised when the product is delivered. Where the terms of transaction provide for licensing the product on a subscription basis, revenue is recognised over the subscription period on a straight-line basis or, if applicable, based on usage.
Substantially all services are provided on a fi xed price basis. Pricing may also include a provision for a surcharge where the actual labour hours incurred in completing a project are signifi cantly above the labour hours quoted in the project proposal. In instances where this occurs, the surcharge will be included in the total revenue base on which to measure proportional performance when the actual threshold is reached provided that collectibility is reasonably assured.
Our 2006 fi nancial statements

Our 2006 fi nancial statementsAccounting policies
WPP ANNUAL REPORT 2006
Public Relations & Public Affairs and Branding & Identity, Healthcare and Specialist Communications
Revenue is typically derived from retainer fees and services to be performed subject to specifi c agreement. Revenue is recognised when the service is performed, in accordance with the terms of the contractual arrangement. Revenue is recognised on long-term contracts, if the fi nal outcome can be assessed with reasonable certainty, by including in the income statement revenue and related costs as contract activity progresses.
Taxation
Corporate taxes are payable on taxable profi ts at current rates.The tax expense represents the sum of the tax
currently payable and deferred tax.The tax currently payable is based on taxable profi t
for the year. Taxable profi t differs from net profi t as reported in the income statement because it excludes items of income or expense that are taxable or deductible in other years and it further excludes items that are never taxable or deductible. The Group’s liability for current tax is calculated using tax rates that have been enacted or substantively enacted by the balance sheet date.
Deferred tax is the tax expected to be payable or recoverable on differences between the carrying amounts of assets and liabilities in the fi nancial statements and the corresponding tax bases used in the computation of taxable profi t, and is accounted for using the balance sheet liability method. Deferred tax liabilities are recognised for all taxable temporary differences unless specifi cally excepted by IAS 12. Deferred tax assets are recognised to the extent that it is probable that taxable profi ts will be available against which deductible temporary differences can be utilised. Such assets and liabilities are not recognised if the temporary difference arises from the initial recognition of goodwill or other assets and liabilities (other than in a business combination) in a transaction that affects neither the tax profi t nor the accounting profi t.
Deferred tax liabilities are recognised for taxable temporary differences arising on investments in subsidiaries and associates, and interests in joint ventures, except where the Group is able to control the reversal of the temporary difference and it is probable that the temporary difference will not reverse in the foreseeable future.
The carrying amount of deferred tax assets is reviewed at each balance sheet date and reduced to the extent that it is no longer probable that suffi cient taxable profi ts will be available to allow all or part of the asset to be recovered.
Deferred tax is calculated at the tax rates that are expected to apply in the period when the liability is settled or the asset is realised based on enacted or substantively enacted legislation. Deferred tax is charged or credited in the income statement, except when it relates to items charged or credited directly to equity, in which case the deferred tax is also dealt with in equity.
Retirement benefi t costs
For defi ned contribution schemes, contributions are charged to the income statement as payable in respect of the accounting period.
For defi ned benefi t schemes the amounts charged to operating profi t are the current service costs and gains and losses on settlements and curtailments. They are included as part of staff costs. Past service costs are recognised immediately in the income statement if the benefi ts have vested. If the benefi ts have not vested, the costs are recognised over the period until vesting occurs. The interest cost and the expected return on assets are shown within fi nance costs and fi nance income respectively. Actuarial gains and losses are recognised immediately in the Statement of Recognised Income and Expense.
Where defi ned benefi t schemes are funded, the assets of the scheme are held separately from those of the Group, in separate trustee-administered funds. Pension scheme assets are measured at fair value and liabilities are measured on an actuarial basis using the projected unit method and discounted at a rate equivalent to the current rate of return on a high-quality corporate bond of equivalent currency and term to the scheme liabilities. The actuarial valuations are obtained at least triennially and are updated at each balance sheet date.
Recognition of a surplus in the defi ned benefi t schemes is limited to the total of any cumulative unrecognised net actuarial losses and past service cost and the present value of any economic benefi ts available in the form of refunds from the plan or reduction in future contributions to the plan.
Our 2006 fi nancial statements

Our 2006 fi nancial statementsAccounting policies
WPP ANNUAL REPORT 2006
Finance leases
Assets held under fi nance leases are recognised as assets of the Group at the inception of the lease at the lower of their fair value and the present value of the minimum lease payments. Depreciation on leased assets is charged to the income statement on the same basis as owned assets. Leasing payments are treated as consisting of capital and interest elements and the interest is charged to the income statement as it is incurred.
Operating leases
Operating lease rentals are charged to the income statement on a straight-line basis over the lease term. Any premium or discount on the acquisition of a lease is spread over the life of the lease on a straight-line basis.
Translation of foreign currencies
Foreign currency transactions arising from normal trading activities are recorded at the rates in effect at the date of the transaction. Monetary assets and liabilities denominated in foreign currencies at the year end are translated at the year-end exchange rate. Foreign currency gains and losses are credited or charged to the income statement as they arise. The income statements of overseas subsidiary undertakings are translated into pounds sterling at average exchange rates and the year-end net assets of these companies are translated at year-end exchange rates. Exchange differences arising from retranslation of the opening net assets and on foreign currency borrowings (to the extent that they hedge the Group’s investment in such operations) are reported in the Statement of Recognised Income and Expense.
Goodwill and fair value adjustments arising on the acquisition of a foreign entity are treated as assets and liabilities of the foreign entity and translated at the closing rate.
Share-based payments
The Group issues equity-settled share-based payments (including share options) to certain employees and accounts for these awards in accordance with IFRS 2 (Share-based payments). Equity-settled share-based payments are measured at fair value (excluding the effect of non market-based vesting conditions) at the date of grant. The Group has used a Black-Scholes valuation model for this purpose.
The fair value determined at the grant date is recognised in the income statement as an expense on a straight-line basis over the relevant vesting period, based on the Group’s estimate of the number of shares that will ultimately vest and adjusted for the effect of non-market-based vesting conditions.
IFRS 2 (Share-based payments) applies to all share-based payments granted since 7 November 2002, but the Group has elected for full retrospective restatement as this better represents the ongoing charge to the income statement.
New IFRS accounting pronouncements
At the date of authorisation of these fi nancial statements, the following Standards and Interpretations which have not been applied in these fi nancial statements were in issue but not yet effective:
• IFRS 7 Financial instruments: Disclosures.
• IFRS 8 Operating Segments.
• IFRIC 7 Applying the Restatement Approach under IAS 29 Financial Reporting in Hyperinfl ationary Economies IFRIC 8 Scope of IFRS 2.
• IFRIC 9 Reassessment of Embedded Derivatives.
• IFRIC 10 Interim Financial Reporting and Impairment.
• IFRIC 11 IFRS 2: Group and Treasury Transactions.
• IFRIC 12: Service Concession Arrangements.The Group does not consider that these Standards
and Interpretations will have a signifi cant impact on the fi nancial statements of the Group except for additional disclosures on capital and fi nancial instruments when the relevant standards come into effect for periods commencing on or after 1 January 2007.
Critical accounting judgements in applying accounting policies
Management is required to make key decisions and judgements in the process of applying the Group’s accounting policies. The most signifi cant areas where such judgements have been necessary are goodwill, acquisition reserves and accounting for pension liabilities. Where judgement has been applied, the key factors taken into consideration are disclosed in the appropriate note in these fi nancial statements.
Our 2006 fi nancial statements

WPP ANNUAL REPORT 2006
Consolidated income statement
For the year ended 31 December 2006 2006 2005 2004 2006 2005 2004Notes £m £m £m $m2 $m2 $m2
Billings 30,140.7 26,673.7 19,598.0 55,555.3 48,516.8 35,915.3
Revenue 2 5,907.8 5,373.7 4,299.5 10,889.2 9,774.2 7,879.3
Direct costs (296.8) (241.0) (225.1) (547.1) (438.4) (412.6)
Gross profi t 5,611.0 5,132.7 4,074.4 10,342.1 9,335.8 7,466.7
Operating costs 3 (4,869.4) (4,479.9) (3,598.9) (8,975.3) (8,148.5) (6,595.3)
Operating profi t 2 741.6 652.8 475.5 1,366.8 1,187.3 871.4
Share of results of associates 4 41.1 33.9 29.5 75.8 61.7 54.1
Profi t before interest and taxation 782.7 686.7 505.0 1,442.6 1,249.0 925.5
Finance income 6 111.0 87.6 77.7 204.6 159.3 142.4
Finance costs 6 (211.7) (182.3) (148.3) (390.2) (331.6) (271.8)
Profi t before taxation 682.0 592.0 434.4 1,257.0 1,076.7 796.1
Taxation 7 (199.4) (194.0) (135.0) (367.5) (352.8) (247.4)
Profi t for the year 482.6 398.0 299.4 889.5 723.9 548.7
Attributable to:
Equity holders of the parent 435.8 363.9 273.0 803.2 661.9 500.3
Minority interests 46.8 34.1 26.4 86.3 62.0 48.4
482.6 398.0 299.4 889.5 723.9 548.7
Headline PBIT 32 859.0 754.8 560.2 1,583.3 1,372.9 1,026.6
Headline PBIT margin 32 14.5% 14.0% 13.0% 14.5% 14.0% 13.0%
Headline PBT 32 766.3 669.0 489.6 1,412.4 1,216.8 897.2
Earnings per share1 9
Basic earnings per ordinary share 36.3p 30.3p 24.0p 66.9¢ 55.1¢ 44.0¢
Diluted earnings per ordinary share 35.2p 29.7p 23.4p 64.9¢ 54.0¢ 42.9¢
Notes
The accompanying notes form an integral part of this income statement.1 The calculations of the Group’s earnings per share and Headline earnings per share are set out in note 9.2 The main reporting currency of the Group is the pound sterling and the fi nancial statements have been prepared on this basis. For illustrative purposes only, the income statement set out on this page is
also expressed in US dollars using the approximate average rate for the year (2006: $1.8432 = £1, 2005: $1.8189 = £1, 2004: $1.8326 = £1). This translation is unaudited and should not be construed as a representation that the pound sterling amounts actually represent, or could be converted into, US dollars at the rates indicated.
Our 2006 fi nancial statements
Our 2006 fi nancial statements

WPP ANNUAL REPORT 2006
For the year ended 31 December 2006 2006 2005 2004 Notes £m £m £m
Net cash infl ow from operating activities 11 661.4 837.5 556.4
Investing activities
Acquisitions and disposals 11 (215.6) (507.7) (208.9)
Purchases of property, plant and equipment (167.8) (160.5) (89.7)
Purchases of other intangible assets (including capitalised computer software) (16.7) (10.8) (5.9)
Proceeds on disposal of property, plant and equipment 22.4 6.7 9.3
Net cash outfl ow from investing activities (377.7) (672.3) (295.2)
Financing activities
Share option proceeds 70.9 20.3 17.9
Share repurchases and buy-backs 11 (257.7) (152.3) (88.7)
Net increase/(decrease) in borrowings 11 382.1 (595.2) 128.6
Financing and share issue costs (3.7) (2.2) (5.0)
Equity dividends paid (118.9) (100.2) (81.7)
Dividends paid to minority shareholders in subsidiary undertakings (28.8) (24.0) (22.5)
Net cash infl ow/(outfl ow) from fi nancing activities 43.9 (853.6) (51.4)
Net increase/(decrease) in cash and cash equivalents 327.6 (688.4) 209.8
Translation differences (50.3) 85.0 (44.6)
Cash and cash equivalents at beginning of year 679.6 1,283.0 1,117.8
Cash and cash equivalents at end of year 11 956.9 679.6 1,283.0
Reconciliation of net cash fl ow to movement in net debt:
Net increase/(decrease) in cash and cash equivalents 327.6 (688.4) 209.8
Cash (outfl ow)/infl ow from decrease/(increase) in debt fi nancing (380.1) 596.9 (124.2)
Net debt acquired – (140.8) (9.6)
Other movements 9.3 (25.9) (8.2)
Translation difference 32.6 8.9 (6.7)
Movement of net debt in the year (10.6) (249.3) 61.1
Net debt at beginning of year (804.0) (300.4) (361.5)
IAS 32 and IAS 39 adjustment at 1 January 2005 12 – (254.3) –
Net debt at end of year 10 (814.6) (804.0) (300.4)
Note
The accompanying notes form an integral part of this cash fl ow statement.
Our 2006 fi nancial statements
Consolidated cash fl ow statement
Our 2006 fi nancial statements

WPP ANNUAL REPORT 2006
Our 2006 fi nancial statements
Consolidated statement of recognised income and expenseFor the year ended 31 December 2006 2006 2005 2004
£m £m £m
Profi t for the year 482.6 398.0 299.4
Exchange adjustments on foreign currency net investments (367.0) 266.1 (102.7)
Revaluation of other investments 9.5 21.0 –
Actuarial gain/(loss) on defi ned benefi t pension schemes 26.0 (16.5) (18.2)
Deferred tax on defi ned benefi t pension schemes 5.3 3.6 3.3
Net (expense)/income recognised directly in equity (326.2) 274.2 117.6
Total recognised income and expense relating to the year 156.4 672.2 181.8
Attributable to:
Equity holders of the parent 109.6 638.1 155.4
Minority interests 46.8 34.1 26.4
156.4 672.2 181.8
Note
The accompanying notes form an integral part of this statement of recognised income and expense.
Our 2006 fi nancial statements

WPP ANNUAL REPORT 2006
Consolidated balance sheet
Our 2006 fi nancial statements
At 31 December 2006 2006 2005 2004 2006 2005 2004Notes £m £m £m $m1 $m1 $m1
Non-current assetsIntangible assets: Goodwill 13 5,434.5 5,675.2 4,389.7 10,634.8 9,754.0 8,409.8 Other 13 1,115.4 1,260.6 773.6 2,182.7 2,166.6 1,482.1Property, plant and equipment 14 415.3 423.5 309.8 812.7 727.9 593.5Interests in associates 15 411.4 509.9 385.5 805.1 876.4 738.5Other investments 15 136.5 55.3 8.1 267.1 95.0 15.5Deferred tax assets 16 108.9 130.3 100.2 213.1 223.9 192.0Trade and other receivables 18 110.3 142.1 59.5 215.8 244.2 114.0 7,732.3 8,196.9 6,026.4 15,131.3 14,088.0 11,545.4Current assetsInventory and work in progress 17 341.5 281.5 220.6 668.3 483.8 422.6Corporate income tax recoverable 26.5 21.0 24.2 51.9 36.1 46.4Trade and other receivables 18 4,931.9 4,774.5 2,517.3 9,651.2 8,205.9 4,822.6Trade receivables within working capital facility: Gross receivables 19 – – 545.7 – – 1,045.5 Non-returnable proceeds 19 – – (261.0) – – (500.0) – – 284.7 – – 545.5Cash and short-term deposits 1,663.7 1,115.2 1,616.0 3,255.7 1,916.7 3,095.9 6,963.6 6,192.2 4,662.8 13,627.1 10,642.5 8,933.0Current liabilitiesTrade and other payables 20 (6,783.8) (6,828.4) (4,515.9) (13,275.2) (11,736.0) (8,651.6)Corporate income tax payable (39.6) (56.5) (53.1) (77.5) (97.1) (101.7)
Bank overdrafts and loans 22 (1,260.6) (545.1) (597.8) (2,466.9) (786.8) (1,145.3) (8,084.0) (7,430.0) (5,166.8) (15,819.6) (12,619.9) (9,898.6)Net current liabilities (1,120.4) (1,237.8) (504.0) (2,192.5) (1,977.4) (965.6)Total assets less current liabilities 6,611.9 6,959.1 5,522.4 12,938.8 12,110.6 10,579.8Non-current liabilitiesBonds and bank loans 22 (1,217.7) (1,374.1) (1,318.6) (2,382.9) (2,511.7) (2,526.1)Trade and other payables 21 (331.9) (330.2) (246.0) (649.5) (567.5) (471.3)Corporate income tax liability (383.7) (372.8) (290.6) (750.9) (640.7) (556.7)Deferred tax liabilities 16 (467.8) (533.1) (312.3) (915.4) (916.2) (598.3)Provision for post-employment benefi ts 25 (187.6) (231.4) (202.3) (367.1) (397.7) (387.6)
Provisions for liabilities and charges 23 (104.8) (131.7) (86.9) (205.1) (226.4) (166.5) (2,693.5) (2,973.3) (2,456.7) (5,270.9) (5,260.2) (4,706.5)Net assets 3,918.4 3,985.8 3,065.7 7,667.9 6,850.4 5,873.3EquityCalled-up share capital 27, 28 124.1 125.3 118.5 242.9 215.4 227.0Share premium account 28 74.9 2.1 1,002.2 146.6 3.6 1,920.0Shares to be issued 28 7.5 37.2 49.9 14.7 63.9 95.6Merger reserve 28 (1,370.0) (1,388.1) 2,920.6 (2,681.0) (2,385.7) 5,595.4Other reserves 28 (170.1) 167.3 (90.6) (332.9) 287.5 (173.6)Own shares 28 (288.5) (292.9) (277.7) (564.6) (503.4) (532.0)Retained earnings 28 5,449.0 5,253.6 (711.8) 10,663.1 9,029.4 (1,363.7)Equity share owners’ funds 3,826.9 3,904.5 3,011.1 7,488.8 6,710.7 5,768.7Minority interests 91.5 81.3 54.6 179.1 139.7 104.6
Total equity 3,918.4 3,985.8 3,065.7 7,667.9 6,850.4 5,873.3
Notes
The accompanying notes form an integral part of this balance sheet.1 The main reporting currency of the Group is the pound sterling and the fi nancial statements have been prepared on this basis. For illustrative purposes only, the balance sheet set out on this page is also
expressed in US dollars using the rate in effect on 31 December (2006: $1.9569 = £1, 2005: $1.7187 = £1, 2004: $1.9158 = £1). This translation is unaudited and should not be construed as a representation that the pound sterling amounts actually represent, or could be converted into, US dollars at the rates indicated.
Signed on behalf of the Board on 15 May 2007:
Sir Martin Sorrell P W G RichardsonGroup chief executive Group fi nance director
Our 2006 fi nancial statements

WPP ANNUAL REPORT 2006
Our 2006 fi nancial statements
Notes to the consolidated fi nancial statementsFor the year ended 31 December 2006
1. General informationWPP Group plc is a company incorporated in the UK under the Companies Act 1985. The address of the registered offi ce is Pennypot Industrial Estate, Hythe, Kent, CT21 6PE. The nature of the Group’s operations and its principal activities are set out in note 2.
These fi nancial statements are presented in pounds sterling because that is the currency of the primary economic environment in which the Group operates. Foreign operations are included in accordance with the policies set out on pages 143 to 148.
2. Segment informationThe Group is a leading worldwide communications services organisation offering national and multinational clients a comprehensive range of communications services.
For management purposes, the Group is currently organised into four operating segments – Advertising and Media Investment Management; Information, Insight & Consultancy; Public Relations & Public Affairs; and Branding & Identity, Healthcare and Specialist Communications. These disciplines are the basis on which the Group reports its primary information. The Group’s operations are located in North America; the UK; Continental Europe; and Asia Pacifi c, Latin America, Africa & Middle East and the Group’s performance has historically been linked with the economic performance of these regions. These geographic divisions are the basis on which the Group reports its secondary information.
Operating sectorsSegment information about these businesses is presented below: Profi t Share of before Profi t Operating result of interest and Finance Finance before Profi t for Revenue1 profi t associates taxation income costs taxation Taxation the year
£m £m £m £m £m £m £m £m £m
2006Advertising and Media Investment Management 2,806.9 365.2 21.9 387.1Information, Insight & Consultancy 892.9 89.0 1.9 90.9Public Relations & Public Affairs 595.7 83.5 3.2 86.7
Branding & Identity, Healthcare
and Specialist Communications 1,612.3 203.9 14.1 218.0 5,907.8 741.6 41.1 782.7 111.0 (211.7) 682.0 (199.4) 482.6
2005Advertising and Media Investment Management 2,606.4 334.0 16.1 350.1Information, Insight & Consultancy 810.4 69.4 6.9 76.3Public Relations & Public Affairs 534.4 72.1 2.1 74.2
Branding & Identity, Healthcare
and Specialist Communications 1,422.5 177.3 8.8 186.1 5,373.7 652.8 33.9 686.7 87.6 (182.3) 592.0 (194.0) 398.0
2004Advertising and Media Investment Management 1,985.3 264.4 18.2 282.6Information, Insight & Consultancy 744.8 63.8 5.0 68.8Public Relations & Public Affairs 445.2 39.4 1.3 40.7
Branding & Identity, Healthcare
and Specialist Communications 1,124.2 107.9 5.0 112.9 4,299.5 475.5 29.5 505.0 77.7 (148.3) 434.4 (135.0) 299.4
Note1 Intersegment sales have not been separately disclosed as they are not material.
Headline Headline Headline Headline PBIT Headline PBIT Headline PBIT PBIT1 margin % PBIT1 margin % PBIT1 margin %
2006 2006 2005 2005 2004 2004 £m £m £m
Advertising and Media Investment Management 443.7 15.8 402.7 15.5 295.0 14.9Information, Insight & Consultancy 98.7 11.1 83.4 10.3 66.1 8.9Public Relations & Public Affairs 89.5 15.0 75.3 14.1 58.4 13.1
Branding & Identity, Healthcare and Specialist Communications 227.1 14.1 193.4 13.6 140.7 12.5 859.0 14.5 754.8 14.0 560.2 13.0
Note1 Headline PBIT is defi ned in note 32.
Our 2006 fi nancial statements

WPP ANNUAL REPORT 2006
Our 2006 fi nancial statementsNotes to the consolidated fi nancial statements
Acquired Depreciation Goodwill Share-based Goodwill intangibles Capital and impairment & Interest inOther information payments additions additions additions1 amortisation write-downs associates
£m £m £m £m £m £m £m
2006Advertising and Media Investment Management 43.7 60.9 4.5 105.8 114.3 28.7 257.1Information, Insight & Consultancy 7.7 12.9 0.4 19.5 17.2 5.6 83.1Public Relations & Public Affairs 4.7 55.5 6.0 15.1 13.8 0.9 18.7
Branding & Identity, Healthcare and Specialist Communications 14.8 78.3 9.4 44.1 40.6 9.1 52.5 70.9 207.6 20.3 184.5 185.9 44.3 411.4
2005Advertising and Media Investment Management 40.0 856.4 250.6 96.8 85.5 35.6 294.0Information, Insight & Consultancy 8.6 20.7 2.4 17.6 17.8 7.1 96.8Public Relations & Public Affairs 4.3 45.7 15.4 20.1 12.1 0.4 18.2
Branding & Identity, Healthcare and Specialist Communications 15.7 205.3 86.1 36.8 32.0 4.0 100.9 68.6 1,128.1 354.5 171.3 147.4 47.1 509.9
2004Advertising and Media Investment Management 30.1 8.0 – 48.5 49.3 20.7 260.5Information, Insight & Consultancy 8.9 155.8 7.0 18.2 18.6 3.8 17.2Public Relations & Public Affairs 5.1 34.7 – 11.9 10.3 17.8 14.3
Branding & Identity, Healthcare and Specialist Communications 14.7 4.9 – 23.4 25.2 10.9 93.5 58.8 203.4 7.0 102.0 103.4 53.2 385.5
Note1 Capital additions include purchases of property, plant and equipment and other intangible assets (including capitalised computer software).
Assets Liabilities
Unallocated Consolidated Unallocated Consolidated Segment corporate total Segment corporate totalBalance sheet assets assets1 assets liabilities liabilities1 liabilities
£m £m £m £m £m £m
2006Advertising and Media Investment Management 7,861.4 (5,912.7)Information, Insight & Consultancy 919.1 (373.9)Public Relations & Public Affairs 1,209.9 (246.3)
Branding & Identity, Healthcare and Specialist Communications 2,906.5 (875.2) 12,896.9 1,799.0 14,695.9 (7,408.1) (3,369.4) (10,777.5)
2005Advertising and Media Investment Management 9,829.6 (5,949.9)Information, Insight & Consultancy 946.6 (401.1)Public Relations & Public Affairs 623.9 (249.5)
Branding & Identity, Healthcare and Specialist Communications 1,722.5 (921.2) 13,122.6 1,266.5 14,389.1 (7,521.7) (2,881.6) (10,403.3)
2004Advertising and Media Investment Management 6,732.7 (3,864.4)Information, Insight & Consultancy 702.3 (363.8)Public Relations & Public Affairs 433.7 (179.6)
Branding & Identity, Healthcare and Specialist Communications 1,080.1 (643.3) 8,948.8 1,740.4 10,689.2 (5,051.1) (2,572.4) (7,623.5)
Note1 Included in unallocated corporate assets and liabilities are corporate income tax, deferred tax and net interest-bearing debt. The debt has not been allocated as it is held centrally and specifi cally allocating it
to individual segments is not considered to be a fair representation of the net asets of those segments.
Our 2006 fi nancial statements

WPP ANNUAL REPORT 2006
Our 2006 fi nancial statementsNotes to the consolidated fi nancial statements
Contributions by geographical area were as follows:2006 2005 2004
£m £m £mRevenue1
North America 2,291.1 2,106.9 1,651.9UK 856.3 808.1 728.5Continental Europe 1,532.9 1,410.3 1,134.8Asia Pacifi c, Latin America, Africa & Middle East 1,227.5 1,048.4 784.3 5,907.8 5,373.7 4,299.5
Margin Margin Margin Headline PBIT2
North America 17.0% 389.0 16.6% 350.1 15.2% 251.2UK 11.4% 97.9 10.5% 84.6 10.4% 75.7Continental Europe 12.7% 194.3 12.5% 176.1 11.3% 128.1Asia Pacifi c, Latin America, Africa & Middle East 14.5% 177.8 13.7% 144.0 13.4% 105.2
14.5% 859.0 14.0% 754.8 13.0% 560.2
Segment AssetsNorth America 4,536.0 5,116.5 3,999.6UK 1,693.8 1,357.3 1,421.9Continental Europe 3,946.0 4,091.2 1,976.9Asia Pacifi c, Latin America, Africa & Middle East 2,721.1 2,557.6 1,550.4 12,896.9 13,122.6 8,948.8
Capital additions3
North America 90.1 80.5 34.4UK 29.4 28.7 24.3Continental Europe 28.7 31.1 21.3Asia Pacifi c, Latin America, Africa & Middle East 36.3 31.0 22.0 184.5 171.3 102.0
Notes1 Intersegment sales have not been separately disclosed as they are not material.2 Headline PBIT is defi ned in note 32.3 Capital additions include purchases of property, plant and equipment and other intangible assets
(including capitalised computer software).
3. Operating costs 2006 2005 2004 £m £m £mTotal staff costs (note 5) 3,474.4 3,186.3 2,531.3Establishment costs 419.1 387.6 327.6Other operating costs (net) 975.9 906.0 740.0Total operating costs 4,869.4 4,479.9 3,598.9Operating costs include:Goodwill impairment 35.5 46.0 40.6Goodwill write-down relating to utilisation of pre-acquisition tax losses (note 13)1 8.8 1.1 12.6Amortisation and impairment of acquired intangible assets (note 13) 43.3 25.3 –Amortisation of other intangible assets (note 13) 13.5 10.7 6.7Depreciation of property, plant and equipment (note 14) 129.1 111.4 96.7(Gains)/losses on sale of property, plant and equipment (3.7) 1.1 1.9Gains on disposal of investments (7.3) (4.3) (3.0)Investment write-downs – – 5.0Net foreign exchange losses 5.0 0.8 1.8Operating lease rentals:Land and buildings 251.7 237.8 205.1Plant and machinery 30.4 34.8 37.5 282.1 272.6 242.6
Notes1 The goodwill write-down in relation to the utilisation of pre-acquisition tax losses is due to the
better than expected performance of certain acquisitions in the year. This enabled the utilisation of pre-acquisition tax attributes that previously could not be recognised at the time of acquisition due to insuffi cient evidence that they were recoverable.
In 2006, operating profi t includes credits totalling £10.6 million (2005: £10.1 million, 2004: £14.0 million) relating to the release of excess provisions and other balances established in respect of acquisitions completed prior to 2005. Further details of the Group’s approach to acquisition reserves, as required by IFRS 3 ‘Business combinations’, are given in note 29.
All of the operating costs of the Group are related to administrative expenses.
Auditors’ remuneration: 2006 2005 2004 £m £m £mFees payable to the Company’s auditors for the audit of the Company’s annual accounts 1.7 1.9 1.4The audit of the Company’s subsidiaries pursuant to legislation 10.8 10.0 6.7 12.5 11.9 8.1Other services pursuant to legislation 4.0 3.0 4.1Fees payable to the auditors pursuant to legislation 16.5 14.9 12.2Tax advisory services 2.8 2.6 2.7Tax compliance services 1.1 1.0 0.7 3.9 3.6 3.4Corporate fi nance services – 0.2 0.9Remuneration services – – 0.6Other services 3.3 2.8 2.8Total non-audit fees 7.2 6.6 7.7Total fees 23.7 21.5 19.9
Minimum committed annual rentalsAmounts payable in 2007 under the foregoing leases will be as follows: Plant and machinery Land and buildings 2007 2006 2005 2007 2006 2005 £m £m £m £m £m £mIn respect of operating leases which expire: – within one year 6.9 7.0 6.9 30.8 20.6 24.0 – within two to fi ve years 13.5 17.9 19.3 95.5 94.5 74.0 – after fi ve years 1.8 1.8 1.5 75.8 90.0 75.9 22.2 26.7 27.7 202.1 205.1 173.9
Future minimum annual amounts payable under all lease commitments in existence at 31 December 2006 are as follows: Minimum Less rental sub-let Net payments rentals payment £m £m £mYear ending 31 December2007 224.3 (20.4) 203.92008 179.0 (19.4) 159.62009 148.4 (17.3) 131.12010 111.5 (15.7) 95.82011 97.4 (12.8) 84.6Later years 344.8 (29.6) 315.2 1,105.4 (115.2) 990.2
4. Share of results of associatesShare of results of associates include: 2006 2005 2004 £m £m £mShare of profi t before interest and taxation 61.4 54.0 48.1Share of exceptional gains 4.0 – –Share of interest and minority interest 0.9 (0.9) (0.7)Share of taxation (25.2) (19.2) (17.9) 41.1 33.9 29.5
Share of exceptional gains of £4.0 million in the year ended 31 December 2006 represents the Group’s share of negative goodwill recognised in the income statements of its associate undertakings during the year.
5. Our peopleOur staff numbers averaged 77,686 against 70,936 in 2005 and 57,788 in 2004, including acquisitions. Their geographical distribution was as follows: 2006 2005 2004North America 22,477 21,261 17,271UK 8,484 8,007 7,069Continental Europe 19,935 18,644 14,793Asia Pacifi c, Latin America, Africa & Middle East 26,790 23,024 18,655 77,686 70,936 57,788
Their operating sector distribution was as follows: 2006 2005 2004Advertising and Media Investment Management 41,030 38,084 29,419Information, Insight & Consultancy 10,869 10,089 9,482Public Relations & Public Affairs 6,616 5,901 5,136Branding & Identity, Healthcare and Specialist Communications 19,171 16,862 13,751 77,686 70,936 57,788
Our 2006 fi nancial statements

WPP ANNUAL REPORT 2006
Our 2006 fi nancial statementsNotes to the consolidated fi nancial statements
At the end of 2006 staff numbers were 79,352 (2005: 74,631, 2004: 59,932). Including all employees of associated undertakings, this fi gure was approximately 98,000 at 31 December 2006 (2005: 92,000, 2004: 84,000) and approximately 100,000 at 30 April 2007.
Total staff costs were made up as follows: 2006 2005 2004 £m £m £mWages and salaries 2,385.8 2,182.1 1,718.4Cash-based incentive plans 176.0 159.0 130.7Share-based incentive plans (note 24) 70.9 68.6 58.8Social security costs 281.7 267.3 210.0Other pension costs (note 25) 81.7 75.6 64.4Other staff costs 478.3 433.7 349.0 3,474.4 3,186.3 2,531.3Staff cost to revenue ratio 58.8% 59.3% 58.9%
Compensation for key management personnel is disclosed on page 126 to 129.
6. Finance income and fi nance costs
Finance income includes: 2006 2005 2004 £m £m £mExpected return on pension scheme assets 25.2 24.2 21.3Investment income 5.7 5.6 –Interest income 80.1 57.8 56.4 111.0 87.6 77.7
Finance costs include: 2006 2005 2004 £m £m £mInterest on pension scheme liabilities 32.4 32.0 30.8Interest payable and similar charges1 171.3 141.4 117.5Finance charges (excluding revaluation of fi nancial instruments) 203.7 173.4 148.3Revaluation of fi nancial instruments 8.0 8.9 – 211.7 182.3 148.3
Note1 The charges for the years ended 31 December 2006 includes an expense of £13.8 million (2005:
£13.8 million) arising from the change in accounting for the Group’s convertible bonds following the adoption of IAS 32 ‘Financial Instruments: Disclosure and Presentation’ and IAS 39 ‘Financial Instruments: Recognition and Measurement’ on 1 January 2005. 2004 comparatives have not been restated as permitted by IFRS 1. This approach also applies to the initial recognition and subsequent re-measurement of the fair value of other fi nancial instruments shown below. UK GAAP has continued to be applied in accounting for fi nancial instruments in 2004.
The following are included in the revaluation of fi nancial instruments shown above: 2006 2005 2004 £m £m £mMovements in fair value of treasury instruments 3.3 3.0 –Revaluation of put options over minority interests (notes 20 and 21 ) 4.7 5.8 –Other – 0.1 – 8.0 8.9 –
Interest payable on the Group’s borrowings, other than the bonds, is payable at a margin of between 0.06% and 0.275% over relevant LIBOR.
The majority of the Group’s long-term debt is represented by $750 million of US dollar bonds at a weighted average interest rate of 6.01% (prior to any interest rate swaps or cross-currency swaps), €1,250 million of Eurobonds at 5.22% (prior to any interest rate or currency swaps) and £450 million of convertible bonds at 3.0% (including redemption premium and issue cost accrual and prior to any interest rate or currency swaps).
Average borrowings under the Syndicated Revolving Credit Facilities (note 10) amounted to $690 million at an average interest rate of 5.16% inclusive of margin.
Average borrowings under the US$ Commercial Paper Program (note 10) amounted to $799 million at an average interest rate of 5.36% inclusive of margin.
7. TaxationThe tax charge is based on the profi t for the year and comprises: 2006 2005 2004 £m £m £mCurrent taxUK corporation tax at 30%: Current year 36.6 32.9 22.5Prior years (44.9) (24.4) – (8.3) 8.5 22.5Foreign tax:Current year 216.9 177.3 108.6Prior years (7.6) 9.9 9.6 209.3 187.2 118.2Total current tax 201.0 195.7 140.7Deferred taxCurrent year (1.6) (1.7) (5.7)Tax charge 199.4 194.0 135.0The tax charge for the year can be reconciled to profi t before taxation in the income statement as follows: 2006 2005 2004 £m £m £mProfi t before taxation 682.0 592.0 434.4Tax at the UK corporation tax rate of 30% 204.6 177.6 130.3Tax effect of share of results of associates (12.3) (10.2) (8.9)Tax effect of expenses that are not deductible in determining taxable profi t 7.4 12.4 1.3Tax effect of utilisation or recognition of tax losses not previously recognised (24.3) (16.8) (18.3)Effect of different tax rates of subsidiaries operating in other jurisdictions 10.3 18.5 20.0Unused tax losses carried forward 13.7 12.5 10.6Tax charge 199.4 194.0 135.0Effective tax rate on profi t before taxation 29.2% 32.8% 31.1%Effective tax rate on Headline PBT1 26.0% 29.0% 27.6%
Note1 Headline PBT is defi ned in note 32.
8. Ordinary dividendsAmounts recognised as distributions to equity holders in the year:
2006 2005 2004 2006 2005 2004Per share Pence per share £m £m £m2005 Final dividend paid 6.34p 5.28p 4.40p 76.1 64.1 52.22006 Interim dividend paid 3.60p 3.00p 2.50p 42.8 36.2 29.4
9.94p 8.28p 6.90p 118.9 100.3 81.6
2006 2005 2004 2006 2005 2004Per ADR1 Cents per ADR $m $m $m2005 Final dividend paid 57.7¢ 48.4¢ 36.0¢ 138.4 117.5 85.42006 Interim dividend paid 33.2¢ 27.3¢ 22.9¢ 78.9 65.8 53.9
90.9¢ 75.7¢ 58.9¢ 217.3 183.3 139.3
Proposed fi nal dividend for the year ended 31 December 2006:2006 2005 2004
Per share Pence per share 2006 Final dividend proposed2 7.61p 6.34p 5.28p
2006 2005 2004Per ADR1 Cents per ADR 2006 Final dividend proposed2 70.1¢ 57.7¢ 48.4¢
Notes1 These fi gures have been translated for convenience purposes only, using the approximate average
rate for the year shown on page 149. This conversion should not be construed as a representation that the pound sterling amounts actually represent, or could be converted into, US dollars at the rates indicated.
2 The Annual General Meeting to approve the fi nal dividend will be held on 26 June 2007 and therefore the fi nal dividend has not been included as a liability in these fi nancial statements.
The payment of this dividend will not have any tax consequences for the Group.
Our 2006 fi nancial statements

WPP ANNUAL REPORT 2006
Our 2006 fi nancial statementsNotes to the consolidated fi nancial statements
9. Earnings per share
Basic EPSThe calculation of basic Reported and Headline EPS is as follows: 2006 2005 2004Reported earnings1 (£m) 435.8 363.9 273.0Headline earnings (£m) (note 32) 520.1 440.9 328.2Average shares used in Basic EPS calculation (m) 1,201.0 1,200.1 1,136.1Reported EPS 36.3p 30.3p 24.0pHeadline EPS 43.3p 36.7p 28.9p
Note1 Reported earnings is equivalent to profi t for the year attributable to equity holders of the parent.
Diluted EPSThe calculation of diluted Reported and Headline EPS is set out below: 2006 2005 2004Diluted Reported Earnings (£m) 436.9 363.9 285.2Diluted Headline Earnings (£m) 521.2 440.9 340.4Average shares used in Diluted EPS calculation (m) 1,242.2 1,224.8 1,219.6Diluted Reported EPS 35.2p 29.7p 23.4pDiluted Headline EPS 42.0p 36.0p 27.9p
Diluted EPS has been calculated based on the Reported and Headline Earnings amounts above. For the year ended 31 December 2006, the $150 million Grey convertible bonds were dilutive to earnings while the £450 million convertible bonds were accretive. Earnings for the purposes of this calculation consequently included an additional £1.1 million in 2006. In 2005, both convertibles were accretive to earnings and therefore excluded from the calculation of dilutive earnings. In 2004, the Group’s convertible bonds then in issue were dilutive and earnings were consequently increased by £12.2 million in that year. In addition, at 31 December 2006, options to purchase 7.6 million ordinary shares (2005: 12.0 million, 2004: 18.4 million) were outstanding, but were excluded from the computation of diluted earnings per share because the exercise prices of these options were greater than the average market price of the Group’s shares and, therefore, their inclusion would have been accretive.
A reconciliation between the shares used in calculating Basic and Diluted EPS is as follows: 2006 2005 2004 m m mAverage shares used in Basic EPS calculation 1,201.0 1,200.1 1,136.1Dilutive share options outstanding 14.9 18.6 20.6Other potentially issuable shares 17.4 6.1 4.6$150 million Grey convertible bonds 8.9 – –$287.5 million convertible bonds – – 16.4£450 million convertible bonds – – 41.9Shares used in Diluted EPS calculation 1,242.2 1,224.8 1,219.6
At 31 December 2006 there were 1,240,605,187 ordinary shares in issue.
10. Sources of fi nanceThe following table summarises the equity and debt fi nancing of the Group, and changes during the year: Shares Debt
2006 2005 2004 2006 2005 2004£m £m £m £m £m £m
Analysis of changes in fi nancingBeginning of year 127.4 1,120.7 1,074.0 1,483.6 1,583.4 1,479.3Reclassifi cation due to Group reconstruction1 – (1,037.9) – – – –Shares issued in respect of acquisitions – 8.5 – – – –Other issues of share capital 75.0 38.5 48.0 – – –Share cancellations (3.3) (2.1) (1.3) – – –Share issue costs paid (0.1) (0.2) – – – –Transfer to goodwill – (0.1) – – – –IAS 32 and IAS 39 adjustment at 1 January 2005 (note 12) – – – – 254.3 –Net (decrease)/increase in drawings on bank loans, corporate bonds and convertible bonds – – – 382.1 (595.1) 128.6Debt acquired (net) – – – – 140.8 9.6Net amortisation of fi nancing costs included in net debt – – – 10.4 7.9 3.8Other movements – – – (21.7) 16.2 –Exchange adjustments – – – (82.9) 76.1 (37.9)End of year 199.0 127.4 1,120.7 1,771.5 1,483.6 1,583.4
Note1 Further details on the Group reconstruction in 2005 are given in note 27.
The above table excludes bank overdrafts which fall within cash and cash equivalents for the purposes of the consolidated cash fl ow statement.
SharesAt 31 December 2006, the Company’s share base was entirely composed of ordinary equity share capital and share premium of £199.0 million (2005: £127.4 million, 2004: £1,120.7 million), further details of which are disclosed in notes 27 and 28.
DebtUSA bond The Group has in issue $100 million of 6.875% bonds due 2008 and $650 million of 5.875% bonds due 2014.
Eurobond In December 2006, the Group issued €600 million of 4.375% bonds due 2013. The Group also has in issue €650 million of 6.0% bonds due 2008.
Sterling bond In April 2007, the Group issued £400 million of 6% bonds due April 2017.
Revolving Credit Facilities The Group has a $1.6 billion seven year Revolving Credit Facility due August 2012. The Group’s borrowing under this facility, which are drawn down predominantly in US dollars and pounds sterling, averaged $690 million in 2006. The Group had available undrawn committed credit facilities of £817 million at December 2006 (2005: £931 million, 2004: £391 million).
Borrowings under the Revolving Credit Facility are governed by certain fi nancial covenants based on the results and fi nancial position of the Group.
US Commercial Paper ProgramIn October 2006, the Group established a $1.4 billion US Commercial Paper Program using the Revolving Credit Facility as a backstop. The Group’s borrowings under this facility are drawn down in US dollars and swapped into other currencies as required. The average commercial paper outstanding since the launch of the program was $799 million. There was no US Commercial Paper outstanding at 31 December 2006.
Convertible bondsIn April 2002, the Group issued £450 million of 2% convertible bonds due April 2007. At the option of the holder, the bonds are convertible at any time into 41,860,465 WPP ordinary shares at an initial price of £10.75. As the bonds are redeemable at a premium of 5.35% over par, the conversion price increases during the life of the bonds to £11.33 per share into the same number of shares as above. The effective interest rate on the liability component is 7.2%. These bonds were redeemed on their due date of 11 April 2007.
In March 2005, with the purchase of Grey Global Group Inc, the Group acquired $150 million of 5% convertible debentures due 2033. Each debenture holder has the right to require Grey and WPP (as co-obligor) to repurchase as of each of 28 October 2008, 2010 and 2013 all or a portion of the holder’s then outstanding debentures at par ($1,000 per debenture) plus the amount of accrued and unpaid interest. WPP has the unrestricted right to call the bond at par from 2013. Each $1,000 of principal amount is initially convertible into 11.820362 WPP ADSs and $499.31 of cash and is convertible at the option of the holder at any time. The effective interest rate on the liability component is 4.5%.
The convertible bonds have a nominal value of £526.7 million at 31 December 2006 (2005: £537.3 million, 2004: £600.1 million). In accordance with IAS 32 and IAS 39, these bonds have been split between a liability component and an equity component by initially valuing the liability component at fair value based on the present value of future cash fl ows and then holding it at amortised cost. The equity component represents the fair value, on initial recognition, of the embedded option to convert the liability into equity of the Group.
The liability element is £561.5 million and the equity component is £68.7 million as at 31 December 2006 (2005: £525.5 million and £68.7 million respectively). 2004 comparatives have not been restated as permitted by IFRS 1 and UK GAAP has continued to be applied in accounting for fi nancial instruments in that year.
The Group estimates that the fair value of the liability component of the convertible bonds at 31 December 2006 to be approximately £538.4 million (2005: £537.0 million). This fair value has been calculated by discounting the future cash fl ows at the market rate.
The following table is an analysis of net debt with debt analysed by year of repayment: 2006 2005 2004 £m £m £mDebtWithin one year (553.8) (109.5) (264.8)Between one and two years (486.4) (446.2) (2.5)Between two and three years – (463.6) (453.3)Between three and four years – (58.2) (510.9)Between four and fi ve years – – –Over fi ve years (731.3) (406.1) (351.9)Debt fi nancing under the Revolving Credit Facility and in relation to unsecured loan notes (1,771.5) (1,483.6) (1,583.4)Short-term overdrafts – within one year (706.8) (435.6) (333.0)Debt fi nancing (2,478.3) (1,919.2) (1,916.4)Cash and short-term deposits 1,663.7 1,115.2 1,616.0Net debt (814.6) (804.0) (300.4)
Our 2006 fi nancial statements

WPP ANNUAL REPORT 2006
Analysis of fi xed and fl oating rate debt by currency including the effect of interest rate and cross-currency swaps:2006 Fixed Floating PeriodCurrency £m rate1 basis (months)1
$ – fi xed 483.9 5.18% n/a 120 – fl oating 72.1 n/a LIBOR n/a€ – fi xed 56.6 8.85% n/a 36 – fl oating 942.0 n/a LIBOR n/aOther 216.9 n/a LIBOR n/a
1,771.5
2005 Fixed Floating PeriodCurrency £m rate1 basis (months)1
$ – fi xed 551.5 5.08% n/a 62 – fl oating 43.6 n/a LIBOR n/a£ – fi xed 104.1 (2.23%) n/a 16 – fl oating 64.0 n/a market n/a€ – fi xed 137.7 8.27% n/a 32 – fl oating 511.5 n/a LIBOR n/a¥ – fi xed 44.4 (1.29%) n/a 16Other 26.8 n/a Various n/a 1,483.6
2004 Fixed Floating PeriodCurrency £m rate1 basis (months)1
$ – fi xed 437.2 5.19% n/a 41 – fl oating 363.72 n/a LIBOR n/a£ – fi xed 239.1 1.94% n/a 28€ – fi xed 176.9 6.00% n/a 42 – fl oating 564.6 n/a EURIBOR n/a¥ – fi xed 45.8 (1.29%) n/a 28Other 17.1 n/a Various n/a 1,844.42
Notes1 Weighted average. These rates do not include the effect of gains on interest rate swap terminations
that are written to income over the life of the original instrument. At 31 December 2006 the amounts still to be written to income were £5.2 million in respect of US dollar swap terminations, to be written to income evenly until June 2014, and £5.2 million in respect of Euro swap terminations to be written to income evenly until June 2008.
2 Including drawings on working capital facility as described in note 19.
11. Analysis of cash fl owsThe following tables analyse the items included within the main cash fl ow headings on page 150.
Net cash from operating activities: 2006 2005 2004 £m £m £mProfi t for the year 482.6 398.0 299.4Taxation 199.4 194.0 135.0Finance costs 211.7 182.3 148.3Finance income (111.0) (87.6) (77.7)Share of results of associates (41.1) (33.9) (29.5)Operating profi t 741.6 652.8 475.5Adjustments for:Non-cash share-based incentive plans (including share options) 70.9 68.6 58.8Depreciation of property, plant and equipment 129.1 111.4 96.7Impairment of goodwill 35.5 46.0 40.6Goodwill write-down relating to utilisation of pre-acquisition tax losses 8.8 1.1 12.6Amortisation of acquired intangible assets 43.3 25.3 –Amortisation of other intangible assets 13.5 10.7 6.7Gains on disposal of investments (7.3) (4.3) (3.0)(Gains)/losses on sale of property, plant and equipment (3.7) 1.1 1.9Amounts written off investments – – 5.0Operating cash fl ow before movements in working capital and provisions 1,031.7 912.7 694.8(Increase)/decrease in inventories and work in progress (83.0) 39.5 40.1Increase in receivables (489.1) (618.5) (414.6)Increase in payables – short term 433.4 710.4 339.0Increase/(decrease) in payables – long term 17.6 (33.8) 29.9(Decrease)/increase in provisions (50.0) 10.0 0.8Cash generated by operations 860.6 1,020.3 690.0Corporation and overseas tax paid (162.0) (136.0) (101.3)Interest and similar charges paid (135.1) (128.2) (99.7)Interest received 75.2 62.4 48.9Investment income 2.4 5.6 –Dividends from associates 20.3 13.4 18.5Net cash infl ow from operating activities 661.4 837.5 556.4
Acquisitions and disposals: 2006 2005 2004 £m £m £mInitial cash consideration (120.5) (561.2) (97.3)Cash and cash equivalents acquired (net) 21.4 173.9 6.3Earnout payments (91.6) (96.7) (78.6)Loan note redemptions (11.7) (33.0) (26.6)Purchase of other investments (including associates) (28.7) (29.0) (22.0)Proceeds on disposal of investments 15.5 38.3 9.3Net cash outfl ow (215.6) (507.7) (208.9)
Share repurchases and buy-backs: 2006 2005 2004 £m £m £mShare cancellations (excluding brokerage fees) (218.8) (123.3) (73.7)Purchase of own shares by ESOP trust (38.9) (29.0) (15.0)Net cash outfl ow (257.7) (152.3) (88.7)
Net increase/(decrease) in borrowings: 2006 2005 2004 £m £m £mIncrease in drawings on bank loans (21.8) 17.1 0.9Proceeds from issue of €600 million Eurobonds 403.9 – –Repayment of $287.5 million convertible bonds – (154.5) –Repayment of $125 million Grey debt – (65.3) –Repayment of working capital facility – (277.2) –Repayment of $200 million bonds – (115.3) –Proceeds from issue of $650 million 10 year bonds – – 358.2Repayment of €350 million bonds – – (230.5)Net cash infl ow/(outfl ow) 382.1 (595.2) 128.6
Our 2006 fi nancial statementsNotes to the consolidated fi nancial statements
Our 2006 fi nancial statements

WPP ANNUAL REPORT 2006
Our 2006 fi nancial statementsNotes to the consolidated fi nancial statements
Cash and cash equivalents: 2006 2005 2004 £m £m £mCash at bank and in hand 1,476.8 1,029.0 1,372.0Short-term bank deposits 186.9 86.2 244.0Overdrafts1 (706.8) (435.6) (333.0)Cash and cash equivalents at end of year 956.9 679.6 1,283.0
Note1 Bank overdrafts are included in cash and cash equivalents because they form an integral part of the
Group’s cash management.
The Group considers that the carrying amount of cash and cash equivalents approximates their fair value.
12. IAS 32 and IAS 39 adjustment at 1 January 2005The IAS 32 and IAS 39 adjustments to net debt at 1 January 2005 are made up of the following: £mReclassifi cation of components of convertible debt 32.4Reclassifi cation of deferred gain arising on termination of swaps (18.6)Recognition of fi nancial instruments at fair value (7.1)Reclassifi cation of the working capital facility1 (261.0) (254.3)
Note1 The Group had a working capital facility (the advance of cash fi nancing against which certain
trade debts have been assigned) that IAS 32 and IAS 39 require to be presented as a bank borrowing. As the Group has elected to apply IAS 32 and IAS 39 from 1 January 2005, net debt at 31 December 2004 has been presented to comply with 2004 UK GAAP as a deduction from debtors, in accordance with the ‘linked presentation’ required by FRS 5 (Reporting the substance of transactions). The drawdown on the facility was transferred to debt at 1 January 2005. The facility was repaid and cancelled on 31 August 2005.
13. Intangible assets
GoodwillThe movements in 2006 and 2005 were as follows: £mCost:1 January 2005 4,728.5Additions1 1,128.1Reclassifi cations to interests in associates and other investments (37.1)Disposals (47.1)Exchange differences 277.131 December 2005 6,049.5Additions1 207.6Exchange differences (433.5)31 December 2006 5,823.6
Accumulated impairment losses and write-downs:1 January 2005 338.8Goodwill write-down relating to utilisation of pre-acquisition tax losses 1.1Impairment losses for the year 34.431 December 2005 374.3Goodwill write-down relating to utilisation of pre-acquisition tax losses 8.8Impairment losses for the year 20.1Exchange differences (14.1)31 December 2006 389.1
Net book value:31 December 2006 5,434.531 December 2005 5,675.21 January 2005 4,389.7
Note1 Additions represent goodwill arising on the acquisition of subsidiary undertakings. Goodwill arising
on the acquisition of associate undertakings is shown within interests in associates in note 15.
Signifi cant components of goodwill as at 31 December 2006, 2005 and 2004 are: 2006 2005 2004 £m £m £mYoung & Rubicam 2,249.6 2,369.9 2,087.7Grey 964.2 992.0 –Mediaedge:cia 874.7 921.3 902.7Other 1,346.0 1,392.0 1,399.3Total goodwill 5,434.5 5,675.2 4,389.7
Other goodwill represents goodwill on a large number of acquisitions, none of which is individually signifi cant in comparison to the total carrying value of goodwill.
Other intangible assets:The movements in 2006 and 2005 were as follows: Brands with an Acquired indefi nite intan- useful life gibles Other Total £m £m £m £mCost:1 January 2005 742.6 7.0 56.3 805.9Additions – – 10.8 10.8Disposals – – (5.1) (5.1)Acquired on acquisition of a subsidiary1 – 354.5 5.3 359.8Other movements – – 7.3 7.3Exchange differences 154.4 (4.9) 2.8 152.331 December 2005 897.0 356.6 77.4 1,331.0Additions – – 16.7 16.7Disposals – – (4.1) (4.1)Acquired on acquisition of a subsidiary – 20.3 – 20.3Other movements – – 15.2 15.2Exchange differences (85.6) (40.4) (8.7) (134.7)31 December 2006 811.4 336.5 96.5 1,244.4
Amortisation and impairment:1 January 2005 – – 32.3 32.3Charge for the year – 25.3 10.7 36.0Disposals – – (4.9) (4.9)Other movements – – 4.2 4.2Exchange differences – 1.0 1.8 2.831 December 2005 – 26.3 44.1 70.4Charge for the year – 43.3 13.5 56.8Other movements – – 12.6 12.6Exchange differences – (5.0) (5.8) (10.8)31 December 2006 – 64.6 64.4 129.0
Net book value:31 December 2006 811.4 271.9 32.1 1,115.431 December 2005 897.0 330.3 33.3 1,260.61 January 2005 742.6 7.0 24.0 773.6
Note1 In accordance with IAS 38, intangible assets acquired as a result of an acquisition have been
presented as an addition to cost at net book value. In previous fi nancial statements, the Group has presented such additions at gross value to cost and amortisation.
Brands with an indefi nite life represent JWT, Hill & Knowlton, Ogilvy & Mather Worldwide and the Young & Rubicam Group. These assets are carried at historical cost in accordance with the Group’s accounting policy for intangible assets. The most signifi cant of these is the Young & Rubicam Group with a carrying value of £488.2 million at 31 December 2006 (2005: £539.4 million, 2004: £453.4 million). The carrying values of the JWT, Hill & Knowlton and Ogilvy & Mather Worldwide brands are not individually signifi cant in comparison with the total carrying value of brands with an indefi nite useful life.
The estimated aggregate amortisation expense in respect of other intangible assets (including acquired intangibles) for each of the next fi ve years is as follows: £45.7 million in 2007, £42.7 million in 2008, £37.5 million in 2009, £31.3 million in 2010 and £24.7 million in 2011.
In accordance with the Group’s accounting policy, the carrying values of goodwill and other intangible assets are reviewed for impairment annually or more frequently if events or changes in circumstances indicate that the asset might be impaired.
The 2006 impairment review was initially undertaken as at 30 June 2006 and then updated as at 31 December 2006. The review assessed whether the carrying value of goodwill was supported by the net present value of future cashfl ows derived from assets using a projection period of up to fi ve years for each cash-generating unit. After the projection period, steady or declining growth has been assumed at rates not exceeding long-term average growth rates for the industry for each cash-generating unit, with no improvements in operating margin being assumed. Except in the case of Young & Rubicam as noted below, an annual growth rate of 3.0% and a pre-tax discount rate of 11.9% have been assumed. After the projection period, projections for Young & Rubicam assume an annual growth rate of 4.4%. The projections also include assumptions about payments for cash taxes, hence the Group’s weighted average cost of capital of 7.25% has been applied to the Young & Rubicam impairment test.
An impairment charge is required for both goodwill and other indefi nite lived intangible assets when the carrying amount exceeds the recoverable amount. Impairment charges of £35.5 million, £46.0 million and £40.6 million were recorded in the years ended 31 December 2006, 2005 and 2004 respectively. The impairment charges relate to certain under-performing businesses in the Group. In certain markets, the impact of current local economic conditions and trading circumstances on these businesses was suffi ciently severe to indicate impairment to the carrying value of goodwill. At 31 December 2006 an impairment charge of acquired intangible assets was recorded for £1.5 million. This charge related to Advertising and Media Investment
Our 2006 fi nancial statements

WPP ANNUAL REPORT 2006
Management for £1.2 million, Branding & Identity, Healthcare and Specialist Communications for £0.2 million, and Public Relations & Public Affairs for £0.1 million. This charge was the result of our review of certain customer relationships which had been lost during the year.
Under IFRS, an impairment charge is required for both goodwill and other indefi nite-lived assets when the carrying amount exceeds the ‘recoverable amount’, defi ned as the higher of fair value less costs to sell and value in use. Our approach in determining the recoverable amount utilises a discounted cash fl ow methodology, which necessarily involves making numerous estimates and assumptions regarding revenue growth, operating margins, tax rates, appropriate discount rates and working capital requirements. These estimates will likely differ from future actual results of operations and cash fl ows, and it is possible that these differences could be material. In addition, judgements are applied in determining the level of cash-generating unit we identify for impairment testing and the criteria we use to determine which assets should be aggregated. A difference in testing levels could affect whether an impairment is recorded and the extent of impairment loss. Changes in our business activities or structure may also result in changes to the level of testing in future periods. Further, future events could cause the Group to conclude that impairment indicators exist and that the asset values associated with a given operation have become impaired. Any resulting impairment loss could have a material impact on the Group’s fi nancial condition and results of operations.
Historically our impairment losses have resulted from a specifi c event, condition or circumstance in one of our companies, such as the loss of a signifi cant client. As a result, changes in the assumptions used in our impairment model have not had a signifi cant effect on the impairment charges recognised. The carrying value of goodwill and other intangible assets will continue to be reviewed at least annually for impairment and adjusted to the recoverable amount if required.
14. Property, plant and equipmentThe movements in 2006 and 2005 were as follows: Land and buildings Fixtures, Short fi ttings Com- lease- and puter Freehold hold equip- equip- Land buildings buildings ment ment Total £m £m £m £m £m £mCost:1 January 2005 14.1 38.7 281.7 240.9 377.2 952.6Additions – 0.7 59.8 36.5 63.5 160.5New acquisitions1 8.6 0.4 31.2 15.9 14.3 70.4Disposals (3.0) (0.1) (35.1) (46.7) (104.2) (189.1)Exchange adjustments (5.1) 11.2 25.9 16.1 16.0 64.131 December 2005 14.6 50.9 363.5 262.7 366.8 1,058.5Additions – 1.4 64.2 39.5 62.7 167.8New acquisitions1 0.1 – 0.9 1.9 0.8 3.7Disposals (1.0) (5.5) (42.1) (46.9) (60.7) (156.2)Exchange adjustments (4.4) (12.6) (32.1) (29.0) (22.7) (100.8)31 December 2006 9.3 34.2 354.4 228.2 346.9 973.0
Depreciation:1 January 2005 – 18.5 139.0 174.9 310.4 642.8Charge for the year – 1.9 34.1 27.6 47.8 111.4Disposals – (0.9) (31.6) (43.0) (90.0) (165.5)Exchange adjustments – 2.3 15.9 12.8 15.3 46.331 December 2005 – 21.8 157.4 172.3 283.5 635.0Charge for the year – 1.7 43.2 30.8 53.4 129.1Disposals – (0.4) (36.6) (43.6) (57.7) (138.3)Exchange adjustments – (7.5) (16.4) (17.9) (26.3) (68.1)31 December 2006 – 15.6 147.6 141.6 252.9 557.7
Net book value:31 December 2006 9.3 18.6 206.8 86.6 94.0 415.331 December 2005 14.6 29.1 206.1 90.4 83.3 423.51 January 2005 14.1 20.2 142.7 66.0 66.8 309.8
Note1 In accordance with IAS 16, property, plant and equipment acquired as a result of an acquisition
has been presented as an addition to cost at fair value. In previous fi nancial statements, the Group has presented such additions at gross value to cost and depreciation.
Leased assets (other than leasehold buildings) included above have a net book value of £5.7 million (2005: £8.3 million, 2004: £8.5 million). Future obligations in respect of these leased assets are £5.8 million (2005: £9.0 million, 2004: £8.6 million) and are included in other creditors.
At the end of the year, capital commitments contracted, but not provided for in respect of property, plant and equipment were £44.4 million (2005: £36.9 million, 2004: £30.9 million).
15. Interests in associates and other investmentsThe movements in 2006 and 2005 were as follows: Net Goodwill assets of and other associate intangibles Total Other under- of associate assoc- invest- takings undertakings iates ments £m £m £m £m1 January 2005 162.9 222.6 385.5 8.1Additions 21.0 – 21.0 23.2Goodwill arising on acquisition of new associates – 42.4 42.4 –Share of results of associate undertakings (note 4) 33.9 – 33.9 –Dividends and other movements (12.3) – (12.3) –Exchange adjustments 2.2 16.3 18.5 –Disposals (0.5) – (0.5) –Reclassifi cation from subsidiaries 1.0 33.1 34.1 3.0Revaluation of other investments – – – 21.0Goodwill impairment – (11.6) (11.6) –Amortisation of other intangible assets – (1.1) (1.1) –31 December 2005 208.2 301.7 509.9 55.3Additions 1.5 – 1.5 18.2Goodwill arising on acquisition of new associates – 13.6 13.6 –Share of results of associate undertakings (note 4) 41.1 – 41.1 –Dividends and other movements (21.5) (2.5) (24.0) –Exchange adjustments (13.9) (17.5) (31.4) (0.8)Disposals (0.1) (0.6) (0.7) (8.6)Reclassifi cation from associates to other investments (21.0) (41.9) (62.9) 62.9Reclassifi cation to subsidiaries (8.5) (11.3) (19.8) –Revaluation of other investments – – – 9.5Goodwill impairment – (15.4) (15.4) –Amortisation of other intangible assets – (0.5) (0.5) –31 December 2006 185.8 225.6 411.4 136.5
The investments included above as ‘other investments’ represent investments in equity securities that present the Group with opportunity for return through dividend income and trading gains. They have no fi xed maturity or coupon rate. The fair values of the listed securities are based on quoted market prices. For unlisted securities, where market value is not available, the Group has estimated relevant fair values on the basis of publicly available information from outside sources or on the basis of discounted cash fl ow models where appropriate.
The Group’s principal associate undertakings at 31 December 2006 included: % Country of owned incorporationAGB Nielsen Media Research BV 50.0 NetherlandsAsatsu-DK 21.7 JapanChime Communications PLC 21.7 UKDentsu, Young & Rubicam Inc. 49.0 JapanHigh Co S.A. 33.1 FranceIbope Latinoamericana SA 31.2 BrazilKinetic Worldwide Limited 50.0 UKGIIR, Inc 28.2 KoreaGrass Roots Group PLC 45.0 UKSingleton, Ogilvy & Mather (Holdings) Pty Limited 33.3 Australia
The market value of the Group’s shares in its principal listed associate undertakings at 31 December 2006 was as follows: Asatsu-DK: £167.8 million, Chime Communications PLC: £30.6 million, High Co S.A.: £28.6 million and GIIR, Inc: £26.4 million. The carrying value (including goodwill) of these equity interests in the Group’s balance sheet at 31 December 2006 was as follows: Asatsu-DK: £134.3 million, Chime Communications PLC: £15.5 million, High Co S.A.: £19.5 million and GIIR, Inc: £25.6 million. The Group’s investments in its principal associate undertakings are represented by ordinary shares.
Our 2006 fi nancial statementsNotes to the consolidated fi nancial statements
Our 2006 fi nancial statements
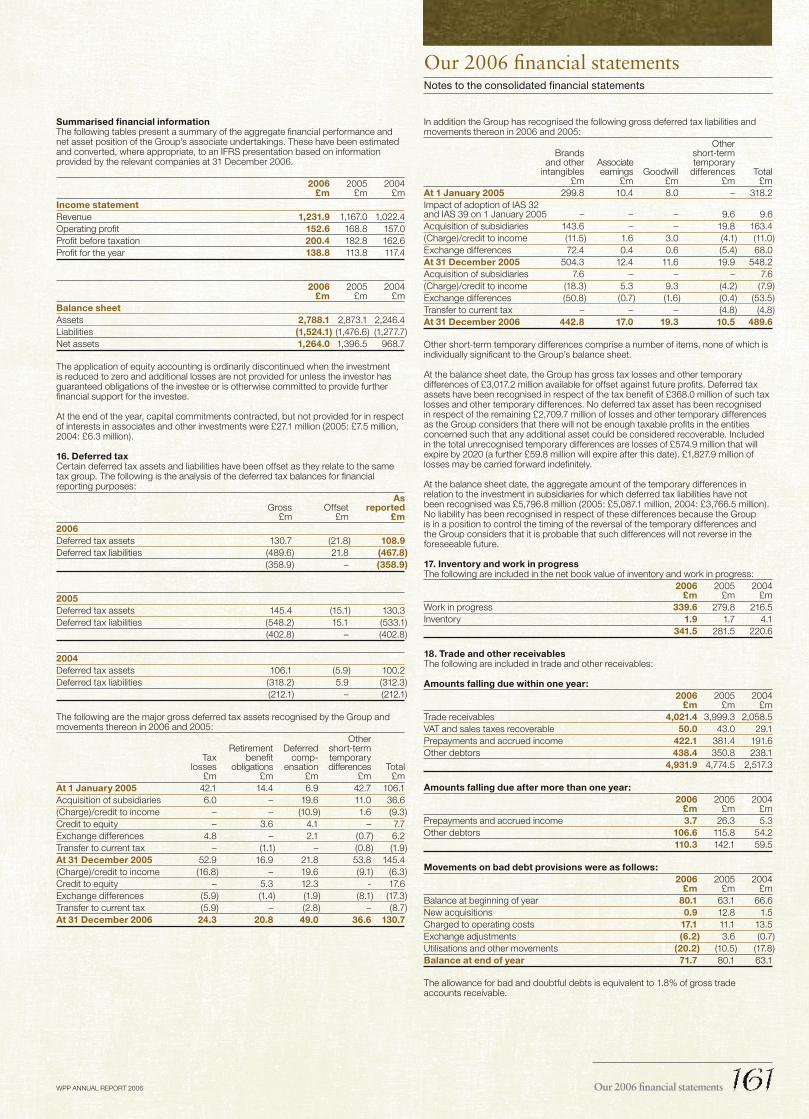
WPP ANNUAL REPORT 2006
Our 2006 fi nancial statementsNotes to the consolidated fi nancial statements
Summarised fi nancial informationThe following tables present a summary of the aggregate fi nancial performance and net asset position of the Group’s associate undertakings. These have been estimated and converted, where appropriate, to an IFRS presentation based on information provided by the relevant companies at 31 December 2006.
2006 2005 2004 £m £m £mIncome statementRevenue 1,231.9 1,167.0 1,022.4Operating profi t 152.6 168.8 157.0Profi t before taxation 200.4 182.8 162.6Profi t for the year 138.8 113.8 117.4
2006 2005 2004 £m £m £mBalance sheetAssets 2,788.1 2,873.1 2,246.4Liabilities (1,524.1) (1,476.6) (1,277.7)Net assets 1,264.0 1,396.5 968.7
The application of equity accounting is ordinarily discontinued when the investment is reduced to zero and additional losses are not provided for unless the investor has guaranteed obligations of the investee or is otherwise committed to provide further fi nancial support for the investee.
At the end of the year, capital commitments contracted, but not provided for in respect of interests in associates and other investments were £27.1 million (2005: £7.5 million, 2004: £6.3 million).
16. Deferred taxCertain deferred tax assets and liabilities have been offset as they relate to the same tax group. The following is the analysis of the deferred tax balances for fi nancial reporting purposes: As Gross Offset reported £m £m £m2006Deferred tax assets 130.7 (21.8) 108.9Deferred tax liabilities (489.6) 21.8 (467.8) (358.9) – (358.9)
2005Deferred tax assets 145.4 (15.1) 130.3Deferred tax liabilities (548.2) 15.1 (533.1) (402.8) – (402.8) 2004Deferred tax assets 106.1 (5.9) 100.2Deferred tax liabilities (318.2) 5.9 (312.3) (212.1) – (212.1)
The following are the major gross deferred tax assets recognised by the Group and movements thereon in 2006 and 2005: Other Retirement Deferred short-term Tax benefi t comp- temporary losses obligations ensation differences Total £m £m £m £m £mAt 1 January 2005 42.1 14.4 6.9 42.7 106.1Acquisition of subsidiaries 6.0 – 19.6 11.0 36.6(Charge)/credit to income – – (10.9) 1.6 (9.3)Credit to equity – 3.6 4.1 – 7.7Exchange differences 4.8 – 2.1 (0.7) 6.2Transfer to current tax – (1.1) – (0.8) (1.9)At 31 December 2005 52.9 16.9 21.8 53.8 145.4(Charge)/credit to income (16.8) – 19.6 (9.1) (6.3)Credit to equity – 5.3 12.3 - 17.6Exchange differences (5.9) (1.4) (1.9) (8.1) (17.3)Transfer to current tax (5.9) – (2.8) – (8.7)At 31 December 2006 24.3 20.8 49.0 36.6 130.7
In addition the Group has recognised the following gross deferred tax liabilities and movements thereon in 2006 and 2005: Other Brands short-term and other Associate temporary intangibles earnings Goodwill differences Total £m £m £m £m £mAt 1 January 2005 299.8 10.4 8.0 – 318.2Impact of adoption of IAS 32 and IAS 39 on 1 January 2005 – – – 9.6 9.6Acquisition of subsidiaries 143.6 – – 19.8 163.4(Charge)/credit to income (11.5) 1.6 3.0 (4.1) (11.0)Exchange differences 72.4 0.4 0.6 (5.4) 68.0At 31 December 2005 504.3 12.4 11.6 19.9 548.2Acquisition of subsidiaries 7.6 – – – 7.6(Charge)/credit to income (18.3) 5.3 9.3 (4.2) (7.9)Exchange differences (50.8) (0.7) (1.6) (0.4) (53.5)Transfer to current tax – – – (4.8) (4.8)At 31 December 2006 442.8 17.0 19.3 10.5 489.6 Other short-term temporary differences comprise a number of items, none of which is individually signifi cant to the Group’s balance sheet.
At the balance sheet date, the Group has gross tax losses and other temporary differences of £3,017.2 million available for offset against future profi ts. Deferred tax assets have been recognised in respect of the tax benefi t of £368.0 million of such tax losses and other temporary differences. No deferred tax asset has been recognised in respect of the remaining £2,709.7 million of losses and other temporary differences as the Group considers that there will not be enough taxable profi ts in the entities concerned such that any additional asset could be considered recoverable. Included in the total unrecognised temporary differences are losses of £574.9 million that will expire by 2020 (a further £59.8 million will expire after this date). £1,827.9 million of losses may be carried forward indefi nitely.
At the balance sheet date, the aggregate amount of the temporary differences in relation to the investment in subsidiaries for which deferred tax liabilities have not been recognised was £5,796.8 million (2005: £5,087.1 million, 2004: £3,766.5 million). No liability has been recognised in respect of these differences because the Group is in a position to control the timing of the reversal of the temporary differences and the Group considers that it is probable that such differences will not reverse in the foreseeable future.
17. Inventory and work in progressThe following are included in the net book value of inventory and work in progress: 2006 2005 2004 £m £m £mWork in progress 339.6 279.8 216.5Inventory 1.9 1.7 4.1 341.5 281.5 220.6
18. Trade and other receivablesThe following are included in trade and other receivables:
Amounts falling due within one year: 2006 2005 2004 £m £m £mTrade receivables 4,021.4 3,999.3 2,058.5VAT and sales taxes recoverable 50.0 43.0 29.1Prepayments and accrued income 422.1 381.4 191.6Other debtors 438.4 350.8 238.1 4,931.9 4,774.5 2,517.3
Amounts falling due after more than one year: 2006 2005 2004 £m £m £mPrepayments and accrued income 3.7 26.3 5.3Other debtors 106.6 115.8 54.2 110.3 142.1 59.5
Movements on bad debt provisions were as follows: 2006 2005 2004 £m £m £mBalance at beginning of year 80.1 63.1 66.6New acquisitions 0.9 12.8 1.5Charged to operating costs 17.1 11.1 13.5Exchange adjustments (6.2) 3.6 (0.7)Utilisations and other movements (20.2) (10.5) (17.8)Balance at end of year 71.7 80.1 63.1
The allowance for bad and doubtful debts is equivalent to 1.8% of gross trade accounts receivable.
Our 2006 fi nancial statements

WPP ANNUAL REPORT 2006
The Group considers that the carrying amount of trade and other receivables approximates their fair value.
19. Trade receivables within working capital facilityThe following are included in trade receivables within the Group’s working capital facilities: 2006 2005 2004 £m £m £mGross trade receivables – – 545.7Non-returnable proceeds – – (261.0) – – 284.7
The Group had a working capital facility in which certain trade receivables were assigned as security against the advance of cash. This security was represented by the assignment of a pool of trade receivables to a bankruptcy-remote subsidiary of the Group, with further assignment to the providers of this working capital facility. The fi nancing provided against this pool took into account, inter alia, the risks that may have been attached to the individual receivables and the expected collection period.
The working capital facility is required to be presented as a bank borrowing under IAS 32 and IAS 39. As the Group has elected to apply IAS 32 and IAS 39 from 1 January 2005 the drawdown on the facility was transferred to debt on this date and the prior period has not been restated. The facility was repaid and cancelled on 31 August 2005.
On termination of the working capital facilities, the Group was not obliged to support any credit-related losses arising from the assigned receivables against which cash had been advanced. The transaction documents stipulate that, in the event of default in payment by a debtor, the providers of the facility may only seek repayment of cash advanced from the remainder of the pool of debts in which they hold an interest and that recourse against the Group is not available.
20. Trade and other payables: amounts falling due within one yearThe following are included in trade and other payables falling due within one year: 2006 2005 2004 £m £m £mTrade payables 4,743.6 4,659.3 2,885.3Other taxation and social security 182.7 161.4 151.4Payments due to vendors (earnout agreements) 87.9 81.3 146.6Loan notes due to vendors 1.8 13.6 7.2Liabilities in respect of put option agreements with vendors1 51.1 50.4 –Other creditors and accruals 1,205.9 1,258.2 919.6Deferred income 510.8 604.2 405.8 6,783.8 6,828.4 4,515.9
Note1 The recognition of liabilities in respect of put options arises from the adoption of IAS 32 and IAS 39.
2004 has not been restated as permitted by IFRS 1.
The Group considers that the carrying amount of trade and other payables approximates their fair value.
21. Trade and other payables: amounts falling due after more than one yearThe following are included in trade and other payables falling due after more than one year: 2006 2005 2004 £m £m £mPayments due to vendors (earnout agreements) 147.6 138.7 152.0Liabilities in respect of put option agreements with vendors1 28.8 39.6 –Other creditors and accruals 155.5 151.9 94.0 331.9 330.2 246.0
Note1 The recognition of liabilities in respect of put options arises from the adoption of IAS 32 and IAS 39.
2004 has not been restated as permitted by IFRS 1.
The Group considers that the carrying amount of trade and other payables approximates their fair value.
The following table sets out payments due to vendors, comprising deferred consideration and the directors’ best estimates of future earnout-related obligations: 2006 2005 2004 £m £m £mWithin one year 87.9 81.3 146.6Between one and two years 36.1 71.9 65.0Between two and three years 34.6 14.7 61.0Between three and four years 49.1 20.3 3.4Between four and fi ve years 27.8 31.8 21.4Over fi ve years – – 1.2 235.5 220.0 298.6
22. Bank overdrafts, bonds and bank loansAmounts falling due within one year: 2006 2005 2004 £m £m £mBank overdrafts 706.8 435.6 333.0Convertible bonds 548.7 87.3 150.1Corporate bonds and bank loans 5.1 22.2 114.7 1,260.6 545.1 597.8
The Group considers that the carrying amount of overdrafts and short-term borrowings approximates their fair value.
Amounts falling due after more than 1 year: 2006 2005 2004 £m £m £mConvertible bonds – 447.6 446.2Corporate bonds and bank loans 1,217.7 926.5 872.4 1,217.7 1,374.1 1,318.6
The Group estimates that the fair value of convertible and corporate bonds is £1,809.3 million (2005: £1,474.0 million) at 31 December 2006. The Group consider that the carrying amount of bank loans approximates their fair value.
The corporate bonds, convertible bonds, bank loans and overdrafts included within creditors fall due for repayment as follows: 2006 2005 2004 £m £m £mWithin one year 1,260.6 545.1 597.8Between one and two years 486.4 446.2 2.5Between two and three years – 463.6 453.3Between three and four years – 58.2 510.9Between four and fi ve years – – –Over fi ve years 731.3 406.1 351.9 2,478.3 1,919.2 1,916.4
Included within convertible bonds due within one year is the Grey $150 million convertible debenture. This was classifi ed as a non-current liability in 2005, but the directors now consider this liability to be current as the holders of the bond can convert at any time. The 2005 comparative fi gures have been reclassifi ed accordingly. Further information on this convertible debenture is provided in note 10.
23. Provisions for liabilities and chargesThe movements in 2006 and 2005 were as follows: Property Other Total £m £m £m1 January 2005 62.7 24.2 86.9Charged to the income statement 3.9 14.3 18.2New acquisitions 16.5 22.3 38.8Utilised (16.3) (13.6) (29.9)Transfers – 9.4 9.4Exchange adjustments 0.9 7.4 8.331 December 2005 67.7 64.0 131.7Charged to the income statement 0.8 0.2 1.0New acquisitions 7.0 0.7 7.7Utilised (10.6) (6.1) (16.7)Released to the income statement (1.2) (5.4) (6.6)Transfers 0.2 (3.8) (3.6)Exchange adjustments (2.1) (6.6) (8.7)31 December 2006 61.8 43.0 104.8
Provisions comprise liabilities where there is uncertainty about the timing of settlement, but where a reliable estimate can be made of the amount. These include provisions for vacant space, sub-let losses and other property-related liabilities. Also included are other provisions, such as certain long-term employee benefi ts and legal claims, where the likelihood of settlement is considered probable.
The Company and various of its subsidiaries are, from time to time, parties to legal proceedings and claims which arise in the ordinary course of business. The directors do not anticipate that the outcome of these proceedings and claims will have a material adverse effect on the Group’s fi nancial position or on the results of its operations.
Our 2006 fi nancial statementsNotes to the consolidated fi nancial statements
Our 2006 fi nancial statements
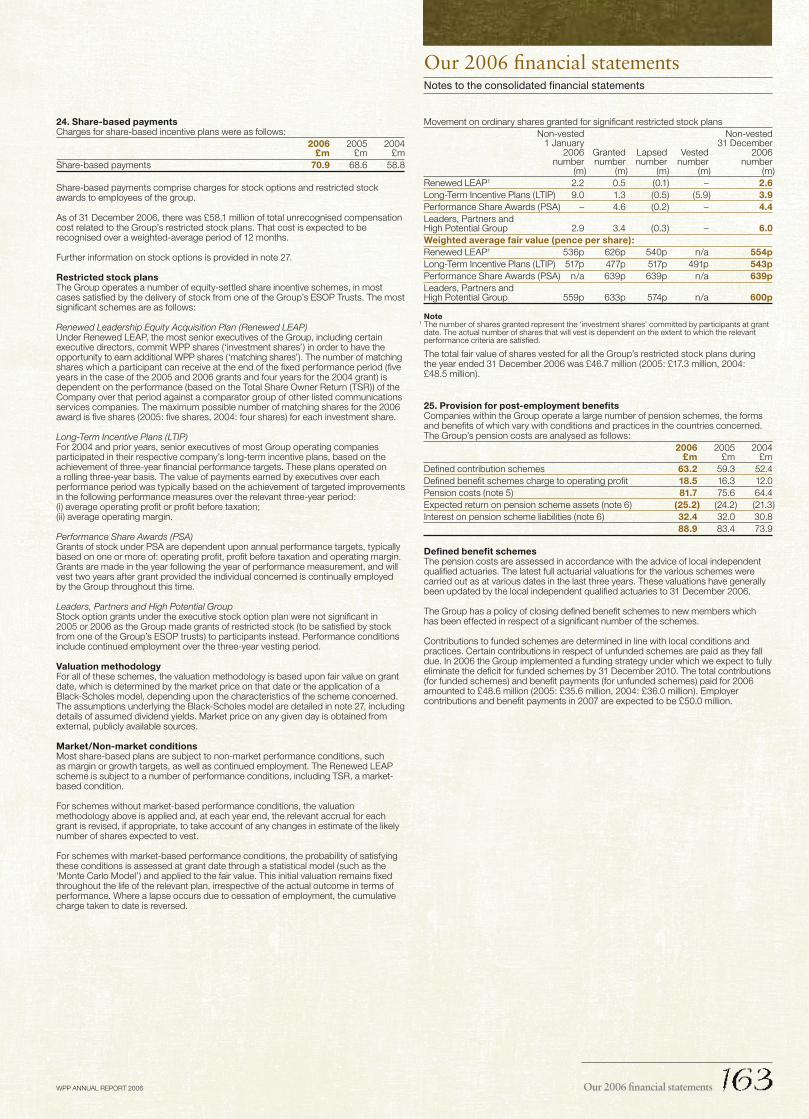
WPP ANNUAL REPORT 2006
Our 2006 fi nancial statementsNotes to the consolidated fi nancial statements
24. Share-based paymentsCharges for share-based incentive plans were as follows: 2006 2005 2004 £m £m £mShare-based payments 70.9 68.6 58.8
Share-based payments comprise charges for stock options and restricted stock awards to employees of the group.
As of 31 December 2006, there was £58.1 million of total unrecognised compensation cost related to the Group’s restricted stock plans. That cost is expected to be recognised over a weighted-average period of 12 months.
Further information on stock options is provided in note 27.
Restricted stock plansThe Group operates a number of equity-settled share incentive schemes, in most cases satisfi ed by the delivery of stock from one of the Group’s ESOP Trusts. The most signifi cant schemes are as follows:
Renewed Leadership Equity Acquisition Plan (Renewed LEAP)Under Renewed LEAP, the most senior executives of the Group, including certain executive directors, commit WPP shares (‘investment shares’) in order to have the opportunity to earn additional WPP shares (‘matching shares’). The number of matching shares which a participant can receive at the end of the fi xed performance period (fi ve years in the case of the 2005 and 2006 grants and four years for the 2004 grant) is dependent on the performance (based on the Total Share Owner Return (TSR)) of the Company over that period against a comparator group of other listed communications services companies. The maximum possible number of matching shares for the 2006 award is fi ve shares (2005: fi ve shares, 2004: four shares) for each investment share.
Long-Term Incentive Plans (LTIP)For 2004 and prior years, senior executives of most Group operating companies participated in their respective company’s long-term incentive plans, based on the achievement of three-year fi nancial performance targets. These plans operated on a rolling three-year basis. The value of payments earned by executives over each performance period was typically based on the achievement of targeted improvements in the following performance measures over the relevant three-year period:(i) average operating profi t or profi t before taxation;(ii) average operating margin.
Performance Share Awards (PSA)Grants of stock under PSA are dependent upon annual performance targets, typically based on one or more of: operating profi t, profi t before taxation and operating margin. Grants are made in the year following the year of performance measurement, and will vest two years after grant provided the individual concerned is continually employed by the Group throughout this time.
Leaders, Partners and High Potential GroupStock option grants under the executive stock option plan were not signifi cant in 2005 or 2006 as the Group made grants of restricted stock (to be satisfi ed by stock from one of the Group’s ESOP trusts) to participants instead. Performance conditions include continued employment over the three-year vesting period.
Valuation methodologyFor all of these schemes, the valuation methodology is based upon fair value on grant date, which is determined by the market price on that date or the application of a Black-Scholes model, depending upon the characteristics of the scheme concerned. The assumptions underlying the Black-Scholes model are detailed in note 27, including details of assumed dividend yields. Market price on any given day is obtained from external, publicly available sources.
Market/Non-market conditionsMost share-based plans are subject to non-market performance conditions, such as margin or growth targets, as well as continued employment. The Renewed LEAP scheme is subject to a number of performance conditions, including TSR, a market-based condition.
For schemes without market-based performance conditions, the valuation methodology above is applied and, at each year end, the relevant accrual for each grant is revised, if appropriate, to take account of any changes in estimate of the likely number of shares expected to vest.
For schemes with market-based performance conditions, the probability of satisfying these conditions is assessed at grant date through a statistical model (such as the ‘Monte Carlo Model’) and applied to the fair value. This initial valuation remains fi xed throughout the life of the relevant plan, irrespective of the actual outcome in terms of performance. Where a lapse occurs due to cessation of employment, the cumulative charge taken to date is reversed.
Movement on ordinary shares granted for signifi cant restricted stock plans Non-vested Non-vested 1 January 31 December 2006 Granted Lapsed Vested 2006 number number number number number (m) (m) (m) (m) (m)Renewed LEAP1 2.2 0.5 (0.1) – 2.6Long-Term Incentive Plans (LTIP) 9.0 1.3 (0.5) (5.9) 3.9Performance Share Awards (PSA) – 4.6 (0.2) – 4.4Leaders, Partners and High Potential Group 2.9 3.4 (0.3) – 6.0Weighted average fair value (pence per share):Renewed LEAP1 536p 626p 540p n/a 554pLong-Term Incentive Plans (LTIP) 517p 477p 517p 491p 543pPerformance Share Awards (PSA) n/a 639p 639p n/a 639pLeaders, Partners and High Potential Group 559p 633p 574p n/a 600p
Note1 The number of shares granted represent the ‘investment shares’ committed by participants at grant
date. The actual number of shares that will vest is dependent on the extent to which the relevant performance criteria are satisfi ed.
The total fair value of shares vested for all the Group’s restricted stock plans during the year ended 31 December 2006 was £46.7 million (2005: £17.3 million, 2004: £48.5 million).
25. Provision for post-employment benefi tsCompanies within the Group operate a large number of pension schemes, the forms and benefi ts of which vary with conditions and practices in the countries concerned. The Group’s pension costs are analysed as follows: 2006 2005 2004 £m £m £mDefi ned contribution schemes 63.2 59.3 52.4Defi ned benefi t schemes charge to operating profi t 18.5 16.3 12.0Pension costs (note 5) 81.7 75.6 64.4Expected return on pension scheme assets (note 6) (25.2) (24.2) (21.3)Interest on pension scheme liabilities (note 6) 32.4 32.0 30.8 88.9 83.4 73.9
Defi ned benefi t schemes The pension costs are assessed in accordance with the advice of local independent qualifi ed actuaries. The latest full actuarial valuations for the various schemes were carried out as at various dates in the last three years. These valuations have generally been updated by the local independent qualifi ed actuaries to 31 December 2006.
The Group has a policy of closing defi ned benefi t schemes to new members which has been effected in respect of a signifi cant number of the schemes.
Contributions to funded schemes are determined in line with local conditions and practices. Certain contributions in respect of unfunded schemes are paid as they fall due. In 2006 the Group implemented a funding strategy under which we expect to fully eliminate the defi cit for funded schemes by 31 December 2010. The total contributions (for funded schemes) and benefi t payments (for unfunded schemes) paid for 2006 amounted to £48.6 million (2005: £35.6 million, 2004: £36.0 million). Employer contributions and benefi t payments in 2007 are expected to be £50.0 million.
Our 2006 fi nancial statements

WPP ANNUAL REPORT 2006
(a) AssumptionsThe main weighted average assumptions used for the actuarial valuations at 31 December are shown in the following table: 2006 2005 2004 2003 % pa % pa % pa % paUKDiscount rate 5.1 4.7 5.3 5.5Rate of increase in salaries 4.5 4.3 4.3 3.6Rate of increase in pensions in payment 3.9 3.8 3.8 3.8Infl ation 3.0 2.8 2.8 2.8Expected rate of return on equities 7.3 7.3 7.5 7.5Expected rate of return on bonds1 5.0 4.5 5.0 5.0Expected rate of return on insured annuities 5.1 4.7 5.3 5.5Expected rate of return on property 7.0 7.0 7.0 7.0Expected rate of return on cash 4.8 4.3 3.0 3.0Weighted average return on assets 5.6 5.2 5.7 5.8North AmericaDiscount rate 5.7 5.5 5.7 6.3Rate of increase in salaries 4.0 4.0 4.0 3.2Infl ation 2.5 2.5 3.0 3.0Expected rate of return on equities 7.9 7.9 7.9 8.2Expected rate of return on bonds1 4.8 4.7 4.8 4.8Expected rate of return on cash 3.0 3.0 1.8 3.1Weighted average return on assets 6.8 6.7 6.9 7.0Continental EuropeDiscount rate 4.6 4.2 4.5 5.3Rate of increase in salaries 2.8 2.9 3.1 3.2Rate of increase in pensions in payment 2.0 1.6 1.7 1.7Infl ation 2.1 2.0 2.0 2.0Expected rate of return on equities 7.2 6.7 7.0 7.5Expected rate of return on bonds1 4.4 4.3 4.5 5.0Expected rate of return on property 6.1 6.2 6.4 7.0Expected rate of return on cash 3.4 2.5 2.6 3.0Weighted average return on assets 5.5 5.4 5.5 5.9Asia Pacifi c, Latin America, Africa & Middle EastDiscount rate 3.1 3.5 3.1 2.8Rate of increase in salaries 3.7 3.6 3.1 2.7Infl ation 1.2 2.0 1.5 1.6Expected rate of return on bonds1 2.9 3.2 3.1 2.6Expected rate of return on property 10.0 11.0 10.0 10.0Expected rate of return on cash 7.5 7.5 7.3 7.3Weighted average return on assets 3.2 3.3 3.1 2.7
Note1 Expected rate of return on bonds assumptions refl ect the yield expected on actual bonds held,
whereas the discount rate assumptions are based on high-quality bond yields.
At 31 December 2006, the life expectancies underlying the value of the accrued liabilities for the main defi ned benefi t pension plans operated by the Group were as follows:As at 31 December 2006 Years life expectancy after age 65– current pensioners (at age 65) – male 19.4– current pensioners (at age 65) – female 22.1– future pensioners (at age 65) – male 20.3– future pensioners (at age 65) – female 23.1
For a 0.25% increase or decrease in the discount rate at 31 December 2006, the 2007 pension expense would be broadly unchanged as the change in service cost and interest cost are similar. The effect on the year-end 2006 pension defi cit would be a decrease or increase, respectively, of approximately £20.0 million.
(b) Assets and liabilitiesAt 31 December, the fair value of the assets in the schemes, and the assessed present value of the liabilities in the schemes are shown in the following table:
2006 2005 2004£m % £m % £m %
GroupEquities 173.7 36.9 164.2 36.2 148.8 37.9Bonds 198.0 42.1 191.1 42.2 157.7 40.1Insured annuities 70.8 15.1 73.2 16.1 66.8 17.0Property 18.7 4.0 17.5 3.9 14.8 3.8Cash 9.2 1.9 7.2 1.6 4.8 1.2Total fair value of assets 470.4 100.0 453.2 100.0 392.9 100.0Present value of scheme liabilities (657.0) (684.6) (595.2)Defi cit in the schemes (186.6) (231.4) (202.3)Irrecoverable surplus (1.0) – –Net liability1 (187.6) (231.4) (202.3)
Schemes in surplus 4.7 – –Schemes in defi cit (192.3) (231.4) (202.3)
Note1 The related deferred tax asset is discussed in note 16.
Defi cit in schemes by region2006 2005 2004
£m £m £m UK (50.0) (54.4) (54.6)North America (82.3) (117.6) (102.9)Continental Europe (51.2) (55.1) (41.3)Asia Pacifi c, Latin America, Africa & Middle East (3.1) (4.3) (3.5)Defi cit in the schemes (186.6) (231.4) (202.3)
Some of the Group’s defi ned benefi t schemes are unfunded (or largely unfunded) by common custom and practice in certain jurisdictions. In the case of these unfunded schemes, the benefi t payments are made as and when they fall due. Pre-funding of these schemes would not be typical business practice.
The following table shows the split of the defi cit at 31 December 2006, 2005 and 2004 between funded and unfunded schemes.
2006 2005 2004Present Present Presentvalue of value of value ofscheme scheme scheme
2006 liabil- 2005 liabil- 2004 liabil-Defi cit ities Defi cit ities Defi cit ities
£m £m £m £m £m £mFunded schemes by regionUK (50.0) (295.8) (54.4) (290.1) (54.6) (262.8)North America (15.0) (178.9) (43.8) (201.8) (48.5) (179.8)Continental Europe 2.0 (43.1) (2.4) (47.6) (5.5) (46.9)Asia Pacifi c, Latin America, Africa & Middle East (2.0) (9.3) (2.4) (8.7) (2.6) (8.1)Defi cit/liabilities in the funded schemes (65.0) (527.1) (103.0) (548.2) (111.2) (497.6)
Unfunded schemes by regionUK – – – – – –North America (67.3) (67.3) (73.8) (74.0) (54.3) (54.4)Continental Europe (53.2) (61.3) (52.7) (60.5) (35.8) (41.9)Asia Pacifi c, Latin America, Africa & Middle East (1.1) (1.3) (1.9) (1.9) (1.0) (1.3)Defi cit/liabilities in the unfunded schemes (121.6) (129.9) (128.4) (136.4) (91.1) (97.6)
Defi cit/liabilities in the schemes (186.6) (657.0) (231.4) (684.6) (202.3) (595.2)
Our 2006 fi nancial statementsNotes to the consolidated fi nancial statements
Our 2006 fi nancial statements
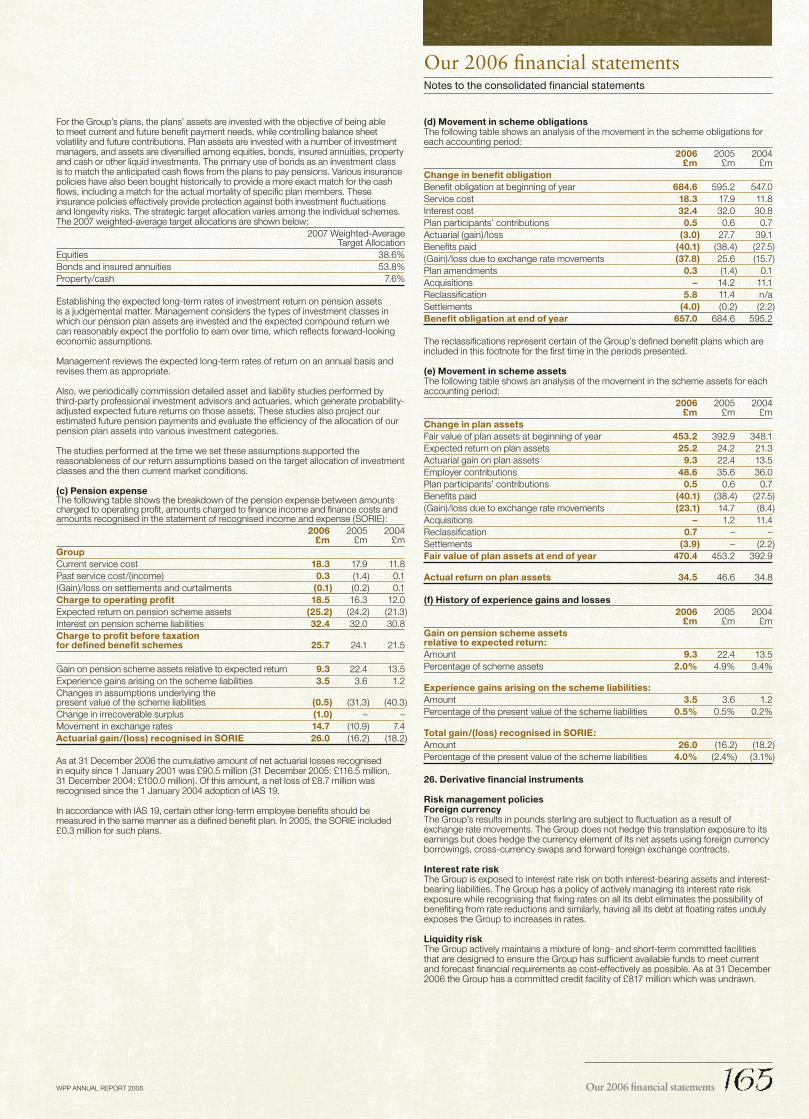
WPP ANNUAL REPORT 2006
Our 2006 fi nancial statementsNotes to the consolidated fi nancial statements
For the Group’s plans, the plans’ assets are invested with the objective of being able to meet current and future benefi t payment needs, while controlling balance sheet volatility and future contributions. Plan assets are invested with a number of investment managers, and assets are diversifi ed among equities, bonds, insured annuities, property and cash or other liquid investments. The primary use of bonds as an investment class is to match the anticipated cash fl ows from the plans to pay pensions. Various insurance policies have also been bought historically to provide a more exact match for the cash fl ows, including a match for the actual mortality of specifi c plan members. These insurance policies effectively provide protection against both investment fl uctuations and longevity risks. The strategic target allocation varies among the individual schemes. The 2007 weighted-average target allocations are shown below: 2007 Weighted-Average Target AllocationEquities 38.6%Bonds and insured annuities 53.8%Property/cash 7.6%
Establishing the expected long-term rates of investment return on pension assets is a judgemental matter. Management considers the types of investment classes in which our pension plan assets are invested and the expected compound return we can reasonably expect the portfolio to earn over time, which refl ects forward-looking economic assumptions.
Management reviews the expected long-term rates of return on an annual basis and revises them as appropriate.
Also, we periodically commission detailed asset and liability studies performed by third-party professional investment advisors and actuaries, which generate probability-adjusted expected future returns on those assets. These studies also project our estimated future pension payments and evaluate the effi ciency of the allocation of our pension plan assets into various investment categories.
The studies performed at the time we set these assumptions supported the reasonableness of our return assumptions based on the target allocation of investment classes and the then current market conditions.
(c) Pension expenseThe following table shows the breakdown of the pension expense between amounts charged to operating profi t, amounts charged to fi nance income and fi nance costs and amounts recognised in the statement of recognised income and expense (SORIE): 2006 2005 2004 £m £m £mGroupCurrent service cost 18.3 17.9 11.8Past service cost/(income) 0.3 (1.4) 0.1(Gain)/loss on settlements and curtailments (0.1) (0.2) 0.1Charge to operating profi t 18.5 16.3 12.0Expected return on pension scheme assets (25.2) (24.2) (21.3)Interest on pension scheme liabilities 32.4 32.0 30.8Charge to profi t before taxation for defi ned benefi t schemes 25.7 24.1 21.5
Gain on pension scheme assets relative to expected return 9.3 22.4 13.5Experience gains arising on the scheme liabilities 3.5 3.6 1.2Changes in assumptions underlying the present value of the scheme liabilities (0.5) (31.3) (40.3)Change in irrecoverable surplus (1.0) – –Movement in exchange rates 14.7 (10.9) 7.4Actuarial gain/(loss) recognised in SORIE 26.0 (16.2) (18.2)
As at 31 December 2006 the cumulative amount of net actuarial losses recognised in equity since 1 January 2001 was £90.5 million (31 December 2005: £116.5 million, 31 December 2004: £100.0 million). Of this amount, a net loss of £8.7 million was recognised since the 1 January 2004 adoption of IAS 19.
In accordance with IAS 19, certain other long-term employee benefi ts should be measured in the same manner as a defi ned benefi t plan. In 2005, the SORIE included £0.3 million for such plans.
(d) Movement in scheme obligationsThe following table shows an analysis of the movement in the scheme obligations for each accounting period: 2006 2005 2004 £m £m £mChange in benefi t obligationBenefi t obligation at beginning of year 684.6 595.2 547.0Service cost 18.3 17.9 11.8Interest cost 32.4 32.0 30.8Plan participants’ contributions 0.5 0.6 0.7Actuarial (gain)/loss (3.0) 27.7 39.1Benefi ts paid (40.1) (38.4) (27.5)(Gain)/loss due to exchange rate movements (37.8) 25.6 (15.7)Plan amendments 0.3 (1.4) 0.1Acquisitions – 14.2 11.1Reclassifi cation 5.8 11.4 n/aSettlements (4.0) (0.2) (2.2)Benefi t obligation at end of year 657.0 684.6 595.2
The reclassifi cations represent certain of the Group’s defi ned benefi t plans which are included in this footnote for the fi rst time in the periods presented.
(e) Movement in scheme assetsThe following table shows an analysis of the movement in the scheme assets for each accounting period: 2006 2005 2004 £m £m £mChange in plan assetsFair value of plan assets at beginning of year 453.2 392.9 348.1Expected return on plan assets 25.2 24.2 21.3Actuarial gain on plan assets 9.3 22.4 13.5Employer contributions 48.6 35.6 36.0Plan participants’ contributions 0.5 0.6 0.7Benefi ts paid (40.1) (38.4) (27.5)(Gain)/loss due to exchange rate movements (23.1) 14.7 (8.4)Acquisitions – 1.2 11.4Reclassifi cation 0.7 – –Settlements (3.9) – (2.2)Fair value of plan assets at end of year 470.4 453.2 392.9
Actual return on plan assets 34.5 46.6 34.8
(f) History of experience gains and losses 2006 2005 2004 £m £m £mGain on pension scheme assets relative to expected return:Amount 9.3 22.4 13.5Percentage of scheme assets 2.0% 4.9% 3.4%
Experience gains arising on the scheme liabilities:Amount 3.5 3.6 1.2Percentage of the present value of the scheme liabilities 0.5% 0.5% 0.2%
Total gain/(loss) recognised in SORIE:Amount 26.0 (16.2) (18.2)Percentage of the present value of the scheme liabilities 4.0% (2.4%) (3.1%)
26. Derivative fi nancial instruments
Risk management policiesForeign currencyThe Group’s results in pounds sterling are subject to fl uctuation as a result of exchange rate movements. The Group does not hedge this translation exposure to its earnings but does hedge the currency element of its net assets using foreign currency borrowings, cross-currency swaps and forward foreign exchange contracts.
Interest rate riskThe Group is exposed to interest rate risk on both interest-bearing assets and interest-bearing liabilities. The Group has a policy of actively managing its interest rate risk exposure while recognising that fi xing rates on all its debt eliminates the possibility of benefi ting from rate reductions and similarly, having all its debt at fl oating rates unduly exposes the Group to increases in rates.
Liquidity riskThe Group actively maintains a mixture of long- and short-term committed facilities that are designed to ensure the Group has suffi cient available funds to meet current and forecast fi nancial requirements as cost-effectively as possible. As at 31 December 2006 the Group has a committed credit facility of £817 million which was undrawn.
Our 2006 fi nancial statements

WPP ANNUAL REPORT 2006
Credit riskThe Group’s principal fi nancial assets are bank balances and cash, trade and other receivables and investments, which represent the Group’s maximum exposure to credit risk in relation to fi nancial assets.
The Group’s credit risk is primarily attributable to its trade receivables. The amounts presented in the balance sheet are net of allowances for doubtful receivables, estimated by the Group’s management based on prior experience and their assessment of the current economic environment.
The credit risk on liquid funds and derivative fi nancial instruments is limited because the counterparties are banks with high credit-ratings assigned by international credit-rating agencies.
A relatively small number of clients contribute a signifi cant percentage of the Group’s consolidated revenues. The Group’s clients generally are able to reduce advertising and marketing spending or cancel projects at any time for any reason. There can be no assurance that any of the Group’s clients will continue to utilise the Group’s services to the same extent, or at all, in the future. A signifi cant reduction in advertising and marketing spending by, or the loss of one or more of, the Group’s largest clients, if not replaced by new client accounts or an increase in business from existing clients, would adversely affect the Group’s prospects, business, fi nancial condition and results of operations.
Currency derivativesThe Group utilises currency derivatives to hedge signifi cant future transactions and cash fl ows. The Group is a party to a variety of foreign currency forward contracts in the management of its exchange rate exposures. The instruments purchased are primarily denominated in the currencies of the Group’s principal markets.
At the balance sheet date, the total notional amount of outstanding forward foreign exchange contracts designated under IAS 32 and IAS 39 was £nil (2005: £188.2 million).
At 31 December 2006, the fair value of the Group’s currency derivatives is estimated to be a net asset of approximately £7.2 million (2005: £9.3 million liability). These amounts are based on market values of equivalent instruments at the balance sheet date, comprising £32.1 million (2005: £5.7 million) assets included in trade and other receivables and £24.9 million (2005: £15.0 million) liabilities included in trade and other payables. The fair value movement of currency derivatives during the year that are designated and effective as net investment hedges amounts to £22.9 million (2005: £7.7 million) and has been charged to and deferred in equity.
Changes in the fair value relating to the ineffective portion of the currency derivatives amounted to £1.3 million (2005: £4.4 million) and has been charged to fi nance costs for the year.
The Group currently designates its foreign currency-denominated debt and cross-currency swaps as hedging instruments against the currency risk associated with the translation of its foreign operations.
At the balance sheet date, the total notional amount of outstanding forward foreign exchange contracts not designated as hedges was £405.6 million. The Group estimates the fair value of these contracts is £403.8 million.
These arrangements are designed to address signifi cant exchange exposure and are renewed on a revolving basis as required.
Interest rate swapsThe Group uses interest rate swaps as hedging instruments in fair value hedges to manage its exposure to interest rate movements on its borrowings. Contracts with nominal values of €400 million have fi xed interest receipts at 6.00% up until June 2008 and have fl oating interest payments averaging EURIBOR plus 2.185%. Contracts with a nominal value of €600 million have fi xed interest receipts of 4.38% up until December 2013 and have fl oating interest payments averaging EURIBOR plus 0.56%. Contracts with a nominal value of £211 million have fi xed interest receipts of 4.21% until April 2007 and have fl oating rate payments averaging LIBOR less 0.82%.
Contracts with a nominal value of $278 million have fi xed interest receipts of 5.88% up until April 2014 and have fl oating rate payments averaging LIBOR plus 0.96%. Contracts with a nominal value of €166 million have fi xed rate receipts of 3.23% up until June 2008 and have fl oating rate payments averaging LIBOR plus 0.02%.
The fair value of swaps entered into at 31 December 2006 is estimated to be a net asset of approximately £0.1 million (2005: £13.1 million). These amounts are based on market values of equivalent instruments at the balance sheet date, comprising £8.2 million (2005: £13.1 million) assets included in trade and other receivables and £8.1 million (2005: £nil) liabilities included in trade and other payables. The fair value movement of interest rate swaps during the year that are designated and effective as fair value hedges amounts to £0.4 million (2005: £nil) and has been charged to and deferred in equity.
Changes in the fair value relating to the ineffective portion of interest rate swaps amounted to £1.3 million (2005: nil) and has been charged to fi nance costs for the year.
In 2005 the Group terminated interest rate swaps for proceeds of £7.4 million. No terminations occurred in 2006.
2004 UK GAAP disclosuresThe accounting policy under UK GAAP for the year ended 31 December 2004 was as follows:
For a forward foreign exchange contract to be treated as a hedge the instrument must be related to actual foreign currency assets or liabilities or to a probable commitment. It must involve the same currency or similar currencies as the hedged item and must also reduce the risk of foreign currency exchange movements on the Group’s operations. Gains and losses arising on these contracts are deferred and recognised in the profi t and loss account or as adjustments to the carrying amount of fi xed assets, only when the hedged transaction has itself been refl ected in the Group’s fi nancial statements.
For an interest rate swap to be treated as a hedge the instrument must be related to actual assets or liabilities or a probable commitment and must change the nature of the interest rate by converting a fi xed rate to a variable rate or vice versa. Interest differentials under these swaps are recognised by adjusting net interest payable over the periods of the contracts.
The following disclosures are in compliance with FRS 13 (Derivatives and other fi nancial instruments: disclosures) as applied by the Group under UK GAAP for 2004. Financial assets and fi nancial liabilities are defi ned differently under IFRS and UK GAAP and as such the amounts included in these captions below are not directly comparable to similar captions elsewhere in these accounts.
Derivative fi nancial instrumentsThe fair value of derivatives, based on the amount that would be receivable or payable if the Group had sought to enter into such transactions, based on quoted market prices where possible, was as follows: 31 Dec 2004 Swaps £mFair value 15.7Book value (2.0)
The book value above represents net accrued interest and the foreign translation difference on the principal amounts.
The Group’s policy is to hedge the following exposures: interest rate risk – using interest rate swaps, caps and collars; currency swaps; and forward foreign currency contracts; structural and transactional currency exposures, and currency exposures on future expected sales – using currency swaps and forward foreign currency contracts.
Gains and losses on instruments used for hedging are not recognised until the exposure that is being hedged is itself recognised. Unrecognised gains and losses on instruments used for hedging, and the movements therein, are as follows: Total Gains Losses net gains £m £m £mUnrecognised gains and losses on hedges at 1 January 2004 34.4 (3.1) 31.3Gains and losses arising in previous years that were recognised in 2004 (3.4) – (3.4)Gains and losses arising in previous years that were not recognised in 2004 31.0 (3.1) 27.9Gains and losses arising in 2004 that were not recognised in 2004 2.0 – 2.0Unrecognised gains and losses on hedges at 31 December 2004 33.0 (3.1) 29.9Gains and losses expected to be recognised in 2005 5.0 – 5.0Gains and losses expected to be recognised in 2006 or later 28.0 (3.1) 24.9
The fair value of the above swaps has been obtained from a market data source.
Non-derivative fi nancial instrumentsThe Group estimates that the aggregate fair value of non-derivative fi nancial instruments at 31 December 2004 does not differ materially from their aggregate carrying values recorded in the consolidated balance sheet.
The Group has used the methods and assumptions detailed below to estimate the fair values of the Group’s fi nancial instruments.
Cash, accounts receivable, accounts payable, overdrafts and short-term borrowings (including those drawn under the Revolving Credit Facilities) are considered to approximate fair value because of the short maturity of such instruments.
The fair value of our $950 million bonds, €650 million Eurobonds, $287.5 million convertible bonds and £450 million convertible bonds at 31 December 2004 was £1,616 million. This is calculated by reference to market prices at 31 December 2004. Considerable judgement is required in interpreting market data to develop the estimates of fair value, and, accordingly, the estimates are not necessarily indicative of the amounts that could be realised in a current market exchange.
Our 2006 fi nancial statementsNotes to the consolidated fi nancial statements
Our 2006 fi nancial statements

WPP ANNUAL REPORT 2006
Our 2006 fi nancial statementsNotes to the consolidated fi nancial statements
27. Authorised and issued share capital Equity Nominal Preference Nominal ordinary value shares of value shares £m £1 each £mAuthorisedAt 1 January 2005 – WPP 2005 Limited (formerly WPP Group plc) 1,750,000,000 175.0 – –At 31 December 2005 – WPP Group plc 1,750,000,000 175.0 – –At 31 December 2006 – WPP Group plc 1,750,000,000 175.0 – –
Issued and fully paidAt 1 January 2005 1,185,338,038 118.5 – –Exercise of share options 8,664,925 0.9 – –Share cancellations (16,625,000) (1.6) – –Acquisitions 77,994,666 7.8 – –Other 1,277,411 0.1 – –At 24 October 2005 – shares in WPP 2005 Limited of 10p each 1,256,650,040 125.7 – –
On formation of WPP 2005 plc 2 – 50,000 –Group reconstruction – shares in WPP 2005 Limited exchanged for shares in WPP Group plcof 475p each 1,256,650,040 5,969.1 – –Capital reduction to 10p per ordinary share – (5,843.4) – –Redemption/cancellation of shares (2) – (50,000) – 1,256,650,040 125.7 – –Exercise of share options 949,332 0.1 – –Share cancellations (4,700,000) (0.5) – –At 31 December 2005 1,252,899,372 125.3 – –Exercise of share options 20,984,083 2.1 – –Share cancellations (33,157,108) (3.3) – –Other (121,160) (0.0) – –At 31 December 2006 1,240,605,187 124.1 – –
Fully paid ordinary shares, which have a per value of 10p, carry one vote per share and the right to dividends.
On 25 October 2005 under a scheme of arrangement between WPP 2005 Limited (formerly WPP Group plc), the former holding company of the Group, and its shareholders under Section 425 of the Companies Act 1985, and as sanctioned by the High Court, all the issued shares in that company were cancelled and the same number of new shares were issued to WPP Group plc in consideration for the allotment to shareholders of one ordinary share in WPP Group plc for each ordinary share in WPP 2005 Limited held on the record date, 24 September 2005. In the above table the fi gures up to 24 October 2005 relate to shares in WPP 2005 Limited. Subsequent movements relate to shares in WPP Group plc.
WPP Group plc was incorporated on 16 August 2005, under the name WPP 2005 plc, with an authorised share capital of £8,312,550,000 and issued shares as follows:– two ordinary shares of 475 pence; and– 50,000 redeemable preference shares of £1 were issued to WPP Group
(Nominees) Limited.
On 25 October 2005 as part of the scheme of arrangement noted above, a further 1,256,650,040 ordinary shares of 475 pence were issued, whereby WPP Group plc was interposed as the new holding company of the WPP Group. As required by Section 131 of the Companies Act 1985 (Merger Relief), no share premium was recognised. Subsequently, the entire issued redeemable preference share capital was redeemed at par, and the two ordinary shares cancelled.
On 27 October 2005 the share capital of WPP Group plc was reduced by reducing the nominal value of the ordinary shares from 475 pence to 10 pence as sanctioned by the High Court. As a result £5,843.4 million was added to retained earnings for both WPP Group plc and the Group. For the Company this amount is distributable.
Share optionsWPP Executive Share Option SchemeAs at 31 December 2006, unexercised options over ordinary shares of 14,583,923 and unexercised options over ADRs of 4,522,893 have been granted under the WPP Executive Share Option Scheme as follows: Number of ordinary Exercise price Exercise shares under option per share (£) dates 6,037 2.535 2000-2007 482,385 2.835 2000-2007 728,449 2.930 2001-2008 5,022 3.030 2001-2008 10,950 3.270 2001-2008 55,111 3.763 2006-2013 19,160 4.210 2005-2006 61,316 4.210 2006-2012 68,980 4.210 2005-2013 1,943,758 4.210 2005-2012 84,311 4.438 2005-2012 41,170 4.615 2006-2013 51,247 4.615 2007-2013 1,489,921 4.865 2004-2011 35,064 4.865 2005-2011 48,624 5.185 2002-2009 2,000,000 5.490 2007-2014 27,288 5.520 2008-2014 28,942 5.535 2007-2008 2,767,566 5.535 2007-2014 6,124 5.535 2007-2015 38,524 5.535 2008-2014 2,618,630 5.595 2006-2013 22.501 5.595 2006-2014 39,698 5.595 2007-2013 21,119 5.595 2006-2007 300,397 5.700 2002-2009 27,092 5.725 2007-2014 11,423 5.775 2009-2015 30,145 5.818 2008-2015 41,035 5.895 2008-2015 44,116 6.105 2008-2015 7,005 6.280 2004-2011 135,588 6.718 2009-2016 2,062 6.938 2009-2016 59,412 7.180 2005-2012 527,485 7.550 2005-2012 3,741 7.550 2006-2012 66,594 8.110 2004-2011 40,195 8.193 2004-2011 542,185 9.010 2003-2010 11,575 9.010 2004-2010 31,976 10.770 2003-2010
Our 2006 fi nancial statements
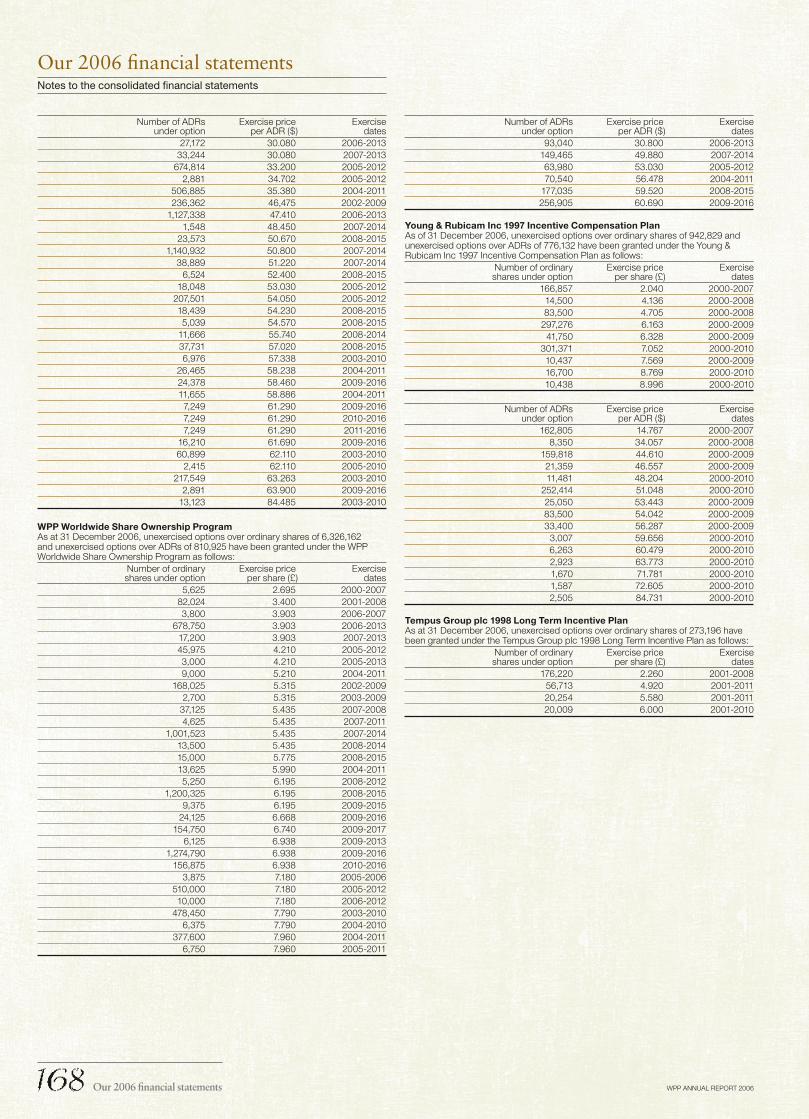
WPP ANNUAL REPORT 2006
Number of ADRs Exercise price Exercise under option per ADR ($) dates 27,172 30.080 2006-2013 33,244 30.080 2007-2013 674,814 33.200 2005-2012 2,881 34.702 2005-2012 506,885 35.380 2004-2011 236,362 46,475 2002-2009 1,127,338 47.410 2006-2013 1,548 48.450 2007-2014 23,573 50.670 2008-2015 1,140,932 50.800 2007-2014 38,889 51.220 2007-2014 6,524 52.400 2008-2015 18,048 53.030 2005-2012 207,501 54.050 2005-2012 18,439 54.230 2008-2015 5,039 54.570 2008-2015 11,666 55.740 2008-2014 37,731 57.020 2008-2015 6,976 57.338 2003-2010 26,465 58.238 2004-2011 24,378 58.460 2009-2016 11,655 58.886 2004-2011 7,249 61.290 2009-2016 7,249 61.290 2010-2016 7,249 61.290 2011-2016 16,210 61.690 2009-2016 60,899 62.110 2003-2010 2,415 62.110 2005-2010 217,549 63.263 2003-2010 2,891 63.900 2009-2016 13,123 84.485 2003-2010
WPP Worldwide Share Ownership ProgramAs at 31 December 2006, unexercised options over ordinary shares of 6,326,162 and unexercised options over ADRs of 810,925 have been granted under the WPP Worldwide Share Ownership Program as follows: Number of ordinary Exercise price Exercise shares under option per share (£) dates 5,625 2.695 2000-2007 82,024 3.400 2001-2008 3,800 3.903 2006-2007 678,750 3.903 2006-2013 17,200 3.903 2007-2013 45,975 4.210 2005-2012 3,000 4.210 2005-2013 9,000 5.210 2004-2011 168,025 5.315 2002-2009 2,700 5.315 2003-2009 37,125 5.435 2007-2008 4,625 5.435 2007-2011 1,001,523 5.435 2007-2014 13,500 5.435 2008-2014 15,000 5.775 2008-2015 13,625 5.990 2004-2011 5,250 6.195 2008-2012 1,200,325 6.195 2008-2015 9,375 6.195 2009-2015 24,125 6.668 2009-2016 154,750 6.740 2009-2017 6,125 6.938 2009-2013 1,274,790 6.938 2009-2016 156,875 6.938 2010-2016 3,875 7.180 2005-2006 510,000 7.180 2005-2012 10,000 7.180 2006-2012 478,450 7.790 2003-2010 6,375 7.790 2004-2010 377,600 7.960 2004-2011 6,750 7.960 2005-2011
Number of ADRs Exercise price Exercise under option per ADR ($) dates 93,040 30.800 2006-2013 149,465 49.880 2007-2014 63,980 53.030 2005-2012 70,540 56.478 2004-2011 177,035 59.520 2008-2015 256,905 60.690 2009-2016
Young & Rubicam Inc 1997 Incentive Compensation PlanAs of 31 December 2006, unexercised options over ordinary shares of 942,829 and unexercised options over ADRs of 776,132 have been granted under the Young & Rubicam Inc 1997 Incentive Compensation Plan as follows: Number of ordinary Exercise price Exercise shares under option per share (£) dates 166,857 2.040 2000-2007 14,500 4.136 2000-2008 83,500 4.705 2000-2008 297,276 6.163 2000-2009 41,750 6.328 2000-2009 301,371 7.052 2000-2010 10,437 7.569 2000-2009 16,700 8.769 2000-2010 10,438 8.996 2000-2010
Number of ADRs Exercise price Exercise under option per ADR ($) dates 162,805 14.767 2000-2007 8,350 34.057 2000-2008 159,818 44.610 2000-2009 21,359 46.557 2000-2009 11,481 48.204 2000-2010 252,414 51.048 2000-2010 25,050 53.443 2000-2009 83,500 54.042 2000-2009 33,400 56.287 2000-2009 3,007 59.656 2000-2010 6,263 60.479 2000-2010 2,923 63.773 2000-2010 1,670 71.781 2000-2010 1,587 72.605 2000-2010 2,505 84.731 2000-2010
Tempus Group plc 1998 Long Term Incentive PlanAs at 31 December 2006, unexercised options over ordinary shares of 273,196 have been granted under the Tempus Group plc 1998 Long Term Incentive Plan as follows: Number of ordinary Exercise price Exercise shares under option per share (£) dates 176,220 2.260 2001-2008 56,713 4.920 2001-2011 20,254 5.580 2001-2011 20,009 6.000 2001-2010
Our 2006 fi nancial statementsNotes to the consolidated fi nancial statements
Our 2006 fi nancial statements

WPP ANNUAL REPORT 2006
Our 2006 fi nancial statementsNotes to the consolidated fi nancial statements
The Grey Global Group, Inc 1994 Stock Incentive PlanAs at 31 December 2006, unexercised options over ordinary shares of 157,660 and unexercised options over ADRs of 243,671 have been granted under the Grey Global Group, Inc 1994 Stock Incentive Plan as follows: Number of ordinary Exercise price Exercise shares under option per share (£) dates 32,619 1.499 2005-2008 54,365 1.598 2005-2009 16,311 2.042 2005-2010 54,365 3.499 2007-2011
Number of ADRs Exercise price Exercise under option per ADR ($) dates 20,224 14.370 2005-2009 13,004 15.290 2005-2008 32,402 19.540 2005-2010 2,892 24.900 2005-2010 2,175 26.990 2005-2011 2,914 27.290 2005-2011 2,175 27.960 2005-2011 7,089 28.210 2006-2013 1,827 28.300 2005-2012 4,545 29.410 2005-2011 10,569 30.270 2007-2011 10,895 30.830 2005-2012 24,640 31.220 2005-2012 6,371 31.420 2005-2012 32,619 31.750 2008-2011 6,264 31.940 2007-2011 4,350 32.290 2005-2012 10,874 33.500 2007-2011 21,745 34.120 2007-2011 6,525 34.740 2006-2011 13,047 36.110 2008-2010 6,525 41.160 2007-2011
The aggregate status of the WPP Share Option Schemes during 2006 was as follows:
Movement on options granted (represented in ordinary shares) Outstanding Exercisable 1 31 31 January December December 2006 Granted Exercised Lapsed 2006 2006 number number number number number numberWPP 52,075,939 468,050 (12,314,304) (3,031,297) 37,198,388 25,467,516WWOP 10,936,623 3,216,575 (1,935,500) (1,836,711) 10,380,987 3,543,374Y&R 10,286,527 – (5,301,638) (161,400) 4,823,489 4,823,489Tempus 409,293 – (134,478) (1,619) 273,196 273,196Grey 2,509,306 – (1,133,291) – 1,376,015 648,485 76,217,688 3,684,625 (20,819,211) (5,031,027) 54,052,075 34,756,060
Weighted-average exercise price for options over:Ordinary shares £ 5.008 6.901 3.442 5.848 5.553 5.311ADRs $ 41.430 67.628 32.081 46.319 46.154 43.678
Options over ordinary shares Outstanding Exercisable Weighted Weighted Weighted Range of average average average Aggregate exercise exercise contractual contractual intrinsic prices price life life value £ £ Months Months £m 1.499-10.770 5.532 84 85 20.7
Options over ADRs Outstanding Exercisable Weighted Weighted Weighted Range of average average average Aggregate exercise exercise contractual contractual intrinsic prices price life life value $ $ Months Months $m 14.370-84.731 46.250 86 87 104.8
As of 31 December 2006 there was £12.7 million of total unrecognised compensation cost related to share options. That cost is expected to be recognised over a weighted average period of 16 months.
Share options are satisfi ed out of newly issued shares.
The total fair value of shares vested during the year ended 31 December 2006 was £76.9 million (2005: £6.0 million, 2004: £5.6 million). The increase in fair value of vested share option schemes in 2006 was due to a number of executive stock option plans vesting in that year following satisfaction of relevant performance criteria, including TSR and EPS conditions.
The total intrinsic value of options exercised was a follows: 2006 2005 2004Ordinary shares £m 16.8 11.4 12.0ADRs $m 92.9 46.7 24.0
The weighted average fair value of options granted in the year calculated using the Black-Scholes model, was as follows: 2006 2005 2004Fair value of UK options (shares) 203.5p 209.3p 205.5pFair value of US options (ADRs) $20.15 $18.42 $18.38Weighted average assumptions: UK Risk-free interest rate 4.72% 4.77% 4.27% US Risk-free interest rate 4.47% 4.06% 3.16% Expected life (months) 48 48 48 Expected volatility 35% 40% 45% Dividend yield 1.7% 1.4% 1.0%
Options are issued at an exercise price equal to market value on the date of grant.
The number of fully vested share options outstanding and share options expected to vest at 31 December 2006 was 50.2 million (2005: 73.2million). The weighted-average exercise price, aggregate intrinsic value and weighted-average contractual life for such options was £5.02, £95.2 million and 85 months respectively.
The weighted average share price of the Group for the year ended 31 December 2006 was £6.58 (2005: £5.88, 2004: £5.55) and the weighted average ADR price for the same period was $60.60 (2005: $53.24, 2004: $50.93).
Expected volatility is sourced from external market data and represents the historic volatility in the Group’s share price over a period equivalent to the expected option life.
Expected life is based on a review of historic exercise behaviour in the context of the contractual terms of the options, as described in more detail below.
Terms of share option plansThe Worldwide Share Ownership Program is open for participation to employees with at least two years’ employment in the Group. It is not available to those participating in other share-based incentive programs or to executive directors. The vesting period for each grant is three years and there are no performance conditions other than continued employment with the Group.
The Executive Stock Option Plan has historically been open for participation to WPP Group Leaders, Partners and High Potential Group. It is not currently offered to parent company executive directors. The vesting period is three years and performance conditions include achievement of various TSR (Total Share Owner Return) and EPS (Earnings per Share) objectives, as well as continued employment. In 2005, the Group moved away from the issuance of stock options for Leaders, Partners and High Potential Group and has since largely made grants of restricted stock instead (note 24).
The Group grants stock options with a life of ten years, including the vesting period. The terms of stock options with performance conditions are such that if, after nine years and eight months, the performance conditions have not been met, then the stock option will vest automatically.
Our 2006 fi nancial statements

WPP ANNUAL REPORT 2006
28. Equity share owners’ fundsMovements during the year were as follows: Ordinary Share share premium Shares to Merger Other Own Retained capital account be issued reserve reserves Shares1 earnings Total £m £m £m £m £m £m £m £mBalance at 1 January 2005 118.5 1,002.2 49.9 2,920.6 (90.6) (277.7) (711.8) 3,011.1Impact of adoption of IAS 32 and IAS 39 on 1 January 2005 – – – – 30.8 – (92.9) (62.1)Reclassifi cation due to Group reconstruction 5,843.4 (1,037.9) – (4,800.5) (5.0) – – –Capital reduction to 10p per ordinary share (5,843.4) – – – – – 5,843.4 –Ordinary shares issued in respect of acquisitions 7.8 0.7 19.7 478.2 – – – 506.4Other ordinary shares issued 1.2 37.3 (32.4) 21.8 – – (9.6)2 18.3Share issue/cancellation costs – (0.2) – (3.2) – – (0.2) (3.6)Share cancellations (2.1) – – – 2.1 – (123.3) (123.3)Exchange adjustments on foreign currency net investments – – – – 266.1 – – 266.1Net profi t for the year – – – – – – 363.9 363.9Dividends paid – – – – – – (100.2) (100.2)Non-cash share-based incentive plans (including stock options) – – – – – – 68.6 68.6Tax benefi t of share-based payments – – – – – – 12.9 12.9Net additions of own shares by ESOP Trusts – – – – – (15.2) (13.8) (29.0)Actuarial loss on defi ned benefi t pension schemes – – – – – – (16.5) (16.5)Deferred tax on defi ned benefi t pension schemes – – – – – – 3.6 3.6Transfer to goodwill (0.1) – – (5.0) – – – (5.1)Revaluation of other investments – – – – 21.0 – – 21.0Recognition of fi nancial instruments during the year – – – – (27.6) – – (27.6)Reclassifi cation of equity component of convertible bond redeemed during the year – – – – (29.5) – 29.5 –Balance at 31 December 2005 125.3 2.1 37.2 (1,388.1) 167.3 (292.9) 5,253.6 3,904.5Ordinary shares issued 2.1 72.9 (29.7) 18.5 – – 9.22 73.0Share issue/cancellation costs – (0.1) – (0.4) – – (1.2) (1.7)Share cancellations (3.3) – – – 3.3 – (218.8) (218.8)Exchange adjustments on foreign currency net investments – – – – (367.0) – – (367.0)Net profi t for the year – – – – – – 435.8 435.8Dividends paid – – – – – – (118.9) (118.9)Non-cash share-based incentive plans (including stock options) – – – – – – 70.9 70.9Tax benefi t of share-based payments – – – – – – 32.3 32.3Net additions of own shares by ESOP Trusts – – – – – 4.4 (43.3) (38.9)Actuarial gain on defi ned benefi t pension schemes – – – – – – 26.0 26.0Deferred tax on defi ned benefi t pension schemes – – – – – – 5.3 5.3Revaluation of other investments – – – – 9.5 – – 9.5Recognition of fi nancial instruments during the year – – – – 16.8 – (1.9) 14.9Balance at 31 December 2006 124.1 74.9 7.5 (1,370.0) (170.1) (288.5) 5,449.0 3,826.9
Notes1 The Company’s holdings of own shares are stated at cost and represent purchases by the Employee Share Ownership Plan (‘ESOP’) trusts of shares in WPP Group plc for the purpose of funding certain of
the Group’s long-term incentive plan liabilities, details of which are disclosed in the Compensation Committee report on pages 118 to 129.
The trustees of the ESOP purchase the Company’s ordinary shares in the open market using funds provided by the Company. The Company also has an obligation to make regular contributions to the ESOP to enable it to meet its administrative costs.
The number and market value of the ordinary shares of the Company held by the ESOP at 31 December 2006 was 51,134,155 (2005: 53,297,356, 2004: 51,657,256) and £353.1 million (2005: £335.2 million, 2004: £296.0 million) respectively.
2 Represents the difference between the legal share capital and premium, recorded on the issue of new shares to satisfy option exercises, and the cash proceeds received on exercise.
Other reserves comprise the following: Capital Total Equity Revaluation redemption Translation other reserve reserve reserve reserve reserves £m £m £m £m £mBalance at 1 January 2005 8.7 – 3.4 (102.7) (90.6)1 January 2005 IAS 32 and IAS 39 adjustments: Recognition of equity component of convertible bonds 88.6 – – – 88.6 Recognition of additional fi nancial liabilities required by IAS 39 (including put options) (56.6) – – (1.2) (57.8)Impact of adoption of IAS 32 and IAS 39 on 1 January 2005 32.0 – – (1.2) 30.8Reclassifi cation due to Group reconstruction – – (5.0) – (5.0)Share cancellations – – 2.1 – 2.1Exchange adjustments on foreign currency net investments – – – 266.1 266.1Revaluation of other investments – 21.0 – – 21.0Recognition of fi nancial instruments during the year (27.6) – – – (27.6)Reclassifi cation of equity component of convertible bond redeemed during the year (29.5) – – – (29.5)Balance at 31 December 2005 (16.4) 21.0 0.5 162.2 167.3Share cancellations – – 3.3 – 3.3Exchange adjustments on foreign currency net investments – – – (367.0) (367.0)Revaluation of other investments – 9.5 – – 9.5Recognition of fi nancial instruments during the year 16.8 – – – 16.8Balance at 31 December 2006 0.4 30.5 3.8 (204.8) (170.1)
Our 2006 fi nancial statementsNotes to the consolidated fi nancial statements
Our 2006 fi nancial statements

WPP ANNUAL REPORT 2006
Reconciliation of movements in consolidated equity share owners’ funds for the year ended 31 December 2006: 2006 2005 2004 £m £m £mNet profi t for the year 435.8 363.9 273.0Dividends paid (118.9) (100.2) (81.6) 316.9 263.7 191.4Non-cash share-based incentive plans (including stock options) 70.9 68.6 58.8Tax benefi t of share-based payments 32.3 12.9 8.7Exchange adjustments on foreign currency net investments (367.0) 266.1 (102.7)Ordinary shares issued in respect of acquisitions – 506.4 –Share issue/cancellation costs (1.7) (3.6) (0.8)Other ordinary shares issued 73.0 18.3 32.8Share cancellations (218.8) (123.3) (73.6)Actuarial gain/(loss) on defi ned benefi t pension schemes 26.0 (16.5) (18.2)Deferred tax on defi ned benefi t pension schemes 5.3 3.6 3.3Net additions of own shares by ESOP Trusts (38.9) (29.0) (14.9)Transfer to goodwill – (5.1) (67.3)Revaluation of other investments 9.5 21.0 –Recognition of fi nancial instruments during the year 14.9 (27.6) –Other movements – – 3.4Net additions to equity share owners’ funds (77.6) 955.5 20.9Opening equity share owners’ funds 3,904.5 3,011.1 2,990.2Impact of adoption of IAS 32 and IAS 39 on 1 January 2005 – (62.1) –Closing equity share owners’ funds 3,826.9 3,904.5 3,011.1
29. AcquisitionsThe Group accounts for acquisitions in accordance with IFRS 3 ‘Business Combinations’. IFRS 3 requires the acquiree’s identifi able assets, liabilities and contingent liabilities (other than non-current assets or disposal groups held for sale) to be recognised at fair value at acquisition date. In assessing fair value at acquisition date, management make their best estimate of the likely outcome where the fair value of an asset or liability may be contingent on a future event. In certain instances, the underlying transaction giving rise to an estimate may not be resolved until some years after the acquisition date. IFRS 3 requires the release to profi t of any acquisition reserves which subsequently become excess in the same way as any excess costs over those provided at acquisition date are charged to profi t. At each period end management assess provisions and other balances established in respect of acquisitions for their continued probability of occurrence and amend the relevant value accordingly through the income statement or as an adjustment to goodwill as appropriate under IFRS 3.
The Group acquired a number of subsidiaries in the year. The following table sets out the book values of the identifi able assets and liabilities acquired and their fair value to the Group. The fair value adjustments for certain acquisitions included in the table below have been determined provisionally at the balance sheet date. Book Fair Fair value at value value acqui- adjust- to sition ments Group £m £m £mIntangible assets 0.1 20.2 20.3Property, plant and equipment 3.7 – 3.7Interests in associates and other investments 0.1 0.1 0.2Current assets 62.6 – 62.6Total assets 66.5 20.3 86.8Current liabilities (44.6) – (44.6)Trade and other payables due after one year (2.0) (6.7) (8.7)Deferred taxes (0.7) (7.5) (8.2)Provisions (0.7) (7.0) (7.7)Total liabilities (48.0) (21.2) (69.2)Net assets/(liabilities) 18.5 (0.9) 17.6Minority interest (5.1)Goodwill 133.2Consideration 145.7Considered satisfi ed by: Cash 88.1Payments due to vendors 55.0Capitalised acquisition costs 2.6
The contribution to revenue and operating profi t of acquisitions completed in 2006 was not material. There were no material acquisitions completed between 31 December 2006 and the date the fi nancial statements have been authorised for issue.
If all acquisitions had been completed on the fi rst day of the fi nancial year, Group revenues for the period would have been £5,950.7 million, Group operating profi t would have been £747.1 million and Headline PBIT would have been £865.5 million.
Our 2006 fi nancial statementsNotes to the consolidated fi nancial statements
30. Principal subsidiary undertakingsThe principal subsidiary undertakings of the Group are: Country of IncorporationGrey Global Group, Inc USJ. Walter Thompson Company, Inc USGroupM Worldwide, Inc USThe Ogilvy Group, Inc USYoung & Rubicam, Inc US
All of these subsidiaries are operating companies and are 100% owned by the Group.
A more detailed listing of the operating subsidiary undertakings is given on pages 10 and 11. The Company directly or indirectly holds controlling interests in the issued share capital of these undertakings with the exception of those specifi cally identifi ed.
Advantage has been taken of Section 231(5) of the Companies Act 1985 to list only those undertakings required by that provision, as an exhaustive list would involve a statement of excessive length. A full listing of the Company’s subsidiary undertakings is included in the Company’s Annual Return.
31. Related party transactionsFrom time to time the Group enters into transactions with its associate undertakings. These transactions were not material for any of the years presented.
In the year ended 31 December 2006, the Group paid costs of £0.3 million in connection with an action for the misuse of private information and an action for libel, in which Sir Martin Sorrell was a claimant. At the date of authorisation of these fi nancial statements, further costs of £0.5 million have been incurred net of settlement monies. These costs were authorised by the Board as an integral part of broader legal actions, some of which are ongoing, to protect the commercial interests of the Group.
32. Reconciliation to non-GAAP measures of performance
Reconciliation of profi t before interest and taxation to Headline PBIT: 2006 2005 2004 £m £m £mProfi t before interest and taxation 782.7 686.7 505.0Gains on disposal of investments (7.3) (4.3) (3.0)Investment write-downs – – 5.0Goodwill impairment 35.5 46.0 40.6Goodwill write-down relating to utilisation of pre-acquisition tax losses 8.8 1.1 12.6Amortisation and impairment of acquired intangible assets 43.3 25.3 –Share of exceptional gains of associates (4.0) – –Headline PBIT 859.0 754.8 560.2Finance income 111.0 87.6 77.7Finance charges (excluding revaluation of fi nancial instruments) (203.7) (173.4) (148.3) (92.7) (85.8) (70.6)Interest cover on Headline PBIT1 9.3 times 8.8 times 7.9 times
Note1 Finance charges of £148.3 million for the year ended 31 December 2004 do not take account of
the change in accounting for the Group’s convertible bonds under IFRS, as the relevant accounting standards, IAS 32 and IAS 39, were adopted on 1 January 2005 without restatement of prior years. Interest cover on a comparable basis for the year ended 31 December 2004 would have been 6.6 times.
Reconciliation of profi t before taxation to Headline PBT and Headline earnings: 2006 2005 2004 £m £m £mProfi t before taxation 682.0 592.0 434.4Gains on disposal of investments (7.3) (4.3) (3.0)Investment write-downs – – 5.0Goodwill impairment 35.5 46.0 40.6Goodwill write-down relating to utilisation of pre-acquisition tax losses 8.8 1.1 12.6Amortisation and impairment of acquired intangible assets 43.3 25.3 –Share of exceptional gains of associates (4.0) – –Revaluation of fi nancial instruments 8.0 8.9 –Headline PBT 766.3 669.0 489.6Taxation (199.4) (194.0) (135.0)Minority interests (46.8) (34.1) (26.4)Headline earnings 520.1 440.9 328.2Ordinary dividends 118.9 100.2 81.6Dividend cover on Headline earnings 4.4 times 4.4 times 4.0 times
Our 2006 fi nancial statements

WPP ANNUAL REPORT 2006
Our 2006 fi nancial statementsNotes to the consolidated fi nancial statements
Calculation of Headline EBITDA: 2006 2005 2004 £m £m £mHeadline PBIT (as above) 859.0 754.8 560.2Depreciation of property, plant and equipment 129.1 111.4 96.7Amortisation of other intangible assets 13.5 10.7 6.7Headline EBITDA 1,001.6 876.9 663.6
Headline PBIT margins before and after share of results of associates:Margin 2006 Margin 2005 Margin 2004
% £m % £m % £mRevenue 5,907.8 5,373.7 4,299.5Headline PBIT 14.5% 859.0 14.0% 754.8 13.0% 560.2Share of results of associates(excluding exceptional gains) (37.1) (33.9) (29.5)Headline PBIT excluding share of results of associates 13.9% 821.9 13.4% 720.9 12.3% 530.7
Calculation of effective tax rate on Headline PBT: 2006 2005 2004 £m £m £mTaxation (199.4) (194.0) (135.0)Headline PBT 766.3 669.0 489.6Effective tax rate on Headline PBT 26.0% 29.0% 27.6%
Headline diluted earnings per ordinary share:2006 2005 2004
£m £m £mHeadline earnings 520.1 440.9 328.2Earnings adjustment: Dilutive effect of convertible bonds 1.1 – 12.2Weighted average number of ordinary shares 1,242,232,290 1,224,804,570 1,219,588,084Headline diluted earnings per ordinary share 42.0p 36.0p 27.9p
Reconciliation of free cash fl ow: 2006 2005 2004 £m £m £mCash generated by operations 860.6 1,020.3 690.0Plus:Interest received 75.2 62.4 48.9Investment income 2.4 5.6 –Dividends from associates 20.3 13.4 18.5Issue of shares 70.9 20.3 17.9Proceeds on disposal of property, plant and equipment 22.4 6.7 9.3Movements in working capital and provisions 171.1 (107.6) 4.8Gains/(losses) on sale of property, plant and equipment 3.7 (1.1) (1.9)Less:Amounts written-off investments – – (5.0)Interest and similar charges paid (135.1) (128.2) (99.7)Purchases of property, plant and equipment (167.8) (160.5) (89.7)Purchases of other intangible assets(including capitalised computer software) (16.7) (10.8) (5.9)Corporation and overseas tax paid (162.0) (136.0) (101.3)Dividends paid to minority shareholders in subsidiary undertakings (28.8) (24.0) (22.5)Free cash fl ow 716.2 560.5 463.4
Our 2006 fi nancial statements
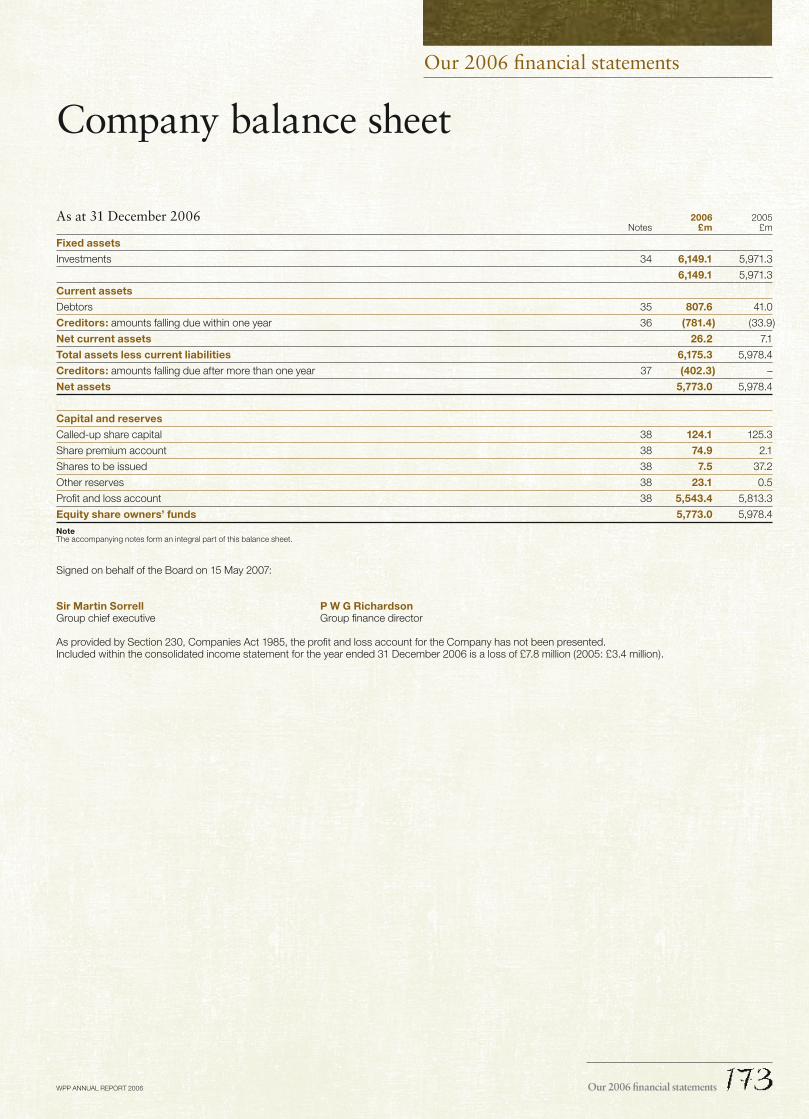
WPP ANNUAL REPORT 2006
Our 2006 fi nancial statements
Company balance sheet
As at 31 December 2006 2006 2005 Notes £m £m
Fixed assets
Investments 34 6,149.1 5,971.3
6,149.1 5,971.3
Current assets
Debtors 35 807.6 41.0
Creditors: amounts falling due within one year 36 (781.4) (33.9)
Net current assets 26.2 7.1
Total assets less current liabilities 6,175.3 5,978.4
Creditors: amounts falling due after more than one year 37 (402.3) –
Net assets 5,773.0 5,978.4
Capital and reserves
Called-up share capital 38 124.1 125.3
Share premium account 38 74.9 2.1
Shares to be issued 38 7.5 37.2
Other reserves 38 23.1 0.5
Profi t and loss account 38 5,543.4 5,813.3
Equity share owners’ funds 5,773.0 5,978.4
NoteThe accompanying notes form an integral part of this balance sheet.
Signed on behalf of the Board on 15 May 2007:
Sir Martin Sorrell P W G RichardsonGroup chief executive Group fi nance director
As provided by Section 230, Companies Act 1985, the profi t and loss account for the Company has not been presented. Included within the consolidated income statement for the year ended 31 December 2006 is a loss of £7.8 million (2005: £3.4 million).
Our 2006 fi nancial statements

WPP ANNUAL REPORT 2006
Our 2006 fi nancial statements
Notes to the Company balance sheet33. Accounting policiesThe principal accounting policies of WPP Group plc (the Company) are summarised below. No changes have been made to these accounting policies since the preceding year other than the adoption of UITF 44 (IFRIC Interpretation 11) FRS 20 (IFRS 2) – Group and Treasury Share Transactions. These accounting policies have all been applied consistently throughout the year and preceding period from 16 August 2005, the date of incorporation, to 31 December 2005.
a) Basis of accountingThe fi nancial statements are prepared under the historical cost convention and in accordance with applicable UK accounting standards and law.
b) Translation of foreign currencyForeign currency transactions arising from operating activities are translated from local currency into pounds sterling at the exchange rates prevailing at the date of the transaction. Monetary assets and liabilities denominated in foreign currencies at the period end are translated at the period-end exchange rate. Foreign currency gains or losses are credited or charged to the profi t and loss account as they arise.
c) InvestmentsFixed asset investments are stated at cost less provision for impairment.
d) TaxationCurrent tax is provided at amounts expected to be paid (or recovered) using the tax rates and laws that have been enacted or substantially enacted by the balance sheet date.
Deferred taxation is provided in full on timing differences that result in an obligation at the balance sheet date to pay more tax, or a right to pay less tax, at a future date, at rates expected to apply when they crystallise based on current tax rates and law. Timing differences arise from the inclusion of items of income and expenditure in taxation computations in periods different from those in which they are included in fi nancial statements. Deferred tax assets and liabilities are not discounted.
e) UITF 44: Group and treasury share transactionsWhere a parent entity grants rights to its equity instruments to employees of a subsidiary, and such share-based compensation is accounted for as equity-settled in the consolidated fi nancial statements of the parent, UITF 44 requires the subsidiary to record an expense for such compensation in accordance with FRS 20 (Share based payments), with a corresponding increase recognised in equity as a contribution from the parent. Consequently, in the fi nancial statements of the parent (WPP Group plc), the Company has recognised an addition to fi xed asset investments of the aggregate amount of these contributions (£70.9 million in 2006), with a credit to equity for the same amount. Comparative fi gures have not been restated as the impact on 2005 was not material.
34. Fixed asset investmentsThe following are included in the net book value of fi xed asset investments: Subsidiary undertakings £mAdditions 5,971.331 December 2005 5,971.3Additions 177.831 December 2006 6,149.1
Fixed asset investments represent 100% of the issued share capital of WPP 2005 Limited, a company incorporated in Great Britain. The fi xed asset investment was purchased in a share-for-share exchange.
35. DebtorsThe following are included in debtors: 2006 2005 £m £mAmounts owed by subsidiary undertakings 806.3 41.0Prepayments and accrued income 1.3 – 807.6 41.0
36. Creditors: amounts falling due within one yearThe following are included in creditors falling due within one year: 2006 2005 £m £mBank loans and overdrafts 764.4 33.9Amounts due to subsidiary undertakings 10.3 –Other creditors and accruals 6.7 – 781.4 33.9
37. Creditors: amounts falling due after more than one yearThe following are included in creditors falling due after more than one year: 2006 2005 £m £mCorporate bonds 402.3 –
In December 2006, the Company issued €600 million of 4.375% bonds due 2013. In April 2007, the Company issued £400 million of 6% bonds due 2017.
38. Equity share owners’ fundsMovements during the period were as follows: Ordinary Share Shares Profi t share premium to be Other and loss capital account issued reserves account £m £m £m £m £mAt 31 December 2005 125.3 2.1 37.2 0.5 5,813.3Ordinary shares issued 2.1 72.9 (29.7) 19.3 5.1Share issue/cancellation costs – (0.1) – – (0.4)Share cancellations (3.3) – – 3.3 (218.8)Retained loss for the year – – – – (7.8)Dividends paid – – – – (118.9)Equity granted to employees of subsidiaries – – – – 70.9At 31 December 2006 124.1 74.9 7.5 23.1 5,543.4
Other reserves at 31 December 2006 comprise a capital redemption reserve of £3.8 million (2005: £0.5 million) and a merger reserve of £19.3 million (2005: £nil).
At 31 December 2006 the Company’s distributable reserves amounted to £5,472.5 million (2005: £5,813.3 million). Further details of the Company’s movements in share capital and the scheme of arrangement are shown in notes 27 and 28.
Reconciliation of movements in equity share owners’ funds for the period ended 31 December 2006: 2006 2005 £m £mLoss for the period (7.8) (3.4)Dividends paid (118.9) – (126.7) (3.4)Ordinary shares issued under the scheme of arrangement – 5,969.1Shares to be issued in respect of acquisitions – 40.7Equity granted to employees of subsidiaries 70.9 –Share issue/cancellation costs (0.5) –Other ordinary shares issued 69.7 (1.3)Share cancellations (218.8) (26.7)Net additions to equity share owners’ funds (205.4) 5,978.4Opening equity share owners’ funds 5,978.4 –Closing equity share owners’ funds 5,773.0 5,978.4
39. Guarantees and other fi nancial commitmentsThe Company guarantees a number of Group banking arrangements and other fi nancial commitments on behalf of certain subsidiary undertakings.
Our 2006 fi nancial statements

WPP ANNUAL REPORT 2006
Our 2006 fi nancial statements
Reconciliation to US Accounting PrinciplesThe following is a summary of adjustments to net income and equity share owners’ funds which would be required if US Generally Accepted Accounting Principles (US GAAP) had been applied.
For the year ended 31 December 2006 2005 2004Net income Notes £m £m £mProfi t for the year under IFRS 482.6 398.0 299.4Profi t attributable to minority interests (46.8) (34.1) (26.4)Profi t attributable to equity holders of the parent under IFRS 435.8 363.9 273.0US GAAP adjustments:Amortisation of intangible assets (a) (14.3) (17.2) (28.5)Goodwill impairment (a) (28.8) (22.7) (10.2)Contingent consideration (b) (33.2) (73.9) (90.5)Accounting for derivatives (c) 7.9 (1.3) (0.3)Recognition of liabilities (h) – – (16.1)Pension accounting (d) (9.1) (15.9) (9.5)Employer payroll taxes (e) 3.2 1.7 2.0Convertible debt (i) 6.4 12.7 –Share-based compensation (j) (0.7) – –Share of results of associates (k) (4.0) – –Tax items (f) (16.2) 4.1 0.4Other – – 6.1 (88.8) (112.5) (146.6)Net income as adjusted for US GAAP 347.0 251.4 126.4
Earnings per shareBasic earnings per share as adjusted for US GAAP 2 28.9p 20.9p 11.1pDiluted earnings per share as adjusted for US GAAP 2 28.0p 20.5p 10.9p
As at 31 December 2006 2005 2004Equity share owners’ funds Notes £m £m £mTotal equity under IFRS 3,918.4 3,985.8 3,065.7Minority interests (91.5) (81.3) (54.6)Equity share owners’ funds under IFRS 3,826.9 3,904.5 3,011.1US GAAP adjustments:Capitalisation of goodwill arising on acquisition (net of accumulated amortisation and impairment and amounts capitalised under IFRS) (a) 514.3 585.0 408.4Other investments (g) (9.7) (1.4) 0.5Contingent consideration (b) (310.7) (277.5) (215.8)Accounting for derivatives (c) 96.7 125.1 34.7Recognition of liabilities (h) – – (16.1)Pension accounting (d) 1.3 13.4 0.9Convertible debt (i) (13.8) (19.7) –Employer payroll taxes (e) 8.9 5.7 4.0Interests in associates (k) (4.0) – –Tax items (f) 287.0 361.9 267.9Other – – 15.3 570.0 792.5 499.8Equity share owners’ funds as adjusted for US GAAP 4,396.9 4,697.0 3,510.9
Movement in equity share owners’ funds under US GAAP 2006 2005 2004 £m £m £mNet income for the year under US GAAP 347.0 251.4 126.4Dividends paid (118.9) (100.2) (81.6)Retained earnings for the year 228.1 151.2 44.8Non-cash share-based incentive plans (including stock options) 71.6 68.6 58.8Exchange adjustments on foreign currency net investments (401.8) 548.2 (172.8)Ordinary shares issued in respect of acquisitions – 422.3 –Share issue/cancellation costs (1.7) (3.6) (0.8)Other ordinary shares issued 73.0 18.3 32.8Share cancellations (218.8) (123.3) (73.6)Pension accounting 8.3 9.2 (11.6)Net additions of own shares by ESOP trusts (38.9) (29.0) (14.9)Transfer to goodwill – (5.1) (67.3)Revaluation of other investments 1.2 19.1 2.3Tax items (21.1) 110.2 (2.0)Other items – – 3.2Net (reductions)/additions to share owners’ funds (300.1) 1,186.1 (201.1)Equity share owners’ funds at 1 January 4,697.0 3,510.9 3,712.0Equity share owners’ funds at 31 December 4,396.9 4,697.0 3,510.9
Our 2006 fi nancial statements

WPP ANNUAL REPORT 2006
Our 2006 fi nancial statements
Notes to the Reconciliation to US Accounting Principles1 Signifi cant differences between IFRS and US Generally Accepted Accounting Principles
The Group’s fi nancial statements are prepared in accordance with IFRS which differ in certain signifi cant respects from US GAAP. These differences relate principally to the following items:
(a) Goodwill and other intangiblesCapitalisation of goodwillUnder US GAAP (Statement of Financial Accounting Standards 141, Business Combinations, or SFAS 141) and IFRS (IFRS 3, Business Combinations), purchase consideration in respect of subsidiaries acquired is allocated on the basis of fair values to the various net assets, including intangible assets, at the dates of acquisition and any net balance is treated as goodwill. As the Group has elected not to restate its prior business combinations on transition to IFRS, goodwill arising on acquisitions before 1 January 1998 remains fully written off against equity share owners’ funds, consistent with the approach under UK GAAP as it stood prior to the transition to IFRS. In accordance with Financial Reporting Standard No. 10 (FRS 10, Goodwill and Intangible Assets), goodwill arising on acquisitions on or after 1 January 1998 and before the adoption of IFRS on 1 January 2004 has been capitalised as an intangible asset. This results in a difference in the gross carrying value of goodwill, including the impact of currency translation, of £1,118.7 million at 31 December 2006 (2005: £1,177.1 million). In addition, as allowed by IFRS 1, a revaluation associated with the acquisition of JWT was recorded in the year following its acquisition and is not recognised under US GAAP. This resulted in a difference in carrying value of £159.7 million. (2005: £175.0 million)
As allowed by IFRS 1, the Group has elected not to apply IFRS 3 retrospectively to business combinations completed prior to 1 January 2004. Therefore WPP has historically amortised a number of acquisitions where the life of the goodwill was determined to be fi nite. IFRS 3 prohibits amortisation of goodwill and instead requires annual impairment testing. Under US GAAP (SFAS 142 Goodwill and Other Intangible Assets) goodwill is not amortised for business combinations completed after 30 June 2001; however, amortisation had been recorded under US GAAP historically on business combinations completed through 30 June 2001. This resulted in a difference in cumulative amortisation of goodwill, including the impact of currency translation, of £407.3 million at 31 December 2006 (2005: £457.3 million).
Under IFRS, and for acquisitions completed prior to 1 January 2004, UK GAAP, share consideration for acquisitions is measured by reference to the share price on the date the acquisition becomes effective, while under US GAAP the relevant measurement date is the date of the announcement of the proposed acquisition and its recommendation to share owners by the respective Boards of directors. For the acquisition of Young & Rubicam Inc, the share consideration was measured under UK GAAP at the share price on 4 October 2000 of £7.99, while under US GAAP, the share consideration was measured at £8.45, the share price on 12 May 2000. This resulted in a purchase price which differed, including the impact of currency translation, by £215.4 million (2005: £223.6 million) and a corresponding difference in the gross carrying amount of goodwill. For the acquisition of Grey, the share consideration was measured under IFRS at the share price on 7 March 2005 of £6.22, while under US GAAP the share consideration was measured at £5.14, the share price on 11 September 2004. This resulted in a purchase price difference, including the impact of currency translation, of £81.8 million (2005: £88.9 million).
ImpairmentThe Group’s indefi nite-lived intangible assets consist of goodwill, including the impact of currency translation, and corporate brand names. The carrying value of these assets is reviewed for impairment annually or more frequently if events or changes in circumstances indicate that the asset might be impaired.
Under IFRS, an impairment charge is required for both goodwill and other indefi nite-lived intangible assets when the carrying amount exceeds the ‘recoverable amount’, defi ned as the higher of fair value less costs to sell and value in use. Our approach in determining the recoverable amount utilises a discounted cash fl ow methodology. Impairment charges recorded under IFRS amounted to £35.5 million, £46.0 million and £40.6 million respectively, in 2006, 2005 and 2004. The impairment charges relate to certain under-performing businesses during each respective period where the impact of the current local economic conditions and trading circumstances on these businesses during each respective period was suffi ciently severe to indicate impairment to the carrying value of goodwill. For further details on the Company’s annual impairment review, see note 13 to the consolidated fi nancial statements.
Additional impairment charges of £28.8 million (£3.1 million related to Public Relations & Public Affairs, £6.5 million related to Branding & Identity, Healthcare and Specialist Communications, £0.3 million related to Information, Insight & Consultancy and £18.9 million related to Advertising & Media Investment Management), £22.7 million (£10.3 million related to Branding & Identity, Healthcare and Specialist Communications, £12.2 million related to Information, Insight & Consultancy and £0.2 million related to Advertising & Media Investment Management) and £10.2 million (£7.0 million related to Branding & Identity, Healthcare and Specialist Communications, £3.1 million related to Advertising & Media Investment Management and £0.3 million related to Public Relations & Public Affairs offset by a reduction of £0.2 million related to Information, Insight & Consultancy) were recorded under US GAAP in 2006, 2005 and 2004, respectively. Under UK GAAP, substantially all such impaired goodwill
had been amortised or included in the write-off against share owners’ funds as at 1 January 1998, as more fully described in the Group’s accounting policies. The cumulative difference in goodwill resulting from incremental US GAAP impairment charges since the implementation of SFAS 142 amounts to £104.3 million as at 31 December 2006 (2005: £75.5 million).
Under US GAAP, SFAS 142 prescribes a two-step impairment test:
• The fi rst step of the goodwill impairment test compares the fair value of a reporting unit with its carrying amount, including goodwill. The Group uses the discounted cash fl ow method in determining the fair value of each reporting unit and also gives consideration to the overall market capitalisation of the Group. There are no differences in the performance of this step between IFRS and US GAAP, other than the amounts tested may differ due to GAAP differences affecting the carrying amounts of goodwill.
• If the carrying amount of a reporting unit exceeds its fair value, the second step of the goodwill impairment test, used to measure the amount of impairment loss, compares the implied fair value of reporting unit goodwill with the carrying amount of that goodwill.
The implied fair value of goodwill is determined in the same manner that the amount of goodwill recognised in a business combination is determined. That is, the Group allocates the fair value of the reporting unit to all of the assets and liabilities of that unit (including any previously unrecognised intangible assets) as if the reporting unit had been acquired in a business combination and the fair value of the reporting unit was the price paid to acquire the reporting unit. The excess of the fair value of the reporting unit over the amounts assigned to its assets and liabilities is the implied fair value of goodwill.
The reporting units of the Group used in this assessment are its operating segments or one level below (i.e. individual offi ces). Where reporting units are represented by individual offi ces, those reporting units are assessed for aggregation for purposes of testing for impairment of goodwill. Reporting units are aggregated if they supply similar services, provide these services in a similar manner, have like types and classes of customers and have similar economic characteristics. The reporting units under US GAAP are the same as the cash generating units under IFRS.
Under IFRS (IAS 36, Impairment of Assets), the impairment test is only a one-step test, as more fully described in the note on accounting policies in the fi nancial statements. This could give rise to a GAAP difference related to the impairment of goodwill. At 31 December 2006 this difference was immaterial.
Other intangiblesUnder IFRS, the Group has applied IAS 38, Intangible Assets to acquisitions completed since 1 January 2004, which has resulted in the recognition of acquired intangible assets with a carrying value of £271.9 million and £330.3 million at 31 December 2006 and 2005, respectively. The Company generally assesses the fair value of identifi able intangible assets based on the net present value of expected future cash fl ows to be derived.
Under US GAAP, in accordance with the provisions of SFAS 141, effective for all business combinations initiated after 30 June 2001, the allocation of purchase consideration should include recognition of the fair value of identifi able intangible assets, as applicable, such as corporate brand names, customer relationships and proprietary tools. Intangible assets, net of amortisation, recognised under US GAAP with respect to business combinations completed prior to 1 January 2004 resulted in a difference in carrying value of acquired intangible assets of £52.3 million at 31 December 2006 (2005: £66.6 million). The additional charge in 2006 relating to amortisation and impairment of these intangibles was £14.3 million (2005: £17.2 million, 2004: £28.5 million).
(b) Contingent considerationUnder IFRS, the Group provides for contingent consideration as a liability when it considers the likelihood of payment as probable. Under US GAAP, contingent consideration is not recognised until the underlying contingency is resolved and consideration is issued or becomes issuable. At 31 December 2006, the Group’s liabilities for vendor payments under IFRS totalled £235.5 million (2005: £220.0 million), of which £213.5 million (2005: £180.6 million) is dependent on the future performance of the interests acquired. As these liabilities are represented by goodwill arising on acquisitions, there is no net effect on equity share owners’ funds. Under US GAAP, however, a balance sheet classifi cation difference arises such that liabilities and goodwill would each be reduced by the amount indicated as of each year end. This difference represents a continuing difference between IFRS and US GAAP.
In certain historical transactions the Group had considered that there was a commercial need to tie in vendors to the businesses acquired; however the directors believe that, in substance, payments made under earnouts represent purchase consideration rather than compensation for services. Under US GAAP, payments made to vendors which are conditional upon them remaining in employment with the Company under earnout are required to be treated as compensation, except in rare instances, and the anticipated compensation expense is therefore accrued on a systematic basis over the earnout period. As allowed by IFRS 1, the Group has elected not to apply IFRS 3 retrospectively to business combinations completed prior to 1 January 2004. Therefore, for these historical transactions such earnout payments are treated as compensation, while under IFRS the payments are treated as part of the purchase price of the transaction. This is a transitional difference between IFRS and US GAAP that will continue to affect the reconciliation of net income until the earnout periods on pre-1 January 2004 acquisitions expire.
Our 2006 fi nancial statements

WPP ANNUAL REPORT 2006
Our 2006 fi nancial statementsNotes to the Reconciliation to US Accounting Principles
(c) Accounting for derivative instruments and hedging activitiesThe Group has taken advantage of the exemption available under IFRS 1 not to apply IAS 32 and IAS 39 in respect of the year ended 31 December 2004. Therefore, as allowed by IFRS 1, in 2004, gains or losses on forward foreign exchange contracts were deferred and recognised in the profi t and loss account or as adjustments to the carrying amount of fi xed assets. Interest differentials as a result of interest rate swaps were recognised by adjusting net interest payable over the periods of the contract. Under US GAAP, the Group accounts for derivative instruments under SFAS 133, Accounting for Derivative Instruments and Hedging Activities. The Statement requires that every derivative instrument (including certain derivative instruments embedded in other contracts) be recorded in the balance sheet as either an asset or liability measured at its fair value. It also requires that changes in the derivative’s fair value be recognised currently in earnings unless specifi c hedge-accounting criteria are met. Special accounting for qualifying hedges allows a derivative’s gains and losses to offset related results on the hedged item in the income statement, and requires that a company must formally document, designate, and assess the effectiveness of transactions that receive hedge accounting.
Following the Group’s adoption of IAS 32 and IAS 39 on 1 January 2005, under IFRS derivatives are recognised in the balance sheet at fair value. However, GAAP differences remain with respect to certain derivatives terminated prior to 1 January 2005 and hedge relationships designated under IFRS with effect from that date, as follows:
(i) under the transitional provisions of IFRS, the Group has deferred the gains on swaps terminated prior to 1 January 2005 and is amortising them over the remaining life of the underlying bond. Under US GAAP the gains were recognised through income prior to termination of the swaps and now reside in retained earnings. This is a transitional GAAP difference and will continue until the gains deferred under IFRS are fully amortised.
(ii) under IFRS the Group has designated certain of its derivatives as hedging instruments in fair value and net investment hedge relationships with effect from 1 January 2005. Under US GAAP these derivatives are not designated as hedging instruments. Consequently, all changes in fair value of these derivatives are recognised in the income statement under US GAAP. Under IFRS, depending on the hedge relationship, changes in fair value of the derivatives may be deferred in equity or offset against changes in fair value of the hedged item within the income statement.
In addition, under IFRS, option agreements that allow the Group’s equity partners to require the Group to purchase a minority interest are treated as derivatives over equity instruments and are recorded in the balance sheet at present value of expected cash outfl ows. Under US GAAP, these options are recorded at their fair value.
(d) Pension accountingUnder IFRS, pension costs are accounted for in accordance with IAS 19, Employee Benefi ts. Under US GAAP, pension costs are determined in accordance with the requirements of SFAS 87, Employers’ Accounting for Pensions, SFAS 88, Employers’ Accounting and Settlements and Curtailments of Defi ned Benefi t Pension Plans and for Termination Benefi ts and, effective 31 December 2006, SFAS 158, Employers’ Accounting for Defi ned Benefi t Pension and other Post Retirement Plans.
The differences in accounting policy are primarily due to differing treatment of actuarial gains and losses which arise over the accounting period (as a result of investment returns and demographic assumptions differing from those previously assumed, and also the effect of changing actuarial assumptions). Under IAS 19, these actuarial gains and losses are immediately recognised in the Statement of Recognised Income and Expense (‘SORIE’), whereas under SFAS 87 the actuarial gains and losses that at the beginning of the year exceed 10% of the greater of the value of assets and the projected benefi t obligation, are amortised over the average future service period of the scheme members.
IAS 19 also requires prior service costs to be expensed over the period in which the benefi t vests, whereas SFAS 87 provides for these costs to be amortised over the future service periods of those employees active at the date of the amendment who are expected to receive benefi ts under the plan.
The 2006 fi nancial statements refl ect a £9.1 million (2005: £15.9 million, 2004: £9.5 million) difference in the defi ned benefi t pensions charge between IFRS and US GAAP. The difference in the defi ned benefi t pension charge is largely due to the Group’s defi ned benefi t schemes experiencing actuarial losses in past years which arose primarily from poor investment returns, somewhat offset by more recent investment returns in excess of expected returns, and changes in actuarial assumptions. The US GAAP charge includes an amortisation component in respect of these past losses, which is not refl ected in the IFRS charge. Such gains and losses will be recycled out of other comprehensive income and continue to be amortised through the income statement over the remaining expected service period of the scheme members, consistent with the accounting in previous years.
Further, SFAS 87 requires the recognition of an additional liability to the extent that the liability in respect of any scheme does not cover the unfunded accumulated benefi t obligation for that scheme. This has been amended by SFAS 158 which requires the employer to recognise the overfunded or underfunded status of a defi ned benefi t pension and other postretirement plan as an asset or liability in its statement of fi nancial position and to recognise the changes in that funded status in the year in which the changes occur through comprehensive income, a separate component of shareholders’ equity.
The 2006 US GAAP pension provision includes a £93.9 million adjustment for the introduction of SFAS 158, to recognise the overall underfunded status of the Group’s defi ned benefi t pension plans. This replaces the additional minimum liability, which would have been £83.7 million under SFAS 87, and represented the amount by which the accumulated benefi t obligation exceeded the fair value of plan assets, for a net adoption impact of £10.2 million. In aggregate, with the adoption of SFAS 158 under US GAAP, there remains a £1.0 million difference in the amount of pension defi cit recognised on the balance sheet due to the irrecoverable surplus under IAS 19. Under IAS 19, recognition of a surplus is limited to the net present value of any economic benefi ts available in the form of refunds from the plan or reductions in future contributions to the plan, while surplus recognition is not limited under SFAS 158.
(e) Employer payroll taxesUnder IFRS, provisions for National Insurance contributions are required to be measured initially at the date of grant of share-based awards and recognised over the vesting period. Under US GAAP, National Insurance contributions with respect to share-based awards are recognised on the date of the event triggering the measurement and payment of the contribution, which is generally the exercise or vesting date. This represents a continuing difference between IFRS and US GAAP.
(f) Tax itemsDeferred taxesUnder both IFRS and US GAAP deferred taxes are accounted for on all temporary differences unless specifi cally excepted by the relevant standards. Deferred tax differences principally arise as a result of additional temporary differences between the IFRS and US GAAP carrying values of assets and liabilities relative to their tax bases, as described in detail throughout these Notes to the Reconciliation to US Accounting Principles.
Treatment of pre-acquisition lossesUnder IFRS (IAS 12, Income Taxes), the tax effect of the recognition of the asset in respect of the utilisation of pre-acquisition losses may be taken to the income statement. Under US GAAP, the tax effect of the recognition of the asset in respect of the utilisation of pre-acquisition losses is recorded to goodwill directly and has no impact on tax expense. In 2006, the adjustment for tax items includes £nil (2005: £nil, 2004: £6.5 million) of tax expense resulting from the utilisation of pre-acquisition losses and an £8.8 million reversal (2005: £1.1 million, 2004: £12.6 million) of associated goodwill write-off recorded under IAS 12.
Treatment of net operating lossesUnder both IFRS and US GAAP, deferred tax assets are recognised for net operating loss carryforwards to the extent there exists an expectation of its utilisation in the future. However, the order in which the net operating losses are utilised differs under IFRS and US GAAP. Therefore, certain deferred tax assets recognised under IFRS are not recognisable under US GAAP. In 2006, this difference resulted in the elimination of £24.3 million of deferred taxes under US GAAP.
Share-based paymentsUnder US GAAP, deferred tax assets for share awards are recorded based on the recorded compensation expense. Under IFRS, deferred tax assets are recognised based on the intrinsic gain at the year end. The amount recognised in the income statement is capped at the tax effected share award charge, with any excess being recognised directly in equity.
(g) Other investmentsUnder IFRS, other investments are classifi ed as available-for-sale. They are recorded at fair value with changes in fair value being reported in equity. Under US GAAP, listed investments are also considered available for sale and are reported at fair value. Unlisted investments are carried at cost less any provision for other than temporary impairment, representing a continuing difference between IFRS and US GAAP. The aggregate carrying value of cost investments as of 31 December 2006 was £30.7 million (2005: £32.0 million, 2004: £7.9 million).
(h) Recognition of liabilitiesUnder US GAAP, in accordance with the provisions of SFAS 140, Accounting for Transfers and Servicing of Financial Assets and Extinguishments of Liabilities, liabilities are released when the underlying legal obligation becomes completely extinguished. Under IFRS, since the Group did not apply IAS 39 in respect of the year ended 31 December 2004, as permitted under IFRS 1, the requirement for liabilities to have been legally extinguished in order for derecognition to occur was not applied until 1 January 2005. This was a transitional difference between IFRS and US GAAP.
(i) Convertible debtUnder IFRS, IAS 32, ‘Financial Instruments: Disclosure and Presentation’, requires convertible debt instruments to be classifi ed into both liability and equity elements, as described in the note on accounting policies in the fi nancial statements.
Under US GAAP, conventional convertible debt instruments are accounted for under APB 14, ‘Accounting for Convertible Debt and Debt Issued with Stock Purchase Warrants’ which requires the issuer of a conventional convertible debt instrument issued without a substantial discount to account for the convertible debt entirely as a liability. As a result, under IFRS the initial recognition of the liability is for a lower amount than under US GAAP and consequently the fi nance cost under IFRS over the period to the redemption of the convertible debt is higher. The impact of this GAAP difference in 2006 is that the fi nance charges relating to the Group’s convertible debt under IFRS are £13.4 million (2005: £13.8 million, 2004: nil) higher than under US GAAP.
Convertible debt instruments in which the conversion feature provides for a settlement in a combination of cash and shares have the conversion feature separately accounted for as a liability under US GAAP. SFAS 133 requires such conversion features to be accounted for as an embedded derivative and measured at fair value at inception and at each balance sheet date with changes in fair value reported in the income statement. The impact of this GAAP difference in 2006 was an additional US GAAP fi nance cost of £7.0 million (2005: £1.1 million, 2004: nil) to recognise the movement in fair value of the conversion feature.
These differences between IFRS and US GAAP will continue.
(j) Share-based compensationIn December 2004, the Financial Accounting Standards Board (FASB) issued SFAS 123 (revised 2004), Share-Based Payment (SFAS 123R). SFAS 123R replaces SFAS 123 and supersedes APB 25. SFAS 123R requires that the cost resulting from all share-based payment transactions be recognised in the fi nancial statements at fair value. SFAS 123R is effective for the Group from 1 January 2006, but early adoption is encouraged. The Group has elected to adopt SFAS 123R effective 1 January 2004 using the modifi ed retrospective method.
Under the modifi ed retrospective method, from the effective date, compensation cost is recognised based on the requirements of SFAS 123R for all new share-based awards and based on the requirements of SFAS 123 for all awards granted prior to the
Our 2006 fi nancial statements

WPP ANNUAL REPORT 2006
Our 2006 fi nancial statementsNotes to the Reconciliation to US Accounting Principles
effective date of SFAS 123R that remain unvested on the effective date. The impact on the 2004 US GAAP income statement was to reduce pre-tax income by £24.9 million, net income by £22.9 million, and each of basic and diluted earnings per share by 2.0p. The balance sheet as of 1 January 2004 refl ects an increase in paid in capital and a corresponding decrease in retained earnings of £83.4 million.
The timing of vesting of certain of the Group’s share options are subject to a performance condition based on earnings per share growth relative to the UK retail price index. SFAS 123R requires plans with such performance criteria be accounted for under the liability method. The liability method, as set out in SFAS 123R, requires a liability to be recorded on the balance sheet until the condition is satisfi ed, whereas no liability is required for equity settled share awards under IFRS 2. In addition, in calculating the income statement charge for share awards under the liability method, the fair value of each award must be remeasured at each reporting date until the condition is satisfi ed, whereas for equity settled awards under IFRS the charge is calculated with reference to the grant fair value. Accordingly, £0.7 million of additional compensation expense was recognised in 2006 under US GAAP. As of 31 December 2006, this performance condition was met and, accordingly, these options are classifi ed as equity instruments at 31 December 2006.
(k) Interests in associatesUnder IFRS, included in the Group’s share of results of associates in 2006 is a £4.0 million gain in respect of the Group’s share of negative goodwill recognised in the income statements of its associate undertakings.
Under US GAAP, negative goodwill must fi rst be applied to reduce the acquiree’s non-monetary assets to zero, with only any residual amount recognised in income. Therefore the £4.0 million of income recognised under IFRS has been reversed and applied against the investment balance.
2 Earnings per share – reconciliation from IFRS to US GAAP
Both basic and diluted earnings per share under US GAAP have been calculated by dividing the net income as adjusted for US GAAP differences by the weighted average number of shares in issue during the year. Under IFRS in 2004, the Group’s convertible bonds then in issue were dilutive in that year. Under US GAAP the Group’s convertible bonds were accretive to earnings and therefore excluded from the calculation of diluted earnings. Details on the securities are included in the note to the consolidated fi nancial statements on earnings per share.
3 New US GAAP accounting pronouncements
The Group has considered the following recent US GAAP accounting pronouncements covering topics that may be applicable to our operations for their potential impact on our results of operations and fi nancial position:
(i) Adopted in the current year:
SFAS 158In September 2006, the FASB issued SFAS 158, Employers’ Accounting for Defi ned Benefi t Pensions and Other Postretirement Plans. SFAS 158 amends FASB Statements 87, 88 and 132 ( R) . SFAS 158 requires an employer to recognise the overfunded or underfunded status of a defi ned benefi t postretirement plan (other than a multiemployer plan) as an asset or liability in its statement of fi nancial position and to recognise changes in that funded status in the year in which the changes occur through comprehensive income. The statement also requires an employer to measure the funded status of a plan as of the date of its year-end statement of fi nancial position. SFAS 158 is effective for the Group from 31 December 2006 and has been adopted as of this date.
SFAS 153In December 2004, the FASB issued SFAS 153, Exchanges of Nonmonetary Assets. SFAS 153 amends APB Opinion 29 replacing the exception from having to apply the fair value accounting provisions of APB 29 for non-monetary exchanges of similar productive assets with a general exception for exchanges of non-monetary assets that do not have commercial substance. SFAS 153 is effective for the fi rst reporting period beginning after 15 June 2005. The adoption of SFAS 153 did not have a material impact on the Group’s consolidated results of operations or fi nancial position.
SFAS 154In May 2005, SFAS 154, Accounting Changes and Error Corrections – replacement of APB Opinion No. 20 and FASB Statement No. 3, was issued. SFAS 154 changes the accounting for and reporting of a change in accounting principle by requiring retrospective application to prior periods’ fi nancial statements of changes in accounting principle unless impracticable. SFAS 154 is effective for accounting changes made in fi scal years beginning after 15 December 2005. The adoption of SFAS 154 did not impact the Group’s historical consolidated results of operations or fi nancial position.
EITF 04-5In June 2005, the EITF reached a consensus on Issue 04-5, Determining Whether a General Partner, or the General Partners as a Group, Controls a Limited Partnership or Similar Entity When the Limited Partners Have Certain Rights (EITF 04-5), regarding how to evaluate whether a partnership should be consolidated by one of its partners. The scope of this Issue is limited to limited partnerships or similar entities (such as limited liability companies that have governing provisions that are the functional equivalent of a limited partnership) that are not variable interest entities under FASB Interpretation 46(R). The EITF concluded that a general partner or a group of general partners of a limited partnership is presumed to control the limited partnership, unless either the limited partners have the substantive ability to dissolve the limited
partnership or otherwise remove the general partner without cause or the limited partners have substantive participating rights. The guidance in the Issue is effective after 29 June 2005 for general partners of all new limited partnerships formed and for existing limited partnerships for which the partnership agreements are modifi ed. For general partners in all other pre-existing limited partnerships, the guidance in this Issue is effective no later than the beginning of the fi rst reporting period in fi scal years beginning after 15 December 2005. The adoption of EITF 04-5 did not have a material impact on the Group’s fi nancial statements.
FSP SFAS 115-1/124-1In November 2005, the FASB issued FSP SFAS 115-1/124-1, The Meaning of Other-Than-Temporary Impairment and Its Application to Certain Investments. The guidance in this FSP addresses the determination of when an investment is considered impaired, whether that impairment is other than temporary, and the measurement of an impairment loss. The FSP also includes accounting considerations subsequent to the recognition of an other-than-temporary impairment and requires certain disclosures about unrealised losses that have not been recognised as other-than-temporary impairments. The guidance in FSP SFAS 115-1/124-1 shall be applied to reporting periods beginning after 15 December 2005. The adoption of FSP SFAS 115-1/124-1 did not have a material impact on the Group’s consolidated results of operations or fi nancial position and the Group has included the required disclosures in its fi nancial statements.
(ii) To be adopted in future periods:
SFAS 155In February 2006, the FASB issued SFAS 155, Accounting for Certain Hybrid Financial Instruments. SFAS 155 amends SFAS 133 and SFAS 140. SFAS 155 resolves issues addressed in SFAS 133 Implementation Issue No.D1 – Application of Statement 133 to Benefi cial Interests in Securitized Financial Assets. SFAS 155 provides relief from separately determining the fair value of an embedded derivative that would otherwise be required to be bifurcated from its host contract in accordance with SFAS 133. SFAS 155 allows an entity to make an irrevocable election to measure such a hybrid fi nancial instrument at fair value in its entirety, with changes in fair value recognised in earnings. Once fair value election has been made, the hybrid fi nancial instrument may not be designated as a hedging instrument pursuant to SFAS 133. This Statement is effective for all fi nancial instruments acquired or issued after the beginning of an entity’s fi rst fi scal year that begins after September 15, 2006. We do not believe the adoption of SFAS 155 will have a material impact on the Group’s fi nancial statements.
SFAS 157 and SFAS 159In September 2006, the FASB issued SFAS 157, Fair Value Measurements. SFAS 157 addresses issues relating to the defi nition of fair value, the methods used to measure fair value and expanded disclosures about fair value measurements. SFAS 157 does not require any new fair value measurements. In February 2007, the FASB issued SFAS 159, The Fair Value Option for Financial Assets and Financial Liabilities Measurement, which includes an amendment of SFAS 115. SFAS 159 permits entities to choose to measure many fi nancial instruments and certain other items at fair value. These statements are effective for fi nancial statements issued for fi scal years beginning after November 15, 2007. We are still in the process of assessing the full impact on the Group’s fi nancial statements.
FIN 48In June 2006, the FASB issued FASB Interpretation No. 48, Accounting for Uncertainty in Income Taxes – an interpretation of SFAS 109 (“FIN 48”), that clarifi es the accounting and recognition for income tax positions taken or expected to be taken in our tax returns. FIN 48 applied to accounting periods commencing after December 15, 2006. We are still in the process of assessing the full impact on the Group’s fi nancial statements.
4 Supplemental discussion of presentational differences
Income StatementPension accountingThe 2006 IFRS defi ned benefi t pensions charge includes net fi nance costs of £7.2 million (2005: £7.8 million, 2004: £9.5 million) that would be recognised as an operating expense under US GAAP.
Equity accountingUnder IFRS, the Group’s share of results of associates is presented above profi t before interest and taxation. Under US GAAP, equity income is presented between income tax expense and income from continuing operations.
Balance SheetDebtUnder IFRS the Group initially states debt as the amount of the net proceeds after deduction of issue costs. US GAAP requires such costs to be recorded as a deferred charge and not as a reduction in the carrying value of the debt. The amount of issue costs included in debt at 31 December 2006 was £7.1 million (2005: £9.1 million).
Deferred TaxesUnder IFRS, the Group must disclose the gross deferred tax assets and liabilities as non-current. Under US GAAP, deferred tax assets and liabilities are classifi ed between current and non-current, depending on the items to which they relate, disclosed separately and presented on a net basis, by tax jurisdiction.
Pension accountingIAS 19 does not require distinction between current and non-current portions of assets and liabilities arising from pensions and other post retirement benefi ts and therefore the provision of such benefi ts is recorded as a non-current liability under IFRS. In contrast, SFAS 158 requires classifi cation of the liability as current or non-current. The amount of liability that would be required to be presented as a current liability under US GAAP at 31 December 2006 is £8.5 million.
Our 2006 fi nancial statements

WPP ANNUAL REPORT 2006
Our 2006 fi nancial statements
Independent auditors’ report
Our responsibility is to audit the fi nancial statements and the part of the directors’ remuneration report described as having been audited in accordance with relevant United Kingdom legal and regulatory requirements and International Standards on Auditing (UK and Ireland).
We report to you our opinion as to whether the fi nancial statements give a true and fair view and whether the fi nancial statements and the part of the directors’ remuneration report described as having been audited have been properly prepared in accordance with the Companies Act 1985 and whether, in addition, the Group fi nancial statements have been properly prepared in accordance with Article 4 of the IAS Regulation. We also report to you whether, in our opinion, the information given in the directors’ report is consistent with the fi nancial statements. We also report to you if, in our opinion, the Company has not kept proper accounting records, if we have not received all the information and explanations we require for our audit, or if information specifi ed by law regarding directors’ remuneration and other transactions is not disclosed.
We also report to you if, in our opinion, the Company has not complied with any of the four directors’ remuneration disclosure requirements specifi ed for our review by the Listing Rules of the Financial Services Authority. These comprise the amount of each element in the remuneration package and information on share options, details of long-term incentive schemes, and money purchase and defi ned benefi t schemes. We give a statement, to the extent possible, of details of any non-compliance.
We review whether the corporate governance statement refl ects the Company’s compliance with the nine provisions of the 2003 Combined Code specifi ed for our review by the Listing Rules of the Financial Services Authority, and we report if it does not. We are not required to consider whether the Board’s statements on internal control cover all risks and controls, or form an opinion on the effectiveness of the Group’s corporate governance procedures or its risk and control procedures.
We read the directors’ report and the other information contained in the annual report for the above year as described in the contents section including the unaudited part of the directors’ remuneration report and consider the implications for our report if we become aware of any apparent misstatements or material inconsistencies with the fi nancial statements. Our responsibilities do not extend to any further information outside the Annual Report.
Independent Auditors’ report to the members of WPP Group plc
We have audited the Group and individual company fi nancial statements of WPP Group plc for the year ended 31 December 2006 which comprise the consolidated income statement, the consolidated and individual company balance sheets, the consolidated cash fl ow statement, the consolidated statement of recognised income and expenses, the related notes 1 to 39 and the reconciliation to US accounting principles on pages 175 to 178. These fi nancial statements have been prepared under the accounting policies set out there in. We have also audited the information in the directors’ remuneration report that is described as having been audited.
This report is made solely to the Company’s members, as a body, in accordance with section 235 of the Companies Act 1985. Our audit work has been undertaken so that we might state to the Company’s members those matters we are required to state to them in an auditors’ report and for no other purpose. To the fullest extent permitted by law, we do not accept or assume responsibility to anyone other than the Company and the Company’s members as a body, for our audit work, for this report, or for the opinions we have formed.
Respective responsibilities of directors and auditors
The directors’ responsibilities for preparing the annual report and the group fi nancial statements in accordance with applicable law and International Financial Reporting Standards (IFRS) as adopted for use in the European Union and for preparing the parent individual company fi nancial statements and the directors’ remuneration report in accordance with applicable law and United Kingdom Accounting Standards (United Kingdom Generally Accepted Accounting Practice) are set out in the statement of directors’ responsibilities.
Our 2006 fi nancial statements

WPP ANNUAL REPORT 2006
Our 2006 fi nancial statementsIndependent auditors’ report
Basis of audit opinion
We conducted our audit in accordance with International Standards on Auditing (UK and Ireland) issued by the Auditing Practices Board. An audit includes examination, on a test basis, of evidence relevant to the amounts and disclosures in the fi nancial statements and the part of the directors’ remuneration report described as having been audited. It also includes an assessment of the signifi cant estimates and judgements made by the directors in the preparation of the fi nancial statements, and of whether the accounting policies are appropriate to the Company’s circumstances, consistently applied and adequately disclosed.
We planned and performed our audit so as to obtain all the information and explanations which we considered necessary in order to provide us with suffi cient evidence to give reasonable assurance that the fi nancial statements and the part of the directors’ remuneration report to be audited are free from material misstatement, whether caused by fraud or other irregularity or error. In forming our opinion we also evaluated the overall adequacy of the presentation of information in the fi nancial statements and the part of the directors’ remuneration report described as having been audited.
Opinion
In our opinion:
• the Group fi nancial statements give a true and fair view, in accordance with IFRS as adopted for use in the European Union, of the state of the Group’s affairs as at 31 December 2006 and of its profi t for the year then ended;
• the Group fi nancial statements have been properly prepared in accordance with the Companies Act 1985 and Article 4 of the IAS Regulation;
• the individual company fi nancial statements give a true and fair view, in accordance with United Kingdom Generally Accepted Accounting Practice, of the state of the individual company’s affairs as at 31 December 2006;
• the individual company fi nancial statements and the part of the directors’ remuneration report described as having been audited have been properly prepared in accordance with the Companies Act 1985; and
• the information given in the Directors’ Report is consistent with the fi nancial statements.
Separate opinion in relation to IFRS
As explained in the accounting policies to the fi nancial statements, the Group, in addition to complying with its legal obligation to comply with IFRS as adopted by the European Union, has also complied with the IFRS as issued by the International Accounting Standards Board. Accordingly, in our opinion the fi nancial statements give a true and fair view, in accordance with IFRS, of the state of the Group’s affairs as at 31 December 2006 and of its profi t for the year then ended.
Deloitte & Touche LLPChartered Accountants and Registered AuditorsLondon, 15 May 2007
Our 2006 fi nancial statements
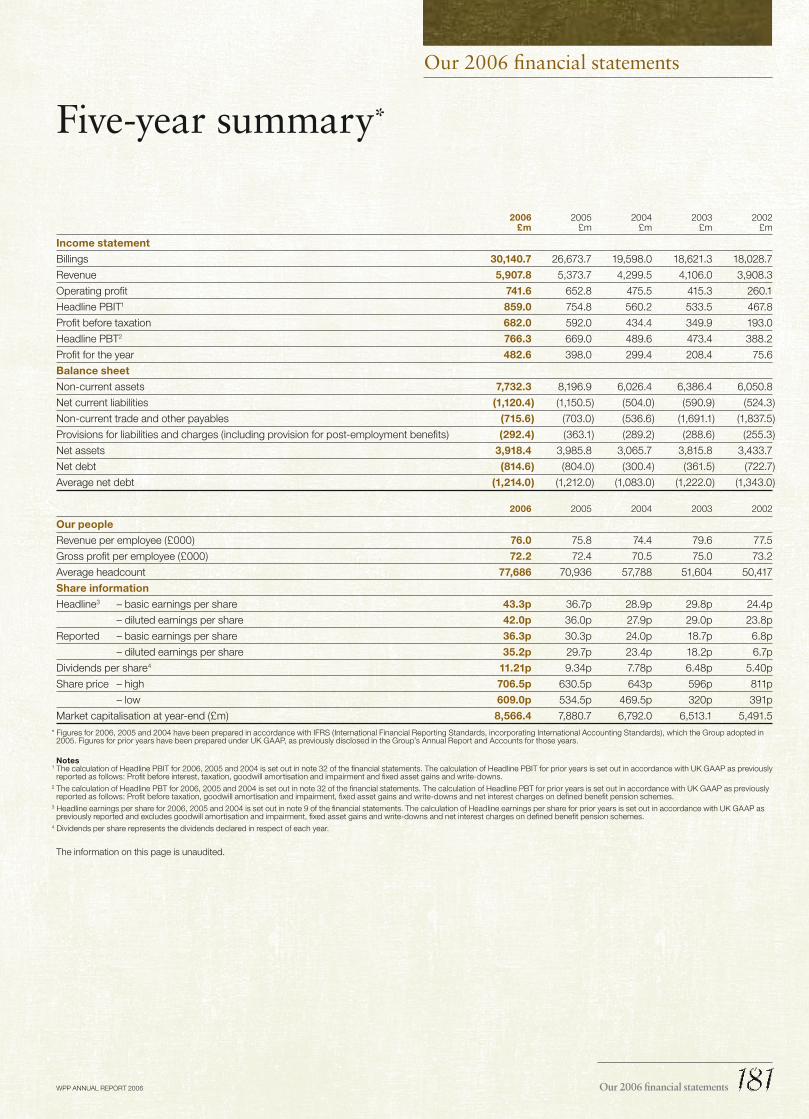
WPP ANNUAL REPORT 2006
Our 2006 fi nancial statements
Five-year summary*
2006 2005 2004 2003 2002£m £m £m £m £m
Income statement
Billings 30,140.7 26,673.7 19,598.0 18,621.3 18,028.7
Revenue 5,907.8 5,373.7 4,299.5 4,106.0 3,908.3
Operating profi t 741.6 652.8 475.5 415.3 260.1
Headline PBIT1 859.0 754.8 560.2 533.5 467.8
Profi t before taxation 682.0 592.0 434.4 349.9 193.0
Headline PBT2 766.3 669.0 489.6 473.4 388.2
Profi t for the year 482.6 398.0 299.4 208.4 75.6
Balance sheet
Non-current assets 7,732.3 8,196.9 6,026.4 6,386.4 6,050.8
Net current liabilities (1,120.4) (1,150.5) (504.0) (590.9) (524.3)
Non-current trade and other payables (715.6) (703.0) (536.6) (1,691.1) (1,837.5)
Provisions for liabilities and charges (including provision for post-employment benefi ts) (292.4) (363.1) (289.2) (288.6) (255.3)
Net assets 3,918.4 3,985.8 3,065.7 3,815.8 3,433.7
Net debt (814.6) (804.0) (300.4) (361.5) (722.7)
Average net debt (1,214.0) (1,212.0) (1,083.0) (1,222.0) (1,343.0)
2006 2005 2004 2003 2002
Our people
Revenue per employee (£000) 76.0 75.8 74.4 79.6 77.5
Gross profi t per employee (£000) 72.2 72.4 70.5 75.0 73.2
Average headcount 77,686 70,936 57,788 51,604 50,417
Share information
Headline3 – basic earnings per share 43.3p 36.7p 28.9p 29.8p 24.4p
– diluted earnings per share 42.0p 36.0p 27.9p 29.0p 23.8p
Reported – basic earnings per share 36.3p 30.3p 24.0p 18.7p 6.8p
– diluted earnings per share 35.2p 29.7p 23.4p 18.2p 6.7p
Dividends per share4 11.21p 9.34p 7.78p 6.48p 5.40p
Share price – high 706.5p 630.5p 643p 596p 811p
– low 609.0p 534.5p 469.5p 320p 391p
Market capitalisation at year-end (£m) 8,566.4 7,880.7 6,792.0 6,513.1 5,491.5
* Figures for 2006, 2005 and 2004 have been prepared in accordance with IFRS (International Financial Reporting Standards, incorporating International Accounting Standards), which the Group adopted in 2005. Figures for prior years have been prepared under UK GAAP, as previously disclosed in the Group’s Annual Report and Accounts for those years.
Notes1 The calculation of Headline PBIT for 2006, 2005 and 2004 is set out in note 32 of the fi nancial statements. The calculation of Headline PBIT for prior years is set out in accordance with UK GAAP as previously
reported as follows: Profi t before interest, taxation, goodwill amortisation and impairment and fi xed asset gains and write-downs.2 The calculation of Headline PBT for 2006, 2005 and 2004 is set out in note 32 of the fi nancial statements. The calculation of Headline PBT for prior years is set out in accordance with UK GAAP as previously
reported as follows: Profi t before taxation, goodwill amortisation and impairment, fi xed asset gains and write-downs and net interest charges on defi ned benefi t pension schemes.3 Headline earnings per share for 2006, 2005 and 2004 is set out in note 9 of the fi nancial statements. The calculation of Headline earnings per share for prior years is set out in accordance with UK GAAP as
previously reported and excludes goodwill amortisation and impairment, fi xed asset gains and write-downs and net interest charges on defi ned benefi t pension schemes.4 Dividends per share represents the dividends declared in respect of each year.
The information on this page is unaudited.
Our 2006 fi nancial statements

WPP ANNUAL REPORT 2006
Our 2006 fi nancial statements
Financial glossary
Term used in Annual Report US equivalent or brief description
Allotted Issued
ADRs/ADSs American Depositary Receipts/American Depositary Shares. The Group
uses the terms ADR and ADS interchangeably. One ADR/ADS represents
fi ve ordinary shares
Average net debt Average net debt is calculated as the average daily net bank borrowings of
the Group, derived from the Group’s automated banking system. Net debt
at a period end is calculated as the sum of the net bank borrowings of the
Group, derived from the cash ledgers and accounts in the balance sheet
Billings Billings comprises the gross amounts billed to clients in respect of
commission-based/fee-based income together with the total of other
fees earned
Called-up share capital Ordinary shares, issued and fully paid
Capital allowances Tax term equivalent to US tax depreciation allowances
Combined Code The ‘Principles of Good Governance’ and the provisions of the ‘Code of
Best Practice’ issued by the Hampel Committee on Corporate Governance
and the London Stock Exchange
Constant currency The Group uses US dollar-based, constant currency models to measure
performance. These are calculated by applying budgeted 2006 exchange
rates to local currency reported results for the current and prior year. This
gives a US dollar-denominated income statement and balance sheet which
exclude any variances attributable to foreign exchange rate movements
ESOP Employee share ownership plan
Estimated net new billings Net new billings represent the estimated annualised impact on billings of
new business gained from both existing and new clients, net of existing
client business lost. The estimated impact is based upon initial assessments
of the clients’ media budgets, which may not necessarily result in actual
billings of the same amount
EURIBOR The euro area inter-bank offered rate for euro deposits
Finance lease Capital lease
Free cash fl ow Free cash fl ow is calculated as headline operating profi t before non cash
charges for share-based incentive plans, depreciation of property, plant and
equipment and amortisation of other intangible assets, including dividends
received from associates, interest received, investment income received,
proceeds from the issue of shares, and proceeds from the disposal of
property, plant and equipment, less corporation and overseas tax paid,
interest and similar charges paid, dividends paid to minority shareholders in
subsidiary undertakings, purchases of property, plant and equipment and
purchases of other intangible assets
Freehold Ownership with absolute rights in perpetuity
Hampel Committee UK committee on corporate governance established in November 1995 to
review the implementation of the fi ndings of the Cadbury and Greenbury
Committees
Headline earnings Headline PBT less taxation and minority interests
Headline EBITDA Profi t before fi nance income/costs, taxation, investment gains and write-
downs, goodwill impairment and other goodwill write-downs, amortisation
and impairment of intangible assets and depreciation of property, plant
and equipment
Our 2006 fi nancial statements

WPP ANNUAL REPORT 2006
Our 2006 fi nancial statements
Term used in Annual Report US equivalent or brief description
Headline operating profi t Operating profi t before investment gains and write-downs, goodwill
impairment and other goodwill write-downs, and amortisation and
impairment of acquired intangible assets
Headline PBIT Profi t before fi nance income/costs, taxation, investment gains and
write-downs, goodwill impairment and other goodwill write-downs, and
amortisation and impairment of acquired intangible assets and share of
exceptional gains of associates
Headline PBT Profi t before taxation, investment gains and write-downs, goodwill
impairment and other goodwill write-downs, amortisation and impairment
of acquired intangible assets, share of exceptional gains of associates and
gains/losses arising from the revaluation of fi nancial instruments
Higgs Report Report in the UK by Derek Higgs on the role and effectiveness of non-
executive directors
IFRS/IAS International Financial Reporting Standard/International Accounting
Standard
LIBOR The London inter-bank offered rate
Operating margin Headline PBIT as a percentage of revenue
Profi t Income
Profi t attributable to equity holders of the parent Net income
Pro forma (‘like-for-like’) Pro forma comparisons are calculated as follows: current year, constant
currency actual results (which include acquisitions from the relevant date of
completion) are compared with prior year, constant currency actual results,
adjusted to include the results of acquisitions for the commensurate period
in the prior year. The Group uses the terms ‘pro forma’ and ‘like-for-like’
interchangeably
Proposed dividend Dividend declared by directors but not yet approved by share owners
Provision against deferred tax assets Valuation allowance
Sarbanes-Oxley Act An Act passed in the US to protect investors by improving the accuracy and
reliability of corporate disclosures made pursuant to the securities laws, and
for other purposes
Share capital Ordinary shares, capital stock or common stock issued and fully paid
Share premium account Additional paid-in capital or paid-in surplus (not distributable)
Shares in issue Shares outstanding
Short leasehold A short lease is where the portion of the term remaining unexpired at the
end of the fi nancial year is less than 50 years
Smith Report Report in the UK by Sir Robert Smith on the role of audit committees
SORIE Consolidated statement of recognised income and expense
2004 UK GAAP UK Generally Accepted Accounting Principles (‘UK GAAP’) extant in respect
of 2004 – the basis of preparation of the Group’s consolidated fi nancial
statements for the year ended 31 December 2004, as previously reported,
prior to the implementation of International Financial Reporting Standards
(‘IFRS’)
Turnbull Report Guidance issued by the Institute of Chartered Accountants in England &
Wales on the implementation of the internal control requirements of the
Combined Code on Corporate Governance at the request of the London
Stock Exchange
Our 2006 fi nancial statements

WPP ANNUAL REPORT 2006About share ownership

WPP ANNUAL REPORT 2006
Share owners’ register
A register of share owners’ interests is kept at the Company’s head offi ce and is available for inspection on request. The register includes information on nominee accounts and their benefi cial owners.
Analysis of shareholdings at 31 December 2006
Issued share capital as at 31 December 2006: 1,240,605,187 ordinary shares.
Number of shares held Number of owners % Total of shares %
1 – 100 2,493 24.25 88,131 0.01
101 – 250 1,344 13.08 248,079 0.02
251 – 500 1,576 15.33 602,294 0.05
501 – 1,000 1,707 16.61 1,330,969 0.11
1,001 – 5,000 1,773 17.25 3,926,980 0.32
5,001 – 10,000 263 2.56 1,882,008 0.15
10,001 – 25,000 258 2.51 4,254,289 0.34
25,001 – 50,000 157 1.53 5,732,639 0.46
50,001 – 100,000 155 1.51 11,047,052 0.89
100,001 – 500,000 282 2.74 68,545,586 5.52
500,001 – 1,000,000 90 0.88 63,740,423 5.14
1,000,001 – 2,000,000 78 0.76 107,561,309 8.67
2,000,001 – 3,000,000 32 0.31 78,285,849 6.31
3,000,001 – 4,000,000 14 0.14 47,298,700 3.81
4,000,001 and above 56 0.54 846,060,879 68.20
Totals 10,278 100 1,240,605,187 100
Share owners by geography % Share owners by type %
UK 40 Institutional investors 95
US 46 Employees 4
Asia Pacifi c, Latin America, Africa & Middle East and Continental Europe 14 Other individuals 1
Total 100 Total 100
Information for share owners
About share ownership
• Institutional investors 95
• Employees 4
• Other individuals 1
Share owners by type %
• UK 40
• US 46
• Asia Pacific, Latin America, Africa & Middle East and Continental Europe 14
Share owners by geography %
About share ownership

WPP ANNUAL REPORT 2006
About share ownershipInformation for share owners
Dividends
Ordinary share owners have received the following dividends in respect of each fi nancial year:
2006 2005 2004 2003 2002
Interim dividend per ordinary share 3.60p 3.00p 2.50p 2.08p 1.73p
Final (2006 proposed) dividend per ordinary share 7.61p 6.34p 5.28p 4.40p 3.67p
Total 11.21p 9.34p 7.78p 6.48p 5.40p
American Depositary Receipts (ADRs)
Each ADR represents fi ve ordinary shares.ADR holders receive the annual and interim reports
issued by WPP Group plc.WPP Group plc is subject to the informational
requirements of the US securities laws applicable to foreign companies and fi les an annual report on Form 20-F and other information with the US Securities and Exchange Commission. These documents are available at the Commission’s website, www.sec.gov. Our reports on Form 20-F are also available from our Investor Relations departments in London or New York.
ADR dividends
ADR holders are eligible for all stock dividends or other entitlements accruing on the underlying WPP Group plc shares and receive all cash dividends in US dollars. These are normally paid twice a year.
Dividend cheques are mailed directly to the ADR holder on the payment date if ADRs are registered with WPP’s US depositary. Dividends on ADRs that are registered with brokers are sent to the brokers, who forward them to ADR holders. WPP’s US depositary is Citibank N.A. (address on page 187).
Dividends per ADR in respect of each fi nancial year are set out below.
2006 2005 2004 2003 2002
In £ sterling
Interim 18.00p 15.00p 12.50p 10.40p 8.65p
Final (2006 proposed) 38.05p 31.70p 26.40p 22.00p 18.35p
Total 56.05p 46.70p 38.90p 32.40p 27.00p
In US dollars1
Interim 33.18¢ 27.28¢ 22.91¢ 17.01¢ 13.00¢
Final (2006 proposed) 70.13¢ 57.66¢ 48.38¢ 35.98¢ 27.60¢
Total 103.31¢ 84.94¢ 71.29¢ 52.99¢ 40.60¢
Note1 These fi gures have been translated for convenience purposes only, using the approximate
average rate for the year shown on page 149. This conversion should not be construed as a representation that the pound sterling amounts actually represent, or could be converted into, US dollars at the rates indicated.
Dollar amounts paid to ADR holders depend on the sterling/dollar exchange rate at the time of payment.
No withholding tax is imposed on dividends paid to ADR holders and there will be no entitlement to offset any part of the notional UK taxation credit against any US taxation liability. The dividend received will be subject to US taxation.
Following the Jobs and Growth Tax Relief Reconciliation Act of 2003, certain dividends subject to US taxation may be taxed at a reduced rate of 15% if various conditions are met; share owners are advised to consult their professional advisors accordingly.
Financial calendar
• The 2006 fi nal dividend will be paid on 9 July 2007 to share owners on the register at 8 June 2007.
• Interim statements for the half-year ending 30 June are issued in August.
• Quarterly trading announcements are issued in April and October.
• Interim dividends are paid in November.
• Preliminary announcements of results for the fi nancial year ending 31 December are issued in February.
• Annual reports are posted to share owners in May/June.
• Annual General Meetings are held in London in June.
About share ownership

WPP ANNUAL REPORT 2006
Share price
The mid-market price of the shares at 31 December was as follows:
2006 2005 2004 2003 2002
Ordinary 10p shares 690.5p 629.0p 573.0p 548.5p 474.5p
Within the UK, the latest ordinary share price information is available on Ceefax and Teletext and also the Cityline service operated by the Financial Times (telephone 0906 843 4544; calls charged at 60p per minute at all times).
Share price information is also available online at www.wpp.com/investor.
Access numbers/Ticker symbols
NASDAQ Reuters Bloomberg
Ordinary shares – WPP.L WPP LN
American Depositary Shares WPPGY WPPGY.O WPPGY US
Online information
WPP’s public website, www.wpp.com, provides current and historical fi nancial information, news releases, trading reports and share price information. Go to www.wpp.com/investor.
Registrar and transfer offi ce
Computershare Investor Services PLCPO Box 82The PavilionsBridgwater RoadBristol BS99 7NHGeneral enquiry number: 0870 702 0000
American Depositary Receipts (ADRs) offi ce
Citibank N.A.PO Box 43077ProvidenceRI 02940-3077
Telephone enquiries: within the US 1 877 248 4237Telephone enquiries: outside the US 1 781 575 4555E-mail enquiries: [email protected]
WPP registered offi ce
Pennypot Industrial EstateHytheKent CT21 6PE
The Company’s registered number is 05537577.
Tax information
Reclaiming income tax on dividends
For all dividends, the tax credit available to individual share owners resident in the UK is one-ninth of the dividend; tax credits are not repayable to UK holders with no tax liability. Individuals whose income is within the lower or basic tax rate bands are liable to tax at 10% on the dividend income and the tax credit will satisfy their income tax liability on UK dividends. The higher rate of tax on dividend income is 32.5% with relief available for the tax credit referred to above.
Capital gains tax
The market value of an ordinary share at 31 March 1982 was 39p. Since that date rights issues have occurred in September 1986, August 1987 and April 1993. For capital gains tax purposes the acquisition cost of ordinary shares is adjusted to take account of such rights issues. Since any adjustments will depend on individual circumstances, share owners are advised to consult their professional advisors.
About share ownershipInformation for share owners
About share ownership .

WPP ANNUAL REPORT 2006Where to fi nd us
Group information
WPP London27 Farm StreetLondon W1J 5RJTel +44 (0)20 7408 2204Fax +44 (0)20 7493 6819
WPP New York125 Park AvenueNew York NY 10017-5529Tel +1 (212) 632 2200Fax +1 (212) 632 2222
WPP Asia Pacifi cStuart NeishTel +81 90 9688 1951Fax +852 2280 [email protected]
WPP Latin AmericaAnn NewmanTel +1 (212) 632 2275Fax +1 (212) 632 [email protected]
WPP ChinaScott SpiritTel +86 21 2405 1253Fax +86 21 5407 [email protected]
Investor relationsPaul RichardsonGroup fi nance directorTel +1 (212) 632 2200Fax +1 (212) 632 [email protected]
Chris SweetlandDeputy Group fi nance directorTel +44 (0)20 7408 2204Fax +44 (0)20 7493 [email protected]
Fran ButeraInvestor relations directorTel +1 (212) 632 2235Fax +1 (212) 632 [email protected]
Investor informationInvestor relations material and our fi nancial statements are available online at www.wpp.com/investor.
Media relationsFeona McEwanGroup communications directorTel +44 (0)20 7408 2204Fax +44 (0)20 7493 [email protected]
Kevin McCormackUS press offi cerTel +1 (212) 632 2239Fax +1 (212) 632 [email protected]
Contact points
Where to fi nd us
If you would like further general information about WPP, its companies or any of the programs, publications or initiatives mentioned in this report, please visit our website: www.wpp.com or contact:
Feona McEwan or Richard Hampsonat WPP in LondonTel +44 (0)20 7408 2204Fax +44 (0)20 7493 [email protected]@wpp.com
Kevin McCormackat WPP in New YorkTel +1 (212) 632 2200Fax +1 (212) 632 [email protected]
e.wire, our monthly online bulletin providing a round-up of news from around the WPP world, is automatically delivered to subscribers’ e-mail addresses. Register to receive e.wire at www.wpp.com.
Recognition for WPP Annual Reports2006 Ranked No.4 (out of 1,957
worldwide entries) to feature in Top 100 Annual Reports of 2005, LACP Vision Awards
2006 Platinum Award, LACP Vision Awards
2006 Four Golds (Overall Annual Report, Internal Design, Written Text, Illustrations), International ARC Awards
2005 Accountancy Age, Winner2005 Ranked No.5 in Global
Top 200 in Annual Report on Annual Reports (“A+ worldclass”)
2005 Ranked No.9 (out of 1,435 worldwide entries) to feature in Top 100 Annual Reports of 2004, LACP Vision Awards
2005 Platinum Award for Best in Class, LACP Vision Awards
2005 Platinum Award for Most Engaging Annual Report across all categories of companies, LACP Vision Awards
2005 Ranked No.3 in European Annual Report Top 60 by e.com and Real IR magazine
2004 Ranked No.13 in Global Top 200 in Annual Report on Annual Reports (“A- superior report”)
2003 Platinum Award, LACP Vision Awards
2003 Gold Award, Most Creative Annual Report, LACP Vision Awards
2003 Accountancy Age, Runner-up
Written and produced by WPP
Paintings by Feng Feng
Calligraphy by Manny Ling
Portraits by Mitch Jenkins
Designed by Addison Corporate Marketing
Printed in the UK by St Ives Westerham Press Ltd
©WPP 2007

WPP ANNUAL REPORT 2006
Contents What we thinkThe Advertising & Marketing Services Industry:China and the internet by Sir Martin Sorrell 72In Praise of Interior Decorators (Or at Least Some of Them) by Jeremy Bullmore 95
Who runs WPPBoard of Directors 98Senior offi cers and advisors to the Board 101
How we behaveDirectors’ reportReview of the Company’s governance and the Nomination Committee 103
Review of the Audit Committee 105Review of the Compensation Committee 106The Board of Directors 107Committee meetings 107Share owner relations 108Internal control 108Sarbanes-Oxley s404 109Going concern 109Responsibilities in respect of the preparation of fi nancial statements 110
Substantial share ownership 110Election of directors 110Profi ts and dividends 110Parent company charitable donations 110Group activities 111Share capital 111Authority for purchase of own shares 111Supplier payment policy 111Auditors 111Corporate responsibilityBusiness impact 112Signifi cant issues 112How we manage corporate responsibility riskand opportunity 112
Corporate responsibility goals 112Progress in 2006 113The impact of our work 113Marketing ethics 113WPP as an employer 114Environment 115WPP’s carbon footprint 116Supply chain 116Social investment 117Pro bono work 117
The fast readAbout WPP 2A six-minute read 3
Who we areOur companies and associates 10
Why we existWhy we exist 12Our mission 13
How we’re doingFinancial summary 15Letter to share owners 18Reports from our operating brands 27Ogilvy & Mather Worldwide 28JWT 33Young & Rubicam Brands 35Grey Global Group 42The Voluntarily United Group of Creative Agencies 45BatesAsia 141 46GroupM 47MediaCom 49Mediaedge:cia 51MindShare 52The Kantar Group 54Public Relations & Public Affairs: overview 59Hill & Knowlton 60Burson-Marsteller 38Ogilvy Public Relations Worldwide 30Cohn & Wolfe 61GCI Group 62B to D Group 63Enterprise IG 64Fitch 66CommonHealth 67Sudler & Hennessey 40Ogilvy Healthworld 31Grey Healthcare 44Specialist Communications 69
8310_AR06_(01)v10_160507_AT.inddC2 C2 17/5/07 17:46:23
WPP ANNUAL REPORT 2006
About the artists
Manny LingCalligrapherHong Kong-born calligrapher who practises in both eastern and western traditions.
Feng FengArtistThe paintings in this Report are the work of Feng Feng, a Beijing-based artist and poet with an established reputation in China and beyond.
Born in 1956, Feng Feng, like so many artists, joined the army during the cultural revolution. In 1984 he graduated from Tianjin University with a degree in architecture followed by several years working as a journalist. Throughout this period, he never abandoned painting.
Feng Feng’s technique combines acrylic paint with secret ingredients which he refuses to disclose. There are many layers to his work – he may use up to a hundred combinations of colour before achieving his precise intention. The three-dimensional effect of his work is achieved by employing a unique process involving the use of ancient Chinese woodblock plates and coins. These are pressed against the back of the canvas – and then heat is applied until the desired texture develops.
His skill in blending traditional Chinese historical reference with modern abstract painting creates a strong link between past and present. The more you look at Feng Feng’s work, the more you see.
WPP, a global company with a fruitful long-term business relationship with China, takes great pleasure in embracing Feng Feng’s work. It would not have been possible without the endlessly helpful cooperation of his representatives at the ArtSceneChina Gallery in Shanghai, to whom we express our gratitude.
This Report uses paper manufactured from 100% recycled de-inked post
consumer waste. All by-products from both the pulp and paper production
are used for a variety of things including fertiliser, cement production and
energy for heating the local community.
8310_AR06_(10)v4_160507_AT.indd 189 22/5/07 09:01:418310_AR06_(00)+spine_130507_JL.i2 28310_AR06_(00)+spine_130507_JL.i2 2 22/5/07 09:06:1522/5/07 09:06:15

Annual Report & Accounts 2006
AdvertisingMedia Investment Management
Information, Insight & ConsultancyPublic Relations & Public Affairs
Branding & IdentityHealthcare Communications
Direct, Digital, Promotion & Relationship MarketingSpecialist Communications
27 Farm StreetLondon W1J 5RJ
Telephone +44 (0)20 7408 2204Fax +44 (0)20 7493 6819
125 Park AvenueNew York NY 10017-5529
Telephone +1 (212) 632 2200Fax +1 (212) 632 2222
www.wpp.com
Annual R
eport & A
ccounts 2006
8310_AR06_(00)+spine_130507_JL.i1 18310_AR06_(00)+spine_130507_JL.i1 1 17/5/07 01:03:3017/5/07 01:03:30