Annual Report & Accounts 2009 - WPP
196
Annual Report & Accounts 2009
-
Upload
khangminh22 -
Category
Documents
-
view
1 -
download
0
Transcript of Annual Report & Accounts 2009 - WPP

AdvertisingMedia Investment Management
Consumer InsightPublic Relations & Public Affairs
Branding & IdentityHealthcare Communications
Direct, Digital, Promotion & Relationship MarketingSpecialist Communications
6 Ely PlaceDublin 2
Tel +353 1669 0333Fax +353 1669 0334
100 Park Avenue
New York NY 10017 Tel +1 (212) 632 2200Fax +1 (212) 632 2222
(from 7 June 2010)
27 Farm Street
London W1J 5RJTel +44 (0)20 7408 2204Fax +44 (0)20 7493 6819
Yebisu Garden Place Tower, 29/F
4-20-3 EbisuShibuya-ku
Tokyo 151-0053Tel +81 90 9688 1951Fax +852 2280 5412
31/F The Center
989 Changle RoadShanghai
Tel +86 21 2405 1649Fax +86 21 2405 1600
www.wpp.com
An
nual R
eport &
Accou
nts 2009
Annual Report & Accounts 2009
Contents
What we think78 After the threat of apocalypse, new centres
of gravity by Sir Martin Sorrell
102 Why a Ruritanian Poltergeist can be as Valuable as an Automated Processing Plant by Jeremy Bullmore
Who runs WPP104 Board of Directors107 Advisors to the Board
How we behave109 Directors’ report 109 Review of the Company’s governance
and the Nomination Committee 113 Review of the Audit Committee 114 The Board of Directors 114 Election of directors 114 Conflicts of interest 115 Committee meetings 115 Share owner relations 115 Internal control 117 Principal risks and uncertainties 119 Sarbanes-Oxley section 404 119 Going concern 119 Responsibilities in respect of the preparation
of financial statements 119 Substantial share ownership 120 Profits and dividends 120 Charitable donations 120 Significant agreements and change of control 120 Articles of Association 120 Group activities 120 Share capital 121 Authority for purchase of own shares 121 Supplier payment policy 121 Auditors 122 Corporate responsibility 122 CR and our business strategy 122 How we manage CR risk and opportunity 123 The impact of our work 124 Marketing ethics 125 WPP as an employer 128 Environment 128 WPP’s carbon footprint 130 Supply chain 130 Social investment
The fast read2 A six-minute read
Who we are10 Our companies & associates
Why we exist12 Our mission
How we’re doing15 Financial summary18 Letter to share owners31 Reports from our operating brands 32 Agency networks 32 Ogilvy Group 37 JWT 39 Young & Rubicam Brands 46 Grey Group 49 United Network 50 Bates 14151 Media Investment Management 51 GroupM 53 Maxus 54 MediaCom 55 MEC 56 Mindshare 57 Consumer Insight 57 Kantar62 Public Relations & Public Affairs 62 Hill & Knowlton 63 Cohn & Wolfe 64 Burson-Marsteller 64 Ogilvy Public Relations Worldwide 65 Branding & Identity 65 B to D Group 43 Landor Associates 67 The Brand Union 68 Fitch69 Healthcare Communications 69 CommonHealth 70 ghg 70 GCI Health 71 Ogilvy Healthworld 71 Sudler & Hennessey72 Specialist Communications75 WPP Digital
This Annual Report is printed on Revive 100 Pure Natural Silk. This paper is made from 100% de-inked post-consumer waste. It is manufactured at a mill that is certified to ISO14001 and EMAS environmental standards. It has been independently certified as meeting the standards of the Forest Stewardship Council (FSC). All pulps used by the mill are totally chlorine free (TCF) and unbleached. The inks used in printing this Annual Report are all vegetable-based.
Printed at St Ives Westerham Press Ltd, ISO14001, FSC certified and CarbonNeutral®.
Written and produced by WPPDesigned by Addison www.addison.co.uk©WPP 2010
WPP AnnuAl rePort 2009 1
How we’re rewarded132 Compensation Committee report
on behalf of the Board 133 2009 highlights 133 What changed in 2009? 134 Composition of the Compensation Committee 134 Advisors to the Compensation Committee 134 the link between compensation and business
objectives 135 the role of the Compensation Committee in
improving risk management 135 tSr performance 135 Key elements of short- and long-term
remuneration 137 Share incentive dilution for 2005 to 2009139 Directors’ remuneration and other statutory
information143 Directors’ interests
Our 2009 financial statements
145 Accounting policies152 Consolidated income statement153 Consolidated statement of comprehensive income154 Consolidated cash flow statement155 Consolidated balance sheet156 Consolidated statement of changes in equity157 Notes to the consolidated financial statements 177 Company profit and loss account177 Company balance sheet178 Notes to the Company balance sheet179 Independent auditors’ report181 Five-year summary182 Financial glossary
About share ownership185 Information for share owners 185 Share owners’ register 185 Analysis of shareholdings at 31 December 2009 186 Dividends 186 American Depositary receipts (ADrs) 186 Financial calendar 186 Share price 187 Access numbers/ticker symbols 187 online information 187 registrar and transfer office 187 American Depositary receipts (ADrs) office 187 WPP registered office 187 tax information
189 Recognition for recent WPP Annual Reports190 About the artist
Where to find us192 Contact points 192 WPP offices 192 Investor relations 192 Investor information 192 Media relations192 Group information
this Annual report, together with trading statements, news releases, presentations, and previous Annual reports, is available online at
www.wpp.com
You can sign up to receive WPP’s public monthly online news bulletin by e-mail at
www.wpp.com/ewire
For information in a mobile format please visit
m.wpp.com
WPP AnnuAl rePort 2009 2
The fast read
For a quick, pre-digested, highly-compressed version of this Annual Report: read the next six pages.
The full story starts on page 8. Please read that, too.
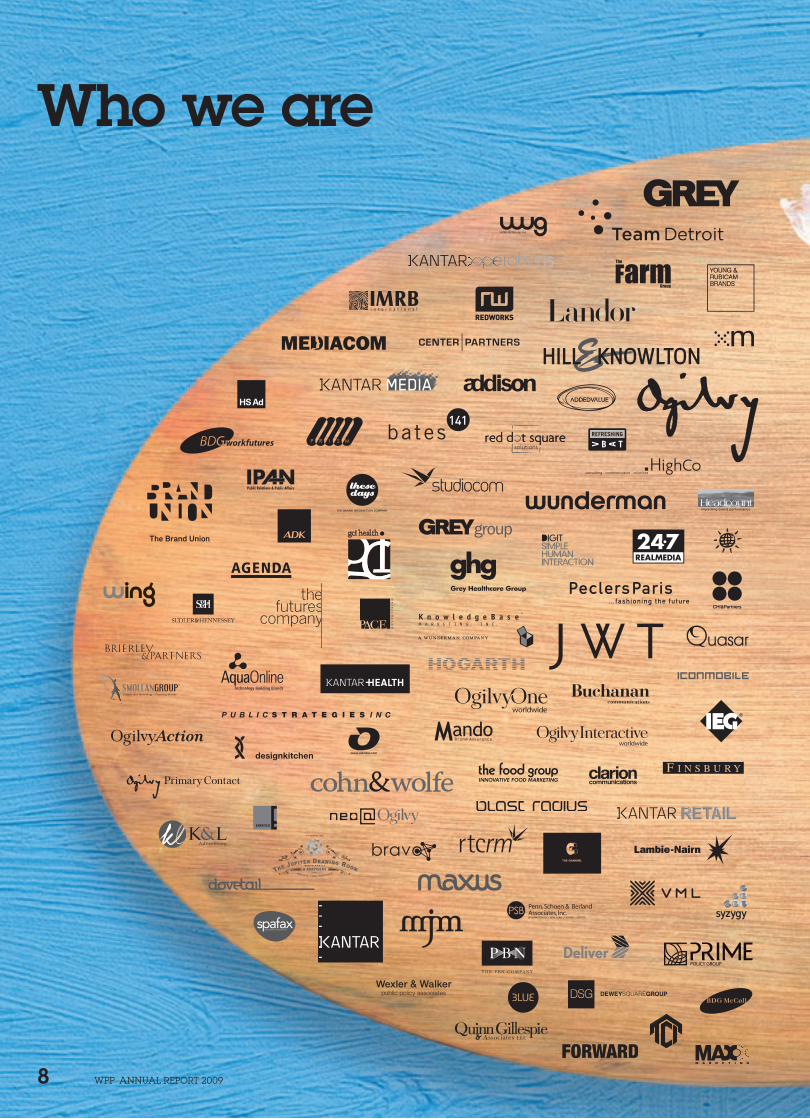
Who we are
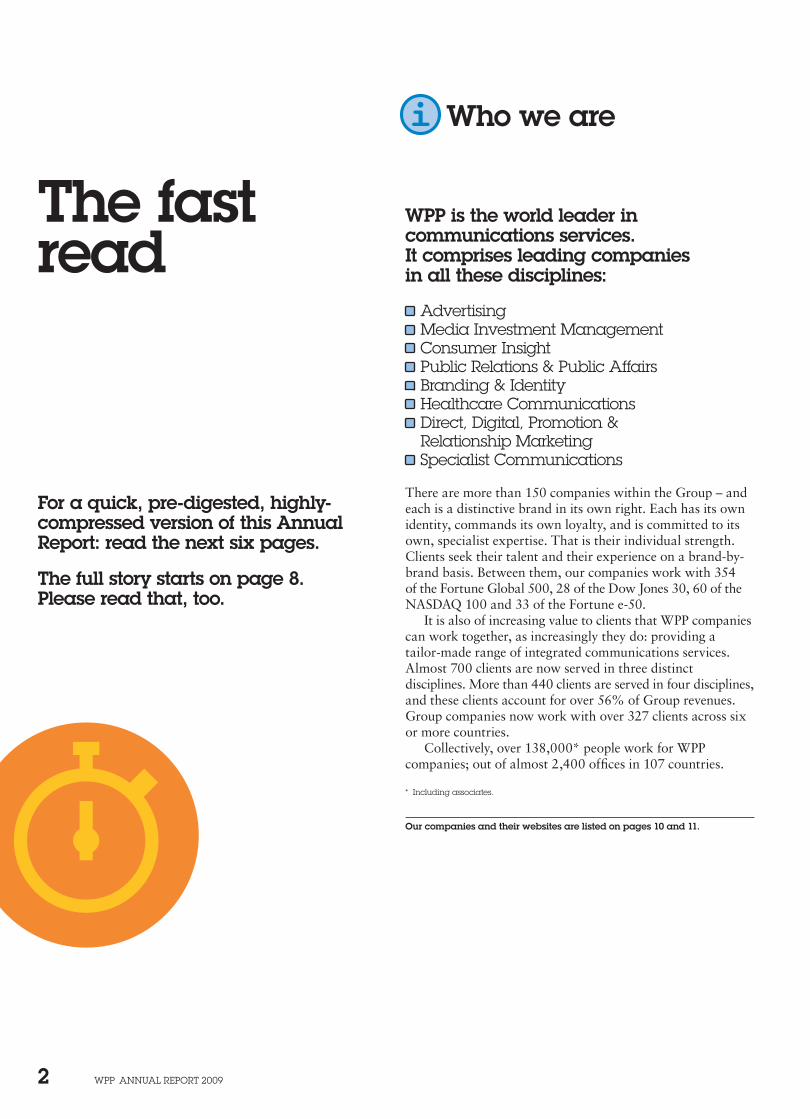
WPP is the world leader in communications services. It comprises leading companies in all these disciplines:
Advertising Media Investment Management Consumer Insight Public relations & Public Affairs Branding & Identity Healthcare Communications Direct, Digital, Promotion & relationship Marketing
Specialist Communications
There are more than 150 companies within the Group – and each is a distinctive brand in its own right. Each has its own identity, commands its own loyalty, and is committed to its own, specialist expertise. That is their individual strength. Clients seek their talent and their experience on a brand-by-brand basis. Between them, our companies work with 354 of the Fortune Global 500, 28 of the Dow Jones 30, 60 of the NASDAQ 100 and 33 of the Fortune e-50.
It is also of increasing value to clients that WPP companies can work together, as increasingly they do: providing a tailor-made range of integrated communications services. Almost 700 clients are now served in three distinct disciplines. More than 440 clients are served in four disciplines, and these clients account for over 56% of Group revenues. Group companies now work with over 327 clients across six or more countries.
Collectively, over 138,000* people work for WPP companies; out of almost 2,400 offices in 107 countries.
* Including associates.
Our companies and their websites are listed on pages 10 and 11.
WPP AnnuAl rePort 2009 3
Why we exist What we think
Our mission to develop and manage talent; to apply that talent, throughout the world, for the benefit of clients; to do so in partnership; to do so with profit.
Within the WPP Group, our clients have access to companies with all the necessary marketing and communications skills; companies with strong and distinctive cultures of their own; famous names, many of them.
WPP, the parent company, complements these companies in three distinct ways.
First, it relieves them of much administrative work. Financial matters (such as planning, budgeting, reporting, control, treasury, tax, mergers, acquisitions, investor relations, legal affairs and internal audit) are co-ordinated centrally. For the operating companies, every administrative hour saved is an extra hour to be devoted to the pursuit of professional excellence.
Second, the parent company encourages and enables operating companies of different disciplines to work together for the benefit of clients. Such collaborations have the additional benefit of enhancing the job satisfaction of our people. The parent company also plays an across-the-Group role in the following functions: the management of talent, including recruitment and training; in property management; in procurement and information technology; in knowledge sharing and practice development.
And, finally, WPP itself can function as the 21st-century equivalent of the full-service agency. For some clients, predominantly those with a vast geographical spread and a need for marketing services ranging from advertising through design and website construction to research and internal communications, WPP can act as a portal to provide a single point of contact and accountability.
Read more about our role on page 12.
After the threat of apocalypse, new centres of gravity by Sir Martin Sorrell
2009 was very tough, a year of two halves, moving from staring into the abyss to a less-worse performance. Although 2010 has been flat so far, we expect top-line growth in the second quarter, albeit through easier comparatives. Mini-quadrennial events this year, including the FIFA World Cup and the Shanghai Expo, will further bolster results. We see similarly mild growth in 2011.
As we recover from the recession, a pattern is emerging of three-speed growth: slow in Western Europe, quicker in the US, and fastest in the BRICs and Next 11 countries, as identified by Goldman Sachs.
Crosscut with this trend are big changes in function and technology in our industry – greater concentration on the traditional below-the-line disciplines of marketing services, growing migration to the internet and other technologies at the expense of older media forms.
WPP is well-placed to make the most of all these developments. Price pressure from global retailers, overcapacity in industry and subsequent discounting, the shortage of human capital, the growing needs of government as client and the power of the internet to shatter business models, point to the ever greater need for creativity, branding and innovation – basically what we do.
Sir Martin Sorrell’s article begins on page 78.
Why a Ruritanian Poltergeist can be as Valuable as an Automated Processing Plant by Jeremy Bullmore
Both the Marketing Director and the Production Director have put in strong bids for bigger budgets. The Production Director needs a new robotic processing plant; the Marketing Director needs increased support for a successful multi-media campaign featuring a kilt-wearing Ruritanian poltergeist called Feliks. The Board listens attentively to both – but particularly in these difficult days, believes it more responsible to authorise additional Capex than additional promotional spend. Remarkable new research from Deutsche Bank, however, suggests in the strongest possible terms that a company’s assets, both tangible and intangible, need equivalent support and nourishment.
Jeremy Bullmore’s essay can be read in full on pages 102 and 103.
_Superscript_Demi
WPP AnnuAl rePort 2009 4
Financial summary
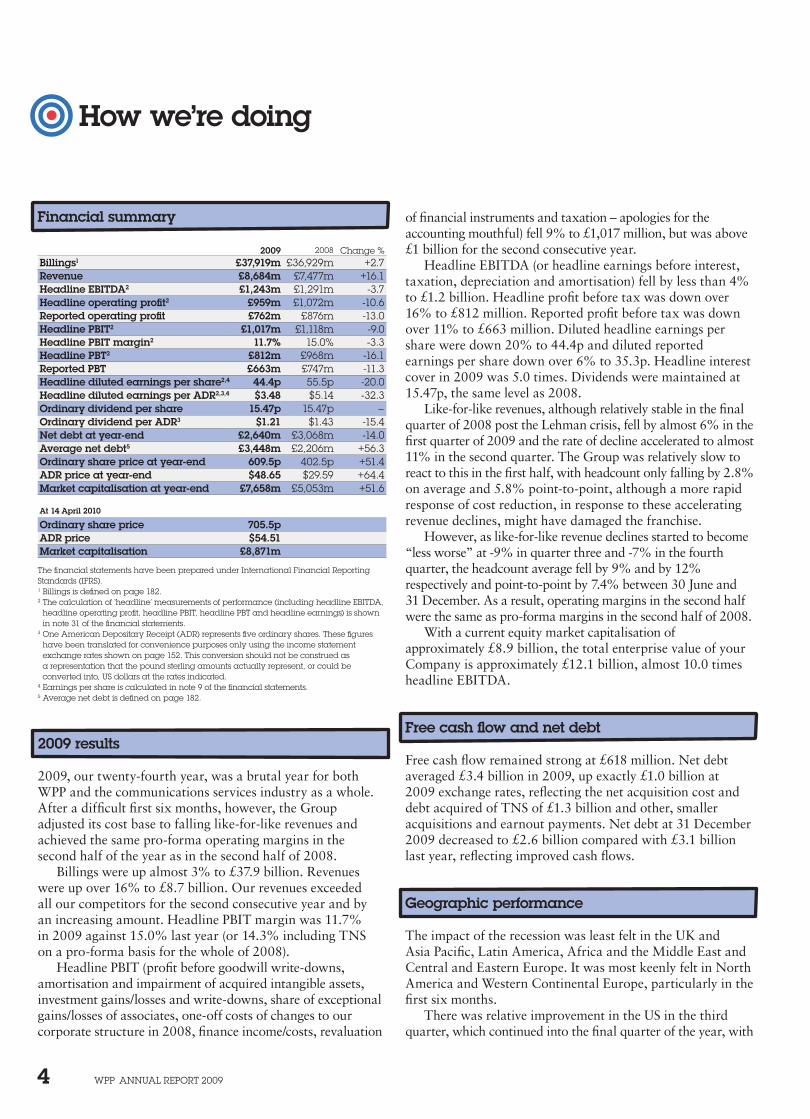
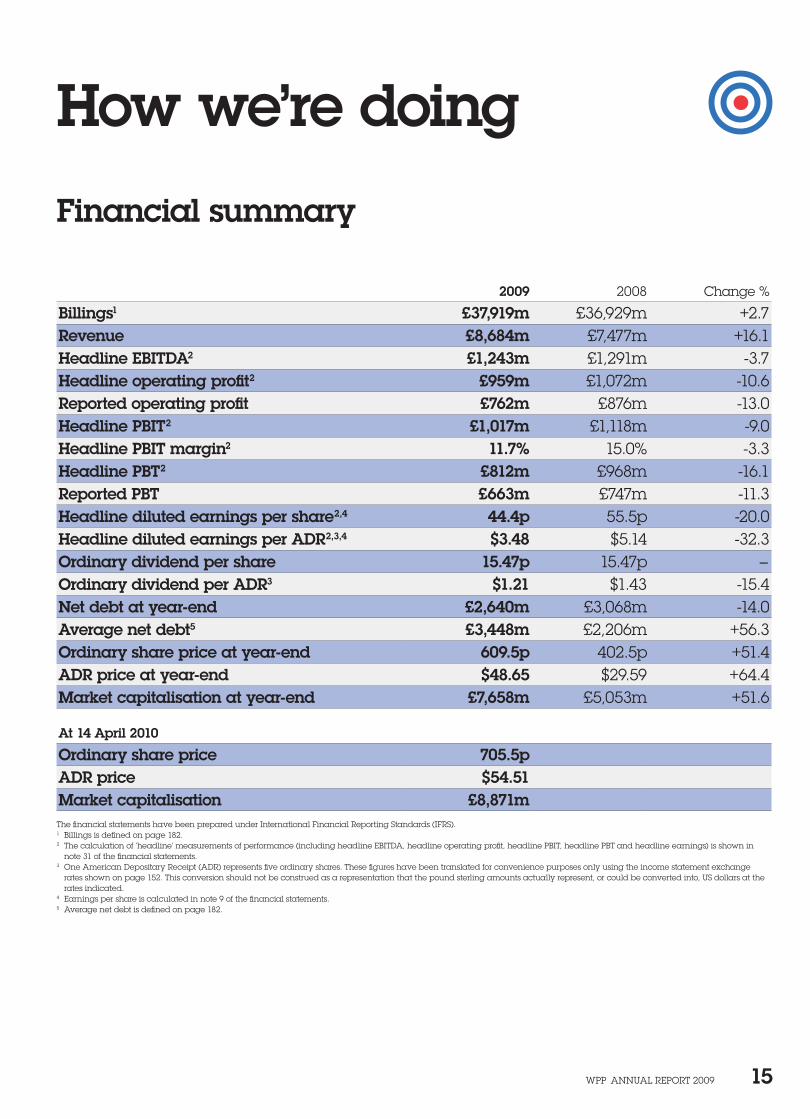
2009 2008 Change %Billings1 £37,919m £36,929m +2.7Revenue £8,684m £7,477m +16.1Headline EBITDA2 £1,243m £1,291m -3.7Headline operating profit2 £959m £1,072m -10.6Reported operating profit £762m £876m -13.0Headline PBIT2 £1,017m £1,118m -9.0Headline PBIT margin2 11.7% 15.0% -3.3Headline PBT2 £812m £968m -16.1Reported PBT £663m £747m -11.3Headline diluted earnings per share2,4 44.4p 55.5p -20.0Headline diluted earnings per ADR2,3,4 $3.48 $5.14 -32.3Ordinary dividend per share 15.47p 15.47p –Ordinary dividend per ADR3 $1.21 $1.43 -15.4Net debt at year-end £2,640m £3,068m -14.0Average net debt5 £3,448m £2,206m +56.3Ordinary share price at year-end 609.5p 402.5p +51.4ADR price at year-end $48.65 $29.59 +64.4Market capitalisation at year-end £7,658m £5,053m +51.6
At 14 April 2010
Ordinary share price 705.5pADR price $54.51Market capitalisation £8,871m
the financial statements have been prepared under International Financial reporting Standards (IFrS).1 Billings is defined on page 182.2 the calculation of ‘headline’ measurements of performance (including headline eBItDA,
headline operating profit, headline PBIt, headline PBt and headline earnings) is shown in note 31 of the financial statements.
3 one American Depositary receipt (ADr) represents five ordinary shares. these figures have been translated for convenience purposes only using the income statement exchange rates shown on page 152. this conversion should not be construed as a representation that the pound sterling amounts actually represent, or could be converted into, uS dollars at the rates indicated.
4 earnings per share is calculated in note 9 of the financial statements.5 Average net debt is defined on page 182.
2009 results
2009, our twenty-fourth year, was a brutal year for both WPP and the communications services industry as a whole. After a difficult first six months, however, the Group adjusted its cost base to falling like-for-like revenues and achieved the same pro-forma operating margins in the second half of the year as in the second half of 2008.
Billings were up almost 3% to £37.9 billion. Revenues were up over 16% to £8.7 billion. Our revenues exceeded all our competitors for the second consecutive year and by an increasing amount. Headline PBIT margin was 11.7% in 2009 against 15.0% last year (or 14.3% including TNS on a pro-forma basis for the whole of 2008).
Headline PBIT (profit before goodwill write-downs, amortisation and impairment of acquired intangible assets, investment gains/losses and write-downs, share of exceptional gains/losses of associates, one-off costs of changes to our corporate structure in 2008, finance income/costs, revaluation
of financial instruments and taxation – apologies for the accounting mouthful) fell 9% to £1,017 million, but was above £1 billion for the second consecutive year.
Headline EBITDA (or headline earnings before interest, taxation, depreciation and amortisation) fell by less than 4% to £1.2 billion. Headline profit before tax was down over 16% to £812 million. Reported profit before tax was down over 11% to £663 million. Diluted headline earnings per share were down 20% to 44.4p and diluted reported earnings per share down over 6% to 35.3p. Headline interest cover in 2009 was 5.0 times. Dividends were maintained at 15.47p, the same level as 2008.
Like-for-like revenues, although relatively stable in the final quarter of 2008 post the Lehman crisis, fell by almost 6% in the first quarter of 2009 and the rate of decline accelerated to almost 11% in the second quarter. The Group was relatively slow to react to this in the first half, with headcount only falling by 2.8% on average and 5.8% point-to-point, although a more rapid response of cost reduction, in response to these accelerating revenue declines, might have damaged the franchise.
However, as like-for-like revenue declines started to become “less worse” at -9% in quarter three and -7% in the fourth quarter, the headcount average fell by 9% and by 12% respectively and point-to-point by 7.4% between 30 June and 31 December. As a result, operating margins in the second half were the same as pro-forma margins in the second half of 2008.
With a current equity market capitalisation of approximately £8.9 billion, the total enterprise value of your Company is approximately £12.1 billion, almost 10.0 times headline EBITDA.
Free cash flow and net debt
Free cash flow remained strong at £618 million. Net debt averaged £3.4 billion in 2009, up exactly £1.0 billion at 2009 exchange rates, reflecting the net acquisition cost and debt acquired of TNS of £1.3 billion and other, smaller acquisitions and earnout payments. Net debt at 31 December 2009 decreased to £2.6 billion compared with £3.1 billion last year, reflecting improved cash flows.
Geographic performance
The impact of the recession was least felt in the UK and Asia Pacific, Latin America, Africa and the Middle East and Central and Eastern Europe. It was most keenly felt in North America and Western Continental Europe, particularly in the first six months.
There was relative improvement in the US in the third quarter, which continued into the final quarter of the year, with
How we’re doing
WPP AnnuAl rePort 2009 5
like-for-like revenues down 6.1%. Although the UK showed some softening in the third quarter compared with the second quarter, there was a marked “less worse” improvement in the final quarter, with like-for-like revenues falling less at -4.6%. The relative improvement in Western Continental Europe and Asia Pacific in the third quarter continued, with both regions showing significantly “less worse” growth in the final quarter. The Middle East continued to be challenging in the second half, while Latin America had a relatively strong year overall.
Markets outside North America now account for over 65% of our revenues, up from 61% five years ago.
Sector performance
Branding & Identity, Healthcare and Specialist Communications (including direct, digital and interactive) was least affected by the recession, with the improvement in the Group’s healthcare businesses, seen in the second quarter, continuing in the second half, with like-for-like growth in the final quarter of the year.
Pressure continued on the Group’s Advertising and Media Investment Management businesses, although the pressure seen by Media Investment Management in quarters two and three eased significantly in the final quarter.
Public Relations & Public Affairs also experienced a substantially “less worse” position in quarter four. Consumer Insight saw sequential quarterly improvement in the second half, with a marked improvement in the final quarter.
Marketing services rose to over 61% of our revenues in 2009, up from 56% in 2008, largely due to the impact of TNS on Consumer Insight.
Our key priorities
Our goal remains to be the world’s most successful provider of communications services to multinational and local companies, not just the largest. To that end, we have three key strategic priorities:
Our immediate priority is to emerge from the financial crisis successfully.
Medium term, to build upon the successful base we have established together with our recent acquisitions.
Long-term, to increase the combined geographic share of revenues from the faster-growing markets to one-third; to increase the share of revenues of marketing services to two-thirds; to maintain the share of more measurable marketing services at 50% of revenues.
Our letter to share owners starts on page 18. Our 2009 financial statements are presented in full on pages 145 to 183 and at www.wpp.com/investor.
1 Percentages are calculated on a constant currency basis. See definition on page 182.2 the calculation of headline PBIt is set out in note 31 of the financial statements.3 the Group previously reported Continental europe as a geographic segment. Western
Continental europe is now reported separately, with Central & eastern europe included with Asia Pacific, latin America, Africa & Middle east.
4 Consumer Insight was previously reported as Information, Insight & Consultancy.
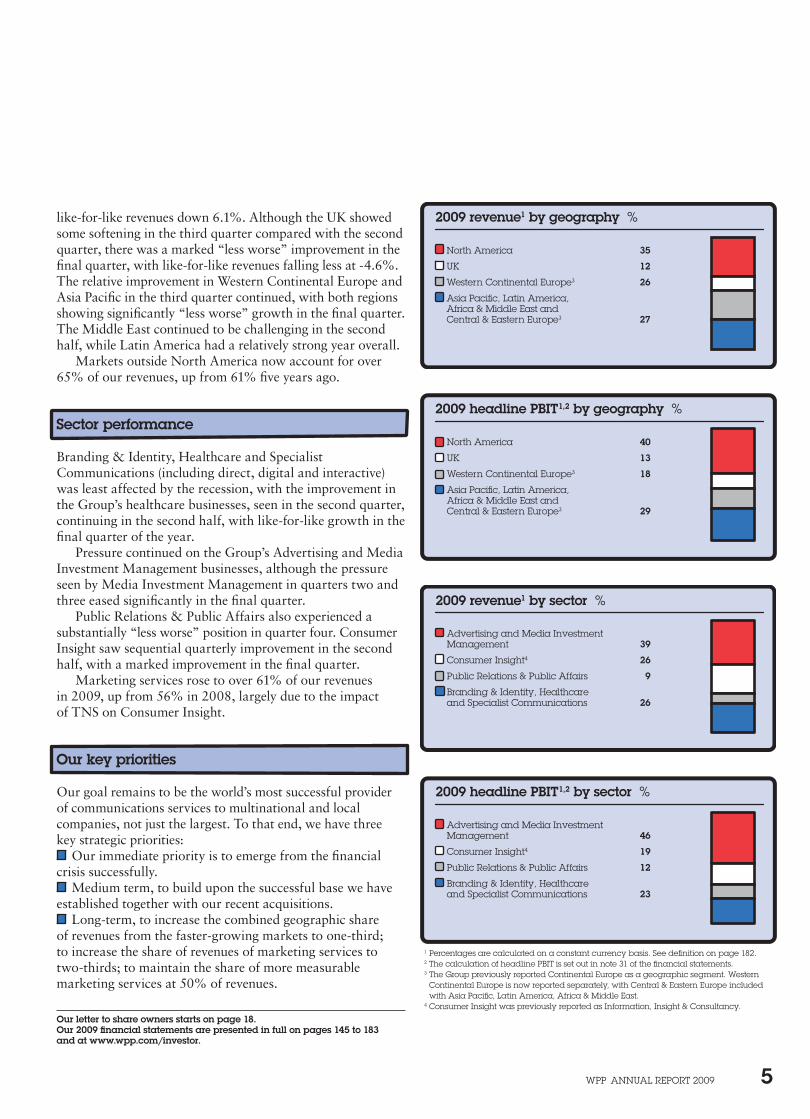
2009 revenue1 by geography %
North America 35
UK 12
Western Continental Europe3 26
Asia Pacific, Latin America, Africa & Middle East and Central & Eastern Europe3 27
2009 headline PBIT1,2 by geography %
North America 40
UK 13
Western Continental Europe3 18
Asia Pacific, Latin America, Africa & Middle East and Central & Eastern Europe3 29
2009 revenue1 by sector %
Advertising and Media Investment Management 39
Consumer Insight4 26
Public Relations & Public Affairs 9
Branding & Identity, Healthcare and Specialist Communications 26
2009 headline PBIT1,2 by sector %
Advertising and Media Investment Management 46
Consumer Insight4 19
Public Relations & Public Affairs 12
Branding & Identity, Healthcare and Specialist Communications 23
WPP AnnuAl rePort 2009 6
Non-executive chairman
Philip LaderChairman of the Nomination Committee Member of the Compensation Committee
Executive directors
Sir Martin SorrellChief executivePaul RichardsonFinance director Chairman of the Corporate Responsibility CommitteeMark ReadStrategy directorChief executive, WPP Digital
Non-executive directors
Colin DayMember of the Audit CommitteeEsther DysonMember of the Compensation Committee and Nomination Committee
Orit GadieshMember of the Nomination Committee
David Komansky (regrettably retired 6 February 2009)Stanley (Bud) MortenSenior independent director (until April 2010)Koichiro Naganuma Lubna Olayan Member of the Nomination CommitteeJohn Quelch Jeffrey Rosen Chairman of the Compensation Committee Member of the Audit Committee Senior independent director (from April 2010)
Timothy ShriverMember of the Audit CommitteePaul SpencerChairman of the Audit Committee
Members of the Advisory Board
Jeremy BullmoreJohn JacksonRichard Rivers
Company Secretary
Marie Capes
Directors’ biographies appear on pages 104 to 106.
Corporate governance
The Board of Directors as a whole is collectively accountable to the Company’s share owners for good corporate governance and is committed to achieving compliance with the principles of corporate governance set out in the Combined Code.
Our goal is to comply with relevant laws, regulations, and guidelines such as the Combined Code, the US Sarbanes-Oxley Act 2002, the NASDAQ rules and, where practicable, with the guidelines issued by institutional investors and their representative bodies.
WPP operates a system of internal control, which is maintained and reviewed in accordance with the Combined Code and the guidance in the Turnbull Report as well as the relevant provisions of the Securities Exchange Act 1934 and related SEC rules, as they currently apply to the Company. In the opinion of the Board, the Company has complied throughout the year with the Combined Code, the Turnbull Report and also with the relevant provisions of the Securities Exchange Act 1934 and SEC rules.
Corporate responsibility
WPP’s Corporate Responsibility Committee, which is chaired by Paul Richardson, advises on policy, monitors emerging issues and co-ordinates communication among Group companies. WPP’s five most significant corporate responsibility issues are:
The social and environmental impact of our work for clients.
The impact of our work, including marketing ethics, compliance with marketing standards, protection of personal, consumer and corporate data and increasing transparency about our marketing practices.
Employment, including diversity and equal opportunities, business ethics, employee development, remuneration, communication and health and safety. In 2009, WPP invested £39.9 million (2008: £42.6 million) in training and wellbeing across the Group.
Social investment, including pro bono work, donations to charity and employee volunteering. In 2009, our total social investment was worth £14.9 million (2008: £14.6 million), equivalent to 2.2% of reported profit before tax. This includes £10.8 million in pro bono work (based on the fees the benefiting organisations would have paid for our work) and £4.1 million in donations.
Climate change, including the emissions from energy used in our offices and during business travel.
Full details of our governance policies and practices, and our corporate responsibility activities, can be found on pages 109 to 131.
Who runs WPP How we behave
WPP AnnuAl rePort 2009 7
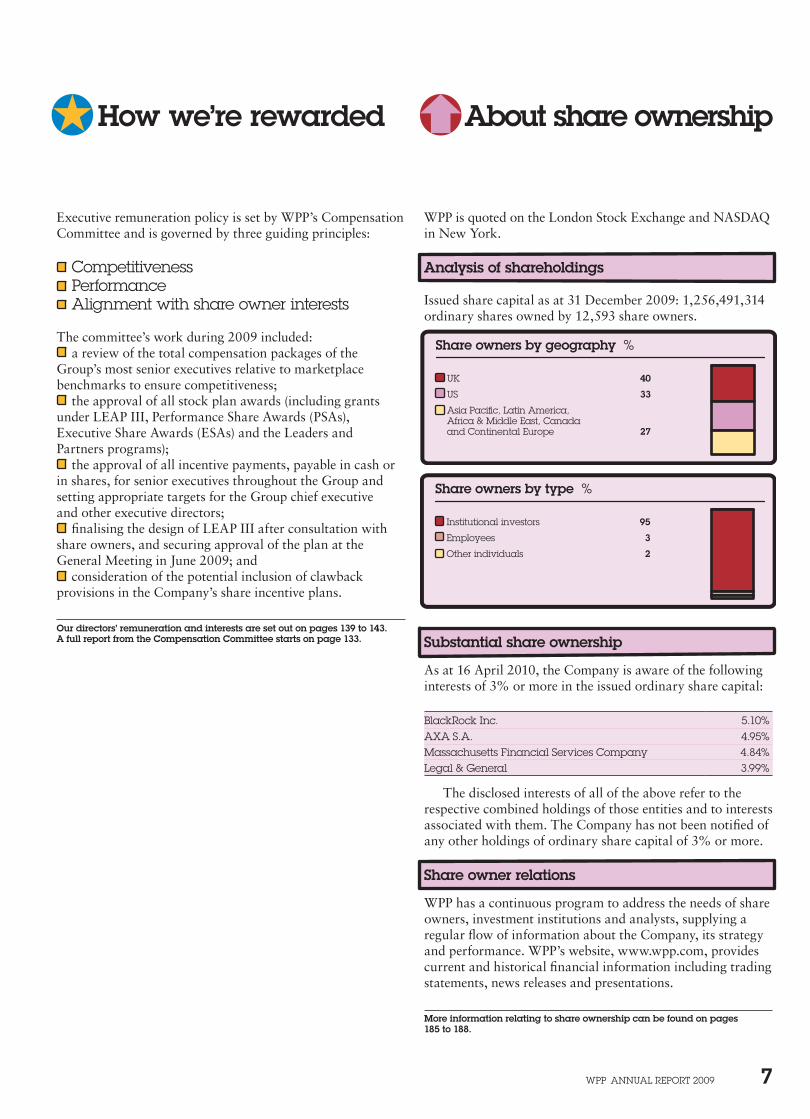
Executive remuneration policy is set by WPP’s Compensation Committee and is governed by three guiding principles:
Competitiveness Performance Alignment with share owner interests
The committee’s work during 2009 included: a review of the total compensation packages of the
Group’s most senior executives relative to marketplace benchmarks to ensure competitiveness;
the approval of all stock plan awards (including grants under LEAP III, Performance Share Awards (PSAs), Executive Share Awards (ESAs) and the Leaders and Partners programs);
the approval of all incentive payments, payable in cash or in shares, for senior executives throughout the Group and setting appropriate targets for the Group chief executive and other executive directors;
finalising the design of LEAP III after consultation with share owners, and securing approval of the plan at the General Meeting in June 2009; and
consideration of the potential inclusion of clawback provisions in the Company’s share incentive plans.
Our directors’ remuneration and interests are set out on pages 139 to 143. A full report from the Compensation Committee starts on page 133.
WPP is quoted on the London Stock Exchange and NASDAQ in New York.
Analysis of shareholdings
Issued share capital as at 31 December 2009: 1,256,491,314 ordinary shares owned by 12,593 share owners.
Substantial share ownership
As at 16 April 2010, the Company is aware of the following interests of 3% or more in the issued ordinary share capital:
Blackrock Inc. 5.10%AXA S.A. 4.95%Massachusetts Financial Services Company 4.84%legal & General 3.99%
The disclosed interests of all of the above refer to the respective combined holdings of those entities and to interests associated with them. The Company has not been notified of any other holdings of ordinary share capital of 3% or more.
Share owner relations
WPP has a continuous program to address the needs of share owners, investment institutions and analysts, supplying a regular flow of information about the Company, its strategy and performance. WPP’s website, www.wpp.com, provides current and historical financial information including trading statements, news releases and presentations.
More information relating to share ownership can be found on pages 185 to 188.
Share owners by geography %
UK 40
US 33
Asia Pacific, Latin America, Africa & Middle East, Canadaand Continental Europe 27
Share owners by type %
Institutional investors 95
Employees 3
Other individuals 2
How we’re rewarded About share ownership
WPP AnnuAl rePort 2009 8
Who we are

WPP AnnuAl rePort 2009 9
WPP AnnuAl rePort 2009 10
Who we are
Our companies & associates
Advertising
ADK1
www.adk.jpBates 141www.bates141.comBrandBuzz■
www.brandbuzz.comCHI & Partners1
www.chiandpartners.comDentsu Y&r1,2,■
www.dyr.co.jpGreywww.grey.comHS Ad1
www.hs-ad.co.krJWtwww.jwt.comJohannes leonardo1
www.johannesleonardo.comMarsteller Advertising■
www.marsteller.comogilvy & Matherwww.ogilvy.comSantowww.santo.netScangroup1
www.scangroup.bizSoho Squarewww.sohosq.comtapsawww.tapsa.esteam Detroitwww.teamdetroit.comthe Jupiter Drawing room & Partners1
www.jupiter.co.zaunited networkwww.theunitednetwork.netY&r■
www.yandr.com
Media Investment Management
GroupM:www.groupm.comMaxuswww.maxusglobal.comMediaComwww.mediacom.comMeCwww.mecglobal.comMindsharewww.mindshareworld.comoutrider/Quismawww.outrider.com www.quisma.comCatalystwww.catalystsearchmarketing.comOther media agenciesKinetic Worldwide2
www.kineticww.comKr Media1
www.krmedia-france.com
Consumer Insight
Kantar:www.kantar.comAdded Valuewww.added-value.comCenter Partnerswww.centerpartners.comIMrB Internationalwww.imrbint.comKantar Healthwww.kantarhealth.comKantar Japanwww.jp.kantargroup.comKantar Mediawww.kantarmedia.comKantar operationswww.kantaroperations.comKantar retailwww.kantarretail.comKantar Worldpanelwww.kantarworldpanel.com lightspeed researchwww.lightspeedresearch.comMillward Brownwww.millwardbrown.comthe Futures Companywww.thefuturescompany.comtnSwww.tnsglobal.comOther marketing consultancieseverystonewww.everystonegroup.comohalwww.ohal-group.com
Public Relations & Public Affairs
Blanc & otuswww.blancandotus.comBuchanan Communicationswww.buchanan.uk.comBurson-Marsteller■www.bm.comChime Communications PlC1
www.chime.plc.ukClarion Communicationswww.clarioncomms.co.ukCohn & Wolfe■
www.cohnwolfe.comDewey Square Groupwww.deweysquare.comFinsburywww.finsbury.comHill & Knowltonwww.hillandknowlton.comogilvy Government relationswww.ogilvygr.comogilvy Public relations Worldwidewww.ogilvypr.comthe PBn Company1
www.pbnco.comPenn, Schoen & Berland■
www.psbresearch.com
Prime Policy Groupwww.prime-policy.comPublic Strategieswww.pstrategies.comQuinn Gillespiewww.quinngillespie.comrobinson lerer & Montgomery■
www.rlmnet.comWexler & Walker Public Policy Associateswww.wexlergroup.com
Branding & Identity
Addison Corporate Marketing●
www.addison.co.ukBDGMcCollwww.bdg-mccoll.comBDGworkfutureswww.bdgworkfutures.comColey Porter Bellwww.cpb.co.ukDovetailwww.dovetailfurniture.comFItCH●
www.fitchww.comlambie-nairn●
www.lambie-nairn.comlandor Associates■,●
www.landor.comPeclersParis●
www.peclersparis.comthe Brand union●
www.thebrandunion.comthe Partners●
www.thepartners.co.ukVBAt●
www.vbat.com
Healthcare Communications
CommonHealthwww.commonhealth.comFeinstein Kean Healthcarewww.fkhealth.comGCI Healthwww.gcihealth.comghgwww.ghgroup.comogilvy Healthworldwww.ogilvyhealthworld.comSudler & Hennessey■
www.sudler.com
WPP AnnuAl rePort 2009 11
our companies & associates
Who we are
Direct, Digital, Promotion & Relationship Marketing
A. eicoff & Cowww.eicoff.comActis Systems+
www.actis.ruAGenDA+
www.agenda-asia.comAqua online+
www.aquaonline.comBlast radius+
www.blastradius.com Bridge Worldwidewww.bridgeworldwide.comBrierley & Partners1
www.brierley.comDesignkitchen+
www.designkitchen.comDialogue 141www.dialogue141.comDigitwww.digitlondon.comeWAwww.ewa.ltd.ukFullSIX3
www.fullsix.comGrass roots1
www.grg.comG2www.g2.com– G2 Branding & Design– G2 Interactive– G2 Direct & Digital– G2 Promotional MarketingHeadcount Worldwide Field Marketingwww.headcount.co.ukHigh Co1
www.highco.fr Kassius+
www.kassius.frKnowledgeBase Marketing+
Mando Brand Assurancewww.mando.co.ukMaxx Marketingwww.maxx-marketing.comogilvyActionwww.ogilvyaction.comogilvyone Worldwidewww.ogilvy.comogilvyAction Sports & entertainment Marketingwww.ogilvyaction.com oot2
www.oot.itrtC relationship Marketing■
www.rtcrm.comSmollan Group1
www.smollan.co.zaStudiocom■
www.studiocom.comthese Days+
www.thesedays.comVMl■
www.vml.comWunderman■
www.wunderman.comZAAZ+
www.zaaz.com
Specialist Communications
Corporate/B2Bogilvy Primary Contactwww.primary.co.ukCustom mediaForwardwww.theforwardgroup.comSpafaxwww.spafax.comDemographic marketingthe Bravo Group■
www.thinkbravo.comKang & lee■
www.kanglee.comMosaicaMDwww.mosaicamd.comuniWorld1
www.uniworldgroup.comWInG■
www.insidewing.comEmployer branding/recruitmentJWt Insidewww.jwtinside.comEvent/face-to-face marketingMJMwww.mjmcreative.comMetrowww.metrobroadcast.comFoodservice marketingthe Food Groupwww.thefoodgroup.comSports marketingPrISM Groupwww.prismteam.comEntertainment marketingAlliancewww.alliance-agency.comYouth marketingthe Geppetto Groupwww.geppettogroup.comReal estate marketingPacewww.paceadv.comTechnology marketingBanner Corporation■
www.b1.comMedia & production servicesthe Farm Groupwww.farmgroup.tv Hogarth Worldwide2
www.hogarthww.comImagina3
www.mediapro.es MrC3
www.mrcstudios.comthe Weinstein Company3
www.weinsteinco.com
WPP Digital
24/7 real Mediawww.247realmedia.comBluewww.blue-interactive.com Deliverwww.deliveroffshoring.com iconmobile1
www.iconmobile-group.comQuasarwww.quasar.co.inSchematicwww.schematic.comSyzygy1
www.syzygy.net
WPP Digital partner companies
HDt Holdings technology3
www.hdtworld.comIn Game Ad Interactive3
www.ingamead.cnInvidi3www.invidi.comJumptap3
www.jumptap.comliveWorld3
www.liveworld.comProclivity Systems3
www.proclivitysystems.comrealtime Worlds3
www.realtimeworlds.comSpotrunner3
www.spotrunner.comVideoegg3
www.videoegg.comVisible technologies1
www.visibletechnologies.comVisible World3
www.visibleworld.comWildtangent3www.wildtangent.comYield Software3
www.yieldsoftware.com
WPP knowledge communities
the Channelthe [email protected]
Key1 Associate2 Joint venture3 Investment■A Young & rubicam Brands company● A member of B to D Group + Part of the Wunderman network
As at April 2010.
WPP AnnuAl rePort 2009 12
Our mission to develop and manage talent; to apply that talent, throughout the world, for the benefit of clients; to do so in partnership; to do so with profit.
B etween them, WPP companies have tens of thousands of individual clients. They range from Fortune 500 global giants through single-nation start-ups to the smallest of specialist charities. Diverse as they are, they have one thing in common: in pursuing their objectives, they face formidable
competition. Growing affluence in many parts of the world – combined with overcapacity and over-supply in almost every significant consumer market – has put more and more power into the hands of consumers, accelerated by technology.
As always, if they are to succeed – or even to survive with profit – every competitive company needs an intrinsically appealing product or service. But that, though it remains the most fundamental of requirements, is no longer enough. Just as competitive costermongers arrange their apples in appealing displays and polish them lovingly to catch their customers’ eyes, so all companies need to display their wares compellingly.
They need access to high-quality information, strategic advice and specialist communications skills. And it’s in the nature of specialist and creative talent that it is unlikely to flourish within the confines of a manufacturing or service company. People with specialist talents work best – and contribute more – when recruited, trained and inspired by specialist companies.
Within the WPP Group, our clients have access to companies with all the necessary marketing and communications skills; companies with strong and distinctive cultures of their own; famous names, many of them. WPP, the parent company, complements these companies in three distinct ways.
First, it relieves them of much administrative work. Financial matters (such as planning, budgeting, reporting, control, treasury, tax, mergers, acquisitions, investor relations, legal affairs and internal audit) are co-ordinated centrally. For the operating companies, every administrative hour saved is an extra hour to be devoted to the pursuit of professional excellence.
Second, the parent company encourages and enables operating companies of different disciplines to work together for the benefit of clients. Such collaborations have the additional benefit of enhancing the job satisfaction of our people. The parent company also plays an across-the-Group role in the following functions: the management of talent, including recruitment and training; in property management; in procurement and IT; in knowledge sharing and practice development.
And finally, WPP itself can function as the 21st-century equivalent of the full-service agency. For some clients, predominantly those with a vast geographical spread and a need for marketing services ranging from advertising through design and website construction to research and internal communications, WPP can act as a portal to provide a single point of contact and accountability.
No two clients are structured in precisely the same way. Within WPP’s operating companies, teams can be tailor-made to match any and all.
Why we exist


WPP AnnuAl rePort 2009 15
How we’re doing
Financial summary
2009 2008 Change %
Billings1 £37,919m £36,929m +2.7Revenue £8,684m £7,477m +16.1Headline EBITDA2 £1,243m £1,291m -3.7Headline operating profit2 £959m £1,072m -10.6Reported operating profit £762m £876m -13.0Headline PBIT2 £1,017m £1,118m -9.0Headline PBIT margin2 11.7% 15.0% -3.3Headline PBT2 £812m £968m -16.1Reported PBT £663m £747m -11.3Headline diluted earnings per share2,4 44.4p 55.5p -20.0Headline diluted earnings per ADR2,3,4 $3.48 $5.14 -32.3Ordinary dividend per share 15.47p 15.47p –Ordinary dividend per ADR3 $1.21 $1.43 -15.4Net debt at year-end £2,640m £3,068m -14.0Average net debt5 £3,448m £2,206m +56.3Ordinary share price at year-end 609.5p 402.5p +51.4ADR price at year-end $48.65 $29.59 +64.4Market capitalisation at year-end £7,658m £5,053m +51.6
At 14 April 2010
Ordinary share price 705.5pADR price $54.51Market capitalisation £8,871mthe financial statements have been prepared under International Financial reporting Standards (IFrS).1 Billings is defined on page 182.2 the calculation of ‘headline’ measurements of performance (including headline eBItDA, headline operating profit, headline PBIt, headline PBt and headline earnings) is shown in
note 31 of the financial statements.3 one American Depositary receipt (ADr) represents five ordinary shares. these figures have been translated for convenience purposes only using the income statement exchange
rates shown on page 152. this conversion should not be construed as a representation that the pound sterling amounts actually represent, or could be converted into, uS dollars at the rates indicated.
4 earnings per share is calculated in note 9 of the financial statements.5 Average net debt is defined on page 182.
After-tax return on average capital employed2 %
Weighted average costof capital (WACC)
8.912.311.811.59.6
0908070605
14
12
10
0
2
4
6
8
8.9%
Headline PBIT1 £m
Headline PBIT1 margin % 1,0171,118928859755
0908070605
20
0
4
8
12
16
1,017m
Headline diluted earnings per share1 p
Dividends per share p 44.455.545.841.235.2
0908070605
20
0
4
8
12
16
44.4p
Revenue £m
8,6847,4776,1865,9085,374
09080706058,684m
Headline EBITDA1 £m
1,2431,2911,0721,002877
09080706051,243m
Relative TSR Rebased to 31 December 20043
31.12.0931.12.0831.12.0731.12.0631.12.0531.12.04
WPP 200
0
50
100
150FTSE 100
Omnicom
Interpublic
Publicis
WPP AnnuAl rePort 2009 16
How we’re doing
Financial summary
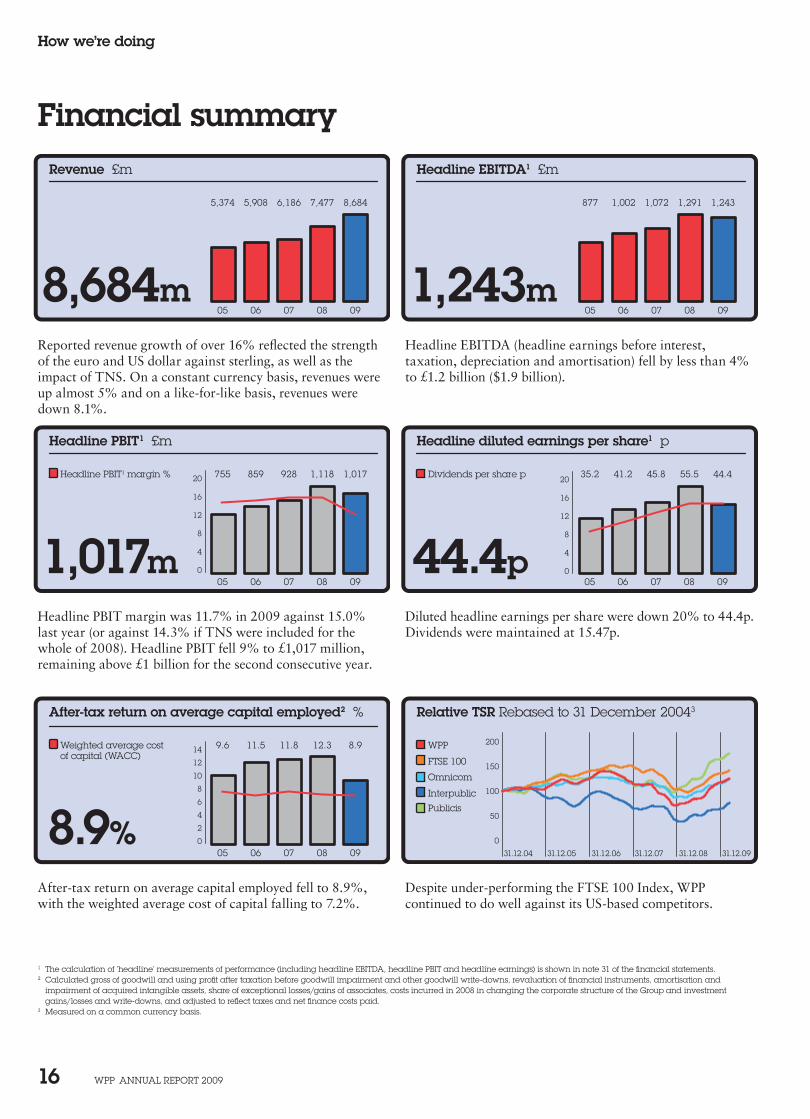
Reported revenue growth of over 16% reflected the strength of the euro and US dollar against sterling, as well as the impact of TNS. On a constant currency basis, revenues were up almost 5% and on a like-for-like basis, revenues were down 8.1%.
Headline EBITDA (headline earnings before interest, taxation, depreciation and amortisation) fell by less than 4% to £1.2 billion ($1.9 billion).
1 the calculation of ‘headline’ measurements of performance (including headline eBItDA, headline PBIt and headline earnings) is shown in note 31 of the financial statements.2 Calculated gross of goodwill and using profit after taxation before goodwill impairment and other goodwill write-downs, revaluation of financial instruments, amortisation and
impairment of acquired intangible assets, share of exceptional losses/gains of associates, costs incurred in 2008 in changing the corporate structure of the Group and investment gains/losses and write-downs, and adjusted to reflect taxes and net finance costs paid.
3 Measured on a common currency basis.
Headline PBIT margin was 11.7% in 2009 against 15.0% last year (or against 14.3% if TNS were included for the whole of 2008). Headline PBIT fell 9% to £1,017 million, remaining above £1 billion for the second consecutive year.
Diluted headline earnings per share were down 20% to 44.4p. Dividends were maintained at 15.47p.
After-tax return on average capital employed fell to 8.9%, with the weighted average cost of capital falling to 7.2%.
Despite under-performing the FTSE 100 Index, WPP continued to do well against its US-based competitors.
2009 revenue1 by sector %
Advertising and Media Investment Management 39
Consumer Insight7 26
Public Relations & Public Affairs 9
Branding & Identity, Healthcare and Specialist Communications 26
2009 revenue1 by geography %
North America 35
UK 12
Western Continental Europe6 26
Asia Pacific, Latin America, Africa & Middle East andCentral & Eastern Europe6 27
Average net debt4 and interest cover multiples £m
Net interest3 coveron headline PBIT2
3,4482,2061,4581,2141,212
0908070605
10
0
2
4
6
8
3,448m
2009 headline PBIT1,2 by geography %
North America 40
UK 13
Western Continental Europe6 18
Asia Pacific, Latin America, Africa & Middle East andCentral & Eastern Europe6 29
Debt maturity5 £m
200–4006654441,24053275––
18 19+1716151413121110
2009 headline PBIT1,2 by sector %
Advertising and Media Investment Management 46
Consumer Insight7 19
Public Relations & Public Affairs 12
Branding & Identity, Healthcare and Specialist Communications 23
WPP AnnuAl rePort 2009 17
How we’re doingFinancial Summary
1 Percentages are calculated on a constant currency basis. See definition on page 182.2 the calculation of headline PBIt is set out in note 31 of the financial statements.3 Interest excludes the revaluation of financial instruments.4 Average net debt for 2005 includes amounts drawn down in that year on the Group’s working capital facility (the advance of cash financing against which certain trade debts were
assigned). this facility was repaid and cancelled on 31 August 2005.5 Includes corporate bonds, convertible bonds and bank loans payable at par value, excluding any redemption premium due, by due date.6 the Group previously reported Continental europe separately. Western Continental europe is now reported separately, with Central & eastern europe included with Asia Pacific,
latin America, Africa & Middle east.7 Consumer Insight was previously reported as Information, Insight & Consultancy.
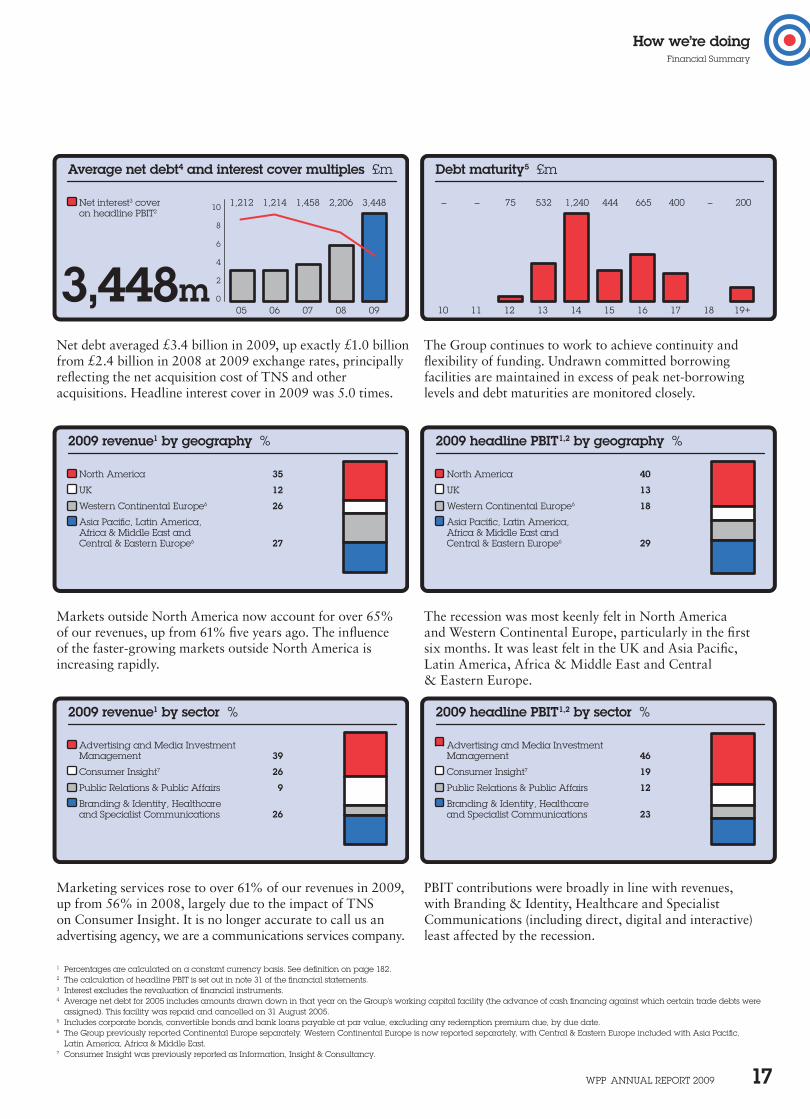
Net debt averaged £3.4 billion in 2009, up exactly £1.0 billion from £2.4 billion in 2008 at 2009 exchange rates, principally reflecting the net acquisition cost of TNS and other acquisitions. Headline interest cover in 2009 was 5.0 times.
The Group continues to work to achieve continuity and flexibility of funding. Undrawn committed borrowing facilities are maintained in excess of peak net-borrowing levels and debt maturities are monitored closely.
Markets outside North America now account for over 65% of our revenues, up from 61% five years ago. The influence of the faster-growing markets outside North America is increasing rapidly.
The recession was most keenly felt in North America and Western Continental Europe, particularly in the first six months. It was least felt in the UK and Asia Pacific, Latin America, Africa & Middle East and Central & Eastern Europe.
Marketing services rose to over 61% of our revenues in 2009, up from 56% in 2008, largely due to the impact of TNS on Consumer Insight. It is no longer accurate to call us an advertising agency, we are a communications services company.
PBIT contributions were broadly in line with revenues, with Branding & Identity, Healthcare and Specialist Communications (including direct, digital and interactive) least affected by the recession.
WPP AnnuAl rePort 2009 18
How we’re doing
Dear share owner
2009, our twenty-fourth year, was a brutal year for both WPP and the communications services industry as a whole. After a difficult first six
months, however, the Group adjusted its cost base to falling like-for-like revenues and achieved the same pro-forma operating margins in the second half of the year as in the second half of 2008.
Despite such a difficult year in the real world, total share owner return increased sharply, with your share price rising over 200p, or 50%, to 609.5p from 402.5p during the year, in part due to the recovery of the financial markets.
A year ago, the downturn in the media sector in general weighed heavily on your share price despite the outlook for the wider sector being increasingly less relevant to your Company’s prospects: the many ways in which our business is being transformed by new markets, new media and new capabilities provide major opportunities to enhance our future growth and profitability. Pleasingly, since the year end, your share price has increased a further 96.0p, or 16%, to 705.5p at the time of writing. Dividends were maintained at 15.47p, the same level as 2008.
Billings were up almost 3% to £37.9 billion. Revenues were up over 16% to £8.7 billion. Our revenues exceeded all our competitors for the second consecutive year, by an increasing amount. Headline PBIT margin was 11.7% in 2009 against 15.0% last year (or 14.3% including TNS on a pro-forma basis for the whole of 2008). The Group achieved a Headline PBIT margin of 15.4% in the second half of the year, equal to the margin achieved in the second half of 2008, including TNS, again on a pro-forma basis, and in line with the target set at the time of the Group’s 2009 half-year results announcement. Headline PBIT – that is, profit before goodwill write-downs, amortisation and impairment of acquired intangible assets, investment gains/losses and write-downs, share of exceptional gains/losses of associates, one-off costs of changes to our corporate structure in 2008, finance income/costs, revaluation of financial instruments and taxation (what a mouthful!) – fell 9% to £1,017 million, but was above £1 billion for the second consecutive year.
Headline EBITDA (or headline earnings before interest, taxation, depreciation and amortisation – another mouthful! – which is a key metric that private equity firms, for example, use for valuing companies) fell by less than 4% to £1.2 billion but remained above £1 billion for the fourth consecutive year.
Headline profit before tax was down over 16% to £812 million. Reported profit before tax was down over 11% to £663 million. Diluted headline earnings per share were down 20% to 44.4p and diluted reported earnings per share down over 6% to 35.3p.
Free cash flow remained strong at £618 million. Net debt averaged £3.4 billion in 2009, up exactly £1.0 billion at 2009 exchange rates, reflecting the net acquisition cost and debt acquired of TNS of £1.3 billion and other, smaller acquisitions and earnout payments. Equity analysts appear comfortable with the level of the Group’s average net debt, which was around 2.8 times headline EBITDA in 2009. Questions from institutions and analysts have shifted from concerns about debt levels at the beginning of the year, to questions at the end of the year about what we will do with our borrowing capacity, as net debt falls. Net debt at 31 December 2009 decreased to £2.6 billion compared with £3.1 billion last year, reflecting improved cash flows. Headline interest cover in 2009 was 5.0 times. So far, in the first three months of 2010, average net debt was down over
Letter to share owners*
* this letter to share owners should be read in conjunction with and as part of the management report set out in the section headed Directors’ report on pages 109 to 121.
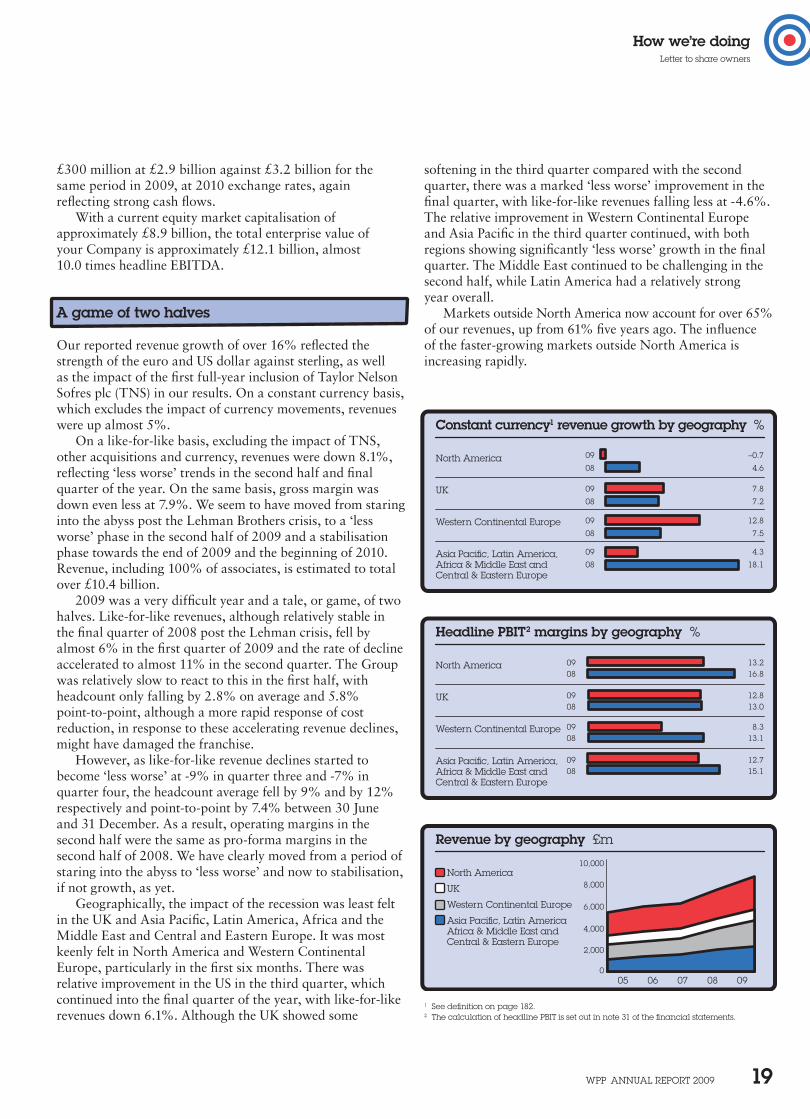
Constant currency1 revenue growth by geography %
Western Continental Europe
Asia Pacific, Latin America,Africa & Middle East and Central & Eastern Europe
UK
09
08
09
08
09
08
09
08
–0.7
4.6
7.8
7.2
12.8
7.5
4.3
18.1
North America
Headline PBIT2 margins by geography %
Western Continental Europe
Asia Pacific, Latin America,Africa & Middle East and Central & Eastern Europe
UK
0908
0908
0908
0908
13.216.8
12.813.0
8.313.1
12.715.1
North America
Revenue by geography £m
North America10,000
0
4,000
2,000
6,000
8,000UK
Western Continental Europe
Asia Pacific, Latin AmericaAfrica & Middle East andCentral & Eastern Europe
08070605 09
WPP AnnuAl rePort 2009 19
How we’re doingletter to share owners
softening in the third quarter compared with the second quarter, there was a marked ‘less worse’ improvement in the final quarter, with like-for-like revenues falling less at -4.6%. The relative improvement in Western Continental Europe and Asia Pacific in the third quarter continued, with both regions showing significantly ‘less worse’ growth in the final quarter. The Middle East continued to be challenging in the second half, while Latin America had a relatively strong year overall.
Markets outside North America now account for over 65% of our revenues, up from 61% five years ago. The influence of the faster-growing markets outside North America is increasing rapidly.
£300 million at £2.9 billion against £3.2 billion for the same period in 2009, at 2010 exchange rates, again reflecting strong cash flows.
With a current equity market capitalisation of approximately £8.9 billion, the total enterprise value of your Company is approximately £12.1 billion, almost 10.0 times headline EBITDA.
A game of two halves
Our reported revenue growth of over 16% reflected the strength of the euro and US dollar against sterling, as well as the impact of the first full-year inclusion of Taylor Nelson Sofres plc (TNS) in our results. On a constant currency basis, which excludes the impact of currency movements, revenues were up almost 5%.
On a like-for-like basis, excluding the impact of TNS, other acquisitions and currency, revenues were down 8.1%, reflecting ‘less worse’ trends in the second half and final quarter of the year. On the same basis, gross margin was down even less at 7.9%. We seem to have moved from staring into the abyss post the Lehman Brothers crisis, to a ‘less worse’ phase in the second half of 2009 and a stabilisation phase towards the end of 2009 and the beginning of 2010. Revenue, including 100% of associates, is estimated to total over £10.4 billion.
2009 was a very difficult year and a tale, or game, of two halves. Like-for-like revenues, although relatively stable in the final quarter of 2008 post the Lehman crisis, fell by almost 6% in the first quarter of 2009 and the rate of decline accelerated to almost 11% in the second quarter. The Group was relatively slow to react to this in the first half, with headcount only falling by 2.8% on average and 5.8% point-to-point, although a more rapid response of cost reduction, in response to these accelerating revenue declines, might have damaged the franchise.
However, as like-for-like revenue declines started to become ‘less worse’ at -9% in quarter three and -7% in quarter four, the headcount average fell by 9% and by 12% respectively and point-to-point by 7.4% between 30 June and 31 December. As a result, operating margins in the second half were the same as pro-forma margins in the second half of 2008. We have clearly moved from a period of staring into the abyss to ‘less worse’ and now to stabilisation, if not growth, as yet.
Geographically, the impact of the recession was least felt in the UK and Asia Pacific, Latin America, Africa and the Middle East and Central and Eastern Europe. It was most keenly felt in North America and Western Continental Europe, particularly in the first six months. There was relative improvement in the US in the third quarter, which continued into the final quarter of the year, with like-for-like revenues down 6.1%. Although the UK showed some
1 See definition on page 182.2 the calculation of headline PBIt is set out in note 31 of the financial statements.
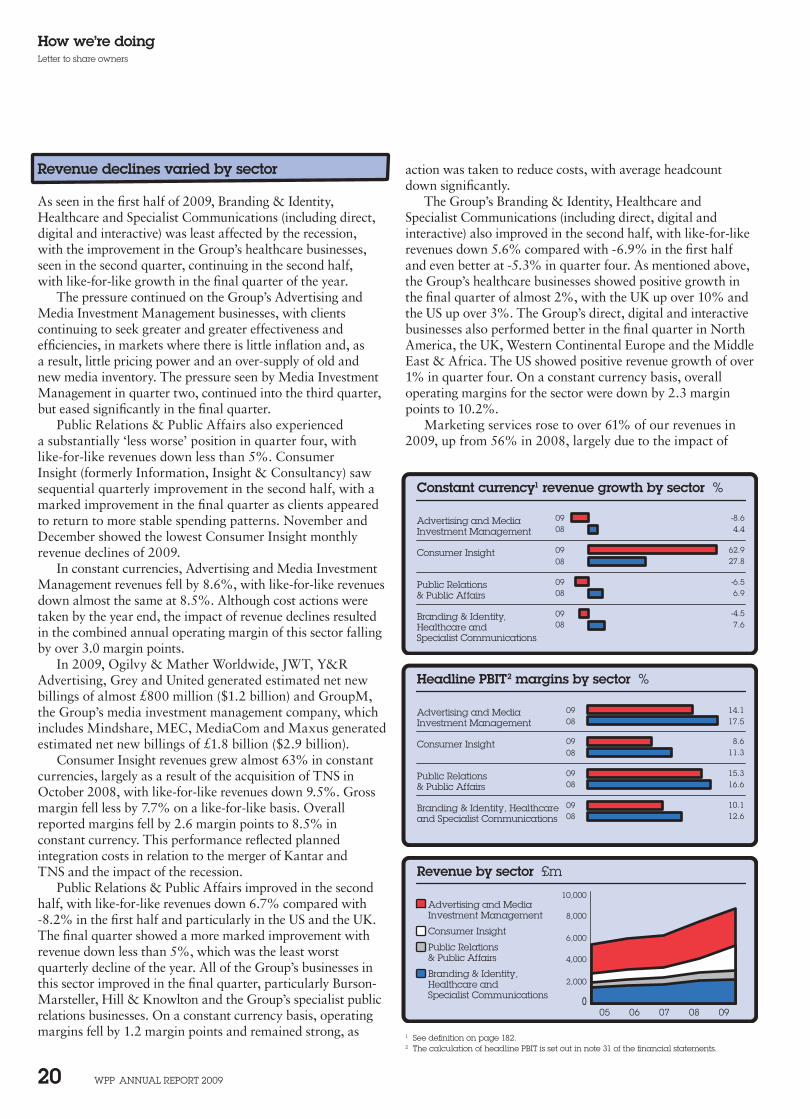
Constant currency1 revenue growth by sector %
Public Relations & Public Affairs
Branding & Identity, Healthcare and Specialist Communications
Consumer Insight
0908
0908
0908
0908
-8.64.4
62.927.8
-6.56.9
-4.57.6
Advertising and MediaInvestment Management
Headline PBIT2 margins by sector %
Public Relations & Public Affairs
Branding & Identity, Healthcare and Specialist Communications
Consumer Insight
0908
0908
0908
0908
14.117.5
8.611.3
15.316.6
10.112.6
Advertising and MediaInvestment Management
Revenue by sector £m
Advertising and MediaInvestment Management
Consumer Insight
Public Relations & Public Affairs
Branding & Identity, Healthcare and Specialist Communications
10,000
0
2,000
4,000
6,000
8,000
08070605 09
WPP AnnuAl rePort 2009 20
How we’re doingletter to share owners
action was taken to reduce costs, with average headcount down significantly.
The Group’s Branding & Identity, Healthcare and Specialist Communications (including direct, digital and interactive) also improved in the second half, with like-for-like revenues down 5.6% compared with -6.9% in the first half and even better at -5.3% in quarter four. As mentioned above, the Group’s healthcare businesses showed positive growth in the final quarter of almost 2%, with the UK up over 10% and the US up over 3%. The Group’s direct, digital and interactive businesses also performed better in the final quarter in North America, the UK, Western Continental Europe and the Middle East & Africa. The US showed positive revenue growth of over 1% in quarter four. On a constant currency basis, overall operating margins for the sector were down by 2.3 margin points to 10.2%.
Marketing services rose to over 61% of our revenues in 2009, up from 56% in 2008, largely due to the impact of
Revenue declines varied by sector
As seen in the first half of 2009, Branding & Identity, Healthcare and Specialist Communications (including direct, digital and interactive) was least affected by the recession, with the improvement in the Group’s healthcare businesses, seen in the second quarter, continuing in the second half, with like-for-like growth in the final quarter of the year.
The pressure continued on the Group’s Advertising and Media Investment Management businesses, with clients continuing to seek greater and greater effectiveness and efficiencies, in markets where there is little inflation and, as a result, little pricing power and an over-supply of old and new media inventory. The pressure seen by Media Investment Management in quarter two, continued into the third quarter, but eased significantly in the final quarter.
Public Relations & Public Affairs also experienced a substantially ‘less worse’ position in quarter four, with like-for-like revenues down less than 5%. Consumer Insight (formerly Information, Insight & Consultancy) saw sequential quarterly improvement in the second half, with a marked improvement in the final quarter as clients appeared to return to more stable spending patterns. November and December showed the lowest Consumer Insight monthly revenue declines of 2009.
In constant currencies, Advertising and Media Investment Management revenues fell by 8.6%, with like-for-like revenues down almost the same at 8.5%. Although cost actions were taken by the year end, the impact of revenue declines resulted in the combined annual operating margin of this sector falling by over 3.0 margin points.
In 2009, Ogilvy & Mather Worldwide, JWT, Y&R Advertising, Grey and United generated estimated net new billings of almost £800 million ($1.2 billion) and GroupM, the Group’s media investment management company, which includes Mindshare, MEC, MediaCom and Maxus generated estimated net new billings of £1.8 billion ($2.9 billion).
Consumer Insight revenues grew almost 63% in constant currencies, largely as a result of the acquisition of TNS in October 2008, with like-for-like revenues down 9.5%. Gross margin fell less by 7.7% on a like-for-like basis. Overall reported margins fell by 2.6 margin points to 8.5% in constant currency. This performance reflected planned integration costs in relation to the merger of Kantar and TNS and the impact of the recession.
Public Relations & Public Affairs improved in the second half, with like-for-like revenues down 6.7% compared with -8.2% in the first half and particularly in the US and the UK. The final quarter showed a more marked improvement with revenue down less than 5%, which was the least worst quarterly decline of the year. All of the Group’s businesses in this sector improved in the final quarter, particularly Burson-Marsteller, Hill & Knowlton and the Group’s specialist public relations businesses. On a constant currency basis, operating margins fell by 1.2 margin points and remained strong, as 1 See definition on page 182.
2 the calculation of headline PBIt is set out in note 31 of the financial statements.
WPP AnnuAl rePort 2009 21
How we’re doingletter to share owners
year, reflecting higher average net debt as a result of the full year impact of the acquisition of TNS, partly offset by lower interest rates.
Headline profit before tax decreased by over 16% to £812 million and reported profit before tax fell by more than 11% to £663 million, although still above $1 billion for the fifth consecutive year.
The Group’s tax rate on headline profit before tax was 23.8%, a reduction of 1.5 percentage points from 2008, as a result of continuing tax planning initiatives.
Diluted headline earnings per share fell 20% to 44.4p and diluted reported earnings per share fell only 6% to 35.3p mainly because ‘re-measurement gains’ on financial instruments have not been included in headline earnings per share, unlike one of our US competitors. In addition, and prudently, no severance or integration expenses have been excluded in arriving at the same headline number. This again is not competitive practice, which is also odd.
Integration of TNS
Following the acquisition of TNS in October 2008, the Custom business of TNS has been combined with Research International and other operations merged with several of the Kantar businesses to form Kantar Media, Kantar Worldpanel, Kantar Retail and Kantar Health. The integration has gone well so far and, although not complete, our increased estimates of synergy benefits are being met and in fact being added to. As a result of actions taken since acquisition, as at 31 December 2009, gross synergies (annualised synergy benefits before costs of achieving these benefits) exceeded £40 million. The Group is on track to achieve the revised merger benefits target of an annualised £60 million or more in 2011, as opposed to the original commitment of £52 million.
2010 should be a more stable year
Despite the overall slow-down in the industry growth rate, three engines of relative growth remain: new markets, new media and consumer insight. Asia Pacific, Latin America, Africa and the Middle East and Central and Eastern Europe, iconically represented by the BRICs and those of the Next 11 markets where we are present (Bangladesh, Egypt, Indonesia, Mexico, Nigeria, Pakistan, the Philippines, South Korea, Turkey and Vietnam), continued to grow faster and now represent almost 27% of the Group’s approximately $14 billion revenue. As did new media and the application of technology in the form of internet, PC, mobile, video content, search and social networks, which also now account for almost 27% of Group revenues. And finally, as did Consumer Insight, which now accounts for over 26% of Group revenues.
2010 should be a more stable year (famous last words!). There are several mini-quadrennial events that will help – the Winter Olympic Games in Vancouver, the Asian Games in
TNS on Consumer Insight. It is no longer accurate to call us an advertising agency, we are a communications services company.
Margin down for the year but stabilised in the second half
Headline PBIT margins fell to 11.7% for the year against 15.0% in 2008 (or against 14.3% if TNS were included for the whole of 2008), but, as mentioned above, the Group achieved a margin of 15.4% in the second half of the year, the same pro-forma margin as in the second half of 2008.
On a like-for-like basis the average number of people in the Group decreased 6.7% in 2009. On the same basis, the number of people in the Group at 31 December 2009 was 12.3% lower than at the end of 2008. As these figures illustrate, further action to reduce headcount was taken during the second half of 2009 with year-end headcount being 7.4% lower than at 30 June and 6.3% lower than at 31 July.
Reported staff costs, excluding incentives, were up 19.4%. Incentive payments (including the cost of share-based compensation) fell by almost 17% to £178 million from £214 million. Excluding these incentive payments, headline PBIT margins fell by 4.0 margin points from 17.8% in 2008 to 13.8% in 2009. Incentives represented almost 16% of headline operating profit before bonuses and income from associates, against almost 17% in 2008. Cash-based incentives totalled £123 million or just over 12% of headline operating profit before bonuses and income from associates against £151 million and almost 14% in 2008. The balance of £55 million in 2009 represents share-based incentives granted in previous years. Our objective remains to pay out approximately 20% of operating profit before bonus and taxes at maximum and 15% at target. Before severance costs, headline PBIT margins fell by 2.7 margin points to 13.2%.
Part of the Group’s strategy is to continue to ensure that variable staff costs (freelancers, consultants and incentive payments) are a significant proportion of total staff costs and revenue, as this provides flexibility to deal with volatility in revenues and recessions or slow-downs. In 2009, the ratio of variable staff costs to total staff costs fell to 9.7% compared with 11.4% in 2008 and 12.7% in 2007. As a proportion of revenue, variable staff costs were 5.7% in 2009 compared with 6.6% in 2008 and 7.4% in 2007.
On a reported basis, the Group’s staff cost-to-revenue ratio increased to 58.9% compared with 58.2% in 2008.
As a result of all this, headline PBIT fell 9% to £1,017 million from £1,118 million, down almost 17% in constant currencies. Reported PBIT fell over 11% to £819 million, almost 20% in constant currencies, reflecting a lower charge for goodwill impairment and investment write-downs, more than offset by higher charges for amortisation of intangible assets following the acquisition of TNS.
Net finance costs (excluding the revaluation of financial instruments) were £205 million, up from £150 million last
WPP AnnuAl rePort 2009 22
How we’re doingletter to share owners
Revised margin objectives
Operating margins for 2010 are targeted to rise by one margin point to 12.7%. The operating margin target for 2011 has initially been set at 13.2%. In the longer term, we continue to believe we can improve our operating margin to 18%. This is challenging, of course, but not so outrageous as some believe, given that our best performing companies in each services sector have already demonstrated they can perform at a combined Group margin of 17%.
The longer term
Worries continue about how and when governments and central banks will withdraw the considerable fiscal and monetary post-Lehman stimulus, as well as the likely impact. These already approximate to $13 trillion or approximately 20% of worldwide GDP of $64 trillion. Withdrawal of the automotive ‘Cash for Clunkers’ stimulus in North America reduced demand for cars and trucks in the US from an annualised level of 14 million units to 10 million units. This should serve as a warning.
The more interesting question, probably, is how the West, in particular, will emerge from the current crisis and reduce the colossal government deficit needed to fund the early stage of the recovery. There seem to be two possible routes. First, the more prudent and painful – reduce government spending, increase taxes and unemployment and learn to save again, with the risk of a double-dip. Secondly, inflate our way out of the problem and continue to spend and lend, with likely significant resultant increases in inflation and long-term interest rates. The UK election, for example, is being fought on these issues.
Given the politically unpleasant implications of the first route and the proximity of elections, the second course is more likely. As a result, those countries that are capital rich and have saved – like Brazil, China, India, Japan and eventually, with strong oil prices, Russia – will benefit even more. And the Group’s strategic focus on the BRICs and Next 11, on the new media and on consumer insight will benefit accordingly.
In any event, consumers and clients exhibit continued caution – consumers concerned about high levels of unemployment and clients continually conservative in a low-growth environment, achieving lowered market profit expectations, by getting there ‘ugly’ – by cutting costs and focusing on efficiency. Sadly, the fact that you cannot cost-cut your way to prosperity has not been accepted – as yet. Long-term growth depends on brand-building and revenue growth. Promote on price and you create commodities. Innovate and differentiate, you create brands and the right to demand a premium from the consumer. Maybe the change we have seen in the first three months of 2010 signals first, the end of the post-Lehman cost and
Guangzhou, the FIFA World Cup in South Africa, the IPL cricket league and Commonwealth Games, both in India, the World Expo in Shanghai and last, but not least, the mid-term Congressional elections in the US, all of which should, on the basis of past experience, add approximately 1 percentage point to industry growth rates.
Our budgets for 2010 indicate flat like-for-like revenue growth, with a mildly weaker first-half and stronger second-half. The second quarter shows like-for-like top line growth – a budgeted return to growth for the first time in six quarters, although the second quarter of 2009 is the weakest comparator. GroupM forecasts that global advertising spending (which impacts approximately 39% of the Group’s revenues) will rise by 0.8% in 2010 versus a 6.6% fall in 2009. GroupM also forecasts that marketing spending, broadly the other 61% of WPP, will fall by 2% in 2010 against an 8% fall in 2009. On these forecasts, flat revenues would mean increased market share.
Geographically, there are relatively brighter spots budgeted in Asia Pacific, Latin America and the Middle East and Africa, reflecting the continued relative strength of the BRIC and Next 11 markets. Central and Eastern Europe, as a whole, remains relatively flat, with Russia recovering as the oil price rises. At $60-70 per barrel, the Russian economy works. Western Continental Europe is budgeted to be relatively weak, with France, Germany and Spain still challenged. The UK is budgeted flat (although there are post-election concerns), with the US showing a little growth. Latin America remains the healthiest region.
All sectors, other than Advertising and Media Investment Management, are budgeted to grow at a modest rate in 2010. Advertising remains challenged by clients’ continued demands for efficiency, particularly in mature markets. Media Investment Management is budgeted to recover in 2010, with growth reinforced by very significant new business wins so far this year.
Incentive plans for 2010 will place increased emphasis on revenue growth and improvement in operating margins in conjunction with operating profit growth, although objectives will continue to include improvements in staff costs-to-revenue ratios and qualitative Group objectives, including Group co-ordination and co-operation, talent management and succession planning.
At the time of writing, we have revenue and profit data for the first three months of 2010. Like-for-like revenues for the first quarter were flat on the first quarter of 2009, indicating an encouraging return to stability. This was first evident in November 2009, when revenue trends were markedly ‘less worse’ than before. Although this return to stability seems widespread both geographically and functionally, there is no marked growth as yet, even against weak comparatives, although the US did show an encouraging return to growth in the first three months. America is biting back. Operating profits for these three months were also better than budgeted.
WPP AnnuAl rePort 2009 23
How we’re doingletter to share owners
continue to be developed. There is an increasing number of major client creative and integration opportunities at a Group level. The Group continues to be extremely successful in most, if not all, of the integrated marketing competitions that clients are increasingly initiating. These opportunities range from the creation of teams across the Group to the integration of various operating units and to the creation of individually tailored agencies to meet clients’ needs. The Group’s integration record leads its competitors by a considerable distance.
Our key priorities
Our reason for being, the justification for WPP’s existence, continues to be to add value to our clients’ businesses and our people’s careers. Our goal remains to be the world’s most successful provider of communications services to multinational and local companies, not just the largest. To that end, we have three key strategic priorities.
1 Firstly, our immediate priority is to emerge from the financial crisis successfully. Compared with the last downturn, our people are stronger: they are better
resourced, motivated and incentivised than when we exited the last recessions in the early 1990s and 2000s. The Company is also more profitable, more liquid and better structured. In this economic cycle, margins have peaked at 15.0% and bottomed (we believe) at 11.7%, as opposed to 10.5% and 5.6% in the early 1990s.
2 Second, in the medium term, to build upon the successful base we have established together with the most recent acquisitions, for example, of TNS, Young
& Rubicam Brands and Grey. At Grey, the management structure has been settled for some time and the planned integration is now completed. Grey Advertising has now started to raise its game in terms of revenue growth and ghg has started to overcome the impact of FDA non-approvals on products that clients have assigned to them. At Young & Rubicam Brands, our plans are also largely implemented, the one remaining task being to continue to strengthen the Y&R advertising agency, although the business is showing stability, particularly in the US. At TNS the integration has gone well and the focus has to now be on revenue growth, capturing greater market share.
3 Our third priority, in the long term or over the next five to 10 years, is to:
Increase the combined geographic share of revenues from the faster-growing markets of Asia Pacific, Latin America, Africa and the Middle East, and Central and Eastern Europe, from around 27% to one-third.
Increase the share of revenues of marketing services including new media from around 61% now to two-thirds.
Maintain the share of more measurable marketing services – such as Consumer Insight and direct, digital and interactive – at 50% of revenues.
liquidity-driven terror evident in budgeting in 2009 and, secondly, the realisation that revenue growth requires marketing investment and a loosening of the marketing purse strings.
According to the recent Deutsche Bank investment research note* on more than 30 large European and US consumer staples companies over a period of more than 15 years, those companies that increase advertising and promotion spending deliver sales growth 30% faster and profit growth 50% faster than their peers. Including leverage would increase the differential profit returns and advertising and promotion expenditure cutters had the benefit of increased short-term profitability in the comparison.
In the long term, the outlook for the advertising and marketing services industry appears favourable. Increasing globalisation, overcapacity of production in most sectors and the shortage of human capital, the developments in new technologies and media, the growth in importance of internal communications, the need to influence distribution, the new focus on corporate responsibility issues such as climate change, the growth of government as a client and the focus on global and country organisational structures, underpin the need for our clients to continue to differentiate their products and services both tangibly and intangibly.
Moreover, the continuing growth of the BRICs, and other faster-growing geographical markets, will add significant opportunities in Asia Pacific, Latin America, Africa and the Middle East and Central and Eastern Europe – along with the growth of the Next 11 such as Vietnam, Pakistan, Indonesia and Bangladesh. Advertising and marketing services expenditure as a proportion of gross national product should eventually resume its growth. Meanwhile, in these difficult times, we are committed to working with our clients to improve the effectiveness (quality) and efficiency (cost) of their spending, or as we prefer to call it, investment.
Given these short-term and long-term trends, your Company believes it has the correct strategic priorities – new markets, new media and consumer insight.
Including associates, the Group had over 138,000 full-time people in almost 2,400 offices in 107 countries at the year end. It services 354 of the Fortune Global 500 companies, 28 of the Dow Jones 30, 60 of the Nasdaq 100, 33 of the Fortune e-50, and 698 national or multi-national clients in three or more disciplines. 443 clients are served in four disciplines and these clients account for over 56% of Group revenues. The Group also works with over 327 clients in six or more countries.
These statistics reflect the increasing opportunities for developing client relationships between activities nationally, internationally and by function. We estimate that over 35% of new assignments in the year were generated through the joint development of opportunities by two or more Group companies. New integration mechanisms, sensitive to global and local opportunities, including WPP global client leaders for our top 30 clients and country managers,
* See page 103.
WPP AnnuAl rePort 2009 24
How we’re doingletter to share owners
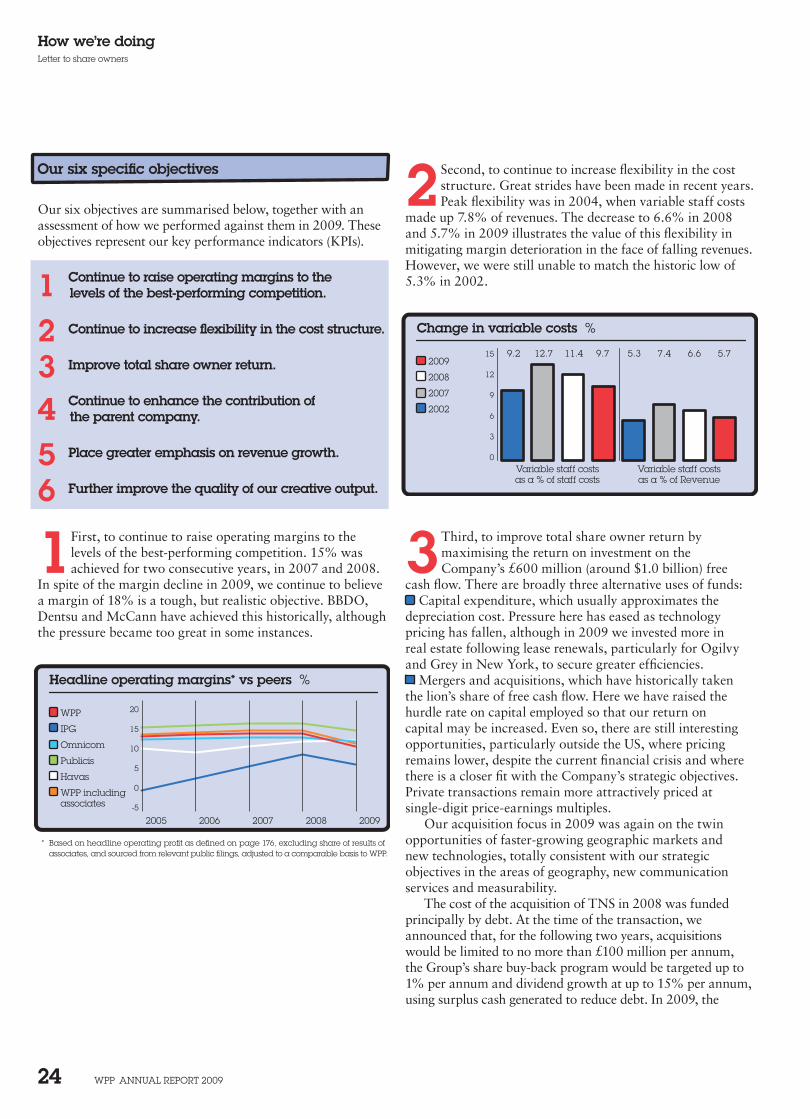
2 Second, to continue to increase flexibility in the cost structure. Great strides have been made in recent years. Peak flexibility was in 2004, when variable staff costs
made up 7.8% of revenues. The decrease to 6.6% in 2008 and 5.7% in 2009 illustrates the value of this flexibility in mitigating margin deterioration in the face of falling revenues. However, we were still unable to match the historic low of 5.3% in 2002.
3 Third, to improve total share owner return by maximising the return on investment on the Company’s £600 million (around $1.0 billion) free
cash flow. There are broadly three alternative uses of funds: Capital expenditure, which usually approximates the
depreciation cost. Pressure here has eased as technology pricing has fallen, although in 2009 we invested more in real estate following lease renewals, particularly for Ogilvy and Grey in New York, to secure greater efficiencies.
Mergers and acquisitions, which have historically taken the lion’s share of free cash flow. Here we have raised the hurdle rate on capital employed so that our return on capital may be increased. Even so, there are still interesting opportunities, particularly outside the US, where pricing remains lower, despite the current financial crisis and where there is a closer fit with the Company’s strategic objectives. Private transactions remain more attractively priced at single-digit price-earnings multiples.
Our acquisition focus in 2009 was again on the twin opportunities of faster-growing geographic markets and new technologies, totally consistent with our strategic objectives in the areas of geography, new communication services and measurability.
The cost of the acquisition of TNS in 2008 was funded principally by debt. At the time of the transaction, we announced that, for the following two years, acquisitions would be limited to no more than £100 million per annum, the Group’s share buy-back program would be targeted up to 1% per annum and dividend growth at up to 15% per annum, using surplus cash generated to reduce debt. In 2009, the
Our six specific objectives
Our six objectives are summarised below, together with an assessment of how we performed against them in 2009. These objectives represent our key performance indicators (KPIs).
1 Continue to raise operating margins to the levels of the best-performing competition.
2 Continue to increase flexibility in the cost structure.
3 Improve total share owner return.
4 Continue to enhance the contribution of the parent company.
5 Place greater emphasis on revenue growth.
6 Further improve the quality of our creative output.
1 First, to continue to raise operating margins to the levels of the best-performing competition. 15% was achieved for two consecutive years, in 2007 and 2008.
In spite of the margin decline in 2009, we continue to believe a margin of 18% is a tough, but realistic objective. BBDO, Dentsu and McCann have achieved this historically, although the pressure became too great in some instances.
Change in variable costs %
2009
2008
2007
2002
Variable staff costsas a % of Revenue
Variable staff costsas a % of staff costs
15 9.2 12.7 11.4 9.7 5.3 7.4 6.6 5.7
0
3
6
9
12
Headline operating margins* vs peers %
WPP
IPG
Omnicom
Publicis
Havas
WPP includingassociates
20092008200720062005-5
5
0
10
15
20
* Based on headline operating profit as defined on page 176, excluding share of results of associates, and sourced from relevant public filings, adjusted to a comparable basis to WPP.
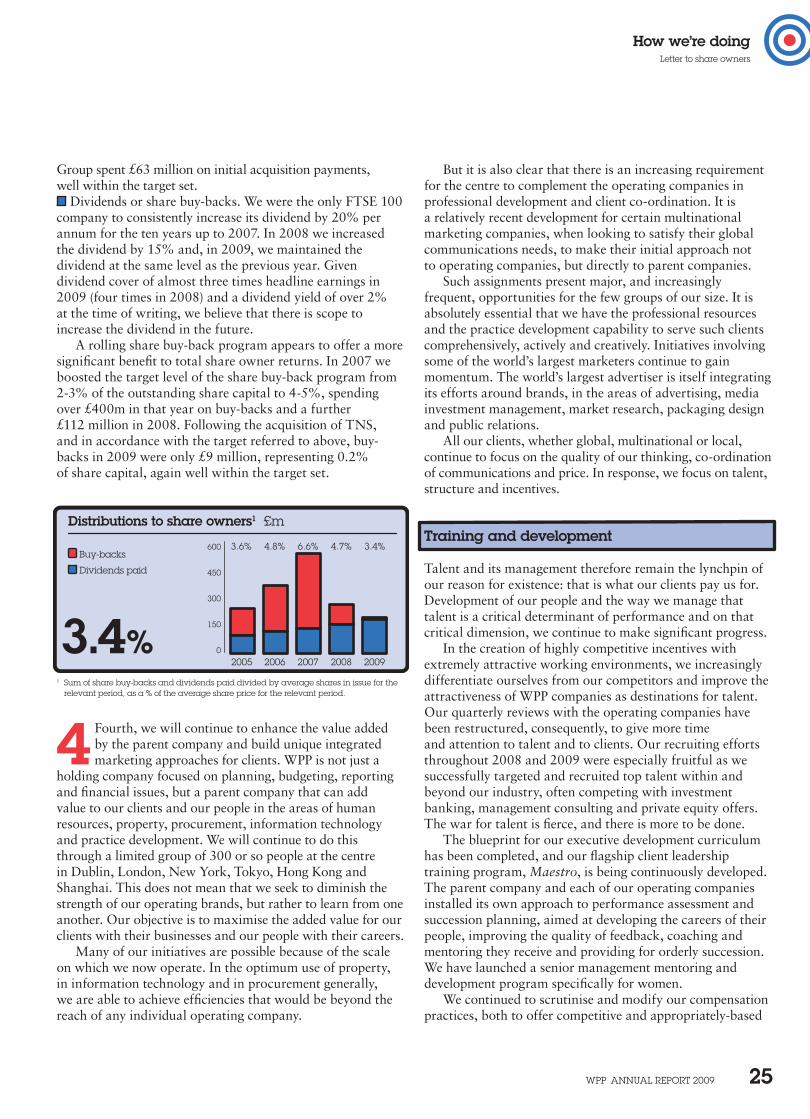
WPP AnnuAl rePort 2009 25
How we’re doingletter to share owners
But it is also clear that there is an increasing requirement for the centre to complement the operating companies in professional development and client co-ordination. It is a relatively recent development for certain multinational marketing companies, when looking to satisfy their global communications needs, to make their initial approach not to operating companies, but directly to parent companies.
Such assignments present major, and increasingly frequent, opportunities for the few groups of our size. It is absolutely essential that we have the professional resources and the practice development capability to serve such clients comprehensively, actively and creatively. Initiatives involving some of the world’s largest marketers continue to gain momentum. The world’s largest advertiser is itself integrating its efforts around brands, in the areas of advertising, media investment management, market research, packaging design and public relations.
All our clients, whether global, multinational or local, continue to focus on the quality of our thinking, co-ordination of communications and price. In response, we focus on talent, structure and incentives.
Training and development
Talent and its management therefore remain the lynchpin of our reason for existence: that is what our clients pay us for. Development of our people and the way we manage that talent is a critical determinant of performance and on that critical dimension, we continue to make significant progress.
In the creation of highly competitive incentives with extremely attractive working environments, we increasingly differentiate ourselves from our competitors and improve the attractiveness of WPP companies as destinations for talent. Our quarterly reviews with the operating companies have been restructured, consequently, to give more time and attention to talent and to clients. Our recruiting efforts throughout 2008 and 2009 were especially fruitful as we successfully targeted and recruited top talent within and beyond our industry, often competing with investment banking, management consulting and private equity offers. The war for talent is fierce, and there is more to be done.
The blueprint for our executive development curriculum has been completed, and our flagship client leadership training program, Maestro, is being continuously developed. The parent company and each of our operating companies installed its own approach to performance assessment and succession planning, aimed at developing the careers of their people, improving the quality of feedback, coaching and mentoring they receive and providing for orderly succession. We have launched a senior management mentoring and development program specifically for women.
We continued to scrutinise and modify our compensation practices, both to offer competitive and appropriately-based
Group spent £63 million on initial acquisition payments, well within the target set.
Dividends or share buy-backs. We were the only FTSE 100 company to consistently increase its dividend by 20% per annum for the ten years up to 2007. In 2008 we increased the dividend by 15% and, in 2009, we maintained the dividend at the same level as the previous year. Given dividend cover of almost three times headline earnings in 2009 (four times in 2008) and a dividend yield of over 2% at the time of writing, we believe that there is scope to increase the dividend in the future.
A rolling share buy-back program appears to offer a more significant benefit to total share owner returns. In 2007 we boosted the target level of the share buy-back program from 2-3% of the outstanding share capital to 4-5%, spending over £400m in that year on buy-backs and a further £112 million in 2008. Following the acquisition of TNS, and in accordance with the target referred to above, buy-backs in 2009 were only £9 million, representing 0.2% of share capital, again well within the target set.
4 Fourth, we will continue to enhance the value added by the parent company and build unique integrated marketing approaches for clients. WPP is not just a
holding company focused on planning, budgeting, reporting and financial issues, but a parent company that can add value to our clients and our people in the areas of human resources, property, procurement, information technology and practice development. We will continue to do this through a limited group of 300 or so people at the centre in Dublin, London, New York, Tokyo, Hong Kong and Shanghai. This does not mean that we seek to diminish the strength of our operating brands, but rather to learn from one another. Our objective is to maximise the added value for our clients with their businesses and our people with their careers.
Many of our initiatives are possible because of the scale on which we now operate. In the optimum use of property, in information technology and in procurement generally, we are able to achieve efficiencies that would be beyond the reach of any individual operating company.
Distributions to share owners1 £m
Buy-backs
Dividends paid
20092008200720062005
600 3.6% 4.8% 6.6% 4.7% 3.4%
0
150
300
450
3.4%1 Sum of share buy-backs and dividends paid divided by average shares in issue for the
relevant period, as a % of the average share price for the relevant period.
WPP AnnuAl rePort 2009 26
How we’re doingletter to share owners
in procurement people, processes and technology, our goal is to maintain the ratio of bought-in costs to revenue at around 15%, by leveraging Group scale across all of our major markets, and focusing on those expenditure categories most favourable for global, regional and local supply contracts, such as in IT, telecoms, travel, professional services, facilities and production.
IT
In IT we continue to consolidate our core technology infrastructure with the objectives of reducing cost and improving quality. This enables our operating companies to concentrate their efforts on client-related developments and other internal business-focused applications.
The convergence of mobile, voice and data communications has allowed us to take advantage of new offerings in the telecommunications sector to drive efficiencies and to provide enhanced support to our increasingly mobile workforce.
Practice development
Finally, in practice development we continue to develop horizontal initiatives in a focused set of high-potential areas across our vertical operating brands: in media, healthcare, new technologies, new faster-growing markets, internal communications, retail, entertainment and media, financial services, hi-tech and telecommunications and corporate responsibility. Specifically, we continue to invest in sharing insights and developing initiatives through WPP Digital (in digital marketing and media) and The Store (in distribution and retail).
In key geographic markets we are increasingly co-ordinating our activities through WPP Country Managers. We continue to believe that increasing co-ordination is required between our brands at the country and global levels, as the arguments for investment in regional management become weaker. As experience has demonstrated, however, the activities of Country Managers must be closely aligned and monitored. In addition, we are increasing the number of WPP Global Client Leaders to co-ordinate our efforts on behalf of clients and to ensure they get maximum benefit from their relationships with WPP operating brands. We are focused currently on our top 30 global clients accounting for around a third of total revenues and where our revenues declined at less than 2.0% in 2009, much lower than the overall fall of 8.1%.
Furthermore, we continue to encourage internal strategic alliances and promote co-operation. Practice development initiatives have therefore been reinforced in such areas as healthcare, retail, internal communications and media and entertainment. This has been especially important to develop
rewards to our people and to attract outstanding talent from elsewhere. This is going to be a key strategic priority for us. Our competition is, sometimes, not so rigorous in evaluating and rewarding performance – for example, taking advantage of sharp falls in share prices to re-price or issue options or giving limited disclosure to investors of compensation plan details.
Communications
A communications services company must be a model of excellent external and internal communications. To that end, we accelerate understanding of the Group’s vast resources with a raft of regular communications through our websites and in print: our monthly public online news bulletin, e.wire; our consistently award-winning global newspaper, The WIRE; our annual Atticus Journal of original marketing thinking; the WPP Reading Room, an extensive online library of thinkpieces (both public and original) from WPP professionals worldwide; our online FactFiles profiling Group resources/companies/products; our annual Corporate Responsibility Report and this consistently award-winning Annual Report.
Property management
2009 was a difficult year with our property portfolio, but we were able to reduce it by 4% to 23.7 million sq ft; this was in the context of revenue down 8% and staff numbers during the year down 12.3%. It was not possible to adjust the property portfolio in line with the recession and, as a result, average square foot per head is up from 218 sq ft in 2008 to 230 sq ft in 2009 and establishment cost-to-revenue ratio is up from 6.9% to 8.0%, effectively back, unfortunately, at the relative levels of 2002 and 2003, albeit with a bigger business following the acquisitions, for example, of Grey and TNS.
Our key property task over the next three years is to manage the portfolio to bring these ratios back into line and return to our medium-term objective of 7% for the establishment cost-to-revenue ratio. We will achieve this by using the upcoming lease breaks to reduce space and to take advantage of the current market to negotiate better terms on any lease extensions.
Procurement
In procurement, we continue to set ourselves the goal of being the undisputed leader of procurement practice in the global advertising and marketing services industry.
We aim to benchmark ourselves regularly against our competitors and our clients. Through intensified investment
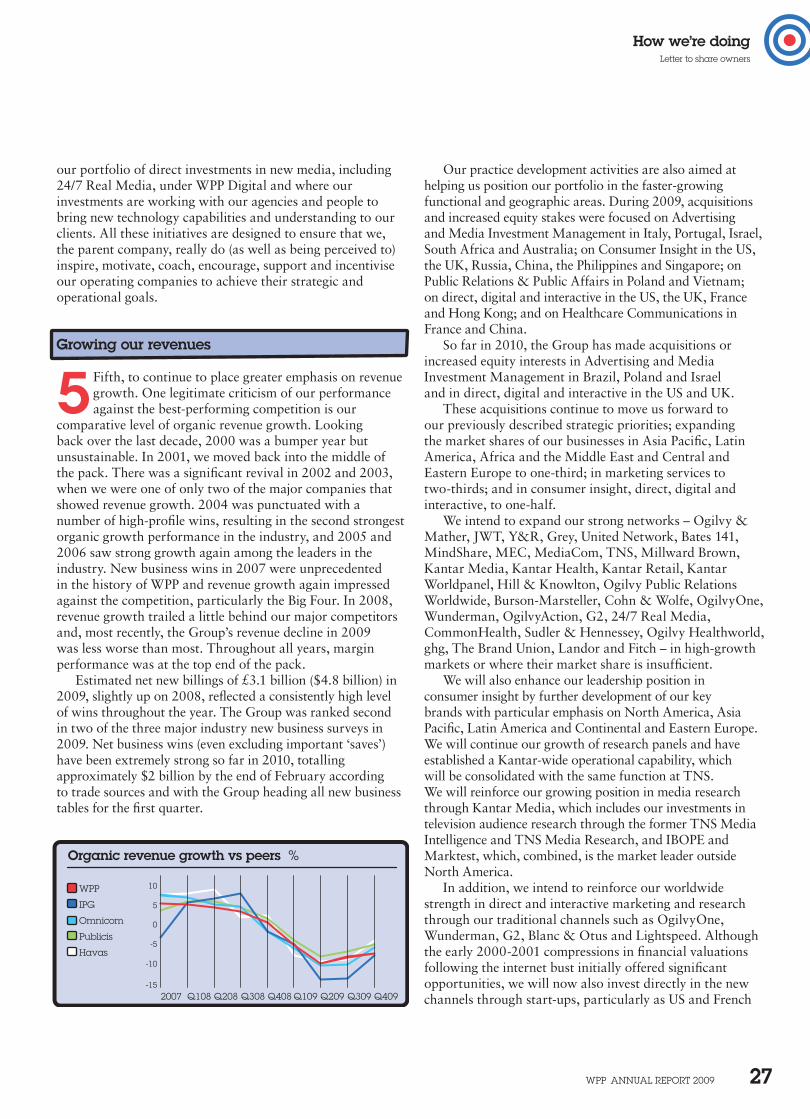
WPP AnnuAl rePort 2009 27
How we’re doingletter to share owners
Our practice development activities are also aimed at helping us position our portfolio in the faster-growing functional and geographic areas. During 2009, acquisitions and increased equity stakes were focused on Advertising and Media Investment Management in Italy, Portugal, Israel, South Africa and Australia; on Consumer Insight in the US, the UK, Russia, China, the Philippines and Singapore; on Public Relations & Public Affairs in Poland and Vietnam; on direct, digital and interactive in the US, the UK, France and Hong Kong; and on Healthcare Communications in France and China.
So far in 2010, the Group has made acquisitions or increased equity interests in Advertising and Media Investment Management in Brazil, Poland and Israel and in direct, digital and interactive in the US and UK.
These acquisitions continue to move us forward to our previously described strategic priorities; expanding the market shares of our businesses in Asia Pacific, Latin America, Africa and the Middle East and Central and Eastern Europe to one-third; in marketing services to two-thirds; and in consumer insight, direct, digital and interactive, to one-half.
We intend to expand our strong networks – Ogilvy & Mather, JWT, Y&R, Grey, United Network, Bates 141, MindShare, MEC, MediaCom, TNS, Millward Brown, Kantar Media, Kantar Health, Kantar Retail, Kantar Worldpanel, Hill & Knowlton, Ogilvy Public Relations Worldwide, Burson-Marsteller, Cohn & Wolfe, OgilvyOne, Wunderman, OgilvyAction, G2, 24/7 Real Media, CommonHealth, Sudler & Hennessey, Ogilvy Healthworld, ghg, The Brand Union, Landor and Fitch – in high-growth markets or where their market share is insufficient.
We will also enhance our leadership position in consumer insight by further development of our key brands with particular emphasis on North America, Asia Pacific, Latin America and Continental and Eastern Europe. We will continue our growth of research panels and have established a Kantar-wide operational capability, which will be consolidated with the same function at TNS. We will reinforce our growing position in media research through Kantar Media, which includes our investments in television audience research through the former TNS Media Intelligence and TNS Media Research, and IBOPE and Marktest, which, combined, is the market leader outside North America.
In addition, we intend to reinforce our worldwide strength in direct and interactive marketing and research through our traditional channels such as OgilvyOne, Wunderman, G2, Blanc & Otus and Lightspeed. Although the early 2000-2001 compressions in financial valuations following the internet bust initially offered significant opportunities, we will now also invest directly in the new channels through start-ups, particularly as US and French
our portfolio of direct investments in new media, including 24/7 Real Media, under WPP Digital and where our investments are working with our agencies and people to bring new technology capabilities and understanding to our clients. All these initiatives are designed to ensure that we, the parent company, really do (as well as being perceived to) inspire, motivate, coach, encourage, support and incentivise our operating companies to achieve their strategic and operational goals.
Growing our revenues
5 Fifth, to continue to place greater emphasis on revenue growth. One legitimate criticism of our performance against the best-performing competition is our
comparative level of organic revenue growth. Looking back over the last decade, 2000 was a bumper year but unsustainable. In 2001, we moved back into the middle of the pack. There was a significant revival in 2002 and 2003, when we were one of only two of the major companies that showed revenue growth. 2004 was punctuated with a number of high-profile wins, resulting in the second strongest organic growth performance in the industry, and 2005 and 2006 saw strong growth again among the leaders in the industry. New business wins in 2007 were unprecedented in the history of WPP and revenue growth again impressed against the competition, particularly the Big Four. In 2008, revenue growth trailed a little behind our major competitors and, most recently, the Group’s revenue decline in 2009 was less worse than most. Throughout all years, margin performance was at the top end of the pack.
Estimated net new billings of £3.1 billion ($4.8 billion) in 2009, slightly up on 2008, reflected a consistently high level of wins throughout the year. The Group was ranked second in two of the three major industry new business surveys in 2009. Net business wins (even excluding important ‘saves’) have been extremely strong so far in 2010, totalling approximately $2 billion by the end of February according to trade sources and with the Group heading all new business tables for the first quarter.
Organic revenue growth vs peers %
WPP
IPG
Omnicom
Publicis
Havas
Q309 Q409Q209Q109Q308 Q408Q208Q1082007-15
-10
-5
5
0
10
WPP AnnuAl rePort 2009 28
How we’re doingletter to share owners
Putter as WPP’s worldwide creative director. Under John’s guidance, gratifying and discernible progress continues.
2009 saw the third annual WPPED Cream awards, our internal award scheme for outstanding work across the Group. Your Company also amassed the second largest points tally at the 2009 advertising and marketing services festival in Cannes for the second year in a row and narrowed the gap to first place (please refer to our website, www.wpp.com, for detailed, accurate calculations).
At the same time we are committed to achieving all these objectives as a significantly responsible corporate citizen of the world at large and in the communities in which we operate.
As a parent company, we continue to develop practical principles and policies for our companies’ charitable giving and services to the environment, education, the arts and healthcare based on best practice guidelines. We conservatively calculate that the WPP organisation contributed an estimated £14.9 million worth of time, skills, materials and money to social and community causes in 2009. A summary of the Group’s approach to corporate responsibility can be found on pages 122 to 131. Doing good is not altruism or charity, it is good business, when like us you are focused on long-term total share owner return.
Please also see our annual and unique (in our industry) Corporate Responsibility Report on the work our clients and our people do in these increasingly important areas.
Future challenges
A colossal amount remains to be done – challenging our clients, and therefore us. It seems certain that once these objectives are achieved, they will be replaced by new ones. As companies grow in size, most chairmen and CEOs become concerned that their organisations may become flabby, slow to respond, bureaucratic and sclerotic. Any sensible business leader aggressively resists this phenomenon; we all seek the benefits of size and scale without sacrificing the suppleness and energy of a smaller firm. And, for the first time, new technologies now make this possible on a global platform. WPP wants the scale and resources of the largest firm together with the heart and mind of a small one.
And finally...
2009 was a year when no sensible company took anything – or anyone – for granted. Just because it had worked before, it didn’t mean it would work again. Just because a consumer had been a brand loyalist for nine consecutive years, it didn’t mean you should count on his or her custom for a 10th. Everything needed re-examination: not for the sake of making aimless change; much more for the sake of making certain.
Though always uncomfortable, years when all accepted
valuations in search, for example, are still prohibitive, despite the financial crisis. Other opportunities will be sought to enhance our online capabilities.
Lastly, we will continue to develop our specialist expertise in areas such as healthcare, retail and interactive and to identify new high-growth areas.
Creativity remains paramount
6 It seems entirely right that we should open this section with a tribute to Robyn Putter, a towering creative figure in our industry who sadly died at a young age
on 1 March 2010. First in his own South African agency, then for more
than 30 years with Ogilvy & Mather and latterly as creative head at WPP, Robyn practised, preached and as a person epitomised all that is most admirable in the creative function. Endlessly inventive himself, his benign influence reached every part of Ogilvy – and ultimately the whole Group. As principled as he was creative, he set the highest of standards – and inspired thousands around the world to meet them. His influence, happily, is with us still.
Robyn was centrally important to us because he represented, championed and endlessly encouraged the improvement in the quality of creative work throughout the Group – which continues to be our sixth objective. Despite the growing importance of co-ordinated communications and price effectiveness, the quality of the work remains and will remain paramount. If you drew a graph plotting creative awards (as a proxy for creativity) against margins for any group of agencies, there would be a very strong correlation. The more awards, the stronger the margins. The client’s procurement department fades into the background when the work is strong. Of the three things we do – strategic thinking, creative execution and co-ordination – creative execution is undoubtedly the most important, and that means creativity in its broadest sense.
Clients look for creative thinking and output not just from advertising agencies, public relations and design companies, but also from our media companies and our research companies. Millward Brown remains arguably one of our most creative brands. Witness the BrandZ™ Top 100 Most Powerful Brands Study published annually with the Financial Times.
We intend to achieve this objective by stepping up our training and development programs; by recruiting the finest external talent; by celebrating and rewarding outstanding creative success tangibly and intangibly; by acquiring strong creative companies; and by encouraging, monitoring and promoting our companies’ achievements in winning creative awards.
In pursuing these aims, the Group now looks for leadership to John O’Keeffe, who in 2008 succeeded Robyn
WPP AnnuAl rePort 2009 29
How we’re doingletter to share owners
Forward-looking statements
In connection with the provisions of the Private Securities litigation reform Act of 1995 (the ‘reform Act’), the Company may include forward-looking statements (as defined in the reform Act) in oral or written public statements issued by or on behalf of the Company. these forward-looking statements may include, among other things, plans, objectives, projections and anticipated future economic performance based on assumptions and the like that are subject to risks and uncertainties. As such, actual results or outcomes may differ materially from those discussed in the forward-looking statements. Important factors which may cause actual results to differ include but are not limited to: the unanticipated loss of a material client or key personnel, delays or reductions in client advertising budgets, shifts in industry rates of compensation, government compliance costs or litigation, natural disasters or acts of terrorism, the Company’s exposure to changes in the values of other major currencies (because a substantial portion of its revenues are derived and costs incurred outside of the uK) and the overall level of economic activity in the Company’s major markets (which varies depending on, among other things, regional, national and international political and economic conditions and government regulations in the world’s advertising markets). In addition, you should consider the risks described under the caption ‘Principal risks and uncertainties’ on pages 117 and 118, which could also cause actual results to differ from forward-looking information. In light of these and other uncertainties, the forward-looking statements included in this document should not be regarded as a representation by the Company that the Company’s plans and objectives will be achieved. the Company undertakes no obligation to update or revise any such forward-looking statements, whether as a result of new information, future events or otherwise.
practice is subjected to fierce scrutiny and challenge invariably turn out to be fruitful ones – and 2009 was no exception. The open-mindedness and good-humoured resilience of WPP companies has been exemplary and their response full-blooded. Inventiveness soared. Their clients are by far the best witnesses to this claim – but the results of creative awards, in all disciplines and in all parts of the world, confirm a remarkable advance, over both previous years and our principal competitors.
All too easily, such an admirable response to tough times tends to get de-humanised – it gets disguised in amalgamated figures and broad generalities. So we would like to close this report by reminding all our audiences of a permanent truth of our business. It is a business that is wholly dependent on the intelligence, the talent, the integrity and the determination of each individual member of each of our companies. Never has that been more apparent – or more welcome – than in 2009. We thank and salute them all.
Philip LaderChairman
Sir Martin SorrellGroup chief executive
Paul RichardsonGroup finance director
* this letter to share owners should be read in conjunction with and as part of the management report set out in the section headed Directors’ report on pages 109 to 121.

WPP AnnuAl rePort 2009 31
Agency networks p32-50
Media Investment Management p51-56
Consumer Insight p57-61
Public relations & Public Affairs p62-64
Branding & Identity p65-68
Healthcare Communications p69-71
Specialist Communications p72-74
WPP Digital p75-77
Reports from our operating brands
WPP AnnuAl rePort 2009 32
How we’re doing
Ogilvy Group Ogilvy & Mather
Report by Miles Young (below)
Chief executive officer
I subscribe to the Chinese view that ‘crisis’ spells opportunity: and that “when the going gets tough, the tough get going.”
It put into relief the basic reason we are in business – to produce superb work for our clients which is outstandingly effective – great work that works. Sometimes, years of growth dull the edges of such simplicity. But driven by this mantra, we spent the year laying the groundwork for a formidable bounce back.
Despite all the circumstances, we showed that we were a feisty business with winning ways. In this industry there was just one large global pitch in 2009, for UPS. We won this business in September, the culmination of months of effort. We are proud to have a brand like UPS, with a wonderful heritage and an ambitious future, join our portfolio of clients.
One of the reasons for this success is that our 360 business model – offering ‘deep integration’ at a strategic level – was able to leverage creative, planning, digital, analytical, and executional assets in a way which addressed the deeper business problem, not just a ‘communications’ lens of it. By the end of the year our North American business triumphed in two other major pitches – for CDW and Citizens Bank. In each case, the same lessons applied.
Two other clients deserve special mention in 2009. IBM, thanks to its own visionary leadership, provided the platform for the acclaimed Smarter Planet program. This body of
Agency networkswork breaks new ground in many ways, building a digitally-enabled system of content which roots communication at the center and not at the periphery of the company’s value system.
Coca-Cola was our fastest-growing client in 2009, awarding us multiple assignments, at the center and in markets around the world. Our work for them is fresh and at the edge of cultural insight and expression.
In 2009 we appointed new leaders who are writing Ogilvy’s next chapter. Tham Khai Meng moved from Singapore to our global headquarters in New York to take on the role of worldwide creative director: we share the same office. Gloria Gibbons and Donna Tuths were appointed joint worldwide CEOs of Ogilvy Healthworld. Chris Graves stepped into Marcia Silverman’s role as CEO of Ogilvy Public Relations in January 2010, while Marcia Silverman took on the new role of chair. PRWeek named Ogilvy PR as an agency to watch in 2010, citing that Chris Graves “will lead the firm into a new era that can provide integrated programs for global clients who need them”. John Shaw and Colin Mitchell were named joint worldwide planning directors, and Tim Broadbent was appointed effectiveness director. Marie Claire Barker was named chief talent officer. John Seifert now runs Ogilvy North America. Carla Hendra is heading up our new Global Strategy & Innovation Practice. Gustavo Martinez relocated from Mexico to New York to be our first global new business director. What is gratifying is that none of these leaders is new to Ogilvy. They have continuity and carry on our culture, even as we gain from their new energy and insight.
People are the only important asset in this industry. And now, more than ever, our business requires people who really understand integration, who ‘get’ the new paradigms of content that are emerging, and who have experience in different disciplines. Fortunately, as a 360 degree agency, we have a very high share of these people. But in the past year we managed to attract and hire additional world-class senior talent in management, in creative, in digital and in strategic planning in particular who will help us drive the business forward.
Around the world, we approached the recession proactively by responding with targeted new offerings. Launched in 2008, our Recession Marketing Practice continued to give practical counsel to our clients on how best to cope as the recession gathered force in 2009, and helped them plan for recovery; and its publications have been praised for establishing industry leadership in this area.
We launched OgilvyEarth, a first-of-its-kind global sustainability practice. It is driven by an outstanding team from around the world, representing advertising, public relations, interactive, activation, entertainment and other of our disciplines. It has helped companies such as BP, Coca-Cola, DuPont, Qantas and Tetra Pak develop a vision of sustainability that drives business results.
WPP AnnuAl rePort 2009 33
How we’re doingAgency networks
of the Year at Spikes Asia. Marketing magazine named Ogilvy & Mather Singapore Creative Agency of the Year and bestowed quadruplet honors to Ogilvy Hong Kong as Creative Agency of the Year, Digital Agency of the Year, Direct Marketing Agency of the Year and PR Agency of the Year.
In Latin America, our offices in Mexico, Honduras, Puerto Rico and Panama were singled out as Agency of the Year by key industry organizations in their countries. At the Eurobest Festival, Ogilvy & Mather Paris was named European Agency of the Year. OgilvyOne Portugal was given the same honor at the 2009 SAPO Awards, Portugal’s specialist digital communications awards festival. Ogilvy Germany was named Agency of the Year by German DDP dialogue marketing award show for the fourth consecutive year.
AdFocus named Ogilvy Johannesburg 2009 Advertising Agency of the Year, and Ogilvy Africa African Agency Network of the Year. Ogilvy Johannesburg was also named
Gauteng Agency of the Year at the 2009 AdReview Awards.OgilvyOne Worldwide was named Direct Agency of the
Year for 2009 by BtoB magazine. Ogilvy Public Relations was named Large Agency of the Year at the PRNews Platinum PR Awards and Asia Pacific Network of the Year by the Asia Pacific PR Awards.
It is perhaps not surprising that one of our success stories in 2009 was RedWorks. In creating this as a ‘production dependent’ we have arrived at a recipe which clients find very compelling. Utilizing low-cost hubs in locations like Bangladesh, Argentina and Slovakia, as well as other WPP offerings, RedWorks has delivered significant cost savings to many of them.
It provides all the cost benefits of a decoupled solution with the added value of a brand-centric approach. In other words, decouple for cost savings, but re-couple for quality assurance. We have also developed RedWorks as a project-based, creative offering that supports Ogilvy creative teams as well as providing a ‘small bucket shop creative offer for non-Ogilvy clients.’
My colleagues will detail the performance of the disciplines for which they are responsible below. Meanwhile, as I look to 2010 and indeed to the next decade, I am full of confidence. Not only do we have all the hard assets, from our specialist-in-discipline expertise to our ownership of the high ground of branding; from our proven tool-kits to a legion of innovations; but our soft assets – the Ogilvy culture which makes us a global family, demonstrably unique in touch and feel – are a winning recipe.
Our Global Strategy & Innovation Practice, launched in January 2010, was created specifically to offer clients multidisciplinary strategic services that combine creativity with rigorous effectiveness. We seek to raise our client engagement beyond just producing solutions, to the level of diagnosing and solving business problems.
We launched a global data practice, headed by Dimitri Maex, which is driving our ambition in ‘data’. This is now one of our fastest-growing specialties. Our Digital Labs around the world continue to create breakthrough campaigns and applications in all areas of digital. From a ‘stealth’ mobile phone application audible only to people under 25 to help Fanta engage its teenage customer base, to using augmented reality to help Lenovo sells laptops to Chinese college students, to hosting an ‘Outernet’ conference that brought together the foremost experts in digital out-of-home and point-of-sale technology, we are helping clients stay at the leading edge of digital technology.
All of this depends, of course, on creativity. After all, David Ogilvy founded this business as a creative business, first and foremost. In 2009, with a full-time worldwide creative director, we have made good progress.
One very noticeable example was the high profile we gained through our 360 degree campaign to promote the United Nation’s Copenhagen climate change summit in December 2009. ‘Hopenhagen’ made an impact not just there, but with our peers in the global creative community.
When you do great work, the industry notices and responds. Our creative teams captured a major share of the world’s awards for creative excellence and marketing effectiveness: 40 London International Awards; 31 Cannes Lions; 19 Clios; 16 DMA Echoes; seven One Show Pencils; and 71 Effies for our work in multiple countries as diverse as Australia, Dubai, Ecuador, France, Guatemala, Hong Kong, India, Malaysia, Mexico, New Zealand, Peru, Poland, Ukraine, the US, Uruguay, Singapore, Spain and Sri Lanka.
Our leadership in many of the world’s developing and fast-growing markets is corroborated by the various industry analysts in these regions. Ogilvy & Mather Asia Pacific was the most-awarded agency in the region, according to the first-ever Asia Pacific Gunn Report. Ogilvy India was voted the No.1 creative agency in the region by Brand Equity Ad Agency Reckoner and named Agency of the Year at the India Effie Awards. Ogilvy & Mather Thailand was named Agency
As I look to 2010 and indeed to the next decade, I am full of confidence
We seek to raise our client engagement beyond just producing solutions, to the level of diagnosing and solving business problems

WPP AnnuAl rePort 2009 34
How we’re doingAgency networks
and São Paulo, we bring innovative applications and technologies to market with our clients. Among the innovations currently featured in the lab: how to systematically measure the impact of social media; how to use augmented reality in mobile search applications; and digital point-of-sale technologies that deliver targeted messaging. The lab is gaining traction. Global clients have commissioned us to create innovation labs on their own premises, and The Mobile Marketing Association named us as the top global agency for innovation.
The future of OgilvyOne lies in our unique combination of creativity and performance results. Our mission is to help build the volume and value of our clients’ customers. And data will be the fuel. To this end, in 2009 we launched the Global Data Practice – a global team of over 250 data and analytics specialists devoted to finding customer insights and connecting them to the cash register. This will form a critical platform for future growth as it underscores our rallying cry: ‘We sell, or else.’
Ogilvy Public Relations Worldwide
Report by Christopher Graves (below)
Global chief executive officer and Marcia Silverman (below right)
Chair
In a year considered the worst for communications since 2001, Ogilvy PR drew upon its highly-diversified, global network to deliver solid results. While some of its more than
OgilvyOne Worldwide
Report by Brian Fetherstonhaugh (below)
Chairman and chief executive officer
Despite the highly challenging economic environment, OgilvyOne was able to grow in critical areas and continue to shape ourselves for the future. Digital marketing is the single greatest growth pillar for OgilvyOne, and we must
80 offices around the world were hit hard, others soared to record profits, reinforcing the strength of a genuine network with broad-reaching, yet deep local roots.
In the midst of the economic storm, Ogilvy PR played a central role in the Ogilvy & Mather group initiative designed to lead clients to opportunities in the downturn,
relentlessly innovate to stay ahead of the pack. Forrester ranked OgilvyOne among its top echelon of leaders in its 2009 report, and OgilvyInteractive was recognized as the No.1 largest digital agency network by RECMA. Neo@Ogilvy, our innovative global search, digital media and performance marketing offering, was once again the fastest-growing part of the company.
Digital work from London, Dusseldorf and New York was honored at Cannes. At the 2009 global DMA Echo Awards, OgilvyOne won 16 medals, more than any other agency network. OgilvyOne achieved agency-of-the-year status in Germany, Greece, Hong Kong and Portugal. The Mobile Marketing Association named Ogilvy the top global agency for innovation. And, in North America, we were named Business-to-Business Agency of the Year by BtoB magazine.
Even more rewarding than industry recognition was client success: in 2009 we added significant new digital assignments from BT, Nestlé, Purina, Sony, Unilever, Yahoo! International and Zurich Financial Group.
One way we plan to stay at the leading edge of digital marketing is through the Ogilvy Digital Lab network. From our labs in Singapore, New York, London, Beijing
WPP AnnuAl rePort 2009 35
How we’re doingAgency networks
called Marketing in a Recession, which won this year’s WPP Atticus Award for Public Relations. Indeed it was a banner year for Ogilvy PR in terms of awards. We claimed several Atticus honors, three of the four WPPED Cream Awards for PR, and were named Asia Pacific Agency of the Year and Large Agency of the Year by PR News and The Holmes Report respectively. Many local offices won honors in their own right as well.
The specialist social media offering from Ogilvy PR, 360 Degree Digital Influence, continued to drive the transformation of client thinking while accelerating the internal training of hundreds of our people worldwide. The specialty continued to recruit top talent, created new tools and measurement methodologies and, in an industry-leading move, added resources in digital healthcare and pioneering digital practices in closely-regulated arenas. In fact, two leaders from the group, global managing director John Bell and author of Personality Not Included, Rohit Bhargava testified as expert witnesses in the US Food & Drug Administration hearings on social media in healthcare.
Healthcare and health policy specialist offerings continued to underpin the growth of Ogilvy PR, from large wins in Washington, DC (National Institutes of Health, Blue Cross Blue Shield Association and the Centers for Disease Control and Prevention), to cutting-edge, molecular medicine communications at Feinstein Kean Health, to a
fast-growing 360-degree practice in Asia Pacific called Ogilvy Health, to a joint venture with Shire Health in London, Ogilvy Health PR.
Collaborative management of global clients helped drive Ogilvy PR’s relative success in 2009. Beyond internal connections of the network, Ogilvy PR partnered with other WPP agencies to win LG Electronics, create new value propositions for Ford, and continue to service DuPont, Unilever and Savvis globally. Meanwhile, 75% of clients polled in a 2009 survey said they found their Ogilvy PR experience to be far superior compared with other agencies and that they would recommend Ogilvy PR to others.
Confident in the state of the public relations industry, Ogilvy PR will further provide 360 degree integrated solutions to clients, noting in The Economist, “When you look at advertising versus public relations, it’s not going to be those clearly defined silos. It may be indistinguishable at some point where one ends and the other begins”.
Ogilvy Healthworld
Report by Donna Tuths (left) and Gloria Gibbons (right)
Joint worldwide Ceos
Collaborative management of global clients helped drive Ogilvy PR’s relative success in 2009
In 2009 we focused on strengthening Ogilvy Healthworld as a truly global network, with a clear global proposition for customers and with an effective and responsive infrastructure.
We established GBM Pharma, a senior management team comprised of leaders for each of our key global clients. The focus will be on developing strategic partnerships and orchestrating talent, without geographical boundaries and from a channel-neutral perspective, to best deliver against our clients’ marketing and communications needs. We have experienced growth on Bayer, Pfizer and Boehringer Ingelheim.
Our clients are centralizing their marketing and their spend to hub offices – we have created global and regional hub offices in response: in New York, London, Paris, Mexico and Singapore. Despite the economic challenges of last year, it is worthwhile to note that OHW UK delivered strong growth in 2009, not least due to its role as an international hub and its collaborative 360 working model.
Working with Ogilvy & Mather regional management in Asia Pacific and Latin America we are establishing a stronger health presence in those regions too. We are diversifying the current offer and raising talent skills, as well as sharing expertise and client connections.
As we are increasingly seeing scientific expertise, data management and stakeholder mapping being requested and valued by our clients, for Rx (prescription medicines) brand positioning and market access, we are committed to ensuring that medical education is established as a core offer. A worldwide medical education plan has been launched to bed the discipline strongly across all our regions.
And let’s not forget that clients buy us for ideas – creative, strategic and commercial – and the fact that we can turn these ideas into cost-effective programs that have a real impact.
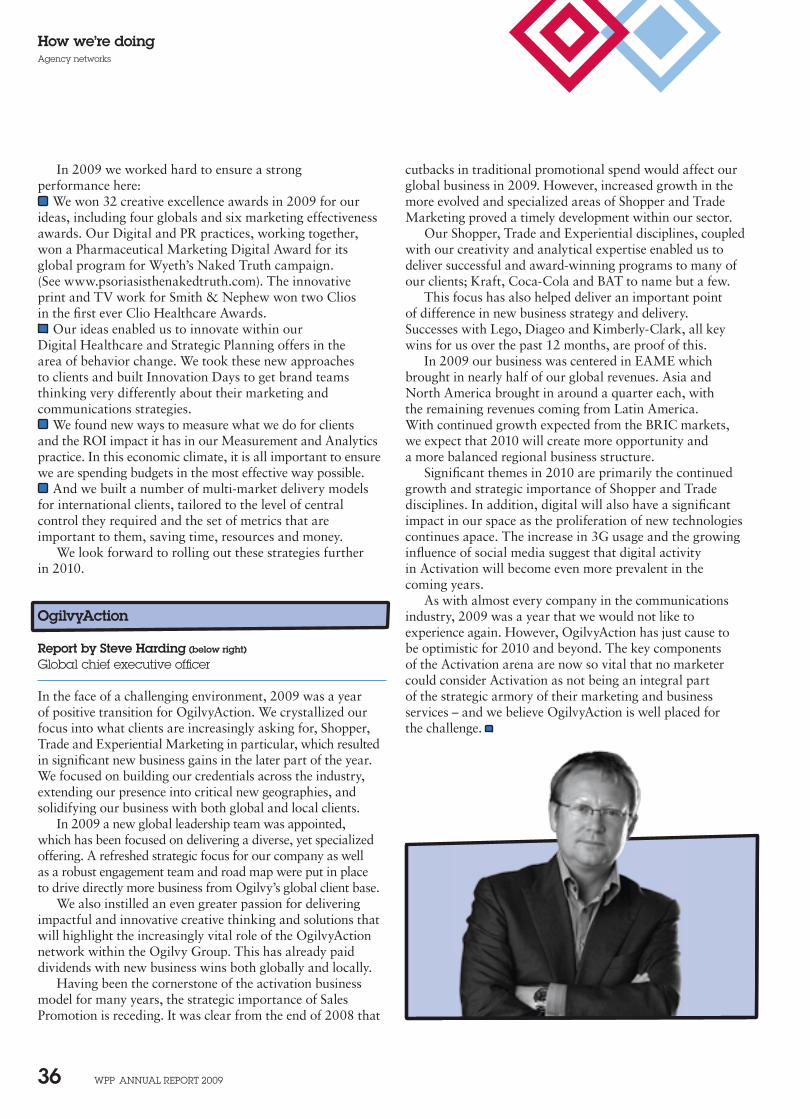
WPP AnnuAl rePort 2009 36
How we’re doingAgency networks
In 2009 we worked hard to ensure a strong performance here:
We won 32 creative excellence awards in 2009 for our ideas, including four globals and six marketing effectiveness awards. Our Digital and PR practices, working together, won a Pharmaceutical Marketing Digital Award for its global program for Wyeth’s Naked Truth campaign. (See www.psoriasisthenakedtruth.com). The innovative print and TV work for Smith & Nephew won two Clios in the first ever Clio Healthcare Awards.
Our ideas enabled us to innovate within our Digital Healthcare and Strategic Planning offers in the area of behavior change. We took these new approaches to clients and built Innovation Days to get brand teams thinking very differently about their marketing and communications strategies.
We found new ways to measure what we do for clients and the ROI impact it has in our Measurement and Analytics practice. In this economic climate, it is all important to ensure we are spending budgets in the most effective way possible.
And we built a number of multi-market delivery models for international clients, tailored to the level of central control they required and the set of metrics that are important to them, saving time, resources and money.
We look forward to rolling out these strategies further in 2010.
OgilvyAction
Report by Steve Harding (below right)
Global chief executive officer
In the face of a challenging environment, 2009 was a year of positive transition for OgilvyAction. We crystallized our focus into what clients are increasingly asking for, Shopper, Trade and Experiential Marketing in particular, which resulted in significant new business gains in the later part of the year. We focused on building our credentials across the industry, extending our presence into critical new geographies, and solidifying our business with both global and local clients.
In 2009 a new global leadership team was appointed, which has been focused on delivering a diverse, yet specialized offering. A refreshed strategic focus for our company as well as a robust engagement team and road map were put in place to drive directly more business from Ogilvy’s global client base.
We also instilled an even greater passion for delivering impactful and innovative creative thinking and solutions that will highlight the increasingly vital role of the OgilvyAction network within the Ogilvy Group. This has already paid dividends with new business wins both globally and locally.
Having been the cornerstone of the activation business model for many years, the strategic importance of Sales Promotion is receding. It was clear from the end of 2008 that
cutbacks in traditional promotional spend would affect our global business in 2009. However, increased growth in the more evolved and specialized areas of Shopper and Trade Marketing proved a timely development within our sector.
Our Shopper, Trade and Experiential disciplines, coupled with our creativity and analytical expertise enabled us to deliver successful and award-winning programs to many of our clients; Kraft, Coca-Cola and BAT to name but a few.
This focus has also helped deliver an important point of difference in new business strategy and delivery. Successes with Lego, Diageo and Kimberly-Clark, all key wins for us over the past 12 months, are proof of this.
In 2009 our business was centered in EAME which brought in nearly half of our global revenues. Asia and North America brought in around a quarter each, with the remaining revenues coming from Latin America. With continued growth expected from the BRIC markets, we expect that 2010 will create more opportunity and a more balanced regional business structure.
Significant themes in 2010 are primarily the continued growth and strategic importance of Shopper and Trade disciplines. In addition, digital will also have a significant impact in our space as the proliferation of new technologies continues apace. The increase in 3G usage and the growing influence of social media suggest that digital activity in Activation will become even more prevalent in the coming years.
As with almost every company in the communications industry, 2009 was a year that we would not like to experience again. However, OgilvyAction has just cause to be optimistic for 2010 and beyond. The key components of the Activation arena are now so vital that no marketer could consider Activation as not being an integral part of the strategic armory of their marketing and business services – and we believe OgilvyAction is well placed for the challenge.
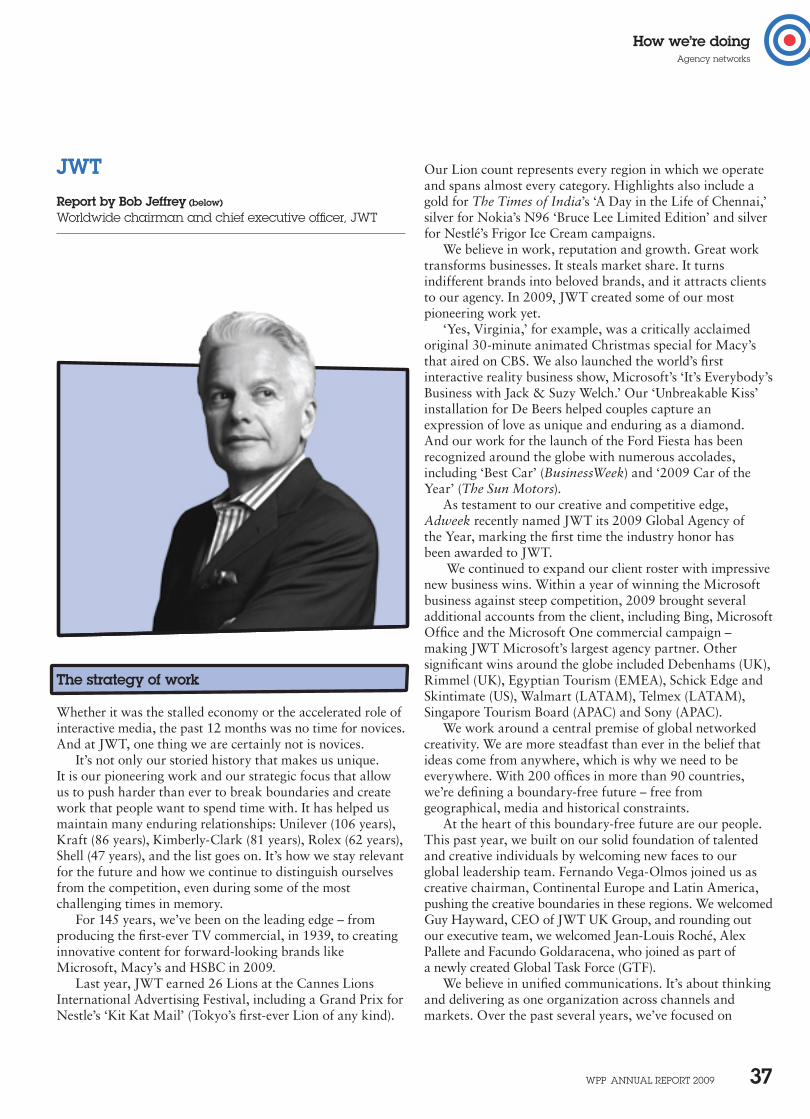
WPP AnnuAl rePort 2009 37
How we’re doingAgency networks
JWTReport by Bob Jeffrey (below)
Worldwide chairman and chief executive officer, JWt
The strategy of work
Whether it was the stalled economy or the accelerated role of interactive media, the past 12 months was no time for novices. And at JWT, one thing we are certainly not is novices.
It’s not only our storied history that makes us unique. It is our pioneering work and our strategic focus that allow us to push harder than ever to break boundaries and create work that people want to spend time with. It has helped us maintain many enduring relationships: Unilever (106 years), Kraft (86 years), Kimberly-Clark (81 years), Rolex (62 years), Shell (47 years), and the list goes on. It’s how we stay relevant for the future and how we continue to distinguish ourselves from the competition, even during some of the most challenging times in memory.
For 145 years, we’ve been on the leading edge – from producing the first-ever TV commercial, in 1939, to creating innovative content for forward-looking brands like Microsoft, Macy’s and HSBC in 2009.
Last year, JWT earned 26 Lions at the Cannes Lions International Advertising Festival, including a Grand Prix for Nestle’s ‘Kit Kat Mail’ (Tokyo’s first-ever Lion of any kind).
Our Lion count represents every region in which we operate and spans almost every category. Highlights also include a gold for The Times of India’s ‘A Day in the Life of Chennai,’ silver for Nokia’s N96 ‘Bruce Lee Limited Edition’ and silver for Nestlé’s Frigor Ice Cream campaigns.
We believe in work, reputation and growth. Great work transforms businesses. It steals market share. It turns indifferent brands into beloved brands, and it attracts clients to our agency. In 2009, JWT created some of our most pioneering work yet.
‘Yes, Virginia,’ for example, was a critically acclaimed original 30-minute animated Christmas special for Macy’s that aired on CBS. We also launched the world’s first interactive reality business show, Microsoft’s ‘It’s Everybody’s Business with Jack & Suzy Welch.’ Our ‘Unbreakable Kiss’ installation for De Beers helped couples capture an expression of love as unique and enduring as a diamond. And our work for the launch of the Ford Fiesta has been recognized around the globe with numerous accolades, including ‘Best Car’ (BusinessWeek) and ‘2009 Car of the Year’ (The Sun Motors).
As testament to our creative and competitive edge, Adweek recently named JWT its 2009 Global Agency of the Year, marking the first time the industry honor has been awarded to JWT.
We continued to expand our client roster with impressive new business wins. Within a year of winning the Microsoft business against steep competition, 2009 brought several additional accounts from the client, including Bing, Microsoft Office and the Microsoft One commercial campaign – making JWT Microsoft’s largest agency partner. Other significant wins around the globe included Debenhams (UK), Rimmel (UK), Egyptian Tourism (EMEA), Schick Edge and Skintimate (US), Walmart (LATAM), Telmex (LATAM), Singapore Tourism Board (APAC) and Sony (APAC).
We work around a central premise of global networked creativity. We are more steadfast than ever in the belief that ideas come from anywhere, which is why we need to be everywhere. With 200 offices in more than 90 countries, we’re defining a boundary-free future – free from geographical, media and historical constraints.
At the heart of this boundary-free future are our people. This past year, we built on our solid foundation of talented and creative individuals by welcoming new faces to our global leadership team. Fernando Vega-Olmos joined us as creative chairman, Continental Europe and Latin America, pushing the creative boundaries in these regions. We welcomed Guy Hayward, CEO of JWT UK Group, and rounding out our executive team, we welcomed Jean-Louis Roché, Alex Pallete and Facundo Goldaracena, who joined as part of a newly created Global Task Force (GTF).
We believe in unified communications. It’s about thinking and delivering as one organization across channels and markets. Over the past several years, we’ve focused on
WPP AnnuAl rePort 2009 38
How we’re doingAgency networks
building an integrated model that provides stronger and more effective creative than either traditional stand-alone agencies or siloed interactive shops can offer.
We’ve seen our interactive and activation expertise yield more work from clients, including Shell, Johnson & Johnson, Cadbury, Royal Caribbean, Shell, Diageo and Kimberly-Clark. Our ongoing success with the U.S. Marine Corps continues to result in stellar recruitment numbers, outpacing the Marines’ own forecasts.
We have put interactivity at the heart of our agency. In 2009, we unified our core disciplines, leadership and talent to create a joint RMG/JWT offering under the JWT brand name. This will bring analytics, CRM and digital direct fully into JWT and unify our overall interactive capabilities.
We’re defining a boundary-free future – free from geographical, media and historical constraints
To further fortify our online expertise, we introduced a new discipline, the Experience department. Positioned as a peer to the Creative, Planning and Account departments, the Experience department is geared to ‘ideate’ and develop digital experiences that enhance the other online skill sets within the business. This department is home to creative technologists, user experience designers, social media experts, mobile marketing specialists, digital strategists and media planners. New York, London, São Paulo, Hong Kong and Singapore will serve as the centers of excellence for this department, which will continue to expand throughout our network.
As we negotiate 2010 and the challenges and opportunities it brings to our agency and our clients, our focus will be on building global brands across new channels through our new network model. We will continue to push forward as the anti-novices – as experts, pioneers and the standard against which the rest of the industry will measure themselves.
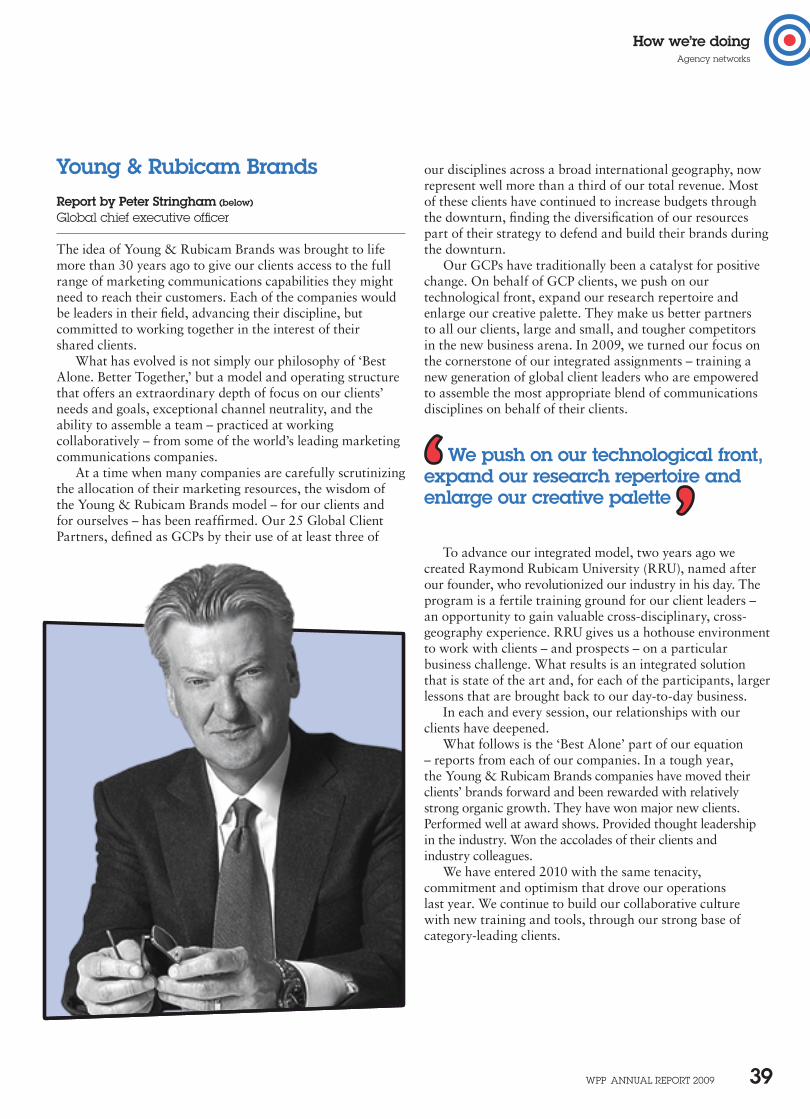
WPP AnnuAl rePort 2009 39
How we’re doingAgency networks
Young & Rubicam BrandsReport by Peter Stringham (below)
Global chief executive officer
The idea of Young & Rubicam Brands was brought to life more than 30 years ago to give our clients access to the full range of marketing communications capabilities they might need to reach their customers. Each of the companies would be leaders in their field, advancing their discipline, but committed to working together in the interest of their shared clients.
What has evolved is not simply our philosophy of ‘Best Alone. Better Together,’ but a model and operating structure that offers an extraordinary depth of focus on our clients’ needs and goals, exceptional channel neutrality, and the ability to assemble a team – practiced at working collaboratively – from some of the world’s leading marketing communications companies.
At a time when many companies are carefully scrutinizing the allocation of their marketing resources, the wisdom of the Young & Rubicam Brands model – for our clients and for ourselves – has been reaffirmed. Our 25 Global Client Partners, defined as GCPs by their use of at least three of
our disciplines across a broad international geography, now represent well more than a third of our total revenue. Most of these clients have continued to increase budgets through the downturn, finding the diversification of our resources part of their strategy to defend and build their brands during the downturn.
Our GCPs have traditionally been a catalyst for positive change. On behalf of GCP clients, we push on our technological front, expand our research repertoire and enlarge our creative palette. They make us better partners to all our clients, large and small, and tougher competitors in the new business arena. In 2009, we turned our focus on the cornerstone of our integrated assignments – training a new generation of global client leaders who are empowered to assemble the most appropriate blend of communications disciplines on behalf of their clients.
To advance our integrated model, two years ago we created Raymond Rubicam University (RRU), named after our founder, who revolutionized our industry in his day. The program is a fertile training ground for our client leaders – an opportunity to gain valuable cross-disciplinary, cross-geography experience. RRU gives us a hothouse environment to work with clients – and prospects – on a particular business challenge. What results is an integrated solution that is state of the art and, for each of the participants, larger lessons that are brought back to our day-to-day business.
In each and every session, our relationships with our clients have deepened.
What follows is the ‘Best Alone’ part of our equation – reports from each of our companies. In a tough year, the Young & Rubicam Brands companies have moved their clients’ brands forward and been rewarded with relatively strong organic growth. They have won major new clients. Performed well at award shows. Provided thought leadership in the industry. Won the accolades of their clients and industry colleagues.
We have entered 2010 with the same tenacity, commitment and optimism that drove our operations last year. We continue to build our collaborative culture with new training and tools, through our strong base of category-leading clients.
We push on our technological front, expand our research repertoire and enlarge our creative palette
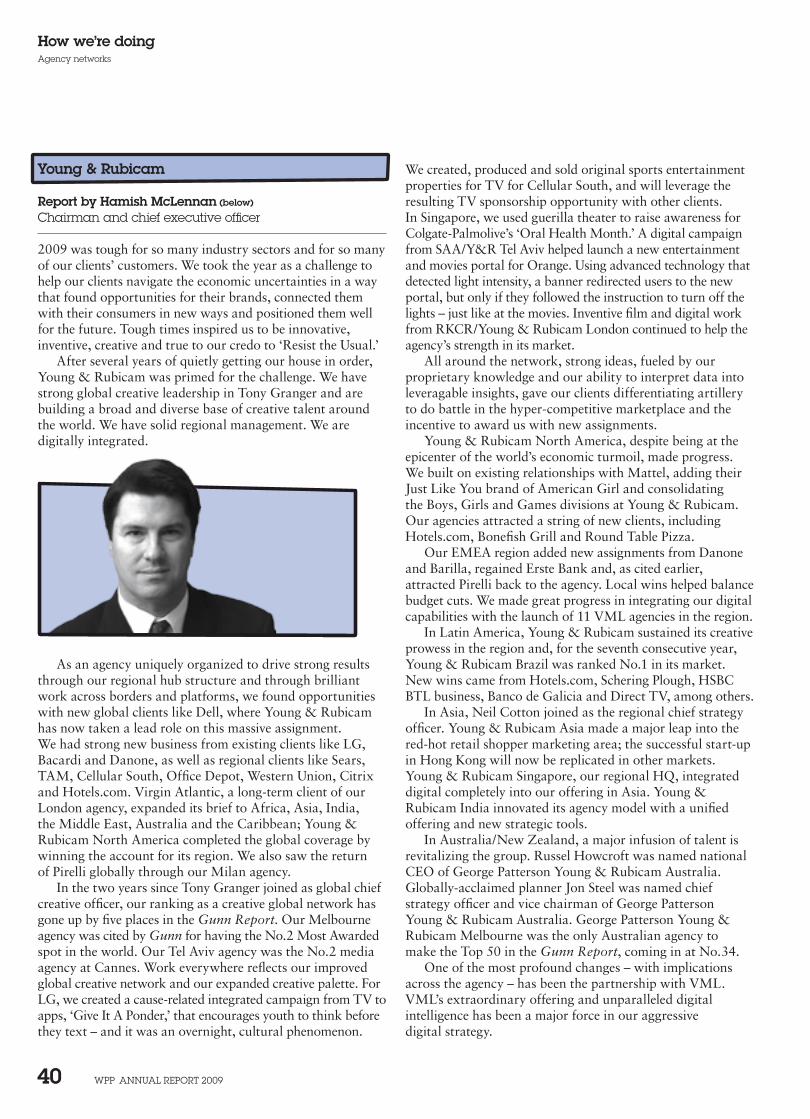
WPP AnnuAl rePort 2009 40
How we’re doingAgency networks
We created, produced and sold original sports entertainment properties for TV for Cellular South, and will leverage the resulting TV sponsorship opportunity with other clients. In Singapore, we used guerilla theater to raise awareness for Colgate-Palmolive’s ‘Oral Health Month.’ A digital campaign from SAA/Y&R Tel Aviv helped launch a new entertainment and movies portal for Orange. Using advanced technology that detected light intensity, a banner redirected users to the new portal, but only if they followed the instruction to turn off the lights – just like at the movies. Inventive film and digital work from RKCR/Young & Rubicam London continued to help the agency’s strength in its market.
All around the network, strong ideas, fueled by our proprietary knowledge and our ability to interpret data into leveragable insights, gave our clients differentiating artillery to do battle in the hyper-competitive marketplace and the incentive to award us with new assignments.
Young & Rubicam North America, despite being at the epicenter of the world’s economic turmoil, made progress. We built on existing relationships with Mattel, adding their Just Like You brand of American Girl and consolidating the Boys, Girls and Games divisions at Young & Rubicam. Our agencies attracted a string of new clients, including Hotels.com, Bonefish Grill and Round Table Pizza.
Our EMEA region added new assignments from Danone and Barilla, regained Erste Bank and, as cited earlier, attracted Pirelli back to the agency. Local wins helped balance budget cuts. We made great progress in integrating our digital capabilities with the launch of 11 VML agencies in the region.
In Latin America, Young & Rubicam sustained its creative prowess in the region and, for the seventh consecutive year, Young & Rubicam Brazil was ranked No.1 in its market. New wins came from Hotels.com, Schering Plough, HSBC BTL business, Banco de Galicia and Direct TV, among others.
In Asia, Neil Cotton joined as the regional chief strategy officer. Young & Rubicam Asia made a major leap into the red-hot retail shopper marketing area; the successful start-up in Hong Kong will now be replicated in other markets. Young & Rubicam Singapore, our regional HQ, integrated digital completely into our offering in Asia. Young & Rubicam India innovated its agency model with a unified offering and new strategic tools.
In Australia/New Zealand, a major infusion of talent is revitalizing the group. Russel Howcroft was named national CEO of George Patterson Young & Rubicam Australia. Globally-acclaimed planner Jon Steel was named chief strategy officer and vice chairman of George Patterson Young & Rubicam Australia. George Patterson Young & Rubicam Melbourne was the only Australian agency to make the Top 50 in the Gunn Report, coming in at No.34.
One of the most profound changes – with implications across the agency – has been the partnership with VML. VML’s extraordinary offering and unparalleled digital intelligence has been a major force in our aggressive digital strategy.
Young & Rubicam
Report by Hamish McLennan (below)
Chairman and chief executive officer
2009 was tough for so many industry sectors and for so many of our clients’ customers. We took the year as a challenge to help our clients navigate the economic uncertainties in a way that found opportunities for their brands, connected them with their consumers in new ways and positioned them well for the future. Tough times inspired us to be innovative, inventive, creative and true to our credo to ‘Resist the Usual.’
After several years of quietly getting our house in order, Young & Rubicam was primed for the challenge. We have strong global creative leadership in Tony Granger and are building a broad and diverse base of creative talent around the world. We have solid regional management. We are digitally integrated.
As an agency uniquely organized to drive strong results through our regional hub structure and through brilliant work across borders and platforms, we found opportunities with new global clients like Dell, where Young & Rubicam has now taken a lead role on this massive assignment. We had strong new business from existing clients like LG, Bacardi and Danone, as well as regional clients like Sears, TAM, Cellular South, Office Depot, Western Union, Citrix and Hotels.com. Virgin Atlantic, a long-term client of our London agency, expanded its brief to Africa, Asia, India, the Middle East, Australia and the Caribbean; Young & Rubicam North America completed the global coverage by winning the account for its region. We also saw the return of Pirelli globally through our Milan agency.
In the two years since Tony Granger joined as global chief creative officer, our ranking as a creative global network has gone up by five places in the Gunn Report. Our Melbourne agency was cited by Gunn for having the No.2 Most Awarded spot in the world. Our Tel Aviv agency was the No.2 media agency at Cannes. Work everywhere reflects our improved global creative network and our expanded creative palette. For LG, we created a cause-related integrated campaign from TV to apps, ‘Give It A Ponder,’ that encourages youth to think before they text – and it was an overnight, cultural phenomenon.
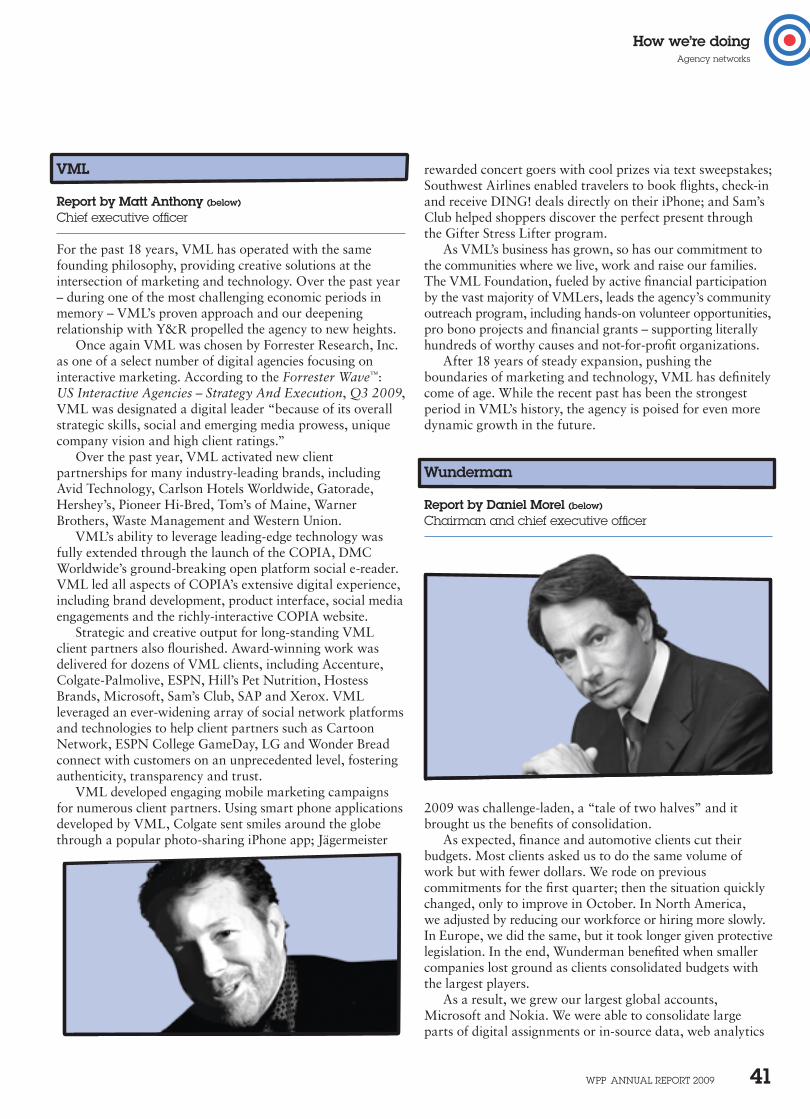
WPP AnnuAl rePort 2009 41
How we’re doingAgency networks
VML
Report by Matt Anthony (below)
Chief executive officer
For the past 18 years, VML has operated with the same founding philosophy, providing creative solutions at the intersection of marketing and technology. Over the past year – during one of the most challenging economic periods in memory – VML’s proven approach and our deepening relationship with Y&R propelled the agency to new heights.
Once again VML was chosen by Forrester Research, Inc. as one of a select number of digital agencies focusing on interactive marketing. According to the Forrester Wave™: US Interactive Agencies – Strategy And Execution, Q3 2009, VML was designated a digital leader “because of its overall strategic skills, social and emerging media prowess, unique company vision and high client ratings.”
Over the past year, VML activated new client partnerships for many industry-leading brands, including Avid Technology, Carlson Hotels Worldwide, Gatorade, Hershey’s, Pioneer Hi-Bred, Tom’s of Maine, Warner Brothers, Waste Management and Western Union.
VML’s ability to leverage leading-edge technology was fully extended through the launch of the COPIA, DMC Worldwide’s ground-breaking open platform social e-reader. VML led all aspects of COPIA’s extensive digital experience, including brand development, product interface, social media engagements and the richly-interactive COPIA website.
Strategic and creative output for long-standing VML client partners also flourished. Award-winning work was delivered for dozens of VML clients, including Accenture, Colgate-Palmolive, ESPN, Hill’s Pet Nutrition, Hostess Brands, Microsoft, Sam’s Club, SAP and Xerox. VML leveraged an ever-widening array of social network platforms and technologies to help client partners such as Cartoon Network, ESPN College GameDay, LG and Wonder Bread connect with customers on an unprecedented level, fostering authenticity, transparency and trust.
VML developed engaging mobile marketing campaigns for numerous client partners. Using smart phone applications developed by VML, Colgate sent smiles around the globe through a popular photo-sharing iPhone app; Jägermeister
2009 was challenge-laden, a “tale of two halves” and it brought us the benefits of consolidation.
As expected, finance and automotive clients cut their budgets. Most clients asked us to do the same volume of work but with fewer dollars. We rode on previous commitments for the first quarter; then the situation quickly changed, only to improve in October. In North America, we adjusted by reducing our workforce or hiring more slowly. In Europe, we did the same, but it took longer given protective legislation. In the end, Wunderman benefited when smaller companies lost ground as clients consolidated budgets with the largest players.
As a result, we grew our largest global accounts, Microsoft and Nokia. We were able to consolidate large parts of digital assignments or in-source data, web analytics
rewarded concert goers with cool prizes via text sweepstakes; Southwest Airlines enabled travelers to book flights, check-in and receive DING! deals directly on their iPhone; and Sam’s Club helped shoppers discover the perfect present through the Gifter Stress Lifter program.
As VML’s business has grown, so has our commitment to the communities where we live, work and raise our families. The VML Foundation, fueled by active financial participation by the vast majority of VMLers, leads the agency’s community outreach program, including hands-on volunteer opportunities, pro bono projects and financial grants – supporting literally hundreds of worthy causes and not-for-profit organizations.
After 18 years of steady expansion, pushing the boundaries of marketing and technology, VML has definitely come of age. While the recent past has been the strongest period in VML’s history, the agency is poised for even more dynamic growth in the future.
Wunderman
Report by Daniel Morel (below)
Chairman and chief executive officer
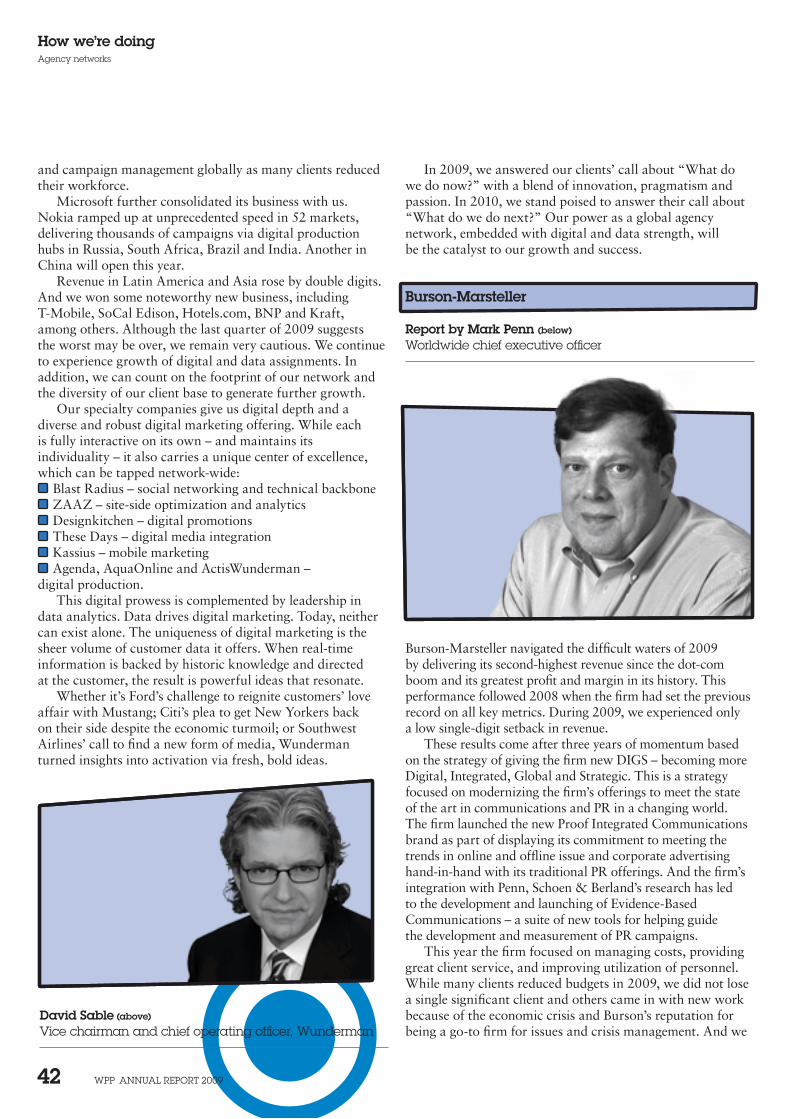
WPP AnnuAl rePort 2009 42
How we’re doingAgency networks
and campaign management globally as many clients reduced their workforce.
Microsoft further consolidated its business with us. Nokia ramped up at unprecedented speed in 52 markets, delivering thousands of campaigns via digital production hubs in Russia, South Africa, Brazil and India. Another in China will open this year.
Revenue in Latin America and Asia rose by double digits. And we won some noteworthy new business, including T-Mobile, SoCal Edison, Hotels.com, BNP and Kraft, among others. Although the last quarter of 2009 suggests the worst may be over, we remain very cautious. We continue to experience growth of digital and data assignments. In addition, we can count on the footprint of our network and the diversity of our client base to generate further growth.
Our specialty companies give us digital depth and a diverse and robust digital marketing offering. While each is fully interactive on its own – and maintains its individuality – it also carries a unique center of excellence, which can be tapped network-wide:
Blast Radius – social networking and technical backbone ZAAZ – site-side optimization and analytics Designkitchen – digital promotions These Days – digital media integration Kassius – mobile marketing Agenda, AquaOnline and ActisWunderman –
digital production.This digital prowess is complemented by leadership in
data analytics. Data drives digital marketing. Today, neither can exist alone. The uniqueness of digital marketing is the sheer volume of customer data it offers. When real-time information is backed by historic knowledge and directed at the customer, the result is powerful ideas that resonate.
Whether it’s Ford’s challenge to reignite customers’ love affair with Mustang; Citi’s plea to get New Yorkers back on their side despite the economic turmoil; or Southwest Airlines’ call to find a new form of media, Wunderman turned insights into activation via fresh, bold ideas.
In 2009, we answered our clients’ call about “What do we do now?” with a blend of innovation, pragmatism and passion. In 2010, we stand poised to answer their call about “What do we do next?” Our power as a global agency network, embedded with digital and data strength, will be the catalyst to our growth and success.
Burson-Marsteller
Report by Mark Penn (below)
Worldwide chief executive officer
Burson-Marsteller navigated the difficult waters of 2009 by delivering its second-highest revenue since the dot-com boom and its greatest profit and margin in its history. This performance followed 2008 when the firm had set the previous record on all key metrics. During 2009, we experienced only a low single-digit setback in revenue.
These results come after three years of momentum based on the strategy of giving the firm new DIGS – becoming more Digital, Integrated, Global and Strategic. This is a strategy focused on modernizing the firm’s offerings to meet the state of the art in communications and PR in a changing world. The firm launched the new Proof Integrated Communications brand as part of displaying its commitment to meeting the trends in online and offline issue and corporate advertising hand-in-hand with its traditional PR offerings. And the firm’s integration with Penn, Schoen & Berland’s research has led to the development and launching of Evidence-Based Communications – a suite of new tools for helping guide the development and measurement of PR campaigns.
This year the firm focused on managing costs, providing great client service, and improving utilization of personnel. While many clients reduced budgets in 2009, we did not lose a single significant client and others came in with new work because of the economic crisis and Burson’s reputation for being a go-to firm for issues and crisis management. And we
David Sable (above)
Vice chairman and chief operating officer, Wunderman
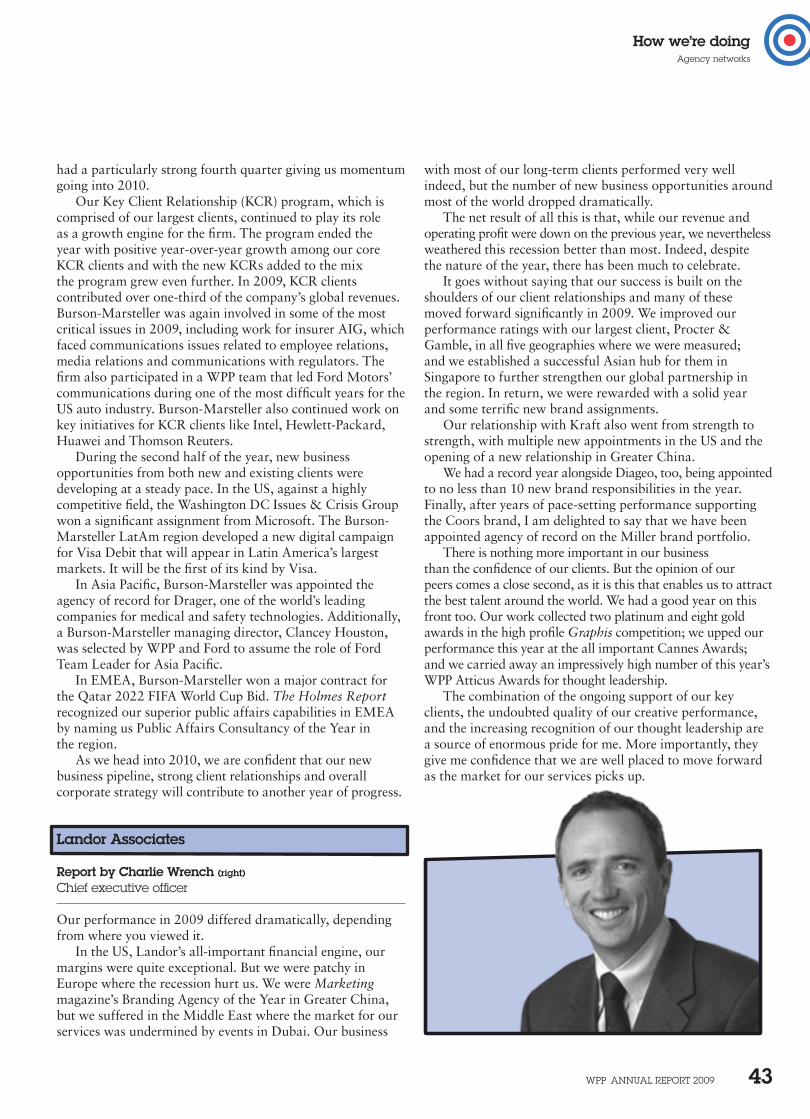
WPP AnnuAl rePort 2009 43
How we’re doingAgency networks
with most of our long-term clients performed very well indeed, but the number of new business opportunities around most of the world dropped dramatically.
The net result of all this is that, while our revenue and operating profit were down on the previous year, we nevertheless weathered this recession better than most. Indeed, despite the nature of the year, there has been much to celebrate.
It goes without saying that our success is built on the shoulders of our client relationships and many of these moved forward significantly in 2009. We improved our performance ratings with our largest client, Procter & Gamble, in all five geographies where we were measured; and we established a successful Asian hub for them in Singapore to further strengthen our global partnership in the region. In return, we were rewarded with a solid year and some terrific new brand assignments.
Our relationship with Kraft also went from strength to strength, with multiple new appointments in the US and the opening of a new relationship in Greater China.
We had a record year alongside Diageo, too, being appointed to no less than 10 new brand responsibilities in the year. Finally, after years of pace-setting performance supporting the Coors brand, I am delighted to say that we have been appointed agency of record on the Miller brand portfolio.
There is nothing more important in our business than the confidence of our clients. But the opinion of our peers comes a close second, as it is this that enables us to attract the best talent around the world. We had a good year on this front too. Our work collected two platinum and eight gold awards in the high profile Graphis competition; we upped our performance this year at the all important Cannes Awards; and we carried away an impressively high number of this year’s WPP Atticus Awards for thought leadership.
The combination of the ongoing support of our key clients, the undoubted quality of our creative performance, and the increasing recognition of our thought leadership are a source of enormous pride for me. More importantly, they give me confidence that we are well placed to move forward as the market for our services picks up.
had a particularly strong fourth quarter giving us momentum going into 2010.
Our Key Client Relationship (KCR) program, which is comprised of our largest clients, continued to play its role as a growth engine for the firm. The program ended the year with positive year-over-year growth among our core KCR clients and with the new KCRs added to the mix the program grew even further. In 2009, KCR clients contributed over one-third of the company’s global revenues. Burson-Marsteller was again involved in some of the most critical issues in 2009, including work for insurer AIG, which faced communications issues related to employee relations, media relations and communications with regulators. The firm also participated in a WPP team that led Ford Motors’ communications during one of the most difficult years for the US auto industry. Burson-Marsteller also continued work on key initiatives for KCR clients like Intel, Hewlett-Packard, Huawei and Thomson Reuters.
During the second half of the year, new business opportunities from both new and existing clients were developing at a steady pace. In the US, against a highly competitive field, the Washington DC Issues & Crisis Group won a significant assignment from Microsoft. The Burson-Marsteller LatAm region developed a new digital campaign for Visa Debit that will appear in Latin America’s largest markets. It will be the first of its kind by Visa.
In Asia Pacific, Burson-Marsteller was appointed the agency of record for Drager, one of the world’s leading companies for medical and safety technologies. Additionally, a Burson-Marsteller managing director, Clancey Houston, was selected by WPP and Ford to assume the role of Ford Team Leader for Asia Pacific.
In EMEA, Burson-Marsteller won a major contract for the Qatar 2022 FIFA World Cup Bid. The Holmes Report recognized our superior public affairs capabilities in EMEA by naming us Public Affairs Consultancy of the Year in the region.
As we head into 2010, we are confident that our new business pipeline, strong client relationships and overall corporate strategy will contribute to another year of progress.
Landor Associates
Report by Charlie Wrench (right)
Chief executive officer
Our performance in 2009 differed dramatically, depending from where you viewed it.
In the US, Landor’s all-important financial engine, our margins were quite exceptional. But we were patchy in Europe where the recession hurt us. We were Marketing magazine’s Branding Agency of the Year in Greater China, but we suffered in the Middle East where the market for our services was undermined by events in Dubai. Our business
WPP AnnuAl rePort 2009 44
How we’re doingAgency networks
we worked to ensure that offline and online brand communications converged productively. This meant providing effective strategic solutions to the growing role of relationship marketing between HCPs, patients and caregiver communities in brand preference and behaviors that drive them.
To oversee our international operations, Max Jackson was promoted to CEO of our EMEA and APAC regions. Louisa Holland and Rob Rogers continue as co-CEOs for The Americas, overseeing our US and Canadian operations and continued expansion into Latin America.
Supporting growing global opportunities, we expanded our geographic footprint with affiliate offices in Johannesburg and Moscow; the acquisition of MDS Healthcare in Shanghai and Beijing (now Sudler/MDS); strengthened our capabilities in Spain through a collaboration (now CYS/Sudler); increased Canadian operations; and broadened our Mexico City presence with medical education, advertising and CRM offerings that serve both the country as well as many parts of the LatAm region.
The Bravo Group
Report by Eddie Gonzalez (below)
Chairman and chief executive officer
Bravo’s transformation continued on track in 2009 with enhanced client relationships, evolving digital capabilities and the addition of more senior talent. The year started tentatively with clients debating Hispanic and multicultural investments Sudler & Hennessey
Report by Jed Beitler (below)
Chairman and worldwide chief executive officer
Sudler & Hennessey is one of the worlds’ most sought-after healthcare communications networks. During a year of economic challenges, we continued to build on our successes by bringing ‘Established Innovation’ services and geographic offerings to meet the ever-changing needs of our clients within human and animal health industries including pharmaceuticals, biotech, fast-moving consumer goods, foods, device/diagnostics, governmental and non-governmental organizations. The S&H network focused on strengthening its relationships with current clients, growing network opportunities and providing 100% client satisfaction, resulting in positive outcomes for the network.
In 2009, the S&H network was honored with over 35 awards from creative festivals around the world, including the Global Awards, the Rx Club, Best of Health, Effie Awards and Comprix Awards.
In 2009, we continued our focus on supporting client technology needs through S&H Digital, adding digital strategists and expanding our overall delivery across a wide array of interactive solutions. As opportunities grew,
WPP AnnuAl rePort 2009 45
How we’re doingAgency networks
strengthening our culture and talent, while maintaining a solid client base during the tough economic climate. By keeping clients and staff motivated in 2009, Cohn & Wolfe entered 2010 with a dedicated team and committed clients, both existing and new.
Robinson Lerer & Montgomery
Report by Linda Gosden RobinsonChairman
Robinson Lerer & Montgomery (RLM), a New York-based strategic communications firm, serves the directors and senior management of companies in every major industry on a broad range of ongoing assignments and special situations.
In a difficult environment, RLM reported strong results, driven primarily by continuing corporate communications assignments for major financial institutions, assisting them as they navigate the unprecedented upheaval in their industry. In addition, the firm continued to provide ongoing and project-related corporate communications and strategic marketing services to numerous clients in various other industries. Such work encompassed crisis management, corporate positioning, litigation support, regulatory issues and financial transactions, among other matters.
during a recessionary environment, but ended well due to Bravo’s superior performance. Whereas revenue was down slightly, operating profits and margins enjoyed double-digit improvements versus 2008. Bravo was ranked No.3 in Advertising Age’s Hispanic Agency rankings for 2009.
We knew 2009 would be challenging, but Bravo’s enhanced capabilities and its ability to clearly drive incremental growth for our clients during these tough times proved noteworthy. A network model built on client centricity, superior talent, and operational efficiency is paying big dividends with client satisfaction and superior creative work. Relationships and revenues with Bravo’s top 10 clients grew and clients’ satisfaction survey data from the last two years continues to over-index positively. One disappointing factor was the near-dormant level of category new business opportunities in available business sectors that stifled top-line revenue growth possibilities.
Superior talent continues to augment Bravo’s capabilities: new managing directors were added in our New York (Chris Campos) and San Francisco (Melissa Lammers) offices. Additionally, digital and creative talent continues to drive Bravo’s transformation.
Bravo is now leading and driving business strategies; we are truly helping our clients leverage and profit from the Hispanic market. By taking a bold stance on new opportunities, creative work and performance accountability, clients are recognizing Bravo as a real strategic leader and business differentiator. With the 2010 US Census under way, we expect further validation of the attractiveness of the Hispanic sector as a critical demographic that is ripe for business development.
2010 has started well, with Bravo being named Pfizer’s multicultural agency of record and strong top-line growth projected for the agency.
Cohn & Wolfe (full report on page 63)
Report by Donna ImperatoChief executive officer
Strengthening the agency and setting us up for future growth were Cohn & Wolfe’s key goals for 2009. It was our first full year following the merger with GCI which doubled our business and our talent base. And we succeeded in
WPP AnnuAl rePort 2009 46
How we’re doingAgency networks
Grey GroupReport by Jim Heekin (below)
Chairman and chief executive officer Grey Group and Grey
In 2009, Grey’s revitalization delivered on every key measure: new business success, growth from existing clients, improved profitability, a soaring creative reputation and the opening of a state-of-the art new world headquarters in New York. And we achieved this momentum in one of the worst economic downturns on record.
We adopted a new agency mission: “Grey Famously Effective Since 1917.” It leverages our heritage of producing communication that gets results, a 93-year track record of helping to build many of the world’s great brands, while acknowledging our creative ambition, our growing cachet for famous work that permeates popular culture and engages people.
The linkage between excellence in our offering and positive growth was undeniable in 2009. Grey delivered one of its best new business years ever. We were proud to win such new clients/brands as Allianz across the globe; the NFL, T.J. Maxx, Sargento Foods, America’s Natural Gas Alliance, Reliant Energy, Bosch Purolator, Mayflower/United Van Lines, TruTV, TOTO USA in the US; Scotiabank, Translink, Four Seasons (digital) in Canada; Honda and Samsung in the UK; Panasonic and Yello Energy in Germany; ING and Mobitel in Asia Pacific; Alcosto in Columbia, La Preferida in Chile and Nestlé in Mexico.
The foundation of Grey is its enduring, dynamic partnerships with global clients. Many of our top clients
grew in agency revenue, some by double-digits, and we were awarded more than 30 significant new brand assignments from Procter & Gamble, GlaxoSmithKline, Eli Lilly, Diageo, Boehringer Ingelheim, Pfizer, Playtex and Coca-Cola.
Grey New York and Grey London made enormous strides on their trajectory to enhanced growth and success. Once again, the famous E*TRADE ‘Talking Baby’ TV campaign, guided by Tor Myhren, Grey New York’s chief creative officer, set new records for popularity and effectiveness in the SuperBowl, as did commercials for the NFL and TruTV. Together, they dominated social media, generating millions of dollars in free publicity and critical acclaim from Advertising Age, The Wall Street Journal, Forbes, The New York Times and sites ranging from YouTube to Hulu. World-class campaigns for Cover Girl, starring Ellen DeGeneres, Diageo and Canon achieved global awareness and record sales success.
Grey New York today is delivering multiplatform creative excellence and the world is taking notice. Grey worldwide and Grey New York were named to Advertising Age’s prestigious A-List, comprising the best agencies in the business. Fast Company, the respected magazine devoted to the business of innovation, honored Grey New York as one of ‘The World’s 50 Most Innovative Companies,’ the only advertising agency to be named to the list. And Creativity magazine, part of Advertising Age, chose Tor Myhren as one of its ‘Creative 50,’ those influential and inspiring leaders who have made the biggest impact across all areas of creative culture.
Grey London, led by David Patton, CEO, continued its resurgence winning one of the biggest pitches of 2009, the global Allianz account, among other high-profile additions. Campaign magazine gave the agency its best report card ever. Breakthrough work for Toshiba, Samsung, Women’s Aid and the British Heart Foundation have underscored its growing creative momentum.
We strengthened our global leadership in 2010 with the appointment of David Patton as president and CEO of Grey Group EMEA. Chris Hirst, managing director of Grey London, was promoted to CEO. Both have played pivotal roles in building the agency into one of the UK’s most dynamic. Riccardo Ferraris was appointed chairman of the Grey Latin America Leadership Council and CEO of Grey Brazil after a track record of success in Mexico. These promotions are part of our commitment to growing our best talent.
Tim Mellors, vice chairman of Grey Group and worldwide chief creative director, who leads our Worldwide Creative Council, made significant strides in elevating our creative performance and award recognition. Last year, Grey doubled its Cannes Festival showing, winning 18 Lions. The agency also had its best showing ever at the London International Awards, Clios, One Show and D&AD.
Grey’s P&G CoverGirl campaign, starring Queen Latifah, won the Grand Prix as the most effective magazine ad of 2009, ranking first on an Affinity Vista index of ad recall,
WPP AnnuAl rePort 2009 47
How we’re doingAgency networks
communications, we have expanded our comprehensive leadership development and training programs and launched innovative internet learning and knowledge sharing programs.
In 2009, we turned challenge to opportunity and prospered in the face of tough economic conditions. We led the way and exceeded the expectations of our clients. As the world recovers, we expect Grey to set the pace and excel in 2010.
G2 (Activation Marketing)
Report by Joe Celia (below)
Chairman and chief executive officer, G2 Worldwide Vice chairman, Grey Group
In 2009 we experienced the toughest global economic environment that the world has seen since the Great Depression. With marketers under considerable pressure to reduce costs, we, in turn, felt that pressure as clients reduced budgets and asked agencies to do more for less.
Yet during this challenging period we experienced a positive side with many of our key clients reaffirming the strength of our relationships. The drive and commitment of the people who comprise the G2 organisations around the world was more apparent than ever. We made positive strides both in winning business and in raising our standing in the industry.
G2’s top 20 clients account for the lion’s share of our total global revenue. I’m happy to say that these critical client relationships remained strong even in the face of the recession. We were given incremental assignments from P&G and BAT around the world for a range of brands and expanded our
brand association and actions taken among 30,000 ads. Our ads for P&G’s Pantene and Allergan’s Latisse took the top rank in their categories.
Among the hundreds of pro bono campaigns Grey contributes to its communities around the world, one deserves special mention. Grey New York has created several national public service efforts for the US Department of Health and Human Services (HHS), in collaboration with the Ad Council, to raise awareness and action to address mental health problems among young adults in the African-American community. We were pleased to receive the HHS Voice Award in 2009.
Wing, our multicultural communications agency, was named ‘Best Hispanic New York Marketing Firm Using Social Media’ by Latinos in Social Media (LATISM), the largest organization of social media professionals of Hispanic origin.
Once again, Grey’s Eye on Asia proprietary trends study opened a window into the region’s psyche and provided our clients with actionable information on coping with the recession. This project, spearheaded by Nirvik Singh, chairman and CEO of Grey Group Asia Pacific, continues to showcase Grey’s thought leadership via millions of readers of the world’s media and has become a model for future global efforts.
Suresh Nair, director of global strategic planning, Grey Group, launched our Worldwide Planning Council. The council, building on Grey’s long tradition of pre-eminence in consumer insight, is refining our common strategic platform, tools and language to create communications that resonate across every channel.
Grey continues to rank among the top tier of global advertising agencies because of the reach and resources of our network in 96 countries. Our blue-chip client roster counts one-fifth of all Fortune 500 companies and our legacy of launching and sustaining leading brands continues to progress in today’s media landscape.
Today, we are producing some of the most leading-edge creative work across platforms, breaking new ground in brand experience and building relationships. Please go to www.grey.com to see our successful case histories across countries, cultures and the media spectrum.
We added to our digital marketing offering by recruiting renowned digital creative leaders and expanding our digital centers of excellence in Latin America and Asia Pacific. Importantly, we have strengthened our synergy with G2. We are delivering a seamless, integrated offering that unites the creative expertise of Grey with the activation marketing expertise of G2. This powerful competitive advantage resulted in dozens of joint new business wins across the globe.
During the past three years, we have welcomed a tremendous infusion of world-class talent to our ranks in creative, planning, digital and management worldwide. To keep pace with the warp-speed change in
WPP AnnuAl rePort 2009 48
How we’re doingAgency networks
Hiring, retaining and utilizing the best talent continues to be a priority for our organization. After five years as CEO, Grey Group Central & Eastern Europe, Pietro Leone joined our G2 global management team as chief operating officer, G2 EMEA. Pietro also joined G2’s Global Management Board alongside myself, Matthew Schetlick, Jonathan Dodd, Ken Levy, Nirvik Singh and John Paulson.
Jim Taylor, formerly of MEC, where he was the agency’s communications retail director and planning partner, joined G2 in the newly created role of global communications planning director. In Jim, we now have one of the world’s leading authorities on communications planning, an increasingly vital element of G2’s offer. In North America, Marty Laiks was promoted to director, strategy, in our Relationship Marketing group, driving the growth of this important area of the business.
In LatAm, G2’s Steve Stroud, who has led G2 Mexico very successfully since 2007 and was instrumental in our growth and success in that market, was promoted to president and CEO of Grey Group Mexico, overseeing both G2 and Grey in this market.
At G2, we believe that companies should bring more to the world than just their commercial offering. In 2009, G2 partnered with Save The Children to build a school in Mali, Africa. By the end of the year, the school was up and running and filled with young students. We are now working to build a well to provide fresh water for an entire village.
Looking ahead for 2010, I think we can be cautiously optimistic. The consensus seems to be that the worst of the recession is behind us in most parts of the world. While that would certainly be welcome news, there are still tough challenges to overcome.
In 2010 we will be focusing on driving home to clients and prospective clients the value that we bring to their business. We as marketers have developed great expertise in convincing consumers that our clients’ brands provide greater value than their competitors. That is how we make our living.
The agencies that succeed in the long run will be the ones that clients perceive offer greater value, not necessarily the ones with the lowest cost. They will equate value with positive impact on their business. Therefore, we will put increased focus on making G2 invaluable in the marketplace. We will do that via creativity, superior skill in our core disciplines, of Retail & Promotional Marketing, Relationship Marketing, Data & Analytics, and all things digital. That, coupled with our superior ability to bring multifaceted programs together will be our winning formula.
This year we will also be rolling out a new and exciting process and set of tools, proprietary to G2 and unique in the marketplace, which will become the underpinning for our positioning in the marketplace. This has been a tough time, but the future is looking bright, or at least brighter. We are getting stronger every year, and will continue to do so.
relationship with Heineken both in LatAm and the US. Also in the US, we won new assignments from Adobe, Liberty Mutual, Boehringer Ingelheim, Time Warner, Allergan, Kraft and MARS. Additional work was awarded by Nokia to G2 Interactive in Spain; by Volkswagen in Germany, China and Spain; and by Coca-Cola to argonauten G2 in Germany. We take great pride in the fact that our clients value what we do and even in a tough economic environment are willing to invest their money in our expertise.
Despite the overall decline in pitches being held in 2009, we were fortunate to be able to add several new major brands to our portfolio. In the US, our promotional marketing group won a significant assignment from Waste Management and our digital team brought new client Electronic Arts (EA) Gaming on board. In EMEA, G2 UK won a major integrated marketing project for Nectar (loyalty cards) and G2 Amsterdam won an assignment from Unilever. In LatAm, Natura (Brazilian cosmetics company) tapped MDS–Brazil for a database and loyalty program. In APAC, G2 Japan won work from Glacéau vitaminwater and Cadbury; G2 China from Hallmark and G2 Vietnam added Bayer to its client roster.
In 2009, Advertising Age magazine published its 65th Annual Agency Report. G2 made a good showing, and moved up in all key rankings:
Marketing Services Agency Networks – G2 retained its ranking among the Top 5 worldwide.
Promotion and Event Marketing Agencies – G2 ranked No.6 worldwide.
Digital Agencies – G2 moved into the Top 25 worldwide. Direct Marketing Agencies – G2 moved into the Top
15 worldwide.In The Hub magazine, a US publication dedicated to
retail and shopper marketing, G2 made a good showing in their Best of the Best Agencies report as one of the Top 10 shopper marketing agencies. In B to B magazine’s Direct Agency of the Year competition, G2 was first runner-up against the best direct agencies in the business. These rankings were the result of a combination of great work, new business wins and recognized talent.
For the third year, G2 partnered with The Economist to sponsor the Media Convergence Forum, an event dedicated to discussion and debate surrounding the rapidly changing media and marketing landscape. We gathered a unique group of thought leaders, including CMOs, media executives, marketing psychologists, technology experts, futurists and other communications professionals to peer into the future to consider the ideas, technologies and tactics that are changing our industry. As part of the event, G2 hosted a panel discussion on the challenges facing marketers bombarded with a plethora of new media alternatives, a subject well-suited to G2’s expertise. The panel included senior executives from Google, MySpace and Twitter.
WPP AnnuAl rePort 2009 49
How we’re doingAgency networks
United NetworkReport by Ewen Cameron (right)
Chief executive officer and Laurence Mellman Chief operating officer
Despite a tough economic climate in every market in which we operate, 2009 saw some real progress for individual agencies in our group. In Italy, 1861 United had a banner year for new business, winning Lexus and Diners Club and consolidating more prestigious assignments from their core clients Sky, Vodafone and IKEA. 1861 also continued to dominate domestic creative awards and build an increasingly international creative reputation. Our French agency, Les Ouvriers du Paradis United, won the global branding assignment for Japanese brand Seiko Watches.
In Spain, one of the markets worst hit by the global recession, Sra Rushmore had another great year, winning major assignments from Visa, CEPSA, El Corte Ingles and RENFE Spanish Railways amongst others and consolidating
its role as a global anchor agency for clients such as Coca-Cola, Diageo and Telefonica. The continued outstanding performance of Sra Rushmore and the excellence of its creative work was recognized with the agency being named Agency of the Decade by industry publication El Publicista.
In the US, budget cuts at clients were matched with fast and decisive action by management so, while revenues contracted, profits held up well. Berlin Cameron United continued to grow its high profile Comcast business, added a major national brand-building assignment for internet phenomenon Amazon.com and provided a strong creative resource for Group client Ford Motor Company. Cole & Weber United launched a very successful campaign for the International Olympic Committee that was universally admired and built an online challenge campaign to activate the youth of the world around the Olympics which after three months had accrued over three million interactions from over 200 countries.
So, as we launch ourselves into 2010 with great energy and enthusiasm, we do so with the confidence that despite very real challenges, 2009 bore out our core belief that big complex clients need small nimble creative agencies to tackle the fast-moving problems in today’s markets.
As the recessionary grip seems to be subsiding globally we are already seeing great signs of promise for 2010 in our first-quarter new business activity.
Big complex clients need small nimble creative agencies, to tackle the fast-moving problems in today’s markets
WPP AnnuAl rePort 2009 50
How we’re doingAgency networks
Bates 141Report by Jeffrey Yu (right)
Chairman
For the last three years at Bates 141, we have marshalled our philosophy and operations around understanding, harnessing and creating ‘Change’ for our clients across Asia. While 2009 was a challenging year, it was this singular focus that kept us strong commercially and attitudinally and saw us grow across nearly all dimensions. 2009 was our greatest year yet of delivering change for our clients.
We helped Chengdu City rebuild its image as China’s most ‘liveable city’ after the devastating earthquake that hit Sichuan province in 2008. The campaign won Gold at the China Effies. We partnered with Shanghai General Motors for the 12th consecutive year, helping grow Buick to be the top-selling brand for GM.
We helped Virgin Mobile establish the first true youth brand in India and, in the process, won many awards including Silver at the Asian Marketing Effectiveness Awards and the India Effies, as well as Bronze at the prestigious global Jay Chiat awards.
In Singapore, we created a social marketing campaign for the National Council against Problem Gambling, ‘Know the Line’, targeting social gamblers who cross the line into habit.
In Taiwan, we were ranked No.1 by Campaign Brief and seven people in our creative department made the top talent list, led by our Taiwan ECD Richard Yu. We were also the most-awarded agency in Greater China, according to the 16th Chinese Times Advertising Awards.
To complement our work and growth, we kept thought leadership on the top of the agenda. Our A-Z Dictionary of Change picked up the Grand Prix at WPP’s Atticus Awards. Our ‘ChangeBites’ fueled many new client solutions with specific discovery work for key markets and categories. Our blog, Changing Asias, has also been ranked in the top 25 by Advertising Age China.
2009 was a terrific year for new business. Much of this came from our existing clients, including Sony, HSBC and Rémy Martin. New clients included Heineken in Hong Kong, Pizza Hut, Singapore Expo, Sina, F&N, Nissan, LiNing, Vitalon, TVS Motors and Dabur.
We added new creative talent including Kenny Choo, a multi-award winner and China expert. We appointed technology experts Soonkeat Loo and Kyle Ho and, on the business side, we appointed Barry Leung as regional director to build a strong, customized integrated agency offering and grow the activation business across China. In Indonesia, we welcomed CEO Shubo Sarkar.
To generate value for our clients in times of recession and change, we enhanced our proprietary ChangeDay workshops and conducted ChangeDays for HSBC, Avon, Darbur, Max Bupa, Bank of Communications, Sina, F&N, Dell, PCCC and SGM.
We launched 141 Design, a specialist unit based in Kolkata working on a range of clients including Coca-Cola, Dabur and Fortune. We also expanded our digital network, 141 Digital, to five hubs across Asia.
We expanded our footprint, opening an office in Dhaka, Bangladesh. This is a very exciting and untapped market of 160 million consumers and, together with 141 Sercon, we extended our services to some of our clients who have entered the market including Marico, Coca-Cola, Nokia and Sun Microsystems.
We continued our momentum on corporate and social responsibility. Our ChangeRally initiative helped our people to deliver change for special causes in Asia and can help clients see the bigger picture of giving back to society.
With funds donated by employees of Bates 141 and Ogilvy China, we rebuilt the Hong Qi Cun Red Flag Elementary School, which had been devastated by the Sichuan earthquake. When The Philippines was struck by a series of typhoons and storms that killed more than 250 people and displaced thousands more, all our offices stepped up to help the charities we are aligned with. In Cambodia, we worked with a group of children at the Sunrise Orphanage to create a film to explain the plight of Cambodian families.
It is good to see that this energy and action throughout 2009 is being noticed across the marketplace. We recently scored a seven (out of 10) in the industry- and client-recognized Media Asia Agency Rankings Report for 2009. We took joint second place out of the WPP advertising agencies and were sixth overall for all agencies in the Asia region. All this great work by our people helps position us for an even stronger 2010.
WPP AnnuAl rePort 2009 51
How we’re doing
Media Investment ManagementGroupMReport by Irwin Gotlieb (below)
Chief executive officer
The year 2009 was an eventful one for GroupM, the parent company to WPP’s media agencies – Maxus, MediaCom, MEC and Mindshare. RECMA, the independent organization that measures media agency sector operations, reported that GroupM held a 32.4% share of the total measured volume among all global media agency networks. The figure indicates that we grew our share of global media by a full share point over the previous year. As such, once again GroupM established itself as the world’s leading global media investment management company with more than $84 billion in worldwide billings (RECMA reported), more than 44% ahead of our closest competitor in billings.
GroupM’s primary goal is to support each of our operating companies as both a parent company and a collaborator in activities that benefit our clients, including trading, content creation, digital communications, new business, finance, proprietary tool development and other critical capabilities.
2009 was definitely a difficult year. It was a difficult year for us because it was a difficult year for our clients. GroupM agencies represent clients that run the gamut of all significant
product and service categories. Many of these categories were severely impacted by the global economic downturn that began in 2008 and extended throughout last year, and no category was unaffected. This put us in the position of dealing with the dual challenge of helping our clients through the recession while simultaneously managing our own business to mitigate adverse effects. We had to provide the highest possible level of service and support to our clients, extract greater value for their media investments and do so with improved operational efficiency on our side. It was, to be sure, a delicate balance.
Despite these formidable challenges, each of our agencies scored impressive new business gains in what was the most difficult competitive environment we have ever encountered. These wins, along with a record number of industry awards, are outlined in the individual agency accounts that follow later in this report. Beyond those accomplishments, GroupM also developed new initiatives designed to keep our company at the forefront of the media services business and maintain our global reputation as a pioneering influence throughout our industry.
In difficult economic times, clients place greater emphasis and priority on improved media pricing and the exploitation of opportunities associated with media deflation. GroupM, with our focus on the intelligent application of scale, made further advances in organizing our trading structures to maximize the value that we can deliver to clients. Our advanced marketplace analytics, benchmarking and market simulation modeling informed our trading strategies and provided best-in-class results for our clients.
In the area of online investment, GroupM took a breakthrough, pioneering stance when we became the only major media agency company to change the terms and conditions of online advertising buys to address the issue of data usage rights. This will serve to protect the confidentiality of our agencies’ and clients’ data and ensure that we have influence over the use of such data. GroupM also led a team of WPP companies to develop an industry approach to online self-regulation by creating a standard icon to appear on all behaviorally-targeted advertising that will allow consumers to control what information is shared with advertisers. The initiative has been endorsed by the US Federal Trade Commission as a positive move toward self-regulation.
We were also active in the area of digital research projects. In October 2009, GroupM Search and comScore, Inc., a leader in measuring the digital world, announced the results of the first study ever conducted by comScore looking at the relationship between social media exposure and search behaviors. Conducted in tandem with our social media agency M80, the study, The Influenced: Social Media, Search and the Interplay of Consideration and Consumption, revealed the dramatic correlation that influenced discovery of brands through social media has with search behavior, including more lower-funnel searches and increased paid search click-through-rates (CTR).
WPP AnnuAl rePort 2009 52
How we’re doingMedia Investment Management
GroupM also continued to be a leader in forecasting worldwide advertising spending in both traditional and digital media, issuing several This Year, Next Year forecast reports and periodic updates throughout 2009. Last year we published forecasts on the UK and Russian markets, as well as a worldwide report that received widespread press coverage and was presented at the annual Global Media and Communications Conference, hosted by investment bank UBS in New York. The worldwide report, traditionally issued early in the year, is then updated and released about six to eight months later.
The year was also eventful in the field of branded entertainment and content creation. In October 2009, GroupM Entertainment and Yahoo! announced a partnership to help marketers creatively incorporate their brands into original online programming. GroupM also expanded its international content operations and we now manage content in North America, Europe and Asia. In the US, Mindshare and GroupM Entertainment partnered with Disney ABC to produce In the Motherhood, the first ever network television series to have originated as a branded content internet project produced by a media services agency. GME also co-produced
and financed Battle of the Blades for the Canadian Broadcasting Corporation, which became the No.1 rated primetime series to originate in Canada, as well as a new daytime and primetime series with Channel 5 in the UK.
GroupM also aggressively continues to pursue and advance our investments in new technologies and systems to maintain our history of driving innovation and influencing our industry.
We firmly believe it is our responsibility not only to explore but also to lead the market in new directions and catalyze the development of innovative opportunities for our clients. These investments include our 2007 equity stake in Invidi Technologies Corporation, which advanced our role in addressable television advertising, which will set new standards in targeting precision and accountability. We have formed key partnerships to speed deployment and adoption of these technologies. All of these moves reflect our belief that within the next few years all media will be addressable, capable of requests for information (RFIs) and message telescoping (in which viewers can request a longer version of the commercial message), census-level measurable and even transaction-capable. We are taking steps today to ensure that GroupM and its agencies proactively shape the future and maintain leadership in this space.
In 2009, we learned to operate at new levels of efficiency, to deliver greater value to our clients and to exploit technologies to improve the targeting and accountability of our business. Our actions are designed to further GroupM’s position in the media services marketplace for the benefit of our stakeholders, while at the same time expanding on the competitive advantage that we bring to our clients. We will continue to be aggressive in our efforts to realize both of those goals throughout the coming year.
GroupM also aggressively continues to pursue and advance our investments in new technologies and systems to maintain our history of driving innovation and influencing our industry
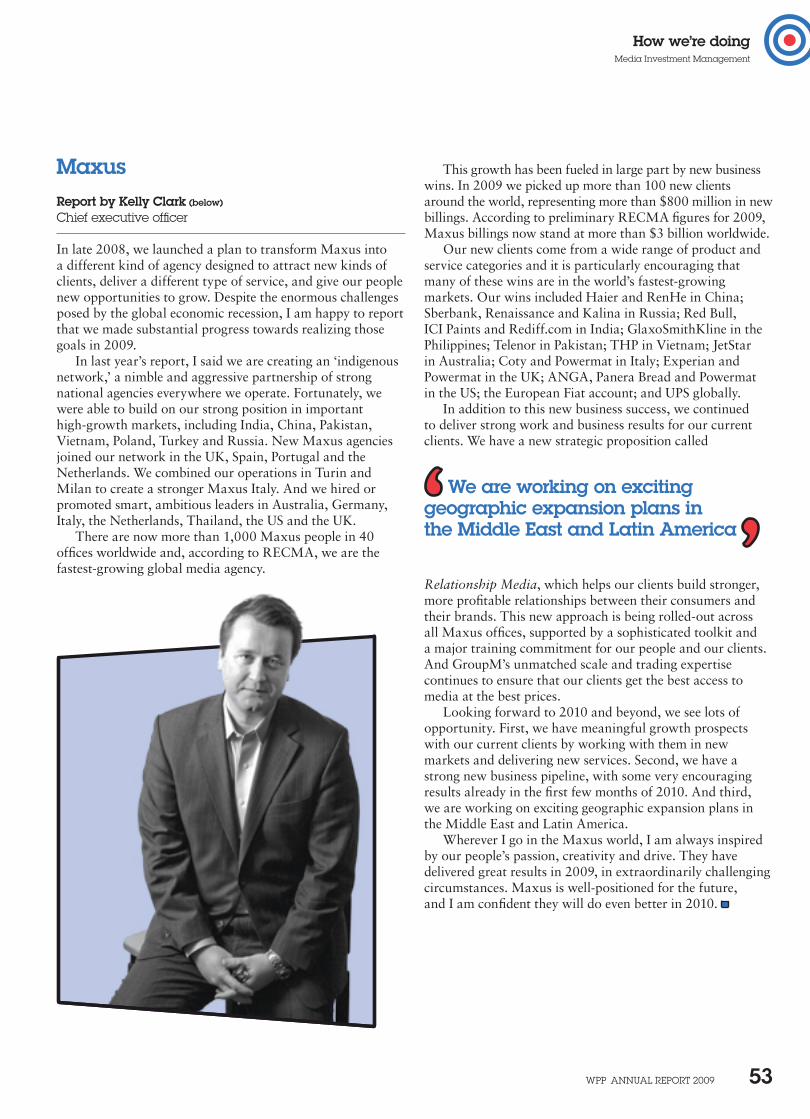
WPP AnnuAl rePort 2009 53
How we’re doingMedia Investment Management
MaxusReport by Kelly Clark (below)
Chief executive officer
In late 2008, we launched a plan to transform Maxus into a different kind of agency designed to attract new kinds of clients, deliver a different type of service, and give our people new opportunities to grow. Despite the enormous challenges posed by the global economic recession, I am happy to report that we made substantial progress towards realizing those goals in 2009.
In last year’s report, I said we are creating an ‘indigenous network,’ a nimble and aggressive partnership of strong national agencies everywhere we operate. Fortunately, we were able to build on our strong position in important high-growth markets, including India, China, Pakistan, Vietnam, Poland, Turkey and Russia. New Maxus agencies joined our network in the UK, Spain, Portugal and the Netherlands. We combined our operations in Turin and Milan to create a stronger Maxus Italy. And we hired or promoted smart, ambitious leaders in Australia, Germany, Italy, the Netherlands, Thailand, the US and the UK.
There are now more than 1,000 Maxus people in 40 offices worldwide and, according to RECMA, we are the fastest-growing global media agency.
This growth has been fueled in large part by new business wins. In 2009 we picked up more than 100 new clients around the world, representing more than $800 million in new billings. According to preliminary RECMA figures for 2009, Maxus billings now stand at more than $3 billion worldwide.
Our new clients come from a wide range of product and service categories and it is particularly encouraging that many of these wins are in the world’s fastest-growing markets. Our wins included Haier and RenHe in China; Sberbank, Renaissance and Kalina in Russia; Red Bull, ICI Paints and Rediff.com in India; GlaxoSmithKline in the Philippines; Telenor in Pakistan; THP in Vietnam; JetStar in Australia; Coty and Powermat in Italy; Experian and Powermat in the UK; ANGA, Panera Bread and Powermat in the US; the European Fiat account; and UPS globally.
In addition to this new business success, we continued to deliver strong work and business results for our current clients. We have a new strategic proposition called
Relationship Media, which helps our clients build stronger, more profitable relationships between their consumers and their brands. This new approach is being rolled-out across all Maxus offices, supported by a sophisticated toolkit and a major training commitment for our people and our clients. And GroupM’s unmatched scale and trading expertise continues to ensure that our clients get the best access to media at the best prices.
Looking forward to 2010 and beyond, we see lots of opportunity. First, we have meaningful growth prospects with our current clients by working with them in new markets and delivering new services. Second, we have a strong new business pipeline, with some very encouraging results already in the first few months of 2010. And third, we are working on exciting geographic expansion plans in the Middle East and Latin America.
Wherever I go in the Maxus world, I am always inspired by our people’s passion, creativity and drive. They have delivered great results in 2009, in extraordinarily challenging circumstances. Maxus is well-positioned for the future, and I am confident they will do even better in 2010.
We are working on exciting geographic expansion plans in the Middle East and Latin America
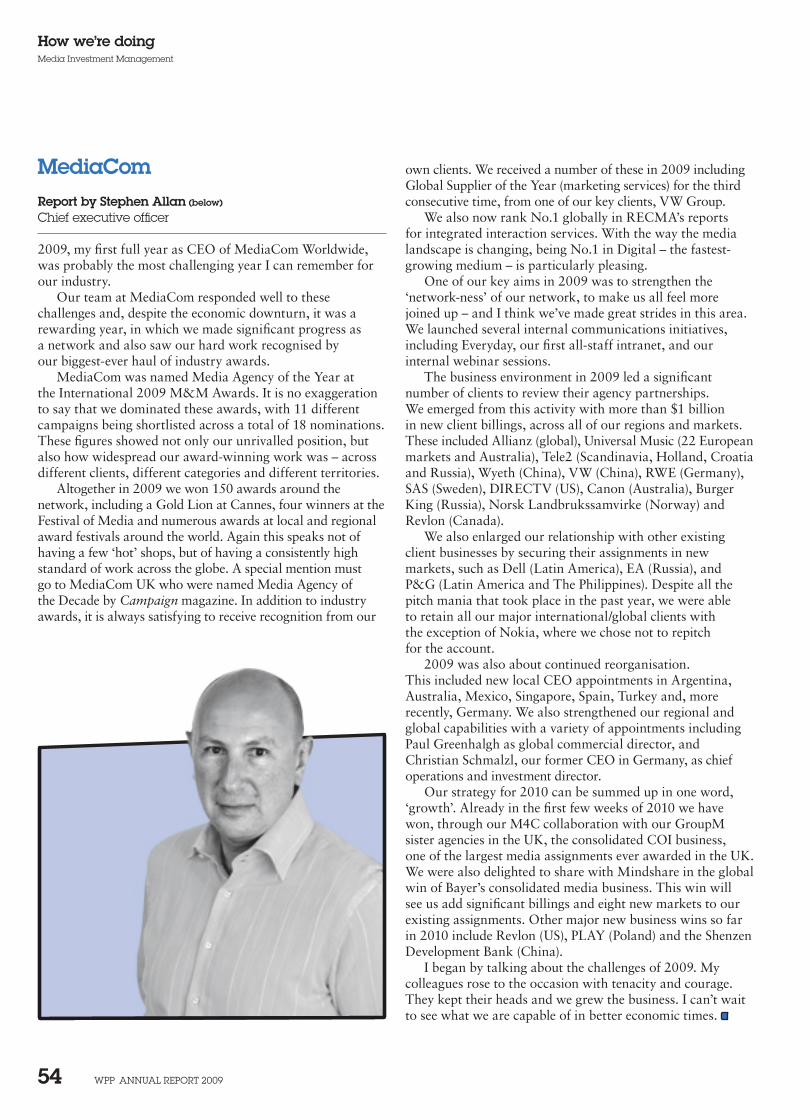
WPP AnnuAl rePort 2009 54
How we’re doingMedia Investment Management
MediaComReport by Stephen Allan (below)
Chief executive officer
2009, my first full year as CEO of MediaCom Worldwide, was probably the most challenging year I can remember for our industry.
Our team at MediaCom responded well to these challenges and, despite the economic downturn, it was a rewarding year, in which we made significant progress as a network and also saw our hard work recognised by our biggest-ever haul of industry awards.
MediaCom was named Media Agency of the Year at the International 2009 M&M Awards. It is no exaggeration to say that we dominated these awards, with 11 different campaigns being shortlisted across a total of 18 nominations. These figures showed not only our unrivalled position, but also how widespread our award-winning work was – across different clients, different categories and different territories.
Altogether in 2009 we won 150 awards around the network, including a Gold Lion at Cannes, four winners at the Festival of Media and numerous awards at local and regional award festivals around the world. Again this speaks not of having a few ‘hot’ shops, but of having a consistently high standard of work across the globe. A special mention must go to MediaCom UK who were named Media Agency of the Decade by Campaign magazine. In addition to industry awards, it is always satisfying to receive recognition from our
own clients. We received a number of these in 2009 including Global Supplier of the Year (marketing services) for the third consecutive time, from one of our key clients, VW Group.
We also now rank No.1 globally in RECMA’s reports for integrated interaction services. With the way the media landscape is changing, being No.1 in Digital – the fastest-growing medium – is particularly pleasing.
One of our key aims in 2009 was to strengthen the ‘network-ness’ of our network, to make us all feel more joined up – and I think we’ve made great strides in this area. We launched several internal communications initiatives, including Everyday, our first all-staff intranet, and our internal webinar sessions.
The business environment in 2009 led a significant number of clients to review their agency partnerships. We emerged from this activity with more than $1 billion in new client billings, across all of our regions and markets. These included Allianz (global), Universal Music (22 European markets and Australia), Tele2 (Scandinavia, Holland, Croatia and Russia), Wyeth (China), VW (China), RWE (Germany), SAS (Sweden), DIRECTV (US), Canon (Australia), Burger King (Russia), Norsk Landbrukssamvirke (Norway) and Revlon (Canada).
We also enlarged our relationship with other existing client businesses by securing their assignments in new markets, such as Dell (Latin America), EA (Russia), and P&G (Latin America and The Philippines). Despite all the pitch mania that took place in the past year, we were able to retain all our major international/global clients with the exception of Nokia, where we chose not to repitch for the account.
2009 was also about continued reorganisation. This included new local CEO appointments in Argentina, Australia, Mexico, Singapore, Spain, Turkey and, more recently, Germany. We also strengthened our regional and global capabilities with a variety of appointments including Paul Greenhalgh as global commercial director, and Christian Schmalzl, our former CEO in Germany, as chief operations and investment director.
Our strategy for 2010 can be summed up in one word, ‘growth’. Already in the first few weeks of 2010 we have won, through our M4C collaboration with our GroupM sister agencies in the UK, the consolidated COI business, one of the largest media assignments ever awarded in the UK. We were also delighted to share with Mindshare in the global win of Bayer’s consolidated media business. This win will see us add significant billings and eight new markets to our existing assignments. Other major new business wins so far in 2010 include Revlon (US), PLAY (Poland) and the Shenzen Development Bank (China).
I began by talking about the challenges of 2009. My colleagues rose to the occasion with tenacity and courage. They kept their heads and we grew the business. I can’t wait to see what we are capable of in better economic times.
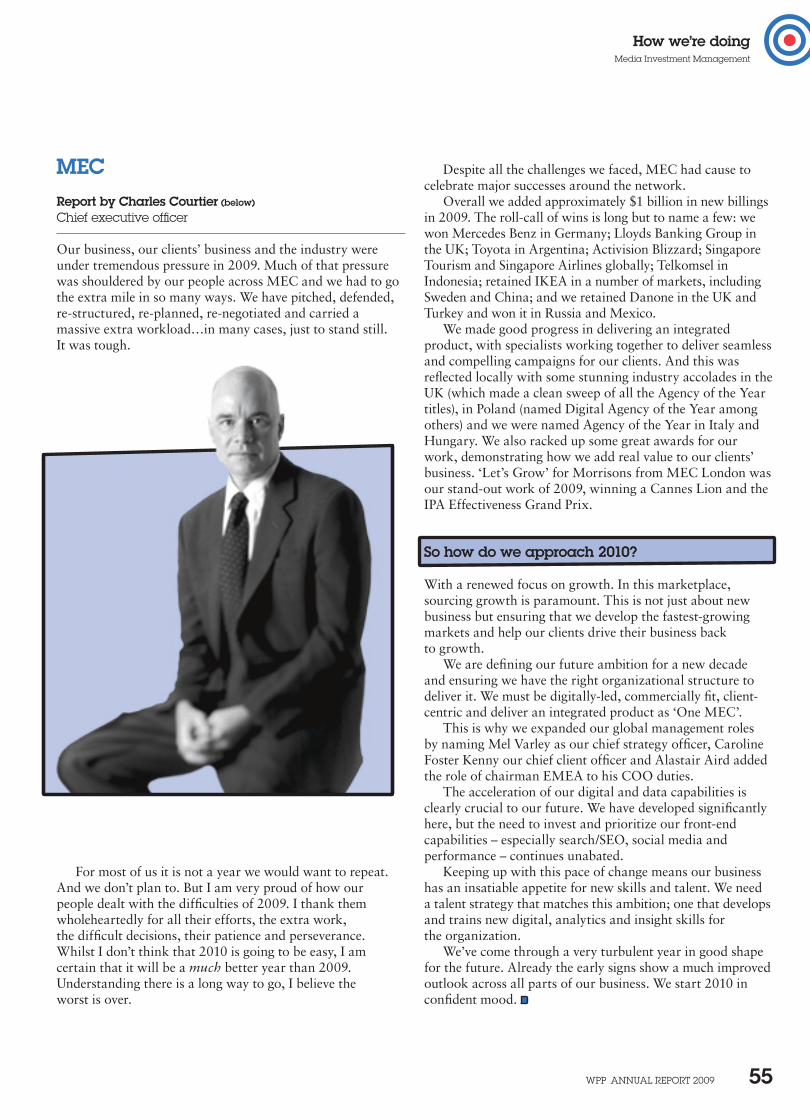
WPP AnnuAl rePort 2009 55
How we’re doingMedia Investment Management
MECReport by Charles Courtier (below)
Chief executive officer
Our business, our clients’ business and the industry were under tremendous pressure in 2009. Much of that pressure was shouldered by our people across MEC and we had to go the extra mile in so many ways. We have pitched, defended, re-structured, re-planned, re-negotiated and carried a massive extra workload…in many cases, just to stand still. It was tough.
Despite all the challenges we faced, MEC had cause to celebrate major successes around the network.
Overall we added approximately $1 billion in new billings in 2009. The roll-call of wins is long but to name a few: we won Mercedes Benz in Germany; Lloyds Banking Group in the UK; Toyota in Argentina; Activision Blizzard; Singapore Tourism and Singapore Airlines globally; Telkomsel in Indonesia; retained IKEA in a number of markets, including Sweden and China; and we retained Danone in the UK and Turkey and won it in Russia and Mexico.
We made good progress in delivering an integrated product, with specialists working together to deliver seamless and compelling campaigns for our clients. And this was reflected locally with some stunning industry accolades in the UK (which made a clean sweep of all the Agency of the Year titles), in Poland (named Digital Agency of the Year among others) and we were named Agency of the Year in Italy and Hungary. We also racked up some great awards for our work, demonstrating how we add real value to our clients’ business. ‘Let’s Grow’ for Morrisons from MEC London was our stand-out work of 2009, winning a Cannes Lion and the IPA Effectiveness Grand Prix.
So how do we approach 2010?
With a renewed focus on growth. In this marketplace, sourcing growth is paramount. This is not just about new business but ensuring that we develop the fastest-growing markets and help our clients drive their business back to growth.
We are defining our future ambition for a new decade and ensuring we have the right organizational structure to deliver it. We must be digitally-led, commercially fit, client-centric and deliver an integrated product as ‘One MEC’.
This is why we expanded our global management roles by naming Mel Varley as our chief strategy officer, Caroline Foster Kenny our chief client officer and Alastair Aird added the role of chairman EMEA to his COO duties.
The acceleration of our digital and data capabilities is clearly crucial to our future. We have developed significantly here, but the need to invest and prioritize our front-end capabilities – especially search/SEO, social media and performance – continues unabated.
Keeping up with this pace of change means our business has an insatiable appetite for new skills and talent. We need a talent strategy that matches this ambition; one that develops and trains new digital, analytics and insight skills for the organization.
We’ve come through a very turbulent year in good shape for the future. Already the early signs show a much improved outlook across all parts of our business. We start 2010 in confident mood.
For most of us it is not a year we would want to repeat. And we don’t plan to. But I am very proud of how our people dealt with the difficulties of 2009. I thank them wholeheartedly for all their efforts, the extra work, the difficult decisions, their patience and perseverance. Whilst I don’t think that 2010 is going to be easy, I am certain that it will be a much better year than 2009. Understanding there is a long way to go, I believe the worst is over.
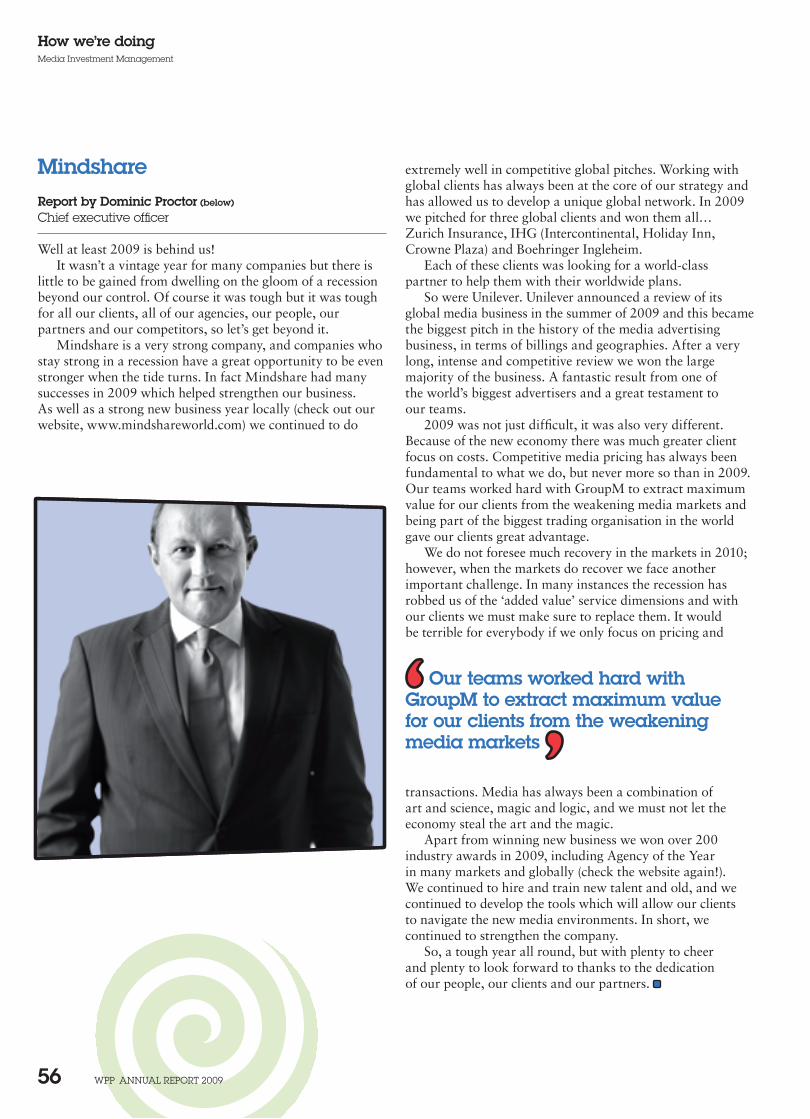
WPP AnnuAl rePort 2009 56
How we’re doingMedia Investment Management
MindshareReport by Dominic Proctor (below)
Chief executive officer
Well at least 2009 is behind us!It wasn’t a vintage year for many companies but there is
little to be gained from dwelling on the gloom of a recession beyond our control. Of course it was tough but it was tough for all our clients, all of our agencies, our people, our partners and our competitors, so let’s get beyond it.
Mindshare is a very strong company, and companies who stay strong in a recession have a great opportunity to be even stronger when the tide turns. In fact Mindshare had many successes in 2009 which helped strengthen our business. As well as a strong new business year locally (check out our website, www.mindshareworld.com) we continued to do
extremely well in competitive global pitches. Working with global clients has always been at the core of our strategy and has allowed us to develop a unique global network. In 2009 we pitched for three global clients and won them all… Zurich Insurance, IHG (Intercontinental, Holiday Inn, Crowne Plaza) and Boehringer Ingleheim.
Each of these clients was looking for a world-class partner to help them with their worldwide plans.
So were Unilever. Unilever announced a review of its global media business in the summer of 2009 and this became the biggest pitch in the history of the media advertising business, in terms of billings and geographies. After a very long, intense and competitive review we won the large majority of the business. A fantastic result from one of the world’s biggest advertisers and a great testament to our teams.
2009 was not just difficult, it was also very different. Because of the new economy there was much greater client focus on costs. Competitive media pricing has always been fundamental to what we do, but never more so than in 2009. Our teams worked hard with GroupM to extract maximum value for our clients from the weakening media markets and being part of the biggest trading organisation in the world gave our clients great advantage.
We do not foresee much recovery in the markets in 2010; however, when the markets do recover we face another important challenge. In many instances the recession has robbed us of the ‘added value’ service dimensions and with our clients we must make sure to replace them. It would be terrible for everybody if we only focus on pricing and
transactions. Media has always been a combination of art and science, magic and logic, and we must not let the economy steal the art and the magic.
Apart from winning new business we won over 200 industry awards in 2009, including Agency of the Year in many markets and globally (check the website again!). We continued to hire and train new talent and old, and we continued to develop the tools which will allow our clients to navigate the new media environments. In short, we continued to strengthen the company.
So, a tough year all round, but with plenty to cheer and plenty to look forward to thanks to the dedication of our people, our clients and our partners.
Our teams worked hard with GroupM to extract maximum value for our clients from the weakening media markets
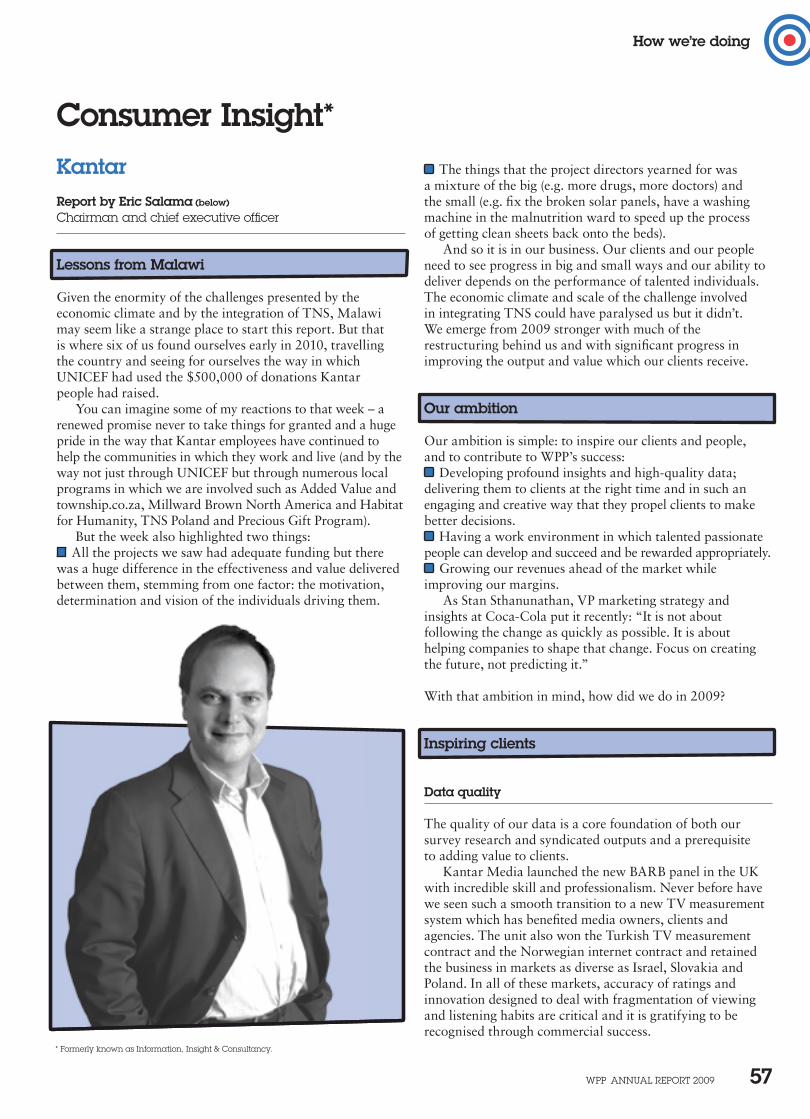
WPP AnnuAl rePort 2009 57
How we’re doing
KantarReport by Eric Salama (below)
Chairman and chief executive officer
Lessons from Malawi
Given the enormity of the challenges presented by the economic climate and by the integration of TNS, Malawi may seem like a strange place to start this report. But that is where six of us found ourselves early in 2010, travelling the country and seeing for ourselves the way in which UNICEF had used the $500,000 of donations Kantar people had raised.
You can imagine some of my reactions to that week – a renewed promise never to take things for granted and a huge pride in the way that Kantar employees have continued to help the communities in which they work and live (and by the way not just through UNICEF but through numerous local programs in which we are involved such as Added Value and township.co.za, Millward Brown North America and Habitat for Humanity, TNS Poland and Precious Gift Program).
But the week also highlighted two things: All the projects we saw had adequate funding but there
was a huge difference in the effectiveness and value delivered between them, stemming from one factor: the motivation, determination and vision of the individuals driving them.
Consumer Insight* The things that the project directors yearned for was
a mixture of the big (e.g. more drugs, more doctors) and the small (e.g. fix the broken solar panels, have a washing machine in the malnutrition ward to speed up the process of getting clean sheets back onto the beds).
And so it is in our business. Our clients and our people need to see progress in big and small ways and our ability to deliver depends on the performance of talented individuals. The economic climate and scale of the challenge involved in integrating TNS could have paralysed us but it didn’t. We emerge from 2009 stronger with much of the restructuring behind us and with significant progress in improving the output and value which our clients receive.
Our ambition
Our ambition is simple: to inspire our clients and people, and to contribute to WPP’s success:
Developing profound insights and high-quality data; delivering them to clients at the right time and in such an engaging and creative way that they propel clients to make better decisions.
Having a work environment in which talented passionate people can develop and succeed and be rewarded appropriately.
Growing our revenues ahead of the market while improving our margins.
As Stan Sthanunathan, VP marketing strategy and insights at Coca-Cola put it recently: “It is not about following the change as quickly as possible. It is about helping companies to shape that change. Focus on creating the future, not predicting it.”
With that ambition in mind, how did we do in 2009?
Inspiring clients
Data quality
The quality of our data is a core foundation of both our survey research and syndicated outputs and a prerequisite to adding value to clients.
Kantar Media launched the new BARB panel in the UK with incredible skill and professionalism. Never before have we seen such a smooth transition to a new TV measurement system which has benefited media owners, clients and agencies. The unit also won the Turkish TV measurement contract and the Norwegian internet contract and retained the business in markets as diverse as Israel, Slovakia and Poland. In all of these markets, accuracy of ratings and innovation designed to deal with fragmentation of viewing and listening habits are critical and it is gratifying to be recognised through commercial success.
* Formerly known as Information, Insight & Consultancy.
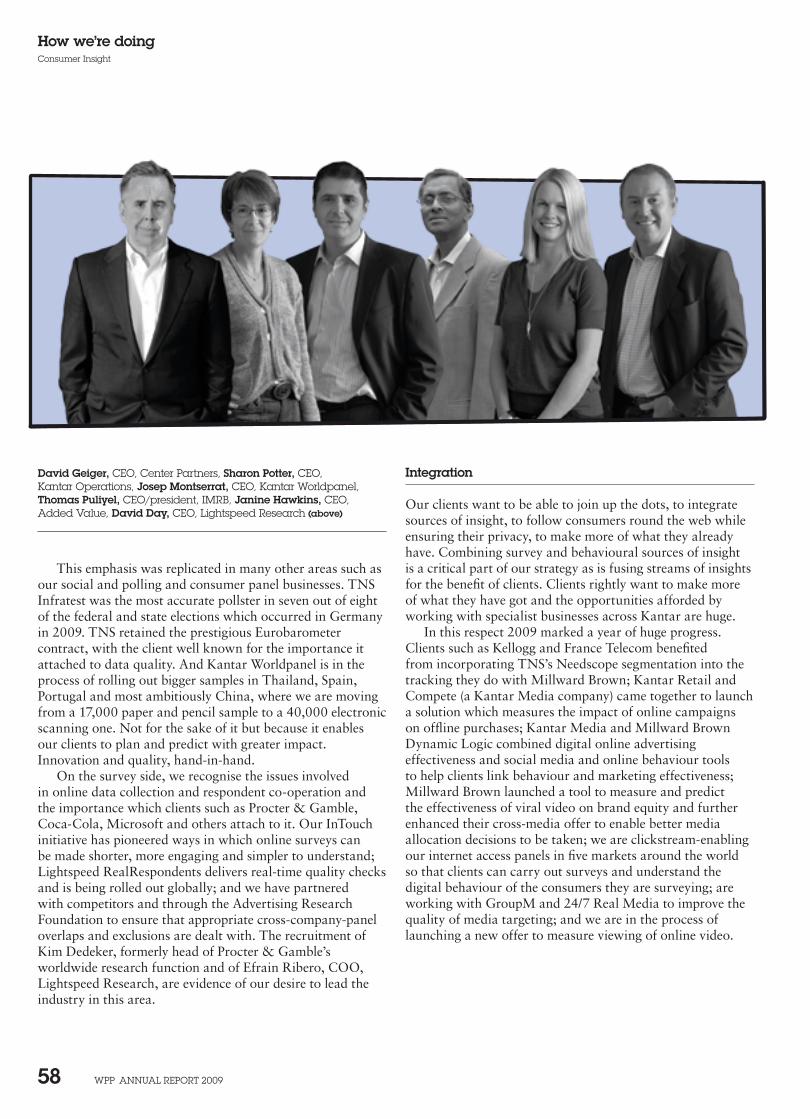
WPP AnnuAl rePort 2009 58
How we’re doingConsumer Insight
Integration
Our clients want to be able to join up the dots, to integrate sources of insight, to follow consumers round the web while ensuring their privacy, to make more of what they already have. Combining survey and behavioural sources of insight is a critical part of our strategy as is fusing streams of insights for the benefit of clients. Clients rightly want to make more of what they have got and the opportunities afforded by working with specialist businesses across Kantar are huge.
In this respect 2009 marked a year of huge progress. Clients such as Kellogg and France Telecom benefited from incorporating TNS’s Needscope segmentation into the tracking they do with Millward Brown; Kantar Retail and Compete (a Kantar Media company) came together to launch a solution which measures the impact of online campaigns on offline purchases; Kantar Media and Millward Brown Dynamic Logic combined digital online advertising effectiveness and social media and online behaviour tools to help clients link behaviour and marketing effectiveness; Millward Brown launched a tool to measure and predict the effectiveness of viral video on brand equity and further enhanced their cross-media offer to enable better media allocation decisions to be taken; we are clickstream-enabling our internet access panels in five markets around the world so that clients can carry out surveys and understand the digital behaviour of the consumers they are surveying; are working with GroupM and 24/7 Real Media to improve the quality of media targeting; and we are in the process of launching a new offer to measure viewing of online video.
This emphasis was replicated in many other areas such as our social and polling and consumer panel businesses. TNS Infratest was the most accurate pollster in seven out of eight of the federal and state elections which occurred in Germany in 2009. TNS retained the prestigious Eurobarometer contract, with the client well known for the importance it attached to data quality. And Kantar Worldpanel is in the process of rolling out bigger samples in Thailand, Spain, Portugal and most ambitiously China, where we are moving from a 17,000 paper and pencil sample to a 40,000 electronic scanning one. Not for the sake of it but because it enables our clients to plan and predict with greater impact. Innovation and quality, hand-in-hand.
On the survey side, we recognise the issues involved in online data collection and respondent co-operation and the importance which clients such as Procter & Gamble, Coca-Cola, Microsoft and others attach to it. Our InTouch initiative has pioneered ways in which online surveys can be made shorter, more engaging and simpler to understand; Lightspeed RealRespondents delivers real-time quality checks and is being rolled out globally; and we have partnered with competitors and through the Advertising Research Foundation to ensure that appropriate cross-company-panel overlaps and exclusions are dealt with. The recruitment of Kim Dedeker, formerly head of Procter & Gamble’s worldwide research function and of Efrain Ribero, COO, Lightspeed Research, are evidence of our desire to lead the industry in this area.
David Geiger, Ceo, Center Partners, Sharon Potter, Ceo, Kantar operations, Josep Montserrat, Ceo, Kantar Worldpanel, Thomas Puliyel, Ceo/president, IMrB, Janine Hawkins, Ceo, Added Value, David Day, Ceo, lightspeed research (above)
WPP AnnuAl rePort 2009 59
How we’re doingConsumer Insight
not more data collection. The Futures Company and Kantar Worldpanel combined their future segmentation approach and panel data to enable Morrisons and their packaged-goods suppliers to understand the way in which UK consumers were reacting to the recession and to predict how their behaviour would change going forward. Strategic work for Pepsi and Unilever involved no new data collection and instead centred on analysis and testing of creative hypotheses to improve performance in various markets.
There is much more to do but we all recognise that how we deliver our insights is as important a determinant for clients to make better decisions as is the nature of the insights themselves.
Inspiring people
While there are some high spots and some parts of the world where our management teams have done wonderful things in difficult circumstances, we have to acknowledge that too many of our people did not find 2009 inspiring. It was a tough year in which our headcount fell by 8% during the year, in which some people voluntarily took salary cuts, in which the client agenda of ‘more for less’ meant that people were stretched as never before and in which many finance, operations, IT and HR people had to deal with one of the most complex integrations that our industry has seen. And while the integration activities described below are improving our business immeasurably and to the benefit of our people and clients, 2009 saw much of the pain involved in this process with little of the gain – a situation which will thankfully reverse itself in 2010.
At the same time our employee-wide survey shows that our people continue to have huge pride in our business, faith in our direction and trust in our management. They know that we successfully carried out much of the cost and infrastructure work which was necessary, training and development budgets have been restored to higher levels and that there is a unanimous determination amongst senior management across the business to put back the emphasis on people issues.
Reshaping the business
Some units – notably Kantar Worldpanel, Kantar Media Audiences, Center Partners, TNS Social and Polling, Kantar Operations, Millward Brown Asia Africa and LatAm – had good years financially. Overall our results will have disappointed our high expectations, but we should be pleased with the progress we made in integrating TNS and in generating the synergies we committed to.
Innovation
If we are to inspire our clients, we must help them see the world through new lenses. Hence the emphasis which Millward Brown has put on the use of neuroscience to tap into the unconscious and enrich our understanding of how communication works; the work that IMRB is doing with
JWT in understanding the rural consumer in India; that TNS is doing with Ogilvy in understanding the Islamic consumer; that Added Value is doing in using semiotic techniques to understand the way in which consumers are reacting to visual and other sensory cues; the wide range of ethnographic projects which we now undertake which bring our clients closer to the reality of the world which their consumers inhabit.
And it’s not just short-term or high-tech innovation that we are focused on. We are heavily involved in most of the research projects sponsored by WPP and Google, involving clients and academics. And TNS Indonesia won the prestigious ‘best paper’ award at ESOMAR’s global conference for developing an innovative diary method for better understanding how illiterate rural consumers used toothpaste.
Creativity
Our focus is on making our deliverables more accessible, more engaging, more impactful, more forward-looking. And in those respects we had tangible signs of progress which benefited clients.
BrandZ™ insights were delivered through an iPhone application; WorldpanelOnline is transforming the way clients access panel data; Added Value’s Charac+erLab™
is a unique approach to brand character development which clients can create and deliver to themselves online; and RedDot has become the virtual reality platform of choice for most of the world’s top retailers and packaged good companies, enabling improvements in supply chain management, pricing and product testing which will become more commonplace in years to come. But remember, you saw it here first!
Much more of our output now takes the form of video and storytelling which engages and inspires. And more broadly, some of the best work we carried out and some of our best deliverables were based on innovative analysis,
Our clients want to be able to join up the dots, to integrate sources of insight, to follow consumers round the web while ensuring their privacy, to make more of what they already have
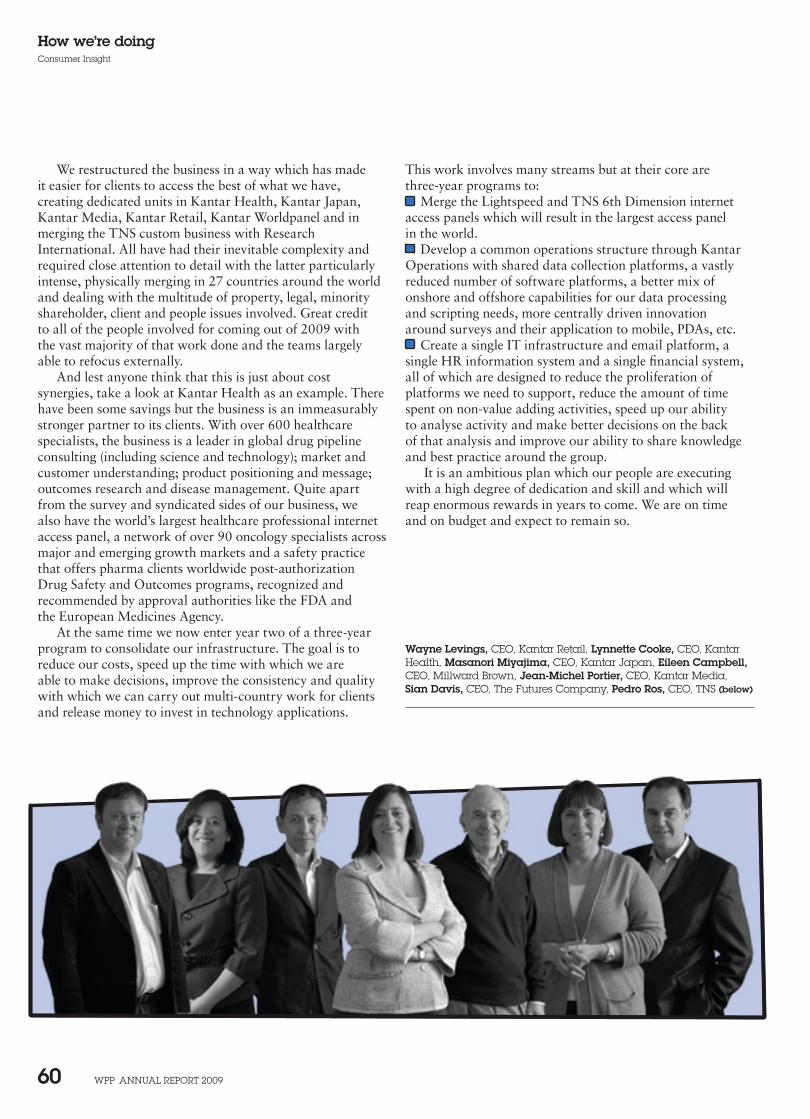
WPP AnnuAl rePort 2009 60
How we’re doingConsumer Insight
This work involves many streams but at their core are three-year programs to:
Merge the Lightspeed and TNS 6th Dimension internet access panels which will result in the largest access panel in the world.
Develop a common operations structure through Kantar Operations with shared data collection platforms, a vastly reduced number of software platforms, a better mix of onshore and offshore capabilities for our data processing and scripting needs, more centrally driven innovation around surveys and their application to mobile, PDAs, etc.
Create a single IT infrastructure and email platform, a single HR information system and a single financial system, all of which are designed to reduce the proliferation of platforms we need to support, reduce the amount of time spent on non-value adding activities, speed up our ability to analyse activity and make better decisions on the back of that analysis and improve our ability to share knowledge and best practice around the group.
It is an ambitious plan which our people are executing with a high degree of dedication and skill and which will reap enormous rewards in years to come. We are on time and on budget and expect to remain so.
We restructured the business in a way which has made it easier for clients to access the best of what we have, creating dedicated units in Kantar Health, Kantar Japan, Kantar Media, Kantar Retail, Kantar Worldpanel and in merging the TNS custom business with Research International. All have had their inevitable complexity and required close attention to detail with the latter particularly intense, physically merging in 27 countries around the world and dealing with the multitude of property, legal, minority shareholder, client and people issues involved. Great credit to all of the people involved for coming out of 2009 with the vast majority of that work done and the teams largely able to refocus externally.
And lest anyone think that this is just about cost synergies, take a look at Kantar Health as an example. There have been some savings but the business is an immeasurably stronger partner to its clients. With over 600 healthcare specialists, the business is a leader in global drug pipeline consulting (including science and technology); market and customer understanding; product positioning and message; outcomes research and disease management. Quite apart from the survey and syndicated sides of our business, we also have the world’s largest healthcare professional internet access panel, a network of over 90 oncology specialists across major and emerging growth markets and a safety practice that offers pharma clients worldwide post-authorization Drug Safety and Outcomes programs, recognized and recommended by approval authorities like the FDA and the European Medicines Agency.
At the same time we now enter year two of a three-year program to consolidate our infrastructure. The goal is to reduce our costs, speed up the time with which we are able to make decisions, improve the consistency and quality with which we can carry out multi-country work for clients and release money to invest in technology applications.
Wayne Levings, Ceo, Kantar retail, Lynnette Cooke, Ceo, Kantar Health, Masanori Miyajima, Ceo, Kantar Japan, Eileen Campbell, Ceo, Millward Brown, Jean-Michel Portier, Ceo, Kantar Media, Sian Davis, Ceo, the Futures Company, Pedro Ros, Ceo, tnS (below)
WPP AnnuAl rePort 2009 61
How we’re doingConsumer Insight
And finally…
One of our clients recently described his state of mind as “pleased but not satisfied”. While none of us can be pleased or satisfied with our performance in 2009, it is how I feel from a business transformation point of view.
We are doing great work for many clients in many places and get recognised for doing so through various awards at both an individual and corporate level. IMRB was voted best agency in India, Millward Brown was recognised for its outstanding contribution to UK research and won company of the year in Poland and their clients won nine Ogilvy Effies, Kantar Health won Eli Lilly’s best insight award for work in the insulin category, Stephen Palacios of Added Value was honoured by Target as best contributor, George Shababb and Larry Friedman and others were recognised as ARF Great Minds. The list is much longer. But our ambition is far greater. We want to see clients thrive by partnering with us and we want our people to benefit and improve by working for us. Not just occasionally or in some places but everywhere, all the time.
We know that we are unique in many respects – in being global and big in most local markets; in having a mix of data, insight and consulting skills; in being able to work at a high level across a wider spectrum than any competitor spanning measurement, innovation, branding, customer experience, futurology; in having specialist businesses working together for the benefit of clients; in having an opportunity to use the integration of TNS to make us a more effective and higher margin business.
We know what we need to do; in true research fashion we measure our financial progress, employee engagement and customer satisfaction in every unit around the world regularly so we are never deluded about ourselves; and we are collectively determined.
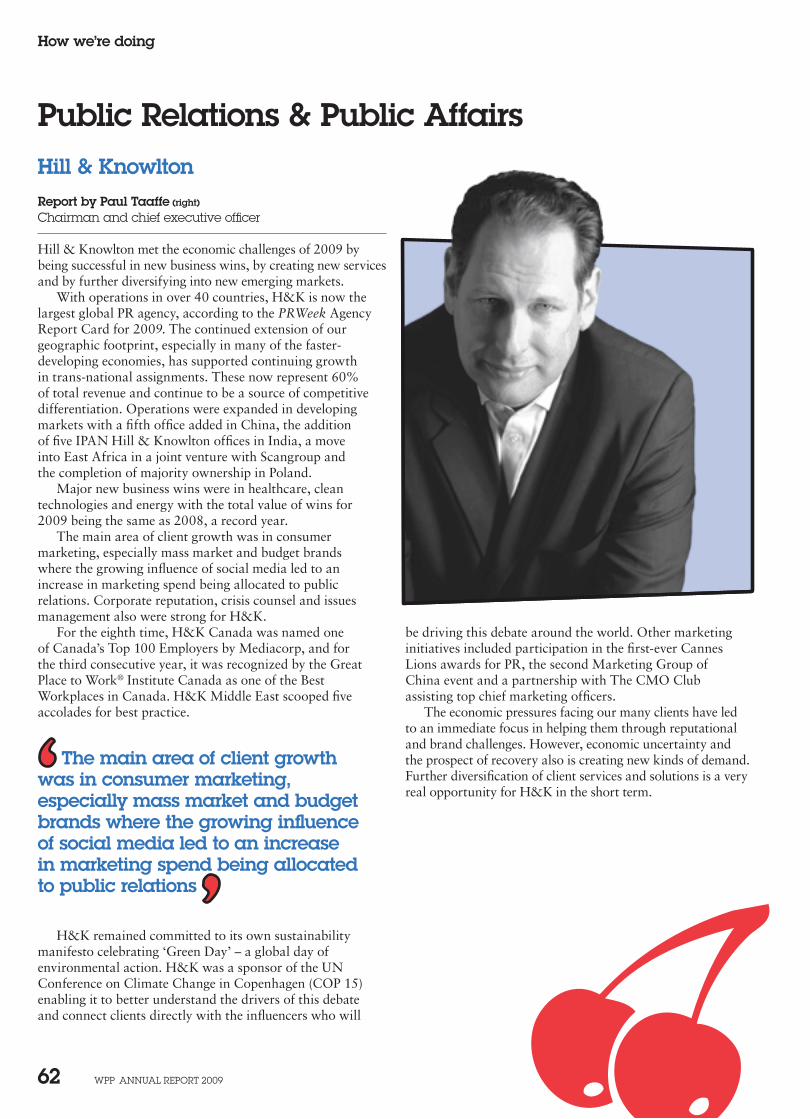
WPP AnnuAl rePort 2009 62
How we’re doing
be driving this debate around the world. Other marketing initiatives included participation in the first-ever Cannes Lions awards for PR, the second Marketing Group of China event and a partnership with The CMO Club assisting top chief marketing officers.
The economic pressures facing our many clients have led to an immediate focus in helping them through reputational and brand challenges. However, economic uncertainty and the prospect of recovery also is creating new kinds of demand. Further diversification of client services and solutions is a very real opportunity for H&K in the short term.
Hill & KnowltonReport by Paul Taaffe (right)
Chairman and chief executive officer
Hill & Knowlton met the economic challenges of 2009 by being successful in new business wins, by creating new services and by further diversifying into new emerging markets.
With operations in over 40 countries, H&K is now the largest global PR agency, according to the PRWeek Agency Report Card for 2009. The continued extension of our geographic footprint, especially in many of the faster-developing economies, has supported continuing growth in trans-national assignments. These now represent 60% of total revenue and continue to be a source of competitive differentiation. Operations were expanded in developing markets with a fifth office added in China, the addition of five IPAN Hill & Knowlton offices in India, a move into East Africa in a joint venture with Scangroup and the completion of majority ownership in Poland.
Major new business wins were in healthcare, clean technologies and energy with the total value of wins for 2009 being the same as 2008, a record year.
The main area of client growth was in consumer marketing, especially mass market and budget brands where the growing influence of social media led to an increase in marketing spend being allocated to public relations. Corporate reputation, crisis counsel and issues management also were strong for H&K.
For the eighth time, H&K Canada was named one of Canada’s Top 100 Employers by Mediacorp, and for the third consecutive year, it was recognized by the Great Place to Work® Institute Canada as one of the Best Workplaces in Canada. H&K Middle East scooped five accolades for best practice.
H&K remained committed to its own sustainability manifesto celebrating ‘Green Day’ – a global day of environmental action. H&K was a sponsor of the UN Conference on Climate Change in Copenhagen (COP 15) enabling it to better understand the drivers of this debate and connect clients directly with the influencers who will
Public Relations & Public Affairs
The main area of client growth was in consumer marketing, especially mass market and budget brands where the growing influence of social media led to an increase in marketing spend being allocated to public relations

WPP AnnuAl rePort 2009 63
How we’re doingPublic relations & Public Affairs
Eli Lilly, Folgers, Axa Insurance, Panasonic and many more. And we grew organically with existing clients Merck, Colgate-Palmolive, JM Smucker and Boehringer Ingelheim.
Digital was a significant revenue driver in 2009 and will continue to be a major growth area for Cohn & Wolfe. ExxonMobil tapped us for their first ever online monitoring and response effort. Our initial digital program for MasterCard’s B2B work was so successful we were asked to handle the social media roll-out of the classic ‘Priceless’ campaign and other consumer-facing programs. We helped leading pharmaceutical companies, including Genentech, GlaxoSmithKline, Lilly, Merck and Roche establish their strategic digital frameworks and internal standard operating procedures and continue to counsel many of our clients on regulatory issues related to the digital landscape. We also conducted more than 40 customized ‘Digital Immersions’ for clients across all sectors, industries and audiences.
Branding continues to be a core strength at Cohn & Wolfe where our craft is public relations but our business is brand marketing. While the tools of PR are changing, the fundamentals of building strong brands are more important than ever. For years Cohn & Wolfe has been one of the few PR agencies with a dedicated Brand Planning and Evaluation team. In 2009, we invested in and expanded that team under the leadership of a newly appointed chief branding officer. The position will oversee brand planning, consumer insights, research and analysis and help our clients across all key practices.
Cohn & Wolfe also celebrated dozens of awards from around the world for our creativity – and for our employee satisfaction. We were one of only five global agencies to be named Best Agency To Work For in The Holmes Report’s prestigious annual Report Card, a recognition we’ve achieved for five years in a row. Our strong culture has helped us attract great talent, including one of the industry’s top digital experts to head up our digital practice globally.
We also focused heavily on thought leadership to help clients make better business decisions. Our Financial Confidence Survey gauged the impact of the financial crisis on consumer confidence and led to many new business leads. Our annual Green Brands study expanded to seven countries and helped us counsel clients on the role and impact of green initiatives within their overall business strategy.
Cohn & WolfeReport by Donna Imperato (below)
Chief executive officer
Strengthening the agency and setting us up for future growth were Cohn & Wolfe’s key goals for 2009. It was our first full year following the merger with GCI which doubled our business and our talent base. And we succeeded in strengthening our culture and talent, while maintaining a solid client base during the tough economic climate. By keeping clients and staff motivated in 2009, Cohn & Wolfe entered 2010 with a dedicated team and committed clients, both existing and new. It was a great year for new business.
We prevailed in many of the industry’s most coveted competitions, adding three new clients from the Fortune 15 including the top two – Walmart and ExxonMobil – and more than 50 accounts overall. Walmart, in particular, was a game-changing win for our US region in terms of revenue. We also added McKesson, MasterCard, AstraZeneca, Heinz,
Branding continues to be a core strength at Cohn & Wolfe where our craft is public relations but our business is brand marketing
WPP AnnuAl rePort 2009 64
How we’re doingPublic relations & Public Affairs
Cohn & Wolfe is also parent to two specialty agencies, GCI Health and AxiCom. GCI Health has earned a reputation as one of the foremost healthcare communications agencies, adept at the key elements of health communications: crisis management, digital health strategy, high-science communications and ROI-generating product marketing (for full report, see page 71). AxiCom, our recently acquired European technology agency, had a very successful 2009 underscored by a high-profile expansion in the US. Enfatico’s public relations division rebranded to become AxiCom US, creating a global communications firm under the AxiCom brand. It continues to serve as the global PR agency of record for Dell, as well as other blue-chip technology and telecommunications companies.
After a full year as the new Cohn & Wolfe, we are poised to capitalize on key opportunities in the digital landscape and leverage our expertise with chief marketing officers who want and understand the value of brand-building public relations. We continue to impress clients and prospects with our creative programming, insights and nimbleness as an organization. Our entrepreneurial culture allows us to transform with the communications environment and meet ever-changing and more demanding client needs. 2010 is going to be a very good year for Cohn & Wolfe.
Burson-MarstellerFull report on page 64
Burson-Marsteller navigated the difficult waters of 2009 by delivering its second-highest revenue since the dot-com boom and its greatest profit and margin in its history. This performance followed 2008 when the firm had set the previous record on all key metrics. During 2009, we experienced only a low single-digit setback in revenue.
Ogilvy Public Relations WorldwideFull report on page 65
In a year considered the worst for communications since 2001, Ogilvy PR drew upon its highly-diversified, global network to deliver solid results. While some of its more than 80 offices around the world were hit hard, others soared to record profits, reinforcing the strength of a genuine network with broad-reaching, yet deep local roots.
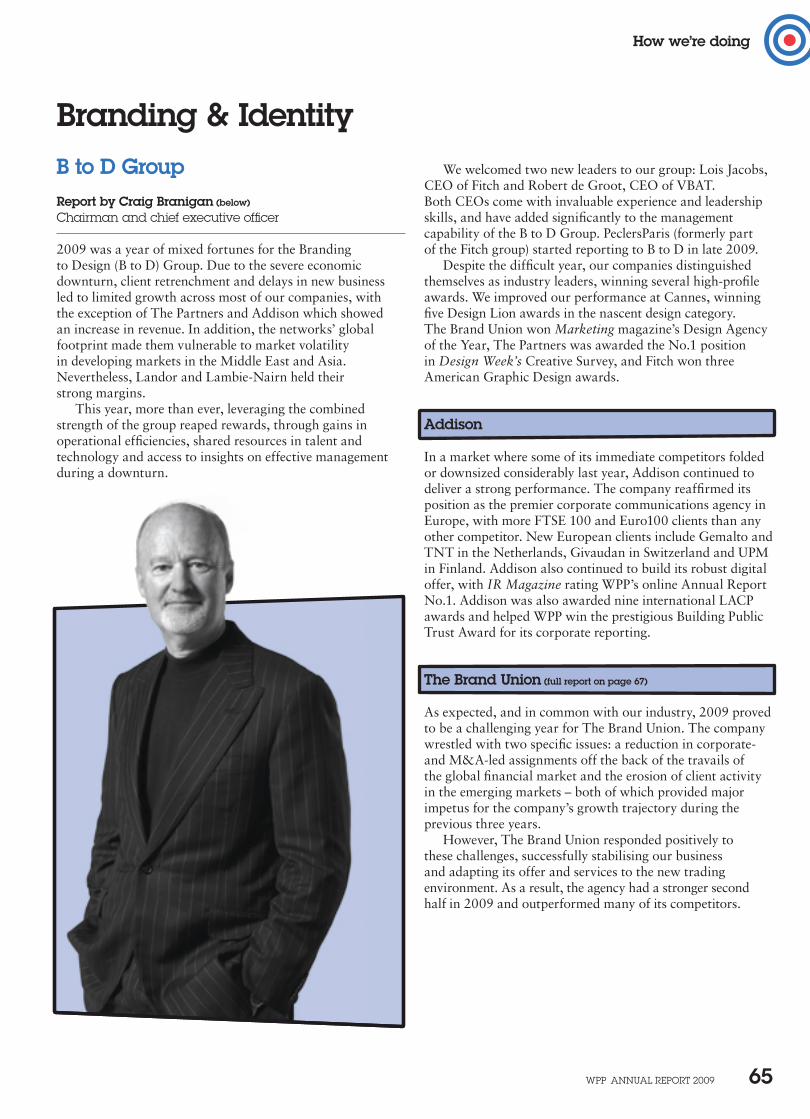
WPP AnnuAl rePort 2009 65
How we’re doing
B to D GroupReport by Craig Branigan (below)
Chairman and chief executive officer
2009 was a year of mixed fortunes for the Branding to Design (B to D) Group. Due to the severe economic downturn, client retrenchment and delays in new business led to limited growth across most of our companies, with the exception of The Partners and Addison which showed an increase in revenue. In addition, the networks’ global footprint made them vulnerable to market volatility in developing markets in the Middle East and Asia. Nevertheless, Landor and Lambie-Nairn held their strong margins.
This year, more than ever, leveraging the combined strength of the group reaped rewards, through gains in operational efficiencies, shared resources in talent and technology and access to insights on effective management during a downturn.
We welcomed two new leaders to our group: Lois Jacobs, CEO of Fitch and Robert de Groot, CEO of VBAT. Both CEOs come with invaluable experience and leadership skills, and have added significantly to the management capability of the B to D Group. PeclersParis (formerly part of the Fitch group) started reporting to B to D in late 2009.
Despite the difficult year, our companies distinguished themselves as industry leaders, winning several high-profile awards. We improved our performance at Cannes, winning five Design Lion awards in the nascent design category. The Brand Union won Marketing magazine’s Design Agency of the Year, The Partners was awarded the No.1 position in Design Week’s Creative Survey, and Fitch won three American Graphic Design awards.
Addison
In a market where some of its immediate competitors folded or downsized considerably last year, Addison continued to deliver a strong performance. The company reaffirmed its position as the premier corporate communications agency in Europe, with more FTSE 100 and Euro100 clients than any other competitor. New European clients include Gemalto and TNT in the Netherlands, Givaudan in Switzerland and UPM in Finland. Addison also continued to build its robust digital offer, with IR Magazine rating WPP’s online Annual Report No.1. Addison was also awarded nine international LACP awards and helped WPP win the prestigious Building Public Trust Award for its corporate reporting.
The Brand Union (full report on page 67)
As expected, and in common with our industry, 2009 proved to be a challenging year for The Brand Union. The company wrestled with two specific issues: a reduction in corporate- and M&A-led assignments off the back of the travails of the global financial market and the erosion of client activity in the emerging markets – both of which provided major impetus for the company’s growth trajectory during the previous three years.
However, The Brand Union responded positively to these challenges, successfully stabilising our business and adapting its offer and services to the new trading environment. As a result, the agency had a stronger second half in 2009 and outperformed many of its competitors.
Branding & Identity
WPP AnnuAl rePort 2009 66
How we’re doingBranding & Identity
Fitch (full report on page 68)
In common with many of its retail clients, 2009 was a challenging year for Fitch. While the company experienced growth in Asia, other parts of its network were more affected by the economic downturn.
Fitch’s ability to translate brands into experiences enabled it to win fresh assignments for many new clients. The company welcomed Barclaycard, McLaren, Hyundai, Arcelik Beko, VM Ware, Sberbank and Morrisons to Fitch in 2009.
Lambie-Nairn
Lambie-Nairn delivered a strong operating profit margin. The company continued to build key client relationships with the BBC, O2 and Sainsbury’s. 2009 was a year of exciting geographic expansion based on client needs. Lambie-Nairn’s office in Munich continued to grow, adding EADs, Airtours and Scleich; it maintained its dominance of the Middle Eastern media market with MBC, Abu Dhabi Media Company and Baynounah among their clients.
The company’s most significant win was the appointment to develop and undertake the global brand guardianship for the Telefónica Group. This high-profile program will involve the creation of new hubs in Argentina, Brazil, Colombia, Mexico and Spain. This project lays the foundation for a strategic footprint for Lambie-Nairn and the B to D Group in South America. Led by CEO Christian Schroeder, Lambie-Nairn is poised to deliver ongoing growth, propelling it to become more of an international player.
Landor Associates (full report on page 43)
Landor’s performance in 2009 differed dramatically, depending from where you viewed it. In the US, Landor’s all-important financial engine, margins were quite exceptional. But it was patchy in Europe where the recession bit.
Landor was Marketing magazine’s Branding Agency of the Year in Greater China, but the company suffered in the Middle East where the market for its services was undermined by events in Dubai. Business with most of its long-term clients performed very well indeed but the number of new business opportunities around most of the world dropped dramatically.
The net result of all this is that, while revenue and operating profit were down on the previous year, the company nevertheless weathered this recession better than most.
The Partners
The Partners grew from strength to strength, delivering excellent growth in revenue. The agency’s focus on big ideas and creative excellence helped it to grow key client relationships with Aviva, Deloitte, Imperial Tobacco, Network Rail and Novo Nordisk.
Led by CEO Jim Prior, The Partners continues to be one of the most creatively recognized agencies in the world. Under the creative stewardship of Greg Quinton, they were awarded first position in Design Week’s Creative Survey; it won two Design Lions at Cannes and several other awards from Graphis, Clio, New York Art Directors Club and Mobius, among others. Pursuing the strategy of ‘One agency, two doors’, The Partners exported its superior creative reputation to successfully build its office in New York.
VBAT
Under the leadership of chairman Eugene Bay and new CEO, Robert de Groot, VBAT continued to drive a strong and steady business built upon its long-term relationships with Campina, Heineken, Intergamma, NS (Dutch railway), and SNS REAAL. VBAT focused on building its retail expertise, leading to new opportunities with Jumbo supermarkets.
Business innovations included the development of a new low-cost production offer, GroundFloor. VBAT was recognized with a silver Penta award for Jillz, a Heineken-owned cider brand. The company continued to build its international profile, with successful launches for Banco de Chile, Cristal Beer (Chile), and Maes Beer (Belgium).
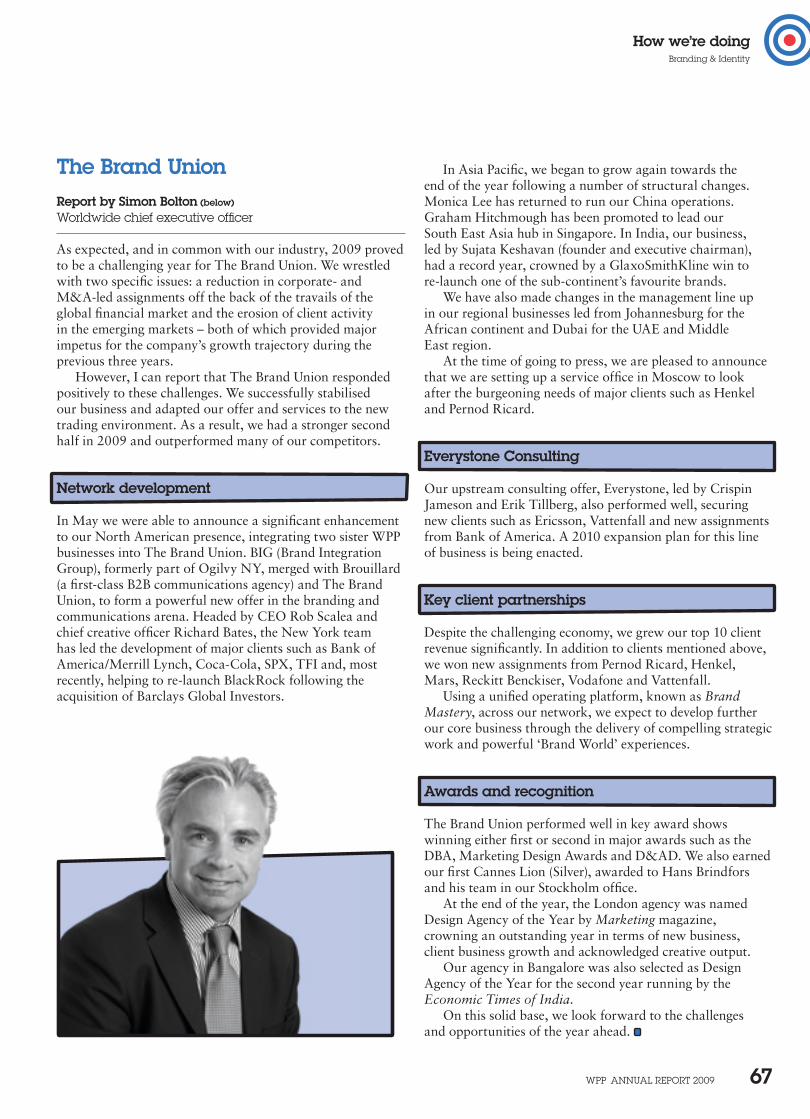
WPP AnnuAl rePort 2009 67
How we’re doingBranding & Identity
In Asia Pacific, we began to grow again towards the end of the year following a number of structural changes. Monica Lee has returned to run our China operations. Graham Hitchmough has been promoted to lead our South East Asia hub in Singapore. In India, our business, led by Sujata Keshavan (founder and executive chairman), had a record year, crowned by a GlaxoSmithKline win to re-launch one of the sub-continent’s favourite brands.
We have also made changes in the management line up in our regional businesses led from Johannesburg for the African continent and Dubai for the UAE and Middle East region.
At the time of going to press, we are pleased to announce that we are setting up a service office in Moscow to look after the burgeoning needs of major clients such as Henkel and Pernod Ricard.
Everystone Consulting
Our upstream consulting offer, Everystone, led by Crispin Jameson and Erik Tillberg, also performed well, securing new clients such as Ericsson, Vattenfall and new assignments from Bank of America. A 2010 expansion plan for this line of business is being enacted.
Key client partnerships
Despite the challenging economy, we grew our top 10 client revenue significantly. In addition to clients mentioned above, we won new assignments from Pernod Ricard, Henkel, Mars, Reckitt Benckiser, Vodafone and Vattenfall.
Using a unified operating platform, known as Brand Mastery, across our network, we expect to develop further our core business through the delivery of compelling strategic work and powerful ‘Brand World’ experiences.
Awards and recognition
The Brand Union performed well in key award shows winning either first or second in major awards such as the DBA, Marketing Design Awards and D&AD. We also earned our first Cannes Lion (Silver), awarded to Hans Brindfors and his team in our Stockholm office.
At the end of the year, the London agency was named Design Agency of the Year by Marketing magazine, crowning an outstanding year in terms of new business, client business growth and acknowledged creative output.
Our agency in Bangalore was also selected as Design Agency of the Year for the second year running by the Economic Times of India.
On this solid base, we look forward to the challenges and opportunities of the year ahead.
The Brand UnionReport by Simon Bolton (below)
Worldwide chief executive officer
As expected, and in common with our industry, 2009 proved to be a challenging year for The Brand Union. We wrestled with two specific issues: a reduction in corporate- and M&A-led assignments off the back of the travails of the global financial market and the erosion of client activity in the emerging markets – both of which provided major impetus for the company’s growth trajectory during the previous three years.
However, I can report that The Brand Union responded positively to these challenges. We successfully stabilised our business and adapted our offer and services to the new trading environment. As a result, we had a stronger second half in 2009 and outperformed many of our competitors.
Network development
In May we were able to announce a significant enhancement to our North American presence, integrating two sister WPP businesses into The Brand Union. BIG (Brand Integration Group), formerly part of Ogilvy NY, merged with Brouillard (a first-class B2B communications agency) and The Brand Union, to form a powerful new offer in the branding and communications arena. Headed by CEO Rob Scalea and chief creative officer Richard Bates, the New York team has led the development of major clients such as Bank of America/Merrill Lynch, Coca-Cola, SPX, TFI and, most recently, helping to re-launch BlackRock following the acquisition of Barclays Global Investors.
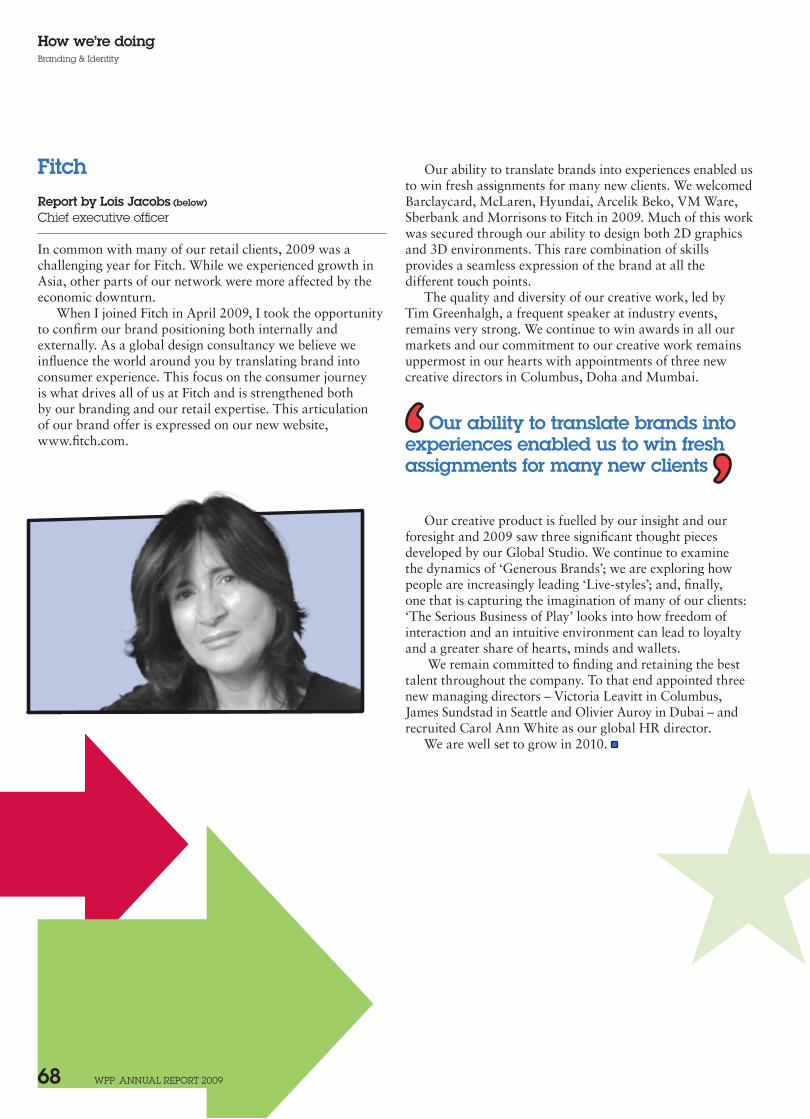
WPP AnnuAl rePort 2009 68
How we’re doingBranding & Identity
Fitch Report by Lois Jacobs (below)
Chief executive officer
In common with many of our retail clients, 2009 was a challenging year for Fitch. While we experienced growth in Asia, other parts of our network were more affected by the economic downturn.
When I joined Fitch in April 2009, I took the opportunity to confirm our brand positioning both internally and externally. As a global design consultancy we believe we influence the world around you by translating brand into consumer experience. This focus on the consumer journey is what drives all of us at Fitch and is strengthened both by our branding and our retail expertise. This articulation of our brand offer is expressed on our new website, www.fitch.com.
Our ability to translate brands into experiences enabled us to win fresh assignments for many new clients. We welcomed Barclaycard, McLaren, Hyundai, Arcelik Beko, VM Ware, Sberbank and Morrisons to Fitch in 2009. Much of this work was secured through our ability to design both 2D graphics and 3D environments. This rare combination of skills provides a seamless expression of the brand at all the different touch points.
The quality and diversity of our creative work, led by Tim Greenhalgh, a frequent speaker at industry events, remains very strong. We continue to win awards in all our markets and our commitment to our creative work remains uppermost in our hearts with appointments of three new creative directors in Columbus, Doha and Mumbai.
Our creative product is fuelled by our insight and our foresight and 2009 saw three significant thought pieces developed by our Global Studio. We continue to examine the dynamics of ‘Generous Brands’; we are exploring how people are increasingly leading ‘Live-styles’; and, finally, one that is capturing the imagination of many of our clients: ‘The Serious Business of Play’ looks into how freedom of interaction and an intuitive environment can lead to loyalty and a greater share of hearts, minds and wallets.
We remain committed to finding and retaining the best talent throughout the company. To that end appointed three new managing directors – Victoria Leavitt in Columbus, James Sundstad in Seattle and Olivier Auroy in Dubai – and recruited Carol Ann White as our global HR director.
We are well set to grow in 2010.
Our ability to translate brands into experiences enabled us to win fresh assignments for many new clients
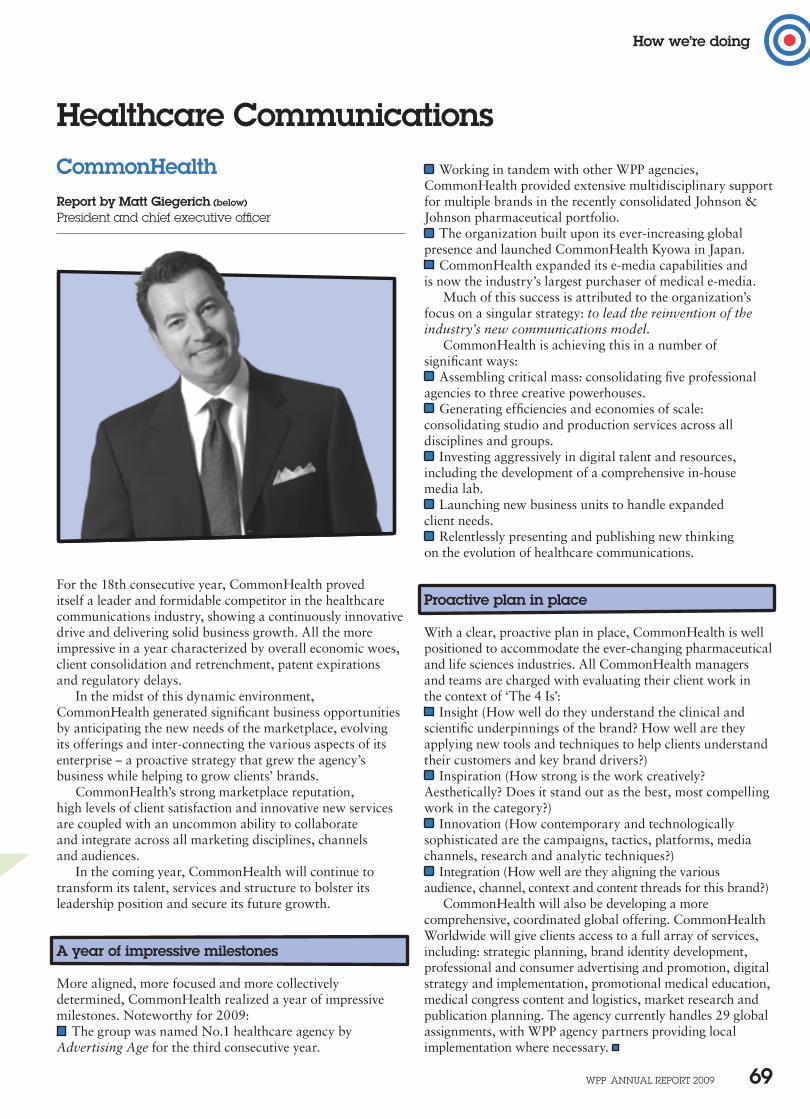
WPP AnnuAl rePort 2009 69
How we’re doing
CommonHealthReport by Matt Giegerich (below)
President and chief executive officer
Working in tandem with other WPP agencies, CommonHealth provided extensive multidisciplinary support for multiple brands in the recently consolidated Johnson & Johnson pharmaceutical portfolio.
The organization built upon its ever-increasing global presence and launched CommonHealth Kyowa in Japan.
CommonHealth expanded its e-media capabilities and is now the industry’s largest purchaser of medical e-media.
Much of this success is attributed to the organization’s focus on a singular strategy: to lead the reinvention of the industry’s new communications model.
CommonHealth is achieving this in a number of significant ways:
Assembling critical mass: consolidating five professional agencies to three creative powerhouses.
Generating efficiencies and economies of scale: consolidating studio and production services across all disciplines and groups.
Investing aggressively in digital talent and resources, including the development of a comprehensive in-house media lab.
Launching new business units to handle expanded client needs.
Relentlessly presenting and publishing new thinking on the evolution of healthcare communications.
Proactive plan in place
With a clear, proactive plan in place, CommonHealth is well positioned to accommodate the ever-changing pharmaceutical and life sciences industries. All CommonHealth managers and teams are charged with evaluating their client work in the context of ‘The 4 Is’:
Insight (How well do they understand the clinical and scientific underpinnings of the brand? How well are they applying new tools and techniques to help clients understand their customers and key brand drivers?)
Inspiration (How strong is the work creatively? Aesthetically? Does it stand out as the best, most compelling work in the category?)
Innovation (How contemporary and technologically sophisticated are the campaigns, tactics, platforms, media channels, research and analytic techniques?)
Integration (How well are they aligning the various audience, channel, context and content threads for this brand?)
CommonHealth will also be developing a more comprehensive, coordinated global offering. CommonHealth Worldwide will give clients access to a full array of services, including: strategic planning, brand identity development, professional and consumer advertising and promotion, digital strategy and implementation, promotional medical education, medical congress content and logistics, market research and publication planning. The agency currently handles 29 global assignments, with WPP agency partners providing local implementation where necessary.
Healthcare Communications
For the 18th consecutive year, CommonHealth proved itself a leader and formidable competitor in the healthcare communications industry, showing a continuously innovative drive and delivering solid business growth. All the more impressive in a year characterized by overall economic woes, client consolidation and retrenchment, patent expirations and regulatory delays.
In the midst of this dynamic environment, CommonHealth generated significant business opportunities by anticipating the new needs of the marketplace, evolving its offerings and inter-connecting the various aspects of its enterprise – a proactive strategy that grew the agency’s business while helping to grow clients’ brands.
CommonHealth’s strong marketplace reputation, high levels of client satisfaction and innovative new services are coupled with an uncommon ability to collaborate and integrate across all marketing disciplines, channels and audiences.
In the coming year, CommonHealth will continue to transform its talent, services and structure to bolster its leadership position and secure its future growth.
A year of impressive milestones
More aligned, more focused and more collectively determined, CommonHealth realized a year of impressive milestones. Noteworthy for 2009:
The group was named No.1 healthcare agency by Advertising Age for the third consecutive year.
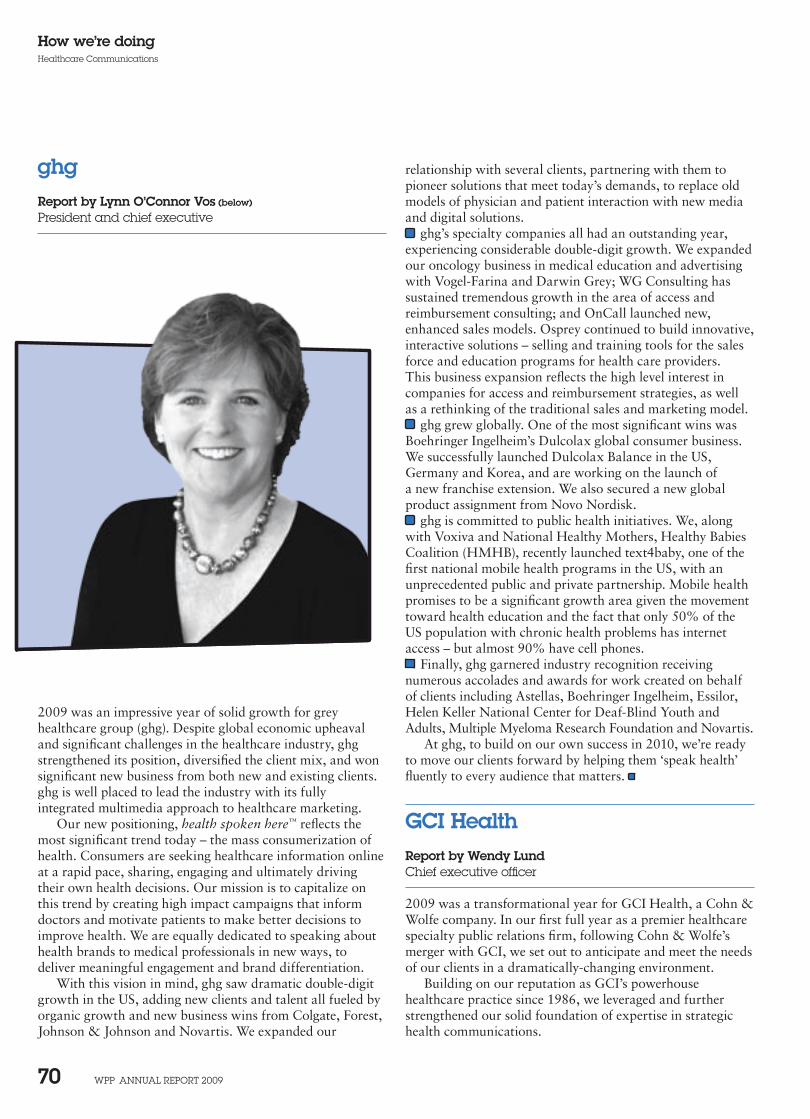
WPP AnnuAl rePort 2009 70
How we’re doingHealthcare Communications
ghgReport by Lynn O’Connor Vos (below)
President and chief executive
2009 was an impressive year of solid growth for grey healthcare group (ghg). Despite global economic upheaval and significant challenges in the healthcare industry, ghg strengthened its position, diversified the client mix, and won significant new business from both new and existing clients. ghg is well placed to lead the industry with its fully integrated multimedia approach to healthcare marketing.
Our new positioning, health spoken here™ reflects the most significant trend today – the mass consumerization of health. Consumers are seeking healthcare information online at a rapid pace, sharing, engaging and ultimately driving their own health decisions. Our mission is to capitalize on this trend by creating high impact campaigns that inform doctors and motivate patients to make better decisions to improve health. We are equally dedicated to speaking about health brands to medical professionals in new ways, to deliver meaningful engagement and brand differentiation.
With this vision in mind, ghg saw dramatic double-digit growth in the US, adding new clients and talent all fueled by organic growth and new business wins from Colgate, Forest, Johnson & Johnson and Novartis. We expanded our
relationship with several clients, partnering with them to pioneer solutions that meet today’s demands, to replace old models of physician and patient interaction with new media and digital solutions.
ghg’s specialty companies all had an outstanding year, experiencing considerable double-digit growth. We expanded our oncology business in medical education and advertising with Vogel-Farina and Darwin Grey; WG Consulting has sustained tremendous growth in the area of access and reimbursement consulting; and OnCall launched new, enhanced sales models. Osprey continued to build innovative, interactive solutions – selling and training tools for the sales force and education programs for health care providers. This business expansion reflects the high level interest in companies for access and reimbursement strategies, as well as a rethinking of the traditional sales and marketing model.
ghg grew globally. One of the most significant wins was Boehringer Ingelheim’s Dulcolax global consumer business. We successfully launched Dulcolax Balance in the US, Germany and Korea, and are working on the launch of a new franchise extension. We also secured a new global product assignment from Novo Nordisk.
ghg is committed to public health initiatives. We, along with Voxiva and National Healthy Mothers, Healthy Babies Coalition (HMHB), recently launched text4baby, one of the first national mobile health programs in the US, with an unprecedented public and private partnership. Mobile health promises to be a significant growth area given the movement toward health education and the fact that only 50% of the US population with chronic health problems has internet access – but almost 90% have cell phones.
Finally, ghg garnered industry recognition receiving numerous accolades and awards for work created on behalf of clients including Astellas, Boehringer Ingelheim, Essilor, Helen Keller National Center for Deaf-Blind Youth and Adults, Multiple Myeloma Research Foundation and Novartis.
At ghg, to build on our own success in 2010, we’re ready to move our clients forward by helping them ‘speak health’ fluently to every audience that matters.
GCI HealthReport by Wendy LundChief executive officer
2009 was a transformational year for GCI Health, a Cohn & Wolfe company. In our first full year as a premier healthcare specialty public relations firm, following Cohn & Wolfe’s merger with GCI, we set out to anticipate and meet the needs of our clients in a dramatically-changing environment.
Building on our reputation as GCI’s powerhouse healthcare practice since 1986, we leveraged and further strengthened our solid foundation of expertise in strategic health communications.
WPP AnnuAl rePort 2009 71
How we’re doingHealthcare Communications
As the entire healthcare landscape continues to face unprecedented and complex change, our imperative is to propel action, build strong product brands and corporate reputations and achieve concrete business results. With our renowned focus on high science communications, digital health strategy, issues management, patient advocacy and consumer action, coupled with our deep talent and experience across many therapeutic categories, GCI Health continues to attack every client challenge with a fearless and proven approach.
We enter the new decade poised for growth and prepared to position the firm as the agency of choice for clients seeking an experienced, healthcare PR firm with a ‘best team’ approach. Our goal for driving growth in 2010 is simple: Dispense insightful strategy. Deploy meaningful action. Deliver impactful ROI.
Ogilvy HealthworldFull report on page 35
In 2009 we focused on strengthening Ogilvy Healthworld as a truly global network, with a clear global proposition for customers and with an effective and responsive infrastructure.
Our clients are centralizing their marketing and their spend to hub offices – we have created global and regional hub offices in response: in New York, London, Paris, Mexico and Singapore.
Working with Ogilvy & Mather regional management in Asia Pacific and Latin America we are establishing a stronger health presence in those regions too. We are diversifying the current offer and up-skilling talent, as well as sharing expertise and client connections.
Sudler & HennesseyFull report on page 44
During a year of economic challenges, we continued to build on our successes by bringing ‘Established Innovation’ services and geographic offerings to meet the ever-changing needs of our clients within human and animal health industries including pharmaceuticals, biotech, fast-moving consumer goods, foods, device/diagnostics, governmental and nongovernmental organizations.
The S&H network focused on strengthening its relationships with current clients, growing network opportunities, and providing 100% client satisfaction, resulting in positive outcomes for the network.
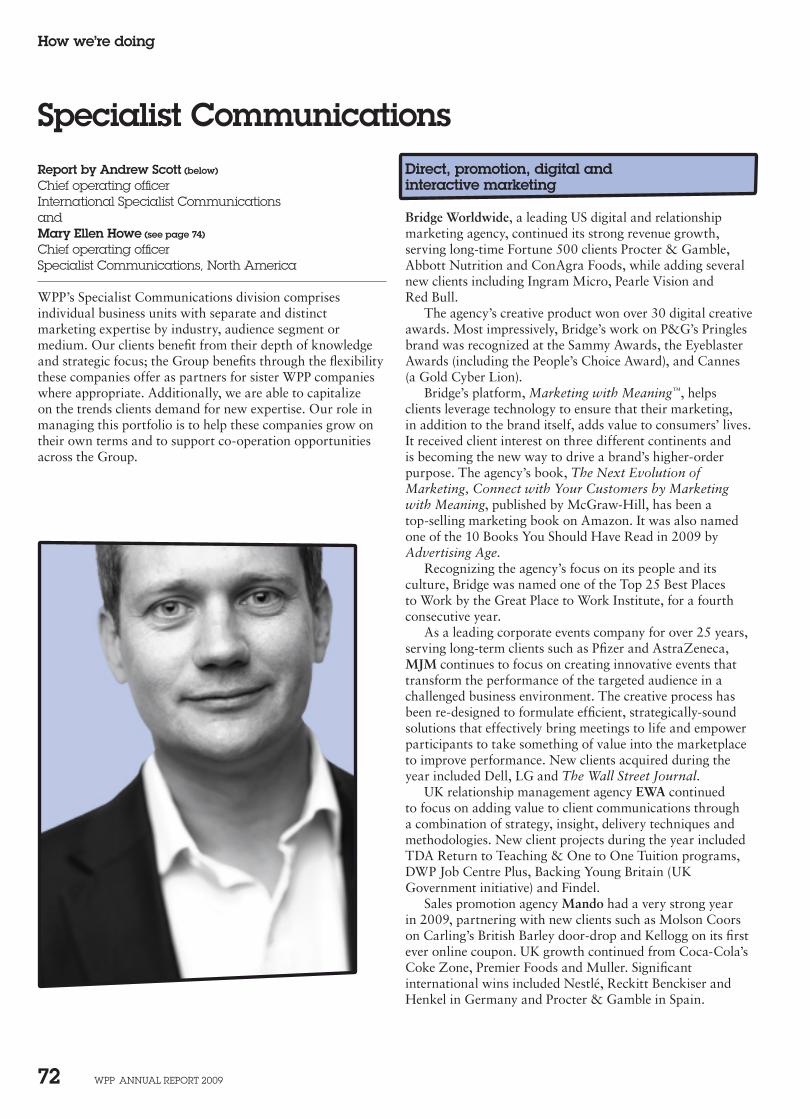
WPP AnnuAl rePort 2009 72
How we’re doing
Report by Andrew Scott (below)
Chief operating officer International Specialist Communications andMary Ellen Howe (see page 74) Chief operating officer Specialist Communications, north America
WPP’s Specialist Communications division comprises individual business units with separate and distinct marketing expertise by industry, audience segment or medium. Our clients benefit from their depth of knowledge and strategic focus; the Group benefits through the flexibility these companies offer as partners for sister WPP companies where appropriate. Additionally, we are able to capitalize on the trends clients demand for new expertise. Our role in managing this portfolio is to help these companies grow on their own terms and to support co-operation opportunities across the Group.
Direct, promotion, digital and interactive marketing
Bridge Worldwide, a leading US digital and relationship marketing agency, continued its strong revenue growth, serving long-time Fortune 500 clients Procter & Gamble, Abbott Nutrition and ConAgra Foods, while adding several new clients including Ingram Micro, Pearle Vision and Red Bull.
The agency’s creative product won over 30 digital creative awards. Most impressively, Bridge’s work on P&G’s Pringles brand was recognized at the Sammy Awards, the Eyeblaster Awards (including the People’s Choice Award), and Cannes (a Gold Cyber Lion).
Bridge’s platform, Marketing with Meaning™, helps clients leverage technology to ensure that their marketing, in addition to the brand itself, adds value to consumers’ lives. It received client interest on three different continents and is becoming the new way to drive a brand’s higher-order purpose. The agency’s book, The Next Evolution of Marketing, Connect with Your Customers by Marketing with Meaning, published by McGraw-Hill, has been a top-selling marketing book on Amazon. It was also named one of the 10 Books You Should Have Read in 2009 by Advertising Age.
Recognizing the agency’s focus on its people and its culture, Bridge was named one of the Top 25 Best Places to Work by the Great Place to Work Institute, for a fourth consecutive year.
As a leading corporate events company for over 25 years, serving long-term clients such as Pfizer and AstraZeneca, MJM continues to focus on creating innovative events that transform the performance of the targeted audience in a challenged business environment. The creative process has been re-designed to formulate efficient, strategically-sound solutions that effectively bring meetings to life and empower participants to take something of value into the marketplace to improve performance. New clients acquired during the year included Dell, LG and The Wall Street Journal.
UK relationship management agency EWA continued to focus on adding value to client communications through a combination of strategy, insight, delivery techniques and methodologies. New client projects during the year included TDA Return to Teaching & One to One Tuition programs, DWP Job Centre Plus, Backing Young Britain (UK Government initiative) and Findel.
Sales promotion agency Mando had a very strong year in 2009, partnering with new clients such as Molson Coors on Carling’s British Barley door-drop and Kellogg on its first ever online coupon. UK growth continued from Coca-Cola’s Coke Zone, Premier Foods and Muller. Significant international wins included Nestlé, Reckitt Benckiser and Henkel in Germany and Procter & Gamble in Spain.
Specialist Communications
WPP AnnuAl rePort 2009 73
How we’re doingSpecialist Communications
2009 marked the 60th anniversary of Pace Advertising, WPP’s first US acquisition. Pace is a specialist in the real estate and luxury lifestyle sectors, including hotels and hospitality, spas, restaurants and luxury lifestyle products, working for leading national homebuilders such as K. Hovnanian® Homes®, as well as luxury brands such as The Setai Group.
In 2009, Pace introduced P2, a customer relationship management tool designed to track leads and develop marketing intelligence for clients in the real estate sector.
Working environment design consultancy BDGworkfutures continued to benefit from being on the Office of Government Commerce framework with significant work from the Communities and Local Government in the UK. Its ongoing relationships with BNY Mellon, Network Rail and EDF Energy continued to strengthen, and its international reach continued to expand with a new client win in Moscow – Interrao.
Edinburgh-based architects and interior designers BDG McColl worked successfully through 2009 with new and existing clients in both public and private sectors, despite the recessionary influences on the property sector. In the public sector, clients included the Universities of Edinburgh and St. Andrews, Lothian and Borders Police, and Glasgow District Council. In the private sector, UK clients included BP, Balfour Beatty, State Street Bank and Wood Mackenzie; international clients included A. T. Osborne in the Netherlands and Mellin in Milan.
Ongoing relationships with organisations such as Unilever, Burberry, Conoco and Deloitte were the backbone of Dovetail’s contract business in 2009, while new clients added include GMR Infrastructure (UK) Ltd, Skanska ID and the Arts Council.
Media and film production services
In 2009, MRC continued to build its reputation as one of the world’s leading independent film, television and digital studios. MRC Film released four films in 2009: Brüno, starring Sacha Baron Cohen and directed by Larry Charles (Seinfeld, Curb Your Enthusiasm); The Invention of Lying, co-written by, co-directed by and starring Ricky Gervais; The Box, starring Cameron Diaz; and Shorts, directed by Robert Rodriguez (Spy Kids, Sin City). MRC also completed principal photography on two films – The Adjustment Bureau starring Matt Damon and Emily Blunt, and Devil produced by M. Night Shyamalan and directed by the Dowdle Brothers (Quarantine).
In television, MRC aired multiple shows including The Life and Times of Tim on HBO, the reality show Shaq vs on ABC starring NBA superstar Shaquille O’Neal, Rita Rocks on Lifetime and The Goode Family on Comedy Central from executive producer Mike Judge (King of the Hill,
Headcount delivered field marketing campaigns for clients such as Sainsbury’s, Kraft, Warner Home Video and Digital UK during 2009. It also won a number of new campaigns for government bodies through its COI relationship. Headcount ended the year strongly, winning contracts with Whirlpool and BT.
Custom media
Forward continued to build its reputation as a market-leading branded content provider delivering ROI across multiple channels. Forward’s portfolio saw a significant growth in digital content including campaign-specific microsites, interactive ezines, content-rich emails and viral games. Key successes include winning monthly property magazine Fabric, launching a new online magazine for Regus and retaining business with TfL, following a seven-way pitch.
In a challenging year for airlines and advertising, Spafax’s award-winning custom media business won contracts with MSN, Mercedes and Bombardier in North America and Teatro in Chile. In the area of inflight entertainment, important contracts with Air Canada and British Airways were renewed, alongside renewals with Finnair, Swiss and SAS and new clients in Egypt and Vietnam. For the third year in succession, its client Emirates won Best Inflight Entertainment in the World as determined by the industry appointed Skytrax survey. Spafax also added a new digital division, expanding into ancillary airline passenger communications platforms such as social media and mobile. The company’s own blogsite, www.sparksheet.com, grew from launch to attract over 10,000 subscribers worldwide.
Demographic and sector marketing
The Food Group solidified its position as a leading food and beverage agency by re-establishing its relationship with the Norwegian Seafood Export Council as it re-entered the US market. In addition, The Food Group became agency of record for Wynnstarr Flavors and Gilsa Dairy, which markets the Frusion®, la Crème®, Weight Watchers® and LALA® brands.
In 2009, The Food Group continued to work with Kraft Foods, Tabasco®, Dawn Foods, Florida Department of Citrus, Simplot, Dannon and PepsiCo. It also continued its 15-year relationship with Nike by hosting the premier food and beverage networking event at the flagship store on the Magnificent Mile in Chicago.
Geppetto, the youth marketing company, worked with a range of clients such as ConAgra Foods, Walmart, PepsiCo and Hershey’s®, to develop both new products and activation programs designed to grow those businesses with young people and mothers.
WPP AnnuAl rePort 2009 74
How we’re doingSpecialist Communications
Office Space). MRC Digital distributed Seth MacFarlane’s Cavalcade of Cartoon Comedy, which has sponsorships with companies such as Nike and Burger King, and MommyCast, a weekly videocast sponsored by companies such as Procter & Gamble, State Farm and Johnson & Johnson.
Metro bucked the trend in the London event market and had a successful 2009. It expanded its reach within Shell International and was awarded a place on the three-year MICE roster to provide event production and AV support. New business wins included the Tesco AGM, Deloitte Annual Partners’ Meeting, numerous conferences for Roche, securing a place on the COI roster (for event management and webcasting), a Rolex event at the Royal Opera House, ING webcasts to market analysts, and sole-supplier status for Vinopolis. Metro continued to support recruitment roadshows for Accenture, Linklaters, Deloitte and Ernst and Young. Metro Ecosse in Edinburgh strengthened its relationship with Experian by winning sole supplier status for event production and successfully produced webcasts for NHS Scotland, Experian and the EICC, and for the fourth year in a row provided technical production support for the Edinburgh Film Festival.
The Farm Group enjoyed a highly successful year in 2009. It maintained its dominant share of the ever-competitive London post-production market and again, supplied full post-production services on the high-rating and award-winning ITV primetime shows The X Factor and Britain’s Got Talent as well as key performers on the other main
channels, including: Deal or No Deal, Shameless, Skins, Friday Night with Jonathan Ross, Gavin and Stacey, Alan Carr Chatty Man, Live at the Apollo, Jamie Oliver’s Tour of America, Casualty 1909 and Total Wipeout.
The Farm and its staff were proud to win a Bafta in 2009 for the audio mix on Ross Kemp on Gangs as well as two Royal Television Society awards; for the editing on The X Factor and the digital picture enhancement on Wallander.
In the future
2010 is expected to be challenging as our businesses focus on adding value in a restricted spending environment. We will continue to emphasize developing digital opportunities, controlling costs, and providing superior client service through specialized expertise and effective collaboration across disciplines.
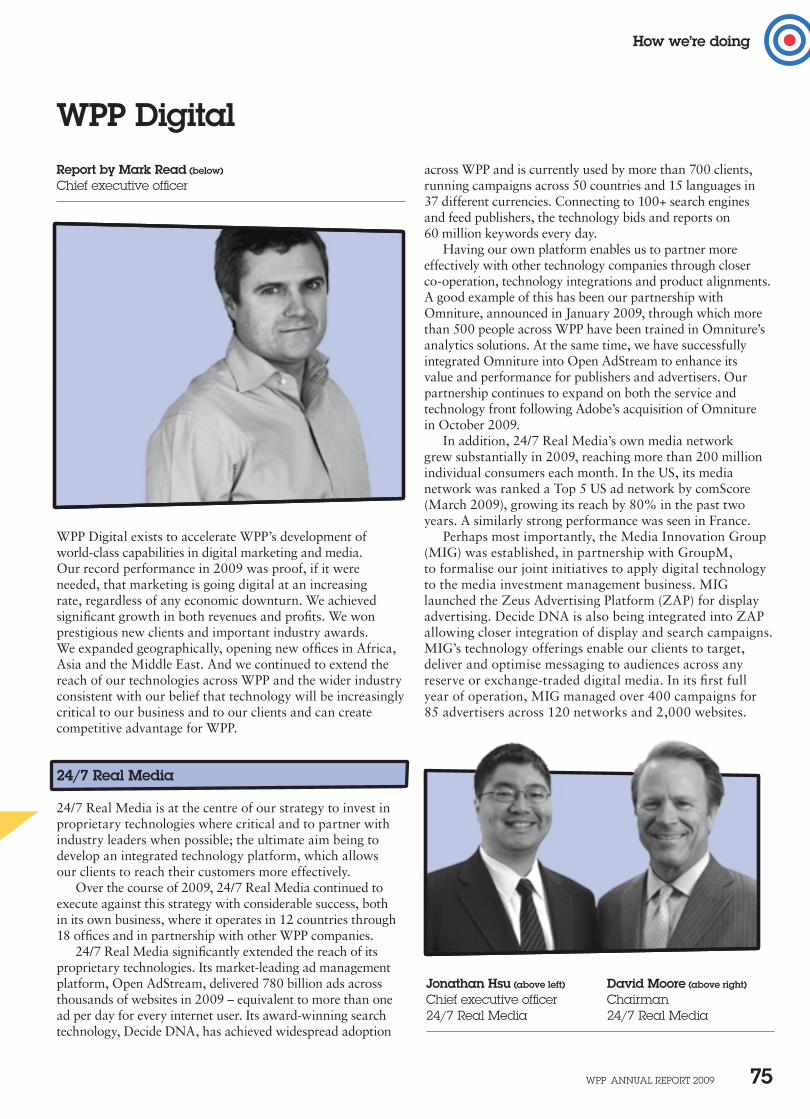
Jonathan Hsu (above left) David Moore (above right)
Chief executive officer Chairman 24/7 real Media 24/7 real Media
WPP AnnuAl rePort 2009 75
How we’re doing
WPP Digital exists to accelerate WPP’s development of world-class capabilities in digital marketing and media. Our record performance in 2009 was proof, if it were needed, that marketing is going digital at an increasing rate, regardless of any economic downturn. We achieved significant growth in both revenues and profits. We won prestigious new clients and important industry awards. We expanded geographically, opening new offices in Africa, Asia and the Middle East. And we continued to extend the reach of our technologies across WPP and the wider industry consistent with our belief that technology will be increasingly critical to our business and to our clients and can create competitive advantage for WPP.
24/7 Real Media
24/7 Real Media is at the centre of our strategy to invest in proprietary technologies where critical and to partner with industry leaders when possible; the ultimate aim being to develop an integrated technology platform, which allows our clients to reach their customers more effectively.
Over the course of 2009, 24/7 Real Media continued to execute against this strategy with considerable success, both in its own business, where it operates in 12 countries through 18 offices and in partnership with other WPP companies.
24/7 Real Media significantly extended the reach of its proprietary technologies. Its market-leading ad management platform, Open AdStream, delivered 780 billion ads across thousands of websites in 2009 – equivalent to more than one ad per day for every internet user. Its award-winning search technology, Decide DNA, has achieved widespread adoption
Report by Mark Read (below)
Chief executive officeracross WPP and is currently used by more than 700 clients, running campaigns across 50 countries and 15 languages in 37 different currencies. Connecting to 100+ search engines and feed publishers, the technology bids and reports on 60 million keywords every day.
Having our own platform enables us to partner more effectively with other technology companies through closer co-operation, technology integrations and product alignments. A good example of this has been our partnership with Omniture, announced in January 2009, through which more than 500 people across WPP have been trained in Omniture’s analytics solutions. At the same time, we have successfully integrated Omniture into Open AdStream to enhance its value and performance for publishers and advertisers. Our partnership continues to expand on both the service and technology front following Adobe’s acquisition of Omniture in October 2009.
In addition, 24/7 Real Media’s own media network grew substantially in 2009, reaching more than 200 million individual consumers each month. In the US, its media network was ranked a Top 5 US ad network by comScore (March 2009), growing its reach by 80% in the past two years. A similarly strong performance was seen in France.
Perhaps most importantly, the Media Innovation Group (MIG) was established, in partnership with GroupM, to formalise our joint initiatives to apply digital technology to the media investment management business. MIG launched the Zeus Advertising Platform (ZAP) for display advertising. Decide DNA is also being integrated into ZAP allowing closer integration of display and search campaigns. MIG’s technology offerings enable our clients to target, deliver and optimise messaging to audiences across any reserve or exchange-traded digital media. In its first full year of operation, MIG managed over 400 campaigns for 85 advertisers across 120 networks and 2,000 websites.
WPP Digital
WPP AnnuAl rePort 2009 76
How we’re doingWPP Digital
Music Group’s VEVO.com, which attracted over 35 million registered users in its first three weeks.
We were delighted that industry-leading work like this was recognized by Advertising Age again including Schematic in the 2009 Digital A-List issue, and Target honouring Schematic with its coveted Best of the Bullseye Award for Top Partner.
Deliver
In 2008, in recognition of clients’ needs to produce quality digital work more cost-effectively, we took the decision to invest in high-quality, low-cost production with the establishment of Deliver. In its first full year, Deliver won significant production work from Dell and Nokia, its founding clients, and new work from AstraZeneca as well as clients from sister WPP agencies, including AT&T, HSBC, Colgate, Campbell Soup and Smuckers. Deliver also launched DEPP, the Deliver Efficient Production Platform, which provides world-class briefing, workflow and reporting management for its more than 1,000 people who operate from seven locations across the globe.
Johannes Leonardo
Creative hotshop Johannes Leonardo was recognized by Advertising Age with one of the first-ever Small Agency of the Year Awards. Based in New York, Johannes Leonardo continues to create breakthrough ideas that harness the potential of our consumer-driven digital landscape for leading companies including Google, Unilever, Daffy’s, Nestlé, Clarins, Pele Sports and Chanel. Most recently, the agency launched the global digital platform Womanity.com for Thierry Mugler.
iconmobile
For iconmobile, the year 2009 was its most successful yet on the back of strong interest in mobile as a marketing channel, driven by the success of the iPhone and the launch of new mobile platforms such as Android by Google. Much of its work was in the software, financial services, luxury goods and automotive sectors. It built the first smart phone-enabled mobile payment service for Barclaycard, a new application concept showing the possibilities for virtual instrumentation in the automobile of the future for Fujitsu and supported North Face in launching the Red Flag Campaign in China, that used the mobile channel to integrate digital, event, field marketing, media, PR and in-store marketing activities.
Serving over 20 billion targeted impressions, MIG grew billings under management five-fold in 2009.
BLUE
BLUE celebrated its 10th anniversary in 2009 with a strong year of growth and the Marketing magazine Agency of the Year Award for Singapore. We were particularly proud as this is the first time this coveted award, voted on by clients, has been given to a digital agency. While this was the highlight of a long list of awards, BLUE won other industry accolades in 2009, including client and peer awards in search marketing, email marketing, online advertising and web design.
BLUE continued to grow its client roster, adding leading brands such as Air China, Adobe, Danone and Standard Chartered Bank to its existing list of blue-chip clients. It also opened up a new regional hub in Dubai to better serve the needs of its clients in the GCC countries and the Middle East.
Quasar
Quasar continues to be India’s leading digital marketing services company. Along with a strong domestic presence in India, Quasar has now created a digital production hub for WPP agencies and international clients, a key part of Deliver (see below). Nokia, through Wunderman, is already one of the clients for this hub. Quasar’s leading clients include Microsoft, Chevrolet, Monster, Plan, MakeMyTrip and Skoda. During 2009, Quasar also started operations in Kenya under the brand Squad Digital, through a joint venture with WPP and Scangroup.
Schematic
Schematic had a successful 2009 adding prestigious clients including Best Buy, Orange, Bank of America, Logitech, Johnson & Johnson and Universal Music Group to its roster and continuing to grow existing relationships with Microsoft, Nokia, Dell, Target and Comcast among others.
In June, Schematic received international acclaim for the launch of its interactive Touchwall at the Cannes Lions Advertising Festival, garnering 25 million media impressions and resulting in the launch of a new digital out of home division, Schematic Touch. The firm’s pro bono work on the Interactive Advertising Bureau’s ‘Privacy Matters’ campaign has generated over 20 million impressions to date, along with a full-page article in The New York Times. Notable client milestones include the launch of Nokia’s OVI app store (now with over one million downloads a day) and Universal
WPP AnnuAl rePort 2009 77
How we’re doingWPP Digital
Syzygy
Syzygy had a good year despite the challenging economic environment. Two creative highlights were the launch of the global brand platform for Jägermeister by Syzygy and sister agency High-ReS! and the online support for the global launch of the prestigious Chanel No.5 advertising film, which for the first time premiered on the internet rather than through traditional media.
Other developments
In January 2009, we made a $25 million investment in Omniture which was acquired by Adobe in October 2009. The Group benefitted from a $36 million gain on this investment and we continue to develop a strong partnership with the broader group.
Elsewhere in the technology area, we announced the results of the first Google WPP Marketing Research Awards at a joint conference in New York in November, attended by both companies and our clients. We were very pleased with the initial findings and the program is being continued this year with a further set of grants to 11 academic teams.
The future
Across WPP Digital we possess a unique group of companies with a breadth of skills that span the digital marketing industry: analytics, mobile, search marketing, social media, user experience. Our companies share a common belief in digital marketing and in the importance of technology and innovation, of data and analytics and of delivering results to clients. Each of these factors is becoming increasingly important to WPP’s clients. Indeed, one of the strengths of our business is that the market is heading in our direction. Another is the group of bright, talented, innovative people who are excited by what they do. They worked hard in a difficult environment and we would like to thank them for all their contributions over the past year.
WPP AnnuAl rePort 2009 78
What we think
After the threat of apocalypse, new centres of gravity
WPP CEO Sir Martin Sorrell reports
What we think
I t’s an acronym, but one that carries more than a little truth. The expression ‘L-U-V’ was coined* to describe the way the world’s regional economies would pull out of recession, but it serves equally as a reminder of where
we are going. It works like this – a flatter ‘L’ or italic ‘L’ for Western European growth, a speedier ‘U’ for the US and a sharper, more rapid ‘V’ for the BRICs nations and the Next 11 as identified by Goldman Sachs. The letters approximate the fragile recovery of 2009 – very much a year of two halves – but also the shape of things to come, as the planet’s economic tectonic plates shift into a new pattern. With apologies to Paul Young, LUV is in the air.
Over a quarter of a century, WPP’s strength has been our ability to identify trends and capitalise on them for our clients and ourselves. It’s how we began with two people in a room all those years ago. It is how we have weathered the recent crisis. And it is how we will position WPP for sustained growth in the years ahead – albeit with nearly 100,000 people directly with us, access to over 138,000 and rather more rooms than we started with.
* By Stella Dawson of thomson reuters in July 2009.

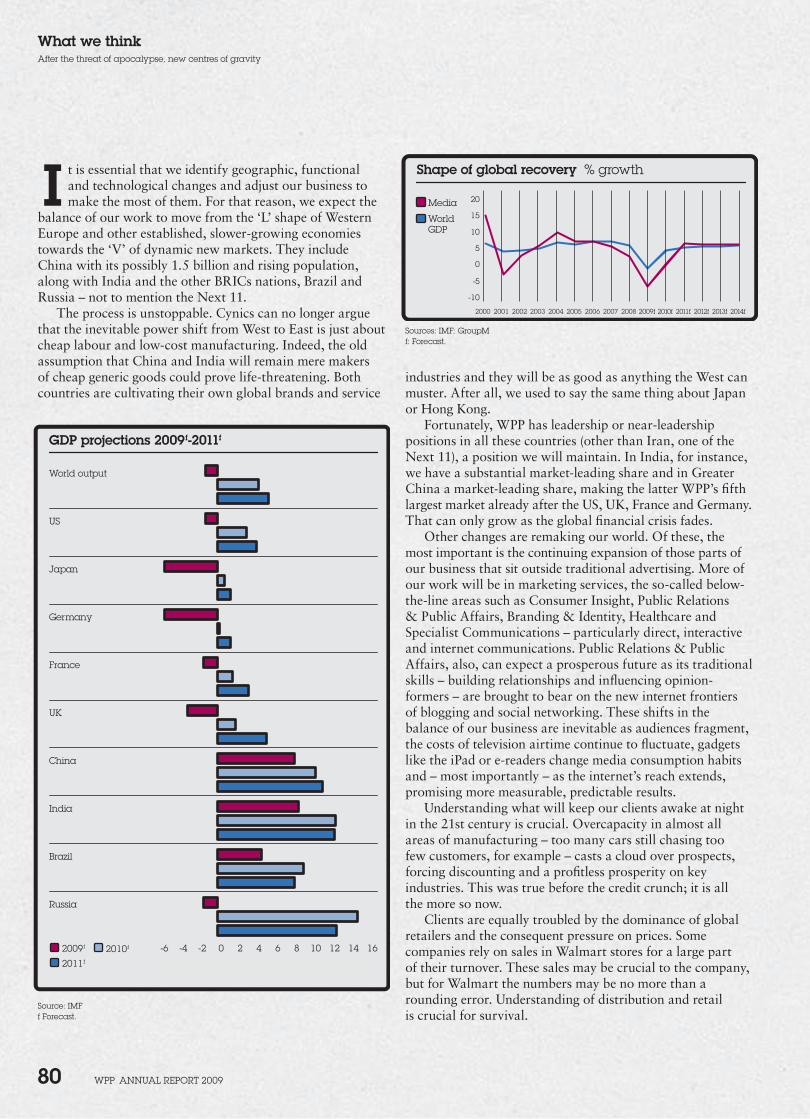
2009f
2011f
2010f
GDP projections 2009f-2011f
4 10820-2-4-6
France
Germany
Japan
US
Brazil
India
China
UK
Russia
World output
6 161412
Shape of global recovery % growth
Media
WorldGDP
2000 2001 2002 2003 2004 2005 2006 2007 2008 2009f 2010f 2011f 2012f 2013f 2014f
-10
-5
5
0
10
15
20
WPP AnnuAl rePort 2009 80
What we thinkAfter the threat of apocalypse, new centres of gravity
I t is essential that we identify geographic, functional and technological changes and adjust our business to make the most of them. For that reason, we expect the
balance of our work to move from the ‘L’ shape of Western Europe and other established, slower-growing economies towards the ‘V’ of dynamic new markets. They include China with its possibly 1.5 billion and rising population, along with India and the other BRICs nations, Brazil and Russia – not to mention the Next 11.
The process is unstoppable. Cynics can no longer argue that the inevitable power shift from West to East is just about cheap labour and low-cost manufacturing. Indeed, the old assumption that China and India will remain mere makers of cheap generic goods could prove life-threatening. Both countries are cultivating their own global brands and service
industries and they will be as good as anything the West can muster. After all, we used to say the same thing about Japan or Hong Kong.
Fortunately, WPP has leadership or near-leadership positions in all these countries (other than Iran, one of the Next 11), a position we will maintain. In India, for instance, we have a substantial market-leading share and in Greater China a market-leading share, making the latter WPP’s fifth largest market already after the US, UK, France and Germany. That can only grow as the global financial crisis fades.
Other changes are remaking our world. Of these, the most important is the continuing expansion of those parts of our business that sit outside traditional advertising. More of our work will be in marketing services, the so-called below-the-line areas such as Consumer Insight, Public Relations & Public Affairs, Branding & Identity, Healthcare and Specialist Communications – particularly direct, interactive and internet communications. Public Relations & Public Affairs, also, can expect a prosperous future as its traditional skills – building relationships and influencing opinion-formers – are brought to bear on the new internet frontiers of blogging and social networking. These shifts in the balance of our business are inevitable as audiences fragment, the costs of television airtime continue to fluctuate, gadgets like the iPad or e-readers change media consumption habits and – most importantly – as the internet’s reach extends, promising more measurable, predictable results.
Understanding what will keep our clients awake at night in the 21st century is crucial. Overcapacity in almost all areas of manufacturing – too many cars still chasing too few customers, for example – casts a cloud over prospects, forcing discounting and a profitless prosperity on key industries. This was true before the credit crunch; it is all the more so now.
Clients are equally troubled by the dominance of global retailers and the consequent pressure on prices. Some companies rely on sales in Walmart stores for a large part of their turnover. These sales may be crucial to the company, but for Walmart the numbers may be no more than a rounding error. Understanding of distribution and retail is crucial for survival.
Source: IMFf Forecast.
Sources: IMF; GroupMf: Forecast.
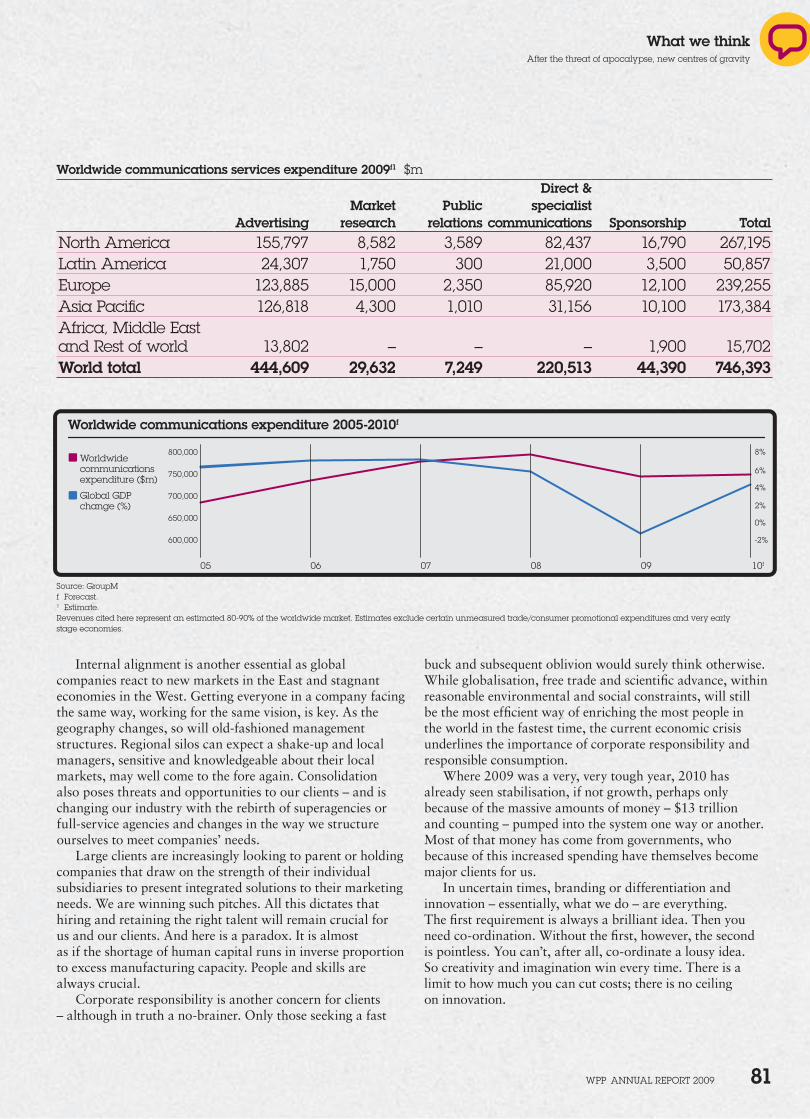
Worldwide communications expenditure ($m)
Global GDP change (%)
Worldwide communications expenditure 2005-2010f
0908 10f070605
800,000
600,000
700,000
650,000
750,000
8%
-2%
2%
0%
6%
4%
WPP AnnuAl rePort 2009 81
What we thinkAfter the threat of apocalypse, new centres of gravity
buck and subsequent oblivion would surely think otherwise. While globalisation, free trade and scientific advance, within reasonable environmental and social constraints, will still be the most efficient way of enriching the most people in the world in the fastest time, the current economic crisis underlines the importance of corporate responsibility and responsible consumption.
Where 2009 was a very, very tough year, 2010 has already seen stabilisation, if not growth, perhaps only because of the massive amounts of money – $13 trillion and counting – pumped into the system one way or another. Most of that money has come from governments, who because of this increased spending have themselves become major clients for us.
In uncertain times, branding or differentiation and innovation – essentially, what we do – are everything. The first requirement is always a brilliant idea. Then you need co-ordination. Without the first, however, the second is pointless. You can’t, after all, co-ordinate a lousy idea. So creativity and imagination win every time. There is a limit to how much you can cut costs; there is no ceiling on innovation.
Internal alignment is another essential as global companies react to new markets in the East and stagnant economies in the West. Getting everyone in a company facing the same way, working for the same vision, is key. As the geography changes, so will old-fashioned management structures. Regional silos can expect a shake-up and local managers, sensitive and knowledgeable about their local markets, may well come to the fore again. Consolidation also poses threats and opportunities to our clients – and is changing our industry with the rebirth of superagencies or full-service agencies and changes in the way we structure ourselves to meet companies’ needs.
Large clients are increasingly looking to parent or holding companies that draw on the strength of their individual subsidiaries to present integrated solutions to their marketing needs. We are winning such pitches. All this dictates that hiring and retaining the right talent will remain crucial for us and our clients. And here is a paradox. It is almost as if the shortage of human capital runs in inverse proportion to excess manufacturing capacity. People and skills are always crucial.
Corporate responsibility is another concern for clients – although in truth a no-brainer. Only those seeking a fast
Worldwide communications services expenditure 2009f1 $m Direct &
Market Public specialistAdvertising research relations communications Sponsorship Total
north America 155,797 8,582 3,589 82,437 16,790 267,195latin America 24,307 1,750 300 21,000 3,500 50,857europe 123,885 15,000 2,350 85,920 12,100 239,255Asia Pacific 126,818 4,300 1,010 31,156 10,100 173,384Africa, Middle east and rest of world 13,802 – – – 1,900 15,702World total 444,609 29,632 7,249 220,513 44,390 746,393
Source: GroupMf Forecast.1 estimate.revenues cited here represent an estimated 80-90% of the worldwide market. estimates exclude certain unmeasured trade/consumer promotional expenditures and very early stage economies.
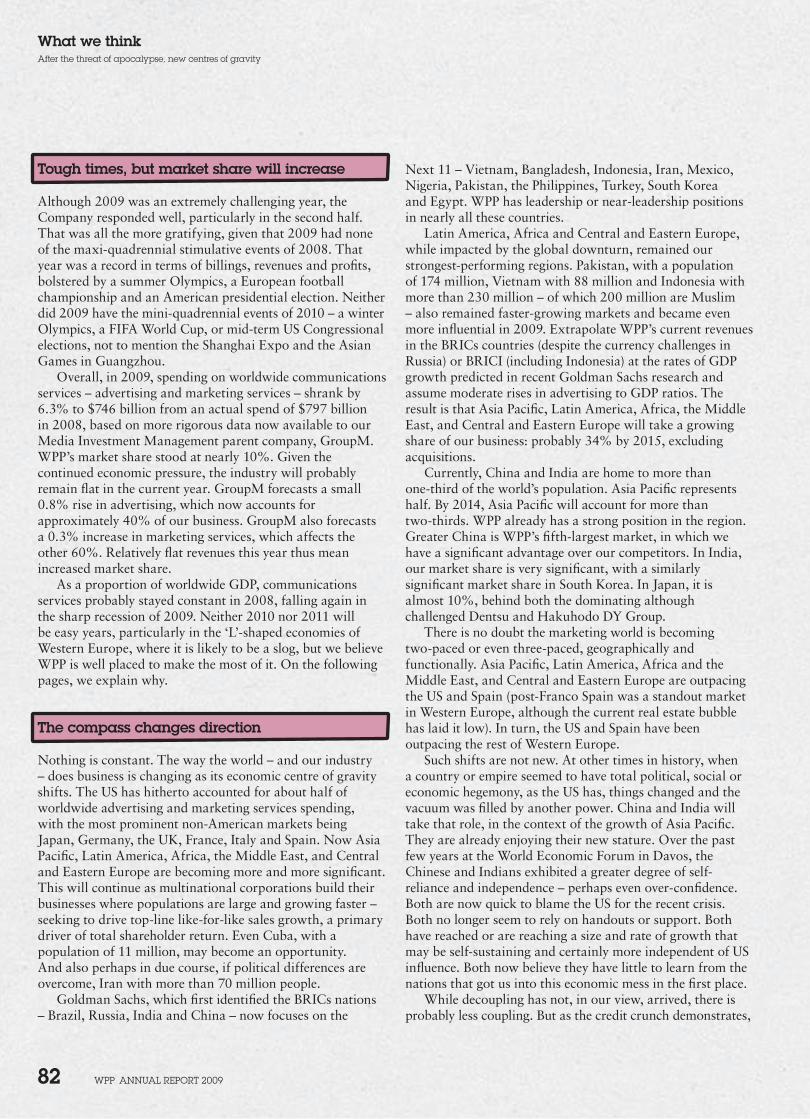
WPP AnnuAl rePort 2009 82
What we thinkAfter the threat of apocalypse, new centres of gravity
Next 11 – Vietnam, Bangladesh, Indonesia, Iran, Mexico, Nigeria, Pakistan, the Philippines, Turkey, South Korea and Egypt. WPP has leadership or near-leadership positions in nearly all these countries.
Latin America, Africa and Central and Eastern Europe, while impacted by the global downturn, remained our strongest-performing regions. Pakistan, with a population of 174 million, Vietnam with 88 million and Indonesia with more than 230 million – of which 200 million are Muslim – also remained faster-growing markets and became even more influential in 2009. Extrapolate WPP’s current revenues in the BRICs countries (despite the currency challenges in Russia) or BRICI (including Indonesia) at the rates of GDP growth predicted in recent Goldman Sachs research and assume moderate rises in advertising to GDP ratios. The result is that Asia Pacific, Latin America, Africa, the Middle East, and Central and Eastern Europe will take a growing share of our business: probably 34% by 2015, excluding acquisitions.
Currently, China and India are home to more than one-third of the world’s population. Asia Pacific represents half. By 2014, Asia Pacific will account for more than two-thirds. WPP already has a strong position in the region. Greater China is WPP’s fifth-largest market, in which we have a significant advantage over our competitors. In India, our market share is very significant, with a similarly significant market share in South Korea. In Japan, it is almost 10%, behind both the dominating although challenged Dentsu and Hakuhodo DY Group.
There is no doubt the marketing world is becoming two-paced or even three-paced, geographically and functionally. Asia Pacific, Latin America, Africa and the Middle East, and Central and Eastern Europe are outpacing the US and Spain (post-Franco Spain was a standout market in Western Europe, although the current real estate bubble has laid it low). In turn, the US and Spain have been outpacing the rest of Western Europe.
Such shifts are not new. At other times in history, when a country or empire seemed to have total political, social or economic hegemony, as the US has, things changed and the vacuum was filled by another power. China and India will take that role, in the context of the growth of Asia Pacific. They are already enjoying their new stature. Over the past few years at the World Economic Forum in Davos, the Chinese and Indians exhibited a greater degree of self-reliance and independence – perhaps even over-confidence. Both are now quick to blame the US for the recent crisis. Both no longer seem to rely on handouts or support. Both have reached or are reaching a size and rate of growth that may be self-sustaining and certainly more independent of US influence. Both now believe they have little to learn from the nations that got us into this economic mess in the first place.
While decoupling has not, in our view, arrived, there is probably less coupling. But as the credit crunch demonstrates,
Tough times, but market share will increase
Although 2009 was an extremely challenging year, the Company responded well, particularly in the second half. That was all the more gratifying, given that 2009 had none of the maxi-quadrennial stimulative events of 2008. That year was a record in terms of billings, revenues and profits, bolstered by a summer Olympics, a European football championship and an American presidential election. Neither did 2009 have the mini-quadrennial events of 2010 – a winter Olympics, a FIFA World Cup, or mid-term US Congressional elections, not to mention the Shanghai Expo and the Asian Games in Guangzhou.
Overall, in 2009, spending on worldwide communications services – advertising and marketing services – shrank by 6.3% to $746 billion from an actual spend of $797 billion in 2008, based on more rigorous data now available to our Media Investment Management parent company, GroupM. WPP’s market share stood at nearly 10%. Given the continued economic pressure, the industry will probably remain flat in the current year. GroupM forecasts a small 0.8% rise in advertising, which now accounts for approximately 40% of our business. GroupM also forecasts a 0.3% increase in marketing services, which affects the other 60%. Relatively flat revenues this year thus mean increased market share.
As a proportion of worldwide GDP, communications services probably stayed constant in 2008, falling again in the sharp recession of 2009. Neither 2010 nor 2011 will be easy years, particularly in the ‘L’-shaped economies of Western Europe, where it is likely to be a slog, but we believe WPP is well placed to make the most of it. On the following pages, we explain why.
The compass changes direction
Nothing is constant. The way the world – and our industry – does business is changing as its economic centre of gravity shifts. The US has hitherto accounted for about half of worldwide advertising and marketing services spending, with the most prominent non-American markets being Japan, Germany, the UK, France, Italy and Spain. Now Asia Pacific, Latin America, Africa, the Middle East, and Central and Eastern Europe are becoming more and more significant. This will continue as multinational corporations build their businesses where populations are large and growing faster – seeking to drive top-line like-for-like sales growth, a primary driver of total shareholder return. Even Cuba, with a population of 11 million, may become an opportunity. And also perhaps in due course, if political differences are overcome, Iran with more than 70 million people.
Goldman Sachs, which first identified the BRICs nations – Brazil, Russia, India and China – now focuses on the
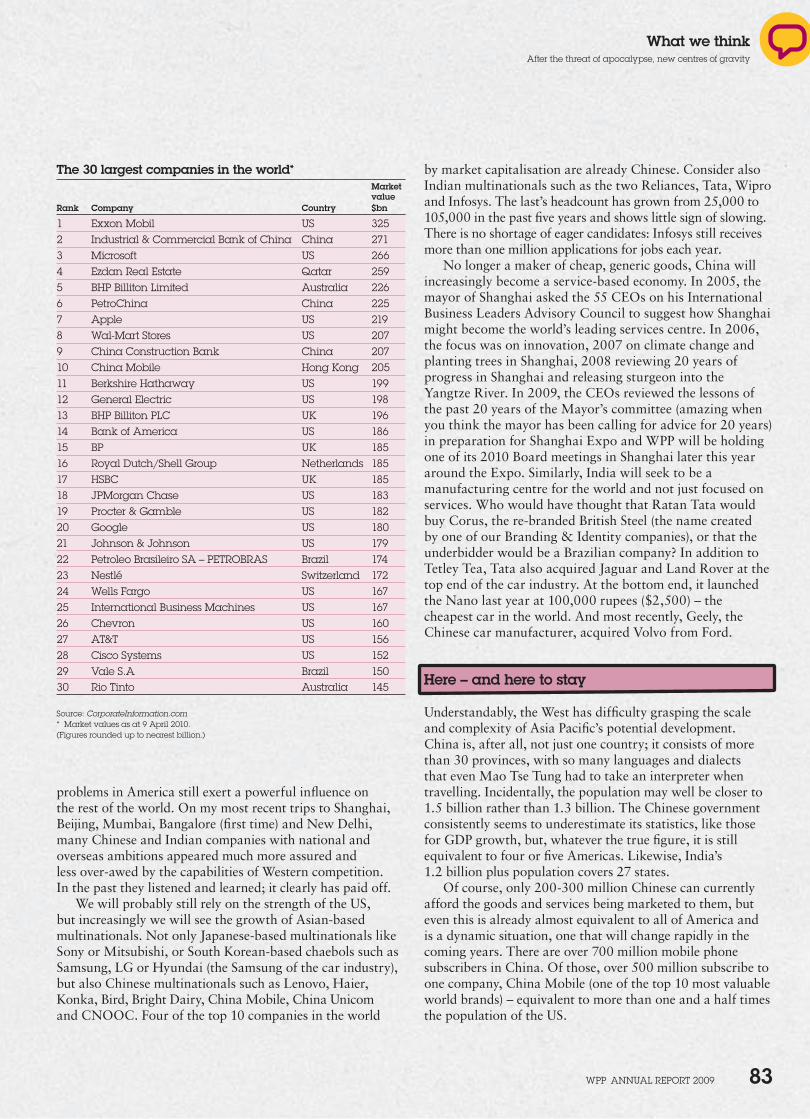
WPP AnnuAl rePort 2009 83
What we thinkAfter the threat of apocalypse, new centres of gravity
by market capitalisation are already Chinese. Consider also Indian multinationals such as the two Reliances, Tata, Wipro and Infosys. The last’s headcount has grown from 25,000 to 105,000 in the past five years and shows little sign of slowing. There is no shortage of eager candidates: Infosys still receives more than one million applications for jobs each year.
No longer a maker of cheap, generic goods, China will increasingly become a service-based economy. In 2005, the mayor of Shanghai asked the 55 CEOs on his International Business Leaders Advisory Council to suggest how Shanghai might become the world’s leading services centre. In 2006, the focus was on innovation, 2007 on climate change and planting trees in Shanghai, 2008 reviewing 20 years of progress in Shanghai and releasing sturgeon into the Yangtze River. In 2009, the CEOs reviewed the lessons of the past 20 years of the Mayor’s committee (amazing when you think the mayor has been calling for advice for 20 years) in preparation for Shanghai Expo and WPP will be holding one of its 2010 Board meetings in Shanghai later this year around the Expo. Similarly, India will seek to be a manufacturing centre for the world and not just focused on services. Who would have thought that Ratan Tata would buy Corus, the re-branded British Steel (the name created by one of our Branding & Identity companies), or that the underbidder would be a Brazilian company? In addition to Tetley Tea, Tata also acquired Jaguar and Land Rover at the top end of the car industry. At the bottom end, it launched the Nano last year at 100,000 rupees ($2,500) – the cheapest car in the world. And most recently, Geely, the Chinese car manufacturer, acquired Volvo from Ford.
Here – and here to stay
Understandably, the West has difficulty grasping the scale and complexity of Asia Pacific’s potential development. China is, after all, not just one country; it consists of more than 30 provinces, with so many languages and dialects that even Mao Tse Tung had to take an interpreter when travelling. Incidentally, the population may well be closer to 1.5 billion rather than 1.3 billion. The Chinese government consistently seems to underestimate its statistics, like those for GDP growth, but, whatever the true figure, it is still equivalent to four or five Americas. Likewise, India’s 1.2 billion plus population covers 27 states.
Of course, only 200-300 million Chinese can currently afford the goods and services being marketed to them, but even this is already almost equivalent to all of America and is a dynamic situation, one that will change rapidly in the coming years. There are over 700 million mobile phone subscribers in China. Of those, over 500 million subscribe to one company, China Mobile (one of the top 10 most valuable world brands) – equivalent to more than one and a half times the population of the US.
problems in America still exert a powerful influence on the rest of the world. On my most recent trips to Shanghai, Beijing, Mumbai, Bangalore (first time) and New Delhi, many Chinese and Indian companies with national and overseas ambitions appeared much more assured and less over-awed by the capabilities of Western competition. In the past they listened and learned; it clearly has paid off.
We will probably still rely on the strength of the US, but increasingly we will see the growth of Asian-based multinationals. Not only Japanese-based multinationals like Sony or Mitsubishi, or South Korean-based chaebols such as Samsung, LG or Hyundai (the Samsung of the car industry), but also Chinese multinationals such as Lenovo, Haier, Konka, Bird, Bright Dairy, China Mobile, China Unicom and CNOOC. Four of the top 10 companies in the world
The 30 largest companies in the world* Marketvalue
Rank Company Country $bn
1 exxon Mobil uS 3252 Industrial & Commercial Bank of China China 2713 Microsoft uS 2664 ezdan real estate Qatar 2595 BHP Billiton limited Australia 2266 PetroChina China 2257 Apple uS 2198 Wal-Mart Stores uS 2079 China Construction Bank China 20710 China Mobile Hong Kong 20511 Berkshire Hathaway uS 19912 General electric uS 19813 BHP Billiton PlC uK 19614 Bank of America uS 18615 BP uK 18516 royal Dutch/Shell Group netherlands 18517 HSBC uK 18518 JPMorgan Chase uS 18319 Procter & Gamble uS 18220 Google uS 18021 Johnson & Johnson uS 17922 Petroleo Brasileiro SA – PetroBrAS Brazil 17423 nestlé Switzerland 17224 Wells Fargo uS 16725 International Business Machines uS 16726 Chevron uS 16027 At&t uS 15628 Cisco Systems uS 15229 Vale S.A Brazil 15030 rio tinto Australia 145
Source: CorporateInformation.com* Market values as at 9 April 2010.(Figures rounded up to nearest billion.)
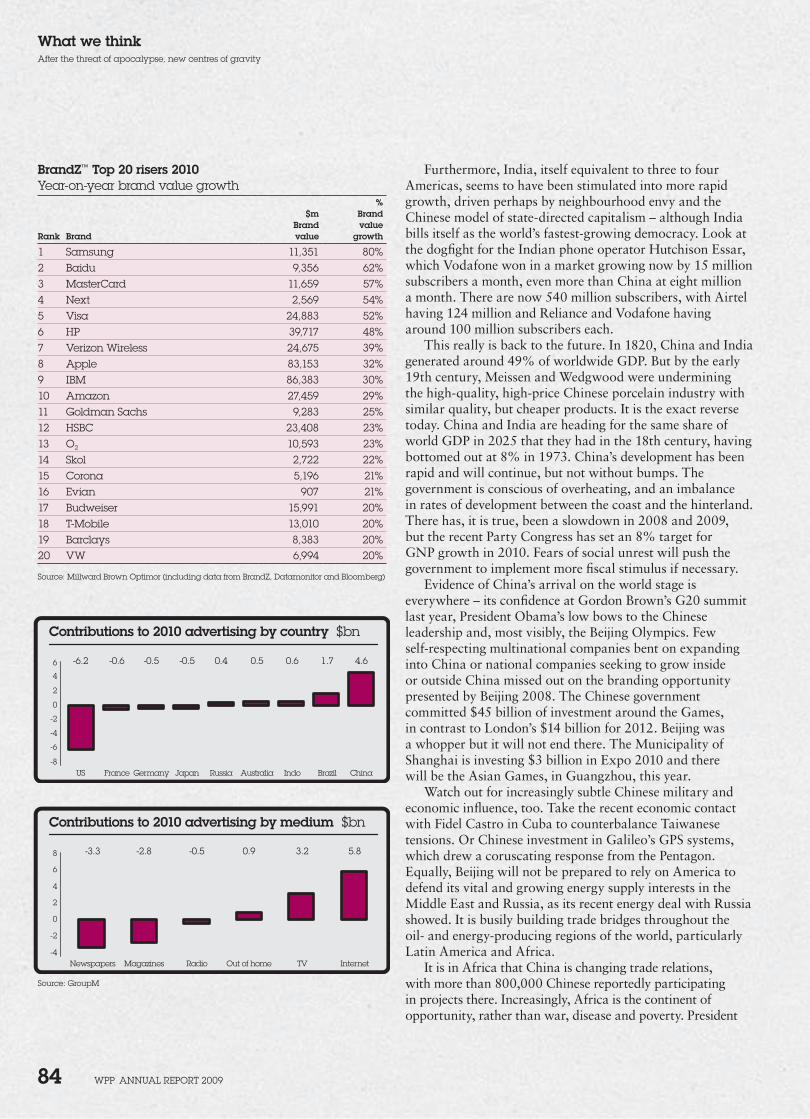
Contributions to 2010 advertising by country $bn
France Germany Japan Russia Australia Indo Brazil ChinaUS
-0.6 -0.5 -0.5 0.4 0.5 0.6 1.7 4.6-6.26
-8
-6
-4
-2
0
4
2
Contributions to 2010 advertising by medium $bn
Magazines Radio Out of home TV InternetNewspapers
-2.8 -0.5 0.9 3.2 5.8-3.38
-4
-2
0
2
4
6
WPP AnnuAl rePort 2009 84
What we thinkAfter the threat of apocalypse, new centres of gravity
Furthermore, India, itself equivalent to three to four Americas, seems to have been stimulated into more rapid growth, driven perhaps by neighbourhood envy and the Chinese model of state-directed capitalism – although India bills itself as the world’s fastest-growing democracy. Look at the dogfight for the Indian phone operator Hutchison Essar, which Vodafone won in a market growing now by 15 million subscribers a month, even more than China at eight million a month. There are now 540 million subscribers, with Airtel having 124 million and Reliance and Vodafone having around 100 million subscribers each.
This really is back to the future. In 1820, China and India generated around 49% of worldwide GDP. But by the early 19th century, Meissen and Wedgwood were undermining the high-quality, high-price Chinese porcelain industry with similar quality, but cheaper products. It is the exact reverse today. China and India are heading for the same share of world GDP in 2025 that they had in the 18th century, having bottomed out at 8% in 1973. China’s development has been rapid and will continue, but not without bumps. The government is conscious of overheating, and an imbalance in rates of development between the coast and the hinterland. There has, it is true, been a slowdown in 2008 and 2009, but the recent Party Congress has set an 8% target for GNP growth in 2010. Fears of social unrest will push the government to implement more fiscal stimulus if necessary.
Evidence of China’s arrival on the world stage is everywhere – its confidence at Gordon Brown’s G20 summit last year, President Obama’s low bows to the Chinese leadership and, most visibly, the Beijing Olympics. Few self-respecting multinational companies bent on expanding into China or national companies seeking to grow inside or outside China missed out on the branding opportunity presented by Beijing 2008. The Chinese government committed $45 billion of investment around the Games, in contrast to London’s $14 billion for 2012. Beijing was a whopper but it will not end there. The Municipality of Shanghai is investing $3 billion in Expo 2010 and there will be the Asian Games, in Guangzhou, this year.
Watch out for increasingly subtle Chinese military and economic influence, too. Take the recent economic contact with Fidel Castro in Cuba to counterbalance Taiwanese tensions. Or Chinese investment in Galileo’s GPS systems, which drew a coruscating response from the Pentagon. Equally, Beijing will not be prepared to rely on America to defend its vital and growing energy supply interests in the Middle East and Russia, as its recent energy deal with Russia showed. It is busily building trade bridges throughout the oil- and energy-producing regions of the world, particularly Latin America and Africa.
It is in Africa that China is changing trade relations, with more than 800,000 Chinese reportedly participating in projects there. Increasingly, Africa is the continent of opportunity, rather than war, disease and poverty. President
Source: GroupM
BrandZ™ Top 20 risers 2010 Year-on-year brand value growth
% $m Brand
Brand valueRank Brand value growth
1 Samsung 11,351 80%2 Baidu 9,356 62%3 MasterCard 11,659 57%4 next 2,569 54%5 Visa 24,883 52%6 HP 39,717 48%7 Verizon Wireless 24,675 39%8 Apple 83,153 32%9 IBM 86,383 30%10 Amazon 27,459 29%11 Goldman Sachs 9,283 25%12 HSBC 23,408 23%13 o2 10,593 23%14 Skol 2,722 22%15 Corona 5,196 21%16 evian 907 21%17 Budweiser 15,991 20%18 t-Mobile 13,010 20%19 Barclays 8,383 20%20 VW 6,994 20%
Source: Millward Brown optimor (including data from BrandZ, Datamonitor and Bloomberg)
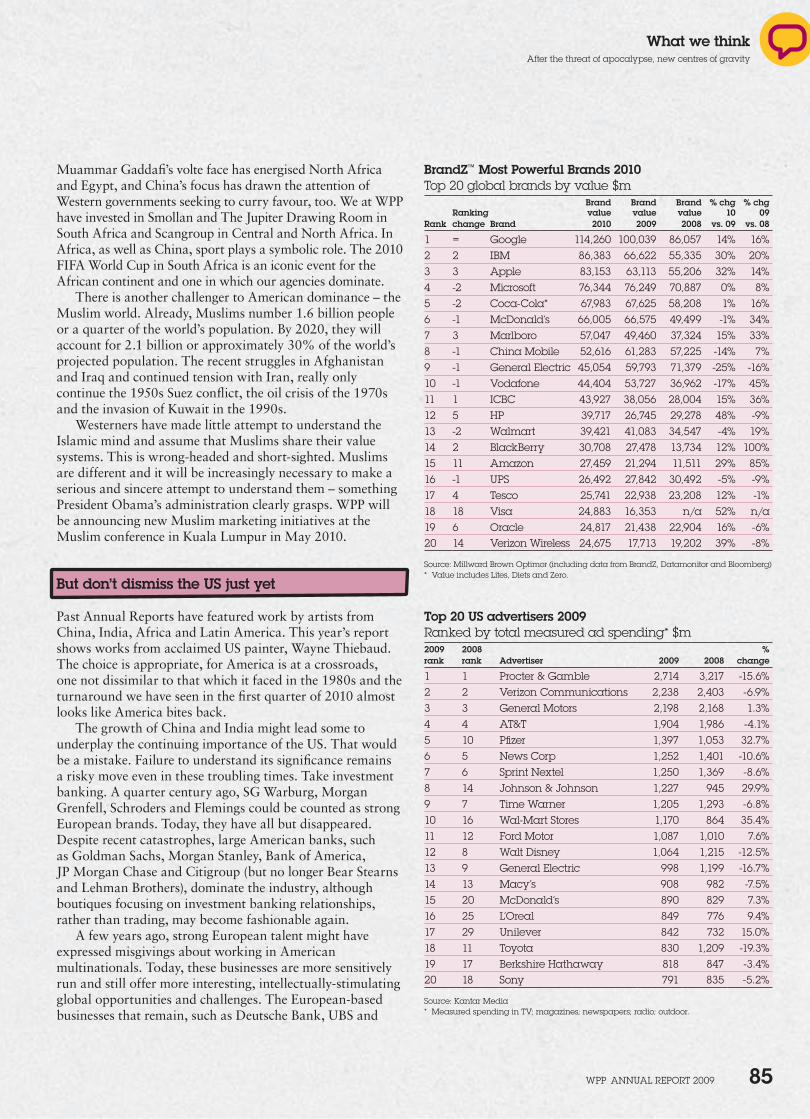
WPP AnnuAl rePort 2009 85
What we thinkAfter the threat of apocalypse, new centres of gravity
Muammar Gaddafi’s volte face has energised North Africa and Egypt, and China’s focus has drawn the attention of Western governments seeking to curry favour, too. We at WPP have invested in Smollan and The Jupiter Drawing Room in South Africa and Scangroup in Central and North Africa. In Africa, as well as China, sport plays a symbolic role. The 2010 FIFA World Cup in South Africa is an iconic event for the African continent and one in which our agencies dominate.
There is another challenger to American dominance – the Muslim world. Already, Muslims number 1.6 billion people or a quarter of the world’s population. By 2020, they will account for 2.1 billion or approximately 30% of the world’s projected population. The recent struggles in Afghanistan and Iraq and continued tension with Iran, really only continue the 1950s Suez conflict, the oil crisis of the 1970s and the invasion of Kuwait in the 1990s.
Westerners have made little attempt to understand the Islamic mind and assume that Muslims share their value systems. This is wrong-headed and short-sighted. Muslims are different and it will be increasingly necessary to make a serious and sincere attempt to understand them – something President Obama’s administration clearly grasps. WPP will be announcing new Muslim marketing initiatives at the Muslim conference in Kuala Lumpur in May 2010.
But don’t dismiss the US just yet
Past Annual Reports have featured work by artists from China, India, Africa and Latin America. This year’s report shows works from acclaimed US painter, Wayne Thiebaud. The choice is appropriate, for America is at a crossroads, one not dissimilar to that which it faced in the 1980s and the turnaround we have seen in the first quarter of 2010 almost looks like America bites back.
The growth of China and India might lead some to underplay the continuing importance of the US. That would be a mistake. Failure to understand its significance remains a risky move even in these troubling times. Take investment banking. A quarter century ago, SG Warburg, Morgan Grenfell, Schroders and Flemings could be counted as strong European brands. Today, they have all but disappeared. Despite recent catastrophes, large American banks, such as Goldman Sachs, Morgan Stanley, Bank of America, JP Morgan Chase and Citigroup (but no longer Bear Stearns and Lehman Brothers), dominate the industry, although boutiques focusing on investment banking relationships, rather than trading, may become fashionable again.
A few years ago, strong European talent might have expressed misgivings about working in American multinationals. Today, these businesses are more sensitively run and still offer more interesting, intellectually-stimulating global opportunities and challenges. The European-based businesses that remain, such as Deutsche Bank, UBS and
Top 20 US advertisers 2009 ranked by total measured ad spending* $m2009 2008 %rank rank Advertiser 2009 2008 change
1 1 Procter & Gamble 2,714 3,217 -15.6%2 2 Verizon Communications 2,238 2,403 -6.9%3 3 General Motors 2,198 2,168 1.3%4 4 At&t 1,904 1,986 -4.1%5 10 Pfizer 1,397 1,053 32.7%6 5 news Corp 1,252 1,401 -10.6%7 6 Sprint nextel 1,250 1,369 -8.6%8 14 Johnson & Johnson 1,227 945 29.9%9 7 time Warner 1,205 1,293 -6.8%10 16 Wal-Mart Stores 1,170 864 35.4%11 12 Ford Motor 1,087 1,010 7.6%12 8 Walt Disney 1,064 1,215 -12.5%13 9 General electric 998 1,199 -16.7%14 13 Macy’s 908 982 -7.5%15 20 McDonald’s 890 829 7.3%16 25 l’oreal 849 776 9.4%17 29 unilever 842 732 15.0%18 11 toyota 830 1,209 -19.3%19 17 Berkshire Hathaway 818 847 -3.4%20 18 Sony 791 835 -5.2%
Source: Kantar Media* Measured spending in tV; magazines; newspapers; radio; outdoor.
BrandZ™ Most Powerful Brands 2010 top 20 global brands by value $m
Brand Brand Brand % chg % chgRanking value value value 10 09
Rank change Brand 2010 2009 2008 vs. 09 vs. 08
1 = Google 114,260 100,039 86,057 14% 16%2 2 IBM 86,383 66,622 55,335 30% 20%3 3 Apple 83,153 63,113 55,206 32% 14%4 -2 Microsoft 76,344 76,249 70,887 0% 8%5 -2 Coca-Cola* 67,983 67,625 58,208 1% 16%6 -1 McDonald’s 66,005 66,575 49,499 -1% 34%7 3 Marlboro 57,047 49,460 37,324 15% 33%8 -1 China Mobile 52,616 61,283 57,225 -14% 7%9 -1 General electric 45,054 59,793 71,379 -25% -16%10 -1 Vodafone 44,404 53,727 36,962 -17% 45%11 1 ICBC 43,927 38,056 28,004 15% 36%12 5 HP 39,717 26,745 29,278 48% -9%13 -2 Walmart 39,421 41,083 34,547 -4% 19%14 2 BlackBerry 30,708 27,478 13,734 12% 100%15 11 Amazon 27,459 21,294 11,511 29% 85%16 -1 uPS 26,492 27,842 30,492 -5% -9%17 4 tesco 25,741 22,938 23,208 12% -1%18 18 Visa 24,883 16,353 n/a 52% n/a19 6 oracle 24,817 21,438 22,904 16% -6%20 14 Verizon Wireless 24,675 17,713 19,202 39% -8%
Source: Millward Brown optimor (including data from BrandZ, Datamonitor and Bloomberg)* Value includes lites, Diets and Zero.
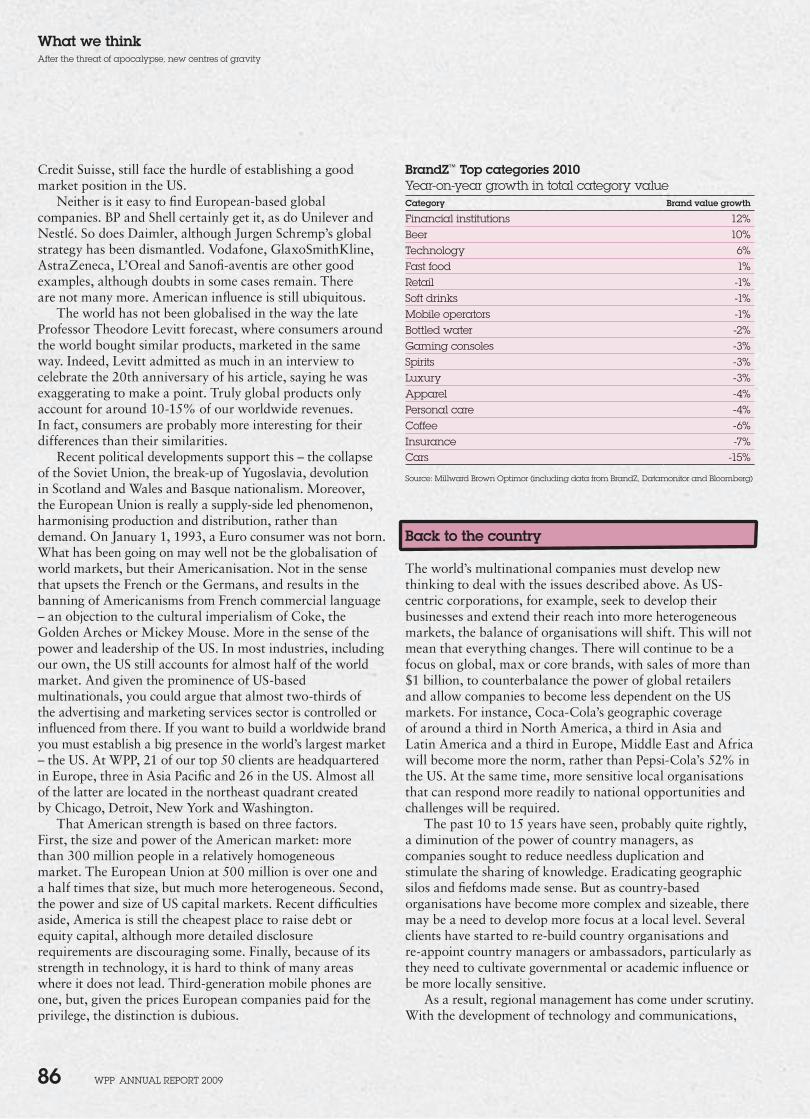
WPP AnnuAl rePort 2009 86
What we thinkAfter the threat of apocalypse, new centres of gravity
Back to the country
The world’s multinational companies must develop new thinking to deal with the issues described above. As US-centric corporations, for example, seek to develop their businesses and extend their reach into more heterogeneous markets, the balance of organisations will shift. This will not mean that everything changes. There will continue to be a focus on global, max or core brands, with sales of more than $1 billion, to counterbalance the power of global retailers and allow companies to become less dependent on the US markets. For instance, Coca-Cola’s geographic coverage of around a third in North America, a third in Asia and Latin America and a third in Europe, Middle East and Africa will become more the norm, rather than Pepsi-Cola’s 52% in the US. At the same time, more sensitive local organisations that can respond more readily to national opportunities and challenges will be required.
The past 10 to 15 years have seen, probably quite rightly, a diminution of the power of country managers, as companies sought to reduce needless duplication and stimulate the sharing of knowledge. Eradicating geographic silos and fiefdoms made sense. But as country-based organisations have become more complex and sizeable, there may be a need to develop more focus at a local level. Several clients have started to re-build country organisations and re-appoint country managers or ambassadors, particularly as they need to cultivate governmental or academic influence or be more locally sensitive.
As a result, regional management has come under scrutiny. With the development of technology and communications,
Credit Suisse, still face the hurdle of establishing a good market position in the US.
Neither is it easy to find European-based global companies. BP and Shell certainly get it, as do Unilever and Nestlé. So does Daimler, although Jurgen Schremp’s global strategy has been dismantled. Vodafone, GlaxoSmithKline, AstraZeneca, L’Oreal and Sanofi-aventis are other good examples, although doubts in some cases remain. There are not many more. American influence is still ubiquitous.
The world has not been globalised in the way the late Professor Theodore Levitt forecast, where consumers around the world bought similar products, marketed in the same way. Indeed, Levitt admitted as much in an interview to celebrate the 20th anniversary of his article, saying he was exaggerating to make a point. Truly global products only account for around 10-15% of our worldwide revenues. In fact, consumers are probably more interesting for their differences than their similarities.
Recent political developments support this – the collapse of the Soviet Union, the break-up of Yugoslavia, devolution in Scotland and Wales and Basque nationalism. Moreover, the European Union is really a supply-side led phenomenon, harmonising production and distribution, rather than demand. On January 1, 1993, a Euro consumer was not born. What has been going on may well not be the globalisation of world markets, but their Americanisation. Not in the sense that upsets the French or the Germans, and results in the banning of Americanisms from French commercial language – an objection to the cultural imperialism of Coke, the Golden Arches or Mickey Mouse. More in the sense of the power and leadership of the US. In most industries, including our own, the US still accounts for almost half of the world market. And given the prominence of US-based multinationals, you could argue that almost two-thirds of the advertising and marketing services sector is controlled or influenced from there. If you want to build a worldwide brand you must establish a big presence in the world’s largest market – the US. At WPP, 21 of our top 50 clients are headquartered in Europe, three in Asia Pacific and 26 in the US. Almost all of the latter are located in the northeast quadrant created by Chicago, Detroit, New York and Washington.
That American strength is based on three factors. First, the size and power of the American market: more than 300 million people in a relatively homogeneous market. The European Union at 500 million is over one and a half times that size, but much more heterogeneous. Second, the power and size of US capital markets. Recent difficulties aside, America is still the cheapest place to raise debt or equity capital, although more detailed disclosure requirements are discouraging some. Finally, because of its strength in technology, it is hard to think of many areas where it does not lead. Third-generation mobile phones are one, but, given the prices European companies paid for the privilege, the distinction is dubious.
BrandZ™ Top categories 2010 Year-on-year growth in total category valueCategory Brand value growth
Financial institutions 12%Beer 10%technology 6%Fast food 1%retail -1%Soft drinks -1%Mobile operators -1%Bottled water -2%Gaming consoles -3%Spirits -3%luxury -3%Apparel -4%Personal care -4%Coffee -6%Insurance -7%Cars -15%
Source: Millward Brown optimor (including data from BrandZ, Datamonitor and Bloomberg)
WPP AnnuAl rePort 2009 87
What we thinkAfter the threat of apocalypse, new centres of gravity
organisational span-breakers may not be so necessary. In addition, given the complexity of regional tasks, regional managers become no more than glorified financial directors. The average advertising agency regional director in Europe, for example, may have to cover 100 offices in a 250-day working year. It would be difficult to add significant value while spending an average of one to two days in each office a year, even if he or she travelled constantly.
At WPP, we are experimenting with two new organisational responses. First, Global Client Leaders to manage at least the 30 biggest clients across WPP on a worldwide basis. Second, WPP Country Managers focusing on three key issues – people, local clients and acquisitions.
Both responses cause angst to our operating company or tribal leaders, who continue to have primary organisational control. Both cut across traditional organisational structures. Both demand new ways of working together, denying turf, territory and ego. Both raise questions about motives, methods and values. But both are necessary, responding to client needs and developments. Organisations are becoming more and more networked, less and less pyramidic.
Furthermore, as the balance of economic power shifts, there will have to be similar shifts in power within corporations. Salary increases, benefits, STIPs, LTIPs, share options, restricted stock allocations, capital expenditure, for example, will have to be allocated more fairly, as growth favours these faster-growing markets. This will mean that Anglo-American or American-Western European management cliques will have to open up, as, for example, Unilever has done, with over 400 Indian managers already exported around the world in senior positions. There will be more.
The rise of marketing services
While Advertising and Media Investment Management – which historically has concentrated on traditional areas such as television, radio, newspapers, magazines, outdoor and cinema – has thrived in recent times, its overall share has declined. In its place, supposedly less sophisticated, less global and less-developed marketing services have gained as a proportion of our total business. These areas are Consumer Insight, Public Relations & Public Affairs, Branding & Identity, Healthcare and Specialist Communications – particularly direct, interactive and internet communications.
Marketing services have grown more quickly for two reasons. First, network television pricing has risen faster than inflation, to the disquiet of big advertisers. Procter & Gamble, the world’s biggest advertiser, Unilever, Coca-Cola and American Express have all registered voluble protests in recent times. They are sick and tired of paying more for less and hence their laser-like focus on value in the recession.
Although the pressures on US network television intensified in 2006, network cost per thousand probably rose by 4-5%, still faster than general price inflation of 3%. In 2007, network cost per thousand again rose faster than general price inflation and, even with the acute economic pressures of 2008, US network television may have increased in cost relatively. 2009 was the only weakening in the trend, as network pricing probably fell for the first time for a long time by approximately -3%. In the UK, ITV pricing may have fallen back to prices achieved as much as five or 10 years ago, the biggest bargain for a long time.
Nevertheless, the trend is clear. Imagine what would happen in the car industry if the price of steel rose consistently by 10% against general price inflation of 3%. Manufacturers would use less steel or find a substitute. That is what is happening in our industry, too. Marketing services, digital and even other traditional media such as radio, outdoor and cinema advertising are becoming more acceptable substitutes.
Don’t expect network television, however, to disappear any time soon. It will remain important. If we were starting a multinational packaged goods company from scratch, we would still use network television to influence the largest number of people in the shortest time at the lowest cost. Clients still need reach, but it isn’t what it was. In the US, for example, primetime network television used to claim 90% of households. A few years ago it was 50%; today it is perhaps only 33%. There are, of course, still programs with significant global or national reach, such as the World Cup final (500 million); the Olympics (400 million in a normal year – but an audience of over two billion for the opening ceremony in Beijing in 2008); the Super Bowl (106 million); and the Academy Awards (42 million).
The largest regular live event audience, however, is none of the above. It is the Chinese New Year Gala on CCTV in China, Asia and elsewhere, watched consistently by more than one billion. These events remain in relatively fixed supply, while the pools of money chasing them are stable or growing. As a result, their prices are bid up. That’s why a 30-second Super Bowl advert still costs around $2.8 million and an Academy Awards slot around $1.3 million.
This is not a situation that can last, particularly when significant segments of the viewing population seem to go missing. Phenomena such as the disappearance of young American men on Monday nights – perhaps to gaming on the internet or watching sport in bars – and the defection of housewives from soap operas have prompted changes to the way audience figures are compiled.
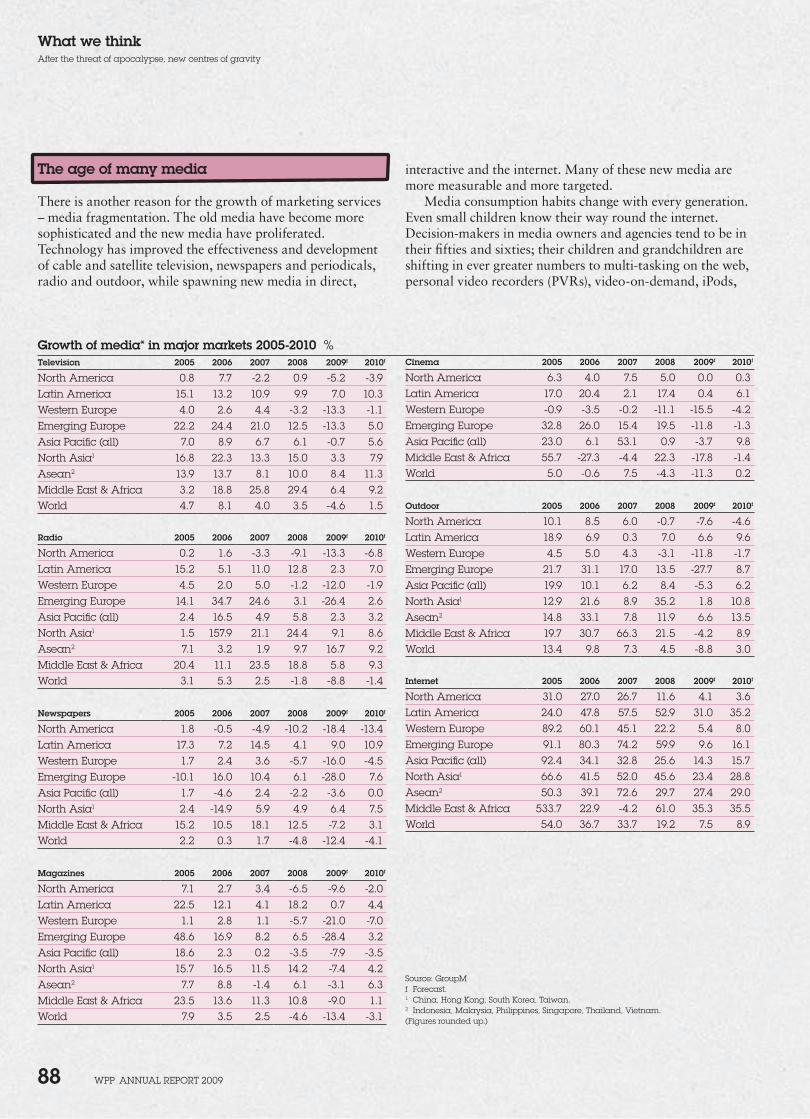
WPP AnnuAl rePort 2009 88
What we thinkAfter the threat of apocalypse, new centres of gravity
The age of many media
There is another reason for the growth of marketing services – media fragmentation. The old media have become more sophisticated and the new media have proliferated. Technology has improved the effectiveness and development of cable and satellite television, newspapers and periodicals, radio and outdoor, while spawning new media in direct,
interactive and the internet. Many of these new media are more measurable and more targeted.
Media consumption habits change with every generation. Even small children know their way round the internet. Decision-makers in media owners and agencies tend to be in their fifties and sixties; their children and grandchildren are shifting in ever greater numbers to multi-tasking on the web, personal video recorders (PVRs), video-on-demand, iPods,
Cinema 2005 2006 2007 2008 2009f 2010f
north America 6.3 4.0 7.5 5.0 0.0 0.3latin America 17.0 20.4 2.1 17.4 0.4 6.1Western europe -0.9 -3.5 -0.2 -11.1 -15.5 -4.2emerging europe 32.8 26.0 15.4 19.5 -11.8 -1.3Asia Pacific (all) 23.0 6.1 53.1 0.9 -3.7 9.8Middle east & Africa 55.7 -27.3 -4.4 22.3 -17.8 -1.4World 5.0 -0.6 7.5 -4.3 -11.3 0.2
Outdoor 2005 2006 2007 2008 2009f 2010f
north America 10.1 8.5 6.0 -0.7 -7.6 -4.6latin America 18.9 6.9 0.3 7.0 6.6 9.6Western europe 4.5 5.0 4.3 -3.1 -11.8 -1.7emerging europe 21.7 31.1 17.0 13.5 -27.7 8.7Asia Pacific (all) 19.9 10.1 6.2 8.4 -5.3 6.2north Asia1 12.9 21.6 8.9 35.2 1.8 10.8Asean2 14.8 33.1 7.8 11.9 6.6 13.5Middle east & Africa 19.7 30.7 66.3 21.5 -4.2 8.9World 13.4 9.8 7.3 4.5 -8.8 3.0
Internet 2005 2006 2007 2008 2009f 2010f
north America 31.0 27.0 26.7 11.6 4.1 3.6latin America 24.0 47.8 57.5 52.9 31.0 35.2Western europe 89.2 60.1 45.1 22.2 5.4 8.0emerging europe 91.1 80.3 74.2 59.9 9.6 16.1Asia Pacific (all) 92.4 34.1 32.8 25.6 14.3 15.7north Asia1 66.6 41.5 52.0 45.6 23.4 28.8Asean2 50.3 39.1 72.6 29.7 27.4 29.0Middle east & Africa 533.7 22.9 -4.2 61.0 35.3 35.5World 54.0 36.7 33.7 19.2 7.5 8.9
Source: GroupMf Forecast.1 China, Hong Kong, South Korea, taiwan.2 Indonesia, Malaysia, Philippines, Singapore, thailand, Vietnam.(Figures rounded up.)
Growth of media* in major markets 2005-2010 % Television 2005 2006 2007 2008 2009f 2010f
north America 0.8 7.7 -2.2 0.9 -5.2 -3.9latin America 15.1 13.2 10.9 9.9 7.0 10.3Western europe 4.0 2.6 4.4 -3.2 -13.3 -1.1emerging europe 22.2 24.4 21.0 12.5 -13.3 5.0Asia Pacific (all) 7.0 8.9 6.7 6.1 -0.7 5.6north Asia1 16.8 22.3 13.3 15.0 3.3 7.9Asean2 13.9 13.7 8.1 10.0 8.4 11.3Middle east & Africa 3.2 18.8 25.8 29.4 6.4 9.2World 4.7 8.1 4.0 3.5 -4.6 1.5
Radio 2005 2006 2007 2008 2009f 2010f
north America 0.2 1.6 -3.3 -9.1 -13.3 -6.8latin America 15.2 5.1 11.0 12.8 2.3 7.0Western europe 4.5 2.0 5.0 -1.2 -12.0 -1.9emerging europe 14.1 34.7 24.6 3.1 -26.4 2.6Asia Pacific (all) 2.4 16.5 4.9 5.8 2.3 3.2north Asia1 1.5 157.9 21.1 24.4 9.1 8.6Asean2 7.1 3.2 1.9 9.7 16.7 9.2Middle east & Africa 20.4 11.1 23.5 18.8 5.8 9.3World 3.1 5.3 2.5 -1.8 -8.8 -1.4
Newspapers 2005 2006 2007 2008 2009f 2010f
north America 1.8 -0.5 -4.9 -10.2 -18.4 -13.4latin America 17.3 7.2 14.5 4.1 9.0 10.9Western europe 1.7 2.4 3.6 -5.7 -16.0 -4.5emerging europe -10.1 16.0 10.4 6.1 -28.0 7.6Asia Pacific (all) 1.7 -4.6 2.4 -2.2 -3.6 0.0north Asia1 2.4 -14.9 5.9 4.9 6.4 7.5Middle east & Africa 15.2 10.5 18.1 12.5 -7.2 3.1World 2.2 0.3 1.7 -4.8 -12.4 -4.1
Magazines 2005 2006 2007 2008 2009f 2010f
north America 7.1 2.7 3.4 -6.5 -9.6 -2.0latin America 22.5 12.1 4.1 18.2 0.7 4.4Western europe 1.1 2.8 1.1 -5.7 -21.0 -7.0emerging europe 48.6 16.9 8.2 6.5 -28.4 3.2Asia Pacific (all) 18.6 2.3 0.2 -3.5 -7.9 -3.5north Asia1 15.7 16.5 11.5 14.2 -7.4 4.2Asean2 7.7 8.8 -1.4 6.1 -3.1 6.3Middle east & Africa 23.5 13.6 11.3 10.8 -9.0 1.1World 7.9 3.5 2.5 -4.6 -13.4 -3.1
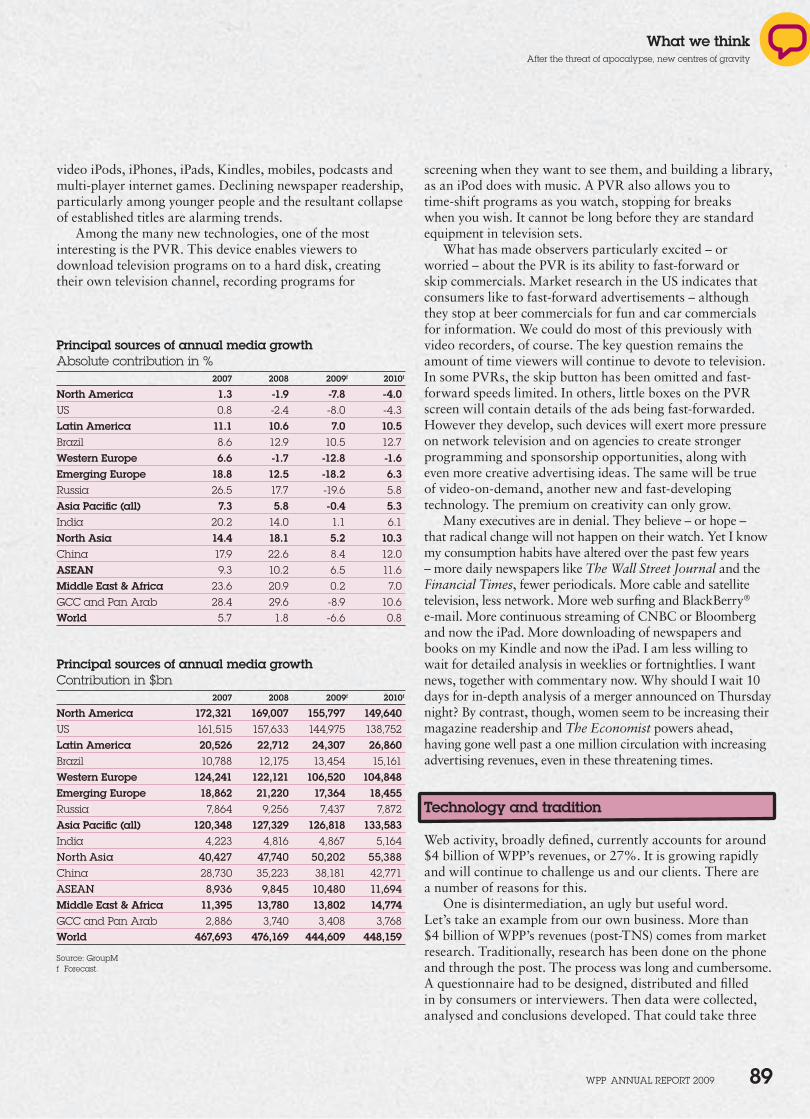
WPP AnnuAl rePort 2009 89
What we thinkAfter the threat of apocalypse, new centres of gravity
screening when they want to see them, and building a library, as an iPod does with music. A PVR also allows you to time-shift programs as you watch, stopping for breaks when you wish. It cannot be long before they are standard equipment in television sets.
What has made observers particularly excited – or worried – about the PVR is its ability to fast-forward or skip commercials. Market research in the US indicates that consumers like to fast-forward advertisements – although they stop at beer commercials for fun and car commercials for information. We could do most of this previously with video recorders, of course. The key question remains the amount of time viewers will continue to devote to television. In some PVRs, the skip button has been omitted and fast-forward speeds limited. In others, little boxes on the PVR screen will contain details of the ads being fast-forwarded. However they develop, such devices will exert more pressure on network television and on agencies to create stronger programming and sponsorship opportunities, along with even more creative advertising ideas. The same will be true of video-on-demand, another new and fast-developing technology. The premium on creativity can only grow.
Many executives are in denial. They believe – or hope – that radical change will not happen on their watch. Yet I know my consumption habits have altered over the past few years – more daily newspapers like The Wall Street Journal and the Financial Times, fewer periodicals. More cable and satellite television, less network. More web surfing and BlackBerry® e-mail. More continuous streaming of CNBC or Bloomberg and now the iPad. More downloading of newspapers and books on my Kindle and now the iPad. I am less willing to wait for detailed analysis in weeklies or fortnightlies. I want news, together with commentary now. Why should I wait 10 days for in-depth analysis of a merger announced on Thursday night? By contrast, though, women seem to be increasing their magazine readership and The Economist powers ahead, having gone well past a one million circulation with increasing advertising revenues, even in these threatening times.
Technology and tradition
Web activity, broadly defined, currently accounts for around $4 billion of WPP’s revenues, or 27%. It is growing rapidly and will continue to challenge us and our clients. There are a number of reasons for this.
One is disintermediation, an ugly but useful word. Let’s take an example from our own business. More than $4 billion of WPP’s revenues (post-TNS) comes from market research. Traditionally, research has been done on the phone and through the post. The process was long and cumbersome. A questionnaire had to be designed, distributed and filled in by consumers or interviewers. Then data were collected, analysed and conclusions developed. That could take three
video iPods, iPhones, iPads, Kindles, mobiles, podcasts and multi-player internet games. Declining newspaper readership, particularly among younger people and the resultant collapse of established titles are alarming trends.
Among the many new technologies, one of the most interesting is the PVR. This device enables viewers to download television programs on to a hard disk, creating their own television channel, recording programs for
Principal sources of annual media growth Absolute contribution in %
2007 2008 2009f 2010f
North America 1.3 -1.9 -7.8 -4.0uS 0.8 -2.4 -8.0 -4.3Latin America 11.1 10.6 7.0 10.5Brazil 8.6 12.9 10.5 12.7Western Europe 6.6 -1.7 -12.8 -1.6Emerging Europe 18.8 12.5 -18.2 6.3russia 26.5 17.7 -19.6 5.8Asia Pacific (all) 7.3 5.8 -0.4 5.3India 20.2 14.0 1.1 6.1North Asia 14.4 18.1 5.2 10.3China 17.9 22.6 8.4 12.0ASEAN 9.3 10.2 6.5 11.6Middle East & Africa 23.6 20.9 0.2 7.0GCC and Pan Arab 28.4 29.6 -8.9 10.6World 5.7 1.8 -6.6 0.8
Principal sources of annual media growth Contribution in $bn
2007 2008 2009f 2010f
North America 172,321 169,007 155,797 149,640uS 161,515 157,633 144,975 138,752Latin America 20,526 22,712 24,307 26,860Brazil 10,788 12,175 13,454 15,161Western Europe 124,241 122,121 106,520 104,848Emerging Europe 18,862 21,220 17,364 18,455russia 7,864 9,256 7,437 7,872Asia Pacific (all) 120,348 127,329 126,818 133,583India 4,223 4,816 4,867 5,164North Asia 40,427 47,740 50,202 55,388China 28,730 35,223 38,181 42,771ASEAN 8,936 9,845 10,480 11,694Middle East & Africa 11,395 13,780 13,802 14,774GCC and Pan Arab 2,886 3,740 3,408 3,768World 467,693 476,169 444,609 448,159
Source: GroupMf Forecast.
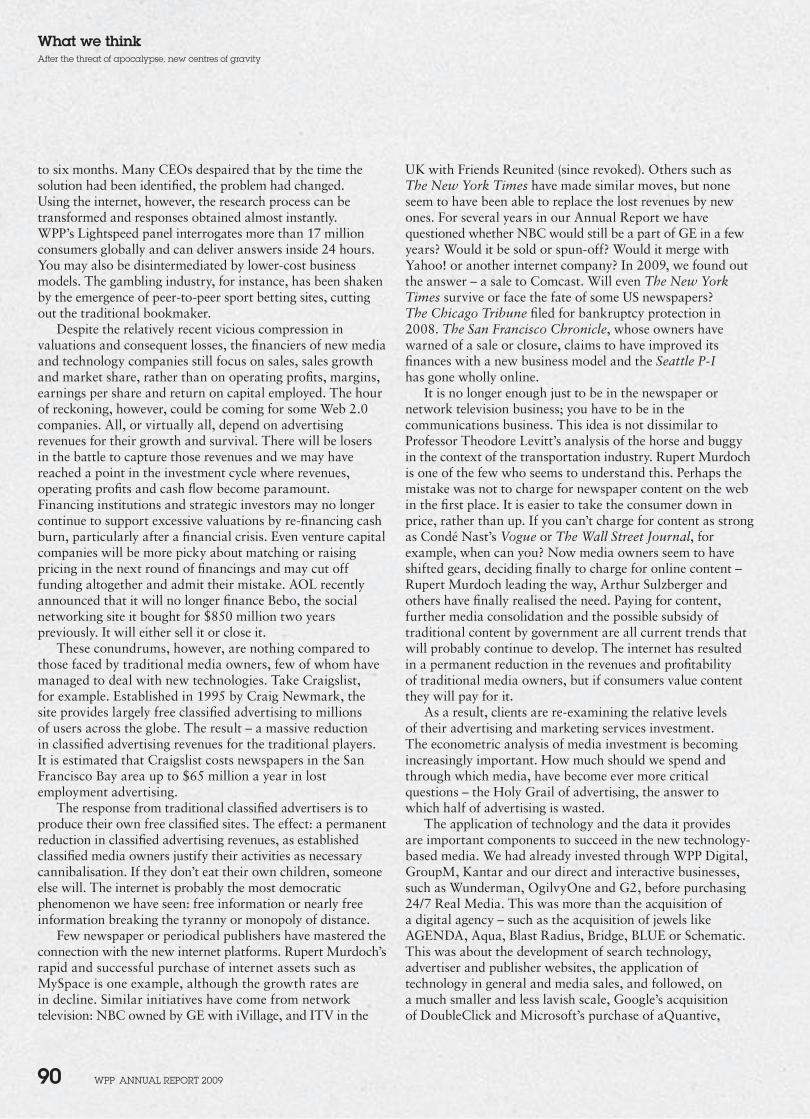
WPP AnnuAl rePort 2009 90
What we thinkAfter the threat of apocalypse, new centres of gravity
to six months. Many CEOs despaired that by the time the solution had been identified, the problem had changed. Using the internet, however, the research process can be transformed and responses obtained almost instantly. WPP’s Lightspeed panel interrogates more than 17 million consumers globally and can deliver answers inside 24 hours. You may also be disintermediated by lower-cost business models. The gambling industry, for instance, has been shaken by the emergence of peer-to-peer sport betting sites, cutting out the traditional bookmaker.
Despite the relatively recent vicious compression in valuations and consequent losses, the financiers of new media and technology companies still focus on sales, sales growth and market share, rather than on operating profits, margins, earnings per share and return on capital employed. The hour of reckoning, however, could be coming for some Web 2.0 companies. All, or virtually all, depend on advertising revenues for their growth and survival. There will be losers in the battle to capture those revenues and we may have reached a point in the investment cycle where revenues, operating profits and cash flow become paramount. Financing institutions and strategic investors may no longer continue to support excessive valuations by re-financing cash burn, particularly after a financial crisis. Even venture capital companies will be more picky about matching or raising pricing in the next round of financings and may cut off funding altogether and admit their mistake. AOL recently announced that it will no longer finance Bebo, the social networking site it bought for $850 million two years previously. It will either sell it or close it.
These conundrums, however, are nothing compared to those faced by traditional media owners, few of whom have managed to deal with new technologies. Take Craigslist, for example. Established in 1995 by Craig Newmark, the site provides largely free classified advertising to millions of users across the globe. The result – a massive reduction in classified advertising revenues for the traditional players. It is estimated that Craigslist costs newspapers in the San Francisco Bay area up to $65 million a year in lost employment advertising.
The response from traditional classified advertisers is to produce their own free classified sites. The effect: a permanent reduction in classified advertising revenues, as established classified media owners justify their activities as necessary cannibalisation. If they don’t eat their own children, someone else will. The internet is probably the most democratic phenomenon we have seen: free information or nearly free information breaking the tyranny or monopoly of distance.
Few newspaper or periodical publishers have mastered the connection with the new internet platforms. Rupert Murdoch’s rapid and successful purchase of internet assets such as MySpace is one example, although the growth rates are in decline. Similar initiatives have come from network television: NBC owned by GE with iVillage, and ITV in the
UK with Friends Reunited (since revoked). Others such as The New York Times have made similar moves, but none seem to have been able to replace the lost revenues by new ones. For several years in our Annual Report we have questioned whether NBC would still be a part of GE in a few years? Would it be sold or spun-off? Would it merge with Yahoo! or another internet company? In 2009, we found out the answer – a sale to Comcast. Will even The New York Times survive or face the fate of some US newspapers? The Chicago Tribune filed for bankruptcy protection in 2008. The San Francisco Chronicle, whose owners have warned of a sale or closure, claims to have improved its finances with a new business model and the Seattle P-I has gone wholly online.
It is no longer enough just to be in the newspaper or network television business; you have to be in the communications business. This idea is not dissimilar to Professor Theodore Levitt’s analysis of the horse and buggy in the context of the transportation industry. Rupert Murdoch is one of the few who seems to understand this. Perhaps the mistake was not to charge for newspaper content on the web in the first place. It is easier to take the consumer down in price, rather than up. If you can’t charge for content as strong as Condé Nast’s Vogue or The Wall Street Journal, for example, when can you? Now media owners seem to have shifted gears, deciding finally to charge for online content – Rupert Murdoch leading the way, Arthur Sulzberger and others have finally realised the need. Paying for content, further media consolidation and the possible subsidy of traditional content by government are all current trends that will probably continue to develop. The internet has resulted in a permanent reduction in the revenues and profitability of traditional media owners, but if consumers value content they will pay for it.
As a result, clients are re-examining the relative levels of their advertising and marketing services investment. The econometric analysis of media investment is becoming increasingly important. How much should we spend and through which media, have become ever more critical questions – the Holy Grail of advertising, the answer to which half of advertising is wasted.
The application of technology and the data it provides are important components to succeed in the new technology-based media. We had already invested through WPP Digital, GroupM, Kantar and our direct and interactive businesses, such as Wunderman, OgilvyOne and G2, before purchasing 24/7 Real Media. This was more than the acquisition of a digital agency – such as the acquisition of jewels like AGENDA, Aqua, Blast Radius, Bridge, BLUE or Schematic. This was about the development of search technology, advertiser and publisher websites, the application of technology in general and media sales, and followed, on a much smaller and less lavish scale, Google’s acquisition of DoubleClick and Microsoft’s purchase of aQuantive,
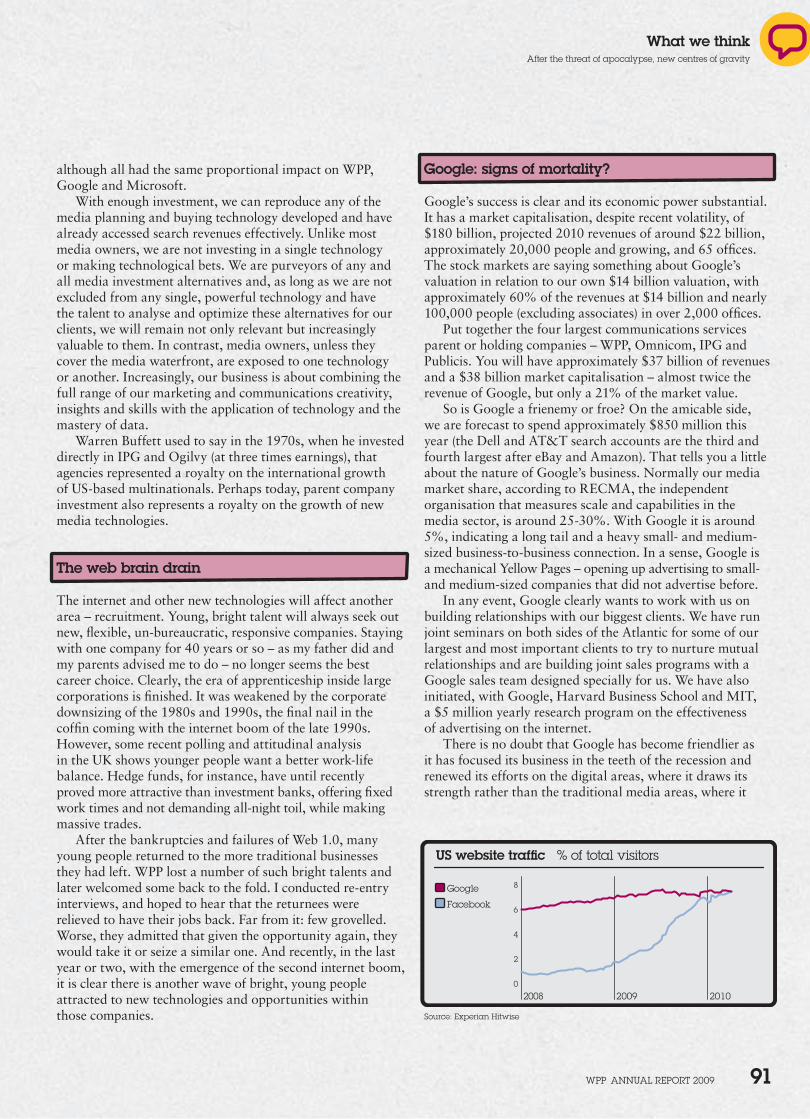
US website traffic % of total visitors
Google 8
0
2
4
6Facebook
2009 20102008
WPP AnnuAl rePort 2009 91
What we thinkAfter the threat of apocalypse, new centres of gravity
Google: signs of mortality?
Google’s success is clear and its economic power substantial. It has a market capitalisation, despite recent volatility, of $180 billion, projected 2010 revenues of around $22 billion, approximately 20,000 people and growing, and 65 offices. The stock markets are saying something about Google’s valuation in relation to our own $14 billion valuation, with approximately 60% of the revenues at $14 billion and nearly 100,000 people (excluding associates) in over 2,000 offices.
Put together the four largest communications services parent or holding companies – WPP, Omnicom, IPG and Publicis. You will have approximately $37 billion of revenues and a $38 billion market capitalisation – almost twice the revenue of Google, but only a 21% of the market value.
So is Google a frienemy or froe? On the amicable side, we are forecast to spend approximately $850 million this year (the Dell and AT&T search accounts are the third and fourth largest after eBay and Amazon). That tells you a little about the nature of Google’s business. Normally our media market share, according to RECMA, the independent organisation that measures scale and capabilities in the media sector, is around 25-30%. With Google it is around 5%, indicating a long tail and a heavy small- and medium-sized business-to-business connection. In a sense, Google is a mechanical Yellow Pages – opening up advertising to small- and medium-sized companies that did not advertise before.
In any event, Google clearly wants to work with us on building relationships with our biggest clients. We have run joint seminars on both sides of the Atlantic for some of our largest and most important clients to try to nurture mutual relationships and are building joint sales programs with a Google sales team designed specially for us. We have also initiated, with Google, Harvard Business School and MIT, a $5 million yearly research program on the effectiveness of advertising on the internet.
There is no doubt that Google has become friendlier as it has focused its business in the teeth of the recession and renewed its efforts on the digital areas, where it draws its strength rather than the traditional media areas, where it
although all had the same proportional impact on WPP, Google and Microsoft.
With enough investment, we can reproduce any of the media planning and buying technology developed and have already accessed search revenues effectively. Unlike most media owners, we are not investing in a single technology or making technological bets. We are purveyors of any and all media investment alternatives and, as long as we are not excluded from any single, powerful technology and have the talent to analyse and optimize these alternatives for our clients, we will remain not only relevant but increasingly valuable to them. In contrast, media owners, unless they cover the media waterfront, are exposed to one technology or another. Increasingly, our business is about combining the full range of our marketing and communications creativity, insights and skills with the application of technology and the mastery of data.
Warren Buffett used to say in the 1970s, when he invested directly in IPG and Ogilvy (at three times earnings), that agencies represented a royalty on the international growth of US-based multinationals. Perhaps today, parent company investment also represents a royalty on the growth of new media technologies.
The web brain drain
The internet and other new technologies will affect another area – recruitment. Young, bright talent will always seek out new, flexible, un-bureaucratic, responsive companies. Staying with one company for 40 years or so – as my father did and my parents advised me to do – no longer seems the best career choice. Clearly, the era of apprenticeship inside large corporations is finished. It was weakened by the corporate downsizing of the 1980s and 1990s, the final nail in the coffin coming with the internet boom of the late 1990s. However, some recent polling and attitudinal analysis in the UK shows younger people want a better work-life balance. Hedge funds, for instance, have until recently proved more attractive than investment banks, offering fixed work times and not demanding all-night toil, while making massive trades.
After the bankruptcies and failures of Web 1.0, many young people returned to the more traditional businesses they had left. WPP lost a number of such bright talents and later welcomed some back to the fold. I conducted re-entry interviews, and hoped to hear that the returnees were relieved to have their jobs back. Far from it: few grovelled. Worse, they admitted that given the opportunity again, they would take it or seize a similar one. And recently, in the last year or two, with the emergence of the second internet boom, it is clear there is another wave of bright, young people attracted to new technologies and opportunities within those companies. Source: experian Hitwise
WPP AnnuAl rePort 2009 92
What we thinkAfter the threat of apocalypse, new centres of gravity
had stumbled. Having hired a new CFO and cut $1 billion in costs, its renewed focus on search, digital display and particularly mobile indicates the future, with the launch, for example, of Nexus One (which, by the way, disintermediates both the mobile handset industry and the mobile operator networks at the same time). On the less friendly side, CEO Eric Schmidt says Google is targeting the advertising sector. Google experimented in many traditional areas such as print and TV, signing deals with Clear Channel and Echostar, though recently scaling back in some traditional areas. It has hired creative people to write ads and one of our creative directors to head up its creative efforts. It has approached US clients to see if it can set up a direct, electronic media-buying exchange. Google is also looking at electronic media planning and buying models, which can be accessed through the web.
Google has also concluded a billion dollar deal with AOL and Time-Warner has indicated in internal memos that it plans to co-operate with Google in television, print and other media. The opportunity exists, although it is doubtful if the traditional Time-Warner operating company verticals will be easily persuaded to give up on digital expansion and opportunities to meet their budgets and targets. It also offers, through Google Analytics, a free analytical service.
In 2006, Google made Rupert Murdoch’s purchase of MySpace a stunning success with a $300 million per annum, three-year deal for internet revenues. This against a purchase price of around $680 million. And then it overcame its lack of success with video by buying YouTube for $1.65 billion, despite little or no revenues and a bunch of copyright lawsuits, part of which were solved by making three music companies momentarily YouTube share owners and $50 million richer on the morning of the sale. Finally, it gave Warren Hellman and Hellman & Friedman a return of 800-900% over two years on DoubleClick, paying over $3 billion – 10 times revenues and 30 times EBITDA. Entry to the first round of the auction was 13-14 times EBITDA, which we could not reach. Through DoubleClick, Google may control more than 80% of targeted and contextual internet advertising, along with much valuable client and publisher data.
This last transaction awoke the dragon. Microsoft initiated a heavy response, not only on regulatory fronts, but from transactions, too. 2007’s rumours were confirmed, as Microsoft bid for Yahoo! (and then partnered with it in search), aQuantive and others. Already, Yahoo! has paid an infinite EBITDA multiple for Right Media. Sane strategic moves or irrational exuberance?
All in all, Google has opened up an attack on many fronts. Perhaps too many, particularly when you consider the other theatres it is fighting in, such as book publishing and robots to the moon. One gets the impression it was throwing a lot of mud against the wall to see if any sticks – maybe confining itself to search and mobile search would be best, as it now seems to be doing. Yahoo! has a different approach,
working through its agency partners and believing in the power of people, rather than Google’s greater focus on technology. Certainly, the combination of Microsoft and Yahoo! in any way has brought greater balance to the markets. Our clients and our agencies favour a duopoly rather than a monopoly. Google’s poor handling of Chinese government relations and withdrawal from the Chinese market and issues in the EU with business practices, specifically in France, Italy and Germany, do not help, along with Federal Trade Commission issues over the AdMob acquisition in the US. The latter reflects the emerging battle between Google and Apple, highlighted in recent press articles that cover the increasingly fractious relationship between the companies that are both collaborators and competitors or another example where Google has become a frienemy.
Perhaps, the biggest threat to Google is from within. As Warren Buffett recently pointed out in China, if Google was worth $250 billion then (more than his own Berkshire Hathaway and in the top three US companies by market capitalisation after only 10 years), it would have to be worth $350-400 billion in two or three years to justify that valuation. After that comment, Google’s market capitalisation fell, although it has now recovered significantly. It may be the frustrations of a 76-year-old (and friend of Bill Gates) fuming that it took him 40 years to build a company to a value of $200 billion – rather than 10 years. What’s more, Sergey Brin and Larry Page were worth $14 billion each and only in their mid-30s.
In any event, recent data on click-through rates makes even Google look mortal and volatility of market value on this scale threatens internal motivation and loyalty. Bright young computer engineers may be tempted to try venture capital opportunities in Silicon Valley, rather than continue to hold vulnerable equity. The answer to the question whether Google is a frienemy or froe, is probably both. Short-term friend, long-term foe although, more recently, Google has become a friendlier frienemy to us while making more frienemies on the way.
Where public relations wins
Good editorial cannot be bought, only influenced, making one marketing discipline increasingly important – Public Relations & Public Affairs. The growth of the internet and the growing sophistication of polling techniques play to the traditional strengths of Public Relations & Public Affairs, where relationships need to be built with opinion formers. Blogs, social networks and customer websites are a new form of editorial, as important if not more important than The New York Times. Because they are fast and have a more intimate relationship with their readers, blogs can cause disproportionate harm to a brand – or conversely
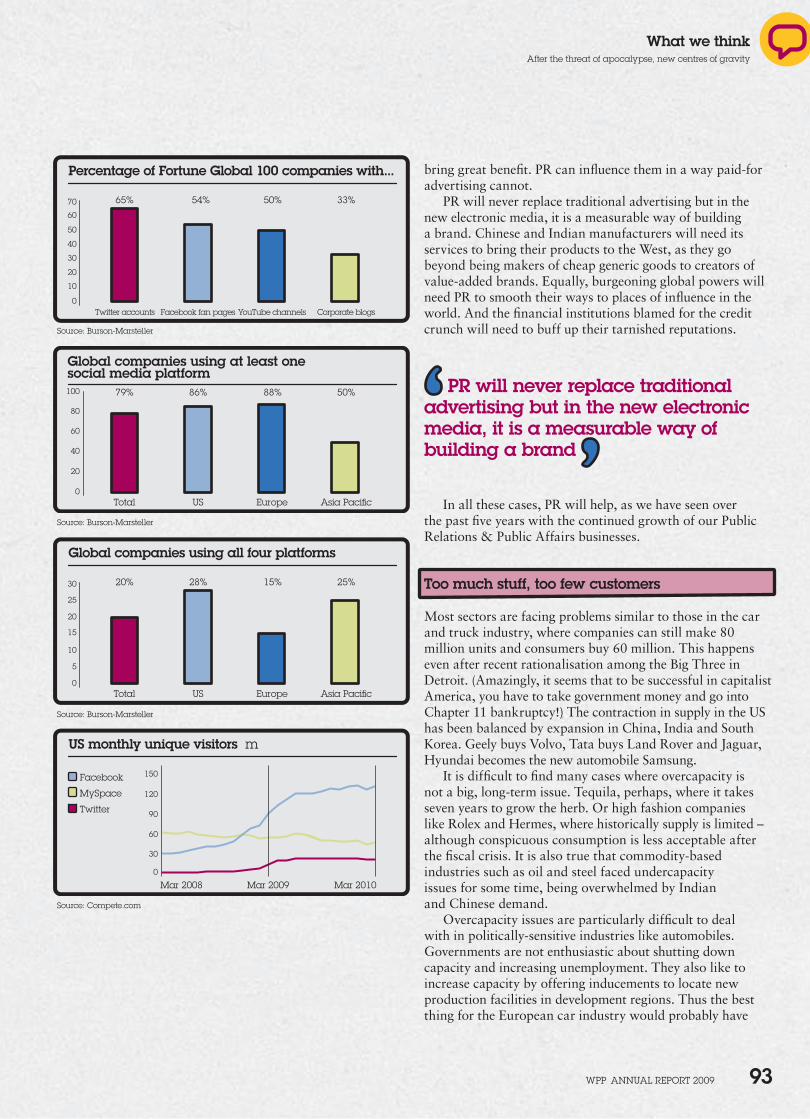
Global companies using all four platforms
25%15%28%20%
Asia PacificEuropeUSTotal
30
0
5
10
15
20
25
Global companies using at least one social media platform
50%88%86%79%
Asia PacificEuropeUSTotal0
20
40
60
80
100
US monthly unique visitors m
MySpace
Mar 2010Mar 2009Mar 20080
30
60
90
120
150
Percentage of Fortune Global 100 companies with...
33%50%54%65%
Corporate blogsYouTube channelsFacebook fan pagesTwitter accounts
70
0
10
20
30
40
60
50
WPP AnnuAl rePort 2009 93
What we thinkAfter the threat of apocalypse, new centres of gravity
bring great benefit. PR can influence them in a way paid-for advertising cannot.
PR will never replace traditional advertising but in the new electronic media, it is a measurable way of building a brand. Chinese and Indian manufacturers will need its services to bring their products to the West, as they go beyond being makers of cheap generic goods to creators of value-added brands. Equally, burgeoning global powers will need PR to smooth their ways to places of influence in the world. And the financial institutions blamed for the credit crunch will need to buff up their tarnished reputations.
In all these cases, PR will help, as we have seen over the past five years with the continued growth of our Public Relations & Public Affairs businesses.
Too much stuff, too few customers
Most sectors are facing problems similar to those in the car and truck industry, where companies can still make 80 million units and consumers buy 60 million. This happens even after recent rationalisation among the Big Three in Detroit. (Amazingly, it seems that to be successful in capitalist America, you have to take government money and go into Chapter 11 bankruptcy!) The contraction in supply in the US has been balanced by expansion in China, India and South Korea. Geely buys Volvo, Tata buys Land Rover and Jaguar, Hyundai becomes the new automobile Samsung.
It is difficult to find many cases where overcapacity is not a big, long-term issue. Tequila, perhaps, where it takes seven years to grow the herb. Or high fashion companies like Rolex and Hermes, where historically supply is limited – although conspicuous consumption is less acceptable after the fiscal crisis. It is also true that commodity-based industries such as oil and steel faced undercapacity issues for some time, being overwhelmed by Indian and Chinese demand.
Overcapacity issues are particularly difficult to deal with in politically-sensitive industries like automobiles. Governments are not enthusiastic about shutting down capacity and increasing unemployment. They also like to increase capacity by offering inducements to locate new production facilities in development regions. Thus the best thing for the European car industry would probably have
PR will never replace traditional advertising but in the new electronic media, it is a measurable way of building a brand
Source: Burson-Marsteller
Source: Burson-Marsteller
Source: Burson-Marsteller
Source: Compete.com
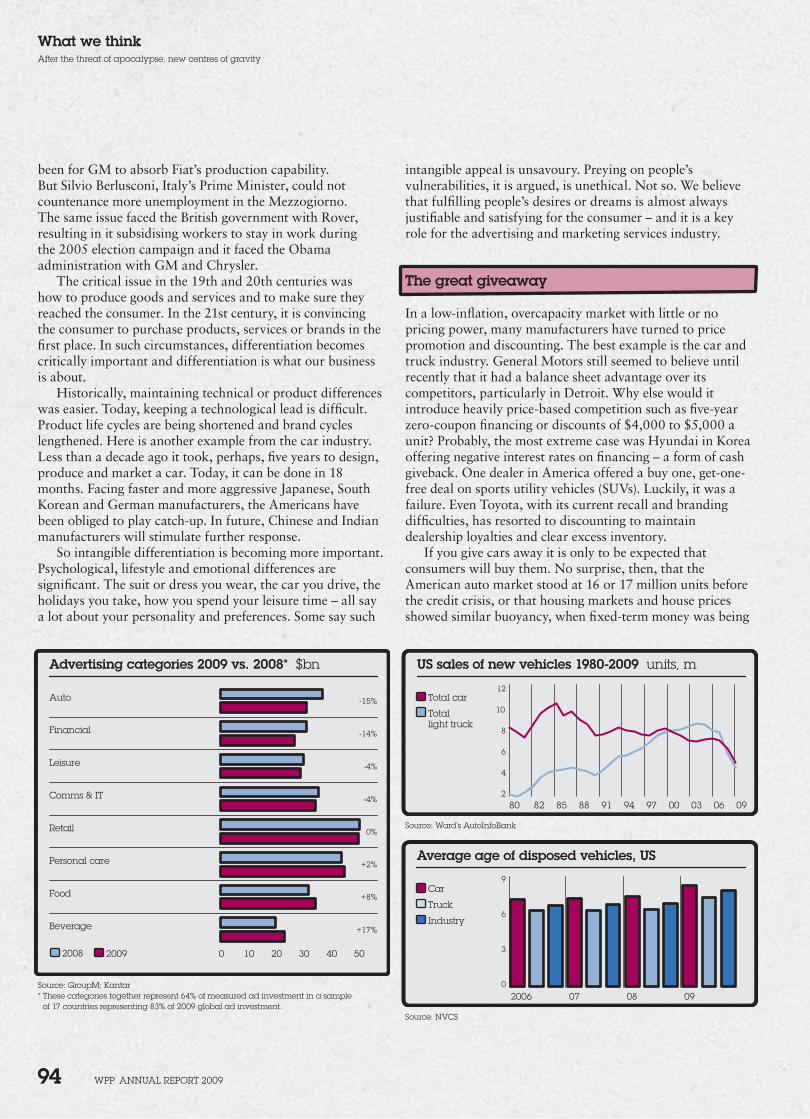
WPP AnnuAl rePort 2009 94
What we thinkAfter the threat of apocalypse, new centres of gravity
intangible appeal is unsavoury. Preying on people’s vulnerabilities, it is argued, is unethical. Not so. We believe that fulfilling people’s desires or dreams is almost always justifiable and satisfying for the consumer – and it is a key role for the advertising and marketing services industry.
The great giveaway
In a low-inflation, overcapacity market with little or no pricing power, many manufacturers have turned to price promotion and discounting. The best example is the car and truck industry. General Motors still seemed to believe until recently that it had a balance sheet advantage over its competitors, particularly in Detroit. Why else would it introduce heavily price-based competition such as five-year zero-coupon financing or discounts of $4,000 to $5,000 a unit? Probably, the most extreme case was Hyundai in Korea offering negative interest rates on financing – a form of cash giveback. One dealer in America offered a buy one, get-one-free deal on sports utility vehicles (SUVs). Luckily, it was a failure. Even Toyota, with its current recall and branding difficulties, has resorted to discounting to maintain dealership loyalties and clear excess inventory.
If you give cars away it is only to be expected that consumers will buy them. No surprise, then, that the American auto market stood at 16 or 17 million units before the credit crisis, or that housing markets and house prices showed similar buoyancy, when fixed-term money was being
been for GM to absorb Fiat’s production capability. But Silvio Berlusconi, Italy’s Prime Minister, could not countenance more unemployment in the Mezzogiorno. The same issue faced the British government with Rover, resulting in it subsidising workers to stay in work during the 2005 election campaign and it faced the Obama administration with GM and Chrysler.
The critical issue in the 19th and 20th centuries was how to produce goods and services and to make sure they reached the consumer. In the 21st century, it is convincing the consumer to purchase products, services or brands in the first place. In such circumstances, differentiation becomes critically important and differentiation is what our business is about.
Historically, maintaining technical or product differences was easier. Today, keeping a technological lead is difficult. Product life cycles are being shortened and brand cycles lengthened. Here is another example from the car industry. Less than a decade ago it took, perhaps, five years to design, produce and market a car. Today, it can be done in 18 months. Facing faster and more aggressive Japanese, South Korean and German manufacturers, the Americans have been obliged to play catch-up. In future, Chinese and Indian manufacturers will stimulate further response.
So intangible differentiation is becoming more important. Psychological, lifestyle and emotional differences are significant. The suit or dress you wear, the car you drive, the holidays you take, how you spend your leisure time – all say a lot about your personality and preferences. Some say such
Car
Truck
Industry
Average age of disposed vehicles, US
9
0
3
6
0907 082006
Source: nVCS
US sales of new vehicles 1980-2009 units, m
Total car12
2
4
6
8
10Total light truck
0991 94 97 00 03 0688858280
Advertising categories 2009 vs. 2008* $bn
30 40100
Retail
Comms & IT
Leisure
Financial
Beverage
Food
Personal care
Auto
20 50
-15%
-14%
-4%
-4%
0%
+2%
+8%
+17%
2008 2009
Source: GroupM; Kantar* these categories together represent 64% of measured ad investment in a sample
of 17 countries representing 83% of 2009 global ad investment.
Source: Ward’s AutoInfoBank
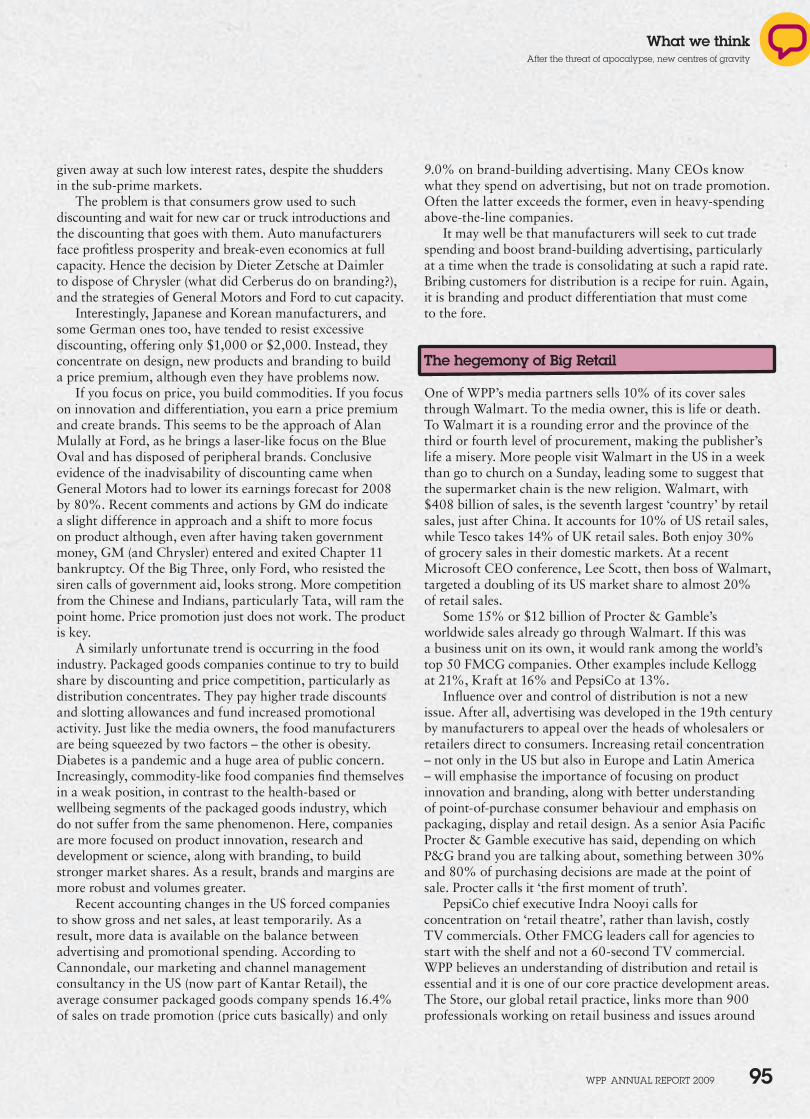
WPP AnnuAl rePort 2009 95
What we thinkAfter the threat of apocalypse, new centres of gravity
9.0% on brand-building advertising. Many CEOs know what they spend on advertising, but not on trade promotion. Often the latter exceeds the former, even in heavy-spending above-the-line companies.
It may well be that manufacturers will seek to cut trade spending and boost brand-building advertising, particularly at a time when the trade is consolidating at such a rapid rate. Bribing customers for distribution is a recipe for ruin. Again, it is branding and product differentiation that must come to the fore.
The hegemony of Big Retail
One of WPP’s media partners sells 10% of its cover sales through Walmart. To the media owner, this is life or death. To Walmart it is a rounding error and the province of the third or fourth level of procurement, making the publisher’s life a misery. More people visit Walmart in the US in a week than go to church on a Sunday, leading some to suggest that the supermarket chain is the new religion. Walmart, with $408 billion of sales, is the seventh largest ‘country’ by retail sales, just after China. It accounts for 10% of US retail sales, while Tesco takes 14% of UK retail sales. Both enjoy 30% of grocery sales in their domestic markets. At a recent Microsoft CEO conference, Lee Scott, then boss of Walmart, targeted a doubling of its US market share to almost 20% of retail sales.
Some 15% or $12 billion of Procter & Gamble’s worldwide sales already go through Walmart. If this was a business unit on its own, it would rank among the world’s top 50 FMCG companies. Other examples include Kellogg at 21%, Kraft at 16% and PepsiCo at 13%.
Influence over and control of distribution is not a new issue. After all, advertising was developed in the 19th century by manufacturers to appeal over the heads of wholesalers or retailers direct to consumers. Increasing retail concentration – not only in the US but also in Europe and Latin America – will emphasise the importance of focusing on product innovation and branding, along with better understanding of point-of-purchase consumer behaviour and emphasis on packaging, display and retail design. As a senior Asia Pacific Procter & Gamble executive has said, depending on which P&G brand you are talking about, something between 30% and 80% of purchasing decisions are made at the point of sale. Procter calls it ‘the first moment of truth’.
PepsiCo chief executive Indra Nooyi calls for concentration on ‘retail theatre’, rather than lavish, costly TV commercials. Other FMCG leaders call for agencies to start with the shelf and not a 60-second TV commercial. WPP believes an understanding of distribution and retail is essential and it is one of our core practice development areas. The Store, our global retail practice, links more than 900 professionals working on retail business and issues around
given away at such low interest rates, despite the shudders in the sub-prime markets.
The problem is that consumers grow used to such discounting and wait for new car or truck introductions and the discounting that goes with them. Auto manufacturers face profitless prosperity and break-even economics at full capacity. Hence the decision by Dieter Zetsche at Daimler to dispose of Chrysler (what did Cerberus do on branding?), and the strategies of General Motors and Ford to cut capacity.
Interestingly, Japanese and Korean manufacturers, and some German ones too, have tended to resist excessive discounting, offering only $1,000 or $2,000. Instead, they concentrate on design, new products and branding to build a price premium, although even they have problems now.
If you focus on price, you build commodities. If you focus on innovation and differentiation, you earn a price premium and create brands. This seems to be the approach of Alan Mulally at Ford, as he brings a laser-like focus on the Blue Oval and has disposed of peripheral brands. Conclusive evidence of the inadvisability of discounting came when General Motors had to lower its earnings forecast for 2008 by 80%. Recent comments and actions by GM do indicate a slight difference in approach and a shift to more focus on product although, even after having taken government money, GM (and Chrysler) entered and exited Chapter 11 bankruptcy. Of the Big Three, only Ford, who resisted the siren calls of government aid, looks strong. More competition from the Chinese and Indians, particularly Tata, will ram the point home. Price promotion just does not work. The product is key.
A similarly unfortunate trend is occurring in the food industry. Packaged goods companies continue to try to build share by discounting and price competition, particularly as distribution concentrates. They pay higher trade discounts and slotting allowances and fund increased promotional activity. Just like the media owners, the food manufacturers are being squeezed by two factors – the other is obesity. Diabetes is a pandemic and a huge area of public concern. Increasingly, commodity-like food companies find themselves in a weak position, in contrast to the health-based or wellbeing segments of the packaged goods industry, which do not suffer from the same phenomenon. Here, companies are more focused on product innovation, research and development or science, along with branding, to build stronger market shares. As a result, brands and margins are more robust and volumes greater.
Recent accounting changes in the US forced companies to show gross and net sales, at least temporarily. As a result, more data is available on the balance between advertising and promotional spending. According to Cannondale, our marketing and channel management consultancy in the US (now part of Kantar Retail), the average consumer packaged goods company spends 16.4% of sales on trade promotion (price cuts basically) and only
WPP AnnuAl rePort 2009 96
What we thinkAfter the threat of apocalypse, new centres of gravity
It’s what’s inside that matters
Probably the biggest block to progress for our clients – and indeed ourselves – is internal politics. Turf, territory and ego prevent productive change. If the chairmen or CEOs of our clients saw what we saw, they would be horrified. If they and we devoted half the time that they or we spent on internal politics on the consumer, client or competition, they and we would be considerably more successful.
You could argue that most of the communication we co-ordinate is aimed at internal audiences rather than external ones. Some people, such as David Ogilvy and Allan Leighton (when long ago he was at retailer Asda) have maintained that ensuring your internal constituencies are on side is often more important than external ones. Only when internal communications are working can your company talk positively to customers, potential customers, suppliers, potential employees, journalists, analysts, investors, government and NGOs.
Building such virtuous circles in a uni-branded company is one thing. Inside a multi-branded company such as WPP, which has grown by acquisition, our tribes operate independently to deal with dis-economies of scale and client conflict. Things are far more complicated. Trying to ensure 100,000 people face in the same direction at the same time is not easy. On the other hand, once achieved, internal unison and common focus make a very powerful army. It may not be fashionable to talk about charismatic or strong CEO leadership; the focus is more on the CEO as coach, mentor or team leader. But our experience is that the most successful companies with which we work have CEOs who understand the importance of the brand, have a strong vision and implement that through a strong CMO.
After all, at long last, it is understood that all business strategy is really marketing strategy, starting with the consumer and working backwards from there. Most of our companies develop internal communications through Advertising, Media Investment Management, Consumer Insight, Public Relations & Public Affairs, Branding & Identity, and Healthcare and Specialist Communications. However, no single operating entity exists within WPP to execute internal communications on a worldwide basis. Still an opportunity for the future.
The government as client
The speculative blowouts around the internet in 2001 and 2002, and sub-prime and insurance monoline crises starting in October 2007 were perhaps inevitable and, given their size, lengthy corrections were necessary. Overall, the past seven or so years have had their share of pain.
The US economy was in a political cycle in 2004, as the government used fiscal spending to stimulate the economy.
the world, updating them on the latest developments and trends – subject to client confidentiality. Management Ventures – with more than 50 global retail analysts – along with Cannondale and Glendinning Associates, both experts in channel management, supplement and consolidate our knowledge of global retailing.
In addition, OgilvyAction gives WPP an even broader distribution offer with its focus on product categories that have been denied access to traditional media. Our new investment, Smollan, has over 15,000 people focused on retail brand management in South Africa, China, India and, next, Brazil. Recent comments by Walmart, for example, seem to indicate an even greater focus on global purchasing discounts and co-ordination with manufacturers, spelling more price pressure and referred pain for suppliers. At the same time, Procter & Gamble has taken a minority stake in Ocado, the UK’s leading online home shopping, direct delivery food network to move closer to the customer.
A quest for talent
Attracting, recruiting, developing, training, motivating, incentivising and retaining human capital remains crucial. While there is certainly too much production and capacity in general, one resource is in ever shorter supply in the 21st century – talent. Every statistic points to a reduction. The slowing birth rate, declining marriage rates, more working women, higher divorce rates, more single-parent families, smaller families, ageing populations – all these factors are reducing the supply of talent.
Even countries with strong, younger demographics, such as Mexico, will face similar situations by 2020. Some governments are trying to stimulate the birth rate. The Chinese government is said to be reviewing the one-baby policy and Russia is worried about its ageing 141 million population. Western Europe and Japan face significant longer-term economic growth issues as a result of the declining proportion of young people and an overall population decline. The elected and then rejected Prime Minister Shinzo Abe of Japan wanted to stimulate the Japanese birth rate, as one way of strengthening the economic growth rate. That is one reason why the rapid inclusion of Turkey into the EU is so important: another source of population growth, as well as immigrants to stimulate economic growth and access to the Muslim world.
In a less differentiated world, it will become more and more important for companies to stand out through the quality and responsiveness of their people. Making sure that your people buy into your strategy and structure will be increasingly important. Living the brand – operationally – will be critical.
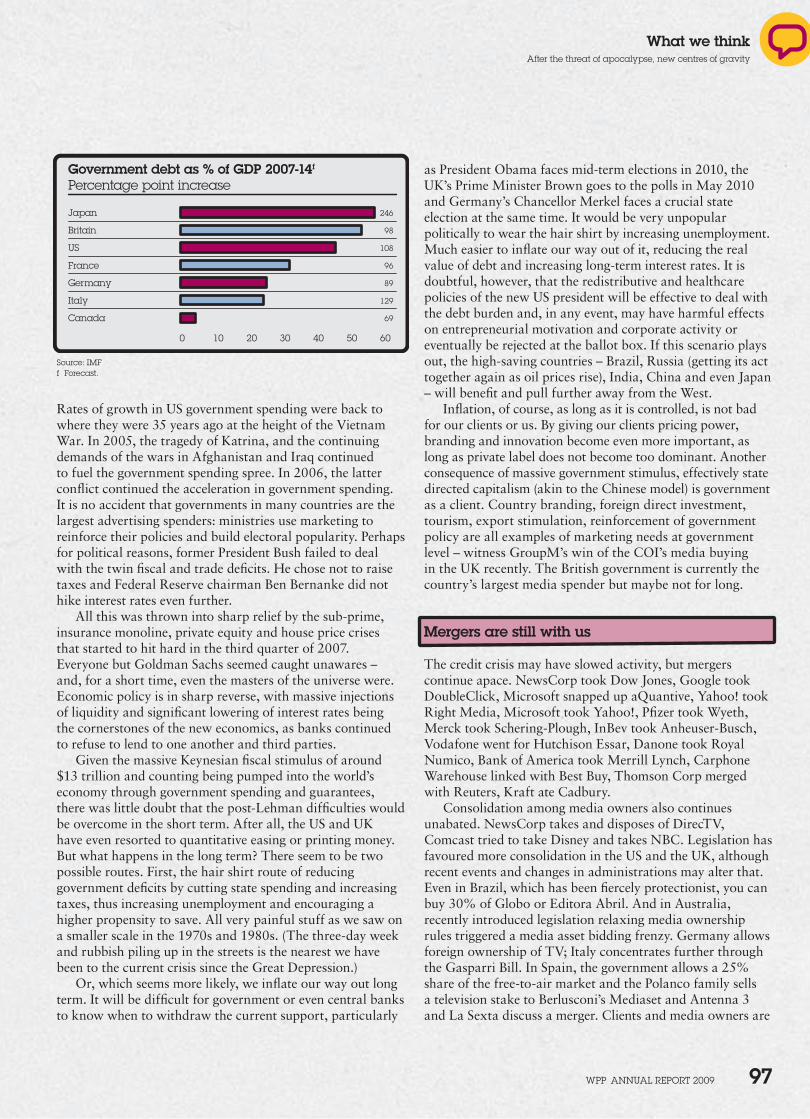
WPP AnnuAl rePort 2009 97
What we thinkAfter the threat of apocalypse, new centres of gravity
as President Obama faces mid-term elections in 2010, the UK’s Prime Minister Brown goes to the polls in May 2010 and Germany’s Chancellor Merkel faces a crucial state election at the same time. It would be very unpopular politically to wear the hair shirt by increasing unemployment. Much easier to inflate our way out of it, reducing the real value of debt and increasing long-term interest rates. It is doubtful, however, that the redistributive and healthcare policies of the new US president will be effective to deal with the debt burden and, in any event, may have harmful effects on entrepreneurial motivation and corporate activity or eventually be rejected at the ballot box. If this scenario plays out, the high-saving countries – Brazil, Russia (getting its act together again as oil prices rise), India, China and even Japan – will benefit and pull further away from the West.
Inflation, of course, as long as it is controlled, is not bad for our clients or us. By giving our clients pricing power, branding and innovation become even more important, as long as private label does not become too dominant. Another consequence of massive government stimulus, effectively state directed capitalism (akin to the Chinese model) is government as a client. Country branding, foreign direct investment, tourism, export stimulation, reinforcement of government policy are all examples of marketing needs at government level – witness GroupM’s win of the COI’s media buying in the UK recently. The British government is currently the country’s largest media spender but maybe not for long.
Mergers are still with us
The credit crisis may have slowed activity, but mergers continue apace. NewsCorp took Dow Jones, Google took DoubleClick, Microsoft snapped up aQuantive, Yahoo! took Right Media, Microsoft took Yahoo!, Pfizer took Wyeth, Merck took Schering-Plough, InBev took Anheuser-Busch, Vodafone went for Hutchison Essar, Danone took Royal Numico, Bank of America took Merrill Lynch, Carphone Warehouse linked with Best Buy, Thomson Corp merged with Reuters, Kraft ate Cadbury.
Consolidation among media owners also continues unabated. NewsCorp takes and disposes of DirecTV, Comcast tried to take Disney and takes NBC. Legislation has favoured more consolidation in the US and the UK, although recent events and changes in administrations may alter that. Even in Brazil, which has been fiercely protectionist, you can buy 30% of Globo or Editora Abril. And in Australia, recently introduced legislation relaxing media ownership rules triggered a media asset bidding frenzy. Germany allows foreign ownership of TV; Italy concentrates further through the Gasparri Bill. In Spain, the government allows a 25% share of the free-to-air market and the Polanco family sells a television stake to Berlusconi’s Mediaset and Antenna 3 and La Sexta discuss a merger. Clients and media owners are
Rates of growth in US government spending were back to where they were 35 years ago at the height of the Vietnam War. In 2005, the tragedy of Katrina, and the continuing demands of the wars in Afghanistan and Iraq continued to fuel the government spending spree. In 2006, the latter conflict continued the acceleration in government spending. It is no accident that governments in many countries are the largest advertising spenders: ministries use marketing to reinforce their policies and build electoral popularity. Perhaps for political reasons, former President Bush failed to deal with the twin fiscal and trade deficits. He chose not to raise taxes and Federal Reserve chairman Ben Bernanke did not hike interest rates even further.
All this was thrown into sharp relief by the sub-prime, insurance monoline, private equity and house price crises that started to hit hard in the third quarter of 2007. Everyone but Goldman Sachs seemed caught unawares – and, for a short time, even the masters of the universe were. Economic policy is in sharp reverse, with massive injections of liquidity and significant lowering of interest rates being the cornerstones of the new economics, as banks continued to refuse to lend to one another and third parties.
Given the massive Keynesian fiscal stimulus of around $13 trillion and counting being pumped into the world’s economy through government spending and guarantees, there was little doubt that the post-Lehman difficulties would be overcome in the short term. After all, the US and UK have even resorted to quantitative easing or printing money. But what happens in the long term? There seem to be two possible routes. First, the hair shirt route of reducing government deficits by cutting state spending and increasing taxes, thus increasing unemployment and encouraging a higher propensity to save. All very painful stuff as we saw on a smaller scale in the 1970s and 1980s. (The three-day week and rubbish piling up in the streets is the nearest we have been to the current crisis since the Great Depression.)
Or, which seems more likely, we inflate our way out long term. It will be difficult for government or even central banks to know when to withdraw the current support, particularly
Source: IMFf Forecast.
Government debt as % of GDP 2007-14f
Percentage point increase
403020100
Germany
France
US
Britain
Canada
Italy
Japan
50 60
246
98
108
96
89
129
69
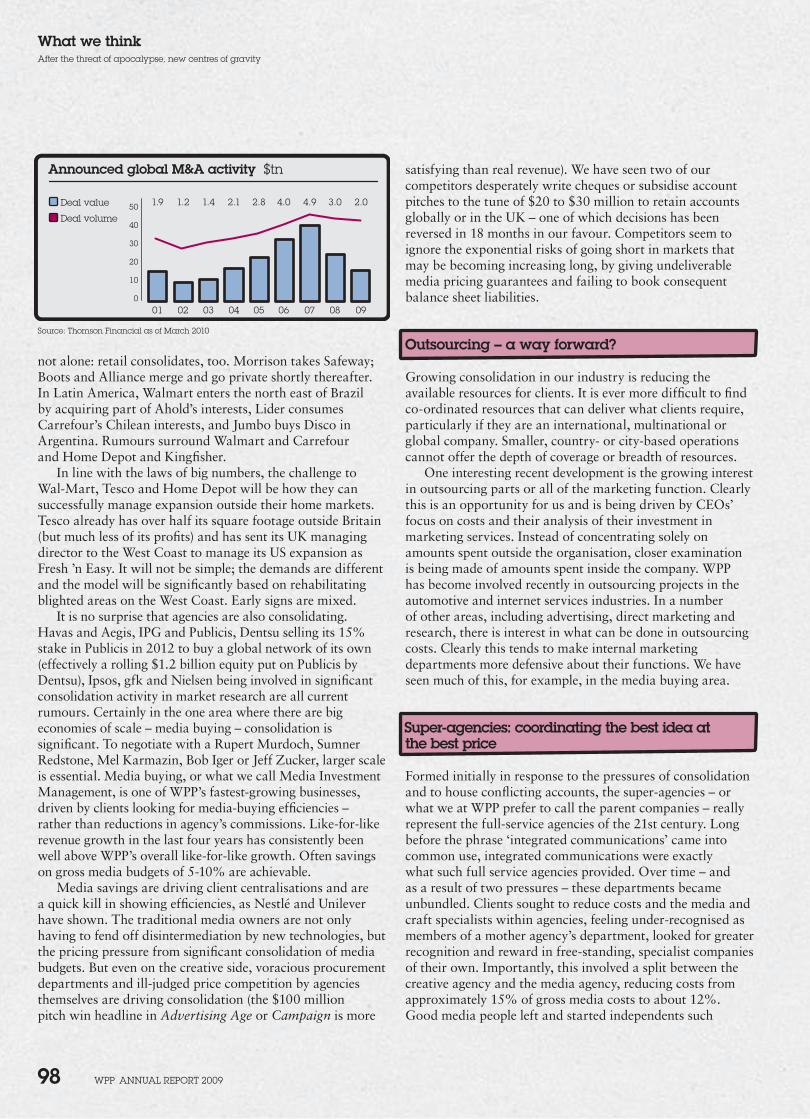
WPP AnnuAl rePort 2009 98
What we thinkAfter the threat of apocalypse, new centres of gravity
satisfying than real revenue). We have seen two of our competitors desperately write cheques or subsidise account pitches to the tune of $20 to $30 million to retain accounts globally or in the UK – one of which decisions has been reversed in 18 months in our favour. Competitors seem to ignore the exponential risks of going short in markets that may be becoming increasing long, by giving undeliverable media pricing guarantees and failing to book consequent balance sheet liabilities.
Outsourcing – a way forward?
Growing consolidation in our industry is reducing the available resources for clients. It is ever more difficult to find co-ordinated resources that can deliver what clients require, particularly if they are an international, multinational or global company. Smaller, country- or city-based operations cannot offer the depth of coverage or breadth of resources.
One interesting recent development is the growing interest in outsourcing parts or all of the marketing function. Clearly this is an opportunity for us and is being driven by CEOs’ focus on costs and their analysis of their investment in marketing services. Instead of concentrating solely on amounts spent outside the organisation, closer examination is being made of amounts spent inside the company. WPP has become involved recently in outsourcing projects in the automotive and internet services industries. In a number of other areas, including advertising, direct marketing and research, there is interest in what can be done in outsourcing costs. Clearly this tends to make internal marketing departments more defensive about their functions. We have seen much of this, for example, in the media buying area.
Super-agencies: coordinating the best idea at the best price
Formed initially in response to the pressures of consolidation and to house conflicting accounts, the super-agencies – or what we at WPP prefer to call the parent companies – really represent the full-service agencies of the 21st century. Long before the phrase ‘integrated communications’ came into common use, integrated communications were exactly what such full service agencies provided. Over time – and as a result of two pressures – these departments became unbundled. Clients sought to reduce costs and the media and craft specialists within agencies, feeling under-recognised as members of a mother agency’s department, looked for greater recognition and reward in free-standing, specialist companies of their own. Importantly, this involved a split between the creative agency and the media agency, reducing costs from approximately 15% of gross media costs to about 12%. Good media people left and started independents such
not alone: retail consolidates, too. Morrison takes Safeway; Boots and Alliance merge and go private shortly thereafter. In Latin America, Walmart enters the north east of Brazil by acquiring part of Ahold’s interests, Lider consumes Carrefour’s Chilean interests, and Jumbo buys Disco in Argentina. Rumours surround Walmart and Carrefour and Home Depot and Kingfisher.
In line with the laws of big numbers, the challenge to Wal-Mart, Tesco and Home Depot will be how they can successfully manage expansion outside their home markets. Tesco already has over half its square footage outside Britain (but much less of its profits) and has sent its UK managing director to the West Coast to manage its US expansion as Fresh ’n Easy. It will not be simple; the demands are different and the model will be significantly based on rehabilitating blighted areas on the West Coast. Early signs are mixed.
It is no surprise that agencies are also consolidating. Havas and Aegis, IPG and Publicis, Dentsu selling its 15% stake in Publicis in 2012 to buy a global network of its own (effectively a rolling $1.2 billion equity put on Publicis by Dentsu), Ipsos, gfk and Nielsen being involved in significant consolidation activity in market research are all current rumours. Certainly in the one area where there are big economies of scale – media buying – consolidation is significant. To negotiate with a Rupert Murdoch, Sumner Redstone, Mel Karmazin, Bob Iger or Jeff Zucker, larger scale is essential. Media buying, or what we call Media Investment Management, is one of WPP’s fastest-growing businesses, driven by clients looking for media-buying efficiencies – rather than reductions in agency’s commissions. Like-for-like revenue growth in the last four years has consistently been well above WPP’s overall like-for-like growth. Often savings on gross media budgets of 5-10% are achievable.
Media savings are driving client centralisations and are a quick kill in showing efficiencies, as Nestlé and Unilever have shown. The traditional media owners are not only having to fend off disintermediation by new technologies, but the pricing pressure from significant consolidation of media budgets. But even on the creative side, voracious procurement departments and ill-judged price competition by agencies themselves are driving consolidation (the $100 million pitch win headline in Advertising Age or Campaign is more
Announced global M&A activity $tn
Deal value
Deal volume
090807060504030201
2.03.04.94.02.82.11.41.21.950
0
10
20
30
40
Source: thomson Financial as of March 2010
WPP AnnuAl rePort 2009 99
What we thinkAfter the threat of apocalypse, new centres of gravity
In addition, many other group pitches have taken place – particularly in pharmaceuticals, and Public Relations & Public Affairs – that have been under the trade papers’ radar. The only issue preventing this from being a trend is whether clients can be convinced of the benefits.
The middle of the road is becoming an increasingly difficult place to be, with traffic coming from both directions. Agencies excluded from the super-agency pitches because they lack the scale and resources must be feeling uncomfortable. Our business is polarising between big and small.
The pressure on creativity
The days of 15% gross commissions – 17.65% on cost – are long gone. Commission levels have receded to around 12% gross for full service, including media planning and buying, or, as we put it, Media Investment Management. Production commissions have largely been reduced or eliminated, although there are interesting procurement opportunities for agencies themselves in television production.
While commissions persist, fees are becoming more popular with clients, although that momentum seems to have slowed recently. They now represent at least 75% of our business. Usually time-based, with incentives, they are used almost exclusively in our marketing services business, which accounts for 59% of our revenues. In advertising, they account for well over half of our business.
Fees have a number of advantages and, on balance, we prefer them. They are not seasonal, in a business where spending tends to be concentrated in the second and fourth quarters. January, however, has generally become a more rewarding month. If clients cut or do not spend or continually re-brief us, we still get paid.
Finally, when fee-driven, we tend to plan our annual business better. Fees have also tended to dampen volatility in our operating margins.
I cannot remember a time, in the 35 or so years I have been in the industry, when clients have been so focused on cost. Given overcapacity, low inflation and lack of pricing power and high management turnover and, most importantly, the still current economic crisis and the near Armageddon or Apocalypse Now of the Lehman weekend, that is perhaps understandable. However, the question remains whether the procurement process can successfully purchase creative services in the way door handles or widgets are bought. The emphasis on procurement seemed to start in the pharmaceutical industry and then moved elsewhere. It may work in media buying, where there are clearly economies of scale, but not necessarily in media planning or other creative areas.
It is true we must improve our processes and eliminate waste, but can you buy ideas or our people’s creativity in such a mechanical way? Increasingly, pressure on price will
as Carat, Media Planning Group, CIA and Western International, which grew organically and by acquisition.
The same pattern was seen among packaging, market research, merchandising, PR and other specialist skills. Many such companies have now been re-absorbed into the super-agencies, but in an inter-dependent or autonomous form. Strong media or marketing services specialists do not like, understandably, to be subsumed under advertising professionals, particularly when they have enjoyed a taste of freedom.
As the new specialist media investment management agencies have grown in power, new media technologies have developed and the media agencies have developed strong client relationships. The creative agencies have become increasingly discomforted and called for re-integration. This is not possible in our view; the toothpaste is out of the tube. Media agencies have declared UDI and won their independence. They will not report again to account, planning or creative management. Similarly, media agencies should not develop traditional creative capabilities, even under the guise of digital. If clients want better co-ordination between creative and media agency – which in some cases needs to be improved – the best way to do it is by housing the media planners in the creative agency, but with them remaining employed by the media agency. The creative agencies have paid a heavy price for ignoring the importance of media. The medium is increasingly becoming more important or as important as the message.
Today, the new super-agencies have a big opportunity. Clients still require, first and foremost, creativity and great creative ideas. Second, but increasingly, they want better co-ordination (although it is no good co-ordinating a lousy idea). Finally, they want it at the lowest possible price. The challenge is therefore to provide the best ideas in the best co-ordinated or integrated way at the lowest cost. Until recently, this might have been seen as a fad, but now the concept may be taking root. Four major multinational clients – three of them with origins or significant parts of their business in Asia – invited four or five of the largest holding or parent companies to present for their global advertising and marketing services business. In all cases the presentations included advertising and media investment management, and direct – and in one case research. All these clients were looking for an integrated global solution to their needs and for groups that can offer alternative solutions – potentially a weakness of the single network.
In all four pitches, a group or parent company solution was selected. WPP tribes were successful in two of them. In the third and fourth, we were constrained by significant conflict issues. The CEO of one eliminated parent company in the first round of the first pitch declared that this was not a trend.
After at least four similar pitches, he has changed his mind and is pursuing a holding company approach.
WPP AnnuAl rePort 2009 100
What we thinkAfter the threat of apocalypse, new centres of gravity
drive our best creative resources to clients and categories where their services are rewarded appropriately. Many marketing clients still appreciate that great advertising ideas and copy deliver outstanding results. Reducing marketing costs indiscriminately, particularly in industries with heavy fixed production costs, will only result in having to spread those costs over fewer unit sales.
The procurement process seems to be based on the idea that what we provide is low value-added and that, because we are dependent on significant revenues from large clients, we can be squeezed. This thinking may be flawed. First, what we do is critical. There is a limit to how far costs can be reduced; but there is almost no limit (apart from 100% market share) to how far you can grow revenues. Second, in an increasingly undifferentiated world, what we do – differentiate products and services, tangibly and intangibly – is becoming more and more important, particularly in the slower-growth markets of the US and Western Europe, where overcapacity, commoditisation and retail concentration are more pressing issues.
Corporate responsibility: more important than ever
Many companies have made an increasingly important virtue and value of positioning their brand, goods or services as corporately responsible. If you are in the business of building brands, products, services or corporate brands in the long term, this is surely a given. If you want to build long-term profitability, you cannot dismiss the environment, society, government, NGOs or the press. Indeed, you would only ignore these constituencies if you were in business for a quick buck or short-term profit. We already know from our market research agencies that consumers and people inside companies value socially-responsible companies more highly.
BP in the oil and energy industry, HSBC in banking, and Walmart and M&S in retail are good examples of corporate responsibility. However, three relatively recent events have heightened the importance and significance of CR or Global Corporate Citizenship and made them very fashionable. First, the deal between Warren Buffett and Bill Gates, involving an exchange of Microsoft and Berkshire Hathaway stocks, to enable the Gates Foundation to do even greater charitable work. Second, the decision by Sir Richard Branson, at the second Clinton Global Initiative in New York, to donate up to $3 billion in profits from his Virgin companies to good causes. And finally, the decision by James Murdoch at BSkyB and his father Rupert Murdoch at NewsCorp to espouse carbon neutrality – along with Al Gore’s influential film, An Inconvenient Truth. All of these events have made it fashionable for chairmen and CEOs to embrace corporate responsibility – and embarrassing for them if they do not.
People will not consume luxury in the way they did until recently, particularly in Western markets, at least for some considerable time in the future. Responsible consumption will become more important, rather than conspicuous consumption. Consuming less in a more socially responsible way will be crucial – in relation to society, the environment and economy. Thus social responsibility will be more significant to the consumer, our clients, governments, NGOs and all constituencies.
Conclusion
2009 was an uncompromising year. As forecast last year, it was a game of two halves. We did not play particularly well in the first half, but picked up our rhythm in the second. We moved from staring into the abyss, to a less-worse performance. So far in 2010 we have seen a return of stability, but not growth as yet. The second quarter should see significant top-line growth for the first time for six quarters, but mainly because of easier comparatives. Overall, 2010 should be flat or up slightly. 2011 should see similar, but not spectacular improvement, as clients get further over the terrifying post-Lehman experience, which restricted 2009 budgets, and realise that long-term growth depends on top-line expansion, not cost cutting in their budgets for 2010, 2011 and beyond.
Governments are now faced with a dilemma, a choice between the pain of higher taxes combined with government cuts to reduce the deficit – or inflating our way out of trouble. We can make it easier in the long term by wearing the hair shirt now, slashing state spending and raising taxes, with the resulting loss of jobs. Or we can make it easier in the short term by stoking inflation, with long-term interest rates rising. It is worth pausing to consider this paradox: we are being asked to spend and lend our way out of this recession. That, surely, is what got us into crisis in the first place.
Whatever the conclusion, WPP’s strategy remains appropriate. New geographical markets, new media and consumer insights will become more important. Furthermore, globalisation, overcapacity and the shortage of human capital, the web, internal communications, concentrating distribution, corporate responsibility, the government as a client, and a balance between global and local organisational structures, will continue to drive branding and differentiation, and advertising and marketing services.

WPP AnnuAl rePort 2009 101
What we thinkAfter the threat of apocalypse, new centres of gravity
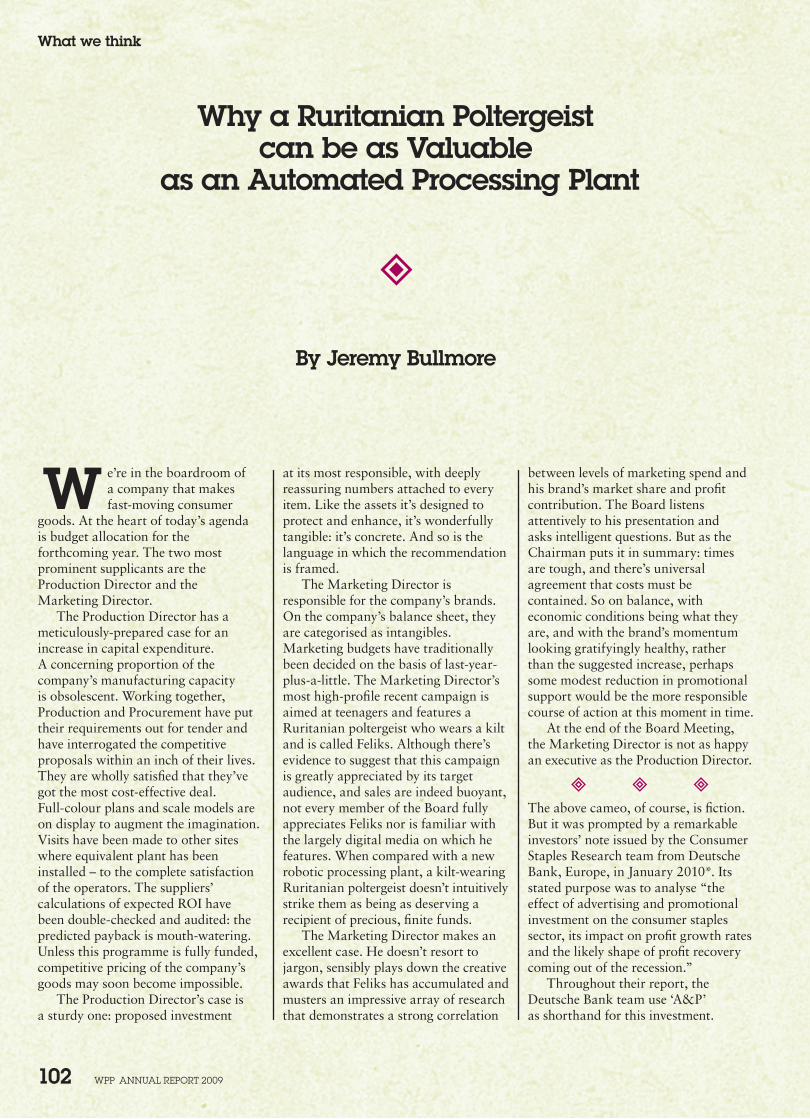
WPP AnnuAl rePort 2009 102
What we think
Why a Ruritanian Poltergeist can be as Valuable
as an Automated Processing Plant
W e’re in the boardroom of a company that makes fast-moving consumer
goods. At the heart of today’s agenda is budget allocation for the forthcoming year. The two most prominent supplicants are the Production Director and the Marketing Director.
The Production Director has a meticulously-prepared case for an increase in capital expenditure. A concerning proportion of the company’s manufacturing capacity is obsolescent. Working together, Production and Procurement have put their requirements out for tender and have interrogated the competitive proposals within an inch of their lives. They are wholly satisfied that they’ve got the most cost-effective deal. Full-colour plans and scale models are on display to augment the imagination. Visits have been made to other sites where equivalent plant has been installed – to the complete satisfaction of the operators. The suppliers’ calculations of expected ROI have been double-checked and audited: the predicted payback is mouth-watering. Unless this programme is fully funded, competitive pricing of the company’s goods may soon become impossible.
The Production Director’s case is a sturdy one: proposed investment
at its most responsible, with deeply reassuring numbers attached to every item. Like the assets it’s designed to protect and enhance, it’s wonderfully tangible: it’s concrete. And so is the language in which the recommendation is framed.
The Marketing Director is responsible for the company’s brands. On the company’s balance sheet, they are categorised as intangibles. Marketing budgets have traditionally been decided on the basis of last-year-plus-a-little. The Marketing Director’s most high-profile recent campaign is aimed at teenagers and features a Ruritanian poltergeist who wears a kilt and is called Feliks. Although there’s evidence to suggest that this campaign is greatly appreciated by its target audience, and sales are indeed buoyant, not every member of the Board fully appreciates Feliks nor is familiar with the largely digital media on which he features. When compared with a new robotic processing plant, a kilt-wearing Ruritanian poltergeist doesn’t intuitively strike them as being as deserving a recipient of precious, finite funds.
The Marketing Director makes an excellent case. He doesn’t resort to jargon, sensibly plays down the creative awards that Feliks has accumulated and musters an impressive array of research that demonstrates a strong correlation
between levels of marketing spend and his brand’s market share and profit contribution. The Board listens attentively to his presentation and asks intelligent questions. But as the Chairman puts it in summary: times are tough, and there’s universal agreement that costs must be contained. So on balance, with economic conditions being what they are, and with the brand’s momentum looking gratifyingly healthy, rather than the suggested increase, perhaps some modest reduction in promotional support would be the more responsible course of action at this moment in time.
At the end of the Board Meeting, the Marketing Director is not as happy an executive as the Production Director.
The above cameo, of course, is fiction. But it was prompted by a remarkable investors’ note issued by the Consumer Staples Research team from Deutsche Bank, Europe, in January 2010*. Its stated purpose was to analyse “the effect of advertising and promotional investment on the consumer staples sector, its impact on profit growth rates and the likely shape of profit recovery coming out of the recession.”
Throughout their report, the Deutsche Bank team use ‘A&P’ as shorthand for this investment.
By Jeremy Bullmore
WPP AnnuAl rePort 2009 103
What we thinkWhy a ruritanian Poltergeist can be as Valuable as an Automated Processing Plant
Here are three of their conclusions. “Brands are critical in consumer
staples Intangible assets account for more than 100% of the market value of the consumer staples sector reflecting the power of brands built up over many decades. Indeed, just as Capex protects the tangible assets, advertising and promotional spend builds and protects the value of consumer brands.”
“The importance of A&P is not well understood A&P spend is the second largest cost for the staples industry and critical to the health of brands and thus valuation. However, financial disclosure of these items is generally poor and 73% of respondents in our investor survey said that they did not have a good idea of how the industry spends its marketing budget.”
“Actions in recession key to shape of recovery Our analysis shows that companies who continue to invest, grow faster, and we can see clear trends in terms of A&P investment during the downturn. The actions of companies through the recession have diverged significantly and it is those actions that we believe will drive the trajectory of subsequent profit recovery.”
Their analysis of over 30 large European and US consumer staples companies over more than 15 years shows “that companies that increase A&P to sales ratios deliver sales
growth 30% faster than those who do not.” And while it’s self-evident that cutting marketing spend delivers an immediate cost benefit, “companies that increase A&P deliver profit growth faster than those that cut A&P.” They add the chilling comment: “Losing market share can be quite a profitable experience – it is the cost of stabilising and rebuilding a brand that is expensive.”
What the Deutsche Bank note does, among many useful things, is to remind us of the remarkable differences in vocabulary, in the use of language, that are employed when we talk about a company’s different assets.
A company’s tangible assets are exactly that. They’re tangible. The money that is commonly agreed to be necessary for the maintenance and enhancement of those assets has a commonly agreed name: capital expenditure, or Capex. A public company’s Capex is necessarily disclosed.
A company’s brands, perhaps representing more than 100% of its market value, are called intangibles. Synonyms for intangible include insubstantial, elusive, vague, ethereal and indefinable. The money that every company knows to be necessary for the maintenance and enhancement of those assets has no commonly agreed
name. Among the 30 companies scrutinised, Deutsche Bank identified 10 slightly different terms for A&P expenditure. The precise composition of different companies’ A&P expenditures also varies widely – and in several instances, their expenditures are not disclosed at all.
To attempt to compare the relative values of Capex and A&P would be as pointless as attempting to determine which is the more important wheel on a bicycle. To be unable to make what you sell is neither better nor worse than being unable to sell what you make. But because of their uniquely elusive quality, the value of brands – rather more than the value of machinery – badly needs periodic championing; and so, it follows, does the importance of A&P.
Mere products may have life cycles – and tangible assets certainly do. But if nurtured and nourished by its A&P, a brand can be for ever.
It seems somehow appropriate that the only company asset capable of returning a profit for all eternity should be called an intangible.
Jeremy Bullmore is a member of the WPP Advisory Board
* European Consumer Staples: The Importance of A&P, 15 January 2010. Deutsche Bank AG, Consumer Staples research team. extracts from Deutsche Bank note reproduced with kind permission.
WPP AnnuAl rePort 2009 104
Non-executive chairman
Philip LaderChairman of the Nomination Committee Member of the Compensation Committee
Executive directors
Sir Martin SorrellChief executive
Paul RichardsonFinance director Chairman of the Corporate Responsibility CommitteeMark ReadStrategy director Chief executive, WPP Digital
Non-executive directors
Colin DayMember of the Audit CommitteeEsther DysonMember of the Compensation Committee and Nomination Committee
Orit GadieshMember of the Nomination Committee
David Komansky (retired 6 February 2009)Stanley (Bud) MortenSenior independent director (until April 2010)Koichiro Naganuma Lubna Olayan Member of the Nomination CommitteeJohn Quelch Jeffrey Rosen Chairman of the Compensation Committee Member of the Audit Committee Senior independent director (from April 2010)
Timothy ShriverMember of the Audit CommitteePaul SpencerChairman of the Audit Committee
Members of the Advisory Board
Jeremy BullmoreJohn JacksonRichard Rivers
Company Secretary
Marie Capes
Board of Directors
Philip Lader Non-executive chairman Age 64
Philip Lader was appointed chairman in 2001. The US Ambassador to the Court of St James’s from 1997 to 2001, he previously served in several senior executive roles in the US Government, including as a Member of the President’s Cabinet and as White House Deputy Chief of Staff. Before entering government service, he was executive vice president of the company managing the late Sir James Goldsmith’s US holdings and president of both a prominent American real estate company and universities in the US and Australia.
A lawyer, he is also a Senior Advisor to Morgan Stanley, a director of Marathon Oil, AES and Rusal Corporations, a trustee of RAND Corporation, the Smithsonian Museum of American History and the Atlantic Council and a member of the Council on Foreign Relations.
Sir Martin Sorrell Chief executive Age 65
Sir Martin Sorrell joined WPP in 1986 as a director, becoming Group chief executive in the same year. He is a non-executive director of Formula One and Asatsu-DK Inc. [email protected]
Paul Richardson Finance director Age 52
Paul Richardson became Group finance director of WPP in 1996 after four years with the Company as director of treasury. He is responsible for the Group’s worldwide functions in finance, information technology, procurement, property, treasury, taxation, internal audit and corporate responsibility. He is also the Country Manager for Italy.
He is a chartered accountant and fellow of the Association of Corporate Treasurers. He is a non-executive director of CEVA Group plc, Chime Communications PLC and STW Communications Group Limited in Australia, the last two being companies associated with the Group [email protected]
Mark Read Strategy director and CEO, WPP Digital Age 43
Mark Read was appointed a director in March 2005. He has been WPP’s director of strategy since 2002 and is also chief executive of WPP Digital. He is a member of the Supervisory Board of HighCo and a director of CHI & Partners. He worked at WPP between 1989 and 1995 in both parent company and operating company roles. Prior to rejoining WPP in 2002, he was a principal at the consultancy firm of Booz-Allen & Hamilton and founded and developed the company WebRewards in the UK [email protected]
Who runs WPP
WPP AnnuAl rePort 2009 105
Who runs WPPBoard of Directors
Colin Day Non-executive director Age 55
Colin Day was appointed a director in July 2005. He is group finance director of Reckitt Benckiser plc, having been appointed to its board in September 2000 and became a non-executive director of Cadbury plc in December 2008. Prior to joining Reckitt Benckiser he was group finance director of Aegis Group plc and previously held a number of senior finance positions with ABB Group plc and De La Rue Group plc. He was a non-executive director of Imperial Tobacco plc until February 2007 and of easyJet plc until 30 September 2005.
Esther Dyson Non-executive director Age 58
Esther Dyson was appointed a director in 1999. In 2004 she sold her company, EDventure Holdings, to CNET Networks, the US-based interactive media company now owned by CBS. She left CNET at the end of 2006 and now operates as an independent investor and writer, again under the name of EDventure. She has been highly influential for the past 20 years on the basis of her insights into online/information technology markets and their social impact worldwide, including the emerging markets of Central and Eastern Europe and Asia.
An active investor, she participated in the sale of Flickr to Yahoo! and of Medstory to Microsoft. She sits on the boards of non-listed start-ups including Boxbe (US), Evernote (US), 23andMe (US), Airship Ventures (US), Eventful.com (US), Meetup Inc. (US), NewspaperDirect (Canada), Voxiva (US) and Yandex (Russia). She is also active in public affairs and was founding chairman of ICANN, the domain name policy agency, from 1998 to 2000. She currently sits on the board of the Sunlight Foundation, which advocates transparency in government; StopBadware.org, an anti-malware group; and PersonalGenome.org. She is also a member of the NASA Advisory Council and Chairman of its Technology and Innovation Committee.
Orit Gadiesh Non-executive director Age 59
Orit Gadiesh was appointed a director in April 2004. She is chairman of Bain & Company, Inc. and a world-renowned expert on management and corporate strategy. She holds an MBA from Harvard Business School and was a Baker Scholar.
She is a member of the International Advisory Board at Haute Ecole Commerciale in France, as well as a member of the Foundation Board for the World Economic Forum and the Board of Directors of The Peres Institute for Peace. She is a member of the Council on Foreign Relations, and a trustee for Eisenhower Fellowships.
David H. Komansky Non-executive director Age 70
David Komansky was appointed a director in January 2003 and retired on 6 February 2009. He was chairman of the Board of Merrill Lynch & Co, Inc, serving until his retirement on 28 April 2003. He served as chief executive officer from 1996 to 2002, having begun his career at Merrill Lynch in 1968.
Among many professional affiliations, he serves as a director of Black Rock, Inc. and as a member of the International Advisory Board of the British American Business Council. Active in many civic and charitable organisations, he serves on the Board of the New York Presbyterian Hospital.
Stanley (Bud) Morten Non-executive director Age 66
Bud Morten was appointed a director in 1991. He is a consultant, private investor and one of the five public members of the Investment Advisory Council of the State of Connecticut. From 2003 to 2009 he was the Independent Consultant to Citigroup/Smith Barney with responsibility for its independent research requirements.
Previously he was the chief operating officer of Punk, Ziegel & Co, a New York investment banking firm with a focus on the healthcare and technology industries. Before that he was the managing director of the equity division of Wertheim Schroder & Co, Inc. in New York. He is a former non-executive director of Register.com, which was sold to a private equity firm in November 2005. He is also a non-executive director of The Motley Fool, Inc., and of Darien Rowayton Bank, both of which are private companies.
Koichiro Naganuma Non-executive director Age 65
Koichiro Naganuma was appointed a director in February 2004. He is Chairman and group chief executive officer of Asatsu-DK Inc., also known as ADK. Joining the agency in 1981, he began his career with the account service of global clients in the agency. His mandate thereafter expanded to the total operation of the group.
ADK is Japan’s third largest advertising and communications company, and 10th largest in the world.
WPP AnnuAl rePort 2009 106
Who runs WPPBoard of Directors
Timothy (Tim) Shriver Non-executive director Age 50
Tim Shriver was appointed a director in August 2007. He is Chairman and CEO of Special Olympics, serving over three million Special Olympic athletes and their families in 180 countries. In recent years, he has produced films for Disney, Dream Works and Fox Searchlight and Hallmark Hall of Fame. Since January 2007 he has been writing a column for The Washington Post/Newsweek.com.
He co-founded the Collaborative for Academic, Social and Emotional Learning (CASEL) and currently chairs the CASEL Board. He is a member of the Council on Foreign Relations and is also a non-executive director of the Malaria No More, Neogenix Oncology, and he is the founder and President of the Center for Interface Action on Global Poverty. He serves on the advisory committee of Main Street Advisors and Leeds Equity.
Paul Spencer Non-executive director Age 60
Paul Spencer was appointed a director in April 2004. He is a financier with 20 years’ experience in the financial management of a number of blue chip companies, including British Leyland PLC, Rolls-Royce PLC, Hanson PLC and Royal & Sun Alliance PLC.
Paul has held a number of non-executive directorships including until 2009 Chairman of NS and I (National Savings). He is currently Chairman of State Street Managed Pension Funds and chairs audit at TR Property Investment Trust PLC. He is the independent Trustee of the BAT, BT, BA and Rolls-Royce Pension Funds. In the 2010 Honours he was awarded a CBE for services to the financial services industry. Paul is a governor of the charity Motability.
Lubna Olayan Non-executive director Age 54
Lubna Olayan was appointed a director in March 2005. Ms Olayan is the deputy chairman and chief executive officer of the Olayan Financing Company, a subsidiary and the holding entity for the Olayan Group’s operations in the Kingdom of Saudi Arabia and the Middle East.
Ms Olayan is a Board Member of Saudi Hollandi Bank, a publicly listed company in Saudi Arabia. She is on the International Advisory Board of the Council on Foreign Relations, a member of the Board of Directors of INSEAD and a member of the Board of Trustees of Cornell University and KAUST (King Abdullah University of Science & Technology). Ms Olayan joined the International Advisory Board of Rolls-Royce in October 2006 and Akbank International Advisory Board in April 2009.
John Quelch Non-executive director Age 58
John Quelch was appointed a director in 1988. He is the Lincoln Filene Professor of Business Administration at Harvard Business School. Between 1998 and 2001 he was Dean of the London Business School. From 2001 to 2009, he was also a senior associate dean at Harvard Business School. He has served since 2002 as chairman of the Massachusetts Port Authority. He is the honorary counsel general of the Kingdom of Morocco in New England and honorary chairman of the British American Business Council of New England. He is also a member of the Council on Foreign Relations.
Professor Quelch’s writings focus on global business practice in emerging as well as developed markets, international marketing and the role of the multinational corporation and the nation state. He is a non-executive director of Inverness Medical Innovations, Inc. He served previously on the boards of Blue Circle Industries plc, easyJet plc, Pentland Group plc, Pepsi Bottling Group and Reebok International Limited.
Jeffrey A. Rosen Non-executive director Age 62
Jeffrey Rosen was appointed a director in December 2004. He is a deputy chairman and managing director of Lazard. He has over 30 years’ experience in international investment banking and corporate finance. He is a member of the Council on Foreign Relations and is President of the Board of Trustees of the International Center of Photography in New York.
WPP AnnuAl rePort 2009 107
Who runs WPP
Stockbrokers
Merrill Lynch International Corporate Broking 2 King edward Street london eC1A 1HQ
Auditors and accountancy advisors
Deloitte LLP2 new Street Square london eC4A 3BZErnst & Young LLP1 More london Place london Se1 2AFKPMG LLP1 Puddle Dock london eC4V 3DSPricewaterhouseCoopers LLP1 embankment Place london WC2n 6rH
Remuneration consultants
Towers Watson71 High Holborn london WC1V 6tP
Property advisors
CB Richard Ellis200 Park Avenue new York nY 10166Cushman & Wakefield 1290 Avenue of the Americas new York nY 10104-6178 James Andrew International72/75 Marylebone High Street london W1u 5JWJones Lang LaSalle22 Hanover Square london W1A 2Bn
Investment bankers
CitigroupCitigroup Centre 33 Canada Square Canary Wharf london e14 5lBGoldman Sachs International LtdPeterborough Court 133 Fleet Street london eC4A 2BBHSBC8 Canada Square london e14 5HQMerrill Lynch International2 King edward Street london eC1A 1HQMorgan Stanley & Co Limited20 Bank Street Canary Wharf london e14 4QA
Legal advisors
Allen & Overy LLPone Bishops Square london e1 6AoDavis & Gilbert LLP1740 Broadway new York nY 10019Freshfields Bruckhaus Deringer65 Fleet Street london eC4Y 1HSFried, Frank, Harris, Shriver & Jacobson LLP1 new York Plaza new York nY 10004Hammonds LLP7 Devonshire Square Cutlers Gardens london eC2M 4YHMourant du Feu & Jeune22 Grenville Street St Helier Jersey Je4 8PX
Advisors to the Board

WPP AnnuAl rePort 2009 109
Review of the Company’s governance and the Nomination Committee
Dear share owner
S urveying worldwide economic conditions in last year’s Annual Report, the Group chief executive observed that the coming year “won’t be tidy.” In sharp contrast with 2008, when WPP posted record billings, revenues
and operating profit, the past year was, again in his word, “brutal” for our Company and the marketing communications services industry in its entirety.
That total share owner return actually increased during this period – with WPP’s dividend level being maintained and its share price rising considerably – can be attributed to very specific factors. Recovery of the global financial markets and key industries was essential, and advantageous currency impacts certainly helped. Our long-term strategy of geographic and product diversification and investment in digital and consumer insight businesses continues to be successful, particularly when more traditional locales and platforms are under severe pressure. Especially noteworthy was the consistency of our operating companies’ new business wins. But having monitored management very closely during this trying year, the Board especially recognizes management’s adroit, albeit painful, calibration of expenses, personnel and treasury functions.
once again, this year the Directors’ report includes reviews from the chairmen of three Board committees: Philip lader, as chairman of the Company and its nomination Committee; Paul Spencer, as chairman of the Audit Committee; and Jeffrey rosen, as chairman of the Compensation Committee. It also contains an analysis of the Company’s compliance with statutory and regulatory requirements.
How we behave
Directors’ report
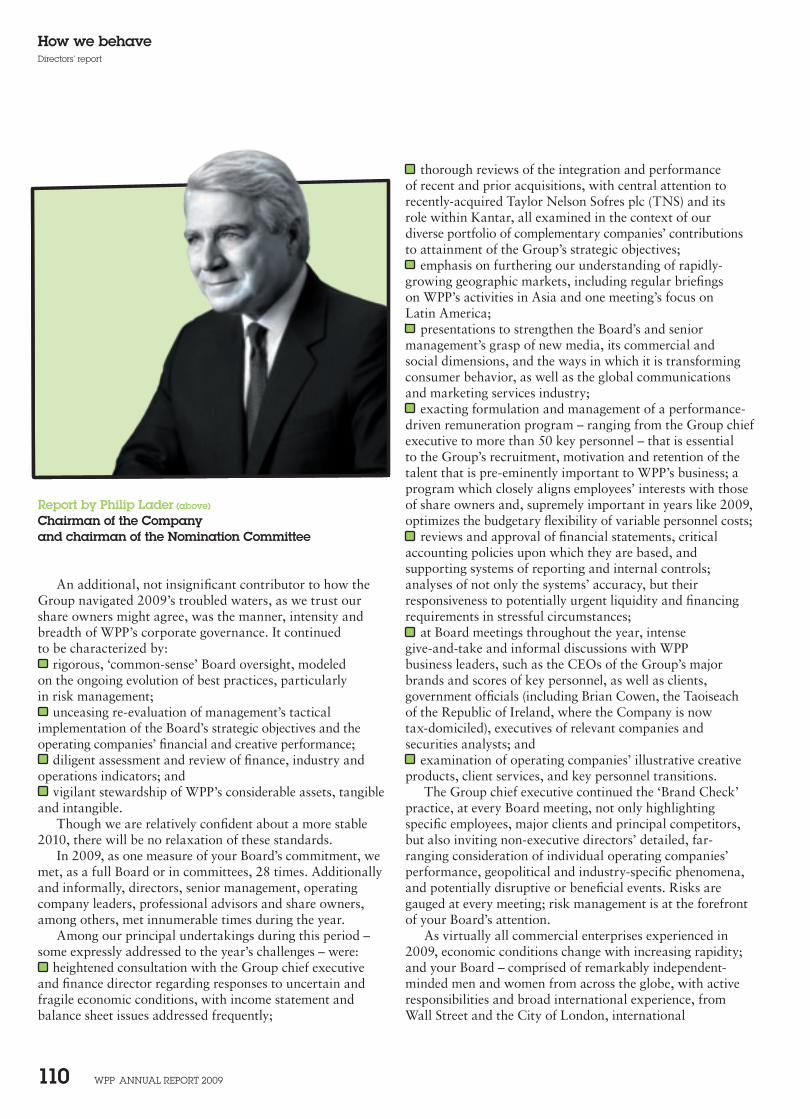
WPP AnnuAl rePort 2009 110
How we behaveDirectors’ report
thorough reviews of the integration and performance of recent and prior acquisitions, with central attention to recently-acquired Taylor Nelson Sofres plc (TNS) and its role within Kantar, all examined in the context of our diverse portfolio of complementary companies’ contributions to attainment of the Group’s strategic objectives;
emphasis on furthering our understanding of rapidly-growing geographic markets, including regular briefings on WPP’s activities in Asia and one meeting’s focus on Latin America;
presentations to strengthen the Board’s and senior management’s grasp of new media, its commercial and social dimensions, and the ways in which it is transforming consumer behavior, as well as the global communications and marketing services industry;
exacting formulation and management of a performance-driven remuneration program – ranging from the Group chief executive to more than 50 key personnel – that is essential to the Group’s recruitment, motivation and retention of the talent that is pre-eminently important to WPP’s business; a program which closely aligns employees’ interests with those of share owners and, supremely important in years like 2009, optimizes the budgetary flexibility of variable personnel costs;
reviews and approval of financial statements, critical accounting policies upon which they are based, and supporting systems of reporting and internal controls; analyses of not only the systems’ accuracy, but their responsiveness to potentially urgent liquidity and financing requirements in stressful circumstances;
at Board meetings throughout the year, intense give-and-take and informal discussions with WPP business leaders, such as the CEOs of the Group’s major brands and scores of key personnel, as well as clients, government officials (including Brian Cowen, the Taoiseach of the Republic of Ireland, where the Company is now tax-domiciled), executives of relevant companies and securities analysts; and
examination of operating companies’ illustrative creative products, client services, and key personnel transitions.
The Group chief executive continued the ‘Brand Check’ practice, at every Board meeting, not only highlighting specific employees, major clients and principal competitors, but also inviting non-executive directors’ detailed, far-ranging consideration of individual operating companies’ performance, geopolitical and industry-specific phenomena, and potentially disruptive or beneficial events. Risks are gauged at every meeting; risk management is at the forefront of your Board’s attention.
As virtually all commercial enterprises experienced in 2009, economic conditions change with increasing rapidity; and your Board – comprised of remarkably independent-minded men and women from across the globe, with active responsibilities and broad international experience, from Wall Street and the City of London, international
An additional, not insignificant contributor to how the Group navigated 2009’s troubled waters, as we trust our share owners might agree, was the manner, intensity and breadth of WPP’s corporate governance. It continued to be characterized by:
rigorous, ‘common-sense’ Board oversight, modeled on the ongoing evolution of best practices, particularly in risk management;
unceasing re-evaluation of management’s tactical implementation of the Board’s strategic objectives and the operating companies’ financial and creative performance;
diligent assessment and review of finance, industry and operations indicators; and
vigilant stewardship of WPP’s considerable assets, tangible and intangible.
Though we are relatively confident about a more stable 2010, there will be no relaxation of these standards.
In 2009, as one measure of your Board’s commitment, we met, as a full Board or in committees, 28 times. Additionally and informally, directors, senior management, operating company leaders, professional advisors and share owners, among others, met innumerable times during the year.
Among our principal undertakings during this period – some expressly addressed to the year’s challenges – were:
heightened consultation with the Group chief executive and finance director regarding responses to uncertain and fragile economic conditions, with income statement and balance sheet issues addressed frequently;
Report by Philip Lader (above)
Chairman of the Company and chairman of the Nomination Committee
WPP AnnuAl rePort 2009 111
How we behaveDirectors’ report
assert that a worldwide enterprise of WPP’s scale and range of commercial activities benefits enormously from long-term directors who are actively engaged in the Group’s governance and that ‘independence’ should be determined not by such an arbitrary standard as tenure, but on a case-by-case basis, with full disclosure to share owners of any appearance of conflict with published guidelines.
We do agree that occasional change and renewal are healthy for a Board. For that reason, Bud Morten – an exemplary non-executive director, whose experience, judgment and commitment of time have constituted an invaluable asset of the Group – has stepped down as the Board’s senior independent director. One cannot exaggerate how well served we share owners have been by this respected individual’s service. His quantitative analytical experience, qualitative judgment and routinely painstaking review of all relevant documents are indicative of his long-standing record of diligence and discernment. Only valued more by his Board colleagues is his capacity to challenge and debate – with senior management and often with several of us – without being disagreeable. He has been and, by standing for re-election as a non-executive director, will continue to be, we trust, a model director, one with an unflagging, demonstrated inclination towards independent-mindedness.
Succeeding Bud as senior independent director is Jeffrey Rosen, deputy chairman of Lazard, a member of this Board since December 2004, and a distinguished 30-year veteran of international financial transactions. He also brings to this role a thorough understanding of WPP from his conscientious service as chairman of our Compensation Committee and energetic membership of our Audit Committee.
Evidenced by our current slate of candidates for this Board, we continue to require that non-executive directors who have served on the Board for nine years or more submit themselves for re-election annually. For that reason, my name is among those on the list. The Board does not view my position as non-executive chairman, my chairmanship of the Nomination Committee and membership on the Compensation Committee, or my nine years’ service as compromising my independence. It is their considered judgment – formally reviewed on an annual basis – that such continuity helps ensure co-ordination of related Board matters and practicable, informed management of our governance work. By invitation of the Audit Committee’s chairman, I also attended all of its meetings in 2009 and, with his consent, will continue this practice to stay fully abreast of the Committee’s and our auditors’ findings.
The Board’s Nomination Committee – now comprised of Esther Dyson, Orit Gadiesh, Lubna Olayan and me – invites the participation, in whole or in part, of the Group chief executive, the Company Secretary, and the Group chief counsel in its meetings. In 2009, we formally met three times and more frequently conversed informally to assess the Board’s composition and to consider potential new members,
management consulting, asset management, angel investing and academia, advertising and internet start-ups, consumer-products, energy and manufacturing industries, government and global non-profit organizations – employs the breadth and depth of these perspectives in its fashioning and assessing the Group’s risk management.
In that context, succession of the Group’s CEO and other key executives was – again, as for the past seven years – addressed substantively in 2009. The entire Board devoted major parts of two meetings to reflecting on these individuals and some other 200 senior managers and ‘rising stars’, skills, performance, developmental opportunities and potential successors. Some of our businesses, if independent, would rank among our industry’s largest, and we are therefore fortunate to have an impressive roster of executives with extensive senior management experience, several dozen of who could readily undertake parent company or other key roles.
Your Board and the Group’s chief executive have exchanged candid, specific, current opinions about the candidates, internal and external, best qualified to succeed him; and on several structured and informal occasions, the non-executive directors, in his absence, addressed the potential selection process and succession candidates. We take this risk management responsibility extremely seriously. We continue to adhere to the position that – lest public discussion of this subject foster speculation and distraction – the content of these ongoing deliberations should remain strictly confidential.
In light of the financial community’s experience since 2008, your Board concurs with the general calls for intensified corporate governance and believes that our practices have evidenced this. We have been attentive, nonetheless, to the slew of reviews and reports on this subject; and on my colleagues’ behalf, I have personally engaged in a variety of such studies. Given WPP’s global operations and complexity, your Board welcomes meaningful and beneficial engagement with share owners to convey our governance practices. To that end, we hope that our communications throughout the year and this Annual Report provide a comprehensive, clear picture of how the Board and the Group operate.
For governance to be genuinely effective, however, every board must tailor best practices and innovations to the idiosyncrasies of its organization’s industry, culture, operations, regions, and personalities – without diminishing the rigorous execution of oversight responsibilities. Of WPP’s exceptions from some advisory groups’ preferences, one example that is occasionally referenced is our position that a director’s ‘independence’ may be determined on a factual, rather than mere chronological, basis.
Some institutional investors and their representative bodies contend that directors who have served for more than nine years should no longer be considered ‘independent’; nor, by definition, should the Group chairman. We respectfully
WPP AnnuAl rePort 2009 112
How we behaveDirectors’ report
identified from a variety of both internal and external sources. Paramount to our thinking has been how both the Company’s progress on its long-term strategic objectives and its month-by-month performance towards financial goals can best be assessed by the collective experience of individuals serving on this Board.
For the present, no changes were deemed necessary. Practically all of our directors hold or have recently held strategic leadership positions; and one, Orit Gadiesh, is chairman of Bain & Company, one of the world’s most sought-after strategic consultants. European, American, Asian and Middle Eastern directors together inform our global perspective and ever-increasing focus on faster-growing markets. Several directors who are deeply involved with new media – notably, Esther Dyson, an acknowledged web authority and active investor in new information technologies, and Mark Read, who oversees the Group’s interactive portfolio – take the lead in monitoring WPP’s strides in this field and identifying opportunities and threats. Our Consumer Insight initiatives are especially informed by Harvard Business School professor (and former London Business School Dean) John Quelch, one of academe’s most highly regarded marketing experts, and Colin Day, Reckitt Benckiser Group’s finance director and former Cadbury plc director.
All of us directors have managed large organizations: Lubna Olayan, for example, is currently CEO of a major Saudi Arabian corporate group. Most have had hands-on financial responsibility: witness Her Majesty honoring Paul Spencer last year for his contributions to financial accountability, practiced as chairman of our Audit Committee and as Independent Trustee of BA, BAT, BT and Rolls-Royce’s pension funds.
Our corporate responsibility program – summarized in this report and in our separate CR publication and championed by our Board colleague Tim Shriver, the CEO of Special Olympics and prominent spokesman for business’ public duties – is comprehensive and impactful. Well beyond the Group’s measures to improve our workplaces, enhance our people’s employment experience and contribute to environmental sustainability, as well as other articulated CR undertakings, WPP companies and their teams complete uncompensated promotional, design and related services for hundreds of worthy causes worldwide.
In addition to evaluating the relevance of our directors’ profiles to our strategic objectives, the Nomination Committee’s 2009 work also complied with governance duties ranging from implementation of rules governing the disclosure and approval of directors’ conflicts-of-interest and review of committee terms of reference to oversight of succession planning and the Board self-evaluation. The Board again completed, in 2009, as part of its commitment to rigorous standards of corporate governance, a thorough self-evaluation. All directors completed a confidential
questionnaire in this regard and identified opportunities for improvement. Separate conversations were then held between each director and either the chairman or the senior independent director, who also led the non-executive directors’ assessment of my performance as chairman. Based on this process, we continued our tradition of implementing changes to enhance the Board’s performance of its responsibilities.
‘Groupthink’ is the antithesis of our Board’s behavior. Each Board and Committee meeting challenges well-tested assumptions, long-standing practices and even iconic executives. We thereby seek to comply with – and throughout the financial year ended 31 December 2009, WPP plc did so or surpassed – the requirements of the Combined Code on Corporate Governance, NASDAQ’s rules, US Sarbanes-Oxley requirements and, where practicable, guidelines issued by institutional investors and their representative bodies.
Each year over the past decade, our responsibilities as non-executive directors have increased substantially. We do not shrink from these; nor do we take them lightly. Our iPhones and BlackBerrys hum with near-daily messages prompted by packs of WPP reading materials, the Group chief executive’s, the senior independent director’s or my musings, or any director’s reaction to news-of-the-day. They, as well as our Company Secretary and Group chief counsel, devote an enormous amount of time, frequently with personal sacrifice. Essential to our effectiveness are the oft-unsung efforts of those at WPP who directly support our work and the highly competent professionals who meet the never-ending stream of legal, regulatory, tax, accounting and administrative demands.
While forecasters promise a more benevolent economy for 2010 – and early signs are encouraging, operating in more than 100 jurisdictions, with 138,000 people and some 2,400 offices, can be ‘tidy’ only through their disciplined, co-ordinated efforts. WPP’s people across the globe are creating value each day, for our clients and for our share owners. It is, every day, a competition with other firms and with our own past creativity. That tenacity and dedication brought us through 2009 relatively unscathed. It is such professionalism which can generate superior returns for our share owners in this and future years.
For that and for our fellow share owners’ trust in our stewardship of these interests, we directors are most thankful.
Philip Lader16 April 2010
WPP AnnuAl rePort 2009 113
How we behaveDirectors’ report
Review of the Audit Committee
Report by Paul SpencerChairman of the Audit Committee
Dear share owner
D uring 2009, Tim Shriver, Jeffrey Rosen and Colin Day were my colleagues on the committee.We held eight meetings during the year, which were
also attended (by invitation for all or part of any meeting) by the external auditors, the Company’s chairman, the Group finance director, the senior independent director, the director of internal audit, the Group chief counsel, deputy Group chief counsel and the Company Secretary. Preparatory meetings were also held with the internal and external auditors as well as members of the Company’s senior management including the heads of the Tax, Treasury, Legal and Group Reporting teams. The committee received presentations from the heads of Tax, Mergers & Acquisitions, IT and Corporate Responsibility. The committee also received reports from the Disclosure Committee in relation to the Disclosure Committee’s review and work on financial reports. The Board received regular reports on all matters of particular significance arising at the committee meetings.
The committee’s terms of reference, which are reviewed with the Board annually and most recently in February 2010, are available for inspection on the Company’s website at www.wpp.com and are on display prior to and at all general meetings of the Company.
During the year, the committee and its members were formally assessed by the chairman of the Company for their technical suitability to be members of the committee and also for the committee’s overall effectiveness. The Board has designated me as the committee’s financial expert for Sarbanes-Oxley Act (SOX) purposes and as having recent and relevant financial experience for the purposes of the Combined Code.
The committee has once again overseen the progress towards compliance with Section 404 of SOX for 2009, through regular status reports submitted by the internal and external auditors.
The committee received and reviewed regular reports on both our Right to Speak helpline, which is made available to our people to enable them to communicate confidentially on matters of concern and the actions taken in response to those calls.
The committee has established a policy regarding non-audit services that may be provided by the external auditors, which prohibits certain categories of work in line with relevant guidance on independence, such as ethical standards issued by the Auditing Practices Board and SOX. Other categories of work may be provided by the auditors if it is appropriate for them to do so. The provision of such services and associated fees are pre-approved by the committee, either as individual assignments or as aggregate amounts
for specified categories of services. All fees are summarised periodically for the committee to assess the aggregate value of non-audit fees against audit fees. The level of fees for 2009 is shown in note 3 on page 159.
In line with the committee’s responsibility to review and appoint the external auditors and approve their remuneration and terms of engagement, in 2009 the committee assessed whether to tender the external audit.
Having monitored Deloitte’s independence, objectivity and performance in 2009 as in prior years since Deloitte’s original appointment in 2002, with reference to a detailed assessment prepared by the director of internal audit and frequent reports during the year from Deloitte covering, inter alia, their team and required audit partner rotation plans, the overall audit strategy and the progress and results of the audit, the committee decided it was in the Group’s and share owners’ interests not to tender the external audit in 2010 and recommends the reappointment of Deloitte.
Other work carried out by the committee in 2009 included:
monitoring the integrity of the Company’s financial statements and reviewing significant financial reporting judgements;
reviewing internal financial control and internal audit activities;
assisting the Board in meeting its responsibilities in respect of reviewing and reporting on the systems and key elements of risk management as they affect the Group;
reviewing the Group Treasury policy with particular focus on debtors, funding and the continued ability of the Group to adopt the going concern basis in preparing financial statements;
reviewing reports on any material litigation involving Group companies;
reviewing the Group’s mergers and acquisitions strategy and the debt financing by the Group;
reviewing the Group’s Code of Conduct and supporting training programs;
reviewing the Group’s tax strategy; reviewing the Group’s IT functions and strategy; monitoring the accounting and legal reporting
requirements, including all relevant regulations of the UK Listing Authority, the SEC and NASDAQ and the Jersey Financial Services Commission with which the Company must comply; and
in conjunction with Paul Richardson, the director responsible for corporate responsibility in 2009, ensuring systems are in place to monitor social, environmental and ethical issues which may affect the Group (other than issues which fall within the remit of the Compensation Committee).
I would like to thank my colleagues on the committee, the head office executives and the external advisors for their help in another challenging year.
Paul Spencer16 April 2010
WPP AnnuAl rePort 2009 114
How we behaveDirectors’ report
The Board of DirectorsThe Board is collectively responsible for promoting the success of the Company by directing and supervising the Company’s policy and strategy and is responsible to share owners for the Group’s financial and operational performance. Responsibility for the development and implementation of Group policy and strategy and for day-to-day management issues is delegated by the Board to the Group chief executive and other executive directors.
For the year under review, Philip Lader continued as chairman of the Board, responsible for the leadership of the Board. Sir Martin Sorrell, as the Group chief executive, continued to be responsible for the development and implementation of policy and strategy and for the day-to-day operations of the Group. The biographies of the current Board members appear on pages 104 to 106.
All directors are fully briefed on important developments in the various business activities which the Group carries out worldwide and regularly receive extensive information concerning the Group’s operations, finances, risk factors and its people, enabling them to fulfil their duties and obligations as directors. The directors are also frequently advised on regulatory and best practice requirements which affect the Group’s businesses on a global basis, but particularly in the US and the UK.
During 2009, the Board met six times formally and held 22 committee meetings throughout the year. With the exception of John Quelch, Colin Day, Esther Dyson and Orit Gadiesh (each absent for one meeting), Tim Shriver (absent for two meetings), Lubna Olayan (absent for three meetings) and Koichiro Naganuma who was only able to attend one meeting, there was full attendance at all formal meetings of the Board during 2009.
The Board was composed of 14 directors in 2009 (following the retirement of David Komansky on 6 February 2009). Three members are executive directors and 10, plus the chairman, are non-executive directors. The Board considers that eight of the 10 non-executive directors, in addition to the chairman, are independent. John Quelch and Koichiro Naganuma are the only non-executive directors the Board considers are not independent.
The shareholdings of non-executive directors are set out on page 143. Non-executive directors do not participate in the Company’s pension, share option or other incentive plans, but may receive a part of their fees in ordinary shares of the Company and may participate in the Company’s deferred compensation program.
The Board considers that the non-executive directors’ remuneration conforms with the requirements of the Combined Code.
The fees payable to non-executive directors represent compensation in connection with Board and Board committee meetings and where appropriate for devoting additional time and expertise for the benefit of the Group in a wider capacity.
Details of directors’ remuneration and service contracts form part of the report of the Compensation Committee which commences on page 133.
Election of directors
As a matter of policy the Company requires all directors to submit themselves for re-election by an ordinary resolution of share owners at least every three years or every year in the case of those non-executive directors who have held office for more than nine years. Directors may be appointed by share owners by ordinary resolution or by the Board on the recommendation of the Nomination Committee and must then stand for re-election at the next Annual General Meeting where they may be re-elected by ordinary resolution of the share owners.
The Board recommends that share owners vote in favour of the resolutions to re-elect the relevant directors, namely Philip Lader, Esther Dyson, Stanley (Bud) Morten, John Quelch, and Paul Richardson, and sets out their reasons for this recommendation in the Appendix to the Notice of the Annual General Meeting.
Conflicts of interest
The Company’s Articles of Association permit the Board to consider and, if it sees fit, to authorise situations where a director has an interest that conflicts, or may possibly conflict, with the interests of the Company (Situational Conflicts). The Board has a formal system in place for directors to declare Situational Conflicts to be considered for authorisation by those directors who have no interest in the matter being considered. In deciding whether to authorise a Situational Conflict, the non-conflicted directors must act honestly and in good faith with a view to the best interests of the Company and they may impose limits or conditions when giving the authorisation, or subsequently, if they think this is appropriate.
Any Situational Conflicts considered, and any authorisations given, are recorded in the relevant minutes. The prescribed procedures have been followed in deciding whether, and on what terms, to authorise Situational Conflicts and the Board believes that the systems it has in place for reporting and considering Situational Conflicts continue to operate effectively.
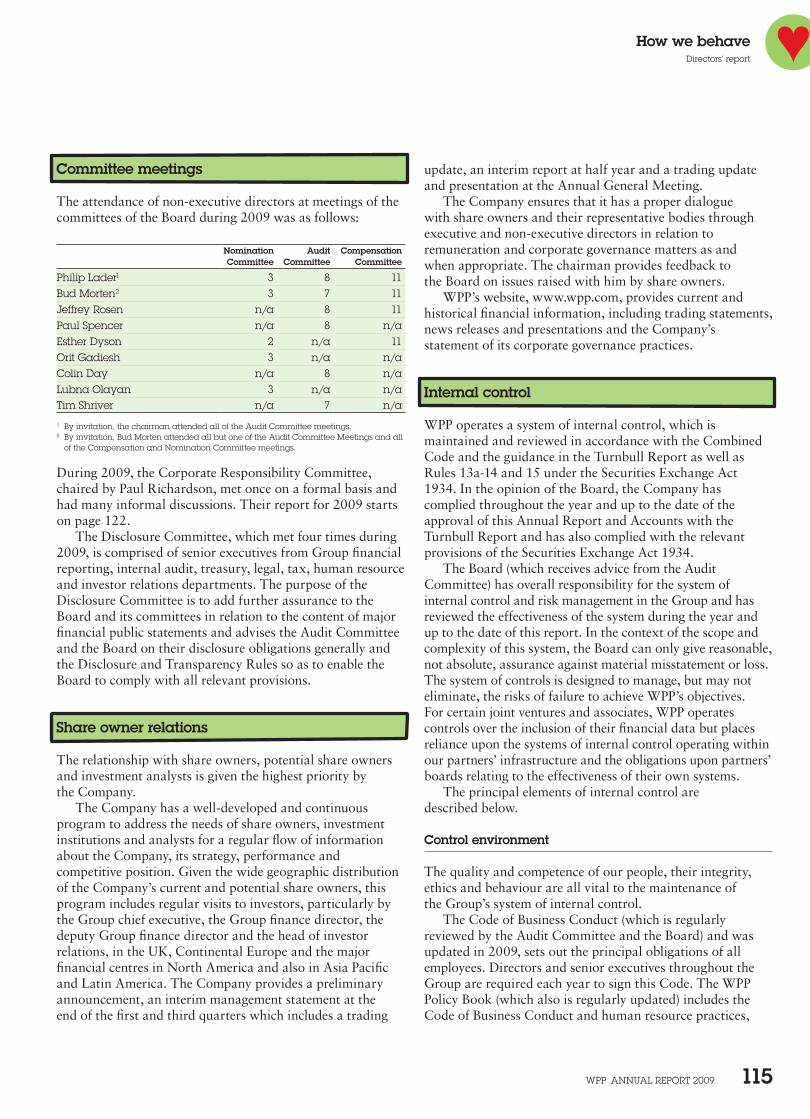
WPP AnnuAl rePort 2009 115
How we behaveDirectors’ report
update, an interim report at half year and a trading update and presentation at the Annual General Meeting.
The Company ensures that it has a proper dialogue with share owners and their representative bodies through executive and non-executive directors in relation to remuneration and corporate governance matters as and when appropriate. The chairman provides feedback to the Board on issues raised with him by share owners.
WPP’s website, www.wpp.com, provides current and historical financial information, including trading statements, news releases and presentations and the Company’s statement of its corporate governance practices.
Internal control
WPP operates a system of internal control, which is maintained and reviewed in accordance with the Combined Code and the guidance in the Turnbull Report as well as Rules 13a-14 and 15 under the Securities Exchange Act 1934. In the opinion of the Board, the Company has complied throughout the year and up to the date of the approval of this Annual Report and Accounts with the Turnbull Report and has also complied with the relevant provisions of the Securities Exchange Act 1934.
The Board (which receives advice from the Audit Committee) has overall responsibility for the system of internal control and risk management in the Group and has reviewed the effectiveness of the system during the year and up to the date of this report. In the context of the scope and complexity of this system, the Board can only give reasonable, not absolute, assurance against material misstatement or loss. The system of controls is designed to manage, but may not eliminate, the risks of failure to achieve WPP’s objectives. For certain joint ventures and associates, WPP operates controls over the inclusion of their financial data but places reliance upon the systems of internal control operating within our partners’ infrastructure and the obligations upon partners’ boards relating to the effectiveness of their own systems.
The principal elements of internal control are described below.
Control environment
The quality and competence of our people, their integrity, ethics and behaviour are all vital to the maintenance of the Group’s system of internal control.
The Code of Business Conduct (which is regularly reviewed by the Audit Committee and the Board) and was updated in 2009, sets out the principal obligations of all employees. Directors and senior executives throughout the Group are required each year to sign this Code. The WPP Policy Book (which also is regularly updated) includes the Code of Business Conduct and human resource practices,
Committee meetings
The attendance of non-executive directors at meetings of the committees of the Board during 2009 was as follows:
Nomination Audit CompensationCommittee Committee Committee
Philip lader1 3 8 11Bud Morten2 3 7 11Jeffrey rosen n/a 8 11Paul Spencer n/a 8 n/aesther Dyson 2 n/a 11orit Gadiesh 3 n/a n/a Colin Day n/a 8 n/alubna olayan 3 n/a n/atim Shriver n/a 7 n/a
1 By invitation, the chairman attended all of the Audit Committee meetings.2 By invitation, Bud Morten attended all but one of the Audit Committee Meetings and all
of the Compensation and nomination Committee meetings.
During 2009, the Corporate Responsibility Committee, chaired by Paul Richardson, met once on a formal basis and had many informal discussions. Their report for 2009 starts on page 122.
The Disclosure Committee, which met four times during 2009, is comprised of senior executives from Group financial reporting, internal audit, treasury, legal, tax, human resource and investor relations departments. The purpose of the Disclosure Committee is to add further assurance to the Board and its committees in relation to the content of major financial public statements and advises the Audit Committee and the Board on their disclosure obligations generally and the Disclosure and Transparency Rules so as to enable the Board to comply with all relevant provisions.
Share owner relations
The relationship with share owners, potential share owners and investment analysts is given the highest priority by the Company.
The Company has a well-developed and continuous program to address the needs of share owners, investment institutions and analysts for a regular flow of information about the Company, its strategy, performance and competitive position. Given the wide geographic distribution of the Company’s current and potential share owners, this program includes regular visits to investors, particularly by the Group chief executive, the Group finance director, the deputy Group finance director and the head of investor relations, in the UK, Continental Europe and the major financial centres in North America and also in Asia Pacific and Latin America. The Company provides a preliminary announcement, an interim management statement at the end of the first and third quarters which includes a trading
WPP AnnuAl rePort 2009 116
How we behaveDirectors’ report
Group has specific policies in place to ensure that risks are properly evaluated and managed at the appropriate level within the Group.
Control activities and monitoring
Policies and procedures for all operating companies are set out and communicated in the WPP Policy Book, internal control bulletins and accounting guidelines. The application of these policies and procedures is monitored within the individual businesses and by the Company’s director of internal audit and the Group chief counsel.
Operating companies are required to maintain and update documentation of their internal controls and processes. This documentation incorporates an analysis of business risks, detailed control activities and monitoring, together with controls over security of data and the provision of timely and reliable information to management. IT and financial controls are also included.
The internal audit department was responsible for reviews and testing of the documentation and the relevant controls for a majority of the Group during 2009, the results of which were reported to the Audit Committee.
Financial reporting
Each operating company annually updates a three-year strategic plan which incorporates financial objectives. These are reviewed by the parent company’s management and are agreed with the chief executive of the relevant operating company.
The Group operates a rigorous procedure for the development of operating company budgets which build up the Group’s budget. During the final quarter of each financial year, operating companies prepare detailed budgets for the following year for review by the parent company. The Group’s budget is reviewed by the Board before being adopted formally. Operating company results are reported monthly and are reviewed locally, regionally and globally by the business groups and by Group management on a consolidated basis and ultimately by the Board. The results are compared to budget and the previous year, with full-year forecasts prepared and updated quarterly throughout the year. The Company reports to share owners four times a year.
At each year-end, all operating companies supply their full-year financial results with such additional information as is appropriate. This information is consolidated to allow the Group to present the necessary disclosures for International Financial Reporting Standards (IFRS) including International Accounting Standards (IAS).
The Disclosure Committee gives further assurance that publicly-released information is free from material omission or misstatement.
as well as guidance on practices in many operational areas. Breaches or alleged breaches of this Code of Conduct are investigated by the director of internal audit and the Group chief counsel.
The Group has an independently operated helpline, Right to Speak, to enable our people to report issues that they feel unable to raise locally. A number of issues have been raised during 2009 through 43 calls to this helpline, all of which have been followed through and investigated where appropriate and reported to the Audit Committee.
Risk assessment
Risk monitoring of all of the Group’s operations throughout the world is given the highest priority by the Group chief executive, the Group finance director, the chairman of the Audit Committee and the Board, as it is essential to the creation and protection of share owner value and the development of the careers of our people. The Board realises that WPP is a service company and its ongoing prosperity depends on being able to continue to provide a quality service to its existing and potential clients in a creative, efficient and economic way.
At each Board meeting, the Group chief executive presents a Brand Check review of each of the business’ operations, including an assessment of the risk in each business, providing feedback on the business risks and details of any change in the risk profile since the last Board meeting.
The Brand Check covers such issues as: the possibility of the loss or win of major business (e.g. as
a result of a change of senior management at a major client); loss of a key executive of the Group; introduction of new legislation in an important market; corporate responsibility; political instability in an important market; and changes in accounting or corporate governance practice.
Each operating group undertakes monthly and quarterly procedures and day-to-day management activities to review their operations and business risks. These are formally communicated to the Group chief executive, other executive directors and senior executives in quarterly review meetings and, in turn, to the Board.
The Board is firmly of the opinion that the monitoring of risk is strongly embedded in the culture of the Company and of the operating companies, in a manner which the Board considers goes beyond the Turnbull recommendations and the requirements of Rules 13a-14 and 15 under the Securities Exchange Act 1934.
Principal risks and uncertainties
The Board has considered the principal risks and uncertainties affecting the Group as at 31 December 2009 and up to the date of this report. These are described on pages 117 to 118 and on page 122. As set out above, the
WPP AnnuAl rePort 2009 117
How we behaveDirectors’ report
Principal risks and uncertaintiesIssue Potential impact How it is managed
Economicthe Group’s businesses are subject to economic and political cycles. Many of the economies in which the Group operates have been under significant stress or in recession.
reduction in client spending or postponing spending on the services offered by the Group or switching of client expenditure to non-traditional media and renegotiation of contract terms leading to reduced profitability and cashflow.
reduction in headcount and overhead. ensuring that variable staff costs are a significant proportion of total staff costs and revenue.
Increased controls over capital expenditure and working capital.
Strategic focus on BrICs, the next 11, new media and consumer insight.
Brand Check at every Board meeting.
FinancialCurrency exchange rate fluctuations could adversely impact the Group’s consolidated results.
the Company’s reporting currency is pounds sterling. Given the Group’s significant international operations, changes in exchange rates cause fluctuations in the Company’s results when measured in pounds sterling.
the balance sheet and cash flows of the Company are hedged by borrowing in the currency of those cash flows.
the Company publishes and explains its results in constant currency terms, as well as in sterling and on an actual dollar basis.
Changes to the Group’s debt issue ratings by the rating agencies Moody’s Investor Services and Standard and Poor’s rating Service may affect the Group’s access to debt capital.
the Company’s long-term debt is currently rated Baa3 and BBB by the rating agencies respectively and the Company’s short-term debt obligations P3 and A3 respectively. Standard and Poor’s rating Service has placed the Company’s debt ratings on “negative outlook”. If the Company’s financial performance and outlook materially deteriorate, a ratings downgrade could occur and the interest rates and fees payable on certain of the Company’s revolving credit facilities could be increased.
Active dialogue with the rating agencies to ensure they are fully apprised of any actions that may affect the Company’s debt ratings. the Company also seeks to manage its financial ratios and to pursue policies so as to maintain its investment grade ratings.
the Company has published half yearly its banking covenant compliance ratios and quantified the financial impact should there be a fall in ratings to non-investment grade.
the Group may be unable to collect balances due from any client that files for bankruptcy or becomes insolvent.
the Group is generally paid in arrears for its services. Invoices are typically payable within 30 to 60 days.
the Group commits to media and production purchases on behalf of some of its clients as principal or agent depending on the client and market circumstances. If a client is unable to pay sums due, media and production companies may look to the Group to pay such amounts to which it committed as an agent on behalf of those clients.
evaluating and monitoring clients’ ongoing creditworthiness and in some cases requiring credit insurance or payments in advance.
Mergers & Acquisitionsthe Group may be unsuccessful in evaluating material risks involved in completed and future acquisitions and may be unsuccessful in integrating any acquired operations with its existing businesses.
the Group regularly reviews potential acquisitions of businesses that are complementary to its operations and clients needs. If material risks are not identified prior to acquisition or the Group experiences difficulties in integrating an acquired business, it may not realise the expected benefits from such acquisition and the Group’s financial condition could be adversely affected.
Business, legal, tax and financial due diligence carried out prior to acquisition to seek to identify and evaluate material risks and plan the integration process. Warranties and indemnities included in purchase agreements.
Audit Committee oversight of acquisition and Board oversight of material acquisitions and review of the integration and performance of recent and prior acquisitions.
Goodwill and other acquired intangible assets recorded on the Group’s balance sheet with respect to acquired companies may become impaired.
the Group has a significant amount of goodwill and other acquired intangible assets recorded on its balance sheet with respect to acquired companies. the Group annually tests the carrying value of goodwill for impairment. the estimates and assumptions about results of operations and cash flows made in connection with impairment testing could differ from future results of operations and cash flows. Future events could cause the Group to conclude that the asset values associated with a given operation have become impaired which could have a material impact on the Groups financial condition.
regular impairment testing which is a recurring agenda item for the Audit Committee.
WPP AnnuAl rePort 2009 118
How we behaveDirectors’ report
Issue Potential impact How it is managed
Clientsthe Group competes for clients in a highly competitive industry and client loss may reduce market share and decrease profits.
Competitors include large multinational advertising and marketing communication companies and regional and national marketing services companies.
new market participants include database marketing and modelling companies, telemarketers and internet companies.
Service agreements with clients are generally terminated by the client on 90 days’ notice and many clients put their advertising and communications business up for competitive review from time to time. the ability to attract new clients and to retain existing clients may also in some cases be limited by clients’ policies about conflicts of interest.
operating companies seek to establish reputations in the industry that attract and retain clients, including by improving the quality of their creative output.
the Group’s different agency networks limit potential conflicts of interest and the Group’s cross- discipline team approach seeks to retain clients.
Brand Check at every Board meeting.
the Group receives a significant portion of its revenues from a limited number of large clients and the loss of these clients could adversely impact the Group’s prospects, business, financial condition and results of operations.
A relatively small number of clients contribute a significant percentage of the Group’s consolidated revenues. the Group’s 10 largest clients accounted for almost 18% of revenues in the year ended 31 December 2009. Clients generally are able to reduce advertising and marketing spend or cancel projects on short notice. the loss of one or more of the Group’s largest clients, if not replaced by new client accounts or an increase in business from existing clients, would adversely affect the Group’s financial condition.
Global client account managers seek to ensure the Group maintains partnership relationship with major clients. operating companies seek to establish reputations in the industry that attract and retain clients and key talent.
Brand Check at every Board meeting and regular dialogue between directors of the Company and directors of the Group’s largest clients.
Operationalthe Group operates in 107 countries and is exposed to the risks of doing business internationally.
the Group’s international operations are subject to exchange rate fluctuations, restrictions and/or taxation on repatriations of earnings, social, political and economic instability, conflicts of laws and interpretation of contracts.
Affiliate, associate and joint venture structures with local partners used in developing markets.
Brand Check at every Board meeting.
uniform approach to internal controls ensuring best practice employed in all jurisdictions.
Peoplethe Group’s performance could be adversely affected if it were unable to attract and retain key talent or had inadequate talent management and succession planning for key management roles.
the Group is highly dependent on the talent, creative abilities and technical skills of our personnel as well as their relationships with clients. the Group is vulnerable to the loss of personnel to competitors and clients leading to disruption to the business.
the Group’s incentive plans are structured to provide retention value for example by paying part of annual incentives in shares that vest two years after grant and having a five-year performance period for leAP.
operating companies seek to establish reputations in the industry that attract and retain key personnel, including by improving the quality of their creative output.
Succession planning of key executives is a recurring agenda item of the Board and nomination Committee.
Regulatory/Legalthe Group may be subject to regulations affecting its activities.
Governments, government agencies and industry self-regulatory bodies from time to time adopt statutes and regulations that directly or indirectly affect the form, content and scheduling of advertising, public relations and public affairs and market research or otherwise limit the scope of the activities of the Group and its clients which could have a material adverse impact on our financial position. Changes in tax laws or their application may also adversely affect the Group’s reported results.
the Group actively monitors any proposed regulatory or statutory changes and consults with government agencies and regulatory bodies where possible on such proposed changes.
regular briefings to the Audit Committee of significant regulatory or statutory changes.
Group representation on a number of industry advisory bodies.
the Group may be exposed to liabilities from allegations that certain of its clients’ advertising claims may be false or misleading or that its clients products may be defective.
the Group may be, or may be joined as a defendant, in litigation brought against its clients in respect of services provided by the Group.
the Group seeks to comply with all laws and industry codes governing marketing material.
upward referral procedure within operating companies and to WPP ethical review meetings.
WPP AnnuAl rePort 2009 119
How we behaveDirectors’ report
In virtually all circumstances, a fair presentation will be achieved by compliance with all applicable IFRSs. Directors are also required to:
properly select and apply accounting policies; present information, including accounting policies,
in a manner that provides relevant, reliable, comparable and understandable information;
provide additional disclosures, when compliance with the specific requirements in IFRSs is insufficient to enable users to understand the impact of particular transactions, other events and conditions on the entity’s financial position and financial performance; and
make an assessment of the Company’s ability to continue as a going concern.
The directors are responsible for keeping proper accounting records which disclose with reasonable accuracy at any time the financial position of the Company, for safeguarding the assets, for taking reasonable steps for the prevention and detection of fraud and other irregularities and for the preparation of a directors’ report and directors’ remuneration report.
The directors are responsible for the maintenance and integrity of the Company website. Jersey legislation and UK regulation governing the preparation and dissemination of financial statements differs from legislation in other jurisdictions.
The directors confirm that so far as they are aware, there is no relevant audit information of which the Company’s auditors are unaware. Each director has taken all the steps that he or she ought to have taken, as a director, in order to make himself or herself aware of any relevant audit information and to establish that the Company’s auditors are aware of that information.
The following information, together with the letters from the chairmen of the Nomination, Audit and Compensation Committees, the statements regarding directors’ responsibilities and statement of going concern set out above and the directors’ remuneration and interests in the share capital of the Company set out on pages 139 to 143, are included in the Directors’ report, which also includes the sections ‘Letter to share owners,’ ‘Who runs WPP’ and ‘What we think’.
Substantial share ownership
As at 16 April 2010, the Company is aware of the following interests of 3% or more in the issued ordinary share capital:
Blackrock Inc. 5.10%AXA S.A. 4.95%Massachusetts Financial Services Company 4.84%legal & General 3.99%
Sarbanes-Oxley section 404
The provisions of section 404 of the Sarbanes-Oxley Act require the Company’s management to report on the effectiveness of internal control over financial reporting in its Annual Report on Form 20-F which is filed with the US Securities and Exchange Commission. The 2008 assessment and related report from the external auditors confirmed that the Company’s internal control over financial reporting was effective and included in the Company’s Annual Report on Form 20-F for the year ended 31 December 2008. The 2009 assessment and related report will be included in the Company’s Annual Report on Form 20-F that will be published in May 2010.
Going concern
The directors are required to consider whether it is appropriate to prepare the financial statements on the basis that the Company and the Group are going concerns. As part of its normal business practice, the Group prepares annual and longer-term plans and in reviewing this information and in particular the 2010 three-year plan and budget the directors believe that the Company and the Group have adequate resources for the foreseeable future. Therefore the Company and the Group continue to adopt the going concern basis in preparing the financial statements.
Further details of the Group’s financial position and borrowing facilities are described in note 24 of the financial statements.
Responsibilities in respect of the preparation of financial statements
The directors are responsible for preparing the financial statements in accordance with applicable law and regulations. The directors have elected to prepare financial statements for the Group in accordance with International Financial Reporting Standards as adopted by the EU (IFRSs) and have also elected to prepare financial statements for the Company in accordance with UK accounting standards. Company law requires the directors to prepare such financial statements in accordance with the Companies (Jersey) Law 1991.
International Accounting Standard 1 requires that financial statements present fairly for each financial year the Company’s financial position, financial performance and cash flows. This requires the faithful representation of the effects of transactions, other events and conditions in accordance with the definitions and recognition criteria for assets, liabilities, income and expenses set out in the International Accounting Standards Board’s ‘Framework for the Preparation and Presentation of Financial Statements’.
WPP AnnuAl rePort 2009 120
How we behaveDirectors’ report
The disclosed interests of all of the above refer to the respective combined holdings of those entities and to interests associated with them.
The Company has not been notified of any other holdings of ordinary share capital of 3% or more.
Profits and dividends
The profit before tax for the year was £662.6 million (2008: £746.8 million). The directors declared a second interim dividend of 10.28p (2008: 10.28p) per share paid on 1 April 2010 to share owners on the register at 19 March 2010 which, together with the first interim ordinary dividend of 5.19p (2008: 5.19p) per share paid on 9 November 2009, makes a total of 15.47p for the year (2008: 15.47p).
Charitable donations
Our head office made charitable donations of £191,000 (2008: £201,000). Collectively, WPP companies together with the parent company made an estimated £4.1 million of charitable donations in 2009. More detailed information regarding the Group’s support of charities is set out in the section dealing with corporate responsibility on pages 122 to 133.
It is the Company’s policy not to make payments for political purposes.
Significant agreements and change of control
In addition to the financing agreements to which the Company is a party, details of which are given in note 24 on page 169, the Company is a party to an agreement with Asatsu-DK Inc dated 3 August 1998 pursuant to which WPP subscribed for 20% (at that time) of the share capital of Asatsu and Asatsu subscribed for approximately 4% (at that time) of the issued share capital of WPP. The respective shareholdings may only be transferred following a procedure set out in the agreement. WPP and Asatsu are each entitled to nominate a non-executive director to the board of the other subject to retaining its shareholding in the other.
Each of the €600 million 4.375% bonds due in December 2013, £400 million 6% bonds due in April 2017, €500 million 5.25% bonds due in January 2015, €750 million 6.625% bonds due 2016, the £200 million 6.375% bonds due November 2020, £450 million 5.75% convertible bonds due May 2014 and the $600 million 8% bonds due
September 2014, contain provisions which are triggered on a change of control of the Company. The holders of such bonds (other than the £450 million 5.75% bonds) have the right to repayment at par (except for holders of the $600 million 8% bonds where the holders have the right to redeem the bonds at 101% of par) if the Company is non-investment grade at the time of the change of control or becomes non-investment grade within 120 days of the announcement of the change of control.
In addition the Group has a $1.6 billion Revolving Credit Facility due August 2012 and a £400 million Revolving Credit Facility agreement expiring July 2011, the terms of which require the consent of the majority of the lenders if a proposed merger or consolidation of the Company would alter its legal personality or identity.
The impact of a change of control on WPP’s incentive plans is dealt with on page 138.
Articles of Association
There are no restrictions on amending the Articles of Association of the Company other than the need to pass a special resolution of the share owners.
Group activities
The principal activity of the Group continues to be the provision of communications and marketing services worldwide. The Company acts only as a parent company and does not trade.
Share capital
The Company’s authorised share capital consists solely of 175,000,000 ordinary 10 pence shares. The Company operates an American Depositary Receipt program. The rights and obligations relating to the ordinary share capital are outlined in the Articles of Association; there are no restrictions on transfer, no restrictions on voting rights and no securities carry special voting rights with regard to control of the Company.
At the Annual General Meeting in June 2009, share owners passed resolutions authorising the Company, in accordance with its Articles of Association, to allot shares up to a maximum nominal amount of £45,985,690 of which £6,276,908 could be allotted for cash free of statutory pre-emption rights. In the year under review no shares were issued for cash free from pre-emption rights. Details of share capital movements are given in note 26 on pages 171 to 175.
WPP AnnuAl rePort 2009 121
How we behaveDirectors’ report
Authority for purchase of own shares
At the Annual General Meeting in 2009 share owners passed a special resolution authorising the Company, in accordance with its Articles of Association, to purchase up to 125,294,634 of its own shares in the market. In the year under review, 2,435,288 ordinary shares of 10 pence each were purchased to be held as treasury shares at an average price of £3.92 per share.
Supplier payment policy
The Company has no trade creditors because it is a parent company and does not generate trading revenues. Accordingly, no disclosure can be made of year-end trade creditor days. However, the Group’s policy is to settle the terms of payment with suppliers when agreeing the terms of each transaction and to ensure that suppliers are made aware of the terms of payment and to abide by the terms of payment. The average trade creditors for the Group, expressed as a number of days, were 45 (2008: 46).
Auditors
Deloitte LLP were appointed as auditors of the Company on incorporation and the directors will propose a resolution at the AGM to re-appoint them.
By Order of the Board:
Marie CapesCompany Secretary16 April 2010
* the sections headed ‘letter to share owners’, ‘Who we are’ and ‘What we think’ should be read in conjunction with and as part of the section headed Directors’ report.
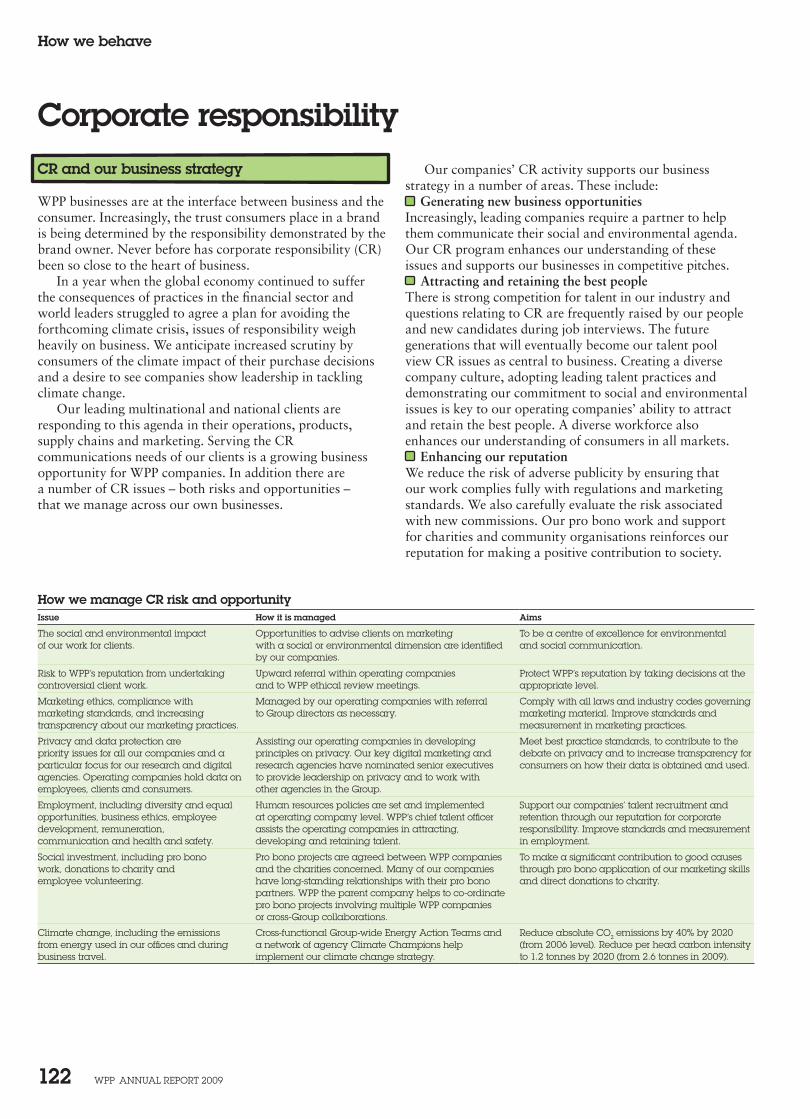
WPP AnnuAl rePort 2009 122
How we behave
How we manage CR risk and opportunityIssue How it is managed Aims
the social and environmental impact of our work for clients.
opportunities to advise clients on marketing with a social or environmental dimension are identified by our companies.
to be a centre of excellence for environmental and social communication.
risk to WPP’s reputation from undertaking controversial client work.
upward referral within operating companies and to WPP ethical review meetings.
Protect WPP’s reputation by taking decisions at the appropriate level.
Marketing ethics, compliance with marketing standards, and increasing transparency about our marketing practices.
Managed by our operating companies with referral to Group directors as necessary.
Comply with all laws and industry codes governing marketing material. Improve standards and measurement in marketing practices.
Privacy and data protection are priority issues for all our companies and a particular focus for our research and digital agencies. operating companies hold data on employees, clients and consumers.
Assisting our operating companies in developing principles on privacy. our key digital marketing and research agencies have nominated senior executives to provide leadership on privacy and to work with other agencies in the Group.
Meet best practice standards, to contribute to the debate on privacy and to increase transparency for consumers on how their data is obtained and used.
employment, including diversity and equal opportunities, business ethics, employee development, remuneration, communication and health and safety.
Human resources policies are set and implemented at operating company level. WPP’s chief talent officer assists the operating companies in attracting, developing and retaining talent.
Support our companies’ talent recruitment and retention through our reputation for corporate responsibility. Improve standards and measurement in employment.
Social investment, including pro bono work, donations to charity and employee volunteering.
Pro bono projects are agreed between WPP companies and the charities concerned. Many of our companies have long-standing relationships with their pro bono partners. WPP the parent company helps to co-ordinate pro bono projects involving multiple WPP companies or cross-Group collaborations.
to make a significant contribution to good causes through pro bono application of our marketing skills and direct donations to charity.
Climate change, including the emissions from energy used in our offices and during business travel.
Cross-functional Group-wide energy Action teams and a network of agency Climate Champions help implement our climate change strategy.
reduce absolute Co2 emissions by 40% by 2020 (from 2006 level). reduce per head carbon intensity to 1.2 tonnes by 2020 (from 2.6 tonnes in 2009).
CR and our business strategy
WPP businesses are at the interface between business and the consumer. Increasingly, the trust consumers place in a brand is being determined by the responsibility demonstrated by the brand owner. Never before has corporate responsibility (CR) been so close to the heart of business.
In a year when the global economy continued to suffer the consequences of practices in the financial sector and world leaders struggled to agree a plan for avoiding the forthcoming climate crisis, issues of responsibility weigh heavily on business. We anticipate increased scrutiny by consumers of the climate impact of their purchase decisions and a desire to see companies show leadership in tackling climate change.
Our leading multinational and national clients are responding to this agenda in their operations, products, supply chains and marketing. Serving the CR communications needs of our clients is a growing business opportunity for WPP companies. In addition there are a number of CR issues – both risks and opportunities – that we manage across our own businesses.
Our companies’ CR activity supports our business strategy in a number of areas. These include:
Generating new business opportunities Increasingly, leading companies require a partner to help them communicate their social and environmental agenda. Our CR program enhances our understanding of these issues and supports our businesses in competitive pitches.
Attracting and retaining the best peopleThere is strong competition for talent in our industry and questions relating to CR are frequently raised by our people and new candidates during job interviews. The future generations that will eventually become our talent pool view CR issues as central to business. Creating a diverse company culture, adopting leading talent practices and demonstrating our commitment to social and environmental issues is key to our operating companies’ ability to attract and retain the best people. A diverse workforce also enhances our understanding of consumers in all markets.
Enhancing our reputationWe reduce the risk of adverse publicity by ensuring that our work complies fully with regulations and marketing standards. We also carefully evaluate the risk associated with new commissions. Our pro bono work and support for charities and community organisations reinforces our reputation for making a positive contribution to society.
Corporate responsibility
WPP AnnuAl rePort 2009 123
How we behaveCorporate responsibility
a wide range of ethical, social and environmental subjects. Both documents are publicly available on our website, www.wpp.com. The Code was strengthened during 2009 to incorporate key principles from the CR Policy and include guidance on avoidance of risks relating to client work. CEOs of each of our businesses complete an annual statement of compliance with the Code of Business Conduct.
We have established a set of key performance indicators (KPIs) relating to employment, social investment, environment and climate change. We report performance against these in our annual Corporate Responsibility Report.
CR data is collected quarterly through our Group financial reporting system. WPP’s internal audit function assesses CR risks relating to employment, marketing ethics and business ethics during reviews of Group companies.
Reporting
We will publish our eighth Corporate Responsibility Report in June 2010. These reports provide a detailed account of our CR performance and are the benchmark for our sector. They are an attribute to our businesses during pitches. A summary of our progress is provided below.
The impact of our work
The social and environmental impact of the work we undertake for clients is one of our most important CR issues. Our goal is for WPP to be a centre of excellence for environmental and social communication.
Sustainability in marketing
Consumer concerns about the environment and labour standards are creating markets for green and fair trade products. In many regions, businesses are subject to a growing volume of regulation and increased scrutiny from pressure groups, the media and the public on a wide range of social and environmental issues.
Leading companies are responding positively, by embedding ethical values in their brands and developing products with better social or environmental standards. They need effective marketing to communicate the benefits to consumers. For example, our businesses have formed a multi-disciplinary sustainability team to meet Procter & Gamble’s specialist needs.
In 2009 Ogilvy & Mather established Ogilvy Earth, creating a global network of sustainability marketing specialists. In our Corporate Responsibility Report, which is available online at www.wpp.com from June 2010, we profile some of our work in this emerging area.
Meeting investor expectationsWPP share owners continue to show interest in our CR practices and we aim to respond constructively to their requests for information. In 2009 this included requests for information from, or meetings with, the following organisations:
Bloomberg –Carbon Disclosure Project –Dow Jones Sustainability Index –Ethical Investment Research Service (EIRIS) –FTSE4Good –Goldman Sachs –Innovest –Jupiter Asset Management –KLD –LCF Rothschild –Norges Bank Investment Management –Truscost –UN Principles for Responsible Investment –Vigeo –
Investors focused on human rights, ethics, CR risks associated with client work and water use. WPP is included in the FTSE4Good Index.
Improving efficiencyOur climate change strategy is reducing costs associated with business travel and energy use. Investment in videoconference facilities enables an increasing number of meetings to be held without the cost and carbon footprint of flights.
CR issues in our supply chain and our environmental impacts beyond climate change are also important for WPP and its companies.
CR management
Paul Richardson, WPP’s Group finance director, is the Board director responsible for corporate responsibility. He chairs WPP’s Corporate Responsibility Committee, established in 2003. The committee is made up of senior representatives from our companies. Its role is to advise on policy. The committee met once formally in 2009 when the main topics discussed were:
Privacy Client work-related risk The impact of sustainability on marketing Employment Climate strategy
Paul Richardson provides an annual assessment of corporate responsibility risks and performance to the Audit Committee. This is in addition to the business and financial reporting risks process described in Internal control on page 115.
WPP’s Code of Business Conduct and CR Policy set out the standards we expect our companies and our people to meet in their work. They provide guidance in dealing with
WPP AnnuAl rePort 2009 124
How we behaveCorporate responsibility
our Code of Business Conduct during 2009 and strengthened clauses on CR. Key excerpts include:
“We will not knowingly create work which contains statements, suggestions or images offensive to general public decency and will give appropriate consideration to the impact of our work on minority segments of the population, whether that minority be by race, religion, national origin, colour, sex, sexual orientation, gender identity or expression, age or disability.
We will not undertake work which is intended or designed to mislead, including in relation to social, environmental and human rights issues.
We will consider the potential for clients or work to damage the Group’s reputation prior to taking them on. This includes reputational damage due to participating in business activities that abuse human rights. WPP companies will not undertake work designed to mislead in any respect, including social, environmental and human rights issues.
WPP companies will comply with applicable regulations and self-regulatory codes of practice in the countries in which they operate.”
Ethical issues in client work
Where we operate, who we work for and the type of work we undertake can give rise to ethical issues. Examples include: work undertaken for government clients; operating in countries with a poor human rights record; and marketing for sensitive or controversial products.
In cases where work may be a potential risk to WPP’s reputation, employees are required to elevate the decision to the most senior person in the relevant office and then to the most senior executive of the operating company in the country concerned, who will decide if further referral to a WPP director is required.
Strengthening our decision-making processWe have strengthened our internal processes for assessing risks associated with client work and prepared a training module on this subject. Broad cross-company training on the revised Code of Business Conduct will be rolled out during 2010.
When required we hold review meetings for senior managers at Group level to discuss cases of concern and identify new risk areas. The internal audit program of work now incorporates a review of the considerations given by management to possible impacts on the Group’s reputation prior to accepting new clients.
Social marketing
These are campaigns with social or environmental objectives, usually undertaken for government or NGO clients, tackling issues related to public health, safety or the environment. They are designed to raise awareness or encourage people to change their behaviour. Several WPP companies specialise in social marketing, including Ogilvy Outreach, Ogilvy PR’s social marketing practice, and Thompson Social.
Examples of social marketing campaigns by WPP companies in 2009 will be included in our Corporate Responsibility Report, available online at www.wpp.com from June 2010.
Climate change awarenessThe issue of climate change presents many communications challenges to governments, companies and NGOs. WPP aims to support these organisations in their efforts to educate and encourage consumers to adopt low-carbon lifestyles.
WPP companies Ogilvy & Mather, through Ogilvy Earth, and Hill & Knowlton provided pro bono marketing and communications support to the UN Climate Change conference in Copenhagen, in December 2009. Ogilvy Earth created the ‘Hopenhagen’ campaign designed to capture global public attention.
WPP’s CEO Sir Martin Sorrell addressed the World Business Summit on Climate Change in Copenhagen in May 2009, on the role of marketing in tackling climate change.
Cause-related marketing
Cause-related marketing links brands to charities, usually through a donation for every product purchased. Executed sensitively, these campaigns benefit both the brand and the charity. Many WPP companies work on cause-related marketing. Examples from 2009 are included in our Corporate Responsibility Report, available online at www.wpp.com from June 2010.
Marketing ethics
As a minimum our companies are expected to comply with all laws, regulations and codes of marketing practice. All advertising produced by WPP companies should present products fairly and accurately, comply with the relevant law and marketing codes, and reflect changing public attitudes to questions of taste and decency or marketing of sensitive products.
Our Code of Business Conduct and CR Policy set out our approach and provide guidance to our companies and our people on the standards we expect. We benchmarked
WPP AnnuAl rePort 2009 125
How we behaveCorporate responsibility
WPP as an employer
WPP employs over 138,000 people (including employees in our associate companies) in almost 2,400 offices in 107 countries. Attracting and retaining talent is a central business issue for WPP companies. Our approach includes competitive remuneration, investment in training and development and a commitment to an inclusive workplace culture.
In 2009, like all businesses in the current economy, we monitored staff costs closely and reduced our workforce where necessary. The total number of people in the Group, excluding associates, at 31 December 2009 was 98,759 compared with 112,262 at the end of 2008, a decrease of 13,503, or 12.0%.
Diversity and inclusion
Competition for top contributors is strong and will continue to be intense in the communications services industry.
WPP companies invest a significant proportion of revenues in developing and rewarding employees. The quality of our companies’ employee training, development and reward programs differentiates us from our competitors. We aim to create an inclusive work environment that attracts the most talented people from all backgrounds.
WPP’s chief talent officer, Mark Linaugh, and our talent team assist our operating companies and their talent teams’ efforts to attract, develop and retain our talent. Human resources policies are agreed and implemented at operating company level. A cross section of HR leaders from US businesses met in October 2009 to discuss the significance of CR in attracting new talent to their respective companies and to share best practices.
A diverse workforce adds value to our businesses. It helps us understand consumers from all walks of life and create compelling marketing for our clients. An inclusive workplace culture helps us attract the most talented people from all backgrounds.
We introduced a non-discrimination policy in 1992. This commits all WPP companies to select, develop and promote people based on merit and regardless of race, religion, national origin, colour, sex, sexual orientation, gender identity or expression, age or disability. Our Code of Conduct contains policies on harassment and non-discrimination. Where existing employees become disabled, our policy is to provide continuing employment and training wherever practicable.
Our people can report any concerns or suspected cases of discrimination or misconduct confidentially (and anonymously if desired) through our Right to Speak helpline.
In 2009, women accounted for 32% of board members/executive leaders, 46% of senior managers and 54% of total employees. There are currently three women on WPP’s Board and a female Company Secretary, Group communications director and Group chief counsel.
Involvement in industry groups
Many professionals from within WPP companies play an important part in developing and revising industry codes in sensitive areas such as advertising to children and the marketing of food and pharmaceutical products.
Complaints
Few campaigns that we produce for clients provoke complaint, but occasionally complaints do occur relating to matters of taste or fact. In most countries these are arbitrated by government or industry organisations. More information is available in our Corporate Responsibility Report.
Privacy
Privacy and data protection are priority issues for all our companies and we aim to meet best practice standards. Our research and digital companies contribute to the debate on privacy and aim to increase transparency for consumers on how their data is obtained and used.
Our approachWe are assisting our companies in developing a set of principles on privacy to guide their approach and provide a consistent definition of ‘personal information’. Many companies have additional privacy policies and procedures, and some have developed their own technology and tools to improve transparency. Some of our companies collect and use consumer data to study attitudes and purchasing habits and to create targeted digital and direct marketing campaigns. We endeavour to comply with data protection laws and marketing codes of practice as applicable.
Our internal audit function is including privacy in its reviews of group companies. These assessments cover data security, privacy policies, procedures and compliance with regulations and best practice standards. Our key digital marketing and research agencies have nominated senior executives to provide leadership on privacy and to work with other agencies in the group.
We communicate regularly with clients on privacy issues to explain our approach and help them to keep abreast of current thinking and best practice. We also collaborate with others in our industry to improve privacy standards and ensure that information is accessible to consumers. We are members of the online Behavioural Advertising Self Regulation Coalition (BASRC) and many of our people are active participants in organizations such as the Interactive Advertising Bureau (IAB), Network Advertising Initiative (NAI) and Association of National Advertisers (ANA). In 2009 we collaborated with the Future Privacy Forum and others to enhance consumer information on privacy.
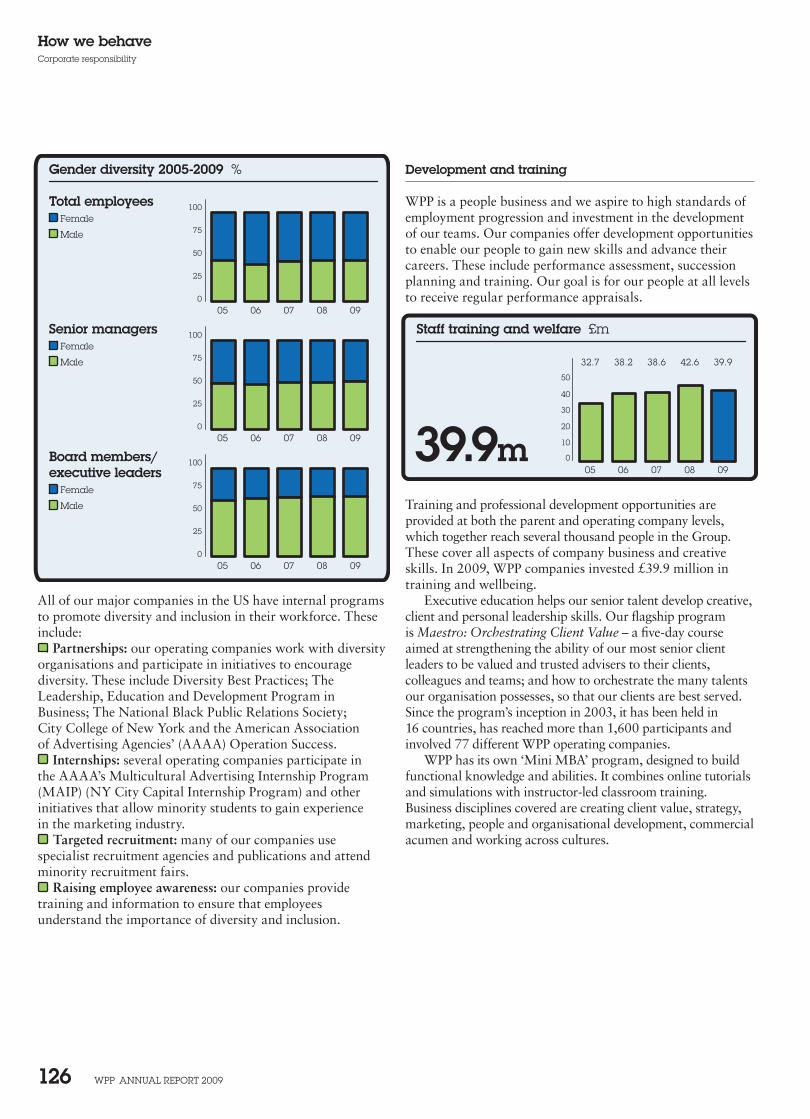
WPP AnnuAl rePort 2009 126
How we behaveCorporate responsibility
Development and training
WPP is a people business and we aspire to high standards of employment progression and investment in the development of our teams. Our companies offer development opportunities to enable our people to gain new skills and advance their careers. These include performance assessment, succession planning and training. Our goal is for our people at all levels to receive regular performance appraisals.
Training and professional development opportunities are provided at both the parent and operating company levels, which together reach several thousand people in the Group. These cover all aspects of company business and creative skills. In 2009, WPP companies invested £39.9 million in training and wellbeing.
Executive education helps our senior talent develop creative, client and personal leadership skills. Our flagship program is Maestro: Orchestrating Client Value – a five-day course aimed at strengthening the ability of our most senior client leaders to be valued and trusted advisers to their clients, colleagues and teams; and how to orchestrate the many talents our organisation possesses, so that our clients are best served. Since the program’s inception in 2003, it has been held in 16 countries, has reached more than 1,600 participants and involved 77 different WPP operating companies.
WPP has its own ‘Mini MBA’ program, designed to build functional knowledge and abilities. It combines online tutorials and simulations with instructor-led classroom training. Business disciplines covered are creating client value, strategy, marketing, people and organisational development, commercial acumen and working across cultures.
39.9m
50
0
10
20
30
40
Staff training and welfare £m
39.942.638.638.232.7
0908070605
All of our major companies in the US have internal programs to promote diversity and inclusion in their workforce. These include:
Partnerships: our operating companies work with diversity organisations and participate in initiatives to encourage diversity. These include Diversity Best Practices; The Leadership, Education and Development Program in Business; The National Black Public Relations Society; City College of New York and the American Association of Advertising Agencies’ (AAAA) Operation Success.
Internships: several operating companies participate in the AAAA’s Multicultural Advertising Internship Program (MAIP) (NY City Capital Internship Program) and other initiatives that allow minority students to gain experience in the marketing industry.
Targeted recruitment: many of our companies use specialist recruitment agencies and publications and attend minority recruitment fairs.
Raising employee awareness: our companies provide training and information to ensure that employees understand the importance of diversity and inclusion.
Gender diversity 2005-2009 %
Total employeesFemale
0908070605
100
0
25
50
75Male
Senior managersFemale
0908070605
100
0
25
50
75Male
Board members/executive leaders
Female
0908070605
100
0
25
50
75
Male
WPP AnnuAl rePort 2009 127
How we behaveCorporate responsibility
Health and wellbeing
Promoting a healthy workforce benefits our business by increasing productivity and reducing the costs of people taking time off work due to illness. We have identified two main risks to health and wellbeing associated with office workplaces, where most of our people are based. These are work-related stress and injuries connected to workstation ergonomics. Our companies seek to create an environment where people feel able to discuss any issues, including stress, with their manager or human resources department. Our companies also assess the risk of work-related stress through regular staff surveys and by monitoring issues raised via our Right to Speak helpline, Employee Assistance Programs and during exit interviews.
Initiatives to combat workplace stress vary by company but include:
Employee Assistance Programs – a source of confidential advice, support and counselling.
Flexible benefit programs, including subsidised childcare. Flexible work arrangements enabling people to work
part-time or from home. Medical checks and health screening. Training on stress and time management.
Ensuring our workstations follow good practice design reduces problems such as repetitive strain injury or back problems.
Employee external appointments
We recognise that our companies’ executives may be invited to become non-executive directors of other companies, and that such experience may be beneficial to the Group. Consequently, executives are allowed to accept non-executive appointments with non-competing companies, subject to obtaining the approval of the Group chief executive in the case of senior executives, the Group chief executive and chairman in the case of Board members and the approval of the Nomination Committee in the case of the chairman or Group chief executive. Any fees receivable out of such appointments may be retained by the individuals concerned.
Remuneration and share ownership
Competitive remuneration packages help our companies attract and retain the best people. We regularly benchmark our compensation against other companies in our sector.
We motivate our people by providing performance-related remuneration in addition to basic salaries. More senior employees are eligible for incentives based on their performance against annual or multi-year goals for the operations they lead.
Share ownership gives our people a financial stake in the company and a share in its success. WPP’s Worldwide Ownership Plan, introduced in 1997, has granted share options to approximately 84,500 of our people.
Communication
With over 138,000 people in 107 countries, strong internal communication is essential. Some examples of our communications channels are:
WPP’s public website (www.wpp.com), Group intranet site and professional knowledge communities.
WPP’s annual journal of original thinking, the Atticus Journal; WPP’s multi-award winning global newspaper and eBook, The WIRE; regular FactFiles profiling specialist services and resources within the Group.
WPP’s public monthly online news bulletin – e.wire. The WPP Reading Room, an extensive online library
of thinkpieces (both public and original) from WPP professionals worldwide.
Regular communication on Group initiatives such as the Worldwide Partnership Program, BrandZ™, the Atticus Awards, The WPPED Cream awards, the WPP Marketing Fellowship Program and professional development workshops.
Periodic reports from Sir Martin Sorrell on topics of importance.
Formal and informal meetings at operating company level. Our multi-award winning Annual Report & Accounts,
financial statements and Corporate Responsibility Report are widely distributed across WPP and are available on our websites.
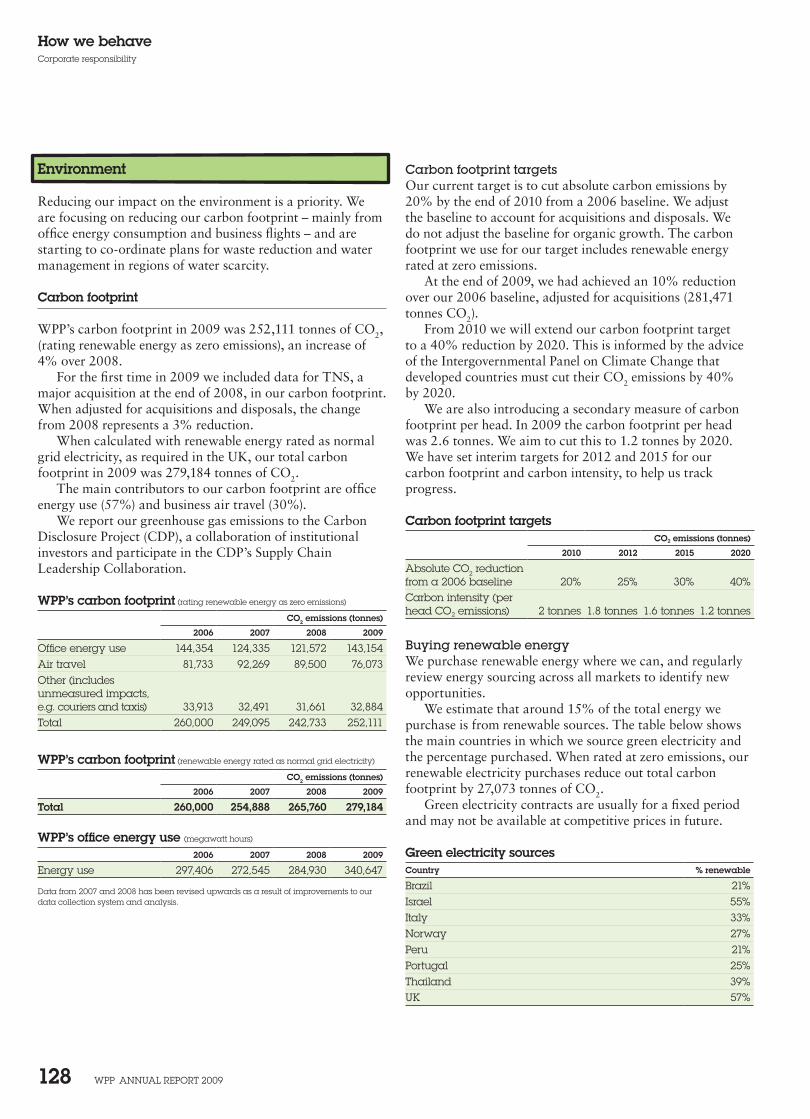
WPP AnnuAl rePort 2009 128
How we behaveCorporate responsibility
Carbon footprint targetsOur current target is to cut absolute carbon emissions by 20% by the end of 2010 from a 2006 baseline. We adjust the baseline to account for acquisitions and disposals. We do not adjust the baseline for organic growth. The carbon footprint we use for our target includes renewable energy rated at zero emissions.
At the end of 2009, we had achieved an 10% reduction over our 2006 baseline, adjusted for acquisitions (281,471 tonnes CO2).
From 2010 we will extend our carbon footprint target to a 40% reduction by 2020. This is informed by the advice of the Intergovernmental Panel on Climate Change that developed countries must cut their CO2 emissions by 40% by 2020.
We are also introducing a secondary measure of carbon footprint per head. In 2009 the carbon footprint per head was 2.6 tonnes. We aim to cut this to 1.2 tonnes by 2020. We have set interim targets for 2012 and 2015 for our carbon footprint and carbon intensity, to help us track progress.
Carbon footprint targetsCO2 emissions (tonnes)
2010 2012 2015 2020
Absolute Co2 reduction from a 2006 baseline 20% 25% 30% 40%Carbon intensity (per head Co2 emissions) 2 tonnes 1.8 tonnes 1.6 tonnes 1.2 tonnes
Buying renewable energyWe purchase renewable energy where we can, and regularly review energy sourcing across all markets to identify new opportunities.
We estimate that around 15% of the total energy we purchase is from renewable sources. The table below shows the main countries in which we source green electricity and the percentage purchased. When rated at zero emissions, our renewable electricity purchases reduce out total carbon footprint by 27,073 tonnes of CO2.
Green electricity contracts are usually for a fixed period and may not be available at competitive prices in future.
Green electricity sourcesCountry % renewable
Brazil 21%Israel 55%Italy 33%norway 27%Peru 21%Portugal 25%thailand 39%uK 57%
Environment
Reducing our impact on the environment is a priority. We are focusing on reducing our carbon footprint – mainly from office energy consumption and business flights – and are starting to co-ordinate plans for waste reduction and water management in regions of water scarcity.
Carbon footprint
WPP’s carbon footprint in 2009 was 252,111 tonnes of CO2, (rating renewable energy as zero emissions), an increase of 4% over 2008.
For the first time in 2009 we included data for TNS, a major acquisition at the end of 2008, in our carbon footprint. When adjusted for acquisitions and disposals, the change from 2008 represents a 3% reduction.
When calculated with renewable energy rated as normal grid electricity, as required in the UK, our total carbon footprint in 2009 was 279,184 tonnes of CO2.
The main contributors to our carbon footprint are office energy use (57%) and business air travel (30%).
We report our greenhouse gas emissions to the Carbon Disclosure Project (CDP), a collaboration of institutional investors and participate in the CDP’s Supply Chain Leadership Collaboration.
WPP’s carbon footprint (rating renewable energy as zero emissions)
CO2 emissions (tonnes)
2006 2007 2008 2009
office energy use 144,354 124,335 121,572 143,154Air travel 81,733 92,269 89,500 76,073other (includes unmeasured impacts, e.g. couriers and taxis) 33,913 32,491 31,661 32,884total 260,000 249,095 242,733 252,111
WPP’s carbon footprint (renewable energy rated as normal grid electricity)
CO2 emissions (tonnes)
2006 2007 2008 2009
Total 260,000 254,888 265,760 279,184
WPP’s office energy use (megawatt hours)
2006 2007 2008 2009
energy use 297,406 272,545 284,930 340,647
Data from 2007 and 2008 has been revised upwards as a result of improvements to our data collection system and analysis.
WPP AnnuAl rePort 2009 129
How we behaveCorporate responsibility
Carbon offsetIn 2009, we offset 130,000 tonnes of CO2 through support for renewable energy projects. All carbon offset projects supported by WPP are renewable energy projects arranged by the CarbonNeutral Company. We currently fund seven projects, including wind farm and hydroelectric projects in China and wind and solar generation in India. We do not support forestry offset.
From 2010, we will offset only the equivalent of our emissions from flights, concentrating our investment in making energy efficiency savings in buildings and IT. Our operating companies will continue to meet the cost of offset.
Office energy efficiency
We have established Energy Action Teams in North America, Europe, Asia Pacific and Latin America. These include members of our IT, real estate and procurement functions. Their job is to identify energy-saving measures and provide technical guidance to our agencies on energy reduction. They are supported by a network of on-the-ground Climate Champions, who help to implement energy-saving measures in our companies.
In 2009, we continued to implement our global metering project to bring energy savings by cutting waste. We are investing £600,000 to install meters in our top 100 ‘strategic locations’ that are both large and have long leases. These represent about 40% of our total floorspace. By the end of 2009 we had installed meters at 55 sites.
We have identified preferred suppliers in all regions, which our operating companies can use to buy and install low-energy light fittings. We began an installation program for low-energy fittings in 2009. We have set up procurement contracts with furniture and carpet suppliers to ensure the products we purchase come from sustainable sources and can be disposed of in a responsible manner.
Where possible, we aim to ensure that any properties we purchase meet advanced environmental standards such as Leadership in Energy and Environmental Design (LEED) and BRE Environment Assessment Method (BREEAM). For example, major new locations for Grey and Ogilvy & Mather Worldwide in New York are LEED certified. A new purpose-built facility for nine of our companies in Singapore has been designed to the Green Mark Scheme Gold Standard, equivalent to LEED.
Sustainable IT
WPP’s personal and network IT equipment accounts for a large proportion of our energy use. We aim to cut the energy used by our computers by up to 30%, and have introduced requirements to improve the energy efficiency of our IT equipment. Through our server virtualisation program and the use of new energy-efficient blade-based server technology we aim to achieve up to 40% reduction in power consumption for key IT applications. We successfully piloted this approach in 2009 with the Group financial reporting IT systems and are adopting the approach as standard for future server installations and upgrades.
Following pilot projects at three London companies we agreed a program of printer rationalisation for major locations in key markets that we expect to reduce paper, toner and energy consumption by 20% to 30%.
VideoconferencingWe encourage our people to meet via videoconferencing, avoiding the environmental impacts of travelling to meetings. We have successfully trialled high-definition videoconferencing in London and New York, and we are investing to set up facilities in key cities around the world.
By the end of 2009, we had installed 65 high-definition videoconferencing units around the world, including 40 shared units which can be used by any WPP company. In 2010 we will install another 35 shared units, bringing the total to 75 shared sites.
Videoconferencing rooms can be booked by any WPP company via the WPP intranet. We are also experimenting with one-to-one videoconferencing technology for senior executives and operating companies.
Waste and recycling
In 2009 we developed a strategy to reduce waste and increase reuse and recycling at our top 100 strategic locations (representing 40% of our property portfolio by floor space). The strategy will be launched in 2010 and we will track reuse and recycling rates at participating sites quarterly. Key commitments include:
PaperUse post-consumer recycled office paper. –Set printers to double-sided as default. –
Electronic waste (e.g. IT and mobile phones)Establish electronic equipment recycling contracts. –Encourage local arrangements for computer re-use. –
Office consumables (e.g. paper, card, cans, plastic bottles, toner cartridges)
Establish recycling contracts at all locations for –standard office consumable items.
Kitchen wastePhase out disposable crockery and drinking cups. –
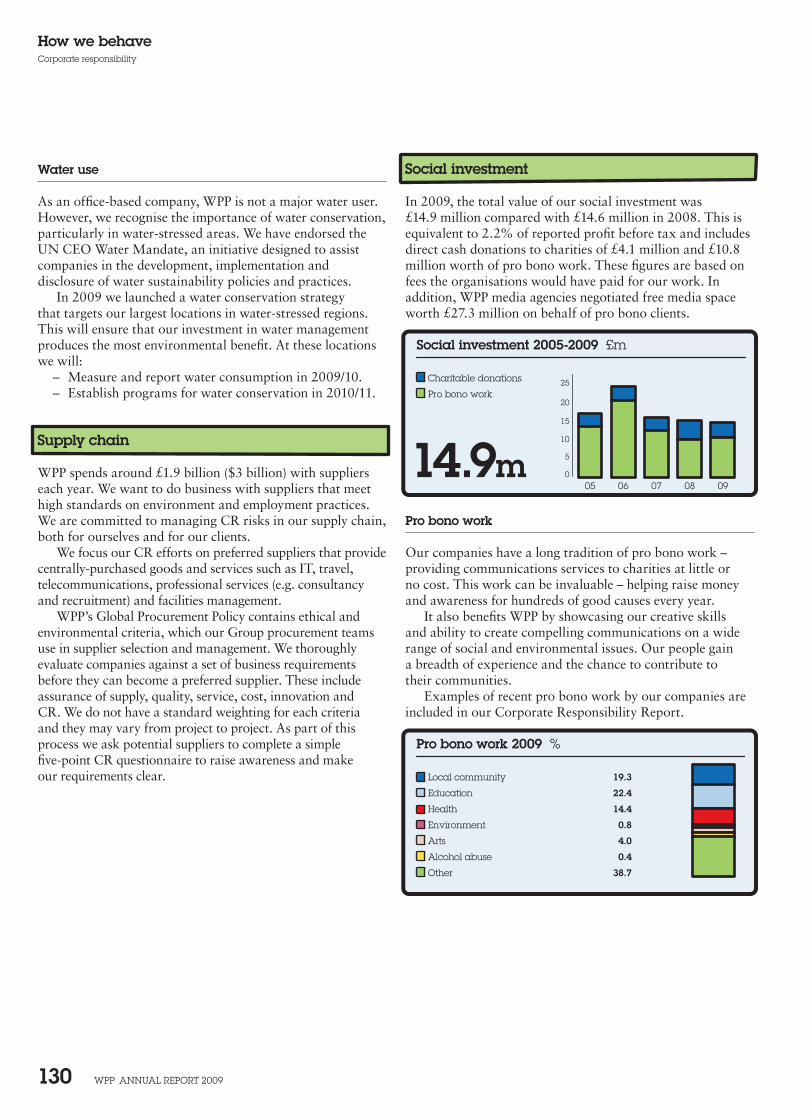
WPP AnnuAl rePort 2009 130
How we behaveCorporate responsibility
Social investment
In 2009, the total value of our social investment was £14.9 million compared with £14.6 million in 2008. This is equivalent to 2.2% of reported profit before tax and includes direct cash donations to charities of £4.1 million and £10.8 million worth of pro bono work. These figures are based on fees the organisations would have paid for our work. In addition, WPP media agencies negotiated free media space worth £27.3 million on behalf of pro bono clients.
Pro bono work
Our companies have a long tradition of pro bono work – providing communications services to charities at little or no cost. This work can be invaluable – helping raise money and awareness for hundreds of good causes every year.
It also benefits WPP by showcasing our creative skills and ability to create compelling communications on a wide range of social and environmental issues. Our people gain a breadth of experience and the chance to contribute to their communities.
Examples of recent pro bono work by our companies are included in our Corporate Responsibility Report.
Social investment 2005-2009 £m
Charitable donations
0908070605
25
0
5
10
15
20Pro bono work
14.9m
Pro bono work 2009 %
Local community 19.3
Education 22.4
Health 14.4
Environment 0.8
Arts 4.0
Alcohol abuse 0.4
Other 38.7
Water use
As an office-based company, WPP is not a major water user. However, we recognise the importance of water conservation, particularly in water-stressed areas. We have endorsed the UN CEO Water Mandate, an initiative designed to assist companies in the development, implementation and disclosure of water sustainability policies and practices.
In 2009 we launched a water conservation strategy that targets our largest locations in water-stressed regions. This will ensure that our investment in water management produces the most environmental benefit. At these locations we will:
Measure and report water consumption in 2009/10. –Establish programs for water conservation in 2010/11. –
Supply chain
WPP spends around £1.9 billion ($3 billion) with suppliers each year. We want to do business with suppliers that meet high standards on environment and employment practices. We are committed to managing CR risks in our supply chain, both for ourselves and for our clients.
We focus our CR efforts on preferred suppliers that provide centrally-purchased goods and services such as IT, travel, telecommunications, professional services (e.g. consultancy and recruitment) and facilities management.
WPP’s Global Procurement Policy contains ethical and environmental criteria, which our Group procurement teams use in supplier selection and management. We thoroughly evaluate companies against a set of business requirements before they can become a preferred supplier. These include assurance of supply, quality, service, cost, innovation and CR. We do not have a standard weighting for each criteria and they may vary from project to project. As part of this process we ask potential suppliers to complete a simple five-point CR questionnaire to raise awareness and make our requirements clear.
WPP AnnuAl rePort 2009 131
How we behaveCorporate responsibility
WPP the parent company
WPP, the parent company, supports a range of charities and non-profit organisations, with a particular focus on education, the arts and young people. These include:
Gambian Education Development Trust INSEAD Trust for European Management Education NABS (a charity which offers financial, practical and
emotional support to those in the advertising industry) The London Business School The National Portrait Gallery The Natural History Museum The Paley Center for Media University of Oxford
WPP is also a member of: Business in the Community (an organisation that
promotes responsible business practice) Employers Forum on Disability The Institute of Business Ethics
Many senior WPP executives also give pro bono advice and support. Sir Martin Sorrell is an active participant in programs at the following international business schools: London Business School; IESE, Spain; Indian Business School; Harvard Business School; and Boston University, School of Management.
How we’re rewardedCompensation Committee report on behalf of the Board
WPP AnnuAl rePort 2009 133
Dear share owner
E conomic pressures on WPP and on marketing services companies in general did not abate during 2009 and are reflected in reduced levels of compensation throughout the Group. These circumstances reinforced the importance of the
committee’s work to ensure that compensation policies strike a fair balance between peoples’ compensation and long-term share owner interests and enable the Company to attract, retain, and motivate the best talent in the business.
2009 highlights
The committee’s work during 2009 included: a review of the total compensation packages of the Group’s most senior
executives relative to marketplace benchmarks to ensure competitiveness; the approval of all stock plan awards (including grants under LEAP III,
Performance Share Awards (PSAs), Executive Share Awards (ESAs) and the Leaders and Partners programs);
the approval of all incentive payments, payable in cash or in shares, for senior executives throughout the Group and setting appropriate targets for the Group chief executive and other executive directors;
finalising the design of LEAP III after consultation with share owners, and securing approval of the plan at the General Meeting in June 2009; and
consideration of the potential inclusion of clawback provisions in the Company’s share incentive plans.
What changed in 2009?
Details of all elements of compensation and any changes made to them are found in the following pages. To summarise, the key decisions and changes to compensation during the year were as follows:
proposals for LEAP III were approved by share owners at the General Meeting in June 2009. LEAP III is similar to the previous LEAP plans but includes (i) weighting of the peer group based on market capitalisation and (ii) a feature under which participants may be invited to purchase investment options as well as investment shares (at the discretion of the Compensation Committee);
the first awards under LEAP III were granted during the year. Given the general economic conditions, the committee limited the value of the 2009 award to the Group chief executive to 80% of the maximum possible in future years;
salary increases throughout the Group were given only in exceptional circumstances and no increases were approved for the chairman, the Group chief executive or other executive directors. The fees of non-executive directors also remained unchanged; and
bonuses in respect of 2009 performance were down for the Group as a whole and for executive directors. In comparison to 2008 (when bonus awards were lower than in 2007), bonus awards were down 52.5% for the chief executive, 31.4% for the Group finance director, and 31.8% for the Group strategy director. A larger percentage than usual of reduced executive bonuses was awarded in shares with a vesting period of three years rather than two years, based on the committee’s view that this reflected a better alignment with long-term share owner interests following a challenging year.
As always, I would like to thank my fellow committee members, Philip Lader and Esther Dyson, and also Bud Morten, the former chairman of the committee, for their continued support. The committee’s thanks also go to Marie Capes (the Company Secretary), Mark Linaugh (the chief talent officer) and Adrian Jackson (the director of compensation and benefits).
Jeffrey RosenChairman of the Compensation Committee16 April 2010
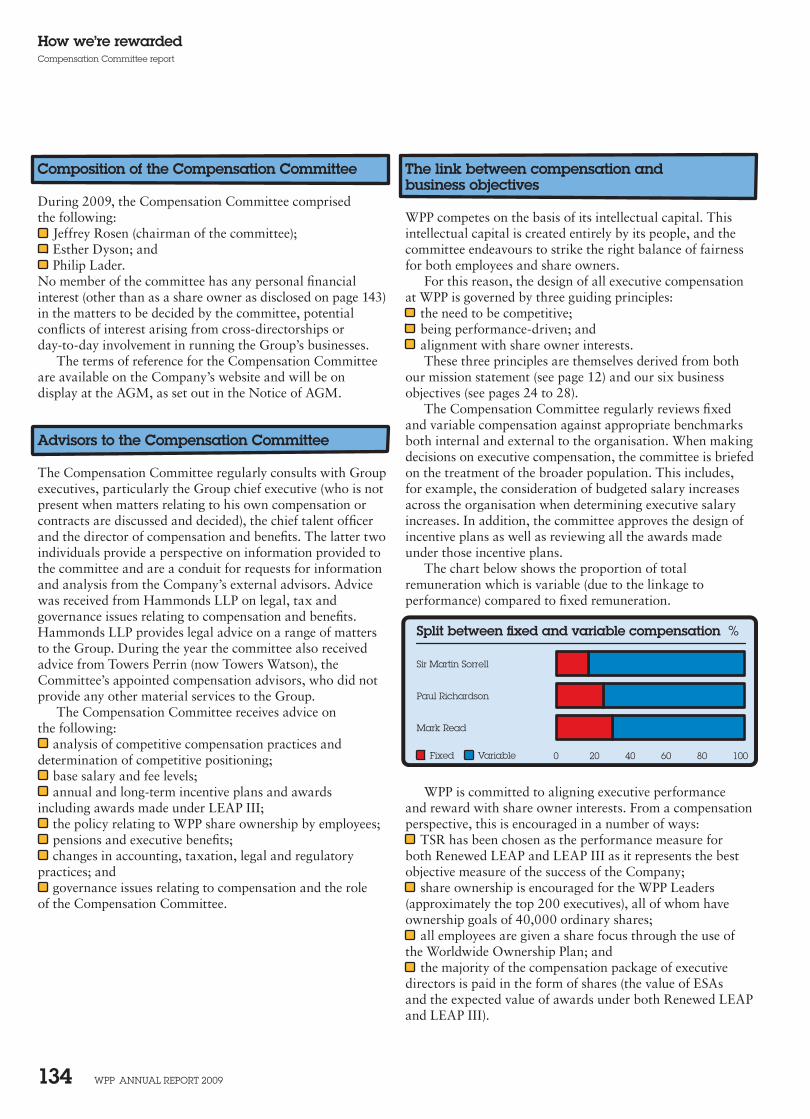
WPP AnnuAl rePort 2009 134
How we’re rewardedCompensation Committee report
The link between compensation and business objectives
WPP competes on the basis of its intellectual capital. This intellectual capital is created entirely by its people, and the committee endeavours to strike the right balance of fairness for both employees and share owners.
For this reason, the design of all executive compensation at WPP is governed by three guiding principles:
the need to be competitive; being performance-driven; and alignment with share owner interests.
These three principles are themselves derived from both our mission statement (see page 12) and our six business objectives (see pages 24 to 28).
The Compensation Committee regularly reviews fixed and variable compensation against appropriate benchmarks both internal and external to the organisation. When making decisions on executive compensation, the committee is briefed on the treatment of the broader population. This includes, for example, the consideration of budgeted salary increases across the organisation when determining executive salary increases. In addition, the committee approves the design of incentive plans as well as reviewing all the awards made under those incentive plans.
The chart below shows the proportion of total remuneration which is variable (due to the linkage to performance) compared to fixed remuneration.
WPP is committed to aligning executive performance and reward with share owner interests. From a compensation perspective, this is encouraged in a number of ways:
TSR has been chosen as the performance measure for both Renewed LEAP and LEAP III as it represents the best objective measure of the success of the Company;
share ownership is encouraged for the WPP Leaders (approximately the top 200 executives), all of whom have ownership goals of 40,000 ordinary shares;
all employees are given a share focus through the use of the Worldwide Ownership Plan; and
the majority of the compensation package of executive directors is paid in the form of shares (the value of ESAs and the expected value of awards under both Renewed LEAP and LEAP III).
0 20 40 60 80 100Fixed Variable
Mark Read
Paul Richardson
Sir Martin Sorrell
Split between fixed and variable compensation %
Composition of the Compensation Committee
During 2009, the Compensation Committee comprised the following:
Jeffrey Rosen (chairman of the committee); Esther Dyson; and Philip Lader.
No member of the committee has any personal financial interest (other than as a share owner as disclosed on page 143) in the matters to be decided by the committee, potential conflicts of interest arising from cross-directorships or day-to-day involvement in running the Group’s businesses.
The terms of reference for the Compensation Committee are available on the Company’s website and will be on display at the AGM, as set out in the Notice of AGM.
Advisors to the Compensation Committee
The Compensation Committee regularly consults with Group executives, particularly the Group chief executive (who is not present when matters relating to his own compensation or contracts are discussed and decided), the chief talent officer and the director of compensation and benefits. The latter two individuals provide a perspective on information provided to the committee and are a conduit for requests for information and analysis from the Company’s external advisors. Advice was received from Hammonds LLP on legal, tax and governance issues relating to compensation and benefits. Hammonds LLP provides legal advice on a range of matters to the Group. During the year the committee also received advice from Towers Perrin (now Towers Watson), the Committee’s appointed compensation advisors, who did not provide any other material services to the Group.
The Compensation Committee receives advice on the following:
analysis of competitive compensation practices and determination of competitive positioning;
base salary and fee levels; annual and long-term incentive plans and awards
including awards made under LEAP III; the policy relating to WPP share ownership by employees; pensions and executive benefits; changes in accounting, taxation, legal and regulatory
practices; and governance issues relating to compensation and the role
of the Compensation Committee.
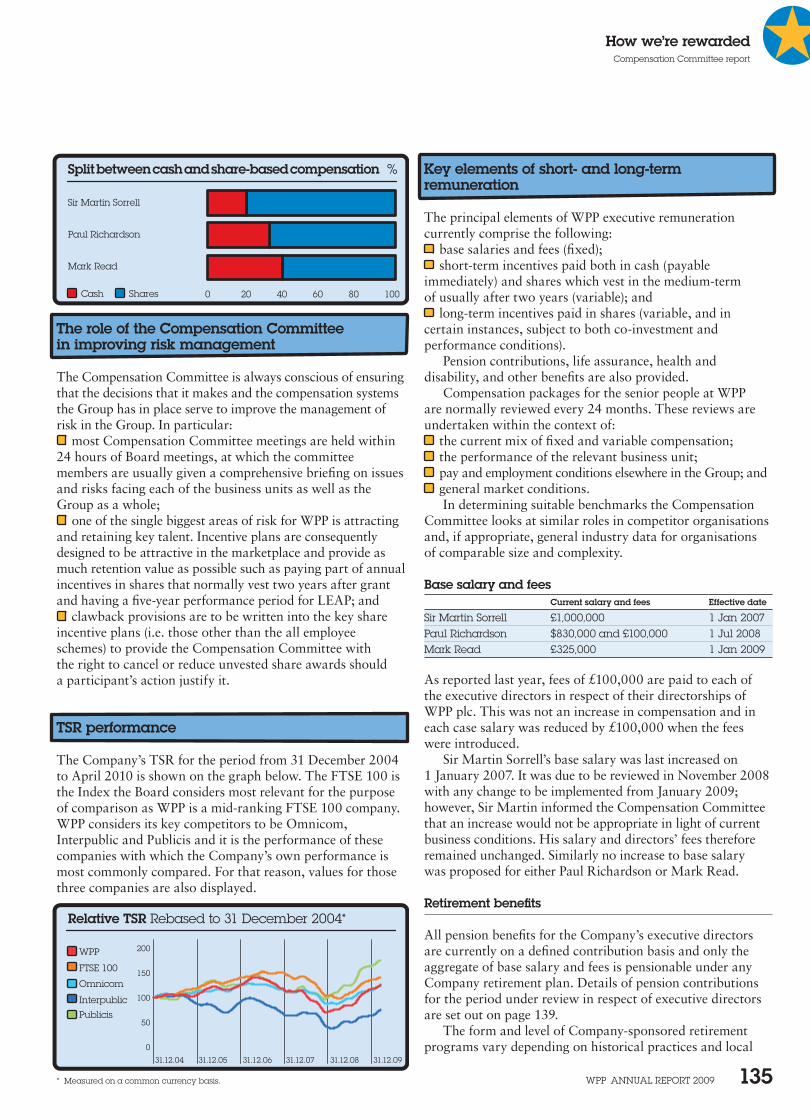
WPP AnnuAl rePort 2009 135
How we’re rewardedCompensation Committee report
Key elements of short- and long-term remuneration
The principal elements of WPP executive remuneration currently comprise the following:
base salaries and fees (fixed); short-term incentives paid both in cash (payable
immediately) and shares which vest in the medium-term of usually after two years (variable); and
long-term incentives paid in shares (variable, and in certain instances, subject to both co-investment and performance conditions).
Pension contributions, life assurance, health and disability, and other benefits are also provided.
Compensation packages for the senior people at WPP are normally reviewed every 24 months. These reviews are undertaken within the context of:
the current mix of fixed and variable compensation; the performance of the relevant business unit; pay and employment conditions elsewhere in the Group; and general market conditions.
In determining suitable benchmarks the Compensation Committee looks at similar roles in competitor organisations and, if appropriate, general industry data for organisations of comparable size and complexity.
Base salary and feesCurrent salary and fees Effective date
Sir Martin Sorrell £1,000,000 1 Jan 2007Paul richardson $830,000 and £100,000 1 Jul 2008Mark read £325,000 1 Jan 2009
As reported last year, fees of £100,000 are paid to each of the executive directors in respect of their directorships of WPP plc. This was not an increase in compensation and in each case salary was reduced by £100,000 when the fees were introduced.
Sir Martin Sorrell’s base salary was last increased on 1 January 2007. It was due to be reviewed in November 2008 with any change to be implemented from January 2009; however, Sir Martin informed the Compensation Committee that an increase would not be appropriate in light of current business conditions. His salary and directors’ fees therefore remained unchanged. Similarly no increase to base salary was proposed for either Paul Richardson or Mark Read.
Retirement benefits
All pension benefits for the Company’s executive directors are currently on a defined contribution basis and only the aggregate of base salary and fees is pensionable under any Company retirement plan. Details of pension contributions for the period under review in respect of executive directors are set out on page 139.
The form and level of Company-sponsored retirement programs vary depending on historical practices and local
The role of the Compensation Committee in improving risk management
The Compensation Committee is always conscious of ensuring that the decisions that it makes and the compensation systems the Group has in place serve to improve the management of risk in the Group. In particular:
most Compensation Committee meetings are held within 24 hours of Board meetings, at which the committee members are usually given a comprehensive briefing on issues and risks facing each of the business units as well as the Group as a whole;
one of the single biggest areas of risk for WPP is attracting and retaining key talent. Incentive plans are consequently designed to be attractive in the marketplace and provide as much retention value as possible such as paying part of annual incentives in shares that normally vest two years after grant and having a five-year performance period for LEAP; and
clawback provisions are to be written into the key share incentive plans (i.e. those other than the all employee schemes) to provide the Compensation Committee with the right to cancel or reduce unvested share awards should a participant’s action justify it.
TSR performance
The Company’s TSR for the period from 31 December 2004 to April 2010 is shown on the graph below. The FTSE 100 is the Index the Board considers most relevant for the purpose of comparison as WPP is a mid-ranking FTSE 100 company. WPP considers its key competitors to be Omnicom, Interpublic and Publicis and it is the performance of these companies with which the Company’s own performance is most commonly compared. For that reason, values for those three companies are also displayed.
* Measured on a common currency basis.
Cash Shares
Split between cash and share-based compensation %
Mark Read
Paul Richardson
0 20 40 60 80 100
Sir Martin Sorrell
Relative TSR Rebased to 31 December 2004*
31.12.0931.12.0831.12.0731.12.0631.12.0531.12.04
WPP 200
0
50
100
150FTSE 100
Omnicom
Interpublic
Publicis
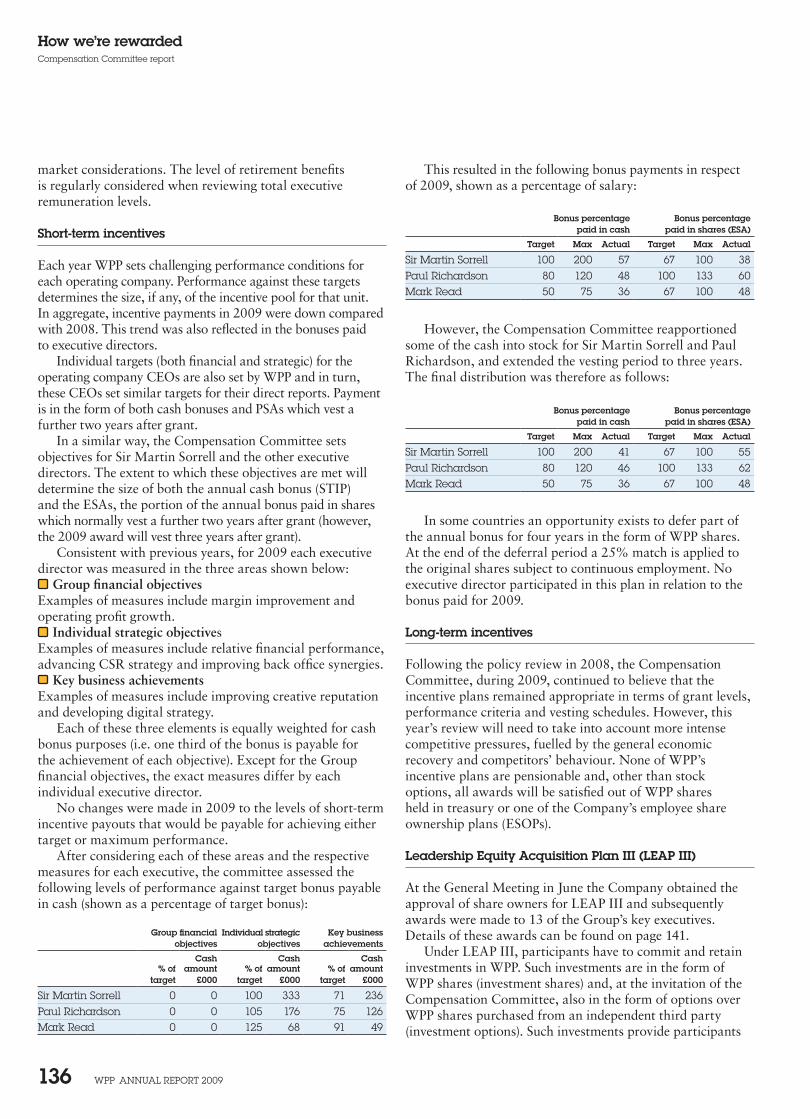
WPP AnnuAl rePort 2009 136
How we’re rewardedCompensation Committee report
This resulted in the following bonus payments in respect of 2009, shown as a percentage of salary:
Bonus percentage Bonus percentagepaid in cash paid in shares (ESA)
Target Max Actual Target Max Actual
Sir Martin Sorrell 100 200 57 67 100 38Paul richardson 80 120 48 100 133 60Mark read 50 75 36 67 100 48
However, the Compensation Committee reapportioned some of the cash into stock for Sir Martin Sorrell and Paul Richardson, and extended the vesting period to three years. The final distribution was therefore as follows:
Bonus percentage Bonus percentagepaid in cash paid in shares (ESA)
Target Max Actual Target Max Actual
Sir Martin Sorrell 100 200 41 67 100 55Paul richardson 80 120 46 100 133 62Mark read 50 75 36 67 100 48
In some countries an opportunity exists to defer part of the annual bonus for four years in the form of WPP shares. At the end of the deferral period a 25% match is applied to the original shares subject to continuous employment. No executive director participated in this plan in relation to the bonus paid for 2009.
Long-term incentives
Following the policy review in 2008, the Compensation Committee, during 2009, continued to believe that the incentive plans remained appropriate in terms of grant levels, performance criteria and vesting schedules. However, this year’s review will need to take into account more intense competitive pressures, fuelled by the general economic recovery and competitors’ behaviour. None of WPP’s incentive plans are pensionable and, other than stock options, all awards will be satisfied out of WPP shares held in treasury or one of the Company’s employee share ownership plans (ESOPs).
Leadership Equity Acquisition Plan III (LEAP III)
At the General Meeting in June the Company obtained the approval of share owners for LEAP III and subsequently awards were made to 13 of the Group’s key executives. Details of these awards can be found on page 141.
Under LEAP III, participants have to commit and retain investments in WPP. Such investments are in the form of WPP shares (investment shares) and, at the invitation of the Compensation Committee, also in the form of options over WPP shares purchased from an independent third party (investment options). Such investments provide participants
market considerations. The level of retirement benefits is regularly considered when reviewing total executive remuneration levels.
Short-term incentives
Each year WPP sets challenging performance conditions for each operating company. Performance against these targets determines the size, if any, of the incentive pool for that unit. In aggregate, incentive payments in 2009 were down compared with 2008. This trend was also reflected in the bonuses paid to executive directors.
Individual targets (both financial and strategic) for the operating company CEOs are also set by WPP and in turn, these CEOs set similar targets for their direct reports. Payment is in the form of both cash bonuses and PSAs which vest a further two years after grant.
In a similar way, the Compensation Committee sets objectives for Sir Martin Sorrell and the other executive directors. The extent to which these objectives are met will determine the size of both the annual cash bonus (STIP) and the ESAs, the portion of the annual bonus paid in shares which normally vest a further two years after grant (however, the 2009 award will vest three years after grant).
Consistent with previous years, for 2009 each executive director was measured in the three areas shown below:
Group financial objectives Examples of measures include margin improvement and operating profit growth.
Individual strategic objectives Examples of measures include relative financial performance, advancing CSR strategy and improving back office synergies.
Key business achievements Examples of measures include improving creative reputation and developing digital strategy.
Each of these three elements is equally weighted for cash bonus purposes (i.e. one third of the bonus is payable for the achievement of each objective). Except for the Group financial objectives, the exact measures differ by each individual executive director.
No changes were made in 2009 to the levels of short-term incentive payouts that would be payable for achieving either target or maximum performance.
After considering each of these areas and the respective measures for each executive, the committee assessed the following levels of performance against target bonus payable in cash (shown as a percentage of target bonus):
Group financial Individual strategic Key business objectives objectives achievements
Cash Cash Cash% of amount % of amount % of amount
target £000 target £000 target £000
Sir Martin Sorrell 0 0 100 333 71 236Paul richardson 0 0 105 176 75 126Mark read 0 0 125 68 91 49
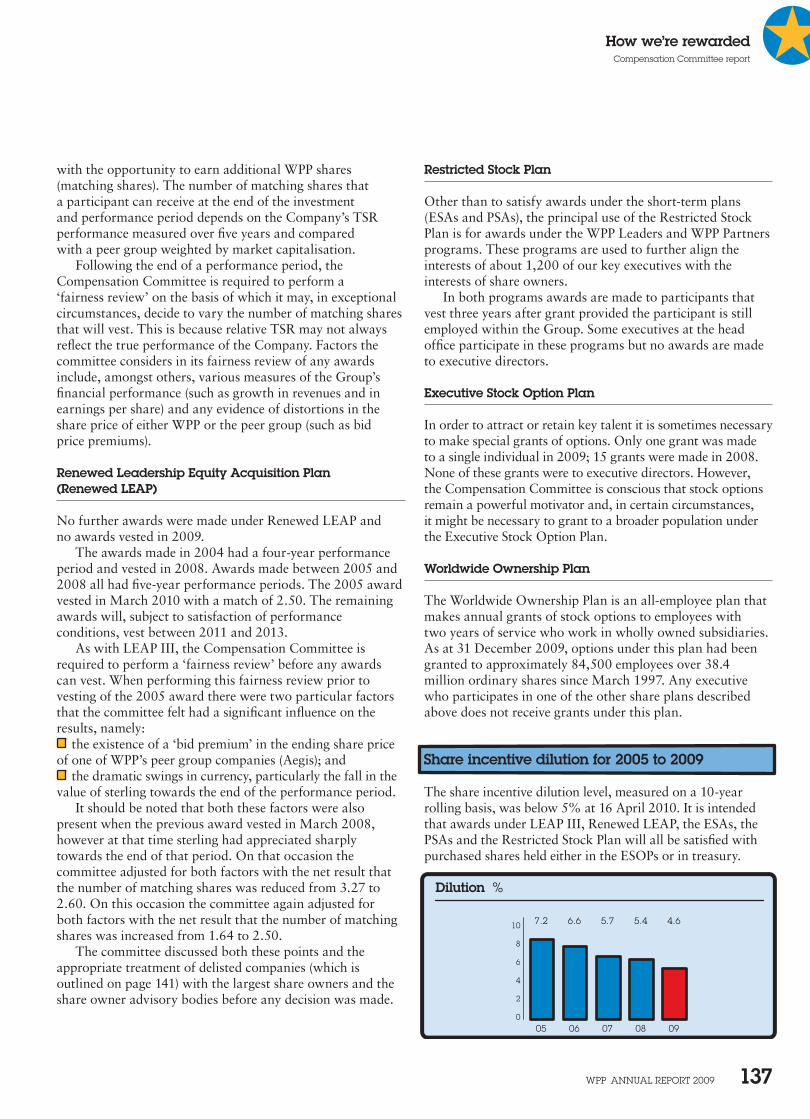
WPP AnnuAl rePort 2009 137
How we’re rewardedCompensation Committee report
Restricted Stock Plan
Other than to satisfy awards under the short-term plans (ESAs and PSAs), the principal use of the Restricted Stock Plan is for awards under the WPP Leaders and WPP Partners programs. These programs are used to further align the interests of about 1,200 of our key executives with the interests of share owners.
In both programs awards are made to participants that vest three years after grant provided the participant is still employed within the Group. Some executives at the head office participate in these programs but no awards are made to executive directors.
Executive Stock Option Plan
In order to attract or retain key talent it is sometimes necessary to make special grants of options. Only one grant was made to a single individual in 2009; 15 grants were made in 2008. None of these grants were to executive directors. However, the Compensation Committee is conscious that stock options remain a powerful motivator and, in certain circumstances, it might be necessary to grant to a broader population under the Executive Stock Option Plan.
Worldwide Ownership Plan
The Worldwide Ownership Plan is an all-employee plan that makes annual grants of stock options to employees with two years of service who work in wholly owned subsidiaries. As at 31 December 2009, options under this plan had been granted to approximately 84,500 employees over 38.4 million ordinary shares since March 1997. Any executive who participates in one of the other share plans described above does not receive grants under this plan.
Share incentive dilution for 2005 to 2009
The share incentive dilution level, measured on a 10-year rolling basis, was below 5% at 16 April 2010. It is intended that awards under LEAP III, Renewed LEAP, the ESAs, the PSAs and the Restricted Stock Plan will all be satisfied with purchased shares held either in the ESOPs or in treasury.
Dilution %
4.65.45.76.67.2
0908070605
10
0
2
4
6
8
with the opportunity to earn additional WPP shares (matching shares). The number of matching shares that a participant can receive at the end of the investment and performance period depends on the Company’s TSR performance measured over five years and compared with a peer group weighted by market capitalisation.
Following the end of a performance period, the Compensation Committee is required to perform a ‘fairness review’ on the basis of which it may, in exceptional circumstances, decide to vary the number of matching shares that will vest. This is because relative TSR may not always reflect the true performance of the Company. Factors the committee considers in its fairness review of any awards include, amongst others, various measures of the Group’s financial performance (such as growth in revenues and in earnings per share) and any evidence of distortions in the share price of either WPP or the peer group (such as bid price premiums).
Renewed Leadership Equity Acquisition Plan (Renewed LEAP)
No further awards were made under Renewed LEAP and no awards vested in 2009.
The awards made in 2004 had a four-year performance period and vested in 2008. Awards made between 2005 and 2008 all had five-year performance periods. The 2005 award vested in March 2010 with a match of 2.50. The remaining awards will, subject to satisfaction of performance conditions, vest between 2011 and 2013.
As with LEAP III, the Compensation Committee is required to perform a ‘fairness review’ before any awards can vest. When performing this fairness review prior to vesting of the 2005 award there were two particular factors that the committee felt had a significant influence on the results, namely:
the existence of a ‘bid premium’ in the ending share price of one of WPP’s peer group companies (Aegis); and
the dramatic swings in currency, particularly the fall in the value of sterling towards the end of the performance period.
It should be noted that both these factors were also present when the previous award vested in March 2008, however at that time sterling had appreciated sharply towards the end of that period. On that occasion the committee adjusted for both factors with the net result that the number of matching shares was reduced from 3.27 to 2.60. On this occasion the committee again adjusted for both factors with the net result that the number of matching shares was increased from 1.64 to 2.50.
The committee discussed both these points and the appropriate treatment of delisted companies (which is outlined on page 141) with the largest share owners and the share owner advisory bodies before any decision was made.
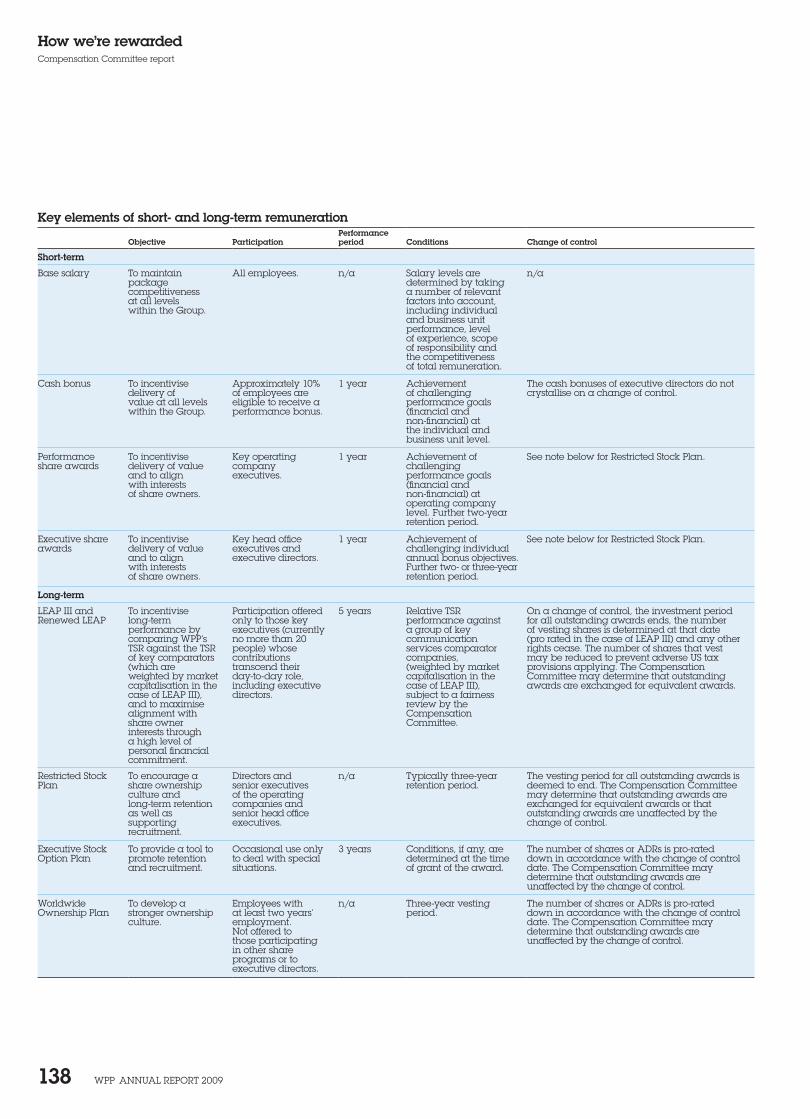
WPP AnnuAl rePort 2009 138
How we’re rewardedCompensation Committee report
Key elements of short- and long-term remunerationPerformance
Objective Participation period Conditions Change of control
Short-term
Base salary to maintain package competitiveness at all levels within the Group.
All employees. n/a Salary levels are determined by taking a number of relevant factors into account, including individual and business unit performance, level of experience, scope of responsibility and the competitiveness of total remuneration.
n/a
Cash bonus to incentivise delivery of value at all levels within the Group.
Approximately 10% of employees are eligible to receive a performance bonus.
1 year Achievement of challenging performance goals (financial and non-financial) at the individual and business unit level.
the cash bonuses of executive directors do not crystallise on a change of control.
Performance share awards
to incentivise delivery of value and to align with interests of share owners.
Key operating company executives.
1 year Achievement of challenging performance goals (financial and non-financial) at operating company level. Further two-year retention period.
See note below for restricted Stock Plan.
executive share awards
to incentivise delivery of value and to align with interests of share owners.
Key head office executives and executive directors.
1 year Achievement of challenging individual annual bonus objectives. Further two- or three-year retention period.
See note below for restricted Stock Plan.
Long-term
leAP III and renewed leAP
to incentivise long-term performance by comparing WPP’s tSr against the tSr of key comparators (which are weighted by market capitalisation in the case of leAP III), and to maximise alignment with share owner interests through a high level of personal financial commitment.
Participation offered only to those key executives (currently no more than 20 people) whose contributions transcend their day-to-day role, including executive directors.
5 years relative tSr performance against a group of key communication services comparator companies, (weighted by market capitalisation in the case of leAP III), subject to a fairness review by the Compensation Committee.
on a change of control, the investment period for all outstanding awards ends, the number of vesting shares is determined at that date (pro rated in the case of leAP III) and any other rights cease. the number of shares that vest may be reduced to prevent adverse uS tax provisions applying. the Compensation Committee may determine that outstanding awards are exchanged for equivalent awards.
restricted Stock Plan
to encourage a share ownership culture and long-term retention as well as supporting recruitment.
Directors and senior executives of the operating companies and senior head office executives.
n/a typically three-year retention period.
the vesting period for all outstanding awards is deemed to end. the Compensation Committee may determine that outstanding awards are exchanged for equivalent awards or that outstanding awards are unaffected by the change of control.
executive Stock option Plan
to provide a tool to promote retention and recruitment.
occasional use only to deal with special situations.
3 years Conditions, if any, are determined at the time of grant of the award.
the number of shares or ADrs is pro-rated down in accordance with the change of control date. the Compensation Committee may determine that outstanding awards are unaffected by the change of control.
Worldwide ownership Plan
to develop a stronger ownership culture.
employees with at least two years’ employment. not offered to those participating in other share programs or to executive directors.
n/a three-year vesting period.
the number of shares or ADrs is pro-rated down in accordance with the change of control date. the Compensation Committee may determine that outstanding awards are unaffected by the change of control.
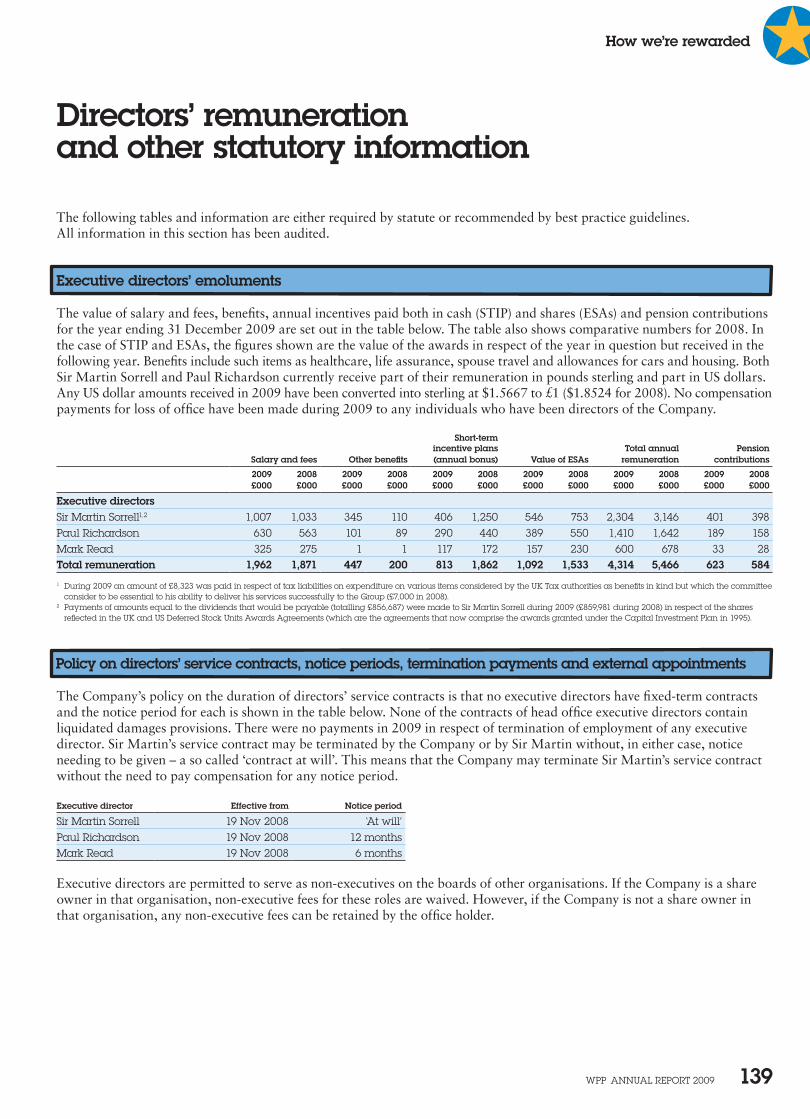
WPP AnnuAl rePort 2009 139
How we’re rewarded
The following tables and information are either required by statute or recommended by best practice guidelines. All information in this section has been audited.
Executive directors’ emoluments
The value of salary and fees, benefits, annual incentives paid both in cash (STIP) and shares (ESAs) and pension contributions for the year ending 31 December 2009 are set out in the table below. The table also shows comparative numbers for 2008. In the case of STIP and ESAs, the figures shown are the value of the awards in respect of the year in question but received in the following year. Benefits include such items as healthcare, life assurance, spouse travel and allowances for cars and housing. Both Sir Martin Sorrell and Paul Richardson currently receive part of their remuneration in pounds sterling and part in US dollars. Any US dollar amounts received in 2009 have been converted into sterling at $1.5667 to £1 ($1.8524 for 2008). No compensation payments for loss of office have been made during 2009 to any individuals who have been directors of the Company.
Short-termincentive plans Total annual Pension
Salary and fees Other benefits (annual bonus) Value of ESAs remuneration contributions
2009 2008 2009 2008 2009 2008 2009 2008 2009 2008 2009 2008£000 £000 £000 £000 £000 £000 £000 £000 £000 £000 £000 £000
Executive directorsSir Martin Sorrell1,2 1,007 1,033 345 110 406 1,250 546 753 2,304 3,146 401 398 Paul richardson 630 563 101 89 290 440 389 550 1,410 1,642 189 158 Mark read 325 275 1 1 117 172 157 230 600 678 33 28 Total remuneration 1,962 1,871 447 200 813 1,862 1,092 1,533 4,314 5,466 623 584
1 During 2009 an amount of £8,323 was paid in respect of tax liabilities on expenditure on various items considered by the uK tax authorities as benefits in kind but which the committee consider to be essential to his ability to deliver his services successfully to the Group (£7,000 in 2008).
2 Payments of amounts equal to the dividends that would be payable (totalling £856,687) were made to Sir Martin Sorrell during 2009 (£859,981 during 2008) in respect of the shares reflected in the uK and uS Deferred Stock units Awards Agreements (which are the agreements that now comprise the awards granted under the Capital Investment Plan in 1995).
Policy on directors’ service contracts, notice periods, termination payments and external appointments
The Company’s policy on the duration of directors’ service contracts is that no executive directors have fixed-term contracts and the notice period for each is shown in the table below. None of the contracts of head office executive directors contain liquidated damages provisions. There were no payments in 2009 in respect of termination of employment of any executive director. Sir Martin’s service contract may be terminated by the Company or by Sir Martin without, in either case, notice needing to be given – a so called ‘contract at will’. This means that the Company may terminate Sir Martin’s service contract without the need to pay compensation for any notice period.
Executive director Effective from Notice period
Sir Martin Sorrell 19 nov 2008 ‘At will’Paul richardson 19 nov 2008 12 monthsMark read 19 nov 2008 6 months
Executive directors are permitted to serve as non-executives on the boards of other organisations. If the Company is a share owner in that organisation, non-executive fees for these roles are waived. However, if the Company is not a share owner in that organisation, any non-executive fees can be retained by the office holder.
Directors’ remuneration and other statutory information
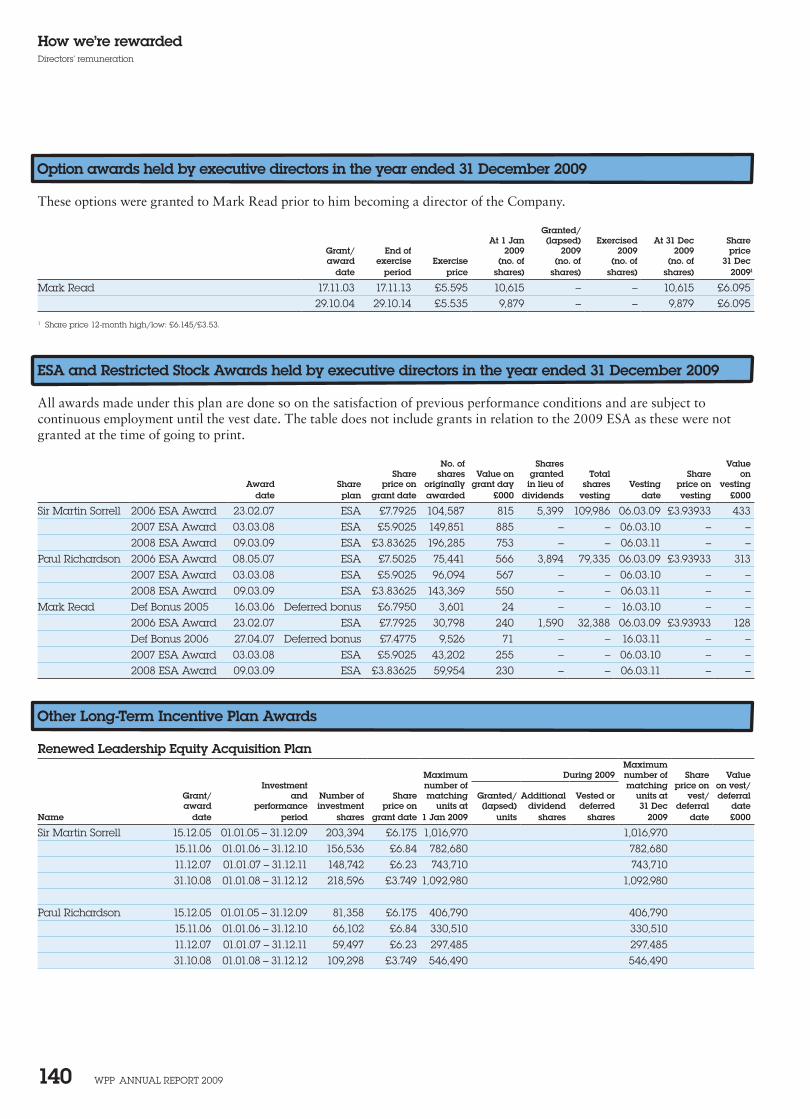
WPP AnnuAl rePort 2009 140
How we’re rewardedDirectors’ remuneration
Option awards held by executive directors in the year ended 31 December 2009
These options were granted to Mark Read prior to him becoming a director of the Company.
Granted/At 1 Jan (lapsed) Exercised At 31 Dec Share
Grant/ End of 2009 2009 2009 2009 priceaward exercise Exercise (no. of (no. of (no. of (no. of 31 Dec
date period price shares) shares) shares) shares) 20091
Mark read 17.11.03 17.11.13 £5.595 10,615 – – 10,615 £6.09529.10.04 29.10.14 £5.535 9,879 – – 9,879 £6.095
1 Share price 12-month high/low: £6.145/£3.53.
ESA and Restricted Stock Awards held by executive directors in the year ended 31 December 2009
All awards made under this plan are done so on the satisfaction of previous performance conditions and are subject to continuous employment until the vest date. The table does not include grants in relation to the 2009 ESA as these were not granted at the time of going to print.
No. of Shares ValueShare shares Value on granted Total Share on
Award Share price on originally grant day in lieu of shares Vesting price on vesting date plan grant date awarded £000 dividends vesting date vesting £000
Sir Martin Sorrell 2006 eSA Award 23.02.07 eSA £7.7925 104,587 815 5,399 109,986 06.03.09 £3.93933 433 2007 eSA Award 03.03.08 eSA £5.9025 149,851 885 – – 06.03.10 – – 2008 eSA Award 09.03.09 eSA £3.83625 196,285 753 – – 06.03.11 – –
Paul richardson 2006 eSA Award 08.05.07 eSA £7.5025 75,441 566 3,894 79,335 06.03.09 £3.93933 313 2007 eSA Award 03.03.08 eSA £5.9025 96,094 567 – – 06.03.10 – –2008 eSA Award 09.03.09 eSA £3.83625 143,369 550 – – 06.03.11 – –
Mark read Def Bonus 2005 16.03.06 Deferred bonus £6.7950 3,601 24 – – 16.03.10 – – 2006 eSA Award 23.02.07 eSA £7.7925 30,798 240 1,590 32,388 06.03.09 £3.93933 128 Def Bonus 2006 27.04.07 Deferred bonus £7.4775 9,526 71 – – 16.03.11 – –2007 eSA Award 03.03.08 eSA £5.9025 43,202 255 – – 06.03.10 – – 2008 eSA Award 09.03.09 eSA £3.83625 59,954 230 – – 06.03.11 – –
Other Long-Term Incentive Plan Awards
Renewed Leadership Equity Acquisition PlanMaximum
Maximum During 2009 number of Share ValueInvestment number of matching price on on vest/
Grant/ and Number of Share matching Granted/ Additional Vested or units at vest/ deferralaward performance investment price on units at (lapsed) dividend deferred 31 Dec deferral date
Name date period shares grant date 1 Jan 2009 units shares shares 2009 date £000
Sir Martin Sorrell 15.12.05 01.01.05 – 31.12.09 203,394 £6.175 1,016,970 1,016,970 15.11.06 01.01.06 – 31.12.10 156,536 £6.84 782,680 782,68011.12.07 01.01.07 – 31.12.11 148,742 £6.23 743,710 743,71031.10.08 01.01.08 – 31.12.12 218,596 £3.749 1,092,980 1,092,980
Paul richardson 15.12.05 01.01.05 – 31.12.09 81,358 £6.175 406,790 406,79015.11.06 01.01.06 – 31.12.10 66,102 £6.84 330,510 330,51011.12.07 01.01.07 – 31.12.11 59,497 £6.23 297,485 297,48531.10.08 01.01.08 – 31.12.12 109,298 £3.749 546,490 546,490
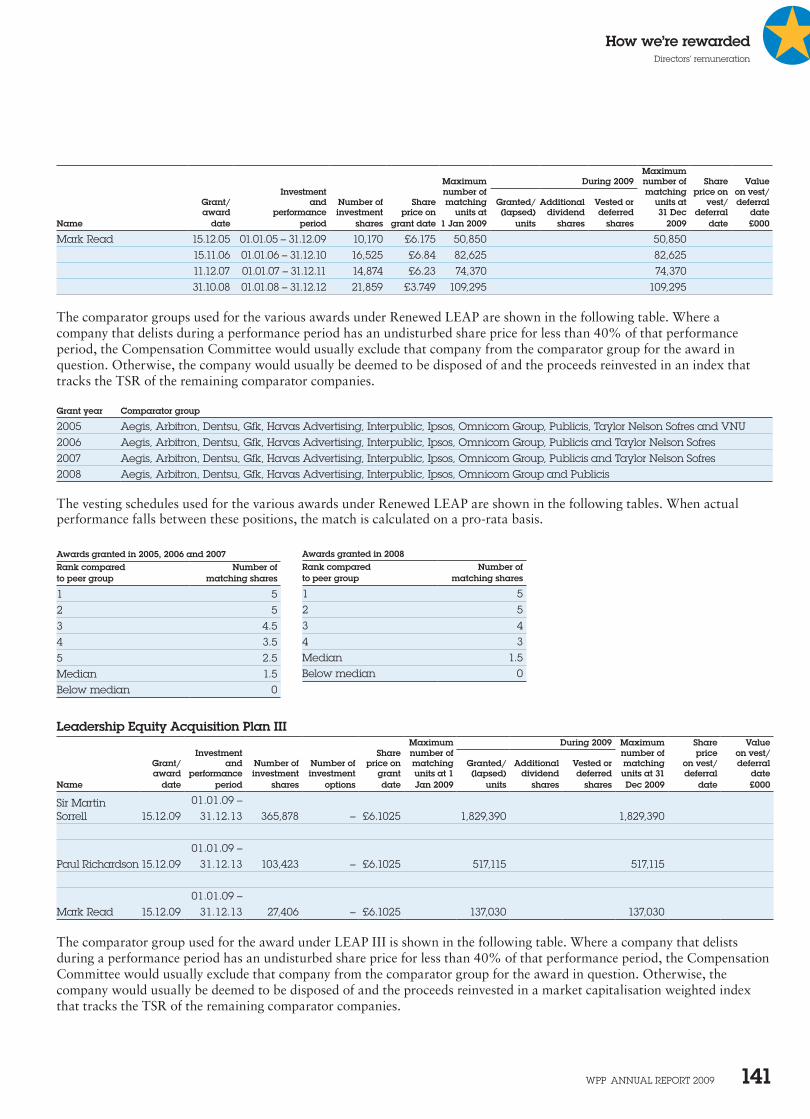
WPP AnnuAl rePort 2009 141
How we’re rewardedDirectors’ remuneration
MaximumMaximum During 2009 number of Share Value
Investment number of matching price on on vest/Grant/ and Number of Share matching Granted/ Additional Vested or units at vest/ deferralaward performance investment price on units at (lapsed) dividend deferred 31 Dec deferral date
Name date period shares grant date 1 Jan 2009 units shares shares 2009 date £000
Mark read 15.12.05 01.01.05 – 31.12.09 10,170 £6.175 50,850 50,85015.11.06 01.01.06 – 31.12.10 16,525 £6.84 82,625 82,62511.12.07 01.01.07 – 31.12.11 14,874 £6.23 74,370 74,37031.10.08 01.01.08 – 31.12.12 21,859 £3.749 109,295 109,295
The comparator groups used for the various awards under Renewed LEAP are shown in the following table. Where a company that delists during a performance period has an undisturbed share price for less than 40% of that performance period, the Compensation Committee would usually exclude that company from the comparator group for the award in question. Otherwise, the company would usually be deemed to be disposed of and the proceeds reinvested in an index that tracks the TSR of the remaining comparator companies.
Grant year Comparator group
2005 Aegis, Arbitron, Dentsu, Gfk, Havas Advertising, Interpublic, Ipsos, omnicom Group, Publicis, taylor nelson Sofres and Vnu 2006 Aegis, Arbitron, Dentsu, Gfk, Havas Advertising, Interpublic, Ipsos, omnicom Group, Publicis and taylor nelson Sofres2007 Aegis, Arbitron, Dentsu, Gfk, Havas Advertising, Interpublic, Ipsos, omnicom Group, Publicis and taylor nelson Sofres2008 Aegis, Arbitron, Dentsu, Gfk, Havas Advertising, Interpublic, Ipsos, omnicom Group and Publicis
The vesting schedules used for the various awards under Renewed LEAP are shown in the following tables. When actual performance falls between these positions, the match is calculated on a pro-rata basis.
Leadership Equity Acquisition Plan IIIMaximum During 2009 Maximum Share Value
Investment Share number of number of price on vest/Grant/ and Number of Number of price on matching Granted/ Additional Vested or matching on vest/ deferralaward performance investment investment grant units at 1 (lapsed) dividend deferred units at 31 deferral date
Name date period shares options date Jan 2009 units shares shares Dec 2009 date £000
Sir Martin Sorrell 15.12.09
01.01.09 – 31.12.13 365,878 – £6.1025 1,829,390 1,829,390
Paul richardson 15.12.0901.01.09 –
31.12.13 103,423 – £6.1025 517,115 517,115
Mark read 15.12.0901.01.09 –
31.12.13 27,406 – £6.1025 137,030 137,030
The comparator group used for the award under LEAP III is shown in the following table. Where a company that delists during a performance period has an undisturbed share price for less than 40% of that performance period, the Compensation Committee would usually exclude that company from the comparator group for the award in question. Otherwise, the company would usually be deemed to be disposed of and the proceeds reinvested in a market capitalisation weighted index that tracks the TSR of the remaining comparator companies.
Awards granted in 2005, 2006 and 2007Rank compared Number ofto peer group matching shares
1 52 53 4.54 3.55 2.5Median 1.5 Below median 0
Awards granted in 2008Rank compared Number ofto peer group matching shares
1 52 53 44 3Median 1.5 Below median 0
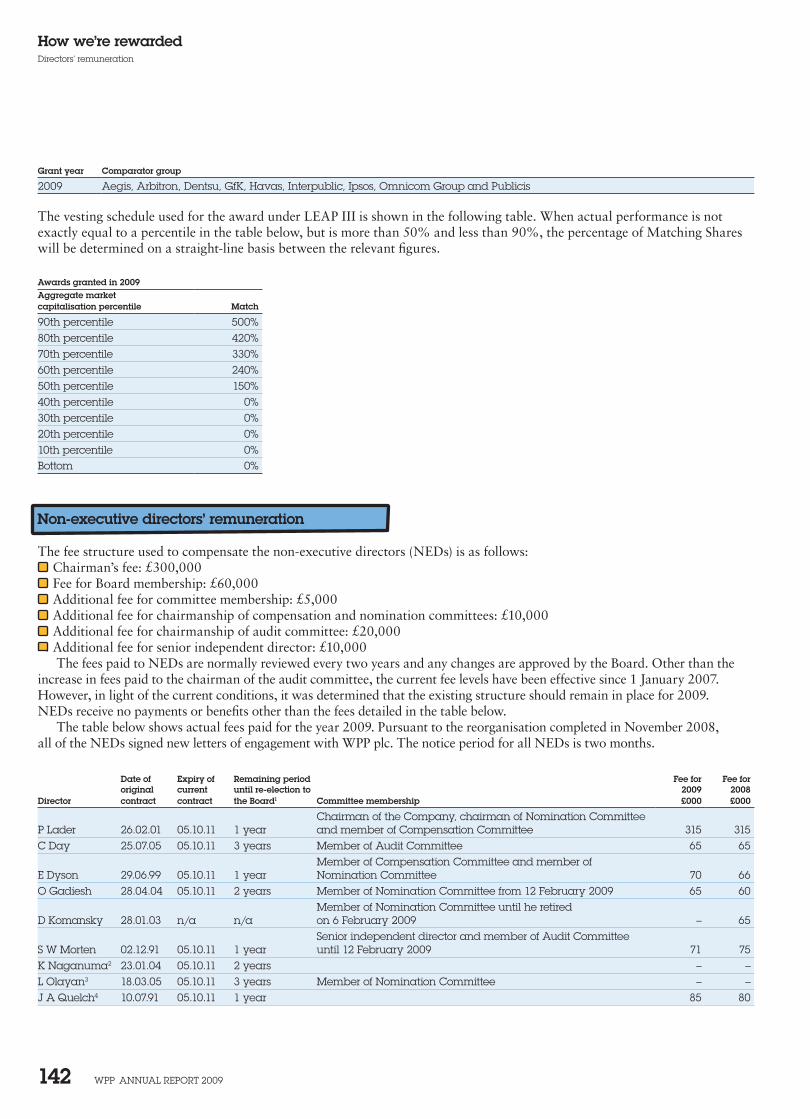
WPP AnnuAl rePort 2009 142
How we’re rewardedDirectors’ remuneration
Grant year Comparator group
2009 Aegis, Arbitron, Dentsu, GfK, Havas, Interpublic, Ipsos, omnicom Group and Publicis
The vesting schedule used for the award under LEAP III is shown in the following table. When actual performance is not exactly equal to a percentile in the table below, but is more than 50% and less than 90%, the percentage of Matching Shares will be determined on a straight-line basis between the relevant figures.
Non-executive directors’ remuneration
The fee structure used to compensate the non-executive directors (NEDs) is as follows: Chairman’s fee: £300,000 Fee for Board membership: £60,000 Additional fee for committee membership: £5,000 Additional fee for chairmanship of compensation and nomination committees: £10,000 Additional fee for chairmanship of audit committee: £20,000 Additional fee for senior independent director: £10,000
The fees paid to NEDs are normally reviewed every two years and any changes are approved by the Board. Other than the increase in fees paid to the chairman of the audit committee, the current fee levels have been effective since 1 January 2007. However, in light of the current conditions, it was determined that the existing structure should remain in place for 2009. NEDs receive no payments or benefits other than the fees detailed in the table below.
The table below shows actual fees paid for the year 2009. Pursuant to the reorganisation completed in November 2008, all of the NEDs signed new letters of engagement with WPP plc. The notice period for all NEDs is two months.
Date of Expiry of Remaining period Fee for Fee fororiginal current until re-election to 2009 2008
Director contract contract the Board1 Committee membership £000 £000
P lader 26.02.01 05.10.11 1 yearChairman of the Company, chairman of nomination Committee and member of Compensation Committee 315 315
C Day 25.07.05 05.10.11 3 years Member of Audit Committee 65 65
e Dyson 29.06.99 05.10.11 1 yearMember of Compensation Committee and member of nomination Committee 70 66
o Gadiesh 28.04.04 05.10.11 2 years Member of nomination Committee from 12 February 2009 65 60
D Komansky 28.01.03 n/a n/aMember of nomination Committee until he retired on 6 February 2009 – 65
S W Morten 02.12.91 05.10.11 1 yearSenior independent director and member of Audit Committee until 12 February 2009 71 75
K naganuma2 23.01.04 05.10.11 2 years – –l olayan3 18.03.05 05.10.11 3 years Member of nomination Committee – –J A Quelch4 10.07.91 05.10.11 1 year 85 80
Awards granted in 2009Aggregate marketcapitalisation percentile Match
90th percentile 500%80th percentile 420%70th percentile 330%60th percentile 240%50th percentile 150%40th percentile 0%30th percentile 0%20th percentile 0%10th percentile 0%Bottom 0%
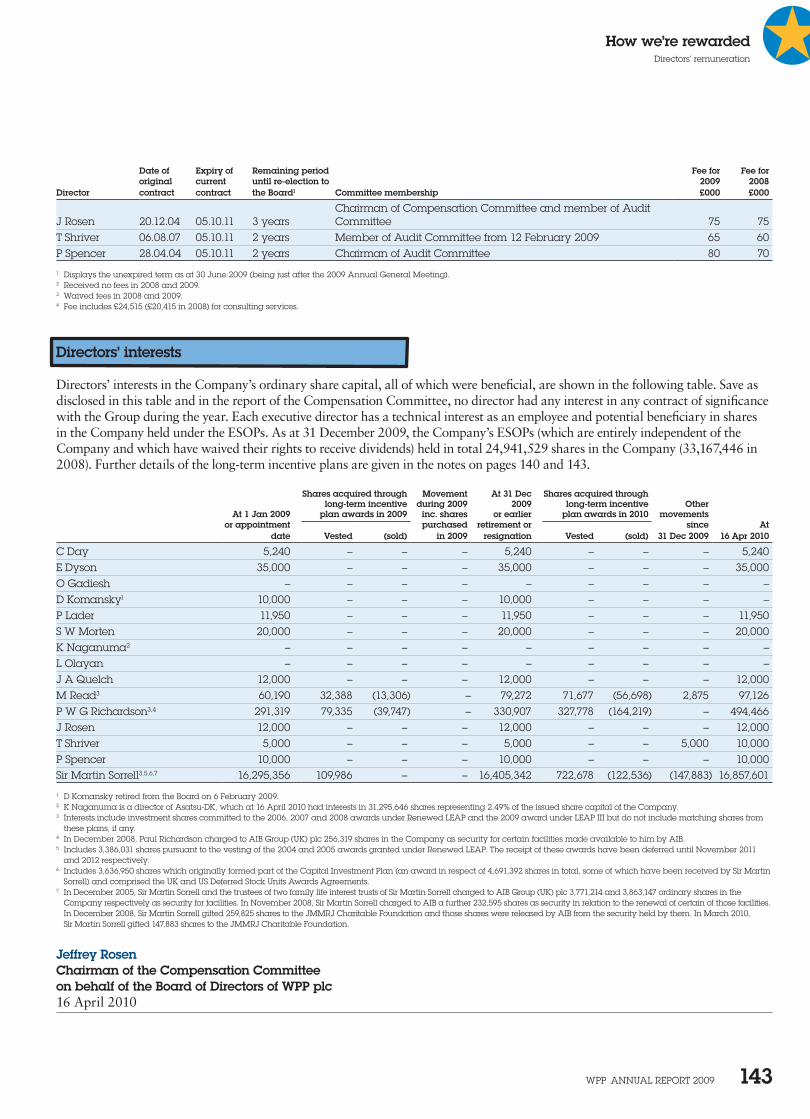
WPP AnnuAl rePort 2009 143
How we’re rewardedDirectors’ remuneration
Date of Expiry of Remaining period Fee for Fee fororiginal current until re-election to 2009 2008
Director contract contract the Board1 Committee membership £000 £000
J rosen 20.12.04 05.10.11 3 yearsChairman of Compensation Committee and member of Audit Committee 75 75
t Shriver 06.08.07 05.10.11 2 years Member of Audit Committee from 12 February 2009 65 60P Spencer 28.04.04 05.10.11 2 years Chairman of Audit Committee 80 70
1 Displays the unexpired term as at 30 June 2009 (being just after the 2009 Annual General Meeting). 2 received no fees in 2008 and 2009.3 Waived fees in 2008 and 2009.4 Fee includes £24,515 (£20,415 in 2008) for consulting services.
Directors’ interests
Directors’ interests in the Company’s ordinary share capital, all of which were beneficial, are shown in the following table. Save as disclosed in this table and in the report of the Compensation Committee, no director had any interest in any contract of significance with the Group during the year. Each executive director has a technical interest as an employee and potential beneficiary in shares in the Company held under the ESOPs. As at 31 December 2009, the Company’s ESOPs (which are entirely independent of the Company and which have waived their rights to receive dividends) held in total 24,941,529 shares in the Company (33,167,446 in 2008). Further details of the long-term incentive plans are given in the notes on pages 140 and 143.
Shares acquired through Movement At 31 Dec Shares acquired throughlong-term incentive during 2009 2009 long-term incentive Other
At 1 Jan 2009 plan awards in 2009 inc. shares or earlier plan awards in 2010 movementsor appointment purchased retirement or since At
date Vested (sold) in 2009 resignation Vested (sold) 31 Dec 2009 16 Apr 2010
C Day 5,240 – – – 5,240 – – – 5,240e Dyson 35,000 – – – 35,000 – – – 35,000o Gadiesh – – – – – – – – –D Komansky1 10,000 – – – 10,000 – – – –P lader 11,950 – – – 11,950 – – – 11,950S W Morten 20,000 – – – 20,000 – – – 20,000K naganuma2 – – – – – – – – –l olayan – – – – – – – – –J A Quelch 12,000 – – – 12,000 – – – 12,000M read3 60,190 32,388 (13,306) – 79,272 71,677 (56,698) 2,875 97,126P W G richardson3,4 291,319 79,335 (39,747) – 330,907 327,778 (164,219) – 494,466J rosen 12,000 – – – 12,000 – – – 12,000t Shriver 5,000 – – – 5,000 – – 5,000 10,000P Spencer 10,000 – – – 10,000 – – – 10,000Sir Martin Sorrell3,5,6,7 16,295,356 109,986 – – 16,405,342 722,678 (122,536) (147,883) 16,857,601
1 D Komansky retired from the Board on 6 February 2009.2 K naganuma is a director of Asatsu-DK, which at 16 April 2010 had interests in 31,295,646 shares representing 2.49% of the issued share capital of the Company.3 Interests include investment shares committed to the 2006, 2007 and 2008 awards under renewed leAP and the 2009 award under leAP III but do not include matching shares from
these plans, if any.4 In December 2008, Paul richardson charged to AIB Group (uK) plc 256,319 shares in the Company as security for certain facilities made available to him by AIB.5 Includes 3,386,031 shares pursuant to the vesting of the 2004 and 2005 awards granted under renewed leAP. the receipt of these awards have been deferred until november 2011
and 2012 respectively.6 Includes 3,636,950 shares which originally formed part of the Capital Investment Plan (an award in respect of 4,691,392 shares in total, some of which have been received by Sir Martin
Sorrell) and comprised the uK and uS Deferred Stock units Awards Agreements.7 In December 2005, Sir Martin Sorrell and the trustees of two family life interest trusts of Sir Martin Sorrell charged to AIB Group (uK) plc 3,771,214 and 3,863,147 ordinary shares in the
Company respectively as security for facilities. In november 2008, Sir Martin Sorrell charged to AIB a further 232,595 shares as security in relation to the renewal of certain of those facilities. In December 2008, Sir Martin Sorrell gifted 259,825 shares to the JMMrJ Charitable Foundation and those shares were released by AIB from the security held by them. In March 2010, Sir Martin Sorrell gifted 147,883 shares to the JMMrJ Charitable Foundation.
Jeffrey RosenChairman of the Compensation Committee on behalf of the Board of Directors of WPP plc 16 April 2010

WPP AnnuAl rePort 2009 145WPP AnnuAl rePort 2009 145
Our 2009 financial statements
Accounting policies
T he consolidated financial statements of WPP plc and its subsidiaries (the Group) for the year ended 31 December 2009 have been prepared in accordance
with International Financial Reporting Standards (IFRS) as adopted by the European Union as they apply to the financial statements of the Group for the year ended 31 December 2009.
The Group’s financial statements are also consistent with International Financial Reporting Standards as issued by the International Accounting Standards Board.
Basis of preparation
The consolidated financial statements have been prepared under the historical cost convention, except for the revaluation of certain financial instruments. The principal accounting policies are set out below.
Basis of consolidation
The consolidated financial statements include the results of the Company and all its subsidiary undertakings made up to the same accounting date. All intra-Group balances, transactions, income and expenses are eliminated in full on consolidation. The results of subsidiary undertakings acquired or disposed of during the period are included or excluded from the income statement from the effective date of acquisition or disposal.
Our 2009 financial statements
WPP AnnuAl rePort 2009 146
Accounting policies
Contingent consideration
Future anticipated payments to vendors in respect of contingent consideration (earnouts) are based on the directors’ best estimates of future obligations, which are dependent on the future performance of the interests acquired and assume the operating companies improve profits in line with directors’ estimates. When earnouts are to be settled by cash consideration, the fair value of the consideration is obtained by discounting the amounts expected to be payable in the future to their present value. The resulting interest charge is included within finance costs.
Property, plant and equipment
Property, plant and equipment are shown at cost less accumulated depreciation and any provision for impairment with the exception of freehold land which is not depreciated. The Group assesses the carrying value of its property, plant and equipment to determine if any impairment has occurred. Where this indicates that an asset may be impaired, the Group applies the requirements of IAS 36 Impairment of Assets in assessing the carrying amount of the asset. This process includes comparing its recoverable amount with its carrying value. Depreciation is provided at rates calculated to write off the cost less estimated residual value of each asset on a straight-line basis over its estimated useful life, as follows:
Freehold buildings – 50 years. Leasehold land and buildings – over the term of the lease
or life of the asset, if shorter. Fixtures, fittings and equipment – 3-10 years. Computer equipment – 3-5 years.
Interests in associates and joint ventures
The Group’s share of the profits less losses of associate undertakings net of tax, interest and minority interest is included in the consolidated income statement and the Group’s share of net assets is shown within interests in associates in the consolidated balance sheet. The Group’s share of the profits less losses and net assets is based on current information produced by the undertakings, adjusted to conform with the accounting policies of the Group.
The Group assesses the carrying value of its associate undertakings to determine if any impairment has occurred. Where this indicates that an investment may be impaired, the Group applies the requirements of IAS 36 in assessing the carrying amount of the investment. This process includes comparing its recoverable amount with its carrying value.
Goodwill and other intangible assets
Intangible assets comprise goodwill, certain acquired separable corporate brand names, acquired customer relationships, acquired proprietary tools and capitalised computer software not integral to a related item of hardware.
Goodwill represents the excess of fair value attributed to investments in businesses or subsidiary undertakings over the fair value of the underlying net assets, including intangible assets, at the date of their acquisition. Goodwill arising on acquisitions before the date of transition to IFRS (1 January 2004) has been retained at the previous UK GAAP amounts subject to being tested for impairment. Goodwill written off to reserves under UK GAAP prior to 1998 has not been reinstated and is not included in determining any subsequent profit or loss on disposal.
Goodwill impairment reviews are undertaken annually or more frequently if events or changes in circumstances indicate a potential impairment. The carrying value of goodwill is compared to the net present value of future cash flows derived from the underlying assets using a projection period of up to five years for each cash-generating unit. After the projection period a steady growth rate representing an appropriate long-term growth rate for the industry is applied. Any impairment is recognised immediately as an expense and is not subsequently reversed.
Corporate brand names, customer relationships and proprietary tools acquired as part of acquisitions of businesses are capitalised separately from goodwill as intangible assets if their value can be measured reliably on initial recognition and it is probable that the expected future economic benefits that are attributable to the asset will flow to the Group.
Certain corporate brands of the Group are considered to have an indefinite economic life because of the institutional nature of the corporate brand names, their proven ability to maintain market leadership and profitable operations over long periods of time and the Group’s commitment to develop and enhance their value. The carrying value of these intangible assets is reviewed at least annually for impairment and adjusted to the recoverable amount if required.
Amortisation is provided at rates calculated to write off the cost less estimated residual value of each asset on a straight-line basis over its estimated useful life as follows:Acquired intangibles
Brand names (with finite lives) – 10-20 years. Customer related intangibles – 3-10 years. Other proprietary tools – 3-10 years. Other (including capitalised computer software) –
3-5 years.
Our 2009 financial statements
WPP AnnuAl rePort 2009 147
Accounting policies
At the inception of the hedge relationship the entity documents the relationship between the hedging instrument and hedged item, along with its risk management objectives and its strategy for undertaking various hedge transactions. Furthermore, at the inception of the hedge and on an ongoing basis, the Group documents whether the hedging instrument that is used in a hedging relationship is highly effective in offsetting changes in fair values or cash flows of the hedged item.
Note 25 contains details of the fair values of the derivative instruments used for hedging purposes.
Changes in the fair value of derivatives that are designated and qualify as fair value hedges are recorded in profit or loss immediately, together with any changes in the fair value of the hedged item that is attributable to the hedged risk.
The effective portion of changes in the fair value of derivatives that are designated and qualify as cash flow or net investment hedges is deferred in equity. The gain or loss relating to the ineffective portion is recognised immediately in profit or loss. Amounts deferred in equity are recycled in profit or loss in the periods when the hedged item is recognised in profit or loss. However, when the forecast transaction that is hedged results in the recognition of a non-financial asset or a non-financial liability, the gains and losses previously deferred in equity are transferred from equity and included in the initial measurement of the cost of the asset or liability.
Hedge accounting is discontinued when the hedging instrument expires or is sold, terminated, or exercised, or no longer qualifies for hedge accounting. At that time, any cumulative gain or loss on the hedging instrument recognised in equity is retained in equity until the forecast transaction occurs. If a hedged transaction is no longer expected to occur, the net cumulative gain or loss recognised in equity is transferred to net profit or loss for the period.
Derivatives embedded in other financial instruments or other host contracts are treated as separate derivatives when their risks and characteristics are not closely related to those of host contracts and the host contracts are not carried at fair value with unrealised gains or losses reported in the income statement.
Liabilities in respect of option agreements
Option agreements that allow the Group’s equity partners to require the Group to purchase a minority interest are treated as derivatives over equity instruments and are recorded in the balance sheet at fair value and the valuation is remeasured at each period end. Fair value is based on the present value of expected cash outflows and the movement in the fair value
The Group accounts for joint venture investments under the equity method which is consistent with the Group’s treatment of associates.
Other investments
Other investments are designated as ‘available for sale’ and are shown at fair value with any movements in fair value taken to equity.
On disposal of the security the cumulative gain or loss previously recognised in equity is included in the profit or loss for the year. Impairment losses recognised in profit or loss for equity investments classified as ‘available for sale’ are not subsequently reversed through profit or loss.
Inventory and work in progress
Work in progress is valued at cost, which includes outlays incurred on behalf of clients and an appropriate proportion of directly attributable costs and overheads on incomplete assignments. Provision is made for irrecoverable costs where appropriate. Inventory is stated at the lower of cost and net realisable value.
Trade receivables
Trade receivables are stated net of provisions for bad and doubtful debts.
Foreign currency and interest rate hedging
The Group’s policy on interest rate and foreign exchange rate management sets out the instruments and methods available to hedge interest and currency risk exposures and the control procedures in place to ensure effectiveness.
The Group uses derivative financial instruments to reduce exposure to foreign exchange risk and interest rate movements. The Group does not hold or issue derivative financial instruments for speculative purposes.
Derivatives are initially recognised at fair value at the date a derivative contract is entered into and are subsequently remeasured to their fair value at each balance sheet date. The resulting gain or loss is recognised in profit or loss immediately unless the derivative is designated and effective as a hedging instrument, in which event the timing of the recognition in profit or loss depends on the nature of the hedge relationship.
Our 2009 financial statements
WPP AnnuAl rePort 2009 148
Accounting policies
Revenue is recognised when the service is performed, in accordance with the terms of the contractual arrangement. Incentive-based revenue typically comprises both quantitative and qualitative elements; on the element related to quantitative targets, revenue is recognised when the quantitative targets have been achieved; on the element related to qualitative targets, revenue is recognised when the incentive is received or receivable.
The Group receives volume rebates from certain suppliers for transactions entered into on behalf of clients that, based on the terms of the relevant contracts and local law, are either remitted to clients or retained by the Group. If amounts are passed on to clients they are recorded as liabilities until settled or, if retained by the Group, are recorded as revenue when earned.
Consumer Insight
Revenue recognised in proportion to the level of service performed for market research contracts is based on proportional performance. In assessing contract performance, both input and output criteria are reviewed. Costs incurred are used as an objective input measure of performance. The primary input of all work performed under these arrangements is labour. As a result of the relationship between labour and cost, there is normally a direct relationship between costs incurred and the proportion of the contract performed to date. Costs incurred as a proportion of expected total costs is used as an initial proportional performance measure. This indicative proportional performance measure is subsequently validated against other more subjective criteria (i.e. relevant output measures) such as the percentage of interviews completed, percentage of reports delivered to a client and the achievement of any project milestones stipulated in the contract. In the event of divergence between the objective and more subjective measures, the more subjective measures take precedence since these are output measures.
While most of the studies provided in connection with the Group’s market research contracts are undertaken in response to an individual client’s or group of clients’ specifications, in certain instances a study may be developed as an off-the-shelf product offering sold to a broad client base. For these transactions, revenue is recognised when the product is delivered. Where the terms of transaction provide for licensing the product on a subscription basis, revenue is recognised over the subscription period on a straight-line basis or, if applicable, based on usage.
Substantially all services are provided on a fixed price basis. Pricing may also include a provision for a surcharge where the actual labour hours incurred in completing a
is recognised as income or expense within revaluation of financial instruments in the consolidated income statement.
Derecognition of financial liabilities
In accordance with IAS 39 Financial Instruments: Recognition and Measurement, a financial liability of the Group is only released to the income statement when the underlying legal obligation is extinguished.
Convertible debt
Convertible debt is assessed according to the substance of the contractual arrangements and is classified into liability and equity elements on the basis of the initial fair value of the liability element. The difference between this figure and the cash received is classified as equity.
The income statement charge for the finance cost is spread evenly over the term of the convertible debt so that at redemption the liability equals the redemption value.
Bank borrowings
Other interest-bearing bank loans and overdrafts are recorded at the proceeds received, net of direct issue costs.
Borrowing costs
Finance costs of borrowing are recognised in the income statement over the term of those borrowings.
Revenue recognition
Revenue comprises commission and fees earned in respect of amounts billed. Direct costs include fees paid to external suppliers where they are retained to perform part or all of a specific project for a client and the resulting expenditure is directly attributable to the revenue earned. Revenue is stated exclusive of VAT, sales taxes and trade discounts.
Advertising and Media Investment Management
Revenue is typically derived from commissions on media placements and fees for advertising services. Revenue may consist of various arrangements involving commissions, fees, incentive-based revenue or a combination of the three, as agreed upon with each client.
Our 2009 financial statements
WPP AnnuAl rePort 2009 149
Accounting policies
corresponding tax bases used in the computation of taxable profit, and is accounted for using the balance sheet liability method. Deferred tax liabilities are recognised for all taxable temporary differences unless specifically excepted by IAS 12 Income Taxes. Deferred tax assets are recognised to the extent that it is probable that taxable profits will be available against which deductible temporary differences can be utilised. Such assets and liabilities are not recognised if the temporary difference arises from the initial recognition of goodwill or other assets and liabilities (other than in a business combination) in a transaction that affects neither the tax profit nor the accounting profit.
The carrying amount of deferred tax assets is reviewed at each balance sheet date and reduced to the extent that it is no longer probable that sufficient taxable profits will be available to allow all or part of the asset to be recovered.
Deferred tax liabilities are recognised for taxable temporary differences arising on investments in subsidiaries and associates, and interests in joint ventures, except where the Group is able to control the reversal of the temporary difference and it is probable that the temporary difference will not reverse in the foreseeable future.
Deferred tax assets and liabilities are offset when there is a legally enforceable right to set off current tax assets against current tax liabilities and when they relate to income taxes levied by the same taxation authority and the Group intends to settle its current tax assets and liabilities on a net basis.
Deferred tax is calculated at the tax rates that are expected to apply in the period when the liability is settled or the asset is realised based on enacted or substantively enacted legislation. Deferred tax is charged or credited in the income statement, except when it relates to items charged or credited directly to equity, in which case the deferred tax is also dealt with in equity.
Retirement benefit costs
For defined contribution schemes, contributions are charged to the consolidated income statement as payable in respect of the accounting period.
For defined benefit schemes the amounts charged to operating profit are the current service costs and gains and losses on settlements and curtailments. They are included as part of staff costs. Past service costs are recognised immediately in the income statement if the benefits have vested. If the benefits have not vested, the costs are recognised over the period until vesting occurs. The interest cost and the expected return on assets are shown within finance costs and finance income respectively. Actuarial gains and losses are recognised immediately in the statement of comprehensive income.
project are significantly above the labour hours quoted in the project proposal. In instances where this occurs, the surcharge will be included in the total revenue base on which to measure proportional performance when the actual threshold is reached provided that collectibility is reasonably assured.
Public Relations & Public Affairs and Branding & Identity, Healthcare and Specialist Communications
Revenue is typically derived from retainer fees and services to be performed subject to specific agreement. Revenue is recognised when the service is performed, in accordance with the terms of the contractual arrangement. Revenue is recognised on long-term contracts, if the final outcome can be assessed with reasonable certainty, by including in the consolidated income statement revenue and related costs as contract activity progresses.
Taxation
Corporate taxes are payable on taxable profits at current rates. The tax expense represents the sum of the tax currently payable and deferred tax.
The Group is subject to corporate taxes in a number of different jurisdictions and judgement is required in determining the appropriate provision for transactions where the ultimate tax determination is uncertain. In such circumstances the Group recognises liabilities for anticipated taxes based on the best information available and where the anticipated liability is both probable and estimable. Where the final outcome of such matters differs from the amount recorded, any differences may impact the income tax and deferred tax provisions in the period in which the final determination is made.
The tax laws that apply to the Group’s subsidiaries may be amended by the relevant tax authorities. Such potential amendments are regularly monitored and adjustments are made to the Group’s tax liabilities and deferred tax assets and liabilities where necessary.
The tax currently payable is based on taxable profit for the year. Taxable profit differs from net profit as reported in the income statement because it excludes items of income or expense that are taxable or deductible in other years and it further excludes items that are never taxable or deductible. The Group’s liability for current tax is calculated using tax rates that have been enacted or substantively enacted by the balance sheet date.
Deferred tax is the tax expected to be payable or recoverable on differences between the carrying amounts of assets and liabilities in the financial statements and the
Our 2009 financial statements
WPP AnnuAl rePort 2009 150
Accounting policies
(to the extent that they hedge the Group’s investment in such operations) are reported in the consolidated statement of comprehensive income.
Goodwill and fair value adjustments arising on the acquisition of a foreign entity are treated as assets and liabilities of the foreign entity and translated at the closing rate.
Share-based payments
The Group issues equity-settled share-based payments (including share options) to certain employees and accounts for these awards in accordance with IFRS 2 (Share-Based Payment). Equity-settled share-based payments are measured at fair value (excluding the effect of non-market-based vesting conditions) at the date of grant. Details regarding the fair value of equity settled share-based transactions are set out in notes 22 and 26.
The fair value determined at the grant date is recognised in the income statement as an expense on a straight-line basis over the relevant vesting period, based on the Group’s estimate of the number of shares that will ultimately vest and adjusted for the effect of non-market-based vesting conditions.
New IFRS accounting pronouncements
At the date of authorisation of these financial statements, the following Standards and Interpretations, which have not been applied in these financial statements, were in issue but not yet effective:
IFRIC 14 (amended)/IAS 19 (amended): The Limit on a Defined Benefit Asset, Minimum Funding Requirements and their Interaction;
IFRIC 19 Extinguishing Financial Liabilities with Equity Instruments;
IFRS 2 (amended): Share-Based Payment; IFRS 9 Financial Instruments; IAS 24 (revised): Related Party Transactions; IAS 32 (amended): Classification of Rights Issues.
The Group does not consider that these Standards and Interpretations will have a significant impact on the financial statements of the Group except for additional disclosures when the relevant standards come into effect for periods commencing on or after 1 January 2010.
In addition, IFRS 3 (revised) Business Combinations and IAS 27 (revised) Consolidated and Separate Financial Statements become effective for the Group in the year ended 31 December 2010. The revisions to these standards will apply to business combinations completed after 1 January 2010. The main changes under the revised standards are:
Where defined benefit schemes are funded, the assets of the scheme are held separately from those of the Group, in separate trustee-administered funds. Pension scheme assets are measured at fair value and liabilities are measured on an actuarial basis using the projected unit method and discounted at a rate equivalent to the current rate of return on a high-quality corporate bond of equivalent currency and term to the scheme liabilities. The actuarial valuations are obtained at least triennially and are updated at each balance sheet date.
Recognition of a surplus in the defined benefit schemes is limited based on the economic gain the company is expected to benefit from in the future by means of a refund or reduction in future contributions to the plan, in accordance with IAS 19 Employee Benefits.
Finance leases
Assets held under finance leases are recognised as assets of the Group at the inception of the lease at the lower of their fair value and the present value of the minimum lease payments. Depreciation on leased assets is charged to the consolidated income statement on the same basis as owned assets. Leasing payments are treated as consisting of capital and interest elements and the interest is charged to the income statement as it is incurred.
Operating leases
Operating lease rentals are charged to the income statement on a straight-line basis over the lease term. Any premium or discount on the acquisition of a lease is spread over the life of the lease on a straight-line basis.
Translation of foreign currencies
Foreign currency transactions arising from normal trading activities are recorded at the rates in effect at the date of the transaction. Monetary assets and liabilities denominated in foreign currencies at the year end are translated at the year-end exchange rate. Foreign currency gains and losses are credited or charged to the consolidated income statement as they arise.
The income statements of overseas subsidiary undertakings are translated into pounds sterling at average exchange rates and the year-end net assets of these companies are translated at year-end exchange rates.
Exchange differences arising from retranslation of the opening net assets and on foreign currency borrowings
Our 2009 financial statements
WPP AnnuAl rePort 2009 151
Accounting policies
assessment, the directors concluded that the reportable business segments identified under the previous standard (IAS 14 Segmental Reporting) remain appropriate under IFRS 8.
During the year, the Group also adopted IAS 1 (revised) Presentation of Financial Statements which requires the presentation of a statement of changes in equity as a primary statement. As a result, a consolidated statement of changes in equity has been included in the primary statements, showing changes in each component of equity for each year presented.
Critical judgements in applying accounting policies
Management is required to make key decisions and judgements in the process of applying the Group’s accounting policies. The most significant areas where such judgements have been necessary are revenue recognition, goodwill and other intangibles, acquisition reserves, taxation and accounting for pension liabilities. Where judgement has been applied, the key factors taken into consideration are disclosed in the accounting policies and the appropriate note in these financial statements.
Directors’ responsibility statement
We confirm that to the best of our knowledge: the financial statements, prepared in accordance with the
applicable set of accounting standards, give a true and fair view of the assets, liabilities, financial position and profit or loss of the Company and the undertakings included in the consolidation taken as a whole; and
the management report, which is incorporated into the Directors’ report, includes a fair review of the development and performance of the business and the position of the Company and the undertakings included in the consolidation taken as a whole, together with a description of the principal risks and uncertainties they face.
Sir Martin Sorrell Paul RichardsonGroup chief executive Group finance director16 April 2010
all acquisition-related costs must be recognised as an expense in the period they are incurred;
contingent consideration payable is to be measured at fair value at the acquisition date. Any subsequent movements in the fair value of such consideration as a result of post-acquisition events (such as changes in estimates of earnout consideration) must be recognised as a gain or loss in the income statement;
equity interests held prior to control being obtained must be re-measured to fair value at the acquisition date, with any gain or loss recognised in the income statement; and
increases in ownership interest in a subsidiary that do not result in a change of control are treated as transactions among equity holders and are reported within equity. No gain or loss is recognised on such transactions and goodwill is not re-measured.
The revisions to the standards apply prospectively to business combinations for which the acquisition date is on or after the first annual financial reporting period beginning on or after 1 July 2009. Consequently, the impact that these revised standards will have on the financial statements of the Group will depend on the circumstances of business combinations occurring on or after 1 January 2010.
In the current year, the following Standards and Interpretations issued became effective:
IFRIC 13 Customer Loyalty; IFRIC 16 Hedges of a Net Investment in a
Foreign Operation; IFRIC 17 Distributions of Non-cash Assets to Owners; IFRIC 18 Transfers of Assets from Customers; IFRS 1 (amended)/IAS 27 (amended): Cost of an Investment
in a Subsidiary, Jointly Controlled Entity or Associate; IAS 23 (revised) Borrowing Costs; and IAS 32 (amended)/IAS 1 (amended): Puttable Financial
Instruments and Obligations arising on Liquidation.The adoption of these Standards and Interpretations has
not led to any changes in the Group’s accounting policies.The Group adopted IFRS 8 Operating Segments during
the year. IFRS 8 requires operating segments to be identified on the same basis as is used internally for the review of performance and allocation of resources by the Group chief executive. Provided certain quantitative and qualitative criteria are fulfilled, IFRS 8 permits the aggregation of these components into reportable segments for the purposes of disclosure in the Group’s financial statements. In assessing the Group’s reportable segments, the directors have had regard to the similar economic characteristics of certain operating segments, their shared client base, the similar nature of their products or services and their long-term margins, amongst other factors. As a result of this
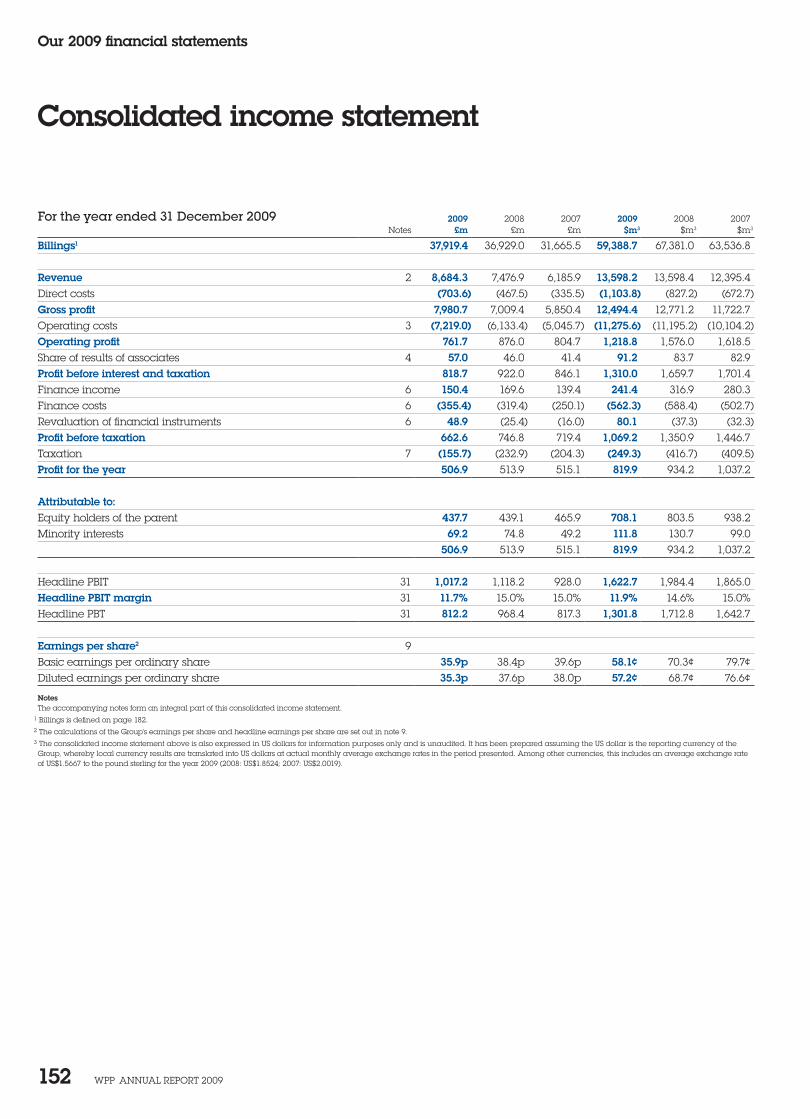
Our 2009 financial statements
WPP AnnuAl rePort 2009 152
Consolidated income statement
For the year ended 31 December 2009 2009 2008 2007 2009 2008 2007notes £m £m £m $m3 $m3 $m3
Billings1 37,919.4 36,929.0 31,665.5 59,388.7 67,381.0 63,536.8
Revenue 2 8,684.3 7,476.9 6,185.9 13,598.2 13,598.4 12,395.4Direct costs (703.6) (467.5) (335.5) (1,103.8) (827.2) (672.7)Gross profit 7,980.7 7,009.4 5,850.4 12,494.4 12,771.2 11,722.7operating costs 3 (7,219.0) (6,133.4) (5,045.7) (11,275.6) (11,195.2) (10,104.2)Operating profit 761.7 876.0 804.7 1,218.8 1,576.0 1,618.5Share of results of associates 4 57.0 46.0 41.4 91.2 83.7 82.9Profit before interest and taxation 818.7 922.0 846.1 1,310.0 1,659.7 1,701.4Finance income 6 150.4 169.6 139.4 241.4 316.9 280.3Finance costs 6 (355.4) (319.4) (250.1) (562.3) (588.4) (502.7)revaluation of financial instruments 6 48.9 (25.4) (16.0) 80.1 (37.3) (32.3)Profit before taxation 662.6 746.8 719.4 1,069.2 1,350.9 1,446.7taxation 7 (155.7) (232.9) (204.3) (249.3) (416.7) (409.5)Profit for the year 506.9 513.9 515.1 819.9 934.2 1,037.2
Attributable to:equity holders of the parent 437.7 439.1 465.9 708.1 803.5 938.2Minority interests 69.2 74.8 49.2 111.8 130.7 99.0
506.9 513.9 515.1 819.9 934.2 1,037.2
Headline PBIt 31 1,017.2 1,118.2 928.0 1,622.7 1,984.4 1,865.0Headline PBIT margin 31 11.7% 15.0% 15.0% 11.9% 14.6% 15.0%Headline PBt 31 812.2 968.4 817.3 1,301.8 1,712.8 1,642.7
Earnings per share2 9Basic earnings per ordinary share 35.9p 38.4p 39.6p 58.1¢ 70.3¢ 79.7¢Diluted earnings per ordinary share 35.3p 37.6p 38.0p 57.2¢ 68.7¢ 76.6¢
Notesthe accompanying notes form an integral part of this consolidated income statement.
1 Billings is defined on page 182.
2 the calculations of the Group’s earnings per share and headline earnings per share are set out in note 9.
3 the consolidated income statement above is also expressed in uS dollars for information purposes only and is unaudited. It has been prepared assuming the uS dollar is the reporting currency of the Group, whereby local currency results are translated into uS dollars at actual monthly average exchange rates in the period presented. Among other currencies, this includes an average exchange rate of uS$1.5667 to the pound sterling for the year 2009 (2008: uS$1.8524; 2007: uS$2.0019).
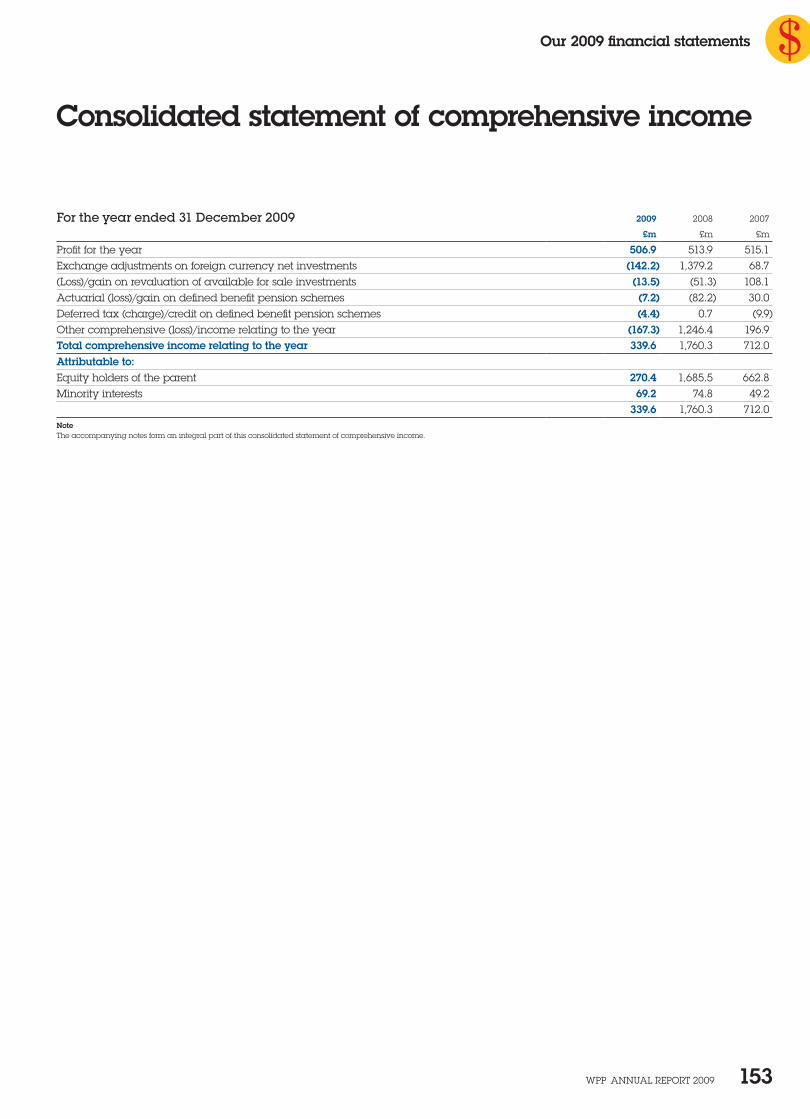
Our 2009 financial statements
WPP AnnuAl rePort 2009 153
Consolidated statement of comprehensive income
For the year ended 31 December 2009 2009 2008 2007
£m £m £m
Profit for the year 506.9 513.9 515.1exchange adjustments on foreign currency net investments (142.2) 1,379.2 68.7(loss)/gain on revaluation of available for sale investments (13.5) (51.3) 108.1Actuarial (loss)/gain on defined benefit pension schemes (7.2) (82.2) 30.0Deferred tax (charge)/credit on defined benefit pension schemes (4.4) 0.7 (9.9)other comprehensive (loss)/income relating to the year (167.3) 1,246.4 196.9Total comprehensive income relating to the year 339.6 1,760.3 712.0Attributable to:equity holders of the parent 270.4 1,685.5 662.8Minority interests 69.2 74.8 49.2
339.6 1,760.3 712.0Notethe accompanying notes form an integral part of this consolidated statement of comprehensive income.
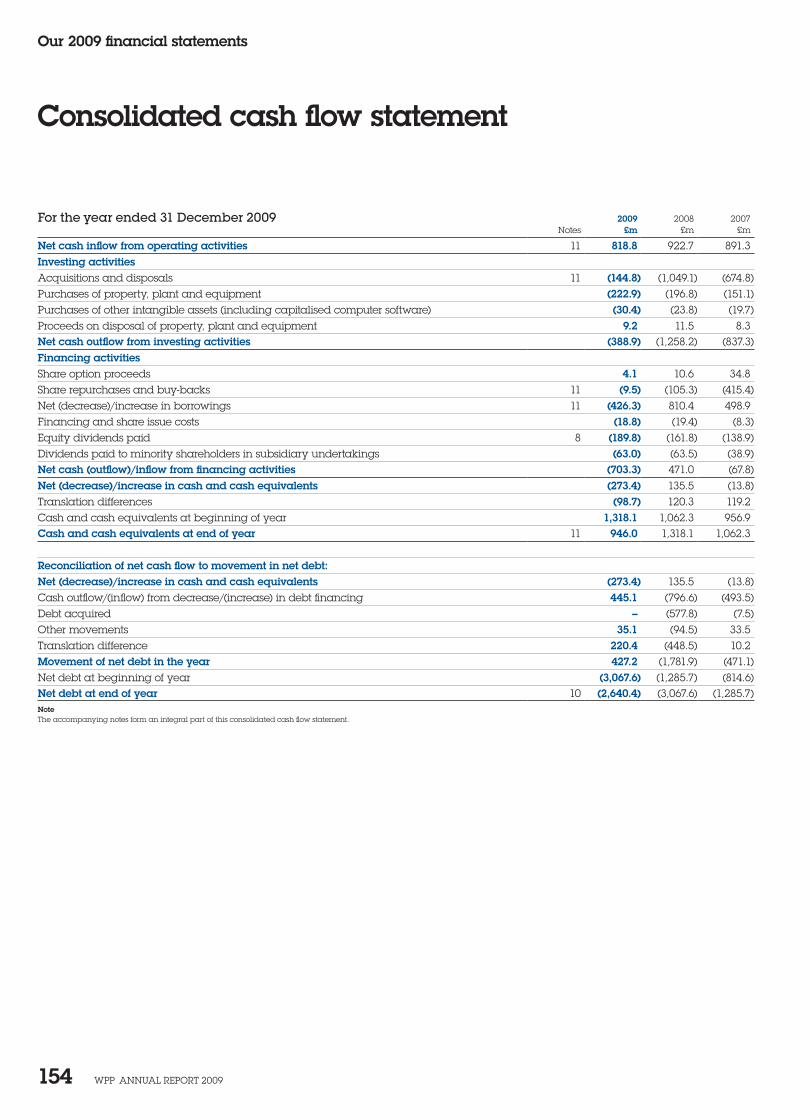
Our 2009 financial statements
WPP AnnuAl rePort 2009 154
Consolidated cash flow statement
For the year ended 31 December 2009 2009 2008 2007notes £m £m £m
Net cash inflow from operating activities 11 818.8 922.7 891.3Investing activitiesAcquisitions and disposals 11 (144.8) (1,049.1) (674.8)Purchases of property, plant and equipment (222.9) (196.8) (151.1)Purchases of other intangible assets (including capitalised computer software) (30.4) (23.8) (19.7)Proceeds on disposal of property, plant and equipment 9.2 11.5 8.3Net cash outflow from investing activities (388.9) (1,258.2) (837.3)Financing activitiesShare option proceeds 4.1 10.6 34.8Share repurchases and buy-backs 11 (9.5) (105.3) (415.4)net (decrease)/increase in borrowings 11 (426.3) 810.4 498.9Financing and share issue costs (18.8) (19.4) (8.3)equity dividends paid 8 (189.8) (161.8) (138.9)Dividends paid to minority shareholders in subsidiary undertakings (63.0) (63.5) (38.9)Net cash (outflow)/inflow from financing activities (703.3) 471.0 (67.8)Net (decrease)/increase in cash and cash equivalents (273.4) 135.5 (13.8)translation differences (98.7) 120.3 119.2Cash and cash equivalents at beginning of year 1,318.1 1,062.3 956.9Cash and cash equivalents at end of year 11 946.0 1,318.1 1,062.3
Reconciliation of net cash flow to movement in net debt:Net (decrease)/increase in cash and cash equivalents (273.4) 135.5 (13.8)Cash outflow/(inflow) from decrease/(increase) in debt financing 445.1 (796.6) (493.5)Debt acquired – (577.8) (7.5)other movements 35.1 (94.5) 33.5translation difference 220.4 (448.5) 10.2Movement of net debt in the year 427.2 (1,781.9) (471.1)net debt at beginning of year (3,067.6) (1,285.7) (814.6)Net debt at end of year 10 (2,640.4) (3,067.6) (1,285.7)Notethe accompanying notes form an integral part of this consolidated cash flow statement.
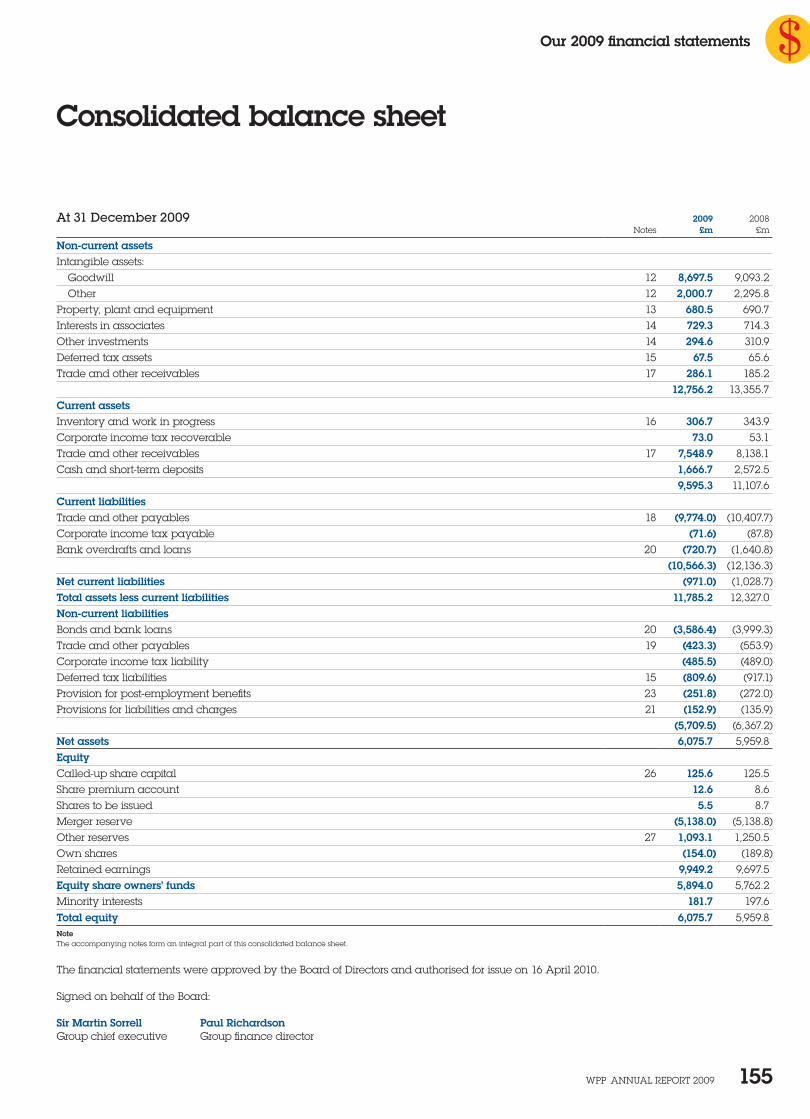
Our 2009 financial statements
WPP AnnuAl rePort 2009 155
Consolidated balance sheet
At 31 December 2009 2009 2008notes £m £m
Non-current assetsIntangible assets:
Goodwill 12 8,697.5 9,093.2other 12 2,000.7 2,295.8
Property, plant and equipment 13 680.5 690.7Interests in associates 14 729.3 714.3other investments 14 294.6 310.9Deferred tax assets 15 67.5 65.6trade and other receivables 17 286.1 185.2
12,756.2 13,355.7Current assetsInventory and work in progress 16 306.7 343.9Corporate income tax recoverable 73.0 53.1trade and other receivables 17 7,548.9 8,138.1Cash and short-term deposits 1,666.7 2,572.5
9,595.3 11,107.6Current liabilitiestrade and other payables 18 (9,774.0) (10,407.7)Corporate income tax payable (71.6) (87.8)Bank overdrafts and loans 20 (720.7) (1,640.8)
(10,566.3) (12,136.3)Net current liabilities (971.0) (1,028.7)Total assets less current liabilities 11,785.2 12,327.0Non-current liabilitiesBonds and bank loans 20 (3,586.4) (3,999.3)trade and other payables 19 (423.3) (553.9)Corporate income tax liability (485.5) (489.0)Deferred tax liabilities 15 (809.6) (917.1)Provision for post-employment benefits 23 (251.8) (272.0)Provisions for liabilities and charges 21 (152.9) (135.9)
(5,709.5) (6,367.2)Net assets 6,075.7 5,959.8EquityCalled-up share capital 26 125.6 125.5Share premium account 12.6 8.6Shares to be issued 5.5 8.7Merger reserve (5,138.0) (5,138.8)other reserves 27 1,093.1 1,250.5own shares (154.0) (189.8)retained earnings 9,949.2 9,697.5Equity share owners’ funds 5,894.0 5,762.2 Minority interests 181.7 197.6Total equity 6,075.7 5,959.8Notethe accompanying notes form an integral part of this consolidated balance sheet.
the financial statements were approved by the Board of Directors and authorised for issue on 16 April 2010.
Signed on behalf of the Board:
Sir Martin Sorrell Paul RichardsonGroup chief executive Group finance director
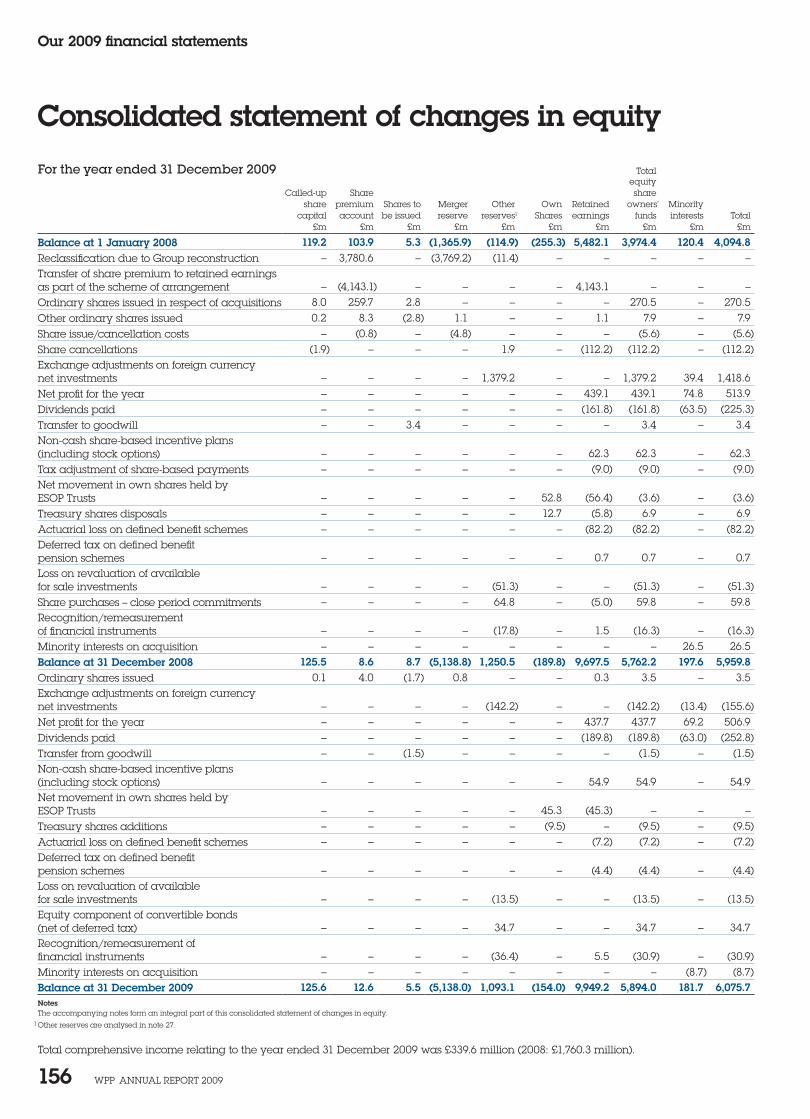
Our 2009 financial statements
WPP AnnuAl rePort 2009 156
Consolidated statement of changes in equity
For the year ended 31 December 2009 totalequity
Called-up Share shareshare premium Shares to Merger other own retained owners’ Minority
capital account be issued reserve reserves1 Shares earnings funds interests total£m £m £m £m £m £m £m £m £m £m
Balance at 1 January 2008 119.2 103.9 5.3 (1,365.9) (114.9) (255.3) 5,482.1 3,974.4 120.4 4,094.8reclassification due to Group reconstruction – 3,780.6 – (3,769.2) (11.4) – – – – –transfer of share premium to retained earnings as part of the scheme of arrangement – (4,143.1) – – – – 4,143.1 – – –ordinary shares issued in respect of acquisitions 8.0 259.7 2.8 – – – – 270.5 – 270.5other ordinary shares issued 0.2 8.3 (2.8) 1.1 – – 1.1 7.9 – 7.9Share issue/cancellation costs – (0.8) – (4.8) – – – (5.6) – (5.6)Share cancellations (1.9) – – – 1.9 – (112.2) (112.2) – (112.2)exchange adjustments on foreign currency net investments – – – – 1,379.2 – – 1,379.2 39.4 1,418.6net profit for the year – – – – – – 439.1 439.1 74.8 513.9Dividends paid – – – – – – (161.8) (161.8) (63.5) (225.3)transfer to goodwill – – 3.4 – – – – 3.4 – 3.4non-cash share-based incentive plans (including stock options) – – – – – – 62.3 62.3 – 62.3tax adjustment of share-based payments – – – – – – (9.0) (9.0) – (9.0)net movement in own shares held by eSoP trusts – – – – – 52.8 (56.4) (3.6) – (3.6)treasury shares disposals – – – – – 12.7 (5.8) 6.9 – 6.9Actuarial loss on defined benefit schemes – – – – – – (82.2) (82.2) – (82.2)Deferred tax on defined benefit pension schemes – – – – – – 0.7 0.7 – 0.7loss on revaluation of available for sale investments – – – – (51.3) – – (51.3) – (51.3)Share purchases – close period commitments – – – – 64.8 – (5.0) 59.8 – 59.8recognition/remeasurement of financial instruments – – – – (17.8) – 1.5 (16.3) – (16.3)Minority interests on acquisition – – – – – – – – 26.5 26.5Balance at 31 December 2008 125.5 8.6 8.7 (5,138.8) 1,250.5 (189.8) 9,697.5 5,762.2 197.6 5,959.8ordinary shares issued 0.1 4.0 (1.7) 0.8 – – 0.3 3.5 – 3.5exchange adjustments on foreign currency net investments – – – – (142.2) – – (142.2) (13.4) (155.6)net profit for the year – – – – – – 437.7 437.7 69.2 506.9Dividends paid – – – – – – (189.8) (189.8) (63.0) (252.8)transfer from goodwill – – (1.5) – – – – (1.5) – (1.5)non-cash share-based incentive plans (including stock options) – – – – – – 54.9 54.9 – 54.9net movement in own shares held by eSoP trusts – – – – – 45.3 (45.3) – – –treasury shares additions – – – – – (9.5) – (9.5) – (9.5)Actuarial loss on defined benefit schemes – – – – – – (7.2) (7.2) – (7.2)Deferred tax on defined benefit pension schemes – – – – – – (4.4) (4.4) – (4.4)loss on revaluation of available for sale investments – – – – (13.5) – – (13.5) – (13.5)equity component of convertible bonds (net of deferred tax) – – – – 34.7 – – 34.7 – 34.7recognition/remeasurement of financial instruments – – – – (36.4) – 5.5 (30.9) – (30.9)Minority interests on acquisition – – – – – – – – (8.7) (8.7)Balance at 31 December 2009 125.6 12.6 5.5 (5,138.0) 1,093.1 (154.0) 9,949.2 5,894.0 181.7 6,075.7Notesthe accompanying notes form an integral part of this consolidated statement of changes in equity.
1 other reserves are analysed in note 27.
total comprehensive income relating to the year ended 31 December 2009 was £339.6 million (2008: £1,760.3 million).
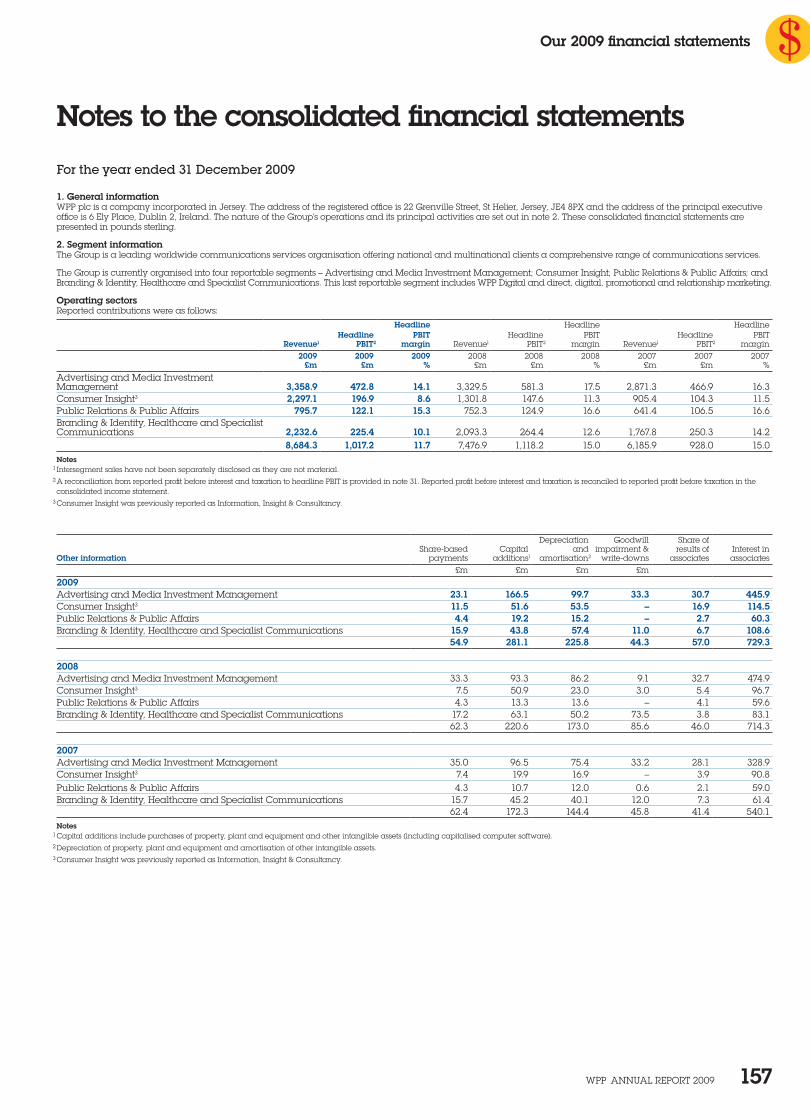
Our 2009 financial statements
WPP AnnuAl rePort 2009 157
Notes to the consolidated financial statements
For the year ended 31 December 2009
1. General informationWPP plc is a company incorporated in Jersey. the address of the registered office is 22 Grenville Street, St Helier, Jersey, Je4 8PX and the address of the principal executive office is 6 ely Place, Dublin 2, Ireland. the nature of the Group’s operations and its principal activities are set out in note 2. these consolidated financial statements are presented in pounds sterling.
2. Segment informationthe Group is a leading worldwide communications services organisation offering national and multinational clients a comprehensive range of communications services.
the Group is currently organised into four reportable segments – Advertising and Media Investment Management; Consumer Insight; Public relations & Public Affairs; and Branding & Identity, Healthcare and Specialist Communications. this last reportable segment includes WPP Digital and direct, digital, promotional and relationship marketing.
Operating sectorsreported contributions were as follows:
Headline Headline HeadlineHeadline PBIT Headline PBIt Headline PBIt
Revenue1 PBIT2 margin revenue1 PBIt2 margin revenue1 PBIt2 margin2009 2009 2009 2008 2008 2008 2007 2007 2007
£m £m % £m £m % £m £m %
Advertising and Media Investment Management 3,358.9 472.8 14.1 3,329.5 581.3 17.5 2,871.3 466.9 16.3Consumer Insight3 2,297.1 196.9 8.6 1,301.8 147.6 11.3 905.4 104.3 11.5Public relations & Public Affairs 795.7 122.1 15.3 752.3 124.9 16.6 641.4 106.5 16.6Branding & Identity, Healthcare and Specialist Communications 2,232.6 225.4 10.1 2,093.3 264.4 12.6 1,767.8 250.3 14.2
8,684.3 1,017.2 11.7 7,476.9 1,118.2 15.0 6,185.9 928.0 15.0Notes 1 Intersegment sales have not been separately disclosed as they are not material.
2 A reconciliation from reported profit before interest and taxation to headline PBIt is provided in note 31. reported profit before interest and taxation is reconciled to reported profit before taxation in the consolidated income statement.
3 Consumer Insight was previously reported as Information, Insight & Consultancy.
Depreciation Goodwill Share ofShare-based Capital and impairment & results of Interest in
Other information payments additions1 amortisation2 write-downs associates associates£m £m £m £m
2009Advertising and Media Investment Management 23.1 166.5 99.7 33.3 30.7 445.9Consumer Insight3 11.5 51.6 53.5 – 16.9 114.5Public relations & Public Affairs 4.4 19.2 15.2 – 2.7 60.3Branding & Identity, Healthcare and Specialist Communications 15.9 43.8 57.4 11.0 6.7 108.6 54.9 281.1 225.8 44.3 57.0 729.3
2008Advertising and Media Investment Management 33.3 93.3 86.2 9.1 32.7 474.9Consumer Insight3 7.5 50.9 23.0 3.0 5.4 96.7Public relations & Public Affairs 4.3 13.3 13.6 – 4.1 59.6Branding & Identity, Healthcare and Specialist Communications 17.2 63.1 50.2 73.5 3.8 83.1 62.3 220.6 173.0 85.6 46.0 714.3
2007Advertising and Media Investment Management 35.0 96.5 75.4 33.2 28.1 328.9Consumer Insight3 7.4 19.9 16.9 – 3.9 90.8Public relations & Public Affairs 4.3 10.7 12.0 0.6 2.1 59.0Branding & Identity, Healthcare and Specialist Communications 15.7 45.2 40.1 12.0 7.3 61.4 62.4 172.3 144.4 45.8 41.4 540.1Notes 1 Capital additions include purchases of property, plant and equipment and other intangible assets (including capitalised computer software).
2 Depreciation of property, plant and equipment and amortisation of other intangible assets.
3 Consumer Insight was previously reported as Information, Insight & Consultancy.
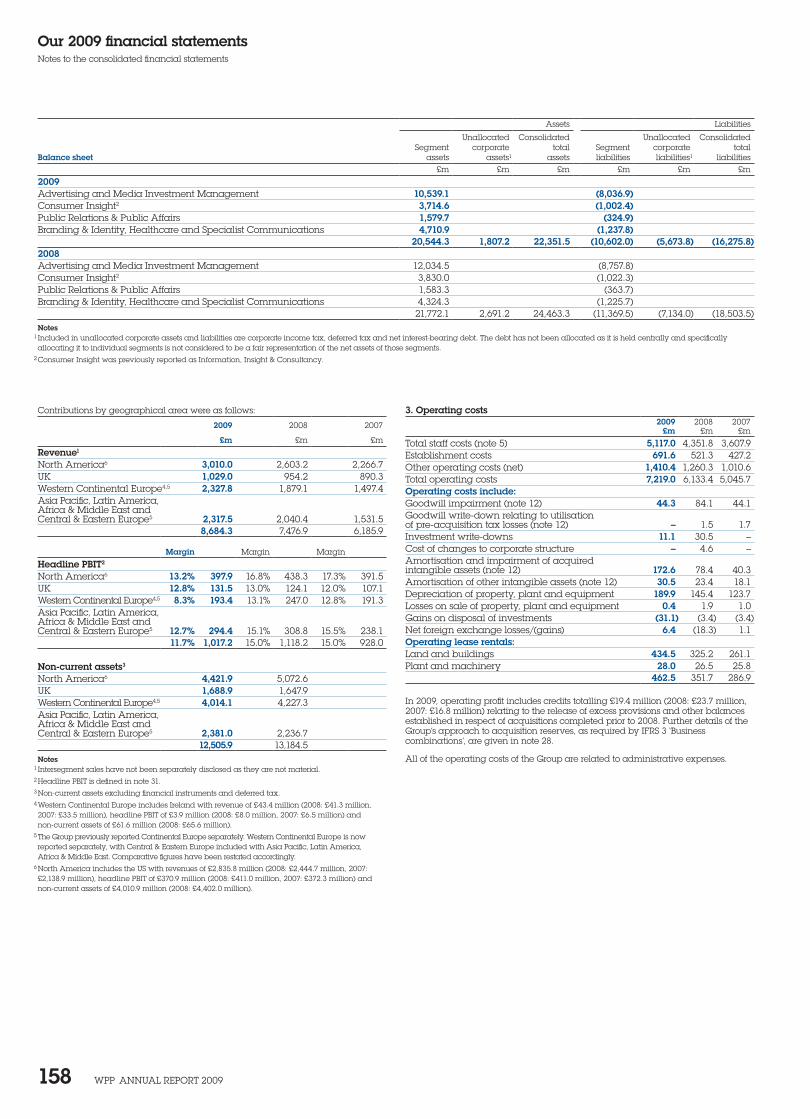
Our 2009 financial statementsnotes to the consolidated financial statements
WPP AnnuAl rePort 2009 158
Contributions by geographical area were as follows:
2009 2008 2007
£m £m £m
Revenue1
north America6 3,010.0 2,603.2 2,266.7uK 1,029.0 954.2 890.3Western Continental europe4,5 2,327.8 1,879.1 1,497.4Asia Pacific, latin America, Africa & Middle east and Central & eastern europe5 2,317.5 2,040.4 1,531.5
8,684.3 7,476.9 6,185.9
Margin Margin Margin
Headline PBIT2
north America6 13.2% 397.9 16.8% 438.3 17.3% 391.5uK 12.8% 131.5 13.0% 124.1 12.0% 107.1Western Continental europe4,5 8.3% 193.4 13.1% 247.0 12.8% 191.3Asia Pacific, latin America, Africa & Middle east and Central & eastern europe5 12.7% 294.4 15.1% 308.8 15.5% 238.1
11.7% 1,017.2 15.0% 1,118.2 15.0% 928.0
Non-current assets3
north America6 4,421.9 5,072.6uK 1,688.9 1,647.9Western Continental europe4,5 4,014.1 4,227.3Asia Pacific, latin America, Africa & Middle east and Central & eastern europe5 2,381.0 2,236.7
12,505.9 13,184.5Notes 1 Intersegment sales have not been separately disclosed as they are not material.
2 Headline PBIt is defined in note 31.
3 non-current assets excluding financial instruments and deferred tax.
4 Western Continental europe includes Ireland with revenue of £43.4 million (2008: £41.3 million, 2007: £33.5 million), headline PBIt of £3.9 million (2008: £8.0 million, 2007: £6.5 million) and non-current assets of £61.6 million (2008: £65.6 million).
5 the Group previously reported Continental europe separately. Western Continental europe is now reported separately, with Central & eastern europe included with Asia Pacific, latin America, Africa & Middle east. Comparative figures have been restated accordingly.
6 north America includes the uS with revenues of £2,835.8 million (2008: £2,444.7 million, 2007: £2,138.9 million), headline PBIt of £370.9 million (2008: £411.0 million, 2007: £372.3 million) and non-current assets of £4,010.9 million (2008: £4,402.0 million).
Assets liabilities
unallocated Consolidated unallocated ConsolidatedSegment corporate total Segment corporate total
Balance sheet assets assets1 assets liabilities liabilities1 liabilities£m £m £m £m £m £m
2009Advertising and Media Investment Management 10,539.1 (8,036.9)Consumer Insight2 3,714.6 (1,002.4)Public relations & Public Affairs 1,579.7 (324.9)Branding & Identity, Healthcare and Specialist Communications 4,710.9 (1,237.8)
20,544.3 1,807.2 22,351.5 (10,602.0) (5,673.8) (16,275.8)2008Advertising and Media Investment Management 12,034.5 (8,757.8)Consumer Insight2 3,830.0 (1,022.3)Public relations & Public Affairs 1,583.3 (363.7)Branding & Identity, Healthcare and Specialist Communications 4,324.3 (1,225.7)
21,772.1 2,691.2 24,463.3 (11,369.5) (7,134.0) (18,503.5)Notes 1 Included in unallocated corporate assets and liabilities are corporate income tax, deferred tax and net interest-bearing debt. the debt has not been allocated as it is held centrally and specifically allocating it to individual segments is not considered to be a fair representation of the net assets of those segments.
2 Consumer Insight was previously reported as Information, Insight & Consultancy.
3. Operating costs2009 2008 2007
£m £m £m
total staff costs (note 5) 5,117.0 4,351.8 3,607.9establishment costs 691.6 521.3 427.2other operating costs (net) 1,410.4 1,260.3 1,010.6total operating costs 7,219.0 6,133.4 5,045.7Operating costs include:Goodwill impairment (note 12) 44.3 84.1 44.1Goodwill write-down relating to utilisation of pre-acquisition tax losses (note 12) – 1.5 1.7Investment write-downs 11.1 30.5 –Cost of changes to corporate structure – 4.6 –Amortisation and impairment of acquired intangible assets (note 12) 172.6 78.4 40.3Amortisation of other intangible assets (note 12) 30.5 23.4 18.1Depreciation of property, plant and equipment 189.9 145.4 123.7losses on sale of property, plant and equipment 0.4 1.9 1.0Gains on disposal of investments (31.1) (3.4) (3.4)net foreign exchange losses/(gains) 6.4 (18.3) 1.1Operating lease rentals:land and buildings 434.5 325.2 261.1Plant and machinery 28.0 26.5 25.8
462.5 351.7 286.9
In 2009, operating profit includes credits totalling £19.4 million (2008: £23.7 million, 2007: £16.8 million) relating to the release of excess provisions and other balances established in respect of acquisitions completed prior to 2008. Further details of the Group’s approach to acquisition reserves, as required by IFrS 3 ‘Business combinations’, are given in note 28.
All of the operating costs of the Group are related to administrative expenses.
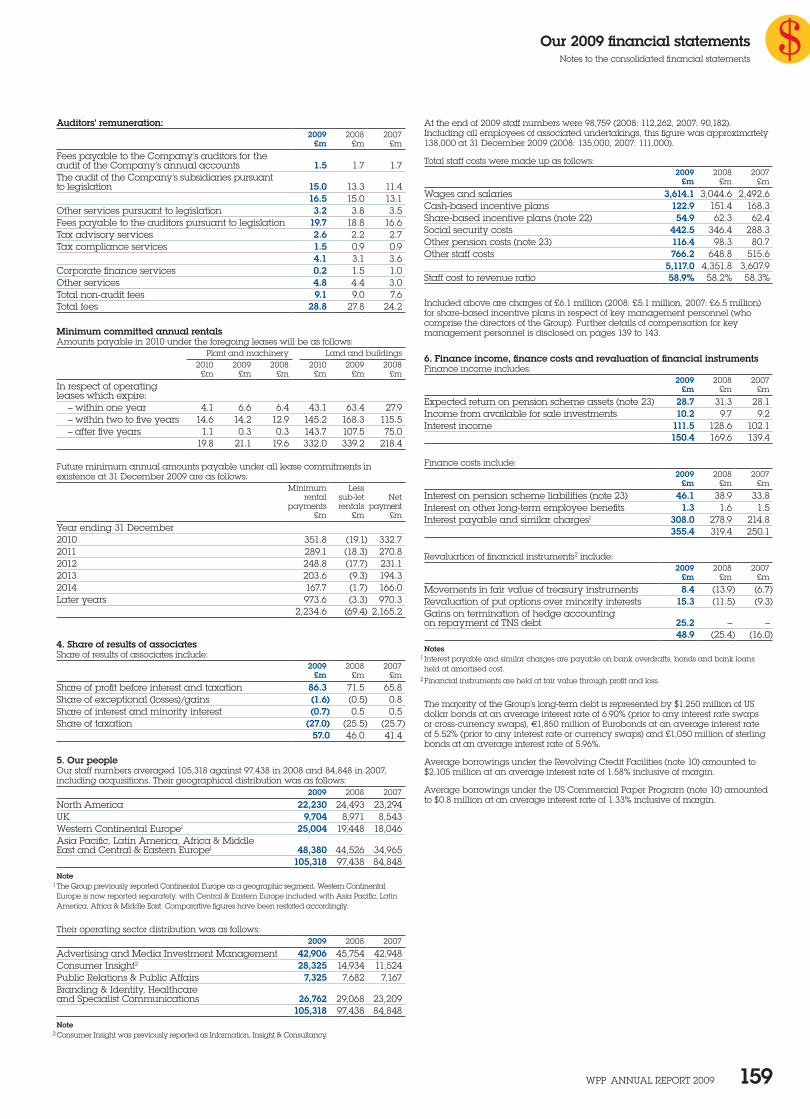
Our 2009 financial statementsnotes to the consolidated financial statements
WPP AnnuAl rePort 2009 159
Auditors’ remuneration:2009 2008 2007
£m £m £m
Fees payable to the Company’s auditors for the audit of the Company’s annual accounts 1.5 1.7 1.7the audit of the Company’s subsidiaries pursuant to legislation 15.0 13.3 11.4
16.5 15.0 13.1other services pursuant to legislation 3.2 3.8 3.5Fees payable to the auditors pursuant to legislation 19.7 18.8 16.6tax advisory services 2.6 2.2 2.7tax compliance services 1.5 0.9 0.9
4.1 3.1 3.6Corporate finance services 0.2 1.5 1.0other services 4.8 4.4 3.0total non-audit fees 9.1 9.0 7.6total fees 28.8 27.8 24.2
Minimum committed annual rentalsAmounts payable in 2010 under the foregoing leases will be as follows:
Plant and machinery land and buildings2010 2009 2008 2010 2009 2008
£m £m £m £m £m £m
In respect of operating leases which expire:
– within one year 4.1 6.6 6.4 43.1 63.4 27.9– within two to five years 14.6 14.2 12.9 145.2 168.3 115.5– after five years 1.1 0.3 0.3 143.7 107.5 75.0
19.8 21.1 19.6 332.0 339.2 218.4
Future minimum annual amounts payable under all lease commitments in existence at 31 December 2009 are as follows:
Minimum lessrental sub-let net
payments rentals payment£m £m £m
Year ending 31 December2010 351.8 (19.1) 332.72011 289.1 (18.3) 270.82012 248.8 (17.7) 231.12013 203.6 (9.3) 194.32014 167.7 (1.7) 166.0later years 973.6 (3.3) 970.3
2,234.6 (69.4) 2,165.2
4. Share of results of associatesShare of results of associates include:
2009 2008 2007£m £m £m
Share of profit before interest and taxation 86.3 71.5 65.8Share of exceptional (losses)/gains (1.6) (0.5) 0.8Share of interest and minority interest (0.7) 0.5 0.5Share of taxation (27.0) (25.5) (25.7)
57.0 46.0 41.4
5. Our peopleour staff numbers averaged 105,318 against 97,438 in 2008 and 84,848 in 2007, including acquisitions. their geographical distribution was as follows:
2009 2008 2007
north America 22,230 24,493 23,294uK 9,704 8,971 8,543Western Continental europe1 25,004 19,448 18,046Asia Pacific, latin America, Africa & Middle east and Central & eastern europe1 48,380 44,526 34,965
105,318 97,438 84,848Note 1 the Group previously reported Continental europe as a geographic segment. Western Continental europe is now reported separately, with Central & eastern europe included with Asia Pacific, latin America, Africa & Middle east. Comparative figures have been restated accordingly.
their operating sector distribution was as follows:2009 2008 2007
Advertising and Media Investment Management 42,906 45,754 42,948Consumer Insight2 28,325 14,934 11,524Public relations & Public Affairs 7,325 7,682 7,167Branding & Identity, Healthcare and Specialist Communications 26,762 29,068 23,209
105,318 97,438 84,848Note 2 Consumer Insight was previously reported as Information, Insight & Consultancy.
At the end of 2009 staff numbers were 98,759 (2008: 112,262, 2007: 90,182). Including all employees of associated undertakings, this figure was approximately 138,000 at 31 December 2009 (2008: 135,000, 2007: 111,000).
total staff costs were made up as follows:2009 2008 2007
£m £m £m
Wages and salaries 3,614.1 3,044.6 2,492.6Cash-based incentive plans 122.9 151.4 168.3Share-based incentive plans (note 22) 54.9 62.3 62.4Social security costs 442.5 346.4 288.3other pension costs (note 23) 116.4 98.3 80.7other staff costs 766.2 648.8 515.6
5,117.0 4,351.8 3,607.9Staff cost to revenue ratio 58.9% 58.2% 58.3%
Included above are charges of £6.1 million (2008: £5.1 million, 2007: £6.5 million) for share-based incentive plans in respect of key management personnel (who comprise the directors of the Group). Further details of compensation for key management personnel is disclosed on pages 139 to 143.
6. Finance income, finance costs and revaluation of financial instrumentsFinance income includes:
2009 2008 2007£m £m £m
expected return on pension scheme assets (note 23) 28.7 31.3 28.1Income from available for sale investments 10.2 9.7 9.2Interest income 111.5 128.6 102.1
150.4 169.6 139.4
Finance costs include:
2009 2008 2007£m £m £m
Interest on pension scheme liabilities (note 23) 46.1 38.9 33.8Interest on other long-term employee benefits 1.3 1.6 1.5Interest payable and similar charges1 308.0 278.9 214.8
355.4 319.4 250.1
revaluation of financial instruments2 include:2009 2008 2007
£m £m £m
Movements in fair value of treasury instruments 8.4 (13.9) (6.7)revaluation of put options over minority interests 15.3 (11.5) (9.3)Gains on termination of hedge accounting on repayment of tnS debt 25.2 – –
48.9 (25.4) (16.0)Notes 1 Interest payable and similar charges are payable on bank overdrafts, bonds and bank loans held at amortised cost.
2 Financial instruments are held at fair value through profit and loss.
the majority of the Group’s long-term debt is represented by $1,250 million of uS dollar bonds at an average interest rate of 6.90% (prior to any interest rate swaps or cross-currency swaps), 11,850 million of eurobonds at an average interest rate of 5.52% (prior to any interest rate or currency swaps) and £1,050 million of sterling bonds at an average interest rate of 5.96%.
Average borrowings under the revolving Credit Facilities (note 10) amounted to $2,105 million at an average interest rate of 1.58% inclusive of margin.
Average borrowings under the uS Commercial Paper Program (note 10) amounted to $0.8 million at an average interest rate of 1.33% inclusive of margin.
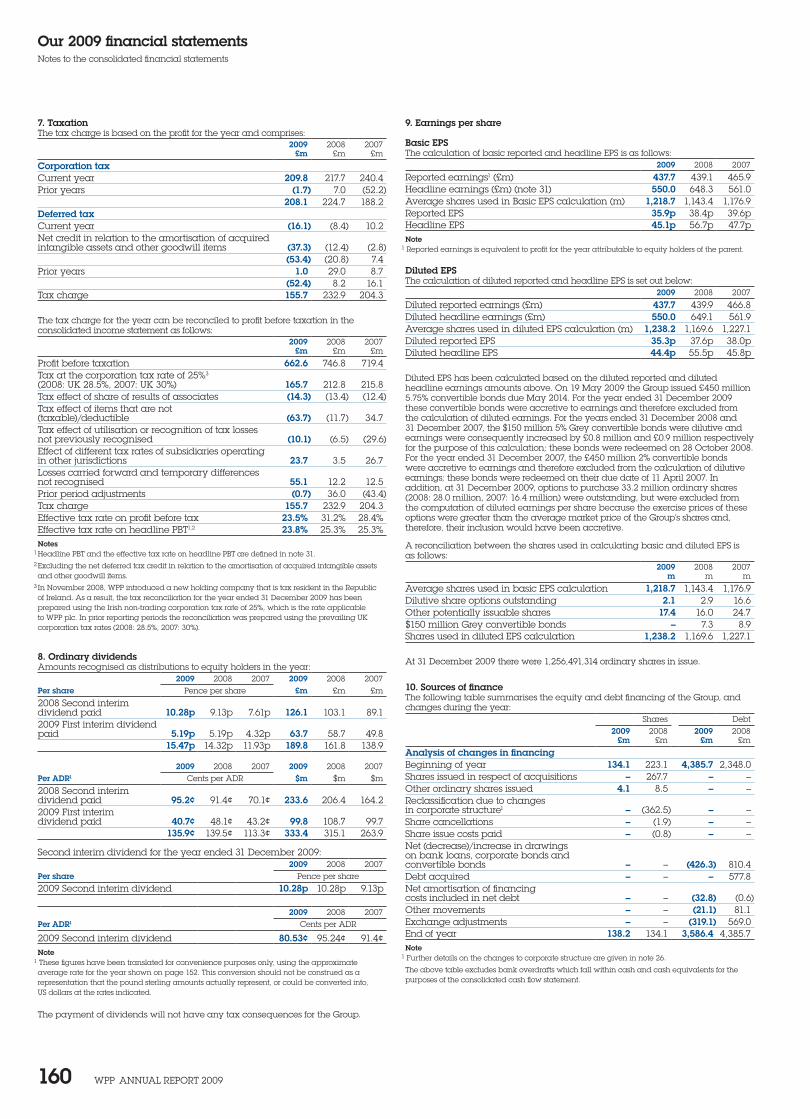
Our 2009 financial statementsnotes to the consolidated financial statements
WPP AnnuAl rePort 2009 160
7. Taxationthe tax charge is based on the profit for the year and comprises:
2009 2008 2007£m £m £m
Corporation taxCurrent year 209.8 217.7 240.4Prior years (1.7) 7.0 (52.2)
208.1 224.7 188.2Deferred taxCurrent year (16.1) (8.4) 10.2net credit in relation to the amortisation of acquired intangible assets and other goodwill items (37.3) (12.4) (2.8)
(53.4) (20.8) 7.4Prior years 1.0 29.0 8.7
(52.4) 8.2 16.1tax charge 155.7 232.9 204.3
the tax charge for the year can be reconciled to profit before taxation in the consolidated income statement as follows:
2009 2008 2007£m £m £m
Profit before taxation 662.6 746.8 719.4tax at the corporation tax rate of 25%3 (2008: uK 28.5%, 2007: uK 30%) 165.7 212.8 215.8tax effect of share of results of associates (14.3) (13.4) (12.4)tax effect of items that are not (taxable)/deductible (63.7) (11.7) 34.7tax effect of utilisation or recognition of tax losses not previously recognised (10.1) (6.5) (29.6)effect of different tax rates of subsidiaries operating in other jurisdictions 23.7 3.5 26.7losses carried forward and temporary differences not recognised 55.1 12.2 12.5Prior period adjustments (0.7) 36.0 (43.4)tax charge 155.7 232.9 204.3effective tax rate on profit before tax 23.5% 31.2% 28.4%effective tax rate on headline PBt1,2 23.8% 25.3% 25.3%Notes 1 Headline PBt and the effective tax rate on headline PBt are defined in note 31.
2 excluding the net deferred tax credit in relation to the amortisation of acquired intangible assets and other goodwill items.
3 In november 2008, WPP introduced a new holding company that is tax resident in the republic of Ireland. As a result, the tax reconciliation for the year ended 31 December 2009 has been prepared using the Irish non-trading corporation tax rate of 25%, which is the rate applicable to WPP plc. In prior reporting periods the reconciliation was prepared using the prevailing uK corporation tax rates (2008: 28.5%, 2007: 30%).
8. Ordinary dividendsAmounts recognised as distributions to equity holders in the year:
2009 2008 2007 2009 2008 2007Per share Pence per share £m £m £m
2008 Second interim dividend paid 10.28p 9.13p 7.61p 126.1 103.1 89.12009 First interim dividend paid 5.19p 5.19p 4.32p 63.7 58.7 49.8
15.47p 14.32p 11.93p 189.8 161.8 138.9
2009 2008 2007 2009 2008 2007Per ADR1 Cents per ADr $m $m $m
2008 Second interim dividend paid 95.2¢ 91.4¢ 70.1¢ 233.6 206.4 164.22009 First interim dividend paid 40.7¢ 48.1¢ 43.2¢ 99.8 108.7 99.7
135.9¢ 139.5¢ 113.3¢ 333.4 315.1 263.9
Second interim dividend for the year ended 31 December 2009:2009 2008 2007
Per share Pence per share
2009 Second interim dividend 10.28p 10.28p 9.13p
2009 2008 2007Per ADR1 Cents per ADr
2009 Second interim dividend 80.53¢ 95.24¢ 91.4¢Note 1 these figures have been translated for convenience purposes only, using the approximate average rate for the year shown on page 152. this conversion should not be construed as a representation that the pound sterling amounts actually represent, or could be converted into, uS dollars at the rates indicated.
the payment of dividends will not have any tax consequences for the Group.
9. Earnings per share
Basic EPSthe calculation of basic reported and headline ePS is as follows:
2009 2008 2007
reported earnings1 (£m) 437.7 439.1 465.9Headline earnings (£m) (note 31) 550.0 648.3 561.0Average shares used in Basic ePS calculation (m) 1,218.7 1,143.4 1,176.9reported ePS 35.9p 38.4p 39.6pHeadline ePS 45.1p 56.7p 47.7pNote 1 reported earnings is equivalent to profit for the year attributable to equity holders of the parent.
Diluted EPSthe calculation of diluted reported and headline ePS is set out below:
2009 2008 2007
Diluted reported earnings (£m) 437.7 439.9 466.8Diluted headline earnings (£m) 550.0 649.1 561.9Average shares used in diluted ePS calculation (m) 1,238.2 1,169.6 1,227.1Diluted reported ePS 35.3p 37.6p 38.0pDiluted headline ePS 44.4p 55.5p 45.8p
Diluted ePS has been calculated based on the diluted reported and diluted headline earnings amounts above. on 19 May 2009 the Group issued £450 million 5.75% convertible bonds due May 2014. For the year ended 31 December 2009 these convertible bonds were accretive to earnings and therefore excluded from the calculation of diluted earnings. For the years ended 31 December 2008 and 31 December 2007, the $150 million 5% Grey convertible bonds were dilutive and earnings were consequently increased by £0.8 million and £0.9 million respectively for the purpose of this calculation; these bonds were redeemed on 28 october 2008. For the year ended 31 December 2007, the £450 million 2% convertible bonds were accretive to earnings and therefore excluded from the calculation of dilutive earnings; these bonds were redeemed on their due date of 11 April 2007. In addition, at 31 December 2009, options to purchase 33.2 million ordinary shares (2008: 28.0 million, 2007: 16.4 million) were outstanding, but were excluded from the computation of diluted earnings per share because the exercise prices of these options were greater than the average market price of the Group’s shares and, therefore, their inclusion would have been accretive.
A reconciliation between the shares used in calculating basic and diluted ePS is as follows:
2009 2008 2007m m m
Average shares used in basic ePS calculation 1,218.7 1,143.4 1,176.9Dilutive share options outstanding 2.1 2.9 16.6other potentially issuable shares 17.4 16.0 24.7$150 million Grey convertible bonds – 7.3 8.9Shares used in diluted ePS calculation 1,238.2 1,169.6 1,227.1
At 31 December 2009 there were 1,256,491,314 ordinary shares in issue.
10. Sources of financethe following table summarises the equity and debt financing of the Group, and changes during the year:
Shares Debt2009 2008 2009 2008
£m £m £m £m
Analysis of changes in financingBeginning of year 134.1 223.1 4,385.7 2,348.0Shares issued in respect of acquisitions – 267.7 – –other ordinary shares issued 4.1 8.5 – –reclassification due to changes in corporate structure1 – (362.5) – –Share cancellations – (1.9) – –Share issue costs paid – (0.8) – –net (decrease)/increase in drawings on bank loans, corporate bonds and convertible bonds – – (426.3) 810.4Debt acquired – – – 577.8net amortisation of financing costs included in net debt – – (32.8) (0.6)other movements – – (21.1) 81.1exchange adjustments – – (319.1) 569.0end of year 138.2 134.1 3,586.4 4,385.7Note 1 Further details on the changes to corporate structure are given in note 26.
the above table excludes bank overdrafts which fall within cash and cash equivalents for the purposes of the consolidated cash flow statement.
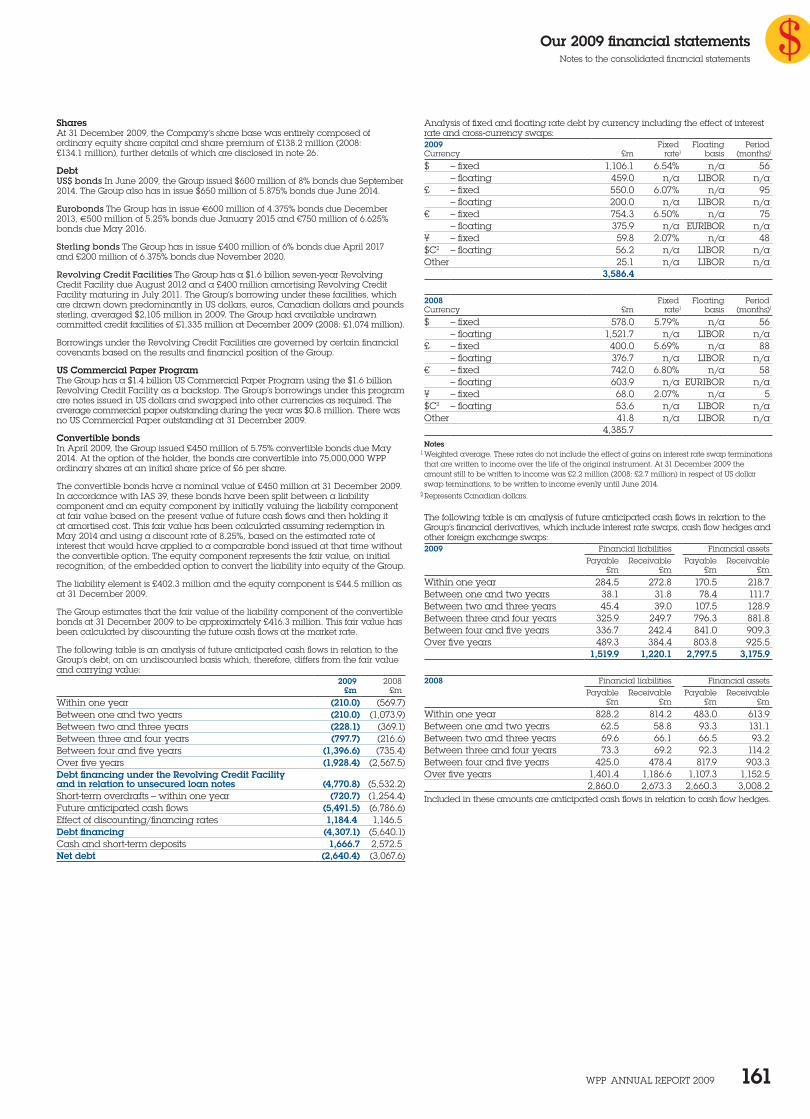
Our 2009 financial statementsnotes to the consolidated financial statements
WPP AnnuAl rePort 2009 161
SharesAt 31 December 2009, the Company’s share base was entirely composed of ordinary equity share capital and share premium of £138.2 million (2008: £134.1 million), further details of which are disclosed in note 26.
DebtUS$ bonds In June 2009, the Group issued $600 million of 8% bonds due September 2014. the Group also has in issue $650 million of 5.875% bonds due June 2014.
Eurobonds the Group has in issue 1600 million of 4.375% bonds due December 2013, 1500 million of 5.25% bonds due January 2015 and €750 million of 6.625% bonds due May 2016.
Sterling bonds the Group has in issue £400 million of 6% bonds due April 2017 and £200 million of 6.375% bonds due november 2020.
Revolving Credit Facilities the Group has a $1.6 billion seven-year revolving Credit Facility due August 2012 and a £400 million amortising revolving Credit Facility maturing in July 2011. the Group’s borrowing under these facilities, which are drawn down predominantly in uS dollars, euros, Canadian dollars and pounds sterling, averaged $2,105 million in 2009. the Group had available undrawn committed credit facilities of £1,335 million at December 2009 (2008: £1,074 million).
Borrowings under the revolving Credit Facilities are governed by certain financial covenants based on the results and financial position of the Group.
US Commercial Paper Programthe Group has a $1.4 billion uS Commercial Paper Program using the $1.6 billion revolving Credit Facility as a backstop. the Group’s borrowings under this program are notes issued in uS dollars and swapped into other currencies as required. the average commercial paper outstanding during the year was $0.8 million. there was no uS Commercial Paper outstanding at 31 December 2009.
Convertible bondsIn April 2009, the Group issued £450 million of 5.75% convertible bonds due May 2014. At the option of the holder, the bonds are convertible into 75,000,000 WPP ordinary shares at an initial share price of £6 per share.
the convertible bonds have a nominal value of £450 million at 31 December 2009. In accordance with IAS 39, these bonds have been split between a liability component and an equity component by initially valuing the liability component at fair value based on the present value of future cash flows and then holding it at amortised cost. this fair value has been calculated assuming redemption in May 2014 and using a discount rate of 8.25%, based on the estimated rate of interest that would have applied to a comparable bond issued at that time without the convertible option. the equity component represents the fair value, on initial recognition, of the embedded option to convert the liability into equity of the Group.
the liability element is £402.3 million and the equity component is £44.5 million as at 31 December 2009.
the Group estimates that the fair value of the liability component of the convertible bonds at 31 December 2009 to be approximately £416.3 million. this fair value has been calculated by discounting the future cash flows at the market rate.
the following table is an analysis of future anticipated cash flows in relation to the Group’s debt, on an undiscounted basis which, therefore, differs from the fair value and carrying value:
2009 2008£m £m
Within one year (210.0) (569.7)Between one and two years (210.0) (1,073.9)Between two and three years (228.1) (369.1)Between three and four years (797.7) (216.6)Between four and five years (1,396.6) (735.4)over five years (1,928.4) (2,567.5)Debt financing under the Revolving Credit Facility and in relation to unsecured loan notes (4,770.8) (5,532.2)Short-term overdrafts – within one year (720.7) (1,254.4)Future anticipated cash flows (5,491.5) (6,786.6)effect of discounting/financing rates 1,184.4 1,146.5Debt financing (4,307.1) (5,640.1)Cash and short-term deposits 1,666.7 2,572.5Net debt (2,640.4) (3,067.6)
Analysis of fixed and floating rate debt by currency including the effect of interest rate and cross-currency swaps:2009 Fixed Floating PeriodCurrency £m rate1 basis (months)1
$ – fixed 1,106.1 6.54% n/a 56– floating 459.0 n/a lIBor n/a
£ – fixed 550.0 6.07% n/a 95– floating 200.0 n/a lIBor n/a
€ – fixed 754.3 6.50% n/a 75– floating 375.9 n/a eurIBor n/a
¥ – fixed 59.8 2.07% n/a 48$C2 – floating 56.2 n/a lIBor n/aother 25.1 n/a lIBor n/a
3,586.4 2008 Fixed Floating PeriodCurrency £m rate1 basis (months)1
$ – fixed 578.0 5.79% n/a 56– floating 1,521.7 n/a lIBor n/a
£ – fixed 400.0 5.69% n/a 88– floating 376.7 n/a lIBor n/a
€ – fixed 742.0 6.80% n/a 58– floating 603.9 n/a eurIBor n/a
¥ – fixed 68.0 2.07% n/a 5$C2 – floating 53.6 n/a lIBor n/aother 41.8 n/a lIBor n/a
4,385.7Notes 1 Weighted average. these rates do not include the effect of gains on interest rate swap terminations that are written to income over the life of the original instrument. At 31 December 2009 the amount still to be written to income was £2.2 million (2008: £2.7 million) in respect of uS dollar swap terminations, to be written to income evenly until June 2014.
2 represents Canadian dollars.
the following table is an analysis of future anticipated cash flows in relation to the Group’s financial derivatives, which include interest rate swaps, cash flow hedges and other foreign exchange swaps:2009 Financial liabilities Financial assets
Payable receivable Payable receivable£m £m £m £m
Within one year 284.5 272.8 170.5 218.7Between one and two years 38.1 31.8 78.4 111.7Between two and three years 45.4 39.0 107.5 128.9Between three and four years 325.9 249.7 796.3 881.8Between four and five years 336.7 242.4 841.0 909.3over five years 489.3 384.4 803.8 925.5
1,519.9 1,220.1 2,797.5 3,175.9
2008 Financial liabilities Financial assetsPayable receivable Payable receivable
£m £m £m £m
Within one year 828.2 814.2 483.0 613.9 Between one and two years 62.5 58.8 93.3 131.1 Between two and three years 69.6 66.1 66.5 93.2 Between three and four years 73.3 69.2 92.3 114.2 Between four and five years 425.0 478.4 817.9 903.3 over five years 1,401.4 1,186.6 1,107.3 1,152.5
2,860.0 2,673.3 2,660.3 3,008.2 Included in these amounts are anticipated cash flows in relation to cash flow hedges.
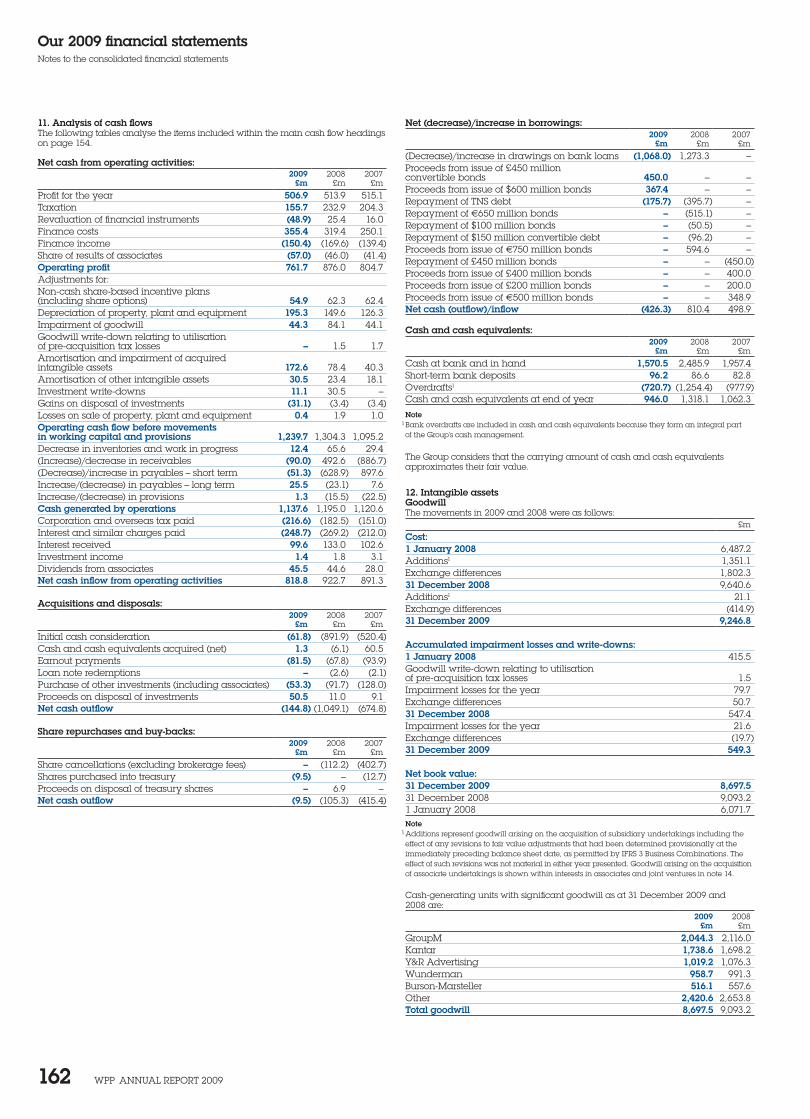
Our 2009 financial statementsnotes to the consolidated financial statements
WPP AnnuAl rePort 2009 162
11. Analysis of cash flowsthe following tables analyse the items included within the main cash flow headings on page 154.
Net cash from operating activities:2009 2008 2007
£m £m £m
Profit for the year 506.9 513.9 515.1taxation 155.7 232.9 204.3revaluation of financial instruments (48.9) 25.4 16.0Finance costs 355.4 319.4 250.1Finance income (150.4) (169.6) (139.4)Share of results of associates (57.0) (46.0) (41.4)Operating profit 761.7 876.0 804.7Adjustments for:non-cash share-based incentive plans (including share options) 54.9 62.3 62.4Depreciation of property, plant and equipment 195.3 149.6 126.3Impairment of goodwill 44.3 84.1 44.1Goodwill write-down relating to utilisation of pre-acquisition tax losses – 1.5 1.7Amortisation and impairment of acquired intangible assets 172.6 78.4 40.3Amortisation of other intangible assets 30.5 23.4 18.1Investment write-downs 11.1 30.5 –Gains on disposal of investments (31.1) (3.4) (3.4)losses on sale of property, plant and equipment 0.4 1.9 1.0Operating cash flow before movements in working capital and provisions 1,239.7 1,304.3 1,095.2Decrease in inventories and work in progress 12.4 65.6 29.4(Increase)/decrease in receivables (90.0) 492.6 (886.7)(Decrease)/increase in payables – short term (51.3) (628.9) 897.6Increase/(decrease) in payables – long term 25.5 (23.1) 7.6Increase/(decrease) in provisions 1.3 (15.5) (22.5)Cash generated by operations 1,137.6 1,195.0 1,120.6Corporation and overseas tax paid (216.6) (182.5) (151.0)Interest and similar charges paid (248.7) (269.2) (212.0)Interest received 99.6 133.0 102.6Investment income 1.4 1.8 3.1Dividends from associates 45.5 44.6 28.0Net cash inflow from operating activities 818.8 922.7 891.3
Acquisitions and disposals:2009 2008 2007
£m £m £m
Initial cash consideration (61.8) (891.9) (520.4)Cash and cash equivalents acquired (net) 1.3 (6.1) 60.5earnout payments (81.5) (67.8) (93.9)loan note redemptions – (2.6) (2.1)Purchase of other investments (including associates) (53.3) (91.7) (128.0)Proceeds on disposal of investments 50.5 11.0 9.1Net cash outflow (144.8) (1,049.1) (674.8)
Share repurchases and buy-backs:2009 2008 2007
£m £m £m
Share cancellations (excluding brokerage fees) – (112.2) (402.7)Shares purchased into treasury (9.5) – (12.7)Proceeds on disposal of treasury shares – 6.9 –Net cash outflow (9.5) (105.3) (415.4)
Net (decrease)/increase in borrowings:2009 2008 2007
£m £m £m
(Decrease)/increase in drawings on bank loans (1,068.0) 1,273.3 –Proceeds from issue of £450 million convertible bonds 450.0 – –Proceeds from issue of $600 million bonds 367.4 – –repayment of tnS debt (175.7) (395.7) –repayment of e650 million bonds – (515.1) –repayment of $100 million bonds – (50.5) –repayment of $150 million convertible debt – (96.2) –Proceeds from issue of f750 million bonds – 594.6 –repayment of £450 million bonds – – (450.0)Proceeds from issue of £400 million bonds – – 400.0Proceeds from issue of £200 million bonds – – 200.0Proceeds from issue of €500 million bonds – – 348.9Net cash (outflow)/inflow (426.3) 810.4 498.9
Cash and cash equivalents:2009 2008 2007
£m £m £m
Cash at bank and in hand 1,570.5 2,485.9 1,957.4Short-term bank deposits 96.2 86.6 82.8overdrafts1 (720.7) (1,254.4) (977.9)Cash and cash equivalents at end of year 946.0 1,318.1 1,062.3
Note 1 Bank overdrafts are included in cash and cash equivalents because they form an integral part of the Group’s cash management.
the Group considers that the carrying amount of cash and cash equivalents approximates their fair value.
12. Intangible assetsGoodwillthe movements in 2009 and 2008 were as follows:
£m
Cost:1 January 2008 6,487.2Additions1 1,351.1exchange differences 1,802.331 December 2008 9,640.6Additions1 21.1exchange differences (414.9)31 December 2009 9,246.8
Accumulated impairment losses and write-downs:1 January 2008 415.5Goodwill write-down relating to utilisation of pre-acquisition tax losses 1.5Impairment losses for the year 79.7exchange differences 50.731 December 2008 547.4Impairment losses for the year 21.6exchange differences (19.7)31 December 2009 549.3
Net book value:31 December 2009 8,697.531 December 2008 9,093.21 January 2008 6,071.7Note 1 Additions represent goodwill arising on the acquisition of subsidiary undertakings including the effect of any revisions to fair value adjustments that had been determined provisionally at the immediately preceding balance sheet date, as permitted by IFrS 3 Business Combinations. the effect of such revisions was not material in either year presented. Goodwill arising on the acquisition of associate undertakings is shown within interests in associates and joint ventures in note 14.
Cash-generating units with significant goodwill as at 31 December 2009 and 2008 are:
2009 2008£m £m
GroupM 2,044.3 2,116.0Kantar 1,738.6 1,698.2Y&r Advertising 1,019.2 1,076.3Wunderman 958.7 991.3Burson-Marsteller 516.1 557.6other 2,420.6 2,653.8Total goodwill 8,697.5 9,093.2
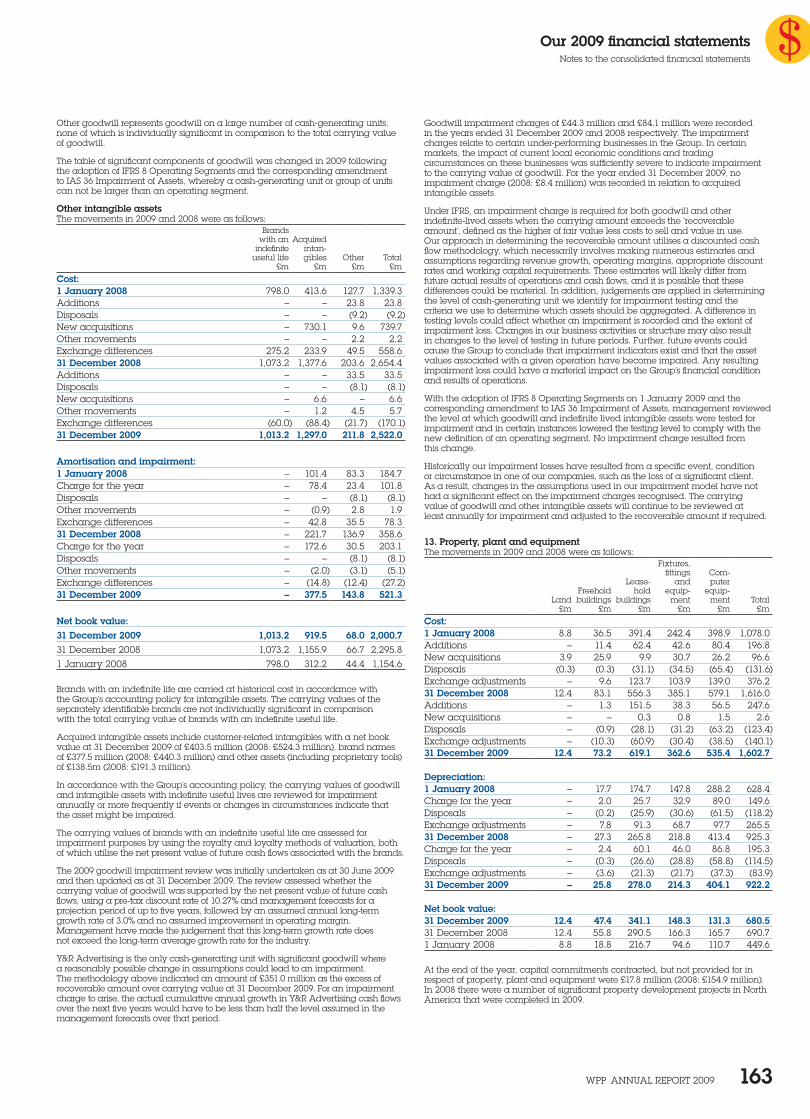
Our 2009 financial statementsnotes to the consolidated financial statements
WPP AnnuAl rePort 2009 163
other goodwill represents goodwill on a large number of cash-generating units, none of which is individually significant in comparison to the total carrying value of goodwill.
the table of significant components of goodwill was changed in 2009 following the adoption of IFrS 8 operating Segments and the corresponding amendment to IAS 36 Impairment of Assets, whereby a cash-generating unit or group of units can not be larger than an operating segment.
Other intangible assetsthe movements in 2009 and 2008 were as follows:
Brands with an Acquired
indefinite intan- useful life gibles other total
£m £m £m £m
Cost:1 January 2008 798.0 413.6 127.7 1,339.3Additions – – 23.8 23.8Disposals – – (9.2) (9.2)new acquisitions – 730.1 9.6 739.7other movements – – 2.2 2.2exchange differences 275.2 233.9 49.5 558.631 December 2008 1,073.2 1,377.6 203.6 2,654.4Additions – – 33.5 33.5Disposals – – (8.1) (8.1)new acquisitions – 6.6 – 6.6other movements – 1.2 4.5 5.7exchange differences (60.0) (88.4) (21.7) (170.1)31 December 2009 1,013.2 1,297.0 211.8 2,522.0
Amortisation and impairment:1 January 2008 – 101.4 83.3 184.7Charge for the year – 78.4 23.4 101.8Disposals – – (8.1) (8.1)other movements – (0.9) 2.8 1.9exchange differences – 42.8 35.5 78.331 December 2008 – 221.7 136.9 358.6Charge for the year – 172.6 30.5 203.1Disposals – – (8.1) (8.1)other movements – (2.0) (3.1) (5.1)exchange differences – (14.8) (12.4) (27.2)31 December 2009 – 377.5 143.8 521.3
Net book value:31 December 2009 1,013.2 919.5 68.0 2,000.731 December 2008 1,073.2 1,155.9 66.7 2,295.81 January 2008 798.0 312.2 44.4 1,154.6
Brands with an indefinite life are carried at historical cost in accordance with the Group’s accounting policy for intangible assets. the carrying values of the separately identifiable brands are not individually significant in comparison with the total carrying value of brands with an indefinite useful life.
Acquired intangible assets include customer-related intangibles with a net book value at 31 December 2009 of £403.5 million (2008: £524.3 million), brand names of £377.5 million (2008: £440.3 million) and other assets (including proprietary tools) of £138.5m (2008: £191.3 million).
In accordance with the Group’s accounting policy, the carrying values of goodwill and intangible assets with indefinite useful lives are reviewed for impairment annually or more frequently if events or changes in circumstances indicate that the asset might be impaired.
the carrying values of brands with an indefinite useful life are assessed for impairment purposes by using the royalty and loyalty methods of valuation, both of which utilise the net present value of future cash flows associated with the brands.
the 2009 goodwill impairment review was initially undertaken as at 30 June 2009 and then updated as at 31 December 2009. the review assessed whether the carrying value of goodwill was supported by the net present value of future cash flows, using a pre-tax discount rate of 10.27% and management forecasts for a projection period of up to five years, followed by an assumed annual long-term growth rate of 3.0% and no assumed improvement in operating margin. Management have made the judgement that this long-term growth rate does not exceed the long-term average growth rate for the industry.
Y&r Advertising is the only cash-generating unit with significant goodwill where a reasonably possible change in assumptions could lead to an impairment. the methodology above indicated an amount of £351.0 million as the excess of recoverable amount over carrying value at 31 December 2009. For an impairment charge to arise, the actual cumulative annual growth in Y&r Advertising cash flows over the next five years would have to be less than half the level assumed in the management forecasts over that period.
Goodwill impairment charges of £44.3 million and £84.1 million were recorded in the years ended 31 December 2009 and 2008 respectively. the impairment charges relate to certain under-performing businesses in the Group. In certain markets, the impact of current local economic conditions and trading circumstances on these businesses was sufficiently severe to indicate impairment to the carrying value of goodwill. For the year ended 31 December 2009, no impairment charge (2008: £8.4 million) was recorded in relation to acquired intangible assets.
under IFrS, an impairment charge is required for both goodwill and other indefinite-lived assets when the carrying amount exceeds the ‘recoverable amount’, defined as the higher of fair value less costs to sell and value in use. our approach in determining the recoverable amount utilises a discounted cash flow methodology, which necessarily involves making numerous estimates and assumptions regarding revenue growth, operating margins, appropriate discount rates and working capital requirements. these estimates will likely differ from future actual results of operations and cash flows, and it is possible that these differences could be material. In addition, judgements are applied in determining the level of cash-generating unit we identify for impairment testing and the criteria we use to determine which assets should be aggregated. A difference in testing levels could affect whether an impairment is recorded and the extent of impairment loss. Changes in our business activities or structure may also result in changes to the level of testing in future periods. Further, future events could cause the Group to conclude that impairment indicators exist and that the asset values associated with a given operation have become impaired. Any resulting impairment loss could have a material impact on the Group’s financial condition and results of operations.
With the adoption of IFrS 8 operating Segments on 1 January 2009 and the corresponding amendment to IAS 36 Impairment of Assets, management reviewed the level at which goodwill and indefinite lived intangible assets were tested for impairment and in certain instances lowered the testing level to comply with the new definition of an operating segment. no impairment charge resulted from this change.
Historically our impairment losses have resulted from a specific event, condition or circumstance in one of our companies, such as the loss of a significant client. As a result, changes in the assumptions used in our impairment model have not had a significant effect on the impairment charges recognised. the carrying value of goodwill and other intangible assets will continue to be reviewed at least annually for impairment and adjusted to the recoverable amount if required.
13. Property, plant and equipmentthe movements in 2009 and 2008 were as follows:
Fixtures,fittings Com-
lease- and puterFreehold hold equip- equip-
land buildings buildings ment ment total£m £m £m £m £m £m
Cost:1 January 2008 8.8 36.5 391.4 242.4 398.9 1,078.0Additions – 11.4 62.4 42.6 80.4 196.8new acquisitions 3.9 25.9 9.9 30.7 26.2 96.6Disposals (0.3) (0.3) (31.1) (34.5) (65.4) (131.6)exchange adjustments – 9.6 123.7 103.9 139.0 376.231 December 2008 12.4 83.1 556.3 385.1 579.1 1,616.0Additions – 1.3 151.5 38.3 56.5 247.6new acquisitions – – 0.3 0.8 1.5 2.6Disposals – (0.9) (28.1) (31.2) (63.2) (123.4)exchange adjustments – (10.3) (60.9) (30.4) (38.5) (140.1)31 December 2009 12.4 73.2 619.1 362.6 535.4 1,602.7
Depreciation:1 January 2008 – 17.7 174.7 147.8 288.2 628.4Charge for the year – 2.0 25.7 32.9 89.0 149.6Disposals – (0.2) (25.9) (30.6) (61.5) (118.2)exchange adjustments – 7.8 91.3 68.7 97.7 265.531 December 2008 – 27.3 265.8 218.8 413.4 925.3Charge for the year – 2.4 60.1 46.0 86.8 195.3Disposals – (0.3) (26.6) (28.8) (58.8) (114.5)exchange adjustments – (3.6) (21.3) (21.7) (37.3) (83.9)31 December 2009 – 25.8 278.0 214.3 404.1 922.2
Net book value:31 December 2009 12.4 47.4 341.1 148.3 131.3 680.531 December 2008 12.4 55.8 290.5 166.3 165.7 690.71 January 2008 8.8 18.8 216.7 94.6 110.7 449.6
At the end of the year, capital commitments contracted, but not provided for in respect of property, plant and equipment were £17.8 million (2008: £154.9 million). In 2008 there were a number of significant property development projects in north America that were completed in 2009.
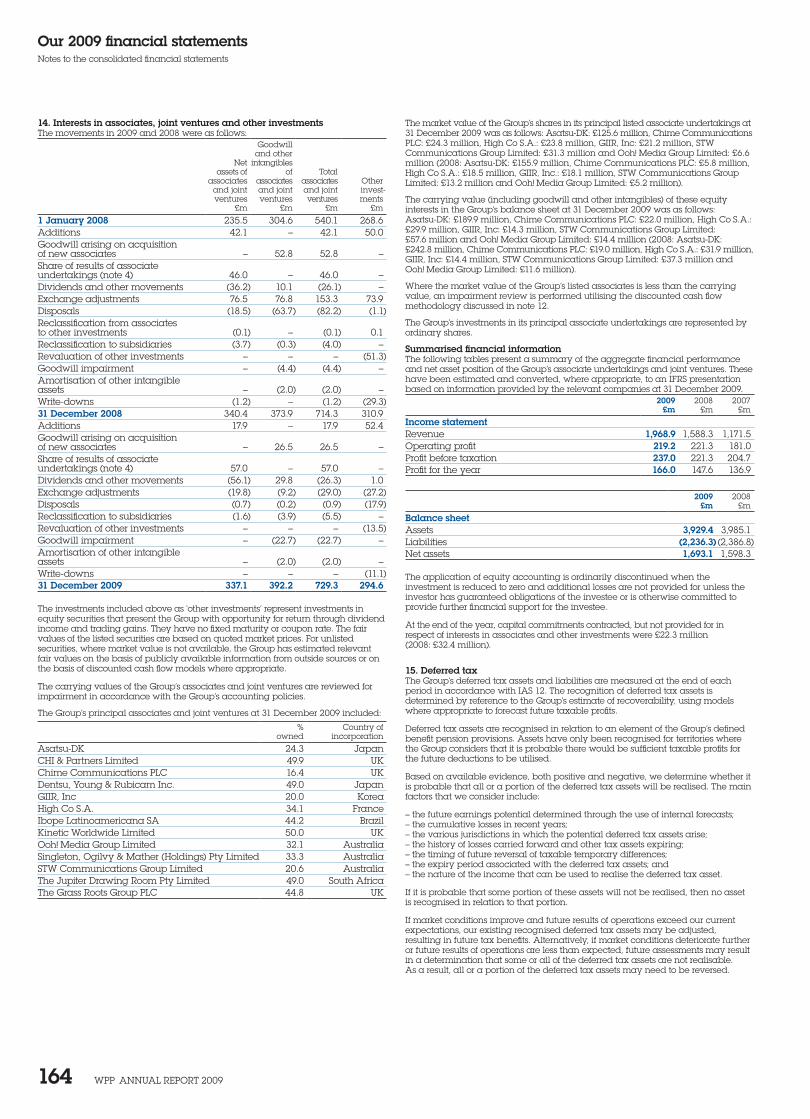
Our 2009 financial statementsnotes to the consolidated financial statements
WPP AnnuAl rePort 2009 164
14. Interests in associates, joint ventures and other investmentsthe movements in 2009 and 2008 were as follows:
Goodwill and other
net intangibles assets of of total
associates associates associates otherand joint and joint and joint invest-ventures ventures ventures ments
£m £m £m £m
1 January 2008 235.5 304.6 540.1 268.6Additions 42.1 – 42.1 50.0Goodwill arising on acquisition of new associates – 52.8 52.8 –Share of results of associate undertakings (note 4) 46.0 – 46.0 –Dividends and other movements (36.2) 10.1 (26.1) –exchange adjustments 76.5 76.8 153.3 73.9Disposals (18.5) (63.7) (82.2) (1.1)reclassification from associates to other investments (0.1) – (0.1) 0.1reclassification to subsidiaries (3.7) (0.3) (4.0) –revaluation of other investments – – – (51.3)Goodwill impairment – (4.4) (4.4) –Amortisation of other intangible assets – (2.0) (2.0) –Write-downs (1.2) – (1.2) (29.3)31 December 2008 340.4 373.9 714.3 310.9Additions 17.9 – 17.9 52.4Goodwill arising on acquisition of new associates – 26.5 26.5 –Share of results of associate undertakings (note 4) 57.0 – 57.0 –Dividends and other movements (56.1) 29.8 (26.3) 1.0exchange adjustments (19.8) (9.2) (29.0) (27.2)Disposals (0.7) (0.2) (0.9) (17.9)reclassification to subsidiaries (1.6) (3.9) (5.5) –revaluation of other investments – – – (13.5)Goodwill impairment – (22.7) (22.7) –Amortisation of other intangible assets – (2.0) (2.0) –Write-downs – – – (11.1)31 December 2009 337.1 392.2 729.3 294.6 the investments included above as ‘other investments’ represent investments in equity securities that present the Group with opportunity for return through dividend income and trading gains. they have no fixed maturity or coupon rate. the fair values of the listed securities are based on quoted market prices. For unlisted securities, where market value is not available, the Group has estimated relevant fair values on the basis of publicly available information from outside sources or on the basis of discounted cash flow models where appropriate.
the carrying values of the Group’s associates and joint ventures are reviewed for impairment in accordance with the Group’s accounting policies.
the Group’s principal associates and joint ventures at 31 December 2009 included:
% Country ofowned incorporation
Asatsu-DK 24.3 Japan CHI & Partners limited 49.9 uKChime Communications PlC 16.4 uKDentsu, Young & rubicam Inc. 49.0 JapanGIIr, Inc 20.0 KoreaHigh Co S.A. 34.1 FranceIbope latinoamericana SA 44.2 BrazilKinetic Worldwide limited 50.0 uKooh! Media Group limited 32.1 AustraliaSingleton, ogilvy & Mather (Holdings) Pty limited 33.3 AustraliaStW Communications Group limited 20.6 Australiathe Jupiter Drawing room Pty limited 49.0 South Africathe Grass roots Group PlC 44.8 uK
the market value of the Group’s shares in its principal listed associate undertakings at 31 December 2009 was as follows: Asatsu-DK: £125.6 million, Chime Communications PlC: £24.3 million, High Co S.A.: £23.8 million, GIIr, Inc: £21.2 million, StW Communications Group limited: £31.3 million and ooh! Media Group limited: £6.6 million (2008: Asatsu-DK: £155.9 million, Chime Communications PlC: £5.8 million, High Co S.A.: £18.5 million, GIIr, Inc.: £18.1 million, StW Communications Group limited: £13.2 million and ooh! Media Group limited: £5.2 million).
the carrying value (including goodwill and other intangibles) of these equity interests in the Group’s balance sheet at 31 December 2009 was as follows: Asatsu-DK: £189.9 million, Chime Communications PlC: £22.0 million, High Co S.A.: £29.9 million, GIIr, Inc: £14.3 million, StW Communications Group limited: £57.6 million and ooh! Media Group limited: £14.4 million (2008: Asatsu-DK: £242.8 million, Chime Communications PlC: £19.0 million, High Co S.A.: £31.9 million, GIIr, Inc: £14.4 million, StW Communications Group limited: £37.3 million and ooh! Media Group limited: £11.6 million).
Where the market value of the Group’s listed associates is less than the carrying value, an impairment review is performed utilising the discounted cash flow methodology discussed in note 12.
the Group’s investments in its principal associate undertakings are represented by ordinary shares.
Summarised financial informationthe following tables present a summary of the aggregate financial performance and net asset position of the Group’s associate undertakings and joint ventures. these have been estimated and converted, where appropriate, to an IFrS presentation based on information provided by the relevant companies at 31 December 2009.
2009 2008 2007£m £m £m
Income statementrevenue 1,968.9 1,588.3 1,171.5operating profit 219.2 221.3 181.0Profit before taxation 237.0 221.3 204.7Profit for the year 166.0 147.6 136.9
2009 2008
£m £m
Balance sheetAssets 3,929.4 3,985.1liabilities (2,236.3) (2,386.8)net assets 1,693.1 1,598.3
the application of equity accounting is ordinarily discontinued when the investment is reduced to zero and additional losses are not provided for unless the investor has guaranteed obligations of the investee or is otherwise committed to provide further financial support for the investee.
At the end of the year, capital commitments contracted, but not provided for in respect of interests in associates and other investments were £22.3 million (2008: £32.4 million).
15. Deferred taxthe Group’s deferred tax assets and liabilities are measured at the end of each period in accordance with IAS 12. the recognition of deferred tax assets is determined by reference to the Group’s estimate of recoverability, using models where appropriate to forecast future taxable profits.
Deferred tax assets are recognised in relation to an element of the Group’s defined benefit pension provisions. Assets have only been recognised for territories where the Group considers that it is probable there would be sufficient taxable profits for the future deductions to be utilised.
Based on available evidence, both positive and negative, we determine whether it is probable that all or a portion of the deferred tax assets will be realised. the main factors that we consider include:
– the future earnings potential determined through the use of internal forecasts;– the cumulative losses in recent years;– the various jurisdictions in which the potential deferred tax assets arise;– the history of losses carried forward and other tax assets expiring;– the timing of future reversal of taxable temporary differences;– the expiry period associated with the deferred tax assets; and– the nature of the income that can be used to realise the deferred tax asset.
If it is probable that some portion of these assets will not be realised, then no asset is recognised in relation to that portion.
If market conditions improve and future results of operations exceed our current expectations, our existing recognised deferred tax assets may be adjusted, resulting in future tax benefits. Alternatively, if market conditions deteriorate further or future results of operations are less than expected, future assessments may result in a determination that some or all of the deferred tax assets are not realisable. As a result, all or a portion of the deferred tax assets may need to be reversed.
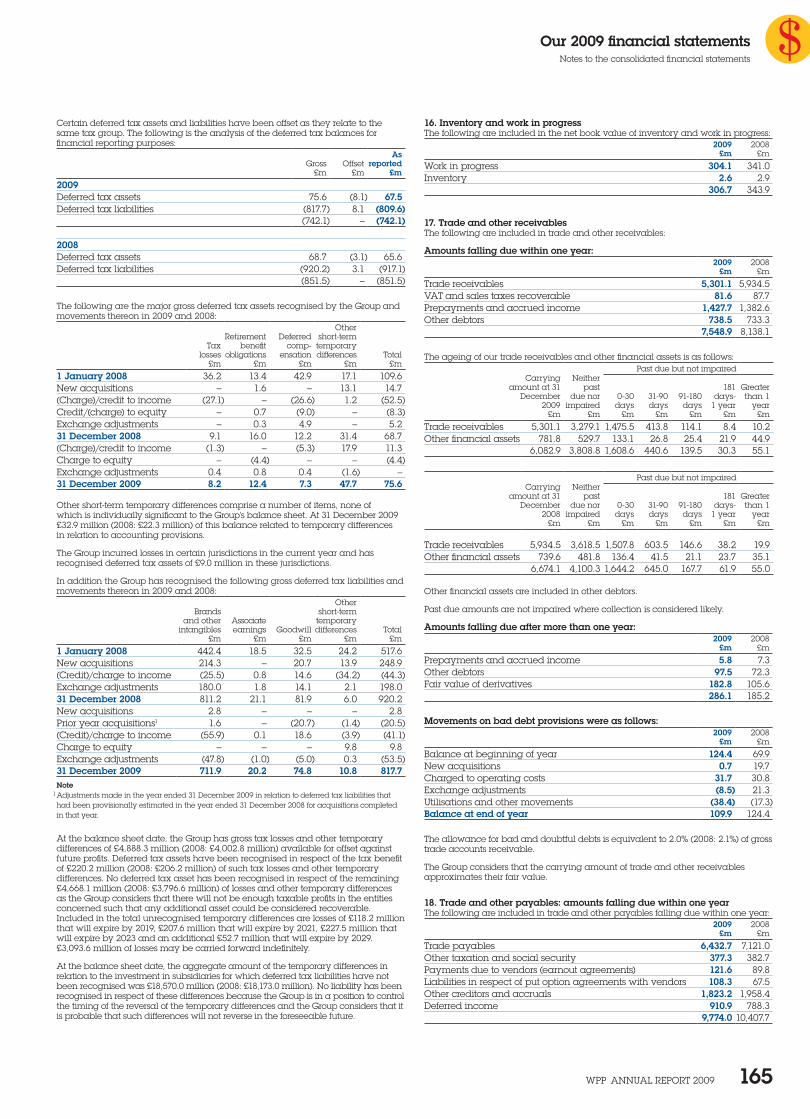
Our 2009 financial statementsnotes to the consolidated financial statements
WPP AnnuAl rePort 2009 165
Certain deferred tax assets and liabilities have been offset as they relate to the same tax group. the following is the analysis of the deferred tax balances for financial reporting purposes:
AsGross offset reported
£m £m £m2009Deferred tax assets 75.6 (8.1) 67.5Deferred tax liabilities (817.7) 8.1 (809.6) (742.1) – (742.1)
2008Deferred tax assets 68.7 (3.1) 65.6Deferred tax liabilities (920.2) 3.1 (917.1)
(851.5) – (851.5)
the following are the major gross deferred tax assets recognised by the Group and movements thereon in 2009 and 2008:
otherretirement Deferred short-term
tax benefit comp- temporarylosses obligations ensation differences total
£m £m £m £m £m
1 January 2008 36.2 13.4 42.9 17.1 109.6new acquisitions – 1.6 – 13.1 14.7(Charge)/credit to income (27.1) – (26.6) 1.2 (52.5)Credit/(charge) to equity – 0.7 (9.0) – (8.3)exchange adjustments – 0.3 4.9 – 5.231 December 2008 9.1 16.0 12.2 31.4 68.7(Charge)/credit to income (1.3) – (5.3) 17.9 11.3Charge to equity – (4.4) – – (4.4)exchange adjustments 0.4 0.8 0.4 (1.6) –31 December 2009 8.2 12.4 7.3 47.7 75.6
other short-term temporary differences comprise a number of items, none of which is individually significant to the Group’s balance sheet. At 31 December 2009 £32.9 million (2008: £22.3 million) of this balance related to temporary differences in relation to accounting provisions.
the Group incurred losses in certain jurisdictions in the current year and has recognised deferred tax assets of £9.0 million in these jurisdictions.
In addition the Group has recognised the following gross deferred tax liabilities and movements thereon in 2009 and 2008:
otherBrands short-term
and other Associate temporaryintangibles earnings Goodwill differences total
£m £m £m £m £m
1 January 2008 442.4 18.5 32.5 24.2 517.6 new acquisitions 214.3 – 20.7 13.9 248.9(Credit)/charge to income (25.5) 0.8 14.6 (34.2) (44.3)exchange adjustments 180.0 1.8 14.1 2.1 198.031 December 2008 811.2 21.1 81.9 6.0 920.2new acquisitions 2.8 – – – 2.8Prior year acquisitions1 1.6 – (20.7) (1.4) (20.5)(Credit)/charge to income (55.9) 0.1 18.6 (3.9) (41.1)Charge to equity – – – 9.8 9.8exchange adjustments (47.8) (1.0) (5.0) 0.3 (53.5)31 December 2009 711.9 20.2 74.8 10.8 817.7Note 1 Adjustments made in the year ended 31 December 2009 in relation to deferred tax liabilities that had been provisionally estimated in the year ended 31 December 2008 for acquisitions completed in that year.
At the balance sheet date, the Group has gross tax losses and other temporary differences of £4,888.3 million (2008: £4,002.8 million) available for offset against future profits. Deferred tax assets have been recognised in respect of the tax benefit of £220.2 million (2008: £206.2 million) of such tax losses and other temporary differences. no deferred tax asset has been recognised in respect of the remaining £4,668.1 million (2008: £3,796.6 million) of losses and other temporary differences as the Group considers that there will not be enough taxable profits in the entities concerned such that any additional asset could be considered recoverable. Included in the total unrecognised temporary differences are losses of £118.2 million that will expire by 2019, £207.6 million that will expire by 2021, £227.5 million that will expire by 2023 and an additional £52.7 million that will expire by 2029. £3,093.6 million of losses may be carried forward indefinitely.
At the balance sheet date, the aggregate amount of the temporary differences in relation to the investment in subsidiaries for which deferred tax liabilities have not been recognised was £18,570.0 million (2008: £18,173.0 million). no liability has been recognised in respect of these differences because the Group is in a position to control the timing of the reversal of the temporary differences and the Group considers that it is probable that such differences will not reverse in the foreseeable future.
16. Inventory and work in progressthe following are included in the net book value of inventory and work in progress:
2009 2008£m £m
Work in progress 304.1 341.0Inventory 2.6 2.9
306.7 343.9
17. Trade and other receivablesthe following are included in trade and other receivables:
Amounts falling due within one year:2009 2008
£m £m
trade receivables 5,301.1 5,934.5VAt and sales taxes recoverable 81.6 87.7Prepayments and accrued income 1,427.7 1,382.6other debtors 738.5 733.3
7,548.9 8,138.1
the ageing of our trade receivables and other financial assets is as follows:
Past due but not impairedCarrying neither
amount at 31 past 181 GreaterDecember due nor 0-30 31-90 91-180 days- than 1
2009 impaired days days days 1 year year£m £m £m £m £m £m £m
trade receivables 5,301.1 3,279.1 1,475.5 413.8 114.1 8.4 10.2other financial assets 781.8 529.7 133.1 26.8 25.4 21.9 44.9
6,082.9 3,808.8 1,608.6 440.6 139.5 30.3 55.1
Past due but not impaired
Carrying neitheramount at 31 past 181 Greater
December due nor 0-30 31-90 91-180 days- than 12008 impaired days days days 1 year year
£m £m £m £m £m £m £m
trade receivables 5,934.5 3,618.5
1,507.8 603.5 146.6 38.2 19.9other financial assets 739.6 481.8 136.4 41.5 21.1 23.7 35.1
6,674.1 4,100.3 1,644.2 645.0 167.7 61.9 55.0
other financial assets are included in other debtors.
Past due amounts are not impaired where collection is considered likely.
Amounts falling due after more than one year:2009 2008
£m £m
Prepayments and accrued income 5.8 7.3other debtors 97.5 72.3Fair value of derivatives 182.8 105.6
286.1 185.2
Movements on bad debt provisions were as follows:
2009 2008£m £m
Balance at beginning of year 124.4 69.9new acquisitions 0.7 19.7Charged to operating costs 31.7 30.8exchange adjustments (8.5) 21.3utilisations and other movements (38.4) (17.3)Balance at end of year 109.9 124.4
the allowance for bad and doubtful debts is equivalent to 2.0% (2008: 2.1%) of gross trade accounts receivable.
the Group considers that the carrying amount of trade and other receivables approximates their fair value.
18. Trade and other payables: amounts falling due within one yearthe following are included in trade and other payables falling due within one year:
2009 2008£m £m
trade payables 6,432.7 7,121.0other taxation and social security 377.3 382.7Payments due to vendors (earnout agreements) 121.6 89.8liabilities in respect of put option agreements with vendors 108.3 67.5other creditors and accruals 1,823.2 1,958.4Deferred income 910.9 788.3
9,774.0 10,407.7
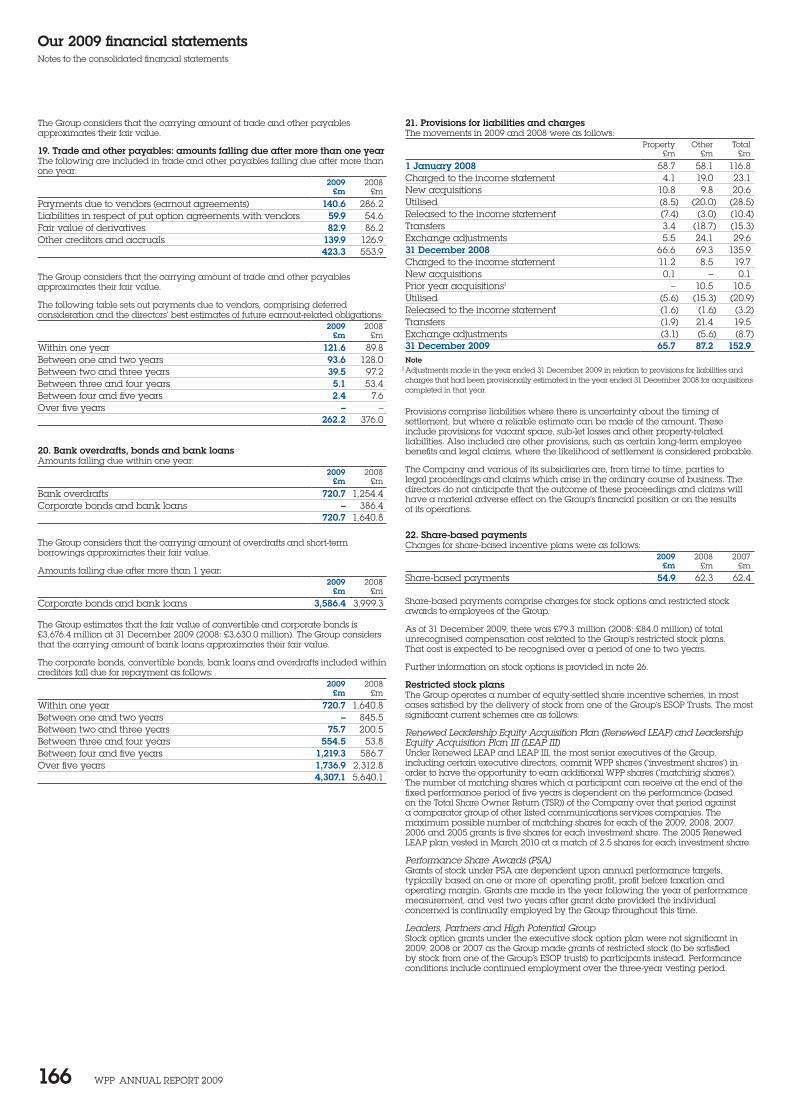
Our 2009 financial statementsnotes to the consolidated financial statements
WPP AnnuAl rePort 2009 166
the Group considers that the carrying amount of trade and other payables approximates their fair value.
19. Trade and other payables: amounts falling due after more than one yearthe following are included in trade and other payables falling due after more than one year:
2009 2008£m £m
Payments due to vendors (earnout agreements) 140.6 286.2liabilities in respect of put option agreements with vendors 59.9 54.6Fair value of derivatives 82.9 86.2other creditors and accruals 139.9 126.9
423.3 553.9
the Group considers that the carrying amount of trade and other payables approximates their fair value.
the following table sets out payments due to vendors, comprising deferred consideration and the directors’ best estimates of future earnout-related obligations:
2009 2008£m £m
Within one year 121.6 89.8Between one and two years 93.6 128.0Between two and three years 39.5 97.2Between three and four years 5.1 53.4Between four and five years 2.4 7.6over five years – –
262.2 376.0
20. Bank overdrafts, bonds and bank loansAmounts falling due within one year:
2009 2008£m £m
Bank overdrafts 720.7 1,254.4Corporate bonds and bank loans – 386.4
720.7 1,640.8
the Group considers that the carrying amount of overdrafts and short-term borrowings approximates their fair value.
Amounts falling due after more than 1 year:2009 2008
£m £m
Corporate bonds and bank loans 3,586.4 3,999.3
the Group estimates that the fair value of convertible and corporate bonds is £3,676.4 million at 31 December 2009 (2008: £3,630.0 million). the Group considers that the carrying amount of bank loans approximates their fair value.
the corporate bonds, convertible bonds, bank loans and overdrafts included within creditors fall due for repayment as follows:
2009 2008£m £m
Within one year 720.7 1,640.8Between one and two years – 845.5Between two and three years 75.7 200.5Between three and four years 554.5 53.8Between four and five years 1,219.3 586.7over five years 1,736.9 2,312.8
4,307.1 5,640.1
21. Provisions for liabilities and chargesthe movements in 2009 and 2008 were as follows:
Property other total£m £m £m
1 January 2008 58.7 58.1 116.8Charged to the income statement 4.1 19.0 23.1new acquisitions 10.8 9.8 20.6utilised (8.5) (20.0) (28.5)released to the income statement (7.4) (3.0) (10.4)transfers 3.4 (18.7) (15.3)exchange adjustments 5.5 24.1 29.631 December 2008 66.6 69.3 135.9Charged to the income statement 11.2 8.5 19.7new acquisitions 0.1 – 0.1Prior year acquisitions1 – 10.5 10.5utilised (5.6) (15.3) (20.9)released to the income statement (1.6) (1.6) (3.2)transfers (1.9) 21.4 19.5exchange adjustments (3.1) (5.6) (8.7)31 December 2009 65.7 87.2 152.9Note 1 Adjustments made in the year ended 31 December 2009 in relation to provisions for liabilities and charges that had been provisionally estimated in the year ended 31 December 2008 for acquisitions completed in that year.
Provisions comprise liabilities where there is uncertainty about the timing of settlement, but where a reliable estimate can be made of the amount. these include provisions for vacant space, sub-let losses and other property-related liabilities. Also included are other provisions, such as certain long-term employee benefits and legal claims, where the likelihood of settlement is considered probable.
the Company and various of its subsidiaries are, from time to time, parties to legal proceedings and claims which arise in the ordinary course of business. the directors do not anticipate that the outcome of these proceedings and claims will have a material adverse effect on the Group’s financial position or on the results of its operations.
22. Share-based paymentsCharges for share-based incentive plans were as follows:
2009 2008 2007£m £m £m
Share-based payments 54.9 62.3 62.4 Share-based payments comprise charges for stock options and restricted stock awards to employees of the Group.
As of 31 December 2009, there was £79.3 million (2008: £84.0 million) of total unrecognised compensation cost related to the Group’s restricted stock plans. that cost is expected to be recognised over a period of one to two years.
Further information on stock options is provided in note 26.
Restricted stock plansthe Group operates a number of equity-settled share incentive schemes, in most cases satisfied by the delivery of stock from one of the Group’s eSoP trusts. the most significant current schemes are as follows:
Renewed Leadership Equity Acquisition Plan (Renewed LEAP) and Leadership Equity Acquisition Plan III (LEAP III)under renewed leAP and leAP III, the most senior executives of the Group, including certain executive directors, commit WPP shares (‘investment shares’) in order to have the opportunity to earn additional WPP shares (‘matching shares’). the number of matching shares which a participant can receive at the end of the fixed performance period of five years is dependent on the performance (based on the total Share owner return (tSr)) of the Company over that period against a comparator group of other listed communications services companies. the maximum possible number of matching shares for each of the 2009, 2008, 2007, 2006 and 2005 grants is five shares for each investment share. the 2005 renewed leAP plan vested in March 2010 at a match of 2.5 shares for each investment share.
Performance Share Awards (PSA)Grants of stock under PSA are dependent upon annual performance targets, typically based on one or more of: operating profit, profit before taxation and operating margin. Grants are made in the year following the year of performance measurement, and vest two years after grant date provided the individual concerned is continually employed by the Group throughout this time.
Leaders, Partners and High Potential GroupStock option grants under the executive stock option plan were not significant in 2009, 2008 or 2007 as the Group made grants of restricted stock (to be satisfied by stock from one of the Group’s eSoP trusts) to participants instead. Performance conditions include continued employment over the three-year vesting period.
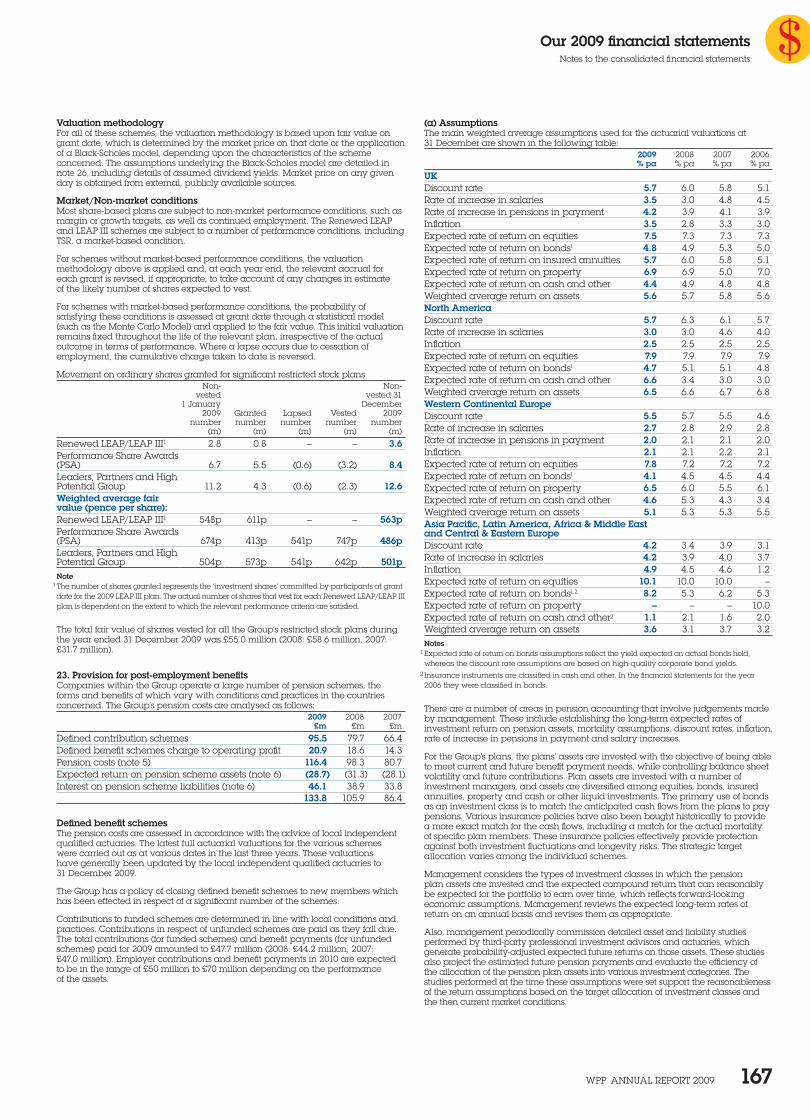
Our 2009 financial statementsnotes to the consolidated financial statements
WPP AnnuAl rePort 2009 167
Valuation methodologyFor all of these schemes, the valuation methodology is based upon fair value on grant date, which is determined by the market price on that date or the application of a Black-Scholes model, depending upon the characteristics of the scheme concerned. the assumptions underlying the Black-Scholes model are detailed in note 26, including details of assumed dividend yields. Market price on any given day is obtained from external, publicly available sources.
Market/Non-market conditionsMost share-based plans are subject to non-market performance conditions, such as margin or growth targets, as well as continued employment. the renewed leAP and leAP III schemes are subject to a number of performance conditions, including tSr, a market-based condition.
For schemes without market-based performance conditions, the valuation methodology above is applied and, at each year end, the relevant accrual for each grant is revised, if appropriate, to take account of any changes in estimate of the likely number of shares expected to vest.
For schemes with market-based performance conditions, the probability of satisfying these conditions is assessed at grant date through a statistical model (such as the Monte Carlo Model) and applied to the fair value. this initial valuation remains fixed throughout the life of the relevant plan, irrespective of the actual outcome in terms of performance. Where a lapse occurs due to cessation of employment, the cumulative charge taken to date is reversed.
Movement on ordinary shares granted for significant restricted stock plansnon- non-
vested vested 311 January December
2009 Granted lapsed Vested 2009number number number number number
(m) (m) (m) (m) (m)
renewed leAP/leAP III1 2.8 0.8 – – 3.6Performance Share Awards (PSA) 6.7 5.5 (0.6) (3.2) 8.4leaders, Partners and High Potential Group 11.2 4.3 (0.6) (2.3) 12.6Weighted average fair value (pence per share):renewed leAP/leAP III1 548p 611p – – 563pPerformance Share Awards (PSA) 674p 413p 541p 747p 486pleaders, Partners and High Potential Group 504p 573p 541p 642p 501pNote 1 the number of shares granted represents the ‘investment shares’ committed by participants at grant date for the 2009 leAP III plan. the actual number of shares that vest for each renewed leAP/leAP III plan is dependent on the extent to which the relevant performance criteria are satisfied.
the total fair value of shares vested for all the Group’s restricted stock plans during the year ended 31 December 2009 was £55.0 million (2008: £58.6 million, 2007: £31.7 million).
23. Provision for post-employment benefitsCompanies within the Group operate a large number of pension schemes, the forms and benefits of which vary with conditions and practices in the countries concerned. the Group’s pension costs are analysed as follows:
2009 2008 2007£m £m £m
Defined contribution schemes 95.5 79.7 66.4Defined benefit schemes charge to operating profit 20.9 18.6 14.3Pension costs (note 5) 116.4 98.3 80.7expected return on pension scheme assets (note 6) (28.7) (31.3) (28.1)Interest on pension scheme liabilities (note 6) 46.1 38.9 33.8
133.8 105.9 86.4
Defined benefit schemes the pension costs are assessed in accordance with the advice of local independent qualified actuaries. the latest full actuarial valuations for the various schemes were carried out as at various dates in the last three years. these valuations have generally been updated by the local independent qualified actuaries to 31 December 2009.
the Group has a policy of closing defined benefit schemes to new members which has been effected in respect of a significant number of the schemes.
Contributions to funded schemes are determined in line with local conditions and practices. Contributions in respect of unfunded schemes are paid as they fall due. the total contributions (for funded schemes) and benefit payments (for unfunded schemes) paid for 2009 amounted to £47.7 million (2008: £44.2 million, 2007: £47.0 million). employer contributions and benefit payments in 2010 are expected to be in the range of £50 million to £70 million depending on the performance of the assets.
(a) Assumptionsthe main weighted average assumptions used for the actuarial valuations at 31 December are shown in the following table:
2009 2008 2007 2006% pa % pa % pa % pa
UKDiscount rate 5.7 6.0 5.8 5.1rate of increase in salaries 3.5 3.0 4.8 4.5rate of increase in pensions in payment 4.2 3.9 4.1 3.9Inflation 3.5 2.8 3.3 3.0expected rate of return on equities 7.5 7.3 7.3 7.3expected rate of return on bonds1 4.8 4.9 5.3 5.0expected rate of return on insured annuities 5.7 6.0 5.8 5.1expected rate of return on property 6.9 6.9 5.0 7.0expected rate of return on cash and other 4.4 4.9 4.8 4.8Weighted average return on assets 5.6 5.7 5.8 5.6North AmericaDiscount rate 5.7 6.3 6.1 5.7rate of increase in salaries 3.0 3.0 4.6 4.0Inflation 2.5 2.5 2.5 2.5expected rate of return on equities 7.9 7.9 7.9 7.9expected rate of return on bonds1 4.7 5.1 5.1 4.8expected rate of return on cash and other 6.6 3.4 3.0 3.0Weighted average return on assets 6.5 6.6 6.7 6.8Western Continental EuropeDiscount rate 5.5 5.7 5.5 4.6rate of increase in salaries 2.7 2.8 2.9 2.8rate of increase in pensions in payment 2.0 2.1 2.1 2.0Inflation 2.1 2.1 2.2 2.1expected rate of return on equities 7.8 7.2 7.2 7.2expected rate of return on bonds1 4.1 4.5 4.5 4.4expected rate of return on property 6.5 6.0 5.5 6.1expected rate of return on cash and other 4.6 5.3 4.3 3.4Weighted average return on assets 5.1 5.3 5.3 5.5Asia Pacific, Latin America, Africa & Middle East and Central & Eastern EuropeDiscount rate 4.2 3.4 3.9 3.1rate of increase in salaries 4.2 3.9 4.0 3.7Inflation 4.9 4.5 4.6 1.2expected rate of return on equities 10.1 10.0 10.0 –expected rate of return on bonds1,2 8.2 5.3 6.2 5.3expected rate of return on property – – – 10.0expected rate of return on cash and other2 1.1 2.1 1.6 2.0Weighted average return on assets 3.6 3.1 3.7 3.2Notes 1 expected rate of return on bonds assumptions reflect the yield expected on actual bonds held, whereas the discount rate assumptions are based on high-quality corporate bond yields.
2 Insurance instruments are classified in cash and other. In the financial statements for the year 2006 they were classified in bonds.
there are a number of areas in pension accounting that involve judgements made by management. these include establishing the long-term expected rates of investment return on pension assets, mortality assumptions, discount rates, inflation, rate of increase in pensions in payment and salary increases.
For the Group’s plans, the plans’ assets are invested with the objective of being able to meet current and future benefit payment needs, while controlling balance sheet volatility and future contributions. Plan assets are invested with a number of investment managers, and assets are diversified among equities, bonds, insured annuities, property and cash or other liquid investments. the primary use of bonds as an investment class is to match the anticipated cash flows from the plans to pay pensions. Various insurance policies have also been bought historically to provide a more exact match for the cash flows, including a match for the actual mortality of specific plan members. these insurance policies effectively provide protection against both investment fluctuations and longevity risks. the strategic target allocation varies among the individual schemes.
Management considers the types of investment classes in which the pension plan assets are invested and the expected compound return that can reasonably be expected for the portfolio to earn over time, which reflects forward-looking economic assumptions. Management reviews the expected long-term rates of return on an annual basis and revises them as appropriate.
Also, management periodically commission detailed asset and liability studies performed by third-party professional investment advisors and actuaries, which generate probability-adjusted expected future returns on those assets. these studies also project the estimated future pension payments and evaluate the efficiency of the allocation of the pension plan assets into various investment categories. the studies performed at the time these assumptions were set support the reasonableness of the return assumptions based on the target allocation of investment classes and the then current market conditions.
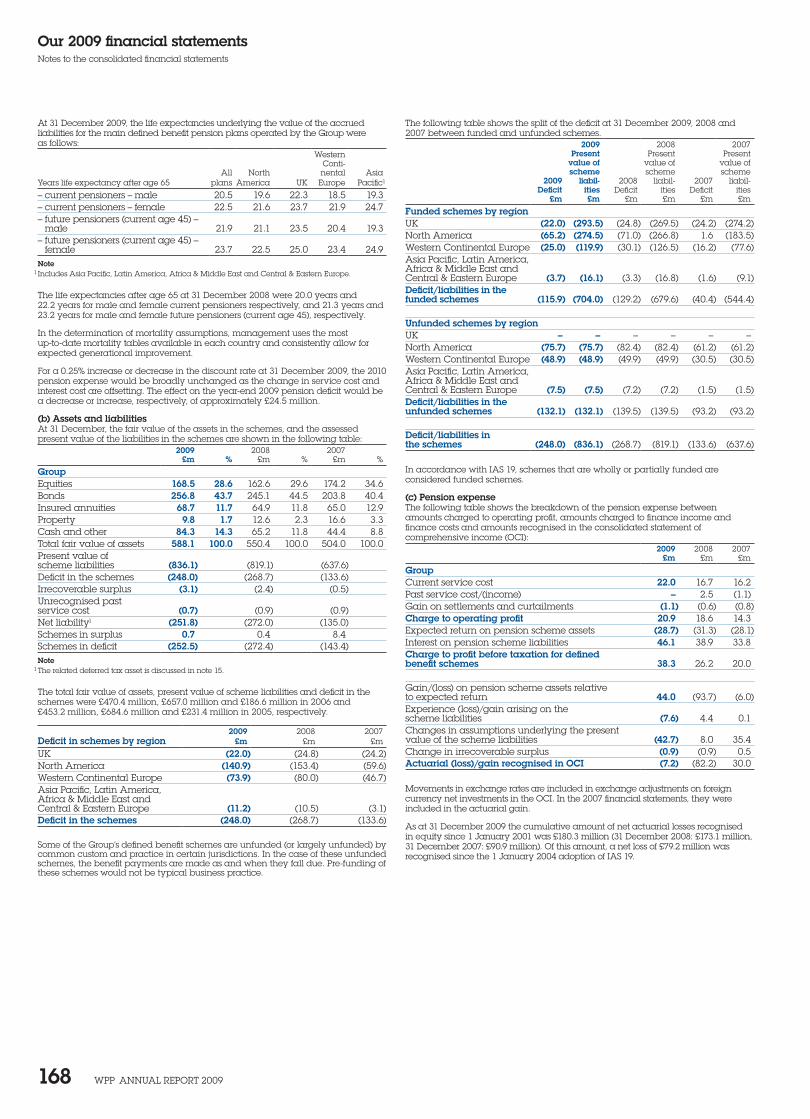
Our 2009 financial statementsnotes to the consolidated financial statements
WPP AnnuAl rePort 2009 168
At 31 December 2009, the life expectancies underlying the value of the accrued liabilities for the main defined benefit pension plans operated by the Group were as follows:
WesternConti-
All north nental AsiaYears life expectancy after age 65 plans America uK europe Pacific1
– current pensioners – male 20.5 19.6 22.3 18.5 19.3– current pensioners – female 22.5 21.6 23.7 21.9 24.7– future pensioners (current age 45) –
male 21.9 21.1 23.5 20.4 19.3– future pensioners (current age 45) –
female 23.7 22.5 25.0 23.4 24.9Note 1 Includes Asia Pacific, latin America, Africa & Middle east and Central & eastern europe.
the life expectancies after age 65 at 31 December 2008 were 20.0 years and 22.2 years for male and female current pensioners respectively, and 21.3 years and 23.2 years for male and female future pensioners (current age 45), respectively.
In the determination of mortality assumptions, management uses the most up-to-date mortality tables available in each country and consistently allow for expected generational improvement.
For a 0.25% increase or decrease in the discount rate at 31 December 2009, the 2010 pension expense would be broadly unchanged as the change in service cost and interest cost are offsetting. the effect on the year-end 2009 pension deficit would be a decrease or increase, respectively, of approximately £24.5 million.
(b) Assets and liabilitiesAt 31 December, the fair value of the assets in the schemes, and the assessed present value of the liabilities in the schemes are shown in the following table:
2009 2008 2007£m % £m % £m %
Groupequities 168.5 28.6 162.6 29.6 174.2 34.6Bonds 256.8 43.7 245.1 44.5 203.8 40.4Insured annuities 68.7 11.7 64.9 11.8 65.0 12.9Property 9.8 1.7 12.6 2.3 16.6 3.3Cash and other 84.3 14.3 65.2 11.8 44.4 8.8total fair value of assets 588.1 100.0 550.4 100.0 504.0 100.0Present value of scheme liabilities (836.1) (819.1) (637.6)Deficit in the schemes (248.0) (268.7) (133.6)Irrecoverable surplus (3.1) (2.4) (0.5)unrecognised past service cost (0.7) (0.9) (0.9)net liability1 (251.8) (272.0) (135.0)Schemes in surplus 0.7 0.4 8.4Schemes in deficit (252.5) (272.4) (143.4)Note 1 the related deferred tax asset is discussed in note 15.
the total fair value of assets, present value of scheme liabilities and deficit in the schemes were £470.4 million, £657.0 million and £186.6 million in 2006 and £453.2 million, £684.6 million and £231.4 million in 2005, respectively.
2009 2008 2007Deficit in schemes by region £m £m £m
uK (22.0) (24.8) (24.2)north America (140.9) (153.4) (59.6)Western Continental europe (73.9) (80.0) (46.7)Asia Pacific, latin America, Africa & Middle east and Central & eastern europe (11.2) (10.5) (3.1)Deficit in the schemes (248.0) (268.7) (133.6)
Some of the Group’s defined benefit schemes are unfunded (or largely unfunded) by common custom and practice in certain jurisdictions. In the case of these unfunded schemes, the benefit payments are made as and when they fall due. Pre-funding of these schemes would not be typical business practice.
the following table shows the split of the deficit at 31 December 2009, 2008 and 2007 between funded and unfunded schemes.
2009 2008 2007Present Present Present
value of value of value ofscheme scheme scheme
2009 liabil- 2008 liabil- 2007 liabil-Deficit ities Deficit ities Deficit ities
£m £m £m £m £m £m
Funded schemes by regionuK (22.0) (293.5) (24.8) (269.5) (24.2) (274.2)north America (65.2) (274.5) (71.0) (266.8) 1.6 (183.5)Western Continental europe (25.0) (119.9) (30.1) (126.5) (16.2) (77.6)Asia Pacific, latin America, Africa & Middle east and Central & eastern europe (3.7) (16.1) (3.3) (16.8) (1.6) (9.1)Deficit/liabilities in the funded schemes (115.9) (704.0) (129.2) (679.6) (40.4) (544.4)
Unfunded schemes by regionuK – – – – – –north America (75.7) (75.7) (82.4) (82.4) (61.2) (61.2)Western Continental europe (48.9) (48.9) (49.9) (49.9) (30.5) (30.5)Asia Pacific, latin America, Africa & Middle east and Central & eastern europe (7.5) (7.5) (7.2) (7.2) (1.5) (1.5)Deficit/liabilities in the unfunded schemes (132.1) (132.1) (139.5) (139.5) (93.2) (93.2)
Deficit/liabilities in the schemes (248.0) (836.1) (268.7) (819.1) (133.6) (637.6)
In accordance with IAS 19, schemes that are wholly or partially funded are considered funded schemes.
(c) Pension expensethe following table shows the breakdown of the pension expense between amounts charged to operating profit, amounts charged to finance income and finance costs and amounts recognised in the consolidated statement of comprehensive income (oCI):
2009 2008 2007£m £m £m
GroupCurrent service cost 22.0 16.7 16.2Past service cost/(income) – 2.5 (1.1)Gain on settlements and curtailments (1.1) (0.6) (0.8)Charge to operating profit 20.9 18.6 14.3expected return on pension scheme assets (28.7) (31.3) (28.1)Interest on pension scheme liabilities 46.1 38.9 33.8Charge to profit before taxation for defined benefit schemes 38.3 26.2 20.0
Gain/(loss) on pension scheme assets relative to expected return 44.0 (93.7) (6.0)experience (loss)/gain arising on the scheme liabilities (7.6) 4.4 0.1Changes in assumptions underlying the present value of the scheme liabilities (42.7) 8.0 35.4Change in irrecoverable surplus (0.9) (0.9) 0.5Actuarial (loss)/gain recognised in OCI (7.2) (82.2) 30.0
Movements in exchange rates are included in exchange adjustments on foreign currency net investments in the oCI. In the 2007 financial statements, they were included in the actuarial gain.
As at 31 December 2009 the cumulative amount of net actuarial losses recognised in equity since 1 January 2001 was £180.3 million (31 December 2008: £173.1 million, 31 December 2007: £90.9 million). of this amount, a net loss of £79.2 million was recognised since the 1 January 2004 adoption of IAS 19.
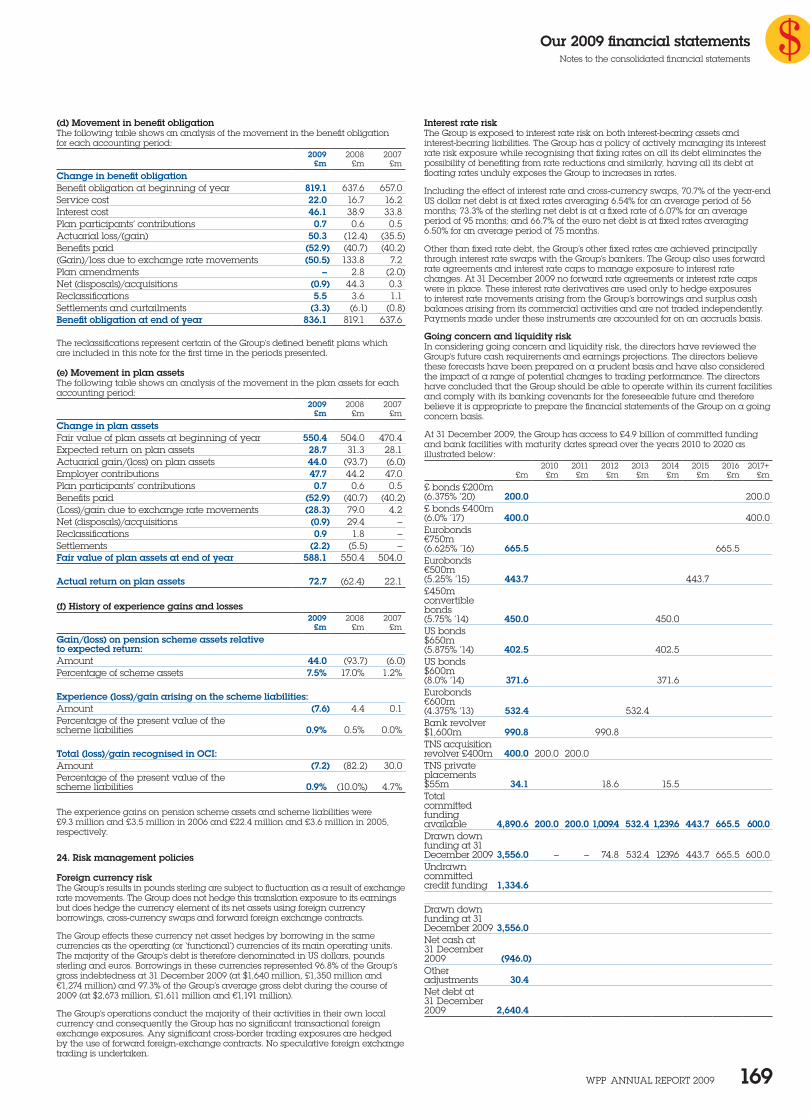
Our 2009 financial statementsnotes to the consolidated financial statements
WPP AnnuAl rePort 2009 169
(d) Movement in benefit obligationthe following table shows an analysis of the movement in the benefit obligation for each accounting period:
2009 2008 2007£m £m £m
Change in benefit obligationBenefit obligation at beginning of year 819.1 637.6 657.0Service cost 22.0 16.7 16.2Interest cost 46.1 38.9 33.8Plan participants’ contributions 0.7 0.6 0.5Actuarial loss/(gain) 50.3 (12.4) (35.5)Benefits paid (52.9) (40.7) (40.2)(Gain)/loss due to exchange rate movements (50.5) 133.8 7.2Plan amendments – 2.8 (2.0)net (disposals)/acquisitions (0.9) 44.3 0.3reclassifications 5.5 3.6 1.1Settlements and curtailments (3.3) (6.1) (0.8)Benefit obligation at end of year 836.1 819.1 637.6
the reclassifications represent certain of the Group’s defined benefit plans which are included in this note for the first time in the periods presented.
(e) Movement in plan assetsthe following table shows an analysis of the movement in the plan assets for each accounting period:
2009 2008 2007£m £m £m
Change in plan assetsFair value of plan assets at beginning of year 550.4 504.0 470.4expected return on plan assets 28.7 31.3 28.1Actuarial gain/(loss) on plan assets 44.0 (93.7) (6.0)employer contributions 47.7 44.2 47.0Plan participants’ contributions 0.7 0.6 0.5Benefits paid (52.9) (40.7) (40.2)(loss)/gain due to exchange rate movements (28.3) 79.0 4.2net (disposals)/acquisitions (0.9) 29.4 –reclassifications 0.9 1.8 –Settlements (2.2) (5.5) –Fair value of plan assets at end of year 588.1 550.4 504.0
Actual return on plan assets 72.7 (62.4) 22.1
(f) History of experience gains and losses
2009 2008 2007£m £m £m
Gain/(loss) on pension scheme assets relative to expected return:Amount 44.0 (93.7) (6.0)Percentage of scheme assets 7.5% 17.0% 1.2%
Experience (loss)/gain arising on the scheme liabilities:Amount (7.6) 4.4 0.1Percentage of the present value of the scheme liabilities 0.9% 0.5% 0.0%
Total (loss)/gain recognised in OCI:Amount (7.2) (82.2) 30.0Percentage of the present value of the scheme liabilities 0.9% (10.0%) 4.7%
the experience gains on pension scheme assets and scheme liabilities were £9.3 million and £3.5 million in 2006 and £22.4 million and £3.6 million in 2005, respectively.
24. Risk management policies
Foreign currency riskthe Group’s results in pounds sterling are subject to fluctuation as a result of exchange rate movements. the Group does not hedge this translation exposure to its earnings but does hedge the currency element of its net assets using foreign currency borrowings, cross-currency swaps and forward foreign exchange contracts.
the Group effects these currency net asset hedges by borrowing in the same currencies as the operating (or ‘functional’) currencies of its main operating units. the majority of the Group’s debt is therefore denominated in uS dollars, pounds sterling and euros. Borrowings in these currencies represented 96.8% of the Group’s gross indebtedness at 31 December 2009 (at $1,640 million, £1,350 million and €1,274 million) and 97.3% of the Group’s average gross debt during the course of 2009 (at $2,673 million, £1,611 million and €1,191 million).
the Group’s operations conduct the majority of their activities in their own local currency and consequently the Group has no significant transactional foreign exchange exposures. Any significant cross-border trading exposures are hedged by the use of forward foreign-exchange contracts. no speculative foreign exchange trading is undertaken.
Interest rate riskthe Group is exposed to interest rate risk on both interest-bearing assets and interest-bearing liabilities. the Group has a policy of actively managing its interest rate risk exposure while recognising that fixing rates on all its debt eliminates the possibility of benefiting from rate reductions and similarly, having all its debt at floating rates unduly exposes the Group to increases in rates.
Including the effect of interest rate and cross-currency swaps, 70.7% of the year-end uS dollar net debt is at fixed rates averaging 6.54% for an average period of 56 months; 73.3% of the sterling net debt is at a fixed rate of 6.07% for an average period of 95 months; and 66.7% of the euro net debt is at fixed rates averaging 6.50% for an average period of 75 months.
other than fixed rate debt, the Group’s other fixed rates are achieved principally through interest rate swaps with the Group’s bankers. the Group also uses forward rate agreements and interest rate caps to manage exposure to interest rate changes. At 31 December 2009 no forward rate agreements or interest rate caps were in place. these interest rate derivatives are used only to hedge exposures to interest rate movements arising from the Group’s borrowings and surplus cash balances arising from its commercial activities and are not traded independently. Payments made under these instruments are accounted for on an accruals basis.
Going concern and liquidity riskIn considering going concern and liquidity risk, the directors have reviewed the Group’s future cash requirements and earnings projections. the directors believe these forecasts have been prepared on a prudent basis and have also considered the impact of a range of potential changes to trading performance. the directors have concluded that the Group should be able to operate within its current facilities and comply with its banking covenants for the foreseeable future and therefore believe it is appropriate to prepare the financial statements of the Group on a going concern basis.
At 31 December 2009, the Group has access to £4.9 billion of committed funding and bank facilities with maturity dates spread over the years 2010 to 2020 as illustrated below:
2010 2011 2012 2013 2014 2015 2016 2017+£m £m £m £m £m £m £m £m £m
£ bonds £200m (6.375% ’20) 200.0 200.0£ bonds £400m (6.0% ’17) 400.0 400.0eurobonds €750m (6.625% ’16) 665.5 665.5eurobonds €500m (5.25% ’15) 443.7 443.7£450m convertible bonds (5.75% ’14) 450.0 450.0uS bonds $650m (5.875% ’14) 402.5 402.5uS bonds $600m (8.0% ’14) 371.6 371.6eurobonds €600m (4.375% ’13) 532.4 532.4Bank revolver $1,600m 990.8 990.8tnS acquisition revolver £400m 400.0 200.0 200.0tnS private placements $55m 34.1 18.6 15.5total committed funding available 4,890.6 200.0 200.0 1,009.4 532.4 1,239.6 443.7 665.5 600.0Drawn down funding at 31 December 2009 3,556.0 – – 74.8 532.4 1,239.6 443.7 665.5 600.0undrawn committed credit funding 1,334.6
Drawn down funding at 31 December 2009 3,556.0net cash at 31 December 2009 (946.0)other adjustments 30.4net debt at 31 December 2009 2,640.4
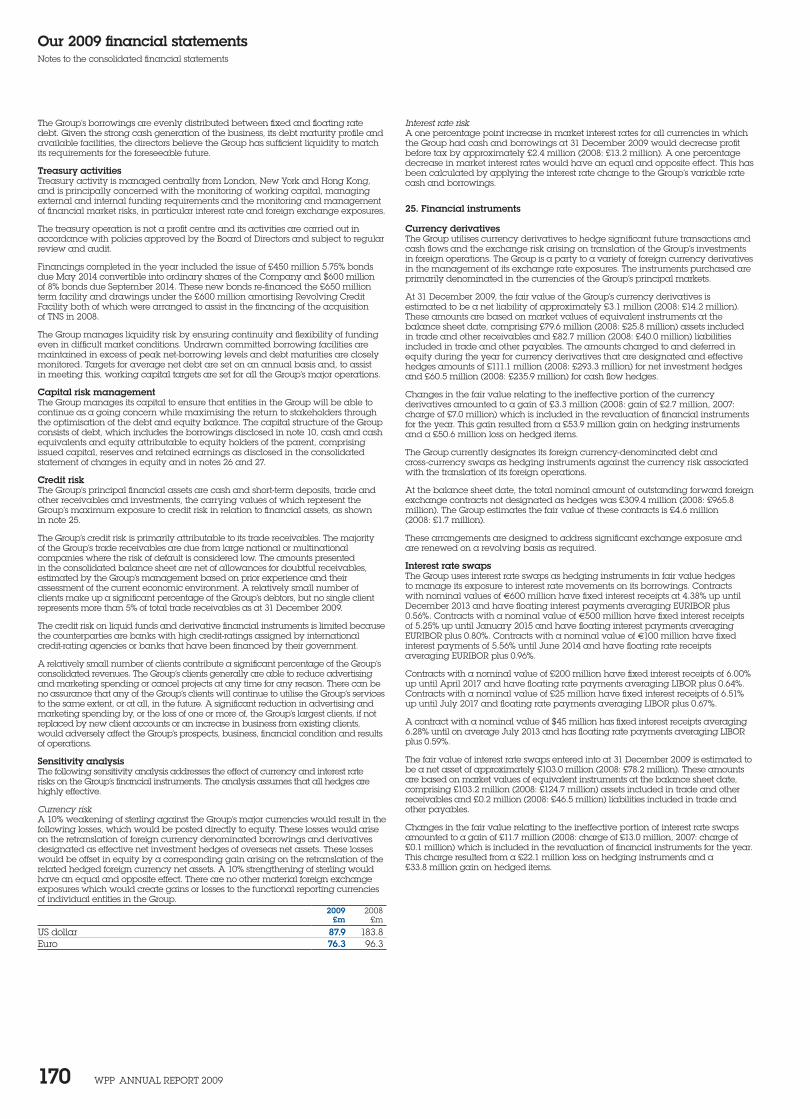
Our 2009 financial statementsnotes to the consolidated financial statements
WPP AnnuAl rePort 2009 170
the Group’s borrowings are evenly distributed between fixed and floating rate debt. Given the strong cash generation of the business, its debt maturity profile and available facilities, the directors believe the Group has sufficient liquidity to match its requirements for the foreseeable future.
Treasury activitiestreasury activity is managed centrally from london, new York and Hong Kong, and is principally concerned with the monitoring of working capital, managing external and internal funding requirements and the monitoring and management of financial market risks, in particular interest rate and foreign exchange exposures.
the treasury operation is not a profit centre and its activities are carried out in accordance with policies approved by the Board of Directors and subject to regular review and audit.
Financings completed in the year included the issue of £450 million 5.75% bonds due May 2014 convertible into ordinary shares of the Company and $600 million of 8% bonds due September 2014. these new bonds re-financed the £650 million term facility and drawings under the £600 million amortising revolving Credit Facility both of which were arranged to assist in the financing of the acquisition of tnS in 2008.
the Group manages liquidity risk by ensuring continuity and flexibility of funding even in difficult market conditions. undrawn committed borrowing facilities are maintained in excess of peak net-borrowing levels and debt maturities are closely monitored. targets for average net debt are set on an annual basis and, to assist in meeting this, working capital targets are set for all the Group’s major operations.
Capital risk managementthe Group manages its capital to ensure that entities in the Group will be able to continue as a going concern while maximising the return to stakeholders through the optimisation of the debt and equity balance. the capital structure of the Group consists of debt, which includes the borrowings disclosed in note 10, cash and cash equivalents and equity attributable to equity holders of the parent, comprising issued capital, reserves and retained earnings as disclosed in the consolidated statement of changes in equity and in notes 26 and 27.
Credit riskthe Group’s principal financial assets are cash and short-term deposits, trade and other receivables and investments, the carrying values of which represent the Group’s maximum exposure to credit risk in relation to financial assets, as shown in note 25.
the Group’s credit risk is primarily attributable to its trade receivables. the majority of the Group’s trade receivables are due from large national or multinational companies where the risk of default is considered low. the amounts presented in the consolidated balance sheet are net of allowances for doubtful receivables, estimated by the Group’s management based on prior experience and their assessment of the current economic environment. A relatively small number of clients make up a significant percentage of the Group’s debtors, but no single client represents more than 5% of total trade receivables as at 31 December 2009.
the credit risk on liquid funds and derivative financial instruments is limited because the counterparties are banks with high credit-ratings assigned by international credit-rating agencies or banks that have been financed by their government.
A relatively small number of clients contribute a significant percentage of the Group’s consolidated revenues. the Group’s clients generally are able to reduce advertising and marketing spending or cancel projects at any time for any reason. there can be no assurance that any of the Group’s clients will continue to utilise the Group’s services to the same extent, or at all, in the future. A significant reduction in advertising and marketing spending by, or the loss of one or more of, the Group’s largest clients, if not replaced by new client accounts or an increase in business from existing clients, would adversely affect the Group’s prospects, business, financial condition and results of operations.
Sensitivity analysisthe following sensitivity analysis addresses the effect of currency and interest rate risks on the Group’s financial instruments. the analysis assumes that all hedges are highly effective.
Currency riskA 10% weakening of sterling against the Group’s major currencies would result in the following losses, which would be posted directly to equity. these losses would arise on the retranslation of foreign currency denominated borrowings and derivatives designated as effective net investment hedges of overseas net assets. these losses would be offset in equity by a corresponding gain arising on the retranslation of the related hedged foreign currency net assets. A 10% strengthening of sterling would have an equal and opposite effect. there are no other material foreign exchange exposures which would create gains or losses to the functional reporting currencies of individual entities in the Group.
2009 2008£m £m
uS dollar 87.9 183.8euro 76.3 96.3
Interest rate riskA one percentage point increase in market interest rates for all currencies in which the Group had cash and borrowings at 31 December 2009 would decrease profit before tax by approximately £2.4 million (2008: £13.2 million). A one percentage decrease in market interest rates would have an equal and opposite effect. this has been calculated by applying the interest rate change to the Group’s variable rate cash and borrowings.
25. Financial instruments
Currency derivativesthe Group utilises currency derivatives to hedge significant future transactions and cash flows and the exchange risk arising on translation of the Group’s investments in foreign operations. the Group is a party to a variety of foreign currency derivatives in the management of its exchange rate exposures. the instruments purchased are primarily denominated in the currencies of the Group’s principal markets.
At 31 December 2009, the fair value of the Group’s currency derivatives is estimated to be a net liability of approximately £3.1 million (2008: £14.2 million). these amounts are based on market values of equivalent instruments at the balance sheet date, comprising £79.6 million (2008: £25.8 million) assets included in trade and other receivables and £82.7 million (2008: £40.0 million) liabilities included in trade and other payables. the amounts charged to and deferred in equity during the year for currency derivatives that are designated and effective hedges amounts of £111.1 million (2008: £293.3 million) for net investment hedges and £60.5 million (2008: £235.9 million) for cash flow hedges.
Changes in the fair value relating to the ineffective portion of the currency derivatives amounted to a gain of £3.3 million (2008: gain of £2.7 million, 2007: charge of £7.0 million) which is included in the revaluation of financial instruments for the year. this gain resulted from a £53.9 million gain on hedging instruments and a £50.6 million loss on hedged items.
the Group currently designates its foreign currency-denominated debt and cross-currency swaps as hedging instruments against the currency risk associated with the translation of its foreign operations.
At the balance sheet date, the total nominal amount of outstanding forward foreign exchange contracts not designated as hedges was £309.4 million (2008: £965.8 million). the Group estimates the fair value of these contracts is £4.6 million (2008: £1.7 million).
these arrangements are designed to address significant exchange exposure and are renewed on a revolving basis as required.
Interest rate swapsthe Group uses interest rate swaps as hedging instruments in fair value hedges to manage its exposure to interest rate movements on its borrowings. Contracts with nominal values of 1600 million have fixed interest receipts at 4.38% up until December 2013 and have floating interest payments averaging eurIBor plus 0.56%. Contracts with a nominal value of 1500 million have fixed interest receipts of 5.25% up until January 2015 and have floating interest payments averaging eurIBor plus 0.80%. Contracts with a nominal value of 1100 million have fixed interest payments of 5.56% until June 2014 and have floating rate receipts averaging eurIBor plus 0.96%.
Contracts with a nominal value of £200 million have fixed interest receipts of 6.00% up until April 2017 and have floating rate payments averaging lIBor plus 0.64%. Contracts with a nominal value of £25 million have fixed interest receipts of 6.51% up until July 2017 and floating rate payments averaging lIBor plus 0.67%.
A contract with a nominal value of $45 million has fixed interest receipts averaging 6.28% until on average July 2013 and has floating rate payments averaging lIBor plus 0.59%.
the fair value of interest rate swaps entered into at 31 December 2009 is estimated to be a net asset of approximately £103.0 million (2008: £78.2 million). these amounts are based on market values of equivalent instruments at the balance sheet date, comprising £103.2 million (2008: £124.7 million) assets included in trade and other receivables and £0.2 million (2008: £46.5 million) liabilities included in trade and other payables.
Changes in the fair value relating to the ineffective portion of interest rate swaps amounted to a gain of £11.7 million (2008: charge of £13.0 million, 2007: charge of £0.1 million) which is included in the revaluation of financial instruments for the year. this charge resulted from a £22.1 million loss on hedging instruments and a £33.8 million gain on hedged items.
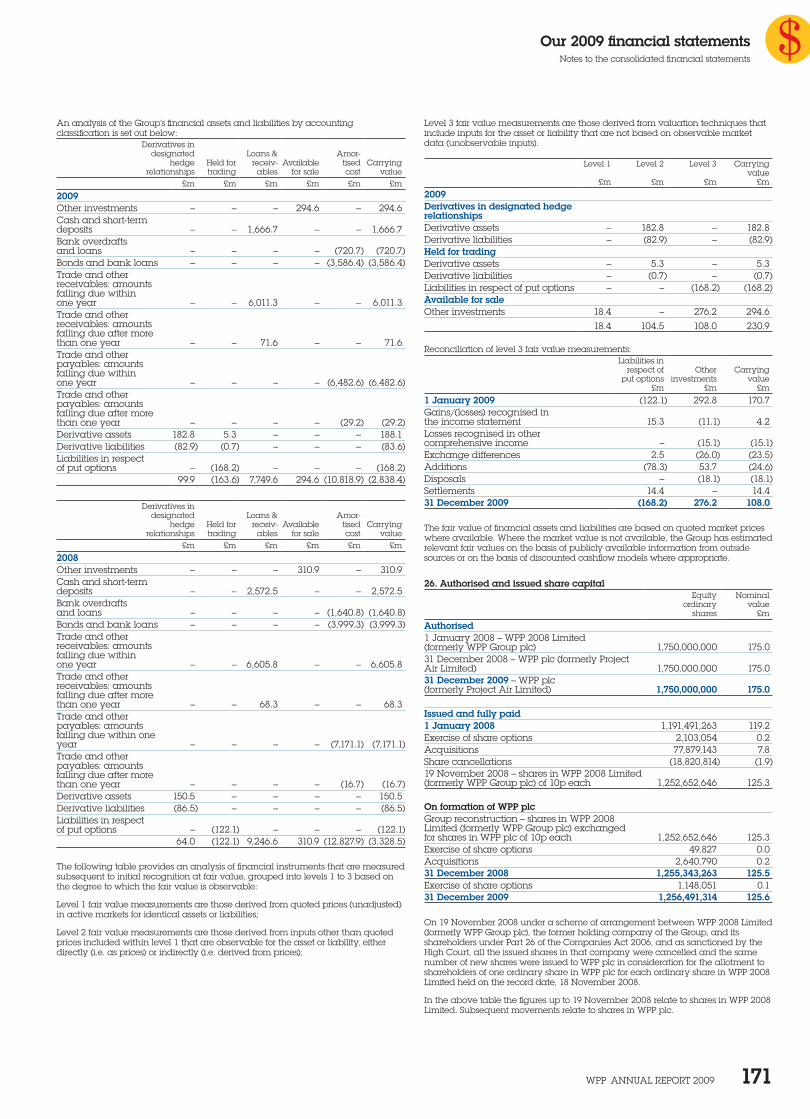
Our 2009 financial statementsnotes to the consolidated financial statements
WPP AnnuAl rePort 2009 171
An analysis of the Group’s financial assets and liabilities by accounting classification is set out below:
Derivatives indesignated loans & Amor-
hedge Held for receiv- Available tised Carryingrelationships trading ables for sale cost value
£m £m £m £m £m £m
2009other investments – – – 294.6 – 294.6 Cash and short-term deposits – – 1,666.7 – – 1,666.7Bank overdrafts and loans – – – – (720.7) (720.7)Bonds and bank loans – – – – (3,586.4) (3,586.4)trade and other receivables: amounts falling due within one year – – 6,011.3 – – 6,011.3trade and other receivables: amounts falling due after more than one year – – 71.6 – – 71.6trade and other payables: amounts falling due within one year – – – – (6,482.6) (6,482.6)trade and other payables: amounts falling due after more than one year – – – – (29.2) (29.2)Derivative assets 182.8 5.3 – – – 188.1Derivative liabilities (82.9) (0.7) – – – (83.6)liabilities in respect of put options – (168.2) – – – (168.2)
99.9 (163.6) 7,749.6 294.6 (10,818.9) (2,838.4)
Derivatives in
designated loans & Amor-hedge Held for receiv- Available tised Carrying
relationships trading ables for sale cost value£m £m £m £m £m £m
2008other investments – – – 310.9 – 310.9 Cash and short-term deposits – – 2,572.5 – – 2,572.5 Bank overdrafts and loans – – – – (1,640.8) (1,640.8)Bonds and bank loans – – – – (3,999.3) (3,999.3)trade and other receivables: amounts falling due within one year – – 6,605.8 – – 6,605.8trade and other receivables: amounts falling due after more than one year – – 68.3 – – 68.3trade and other payables: amounts falling due within one year – – – – (7,171.1) (7,171.1)trade and other payables: amounts falling due after more than one year – – – – (16.7) (16.7)Derivative assets 150.5 – – – – 150.5 Derivative liabilities (86.5) – – – – (86.5)liabilities in respect of put options – (122.1) – – – (122.1)
64.0 (122.1) 9,246.6 310.9 (12,827.9) (3,328.5)
the following table provides an analysis of financial instruments that are measured subsequent to initial recognition at fair value, grouped into levels 1 to 3 based on the degree to which the fair value is observable:
level 1 fair value measurements are those derived from quoted prices (unadjusted) in active markets for identical assets or liabilities;
level 2 fair value measurements are those derived from inputs other than quoted prices included within level 1 that are observable for the asset or liability, either directly (i.e. as prices) or indirectly (i.e. derived from prices);
level 3 fair value measurements are those derived from valuation techniques that include inputs for the asset or liability that are not based on observable market data (unobservable inputs).
level 1 level 2 level 3 Carrying value
£m £m £m £m
2009Derivatives in designated hedge relationshipsDerivative assets – 182.8 – 182.8 Derivative liabilities – (82.9) – (82.9)Held for tradingDerivative assets – 5.3 – 5.3 Derivative liabilities – (0.7) – (0.7)liabilities in respect of put options – – (168.2) (168.2)Available for saleother investments 18.4 – 276.2 294.6
18.4 104.5 108.0 230.9
reconciliation of level 3 fair value measurements:liabilities in
respect of other Carryingput options investments value
£m £m £m
1 January 2009 (122.1) 292.8 170.7Gains/(losses) recognised in the income statement 15.3 (11.1) 4.2losses recognised in other comprehensive income – (15.1) (15.1)exchange differences 2.5 (26.0) (23.5)Additions (78.3) 53.7 (24.6)Disposals – (18.1) (18.1)Settlements 14.4 – 14.4 31 December 2009 (168.2) 276.2 108.0 the fair value of financial assets and liabilities are based on quoted market prices where available. Where the market value is not available, the Group has estimated relevant fair values on the basis of publicly available information from outside sources or on the basis of discounted cashflow models where appropriate.
26. Authorised and issued share capitalequity nominal
ordinary valueshares £m
Authorised1 January 2008 – WPP 2008 limited (formerly WPP Group plc) 1,750,000,000 175.0 31 December 2008 – WPP plc (formerly Project Air limited) 1,750,000,000 175.0 31 December 2009 – WPP plc (formerly Project Air limited) 1,750,000,000 175.0
Issued and fully paid1 January 2008 1,191,491,263 119.2 exercise of share options 2,103,054 0.2 Acquisitions 77,879,143 7.8 Share cancellations (18,820,814) (1.9) 19 november 2008 – shares in WPP 2008 limited (formerly WPP Group plc) of 10p each 1,252,652,646 125.3 On formation of WPP plcGroup reconstruction – shares in WPP 2008 limited (formerly WPP Group plc) exchanged for shares in WPP plc of 10p each 1,252,652,646 125.3exercise of share options 49,827 0.0 Acquisitions 2,640,790 0.231 December 2008 1,255,343,263 125.5exercise of share options 1,148,051 0.1 31 December 2009 1,256,491,314 125.6 on 19 november 2008 under a scheme of arrangement between WPP 2008 limited (formerly WPP Group plc), the former holding company of the Group, and its shareholders under Part 26 of the Companies Act 2006, and as sanctioned by the High Court, all the issued shares in that company were cancelled and the same number of new shares were issued to WPP plc in consideration for the allotment to shareholders of one ordinary share in WPP plc for each ordinary share in WPP 2008 limited held on the record date, 18 november 2008.
In the above table the figures up to 19 november 2008 relate to shares in WPP 2008 limited. Subsequent movements relate to shares in WPP plc.
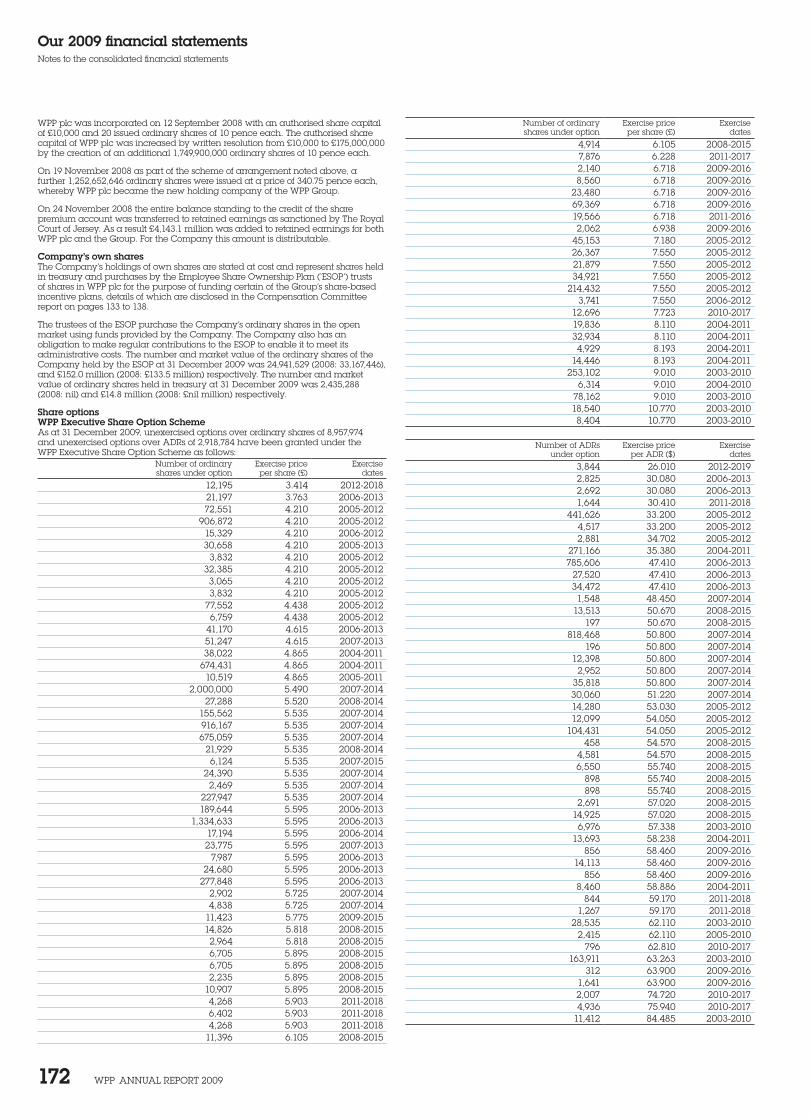
Our 2009 financial statementsnotes to the consolidated financial statements
WPP AnnuAl rePort 2009 172
WPP plc was incorporated on 12 September 2008 with an authorised share capital of £10,000 and 20 issued ordinary shares of 10 pence each. the authorised share capital of WPP plc was increased by written resolution from £10,000 to £175,000,000 by the creation of an additional 1,749,900,000 ordinary shares of 10 pence each.
on 19 november 2008 as part of the scheme of arrangement noted above, a further 1,252,652,646 ordinary shares were issued at a price of 340.75 pence each, whereby WPP plc became the new holding company of the WPP Group.
on 24 november 2008 the entire balance standing to the credit of the share premium account was transferred to retained earnings as sanctioned by the royal Court of Jersey. As a result £4,143.1 million was added to retained earnings for both WPP plc and the Group. For the Company this amount is distributable.
Company’s own sharesthe Company’s holdings of own shares are stated at cost and represent shares held in treasury and purchases by the employee Share ownership Plan (‘eSoP’) trusts of shares in WPP plc for the purpose of funding certain of the Group’s share-based incentive plans, details of which are disclosed in the Compensation Committee report on pages 133 to 138.
the trustees of the eSoP purchase the Company’s ordinary shares in the open market using funds provided by the Company. the Company also has an obligation to make regular contributions to the eSoP to enable it to meet its administrative costs. the number and market value of the ordinary shares of the Company held by the eSoP at 31 December 2009 was 24,941,529 (2008: 33,167,446), and £152.0 million (2008: £133.5 million) respectively. the number and market value of ordinary shares held in treasury at 31 December 2009 was 2,435,288 (2008: nil) and £14.8 million (2008: £nil million) respectively.
Share optionsWPP Executive Share Option SchemeAs at 31 December 2009, unexercised options over ordinary shares of 8,957,974 and unexercised options over ADrs of 2,918,784 have been granted under the WPP executive Share option Scheme as follows:
number of ordinary exercise price exerciseshares under option per share (£) dates
12,195 3.414 2012-201821,197 3.763 2006-201372,551 4.210 2005-2012
906,872 4.210 2005-201215,329 4.210 2006-201230,658 4.210 2005-2013
3,832 4.210 2005-201232,385 4.210 2005-20123,065 4.210 2005-20123,832 4.210 2005-2012
77,552 4.438 2005-20126,759 4.438 2005-2012
41,170 4.615 2006-201351,247 4.615 2007-201338,022 4.865 2004-2011
674,431 4.865 2004-201110,519 4.865 2005-2011
2,000,000 5.490 2007-201427,288 5.520 2008-2014
155,562 5.535 2007-2014916,167 5.535 2007-2014675,059 5.535 2007-2014
21,929 5.535 2008-20146,124 5.535 2007-2015
24,390 5.535 2007-20142,469 5.535 2007-2014
227,947 5.535 2007-2014189,644 5.595 2006-2013
1,334,633 5.595 2006-201317,194 5.595 2006-201423,775 5.595 2007-2013
7,987 5.595 2006-201324,680 5.595 2006-2013
277,848 5.595 2006-20132,902 5.725 2007-20144,838 5.725 2007-2014
11,423 5.775 2009-201514,826 5.818 2008-20152,964 5.818 2008-20156,705 5.895 2008-20156,705 5.895 2008-20152,235 5.895 2008-2015
10,907 5.895 2008-20154,268 5.903 2011-20186,402 5.903 2011-20184,268 5.903 2011-2018
11,396 6.105 2008-2015
number of ordinary exercise price exerciseshares under option per share (£) dates
4,914 6.105 2008-20157,876 6.228 2011-20172,140 6.718 2009-20168,560 6.718 2009-2016
23,480 6.718 2009-201669,369 6.718 2009-201619,566 6.718 2011-20162,062 6.938 2009-2016
45,153 7.180 2005-201226,367 7.550 2005-201221,879 7.550 2005-201234,921 7.550 2005-2012
214,432 7.550 2005-20123,741 7.550 2006-2012
12,696 7.723 2010-201719,836 8.110 2004-201132,934 8.110 2004-20114,929 8.193 2004-2011
14,446 8.193 2004-2011253,102 9.010 2003-2010
6,314 9.010 2004-201078,162 9.010 2003-201018,540 10.770 2003-20108,404 10.770 2003-2010
number of ADrs exercise price exercise
under option per ADr ($) dates
3,844 26.010 2012-20192,825 30.080 2006-20132,692 30.080 2006-20131,644 30.410 2011-2018
441,626 33.200 2005-20124,517 33.200 2005-20122,881 34.702 2005-2012
271,166 35.380 2004-2011785,606 47.410 2006-2013
27,520 47.410 2006-201334,472 47.410 2006-20131,548 48.450 2007-2014
13,513 50.670 2008-2015197 50.670 2008-2015
818,468 50.800 2007-2014196 50.800 2007-2014
12,398 50.800 2007-20142,952 50.800 2007-2014
35,818 50.800 2007-201430,060 51.220 2007-201414,280 53.030 2005-201212,099 54.050 2005-2012
104,431 54.050 2005-2012458 54.570 2008-2015
4,581 54.570 2008-20156,550 55.740 2008-2015
898 55.740 2008-2015898 55.740 2008-2015
2,691 57.020 2008-201514,925 57.020 2008-20156,976 57.338 2003-2010
13,693 58.238 2004-2011856 58.460 2009-2016
14,113 58.460 2009-2016856 58.460 2009-2016
8,460 58.886 2004-2011844 59.170 2011-2018
1,267 59.170 2011-201828,535 62.110 2003-2010
2,415 62.110 2005-2010796 62.810 2010-2017
163,911 63.263 2003-2010312 63.900 2009-2016
1,641 63.900 2009-20162,007 74.720 2010-20174,936 75.940 2010-2017
11,412 84.485 2003-2010
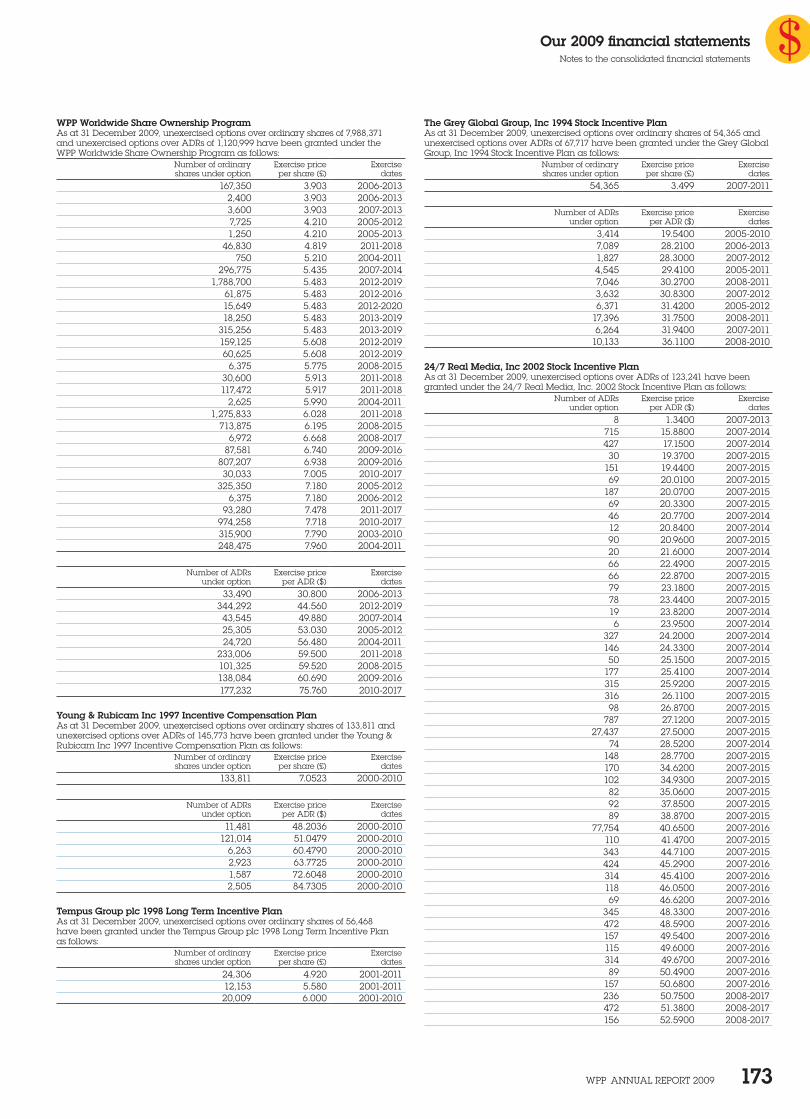
Our 2009 financial statementsnotes to the consolidated financial statements
WPP AnnuAl rePort 2009 173
WPP Worldwide Share Ownership ProgramAs at 31 December 2009, unexercised options over ordinary shares of 7,988,371 and unexercised options over ADrs of 1,120,999 have been granted under the WPP Worldwide Share ownership Program as follows:
number of ordinary exercise price exerciseshares under option per share (£) dates
167,350 3.903 2006-20132,400 3.903 2006-20133,600 3.903 2007-20137,725 4.210 2005-20121,250 4.210 2005-2013
46,830 4.819 2011-2018750 5.210 2004-2011
296,775 5.435 2007-20141,788,700 5.483 2012-2019
61,875 5.483 2012-201615,649 5.483 2012-202018,250 5.483 2013-2019
315,256 5.483 2013-2019159,125 5.608 2012-201960,625 5.608 2012-2019
6,375 5.775 2008-201530,600 5.913 2011-2018117,472 5.917 2011-2018
2,625 5.990 2004-20111,275,833 6.028 2011-2018
713,875 6.195 2008-20156,972 6.668 2008-2017
87,581 6.740 2009-2016807,207 6.938 2009-201630,033 7.005 2010-2017
325,350 7.180 2005-20126,375 7.180 2006-2012
93,280 7.478 2011-2017974,258 7.718 2010-2017315,900 7.790 2003-2010248,475 7.960 2004-2011
number of ADrs exercise price exerciseunder option per ADr ($) dates
33,490 30.800 2006-2013344,292 44.560 2012-201943,545 49.880 2007-201425,305 53.030 2005-201224,720 56.480 2004-2011
233,006 59.500 2011-2018101,325 59.520 2008-2015138,084 60.690 2009-2016177,232 75.760 2010-2017
Young & Rubicam Inc 1997 Incentive Compensation PlanAs at 31 December 2009, unexercised options over ordinary shares of 133,811 and unexercised options over ADrs of 145,773 have been granted under the Young & rubicam Inc 1997 Incentive Compensation Plan as follows:
number of ordinary exercise price exerciseshares under option per share (£) dates
133,811 7.0523 2000-2010
number of ADrs exercise price exercise
under option per ADr ($) dates
11,481 48.2036 2000-2010 121,014 51.0479 2000-2010
6,263 60.4790 2000-2010 2,923 63.7725 2000-2010 1,587 72.6048 2000-2010 2,505 84.7305 2000-2010
Tempus Group plc 1998 Long Term Incentive PlanAs at 31 December 2009, unexercised options over ordinary shares of 56,468 have been granted under the tempus Group plc 1998 long term Incentive Plan as follows:
number of ordinary exercise price exerciseshares under option per share (£) dates
24,306 4.920 2001-201112,153 5.580 2001-201120,009 6.000 2001-2010
The Grey Global Group, Inc 1994 Stock Incentive PlanAs at 31 December 2009, unexercised options over ordinary shares of 54,365 and unexercised options over ADrs of 67,717 have been granted under the Grey Global Group, Inc 1994 Stock Incentive Plan as follows:
number of ordinary exercise price exerciseshares under option per share (£) dates
54,365 3.499 2007-2011
number of ADrs exercise price exercise
under option per ADr ($) dates
3,414 19.5400 2005-20107,089 28.2100 2006-20131,827 28.3000 2007-20124,545 29.4100 2005-20117,046 30.2700 2008-20113,632 30.8300 2007-20126,371 31.4200 2005-2012
17,396 31.7500 2008-20116,264 31.9400 2007-2011
10,133 36.1100 2008-2010
24/7 Real Media, Inc 2002 Stock Incentive PlanAs at 31 December 2009, unexercised options over ADrs of 123,241 have been granted under the 24/7 real Media, Inc. 2002 Stock Incentive Plan as follows:
number of ADrs exercise price exerciseunder option per ADr ($) dates
8 1.3400 2007-2013715 15.8800 2007-2014427 17.1500 2007-201430 19.3700 2007-2015
151 19.4400 2007-201569 20.0100 2007-2015
187 20.0700 2007-201569 20.3300 2007-201546 20.7700 2007-201412 20.8400 2007-201490 20.9600 2007-201520 21.6000 2007-201466 22.4900 2007-201566 22.8700 2007-201579 23.1800 2007-201578 23.4400 2007-201519 23.8200 2007-20146 23.9500 2007-2014
327 24.2000 2007-2014146 24.3300 2007-201450 25.1500 2007-2015
177 25.4100 2007-2014315 25.9200 2007-2015316 26.1100 2007-201598 26.8700 2007-2015
787 27.1200 2007-201527,437 27.5000 2007-2015
74 28.5200 2007-2014148 28.7700 2007-2015170 34.6200 2007-2015102 34.9300 2007-201582 35.0600 2007-201592 37.8500 2007-201589 38.8700 2007-2015
77,754 40.6500 2007-2016110 41.4700 2007-2015343 44.7100 2007-2015424 45.2900 2007-2016314 45.4100 2007-2016118 46.0500 2007-201669 46.6200 2007-2016
345 48.3300 2007-2016472 48.5900 2007-2016157 49.5400 2007-2016115 49.6000 2007-2016314 49.6700 2007-201689 50.4900 2007-2016
157 50.6800 2007-2016236 50.7500 2008-2017472 51.3800 2008-2017156 52.5900 2008-2017
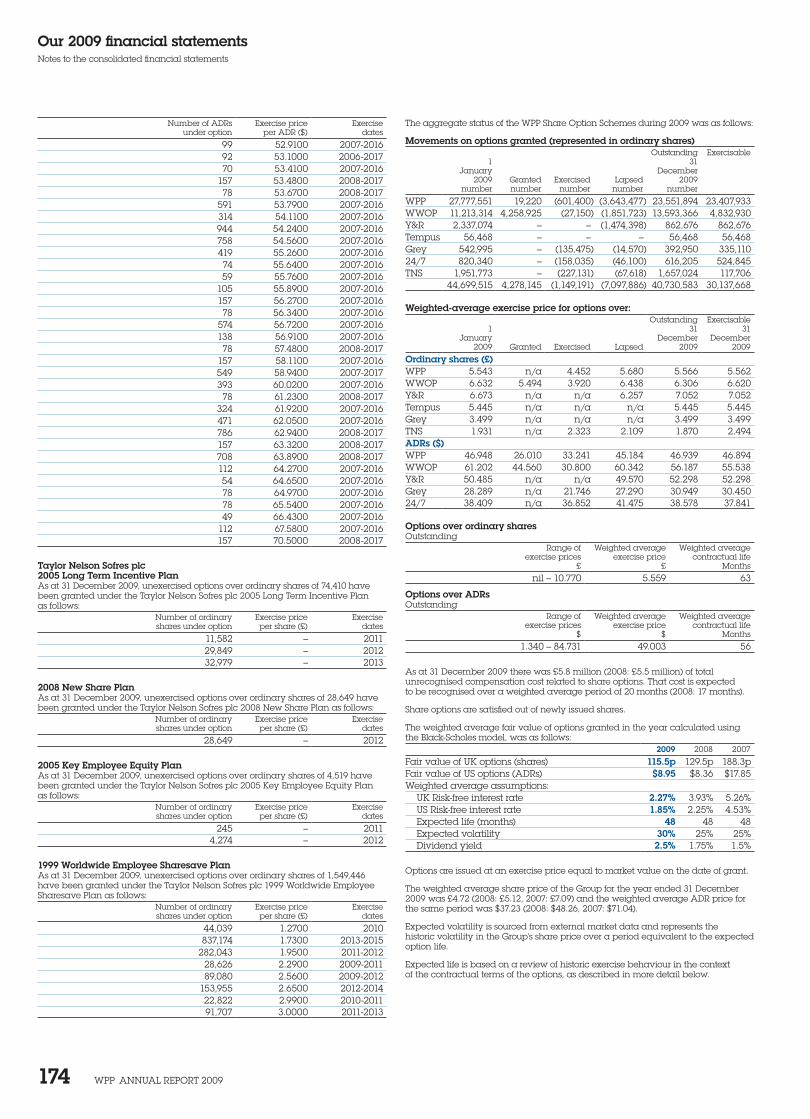
Our 2009 financial statementsnotes to the consolidated financial statements
WPP AnnuAl rePort 2009 174
number of ADrs exercise price exerciseunder option per ADr ($) dates
99 52.9100 2007-201692 53.1000 2006-201770 53.4100 2007-2016
157 53.4800 2008-201778 53.6700 2008-2017
591 53.7900 2007-2016314 54.1100 2007-2016944 54.2400 2007-2016758 54.5600 2007-2016419 55.2600 2007-201674 55.6400 2007-201659 55.7600 2007-2016
105 55.8900 2007-2016157 56.2700 2007-201678 56.3400 2007-2016
574 56.7200 2007-2016138 56.9100 2007-201678 57.4800 2008-2017
157 58.1100 2007-2016549 58.9400 2007-2017393 60.0200 2007-201678 61.2300 2008-2017
324 61.9200 2007-2016471 62.0500 2007-2016786 62.9400 2008-2017157 63.3200 2008-2017708 63.8900 2008-2017112 64.2700 2007-201654 64.6500 2007-201678 64.9700 2007-201678 65.5400 2007-201649 66.4300 2007-2016
112 67.5800 2007-2016157 70.5000 2008-2017
Taylor Nelson Sofres plc2005 Long Term Incentive PlanAs at 31 December 2009, unexercised options over ordinary shares of 74,410 have been granted under the taylor nelson Sofres plc 2005 long term Incentive Plan as follows:
number of ordinary exercise price exerciseshares under option per share (£) dates
11,582 – 201129,849 – 201232,979 – 2013
2008 New Share PlanAs at 31 December 2009, unexercised options over ordinary shares of 28,649 have been granted under the taylor nelson Sofres plc 2008 new Share Plan as follows:
number of ordinary exercise price exerciseshares under option per share (£) dates
28,649 – 2012
2005 Key Employee Equity PlanAs at 31 December 2009, unexercised options over ordinary shares of 4,519 have been granted under the taylor nelson Sofres plc 2005 Key employee equity Plan as follows:
number of ordinary exercise price exerciseshares under option per share (£) dates
245 – 20114,274 – 2012
1999 Worldwide Employee Sharesave Plan As at 31 December 2009, unexercised options over ordinary shares of 1,549,446 have been granted under the taylor nelson Sofres plc 1999 Worldwide employee Sharesave Plan as follows:
number of ordinary exercise price exerciseshares under option per share (£) dates
44,039 1.2700 2010837,174 1.7300 2013-2015
282,043 1.9500 2011-201228,626 2.2900 2009-201189,080 2.5600 2009-2012
153,955 2.6500 2012-201422,822 2.9900 2010-2011 91,707 3.0000 2011-2013
the aggregate status of the WPP Share option Schemes during 2009 was as follows:
Movements on options granted (represented in ordinary shares)outstanding exercisable
1 31 January December
2009 Granted exercised lapsed 2009number number number number number
WPP 27,777,551 19,220 (601,400) (3,643,477) 23,551,894 23,407,933WWoP 11,213,314 4,258,925 (27,150) (1,851,723) 13,593,366 4,832,930Y&r 2,337,074 – – (1,474,398) 862,676 862,676tempus 56,468 – – – 56,468 56,468Grey 542,995 – (135,475) (14,570) 392,950 335,11024/7 820,340 – (158,035) (46,100) 616,205 524,845tnS 1,951,773 – (227,131) (67,618) 1,657,024 117,706
44,699,515 4,278,145 (1,149,191) (7,097,886) 40,730,583 30,137,668
Weighted-average exercise price for options over:outstanding exercisable
1 31 31January December December
2009 Granted exercised lapsed 2009 2009
Ordinary shares (£)WPP 5.543 n/a 4.452 5.680 5.566 5.562WWoP 6.632 5.494 3.920 6.438 6.306 6.620Y&r 6.673 n/a n/a 6.257 7.052 7.052tempus 5.445 n/a n/a n/a 5.445 5.445Grey 3.499 n/a n/a n/a 3.499 3.499tnS 1.931 n/a 2.323 2.109 1.870 2.494ADRs ($)WPP 46.948 26.010 33.241 45.184 46.939 46.894WWoP 61.202 44.560 30.800 60.342 56.187 55.538Y&r 50.485 n/a n/a 49.570 52.298 52.298Grey 28.289 n/a 21.746 27.290 30.949 30.45024/7 38.409 n/a 36.852 41.475 38.578 37.841
Options over ordinary sharesoutstanding
range of Weighted average Weighted averageexercise prices exercise price contractual life
£ £ Months
nil – 10.770 5.559 63
Options over ADRsoutstanding
range of Weighted average Weighted averageexercise prices exercise price contractual life
$ $ Months
1.340 – 84.731 49.003 56
As at 31 December 2009 there was £5.8 million (2008: £5.5 million) of total unrecognised compensation cost related to share options. that cost is expected to be recognised over a weighted average period of 20 months (2008: 17 months).
Share options are satisfied out of newly issued shares.
the weighted average fair value of options granted in the year calculated using the Black-Scholes model, was as follows:
2009 2008 2007
Fair value of uK options (shares) 115.5p 129.5p 188.3pFair value of uS options (ADrs) $8.95 $8.36 $17.85Weighted average assumptions:
uK risk-free interest rate 2.27% 3.93% 5.26%uS risk-free interest rate 1.85% 2.25% 4.53%expected life (months) 48 48 48expected volatility 30% 25% 25%Dividend yield 2.5% 1.75% 1.5%
options are issued at an exercise price equal to market value on the date of grant.
the weighted average share price of the Group for the year ended 31 December 2009 was £4.72 (2008: £5.12, 2007: £7.09) and the weighted average ADr price for the same period was $37.23 (2008: $48.26, 2007: $71.04).
expected volatility is sourced from external market data and represents the historic volatility in the Group’s share price over a period equivalent to the expected option life.
expected life is based on a review of historic exercise behaviour in the context of the contractual terms of the options, as described in more detail below.
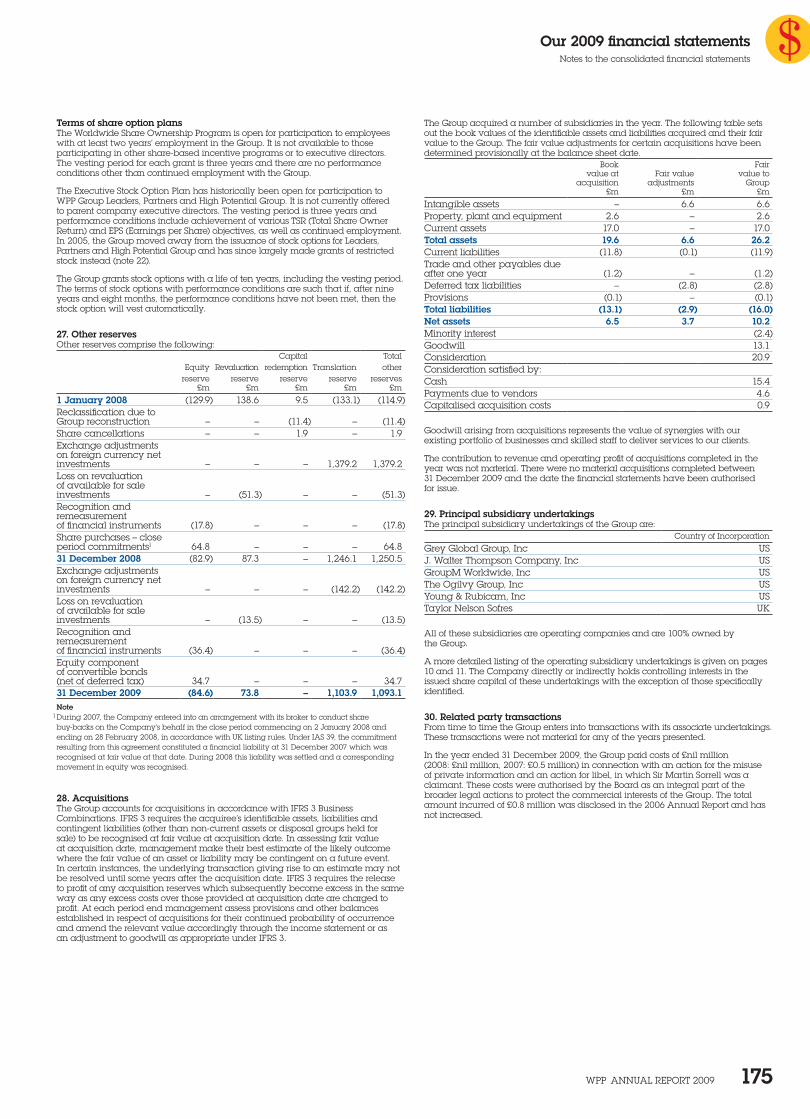
Our 2009 financial statementsnotes to the consolidated financial statements
WPP AnnuAl rePort 2009 175
Terms of share option plansthe Worldwide Share ownership Program is open for participation to employees with at least two years’ employment in the Group. It is not available to those participating in other share-based incentive programs or to executive directors. the vesting period for each grant is three years and there are no performance conditions other than continued employment with the Group.
the executive Stock option Plan has historically been open for participation to WPP Group leaders, Partners and High Potential Group. It is not currently offered to parent company executive directors. the vesting period is three years and performance conditions include achievement of various tSr (total Share owner return) and ePS (earnings per Share) objectives, as well as continued employment. In 2005, the Group moved away from the issuance of stock options for leaders, Partners and High Potential Group and has since largely made grants of restricted stock instead (note 22).
the Group grants stock options with a life of ten years, including the vesting period. the terms of stock options with performance conditions are such that if, after nine years and eight months, the performance conditions have not been met, then the stock option will vest automatically.
27. Other reservesother reserves comprise the following:
Capital totalequity revaluation redemption translation other
reserve reserve reserve reserve reserves£m £m £m £m £m
1 January 2008 (129.9) 138.6 9.5 (133.1) (114.9)reclassification due to Group reconstruction – – (11.4) – (11.4)Share cancellations – – 1.9 – 1.9 exchange adjustments on foreign currency net investments – – – 1,379.2 1,379.2 loss on revaluation of available for sale investments – (51.3) – – (51.3)recognition and remeasurement of financial instruments (17.8) – – – (17.8)Share purchases – close period commitments1 64.8 – – – 64.831 December 2008 (82.9) 87.3 – 1,246.1 1,250.5exchange adjustments on foreign currency net investments – – – (142.2) (142.2)loss on revaluation of available for sale investments – (13.5) – – (13.5)recognition and remeasurement of financial instruments (36.4) – – – (36.4)equity component of convertible bonds (net of deferred tax) 34.7 – – – 34.731 December 2009 (84.6) 73.8 – 1,103.9 1,093.1Note 1 During 2007, the Company entered into an arrangement with its broker to conduct share buy-backs on the Company’s behalf in the close period commencing on 2 January 2008 and ending on 28 February 2008, in accordance with uK listing rules. under IAS 39, the commitment resulting from this agreement constituted a financial liability at 31 December 2007 which was recognised at fair value at that date. During 2008 this liability was settled and a corresponding movement in equity was recognised.
28. Acquisitionsthe Group accounts for acquisitions in accordance with IFrS 3 Business Combinations. IFrS 3 requires the acquiree’s identifiable assets, liabilities and contingent liabilities (other than non-current assets or disposal groups held for sale) to be recognised at fair value at acquisition date. In assessing fair value at acquisition date, management make their best estimate of the likely outcome where the fair value of an asset or liability may be contingent on a future event. In certain instances, the underlying transaction giving rise to an estimate may not be resolved until some years after the acquisition date. IFrS 3 requires the release to profit of any acquisition reserves which subsequently become excess in the same way as any excess costs over those provided at acquisition date are charged to profit. At each period end management assess provisions and other balances established in respect of acquisitions for their continued probability of occurrence and amend the relevant value accordingly through the income statement or as an adjustment to goodwill as appropriate under IFrS 3.
the Group acquired a number of subsidiaries in the year. the following table sets out the book values of the identifiable assets and liabilities acquired and their fair value to the Group. the fair value adjustments for certain acquisitions have been determined provisionally at the balance sheet date.
Book Fairvalue at Fair value value to
acquisition adjustments Group£m £m £m
Intangible assets – 6.6 6.6Property, plant and equipment 2.6 – 2.6Current assets 17.0 – 17.0Total assets 19.6 6.6 26.2Current liabilities (11.8) (0.1) (11.9)trade and other payables due after one year (1.2) – (1.2)Deferred tax liabilities – (2.8) (2.8)Provisions (0.1) – (0.1)Total liabilities (13.1) (2.9) (16.0)Net assets 6.5 3.7 10.2Minority interest (2.4)Goodwill 13.1Consideration 20.9Consideration satisfied by:Cash 15.4Payments due to vendors 4.6Capitalised acquisition costs 0.9
Goodwill arising from acquisitions represents the value of synergies with our existing portfolio of businesses and skilled staff to deliver services to our clients.
the contribution to revenue and operating profit of acquisitions completed in the year was not material. there were no material acquisitions completed between 31 December 2009 and the date the financial statements have been authorised for issue.
29. Principal subsidiary undertakingsthe principal subsidiary undertakings of the Group are:
Country of Incorporation
Grey Global Group, Inc uSJ. Walter thompson Company, Inc uSGroupM Worldwide, Inc uSthe ogilvy Group, Inc uSYoung & rubicam, Inc uStaylor nelson Sofres uK
All of these subsidiaries are operating companies and are 100% owned by the Group.
A more detailed listing of the operating subsidiary undertakings is given on pages 10 and 11. the Company directly or indirectly holds controlling interests in the issued share capital of these undertakings with the exception of those specifically identified.
30. Related party transactionsFrom time to time the Group enters into transactions with its associate undertakings. these transactions were not material for any of the years presented.
In the year ended 31 December 2009, the Group paid costs of £nil million (2008: £nil million, 2007: £0.5 million) in connection with an action for the misuse of private information and an action for libel, in which Sir Martin Sorrell was a claimant. these costs were authorised by the Board as an integral part of the broader legal actions to protect the commercial interests of the Group. the total amount incurred of £0.8 million was disclosed in the 2006 Annual report and has not increased.
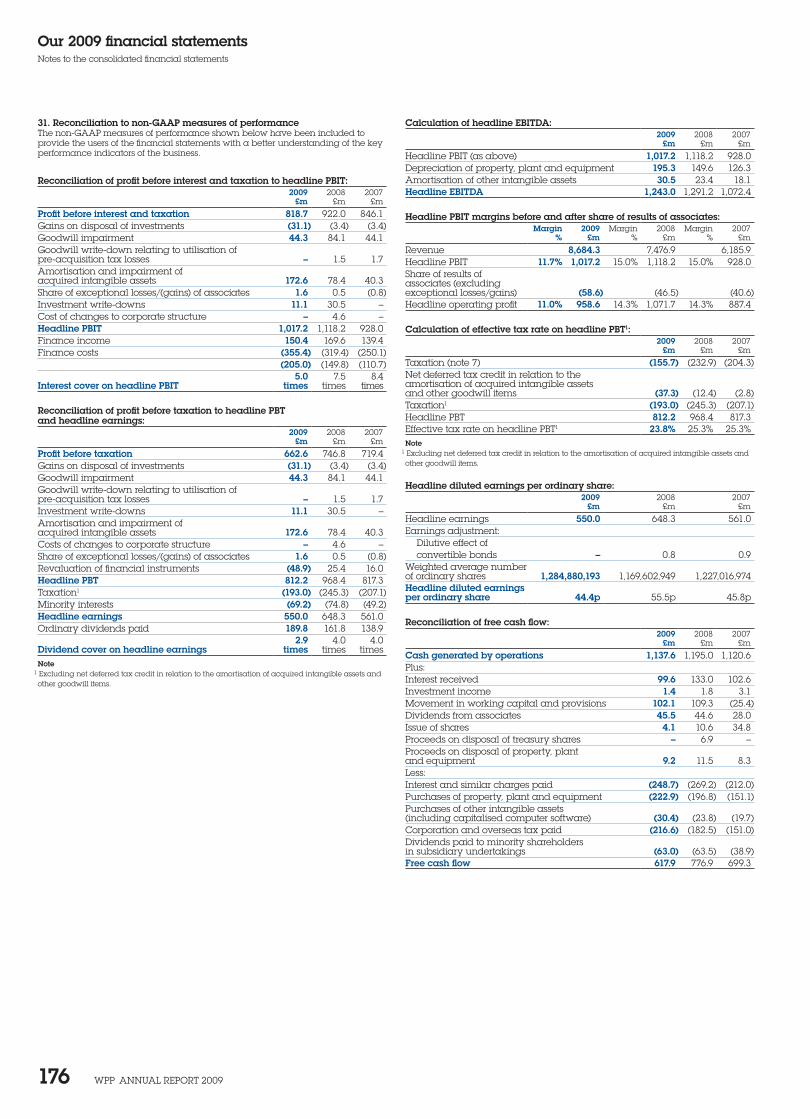
Our 2009 financial statementsnotes to the consolidated financial statements
WPP AnnuAl rePort 2009 176
31. Reconciliation to non-GAAP measures of performancethe non-GAAP measures of performance shown below have been included to provide the users of the financial statements with a better understanding of the key performance indicators of the business.
Reconciliation of profit before interest and taxation to headline PBIT:2009 2008 2007
£m £m £m
Profit before interest and taxation 818.7 922.0 846.1Gains on disposal of investments (31.1) (3.4) (3.4)Goodwill impairment 44.3 84.1 44.1Goodwill write-down relating to utilisation of pre-acquisition tax losses – 1.5 1.7Amortisation and impairment of acquired intangible assets 172.6 78.4 40.3Share of exceptional losses/(gains) of associates 1.6 0.5 (0.8)Investment write-downs 11.1 30.5 –Cost of changes to corporate structure – 4.6 –Headline PBIT 1,017.2 1,118.2 928.0Finance income 150.4 169.6 139.4Finance costs (355.4) (319.4) (250.1)
(205.0) (149.8) (110.7)
Interest cover on headline PBIT5.0
times7.5
times8.4
times
Reconciliation of profit before taxation to headline PBT and headline earnings:
2009 2008 2007£m £m £m
Profit before taxation 662.6 746.8 719.4Gains on disposal of investments (31.1) (3.4) (3.4)Goodwill impairment 44.3 84.1 44.1Goodwill write-down relating to utilisation of pre-acquisition tax losses – 1.5 1.7Investment write-downs 11.1 30.5 –Amortisation and impairment of acquired intangible assets 172.6 78.4 40.3Costs of changes to corporate structure – 4.6 –Share of exceptional losses/(gains) of associates 1.6 0.5 (0.8)revaluation of financial instruments (48.9) 25.4 16.0Headline PBT 812.2 968.4 817.3taxation1 (193.0) (245.3) (207.1)Minority interests (69.2) (74.8) (49.2)Headline earnings 550.0 648.3 561.0ordinary dividends paid 189.8 161.8 138.9
Dividend cover on headline earnings2.9
times4.0
times4.0
timesNote 1 excluding net deferred tax credit in relation to the amortisation of acquired intangible assets and other goodwill items.
Calculation of headline EBITDA:2009 2008 2007
£m £m £m
Headline PBIt (as above) 1,017.2 1,118.2 928.0Depreciation of property, plant and equipment 195.3 149.6 126.3Amortisation of other intangible assets 30.5 23.4 18.1Headline EBITDA 1,243.0 1,291.2 1,072.4
Headline PBIT margins before and after share of results of associates:
Margin 2009 Margin 2008 Margin 2007% £m % £m % £m
revenue 8,684.3 7,476.9 6,185.9Headline PBIt 11.7% 1,017.2 15.0% 1,118.2 15.0% 928.0Share of results of associates (excluding exceptional losses/gains) (58.6) (46.5) (40.6)Headline operating profit 11.0% 958.6 14.3% 1,071.7 14.3% 887.4
Calculation of effective tax rate on headline PBT1:
2009 2008 2007£m £m £m
taxation (note 7) (155.7) (232.9) (204.3)net deferred tax credit in relation to the amortisation of acquired intangible assets and other goodwill items (37.3) (12.4) (2.8)taxation1 (193.0) (245.3) (207.1)Headline PBt 812.2 968.4 817.3effective tax rate on headline PBt1 23.8% 25.3% 25.3%Note 1 excluding net deferred tax credit in relation to the amortisation of acquired intangible assets and other goodwill items.
Headline diluted earnings per ordinary share:2009 2008 2007
£m £m £m
Headline earnings 550.0 648.3 561.0earnings adjustment:
Dilutive effect of convertible bonds – 0.8 0.9
Weighted average number of ordinary shares 1,284,880,193 1,169,602,949 1,227,016,974Headline diluted earnings per ordinary share 44.4p 55.5p 45.8p
Reconciliation of free cash flow:
2009 2008 2007£m £m £m
Cash generated by operations 1,137.6 1,195.0 1,120.6Plus:Interest received 99.6 133.0 102.6Investment income 1.4 1.8 3.1Movement in working capital and provisions 102.1 109.3 (25.4)Dividends from associates 45.5 44.6 28.0Issue of shares 4.1 10.6 34.8Proceeds on disposal of treasury shares – 6.9 –Proceeds on disposal of property, plant and equipment 9.2 11.5 8.3less: Interest and similar charges paid (248.7) (269.2) (212.0)Purchases of property, plant and equipment (222.9) (196.8) (151.1)Purchases of other intangible assets (including capitalised computer software) (30.4) (23.8) (19.7)Corporation and overseas tax paid (216.6) (182.5) (151.0)Dividends paid to minority shareholders in subsidiary undertakings (63.0) (63.5) (38.9)Free cash flow 617.9 776.9 699.3
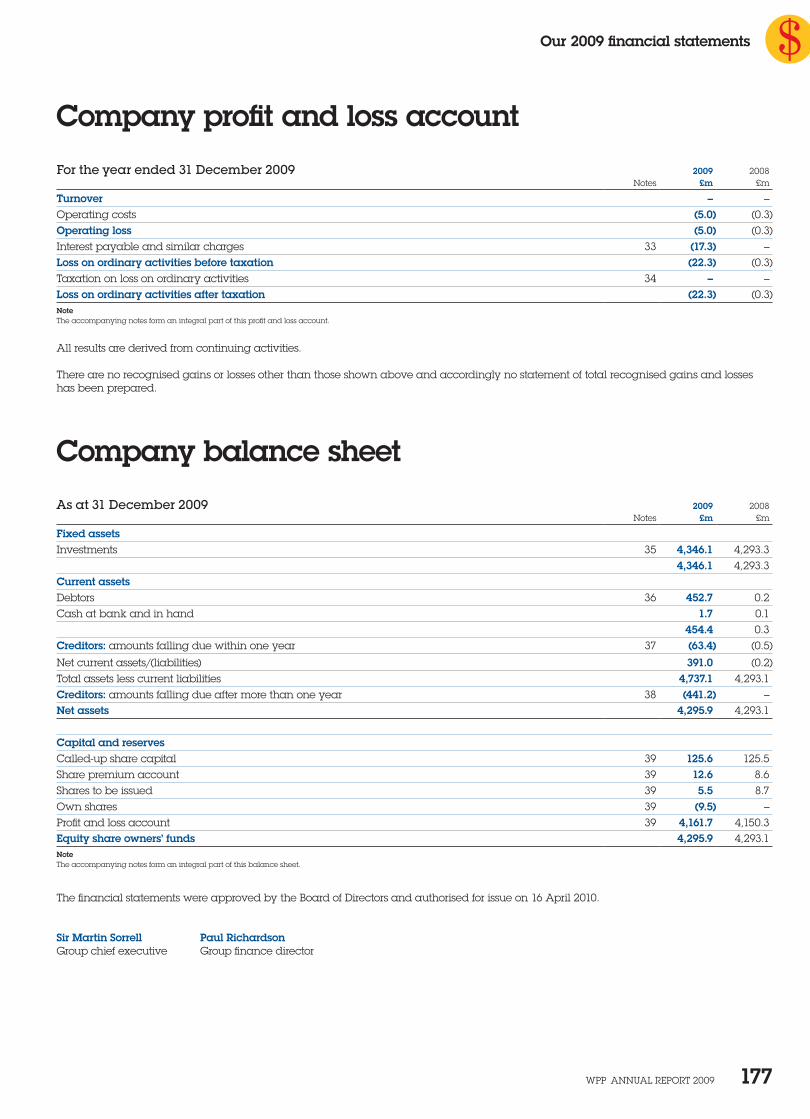
Our 2009 financial statements
WPP AnnuAl rePort 2009 177
Company profit and loss account
Company balance sheet
For the year ended 31 December 2009 2009 2008notes £m £m
Turnover – –operating costs (5.0) (0.3)Operating loss (5.0) (0.3)Interest payable and similar charges 33 (17.3) –Loss on ordinary activities before taxation (22.3) (0.3)taxation on loss on ordinary activities 34 – –Loss on ordinary activities after taxation (22.3) (0.3)Notethe accompanying notes form an integral part of this profit and loss account.
All results are derived from continuing activities.
there are no recognised gains or losses other than those shown above and accordingly no statement of total recognised gains and losses has been prepared.
As at 31 December 2009 2009 2008notes £m £m
Fixed assetsInvestments 35 4,346.1 4,293.3
4,346.1 4,293.3Current assetsDebtors 36 452.7 0.2Cash at bank and in hand 1.7 0.1 454.4 0.3Creditors: amounts falling due within one year 37 (63.4) (0.5)
net current assets/(liabilities) 391.0 (0.2)total assets less current liabilities 4,737.1 4,293.1Creditors: amounts falling due after more than one year 38 (441.2) –Net assets 4,295.9 4,293.1
Capital and reservesCalled-up share capital 39 125.6 125.5Share premium account 39 12.6 8.6Shares to be issued 39 5.5 8.7own shares 39 (9.5) –Profit and loss account 39 4,161.7 4,150.3Equity share owners’ funds 4,295.9 4,293.1Notethe accompanying notes form an integral part of this balance sheet.
the financial statements were approved by the Board of Directors and authorised for issue on 16 April 2010.
Sir Martin Sorrell Paul RichardsonGroup chief executive Group finance director
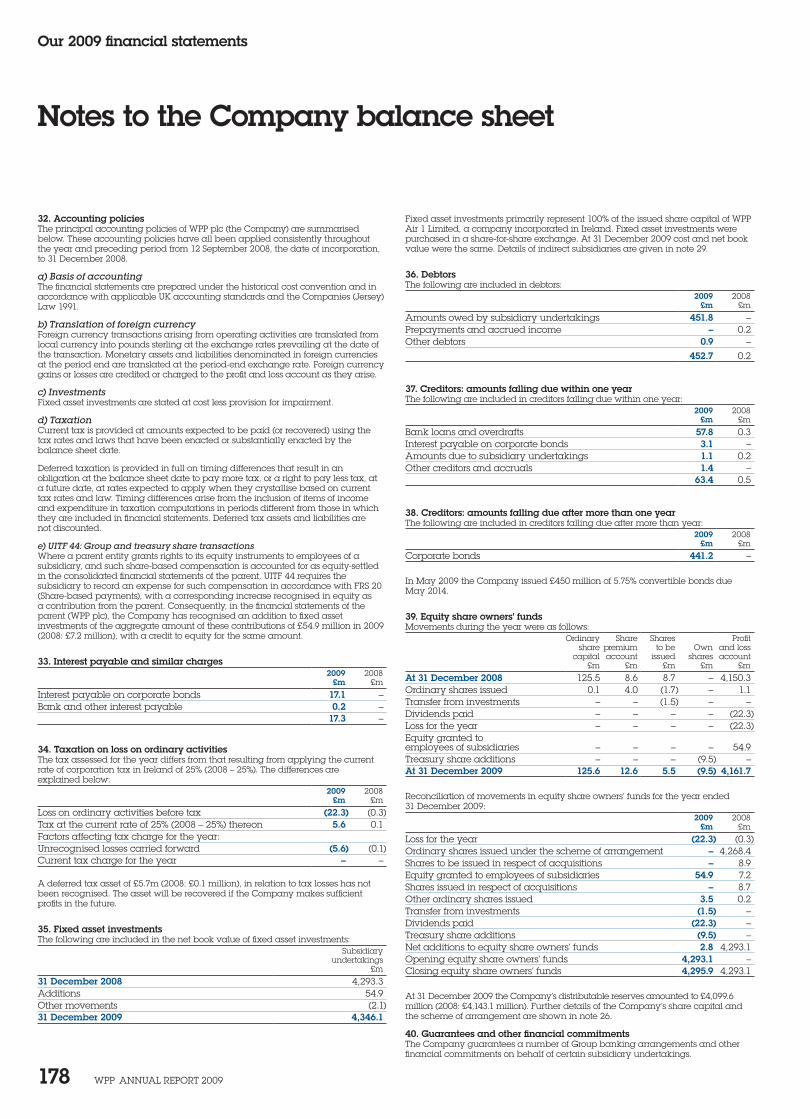
Our 2009 financial statements
WPP AnnuAl rePort 2009 178
Notes to the Company balance sheet
32. Accounting policiesthe principal accounting policies of WPP plc (the Company) are summarised below. these accounting policies have all been applied consistently throughout the year and preceding period from 12 September 2008, the date of incorporation, to 31 December 2008.
a) Basis of accountingthe financial statements are prepared under the historical cost convention and in accordance with applicable uK accounting standards and the Companies (Jersey) law 1991.
b) Translation of foreign currencyForeign currency transactions arising from operating activities are translated from local currency into pounds sterling at the exchange rates prevailing at the date of the transaction. Monetary assets and liabilities denominated in foreign currencies at the period end are translated at the period-end exchange rate. Foreign currency gains or losses are credited or charged to the profit and loss account as they arise.
c) InvestmentsFixed asset investments are stated at cost less provision for impairment.
d) TaxationCurrent tax is provided at amounts expected to be paid (or recovered) using the tax rates and laws that have been enacted or substantially enacted by the balance sheet date.
Deferred taxation is provided in full on timing differences that result in an obligation at the balance sheet date to pay more tax, or a right to pay less tax, at a future date, at rates expected to apply when they crystallise based on current tax rates and law. timing differences arise from the inclusion of items of income and expenditure in taxation computations in periods different from those in which they are included in financial statements. Deferred tax assets and liabilities are not discounted.
e) UITF 44: Group and treasury share transactions Where a parent entity grants rights to its equity instruments to employees of a subsidiary, and such share-based compensation is accounted for as equity-settled in the consolidated financial statements of the parent, uItF 44 requires the subsidiary to record an expense for such compensation in accordance with FrS 20 (Share-based payments), with a corresponding increase recognised in equity as a contribution from the parent. Consequently, in the financial statements of the parent (WPP plc), the Company has recognised an addition to fixed asset investments of the aggregate amount of these contributions of £54.9 million in 2009 (2008: £7.2 million), with a credit to equity for the same amount.
33. Interest payable and similar charges2009 2008
£m £m
Interest payable on corporate bonds 17.1 –Bank and other interest payable 0.2 –
17.3 –
34. Taxation on loss on ordinary activities the tax assessed for the year differs from that resulting from applying the current rate of corporation tax in Ireland of 25% (2008 – 25%). the differences are explained below:
2009 2008£m £m
loss on ordinary activities before tax (22.3) (0.3)tax at the current rate of 25% (2008 – 25%) thereon 5.6 0.1Factors affecting tax charge for the year:unrecognised losses carried forward (5.6) (0.1)Current tax charge for the year – –
A deferred tax asset of £5.7m (2008: £0.1 million), in relation to tax losses has not been recognised. the asset will be recovered if the Company makes sufficient profits in the future.
35. Fixed asset investmentsthe following are included in the net book value of fixed asset investments:
Subsidiaryundertakings
£m
31 December 2008 4,293.3Additions 54.9other movements (2.1)31 December 2009 4,346.1
Fixed asset investments primarily represent 100% of the issued share capital of WPP Air 1 limited, a company incorporated in Ireland. Fixed asset investments were purchased in a share-for-share exchange. At 31 December 2009 cost and net book value were the same. Details of indirect subsidiaries are given in note 29.
36. Debtorsthe following are included in debtors:
2009 2008£m £m
Amounts owed by subsidiary undertakings 451.8 –Prepayments and accrued income – 0.2other debtors 0.9 –
452.7 0.2
37. Creditors: amounts falling due within one yearthe following are included in creditors falling due within one year:
2009 2008£m £m
Bank loans and overdrafts 57.8 0.3Interest payable on corporate bonds 3.1 –Amounts due to subsidiary undertakings 1.1 0.2other creditors and accruals 1.4 –
63.4 0.5
38. Creditors: amounts falling due after more than one yearthe following are included in creditors falling due after more than year:
2009 2008£m £m
Corporate bonds 441.2 –
In May 2009 the Company issued £450 million of 5.75% convertible bonds due May 2014.
39. Equity share owners’ fundsMovements during the year were as follows:
ordinary Share Shares Profitshare premium to be own and loss
capital account issued shares account£m £m £m £m £m
At 31 December 2008 125.5 8.6 8.7 – 4,150.3ordinary shares issued 0.1 4.0 (1.7) – 1.1transfer from investments – – (1.5) – –Dividends paid – – – – (22.3)loss for the year – – – – (22.3)equity granted to employees of subsidiaries – – – – 54.9treasury share additions – – – (9.5) –At 31 December 2009 125.6 12.6 5.5 (9.5) 4,161.7 reconciliation of movements in equity share owners’ funds for the year ended 31 December 2009:
2009 2008£m £m
loss for the year (22.3) (0.3)ordinary shares issued under the scheme of arrangement – 4,268.4Shares to be issued in respect of acquisitions – 8.9equity granted to employees of subsidiaries 54.9 7.2Shares issued in respect of acquisitions – 8.7other ordinary shares issued 3.5 0.2transfer from investments (1.5) –Dividends paid (22.3) –treasury share additions (9.5) –net additions to equity share owners’ funds 2.8 4,293.1opening equity share owners’ funds 4,293.1 –Closing equity share owners’ funds 4,295.9 4,293.1
At 31 December 2009 the Company’s distributable reserves amounted to £4,099.6 million (2008: £4,143.1 million). Further details of the Company’s share capital and the scheme of arrangement are shown in note 26.
40. Guarantees and other financial commitmentsthe Company guarantees a number of Group banking arrangements and other financial commitments on behalf of certain subsidiary undertakings.
Our 2009 financial statements
WPP AnnuAl rePort 2009 179
Independent auditors’ report
Independent Auditors’ report to the members of WPP plc
We have audited the Group and parent company financial statements (the ‘financial statements’) of WPP plc for the year ended 31 December 2009 which comprise the accounting policies, the consolidated income statement (excluding the US Dollar information), the consolidated statement of comprehensive income, the consolidated cash flow statement, the consolidated balance sheet, the consolidated statement of changes in equity, the parent company profit and loss account and balance sheet and the related notes 1 to 40. These financial statements have been prepared under the accounting policies set out therein. The financial reporting framework that has been applied in the preparation of the Group financial statements is applicable law and International Financial Reporting Standards (IFRSs) as adopted by the European Union. The financial reporting framework that has been applied in the preparation of the parent company financial statements is applicable law and United Kingdom Accounting Standards (United Kingdom Generally Accepted Accounting Practice).
This report is made solely to the Company’s members, as a body, in accordance with Article 110 of the Companies (Jersey) Law 1991. Our audit work has been undertaken so that we might state to the Company’s members those matters we are required to state to them in an auditors’ report and for no other purpose. To the fullest extent permitted by law, we do not accept or assume responsibility to anyone other than the Company and the Company’s members as a body, for our audit work, for this report, or for the opinions we have formed.
Respective responsibilities of directors and auditors
As explained more fully in the Directors’ Responsibilities Statement, the directors are responsible for the preparation of the financial statements and for being satisfied that they give a true and fair view. Our responsibility is to audit the financial statements in accordance with applicable law and International Standards on Auditing (UK and Ireland). Those standards require us to comply with the Auditing Practices Board’s (APB’s) Ethical Standards for Auditors.
Scope of the audit of the financial statements
An audit involves obtaining evidence about the amounts and disclosures in the financial statements sufficient to give reasonable assurance that the financial statements are free from material misstatement, whether caused by fraud or error. This includes an assessment of: whether the accounting policies are appropriate to the Group’s and the parent company’s circumstances and have been consistently applied and adequately disclosed; the reasonableness of significant accounting estimates made by the directors; and the overall presentation of the financial statements.
Our 2009 financial statements
WPP AnnuAl rePort 2009 180
Independent auditors’ report
Opinion on financial statements
In our opinion: the financial statements give a true and fair view of the
state of the Group’s and of the parent company’s affairs as at 31 December 2009 and of the Group’s profit and the parent company’s loss for the year then ended;
the Group financial statements have been properly prepared in accordance with IFRSs as adopted by the European Union;
the parent company financial statements have been properly prepared in accordance with United Kingdom Generally Accepted Accounting Practice; and
the financial statements have been prepared in accordance with the Companies (Jersey) Law 1991, and as regards the Group financial statements, Article 4 of the IAS Regulation.
Separate opinion in relation to IFRS as issued by IASB
As explained in the accounting policies to the financial statements, the Group, in addition to complying with its legal obligation to comply with IFRSs as adopted by the European Union, has also applied IFRSs as issued by the International Accounting Standards Board (IASB).
In our opinion the Group financial statements comply with IFRSs as issued by the IASB.
Opinion on matters prescribed by the UK Companies Act 2006 that would have applied if WPP plc were a UK incorporated company
the part of the Directors’ Remuneration Report to be audited has been properly prepared in accordance with the UK Companies Act 2006; and
the information given in the Directors’ Report for the financial year for which the financial statements are prepared is consistent with the financial statements.
Matters on which we are required to report by exception
We have nothing to report in respect of the following matters where the UK Companies Act 2006, which would have applied if WPP plc were a UK incorporated company, requires us to report to you if, in our opinion:
adequate accounting records have not been kept by the parent company, or returns adequate for our audit have not been received from branches not visited by us; or
the parent company financial statements and the part of the Directors’ Remuneration Report to be audited are not in agreement with the accounting records and returns; or
certain disclosures of directors’ remuneration specified by law are not made; or
we have not received all the information and explanations we require for our audit.
Under the UK Listing Rules we are required to review: the directors’ statement contained within the Directors’
report in relation to going concern; and the part of the Corporate Governance Statement relating
to the Company’s compliance with the nine provisions of the June 2008 Combined Code specified for our review.
Deloitte LLPChartered AccountantsLondon, United Kingdom 16 April 2010
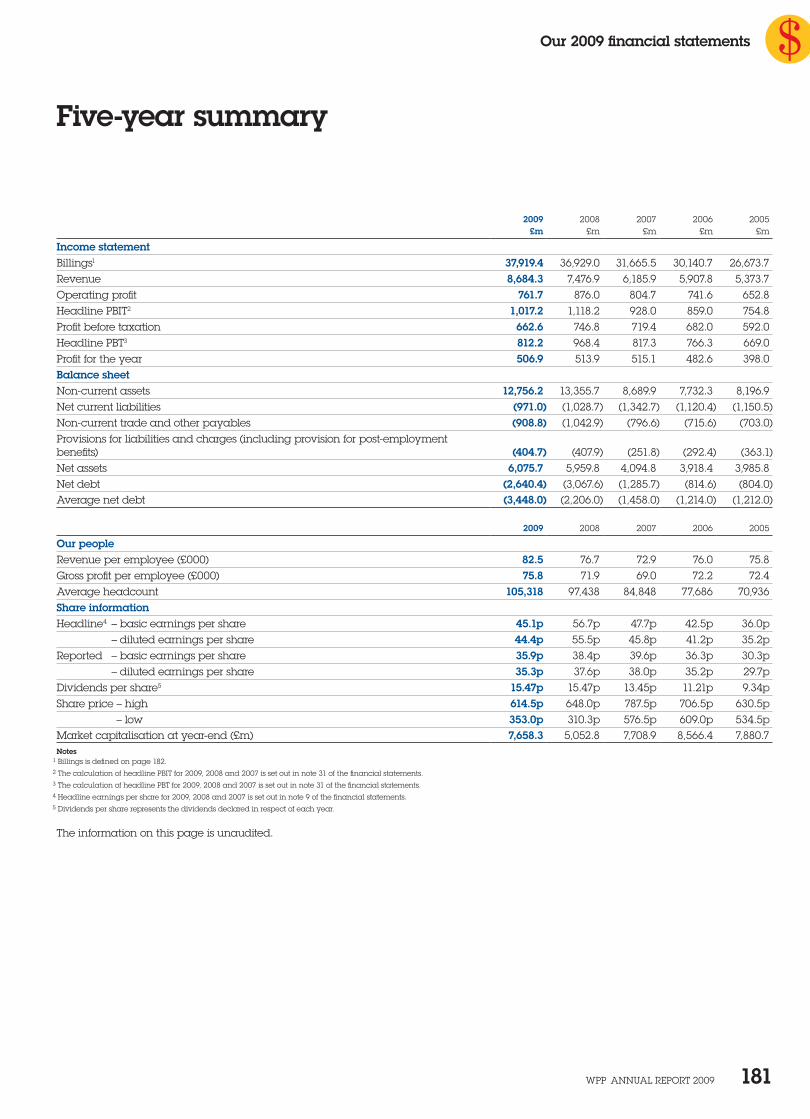
Our 2009 financial statements
WPP AnnuAl rePort 2009 181
Five-year summary
2009 2008 2007 2006 2005£m £m £m £m £m
Income statementBillings1 37,919.4 36,929.0 31,665.5 30,140.7 26,673.7revenue 8,684.3 7,476.9 6,185.9 5,907.8 5,373.7operating profit 761.7 876.0 804.7 741.6 652.8Headline PBIt2 1,017.2 1,118.2 928.0 859.0 754.8Profit before taxation 662.6 746.8 719.4 682.0 592.0Headline PBt3 812.2 968.4 817.3 766.3 669.0Profit for the year 506.9 513.9 515.1 482.6 398.0Balance sheetnon-current assets 12,756.2 13,355.7 8,689.9 7,732.3 8,196.9net current liabilities (971.0) (1,028.7) (1,342.7) (1,120.4) (1,150.5)non-current trade and other payables (908.8) (1,042.9) (796.6) (715.6) (703.0)Provisions for liabilities and charges (including provision for post-employment benefits) (404.7) (407.9) (251.8) (292.4) (363.1)net assets 6,075.7 5,959.8 4,094.8 3,918.4 3,985.8net debt (2,640.4) (3,067.6) (1,285.7) (814.6) (804.0)Average net debt (3,448.0) (2,206.0) (1,458.0) (1,214.0) (1,212.0)
2009 2008 2007 2006 2005
Our peoplerevenue per employee (£000) 82.5 76.7 72.9 76.0 75.8Gross profit per employee (£000) 75.8 71.9 69.0 72.2 72.4Average headcount 105,318 97,438 84,848 77,686 70,936Share informationHeadline4 – basic earnings per share 45.1p 56.7p 47.7p 42.5p 36.0p
– diluted earnings per share 44.4p 55.5p 45.8p 41.2p 35.2preported – basic earnings per share 35.9p 38.4p 39.6p 36.3p 30.3p
– diluted earnings per share 35.3p 37.6p 38.0p 35.2p 29.7pDividends per share5 15.47p 15.47p 13.45p 11.21p 9.34pShare price – high 614.5p 648.0p 787.5p 706.5p 630.5p
– low 353.0p 310.3p 576.5p 609.0p 534.5pMarket capitalisation at year-end (£m) 7,658.3 5,052.8 7,708.9 8,566.4 7,880.7Notes 1 Billings is defined on page 182.
2 the calculation of headline PBIt for 2009, 2008 and 2007 is set out in note 31 of the financial statements.
3 the calculation of headline PBt for 2009, 2008 and 2007 is set out in note 31 of the financial statements.
4 Headline earnings per share for 2009, 2008 and 2007 is set out in note 9 of the financial statements.
5 Dividends per share represents the dividends declared in respect of each year.
the information on this page is unaudited.
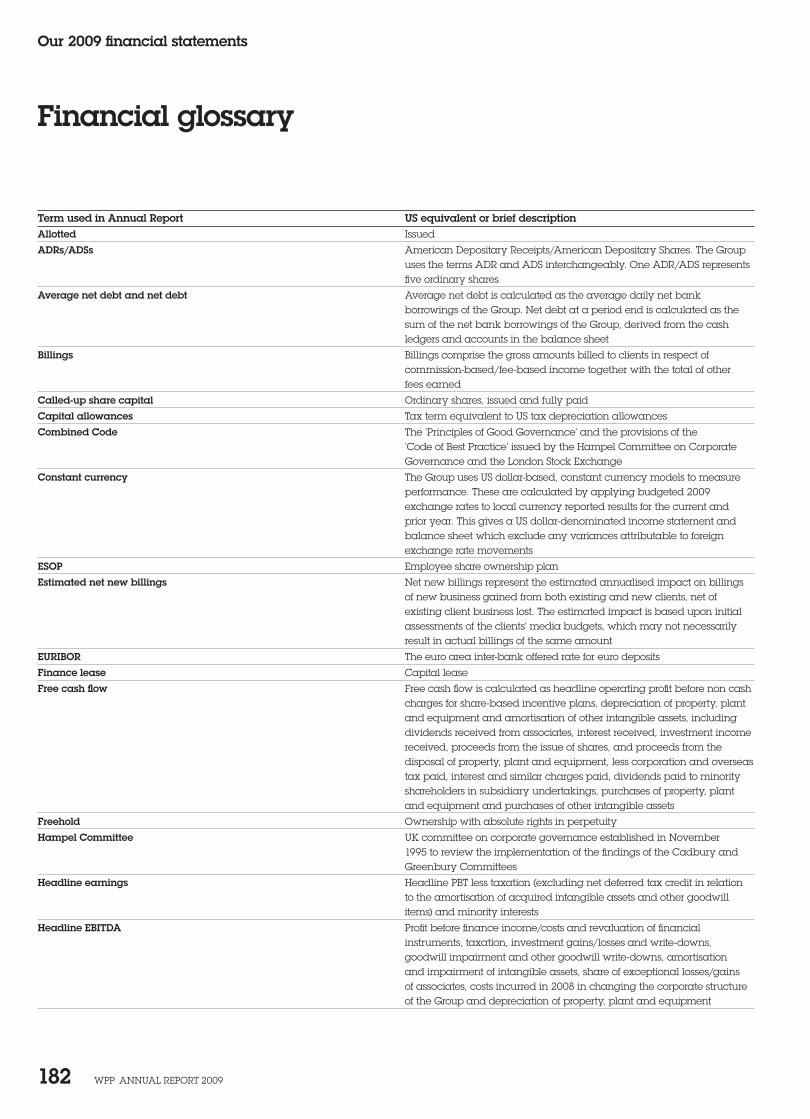
Our 2009 financial statements
WPP AnnuAl rePort 2009 182
Financial glossary
Term used in Annual Report US equivalent or brief descriptionAllotted Issued
ADRs/ADSs American Depositary receipts/American Depositary Shares. the Group uses the terms ADr and ADS interchangeably. one ADr/ADS represents five ordinary shares
Average net debt and net debt Average net debt is calculated as the average daily net bank borrowings of the Group. net debt at a period end is calculated as the sum of the net bank borrowings of the Group, derived from the cash ledgers and accounts in the balance sheet
Billings Billings comprise the gross amounts billed to clients in respect of commission-based/fee-based income together with the total of other fees earned
Called-up share capital ordinary shares, issued and fully paid
Capital allowances tax term equivalent to uS tax depreciation allowances
Combined Code the ‘Principles of Good Governance’ and the provisions of the ‘Code of Best Practice’ issued by the Hampel Committee on Corporate Governance and the london Stock exchange
Constant currency the Group uses uS dollar-based, constant currency models to measure performance. these are calculated by applying budgeted 2009 exchange rates to local currency reported results for the current and prior year. this gives a uS dollar-denominated income statement and balance sheet which exclude any variances attributable to foreign exchange rate movements
ESOP employee share ownership plan
Estimated net new billings net new billings represent the estimated annualised impact on billings of new business gained from both existing and new clients, net of existing client business lost. the estimated impact is based upon initial assessments of the clients’ media budgets, which may not necessarily result in actual billings of the same amount
EURIBOR the euro area inter-bank offered rate for euro deposits
Finance lease Capital lease
Free cash flow Free cash flow is calculated as headline operating profit before non cash charges for share-based incentive plans, depreciation of property, plant and equipment and amortisation of other intangible assets, including dividends received from associates, interest received, investment income received, proceeds from the issue of shares, and proceeds from the disposal of property, plant and equipment, less corporation and overseas tax paid, interest and similar charges paid, dividends paid to minority shareholders in subsidiary undertakings, purchases of property, plant and equipment and purchases of other intangible assets
Freehold ownership with absolute rights in perpetuity
Hampel Committee uK committee on corporate governance established in november 1995 to review the implementation of the findings of the Cadbury and Greenbury Committees
Headline earnings Headline PBt less taxation (excluding net deferred tax credit in relation to the amortisation of acquired intangible assets and other goodwill items) and minority interests
Headline EBITDA Profit before finance income/costs and revaluation of financial instruments, taxation, investment gains/losses and write-downs, goodwill impairment and other goodwill write-downs, amortisation and impairment of intangible assets, share of exceptional losses/gains of associates, costs incurred in 2008 in changing the corporate structure of the Group and depreciation of property, plant and equipment
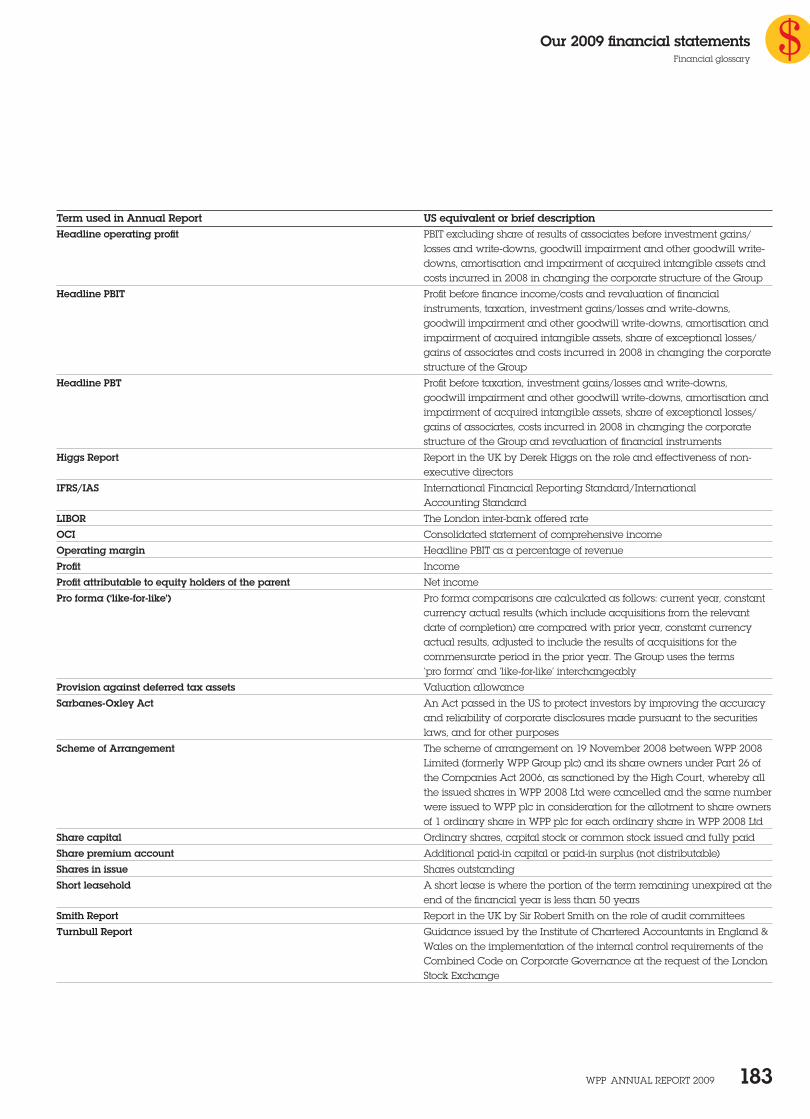
Our 2009 financial statements
WPP AnnuAl rePort 2009 183
Financial glossary
Term used in Annual Report US equivalent or brief descriptionHeadline operating profit PBIt excluding share of results of associates before investment gains/
losses and write-downs, goodwill impairment and other goodwill write-downs, amortisation and impairment of acquired intangible assets and costs incurred in 2008 in changing the corporate structure of the Group
Headline PBIT Profit before finance income/costs and revaluation of financial instruments, taxation, investment gains/losses and write-downs, goodwill impairment and other goodwill write-downs, amortisation and impairment of acquired intangible assets, share of exceptional losses/gains of associates and costs incurred in 2008 in changing the corporate structure of the Group
Headline PBT Profit before taxation, investment gains/losses and write-downs, goodwill impairment and other goodwill write-downs, amortisation and impairment of acquired intangible assets, share of exceptional losses/gains of associates, costs incurred in 2008 in changing the corporate structure of the Group and revaluation of financial instruments
Higgs Report report in the uK by Derek Higgs on the role and effectiveness of non-executive directors
IFRS/IAS International Financial reporting Standard/International Accounting Standard
LIBOR the london inter-bank offered rate
OCI Consolidated statement of comprehensive income
Operating margin Headline PBIt as a percentage of revenue
Profit Income
Profit attributable to equity holders of the parent net income
Pro forma (‘like-for-like’) Pro forma comparisons are calculated as follows: current year, constant currency actual results (which include acquisitions from the relevant date of completion) are compared with prior year, constant currency actual results, adjusted to include the results of acquisitions for the commensurate period in the prior year. the Group uses the terms ‘pro forma’ and ‘like-for-like’ interchangeably
Provision against deferred tax assets Valuation allowance
Sarbanes-Oxley Act An Act passed in the uS to protect investors by improving the accuracy and reliability of corporate disclosures made pursuant to the securities laws, and for other purposes
Scheme of Arrangement the scheme of arrangement on 19 november 2008 between WPP 2008 limited (formerly WPP Group plc) and its share owners under Part 26 of the Companies Act 2006, as sanctioned by the High Court, whereby all the issued shares in WPP 2008 ltd were cancelled and the same number were issued to WPP plc in consideration for the allotment to share owners of 1 ordinary share in WPP plc for each ordinary share in WPP 2008 ltd
Share capital ordinary shares, capital stock or common stock issued and fully paid
Share premium account Additional paid-in capital or paid-in surplus (not distributable)
Shares in issue Shares outstanding
Short leasehold A short lease is where the portion of the term remaining unexpired at the end of the financial year is less than 50 years
Smith Report report in the uK by Sir robert Smith on the role of audit committees
Turnbull Report Guidance issued by the Institute of Chartered Accountants in england & Wales on the implementation of the internal control requirements of the Combined Code on Corporate Governance at the request of the london Stock exchange

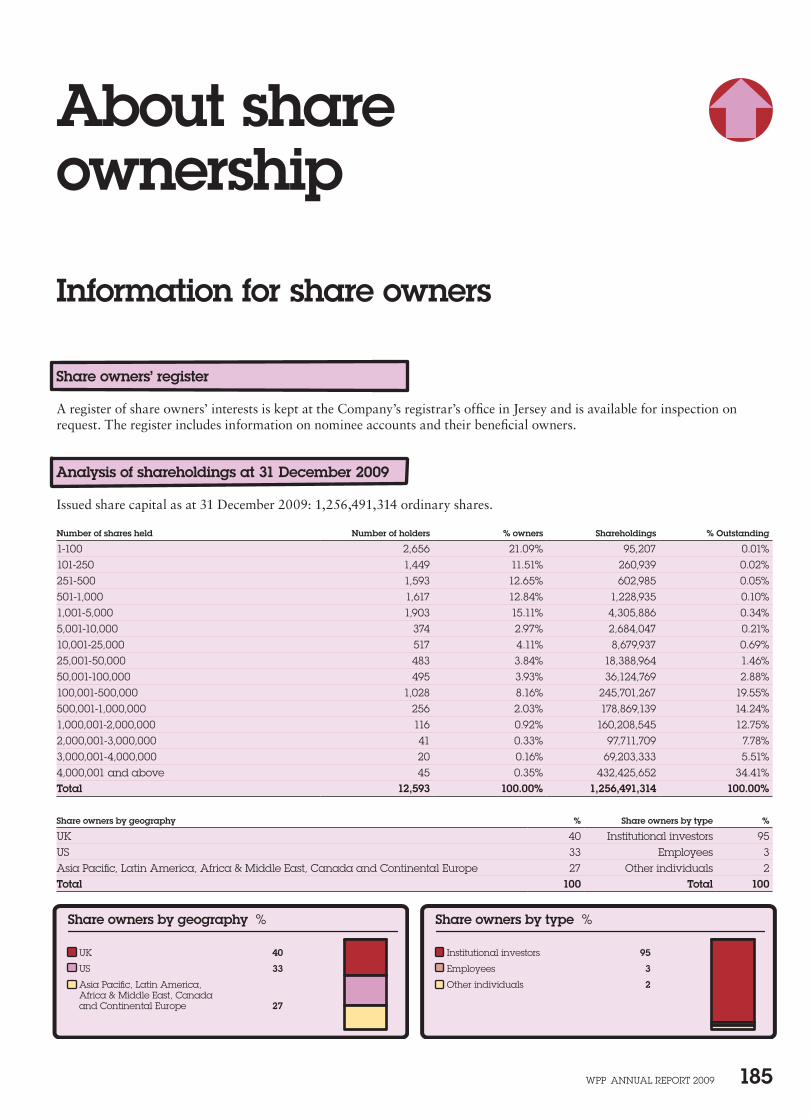
Share owners by geography %
UK 40
US 33
Asia Pacific, Latin America, Africa & Middle East, Canadaand Continental Europe 27
Share owners by type %
Institutional investors 95
Employees 3
Other individuals 2
WPP AnnuAl rePort 2009 185
Share owners’ register
A register of share owners’ interests is kept at the Company’s registrar’s office in Jersey and is available for inspection on request. The register includes information on nominee accounts and their beneficial owners.
Analysis of shareholdings at 31 December 2009
Issued share capital as at 31 December 2009: 1,256,491,314 ordinary shares.
Number of shares held Number of holders % owners Shareholdings % Outstanding
1-100 2,656 21.09% 95,207 0.01%101-250 1,449 11.51% 260,939 0.02%251-500 1,593 12.65% 602,985 0.05%501-1,000 1,617 12.84% 1,228,935 0.10%1,001-5,000 1,903 15.11% 4,305,886 0.34%5,001-10,000 374 2.97% 2,684,047 0.21%10,001-25,000 517 4.11% 8,679,937 0.69%25,001-50,000 483 3.84% 18,388,964 1.46%50,001-100,000 495 3.93% 36,124,769 2.88%100,001-500,000 1,028 8.16% 245,701,267 19.55%500,001-1,000,000 256 2.03% 178,869,139 14.24%1,000,001-2,000,000 116 0.92% 160,208,545 12.75%2,000,001-3,000,000 41 0.33% 97,711,709 7.78%3,000,001-4,000,000 20 0.16% 69,203,333 5.51%4,000,001 and above 45 0.35% 432,425,652 34.41%Total 12,593 100.00% 1,256,491,314 100.00%
Share owners by geography % Share owners by type %
uK 40 Institutional investors 95uS 33 employees 3Asia Pacific, latin America, Africa & Middle east, Canada and Continental europe 27 other individuals 2Total 100 Total 100
About share ownership
Information for share owners
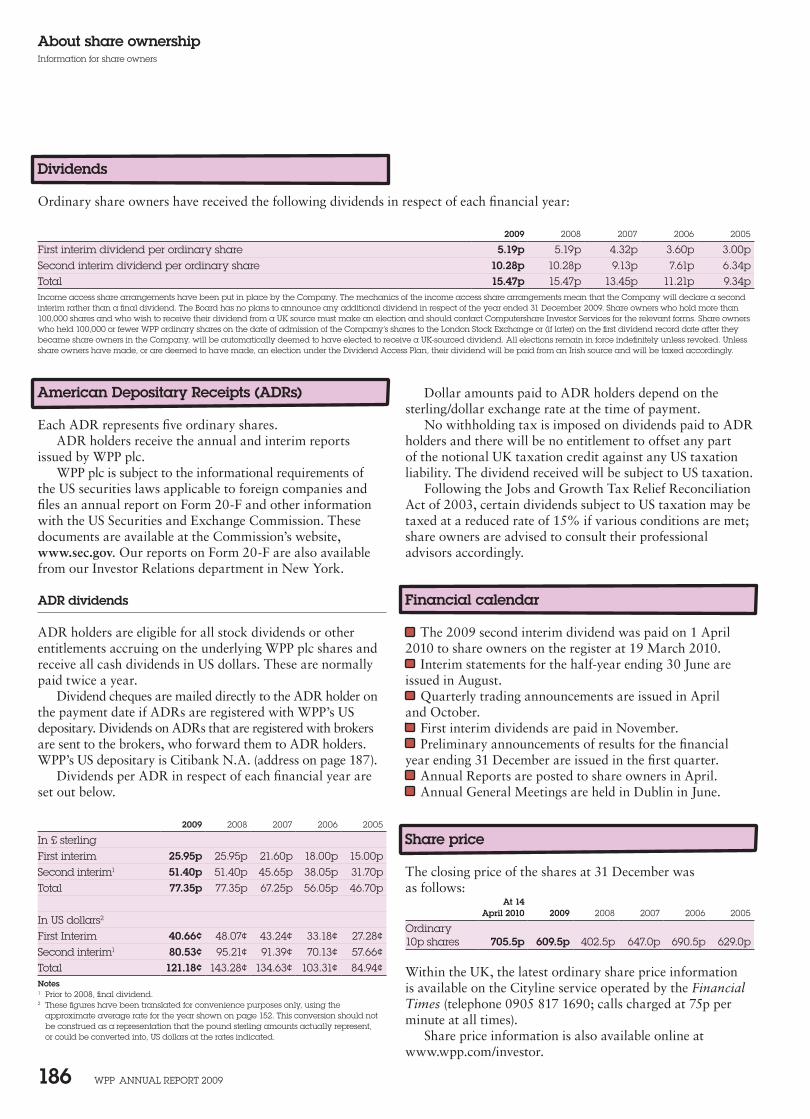
WPP AnnuAl rePort 2009 186
About share ownershipInformation for share owners
American Depositary Receipts (ADRs)
Each ADR represents five ordinary shares.ADR holders receive the annual and interim reports
issued by WPP plc.WPP plc is subject to the informational requirements of
the US securities laws applicable to foreign companies and files an annual report on Form 20-F and other information with the US Securities and Exchange Commission. These documents are available at the Commission’s website, www.sec.gov. Our reports on Form 20-F are also available from our Investor Relations department in New York.
ADR dividends
ADR holders are eligible for all stock dividends or other entitlements accruing on the underlying WPP plc shares and receive all cash dividends in US dollars. These are normally paid twice a year.
Dividend cheques are mailed directly to the ADR holder on the payment date if ADRs are registered with WPP’s US depositary. Dividends on ADRs that are registered with brokers are sent to the brokers, who forward them to ADR holders. WPP’s US depositary is Citibank N.A. (address on page 187).
Dividends per ADR in respect of each financial year are set out below.
2009 2008 2007 2006 2005
In £ sterlingFirst interim 25.95p 25.95p 21.60p 18.00p 15.00pSecond interim1 51.40p 51.40p 45.65p 38.05p 31.70ptotal 77.35p 77.35p 67.25p 56.05p 46.70p
In uS dollars2
First Interim 40.66¢ 48.07¢ 43.24¢ 33.18¢ 27.28¢Second interim1 80.53¢ 95.21¢ 91.39¢ 70.13¢ 57.66¢total 121.18¢ 143.28¢ 134.63¢ 103.31¢ 84.94¢Notes1 Prior to 2008, final dividend.2 these figures have been translated for convenience purposes only, using the
approximate average rate for the year shown on page 152. this conversion should not be construed as a representation that the pound sterling amounts actually represent, or could be converted into, uS dollars at the rates indicated.
Dollar amounts paid to ADR holders depend on the sterling/dollar exchange rate at the time of payment.
No withholding tax is imposed on dividends paid to ADR holders and there will be no entitlement to offset any part of the notional UK taxation credit against any US taxation liability. The dividend received will be subject to US taxation.
Following the Jobs and Growth Tax Relief Reconciliation Act of 2003, certain dividends subject to US taxation may be taxed at a reduced rate of 15% if various conditions are met; share owners are advised to consult their professional advisors accordingly.
Financial calendar
The 2009 second interim dividend was paid on 1 April 2010 to share owners on the register at 19 March 2010.
Interim statements for the half-year ending 30 June are issued in August.
Quarterly trading announcements are issued in April and October.
First interim dividends are paid in November. Preliminary announcements of results for the financial
year ending 31 December are issued in the first quarter. Annual Reports are posted to share owners in April. Annual General Meetings are held in Dublin in June.
Share price
The closing price of the shares at 31 December was as follows:
At 14April 2010 2009 2008 2007 2006 2005
ordinary 10p shares 705.5p 609.5p 402.5p 647.0p 690.5p 629.0p
Within the UK, the latest ordinary share price information is available on the Cityline service operated by the Financial Times (telephone 0905 817 1690; calls charged at 75p per minute at all times).
Share price information is also available online at www.wpp.com/investor.
Dividends
Ordinary share owners have received the following dividends in respect of each financial year:
2009 2008 2007 2006 2005
First interim dividend per ordinary share 5.19p 5.19p 4.32p 3.60p 3.00pSecond interim dividend per ordinary share 10.28p 10.28p 9.13p 7.61p 6.34ptotal 15.47p 15.47p 13.45p 11.21p 9.34pIncome access share arrangements have been put in place by the Company. the mechanics of the income access share arrangements mean that the Company will declare a second interim rather than a final dividend. the Board has no plans to announce any additional dividend in respect of the year ended 31 December 2009. Share owners who hold more than 100,000 shares and who wish to receive their dividend from a uK source must make an election and should contact Computershare Investor Services for the relevant forms. Share owners who held 100,000 or fewer WPP ordinary shares on the date of admission of the Company’s shares to the london Stock exchange or (if later) on the first dividend record date after they became share owners in the Company, will be automatically deemed to have elected to receive a uK-sourced dividend. All elections remain in force indefinitely unless revoked. unless share owners have made, or are deemed to have made, an election under the Dividend Access Plan, their dividend will be paid from an Irish source and will be taxed accordingly.
WPP AnnuAl rePort 2009 187
About share ownershipInformation for share owners
Tax information
UK taxation
Income tax credits on dividendsFor dividends received direct from WPP plc or from WPP DAS Limited via the Dividend Access Plan, the tax credit available to individual share owners resident in the UK is one-ninth of the dividend; tax credits are not repayable to UK holders with no tax liability. Individuals whose income is within the lower or basic tax rate bands are liable to tax at 10% on the dividend income and the tax credit will satisfy their income tax liability on UK dividends. The higher rate of tax on dividend income is 32.5% (increasing to 42.5% for individuals with income of £150,000 or more for dividends received on or after 6 April 2010) with relief available for the tax credit referred to above. The gross amount of the dividend will be regarded as the top slice of the WPP share owner’s income and will be subject to UK income tax as set out above.
Dividends paid by WPP plc will generally be subject to Irish dividend withholding tax (DWT) at the standard rate of income tax (currently 20%) unless the share owner is within one of the categories of exempt share holders as provided in Irish law or by virtue of a relevant tax treaty. DWT is not payable where an exemption applies provided that WPP plc has received all necessary documentation required by the relevant legislation from a WPP share owner prior to the payment of the dividend. Share owners are advised to consult their professional advisors on this point. Where a non-Irish resident share owner is entitled to exemption from DWT but DWT has to be deducted from the dividend by WPP, a claim may be made for a refund of the DWT to the Irish tax authorities.
Dividends received from WPP plc by individual share owners resident in the UK will generally be subject to UK income tax on the gross amount of any dividends paid by WPP before deduction of Irish withholding tax (if any). UK resident WPP share owners may be able to apply for an exemption from withholding taxes under Irish domestic law or the UK-Ireland double tax treaty. Her Majesty’s Revenue & Customs will generally give credit (such credit being limited to the UK-Ireland double tax treaty rate) for any Irish dividend withholding tax withheld from the payment of a dividend (if any) and not recoverable from the Irish tax authorities against the UK income tax payable in respect of the gross amount of the dividend.
Access numbers/Ticker symbols
NASDAQ Reuters Bloomberg
ordinary shares – WPP.l WPP lnAmerican Depositary Shares WPPGY WPPGY.o WPPGY uS
Online information
WPP’s public website, www.wpp.com, provides current and historical financial information, news releases, trading reports and share price information. Go to www.wpp.com/investor.
Registrar and transfer office
Computershare Investor Services (Channel Islands) LimitedPO Box 83Ordnance House31 Pier RoadSt HelierJersey JE4 8PW Enquiry number: 0870 707 1411
American Depositary Receipts (ADRs) office
Citibank N.A.PO Box 43077ProvidenceRI 02940-3077
Telephone enquiries: within the US +1 877 248 4237Telephone enquiries: outside the US +1 781 575 4555E-mail enquiries: [email protected]
WPP registered office
22 Grenville StreetSt HelierJersey JE4 8PX
The Company’s registered number is 101749.
WPP AnnuAl rePort 2009 188
About share ownershipInformation for share owners
An Irish resident or ordinarily resident individual WPP share owner who receives dividends from WPP DAS Limited via the Dividend Access Plan will be taxed upon the cash dividend received at their marginal rate of tax plus the health levy and, in certain circumstances, PRSI. Irish resident taxpayers will not be entitled to claim credit for, or repayment of, the one-ninth UK tax credit attaching to such dividends for UK tax purposes.
Capital gainsAs liability to capital gains tax on a disposal of WPP shares will depend on individual circumstances, share owners are advised to consult their professional advisors.
Capital gains taxThe market value of an ordinary share at 31 March 1982 was 39p. Since that date rights issues have occurred in September 1986, August 1987 and April 1993. For capital gains tax purposes the acquisition cost of ordinary shares is adjusted to take account of such rights issues. Since any adjustments will depend on individual circumstances, share owners are advised to consult their professional advisors.
Republic of Ireland taxation
Income tax credits on dividendsAn Irish resident or ordinarily resident individual WPP share owner who is an individual who does not make, or is not deemed to have made, an election to receive dividends via the Dividend Access Plan will be subject to Irish income tax on the gross dividend at their marginal rate of tax plus the health levy and, in certain circumstances, PRSI (pay related social insurance). The gross dividend is the dividend received plus DWT withheld. Irish resident individual WPP share owners are generally entitled to credit for the DWT deducted against their income tax liability and to have refunded to them any amount by which DWT exceeds such income tax liability.
If a WPP share owner makes, or is deemed to have made, an election in accordance with the terms of the Dividend Access Plan in respect of dividends to be paid by WPP, such WPP share owner will receive dividends direct from WPP DAS Limited. No DWT will be levied on dividends paid by WPP DAS Limited.
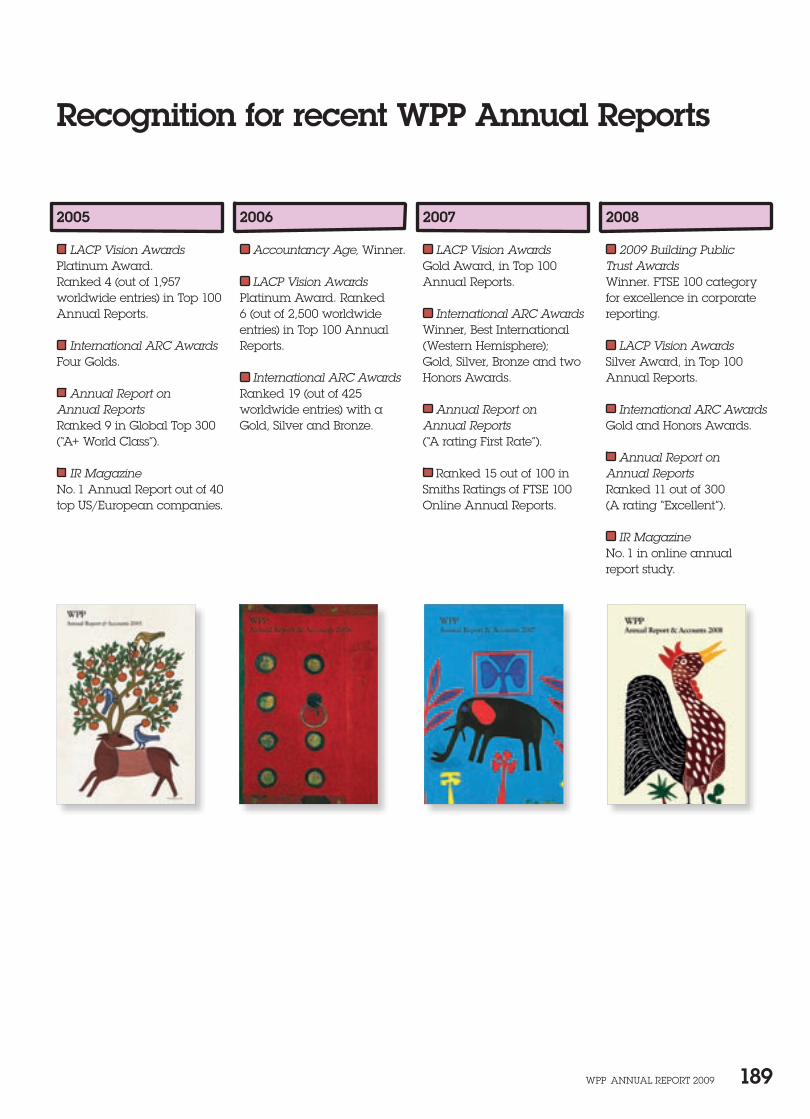
WPP AnnuAl rePort 2009 189
2005
LACP Vision Awards Platinum Award. ranked 4 (out of 1,957 worldwide entries) in top 100 Annual reports.
International ARC Awards Four Golds.
Annual Report on Annual Reports ranked 9 in Global top 300 (“A+ World Class”).
IR Magazineno. 1 Annual report out of 40 top uS/european companies.
2006
Accountancy Age, Winner.
LACP Vision Awards Platinum Award. ranked 6 (out of 2,500 worldwide entries) in top 100 Annual reports.
International ARC Awards ranked 19 (out of 425 worldwide entries) with a Gold, Silver and Bronze.
2007
LACP Vision Awards Gold Award, in top 100 Annual reports.
International ARC Awards Winner, Best International (Western Hemisphere); Gold, Silver, Bronze and two Honors Awards.
Annual Report on Annual Reports (“A rating First rate”).
ranked 15 out of 100 in Smiths ratings of FtSe 100 online Annual reports.
2008
2009 Building Public Trust Awards Winner. FtSe 100 category for excellence in corporate reporting.
LACP Vision Awards Silver Award, in top 100 Annual reports.
International ARC Awards Gold and Honors Awards.
Annual Report on Annual Reports ranked 11 out of 300(A rating “excellent”).
IR Magazine no. 1 in online annual report study.
Recognition for recent WPP Annual Reports
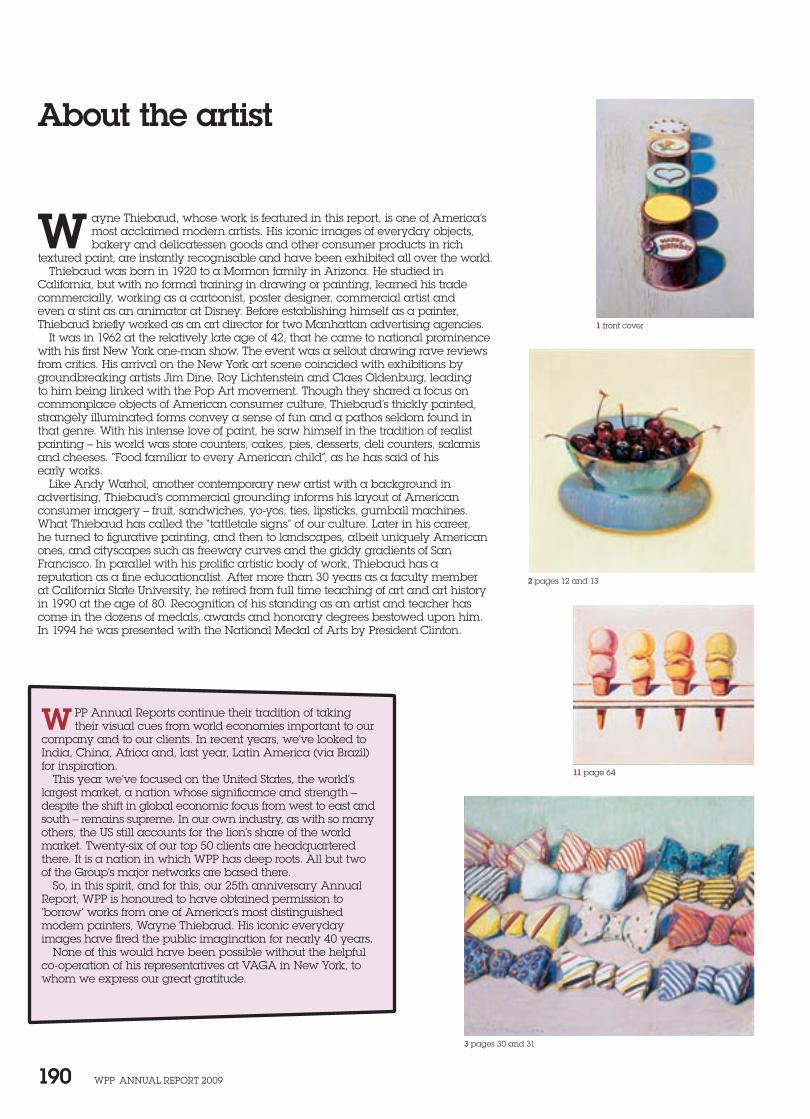
WPP AnnuAl rePort 2009 190
About the artist
W ayne thiebaud, whose work is featured in this report, is one of America’s most acclaimed modern artists. His iconic images of everyday objects, bakery and delicatessen goods and other consumer products in rich
textured paint, are instantly recognisable and have been exhibited all over the world. thiebaud was born in 1920 to a Mormon family in Arizona. He studied in
California, but with no formal training in drawing or painting, learned his trade commercially, working as a cartoonist, poster designer, commercial artist and even a stint as an animator at Disney. Before establishing himself as a painter, thiebaud briefly worked as an art director for two Manhattan advertising agencies.
It was in 1962 at the relatively late age of 42, that he came to national prominence with his first new York one-man show. the event was a sellout drawing rave reviews from critics. His arrival on the new York art scene coincided with exhibitions by groundbreaking artists Jim Dine, roy lichtenstein and Claes oldenburg, leading to him being linked with the Pop Art movement. though they shared a focus on commonplace objects of American consumer culture, thiebaud’s thickly painted, strangely illuminated forms convey a sense of fun and a pathos seldom found in that genre. With his intense love of paint, he saw himself in the tradition of realist painting – his world was store counters, cakes, pies, desserts, deli counters, salamis and cheeses. “Food familiar to every American child”, as he has said of his early works.
like Andy Warhol, another contemporary new artist with a background in advertising, thiebaud’s commercial grounding informs his layout of American consumer imagery – fruit, sandwiches, yo-yos, ties, lipsticks, gumball machines. What thiebaud has called the “tattletale signs” of our culture. later in his career, he turned to figurative painting, and then to landscapes, albeit uniquely American ones, and cityscapes such as freeway curves and the giddy gradients of San Francisco. In parallel with his prolific artistic body of work, thiebaud has a reputation as a fine educationalist. After more than 30 years as a faculty member at California State university, he retired from full time teaching of art and art history in 1990 at the age of 80. recognition of his standing as an artist and teacher has come in the dozens of medals, awards and honorary degrees bestowed upon him. In 1994 he was presented with the national Medal of Arts by President Clinton.
W PP Annual reports continue their tradition of taking their visual cues from world economies important to our
company and to our clients. In recent years, we’ve looked to India, China, Africa and, last year, latin America (via Brazil) for inspiration.
this year we’ve focused on the united States, the world’s largest market, a nation whose significance and strength – despite the shift in global economic focus from west to east and south – remains supreme. In our own industry, as with so many others, the uS still accounts for the lion’s share of the world market. twenty-six of our top 50 clients are headquartered there. It is a nation in which WPP has deep roots. All but two of the Group’s major networks are based there.
So, in this spirit, and for this, our 25th anniversary Annual report, WPP is honoured to have obtained permission to ‘borrow’ works from one of America’s most distinguished modern painters, Wayne thiebaud. His iconic everyday images have fired the public imagination for nearly 40 years.
none of this would have been possible without the helpful co-operation of his representatives at VAGA in new York, to whom we express our great gratitude.
1 front cover
2 pages 12 and 13
3 pages 30 and 31
11 page 64
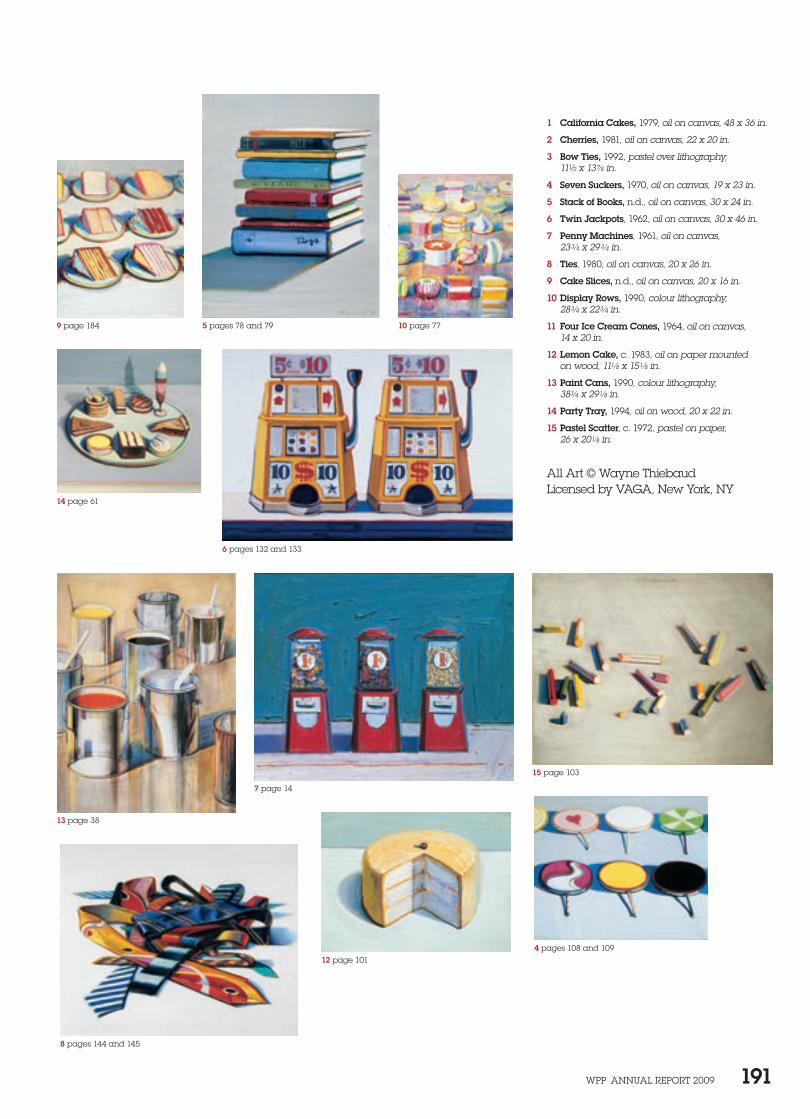
WPP AnnuAl rePort 2009 191
4 pages 108 and 109
5 pages 78 and 799 page 184
13 page 38
6 pages 132 and 133
10 page 77
14 page 61
7 page 14
15 page 103
8 pages 144 and 145
12 page 101
1 California Cakes, 1979, oil on canvas, 48 x 36 in.
2 Cherries, 1981, oil on canvas, 22 x 20 in.
3 Bow Ties, 1992, pastel over lithography, 11½ x 137/8 in.
4 Seven Suckers, 1970, oil on canvas, 19 x 23 in.
5 Stack of Books, n.d., oil on canvas, 30 x 24 in.
6 Twin Jackpots, 1962, oil on canvas, 30 x 46 in.
7 Penny Machines, 1961, oil on canvas, 233/4 x 293/4 in.
8 Ties, 1980, oil on canvas, 20 x 26 in.
9 Cake Slices, n.d., oil on canvas, 20 x 16 in.
10 Display Rows, 1990, colour lithography, 283/4 x 223/4 in.
11 Four Ice Cream Cones, 1964, oil on canvas, 14 x 20 in.
12 Lemon Cake, c. 1983, oil on paper mounted on wood, 111/8 x 151/8 in.
13 Paint Cans, 1990, colour lithography, 383/4 x 291/8 in.
14 Party Tray, 1994, oil on wood, 20 x 22 in.
15 Pastel Scatter, c. 1972, pastel on paper, 26 x 201/8 in.
All Art © Wayne thiebaud licensed by VAGA, new York, nY
WPP AnnuAl rePort 2009 192
Where to find us
WPP Ireland6 ely PlaceDublin 2, Irelandtel +353 1669 0333Fax +353 1669 0334
WPP New York (until 7 June 2010)125 Park Avenuenew York nY 10017-5529tel +1 (212) 632 2200Fax +1 (212) 632 2222
WPP New York (after 7 June 2010) 100 Park Avenue new York nY 10017 tel +1 (212) 632 2200Fax +1 (212) 632 2222
WPP London27 Farm Streetlondon W1J 5rJtel +44 (0)20 7408 2204Fax +44 (0)20 7493 6819
WPP Asia PacificStuart neishtel +81 90 9688 1951Fax +852 2280 [email protected]
WPP Latin AmericaAnn newmantel +1 (212) 632 2275Fax +1 (212) 632 [email protected]
WPP ChinaScott Spirittel +86 21 2405 1649Fax +86 21 2405 [email protected]
Investor relationsPaul richardsonGroup finance directortel +1 (212) 632 2200Fax +1 (212) 632 [email protected]
Chris SweetlandDeputy Group finance directortel +44 (0)20 7408 2204Fax +44 (0)20 7493 [email protected]
Fran ButeraInvestor relations directortel +1 (212) 632 2235Fax +1 (212) 632 [email protected]
Investor informationInvestor relations material and our financial statements are available online at www.wpp.com/investor.
Media relationsFeona McewanGroup communications directortel +44 (0)20 7408 2204Fax +44 (0)20 7493 [email protected]
Kevin McCormackuS press officertel +1 (212) 632 2239Fax +1 (212) 632 [email protected]
Belinda rabanoAsia Pacific head of corporate communicationstel +86 10 8520 3066Fax +86 10 8520 [email protected]
If you would like further general information about WPP, its companies or any of the programs, publications or initiatives mentioned in this Annual Report, please visit our website, www.wpp.com, or contact:
Feona Mcewan or richard Hampsonat WPP in londontel +44 (0)20 7408 2204Fax +44 (0)20 7493 [email protected]@wpp.com
Kevin McCormackat WPP in new Yorktel +1 (212) 632 2200Fax +1 (212) 632 [email protected]
Belinda rabanoat WPP in Beijingtel +86 10 8520 3066Fax +86 10 8520 [email protected]
e.wire, WPP’s public monthly online news bulletin providing a round-up of news from around the WPP world, is automatically delivered to subscribers’ e-mail addresses. Register to receive e.wire at www.wpp.com.
Where to find us
Contact points Group information

Contents
What we think78 After the threat of apocalypse, new centres
of gravity by Sir Martin Sorrell
102 Why a Ruritanian Poltergeist can be as Valuable as an Automated Processing Plant by Jeremy Bullmore
Who runs WPP104 Board of Directors107 Advisors to the Board
How we behave109 Directors’ report 109 Review of the Company’s governance
and the Nomination Committee 113 Review of the Audit Committee 114 The Board of Directors 114 Election of directors 114 Conflicts of interest 115 Committee meetings 115 Share owner relations 115 Internal control 117 Principal risks and uncertainties 119 Sarbanes-Oxley section 404 119 Going concern 119 Responsibilities in respect of the preparation
of financial statements 119 Substantial share ownership 120 Profits and dividends 120 Charitable donations 120 Significant agreements and change of control 120 Articles of Association 120 Group activities 120 Share capital 121 Authority for purchase of own shares 121 Supplier payment policy 121 Auditors 122 Corporate responsibility 122 CR and our business strategy 122 How we manage CR risk and opportunity 123 The impact of our work 124 Marketing ethics 125 WPP as an employer 128 Environment 128 WPP’s carbon footprint 130 Supply chain 130 Social investment
The fast read2 A six-minute read
Who we are10 Our companies & associates
Why we exist12 Our mission
How we’re doing15 Financial summary18 Letter to share owners31 Reports from our operating brands 32 Agency networks 32 Ogilvy Group 37 JWT 39 Young & Rubicam Brands 46 Grey Group 49 United Network 50 Bates 14151 Media Investment Management 51 GroupM 53 Maxus 54 MediaCom 55 MEC 56 Mindshare 57 Consumer Insight 57 Kantar62 Public Relations & Public Affairs 62 Hill & Knowlton 63 Cohn & Wolfe 64 Burson-Marsteller 64 Ogilvy Public Relations Worldwide 65 Branding & Identity 65 B to D Group 43 Landor Associates 67 The Brand Union 68 Fitch69 Healthcare Communications 69 CommonHealth 70 ghg 70 GCI Health 71 Ogilvy Healthworld 71 Sudler & Hennessey72 Specialist Communications75 WPP Digital
This Annual Report is printed on Revive 100 Pure Natural Silk. This paper is made from 100% de-inked post-consumer waste. It is manufactured at a mill that is certified to ISO14001 and EMAS environmental standards. It has been independently certified as meeting the standards of the Forest Stewardship Council (FSC). All pulps used by the mill are totally chlorine free (TCF) and unbleached. The inks used in printing this Annual Report are all vegetable-based.
Printed at St Ives Westerham Press Ltd, ISO14001, FSC certified and CarbonNeutral®.
Written and produced by WPPDesigned by Addison www.addison.co.uk©WPP 2010

AdvertisingMedia Investment Management
Consumer InsightPublic Relations & Public Affairs
Branding & IdentityHealthcare Communications
Direct, Digital, Promotion & Relationship MarketingSpecialist Communications
6 Ely PlaceDublin 2
Tel +353 1669 0333Fax +353 1669 0334
100 Park Avenue
New York NY 10017 Tel +1 (212) 632 2200Fax +1 (212) 632 2222
(from 7 June 2010)
27 Farm Street
London W1J 5RJTel +44 (0)20 7408 2204Fax +44 (0)20 7493 6819
Yebisu Garden Place Tower, 29/F
4-20-3 EbisuShibuya-ku
Tokyo 151-0053Tel +81 90 9688 1951Fax +852 2280 5412
31/F The Center
989 Changle RoadShanghai
Tel +86 21 2405 1649Fax +86 21 2405 1600
www.wpp.com
An
nual R
eport &
Accou
nts 2009
Annual Report & Accounts 2009