Water Accounts - European Commission
215
2 EUROPEAN COMMISSION THEME 2 Economy and finance D E T A I L E D T A B L E S 2002 EDITION Water Accounts — Results of pilot studies
-
Upload
khangminh22 -
Category
Documents
-
view
1 -
download
0
Transcript of Water Accounts - European Commission

2E U R O P E A NC O M M I S S I O N
THEME 2EconomyandfinanceD
ET
AI
LE
D
TA
BL
ES
20
02
ED
ITIO
N
Water Accounts —Results of pilotstudies

A great deal of additional information on the European Union is available on the Internet.It can be accessed through the Europa server (http://europa.eu.int).
Cataloguing data can be found at the end of this publication.
Luxembourg: Office for Official Publications of the European Communities, 2002
ISBN : 92-894-4526-2
© European Communities, 2002
Printed in Belgium
PRINTED ON WHITE CHLORINE-FREE PAPER

3
Table of Contents
List of acronyms and abbreviations .............................................................................................................. 8
Preface .............................................................................................................................................................. 9
Introduction .................................................................................................................................................... 11
1 The Water Accounts framework............................................................................................................. 151.1 Concepts .......................................................................................................................................... 15
1.1.1 Specific characteristics of water............................................................................................ 151.1.2 The economics of water ........................................................................................................ 151.1.3 Water resources as an asset ................................................................................................ 161.1.4 Water as a raw material and a product ................................................................................. 181.1.5 Conclusions as concerns water in the national accounts ..................................................... 201.1.6 Water in environment statistics ............................................................................................. 21
1.2 Systems for water accounting .......................................................................................................... 231.2.1 Eurostat’s proposal ............................................................................................................... 231.2.2 Other national presentations of water accounts ................................................................... 30
1.3 Summary of national contributions ................................................................................................... 361.3.1 Summary table of the national contributions......................................................................... 361.3.2 Country-by-country summaries ............................................................................................. 37
2 Sources and methods ............................................................................................................................. 412.1 The water economy.......................................................................................................................... 41
2.1.1 Exercise suggested by Eurostat ........................................................................................... 412.1.2 Compiling supply-use tables ................................................................................................. 442.1.3 Compiling production accounts ............................................................................................. 472.1.4 Estimating costs for ancillary activities: The Netherlands and Sweden................................ 492.1.5 Comparison of the methods .................................................................................................. 50
2.2 Volumes of water flows .................................................................................................................... 512.2.1 Exercise suggested by Eurostat ........................................................................................... 512.2.2 Use of administrative data: Denmark, Finland and the United Kingdom .............................. 532.2.3 Specific surveys: Spain and the Netherlands ....................................................................... 552.2.4 Mixed methods: Belgium, Germany, Sweden and Portugal ................................................. 562.2.5 Methods studied by Luxembourg.......................................................................................... 602.2.6 Comparison of methods ........................................................................................................ 60
2.3 Flows of pollutants............................................................................................................................ 612.3.1 Exercise suggested by Eurostat ........................................................................................... 612.3.2 Use of coefficients: Germany and Ireland............................................................................. 632.3.3 Use of licence and tax registers: Belgium, Ireland, Netherlands, Finland, UK, Norway ....... 642.3.4 Specific survey: Austria......................................................................................................... 682.3.5 Monitoring network: Portugal ................................................................................................ 692.3.6 Modelling: France.................................................................................................................. 692.3.7 Using environmental reports of enterprises: Sweden ........................................................... 712.3.8 Methods studied by Luxembourg.......................................................................................... 722.3.9 Comparison of methods ........................................................................................................ 72
3 Results and analyses .............................................................................................................................. 733.1 The water economy.......................................................................................................................... 73
3.1.1 Denmark................................................................................................................................ 733.1.2 Spain ..................................................................................................................................... 793.1.3 Ireland ................................................................................................................................... 833.1.4 Portugal ................................................................................................................................. 853.1.5 Sweden ................................................................................................................................. 863.1.6 Norway .................................................................................................................................. 903.1.7 Comparisons between countries........................................................................................... 913.1.8 Conclusion on the water economy accounts ........................................................................ 92

Contents
4
3.2 Volumes of water flows .................................................................................................................... 933.2.1 Belgium ................................................................................................................................. 933.2.2 Denmark................................................................................................................................ 943.2.3 Germany................................................................................................................................ 973.2.4 Greece................................................................................................................................... 993.2.5 Spain ................................................................................................................................... 1003.2.6 The Netherlands.................................................................................................................. 1023.2.7 Sweden ............................................................................................................................... 1033.2.8 The United Kingdom ........................................................................................................... 1053.2.9 Comparisons between countries......................................................................................... 1063.2.10 Appropriateness of the breakdowns ................................................................................... 1083.2.11 Conclusion on water volume flow accounts ........................................................................ 112
3.3 Flows of pollutants.......................................................................................................................... 1133.3.1 Belgium ............................................................................................................................... 1133.3.2 Germany.............................................................................................................................. 1143.3.3 France ................................................................................................................................. 1153.3.4 Ireland ................................................................................................................................. 1203.3.5 The Netherlands.................................................................................................................. 1243.3.6 Austria ................................................................................................................................. 1273.3.7 Portugal ............................................................................................................................... 1333.3.8 Finland................................................................................................................................. 1333.3.9 Sweden ............................................................................................................................... 1353.3.10 The United Kingdom ........................................................................................................... 1373.3.11 Norway ................................................................................................................................ 1423.3.12 Comparisons between countries......................................................................................... 1463.3.13 Conclusion on flows of pollutants........................................................................................ 148
4 Uncovered issues .................................................................................................................................. 1514.1 Space and time dimensions ........................................................................................................... 151
4.1.1 Spain ................................................................................................................................... 1514.1.2 Denmark.............................................................................................................................. 1534.1.3 Ireland ................................................................................................................................. 153
4.2 Water quality accounts ................................................................................................................... 1554.2.1 Exercise suggested by Eurostat ......................................................................................... 1554.2.2 France ................................................................................................................................. 155
4.3 Water quantity accounts ................................................................................................................. 1594.3.1 Description of water flows and stocks................................................................................. 1594.3.2 Economic availability of water ............................................................................................. 161
5 Findings and outstanding issues ........................................................................................................ 1635.1 Lessons learned from pilot applications ......................................................................................... 1635.2 Conclusions of the April 2002 Water Accounts Task Force ........................................................... 164
5.2.1 Results of water accounts pilot exercises ........................................................................... 1645.2.2 The set of standard tables................................................................................................... 1655.2.3 Presentation of results and indicators ................................................................................. 1675.2.4 Future development needs ................................................................................................. 168
Annex 1: Pilot water accounts tables used in the pilot exercises ........................................................ 171
Annex 2: Revised set of standard water accounts tables and explanatory notes .............................. 185
Annex 3: Water-relevant European directives ........................................................................................ 214
Annex 4: NACE Rev. 1, 2-digits with further detail for water-related activities................................... 216
Bibliography ................................................................................................................................................. 218
Contents
5
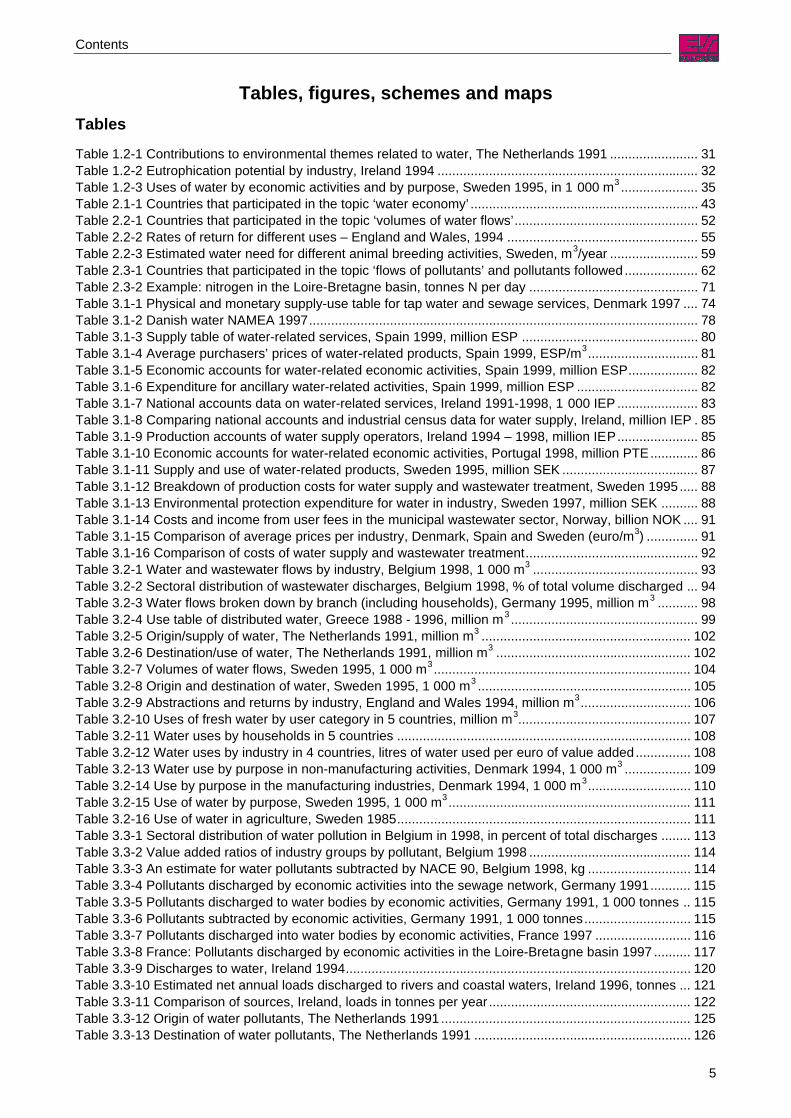
Tables, figures, schemes and mapsTables
Table 1.2-1 Contributions to environmental themes related to water, The Netherlands 1991 ........................ 31Table 1.2-2 Eutrophication potential by industry, Ireland 1994 ....................................................................... 32Table 1.2-3 Uses of water by economic activities and by purpose, Sweden 1995, in 1 000 m3 ..................... 35Table 2.1-1 Countries that participated in the topic ‘water economy’ .............................................................. 43Table 2.2-1 Countries that participated in the topic ‘volumes of water flows’.................................................. 52Table 2.2-2 Rates of return for different uses – England and Wales, 1994 .................................................... 55Table 2.2-3 Estimated water need for different animal breeding activities, Sweden, m3/year ........................ 59Table 2.3-1 Countries that participated in the topic ‘flows of pollutants’ and pollutants followed .................... 62Table 2.3-2 Example: nitrogen in the Loire-Bretagne basin, tonnes N per day .............................................. 71Table 3.1-1 Physical and monetary supply-use table for tap water and sewage services, Denmark 1997 .... 74Table 3.1-2 Danish water NAMEA 1997.......................................................................................................... 78Table 3.1-3 Supply table of water-related services, Spain 1999, million ESP ................................................ 80Table 3.1-4 Average purchasers’ prices of water-related products, Spain 1999, ESP/m3.............................. 81Table 3.1-5 Economic accounts for water-related economic activities, Spain 1999, million ESP................... 82Table 3.1-6 Expenditure for ancillary water-related activities, Spain 1999, million ESP ................................. 82Table 3.1-7 National accounts data on water-related services, Ireland 1991-1998, 1 000 IEP ...................... 83Table 3.1-8 Comparing national accounts and industrial census data for water supply, Ireland, million IEP . 85Table 3.1-9 Production accounts of water supply operators, Ireland 1994 – 1998, million IEP...................... 85Table 3.1-10 Economic accounts for water-related economic activities, Portugal 1998, million PTE............. 86Table 3.1-11 Supply and use of water-related products, Sweden 1995, million SEK ..................................... 87Table 3.1-12 Breakdown of production costs for water supply and wastewater treatment, Sweden 1995 ..... 88Table 3.1-13 Environmental protection expenditure for water in industry, Sweden 1997, million SEK .......... 88Table 3.1-14 Costs and income from user fees in the municipal wastewater sector, Norway, billion NOK .... 91Table 3.1-15 Comparison of average prices per industry, Denmark, Spain and Sweden (euro/m3) .............. 91Table 3.1-16 Comparison of costs of water supply and wastewater treatment............................................... 92Table 3.2-1 Water and wastewater flows by industry, Belgium 1998, 1 000 m3 ............................................. 93Table 3.2-2 Sectoral distribution of wastewater discharges, Belgium 1998, % of total volume discharged ... 94Table 3.2-3 Water flows broken down by branch (including households), Germany 1995, million m3 ........... 98Table 3.2-4 Use table of distributed water, Greece 1988 - 1996, million m3 ................................................... 99Table 3.2-5 Origin/supply of water, The Netherlands 1991, million m3 ......................................................... 102Table 3.2-6 Destination/use of water, The Netherlands 1991, million m3 ..................................................... 102Table 3.2-7 Volumes of water flows, Sweden 1995, 1 000 m3 ...................................................................... 104Table 3.2-8 Origin and destination of water, Sweden 1995, 1 000 m3 .......................................................... 105Table 3.2-9 Abstractions and returns by industry, England and Wales 1994, million m3.............................. 106Table 3.2-10 Uses of fresh water by user category in 5 countries, million m3............................................... 107Table 3.2-11 Water uses by households in 5 countries ................................................................................ 108Table 3.2-12 Water uses by industry in 4 countries, litres of water used per euro of value added............... 108Table 3.2-13 Water use by purpose in non-manufacturing activities, Denmark 1994, 1 000 m3 .................. 109Table 3.2-14 Use by purpose in the manufacturing industries, Denmark 1994, 1 000 m3............................ 110Table 3.2-15 Use of water by purpose, Sweden 1995, 1 000 m3 .................................................................. 111Table 3.2-16 Use of water in agriculture, Sweden 1985................................................................................ 111Table 3.3-1 Sectoral distribution of water pollution in Belgium in 1998, in percent of total discharges ........ 113Table 3.3-2 Value added ratios of industry groups by pollutant, Belgium 1998 ............................................ 114Table 3.3-3 An estimate for water pollutants subtracted by NACE 90, Belgium 1998, kg ............................ 114Table 3.3-4 Pollutants discharged by economic activities into the sewage network, Germany 1991........... 115Table 3.3-5 Pollutants discharged to water bodies by economic activities, Germany 1991, 1 000 tonnes .. 115Table 3.3-6 Pollutants subtracted by economic activities, Germany 1991, 1 000 tonnes............................. 115Table 3.3-7 Pollutants discharged into water bodies by economic activities, France 1997 .......................... 116Table 3.3-8 France: Pollutants discharged by economic activities in the Loire-Bretagne basin 1997 .......... 117Table 3.3-9 Discharges to water, Ireland 1994.............................................................................................. 120Table 3.3-10 Estimated net annual loads discharged to rivers and coastal waters, Ireland 1996, tonnes ... 121Table 3.3-11 Comparison of sources, Ireland, loads in tonnes per year....................................................... 122Table 3.3-12 Origin of water pollutants, The Netherlands 1991 .................................................................... 125Table 3.3-13 Destination of water pollutants, The Netherlands 1991 ........................................................... 126

Contents
6
Table 3.3-14 Austrian water NAMEA for 1994 .............................................................................................. 128Table 3.3-15 Pollutants content of wastewater at different steps of processing, tonnes per year ................ 133Table 3.3-16 Discharges of wastewater, nitrogen and phosphorus, Finland 1995 ....................................... 134Table 3.3-17 Pollutants discharged to sewage network and water bodies by economic activities, Sweden 136Table 3.3-18 Efficiency of MWWTPs, Sweden 1995..................................................................................... 137Table 3.3-19 Overall median load/employee for five regions in the UK, kg/employee/year.......................... 138Table 3.3-20 Total actual load (from matched firms) as a percentage of total consented loads .................. 141Table 3.3-21 Emissions to water of heavy metals from enterprises having discharge licences, Norway ..... 143Table 3.3-22 Emissions of phosphorus and nitrogen to coastal areas, Norway 1996, tonnes ..................... 144Table 3.3-23 Emissions of phosphorus and nitrogen from enterprises reporting to the INKOSYS .............. 145Table 3.3-24 Comparison of countries – COD and BOD loads, kg per employee per year .......................... 147Table 3.3-25 Comparison of countries – N and P loads, kg per employee per year..................................... 148Table 4.1-1 Supply of water-related products in Spanish regions, 1999, million ESP at market prices ....... 152Table 4.1-2 Use of water-related products* in Spanish regions, 1999, thousand m3.................................... 152Table 4.1-3 Groundwater abstraction by counties, GEUS categories (uses), Denmark 1997 ...................... 153Table 4.1-4 Dublin Corporation – Water supply and uses – 1998/99............................................................ 154Table 4.1-5 Greater Dublin – Water supply and wastewater services (tentative figures 1998/99). .............. 154Table 4.1-6 Examples of local water charges in Ireland (Greater Dublin) in IEP/m3..................................... 154Table 4.2-1 Quality classes of surface water in view of human consumption ............................................... 155Table 4.2-2 Water quality account of French watercourses, organic matter indicator, 1 000 km.s.r ............ 156Table 4.2-3 Aggregated water quality grades by size class of watercourse ................................................. 158
Eurostat water accounts pilot tables
Pilot Table 1 - Monetary supply table of some water-related products (in monetary units) .......................... 172Pilot Table 2 - Monetary use table of some water-related products (in monetary units) ............................... 173Pilot Table 3 - Economic accounts for some water-related economic activities (in monetary units) ............. 174Pilot Table 4 - Expenditure for some ancillary water-related activities (in monetary units) ........................... 175Pilot Table 5 - Physical supply of water (corresponding to Pilot Table 1 – in thousand m3) ......................... 176Pilot Table 6 - Physical use of water (corresponding to Pilot Table 2 – in thousand m3).............................. 177Pilot Table 7 - Total abstraction/discharge of water from/into the water bodies (in thousand m3) ................ 178Pilot Table 8 - Abstraction from water bodies for the preparation of drinking water (in thousand m3) .......... 179Pilot Table 9 - Balance of water flows between the economy and the water system (in thousand m3) ........ 180Pilot Table 10 - Pollutants discharged by economic activities into the sewage network (in physical units) .. 181Pilot Table 11 - Pollutants discharged to water bodies by economic activities (in physical units) ................ 182Pilot Table 12 - Pollutants subtracted by economic activities (in physical units) ........................................... 183Pilot Table 13 - Average purchaser's prices of some water-related economic products (in monetary units) 184
Eurostat set of final water accounts tables
Final Table 1 - Supply of distributed water and of wastewater services (in monetary units)......................... 201Final Table 2 - Uses of distributed water and of wastewater services (in monetary units) ........................... 202Final Table 3 - Economic accounts for water distribution and wastewater collection industries ................... 203Final Table 4 - Expenditure for self-supply of water and of wastewater treatment (in monetary units) ........ 204Final Table 5 - Physical flows of water corresponding to economic supply (in thousand m3)....................... 205Final Table 6 - Physical flows of water corresponding to economic uses (in thousand m3).......................... 206Final Table 7 - Abstraction of water (in thousand m3) ................................................................................... 207Final Table 8 - Returns of water (in thousand m3)......................................................................................... 208Final Table 9 - Freshwater balance (in thousand m3).................................................................................... 209Final Table 10 - Pollutant loads of freshwater abstracted for self-supply)..................................................... 210Final Table 11 - Pollutant loads of wastewater discharged to the sewage network ...................................... 211Final Table 12 - Pollutant loads of cooling and wastewater returned to the environment ............................. 212Final Table 13 - Pollutant loads of cooling and wastewater returned to non-fresh sources .......................... 213

Contents
7
Figures
Figure 3.1-1 Implicit water prices by industry (NACE 1-digit level), Denmark 1997, DKK/m3......................... 77Figure 3.1-2 Current costs, payments and ‘subsidy’ per m3 of water consumed by households, Ireland ....... 84Figure 3.1-3 Current costs, payments and ‘subsidy’ per cubic metre consumed by industries, Ireland ......... 84Figure 3.1-4 Irrigation costs Sweden thousands SEK .................................................................................... 89Figure 3.1-5 Environmental-economic profiles for some Swedish industries .................................................. 90Figure 3.2-1 Extraction of groundwater by industries and households in Denmark in 1994........................... 94Figure 3.2-2 Use of tap water by industries and households in Denmark in 1994.......................................... 95Figure 3.2-3 Water intensity in Denmark, 1994. Use of tap water related to output, m3/million DKK ............. 95Figure 3.2-4 Water intensity in Denmark, 1994. Use of tap water in m3 per employee................................... 96Figure 3.2-5 Evolution of the use of water in Denmark, by industry (NACE 1-digit level) .............................. 96Figure 3.2-6 Water productivity in Germany 1991 - 1995 ............................................................................... 97Figure 3.2-7 Use of distributed water by user category, Greece 1988 - 1996 .............................................. 100Figure 3.2-8 Use of water in households by purpose in Sweden, mid 90s ................................................... 112Figure 3.3-1 Share of each river basin in national emissions, France 1997 ................................................. 119Figure 3.3-2 Emission by river basin weighted by the surface of the basin, France 1997 ............................ 119Figure 3.3-3 Emissions of BOD by EPA sector, Ireland, 1998/99 data, tonnes/year .................................... 123Figure 3.3-4 Loads by NACE activity, Ireland, 1998/99 data, kg per 1000 IEP of GVA................................ 123Figure 3.3-5 Annual emission of cadmium by economic activity, Austria mid 90s, kg .................................. 132Figure 3.3-6 Austria: share of the different economic activities in annual emissions of COD....................... 133Figure 3.3-7 United Kingdom: example of variation of a load coefficient by region ...................................... 140Figure 3.3-8 United Kingdom: example of variation of a load coefficient by company size .......................... 140Figure 3.3-9 Heavy metals in sludge from municipal wastewater treatment plants, Norway 1993 - 1999.... 144Figure 4.2-1 Distribution (in %) of the km.s.r per quality grade and per size class of watercourses ............ 157
Schemes
Scheme 1.2-1 A simplified National Accounts Matrix (NAM) for water (in monetary units) ............................ 26Scheme 1.2-2 The NAM extended to a NAMEA for water .............................................................................. 27Scheme 1.2-3 The pilot water accounts tables in a NAMEA-type framework ................................................. 29Scheme 1.2-4 The German MEFIS-Cube ....................................................................................................... 33Scheme 1.2-5 Sweden’s water accounts framework ...................................................................................... 34Scheme 3.2-1 Water flows in the economy and between economy and environment, Spain 1999 ............. 101Scheme 4.3-1 An extended NAMEA-type framework applied to water ......................................................... 160Scheme A-1 Scheme illustrating the main flows of water recorded in the water accounts tables ................ 200
Maps
Map 3.3-1 France: Location, level and origin of nitrogen discharges in Loire-Bretagne ............................... 118Map 4.2-1 Proportion of km.s.r of good or of bad quality, reported to all the classes of water-courses ....... 157

8
List of acronyms and abbreviations
AOX = Absorbable organic halogen compoundsBBR = Bolig og Bygnings-Registeret (Danish Building and Dwelling Register)BNDE = Banque Nationale de données sur l’eau (French national database on water)BOD = Biological oxygen demand (mass concentration of dissolved oxygen consumed under specificconditions by the biological oxidisation of organic and/or inorganic matter in water)CBS = Centraal Bureau voor de Statistiek (Statistics Netherlands)COD = Chemical oxygen demand (mass concentration of oxygen consumed under specific conditions by thechemical oxidisation with bichromate of organic and/or inorganic matter in water)CSO = Central Statistics Office (Ireland)EEA = European Environment AgencyEPA = Environmental Protection AgencyESA = European System of AccountsESRI = The Economic and Social Research Institute (Ireland)ETC/IW = European Topic Centre/Inland waters1
GEUS = Danmarks og Grønlands Geologiske Undersøgelse (Danish Geological Survey)GVA = Gross Value AddedIfen = Institut Français de l’Environnement (French Institute for the Environment)IHERA = Instituto de Hidraúlica, Engenharia Rural e Ambiente (Portuguese Institute of Hydraulic and RuralEngineering and the Environment)INE = Instituto Nacional de Estatística (Portugal)INE = Intituto Nacional de Estadística (Spain)INAG = Instituto da Água (Portuguese Water Institute)IPC = Integrated Pollution Control (license system used in Ireland)IWWTP = Industrial wastewater treatment plantMWWTP = Municipal wastewater treatment plantNAMEA = National Accounting Matrix including Environmental AccountsOIEau = Office International de l’Eau (French international office for water)ONS = Office for National Statistics (United Kingdom)OSPAR = Oslo and Paris conventions for the protection of the marine environment of the North-East AtlanticPARCOM = Paris CommissionRNB = Réseau National de Bassin (French National Network on catchment areas)SERIEE = Système Européen de Rassemblement d’Information Économique sur l’Environnement (EuropeanSystem for the Collection of Economic Information on the Environment)SNA = System of National AccountsSTP = Sewage treatment plantSTW = Sewage treatment workTOC = Total Organic CarbonUGR = Umweltökonomische Gesamtrechnungen (German integrated environmental and economicaccounts)VAV = Svenska vatten-och avloppverkföreningen (Swedish Water and Wastewater Association)
1 This Topic Centre has recently merged with Marine Topic Centre to become ETC/WTR = European Topic Centre on water.

9
PrefaceThis publication summarises the numerical results and methodological findings of pilot water accounts in 15European countries. Water accounts focus on physical flows of water in to and out of the economy:abstraction and use of water by industries and households, emissions to water by different actors; as well asthe costs of water supply and wastewater treatment.
These pilot accounts generated results for many countries, showed the applicability of the Eurostat wateraccounts framework in practice and explored the accounting methods and data sources available. Thispublication will be a valuable source of inspiration for compilers of water accounts. Water policy-makersshould also get an insight into what is and could in future be possible with such accounts.
This publication is one of the outputs of Eurostat’s Environmental Accounting work. It contributes to variousEU-wide and international activities in the context of national accounts and environmental accounting,including the implementation of the European System of Accounts (ESA 1995) and the new world-wideSystem of Integrated Environmental and Economic Accounting (SEEA). The publication was prepared byMrs Christine Spanneut and Mr Gerard Gié of Planistat Europe and Mr Anton Steurer of Eurostat B1.
The pilot applications benefited from financial support provided by the European Commission's DirectorateGeneral for the Environment, in the context of the Communication from the Commission to the Council andthe European Parliament on Directions for the EU on Environmental Indicators and Green NationalAccounting - The Integration of Environmental and Economic Information Systems (COM(94) 670).
The development of the water accounting framework was only possible due to the essential contributionsmade by the members of the Eurostat Water Accounts Task Force. Special thanks are therefore due to themembers of the Water Accounts Task Force.
The Task Force met several times to develop the water accounts framework including a first set of pilot wateraccounts tables for testing in pilot applications, to discuss the results of the pilot studies and, in 2002, toagree on a revised standard set of water accounts tables (presented in Annex 2 of this publication).
The water accounts presently focus on the monetary and physical description of water-related economicactivities and the direct impacts of the economy in terms of water abstraction and emissions to water. Thedevelopment of a wider framework that also describes water in nature is a longer-term objective.
The main conclusions from the pilot applications are the following:• The water accounting framework is adequate and useful for analysis and derivation of indicators.• There are many usable data sources in countries, in particular economic data on water management and
physical data describing the flows of water within the economy and between economy and environment,but systems to collect/centralise these data are not always in place.
• Setting up such systems will need to take account of various factors such as the organisation of watercontrol (centralised/decentralised), of water management (public/private), the existence of taxation onwater abstraction and/or water pollution, the dependency on other regions or other countries for waterresources, and the nature and importance of the concerns about water.
• Data on the emission of pollutants to water by the economic activities are less complete and of lowerquality. This situation should improve in future through the implementation of the European WaterFramework Directive, of the Integrated Pollution Control registers, etc.
• The results show that it is possible to regionalise part of the water accounts.• A major future extension is the development of water quality accounts for surface water bodies.
The work on water accounting is continuing at Eurostat together with the Water Accounts Task Force. Workis focusing on further methodological development and on collecting data more regularly from more MemberStates.
Brian NewsonHead of Unit B1
National accounts methodology,statistics of own resources

11
Introduction
European concerns about waterWater is a vital resource for the economy and society. It is used to produce drinking water, food, energy andother products. It is used for transportation and amenity. It plays a key role in the preservation and protectionof eco-systems. European water bodies are subject to three major threats:• quantitative depletion of water resources of good quality (like groundwater);• qualitative degradation through pollution of water resources as a result of direct discharges into
water (through wastewater) or indirectly through pollution of the air or the soil (acid rain, fertiliser, etc.);• de-structuring of aquatic ecosystems through conversion of surface waters, river regulation for
transportation purposes, land recovery, production of electricity, etc.
European water resources are extremely diverse and variable in space and time in terms of water availabilityand water demand. These diverse conditions and needs should be taken into account in the planning andexecution of measures to ensure protection and sustainable use of water. While problems of wateravailability are concentrated in some regions, water pollution is a major issue all over Europe.
The EU is therefore establishing a series of measures in order to address these problems: quality controls,setting of norms, information for the public, etc., and economic measures such as water pricing, abstractionand pollution taxes, etc.
Water was one of the seven major themes selected in the fifth environment action programme2 of theEuropean Commission. “Ensuring the sustainable use and high quality of our water resources”’ is also one ofthe objectives in the sixth environment action programme3.
In particular, the European Union adopted a Water Framework Directive4 (WFD) which expands waterprotection to all water bodies and aims at achieving good status for those waters. The WFD encourages theMember States to use pricing for water-related services as an effective tool for promoting waterconservation. It recommends environmental costs of water to be reflected in the price of water.Implementation of the WFD will lead to further improvements in the quality of surface water and groundwaterbodies in Europe.
Recognising that water management and water quality must respond to local conditions and needs, the WFDemphasises the need for actors at different levels to take up their responsibilities. The measures needed toimprove the efficiency of water use and to encourage, for example, changes in agricultural practices shouldbe implemented at different levels of decision: local, national or supranational, depending first on the areaconcerned by the problem (from a Southern region which lacks water resources in summer to the drainagebasin of the Rhine, which involves nine European countries) and secondly on the sharing of competenceacross administrative divisions.
Water is an indispensable element to life. The majority of human activities depend on the existence of waterresources, and for some of them, on water of good ecological quality. The interplay between the economyand the environment is particularly strong in the water domain. Economic activities can radically change thenatural state of water as well as its distribution. If water is lacking or is so degraded that usable waterbecomes too costly, the structure of economic activities may have to be modified and even lead to thegeographical displacement of people. This extreme dependence on water makes it a difficult element to dealwith. Arbitration between various political objectives is necessary; the environmental water policy is notindependent of economic and social policies.
The fifth environmental action programme particularly stressed the need to implement the polluter-paysprinciple. This objective requires studying the water use and the pollution flows; the costs to be taken intoaccount (costs of purification for obtaining drinking water, wastewater treatment costs, environmentrestoration costs, etc.) and the pricing methods that could be adopted for water use (installation of meters,
2 OJ C 138 of 17 May 19933 Decision 1600/2002/EC of 22 July 2002 published in OJ L 241 of 10 September 20024 Directive 2000/60/EC of 23 October 2000

Introduction
12
multiple prices, etc.). The recent Communication from the Commission ‘Pricing policies for enhancing thesustainability of water resources’5 addresses such issues.
The sixth environment action programme stresses that the integration of the environment into the economicand social policies that influence the pressures on the environment should be improved. It also stresses theimportance of measuring progress through indicators and benchmarking.
The contribution of water satellite accountsThe integration of economic and environment data within a single framework makes it possible to show theinterplay between the economy and the environment and helps in identifying appropriate measures. Thisintegration can be carried out through a satellite account to the National Accounts that is dedicated to water.Such a satellite system can:
1) show the present management of water, i.e.:• identify all actual costs for the abstraction, treatment and distribution of water including water
abstracted by enterprises and households for their own use; for collection and treatment ofwastewater; for the regulation of water flows in rivers; for in situ de-pollution of surface waters, etc.,
• examine the corresponding financing system, notably the breakdown between individual andcollective expenses,
2) with a view to applying the polluter-pays principle, produce information in physical units on thepressures exerted on water by the different economic activities (quantities abstracted and used,emissions to water),
3) describe the state of the water bodies reached with this management.
National accounts and forecasting models based on national accounts can bring valuable support to thesekinds of studies. Although some water problems are very local, general economic responses are oftennecessary. Simulation models fed with data from the national accounts can inform the definition of policyinstruments as well as mediation between different policy objectives. Such models allow studying thepositive and negative impacts of planned policy measures including the environmental effects of thesemeasures, and the effects on prices of goods and services and on competitiveness, growth, employment,etc.
The national accounts framework as set out in the European System of Accounts (ESA 1995)6, describingthe economic sphere, can be used as the starting point. This system can be expanded as follows:
• the level of disaggregation should be adjusted to clarify all questions relating to water management,• a more complete description of water as a natural resource should be added. Water does not have an
economic origin; in its natural form, it is rarely traded on the market and, therefore, it only appearssporadically in the ESA as a natural resource,
• extend the system to include physical data on the flows and stocks of water and on emissions to water toallow studying the pressures and consequences of economic activities on the water environment.
Some of these data in physical units are already being collected and the water satellite accounts can bebased on these existing sources, notably data collected in the framework of the joint OECD/Eurostatquestionnaire on inland waters. Environment statistics on water are not always compatible with the ESA. Inorder to provide data integrated under a single framework of economic accounting on the environment, theprimary data need to be treated and re-arranged so as to make economic and environmental data consistentwith one another.
The availability of adequate data sources is a precondition for compiling such integrated accounts. Most ofthe data are available in countries but not necessarily in the required format. This is why Eurostat, supportedby the Directorate General for the Environment, has organised a series of pilot studies in order to determinewhich data sets are feasible and at which cost.
5 COM(2000) 477 final6 Council Regulation 2223/96 on the European system for national and regional accounts in the Community

Introduction
13
Work carried out under the aegis of EurostatIn response to requests by European Commission users of statistics, Eurostat developed the water accountsin three steps: 1) develop a framework with harmonised definitions and concepts, 2) organise practicaltesting of this framework, and 3) analyse the results of the test phase before proposing the implementation ofa harmonised European system of water accounts.
A Task Force with interested Member States was established to carry out step 1. It met three times in 1996and 1997. Its first meeting essentially intended to take stock of ongoing work, to decide upon the futuredirections and to discuss the usefulness of producing national and yearly accounts while some concerns arelocal and periodic.
During the second meeting, the participants decided to fix two objectives for the water satellite accounts:• Objective 1: to rapidly develop a monetary and physical description of the water economy and to extend
it to direct interactions between economy and water in nature. A NAMEA-type framework was adoptedfor this description. (NAMEA stands for National Accounting Matrix including Environmental Accounts.)
• Objective 2: to continue reflecting on the development of a more general framework including adescription of water in nature and of indirect impacts of economic activities. The French model ofdescription of water in nature was adopted as a basis for reflection.
At the third meeting, a set of 13 pilot water accounts tables developed on the basis of a priority order and ofassumed data availability was adopted to fulfil objective 1. The tables were organised into three groups:• Monetary tables corresponding to the ESA, but with the extra detail necessary to understand the
economic transactions linked to water supply and use (output, costs, specific taxes, etc.)• Physical description of the water flows within the economy (supply and use of water, wastewater
collected) and between economy and the environment (abstraction of water from the environment andreturns of wastewater to it).
• Description of the flows of pollutants associated with these water flows in order to capture the directemissions of pollutants by economic activities.
In the pilot water accounts tables (see Annex 1), the breakdown of water bodies by categories (lakes, rivers,aquifers, etc.) and by quality classes (only introduced for the abstraction of water for drinking purposes) wasviewed as provisional. The tables were also viewed as flexible as regards the level of detail suggested.
Introducing time and space issues into the accounts was discussed, as well as different ‘economicallyavailable water’ concepts and water quality measurement, but not adopted.
The next step was the practical testing of the 13 pilot water accounts tables. 14 Member States plus Norwaycarried out pilot exercises on the basis of existing statistics.
The Task Force met again in 1999 to review the first results of the pilot exercises. The general conclusionwas that the NAMEA-type approach was successful in combining different data sources in order to producedata sets that are useful for analysis and for deriving indicators. As more results of tests became available, aworkshop was organised in Luxembourg in June 2001 during which the participants in the pilot exercisesshared their experience. In April 2002, the Task Force met again to draw the conclusions from the pilotexercises and to revise and finalise the set of water accounts tables (presented in Annex 2).
Outline of the publicationIt has not been easy to organise the presentation of the results because of the diversity of the pilotapplications: some countries tried to fill in the whole set of 13 tables, others concentrated on a certain kind ofinformation, e.g. on the identification of the quantities of water involved in each economic activity, othersfocused on the quality of the data, compared different sources, etc.
The selection of the results themselves was not easy either: more than 800 pages of reports had to becondensed. The focus has been on sources and methods, since the national results, in terms of indicatorsuseful for European water policy, will only be entirely relevant when they are comparable and consolidated.Some of the numerical results, however, are reproduced for illustration.

Introduction
14
The outline finally retained is as follows:
Chapter 1 explains the context in which these pilot studies have been carried out: the concerns about waterin Europe, the links with economic activities, the objectives that satellite accounts on water should achieve inorder to supply information in support of decision-making. The present state of available economic andenvironmental information is analysed. Chapter 1 concludes by summarising what each country, within thisgeneral framework, has tested as its contribution to the water accounts pilot exercise.
Chapters 2 and 3 form the core of the document, presenting the diverse experiences. Both chapters areorganised by ‘themes’, which more or less correspond to the groups of the tables that were tested.
The first theme examines the ‘water economy’ and describes, in monetary terms, the economic activitiesrelated to water. The second concerns the ‘volumes of water and wastewater flows’. The third themereviews the ‘flows of pollutants’ associated to these water flows. Water flows in nature, however, are notstudied.
For each of these three themes, Chapter 2 reviews, for each country participating to a theme, the objectivesof its pilot exercise, the data sources used and the methods applied to achieve its goal. Countries aregrouped according to the similarities in their approach: for instance, the use of certain data sources such asadministrative data, specific surveys, etc.
Chapter 3 analyses how successful the pilot exercises have been, reporting some of the results, showingtheir limits, raising questions of data reliability and international comparability. Ways of disseminating resultsinitiated by countries are also presented: synthetic indicators, graphic analyses, etc.
Chapter 4 summarises issues not specifically covered by the set of tables tested or which appeared as anew issue for development as a result of the pilot exercises: time and space dimensions, water quality andquantity accounts, water availability.
Chapter 5 summarises the lessons learnt from the whole exercise: workability of the set of water accountstables tested, changes necessary, topics on which a supplementary investigation is needed, etc.
The Annexes include the initial set of pilot water accounts tables that was tested in the pilot exercises(Annex 1) and the revised standard set of water accounts tables with explanatory notes (Annex 2).

15
1 The Water Accounts framework
1.1 Concepts
1.1.1 Specific characteristics of waterAt first sight, water could be perceived as a resource like other natural resources such as mineral deposits orforests. But because of its elusive nature, in accounting, water cannot be dealt with in the same way as otherresources: water travels by itself, beyond human control. Monitoring of quality, time and location is morecrucial than is the case with other resources. Water accounts encounter some of the most fundamentalproblems of environmental accounting.
• Water (like forest) is both an ecosystem and a natural resource and is used by man in both its aspects.As an ecosystem, it is used as a biotope for fish, algae, etc., as a structure for transportation (maritimeand river navigation), for recreation (swimming, water sports, fishing, etc.) and as a dump for liquidwaste. As a raw material water is used in practically all agricultural, industrial and service activities andby households (drinking, washing, etc.). It is also an energetic resource (hydroelectricity generation) andused for cooling.
• Water (like air) is a mobile element with a cyclical course. The water cycle raises the problem of aneconomic definition of water as a resource: should all forms in which it exists in nature, including vapourand ice, be included in the resource description? In practice, man only withdraws water from its naturalenvironment in liquid forms, naturally or artificially structured: watercourses, underground reserves(aquifers) or surface waters (lakes, basins). It is the state of these structured forms which is the subjectof environmental concern, but these structures are themselves fed by unstructured forms such as rainand snow which are also important for the economy (agriculture). The availability of water resourcesdepends on the rate of renewal of their structured forms. The description of water resources at a givenpoint in time (statistics in terms of stocks) provides little information. The rate of renewal of resourcescan itself constitute an environmental problem: excess flows against which preventive measures must betaken (rising waters, floods, tidal waves, etc.), or shortages that have to be remedied (seasonal,temporary or definitive drought).
• Water exchanges matter and energy with the air, the soil and the subsoil. The same water circulatesfrom a river's source to its mouth and takes on or discharges pollutants along its way. Water can take intoxic elements when passing through the air (rain), the ground (drainage), or the subsoil (infiltration).Inversely, it can deposit these same toxic elements (sedimentation, natural filtration). Water quality isinfluenced by emissions to water as well as by natural factors.
• Several successive economic uses are possible: polluted water, unfit for drinking, may still be used forirrigation or as an energy source, according to its state and location. Several successive uses within asingle enterprise are also possible: recycling, use within a closed circuit cooling system, etc. This lastcharacteristic of water is due to the fact that only a minor portion of the water actually disappears in theproduction or consumption processes. It is particularly significant for water accounts that ‘use’ does notmean definitive physical disappearance of water. The major portion remains available for use furtheralong, although its quality may undergo change.
• Contrary to other natural resources, water is inexhaustible on a planetary scale. Its geographicdistribution as well as its breakdown into different forms (vapour, rain, fresh water, salt water, ice, snow,etc.) may evolve. These forms are distributed unequally, oceans constituting 96% of the planet's water.
1.1.2 The economics of waterContrary to other natural resources such as forest or mineral deposits, water in its natural environment israrely considered to be an economic asset. Natural water as such is rarely owned, but rather the right to useit or the services it provides. In most countries ownership rights on water resources are not enforced, neitherby individual units nor by government. When the water leaves the owned property the ownership rightscease. In some countries the water supply system is privatised but this does not necessarily mean thatownership rights to water resources are assigned to the corresponding economic units.
A part of the water resources is under the effective control of economic units: regulation of water bodies,storage of water in reservoirs are examples of this control. However most of the water is ratheruncontrollable: it comes and goes as it pleases (precipitation, evapotranspiration) and floods and droughts

Framework
16
show that total control by economic units is not effective. This can partly be redressed by change of land useand additional regulation of water bodies (drainage, extending the capacity of reservoirs, deliberate influenceon evapotranspiration from agricultural land). In effect, it is possible, to a certain degree, to ‘control’ water.These activities of regulating ‘natural’ water flows should be included in the economic part of water satelliteaccounts.
In fact, with the exception of mineral water resources (springs, wells), a natural water resource is rarely anasset that can be exchanged on the market. Prior to abstraction and ‘processing’, water in nature rarely hasan explicit market price, and it has been considered that natural water can be used without limit ordiscernment. The results may be:
• an over-exploitation of the aquifers in certain regions,• an excessive discharge of pollutants into surface waters,• a creation of unstable artificial ecosystems (deviated watercourses, dried-out marshes, etc.)
The monetary consequences of this water management could be partly obtained from the national accounts(directly or indirectly), if the following costs were isolated:
• increased purification for the purpose of obtaining drinking water and increased de-pollution work onfishing rivers and lakes, on frequented beaches, etc.,
• new construction for water transportation (or, on the contrary, for draining it),• repairs for damage caused by ‘natural’ disasters (floods).
On the other hand, as for the environment in general, the accounts will not directly reveal the symptoms ofunsustainable development such as:
• displacement of population or economic activities due to desertification of a certain region (except inregional accounts),
• deterioration of water quality when purification efforts do not suffice to restore or maintain its originalquality,
• inability of the land to fulfil its future economic role because of present day over-exploitation of waterresources.
National accounts, if they are to answer the sustainability issue must be expanded to include physicalmeasurement of the pressures on, and the state of, water and try to link this measurement with the pressureexerted on water resources by economic activities.
If it is then apparent that decisions are indispensable for the preservation and repair of the environment, theaccounts could be used to test the political measures to be taken, prepare forecasts and observe the results.For that, it suffices that the interplay between economic activities and the pressures exerted by theseactivities on the environment be known, the underlying hypothesis being that the state of the environment isthe result of the pressures exerted upon it.
Due to insufficient knowledge about all the factors that influence the quality of water in nature, the wateraccounts will probably have to be limited to measuring the pressures constituted by the withdrawals and thedirect discharges of pollutants by economic agents and omit the effects of exchanges between water, air, soiland subsoil and the self-cleaning achieved by nature. These latter effects could be taken into considerationwith physical models.
For the national accounts to fulfil the role described above, they must be disaggregated, reformatted andsupplemented by new data (in particular physical ones). Such a process constitutes the drawing of a satelliteaccount. To begin with, the following paragraphs examine how water is recorded in the conventional nationalaccounts, starting with an important feature of water from an accounting point of view: the dual nature ofwater. Water is at the same time an asset, i.e. a structured form, and a natural resource, i.e. a raw material.
1.1.3 Water resources as an assetIn this case, the interest is in the structured forms of water resources (water bodies): rivers, lakes, marshes,aquifers, glaciers, reservoirs, etc. The relevant aspect is the structure through which the water flows or that itfills. Such water resources have a water storage (lakes, underground aquifers) and/or a water deliveringcapacity (springs, rivers). With the exception of groundwater aquifers they also have the character of eco-systems.

Framework
17
In most countries ownership rights on water resources are not enforced, either by individual units, or bycommunities. In general these natural structured forms of water resources (rivers, lakes, etc.) cannot be soldseparately from the land that supports them, although the right to use them or the services they provide mayin some instances be recognised as a separate (intangible) asset. Of course the existence of water caninfluence the value of land, positively or negatively: its presence or its proximity can raise the value of landwhen it allows irrigation or offers specific services including landscape quality or, on the contrary, lower it asin the case of marshland. However the market does generally not make this 'economic value' directly visiblesince it is 'embodied' in the value of the land.
Thus, in practice, the natural structured forms of water resources are not separately recorded in themonetary balance sheets of the national accounts except for "aquifers and other groundwater resources tothe extent that their scarcity leads to the enforcement of ownership and/or use rights, market valuation andsome measure of economic control" (ESA 1995 definition of Water resources (AN.214), ESA Annex 7.1,).This is in particular the case of mineral water resources (springs or wells) that can be exchanged on themarket.
Besides these natural structured forms of water resources, which are "non-produced", numerous forms ofproduced structured forms of water resources exist: reservoirs, artificial lakes, channels for navigation, etc.As these structures are man-made they receive a value in national accounts balance sheets. A specific casecorresponds to the structures for controlling the flows of water: e.g. dams and dykes for flood control,terracing to slow the water runoff and erosion etc. According to national accounts conventions, thesestructures, qualified as "improvement to land' are included in the value of land.
Therefore, whereas the system of national accounts provides the accounting framework for recording assetsand changes in assets, these will only be explicitly recorded for man-made structured forms of water, andpossibly land. The changes in quality of water resources as an asset will only be recorded as a change in thevalue of land: the drying up of a spring or a river, the degradation of a water body in its capacity as eco-system (fishing, bathing, etc.) will be reflected in the value of land. Whereas environmental accounts areinterested in the (changes in) quality and quantity of water it will be difficult to link these accounts with thebalance sheets of national accounts.
In the European System of Accounts (ESA), the economic territory of a country includes ‘the territorialwaters7 and the continental shelf located in international waters, on which the country disposes of exclusiverights’. Thus, the open seas that are outside these limits are excluded from the economic territory.Environmental concerns involving oceans (reduction of fish catch or of the variety of flora and fauna,discharges into the sea, etc.) are difficult to record in a ‘national’ accounting framework except for economicexploitation (fishing, tourism) or discharges in coastal areas. Water accounts will in practice often deal solelywith inland waters. Moreover, whereas an ecological definition of inland water would include the water ofwatercourses, of lakes, ponds, glaciers, and of aquifers to which would be added the water contained in thesoil and vegetation cover as well as that contained in the atmosphere, only water from watercourses andsurface or underground reserves has an economic use.
Asset classificationThe assets considered in the ESA are economic assets8, i.e. they must be owned (individually or collectively)and being capable of providing an economic benefit. Ocean water is generally not owned and therefore doesnot constitute an economic asset. Only aquifers and other groundwater reserves, to which such qualificationsmay be assigned, constitute a non-produced, non-financial asset (Asset AN 214: water resources).
Surface water is not distinguished from the land on which it is located (AN 211 and its subdivisions).
7 The sea within 12 nautical miles from the low water mark or other point on the coastline.8 In the asset classification of the System of Integrated Environmental and Economic Accounting (SEEA 2000), water – accounted for
in physical terms – is classified separately and measured in m3, in addition to being accounted for as water-covered land (measuredin km2). It is further subdivided into:EA.13 Water resources
EA.131 Surface watersEA.1311 ReservoirsEA.1312 LakesEA.1313 Rivers
EA.132 Groundwater

Framework
18
1.1.4 Water as a raw material and a productAs a raw material water has no explicit price prior to abstraction and ‘processing’ although in an increasingnumber of countries taxes on the abstraction of water are put in place, which influence the market price ofdistributed water. The price of water on the market is the price of a product: 'distributed water'. Nationalaccounts record the value of distributed water, and the costs involved in providing the water – abstraction,purification and distribution. Government units (local, regional or national) often provide these services.Subsidies may be involved e.g. due to the social acknowledgement of the right to water access for all peopleor political objectives as concerns agriculture.
On the other side, many economic agents withdraw water directly from the natural environment (electricpower plants, farmers, etc.) and face very variable costs. In addition to differences concerning costs, thesedirect users may also, in certain cases, penalise other users since the water will require re-treatment furtheralong the chain. This abstraction for own use is only recorded in national accounts when for own final use(final consumption)9. Direct abstraction and purification for productive uses is considered as an ancillaryactivity whose output and costs are not isolated.
Water in ESA classificationsClassifications of activities (NACE) and products (CPA)The set of water accounts tables that was tested in the pilot applications used the standard statisticalclassifications in force in the EU. The statistical classification of economic activities in the EuropeanCommunity (NACE Rev. 1) at its subsections level and the statistical classification of products by activity inthe European Economic Community (CPA 1996) were used with some extra detail as regards activitiesrelated to water. In the tables, an asterisk marks codes that did not exactly match NACE and CPAdefinitions. Important categories of NACE and the corresponding categories of CPA are summarised below.
It should be noted that NACE Rev. 1 and CPA 1996 will be replaced by the new NACE Rev. 1.1 and CPA200210 from 1 January 2003. In case of differences between the new and earlier classifications, referencesto both versions are made.
NACE class 41.00 - Collection, purification and distribution of water. The products corresponding to thisactivity are CPA 41.00.1 - Distributed water11 - with a further subdivision into drinking water (CPA 41.00.11)and non-drinking water (CPA 41.00.12) – and CPA 41.00.20 - Distribution services of water, includingnotably reading and maintenance of meters. NACE 41 includes desalting of seawater to produce water asthe principal product of interest. NACE 41 excludes the operation of irrigation systems for agriculturalpurposes (classified in NACE 01.41 - Agricultural service activities; landscape gardening) and the treatmentof wastewater solely in order to prevent pollution (classified in NACE 90 – Sewage and refuse collection).
NACE class 90.00 - Sewage and refuse disposal services, sanitation and similar services. Theproducts ‘Sewage removal and treatment services’ (CPA 90.00.11) and ‘Treatment services of cesspoolsand septic tanks’ (CPA 90.00.12) are classified under NACE 90. Class 90.00 of the NACE Rev. 1 includesalso activities that produce e.g. refuse disposal services. The new NACE Rev. 1.1 provides more detail (seealso Annex 2). New class 90.01 - Collection and treatment of sewage includes:• collecting and transporting of human wastewater from one or several users, as well as rain water by
means of sewerage networks, collectors, tanks and other means of transport (sewage vehicles etc.) andtheir treatment and disposal
• treatment of wastewater by means of physical, chemical and biological processes like dilution,screening, filtering, sedimentation, etc.
• maintenance and cleaning of sewers and drains• emptying and cleaning of cesspools and septic tanks, sinks and pits from sewage, servicing of chemical
toilets• treatment of wastewater from swimming pools and from industry
9 The ESA does not include water in the list of products for which own account output for own final use should be measured.10 Commission Regulation (EC) 29/2002 of 19 December 2001 amending Council Regulation 3037/90 on the statistical classification of
economic activities in the European Community and Commission Regulation (EC) 204/2002 of 19 December 2001 amending CouncilRegulation 3696/93 on the statistical classification of products by activity (CPA) in the European Economic Community.
11 In the official English CPA terminology, the product of this activity is called ‘natural water’ The wording 'distributed water', like in theFrench version of the CPA, is used here in order to avoid a possible confusion with water in nature.
Framework
19
NACE class 01.41* - operation of irrigation systems. The operation of irrigation systems is part of NACEclass 01.41 – Agricultural service activities; landscape gardening and the corresponding product is part ofCPA 01.41.11 - Services incidental to agricultural production. These irrigation systems are supposed to be aspecific provision of water to farmers, especially through a network of open air canals the feeding andallocation of which is managed.
NACE class 75.12* - public administration for water. Water-related public administration is part of NACEclass 75.12 - Regulation of the activities of agencies that provide health care, education, cultural servicesand other social services, excluding social security. The corresponding product is part of CPA 75.12.13 -Administrative housing and community amenity services. This product supplied by government includes:“services provided by offices, bureaux, departments and programme units engaged in developing andadministering regulations concerning water supply; public administrative services related to (…) sewagesystem operation.”
Mineral waters come under CPA 15.98.11 and are not included in the list of water-related economicproducts followed through the water accounts. However, the corresponding abstraction of water will beconsidered as an ancillary activity by beverage producers. Distilled water is part of CPA 24.13.42 (Otherinorganic compounds n.e.c.) and is not included either.
Most other activities also use water in various forms; some are dependent on the existence of water-coveredsurfaces: hydroelectricity, fishing and fish farming, water transportation, recreational services or beachinstallations.
Much construction work is also linked to the storage, transportation, distribution and control of water. Theproducts of these activities are classified in the following CPA categories:
45.21.32: general construction work for other long-distance pipelines, including water45.21.41: general construction work for local water and sewage pipelines, including ancillary works45.24.12: general construction work of dams, canals, irrigation channels and aqueducts45.24.13: general construction work of locks, floodgates and other hydro-mechanical structures45.25.22: water well drilling45.33.20: water plumbing and drain laying work.
Classification of the functions of governmentThe Classification of the functions of government (COFOG) is used in the national accounts to classifygovernment expenditure. The version of COFOG that was in use when the set of tables was developed, hadseparate headings for ‘water supply affairs and services’ (group 07.2) and ‘sanitary affairs and servicesincluding pollution abatement and control’ (group 07.3 – wastewater management was included in this groupalong with other expenditure). The new version of COFOG is more useful for water accounting as itseparately identifies wastewater management (group 05.2) – for detail see Annex 2.
Accounts relating to water within the standard national accountsFor water supply (NACE 41) and wastewater management (part of NACE 90) activities, production accountsand generation of income accounts should be available. However, these accounts are often established onlyat the NACE 2-digit level. Wastewater management is not isolated at this level.
Similarly, for products relating to these activities, we must go down to the CPA 5-digit level to isolate water-related services and construct Supply-Use or Input-Output tables. Such details are generally available for theproduct ‘distributed water’ only. The supply-use tables provide information on the supply and use ofdistributed water by industries and households.
Acquisitions less sales of non-produced, non-financial assets of water resources, when they exist, would berecorded in the capital account. In the Other changes in assets account, the discovery and depletion of watersources would be recorded. However, for water resources such accounts are generally not available.
Geographical breakdownFrom a hydrological point of view, the economic territory of the national accounts is made up of a set ofdrainage basins (or portions of basins). A purely national perspective could be inadequate for the study ofwater problems: problems concerning water availability are often local whereas problems of water pollutiongo beyond national borders: the Danube drains surface waters from 16 countries, the Rhine from 9. Pollutionproblems often increase at the bottom of the basins, whereas problems concerning the regularity of water

Framework
20
resources can be found all along its course. Water withdrawn in one basin cannot easily be used tocompensate for water shortage in another basin due to high transport costs and ecological repercussions.
To analyse water problems in terms of quantity and quality, it would be necessary to have regional data.However, the European regions, based on administrative divisions, do not necessarily correspond to thewater basins. A table relating water basins and the European regions is under construction. It requiresdescending to NUTS 5 level (NUTS is the European Nomenclature of Territorial Statistical Units).Comprehensive integration with economic accounts, desirable for the good management both of water andother resources, is difficult at this level due to limited data availability.
The integrated management of water resources may be complicated. Administrative boundaries may notmatch the boundaries of water basins. Divisions are not only geographical but also regard subjects:distinctions between withdrawal, pollution and treatment problems, on the one hand, and co-ordination withother policies (e.g. agriculture, industry, transport) on the other. Fortunately, these divisions by subject aregradually disappearing and are being replaced by integrated water management administrative structures:basin authorities in Spain, water authorities in the United Kingdom, basin agencies in France, etc.
These new structures are certainly better adapted, but they are still far from allowing for the full integration ofwater policy which demands co-ordination across ministries and regions, or international co-operation. Whena catchment basin includes two or more countries, the treatment of environmental problems requires theparticipation of all countries concerned. The treatment of these questions at the supranational level, such asat the EU level, then makes sense.
Certain instruments of water management – legislative, economic or other – will be defined at the nationallevel or have consequences for the national economy as a whole: pollution standards, rates for waterservices, taxation, etc. Political decisions such as the sharing of costs between different national agents(including between different basins), or the choice between potentially antagonistic policies (for example,between increasing agricultural performance or preserving the quality of groundwater) must necessarily betaken at several geographical levels, including the national level. Obviously, it is this level of decision thatcan benefit most from the light shed by the national accounts.
1.1.5 Conclusions as concerns water in the national accountsActivities classified in NACE 41 and 90 are described in the conventional national accounts. However,national accounts as published will rarely provide sufficient detail for the study of water management. Suchdetail must be found at the level of basic data (surveys of enterprises and government units, administrativesources, etc.). More important, only water-related activities exercised as principal or secondary activities areclassified in NACE 41 and 90. As concerns water, ‘ancillary’ activities (within the enterprise) are definitely notnegligible. For example, water abstraction on own account constitutes the major part of water uses inquantity terms. The decisions required for good water management, such as standards or incentivemeasures must rest on data covering the totality of water-related activities and contain a sufficient level ofdetail.
It is useful, therefore, to obtain the following supplementary data:
1) to collect in detail all costs (in monetary terms) pertaining to present day water management, includingcosts borne by producers for ancillary activities and, simultaneously, to explain the financing of theseexpenditures, notably the financing by water users and by government.
2) to indicate the responsibilities of each economic agent for these costs by establishing the (physical) linksbetween activities and their consequences for water (and in particular abstraction of water and dischargeof pollutants).
3) to examine the adequacy of the present situation in the light of the general goal of sustainabledevelopment. Physical measurements of the environmental state of the country's continental waterswould have to be carried out and compared with the state defined as sustainable.
The first two developments suggested will be discussed in the second part of this chapter. The thirddevelopment is more long-term and will be briefly discussed in chapter 4.

Framework
21
1.1.6 Water in environment statisticsThe OECD/Eurostat Joint Questionnaire on Inland WatersSatellite accounts complement the economic statistics with statistics in physical terms. It is useful at thispoint to present the physical water statistics that Eurostat collects in the framework of the statistics of theenvironment.
The work carried out at Eurostat is developed in close co-operation with the OECD as well as with the UnitedNations Economic Commission for Europe (UN-ECE). Information is collected through a biennialquestionnaire (the OECD/Eurostat joint questionnaire). The definitions of a number of key variables arepresented below. These were the definitions in use at the time when the water accounts tables were set upand tested (see tables in Annex 1). Some of these definitions have been clarified for the 2002 JointQuestionnaire. The new definitions are shown in Annex 2.
Categories of water resources(Fresh) Surface water: ‘Water which flows over, or rests on the surface of a land mass, natural watercoursessuch as rivers, streams, brooks, lakes, etc., as well as artificial watercourses such as irrigation, industrial andnavigation canals, drainage systems and artificial reservoirs.’
(Fresh) Groundwater: ‘Fresh water which is being held in, and can usually be recovered from, or via anunderground formation. All permanent and temporary deposits of water, both artificially charged andnaturally, in the subsoil, of sufficient quantity for at least seasonal use. Includes phreatic water-bearingstrata, as well as deep strata under pressure or not, contained in porous or fracture soils. Includes alsosprings, both concentrated and diffused, which may be sub aqueous.’
Other water: ‘Includes atmospheric precipitation, sea water, permanent bodies of stagnant water both naturaland artificial, mine water, drainage water (reclamations) and transitional water, such as brackish swamps,lagoons and estuarine areas.’
Flows of water between economy and environmentAbstraction (or withdrawal): "Water removed from any source, either permanently or temporarily. Mine waterand drainage water are included. (Water abstractions from groundwater resources in any given time periodare defined as the difference between the total amount of water withdrawn from aquifers and the totalamount charged artificially or injected into aquifers. The amounts of water artificially charged or injected areattributed to abstractions from that water resource from which they were originally withdrawn.)"
Discharge: "The amount of water (in m3) or substance (in kg BOD/d or comparable) added/leached to awater body from a point or a non point source."
Return: "Water abstracted from any fresh water source and discharged without use into fresh surface watersor groundwater. Occurs primarily during mining or construction activities. When abstracted fresh water isdischarged without any use into ‘other water’, it is not considered to be returned water."
Water statistics at European levelEurostat disseminates the information collected through the Joint Questionnaire.12 The following results arepresented:• Intensity of water use in Europe, i.e. the ratio defined by abstractions divided by fresh water resources.• Abstractions by sources (surface or groundwater)• Abstractions by (main) sector• Percentage of population connected to sewerage systems• Efficiency of treatment plants• Wastewater generated by sector• Sewage sludge production and disposal• Investment for the internal treatment of wastewater by industry.
12 Notably in Eurostat’s series Statistics in focus, Theme 8, Environment and energy. The three 2001 issues dealt respectively with‘Water resources, abstraction and use in European countries’ (6/2001), ‘Water management in the regions of the European Union’(13/2001) and ‘Wastewater in European countries’ (14/2001)

Framework
22
However, the coverage is not yet what it should be: the completeness is acceptable for data on waterresources and abstractions, but less satisfactory for water consumption by sector, and for the generation anddischarge of wastewater. A recent balance drawn up by Eurostat also stresses that the comparability ofstatistics collected needs to be improved further.
Intermediate conclusion on environmental statisticsThe environmental statistics concepts are a key basis for water accounts and will be referred to in the rest ofthis document.
Not all environmental statistics will be used in the water accounts. As will be seen in the next section, thedescription of the state of the water resources is not covered by the present water accounts framework.Therefore, purely hydrological concepts are not introduced. Furthermore, in the organisation of the EuropeanUnion institutions, the evaluation of the state of environment is a task delegated to the EuropeanEnvironment Agency (EEA).
The environmental statistics on water are less developed and harmonised than economic statistics. Thesedifficulties will be reflected in setting up water accounts that integrate economic and environmental data.

Framework
23
1.2 Systems for water accounting
1.2.1 Eurostat’s proposalWater accounting is a system allowing to present data concerning water in a way that is consistent witheconomic statistics as well as with the concepts of hydrology. The comprehensiveness of the water accountsshould be determined by the intended usage of such a system for policy making and by the cost andfeasibility of implementing the system based on available data sources.
During the preparation of the water accounts framework two different approaches emerged. The firstemphasised water in the economic sphere including descriptions of human uses of different water qualities,of emission to water by economic actors, of de-pollution by wastewater treatment, of costs generated by thistreatment, of impacts on water quality when measurable. The second approach was a more generaldescription of water within the environment, including a description of the state of the water system and ofthe hydrological cycle. This second approach would allow studying also indirect impacts of economicactivities on water and the management of local or periodic scarcity of water, as well as natural flows ofwater and related substances (pollutants).
The second approach was felt to be out of reach at an EU-wide scale at present and the Eurostat WaterAccounts Task Force recommended to concentrate on the work necessary to implement the first approach.Research work on a comprehensive set of accounts that includes a description of the state of the watersystem including stocks and flows is to be continued within the Water Accounts Task Force.
1.2.1.1 Developments needed within the ESA frameworkThe previous section has shown that in order to provide a useful guide for decision-making on water issuesthe national accounts need to be complemented, notably by:1. a description of all transactions related to water management, including transactions that refer to
ancillary activities,2. a description of the way expenditure related to water and water-related services are financed by the
various categories of water users,3. the identification of the production and consumption activities responsible for the pressures on water
bodies (abstraction of water or discharges of pollutants),4. a description of the state of water bodies, including the sustainability of their present management.
The two first points can be managed entirely within the ESA framework.
1 – Disaggregating and reformatting national accountsThis involves identifying all water-related activities and transactions, and drawing the accounts for theseactivities including transactions for ancillary activities as well as supply-use tables for the respectiveproducts.
a) Disaggregating production accounts and product transactionsThe first stage would be to isolate and regroup the accounts of water-related economic activities and todescribe in detail the supply and use of water-related products. Three aspects of the water management areconcerned.
The collection, purification and distribution of waterSupply of the product ‘distributed water’ through domestic production (imports are usually very small) mustbe examined in detail, as well as its uses by economic activities, including households' consumption.Production accounts and generation of income accounts for NACE 41 and supply-use tables should beestablished and complemented by physical accounts of distributed water by categories of users.
Treatment of wastewaterTreatment of wastewater should be separated from the rest of division 90 of the NACE (Sewage and refusedisposal services, sanitation and similar services). Various other activities for water pollution control and therestoration of aquatic media such as dredging (part of NACE 45.24 and CPA 45.24.14) should, if they can beisolated, also be integrated. The same studies as for NACE 41 would then be carried out.
Framework
24
Prevention of pollutionPrevention of pollution covers the activities for the monitoring of water quality, pollution control, research forless polluting technologies, administration and management of water in general.
These activities are often undertaken by government bodies, and classified in NACE class 75.12.Environmental NPISH (non-profit institutions serving households) can also be active in these areas.
At this step, only data related to activities practised as main activities (potentially also secondary) can becollected. The data required on products of activity 41 are usually available directly from the accounts in anaggregated form (all of NACE 41). Data concerning wastewater treatment (NACE 90) may not be directlyavailable in the national accounts publications at the desired level of detail. However, the basic data used forthe construction of the accounts (surveys for specialised firms and accounts for local government specialisedunits) generally make it possible to construct accounts for wastewater treatment. For the ‘prevention’ item, onthe other hand, the existing accounts can hardly be used. Insofar as it is possible, they will have to berecomposed using specific data.
b) Accounts for ancillary activitiesIn order to establish direct links between water use and the related expenditure, it is necessary to record notonly the expenditure for the use of distributed water and for wastewater treatment services but also theexpenditure or costs related to ancillary activities.
Many economic agents abstract water directly for own use: farmers practising irrigation, electric power plantsusing water for cooling, industrial establishments that abstract their own water etc. The same applies towastewater treatment: enterprises and households may operate their own wastewater treatment facilities(industrial wastewater treatment plants, septic tanks, etc.).
These direct users will have costs for operating their equipment for abstracting and using water. These usersmay also purchase land in proximity to water or undertake construction works in order to use the water.
All these own account activities entail costs: either costs for capital formation or the acquisition of land inproximity to water or current costs directly tied to water usage (electricity or fuels for pumps, chemicals forthe purification of water or treatment of wastewater, compensation of employees, water abstraction orpollution taxes, etc. All these costs for water use should therefore be accounted for: abstraction andpurification costs, treatment and pollution control costs, capital and current costs.
For wastewater treatment and water pollution prevention, the environmental protection expenditure account(EPEA) of the European System for the Collection of Economic Data on the Environment (SERIEE)13 hasalready set a framework for the collection and reporting of such information. This framework should soon beextended to the management of the water as a natural resource (quantity aspects).
2 - Financing of the expenditureThe second objective of detailed water accounts is to determine the present financing mechanisms forexpenditure linked to water management. Although limited to monetary transactions, and thus excluding the'non-market' costs (residual degradation of water bodies), this second objective is directly related to theapplication of the polluter pays principle. Questions are: How are these activities presently financed? Bywhich agents (water users, local governments, central government)? By means of which instruments (salesof services, environmental taxes e.g. on discharges of wastewater, government budget, etc.)?
The purchase of water-related services by households and enterprises is directly visible in the supply-usetables of these products. The identification of expenditure for direct withdrawal should also be possible, as aresult of step 1. The total of this expenditure represents the direct contribution of households and enterprisesin the national expenditure for water. However, purchases of water-related services (and thus sales byproducers) do not generally cover the total amount of costs borne by the producers. For example:• The treatment of wastewater is sometimes a non-market output by local authorities. In the ESA, on the
use side, this appears as government actual collective consumption and is valued by the costs.Nonetheless, it is possible that government units involved in the production of these services do not bear
13 See Eurostat 1994 SERIEE 1994 Version and Eurostat 2002 SERIEE Environmental Protection Expenditure Accounts – CompilationGuide, Office for Official Publications of the European Communities, Luxembourg.

Framework
25
all the costs associated with this production: they may e.g. levy taxes for the treatment of wastewater,which are allocated solely for that purpose. These taxes are often included in water distribution bills.
• Units responsible for the production of water services may benefit from subsidies and capital transfers.Those financing mechanisms must be analysed in detail in order to obtain an accurate description of allflows financing the expenditure for water activities. Subsidies may be justified from a social or economicstandpoint, by the will to avoid that, for example, low-income households or activities exposed tointernational competition or regions where water is scarce, be overly penalised. Other transactions, suchas direct transfers to users or taxes on products should also be examined and a detailed breakdown ofthe financing circuit may appear necessary. In the end, results might be summarised in a SERIEE tableon the financing of national expenditure for wastewater management.
1.2.1.2 Complements needed outside the ESA frameworkAfter this disaggregation and reformatting of national accounts data, next steps of work respond to the twolast objectives of the satellite accounts on water:• the identification of the production or consumption activities responsible for pressures on water bodies
(abstraction of water or discharges of pollutants),• the determining of the state of water bodies, including the sustainability of their present management.
These steps mainly consist in complementing the national accounts data, notably with physical informationon quantities of water abstracted or used and emissions to water. These physical flows within the economyand between the economy and the environment can be included in a NAMEA-type framework, along with thecorresponding economic transactions. NAMEA stands for National Accounts Matrix including EnvironmentAccounts.
A NAMEA-type framework for waterA NAMEA framework extends the matrix presentation of national accounts (NAM) with supplementary rowsand columns where flows of substances (water and pollutants) are recorded in physical units and presentedin parallel with economic transactions. The NAM presentation equally allows for the representation of flowsof water within the economic system (e.g. supply-use tables of distributed water in physical units).
The main pressures placed on the water system by economic activities, i.e. abstraction and emissions ofpollutants to water, and some of the responses (wastewater treatment) can easily be described in a NAMEAframework: the matrix presentation of flows of water, including wastewater, and of pollutants in physical unitsis organised by economic activities in the same way as the monetary transactions connected to water. Thisinformation enables the macro-level analysis of different policy initiatives.
Applied to water, a NAMEA framework could be schematised as is done on the following pages. First, in aNAM detail on water-related transactions is added by using an adequate breakdown of the transactions, forinstance by isolating products CPA 41.00.11 and CPA 90.00.11 and possibly transactions related to ancillaryactivities. Second, the NAM is extended into a NAMEA by adding the corresponding flows of substances(water and pollutants) to the rows and columns of the NAM.

Framework
26
Scheme 1.2-1 A simplified National Accounts Matrix (NAM) for water (in monetary units)
Households Corporations Government Households Corporations Government
1a 41,00,11 90,00,11 1n 2a 41.00 90.00 2m 3 4 5 6a 6b 6c 7a 7b 7c 8a 41.00 90.00 8m 9 10 111a
41.00.1190.00,11
1n2a
41.0090.00
2m
Compensation of employees 3a
Other taxes less subsidies on production 3b
Operating surplus 3c
Households 4a
Corporations 4b
Government 4c
5a
5b
5c
Use of disposable
income accont6
Capital account 7
8a
8mFinancial account 9
Current account 10
Capital account 11
Goods and servicesCPA products
Goods and services (CPA products)
Rest of the world
TOTA
L EC
ON
OM
Y
Production accounts
(by industries)
Generation of income account
Allocation of primary
income account
Secondary distribution of income account
Gross capital formation by
industry
Trade and transport margins
Intermediate consumption
Net Value Added (basic prices)
OUTPUT
Imports
Consumption of fixed capital
TOTAL
Rest of the world
Production (by industry)Use of disposable income
Final consumption
Taxes less subsidies on products
Capital transfers
Net fixed capital formation
Capital account
TOTALCapital account
Gross capital formation Financial account
Current account
TOTAL ECONOMY
Exports
Current transfers
Changes in inventories
Gross capital formation

Framework
27
Scheme 1.2-2 The NAM extended to a NAMEA for water
The A1 part of the above scheme is the NAM presented on the previous page, i.e. it sheds some more lighton water-related economic transactions within the classical framework of national accounts: more detailedtransactions on water-related products, detailed production accounts of water-related activities, expendituresfor ancillary activities related to water within other activities (parts of the production accounts of non-water-related activities), taxes linked to water and to water-related activities (abstraction taxes, pollution taxes,etc.), subsidies in relation to water use, etc.
Matrix A2 translates into physical units some of the transactions reported in matrix A1, more precisely, thoseto which physical flows can be connected: flows of water and pollutants transported in water.
NAM A2 is then complemented by information on the exchanges between the economy and theenvironment: exchanges of water (part B) and exchanges of pollutants (part C).
Such a framework organises in a consistent way information which is necessary for the description of thevarious aspects of the uses of water by economic activities:
• economic transactions related to water,• flows of produced (distributed) water and wastewater within the economic system,• flows of water and pollutants between the economy and the environment: abstraction and returns of
water (in m3), water pollutants eliminated or discharged (in tonnes) by economic activities.
It can be later extended to describe exchanges within the environment: flows between soil and water, flowsbetween the different components of the natural water system, and to describe the stocks and changes instocks between two periods: monetary assets of the economy, physical stocks of water, etc.
A1 NAM in monetary units= Water-related transactions
A2 NAM in physical units= Flows of water and of pollutants inwater within the economic system
Discharge ofwater to thehydrological
system
Emission towater byeconomicactivities
Abstraction of water from thehydrological system by the economic
activities
Absorption of pollutants by economicactivities
Balance ofwater flows
Balance ofpollutants
flows
B Water C Pollutants
Physical flows of substances

Framework
28
The pilot tablesAs a start to water accounting, the Task Force agreed on a set of 13 pilot tables (see Annex 1),concentrating on concerns common to all countries and for which data were thought to be available.
The water-related economic products have been: operation of irrigation systems, distributed water,wastewater treatment services. The selected economic activities related to water have been: abstraction,purification and distribution of water, collection and treatment of wastewater and finally production ofadministrative services for water supply and sewage systems.
Tables 1 to 4 are in monetary units, Tables 5 to 8 describe physical flows of water, whereas Tables 10 to 12report the corresponding flows of pollutants, and finally the different prices are derived in Table 13. In thefollowing, these tables are introduced and related to the Schemes 1.2–1 and 1.2–2 on the previous pages.The tables are located in a NAMEA in the Scheme 1.2–3 on the following page.
Table 1 Supply table of some water-related products in monetary units (part of the first group of columns ofthe NAM presentation (‘goods and services’) – See Scheme 1.2-1)
Table 2 Use table of some water-related products in monetary units (transposed part of the first group ofrows of the NAM presented in Scheme 1.2-1)
Table 3 Economic accounts for some water-related economic activities (second group of columns of theNAM presentation in Scheme 1.2-1 (‘production account’ + elements of other sub-matrices –activities devoted to water only)
Table 4 Expenditure for some ancillary water-related activities (idem, but for other activities)
Table 5 Supply of water within the economy (physical flows corresponding to some transactions of Table 1– NAM in physical units – Part A2 in Scheme 1.2-2)
Table 6 Use of water within the economy (physical flows corresponding to some transactions of Table 2 –NAM in physical units – Part A2 in Scheme 1.2-2)
Table 7 Total abstraction of water from water bodies and discharge of wastewater into water bodies (Partsof upper and left Part B in Scheme 1.2-2)
Table 8 Water abstracted from the water bodies for the preparing of drinking water (detail of Table 7 –restriction to drinking water and introduction of classes of water bodies qualities)
Table 9 Balance of flows of water between economy and water system (Complements to Table 7 andsummary – Upper, middle and left Part B in Scheme 1.2-2)
Table 10 Pollutants discharged by economic activities into the sewage network (physical flowscorresponding to some transactions of Table 2 – NAM in physical units – Part A2 in Scheme 1.2-2)
Table 11 Pollutants discharged to water bodies by discharge of wastewater (Upper Part C in Scheme 1.2-2)
Table 12 Pollutants subtracted by economic activities either along with abstraction of water (Left Part C) orby purification and treatment (A2 matrix in Scheme 1.2-2)
Table 13 Average purchaser’s unit prices of some water-related economic products (simply derived fromTables 2 and 6) (not in Scheme 1.2-3).

Framework
29
Scheme 1.2-3 The pilot water accounts tables in a NAMEA-type framework
Balanceof
Table 9
B – Water
by ancillaryactivities
byproduction
Discharge part ofTable 7
Tables 11 & 12
C – Pollutants
byproduction by ancillary
activities
Tables 1and 2
supply-use Tables 3productionaccounts
Tables 4 costsof ancillaryactivities
A1
Abstraction partof Table7
byproduction by ancillary
activities
Drinkingwater =Table 8
by ancillaryactivities
byproduction
Table 10pollutants to
sewage Table 12pollutantssubtracted ancillary
activities
A2C
Tables 5and 6
supply-use production
ancillaryactivities
A2B
Monetarystratum
Physicalstratum
Framework
30
There is a direct correspondence between the proposed economic and physical tables. Some economicactions, though, are difficult to translate into physical units: this applies in particular to economic instrumentssuch as prices, taxes etc., to construction works and their maintenance, to investment grants for wastewatertreatment, to current transfers from national or regional budgets to local authorities in charge of watertreatment, to capital formation, etc. In order to show how the activities of water supply and control aremanaged in the different countries, it might be interesting to investigate further the possibilities of includingsuch data within the accounts and to clarify the questions of use and ownership of water-related fixed capital.
1.2.1.3 Limitations of the NAMEA-type framework for waterThe supply-use tables in physical units (part A2) only encompass flows of distributed water between twoeconomic units. The flows corresponding to ancillary activities related to water within the economic activities,notably re-used or re-circulated water, are not directly visible in the accounts.
Indirect emissions, i.e. flows of pollutants originating from the economy which at some point in time end up inthe water system via air, soil etc., are not included in the present framework. The emissions of pollutants tothe air or on the soil can be described in other parts of the environmental accounts but a bridge should beintroduced with the water accounts since these pollutants will influence the state of the water system. In thepilot tables it has been proposed to collect at least information on fertilisers that might end up in aquifers.
The state of the water system influences the possible uses of water at present and in the future. Conversely,the uses influence the state of water. The present framework does not describe the state of the water systemand the changes in this state that are due to economic activities. In order to identify the impacts of economicactivities on the water system as an environmental medium, a complete integrated model of thisenvironmental medium would need to be specified. This does not seem possible for the moment.
Availability of water for economic use means that the water has to be at the right place at the right time andin the right quality, i.e. the aspects of quality, time and location are relevant in this context. The presentframework captures such issues only to a limited degree. When data are available, the framework may beapplied, for relevant aspects, at regional scale (e.g. a watershed) or for short periods of time (e.g. a quarter).
Chapter 4 will address the issues of space and time, the concept of availability of water and otheroutstanding issues.
The economy/environment integration proposed here is modest in that it is limited to setting side-by-sideeconomic and social activities and their direct impact on water, and measuring present costs for repair orprevention of damage to water. In this limited form, this integration does provide a reply to most of theconcerns expressed in the Commission's Communication to the Council and to the European ParliamentCOM(2000) 97 final on water pricing policies: “… The availability of information will be key to thedevelopment and use of these guidelines. Thus, Eurostat and the Commission will pursue their efforts toassess the availability, in Member States and also applicant countries, of statistics pertaining to costs ofwater services and water prices. This assessment will feed into the identification of robust and cost-effectivemethodologies for collecting cost, benefit and price information as requested in the proposed WaterFramework Directive… ”
1.2.2 Other national presentations of water accounts
1.2.2.1 The Dutch NAMWA and the environmental themesThe NAMEA integration of economy/environment presented before has been developed in the Dutch CBS.Only part of the Dutch NAMEA model has been kept in the European exercise. In particular, the Dutchpresentation later allocates the pollutants to ‘environmental themes’ in order to offer to the users a moresynthetic presentation of the results. These theme indicators summarise the pressures on the environment.
This method of ‘environmental themes’ was also developed by the Netherlands in the early nineties: ”… Thedegradation of the environment due to pollution cannot be covered in an (other changes in) assets account,but should instead be summarised in an environmental themes account. This is related to the impossibility toincorporate the interaction between environmental pressure and the related environmental degradation.Changes in natural assets are caused by numerous divergent threats which may strengthen or weaken eachother, not to mention the uncertainties in threshold levels of different ecosystems. Non-linear interactionsshould not be handled in the accounting framework. Complex ecological models are needed to estimate

Framework
31
dispersion patterns of pollutants and subsequently the time and place of an occurring damage. In ouropinion, ecological modelling should be excluded from a statistical framework like the NAMEA for that matter.That is why the NAMEA applies instead an environmental-themes account to compile summary indicators onthe potential environmental degradation caused by pollution …”
Concerning water, three environmental themes on pollution have been considered: eutrophication14, organicpollution15 and dispersion of hazardous substances (restricted to heavy metals16). Pollution is recalculatedinto environmental theme equivalents17 and subsequently aggregated by theme. Another environmentaltheme, namely ‘water abstraction’ relates to depletion of resources and not to pollution.
The emission account is therefore extended as in Table1.2-1: the pollutants are recalculated in terms ofenvironmental theme equivalents and subsequently aggregated per theme. The result shows thecontributions of each activity to the environmental themes related to water. The emissions of individualpollutants will be presented in Section 3.3.
Table 1.2-1 Contributions to environmental themes related to water, The Netherlands 1991Water pollution
ORIGIN OF SUBSTANCES
Waterabstraction Eutrophication Organic
pollutionDispersion ofheavy metals
EMISSION BY CONSUMERS 704 197 15068 88946EMISSION BY PRODUCERS
Agriculture, hunting, forestry, fishing 430 2345 62 79053Mining and quarrying 1 0 6 0Manufacturing
Food, beverages and tobacco industry 204 84 2133 1611Textile, wearing apparel and leather industry 12 10 257 644Wood and furniture industry 2 0 28 0Paper, printing and publishing industry 102 14 283 490Petroleum industry 30 0 0 73Chemical industry 928 43 929 26310Rubber and plastic industry 19 0 5 10Construction materials, earthenware and glass 0 0 0products industry 177 0 12 20Basic metal industry 50 1 117 2017Metal products and machinery industry 29 1 222 2551Other manufacturing 37 0 180 0
Public utilitiesElectricity and gas 5150 0 10 0Water supply* 1 0 22 0
Construction 5 0 209 0Transport and storage 9 0 170 0Environmental cleansing and sanitary services 12 -83 -21511 -90831Water boards 0 0 0 0Other services 230 77 3545 0OTHER DOMESTIC ORIGIN
Transport differences 0 5520 0Waste dumping sites 0 0 122Diffuse sources 0 0 49648
TOTAL 8131 2689 7267 160663
(*) excluding water abstraction for the production of drinking water
Source: Water accounts in the Dutch NAMEA: a ‘NAMWA’ for 1991 – CBS, May 1997
14 Eutrophication is the enriching of water with nutrients, namely, nitrogen and phosphorus, which in certain conditions of temperatureand sunlight, lead to excessive growth of algae. This increases the turbidity of water and a scum of algae may form on the surface.
15 The organic pollution is quantified in inhabitant equivalents (i.e.), where one i.e. equals 54 grams of BOD.16 Besides heavy metals, for other topics covered by the NAMEA (i.e. air, waste), the environmental theme indicator for dispersion of
hazardous substances also includes pesticides, organic compounds and radioactive substances.17 For instance, for the ‘eutrophication theme’, P is given a weight of 1 and N a weight of 0,1.

Framework
32
In one of its evaluations, Ireland also aggregated N and P into an indicator for eutrophication potential.Although not dealing with all activities, the results – shown in Table 1.2-2 - are not far from the Dutch ones.Please note that the Irish table applies the principle of net recording, showing the discharges into theenvironment, whereas the Dutch table applies gross recording, showing all emissions generated by all unitsin the Dutch economy. The depollution of wastewater by external cleansing industries (NACE 90) is thusrecorded as a negative pollution by these industries in the Dutch tables.
Table 1.2-2 Eutrophication potential by industry, Ireland 1994
Eutrophication potentialSector
in kg in %
Agriculture, forestry, fishing 18 295 82
Chemical products 219 1
Food, beverages, tobacco 621 3
Textiles, clothes & footwear n.a.
Total industry (direct discharge) 840 4
Transport n.a.
Municipal works 3 250 15
Total services 3 250
Residential (septic tanks) n.a.
Total accounted for discharges* 22 385 100
* Supplementary discharges could emanate from private septic tanks and agriculture.
Source: Compilation of Satellite Environments Accounts – ESRI, September 1998
1.2.2.2 The German MEFIS CubeWater accounts in the Federal Statistical Office of Germany are part of the overall framework of the materialand energy flow information system (MEFIS). In this system, the economic processes (production andconsumption) are understood as the transformation of materials and are represented in a cube: differentmaterials (raw or already transformed) are transformed into other types of materials (economic products orresiduals at the end of the economic processes).
“ … When represented in monetary units within the framework of the monetary input-output table, thosedifferent materials can be aggregated on the basis of market prices. Although representation in physical unitsgenerally allows aggregation too – for example through the weight unit – and provides useful information tosome extent, it must be supplemented by presenting individual types or categories of material. Therefore, theMEFIS cube contains not only the two axes used in the monetary input-output table – forming the top side ofthe cube – but also a third axis showing the types of material, that is, every type of material forms ahorizontal layer within the cube. This allows showing in physical units and for the total economy theabstraction of material from nature, the discharge into nature, and the material-related interaction within theeconomic system in a detailed breakdown by types of material… “
In this representation, economic activities comprise the classical economic branches, plus a branch forexternal environmental protection activities, plus household consumption.
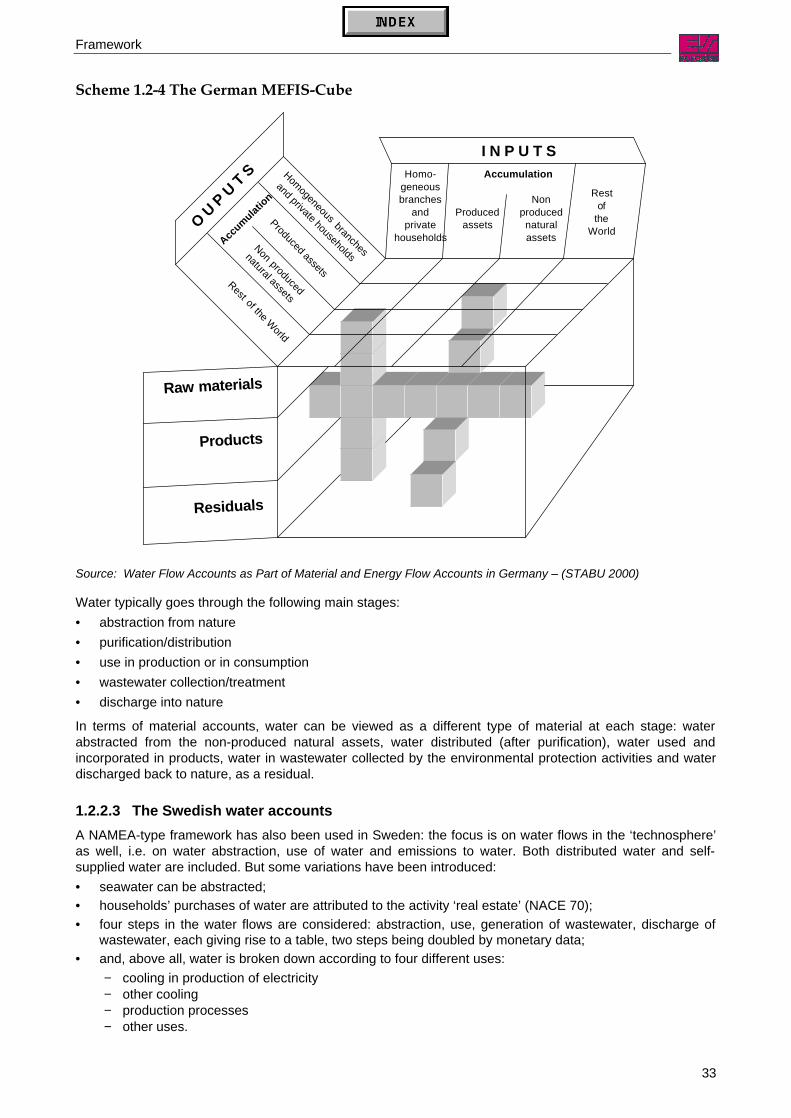
Framework
33
Scheme 1.2-4 The German MEFIS-Cube
Source: Water Flow Accounts as Part of Material and Energy Flow Accounts in Germany – (STABU 2000)
Water typically goes through the following main stages:• abstraction from nature• purification/distribution• use in production or in consumption• wastewater collection/treatment• discharge into nature
In terms of material accounts, water can be viewed as a different type of material at each stage: waterabstracted from the non-produced natural assets, water distributed (after purification), water used andincorporated in products, water in wastewater collected by the environmental protection activities and waterdischarged back to nature, as a residual.
1.2.2.3 The Swedish water accountsA NAMEA-type framework has also been used in Sweden: the focus is on water flows in the ‘technosphere’as well, i.e. on water abstraction, use of water and emissions to water. Both distributed water and self-supplied water are included. But some variations have been introduced:• seawater can be abstracted;• households’ purchases of water are attributed to the activity ‘real estate’ (NACE 70);• four steps in the water flows are considered: abstraction, use, generation of wastewater, discharge of
wastewater, each giving rise to a table, two steps being doubled by monetary data;• and, above all, water is broken down according to four different uses:
− cooling in production of electricity− other cooling− production processes− other uses.
Accumulat
ion
O U P U T SI N P U T S
Homo-geneousbranches
andprivate
households
Producedassets
Nonproducednaturalassets
Restof
theWorld
Accumulation
Products
Residuals
Raw materials
Homogeneous branches
and private households
Produced assets
Non produced
natural assetsRest of the World

Framework
34
Scheme 1.2-5 Sweden’s water accounts framework
Source: Water Accounts. Physical and monetary data connected to abstraction, use and discharge of water in theSwedish NAMEA – Statistiska centralbyrån, December 1999
Groundwater Surface waterSeawater
Collection, purificationdistribution of water
NACE 41
‘All’ industriesNACE 01-99, except 70 and 90.001
Households(NACE 70)
Wastewaterdisposal
NACE 90.001
Surface waterSeawater
Use of waterTable 2
Supply of waterTable 1
Generation ofwastewater
Table 3
Discharge ofwastewater
Table 4
Monetary dataTable 5a
Monetary dataTable 5b
Urban run-offwater

Framework
35
Table 1.2-3 Uses of water by economic activities and by purpose, Sweden 1995, in 1 000 m3
Origin of water Use by purposeNACEcode
ActivityMarket
producedNon-marketproduced
TotalCoolingwater in
productionof
electricity
Othercoolingwater
Productionprocesses
Other uses
1 Agriculture 137 291 137 291 137 2912 Forestry
10/14 Mining and quarrying 1 312 42 594 43 906 271 41 659 1 97715/16 Food products, beverages, tobacco 25 917 48 112 74 029 43 522 27 516 2 99117/19 Textiles, textile products, leather 2 459 9 220 11 679 53 3 773 7 303 551
20 Wood, products of wood, cork, straw, etc. 1 249 18 531 19 780 669 18 256 85521 Pulp, paper and paper products 3 327 975 075 978 402 24 615 279 730 665 309 8 74822 Publishing, printing and reproduction 2 466 64 2 530 190 715 1 62523 Coke, refined petroleum and nuclear fuel 271 126 397 260 87 4824 Chemicals and chemical products 18 891 492 881 511 772 996 482 419 21 305 7 05125 Rubber and plastic products 995 16 782 17 777 15 267 1 844 66626 Non-metallic mineral products 2 716 12 175 14 891 7 796 5 492 1 60227 Basic metals 8 592 351 862 360 454 20 916 257 659 78 422 3 45728 Fabricated metals, except machinery 4 164 12 126 16 290 40 11 251 2 782 2 21629 Machinery and equipment n.e.c. 5 473 19 815 25 288 19 013 2 947 3 32830 Office machinery and computers 406 67 473 223 69 181
31/32 Electrical machinery, radio, TV, etc. 3 385 5 045 8 430 3 473 3 593 1 36433 Medical, precision, optical instr., etc. 1 025 181 1 206 443 195 568
34/35 Motor vehicles and other transport eq. 6 446 10 130 16 576 9 452 4 162 2 96236/37 Other manufacturing 695 360 1 055 137 480 438
Not possible to disaggregate by sector 6 469 5 667 12 136 12 13640 Electricity, gas, steam, hot water supply 6 681 113 551 120 232 105 880 4 866 6 057 3 42941 Collection, purification, distrib. of water 180 596 180 596 180 59645 Construction
50/52 Wholesale and retail trade
55 Hotels and restaurants
60/64 Transport, storage and communication
62 Financial intermediation 86 522 86 522 86 52271/74 Renting and business activities
80/99 Other, excluding 90.01
90.01 Sewage disposal
75 Public administration
70 Real estate 527 975 88 449 616 424 616 424Unspecified use 38 269 38 269 38 269TOTAL 936 301 2 360 104 3 296 405 152 500 1 140 414 888 193 1 115 295
Source: Water Accounts. Physical and monetary data connected to abstraction, use and discharge of water in theSwedish NAMEA – Statistiska centralbyrån, December 1999
In fact, all Member States more or less deviated from the framework initially proposed by Eurostat and, aswill be seen in the detailed chapters, Sweden’s framework is only one example of these deviations. Asummary of the major deviations will be made at the end of the report, as a contribution to the conclusion ofthis pilot exercise that was, it should be recalled, conceived as a test.

Framework
36
1.3 Summary of national contributions
1.3.1 Summary table of the national contributions
Country Reportingorganisation
Content Date ofcompletion
Feasibility study on the possibilities of using the NAMEAframework to account for wastewater
January 2000BELGIUM
Bureau Fédéral duPlan
1998 monetary and physical water accounts for water flowsand water pollution. Estimates of pollution intensity and eco-efficiency ratios for the different industries.
February 2002
1994 water accounts with special focus on water abstractionand use
April 1999
Feasibility study investigating the data concerning theemission of wastewater by industries and households
April 1999
Combination of the above described water flow accounts withconnected economic data for 1995 and 1996
April 2000
DENMARK
Statistics Denmark
Update with 1997 data and presentation of a full analysis ofthe variation along time
April 2001
1995 monetary and physical water accounts for water flowsdeveloped on the basis of the tables proposed by the TaskForce on Water Satellite Accounts
May 2000SPAIN
Instituto Nacional deEstadística
Water Satellite Accounts for Spain 1997-1999 September 2001
Emission Accounts combined with the German Input-Outputtables – Economic key data on air emissions, waste andwastewater for 1990, 1991 and 1993
October 1997
Water flows accounts for 1995 – German Input-Output data onwater
August 1998
GERMANY
StatistischesBundesamt
A Physical Input-Output-Table for Germany 1995 June 2001Supply-use accounts for water, wood, fish, energy and non-energy materials in physical units, emissions to air
June 1998GREECE
National TechnicalUniversity of Athens
Continuation and systematisation of the above-mentionedreport
April 2000
Pilot application of a simplified method on accounting for thequality of water courses, carried out at the level of drainagebasins for all of France
August 1999
Investigations of the feasibility of establishing regionalwastewater NAMEA-type emissions accounts
October 1999
Methodology and results for the building of an expenditureaccount for water abstraction and distribution (SERIEEmethodology)
October 1999
Idem for water ‘in situ’ uses December 1999
FRANCE
Institut Français del’Environnement
Regional wastewater NAMEA-type emissions accounts for theLoire-Bretagne hydrological basin 1997
October 2000
Emissions to air, discharges to water, solid waste, depletion ofresources, 1994
September 1998
Emissions to air, discharges to water, solid waste, energy use,depletion of resources, 1996. Revised method for calculatingwastewater, allocation of the results to geographical areas
May 2000IRELAND
The Economic andSocial ResearchInstitute
Tentative link to economic data: costs and revenues arisingfrom water services, according to different sources – Survey oflocal water authorities
February 2001

Framework
37
Focus on emissions to air 1993, but with an assessment ofthe availability of data for waste, wastewater and naturalresources
December 1997
LUXEMBOURG
Centre deRecherche PublicHenri Tudor
Feasibility study on the possibilities of estimatingabstractions of water and emissions of pollutants to waterwith a breakdown by industry
March 2000
THE
NETHERLANDS
StatisticsNetherlands
The Dutch NAMWA for 1991 – Integrated water abstraction,emission of pollutants to water and monetary data
May 1997
AUSTRIA Statistics Austria Wastewater for 1994, with emissions in m3 and tonnes ofpollutants
November 1998
PORTUGAL Instituto Nacional deEstatística
1998 monetary and physical water accounts for water flowsdeveloped on the basis of the tables proposed by the TaskForce on Water Satellite Accounts
June 2002
Input-output tables, air emissions, waste, wastewater, use ofpeat and wood for 1993
July 1997
FINLAND
Statistics Finland
Input-output tables, air emissions, waste, wastewater, use ofpeat and wood for 1985, 1989, 1990, 1992, 1993 and 1995
November 1999
SWEDEN Statistics Sweden Accounts based on the tables proposed by the Task Forceon Water Satellite Accounts – Data in both monetary andphysical units for 1995
December 1999
1994 preliminary results on water abstraction and emissionloads to water bodies from England and Wales
1998UNITED
KINGDOM
Office for NationalStatistics
Based on the matching of the consents register and thebusiness register, estimates of 1998 emission coefficientsby industry (per unit of turnover or per employee)
July 2000
NORWAY Statistics Norway Natural assets accounts (forest), solid waste, air emissionsand, on the water issue, emissions of pollutants to waterand economic information on the public wastewater sector
October 2000
1.3.2 Country-by-country summariesBELGIUM
In Belgium, a feasibility study was carried out in 1999 to assess the possibilities of setting up NAMEA-typeenvironmental accounts for water. Data on water and wastewater are collected, calculated and estimated atthe level of the three Belgian regions (Flanders, Wallonia and Brussels). As different parameters, definitionsand industry classifications are used, as the structure and the level of detail of the databases are differentfrom one region to another, a number of breakdowns have to be estimated for Belgium as a whole.
This harmonisation work was finalised on the 1998 data, and Belgium could complete several of the tablesproposed by Eurostat for testing. These include monetary and physical supply-use tables for water supply,monetary and physical supply for wastewater services, and discharges of wastewater into the water bodiesin volumes with their detailed pollution content.
The economic data demonstrate the importance of water as an economic good while the environmental dataallow the identification of the sectors responsible for the bulk of water pollution in Belgium. The results showfor instance that more than half of total wastewater discharged in Belgium in 1998 was due to the power andwater sectors, but also that these sectors actually discharged very large volumes of relatively clean water.
The environmental data have been subsequently combined with economic data in order to distinguish theindustries that are important water polluters because of the kind of activity they perform from those that areimportant polluters because of their economic size. In order to make this distinction, eco-efficiency indicatorshave been calculated.

Framework
38
DENMARK
Denmark has submitted to Eurostat four reports regarding water accounting.
One report dealt with the feasibility of compiling data on discharges of wastewater and emissions ofpollutants into water. The report found the possibilities good and suggested methods to adjust the availabledata to the framework.
Two other reports concerned water abstraction and use in Denmark, first in physical units (m3) for 1994,secondly, in both physical terms and monetary units for 1995 and 1996.
The physical data included industrial and domestic use of water by type of water (natural/tap) and bypurpose. A further specification of the purpose was introduced for some group of activities (agriculture,production and distribution of electricity, steam and hot water supply, collection and distribution of water,manufacturing industries) as well as for household consumption.
The monetary data included net payment of tap water charge by households and industries, investments ofNACE 41 and physical and monetary accounts related to sewage removal and disposal. Implicit water pricesaccording to the NAMEA were calculated. The NAMEA water accounts were compiled in co-operation withthe national accounts department and will be used in the future to improve the data regarding water in theDanish national accounts.
The fourth report updated the third one with 1997 data and completed it with the presentation of a fullNAMEA and an analysis of the variations over time.
The main differences between the Danish water NAMEA and Eurostat’s framework for water accounts arethat the Danish data include seawater (mainly used for cooling) and that an important focus of the Danishaccounts is on the types of water use by industries and households.
GERMANY
In Germany, within the framework of the environmental accounts a comprehensive system has beendeveloped which calculates the flows of different materials in the economy (MEFIS). In this framework,physical flows of raw materials, of goods and of residuals are illustrated from their withdrawal from nature totheir discharge back into nature. Flows of water and wastewater are elements of this description.
With regard to wastewater, the 1997 report was based on the German MEFIS and PIOT (physical input-output tables) systems. It included data on wastewater for 1991 and data on the economy of water as well.
The 1998 report on water accounts included extensive water flows tables for 1995, covering almost alltables proposed by Eurostat’s Task Force on water satellite accounting. These efforts were continued and a2000 paper included a time series for aggregates for the former territory of the Federal Republic of Germanyfrom 1960 to 1991 and for all of Germany from 1991 to 1995. In the future, these data will be updated. Theyconcern water withdrawal from and discharge back into nature by industries and households. Further,information is available regarding direct and indirect discharge of water.
GREECE
For Greece, water supply-use tables in cubic meters were combined with symmetrical input-output tablesin the NAMEAs for 1988 to 1996.
SPAIN
As far as data were available, INE has filled in almost all the proposed tables for 1995. The only tables notfilled in were Table 4 regarding expenditure for ancillary water-related activities and tables 10 to 12 regardingpolluting substances. All other aspects of the tables have been covered as far as possible. In a second trial,covering years 1997 to 1999, tables 4 and 12 have also been completed, based on the results from newsurveys.
FRANCE
The French study on water investigated the feasibility of establishing regional wastewater emissionsaccounts. The study tested the results of a model estimating wastewater and pollutants emitted by industryagainst actual data at the experimental level of the Loire-Bretagne hydrological basin in 1997. An extensionof the work to all of France is foreseen as part of future work. Estimations were based on the collection of

Framework
39
individual data and on a modelling developed at NUTS 3 level. This modelling authorises more‘homogeneous’ (local) water accounts. The focus of the report was on emission of pollutants, thus on Tables10 to 12 of the tables proposed by Eurostat.
In the absence of the data necessary for a sophisticated calculation, the French report on quality accountsfor watercourses was based on a simplified method developed by IFEN. The pilot application of thissimplified method was carried out at the level of drainage basins for all of France. A summary of the methodcould be: stretches of watercourses are classified by water quality, and the volumes of water flows areconverted into a standardised derived unit of ‘kilometres of standard river’. For each drainage basin, qualityaccounts, which are comparable at the national level, are produced by weighting the qualities of kilometres ofstandard river. The advantage of this simplified approach would be that the data are readily available and thecosts are relatively low. For each basin, quality indicators have been presented for organic matter, nitrateand eutrophication, showing the overall quality of the basin. These indicators can be aggregated to overallquality indices on the national level. The results can be presented in tables or maps.
IRELAND
The first report for Ireland included an assessment of 1994 levels of nitrogen and phosphorus emissionsinto the soil from fertilisers and livestock waste in the agricultural sector, as well as data on emissions ofBOD, N, P, and other eutrophication substances (in tonnes and in eutrophication potential) by industry.
In the second report, the method for calculating wastewater has been revised compared to the report for1994. Quantifying industrial sources and volumes of BOD discharges, the results were allocated to maingeographical areas and water recipients. The industrial breakdown is quite aggregated.
The aim of the third report was to link physical data with economic information on services related to water,in particular costs and revenues. Information was available for public water services and displayed the‘subsidies’ granted to different sectors (household consumption, in particular, is now 100 percentsubsidised). Another issue was the availability of information at a river basin level (as required in the WaterFramework Directive). For this, local authorities have been surveyed.
LUXEMBOURG
The Luxembourg reports included a short feasibility study regarding NAMEA accounts for water. Possiblefuture water accounts will deal with abstraction of underground and surface water, emissions to water andsewage treatment. Data on water abstraction allocated by industries could be obtained by bringing togetherdispersed data, but wastewater emissions could only be allocated to each industry by rough estimations.Finally, there was a lack of available data for connecting economic agents with sewage treatment activity.
THE NETHERLANDS
For the Netherlands, the NAMWA report included 1991 data on water abstraction, on emissions of pollutantsto water and on economic activities related to water. The pressures of economic activities on all watersystems were captured by a number of environmental pressure indicators. Expenditures related to watermanagement were explicitly shown as well as wastewater emissions in inhabitant equivalents and emissionsof nutrients, BOD, heavy metals to water bodies. Other monetary data regarding water were also included,i.e. sales and purchases of tap water, costs of internal environmental cleansing services related towastewater treatment, taxes related to water pollution and to water abstraction.
AUSTRIA
The report from Austria showed wastewater emissions (partly based on information regarding waterconsumption) for 1994. Emissions of wastewater were shown in cubic meters and pollutant loads in tonnes.They had been calculated partly through emission coefficients and partly through measured data for mainpolluting activities. The report emphasised the fact that the results are rough estimates.
PORTUGAL
Many types of actors operate in the water sector in Portugal since there are several co-existingorganisations: municipal services, public enterprises run by municipalities, private enterprises with publicservice concessions, associations (in the irrigation water domain), etc.
For the building of the 1998 pilot water accounts, two governmental bodies specialising in water policy, theWater Institute (INAG) and the Institute of Hydraulic and Rural Engineering and the Environment (IHERA),

Framework
40
could provide a lot of data to the national statistical institute of Portugal (INE). These sources werecomplemented by economic data currently available, notably through the Annual Industrial ProductionSurvey. Finally INE carried out a specific survey of the municipalities.
Portugal tried to fill in most of the tables suggested by Eurostat’s Task Force. A number of gaps wereidentified. Notably, it has not been possible to provide information on ancillary water-related activities. Someinconsistencies between sources were also identified. INE has now entered into specific protocols in order toregularly exchange information on water with relevant bodies of the Ministry of Environment.
FINLAND
In the first Finnish NAMEA (for 1993) wastewater in inhabitant equivalents was shown, using the Finnishindustry classification.
The 1999 report gave a time series for 1985, 1989, 1990, 1992, 1993 and 1995, including data onwastewater, phosphorus and nitrogen. The economic part was based on the input-output system of thenational accounts. The environmental data, supplementing the economical data, focused on nutrients andorganic pollutants (in BOD7). The report considered two related environmental themes: eutrophication andwastewater production and showed industrial profiles for specific industries. Finally, an assessment wassupplied as regards the NAMEA framework and its feasibility in Finland.
The tables for 1985 – 1993 were compiled according to the Finnish Standard Industrial Classification (SIC-95), based on the NACE Rev.1 classification. The preliminary tables for 1995 differed from previous yearsbecause they were compiled according to the European System of Accounts (ESA95) and used a slightlydifferent industry classification.
SWEDEN
In the Swedish report, the focus was on water in the so-called ‘technosphere’ and most of the tablesproposed by the Task Force on Water Accounting were filled in. The accounts connected physical andmonetary data about the use of water and the treatment of wastewater. The data referred to 1995. Someattention was paid to the different uses of water, which were presented according to their purpose. Waterused for cooling water, including seawater, was included.
UNITED KINGDOM
The United Kingdom carried out an extensive investigation regarding the possibilities of producing waterresource and water pollution accounts.
A first draft of water accounts had been developed for England and Wales in 1998. It included a waterresource account (natural + economic flows of water), abstractions and discharges by industry and somepreliminary data for emissions of substances into controlled water. Built at an aggregated level, it was seenas a starting point for future developments.
A second study concentrated more systematically on estimates of emission coefficients (emissions perunit of gross output or per employee) for BOD, nitrates, phosphates and two heavy metals. The resultsregarding emissions of substances by industries must be viewed as preliminary. Further work is planned andthe expectation is that the preliminary results will have to be revised substantially.
NORWAY
Within the NOREEA project (phase 2), two aspects regarding water have been studied: emissions ofpollutants to water (19 types of heavy metals, phosphorus and nitrogen) and economic information on thepublic wastewater sector.
The Norwegian Pollution Control Authority (SFT) maintains a register of discharge licences which constitutesa major source of information. There is however a double counting problem to solve when firms dischargetheir wastewater into the sewage system, because emissions are also separately measured in the dischargeby wastewater treatment plants.
Two sources have been used to assess public expenditures on wastewater (SERIEE-type analysis): a yearlysurvey of municipal wastewater treatment plants and the economic accounts of the 435 Norwegianmunicipalities. A new municipal reporting system will avoid discrepancies and new developments areexpected from it, notably a better identification of the transfers between different administrative units.

41
2 Sources and methods
2.1 The water economy
2.1.1 Exercise suggested by Eurostat
2.1.1.1 Pilot tables to be filled inThe first four tables of the set of pilot tables (see Annex 1) are expressed in monetary terms and can beconsidered as extracts from ESA, with greater detail: more than 6-CPA-digit products, isolation ofenvironmental taxes or subsidies, of costs of ancillary activities related to water, etc. Pilot table 13 regardingprices is also described in this section.
Pilot table 1: Supply table of water-related productsThe purpose of this table was to report the major economic outputs related to water (as well as imports):production of drinking, non-drinking, irrigation water, production of sewage removal and treatment services.
Minor economic activities involving water were proposed to be reported only optionally or as second priority(in the last column ‘minor products’, to be defined during the exercise). They aimed, for example, atcontrolling water flows, including fighting against flooding, treating polluted water bodies or surveying thequality of water, etc.
However, when some of these ‘second priority’ activities are carried out mainly for water supply orwastewater treatment, attention should be paid to the delimitation of NACE 41 or 90: depending on theorganisation of the water management in a country, or even in a region or district, some activities can becarried out by government units and classified as ‘public administration and defence services activities’(NACE 75). For example, there is a danger that building a dam to create an artificial reservoir is recorded asfixed capital formation either by producers of distributed water (NACE 41) or by administrative services forwater supply (NACE 75). To ensure comparability between countries from this point of view, it was decidedto include as first priority the activities of public administration services regarding water supply and sewageoperations, too.
The bulk of the (market or non-market) supply of water-related products should be recorded in rows 01*, 41,75* and 90* and the rest of the table should be practically empty. However, any other activity may alsoproduce and sell water or water-related services as a secondary activity. For instance, an enterpriseproducing chemicals may have built its own treatment plant and may offer neighbouring enterprises ormunicipalities to treat their wastewater against some participation in the costs.
In pilot table 1, the transition between the value of output at basic price and at purchaser's prices is detailedin order to show taxes and subsidies on products and within these the environmental ones.
Pilot table 2: Use table of some water-related productsPilot table 2 is also a re-composition of ESA accounts. While pilot table 1 presents the conventional supplyside of economic products, pilot table 2 reports the use side of the same products: practically all industriesand households are users of drinking water and of wastewater removal and treatment services, whilegenerally only industries use non-drinking water. Most probably, only farmers use the product ‘operation ofirrigation systems’ (row A*).
The proposed detail regarding industries was considered provisional. As users of large volumes of water arenot necessarily those who pollute it much, another solution could have been to draw two tables with differentindustry classifications: one focussing on water supply, the second on water treatment. To ensureconsistency between the tables, the same level has been kept in the different tables although, depending onthe tables, only some rows or columns have to be filled in.
Government and NPISH (non-profit institutions serving households) have been introduced as possibleconsumers, in order to cover the case that they produce non-market services (e.g. the monitoring quality ofwater bodies) which enter their final consumption expenditure.

Sources and methods
42
Changes in inventories, which is a classic component in ESA supply-use tables, is probably insignificant.This row corresponds to water already prepared and stored in the distribution networks (e.g., in watertowers).
Pilot table 3: Economic accounts for some water-related economic activitiesPilot table 3 has also been built according to ESA definitions and concepts but more detail is needed incomparison to ESA. The table is a reformatting of the standard ESA production and generation of incomeaccounts for the main water-related activities. The table is actually a multiple table. It should be filled in atleast for the 4 major water-related activities:• operation of irrigation systems,• production of distributed water,• production of sewage removal and treatment services,• production of administrative services for water supply and sewage systems.
Furthermore it was recommended to produce, if possible, more tables to separately cover the different typesof water supplied (drinking, non-drinking) and the different stages of the production process:• abstraction (e.g. activity of pumping), purification (filtration, chemical separation, etc.) and distribution
(transport network) for NACE 41;• collection of wastewater (network), treatment (de-pollution in treatment plants) and discharge (back to
water bodies) for NACE 90.
Accounts for minor activities (such as the monitoring of the quality of water bodies) were proposed as one-offexercises to obtain a rough idea of the economic importance of such activities.
In the columns, producing units are grouped together by institutional sectors (ESA definitions), howeverNPISH and households may be rarely met in practice, and are only included for the sake of completeness.
Government may grant subsidies for the coverage of current expenditure (row 2.3: e.g. subsidies forpollution abatement) or investment grants to support new investment (row 4: e.g. financing of a newtreatment plant).
Pilot table 4: Expenditure for some ancillary water-related activitiesThe pilot table 4 records the costs of ancillary (for own final use) water-related activities. These costs consistin compensation of employees, intermediate consumption, other taxes less subsidies on production paid forthe direct extraction of water and own treatment of wastewater and consumption of fixed capital. The table isalso a multiple table. It records information more or less similar to that in table 3 but for activities carried out:• by an industry as an ancillary activity, i.e. for its own account and not for sale. For instance, under this
category could be recorded the direct abstraction of water from a river by a manufacturer of basic metalsfor cooling purposes, or the operation of industrial wastewater treatment plants.
• by households for their own use. In this case, the interest is e.g. to know the costs of operatingequipment for self-supply with water and of individual septic tanks in rural areas.
The activities under review are the same as in pilot table 3 except for the distribution of water and collectionof wastewater which disappear, and internal recycling activities which is added.
The required information is not generally available through classical surveys on enterprises and households,except as concerns wastewater management through the SERIEE system (the European system for thecollection of economic data on the environment). Specific surveys should be carried out for water self-supply.
The ‘second priority’ columns were considered as optional, as it was felt that they would probablynecessitate a lot of estimations.
Table 13: Average purchasers' prices of some water-related economic productsThis table is simply derived by dividing pilot table 2 (use table in monetary terms) by pilot table 6 (use table inphysical terms). The results are average prices that allow comparing prices across industries and countries(or regions, according to the geographical level at which these tables have been built).

Sources and methods
43
A similar table could be built to evaluate average costs of ancillary activities, if the tables needed for thecalculation (pilot tables 4 and 7) have been entirely filled in. A summary table of all costs (main, secondaryand ancillary activities) could also be built. This has not been done during the pilot exercises.
2.1.1.2 Participating countries10 countries volunteered to test (at least partially) the economic part of the set of pilot tables.
Table 2.1-1 Countries that participated in the topic ‘water economy’B DK E F IRL NL P FIN S NO
Pilot table 1: economic supply tableIrrigation yes yesDistributed water (CPA 41) yes yes yes yes yes yes yes yesWastewater services (CPA 90.00.1) yes yes yes yes yes yes yesAdministrative services yes yes yes yes (yes)
Pilot table 2: economic use tableIrrigation yes yesDistributed water (CPA 41) yes yes yes (yes) yes yes yes yesWastewater services (CPA 90.00.1) yes yes (yes) yes yes yes
Pilot table 3: economic accountsIrrigation yes yesWater supply (NACE 41) yes yes yes yes yes yes yes yesWastewater management (NACE 90*) yes yes yes yes yes (yes)Administrative services yes yes yes
Pilot table 4: expenditure for ancillary activities (yes)Irrigation yesWater supply (NACE 41) yes (yes)Wastewater management (NACE 90*) yes yes yes
Pilot table 13: implicit pricesIrrigation yes yesDistributed water (CPA 41) yes yes yes yes yesWastewater services (CPA 90.00.1) yes yes yes yes yes
Pilot tables 1 and 2 for the supply and use of distributed water have been included in the studies by Belgium,Denmark, Spain, Ireland, The Netherlands, Portugal, Finland and Sweden.
In most of these countries, monetary information regarding wastewater services (CPA 90.00.11 Sewageremoval and treatment) has been included too. Denmark, Spain and Portugal have also included data onaverage purchasers prices of distributed water and of wastewater services (pilot table 13). Ireland has alsoprovided information on prices, but on a different basis (local prices).
Pilot table 3: economic accounts. Spain, The Netherlands, Ireland, Portugal and Sweden have includeddetailed monetary data on expenditure related to water distribution and to wastewater treatment. Denmark,France and Finland supplied partial data. Norway also made a trial to identify costs but on a field limited tothe public wastewater sector. Improved monetary data related to water will in future be available as aconsequence of the implementation of ESA 95 in all Member States.
Pilot table 4: expenditure for ancillary activities in relation to water, e.g. expenditure related to directabstraction of water by agriculture or treatment of wastewater by manufacturing industries. Sweden and TheNetherlands included data on the treatment of wastewater that came from surveys on the expenditures byindustries for the protection of the environment. Spain carried out different surveys, depending on the activityof the enterprises and some (aggregated) data are also available for this country.
The methods and sources used for filling in the tables will be presented first by theme (supply-use tables,production accounts, ancillary costs) and then by type. The different types of methods and sources that willbe distinguished are:• surveys: economic units are asked about their behaviour as regards water-related issues. These
surveys can be specific, i.e. made with the aim of a better knowledge of economic water uses, or

Sources and methods
44
general, i.e. with questions about water included in a multipurpose questionnaire (for instance, surveysgathering Structural Business Statistics). In some cases, these surveys include physical measurements.
• use of administrative data: information about water is a by-product of administrative records collectedfor other purposes: for instance, the turnover of enterprises producing water-related services can bederived from the yearly declaration of these enterprises to the tax offices. A particular case ofadministrative data is the analysis of the content of licenses or taxation registers (licenses to abstractwater or to discharge wastewater, taxes on water abstraction or water pollution, etc.).
• enterprise environmental reports: in some countries large enterprises produce environmental reportsin parallel to their annual economic accounts from which information about water is derived.
• application of coefficients: a certain behaviour of the economic units has been observed in the past, oron a small population to be extrapolated (monographs), or has been noted in the literature: the economicunits with the same characteristics are supposed to have a behaviour directly linked to another economicvariable, for instance the same consumption of litres of water per euro of turnover. In a way, this methodis very close to the survey method but is based on a weaker foundation.
• modelling: this method is similar to the method of coefficients but is more sophisticated in the sense thatseveral variables are used and that the link can be non-linear.
• mixed methods: in a large number of cases, the information given by one method is insufficient and hasto be completed: for instance, for manufacturing industries survey results are available, coefficients areused for the services industries and a model is applied to agriculture.
2.1.2 Compiling supply-use tables
2.1.2.1 Use of administrative data: DENMARK
The water industry in Denmark is considered as providing a good, ‘tap’ water, which is charged according tothe volume metered, and two kinds of services: the renting of meters to households and industries and theconnection of new users to the distribution system. Wastewater collection and treatment are chargedtogether with the water and in most cases according to the volume of water. Both the price of tap water andthe price of sewage have a strong regional dependence.
The main data treatment carried out during the pilot study essentially consisted in establishing a matchingbetween information on the water prices available for each municipality in the Danish Water SupplyAssociation (DVF) and information on the reimbursement of a water tax to individual enterprises. Thismatching used the geocode of each enterprise.
Statistics Denmark’s publication on the use of drinking water18, based on reports by the counties was alsoused in this process of estimating total uses, households uses, own use by the water production anddistribution units (filter back-washing) and distribution losses.
The DVF data
The DVF has very detailed data at the level of municipalities. It covers 125 municipalities, i.e. 45 % of allmunicipalities in Denmark and 67 % of the water distributed. For each municipality, the DVF has data on:• the number of inhabitants in the area of distribution,• the abstraction and consumption of water,• a distribution pattern between three different types of consumers: households, industries and
‘institutions’,• an estimate of the losses,• the different elements of the price: unit price for water, renting of the meters and connecting fees• water taxes,• sewage taxes for private households,• and, finally, investments in new plants.
18 Forbruget af drikkevand 1997
Sources and methods
45
DVF data were used to obtain data on prices covering all 276 municipalities. The regional location has beensupposed to be the primary determinant for the prices and missing municipalities were attributed the averageprice of their region, determined by their geocode.
The water tax reimbursement file
The second data source was the reimbursement file on water taxes. Tap water is taxed at a uniform rate (4DKK/m3 in 1997), and most industries qualify for reimbursement of their water taxes. It is therefore possibleto convert the reimbursements into physical uses. Data on each of these companies' reimbursements, incombination with information on the appropriate industry have been used to determine the total use of tapwater by industry. The quantities were directly assessed from the taxes and the price was known through thecompany’s location and the DVF data. As a result of this exercise, a preliminary physical and monetary useaccount concerning tap water and sewage was obtained for 98 out of the 130 industries in the nationalaccounts system.
Other sources used
The third data source, which was used for industries not qualifying for the reimbursement of their watertaxes, was employment data. Most of these industries only use water for their employees' personal needs,and a use of 10 m3 of water per year per employee has been assumed. For more water intensive industriessuch as hospitals, schools etc. the number of employees was increased by the corresponding number ofpatients or pupils.
The next step consisted in allocating the fixed payments for metering and for the connection of new users:the determination of the fixed payment amount depends on two factors: first, on the municipal location of theunit, and secondly on the unit's peak demand for water.• The fixed payment part for households was estimated by using the information available in Statistics
Denmark's Central Register of Buildings and Dwellings, (BBR). A rate was attributed to each of the 8categories of homes listed.
• For companies, an appropriate size of meter was assigned according to the amount of tap water used.
Physical and monetary supply-use tables were then available for all economic products of NACE 41 and 90.
2.1.2.2 Use of surveys: BELGIUM and SPAIN
BELGIUM
In Belgium, the integration of economic and environmental data is essential for sustainable developmentpolicy. Water management is faced with both quantity and quality problems: abstraction (including forcooling) is around 43 % of total available fresh water resources, but 80 % of groundwater resources. Andonly 28 % of urban wastewater is treated, which exacerbates pressures on surface water.
A feasibility study, made in 1999, concluded that data harmonisation work among regions was necessarybefore being in a position to compile national data. In 2002, a first set of NAMEA-type accounts for waterwas completed with 1998 as the reference year.
The ‘Structural Business Survey’ (SBS) was used to build the supply as well as the use side of the supply-use table for water collection, purification and distribution activities. The SBS distinguishes, within thedetailed turnover of NACE 41, between sales to electricity producers, to water distributors, to 'otherindustries' and to domestic users. For most of the 'other industries', the SBS also gives information on thepurchases of water by enterprises. The results from this survey were extrapolated by applying a ratio relatingpurchases of water to total purchases. The difference between total sales of NACE 41 to 'other industries'and purchases by the 'other industries' covered by the SBS was distributed between non-covered industriesaccording to their total intermediate consumption.
It must be noted that an important part of water is exchanged between NACE 41 units. Some operatorsdistribute to end-users water that they purchase from other producers. In order to avoid double counting,these exchanges have been excluded.
As concerns wastewater services, only the total output was available, without any breakdown by categoriesof users.

Sources and methods
46
SPAIN
As recalled in the Spanish report, “Water is a vital natural resource for a country's economic development.Because Spain has based its economic and social structure on a strong agricultural sector within whichirrigation farming is always on the increase, and a powerful tourism sector in which sun and water are crucial,the future development of these sectors is closely tied to the availability of water when it is needed andwhere it is needed.”
This statement explains the importance of water in the Spanish economy, which, contrary to most of theNorth-European countries, also suffers from periodic draughts. Information on water management istherefore a priority, and Spain has tried to build as many of the pilot tables as possible.
Water supply and wastewater services were separated. Economic pilot tables and pilot tables 5 to 7 on flowsof water (see section 2.2 below) were filled-in in parallel. Furthermore, Spain also carried out a trial tocapture the overall costs of the services provided by the government (water-related administrative services inpilot tables 1 and 2).
Water supply
The main statistical source used for drawing up the supply-use table for distributed water is INE's19 survey ofthe supply and treatment of water20. Supplementary information from the following surveys is also used: thesurvey of industrial enterprises21, the survey of the use of water in industry22 and the survey of the use ofwater in services23. The data from these surveys allowed transactions to be valued according to theaccounting standards of the ESA. Water abstraction, production and losses, expressed in cubic metres, werealso estimated using the non-monetary survey data.
In particular, the surveys of the use of water in industry and in services provided information on the use ofwater distributed through public water supply networks to the respective industries, giving intermediateconsumption in monetary terms and use of water in cubic metres.
Water abstraction for own use and discharges into the environment by industries in cubic metres wereestimated using the data from the surveys on the use of water in industry and in services.
Public wastewater services
The main data source is INE's survey of the supply and treatment of water, although information from thefollowing surveys is also used: the survey of sewage and refuse disposal24, the survey of the use of water inindustry and the survey of the use of water in services.
Discharges, expressed in cubic metres, are estimated using the non-monetary data from the survey. A studyentitled ‘Aguas residuales industriales’ (industrial wastewater) by the COTEC Foundation permitted a checkof the reliability of the results obtained.
Water-related administrative services
The output of activities carried out by public administrations units providing services relating to water(Directorate-General of Hydraulic works and Water Quality and Directorate-General of Rural Policy -irrigationplans) has been derived from the annual reports on the Public sector expenditure on environmentalprotection, Ministry of the Environment and from the Yearbook of the Ministry of Internal Development.
19 Instituto Nacional de Estatistica20 Encuesta sobre en suministro y tratamiento del agua21 Encuesta de Empresas Industriales22 Encuesta sobre el uso del agua en la industria23 Encuesta sobre el uso del agua en servicios24 Encuesta de saneamiento público
Sources and methods
47
2.1.2.3 Mixed methods: Portugal and SwedenPORTUGAL
In Portugal, different sources were used to build the monetary supply-use tables: general governmentstatistics (administrative data), industrial statistics (survey) and, as regards irrigation water, data from IHERA(Institute of Hydraulic and Rural Engineering and the Environment).
Supply-use tables for CPA products 41.00 and 90.00.11 were already available from the framework of thenational accounts.
The supply-use tables for water-related administrative services were built on the basis of an identification ofthe administrative units carrying out these activities.
The supply-use tables for irrigation systems were based on a survey of the “associations of beneficiaries”that IHERA yearly carries out. These “associations of beneficiaries” run irrigation systems in the areas underState agricultural development projects. These projects do not cover the entire irrigated area. Information onprivate or local irrigated areas was not available. The survey by IHERA includes monetary data.
SWEDEN
In Sweden, as in many other countries, water and wastewater services are charged together, and in thenational accounts, for the market production, water and wastewater services are mixed together. The datasources used are total supply of water and wastewater services from the Swedish association of water andwastewater services producers (VAV) and an old edition of ‘Statistics of intermediate consumption’, asallocation key to break down the uses between the different NACE codes.
After discussion with national accounts services, it was decided that these estimates were less reliable thancalculations based on physical information on the use of water, as collected during this pilot study. Nationalaccounts will be able to use this information in the future.
Two procedures were applied, depending on the nature of the goods and services produced: Sweden went astep further than Denmark, since ancillary costs have also been estimated (see section 2.1.4).
Four different sources with monetary data have been analysed and used for the pilot study:• Information from national accounts;• Data collected by VAV;• The survey ‘Municipal accounts 1995’, by Statistics Sweden;• The survey ‘Environmental protection expenditure in industry, 1997’, by Statistics Sweden.
The general procedure can be summarised as follows:a. Total expenditures were taken from VAV.b. The expenditures were broken down by NACE with the help of the physical use of water by each NACE.
Adjustments were necessary: rather big amounts of water are lost through the water network and publicwaterworks have their own use of water. The information on the distribution of uses within themanufacturing industry was rather good, while a detailed distribution outside the manufacturing industryhas been much more difficult to make.
2.1.3 Compiling production accounts
2.1.3.1 Use of surveys only: Spain
The same main statistical source used for drawing up the supply-use tables for distributed water, i.e. INE'ssurvey of the supply and treatment of water, was used for constructing the production accounts of the water-related activities.

Sources and methods
48
2.1.3.2 Mixed methods: Ireland, Norway, Sweden and PortugalIRELAND
In Ireland, the exercise was more particularly viewed as a preparation to the implementation of the futureEuropean Water Framework Directive. Two sub-objectives were pursued: (1) to be able to associatedischarges to water and uses of water services, in quantities, with the economic activities and (2) establishthe costs and revenues arising from water services.
The information on water comes from several different sources, built for different purposes. One conclusionof the report is that considerable possibilities exist for exploiting these sources better with minor alterations tothe existing information system.
The different sources used were:a. The Environmental Protection Agency (EPA) database on discharges to water.b. The national accounts in the Irish Central Statistical Office (CSO) for information on public water services
for both water supply and wastewater services. In this area, the national accounts are themselves largelybased on information coming from the Department of the Environment & Local Government (DoELG).
c. The Census of Industrial Production, especially a questionnaire, Form W, which collects detailedinformation on the value of the output and on the costs of inputs and labour.
d. The more specific addition of the pilot study was the specific survey of individual water authorities on alimited area (Greater Dublin).
NORWAY
The public (municipal) sector accounts for the majority of wastewater treatment in Norway. There are alsoprivate industrial treatment plants of various types and sizes and some private treatment plants that servesmall numbers of households. Economic information on these types of installations is not easily availableand for this reason Norway focused on the public wastewater sector.
Two sources were used for the public (municipal) wastewater sector:• The annual municipal wastewater survey conducted by Statistics Norway (SSB) in co-operation with the
Norwegian Pollution Control Authority (SFT), which includes questions regarding investment and runningcosts since 199325.
• The economic accounts of the 435 municipalities reported to Statistics Norway and used for compilingthe national accounts. These economic accounts are currently being revised.
A general comparison has been made between the SSB/SFT survey information and the ‘old’ municipaleconomic accounts data. For some municipalities there is a reasonably good agreement between these twosets of data but not for others. There are a number of possible reasons for these discrepancies. A majordifference lies in the level of detail with which the financing of investments is being reported. The dataobtained from the annual survey are generally more complete than the municipal account because of greaterdetail. However, some municipalities reported budget data and not actual expenditure. Another problem arethe transfers between different levels of general government, which are not available in the survey.
The study was a good test for the application of the new reporting system of municipal accounts.
SWEDEN
The same sources as in the building of supply-use tables (see section 2.1.2) were used, i.e. the datacollected by VAV and the survey ‘Municipal accounts 1995’ by Statistics Sweden.
VAV annually collects information on production costs for distributed water and wastewater treatment. Mainproblems are that not all municipalities report their costs to VAV and that some municipalities buy waterand/or wastewater treatment services from inter-municipal enterprises. Some adjustments had therefore tobe made. The breakdown of the production costs between distribution of water and wastewater treatment isabout 40/60, a proportion that is rather stable over time and across municipalities, according to VAV. It mightbe used as a distribution key for splitting expenditure in national or municipal accounts.
25 Capital costs are calculated using an annuity method: a specified interest rate (with a 1% risk premium added) and depreciation ofthe investments over a 20 year period (excluding subsidies).

Sources and methods
49
The fact that the revenues do not fully cover the costs was clear from the municipal accounts for the functionwater and wastewater. About 7 percent of the total production costs are not covered by the diverse fees andrevenues.
The different sources did not exactly match. Production costs amounted to 9 307 million SEK in themunicipal accounts against 10 108 million in the VAV data. One possible explanation for this difference is thetreatment of replacement investments. These costs are included in VAV production costs, whereas at leastthose financed via the capital budget are treated as capital formation in the municipal accounts. Anotherpossible reason could be that inter-municipal enterprises are incorporated in VAV data.
PORTUGAL
The information necessary for compiling the economic accounts for water-related activities mostly comesfrom the national accounts which are built with great detail in Portugal: accounts are available for eachindustry and also by institutional sector. The information regarding NACE 41 and 90* was therefore alreadyavailable.
As water-related administrative services do not match a CPA product, the corresponding accounts could notbe extracted from the national accounts and administrative units carrying out these activities had to beidentified one by one for the generation of the related economic accounts. Investment grants were alsoestimated this way since only specific administrative units are entitled to grant such subsidies.
It has not been possible to build such accounts for irrigation systems.
2.1.4 Estimating costs for ancillary activities: The Netherlands and SwedenFor this kind of information, only one method was applied by the two testing countries. Spain also partiallyfilled in the pilot table 4.
THE NETHERLANDS
Most of the economic transactions included in the NAMWA come from the detailed regular nationalaccounts.
However, some estimation had to be made for ancillary wastewater treatment activities (internalenvironmental cleansing services). A CBS study26 provided statistics on environmental costs broken downby domain for all enterprises with 20 or more employees in the mining, manufacturing industry and publicutility sectors. The internal costs for water treatment were grossed up to take into account the smallerenterprises and further supplemented with data on other industries provided by the environmental costmodel (RIM) of the National Institute of Public Health and the Environment. As this model only provides aninventory of environmental protection facilities and does not give very reliable data on the correspondingcosts, the NAMWA data should be considered as a preliminary estimate for the internal expenditure forwastewater treatment.
SWEDEN
Two different approaches were used, one for the industries' wastewater treatment ancillary activities and thesecond for water abstraction for irrigation.
Industry
For wastewater, the 1997 survey of environmental protection expenditure in industry gives current andcapital expenditure by enterprises, including expenditure aiming at reducing emissions to water. Currentexpenditure includes both payments for external services (municipal wastewater treatment) and in-houseexpenditure for energy, chemicals, labour, etc. related to own treatment.
Purchases of external services have probably been underestimated, partly because the wastewater part isdifficult to isolate from the water part.
26 Milieukosten van bedrijven 1991
Sources and methods
50
Agriculture
The main source used was the report ‘Irrigation 2000’. An extensive survey on irrigation in Sweden wascarried out in 1985. In 1991, the Swedish National Board of Agriculture got an assignment to investigate thefuture need of irrigation in agriculture and a questionnaire was sent to about 800 farming enterprises. Onlylimited changes were observed in comparison with the 1985 results. Two main elements introduce somevariation in the costs for irrigation: the proportion of variable and fixed costs and the origin of the waterabstracted (surface or groundwater).
2.1.5 Comparison of the methodsPreliminary conclusions of this examination of the methods used by the countries in order to build the‘economic’ part of the framework, are the following:• The choice of the method depends on the organisation of the national water management system. In
countries where the water supply and wastewater management are under the responsibility of themunicipalities, data could often be collected through these municipalities’ normal accounts. When taxesrelated to water use exist they generally provide a useful source of information.
• Supply-use tables of water products in monetary units are generally drawn up in parallel withcorresponding tables in physical units. It means that pilot tables 5 and 6 of Eurostat’s framework (supply-use tables in m3) will often be straightforwardly built.
• The collection of costs of ancillary activities related to water need a specific survey. For wastewatermanagement such surveys often exist, and will be further developed for the purpose of SERIEE andwithin the Structural Business Statistics Regulation. This is not the case for self-supply of water, exceptfor irrigation in some countries.
• New methods were tested and new results obtained that could also be used for the national accounts.

Sources and methods
51
2.2 Volumes of water flows
2.2.1 Exercise suggested by EurostatAs indicated in section 1.2.1, the objective of set of pilot tables was to put in parallel monetary and physicalinformation on water. Therefore, the second sub-set of pilot tables (tables 5 to 9) records the physical flowscorresponding to the monetary transactions described in the first sub-set of pilot tables (tables 1 to 4). Alltables presented in this part are therefore expressed in cubic metres.
2.2.1.1 Tables to be filled inPilot tables 5 and 6: Physical flows of water corresponding to economic transactionsrecorded in pilot tables 1 and 2These tables are the replicas in physical units (m3) of pilot tables 1 and 2. The only exceptions are the puremonetary rows of pilot table 1 (taxes and subsidies) which have been eliminated in pilot table 5. Water-related administrative services and minor (optional) activities recorded in the last column of pilot tables 1 and2 are generally difficult to translate into volumes of water and no physical data have been asked, evenoptionally, for these activities.
Activity 41, as well as activity 90* include several intermediary activities, for which different correspondingflows of water can be recorded.• NACE 41 abstracts water from the environment, purifies it and distributes it to industries and households.• NACE 90 collects wastewater from industries and households, treats it and discharges it back to the
environment.
Flows of water to be recorded in pilot tables 5 and 6 are the physical counterpart of the economictransactions, i.e. flows of water delivered to users (corresponding to sales and purchases) for the supply anduses of NACE 41 products and flows of wastewater collected by the sewage network for the supply and usesof NACE 90* products. In order to get a more precise description of wastewater services, in the pilot table 5,a column also asks for the volumes of water that enter the wastewater treatment plants.
Flows of water between the economy and the environment will be studied through pilot table 7 (abstractionsand returns). Leaks, losses, or additions (e.g. rain water drained into sewers) are described in thereconciliation pilot table 9, which presents a complete balance of water between economy and hydrologicalsystem.
Pilot table 7: Total abstraction of water from the water bodies and total discharge ofwastewater directly into the water bodiesThese flows correspond to the initial flows (abstraction) for the production of distributed water and the finalflows (discharges) for the wastewater removal and treatment services.
The columns of the table correspond to the OECD/Eurostat questionnaire categories of water resources(surface water, groundwater, other water) and flows between economy and environment (abstraction,discharge and return). These definitions have been given in Section 1.1.6.
In order to keep consistency with the previous tables, abstractions and discharges of water for purposesother than use, in particular for actions taken against undesirable water (water pumped from mines anddrainage water, etc.) are not included in the table.
Two exceptions were made because of measurement problems and because monetary counterparts areincluded to some extent in the pilot tables 1 to 4:• leaks and losses in the distribution network: costs of extracting water that is subsequently lost participate
to NACE 41 costs of production,• rain water drained and discharged into wastewater sewers, which influences the NACE 90* costs of
production.

Sources and methods
52
Estimates are often necessary as regards direct discharges by industries and households as these are lesswell known. When wastewater is discharged by these users, it may either run off (to surface water) orinfiltrate and later join either a surface or a groundwater body. In certain cases, it may also evaporate andthus should not be considered as discharged but as consumed. When estimates are difficult to make, acolumn ‘unknown’ can be added in pilot table 7.
Pilot table 8: Abstraction from the water bodies for the preparation of drinking waterObjective of this pilot table was to introduce different quality classes for surface and groundwater at the timeof abstraction. Practically, the issue of water quality fell outside the pilot tables tested.
Pilot table 9: Balance of flows of water between economy and water systemThis table synthesises pilot tables 5, 6 and 7 and adds reconciliation flows. It calculates, as a balance, theconsumption of water by each industry. Two additional data sets are required, in relation to previous pilottables:• leaks and losses at the different steps, notably in the networks,• rainwater drained in towns, which is sometimes collected by the sewerage networks and thus added to
the wastewater discharged by households and industries.
2.2.1.2 Participating countries
Table 2.2-1 Countries that participated in the topic ‘volumes of water flows’B DK D EL E IRL NL A P FIN S UK
Pilot table 5: water/wastewater supplyIrrigation water yes yesWater delivered yes yes yes yes yes yes yes yes yesWastewater collected yes yes yes yes yes yes yes
Pilot table 6: water/wastewater useIrrigation water yes yesWater received yes yes yes yes yes yes yes yes yesWastewater discharged to sewers yes yes yes yes yes yes yes
Pilot table 7: water abstraction/dischargeWater abstracted from nature yes (yes) yes yes (yes) yes yesWastewater discharged to nature (yes) yes (yes) (yes) (yes) (yes) (yes) (yes) yes yes
Pilot table 9: reconciliation flowsLeaks and losses yes yes yes yes yes yesUrban drainage yes yes
With more or less detail, pilot tables 5 and 6 have been filled in by Belgium, Denmark, Germany, Spain, theNetherlands, Portugal and Sweden for the two main products considered, i.e. distributed water andwastewater services. Data on supply and use of marketed irrigation water have also been provided by Spainand Portugal.
Finland and Greece supplied data only for water supply. Portugal could not deal with water-related ancillaryactivities. Therefore, in tables 7 and 9, only flows linked to water-related activities carried out as main activityhave been reported. In table 5, separate figures were provided for wastewater collected and wastewatertreated.
The same 7 countries (Belgium, Denmark, Germany, Spain, the Netherlands, Portugal and Sweden) plus theUnited Kingdom, also filled in pilot table 7, but only in a few cases (those without parentheses in the tableabove) it was possible to break down the abstraction or discharge by type of receiving water bodies. In somecountries (e.g. Denmark and Sweden) seawater abstracted for cooling purposes has been included too.
The balance table (pilot table 9) contains the totals from pilot tables 5, 6 and 7 and further data on leaks andlosses (available for Denmark, Germany, Spain, Ireland, Portugal and Sweden), urban drainage (Germanyand Sweden) and the ‘net’ consumption of water (i.e. the water that ‘disappears’ during use mainly due toevaporation), which has been specified by Denmark, Germany and Spain, but in each country withsomewhat different definitions.

Sources and methods
53
Indicators on reconciliation flows were included in studies not specifically dedicated to water volumes byFrance and Ireland.
Again, the methods and sources used by these countries will be grouped by type (survey, use ofadministrative data…).
2.2.2 Use of administrative data: Denmark, Finland and the United Kingdom
2.2.2.1 Denmark
The general aim of Statistics Denmark was to build a full NAMEA system. Different steps were needed, andin this part, only the building of accounts for physical flows of water will be reported. Four types of water wereconsidered in the Danish model: surface water, groundwater, seawater and tap water. This latest categoryshould be assimilated to ‘drinking water’ in the European classification, since only this type of water issupplied by the water supply industry in Denmark.
Abstractions
Two major institutions provide data used in computing water abstractions of groundwater27 in Denmark:• The DVF, the Danish Water Utilities Organisation. The DVF gets data from two different sources: the
public and private collective water production and distribution units, on the one hand, and the counties,acting as regional water management control units, on the other.
• The GEUS (Geological Survey of Denmark and Greenland) which covers almost all other waterabstractions. The 15 Danish counties report to the GEUS, which publishes annually the total registeredabstraction of groundwater according to 7 categories of users or uses28. The abstractions are eitherdirectly metered, or indirectly measured, for instance through actual running hours or electricityconsumption, or estimated by the municipality or county.
However, many computations have been necessary:• Some residual abstractions are not covered by the GEUS,• The full coverage of water production and distribution units is not achieved by DVF (survey is not
obligatory),• Until recently, reporting by counties was not completely reliable,• GEUS and DVF sources diverge on what they should have in common and, for collective water
production and distribution units, the DVF source has been chosen.
To build the NAMEA, further estimates had to be made, since the GEUS-categories of users were notsufficiently detailed:
• For instance, the water abstracted by the ‘non-collective water production and distribution units’ (lessthan 1% of the overall quantities abstracted in Denmark) has been attributed to farms and households(50% each).
• The GEUS-category ‘institutions’ has also been subdivided into General public services (defence): 40%,Hospitals: 40%, Primary education: 10% and Social institutions for adults: 10%.
Additional sources such as the number of pig and cow farms, environmental reports and accounts of powerplants, etc., were used to further break down the GEUS-category 'industry'29. The abstraction by theremaining 55 industries was then determined with the help of a survey on water consumption withinmanufacturing industry, carried out by the Danish Environmental Agency in 1990. Environmental reports andaccounts by firms and surveys also enabled estimates of sea and surface water uses.
27 99% of the abstraction of fresh water in Denmark is groundwater.28 1. Public water production and distribution units, 2. Private collective water production and distribution units, 3. Non-collective water
production and distribution units, 4. Institutions, 5. Watering of fields, horticulture and fish farming, 6. Industries and 7. Otherabstraction.
29 Surface water used by fish farming has been excluded from the study in spite of the significant polluting effects, because (1) of thedifficulty to obtain data, (2) because water is returned to its source.

Sources and methods
54
The GEUS-category, ‘other extraction’, includes other private drillings and protection drillings made byproduction and distribution units. This later case corresponds to polluted groundwater abstracted in order toprevent it from penetrating into non-polluted resources. Water abstracted by the protection drillings has beenrecorded as supplied to and used by the water supply industry.
The Building and Dwelling Register (BBR) of Statistics Denmark has been used to identify the number offarms and houses not connected to the water supply system. For households, an average consumption ratehas been applied. For farms, a more complicated method took account of the number of cows and pigs inthe respective farms.
Uses of tap water
Own use of tap water by water production and distribution units for filter backwashing has been calculated asthe abstracted groundwater less the water pumped out into the distribution network.
Total amounts of tap water supplied, i.e. actually used by industries or households, has been estimated fromthe water production and distribution units practising metering (60 to 70% of them): the difference betweenthe pumped out amounts and the estimated amounts sold provided an estimate of the losses in distribution.
In the DVF statistics, three types of consumers are identified: households, institutions, and industries. Thisbreakdown has been used, with adjustments in order for instance, to take into account the losses or to avoiddouble counting.
For the further breakdown by industries, two sources of information have been used: the tax register and theemployment statistics. Use of the tax register has been presented in section 2.1.2 above; it covers 98industries.
Employment statistics was used for the breakdown of the remaining 30 industries (4% of the volume) withadjustment to take into account the potential differences in the water use: for hospitals, schools, etc. thenumber of employees has been extended by the relevant number of patients, pupils, etc.
2.2.2.2 FinlandThe Finnish water study was carried out within a more general study aiming at producing a full NAMEAdealing with all the main environmental themes: global warming, ozone depletion, acidification, waste andwastewater production, eutrophication and depletion of natural resources.
A first attempt was completed with 1993 data; then Finland extended its NAMEA and produced, in particular,a NAMEA time series for 1985-1995. Statistics Finland filled in the pilot tables for the flows of water (waterpart of pilot tables 5 and 6). As concerns wastewater, only the discharges of wastewater to nature werestudied (wastewater part of pilot table 7).
The total use of distributed water by small industry, services and households can be obtained from theMunicipal Water Supply statistics. Household use is calculated on the basis of an average consumption of155 litres/inhabitant/day.
Information on the average consumption of water is available for different kinds of buildings: schools,hospitals, indoor swimming pools, shops, offices, theatres, private apartments, etc. Statistics Finland alsohas a register of the cubic capacity of all buildings according to their industrial sector. The breakdown of theother water consumption was obtained by combining this information with the building register.
As concerns wastewater the most important data source is the Finnish Environment Institute's water register,which could be used in the case of large manufacturing industries. For small industries and services severalassumptions and estimations had to be made, notably that these small production units produce as muchwastewater as they use water.
Finally, 15% of the wastewater collected by the network is leakage water and water from melting snow.These flows have been ignored in the NAMEA on the assumption that they hardly contain harmfulsubstances – basically sand and clay.
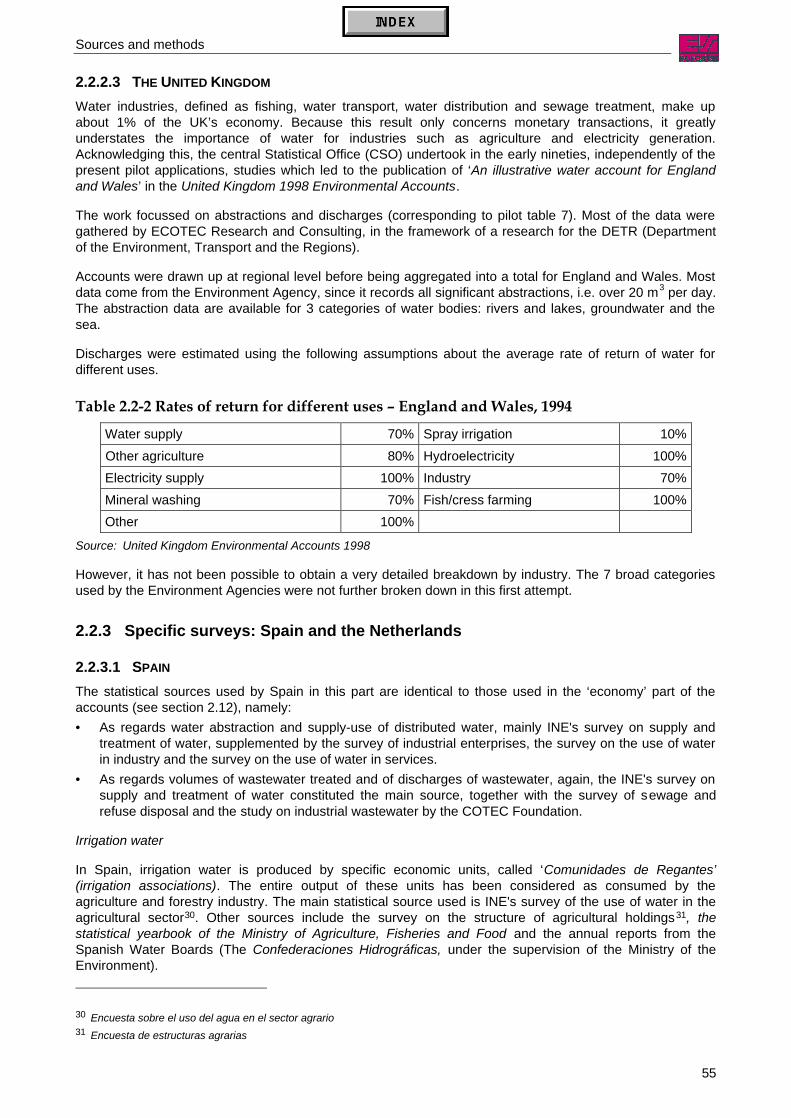
Sources and methods
55
2.2.2.3 THE UNITED KINGDOM
Water industries, defined as fishing, water transport, water distribution and sewage treatment, make upabout 1% of the UK’s economy. Because this result only concerns monetary transactions, it greatlyunderstates the importance of water for industries such as agriculture and electricity generation.Acknowledging this, the central Statistical Office (CSO) undertook in the early nineties, independently of thepresent pilot applications, studies which led to the publication of ‘An illustrative water account for Englandand Wales’ in the United Kingdom 1998 Environmental Accounts.
The work focussed on abstractions and discharges (corresponding to pilot table 7). Most of the data weregathered by ECOTEC Research and Consulting, in the framework of a research for the DETR (Departmentof the Environment, Transport and the Regions).
Accounts were drawn up at regional level before being aggregated into a total for England and Wales. Mostdata come from the Environment Agency, since it records all significant abstractions, i.e. over 20 m3 per day.The abstraction data are available for 3 categories of water bodies: rivers and lakes, groundwater and thesea.
Discharges were estimated using the following assumptions about the average rate of return of water fordifferent uses.
Table 2.2-2 Rates of return for different uses – England and Wales, 1994
Water supply 70% Spray irrigation 10%Other agriculture 80% Hydroelectricity 100%Electricity supply 100% Industry 70%Mineral washing 70% Fish/cress farming 100%Other 100%
Source: United Kingdom Environmental Accounts 1998
However, it has not been possible to obtain a very detailed breakdown by industry. The 7 broad categoriesused by the Environment Agencies were not further broken down in this first attempt.
2.2.3 Specific surveys: Spain and the Netherlands
2.2.3.1 SPAIN
The statistical sources used by Spain in this part are identical to those used in the ‘economy’ part of theaccounts (see section 2.12), namely:• As regards water abstraction and supply-use of distributed water, mainly INE's survey on supply and
treatment of water, supplemented by the survey of industrial enterprises, the survey on the use of waterin industry and the survey on the use of water in services.
• As regards volumes of wastewater treated and of discharges of wastewater, again, the INE's survey onsupply and treatment of water constituted the main source, together with the survey of sewage andrefuse disposal and the study on industrial wastewater by the COTEC Foundation.
Irrigation water
In Spain, irrigation water is produced by specific economic units, called ‘Comunidades de Regantes’(irrigation associations). The entire output of these units has been considered as consumed by theagriculture and forestry industry. The main statistical source used is INE's survey of the use of water in theagricultural sector30. Other sources include the survey on the structure of agricultural holdings31, thestatistical yearbook of the Ministry of Agriculture, Fisheries and Food and the annual reports from theSpanish Water Boards (The Confederaciones Hidrográficas, under the supervision of the Ministry of theEnvironment).
30 Encuesta sobre el uso del agua en el sector agrario31 Encuesta de estructuras agrarias

Sources and methods
56
2.2.3.2 THE NetherlandsIn the framework of its NAMEA, the CBS calculates national fresh water resources and evaluates theirdepletion over time. The water quality control authorities periodically measure the water flows in differentparts of Dutch rivers. This information is used to determine the total annual inflow of surface water into theNetherlands. The total outflow of surface water to the sea cannot easily be measured directly, due to toohigh tides. It is calculated as the annual inflow (from rivers that enter the country) plus precipitation, minusevapo-transpiration and the decline in the groundwater stock. Information on precipitation and evapo-transpiration is provided by the KNMI (Royal Dutch Meteorological Institute) and by the CBS. These freshwater resources are then compared to the uses.
Most of the data on direct abstraction of water by economic activities come from a survey of mining,manufacturing and electricity production industries. This survey is carried out every five years. Water use inagriculture is estimated with the help of a survey by the Economic Institute for Agriculture.
Total tap water production is known from a CBS survey. Tap water use by economic activity and householdsis estimated on the basis of the national accounts use table.
Data on the collection and discharges of wastewater by public wastewater treatment plants are collected bythe CBS in the framework of the ‘Water quality management’ statistics programme.
Finally, a rough estimation of the total abstractions of groundwater by the water boards is based oninformation from the Ministry of Transport and Public Works. This source is also used for information on theannual changes in groundwater resources. The average annual decline in the groundwater table is estimatedto be 1 cm. Because there is no direct information on the net uses (consumption) of water, it has beenpresumed that all abstractions are discharged later.
2.2.4 Mixed methods: Belgium, Germany, Sweden and Portugal
2.2.4.1 BelgiumThe general objective of Belgium, as mentioned in Section 2.1.2.2, was to build as many pilot tables aspossible. Some tables devoted to the volumes of water flows could be completed, namely tables 5 and 6, aswell as the part of table 7 which deals with discharges of wastewater (but with no breakdown according tothe type of receiving body). The other part of table 7 (on abstractions) could not be filled in.
The approaches differed according to the type of flows surveyed. Flows of distributed water could be derivedfrom a survey type methodology, while flows of wastewater came from administrative records.
Water supply
As the ‘Structural Business Survey’ asks for both quantities and values of water sales, it was also used toestimate water supply in physical units. However, not all NACE 41 firms answered to the question about thequantities. Their output in physical terms was estimated with the help of the average unit price calculated onthe basis of the responses received.
A first rough breakdown of the water uses between households, electricity producers, water distributors andother industries has also been possible on the basis of the SBS.
The average unit price was then used to estimate the breakdown of volumes between industrial users,dividing purchases of water by this average price. This method gives only rough estimates, since it is basedon the assumption that prices do not vary very much among industries and regions.
Wastewater services
The data about the volumes of wastewater collected and treated by sewage removal and treatment servicescame from the regional environmental administrations. Wastewater is considered as treated when it isdirected to water treatment plants.
Sources and methods
57
2.2.4.2 GermanyAs explained in section 1.2.2, water accounts complied by the Federal Statistical Office of Germany are partof the overall framework of the material and energy flow information system (MEFIS).
The water flow accounts have been obtained from a lot of statistical sources. Basic statistics had to beconverted into the concepts of the German Environmental Accounts (UGR), and data gaps were filledthrough estimates.
The most important data source were the water surveys of the Federal Statistical Office of Germany, whichhave been conducted at intervals since the late 1950's. These surveys interrogated mining andmanufacturing enterprises with more than 20 employees. The most recent ones were carried out in 1991,1995 and 1998. For the years not covered with surveys, an updating process was developed essentially onthe basis of production trends and of data compiled by economic associations.
For the years covered by the water survey, the calculation procedure was the following: the water flows werecalculated and broken down by industries using the data on public water supply and wastewater collection,on the one hand, and on water abstraction and discharge in mining, manufacturing industries and thermalpower plants, on the other. These data cover 90 % of the flows.
To achieve the transition from industries to homogeneous branches, some reallocations of secondaryactivities had to be made. This mainly concerned power generation and water-related activities. Internalwastewater treatment by enterprises in industrial wastewater treatment plants (IWWTP) has been consideredas an ancillary activity and thus was not reallocated.
Abstraction
Water abstracted from nature was broken down into two main components: first, infiltration and rain water 32,and, secondly, ground, spring, surface water and bank filtrate. The data on infiltration and rainwater drainedby the public wastewater sector were taken directly from the statistics of this sector. The abstraction of othertypes of water resources is based on several sources but basically on:• the statistics of public water supply,• the water survey of mining and manufacturing industries, for enterprises with 20 or more employees.
Water use by enterprises with less than 20 employees has been estimated step by step. The total differencebetween the quantity of water supplied by public water supply and the amount of water received by theindustries covered by water statistics has been broken down according to the turnover, assuming that thewater use coefficient is the same for large and small enterprises. It has also been assumed that the smallenterprises do not withdraw water directly from nature, except for agriculture and some specific branches ofmining and manufacturing industries. The share of small enterprises in the water abstraction in mining andmanufacturing industries amounts to about 2.5%.
Direct water abstraction by private households has been estimated on the basis of information on thenumber of households not connected to the public water supply network and on the assumption that thewater use by not connected households is equal to the water use of connected households. It amounts toabout 1.5% of the total water received by households. The amount of water received by connectedhouseholds is obtained from the public water supply statistics.
Discharges
The same sources were used to calculate the quantity of water discharged: the public water supply statisticsalso provide data on wastewater collected. However, those data are broken down according to only twocategories: private and commercial customers. The results of the survey were used to break down the‘commercial’ total, with the difference again allocated to small enterprises.
Discharge of water into nature has also been subdivided into several elements:• Discharge of infiltration and rainwater which corresponds exactly to the amount withdrawn.• Losses occurring in water distribution are taken from the statistics of public water supply.
32 Infiltration and rain water here applies to water collected in the wastewater network through urban rainwater run-off or pumped ordrained out of cellars, underground structures, etc.

Sources and methods
58
• Water indirectly discharged is provided by the statistics of public water supply, combined with the resultsof the survey.
• Water directly discharged comes from the survey and other sources, as for abstraction.
Other flows
For the water flows not covered above (e.g. irrigation, incorporation into other products or evaporation),specific data or estimation methods have been used:
• In agriculture, water use has been calculated separately for irrigation and livestock farming. The amountof water withdrawn by agriculture for irrigation has been determined on the basis of data provided by theFederal Association for Agricultural Irrigation. This amounts to about 1.5% of the total quantity of waterwithdrawn from nature. Water used in livestock farming has been estimated by means of the animals'average demand for drinking water provided by the Committee for Technology and Construction inAgriculture. Those ratios are combined with data on the stock of such animals, taken from agriculturalstatistics. This amounts to less than 2% of the total quantity of water withdrawn from nature.
• Data on the water quantities used in the construction and services have been derived from informationon the purchases of water (monetary input-output table). Those branches together account for slightlyless than 1.5% of the total amount of abstracted water.
• As far as evaporation and other losses are concerned, direct information or estimation approaches areavailable only for some branches and items, notably for the share of evaporation in irrigation water.Therefore, that value has been obtained – for both the overall economy and the detailed branches – as aresidual value.
• Data on water exports and imports are available through the public water supply statistics.• Water incorporation into other materials and water removal from other materials occurs in agriculture,
food and beverages industry and in household consumption.• It has been assumed that 1% of the irrigation water is incorporated into the plants and that the remaining
share evaporates.• The incorporation of water into animal products (meat, milk, eggs) has been determined on the basis of
the quantities produced and the average water content of such products.• Incorporation of water into farm manure (liquid manure, slurry) has been ascertained through the number
of animals and the average manure production of each animal.• In the food industry, water incorporation as well as water removal occurs. What was explicitly estimated
was only water incorporation during the production of beverages, taking as a basis the quantities ofbeverages produced.
• Water removal in households was determined through the water content of the beverages and foodconsumed.
2.2.4.3 SwedenWater flows
The survey carried out by the VAV is, again, the main source to assess the diverse flows of water within theeconomy and between the environment and the economy. Through a questionnaire to all municipalities VAVcollects annually information on:• total population• population connected to the public water system• population connected to the public wastewater system,• water abstracted from groundwater or surface water,• purchases or sales of water to other municipalities,• use of water by industries, households, public uses (e.g. schools), own uses and losses• number of water production and distribution units and wastewater treatment plants• quantity of treated wastewater
Sources and methods
59
16 municipalities (out of 286) did not answer the 1995 questionnaire. Estimates for these missingmunicipalities used their population and the national average abstraction and use rates.
For water abstracted directly by industries, Statistics Sweden carried out in 1995 a survey which covered930 establishment with 1 280 000 employed persons and corresponded to roughly 90% of the water uses.For the rest of users (7 512 establishments with 470 900 employed persons) the abstraction and use ofwater was estimated by coefficients for the industrial sector, based on a 1983 survey on water use.
For households not connected to public water systems, the average use observed in the public network(189 litre/day/person) was applied. Second homes were assumed to be used by three persons over 60 daysper year.
Two main uses were considered for agriculture: irrigation and livestock. The results of a 1985 survey wereused to assess the water needs for irrigation in a dry summer. A 1991 survey of 800 farming enterprises bythe Swedish board of agriculture did not show any fundamental change. For water needed by livestock,coefficients were applied to the number of animals, taken from agricultural statistics:
Table 2.2-3 Estimated water need for different animal breeding activities, Sweden, m3/year
Dairy cows 30,0 Piglets 0,05Sucker cows, heifers, calves 16,0 Sheep 2,5Horses 16,0 Laying hens 0,1Boars, sows 13,0 Young fowls, slaughter chickens 0,04Fattening pigs 0,875
Source: Water Accounts. Physical and monetary data connected to abstraction, use and discharge of water in theSwedish NAMEA – Statistiska centralbyrån, December 1999
Wastewater flows
The Swedish environmental protection law requires all large point sources of emissions to water to reporttheir main emission parameters in annual environmental reports to their supervision agency (generally alocal authority). The supervision agencies deliver copies of the reports to the County administrative boardand to the Swedish Environmental Protection Agency. The EPA also receives every second or third yearalmost 500 reports from the MWWTP (municipal wastewater treatment plants) serving more than 2 000inhabitant equivalents, defined in Sweden as 70 grams of BOD7 per day. The pulp and paper industry issubject to a specific report by the Swedish EPA.
Some treatment parameters are also reported annually in the VAV survey of municipalities: number oftreatment plants, volume of treated water, inhabitant equivalents served, permanent population.
2.2.4.4 PortugalOnly flows of water and wastewater due to the intervention of public systems could be surveyed in Portugaland not flows induced by own use of water or of wastewater services. Most information on water volumescame from INAG, an institute which monitors the quality of water at abstraction for human use. INAG alsocollects information on wastewater volumes discharged by urban wastewater treatment plants.
Irrigation flows could also be partially measured and the method used by Portugal in order to estimateirrigation flows is rather original. The total volume stored in the dams at the beginning of the irrigation periodhas been considered as the supply, while the use was derived from the volumes provided to the State’sagricultural development projects, volumes which are metered and charged (source: IHERA).
It must be reminded that the State’s agricultural development projects do not cover the whole irrigated areaof Portugal (124 000 out of a total of 988 000 ha). The method used leads to an important discrepancybetween supply and use, discrepancy that is allocated to “change in inventories”. For the estimation of themonetary tables, these flows were multiplied by the average price charged to the State’s agriculturaldevelopment projects.

Sources and methods
60
2.2.5 Methods studied by LuxembourgLuxembourg only made a short feasibility study regarding NAMEA accounts for water. The water division ofLuxembourg’s environment administration has a great deal of quantitative data for reasons of authorisationor evaluation, but these data are not yet centralised.
Water abstraction
In Luxembourg, water is abstracted by urban districts, grouped or not into associations, by enterprises fortheir own needs and by households. Urban districts and their associations produce annual reports which cansupply data, but attention should be paid to the possible exchange of water between the districts. A surveyshould be conducted for enterprises (around 25). No data exist on households, except for those who hadapplied for a subsidy in order to establish a system for recovering rainwater.
Wastewater discharge
There is no centralised data on water consumption by households since it is billed by urban districts.However, it could be estimated if the unit price and the breakdown between households and enterprises areknown. The Environment Administration calculates a technical coefficient with the help of the inhabitantequivalent of each wastewater treatment plant. For the enterprises, it is envisaged to attribute such acoefficient to the number of employed persons.
Wastewater treatment
Wastewater is treated either by the associations of urban districts (public WWTP) or by the manufacturingenterprises themselves. A number of data are collected by the Environment Administration, on both kinds ofWWTP, but it would be difficult to allocate the pollution treated to each source without applying arbitrarycoefficients.
2.2.6 Comparison of methodsAn obvious distinction has to be made among the diverse water flows, the quantification of which wasreviewed in this section: flows transiting through the public networks and exchanged between differenteconomic units on the one hand, flows directly abstracted and discharged by one economic unit for its ownuse, on the other.
Flows linked to public networks
These flows are generally known without difficulties, at least for their totals. Caring about the volumes is anatural concern by the public networks operators, since their costs are somehow proportional. It seemshowever more difficult to allocate total abstraction and discharges to the economic activities that use thewater. As prices are not uniform at the national level (they depend on local hydrological and geographicalconditions), the supply-use tables in monetary terms are not easily translatable into physical units.
A one-shot survey has been the solution in most cases, with the exception of Denmark whose taxationsystem allows direct allocation to industries, with the use of administrative data. Administrative data generallydistinguish categories of users; however these categories are often too broad to allow a detailed breakdown.Therefore, various methods and assumptions are used to disaggregate data: coefficients, ratios, etc.
Individual flows
These flows correspond to direct abstraction and discharges of water by industries and households. Methodsare rather similar across countries: the majority of pilot applications used a specific survey for the flows dueto industrial uses and coefficients for the flows due to household uses.
Denmark, Finland and the UK have regular systems for the recording of abstractions as a by-product ofadministrative sources. However, these administrative sources generally provide an insufficiently detailedbreakdown by economic activities (7 categories of users in Denmark and in the UK). The breakdown of usersin administrative sources is often based on the type of use of water rather than on the economic activityitself. The type of use appears as a key element for the breakdown and this could merit further analysis.
Specific methods were generally observed for the agricultural sector, which does not require the same levelof consideration in all countries.

Sources and methods
61
2.3 Flows of pollutants
2.3.1 Exercise suggested by Eurostat
2.3.1.1 Pilot tables to be filled inDifferent types of water pollutants are generated by economic activities of production and consumption.Dispersed in wastewater, these pollutants are discharged33 into the water bodies, either directly or after atransit through the sewage network and wastewater treatment plants. In this last case, NACE 90 activities –sewage and refuse disposal, sanitation and similar activities – may reduce the polluting load of the originalwastewater by appropriate treatment, and it may be interesting to compare how much pollution enters andleaves the sewage system in order to evaluate the effectiveness of this de-polluting activity.
As regards flows of pollutants associated with water uses, the proposal was to follow three kinds ofinformation: (1) pollutants discharged with wastewater into the public sewage network, (2) pollutantseliminated by NACE 90 activities before discharge back into the natural water bodies and (3) pollutantsfinally discharged into the natural water bodies (either directly by industries or households not connected tothe sewage network or by the sewage system operators).
Different basic types of flows should be distinguished: addition of pollutants to water by nearly all economicactivities and absorption of pollutants by some activities; this absorption takes two forms: subtraction ofpollutants before use by economic activities (notably for drinking purposes) – this is generally the task ofNACE 41 in the water purification stage– and subtraction after use (wastewater treatment), one of the tasksof NACE 90.
Based on the lists of pollutants appearing in various European directives related to water (see Annex 3), themost important pollutants (either in terms of quantity or in terms of dangerousness) were selected, namely:• Biological oxygen demand (BOD)34
• Chemical oxygen demand (COD)35
• Suspended solids• Heavy metals:
• Arsenic (As)• Cadmium (Cd)• Mercury (Hg)• Copper (Cu)• Chromium (Cr)• Nickel (Ni)• Lead (Pb)• Zinc (Zn)
• Eutrophication agents:• Phosphorus – total• Nitrogen – total
It should be noted that NACE 41 also subtracts biological pollution such as germs, coliforms, salmonella,etc., which is not traced in these tables.
Pilot table 10: Pollutants discharged by economic activities into the sewage networkThe purpose of this table was to report the pollutants discharged by economic activities into the sewagenetwork. Columns of the table correspond to the pollutants listed above, whereas the rows correspond toeconomic activities (industries and households as final consumers).
33 OECD/Eurostat questionnaire’s definition of a ‘discharge’ is: the amount of water (in m3) or substance (in kg BOD/day orcomparable) added/ leached to a water body from a point or a non-point source.
34 Biological oxygen demand: mass concentration of dissolved oxygen consumed under specific conditions by the biological oxidisationof organic and/ or inorganic matter in water.
35 Chemical oxygen demand: mass concentration of oxygen consumed under specific conditions by the chemical oxidisation withbichromate of organic and/ or inorganic matter in water.

Sources and methods
62
Pilot table 11: Pollutants discharged to water bodies by economic activitiesThe purpose of this table was to report the pollutants discharged by economic activities to water bodies,either discharged directly by industries or households or by the sewage network. The structure of the table isidentical to the structure of the table 10.
It must be noted that this table traces only part of the flows of pollutants discharged to water bodies andinduced by economic activities. Notably, a case not taken into consideration is the pollution ‘leached’:pollution of aquifers by landfill sites or through fertiliser spread on the soil does not result necessarily from ause of water through networks. It can be due to natural rainfall. Pollution originating from in situ uses of water(navigation, fishing, aquaculture, etc.) was excluded as well. However, an exception was proposed forpollutants originating from fertilisers (appearing as a memorandum item in table 11).
In the absence of leaching from the networks or of addition of pollutants with water such as urban rainwaterrun-off, pollutants treated by NACE 90* should be equal to the row total of pilot table 10 minus the row forNACE 90 from pilot table 11.
Pilot table 12: Pollutants subtracted by economic activitiesThis table intends to record two types of subtraction of pollutants. It covers at the same time• pollutants abstracted before use (e.g. in the process of purification of water before distribution, or the
filtering of suspended solids before use for cooling), and• pollutants abstracted by the units of the NACE 90* industry (wastewater treatment plants).
The table does not cover pollutants abstracted by the industrial wastewater treatment plants.
It should be noted that a final balance, in the same way as for volumes of water flows, could not really bemade for pollutants, for various reasons:• when wastewater is discharged on the soil (after or without treatment), the natural filtration should be
estimated in order to know the proportion of pollution which will finally join the surface or the groundwaterbody;
• indirect/diffuse emissions to water (through air, such as acid rains, or through soil, such as leaching oflandfill sites) are difficult to measure and allocate to industries.
Participating countriesThese three tables have been filled out by Belgium, Germany, France, Ireland, the Netherlands, Austria,Portugal, Finland, Sweden, the United Kingdom and Norway to different degrees, notably as regards thepollutants examined. Spain has filled in pilot table 12, but on the basis of different concepts.
Table 2.3-1 Countries that participated in the topic ‘flows of pollutants’ and pollutantsfollowed
B D E F IRL NL A P FIN S UK NOPilot table 10: Pollutants discharged to network
BOD/COD yes yes yes yes yes (yes) yes yesHeavy metals yes yes yes yes yesP/N yes yes yes yes yes (yes) yes
Pilot table 11: Pollutants discharged to waterBOD/COD yes yes yes yes yes (yes) yes yesHeavy metals yes yes yes yes yes yesP/N yes yes yes yes yes (yes) yes yes yes
Pilot table 12: Pollutants subtractedBOD/COD yes (yes) yes yes (yes) yesHeavy metals yes (yes) yes yes yesP/N yes (yes) yes yes (yes) yes
Most of the countries used a combination of different sources to build up the information: exploitation ofadministrative data (such as licences to pollute), average measured emissions multiplied by grossing-upcoefficients (for instance, to estimate emission of pollutants by households). Therefore the classification bymethodology presented hereafter is somehow arbitrary. One country carried out a specific survey (Austria).

Sources and methods
63
Noticeable is the fact that France and Ireland made an attempt to build emissions accounts at the level ofcatchment areas36. The United Kingdom built accounts for the Environment Agency’s operational regionsthat roughly correspond to the major water basins. There are also plans for such regional accounts in theNetherlands.
2.3.2 Use of coefficients: Germany and Ireland
2.3.2.1 GermanyThe main sources of data on discharges of wastewater and their pollutant load were the statistics derivedfrom a survey of the public water supply and of the sewage operators and treatment plants. The survey wascarried out in 1991. The calculation steps were the following:A. Estimation of the absorption coefficient by the sewage treatment (from the 1991 survey, except for
nitrogen where an approximate efficiency coefficient of 50% was taken as the average between themain types of treatment: mechanical, biological and advanced treatment.
B. From (A) and from the load measured at the discharge point (from the 1991 survey), estimation of thepollutant load of the flow entering the wastewater treatment plants.
C. Estimation of the pollutant load in the untreated sewage.D. (B) plus (C) result in the pollutants discharged into the sewage system37.E. Estimation of the pollutants discharged into the sewage system by households on the basis of the
number of connected inhabitants and of average emission coefficients38.F. Estimation of the discharge to the sewage system by industries as the difference between (D) and (E).G. The discharge of the sewage into nature results from the discharge by the treated sewage works and
from (C).H. Estimation of the direct emissions of the households into nature on the basis of the number of
inhabitants not connected to the sewage system and average emission coefficients.I. Finally, estimations of the direct emissions from the industries were inferred from statistics (German
Federal Statistics Office, 1997) for COD and BOD and from literature (German Federal EnvironmentalAgency, 1994) for nitrogen and phosphorus.
Pollutants collected from industries by sewage operators must still be broken down by industry. Theenvisaged method is to use process-related coefficients for large industries. For small industries, coefficientscan be applied to the turnover of the industry.
2.3.2.2 Ireland 1Two different approaches were followed. The first evaluation was based on the use of coefficients and isdescribed below. The second evaluation used tax register data and will be described in section 2.3.3.
First evaluation
The first Irish NAMEA report (with 1994 data), mainly devoted to air emissions, only gave a brief indication ofdischarges into water. Three pollutants were reviewed: BOD, supposed to arise mainly from sewage, slurryand silage effluent, and nitrogen and phosphorus, the latter two essentially coming from fertilisers andmanure.
The figures came from literature. The amounts going into water from agricultural sources were veryapproximate: the figure for BOD came from an estimate made over a decade ago, figures for N and P wereestimated from nutrient balances. The industries were also poorly covered: they may discharge wastewatereither directly into water bodies, which requires a licence from the EPA, or through municipal sewers. In thislatter case, discharges into water appear as discharges from Government Services (Municipal Works).
36 Germany also tried to build accounts for the Upper Rhine region in 1996 in another context.37 It is assessed that all pollutants result from discharges, i.e. that e.g. rain water run-off does not add any important loads.38 Coefficients used: 60 g BOD5, 120 g COD, 11 g nitrogen and 2.5 g phosphorus per inhabitant per day.

Sources and methods
64
Discharges from the residential sector (septic tanks only, municipal sewers being again accounted for in‘Municipal Works’) seemed difficult to evaluate precisely, as the potential rate of BOD removal by septictanks is rather uncertain.
In addition to the uncertainty about the data supplied, the first report also put a theoretical warning on theresults:… the extent to which discharges have a polluting effect is highly dependent on the state of thereceiving waters and surrounding terrain. In addition it is largely the concentration rather than the quantity ofdischarges that matters….
2.3.3 Use of licence and tax registers: Belgium, Ireland, Netherlands, Finland, UK,Norway
2.3.3.1 BelgiumIn Belgium, data about wastewater is collected in order to calculate taxes on sewage, but, as these taxescome within the remit of the 3 regions (Wallonia, Brussels-Capital and Flanders), their application is subjectto regional differences.
In Flanders, the wastewater taxation system dates from 1971 and was subject to a major revision in 1991. Adistinction is made between small (less than 500 m3) and large consumers.
For the first category (households, small firms, service industries and often farms), taxes are calculated inconnection with an assumed discharge of pollutants (expressed in g or mg per person per day). Anequivalent fixed amount is also required from small consumers that abstract water themselves. Therespective allocation of the pollutants to households and to services and small industries is problematicbecause of the absence of data on the levels of water consumed. The average level for households inWallonia has been used to make this breakdown.
Large consumers can choose between having their emissions actually measured or estimated according to aprofile typical of their activity. The following parameters are taken into account: BOD, COD, suspendedmatters, nitrogen and phosphorus, and heavy metals. Discharges of cooling water are taxed differently. Datahave been provided for 1 500 enterprises for years 1995 to 1997 with the exception of cooling water. Giventhe size of these enterprises, 80% of the industrial emissions are actually measured.
Estimates have also been made for ‘diffuse’ sources of pollution by farms on the basis of the SENTWAmodel, considering data on production, fertiliser consumption, precipitation and meteorological conditions.
In Wallonia, the wastewater taxation system is based on a 1990 decree. Levels of taxes for industrial firmsare set in relation to the average 24-hour sewage flow recorded during the month with the highest activity.From 1994 onwards, suspended matters, COD, heavy metals, nitrogen, phosphorus, and temperature ofcooling water are taken into account. Load, in terms of BOD, is not available. Available data (on about 600enterprises broken down according to 7 types of industries) are reported in the OECD/Eurostat questionnaireon inland water.
For households, taxes are based on the volume of water consumed or, if not known, on a flat rate basis (100m3 per household per year). Services industries and households are grouped together. For servicesindustries, taxes are calculated in connection with the number of employees, and pollution content has beenestimated using the Flemish average per employee.
Estimates have also been made for ‘diffuse’ sources of pollution by farming enterprises on the basis of theirproduction and the number of cattle.
In Brussels-Capital, the legal basis for the wastewater taxation system dates from 1996 (first year available:1997). For industrial plants, taxes are calculated either in relation to actual pollution or, when the level ofpollution is low, according to a flat rate calculated on the volume of consumed water. Firms have to makemonthly internal controls and a yearly external control. Parameters taken into account are: BOD, COD,suspended matters, nitrogen, phosphorus, and heavy metals. The information is still partial: concentrationshave been given for 80 important enterprises but corresponding flows have not been recorded yet, whichprevents the calculation of loads in kg.
For domestic uses (which includes all firms with less than 7 employees), most of the time a flat-rate tax iscalculated on the basis of the water consumption level.

Sources and methods
65
At the time of the pilot study, the information from this taxation system was not available for 1998 yet, andthe Federal Planning Bureau used the Flemish data to estimate the pollutant loads for the Brussels-Capitalregion.
2.3.3.2 Ireland 2The second evaluation by Ireland was carried out on the basis of 1996 data, with a totally new method: thesource was the submission to the OSPAR Convention39 by the EPA (Environmental Protection Agency).
The EPA database contains discharges of BOD, Nitrogen and Phosphorus for 40 basic hydrological areas(later grouped into three main regions). The information is derived from various sources, and includesinformation on agricultural activity, population, etc. In particular information stemming from licenses issued toindustrial enterprises (IPC = Integrated Pollution Control system) is used.
This source enables a regional breakdown (the three large catchment areas were retained) and by type ofwater bodies. On the other hand, the industrial breakdown is less detailed: it is based on the EPA codingsystem, which is process oriented and not directly comparable with NACE Rev.1. A provisional transitiontable between EPA classification and NACE had to be built.
The figures on industrial discharges are estimates based on the licence consents: the assessment is thatcompanies tend to release 25 percent of their consent limit.
A third report used the same methodology as the second, but data were updated and complemented byeconomic data.
2.3.3.3 The NetherlandsThe Dutch emission accounts are part of the ‘NAMWA’ integrated framework (see section 1.2.2.1). Theyinclude direct emissions to surface water, emissions to the sewage system and, in the case of agriculture,emissions to soil. Emissions into salt and brackish water are neglected40.
The emission of heavy metals is to a large extent derived from the "emission register" which displays thedischarges recorded by the Water Quality Control authorities. The Water Quality Control authorities estimatethe discharge of heavy metals into sewage networks and into surface waters. Using information on sewagesludge, the total discharge of heavy metals into wastewater, including non-registered emissions, isestimated.
A particularity of the Dutch accounts is that they also estimate the inflow of pollution into the Netherlands viathe river system and attribute it to the Rest of the World. Again, this inflow of pollutants via rivers into Dutchterritory is estimated by the Water Quality Control authorities. At the other end, some pollution is consideredas ‘exported’:
“ …The total pollution loads from the Dutch territory into open sea is estimated with the help of annualaverage concentrations at the lower end of the river system, measured at Maasluis, and the total annualwater outflow. Maasluis is the most important, but not the only location where inland water reaches opensea… “
In this way the NAMWA describes also the destination of pollutants: pollution accumulated in Dutch inlandwaters and outflow of pollution to the open sea.
2.3.3.4 FinlandThe Finish NAMEA for water is part of a more global NAMEA which also deals with air, waste and naturalresources. A preliminary trial was made with 1993 data. Afterwards, the project was extended to cover theyears 1985, 1989, 1990, 1992 and 1995.
39 Oslo and Paris conventions for the protection of the marine environment of the North-East Atlantic.40 Subsequently, the Eems and Schelde rivers are outside the scope of the accounts, since these rivers are already brackish by the
time they reach the Netherlands’ borders.
Sources and methods
66
The main source for nutrients (P and N) and organic pollution (BOD) is the water register maintained by theFinnish Environment Institute. This register covers all industrial establishments not connected to themunicipal sewage system and that have to report on their water emissions. 70% of all industrialestablishments are registered. It comprises in particular all the paper production units, which are the mostsignificant industrial water polluters.
The classification used in the register is not fully consistent with SIC-95 (the Finnish industrial classification)and some adjustments had to be made.
The register information is supplemented by information on WWTPs, obtained from the Municipal WaterSupply statistics (Finnish Environment Institute) and by estimates (by the Finnish Environment Institute, too)of water emissions from rural settlements: agriculture, fish breeding, milk farming, forestry and peatproduction.
The information collected for industrial establishments is ‘net’, i.e. it relates to pollutants emitted into thewatercourse, after eventual abatement inside the establishment. For municipal WWTPs, both ‘net’ and‘gross’ emissions are available.
Finally, the total figures on pollutants loads were taken from the report ‘A Proposal for Targets of WaterProtection until the Year 2005’, drafted by the Finnish Environment Institute.
Another source, the Association of the Finnish Forest Industry, publishes data on nutrients and wastewaterfor this specific sector. However, the published figures on BOD, N and P were higher than the figures fromthe water register. For consistency, the latter were used.
Several assumptions and estimations had to be made. A first assumption has been that units produce asmuch wastewater as they consume water. Household consumption has been estimated at about155 litres/inhabitant/day. The rest of the distributed water consumption has been attributed to smallindustries and services. Data on how much water is consumed altogether by small industry, services andhouseholds can be obtained from the Municipal Water Supply statistics. The nutrient emissions wereallocated accordingly.
Leakage water and water from melting snow (up to 15% of the wastewater) were finally ignored in thebuilding of the NAMEA, on the basis of the assumption that they do not contain hazardous substances(basically only sand and clay).
2.3.3.5 The United KingdomIn 1998, an initial set of water accounts was produced by the ONS for the DETR (Department of theEnvironment, Transport and the Regions). A framework was established for the development of waterresource and water pollution accounts. Regarding water pollution, the main preliminary elements wereemissions (in tonnes per year) of main pollutants broken down by economic activity. Direct discharges byindustries to the water bodies, discharges by WWTPs, as well as diffuse discharges (e.g. discharge offertiliser to groundwater) were considered.
Different sources were used, according to the substance:• the database maintained by the Environment Agency for the UK submissions to the OSPAR Convention
and Third North Sea Conference Declaration,• Water companies data on consents for firms,• Ministry of Agriculture, Fisheries and Food surveys on pesticides and fertilisers,
but a number of estimating methods, using US emission coefficients, areas for each crop, etc., had to beapplied.
This first attempt demonstrated that for national water accounts the conceptual framework was adequate butthat a comprehensive set of accounts was not possible due to methodological problems and gaps in dataavailability.
In particular, it had not been possible to allocate the discharges from the sewage networks to the variousindustries at the origin of the pollution. Fine-tuning was needed and undertaken in the framework of a pilot

Sources and methods
67
study. Its general objective was to determine the levels of pollutants emitted by each industrial sector interms of load per employee, but the pilot study was also "intended:
− to test the relationship between the levels of discharges which the sector had permission to discharge(known as the consent), and the amounts actually discharged;
− to explore the stability of discharges over time;− to establish whether there are differences in the emissions coefficients between regions and whether
company size was an important determinant of the loads emitted."
ApproachThe ten water companies in England and Wales hold ‘consents’ registers of firms. Unfortunately, theseregisters do not give much indication on the economic activities of the firms. Therefore, the listing ofaddresses from the consents register was matched with a listing from the Inter-Departmental BusinessRegister (IDBR) which contains more detail: industrial sector, number of employees, turnover, etc.
Although the matching was only carried out for sectors which had been identified as likely to have consenteddischarges, many problems had to be faced:• Not all pollutants selected in the previous study are subject to a consent.• As they are maintained at a district level, the consents data are not centrally collected and are not easily
accessible. Often, the data are confidential under the terms of the Water Industry Act 1991. Only fivewater companies’ registers could be exploited.
• The IDBR holds information at different levels, or for different units. For instance, for companies withmore than one site, information on number of employees may be held for each ‘local unit’, whilstinformation on turnover is only available for the company as a whole.
A software tool calculated, for a selection of pollutants, a load per employee by industrial sector, bymultiplying the mean concentration by the total volume of water supplied41.
The results were finally extrapolated in order to take into consideration the firms for which no information wasavailable. Two different approaches were tested, one based on individual firm coefficients and the otherbased on the total load for all matched firms within a sector.
2.3.3.6 NorwayThe work on emissions into water in Norway has focused on emissions of a number of heavy metals, on theone hand, and on emissions of nitrogen and phosphorus, on the other.
Heavy metalsThe available information primarily came from the INKOSYS, an administrative register of discharge licencesissued by SFT (Norwegian Pollution Control Authority). However, firms that emit below the legal permit level,or firms that should have obtained licences but have not applied, do not report to the INKOSYS.
There might be double counting in this database when effluents by a firm are later treated by a wastewatertreatment plant which is also recorded in the database. The importance of this problem has been difficult toestimate: enterprises are asked whether they are connected or not to the municipal wastewater system, butthis information is not often provided.
There are approximately 65 different types of discharge licences listed in the database. This numberchanges with new regulations.
19 heavy metals have been chosen for closer examination: either heavy metals stated as toxic substancesby the Ministry of the Environment42, or covered by the OECD/Eurostat Joint Questionnaire for InlandWaters.
41 This method was compared with the alternative using the mean (concentration x flow) for a small subset of Yorkshire data. Themajority of the ratio between the two estimates (74%) lies between 0.5 and 2.
42 White Paper to the Parliament No. 58.
Sources and methods
68
Three years of data (1995 to 1997) were examined in order to test the variability of the emissions reportedover time and according to NACE categories, but the coverage was not the same: notably, NACE 90appears only from 1996 onwards.
Another problem with the INKOSYS database was the NACE code allocation to the enterprises, which iscorrect only at the 2-digit level.
The calculations must be considered as very preliminary, and a list of areas needing closer examination andperhaps revision, notably because of major discrepancies over the 3-year period under review, is provided inthe report.
In addition to the INKOSYS database, estimates of heavy metals in the sludge from the municipalwastewater treatment plants have also been used. These are not emissions to water but rather the amountof pollutants removed from the wastewater. The content of heavy metals in the sludge removed fromwastewater systems is measured and reported annually for each WWTP to another SFT administrativedatabase (known as ‘SESAM’). Data for seven heavy metals are available: cadmium, chromium, copper,mercury, nickel, lead and zinc.
Phosphorus and nitrogenConcerning these two pollutants, the INKOSYS database has also been used. A conclusion was that thisdatabase could be improved. In particular, the information regarding the connection to municipal wastewatersystems is incomplete.
Apart from this database, use has been explored of a complex model developed to calculate the emissionsof nitrogen and phosphorus to the North Sea, taking into account retention rates along the differentwatersheds and the location of the major emissions sources from enterprises, treatment plants, agriculturalareas and natural areas. This model, known as TEOTIL, provides information concerning the emissions atthe geographic boundaries of the country43. It is used to report to the OSPAR convention about emissions tothe North Sea.
The TEOTIL model is run only with four major categories of sources: agriculture and forestry, municipalwastewater, ‘industry’ and natural run-off from pristine areas. The model calculates concentrations ofnitrogen and phosphorus to the various recipient bodies of water and in particular to the North Sea. Themodel’s predictions are relatively close to the measured values for phosphorus, but not as good for nitrogen.
The four categories used by TEOTIL are too aggregated to be used in a NAMEA. Currently, the ‘industry’category refers to INKOSYS data on NACE 13, 15-37 (and 90). There had not been any attempt to allocateemissions from the municipal wastewater systems to households, enterprises or administrations.
2.3.4 Specific survey: AustriaThe first Austrian attempt of a NAMEA, completed in January 1998, was the development of a NAMEA on airpollutants. Unlike air, for which emissions were calculated by applying process-specific coefficients,emissions to water have been based on actual measurements or, when not available, estimated on the basisof authorisations and limit values laid down for the different economic activities in the Ordinance onWastewater Emissions. It has then been assumed that the emission was 50% of the relevant limit value.
Only ‘net’ emissions have been measured, that is to say, emissions have been measured at the point wherepollutants enter surface water or groundwater. Thus, if the emissions of a plant pass through a treatmentplant, the effects of the treatment have been taken into account in order to estimate the ‘gross’corresponding emissions, either by using data from that precise wastewater treatment plant or from astandardised WWTP of similar size.
The data were acquired by means of a questionnaire. The largest companies were contacted by telephone.Data were provided either by the companies themselves or by professional associations. In some cases(food, beverages and tobacco industry, electrical and electronics industry), professional associations sentthe questionnaire to their members. In others (chemical industry, paper and paperboard industry), theprofessional associations took over the survey themselves.
43 It should be noted that fish hatcheries and fish farms are excluded if located in salt-water areas (fjords).

Sources and methods
69
Altogether, approximately 500 enterprises were surveyed. In terms of water consumption, the rate ofcoverage by industry ranged from 22% to 100%, with an average of 59%.
Individual data were entered into a database, complemented by extra data such as links to the treatmentplants, number of days worked, etc.
If data were not available from some plants of a given industry, an extrapolation of annual loads was carriedout on the basis of data available from the responding individual plants and from the water consumption bythe whole industry, provided by the Austrian Central Statistical Office.
Separate estimates were made for water used in the production process and for water used for sanitation.Cooling water was excluded.
As stated above, the survey was completed by estimates. For instance, when only data on volumes ofwastewater were available, loads from sanitary waters were estimated according to the number ofemployees. For a number of services (public administration, education, banking, etc.) loads were based onthe calculation of sanitary waters only.
The following other sources were used:• Federal Ministry for agriculture and forestry: sewage emission regulations, protection of the aquatic
environment report, various information, e.g. N and P loads for agriculture,• Offices of the State governments: sewage and sewage works data,• Austrian Central Statistical Office: information about water consumption in 1994,• Literature data: abating performance of the wastewater treatment plants for AOX and heavy metals,
heavy metal emissions per inhabitant equivalent.
The resulting tables cover households as well as industries emissions. Due to the heterogeneous nature ofthe data, there is no single reference year but only a reference period 1994-1997.
2.3.5 Monitoring network: PortugalIn Portugal, water quality is regularly monitored by the INAG (Portuguese Water Institute): a network ofsampling points has been constituted in order to measure the quality of water at abstraction (to ensurecompliance with the norms established for abstraction for human use). But INAG also surveys the emissionsof pollutants. It was therefore able to supply INE with data on:
• quality of wastewater arriving at treatment plants,• quality of wastewater at the point of discharge into water bodies.
However, only public wastewater systems are surveyed by INAG. The information on emissions issubsequently partial. No information could be provided on discharges by industrial wastewater treatmentplants as well as on wastewater directly discharged either by industries or by households (64% of thepopulation is connected to a public sewage system).
The information on wastewater quality in the public wastewater system is not as regularly supplied as thaton abstracted water quality.
2.3.6 Modelling: FranceAn emission model had been conceived in a larger framework, in order to answer the multiple requests fromthe OSPAR convention, the European Directives on water, the IPPC Directive, etc. A consortium wasorganised between EEA Topic Centre for Inland Waters at the European level, OIEau and Ifen to develop aflexible model, which was tested on the Loire-Bretagne water basin.
Since a comprehensive national inventory for wastewater discharges does not exist in France, combinationof data had to be used: detailed data on emissions of wastewater and of pollutants in water by the industryon the one hand, and the use of models to estimate pressures by households and the agriculture, on theother.
Different approaches were used, according to the origin of the discharges.
Sources and methods
70
Industry
The 6 Water Agencies, established by the 1964 Water Act, are responsible for the implementation of thenational water policy at the local level. Until recently, they were collecting taxes and fees levied on the waterabstracted and on the estimated wastewater or pollutants releases. Although independent, they use commonmethodologies.
Pollution taxes are calculated according to the gross emission produced by each site. These data are eitherestimated or measured. Larger points sources emissions are usually monitored. Estimates for smaller plantsare based on technical coefficients applied to the level of activity of the site. The coefficients have beendrawn for 375 activities grouped into 15 categories. They are based on the level of activity of the highestproducing month. Since data are available according to a process-oriented classification (TEF), acorrespondence had to be drawn with the NACE nomenclature.
The tax is based on the gross emission but can be reduced if part of the pollution is removed. The final (net)tax paid is then theoretically consistent with the final pollutants discharged. The following parameters areconsidered: Total Suspended Solids (TSS), Total Organic Compounds (TOC), Toxic substances (Tox)especially metals, Nitrogen (N) and Phosphate (P).
Another source of data consists of the monitoring carried out by the Regional Industry and EnvironmentPublic Boards (DRIRE) on installations which need a specific authorisation. These data are regionallycollected and then centralised at the national level by the French Ministry of the Environment.
Finally, two types of organisms, the Water Agencies and the technical assistance service for WWTPoperators (SATESE) collect data on urban wastewater treatment plants: capacity, expressed in organicmatter (MO), actual load and abatement rate for MO, total N, total P and TSS.
Agriculture
A model, using CORINE Land Cover data and data from the 1988 national agricultural census, has beendeveloped to estimate nitrogen surplus and phosphorus at the ‘canton’ level (NUTS 3). The model providesthe nutrient input, on the basis of uses of fertilisers and manure. It is considered that 80% of the nutrientsurplus, defined as nutrient input less ‘exportation’ (i.e. absorption by crops) is discharged into water bodies.
Other diffuse emissions
All the rainwater run-off was considered as directly discharged into the river system. Impervious area wascalculated from CORINE Land Cover database (urban and industrial surfaces). An abatement factor of 50%was applied for urban surfaces and of 20 to 25% for industrial surfaces. Nitrogen loads from rainwater run-offwere calculated from the HYDROSOL database44.
Integration
A model (called NOPOLU) was then developed to estimate emissions to water. It follows different stepsaccording to the source categories (households, agriculture, industries, urban and industrial diffuse sources),the emission channel and categories (gross emission, direct discharge, connection to a sewage network, toa WWTP, final discharge) and the geographical coverage of the information (watershed, river basin oradministrative level).
The basic principle of the model consists in applying a coefficient specific to the characteristics of an activityto the units fulfilling this activity. The coefficient may come from the literature, from a statistical measurementor from another model.
The pilot study tested this model for the Loire Bretagne water basin, by comparing the results with datasupplied by other sources. Four procedures were successively used and the results systematicallycompared:• the already aggregated tables of emissions issued by the Loire-Bretagne Water Agency were applied
using a correspondence table between the Agency's nomenclature of processes and NACE;
44 HYDROSOL is a database created by IFEN combining administrative units with hydrographic boundaries at NUTS 5 and giving thearea of each of the 44 CORINE Land Cover types.

Sources and methods
71
• individual data from the Loire-Bretagne Water Agency database of industrial sites was aggregated on thebasis of their actual NACE code for 80% of the enterprises;
• the NOPOLU model was fed with individual data, applying the correspondence TEF/NACE;• the NOPOLU model was fed with individual data with their NACE code when known.
Table 2.3-2 Example: nitrogen in the Loire-Bretagne basin, tonnes N per day
Sources Grossemission
Direct emission to theenvironment % Transferred Treated Net
emission %
Agriculture 903 582 80.0 0 322 582 80.0Scattered population 37 2 0.3 0 35 2 0.3Urban Population 123 7 0.9 117 0 80 11.0Urban diffuse 28 28 3.8 0 0 28 3.8Industrial, discharges 71 15 2.1 28 28 27 3.8Industrial, diffuse 9 9 1.3 0 0 9 1.3
Total 1 171 727Received in sewage 143 1 0.1 142 0UWWTP 142 13 1.7 72 58Final discharge 72 72 9.9
TOTAL 727 442
Note: data refer to 1997 except agricultural data, which refer to 1990.
Source: Ifen, BETURE-CEREC.
2.3.7 Using environmental reports of enterprises: SwedenStatistics Sweden has been developing an economy-wide material flow account, but water was not includeduntil this pilot study. What was expected from it was a set of supply-use tables in a NAMEA-type frameworkand recommendations for improvement and further development of the accounts.
The project was seen as the first step to set up accounts for water. It focussed on water flows in the‘technosphere’, i.e. on water abstraction and use and on emission of pollutants to water. Only readilyavailable data, in both physical and monetary units, were used, with recalculation when needed foradaptation to the accounts.
The Swedish environmental protection law requires all large point sources of emissions to water to reporttheir main emission parameters to a supervision agency, which is generally a local authority. In most casesemissions are measured. The reporting unit is generally the local unit (establishment), not the enterprise.
For the largest establishments, the supervision agencies deliver copies of the reports to the Countyadministrative boards and to the Swedish Environmental Protection Agency (EPA).
For the pulp and paper industry (65 plants), the aggregated results from the EPA annual publication havebeen used. Estimates of nitrogen discharges for some other industries have also been taken from the EPA.
For their part, the almost 500 MWWTPs serving more than 2 000 inhabitant-equivalents45 are required toproduce environmental reports. They treat about 90 % of the municipal wastewater.
The 25 largest MWWTPs (more than 100 000 inhabitant-equivalents each, treating around half of thewastewater) are surveyed every two or three years. Data were taken from these surveys.
Some treatment parameters reported annually to the Swedish Water and Wastewater Association (the VAV)by the municipalities have also been used in the estimates: number of treatment plants, volume of watertreated, number of inhabitant-equivalents served, permanent population.
45 inhabitant equivalent is defined in Sweden as 70 grams of BOD7 per day
Sources and methods
72
Only emissions stemming from the large point sources have been included in the tables supplied. No attemptto estimate pollution content of the smaller sources has been made. The pollution by small MWWTPs mayamount to a supplementary 10 %. Similarly, a non-negligible part of the industrial discharges might havefallen outside the environmental reporting system.
Most of the data refer to a single year, 1995.
2.3.8 Methods studied by LuxembourgIt is difficult to obtain detailed data on wastewater in Luxembourg: total amounts are well known, but they arenot allocated to the different industries. 16 industrial plants dealing with heavy metals have their own IWWTPand provide data to the Environmental Administration from 1995 onwards. Some other industries (breweriesnotably) also have their own IWWTP.
For each public WWTP, annual data on the amount of wastewater, on BOD, COD, nitrogen and phosphorusat the entry and exit flows and pollutants' content of sludge are available. However the origin of thewastewater is unknown. A coefficient should be used for allocation of incoming flows of wastewater to smallindustries and services, and the number of employees was proposed. As regards households, data on wateruse is available in districts or associations of districts but has never been centralised. Exploitation seemspossible on the basis of unit prices. No data is available on diffuse pollution.
2.3.9 Comparison of methodsAs regards information on the discharge of pollutants into water, European countries are not at the samestage. Some are just looking for data collected at local levels, which could make it possible to buildaggregated information, some are organising a comprehensive reporting system, while others are alreadytrying to relate environmental pressures on water bodies to their state.
Whereas some countries, within this pilot exercise, only tested the feasibility of building accounts with readilyavailable data, others also questioned the quality of the available data.
However, an overall conclusion could be that the availability of basic data are most often linked to strictlegislation on water uses, combined with monitoring and surveying, that is to say, a rigorous water policy.
73
3 Results and analysesThis chapter presents the results of the pilot applications, country by country. Due to the ‘pilot’ nature of thedifferent exercises carried out in the countries, and notably in connection with the data available in each ofthem, the results are not harmonised and it is difficult to compare the countries’ results. Each countryadapted the tables proposed by Eurostat to its own concerns, system and data. These adaptations inthemselves provide interesting conclusions as concerns the feasibility and usefulness of Eurostat’s proposal.
For each country, two types of results will be presented: first rough results, that is to say, more or less thepilot tables proposed by Eurostat, secondly, short analyses which have been carried out by certain MemberStates with the help of derived indicators. Examples of such analyses are evolution of indicators over time,comparison of industries’ performances with regard to their water use, overall economic dependency onwater, etc.
It was of course difficult to make the selection. Fourteen Member States plus Norway supplied reports, someof them supplying several reports. Results were chosen either because of their representativeness of thecommon features of the reports or on the contrary, because of their peculiar point of view, when theunderlying idea seemed to merit discussion at European level.
3.1 The water economy
3.1.1 DenmarkTablesIn Denmark, because it was possible to use data with enterprises as the recording units, very detailed usetables could be drawn up: the information is given for as many as 128 industries.
The following table gathers information included in pilot tables 2 and 13. Some data from pilot table 6 (waterflows corresponding to uses) have also been added, as the element necessary for calculating 'implicit' prices.Furthermore, detail is available for the different components of the use value: the water value (proportional tothe quantity), fixed payment (renting of the meter) and connection fees (one-off payment), as well as thevalue of wastewater services.
The results were compared to the national accounts use table of the product 'distributed water'. With equaltotals (coming from NACE 41 output), different breakdowns were obtained. For instance, in 1996, whilehouseholds accounted for 67,5% of the uses in the national accounts, they amounted to 65,5% according tothe results of the pilot study. At the level of the different industries, the importance of the differencesincreases. For instance, according to exercise, construction activities use more than three times as much asthey are supposed to do in the national accounts.
The water-related taxes showed larger differences between the two sources, even in the totals: nationalaccounts valued them at around 18% more in 1995 and 10% more in 1996 than the present exercise.
All these differences will be later analysed by the national accounts and the environmental accountsdepartments.
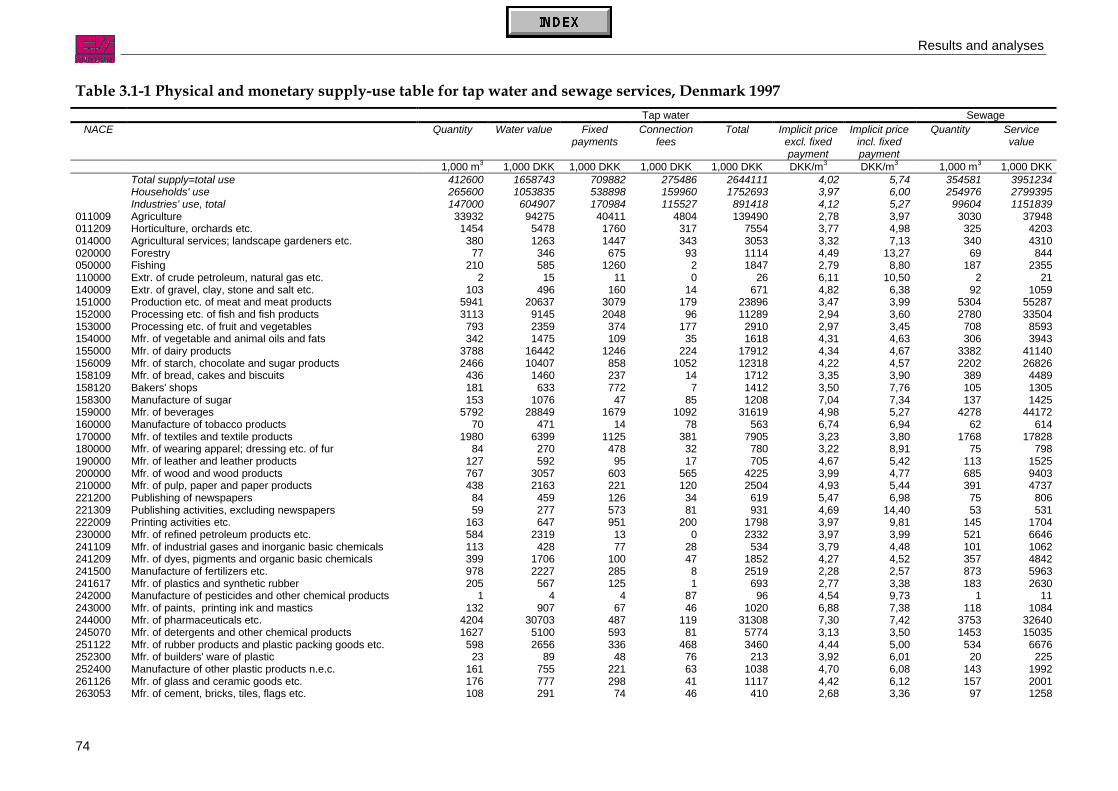
Results and analyses
74
Table 3.1-1 Physical and monetary supply-use table for tap water and sewage services, Denmark 1997Tap water Sewage
NACE Quantity Water value Fixedpayments
Connectionfees
Total Implicit priceexcl. fixedpayment
Implicit priceincl. fixedpayment
Quantity Servicevalue
1,000 m3 1,000 DKK 1,000 DKK 1,000 DKK 1,000 DKK DKK/m3 DKK/m3 1,000 m3 1,000 DKKTotal supply=total use 412600 1658743 709882 275486 2644111 4,02 5,74 354581 3951234Households' use 265600 1053835 538898 159960 1752693 3,97 6,00 254976 2799395Industries' use, total 147000 604907 170984 115527 891418 4,12 5,27 99604 1151839
011009 Agriculture 33932 94275 40411 4804 139490 2,78 3,97 3030 37948011209 Horticulture, orchards etc. 1454 5478 1760 317 7554 3,77 4,98 325 4203014000 Agricultural services; landscape gardeners etc. 380 1263 1447 343 3053 3,32 7,13 340 4310020000 Forestry 77 346 675 93 1114 4,49 13,27 69 844050000 Fishing 210 585 1260 2 1847 2,79 8,80 187 2355110000 Extr. of crude petroleum, natural gas etc. 2 15 11 0 26 6,11 10,50 2 21140009 Extr. of gravel, clay, stone and salt etc. 103 496 160 14 671 4,82 6,38 92 1059151000 Production etc. of meat and meat products 5941 20637 3079 179 23896 3,47 3,99 5304 55287152000 Processing etc. of fish and fish products 3113 9145 2048 96 11289 2,94 3,60 2780 33504153000 Processing etc. of fruit and vegetables 793 2359 374 177 2910 2,97 3,45 708 8593154000 Mfr. of vegetable and animal oils and fats 342 1475 109 35 1618 4,31 4,63 306 3943155000 Mfr. of dairy products 3788 16442 1246 224 17912 4,34 4,67 3382 41140156009 Mfr. of starch, chocolate and sugar products 2466 10407 858 1052 12318 4,22 4,57 2202 26826158109 Mfr. of bread, cakes and biscuits 436 1460 237 14 1712 3,35 3,90 389 4489158120 Bakers' shops 181 633 772 7 1412 3,50 7,76 105 1305158300 Manufacture of sugar 153 1076 47 85 1208 7,04 7,34 137 1425159000 Mfr. of beverages 5792 28849 1679 1092 31619 4,98 5,27 4278 44172160000 Manufacture of tobacco products 70 471 14 78 563 6,74 6,94 62 614170000 Mfr. of textiles and textile products 1980 6399 1125 381 7905 3,23 3,80 1768 17828180000 Mfr. of wearing apparel; dressing etc. of fur 84 270 478 32 780 3,22 8,91 75 798190000 Mfr. of leather and leather products 127 592 95 17 705 4,67 5,42 113 1525200000 Mfr. of wood and wood products 767 3057 603 565 4225 3,99 4,77 685 9403210000 Mfr. of pulp, paper and paper products 438 2163 221 120 2504 4,93 5,44 391 4737221200 Publishing of newspapers 84 459 126 34 619 5,47 6,98 75 806221309 Publishing activities, excluding newspapers 59 277 573 81 931 4,69 14,40 53 531222009 Printing activities etc. 163 647 951 200 1798 3,97 9,81 145 1704230000 Mfr. of refined petroleum products etc. 584 2319 13 0 2332 3,97 3,99 521 6646241109 Mfr. of industrial gases and inorganic basic chemicals 113 428 77 28 534 3,79 4,48 101 1062241209 Mfr. of dyes, pigments and organic basic chemicals 399 1706 100 47 1852 4,27 4,52 357 4842241500 Manufacture of fertilizers etc. 978 2227 285 8 2519 2,28 2,57 873 5963241617 Mfr. of plastics and synthetic rubber 205 567 125 1 693 2,77 3,38 183 2630242000 Manufacture of pesticides and other chemical products 1 4 4 87 96 4,54 9,73 1 11243000 Mfr. of paints, printing ink and mastics 132 907 67 46 1020 6,88 7,38 118 1084244000 Mfr. of pharmaceuticals etc. 4204 30703 487 119 31308 7,30 7,42 3753 32640245070 Mfr. of detergents and other chemical products 1627 5100 593 81 5774 3,13 3,50 1453 15035251122 Mfr. of rubber products and plastic packing goods etc. 598 2656 336 468 3460 4,44 5,00 534 6676252300 Mfr. of builders' ware of plastic 23 89 48 76 213 3,92 6,01 20 225252400 Manufacture of other plastic products n.e.c. 161 755 221 63 1038 4,70 6,08 143 1992261126 Mfr. of glass and ceramic goods etc. 176 777 298 41 1117 4,42 6,12 157 2001263053 Mfr. of cement, bricks, tiles, flags etc. 108 291 74 46 410 2,68 3,36 97 1258

Results and analysis
75
Physical and monetary supply-use table for tap water and sewage services, Denmark 1997. Continued.Tap water Sewage
NACE Quantity Water value Fixedpayments
Connectionfees
Total Implicit priceexcl. fixedpayment
Implicit priceincl. fixedpayment
Quantity Servicevalue
1,000 m3 1,000 DKK 1,000 DKK 1,000 DKK 1,000 DKK DKK/m3 DKK/m3 1,000 m3 1,000 DKK266080 Mfr. of concrete, cement, asphalt and rockwool prod. 988 4242 655 398 5295 4,29 4,96 882 11462271000 Mfr. of basic ferrous metals 86 305 46 86 436 3,53 4,07 77 1299272030 First processing of iron and steel 126 307 102 196 605 2,43 3,24 113 1357274000 Mfr. of basic non-ferrous metals 83 181 51 189 421 2,18 2,79 74 882275000 Casting of metal products 1 3 17 11 32 3,67 23,66 1 8281009 Mfr. of construct. materials of metal etc. 593 2434 1507 1013 4954 4,11 6,65 529 6086286009 Mfr. of hand tools, metal packaging etc. 476 1809 717 210 2737 3,80 5,31 425 4820291000 Mfr. of marine engines, compressors etc. 280 1084 248 177 1509 3,88 4,76 250 2927292000 Mfr. of other general purpose machinery 247 975 440 480 1895 3,96 5,74 220 2543293000 Mfr. of agricultural and forestry machinery 92 436 207 238 880 4,75 7,01 82 948294009 Mfr. of machinery for industries etc. 144 644 465 204 1314 4,47 7,69 129 1474297000 Mfr. of domestic appliances n.e.c. 106 388 111 114 613 3,67 4,73 94 843300000 Mfr. of office machinery and computers 2 9 49 0 59 4,92 31,06 2 21310000 Mfr. of other electrical machinery and apparatus 169 759 499 676 1934 4,49 7,45 151 1715320000 Mfr. of radio and communicat. equipm. etc. 405 1235 348 70 1653 3,05 3,91 361 3935330000 Mfr. of medical and optical instrum. etc. 93 455 349 394 1198 4,88 8,62 83 1078340000 Manufacture of motor vehicles etc. 237 715 192 612 1519 3,01 3,82 212 2293351000 Building and repairing of ships and boats 450 2164 348 200 2713 4,81 5,59 401 5959352050 Mfr. of transp. equipm. excl. ships, motor vehicles etc. 50 185 72 45 302 3,72 5,17 44 610361000 Mfr. of furniture 303 988 899 1896 3783 3,26 6,24 270 3390362060 Mfr. of toys, gold and silver articles etc. 61 195 509 87 790 3,21 11,59 54 716370000 Recycling of waste and scrap 23 128 8 0 136 5,66 6,02 20 221401000 Production and distribution of electricity 5242 26145 1680 2847 30673 4,99 5,31 2895 36656402000 Manufacture and distribution of gas 26 112 25 80 217 4,25 5,21 23 290403000 Steam and hot water supply 806 2447 564 1273 4284 3,04 3,74 50 624410000 Collection and distribution of water 264 1047 587 146 1780 3,96 6,19 236 3045450000 Construction of new buildings 772 3477 11134 0 14611 4,50 18,92 690 8530501009 Sale of motor vehicles, motorcycles etc. 426 1700 1867 1316 4882 3,99 8,37 381 4456502000 Repair and maintenance of motor vehicles 350 1228 2582 555 4365 3,51 10,88 313 3731505000 Service stations 1289 6129 1292 87 7508 4,76 5,76 1151 13627510000 Ws. and commis. trade, exc. of m. vehicles 6854 38826 10945 5032 54803 5,66 7,26 6120 63493521090 Retail trade of food etc. 1113 5697 4392 242 10330 5,12 9,06 994 11742522990 Department stores 533 2617 230 582 3429 4,91 5,34 476 5935523000 Re. sale of phar. goods, cosmetic art. etc. 40 182 583 4 769 4,56 19,21 36 434524190 Re. sale of clothing, footwear etc. 61 234 2440 82 2756 3,84 43,99 54 623524490 Other retail sale, repair work 307 1242 7267 1948 10457 4,05 27,71 274 3318551009 Hotels etc. 2675 10485 2225 771 13481 3,92 4,75 2388 29248553009 Restaurants etc. 1244 4995 5524 1578 12097 4,02 8,46 1110 13185601000 Transport via railways 516 3591 210 3 3804 6,96 7,36 461 4834602100 Other scheduled passenger land transport 119 630 269 10 909 5,28 7,53 107 1249602223 Taxi operation and coach services 225 1081 508 25 1614 4,80 7,06 201 2373602409 Freight transport by road and via pipelines 319 1078 3482 176 4736 3,38 14,30 285 3381610000 Water transport 432 2583 385 4 2972 5,98 6,87 386 3942620000 Air transport 60 436 80 1 517 7,25 8,59 54 564

Results and analyses
76
Physical and monetary supply-use table for tap water and sewage services, Denmark 1997. Continued.Tap water Sewage
NACE Quantity Water value Fixedpayments
Connectionfees
Total Implicit priceexcl. fixedpayment
Implicit priceincl. fixedpayment
Quantity Servicevalue
1,000 m3 1,000 DKK 1,000 DKK 1,000 DKK 1,000 DKK DKK/m3 DKK/m3 1,000 m3 1,000 DKK631130 Cargo handling, harbours etc.; travel agencies 3164 12415 1322 368 14105 3,92 4,34 2825 33288634000 Activities of other transport agencies 95 381 469 115 965 4,02 8,96 85 944640000 Post and telecommunications 357 1642 824 6 2471 4,59 6,90 319 4068651000 Monetary intermediation 404 2039 913 10 2961 5,04 7,30 361 4132652000 Other financial intermediation 78 447 176 431 1054 5,74 7,99 70 787660102 Life insurance and pension funding 27 162 60 1 224 6,06 8,31 24 285660300 Non-life insurance 128 772 289 0 1061 6,03 8,29 114 1254670000 Activities auxiliary to finan. intermediat. 31 213 71 0 284 6,79 9,05 28 281701109 Real estate agents etc. 237 1304 1105 23 2432 5,51 10,19 211 2261702009 Dwellings 437 1658 4168 64504 70331 3,80 13,34 390 4643702040 Letting of non-residential buildings 587 2101 1845 3862 7808 3,58 6,73 524 6504710000 Renting of machinery and equipment etc. 97 327 796 155 1279 3,39 11,63 86 917721009 Computer activities exc. software consultancy and supply 47 276 429 1 706 5,88 14,99 42 496722000 Software consultancy and supply 22 99 1326 50 1474 4,55 65,34 19 211730001 Research and development (market) 11 62 26 0 88 5,47 7,73 10 125730002 Research and development (other non-market) 70 385 159 0 544 5,47 7,73 63 776741100 Legal activities 95 497 214 1 712 5,24 7,49 85 978741200 Accounting, book-keeping, auditing etc. 166 801 375 13 1189 4,82 7,07 148 1744742009 Consulting engineers, architects etc. 127 643 2596 168 3407 5,05 25,42 114 1225744000 Advertising 99 546 224 44 814 5,52 7,77 88 1005747000 Industrial cleaning 352 1656 794 7 2457 4,71 6,97 314 3717748009 Other business activities 381 2043 860 163 3065 5,36 7,62 340 3966751100 General (overall) public service activities 613 2822 294 0 3116 4,61 5,09 547 6581751209 Reg. of public service activities exc. for business 181 1088 408 760 2256 6,02 8,28 161 1851751300 Reg. of and contribution to more eff. op. of business 98 580 221 0 800 5,93 8,19 87 990752000 Provision of services to the community 1167 5307 2633 176 8116 4,55 6,81 1042 12230801000 Primary education 12198 51382 3863 678 55923 4,21 4,53 10891 132771802000 Secondary education 4135 19600 1309 113 21023 4,74 5,06 3692 43266803000 Higher education 1814 10691 574 21 11287 5,89 6,21 1619 18417804001 Adult and other education (market) 31 140 15 48 203 4,56 5,04 27 329804002 Adult and other education (other non-market) 258 1177 124 0 1301 4,56 5,04 230 2768851100 Hospital activities 4078 20526 1291 20 21837 5,03 5,35 3641 43448851209 Medical, dental, veterinary activities etc. 597 2671 1347 434 4452 4,48 6,73 533 6416853109 Social institutions etc. for children 6242 28320 2998 57 31375 4,54 5,02 5573 67508853209 Social institutions etc. for adults 2146 9434 1031 2505 12971 4,40 4,88 1916 23111900010 Sewage removal and disposal 573 2063 350 350 2763 3,60 4,21 512 6111900020 Refuse collection and sanitation 136 566 291 38 895 4,17 6,31 121 1541900030 Refuse dumps and refuse disposal plants 395 1915 175 353 2444 4,84 5,29 353 4320910000 Activities of membership organiza. n.e.c. 369 1885 834 82 2801 5,10 7,36 330 3837920001 Recreational, cultural, sporting activities (mrkt.) 265 1397 84 3147 4628 5,26 5,58 237 2725920002 Recreational, cultural, sporting act. (other non-mrkt.) 1601 8427 507 1108 10041 5,26 5,58 1429 16444930009 Service activities n.e.c 2156 11002 4384 502 15888 5,10 7,14 1925 22198950000 Private households with employed persons 7 38 16 0 54 5,42 7,68 6 73
Source: Statistics Denmark – 1997 water accounts related to NAMEA

Results and analysis
77
Graphic analysesGraphic presentations of the prices have been introduced in the report in order to summarise the informationcollected.
Figure 3.1-1 Implicit water prices by industry (NACE 1-digit level), Denmark 1997, DKK/m3
Source: Statistics Denmark – 1997 water accounts related to NAMEA
The 'implicit' price presented in the graph corresponds to the ratio [value of uses/volumes]. It excludesconnection fees, since this component does not actually provide information about price variations.
From this rather aggregated breakdown of activities, some quick conclusions can be drawn: agriculture payswater at a lower price than other activities. Construction activities and financial intermediaries contributesubstantially to the ‘fixed payment’ element. However, Denmark Statistics noted that location is probably themain element that explains the price. Rural/urban area could also be a discriminating element. Some wateroperators prefer relatively low unit prices and higher fixed payment and some the inverse. The minimum unitprice observed in 1996 among DVF members was 0.5, the maximum 11.25 DKK/m3. The minimum fixedpayment was 0, the maximum 1 150 DKK/year.
NAMEAA full 128x128 input/output table was established with the information collected. A reduced form of theDanish NAMEA is reproduced on next page. The water supply activity (NACE 41) has been isolated.

Results and analyses
78
Table 3.1-2 Danish water NAMEA 1997Production activity Final demand Water discharges
1 2 3a 3b 4 5 6 7 8 Privateconsum
ption
Gov.consump
tion
Gr. fixedCap.Form.
Exports OtherTotal
Addedto
products
Dischargeto sewer
Otherdischarge
Total
Opening stock1. Agriculture,fishing andquarrying 10 630 44 921 3 922 1 1 802 327 22 74 613 3 434 1 089 1 18 079 1 335 86 250 508 4 045 429 931 434 4842. Manufacturing 7 742 72 294 470 43 29 651 13 270 5 602 12 390 9 126 50 160 1 210 25 061 219 929 5 872 452 821 3 971 35 743 209 787 249 5013a. Electricity, gasand heating supply 1 059 5 546 1 873 71 95 2 762 682 973 3 274 15 300 0 0 3 962 227 35 823 0 2 968 5 217 687 5 220 6553b. Water supply 146 195 30 94 15 115 39 85 220 1 788 0 0 0 0 2 728 0 236 469 614 469 8504. Construction 1 168 1 909 1 907 460 1 214 1 333 3 127 14 608 5 706 5 547 6 095 89 779 13 23 132 889 0 690 82 7725. Wholesale andretail trade; hotelsand restaurants 5 416 28 564 226 19 15 407 12 179 6 687 4 009 7 312 116 649 1 660 19 501 30 685 2 036 250 350 0 13 297 1 995 15 2926. Transportstorage andcommunication 1 689 12 446 69 125 2 995 24 438 24 167 9 802 12 551 26 273 837 4 61 656 792 177 844 0 4 723 564 5 2877. Financialintermediation,business activities 3 809 19 614 687 428 19 893 29 018 8 303 37 350 21 842 122 298 3 295 7 068 6 150 42 193 321 946 0 3 031 365 3 3968. Public andpersonal services 1 197 4 900 162 132 1 496 4 822 2 580 6 518 19 498 56 037 267 210 113 1 067 2 484 368 217 0 34 872 5 479 40 3519. Households 0 254 976 28 505 283 481Imports 8 239 95 381 3 378 23 14 605 13 517 44 982 5 221 12 258 58 064 1 818 35 190 69 609 7 609 369 893Taxes, net -2 081 -1 046 103 18 727 3 782 2 353 13 271 16 277 105 304 1 315 23 151 -4 259 347 159 263Compensation ofempl., operatingsurplus 47 236 168 096 22 996 1 313 44 989 144 786 79 300 217 648 259 539 0 0 0 0 -31 051 954 853Total (Mio DKK) 86 250 452 821 35 823 2 728 132 889 250 350 177 844 321 946 368 217 560 854 284 529 199 868 406 891 31 867 3 312 877Groundwater 389 819 52 967 4 070 467 926 0 400 0 0 1 267 17 881 934 330Surface water 8 507 6 107 1 386 1 660 0 0 0 0 24 0 17 684Sea water 0 149 326 5 209 125 0 0 0 0 0 0 0 5 358 451Tap water 36 158 41 101 6 074 264 772 14 892 5 287 3 396 39 060 265 600 412 604Total (1 000 m3) 434 484 249 501 5 220 655 469 850 772 15 292 5 287 3 396 40 351 283 481 4479 354 581 6 364 009 6 723 069
Source: Statistics Denmark – 1997 water accounts related to NAMEA

Results and analysis
79
3.1.2 SpainSpain used the set of pilot tables practically in its entirety to present its results, which proves the proposal’sfeasibility, at least in the Spanish case. It must be remembered that Spain’s data collection system is basedon surveys. As already mentioned, water is particularly important for the Spanish economy, and wellmonitored.
The next pages reproduce pilot tables 1 and 13 without any adaptation.
Spain is a one of the two countries, together with the Netherlands, that conducted a tentative evaluation ofthe central or regional government expenditures regarding water management (CPA column Part 75.12.13 inthe pilot table 1). The production of water-related administrative services, related to the production of watersupply activity is 2,6% in Spain whereas it amounts to 32% in the Netherlands (output of ‘Water Boards’).
As in Denmark, agriculture does not pay the same price as other activities, even for drinking water: theresults suggest less than 10 pesetas against an average of 83 pesetas. Agriculture is also the only activitywhere the price of wastewater treatment services surpasses that of distributed water (together, this time, withmining and quarrying of energy-producing materials). These 'rough' results would need more in-depthanalysis: according to the volumes of water flows not all wastewater is treated in rural areas.
Table 3.1-5 and Table 3.1-6 correspond to the multiple pilot tables 3 and 4 of Eurostat’s set. These multipletables have been aggregated into one, including all water-related products.
In Table 3.1-6 (expenditures for ancillary activities related to water), among current expenditure, only thepurchases of intermediate consumption products could be estimated, and not the compensation ofemployees.

Results and analyses
80
Table 3.1-3 Supply table of water-related services, Spain 1999, million ESPCPA code of the product Part 01.41.11 41.00.11 41.00.12 41.00.20.01 41.00.20.02 41.00 Part 75.12.13 90.00.11
ProductEconomic activities
Operation ofirrigationsystems
Drinkingwater
Non drinkingwater
Distributionservices of
drinking water
Distributionservices of nondrinking water
Totaldistributed
water
Water-relatedadministrative
services
Sewageremoval &treatment
total production at basic prices 61 060 303 014 13 220 40 435 28 820 385 489 9 563 108 423O1* Operation of irrigation systems 61 060A* Agriculture, Hunting and forestryB FishingCA Mining and Quarrying of energy producing materialsCB Mining and Quarrying except energy producing materialsDA Manufacture of food products; Beverages and tobaccoDB Manufacture of textiles and textile productsDC Manufacture of leather and leather productsDD Manufacture of wood and wood productsDE Manufacture of pulp and paper products; publishing and printingDF Manufacture of coke, refined petroleum products and nuclear fuelDG Manufacture of chemicals, chemical products and man-made fibresDH Manufacture of rubber and plastic productsDI Manufacture of other non-metallic mineral productsDJ Manufacture of basic metals and fabricated metal productsDK Manufacture of machinery and equipment n.e.c.DL Manufacture of electrical and optical equipmentDM Manufacture of transport equipmentDN Manufacturing n.e.c.41 Collection, purification and distribution of water 303 014 13 220 40 435 28 820 385 489E* Electricity, gas and water supplyF Construction75* Public administration and Defence; compulsory social security 9 56390* Sewage removal and treatment 108 423R* Others activities (G to Q, except 75* & 90*)Taxes on products 487 1 640 1 640 2 948
Of which environmentalSubsidies on products 1 768 3 846 3 846 1 803
Of which environmentalImports CIFTotal supply at purchasers prices 59 779 300 808 13 220 40 435 28 820 383 283 9 563 109 568
* Specifically defined classes. Source: Eurostat Working Paper n° 2/2001/B/6 – Water Satellite Accounts for Spain 1997-1999
Results and analysis
81
Table 3.1-4 Average purchasers’ prices of water-related products, Spain 1999, ESP/m3
Economic product
Economic agent
Part 01.41.11Operation of
irrigationsystems
41.00.11Drinking water
41.00.12Non drinking
water
41.00.20.01Distributionservices of
drinking water
41.00.20.02Distribution
services of nondrinking water
41.00Total
distributedwater
90.00.11Sewage
removal andtreatment
01* Operation of irrigation systems 90.26 33.81 31.63
A* Agriculture, hunting and forestry, except 01* 3.02 9.89 27.56 1.38 11.62 28.40 34.59
B Fishing 98.27 13.84 120.62 31.32
CA Mining and quarrying of energy producing materials 25.96 3.74 49.83 52.36
CB Mining and quarrying except energy producing materials 27.58 4.26 69.28 12.64
DA Manufacture of food products; beverages and tobacco 83.26 11.60 116.68 72.71
DB Manufacture of textiles and textiles products 96.35 13.40 183.10 83.24
DC Manufacture of leather and leather products 78.19 10.08 168.08 63.68
DD Manufacture of wood and wood products 61.70 8.35 84.35 54.61
DE Manufacture of pulp, paper; publishing and printing 65.93 9.20 124.82 49.42
DF Manufacture of coke, refined petroleum and nuclear fuel 54.74 7.64 74.90 68.27
DG Manufacture of chemicals, man-made fibres 71.14 9.91 100.58 66.12
DH Manufacture of rubber and plastic products 69.81 9.72 112.77 54.64
DI Manufacture of other non-metallic mineral products 75.29 10.69 97.47 45.93
DJ Manufacture of basic metals and fabrication of metal products 78.84 10.99 98.55 49.28
DK Manufacture of machinery and equipment n.e.c. 84.86 11.79 114.14 76.55
DL Manufacture of electrical and optical equipment 80.52 11.26 106.70 44.51
DM Manufacture of transport equipment 61.76 8.59 73.69 42.30
DN Manufacturing n.e.c. 66.27 9.31 88.12 46.39
41 Collection, purification and distribution of water 83.03
E* Electricity, gas and water supply, except 41 87.84 12.28 118.80 67.58
F Construction 78.28 10.93 91.91 29.80
75* Public administrative services for water supply and sewage systems 95.73 14.62 113.04 44.15
90* Sewage removal and treatment services 62.43 20.32 8.75 34.40 60.30
R* Other services (G to Q, except 75* and 90*) 81.48 33.19 11.79 10.67 89.22 34.90
Average price of intermediate consumption of industries 3,02 71.25 26.44 10.24 76.72 86.18 44.09
Average price for households' final consumption 90.86 32.71 11.82 1.75 99.71 41.82
Average FOB price for exportsAverage purchaser's price 3,02 83.51 27.79 11.23 60.58 94.00 42.43
Source: Eurostat Working Paper n° 2/2001/B/6 – Water Satellite Accounts for Spain 1997-1999

Results and analyses
82
Table 3.1-5 Economic accounts for water-related economic activities, Spain 1999, millionESP
Non-financialcorporations
GeneralGovernment
NPISH Households Total
Production and generation of income accounts1 Total intermediate consumption 291 314 1 670 292 9842 Total value added, gross 263 658 7 893 271 551
2.1 Compensation of employees 138 554 3 030 141 5842.2 Other taxes on production 3 045 3 045
Of which: environmental taxes2.3 Less other subsidies on production 2 554 2 554
Of which: environmental subsidies2.4 Consumption of fixed capital 4 863 4 8632.5 Net operating surplus 124 613 124 613
3 Total output at basic prices 554 972 9 563 564 5353.1 Market 554 972 554 9723.2 Non-market 9 563 9 563
Supplementary information about fixed capital and labour inputs4 Investment grants5 Gross fixed capital formation 137 198 54 030 191 2286 Closing stocks of fixed assets7 Total hours worked (number of hours) 65 674 941 66 615
Source: Eurostat Working Paper n° 2/2001/B/6 – Water Satellite Accounts for Spain 1997-1999
Table 3.1-6 Expenditure for ancillary water-related activities, Spain 1999, million ESP
Current expenditureEconomic activities Intermediate
consumptionOther currentexpenditure
Capitalexpenditure
01* Operation of irrigation systems
A* Agriculture, hunting and forestry, except 01* 5 324 1 590
B Fishing 125 35CA Mining and quarrying of energy producing materials 167 715
CB Mining and quarrying except energy producing materials 205 680DA Manufacture of food products; beverages and tobacco 167 7 358
DB Manufacture of textiles and textiles products 1 295 1 052DC Manufacture of leather and leather products 121 997
DD Manufacture of wood and wood products 116 140
DE Manufacture of pulp, paper; publishing and printing 719 732DF Manufacture of coke, refined petroleum and nuclear fuel 416 722
DG Manufacture of chemicals, man-made fibres 1 410 11 748DH Manufacture of rubber and plastic products 121 5 009
DI Manufacture of other non-metallic mineral products 65 2 262
DJ Manufacture of basic metals and fabrication of metal products 279 515DK Manufacture of machinery and equipment n.e.c. 132 459
DL Manufacture of electrical and optical equipment 80 442DM Manufacture of transport equipment 263 472
DN Manufacturing n.e.c. 29 419E F, 75*, 90*, R* no data available
Total industries 11 034 35 347
Households for final consumptionTotal 11 034 35 347
Source: Eurostat Working Paper n° 2/2001/B/6 – Water Satellite Accounts for Spain 1997-1999

Results and analysis
83
3.1.3 IrelandNational accounts dataThe public suppliers of water and wastewater services in Ireland are the local authorities. The CentralStatistics Office receives data on production costs from the DoELG (Department of the Environment & LocalGovernment), on water supply and on wastewater treatment separately, data to which are added estimatesfor private water schemes mainly in rural areas and for some administrative expenditures which cannot bebroken down between water supply and wastewater treatment.
The DoELG also provides data on:• receipts from charges on the household sector (recently abolished) and from the commercial sector (no
breakdown between water supply and wastewater services),• contributions to the capital cost made by industry,• quantities of water consumed and of wastewater collected.
Using the data described above, interpolating for the years in-between and assuming general stability ofproportions, a rather coherent time-series of water consumption was elaborated for the 1991-1998 period.
Table 3.1-7 National accounts data on water-related services, Ireland 1991-1998, 1 000 IEP1991 1992 1993 1994 1995 1996 1997 1998
PUBLIC WATER SUPPLYCURRENT
Expenditure incl. Admin. 83 364 87 038 91 652 99 917 106 427 112 002 116 974 123 294Of which: Domestic 54 186 56 575 59 574 63 947 67 049 69 441 71 354 73 977
Non-domestic 29 177 30 463 32 078 35 970 39 378 42 561 45 620 49 318Receipts from charges* 48 780 55 650 60 490 72 030 77 650 74 920 45 860 42 310Of which: Domestic 24 890 29 030 32 110 39 780 44 880 40 870 10 400 2 310
Non-domestic 23 890 26 620 28 380 32 250 32 770 34 050 35 460 40 000CAPITAL
Expenditure incl. Admin 55 347 47 329 27 726 30 418 68 080 66 173 82 208 n.aQuantity of water consumed (million m3) 240 246 252 259 265 272 279 287
Domestic 157 158 159 161 162 164 166 168Non-domestic 83 88 93 98 104 109 113 119
Current cost per m3 (IEP) 0 35 0 35 0 36 0 39 0 40 0 41 0 42 0 43Of which: Domestic 0 34 0 36 0 37 0 40 0 41 0 42 0 43 0 44
Non-domestic 0 35 0 35 0 34 0 37 0 38 0 39 0 40 0 42WASTEWATER SERVICES
CURRENTExpenditure incl. Admin 37 187 39 881 41 215 43 652 45 212 48 449 51 483 56 518Of which: Domestic 31 609 33 899 35 033 37 105 38 431 41 181 43 761 48 040
Commercial 5 578 5 982 6 182 6 548 6 782 7 267 7 722 8 478Receipts from charges 5 600 6 260 6 670 7 390 9 490 9 230 8 580 7 630Of which: Domestic 1 100 1 190 1 260 1 340 3 250 2 740 1 820 10
Commercial 4 5 5 070 5 410 6 050 6 240 6 490 6 760 7 620CAPITAL
Expenditure incl. Admin 52 114 57 476 45 871 65 905 56 654 67 615 104 440 n.a.
Source: Environmental accounts: Time series + eco-taxes – ESRI, February 2001
Results and analyses
84
Figure 3.1-2 Current costs, payments and ‘subsidy’ per cubic metre of water consumed byhouseholds, Ireland
Source: Environmental accounts: Time series + eco-taxes – ESRI, February 2001
Figure 3.1-3 Current costs, payments and ‘subsidy’ per cubic metre consumed by industries,Ireland
Source: Environmental accounts: Time series + eco-taxes – ESRI, February 2001
Water supply data based on the Census of Industrial Production (CIP)In this census, enterprises from the NACE 41 sector have been asked for the total volume supplied and forthe value of water broken down according to four types of customers: other water enterprises, publicadministration (street cleaning), households and industries.
The CIP only covers water supply, that is NACE 41, and not wastewater treatment. The rationale for this isthat water supply is considered to be the provision of a good, whereas wastewater treatment is considered tobe a service.
There is a close correspondence between the value of gross output of water supply given by the CIP andNational Accounts raw data that exclude the cost of administration.
0.00
0.10
0.20
0.30
0.40
0.50
1990 1991 1992 1993 1994 1995 1996 1997 1998 1999
Irish
pou
nds
Payments Subsidised
0.00 0.05 0.10 0.15 0.20 0.25 0.30 0.35 0.40 0.45 0.50
1990 1991 1992 1993 1994 1995 1996 1997 1998 1999
Irish
pou
nds
Payments Subsidised

Results and analysis
85
Table 3.1-8 Comparing national accounts and industrial census data for water supply,Ireland, million IEP
1991 1992 1993 1994 1995 1996
CIP Gross Output 68.3 71.7 81.2 82.8 84.2 94.2
National accounts data (excluding administrative expenditure) 69.0 71.5 75.3 81.9 88.1 93.0
Source: Environmental accounts: Time series + eco-taxes – ESRI, February 2001
The CIP data provide the production account for water-supply industry. There is however some uncertaintyas concerns the operating surplus ('remainder of net output'), whose level fluctuates over time. According tothe comments made by ESRI some purchase of outside services and contracted work or capital outlays maybe included.
Table 3.1-9 Production accounts of water supply operators, Ireland 1994 – 1998, million IEP
1994 1995 1996 1997 1998
Gross Output 82.77 84.25 94.24 84.87 67.69
Materials 13.12 15.18 18.00 20.17 19.97
Energy 9.47 9.10 9.18 9.13 9.24
Industrial input 22.59 24.28 27.18 29.30 29.20
Net output (GVA) 60.18 59.97 67.06 55.57 38.49
Wage bill 28.22 29.49 29.42 31.31 33.85
Remainder of net output (operating surplus) 31.96 30.48 37.64 24.26 4.64
Employed persons in thousands 2.15 2.12 2.03 2.08 2.06
Volume of water distributed in million m3 550 570
Source: Environmental accounts: Time series + eco-taxes – ESRI, February 2001
It should also be noted that according to the CIP statistics 570 millions m3 of water have been produced in1998 whereas only 287 millions m3 were delivered to the final users according to the national accounts. Areason for that is leakage due to the apparently poor state of the network.
3.1.4 PortugalFor the economic part, Portugal compiled supply-use tables as well as economic accounts for water-relatedactivities (Eurostat pilot table 3). Only economic accounts are reproduced below, notably to show, bycomparison with the same table provided by Spain (see table 3.1-5), the possible analyses.
Unfortunately, as in Spain, the detail according to the type of activity (water supply, sewage services, water-related administrative services) has not been supplied. Unlike in the Spanish table, the activity of operationof irrigation systems is not included. Both countries included the accounts for water-related administrativeservices.
The participation of the general government seems much higher in Portugal than in Spain (through the roleof the municipalities). Unlike in Spain, general government in Portugal does not only supply administrativeservices, it is directly involved in the provision of water supply and wastewater services, for the main part asa non-market supplier.
The shares of the intermediate consumption within the output are not very different: 47% in Portugal, 52% inSpain, but the shares of the compensation of employees are radically different: 4% in Portugal and 25% inSpain. The net operating surplus is sufficient to cover the gross fixed capital formation in Portugal, but not inSpain. However, detail is needed on the ownership of the capital. In Portugal, the “upstream” watermanagement for the water supply (from abstraction to reservoirs) is often delegated to private enterprises,while the “downstream” management (distribution) is the responsibility of the municipalities, indicating that, atleast, the distribution network is owned by the general government sector.
Results and analyses
86
Table 3.1-10 Economic accounts for water-related economic activities, Portugal 1998, millionPTE
Non-financial
corporations
Generalgovernment
NPISH Households Total
Production and generation of income accounts
1 Total intermediate consumption 46 339 8 640 54 9792 Total value added, gross 58 219 39 174 97 393 2.1 Compensation of employees 3 849 7 817 11 666 2.2 Other taxes on production 169 0 169 of which environmental taxes 0 0 0 2.3 Less other subsidies on production 1 137 0 1 137 2.4 Consumption of fixed capital 13 186 34 060 47 246 2.5 Net operating surplus 42 152 -2 703 39 4493 Total output at basic prices 104 558 47 814 152 372 3.1 Market 104 558 17 231 121 789 3.2 Non-market 30 583 30 583
Supplementary information about fixed capital and labour inputs
4 Investment grants 11 793 11 7935 Gross fixed capital formation 21 214 51 876 73 0906 Closing stocks of fixed assets7 Total hours worked
Source: Source: Water accounts project 1998 – Final report to Eurostat – June 2002
3.1.5 SwedenSupply-use table of water-related products
Every year, the VAV carries out a rather detailed survey about production costs and investments withinpublic waterworks and MWWTP in Sweden. Total expenditure has been derived from this survey, after someadjustments. The expenditure has then been broken down by NACE according to the uses of water by eachNACE, after deduction of public waterworks’ own use.
Pilot tables 1 and 2 are presented together below. Investments for public water services are reported in thesame table.

Results and analysis
87
Table 3.1-11 Supply and use of water-related products, Sweden 1995, million SEKDistributed water Wastewater servicesNACE code
Supply Use Investment Supply Use Investment1 Agriculture2 Forestry
10/14 Mining and quarrying 7 1015/16 Food products, beverages, tobacco 132 19117/19 Textiles, textile products, leather 12 18
20 Wood, products of wood, cork, straw, etc. 6 921 Pulp, paper and paper products 17 2422 Publishing, printing and reproduction 13 1823 Coke, refined petroleum and nuclear fuel 1 224 Chemicals and chemical products 96 13925 Rubber and plastic products 5 726 Non-metallic mineral products 14 2027 Basic metals 44 6328 Fabricated metals, except machinery 21 3129 Machinery and equipment n.e.c. 28 4030 Office machinery and computers 2 3
31/32 Electrical machinery, radio, TV, etc. 17 2533 Medical, precision, optical instruments, etc. 5 8
34/35 Motor vehicles and other transport eq. 33 4736/37 Other manufacturing 4 5
Not possible to disaggregate by sector 33 4840 Electricity, gas, steam and hot water supply 34 4941 Collection, purification, distribution of water 4 127 58345 Construction
50/52 Wholesale and retail trade55 Hotels and restaurants
60/64 Transport, storage and communication62 Financial intermediation 728 1 056
71/74 Renting and business activities80/99 Other, excluding 90.0190.01 Sewage disposal 5 981 1 220
75 Public administration70 Real estate (Households) 2 681 3 886
Unspecified use 194 282TOTAL 4 127 4 127 583 5 981 5 981
Note: The lump sum for construction etc., includes a subsidy from the municipalities to all other economic sectors of 256 million SEK fordistributed water and of 371 million SEK for wastewater treatment.
Source: Water Accounts. Physical and monetary data connected to abstraction, use and discharge of water in theSwedish NAMEA – Statistiska centralbyrån, December 1999
Breakdown of production costsThe VAV survey also makes it possible to distribute current and capital costs according to variouscomponents. Although this presentation is not in line with pilot table 3 (production accounts) it providesinteresting information: magnitude of the consumption of fixed capital within current costs and distribution ofinvestment.

Results and analyses
88
Table 3.1-12 Breakdown of production costs for water supply and wastewater treatment,Sweden 1995, million SEK
Water supply Wastewater treatmentCurrent costs 4 127 5 981
Production 1 159 1 968Distribution 1 028 1 131Pressure intensification 99 299Administration 375 479Consumption of fixed capital 1 466 2 105
Investment 583 1 220Distribution network 373 563Reservoirs 28 89Water plants 178 563Other purchases 4 6
Source: Water Accounts. Physical and monetary data connected to abstraction, use and discharge of water in theSwedish NAMEA – Statistiska centralbyrån, December 1999
The report indicates: "the production costs should (in principle) be financed through one fee for bothservices. According to the ‘Municipal accounts 1995’, however, the gross receipts from the fee do not coverthe total costs. A difference of 7 percent has been considered as a subsidy from municipalities to theircustomers". (see footnote on table 3.1-10)
Ancillary activities related to water (pilot table 4)
Not all the necessary information could be collected on this topic. Expenditure for self-supply of wastewaterservices was available through the SERIEE studies, but the expenditure for self-supply of water was notavailable. Tentative estimates of irrigation costs have been added.
Table 3.1-13 Environmental protection expenditure for water in industry, Sweden 1997,million SEK
NACE code Services produced for ownaccount (ancillary activities)
Purchasedservices* Total Investment
10/14 Mining and quarrying 4 1 5 1315/16 Food products, beverages, tobacco 93 71 164 4817/19 Textiles, textile products, leather 8 26 34 15
20 Wood, products of wood, cork, straw, etc. 5 3 8 1021 Pulp, paper and paper products 383 5 387 53722 Publishing, printing and reproduction 1 1 2 1223 Coke, refined petroleum and nuclear fuel 11 0 11 024 Chemicals and chemical products 136 11 148 4725 Rubber and plastic products 1 2 3 226 Non-metallic mineral products 5 4 9 327 Basic metals 102 10 112 2328 Fabricated metals, except machinery 36 7 43 5729 Machinery and equipment n.e.c. 9 6 15 2930 Office machinery and computers 0 0 1 0
31/32 Electrical machinery, radio, TV, etc. 40 6 46 1633 Medical, precision, optical instruments, etc. 1 3 4 0
34/35 Motor vehicles and other transport equip. 57 8 65 1136/37 Other manufacturing 21 6 28 3
40 Electricity, gas, steam and hot water supply 6 5 11 15TOTAL 919 175 1 094 840
Source: Water Accounts. Physical and monetary data connected to abstraction, use and discharge of water in theSwedish NAMEA – Statistiska centralbyrån, December 1999
It should be noted that the purchased services in the above table are largely underestimated: according totable 3.1-10 above the purchase of wastewater treatment services by NACE 10 to 40 industries is 758

Results and analysis
89
millions SEK. Reason of the discrepancy could be that when answering to environmental protection surveyenterprises do not consider their payments for collective wastewater services as environmental protection.Moreover these payments are difficult to isolate within the water bill.
Expenditure in agriculture
The information collected shows that the irrigation costs were as follows:
• For surface water, the fixed cost per hectare was 1 100 SEK and the variable cost was 262 SEK perhectare.
• For groundwater, 1 200 SEK per hectare for fixed cost and 252 SEK per hectare for the variable cost.
As the area which needed irrigation was estimated at 56 000 hectares in a normal year and at around 90 000in a dry year and as the distribution between the types of origin of the water has been estimated at ¾ surfacewater and ¼ groundwater, the total costs for irrigation in Sweden were estimated at 78 million SEK for anormal year and to 125 million SEK for a dry year.
According to meteorological conditions, these expenditures give rise to a variation of 1 to 1.5.
Figure 3.1-4 Irrigation costs Sweden thousands SEK
Source: Water Accounts. Physical and monetary data connected to abstraction, use and discharge of water in theSwedish NAMEA – Statistiska centralbyrån, December 1999
Environmental-economic profiles for some manufacturing industriesThe Swedish report also gives an example of possible analyses when economic and environmental data arepresented in a coherent framework.
The so-called ‘environmental-economic profiles’ show the shares that a specific sector makes in themanufacturing industries total in diverse economic and environmental data: production, value added, inputfactors such as hours worked, use of energy, use of water, discharge to water and environmentalexpenditures and investments related to wastewater treatment.
As can be seen from the four profiles selected hereafter, in proportion to its share in the Swedish economy(less than 10% of the output or of the value added of the manufacturing sector), the pulp and paper industrytakes a larger share in water uses, in particular in the water used in industrial processes where its shareattains 80%. It participates very little to the payments of the MWWTP services, but a great deal (40%) to themanufacturing industry expenditures as internal activities.
0
20000
40000
60000
80000
100000
120000
140000
Normalyear
Dryyear
Type of year
Tota
l cos
t
Groundwater
Surface water
1000 SEK

Results and analyses
90
Figure 3.1-5 Environmental-economic profiles for some Swedish industries
Note: EPE = Environmental protection expenditure, EPI = Environmental protection investment.
Source: Water Accounts. Physical and monetary data connected to abstraction, use and discharge of water in theSwedish NAMEA – Statistiska centralbyrån, December 1999
3.1.6 NorwayNorway’s work about the water economy was restricted to analysing the production accounts of the publicwastewater sector. The following table summarises the major results from the annual survey on municipalwastewater treatment plants.
The results from the current annual survey do not provide enough detail to fill in the pilot tables. From thesurvey data it has not been possible to identify, for example, intermediate consumption, compensation ofemployees, subsidies or taxes on production. This data will be available from the new system of municipal
0 20 40 60 80 100
0 20 40 60 80 100
Pulp, paper and paper productsNACE 21
EPE, internal expenditures
Hours worked
Own discharge of water m 3
Discharge to MWWTP
Use of energy
EPE, payments to MWWTP
EPI for waste water
Use of non-market prod. water
Other use of water
Use of market prod. water
Use of cooling water
Use of process water
Production value
%
%
Value added
EPE, internal expenditures
Hours worked
Own discharge of water m 3
Discharge to MWWTP m 3
Use of energy
EPE, payments to MWWTP
EPI for waste water
Use of non-market prod. water
Other use of water
Use of market prod. water
Use of cooling water
Use of process water
Production value
Value added
Basic metalsNACE 27
0 20 40 60 80 100
0 20 40 60 80 100
Chemicals and chemical productsNACE 24
Other manufacturing industries
Results and analysis
91
accounts. Another problem, which Statistics Norway had not been in a position to solve, is how to breakdown the income from fees between households and other users (schools, hospitals, enterprises, etc.).
Table 3.1-14 Costs and income from user fees in the municipal wastewater sector, Norway,billion NOK
Year Overheads, runningand maintenance costs
Capital costs Total Costs Income from user fees
1999 2.08 1.96 4.04 3.661998 1.93 1.60 3.53 3.461997 1.85 1.41 3.26 3.281996 1.78 1.47 3.25 3.091995 1.71 1.50 3.21 2.961994 1.60 1.43 3.03 2.751993 1.44 1.60 3.04 2.36
Source: Wastewater statistics, Statistics Norway
Some envisaged ways of allocating user fees had been the new dwelling register that is part of the 2001population census (with the information of the dwelling’s connection to the wastewater network) or thehousehold budget survey. According to the national accounts, households paid 51.4% of the product‘municipal sewage fees’ in 1997.
The information available for general government activities for environment-related activities shall be muchbetter when the new COFOG classification of government expenditures by purpose is implemented.
3.1.7 Comparisons between countriesComparison between countries was limited to prices and costs.
Table 3.1-15 Comparison of average prices per industry, Denmark, Spain and Sweden(euro/m3)
Denmark 1997 Spain 1997 Sweden 1995Price in euro/m3 Water Waste-
waterservices
Water Waste-water
services
Water Waste-water
servicesA, B Agriculture, forestry, fisheries 0.55 1.68 0.21 0.06C Mining and quarrying 0.87 1.54 0.19 0.04 0.57 0.93DA Food products, beverages and tobacco 0.60 1.51 0.35 0.14 0.55 0.81DB+DC Textiles and leather products 0.55 1.38 0.55 0.14 0.52 0.63DD Wood and wood products 0.64 1.84 0.26 0.11 0.51 0.73DE Pulp, paper, publishing and printing 0.97 1.57 0.39 0.10 0.56 0.45DF Coke, petroleum and nuclear fuel 0.53 1.71 0.23 0.13 0.40 0.60DG Chemicals and man-made fibres 0.76 1.24 0.30 0.12 0.54 2.78DH Rubber and plastic products 0.67 1.67 0.32 0.11 0.54 0.63DI Other non-metallic mineral products 0.68 1.74 0.29 0.09 0.55 0.82DJ+DK+DL+DM Metal products and machinery 0.73 1.60 0.28 0.10 0.55 0.86DN Manufacturing n.e.c. 0.94 1.68 0.27 0.09 0.62 0.8640 Electricity, gas, steam, hot water supply 0.68 1.69 0.37 0.15 0.55 7.24F-O Construction and other service branches 0.84 1.57 0.29 0.09 0.90 1.31
Unknown industries 0.55 7.08Total industries 0.71 1.55 0.28 0.10 0.71 1.17Households 0.80 1.47 0.30 0.12 0.54 0.79Unknown users 0.54 0.79Total 0.77 1.49 0.29 0.11 0.59 0.88
Note: This comparison should be interpreted with great care. The products are not necessarily equivalent. For instance, withindistributed water, non-drinking water is supplied in Spain.

Results and analyses
92
Table 3.1-16 Comparison of costs of water supply and wastewater treatmentUnit IRL(*) S F(*) NO E(*)
1997 1995 1997p 1999 1999Water supply
Current Mio euro 156 442 6 839Capital Mio euro 110 62 1 984Receipts Mio euro 61 442 7 063Quantity Mio m3 279 936 4 621Unit current costs euro per m3 0.56 0.47 1.48Unit total costs euro per m3 0.95 0.54 1.91Unit current costs euro/inhabitant 43 50 117Unit total costs euro/inhabitant 73 57 151Recovery of current costs percent 39% 100% 103%Recovery of total costs percent 23% 88% 80%
Wastewater servicesCurrent Mio euro 69 641 250Capital Mio euro 139 131 236Receipts Mio euro 11 641 440Quantity Mio m3 866Unit current costs euro per m3 0.74Unit total costs euro per m3 0.89Unit current costs euro/inhabitant 73 56Unit total costs euro/inhabitant 87 109Recovery of current costs percent 16.7% 100.0% 176.0%Recovery of total costs percent 5.5% 83.1% 90.6%
Total water-related servicesCurrent Mio euro 225 1 083 1 350Capital Mio euro 249 193 587Receipts Mio euro 73 1 083 1 704Unit current costs euro/inhabitant 61 123 34Unit total costs euro/inhabitant 129 145 49Recovery of current costs percent 32.3% 100.0% 126.2%Recovery of total costs percent 15.3% 84.9% 87.9%
(*) including administration
3.1.8 Conclusion on the water economy accountsCountries are obviously not at the same stage of information: while Denmark could produce a supply-usetable on 128 industries, only a breakdown between households and industries is available in some othercountries. Often, the uses of distributed water are used to break down the uses of wastewater services aswell: distributed water is followed in economic national accounts, not wastewater services. Furthermore,prices often cover the two products together.
Prices must not be compared without taking into consideration the political context: for example, in Irelandthe decision has been taken not to make households pay for their water. In Sweden, water municipalservices must cover their costs (including consumption of fixed capital).
Ancillary expenditures could only be (partially) known with specific surveys.
It should be noted that in all countries, the exercise gave the opportunity to re-examine and sometimesrevise national accounts data.

Results and analysis
93
3.2 Volumes of water flowsThis section presents the results of pilot applications as concerns the pilot tables 5 to 9. These tables coverthe water flows in m3: water entering the economic sphere, water within the economy and water dischargedback to the environment.
The tables resulting from the test are given, as well as some indicators built on them. As in the previoussection, no attempts are made at harmonisation. In fact, as can be seen from the diagram representations,reproduced from the reports of three countries, concepts and classifications applied differ as regards eitherwater in nature (different components, different types of discharges) or water in the economy (number ofsteps considered, number of economic agents).
3.2.1 BelgiumBelgium supplied two types of tables: tables following the Eurostat format, with detailed information byindustry and aggregated tables. For instance, Table 3.2-2, shown in percentage terms, makes moreapparent the fact that the energy and water distribution industries were responsible for the major part of totalwastewater discharges in 1998. About a quarter of wastewater discharges could be attributed to themanufacturing sector.
However as concerns wastewater discharged into the sewage system, more than 70% of the sewageoriginated from households46.
Table 3.2-1 Water and wastewater flows by industry, Belgium 1998, 1 000 m3
Drinking andnon-drinking
water received
Wastewaterdischarged into
sewage networks
Wastewaterdischarged intowater bodies
A Agriculture, hunting and forestry 470 0 35 038B Fishing 411 17 67CA Mining and quarrying of energy producing materials 1 285 0 0CB Mining and quarrying except energy producing materials 197 706 55 077DA Manufacture of food products; beverages and tobacco 10 608 12 554 37 047DB Manufacture of textiles and textile products 2 556 7 811 4 297DC Manufacture of leather and leather products 40 33 11DD Manufacture of wood and wood products 244 222 0DE Manufacture of pulp, papers; publishing and printing 1 949 746 44 247DF Manufacture of coke, refined petroleum and nuclear fuel 3 636 4 26 224DG Manufacture of chemicals and man-made fibres 22 169 8 674 169 994DH Manufacture of rubber and plastic products 1 432 1 515 219DI Manufacture of other non-metallic mineral products 2 382 369 1 521DJ Manufacture of basic metals and fabricated metal products 24 207 9 166 345 617DK Manufacture of machinery and equipment n.e.c. 603 177 82DL Manufacture of electrical and optical equipment 1 301 1 266 4 461DM Manufacture of transport equipment 1 609 2 388 3 172DN Manufacturing n.e.c. 5 197 411 402
40 Electricity, gas, steam and hot water supply 34 582 2 528 799 48541 Collection, purification and distribution of water 60 772 30 589 602 154
F Construction 2 078 48 0G Wholesale and retail trade; repairs 25 982 148 41H Hotels and restaurants 5 674 630 37I Transport, storage and communication 7 140 66 723J Financial intermediation 132 0 0K Real estate, renting and business activities 12 266 6 108L Public administration and defence; compulsory social security 27 0 191M Education 39 0 10N Health and social work 47 2 877 22790* Sewage removal and treatment 167 : 661 169O* Other community, social and personal services, excluding 90* 1 861 4 634 2 374P Private households with employed persons 1 0 0Q Extra-territorial organisations and bodies 1 0 0Total flows by industries 231 062 87 584 2 793 995Flows by households 329 298 206 622 118 087Total flows 560 361 294 206 2 912 082
Source: The NAMEA water for Belgium, Federal Planning Bureau, February 2002
46 This figure is probably overestimated, since the data for households also include some discharges by the services sector.

Results and analyses
94
Table 3.2-2 Sectoral distribution of wastewater discharges, Belgium 1998, % of total volumedischarged
Primarysector
Manufacturingindustries
Power & waterdistributors
Services Households
Into water bodies 4.0 28.3 62.3 0.2 5.2Into sewage system 0.2 15.4 11.3 2.9 70.2Total 3.6 26.8 56.4 0.5 12.8
Source: The NAMEA water for Belgium, Federal Planning Bureau, February 2002
3.2.2 DenmarkTablesThe same level of detail (128 industries) retained in the Danish monetary supply-use tables is also availablefor the water abstraction and discharge. All these detailed tables could not be reproduced in this publication.Only some key results are presented.
80% of the water comes from and is rejected into the sea. It is mainly abstracted for cooling purposes by theproduction and distribution of electricity sector. 98% of the other abstraction concerns groundwater. Half ofthe water abstracted is used to make ‘tap water’ sold to households and industries. About a third isabstracted by agriculture, the rest directly abstracted by various industries and households.
By construction, the total uses of water (direct abstraction plus use of tap water) are balanced by total‘discharges’ for each industry. This ‘discharge’ concept includes not only discharge of wastewater but alsoelements of what is called ‘water consumption’ in pilot table 9. In the Danish data, ‘discharge’ is furtherbroken down into ‘water added to products’, ‘wastewater discharged to sewers’ and ‘other discharges’.
A very small quantity of water (0.07% of total ‘discharges’) is embodied in economic products ('added toproducts'), essentially by the food and beverages industry, the chemical industry and the manufacturing ofconstruction materials industry. The breakdown of the discharges of wastewater by recipient water bodycould not be given for the flows transiting through sewers and the ‘other discharges’ (which may includeevaporation).
Graphic analysis of the abstraction and use of waterDifferent graphs were built in the report in order to better visualise the share of each economic actor in theabstraction and use of the different categories of water: groundwater and tap water. More than 50% ofgroundwater is extracted by the water supply industry. Households are the main users of tap water.
Figure 3.2-1 Extraction of groundwater by industries and households in Denmark in 1994
Source: Statistics Denmark – NAMEA with water extraction and use – April 1999
D
A
B
E F
C
A. Agriculture, Fishing, Quarrying (1)
B. Manufacturing (2)
C. Electricity, Gas & Heating supply, Water supply (3a,3b)
D. Construction, wholesale & retail trade; Hotels,restaurants; Transport, storage, communication,Financial intermedation, business activities (4, 5, 6, 7)
E. Public & personal services (8)
F. Households

Results and analysis
95
Figure 3.2-2 Use of tap water by industries and households in Denmark in 1994
Source: Statistics Denmark – NAMEA with water extraction and use – April 1999
Water ‘intensity’Statistics Denmark introduced in its reports a concept of ‘water intensity’ linking the quantities of ‘tap’ waterused to some economic characteristics of the industries such as the output and the number of employees.
Agriculture is an intensive consumer of ‘tap’ water in relation to its output and it ranks second when the useof water is linked to the number of employees.
Figure 3.2-3 Water intensity in Denmark, 1994. Use of tap water related to output,m3/million DKK
Source: Statistics Denmark – NAMEA with water extraction and use – April 1999
F
E
C
D
B
AA. Agriculture, Fishing, Quarrying (1)
B. Manufacturing (2)
C. Electricity, Gas & Heating supply, Water supply (3a, 3b)
D. Construction, wholesale & retail trade; Hotels,restaurants; Transport, storage, communication, Financialintermedation, business activities (4, 5, 6, 7)
E. Public & personal services (8)
F. Households
0
50
100
150
200
250
300
350
400
450
500
Agricultureetc. (1)
Manufac-turing (2)
Electricitysupply etc.
(3a)
Water Supply(3b)
Construction(4)
Wholesale,retail trade
etc. (5)
Transport,communica-tion etc. (6)
Financialintermedia-tion etc. (7)
Publicservices etc.
(8)

Results and analyses
96
Figure 3.2-4 Water intensity in Denmark, 1994. Use of tap water in m3 per employee
Note. The private consumption water intensity is a per capita consumption of the householdsSource: Statistics Denmark – NAMEA with water extraction and use – April 1999
The indicator is limited to tap water only, but this presentation may be a good basis in the development ofindicators linking economic and environmental information.
Time analysis of the physical flows of ‘tap water’ 1995-1997As Denmark has been able to carry out its study for 3 years, an analysis of the time dimension was possible.
The total amount of water used increased from 1995 to 1996, then decreased from 1996 to 1997, withnotable variations between the 1-digit NACE groups, as illustrated below.
Figure 3.2-5 Evolution of the use of water in Denmark, by industry (NACE 1-digit level)
Source: Statistics Denmark – 1997 water accounts related to NAMEA
0
50
100
150
200
250
300
350
400
Agricultureetc. (1)
Manufac-turing (2)
Electricitysupply etc.
(3a)
WaterSupply (3b)
Construc-tion (4)
Wholesale,retail trade
etc. (5)
Transport,communica-tion etc. (6)
Financialintermedia-tion etc. (7)
Publicservices etc.
(8)
Privateconsump-
tion
0
5000
10000
15000
20000
25000
30000
35000
40000
45000
50000
Agriculture, fishing and quarrying
1 Manufacturing
2 Electricity, gas and
water supply 3
Construction 4
Wholesale and retail trade; hotels, restaurants
5
Transport, storage and
communication 6
Financial intermediation,
business activities 7
Public and personal services
8
1995 1996 1997
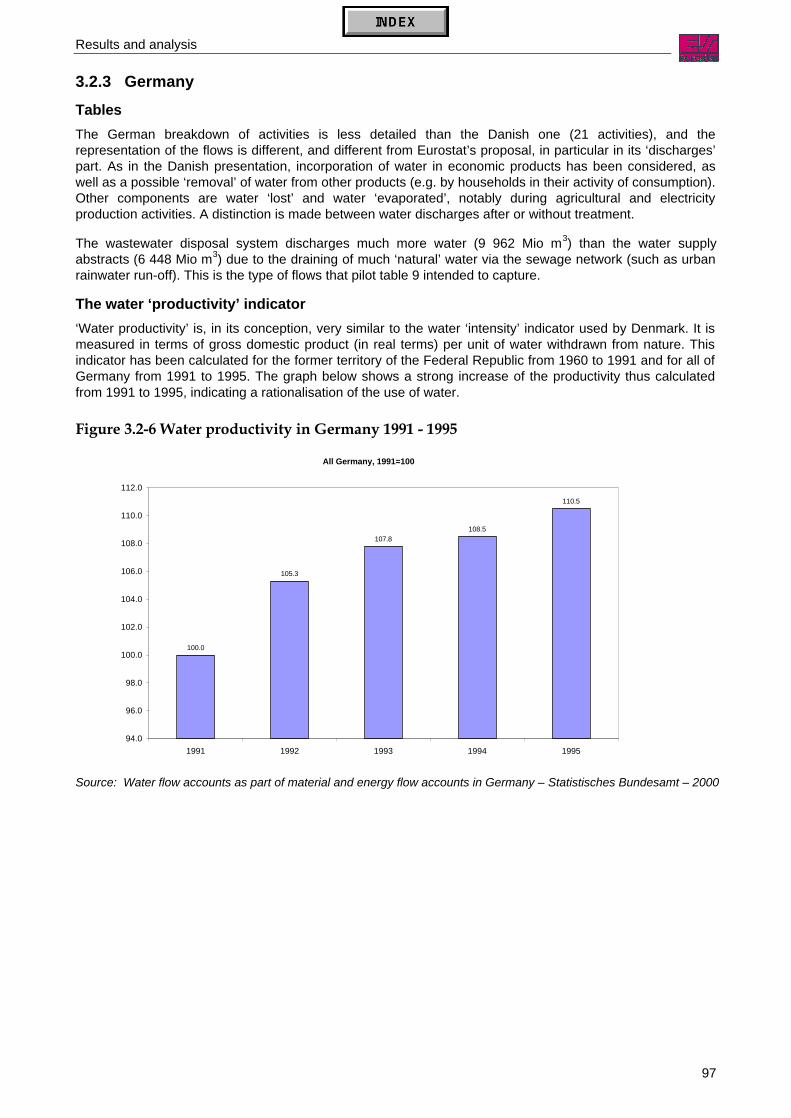
Results and analysis
97
3.2.3 GermanyTablesThe German breakdown of activities is less detailed than the Danish one (21 activities), and therepresentation of the flows is different, and different from Eurostat’s proposal, in particular in its ‘discharges’part. As in the Danish presentation, incorporation of water in economic products has been considered, aswell as a possible ‘removal’ of water from other products (e.g. by households in their activity of consumption).Other components are water ‘lost’ and water ‘evaporated’, notably during agricultural and electricityproduction activities. A distinction is made between water discharges after or without treatment.
The wastewater disposal system discharges much more water (9 962 Mio m3) than the water supplyabstracts (6 448 Mio m3) due to the draining of much ‘natural’ water via the sewage network (such as urbanrainwater run-off). This is the type of flows that pilot table 9 intended to capture.
The water ‘productivity’ indicator‘Water productivity’ is, in its conception, very similar to the water ‘intensity’ indicator used by Denmark. It ismeasured in terms of gross domestic product (in real terms) per unit of water withdrawn from nature. Thisindicator has been calculated for the former territory of the Federal Republic from 1960 to 1991 and for all ofGermany from 1991 to 1995. The graph below shows a strong increase of the productivity thus calculatedfrom 1991 to 1995, indicating a rationalisation of the use of water.
Figure 3.2-6 Water productivity in Germany 1991 - 1995
Source: Water flow accounts as part of material and energy flow accounts in Germany – Statistisches Bundesamt – 2000
All Germany, 1991=100
100.0
105.3
107.8108.5
110.5
94.0
96.0
98.0
100.0
102.0
104.0
106.0
108.0
110.0
112.0
1991 1992 1993 1994 1995

Results and analyses
98
Table 3.2-3 Water flows broken down by branch (including households), Germany 1995, million m3
Withdrawnfrom
nature
Receivedfrom otherbranches
Used Removedfrom
materials
Incorporatedinto othermaterials
Transfer towastewater
disposal
Dischargedby
wastewaterdisposal
Dischargeddirectly
aftertreatment
Dischargeddirectlywithout
treatment
Lost Evaporated Infiltrationand rain
water
Code Activity 1 2 3=1+2 4 5 6 7 8 9 10 11 12A, B Agriculture, forestry, fisheries 764 152 916 0 290 31 0 0 0 0 596 0CA Mining and quarrying of energy producing materials 1 369 115 1 484 0 0 22 0 54 1 361 0 46 0CB Mining and quarrying except energy-producing materials 648 4 652 0 0 7 0 21 593 0 31 0DA Manufacture of food products, beverages and tobacco 316 218 534 0 39 240 0 57 168 0 30 0DB Manufacture of textiles and textile products 52 20 73 0 0 56 0 3 3 0 10 0DC Manufacture of leather and leather products 4 1 4 0 0 3 0 2 0 0 0 0DD Manufacture of wood and wood products 11 4 15 0 0 3 0 0 8 0 3 0DE Manufacture of pulp, paper, publishing and printing 379 70 449 0 0 104 0 226 101 0 18 0DF Manufacture of coke, petroleum and nuclear fuel 231 43 274 0 0 36 0 81 94 0 63 0DG Manufacture of chemicals and man-made fibres 2 723 435 3 158 0 0 223 0 513 2 374 0 48 0DH Manufacture of rubber and plastic products 77 21 98 0 0 23 0 7 60 0 8 0DI Manufacture of other non-metallic mineral products 147 53 200 0 0 33 0 11 102 0 54 0DJ Manufacture of basic metals and fabricated metal products 543 149 693 0 0 92 0 232 311 0 58 0DK Manufacture of machinery and equipment n.e.c. 31 27 59 0 0 29 0 1 23 0 5 0DL Manufacture of electrical and optical equipment 59 40 99 0 0 41 0 1 51 0 5 0DM Manufacture of transport equipment 67 31 98 0 0 32 0 10 45 0 11 0DN Manufacturing n.e.c. 4 6 11 0 0 6 0 0 2 0 2 040 Electricity, gas, steam and hot water supply 2 9715 332 30 046 0 0 59 0 54 29 232 711 701 041 Collection, purification and distribution of water 6 448 -5 613 835 0 0 124 0 0 0 0 0 090 part Sewage disposal 5 273 0 5 273 0 0 -4 689 4 689 0 0 0 0 5 273F-O Construction and other service branches 0 618 618 0 0 594 0 0 0 0 24 0
Total homogeneous branches 48 862 -3 274 45 588 0 329 -2 930 4 689 1 273 34 528 711 1 715 5 273Households 47 3 266 3 313 152 0 2 930 0 0 250 0 285 0Total 48 909 -8 48 901 152 329 0 4 689 1 273 34 778 711 2 000 5 273
Source: Water flow accounts as part of material and energy flow accounts in Germany – Statistisches Bundesamt – 2000

Results and analysis
99
3.2.4 GreeceTablesGreece, provided the following table on the use of distributed water by the industries.
Table 3.2-4 Use table of distributed water, Greece 1988 - 1996, million m3
NACE code 1988 1989 1990 1991 1992 1993 1994 1995 1996
1 /2 111 111 82 85 85 79 91 93 101
5 0 0 0 0 0 0 0 0 0
10/12 0 0 0 0 0 0 0 0 0
13/14 0 0 0 0 0 0 0 0 0
15/16 8 8 11 8 8 8 8 6 7
17/19 26 19 12 18 28 23 23 21 22
20 1 0 0 0 1 1 1 0 0
21/22 5 5 4 4 5 5 5 5 6
23 10 16 13 14 12 9 11 10 9
24/25 10 12 8 7 7 6 7 6 6
26 5 5 4 4 4 3 3 2 3
27 4 6 3 3 4 2 3 3 3
28 0 1 0 0 1 0 0 0 0
29/37 9 8 6 5 7 6 5 4 4
40/41 1 1 1 1 1 1 1 1 1
45 10 9 16 21 14 6 6 4 2
50/52 22 25 26 26 19 22 24 21 22
55 58 63 66 62 72 83 90 79 80
60/64 23 24 26 25 18 19 19 17 19
65/67 8 7 8 9 11 11 14 12 32
70/74 3 4 4 4 4 4 4 3 2
75 & 90 46 49 54 44 49 59 64 39 22
80/85 46 50 50 47 51 53 50 29 24
91 0 1 1 1 1 0 0 0 0
92/95 12 17 15 16 13 14 16 12 10
Total industries 418 441 410 404 415 414 445 367 375
Households 261 269 242 228 233 212 233 326 334
Total uses 679 710 652 632 648 626 678 693 709
Source: Natural resources accounts and environmental input/output tables for Greece 1988-1998, National TechnicalUniversity of Athens, 2000
This long time series enables to draw a chart to analyse the possible changes in the uses of water. Thechanges that thus come forward would be the basis for analysing the causes of the changes (e.g. climaticvariations).

Results and analyses
100
Figure 3.2-7 Use of distributed water by user category, Greece 1988 - 1996
Source: Natural resources accounts and environmental input/output tables for Greece 1988-1998, National TechnicalUniversity of Athens, 2000
3.2.5 SpainFlow diagramSpain translates the pilot tables 5 to 8 into a diagram, which shows in particular the importance of agriculturein water uses. It is responsible for 72% of abstractions. Balancing items, such as evapo-transpiration ofcrops and incorporation of water in products (in particular agricultural products) are not shown.
0
50
100
150
200
250
300
350
400
1988 1989 1990 1991 1992 1993 1994 1995 1996
in Mio m3
580
600
620
640
660
680
700
720
Agriculture Industry Households Total uses (right scale)

Results and analysis
101
Scheme 3.2-1 Water flows in the economy and between economy and environment, Spain 1999, 1 000 m3
Source: Eurostat Working Paper n° 2/2001/B/6 – Water Satellite Accounts for Spain 1997-1999
Consumption ofhouseholds
2.354.428
Econ
omy
Water abstraction33.687.022
Other production sectorsNACE: 05 to 90(except 90.001)
3.423.787
4.51
7.47
7
395.025
1.892.3388
680.8222.228
1.085.608
AgricultureNACE: 0122.305.722
Irrigation operations:NACE: 01.41.11
19.775.400
Distribution of water:NACE: 414.077.686
2.049.0715.163.29424.292.877
348.542
2.181.780
8.721.13333
7.227
749.365
Wastewatertreatment NACE
90.001
Wastewatertreatment
2.263.650
Losses of water in distribution5.603.085
Direct discharges of wastewater9.865.523
Indirect discharges of wastewater2.263.650
319.275
Nature
Nature

Results and analyses
102
3.2.6 The NetherlandsTablesIn the CBS NAMEA framework, a comprehensive point of view is adopted for water. The volumes of waterflows exchanged between the economy and the environment (pilot table 7) and within the economy (pilottables 5 & 6) are put in the same tables and flows of water in nature are recorded as well. The supply-usetables are complemented by an origin/destination part to deal with flows of water in nature. Water andwastewater are not distinguished as such. (Consumers refer to households in these tables.)
Table 3.2-5 Origin/supply of water, The Netherlands 1991, million m3
Tap water Groundwater Surfacewater
Total
SUPPLY OF TAP WATER AND DISCHARGES BY PRODUCERSWater supply 1 278 1 278Environmental cleansing and sanitary services 1 642 1 642Water boards 100 100Discharges by other economic activities 8 130 8 130
OTHER ORIGINSWater inflows from neighbouring counties and precipitation 5 800 84 623 90 423
Total 1 278 5 800 94 495 101 573Source: Water accounts in the Dutch NAMEA: a ‘NAMWA’ for 1991 – CBS, May 1997
Table 3.2-6 Destination/use of water, The Netherlands 1991, million m3
Tap water Ground-water
Surfacewater
Total
USE BY CONSUMERS 704 - - 704USE BY PRODUCERS
Agriculture, hunting, forestry, fishing1 100 130 200 430Mining and quarrying 1 - - 1Manufacturing
Food, beverages and tobacco industry 34 77 94 204Textile, wearing apparel and leather industry 4 5 4 12Wood and furniture industry 2 - - 2Paper, printing and publishing industry 13 32 58 102Petroleum industry 27 0 3 30Chemical industry 36 43 849 928Rubber and plastic industry 2 15 2 19Construction materials, earthenware and glass products 5 14 157 177Basic metal industry 41 7 3 50Metal products and machinery industry 22 5 2 29Other manufacturing 27 7 3 37
Public utilitiesElectricity and gas 5 2 5 143 5 150Water supply 1 842 435 1 278
Construction 5 - - 5Transport and storage 9 - - 9Environmental cleansing and sanitary services 12 - 1 642 1 654Water boards - 100 - 100Other services 230 - - 230
OTHER DESTINATIONSWater outflows to open sea and evapo-transpiration - 4 621 85 902 90 523
NET CHANGES IN STOCK - -100 - -100Total 1 278 5 800 94 495 101 5731: estimated
Source: Water accounts in the Dutch NAMEA: a ‘NAMWA’ for 1991 – CBS, May 1997

Results and analysis
103
3.2.7 SwedenTablesTable 3.2-7 summarises the total abstractions, total discharges and economic flows (supply-use ofdistributed water) and Table 3.2-8 shows the origin of the abstractions and the destination of the privatedischarges. As discharges by wastewater treatment are not incorporated, this table does not balance.
A diagram of the flows of water was also included in the Swedish report (see scheme 1.2-5 in section 1.2).This scheme includes the abstractions and discharges by type of water as shown in Table 3.2-8 but alsoshows flows of seawater (8 500 Mio m3) used by nuclear power plants for cooling (not presented in Table3.2-8). This illustrates that, like in the Danish case, seawater is an important resource.
There are still some uncertainties about possible direct abstractions by services industries.
Contrary to some other countries, Sweden assumed that losses in the supply network are captured by thewastewater network in the form of urban run-offs.
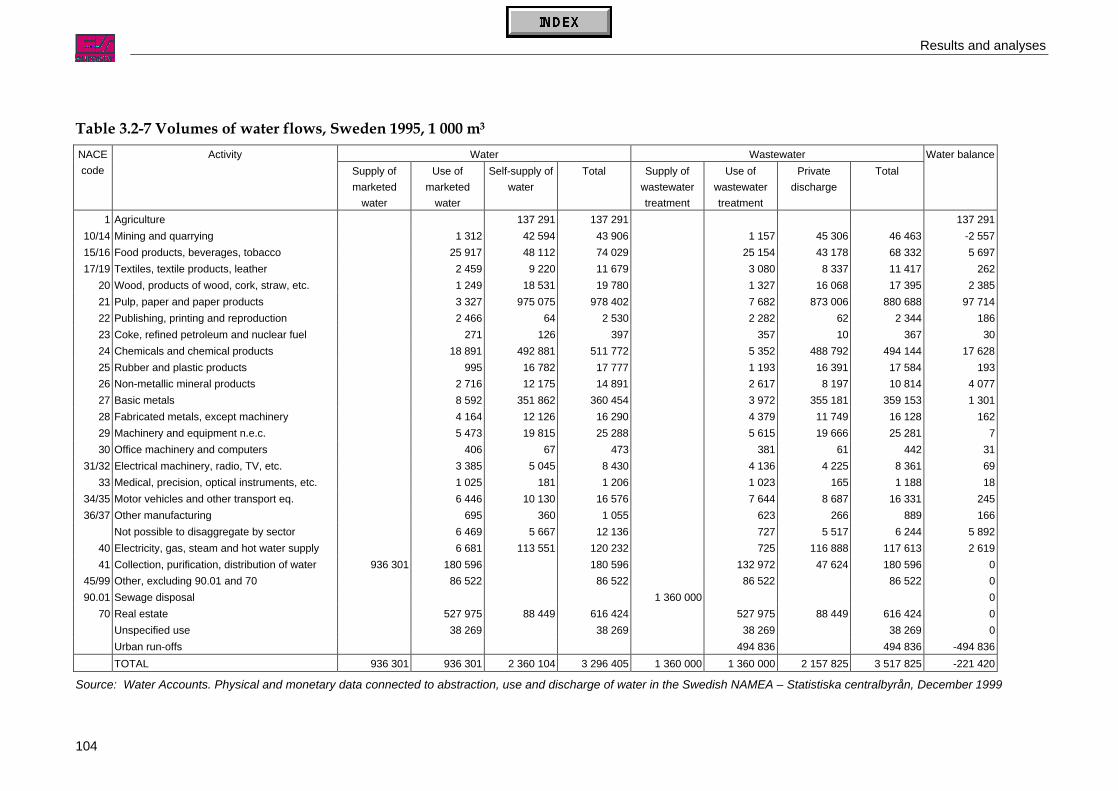
Results and analyses
104
Table 3.2-7 Volumes of water flows, Sweden 1995, 1 000 m3
Water WastewaterNACEcode
ActivitySupply ofmarketed
water
Use ofmarketed
water
Self-supply ofwater
Total Supply ofwastewatertreatment
Use ofwastewatertreatment
Privatedischarge
TotalWater balance
1 Agriculture 137 291 137 291 137 29110/14 Mining and quarrying 1 312 42 594 43 906 1 157 45 306 46 463 -2 55715/16 Food products, beverages, tobacco 25 917 48 112 74 029 25 154 43 178 68 332 5 69717/19 Textiles, textile products, leather 2 459 9 220 11 679 3 080 8 337 11 417 262
20 Wood, products of wood, cork, straw, etc. 1 249 18 531 19 780 1 327 16 068 17 395 2 38521 Pulp, paper and paper products 3 327 975 075 978 402 7 682 873 006 880 688 97 71422 Publishing, printing and reproduction 2 466 64 2 530 2 282 62 2 344 18623 Coke, refined petroleum and nuclear fuel 271 126 397 357 10 367 3024 Chemicals and chemical products 18 891 492 881 511 772 5 352 488 792 494 144 17 62825 Rubber and plastic products 995 16 782 17 777 1 193 16 391 17 584 19326 Non-metallic mineral products 2 716 12 175 14 891 2 617 8 197 10 814 4 07727 Basic metals 8 592 351 862 360 454 3 972 355 181 359 153 1 30128 Fabricated metals, except machinery 4 164 12 126 16 290 4 379 11 749 16 128 16229 Machinery and equipment n.e.c. 5 473 19 815 25 288 5 615 19 666 25 281 730 Office machinery and computers 406 67 473 381 61 442 31
31/32 Electrical machinery, radio, TV, etc. 3 385 5 045 8 430 4 136 4 225 8 361 6933 Medical, precision, optical instruments, etc. 1 025 181 1 206 1 023 165 1 188 18
34/35 Motor vehicles and other transport eq. 6 446 10 130 16 576 7 644 8 687 16 331 24536/37 Other manufacturing 695 360 1 055 623 266 889 166
Not possible to disaggregate by sector 6 469 5 667 12 136 727 5 517 6 244 5 89240 Electricity, gas, steam and hot water supply 6 681 113 551 120 232 725 116 888 117 613 2 61941 Collection, purification, distribution of water 936 301 180 596 180 596 132 972 47 624 180 596 0
45/99 Other, excluding 90.01 and 70 86 522 86 522 86 522 86 522 090.01 Sewage disposal 1 360 000 0
70 Real estate 527 975 88 449 616 424 527 975 88 449 616 424 0Unspecified use 38 269 38 269 38 269 38 269 0Urban run-offs 494 836 494 836 -494 836TOTAL 936 301 936 301 2 360 104 3 296 405 1 360 000 1 360 000 2 157 825 3 517 825 -221 420
Source: Water Accounts. Physical and monetary data connected to abstraction, use and discharge of water in the Swedish NAMEA – Statistiska centralbyrån, December 1999

Results and analysis
105
Table 3.2-8 Origin and destination of water, Sweden 1995, 1 000 m3
Abstractions from Private discharges toNACEcode
ActivityGroundwater Surface water Sea water Inland waters Sea
1 Agriculture 66 418 70 8732 Forestry
10/14 Mining and quarrying 15 229 24 845 2 521 42 767 2 53915/16 Food products, beverages, tobacco 10 600 7 709 29 802 11 107 32 07117/19 Textiles, textile products, leather 913 8 307 8 337
20 Wood, products of wood, cork, straw, etc. 946 15 924 1 661 13 989 2 07921 Pulp, paper and paper products 16 975 059 361 112 511 89422 Publishing, printing and reproduction 3 42 19 41 2123 Coke, refined petroleum and nuclear fuel 8 117 6 424 Chemicals and chemical products 2 968 180 639 309 274 159 999 328 79325 Rubber and plastic products 450 11 286 5 045 5 201 11 19026 Non-metallic mineral products 3 947 6 305 1 923 6 812 1 38527 Basic metals 2 843 160 193 188 826 159 521 195 66028 Fabricated metals, except machinery 721 11 366 38 9 928 1 82129 Machinery and equipment n.e.c. 270 19 545 19 640 2630 Office machinery and computers 42 24 2 59 2
31/32 Electrical machinery, radio, TV, etc. 1 303 1 990 1 753 2 108 2 11733 Medical, precision, optical instruments, etc. 77 44 61 59 106
34/35 Motor vehicles and other transport eq. 238 9 885 7 8 484 20336/37 Other manufacturing 111 238 11 220 46
Not possible to disaggregate by sector 1 474 4 192 1 5 514 340 Electricity, gas, steam and hot water supply 897 68 480 44 174 67 360 49 52841 Collection, purification, distribution of water 444 948 491 35345 Construction
50/52 Wholesale and retail trade55 Hotels and restaurants
60/64 Transport, storage and communication62 Financial intermediation
71/74 Renting and business activities80/99 Other, excluding 90.0190.01 Sewage disposal
75 Public administration70 Real estate 88 449
TOTAL 642 871 2 068 416 585 118 882 264 1 139 488
Source: Water Accounts. Physical and monetary data connected to abstraction, use and discharge of water in theSwedish NAMEA – Statistiska centralbyrån, December 1999
3.2.8 The United KingdomTablesAs explained in the methodological part, the source of the data being the Environment Agency, only a fewdetails are available as concerns activities.
The concept of ‘net uses’ in Table 3.2-9 includes water incorporated in products, water evaporated, but alsoprobably large unknown flows, since it is 1/4 of the total abstractions.

Results and analyses
106
Table 3.2-9 Abstractions and returns by industry, England and Wales 1994, million m3
Public +private
water supply
Agriculture +irrigation
Hydro-electricity
generation
Otherenergy
generation
Industry(non-
energy)
Minerals Other, un-attributed
Total
AbstractionsLakes/rivers 4 300 1 400 2 400 500 700 0 100 9 400Groundwater 1 900 200 0 0 200 100 0 2 500Coastal 0 0 0 7 200 600 0 0 7 800Total 6 200 1 600 2 400 7 700 1 600 100 100 19 700
ReturnsLakes/rivers 3 000 1 500 2 400 500 700 100 100 8 200Groundwater 0 0 0 0 0 0 0 0Coastal 1 300 0 0 7 200 400 0 0 9 000Total 4 400 1 500 2 400 7 700 1 100 100 100 17 200
Net usesLakes/rivers 1 300 -100 0 0 100 0 0 1 100Groundwater 1 900 200 0 0 200 100 0 2 500Coastal -1 300 0 0 0 200 0 0 -1 200Total 1 800 100 0 0 500 0 0 2 500
Notes: The industry classification is that of the Environment Agency. Coastal abstractions relate to tidal waters.
Source: United Kingdom Environmental Accounts 1998
3.2.9 Comparisons between countriesWater usesFive countries (Denmark, Germany, Spain, The Netherlands and Sweden) could provide broadly comparableinformation on direct abstraction as well as on use of distributed water by industry (see Tables 3.2-10).Adding direct abstraction and the use of distributed water indicates the total use of water by industry (leaksand losses in the distribution network are allocated to the water supply industry).
In order to remove the scale effect, these flows have been divided by the number of inhabitants as regardsthe use by households and by the value added as regards industries in Tables 3.2-11 and 3.2-12. Thesetables show large differences in the average water uses. Some differences are easily explained, such as thehigher water use in agriculture in Spain due to climatic conditions and the recourse to irrigation, others wouldneed more research.
Incorporation of water in productsStrangely, it is not the same industries that incorporate water into other products in the Danish and theGerman pilot studies. For Germany, the major incorporating industry is agriculture, followed by food andbeverages manufacturing. No flow is recorded for chemical and construction materials industries, as inDenmark. In Denmark, no incorporation is considered for agriculture.
Water incorporated as a percentage of total water use is small but 10 times higher in Germany than inDenmark (0.7% against 0.07%).

Results and analyses
107
Table 3.2-10 Uses of fresh water by user category in 5 countries, million m3
Germany 1995 The Netherlands 1991 Denmark 1997 Sweden 1995 Spain 1997NACEcode
Directabstraction
Exchangewith otherindustries
Totaluses
Directabstraction
Exchangewith otherindustries
Totaluses
Directabstraction
Exchangewith otherindustries
Totaluses
Directabstraction
Exchangewith otherindustries
Totaluses
Directabstraction
Exchangewith otherindustries
Totaluses
A, B Agriculture, forestry, fisheries 764 152 916 330 100 430 393 36 429 137 0 137 23 214 340 23 554C Mining and quarrying 2 017 119 2 136 0 1 1 5 0 5 40 1 41 133 16 150DA Food products, beverages, tobacco 316 218 534 170 34 204 26 23 49 18 26 44 112 56 167DB/DC Textiles and leather products 56 21 77 8 4 12 8 2 10 9 2 12 103 11 115DD Wood and wood products 11 4 15 0 2 2 2 1 2 17 1 18 21 3 24DE Pulp, paper, publishing and printing 379 70 449 89 13 102 5 1 6 975 6 981 229 12 241DF Coke, petroleum and nuclear fuel 231 43 274 3 27 30 1 1 1 0 0 0 15 33 47DG Chemicals and man-made fibres 2 723 435 3 158 892 36 928 6 8 14 184 19 202 385 76 461DH Rubber and plastic products 77 21 98 16 2 19 0 1 1 12 1 13 21 50 71DI Non-metallic mineral products 147 53 200 172 5 177 8 1 10 10 3 13 12 23 35DJ/DM Metal products and machinery 700 247 947 17 63 80 2 4 6 209 29 238 192 71 264DN Manufacturing n.e.c. 4 6 10 10 27 37 1 0 1 0 1 1 59 9 6840 Electricity, gas, steam, hot water 29 715 332 30 047 5 145 5 5 150 5 6 12 69 7 76 0 41 4141 Water supply 6 448 -5 613 835 1 277 -1 278 -1 470 -412 57 936 -756 181 4 393 -3 697 696part 90 Sewage disposal 5 273 0 5 273 0 12 12 0 1 1 0 0 0 0 160 160F-O Construction and other services 0 618 618 0 244 244 2 63 65 0 87 87 116 678 794
Unknown industry 0 0 0 0 0 0 0 0 0 6 6 12 0 0 0Total industries 48 861 -3 274 45 587 8 130 -705 7 426 934 -266 669 2 623 -566 2 057 29 005 -2 118 26 888Households 47 3 266 3 313 0 704 704 18 266 283 88 528 616 0 2 118 2 118Unknown user 0 0 0 0 0 0 0 0 0 0 38 38 0 0 0Total 48 908 -8 48 900 8 130 -1 8 130 952 0 952 2 711 0 2 711 29 005 0 29 005
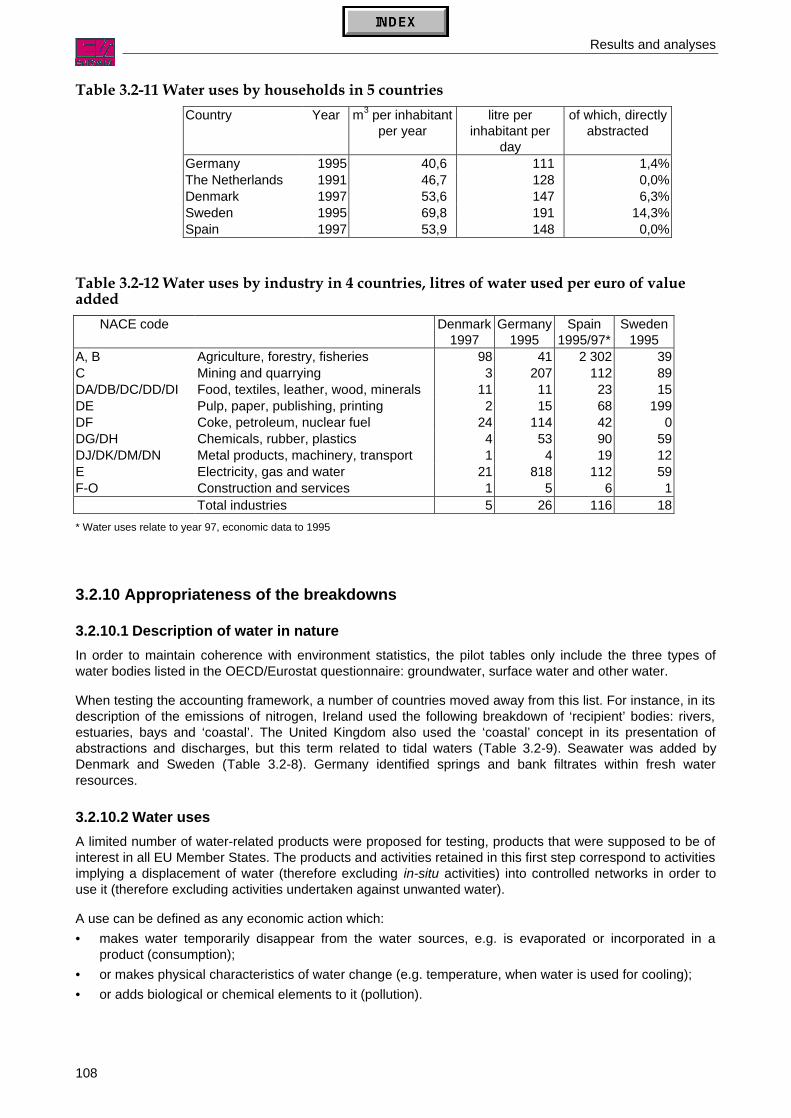
Results and analyses
108
Table 3.2-11 Water uses by households in 5 countriesCountry Year m3 per inhabitant
per yearlitre per
inhabitant perday
of which, directlyabstracted
Germany 1995 40,6 111 1,4%The Netherlands 1991 46,7 128 0,0%Denmark 1997 53,6 147 6,3%Sweden 1995 69,8 191 14,3%Spain 1997 53,9 148 0,0%
Table 3.2-12 Water uses by industry in 4 countries, litres of water used per euro of valueadded
NACE code Denmark1997
Germany1995
Spain1995/97*
Sweden1995
A, B Agriculture, forestry, fisheries 98 41 2 302 39C Mining and quarrying 3 207 112 89DA/DB/DC/DD/DI Food, textiles, leather, wood, minerals 11 11 23 15DE Pulp, paper, publishing, printing 2 15 68 199DF Coke, petroleum, nuclear fuel 24 114 42 0DG/DH Chemicals, rubber, plastics 4 53 90 59DJ/DK/DM/DN Metal products, machinery, transport 1 4 19 12E Electricity, gas and water 21 818 112 59F-O Construction and services 1 5 6 1
Total industries 5 26 116 18* Water uses relate to year 97, economic data to 1995
3.2.10 Appropriateness of the breakdowns
3.2.10.1 Description of water in natureIn order to maintain coherence with environment statistics, the pilot tables only include the three types ofwater bodies listed in the OECD/Eurostat questionnaire: groundwater, surface water and other water.
When testing the accounting framework, a number of countries moved away from this list. For instance, in itsdescription of the emissions of nitrogen, Ireland used the following breakdown of ‘recipient’ bodies: rivers,estuaries, bays and ‘coastal’. The United Kingdom also used the ‘coastal’ concept in its presentation ofabstractions and discharges, but this term related to tidal waters (Table 3.2-9). Seawater was added byDenmark and Sweden (Table 3.2-8). Germany identified springs and bank filtrates within fresh waterresources.
3.2.10.2 Water usesA limited number of water-related products were proposed for testing, products that were supposed to be ofinterest in all EU Member States. The products and activities retained in this first step correspond to activitiesimplying a displacement of water (therefore excluding in-situ activities) into controlled networks in order touse it (therefore excluding activities undertaken against unwanted water).
A use can be defined as any economic action which:• makes water temporarily disappear from the water sources, e.g. is evaporated or incorporated in a
product (consumption);• or makes physical characteristics of water change (e.g. temperature, when water is used for cooling);• or adds biological or chemical elements to it (pollution).
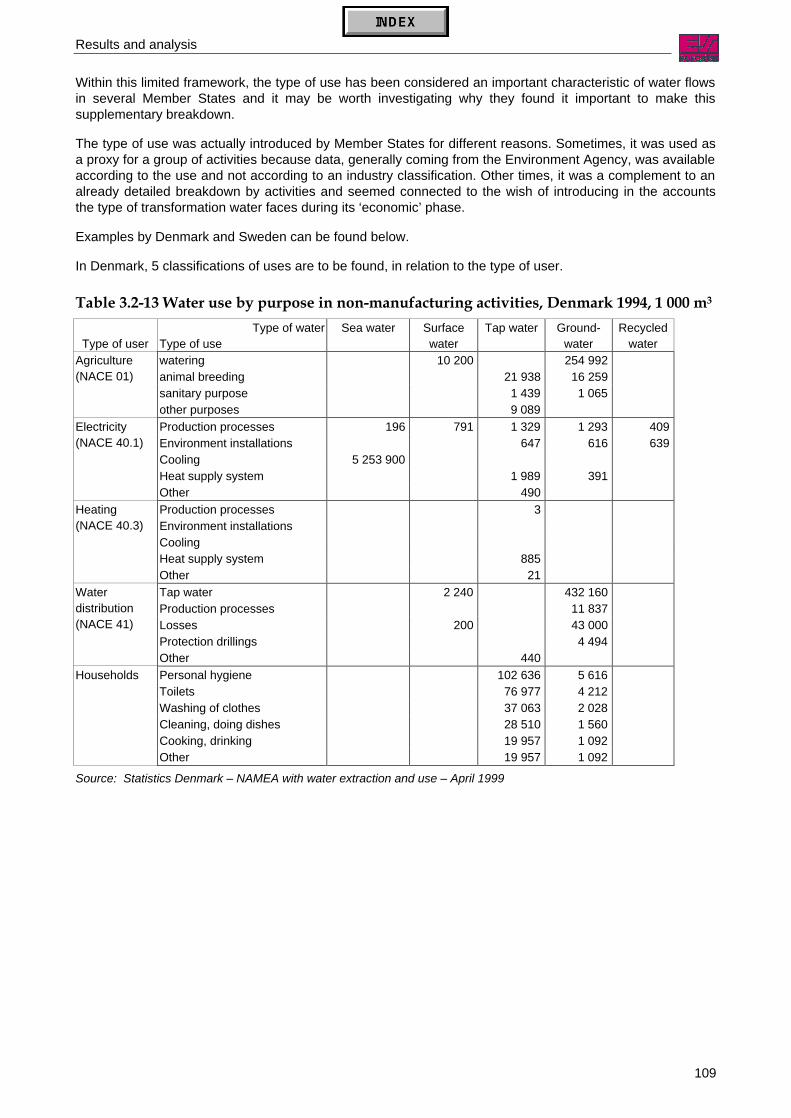
Results and analysis
109
Within this limited framework, the type of use has been considered an important characteristic of water flowsin several Member States and it may be worth investigating why they found it important to make thissupplementary breakdown.
The type of use was actually introduced by Member States for different reasons. Sometimes, it was used asa proxy for a group of activities because data, generally coming from the Environment Agency, was availableaccording to the use and not according to an industry classification. Other times, it was a complement to analready detailed breakdown by activities and seemed connected to the wish of introducing in the accountsthe type of transformation water faces during its ‘economic’ phase.
Examples by Denmark and Sweden can be found below.
In Denmark, 5 classifications of uses are to be found, in relation to the type of user.
Table 3.2-13 Water use by purpose in non-manufacturing activities, Denmark 1994, 1 000 m3
Type of userType of water
Type of useSea water Surface
waterTap water Ground-
waterRecycled
waterwatering 10 200 254 992animal breeding 21 938 16 259sanitary purpose 1 439 1 065
Agriculture(NACE 01)
other purposes 9 089Production processes 196 791 1 329 1 293 409Environment installations 647 616 639Cooling 5 253 900Heat supply system 1 989 391
Electricity(NACE 40.1)
Other 490Production processes 3Environment installationsCoolingHeat supply system 885
Heating(NACE 40.3)
Other 21Tap water 2 240 432 160Production processes 11 837Losses 200 43 000Protection drillings 4 494
Waterdistribution(NACE 41)
Other 440Personal hygiene 102 636 5 616Toilets 76 977 4 212Washing of clothes 37 063 2 028Cleaning, doing dishes 28 510 1 560Cooking, drinking 19 957 1 092
Households
Other 19 957 1 092
Source: Statistics Denmark – NAMEA with water extraction and use – April 1999

Results and analyses
110
Table 3.2-14 Use by purpose in the manufacturing industries, Denmark 1994, 1 000 m3
IndustryRinsing of
raw materialsCleaning Cooling
Used inproduction
Added toproducts
Otheruse
Total
140009 Extr. of gravel, clay, etc. 2 199 547 550 556 548 1 101 5 502151000 Production etc. of meat... 862 4 022 818 7 045 127 2 615 15 489152000 Processing etc. of fish... 515 3 924 1 633 12 120 206 4 456 22 854153000 Processing etc. of fruit... 341 455 424 695 117 29 2 061154000 Manf. of vegetable and... 0 28 2 534 568 76 1 3 209155000 Manf. of dairy products 158 4 410 2 189 1 324 267 205 8 553156009 Manf. of starch, chocolate... 69 2 291 2 324 5 829 140 2 282 12 935158109 Manf. of bread, cakes... 0 230 1 0 212 4 448158120 Bakers' shops 0 83 0 0 96 32 212158300 Manufacture of sugar 835 112 3 967 54 8 3 040 8 016159000 Manf. of beverages 2 632 1 194 9 783 2 603 854 653 17 719160000 Manufacture of tobacco... 2 14 9 0 1 66 93170000 Manf. of textiles... 2 328 144 143 599 35 112 3 361180000 Manf. of wearing apparel... 0 4 0 8 0 45 57190000 Manf. of leather... 0 0 84 1 0 5 90200000 Manf. of wood and ... 73 42 753 444 60 275 1 646210000 Manf. of pulp, paper and... 3 65 3 522 1 664 314 883 6 452221200 Publishing of newspapers 2 2 2 10 0 70 86221309 Publishing activities, excl... 35 74 19 19 0 112 260222009 Printing activities etc. 248 173 22 139 3 150 735230000 Manf. of refined petroleum prod... 320 19 477 1 23 301 1 140241109 Manf. of industrial gases and... 60 22 9 302 347 10 36 9 777241209 Manf. of dyes, pigments and... 297 107 45 876 1 713 48 175 48 216241500 Manufacture of fertilizers etc. 48 17 7 363 275 8 28 7 738241617 Manf. of plastics and... 0 7 72 0 3 1 829 1 910242000 Manufacture of pesticides and... 16 6 2 507 94 3 10 2 635243000 Manf. of paints, printing ink and... 0 35 8 0 46 26 116244000 Manf. of pharmaceuticals etc. 1 939 1 107 2 438 414 446 208 6 552245070 Manf. of detergents and other... 231 168 692 596 75 3 527 5 289251122 Manf. of rubber products and... 83 40 810 202 1 513 1 650252300 Manf. of builders' ware of plastic 3 1 2 9 0 10 26252400 Manufacture of other plastic... 10 6 52 42 0 58 168261126 Manf. of glass and ceramic goods... 50 4 193 18 1 155 421263053 Manf. of cement, bricks... 0 114 620 1 453 8 1 108 3 302266080 Manf. of concrete, cement... 885 168 702 253 254 573 2 835271000 Manf. of basic ferrous metals 1 1 1 367 0 0 74 1 442272030 First processing of iron and steel 0 7 24 195 0 32 258274000 Manf. of basic non-ferrous metals 35 6 5 33 0 5 84275000 Casting of metal products 0 1 1 1 0 1 4281009 Manf. of construct. materials of... 332 96 34 183 0 303 948286009 Manf. of hand tools... 39 32 254 155 0 139 618291000 Manf. af marine engines... 34 39 299 160 0 161 694292000 Manf. of other general purpose... 28 31 95 156 0 231 541293000 Manf. of agricultural and foresty... 32 32 2 38 0 61 165294009 Manf. of machinery for industries... 18 30 35 56 1 145 284297000 Manf. of domestic appliances... 5 6 43 39 0 40 133300000 Manf. of office machinery and... 0 0 0 0 0 0 1310000 Manf. of other electrical... 7 39 42 54 0 66 208320000 Manf. of radio and communicat... 36 8 23 245 0 131 444330000 Manf. of medical and optical... 2 5 36 5 0 70 118340000 Manufacture of motor vehicles... 152 40 38 21 0 112 363351000 Building and repairing of ships... 37 28 3 0 0 218 286352050 Manf. of transport equipment... 12 3 15 9 0 9 49361000 Manf. of furniture 71 53 28 70 0 171 393362060 Manf. of toys, gold and silver... 3 16 23 3 4 78 127
Total manufacturing 15 088 20 112 102 257 40 518 3 996 26 742 208 712
Source: Statistics Denmark – NAMEA with water extraction and use – April 1999
In Sweden, only four categories of uses have been distinguished, with extra detail for agriculture andhousehold uses.

Results and analysis
111
Table 3.2-15 Use of water by purpose, Sweden 1995, 1 000 m3
NACEcode
ActivityCooling water in
production of electricityOther cooling
waterProductionprocesses
Other uses
1 Agriculture 137 2912 Forestry
10/14 Mining and quarrying 271 41 659 1 97715/16 Food products, beverages, tobacco 43 522 27 516 2 99117/19 Textiles, textile products, leather 53 3 773 7 303 551
20 Wood, products of wood, cork, straw, etc. 669 18 256 85521 Pulp, paper and paper products 24 615 279 730 665 309 8 74822 Publishing, printing and reproduction 190 715 1 62523 Coke, refined petroleum and nuclear fuel 260 87 4824 Chemicals and chemical products 996 482 419 21 305 7 05125 Rubber and plastic products 15 267 1 844 66626 Non-metallic mineral products 7 796 5 492 1 60227 Basic metals 20 916 257 659 78 422 3 45728 Fabricated metals, except machinery 40 11 251 2 782 2 21629 Machinery and equipment n.e.c. 19 013 2 947 3 32830 Office machinery and computers 223 69 181
31/32 Electrical machinery, radio, TV, etc. 3 473 3 593 1 36433 Medical, precision, optical instr., etc. 443 195 568
34/35 Motor vehicles and other transport eq. 9 452 4 162 2 96236/37 Other manufacturing 137 480 438
Not possible to disaggregate by sector 12 13640 Electricity, gas, steam, hot water supply 105 880 4 866 6 057 3 42941 Collection, purification, distrib. of water 180 59645 Construction 86 522
50/52 Wholesale and retail trade55 Hotels and restaurants
60/64 Transport, storage and communication62 Financial intermediation
71/74 Renting and business activities80/99 Other, excluding 90.0190.01 Sewage disposal
75 Public administration70 Real estate 616 424
Unspecified use 38 269TOTAL 152 500 1 140 414 888 193 1 115 295
Source: Water Accounts. Physical and monetary data connected to abstraction, use and discharge of water in theSwedish NAMEA – Statistiska centralbyrån, December 1999
Agriculture
Table 3.2-16 Use of water in agriculture, Sweden 1985
million m3 percent
Irrigation 94 69
Livestock 43 31
Total 137 100
Source: Water Accounts. Physical and monetary data connected to abstraction, use and discharge of water in theSwedish NAMEA – Statistiska centralbyrån, December 1999
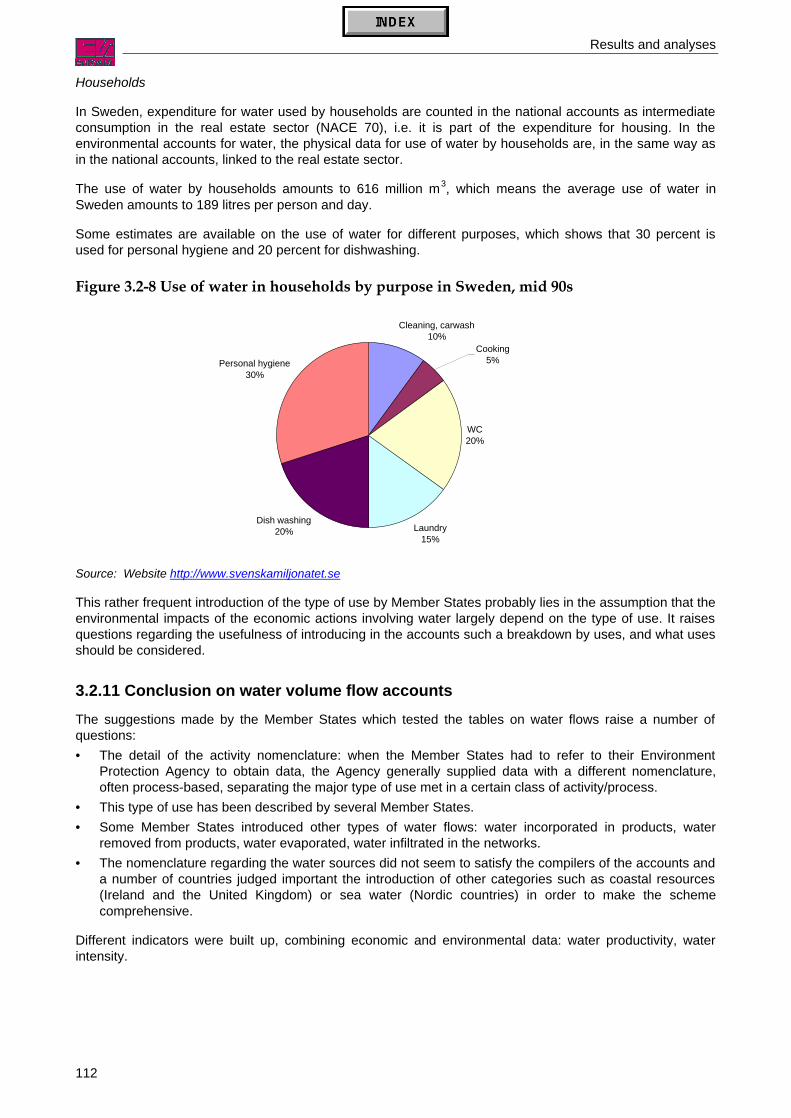
Results and analyses
112
Households
In Sweden, expenditure for water used by households are counted in the national accounts as intermediateconsumption in the real estate sector (NACE 70), i.e. it is part of the expenditure for housing. In theenvironmental accounts for water, the physical data for use of water by households are, in the same way asin the national accounts, linked to the real estate sector.
The use of water by households amounts to 616 million m3, which means the average use of water inSweden amounts to 189 litres per person and day.
Some estimates are available on the use of water for different purposes, which shows that 30 percent isused for personal hygiene and 20 percent for dishwashing.
Figure 3.2-8 Use of water in households by purpose in Sweden, mid 90s
Source: Website http://www.svenskamiljonatet.se
This rather frequent introduction of the type of use by Member States probably lies in the assumption that theenvironmental impacts of the economic actions involving water largely depend on the type of use. It raisesquestions regarding the usefulness of introducing in the accounts such a breakdown by uses, and what usesshould be considered.
3.2.11 Conclusion on water volume flow accountsThe suggestions made by the Member States which tested the tables on water flows raise a number ofquestions:• The detail of the activity nomenclature: when the Member States had to refer to their Environment
Protection Agency to obtain data, the Agency generally supplied data with a different nomenclature,often process-based, separating the major type of use met in a certain class of activity/process.
• This type of use has been described by several Member States.• Some Member States introduced other types of water flows: water incorporated in products, water
removed from products, water evaporated, water infiltrated in the networks.• The nomenclature regarding the water sources did not seem to satisfy the compilers of the accounts and
a number of countries judged important the introduction of other categories such as coastal resources(Ireland and the United Kingdom) or sea water (Nordic countries) in order to make the schemecomprehensive.
Different indicators were built up, combining economic and environmental data: water productivity, waterintensity.
Cleaning, carwash10%
WC20%
Laundry15%
Dish washing20%
Personal hygiene30%
Cooking5%
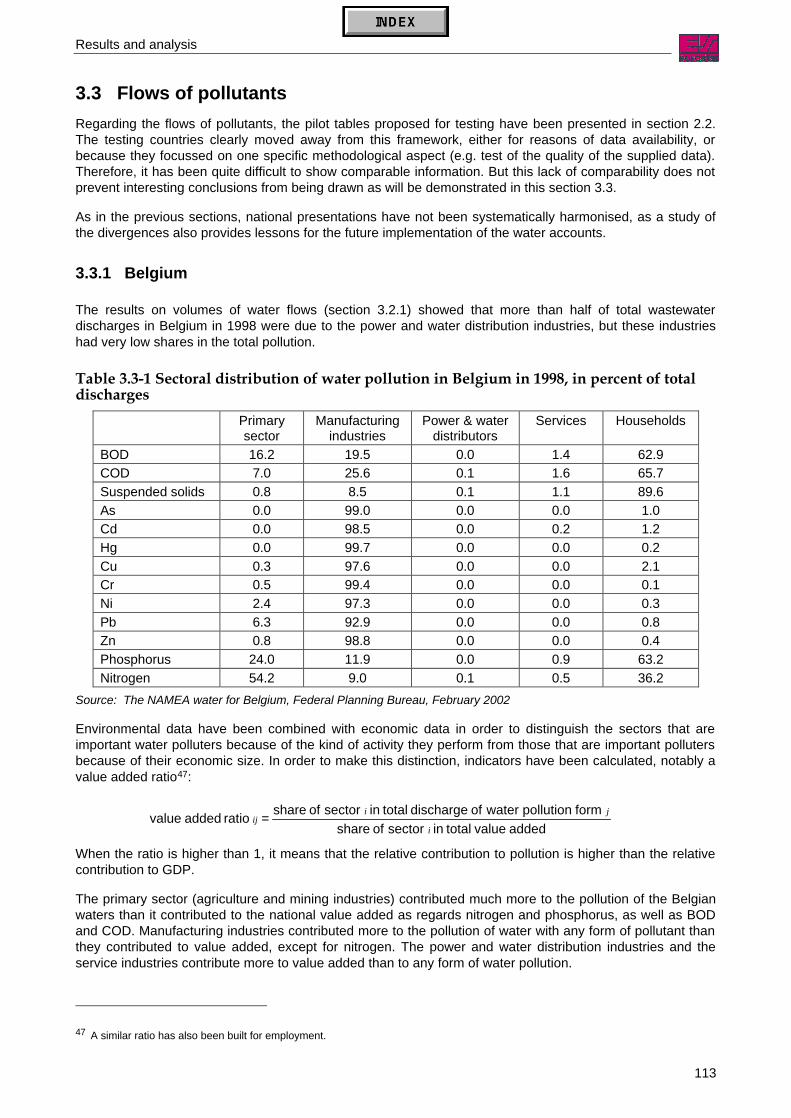
Results and analysis
113
3.3 Flows of pollutantsRegarding the flows of pollutants, the pilot tables proposed for testing have been presented in section 2.2.The testing countries clearly moved away from this framework, either for reasons of data availability, orbecause they focussed on one specific methodological aspect (e.g. test of the quality of the supplied data).Therefore, it has been quite difficult to show comparable information. But this lack of comparability does notprevent interesting conclusions from being drawn as will be demonstrated in this section 3.3.
As in the previous sections, national presentations have not been systematically harmonised, as a study ofthe divergences also provides lessons for the future implementation of the water accounts.
3.3.1 Belgium
The results on volumes of water flows (section 3.2.1) showed that more than half of total wastewaterdischarges in Belgium in 1998 were due to the power and water distribution industries, but these industrieshad very low shares in the total pollution.
Table 3.3-1 Sectoral distribution of water pollution in Belgium in 1998, in percent of totaldischarges
Primarysector
Manufacturingindustries
Power & waterdistributors
Services Households
BOD 16.2 19.5 0.0 1.4 62.9COD 7.0 25.6 0.1 1.6 65.7Suspended solids 0.8 8.5 0.1 1.1 89.6As 0.0 99.0 0.0 0.0 1.0Cd 0.0 98.5 0.0 0.2 1.2Hg 0.0 99.7 0.0 0.0 0.2Cu 0.3 97.6 0.0 0.0 2.1Cr 0.5 99.4 0.0 0.0 0.1Ni 2.4 97.3 0.0 0.0 0.3Pb 6.3 92.9 0.0 0.0 0.8Zn 0.8 98.8 0.0 0.0 0.4Phosphorus 24.0 11.9 0.0 0.9 63.2Nitrogen 54.2 9.0 0.1 0.5 36.2
Source: The NAMEA water for Belgium, Federal Planning Bureau, February 2002
Environmental data have been combined with economic data in order to distinguish the sectors that areimportant water polluters because of the kind of activity they perform from those that are important pollutersbecause of their economic size. In order to make this distinction, indicators have been calculated, notably avalue added ratio47:
When the ratio is higher than 1, it means that the relative contribution to pollution is higher than the relativecontribution to GDP.
The primary sector (agriculture and mining industries) contributed much more to the pollution of the Belgianwaters than it contributed to the national value added as regards nitrogen and phosphorus, as well as BODand COD. Manufacturing industries contributed more to the pollution of water with any form of pollutant thanthey contributed to value added, except for nitrogen. The power and water distribution industries and theservice industries contribute more to value added than to any form of water pollution.
47 A similar ratio has also been built for employment.
added value total in sector of share form pollution waterof discharge total in sector of share ratio added value
i
jiij =
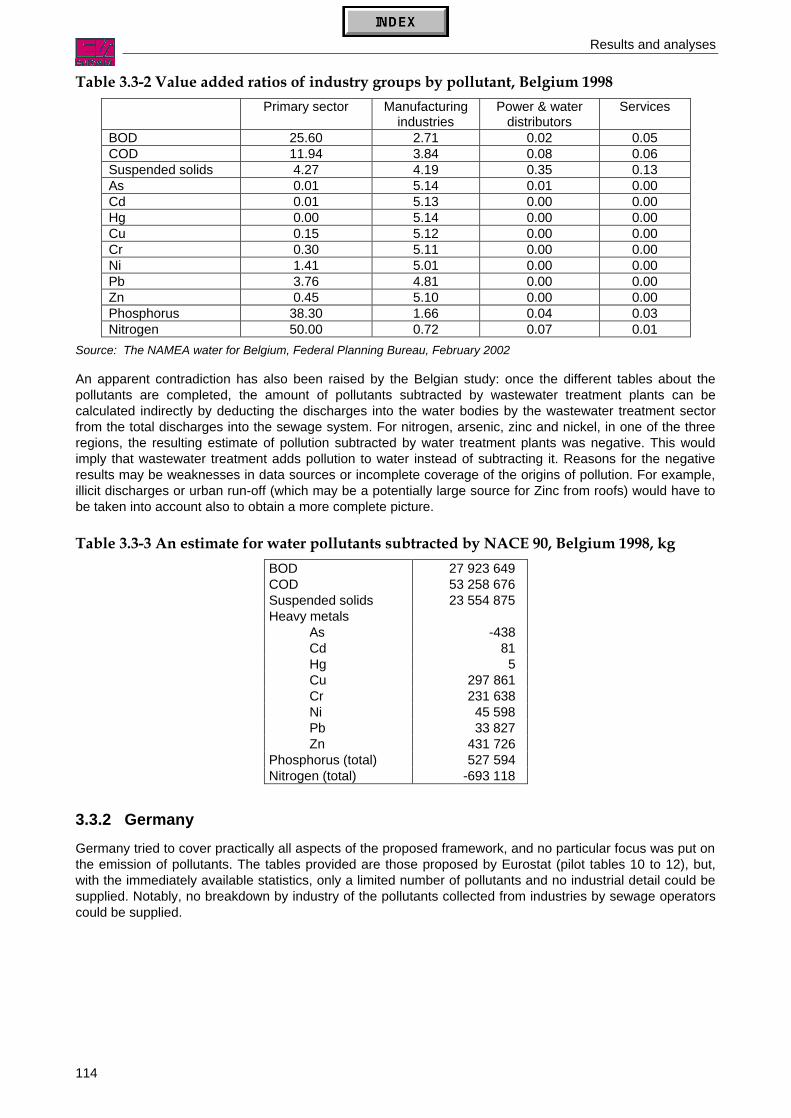
Results and analyses
114
Table 3.3-2 Value added ratios of industry groups by pollutant, Belgium 1998Primary sector Manufacturing
industriesPower & water
distributorsServices
BOD 25.60 2.71 0.02 0.05COD 11.94 3.84 0.08 0.06Suspended solids 4.27 4.19 0.35 0.13As 0.01 5.14 0.01 0.00Cd 0.01 5.13 0.00 0.00Hg 0.00 5.14 0.00 0.00Cu 0.15 5.12 0.00 0.00Cr 0.30 5.11 0.00 0.00Ni 1.41 5.01 0.00 0.00Pb 3.76 4.81 0.00 0.00Zn 0.45 5.10 0.00 0.00Phosphorus 38.30 1.66 0.04 0.03Nitrogen 50.00 0.72 0.07 0.01
Source: The NAMEA water for Belgium, Federal Planning Bureau, February 2002
An apparent contradiction has also been raised by the Belgian study: once the different tables about thepollutants are completed, the amount of pollutants subtracted by wastewater treatment plants can becalculated indirectly by deducting the discharges into the water bodies by the wastewater treatment sectorfrom the total discharges into the sewage system. For nitrogen, arsenic, zinc and nickel, in one of the threeregions, the resulting estimate of pollution subtracted by water treatment plants was negative. This wouldimply that wastewater treatment adds pollution to water instead of subtracting it. Reasons for the negativeresults may be weaknesses in data sources or incomplete coverage of the origins of pollution. For example,illicit discharges or urban run-off (which may be a potentially large source for Zinc from roofs) would have tobe taken into account also to obtain a more complete picture.
Table 3.3-3 An estimate for water pollutants subtracted by NACE 90, Belgium 1998, kgBOD 27 923 649COD 53 258 676Suspended solids 23 554 875Heavy metals
As -438Cd 81Hg 5Cu 297 861Cr 231 638Ni 45 598Pb 33 827Zn 431 726
Phosphorus (total) 527 594Nitrogen (total) -693 118
3.3.2 GermanyGermany tried to cover practically all aspects of the proposed framework, and no particular focus was put onthe emission of pollutants. The tables provided are those proposed by Eurostat (pilot tables 10 to 12), but,with the immediately available statistics, only a limited number of pollutants and no industrial detail could besupplied. Notably, no breakdown by industry of the pollutants collected from industries by sewage operatorscould be supplied.

Results and analysis
115
Table 3.3-4 Pollutants discharged by economic activities into the sewage network, Germany1991, 1 000 tonnes
BOD5 COD Nitrogen PhosphorusSewage operators - - - -Other industries 829 1 949 131 18Households 1 505 3 011 276 63TOTAL 2 334 4 960 407 81
Source: Entwicklung von Physischen Wasserflußrechnungen für Deutschland – Statistisches Bundesamt, August 1998
Table 3.3-5 Pollutants discharged to water bodies by economic activities, Germany 1991,1 000 tonnes
BOD5 COD Nitrogen PhosphorusSewage operators 233 783 196 20Other industries 89 337 91 6Households 172 345 32 7TOTAL 494 1 465 318 33
Source: Entwicklung von Physischen Wasserflußrechnungen für Deutschland – Statistisches Bundesamt, August 1998
Table 3.3-6 Pollutants subtracted by economic activities, Germany 1991, 1 000 tonnes
BOD5 COD Nitrogen PhosphorusSewage operators 2 102 4 177 211 61Other industries - - - -Households - - - -TOTAL 2 102 4 177 211 61
Source: Entwicklung von Physischen Wasserflußrechnungen für Deutschland – Statistisches Bundesamt, August 1998
In Table 3.3-6, no data are provided for ‘households’ and ‘other industries’ (mainly mining and manufacturingindustries) because a ‘net’ concept of emission is applied: if pollution is absorbed by a sewage treatmentplant belonging to the firm, it is an internal process and this pollution is not counted either in the pollutionemitted by the firm. It would be useful to have also the ‘gross’ emissions (prior to internal treatment), forcomparison with environmental protection expenditure accounts, where the expenditure corresponding tointernal treatment will be recorded.
3.3.3 FranceOne main objective was to test the reliability of the data obtained by using the NOPOLU model, as well asthe practicability of a correspondence table between the Water Agencies' industrial process-orientednomenclature (TEF) and NACE. These tests were organised at the Loire-Bretagne region level. Table 3.3-8shows the results of testing various methods. The aggregated results are not very different according to thedifferent sources of data or procedures. The shares of the main aggregated branches of industrial activitiesare also rather equivalent, whatever data or calculation method is used. The use of the correspondencetable between the process-oriented nomenclature and NACE and the actual classification of individual sitesseem to give the same results, at least for the simplified matrices.
Based on these encouraging results, an extension of the NOPOLU model to the national level was carriedout later on after the end of the pilot study.
In spite a common collection framework, some differences were observed between the Water Agencies:• the selection criteria for industrial sites,• the codification process,• the quality of data concerning the connection of industrial sites to WWTP.

Results and analyses
116
Nevertheless, a preliminary national physical account for wastewater emissions was issued, as follows.
Table 3.3-7 Pollutants discharged into water bodies by economic activities, France 1997Suspended
solidskg/day
TOC48
kg/day
Tox49
kg equitox/day
N
kg/day
P
kg/day
Agriculture 20 028 11 011 2 586 774Industry 13 992 892 5 046 008 54 613 497 318 768 86 241 Food and beverages 8 205 721 3 297 353 80 991 197 877 39 533 Consumption goods 170 291 258 658 812 822 15 702 4 183 Vehicles Equipment Intermediate goods 4 829 825 1 429 689 50 903 099 95 086 42 031 Energy 787 055 60 309 2 087 584 10102 494ConstructionTrade, Services, Administration 215 967 347 450 23 201 20 097 4 368TOTAL 14 228 887 5 404 469 54 636 698 341 451 91 383Source: IFEN, Synthesis file based on 1997 fees received by the 6 water agencies
This table is not consistent with Eurostat’s proposal in the sense that it is a combination of two tables:pollutants discharged to the sewage network are re-attributed to their original source. This allocation is ofcourse oriented by the polluter-pays principle: whether the industrial site discharges its wastewater directly tothe water bodies or into the sewage networks, its polluting load is identified and taxed.
48 TOC = total organic carbon49 Tox = toxic substances (notably heavy metals). In order to aggregate these substances, they are expressed in kg equitox. The kg
equitox is a measurement unit that evaluates the capacity of a substance to inhibit the biological functions of a living thing.

Results and analyses
117
Table 3.3-8 France: Pollutants discharged by economic activities in the Loire-Bretagne basin 1997, comparison of 4 procedures
Suspended solidskg/day
TOCkg/day
Toxkg equitox/day
Nkg/day
Pkg/day
Origin ofdischarges TEF Individ-
ual dataNopolu/
TEFNopolu/NACE
TEF Individ-ual data
Nopolu/TEF
Nopolu/NACE
TEF Individ-ual data
TEF Individualdata
Nopolu/TEF
Nopolu/NACE
TEF Individ-ual data
Nopolu/TEF
Nopolu/NACE
Households 54 066 38 522 8 786 2 406
Agriculture 59 67 16 515 756 775 33 2 657 0 0 256 263 38 1 470 858 45 37 6 51 098
Industry 59 202 59 794 52 051 47 354 99 017 99 294 89 112 92 823 1 231 1208 13 867 13 482 12 858 12 979 3 422 3 286 2 565 2 974
Food &beverages 18 834 17 484 17 556 16 630 50 556 50 490 51 026 48 627 4 3 8 271 7 694 7 385 6 639 2 051 1 993 1 978 1 903
Consump. goods 4 131 4 612 4 502 3 537 6 786 7 450 6 846 6 611 44 79 637 791 794 1 025 203 100 100 101
Vehicles 547 1 098 35 55
Equipment 7 954 1 391 383 2850 10 735 552 48 2 622 890 117 559 85 15 168 899 122 102 207
Interm. goods 19 103 25 673 20 068 21 345 29 875 39 258 30 147 32 638 293 942 4 077 2 184 4 347 4 764 242 1 030 360 673
Energy 9 180 10 633 9 543 2 445 1 065 1 274 1 045 1 223 0 67 323 2 728 317 347 27 40 25 34
Construction 21 12 1 0
Trade & Services 7 871 6 076 6 255 5 125 7 521 7 105 7 126 7 550 0 2 831 691 706 651 230 238 239 212
Administration 3 299 4 299 6 641 2 165 2 659 4 747 0 554 619 960 156 173 258
Not allocated 2 863 4 603 281 237
Sewage/waste 84 213 70 836 41 135 3 883
Total production 67 132 69 235 58 322 146 732 107 293 109 340 96 271 183 228 1 231 1 210 14 954 14 990 13 602 1 526 864 3 697 3 717 2 810 58 663
TOTAL 200 797 221 750 1 535 650 61 069
Source: Environmental accounts in France – NAMEA pilot study for France Phase III – IFEN, October 2000 using Loire-Bretagne Water Agency data

Results and analyses
118
Due to the detailed geographical level of the data utilised (NUTS 3), a mapping of the discharges wasundertaken. For each of the pollutants followed, maps such as the one shown below could be drawn.
Map 3.3-1 France: Location, level and origin of nitrogen discharges in Loire-Bretagne
Source: Presentation of Ifen results – RBDE meeting, 14 march 2001
The locations of the main discharges are easily identified by the background colour. The pie charts addinformation on the kind of source which pollutes most.
Other types of regional graphic analyses have been explored at the national level: breakdown of thedischarges by river basins, comparison of emissions by river basin (see examples on the next page).
Origin of Nitrogen Discharges
Settlements, UrbanIndustrialAgricultural
Nitrogen loads (tons N / day)
150 - 200100 - 15075 - 10050 - 7525 - 5010 - 25
0 - 10

Results and analyses
119
Figure 3.3-1 Share of each river basin in national emissions, France 1997
Source: Presentation of Ifen results – RBDE meeting, 14 March 2001
Figure 3.3-2 Emission by river basin weighted by the surface of the basin, France 1997
Note for this graph: Tox is expressed in kg equitox.
Source: Presentation of Ifen results – RBDE meeting, 14 March 2001
0
10
20
30
40
50
60
70
80
90
Artois Picardie Rhin Meuse Rhône MéditerranéeCorse
Adour Garonne Seine Normandie Loire Bretagne
River basin
%
TSS
TOC
Tox
N
P
0
50
100
150
200
250
300
350
400
450
500
Artois Picardie Rhin Meuse Rhône MéditerranéeCorse
Adour Garonne Seine Normandie Loire Bretagne
River basin
kg/d
ay/k
m2
TSS
TOC
Tox
N
P

Results and analyses
120
3.3.4 IrelandTwo tentative evaluations have been undertaken by Ireland, on the basis of (1) coefficients found in theliterature applied to economic data, and (2) of the regional registers of licences to pollute granted toenterprises (complemented by other sources).
First evaluation (1994 data)
Table 3.3-9 Discharges to water, Ireland 1994
SectorNACE –
CLIOR25 code
BOD
in tonnes
N
in tonnes
P
in tonnes
Other
in tonnes
Agriculture. Forestry. fishing 01 10 000 148 500 3 445 136 464 (ammonia)
Chemical products 17 3 650 1 460 73
Food. beverages. tobacco 36 17 340 1 825 438
Textiles. clothes & footwear 42 180
Total industry (direct discharge) 21 170 3 285 511 To be estimated
Transport 61/3/5 Metals. oil. salt
Municipal works 86 36 000 8 500 2 400
Total services 36 000 8 500 2 400
Residential *
Total accounted for discharges** 67 170 160 285 6 356* Emissions by septic tanks could be: 24 455 tonnes BOD, 3 600 tonnes N and 0 tonnes P. These uncertain figures have not been
accounted for.** Supplementary discharges could emanate from private septic tanks (see above) and agriculture: maybe 650 000 tonnes BOD,
226 388 tonnes N and 1 tonne P more.
Source: Compilation of Satellite Environments Accounts – ESRI, September 1998
Second evaluation (1996 and 1998/1999 data)
The second evaluation, based on the submissions to OSPAR confirmed the importance of agriculture in thepollutants loads to water bodies. According to this source, agriculture is responsible for 80% of nitrogen andnearly 70% of phosphorus discharges.
A breakdown by region (three large river basins), by type of water bodies and by type of source(diffuse/point) was possible.

Results and analyses
121
Table 3.3-10 Estimated net annual loads discharged to rivers and coastal waters, Ireland1996, tonnes
Nitrogen Phosphorus BODAgriculture 102 996 4 590 -East 17 144 770 -South 33 226 1 402 -West 52 626 2 418 -Forestry 407 25 -East 72 4 -South 140 9 -West 195 12 -Background run-off 5 364 358 -East 779 52 -South 1 331 89 -West 3 254 217 -Rural/Residential 3 105 310 2 858East 577 58 531South 838 84 771
DiffuseSources
West 1 689 169 1 555IPC Industry Direct 573 231 1 274East 288 5 108South 167 210 802West 117 16 364Non-IPC Industry Direct 1 483 422 5 624East 54 24 396South 94 26 395West 1 335 373 4 833IPC Industry to Sewer 1 173 277 3 248East 321 101 896South 728 143 1 955West 124 33 397Non-IPC Industry to Sewer 1 314 310 2 629East 701 163 1 239South 202 52 650West 411 95 740Urban/Residential 6 015 1 704 26 220East 3 486 987 14 158South 1 315 380 6 793
PointSources
West 1 214 337 5 269All diffuse + point sources 122 430 8 227 41 852East 23 424 2 164 17 328South 38 043 2 393 11 366
Total
West 60 964 3 670 13 158The estimates themselves relate to net nutrient loads reaching coastal waters and include factors for retention of nutrients where theriver basin incorporates lakes.Estimates of BOD discharges are to water's edge and no reference is made to the receiving medium. No estimates are made for diffusesources of BOD discharges, except residential sources, as sufficient data were not available.
Source: Satellite Environmental Accounts for Ireland 1996 – ESRI, May 2000
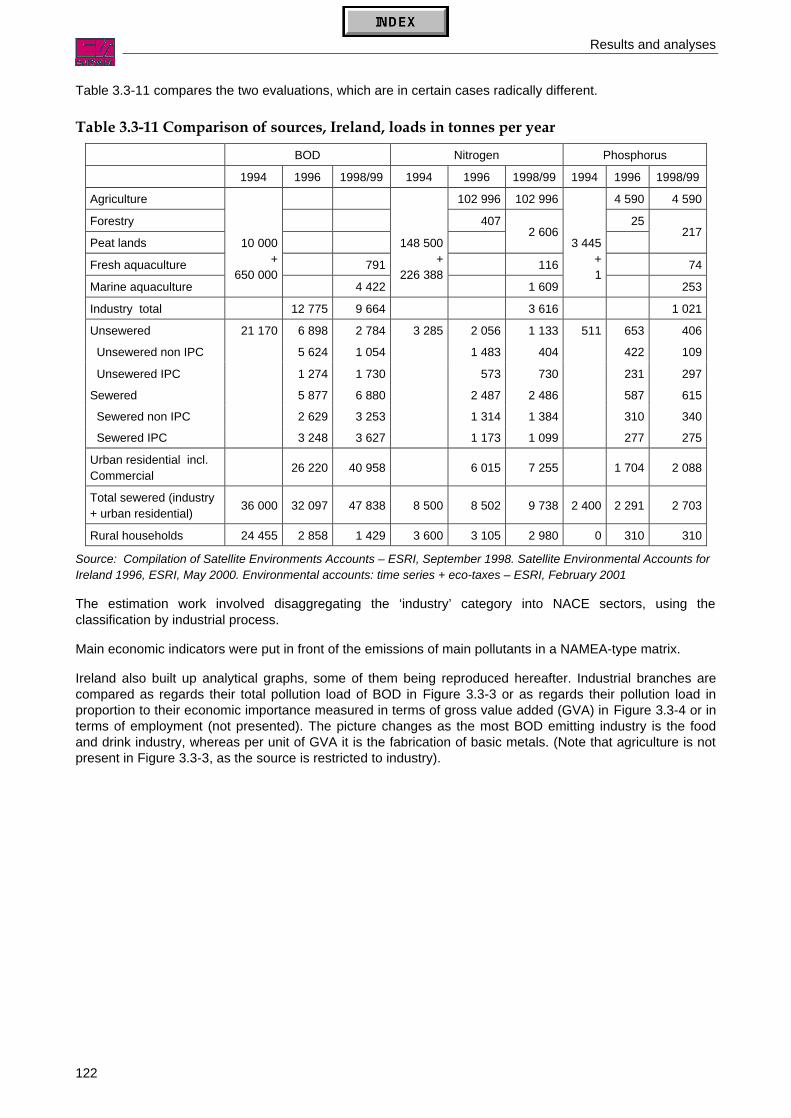
Results and analyses
122
Table 3.3-11 compares the two evaluations, which are in certain cases radically different.
Table 3.3-11 Comparison of sources, Ireland, loads in tonnes per year
BOD Nitrogen Phosphorus
1994 1996 1998/99 1994 1996 1998/99 1994 1996 1998/99
Agriculture 102 996 102 996 4 590 4 590
Forestry 407 25
Peat lands2 606 217
Fresh aquaculture 791 116 74
Marine aquaculture
10 000+
650 0004 422
148 500+
226 3881 609
3 445+1
253
Industry total 12 775 9 664 3 616 1 021
Unsewered 21 170 6 898 2 784 3 285 2 056 1 133 511 653 406
Unsewered non IPC 5 624 1 054 1 483 404 422 109
Unsewered IPC 1 274 1 730 573 730 231 297
Sewered 5 877 6 880 2 487 2 486 587 615
Sewered non IPC 2 629 3 253 1 314 1 384 310 340
Sewered IPC 3 248 3 627 1 173 1 099 277 275
Urban residential incl.Commercial 26 220 40 958 6 015 7 255 1 704 2 088
Total sewered (industry+ urban residential) 36 000 32 097 47 838 8 500 8 502 9 738 2 400 2 291 2 703
Rural households 24 455 2 858 1 429 3 600 3 105 2 980 0 310 310
Source: Compilation of Satellite Environments Accounts – ESRI, September 1998. Satellite Environmental Accounts forIreland 1996, ESRI, May 2000. Environmental accounts: time series + eco-taxes – ESRI, February 2001
The estimation work involved disaggregating the ‘industry’ category into NACE sectors, using theclassification by industrial process.
Main economic indicators were put in front of the emissions of main pollutants in a NAMEA-type matrix.
Ireland also built up analytical graphs, some of them being reproduced hereafter. Industrial branches arecompared as regards their total pollution load of BOD in Figure 3.3-3 or as regards their pollution load inproportion to their economic importance measured in terms of gross value added (GVA) in Figure 3.3-4 or interms of employment (not presented). The picture changes as the most BOD emitting industry is the foodand drink industry, whereas per unit of GVA it is the fabrication of basic metals. (Note that agriculture is notpresent in Figure 3.3-3, as the source is restricted to industry).

Results and analyses
123
Figure 3.3-3 Emissions of BOD by EPA sector, Ireland, 1998/99 data, tonnes/year
Source: Environmental accounts: time series + eco-taxes – ESRI, February 2001
Figure 3.3-4 Loads by NACE activity, Ireland, 1998/99 data, kg per 1000 IEP of GVA
Source: Environmental accounts: time series + eco-taxes – ESRI, February 2001
Mineral
s and
othe
r meta
ls
Energy
Metals
Mineral
fibres
and g
lass
Chemica
ls
Inten
sive a
gricu
lture
Food a
nd dr
ink
Wood,
pape
r, tex
tiles,
leathe
r
Fossil
fuels
Cemen
t
Waste
Surfac
e coa
ting
Other
0
1 000
2 000
3 000
4 000
5 000
6 000
Lost to waters
Generated
1+2 5 13 14 15 17 19 20 21 22 23 24 26 27 28 32 3540+41
70-7490-93
P
BOD
0
5
10
15
20
25
30
35
40
45
kg p
er '0
00 £
GVA
PNBOD

Results and analyses
124
3.3.5 The NetherlandsThe Netherlands produced quite a detailed emission account (11 pollutants x 21 industries). However,according to the pilot study, “ …due to incompleteness and limited reliability, the quality of emission figureson heavy metals is rather poor. The total domestic emission of heavy metals seems rather underestimated,at least for arsenic, but presumably also for other heavy metals: in the first instance, the total accumulation ofarsenic in the Netherlands showed a negative result. As it is very unlikely that the total annual outflow ofarsenic in the Netherlands is higher than its inflow, the emission from diffuse sources was grossed up… “
In the more recent emission register publications, the coverage of heavy metals has been improved.
The table below “ …shows that a considerable amount of all heavy metals are emitted by diffuse, or indirectsources. By far the greatest amount, however, is ‘imported’ from abroad through the rivers, the Rhine, fromGermany, and the Meuse, from France and Belgium …“
It should be remarked that the Dutch version of the tables about flows of pollutants introduces ‘activities’which have not been considered in the pilot tables:• Water boards: this activity (part of general government) does not intervene in the emission topic, but has
been kept here for reasons of consistency with the monetary account;• Waste dumping sites: these are noticeably responsible for some emission to water of dangerous
substances and are therefore shown separately.• Rest of the World: this is clearly an addition towards a second step of the accounts: integration of state
accounts. The Netherlands measures the concentration of pollutants in water bodies (rivers) at entry tonational territory and at exit (open sea) and attributes the incoming and outgoing flows to the Rest of theWorld. This method also allows ‘diffuse sources’ to be estimated by difference.
Table 3.3-13 presents the Dutch equivalent of Eurostat’s proposal concerning the table about pollutantssubtracted by economic activities. The balance is broken down into Rest of the World (pollution exported)and ‘Environmental themes’ (pollution accumulated on the territory). The method of analysis ofeutrophication potential and other environmental themes has been presented in section 1.2.

Results and analyses
125
Table 3.3-12 Origin of water pollutants, The Netherlands 1991Heavy metalsP N Organic
pollution(1) Cadmium Mercury Arsenic Chromium Copper Lead Nickel ZincORIGIN OF SUBSTANCES
1 000 tonnes 1 000 i.e. kg tonnesEMISSION BY CONSUMERS
Other consumption 13 67 15 068 1 327 665 2 981 27 135 75 24 323EMISSION BY PRODUCERS
Agriculture, hunting, forestry, fishing1 134 1 005 62 3 000 - - - 120 68 - 640Mining and quarrying 6Manufacturing
Food, beverages and tobacco industry 6 24 2 133 4 3 108 1 4 - 1 9Textile, wearing apparel and leather industry 1 - 257 - - 5 1 2 - - 2Wood and furniture industry - - 28 - - - - - - - -Paper, printing and publishing industry 1 4 283 4 4 - - 1 - - 1Petroleum industry - - - - - - - - 1 - 2Chemical industry 4 3 929 2 235 317 1 925 11 7 8 10 41Rubber and plastic industry - - 5 2 - - - - - - -Construction materials, earthenware and glass - - 12 4 - - - -Basic metal industry - 1 117 124 33 72 1 - 1 - 6Metal products and machinery industry - 1 222 34 - 41 4 6 1 3 10Other manufacturing - - 180
Public utilitiesElectricity and gas - - 10 - - - - - - - -Water supply - - 22 - - - - - - - -
Construction - - 209 - - - - - - - -Transport and storage - - 170 - - - - - - - -Environmental cleansing and sanitary services 19 53 5 010 847 316 2176 17 61 43 27 147Water boards - - - - - - - - - - -Other services 7 7 3 545
OTHER DOMESTIC ORIGINWaste dumping sites . . . 17 1 32 . . . . .Diffuse sources - - 5 520 748 374 19669 14 75 42 14 181
FROM THE REST OF THE WORLD 19 315 . 14 600 4 980 9 2433 294 474 325 282 2 300TOTAL 204 1 480 33 788 22 946 6 693 11 9442 368 884 564 360 3 662
(1) The organic pollution is quantified as the number of inhabitant equivalents (i.e.), where one i.e. equals 54 grams of Biological Oxygen Demand (BOD).
Source: Water accounts in the Dutch NAMEA: a ‘NAMWA’ for 1991 – CBS, May 1997
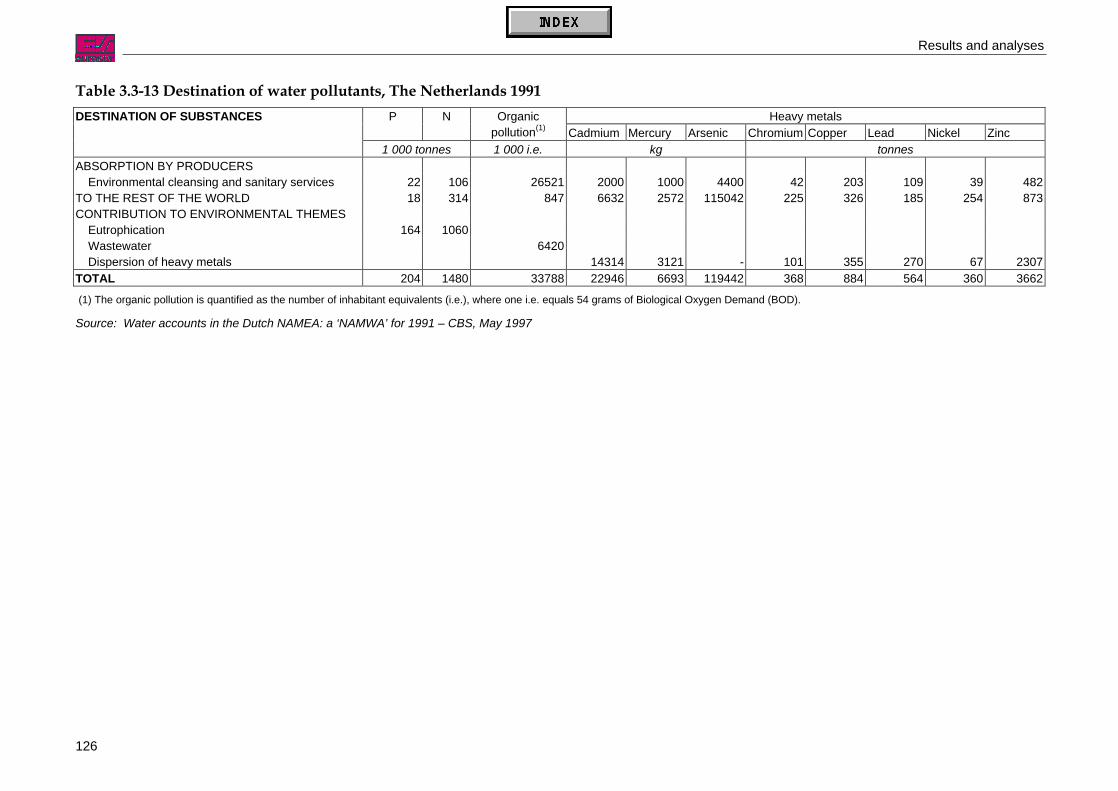
Results and analyses
126
Table 3.3-13 Destination of water pollutants, The Netherlands 1991Heavy metalsP N Organic
pollution(1) Cadmium Mercury Arsenic Chromium Copper Lead Nickel ZincDESTINATION OF SUBSTANCES
1 000 tonnes 1 000 i.e. kg tonnesABSORPTION BY PRODUCERS
Environmental cleansing and sanitary services 22 106 26521 2000 1000 4400 42 203 109 39 482TO THE REST OF THE WORLD 18 314 847 6632 2572 115042 225 326 185 254 873CONTRIBUTION TO ENVIRONMENTAL THEMES
Eutrophication 164 1060Wastewater 6420Dispersion of heavy metals 14314 3121 - 101 355 270 67 2307
TOTAL 204 1480 33788 22946 6693 119442 368 884 564 360 3662
(1) The organic pollution is quantified as the number of inhabitant equivalents (i.e.), where one i.e. equals 54 grams of Biological Oxygen Demand (BOD).
Source: Water accounts in the Dutch NAMEA: a ‘NAMWA’ for 1991 – CBS, May 1997
Results and analyses
127
3.3.6 AustriaThe results of the pilot study carried out in Austria show, industry by industry, at NACE-2 digits level50 thediverse emissions for 14 pollutants (tables on following pages). The emission data are complemented by themain corresponding economic indicators (added value, output and number of employees) to build a NAMEA.
This high level of detail should however be reconsidered in the light of the methodology: the same emissioncoefficient (per employee) has been applied to the majority of services activities.
On this basis, a graphic summary is made by pollutant: graphs show the industries mainly responsible for theemission of a particular pollutant (see examples on following pages). The main results displayed are:• About 75 % of the COD and 65 % of the BOD5 emissions originate from households and the
manufacture of pulp, paper and paper products.• Roughly 90 % of nitrogen and ammonium-nitrogen emissions come from agriculture, forestry and private
households.• 90 % of the phosphorus emissions are caused by agriculture, households, manufacture of basic metals
and forestry – with the latter two contributing only 7 % each to the total emissions.• AOX emissions are mostly caused by the pulp and paper industry and the chemical industry, whilst
households are responsible for 12 %.• Heavy metal emissions originate from several branches. 72 % of the total copper emissions stem from
households, partly due to human excretion.
Contrary to some other countries which recorded emissions at the step of discharge to the water bodies,Austria recorded emissions at the point of the original source industries or households. As explained insection 2.3.4, part of these ‘gross’ emissions (namely the discharges to the sewage network) are latertreated by the sewage treatment plants before final discharge to the water bodies. In the Austrianpresentation, sewage treatment plants do not emit pollutants, except for any (very low) emissions due to theirown activity. The emissions by NACE 90 that are shown are the emissions by other units, e.g. by wastetreatment units. In some case, the ‘gross’ emissions had to be estimated by applying a coefficient to netemissions.
In interpreting the following tables and figures, attention should be paid to the non-comparability of theresults with countries which record net emissions.
According to the authors, the quality of the results depends upon the reliability of the data provided by theindividual plants and on the degree of representativeness of responding plants in their industrial activity. Fora number of industries, emissions should be viewed as rough estimates only.
Another problem has been the poor coverage of heavy metals, especially mercury, chromium and nickel.Only rough estimates were possible in a few cases. Moreover, for many substances, including a largenumber of the hazardous substances listed in EC Directive 76/464/EEC, almost no information wasavailable.
Finally, and this is not specific to the Austrian methodology, it was remarked that the emissions are allocatedto the producing industry and this raises the question of responsibility: for example, emissions from paperproduction are exclusively attributed to the pulp and paper industry and not to large paper consumers suchas publishing or public administration.
50 A 3-digit level is also available for some food, beverages and tobacco manufacturing industries.

Results and analyses
128
Table 3.3-14 Austrian water NAMEA for 1994Share in
GDPGross
productionWastewaterdischarged
COD BOD5 TOC N NH4-N P AOX
Mio ATS current prices
Employees NACEcode
Description
m³/a t/a t/a t/a t/a t/a t/a kg/a50 446 77 526 179 368 01 Agriculture, hunting and related service activities 2 391 573 215 60 81 36 800 23 673 1 345 64.6
included in 01 02 Forestry, logging and related service activities included in 01 9 882 6 357 198included in 01 05 Fishing, fish hatcheries and fish farms; incidental services 365 000 000 500 250 100 64 10
655 1 208 955 10 Mining of coal and lignite; extraction of peat 6 242 1 0 0 0 0 0 0.23 077 11 419 2 370 11 Extraction of crude petroleum and natural gas; incidental services 31 600 3 0 1 1 0 0 0.9
not applicable 12 Mining of uranium and thorium ores not applicable194 310 412 13 Mining of metal ores 3 840 0 0 0 0 0 0 0.1
4 332 8 145 4 742 14 Other mining and quarrying 4 976 967 1 0 0 0 0 0 0.355 458 173 634 94 254 15 Manufacture of food products and beverages 28 428 628 5 893 2 027 1 964 367 236 60 1 229.515 064 17 760 1 245 16 Manufacture of tobacco products not publishable15 598 38 069 31 820 17 Manufacture of textiles 7 737 846 1 391 281 558 116 75 8 494.85 669 12 936 20 843 18 Manufacture of wearing apparel; dressing and dyeing of fur 573 996 82 14 31 1 0 1 4.43 193 9 404 9 176 19 Leather; manufacture of luggage, handbags, saddlery and footwear 1 235 224 408 18 147 144 3 1 229.2
23 475 60 428 53 584 20 Manufacture of wood, products of wood, cork, straw, etc. 5 168 229 427 164 160 12 12 0 63.915 739 47 023 19 118 21 Manufacture of pulp, paper and paper products 134 372 111 37 013 6 469 13 863 41 24 19 68 200.019 654 44 481 30 361 22 Publishing, printing and reproduction of recorded media 404 813 36 6 14 7 4 1 10.917 258 39 516 3 307 23 Manufacture of coke, refined petroleum products and nuclear fuel 8 519 130 285 47 107 12 12 4 212.930 772 81 562 36 947 24 Manufacture of chemicals and chemical products 68 940 040 5 970 572 860 2 300 1 480 0 60 000.013 508 29 563 22 459 25 Manufacture of rubber and plastic products 299 453 27 4 10 5 3 1 8.132 143 69 363 40 416 26 Manufacture of other non-metallic mineral products 7 378 681 331 125 124 24 22 9 1 119.322 725 69 344 35 070 27 Manufacture of basic metals 228 443 250 4 051 1 407 1 071 818 526 222 161.936 991 78 555 67 122 28 Manufacture of fabricated metals, except machinery and equipment 2 311 809 124 47 47 26 23 1 263.251 239 120 861 82 188 29 Manufacture of machinery and equipment n.e.c. 695 892 37 10 14 6 4 1 174.3
56 109 185 30 Manufacture of office machinery and computers 15 333 1 0 1 0 0 0 0.429 289 61 676 45 109 31 Manufacture of electrical machinery and apparatus n.e.c. 1 426 416 42 10 14 12 8 1 34.416 828 46 146 23 405 32 Manufacture of radio, TV and communication equipment 3 275 339 234 102 74 28 17 2 92.58 559 15 882 17 438 33 Manufacture of medical, precision, optical instruments, watches, etc. 84 721 6 1 2 1 0 0 2.4
19 556 59 568 24 466 34 Manufacture of motor vehicles, trailers and semi-trailers 549 664 28 6 12 5 3 1 12.62 965 6 431 5 130 35 Manufacture of other transport equipment 68 400 6 1 2 1 1 0 1.8
19 866 41 950 46 109 36 Manufacture of furniture; manufacturing n.e.c. 185 912 15 4 6 3 2 0 46.1included in other activities 37 Recycling included in other activities
56 520 120 905 33 874 40 Electricity, gas, steam and hot water supply 451 653 41 7 15 13 10 1 12.23 697 5 772 2 521 41 Collection, purification and distribution of water 74 173 4 1 2 1 0 0 0.9
Table continued overleaf

Results and analysis
129
Austrian water NAMEA for 1994 (continued)Share in
GDPGross
productionWastewaterdischarged
COD BOD5 TOC N NH4-N P AOX
Mio ATS current prices
Employees NACEcode
Description
m³/a t/a t/a t/a t/a t/a t/a kg/a165 295 309 334 301 444 45 Construction 4 019 253 362 60 136 66 43 8 108.546 756 74 096 81 776 50 Sale and repair of motor vehicles and motorcycles; retail sale of fuel 1 090 347 98 16 37 18 12 2 29.4
146 676 218 284 189 081 51 Wholesale trade and commission trade 2 521 080 227 38 85 42 27 5 68.193 700 135 394 255 690 52 Retail trade; repair of personal and household goods 3 409 200 307 51 115 56 36 6 92.090 498 155 712 196 171 55 Hotels and restaurants 25 202 835 2 268 378 851 416 268 47 907.362 214 97 683 145 078 60 Land transport; transport via pipelines 1 934 373 174 29 65 32 21 4 52.2
621 2 170 1 264 61 Water transport 93 503 8 1 3 2 1 0 2.56 477 17 768 4 007 62 Air transport 53 427 5 1 2 1 1 0 1.4
22 798 124 673 26 743 63 Supporting and auxiliary transport activities; travel agencies 356 573 32 5 12 6 4 1 9.654 912 62 506 53 711 64 Post and telecommunications 716 147 64 11 24 12 8 1 19.3
113 914 145 901 78 746 65 Financial intermediation, except insurance and pension funding 1 049 947 94 16 35 17 11 2 28.342 282 57 969 34 145 66 Insurance and pension funding, except compulsory social security 455 267 41 7 15 8 5 1 12.34 345 6 152 4 131 67 Activities auxiliary to financial intermediation 55 080 5 1 2 1 1 0 1.5
163 067 229 829 46 872 70 Real estate activities 624 960 56 9 21 10 7 1 16.914 091 18 243 4 684 71 Renting of equipment without operator and of personal goods 62 453 6 1 2 1 1 0 1.78 252 13 037 7 655 72 Computer and related activities 102 067 9 2 3 2 1 0 2.8
798 1 790 3 928 73 Research and development 52 373 5 1 2 1 1 0 1.482 755 129 026 96 519 74 Other business activities 1 286 920 116 19 43 21 14 2 34.7
No data available 75 Public administration and defence; compulsory social security mostly included in ‘public services’3 089 3 993 8 820 80 Education 117 600 11 2 4 2 1 0 3.2
41 779 51 187 59 580 85 Health and social work 794 400 71 12 27 13 8 1 21.412 778 20 235 7 002 90 Sewage and refuse disposal, sanitation and similar activities 2 030 346 6 108 1 432 2 288 429 276 2 9 836.6No data available 91 Activities of membership organizations n.e.c. No data available30 105 44 680 32 894 92 Recreational, cultural and sporting activities 438 587 39 7 15 7 5 1 11.811 799 16 980 64 577 93 Other service activities 802 477 86 12 17 1 1 0 63.64 813 4 813 4 738 95 Private households with employed persons 63 173 6 1 2 1 1 0 1.7
99 Extra-territorial organizations and bodies 60 147 5 1 2 1 1 0 1.6Households1) 538 843 018 48 496 8 083 18 186 8 891 5 719 1 010 19 398.3
303 574 520 374 611 883 Public services 8 158 440 734 122 275 135 87 15 220.345 520 70 684 119 720 Non-profit private services included in ‘public services’
2 147 434 3 882 059 3 374 853 Total 1 467 444 929 116 109 22 201 41 700 60 915 39 115 2 996 163 391Table continued overleaf

Results and analyses
130
Austrian water NAMEA for 1994 (continued)Share in
GDPGross
productionWastewaterdischarged
Zn Cu Cd Pb Cr Ni Hg
Mio ATS current prices
Employees NACEcode
Description
m³/a kg/a kg/a kg/a kg/a kg/a kg/a kg/a50 446 77 526 179 368 01 Agriculture, hunting and related service activities 2 391 573 70.2 73.5 1.0 2.3 0.0 0.0 0.0
included in 01 02 Forestry, logging and related service activities included in 01included in 01 05 Fishing, fish hatcheries and fish farms; incidental services 365 000 000 included in 01
655 1 208 955 10 Mining of coal and lignite; extraction of peat 6 242 0.2 0.2 0.0 0.0 0.0 0.0 0.03 077 11 419 2 370 11 Extraction of crude petroleum and natural gas; incidental services 31 600 0.3 0.1 0.0 0.0 0.0 0.0 0.0
not applicable 12 Mining of uranium and thorium ores not applicable194 310 412 13 Mining of metal ores 3 840 0.1 0.1 0.0 0.0 0.0 0.0 0.0
4 332 8 145 4 742 14 Other mining and quarrying 4 976 967 0.4 0.4 0.0 0.0 0.0 0.0 0.055 458 173 634 94 254 15 Manufacture of food products and beverages 28 428 628 279.0 299.0 1.0 1.8 16.0 57.2 0.115 064 17 760 1 245 16 Manufacture of tobacco products not publishable15 598 38 069 31 820 17 Manufacture of textiles 7 737 846 562.8 432.3 102.8 158.1 599.7 137.3 0.05 669 12 936 20 843 18 Manufacture of wearing apparel; dressing and dyeing of fur 573 996 26.9 42.2 0.4 0.7 5.2 17.1 0.03 193 9 404 9 176 19 Leather; manufacture of luggage, handbags, saddlery and footwear 1 235 224 1.5 2.4 0.9 0.6 494.8 4.0 0.0
23 475 60 428 53 584 20 Manufacture of wood, products of wood, cork, straw, etc. 5 168 229 3.0 2.0 0.3 0.4 0.0 0.2 0.015 739 47 023 19 118 21 Manufacture of pulp, paper and paper products 134 372 111 40.3 28.9 41.7 0.2 0.0 88.2 0.019 654 44 481 30 361 22 Publishing, printing and reproduction of recorded media 404 813 4.2 1.8 0.0 0.1 0.0 0.0 0.017 258 39 516 3 307 23 Manufacture of coke, refined petroleum products and nuclear fuel 8 519 130 0.7 1 062.2 0.0 1 061.5 0.0 1 061.5 40.430 772 81 562 36 947 24 Manufacture of chemicals and chemical products 68 940 040 2 552.7 138.2 24.0 35.0 15.7 217.2 33.013 508 29 563 22 459 25 Manufacture of rubber and plastic products 299 453 3.1 1.3 0.0 0.1 0.0 0.0 0.032 143 69 363 40 416 26 Manufacture of other non-metallic mineral products 7 378 681 3 976.2 233.5 206.7 4 505.7 1 098.5 231.4 0.022 725 69 344 35 070 27 Manufacture of basic metals 228 443 250 14 229.3 441.5 18.8 2 477.2 1 228.7 1 353.4 2.636 991 78 555 67 122 28 Manufacture of fabricated metals, except machinery and equipment 2 311 809 319.8 211.2 8.3 22.1 120.4 422.5 0.251 239 120 861 82 188 29 Manufacture of machinery and equipment n.e.c. 695 892 57.2 29.0 9.5 36.4 45.4 63.9 0.7
56 109 185 30 Manufacture of office machinery and computers 15 333 0.2 0.1 0.0 0.0 0.0 0.0 0.029 289 61 676 45 109 31 Manufacture of electrical machinery and apparatus n.e.c. 1 426 416 286.4 1 180.8 2.8 82.5 43.6 59.6 0.116 828 46 146 23 405 32 Manufacture of radio, tv and communication equipment 3 275 339 259.4 1 048.4 4.7 110.6 9.5 124.2 0.38 559 15 882 17 438 33 Manufacture of medical, precision, optical instruments, watches, etc. 84 721 1.9 15.7 0.1 1.0 0.8 1.0 0.0
19 556 59 568 24 466 34 Manufacture of motor vehicles, trailers and semi-trailers 549 664 38.7 35.5 1.6 5.5 8.4 125.3 0.02 965 6 431 5 130 35 Manufacture of other transport equipment 68 400 0.7 0.3 0.0 0.0 0.0 0.0 0.0
19 866 41 950 46 109 36 Manufacture of furniture; manufacturing n.e.c. 185 912 40.4 25.2 4.6 22.5 2.8 103.6 0.4included in other activities 37 Recycling included in other activities
56 520 120 905 33 874 40 Electricity, gas, steam and hot water supply 451 653 4.7 2.0 0.0 0.1 0.0 0.0 0.03 697 5 772 2 521 41 Collection, purification and distribution of water 74 173 0.3 0.1 0.0 0.0 0.0 0.0 0.0
Table continued overleaf

Results and analysis
131
Austrian water NAMEA for 1994 (end)Share in
GDPGross
productionEmployees Description Wastewater
dischargedZn Cu Cd Pb Cr Ni Hg
Mio ATS current prices
NACEcode
m³/a kg/a kg/a kg/a kg/a kg/a kg/a kg/a165 295 309 334 301 444 45 Construction 4 019 253 41.4 17.6 0.2 1.2 0.0 0.0 0.046 756 74 096 81 776 50 Sale and repair of motor vehicles and motorcycles; retail sale of fuel 1 090 347 11.2 4.8 0.0 0.3 0.0 0.0 0.0
146 676 218 284 189 081 51 Wholesale trade and commission trade 2 521 080 26.0 11.1 0.1 0.7 0.0 0.0 0.093 700 135 394 255 690 52 Retail trade; repair of personal and household goods 3 409 200 35.1 15.0 0.1 1.0 0.0 0.0 0.090 498 155 712 196 171 55 Hotels and restaurants 25 202 835 740.2 774.4 10.7 23.8 0.0 0.0 0.062 214 97 683 145 078 60 Land transport; transport via pipelines 1 934 373 19.9 8.5 0.1 0.6 0.0 0.0 0.0
621 2 170 1 264 61 Water transport 93 503 2.7 2.9 0.0 0.1 0.0 0.0 0.06 477 17 768 4 007 62 Air transport 53 427 1.6 1.6 0.0 0.1 0.0 0.0 0.0
22 798 124 673 26 743 63 Supporting and auxiliary transport activities; travel agencies 356 573 3.7 1.6 0.0 0.1 0.0 0.0 0.054 912 62 506 53 711 64 Post and telecommunications 716 147 7.4 3.1 0.0 0.2 0.0 0.0 0.0
113 914 145 901 78 746 65 Financial intermediation, except insurance and pension funding 1 049 947 10.8 4.6 0.0 0.3 0.0 0.0 0.042 282 57 969 34 145 66 Insurance and pension funding, except compulsory social security 455 267 4.7 2.0 0.0 0.1 0.0 0.0 0.04 345 6 152 4 131 67 Activities auxiliary to financial intermediation 55 080 0.6 0.2 0.0 0.0 0.0 0.0 0.0
163 067 229 829 46 872 70 Real estate activities 624 960 6.4 2.7 0.0 0.2 0.0 0.0 0.014 091 18 243 4 684 71 Renting of equipment without operator and of personal goods 62 453 0.6 0.3 0.0 0.0 0.0 0.0 0.08 252 13 037 7 655 72 Computer and related activities 102 067 1.1 0.4 0.0 0.0 0.0 0.0 0.0
798 1 790 3 928 73 Research and development 52 373 0.5 0.2 0.0 0.0 0.0 0.0 0.082 755 129 026 96 519 74 Other business activities 1 286 920 13.3 5.6 0.1 0.4 0.0 0.0 0.0
No data available 75 Public administration and defence; compulsory social security mostly included in ‘public services’3 089 3 993 8 820 80 Education 117 600 1.2 0.5 0.0 0.0 0.0 0.0 0.0
41 779 51 187 59 580 85 Health and social work 794 400 8.2 3.5 0.0 0.2 0.0 0.0 0.012 778 20 235 7 002 90 Sewage and refuse disposal, sanitation and similar activities 2 030 346 1 614.4 55.8 4.3 22.0 2.2 264.1 1.9
No data available 91 Activities of membership organizations n.e.c. No data available30 105 44 680 32 894 92 Recreational, cultural and sporting activities 438 587 4.5 1.9 0.0 0.1 0.0 0.0 0.011 799 16 980 64 577 93 Other service activities 802 477 119.0 104.7 5.1 1.0 0.6 1.2 0.04 813 4 813 4 738 95 Private households with employed persons 63 173 0.7 0.3 0.0 0.0 0.0 0.0 0.0
99 Extra-territorial organizations and bodies 60 147 0.6 0.3 0.0 0.0 0.0 0.0 0.0Households 538 843 018 15 824.7 16 556.5 229.3 509.7 0.0 0.0 0.0
303 574 520 374 611 883 Public services 8 158 440 84.0 35.8 0.4 2.4 0.0 0.0 0.045 520 70 684 119 720 Non-profit private services included in ‘public services’
2 147 434 3 882 059 3 374 853 Total 1 467 444 929 41 345 22 924 680 9 089 3 692 4 333 80
Source: NAMEA – Wasser – ÖSTAT – November 1998

Results and analyses
132
Figure 3.3-5 Annual emission of cadmium by economic activity, Austria mid 90s, kg
Source: NAMEA – Wasser – ÖSTAT – November 1998
0
50
100
150
200
250
01 02 05 10 11 12 13 14 15 16 17 18 19 20 21 22 23 24 25 26 27 28 29 30 31 32 33 34 35 36 37 40 41 45 50 51 52 55 60 61 62 63 64 65 66 67 70 71 72 73 74 75 80 85 90 91 92 93 95 99 H
Glass, other non-metallic mineral products
Textiles
Paper
Households

Results and analysis
133
Figure 3.3-6 Austria: share of the different economic activities in annual emissions of COD
Source: NAMEA – Wasser – ÖSTAT – November 1998
3.3.7 PortugalPortugal could only follow the pollutant content of the water flows in the public sewage system (about 64% ofthe population enjoy such a system). The pollutant content was measured first in the flow collected by thesewage system operators (pollutants discharged by economic activities into the sewers, but not broken downby industry), and secondly in the flow discharged by the operators into the water bodies.
Table 3.3-15 Pollutants content of wastewater at different steps of processing, tonnes peryear
Biological OxygenDemand (BOD)
Chemical OxygenDemand (COD)
Total suspendedsolids
Phosphorus(Total)
1- Pollutants content of flows dischargedto the public sewage system
132 800 265 600 199 168 6 656
2- Pollutants subtracted by the publicsewage system
61 300 122 700 108 600 200
3- Pollutants content of flows dischargedto the water bodies by the public sewagesystem
71 500 142 900 90 568 6 456
Source: Source: Water accounts project 1998 – Final report to Eurostat – June 2002
3.3.8 FinlandThe results supplied by Finland gave much detail in terms of activities, but only 3 types of pollutants werereviewed. BOD pollution is expressed in inhabitant equivalent.
Households42%
Rest of industries16%
Chemicals and chemical products
5%
Sewage and refuse disposal, etc.
5%
Pulp, paper and paper products
32%
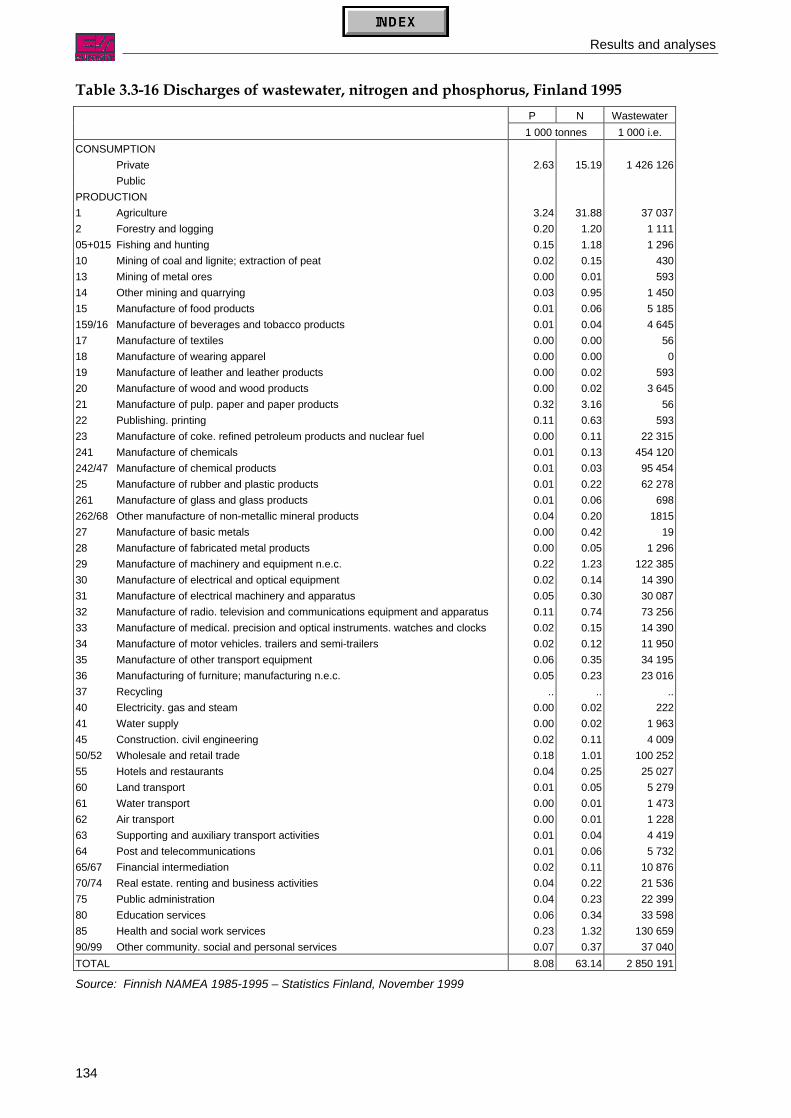
Results and analyses
134
Table 3.3-16 Discharges of wastewater, nitrogen and phosphorus, Finland 1995P N Wastewater
1 000 tonnes 1 000 i.e.CONSUMPTION
Private 2.63 15.19 1 426 126Public
PRODUCTION1 Agriculture 3.24 31.88 37 0372 Forestry and logging 0.20 1.20 1 11105+015 Fishing and hunting 0.15 1.18 1 29610 Mining of coal and lignite; extraction of peat 0.02 0.15 43013 Mining of metal ores 0.00 0.01 59314 Other mining and quarrying 0.03 0.95 1 45015 Manufacture of food products 0.01 0.06 5 185159/16 Manufacture of beverages and tobacco products 0.01 0.04 4 64517 Manufacture of textiles 0.00 0.00 5618 Manufacture of wearing apparel 0.00 0.00 019 Manufacture of leather and leather products 0.00 0.02 59320 Manufacture of wood and wood products 0.00 0.02 3 64521 Manufacture of pulp. paper and paper products 0.32 3.16 5622 Publishing. printing 0.11 0.63 59323 Manufacture of coke. refined petroleum products and nuclear fuel 0.00 0.11 22 315241 Manufacture of chemicals 0.01 0.13 454 120242/47 Manufacture of chemical products 0.01 0.03 95 45425 Manufacture of rubber and plastic products 0.01 0.22 62 278261 Manufacture of glass and glass products 0.01 0.06 698262/68 Other manufacture of non-metallic mineral products 0.04 0.20 181527 Manufacture of basic metals 0.00 0.42 1928 Manufacture of fabricated metal products 0.00 0.05 1 29629 Manufacture of machinery and equipment n.e.c. 0.22 1.23 122 38530 Manufacture of electrical and optical equipment 0.02 0.14 14 39031 Manufacture of electrical machinery and apparatus 0.05 0.30 30 08732 Manufacture of radio. television and communications equipment and apparatus 0.11 0.74 73 25633 Manufacture of medical. precision and optical instruments. watches and clocks 0.02 0.15 14 39034 Manufacture of motor vehicles. trailers and semi-trailers 0.02 0.12 11 95035 Manufacture of other transport equipment 0.06 0.35 34 19536 Manufacturing of furniture; manufacturing n.e.c. 0.05 0.23 23 01637 Recycling .. .. ..40 Electricity. gas and steam 0.00 0.02 22241 Water supply 0.00 0.02 1 96345 Construction. civil engineering 0.02 0.11 4 00950/52 Wholesale and retail trade 0.18 1.01 100 25255 Hotels and restaurants 0.04 0.25 25 02760 Land transport 0.01 0.05 5 27961 Water transport 0.00 0.01 1 47362 Air transport 0.00 0.01 1 22863 Supporting and auxiliary transport activities 0.01 0.04 4 41964 Post and telecommunications 0.01 0.06 5 73265/67 Financial intermediation 0.02 0.11 10 87670/74 Real estate. renting and business activities 0.04 0.22 21 53675 Public administration 0.04 0.23 22 39980 Education services 0.06 0.34 33 59885 Health and social work services 0.23 1.32 130 65990/99 Other community. social and personal services 0.07 0.37 37 040TOTAL 8.08 63.14 2 850 191
Source: Finnish NAMEA 1985-1995 – Statistics Finland, November 1999

Results and analysis
135
Some information was also given on the absorption of pollutants by economic activities: for ‘communities’connected to public wastewater networks and treatment plants (households, small industry and services), thereduction in phosphorus emissions in 1995 was 84 %, in nitrogen 29 % and in BOD 85 %.
3.3.9 SwedenThe two kinds of discharge (into the sewage network, and to water bodies) have been put in one table, sincea breakdown by industry of the discharge of pollutants into the sewage network has not been possible. Thepollutant content is only known for the discharge to water bodies.
Information on cooling water and whether the water is discharged to inland waters or to the sea is alsoavailable from the pilot work (see Table 3.2-8 in section 3.2.7 above). Urban run-offs join the sewagenetwork and have been estimated.
Relatively small amounts of wastewater from the manufacturing industry are treated by the MWWTPs. Thedominating industry in this respect is the food industry, whose wastewater may contain quite large amountsof organic matter (BOD7). For industry in general, the volumes of direct discharges are much larger than thedischarges into the sewage network.
Two original presentations in the Swedish table may be underlined:• A row for mining leakage has been included, although not taken into account in the total. This data refers
to expert assessments of the leakage from mining deposits in northern Sweden.• Pollution by households not connected to the sewage network has apparently also been attributed to
‘real estate’ activity.

Results and analyses
136
Table 3.3-17 Pollutants discharged to sewage network and water bodies by economic activities, Sweden 1995, tonnesNACEcode
Description Wastewaterdischargedto sewage
system
Wastewaterdischarged
to waterbodies
CODCr BOD7 N P As Hg Cd Pb Cu Zn Cr Ni
01 Agriculture02 Forestry
10/14 Mining and quarrying 1 157 45 306 1 1 14Mining and quarrying, leakage 0 0 0,7 2,8 21 357 0 0
15/16 Food products, beverages, tobacco 25 154 43 17817/19 Textiles, textile products, leather 3 080 8 337
20 Wood, products of wood, cork, straw, etc. 1 327 16 06821 Pulp, paper and paper products 7 682 873 006 328 922 95 803 3 844 419 1 3 8 89 4 522 Publishing, printing and reproduction of recorded media 2 282 6223 Coke, refined petroleum products and nuclear fuel 357 10 1 000 10024 Chemicals and chemical products 5 352 488 792 10 000 800 4925 Rubber and plastic products 1 193 16 39126 Non-metallic mineral products 2 617 8 19727 Basic metals 3 972 355 181 400 1 500 1 3 3 9 3 228 Fabricated metals, except machinery and equipment 4 379 11 74929 Machinery and equipment n.e.c. 5 615 19 66630 Office machinery and computers 381 61
31/32 Electrical machinery, radio, TV, communication 4 136 4 22533 Medical, precision, optical instruments, watches, etc. 1 023 165
34/35 Motor vehicles and other transport equipment 7 644 8 68736/37 Other manufacturing 623 266
Not possible to disaggregate by sector 727 5 51740 Electricity, gas, steam and hot water supply 725 116 88841 Collection, purification and distribution of water 132 972 47 62445 Construction
50/52 Wholesale and retail trade55 Hotels and restaurants
60/64 Transport, storage and communication62 Financial intermediation 86 522
71/74 Renting and business activities80/99 Other, excluding 90.0190.01 Sewage disposal 1 360 000 66 840 13 060 25 940 470 1 2 17 52 3 8
75 Public administration70 Real estate 527 975 88 449
Unspecified use 38 269Urban run-off 494 836TOTAL 1 360 000 3 517 825 407 162 108 863 32 184 889 1 1 1 10 29 219 11 15
Source: Water Accounts. Physical and monetary data connected to abstraction, use and discharge of water in the Swedish NAMEA – Statistiska centralbyrån, December 1999
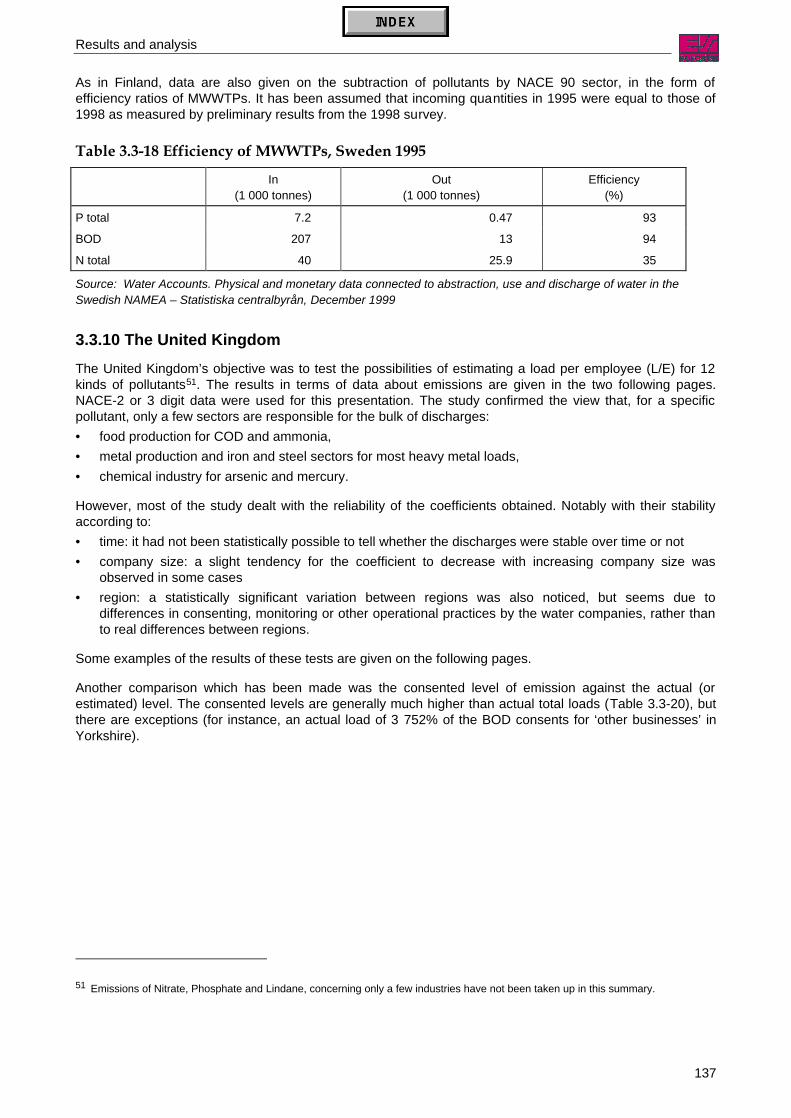
Results and analysis
137
As in Finland, data are also given on the subtraction of pollutants by NACE 90 sector, in the form ofefficiency ratios of MWWTPs. It has been assumed that incoming quantities in 1995 were equal to those of1998 as measured by preliminary results from the 1998 survey.
Table 3.3-18 Efficiency of MWWTPs, Sweden 1995
In(1 000 tonnes)
Out(1 000 tonnes)
Efficiency(%)
P total 7.2 0.47 93
BOD 207 13 94
N total 40 25.9 35
Source: Water Accounts. Physical and monetary data connected to abstraction, use and discharge of water in theSwedish NAMEA – Statistiska centralbyrån, December 1999
3.3.10 The United KingdomThe United Kingdom’s objective was to test the possibilities of estimating a load per employee (L/E) for 12kinds of pollutants51. The results in terms of data about emissions are given in the two following pages.NACE-2 or 3 digit data were used for this presentation. The study confirmed the view that, for a specificpollutant, only a few sectors are responsible for the bulk of discharges:• food production for COD and ammonia,• metal production and iron and steel sectors for most heavy metal loads,• chemical industry for arsenic and mercury.
However, most of the study dealt with the reliability of the coefficients obtained. Notably with their stabilityaccording to:• time: it had not been statistically possible to tell whether the discharges were stable over time or not• company size: a slight tendency for the coefficient to decrease with increasing company size was
observed in some cases• region: a statistically significant variation between regions was also noticed, but seems due to
differences in consenting, monitoring or other operational practices by the water companies, rather thanto real differences between regions.
Some examples of the results of these tests are given on the following pages.
Another comparison which has been made was the consented level of emission against the actual (orestimated) level. The consented levels are generally much higher than actual total loads (Table 3.3-20), butthere are exceptions (for instance, an actual load of 3 752% of the BOD consents for ‘other businesses’ inYorkshire).
51 Emissions of Nitrate, Phosphate and Lindane, concerning only a few industries have not been taken up in this summary.

Results and analyses
138
Table 3.3-19 Overall median load/employee for five regions in the UK (from individual company load/employee), kg/employee/yearNACE Sector COD BOD Ammonia Cadmium Chromium Copper Lead Nickel Mercury Zinc Arsenic
01 Agriculture 214.1 10 Mine Coal 11.0 14 Mine Other 12.6 0.168 15 Food products 201.8 634.5 1.714 0.00010 0.003 0.017 0.003 0.004 0.029 17 Textiles 415.4 223.3 1.556 0.00288 0.129 0.024 0.026 0.350 18 Apparel 14.7 19 Leather 123.2 119.659 2.056 0.079 0.059 0.003 0.027 20 Wood products 1.2 21 Paper 16.1 712.4 0.403 0.00001 0.000 0.031 0.000 0.000 0.003 23 Petroleum 39.3 24.3 0.618 0.006 0.086 2411/2 Dyes & Gas 728.5 389.7 66.050 0.00315 0.643 0.446 0.024 0.003 0.00089 0.106 2413 Inorganic Chemistry 75.3 70.8 6.150 0.00333 0.010 0.026 0.013 0.034 0.027 2414 Organic Chemistry 691.5 1 040.8 6.552 0.00357 0.021 0.146 0.080 0.046 0.04007 0.202 0.040152416 Plastics 96.5 0.2 4.488 0.055 0.098 0.088 0.098 0.08774 0.062 0.08774242 Agro Chemical 19.8 243 Paint etc. 10.0 12.9 0.00015 0.005 0.005 0.013 0.004 0.00004 0.037 244 Pharmaceutical Chemistry 32.8 4.0 0.004 0.005 0.003 0.004 245 Soap etc 56.6 0.015 0.011 246 Chemical products 99.1 419.2 1.339 0.00051 0.013 0.156 0.006 0.005 0.00011 0.009 247 Man made fibre 82.2 251 Rubber products 1.5 0.00008 0.003 0.000 0.008 0.208 252 Plastic products 3.2 0.00058 0.051 0.003 0.021 0.015 261 Glass products 8.7 105.3 0.00047 0.004 0.071 0.083 0.009 0.035 262/3 Ceramic goods 2.3 0.00027 0.006 0.009 0.014 0.005 0.063 266/7/8 Concrete etc 16.3 50.3 1.017 2.000 1.420
Table continued overleaf
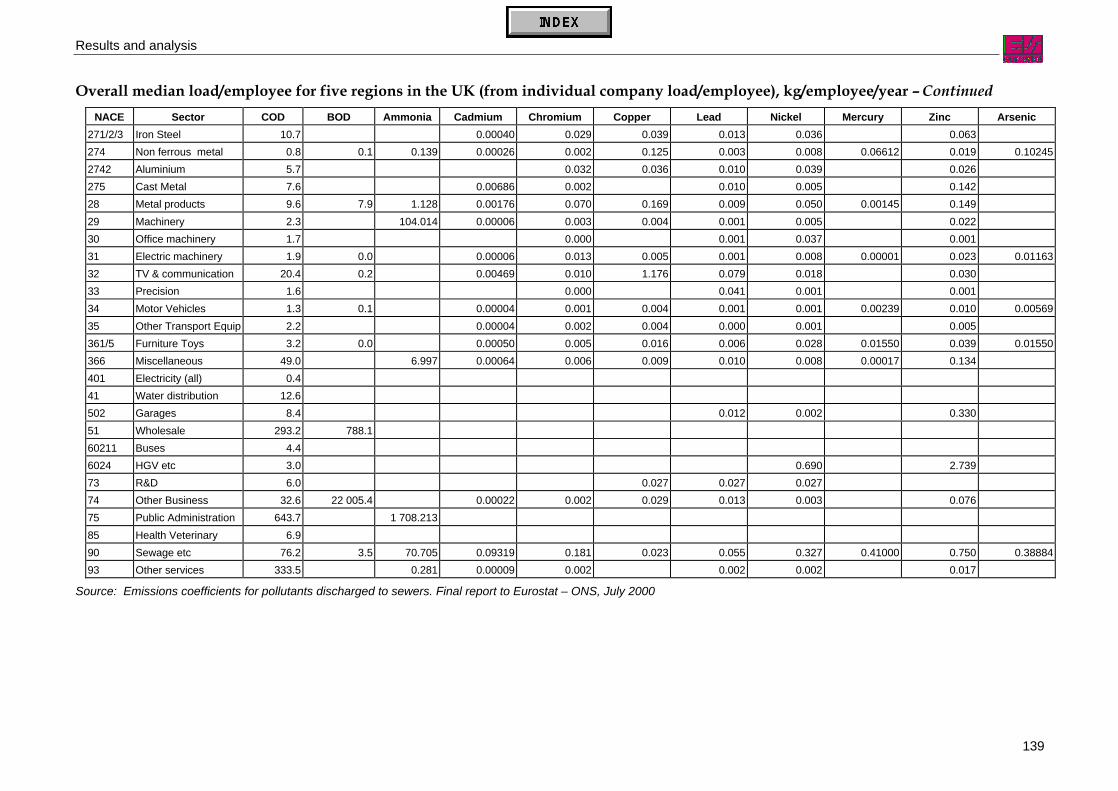
Results and analysis
139
Overall median load/employee for five regions in the UK (from individual company load/employee), kg/employee/year – ContinuedNACE Sector COD BOD Ammonia Cadmium Chromium Copper Lead Nickel Mercury Zinc Arsenic
271/2/3 Iron Steel 10.7 0.00040 0.029 0.039 0.013 0.036 0.063 274 Non ferrous metal 0.8 0.1 0.139 0.00026 0.002 0.125 0.003 0.008 0.06612 0.019 0.102452742 Aluminium 5.7 0.032 0.036 0.010 0.039 0.026 275 Cast Metal 7.6 0.00686 0.002 0.010 0.005 0.142 28 Metal products 9.6 7.9 1.128 0.00176 0.070 0.169 0.009 0.050 0.00145 0.149 29 Machinery 2.3 104.014 0.00006 0.003 0.004 0.001 0.005 0.022 30 Office machinery 1.7 0.000 0.001 0.037 0.001 31 Electric machinery 1.9 0.0 0.00006 0.013 0.005 0.001 0.008 0.00001 0.023 0.0116332 TV & communication 20.4 0.2 0.00469 0.010 1.176 0.079 0.018 0.030 33 Precision 1.6 0.000 0.041 0.001 0.001 34 Motor Vehicles 1.3 0.1 0.00004 0.001 0.004 0.001 0.001 0.00239 0.010 0.0056935 Other Transport Equip 2.2 0.00004 0.002 0.004 0.000 0.001 0.005 361/5 Furniture Toys 3.2 0.0 0.00050 0.005 0.016 0.006 0.028 0.01550 0.039 0.01550366 Miscellaneous 49.0 6.997 0.00064 0.006 0.009 0.010 0.008 0.00017 0.134 401 Electricity (all) 0.4 41 Water distribution 12.6 502 Garages 8.4 0.012 0.002 0.330 51 Wholesale 293.2 788.1 60211 Buses 4.4 6024 HGV etc 3.0 0.690 2.739 73 R&D 6.0 0.027 0.027 0.027 74 Other Business 32.6 22 005.4 0.00022 0.002 0.029 0.013 0.003 0.076 75 Public Administration 643.7 1 708.213 85 Health Veterinary 6.9 90 Sewage etc 76.2 3.5 70.705 0.09319 0.181 0.023 0.055 0.327 0.41000 0.750 0.3888493 Other services 333.5 0.281 0.00009 0.002 0.002 0.002 0.017
Source: Emissions coefficients for pollutants discharged to sewers. Final report to Eurostat – ONS, July 2000

Results and analyses
140
Figure 3.3-7 United Kingdom: example of variation of a load coefficient by region
Source: Emissions coefficients for pollutants discharged to sewers. Final report to Eurostat – ONS, July 2000
Figure 3.3-8 United Kingdom: example of variation of a load coefficient by company size
Source: Emissions coefficients for pollutants discharged to sewers. Final report to Eurostat – ONS, July 2000
Chromium, Machinery (42)
0.000001
0.00001
0.0001
0.001
0.01
0.1
1
10
0 1 2 3 4 5 6
Water company
L/E
(kg/
empl
oyee
)
Anglian Severn Trent Yorkshire
Zinc, Metal Products (41)
0.00001 0.0001 0.001 0.01 0.1
1 10
100 1000
0 1 2 3 4
Inter-quartile
L/E
(kg/
empl
oyee
)

Results and analysis
141
Table 3.3-20 Total actual load (from matched firms) as a percentage of total consented loads(Yorkshire’s results only – industries with other consents than COD)NACE Sector COD BOD Ammonia Cadmium Chromium Copper Lead Nickel Mercury Zinc Arsenic Lindane01 Agriculture 3 115 Food products 72 326 3 67 6 417 Textiles 28 402 91 0 42 0 0 0 172 319 Leather 64 125 1 121 Paper 77 1 145 0 40 0 623 Petroleum 17 42411/2 Dyes & Gas 41 1 825 102 9 37 16 5 2 86 5 02416 Plastics 60 1 5 0 9 35243 Paint etc 40 9 2 1 4 1 2 377 6244 Pharmaceutical Chemistry 37 10 55 4 3 1246 Chemistry Products 16 11247 Man made fibre 18 7 46 5251 Rubber products 24 25252 Plastic products 65 159 3 183 0 5 150261 Glass products 13 14 10 10262/3 Ceramic goods 53 3 2 2 2 0271/2/3 Iron Steel 7 47 21 20 17 11 262742 Aluminium 229 23 12 4 13 3275 Cast Metal 18 1 1 3 7 5 528 Metal products 18 62 6 55 27 5 13 23 21 129 Machinery 40 14 4 5 5 25 1831 Electrical Machinery 4 2 2 3 4 2 032 TV & communication 14 8 118 5 10 3034 Motor Vehicles 37 70 5 2 2535 Other transport equipment 4 5 1 16 2361/5 Furniture Toys 14 0 7 5 17 1 17 2502 Garages 22 974 Other Business 23 3 752 17 0 0 0 090 Sewage etc 6 0 11 0 0 1 1 1 0 0 0
Source: Emissions coefficients for pollutants discharged to sewers. Final report to Eurostat – ONS, July 2000

Results and analyses
142
The conclusion of the ONS study was that resulting coefficients (loads of different pollutants per employee)have to be interpreted cautiously for a number of reasons:• It has been difficult to merge different databases on the basis of the name and address of firms.• The calculated emission coefficients were generally extremely variable within an industrial sector as well
as between sectors.• The estimates of proportion of sectors consented remain uncertain.• Differences in consenting practices in the regions result in discrepancies in the contributing sectors,
which most likely do not mirror real regional differences in the nature of discharges.
Finally, using such coefficients to estimate loads of pollutants in the wastewater is considered to have animportant drawback, even if the coefficients were sufficiently robust. Total loads calculated by using loadsper employee only vary if the number of employees changes. An updating of the coefficients is needed torelate changes due to shifts in process technology or production activities.
To summarise, using emissions coefficients for estimating the loads of pollutants discharged to sewers bydifferent industrial sectors was not considered sufficiently robust for inclusion in the national water accounts.However, the water companies are moving towards a more sophisticated integrated data system, and are insome cases starting to apply SIC codes. The report estimates that in a not too distant future, the generationof appropriate data sets may become a relatively trivial task.
3.3.11 NorwayHeavy metalsUsing the INKOSYS database Statistics Norway drew up emissions accounts for 19 types of toxicsubstances (heavy metals) for the years 1995, 1996 and 1997. According to these accounts, the emissionsseem heavily dependent on the types of processes and technologies used by the enterprises. They primarilycome from the following NACE divisions:• NACE 13 (Mining of metal ores),• NACE 21 (Manufacture of pulp, paper and paper products),• NACE 24 (Manufacture of chemicals and chemical products),• NACE 27 (Manufacture of basic metals).
In addition to the INKOSYS database, estimates of heavy metals in the sludge from the municipalwastewater treatment plants have also been used. Comparing the amounts removed from the water in theform of sludge to the amounts released by enterprises Statistics Norway concluded that there is a need tobetter identify the sources of emissions. For some substances, for example copper, twice as much isremoved in the sludge from the wastewater treatment plants than is released by the enterprises requiring adischarge licence. This would indicate that there are other major emissions sources of copper that areconnected to the municipal wastewater system that need to be identified52. Similarly, for chromium andmercury the amounts reported in the sludge are several times higher than the amounts reported asemissions from the enterprises that have discharge licences.
This conclusion should even be reinforced, considering that, although no data are available as regards thecontent of heavy metals in the effluent released into water bodies after treatment, the removal rate of thesesubstances is most probably less than 100%.
52 Households are the major source for copper, according to the Austrian study.

Results and analysis
143
Table 3.3-21 Emissions to water of heavy metals from enterprises having discharge licences, Norway 1997, kg
NACEAg
Silver
AlAluminium
As1
Arsenic
AuGold
BaBarium
Cd1, 2
Cadmium
CoCobalt
Tot Cr1
chromium
Cu1, 2
Copper
FeIron
Hg1, 2
Mercury
MnManganese
MoMolybdenu
m
Ni1
Nickel
Pb1, 2
Lead
SnTin
TiTitanium
VVanadium
Zn1
Zinc
13 2.4 128 5 2941415 613 19817 17 1.9 7.3 65 201 0.3 11 23 15 49418 4219 822021 0.9 4.6 1.9 0.4 5 852 433 0.0 772 8 8 7622 4 0.023 39 11 0.0 44 39 0.024 23 11 560 329 111 12 2 520 4 244 230 280 300 594 3 2722526 0.01 0.00 0.0 0.027 8 891 130 938 200 232 2 018 824 7 989 120 1 496 3 917 24 6.0 43 17628 3.512 3 750 1.122 0.2 2.8 60 51 1 165 17 169 19 206 1502931 2 9 1.0 1.1 4.4 0.9 3.63540 0.02 0.1 0.360747590 0.2 32 0.7 1 505 251 0.3 2 541 0.6 176 0.3 4.6 2 983
INKOSYStotal 3.512 12 642 147 1.122 36 968 210 492 10 934 331 832 19 6 838 122 11 608 4 201 222 280 368 644 50 155
For memory:Sewage
sludge content76 1 600 22 100 101 900 1 960 28 900
Source: Norwegian Economic and Environment Accounts (NOREEA Phase 2) Project – Statistics Norway, October 2000
1Heavy metals reported in the OECD/Eurostat joint questionnaire, Inland waters (Table 7)2Toxic substances which are to be substantially reduced by 2010 according to White Paper n°58 (1996-1997) to the Norwegian Parliament.Light grey shading are values that are substantially different from the values reported in Table 7 of the OECD/Eurostat joint questionnaire on Inland waters.Values shaded in dark grey highlight data needing additional checking due to inconsistencies between years.

Results and analyses
144
Statistics Norway also elaborated a time series for the seven types of toxic substances that are reported formunicipal sludge (shown below).
The report by Statistics Norway states that: “ …From this figure it appears that the amounts of mercury foundin sludge are being drastically reduced but the emissions from industrial sources show a mixed picture forthe time period 1995 to 1997. Drawing conclusions about trends is difficult from these two sets of data.Further work is needed before overall trends can be identified with confidence... “
Figure 3.3-9 Heavy metals in sludge from municipal wastewater treatment plants, Norway1993 - 1999
Source: Statistics Norway, Wastewater statistics 1999. (http://www.ssb.no/emner/01/04/20/avlut/)
Nitrogen and phosphorusDischarges of nitrogen and phosphorus by industries have been reported separately by Norway, over theyears 1995 to 1997. The results are reproduced below, which show large variations over time.
Total emissions by industry are rather close to emissions calculated by the TEOTIL model for industry. TheTEOTIL model also gives an estimate of total emissions, including ‘natural’ emissions:
Table 3.3-22 Emissions of phosphorus and nitrogen to coastal areas, Norway 1996, tonnes
Phosphorus Nitrogen
Agriculture, hunting and forestry 663 21 988
Municipal wastewater 1 479 19 370
Industry 241 3 908
Natural run-off from pristine areas 1 246 55 016
Total 3 629 100 282
INKOSYS data (mining and manufacturing industry) 283 3 623
Source: Bratli 1998, calculated using the TEOTIL model, cited by Norwegian Economic and Environment Accounts(NOREEA Phase 2) Project – Statistics Norway, October 2000
50 %
60 %
70 %
80 %
90 %
100 %
110 %
120 %
130 %
140 %
1993 1994 1995 1996 1997 1998 1999
Percent of 1993 level
NickelChromiumZincCadmiumCopperLeadMercury
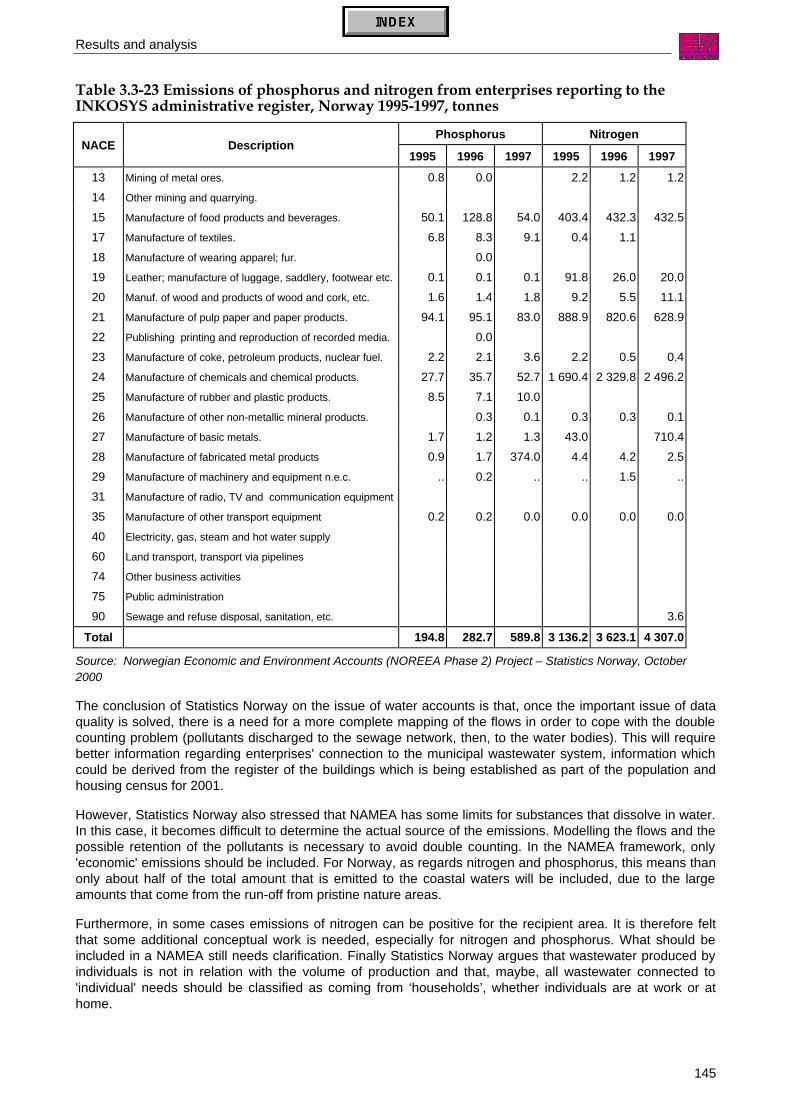
Results and analysis
145
Table 3.3-23 Emissions of phosphorus and nitrogen from enterprises reporting to theINKOSYS administrative register, Norway 1995-1997, tonnes
Phosphorus NitrogenNACE Description
1995 1996 1997 1995 1996 199713 Mining of metal ores. 0.8 0.0 2.2 1.2 1.214 Other mining and quarrying.
15 Manufacture of food products and beverages. 50.1 128.8 54.0 403.4 432.3 432.517 Manufacture of textiles. 6.8 8.3 9.1 0.4 1.118 Manufacture of wearing apparel; fur. 0.019 Leather; manufacture of luggage, saddlery, footwear etc. 0.1 0.1 0.1 91.8 26.0 20.020 Manuf. of wood and products of wood and cork, etc. 1.6 1.4 1.8 9.2 5.5 11.121 Manufacture of pulp paper and paper products. 94.1 95.1 83.0 888.9 820.6 628.922 Publishing printing and reproduction of recorded media. 0.023 Manufacture of coke, petroleum products, nuclear fuel. 2.2 2.1 3.6 2.2 0.5 0.424 Manufacture of chemicals and chemical products. 27.7 35.7 52.7 1 690.4 2 329.8 2 496.225 Manufacture of rubber and plastic products. 8.5 7.1 10.026 Manufacture of other non-metallic mineral products. 0.3 0.1 0.3 0.3 0.127 Manufacture of basic metals. 1.7 1.2 1.3 43.0 710.428 Manufacture of fabricated metal products 0.9 1.7 374.0 4.4 4.2 2.529 Manufacture of machinery and equipment n.e.c. .. 0.2 .. .. 1.5 ..31 Manufacture of radio, TV and communication equipment
35 Manufacture of other transport equipment 0.2 0.2 0.0 0.0 0.0 0.040 Electricity, gas, steam and hot water supply
60 Land transport, transport via pipelines
74 Other business activities
75 Public administration
90 Sewage and refuse disposal, sanitation, etc. 3.6
Total 194.8 282.7 589.8 3 136.2 3 623.1 4 307.0
Source: Norwegian Economic and Environment Accounts (NOREEA Phase 2) Project – Statistics Norway, October2000
The conclusion of Statistics Norway on the issue of water accounts is that, once the important issue of dataquality is solved, there is a need for a more complete mapping of the flows in order to cope with the doublecounting problem (pollutants discharged to the sewage network, then, to the water bodies). This will requirebetter information regarding enterprises' connection to the municipal wastewater system, information whichcould be derived from the register of the buildings which is being established as part of the population andhousing census for 2001.
However, Statistics Norway also stressed that NAMEA has some limits for substances that dissolve in water.In this case, it becomes difficult to determine the actual source of the emissions. Modelling the flows and thepossible retention of the pollutants is necessary to avoid double counting. In the NAMEA framework, only'economic' emissions should be included. For Norway, as regards nitrogen and phosphorus, this means thanonly about half of the total amount that is emitted to the coastal waters will be included, due to the largeamounts that come from the run-off from pristine nature areas.
Furthermore, in some cases emissions of nitrogen can be positive for the recipient area. It is therefore feltthat some additional conceptual work is needed, especially for nitrogen and phosphorus. What should beincluded in a NAMEA still needs clarification. Finally Statistics Norway argues that wastewater produced byindividuals is not in relation with the volume of production and that, maybe, all wastewater connected to'individual' needs should be classified as coming from ‘households’, whether individuals are at work or athome.

Results and analyses
146
3.3.12 Comparisons between countriesAs stated at the beginning of this chapter, it has not been possible to undertake systematic comparisons.Since comparisons between total emissions of pollutants into water do not make much sense, given the sizedifferences between the countries as well as their differences in industrial structure, only ratio comparisonshave been attempted below (discharge per employee, as calculated by Ireland, Austria and the UnitedKingdom).
However, when these ratios were not presented in the pilot studies reports, or if all data necessary for theircalculation were not in the report, no trial has been made to calculate these ratios for other countries with thehelp of external statistics, because the consistency of the series was not guaranteed.
Faced with results that diverge too much, a number of questions may be asked, in particular, about:• the concept applied (emission before/after treatment within the industrial site, before/after treatment by
MWWTP),• the coverage (e.g. inclusion of leaches by agriculture or not),• the representativeness of the samples which had been monitored,• the importance of the differences in industrial processes (especially within a NACE division),• the methodology of measurement of the emission (frequency, instruments, highest level vis-à-vis
average, etc.).
Results show that concepts and methods need to be further clarified and made more comparable.

Results and analysis
147
Table 3.3-24 Comparison of countries – COD and BOD loads, kg per employee per yearCOD BODNACE
codeDescription
A UK IRL A UK
1/2/5 Agriculture, forestry, fishing and related service activities* 1,2 214,1 38,9 3,110 Mining of coal and lignite; extraction of peat 0,6 11,0 0,0 0,111 Extraction of crude petroleum and natural gas; incidental services 1,2 0,0 0,213 Mining of metal ores 0,8 6,7 0,114 Other mining and quarrying 0,2 12,6 64,3 0,015 Manufacture of food products and beverages 62,5 201,8 83,5 21,5 634,517 Manufacture of textiles 43,7 415,4 22,2 8,8 223,318 Manufacture of wearing apparel; dressing and dyeing of fur 3,9 14,7 0,0 0,719 Leather; manufacture of luggage, handbags, saddlery and footwear 44,4 123,2 55,0 2,020 Manufacture of wood, products of wood, cork, straw, etc. 8,0 1,2 0,6 3,121 Manufacture of pulp, paper and paper products 1 936,0 16,1 45,9 338,3 712,422 Publishing, printing and reproduction of recorded media 1,2 0,9 0,223 Manufacture of coke, refined petroleum products and nuclear fuel 86,1 39,3 90,0 14,1 24,324 Manufacture of chemicals and chemical products 161,6 112,9 15,525 Manufacture of rubber and plastic products 1,2 0,0 0,226 Manufacture of other non-metallic mineral products 8,2 5,2 3,127 Manufacture of basic metals 115,5 296,1 40,128 Manufacture of fabricated metals, except machinery and equipment 1,9 9,6 5,2 0,7 7,929 Manufacture of machinery and equipment n.e.c. 0,4 2,3 0,0 0,130 Manufacture of office machinery and computers 7,5 1,7 0,0 1,231 Manufacture of electrical machinery and apparatus n.e.c. 0,9 1,9 0,0 0,2 0,032 Manufacture of radio, tv and communication equipment 10,0 20,4 1,8 4,4 0,233 Manufacture of medical, precision, optical instruments, watches, etc. 0,4 1,6 0,0 0,134 Manufacture of motor vehicles, trailers and semi-trailers 1,2 1,3 0,0 0,2 0,135 Manufacture of other transport equipment 1,2 2,2 0,2 0,236 Manufacture of furniture; manufacturing n.e.c. 0,3 0,0 0,141 Collection, purification and distribution of water 1,8 12,6 0,245 Construction 1,2 0,0 0,251 Wholesale trade and commission trade 1,2 293,2 0,2 788,173 Research and development 1,2 6,0 0,274 Other business activities 1,2 32,6 0,2 22 00575 Public administration and defence; compulsory social security** 1,0 643,7 0,0 0,280 Education 1,2 0,0 0,285 Health and social work 1,2 6,9 0,290 Sewage and refuse disposal, sanitation and similar activities 872,3 76,2 204,6 3,593 Other service activities 1,3 333,5 0,2
Total 34,4 10,0 6,6
* Agriculture only for UK
** Including non profit private institutions for A

Results and analyses
148
Table 3.3-25 Comparison of countries – N and P loads, kg per employee per yearN PNACE
codeDescription
IRL A IRL A
1/2/5 Agriculture, forestry, fishing and related service activities* 795.067 0.261 38.037 0.00910 Mining of coal and lignite; extraction of peat 0.000 0.000 0.000 0.00011 Extraction of crude petroleum and natural gas; incidental services 0.000 0.000 0.000 0.00013 Mining of metal ores 1.111 0.000 0.000 0.00014 Other mining and quarrying 0.000 0.000 0.952 0.00015 Manufacture of food products and beverages 23.988 0.004 5.817 0.00117 Manufacture of textiles 4.857 0.004 1.333 0.00018 Manufacture of wearing apparel; dressing and dyeing of fur 0.000 0.000 0.000 0.00019 Leather; manufacture of luggage, handbags, saddlery and footwear 21.250 0.016 0.625 0.00020 Manufacture of wood, products of wood, cork, straw, etc. 0.149 0.000 0.000 0.00021 Manufacture of pulp, paper and paper products 14.615 0.002 2.051 0.00122 Publishing, printing and reproduction of recorded media 0.000 0.000 0.000 0.00023 Manufacture of coke, refined petroleum products and nuclear fuel 6.667 0.004 0.000 0.00124 Manufacture of chemicals and chemical products 44.788 0.062 16.988 0.00025 Manufacture of rubber and plastic products 0.000 0.000 0.000 0.00026 Manufacture of other non-metallic mineral products 4.631 0.001 0.201 0.00027 Manufacture of basic metals 220.000 0.023 56.842 0.00628 Manufacture of fabricated metals, except machinery and equipment 1.176 0.000 0.860 0.00029 Manufacture of machinery and equipment n.e.c. 0.000 0.000 0.000 0.00030 Manufacture of office machinery and computers 0.000 0.001 0.000 0.00031 Manufacture of electrical machinery and apparatus n.e.c. 0.000 0.000 0.000 0.00032 Manufacture of radio, TV and communication equipment 1.714 0.001 0.333 0.00033 Manufacture of medical, precision, optical instruments, watches, etc. 0.000 0.000 0.000 0.00034 Manufacture of motor vehicles, trailers and semi-trailers 0.000 0.000 0.000 0.00035 Manufacture of other transport equipment 0.000 0.000 0.000 0.00036 Manufacture of furniture; manufacturing n.e.c. 0.000 0.000 0.000 0.00045 Construction 0.000 0.000 0.000 0.00050 Sale and repair of motor vehicles and motorcycles; retail sale of fuel 0.000 0.000 0.00051 Wholesale trade and commission trade 0.000 0.000 0.00052 Retail trade; repair of personal and household goods 0.000 0.000 0.00055 Hotels and restaurants 0.002 0.000 0.00060 Land transport; transport via pipelines 0.000 0.000 0.00075 Public administration and defence; compulsory social security** 0.000 0.000 0.000 0.00080 Education 0.000 0.000 0.000 0.000
Total 74.242 0.018 4.118 0.001
* Agriculture only for United Kingdom
** Including non-profit private institutions for Austria
3.3.13 Conclusion on flows of pollutantsThis issue attracted the largest number of countries, indicating the importance of the pollution aspect formost European countries. However it is worth noting that 'Southern' country, more concerned about resourceavailability in terms of quantity, only marginally participated in it.
As can be seen throughout this section, various adapted versions of the tables initially proposed have finallybeen obtained from the countries participating in the test. The adaptation concerned the list of the pollutantsstudied, the level of detail of the economic activities classification, but also the covered field.
It must be underlined that, in spite of the development of water statistics, the delimitation of the differentsteps followed by the discharge of wastewater is not very fixed, and the countries used different terms fornet/gross emissions with different meanings.

Results and analysis
149
Furthermore, in a number of countries, pollution brought by wastewater which is firstly discharged intocommon sewage networks could not be allocated to the different sources (pilot table 10). The proposed pilottable on the efficiency of wastewater treatment plants (pilot table 12) was only occasionally filled in.
Some minor questions have also been implicitly asked, which need a common answer:• What to do with urban run-off collected by the sewage networks?• How to treat leakage from mining sites, from dumping sites and other diffuse emissions?• In which unit to express organic pollution (kg of BOD or inhabitant-equivalent)?• Is aggregation possible (k-equitox, environmental themes)?
Some countries have been confronted – as with the air pollution issue – with using a classification ofenterprises by industrial process, and had to build correspondence tables between process-basedclassification used by Environmental Agencies or similar bodies and the NACE Rev.1 or national economicclassifications.
Those countries possessing sufficiently detailed data or long time series to give an opinion about the qualityof the data, put forward diverging conclusions: on the one hand, data seem too subject to variability over time(UK, N), according to region (UK), to be reliable. On the other hand, aggregated data do not seem to suffermuch from such variability (F).
In their conclusions, some countries stressed that the indicators chosen cannot easily be linked to the stateof water due to the existence of natural filtration, time lag between the pressure and the impact on waterbodies, etc. Measuring loads in kg without taking into account the concentration sometimes hindered buildinginformation as proposed in the pilot tables, as pollution was only recorded in concentration terms.
On the contrary, some other countries went further in the analysis and proposed indicators or other analyticalinstruments: share of each source in the discharge of one kind of pollutant, global contribution toenvironmental themes, etc.
As a general conclusion nearly all countries insisted on the fact that the results were very preliminary andthat developments were needed to improve the quality of data. Some are already planned: introduction ofrenewed registers of enterprises, modernisation of municipalities’ control of records, etc.

151
4 Uncovered issuesAs stated in the introduction, for some issues related to water accounts no immediate solution could befound at the first meetings of the Task Force organised by Eurostat. Introducing time and space concerns,describing water in nature in a consistent framework, measuring water quality in order to assess thesustainability of the use of water and agreeing on a concept of ‘economically available’ water were the mainproblems outstanding. This chapter reviews the underlying questions and tries to take stock of someexperiments carried out here and there, but in a less systematic way than for the 13 pilot tables proposed asa start for drawing up the accounts.
4.1 Space and time dimensionsThe possible uses of water both at present and in the future are naturally influenced by the impacts of thepressure exerted by economic activities upon the water system. As regards the time and geographicaldimension, the level of aggregation of the proposed NAMEA-type framework is too high to form the basis fora full description of how the water system is influenced by economic activities. These issues are of coursenot exclusively related to water accounts, but are particularly important in this domain.
Environmental problems within the water system are often local or regional phenomena or are restricted tocertain periods of the year. The pressures causing these problems are best described in a system whichtakes into account the locality, notably because river basins are rather independent. The system should alsoconsider the period (season) in which the pressure is applied.
Furthermore, it is not possible to assume that (a change in) the state of the environment is directly a result ofthe pressure exerted upon it. The impact of emissions to water mainly depends on concentration. The impactof one unit pollutant released might be distinctly different from another due to different circumstances at therelease. Similarly, an abstraction of 1 m3 of fresh water does not bear the same consequences if it isabstracted from a resource with a low or quick renewal speed.
The Task Force has investigated the possibilities for including these issues in the water accounts framework.The overall conclusion was that an annual and national framework could not cover directly all aspects of timeand space without attributing weights to emissions and abstractions in relation with the season or locationthey occur, thus involving subjective assessments that may be considered to fall outside an accountingframework.
However it is possible, as a further step, to consider drawing up accounts for regions (if possible hydrologicalregions) and quarters. When applied to flows of water, this would allow investigating the background for localor periodical scarcity of water.
Some Member States already experimented the building of partial water accounts at the regional level. Noneof them tried to build quarterly accounts, at least within this exercise.
4.1.1 SpainThe INE was able to collect most data and elaborate pilot tables at the level of the different Spanishadministrative regions. These regions correspond to the European NUTS 2 level.
Two tables are given below as examples. They concern the supply of water-related products in monetaryunits (pilot table 1) and the uses of the same products in thousand m3 (pilot table 6).
An additional step would be the transition from administrative regions with hydrological basins.

Uncovered issues
152
Table 4.1-1 Supply of water-related products in Spanish regions, 1999, million ESP atmarket prices
Product of NACE activity 01 41 90 75 Total %Andalucía 32 097 47 604 24 809 104 510 18.4%Aragón 1 958 7 048 4 061 13 067 1.8%Asturias 0 4 603 2 357 6 960 1.1%Islas Baleares 0 9 684 5 671 15 355 2.4%Islas Canarias 1 761 38 204 2 160 42 125 9.1%Cantabria 0 4 128 1 380 5 508 1.0%Castilla León 2 048 17 052 2 545 21 645 4.4%Castilla La Mancha 4 163 8 999 2 150 15 312 3.1%Cataluña 1 412 90 311 20 255 111 978 19.6%Comunidad Valenciana 7 855 35 612 7 459 50 926 9.9%Extremadura 1 588 6 719 1 422 9 729 2.0%Galicia 48 20 854 3 362 24 264 4.6%Comunidad de Madrid 243 53 260 9 953 9 563 73 019 12.3%Región de Murcia 5 435 10 706 2 559 18 700 3.6%C. Foral de Navarra 441 4 376 2 588 7 405 1.2%País Vasco 151 20 834 15 193 36 178 4.5%La Rioja 579 2 340 1 212 4 131 0.7%Ceuta y Melilla 0 949 432 1 381 0.2%España 59 779 383 283 109 568 9 563 562 193 100.0%
Source: Eurostat Working Paper n° 2/2001/B/6 – Water Satellite Accounts for Spain, 1997-1999
Table 4.1-2 Use of water-related products* in Spanish regions, 1999, thousand m3
Intermediate consumption
Agriculture Industry ServicesTotal Households Total uses %
Andalucía 5 459 974 59 356 161 486 5 680 816 396 060 6 076 876 18.0%Aragón 2 883 472 16 549 26 242 2 926 263 65 793 2 992 056 2.0%Asturias 17 050 11 507 18 723 47 280 49 971 97 251 1.0%Islas Baleares 12 340 616 15 927 28 883 37 489 66 372 2.2%Islas Canarias 157 980 24 611 33 260 215 851 92 552 308 403 9.0%Cantabria 7 342 4 449 15 700 27 491 36 178 63 669 0.9%Castilla León 2 258 967 8 455 63 327 2 330 749 140 554 2 471 303 4.3%Castilla La Mancha 1 975 533 8 767 40 172 2 024 472 93 882 2 118 354 3.0%Cataluña 2 004 793 128 600 155 950 2 289 343 428 185 2 717 528 20.7%Comunidad Valenciana 2 467 348 19 882 87 665 2 574 895 247 417 2 822 312 9.8%Extremadura 1 572 800 3 046 17 569 1 593 415 55 014 1 648 429 1.9%Galicia 35 374 20 451 60 094 115 919 148 286 264 205 4.7%Comunidad de Madrid 149 857 57 382 118 046 325 285 337 987 663 272 12.1%Región de Murcia 405 639 22 055 17 159 444 853 59 139 503 992 3.6%C. Foral de Navarra 440 332 9 871 13 028 463 231 29 881 493 112 1.1%País Vasco 24 391 59 258 44 160 127 809 111 290 239 099 4.7%La Rioja 264 098 5 906 9 599 279 603 17 322 296 925 0.7%Ceuta y Melilla 405 0 2 095 2 500 7 428 9 928 0.2%España 20 137 695 460 761 900 202 21 498 658 2 354 428 23 853 086 100.0%
(*) except for wastewater treatment
Source: Eurostat Working Paper n° 2/2001/B/6 – Water Satellite Accounts for Spain, 1997-1999
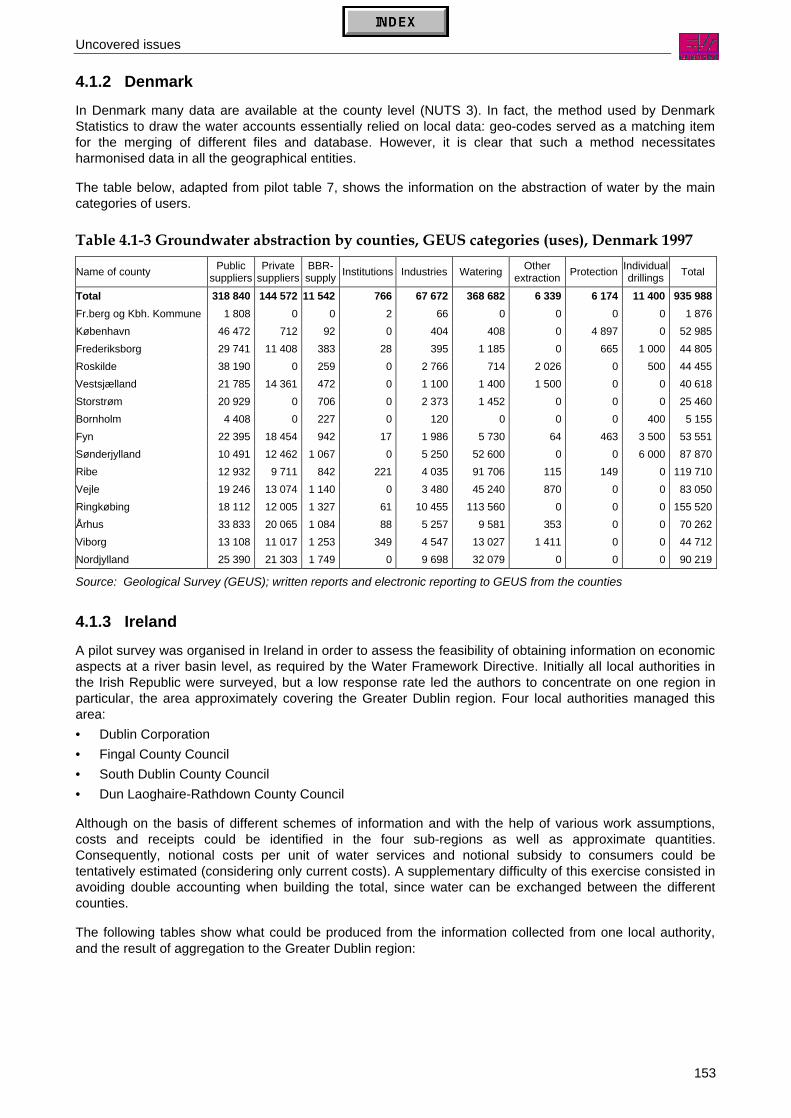
Uncovered issues
153
4.1.2 DenmarkIn Denmark many data are available at the county level (NUTS 3). In fact, the method used by DenmarkStatistics to draw the water accounts essentially relied on local data: geo-codes served as a matching itemfor the merging of different files and database. However, it is clear that such a method necessitatesharmonised data in all the geographical entities.
The table below, adapted from pilot table 7, shows the information on the abstraction of water by the maincategories of users.
Table 4.1-3 Groundwater abstraction by counties, GEUS categories (uses), Denmark 1997
Name of county Publicsuppliers
Privatesuppliers
BBR-supply Institutions Industries Watering Other
extraction Protection Individualdrillings Total
Total 318 840 144 572 11 542 766 67 672 368 682 6 339 6 174 11 400 935 988Fr.berg og Kbh. Kommune 1 808 0 0 2 66 0 0 0 0 1 876København 46 472 712 92 0 404 408 0 4 897 0 52 985Frederiksborg 29 741 11 408 383 28 395 1 185 0 665 1 000 44 805Roskilde 38 190 0 259 0 2 766 714 2 026 0 500 44 455Vestsjælland 21 785 14 361 472 0 1 100 1 400 1 500 0 0 40 618Storstrøm 20 929 0 706 0 2 373 1 452 0 0 0 25 460Bornholm 4 408 0 227 0 120 0 0 0 400 5 155Fyn 22 395 18 454 942 17 1 986 5 730 64 463 3 500 53 551Sønderjylland 10 491 12 462 1 067 0 5 250 52 600 0 0 6 000 87 870Ribe 12 932 9 711 842 221 4 035 91 706 115 149 0 119 710Vejle 19 246 13 074 1 140 0 3 480 45 240 870 0 0 83 050Ringkøbing 18 112 12 005 1 327 61 10 455 113 560 0 0 0 155 520Århus 33 833 20 065 1 084 88 5 257 9 581 353 0 0 70 262Viborg 13 108 11 017 1 253 349 4 547 13 027 1 411 0 0 44 712Nordjylland 25 390 21 303 1 749 0 9 698 32 079 0 0 0 90 219
Source: Geological Survey (GEUS); written reports and electronic reporting to GEUS from the counties
4.1.3 IrelandA pilot survey was organised in Ireland in order to assess the feasibility of obtaining information on economicaspects at a river basin level, as required by the Water Framework Directive. Initially all local authorities inthe Irish Republic were surveyed, but a low response rate led the authors to concentrate on one region inparticular, the area approximately covering the Greater Dublin region. Four local authorities managed thisarea:• Dublin Corporation• Fingal County Council• South Dublin County Council• Dun Laoghaire-Rathdown County Council
Although on the basis of different schemes of information and with the help of various work assumptions,costs and receipts could be identified in the four sub-regions as well as approximate quantities.Consequently, notional costs per unit of water services and notional subsidy to consumers could betentatively estimated (considering only current costs). A supplementary difficulty of this exercise consisted inavoiding double accounting when building the total, since water can be exchanged between the differentcounties.
The following tables show what could be produced from the information collected from one local authority,and the result of aggregation to the Greater Dublin region:

Uncovered issues
154
Table 4.1-4 Dublin Corporation – Water supply and uses – 1998/99
Water inputm3/year
Water inputused locally
m3/year
Currentcosts (IEP)
Current costsper m3
Total revenuefrom sales
(IEP)
% Costrecovery
Implicitsubsidy(IEP/m3)
Households 64 884 000 64 884 000 11 407 643 0.18 - 0% 0.18
Industries 43 256 000 43 256 000 7 605 095 0.18 9 983 152 131% -0.05
Exported to other County Councils 44 000 000 - 3 482 186 0.08 5 205 714 149% -0.04
Exported to other areas 16 060 000 - 1 270 998 0.08 1 900 085 149% -0.04
Total 168 200 000 108 140 000 23 765 922 0.14 17 088 951 72% 0.04
Source: Environmental accounts: time series + eco-taxes – ESRI, February 2001
Table 4.1-5 Greater Dublin – Water supply and wastewater services (tentative figures1998/99).
Volume inm3/year
Current costs(IEP)
Current costper m3
Total revenue(IEP)
% Costrecovery
Implicit subsidy(IEP/m3)
Water supply 170 352 000 34 201 138 0.20 13 550 147 59% 0.12
Of which: Households 113 308 264 22 325 247 0.20 - 0% 0.20
Industries 57 043 736 11 875 891 0.21 13 550 147 168% -0.03
Wastewater services 128 564 029 17 577 273 0.14 5 080 000 29% 0.10
Source: Environmental accounts: time series + eco-taxes – ESRI, February 2001
Finally, an interesting comparison between prices from one area to the other could be made. There are twopoints to note on this topic: the prices are based on the volumes of delivered water: due to leakage and useby the system, prices charged are higher than the ‘per-unit’ production cost shown in the previous tables.Secondly the prices are broadly similar indicating, according to ESRI, that water is in some way a 'tradable'good.
Table 4.1-6 Examples of local water charges in Ireland (Greater Dublin) in IEP/m3
1995 1996 1997 1998 1999 2000 2001Dublin Corporation Commercial 0.433 0.447 0.469 0.493 0.517 0.543 -Fingal County Council (CC) - - - - 0.41 0.43 0.45 -South Dublin County Council - - - - 0.435 0.455 0.475 -Dun Laoghaire-Rathdown CC - - - - 0.41 0.45 0.50 -Cork Corporation Commercial 0.41 0.42 0.44 0.46 0.48 0.50 0.53Cork County Council (South) Industry - - - 0.396 0.411 0.429 0.462
Commerce - - - 0.363 0.374 0.385 0.396Cork County Council (North) - - - 0.407 0.451 0.495 0.506 -Cork County Council (West) - - - - 0.389 0.418 0.462 0.495
Source: Environmental accounts: time series + eco-taxes – ESRI, February 2001
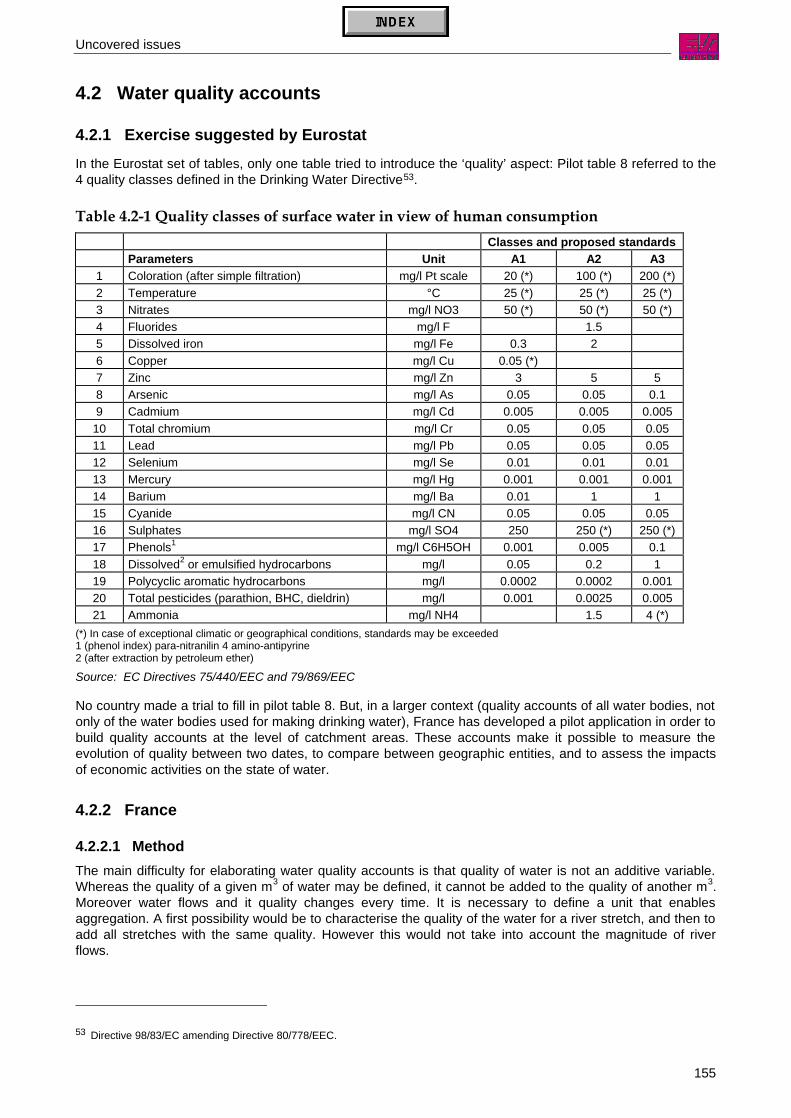
Uncovered issues
155
4.2 Water quality accounts
4.2.1 Exercise suggested by EurostatIn the Eurostat set of tables, only one table tried to introduce the ‘quality’ aspect: Pilot table 8 referred to the4 quality classes defined in the Drinking Water Directive53.
Table 4.2-1 Quality classes of surface water in view of human consumptionClasses and proposed standards
Parameters Unit A1 A2 A31 Coloration (after simple filtration) mg/l Pt scale 20 (*) 100 (*) 200 (*)2 Temperature °C 25 (*) 25 (*) 25 (*)3 Nitrates mg/l NO3 50 (*) 50 (*) 50 (*)4 Fluorides mg/l F 1.55 Dissolved iron mg/l Fe 0.3 26 Copper mg/l Cu 0.05 (*)7 Zinc mg/l Zn 3 5 58 Arsenic mg/l As 0.05 0.05 0.19 Cadmium mg/l Cd 0.005 0.005 0.005
10 Total chromium mg/l Cr 0.05 0.05 0.0511 Lead mg/l Pb 0.05 0.05 0.0512 Selenium mg/l Se 0.01 0.01 0.0113 Mercury mg/l Hg 0.001 0.001 0.00114 Barium mg/l Ba 0.01 1 115 Cyanide mg/l CN 0.05 0.05 0.0516 Sulphates mg/l SO4 250 250 (*) 250 (*)17 Phenols1 mg/l C6H5OH 0.001 0.005 0.118 Dissolved2 or emulsified hydrocarbons mg/l 0.05 0.2 119 Polycyclic aromatic hydrocarbons mg/l 0.0002 0.0002 0.00120 Total pesticides (parathion, BHC, dieldrin) mg/l 0.001 0.0025 0.00521 Ammonia mg/l NH4 1.5 4 (*)
(*) In case of exceptional climatic or geographical conditions, standards may be exceeded1 (phenol index) para-nitranilin 4 amino-antipyrine2 (after extraction by petroleum ether)
Source: EC Directives 75/440/EEC and 79/869/EEC
No country made a trial to fill in pilot table 8. But, in a larger context (quality accounts of all water bodies, notonly of the water bodies used for making drinking water), France has developed a pilot application in order tobuild quality accounts at the level of catchment areas. These accounts make it possible to measure theevolution of quality between two dates, to compare between geographic entities, and to assess the impactsof economic activities on the state of water.
4.2.2 France
4.2.2.1 MethodThe main difficulty for elaborating water quality accounts is that quality of water is not an additive variable.Whereas the quality of a given m3 of water may be defined, it cannot be added to the quality of another m3.Moreover water flows and it quality changes every time. It is necessary to define a unit that enablesaggregation. A first possibility would be to characterise the quality of the water for a river stretch, and then toadd all stretches with the same quality. However this would not take into account the magnitude of riverflows.
53 Directive 98/83/EC amending Directive 80/778/EEC.

Uncovered issues
156
Defined by the Norwegians J.Heldal and T Østdahl, a kilometre of standard river (km.s.r) is the unit whichcorresponds to a river one kilometre long which carries a flow of one cubic meter per second. A km.s.r canrepresent for instance a 1 km long watercourse with a 1 m3/s outflow or a 0.5 km long watercourse with a 2m3/s outflow. This unit allows aggregating the quality, adding together all km.s.r. where the water has thesame quality. Accounts for changes in quality can then be drawn.
Ifen developed a simplified method enabling the production of comparable quality accounts for eachdrainage basin54 by using the number of km.s.r to weight each quality class.
The data used are maps of linear quality of the watercourses. These maps were not conceived for thispurpose and they use a classification of the rivers in only 4 size classes: ‘main rivers’, ‘large tributaries’,‘rivers’ and ‘brooks’. Not all have a quality grade. It has been considered that information available for eachclass of watercourses was representative of the whole class.
Different indicators have been built up in the framework of this water quality evaluation system. Only the« organic and oxydizable matter » indicator has been kept for illustrating the method. It takes intoconsideration the following parameters: dissolved oxygen, BOD5 (biochemical oxygen demand at 5 days),COD (chemical oxygen demand) and ammonium (ion NH4
+). 5 classes have been built according to thisindicator, noted 1A (best), 1B, 2, 3 and HC (not classified). Other indicators were built notably as regardsnitrate and eutrophication.
4.2.2.2 ResultsTwo data sources were tested: a 1992 map, not drawn up strictly according to the assignment rules of thequalification system and a 1994 map, more in conformity with the indicator, but with less information onwatercourses. Therefore, the differences displayed in the table below should not be attributed to differencesin quality only.
Table 4.2-2 Water quality account of French watercourses, organic matter indicator, 1 000km.s.r
Watercourse category 1992 state 1994 state1A 1B 2 3 HC 1A 1B 2 3 HC
Main rivers 5 1 253 891 510 177 8 1 583 893 358 12Large tributaries 309 1 228 1 194 336 50 325 1 691 919 154 28Rivers 260 615 451 128 47 306 749 322 110 18Brooks 860 1 464 690 243 95 810 1 295 917 258 72Total 1 434 4 560 3 226 1 217 369 1 448 5 318 3 051 881 131
Source: Ifen – The accounts of the quality of the watercourses –August 1999
54 The European territory of France is broken down into 55 large drainage basins, under the management of 6 Water agencies. Eachbasin has a surface ranging between 6 000 and 13 000 km2.
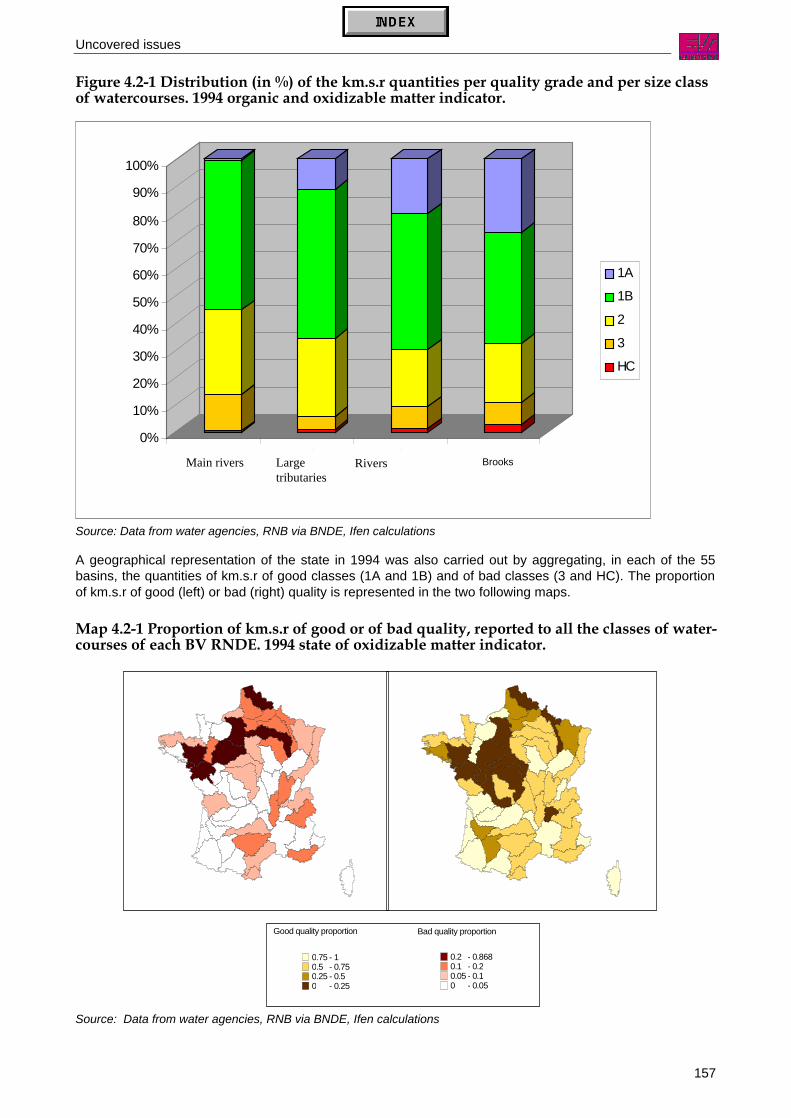
Uncovered issues
157
Figure 4.2-1 Distribution (in %) of the km.s.r quantities per quality grade and per size classof watercourses. 1994 organic and oxidizable matter indicator.
Source: Data from water agencies, RNB via BNDE, Ifen calculations
A geographical representation of the state in 1994 was also carried out by aggregating, in each of the 55basins, the quantities of km.s.r of good classes (1A and 1B) and of bad classes (3 and HC). The proportionof km.s.r of good (left) or bad (right) quality is represented in the two following maps.
Map 4.2-1 Proportion of km.s.r of good or of bad quality, reported to all the classes of water-courses of each BV RNDE. 1994 state of oxidizable matter indicator.
Source: Data from water agencies, RNB via BNDE, Ifen calculations
0%
10%
20%
30%
40%
50%
60%
70%
80%
90%
100%
Fleuves G. rivières Rivières Ruisseaux
Groupe de taille
1A
1B
2
3
HC
Main rivers Largetributaries
Rivers Brooks
Bad quality proportion
0.2 - 0.8680.1 - 0.20.05 - 0.10 - 0.05
Good quality proportion
0.75 - 10.5 - 0.750.25 - 0.50 - 0.25
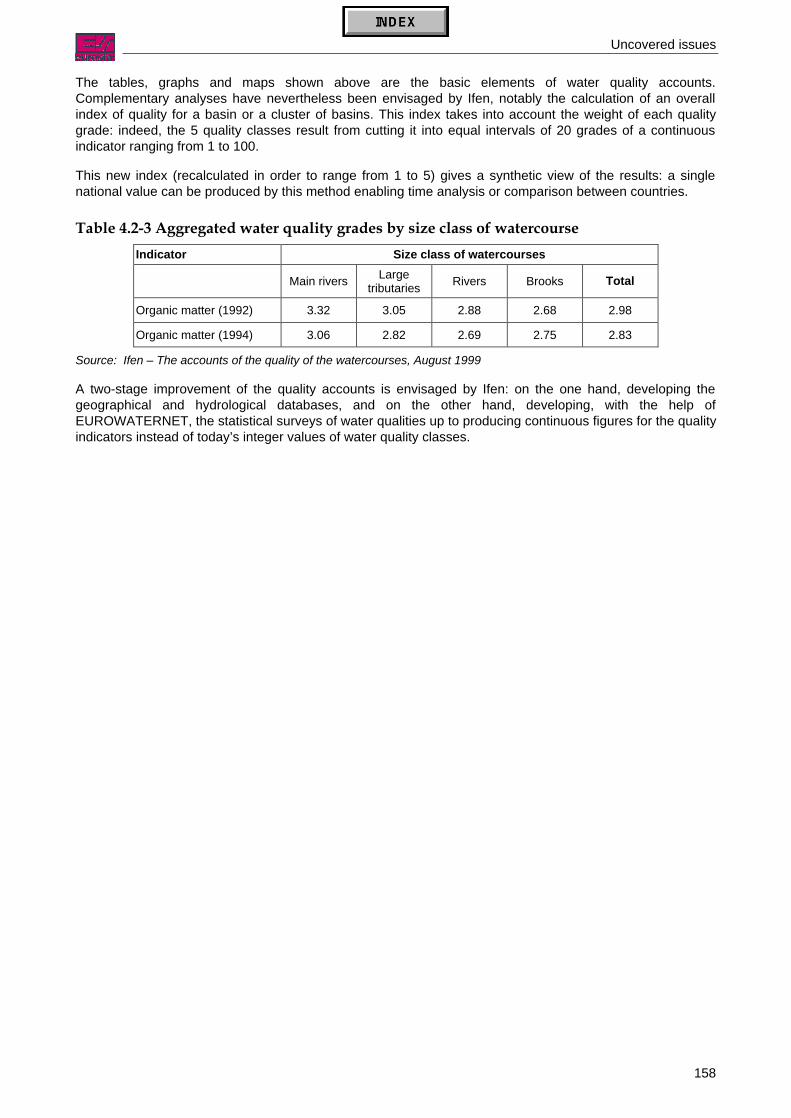
Uncovered issues
158
The tables, graphs and maps shown above are the basic elements of water quality accounts.Complementary analyses have nevertheless been envisaged by Ifen, notably the calculation of an overallindex of quality for a basin or a cluster of basins. This index takes into account the weight of each qualitygrade: indeed, the 5 quality classes result from cutting it into equal intervals of 20 grades of a continuousindicator ranging from 1 to 100.
This new index (recalculated in order to range from 1 to 5) gives a synthetic view of the results: a singlenational value can be produced by this method enabling time analysis or comparison between countries.
Table 4.2-3 Aggregated water quality grades by size class of watercourseIndicator Size class of watercourses
Main rivers Largetributaries Rivers Brooks Total
Organic matter (1992) 3.32 3.05 2.88 2.68 2.98
Organic matter (1994) 3.06 2.82 2.69 2.75 2.83
Source: Ifen – The accounts of the quality of the watercourses, August 1999
A two-stage improvement of the quality accounts is envisaged by Ifen: on the one hand, developing thegeographical and hydrological databases, and on the other hand, developing, with the help ofEUROWATERNET, the statistical surveys of water qualities up to producing continuous figures for the qualityindicators instead of today’s integer values of water quality classes.

Uncovered issues
159
4.3 Water quantity accounts
4.3.1 Description of water flows and stocksAs explained in section 1.2.1.3, in its present form, the set of pilot tables does not include any measurementof the flows of water in nature. Only water flows within the economy (water uses by economic activities) andbetween the economy and the nature (abstraction and discharges) are dealt with in pilot tables 6 to 9.
However flows of water in the nature, 'natural' flows, are important to assess and describe because theydetermine the availability of water for the economy. Natural flows not only affect the quantitative availabilityof water, but also the flows of pollutants. The Norwegian pilot application shows that an important part of thenitrogen emissions are due to natural flows. Furthermore, water has many in situ uses, which influenceeconomic activities (fishing, hydroelectricity, river transportation; leisure, etc.).
In current national accounts, apart from groundwater which may have an economic value, natural waterresources are not distinguished from the land they cover. Although a monetary valuation of the waterresources as such seems out of range for the moment and outside of the agenda of national accountsdevelopments, research is being carried out to study land valuation and hedonic pricing techniques couldgive rise to some progress. In any case due to its characteristics, water cannot be studied alone: a completeaccounting framework should integrate also accounts on land use, on material flow balances of pollutants,etc.
The NAMEA-type framework can easily be extended without having to reconsider the present developments.In addition to parts A, B and C of the NAMEA framework used as a background for the pilot set of tables afourth part D can describe in physical terms the ‘natural’ flows of water and of water pollutants. These naturalflows are not under the control of any institutional unit. It means that although they may be influenced orinduced by human activities, they are not totally controlled.
Natural flows of water could consist in: precipitation, inflows from other (foreign) inland water systems(surface or groundwater), outflows to other inland systems and to the sea, evapotranspiration and naturaltransfers between components of the hydrological system such as infiltration or run-off.
In this context, renewable resources are calculated as the sum of precipitation plus inflows lessevapotranspiration; they also include the effects of natural transfers between components of the hydrologicalsystem. The natural accumulation in the water system is calculated by deducting, by component(groundwater or surface water), outflows to other hydrological water systems (or sea). The overallaccumulation into the various components of the water system results from the natural accumulation and theeconomic balance.
The same kind of description can apply to flows (and stocks) of water pollutant transported by the variousnatural flows of water: examples are atmospheric pollutants brought by acid rains, indirect pollution fromfertiliser, pesticides, manure spread on agricultural land, etc.
The description of the flows of water can also be supplemented with the description of opening and closingstocks of water, i.e. the volume of water bodies filled with water at the beginning and the end of theaccounting period. Overall accumulation would be equal to the change in stocks during the accountingperiod.
These stocks themselves can also be described for example in terms of km.s.r of different quality classes forsurface water bodies (see Section 4.2) and a part E would record, by classes, the changes and the stocks atthe beginning and end of the period. The sustainability would then be assessed through the evolution of suchindicators as the aggregated water quality grades presented in Table 4.2-3.
There is still much work to be done before being able to build a complete system at the European level.What is important to note is that the proposed start leaves room for necessary improvement and extension.

Uncovered issues
160
Scheme 4.3-1 An extended NAMEA-type framework applied to water
B C EWater Pollutants Water system stateflows flows
Classes ClassesOpening stock (previous period)
Changes due to economic activities
A1 + A2Discharges Emissions from
Economic transactions due to final consumption final consumption+ physical equivalents and production and production
abstraction by economic activities
Surfacegroundwater balanceOther (economic activities)
absorption by economic activitiesBODNitrates balanceOther (economic activities)
Natural and non-referable flows Changes due to natural causes
D Precipitation, run-off Evapotranspiration natural in and outflows
Overall balance
Closing stock (current period)

Uncovered issues
161
4.3.2 Economic availability of waterThe previous scheme includes a description of the stocks and flows of water resources. However, waterresources which are not accessible given the current infrastructure, the quality of the water bodies, therelative price etc. should clearly not be included in this description of water resources which is linked to theeconomy. All water, though, should be recorded in a hydrological description, as also inaccessible waterresources may be important to water management including because of the natural transfers between thedifferent components of the hydrological system.
An indicator frequently used compares the abstraction of water in cubic meters with the amount of therenewable resources (definition in above section) in a certain period. Again, renewable resources are not‘economic’ in their totality, nor may they be totally abstracted. Only a part of renewable resources areexploitable: a number of hydrological-environmental or socio-economic considerations or constraints reducethe possibility of abstraction. There are ‘physical’ constraints: for instance, during certain periods of the year,water is stored in soil or glaciers and cannot be abstracted. Water may also be ‘lost’ underground, i.e. that itinfiltrates, but a corresponding aquifer is not identified. Secondly, for each component of the hydrologicalsystem and for a given period, a constraint is the maintenance of all its functions:• for an aquifer, abstraction must not contradict the future replenishment of the aquifer and the
maintenance of its functions (avoiding, e.g. salt intrusion, subsidence, stress due to insufficient supply ofwater for crops, springs drying, etc.).
• for water in lakes, reservoirs, dams, etc. and for current watercourses (rivers, brooks, etc.) abstractionmust not threaten the maintenance of the economic, ecological or recreational ‘in situ’ functions or usesof water (support of biodiversity, bathing, fishing, sailing, outflows to other components of the inlandwater system, etc.).
• The replenishment speed for each component has to be considered, as well as the definition of aminimal flow which respects the constraints cited above. Again, with ‘speed’ and ‘flow’, we face theproblem of the introduction of time in the accounts.
Abstraction is not only limited by the requirement to maintain minimum flows or levels of water but alsolimited by current technology, by the costs of abstraction, purification and distribution compared to prices.
On the other hand, water may be used more than once. Water abstracted and discharged upstream may beused again further downstream. It would therefore in principle be possible that total water use exceeds 100%of the renewable resource. No Member State has yet tried to measure ‘economically available’ water.
163
5 Findings and outstanding issues
5.1 Lessons learned from pilot applicationsIn 14 EU Member States plus Norway, pilot studies on water accounts have been carried out. The generalaim of the studies was to try to measure the interactions between economy and the water environment, butthey varied to a high degree in their objectives, coverage and methods. What the studies had in common isthat they used the concepts of national accounting to present physical data about water. Therefore, resultscan straightforwardly be compared to the detailed data for the economy available in the national accounts.
Thanks to the variety of the studies, much methodological material has been extracted, some studiescomplementing others. At this stage, the main conclusions to draw from the studies are the following.
General accounting frameworkNo result actually calls the chosen framework into question. The necessity to build a bridge betweeneconomic and environment statistics is obvious and the form of a satellite to national accounts seems welladapted.
Some deviations from the initial proposal in the implementation by certain Member States are worthdiscussing:• Types of uses: since we must stop at a certain level of detail in the NACE classification, the question is
raised regarding the possibility of grouping the NACE classes according to the type of use they make ofwater.
• Coverage: some countries extended the study to some seawater uses.• Territorial level: countries have already begun to build some accounts at infra-national levels such as
existing administrative entities (e.g. counties) or water-related geographical entities (hydrological basins).Given the importance of river basin integrity in the Water Framework Directive, these developments areparticularly interesting and encouraging.
• Time: in relation to the cyclical characteristic of water, time appears as an essential element to accountfor, notably in the definition of sustainable economic development vis-à-vis water. For the moment, thereare still difficulties in tackling this problem and research must go on.
It should also be highlighted that this test only included the economy’s more obvious relations to water,essentially water distribution and wastewater treatment. In situ uses of water have not been covered.
ConceptsOverall, the concepts have not been questioned by the tests. However, in practical implementation, anumber of concepts have not been fully respected. This may be due to a lack of data and, in this case,proxies have been provided. This is typically the case for different nomenclatures of activities, for example.Another reason is that, contrary to national accounts, it has not been a long time that European conceptsregarding environmental statistics are in place, and they have not been sufficiently well harmonised yet. Inparticular, different classifications of water bodies could be found.
Pilot tablesOne table, Table 8, on the abstraction of water for making drinking water by classes of water quality, has notbeen filled in by any country due to lack of data.
All other tables proposed by the Task Force have been filled in at least partially, by at least one country, ifthe question of the detailed format is put aside. This, in itself, proves its feasibility.
Nonetheless, a better clarification of their integration seemed necessary, as well as more precise definitions.
Eurostat will also have to consider which parts of the framework have the highest priority, referring inparticular to the new political developments (notably the Water Framework Directive). In some countries,considering the present state of data availability, it will be rather costly to establish a complete data collectionsystem.
Findings
164
Availability of dataMany countries concluded their study by saying that there are apparently many sources available and that itis just a question of organisation and harmonisation.
From this point of view, however, countries are not at an equal stage. Particular links have been noted with:• the nature and degree of concern about water in the country (abundance or lack, good or poor quality),• the administrative organisation of the water control (one national Environment Agency, regional ‘water
boards’, local authorities),• the local management of the water-related activities (private or public),• the existence of a taxation system related to water (for abstraction and/or pollution).
Some monetary data regarding water (covering essentially NACE 41 activity) are already included in themain sets of national accounts and an extra unexpected result was that, through this pilot study, a number ofMember States discovered new sources for improving their national accounts.
AnalysesAnother unexpected outcome of the studies has been the provision by practically all Member States ofanalyses of the data collected: ratios, graphic analyses, times series, etc.
Indeed, consideration should be given as to how to present the results in a way adapted to users. This raisesthe question of extracting indicators from the global framework. Very interesting ones have been built in thedifferent tests and Eurostat will have to consider how to include them in the framework.
5.2 Conclusions of the April 2002 Water Accounts Task ForceIn April 2002 the Task Force on Water Accounting met once again. The meeting drew conclusions asconcerns the results of the water accounts pilot exercises and developed a revised set of tables (presentedin Annex 2). The joint meeting of the Working Group "Environment and Sustainable Development" and theWorking Party "Economic Accounts for the Environment" (Luxembourg 1 to 3 October 2002) welcomed theprogress made. The Working Party "Economic Accounts for the Environment" agreed that data collectionfrom Member States should start based on the revised set of water accounts tables.
The main conclusions of the April 2002 meeting of the Water Accounts Task Force are summarised below.The Task Force had in front of it a draft revised set of water accounts tables which was the basis fordiscussion (the table numbers in the conclusions refer to this draft revised set).
5.2.1 Results of water accounts pilot exercisesAfter reviewing the draft Eurostat publication ‘Water Accounts – Results of pilot studies’ the Task forceconcluded that:
1. Sources of water-related data often exist but are not always easily accessible centrally. Accessibilitydepends on the organisation of water policy in countries. Where the competence is regional or local,data sources are often diverse and no central system is in place. Where shared waters are a commonconcern (such as the Rhine or the Baltic Sea) data availability may be better.
2. For some variables (e.g. pollutants) the quality of data is improving and expected to improve further dueto the Integrated Pollution Prevention and Control Directive (IPPC) and the Water Framework Directive(WFD). At present rough estimates are often necessary.
3. The links among the standard set of water accounts tables, the OECD/Eurostat Joint Questionnaire onInland Waters and the requirements of the WFD (e.g. the economic variables needed) should beimproved and definitions harmonised to the maximum extent possible.
4. The tables that countries chose to test: some countries (e.g. E, NL, S) tried to implement the completeset of tables whereas others focused on subsets (e.g. physical flows or flows of pollutants) due to policyinterest or in order to identify data gaps and devise strategies for improving information systems. Alsoinstitutional arrangements are reflected in the results. Where environmental agencies conducted the test,the focus was on physical data. For these countries, more tables could be implemented than weretested.
Findings
165
5. Primary data on water flows are often based on surveys that are multi-annual (e.g. D, NL). Annual wateraccounts linked to the national accounts are possible using interpolation and extrapolation methods.Some countries are moving towards annual data collection.
6. For the monetary data, the national accounts did not always provide sufficient detail and primary datasources were directly used. For example, where the same units undertake water supply and wastewatermanagement, the business registers and the national accounts will apply the main activity criterion,classifying the whole of the economic data under either NACE 41 or NACE 90.01. For the wateraccounts, primary data were used to split these data.
7. The water accounts framework with its set of tables was considered practical and useful. Wider issuesexist (e.g. state of water bodies, indirect effects) but should not be incorporated into the set of tables atthis stage. The set of tables was considered a useful key input for modelling work that links pressures(abstraction, pollutants) to changes in state.
8. Seawater used mainly for cooling should be shown separately in the tables. It was however noted thatfor publication purposes the focus would often be on freshwater as the amounts of seawater used maybe enormous.
9. Old table 8 (quality of the raw water abstracted for making drinking water) was not filled in by anycountry. Data by industry would not be available, only data from the waterworks could be expected. Asimilar table that was in the OECD/Eurostat Joint Questionnaire on Inland Waters has been deleted dueto lack of response. However, as the data are expected to improve, Table 8 should be put on ice and re-considered together with the issue of the status (quality) of water bodies at a later stage.
10. A priority ranking for the tables was not useful, as all were essential.
5.2.2 The set of standard tablesThe Task Force reviewed the proposed ‘Revised set of standard water accounts tables’ and concluded that:
11. Some changes in the set of tables will be made that are due to external events (new Joint Questionnairedefinitions, revised NACE…).
12. Tables 8 and 13 will be removed from the standard set. Old table 7 will be split in two (one forabstractions, one for returns of water).
13. The industry classification was agreed. It was noted that some countries would have difficulties toprovide the desired detail for services. The industry ’75.12*’ was discussed at length. Some countrieshad included data relating to flood defence or restoring the quality of water bodies – activities unrelatedto water supply or wastewater management. The Task Force agreed to restrict the definition to activitiesrelated to water supply or wastewater management. To the extent possible, this industry should be splitup and the data recorded under NACE 41 and 90.01, respectively. Flood protection, dredging of rivers,navigation and damages due to floods should be excluded altogether at this stage. Water abstracted butnot used (e.g. pumping of water from polders in the Netherlands) is however included. If such activitiesare important, the category ’75.12*’ should be sub-divided.
14. The breakdown of products (drinking water, non-drinking water, and distribution services) will be keptalthough it was expected that this distinction was not important in most cases.
15. Types of uses: irrigation, cooling and ‘other’ will be distinguished. This will only be done in new tables 7A(abstractions of water) and 7B (returns of water), adding columns for cooling and a row ‘of whichirrigation’ under the row ‘Agriculture’. The ‘Total abstractions’ will be termed ‘Gross abstractions’ inaccordance with the new Joint Questionnaire. It will be clarified in the notes to the tables that abstractionfor distribution from non-freshwater sources will only include desalinated water and self-supplied waterfrom non-freshwater sources is sea and brackish water mainly used for cooling.
16. The category ‘rainwater, drainage and net infiltration’ was agreed as an extra ‘source’ of water so as toensure that abstractions and returns balance. The use ‘environmental protection’ as distinguished inDenmark represents about 2% of total fresh water abstraction and refers to abstracting groundwater forpurposes of influencing water tables so as to prevent pollutants from entering areas designated fordrinking water supply. This will be added as an additional example of ‘abstraction not for use’ in thenotes to the tables.
17. All the original 8 heavy metals and other pollutants will be kept. No new pollutants will be added.

Findings
166
18. NPISHs will no longer be separately distinguished.
19. The industries in the tables were actually homogeneous branches of production in D and DK. Othercountries used specific data sources for NACE 41 and 90.01 to arrive at a concept close to ‘purebranches’. It was agreed that for NACE 41 and 90.01 such ‘purification’ should be done to the extentpossible.
20. Deliveries among water producers exist but are perhaps not very important. Equally important are theuses of water by the water producers, e.g. for cleaning of pipes (5% of total water for distribution in S,2% in D). These own uses appear in the physical tables but not in the monetary tables.
21. In table 2, the column for CPA 90.01 will be kept.
22. Old table 3 requested a split of water supply into sub-functions (purification, distribution). Only Swedencould do a split. The simplified version of table 3 without such sub-functions was agreed. The ‘of whichenvironmental’ under taxes and subsidies will be deleted.
23. Self-supply in monetary terms (Table 4) is possible for wastewater management due to establishedspecific data collection systems (SERIEE, environmental expenditure variables in the StructuralBusiness Statistics Regulation, national environmental expenditure surveys). The notes to the table willexplain that some of these sources may not provide all variables. E.g. compensation of employees,intermediate consumption and taxes on production may only be available as a sum; data onconsumption of fixed capital may not be available directly and will have to be estimated usingestablished national accounts procedures. For self-supply of water such specific sources are generallymissing. Surveys or estimations based on physical quantities would be required. The columns referringto self-supply of water will be kept.
24. Tables 5 and 6 will be changed to be consistent with the conclusions above. No other changes willoccur.
25. The Task Force discussed the usefulness and feasibility of splitting the discharges into ‘returns to inlandwaters’ and ‘discharges to the sea’. It was noted that the boundary between inland waters and sea isoften blurred due to estuaries. The split was nonetheless considered useful. There is no experience fromthe Joint Questionnaire as this split was newly introduced in the latest revision. Data that allow this splitfor the volumes of water discharged are available in many countries. It is more doubtful whether this splitcan be provided by industry.
26. The usefulness of consolidation items in Table 9 was discussed. A particular issue is leakage from thesewage network which cannot be measured directly. What can be estimated is the difference betweenthe volumes of wastewater discharged to the sewage system and the volumes of wastewater dischargedby the collection systems. This difference results from the net effect of rainwater that enters the sewagesystem, the infiltration of groundwater into the sewage system and the losses of wastewater throughleakage. The order of magnitude for this difference is substantial (in some countries an order of 1/3 ofthe wastewater arriving at wastewater treatment plants). Therefore, this consolidation item will be kept. Itwill be clarified that the net infiltration (which can be negative) should be recorded as part of the column“rainwater, drainage and infiltration” in table 7A. A better title for this column will be sought to make theconcept clearer. Two main components are usefully distinguished: a) water abstracted not for use frome.g. mining and construction sites and b) rainwater and net infiltration entering the sewage system.
27. Pumping for drying polders seems similar to pumping in mining activities. It will also be recorded in table7A, column “rainwater, drainage and infiltration” as regards the physical flows, and a specific sub-columnwill be created in table 1 (column 75.12*) to record the corresponding production (see also above point13).
28. The consolidation flows in table 9 can easily be introduced in tables 7A and 7B. Table 9 will therefore bereplaced by an extension of tables 7A and 7B. This includes for example to add the re-used wastewaterand the distribution losses in tables 7A and 7B (or directly in Table 5), and the resulting balance in table7B. Cooling water returns will be shown also. The links to columns in other tables will be made clearer byspecific reference numbers and by using the same titles.
29. Table 9A describes the transition from physical ‘consumption’ of freshwater (i.e. all water not returned tothe inland water system) to the physical ‘consumptive use’ of water (i.e. mainly the water evaporated).The difference between these two concepts taken from the Joint Questionnaire is the water dischargedto the sea. The Joint Questionnaire definition of ‘consumptive use’ also includes some (usually small)flows such as the incorporation of water into products or changes in stocks of produced water. Theorders of magnitude of water incorporated in products are small (e.g. in Germany some 0.5% of total

Findings
167
freshwater use) but this share is higher e.g. for the industries where the incorporation of water takesplace such as in manufacturing of beverages, dairy farming, construction (cement), etc. In Table 9A alsothe water removed from products is shown which mainly occurs during consumption of agriculturalproducts and beverages by households. Only D and DK have information available to fill in table 9A.Following the many flows of water contained in other materials is complicated and requires estimations.For example, water incorporated in products from rain-fed agriculture does not come from abstraction(only irrigation water is recorded as abstracted) and could be recorded as an ‘eco-system input’. Manurefrom agriculture spread on fields can include a lot of water (about 8% compared to total agriculturalfreshwater use in Germany) but may not be recorded as a discharge. Water may be contained inproducts imported and exported, or in organic waste that is incinerated or land filled. The category ‘otherconsumptive uses’ in Table 9A (essentially the water evaporated during use) is derived as a balancingitem and thus also includes any statistical discrepancies. An attempt will be made to integrate Table 9Awith table 7B for countries that need it.
30. For the tables on pollution the Task Force discussed two alternatives (tables 10 to 12 versus tables 10Ato 13A). Theoretically, the “emission” of pollutants is the difference between the pollutants discharged inwastewater at the end of the production process and the pollutants contained already in the waterpurchased or abstracted at the beginning of the production process. In practice, estimating the true“emissions” of pollutants would require to assess the pollution loads in both the incoming water and theoutgoing wastewater.
31. In statistical practice, some countries (e.g. A and NL) recorded actual emissions, while others (e.g. S andD) recorded only pollutants discharged in wastewater because data on the pollution content ofabstracted water is not available. The latter approach corresponds to the assumption that waterabstracted is not polluted which is realistic for some countries and pollutants. However, the differencesbetween the two methods can be important for some heavy metals and for some processes. Forexample, the difference between the emissions (i.e. the pollutant load added by an industry) and the totaldischarge was 20% for zinc in Austria, mainly due to river water (already contaminated with zinc fromroofs etc.) used for processing in the metal industry. Also for AOX the differences can be important. TheTask Force concluded that alternative tables 10A, 11A, 12A and 13A should be maintained.
32. Table 11A will be kept for cases of distributed non-drinking water only. It will be assumed that drinkingwater does not include any significant quantities of the pollutants recorded in tables 10A to 13A.
33. To keep coherence with the recording of water flows, table 13A will be split in two: pollutants going to thefresh water system and pollutants going directly to the sea. For the moment (for example in the UK), thisbreakdown is possible for the total but not by industry. Table 13A will be complemented by a “Table13Aa - of which: to the sea” to promote developments in data availability. Only net abstractions will beconsidered in table 10A and returned (unused) water will not be followed either in table 13A.
34. Information about the pollutants abstracted by internal treatment (within an establishment) would be veryinteresting but very few countries would have the data to do this. Extra information will thus not berequired.
35. The old table 13 (on implicit prices) will be removed from the set of standard tables.
36. The monetary tables will be in national currency. For Member States outside the euro-zone, Eurostat willapply a standard conversion rate to the euro.
5.2.3 Presentation of results and indicatorsAs concerns the presentation of results and indicators the Task Force concluded that:
37. Implicit water prices (example of DK): DK does not show implicit water prices any more in itspublications. Implicit water prices may be influenced more by the location of the economic activities thanby the activities themselves. In rural areas, the water price is generally lower. Fixed payments representfees paid for connection of new buildings to the networks. They are paid first by the construction industryand resold in the buildings’ values.
38. The comparisons between costs and charges show an “election” effect for Ireland. It would be interestingto compare these series with the series of the uses in m3.
39. A diagrammatic presentation of water flows (example of Spain, also done in e.g. Germany or Sweden) isparticularly useful to detect missing information and to reconcile different sources, for instance actualmeasurements and estimates at different places. The flows should be presented proportionally with the

Findings
168
thickness of the arrows representing the order of magnitude of the flow. Also, physical consumption andconsumptive uses should be shown (i.e. the diagram should balance).
40. DK publishes a “water intensity” indicator every year. Its power mainly lies in a time series analysis forthe same industry: in that case, it shows how a specific industry improves its efficiency as regards theuse of water. In some cases, however, results cannot be analysed in these terms: variations in water useby agriculture, for example, can be due to variations in rainfall. Such intensity data have been used in UKto decide upon the abandonment of certain crops, but interpretation of water intensities across industriesrequires care.
41. The same remark applies to eco-environmental industry profiles: they are most useful to analyseimprovement/deterioration of eco-efficiency in a specific industry along the time dimension. Care needsto be taken as the results are sensitive to the level of aggregation of industries which may group togethersub-industries with very different water use or pollution profiles (e.g. leather tanning with manufacture ofleather products, finishing of textiles such as bleaching and dyeing together with weaving andmanufacture of textile articles, etc.). With a view to regional accounts this issue may be even moreimportant. The eco-profiles should be complemented by input-output analysis showing the allocation ofthe indicators to final demand categories. For instance, DK has estimated that 56% of its water use canbe imputed to exports.
42. The “water productivity” indicator used e.g. in D shows the technological improvements (re-use of water,replacement of water by another product in certain uses, less consuming household equipment, etc.) butalso the introduction of pricing for irrigation water in Eastern Germany. During the meeting, D distributedan “Abstract of the press conference report 2001 on environmental-economic accounting in Germany”showing different indicators: water uses by sector, discharge of wastewater, European comparisons ofwithdrawal of water and of withdrawal of water per inhabitant.
43. In NL, impacts of the different pollutants are grouped into environmental “themes” by attributing weights(supplied by the Environment Department) to them. In this representation, cleansing activities have, ofcourse, negative impacts.
44. Maps were considered a very useful way of presenting results. Clear texts to explain the maps wereconsidered essential.
45. S builds graphs showing on the X-axis the percentage change in the value added and on the Y-axis thepercentage change in water use. According to the quadrant in which the time series is located, thedegree of de-coupling of water use can be shown.
46. The Task Force noted that when time series are available, decomposition techniques could be appliedshowing the factors that explain the total change (economic growth, structural change, technologicalimprovements, etc.).
5.2.4 Future development needsThe Task Force concluded that:
47. The regionalisation of the water accounts and the water quality accounts are key direction for futuredevelopment.
48. Regional accounts: in D, regional accounts have already been built for 2 Länder, others are currentlybeing built. In the NL, accounts are being built at the river basin level, but confidentiality problems aremet. In DK, regional data exist, but here also, confidentiality is a problem. In France, many of the dataare available for the main river basins. In F and DK, public water supply data are also available at lowerregional levels. In UK, the water companies can provide regional data and regional environmentalaccounts are being developed on different topics (air emissions…). In A, physical data are available forthe 9 regions. S did already work on developing methods for regionalising the water accounts and nowwaits for a definition of the river basin districts by the legislator to begin implementing the breakdown.
49. Water quality accounts have been built in France, initially by combining water quality maps andmeasurement of the flows in the rivers. A specific accounting unit (the kmsr or kilometre of standardriver) allows aggregation and comparisons of water quality. These accounts have also been tested inIreland, England and Wales and Slovenia. The general view about this type of accounts was that theyshould be built by national environmental protection agencies and the European Environment Agency.
50. None of the countries represented at the Task Force plans to integrate the concern about time. Quarterlyaccounts are only needed for few countries where seasonal availability of water is a key issue.
Findings
169
51. Physical stocks of water have been determined for some countries. Canada is currently investigatingpossibilities for the monetary valuation of water stocks. Stocks are not a main concern at the Europeanlevel. More interesting is the estimation of renewable resources and such an estimate is for examplemade in A and D by the Institutes of Hydrology. In some countries, the abstraction of water is taxedwhich could be the starting point for monetary valuation. Issues of stocks and stock valuation wereconsidered interesting areas for future research.
52. In most countries, the implementation of the Water Framework Directive will imply sizeabledevelopments. Key issues include regional accounts and emission data. In D, the WFD will imply newmonetary data, regional data, data on emissions. In DK, Statistics Denmark is not directly involved in theimplementation of the WFD but will participate on the pollutants part. Taxation of water is a key issue.Water in DK now has a higher share in the household budgets than electricity and as much as heating.Water prices are also a concern in France, where the plan is a disaggregation of annual and nationalaccounts by industry and by region. The UK has recently finished the exploitation of a survey aboutabstractions and will try to fill in the data gaps concerning pollutant loads. NL is about to publish nationaldata for 96, 97 and 98 and will regionalise the accounts if the necessary funding can be found. A willwork on disaggregating to catchment areas and on the implementation of the WFD, notably on therecommendations of the WFD Working Groups and on efficient systems of data collection. S is currentlyfinishing accounts for 2000, tries to improve the quality of the data, works on the harmonisation with thenational accounts and will try to develop better data on pollutant loads.

171
Annex 1: Pilot water accounts tables used in the pilotexercisesThe following tables, proposed for testing after the first round of meetings of the Eurostat Task Force onwater accounting have been described in various parts of the document:• The general framework, the definitions of the concepts and nomenclatures used, the links between the
different tables in Chapter 1 Section 1.2.4,• Tables 1 to 4 and Table 13 (water economy) in Section 2.1,• Tables 5 to 9 (flows of water) in Section 2.2,• Tables 10 to 12 (flows of pollutants) in Section 2.3.
Classifications usedMost of the concepts used in the tables refer to ESA, the classifications refer to NACE Rev.1 for activities,and to CPA for products.
Classification of industries (nearly all tables):NACE Rev.1 at the level of subsections has been chosen with the following amendments.
Services have been grouped, as probable lesser users of water, while, on the contrary NACE 41, and partsof NACE 01, 75 and 90 have been isolated. However, in the broader context of satellite accounts integratingother environmental themes, it might conceivably be better to keep the service sectors separate.
NACE 90 has been broken down into 2 sub-classes:a. 90* corresponding to the activity of sewage removal and treatment (production of CPA 90.00.11 product)b. the other activities of NACE 90 have been grouped with the rest of the services.
The same applies to NACE A in order to isolate the producers of services of operation of irrigation systemsand to NACE 75 in order to isolate the producers of administrative services related to water supply andsewage systems.
Classification of water-related products (Tables 1, 2, 5, 6, 8 and 13):CPA level of sub-categories, but if possible, even part of a CPA sub-category, when referred to in the CPAexplanatory notes, would be better.
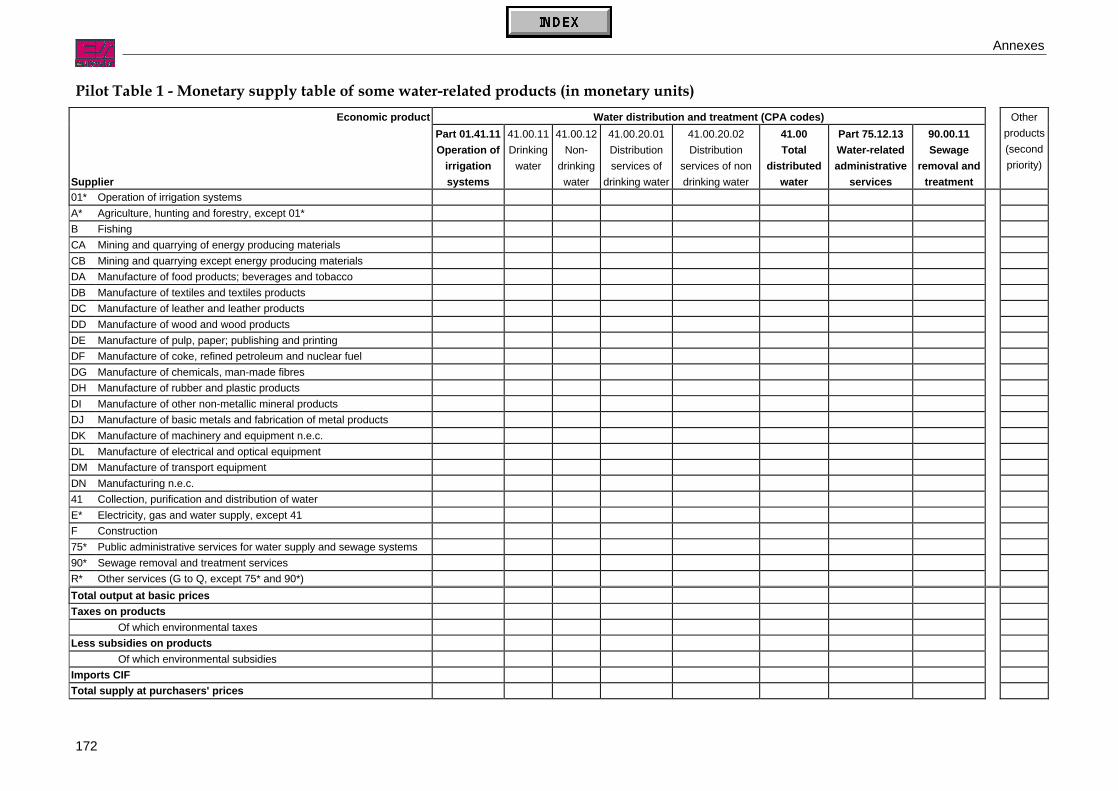
Annexes
172
Pilot Table 1 - Monetary supply table of some water-related products (in monetary units)Economic product Water distribution and treatment (CPA codes)
Supplier
Part 01.41.11Operation of
irrigationsystems
41.00.11Drinking
water
41.00.12Non-
drinkingwater
41.00.20.01Distributionservices of
drinking water
41.00.20.02Distribution
services of nondrinking water
41.00Total
distributedwater
Part 75.12.13Water-relatedadministrative
services
90.00.11Sewage
removal andtreatment
Otherproducts(secondpriority)
01* Operation of irrigation systemsA* Agriculture, hunting and forestry, except 01*B FishingCA Mining and quarrying of energy producing materialsCB Mining and quarrying except energy producing materialsDA Manufacture of food products; beverages and tobaccoDB Manufacture of textiles and textiles productsDC Manufacture of leather and leather productsDD Manufacture of wood and wood productsDE Manufacture of pulp, paper; publishing and printingDF Manufacture of coke, refined petroleum and nuclear fuelDG Manufacture of chemicals, man-made fibresDH Manufacture of rubber and plastic productsDI Manufacture of other non-metallic mineral productsDJ Manufacture of basic metals and fabrication of metal productsDK Manufacture of machinery and equipment n.e.c.DL Manufacture of electrical and optical equipmentDM Manufacture of transport equipmentDN Manufacturing n.e.c.41 Collection, purification and distribution of waterE* Electricity, gas and water supply, except 41F Construction75* Public administrative services for water supply and sewage systems90* Sewage removal and treatment servicesR* Other services (G to Q, except 75* and 90*)Total output at basic pricesTaxes on products
Of which environmental taxesLess subsidies on products
Of which environmental subsidiesImports CIFTotal supply at purchasers' prices

Annexes
173
Pilot Table 2 - Monetary use table of some water-related products (in monetary units)Economic product Water distribution and treatment (CPA codes)
User
Part 01.41.11Operation of
irrigationsystems
41.00.11Drinking
water
41.00.12Non
drinkingwater
41.00.20.01Distributionservices of
drinking water
41.00.20.02Distribution
services of nondrinking water
41.00Total
distributedwater
Part 75.12.13Water-relatedadministrative
services
90.00.11Sewage
removal andtreatment
Otherproducts(secondpriority)
01* Operation of irrigation systemsA* Agriculture, hunting and forestry, except 01*B FishingCA Mining and quarrying of energy producing materialsCB Mining and quarrying except energy producing materialsDA Manufacture of food products; beverages and tobaccoDB Manufacture of textiles and textiles productsDC Manufacture of leather and leather productsDD Manufacture of wood and wood productsDE Manufacture of pulp, paper; publishing and printingDF Manufacture of coke, refined petroleum and nuclear fuelDG Manufacture of chemicals, man-made fibresDH Manufacture of rubber and plastic productsDI Manufacture of other non-metallic mineral productsDJ Manufacture of basic metals and fabrication of metal productsDK Manufacture of machinery and equipment n.e.c.DL Manufacture of electrical and optical equipmentDM Manufacture of transport equipmentDN Manufacturing n.e.c.41 Collection, purification and distribution of waterE* Electricity, gas and water supply, except 41F Construction75* Public administrative services for water supply and sewage systems90* Sewage removal and treatment servicesR* Other services (G to Q, except 75* and 90*)Total intermediate consumption of industriesTotal final consumptionOf which by government
by NPISHby households
Changes in inventoriesExports FOBTotal uses at purchasers' prices

Annexes
174
Pilot Table 3 - Economic accounts for some water-related economic activities(in monetary units, except for item 7)
Non-financialcorporations
GeneralGovernment
NPISH Households Total
Production and generation of income accounts1 Total intermediate consumption2 Total value added, gross
2.1 Compensation of employees2.2 Other taxes on production
Of which: environmental taxes2.3 Less other subsidies on production
Of which: environmental subsidies2.4 Consumption of fixed capital2.5 Net operating surplus
3 Total output at basic prices3.1 Market3.2 Non-market
Supplementary information about fixed capital and labour inputs4 Investment grants5 Gross fixed capital formation6 Closing stocks of fixed assets7 Total hours worked
Ideally, a table must be filled in for each of the following major activities:1 operation of irrigation systems (part of NACE 01)2 production of distributed water (NACE 41), if possible broken down into:
2.1 production of drinking water, if possible broken down into:2.1.1 abstraction2.1.2 purification
2.2 production of non-drinking water, if possible broken down into:2.2.1 abstraction2.2.2 purification
2.3 distribution services of water, if possible broken down into:2.3.1 for drinking water2.3.2 for non-drinking water
3 sewage removal and treatment (part of NACE 90), if possible broken down into:3.1 removal3.2 treatment3.3 discharge
4 administrative services related to water supply and sewage systems (part of NACE 75) and as much aspossible for second priority activities.

Annexes
175
Pilot Table 4 - Expenditure for some ancillary water-related activities (in monetary units, except for last column)Current expenditure Second priorityExpenditure
Intermediateconsumption
Compensationof employees
Taxesrelated to
water
Less subsidiesrelated to water
Capitalexpenditure Consumption
of fixedcapital
Closing stockof fixedassets
Labour inputsin total hours
worked01* Operation of irrigation systemsA* Agriculture, hunting and forestry, except 01*B FishingCA Mining and quarrying of energy producing materialsCB Mining and quarrying except energy producing materialsDA Manufacture of food products; beverages and tobaccoDB Manufacture of textiles and textiles productsDC Manufacture of leather and leather productsDD Manufacture of wood and wood productsDE Manufacture of pulp, paper; publishing and printingDF Manufacture of coke, refined petroleum and nuclear fuelDG Manufacture of chemicals, man-made fibresDH Manufacture of rubber and plastic productsDI Manufacture of other non-metallic mineral productsDJ Manufacture of basic metals and fabrication of metal productsDK Manufacture of machinery and equipment n.e.c.DL Manufacture of electrical and optical equipmentDM Manufacture of transport equipmentDN Manufacturing n.e.c.41 Collection, purification and distribution of waterE* Electricity, gas and water supply, except 41F Construction75* Public administrative services for water supply and sewage systems90* Sewage removal and treatment servicesR* Other services (G to Q, except 75* and 90*)Total industriesHouseholds for final consumptionTotal
Ideally, a table must be filled in for each of the following activities: abstraction of water from water system; purification of abstracted water; internal recycling of water; internal treatment of wastewater beforedischarge; and discharge of wastewater into water system and as much as possible for second priority activities.

Annexes
176
Pilot Table 5 - Physical supply of water (corresponding to Pilot Table 1 – in thousand m3)Economic product
Supplier
Irrigation waterdelivered
Drinking waterdelivered
Non-drinking waterdelivered
Total drinking + nondrinking
Wastewatercollected by
sewage networks
Wastewatertreated by
sewage networks01* Operation of irrigation systemsA* Agriculture, hunting and forestry, except 01*B FishingCA Mining and quarrying of energy producing materialsCB Mining and quarrying except energy producing materialsDA Manufacture of food products; beverages and tobaccoDB Manufacture of textiles and textiles productsDC Manufacture of leather and leather productsDD Manufacture of wood and wood productsDE Manufacture of pulp, paper; publishing and printingDF Manufacture of coke, refined petroleum and nuclear fuelDG Manufacture of chemicals, man-made fibresDH Manufacture of rubber and plastic productsDI Manufacture of other non-metallic mineral productsDJ Manufacture of basic metals and fabrication of metal productsDK Manufacture of machinery and equipment n.e.c.DL Manufacture of electrical and optical equipmentDM Manufacture of transport equipmentDN Manufacturing n.e.c.41 Collection, purification and distribution of waterE* Electricity, gas and water supply, except 41F Construction75* Public administrative services for water supply and sewage systems90* Sewage removal and treatment servicesR* Other services (G to Q, except 75* and 90*)Total outputImportsTotal supply
1 These flows of water correspond to the supply of ‘removal of wastewater’ service provided by NACE 90 industry2 These flows of water correspond to the supply of ‘treatment of wastewater’ service provided by NACE 90 industry.
The provision of ‘wastewater treatment’ service will also be recorded by corresponding pollutants flows tables (Tables 10 and 11)

Annexes
177
Pilot Table 6 - Physical use of water (corresponding to Pilot Table 2 – in thousand m3)Economic product
User
Irrigation water used Drinking water used Non-drinking water used Total drinking + nondrinking
Wastewaterdischarged in sewage
networks01* Operation of irrigation systemsA* Agriculture, hunting and forestry, except 01*B FishingCA Mining and quarrying of energy producing materialsCB Mining and quarrying except energy producing materialsDA Manufacture of food products; beverages and tobaccoDB Manufacture of textiles and textiles productsDC Manufacture of leather and leather productsDD Manufacture of wood and wood productsDE Manufacture of pulp, paper; publishing and printingDF Manufacture of coke, refined petroleum and nuclear fuelDG Manufacture of chemicals, man-made fibresDH Manufacture of rubber and plastic productsDI Manufacture of other non-metallic mineral productsDJ Manufacture of basic metals and fabrication of metal productsDK Manufacture of machinery and equipment n.e.c.DL Manufacture of electrical and optical equipmentDM Manufacture of transport equipmentDN Manufacturing n.e.c.41 Collection, purification and distribution of waterE* Electricity, gas and water supply, except 41F Construction75* Public administrative services for water supply and sewage systems90* Sewage removal and treatment servicesR* Other services (G to Q, except 75* and 90*)Total intermediate consumption by industriesFinal consumptionOf which: by government
by householdsby NPISH
Change in inventoriesExportsTotal uses
The flows of water recorded in last column correspond to the use, by industries or households, of the ‘removal of wastewater’ services provided by NACE 90 industry.
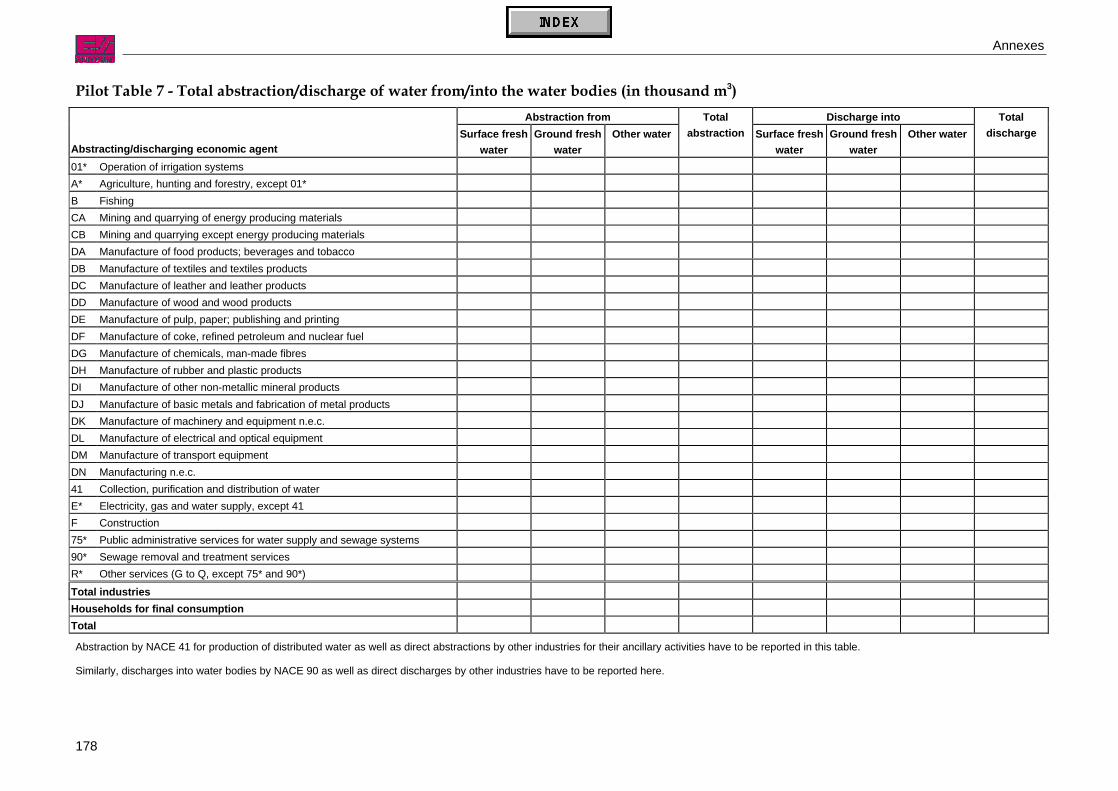
Annexes
178
Pilot Table 7 - Total abstraction/discharge of water from/into the water bodies (in thousand m3)Abstraction from Discharge into
Abstracting/discharging economic agentSurface fresh
waterGround fresh
waterOther water
Totalabstraction Surface fresh
waterGround fresh
waterOther water
Totaldischarge
01* Operation of irrigation systemsA* Agriculture, hunting and forestry, except 01*B FishingCA Mining and quarrying of energy producing materialsCB Mining and quarrying except energy producing materialsDA Manufacture of food products; beverages and tobaccoDB Manufacture of textiles and textiles productsDC Manufacture of leather and leather productsDD Manufacture of wood and wood productsDE Manufacture of pulp, paper; publishing and printingDF Manufacture of coke, refined petroleum and nuclear fuelDG Manufacture of chemicals, man-made fibresDH Manufacture of rubber and plastic productsDI Manufacture of other non-metallic mineral productsDJ Manufacture of basic metals and fabrication of metal productsDK Manufacture of machinery and equipment n.e.c.DL Manufacture of electrical and optical equipmentDM Manufacture of transport equipmentDN Manufacturing n.e.c.41 Collection, purification and distribution of waterE* Electricity, gas and water supply, except 41F Construction75* Public administrative services for water supply and sewage systems90* Sewage removal and treatment servicesR* Other services (G to Q, except 75* and 90*)Total industriesHouseholds for final consumptionTotal
Abstraction by NACE 41 for production of distributed water as well as direct abstractions by other industries for their ancillary activities have to be reported in this table.
Similarly, discharges into water bodies by NACE 90 as well as direct discharges by other industries have to be reported here.

Annexes
179
Pilot Table 8 - Abstraction from water bodies for the preparation of drinking water (in thousand m3)Surface water
Abstracting economic agent Quality A1(*) A2, not A1 A3, not A2 Not meeting standardsGroundwater Other water
01* Operation of irrigation systemsA* Agriculture, hunting and forestry, except 01*B FishingCA Mining and quarrying of energy producing materialsCB Mining and quarrying except energy producing materialsDA Manufacture of food products; beverages and tobaccoDB Manufacture of textiles and textiles productsDC Manufacture of leather and leather productsDD Manufacture of wood and wood productsDE Manufacture of pulp, paper; publishing and printingDF Manufacture of coke, refined petroleum and nuclear fuelDG Manufacture of chemicals, man-made fibresDH Manufacture of rubber and plastic productsDI Manufacture of other non-metallic mineral productsDJ Manufacture of basic metals and fabrication of metal productsDK Manufacture of machinery and equipment n.e.c.DL Manufacture of electrical and optical equipmentDM Manufacture of transport equipmentDN Manufacturing n.e.c.41 Collection, purification and distribution of waterE* Electricity, gas and water supply, except 41F Construction75* Public administrative services for water supply and sewage systems90* Sewage removal and treatment servicesR* Other services (G to Q, except 75* and 90*)Total industriesHouseholds for final consumptionTotal abstraction
(*) Quality standards refer to Directives 75/440/EEC and 79/869/EEC. They are recalled in the body text at Section 4.3.
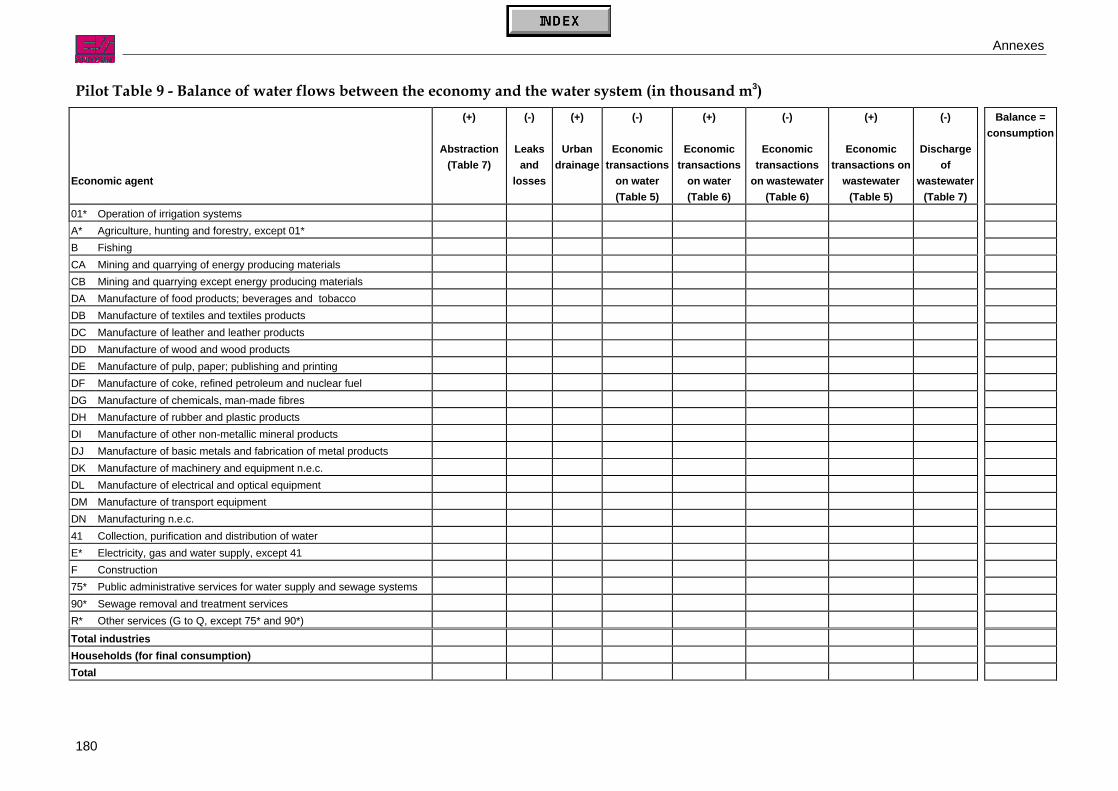
Annexes
180
Pilot Table 9 - Balance of water flows between the economy and the water system (in thousand m3)(+) (-) (+) (-) (+) (-) (+) (-) Balance =
consumption
Economic agent
Abstraction(Table 7)
Leaksand
losses
Urbandrainage
Economictransactions
on water(Table 5)
Economictransactions
on water(Table 6)
Economictransactions
on wastewater(Table 6)
Economictransactions on
wastewater(Table 5)
Dischargeof
wastewater(Table 7)
01* Operation of irrigation systemsA* Agriculture, hunting and forestry, except 01*B FishingCA Mining and quarrying of energy producing materialsCB Mining and quarrying except energy producing materialsDA Manufacture of food products; beverages and tobaccoDB Manufacture of textiles and textiles productsDC Manufacture of leather and leather productsDD Manufacture of wood and wood productsDE Manufacture of pulp, paper; publishing and printingDF Manufacture of coke, refined petroleum and nuclear fuelDG Manufacture of chemicals, man-made fibresDH Manufacture of rubber and plastic productsDI Manufacture of other non-metallic mineral productsDJ Manufacture of basic metals and fabrication of metal productsDK Manufacture of machinery and equipment n.e.c.DL Manufacture of electrical and optical equipmentDM Manufacture of transport equipmentDN Manufacturing n.e.c.41 Collection, purification and distribution of waterE* Electricity, gas and water supply, except 41F Construction75* Public administrative services for water supply and sewage systems90* Sewage removal and treatment servicesR* Other services (G to Q, except 75* and 90*)Total industriesHouseholds (for final consumption)Total

Annexes
181
Pilot Table 10 - Pollutants discharged by economic activities into the sewage network (in physical units: kg, tonnes or a more adapted unit)Pollutants BOD COD Suspended Heavy metals Phosphorus Nitrogen
Economic agent solids As Cd Hg Cu Cr Ni Pb Zn (total) (total)01* Operation of irrigation systemsA* Agriculture, hunting and forestry, except 01*B FishingCA Mining and quarrying of energy-producing materialsCB Mining and quarrying except energy-producing materialsDA Manufacture of food products; beverages and tobaccoDB Manufacture of textiles and textiles productsDC Manufacture of leather and leather productsDD Manufacture of wood and wood productsDE Manufacture of pulp, paper; publishing and printingDF Manufacture of coke, refined petroleum and nuclear fuelDG Manufacture of chemicals, man-made fibresDH Manufacture of rubber and plastic productsDI Manufacture of other non-metallic mineral productsDJ Manufacture of basic metals and fabrication of metal productsDK Manufacture of machinery and equipment n.e.c.DL Manufacture of electrical and optical equipmentDM Manufacture of transport equipmentDN Manufacturing n.e.c.41 Collection, purification and distribution of waterE* Electricity, gas and water supply, except 41F Construction75* Public administrative services for water supply and sewage systems90* Sewage removal and treatment servicesR* Other services (G to Q, except 75* and 90*)Total industriesHouseholds for final consumptionTOTAL

Annexes
182
Pilot Table 11 - Pollutants discharged to water bodies by economic activities (in physical units: kg, tonnes or a more adapted unit)Pollutants BOD COD Suspended Heavy metals Phosphorus Nitrogen
Economic agent Solids As Cd Hg Cu Cr Ni Pb Zn (total) (total)01* Operation of irrigation systemsA* Agriculture, hunting and forestry, except 01*B FishingCA Mining and quarrying of energy producing materialsCB Mining and quarrying except energy producing materialsDA Manufacture of food products; beverages and tobaccoDB Manufacture of textiles and textiles productsDC Manufacture of leather and leather productsDD Manufacture of wood and wood productsDE Manufacture of pulp, paper; publishing and printingDF Manufacture of coke, refined petroleum and nuclear fuelDG Manufacture of chemicals, man-made fibresDH Manufacture of rubber and plastic productsDI Manufacture of other non-metallic mineral productsDJ Manufacture of basic metals and fabrication of metal productsDK Manufacture of machinery and equipment n.e.c.DL Manufacture of electrical and optical equipmentDM Manufacture of transport equipmentDN Manufacturing n.e.c.41 Collection, purification and distribution of waterE* Electricity, gas and water supply, except 41F Construction75* Public administrative services for water supply and sewage systems90* Sewage removal and treatment servicesR* Other services (G to Q, except 75* and 90*)
Total industriesHouseholds for final consumptionTOTAL
p.m. fertilisers spread on soils by agriculturePollutants can be discharged into the water bodies either directly by industries and households not connected to the sewage network or by the operators of the sewerage (NACE 90).

Annexes
183
Pilot Table 12 - Pollutants subtracted by economic activities (in physical units: kg, tonnes or a more adapted unit)Pollutants BOD COD Suspended Heavy metals Phosphorus Nitrogen
Economic agent solids As Cd Hg Cu Cr Ni Pb Zn (total) (total)01* Operation of irrigation systemsA* Agriculture, hunting and forestry, except 01*B FishingCA Mining and quarrying of energy producing materialsCB Mining and quarrying except energy producing materialsDA Manufacture of food products; beverages and tobaccoDB Manufacture of textiles and textiles productsDC Manufacture of leather and leather productsDD Manufacture of wood and wood productsDE Manufacture of pulp, paper; publishing and printingDF Manufacture of coke, refined petroleum and nuclear fuelDG Manufacture of chemicals, man-made fibresDH Manufacture of rubber and plastic productsDI Manufacture of other non-metallic mineral productsDJ Manufacture of basic metals and fabrication of metal productsDK Manufacture of machinery and equipment n.e.c.DL Manufacture of electrical and optical equipmentDM Manufacture of transport equipmentDN Manufacturing n.e.c.41 Collection, purification and distribution of waterE* Electricity, gas and water supply, except 41F Construction75* Public administrative services for water supply and sewage systems90* Sewage removal and treatment servicesR* Other services (G to Q, except 75* and 90*)
Total industriesHouseholds for final consumptionTOTAL
Pollutants can be absorbed by economic activities before economic use (e.g. elimination of germs before drinking, filtering of suspended solids before use for cooling) as well as after economic use(treatment of wastewater).

Annexes
184
Pilot Table 13 - Average purchasers' prices of some water-related economic products (in monetary units per m3)Economic product
Economic agent
Part 01.41.11Operation of
irrigationsystems
41.00.11Drinking water
41.00.12Non-drinking
water
41.00.20.01Distributionservices of
drinking water
41.00.20.02Distributionservices of
non- drinkingwater
41.00Total
distributedwater
Part 75.12.13Water-relatedadministrative
services
90.00.11Sewage
removal andtreatment
01* Operation of irrigation systemsA* Agriculture, hunting and forestry, except 01*B FishingCA Mining and quarrying of energy producing materialsCB Mining and quarrying except energy producing materialsDA Manufacture of food products; beverages and tobaccoDB Manufacture of textiles and textiles productsDC Manufacture of leather and leather productsDD Manufacture of wood and wood productsDE Manufacture of pulp, paper; publishing and printingDF Manufacture of coke, refined petroleum and nuclear fuelDG Manufacture of chemicals, man-made fibresDH Manufacture of rubber and plastic productsDI Manufacture of other non-metallic mineral productsDJ Manufacture of basic metals and fabrication of metal productsDK Manufacture of machinery and equipment n.e.c.DL Manufacture of electrical and optical equipmentDM Manufacture of transport equipmentDN Manufacturing n.e.c.41 Collection, purification and distribution of waterE* Electricity, gas and water supply, except 41F Construction75* Public administrative services for water supply and sewage systems90* Sewage removal and treatment servicesR* Other services (G to Q, except 75* and 90*)Average price of intermediate consumption of industriesAverage price for households' final consumptionAverage FOB price for exportsAverage purchaser's price

Annexes
185
Annex 2: Revised set of standard water accounts tables andexplanatory notesThis Annex 2 presents the new standard set of water accounts tables and explanatory notes. This new set oftables was produced and agreed by the Water Accounts Task Force in 2002, and approved by the WorkingParty ‘Economic Accounts for the Environment’ in October 2002.
Explanatory notes
The water accounts frameworkPressures by economic activities on the water system (e.g. abstraction of water and discharges of pollutants)and economic responses (e.g. water purification and wastewater treatment) can easily be described in amatrix format. This matrix presents the flows of water and of polluting substances in physical units as well asthe monetary transactions connected to water by classes of economic activities.
The framework uses the concepts of the European System of Accounts (ESA 95) and the Europeannomenclatures of economic activities and products (NACE and CPA) to present the economy in a simplifiednational accounting matrix (NAM) with a focus on water-related issues. This NAM is extended to describeflows of water between the economy and the environment and emissions of pollutants to water due toeconomic activities.
In principle, such a NAMEA-type framework for water would consist of four parts.
A) A NAM describing the economic transactions, i.e. the supply and use tables of the national accountstogether with income, capital and rest of the world accounts. Monetary flows corresponding to ancillaryactivities related to self-supply of water and own account treatment of wastewater could be specifiedthrough “of which” columns. Supply and use tables in physical units could be added to describe flows ofdistributed water and collected wastewater within the economy.
B) The second part shows the flows of water in physical units (cubic meters) between the economy andthe environment. This includes abstraction (including abstraction by economic activities for self-supply)by components of the water system and returns of (waste) water into the various components of thehydrological system. Net uses of water for intermediate and final consumption, increases in inventoriesand imports and exports of water could be shown as well.
C) The emissions of pollutants to water could be recorded in a third part, by pollutant, according to theirorigin (economic activity) and to the component of the water system in which they are emitted. Thesubtraction of pollutants from natural water bodies by economic activities may also be presented bypollutant and by component of the water system. These activities could include purification of abstractedwater prior to using it.
D) A fourth part regarding the flows within nature of water and water pollutants described in physical unitscould be added. These flows are not under the (total) control of any economic agent even thoughpossibly influenced by human activities. Precipitation, inflows from other inland water systems,evapotranspiration, natural transfers between components of the water system (infiltration, runoff etc.)and the corresponding indirect emissions to water bodies (e.g. indirect pollution from fertilisers,pesticides and acid rain) could be included in this section.
In principle, a 5th part could be added to describe the quality of water in nature (e.g. water quality accountsfor rivers) and of the stocks of water in nature.

Annexes
186
B CWater Pollutants
AReturns Emissions to water
Transactions (simplified NAM) of water due to
and physical supply-and-use tables forproduced water and wastewater
final consumption andproduction
abstraction by economic activities
NACE
41
other industries
surface water balance
groundwater (economic activities)
absorption by economic activities
(by pollutant) NACE
41
surface water balance
groundwater (economic activities)
DNatural flows and accumulation
from atmosphere to ground
from ground to atmosphere
precipitation
evapotranspiration
e.g. acid rains
from other inland systems natural inflows
transfers between components e.g. run-off
renewable resources
to other inland systems natural outflows
balance: natural flows
Overall balance
monetary and physical data physical data only

Annexes
187
In the standard set of tables, the scope is restricted to parts A) - economic transactions related to water,flows of water inside the economy, B) - flows of water between the economy and the environment) and C) -exchange of pollutants between the economy and the water environment, while D) is not included for themoment.
This framework would still be very large due to NAM data that are not specific to water. In the set of standardtables, only data specific to water have been selected to make the set of tables easier to manipulate.
Furthermore, some economic uses of water and not all emissions of pollutants are not covered. Notably, insitu uses of water (such as water transport or hydroelectricity) as well as economic actions consisting infighting against water (e.g. in case of flood) are excluded. Only a selection of pollutants will be followed.
A2-1.1 The set of standard tablesThe set consists of 13 tables.
Table 1 - Supply of distributed water and of wastewater servicesTable 2 - Use of distributed water and of wastewater servicesTable 3 – Economic accounts for water distribution and wastewater collection industriesTable 4 - Expenditures for self-supply of water and of wastewater treatmentTable 5 - Physical flows of water corresponding to economic supply recorded in table 1Table 6 - Physical flows of water corresponding to economic uses recorded in table 2Table 7 - Abstractions of waterTable 8 - Returns of waterTable 9 - Freshwater balanceTable 10 – Pollutant loads of freshwater abstracted for self-supplyTable 11 – Pollutant loads of wastewater discharged to the sewage systemTable 12 - Pollutant loads of cooling and wastewater returned to the environmentTable 13 – Pollutant loads of cooling and wastewater returned to non-fresh sources
The tables are organised in 3 main groups:• tables 1 to 4 are in monetary units and describe economic transactions,• tables 5 to 9 describe physical flows of water,• tables 10 to 13 report physical flows of pollutants.
There is a direct correspondence between the economic and physical tables.
The cells that are usually most important have been framed in the tables. This does not mean that othercells are necessarily empty. For instance, in table 1, NACE 41 is the normal producer and thus supplier ofnon-drinking water (product CPA 41.00.12). This does not exclude the possibility of a supply of non-drinkingwater by NACE 40, for instance, as the output of a secondary activity. Wastewater re-used can be providedby NACE 90.01 to NACE 41, which, in turn, distributes it to other users. Conversely, it has been assumed intable 2 that all manufacturing industries are potential users of non-drinking water, while, in practice, only fewmanufacturing industries may use this kind of water. Some service industries (e.g. car washing services)may also use non-drinking water.
Classifications: industries and homogenous branchesIndustries or homogeneous branches may be used in the tables.
Industries. When industries are used, the supply of each water-related product is recorded according to themain activity of its producer. That is to say that secondary production of these products is recorded under theheading corresponding to the main activity of their producer. For instance, the main activity of industry NACEgroup 90.01 is the collection and treatment of wastewater but this industry may also supply treatedwastewater for re-use and thus be a supplier of e.g. non-drinking water (CPA 41.00.12). General publicservices activities (NACE section L) can supply water or wastewater services if these services are directlyprovided by the county, the municipality, etc. Manufacturing industries that abstract water for their own use

Annexes
188
(self-supply) may supply some of this water to other users. This means that secondary output of water-related products may come from many industries and many of the non-framed cells may be filled in.
Homogeneous branches. Secondary activities can be reclassified to the corresponding homogeneousbranch. In that case, all CPA products beginning by 41 are attributed to NACE 41 whatever the main activityof their actual producer, and so on. Only the framed cells are filled in, plus the total columns.
Both presentations have their pros and cons, depending on the analysis that is in mind.
When focusing on the water supply or wastewater collection and treatment activities, attention should bepaid to the classification of economic agents dealing with activities coded under NACE 41, 75 and 90.01.The organisation of water management differs across countries and even across regions or districts within acountry. Some activities related to water supply (NACE 41) and wastewater collection and treatment (NACE90.01) are carried out by central or local government agents. These activities are not always classified underNACE 41 or NACE 90.01 but sometimes with "public administration and defence" (NACE 75). This can forexample occur when the local governments’ accounts are not detailed enough to separate water supply orsewage collection from other activities. In some countries, the same producer units practise both activities ofwater supply (NACE 41) and wastewater management (NACE 90): one is their main activity, the other theirsecondary activity. Whenever possible, these activities should be estimated and reclassified. In this caseplease indicate in a note any differences this treatment introduces in relation to standard national accounts.
Classifications: nomenclatures of activities (NACE) and products (CPA)The set of tables uses the NACE Rev. 1.1 at its subsections level with some extra detail as regards activitiesrelated to water and the CPA 2002. In the tables, an asterisk marks codes that are not exactly matchingNACE and CPA definitions. It must be noted that the NACE Rev. 1.1 and the CPA 2002 will only enter intoforce on 1 January 2003. However, national classifications are generally more detailed so that often it will bepossible to provide data according to the new NACE and CPA and for the codes marked with an asterisk.Important categories of NACE and the corresponding categories of CPA are summarised below. In case ofdifferences between the new and earlier classifications, references to both versions are made.
NACE class 41.00 - Collection, purification and distribution of water. The products corresponding to thisactivity are CPA 41.00.1 - distributed water55 - with a further subdivision into drinking water (CPA 41.00.11)and non-drinking water (CPA 41.00.12) – and CPA 41.00.2 - distribution services of water, including notablyreading and maintenance of meters. NACE 41 includes desalting of seawater to produce water as theprincipal product of interest. NACE 41 excludes the operation of irrigation systems for agricultural purposes(classified in NACE 01.41 - Agricultural service activities; landscape gardening) and the treatment ofwastewater solely in order to prevent pollution (classified in NACE 90.01 – collection and treatment ofsewage). The breakdown of distributed water into drinking water, non-drinking water and distribution servicesis not expected to be important in most cases.
NACE class 90.01 - Collection and treatment of sewage. This class includes:- collecting and transporting of human wastewater from one or several users, as well as rain water by
means of sewerage networks, collectors, tanks and other means of transport (sewage vehicles etc.) andtheir treatment and disposal
- treatment of wastewater by means of physical, chemical and biological processes like dilution,screening, filtering, sedimentation, etc.
- maintenance and cleaning of sewers and drains- emptying and cleaning of cesspools and septic tanks, sinks and pits from sewage, servicing of chemical
toilets- treatment of wastewater from swimming pools and from industry
NACE class 01.41* - operation of irrigation systems. The operation of irrigation systems is part of NACEclass 01.41 – Agricultural service activities; landscape gardening and the corresponding product is part ofCPA 01.41.11 - services incidental to agricultural production. These irrigation systems are supposed to be a
55 In the official English CPA terminology, the product of this activity is called ‘natural water’. We here use the wording ‘distributedwater’, like in the French version of the CPA, to avoid possible confusion with water in nature.
Annexes
189
specific provision of water to farmers, especially through a network of open air canals the feeding andallocation of which is managed.
NACE class 75.12* - public administration for water. Water-related public administration is part of NACEclass 75.12 - Regulation of the activities of agencies that provide health care, education, cultural servicesand other social services, excluding social security. The corresponding product is part of CPA 75.12.13 -administrative housing and community amenity services. This product supplied by government includes:“services provided by offices, bureaux, departments and programme units engaged in developing andadministering regulations concerning water supply; public administrative services related to (…) sewagesystem operation.”
The definition of activities recorded under 75.12* is restricted to activities related to water supply orwastewater management. Activities that are not related to water supply or wastewater management such asflood protection, repair of damages due to floods, dredging of rivers, navigation and restoring the quality ofwater bodies are to be excluded. Water abstracted but not used (e.g. pumping of water from polders) ishowever included. If such activities are important, the category 75.12* should be sub-divided.
In principle, NACE 75.12 should only include regulatory activities such as those of water-related departmentsin central and regional governments. In practice, however, some activities related to water supply or sewagecollection carried out by central or local government agents may not be classified under NACE 41 or NACE90.01 but under NACE 75 - public administration and defence. This can for example occur when the localgovernment accounts are not detailed enough to separate water supply or sewage collection from otheractivities. It may also occur that these services only invest in new networks and are the owners of the watersupply networks or of the sewage systems, whereas the operation of these systems is contracted out.
To the extent possible, this industry should be split up and the data recorded under NACE 41 and 90.01,respectively.
Mineral waters come under CPA 15.98.11 and are not included in the list of water-related economicproducts followed through the accounts. However, the corresponding abstraction of water will be consideredas an ancillary activity by beverage producers. Distilled water is part of CPA 24.13.42 (Other inorganiccompounds n.e.c.) and is not included either.
Table-by-table descriptionTable 1 - Supply of distributed water and of wastewater servicesThe purpose of table 1 is to show the economic output of water-related products as well as possible importsto determine the total supply in monetary units of drinking, non-drinking and irrigation water, of sewagecollection and treatment services, and of some water-related administrative services. The supply of water-related products is recorded at basic prices. Taxes less subsidies and imports are included in table 1,providing the figures of total supply at purchasers' prices.
Only supply implying an economic transaction between two different economic agents is to be recorded inthis table: this generally implies a monetary counterpart. Expenditures connected to self-supplied water(water abstracted and purified for own use) and to ancillary activities regarding own account wastewatertreatment are to be recorded in table 4.
If no distinction is possible between drinking and non-drinking, the column “total distributed water" can beused. It should be noted that:• Drinking water does not refer to the actual use of water, but to its quality (= water usable for drinking
purposes).• Non-drinking water implies that less purification is needed than for drinking water, but some purification
might be necessary. This type of water is mostly used in some industrial processes.
Table 1 is directly linked to table 5.
Table 2 - Use of distributed water and of wastewater servicesTable 2 reports the uses of the water-related products for intermediate and final consumption, exports andinventory changes. The framed cells reflect the assumption that all industries and households will be users of

Annexes
190
drinking water and of wastewater collection and treatment services, while only agriculture, mining andmanufacturing industries use non-drinking water.
Final consumption should be recorded as actual final consumption (“individual consumption” concept - seeESA definitions in annex). The government is therefore the “collective consumer” of its own production ofcollective non-market services (for instance of administrative services of water control), whereas the use ofwater and of wastewater services by households should be recorded in the row “final consumption byhouseholds” even if these services have been supplied to them free of charge by the government.
Changes in inventories are probably insignificant: this row corresponds to changes in the volumes of alreadypurified water, e.g. water stored in reservoirs (water towers).
Only uses implying an economic transaction between two different economic agents are to be recorded inthis table: this generally implies a monetary counterpart, except in such cases as individual consumption orinventory changes explained above. Expenditures connected to the (own) use of self-supplied water and toancillary activities regarding own account wastewater treatment are to be recorded in table 4.
If water is exchanged between water producers and distributors (for instance in case of temporaryinsufficiency of a local source), these exchanges should be recorded at the crossing of NACE 41 (or 01.41*)and the corresponding type of water which is exchanged. The price of this water is generally lower since itdoes not include the cost of distribution to the final users.
Table 2 is linked to table 6.
Table 3 – Economic accounts for water distribution and wastewater collection industriesThis table is a summary of the ESA production and generation of income accounts of each of the majorindustries related to water. Supplementary information about fixed capital and labour inputs is also asked.ESA definitions and concepts are applied (see annex for a reminder of the definitions). Secondary (non-water-related) activities are thus included when the tables are based on industries whereas secondary water-related activities by other industries are included when the tables are based on homogeneous branches.
The institutional sector headings of the sub-columns are the producing sectors. For simplification, NPISHs(non-profit institutions serving households, see definition in annex) are put together with households andtheir production costs reported in table 4 under the “households” row. This case is assumed to be rare, forexample local water supply associations of households in rural areas. Expenditure for self-supply of waterand ancillary activities regarding wastewater treatment are not recorded here but in table 4.
Table 4 - Expenditures for self-supply of water and of wastewater treatmentThis table describes activities related to water carried out:• as “ancillary” activities by industries, i.e. for their own use (e.g. direct abstraction of water from a river by
a manufacturer of basic metals for cooling purposes or own account wastewater treatment by amanufacturer of chemicals);
• or by the households for their own consumption (e.g. self-supply of water with individual pumps and theuse of septic tanks for treating wastewater in rural areas not connected to a sewage network).
Table 4 includes information more or less similar to that in table 3. In the national accounts, theseexpenditures are recorded either as intermediate consumption, compensation of employees and fixed capitalformation by the industry under review or as final consumption by households (potentially also as fixedcapital formation when the buying of the septic tank is included in the value of a house). The table selectswithin their total expenditures only those related to the self-supply of water or of wastewater treatment.
As only activities for own use are included, only costs of production are asked for: there are nocorresponding sales.
The information required for table 4 will often be available for wastewater management from establishedspecific data collection systems such as national environmental protection expenditure surveys and othersources on environmental expenditure. Some of these sources may not provide all variables. E.g.compensation of employees, intermediate consumption and taxes on production may only be available as asum of ‘current expenditure’; data on consumption of fixed capital may not be available directly and will haveto be estimated using established national accounts procedures.
Annexes
191
For self-supply of water such specific sources are not likely to be available in many countries at present.Physical quantities of water abstracted for self-supply and average costs could be used to estimate thesedata.
Table 5 - Physical flows of water corresponding to economic supply recorded in table 1Table 5 corresponds to table 1 but is expressed in physical units. Table 5 records, by supplying industry, thewater delivered and the wastewater collected in thousand m3.
Purely monetary rows (e.g. taxes) or non-material services (e.g. distribution services) are not shown andsewage collection and treatment services have been converted into the corresponding flows of wastewater.
In order to maintain consistency with the monetary tables, flows of water to be recorded here correspond tothe economic transactions, i.e. flows of water delivered at the end of the production process for NACE 41products and flows of wastewater collected at the beginning of the production process for NACE 90.01products. Water or wastewater potentially lost during its transportation to or from the user should not berecorded here (but will be recorded in table 9).
Table 7 will describe the environmental origin (i.e. the abstraction) of the flows of water exchanged betweeneconomic agents. However, some of the economic freshwater exchanges have only an economic origin: re-use of wastewater implies that the water abstracted from the environment at the beginning of the economicprocess is sold repeatedly. Freshwater coming from desalinated seawater must also be isolated because itresults from an economic transformation of non-fresh water into freshwater and it will be necessary to buildthe balance of the flows of freshwater between the economy and the environment. These two supplementarypieces of information have therefore been introduced in table 5.
Table 6 - Physical flows of water corresponding to economic uses recorded in table 2Similarly, table 6 is the replica of table 2 in physical units (thousand m3).
Table 7 - Abstractions of water and Table 8 - Returns of waterTable 7 describes the abstractions of water from the environment and table 8 the discharges of wastewaterand other returns of water back to the environment.
Table 7 shows abstractions according to the type of water body used as a source. 3 types of water bodiesare distinguished: fresh surface water, fresh groundwater and non-fresh water sources in coherence with theOECD/Eurostat Joint Questionnaire on inland waters (see annex for a definition of the water sources and ofthe water flows). All water abstracted by water producers should be recorded in the columns “abstraction fordistribution” even if some of this water is not finally delivered to end users: part of the water abstracted is lostduring distribution or is used by the water producers to clean the networks.
Abstraction of water from the environment as a consequence of self-supply by industries or households isalso to be reported in the columns “abstraction for self-supply” in table 7.
The columns under ‘Abstraction not for use’ report abstractions that are not induced by a use of water. Waterdisplaced by pumping and draining but not used (e.g. pumping from mining or construction sites) should bereported under “mine and drainage water” (column A9). Other examples are: pumping of water from poldersto keep the water table low; abstraction of groundwater in order to influence groundwater tables so as toprevent pollutants from entering areas designated for drinking water supply, and water abstracted for re-charging other water bodies.
Abstraction from non-fresh water sources will essentially be sea and brackish water abstracted for coolingpurposes. A small amount of seawater may be abstracted for desalination or other purposes.
Table 8 shows the various returns to the environment including the returns of (treated or untreated)wastewater by the sewage system, individual returns of wastewater from industries and households (e.g. viaseptic tanks) and returns of fresh cooling water. The returns of unused water (column R1) correspond to themine and drainage water abstracted but not used. The total returns of freshwater (column R10) are brokendown by destination: returns to non-fresh water bodies and returns to freshwater bodies. The returns of non-fresh water to non-fresh sources (R13) are sea and brackish water used for cooling and returned to the seaafter use.

Annexes
192
The flows recorded in table 5 and 6 were the end-of-pipe flows in the production process of distribution ofwater (distributed water arriving at the consumer’s place) and the beginning-of-pipe flows in the productionprocess of wastewater removal and treatment (wastewater collected at the consumer’s place). Tables 7 and8, on the contrary, describe the flows at the beginning of the process for NACE 41 (abstraction of water fromthe environment in order to purify and distribute it) and the flows at the end of the process for NACE 90(discharge of the treated or untreated wastewater back to the environment).
Urban rainwater run-off collected in sewers will be included in the wastewater returned by sewage network intable 8 (column R4) whereas the wastewater discharged into the sewage system by the users of sewageservices (column PU6 in table 6) will not include this urban run-off. Also leakage from the sewage network aswell as the infiltration of groundwater into sewage systems may occur. These flows cannot be measureddirectly but can be very substantial. The difference between the volumes of wastewater collected from usersand the volumes of wastewater discharged by the sewage systems to the environment represents the neteffect of rainwater that enters the sewage system, the infiltration of groundwater into the sewage system andthe losses of wastewater through leakage. This net flow should be recorded under ‘rainwater and netinfiltration’ (column A10) in table 7.
Table 9- Freshwater balanceTable 9 establishes the balance of the flows of freshwater between the economy and the water system inphysical terms. Columns from tables 5, 6, 7 and 8 are re-arranged in order to get a global view of thefreshwater flows and in order to derive indicators of physical consumption of water for each industry. It isimportant to note that only freshwater flows are reported here, and the balance is settled with the fresh watersystem. Therefore, water abstracted from the fresh water system but then discharged into the sea isconsidered as “consumed” (i.e. removed from the fresh water system). As this disappearance from the freshwater system is not linked to the use made of the water but to the way of returning water after use, theconcept of “consumptive use” is also introduced (i.e. mainly the water evaporated). The difference betweenthese two concepts taken from the OECD/Eurostat Joint Questionnaire is the water discharged to the sea.
Consumptive uses can be further broken down into components. The first component is evaporation fromdistribution networks (e.g. open canals used for distributing irrigation water). The second component is theincorporation of water into other products. The orders of magnitude of water incorporated in products aretypically small but can be important for the industries where the incorporation of water takes place(manufacturing of beverages, dairy farming, making of concrete, etc.).
Water removal from products (which is a negative consumption) occurs mainly during consumption ofagricultural products and beverages by households. Water removal can also occur during other activitiessuch as making sugar from sugar beets.
The category ‘other consumptive uses’ in Table 9 essentially represents the water evaporated during useand is derived as a balancing item. This balancing item may thus also include any statistical discrepancies.Changes in stocks of produced water may also be shown in the row ‘changes to inventories’.
Following all the flows of water contained in other products or in waste can be complex and requiresestimations. Water may be contained in products imported and exported, or in organic waste that is landfilled. Manure from agriculture spread on fields can include a lot of water. Sewage sludge from wastewatertreatment will contain water also. Water incorporated in products from rain-fed agriculture does not comefrom abstraction (only irrigation water is recorded as abstracted in table 7). If this flow is consideredimportant it could be recorded in an extra column to avoid inconsistencies between the water available foruse and the return of wastewater for industries and households.
The concepts of physical consumption and consumptive uses have different analytical potentials dependingon the industry under review. For industries not specifically related to water, it may be interesting to knowwhat types of consumptive uses are systematically involved. For NACE 41 and 01.41*, it should be notedthat desalinated water and re-use of water change the balance and that this could be important for thejudgement of the consumption by the whole economy.
Tables 10 to 13 – Pollutant loadsThe aim of tables 10 to 13 is to record the pollutants that are added by the economic uses of water as wellas the subtraction of pollutants by economic activities of purification and treatment.

Annexes
193
The pollutants recorded in the table are BOD, COD, (see annex for the definitions), suspended solids, 8heavy metals, phosphorous and nitrogen. The unit for all these tables is a measure of weight (kg or tonne,depending on the pollutant under review). The reference period is a year.
The aim is to record the emissions of pollutants by economic activities into water bodies. This means thatonly the pollutants added by economic activities should be recorded. For instance, if an industry abstracts 1m3 of water which already contains q0 kg of a pollutant and returns to a river 1 m3 of wastewater with q1 kg, adischarge of q1 kg to the river is recorded, but only (q1 minus q0) kg has been added to the inland watersystem by the industry. Thus only (q1 minus q0) kg should be recorded as the emission by this industry. Inpractice, to estimate these emissions, it will usually be necessary to measure or estimate the pollutant loadsin the incoming and in the outgoing flows of water for each economic agent.
A set of 4 tables (10, 11, 12 and 13) describes the pollutant loads of the flows of water at different steps oftheir way from abstraction via circulation within the economy to returns to the environment. Pollutant loads ofwater are recorded at abstraction (table 10), at discharge to the sewage network prior to treatment by thesewage operators (table 11) and at return to the environment (table 12). Table 13 shows those pollutantloads recorded in table 12 that are returned to the sea. Therefore, subtracting table 13 from table 12 allowscalculating the discharges of pollutants into the fresh water environment.
A full description of the pollutant loads of all water flows recorded in tables 5 to 9 would be very complex andwould require many tables. As many water flows are of no particular interest for determining the emissions ofpollutants by the economy, simplifications are made:• Unused water is ignored, assuming that these water flows contain the same amount of pollutants when
abstracted (flow A9 in table 7) and when returned (flow R1 in table 8).• Irrigation water (part of flows A3 and A6, R3) is also ignored. The hypothesis of identical loads of
pollutants at the abstraction and return steps may be unrealistic for irrigation. The plants and the soil mayabsorb pollutants contained in the irrigation water. New pollutants may be added due to soil erosion ormanure, fertiliser, pesticides, etc. spread on the fields. However, the pollutant loads in returned irrigationwater are considered as an indirect pollution (via the soil) which is out of the scope of the water accountsin their present form. Estimates of diffuse pollution from non-point sources by agriculture can be recordedin the OECD/Eurostat Joint Questionnaire on Inland Waters. The total diffuse pollution from non-pointsources by agriculture will include pollution induced by rain-fed agriculture, i.e. pollution carried byrainwater that is not surveyed in the water accounts tables for the moment. Therefore, diffuse pollution byagriculture should be reported in the water accounts only as a ‘for memory’ item in table 12.56
• Distributed water is assumed to contain no significant amounts of the pollutants that are recorded intables 10 to 13. This assumption applies to all flows in the distribution process: water abstracted bydistributors (A3), leaks during distribution (R2), water distributed to the users (PS4). Purification ofdrinking water generally involves other pollutants than those recorded in the water accounts tables atpresent. There might be some purification of distributed non-drinking water that involves pollutantsrecorded in the water accounts tables, but in most countries the flows of distributed non-drinking waterare much smaller than those of drinking water.
• The pollutant content of the flows of non-fresh water is not estimated (neither at abstraction, nor atreturn) because the focus of the accounts is on fresh water and because non-fresh water is mainly usedfor cooling in the production of electricity and therefore should not change much in pollution content.
Therefore, in order to calculate the emissions to water bodies, only the pollutant content of the followingflows of water need to be tracked (see also the simplified scheme below):• at abstraction (table 10): only abstractions for self-supply from fresh sources. This corresponds to flow
A6 in table 7.57 The pollutant content of water abstracted for irrigation is ignored.• at discharge to the sewage network (table 11), including unallocated discharge due to urban run-off and
unallocated changes in pollution load due to leakage from the sewage system and infiltration ofgroundwater into the sewage system. This corresponds to flows PU6 in table 6 and A10 in table 7.
56 This may be changed in a future revision, when methods are available that allow estimating how much of the diffuse pollution fromagriculture is from returned irrigation water, and how much of the pollution in returned irrigation water is due to economic causes(fertiliser use etc.)
57 If no direct information is available on the pollution content of fresh water abstracted for self-supply, average water quality data couldbe applied to row A6 in table 7. Some of the components of flow A6 may be assumed to contain no significant amounts of thepollutants recorded in tables 10 to 13, for example, water abstracted by households for their own use.

Annexes
194
Practically, this means that the pollution content should be measured or estimated first in the outgoingflows from industries (or households) and a second time in the incoming flows at the treatment plants (orat the outlet of the sewage system when collected wastewater is discharged without treatment).
• at return to the environment (table 12). This corresponds to flows of wastewater and of returned freshcooling water, i.e. flows R4, R6 and R8 in table 8. It should be noted that, in comparison to theOECD/Eurostat Joint Questionnaire, estimates of pollutant content of returned fresh cooling water arerequired in the water accounts, due to the potentially significant amounts of some pollutants dischargedwith cooling water (e.g. heavy metals by industries such as manufacture of basic metals).
• at return to non-fresh sources (table 13). This corresponds to the discharge of wastewater and of freshcooling water to non-fresh sources, that is to say flows R5, R7 and R9 in table 8.
The emissions of pollutants by a specific industry other than NACE 01.41*, 41 and 90.01 can be calculatedby the following formula: table 11 (discharge to sewage system) plus table 12 (direct discharge to theenvironment) minus table 10 (pollutant content of water abstracted for self-supply). This formula gives thegross emissions, i.e. including the emissions into the sewage network prior to treatment by the sewageoperators.
For NACE 01.41* and 41 it is assumed that neither the water abstracted nor the water delivered containssignificant amounts of the pollutants that are recorded in the set of standard tables. The emissions of NACE01.41* and 41 are equal to the sum of table 11 and table 12.
The (negative) emissions by NACE 90.01 are calculated by subtracting table 11 (Supplementary table row“Total received by sewage system”) from table 12. This is a convention, because the negative emissions byNACE 90.01 include the depollution of flow A10 whose composition and origin is not known. Flow A10 is theresult of 3 separate flows with different origins and pollution content: rainwater/urban run-off, leaks from thesewage network and infiltration of groundwater into the sewage network. In principle, the volumes andpollution loads of the three flows should be estimated separately. However, this does not seem to be feasiblegiven current data availability. Even if separate estimates are possible, the allocation of these loads toindustries and households is not straightforward. The pollution content of leaks and infiltration flows could beallocated to the operators of the sewage systems (typically NACE 90) which are responsible for the network.It would be difficult to allocate the pollutant content of rainwater/urban run-off to the industries (orhouseholds) that “caused” them. Another problem is the “natural” pollution potentially collected with therainwater/urban run-off such as dust and dry and wet deposition of air pollutants part of which has alreadybeen accounted for as air emissions in the NAMEA air standard tables.
Therefore, at present, the net infiltration into the sewage system (flow A10) is not allocated to economicagents. However, the data can be used to calculate the de-pollution by NACE 90.01, which is equivalent tothe pollution load of R4 minus the pollution load of PU6 and A10. Data may also be used to makecomparisons of the efficiency of the different treatment systems across countries and over time by type oftreatment.
NACE 41 Industriesand
households
NACE90
Table 10
Table 11
Table 12
Self-supplySelf-supply
Run-off, infiltration

Annexes
195
Annex: Terms and definitions
Terms and definitions used in the 2002 OECD/Eurostat Joint Questionnaire onInland WatersDefinition of categories of water sources(Fresh) surface waterWater which flows over, or rests on the surface of a land mass, natural watercourses such as rivers,streams, brooks, lakes, etc., as well as artificial watercourses such as irrigation, industrial and navigationcanals, drainage systems and artificial reservoirs. For purposes of the joint questionnaire, bank filtration isincluded under (fresh) surface water. Seawater and transitional waters, such as brackish swamps, lagoonsand estuarine areas are not considered (fresh) surface water and so are included under non-fresh watersources.
(Fresh) groundwaterFreshwater which is being held in, and can usually be recovered from, or via, an underground formation. Allpermanent and temporary deposits of water, both artificially charged and naturally, in the subsoil, of sufficientquality for at least seasonal use. This category includes phreatic water-bearing strata, as well as deep strataunder pressure or not, contained in porous or fracture soils. For purposes of the joint questionnaire,groundwater includes springs, both concentrated and diffused, which may be sub-aqueous.
Non-fresh water sourcesIncludes seawater and transitional water, such as brackish swamps, lagoons and estuarine areas. Suchwater resources may be of great importance locally, although in a national context, they are usually of lesserimportance as compared to surface and groundwater resources.
Definitions of flows within the economy or between economy and environmentWater gross abstraction (or withdrawal)Water removed from any source, either permanently or temporarily. Mine water and drainage water areincluded. Water abstractions from groundwater resources in any given time period are defined as thedifference between the total amount of water withdrawn from aquifers and the total amount chargedartificially or injected into aquifers. Water abstractions from precipitation (e.g. rain water collected for use)should be included under abstractions from surface water. The amounts of water artificially charged orinjected are attributed to abstractions from that water resource from which they were originally withdrawn.Water used for hydroelectricity generation is an in-situ use and should be excluded.
Returned waterWater abstracted from any fresh water source and discharged into fresh waters without use, or before use.Occurs primarily during mining, construction activities. Discharges to the sea are excluded.
Supply of waterDelivery of water to final users including abstraction for own final use (self-supply).
Self-supplyAbstraction of water by the user for own final use.
Re-used waterWater that has undergone wastewater treatment and is delivered to a user as reclaimed wastewater. Thismeans the direct supply of treated effluent to the user. Excluded is wastewater discharged into awatercourse and used again downstream. Recycling within industrial sites is excluded.
Water lossesVolume of water lost during transport (through leakage or evaporation) between a point of abstraction and apoint of use, or between points of use and reuse.
Consumptive water useWater abstracted which is no longer available for use because it has evaporated, transpired, beenincorporated into products and crops, or consumed by man or livestock. Water losses due to leakages duringthe transport of water between the point or points of abstraction and the point or points of use are excluded.

Annexes
196
Total water consumptionWater abstracted which is no longer available for use because it has evaporated, transpired, beenincorporated into products and crops, consumed by man or livestock, ejected directly to the sea, or otherwiseremoved from fresh water resources. Water losses due to leakages during the transport of water betweenthe point or points of abstraction and the point or points of use are excluded. For the purpose of the JointQuestionnaire, total water consumption equals consumptive water use plus discharges to the sea.
WastewaterWater which is of no further immediate value to the purpose for which it was used or in the pursuit of which itwas produced because of its quality, quantity or time of occurrence. However, wastewater from one user canbe a potential supply to a user elsewhere. Cooling water is not considered to be wastewater for the purposeof the Joint Questionnaire.
Water useRefers to water that is actually used by end users for a specific purpose within a territory, such as fordomestic use, irrigation or industrial processing. Excludes returned water.
Irrigation useArtificial application of water on lands to assist in the growing of crops and pastures.
Irrigation waterWater which is applied to soils in order to increase their moisture content and to provide for normal plantgrowth. For purposes of the Joint Questionnaire, data reported under this item fit in NACE/ISIC division 01.
Cooling waterWater which is used to absorb and remove heat. In this questionnaire cooling water is broken down intocooling water used in the generation of electricity in power stations, and cooling water used in other industrialprocesses.
Discharge of used waterWater discharged into fresh waters after use (with or without treatment) so that it becomes available againfor abstraction. Discharges to the sea are excluded.
Wastewater generateda) the quantity of water in cubic meters that has been polluted during use by adding waste.b) the substances (pollution in kg BOD/day or comparable) that have been added to the wastewater.The origin can be domestic use (used water from bathing, toilets, cooking, etc.) or industrial use.
Definitions of pollutantsBOD = Biological oxygen demand (mass concentration of dissolved oxygen consumed under specificconditions by the biological oxidisation of organic and/or inorganic matter in water)
COD = Chemical oxygen demand (mass concentration of oxygen consumed under specific conditions by thechemical oxidisation with bichromate of organic and/ or inorganic matter in water)
Definitions of types of treatmentPrimary treatmentTreatment of (urban) wastewater by a physical and/or chemical process involving settlement of suspendedsolids, or other process in which the BOD5 of the incoming wastewater is reduced by at least 20% beforedischarge and the total suspended solids of the incoming wastewater are reduced by at least 50%.
Secondary treatmentTreatment of (urban) wastewater by a process generally involving biological treatment with a secondarysettlement or other process, resulting in a BOD removal of at least 70% and a COD removal of at least 75%.
Tertiary treatmentTreatment (additional to secondary treatment) of nitrogen and/or phosphorous and/or any other pollutantaffecting the quality or a specific use of water: microbiological pollution, colour etc. Treatment efficiencies:organic pollution removal of at least 95% for BOD, or 85% for COD, or nitrogen removal of at least 70%, or

Annexes
197
phosphorus removal of at least 80%, or microbiological removal to achieve faecal coliform counts of< 1000/100 ml.
National accounts terms (ESA 1995)Institutional unitsNon-financial corporations: this sector consists of institutional units whose distributive and financialtransactions are distinct from those of their owners and which are market producers, whose principal activityis the production of goods and non-financial services.
General government: this sector includes all institutional units which are non-market producers whoseoutput is intended for individual and collective consumption, and mainly financed by compulsory paymentsmade by the units belonging to other sectors, and/or institutional units principally engaged in theredistribution of national income and wealth.
Households: this sector covers individuals or groups of individuals as consumers and possibly also asentrepreneurs producing market goods and non-financial and financial services (market producers) providedthat, in the latter case, the corresponding activities are not those of separate entities treated as quasi-corporations. It also includes individuals or groups of individuals as producers of goods and non-financialservices for exclusively own final use.
NPISHs: Non-profit institutions serving households consist of non-profit institutions which are separate legalentities, serve households and are private other non-market producers. Their principal resources are derivedfrom voluntary contributions in cash or in kind from households in their capacity of consumers, frompayments made by general governments and from property income.
ActivitiesThe principal (or main) activity: is the activity whose value added exceeds that of any other activity carriedout within the same unit. The classification of the principal activity is determined by reference to NACE, firstat the highest level of the classification and then at more detailed levels. A secondary activity is an activitycarried out in addition to the principal activity. The output of a secondary activity is a secondary product. Theoutput of an ancillary activity is not intended for use outside the enterprise. An ancillary activity is asupporting activity undertaken within an enterprise in order to create the conditions within which the principalor secondary activities can be carried out.
Economic transactionsOutput: consists of the products created during the accounting period. Market output consists of output thatis disposed of on the market or intended to be disposed of on the market.
Basic price: is the price receivable by the producers from the purchaser for a unit of a good or serviceproduced as output minus any tax payable plus any subsidy receivable on that unit as a consequence of itsproduction or sale. It excludes any transport charges invoiced separately by the producer. It includes anytransport margins charged by the producer on the same invoice, even when they are included as a separateitem on the invoice.
Intermediate consumption: consists of the value of goods and services consumed as inputs by a processof production, excluding fixed assets whose consumption is recorded as consumption of fixed capital. Thegoods and services may be either transformed or used up by the production process.
Final consumption expenditure: consists of expenditure incurred by resident institutional units on goods orservices that are used for the direct satisfaction of individual needs or wants or the collective needs ofmembers of the community. Final consumption expenditure may take place on the domestic territory orabroad.
Actual final consumption: consists of the goods or services that are acquired by resident institutional unitsfor the direct satisfaction of human needs, whether individual or collective.

Annexes
198
Goods and services for individual consumption: (’individual goods and services’) are acquired by ahousehold and used to satisfy the needs and wants of members of that household. Individual goods andservices have the following characteristics:
a) It must be possible to observe and record the acquisition of the good or services by anindividual household or member thereof and also the time at which it took place;b) the household must have agreed to the provision of the good or service and take whateveraction is necessary to make it possible, for example by attending a school or clinic;c) the good or service must be such that its acquisition by one household or person, or possiblyby a small, restricted group of persons, precludes its acquisition by other households or persons.
Services for collective consumption: (’collective services’) are provided simultaneously to all members ofthe community or all members of a particular section of the community, such as all households living in aparticular region. Collective services have the following characteristics:
a) they can be delivered simultaneously to every member of the community or to particularsections of the community, such as those in a particular region or locality;b) the use of such services is usually passive and does not require the explicit agreement oractive participation of all the individuals concerned;c) the provision of a collective service to one individual does not reduce the amount available toother in the same community or section of the community. There is no rivalry in acquisition.
Compensation of employees: is defined as the total remuneration, in cash or in kind, payable by anemployer to an employee in return for work done by the latter during the accounting period.
Consumption of fixed capital: represents the amount of fixed assets used up, during the period underconsideration, as a result of normal wear and tear and foreseeable obsolescence, including a provision forlosses of fixed assets as a result of accidental damage which can be insured against.
Gross capital formation: consists of resident producers’ acquisitions, less disposals, of fixed assets duringa given period plus certain additions to the value of non-produced assets realised by the productive activityof producer or institutional units. Fixed assets are tangible or intangible assets produced as outputs fromprocesses of production that are themselves used repeatedly or continuously, in processes of production formore than one year.
Investment grants: consist of capital transfers in cash or in kind made by governments or by the rest of theworld to other resident or non-resident institutional units to finance all or part of the costs of their acquiringfixed assets.
Revision of the NACENACE (Rev.1) 90 (sewage and refuse disposal services, sanitation and similar services) comprised only oneclass, and it was only at the level of the products (CPA 90.00.11 ‘Sewage removal and treatment services’and CPA 90.00.12 ‘treatment services of cesspools and septic tanks’) that it was possible to isolate water-related activities.
NACE Rev.1.1 will introduce classes within this group 90 and in particular:
New NACE class 90.01 ‘Collection and treatment of sewage’ includes:• collecting and transporting of human wastewater from one or several users, as well as rain water by
means of sewerage networks, collectors, tanks and other means of transport (sewage vehicles etc.) andtheir treatment and disposal
• treatment of wastewater by means of physical, chemical and biological processes like dilution,screening, filtering, sedimentation, etc.
• maintenance and cleaning of sewers and drains• emptying and cleaning of cesspools and septic tanks, sinks and pits from sewage, servicing of chemical
toilets• treatment of wastewater from swimming pools and from industry
It excludes:• construction of sewer systems (see 45.21)

Annexes
199
• clearing, de-blocking of sewers (45.33)• treatment of polluted ground or surface water in combination with cleaning up of environmental pollution
(see 90.03).
Revision of the COFOGThe new 1998 version introduced a specific class (05) for environmental protection with the sub-class 05.2.0Wastewater management, including:• administration, supervision, inspection, operation or support of sewage systems and wastewater
treatment;• grants, loans or subsidies to support the operation, construction, maintenance or upgrading of such
systems.Water supply (06.3.0) is now part of class 06 ‘housing and community amenities’. It includes:• administration of water supply affairs; assessment of future needs and determination of availability in
terms of such assessment; supervision and regulation of all facets of potable water supply includingwater purity, price and quantity controls;
• construction or operation of non-enterprise-type of water supply systems;• production and dissemination of general information, technical documentation and statistics on water
supply affairs and services;• grants, loans or subsidies to support the operation, construction, maintenance or upgrading of water
supply systems.It excludes:• irrigation systems (classified in 04.2.1);• multipurpose projects (04.7.4);• collection and treatment of wastewater (05.2.0).

Annexes
200
Scheme A-1 Scheme illustrating the main flows of water recorded in the water accounts tables(References in brackets refer to column numbers of tables 5 to 9)
Imports ofwater
(Table 5)
Leaks in distributionnetwork
(R2)
Evaporationfrom
distributionnetwork
(C3)
Exportsof water(Table 6)
Abstraction from non-fresh sources for use
(A12)
Changes in economicstocks of water
(Table 6, C4, C5)
Re-usedwastewater
(PS7)
Desalinated water(PS6)
Returns of wastewaterto fresh sources
((R4-R5) + (R6-R7))
Returns of non-fresh water to
non-freshsources(R13)
Abstraction from freshsources for use
(A8)Returns ofirrigation
water(R3)
Returnsof freshcoolingwater to
non-fresh
sources(R9)
Non-fresh water sources
Freshwater sources
Evaporationof freshwater
from otheruses
(part of C6)
Returnsof waste-water to
non-freshsources(R5+R7)
Evaporation ofnon-fresh waterfrom economic
uses(not in Tables)
Abstractionstep
Returns after usestep
Supply/usestep
Netinfiltrationin sewagenetwork(A10)
Returns offresh
coolingwater to
freshsources(R8-R9)
Self supplyof non-fresh
water(A12-PS6)
Selfsupply of
freshwater(A6)
Returns of wastewaterby sewage network
(R4)
Individual returns ofwastewater (R6)
Economicsupply of
distributedwater(PS5)
Intra-sectoralsales of water
(Table 6)
Own useby water
distributors(A3-PS4)
Abstraction fromfresh sources notfor use (A9+A10)
Returns ofunused water
(R1)
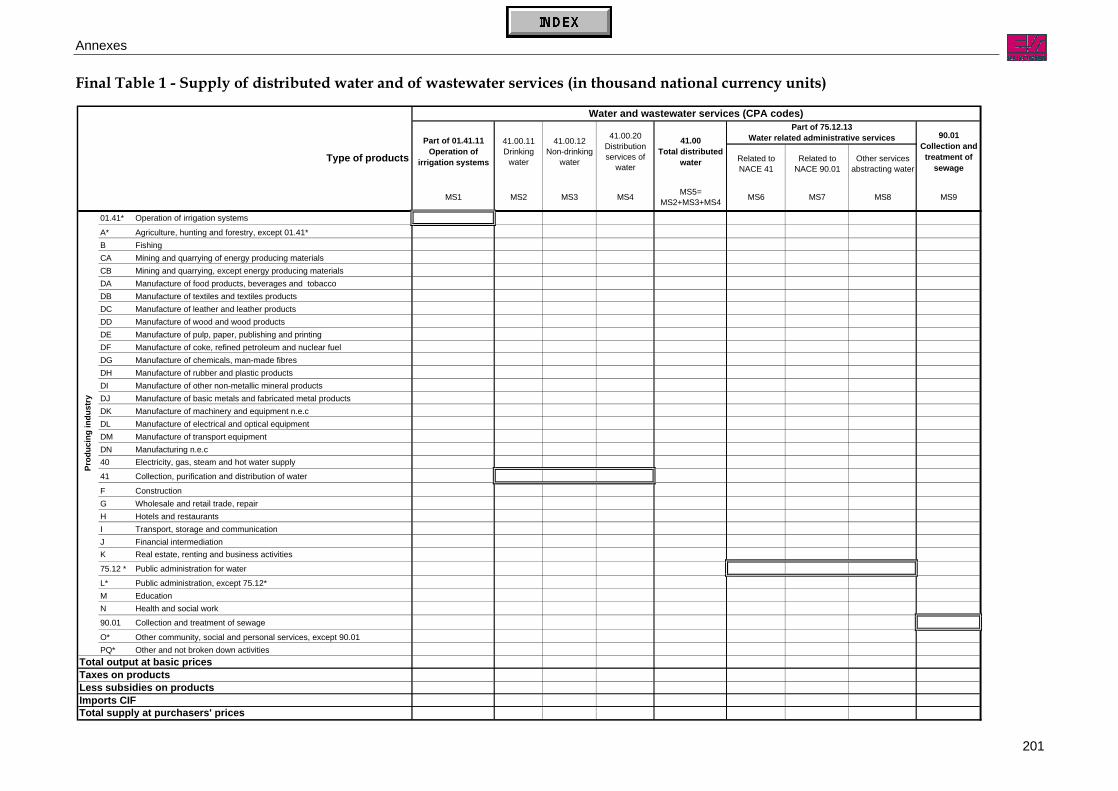
Annexes
201
Final Table 1 - Supply of distributed water and of wastewater services (in thousand national currency units)
Related to NACE 41
Related to NACE 90.01
Other services abstracting water
MS1 MS2 MS3 MS4 MS5=MS2+MS3+MS4 MS6 MS7 MS8 MS9
01.41* Operation of irrigation systems
A* Agriculture, hunting and forestry, except 01.41*B FishingCA Mining and quarrying of energy producing materialsCB Mining and quarrying, except energy producing materialsDA Manufacture of food products, beverages and tobaccoDB Manufacture of textiles and textiles productsDC Manufacture of leather and leather productsDD Manufacture of wood and wood productsDE Manufacture of pulp, paper, publishing and printingDF Manufacture of coke, refined petroleum and nuclear fuelDG Manufacture of chemicals, man-made fibresDH Manufacture of rubber and plastic productsDI Manufacture of other non-metallic mineral productsDJ Manufacture of basic metals and fabricated metal productsDK Manufacture of machinery and equipment n.e.cDL Manufacture of electrical and optical equipmentDM Manufacture of transport equipmentDN Manufacturing n.e.c40 Electricity, gas, steam and hot water supply
41 Collection, purification and distribution of water
F ConstructionG Wholesale and retail trade, repairH Hotels and restaurantsI Transport, storage and communicationJ Financial intermediationK Real estate, renting and business activities
75.12 * Public administration for water
L* Public administration, except 75.12*M EducationN Health and social work
90.01 Collection and treatment of sewage
O* Other community, social and personal services, except 90.01PQ* Other and not broken down activities
Total output at basic pricesTaxes on productsLess subsidies on productsImports CIFTotal supply at purchasers' prices
Type of products
90.01Collection and
treatment of sewage
Part of 75.12.13 Water related administrative services
Prod
ucin
g in
dust
ry
Part of 01.41.11 Operation of
irrigation systems
41.00.11 Drinking
water
41.00.12Non-drinking
water
41.00.20 Distribution services of
water
41.00Total distributed
water
Water and wastewater services (CPA codes)

Annexes
202
Final Table 2 - Uses of distributed water and of wastewater services (in thousand national currency units)
TotalOf which:
desalinated water
Of which: wastewater re-
used
PS1 PS2 PS3 PS4=PS2+PS3
PS5=PS1+PS4 PS6 PS7 PS8
01.41* Operation of irrigation systems
A* Agriculture, hunting and forestry, except 01.41*B FishingCA Mining and quarrying of energy producing materialsCB Mining and quarrying, except energy producing materialsDA Manufacture of food products, beverages and tobaccoDB Manufacture of textiles and textiles productsDC Manufacture of leather and leather productsDD Manufacture of wood and wood productsDE Manufacture of pulp, paper, publishing and printingDF Manufacture of coke, refined petroleum and nuclear fuelDG Manufacture of chemicals, man-made fibresDH Manufacture of rubber and plastic productsDI Manufacture of other non-metallic mineral productsDJ Manufacture of basic metals and fabricated metal productsDK Manufacture of machinery and equipment n.e.cDL Manufacture of electrical and optical equipmentDM Manufacture of transport equipmentDN Manufacturing n.e.c40 Electricity, gas, steam and hot water supply
41 Collection, purification and distribution of water
F ConstructionG Wholesale and retail trade, repairH Hotels and restaurantsI Transport, storage and communicationJ Financial intermediationK Real estate, renting and business activities75.12 * Public administration for waterL* Public administration, except 75.12*M EducationN Health and social work
90.01 Collection and treatment of sewage
O* Other community, social and personal services, except 90.01PQ* Other and not broken down activities
Total outputImportsTotal supply
Wastewater collected by
sewage networks
Prod
ucin
g in
dust
ry
Irrigation water
delivered
Total water deliveredDrinking
water delivered
Non-drinking water
delivered
Total drinking +
non-drinking water
Type of water

Annexes
203
Final Table 3 - Economic accounts for water distribution and wastewater collection industries (in thousand national currency units)
Related to NACE 41
Related to NACE 90.01
Other services abstracting water
Corporations General government Corporations General
governmentGeneral
governmentGeneral
governmentGeneral
government Corporations General government
Production and generation of income accounts1 Total intermediate consumption2 Total value added, gross
2.1 Compensation of employees2.2 Other taxes on production2.3 Less other subsidies on production2.4 Consumption of fixed capital2.5 Net operating surplus
3 Total output at basic prices3.1 Market water-related output3.2 Non-market water-related output3.3 Non-water-related output
Fixed capital4 Investment grants received5 Gross fixed capital formation6 Closing stocks of fixed assets
Labour inputs7 Total hours worked
Collection and treatment of sewage
(NACE 90.01)
Water related administrative services(part of NACE 75.12)
Type of institutional unit
Type of activityOperation of irrigation
systems(part of NACE 01.41)
Collection, purification and distribution of water
(NACE 41)

Annexes
204
Final Table 4 - Expenditure for self-supply of water and of wastewater treatment (in thousand national currency units)Self-supply of water Self-supply of wastewater collection and treatment
Current expenditure Current expenditureInter-
mediateconsump-
tion
Compen-sation of
employees
Taxesrelated to
self-supply of
water
Lesssubsidiesrelated to
self-supply of
water
Consump-tion offixed
capital
Capitalexpendi-
ture
Closingstock of
fixedassets
Labourinputs in
totalhours
worked
Inter-mediate
consump-tion
Compen-sation of
employees
Taxesrelated to
self-supply oftreatment
andremoval
Lesssubsidiesrelated to
self-supply oftreatment
andremoval
Consump-tion offixed
capital
Capitalexpendi-
ture
Closingstock of
fixedassets
Labourinputs in
totalhours
worked
01.41* Operation of irrigation systems
A* Agriculture, hunting and forestry, except 01.41*B FishingCA Mining and quarrying of energy producing materialsCB Mining and quarrying, except energy producing materialsDA Manufacture of food products, beverages and tobaccoDB Manufacture of textiles and textiles productsDC Manufacture of leather and leather productsDD Manufacture of wood and wood productsDE Manufacture of pulp, paper, publishing and printingDF Manufacture of coke, refined petroleum and nuclear fuelDG Manufacture of chemicals, man-made fibresDH Manufacture of rubber and plastic productsDI Manufacture of other non-metallic mineral productsDJ Manufacture of basic metals and fabricated metal productsDK Manufacture of machinery and equipment n.e.c.DL Manufacture of electrical and optical equipmentDM Manufacture of transport equipmentDN Manufacturing n.e.c.40 Electricity, gas, steam and hot water supply
41 Collection, purification and distribution of water
F Construction
G Wholesale and retail trade, repairH Hotels and restaurantsI Transport, storage and communicationJ Financial intermediationK Real estate, renting and business activities75.12 * Public administration for waterL* Public administration, except 75.12*M EducationN Health and social work90.01 Collection and treatment of sewageO* Other community, social and personal services, except 90.01
Self-
supp
lyin
g in
dust
ry
PQ* Other and not broken down activitiesTotal industriesHouseholds for their own consumption
Total industries

Annexes
205
Final Table 5 - Physical flows of water corresponding to economic supply recorded in Table 1 (in thousand m3)
TotalOf which:
desalinated water
Of which: wastewater re-
used
PS1 PS2 PS3 PS4=PS2+PS3
PS5=PS1+PS4 PS6 PS7 PS8
01.41* Operation of irrigation systems
A* Agriculture, hunting and forestry, except 01.41*B FishingCA Mining and quarrying of energy producing materialsCB Mining and quarrying, except energy producing materialsDA Manufacture of food products, beverages and tobaccoDB Manufacture of textiles and textiles productsDC Manufacture of leather and leather productsDD Manufacture of wood and wood productsDE Manufacture of pulp, paper, publishing and printingDF Manufacture of coke, refined petroleum and nuclear fuelDG Manufacture of chemicals, man-made fibresDH Manufacture of rubber and plastic productsDI Manufacture of other non-metallic mineral productsDJ Manufacture of basic metals and fabricated metal productsDK Manufacture of machinery and equipment n.e.cDL Manufacture of electrical and optical equipmentDM Manufacture of transport equipmentDN Manufacturing n.e.c40 Electricity, gas, steam and hot water supply
41 Collection, purification and distribution of water
F ConstructionG Wholesale and retail trade, repairH Hotels and restaurantsI Transport, storage and communicationJ Financial intermediationK Real estate, renting and business activities75.12 * Public administration for waterL* Public administration, except 75.12*M EducationN Health and social work
90.01 Collection and treatment of sewage
O* Other community, social and personal services, except 90.01PQ* Other and not broken down activities
Total outputImportsTotal supply
Wastewater collected by
sewage networks
Prod
ucin
g in
dust
ry
Irrigation water
delivered
Total water deliveredDrinking
water delivered
Non-drinking water
delivered
Total drinking +
non-drinking water
Type of water

Annexes
206
Final Table 6 - Physical flows of water corresponding to economic uses recorded in Table 2 (in thousand m3)
Irrigation water received
Drinking water
received
Non-drinking water received
Total drinking + non-drinking
water received
Total water received
Wastewater discharged to
sewage networks
PU1 PU2 PU3 PU4=PU2+PU3
PU5=PU1+PU4 PU6
01.41* Operation of irrigation systems
A* Agriculture, hunting and forestry, except 01.41*
B FishingCA Mining and quarrying of energy producing materialsCB Mining and quarrying, except energy producing materialsDA Manufacture of food products, beverages and tobaccoDB Manufacture of textiles and textiles productsDC Manufacture of leather and leather productsDD Manufacture of wood and wood productsDE Manufacture of pulp, paper, publishing and printingDF Manufacture of coke, refined petroleum and nuclear fuelDG Manufacture of chemicals, man-made fibresDH Manufacture of rubber and plastic productsDI Manufacture of other non-metallic mineral productsDJ Manufacture of basic metals and fabricated metal productsDK Manufacture of machinery and equipment n.e.cDL Manufacture of electrical and optical equipmentDM Manufacture of transport equipmentDN Manufacturing n.e.c40 Electricity, gas, steam and hot water supply
41 Collection, purification and distribution of waterIntra-sectoral
salesF ConstructionG Wholesale and retail trade, repairH Hotels and restaurantsI Transport, storage and communicationJ Financial intermediationK Real estate, renting and business activities75.12 * Public administration for waterL* Public administration, except 75.12*M EducationN Health and social work
90.01 Collection and treatment of sewage
O* Other community, social and personal services, except 90.01PQ* Other and not broken down activities
Total intermediate consumption of industriesFinal consumption
by governmentby households
Change in inventoriesExportsTotal uses
Con
sum
ing
indu
stry
Type of water

Annexes
207
Final Table 7 - Abstraction of water (in thousand m3)
A1 A2 A3 A4 A5 A6 A7 A8=A3+A6 A9 A10 A11=A8+A9+A10 A12 A13 A14=A11+A12
01.41* Operation of irrigation systems
A* Agriculture, hunting and forestry, except 01.41*Of which: for irrigation
B Fishing
CA Mining and quarrying of energy producing materialsCB Mining and quarrying, except energy producing materials
DA Manufacture of food products, beverages and tobaccoDB Manufacture of textiles and textiles productsDC Manufacture of leather and leather productsDD Manufacture of wood and wood productsDE Manufacture of pulp, paper, publishing and printingDF Manufacture of coke, refined petroleum and nuclear fuelDG Manufacture of chemicals, man-made fibresDH Manufacture of rubber and plastic productsDI Manufacture of other non-metallic mineral productsDJ Manufacture of basic metals and fabricated metal productsDK Manufacture of machinery and equipment n.e.cDL Manufacture of electrical and optical equipmentDM Manufacture of transport equipmentDN Manufacturing n.e.c40 Electricity, gas, steam and hot water supply
41 Collection, purification and distribution of water
F Construction
G Wholesale and retail trade, repairH Hotels and restaurantsI Transport, storage and communicationJ Financial intermediationK Real estate, renting and business activities75.12 * Public administration for waterL* Public administration, except 75.12*M EducationN Health and social work
90.01 Collection and treatment of sewage
O* Other community, social and personal services, except 90.01PQ* Other and not broken down activities
Total industriesHouseholds (for final consumption)Total
Fresh surface water
Abstraction for self-supplyAbstraction for distribution
Fresh surface water
Fresh ground water
Total fresh water
Total freshwater abstraction
From non fresh-water sources
Rainwater & net infiltration into sewage
system
Fresh ground water
Total fresh-water
Abs
trac
ting
indu
stry
Total abstraction
Abstraction from freshwater sources
Type of abstractionOf which: for cooling
Of which: for cooling
Total non-freshwater
Abstraction not for use
Mine and drainage
water
Total freshwater
abstraction for use
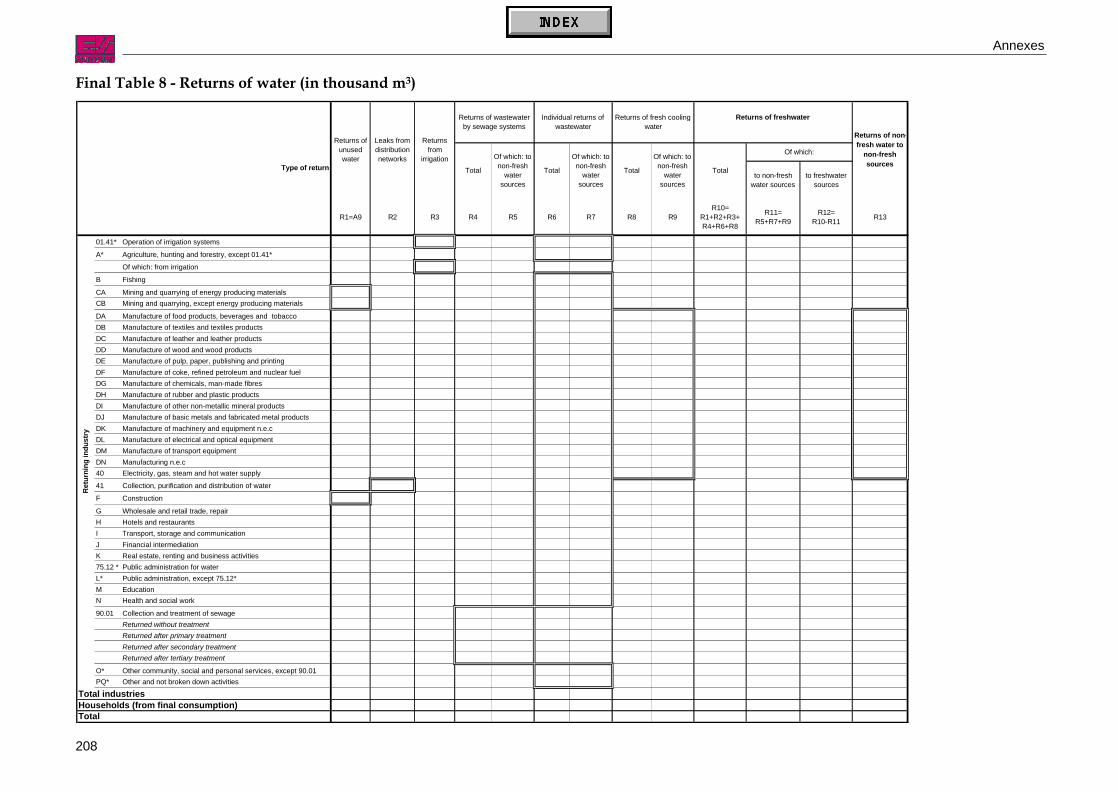
Annexes
208
Final Table 8 - Returns of water (in thousand m3)
to non-fresh water sources
to freshwater sources
R1=A9 R2 R3 R4 R5 R6 R7 R8 R9R10=
R1+R2+R3+R4+R6+R8
R11=R5+R7+R9
R12=R10-R11 R13
01.41* Operation of irrigation systems
A* Agriculture, hunting and forestry, except 01.41*
Of which: from irrigation
B Fishing
CA Mining and quarrying of energy producing materialsCB Mining and quarrying, except energy producing materials
DA Manufacture of food products, beverages and tobaccoDB Manufacture of textiles and textiles productsDC Manufacture of leather and leather productsDD Manufacture of wood and wood productsDE Manufacture of pulp, paper, publishing and printingDF Manufacture of coke, refined petroleum and nuclear fuelDG Manufacture of chemicals, man-made fibresDH Manufacture of rubber and plastic productsDI Manufacture of other non-metallic mineral productsDJ Manufacture of basic metals and fabricated metal productsDK Manufacture of machinery and equipment n.e.cDL Manufacture of electrical and optical equipmentDM Manufacture of transport equipmentDN Manufacturing n.e.c40 Electricity, gas, steam and hot water supply
41 Collection, purification and distribution of water
F Construction
G Wholesale and retail trade, repairH Hotels and restaurantsI Transport, storage and communicationJ Financial intermediationK Real estate, renting and business activities75.12 * Public administration for waterL* Public administration, except 75.12*M EducationN Health and social work
90.01 Collection and treatment of sewageReturned without treatmentReturned after primary treatmentReturned after secondary treatmentReturned after tertiary treatment
O* Other community, social and personal services, except 90.01PQ* Other and not broken down activities
Total industriesHouseholds (from final consumption)Total
Returns of non-fresh water to
non-fresh sources
Returns of freshwaterIndividual returns of wastewater
Returns of fresh cooling water
Total Total
Of which: to non-fresh
water sources
Of which:
Ret
urni
ng in
dust
ry
Of which: to non-fresh
water sources
TotalType of returnOf which: to non-fresh
water sources
Returns of unused water
Leaks from distribution networks
Returns of wastewater by sewage systems
Returns from
irrigationTotal

Annexes
209
Final Table 9 - Freshwater balance (in thousand m3)
(+)Water
received
(-)Water
delivered
(-)Wastewater
discharged to sewage system
(+)Wastewater collected by
sewage system
Evaporation from
distribution networks
Water incorporated in products
Water removed
from products
Others(including
other evaporation
of freshwater)
=A11 =PU5 =PS5 =PU6 =PS6 =R12 C1 =R11 C2 C3 C4 C5C6=
C2-C3-C4+C5
01.41* Operation of irrigation systemsA* Agriculture, hunting and forestry, except 01.41*
Of which: irrigation water
B FishingCA Mining and quarrying of energy producing materialsCB Mining and quarrying, except energy producing materials
DA Manufacture of food products, beverages and tobacco
DB Manufacture of textiles and textiles productsDC Manufacture of leather and leather productsDD Manufacture of wood and wood productsDE Manufacture of pulp, paper, publishing and printingDF Manufacture of coke, refined petroleum and nuclear fuelDG Manufacture of chemicals, man-made fibresDH Manufacture of rubber and plastic productsDI Manufacture of other non-metallic mineral productsDJ Manufacture of basic metals and fabricated metal productsDK Manufacture of machinery and equipment n.e.cDL Manufacture of electrical and optical equipmentDM Manufacture of transport equipmentDN Manufacturing n.e.c40 Electricity, gas, steam and hot water supply
41 Collection, purification and distribution of water
F Construction
G Wholesale and retail trade, repairH Hotels and restaurantsI Transport, storage and communicationJ Financial intermediationK Real estate, renting and business activities75.12 * Public administration for waterL* Public administration, except 75.12*M EducationN Health and social work90.01 Collection and treatment of sewageO* Other community, social and personal services, except 90.01PQ* Other and not broken down activities
Total industriesHouseholds (final consumption)Change in inventoriesRest of the WorldTotal
(=)Consumptive
water uses
Of which:
Indu
stry
(-)Returns of
freshwater to non-fresh
water sources
(=)Physical
consumption of freshwater
Total freshwater abstraction
(-)Total
returns of freshwater
to fresh sources
Balance of economic flows
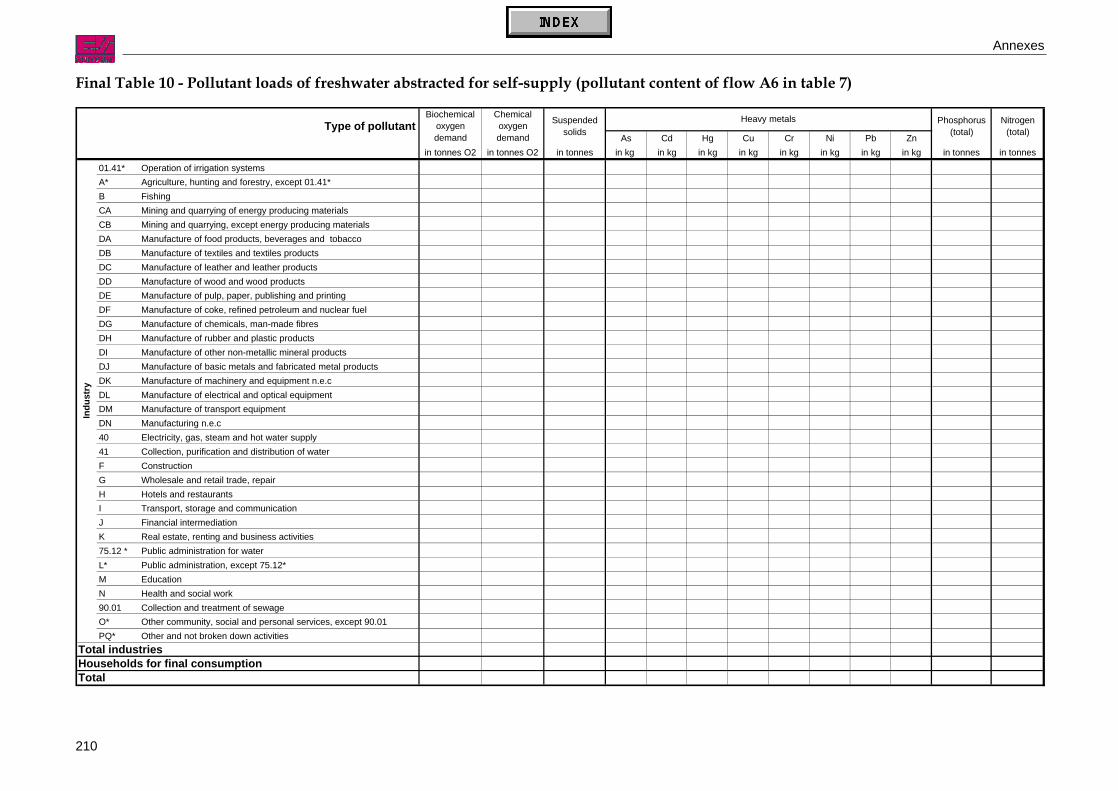
Annexes
210
Final Table 10 - Pollutant loads of freshwater abstracted for self-supply (pollutant content of flow A6 in table 7)
As Cd Hg Cu Cr Ni Pb Znin tonnes O2 in tonnes O2 in tonnes in kg in kg in kg in kg in kg in kg in kg in kg in tonnes in tonnes
01.41* Operation of irrigation systemsA* Agriculture, hunting and forestry, except 01.41*B FishingCA Mining and quarrying of energy producing materialsCB Mining and quarrying, except energy producing materialsDA Manufacture of food products, beverages and tobaccoDB Manufacture of textiles and textiles productsDC Manufacture of leather and leather productsDD Manufacture of wood and wood productsDE Manufacture of pulp, paper, publishing and printingDF Manufacture of coke, refined petroleum and nuclear fuelDG Manufacture of chemicals, man-made fibresDH Manufacture of rubber and plastic productsDI Manufacture of other non-metallic mineral productsDJ Manufacture of basic metals and fabricated metal productsDK Manufacture of machinery and equipment n.e.cDL Manufacture of electrical and optical equipmentDM Manufacture of transport equipmentDN Manufacturing n.e.c40 Electricity, gas, steam and hot water supply41 Collection, purification and distribution of waterF ConstructionG Wholesale and retail trade, repairH Hotels and restaurantsI Transport, storage and communicationJ Financial intermediationK Real estate, renting and business activities75.12 * Public administration for waterL* Public administration, except 75.12*M EducationN Health and social work90.01 Collection and treatment of sewageO* Other community, social and personal services, except 90.01PQ* Other and not broken down activities
Total industriesHouseholds for final consumptionTotal
Indu
stry
Phosphorus (total)
Nitrogen (total)Type of pollutant
Biochemical oxygen demand
Chemical oxygen demand
Suspended solids
Heavy metals
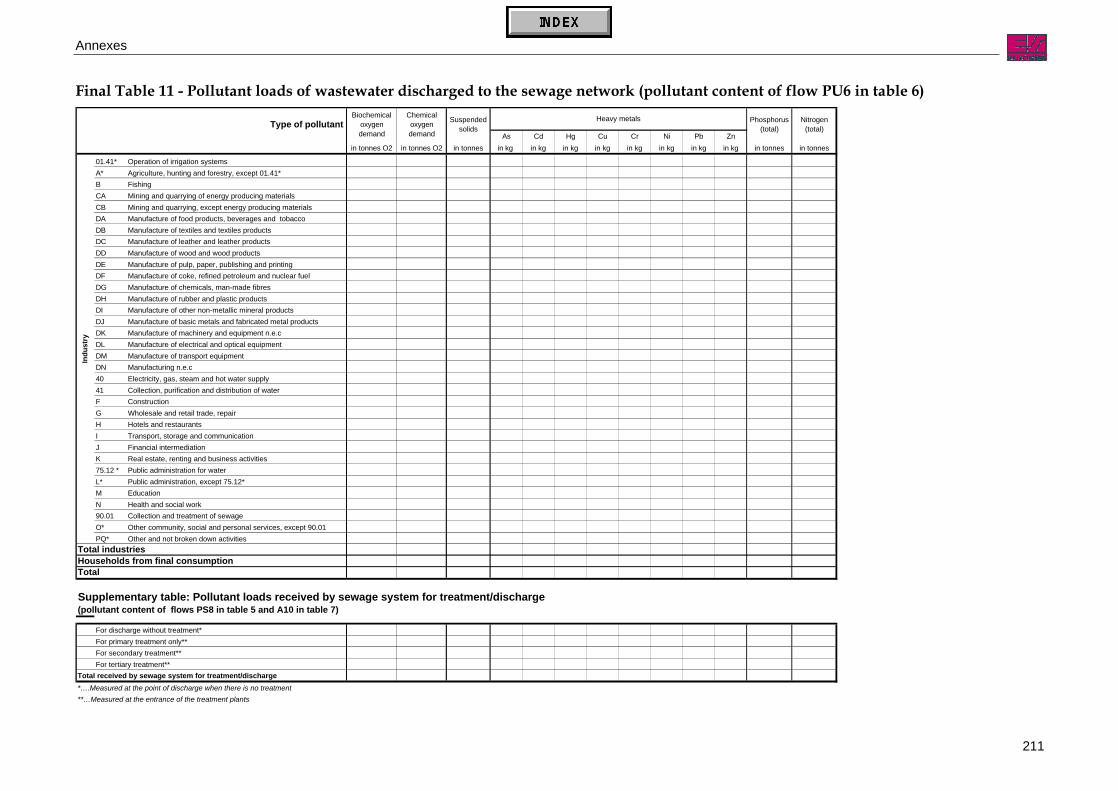
Annexes
211
Final Table 11 - Pollutant loads of wastewater discharged to the sewage network (pollutant content of flow PU6 in table 6)
As Cd Hg Cu Cr Ni Pb Znin tonnes O2 in tonnes O2 in tonnes in kg in kg in kg in kg in kg in kg in kg in kg in tonnes in tonnes
01.41* Operation of irrigation systemsA* Agriculture, hunting and forestry, except 01.41*B FishingCA Mining and quarrying of energy producing materialsCB Mining and quarrying, except energy producing materialsDA Manufacture of food products, beverages and tobaccoDB Manufacture of textiles and textiles productsDC Manufacture of leather and leather productsDD Manufacture of wood and wood productsDE Manufacture of pulp, paper, publishing and printingDF Manufacture of coke, refined petroleum and nuclear fuelDG Manufacture of chemicals, man-made fibresDH Manufacture of rubber and plastic productsDI Manufacture of other non-metallic mineral productsDJ Manufacture of basic metals and fabricated metal productsDK Manufacture of machinery and equipment n.e.cDL Manufacture of electrical and optical equipmentDM Manufacture of transport equipmentDN Manufacturing n.e.c40 Electricity, gas, steam and hot water supply41 Collection, purification and distribution of waterF ConstructionG Wholesale and retail trade, repairH Hotels and restaurantsI Transport, storage and communicationJ Financial intermediationK Real estate, renting and business activities75.12 * Public administration for waterL* Public administration, except 75.12*M EducationN Health and social work90.01 Collection and treatment of sewageO* Other community, social and personal services, except 90.01PQ* Other and not broken down activities
Total industriesHouseholds from final consumptionTotal
Supplementary table: Pollutant loads received by sewage system for treatment/discharge (pollutant content of flows PS8 in table 5 and A10 in table 7)
For discharge without treatment*For primary treatment only**For secondary treatment**For tertiary treatment**
Total received by sewage system for treatment/discharge *….Measured at the point of discharge when there is no treatment**…Measured at the entrance of the treatment plants
Indu
stry
Type of pollutant Suspended solids
Phosphorus (total)
Nitrogen (total)
Biochemical oxygen demand
Chemical oxygen demand
Heavy metals

Annexes
212
Final Table 12 - Pollutant loads of cooling and wastewater returned to the environment (pollutant content of flows R4, R6 and R8 in Table
As Cd Hg Cu Cr Ni Pb Znin tonnes O2 in tonnes O2 in tonnes in kg in kg in kg in kg in kg in kg in kg in kg in tonnes in tonnes
01.41* Operation of irrigation systemsA* Agriculture, hunting and forestry, except 01.41*B FishingCA Mining and quarrying of energy producing materialsCB Mining and quarrying, except energy producing materialsDA Manufacture of food products, beverages and tobaccoDB Manufacture of textiles and textiles productsDC Manufacture of leather and leather productsDD Manufacture of wood and wood productsDE Manufacture of pulp, paper, publishing and printingDF Manufacture of coke, refined petroleum and nuclear fuelDG Manufacture of chemicals, man-made fibresDH Manufacture of rubber and plastic productsDI Manufacture of other non-metallic mineral productsDJ Manufacture of basic metals and fabricated metal productsDK Manufacture of machinery and equipment n.e.cDL Manufacture of electrical and optical equipmentDM Manufacture of transport equipmentDN Manufacturing n.e.c40 Electricity, gas, steam and hot water supply41 Collection, purification and distribution of waterF ConstructionG Wholesale and retail trade, repairH Hotels and restaurantsI Transport, storage and communicationJ Financial intermediationK Real estate, renting and business activities75.12 * Public administration for waterL* Public administration, except 75.12*M EducationN Health and social work90.01 Collection and treatment of sewage
Discharged without treatmentDischarged after primary treatmentDischarged after secondary treatmentDischarged after tertiary treatment
O* Other community, social and personal services, except 90.01PQ* Other and not broken down activities
Total industriesHouseholds from final consumptionTotal
For memory: Pollutant loads from other sources returned to non-fresh sources
Diffuse pollution from agriculture (non-point sources)Any other sources (please specify*)*…Could for example include pollutant loads in drainage water flows from agriculture or non-point pollution from run-off from roads not captured by sewage systems.
Indu
stry
Phosphorus (total)
Nitrogen (total)Type of pollutant
Biochemical oxygen demand
Chemical oxygen demand
Suspended solids
Heavy metals

Annexes
213
Final Table 13 - Pollutant loads of cooling and wastewater returned to non-fresh sources (flows R5, R7 and R9 in Final Table 8)
As Cd Hg Cu Cr Ni Pb Znin tonnes O2 in tonnes O2 in tonnes in kg in kg in kg in kg in kg in kg in kg in kg in tonnes in tonnes
01.41* Operation of irrigation systemsA* Agriculture, hunting and forestry, except 01.41*B FishingCA Mining and quarrying of energy producing materialsCB Mining and quarrying, except energy producing materialsDA Manufacture of food products, beverages and tobaccoDB Manufacture of textiles and textiles productsDC Manufacture of leather and leather productsDD Manufacture of wood and wood productsDE Manufacture of pulp, paper, publishing and printingDF Manufacture of coke, refined petroleum and nuclear fuelDG Manufacture of chemicals, man-made fibresDH Manufacture of rubber and plastic productsDI Manufacture of other non-metallic mineral productsDJ Manufacture of basic metals and fabricated metal productsDK Manufacture of machinery and equipment n.e.cDL Manufacture of electrical and optical equipmentDM Manufacture of transport equipmentDN Manufacturing n.e.c40 Electricity, gas, steam and hot water supply41 Collection, purification and distribution of waterF ConstructionG Wholesale and retail trade, repairH Hotels and restaurantsI Transport, storage and communicationJ Financial intermediationK Real estate, renting and business activities75.12 * Public administration for waterL* Public administration, except 75.12*M EducationN Health and social work90.01 Collection and treatment of sewage
Discharged without treatmentDischarged after primary treatmentDischarged after secondary treatmentDischarged after tertiary treatment
O* Other community, social and personal services, except 90.01PQ* Other and not broken down activities
Total industriesHouseholds from final consumptionTotal
For memory: Pollutant loads from other sources
Diffuse pollution from agriculture (non-point sources)Any other sources (please specify*)*…Could for example include pollutant loads in drainage water flows from agriculture or non-point pollution from run-off from roads not captured by sewage systems.
Type of pollutant Suspended solids
Indu
stry
Phosphorus (total)
Nitrogen (total)
Biochemical oxygen demand
Chemical oxygen demand
Heavy metals

Annexes
214
Annex 3: Water-relevant European directivesExtracts from the Water Framework DirectiveThe EU Water Framework Directive (WFD) was adopted by the European Parliament and the Council on23 October 2000. It entered into force at the time of its publication in the Official Journal of the EuropeanCommunities, on 22 December 2000 as Directive 2000/60/EC, ‘establishing a framework for Communityaction in the field of water policy’.
Two articles of the FWD (Articles 5 and 9) directly introduce economic elements:
“ …Article 5 – Characteristics of the river basin district, review of the environmental impact of human activity andeconomic analysis of water use
1. Each Member State shall ensure that for each river basin district or for the portion of an international riverbasin district falling within its territory:
− an analysis of its characteristics,− a review of the impact of human activity on the status of surface waters and on groundwater, and− an economic analysis of water use58
is undertaken according to the technical specifications set out in Annexes II and III and that it is completed,at the latest, four years after the date of entry into force of this Directive.
2. The analyses and reviews mentioned under paragraph 1 shall be reviewed, and if necessary updated, atthe latest, 13 years after the date of entry into force of this Directive and every six years thereafter… ”
“ …Article 9 – Recovery of costs for water services
1. Member States shall take account of the principle of recovery of the costs of water services, includingenvironmental and resource costs, having regard to the economic analysis conducted according to Annex III,and in accordance, in particular, with the polluter-pays principle.
Member States shall ensure by 2010:– that water-pricing policies provide adequate incentives for users to use water resources efficiently, andthereby contribute to the environmental objectives of this Directive,– an adequate contribution of the different water users, disaggregated into at least industry, households andagriculture, to the recovery of the costs of water services, based on the economic analysis conductedaccording to Annex III and taking account of the polluter pays principle.
Member States may in so doing have regard to the social, environmental and economic effects of therecovery as well as the geographic and climatic conditions of the region or regions affected…”
But, other references to economics are found elsewhere in the FWD text, in particular in all paragraphsrelated to measurement of pressures:
“ …Member States shall collect and maintain information on the type and magnitude of the significantanthropogenic pressures59 to which the surface water bodies in each river basin district are liable to besubject, in particular the following… ”
58 This economic analysis is further briefly developed in Annex III:‘The economic analysis shall contain enough information in sufficient detail (taking account of the costs associated with collection ofthe relevant data) in order to:(a) make the relevant calculations necessary for taking into account, under Article 9, the principle of recovery of the costs of waterservices, taking account of long term forecasts of supply and demand for water in the river basin district and, where necessary:– estimates of the volume, prices and costs associated with water services, and– estimates of relevant investment including forecasts of such investments;(b) make judgements about the most cost-effective combination of measures in respect of water uses to be included in theprogramme of measures under Article 11 based on estimates of the potential costs of such measures.’
59 The following are cited, in particular:1. estimation and identification of significant point and diffuse source pollution;2. estimation and identification of significant water abstraction for urban, industrial, agricultural and other uses, including
seasonal variations and total annual demand, and of loss of water in distribution systems;

Annexes
215
pressures which inevitably send back to the measurement of economic activities.
And, last but not least, exceptions to the achievement of the objectives of the WFD can be accepted foreconomic reasons: for example, Article 4 states that:
“ …5- Member States may aim to achieve less stringent environmental objectives than those requiredunder paragraph 1 for specific bodies of water when they are so affected by human activity, as determinedin accordance with Article 5(1), or their natural condition is such that the achievement of these objectiveswould be infeasible or disproportionately expensive, and all the following conditions are met:
(a) the environmental and socio-economic needs served by such human activity cannot be achieved byother means, which are a significantly better environmental option not entailing disproportionate costs;…”
List of other water-relevant directives1. Directives establishing emissions limit values and environmental quality standards:
− Directive 76/464/EEC on pollution caused by certain dangerous substances discharged into theaquatic environment of the Community and its daughter Directives• Mercury Discharges Directive (82/176/EEC)• Cadmium Discharges Directive (83/513/EEC)• Mercury Directive (84/156/EEC)• Hexachlorocyclohexane Discharges Directive (84/491/EEC)• Dangerous Substance Discharges Directive (86/280/EEC)
2. Other existing EU legislation on water quality
− Bathing Water Quality Directive (76/160/EEC)− Urban Wastewater Treatment Directive (98/15/EEC amending Council Directive 91/271/EEC)− IPPC Directive (96/61/EC – industrial wastewater treatment)− Nitrates Directive (91/676/EEC)− Drinking Water Directive (98/83/EC amending Directive 80/778/EEC)
3. Other EU legislation referred to in the WFD
− Birds' Directive (79/409/EEC)− Major Accidents Directive (96/82/EC – Seveso)− Environmental Impact Assessment Directive (85/337/EEC)− Sewage Sludge Directive (86/278/EEC)− Plant Protection Products Directive (91/414/EEC)− Habitats Directive (92/43/EEC)
3. estimation and identification of artificial recharge for groundwater;4. estimation and identification of the impact of significant water flow regulation, including water transfer and diversion, on overall
flow characteristics and water balances; and5. estimation of land use patterns, including identification of the main urban, industrial and agricultural areas and, where
relevant, fisheries and forests.

Annexes
216
Annex 4: NACE Rev. 1, 2-digits with further detail for water-related activitiesSection A Agriculture, hunting and forestry
01 Agriculture, hunting and related service activities01.4 Agricultural and animal husbandry service activities, except veterinary activities
01.41 Agricultural service activities01.5 Hunting, trapping and game propagation, including related service activities
02 Forestry, logging and related service activitiesSection B Fishing
05 Fishing, operation of fish hatcheries and fish farms; service activities incidental to fishing05.0 Fishing, operation of fish hatcheries and fish farms; service activities incidental to fishing
05.02 Operation of fish hatcheries and fish farmsSection C Mining and quarrying Subsection CA Mining and quarrying of energy producing materials
10 Mining of coal and lignite; extraction of peat11 Extraction of crude petroleum and natural gas; service activities incidental to oil and gas
extraction, excluding surveying12 Mining of uranium and thorium ores
Subsection CB Mining and quarrying, except of energy producing materials13 Mining of metal ores14 Other mining and quarrying
Section D Manufacturing Subsection DA Manufacture of food products, beverages and tobacco
15 Manufacture of food products and beverages15.9 Manufacture of beverages
15.98 Production of mineral waters and soft drinks16 Manufacture of tobacco products
Subsection DB Manufacture of textiles and textile products17 Manufacture of textiles18 Manufacture of wearing apparel; dressing and dyeing of fur
Subsection DC Manufacture of leather and leather products19 Tanning and dressing of leather; manufacture of luggage, handbags, saddlery, harness and
footwear Subsection DD Manufacture of wood and wood products
20 Manufacture of wood and of products of wood and cork, except furniture; manufacture ofarticles of straw and plaiting materials
Subsection DE Manufacture of pulp, paper and paper products; publishing and printing21 Manufacture of pulp, paper and paper products22 Publishing, printing and reproduction of recorded media
Subsection DF Manufacture of coke, refined petroleum products and nuclear fuel23 Manufacture of coke, refined petroleum products and nuclear fuel
Subsection DG Manufacture of chemicals, chemical products and man-made fibres24 Manufacture of chemicals and chemical products
Subsection DH Manufacture of rubber and plastic products25 Manufacture of rubber and plastic products
Subsection DI Manufacture of other non-metallic mineral products26 Manufacture of other non-metallic mineral products
Subsection DJ Manufacture of basic metals and fabricated metal products27 Manufacture of basic metals28 Manufacture of fabricated metal products, except machinery and equipment
Subsection DK Manufacture of machinery and equipment n.e.c.29 Manufacture of machinery and equipment n.e.c.
Subsection DL Manufacture of electrical and optical equipment30 Manufacture of office machinery and computers31 Manufacture of electrical machinery and apparatus n.e.c.32 Manufacture of radio, television and communication equipment and apparatus
Subsection DM Manufacture of transport equipment34 Manufacture of motor vehicles, trailers and semi-trailers

Annexes
217
35 Manufacture of other transport equipment Subsection DN Manufacturing n.e.c.
36 Manufacture of furniture; manufacturing n.e.c.37 Recycling
Section E Electricity, gas and water supply40 Electricity, gas, steam and hot water supply
40.3 Steam and hot water supply41 Collection, purification and distribution of water
41.0 Collection, purification and distribution of water41.00 Collection, purification and distribution of water
Section F Construction45 Construction
Section G Wholesale and retail trade; repair of motor vehicles, motorcycles and personal andhousehold goods
50 Sale, maintenance and repair of motor vehicles and motorcycles; retail sale of automotive fuel51 Wholesale trade and commission trade, except of motor vehicles and motorcycles52 Retail trade, except of motor vehicles and motorcycles; repair of personal and household goods
Section H Hotels and restaurants55 Hotels and restaurants
Section I Transport, storage and communication60 Land transport; transport via pipelines61 Water transport62 Air transport63 Supporting and auxiliary transport activities; activities of travel agencies64 Post and telecommunications
Section J Financial intermediation65 Financial intermediation, except insurance and pension funding66 Insurance and pension funding, except compulsory social security67 Activities auxiliary to financial intermediation
Section K Real estate, renting and business activities70 Real estate activities71 Renting of machinery and equipment without operator and of personal and household goods72 Computer and related activities73 Research and development74 Other business activities
Section L Public administration and defence; compulsory social security75 Public administration and defence; compulsory social security
Section M Education80 Education
Section N Health and social work85 Health and social work
Section O Other community, social and personal service activities90 Sewage and refuse disposal, sanitation and similar activities
90.0 Sewage and refuse disposal, sanitation and similar activities90.00 Sewage and refuse disposal, sanitation and similar activities
91 Activities of membership organizations n.e.c.92 Recreational, cultural and sporting activities93 Other service activities
Section P Private households with employed persons95 Private households with employed persons
Section Q Extra-territorial organizations and bodies99 Extra-territorial organizations and bodies

218
Bibliography
References for the pilot studies on waterBie, Thomas (2000). Monetary Water Account Related to NAMEA. Report to Eurostat from StatisticsDenmark, April 2000
Bie, Thomas and Bo Simonsen (1999). NAMEA with Water Extraction and Use. Report to Eurostat fromStatistics Denmark, April 1999
Bouchereau, Jean-Marie and Mark Tuddenham (2000). Environmental accounts in France – NAMEA pilotstudy for France Phase III. Final Report to Eurostat from IFEN, October 2000
Brånvall, Gunnar, Marianne Eriksson, Ulf Johansson and Peter Svensson (1999). Water Accounts. Physicaland monetary data connected to abstraction, use and discharge of water in the Swedish NAMEA. Report toEurostat from Statistiska centralbyrån, December 1999
Centre de Recherche Public Henri Tudor (1997). A preliminary national accounting matrix includingenvironmental accounts (NAMEA) for Luxembourg. Report to Eurostat, December 1997
Chang Marisa in co-operation with Quintela Isabel (2002). Water accounts project 1998. Report to Eurostatfrom INE, June 2002
Curtis, John (2000). Satellite Environmental Accounts for Ireland 1996. Report to the Central Statistics Office(Eurostat/DG Environment financing) from the Economic and Social Research Institute, May 2000
De Haan, Mark (1997). Water accounts in the Dutch NAMEA: a ‘NAMWA’ for 1991. Report to Eurostat fromStatistics Netherlands, May 1997
Fuerhacker, M.A., W.R. Vogel, M. Nagy, M. Haberbauer, A. Ruppert (1998). NAMEA – Wasser. Report toEurostat from ÖSTAT, November 1998
Grobecker, Claire (1998). Entwicklung von Physischen Wasserflussrechnungen für Deutschland. Report toEurostat from Statistisches Bundesamt, August 1998
Harris, Rocky (2000). Emissions coefficients for pollutants discharged to sewer. Final report to Eurostat fromOffice for National Statistics – July 2000
IFEN (1999). French Pilot project on NAMEA-Air Phase II and NAMEA-Water Phase I. Final Report toEurostat, October 1999
IFEN (1999). Les comptes de l'eau. Compte de la dépense des Usages de l'Eau in Situ. Report to Eurostat,December 1999
IFEN (1999). The accounts of the quality of the water-courses. Implementation of a simplified method.Synthesis of the general Report to Eurostat and DG Env, August 1999
IFEN (1999). The expenditure account of water abstraction and distribution – Methodology and results.Report to Eurostat, October 1999
Jørgensen, Leif Albert (1999). Investigation of NAMEA Water Pollution Data Availability. Report to Eurostatfrom Statistics Denmark, April 1999
Luengo, Félix Alonso and Fátima Escribano Morales (2000). Cuentas satélite del agua en España. INE,Unidad de Estadísticas de Medio Ambiente, May 2000
Luengo, Félix Alonso and Fátima Escribano Morales (2001). Water Satellite Accounts for Spain 1997-1999,INE, Eurostat Working Paper Nr. 2/2001/B/6, September 2001
Manninen, Harri (1999). Finnish NAMEA 1985-1995. Report to Eurostat from Statistics Finland, November1999
Ministère de l’Environnement (2000). Matrices NAMEA pour le Grand-Duché de Luxembourg – Matricesrelatives aux émissions atmosphériques, aux déchets et à l’eau: premiers résultats et étude de faisabilité.Report to Eurostat, Mars 2000
Mylonas, Dr Nikos A. (1998). On natural resources and environment in the frame of input-output tables andaccounts of a type NAMEA for Greece 1988-1997. Report to Eurostat from the Institute of computer andcommunication systems (National technical university of Athens), June 1998
Bibliography
219
Mylonas, Dr Nikos A. (2000). Natural resource Accounts and Environmental Input-Output Tables for Greece1988-1998. Report to Eurostat from the Institute of computer and communication systems (National technicaluniversity of Athens), April 2000
Pedersen, Lene Aagaard and Christian Tronier (2001). 1997 Water accounts related to NAMEA. Report toEurostat from Statistics Denmark, April 2001
Schoer, Dr Karl and Christine Flachmann (2000). Water flow accounts as part of material and energy flowaccounts in Germany, Statistisches Bundesamt, 2000
Scott, S., J. Curtis J. Eakins J. Fitz Gerald and J. Hore (2001). Environmental accounts: time series + eco-taxes. Report to Eurostat from the Economic and Social Research Institute, February 2001
Scott, Susan (1998). Compilation of Satellite Environmental Accounts. Report to the Central Statistics Office(Eurostat/DG Environment financing) from the Economic and Social Research Institute, September 1998
Sørensen, Knut Ø. and Julie L. Hass (2000). Norwegian Economic and Environment Accounts (NOREEAPhase 2). Project 2000 final report to Eurostat from Statistics Norway – October 2000
Statistisches Bundesamt (1997). Erstellung eines ersten ESI für Deutschland Teil 1: Stoffliche Belastungen.Report to Eurostat from Statistisches Bundesamt, October 1997
Suokko, Mia (1997). Finnish NAMEA 1993. Report to Eurostat from Statistics Finland, July 1997
van den Berghe, Sophie (2000). NAMEA-Air Belgique – Étude de faisabilité NAMEA Eau. Report to Eurostatfrom Bureau Fédéral du Plan, January 2000
Vandille, Guy (2002). The NAMEA Air for Belgium (1994-1998) – The NAMEA Water for Belgium (1998).Federal Planning Bureau, February 2002.
Vaze, Prashant (1998). An illustrative water account for England and Wales. in United KingdomEnvironmental Accounts 1998. Office for National Statistics, 1998
Related websitesEurostat: http://europa.eu.int/comm/eurostatEuropean Commission – DG Environment: http://europa.eu.int/comm/dgs/environmentEuropean Environment Agency: http://www.eea.eu.int/European Topic Centre on Water: http://water.eionet.eu.int/World Resources Institute: http://www.wri.org/Organisation for Economic Co-operation and Development: http://www.oecd.orgUnited Nations Environment Programme: http://www.unep.org/