EUROPEAN COMMISSION JOINT RESEARCH CENTRE ...
180
1 EUROPEAN COMMISSION JOINT RESEARCH CENTRE Directorate B, Growth and Innovation (Sevilla) Unit 5, Circular Economy and Industrial Leadership Guidance for the Assessment of Material Efficiency: Application to smartphones 1 – v 2 2 Author(s): Mauro Cordella, Felice Alfieri, Javier Sanfélix (JRC – B.5) Date: 6 May 2019 Summary: Improving the material efficiency of products has the potential of bringing added value to the environment and to the economy, by saving resources and avoiding production of waste. However, improved design of products needs to be assisted by appropriate assessment methods. In this context, the Joint Research Centre Directorate B, Circular Economy & Industrial Leadership unit (JRC B.5), has prepared a methodological guide for the assessment of material efficiency of products (GAME). The methodology is based on the analysis of technical and functional aspects of products, as well as on the definition of life cycle assessment scenarios targeting environmental and economic impacts, aiming at two practical targets: To identify key material efficiency aspects of products; To propose tangible improvement measures. This report describe the application of the methodology to the assessment of material efficiency aspects for smartphones, with the aim of compiling a list of possible actions for improving their performance with respect aspects as durability, reparability, upgradability, use of materials and recyclability. The report is structured in the following chapters: 1. Product group definition and characterisation (including: scoping, legislation and testing methods of interest, relevant information on market, user behaviour and products); 2. Identification of hot-spots for material efficiency (based on product- specific information and life cycle considerations); 3. Technical analysis and assessment of material efficiency aspects (e.g. durability, reparability, use and recycling of materials); 4. Definition of possible improvement measures. This is the draft version of the final report, which you are asked to comment by 2 June 2019. Depending on your interest in and familiarity with the subjects covered in the report, you may provide input either to all or some parts and questions of the report, by using the provided commenting form.
-
Upload
khangminh22 -
Category
Documents
-
view
2 -
download
0
Transcript of EUROPEAN COMMISSION JOINT RESEARCH CENTRE ...

1
EUROPEAN COMMISSION
JOINT RESEARCH CENTRE
Directorate B, Growth and Innovation (Sevilla)
Unit 5, Circular Economy and Industrial Leadership
Guidance for the Assessment of Material Efficiency: Application to smartphones 1
– v 2 2
Author(s): Mauro Cordella, Felice Alfieri, Javier Sanfélix
(JRC – B.5)
Date: 6 May 2019
Summary:
Improving the material efficiency of products has the potential of bringing added
value to the environment and to the economy, by saving resources and avoiding
production of waste. However, improved design of products needs to be assisted by
appropriate assessment methods.
In this context, the Joint Research Centre Directorate B, Circular Economy &
Industrial Leadership unit (JRC B.5), has prepared a methodological guide for the
assessment of material efficiency of products (GAME). The methodology is based on
the analysis of technical and functional aspects of products, as well as on the
definition of life cycle assessment scenarios targeting environmental and economic
impacts, aiming at two practical targets:
To identify key material efficiency aspects of products;
To propose tangible improvement measures.
This report describe the application of the methodology to the assessment of material
efficiency aspects for smartphones, with the aim of compiling a list of possible actions
for improving their performance with respect aspects as durability, reparability,
upgradability, use of materials and recyclability.
The report is structured in the following chapters:
1. Product group definition and characterisation (including: scoping,
legislation and testing methods of interest, relevant information on market,
user behaviour and products);
2. Identification of hot-spots for material efficiency (based on product-
specific information and life cycle considerations);
3. Technical analysis and assessment of material efficiency aspects (e.g.
durability, reparability, use and recycling of materials);
4. Definition of possible improvement measures.
This is the draft version of the final report, which you are asked to comment by 2 June
2019. Depending on your interest in and familiarity with the subjects covered in the
report, you may provide input either to all or some parts and questions of the report,
by using the provided commenting form.

2
DISCLAIMER: The views expressed are purely those of the authors and may not in 3
any circumstances be regarded as stating an official position of the European 4
Commission. 5

3
6
Table of Contents 7
SUMMARY ..................................................................................................................... 6 8
LIST OF ACRONYMS .................................................................................................. 7 9
INTRODUCTION......................................................................................................... 11 10
1 PRODUCT GROUP DEFINITION ..................................................................... 13 11
1.1 SCOPING ...................................................................................................................... 13 12
1.1.1 Key definitions................................................................................................... 13 13
1.1.2 Product classification ......................................................................................... 14 14
1.1.3 Scope of the study .............................................................................................. 14 15
1.2 LEGISLATIVE CONTEXT AND TESTING METHODS ........................................................ 15 16
1.2.1 Safety ................................................................................................................. 15 17
1.2.2 Chemicals .......................................................................................................... 16 18
1.2.3 Materials ............................................................................................................ 18 19
1.2.4 Functional and performance aspects .................................................................. 20 20
1.2.5 End-of-Life of the product ................................................................................. 29 21
1.2.6 Ecolabels and Green Public Procurement .......................................................... 33 22
2 MARKET ............................................................................................................... 36 23
2.1 BASIC MARKET DATA .................................................................................................. 36 24
2.1.1 Market sales ....................................................................................................... 36 25
2.1.2 Market penetration ............................................................................................. 38 26
2.1.3 Market shares by vendor .................................................................................... 39 27
2.1.4 Market shares by operating system .................................................................... 40 28
2.2 KEY ACTORS ................................................................................................................ 41 29
2.3 COSTS .......................................................................................................................... 43 30
2.3.1 Purchase price .................................................................................................... 43 31
2.3.2 Margins .............................................................................................................. 44 32
2.3.3 Repair/refurbishment costs ................................................................................ 47 33
2.3.4 Overview of life cycle costs .............................................................................. 50 34
2.4 MARKET DRIVERS, TRENDS AND CIRCULAR BUSINESS MODELS ................................. 50 35
2.4.1 Design of the product and provision of extended support and accessories ....... 53 36
2.4.2 Reuse-promoting activities and markets ............................................................ 54 37
3 USER BEHAVIOUR ............................................................................................. 58 38
3.1 CONDITIONS OF USE AND BEHAVIOURAL ASPECTS ..................................................... 58 39
3.1.1 Type of phone and age of users ......................................................................... 58 40
3.1.2 Functionalities.................................................................................................... 59 41
3.1.3 Time and place of use ........................................................................................ 61 42
3.1.4 Purchasing behaviour ......................................................................................... 62 43
3.2 CAUSES OF REPLACEMENT .......................................................................................... 62 44
3.3 PRODUCT'S LIFETIME ................................................................................................... 63 45
4 TECHNICAL ANALYSIS AND SYSTEM ASPECTS ...................................... 65 46

4
4.1 TECHNOLOGICAL ASPECTS .......................................................................................... 65 47
4.1.1 Design and innovation ....................................................................................... 65 48
4.1.2 Functions ........................................................................................................... 66 49
4.1.3 Parts ................................................................................................................... 67 50
4.2 MATERIALS ................................................................................................................. 72 51
4.2.1 Bill of Materials ................................................................................................. 72 52
4.2.2 Critical Raw Materials and minerals from conflict-affected and high-risk 53
areas ................................................................................................................... 75 54
4.2.3 Recycled materials ............................................................................................. 77 55
4.2.4 Other substances of concern .............................................................................. 78 56
4.2.5 Possible measures for reducing impacts of materials ........................................ 79 57
4.3 MANUFACTURE ........................................................................................................... 80 58
4.4 PRODUCT'S LONGEVITY ............................................................................................... 81 59
4.4.1 Limiting states ................................................................................................... 82 60
4.4.2 Durability analysis ............................................................................................. 86 61
4.4.3 Reparability and upgradability analysis ............................................................. 90 62
4.5 END OF LIFE .............................................................................................................. 101 63
4.5.1 End of Life practices ........................................................................................ 101 64
4.5.2 Collection and end of life services ................................................................... 101 65
4.5.3 Recycling process ............................................................................................ 103 66
4.5.4 Transport and risk of illegal export of WEEE ................................................. 108 67
4.5.5 Possible measure relating to recycling ............................................................. 109 68
4.6 TRADE-OFFS BETWEEN MATERIAL EFFICIENCY ASPECTS.......................................... 110 69
4.7 NETWORKS, CLOUD OFFLOADING AND DATA CENTRES ............................................ 111 70
5 MATERIAL EFFICIENCY HOT-SPOTS ........................................................ 112 71
5.1 MATERIAL EFFICIENCY CONCEPT .............................................................................. 112 72
5.2 GUIDANCE FOR THE LCA-SUPPORTED ANALYSIS OF HOTSPOTS ............................... 113 73
5.3 LCA OF SMARTPHONES ............................................................................................. 114 74
5.3.1 Goal and scope ................................................................................................. 114 75
5.3.2 Key Performance Indicators ............................................................................ 114 76
5.3.3 Functional Unit and Reference Flow ............................................................... 115 77
5.3.4 Reference Product, System Boundaries and Scenarios .................................... 115 78
5.3.5 Scenarios of assessment ................................................................................... 119 79
5.3.6 Life Cycle Costing and technical considerations relating to alternative 80
scenarios .......................................................................................................... 120 81
5.4 PRELIMINARY CONSIDERATIONS ............................................................................... 123 82
6 DEFINITION OF POSSIBLE DESIGN MEASURES FOR IMPROVING 83
MATERIAL EFFICIENCY................................................................................ 125 84
7 QUESTIONS FOR STAKEHOLDERS............................................................. 133 85
8 PRELIMINARY CONCLUSIONS .................................................................... 136 86
9 ACKNOWLEDGEMENTS ................................................................................ 137 87
10 REFERENCES ..................................................................................................... 138 88
ANNEX I – ECOLABELLING REQUIREMENTS FOR SMARTPHONES ...... 147 89

5
ANNEX II – REPARABILITY SCORES FOR SMARTPHONES BY IFIXIT ... 173 90
91
92

6
SUMMARY 93
94

7
LIST OF ACRONYMS 95
1G First Generation 96
2G Second Generation 97
3G Third Generation 98
3GPP 3rd Generation Partnership Project 99
3TG Tungsten, Tantalum, Tin, and Gold 100
4G Fourth Generation 101
5G Fifth Generation 102
AC Alternating Current 103
AMOLED Active Matrix OLED 104
AMPS Advanced Mobile Phone System 105
ASM Artisanal small-scale mining 106
BBP Butyl benzyl phthalate 107
BFR Brominated flame retardants 108
BS Base Station 109
BoM Bill of Materials 110
C&L Classification & Labelling 111
CBD Chronic Beryllium Disease 112
CDMA Code division multiple access 113
CEPN Clean Electronics Production Network 114
CF Carbon Footprint 115
CFC Chlorofluorocarbons 116
CLP Classification, Labelling and Packaging 117
CoC Code of Conduct 118
CMR Carcinogenic, Mutagenic or toxic for Reproduction 119
CPU Central Processing Unit 120
CRM Critical Raw Materials 121
DBP Dibutyl phthalate 122
DC Direct Current 123
DEHP Bis(2-ethylhexyl) phthalate 124
DIBP Diisobutyl phthalate 125
DINP di-isononyl phthalate 126
DIY Do It Yourself 127
DNOP di-n-octyl phthalate 128
DRC Democratic Republic of Congo 129
EC European Commission 130
ECHA European Chemical Agency 131

8
EDGE Enhanced Data rates for GSM Evolution 132
EEE Electrical and Electronic Equipment 133
ELV End-of-Life Vehicles 134
EoL End of Life 135
EPR Extended Product Responsibility 136
EPS External Power Supplies 137
Evolved Packet System 138
ErP Energy-related Product 139
ESD Electrostatic Discharges 140
EU European Union 141
EUTRAN evolved UMTS terrestrial radio access network 142
E-UTRA evolved UMTS terrestrial radio access 143
GAME Guide for the Assessment of Material Efficiency 144
GB Gigabyte 145
GGSN Gateway GPRS Support Node 146
GHG Greenhouse gas 147
GPP Green Public Procurement 148
GPRS General Packet Radio Service 149
GPS Global Positioning System 150
GPSD General Product Safety Directive 151
GPU Graphics Processing Unit 152
GSH Globally Harmonised System 153
GSM Global Systems for Mobile Communications 154
GWP Global Warming Potential 155
HBCDD Hexabromocyclododecane 156
HC Hydrocarbons 157
HCFC Hydrochlorofluorocarbons 158
HD High Definition 159
HDSPA High-Speed Downlink Packet Access 160
HFC Hydrofluorocarbons 161
IC Integrated Circuit 162
ICT Information and Communications Technology 163
IEC International Electrotechnical Commission 164
IPXX Ingress Protection XX 165
LCA Life Cycle Assessment 166
LCC Life Cycle Costing 167
LCD Liquid Cristal Display 168

9
LCI Life Cycle Inventory 169
LED Light Emitting Diode 170
LP Low Power 171
LPDDR Low-Power Double Data Rate 172
LTE Long Term Evolution 173
MIMO Multi Input Multi Output 174
MoU Memorandum of Understanding 175
MP Mega Pixels 176
NFC Near Field Communication 177
NGO Non-Governmental Organisation 178
NIB Neodymium 179
NMT Nordic Mobile Telephone 180
OEM Original Equipment Manufacturer 181
OS Operating System 182
PA Power Amplifiers 183
PBB Polybrominated biphenyls 184
PBDE Polybrominated diphenyl ethers 185
PBT Persistent, Bio-accumulative and Toxic 186
PC Personal Computer 187
PCB Polychlorinated biphenyls 188
PCT Polychlorinated terphenyls 189
Projected Capacitive Touch 190
PRO Producer Responsibility Organisation 191
PVC Poly Vinyl chloride 192
RAM Random-Access Memory 193
RAPEX Rapid Alert System for non-food dangerous products 194
REAPRO Resource Efficiency Assessment of Energy-related PROducts 195
REACH Registration, Evaluation, Authorisation and Restriction of Chemicals 196
RCI Responsible Cobalt Initiative 197
RED Radio Equipment Directive 198
REE Rare Earth Elements 199
RNC Radio Network Controller 200
ROHS Restriction of Hazardous Substances Directive 201
SD Storage Device 202
SGSN Serving GPRS Support Node 203
SIM Subscriber Identity Module 204
SMD Surface Mount Device 205

10
SoC State of Charge 206
System on a Chip 207
SVHC Substance of Very High Concern 208
TACS Total Access Communication System 209
TBBPA Tetrabromobisphenol A 210
TCPP Phosphoric acid tris (2-chloro-1-methylethyl) ester 211
TDCPP tris (1,3-dichloro-2-propyl) phosphate 212
TDMA Time Division Multiple Access 213
TD-CDMA Time Division Synchronous Code Division Multiple Access 214
TD-SCDMA Time Division Synchronous Code Division Multiple Access 215
TWG Technical Working Group 216
UMTS Universal Mobile Telephone System 217
UN United Nations 218
UPA Universal Power Adaptor 219
USB Universal Serial Bus 220
vPvB very Persistent and very Bio-accumulative 221
WEEE Waste Electrical and Electronic Equipment 222
WiFi Wireless Fidelity 223
WMSC Wideband CDMA Mobile Switching Centre 224
W-CDMA Wideband CDMA Mobile Switching Centre 225
226

11
INTRODUCTION 227
The Communications from the Commission COM(2015) 614 "Closing the loop – An EU 228
action plan for the Circular Economy" and COM(2016) 773 "Ecodesign Working Plan 2016-229
2019" point out the increased importance of improving the resource efficiency of products in 230
order to promote a transition towards a more circular economy in the EU. This can be for 231
instance supported through a series of measures aiming to make products more durable, easier 232
to repair, reuse or recycle. 233
Improving the material efficiency of products has the potential of bringing added value to the 234
environment and to the economy, by saving resources and avoiding production of waste. 235
However, improved design of products needs to be assisted by appropriate assessment 236
methods. The importance of assessment and verification procedures is also confirmed by the 237
recent creation of the CEN/CENELEC JTC10 "Energy-related products – Material Efficiency 238
Aspects for eco-design", which is working on the development of general standards on 239
material efficiency aspects for Energy-related Products (ErP). 240
In this context, the Commission has launched a research study focused on the assessment of 241
material efficiency aspects for smartphones, and aimed at compiling a list of possible actions 242
for improving their performance with respect to circular economy aspects such as durability, 243
reparability and upgradability, use of materials and recyclability. The study, entrusted by DG 244
ENV to the Joint Research Centre Directorate B, Circular Economy & Industrial Leadership 245
unit (JRC B.5), will follow the Guidance for the Assessment of Material Efficiency (GAME), 246
which is described in the present document while applied to the analysis of smartphones. 247
GAME has been prepared by JRC B.5 to support the assessment of material efficiency of 248
products and the definition of possible improvement measures in those areas. The 249
methodology is targeted at achieving two practical aims: 250
1. Identification of key material efficiency aspects of products; 251
2. Proposal of tangible improvement measures. 252
GAME is based on the analysis of technical and functional aspects of products, as well as on 253
the definition of life cycle scenarios of assessment targeting environmental and economic 254
impacts. The methodology builds on in-house knowledge about Life Cycle Assessment 255
(LCA) (Cordella et al. 2015; Cordella and Hidalgo 2016), material efficiency analysis (Alfieri 256
et al. 2018a; Cordella et al. 2018a; Cordella et al. 2019a) and product policy analysis and 257
implementation (Cordella et al. 2018b, 2019b), as well as on former methodological work 258
carried out in the JRC (Ardente and Mathieux 2014). 259
Final results of the study, which has a research orientation, could feed into work on actions 260
covered under the Circular Economy Action Plan and related to product policy1 and the 261
Ecodesign task force for ICT products2. 262
This draft report is structured in the following chapters: 263
1. Product group definition (scoping, legislation and testing methods of interest); 264
2. Market characterisation; 265
3. Information on user behaviour; 266
4. Analysis of technical and system aspects; 267
1 COM(2015) 614
2 COM(2016) 773

12
5. Definition of a framework for the life cycle assessment of material efficiency 268
hotspots (Note: analysis to be completed for the final report); 269
6. Definition of improvement measures; 270
7. Questions for stakeholders; 271
8. Preliminary conclusions. 272
A Technical Working Group (TWG) of experts, consisting of manufacturers, retailers, 273
repairers, recyclers, academia, environmental and consumer NGOs, as well as experts 274
working in relevant authorities of Member States, has been formed to provide input to the 275
study. Two written consultations have been planned to get technical input and feedback from 276
stakeholders: 277
The first consultation took place from 23 April 2018 until 21 May 2018. 278
The second consultation is taking place from 6 May 2019 until 2 June 2019. 279
A series of boxes have been inserted along the document in order to point out specific 280
questions of interest for the study team. We would much appreciate if you could send your 281
feedback, on these questions and any other comments you may have, to JRC-B5-282
[email protected] by using the provided commenting form. Depending on your interest and 283
familiarity with the subjects covered in the report, you may provide input either to all or some 284
parts of the report. 285
Information about the progress of the study and the final report will be made available on a 286
dedicate website (http://susproc.jrc.ec.europa.eu/E4C/index.html). 287
288

13
1 PRODUCT GROUP DEFINITION 289
The present study focuses on the assessment of material efficiency aspects associated to the 290
design of smartphones. The first step is to define the scope of the analysis, including the 291
identification of legislative references and existing testing methods. 292
Once the product group is defined, background information has to be gathered about: 293
Market and use of the product (e.g. information about prices of new and second hand 294
products, costs of repair/refurbishment, functional lifetime, consumers expectations, 295
market failures, circular business models). 296
Technical design and related product systems (e.g. functions, parts and technologies, 297
main causes of failure, Bill of Materials and End of Life, hazardous components). 298
This will be used in the study for the definition of product design option(s) which can be 299
considered representative for average performance conditions, and for the further assessment 300
of material efficiency aspects. 301
302
1.1 Scoping 303
1.1.1 Key definitions 304
Some general definitions were found in a few voluntary labelling and certification schemes, 305
as described in the table below. As apparent, no standard definition is used internationally for 306
this fast developing product group. 307
308
Table 1: Definitions provided in different labelling and certification schemes 309
Reference Scope Definition
RAL-UZ 106 (2017)
- Blue Angel Eco-
Label for Mobile
Phones
Mobile
phones
Mobile phones, i.e. portable, cordless phones that
transmit telephone calls via mobile phone networks.
The mobile phone is equipped with a module (SIM
card) which allows the identification of the individual
subscriber. In addition to the telephony function the
mobile phone can provide several other functions, such
as, for example, transmission of text messages, mobile
use of Internet services, execution of programmes or
recording and replay of video and audio signals.
Mobile phones are also called cellular phone, cell
phone, or smartphone - and many Germans call their
mobile phone "handy"3.
3 The former definition, used in 2013 version of RAL-UZ 106 was "Mobile phones include "Handys"
(as the Germans call mobile phones) and smart phones using the LTE (often also called 4G), HSDPA
(3G+), UMTS (3G) or GSM standard (2G). The devices shall be primarily designed for making phone
calls, text messaging and/or the mobile use of internet services. The size of the visible display is used
to distinguish mobile phones from mobile computers (e.g. tablet PCs). Thus, devices with a maximum
visible display size of 100 cm2 are considered as mobile phones, provided that they meet the above
requirements"

14
TCO Certified
Smartphones 2.0
Smart-
phones
(display
sizes ≥ 3"
to ≤ 6")
The intended use of a Smartphone is portable
computing and mobile communication.
A Smartphone is an electronic device used for long-
range communication over a cellular network of
specialized base stations known as cell sites. It must
also have functionality similar to a wireless, portable
computer that is primarily for battery mode usage and
has a touch screen interface. Connection to mains via
an external power supply is considered to be mainly for
battery charging purposes and an onscreen virtual
keyboard or a digital pen is in place of a physical
keyboard.
UL Standard 110,
Edition 2 - Standard
for Sustainability for
Mobile Phones
(2017)
Mobile
phones
A wireless handheld device that is designed to send and
receive transmissions through a cellular radiotelephone
service including only the device itself and not
packaging or accessories. Slates/tablets, as defined in
the most recent applicable version of Energy Star
specification, are excluded from this definition.
310
1.1.2 Product classification 311
Some characteristics which can be used to classify smartphones are reported in Table 2 (OCU 312
2018a). 313
314
Table 2: Examples of key characteristics which can be used to classify smartphones (OCU 2018a) 315
Part Characteristics
Display > 5.5" (Phablets)
5-5.5" (Medium-size smartphones)
< 5" (Small-size smartphones)
Operating System (OS) iOS (Apple) vs. Android
Memory > 11-17 GB (iOS), > 8-13 GB (Android), external micro SD
Battery 2000-5000 mAh (theoretical vs. real)4
Camera 5-23 MP (back), 1-16 MP (front)
Hardware (e.g. 1 vs. 2 back cameras) and software
4K, full HD, HD (video)
316
1.1.3 Scope of the study 317
For the purposes of this study, a smartphone is described as follows: 318
4 Main sources of energy consumption: display, web browsing, watching videos, GPS

15
A smartphone is a handheld electronic device designed for mobile communication 319
(making phone calls, text messaging), internet connection and other uses (e.g. 320
multimedia, gaming). 321
It can be used for long-range communication over a cellular network of specialized 322
base stations known as cell sites5. 323
It is functionally similar to wireless, portable computers (e.g. tablet PCs), since 324
- designed for battery mode usage, and connection to mains via an external power 325
supply is mainly for battery charging purposes, 326
- presenting an operating system6, WiFi connectivity, web browsing capability, and 327
ability to accept original and third-party applications (Apps), 328
It has a display size between 4 and 6.5 inches, a high-resolution touch screen 329
interface in place of a physical keyboard, a fissure for a Subscriber Identity Module 330
(SIM), and usually a camera. 331
In particular, the following functions and technical specifications seem to be important for 332
consumers: 333
Size of the screen, camera, quality aspects as reliability and screen resolution (Kantar 334
World Panel 2017), 335
Longevity of battery, internet access, and high specification camera (Benton et al. 336
2015). 337
Availability of operating system updates, which do not decrease the operating speed 338
of the device (also known as "software obsolescence"). 339
Basic mobile phones, feature phones7 and smart-watch phones are not considered in the scope 340
of this study. 341
342
1.2 Legislative context and testing methods 343
This section describes legislative aspects that can influence material efficiency of the product 344
(e.g. repair and/or upgrade, use of materials). Testing methods and standards which are used 345
worldwide to assess and verify material efficiency of the product are also presented. 346
1.2.1 Safety 347
1.2.1.1 General Product Safety Directive 348
The General Product Safety Directive (GPSD) 2001/95/EC aims to ensure that only safe 349
products are made available on the market. The GPSD applies in the absence of other EU 350
legislation, national standards, Commission recommendations or codes of practice relating to 351
safety of products. It also complements sector specific legislation. Specific rules exist for the 352
safety of toys, electrical and electronic goods, cosmetics, chemicals and other specific product 353
groups8. The GPSD establishes obligations to both businesses and Member States' authorities: 354
5 These include GSM standard (2G), UMTS (3G), HSDPA (3G+), LTE (often also called 4G), 5G, or
similar 6 For examples: Google's Android, BlackBerry OS, Apple's iOS, Nokia's Symbian, Microsoft's
Windows Phone, or similar 7 A feature phone is a mobile phone that incorporates features such as the ability to access the Internet
and store and play music but lacks the advanced functionality of a smartphone. 8 https://ec.europa.eu/info/business-economy-euro/product-safety-and-requirements/consumer-product-
safety/standards-and-risks-specific-products_en (accessed on 27 February 2019)

16
Businesses should place only products which are safe on the market, inform 355
consumers of any risks associated with the products they supply. They also have to 356
make sure any dangerous products present on the market can be traced so they can be 357
removed to avoid any risks to consumers. 358
Member States, through their appointed national authorities, are responsible for 359
market surveillance to check that products on the market are safe. Information about 360
dangerous products found on the market has to be reported to the Rapid Alert System 361
for non-food dangerous products (RAPEX). 362
1.2.1.2 Radio Equipment Directive 363
The Radio Equipment Directive 2014/53/EU (RED) ensures a Single Market for radio 364
equipment by setting essential requirements for safety and health, electromagnetic 365
compatibility, and the efficient use of the radio spectrum. It applies to all products using the 366
radio frequency spectrum, including smartphones. 367
The Radio Equipment Directive requires that manufacturers ensure that the radio equipment 368
is accompanied by instructions and safety information. Such information has to include, 369
where applicable, a clear description of accessories and components, including software, 370
which allow the radio equipment to operate as intended. 371
In the recital of the Radio Equipment Directive there is moreover a clear reference to mobile 372
phones and their compatibility with a common charger. 373
1.2.1.3 Main standards and testing methods 374 Main standards and testing methods on safety include: 375
IEC 60065:2014 - Audio, video and similar electronic apparatus - Safety 376
requirements. 377
IEC 60950-1:2005+AMD1:2009+AMD2:2013 CSV - Information technology 378
equipment - Safety - Part 1: General requirements. 379
IEC 62209-1:2016 - Measurement procedure for the assessment of specific 380
absorption rate of human exposure to radio frequency fields from hand-held and 381
body-mounted wireless communication devices. Devices used next to the ear 382
(Frequency range of 300 MHz to 6 GHz). 383
IEC 62368-1:2014 - Audio/video, information and communication technology 384
equipment - Part 1: Safety requirements. 385
1.2.2 Chemicals 386
1.2.2.1 CLP Regulation 387
The Classification, Labelling and Packaging (CLP) Regulation (EC) No 1272/2008 is based 388
on the UN's Globally Harmonised System (GHS) and its purpose is to ensure a high level of 389
protection of health and the environment, as well as the free movement of substances, 390
mixtures and articles. 391
Since 1 June 2015, CLP is the only legislation in force in the EU for classification and 392
labelling of substances and mixtures. CLP is legally binding across the Member States and 393
directly applicable to all industrial sectors. It requires manufacturers, importers or 394
downstream users of substances or mixtures to classify, label and package their hazardous 395
chemicals appropriately before placing them on the market. Hazard classes used in CLP cover 396
physical, health, environmental and additional hazards. 397
CLP is also the basis for many legislative provisions on the risk management of chemicals. In 398
addition, the notification obligation under CLP requires manufacturers and importers to 399
submit classification and labelling information for the substances they are placing on the 400
market to a database (the "C&L Inventory"') held by the European Chemical Agency 401
(ECHA). 402

17
1.2.2.2 REACH Regulation 403 The Regulation (EC) No 1907/2006 concerning the Registration, Evaluation, Authorisation 404
and Restriction of Chemicals (REACH) aims to improve the protection of human health and 405
the environment from the risks that can be posed by chemicals because of their intrinsic 406
properties. REACH establishes procedures for collecting and assessing information on the 407
properties and hazards of substances. 408
Companies are responsible for collecting and communicating information on the properties 409
and uses of the substances they manufacture, import or use in their products above one tonne 410
a year. Depending on the volume of the substance, different rules apply. The Regulation also 411
calls for the progressive substitution of the most dangerous chemicals (referred to as 412
"Substances of Very High Concern") when suitable alternatives have been identified. SHVCs 413
are defined as: 414
1. Substances meeting the criteria for classification as carcinogenic, mutagenic or toxic 415
for reproduction (CMR) category 1A or 1B in accordance with the CLP Regulation. 416
2. Substances which are persistent, bio-accumulative and toxic (PBT) or very persistent 417
and very bio-accumulative (vPvB) according to REACH Annex XIII. 418
3. Substances on a case-by-case basis, which cause an equivalent level of concern as 419
CMR or PBT/vPvB substances. 420
Once a substance is identified as an SVHC, it is included in the Candidate List. ECHA 421
regularly assesses the substances from the Candidate List to determine which ones should be 422
included in the Authorisation List (Annex XIV). Once a substance is included in an 423
Authorisation List, this can be used/produced only if 424
a. The risk to human health or the environment is adequately controlled, or 425
b. It can be demonstrated that the socio-economic benefits compensate the impacts, also 426
taking into account possible alternatives 427
A Restrictions List (Annex XVII) is also periodically revised. Once a substance is included in 428
the Restrictions List, specific or general uses of such substance are prohibited. 429
Article 33 of REACH establishes the right of consumers to be able to obtain information from 430
suppliers on substances in articles and also suppliers of articles are obliged to provide 431
industrial/professional users or distributors with certain pieces of information on articles 432
containing substances with irreversible effects on human health or the environment. 433
1.2.2.3 ROHS Directive 434 Smartphones are in the scope of the Restriction of Hazardous Substances Directive 435
2011/65/EU (ROHS), included as "IT and telecommunications equipment". The legislation 436
restricts the use of certain hazardous substances used in electrical and electronic equipment, 437
which have to be substituted by safer alternatives. As listed in the amended Annex II of the 438
Commission Delegated Directive (EU) 2015/863, restricted substances are: 439
Lead (0.1 %) 440
Mercury (0.1 %) 441
Cadmium (0.01 %) 442
Hexavalent chromium (0.1 %) 443
Polybrominated biphenyls (PBB) (0.1 %) 444
Polybrominated diphenyl ethers (PBDE) (0.1 %) 445
Bis(2-ethylhexyl) phthalate (DEHP) (0.1 %) 446
Butyl benzyl phthalate (BBP) (0.1 %) 447

18
Dibutyl phthalate (DBP) (0.1 %) 448
Diisobutyl phthalate (DIBP) (0.1 %) 449
The restriction of DEHP, BBP, DBP and DIBP does not apply to cables or spare parts for the 450
repair, the reuse, the updating of functionalities or upgrading of capacity of Electrical and 451
Electronic Equipment (EEE) placed on the market before 22 July 2019. Further exemptions 452
are provided in Annex III and Annex IV. 453
1.2.3 Materials 454
1.2.3.1 EU list of Critical Raw Materials (CRM) 455
The Commission's communication COM(2017) 490 "on the 2017 list of Critical Raw 456
Materials for the EU" indicates 27 raw materials that can be defined as critical because risks 457
of supply shortage and their impacts on the economy are higher than those of most of the 458
other raw materials (see Table 3). 459
460
Table 3: EU list of Critical Raw Materials on 13 September 2017 461
Raw Material
1. Antimony 10. Germanium 19. Phosphorus
2. Baryte 11. Hafnium 20. Scandium
3. Beryllium 12. Helium 21. Silicon metal
4. Bismuth 13. Indium 22. Tantalum
5. Borate 14. Magnesium 23. Tungsten
6. Cobalt 15. Natural graphite 24. Vanadium
7. Coking coal 16. Natural rubber 25. Platinum Group Metals
8. Fluorspar 17. Niobium 26. Heavy Rare Earth Elements
9. Gallium 18. Phosphate rock 27. Light Rare Earth Elements
462
1.2.3.2 Import of minerals from conflict-affected and high-risk areas 463
The EU Regulation 2017/821 establishes a Union system for supply chain due diligence in 464
order to curtail opportunities for armed groups and security forces to trade in tin, tantalum and 465
tungsten, their ores, and gold. Minerals and metals covered by the EU Regulation 2017/821 466
are listed in Table 4. 467
468
Table 4: Conflict minerals and metals covered by the EU Regulation 2017/821 469
Description Volume threshold (kg)
Tin ores and concentrates 5 000
Tungsten ores and concentrates 250 000
Tantalum or niobium ores and concentrates To be adopted no later
than 1 July 2020
Gold ores and concentrates To be adopted no later
than 1 July 2020
Gold, unwrought or in semi-manufactured forms, or in powder
with a gold concentration lower than 99,5 % that has not passed
the refining stage
100
Tungsten oxides and hydroxides 100 000
Tin oxides and hydroxides To be adopted no later
than 1 July 2020
Tin chlorides 10 000
Tungstates 100 000

19
Tantalates To be adopted no later
than 1 July 2020
Carbides of tungsten 10 000
Carbides of tantalum To be adopted no later
than 1 July 2020
Gold, unwrought or in semi-manufactured forms, or in powder
form with a gold concentration of 99,5 % or higher that has
passed the refining stage
100
Ferrotungsten and ferro-silico-tungsten 25 000
Tin, unwrought 100 000
Tin bars, rods, profiles and wires 1 400
Tin, other articles 2 100
Tungsten, powders 2 500
Tungsten, unwrought, including bars and rods obtained simply by
sintering
500
Tungsten wire 250
Tungsten bars and rods, other than those obtained simply by
sintering, profiles, plates, sheets, strip and foil, and other
350
Tantalum, unwrought including bars and rods, obtained simply by
sintering; powders
2 500
Tantalum bars and rods, other than those obtained simply by
sintering, profiles, wire, plates, sheets, strip and foil, and other
150
470
This Regulation, which took effect on 1 January 2012, was designed to provide transparency 471
and certainty as regards the supply practices of Union importers, and of smelters and refiners 472
sourcing minerals and metals from conflict-affected and high-risk areas. Union importers of 473
these minerals or metals have disclosure obligations: 474
Make available to Member State competent authorities the reports of any third-party 475
audit carried out or evidence of conformity with a supply chain due diligence scheme 476
recognised by the Commission; 477
Make available to their immediate downstream purchasers all information gained and 478
maintained pursuant to their supply chain due diligence with due regard for business 479
confidentiality and other competitive concerns; 480
Publicly report as widely as possible, including on the internet, on their supply chain 481
due diligence policies and practices for responsible sourcing. 482
Where a Union importer can reasonably conclude that metals are derived only from recycled 483
or scrap sources, it has to disclose publicly its conclusion and describe in detail the supply 484
chain due diligence measures exercised. With the exception of this disclosure requirement, 485
this Regulation does not apply to recycled metals. 486
1.2.3.3 Main standards and testing methods 487
Main standards and testing methods on materials have been identified only for plastics: 488
ISO 1043-1:2011 - Plastics - Symbols and abbreviated terms - Part 1: Basic polymers 489
and their special characteristics. The standard defines abbreviated terms for the basic 490
polymers used in plastics, symbols for components of these terms, and symbols for 491
special characteristics of plastics. 492
ISO 1043-2:2011- Plastics - Symbols and abbreviated terms - Part 2: Fillers and 493
reinforcing materials. The standard specifies uniform symbols for terms referring to 494
fillers and reinforcing materials. 495

20
ISO 1043-3:2016 - Plastics - Symbols and abbreviated terms - Part 3: Plasticizers. 496
The standard provides uniform symbols for components of terms relating to 497
plasticizers to form abbreviated terms. 498
ISO 1043-4:1998 - Plastics - Symbols and abbreviated terms - Part 4: Flame 499
retardants. The standard provides uniform symbols for flame retardants added to 500
plastics materials. 501
ISO 11469:2016 - Plastics - Generic identification and marking of plastics products. 502
The standard specifies a system of uniform marking of products that have been 503
fabricated from plastics materials. Provision for the process or processes to be used 504
for marking is outside the scope of this International Standard. 505
1.2.4 Functional and performance aspects 506
1.2.4.1 Batteries 507 The Batteries Directive 2006/66/EC intends to contribute to the protection, preservation and 508
improvement of the quality of the environment by minimising the negative impact of batteries 509
and accumulators and waste batteries and accumulators. It also ensures the smooth 510
functioning of the internal market by harmonising requirements as regards the placing on the 511
market of batteries and accumulators. With some exceptions, it applies to all batteries and 512
accumulators, no matter their chemical nature, size or design. 513
The Directive: 514
Prohibits the marketing of batteries containing some hazardous substances (Batteries 515
and accumulators must not have a lead, mercury or cadmium content above the fixed 516
threshold limits of 0.004%, 0.0005% and 0.002% by weight, respectively, unless 517
labelled in accordance with the Directive. Specific labelling requirements are outlined 518
in the directive where these thresholds are exceeded); 519
Defines measures to establish schemes aiming at high level of collection and 520
recycling; 521
Fixes targets to Member States for collection and recycling activities; 522
Sets out provisions on labelling of batteries (in particular, all batteries have to be 523
marked with the crossed-out wheeled bin symbol indicating "separate collection"); 524
Sets out provision on their removability from equipment: Member States have to 525
ensure that manufacturers design appliances in such a way that waste batteries and 526
accumulators can be readily removed, either by end-users or by independent qualified 527
professionals. 528
Producers of batteries and accumulators and producers of other products incorporating a 529
battery or accumulator are moreover given responsibility for the waste management of the 530
batteries and accumulators that they place on the market. 531
1.2.4.2 External power supply 532 External Power Supplies (EPS) are subject to the EU ecodesign regulation (EC) No 278/2009. 533
They convert power input from the mains into lower voltage output for smartphones and a 534
large variety of other electric and electronic products. 535
Ecodesign requirements for EPS are mandatory for all manufacturers and suppliers wishing to 536
sell their products in the EU. These requirements cover both the "active" efficiency, i.e. the 537
average efficiency when power is supplied to, and the "no-load" power consumption, i.e. the 538
power that the supply still uses when connected to the power mains but not supplying 539
electricity to any device. 540
An EU Code of Conduct (CoC) on Energy efficiency of EPS is also available, the version 5 541
being released in 2013. The Code of Conduct is a voluntary initiative targeting single voltage 542

21
external AC/DC and AC/AC power supplies for electronic and electrical appliances, which 543
also include mobile phone chargers. The initiative aims to minimise the energy consumption 544
of external power supplies both under no-load and load conditions in the output power range 545
0.3W to 250W. 546
At international level, an international efficiency marking protocol for EPS was developed by 547
the U.S. EPA. This provides a system to designate the minimum efficiency performance of an 548
EPS, so that finished product manufacturers and government representatives can easily 549
determine a unit's efficiency. This mark demonstrates the performance of the EPS when tested 550
to the internationally supported test methods (U.S. Department of Energy 2013). 551
In June 2009, a campaign9 for the introduction of a voluntary agreement for a common 552
charger for mobile phones was launched. many of the world's largest mobile phone 553
manufacturers signed an EC-sponsored Memorandum of Understanding (MoU), agreeing to 554
make most new data-enabled mobile phones marketed in the European Union compatible 555
with a to-be-specified common EPS. All signatories agreed to develop a common 556
specification for the EPS to allow for full compatibility and safety of chargers and mobile 557
phones. The standard was published in December 2010 as EN 62684:2010 "Interoperability 558
specifications of common EPS for use with data-enabled mobile telephones" and in January 559
2011 as IEC 62684:2011. Vencovsky et al. (2014) found that 99% of data-enabled phones 560
sold in Europe in 2013 were compliant with the MoU. An updated version of IEC 62684:2018 561
has been published this year that makes it clearer that compliance with the MoU is equivalent 562
to compliance with the standard. This standard specifies the interoperability based on Micro 563
USB-B technologies. According to this standard the EPS must operate in the following 564
ranges: 565
100-230 V 566
50-60 Hz 567
0 to 35 °C 568
Up to 90% of relative humidity. 569
USB Micro-B is currently giving way to USB Type-C. Many manufacturers (Apple, Google, 570
Lenovo, LG, Motorola, Samsung, and Sony) have signed a new MoU10
committing that new 571
smartphone models will be chargeable through a USB Type-C connector or cable assembly. 572
For these purposes, the relevant standard is IEC 63002:2016 "Identification and 573
Communication Interoperability Method for External Power Supplies Used with Portable 574
Computing Devices". The objective of this International Standard is to support 575
interoperability of external power supplies used with the increasing variety of portable 576
computing devices that implement the IEC 62680-1-2 "USB Power Delivery" with the IEC 577
62680-1-3 "USB Type-C" connector standards. Broad market adoption of this International 578
Standard is expected to make a significant contribution to the global goals of consumer 579
convenience and re-usability of power supplies by building a global market system of IEC 580
62680 compliant devices and facilitating interoperability across different product categories. 581
However, the new agreement still allows manufacturers to use also vendor-specific 582
connectors. 583
9 http://ec.europa.eu/growth/sectors/electrical-engineering/red-directive/common-charger_en (accessed
on 9 October 2018) 10 https://www.digitaleurope.org/wp/wp-content/uploads/2019/01/2018.03.20-
MoU%20on%20the%20future%20of%20Common%20Charging%20Solutions%20(1)%20(1)%202.pdf
(accessed on 22 February 2019)

22
1.2.4.3 Packaging and Packaging Waste Directive 584 The Packaging and Packaging Waste Directive 2004/12/EC seeks to reduce the impact of 585
packaging and packaging waste on the environment by introducing recovery and recycling 586
targets for packaging waste, and by encouraging minimisation and reuse of packaging. A 587
scheme of symbols, currently voluntary, has been prepared through Commission Decision 588
97/129/EC. These can be used by manufacturers on their packaging so that different materials 589
can be identified to assist end-of-life recycling. The latest revision of the Packaging and 590
Packaging Waste Directive was published on 29 April 2015 with the adoption of Directive 591
(EU) 2015/720 of the European Parliament and of the Council amending Directive 94/62/EC 592
as regards the consumption of lightweight plastic carrier bags. 593
1.2.4.4 Guarantees for consumers 594 The Consumer Sales Directive 1999/44/EC regulates aspects of the sale of consumer goods 595
and associated legal guarantees. According to the 1999/44/EC Directive the term guarantee 596
shall mean any undertaking by a seller or producer to the consumer, given without extra 597
charge, to reimburse the price paid or to replace, repair or handle consumer goods in any way 598
if they do not meet the specifications set out in the guarantee statement or in the relevant 599
advertising. 600
The duration of the guarantee for new products must be at least 2 years. The minimum 601
duration is applied in the majority of EU-countries. Longer durations are applied in some 602
countries (e.g. Sweden, Ireland, the Netherlands and Finland) depending on the expected 603
lifespan of the item sold. The duration of the guarantee for second hand goods can be lower 604
(minimum 1 year). 605
The seller must deliver goods to the consumer, which are in conformity with the contract of 606
sale, and then further specifies presumption of conformity of a number of conditions. All 607
Member States introduced in their national law a "reversal of burden of proof" of at least 6-608
months. This is the period within which the lack of conformity is presumed to have existed at 609
the time of delivery and the seller is thus liable to the consumer, i.e. the seller must prove that 610
the item was not defective. After six months the burden of proof shifts to the consumer, i.e. 611
the consumer must prove that the product was defective. 612
Article 3 of the Consumer Sales Directive indicates a list of remedies that should be provided 613
to the consumer in the case of a defect (i.e. repair, replacement, reduction in price and 614
rescission of contract). In the first place, the consumer may require the seller to repair the 615
goods or he may require the seller to replace them. 616
In addition, Directive 2011/83/EU on consumer rights defines the concept of "commercial 617
guarantee" (also known as "warranty"), which can be offered by sellers or producers in 618
addition to the legal guarantee obligation. This can either be included in the price of the 619
product or at an extra cost. 620
The average consumer does not seem to be aware of the provisions set by legal guarantees. At 621
EU level, awareness of commercial guarantees lies at 67% while only 35% are also aware of 622
the legal guarantee period in their country: the majority of consumers in half of EU Member 623
States think that the legal guarantee period is a single year. Additional coverage over a wider 624
range of cases (e.g. accidental damage, water damage) is increasingly being offered to 625
consumers as a complimentary service, in sales campaigns or in return for additional payment 626
(Watson et al. 2017). 627

23
In 2018 the European Commission plans to propose "A New Deal for Consumers"11. This 628
consists in the revision of the Injunctions Directive, with a view of fully exploiting the 629
potential of injunctions by addressing the main problems faced by consumers in obtaining 630
redress, and by diminishing significant disparities among Member States in the level of the 631
use of the injunction procedure and its effectiveness. The Commission announced that the 632
revision of the Injunction Directive would be presented as a "New Deal for Consumers" 633
package together with other possible legislative actions on EU consumer law directives: 634
Providing consumers with rights to individual remedies/redress against unfair 635
commercial practices (by amending the Unfair Commercial Practices Directive); 636
Ensuring more proportionate, effective and deterrent financial penalties to tackle 637
breaches of consumer laws (by amending the Unfair Commercial Practices Directive, 638
Unfair Contract Terms Directive, Consumer Rights Directive and Price Indication 639
Directive); 640
Introducing additional transparency requirements for online platforms, especially on 641
whom consumers conclude contracts with when buying on online platforms (by 642
amending the Consumer Rights Directive); 643
Extending some consumer rights to contracts where consumers provide data instead 644
of paying with money (by amending the Consumer Rights Directive); 645
Simplifying some rules and requirements, such as information requirements and rules 646
on sending back goods and reimbursement (by amending the Consumer Rights 647
Directive and/or Unfair Commercial Practices Directive). 648
1.2.4.5 Durability and reparability 649
A press release of the European Parliament12
informed the public about the request by MEPs 650
of making goods and software easier to repair and update. Parliament highlights the 651
importance of promoting a longer product lifespan, in particular by tackling programmed 652
obsolescence for tangible goods and for software, and making spare parts affordable. More 653
specifically, recommendations include: 654
"Minimum resistance criteria" to be established for each product category from the 655
design stage 656
Extension of guarantees to fully cover periods of time in which repair is expected 657
Promotion of repairs and second-hand sales 658
Avoidance of technical, safety or software solutions which prevent repairs from being 659
performed, other than by approved firms or bodies 660
Ease of disassembly of essential components (such as batteries and displays), unless 661
for safety reasons 662
Availability of spare parts which are indispensable for the proper and safe functioning 663
of the goods 'at a price commensurate with the nature and life-time of the product' 664
Introduction of an EU-wide definition of "planned obsolescence" and of a system that 665
could test and detect the "built-in obsolescence", as well as "appropriate dissuasive 666
measures for producers". 667
11 http://www.europarl.europa.eu/legislative-train/theme-area-of-justice-and-fundamental-rights/file-
new-deal-for-consumers (accessed on 18 April 2018) 12 http://www.europarl.europa.eu/news/en/press-room/20170629IPR78633/making-consumer-products-
more-durable-and-easier-to-repair (accessed on 21 March 2018)

24
Development of an EU label to inform consumers better about product's durability, 668
eco-design features, upgradeability in line with technical progress and reparability. 669
At Member State level, the French decree 2014-1482 published in December 201413
put new 670
requirements on retailers to inform consumers about the durability of their products and the 671
availability of spare parts, under the threat of fine of 15000 EUR. Manufacturers are required 672
to deliver the parts needed for repairs within two months. The French decree also extends the 673
burden of proof on the seller in the case of a fault within 24 months. Planned obsolescence is 674
also a legal offence punishable by 300000 EUR. Planned obsolescence is defined as "all 675
techniques by which a producer seeks to deliberately limit product life in order to increase the 676
replacement rate" (Transform Together 2018). 677
Additionally, Sweden has lowered the VAT on the repair of certain products and allowed the 678
tax deduction of repair costs. However, ICT products are not yet covered in this legislative 679
context (Transform Together 2018). In Belgium, VAT is set at 6% for the repair of bicycles, 680
shoes and clothes14
. 681
Out of the legislative context, some manufactures claim to meet specific standards and 682
certifications to ensure a more durable smartphone: 683
The Galaxy S8 Active claims to be tested to achieve both MIL-STD-810G15 684
specification and IP68 certification16
. This MIL-STD (also called MIL-SPEC, 685
military standard, or MilSpecs) was developed by the U.S. Defense Department to 686
test the survivability of devices that might be used by troops in the harshest 687
conditions. Phones meet MIL-SPEC by undergoing a range of trials, among which a 688
Transit Drop Test (Method 516.6 Procedure IV). 689
A specific test method is also proposed by CTIA Certification, with a Device 690
Hardware Reliability Test Plan (version 1.1) published in August 201717
. CTIA 691
Hardware Reliability Certification is a voluntary initiative run by a trade association 692
for the American market. 693
IEC 60529 - Degrees of protection provided by enclosures (IP Code) (Table 5) is an 694
important standard to classify products based on the degrees of protection provided 695
against the intrusion of solid objects (including body parts like hands and fingers), 696
dust, accidental contact, and water in electrical enclosures. The standard aims to 697
provide users more detailed information than vague marketing terms such as 698
waterproof. This standard defines the IP codes, which are designed as a 'system for 699
classifying the degrees of protection provided by the enclosures of electrical 700
equipment'. The IP Code (or International Protection Rating, sometimes also 701
interpreted as Ingress Protection Rating) consists of the letters IP followed by two 702
digits and an optional letter. The first number (from 0 to 6) in the rating code 703
represents the degree of protection provided against the entry of foreign solid objects, 704
such as fingers or dust (Table 6). The second number (from 0 to 8) represents the 705
degree of protection against the entry of moisture (Table 7). IP67 and IP68 are the 706
13 Decree No. 2014-1482 of 9 December 2014 concerning Disclosure Requirements and Supply of
Spare Parts 14 https://www.unizo.be/advies/welke-btw-tarieven-moet-u-toepassen (accessed on 30 May 2018) 15 MIL-STD-810G available at http://everyspec.com/MIL-STD/MIL-STD-0800-0899/MIL-STD-
810G_12306/ (accessed on 12 March 2019) 16 https://insights.samsung.com/2017/08/11/drop-testing-samsungs-most-durable-smartphone-2/
(accessed on 13 February 2018) 17 https://api.ctia.org/docs/default-source/certification/ctia-device-hardware-reliability-test-plan-ver-1-
1.pdf (accessed on 7 June 2018)

25
highest level of protection claimed by some manufacturers. An IP code with an 'X' in 707
place of the first or second number means that a device has not been tested with 708
respect to the corresponding type of protection. Devices are not required to pass every 709
test below the claimed rating, although many companies test their smartphones at 710
various protection levels. Examples of how some devices are rated by manufacturers: 711
- The iPhone 8 and 8 Plus are rated with an IP67 rating, which means that they are 712
fully protected from dust (6) and can also withstand being submerged in 1m of static 713
water for up to 30 mins (7). 714
- The Samsung Galaxy S8 is rated IP68. This means that, like the iPhone 8 (and 8 715
Plus), the Galaxy S8 can withstand being submerged in static water, but the specific 716
depth and duration must be disclosed by the company, which in this case is 1.5 meters 717
for up to 30 minutes. 718
- The Sony Xperia XZ is rated with an IP65 and IP68 rating, meaning that it is 719
protected from dust and against low-pressure water jets, such as a faucet, when all 720
ports are closed. The company also specifies that the Z5 can be submerged in 1.5 721
meters of fresh water for up to 30 mins. 722
723
Table 5: meaning of IP codes used to claim the Smartphone's level of protection 724
IP
codes First Digit - SOLIDS Second Digit - LIQUIDS
IP67 Protected from total dust
ingress.
Protected from immersion between 15 centimetres and
1 meter in depth.
IP68 Protected from total dust
ingress.
Protected from long term immersion up to a specified
pressure.
725
Table 6: Solid protection levels set by the IEC 6052918
726
Level Effective
against Description
0 - No protection against contact and ingress of objects
1 >50 mm Any large surface of the body, such as the back of a hand, but no
protection against deliberate contact with a body part
2 >12.5 mm Fingers or similar objects
3 >2.5 mm Tools, thick wires, etc.
4 >1 mm Most wires, slender screws, large ants etc.
5 Dust
protected
Ingress of dust is not entirely prevented, but it must not enter in
sufficient quantity to interfere with the satisfactory operation of the
equipment
6 Dust tight
No ingress of dust; complete protection against contact (dust tight). A
vacuum must be applied. Test duration of up to 8 hours based on air
flow
727
Table 7: Moisture protection levels set by the IEC 6052919
728
18 https://www.cnet.com/how-to/how-waterproof-are-the-new-iphones-heres-what-all-the-ratings-mean/
(accessed on 13 February 2018)

26
Level Protection
against
Effective against Details
0 None - -
1 Dripping
water
Dripping water (vertically falling drops)
shall have no harmful effect on the
specimen when mounted in an upright
position onto a turntable and rotated at 1
RPM.
Test duration:
10 minutes
Water equivalent to
1 mm rainfall per
minute
2 Dripping
water when
tilted at 15°
Vertically dripping water shall have no
harmful effect when the enclosure is
tilted at an angle of 15° from its normal
position. A total of four positions are
tested within two axes.
Test duration:
2.5 minutes for every
direction of tilt (10
minutes total)
Water equivalent to
3 mm rainfall per
minute
3 Spraying
water
Water falling as a spray at any angle up to
60° from the vertical shall have no
harmful effect, utilizing either: a) an
oscillating fixture, or b) A spray nozzle
with a counterbalanced shield.
Test a) is conducted for 5 minutes, then
repeated with the specimen rotated
horizontally by 90° for the second 5-
minute test. Test b) is conducted (with
shield in place) for 5 minutes minimum.
For a Spray Nozzle:
Test duration: 1 minute
per square meter for at
least 5 minutes
Water volume: 10 litres
per minute
Pressure: 50–150 kPa
For an oscillating tube:
Test duration: 10
minutes
Water Volume: 0.07
l/min per hole
4 Splashing of
water
Water splashing against the enclosure
from any direction shall have no harmful
effect, utilizing either: a) an oscillating
fixture, or b) A spray nozzle with no
shield.
Test a) is conducted for 10 minutes. Test
b) is conducted (without shield) for 5
minutes minimum.
Oscillating tube: Test
duration: 10 minutes, or
spray nozzle (same as
IPX3 spray nozzle with
the shield removed)
5 Water jets Water projected by a nozzle (6.3 mm)
against enclosure from any direction shall
have no harmful effects.
Test duration: 1 minute
per square meter for at
least 15 minutes
Water volume:
12.5 litres per minute
Pressure: 30 kPa at
distance of 3 m
19 https://www.cnet.com/how-to/how-waterproof-are-the-new-iphones-heres-what-all-the-ratings-mean/
(accessed on 13 February 2018)

27
6 Powerful
water jets
Water projected in powerful jets
(12.5 mm nozzle) against the enclosure
from any direction shall have no harmful
effects.
Test duration: 1 minute
per square meter for at
least 3 minutes
Water volume:
100 litres per minute
Pressure: 100 kPa at
distance of 3 m
6K Powerful
water jets
with
increased
pressure
Water projected in powerful jets (6.3 mm
nozzle) against the enclosure from any
direction, under elevated pressure, shall
have no harmful effects. Found in DIN
40050, and not IEC 60529.
Test duration: at least
3 minutes
Water volume: 75 litres
per minute
Pressure: 1000 kPa at
distance of 3 m
7 Immersion,
up to 1 m
depth
Ingress of water in harmful quantity shall
not be possible when the enclosure is
immersed in water under defined
conditions of pressure and time (up to
1 m of submersion).
Test duration:
30 minutes - ref IEC
60529, table 8.
Tested with the lowest
point of the enclosure
1000 mm below the
surface of the water, or
the highest point
150 mm below the
surface, whichever is
deeper.
8 Immersion,
1 m or more
depth
The equipment is suitable for continuous
immersion in water under conditions
which shall be specified by the
manufacturer. However, with certain
types of equipment, it can mean that
water can enter but only in such a manner
that it produces no harmful effects. The
test depth and duration is expected to be
greater than the requirements for IPx7,
and other environmental effects may be
added, such as temperature cycling before
immersion.
Test duration:
Agreement with
Manufacturer
Depth specified by
manufacturer, generally
up to 3 m
9K Powerful high
temperature
water jets
Protected against close-range high
pressure, high temperature spray downs.
Smaller specimens rotate slowly on a
turntable, from 4 specific angles. Larger
specimens are mounted upright, no
turntable required, and are tested
freehand for at least 3 minutes at distance
of 0.15–0.2 m.
There are specific requirements for the
nozzle used for the testing.
This test is identified as IPx9 in IEC
60529.
Test duration: 30
seconds in each of 4
angles (2 minutes total)
Water volume: 14–
16 litres per minute
Pressure: 8–10 MPa
(80–100 bar) at distance
of 0.10–0.15 m
Water temperature:
80°C
729
Test methods are developed and used also by consumers testing organizations ( 730
Table 8) in order to test and inform consumers about different performance aspects and 731
durability of their products (e.g. battery performance, resistance to specific stresses as rain, 732
water submersion, shocks). 733

28
734 Table 8: Examples of durability tests carried out by Consumer Testing Organizations
20 735
Test Type Description
Running time
test
The running time test is performed by a robot that repeats a list of common
tasks until the battery is empty. This includes: voice calls, standby, playback
of on-line videos, taking of pictures, scrolling on digital maps.
Rain test
The mobile phones are switched on and connected to a network. A
measurement according to EN 60529 - 2000-09 is performed. A raining
appliance is used to give an even rain distribution according to IPx1 (7.2 l/h).
The phones lie horizontally on a rotary table and are irrigated for 5 minutes.
The correct function is assessed immediately, after one day, after 2 days and
after 3 days.
Water
resistance
submersion
Only devices that are claimed to be waterproof (IPxx) are tested. They are
submerged into water tube at the stated maximum depth for 30 minutes to
verify the waterproofness. The correct functioning is assessed immediately,
after one day, after 2 days and after 3 days.
Shock
resistance
tumble test
The durability against mechanical shocks (e.g. drops) is tested with a
tumbling barrel to simulate an 80 cm fall against a stone surface, as
described in EN 60065. Handsets are switched on and set into operation
(call) and are put into a tumbling drum (tumbling height of 80 cm) for 50
rotations (100 drops) and the damages are checked after each 25 and 50
rotations.
Scratch
resistance test
The scratch resistance of the phones' displays and their bodies is examined.
Therefore, a hardness test pencil (ERICHSEN, Model 318 S) is used. A
rating for the display is generated depending on the maximum load that does
not lead to permanent scratches on the device under test.
736
1.2.4.6 Other standards and testing methods 737 In response to the Commission's Mandate 543
21, the CEN/CENELEC JTC10 "Energy-related 738
products – Material Efficiency Aspects for Eco-design"22
has been created. The 739
CEN/CENELEC JTC10 aims to develop general standards on material efficiency aspects for 740
Energy-related Products, which can be used to support the policy making process. The 741
standards, planned to be published in 2019/2020, will be followed, wherever needed, by 742
vertical implementation. Six working groups have been formed: 743
WG1: Terminology 744
WG2: Durability 745
WG3: Reparability, upgradability and reusability 746
WG4: Ability to Remanufacture 747
20 Based on input from Consumers Testing Organisations
21 M/543 COMMISSION IMPLEMENTING DECISION C(2015)9096 of 17.12.2015 on a
standardisation request to the European standardisation organisations as regards ecodesign
requirements on material efficiency aspects for energy-related products in support of the
implementation of Directive 2009/125/EC of the European Parliament and of the Council 22
https://www.cenelec.eu/dyn/www/f?p=104:7:1299206399119101::::FSP_ORG_ID:2240017
(accessed on 1 June 2018)

29
WG5: Recyclability, recoverability and recycled content (including critical raw 748
materials) 749
WG6: Provision of information (including critical raw materials). 750
Other standards and testing methods on functional and performance include: 751
IEC 61960-3:2017 - Secondary cells and batteries containing alkaline or other non-752
acid electrolytes. Secondary lithium cells and batteries for portable applications. 753
Prismatic and cylindrical lithium secondary cells, and batteries made from them 754
IEC 61966-2-1:1999 - Multimedia systems and equipment - Colour measurement and 755
management - Part 2-1: Colour management - Default RGB colour space – sRGB. 756
IEC 62133-1:2017 - Secondary cells and batteries containing alkaline or other non-757
acid electrolytes - Safety requirements for portable sealed secondary cells, and for 758
batteries made from them, for use in portable applications – Part 1: Nickel systems 759
IEC 62133-2:2017 - Secondary cells and batteries containing alkaline or other non-760
acid electrolytes – Safety requirements for portable sealed secondary cells, and for 761
batteries made from them, for use in portable applications – Part 2: Lithium systems 762
ISO 3664:2009 - Graphic technology and photography – Viewing conditions 763
ISO 3741:2010 - Acoustics -- Determination of sound power levels and sound energy 764
levels of noise sources using sound pressure -- Precision methods for reverberation 765
test rooms 766
ISO 3744:2010 - Acoustics -- Determination of sound power levels and sound energy 767
levels of noise sources using sound pressure -- Engineering methods for an essentially 768
free field over a reflecting plane 769
ISO 3745:2003 - Acoustics -- Determination of sound power levels of noise sources 770
using sound pressure -- Precision methods for anechoic and hemi-anechoic rooms 771
ISO 7779:2010 - Acoustics -- Measurement of airborne noise emitted by information 772
technology and telecommunications equipment 773
ISO 9241-400:2007 - Ergonomics of human--system interaction -- Part 400: 774
Principles and requirements for physical input devices. 775
ISO 9296:2017 - Acoustics -- Declared noise emission values of information 776
technology and telecommunications equipment 777
ISO 11201:2010 - Acoustics -- Noise emitted by machinery and equipment -- 778
Determination of emission sound pressure levels at a work station and at other 779
specified positions in an essentially free field over a reflecting plane with negligible 780
environmental corrections 781
ISO 12646:2015 - Graphic technology -- Displays for colour proofing -- 782
Characteristics 783
Standard ECMA-74- Measurement of Airborne Noise emitted by Information 784
Technology and Telecommunications Equipment 785
786
1.2.5 End-of-Life of the product 787
788
1.2.5.1 Waste Directive 789 Directive 2008/98/EC, amended by Directive (EU) 2018/851, sets the basic concepts and 790
definitions related to waste management, such as definitions of waste, recycling, recovery. It 791

30
explains when waste ceases to be waste and becomes a secondary raw material (so called end-792
of-waste criteria), and how to distinguish between waste and by-products. The Directive lays 793
down some basic waste management principles: it requires that waste is managed without 794
endangering human health and harming the environment, and in particular without risk to 795
water, air, soil, plants or animals, without causing a nuisance through noise or odours, and 796
without adversely affecting the countryside or places of special interest. Waste legislation and 797
policy of the EU Member States shall apply as a priority order the following waste 798
management hierarchy: 799
1. Prevention 800
2. Preparation for reuse 801
3. Recycling 802
4. Recovery 803
5. Disposal. 804
The Directive introduces the "polluter pays principle" and the "extended producer 805
responsibility". It incorporates provisions on hazardous waste and waste oils, and includes 806
two new recycling and recovery targets to be achieved by 2020: 50% preparing for re-use and 807
recycling of certain waste materials from households and other origins similar to households, 808
and 70% preparing for re-use, recycling and other recovery of construction and demolition 809
waste. The Directive requires that Member States adopt waste management plans and waste 810
prevention programmes. These also include measures to encourage the design of safer, more 811
durable, re-usable and recyclable products. 812
Annex III of the Waste Framework Directive 2008/98/EC also defines which properties 813
render waste hazardous. 814
815
1.2.5.2 Waste Electrical and Electronic Equipment (WEEE) Directive 816 Smartphones fall in the scope of the WEEE Directive 2012/19/EU as "small IT and 817
telecommunication equipment (no external dimension more than 50 cm)". 818
According to Article 4, Member States shall encourage cooperation between producers and 819
recyclers and measures to promote the design and production of EEE, notably in view of 820
facilitating re-use, dismantling and recovery of WEEE. 821
Annex VII of WEEE lists a series of materials and components to remove and collect 822
separately for depollution at the EOL of products: 823
Polychlorinated biphenyls (PCB) containing capacitors in accordance with Council 824
Directive 96/59/EC of 16 September 1996 on the disposal of polychlorinated 825
biphenyls and polychlorinated terphenyls (PCB/PCT), 826
Mercury containing components, such as switches or backlighting lamps, 827
Batteries, 828
Printed circuit boards of mobile phones generally, and of other devices if the surface 829
of the printed circuit board is greater than 10 square centimetres, 830
Toner cartridges, liquid and paste, as well as colour toner, 831
Plastic containing brominated flame retardants, 832
Asbestos waste and components which contain asbestos, 833
Cathode ray tubes (the fluorescent coating has to be removed), 834

31
Chlorofluorocarbons (CFC), hydrochlorofluorocarbons (HCFC) or 835
hydrofluorocarbons (HFC), hydrocarbons (HC). Equipment containing gases that are 836
ozone depleting or have a global warming potential (GWP) above 15, such as those 837
contained in foams and refrigeration circuits: the gases must be properly extracted 838
and properly treated. Ozone-depleting gases must be treated in accordance with 839
Regulation (EC) No 1005/2009, 840
Gas discharge lamps, 841
Liquid crystal displays (together with their casing where appropriate) of a surface 842
greater than 100 square centimetres and all those back-lighted with gas discharge 843
lamps, 844
External electric cables (the mercury shall be removed), 845
Components containing refractory ceramic fibres as described in Commission 846
Directive 97/69/EC of 5 December 1997 adapting to technical progress for the 23rd 847
time Council Directive 67/548/EEC on the approximation of the laws, regulations and 848
administrative provisions relating to the classification, packaging and labelling of 849
dangerous substances, 850
Components containing radioactive substances with the exception of components that 851
are below the exemption thresholds set in Article 3 of and Annex I to Council 852
Directive 96/29/Euratom of 13 May 1996 laying down basic safety standards for the 853
protection of the health of workers and the general public against the dangers arising 854
from ionizing radiation, 855
Electrolyte capacitors containing substances of concern (height > 25 mm, diameter > 856
25 mm or proportionately similar volume)23
857
These substances, mixtures and components shall be disposed of or recovered in 858
compliance with Directive 2008/98/EC. 859
Article 14 allows Member States to require producers to show purchasers, at the time of sale 860
of new products, information on collection, treatment and disposal of EEE. These can 861
include: (a) the requirement not to dispose of WEEE as unsorted municipal waste and to 862
collect such WEEE separately; (b) the return and collection systems available to them, 863
encouraging the coordination of information on the available collection points irrespective of 864
the producers or other operators which have set them up; (c) their role in contributing to re-865
use, recycling and other forms of recovery of WEEE; (d) the potential effects on the 866
environment and human health as a result of the presence of hazardous substances in EEE; (e) 867
the meaning of the symbol shown in Annex IX, which must be applied to each EEE placed on 868
the market. Moreover, article 15 establishes that in order to facilitate the preparation for re-869
use and the correct and environmentally sound treatment of WEEE, including maintenance, 870
upgrade, refurbishment and recycling, Member States must take necessary steps to ensure that 871
producers provide information free of charge about preparation for re-use and treatment in 872
respect of each type of new EEE placed for the first time on the market within one year after 873
the equipment is placed on the market. 874
875
23 Substance of concern could be defined based on Annex II of RoHS Directive 2011/65EU (+
exemptions in Annex III and Annex IV); Annex XVII (restriction list) and Annex XIV (authorisation
list) of REACH; Annex III of the Waste Framework Directive 2008/98/EC

32
1.2.5.3 Extended Product Responsibility 876 To raise levels of high-quality recycling, improvements are needed in waste collection and 877
sorting. Collection and sorting systems are often financed in part by extended producer 878
responsibility (EPR) schemes, in which manufacturers contribute to product collection and 879
treatment costs24
. 880
All Member States of the EU have implemented EPR schemes on the four waste streams for 881
which EU Directives recommend the use of EPR policies: packaging, batteries, End-of-Life 882
Vehicles (ELVs) and Electrical and Electronic Equipment (WEEE). In addition, a number of 883
Member States have put in place additional schemes for products that are not directly 884
addressed in EU-wide legislation (e.g. for tyres, graphic paper, oil and medical waste) (OECD 885
2014). 886
In order to recycle waste electrical and electronic equipment (WEEE) properly and in 887
environmentally sound manner, it is necessary that old equipment is collected separately from 888
other waste. Smartphones are generally included in EPR systems together with other EEE and 889
covered as part of a larger collection and treatment ICT group. Collection networks have been 890
established at point of sales and through public waste management authorities. In Germany, it 891
has been reported by stakeholders involved in the development of this study that consumers 892
can use an "eSchrott" (WEEE) app since 2013 to display the nearest collection point for old 893
electrical appliances. 894
Costs for collection and treatment are shared by producers according to market share. In 895
countries like Germany, producers must provide an insolvency-proof guarantee upon 896
registration in order to ensure e-waste is being properly treated and recovered even if the 897
original producer is no longer in the market. In Belgium, EUR 0.05-0.09 (incl. VAT) are 898
charged for the purchase of a new smartphone with the aim to fund collection schemes for 899
used smartphones. E-waste recyclers in Belgium have to place bids on appliances collected 900
through Recupel. The winning bidder has a right to purchase 50% of the lot and others can 901
purchase the rest by aligning to the winning price. Stakeholders involved in the development 902
of this study reported that the collection scheme is highly profitable since purchase prices for 903
high-value WEEE are considerably higher than the taxes to be paid for the same amount of 904
products, at least in the case of smartphones. 905
Moreover, article 15 of the WEEE Directive requires producers to provide information free of 906
charge about preparation for re-use and treatment for each type of EEE placed on the market. 907
To this purpose, APPLIA and DIGITALEUROPE developed an online database where 908
recyclers can access all recycling information for EEE: the I4R platform25
. 909
Any seller of electrical or electronic appliances is obliged to take back old appliances upon 910
sales of new ones, whilst large distributors of electrical and electronic equipment are obliged 911
to take back WEEE free of charge and to inform consumers about the created return facilities. 912
That means that stationary/online shops with EEE sales/shipment areas of at least 400 m2: 913
Have to take back WEEE in exchange for a new product, as long as the WEEE is of 914
equivalent type and has fulfilled the same functions (1:1 Take-back) and 915
Have to take back small WEEE (no external dimension more than 25 cm) without the 916
obligation to buy any new EEE (0:1 Take-back). 917
However, many waste smartphones from private households are collected also by: 918
Public waste management authorities; 919
24 COM(2015) 614 final
25 https://i4r-platform.eu (accessed on 4 June 2018)

33
Manufacturers, telecom operators, charities, NGOs and other parties. 920
In the latter case, smartphones are typically collected for refurbishment or direct resale in 921
Europe or abroad. Some companies also established individual return systems by mail. There 922
are some programmes to mail EOL smartphones back free of charge26
27
. 923
924
1.2.6 Ecolabels and Green Public Procurement 925
Environmental Labelling and green public procurement criteria have been developed to help 926
customers and public authorities to identify and purchase smartphones that meet 927
environmental criteria. Criteria typically cover energy use, sustainable sourcing of materials, 928
product life extension, restrictions in the use of hazardous materials and conflict minerals, as 929
well as social aspects. However, the market uptake of ecolabeled products appears so far 930
limited. 931
According to stakeholders involved in the development of this study, sustainability criteria for 932
smartphones should also cover the provision of software updates. When a smartphone 933
manufacture stops providing software updates, older phones automatically become obsolete 934
due to security issues, although they can be still usable. 935
936
1.2.6.1 Blue Angel 937
Criteria for the award of the Blue Angel ecolabel to mobile phones have been setup in 938
Germany. The last version of the criteria is dated July 2017. To the knowledge of the authors 939
of this report, for the time being the label has been awarded only to Fairphone 2. 940
The Blue Ange for mobile phones considers climate protection, reduction of energy 941
consumption, increased resource efficiency and the avoidance of harmful substances and 942
waste as key objectives of environmental protection. The ecolabel may be awarded to devices 943
featuring the following environmental properties: 944
Product longevity Low user exposure to electromagnetic radiation; 945
Design that supports maintenance and recycling; 946
High-value (secondary) batteries; 947
Compliance with fundamental social standards. 948
Besides, the Blue Angel distinguishes a product whose manufacturer actively supports an 949
improved take-back and recycling scheme. Requirements are summarised in Annex I. 950
951
1.2.6.2 TCO 952 TCO Certified is an international third party sustainability certification scheme for IT 953
products. Although covering mobile phones, no model is awarded with this standard. 954
TCO is a type-1 label certifying that products fulfil requirements along its life cycle: 955
Manufacturing (social responsible manufacturing, environmental management 956
system) 957
Use phase (climate, ergonomics, health and safety, extended product life and 958
emissions) 959
26 https://www.deutschepost.de/de/e/electroreturn.html (accessed on 30 May 2018) 27 https://www.apple.com/de/trade-in/ (accessed on 30 May 2018)

34
End of life (reduction of hazardous content and chemicals, design for recycling) 960
The second and last version of criteria for smartphones is the TCO Certified Smartphones 2.0, 961
which has been released in November 2015. Requirements needed to be met by TCO 962
Certified Smartphones are summarised in Annex I. At the moment there are no models 963
awarded and registered as TCO Certified28
. 964
The launch of the next generation of TCO Certified ("Generation 8") is expected in December 965
201829
. The new set of criteria is planned to include resource efficiency aspects such as the 966
availability of spare parts for critical components (e.g. battery and display). 967
968
1.2.6.3 EPEAT 969
EPEAT is a free source of environmental product ratings allowing the selection of high-970
performance electronics. The system began in 2003 with a stakeholder process convened by 971
the U.S. Environmental Protection Agency and has grown to become a global environmental 972
rating system for electronics. Managed by the Green Electronics Council, EPEAT currently 973
tracks more than 4400 products from more than 60 manufacturers across 43 countries. 974
Manufacturers register products in EPEAT based on the devices' ability to meet certain 975
required and optional criteria that address the full product lifecycle, from design and 976
production to energy use and recycling: 977
Bronze-rated products meet all of the required criteria in their category. 978
Silver-rated products meet all of the required criteria and at least 50% of the optional 979
criteria, 980
Gold-rated products meet all of the required criteria and at least 75% of the optional 981
criteria. 982
The U.S EPEAT registry uses a lifecycle based sustainability standard developed by UL 983
(Underwriter Laboratories). In particular, mobile phones are addressed by UL 11030
. 984
Requirements applied to smartphones are listed in Annex I. The EPEAT, with 33 registered 985
mobile phone models from 4 different manufacturers (i.e. Apple, Google, LG, Samsung)31
, 986
seems the most popular eco-label for mobile phones. 987
988
1.2.6.4 iFixit 989
iFixit has developed a Reparability Score for smartphones32
(see Annex II). Points are gained 990
based on the ease of opening the device, the types of fasteners and tools used, the complexity 991
of replacing key components, upgradability and modularity of the device. 992
As part of the Horizon 2020 project Sustainably Smart, which focuses on material efficiency 993
of smart devices33
, iFixit is working to upgrade the scoring system and create a more 994
objective and robust methodology which can allow the assessment at part level. 995
996
28 http://tcocertified.com/product-finder/ (accessed on 11 July 2018) 29 http://tcocertified.com/new-generation-tco-certified/#draftcriteria (accessed on 30 May 2018) 30 epeat.net/...round/UL%20110%20Verification%20Requirements%20-%20FINAL.pdf (accessed on
23 March 2018) 31 https://ww2.epeat.net/Companies.aspx?stdid=0&epeatcountryid=0 (accessed on 30 May 2018) 32 https://www.ifixit.com/smartphone_repairability (accessed on 8 April 2019) 33 https://www.sustainably-smart.eu/ (accessed on 11 July 2018)

35
1.2.6.5 Green public procurement 997 There are examples of green public procurement requirements for smartphones in the EU and 998
worldwide: 999
The Scottish Procurement established a new suite of frameworks for the supply of 1000
ICT client devices in 2016, which included mobile phones34
. In the framework 1001
contract for Information and Communications Technology (ICT), client devices 1002
bidders must meet or exceed the EPEAT Gold or Silver compliance requirements 1003
(depending on the product category), as well as reduce packaging and extend the 1004
lifetime of their products. Award criteria also cover social aspects (e.g. work 1005
conditions and supply chain control). 1006
In the U.S., Federal government agencies and many states, provincial, and local 1007
governments are required to buy greener electronics (including mobile phones) off of 1008
the EPEAT registry, where manufacturers register their products stating the 1009
environmental performance of their products. 1010
In Japan the Law on Promoting Green Purchasing sets out criteria including 1011
provisions for material efficiency and it specifically covers mobile phones. 1012
1013
34 http://ec.europa.eu/environment/gpp/pdf/news_alert/Issue69_Case_Study_139_Scotland.pdf
(accessed on 18 April 2018)

36
2 MARKET 1014
This section provides indications about the market of the product, to better understand its 1015
penetration, the involved life cycle costs, main business practices, trends and associated 1016
consequence at material efficiency level. 1017
1018
2.1 Basic market data 1019
1020
2.1.1 Market sales 1021
Smartphones came onto the consumer market in the late 90s but only gained mainstream 1022
popularity with the introduction of Apple's iPhone in 2007 (Statista, 2018a). Smartphones 1023
have rapidly overtaken basic mobile phones and feature phones (Figure 1), as well as other 1024
small electronics as digital cameras, GPS, MP3 players, calculators, voice recorders. Every 1025
two out of three mobile phones that were shipped globally in 2014 were smartphones: the 1026
introduction of smartphones on the market has changed the behaviour of both consumers and 1027
businesses (Watson et al. 2017). 1028
1029
Figure 1: Smartphone and feature phone ownership in the UK (Source: Farmer 2015) 1030
1031
The smartphone industry has been steadily developing and growing, both in market size, as 1032
well as in models and suppliers. Almost 1.5 billion smartphones were sold to end users in 1033
2016, an increase from less than 300 million units in 2010 (Statista 2018b). 1034
The smartphone market has been reported to stop is growth in 2016. Smartphone sales 1035
between 2015 and 2016 dropped by 2% in US, Great Britain, Germany, France, Italy, Spain, 1036
China, Australia, and Japan. As the smartphone industry matures, fewer consumers are 1037
moving between brands and market growth has increasingly relied on replacing existing 1038
devices (Kantar World Panel 2017). No market data has been found to confirm this trend also 1039
for 2017-2018. Smartphone shipments worldwide are projected to add up to 1.71 billion in 1040
2020 (Statista, 2018a), a tenfold increase from 2009 although an asymptotic limit appears 1041
approached (Figure 2). 1042
Sales of smartphones in Western Europe increased from 115.4 million units in 2013 to 125.6 1043
million units in 2017 (+9%). Sales reached a peak of 135 million units in 2015, after which 1044
they decreased by 3-4% (Statista 2018c). Sales are instead increasing in Central and Eastern 1045
Europe, from 50.9 million units in 2013 to 85.2 million units in 2017 (+67%) (Statista 1046
2018d). The overall picture for Europe results in an increase of shipments from 166.3 million 1047
units in 2013 to 210.8 units in 2018 (+27%). Sales in Europe represent around 15% of the 1048
global sales of smartphones (Figure 3). 1049

37
1050
1051
Figure 2: Global smartphone shipment forecast from 2010 to 2021 (million units) (Statista 2018e) 1052
1053
1054
Figure 3: Smartphone unit shipments worldwide from 2013 to 2017 (in million units), by region (Statista 1055 2018f) 1056
1057
In terms of total value, sales of smartphones in 2017 were 56 billion USD in Western Europe 1058
(Statista 2018g) and 21.2 billion USD in Central and Eastern Europe Statista 2018h), which 1059
add to 77.2 billion USD. Total value of sales has increased constantly since 2013. 1060
Values of single units in 2017 for Western Europe and for Central and Eastern Europe would 1061
correspond to 446 and 249 USD, respectively. Compared to 2013, the single unit value has 1062
decreased by 16% in Eastern Europe while it has remained almost constant in Western 1063
Europe. The European average is 366 USD, 10% less than in 2013. 1064

38
1065
2.1.2 Market penetration 1066
The number of smartphone users is forecast to grow from 2.1 billion in 2016 to around 2.5 1067
billion in 2018 (Figure 4), with smartphone penetration rates increasing as well. Over 36% of 1068
the world's population is projected to use a smartphone by 2018, up from about 10% in 2011 1069
(Statista 2018i) and 21.6% in 2014 (Statista 2018b). Higher penetration levels are achieved in 1070
some markets and saturation may be reached soon in developed countries (e.g. in Japan 97% 1071
of mobile subscribers have smartphones) (Benton et al. 2015). 1072
1073
1074
Figure 4: Number of smartphone users worldwide from 2014 to 2020 (in billions) (Statista 2018i) 1075
1076
China, the most populous country in the world, leads the smartphone industry. The number of 1077
smartphone users in China is forecast to grow from around 563 million in 2016 to almost 675 1078
million in 2019. Around half of the Chinese population is projected to use a smartphone by 1079
2020 (Statista 2018i). This would correspond to about a quarter of all smartphone users in the 1080
world (Statista 2018a). 1081
The smallest regional market for smartphones is the Middle East and Africa, where 1082
smartphone penetration will stand at an estimated 13.6% (Statista 2018b). The highest 1083
penetration rates are instead registered in Western Europe and North America. It is estimated 1084
that in 2018 about 64% of the population of those regions will own a smartphone. Market 1085
penetration has increased significantly in the last years in both regions: from 22.7% in 2011 in 1086
Western Europe, and from 51% in 2014 for North America (Statista 2018b, 2018j). 1087
Smartphone penetration per capita in Central & Eastern Europe has been estimated to increase 1088
from 13.3% in 2011 to 58.2% in 2017. Penetration rates appear significant in the most 1089
populated countries of Europe: 1090
The number of smartphone users in France was estimated to reach 43.35 million in 1091
2017. From 2015 to 2022 the number of smartphone users is expected to grow by 1092
17.68 million users (+26%). Most individuals without a smartphone still own a 1093
regular mobile phone and only 7% of the population own no type of phones (Statista 1094
2018k). In relative terms, the share of monthly active smartphone users is projected to 1095
increase from 59% of the total population in 2016 to 78.5% in 2022 (Statista 2018k). 1096

39
The number of smartphone users in Germany was estimated to reach 55.46 million in 1097
2017 (Statista 2018l). In relative terms, the share of monthly active smartphone users 1098
is projected to increase from 61% of the total population in 2016 to 78.5% in 2022 1099
(Statista 2018m). 1100
The number of smartphone users in Italy was estimated to increase from 26.8 million 1101
in 2015 to 31.5 million in 2017 (Statista 2018n). In relative terms, the share of 1102
monthly active smartphone users is projected to increase from 46% of the population 1103
in 2014 to 65% in 2021 (Statista 2018o). 1104
The number of smartphone users in Spain was estimated to reach 30.3 million in 1105
2017. From 2015 and 2021 the number of user is expected to grow by 7.7 million to 1106
34.3 million users (+16%) (Statista 2018p). In relative terms, the share of monthly 1107
active smartphone users is projected to increase from 59% of the population in 2016 1108
to 72% in 2022 (Statista 2018q). 1109
The number of monthly active smartphone users in the United Kingdom (UK) is 1110
projected to grow steadily from 41.09 million in 2015 to 53.96 million in 2022 1111
(Statista 2018r). In relative terms, the share of monthly active smartphone users is 1112
projected to increase from 62% of the population in 2014 to 78% in 2022 (Statista 1113
2018s). 1114
However, ownership differs across age groups. For example, 88% of 16-24 year olds owned 1115
smartphones in 2014 in the UK, compared to 14% of those over 65 (Benton et al. 2015). 1116
2.1.3 Market shares by vendor 1117
Until the first quarter of 2011, Nokia was the leading smartphone vendor worldwide with a 1118
24% market share (Statista 2018a). As represented in Figure 5, the leading smartphone 1119
vendors in 2016 were Samsung and Apple, with about 20-25% and 15% of the share 1120
respectively, followed by Huawei, OPPO and Vivo (IDC, Statista 2018i). Other prominent 1121
smartphone vendors include Lenovo and Xiaomi (IDC, Statista 2018a). At the end of 2017, 1122
Apple had a worldwide market share of 19%, surpassing Samsung (Statista 2018t). 1123
China is not only home of three of the top smartphone vendors (Huawei, Lenovo and 1124
Xiaomi), but it is also the largest smartphone market in the world (Statista 2018u). Shares 1125
vary depending on the country and the year considered. For example, in the UK the most 1126
popular mobile device vendor has been Apple since 2010, which had a total market share of 1127
49% in the first eight months of 2017. In January 2017, the total market share of the Apple 1128
iPhone 7 Plus in terms of total smartphone sales in the UK was higher than all others (Statista 1129
2018s). 1130
1131
Figure 5: Worldwide Smartphone Company Market Share from 2014 to first quarter of 2017 (Share in Unit 1132 Shipments) (IDC) 1133

40
1134
2.1.4 Market shares by operating system 1135
Google's Android is the clear leader among operating systems with a global market share of 1136
more than 80%. Apple's operating system iOS is its main competitor, accounting for about 1137
15% of the share (Statista 2018a). The two operating systems amounted to 352.67 million 1138
Android units and 77.04 million iOS units being shipped in the final quarter of 2016 (Statista 1139
2018e) (see also Figure 6, Figure 7, Figure 8). There are however differences between 1140
regional markets; in the United States for example, the market is almost equally divided 1141
between Android and iOS (Statista 2018v). 1142
Microsoft's Windows Phone is another smartphone operating systems on the market. 1143
Symbian, which was used extensively on mobile phones and early generations of smartphones 1144
by leading manufacturers, such as Samsung, LG, Motorola and Nokia, was a dominant player 1145
on the market in 2009 and 2010. Due to the growing popularity of Android, which most major 1146
smartphone manufacturers adopted as their OS of choice, and Nokia's partnership with 1147
Windows Phone, which began in 2011, Symbian was pushed off the market in 2014 (Statista 1148
2018v). It has been also reported by stakeholders involved in the development of this study 1149
that Blackberry stopped shipping products with Blackberry 10 in 2015 and switched to 1150
Android. 1151
Although the main producers of operating systems are based in the U.S., the Chinese 1152
smartphone industry may dominate the market in the future: China could control about a third 1153
of the smartphone market in 2017 (Statista 2018e). 1154
1155
1156
Figure 6: Global smartphone sales to end users by operating system from 1st quarter 2009 to 2nd quarter 1157 2017 (in million units) (Statista 2018w) 1158
1159

41
1160
Figure 7: Global market share held by the leading smartphone operating systems in sales to end users 1161 (Statista 2018z) 1162
1163
1164
Figure 8: Installed base of smartphones by operating system from 2015 to 2017 (in million units) (Statista 1165 2018aa) 1166
1167
2.2 Key actors 1168
Different actors play an important role in the smartphone business: 1169
Mobile phone producers, which have a direct influence on the design and servicing of 1170
smartphones (Watson et al. 2017). The landscape of producers is characterised by the 1171
large established global companies such as Apple, Samsung, Sony and Nokia35
. Start-1172
35 Nokia’s mobile phone section was bought by Microsoft and ran on a Microsoft operating system, but
announced that production would seize in summer 2017. Meanwhile, Finnish company HMD began
production of Nokia-branded Android phones in 2014

42
up companies, such as Fairphone, that have sustainability as a core element of their 1173
business, are gaining popularity although their market share is still quite small. 1174
Software producers, which make business through the use of a device (e.g. Google, 1175
Apple, and other digital services and app developers) and have interest in securing 1176
agreements with hardware providers and providing up-to-date software along the 1177
lifetime of smartphones to avoid the installation of a different operating system 1178
(Benton et al. 2015). 1179
Retailers, which are among the biggest providers of mobile phones, which can 1180
influence customers towards certain business models, and which can enter 2nd
-hand 1181
markets (Watson et al. 2017). Many EU countries also oblige retailers under specific 1182
conditions (e.g. size of shop) to provide a collection point for WEEE36
. For large 1183
retail chains of electronics and white goods, sales of mobile phones represent a minor 1184
element of total turnover, however these sales are growing in importance. For more 1185
specialised retailers the share of turnover represented by phone sales can be as high as 1186
80%, with the remaining 20% represented by reparations, tablets or accessories. 1187
Network service providers, which are large sellers/providers of mobile phones which 1188
they sell via subscriptions of network services to attract and keep customers (Watson 1189
et al. 2017). They can have a strong influence over how often customers upgrade their 1190
telephones, but also have relevance to warranties, repair and refurbishment processes. 1191
The range of models via which network service providers are offering mobile phone 1192
upgrades have been diversifying rapidly over the past few years in global markets and 1193
now can include leasing and buy-back upgrades. Sales of phones do not directly 1194
generate profits for the service providers (some service providers even claim it is a 1195
cost). The providers' main turnover is via data and network services and subscriptions 1196
for these. 1197
Mobile phone repairers, which are more and more frequent to find. Phone 1198
producers/electronics retailers increasingly demand that repair shops are certified in 1199
order to activate product warranties (Watson et al. 2017). However, there is also a 1200
wide range of repairers ranging from authorised, through unauthorised but above-1201
board repairers, to grey actors. For repair companies, repair of mobile phones is in 1202
general a large part of the business representing up to 95% of the turnover. However, 1203
accessories are of increasing importance (up to 80% of turnover for a company). 1204
Refurbishers and 2nd
-hand sellers, which commercialise 2nd
-hand IT with warranties 1205
(Watson et al. 2017). These can be single shops, as well as chains. Market is 1206
expanding as smartphone prices increase. There is also an overlap between 1207
companies involved in mobile phone repair and 2nd
-hand sales. 1208
1209
1210
36 For instance, in Spain, shops with a surface larger than 400 m2 must accept small electronic devices
(as smartphones) with no burden for customers (https://www.ecolec.es/sociedad/que-hago-con-el-raee/,
accessed on 21 March 2018)

43
2.3 Costs 1211
1212
2.3.1 Purchase price 1213
Statistics available online (Statista 2018ab) indicate that the average selling price for 1214
smartphones in Europe was 366 USD in 2017 (310 USD as worldwide average in 2014). This 1215
would correspond to about 320 EUR37. 1216
Over the last few years, mid-range smartphones accounted for about 40-50% of all 1217
smartphone shipments, while low-end's share varied between 26-34% and high-end held from 1218
20-28% of the share. Smartphones that cost less than 150 USD (about 130 EUR) are 1219
considered low-end models. Mid-range smartphone retail prices vary from 150 USD to 550 1220
USD. Any smartphone above 550 USD (about 480 EUR) fits in the high-end category 1221
(Statista 2018ab). 1222
Since 2010, the average selling prices of smartphones worldwide has varied within the mid-1223
range category. In 2010, customers paid, on average, 440 USD for a smartphone, the highest 1224
price over the last six years. The average selling price of smartphones worldwide was 333 1225
USD in 2013, 310 USD in 2014, and 305 USD in 2015, with further reductions predicted for 1226
the future years (Statista 2018ab), as also shown in Figure 9. 1227
1228
1229
Figure 9: Average selling price of smartphones worldwide from 2010 to 2016 (in USD) (Statista 2018ab) 1230
1231
The average selling price for an Android smartphone was 231 USD in 2015. In comparison, 1232
Blackberry smartphones costed about 348 USD and Windows Phones had an average selling 1233
price of 247 USD in the same year. By 2018, Windows Phones are projected to become the 1234
most affordable smartphones, with an average selling price of 195 USD. Android 1235
37 Considering an exchange rate of 0.8712 EUR / USD on 9 October 2018
(https://www.ecb.europa.eu/stats/policy_and_exchange_rates/euro_reference_exchange_rates/html/eur
ofxref-graph-usd.en.html)

44
smartphones are forecast to cost 202 USD by 2018. iPhones have the highest average selling 1236
price: the average cost of an iPhone in 2015 was 652 USD. A decline in the average selling 1237
price of Android smartphones (202 USD) and iPhones (610 USD) is expected by 2018 1238
(Statista 2018ab). 1239
According to Counterpoint Research (2016), more than half of the Australian, Chinese, 1240
German and Saudi smartphone users revealed that they would be willing to spend more than 1241
400 USD to replace their current device. More than one third of German and Australian users 1242
would be willing to spend more than 500 USD in their next smartphone purchase. Apple 1243
dominates the installed base in both countries, and more than 85% of the Apple users would 1244
not switch brands. Willingness to pay more than 400 USD significantly decreases in the other 1245
countries investigated in the survey (30% in Thailand, 27% in South Africa, 23% in Malaysia, 1246
13% in Japan, 5% in India). 1247
Globally, the average value of 2nd
hand smartphones could be estimated to be around 140 1248
USD per device (Watson et al. 2017). A study financed by WRAP (Culligan and Menzies 1249
2013) investigated more in detail the value of electronics for trade-in and re-sale. Although 1250
not covering smartphones, the study analysed tablets, which can be considered, to some 1251
extent, as a proxy for smartphones. The study provides indication about the depreciation of 1252
electronic devices (Table 9). Like most new consumer items, most value is lost in the first 1253
year with depreciation slowing over subsequent years. For example, the residual value could 1254
be on average: 1255
54% of the original price for 1 year old product 1256
32% after 2 years 1257
20% after 3 years. 1258
Trade-in could be no longer economic after 4-5 years. 1259
1260
Table 9: Depreciation of tablets from year to year (Culligan and Menzies 2013) 1261
1262
1263
2.3.2 Margins 1264
The purchase price (PP) of products is given by the manufacturing costs (MC) plus the 1265
margins added, which could be simplified as follows (adapted from Boyano et al. 2017): 1266

45
PP = MC x (1+MM) x (1 + RM) x (1+VAT) 1267
Where: 1268
MC = material costs, considered to include the cost of the smartphone's parts 1269
MM = manufacturing margins, considered to include additional costs (e.g. investment 1270
and operational costs associated with manufacturing, product design, software, 1271
Intellectual Property, certifications) 1272
RM = aggregated sale margin 1273
VAT = value-added tax (e.g. 21.6% as average in the EU in 2015) 1274
PP of Fairphone 2 was reported to be about 1.5 times MC, and MM to be about 20% of MC 1275
(Fairphone 2015). MC of Galaxy S has been indicated to increase from 213 USD for the S3 to 1276
375 USD for the S9+ (+76%). Since PP would have increased instead from 599 USD for the 1277
S3 to 840 USD for the S9+ (+40%), it means that the ratio of PP to MC has decreased from 1278
2.8 to 2.238. The same source indicates that MC and PP of iPhones have increased from 174 1279
USD and 599 USD (about 3.5 times the MC) for the iPhone 3G to 370 USD and 999 USD 1280
(about 2.7 times the MC) for the iPhone X. MM could be up to 40% of MC in the case of the 1281
iPhone 539. 1282
In terms of manufacturing costs (see 1283
38 https://hipertextual.com/2018/06/precio-smartphones (Accessed on 6 March 2019)
39 https://www.digitaltrends.com/mobile/iphone-cost-what-apple-is-paying/ (Accessed on 6 March
2019)

46
Table 10, made from data reported in Statista 2018ac): 1284
Display was reported to be the most important component (20% of the total 1285
manufacturing cost), followed by apps/baseband processor (17%) and mechanicals 1286
(12%). These 3 components make together up to 50% of the manufacturing costs; 1287
75% of the total manufacturing cost is reached by adding 3 components 1288
(electromechanicals (8%), radio frequency power amplifier (RF/PA) (7%) and 1289
cameras (6%)); 1290
90% of the total manufacturing cost is reached by further including 2 additional 1291
components (user interface (5%) and power management (4%)); 1292
Other 5 components (box contents, conversion costs, blue tooth and wireless local-1293
area network (BT/WLAN), battery, glue logic & micro-controller units (MCU)) make 1294
the remaining 10% of the manufacturing costs. 1295
Such orders of magnitude find some level of confirmation on the web40 41. 1296
As commented by some stakeholders involved in the development of this study, 1297
environmental externalities (for instance related to extraction of raw materials, long-distance 1298
transportation, end-of life treatment) are not accounted in the manufacturing costs but they 1299
could cause a significant distortion of the product price compared to the "real" costs, biasing 1300
the market towards early product replacement. 1301
1302
40 https://www.digitaltrends.com/mobile/iphone-cost-what-apple-is-paying/ (Accessed on 6 March
2019) 41
https://technology.ihs.com/601100/galaxy-s9-materials-cost-43-more-than-previous-versions-ihs-
markit-teardown-shows (Accessed on 6 March 2019)

47
Table 10: Bill of materials cost for Google Pixel XL by component in 2016 (in USD) (Statista 2018ac) 1303
Part Cost (USD) %
Display 58.0 20.3%
Apps/baseband processor 50.0 17.5%
Mechanicals 35.0 12.2%
Memory 26.5 9.3%
Electromechanicals 24.0 8.4%
RF/PA 19.5 6.8%
Cameras 17.5 6.1%
User interface 15.5 5.4%
Power management 11.0 3.8%
Box contents 10.0 3.5%
Conversion costs 7.8 2.7%
BT/WLAN 5.0 1.7%
Battery 4.0 1.4%
Glue logic & MCU 2.0 0.7%
Total 285.8
1304
2.3.3 Repair/refurbishment costs 1305
Some smartphone manufacturers publish repair and/or spare part costs on their website. For 1306
example, Fairphone publishes on its website the price of smartphone's module as spare parts 1307
and claims that each module can be replaced without the need to return the entire device. 1308
Spare part price of each module, expressed as percentage of the purchase price of the 1309
Fairphone 2, is reported in Table 11. Apple instead publishes on its website the repair prices 1310
in different countries (e.g. Spain, as reported in 1311

48
Table 12). 1312
In addition, Culligan and Menzies (2013) provided indication about the impact that average 1313
refurbishment and repair costs have on the life cycle value of tablets (which can be considered 1314
as a proxy for smartphones) (Table 13). 1315
1316
Table 11: Indicative price of spare parts, reported as percentage of the Fairphone 2 purchase price42 1317
Spare part Relative price
(as % of the product's purchase price
Display 16%
Back cover 6%
Battery 4%
Charging port module 4%
1318
42 Calculated based on the information available on https://shop.fairphone.com/en/spare-parts and
https://shop.fairphone.com/en/buy-fairphone2-2/ (accessed on 5 September 2018)

49
Table 12: iPhone's repair service pricing applied by Apple in Spain43 1319
iPhone model Screen repair only (EUR) Other damages (EUR)
iPhone X 321.10 611.10
iPhone 8 Plus 201.10 451.10
iPhone 8 181.10 401.10
iPhone 7 Plus 201.10 401.10
iPhone 7 181.20 371.10
iPhone 6s Plus 201.10 391.10
iPhone 6s 181.10 351.10
iPhone 6 Plus 181.10 391.10
iPhone 6 161.10 351.10
iPhone SE iPhone 5s,
iPhone 5c, iPhone 5 161.10 311.10
iPhone 4s To consult
"the other damage" tariff 241.10
1320
Table 13: Breakdown of refurbishment cost for PC Tablets (Culligan and Menzies 2013) 1321
1322
43 https://support.apple.com/es-es/iphone/repair/service/pricing (accessed on 5 September 2018)

50
2.3.4 Overview of life cycle costs 1323
The life cycle cost information collected for smartphones and presented in the sections above 1324
is summarised in Table 14. 1325
1326
Table 14: Summary of life cycle cost information for smartphones 1327
Cost category Average value (1) (2)
Purchase price
Low-end < 130 EUR/product
Medium 320 EUR/product
High-end > 480 EUR/product
Value of the product 54% of original price after 1 year, 32% of original price after 2
years, 20% of original price after 3 years
Installation costs Not relevant
Maintenance costs Not relevant
Repair/refurbishment
costs (3)
About 15-40% of the product price for display; usually above
10% of the product price for other repairs
Disposal costs
(EUR/product)
In accordance to the WEEE directive provisions, producers fulfil
their responsibility of financing the costs of collection, treatment,
recovery and environmentally sound disposal of domestic WEEE
deposited at collection facilities. To some extent these costs are
passed over to the consumer in the final purchase price.
WEEE financing is a part of selling price, with relevant
differences across the EU. In UK the fee is not visible, in Italy the
fee is visible to trade partners, but not to consumers, in France the
fee is visible also to final consumer.
Costs also vary from country to country, logistic costs are a main
source of variability.
Manufacturers can leverage on economies of scale to ensure that
collection and treatment costs are optimised.
Note:
(1) VAT included
(2) Costs are quantified on the basis of the information collected in Section 1.3 and
considered representative for 2018
(3) Where relevant
1328
2.4 Market drivers, trends and circular business models 1329
The following market drivers and trends have been identified for smartphones: 1330
1. Quality of screen and camera are leading drivers of purchase (Kantar World Panel 1331
2017). However, also the longevity of the battery is an important feature (Benton et 1332
al. 2015, Priya et al. 2016). According to some manufacturers, customers are 1333
demanding highly portable devices with batteries that can last all day, which requires 1334
successful products to be highly integrated, thin, light, and durable to withstand the 1335
rigours of everyday use. 1336
2. Internet sales continue to increase in total market share, along with shopping through 1337
value-based websites like Amazon and eBay. In the US, a third of smartphone sales 1338
were made online in 2016, up from 27% in 2014, while 34% of purchases in Urban 1339
China were transacted online. Global trade and the rise of online retail make it easier 1340
to buy cheaper smartphones from abroad which do not necessarily need to comply 1341

51
with European standards and regulations, e.g. regarding hazardous substances, 1342
potentially causing health risks to the consumers (Transform Together 2018). 1343
3. Smartwatches were expected to become as popular as phones. These wearable 1344
smartphones have achieved good levels of penetration only in some markets (e.g. 1345
16% in the US, 9% in Europe). The brands experiencing significant success are those 1346
which focused on individual needs through niche products, rather than on a fit-all-1347
purposes device. Wearables appear to be appealing to consumers interested in 1348
monitoring health parameters and track their performance, but do not have gained 1349
much application beyond that (Kantar World Panel 2017). The use of fingerprint 1350
readers and other biometric identifiers (e.g. eye, face recognition) is instead expected 1351
to continue increasing (Deloitte 2016). A more disruptive technology could be the 1352
introduction on the market of foldable phones with flexible displays44.
1353
4. Virtual reality (VR), augmented reality (AR), artificial intelligence (AI), and virtual 1354
assistants may produce a big impact, and several companies are investing in this 1355
direction (e.g. Google's Daydream VR and Project Tango, Facebook's Oculus, 1356
Samsung's Gear VR, Asus' Zenfone AR, Microsoft's HoloLens, HTC's Vive VR, 1357
Apple's AR) (Kantar World Panel 2017). As mobile VR/AR grows, screen size will 1358
remain at the top of the feature preference list, since delivering the most realistic user 1359
experience relies on devices with large AMOLED screens. This fits with the current 1360
market trend towards the sales of screens above 5". However, the high-resolution 1361
requirements and AMOLED screens present a challenge to manufacturers wanting to 1362
lower their cost of production (Kantar World Panel 2017). 1363
5. Services may play a more important role in particular those related to multimedia 1364
streaming (e.g. music, videos, TV) (Kantar World Panel 2017). Morever, there is a 1365
recent trend towards storing and process information remotely in the cloud (e.g. 1366
Dropbox, Google Docs). Offloading tasks to the cloud means older hardware can be 1367
used, including second-hand devices. More durable hardware could be helpful, and 1368
performance diagnosis software would need to be integrated to ensure that the agreed 1369
service commitments (e.g. speed to load webpages) were met (Benton et al. 2015). 1370
6. In June 2016, the first 500 megabit per second (Mbit/s) mobile broadband services 1371
were launched in South Korea, with a gigabit per second (Gbit/s, equivalent to 1,000 1372
Mbit/s) service planned for 2019. Delivering 1 Gbit/s connection over a mobile 1373
network is a significant technological achievement. However, this can come with 1374
questions over the actual need, and commercial viability, of such high speeds. Over 1375
half of UK adults have a 4G connection, and this already offers peak headline speeds 1376
of over 300 Mbit/s across parts of the UK. This headline speed is higher than the 1377
maximum speeds available from the majority of active fixed broadband connections. 1378
A 2 Mbit/s connection is sufficient to deliver a high-definition television image to a 1379
40 inch screen, and even a 20 Mbit/s connection is more than sufficient to download 1380
high-definition videos to a five-inch smartphone screen. Although a large household 1381
might have many bandwidth-consuming devices (e.g. multiple TV sets) which might 1382
have an aggregate demand close to 1 Gbit/s at peak times, smartphones are owned 1383
and used by individuals, and typical usage does not need for 1 Gbit/s. There is no 1384
consumer application that currently requires a Gbit/s connection to a mobile phone 1385
and there are no websites, at the moment, that can transfer data at 1 Gbit/s (Deloitte 1386
2016). On the other hand, the fast development of mobile broadband services is a 1387
critical factor for determining the obsolescence of devices. Vodafone, for example, is 1388
44 https://www.androidauthority.com/best-foldable-phones-922793/ (Accessed on 6 March 2019)

52
planning to shut off its 3G network in 2020, with the potential cut-off of many 1389
smartphones from data services45. 1390
7. Sales of smartphones could stop to increase, especially in developed economies, also 1391
because of the relatively high price of new smartphones, compared to the 1392
technological innovation brought by new models. This could result in lower 1393
replacement/upgrade rates, or longer times of use of the device from the other side 1394
(Watson et al. 2017). 1395
8. Early upgrade programmes were designed by retailers to convince consumers to 1396
upgrade their devices on a frequent basis – usually every 12 months – improving 1397
revenues and keeping customers locked into a specific smartphone vendor and 1398
carrier. However, these programmes did not result being attractive to consumers, also 1399
due to the fact that the market is saturated and offering no disruptive but similarity 1400
competitive technologies. Some manufacturers (e.g. Apple and Samsung) now offer 1401
branded upgrade plans directly to consumers, but sales from these channels remain a 1402
small part of the overall smartphone business (Kantar World Panel 2017). This is now 1403
being challenged by rising demand for SIM-only services and reluctance to accept 1404
long binding periods (Watson et al. 2017). 1405
9. Businesses increasingly have to compete on price and user experience rather than 1406
impressive features to attract and retain customers (Benton et al. 2015). Quality of 1407
materials and design has become an important area of innovation also for low and 1408
mid-range devices, where full metal and glass designs can be now found (Kantar 1409
World Panel 2017). The apparent tendency to all-glass, bezel-free smartphones could 1410
increase the area of the phone that is susceptible to cracks and breakages46. 1411
10. Premium market saturation and slowing pace of technology change can also be an 1412
opportunity for the 2nd
-hand market (Benton et al. 2015). Repair, refurbishment and 1413
2nd
-hand sales are growing in association with take-back/buy-back schemes operated 1414
by producers/retailers/network service providers (Watson et al. 2017). 2nd
-hand 1415
premium devices from developed countries can compete with low-end and mid-tier 1416
devices in developing countries, where there is still only 10% smartphone penetration 1417
of the mobile market, and projections indicate rapid growth rates will continue, 1418
especially in urban areas. Penetration may be further boosted by prices falling, e.g. 1419
smartphones costing less than 100 USD or even less than 50 USD (Benton et al. 1420
2015). 1421
11. Due to consumers' increasing dependence on smartphones, a strong demand for rapid 1422
repair services (under one hour) has developed in recent years. Fast-repairers are 1423
experiencing significant growth and require physical repair shops. Phones could be 1424
borrowed to consumers for longer repairs. This could be enabled by increasing 1425
reliance on "cloud off-loading" to allow easy transfer of data to a temporary borrowed 1426
phone. 1427
12. More attention is paid by manufacturers on durability and reparability aspects in the 1428
design stage also to reduce the warranty costs (Watson et al. 2017). 1429
In this context, business strategies undertaken in the smartphones market can be divided in 1430
two main groups: 1431
45 https://www.gsmarena.com/vodafone_netherlands_will_kill_its_3g_network_in_2020-news-
28762.php (accessed on 6 June 2018) 46 https://www.theverge.com/2017/3/29/15104372/glass-screen-smartphone-design-lg-g6-samsung-
galaxy-s8 (accessed on 18 April 2018)

53
Some are focusing their R&D and marketing efforts on the upgrade of models and the 1432
integration of new technological features; 1433
Others are contributing to the development of circular business models (Watson et al. 1434
2017) that can allow increasing / retaining / recovering the product's value (e.g. by 1435
extending the longevity of the smartphone and/or facilitating its take-back, repair, 1436
refurbishment and resale). 1437
Circular business models can in general cover: 1438
Design of the product and provision of extended support and accessories: 1439
Reuse-promoting activities and markets: 1440
The growth in circular businesses is leading to partnerships and interactions across the value 1441
chain between sellers of phones (producers, retailers, network service providers), repairers, 1442
2nd
-hand sellers and refurbishers. At the same time, some service providers are developing in-1443
house refurbishment and repair services (Watson et al. 2017). No model can be considered as 1444
the best one, being all options potentially contributing to improve the resource efficiency of 1445
smartphones. 1446
1447
2.4.1 Design of the product and provision of extended support and 1448
accessories 1449
The design of smartphones can potentially integrate the use of more sustainable materials and 1450
the consideration of durability, reparability and upgradeability aspects (for hardware, software 1451
and firmware). The selection of more sustainable materials can contribute to mitigate the 1452
environmental impacts of smartphones47
. However, consumers seem more interested in the 1453
reliability of electronic products and in saving costs (Watson et al. 2017). This calls for design 1454
approaches aimed at ensuring a satisfactory use of smartphones over time (by reducing the 1455
likelihood of failures) and facilitating their disassembly, repair and upgrade. 1456
Some companies have advertised their smartphones showing how their products are tested 1457
and remanufactured. However, there are currently no minimum quality standards available at 1458
EU or national level. Other companies have explored the concept of modular phone (e.g. 1459
Google, ZTE, Puzzlephone, Fairphone) (Watson et al. 2017), although only Fairphone and 1460
Shiftphone48, 49, 50
seem to have been able to bring it to the market. 1461
The lifetime of smartphones can be extended also through accessories (e.g. new covers) 1462
which can protect the device from damages and/or give them a new look (which could 1463
possibly reduce the likelihood to replace the phone with a new model). 1464
Apart from hardware considerations, design of smartphones also concerns firmware and 1465
software issues (Watson et al. 2017). The availability of extended support is an essential 1466
condition for ensuring the functionality of smartphones over time and reducing the risk of 1467
47 More sustainable materials generally refer to material options that are assessed as being less critical
with respect to environmental, economic and social issues. In practice, these can for instance include, if
supported by evidence: recycled or bio-based materials, materials that do not pose any social or
chemical concerns, materials characterised by a lower embodied carbon/energy. 48
https://www.theverge.com/2016/9/2/12775922/google-project-ara-modular-phone-suspended-
confirm (accessed on 6 June 2018) 49
https://www.techradar.com/news/they-were-supposed-to-be-the-future-so-why-havent-modular-
phones-taken-off (accessed on 6 June 2018) 50 https://www.shiftphones.com/en/ (accessed on 8 April 2019)

54
replacing prematurely the device. This can include the provision of spare parts, 1468
firmware/software updates, and online support, as well as the availability of features 1469
facilitating the transfer and deletion of data, and the restoration of passwords and settings. 1470
Such characteristics can also have an influence over the resale value of smartphones (Benton 1471
et al. 2015). 1472
The implementation of design approaches aimed at promoting the use of smartphones over 1473
time could be stimulated also through extended guarantee policies (Watson et al. 2017). 1474
A more detailed description of key design aspects is provided in section 4. 1475
1476
2.4.2 Reuse-promoting activities and markets 1477
When a failure cannot be avoided, smartphones can be repaired and re-used by the same or a 1478
new user. The same occur when discarded devices are collected. In both cases a smartphone 1479
can be either refurbished, to make it again fully functional, or remanufactured, to restore it to 1480
original "as new" conditions51. In any case, reuse of products and recovery of parts avoid the 1481
production of new parts. 1482
Repair activities are attractive for smartphones because of the relatively high price of the 1483
product. In recent times, several examples of small, independent services can be found, 1484
besides officially authorised networks, which can offer repair training and services, used 1485
devices and parts. Access to repair manuals, diagnostic tools, original components, and 1486
specialised repair equipment is in some cases restricted to authorised centres only. 1487
Cooperation with independent repairers can be limited by factors as: safety, guarantee and 1488
quality issues related to customer satisfaction and producer liability, intellectual property 1489
rights, competition in the repair market. The unavailability of original spare parts can in 1490
particular result in the purchase of 2nd
hand smartphones to cannibalise for components, or in 1491
the use of compatible parts, of the same or lower quality, from other sources. By not issuing 1492
original parts, producers could be undermining the quality of repairs made through 1493
independent channels and losing a potential source of income (Watson et al. 2017). However, 1494
manufacturers pointed that other important elements to take into account include: the training 1495
of repairers and the control over the quality of the repair operation, as well as contractual 1496
issues. 1497
Repair operations undertaken by independent repairers could compromise the consumer's 1498
warranty. However, from another perspective, they can avoid the return of functional products 1499
to manufacturers and retailers (Benton et al. 2015). The possibility to apply a warranty on 1500
repaired products would be important to build trust and deliver a good service, especially for 1501
repairers that are not certified by manufacturers. Repair services are also challenged by the 1502
cost of work, which could be counter balanced through the implementation of lower VAT or 1503
tax breaks (Watson et al. 2017). 1504
The circular business model that seems to be most widely implemented is the take-back and 1505
buy-back of used phones and their remanufacturing/refurbishment for resale and/or 1506
revalorisation of their parts (Watson et al. 2017). The majority of the value of devices lies in 1507
their highly engineered parts, rather than raw materials (Figure 10). This means that this route 1508
is more valuable than recycling. Opportunities for the re-use of parts include the use of older 1509
screens and cameras in low cost devices, and the use of batteries to power LED lighting 1510
(Benton et al. 2015). 1511
51 When the product is considered a waste, it is referred to as "preparation for reuse"

55
1512
Figure 10: Contribution of materials and parts to the total product price for new and 2nd hand phones 1513 (Benton et al. 2015) 1514
1515
Devices which are still relatively new can be reused internally by manufacturers. Older 1516
devices can be sold in 2nd
hand markets (Benton et al. 2015). The market for 2nd
hand mobile 1517
phones has been growing since the early 2000s in developing countries. It is only more 1518
recently with smartphones that 2nd
hand markets have become more important also in 1519
developed countries (Watson et al. 2017). The 2nd
hand market of smartphones is expected to 1520
rise globally from 53 million in 2013 to 257 million in 2018. However, old devices are sold or 1521
traded only in 12% of upgrades. The reuse of smartphones in 2018 could account for about 1522
8% of the global market (Benton et al. 2015). 1523
Mugge et al. (2017) suggest a positive attitude of consumers towards reused smartphones 1524
because of the perceived environmental benefits. However, the growth in the 2nd
hand market 1525
can be correlated also with the higher price of new devices. Nearly two thirds of smartphones 1526
live a 2nd
life in Germany and in the U.S., either as new sale or exchange between users. 1527
When a new high-end smartphone model is introduced, previous models become available on 1528
2nd
hand markets. Best quality used goods are re-circulated in domestic markets, while lower 1529
quality goods go to markets with lower purchasing power (Watson et al. 2017). 2nd
hand 1530
smartphones can be competitive with mid-to-low end devices: for instance, the Moto E had 1531
great success in 2012, in part because it was retailed for 90 GBP (130 USD), but the 2-year 1532
older Galaxy S3 had slightly superior specifications, and sold on eBay for 70-140 GBP (see 1533
Figure 11). Makov et al. (2019) highlight that depreciation can vary depending on the brand 1534
and the perceived quality. 1535
1536
1537
Figure 11: Specifications of two similar smartphones sold in the UK in 2012 and 2014 (Benton et al. 2015) 1538

56
1539
While some producers are fully engaged with international refurbishment and resale 1540
companies, others fear that uncontrolled resale could damage their image through the sale of 1541
low-quality 2nd
-hand versions of their phones. This problem seems to have been reduced with 1542
the establishment of large, international refurbishing companies. However, some refurbishers 1543
find that the supply of take-back phones is too limited and that better methods for marketing 1544
and incentivising consumers to return their phones should be developed. A retailer can act 1545
both as an official WEEE collector for discarded mobile phones, and in a separate take-back-1546
and-buy channel, where they purchase used phones from consumers (in the understanding that 1547
they are not waste since intended for reuse) (Watson et al. 2017). Collaboration between 1548
carriers, retailers, software providers and consumers could facilitate the recovery of devices 1549
that would be otherwise scrapped or stored away. However, it is reported that many phones in 1550
developed countries are kept at home unused (e.g. in US and UK, where unused devices make 1551
up to 58 billion USD). Between 27% and 36% of US consumers said they keep an old phone 1552
because they "don't know what to do with it"; 17% were "too lazy" to get rid of them. 1553
Consumers could be incentivised to sell their old devices by being made aware of the value 1554
the devices still have and the availability of platforms to sell them (Benton et al. 2015). 1555
Device deposits have been also introduced to promote the return of used phones to the 1556
original manufacturer either for refurbishing or for recycling52. 1557
Take-back services can allow the recovery of parts and materials, and the proper recycle / 1558
final disposal of the device. For example, remade53 is a French organization specialised in the 1559
remanufacturing of a specific brand of smartphone (iPhones). The entire process is conducted 1560
in France and includes the repair of screens (often only the glass needs replacement), 1561
motherboards and back covers. In 2017, Remade refurbished more than 600000 smartphones. 1562
These are mainly 1 year old phones supplied from leasing programmes for iPhones in the 1563
US54. 1564
However, 2nd
hand phones shipped to developing countries typically end in open landfills 1565
once they are disposed, with negative consequences for human health and the environment, at 1566
least until modern e-waste recycling facilities will be deployed there. Closing the loop55 1567
collects client's phones for reuse/recycle purposes. For each phone, a waste phone is collected 1568
from developing countries and brought back to countries with appropriate recycling 1569
infrastructures. The programme also allows manufacturers to buy and recycle old phones 1570
from developing countries for each new phone put on the market (Transform Together 2018). 1571
Refurbishment and 2nd
hand businesses are also affected by the Consumer Sales Directive. 1572
For example, sellers of 2nd
hand phones in Nordic Countries have the same minimum 1573
guarantee obligations as sellers of new phones. In practice, however, only a six month 1574
guarantee period is effectively applied in most cases. Enforcing the full guarantee period 1575
could have both negative (increase of costs) and positive (increase of consumer confidence) 1576
effects (Watson et al. 2017). 1577
Sustainable Product Service Systems (SPSS) could be an additional strategy of interest within 1578
the circular economy. The core concept of these models is that businesses retain ownership on 1579
the product and rather sell a service to consumers. SPSS can be broadly classified as (Hobson 1580
et al. 2018): 1581
52 www.shiftphones.com/en/deposit/ (accessed on 7 June 2018) 53 https://www.remade.com/ (accessed on 12 March 2019) 54 http://trendnomad.com/refurbished-phone-smarter-than-the-latest-model/ (accessed on 12 March
2019) 55 http://www.closingtheloop.eu/ (last accessed on 01/02/19)

57
1. Product-Oriented (selling a good with additional services); 1582
2. Use-Oriented (leasing or renting goods with attached services); and 1583
3. Result-Oriented (providing a service rather than just material goods). 1584
The offer of products as services provides an incentive, to the actor offering the service, to 1585
optimise their products in terms of material efficiency aspects such as their durability, 1586
reparability, upgradability, and suitability for remanufacturing. However, it should be pointed 1587
out that this does not represent by default an improvement of the material efficiency of the 1588
product (for example in case upgrades are frequently offered by providers). 1589
1590

58
3 USER BEHAVIOUR 1591
This section provides information about how consumers use and interact with the product and 1592
the technologies applied in it. This is fundamental to understand up to which point the 1593
impacts of products are influenced by users and/or inherent design and performance 1594
characteristics. 1595
1596
3.1 Conditions of use and behavioural aspects 1597
Smartphones have changed the world in a relatively short time frame (around a decade) and 1598
have become an essential tool and accessory for users. Over 36% of the world's population is 1599
estimated to use a smartphone these days and penetration per capita in Central & Eastern 1600
Europe has been estimated to be almost 60% in 2017 (Statista 2018i). 1601
The devices are used for many different purposes, and as a result have made many other small 1602
electronic devices (e.g. digital cameras) unnecessary (Watson et al. 2013). Smartphones are 1603
multifunctional devices and they need mobile telecommunication (telco) networks and the 1604
internet in order to deliver all their functions. Popularity of smartphones also increases the 1605
overall data traffic in networks. 1606
1607
3.1.1 Type of phone and age of users 1608
A majority of consumers in both developed and high-growth economies owns a mobile 1609
phone, although there are some differences in the types of mobile devices owned (Figure 12). 1610
In general, younger users are more likely to own a smartphone than older users, although 1611
there can be some exceptions (Nielsen 2013). 1612
1613
Figure 12: Use of mobile phones in different countries (Nielsen 2013) 1614
1615

59
3.1.2 Functionalities 1616
Browsing the internet and gaming are amongst the most popular activities on a smartphone 1617
across different countries (Figure 13). Voice calls remain the preferred choice of 1618
communication in some markets (e.g. Germany and Japan), although messaging is more and 1619
more popular especially in emerging Asian and African markets. Watching videos and 1620
spending time on social networks are the fifth and sixth most popular activities on a 1621
smartphone (Counterpoint Research 2016). 1622
It is reported that on average, a consumer in the US spends about 644 minutes per month in 1623
voice calls (164.5 voice call per month) and exchanges about 764 text messages (Nielsen 1624
2013). 1625
1626
Figure 13: Global daily use behaviour (Counterpoint Research 2016) 1627
1628
The use of internet in smartphones is mainly associated with search engines, checking of 1629
email accounts and visiting social networks. These are the most common activities carried out 1630
weekly with a smartphone in countries like France, Spain, and the UK (Statista 2018k, 2018p, 1631
2018s). As shown in Figure 14, the use of these services is increasing over time, as well as the 1632
use of data communication services(Deloitte 2016). 1633
1634
1635
Figure 14: Smartphone users who use data communication services weekly in the UK(%) (Deloitte 2016) 1636
1637
Interestingly, as shown in Figure 15, the use of smartphones for voice calls, which is the 1638
primary function of phones, seems to be decreasing over time (Deloitte 2016). 1639

60
1640
Figure 15: Use of smartphones for standard phone calls in the UK from 2012 to 2016 (%) (Deloitte 2016) 1641
1642
Applications are one of the most disruptive innovations of the last decade and have played a 1643
core role for the commercial success of smartphones (Figure 16). Apps tend to be most 1644
successful for tasks which are undertaken regularly (Deloitte 2016). 1645
Applications installed on smartphones devices often track user's location, contributing to 1646
higher battery drain, as well as to privacy concerns, which could be limited by disabling 1647
features when not needed. However, smartphones can also offer the opportunity to drive 1648
sustainable development through the use of certain apps. For example, applications 1649
facilitating sharing economy practices and providing information about products (e.g. 1650
environmental impacts, energy-efficiency) are becoming increasingly popular and can 1651
represent an efficient way of using a smartphone (Transform Together 2018). 1652
1653
1654
Figure 16: Top ten activities accessed in the UK when using an app or a browser (%) (Deloitte 2016) 1655
1656
Another important functionality of smartphones is their ability to take pictures (Figure 17). In 1657
the UK, for instance, it has been observed that photo taking and sharing has increased in the 1658
last years. 27% of people took photos on a daily basis in 2016, more than double than in 2015. 1659
At the same time, there has been a corresponding increase in daily photo posting to social 1660
media and sharing via instant messaging, from 5% to 12%. Videos are also becoming more 1661
and more popular, also because of faster connectivity speeds and the availability of sharing 1662
applications and social media platforms (Deloitte 2016). However, video viewing is not 1663
considered universally a full replacement of TV (Nielsen 2013). 1664

61
1665
1666
Figure 17: Photo and video taking and sharing in the UK in 2015 and 2016 (%) (Deloitte 2016) 1667
1668
With respect to other features, only 12% of users were reported to use the voice assistant in 1669
the UK in 2016, and another 21% were using the fingerprint identity verification method to 1670
log into their devices (Statista 2018r). However, more recent data for the UK market seems to 1671
indicate that the frequency of use of such services has increased significantly in the recent 1672
period (Deloitte 2018). Moreover, it has been reported by stakeholders involved in the 1673
development of this study that also other forms of identifications, as face identification, are 1674
available since 2017. 1675
Smartphones compete with other devices such as laptops and tablets for a range of 1676
applications. According to a survey conducted in the UK (Deloitte 2016), smartphones would 1677
be the preferred device for checking social networks, calling using internet, playing games, 1678
taking photos and recording videos. 1679
1680
3.1.3 Time and place of use 1681
People spend more time on their smartphones than any other device: smartphones are taking a 1682
central stage of consumer life (Figure 18). Almost half of respondents to a global survey spent 1683
more than 5 hours per day on their smartphone. Additionally, one in four users spent more 1684
than 7 hours every day on their smartphone (Counterpoint Research 2016). 1685
1686
1687
Figure 18: Time Spent on Smartphones Daily (Counterpoint Research 2016) 1688
1689

62
The use of smartphones can enhance social lives, but also comes with risks (e.g. dependency, 1690
distraction, arguments). In the UK, a tenth of smartphone owners instinctively reach for their 1691
phones as soon as they wake up, and not just to turn off their alarm. A third reaches for their 1692
phones within five minutes of waking, and half within a quarter of an hour. A similar pattern 1693
takes place at night. Two thirds of smartphone owners do not check their phones at night, 1694
however, over three quarters of smartphone owners check their phones within one hour before 1695
going to sleep; half within 30 minutes; a quarter within five minutes; and a tenth immediately 1696
before. Exposure to light, including that from a screen just before going to sleep, can confuse 1697
the brain into thinking it is still day-time, and inhibit the process of falling asleep. Screens 1698
should be turned off at least an hour before turning out the lights. Alternatively, night-time 1699
modes should be used that make screens with warmer and yellower tones instead of standard 1700
blue lights. As with most emerging technologies, consumers need to find a balance between 1701
usefulness and overuse of smartphones (Deloitte 2016). 1702
1703
3.1.4 Purchasing behaviour 1704
The main factor consumers in the UK are taking into consideration when making a decision 1705
about purchasing a new smartphone is the price, while the main reason for purchasing a new 1706
smartphone is that the consumer's current device is out of date (Statista 2018r). 1707
Environmental concerns do not seem to be a key driver of purchase for most consumers. 1708
Retailers do not report any increased interest in smartphones made from materials which 1709
embed lower environmental impacts, or modular devices which can facilitate the repair and/or 1710
upgrade of their parts. This is confirmed also by some manufacturers, who indicate that the 1711
user experience with the phone and the value for money are what really matter for most 1712
consumers (Nielsen 2013; Watson et al. 2017). 1713
1714
3.2 Causes of replacement 1715
According to a recent study (Watson et al. 2017) discarded or replaced phones are often 1716
replaced because of functional obsolescence driven by launching of new models and features, 1717
and by social expectations. However, loss of performance, failures and breakages of 1718
smartphones can still be important reasons for replacing the product in Europe. 1719
The decision on whether to repair or replace the device may depend on a number of factors, 1720
such as: type and value of the product, lifetime considerations, functionality of 1721
new/alternative products and technologies, emotional attachment. The decision can also be 1722
influenced by sociodemographic factors (e.g. age, relationship with technology, attitude 1723
towards new vs. conserving the old, social pressures). 1724
1725
Figure 19: Reasons for smartphone replacement (Watson et al. 2017) 1726
1727

63
3.3 Product's lifetime 1728
The average upgrade cycle for most smartphone buyers was 23 months in 201456
. According 1729
to the results of a global consumer survey (Counterpoint Research 2016), the average global 1730
smartphone replacement cycle was 21 months in 2016 (Figure 20). Emerging market 1731
consumers seem more assertive in replacing their device than consumers in developed 1732
markets. This could be triggered by the growth of Chinese brands offering higher 1733
specification devices at affordable prices, as well as by the rise of 2nd
hand and refurbished 1734
smartphones (Counterpoint Research 2016). In alignment with the figure just provided, 1735
another survey (Kantar World Panel 2017) indicates that the average life cycle of 1736
smartphones increased from 18.3 months in 2013 to 21.6 months in 2016 in the most 1737
populated countries of the Europe (Figure 21). Consumers of developed countries would be 1738
holding their phones longer than in the last years, perhaps as a consequence of the slower 1739
speed of innovation. 1740
1741
1742
1743
Figure 20: Average replacement cycle for smartphones in 2016 (Counterpoint Research 2016) 1744
1745
1746
Figure 21: Average time of first use of smartphones by country (number of months) (Kantar World Panel 1747 2017) 1748
1749
A review study for the German context (Prakash et al. 2015) also reports that the time of first 1750
use is 2 years for new mobile phones. This would increase to 2.5 years considering 2nd
hand 1751
use. This could be due to the fact that mobile phone contracts in Germany usually run over 2 1752
years. With the conclusion of a contract, a new model is often purchased and the old device 1753
taken out of service. Such outcomes are aligned with indications from Stiftung Warentest, 1754
56 https://www.wsj.com/articles/your-love-of-your-old-smartphone-is-a-problem-for-apple-and-
samsung-1519822801 (accessed on 1 March 2018)

64
according to which 42% of users in Germany exchange their mobile phone within 2 years. 1755
Around 16% of users change phones every 3 years, with another 12% every 4 years. Only 1756
about 20% of respondents exchange their mobile phone less frequently than every 5 years 1757
(Prakash et al. 2015). 1758
However, the lifespan of a mobile phone can range from 1.7 up to 7.99 years57, with the 1759
median reported to decrease from 4.8 to 4.6 years (-3%) between 2000 and 2005 (Bakker et 1760
al. 2014). According to data available on the website of the German WEEE registry (EAR), 6 1761
years would instead be the average time before a mobile phone reaches the end-of-life58, 1762
probably due to reuse of mobile phones and/or the storage of unused devices at home. 1763
1764
57 Encyclopedia of mobile phone behavior / Zheng Yan, editor. Information Science Reference (an
imprint of IGI Global), Hershey PA (USA). ISBN 978-1-4666-8239-9 (hardcover) -- ISBN 978-1-
4666-8240-5 (ebook) 58
German register for waste electric (WEEE registry), https://www.stiftung-
ear.de/hersteller/produktbereiche-regelsetzung-und-regeln/produktuebergreifende-arbeitsgruppe-
pbue/regelsetzung-garantiehoehe (accessed on 13 June 2018)

65
4 TECHNICAL ANALYSIS AND SYSTEM ASPECTS
This section provides technical elements for the analysis of material efficiency aspects as durability,
reparability and recyclability. These include the analysis of: key functionalities, parts and materials
used in the product; strategies to avoid/overcome typical limiting states; EOL practices. System
aspects and trade-offs are also addressed. The aim is to set the basis for the identification of a
preliminary list of design measures which can improve the material efficiency of products.
4.1 Technological aspects 4.1.1 Design and innovation Decisions taken during the design of a product can have consequences over its entire life cycle. These
can for instance address: functionalities and target levels of performance, aesthetic considerations,
type and quality of parts, their durability and disassemblability, supply, safety and recyclability of
materials. The design phase plays a key role in determining the impacts of a product. Trade-offs can
be in particular associated to different design strategies addressing material efficiency aspects as
durability, reparability and recyclability, as discussed in Section 4.7.
Mobile phones are changing every subsequent generation in terms of quality, computational power,
size of parts, and materials. The Moore's law (doubling of computational power every two years)
contributes to define the raw materials needed to produce the devices (Transform Together 2018).
Mobile phones are becoming more powerful and, consequently, the energy consumption of their parts
(e.g. chipsets and screens) increases (Transform Together 2018). Miniaturisation is also leading to use
fewer resources, expressed as overall mass, although some of them can be precious and/or critical.
Smartphones on the market can be considered to belong to the fourth generations of mobile
communication systems (Agrawal et al. 2015), while the fifth generation is going to be available
shortly. The main features of each generation are described below:
1. The first generation of mobile communication networks was introduced in 1980s and was
based on the analog 1G system. The most popular were the Advanced Mobile Phone System
(AMPS) in the US and the Nordic Mobile Telephone (NMT) and the Total Access
Communication System (TACS) in Europe. Analog systems were based on circuit switching
technology, which supported transfer speed of up to 2.4kbps and offered only voice
communication.
2. The second generation, conceived as 2G technology, was introduced in late 1980s and was
based on low-band digital data signaling. Analog technology was replaced by Digital Access
techniques such as TDMA (Time Division Multiple Access) and CDMA (Code Division
Multiple Access). The most popular 2G wireless technology is known as Global Systems for
Mobile Communications (GSM). The CDMA breaks down voice and data transmission on a
signal by codes, whereas TDMA breaks them down by time slots. The result in both cases is
an increased network capacity for the wireless carrier and a lack of interference. Transfer
speeds of 64 kbps were provided.
3. The third generation (3G) was introduced at the end of 1990s. The 3G brought disruptive
transformation in the mobile communication by providing peak data rates of at least 200
kbit/s. The most important technology was the Universal Mobile Telecommunications System
(UMTS). The UMTS uses the W-CDMA, TD-CDMA, or TD-SCDMA air interfaces. The
main components includes BS (Base Station) or nod B, RNC (Radio Network Controller),
apart from WMSC (Wideband CDMA Mobile Switching Centre) and SGSN/GGSN. The W-
CDMA gave additional advantages of high transfer rate, and increased system capacity and
communication quality. In the W-CDMA system, the data is split into separate packets, which
are then transmitted and reassembled in the correct sequence at the receiver by using the code
that is sent with each packet. The UMTS systems are designed to provide a range of data rates
(up to 144 kbps for moving vehicles, up to 384 kbps for pedestrians and up to 2 Mbps for
indoor or stationary users). The 3G allowed multimedia applications such as video and
photography, and the provision of services like mobile television, GPS (global positioning
system), video call and conferencing, high speed mobile internet access.

66
4. The fourth generation (4G) was introduced at the end of 2000s, also due to an increased
demand of data transfer. Better modulation techniques were used to improve the upload and
download rate of data. The Long Term Evolution (LTE) was the evolution of universal
mobile telephone system (UMTS). Its components are named "evolved UMTS terrestrial
radio access" (E-UTRA) and "evolved UMTS terrestrial radio access network" (EUTRAN).
The basic architecture of LTE contains a separate IP connectivity layer for all the IP based
services and Evolved Packet System (EPS) which handles the overall communication
procedure. Since LTE allows for inter-operation with existing systems, there are various paths
available to connect to LTE: both an operator with a GPRS/EDGE network or a Non-3GPP
systems can connect to a LTE network. LTE can have download rates of about 100 Mbps in
update rate of 50 Mbps. Higher rates can be achieved if multiple-input multiple-output
(MIMO), i.e. antenna arrays, are used. Moreover, it provides better quality of communication,
easy access to internet, streaming media, video calling services. A 5G is currently under
development which should allow, among other things, data transfer at a speed of 1 Gbps.
5. 5G is the latest generation of cellular mobile communications, which targets high data rate,
reduced latency, energy saving, cost reduction, higher system capacity, and massive device
connectivity. The first phase of definition of 5G specifications is planned to be completed by
April 2019, to be followed by commercial deployment59.
When smartphones were introduced on the market, products were innovating rapidly: the average
time new models spent on the market was 6-9 months in 2010, whilst the average shelf time was
about three years prior to 200760. However, longer update cycles could be adopted now (Watson et al
2017).
4.1.2 Functions Products are conceived to deliver certain functions. The analysis of functions (also referred to as
functional analysis in this report) is fundamental to understand the purpose of a product, identify the
parts needed and define their technical specifications. Functions of a product and their relative
importance can be analysed following the principles of the standard EN 12973:2000 – Value
Management61
.
A smartphone has been described in section 1.1.3 as follows:
It is an electronic device primarily designed for mobile communication (making phone calls,
text messaging) and use of internet services;
It can be used for long-range communication over a cellular network of specialized base
stations known as cell sites, including LTE (often also called 4G), HSDPA (3G+), UMTS
(3G) or GSM standard (2G);
It is functionally similar to wireless, portable computers (e.g. tablet PCs), since
- designed for battery mode usage, and connection to mains via an external power supply is
mainly for battery charging purposes,
- presenting an operating system (Google's Android, BlackBerry OS, Apple's iOS, Nokia's
Symbian, Microsoft's Windows Phone), WiFi connectivity, web browsing capability, and
ability to accept sophisticated applications;
59 https://en.wikipedia.org/wiki/5G (accessed on 4 April 2019) 60
http://money.cnn.com/2011/01/31/technology/new_smartphone/index.htm (accessed on 1 March 2018) 61
5 steps are defined: 1) Identification and list of functions; 2) Organisation of the functions; 3) Characterisation
of the functions; 4) Setting the functions in a hierarchical order; 5) Evaluation of the functions

67
It has a display size between 3 and 6 inches and a high-resolution touch screen interface, in
place of a physical keyboard.
Functions of a smartphone could be classified as:
Communication functions (phone calls making, text messaging, access to web services,
keyboard, touch-screen interface);
Portable operability (rechargeable battery input, duration of battery, computational features);
Multimedia functions (camera features, audio/video recording, audio/video reproduction,
screen size and resolution).
According to the information collected in the former sections 2 and 3, the following functions seem
particularly important for consumers:
Size of the screen, camera, quality aspects as reliability and screen resolution (Kantar World
Panel, 2017)
Longevity of battery, internet access, and high specification camera (Benton et al. 2015).
A classification of smartphone's functions is reported in Table 15.
Table 15: Smartphone's functions and related characteristics
Function Required characteristic
Safe access, communication and
connectivity
- Cellular Band communication
- Wi-Fi Networks Connections
- Internet Access
- Microphone and video
- Keyboard and/or touch-screen
- Near Field Communication (NFC)
- USB/cable connection
- Infrared/blue-tooth connection
- GPS connection
- Tethering
- Recognition technologies (e.g. fingerprint sensors, face
ID)
Multimedia reproduction - Functional display (size and resolution)
Integrated photo and video-camera
Portable operability - Rechargeable battery, power supply and connector
- Duration cycle of the battery
- Updatable operating system and software
Longevity - Resistance to stresses
- Longevity of battery
- Ease of repair and upgrade
4.1.3 Parts
The delivery of functions is done by parts. Smartphones is composed of between 500 to 1000 different
components, many of which are extremely small (Wiens 2014).

68
Figure 22: Parts of a smartphone: exploded view based of the Google Pixel XL62
The main parts of a smartphones are described below.
4.1.3.1 Frame and back cover
The phone is typically designed to find a balance between aesthetics and durability. Frame and back
cover are the endo- and exo-skeleton of smartphones and are typically made of metals (mainly
aluminium, copper and iron/steel alloys), plastics, glass and ceramics (Andrae 2016; Manhart et al.
2016; Proske et al. 2016).
4.1.3.2 Screen
The screen of smartphones is the interface which allows users to visualise information on their
devices. A standard three-part screen consists of a display, a capacitive layer (touch screen) and a
glass cover. For several models on the market, such parts are glued together and form one unit.
In terms of size, most displays sold in 2016 were larger than 5" (Kantar World Panel 2018).
Alternative technologies can be applied for the visualisation of information (Fossbytes 2017):
1. Liquid Crystal Displays (LCDs), where a backlight is transmitted through some polarizers and
filters and result in different colours in the display. The light is not being generated by the
display itself. When the display is black, no light gets through its crystal. However, the light
behind the display is still being generated meaning that the smartphone is still using a bit of
battery;
2. Light-Emitting Diodes (LEDs), where pixels are illuminated by light-emitting-diodes (also
known as LEDs) which produce red, green, and blue colours. The display itself is generating
the different colours. This means that no energy is used when a pixel is off and colour is
black, resulting beneficial for the battery life;
62 https://www.businesswire.com/news/home/20161025005551/en/Google-Pixel-XL-Manufacturing-Cost-Line-
Rival (accessed on 6 March 2019)

69
3. OLED (Organic Light-Emitting Diode), where pixels actually produce their own light. These
pixels are called "emissive". OLED are typically used in high-end phones although they are is
becoming popular since they have a very fast response time and allow making curved and
flexible screens, good view angles and an always-on display mode63;
4. AMOLED (Active Matrix OLED) is a type of OLED technology used in smartphones which
is more energy efficient thanks to the use of at least two thin-film transistors that control the
current flowing of each pixel.
Manufacturing costs of different display panels are reported in Figure 23. The cost of OLED displays
is relatively higher than other types of displays, however, smartphones with OLED displays are more
expensive also because they generally include also other high-end parts (e.g. camera, chip)64.
Figure 23: Manufacturing cost of different display panels65
The touch screen consists of a capacitive layer typically based on Projected Capacitive Touch (PCT)
technology. A voltage is applied to a grid to create a uniform electrostatic field. When a conductive
object touches the PCT panel, it distorts the electrostatic field of the electrodes that are nearby the
touch point. This is measurable as a change in the electrode capacitance. If a finger bridges the gap
between two of the electrodes, the charge field is further affected. The capacitance can be changed
and measured at every individual point on the grid. Therefore, this system is able to accurately
estimate the touch position (Li Du 2016).
The glass cover is the outer part of a screen. Modern smartphones feature a toughened glass
(commonly an alkali-aluminosilicate glass)66. This increases the durability of the display in terms of
scratch- and drop-resistance and ensures a clear visualisation of images. Strengthened glass panels are
getting more and more durable. Corning's Gorilla Glass 4, for example, offers twice the protection of
its predecessor (Gorilla Glass 3). Both Gorilla Glass and Apple's ion-strengthened glass have been
chemically altered via ion exchange to improve their strength. The process involves the exchange of
63 http://www.displaymate.com/Galaxy_S10_ShootOut_1S.htm#Table (accessed on 4 April 2019) 64 http://www.displaymate.com/iPhoneXS_ShootOut_1s.htm (accessed on 10 April 2019) 65 https://technology.ihs.com/603423/smartphone-display-with-notch-design-estimated-to-cost-about-20-
percent-more-ihs-markit-says (accessed on 10 April 2019) 66 https://www.androidguys.com/tips-tools/types-of-smartphone-glass/ (accessed on 27 March 2019)

70
sodium ions in the glass material with larger potassium ions under high temperature. The end result is
a material that is more impact resistant and scratch-proof than regular glass67.
Recently, a new type of glass that can heal itself from cracks and breaks has been developed. This is
made from a low weight polymer called "polyether-thioureas" and can heal breaks when pressed
together by hand without the need for high heat to melt the material68.
4.1.3.3 Battery Batteries of phones are normally based on lithium-ion (Li-ion) technology (Fossbytes 2017) and can
be removable either by end-users or only by professionals.
Lithium polymer (Li-poly) is the latest technology commercially available for smartphones where a
polymer electrolyte is used, instead of a liquid one. Li-ion and Li-poly batteries have the same
chemical composition, but one of their differences is that Li-ion batteries have a tendency to overheat
and need to have an active protection circuit to prevent overheating. Since Li-poly batteries do not
require such protection circuit they allow thinner formats of cells. Another characteristic of the Li-
poly batteries is that they do not suffer from memory effect69, 70. Li-ion batteries have a higher energy
density and cos less for their manufacturing71.
Solid-state lithium batteries could represent one of the main evolutions of Li-ion batteries for the
future (Science for Environment Policy 2018), as well as silicon anode batteries, energy-harvesting
nanogenerators, durable nanowire batteries and organic "flash" batteries72.
4.1.3.4 Electronics
The "System-on-a-Chip" or SoC (also known as an IC chip) is one the most important part of a
smartphone. This comprises the CPU (Central Processing Unit), the GPU (Graphics Processing Unit),
the modem, the display and video processors, and other electronics that turn the product into a
functional system. Most of smartphones use the same architecture from ARM73. Some companies
instead make their proprietary processors but these are compatible with ARM's system architecture
(Fossbytes 2017).
With respect to modems (Fossbytes 2017), these are communication components used in smartphones
to receive and send information. Every SoC manufacturer has its own brand of modems. The fastest
one is the Cat. 9 LTE modem. However, this can be used at its full potentiality only if the level of
speed is supported in the cellular network.
67 https://smartphones.gadgethacks.com/how-to/4-most-durable-premium-smartphones-for-clumsy-people-
0175454/#jump-comparisonchart (accessed on 23 March 2018) 68 https://www.theguardian.com/technology/2017/dec/18/smashed-cracked-phone-screen-self-healing-glass-
university-of-tokyo (accessed on 23 March 2018) 69 The "memory effect" happens when rechargeable batteries are not fully discharged between charge cycles; as
a result the battery "remembers" the shortened cycle and is thus reduces its capacity 70 https://www.themobileindian.com/news/understanding-cell-phone-batteries-5168 (accessed on 8 April 2019) 71 https://www.quora.com/Which-type-of-battery-for-smartphone-is-better-Li-Ion-or-Li-Po (accessed on 8 April
2019) 72 https://enterprisersproject.com/article/2018/10/5-mobile-phone-battery-breakthroughs-watch (accessed on 10
April 2019 73 https://www.arm.com/ (accessed on 8 March 2019)

71
4.1.3.5 Memory and storage No smartphone can function without a RAM and an internal memory storage system (Fossbytes
2017). The internal memory storage system ranges typically from 32GB to 256GB. With respect to
the RAM, most mobile devices are shipped with LPDDR3 or LPDDR4, while some high-end
smartphones are shipped with LPDDR4X RAM. LP stands for "Low-Power" and reduces the total
voltage of these chips, making them highly efficient and giving mobile phones an extended battery
life. LPDDR4 is more efficient and powerful than LPDDR3, while the LPDDR4X is the fastest, most
efficient, but expensive. Newer generations of RAM are going to be introduced, such as LPDDR5. In
terms of capacity the current RAM usually ranges between 2 GB and 8 GB. Terminating or
uninstalling unused apps can result in the availability of more RAM and can improve the performance
of a smartphone.
4.1.3.6 Firmware and software Smartphones are run through an Operating System (OS) and firmware. An operating system allows
the device to run applications and programs, therefore, bringing advanced functions that were
previously restricted to computers only (Statista 2018z). The firmware is a kind of software that
serves for specific purposes related to hardware parts.
Updates are provided by manufacturer on a regular basis to fix problems and security issues. Updates
are as important as the physical elements of a smartphone to ensure a longer life of the device and to
reduce phone replacement rates. A lack of updates might indeed make smartphones obsolete while its
hardware is still fully functioning (Watson et al. 2017).
4.1.3.7 Multimedia and connections
Multimedia-related parts include the camera and audio components as microphone, speakers, headset
connector. In particular, all smartphones come with rear-facing and front-shooting cameras. The
camera comprises up of three main parts: the sensor (which detects light), the lens (the component in
which light comes through), and the image processor. While the megapixels on the smartphone are
still an important part of the camera, they carry less importance than in the past. Instead, the primary
limiting factor is the camera sensor of the phone and how sensitive it is when light passes through the
lens. Each sensor behaves differently from smartphone to smartphone. Since smartphones have small
sensor sizes, they tend to perform badly in low-light areas. This is an area where camera sensor
manufacturers have been working to improve the performance of the device (Fossbytes 2017).
Interactivity with the user is also possible through USB ports.
4.1.3.8 Other functional parts Smartphones come with a vibration mechanism and with sensors that provide specific functionalities
(Fossbytes 2017):
Accelerometer, which is used by apps to detect the orientation of the device and its
movements, as well as allows the phone to react to the shaking of the device (e.g. to change
music);
Gyroscope, which works with the Accelerometer to detect the rotation of the device, for
features like tilting the phone to play racing games or to watch a movie;
Digital Compass, which helps the device to find the North direction, for map/navigation
purposes;
Ambient Light Sensor, which automatically sets the screen brightness based on the
surrounding light, thus helping to reduce the eyes strain and to conserve the battery life;
Proximity Sensor, which detects the proximity of the device with the body, so that the screen
is automatically locked when brought near the ears to prevent unwanted touch commands.

72
4.1.3.9 Accessories A smartphone can include a set of accessories in the sale package:
1. Headset;
2. Transfer cable;
3. External Power Supply (charger);
Instead of including a captive charger and data transfer cable, it could be more efficient to use a
detachable charger (RPA 2014). Interoperability of chargers can be ensured by the compliance with
the IEC 62684:2018 "Interoperability specifications of common external power supply (EPS) for use
with data-enabled mobile telephones" that is based on the common use of USB 2.0 Micro B
interfaces. However in March 2018 several manufacturers have signed a MoU committing, by three
years from the signature date, to produce smartphones that will be chargeable through a USB Type-C
connector or cable assembly (RPA 2014). For these purposes, the relevant EPS interoperability
standard is IEC 63002:2016 "Identification and Communication Interoperability Method for External
Power Supplies Used with Portable Computing Devices". However, an effective saving of materials
can be achieved only if the sale of EPSs is decoupled from the sales of the smartphones (RPA 2014;
Sustainably SMART 2019).
Others accessories generally not sold by the OEM but necessary for a smartphone to function properly
over time include:
Micro SD cards and micro SIMs;
Protection accessories: protective cases (also called bumpers) and screen protectors.
4.2 Materials 4.2.1 Bill of Materials Compiling a precise list of materials contained in a smartphone is difficult due to tightly protected
Intellectual Property and variations between models and manufacturers over time.
Prunel et al. (2015) indicate that the weight of mobile communication appliances can range from 60 g
(when the display size is 1.5", for a surface of 7 cm2) to 200 g (when the display size is 6.5", for a
surface of 120 cm2). However, this is beyond the scope of this study, which focuses on 4-6.5"
smartphones.
Data available for 32 models of smartphones produced by Huawei74
shows a range in weight from
142.4 g to 232 g. Battery represents around 25-30% of the product weight and together with glass and
ceramic materials represent more than 50% of the smartphone mass.
Weights of 15 models of smartphones produced by Apple75
instead ranges from 112 g to 208 g, with
an apparently higher weight for newer models. The relative weight of batteries has passed from about
25% for older models to about 40% for the newest ones. Interestingly, stainless steel is reported to be
used more than aluminium and plastics. However, a variation in the use of different materials over
time is also appreciable.
74 https://consumer.huawei.com/en/support/product-environmental-information/ (accessed on 31 January 2019) 75 https://www.apple.com/lae/environment/reports/ (accessed on 31 January 2019)

73
The weights of smartphone models from Fairphone (170 g for a size of 75.5 cm2) (Proske et al. 2016)
and Samsung76
are also included in the range described above.
Based on the available data, the weight of smartphone could be estimated approximately as 29 g per
display size inch (+/- 15%). A smartphone has been reported (Manhart et al. 2016) to have, on
average, a display size of 75.53 cm2 and a weight of 160 grams, including 39 g for the battery, and
excluding accessories and packaging.
The mass of a smartphone in general consists of metals (mainly aluminium, copper and iron/steel
alloys, but also minor quantities of other elements used for specific applications because of their
properties, including rare earth elements and conflict minerals), glass and ceramics, plastics, and other
materials (Andrae A. 2016; Manhart et al. 2016; Proske et al. 2016).
Screens are manufactured mainly from aluminosilicate glass, a mixture of aluminium oxide and
silicon dioxide, which is then placed in a hot bath of molten salt. These are pressed together when the
glass cools, producing a layer of compressive stress on the glass and increasing its strength and
resistance to mechanical damage. A thin, transparent, conductive layer of indium tin oxide is
deposited on the glass in order to allow it to function as a touch screen. Several rare earth elements are
also present in very small quantities to produce the colours displayed on the screen (Compoundchem
2014).
The majority of smartphones use lithium ion batteries. These batteries tend to use lithium cobalt oxide
as the positive electrode in the battery (though other transition metals are sometimes used in place of
cobalt), whilst the negative electrode is formed from carbon in the form of graphite. Batteries also
have an organic solvent which acts as the electrolytic fluid. The lithium in the positive electrode is
ionised during charging of the battery, and moves into the layers of the graphite electrode. During
discharge, the ions move back to the positive electrode. The battery is usually housed in an aluminium
casing (Compoundchem 2014).
A wide range of elements and compounds are used in the electronics of a phone. The main processor
of the phone is made from pure silicon, which is then exposed to oxygen and heat in order to produce
a film of silicon dioxide on its surface. Parts of this silicon dioxide layer are then removed where
current is required to flow. Silicon does not conduct electricity without being doped with other
elements; this process involves the silicon being bombarded with a variety of different elements,
which can include phosphorus, antimony, arsenic, boron, indium or gallium. Different types of
semiconductor (P or N) are produced depending on the element used, with boron being the most
common type of P-type dopant (Compoundchem 2014). The micro-electrical components and wiring
in the phone are composed mainly of copper, gold, and silver. Tantalum is also used, being the main
component of micro-capacitors. A range of other elements, including platinum and palladium are also
used. Solder is used to join electrical components together. This was usually composed of tin and lead
but in recent years lead-free alternatives have been developed, many of which use a combination of
tin, silver and copper (Compoundchem 2014).
The microphone and speaker of the phone both contain magnets, which are usually neodymium-iron-
boron alloys, though dysprosium and praseodymium are often also present in the alloy. These are also
found in the vibration unit of the phone (Compoundchem 2014).
The casing can be made of metal or plastic, or a mix of the two. Metal casings can be made of
magnesium alloys, whilst plastic casings are carbon based. The casing can often contain flame
retardant compounds. Efforts have been being made to minimise the use of brominated flame
retardants (Compoundchem 2014).
76 https://images.samsung.com/is/content/samsung/p5/sec/aboutsamsung/sustainability/pdf/2018/2018Life-
CycleAssessmentforHHPandDisplay_180831.pdf (accessed on 8 March 2019)

74
The current trend in smartphone body design seems to be towards the use of high-grade materials (as
aluminium, stainless steel or even titanium) instead of commonly used plastics and also specialty
ceramics and toughened glass are used increasingly (Triggs 2019). Environmental burdens embedded
in materials, can be higher for smartphones that have larger size and functionalities, use more
advanced chips and/or higher-grade materials.
A list of the most common materials used in smartphones is provided in
Table 16. The Bill of Materials is in general represented at elemental level, so that compounds as
alumina silicates used in display's glass, PVC and flame retardants are not addressed. Another
illustrative Bill of Materials at compound level is provided in Table 17. Additional materials are
necessary for packaging, documentation and accessories (Ercan et al. 2016) as head-set, USB-cable,
charger, including a quite relevant amount of plastic materials. Packaging (Proske et al. 2016) is
typically made of fibre (e.g. cardboard) and, to a lower extent, plastic materials77
.
With respect to the origin of materials, many smartphone materials are sourced in China, via
companies that have traditionally been reticent to reveal too much about their methods (Nield 2015).
Nevertheless, some companies like Fairphone are committed to provide transparency about their
supply chain78.
Selection of materials is a key factor for determining the environmental impacts of smartphones. For
example, it has been reported that the impact on climate change of primary aluminium is about 20 kg
CO2eq per kg of materials when produced from coal-based electricity, and this drops to about 5 kg
CO2eq per kg of materials when produced using hydro-based electricity. The carbon footprint of most
plastics is instead about 4-5 kg CO2eq per kg of material. Recycled aluminium has an even lower
impact on climate change.
Table 16: Bill of Materials at elemental level for an average smartphone (Manhart et al. 2016)
Material Common Use Content per
smartphone (g) Content in all
smartphones made
since 2007 (t)
CRM
listed
(Y/N)
Aluminium (Al) Case 22.18 157 478 N
Copper (Cu) Wires, alloys, electromagnetic
shielding, PCB, speakers,
vibration alarm 15.12 107 352 N
Plastics Case 9.53 67 663 N
Magnesium
(Mg) Case 5.54 39 334 N
Cobalt (Co) Lithium-ion battery 5.38 38 198 Y
Tin (Sn) Solder paste 1.21 8 591 N
Iron (steel) (Fe) Case 0.88 6 248 N
Tungsten (W) Vibration alert module 0.44 3 124 Y
Silver (Ag) Solder, PCB 0.31 2 201 N
Gold (Au) PCB 0.03 213 N
Neodymium
(Nd) Speakers Magnets 0.05 355 Y
Praseodyimium
(Pr) Speakers Magnets 0.01 71
Tantalum (Ta) Capacitors 0.02 142
Indium (In) Display 0.01 71 Y
77 https://www.apple.com/lae/environment/reports/ (accessed on 31 January 2019)
78 http://open.sourcemap.com/maps/57bd640851c05c0a5b5a8be1

75
Palladium (Pd) PCB 0.01 71 N
Gallium (Ga) LED-backlights 0.0004 3 Y
Gadolinium
(Gd) LED-backlights 0.0002 1 Y
Europium (Eu) LED-backlights 0.0001 - Y
Cerium (Ce) LED-backlights 0.00003 - Y
Others (glass, ceramic, semiconductors) 99.29 - Y
Table 17: Illustrative Bill of Materials at compound level for a smartphone (Andrae 2016)
Raw material Content per smartphone
(g) (%)
Iron/steel alloys (primary) 16.250 7%
Allumium alloys (primary) 8.690 4%
Copper alloys (primary) 36.250 16%
Gold (primary) 0.121 0%
Silver (primary) 0.198 0%
Nickel 1.500 1%
Tin 2.000 1%
Palladium 0.034 0%
Zinc 1.213 1%
Acrylonitrile butadiene styrene 22.500 10%
Poly(methy methacrylate) 1.875 1%
PA (Nylon) 1.625 1%
PVC 18.750 8%
Polyethylene-high-density 8.625 4%
Polyester (e.g. polyethylene terephthalate) 2.875 1%
Polycarbonate 2.625 1%
Polypropylene 1.313 1%
Polyurethane 1.625 1%
Epoxy 20.000 9%
Fiberglass 43.750 19%
Glass 33.750 15%
Total 225.569
4.2.2 Critical Raw Materials and minerals from conflict-affected and high-risk areas
Of the 83 stable and non-radioactive elements in the periodic table, more than 60 can be found in
smartphones (Manhart et al. 2016). Most of them are metals, with some of them like iron and
aluminium, available in large quantities. For others, there are potential supply concerns and risks. For
instance, some of these materials are included in the EU list of critical raw materials79
:
Cobalt is used as cathode material in Li-on battery chemistries with extended lifetime, on
average 5.38 g per device (Manhart et al. 2016). A large portion of the mined cobalt
79 COM(2017) 490 (see section 1.2.3)

76
production (around 50%) is in the DRC, where a significant amount of cobalt is mined by
unregulated artisanal and small-scale mining practices (ASM).
Tungsten is used in the vibration alert module, on average 0.44 g per device (Manhart et al.
2016).
Indium is used in displays, on average 0.01 g per device (Manhart et al. 2016).
Gallium is used in Power Amplifiers (PAs) to amplify voice and data signals to the
appropriate power level allowing their transmission to the network base-station and in LED-
backlights. The use of Gallium is on average 0.0004 g per device (Manhart et al. 2016).
16 (out of 17) rare earth elements (REE) are of relevant for smartphones. Neodymium,
praseodymium and dysprosium are used to allow smartphones to vibrate through permanent
magnet motors (also called NIB magnets); terbium and dysprosium are used in tiny quantities
in touchscreens to produce the colours of a phone display (Nield 2015). The majority of REE
production taking place in China.
Furthermore, smartphones also require conflict minerals (also referred to as 3TG = Tungsten,
Tantalum, Tin, and Gold). These materials come from areas where they are mined in conditions of
armed conflict and in which human rights abuses are common. They are then sold or traded by armed
groups. This is an issue particularly associated with the DRC80
. As described in section 1.2.3, the EU
Regulation 2017/821 establishes a Union system for supply chain due diligence of 3TG minerals and
ores that will be mandatory from 2021 for the EU importers.
Some manufacturers are currently committed in supply chain transparency and/or due-diligence on
conflict minerals. For example, Fairphone (2016) sources fairtrade certified gold for its phones and
has extended its supply chain due-diligence programmes beyond 3TG to include cobalt, as well as
Apple did (Apple 2018a). Currently 9 out of every 10 smelters in Apple's supply chain are reported to
have been verified as conflict-free or are undergoing audits. Manufacturers like Samsung, Sony,
Apple and Huawei are also members of the Responsible Cobalt Initiative (RCI)81
, which is driving the
supply chain due diligence system and standards for cobalt (Transform Together 2018). Other
responsible mining initiatives have been developed by NGOs and/or mining companies (e.g. Alliance
for Responsible Mining82
, Responsible Minerals Initiative83
, Enough Project84
, Initiative for
Responsible Mining Assurance85
, Towards Sustainable Mining Initiative86
, The Finnish Network for
Sustainable Mining87
, European Partnership for Responsible Materials88
, Global e-Sustainability
Initiative89
).
80 http://ec.europa.eu/trade/policy/in-focus/conflict-minerals-regulation/ (accessed on 8 March 2019)
81 https://www.firstcobalt.com/responsibility/responsible-cobalt-initiative/ (accessed on 8 March 2019)
82 http://www.responsiblemines.org/en/# (accessed on 18 October 2018)
83 www.responsiblemineralsinitiative.org/ (accessed on 18 October 2018)
84 https://enoughproject.org/products/reports/conflict-minerals (accessed on 18 October 2018)
85 https://responsiblemining.net/ (accessed on 18 October 2018)
86 http://mining.ca/towards-sustainable-mining (accessed on 18 October 2018)
87 https://www.kaivosvastuu.fi/finnish-sustainability-standard-for-mining-translated-into-english/ (accessed on
18 October 2018) 88
https://europeanpartnership-responsibleminerals.eu/ (accessed on 18 October 2018) 89
https://gesi.org/ (accessed on 18 October 2018)

77
Figure 24: Chemical elements in smartphones (Jardim 2017)
4.2.3 Recycled materials
Smartphones contain a wide variety of materials, often speciality metals. Recycled materials could be
used in smartphones, especially those presenting a high recycling rate like precious metals (gold and
silver), base metals and alloys (copper and steel). Unfortunately, this is not the case of REE and other
priority materials such as Indium, Gallium, Litium and Tantalum (Compoundchem 2015).
Some companies have started to pay attention on the use of recycled materials (Jardim 2017).
However, the recycled content of smartphones, and particularly of high-grade materials, still remains
relatively low (Transform Together 2018).
For most manufacturers the secondary materials use is mainly limited to plastic. Samsung uses
recycled plastic in travel adaptors (20% content of recycle plastics), in ear phone cases and in
packaging trays. The use of recycled plastic is not feasible for electrical parts of the phone according
to stakeholders of this study.
Fairphone has reported to use recycled copper and tungsten in its devices. To prioritize which
materials to tackle first, Apple has instead created Material Impact Profiles for 45 elements and raw
materials, which combine environmental, social, and supply risk factors along the value chain (Apple
2018a).
Aluminium, tin, and cobalt have been identified as priority materials for the supply of secondary
sources of materials. Regarding aluminium, Apple claims that the quality level requested in their
products can be achieved only with clean material streams. For this reason, recycled aluminium is not
mixed with other grades of scrap aluminium (Apple 2018a).
Apple has also reported to use 100% recycled tin for soldering the main logic board (Apple 2018a).
Apple finally announced its target to create a closed- loop supply chain, where products are made
using recycled or renewable materials only, and where Apple returns an equivalent amount of material
back to the global market (Apple 2018a).
Despite some progress made in closing the loop on materials, smartphone manufacturers are at least
partially reliant on virgin materials (Transform Together 2018). Sourcing and supply of recycled
materials are the main constrains.
Although EOL smartphones can be a great source of high value secondary materials, recovery of
some of the materials becomes challenging when mixed with other WEEE. According to some
manufactures another barrier to the use of recycled material is also the perception that recycled
materials are of lower quality than primary materials. The validity of this perception is variable

78
depending on the material (e.g. paperboard, plastic, glass) and the application for which it is intended
(Manhart et al. 2016).
Moreover, for materials for which there is not sufficient market availability, a higher recycled content
in products does not necessarily have a positive effect as it will likely lead to a situation where lower
amounts of secondary materials are used for other products (Manhart et al. 2016). When the market of
certain recycled materials needs to be stimulated, it could be more appropriate to quantify
recyclability targets (Cordella et al. 2019b).
4.2.4 Other substances of concern
Substances of concern are defined here as those chemicals that may have significant impact on both
humans and the global environment, independently whether they are controlled by law or not. The use
of these substances on the EU market is prohibited/restricted or gradually phased out through ROHS
directive and REACH regulation (See section 1.2.2).
The smartphone industry is currently committed to limit the use of certain substances (Jardim 2017):
1. PVC: Due to possible formation of hazardous substances from the incineration of this type of
plastic, some manufacturers have been reducing the content of PVC in the product. For
instance, Sony (2018), Fairphone90 and Apple (2018a) declared to have banned the use of
PVC in their devices.
2. Brominated flame retardants (BFRs): Plastics containing brominated flame retardants have to
be separated according to WEEE. These compounds can result in the release of highly toxic
dioxins, among other hazardous chemicals, when scrap is burned (especially in case of
rudimentary e-waste recycling operations). Because of this, industry is working to limit the
use of parts and materials containing BFRs. Sony (2018) for instance claims not to use
polybrominated diphenyl ethers, polybrominated biphenyls, hexabromocyclododecanes, in a
progressive effort of phasing out BFRs. Sony has developed a bromine-free flame retardant
for the manufacture of a polycarbonate plastic. Moreover, Sony has banned the use of tris(2-
chloroethyl) phosphate, a chlorinated flame retardant identified to carry similar risks to those
associated with brominated flame retardants, as well as phosphoric acid tris (2-chloro-1-
methylethyl) ester (TCPP) and tris (1,3-dichloro-2-propyl) phosphate (TDCPP). Also Apple,
LGE and Samsung have eliminated the use of BFRs (Jardim 2017). Moreover, other flame
retardants such as hexabromocyclododecane (HBCDD) and tetrabromobisphenol A (TBBPA)
have not been detected when specific parts of Fairphone 2 were tested91.
3. Beryllium: Copper beryllium is used in electronic and electrical connectors, battery, undersea
fibre optic cables, chips (consumer electronics and telecommunications infrastructure).
Beryllium is used as an alloying element in copper to improve its mechanical properties
without impairing the electric conductivity. Scrap generated during manufacturing in the EU
are typically sent back to suppliers outside Europe for recycling. However, beryllium
contained in the waste can end up in landfill or be down-cycled so that there is actually no
post-consumer functional recycling of beryllium neither in Europe nor in the world (Jardim
2017). Beryllium and beryllium compounds are recognized as carcinogens and they can be
released as dusts or fumes during processing and recycling. Exposure to these chemicals, even
at very low levels and for short periods of time, can cause chronic beryllium disease (CBD),
an incurable and debilitating lung disease. Beryllium is moreover included in the EU List of
90 https://support.fairphone.com/hc/en-us/articles/215392683-How-about-hazardous-materials- (accessed on 19
April 2018) 91 https://support.fairphone.com/hc/en-us/articles/215392683-How-about-hazardous-materials- (accessed on 19
April 2018)

79
Critical Raw Materials. Industry is working to avoid the use of such substances: Sony (2018)
for instance is using no beryllium compounds, and also Apple (2018a) has reported to have
eliminated Beryllium from all new product designs.
4. Antimony: this element is alloyed with lead or other metals to improve their hardness and
strength and is used in the electronics industry to make some semiconductor devices, such as
infrared detectors and diodes. Other uses include batteries, metal printing, cable sheathing.
Antimony compounds are moreover used to make flame-retardant materials, paints, enamels,
glass and pottery (CRM Alliance 2019). Antimony trioxide is recognized as a possible human
carcinogen and exposure to high levels in the workplace, as dusts or fumes, can lead to severe
skin problems and other health effects (Transform Together 2018). Antimony is also included
in the EU List of Critical Raw Materials (COM(2017) 490). Several manufacturers (e.g.
Apple, LGE, Sony, Samsung, Fairphone) have eliminated the use of Antimony (Jardim 2017).
5. Phthalates: used as softeners for PVC, some of these substances are classified as "toxic to
reproduction" and are known to be hormone disrupters. Industry is working to eliminate
specific phthalates. Sony (2018) for instance has succeeded in eliminating the phthalates
DEHP, DBP, BBP, DIDP, DNOP and DINP. Fairphone92 and Apple (2018a) have also
reported to have eliminated these substances across their product portfolio. According to the
ECHA (2013), in the specific case of DINP and DIDP, dermal exposure is not anticipated to
result in a risk for the adult population, whereas a risk from the mouthing of toys and
childcare articles with DINP and DIDP cannot be excluded.
6. Arsenic compounds: Sony (2018) has banned the use of LCD panels containing diarsenic
trioxide and diarsenic pentoxide. Also Apple (2018b) claims to have restricted the use of
Arsenic (50 ppm thresholds are set for LCD display glass, camera lens, trackpad glass,
display cover glass, antifouling agents).
7. 1,3-propanesultone: used in the battery cell electrolyte, this is a SVHC. According to the
harmonised classification and labelling approved by the European Union, this substance may
cause cancer, is harmful if swallowed and is harmful in contact with skin93.
8. Cadmium: this element can bio-accumulate in the environment and is highly toxic. The
availability of cadmium-free substitutes for batteries (e.g. lithium-ion battery technologies)
has reduced the risk of contamination by cadmium. Cadmium could be also present in
pigment stabilizer, copper alloys in electronic contacts (Apple, 2018b).
Some manufactures have implemented a Substance Control system for "Environment-related
Substances to be Controlled" (also referred to as "Controlled Substances") or "Restricted Substances"
(Sony 2019, Apple 2018b).
4.2.5 Possible measures for reducing impacts of materials
As described above smartphones are made of a broad and heterogeneous list of materials, also
including critical raw materials, minerals that could come from conflicting areas, and hazardous
substances. Sustainability of the product could be improved by:
Reducing and/or optimising the amount of materials used in the product, for example through
the application of lean designs94 and the avoidance of unnecessary accessories (as could be the
case of external power supplies supplied with new products95);
92 https://support.fairphone.com/hc/en-us/articles/215392683-How-about-hazardous-materials- (accessed on 19
April 2018) 93 https://echa.europa.eu/substance-information/-/substanceinfo/100.013.017 (accessed on 13 June 2018)

80
Increasing the amount of recycled and renewables-based materials. The recycled content can
however be limited by aspects related to regulations and standards, market availability,
technical design specifications. In terms of secondary materials, the use of recycled
Aluminium, Copper, Tin and Tungsten appears already feasible for manufacturers;
Avoiding/substituting hazardous materials with inherently safer solutions, as some
manufacturers are doing.
Any strategy addressing the use of materials should ensure the fulfilment of technical specifications
relating to the safety, performance and durability of the products. Moreover, possible trade-offs for
other material efficiency aspects should be also assessed (Cordella et al. 2019b).
4.3 Manufacture
Smartphones are complex products for which increasing computing power, display and device size,
and use of high-grade materials are demanded. Electronics are required in a smartphone (e.g.
integrated circuits (IC), printed wiring boards (PWB), batteries, or displays) which production is a
very energy intensive and pollutant process (Transform Together 2018). Environmental concerns are
also due to the high consumption of water, including ultrapure water, for the cleaning and rinsing
phases required in the production of smartphones, as well as the use of hazardous materials
(Transform Together 2018).
The majority of smartphones are produced in Asia, mainly in China (e.g. Apple, Nokia, Xiaomi,
Huawei), South Korea (Samsung), Japan (Sony), India (LG), or Taiwan (HTC). The production
deployment in some of these countries raises also some social concerns about the working conditions
associated to exposure to harmful chemicals, child labour exploitation, work overload and low wages
(Transform Together 2018).
Some manufacturers are committing to reduce the impact of the production stage. For instance,
Apple's supplier facilities have committed to Zero Waste to landfill and Apple's facilities in the 2018
were reported to use 100% of their electricity from renewables. However, overall energy
consumption, water consumption and waste generation seem to have increased in absolute terms in
the last five years (Apple 2018a), probably due to an increased market volume.
Selecting, monitoring and working closely with suppliers are also important to improve working
conditions during manufacturing and assembly of parts. Companies are committed to improve
working conditions along the product's supply chain, as for instance is the case of Fairphone
(Transform Together 2018) and Apple96. The majority of the smartphone manufacturers have a
supplier management and audit programme in place, although their efforts in this area can vary. Many
of the big manufacturers are part of The Responsible Business Coalition (formerly known as
Electronic Industry Citizenship Coalition), which requires its members to adhere to a Code of
Conduct that sets standards on social, ethical and environmental issues. Apple and Fairphone are also
part of the Clean Electronics Production Network (CEPN) which has the goal to move toward zero
exposure of workers to toxic chemicals in the electronics manufacturing process (Transform Together
2018).
94 Although this could come with possible trade-offs for other material efficiency aspects (see section 4.7) 95
This should be coupled with the use of standard USB-C interfaces (IEC 63002:2016) to ensure
interoperability between EPS owned by users. Information on technical specifications and interoperability of the
accessories (voltage, power output and connector type) should be also provided. 96 https://www.apple.com/supplier-responsibility/ (accessed on 8 April 2019)

81
4.4 Product's longevity Depletion of materials and production of waste tend to decrease when the lifetime of a product is
increased97
. Designing long-lasting products is a key strategy to save materials and reduce the amount
of waste to handle at the End of Life.
A product can function as required, under defined conditions of use, maintenance and repair, until a
limiting state is reached. A limiting state is reached when one or more required functions/sub-
functions are no longer delivered (Alfieri et al 2018a). The limiting state could either due to technical
failure and/or other socio-economic conditions, so that the lifetime of a product can be differentiated
between:
Technical lifetime (European Environmental Agency 2017), which is the time span or number
of usage cycles for which a product is considered to function as required, under defined
conditions of use, until a first failure occurs98
;
Functional lifetime (European Environmental Agency 2017), which is the time a product is
used until the requirements of the user are no longer met, due to the economics of operation,
maintenance and repair or obsolescence99
.
From a purely technical point of view, an extension of lifetime of products can be pursued through
complementary strategies:
1. By increasing the durability of products and postponing the occurrence of a limiting state
(Alfieri et al. 2018a, 2018b);
2. By increasing the upgradability of products and enhancing the functionality of a product
(Cordella et al. 2018a);
3. By increasing the reparability of products and restoring the functionality of a product after a
fault (Cordella et al. 2018a).
Point of action of such strategies in the lifetime of products is represented in Figure 25.
Figure 25: Extending the lifetime of products
Technical problems that could cause the replacement of a product and measures that could prevent it
need thus to be analysed:
a. A durability analysis (Alfieri et al 2018b) will focus on how to delay limiting states over time
by identifying stress conditions, design aspects and misuses that could produce failures of key
97 This is generally the case when an increase of lifetime is not associated to design choices or
repair/refurbishment operations requiring a significant addition of materials. Trade-offs among different
material efficiency aspects could otherwise occur 98 This can be modelled based on statistical data and accelerated tests 99 This can be differentiated between first and successive users

82
parts and loss of function(s)/sub-function(s) during the normal and/or special conditions of
operation. Key aspects and/or correction measures to increase the longevity of the product
and its parts are identified.
b. A reparability/upgradability analysis (Cordella et al. 2018a) will focus on fixing a technical
problem and/or extending the function lifetime by identifying barriers and factors influencing
the chance of repair/upgrade, and more in general reuse. Key aspects and/or correction
measures to increase the reparability and reusability of the product and its parts are identified.
Considerations about re-manufacturability can also be included in this analysis.
The two analyses can be based on a common ground of information (see Figure 26):
1. The functional analysis of the product100
, in order to define main functions and sub-functions
and to understand conditions of use and interactions between product and users (see Section
4.1);
2. Lifetime and durability expectation (see Section 3.3);
3. The analysis of limiting states, such as failures and other causes of replacements, their
frequency and impacted parts, typical repair and upgrade operations;
4. The analysis of the barriers hindering the longevity and repair of products and of the
environmental and economic costs and benefits, also taking quality aspects into account.
This information can also allow identifying priority parts where to focus any design action and further
assessment, as well as setting preliminary objectives.
Figure 26: Approach for the analysis of durability and reparability of products
4.4.1 Limiting states
As described in section 3.3, discarded or replaced phones are often replaced because of functional
obsolescence driven by launching of new models and features, and by social expectations (Watson et
al. 2017).
100 EN 12973:2000 - Value management

83
However, loss of performance, failures and breakages of smartphones are other important reasons for
replacing the product. Technical factors producing failures and other limiting states include the
stresses of product's parts and their capability to withstand these constrains and to provide a
satisfactory performance level. Stress factors can be linked to environmental conditions (e.g. ambient
temperature and humidity, mechanical shocks and vibration due to the transportation) or to operating
conditions (e.g. electrical stresses, temperature variation during the turning on/off, shocks and
vibration, drops, and mechanical impacts, ingress of dust and water ). These stress factors can result in
failures of the whole product due to short circuits or disconnection of main parts.
Sources of data about limiting states and failures statistics have been analysed including consumer's
organization surveys and repairer's statistics and interviews.
A recent survey (OCU 2018b) reports that smartphones are characterized by the highest frequency of
failures among a group of 10 products (5 appliances and 5 ICT products).
47% of faults occurred in the first 2 years of use, while an additional 39% of faults occurred between
the 2nd
and the 3rd
year of use. The highest number of problems was related to the battery (42%) and to
the operating system (14%).
Product failure in 2013 were reported to be due to the drop on a hard surface (43%) and the contact
with water (35%) (Watson et al. 2017). However, these statistics could be less representative for
current technologies and designs.
Although different from failure data, indirect information about limiting states can be gathered from
repair statistics. The repair platform "Handyreparaturvergleich"101
reports statistics about
failures/repairs for common models of smartphones sold in Germany (see for instance Table 18 and
Table 19). In particular, screens appear as the part of smartphones that are most frequently repaired.
The dominant importance of screens has been confirmed by the repair organization "Vangerow"102
. It
is also interesting to observe that the repair of back cover became an issue for more recent models.
Table 18: Repair service statistics for iPhone models8
Repair requests iPhone X103 iPhone 6104
Display 98 (38.0%) 111 (48.5%)
Back cover 92 (35.7%) 2 (0.9%)
Display glass / Touchscreen 31 (12.0%) 22 (9.6%)
LCD Display 16 (6.2%) 16 (7%)
Battery 3 (1.2%) 39 (17%)
Others 18 (6.9%) 39 (17%)
Table 19: Repair service statistics for Samsung models
Repair requests S9105 S6106
Display 186 (49.9%) 19 (13.7%)
101 https://www.handyreparaturvergleich.de/ (accessed on 13 March 2019)
102 https://vangerow.de/ (accessed on 13 March 2019)
103 https://www.handyreparaturvergleich.de/apple-iphones-reparatur/defektes-apple-iphone-x-display-diagnose-
reparieren-preisvergleich.html#welche-reparatur (accessed on 27 March 2019) 104 https://www.handyreparaturvergleich.de/apple-iphones-reparatur/defektes-apple-iphone-6-display-diagnose-
reparieren-preisvergleich.html#welche-reparatur (accessed on 27 March 2019) 105 https://www.handyreparaturvergleich.de/samsung-smartphones-reparatur/defektes-samsung-galaxy-s9-
display-diagnose-reparieren-preisvergleich.html#welche-reparatur (accessed on 27 March 2019) 106 https://www.handyreparaturvergleich.de/samsung-smartphones-reparatur/defektes-samsung-galaxy-s6-
display-diagnose-reparieren-preisvergleich.html#welche-reparatur (accessed on 27 March 2019)

84
Repair requests S9105 S6106
Backcover 81 (21.7%) 2 (1.4%)
Display glass/ Touchscreen 70 (18.8%) 10 (7.2%)
LCD Display 20 (5.4%) 10 (7.2%)
Camera 5 (1.3%) 6 (4.3%)
Buttons 3 (0.8%) 17 (12.2%)
Ports/connectors 2 (0.5%) 6 (4.3%)
Battery 1 (0.3%) 61 (43.9%)
Others 5 (1.3%) 8 (5.8%)
The failure of the screen can have several modalities. For example, after a fall the smartphone no
longer responds to inputs, remains completely black, has pixel errors or is scratched, cracked or
splintered. In most of the cases, the screen cannot be repaired, but the entire unit must be replaced
since the individual components (sensors, LCD display, touch screen) are firmly glued together and
come as one unit107. The repair or replacement of the touchscreen is instead necessary if the display
glass and the touchscreen have broken (scratched, cracked or splintered), no longer reacts, or only
reacts with delay or with greater pressure.
With respect to batteries, their duration and performance over time can affect the lifetime of the
smartphones, in particular when they are not replaceable by users. However, some manufacturers
claim that trade-offs between longevity and reparability can occur. A manufacturer stated that
batteries are now designed to last longer in terms of charging cycles so that replacement of batteries is
less important for consumers. This could be supported by the information provided in Table 18 and
Table 19, from which it can be observed that the battery repair service has dropped significantly from
older models to more recent ones. For devices with removable batteries there could be repair and
safety issues regarding counterfeit batteries, as well as dust and water damage. Additionally, battery
replacement by professionals could increase recycling efficiency.
Om the other hand, research on smartphone battery ageing (Sustainably SMART 2018) confirms
some essential factors for obsolescence of batteries and devices with embedded batteries (e.g. extreme
ambient temperature; state of charge lower of 20% or higher than 80%). Provision of information for
consumers could help to maximize battery life and lifespan of devices. Some manufacturers provide
tips (e.g. Apple108
) and tools (Figure 27) to maximize battery lifespan.
Figure 27: Battery Health tool in iPhone smartphone109
107 https://www.handyreparaturvergleich.de/apple-iphones-reparatur/defektes-apple-iphone-x-display-diagnose-
reparieren-preisvergleich.html (accessed on 9 April 2019) 108 https://www.apple.com/batteries/maximizing-performance/ (accessed on 4 July 2018) 109 https://support.apple.com/en-us/HT208387 (accessed on 14 March 2019)

85
Another important factor that can affect the functional lifetime of smartphones can be the end of the
software supporting period offered by manufacturers.
In general, in case of smartphones using Android, the support period tends to vary between 2 and 3
years. This means that many smartphones do not run the most updated version of the OS. Even though
the absence of OS updates does not generate any immediate failure, it can result in a loss of security
and, at long term, it could affect the functionality of the applications installed on the smartphones
(OCU 2017). Manufacturers that do not release updates for the last available Android versions can
still provide security patches also for older versions of the OS. Table 20 below shows the relative
number of devices running a given version of the Android OS.
Apples claims to provide OS update for a longer period of time, with more than 80% of the products
using the last version of the iOS110, i.e. iOS 12111. Models released up to 5 years ago (e.g. iPhone 5S)
are still compatible with these OS updates.
Table 20: Percentage of devices running a given version of Android (October 2018)112
Version Code name Distribution
2.3.3 Gingerbread 0.2%
2.3.7
4.03 Ice Cream Sandwich 0.3%
4.04
4.1x Jelly Bean 1.1.%
4.2x 1.5%
4.3 0. 4%
4.4 KitKat 7.6%
5 Lollipop 3.5%
5.1 14.4%
6 Marshmallow 21.3%
7 Nougat 18.1%
7.1 10.1%
8 Oreo 14.0%
8.1 7.5%
Another relevant aspect is the impact of the Operating System update on the smartphone performance.
Recently, as result of an investigation launched in January by the Italian competition authority it was
found that certain smartphone software updates had a negative effect on the performance of the
devices, without informing adequately consumers or providing them any means of restoring the
original functionality of the products. Moreover, a case was found for which no clear information was
provided for "essential" characteristics of lithium batteries, including their average life expectancy
and how to maintain and replace them113.
110 https://developer.apple.com/support/app-store/ (accessed on 14 March 2019) 111
https://www.apple.com/ios/ios-12/ (accessed on 27 March 2019) 112
https://developer.android.com/about/dashboards/ (accessed on 27 March 2019) 113 https://www.theguardian.com/technology/2018/oct/24/apple-samsung-fined-for-slowing-down-phones
(accessed on 27 March 2019)

86
Main limiting states of technical nature for smartphones are summarised in the table below (Table
21), also with a description of possible failure mechanisms. Such limiting states of smartphones can
be handled through alternative measures analysed in the following sections.
Table 21: Main failures for smartphones
Part Main failures Failure mechanism
Screen:
- Glass cover
Screen cracked, scratched,
splintered
Accidental drops or other
mechanical stresses (shocks,
vibrations)
- Touch screen layer Screen cracked, scratched,
splintered
Accidental drops or other
mechanical stresses (shocks,
vibrations)
- Display Black screen, broken/dead
pixels (spots, stripes or similar),
no background light
Accidental drops or other
mechanical stresses (shocks,
vibrations)
Back cover Breakage Accidental drops or other
mechanical stresses (shocks,
vibrations)
Battery Loss of performance in terms of
duration of battery cycles
Aging of the battery due to
quality issues or use under
stress conditions
Battery not charging EPS / battery connection failure
Overheating
Operating System Malfunctioning/ loss of security
and performance (e.g. device
not switching on, error codes,
apps crashes)
OS updates not provided by the
manufacturer
Whole Product Short circuits, disconnection of
main parts (including buttons
and connectors)
Stress conditions (e.g. exposure
dust and water, shocks,
vibration).
4.4.2 Durability analysis
The durability analysis aims at the identification of maintenance needs and possible measures to avoid
or postpone faults, which address;
The design of more durable smartphones and the availability of updates over time;
External accessories to protect the device, as screen protectors and cases114.
This is based on the analysis of degradation mechanisms and paths that may cause limiting states, i.e.
failure modes of main functions and/or sub-functions115
(Table 21).
114 https://www.nytimes.com/2017/05/24/technology/personaltech/reality-check-what-does-and-doesnt-protect-
your-smartphone.html (accessed on 9 March 2018)

87
Although strengthened glass panels are getting more and more durable, screens are still affected by a
relatively high frequency of failures. The failure of the screen can have several modalities. For
example, after a fall the smartphone no longer responds to inputs, remains completely black, has pixel
errors or is scratched, cracked or splintered. Almost 3/4 of all screen damages are due to drops on
corners or edges (Sustainably SMART 2017). Moreover, as pointed out by some testing
organizations116, 117, smartphones with larger glass surfaces are more exposed to impacts and damages.
Screen damages due to falls and contact with water are normally considered to be under the
responsibility of consumers and are not covered by legal guarantees. Smartphones can be designed to
withstand expected usage profiles and information about how to use them should be provided
(Watson et al. 2017). Damages due to water contact seem to have become less relevant due to the
development of smartphones featuring a waterproof design118.
Resistance to common causes of failure as fall on a hard surface, immersion in water and ingress of
dust can be measured via specific product testing. The following test methods (see section 1.2.4.5)
have been already applied by manufacturers:
Drop tests, to determine how resistant a handset is to physical damages;
Water- and dust proof tests (IP rating).
Smartphones complying with an IP rating of 68 (water and dust proof), and drop tested onto a hard
surface from a minimum of 1.2 metres (usually as part of support for the MIL-STD-810G) are
available on the market and are classified as rugged smartphones119 (Bullitt 2017). The inclusion of
ergonomics and slip resistance considerations in the design of smartphones could also be beneficial
for the fitness of use of the device120.
Screen protectors and protective cases (also called bumper) are also effective ways to avoid limiting
states due to falls or other mechanical stresses. The frequency of brakeage could be halved in case of
protected smartphones (Wertgarantie 2017). Protective accessories are available in many designs from
manufacturers or third party companies. Some protective cases even allow upgrading the
functionalities of smartphones by adding additional battery capacity or additional lenses. However,
rather than relying on the user to purchase protectors for inherently fragile devices, it could be more
effective to provide extra-protective functions and/or accessories with the product. Screen protectors
are pre-installed for some smartphone models (e.g. Samsung Galaxy S10121).
More durable design could be also incentivised by including failure due to accidental drops (e.g. free
falls from up to 1.5 meters) and short term water contacts in the failures covered by legal guarantee.
Performance of batteries is also very important for the durability of smartphones, especially because
new models have bigger screens, faster processors and apps that require more and more energy, and
thus long lasting batteries. Longest life batteries currently used in smartphones have a capacity of
115 IEC 60300-3-1 - Dependability management – Part 3-1: Application guide – Analysis techniques for
dependability – Guide on methodology 116 https://www.consumerreports.org/smartphones/iphone-x-review-test-results/ (accessed on 8 April 2019) 117 https://www.cnet.com/news/apple-iphone-x-drop-test/ (accessed on 8 April 2019) 118 https://www.cnet.com/news/how-does-waterproofing-work-apple-iphone-7-samsung-galaxy-s7-sony-xperia/
(accessed on 8 April 2019) 119 A distinction has to be done between rugged smartphones and ultra-rugged smartphones, with the latter
specifically designed for industrial uses or to survive extreme rugged testing. Ultra-rugged smartphones are
usually considerably more expensive, and will often be engineered to be non-incendiary and intrinsically safe,
making them suitable for use in hazardous environments 120 https://smartphones.gadgethacks.com/how-to/4-most-durable-premium-smartphones-for-clumsy-people-
0175454/#jump-comparisonchart (accessed on 23 March 2018) 121 https://www.samsung.com/au/support/mobile-devices/galaxy-s10-in-box-items/ (accessed on 27 March 2019)
88
4000-5000 mAh122
, which in some cases can allow them to function as a power bank123
. A long
battery lifespan can reduce the chance of replacement of battery and device, with possible economic
and environmental benefits (Science for Environment Policy 2018). The lifespan of batteries can be
measured in two ways:
1. Calendar life: time during which the battery can be stored with minimal discharges until its
capacity decreases below 80% of the initial one, and
2. Cycle life: number of times (cycles) a battery can be recharged and discharged before it
becomes unsuitable for a given application. This is usually when it can only be charged up to
80% of initial capacity, given that the battery degrades quickly after this point.
The battery life can be tested according to IEC EN 61960124. Performance can be assessed as:
a. Remaining full charge capacity of the battery compared to the initial charge capacity, after x
and y charge/discharge cycles (e.g. 300 and 500), or
b. Minimum number of full charge/discharge cycles achievable with more than 80% and 60% of
the initial capacity.
Software tools can also contribute to optimise the battery lifetime. Pre-installed software can enable
limiting the battery state of charge (SoC) when the smartphone is connected to the grid (e.g. overnight
charge). Such functionality prevents that the battery is loaded at full charge.
Durability of smartphones is influenced also by the quality of other hardware parts:
Fingerprint Sensor: a scratched or cracked sensor can for instance hinder the phone's ability to
read fingerprints. The use of high-end materials can improve the overall reliability of the
device125.
Camera lens: a cracked/scratched camera lens can affect the photo quality and compromise
the device resistance to water and other contaminants. Sapphire crystal lens are reported to be
harder than glass126.
Charging port: wear and tear could damage the charging port. Modular designs have been
applied to facilitate its replacement127. Also symmetric ports reduce the risk of breaking the
slot while forcing the cable into the wrong side (e.g. USB-C). However, the current trend
towards wireless charging might eliminate or reduce the need for charging ports.
However, as described in section 4.4.1, unavailability of software/firmware updates can make
smartphones obsolete even if their hardware parts are still fully functioning (Transform Together
2018). For an effective increase of the durability of smartphones it is thus needed to ensure the
possibility of keeping software and firmware updated over time. From the other side, it has to be
ensured that the Operating System updates do not negatively impact the smartphone performance and
the reversibility of the software update.
122 https://www.tomsguide.com/us/smartphones-best-battery-life,review-2857.html (accessed on 22 March 2018) 123 https://www.xataka.com/tecnologiazen/avances-en-baterias-moviles-cuando-llegara-el-sustituto-del-ion-litio
(accessed on 22 March 2018) 124 IEC 61960-3:2017 – Secondary cells and batteries containing alkaline or other non-acid electrolytes.
Secondary lithium cells and batteries for portable applications. Prismatic and cylindrical lithium secondary cells,
and batteries made from them 125 https://smartphones.gadgethacks.com/how-to/4-most-durable-premium-smartphones-for-clumsy-people-
0175454/#jump-comparisonchart (accessed on 23 March 2018) 126 https://smartphones.gadgethacks.com/how-to/4-most-durable-premium-smartphones-for-clumsy-people-
0175454/#jump-comparisonchart (accessed on 23 March 2018) 127 https://smartphones.gadgethacks.com/how-to/4-most-durable-premium-smartphones-for-clumsy-people-
0175454/#jump-comparisonchart (accessed on 23 March 2018)

89
A commitment on software support provision by manufacturers could increase the lifetime of
smartphones. Google, for its own-brand smartphones is communicating the minimum update and
support periods ensured for the models on the market. OS and software update (security) are ensured
for three years for Pixel 2128 and Pixel 3129. Devices with unsupported operating systems could
moreover have limited-to-no resale value, which is a major barrier to reuse.
Durability metrics and related test methods are already applied by some smartphone's manufacturers
in the design of their products to claim durability performance (not limited only to the market segment
of rugged and ultra-rugged smartphones). A summary of the international standard methods applied is
provided in Table 22. Longevity of smartphones could be potentially increased through these metrics,
to demonstrate compliance with durability requirements and/or provide durability information.
Table 22: Possible measures to increase the durability of smartphones
Aspect Measure Assessment and
verification
Mechanical stress
resistance
- Resistance to accidental drops (e.g. 1.2-1.5 meters)
and other stress tests (e.g. extreme temperatures,
solar radiations)
- IEC 60068 Part 2-31:
Tests – Test Ec: Rough
handling shocks,
primarily for
equipment-type
specimens (Freefall,
procedure 1 - Free fall)
- Provision of protective accessories - Visual check
Dust protection - Protected from total dust ingress (IP6X) - IEC 60529 - Degrees
of protection provided
by enclosures (IP
Code)
Water protection - Protected from immersion between 15 centimetres
and 1 meter in depth (IPX7) or from long term
immersion up to a specified pressure. (IPX8)
- IEC 60529 - Degrees
of protection provided
by enclosures (IP
Code)
Battery longevity - Minimum number of cycles with the battery
properly functioning (e.g. 500 cycles at 80% of
initial performance)
- Testing the battery
life according to the
IEC EN 61960
- Availability of software for the battery
management
- Declaration/
guarantee from
manufacturer
Operating System,
software and
firmware
- No functionally obsolete capacity and OS at the
moment of purchase
- Availability of update support along the product
lifetime
- Information on impact of updates, reversibility of
updates
- Declaration/
guarantee from
manufacturer
Guarantee issue - Inclusion of failures due to accidental drops and
contact with water in the legal guarantee
- Extended guarantees
- Declaration/
guarantee from
manufacturer
128 https://store.google.com/product/pixel_2_xl_specs?srp=/product/pixel_2_specs (accessed on 27 March 2019)
129 https://store.google.com/product/pixel_3_specs (accessed on 27 March 2019)

90
User behaviour - Information on correct use and maintenance of the
device
- Provision of
information from
manufacturer
4.4.3 Reparability and upgradability analysis The reparability and reusability analysis aims at the identification of measures that could improve the
reparability and reusability of products, and thus overcoming a limiting state. The analysis is based on
information on repair statistics, typical upgrades and technical, market and legal barriers130, which is
also reported in section 4.4.1.
Lack of spare parts and software/firmware updates (Watson et al. 2017), as well as their relative cost,
can be an important barrier to repair. Some manufacturers raised the attention on the presence on the
market of counterfeit parts/products, which could undermine the functionality of the device and the
brand reputation, especially in case of bad repair.
Repair can be facilitated by the provision of information. Some manufacturers provide information of
the web about the availability /cost of the repair services in different EU countries131, as well as costs
of spare parts132, 133.
According to Watson et al. (2017), repair could be worthwhile even 3-5 years after sale; however,
there is huge variation in the cost of repair since many devices do not have easily removable batteries
or replaceable screens. Repair costs are in particular a barrier for screens. The repair of a screen can
cost up to a 40% of the product price and the trend is towards more expensive repairs for more recent
models134.
Ease of disassembly of parts is considered as one of the main barriers to repair. Repair could be
facilitated through the implementation of modular designs, the use of reversible fasteners are the
commercial availability of repair tools.
Due to their priority for repair, effective modular designs should also consider the implementation of
a non-permanent fixation of front glass and display module in screens (Schischke et al. 2016).
However, there is an apparent trend towards the increased use of adhesives, glues and of glass parts,
which make more difficult to disassemble parts (Greenpeace 2017). According to some
manufacturers, main reasons for using adhesive and glues include reduction/control of the mass and
volume of devices, as well as reliability and durability considerations (e.g. water protection).
Moreover, a modular design focused on the improvement of reparability/upgradability could require
larger amounts of materials.
For example, in some recent models of smartphones, the removal of batteries requires the intervention
of an experienced repairer. This means that the battery can directly affect the lifetime of the product135.
Easy-to-replace batteries may require additional casing, which can mean thicker product designs and
the use of more materials.
A global support platform for the repair of smartphones is provided by iFixit136
. Instructions include
the replacement of batteries, and screens. Reparability scores for smartphones are also calculated by
130 This can cover aspects as obsolescence, cost of repair operations, ease of disassembly of parts, availability of
spare parts, updates and instructions 131 https://support.apple.com/repair (accessed on 29 March 2019) 132 https://www.parts4repair.com/xiaomi (accessed on 17 October 2018) 133 https://www.spareslg.com (accessed on 17 October 2018) 134 Personal communication from stakeholders 135 Personal communication from stakeholders 136
https://www.ifixit.com/Device/Phone (accessed on 9 March 2018)

91
iFixit (2019), as reported in Annex II. iFixit analysed about 100 models. The worst 10% performing
models in terms of reparability received a score between 1 and 3. These are characterized by:
- High difficulty to open the rear case and access to any parts;
- Intensive use of adhesive making any disassembly step complex and dangerous;
- Very difficult replacement of the battery (e.g. in case of soldered battery, buried beneath the mother
board, or needing very complex disassembly process in terms of steps and time);
- High number of steps to remove the display.
Technical aspect influencing the repair and upgrade of products have been analysed by JRC (Cordella
et al. 2019a). Aspects considered relevant for smartphones are analysed here, with the aim of
providing a reference for the identification of best practices and/or minimum performance levels137 for
the whole product and its priority parts138. The following priority parts are considered in this study for
smartphones:
1. Screen;
2. Back cover;
3. Battery;
4. OS.
4.4.3.1 Disassembly depth/sequence The disassembly depth is the number of steps required to remove a part from a product. The analysis
of disassembly depths is fundamental to assess the effort required to access and/or replace priority
parts. The disassembly sequence is necessary to assess the disassembly depth. It is the order of steps139
needed to remove a part from a product (which might include getting access to fasteners). The
repair/upgrade operation can be facilitated by the availability of information about the steps needed to
disassemble specific parts, as well as by design options where the number of disassembly steps is
reduced. Some of this information may be relevant for some categories of repairers only, also because
of safety reasons.
Indications about the steps necessary to disassembly parts of smartphones are provided by iFixit140
.
Based on the analysis of a sample of products141, and with a focus on priority parts, it was found that
disassembly steps range, depending on the model:
From 2 to 46 for the battery (median value = 28);
From 15 to 45 for the screen (median value = 30);
From 1 to 103 for the back cover (median value = 14).
Such values could be used to set disassembly depth targets for priority parts of smartphones.
137 Depending on the application a more or less ambition level could be considered (Cordella et al. 2018b) 138
Based on Cordella et al. (2019a), priority parts are those parts that are more important for repair and/or
upgrade operations. 139 According to Commission Decision (EU) 2016/1371, a step consists of an operation that finishes with the
removal of a part, and/or with a change of tool 140
https://www.ifixit.com/Device/Phone (accessed on 9 March 2018) 141 On 8 April 2019, analysed products include: 13 models from Apple (iPhone 6, iPhone 6 Plus, iPhone 6s,
iPhone 6s Plus, iPhone SE, iPhone 7, iPhone 7 Plus, iPhone 8, iPhone 8 Plus, iPhone X, iPhone XS, iPhone XS
max, iPhone XR), 5 models from Samsung (SIII, S5, S10, S10e, S10 Plus), 1 model from Huawei (P9)

92
4.4.3.2 Fasteners
Fasteners play an important role in the disassembly of a product. Fasteners are closely interlinked to
the assessment of necessary tools and skills for repair, re-use or upgrade. The number and type of
fasteners, as well as their visibility, may be used as a proxy for the time needed to repair or upgrade a
product. However, their visibility (e.g. through labelling and marking) is not as important if repair
manuals are available and if fasteners are physically accessible. For the assessment of fasteners, more
important criteria are their reversibility and the re-usability.
The best design scenario for the repair of smartphones would be the use of reusable, or at least
removable, fastening systems in the assembly of priority parts. On the other hand, the worst scenario
for reparability sees the use of non-removable fastening systems such as glues.
4.4.3.3 Tools Repair of smartphones can require a set of product-specific tools. Since most parts inside smartphones
are sensitive to electrostatic discharges (ESD) or static electricity, it would be recommendable to use
only ESD-safe tools and equipment. The list of tools and equipment includes142:
Soldering Iron or Soldering Station, used to solder parts and components like capacitor,
resistor, diode, transistor, regulator, speaker, microphone, display.
Cleaning Sponge, used to clean tip of soldering iron while soldering.
Hot Air Blower, also called SMD (Surface Mount Device) rework system and SMD repair
system, regulating or managing temperature and flow or hot air, and used to remove and again
solder ICs.
PCB Holder / PCB Stand, used to hold the PCB of a mobile phone while soldering or
repairing.
Solder Wire and Flux, used to solder electronic components. Flux is applied before soldering
to remove any oxide or contamination at the solder joints.
Solder Paste, which is solder in melted semi-solid form looking like paste and used mainly for
Reballing of ICs.
Desoldering Wire, or Desolder wire, used to remove excess solder from track of PCB.
Thinner or PCB Cleaner: Thinner or PCB cleaner is used to clean the PCB of a mobile phone.
The most common PCB cleaner used in mobile phone repairing is IPA or Isopropyl Alcohol.
Jumper Wire, which is a thin laminated or coated copper wire used to jumper from one point
to another on the track of a mobile phone while repairing.
Point Cutter, used for cutting wires.
Precision Screwdriver, used to remove and tighten screws while assembling and dissembling
a mobile phone. Precision screwdrivers of sizes T4, T5, T6 and four head are good for most
mobile repairing operations.
Tweezers, used to hold electronic components while soldering and desoldering.
ESD-Safe Cleaning Brush, used for cleaning the PCB of a mobile phone while repairing.
Multimeter, used to find faults, check track and components.
Battery Booster, used to boost the power of battery of a mobile phone.
142 http://www.smartphonetrainingcourses.com/repair-tool-kits/ (accessed on 9 March 2018)

93
Ultrasonic Cleaner, used to clean PCB of a mobile phone and electronic components.
BGA (Ball Grid Array) Kit, used to Reball and repair ball-type ICs.
Magnifying Lamp, used to see the magnified view of the PCB of a mobile phone. Most
magnifying lamps also have light. Magnifying lamps are available in different magnification
such as 3x, 4x, 5x, 10x, 50x.
Mobile Opener, used to open the housing or body of a mobile phone.
DC Power Supply, Regulated DC (Direct Current) power supply, used to supply DC current
to a mobile phone to switch on a mobile phone without battery.
Moreover, proprietary tools143 are required for some products. For example, proprietary screws are
used which require a special pentalobe screwdriver, which can make the removal of batteries a
lengthy process. The replacement of screen can be done with precision screwdrivers and/or prying
tools like spudgers (Wiens 2014).
Tools needed for repair/upgrade contribute to determine the complexity of the operation itself.
Manufacturers can play a significant contribution in defining such complexity. The tools needed are in
fact determined by the product design and are therefore an objective characteristic. In particular, the
need of proprietary tools could limit the possibility to carry out a repair/upgrade, whilst repairs are
inherently easier when commonly available tools are requested for such operations.
4.4.3.4 Disassembly time
Factors influencing the disassembly process (e.g. disassembly steps, fasteners, tools) could be
combined all together through the calculation of disassembly times (Cordella et al. 2019a). Time can
be important to determine the operational cost in case a service is paid, but it has also to be considered
with other factors (e.g. the cost of spare parts).
Indications about the time necessary to disassembly parts of smartphones are provided by iFixit144
.
Based on the analysis of a sample of products145, and with a focus on priority parts, it was found that
minimum disassembly time ranges, depending on the model:
From 1 to 120 min for the battery (median value = 30 min);
From 20 to 120 min for the screen (median value = 40 min);
From 1 to 180 min for the back cover (median value = 53 min).
Such values could be potentially used to set disassembly time targets for priority parts of
smartphones. However, their calculation should be based on standard time units (Zandin 2003) and
supported by appropriate methodological guidance, as done in eDiM (Peeters et al. 2018; Vanegas et
al. 2016, 2018).
4.4.3.5 Type and availability of information
The provision of information is necessary to support the repair/upgrade operation and should recollect
all the information mentioned in the other parameters (e.g. through user manuals). Information should
143 Proprietary tools are tools that are not available for purchase by the general public or for which any exclusive
intellectual property rights prevent their open use under fair, reasonable, and non-discriminatory terms 144
https://www.ifixit.com/Device/Phone (accessed on 9 March 2018) 145 On 8 April 2019, analysed products include: 13 models from Apple (iPhone 6, iPhone 6 Plus, iPhone 6s,
iPhone 6s Plus, iPhone SE, iPhone 7, iPhone 7 Plus, iPhone 8, iPhone 8 Plus, iPhone X, iPhone XS, iPhone XS
max, iPhone XR), 5 models from Samsung (SIII, S5, S10, S10e, S10 Plus), 1 model from Huawei (P9)
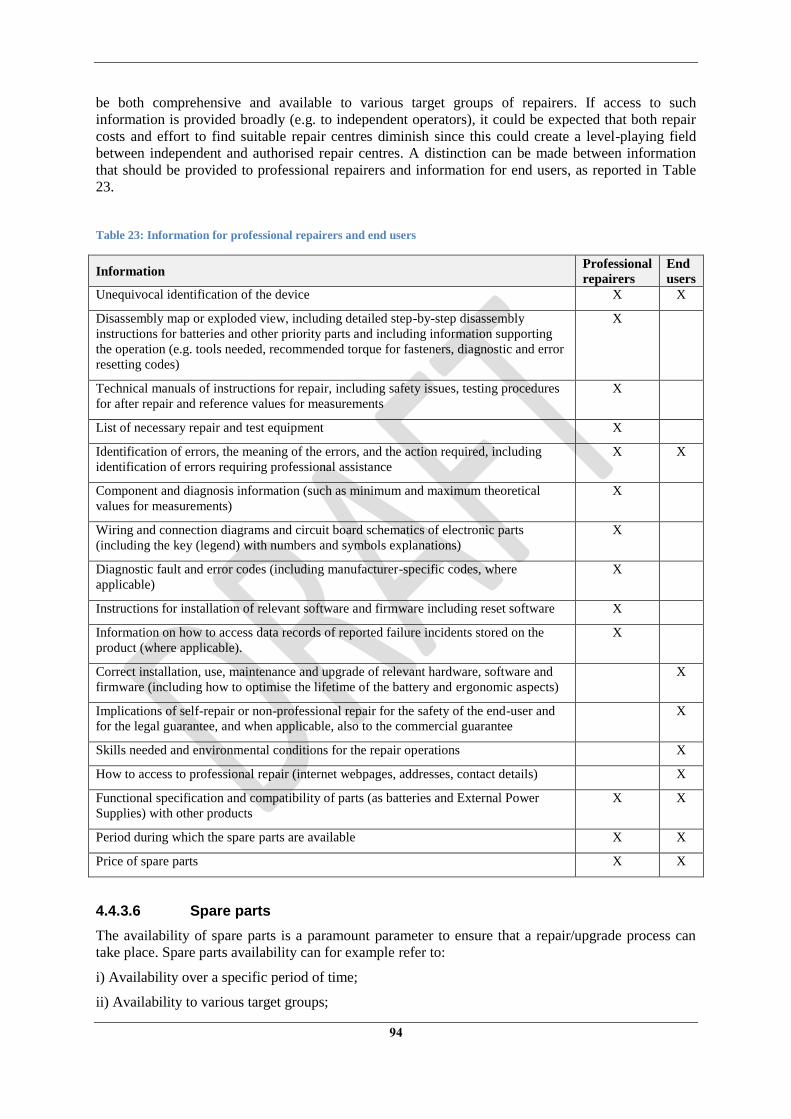
94
be both comprehensive and available to various target groups of repairers. If access to such
information is provided broadly (e.g. to independent operators), it could be expected that both repair
costs and effort to find suitable repair centres diminish since this could create a level-playing field
between independent and authorised repair centres. A distinction can be made between information
that should be provided to professional repairers and information for end users, as reported in Table
23.
Table 23: Information for professional repairers and end users
Information Professional
repairers
End
users
Unequivocal identification of the device X X
Disassembly map or exploded view, including detailed step-by-step disassembly
instructions for batteries and other priority parts and including information supporting
the operation (e.g. tools needed, recommended torque for fasteners, diagnostic and error
resetting codes)
X
Technical manuals of instructions for repair, including safety issues, testing procedures
for after repair and reference values for measurements
X
List of necessary repair and test equipment X
Identification of errors, the meaning of the errors, and the action required, including
identification of errors requiring professional assistance
X X
Component and diagnosis information (such as minimum and maximum theoretical
values for measurements)
X
Wiring and connection diagrams and circuit board schematics of electronic parts
(including the key (legend) with numbers and symbols explanations)
X
Diagnostic fault and error codes (including manufacturer-specific codes, where
applicable)
X
Instructions for installation of relevant software and firmware including reset software X
Information on how to access data records of reported failure incidents stored on the
product (where applicable).
X
Correct installation, use, maintenance and upgrade of relevant hardware, software and
firmware (including how to optimise the lifetime of the battery and ergonomic aspects)
X
Implications of self-repair or non-professional repair for the safety of the end-user and
for the legal guarantee, and when applicable, also to the commercial guarantee
X
Skills needed and environmental conditions for the repair operations X
How to access to professional repair (internet webpages, addresses, contact details) X
Functional specification and compatibility of parts (as batteries and External Power
Supplies) with other products
X X
Period during which the spare parts are available X X
Price of spare parts X X
4.4.3.6 Spare parts
The availability of spare parts is a paramount parameter to ensure that a repair/upgrade process can
take place. Spare parts availability can for example refer to:
i) Availability over a specific period of time;
ii) Availability to various target groups;

95
iii) Delivery time.
Priority parts should be made available as spare parts for 2-6 years after placing the last unit of the
model on the market. These could also include approved-by-manufacturer compatible spare parts
produced by third parties. The delivery time could be 2-15 working days.
Moreover, the list of spare parts, the procedure for ordering them and the related prices should be
publicly available on the free access website of the manufacturer, importer or authorised
representative.
Although not defined as priority parts, the use of standard interfaces could also be beneficial for the
replacement of some parts:
Micro USB can be specified according to IEC 62684:2018;
USB type-C can be specified according to the IEC 62680-1-3 and IEC 63002 (Figure 28);
External Power Supply (EPS) can be specified following the Recommendation of ITU-T
L.1002 (10/16) (ITU-T 2016). The basic EPS configuration suggested by ITU-T L.1002
consists of an EPS with a detachable input cable and a detachable output cable to the ICT
device (Figure 29). A detachable DC cable is required as the DC cable is generally the
weakest point of the portable power supply and the main point of failure. Adapters which
have captive cables, in case of failure of the latter, require all the rest of the equipment and in
particular its active part, to be discarded, adding up unnecessary e-waste and cost for the users
that could be a barrier for repair. Furthermore, the detachable cable enables more reuse and an
increased lifetime of the power supply unit.
Figure 28: USB type-C cable and connectors (USB Implementers Forum 2016)
Figure 29: Basic Universal Power Adaptor (UPA) configurations and connection options (ITU-T 2016)

96
4.4.3.7 Software and firmware
Similarly with spare parts, the availability of software and firmware updates and/or support (including
compatibility with open source programs) is a paramount parameter for smartphones. See section
4.4.2.
4.4.3.8 Data transfer and deletion
Data transfer and deletion is needed in repair/upgrade operations associated with the continued use or
reuse of products (where privacy of personal data must be ensured) or the cleaning of memory space
(e.g. for the repair of a smartphone). Secure data deletion/transfer tools should be pre-installed or
made available (e.g. via installed or downloadable tools such as an application, a cloud-based service
or instructions detailing a manual process). It is thus important that smartphones present such
functions that facilitate reparability/reusability of the whole products without the risk of transfer of
any sensitive and personal data in reused equipment.
Secure data deletion146 tools should built-in (or as second option made available on request) and
should permanently delete all user data without compromising the functionality of the device for
further use. Simplified transfer of data from an old to a new product should also be made available via
installed or downloadable tools such as applications, cloud-based services or instructions detailing a
manual process.
4.4.3.9 Password reset and restoration of factory settings Settings for password reset and restoration of factory settings is needed in repair/upgrade operations
associated with the continued use or reuse of products (e.g. change of user in the same organisation).
Password reset and restoration tools should be pre-installed or made available (e.g. via installed or
downloadable tools such as an application, a cloud-based service or instructions detailing a manual
process). In addition, the device should also include a software function that resets the device to its
factory settings. This should come with detailed instructions.
4.4.3.10 Commercial guarantee
Commercial guarantees can be potentially a useful tool for controlling the risk of failure of products,
and/or enabling the repair operation when needed. A "commercial guarantee" for the (entire) product
could include a "commitment to free repair as first remedy" in case of failures and, where relevant, a
"commitment to upgrade the product periodically". See also section 4.4.2.
4.4.3.11 Overview of possible measures to increase the reparability and upgradability of smartphones
An overview of possible measures to increase the reparability and upgradability of smartphones is
provided in Table 24.
146 According to the Commission Regulation (EU) 2019/424 of 15 March 2019 laying down ecodesign
requirements for servers and data storage products "secure data deletion" means the effective erasure of all
traces of existing data from a data storage device, overwriting the data completely in such a way that access to
the original data, or parts of them, becomes infeasible for a given level of effort.

97
Such information could be also used as basis for the development of scoring system (Cordella et al.
2019a). In such case, a higher weight could be considered for:
Functionally essential parts (screen, battery, operating system);
Aspects relating to disassemblability and to availability of spare parts, updates and
information.

98
Table 24: Possible measures to increase the reparability and upgradability of smartphones
Aspect Measures Assessment and Verification
Disassembly
depth/sequence
Information about disassembly sequences to be made available
Setting thresholds on disassembly steps for priority parts
A: A description supported by illustrations of the
steps needed to disassemble parts is needed.
The description has to show that the disassembly is
reversible by including the steps needed for the
reassembly of priority parts.
V: Physical disassembly and recording of the
operation are needed.
Fasteners and
connectors
Reusable/removable fasteners to beused for the assembly of priority parts.
Note:
- Reusable: an original fastening system that can be completely re-used, or any elements of
the fastening system that cannot be re-used are supplied with the new part for a repair, re-use
or upgrade process;
- Removable: an original fastening system that is not reusable, but can be removed without
causing damage or leaving residue which precludes reassembly or reuse of the removed part.
A: A description supported by illustrations of the
fasteners to be removed for the disassembly of parts
is needed.
V: Physical disassembly and inventory of fasteners
are needed.
Tools Disassembly of priority parts is possible without the use of proprietary tools. A: Description of the repair/upgrade operations,
including documentation of the tools to use, is
needed.
V: Physical disassembly and check of suitability of
tools are needed.
Disassembly time Setting thresholds on disassembly times for priority parts A: Disassembly times quantified for parts and
related data sources and calculation details are
needed.
In case additional research was needed to fill any
data gap, supporting information has to be provided
as well by the manufacturer.
V: Physical disassembly, recording of the operation
and check of calculations are needed.
Type and availability Information for repair/upgrade of smartphones to be made available to professional repairers A: Relevant information for maintenance, repair
and upgrade needs to be compiled and made

99
Aspect Measures Assessment and Verification
of information and final users
Note: different information could be made available to different target groups
available to the target group of repairers.
V: Check of actual availability.
Spare parts Spare parts to be made available by manufacturers, importers or authorised representatives for
a minimum period of time after placing the last unit of the model on the market.
List of parts and prices to be available on-line, delivery within 2 working days after having
received the order.
Standard interface to be used for some parts.
A: Commitment by the manufacturer about the
availability of spare parts over time, as well as
provision of information about:
- Delivery time
- Recommended retail price of spare parts
- Target groups
- Interface used.
V: Check of actual availability.
Software and
firmware147
Software (at least for the Operating System) and firmware updates and support offered to end
users for a duration of X years after placing the last unit of the model on the market, including
the possibility to use open source Operating Systems or open source Virtual Machine
software.
Information about the impact of future updates on the original system characteristics (e.g.
RAM, CPU) to be provided, and there has to be always the option to not install, to install or to
uninstall the update.
A: Declaration about the duration of availability of
software and firmware over time, as well as
information about costs, and information about how
updates will affect the original system
characteristics.
V: Check of actual availability, compatibility, and
possibility to avoid/reverse the update.
Data transfer and
deletion
Secure data transfer and deletion functionality to be made available. This can either:
I) Be a feature built-in in the device;
II) Be permitted without restrictions using freely accessible software or hardware solutions
III) Be available on request from the OEM.
A: Information about the availability of secure data
transfer and deletion functionality / service is
needed.
V: Check of actual availability.
Password reset and
restoration of factory
To provide an option for resetting the password and restoring the factory setting. This can
either:
A: Information about the availability of a feature /
service for password reset and restoration of factory
147 This has been considered also as durability measure

100
Aspect Measures Assessment and Verification
settings I) Be integrated within the device;
II) Be permitted without restrictions, using freely accessible software or hardware solutions
III) Be available on request from the OEM.
settings is needed.
V: Check of actual availability.
Commercial
guarantee148
A "commercial guarantee" for the (entire) product to be offered by the guarantor, and
including a "commitment to free repair as first remedy" in case of failures and a "commitment
to upgrade the product periodically".
Notes:
- "Commercial guarantee" means any undertaking by the seller or a producer (the guarantor)
to the consumer, in addition to his legal obligation relating to the guarantee of conformity, to
reimburse the price paid or to replace, repair or service goods in any way if they do not meet
the specifications or any other requirements not related to conformity set out in the guarantee
statement or in the relevant advertising available at the time of, or before the conclusion of the
contract.
- The commercial guarantee must be related to the entire product (not only specific
components), provided in the entire EU, be included in the sale price of the product, and the
remedies proposed by the guarantor will not result in any costs for the consumer (e.g. it means
that the repair is for free).
A: Guarantee contract is needed, with emphasis on
"free repair first" clauses.
V: Check of availability of guarantee, clauses
statement and actual possibility of repair in case of
failure.
148 This has been considered also as durability measure

101
4.5 End of Life 1
After their useful life, products are disposed in order to remove and treat properly any source 2
of hazard and to recover value embedded in components and/or materials. This is done in the 3
recycling process. Recovery of materials and energy can also avoid the depletion of new 4
resources. The effectiveness and efficiency of recycling can be facilitated through appropriate 5
designs that can facilitate the recycling process, for instance improving depollution, 6
dismantling, recyclability and recoverability of products, can have positive effects. 7
8
4.5.1 End of Life practices 9
The worldwide collection rates for small electronics are still low (Manhart et al. 2016). 10
Although there are no global statistics available on this issue, data from various authors and 11
regions of the world estimate that global collection rates for end-of-life mobile phones are 12
below 50%, probably below 20% (Manhart et al. 2016). From a review of information 13
reported in the literature: 14
20% of young Norwegian adults throw small electronics in the waste bin (Watson et 15
al. 2017), while 89% of the mobile devices thrown away in the US in 2010 (141 16
million units) were disposed in landfill (Benton et al. 2015)149
; 17
28-125 million phones languish unused in the UK, meaning that for every phone in 18
use, up to four sit in drawers unused (Benton et al. 2015). A similar situation occurs 19
in Finland, where consumers typically have between two and five functioning mobile 20
phones stored at home that are not in use (Watson et al. 2017), and North Rhine 21
Westphalia, where 106 million of unused mobile phones and smartphones were 22
stored in households in 2016150
. 23
Collection rate in Europe for recycling, refurbishing and/or remanufacturing of 24
smartphones was about 15% in Europe in 2012 (Ellen Macarthur Foundation 2012). 25
Disposal with household waste clearly has negative environmental impacts due to the missed 26
recovery of the residual value of products and to the fact that most household waste 27
management systems are not designed for treating the various chemicals embedded in EEE. 28
However, also prolonged storage in households does have negative impacts since representing 29
a missed reuse/ recycling opportunity. 30
31
4.5.2 Collection and end of life services 32
End-of-life smartphones are managed in Europe according to WEEE Directive. The end-of-33
life management of these devices is under the responsibility of producers and importers, who 34
can manage their EEE either individually or through a Producer Responsibility Organisation 35
(PRO) by transferring their obligation to the PRO by paying a fee, in accordance with the 36
principle of the extended producer responsibility (EPR). 37
In Europe, large distributors of electrical and electronic equipment (EEE) are obliged since 38
2016 to take back such devices free of charge and to inform consumers about the availability 39
of return facilities. Stationary/online shops with sales/shipment areas relating to EEE of at 40
least 400 m2 have to take back small WEEE (no external dimension more than 25 cm) like 41
smartphones without the obligation to buy any new EEE (0:1 Take-back). 42
149 The US landfill number is very likely not representative for the EU 150 Personal communication by stakeholders involved in the development of this study

102
In terms of targets set by the WEEE Directive, 75% of small IT and telecommunication 43
equipment must be recovered from August 2018, and 55% must be recycled/ prepared for 44
reuse. Despite this commitment, a high share of broken or unused smartphones is not 45
collected for recycling. Statistics from Eurostat show a strong discrepancy between EEE put 46
on the EU market in the period 2010-2015 and the amount of WEEE collected, treated and 47
recycled, with their collection considered being the main barrier. 48
49
50
Figure 30: Electrical and Electronic Equipment put on the market and Waste EEE collected and treated in 51 the EU in 2010-2015151 52
53
This problem of insufficient collection is particularly pronounced for small devices such as 54
smartphones and tablets. Main reasons for low collection rates can be summarised as follows 55
(Manhart et al. 2016; Martinho et al. 2017): 56
Lack of information about the disposal of devices; 57
Perceived value of unused devices; 58
Data security issues. 59
In particular, collection efficiency could be improved by making consumers aware of the 60
importance of recycling, and changing disposal habits of the society. This could require 61
communication efforts and a broad availability of take back options (Tanskanen 2012). 62
Beside collection rates, the quality of the collected waste is also an important factor in the 63
end-of-life management of smartphones. Collection and storage should ideally not expose 64
devices to mechanical and physical stresses such as moisture. In addition, the level of sorting 65
is an important factor for the subsequent reuse and recycling logistics. If smartphones are 66
mixed with other product groups such as household appliances at the point of collection, the 67
efforts for effective sorting can increase significantly, which can be economically 68
unfavourable, especially in regions with high labour costs. Innovation in robotics and 69
artificial intelligence can lead to the development of new sorting and data acquisition 70
technologies for recycling. 71
151 https://ec.europa.eu/eurostat/statistics-
explained/index.php?title=File:Figure_1_Electrical_and_electronic_equipment_(EEE)_put_on_the_ma
rket_and_waste_EEE_collected_and_treated,_EU,_2010%E2%80%932015.png&oldid=372559e
(accessed on 2 April 2019)

103
Apart from manufacturers offering take-back systems (either for free or with a refund on a 72
new purchase), remanufacture152, recycle and re-sale of used phones and parts are of interest 73
also for other market players (Watson et al. 2015). However, anti-theft and security software 74
installed on smartphones can be a barrier for independent organisations and professionals 75
since this software can only be removed by the original owner or by the manufacturer 76
(Transform Together 2018). 77
78
4.5.3 Recycling process 79
The recycling process can be split into two main stages: 80
1. Pre-processing, encompassing all steps necessary to separate and sort parts and 81
materials for safe disposal and recovery operations; 82
2. End-processing, encompassing all steps necessary to recover secondary materials 83
from the processing of scraps (e.g. in smelters and refineries). 84
4.5.3.1 Pre-processing 85
Pre-processing operations typically start with depollution. The aim of this step is to comply 86
with selective treatment (depollution) requirements, such as those laid out in Annex VII of the 87
European WEEE Directive. With regards to smartphones, selective treatments involve the 88
removal of: 89
Battery; 90
Printed circuit board; 91
External electric cables (chargers). 92
Moreover, the WEEE Directive states that also BFR containing plastics have to be removed. 93
Some manufacturers have voluntary committed to avoid the use of BFR (Jardim 2017). Some 94
specific BFRs as polybrominated biphenyls (PBB) or polybrominated diphenyl ethers 95
(PBDE) are mandatory restricted in homogeneous materials (< 0.1% by mass) also according 96
to the ROHS Directive. 97
Design features allowing easy access and removal of the components listed in annex VII of 98
the WEEE Directive are essential to ensure optimal depollution of devices. Specifications for 99
WEEE de-pollution are provided in CLC/TS 50625-3-1153. Disassembly instructions for 100
relevant components are provided by Digital Europe on the Recycling Information 101
Platform154. 102
It is possible to disassemble and then reprocess an EoL battery to its original manufacturer 103
specifications. This involves thoroughly inspection and cleaning of each component. Another 104
option for spent lithium-ion batteries may be re-functionalisation of cathodes, e.g. by 105
restoring chemically lithium content to cathodes (Science for Environment Policy 2018). 106
Some design principles could help overcome the difficulties associated with recycling 107
lithium-ion technologies and encourage their re-use, as for instance: designs that allow easy 108
separation of parts, use of reversible joining techniques, labelling of parts, use of a minimum 109
number of materials and components, use of standard formats and materials, ease of removal 110
152 See for instance: https://www.remade.com/ (accessed on 3 April 2019) 153 CENELEC (2015) CLC/TS 50625-3-1: Collection, logistics & treatment requirements for WEEE -
Part 3-1: Specification for de-pollution - General 154 https://i4r-platform.eu/ (accessed on 3 April 2019)

104
of the battery from the device, minimised use of hazardous materials (Science for 111
Environment Policy 2018). 112
It has been reported that batteries are typically removed, if technically feasible, in a realistic 113
amount of time. Other parts cannot usually be separated as these are strongly tied together. No 114
solution apparently exists to efficiently remove batteries as required prior to treatment when 115
they are glued-together with smartphones. 116
After depollution, WEEE is broken down into parts and components either by: 117
Mechanical processes (e.g. shredding); 118
Manual operations (dismantling); 119
A combination of the two. 120
The mixed scrap that is generated is then sorted into material output fractions (e.g. steel scrap, 121
aluminium scrap, copper scrap, printed circuit boards, plastics) that are either passed on to 122
end-processing units or to specialised companies that conduct more specific sorting (e.g. into 123
various grades of aluminium- or steel-scrap). 124
Mechanical pre-processing steps (e.g. shredding) can lead to losses of metals that cannot be 125
separated perfectly. Furthermore, mechanical stresses can also cause losses of metals in the 126
form of dust (Manhart et al. 2016). Because of this, after the extraction of batteries, mobile 127
phones and comparable devices are often delivered directly to end-processing units 128
specialised in the recovery of copper and other precious metals. 129
The economic viability of WEEE recycling activities can only be ensured if a large number of 130
appliances are treated in short time and with a satisfactory level of sorting. Processing of well 131
sorted IT-equipment (e.g. smartphones only) can be more attractive from an economic point 132
of view, and can increase the efficiency of recovery of parts and materials. In this way, 133
devices can be screened to select those suitable for repair and reuse, whilst remaining devices 134
can undergo a more thorough depollution where most batteries are removed for separate 135
treatment. 136
Some European projects (Sustainably SMART155 and ADIR156) are focusing on automated 137
disassembly systems designed to manage and recover materials from smartphones. Apple has 138
also developed automated disassembly systems as the LIAM-robot, custom built for the 139
iPhone 6, and Daisy157, an improved version of the Liam, that can take apart nine different 140
versions of the iPhone. Daisy seems ensuring a higher granularity, allowing the recovery of 141
Neodymium permanent magnets and tungsten vibration mechanism that are usually not 142
recovered in the current recycling processes. It is however unclear whether robots as Daisy 143
are already applied at industrial scale and at which degree the parts/ materials recovered close 144
the loop in the re-manufacturing process. 145
146
4.5.3.2 End-processing 147
In terms of mass, smartphones are mainly composed of plastics and aluminium. However, the 148
main contribution to the residual value of smartphones is due to the content of precious 149
metals. The recovery of materials from WEEE is the main aim of end processing, although it 150
presents some challenges (Akcil et al. 2015). 151
155 https://www.sustainably-smart.eu/ (accessed on 13 June 2018) 156 https://www.adir.eu/ (accessed on 13 June 2018) 157 https://www.apple.com/environment/resources/ (accessed on 1 February 2019)

105
Table 25Error! Reference source not found. provides an overview on various recycling 152
options for smartphones and tablets (Manhart et al., 2016). There is no perfect recycling path. 153
Nevertheless, the most typical scenario sees the removal of the battery, separate smelting of 154
the device, and recovery of precious materials (Manhart et al. 2016). 155
156
Table 25: Major recycling options for smartphones and tablets and material recovery capacity (Manhart et 157 al. 2016) 158
159
160
The common recycling route for the recovery of metals in Europe is based on the pyro-161
metallurgical methods, basically based on smelting (Figure 31, red line) and adopted in 162
different plants (e.g. Umicore in Belgium and Aurubis in Germany). Losses of precious 163
metals can occur if this is associated with mechanical pre-treatments for the separation of 164
steel and aluminium scraps. On the other hand, the practice of feeding smartphones directly 165
into secondary Cu-smelters leads to losses of aluminium and iron as these metals move into 166
the slag phase of the smelters. Plastics are instead reported to be burnt to fuel such smelters 167
(Manhart et al. 2016). 168
Dedicated smelting processes are also available for recycling of batteries and recovery of 169
cobalt that can be used for new rechargeable batteries (e.g. UHT furnace in Hoboken158). 170
Different EU projects have been also investigating innovative routes to recover cobalt and 171
other valuable materials included in the Lithium-ion batteries159, 160 172
Li-ion batteries cannot be landfilled as they leach substances that are toxic and explosive. 173
However, recycling of Li-ion batteries is technologically challenging (Science for 174
Environment Policy 2018) since: 175
158 https://csm.umicore.com/en/recycling/battery-recycling/our-recycling-process (accessed on 31
January 2019) 159 https://h2020-crocodile.eu/project-2/ (accessed on 31 January 2019) 160 http://www.colabats.eu/ (accessed on 31 January 2019)

106
They contain a large number of blended materials, which makes recycling more 176
complex than for simpler technologies like lead-acid. 177
The array of chemical compositions for the electrodes adds a further complication, 178
especially as the composition is not labelled for the recycler’s information. 179
The two main methods of recycling for lithium-ion batteries are energy intensive. 180
Recycling of waste lithium-ion batteries is generally aimed at recovering cobalt, nickel and 181
copper due to their economic value. These materials are only partially recovered. Most other 182
substances contained in the battery are not recovered, even if technically possible. 183
Lithium usually ends up in the slags of recycling processes which are used as construction 184
materials. The declining use of cobalt in lithium-ion batteries could make recycling 185
unattractive from an economic point of view. 186
Although most industrial applications for WEEE recycling are still restricted to physical and 187
pyro-metallurgical processes, emerging techniques include (Akcil et al. 2015): 188
Hydrometallurgical techniques (Figure 31, blue line), which focus on precious metals 189
contained in PCBs. Hydro-based systems are able to process smaller quantities of 190
recyclable material than smelting processes, thus needing a lower initial investment. 191
The hydro-metallurgical process requires a series of pre-treatments on WEEE 192
(collection, sorting and shredding of PCBs) and further separation of ferrous metals 193
and aluminium. PCB granulates then undergo sulphuric acid leaching and solid/liquid 194
separation. The leach liquor, which is rich in copper, is neutralised to recover copper 195
in the solution. The residue obtained from sulphuric acid leaching goes to cyanide or 196
thiourea leaching for the recovery of precious metals such as gold and silver 197
(Rocchetti et al. 2013) 198
Biotechnologies, which exploit the ability of microbes to accumulate metal ions for 199
their vital functions. This could be used for the selective recovery of metals. 200
However, the main barrier at the moment seems to be linked to the low speed of these 201
techniques. 202
203

107
204
Figure 31: Typical end processing steps for the recovery of precious metals by pyro-metallurgical methods 205 (in red) or hydro-metallurgical methods (in blue) from WEEEs (Akcil et al. 2015) 206
207
Several precious materials have a potentially high recyclability rate with the current EoL 208
scenarios, as for instance: cobalt, copper, gold, silver, palladium, tin (Manhart et al. 2016). 209
Critical raw materials are other relevant elements for recycling, however they are not 210
recovered effectively in the current EoL scenarios: 211
Tungsten: recycling rates of tungsten are low/moderate in typical recycling plants 212
(Fairphone 2017). However, pilot disassembly programmes are able to recover the 213
vibration module and send it to a dedicated recycler for tungsten recovery161; 214
Rare Earth Elements (REE): less than 1% of REEs are currently recycled from 215
postconsumer waste (Fairphone 2017). The REE4EU project162 aims to develop and 216
demonstrate the feasibility of an innovative Rare Earth Alloys (REA) recovery route 217
from the recycle of permanent magnets (PM) and batteries; 218
161 https://www.apple.com/lae/environment/resources/ (accessed on 30 January 2019) 162 http://www.ree4eu.eu/ (accessed on 23 October 2018)

108
Gallium and Indium: less than 1% of gallium is estimated to be recycled from post-219
consumer waste. Gallium is sometimes substituted by Indium, which is however 220
associated with similar supply and recycling problems (Fairphone 2017). 221
The Sustainably SMART163 project is exploring the possibility to separate tantalum-rich, 222
gallium-rich and tungsten-rich components from disassembled smartphones as these metals 223
are currently lost in conventional electronics waste recycling processes. 224
A significant barrier for the recycling process is the critical volume required by end-225
processors of speciality metals, as the waste stream of smartphones is relatively small 226
compared to the scale of recycling facilities (and also in comparison with other waste streams 227
from the automotive, machining, building/infrastructure sectors). End-processors often do not 228
accept volumes below 100 t which is a difficult quantity to accumulate for smartphones. 229
Moreover, although elements can be available at industrial recycling capacity (e.g. 230
magnesium, tungsten, some rare earth elements, tantalum), pure input of materials is required. 231
Different models of smartphones are instead made of different mixture of heterogeneous 232
materials, which further complicate the recycling process. For example, cases are made of 233
different materials, and metals are alloyed together. Roughly half of the metals in a cell phone 234
are lost in a smelter during the recycling process164. 235
Possible improvements mainly depend on the effective collection and separation of batteries, 236
smartphones and their constituents. However, such effort could be not justified from an 237
economic perspective due to the relatively small quantities of metals contained in 238
smartphones and tablets. Some metals, like critical rare earth elements, are too difficult or too 239
expensive to separate out for recycling. 240
241
4.5.4 Transport and risk of illegal export of WEEE 242
WEEE, including smartphones, can also end up, through informal routes, in countries which 243
do not have appropriate recycling facilities. This can cause environmental pollution and 244
health risks in these countries (Basel Action Network 2019). For instance, the presence of 245
polyvinyl chloride (PVC) plastic and brominated flame retardants (BFRs) can contribute to 246
the formation of dioxins, among other hazardous chemicals, when scrap is burned, especially 247
if in an uncontrolled way. 248
Annex VI of the WEEE Directive 2012/19/EU states that in order to distinguish between EEE 249
suitable for reuse and devices not suitable for reuse and legally classified as a waste (WEEE), 250
where the holder of the object claims that they intend to ship or is shipping used EEE and not 251
WEEE, Member States shall require the holder to have available the following to substantiate 252
this claim: 253
a copy of the invoice and contract relating to the sale and/or transfer of ownership of 254
the EEE which states that the equipment is destined for direct re-use and that it is 255
fully functional; 256
evidence of evaluation or testing in the form of a copy of the records (certificate of 257
testing, proof of functionality) on every item within the consignment and a protocol 258
containing all record information; 259
163 https://www.sustainably-smart.eu/ (accessed on 30 January 19) 164 https://ifixit.org/recycling (accessed on 8 February 2019)

109
a declaration made by the holder who arranges the transport of the EEE that none of 260
the material or equipment within the consignment is waste as defined by Article 3(1) 261
of Directive 2008/98/EC; and 262
appropriate protection against damage during transportation, loading and unloading in 263
particular through sufficient packaging and appropriate stacking of the load. 264
Further Technical Guidelines for the transboundary movements of WEEE and used EEE and 265
for the differentiation between the definition of waste and non-waste are provided by the 266
United Nations (UN 2015). 267
268
4.5.5 Possible measure relating to recycling 269
Recyclability and recoverability of materials at the end of life can be limited by the presence 270
of specific substances, and by technological and design issues. Based on the analysis provided 271
above, measures that could improve the material efficiency of smartphones in this area should 272
in particular include: 273
1. The availability of take-back programmes for the collection smartphones and the 274
proper information of consumers about the importance of giving back unused 275
devices for recycling purposes 276
2. The ease of disassembly and marking of: 277
- Parts listed in Annex VII of WEEE because of their hazardousness (battery and 278
PCBs); 279
- Parts that could be reused (e.g. displays); 280
- Parts containing precious/critical materials. 281
3. The documentation of the sequence of dismantling operations needed to access the 282
components listed above (including type and number of fastening techniques(s) to be 283
unlocked and tool(s) required); 284
4. The provision of information on CRM, flame retardants used in plastic parts, as well 285
as the marking of plastic parts. 286
287
288

110
4.6 Trade-offs between material efficiency aspects 289
Possible measures to improve the material efficiency of products should not be seen as a pool 290
of separate alternatives but rather as a set of interconnected options which can affect and/or be 291
influenced by other aspects (Cordella et al. 2019b). First of all, since smartphones are based 292
on materials (as all products), there are inherently physical limits for the quantity and quality 293
of materials used. Any strategy addressing directly the materials used in the product should 294
ensure the fulfilment of technical specifications for product safety, performance and 295
durability as well as analyse the related impacts. Moreover, actions that can potentially have a 296
positive influence with respect to a specific material efficiency aspect could have negative 297
consequences for other aspects (e.g. the use of glues for durability could compromise 298
reparability, lean designs might reduce recyclability of the product). 299
Some manufactures claim that they prioritise durability and reliability in the design of their 300
smartphones (e.g. robustness and water resistance), even though this could make more 301
difficult for common users to repair the product, for instance due to embedded batteries and 302
adhesives. Embedded batteries, which are more and more used, could be more difficult to 303
replace. Nevertheless, it has been reported that their enclosure requires in general less plastic 304
and metal materials to protect the battery cells. It has been also reported that innovative 305
adhesives could make the repair of smartphones easier, at least for professionals. 306
Other manufacturers have been found to prioritise ease of repair and upgrade. In particular, 307
the concept of modular smartphone has received lot of attention during the past years. 308
Modular smartphones (e.g. Fairphone and Puzzlephone) offer the possibility to replace 309
specific modules of the device, although they have not reached a large scale production. 310
Actually, the only market case seems to be that of Fairphone 2165
. Modular design comes with 311
some challenges due to the larger mass and volume needed to house different parts in a way 312
they ensure full flexibility of the device (Transform Together 2018). As an example, the 313
modular design of Fairphone requires more materials due to the increased number of 314
connectors and the sub-housing of modules (Proske et al. 2016). However, smartphones do 315
not necessarily need to be fully modular. Research suggests that in order to achieve highest 316
efficiency in terms of material recovery and cost savings, modularity should focus on printed 317
circuit boards (PCBs), screens, shells and batteries (Souchet et al. 2017). 318
The analysis of material efficiency should be also supported by LCA considerations to 319
understand which aspect can be more important from an environmental perspective and the 320
magnitude of trade-offs (Cordella et al. 2019b). 321
165 https://www.fairphone.com/en/upgrade-fairphone2-camera/ (accessed on 4 July 2018)

111
4.7 Networks, cloud offloading and data centres 322
The use of smartphones relies on mobile networks (voice and data) and data servers storing 323
user (e.g. photos, videos) and provider data (e.g. music, maps, apps and their back-end data). 324
The monthly average consumption of mobile data has grown between 2012 and 2017 from 325
450 MB to up to 3.9 GB and 6.9 GB in Western Europe and North America, respectively. The 326
monthly mobile data traffic per active smartphone in North America could reach 26 GB in 327
2022. Despite the increase in energy efficiency, the higher volumes of transferred data might 328
cause a net increase in energy consumption of networks and of data centres (Transform 329
Together 2018). 330
In Europe, data centres have been report to account for approx. 2% of the total energy 331
consumption (Bertoldi et al. 2012). Furthermore, increased transmission speeds require 332
continuous updates of the physical infrastructures (Transform Together 2018) with a 333
continuous increase of the power needs foreseen for the next years (Figure 32). 334
335
336
Figure 32: Global power demand of data centres166 337
338
Impacts from networks and data centres could be for instance reduced by: 339
Developing active networks adjusting their-selves based on the activity of users and 340
building zero-emission radio access networks (RAN) to increase energy-efficiency of 341
telco networks, which also requires greater use of renewable energy and innovative 342
energy-efficiency solutions such as liquid cooling of base stations (BTS) connected to 343
local or district heating (Transform Together 2018); 344
Designing apps that demand smaller amounts of data in order to function; 345
Improving the energy efficiency of data centres and sourcing them with clean forms 346
of energy. For example, it has been reported that 60-70% of the energy consumed in 347
Apples' worldwide corporate offices, retail stores, and data centres come from 348
renewable sources. 349
166 http://www.yole.fr/iso_upload/News/2015/PR_DataCenterTechnologies_SiPhotonics_YOLE_Oct2015.
pdf (accessed on 3 April 2019)

112
5 MATERIAL EFFICIENCY HOT-SPOTS 350
351
5.1 Material efficiency concept 352
Material efficiency can be defined as the ratio between the performance output of a product, 353
service or energy system and the input of materials required to provide such output. It is thus 354
apparent that material efficiency can increase either by improving the performance or 355
reducing the input of materials to provide a certain performance (Cordella et al. 2019b). 356
From a system perspective, material efficiency can be considered as a range of strategies 357
relating to the use and management of resources throughout the life cycle of a product or 358
service, and which aim to minimise material consumption, waste production, and their related 359
environmental impacts (Allwood et al. 2011; Huysman et al. 2015), without affecting 360
functionalities negatively. 361
Figure 33 shows alternative routes for products before their final disposal in landfill, which 362
can contribute to improving their material efficiency. At the macro-scale level, material 363
efficiency can mean moving from a linear model of production and consumption (i.e. from 364
virgin material extraction, to short/single use of products, and final disposal in landfill) to a 365
more circular model, where input of virgin materials can be reduced and landfill disposal is 366
minimised, or at least kept controlled in a growing economy. 367
368
369
Figure 33: Material efficiency aspects in the life cycle of a product (Cordella et al. 2019b) 370
371
Material efficiency strategies can be quite well mirrored by the hierarchical approach set out 372
by the Waste Framework Directive (Allwood et al. 2011; Bakker et al. 2014), as shown in 373
Figure 34. The waste hierarchy aims at reducing the waste output and its disposal in landfill. 374
Material efficiency goes beyond and promotes also the prevention of material consumption. 375
Taking the example of waste management, a hierarchy of strategies can be drawn for material 376
efficiency aspects at the product level (Cordella et al. 2019b): 377
1. Reduction of material consumption; 378
2. Value retention in product systems; 379
3. Recycling and recovery of materials. 380
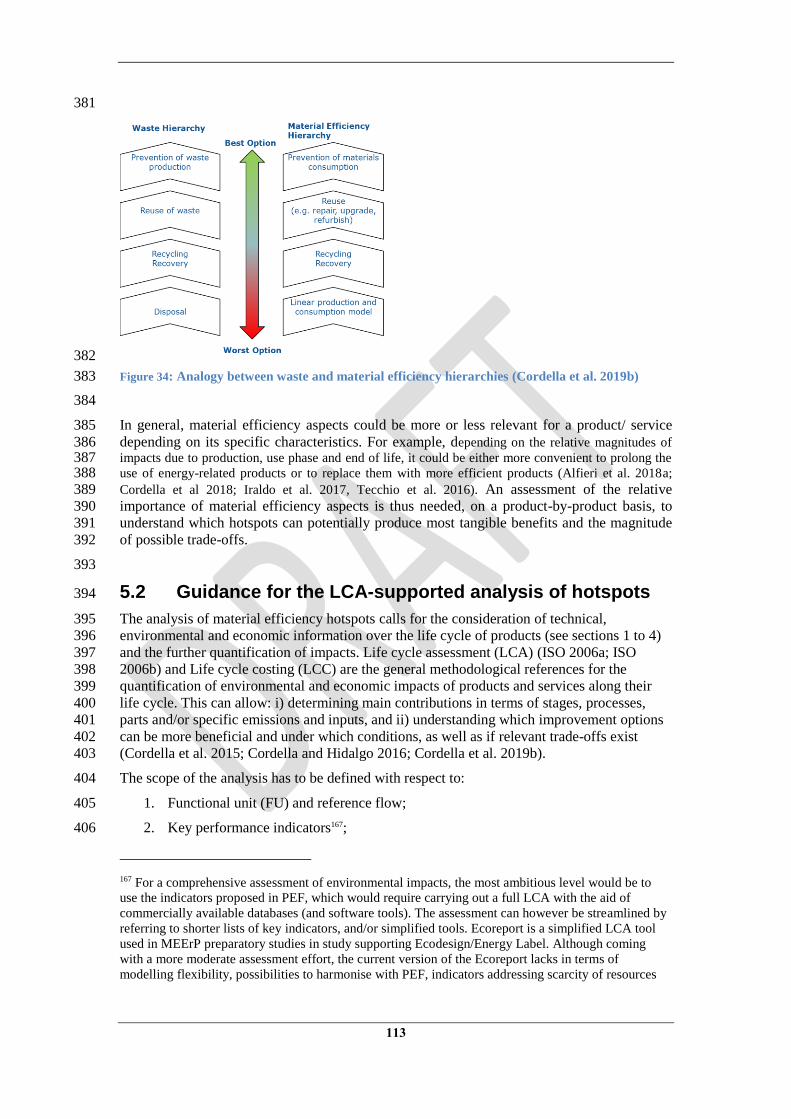
113
381
382
Figure 34: Analogy between waste and material efficiency hierarchies (Cordella et al. 2019b) 383
384
In general, material efficiency aspects could be more or less relevant for a product/ service 385
depending on its specific characteristics. For example, depending on the relative magnitudes of 386 impacts due to production, use phase and end of life, it could be either more convenient to prolong the 387 use of energy-related products or to replace them with more efficient products (Alfieri et al. 2018a; 388 Cordella et al 2018; Iraldo et al. 2017, Tecchio et al. 2016). An assessment of the relative 389
importance of material efficiency aspects is thus needed, on a product-by-product basis, to 390
understand which hotspots can potentially produce most tangible benefits and the magnitude 391
of possible trade-offs. 392
393
5.2 Guidance for the LCA-supported analysis of hotspots 394
The analysis of material efficiency hotspots calls for the consideration of technical, 395
environmental and economic information over the life cycle of products (see sections 1 to 4) 396
and the further quantification of impacts. Life cycle assessment (LCA) (ISO 2006a; ISO 397
2006b) and Life cycle costing (LCC) are the general methodological references for the 398
quantification of environmental and economic impacts of products and services along their 399
life cycle. This can allow: i) determining main contributions in terms of stages, processes, 400
parts and/or specific emissions and inputs, and ii) understanding which improvement options 401
can be more beneficial and under which conditions, as well as if relevant trade-offs exist 402
(Cordella et al. 2015; Cordella and Hidalgo 2016; Cordella et al. 2019b). 403
The scope of the analysis has to be defined with respect to: 404
1. Functional unit (FU) and reference flow; 405
2. Key performance indicators167; 406
167 For a comprehensive assessment of environmental impacts, the most ambitious level would be to
use the indicators proposed in PEF, which would require carrying out a full LCA with the aid of
commercially available databases (and software tools). The assessment can however be streamlined by
referring to shorter lists of key indicators, and/or simplified tools. Ecoreport is a simplified LCA tool
used in MEErP preparatory studies in study supporting Ecodesign/Energy Label. Although coming
with a more moderate assessment effort, the current version of the Ecoreport lacks in terms of
modelling flexibility, possibilities to harmonise with PEF, indicators addressing scarcity of resources

114
3. Reference product(s)/ types of products; 407
4. System Boundary and modelling approach168
. 408
Depending on the quality of the available information, the assessment can be based on 409
existing studies (Cordella and Hidalgo 2016) and/or ad-hoc models which match, as close as 410
possible, the stock/market conditions of the analysed product (Cordella et al. 2015). 411
412
5.3 LCA of smartphones 413
5.3.1 Goal and scope 414
The aim of this LCA application is to analyse material efficiency hot-spots relating to the 415
average use of smartphones in the EU. Baseline and alternative scenarios potentially leading 416
to an improvement of the material efficiency of smartphones are also defined and assessed. 417
The assessment is assisted by an ad-hoc LCA model, developed based on the information 418
available in the literature. 419
LCA studies for mobile phones published after 2010169 were screened, based on elements 420
provided by Cordella and Hidalgo (2016),to identify those which could constitute a 421
potentially valuable resource for the analysis in terms of: scope of the analysis, data quality 422
and representativeness, impact assessment metric, relevance and robustness of findings 423
(Ercan 2013; Ercan et al. 2016; Manhart et al. 2016; Moberg et al. 2014;Proske et al. 2016; 424
Prunel et al. 2014; Prunel et al. 2015; Suckling and Lee 2015). Additionally, LCA results for 425
different models of smartphones have been shared by Apple, Huawei and Samsung. 426
427
5.3.2 Key Performance Indicators 428
LCA studies on smartphones (see for all: Ercan 2013; Ercan et al. 2016; Manhart et al. 2016; 429
Moberg et al. 2014;Proske et al. 2016; Prunel et al. 2014; Prunel et al. 2015; Suckling and Lee 430
2015) have typically focused on the analysis of the Carbon Footprint (CF) of the product, i.e. 431
the greenhouse gases (GHGs) emitted along the product life cycle, measured as CO2,eq. in 432
terms of Global Warming Potential over 100 years (GWP100). 433
The dominant contribution of materials and manufacturing processes to the CF of 434
smartphones is described in several studies (Andrae 2016; Ercan 2013; Manhart 2016; 435
Suckling and Lee 2015). When a broader set of indicators was used (Ercan et al. 2016; 436
Moberg et al. 2014; Proske et al. 2016; Prunel et al 2015; Prunel et al 2016), materials and 437
(e.g. ADP). Reference impact categories could be identified based on the observation of Product
Category Rules and relevant studies, as for instance described by Cordella and Hidalgo (2016). Since
different hotspots are in general associated to different impact categories, it can be possible to narrow
down further the list of impact categories. For example: 1) an environmental indicator where
contribution to the impacts due to materials is dominant (e.g. 75-100% of the overall impact); 2) an
environmental indicator where contribution to the impacts due to the use phase is dominant; 3) an
environmental indicator where contribution to the impacts from both materials and use phase is
significant (e.g. 30-50% each); 4) total cost of ownership (EUR).
168 The modelling of the life cycle can include the application of assumptions and the further processing
of foreground and LCI data for the calculation of the inputs and outputs associated to the key elements
of the product's life cycle: Bill of Materials (BOM) and manufacturing processes, transports and
distribution, expected time of use, maintenance and repair activities, EoL scenarios. A sensitivity
analysis should be carried out when the uncertainty of assumptions and/or data is significant 169 Considering that smartphones have been introduced on the market in 2007 (Arthur 2012) and that
some years are needed before relevant LCA information is made available.

115
manufacturing processes were confirmed to be very relevant in determining the 438
environmental profile of smartphones. 439
Although the quantitative assessment of the sustainability of products should be generally 440
based on a comprehensive metric of indicators, this application is limited to the calculation of 441
GWP100 and total cost of ownership for consumers (EUR) along the life cycle of 442
smartphones. This is due to the fact that: 443
Smartphones are per se a complex product system; 444
GWP100 is a popular indicator representing a global environmental priority, which is 445
also correlated to other indicators (Askham et al. 2012; Huijbregts et al. 2005); 446
Economic considerations are important to complement GWP100; 447
A broader metric would confirm the importance of consumption and disposal of 448
materials, at least from a qualitative point of view. 449
450
5.3.3 Functional Unit and Reference Flow 451
This application refers to the average use of smartphones in the EU. The definition of a 452
representative Functional Unit (FU) is complicated by the fact that smartphones integrate 453
many functions at different levels of performance (potentially replacing the use of other 454
products such as cameras and music players). 455
For comparative purposes, equivalency between smartphone systems must be ensured by 456
selecting and defining relevant function(s) and functional unit(s). This would include the 457
consideration of quantitative and qualitative aspects: 458
What, when and how well: e.g. a smartphone produced in 2018, enabling 3G/4G 459
speed and Wi-Fi access, equipped with a 5.9 inch display of 1440 × 2560 pixels, with 460
64 GB of storage memory and 4 GB of RAM, with a 20 Mega Pixel (MP) video-461
camera, and with a 4,000 mAh battery capacity; 462
How much and how long: e.g. 1 hour calling, 1 hour web browsing, and 1 hour video 463
watching per day, for a total of 4 years of use. 464
In practice, it is likely that conducting a coherent comparison between models is hindered by 465
the different characteristics of such models. 466
The FU can be then converted in terms of Reference Flow, which is the amount of product(s) 467
needed to deliver defined functions. The use of a phone for a certain number of years is the 468
most commonly used reference flow (ETSI 2018). This simplification is considered useful for 469
the analysis of the relevance of material efficiency hot-spots in the life cycle of a generic 470
product. The analysis has been thus referred to the use of a smartphone for 4.5 years, based on 471
the information reported in section 3.3. Further assumptions are defined in the next section. 472
473
5.3.4 Reference Product, System Boundaries and Scenarios 474
Smartphones on the market are multi-functionality products offering different levels of 475
performance depending on the technologies used. The comparison of specific models of 476
smartphones should be carried with an adequate level of granularity, so that products with 477
similar characteristics are assessed within the same product category. 478
Since this application does not aim to compare specific models of smartphones, but rather 479
produce general considerations for this product group, a virtual (non-existing) product made 480
up of different technologies/materials is considered as reference for this assessment. 481
The System Boundaries include the evolution of the product from cradle-to-grave: 482

116
a. Production (i.e. extraction, processing and transportation of materials and 483
parts and further assembly, including the product packaging); 484
b. Distribution (i.e. transportation of the product from manufacturing plants to 485
regional hubs and final customers); 486
c. Use (by first/following owners, including system aspects); 487
d. End of Life (i.e. typical disposal scenarios, including transportation and 488
recycling of the product). 489
Foreground data has been gathered from the literature; elementary input/output flows have 490
been then calculated based on LCI datasets. Services and material goods to support the 491
business are not considered (e.g. research and development activities, marketing). 492
493
5.3.4.1 Materials, manufacturing and assembly 494
Based on Section 4.2.1, an average smartphone is considered to have a display size of 75.53 495
cm2 and a weight of 160 grams, including 39 g for the battery and excluding accessories and 496
packaging. The weight of the smartphone has been estimated approximately as 29 g per 497
display size inch (+/- 15%). Additional materials are necessary for packaging, documentation 498
and accessories as head-set, USB-cable, charger. Packaging is typically made of fibre (e.g. 499
cardboard) and, to a lower extent, plastic materials. A Bill of Materials has been estimated on 500
the basis of the available information and reported in Table 26. The objective is to find a 501
balance between comprehensiveness of materials, and simplicity for the modelling. 502
According to Proske et al. (2016), 4.698 kWh are needed for manufacturing one unit of 503
smartphones. It has been estimated that this value could vary +/- 50%. Manufacturing has 504
been considered to happen in China. 505
506
Table 26: Bill of Materials for a generic smartphone in the EU 507
Module Part Avg. weight
(variation) Transport
Housing Plastic elements (PC) 9.5 g T: 1000
km Metal frame and case:
- Aluminium
- Steel
22 g
6.5 g
T: 1000
km
Screen/Display LCD display (75.5 cm2) 30 g F: 1000
km
T: 100 km Electronics PCB (14 cm2) 28 g F: 1000
km
T: 100 km IC die area (3 cm2) 2 g F: 1000
km
T: 100 km Battery Battery 39 g (19-48 g) F: 1000
km
T: 100 km Audio-visual Speakers and
microphone 2 g F: 1000
km
T: 100 km Cameras 1.25 g (1-1.5 g) F: 1000
km
T: 100 km

117
Others Buttons 0.1 g F: 1000
km
T: 100 km Resistors 2 g F: 1000
km
T: 100 km Diodes 0.9 g F: 1000
km
T: 100 km Capacitors 0.7 g F: 1000
km
T: 100 km Inductors 0.2 g F: 1000
km
T: 100 km Transistors 0.1 g F: 1000
km
T: 100 km Filters 0.1 g F: 1000
km
T: 100 km Connections 0.25 F: 1000
km
T: 100 km Vibration motor 1 g F: 1000
km
T: 100 km Other electro-mechanical
components 14.5 g F: 1000
km
T: 100 km Accessories Charger 50 g (50-56 g) F: 1000
km
T: 100 km USB cable 20 g F: 1000
km
T: 100 km Headset 15 g F: 1000
km
T: 100 km
Packaging (primary, secondary and
tertiary) and documentation
Paper 50 g T: 100 km
Cardboard 110 g T: 100 km
LDPE film 20 g T: 100 km
Note: 508 F: flight 509 T: Truck 510
511
5.3.4.2 Distribution 512
The following means of transport are considered for the distribution of the product from 513
China to the EU: 514
100 km by truck, in China; 515

118
8000 km by flight (distance from Beijing to Paris170) 516
500 km by truck > 32t, in Europe 517
100 km by truck 16t, in Europe 518
519
5.3.4.3 Use 520
The use of smartphones mainly implies consumption of electricity in the battery recharge 521
cycles. Actual consumption depends on user behaviour and on efficiency of battery/charger. 522
An electricity consumption of 4.9 kWh per year is calculated by Proske et al. (2016) 523
considering a battery capacity of 2420 mAh, 3.8 V of voltage, 69% of recharge efficiency, 524
and 365 charge cycle per year. According to Andrae (2016), energy consumption is 1.538 525
times the battery capacity and can vary between 2 and 6 kWh per year. Ercan et al. (2016) 526
estimated that the annual electricity demand of a smartphones can range from 2.58 kWh, 527
considering 1 recharge every 3 days, to 7.74 kWh, considering 1 recharge per day. The 528
electricity consumption range is instead 3-6 kWh/year according to Manhart et al. (2016). 529
Based on the available information it is considered that the electricity consumption associated 530
to the use of smartphones in the EU is 4 kWh/year, on average, and that this could be equal to 531
2 and 6 kWh/year in case of more moderate and intensive uses, respectively. 532
In terms of lifetime, it is considered that the average technical lifetime of a smartphone can be 533
4.5 year, while the time of use of the first user is 2 years, on average. This corresponds to the 534
default scenario, additional scenarios are assessed, as described in Section 5.3.5. 535
536
5.3.4.4 End of Life 537
Re-elaborating the information from Ercan (2013): 538
49% of smartphones are kept unused at home, once they reach their end of life; 539
22% of smartphones find a 2nd
user, either as donation or through the 2nd
hand 540
market; 541
29% of smartphones are collected and recycled/remanufactured. 542
In case of recycling/remanufacture, it is considered that waste smartphones have to be 543
transported 1125 km by truck and 375 km by train (Proske et al. 2016). 544
545
5.3.4.5 System aspects 546
Apart from the consumption of electricity associated to the recharge of batteries, additional 547
energy is consumed due to the infrastructures needed to transfer and store information. 548
Ercan et al. (2016) estimates the electricity consumption associated to network usage for 549
representative, light and heavy users, as reported in Table 27. 550
According to Andrae (2016), the electricity consumption would be 1.16 kWh per GB of data 551
used (1 kWh due to extra wireless networks; 0.1 kWh due to Wi-Fi/fixed backhaul; 0.06 kWh 552
due to data centres). Considering an average consumption of 4 GB per month (see Section 3), 553
or 48 GB per year, the annual consumption would be 55.7 kWh/year, which correspond to the 554
170 https://www.distance.to/Paris/Beijing (Accessed on 4 April 2019)

119
heavy use of smartphones, according to Ercan et al. (2016). This value is considered to be 555
representative for the current use of smartphones, due to the current trend towards an 556
increased consumption of data. It could be considered that more moderate and intensive uses 557
of smartphones can imply the consumption of +/- 50% of electricity per year. 558
559
Table 27: Consumption of electricity associated to network usage (adapted from Ercan et al. 2016) 560
Light
User
Representative
User
Heavy
User
Mobile network + Wi-Fi data traffic per year 5.5GB + 5.5 GB 11GB + 11 GB 30GB +
30 GB
Mobile network (kWh/year) 33.8 36.8 46.8
Wi-fi Operation (kWh/year) 1.8 3.6 9.9
Total (kWh/year) 35.6 40.4 56.7
Total (kWh/GB) 3.2 1.8 0.9
561
5.3.5 Scenarios of assessment 562
Building up on the information described above, a number of scenarios have been defined for 563
the assessment of material efficiency aspects. Scenarios are reported in Table 28. Each 564
scenarios address different material efficiency aspects and can be associated to the 565
implementation of specific designs, technologies, behavioural practices. 566
567
Table 28: Scenarios considered for the assessment of material efficiency aspects in the life cycle of 568 smartphones 569
Scenario Reference
lifetime Use and EOL
1. Default (D0) 4.5 years
Smartphone replaced by a new device every 2 years.
The old product is kept unused at home.
New units (same device) bought and disposed as above
to reach 4.5 years.
2. Durability 1 (D1) 4.5 year
Smartphone replaced by a new device every 3 years.
The old product is kept unused at home.
New units (same device) bought and disposed as above
to reach 4.5 years.
3. Durability 2 (D2) 4.5 year
Smartphone replaced by a new device every 4.5 years
(battery changed once).
The old product is kept unused at home.
4. Durability 3 (D3) 4.5 year
Smartphone replaced by a new device every 6 years
(battery changed twice).
The old product is kept unused at home.
Impacts allocated to 4.5 years of use.
5. Reparability 1 (R1) 4.5 years
Smartphone break down (display) after 1 year.
The product is repaired and used for another year.
At the end of life the product is kept unused at home.
New units (same device) bought and disposed as above
to reach 4.5 years.
6. Reparability 2 (R2) 4.5 years
Smartphone break down (display) after 2 years.
The product is repaired, the battery is changed and the
device is used for other 2 years.
At the end of life the product is kept unused at home.
New units (same device) bought and disposed as above
to reach 4.5 years.

120
7. Re-use (RU) 4.5 years
Smartphone replaced by a new device every 2 years.
The old product is used by a different user for other 2
years (only battery changed) and then kept unused at
home.
A credit for the avoided manufacture of a device is
assigned for the re-use.
New units (same device) bought and disposed as above
to reach 4.5 years.
8. Recycle (RC) 4.5 year
Smartphone replaced by a new device every 2 years.
The old product is sent to recycle; a credit is assigned
for the recovery of parts/materials.
New units (same device) bought and disposed as above
to reach 4.5 years.
9. Remanufacture (RM) 4.5 year
Smartphone replaced by a new device every 2 years.
The old product is sent to remanufacture; a credit is
assigned for the recovery of parts/materials.
New units (same device) bought and disposed as above
to reach 4.5 years.
570
5.3.6 Life Cycle Costing and technical considerations relating to 571
alternative scenarios 572
573
5.3.6.1 Calculation of the total cost of ownership for consumers along 574
the life cycle of the product 575
Life Cycle Costs for end users, expressed in Euros, can be calculated according to equation 576
below: 577
𝑳𝑪𝑪 = 𝑷𝑷 +∑𝑷𝑾𝑭 ∗ 𝑶𝑬
𝑵
𝟏
+𝑬𝑶𝑳
Where: 578
LCC: Life Cycle Costs for end-users; 579
PP: Purchase price (including installation costs); 580
OE: annual operating expenses for each year of use; 581
EOL: End-of-life costs for end-users (i.e. costs for disposal); 582
PWF: Present Worth Factor 583
PWF can be calculated as: 584
585
Where 586
e is the aggregated annual growth rate of the operating expense ("escalation rate"); 587
d is the discount rate (= interest – inflation) in %; 588
N is the product life in years. 589
To calculate the PWF the discount rate (d) and the escalation rate (e) of the operating 590
expenses have to be defined. Assuming that d and e are the same, e.g. 4% (Boyano et al. 591

121
2017) , PWF is 1 to the power of the product life N. Moreover, end-users in Europe do not 592
have separate costs for the disposal of smartphones. The formula can be thus simplified as: 593
𝑳𝑪𝑪 = 𝑷𝑷 +∑ 𝑶𝑬𝑵𝟏 594
595
5.3.6.2 Purchase price and electricity cost 596
From section 2.3.4, it is considered that the purchase price of an average smartphone in the 597
EU is 320 EUR. The price could change to less than 130 EUR and more than 480 EUR for 598
low and high-end products, respectively. 599
The only operative cost considered for the product is the consumption of electricity to 600
recharge the battery of the smartphone: 0.208 EUR per kWh (Boyano et al. 2017). 601
602
5.3.6.3 Depreciation 603
The value of the device is 54% of the original price after 1 year, 32% of the original price 604
after 2 years, 20% of the original price after 3 years. Lifespan and residual value of 605
smartphones can vary depending on manufacturers and models. In particular, high-end 606
smartphones have a higher residual value (Makov 2018) 607
608
5.3.6.4 Failures and repair costs 609
According to Bullitt (2017), 34% of the EU consumers has suffered a damage of their devices 610
in a three-years period of observation. 24% of users in the UK have a screen breakage in a 611
two-years period of observation171. Data from US reports even show higher frequency of 612
failures172. 613
The most frequent failure types, related to the screen, are usually not covered by legal 614
guarantee, generating in case of failure a repair cost of 15-40% (25% as average) of the 615
purchase price. The replacement of the battery can instead cost 5-10% of the purchase price. 616
Based on this data, average repair costs in the EU could be roughly estimated as 11% of the 617
purchase price (25% of the purchase price for the repair of screens, multiplied by a frequency 618
of failure of 34%). 619
620
5.3.6.5 Design for durability 621
More durable designs can be pursued through the following technical measures: 622
IP68 protection level (dust and waterproof): it is mainly associated to current high-623
end devices173 or to the specific market segment of rugged smartphones. However 624
also some devices not belonging to the high-end class are reported to be IP68174. IP67 625
171 https://www.mintel.com/press-centre/technology-press-centre/smashing-times-24-of-uk-
smartphone-owners-have-broken-their-screen-in-the-past-two-years (accessed on 5 April 2019) 172 https://bgr.com/2018/11/20/smartphone-screen-repair-data/ (accessed on 5 April 2019) 173 E.g. Galaxy S8 Plus, LG V30, LG G6, Sony Xperia XZ1, Sony Xperia XZ Premium and
the Samsung Galaxy S7, iPhone XS and XS Max 174
E.g. LG X venture, Samsung Galaxy A8, Xiaomi Pocophone F1claim - IP68 dust/water proof (up to
1.5m for 30 mins). LG X venture also claims to be compliant with MIL-STD 810G

122
protection levels (dust and waterproof) are claimed for more models on the market175. 626
IP67 and 68 cannot be ensured in case of modular design176). Based on this 627
information, no significant additional costs seem associated to the fulfilment of IP68 628
protection levels. 629
Resistance to drops: drop tests results and compliance with related standards are 630
usually reported for rugged smartphones177. However also some devices classified to 631
have a medium price are claimed to have a high mechanical resistance178. Mechanical 632
resistance can come with some trade-offs. For example, use of glass in the back cover 633
and bezel-free smartphones are more fragile. Higher resistance could be ensured with 634
different materials, smaller screen sizes and the use of bezels. Moreover, mechanical 635
resistance can be improved through protective covers/bumpers. Model-specific 636
certified bumpers are provided by some manufacturers179. Pre-installed protective 637
layers are also provided for some models180. Based on this information, no significant 638
additional costs seem associated to the fulfilment of a high mechanical resistance. 639
Longer battery life: a manufacturer reports that their batteries are designed to retain 640
up to 80% of its original capacity at 500 complete charge cycles181 (equivalent to 641
about 2 years). Since the cost of battery is relatively small compared to the total price 642
of the products, no significant additional costs seem associated to the provision of 643
long battery lives. 644
Minimum guaranteed OS support period: this appears feasible, as claimed by a 645
manufacturer182, and without entailing significant additional costs. 646
A more durable design can have positive effects: 647
1. Extension of the technical lifetime, including reuse, from 4.5 years to 6 years; 648
1. Direct saving in maintenance/ repair; 649
2. Increase residual value (value retention) at the end of the first use. 650
On the other hand, a more durable design is normally associated to high-end products which 651
present higher purchase prices, although this is also implemented in some products that are in 652
the medium price range. 653
654
5.3.6.6 Design for reparability 655
An extension in the product lifetime and a reduction in maintenance/ repair costs can be 656
achieved also through designs focused to increase the reparability of smartphones (especially 657
175 E.g. Huawei P20 Pro, Apple iPhone X , The Pixel 2 XL, Nokia 8 Sirocco, Sony Xperia XZ2
Compact, Motorola X4 4th Gen 176
E.g. Fairphone, see: https://support.fairphone.com/hc/en-us/articles/115001535486-Is-the-
Fairphone-2-dust-or-water-resistant- (accessed on 5 April 2019) 177
https://www.toughgadget.com/best-rugged-smartphones-unlocked/ (accessed on 5 April 2019) 178
e.g. LG X venture claims - IP68 dust/water proof (up to 1.5m for 30 mins) and MIL-STD 810G
certified 179
Samsung is providing protective covers certified to be compliant to drop tests according to the MIL-
STD-810G-516.7(United States Military Standard Test - Shock), see:
https://www.amazon.com/Samsung-Official-Protective-Standing-EF-
RG965CBEGKR/dp/B07BNCLSVY (accessed on 5 April 2019) 180
https://www.samsung.com/au/support/mobile-devices/galaxy-s10-in-box-items/ (accessed on 5
April 2019) 181
https://www.apple.com/batteries/service-and-recycling/ (accessed on 5 April 2019) 182
https://store.google.com/product/pixel_3_specs (accessed on 5 April 2019)

123
with respect to the replacement of batteries and screens). Such designs should cover at least: 658
ease of disassembly of critical parts, availability of tools and spare parts, provision of repair 659
information, as well as data erasure/transfer features and provision of software/firmware 660
updates. 661
Reduction in repair costs can offset additional costs potentially associated to this design 662
strategy. In case of modular designs (which are by definition easier to repair and upgrade) 663
possible trade-offs with durability features can occur (e.g. waterproofing). 664
665
5.3.6.7 Design for recycling 666
Design strategies targeting the recycling process can produce economic benefits from a life 667
cycle perspective. 668
Ease of dismantling of batteries, PCBs and screens could potentially increase their separate 669
collection and recovery. Smartphones should be designed in a way that the access and 670
removal of these components is possible with commercially available tools. Moreover, the 671
sequence of dismantling operations should be provided to recyclers. In general, no additional 672
costs seem associated to such measures. WEEE fees are considered to be integrated in the 673
product purchase price. 674
Materials can also have an influence on price and feasibility/ profitability of the recycling 675
process. However an analysis of their impact is quite difficult due to the broad heterogeneity 676
of material design options and market value fluctuations. This also apply to the use of 677
recycled materials, which can present uncertainty with respect to their availability and value 678
over time, as well as unexpected side effects (e.g. diverting materials from one sector to 679
another). 680
681
5.3.6.8 Lean Design 682
The inclusion of less accessories in the packaging could contribute to save materials and 683
costs: 684
Smartphones could be marketed without an external power supply; 685
When a standard power supply is provided, this comes with detachable cables. 686
687
5.3.6.9 Environmental externalities 688
In order to internalise environmental costs, it is considered that each ton of CO2 emitted in 689
the life cycle of the product has a societal cost of 90 EUR/tonne (current price in the EU 690
market is around 23 EUR/tonne)183,184
. 691
692
5.4 Preliminary considerations 693
The assessment will be completed for the final report. Preliminary considerations to be 694
checked by the study team are the following: 695
183 https://markets.businessinsider.com/commodities/co2-emissionsrechte (accessed on 5 April 2019) 184
https://www.decluttr.com/blog/2017/04/05/how-quickly-does-your-phone-depreciate-in-value/
(accessed on 5 April 2019)

124
Increasing durability (in terms of reliability of hardware and upgradability of 696
software) and increasing reparability are core strategies to extend the technical 697
lifetime of a smartphone and improve its material efficiency. This should be 698
supported also by information provision. Moreover, consumers should be also 699
triggered to use their products for a longer period of time. Factors as functionality, 700
design, utility and value of the product. 701
Ease of disassembly can have positive effects on both reparability and recyclability of 702
smartphones. However, recyclability can only be assessed in relation to the applied 703
recycling processes. With the current practice it seems possible to recycle only a 704
small fraction of materials. Further innovation is needed to deal with small and highly 705
integrated products at a commercial scale and to recover materials that are lost in 706
today's recycling practices. 707

125
708
6 DEFINITION OF POSSIBLE DESIGN MEASURES FOR 709
IMPROVING MATERIAL EFFICIENCY 710
This section aims to sum up the information gathered in the former sections and to define 711
practical design measures that could help to improve the material efficiency of the product. 712
The ambition is also to analyse relevance and technical feasibility of each measure, as well as 713
to describe available methods for assessment and verification purposes. 714
An illustrative list of possible measures to improve the material efficiency of smartphones is reported in 715

126
Table 29. It should be underlined that this list does not have to be considered like a policy 716
proposal but rather as examples of possible improvement options. 717
718

127
Table 29: Possible measures to improve the material efficiency of smartphones 719
Strategy (*)
Measure Relevance Feasibility Assessment and verification
Reduction and/or
optimisation the amount of
materials used
1) Reduction of materials
a. Provision of smartphones without EPS.
b. To be complemented by measures for the
interoperability of EPS:
- Provision of information on the technical
specifications of the accessories (voltage, power
output and connector type of the EPS).
- Compliance with IEC 62684:2018 or IEC
63002:2016
Many users have another
charger that could be
compatible and reused185
.
Impacts can be quantified
via LCA/LCC
Technical feasible
Visual check of the product
package, ports and
documental review of the
claimed specifications in the
instruction manual provided
with the product (voltage,
power output and connector
type)
2) Use of recycled and/or renewable materials
Use of recycled Aluminium, Copper, Tin and
Tungsten
Environmental impacts for
aluminium and copper.
Socio-economic impacts
for Tungsten (CRM and
Conflict Material) and Tin
(Conflict Material).
Apparently feasible for
some manufacturers.
Uncertainty about the
recycled Tungsten supply
chain.
Risk of material diversion
to be verified for
aluminium and copper.
Chain of custody and mass
balance methods
3) Substances of concern
Monitoring, restriction and provision of
information on substances of concerns. (e.g.
Stimulating safer designs
Several manufacturers in
the ICT sector have
IEC TR 62476:2010 provides
guidance for the evaluation of
185 https://support.fairphone.com/hc/en-us/articles/201065667-Why-don-t-you-offer-a-charger-with-Fairphone-2- (accessed on 10 April 2019)

128
Strategy (*)
Measure Relevance Feasibility Assessment and verification
halogens, Antimony, Phthalates, Arsenic
compounds)
and processes already implemented
Substance Control systems
substances in EEE
Increase of durability 1) Protection from water and dust
Compliance with the IP68 or IP67 levels of
protection
Accidental ingress of
water and dust is a
relevant reason of product
failure
There are models of
smartphones on the market
that are compliant with
these requirements.
IEC 60529 - Degrees of
protection provided by
enclosures (IP Code)
2) Resistance to accidental drops
a. Compliance with specific drop tests
and/or
b. Provision (at the moment of purchase) of screen
protectors and protective cases enabling the same
level of protection.
Accidental drops are one
of the main reasons of
product failure.
a. There are models of
smartphones that are
compliant with these
requirements.
b. It has been
demonstrated that
protective accessories are
effective.
a. MIL-STD-810G or IEC
60068 E.g. Part 2-31: Ec
(Freefall, procedure 1)
b. Visual check of the product
package, ports and
documental review of the
claimed specifications in the
instruction manual provided
with the product.
3) Battery life:
a. Minimum number of cycles with the battery
properly functioning (e.g. 500 cycles at 80% of
initial performance)
Alternative for a: the remaining full charge
capacity of the battery compared to the initial
charge capacity, after x and y charge/discharge
cycles (e.g. 300 and 500) is higher than XX%
b. Software is pre-installed to enable a limit on the
battery state of charge (SoC) when the smartphone
is connected to the grid (e.g. overnight charge). To
be complemented with information about the
Battery aging is a
common problem in
smartphones
a/b. Already feasible for
products on the market
a. Battery life testing
according to IEC EN 61960.
b. Provision of information
from manufacturers

129
Strategy (*)
Measure Relevance Feasibility Assessment and verification
existence and the benefits of such functionality
4) Operating System, software and firmware
a. Availability of update support (at least along the
entire guarantee period), including information on
impact and reversibility of updates
b. The device is placed on the market with
sufficient capacity and the last available OS model
Software issues have been
found to be a limiting
state even for products
with a still functioning
hardware.
Availability of updates is
technically feasibile for
products on the market.
Declaration/ guarantee from
manufacturer
5) Guarantee
a. Inclusion of failures due to accidental drops and
contact with water in the legal guarantee
b. Extended guarantee
Note: the guarantee could also include
"commitment to free repair as first remedy" in case
of failures and a "commitment to upgrade the
product periodically
The inclusion of common
failures in legal
guarantees and/or the
provision of extended
guarantees could stimulate
the design of more durable
devices.
Already feasible for some
products/countries
Declaration/ guarantee from
manufacturer
6) User behaviour
Provision of information about the correct use and
maintenance of the device
Behavioural patterns can
be cause of early failures
and/or replacement of
devices
No barrier identified
Provision of information by
manufacturer
Increase of reparability and
upgradability
1) Disassemblability
a. Batteries, screens and back covers removable in
28, 30 and 14 steps, respectively (a more
ambitious level would be 2, 15 and 1 steps)
b. Batteries, screens and back cover to be easily
accessible and replaceable using universally
Priority parts should be
easy-to-disassemble to
facilitate the repair
process (and reduce the
related costs).
There is a broad
heterogeneity in designs,
with some devices being
more reparable than
others.
Provision of a manual with an
exploded diagram of the
device, and an illustration of
how parts can be accessed
and replaced, also with an
indication of tools required

130
Strategy (*)
Measure Relevance Feasibility Assessment and verification
available tools. Non-removable fasteners are
avoided.
Alternatively to a and b:
c. Batteries, screens and back covers removable in
30, 40 and 53 minutes, respectively (a more
ambitious level would be 1, 20 and 1 minutes)
and associated difficulty (e.g.
time needed).
2) Provision of information
Repair and maintenance information to be
provided to
- final users (at least with respect to priority parts)
- professional repairers
Priority parts, and other
parts, should be reparable
in case of failure
No barrier identified
Check of the information
provided
3) Availability of spare parts
a. Priority parts should be made available as spare
parts for at least 4 years after placing the last unit
of the model on the market (availability could be
extended up to 6 years). These could also include
approved-by-manufacturer compatible spare parts
produced by third parties. The delivery time has to
be 2 working days.
b. Standardized interfaces are used for connectors
and EPS
a. Spare parts are
necessary for ensuring the
repair/upgrade of devices
b. Standardised interfaces
could facilitate the
replacement of parts (and
reduce costs).
No barrier identified
Declaration and check
4) Data transfer and deletion
a. Secure data deletion tools should built-in (or as
second option made available) to permanently
delete all user data without compromising the
functionality of the device.
b. Simplified transfer of data from an old to a new
product should be made available via installed or
These functions are
important for data
protection and privacy of
users, and can facilitate
the transfer/deletion of
data in case of
No barrier identified
Declaration and check
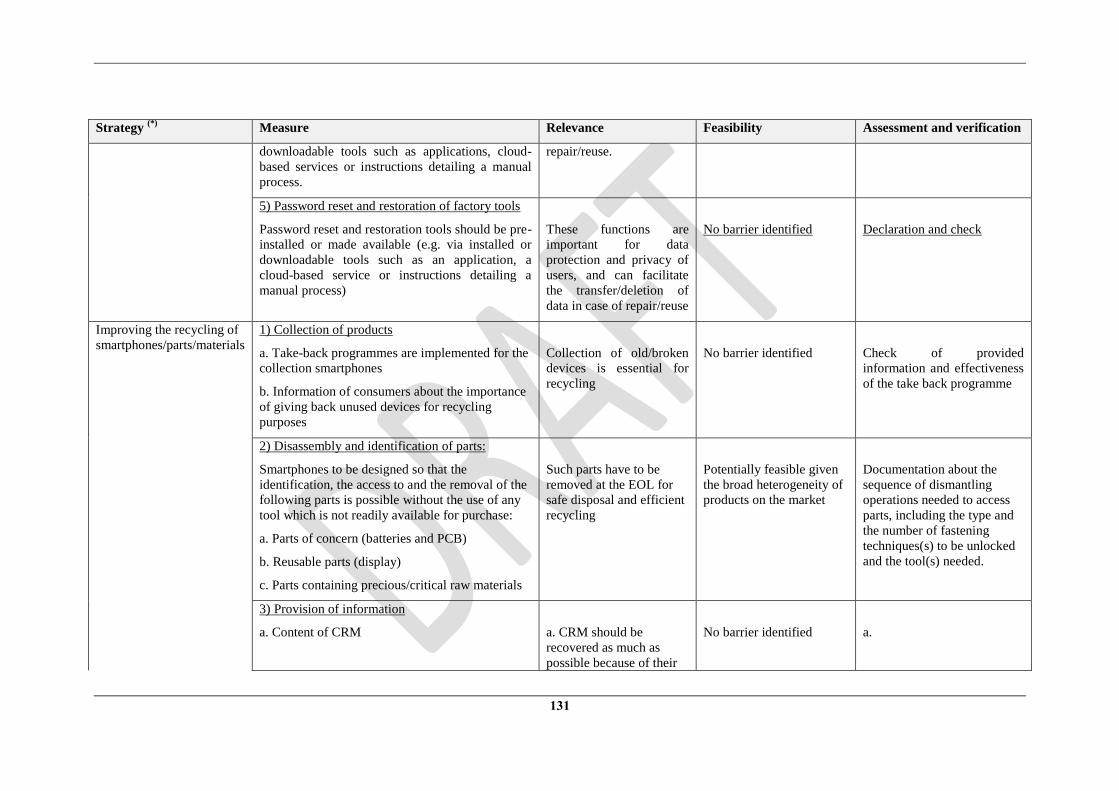
131
Strategy (*)
Measure Relevance Feasibility Assessment and verification
downloadable tools such as applications, cloud-
based services or instructions detailing a manual
process.
repair/reuse.
5) Password reset and restoration of factory tools
Password reset and restoration tools should be pre-
installed or made available (e.g. via installed or
downloadable tools such as an application, a
cloud-based service or instructions detailing a
manual process)
These functions are
important for data
protection and privacy of
users, and can facilitate
the transfer/deletion of
data in case of repair/reuse
No barrier identified
Declaration and check
Improving the recycling of
smartphones/parts/materials
1) Collection of products
a. Take-back programmes are implemented for the
collection smartphones
b. Information of consumers about the importance
of giving back unused devices for recycling
purposes
Collection of old/broken
devices is essential for
recycling
No barrier identified
Check of provided
information and effectiveness
of the take back programme
2) Disassembly and identification of parts:
Smartphones to be designed so that the
identification, the access to and the removal of the
following parts is possible without the use of any
tool which is not readily available for purchase:
a. Parts of concern (batteries and PCB)
b. Reusable parts (display)
c. Parts containing precious/critical raw materials
Such parts have to be
removed at the EOL for
safe disposal and efficient
recycling
Potentially feasible given
the broad heterogeneity of
products on the market
Documentation about the
sequence of dismantling
operations needed to access
parts, including the type and
the number of fastening
techniques(s) to be unlocked
and the tool(s) needed.
3) Provision of information
a. Content of CRM
a. CRM should be
recovered as much as
possible because of their
No barrier identified
a.

132
Strategy (*)
Measure Relevance Feasibility Assessment and verification
b. Content of flame retardant in plastic parts socio-economic impacts.
b. Flame retardants can
hinder the recycling of
plastics.
b.
4) Marking of parts:
Marking of plastic parts > 200 mm2 in accordance
to ISO 11469
Marking of plastics could
improve their separation
and recycling efficiency
At least for larger parts
ISO 11469
(*) For illustrative purposes only. In case of potential consideration for policy implementation, such options should be properly assessed to understand their 720
impact and side effects. 721
722

133
7 QUESTIONS FOR STAKEHOLDERS 723
724
A list of questions for stakeholders is reported below. Stakeholders are invited to reply to 725
experience-relevant questions and to support their views with supporting information. 726
727
Section 2
1) Can the price/cost information reported in section 2.3 be representative for the EU or
would you apply any modifications?
Section 4 (and section 6)
2) Do you consider that the technical description for functions (4.1.2) and parts (4.1.3) is
comprehensive? Do you have additional information to differentiate between technologies in
terms of material efficiency aspects and costs?
3) Could you please provide additional information on disruptive innovations/ technological
advances (e.g. foldable phones), and implications in terms of technologies, material efficiency
aspects and costs?
4) Which technologies and functions could become obsoletes in short/medium time, under
which conditions?
e.g. is IEC 62684 on ports and power supplies already obsolete and reference should be
instead made only to IEC 63002?
5) Which minimum levels of performance should be ensured to avoid the premature
obsolescence of the device (e.g. memory capacity and OS version)?
6) We have found information on the size of smartphones reported either as cm2 (area) or
inches (length). Is there an explanation and any agreed conversion factor?
7) Do you agree with the Bill of Materials reported in section 4.2?
8) Do you have considerations to add about the use of materials in smartphones?
9) Do you agree with the substances/parts of concern identified in section 4.2.4 and 4.5.3 or
do you have any change/addition to propose?
10) Do you agree with the limiting states and barriers for durability/reparability identified in
section 4.4? Do you have additional information (either quantitative or qualitative) to share?

134
11) Do you agree with the list of priority parts defined in section 4.4, or would you add other
parts? Why?
12) Do you agree with the measures (and the related assessment and verification methods)
that are described in the report to improve the material efficiency of smartphones? Do you
have any deletions/modifications/additions to propose?
Reduction of the direct consumption of materials (4.2.5);
Increase of the durability of the device (4.4.2);
Increase of the reparability and upgradability of the device (4.4.3);
Improvement of the recyclability of the device (4.5.5)
System overview (6)
13) With respect to the question above, how would you calibrate the ambition level for key
measures to differentiate between:
MUST conditions: all products on the market should fulfil such characteristic;
NICE TO HAVE conditions: front-runner products should fulfil such characteristic.
14) With respect the questions above, and to the information reported in section 4.6, do you
have any additional indications to provide about possible trade-offs associated to different
material efficiency strategies?
Section 5
15) Do you agree with the main assumptions made for this LCA/LCC application? If not,
what did you change and why?
16) A model of BOM to use for LCA/LCC is reported in section in section 5.3.4.1. The
intention is to find a balance between comprehensiveness and complexity and focus on a
representative number of key parts. Do you agree with the model and which
simplifications/changes would you suggest?
17) What is the influence of battery performance/technology and user behaviour on the
energy consumption of a smartphone during the use phase? Which factor is more important?
18) How the housing of a smartphone could change in terms of type and mass of materials?
19) How the weight of a screen/display and of a battery can vary depending on the
size/technology?
20) Is the list of electronics complete and plausible or would you modify it?

135
21) Can other parts be modelled as electro-mechanics or as cluster(s) of generic parts?
Which one(s)?
22) Are there technology relevant differentiations that you would suggest to analyse?
23) Do you have LCI datasets to recommend?
24) Do you agree with the scenario of assessment presented? Are there any additional
scenarios that you would propose and why?
25) Do you agree with the technical and economic assumptions made for the assessment
scenarios? Are there additional implications that you would like to point out?
25) How the LCA/LCC modelling could differentiate between recycle/remanufacture?
728

136
8 PRELIMINARY CONCLUSIONS 729
A methodological guidance for the analysis of material efficiency of products, based on 730
technical, economic and environmental information as well as LCA/LCC considerations, has 731
been presented in this report and applied to smartphones. 732
Apart for handling methodological aspects, the guidance is oriented to the tangible goal of 733
defining possible requirements with which improving the material efficiency of products and 734
contributing to a transition toward a more circular economy. 735
The application of the guidance to smartphones has allowed the identification of design 736
practices which can support an improvement in the material efficiency of the product by: 737
Reducing the direct consumption of materials; 738
Increasing the durability, reparability and upgradability of the device; 739
Improving the recyclability of the device. 740
Such measures also include considerations on critical raw materials and software, as well as 741
the provision of information to users. 742
It is anticipated that durability could be one the most important aspect to tackle for 743
smartphones. In this respect, apart from the hardware, also user behaviour and software can 744
play an important role. However, the analysis has still to be completed with LCA/LCC 745
calculations and further input form stakeholders. 746
Final results of the study can be used for integrating circular economy aspects in the design of 747
smartphones, for feeding standardisation work and policy discussion on ICT products, as well 748
as for supporting the revision of the Methodology for the Ecodesign of Energy-related 749
Products (MEErP). 750
751

137
9 ACKNOWLEDGEMENTS 752
The authors are grateful to the European Commission for financing this work through the 753
Administrative Agreement N. 070201/2015/SI2.719458/ENV.A.1 signed by DG ENV and 754
DG JRC. 755
The authors would like to thank the experts involved in the development of this study, 756
representing Member States, industry, NGOs and consumer testing organisations, for the 757
input provided. 758
The authors are also grateful to colleagues in DG JRC and DG ENV for the input provided for 759
the report as well as to Mr. Rick Nowfer for the editorial support. 760
761

138
10 REFERENCES 762
Akcil A, Ceren Erust C, Sekhar Gahan C, Ozgun M, Sahin M, Tuncuk A (2015) Precious 763
metal recovery from waste printed circuit boards using cyanide and non-cyanide lixiviants – 764
A review. Waste Management 45, 258–271 765
Agrawal J, Patel R, Mor P, Dubey P, Keller JM (2015) Evolution of Mobile Communication 766
Network: from 1G to 4G. Int. J. of Multidisciplinary and Current Research, Vol.3 (Nov/Dec 767
2015). ISSN: 2321-3124, http://ijmcr.com (accessed on 19 October 2018) 768
Alfieri F, Cordella M, Sanfelix J, Dodd N (2018a) An Approach to the Assessment of 769
Durability of Energy-related Products. Proc CIRP, 69: 878-891, 770
https://doi.org/10.1016/j.procir.2017.11.082 771
Alfieri F, Cordella M, Stamminger R, Bues A (2018b) Durability assessment of products: 772
analysis and testing of washing machines, EUR 29487 EN, Publications Office of the 773
European Union, Luxembourg, 2018, ISBN 978-92-79-98136-4, doi:10.2760/115684, 774
JRC114329 775
Allwood JM, Ashbya MF, Gutowski TG, Worrell E (2011) Material efficiency: A white 776
paper. Resour Conserv Recy 55: 362–381, doi:10.1016/j.resconrec.2010.11.002 777
Andrae A. (2016) Life-Cycle Assessment of Consumer Electronics - A review of 778
methodological approaches. IEEE Consumer Electronic Magazine, Volume: 5, Issue 1 , 51-779
60. DOI: 10.1109/MCE.2015.2484639 780
Apple (2018a) Environmental Responsibility Report 2018 Progress Report, Covering Fiscal 781
Year 2017, 782
https://www.apple.com/lae/environment/pdf/Apple_Environmental_Responsibility_Report_2783
018.pdf (accessed 5 March 2019) 784
Apple (2018b) Apple Regulated Substances Specification 069-0135-K, 785
https://www.apple.com/supplier-786
responsibility/pdf/Apple_Regulated_Substances_Specification_Sept2018.pdf (accessed on 5 787
March 2019) 788
Ardente F, Mathieux F (2014) Identification and assessment of product's measures to improve 789
resource efficiency: the case study of an energy using Product. Journal of Cleaner Production, 790
83: 126-141, https://doi.org/10.1016/j.jclepro.2014.07.058 791
Arthur C (2012) The history of smartphones: timeline, 792
https://www.theguardian.com/technology/2012/jan/24/smartphones-timeline) (accessed on 4 793
April 2019) 794
Askham C, Hanssen OJ, Gade AL, Nereng G, Aaser CP, Christensen P (2012) Strategy tool 795
trial for office furniture. Int. J. Life Cycle Assess. 17, 666–677, 796
http://dx.doi.org/10.1007/s11367-012-0406-y 797
Bakker C, Wang F, Huisman J, den Hollander M (2014) Products that go round: exploring 798
product life extension through design. Journal of Cleaner Production 69, 10-16, 799
doi:https://doi.org/10.1016/j.jclepro.2014.01.028 800
Basel Action Network (2019) Holes in the Circular Economy: WEEE Leakage from Europe, 801
http://wiki.ban.org/images/f/f4/Holes_in_the_Circular_Economy-802
_WEEE_Leakage_from_Europe.pdf (accessed on 3 April 2019) 803
Benton D, Coats E, Hazell J (2015) A circular economy for smart devices: Opportunities in 804
the US, UK and India, Green Alliance, https://www.green-805
alliance.org.uk/a_circular_economy_for_smart_devices.php (accessed on 27 February 2019) 806
Bertoldi P, Hirl B, Labanca N (2012) Energy Efficiency Status report 2012. Electricity 807
Consumption and Efficiency Trends in the EU -27. Joint Research Centre - Institute for 808

139
Energy and Transport, https://ec.europa.eu/jrc/en/publication/eur-scientific-and-technical-809
research-reports/energy-efficiency-status-report-2012-electricity-consumption-and-efficiency-810
trends-eu-27 (accessed on 19 April 2018) 811
Boyano Larriba, A., Cordella, M., Espinosa Martinez, M., Villanueva Krzyzaniak, A., 812
Graulich, K., Rüdinauer, I., Alborzi, F., Hook, I. and Stamminger, R. (2017) Ecodesign and 813
Energy Label for household washing machines and washer dryers, EUR 28809 EN, 814
Publications Office of the European Union, Luxembourg, 2017, ISBN 978-92-79-74183-8, 815
doi:10.2760/029939, JRC109033 816
Bullitt (2017) Rapid Growth in Rugged Phones, https://bullitt-group.com/wp-817
content/uploads/2017/08/Rugged-market-position-paper-v8.pdf (accessed on 5 April 2019) 818
CEN/CENELEC JTC 10, Energy-related products - Material Efficiency Aspects for 819
Ecodesign, 820
https://www.cenelec.eu/dyn/www/f?p=104:7:1299206399119101::::FSP_ORG_ID:2240017 821
(accessed on 27 February 2019) 822
COM(2015) 614 "Closing the loop - An EU action plan for the Circular Economy" 823
COM(2016) 773 "Ecodesign Working Plan 2016-2019" 824
COM(2017) 490 "on the 2017 list of Critical Raw Materials for the EU" 825
Compoundchem (2014) The Chemical Elements of a Smartphone, 826
https://www.compoundchem.com/2014/02/19/the-chemical-elements-of-a-smartphone/ 827
(accessed on 8 March 2019) 828
Compoundchem (2015) The Recycling Rates of Smartphone Metals, 829
https://www.compoundchem.com/2015/09/15/recycling-phone-elements/ (accessed on 8 830
March 2019) 831
Cordella M, Alfieri F, Sanfelix J (2019a) Analysis and development of a scoring system for 832
repair and upgrade of products – Final report, EUR 29711 EN, Publications Office of the 833
European Union, Luxembourg, 2019, ISBN 978-92-76-01602-1, doi:10.2760/725068, 834
JRC114337 835
Cordella M, Alfieri F, Sanfelix J, Donatello S, Kaps R, Wolf O (2019b) Improving material 836
efficiency in the life cycle of products: a review of EU Ecolabel criteria, Int J Life Cycle 837
Assess (2019), https://doi.org/10.1007/s11367-019-01608-8 838
Cordella M, Bauer I, Lehmann A, Schulz M, Wolf O (2015) Evolution of disposable baby 839
diapers in Europe: life cycle assessment of environmental impacts and identification of key 840
areas of improvement. J Clean Prod, 95: 322-331, 841
http://dx.doi.org/10.1016/j.jclepro.2015.02.040 842
Cordella M, Hidalgo C (2016) Analysis of key environmental areas in the design and 843
labelling of furniture products: Application of a screening approach based on a literature 844
review of LCA studies. Sustainable Production and Consumption, 8: 64-77; 845
https://doi.org/10.1016/j.spc.2016.07.002 846
Cordella M, Sanfelix J, Alfieri F (2018a) Development of an Approach for Assessing the 847
Reparability and Upgradability of Energy-related Products. Proc CIRP, 69: 888-892, 848
https://doi.org/10.1016/j.procir.2017.11.080 849
Cordella M, Sanfelix A, Alfieri F, Bennett M (2018b) Investigating alignment and potential 850
synergies on circular economy requirements between sustainable product policy instruments, 851
JRC114333, 852
http://susproc.jrc.ec.europa.eu/E4C/docs/task_6_requirements&policies_analysis_final_v2.2.853
pdf (accessed on 14 March 2019) 854

140
Counterpoint Research (2016), https://www.counterpointresearch.com/almost-half-of-855
smartphone-users-spend-more-than-5-hours-a-day-on-their-mobile-device/ (accessed on 20 856
February 2018) 857
CRM Alliance (2017) Antimony, http://criticalrawmaterials.org/antimony/ (accessed on 13 858
March 2019) 859
Culligan K, Menzies B (2013) The value of consumer electronics for trade-in and re-sale, 860
WRAP's report for the project HWP200-401, http://www.wrap.org.uk/sustainable-861
electricals/esap/resource-efficient-business-models/reports/value-consumer-electronics-trade-862
and-re-sale (accessed on 15 February 2018) 863
Deloitte (2016) There’s no place like phone - Consumer usage patterns in the era of peak 864
smartphone - Global Mobile Consumer Survey 2016: UK cut, 865
www.deloitte.co.uk/mobileuk2016/assets/pdf/Deloitte-Mobile-Consumer-2016-There-is-no-866
place-like-phone.pdf (accessed on 20 February 2018) 867
Deloitte (2018) Mobile Consumer Survey 2018: The UK cut, 868
https://www2.deloitte.com/uk/en/pages/technology-media-and-869
telecommunications/articles/mobile-consumer-survey.html (accessed on 5 March 2019) 870
ECHA (2013). Evaluation of new scientific evidence concerning DINP and DIDP in relation 871
to entry 52 of Annex XVII to REACH Regulation (EC) No 1907/2006, 872
https://echa.europa.eu/documents/10162/31b4067e-de40-4044-93e8-9c9ff1960715 (accessed 873
on 4 April 2019) 874
Ellen Macarthur Foundation (2012) In-depth - Mobile Phones, 875
https://www.ellenmacarthurfoundation.org/news/in-depth-mobile-phones (accessed on 4 876
April 2019) 877
Ercan EM (2013) Global Warming Potential of a Smartphone - Using Life Cycle Assessment 878
Methodology, Master of Science Thesis, Stockholm, http://kth.diva-879
portal.org/smash/get/diva2:677729/FULLTEXT01.pdf (accessed on 4 April 2019) 880
Ercan M, Malmodin J, Bergmark P, Kimfalk E, Nilsson E (2016) Life Cycle Assessment of a 881
Smartphone. Proceedings of the 4th International Conference on ICT for Sustainability 882
(ICT4S 2016). DOI: 10.2991/ict4s-16.2016.15 883
ETSI (2018) Draft ETSI TR-MICT2 2 V0.0.10 (2018-12): Environmental Engineering (EE); 884
Explore the challenges of developing product group-specific Product Environmental Footprint 885
Category Rules for Smart Phones. http://www.etsi.org/standards-search (accessed on 4 April 886
2019) 887
European Commission (2018). Summary document of the Waste electrical and electronic 888
equipment rates and targets, https://ec.europa.eu/eurostat/documents/342366/351758/Target-889
Rates-WEEE (accessed on 7 March 2019) 890
European Environment Agency (2017). Circular by design. Products in the circular economy. 891
doi:10.2800/860754 892
Fairphone (2015) Cost breakdown of the Fairphone 2, 893
https://www.fairphone.com/it/2015/09/09/cost-breakdown-of-the-fairphone-2/ (accessed on 9 894
October 2018) 895
Fairphone (2016) How we got Fairtrade certified gold in the Fairphone 2 supply chain, 896
https://www.fairphone.com/en/2016/01/27/how-we-got-fairtrade-certified-gold-in-the-897
fairphone-2-supply-chain/ (accessed on 8 March 2019) 898
Fairphone (2017) Smartphone Material Profiles Opportunities for improvement in ten supply 899
chains, https://www.fairphone.com/wp-900
content/uploads/2017/05/SmartphoneMaterialProfiles_May2017.pdf (accessed on 19 April 901
2018) 902

141
Farmer A (2015) SIM-only on the march as consumers hold on to handsets for longer, 19th 903
August 2015, https://yougov.co.uk/news/2015/08/19/sim-only-march-consumers-hold-904
handsets-longer/ (Accessed on 9 February 2018) 905
Fossbytes (2017) https://fossbytes.com/whats-inside-smartphone-depth-look-parts-powering-906
everyday-gadget/ (accessed on 2 March 2018) 907
Greenpeace (2017). How repairable is your device? A product guide to best-selling 908
smartphones, tablets and laptops. A product guide to best-selling smartphones, tablets and 909
laptops. Available at 910
http://www.greenpeace.org/eastasia/Global/eastasia/publications/reports/toxics/2017/howrepa911
irableisyourmobiledevice.pdf 912
Hobson K, Lynch N, Lilley D, Smalley G (2018) Systems of practice and the Circular 913
Economy: Transforming mobile phone product service systems. Environmental Innovation 914
and Societal Transitions 26, 147–157 915
Huijbregts MAJ, Rombouts LJA, Hellweg S, Frischknecht R, Hendriks AJ, van de Meent D, 916
Ragas AMJ, Reijnders L, Struijs J (2006) Is cumulative fossil energy demand a useful 917
indicator for the environmental performance of products? Environ. Sci. Technol. 40, 641–918
648. http://dx.doi.org/10.1021/es051689g 919
Huysman S, Sala S, Mancini L, Ardente F, Alvarenga RAF, De Meester S, Mathieux F, 920
Dewulf J (2015) Toward a systematized framework for resource efficiency indicators. Resour 921
Conserv Recy, 95: 68–76, http://dx.doi.org/10.1016/j.resconrec.2014.10.014 922
IDC, Smartphone Market Share, https://www.idc.com/promo/smartphone-market-923
share/vendor (accessed on 13 February 2018) 924
IFIXIT (2019) Smartphone Reparability Scores, https://www.ifixit.com/smartphone-925
repairability?sort=score (accessed on 29 March 2019) 926
Iraldo F, Facheris C, Nucci B (2017) Is product durability better for environment and for 927
economic efficiency? A comparative assessment applying LCA and LCC to two energy-928
intensive products. J Clean Prod, 140: 1353-1364, 929
http://dx.doi.org/10.1016/j.jclepro.2016.10.017 930
ISO (2006a) International Organization for Standardization. ISO 14040: 2006 Environmental 931
management— life cycle assessment— principles and framework 932
ISO (2006b) International Organization for Standardization. ISO 14044: 2006 Environmental 933
management — life cycle assessment — requirements and guidelines 934
ITU-T (2016) ITU-T L.1002 (10/16) External universal power adapter solutions for portable 935
information and communication technology devices 936
Jardim E (2017) FROM SMART TO SENSELESS: The Global Impact of 10 Years of 937
Smartphones. Greenpeace, http://www.greenpeace.org/usa/wp-938
content/uploads/2017/03/FINAL-10YearsSmartphones-Report-Design-230217-Digital.pdf 939
(accessed on 1 March 2018) 940
Kantar World Panel (2017) AN INCREDIBLE DECADE FOR THE SMARTPHONE: 941
WHAT'S NEXT? The Future of Mobile is in Combining Devices, Content, and Services - 942
Rev 2017-24-Feb-0925, 943
https://www.kantarworldpanel.com/dwl.php?sn=news_downloads&id=1361 (accessed on 27 944
February 2019) 945
Li Du (2016) An Overview of Mobile Capacitive Touch Technologies Trends, 946
https://arxiv.org/pdf/1612.08227 (accessed on 4 March 2019) 947
Makov T, Fishman T, Chertow MR, Blass V (2018) What affects the second value of 948
Smartphones. Journal of Industrial Ecology 0(0) DOI: 10.1111/jiec.12806 949

142
Manhart A, Blepp M, Fischer C, Graulich K, Prakash S, Priess R, Schleicher T, Tür M (2016) 950
Resource Efficiency in the ICT Sector – Final Report, November 2016, Oko-Institut e.V., 951
https://www.greenpeace.de/sites/www.greenpeace.de/files/publications/20161109_oeko_reso952
urce_efficency_final_full-report.pdf (accessed on 6 March 2019) 953
Martinho G., Magalhãnes D, Pires A (2017) Consumer behaviour with respect to the 954
consumption and recycling of smartphones and tablets: An exploratory study in Portugal. 955
Journal of Cleaner Production 156, 147-158 956
Moberg A, Borggren C, Ambell C, Finnveden G, Guldbrandsson F, Bondesson A, Malmodin 957
J, Bergmark P (2014) Simplifying a life cycle assessment of a mobile phone. Int J Life Cycle 958
Assess, 19:979–993. DOI 10.1007/s11367-014-0721-6 959
Mugge R, Jockin B, Bocken N (2017) How to sell refurbished smartphones? An investigation 960
of different customer groups and appropriate incentives, Journal of Cleaner Production 147, 961
284-296, https://doi.org/10.1016/j.jclepro.2017.01.111 962
Nield D (2015) Our smartphone addiction is costing the Earth, 963
https://www.techradar.com/news/phone-and-communications/mobile-phones/our-964
smartphone-addiction-is-costing-the-earth-1299378 (accessed on 13 March 2019) 965
Nielsen (2013) The Mobile Consumer: A Global Snapshot – February 2013, 966
http://www.nielsen.com/content/dam/corporate/us/en/reports-967
downloads/2013%20Reports/Mobile-Consumer-Report-2013.pdf (accessed on 13 February 968
2013) 969
OCU (2017) Obsolescencia del software, una vida demasiado corta. Compra Maestra 423 - 970
Marzo 2017 971
OCU (2018a) Análisis de teléfonos móviles: Guía de compra, 972
https://www.ocu.org/tecnologia/telefono/guia-compra/analisis-moviles (accessed on 27 973
February 2019) 974
OCU (2018b) https://www.ocu.org/consumo-familia/derechos-975
consumidor/noticias/obsolescencia-prematura (accessed on 13 March 2019) 976
OECD (2014) The State of Play on Extended Producer Responsibility (EPR): Opportunities 977
and Challenges, Global Forum on Environment: Promoting Sustainable Materials 978
Management through Extended Producer Responsibility (EPR), 17-19 June 2014, Tokyo, 979
Japan, 980
https://www.oecd.org/environment/waste/Global%20Forum%20Tokyo%20Issues%20Paper%981
2030-5-2014.pdf (accessed on 6 April 2018) 982
Peeters JR, Tecchio P, Ardente F, Vanegas P, Coughlan D, Duflou J (2018) eDIM: further 983
development of the method to assess the ease of disassembly and reassembly of products — 984
Application to notebook computers, EUR 28758 EN, Publications Office of the European 985
Union, Luxembourg, ISBN 978-814 92-79-73189-1, doi:10.2760/864982, JRC107773 986
Prakash S, Dehoust G, Gsell M, Schleicher T, Stamminger R (2015) Einfluss der 987
Nutzungsdauer von Produkten auf ihre Umweltwirkung: Schaffung einer 988
Informationsgrundlage und Entwicklung von Strategien gegen „Obsoleszenz“, 989
ZWISCHENBERICHT: Analyse der Entwicklung der Lebens-, Nutzungs- und Verweildauer 990
von ausgewählten Produktgruppen. TEXTE 10/2015, Umweltforschungsplan des 991
Bundesministeriums für Umwelt, Naturschutz, Bau und Reaktorsicherheit 992
Forschungskennzahl 371332315, http://www.umweltbundesamt.de/publikationen/einfluss-993
der-nutzungs-dauer-von-produkten-auf-ihre (accessed on 22 February 2018) 994
Priya L, Visalaxi S, Mohana E (2016) A Study on Smart Phone Batteries and its Power 995
Utilization. International Journal of Innovative Research in Computer and Communication 996
Engineering, Vol.4, Special Issue 3, April 2016. ISSN(Online): 2320-9801; ISSN (Print): 997
2320-9798 998

143
Product Bureau, http://susproc.jrc.ec.europa.eu/product_bureau/ (accessed on 27 February 999
2019) 1000
Proske M, Clemm C, Richter N (2016) Life cycle assessment of the Fairphone 2. Fraunhofer 1001
IZM. Berlin, November 2016, https://www.fairphone.com/wp-1002
content/uploads/2016/11/Fairphone_2_LCA_Final_20161122.pdf 1003
Prunel D, Perasso EL, Roy A, Moulin C (2014) Environmental labelling of mobile phones: 1004
LCA standardisation process. Proceedings of the 2nd
International Conference on ICT for 1005
Sustainability (ICT4S 2014). DOI: 10.2991/ict4s-14.2014.27 1006
Prunel D, Roy A, Arnould R (2015). Environmental labelling of electronic products: mobile 1007
phones, laptop and tablet. DOI: 10.13140/RG.2.1.2730.8007 1008
Rocchetti L, Vegliò F, Kopacek B, Beolchini F (2013) Environmental impact assessment of 1009
hydrometallurgical processes for metal recovery from WEEE residues using a portable 1010
prototype plant. Environ. Sci. Technol. 47 (3), 1581–1588 1011
RPA (2014) Study on the Impact of the MoU on Harmonisation of Chargers for Mobile 1012
Telephones and to Assess Possible Future Options Final Report (Main Report) prepared for 1013
DG Enterprise and Industry, 1014
https://ec.europa.eu/docsroom/documents/7432/attachments/1/translations/en/renditions/pdf 1015
(accessed on 5 March 2019) 1016
Schischke K, Proske M, Nissen NF, Lang K (2016) Modular Products: Smartphone Design 1017
from a Circular Economy Perspective. Electronics Goes Green 2016+, DOI: 1018
10.1109/EGG.2016.7829810 1019
Science for Environment Policy (2018) Towards the battery of the future. Future Brief 20. 1020
Brief produced for the European Commission DG Environment by the Science 1021
Communication Unit, UWE, Bristol, doi:10.2779/674936, http://ec.europa.eu/science-1022
environment-policy (accessed on 6 March 2019) 1023
Sony (2018) Reduction and Replacement of Chemical Substances of Very High Concern, 1024
https://www.sony.net/SonyInfo/csr_report/environment/products/replace.html (accessed on 1025
13 March 2019) 1026
Sony (2019) Management Regulations for the environment related substances to be controlled 1027
which are included in parts and materialsSS-00259 for General Use, Seventeenth Edition, 1028
https://www.sony.net/SonyInfo/procurementinfo/ss00259/ss_00259e_General_use_17E.pdf 1029
(accessed on 5 March 2019) 1030
Souchet F, Meloni M, Sturges D (2017) Your circular electronic product must have these 1031
three features, https://circulatenews.org/2017/12/circular-electronic-product-must-three-1032
features/?lipi=urn%3Ali%3Apage%3Ad_flagship3_feed%3BHD7nUnWAR0ik%2FdKTHcR1033
qWg%3D%3D) (accessed on 4 April 2019) 1034
Statista (2018a) Smartphones industry: Statistics & Facts, 1035
https://www.statista.com/topics/840/smartphones/ (accessed on 12 February 2018) 1036
Statista (2018b) Smartphone user penetration as percentage of total global population from 1037
2014 to 2021, https://www.statista.com/statistics/203734/global-smartphone-penetration-per-1038
capita-since-2005/ (accessed on 12 February 2018) 1039
Statista (2018c) Smartphone unit shipments in Western Europe from 2013 to 2017 (in million 1040
units), https://www.statista.com/statistics/412224/global-smartphone-shipments-western-1041
europe/ (accessed on 12 February 2018) 1042
Statista (2018d) Smartphone unit shipments in Central & Eastern Europe from 2013 to 2017 1043
(in million units), https://www.statista.com/statistics/412204/global-smartphone-shipments-1044
central-and-eastern-europe/ (accessed on 12 February 2018) 1045

144
Statista (2018e) Global smartphone shipments forecast from 2010 to 2022 (in million units), 1046
https://www.statista.com/statistics/263441/global-smartphone-shipments-forecast/ (accessed 1047
on 12 February 2018) 1048
Statista (2018f) Smartphone unit shipments worldwide from 2013 to 2017 (in million units), 1049
by region, https://www.statista.com/statistics/412108/global-smartphone-shipments-global-1050
region/ (accessed on 12 February 2018) 1051
Statista (2018g) Smartphone sales value in Western Europe from 2013 to 2017 (in billion 1052
U.S. dollars), https://www.statista.com/statistics/412280/global-smartphone-sales-value-1053
western-europe/ (accessed on 12 February 2018) 1054
Statista (2018h) Smartphone sales value in Central and Eastern Europe from 2013 to 2017 (in 1055
billion U.S. dollars), https://www.statista.com/statistics/412256/global-smartphone-sales-1056
value-central-and-eastern-europe/ (accessed on 12 February 2018) 1057
Statista (2018i) Number of smartphone users worldwide from 2014 to 2020 (in billions), 1058
https://www.statista.com/statistics/330695/number-of-smartphone-users-worldwide/ 1059
(accessed on 12 February 2018) 1060
Statista (2018j) Smartphone user penetration as percentage of total population in Western 1061
Europe from 2011 to 2018, https://www.statista.com/statistics/203722/smartphone-1062
penetration-per-capita-in-western-europe-since-2000/ (accessed on 12 February 2018) 1063
Statista (2018k) Number of smartphone users in France from 2015 to 2022 (in millions), 1064
https://www.statista.com/statistics/467177/forecast-of-smartphone-users-in-france/ (accessed 1065
on 12 February 2018) 1066
Statista (2018l) Number of smartphone users in Germany from 2015 to 2022 (in millions), 1067
https://www.statista.com/statistics/467170/forecast-of-smartphone-users-in-germany/ 1068
(accessed on 12 February 2018) 1069
Statista (2018m) Forecast of the smartphone user penetration rate in Germany from 2015 to 1070
2022, https://www.statista.com/statistics/568095/predicted-smartphone-user-penetration-rate-1071
in-germany/ (accessed on 12 February 2018) 1072
Statista (2018n) Number of smartphone users in Italy from 2015 to 2021 (in millions), 1073
https://www.statista.com/statistics/467179/forecast-of-smartphone-users-in-italy/ (accessed 1074
on 12 February) 1075
Statista (2018o) Forecast of the smartphone user penetration rate in Italy from 2014 to 2021, 1076
https://www.statista.com/statistics/568187/predicted-smartphone-user-penetration-rate-in-1077
italy/ (accessed on 12 February 2018) 1078
Statista (2018p) Number of smartphone users in Spain from 2015 to 2022 (in millions), 1079
https://www.statista.com/statistics/467185/forecast-of-smartphone-users-in-spain/ (accessed 1080
on 12 February 2018) 1081
Statista (2018q) Forecast of the smartphone user penetration rate in Spain from 2015 to 2022, 1082
https://www.statista.com/statistics/568268/predicted-smartphone-user-penetration-rate-in-1083
spain/ (accessed on 12 February 2018) 1084
Statista (2018r) Forecast of smartphone user numbers in the United Kingdom (UK) from 2015 1085
to 2022 (in million users), https://www.statista.com/statistics/553464/predicted-number-of-1086
smartphone-users-in-the-united-kingdom-uk/ (accessed on 12 February 2018) 1087
Statista (2018s) Forecast of the smartphone user penetration rate in the United Kingdom (UK) 1088
from 2015 to 2022, https://www.statista.com/statistics/553707/predicted-smartphone-user-1089
penetration-rate-in-the-united-kingdom-uk/ (accessed on 12 February 2018) 1090
https://www.statista.com/statistics/412256/global-smartphone-sales-value-central-and-eastern-europe/

145
Statista (2018t) Smartphone shipments by vendor worldwide from 4th quarter 2009 to 4th 1091
quarter 2018 (in million units), https://www.statista.com/statistics/271490/quarterly-global-1092
smartphone-shipments-by-vendor/ (accessed on 12 February 2018) 1093
Statista (2018u) Global smartphone shipments market share of Lenovo by quarter from 2012 1094
to 2015, https://www.statista.com/statistics/299121/global-market-share-held-by-lenovo-1095
smartphones/ (accessed on 12 February 2018) 1096
Statista (2018v) Global market share held by smartphone operating systems from 2009 to 1097
2017, https://www.statista.com/statistics/263453/global-market-share-held-by-smartphone-1098
operating-systems/ (accessed on 12 February 2018) 1099
Statista (2018w) Global smartphone sales to end users from 1st quarter 2009 to 2nd quarter 1100
2018, by operating system (in million units), 1101
https://www.statista.com/statistics/266219/global-smartphone-sales-since-1st-quarter-2009-1102
by-operating-system/ (accessed on 12 February 2018) 1103
Statista (2018z) Global mobile OS market share in sales to end users from 1st quarter 2009 to 1104
2nd quarter 2018, https://www.statista.com/statistics/266136/global-market-share-held-by-1105
smartphone-operating-systems/ (accessed on 12 February 2018) 1106
Statista (2018aa) Installed base of smartphones by operating system from 2015 to 2017 (in 1107
million units), https://www.statista.com/statistics/385001/smartphone-worldwide-installed-1108
base-operating-systems/ (accessed on 12 February 2018) 1109
Statista (2018ab) Average selling price of smartphones worldwide from 2012 to 2017 (in U.S. 1110
dollars), https://www.statista.com/statistics/510668/smartphone-average-selling-price-1111
worldwide/ (accessed on 14 February 2018) 1112
Statista (2018ac) Manufacturing costs for Google Pixel XL by component in 2016 (in U.S. 1113
dollars), https://www.statista.com/statistics/625527/manufacturing-costs-of-google-pixel-xl/ 1114
(accessed on 12 February 2018) 1115
Suckling J, Lee J (2015) Redefining scope: the true environmental impact of smartphones? Int 1116
J Life Cycle Assess, 20:1181–1196. DOI 10.1007/s11367-015-0909-4 1117
Sustainably SMART (2017) Sustainable Smart Mobile Devices Lifecycles through Advanced 1118
Redesign, Reliability, and Re-use and Remanufacturing Technologies. Deliverable 7.1, 1119
https://www.sustainably-1120
smart.eu/app/download/9094936482/DisassemblyStudies.pdf?t=1548940654 (accessed on 7 1121
March 2019) 1122
Sustainably SMART (2018) Eco-design of Policy Conclusion - Policy Brief No. 1, 1123
https://www.sustainably-1124
smart.eu/app/download/8928556482/sustainablySMART_Policy_Brief_No.1_25012018.pdf?t1125
=1527258511 (accessed on 4 July 2018) 1126
Sustainably SMART (2019) Policy initiative on standard chargers for mobile phones, Policy 1127
Brief No. 2, https://www.sustainably-1128
smart.eu/app/download/9262387882/sustainablySMART_Policy_Brief_No.2_28012019.pdf?t1129
=1548941170 (accessed on 27 March 2019) 1130
Tanskanen P (2012). Electronics Waste: Recycling of Mobile Phones, Post-Consumer Waste 1131
Recycling and Optimal Production, Prof. Enri Damanhuri (Ed.), ISBN: 978-953-51-0632-6, 1132
InTech, 1133
http://cdn.intechopen.com/pdfs/37110/InTechElectronics_waste_recycling_of_mobile_phone1134
s.pdf (accessed 2 April 2019) 1135
Tecchio P, Ardente F, Mathieux F (2016) Analysis of durability, reusability and reparability 1136
— Application to washing machines and dishwashers, Publications Office of the European 1137
Union, EUR 28042 EN, doi:10.2788/630157 1138

146
Transform Together (2018) Creating sustainable smartphones: Scaling up best practice to 1139
achieve SDG 12, https://transform-together.weebly.com/uploads/7/9/7/3/79737982/report_-1140
_creating-sustainable-smartphone_scaling-up-best-practice-to-achieve-sdg-12.pdf (accessed 1141
on 4 March 2019) 1142
Triggs R (2019) Build materials: metal vs glass vs plastic, 1143
https://www.androidauthority.com/build-materials-metal-vs-glass-vs-plastic-617553/ 1144
(Accessed on 13 March 2019) 1145
UN (2015). Technical guidelines on transboundary movements of electrical and electronic 1146
waste and used electrical and electronic equipment, in particular regarding the distinction 1147
between waste and non-waste under the Basel Convention. UNEP/CHW.12/5/Add.1/Rev.1 1148
U.S. Department of Energy (2013) International Efficiency Marking Protocol for External 1149
Power Supplies Version 3.0, September 2013, 1150
https://www.regulations.gov/document?D=EERE-2008-BT-STD-0005-0218 (accessed on 18 1151
April 2018) 1152
Vanegas P, Peeters JR, Cattrysse D, Tecchio P, Ardente F, Mathieux F, Dewulf W, Duflou JR 1153
(2018) Ease of disassembly of products to support circular economy strategies. Resources, 1154
Conservation and Recycling 135, 323-334 1155
Vanegas P, Peeters JR, Cattrysse D, Duflou JR, Tecchio P, Mathieux F, Ardente F (2016) 1156
Study for a method to assess the ease of disassembly of electrical and electronic equipment - 1157
Method development and application in a flat panel display case study. EUR 27921 EN. 1158
doi:10.2788/130925 1159
Vencovsky D, Fleet D, Le Crom Y, Marshall S, Floyd P, Risk&Policy Analysts (2014) Study 1160
on the Impact of the MoU on Harmonisation of Chargers for Mobile Telephones and to 1161
Assess Possible Future Options, Final Report (Main Report) prepared by Risk&Policy 1162
analysis for DG Enterprise and Industry, https://publications.europa.eu/en/publication-detail/-1163
/publication/4b3e4ea8-4f44-4687-96e4-cd3264407c5b (accessed on 27 February 2019) 1164
Watson D, Charlotte Gylling A, Tojo N, Throne-Holst H, Bauer B, Milios L (2017) Circular 1165
Business Models in the Mobile Phone Industry, Nordic Council of Ministers 2017, 1166
http://dx.doi.org/10.6027/TN2017-560 1167
Smartphone-Studie 2017 1168
Wergarantie (2017) Mit Schadendaten von rund einer Million Smartphones, 1169
https://www.clickrepair.de/images/presse/downloads/pdf/clickrepair-smartphone-studie-1170
2017.pdf (accessed on 05 April 2019) 1171
Wiens K (2014) Smartphone Repairs You Can Do on Earth Day, 1172
https://ifixit.org/blog/6448/smartphone-repairs/ (accessed on 6 March 2019) 1173
Zandin KB (2003) MOST Work Measurement Systems. New York: Marcel Dekker. ISBN 0-1174
8247-816 0953-5 1175
1176
1177

147
ANNEX I – ECOLABELLING REQUIREMENTS FOR SMARTPHONES 1178
The following tables summarises the requirements that smartphones have to fulfil to be labelled according to Blue Angel (Table 30), TCO ( 1179

148
Table 31) and EPEAT (Table 32). 1180
1181
Table 30: Requirements for the award of the Blue Angel to mobile-phones 1182
Aspect Requirement
3.1 Battery State-of-Charge
Indicator
The mobile phone must have an integrated charge indicator indicating the current state of battery charge during use and charging. Also, the
device must show in a clear manner that the charging has been completed.
3.2External Power Supply The applicant shall provide a distribution channel for the mobile phone through which the mobile phone is marketed without an external
power supply

149
3.3Secondary Batteries
3.3.1Replaceability of the
battery
3.3.2 Battery Capacity
3.3.3 Battery Marking
3.3.4 Durability of the Battery
3.3.5 Battery Safety
The mobile phone shall be designed so as to allow the user to replace the rechargeable battery without special expert knowledge and
without damaging the telephone.
The battery capacity shall be measured in accordance with paragraph 7.3.1 „Discharge performance at 20 °C (rated capacity)“ of EN 61960
standard „Secondary cells and batteries containing alkaline or other non-acid electrolytes - Secondary lithium cells and batteries for
portable applications“, as amended (current version: DIN EN 61960:2012-04). The rated
9/24 DE-UZ 106 Edition July 2017 capacity (C) thus determined must be at least as high as the nominal capacity (N) indicated on the
battery and in the product documents.
The battery (or battery pack) must be marked in accordance with EN 61960 providing at least the following information:
• nominal capacity (N),
• nominal voltage,
• type designation,
• date of manufacture (may be coded).
These specifications (except for the date of manufacture) shall also be given in the product documents. In case the date of manufacture is
coded the product documents shall include instructions for decoding.
In addition, the battery (or battery pack) shall be marked with an international recycling symbol as given in ISO 7000 (Graphical symbols
for use on equipment) and specify the cell chemistry of the battery (e.g. Li-Ion, Ni-MH). This symbol shall be colour-coded in accordance
with the recommendations of the Battery Association of Japan15 or the draft IEC 62902 standard
The battery must achieve a minimum of 500 full charge cycles: full charge cycles ≥ 500.
A full charge cycle is to be understood as the drain of a quantity of electricity (in ampere hours) from the battery to the amount of its
nominal capacity (N) that has been stored in the battery by one or more charging processes.
The minimum number of full charge cycles achievable shall be specified in the product documents.
After 500 full charge cycles the battery must, in addition, have in a fully charged state, a remaining capacity (QRem) of at least 90 percent
of the nominal capacity (N).
QRem ≥ 90% * N
Full charge cycles shall be calculated and remaining capacity shall be measured in accordance with the requirements set out in Appendix
A.
The batteries must meet the test requirements of EN 62133-2 "Secondary cells and batteries containing alkaline or other non-acid
electrolytes – Safety requirements for portable sealed secondary cells, and for batteries made from them, for use in portable applications –
Part 2: Lithium systems", as amended.

150
3.4 Longevity
3.4.1 Warranty
3.4.2 Availability of Spare
Parts and Repair
The applicant undertakes to offer a free minimum 2-year warranty on the mobile phone, except for the batteries.
In addition, the applicant shall offer a free minimum 1-warranty on the battery which covers a remaining capacity of at least 90%, provided
that the phone is properly used and charged with the manufacturer's own or another suitable charging device.
The product documents shall provide details of such warranties.
The applicant undertakes to make sure that the availability of spare parts for device repair is guaranteed for at least 3 years from the time
that production ceases. Spare parts shall be offered at reasonable prices by the manufacturer itself or a by third party.
Spare parts are those parts which, typically, may fail or break down within the scope of the ordinary use of a product, especially batteries,
displays and front glasses. The mobile phones shall be so designed as to enable qualified specialist workshops to replace such spare parts
with reasonable effort. The product documents shall provide information on spare parts supply and repair services.
3.4.3 Software Updates The device shall come with a free function to allow the user to update the operating system. The aim of these updates is, above all, the
closing of security holes, as well as other software updates, if applicable. The applicant undertakes to offer security updates for the
operating system of the mobile phone to be eco-labelled for at least 4 years from the time that production ceases.
3.4.4. Data Deletion To allow reuse of the device it shall be designed so as to enable the user to completely and securely delete all personal data without the
help of pay software. This can be accomplished by either physically removing the memory card or the use of free manufacturer-provided
software. As an alternative to removing the data, it shall also be possible to encode the personal data on the data medium by means of
software provided, thus allowing a secure deletion of the key.
In addition, the device shall include a software function that resets the device to its factory settings.
The product documents shall include detailed instructions on how to securely delete data and how to reset the device to its factory settings.
3.5 Take Back and Recycling
3.5.1 Take Back
The applicant shall operate its own take-back scheme for mobile phones to direct all collected devices to reuse or professional recycling.
The applicant shall actively communicate this system to its customers. This take-back scheme can be based on collections at the branches,
return campaigns, deposit systems or the like. A mere reference to the collection governed by the Elektro- and Elektronikgesetz (ElektroG)
(Electrical and Electronic Equipment Act) would not be sufficient. The collection system can be organised by the applicant itself, by
contracting partners and/or together with other manufacturers of mobile phones.
3.5.2 Recyclable Design
An efficient removal of the secondary batteries for recycling purpose shall be possible with no special knowledge being required (guidance
value: in no more than 5 seconds). The battery chemicals must be prevented from leaking during the removal.

151
3.6 Material Requirements
3.6.1 Plastics used in Housings
and Housing Parts
3.6 Use of Biocidal Silver
The plastics used in housings and housing parts must not contain, as constituent components, any substances with the following
characteristics16:
1. Substances that have been identified as substances of very high concern according to Regulation (EC) No 1907/2006) (REACH6) and
have been included in the list (so-called Candidate List) set up in accordance with REACH, Article 59(1).17.
2. Substances that have been classified according to the CLP Regulation18 in the following hazard categories or meet the criteria for such
classification19:
Halogenated polymers shall not be permitted in housings and housing parts. Nor may halogenated organic compounds be added as flame
retardants. Nor shall any flame retardants be permitted which are classified under the CLP Regulation as carcinogenic of Category Carc. 2
or as hazardous to waters of Category Aquatic Chronic 1.
The hazard statements (H-phrases) assigned to the hazard categories can be seen from Appendix 2: „Assignment of Hazard Categories and
Hazard Statements“.
The following shall be exempt from this requirement:
• fluoroorganic additives (as, for example, anti-dripping agents) used to improve the physical properties of plastics, provided that they do
not exceed 0.5 weight percent;
• plastic parts weighing 10 grams or less, where - with regard to multiple part housings - the total weight of all parts made of the same
plastic shall be the decisive factor in determining the mass.
The use of biocidal silver on touchable surfaces shall not be permitted.
.
3.7 Electromagnetic Radiation Devices to be Blue Angel eco-labelled shall be designed so as to make sure that - when used at the ear - the specific absorption rate (SAR)
induced by the radio-frequency electromagnetic radiation emitted does not exceed 0.5 watts per kg and - when used near the body - 1.0
watt per kg - locally averaged over 10 grams of tissue.
3.8 Additional Functions
The mobile phone must provide the technical tools needed to make phone calls without holding the mobile phone close to ear or mouth.
To achieve this aim the mobile phone
1. must be equipped with an interface for connecting a headset (combination of headphones and microphone) and
2. offer a speakerphone function.

152
3.9 Social Corporate
Responsibility
3.9.1 Due Diligence for
Conflict Minerals
3.9.2 Working Conditions
As regards the conflict minerals used in mobile phones, such as tin, tantalum, tungsten and their ores as well as gold the applicant shall
perform its corporate due diligence by complying with the „OECD Due Diligence Guidance for Responsible Supply Chains of Minerals
from Conflict-Affected and High-Risk Areas“22,23.
The applicant shall present a list of the components that contain the predominant mass fraction in relation to the respective conflict mineral.
The applicant shall name the supplier and the respective supply chain scheme or project for each component to ensure responsible sourcing
of conflict minerals used in the mobile phone.
In addition, the applicant shall support at least one of the initiatives listed in Appendix C which promotes responsible sourcing and trading
of the above-mentioned minerals in line with OECD Guidance.
Fundamental principles and universal human rights as stipulated by the applicable core labour standards of the International Labour
Organisation24 (ILO) must be observed during the final assembly of Blue Angel eco-labelled products.
Employee rights and benefits shall apply to all forms of employment, including atypical forms of employment, such as part-time work,
piecework, seasonal workers or home workers as well as to employees of subcontractors and those employed by subcontract.
All workers shall receive a written employment contract that is in line with the legal provisions.
The applicant shall ensure compliance with the following core labour standards:
i) Conventions against child labour:
- Minimum Age Convention, 1973 (No. 138)
- Worst Forms of Child Labour Convention, 1999 (No. 182)
ii) Conventions against forced and compulsory labour:
- Forced Labour Convention, 1930 (No. 29) and the protocol of 2014 to the Forced Labour Convention
- Abolition of Forced Labour Convention, 1957 (No. 105)
iii) Freedom of association and the right to collective bargaining:
- Freedom of Association and Protection of the Right to Organise Convention, 1948 (No. 87)
- Right to Organise and Collective Bargaining Convention, 1949 (No. 98)
- If the ILO core labour standards on freedom of association and collective bargaining are not or only insufficiently implemented due to
national framework conditions the companies shall provide evidence of their efforts and achievements in supporting freely elected and true
workers' representations by presenting relevant documentations in order to verify that concrete measures have been taken to allow
independent observers to monitor elections and that measures have been taken to promote a constructive dialogue between
workers/workers' representations and the management.
iv) Conventions against discrimination:
- Equal Remuneration Convention, 1951 (No. 100)
- Discrimination (Employment and Occupation) Convention, 1958 (No. 111)
In addition to the ILO core labour standards compliance with the following additional ILO conventions shall be ensured during the final
assembly:
v) Adequate hours of work and remuneration:
- Hours of Work (Industry) Convention, 1919 (No. 1)
Convention, 1970 (No. 131)
stry
standards and are always sufficient to meet the basic needs of personnel and provide some discretionary income.
vi) Protection of health and safety:

153
3.10 Operating Instructions The product documents included with the devices shall include both the technical specifications and the user information relating to
environment and health. They shall be either installed on the mobile phone, easily accessible on the Internet or supplied as a data medium
or in printed form together with the device. The product documents shall include and manufacturer’s website shall allow easy access to the
following basic user information:
1. Information on the significance and correct interpretation of the state-of-charge indicator (cf. para. 3.1).
2. Instructions to disconnect the charger from the mains upon completion of the charging process in order to reduce no-load losses.
3. Instructions that charging on non-used PCs should be avoided in order to reduce power consumption during charging.
4. Instructions for using a proper charging unit.
5. Information on how to extend the battery life.
6. Instructions for replacing the battery (cf. para. 3.3.1).
7. Specification of nominal capacity, nominal voltage and type designation of the battery as well as information on the recycling process
(cf. para. 3.3.3)
8. Indication of the number of full-charge cycles achievable (cf. para. 3.3.4).
9. Information on the warranty periods for mobile phone and battery as well as on the warranty terms (cf. para. 3.4.1).
10. Information on the availability of spare parts and repair services (cf. para. 3.4.2).
11. Information on software updates (cf. para. 3.4.3).
12. Information on secure data deletion and the reset function to restore factory settings (cf. para. 3.4.4).
13. Information on environmental and resource significance of proper product disposal as well as information on the take-back scheme (cf.
para. 3.5.1).
14. Information on an environmentally sound disposal at the end of use in accordance with the German Elektrogesetz (Electrical and
Electronic Equipment Act) as well as instructions that the battery should not be disposed of as normal household waste but instead should
be taken to a battery collection facility.
15. Specification and explanatory information on the SAR data (cf. para. 3.7).
16. Information on how to reduce health effects from radio waves when using the mobile phone, at least by recommending the use of
headset or speakerphone function (cf. para. 3.8).
3.12 Outlook on Possible
Future Requirements
A future revision of these Basic Criteria is expected to further toughen the requirements for social corporate responsibility. For this
purpose, additional conflict-affected ores will probably be added to the list of conflict minerals (currently: tin, tantalum, tungsten and gold)
and the criteria for social working conditions (currently: final assembly plants) will have to be met by additional plants along the supply
chain (e.g. component suppliers).
Also, the availability of spare parts is expected to be extended from 3 to 4 years.
1183

154
Table 31: Requirements and related background information for TCO Certified Smartphones. 1184
Aspect Background Requirement
A.1.1.
Information to
End-Users
It is important that the purchaser of a product that has been
certified in accordance with TCO Certified Smartphones receive
information concerning the quality, features and capabilities of
the product. This information is based on the viewpoint from the
user's perspective that TCO Development represents.
An information document called 'TCO Certified Document' provided by TCO
Development shall accompany the product to describe why these particular criteria
have been chosen for the products within the TCO Certified program, and what is
expected to be achieved by them.
A.2 Visual
ergonomics
Good visual ergonomics is a very important aspect of quality that
can also have a direct effect on the health, comfort and
performance of the user. Good ergonomics, such as a high quality
display image, can also influence our productivity and extend the
usable life of a product. In this way, ergonomic design can also
offer sustainability benefits.
A.2.1
Luminance
characteristics
A.2.1.1
Luminance
level
Luminance being emitted from a particular area is a measure of
the luminous intensity per unit area of light travelling in a given
direction and falls within a given solid angle. The unit of
luminance is cd/m2.
It shall be possible to set the luminance level according to the
lighting conditions of the surroundings. Poor luminance can lead
to low contrast and consequently affect legibility and colour
discrimination and thus lead to misinterpretations. It shall be
possible to set a sufficiently high luminance level with respect to
the ambient lighting in order to present a comfortable viewing
situation and to avoid eyestrain.
The following conditions shall be fulfilled:
- The maximum white luminance shall be ≥ 200 cd/m2 at 80% image loading.
- The minimum white luminance shall be ≤ 100 cd/m2 at 80% image loading

155
A.2.1.2
Luminance
uniformity
Luminance uniformity is the capacity of the display to maintain
the same luminance level over the whole active screen area. The
luminance uniformity is defined as the ratio of maximum to
minimum luminance within the fully active screen area.
Image quality is badly affected by non-uniform luminance. When
poor luminance uniformity is visible, it can locally affect the
contrast and consequently the legibility of information on the
display. The areas of deviating luminance can have different sizes
and cause varying contour sharpness.
Luminance variation across the active screen, the Lmax to Lmin ratio, shall be 1.20
A.2.1.3
Greyscale
gamma curve
Greyscale gamma curve is the capability of the imaging device to
maintain the original greyscale luminance of a greyscale pattern
at all tested greyscale levels.
A TCO Certified Smartphone shall be delivered with a
sufficiently accurate calibrated gamma curve in default pre-set
since it makes it easier to distinguish between different light
levels in the display image. A well-tuned greyscale is the basis for
accurate detail rendering of any imaging device. The greyscale
rendering is measured via a number of steps in a greyscale in the
test image. Each greyscale step, regardless of grey level, shall
have a relative luminance close to what is specified by common
video standards sRGB and ITU Rec709 in order to give accurate
rendering of the greyscale of the original image.
The different grey scale luminance levels shall be within the Max- and Min levels
according to the table below, where 100% means the luminance level measured for
white, RGB 255, 255, 255.
A.2.2 Screen
colour
characteristics

156
A.2.2.1
Correlated
colour
temperature,
CCT variation
The correlated colour temperature (CCT) is the temperature of the
Planckian radiator whose perceived colour most closely
resembles that of a given stimulus at the same brightness and
under specified viewing conditions. It is expressed in kelvin (K).
The colour of a white area in nature could be neutral, warmer or
colder dependent of e.g. the weather and lighting conditions. This
is called the colour temperature of the white. The colour
temperature of the display should be about the same as of the
ambient lighting conditions. This makes it possible to more
accurately evaluate the colour of an image on the display
compared to real scenes or prints. Normal daylight has a
correlated colour temperature in the range 5000 – 10000 K.
The default correlated colour temperature of the active display shall be in the range
5000K to 10000K.
A.2.2.2 Colour
uniformity
The colour uniformity of a display is the capability to maintain
the same colour in any part of the screen.
The human visual system is very sensitive to changes in colour
hue in white and grey areas. Since the white or grey colour hues
are the background on which most colours are judged, the white
or grey areas are the reference colours on the screen.
Patches of colour variation on an active white or grey screen
could reduce the contrast locally, be disturbing and affect the
legibility, colour rendering and colour differentiation.
The maximum colour deviation between measured active areas on the screen that are
intended to maintain the same colour shall be Δu'v' 0.012

157
A.2.2.3 RGB
settings
The RGB colour model is an additive colour model in which red,
green, and blue light are added together in various ways to
reproduce a broad array of colours.
Accurate colour rendering is important when realistic colour
images or colour presentations are presented on the display. Poor
colour rendering can lead to poor legibility and misinterpretation.
The u' and v' chromaticity co-ordinates of the primary colours red
(R), green (G) and blue (B) of the screen shall aim at values given
in international IEC, EBU and ITU standards. The u' and v'
chromaticity co-ordinates of the primary colours R, G and B form
a triangle in the CIE 1976 uniform chromaticity scale diagram.
The larger the area of the triangle, the wider the range of colours
the screen is capable of presenting.
The colour characteristics of a display are based on the visual
appearance of the display's primary colour stimuli, the R, G, B-
stimuli.
The minimum colour triangle shall have the following coordinates:
Red Green Blue
Co-ordinate u' v' u' v' u' v'
Requirement ≥ 0.375 ≥ 0.503 0.160 ≥ 0.548 ≥ 0.135 0.305
A.3 Workload
ergonomics
A.3.1 Material
Characteristics
Normal use is considered as the operation descriptions given in
the product's user manual/guides.
Skin allergies, in the form of rash or inflammation, may happen
when the skin comes in contact with substances that irritate the
skin. It is medically termed as 'contact dermatitis'. Nickel is a
well-known contact allergen and irritant, which may cause skin
reactions upon exposure, including itching, irritation,
inflammation or the appearance of rashes.
The Smartphone shall not release nickel from the surfaces that come in contact with
user´s skin during normal use
A.3.2 Headset A headset is headphones combined with a microphone, or one
headphone with a microphone.
A headset provides hands-free smartphone communication. This
has many benefits, especially in call centers and other telephone-
intensive jobs and for anybody wishing to have both hands free
during a telephone conversation. It also reduces the emissions
from the smartphone towards the head as it can be placed further
away from the head while making a call.
The Smartphone shall be delivered with a headset to be used for audio
communication over the cellular network.

158
A.5 Electrical
Safety
A.5.1 Electrical
Safety
Electrical safety concerns the electrical design of apparatus with
respect to its electrical insulation and other arrangements that are
intended to prevent accidents resulting from contact with live
components, and the risk of fire or explosion as a result of
electrical flash-over due to inadequate or faulty electrical
insulation.
The Smartphone and the internal or external power supply/supplies shall be certified
in accordance with EN/IEC 60 950 or EN/IEC 60065 or EN 62368-1.
A.6
Environment
This section details the environmental criteria in TCO Certified,
which offer a unique, integrated balance of environmental issues
in the manufacturing, use and end of life phases of the product.
The environmental criteria are divided into the following sections:
1. Manufacturing – criteria focusing on the manufacturing phase
and environmental management
2. Climate – energy consumption, one of the most important
issues in the environmental impact of IT products.
3. Hazardous Substances – heavy metals, flame retardants,
plastics.
4. Material resource efficiency – factors to extend the life of the
product and influence better use of material resources.
5. End of life – factors to stimulate recycling and minimize the
impact of e-waste.
Potential environmental effects are evident at each stage of the
product life cycle. The environmental criteria TCO Development
has focused on in this document are those that we consider most
relevant to the product group. They have also proved to be
attainable in volume manufacturing and are verifiable. Future
criteria updates will likely focus on the manufacturing phase,
hazardous substances and climate issues.
Compliance with these criteria is verified by sending the
requested information to a verifier approved by TCO
Development.

159
A.6.1 Product
description
The aim of this product description is to provide third party
verified information about the product. The information is used
by TCO Development to verify that the product complies with the
criteria in TCO Certified.
The information is also provided on the certificate to buyers so
that it helps them calculate the sustainability impact of the
products and the benefit of buying products that fulfil TCO
Certified.
Using the declared sustainability information a buyer can, for
example, implement climate compensation or other sustainability-
related measures connected to the sustainability impact of the
product. This data is often used by organisations in their annual
sustainability report or internal programs aimed at minimizing the
environmental impact of IT.
Recycled plastic is post-consumer recycled plastic, which has
been used in products.
Plastic parts are all product parts made out of plastic except
panels, electronic components, cables, connectors, PWBs,
insulating mylar sheets and labels. This is primarily due to
insufficient available alternatives. This also means that the weight
of these items is not included when calculating the total weight of
the plastic in the product in this requirement.
Marking plate /Marking label is the label that contains the
product's electrical rating in terms of voltage, frequency, current
and the manufacturer's name, trademark or identification mark
together with the manufacturer's model or type reference. The
label shall be in accordance with IEC 60 950:1 clause 1.7.1.
A product declaration shall be provided for the Smartphone. The following
information shall be verified by the third party facility and is printed by TCO
Development on the certificate.
A.6.2
Manufacturing

160
A.6.2.1
Environmental
management
system
certification
Manufacturing plant: Manufacturing facility where the final
assembly of the TCO Certified product takes place.
A certified environmental management system shows that the
company has chosen to work in a systematic way with constant
improvement of the environmental performance of the company
and its products. A certified environmental management system
includes external independent reviews.
Each manufacturing plant must be certified in accordance with ISO 14001, or EMAS
registered. If the product is manufactured by a third party, it is this company that shall
be certified or registered.
A.6.3 Climate
A.6.3.1 Energy
consumption
Energy is the single most important topic in the issue of climate
change. Energy efficient equipment is an important and effective
way to fight climate change. With an ever-increasing volume of
IT equipment in use, the efficiency of each product is vital. To
reduce energy consumption from the Smartphone the external
power supply shall comply with the International Efficiency
Marking Protocol for External Power Supplies.
The external power supply shall meet at least the International Efficiency Protocol
requirement for level V.
A.6.4
Hazardous
substances
A.6.4.1
Cadmium (Cd),
mercury (Hg),
lead (Pb) and
hexavalent
chromium
(CrVI)
The effects of cadmium, mercury, lead and hexavalent chromium
are well documented as substances that are hazardous to both our
health and the environment. Electronic devices contain hazardous
substances like heavy metals and brominated flame retardants.
This causes problems both in the use phase (additives can leak
from the plastic and accumulate in dust, harming both our health
and the environment) and at end-of-life, where uncontrolled
recycling can cause the release of toxins such as dioxins and
furans.
This criterion is harmonized with EU RoHS2 Directive
(2011/65/EU), except that TCO Certified does not allow mercury
in the display panel backlight. As TCO Certified is a global label
this also affects products sold outside the EU.
The Smartphone shall not contain cadmium, mercury, lead and hexavalent chromium.

161
A.6.4.2
Halogenated
substances
Halogenated flame retardants and plasticizers are often persistent,
can bio-accumulate in living organisms and have been detected in
both humans and the environment. These substances are
problematic in the manufacturing and end of life phases where
workers or the environment can be exposed. They can also
migrate from the products during the use phase with unknown
health effects as a result.
Plastic parts are parts made mainly of plastics, e.g. the housing.
Parts containing other materials in any significant amounts, e.g.
cables with metal conductors, are not included in the definition.
Printed wiring board laminate is a printed board that provides
point-to-point connections but not printed components in a
predetermined configuration on a common base.
Halogens are a group of five chemically related non-metallic
elements in the Periodic Table; fluorine, chlorine, bromine, iodine
and astatine.
Polybrominated biphenyls (PBB) and Polybrominated diphenyl
ethers (PBDE) are restricted in the RoHS directive (2002/95/EC)
due to the hazardous properties of these substances.
Hexabromocyclododecane (HBCDD) has been identified as a
Substance of Very High Concern in accordance with EU REACH
criteria due to PBT (persistent, bio accumulative, toxic)
properties.
1. Plastic parts weighing more than 5 grams shall not contain flame retardants or
plasticizers that contain halogenated substances.
Note: This applies to plastic parts in all assemblies and sub-assemblies. Exempted are
printed wiring board laminates, electronic components and all kinds of cable
insulation.
2. The Smartphone shall not contain PBB, PBDE and HBCDD.
Note: This applies to components, parts and raw materials in all assemblies and sub-
assemblies of the product e.g. batteries, paint, surface treatment, plastics and
electronic components.

162
A.6.4.3 Non-
halogenated
substances
The purpose of this mandate is to increase the knowledge of
substances with regards to their human and environmental
impacts and to drive a shift towards less hazardous alternatives.
These substances may be problematic in the manufacturing and
end of life phase where workers or the environment can get
exposed and can also migrate from the products during the use
phase with unknown health effects as a result.
The mandate uses the hazard assessment and decision logic
framework called GreenScreen™ for Safer Chemicals developed
by the non-profit organization Clean Production Action (CPA).
The GreenScreen methodology can be used for identifying
substances of high concern and safer alternatives.
The GreenScreen criteria are in line with international standards
and regulations including the Globally Harmonized System of
Classification and Labelling of Chemicals (GHS), OECD testing
protocols and the European REACH Regulation. The U.S. EPA's
Design for Environment (DfE) Alternatives Assessment is also an
important influence on the GreenScreen™ for Safer Chemicals.
Plastic parts are parts made mainly of plastics, e.g. the housing.
Parts containing other materials in any significant amounts, e.g.
cables with metal conductors, are not included in the definition.
Printed wiring board laminate is a printed board that provides
point-to-point connections but not printed components in a
predetermined configuration on a common base.
Licenced Profilers are organisations approved by CPA with the
capacity to provide GreenScreen assessments.
Accepted substances are considered the most sustainable
alternatives which are possible for the industry to use, also taking
into consideration aspects such as availability and functionality.
Accepted substances are found on the TCO Development website
under 'Accepted Substances list'.
Non halogenated flame retardants used in plastic parts that weigh more than 5 grams
shall be on the publically available Accepted Substance List for TCO Certified. This
means that the substance has been assessed by a licensed profiler according to
GreenScreen™ and been assigned a benchmark score ≥ 2
The following acceptance decisions apply to substances given Benchmarks 4, 3, 2, 1
or designated U (undefined):
4: Accepted – (Few concerns)
3: Accepted – (Slight concern)
2: Accepted – (Moderate concern)
1: Not accepted - (High concern)
U: Not accepted - (Unspecified)
All substances of a flame retardant mixture shall be accounted for. Non-accepted
components shall not exceed concentration levels of 0.1% by weight of the flame
retardant.
Exempted are printed wiring board laminates, electronic components and all kinds of
cable insulation.
A grace period for the above may be granted, see B.6.4.3 for rules
TCO Development will conduct spot-checks and require full disclosure of the flame
retardants, including CAS number, used in the product to verify that the obligations
according to this mandate are fulfilled.

163
A.6.4.4
Halogenated
plastics
PVC is by far the most common halogen containing plastic. There
are however other plastics that contain halogens in the plastic
itself. Halogens are problematic from both a health and
environmental perspective throughout the product life cycle and
should be phased out.
Plastic parts are parts made mainly of plastics, e.g. the housing.
Parts containing other materials in any significant amounts, e.g.
cables with metal conductors, are not included in the definition.
Printed wiring board laminate is a printed board that provides
point-to-point connections but not printed components in a
predetermined configuration on a common base.
Halogens are a group of five chemically related non-metallic
elements in the Periodic Table; fluorine, chlorine, bromine, iodine
and astatine.
Plastic parts in the Smartphone weighing more than 5 grams shall not contain
intentionally added halogens as a part of the polymer.
Note: Printed wiring board laminates, and all kinds of internal and external cable
insulation are not considered to be part of plastic parts and are therefore not included
in the mandate.
A.6.4.5
Phthalates
Phthalates are substances mainly used as plasticizers. The
substances restricted in the mandate are listed as Substances of
Very High Concern and are included in REACH Annex XIV
classified as toxic to reproduction. These substances are
problematic from both a health and environmental perspective
throughout the product life cycle and should be phased out.
The Smartphone shall not contain Bis (2-ethylhexyl) phthalate (DEHP), Butyl benzyl
phthalate (BBP), Dibutyl phthalate (DBP), and Diisobutyl phthalate (DIBP). No parts
of the product are exempted.
Also diisononyl phthalate (DINP, CAS no. 28553-12-0), diisodecyl phthalate (DIDP,
CAS no. 26761-40-0) and di-n-octyl phthalate (DNOP, CAS no. 117-84-0)
A.6.4.6
Hazardous
substances in
product
packaging
Packaging constitutes a well-known environmental problem and
is regulated in many countries worldwide. Packaging material has
a short lifetime and generates large volumes of waste.
There are three main areas of concern, content of hazardous
substances, use of resources and transport volume.
The packaging material shall not contain lead (Pb), cadmium (Cd), mercury (Hg) or
hexavalent chromium (Cr6).
Plastic packaging material shall not contain organically bound halogens.

164
A.6.4.7
Batteries
The widespread use of batteries has given rise to many
environmental concerns, such as toxic metal pollution, as they
may contain very high amounts of lead, cadmium and mercury.
Used batteries also contribute to electronic waste.
In the United States, the Mercury-Containing and Rechargeable
Battery Management Act of 1996 banned the sale of mercury-
containing batteries, enacted uniform labeling requirements for
rechargeable batteries, and required that rechargeable batteries be
easily removable. The Battery Directive of the European Union
has similar requirements, in addition to requiring increased
recycling of batteries.
Note that restrictions on hazardous substances in batteries are
covered by A.6.4.1 Hazardous substances
Batteries shall be rechargeable and when necessary, replaceable by the end user or a
qualified professional.
A.6.5 Material
Resource
Efficiency

165
A.6.5.1
Lifetime
extension
A longer product lifetime makes a significant positive
contribution to more efficient resource use as well as the
reduction of air and water pollution. A pre-condition for
prolonged lifetime is that the product is of high quality, which is
supported by good warranties. Another requirement is the
availability of spare parts for a number of years once the product
is taken out of production. During this period, products should, if
possible, be repaired and not replaced.
Brand owner: The company or organization owning or controlling
the Brand Name.
Brand Name: The name or sign, including but not limited to a
trademark or company name, used to identify, amongst users and
customers, the manufacturer or seller of a product.
Product Warranty is a period where the Brand owner offers to
repair or replace broken products during a period of time at no
charge.
Spare parts are those parts that have the potential to fail during
normal use of the product. Product parts whose life cycle usually
exceeds the average usual life of the product need not be
provisioned as spare parts. When the cost for replacing a broken
part (e.g. panel) exceeds the cost of replacing the whole product,
then that part need not be considered as a spare part under this
mandate.
1. The brand owner shall provide a product warranty for at least one year on all
markets where the product is sold.
2. The brand owner shall guarantee the availability of spare parts for at least three
years from the time that production ceases. Instructions on how to replace these parts
shall be available to professionals upon request.
A.6.6 End of
life

166
A.6.6.1
Material coding
of plastics
Prolonging the life of IT-products by reuse is the best way to
minimize their environmental impact. But when this is no longer
possible, it is important to facilitate material recycling of the
products. Material coding of plastics aims at making the recycling
of plastics easier so that the plastic can be used in new IT
equipment.
Plastic parts are parts made mainly of plastics, e.g. the housing.
Parts containing other materials in any significant amounts, e.g.
cables with metal conductors, are not included in the definition.
Printed wiring board laminate is a printed board that provides
point-to-point connections but not printed components in a
predetermined configuration on a common base.
Plastic parts weighing more than 5 grams shall be material coded in accordance with
ISO 11469 and ISO 1043-1, -2, -3, -4.
Exempted are printed wiring board laminates.

167
A.6.6.2 Take
back system
The amount of electronic waste in the world today is enormous
and a growing environmental problem. It is important that
manufacturers provide mechanisms to take back their equipment
at end-of-life under the principle of individual producer
responsibility wherein each manufacturer must be financially
responsible for managing its own branded products at end-of-life.
Currently much electronic waste is being exported to developing
countries where it is managed unsustainably and
disproportionately burdens those regions with this global
environmental problem. The Basel Convention and its decisions
govern the export of many types of electronic waste, however it is
not properly implemented in all countries. With this mandate
TCO Development aims to influence the expansion of better
electronic waste management practices to more countries.
Brand owner is the company that owns the brand name visible on
the product.
Take back system is a system that makes sure that the customer
can return used products to be recycled. The system can be with
or without a fee.
Environmentally acceptable recycling methods are:
• Product and component reuse
• Material recycling with secured handling of hazardous
chemicals and heavy metals
• Pollution-controlled energy recovery of parts of the product
The brand owner (or its representative, associated company or affiliate) shall offer
their customers the option to return used products for environmentally acceptable
recycling methods in at least one market where the product is sold and where
electronics take back regulation is not in practice at the date of application.
A.6.6.3
Preparation for
recycling of
product
packaging
material
Packaging constitutes a well-known environmental problem and
is regulated in many countries worldwide. Packaging material has
a short lifetime and generates large volumes of waste.
There are three main areas of concern; hazardous substance
content, use of resources and transport volume.
Brand owner is the company that owns the brand name visible on
the product.
Non-reusable packaging components weighing more than 5 grams shall be possible to
separate into single material types without the use of tools.
Exempted is reusable packaging.

168
A.7 Socially
responsible
manufacturing
Shorter product cycles and growing demand for new technologies
put increasing pressure on industry and its complex supply chain
to deliver new devices faster and at a low cost. The result is often
inadequate working conditions at manufacturing facilities, long
working hours, low wages and a lack of health and safety
measures.
TCO Development aims for greater brand engagement throughout
the supply chain by setting criteria and verification routines that
create strict social policies toward suppliers, as well as factory
audit structures and an open dialog within the IT industry.

169
A.7.1 Supply
chain
responsibility
It is TCO Development's opinion that codes of conduct and
factory audits are currently the tools that are most practical to
help the majority of brands to work with socially responsible
manufacturing in a structured way. It is also TCO Development's
opinion that these tools are improving the situation incrementally
as long as they are used in the correct and committed way by the
brand.
The contribution of TCO Certified is:
• TCO Certified defines a minimum level of the Brand owner's
code of conduct.
• TCO Certified is a control system to ensure that the brand takes
the responsibility and works in a structured way in accordance
with their code of conduct.
• TCO Certified creates an incentive for Brand owners to work
proactively.
Brand owner: The company or organization owning or controlling
the brand name.
First tier manufacturing facility: Manufacturing plant where the
final assembly of the TCO Certified product is taking place.
Corrective action plan: A list of actions and an associated
timetable detailing the remedial process to address a specific
problem.
By signing this mandate the Brand owner agrees to the (1. Commitment) and agrees
to conduct the (2. Structured work). Additionally TCO Development requires that the
Brand owner show (3. Proof) of the commitment and the structured work by allowing
random inspections, by sharing audit reports and corrective action plans and by
providing other documented proof described below.
1. Commitment:
The Brand owner shall have a code of conduct that is considered consistent with the
following in the manufacturing of TCO Certified products:
• ILO eight core conventions: 29, 87*, 98*, 100, 105, 111, 138 and 182.
• UN Convention on the Rights of the Child, Article 32.
• Relevant local and national Health & Safety and Labour laws effective in the
country of manufacture.
*In situations with legal restrictions on the right to freedom of association and
collective bargaining, non-management workers must be permitted to freely elect
their own worker representative(s) (ILO Convention 135 and Recommendation 143).
2. Structured work:
• The Brand owner shall ensure that routines are in place to implement and monitor
their code of conduct in the manufacturing of TCO Certified products.
• In the final assembly factories the Brand owner shall ensure the implementation of
their code of conduct through factory audits.
• In the final assembly factories and in the rest of the supply chain the Brand owner
shall ensure that a corrective action plan is developed and fulfilled within reasonable
time for all violations against their code of conduct that the Brand owner is made
aware of.
3. Proof:
• TCO Development may conduct/commission random factory inspections (spot-
checks) at any final assembly factory manufacturing TCO Certified products for the
Brand owner and may require full audit reports during the certification period in order
to assess social commitment and advancement.
• TCO Development may also require seeing corrective action plans and auditing
reports from factories further down the supply chain to ensure that corrective actions
have been successfully implemented.
• TCO Development additionally requires the documentation below to be verified by
a third party approved verifier.

170
A.7.2 Senior
Management
Representative
It is beneficial to all parties that an open and transparent dialogue
between TCO Development and the Brand owner exists for the
monitoring of compliance with the criteria or when issues
concerning working conditions at manufacturing facilities require
clarification. A contact person responsible for the organization's
efforts to enforce the socially responsible manufacturing criteria
needs to be consistently available for dialogue with TCO
Development throughout the validity of the certificate.
The Brand owner shall have an appointed Senior Management Representative (SMR)
who, irrespective of other responsibilities, has the authority to ensure that the social
criteria in the manufacturing of TCO Certified products are met and who reports
directly to top management.
• The contact details of the SMR shall be submitted and the SMR shall be available
for dialogue in English with TCO Development throughout the validity of all the
Brand owners' certificates.
• To ensure that the SMR has the necessary authority and is working in a structured
and proactive way implementing the code of conduct, a review of the SMR shall be
done every year according to B.7.2.2.
A.7.3 Conflict
minerals
The exploitation and trade of the natural resources Tantalum, Tin,
Tungsten and Gold (3T+G) from conflict-affected areas is
commonly regarded as a major source of conflict financing. TCO
Development supports the underlying goal of the EU conflict
minerals measures and those contained in the Dodd Frank Act
1502, but believe it is also vital to support in-region responsible
sourcing programs in order to help suppliers meet these due
diligence requirements, maintain trade and develop mining that
directly benefits the people whose livelihoods depend on a
legitimate trade. TCO Development now requires all Brand
owners who use TCO Certified to address the issue of conflict
minerals in their certified products in a progressive and proactive
way.
Conflict minerals: Tantalum, Tin, Tungsten and Gold = 3T+G
DRC: Democratic Republic of the Congo
The Brand owner shall have a public conflict minerals policy and also indicate all the
initiatives they are using/funding. It is TCO Developments opinion that the OECD
Due Diligence Guidance for Responsible Supply Cain of Conflict-Affected or High-
risk Areas is the most ambitious approach in the list.
At least one of the following options shall be marked:
• A Due Diligence process based on the OECD Due Diligence Guidance for
Responsible Supply Chains of Minerals from Conflict-Affected or High-risk Areas
• iTSCi (International Tin Research Institute (ITRI) Tin Supply Chain Initiative).
• CFTI (Conflict-free Tin Initiative).
• PPA (The Public-Private Alliance for Responsible Minerals Trade).
• Other relevant DRC in-region initiative
• CFSI (EICC/GeSi Conflict-Free Sourcing Initiative).
1185
1186

171
Table 32: EPEAT requirements for Mobile Phones. 1187
Area Requirement
7. Supply Chain Management of Materials R 7.1.1 Compliance with the European Union REACH Regulation
O 7.2.1 Reduction of European Union REACH Candidate SVHC Substances
O 7.3.1 Substitutions assessment
O 7.4.1 Requesting substance inventory
O 7.4.2 Receiving substance inventory
8. Sustainable Materials Use R 8.1.1 Declaration of post-consumer recycled and biobased plastics content
O 8.1.2 Post-consumer recycled plastic and biobased plastic content in the mobile phone
O 8.1.3 Post-consumer recycled plastic and biobased plastic content in accessories
9. Substances of Concern R 9.1.1 Compliance with the European Union RoHS Directive
R 9.2.1 Restrictions of extractable nickel
O 9.2.2 Restrictions of DEHP, DBP, and BBP product
O 9.2.3 Restriction of bromine and chlorine
R 9.2.4 Restriction of cadmium and mercury in the mobile phone battery cell
R 9.2.5 Restriction of substances in textile and leather
10. Energy Use Requirements R 10.1.1 Battery charger systems
O 10.1.2 Reduction of energy consumption of battery charging systems
R 10.1.3 External power supply energy efficiency
O 10.1.4 Reduced maintenance mode power
11. End of Life Management R 11.1.1 Take-back program
R 11.2.1 Primary recyclers third party certified
R 11.3.1 Battery removability/replacement by qualified repair service providers or authorized repair providers
O 11.3.2 Battery removability/replacement instructions
O 11.3.3 Battery removability/replacement without use of tools
R 11.4.1 Ease of disassembling mobile phone
O 11.4.2 Further ease of disassembling mobile phone
R 11.5.1 Feature to erase user data from mobile phone
R 11.6.1 Repair and refurbishment
O 11.6.2 Further repair and refurbishment
R 11.7.1 Availability of replacement parts
R 11.8.1 Notification regarding and the identification of materials and components requiring selective treatment
12. Packaging O 12.1.1 Use of recyclable fiber based packaging materials

172
R 12.2.1 Separability and labelling of plastics in packaging
O 12.3.1 Use of post-consumer recycled plastic packaging
R 12.4.1 Expanded polystyrene packaging (EPS) restriction
R 12.5.1 Recycled content in fiber packaging
O 12.6.1 Environmentally preferable paper/paperboard in POS packaging
O 12.6.2 Environmentally preferable paper/paperboard for printed content
R 12.7.1 Restriction of chlorine in packaging materials
R 12.8.1 Heavy metal restriction in packaging
O 12.9.1 Improve packaging efficiency
13. Corporate Sustainability R 13.1.1 Corporate sustainability (CS) reporting
O 13.2.1 Corporate sustainability (CS) reporting in the supply chain
O 13.3.1 Third party assurance of corporate sustainability (CS) reporting
14. Life Cycle Assessment O 14.1.1 Conducting a life cycle assessment
O 14.2.1 Product LCA third-party verification of making LCA publicly available
15. Supply Chain Impacts O 15.1.1 Supplier responsibility
R 15.2.1 Final assembly facilities environmental management system
O 15.2.2 Supplier production facilities environmental management system
R 15.3.1 Conflict minerals public disclosure
O 15.4.1 Reduce fluorinated gas emissions resulting from flat panel display manufacturing
1188

173
ANNEX II – REPARABILITY SCORES FOR SMARTPHONES BY IFIXIT
Reparability Scores for smartphones available on the market as published by iFixit (2019).
Table 33: Reparability Scores for smartphones available on the market (iFixit 2019)
Model (Year) Characteristics Score
Fairphone 2
(2015)
+ The most commonly failing components, battery and display, can be replaced
without tools.
+ Internal modules are secured with Phillips #0 screws and simple spring
connectors.
+ Individual modules can be opened, and many components can be individually
replaced.
10
Motorola Droid
Bionic 2011
+ No tools are necessary for changing the SIM and microSD
+ The battery can be removed in seconds.
+The phone is held together with a limited number of screws and plastic clips.
Adhesive is minimally used in its construction
9
Motorola Atrix
4G 2011
+The LCD is separable from the glass front panel, making them independently
replaceable.
+ The phone is held together with a limited number of screws and plastic clips.
Adhesive is minimally used in its construction.
+ The battery can be removed in seconds..
9
Xiaomi Redmi
Note 3 2015
+ Despite no external screws, the rear case is fairly easy to remove.
+ Battery is easy to access and remove.
− Display assembly is a single fused component, that requires disassembling the
entire phone to replace.
9
LG G5 2016
+ The user-removable, slide-out battery is a huge boon to phone lifespan.
+ No glue and few screws make for a relatively simple opening procedure.
− The fused display assembly will need to be replaced if the LCD or glass breaks,
increasing costs.
8
LG G4 2015
+ Rear panel and battery can be removed with no tools.
+Many components are modular and can be replaced independently.
− Fused display assembly—glass and LCD will need to be replaced together if one
or the other breaks.
8
Google Nexus 5
2013
+ Very modular design allows independent replacement of several wear-prone
components—like the headphone jack and speakers.
+ Only very mild adhesive holds the battery in place, making it fairly easy to safely
remove and replace.
− The glass and LCD are fused to the display frame. Fixing broken glass will be
either expensive or very difficult.
8
Samsung
Galaxy S4 2013
+ The battery can be replaced in seconds, without any tools.
+ Very easy to open for access to internal components.
− The glass is fused to both the display and the display frame, increasing repair
costs.
8
Blackberry Z10
2013
+The battery can be replaced without any tools.
+Motherboard and display come out with little difficulty and are held in place with
little adhesive
Smaller components (headphone jack, camera) are modular and can be replaced
individually, but have somewhat strong adhesive holding them in place.
8
Samsung
Galaxy Note II
2012
+Battery is easy to replace.
+Very easy to open for access to internal components.
−Components adhered to the back of a fused display assembly.
8
Samsung
Galaxy S III
2012
+The battery can be replaced without any tools.
+Very easy to open and access internal components.
The glass is fused to both the display and the display frame, increasing repair costs.
8
Samsung
Galaxy Note
2011
+Battery is easy to replace
+Very easy to open for access to internal components.
−Components adhered to the back of a fused display assembly.
8
Samsung
Galaxy S II
2011
+Battery is easy to replace.
+Very easy to open for access to internal components.
−Components adhered to the back of a fused display assembly.
8

174
Nokia N8 2010
+The battery, although considered by Nokia not to be user-serviceable, can be
easily removed.
+The AMOLED display easily comes apart from the glass, which means that you
can replace the glass and the display independently.
−Removing the cameras is near-impossible, and requires tedious, potentially
detrimental steps..
8
Moto Z 2017
+Pull-tab on battery, easy to access once you have the device open.
+Modular assembly allows independent replacement of many components
−Charging port soldered to the motherboard means a common repair will be very
expensive.
7
Vivo
X7 Plus
201
+Battery is fairly easily accessible and removable.
+Parts could be more modular, especially mechanical/high wear components.
−The single unit display assembly is annoying to reach, and will be a costly part.
7
Oppo
R9m
2017
+Battery is fairly easily accessible and removable.
+Most components are extremely modular making for cheaper repairs.
−The opening procedure is extremely tough, clips are very stiff and likely to be
broken.
7
OnePlus
5
2017
+There are no proprietary screws.
+The OnePlus 5’s display is held on by easy to dispatch reusable plastic clips.
−The display and glass are fused and the home button is integrated into the display
assembly making repair of all three of these parts more complicated and expensive.
7
Wiko
Pulp 4G Phone
201
+Replacing the battery is easy as pie with the swappable back cover.
+This phone doesn't use excessive glue nor proprietary screws—we found only
Phillips throughout the entirety.
−Unfortunately, the components on the daughterboard are soldered on, making a
repair on an individual component difficult.
Meizu MX6
2016
+The display assembly is the first component out, simplifying screen repairs.
+Modular components with spring contacts, large screws, and thoughtful cabling
all make repair cheaper and easier.
−The MX6 uses Pentalobe security screws on the exterior, requiring a specialty
screwdriver to open the phone before any repair.
7
Google Pixel
2016
+The battery is secured with removable adhesive tabs, making replacement simple.
+Many components are modular and can be replaced independently.
−The fused display is thin and unsupported, and must be removed to access any
other component.
7
Google Pixel
XL 2016
+Many components are modular and can easily be replaced once the display
assembly is removed.
+The battery has a removal tab and is adhered by a modest amount of adhesive,
making its removal painless.
−The opening procedure requires prying up a thin, poorly-supported display
assembly making it difficult to open the phone without damage.
7
Apple iPhone 7
Plus 2016
+The battery is straightforward to access. Removing it requires specialty
screwdrivers and knowledge of the adhesive removal technique, but is not difficult.
+The solid state home button eliminates a common point of failure.
−With the addition of tri-point screws, many iPhone 7 Plus repairs will require up
to four different types of drivers.
7
Apple iPhone 7
2016
+The battery is straightforward to access. Removing it requires specialty
screwdrivers and knowledge of the adhesive removal technique, but is not difficult.
+The solid state home button eliminates a common point of failure.
−With the addition of tri-point screws, many iPhone 7 repairs will require up to
four different types of drivers.
7
Huawei P9 2016
+Modular components with spring contacts, thoughtful cabling, and minimal
adhesive all make repair cheaper and easier.
+The battery is straightforward to access. Removing it requires knowledge of the
adhesive removal technique, but is not difficult.
−The display assembly is a fused unit, and replacement requires near complete
disassembly of the phone.
7
Nexus 5x 2015
+Many components are modular and can be replaced independently.
+Standard Phillips screws means a driver is easy to find.
−Fused display assembly—glass and LCD will need to be replaced together if one
or the other breaks.
7

175
Apple iPhone 6
Plus 2015
+The display assembly continues to be the first component out, simplifying screen
repairs.
+The battery is straightforward to access. Removing it requires a proprietary
+Pentalobe screwdriver and knowledge of the adhesive removal technique, but is
not difficult.
−The iPhone 6s Plus still uses proprietary Pentalobe screws on the exterior,
requiring a specialty screwdriver to remove.
7
iPhone
6s
2015
+The display assembly continues to be the first component out, simplifying screen
repairs.
+The battery is straightforward to access. Removing it requires a proprietary
pentalobe screwdriver and knowledge of the adhesive removal technique, but is not
difficult.
−The iPhone 6s still uses proprietary Pentalobe screws on the exterior, requiring a
specialty screwdriver to remove.
7
OnePlus
2
2015
+A single (non-proprietary) screw head decreases cost of tools for repairs.
+Many components are modular and can be replaced independently.
−The LCD and digitizer glass are fused together and must be replaced as a single
part; heat is required to remove it from the midframe.
7
Google Nexus 6
2014
+Pressure contacts and cable connectors make the modular components (cameras,
buttons, headphone jack) easy to replace.
+The Nexus 6 uses a single kind of screw, although it's a fairly uncommon size
(T3).
−Several components (vibrator, SIM slot, speaker, USB port) are soldered directly
to the motherboard and will be more difficult to replace than if they were
connected by cable.
7
iPhone
6 Plus
2014
+Continuing the trend from the iPhone 5 series, the display assembly comes out of
the phone first, simplifying screen repairs.
+The battery is straightforward to access. Removing it requires a proprietary
pentalobe screwdriver and knowledge of the adhesive removal technique, but is not
difficult.
−The iPhone 6 Plus still uses proprietary Pentalobe screws on the exterior,
requiring a specialty screwdriver to remove.
7
iPhone
6
2014
+Continuing the trend from the iPhone 5 series, the display assembly comes out of
the phone first, simplifying screen repairs.
+The battery is straightforward to access. Removing it requires a proprietary
pentalobe screwdriver and knowledge of the adhesive removal technique, but is not
difficult.
The iPhone 6 still uses proprietary Pentalobe screws on the exterior, requiring a
specialty screwdriver to remove.
7
Fairphone 1.0
2014
+The battery can be replaced without any tools.
+It's very easy to open and access the internal components.
−Several smaller components are soldered to the motherboard, increasing repair
difficulty (front-facing camera, vibrator motor, LED flash, and headphone jack).
7
Motorola
Moto X 1st
Generation
2013
+Pressure contacts and cable connectors make the modular components (cameras,
buttons, headphone jack and speakers) easy to replace.
+The Moto X uses a single kind of screw, although it's a fairly uncommon size
(T3).
Sticky adhesive on the back cover is annoying and will slow opening the phone.
Samsung
Galaxy Nexus
2011
+Battery replacement is incredibly simple thanks to the removable rear panel.
+Minimal adhesive makes removal of the motherboard and other components a
snap.
−Removing the rear case to access the motherboard and other internals requires a
lot of careful prying and guitar-picking.
7
Nexus
S
2010
+Battery is very easily replaceable -- just remove the back cover to swap it out.
+The motherboard comes out easily once you're inside, as it's held in place by
regular screws and connectors.
−Front panel is attached with adhesive instead of screws, so it's harder to take off
than on the iPhone.
7
iPhone
3G
2009
+LCD and front glass are not fused and can be replaced individually.
+Standard Phillips screws used throughout.
Battery is buried under the logic board, making it difficult to replace.
7
iPhone
3GS
2009
+LCD and front glass are not fused and can be replaced individually.
+Standard Phillips screws used throughout.
−Battery is buried under the logic board, making it difficult to replace.
7

176
iPhone
XR
2018
+The display-first opening procedure and easy access to the battery remain design
priorities.
+A broken display can be replaced with minimal hardware removal, and with a
little care you can preserve Face ID.
− Glass on front and back doubles the crackability—and broken back glass requires
an entire chassis replacement.
6
iPhone
XS
2018
+Critical display and battery repairs remain a priority in the iPhone's design.
+A broken display can be replaced without removing the biometric Face ID
hardware.
− Glass on front and back doubles the likelihood of drop damage—and if the back
glass breaks, you'll be removing every component and replacing the entire chassis.
6
Pixel 2 XL
2017
+Many components are modular and can be replaced once the display assembly is
removed.
+All of the screws are common Phillips #00 screws, and there are only 9 of them.
The battery's loss of pull-tab adhesive, plus tightly walled-in placement, makes it
much harder to remove.
6
Google Pixel 2
2017
+Front panel is fairly easy to remove and replace
+Standard screws used throughout.
Cable placement makes battery removal more difficult than necessary.
6
iPhone
8 Plus
2017
+The display and battery are straightforward to access—with the proper knowledge
and tools.
+Wireless charging means less wear on the all-purpose Lightning port, a common
point of failure.
− Despite alleged durability, the back glass is breakable and next to impossible to
replace when cracked.
6
iPhone
8
2017
+The two most commonly replaced components, display and battery, remain
straightforward to access with the proper knowledge and tools.
+The addition of wireless charging means less strain on your Lightning port, a
common point of failure.
− The durability of the glass back remains to be seen—but replacements are likely
to be very difficult.
6
Sony Xperia X
Compact 2017
+Modular design allows for replacement of many individual components.
Battery is fairly easy to access and remove, but requires removal of the delicate
NFC antenna to replace.
− Adhesive used throughout will need to be replaced during reassembly, and may
never be as waterproof again.
6
Xiaomi
Mi 5
2017
+The motherboard and battery can be replaced independently and easily.
+Most components are modular and can be replaced independently.
− The display is difficult to replace, requiring complete disassembly and
purchasing consumables.
6
AsusZenfone 3
Max 2017
+Battery is easily accessible and removable.
Parts could be more modular, especially mechanical/high wear components.
− The opening procedure is extremely tough, clips are stiff and likely to be broken,
and the SIM slot bends easily.
6
Vivo
X7
2017
+Battery is fairly easily accessible and removable.
Parts could be more modular, especially mechanical/high wear components.
−The opening procedure is extremely tough, clips are very stiff and likely to be
broken.
6
Huawei
Mate 8
2017
+Many components are modular and can be individually replaced.
Opening the phone requires only a Torx screwdriver and a prying tool (No
adhesive holding it together).
− A tamper evident sticker must be removed when disconnecting the battery.
6
Lenovo
K5 Note
2017
+Battery is replaceable with just a couple of tools.
+A single Phillips 00 driver takes care of all the screws.
− Replacing the display assembly requires removing every other component from
the device first.
6
Shift 5.1
+Cover and battery are easy to remove and can be swapped without using tools.
+No excessive glue and no proprietary screws are used, only Phillips #000.
− Lots of components and connectors are soldered to the motherboard. They could
be soldered by hand if needed but this makes repairs more difficult.
6
iPhone
SE
2016
+The display assembly is the first component out of the phone, simplifying screen
replacements.
+The battery is fairly easy to access, even though it's not technically "user
replaceable."
− The Touch ID cable could be easily ripped out of its socket if a user is not careful
when opening the phone.
6

177
iPhone
5c
2013
+Just like in the iPhone 5, the display assembly is the first component out of the
phone, simplifying screen replacements.
+The battery is still fairly easy to access, even though it's not technically "user
replaceable."
− Adhesive on the antenna connectors hinder disassembly.
6
iPhone
5s
2013
+Just like in the iPhone 5, the display assembly is the first component out of the
phone, simplifying screen replacements.
+The battery is still fairly easy to access, even though it's not technically "user
replaceable."
−The fingerprint sensor cable could be easily ripped out of its socket if a user is not
careful while opening the phone.
6
iPhone
4S
2011
+The iPhone 4S is still held together primarily with screws and limited adhesive.
+The rear panel and battery are both easy to remove and replace (provided you
have the correct screwdriver).
Apple is again using Pentalobe screws to secure the rear panel and keep people out
6
SamsungGalaxy
S 4G2011
+Removing the rear panel to replace the microSD/SIM cards and the battery
requires no tools.
+Attaching components like the headphone jack to separate cables makes their
replacement less costly than replacing the entire motherboard.
−The front panel is adhered to the AMOLED display, so they must be replaced as
one expensive unit.
6
Motorola
Droid 3
2011
+There were no security screws in the entire device.
+The battery was not soldered to anything and was easy to replace.
There is a lot of adhesive holding things together, making disassembly and
reassembly difficult.
6
iPhone
4 Verizon
2011
+The iPhone 4 is held together primarily with [lots of] screws, sans tabs, and
limited adhesive.
+The rear panel and battery are both easy to remove and replace (provided you
have the right screwdriver).
−Apple is using Pentalobe screws to secure the rear panel and keep people out.
6
OnePlus 6 2018
− Display replacement, the most common repair, is not prioritized in the design and
will take a lot of work.
− Front and back glass means twice the risk of cracks—without even the benefit of
wireless charging.
+The battery can be accessed almost the moment you open the phone, and is only
lightly adhered in place. Plus, there's a convenient pull tab.
5
Huawei Mate 9
2017
− Replacing a broken display, one of the most common repairs, will be one of the
most difficult ones on this phablet.
The battery is trapped behind some flex cables and is glued tightly into place, but
still can be swapped out when its power starts to fade away.
Most of the components—like both camera units, the loudspeaker, and the USB
+board—can be replaced. Even the proximity sensor and the NFC antenna are
modular.
5
LG G6 2017
−Front and back glass doubles the crackability, and strong adhesive on both makes
it tough to begin any repair.
−Components adhered to the back of a fused display assembly.
+Many components are modular and can be replaced independently.
5
Samsung
Galaxy Alpha
2014
−The display assembly is held in with a significant amount of adhesive and
requires very careful prying and a considerable amount of heat to remove without
cracking the thin glass or cutting cables.
−Replacing anything other than the battery requires first removing the display,
risking extra damage on the way to a repair.
+The battery is incredibly easy to remove and replace.
5
Samsung
Galaxy S5 Mini
2014
− Replacing anything other than the battery requires first removing the display,
risking extra damage on the way to a repair.
− The display is now one of the first components out, making its replacement a
little faster. However, it is held in with a significant amount of adhesive and
requires very careful and persistent prying, as well as a considerable amount of
heat to remove without cracking the glass or cutting cables.
+ The battery is incredibly easy to remove and replace.
5

178
OnePlus
One
2014
− Replacing anything other than the battery requires first removing the display,
risking extra damage on the way to a repair.
The display is now one of the first components out, making replacements a little
faster. However, it is held in with a significant amount of adhesive and requires
very careful and persistent prying and a considerable amount of heat to remove
without cracking the glass or cutting cables.
+The battery is incredibly easy to remove and replace.
HTC Surround
2011
− Unable to access the internal MicroSDHC card without voiding the warranty.
− It is very difficult to access the front panel and LCD for replacement.
Relatively easy to remove the rear case to replace the battery.
5
Huawei Mate 20
Pro 2018
− Glued-down front and back glass means greater risk of breakage while making
repairs difficult to start.
− Screen repairs require a lot of disassembly while battling tough adhesive.
Many components are modular and can be replaced independently.
4
Pixel 3
2018
− Display repairs are much more difficult than previous models, requiring
complete disassembly of the phone.
− To service any component, you'll have to painstakingly un-glue (and later re-
glue) the glass rear panel.
+The only screws are standard T3 Torx fasteners.
4
Pixel 3 XL
2018
− Display repairs are much more difficult than previous models, requiring
complete disassembly of the phone.
−To service any component, you'll have to painstakingly un-glue (and later re-
glue) the glass rear panel.
+The only screws are standard T3 Torx fasteners.
4
LG
G7 Thin Q 2018
− Front and back glass make for double the crackability, and strong adhesive on
both makes it tough to access the internals for any repair.
− Screen repair, the most common type repair, is not prioritized, requiring an
almost complete disassembly while battling tough adhesive.
+Lots of components are modular and can be replaced independently
4
Huawei P20 Pro
2018
− Double the risk for breakage with glass front and back.
− Replacing the screen requires going through at least two layers of adhesive and
some disassembly.
+Many components are modular and can be replaced independently.
4
SamsungGalaxy
S9 2018
− Glued-down glass both front and back means greater risk of breakage, and makes
repairs difficult to start.
− Screen repairs require a lot of disassembly while battling tough adhesive.
+Many components are modular and can be replaced independently.
4
SamsungGalaxy
S9 Plus 2018
− Glued-down glass both front and back means greater risk of breakage, and makes
repairs difficult to start.
− Screen repairs require a lot of disassembly while battling tough adhesive.
+Many components are modular and can be replaced independently
4
Huawei Mate 10
Pro 2017
− A damaged front camera means switching the whole display including the
frame, or damaging the display while trying to remove it.
− And replacing the display—the most common repair—means taking out almost
every component.
+Despite the IP67-rated seals, the back cover is fairly easy to open.
4
Samsung
Galaxy Note
2017
− All repairs require removing the glass rear panel, which is challenging due to the
large amount of adhesive.
− Replacing the display requires removing the glass rear panel and the display,
both of which are fragile and secured with strong adhesive.
+Many components, including all of those that experience wear, are modular and
can be replaced independently.
4
Samsung
Galaxy Note
Fan Edition
2017
− Front and back glass make for double the crackability, and strong adhesive on the
rear glass makes it very difficult to gain entry into the device.
− Because of the curved screen, replacing the front glass without destroying the
display is probably impossible.
+Many components are modular and can be replaced independently.
4
Samsung
Galaxy S8 2017
− Front and back glass make for double the crackability, and strong adhesive on
both makes it tough to access the internals for any repair.
− Because of the curved screen, replacing the front glass without destroying the
display is extremely difficult.
+Lots of components are modular and can be replaced independently.
4

179
Samsung
Galaxy S8 Plus
2017
− Front and back glass make for double the crackability, and strong adhesive on
both makes it tough to access the internals for any repair.
− Because of the curved screen, replacing the front glass without destroying the
display is extremely difficult.
+Many components are modular and can be replaced independently.
4
Samsung
Galaxy Note7
2016
− Front and back glass make for double the crackability, and strong adhesive on the
rear glass makes it very difficult to gain entry into the device.
− Because of the curved screen, replacing the front glass without destroying the
display is probably impossible.
+Many components are modular and can be replaced independently.
4
Samsung
Galaxy S6 2015
− Front and back glass make for double the crackability, and strong adhesive on the
rear glass makes it very difficult to gain entry into the device.
− Replacing the glass without destroying the display is probably impossible.
Many components are modular and can be replaced independently.
4
Motorola Droid
4 2012
− Keyboard contacts are located on the motherboard, making keyboard
replacement costly and difficult.
− Tons of glue adheres the glue that is securing the glue to the glue that holds the
phone together.
+The lack of security or proprietary screws is a welcome sight.
4
Motorola Droid
RAZR 2011
− The front panel is adhered to the AMOLED display, so they must be replaced as
one expensive unit.
− All plastic frames and casing proved to be incredibly tedious to remove, and felt
like they would break at any moment.
Once the battery and motherboard are within reach, replacement is easy—no
soldering required.
4
Samsung
Galaxy S10
2019
− Battery replacement is possible, but still unnecessarily difficult.
− Glued-down glass both front and back means greater risk of breakage, and makes
repairs difficult to start.
+A single Phillips driver takes care of all the screws.
4
Samsung
Galaxy S7 Edge
2016
−The display needs to be removed (and likely destroyed) if you want to replace the
USB port.
−Front and back glass make for double the crackability, and strong adhesive on the
rear glass makes it very difficult to gain entry into the device.
+Many components are modular and can be replaced independently.
3
Samsung
Galaxy S7 2016
−The display needs to be removed (and likely destroyed) if you want to replace the
USB port.
−Front and back glass make for double the crackability, and strong adhesive on the
rear glass makes it very difficult to gain entry into the device.
+Many components are modular and can be replaced independently.
3
Samsung
Galaxy S6 Edge
2015
−Front and back glass make for double the crackability, and strong adhesive on the
rear glass makes it very difficult to gain entry into the device.
−The battery is very tightly adhered to the back of the display, and buried beneath
the midframe and motherboard.
+ components are modular and can be replaced independently.
3
Amazon Fire
2014
−Tons of cables and connectors make disassembly tedious and reassembly
difficult.
−The four Dynamic Perspective cameras are encased in glue. Replacement will
mean heat and cutting.
+External, non-proprietary screws means no adhesive holding the device together,
and an easier time getting in.
3
Nexus 6P 2015
−It's very difficult—although not impossible—to open the device without
damaging the glass camera cover. Because of the unibody design, this makes every
component extremely difficult to replace.
−The display assembly cannot be replaced without tunneling through the entire
phone. This makes one of the most common repairs, a damaged screen, difficult to
accomplish.
−Tough adhesive holds the rear cover panels and battery in place.
2
HTC One M9
2015
−The battery is buried beneath the motherboard and adhered to the midframe,
hindering its replacement.
−The display assembly cannot be replaced without tunneling through the entire
phone. This makes one of most common repairs—a damaged screen—very
difficult to accomplish.
−Intense adhesives make many components difficult, and even dangerous, to
remove and replace.
2

180
HTC One M8
2014
−It's very difficult—although no longer impossible—to open the device without
damaging the rear case. This makes every component extremely difficult to
replace.
−The battery is buried beneath the motherboard and adhered to the midframe,
hindering its replacement.
−The display assembly cannot be replaced without tunneling through the entire
phone. This makes one of most common repairs, a damaged screen, very difficult
to accomplish.
2
iPhone
1st Generation
2009
−Hidden clips make it nearly impossible to open rear case without damaging it.
−Soldered battery is very difficult to replace.
+Standard Phillips screws used throughout.
2
Essential
Phone
2017
−The USB-C port is soldered to the motherboard, and with no headphone jack it'll
be subject to extra wear.
−Nearly invisible seams and copious adhesive means any attempt at repair is likely
to inflict as much damage as it fixes.
−Did we mention we had to freeze it?
1
HTC One 2013
−Very, very difficult (possibly impossible?) to open the device without damaging
the rear case. This makes every component extremely difficult to replace.
−The battery is buried beneath the motherboard and adhered to the midframe,
hindering its replacement.
−The display assembly cannot be replaced without removing the rear case—this
will make the most common repair, a damaged screen, nearly impossible.
1