EASTSPRING INVESTMENTS - Fundsquare
239
EASTSPRING INVESTMENTS SOCIÉTÉ D’INVESTISSEMENT À CAPITAL VARIABLE LUXEMBOURG AUDITED ANNUAL REPORT AS AT DECEMBER 31, 2015 26, boulevard Royal L-2449 Luxembourg Grand Duchy of Luxembourg R.C.S. Luxembourg B 81.110 No subscription can be received on the basis of this report. Subscriptions can be accepted only on the basis of the current Prospectus of the SICAV.
-
Upload
khangminh22 -
Category
Documents
-
view
0 -
download
0
Transcript of EASTSPRING INVESTMENTS - Fundsquare
EASTSPRING INVESTMENTSSOCIÉTÉ D’INVESTISSEMENT À CAPITAL VARIABLELUXEMBOURG
AUDITED ANNUAL REPORTAS AT DECEMBER 31, 2015
26, boulevard RoyalL-2449 LuxembourgGrand Duchy of Luxembourg
R.C.S. Luxembourg B 81.110
No subscription can be received on the basis of this report. Subscriptions can be accepted only on the basis of the current Prospectus of the SICAV.
1
EASTSPRING INVESTMENTS
TABLE OF CONTENTS
Directory, Administration and Management 2General Information 4Report of the Board of Directors 5Report of the Investment Manager 6Report of the Réviseur d’Entreprises agréé 8Combined Statement of Net Assets 9Combined Statement of Operations and Changes in Net Assets 20Statement of Changes in Shares Outstanding 31Statistics 40Statement of Investments
Eastspring Investments – Asia Pacific Equity Fund(*) (“Asia Pacific Equity Fund”) Eastspring Investments – Asian Bond Fund (“Asian Bond Fund”)Eastspring Investments – Asian Dynamic Fund(*) (“Asian Dynamic Fund”)Eastspring Investments – Asian Equity Fund (“Asian Equity Fund”)Eastspring Investments – Asian Equity Income Fund (“Asian Equity Income Fund”)Eastspring Investments – Asian High Yield Bond Fund (“Asian High Yield Bond Fund”)Eastspring Investments – Asian Infrastructure Equity Fund (“Asian Infrastructure Equity Fund”)Eastspring Investments – Asian Local Bond Fund (“Asian Local Bond Fund”)Eastspring Investments – Asian Property Securities Fund(1) (“Asian Property Securities Fund”)Eastspring Investments – China Equity Fund (“China Equity Fund”)Eastspring Investments – Developed Asia Equity Fund(*) (“Developed Asia Equity Fund”)Eastspring Investments – Dragon Peacock Fund (“Dragon Peacock Fund”)Eastspring Investments – Emerging Asia Equity Fund(*) (“Emerging Asia Equity Fund”)Eastspring Investments – Emerging Europe, Middle East and Africa Dynamic Fund (“Emerging Europe, Middle East and Africa Dynamic Fund”)Eastspring Investments – European Investment Grade Bond Fund (“European Investment Grade Bond Fund”)Eastspring Investments – Global Bond Navigator Fund(*) (“Global Bond Navigator Fund”)Eastspring Investments – Global Emerging Markets Bond Fund(*) (“Global Emerging Markets Bond Fund”)Eastspring Investments – Global Emerging Markets Dynamic Fund (“Global Emerging Markets Dynamic Fund”)Eastspring Investments – Global Equity Navigator Fund(*) (“Global Equity Navigator Fund”)Eastspring Investments – Global Low Volatility Equity Fund(*) (“Global Low Volatility Equity Fund”)Eastspring Investments – Global Market Navigator Fund (“Global Market Navigator Fund”)Eastspring Investments – Global Technology Fund(*) (“Global Technology Fund”)Eastspring Investments – Greater China Equity Fund (“Greater China Equity Fund”)Eastspring Investments – Hong Kong Equity Fund (“Hong Kong Equity Fund”)Eastspring Investments – India Equity Fund (“India Equity Fund”)Eastspring Investments – Indonesia Equity Fund (“Indonesia Equity Fund”)Eastspring Investments – Japan Dynamic Fund (“Japan Dynamic Fund”)Eastspring Investments – Japan Equity Fund(*) (“Japan Equity Fund”)Eastspring Investments – Japan Fundamental Value Fund(*) (“Japan Fundamental Value Fund”)Eastspring Investments – Japan Smaller Companies Fund(*) (“Japan Smaller Companies Fund”) Eastspring Investments – Latin American Equity Fund (“Latin American Equity Fund”) Eastspring Investments – Malaysia Equity Fund(*) (“Malaysia Equity Fund”)Eastspring Investments – North American Value Fund (“North American Value Fund”)Eastspring Investments – Pan European Fund(*) (“Pan European Fund”)Eastspring Investments – Philippines Equity Fund(*) (“Philippines Equity Fund”)Eastspring Investments – Thailand Equity Fund (“Thailand Equity Fund”)Eastspring Investments – US Bond Fund(*) (“US Bond Fund”) Eastspring Investments – US Corporate Bond Fund (“US Corporate Bond Fund”)Eastspring Investments – US High Investment Grade Bond Fund (“US High Investment Grade Bond Fund”)Eastspring Investments – US High Yield Bond Fund (“US High Yield Bond Fund”)Eastspring Investments – US Investment Grade Bond Fund (“US Investment Grade Bond Fund”)Eastspring Investments – US Strategic Income Bond Fund(*) (“US Strategic Income Bond Fund”)Eastspring Investments – US Total Return Bond Fund(*) (“US Total Return Bond Fund”) Eastspring Investments – Vietnam Equity Fund(*) (“Vietnam Equity Fund”) Eastspring Investments – World Value Equity Fund (“World Value Equity Fund”)
Notes to the Financial Statements 205Appendices 224
(*) Not authorized in Hong Kong and not available to Hong Kong residents. (1) This Sub-Fund is not authorized by the Hong Kong Securities and Futures Commission under the Code on REITs, but is authorized under the Code on Unit Trusts and Mutual Funds. Such authorization is not a recommendation or endorsement of the Sub-Fund nor does it guarantee the commercial merits of the Sub-Fund or its performance. It does not mean the Sub-Fund is suitable for all investors nor is it an endorsement of its suitability for any particular investor or class of investors. Furthermore, the dividend/payout policy of this Sub-Fund is not representative of the dividend/payout policy of the underlying REITs.
51536466687175778486878991
9395
103104115117118124126128130131132134135137139140142143145147148150153164169179186192198199
2
EASTSPRING INVESTMENTS
Board of Directors
ChairmanMr Graham David MASON (until February 27, 2015)Executive Vice-Chairman Eastspring Investments
Mr Peter Martin LLOYD (since February 28, 2015)1
Independent DirectorFormer Chief Actuary – Prudential Corporation AsiaUnited Kingdom
DirectorsMr Guy Robert STRAPP (since February 28, 2015)Chief Executive OfficerEastspring Investments
Mrs Francine KEISERIndependent DirectorGrand Duchy of Luxembourg
Mr Manuel HAUSERIndependent DirectorGrand Duchy of Luxembourg
Administration and Management
Registered office26, boulevard RoyalL-2449 LuxembourgGrand Duchy of Luxembourg
Management CompanyEastspring Investments (Luxembourg) S.A.26, boulevard RoyalL-2449 LuxembourgGrand Duchy of Luxembourg
Board of Directors of the Management CompanyMr Guy Robert STRAPPChief Executive OfficerEastspring Investments
Mr Graham David MASON (until February 27, 2015)Executive Vice-ChairmanEastspring Investments
Mrs Michele Mi-Kyung BANG (since 28 February 2015)Deputy Chief Executive OfficerEastspring Investments
Mr Hendrik Gerrit RUITENBERGExecutive OfficerEastspring Investments (Luxembourg) S.A.
1 Mr Peter Martin Lloyd was a Director for the full year and Chairman of the Board of Directors since February 28, 2015.
Administration and Management (continued)
Conducting Officers of the Management CompanyMr Hendrik Gerrit RUITENBERGExecutive OfficerEastspring Investments (Luxembourg) S.A.
Mr Christophe BÉCUECompliance OfficerEastspring Investments (Luxembourg) S.A.
Auditor of the Management CompanyKPMG Luxembourg, Société coopérative39, Avenue John F. KennedyL-1855 LuxembourgGrand Duchy of Luxembourg
Investment ManagerEastspring Investments (Singapore) Limited10 Marina Boulevard #32-01Marina Bay Financial Centre Tower 2Singapore 018983
Investment Sub-ManagersFor European Investment Grade Bond Fund,Pan European Fund and World Value Equity Fund(for investments in Europe):M&G Investment Management LimitedLaurence Pountney Hill, London EC4R 0HHUnited Kingdom
For Global Technology Fund:Henderson Global Investors Limited201 Bishopsgate, London EC2M 3AEUnited Kingdom
For China Equity Fund, Dragon Peacock Fund2
(for investments in the PRC), Greater China Equity Fund and Hong Kong Equity Fund:Eastspring Investments (Hong Kong) Limited13/F, One International Financial Centre1 Harbour View StreetCentral, Hong Kong
For North America Fund (until March 19, 2015), North American Value Fund, US Bond Fund, US Corporate Bond Fund, US High Investment Grade Bond Fund, US High Yield Bond Fund, US Investment Grade Bond Fund, US Strategic Income Bond Fund, US Total Return Bond Fund and World Value Equity Fund (for investments in the US):PPM America, Inc.225 West Wacker Drive, Suite 1200Chicago, Illinois 60606United States of America
2 With effect from 1 July 2015, Eastspring Investments (Hong Kong) Limited ceased to be Investment Sub Manager of Eastspring Investments – Dragon Peacock Fund.
DIRECTORY, ADMINISTRATION AND MANAGEMENT
3
EASTSPRING INVESTMENTS
Administration and Management (continued)
Global DistributorEastspring Investments (Singapore) Limited10 Marina Boulevard #32-01Marina Bay Financial Centre Tower 2Singapore 018983
Custodian, Central Administration, Registrar and Transfer Agent and Listing AgentThe Bank of New York Mellon (Luxembourg) S.A.Vertigo Building – Polaris2-4, rue Eugène RuppertL-2453 LuxembourgGrand Duchy of Luxembourg
Auditor of the SICAVKPMG Luxembourg, Société coopérative39, Avenue John F. KennedyL-1855 LuxembourgGrand Duchy of Luxembourg
Legal AdvisorClifford Chance10, boulevard G-D CharlotteL-1011 LuxembourgGrand Duchy of Luxembourg
DIRECTORY, ADMINISTRATION AND MANAGEMENT (continued)
4
EASTSPRING INVESTMENTS
Current ProspectusCopies of Eastspring Investments’ (the “SICAV”) Articles of Association, Prospectus dated October 2015 and KIID may be obtained, free of charge, from the Registered Office of the SICAV.
Please refer to the Prospectus dated October 2015 to have the current applicable terms and conditions.
The SICAV is governed by the Luxembourg Law dated December 17, 2010, as amended (the “2010 Law”). The SICAV complies with the provisions of Directive 2009/65/EC of the European Parliament and of the Council of July 13, 2009 on the coordination of laws, regulations and administrative provisions relating to undertakings for collective investment in transferable securities (UCITS).
Annual General MeetingThe annual general meeting of Shareholders of the SICAV will be held at the Registered Office of the SICAV or at such other place in Luxembourg on the second Friday of April in each year at 11 a.m., or if any such day is not a business day in Luxembourg, on the next following business day in Luxembourg.
Notices of all general meetings will be sent to the holders of registered Shares by post prior to the meeting at their addresses in the register of Shareholders.
The notices of all general meetings of Shareholders may be published in any newspapers as the Board of Directors may decide.
Report and AccountsThe financial year-end of the SICAV will be the last day of December of each year.
Audited annual reports will be published within 4 months after the financial year-end and unaudited semi-annual reports will be published within 2 months after the end of the relevant period. Such reports will be made available at the registered office of the SICAV during normal business hours.
Publication of PricesThe NAV and the issue, Conversion and Redemption Prices of the Shares in any Sub-Fund will be made public and available at the registered office of the SICAV.
The SICAV will further arrange for regular publication of the NAV in the Financial Times or in such other newspapers as the Board of Directors may decide on. Prices for the share classes listed on the Luxembourg Stock Exchange are available on the Bourse de Luxembourg (www.bourse.lu).
Purchases and SalesA detailed list of investments purchased and sold for any Sub-Fund during the year/period is available upon request, free of charge, from the Registered Office of the SICAV.
GENERAL INFORMATION
5
EASTSPRING INVESTMENTS
REPORT OF THE BOARD OF DIRECTORSAs at December 31, 2015
Dear Shareholders,
I. Financial StatementsThe Directors would like to submit to you their report and the audited financial statements for the year ended December 31, 2015.
The audited financial statements are set out on pages 9 to 50 of this Annual Report, with results for the year appearing in the Combined Statement of Net Assets on pages 9 to 19 and the Combined Statement of Operations and Changes in Net Assets on pages 20 to 30.
II. Activities during the yearDuring the past year, the SICAV launched forty two additional Classes of Shares and three new Sub-Funds. One Sub-Fund closed. As at December 31, 2015, assets equalled USD 25.175 billion for a total of 45 Sub-Funds and 365 Classes of Shares.
The performance of each Sub-Fund is provided in Appendix 3 and on page 7.
III. Board of DirectorsThe Directors of the SICAV are listed on page 2. Three of the four Directors, serving as at December 31, 2015, are independent directors and free from any business or other relationship which could materially interfere with the exercise of their independent judgment.
The Board of Directors has delegated the management and operation of the SICAV to Eastspring Investments (Luxembourg) S.A., (the “Management Company”). The Management Company is entrusted with the day-to-day management of the SICAV, with responsibility for performing directly or by way of delegation all operational functions relating to the SICAV’s investment management, administration, risk management and marketing of the Sub-Funds.
The Directors are formally responsible for the Annual Report and the financial statements for each financial year, which are required under general principles to give a true and fair view of the state of affairs of the SICAV.
The Board of Directors would like to take this opportunity to thank the Shareholders for their on-going support.
Luxembourg,March 2016
6
EASTSPRING INVESTMENTS
REPORT OF THE INVESTMENT MANAGERAs at December 31, 2015
Dear ShareholdersDear Directors,
2015 proved to be an eventful year for global markets. The MSCI AC World index declined by more than 4% in USD terms as equities were roiled by both growth and policy uncertainties in key economies. Equities opened the year up with US markets reaching record highs in the first quarter but quickly lost steam as an anti-austerity government came into power in Greece, US corporate earnings disappointed and economic weakness in emerging economies became more apparent. These compounded anxiety and confusion over the US Federal Reserve’s (the “US Fed”)policy stance which caused episodic selloffs and major currency and rates movements.
Much of the year’s volatility could be attributed to three main events. First, the global markets struggled to digest the impact of the impending monetary policy divergence. The US Fed went ahead with a rate hike just before the year ended. Concurrently, the European Central Bank and the Bank of Japan pledged to ease policies further if required. Although the USD gained significantly against the EUR, the JPY held its own due to strong haven demand in the second half of the year. Built-in expectations over the Fed’s move also had a profound impact on emerging market currencies throughout the year as capital outflows intensified on USD-denominated debt concerns. In Asia, the Malaysian Ringgit and Indonesian Rupiah were amongst the worst performers while key BRIC members Brazil and Russia also saw their currencies depreciate significantly against the USD.
Second, the Chinese economy continued its slowdown as the government intensified reforms to reduce overinvestment and graft, while transiting the economy towards a more service-oriented structure. China’s clampdown on margin trading and its surprise devaluation of the RMB in the third quarter caused a massive spike in risk aversion. This led to a selloff in global equities as investors questioned the true extent of China’s slowdown and the possibility of competitive currency devaluations across emerging markets. Botched market interventions to stem equity market losses such as selling restrictions only exacerbated the panic.
Third, commodities across the board plunged to multi-year lows on oversupply and weakening demand from China, driving losses across asset classes in commodity-reliant economies such as Australia and Malaysia. Oil prices ended the year at a decade-low as OPEC embarked on a price war to maintain its market share amid increasing competition from North American shale producers. Depressed oil prices decimated the balance sheets of energy companies and forced them to cut back on capital expenditure, as well as generating turmoil in the US high yield bond market.
Fixed income performance for the year was subdued too. US and Japan government bonds eked out small gains for the year while local Asian bonds suffered overall losses for the year due to a combination of rising yields and weakened currencies. Global investment grade bonds1 lost almost 4% while US high yield2 was the worst performer, declining around 5%.
On the equity front, Japan outperformed in both USD and local currency (LCY) terms for the year as corporate profits surprised positively alongside an economy which appears to be on firmer footing. Emerging markets equities suffered steep losses as investors sought safe havens. The MSCI Latin America index retreated around 30% for the year with Brazil, Chile and Colombia responsible for the largest declines. Emerging Asia was not spared as political and economic uncertainties coalesced in Thailand and Malaysia to head losses.
Heading into 2016, investors will focus on the pace of tightening by the US Fed and the transmission effects of the rate hikes. Markets will watch US data closely to anticipate signs of recession which could force the central bank to reverse on its tightening. In Asia, China’s growth outlook will continue to dominate but it is useful to note that the likes of India, Philippines, Indonesia and even Vietnam are likely to embark on a higher growth trajectory that could offer a good diversion. Geopolitics could play a big part in global markets too. The US presidential election, referendum on the UK’s EU membership and other leadership transitions will have material consequences while developments in North Korea, the South China Seas, the refugee crisis in Europe and terrorism-related activities could be potential black swan events.
1 Barclays Global Aggregate - Corporates2 US HY: BofA/Merrill Lynch US HY Constrained
7
EASTSPRING INVESTMENTS
Entity Name Official Benchmark Name*Inception Date
1Y Fund
1Y Bench-
mark3Y
Fund
3Y Bench-
mark5Y
Fund
5Y Bench-
mark
Since Incep-
tion Fund
Since Incep-
tion Bench-
mark
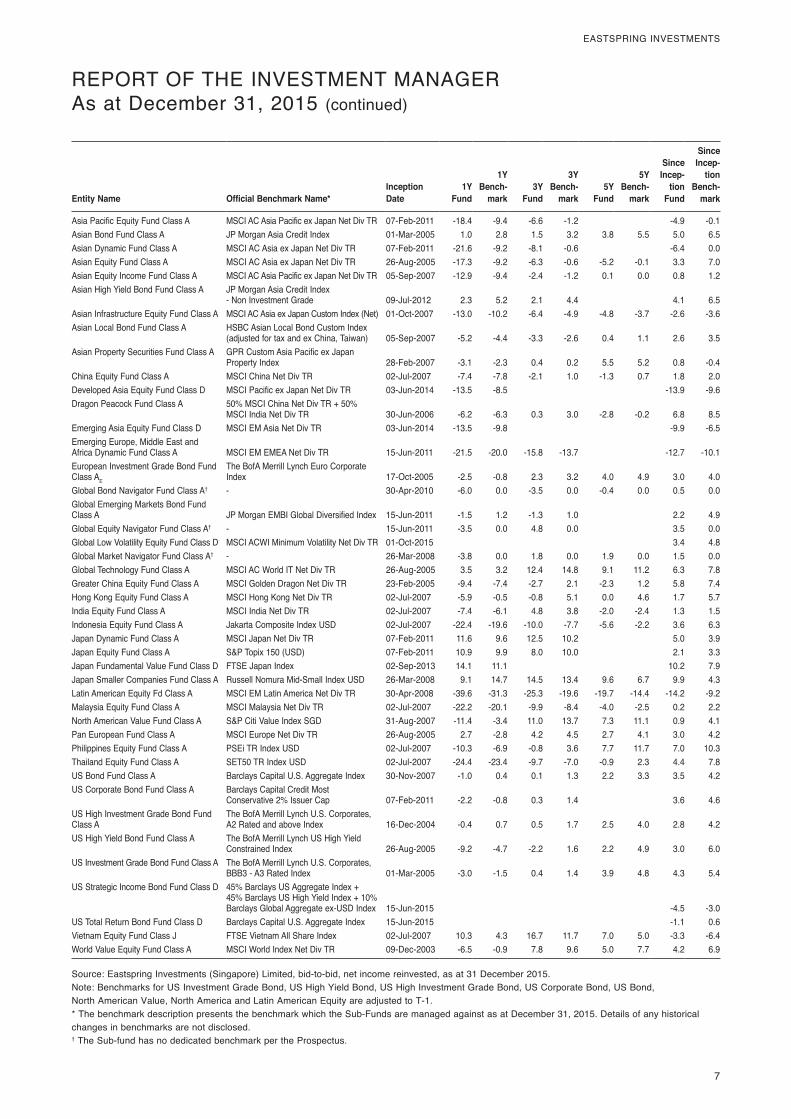
Asia Pacific Equity Fund Class A MSCI AC Asia Pacific ex Japan Net Div TR 07-Feb-2011 -18.4 -9.4 -6.6 -1.2 -4.9 -0.1Asian Bond Fund Class A JP Morgan Asia Credit Index 01-Mar-2005 1.0 2.8 1.5 3.2 3.8 5.5 5.0 6.5Asian Dynamic Fund Class A MSCI AC Asia ex Japan Net Div TR 07-Feb-2011 -21.6 -9.2 -8.1 -0.6 -6.4 0.0Asian Equity Fund Class A MSCI AC Asia ex Japan Net Div TR 26-Aug-2005 -17.3 -9.2 -6.3 -0.6 -5.2 -0.1 3.3 7.0Asian Equity Income Fund Class A MSCI AC Asia Pacific ex Japan Net Div TR 05-Sep-2007 -12.9 -9.4 -2.4 -1.2 0.1 0.0 0.8 1.2Asian High Yield Bond Fund Class A JP Morgan Asia Credit Index
- Non Investment Grade 09-Jul-2012 2.3 5.2 2.1 4.4 4.1 6.5Asian Infrastructure Equity Fund Class A MSCI AC Asia ex Japan Custom Index (Net) 01-Oct-2007 -13.0 -10.2 -6.4 -4.9 -4.8 -3.7 -2.6 -3.6Asian Local Bond Fund Class A HSBC Asian Local Bond Custom Index
(adjusted for tax and ex China, Taiwan) 05-Sep-2007 -5.2 -4.4 -3.3 -2.6 0.4 1.1 2.6 3.5Asian Property Securities Fund Class A GPR Custom Asia Pacific ex Japan
Property Index 28-Feb-2007 -3.1 -2.3 0.4 0.2 5.5 5.2 0.8 -0.4China Equity Fund Class A MSCI China Net Div TR 02-Jul-2007 -7.4 -7.8 -2.1 1.0 -1.3 0.7 1.8 2.0Developed Asia Equity Fund Class D MSCI Pacific ex Japan Net Div TR 03-Jun-2014 -13.5 -8.5 -13.9 -9.6Dragon Peacock Fund Class A 50% MSCI China Net Div TR + 50%
MSCI India Net Div TR 30-Jun-2006 -6.2 -6.3 0.3 3.0 -2.8 -0.2 6.8 8.5Emerging Asia Equity Fund Class D MSCI EM Asia Net Div TR 03-Jun-2014 -13.5 -9.8 -9.9 -6.5Emerging Europe, Middle East and Africa Dynamic Fund Class A MSCI EM EMEA Net Div TR 15-Jun-2011 -21.5 -20.0 -15.8 -13.7 -12.7 -10.1European Investment Grade Bond Fund Class AE
The BofA Merrill Lynch Euro Corporate Index 17-Oct-2005 -2.5 -0.8 2.3 3.2 4.0 4.9 3.0 4.0
Global Bond Navigator Fund Class A† - 30-Apr-2010 -6.0 0.0 -3.5 0.0 -0.4 0.0 0.5 0.0Global Emerging Markets Bond Fund Class A JP Morgan EMBI Global Diversified Index 15-Jun-2011 -1.5 1.2 -1.3 1.0 2.2 4.9Global Equity Navigator Fund Class A† - 15-Jun-2011 -3.5 0.0 4.8 0.0 3.5 0.0Global Low Volatility Equity Fund Class D MSCI ACWI Minimum Volatility Net Div TR 01-Oct-2015 3.4 4.8Global Market Navigator Fund Class A† - 26-Mar-2008 -3.8 0.0 1.8 0.0 1.9 0.0 1.5 0.0Global Technology Fund Class A MSCI AC World IT Net Div TR 26-Aug-2005 3.5 3.2 12.4 14.8 9.1 11.2 6.3 7.8Greater China Equity Fund Class A MSCI Golden Dragon Net Div TR 23-Feb-2005 -9.4 -7.4 -2.7 2.1 -2.3 1.2 5.8 7.4Hong Kong Equity Fund Class A MSCI Hong Kong Net Div TR 02-Jul-2007 -5.9 -0.5 -0.8 5.1 0.0 4.6 1.7 5.7India Equity Fund Class A MSCI India Net Div TR 02-Jul-2007 -7.4 -6.1 4.8 3.8 -2.0 -2.4 1.3 1.5Indonesia Equity Fund Class A Jakarta Composite Index USD 02-Jul-2007 -22.4 -19.6 -10.0 -7.7 -5.6 -2.2 3.6 6.3Japan Dynamic Fund Class A MSCI Japan Net Div TR 07-Feb-2011 11.6 9.6 12.5 10.2 5.0 3.9Japan Equity Fund Class A S&P Topix 150 (USD) 07-Feb-2011 10.9 9.9 8.0 10.0 2.1 3.3Japan Fundamental Value Fund Class D FTSE Japan Index 02-Sep-2013 14.1 11.1 10.2 7.9Japan Smaller Companies Fund Class A Russell Nomura Mid-Small Index USD 26-Mar-2008 9.1 14.7 14.5 13.4 9.6 6.7 9.9 4.3Latin American Equity Fd Class A MSCI EM Latin America Net Div TR 30-Apr-2008 -39.6 -31.3 -25.3 -19.6 -19.7 -14.4 -14.2 -9.2Malaysia Equity Fund Class A MSCI Malaysia Net Div TR 02-Jul-2007 -22.2 -20.1 -9.9 -8.4 -4.0 -2.5 0.2 2.2North American Value Fund Class A S&P Citi Value Index SGD 31-Aug-2007 -11.4 -3.4 11.0 13.7 7.3 11.1 0.9 4.1Pan European Fund Class A MSCI Europe Net Div TR 26-Aug-2005 2.7 -2.8 4.2 4.5 2.7 4.1 3.0 4.2Philippines Equity Fund Class A PSEi TR Index USD 02-Jul-2007 -10.3 -6.9 -0.8 3.6 7.7 11.7 7.0 10.3Thailand Equity Fund Class A SET50 TR Index USD 02-Jul-2007 -24.4 -23.4 -9.7 -7.0 -0.9 2.3 4.4 7.8US Bond Fund Class A Barclays Capital U.S. Aggregate Index 30-Nov-2007 -1.0 0.4 0.1 1.3 2.2 3.3 3.5 4.2US Corporate Bond Fund Class A Barclays Capital Credit Most
Conservative 2% Issuer Cap 07-Feb-2011 -2.2 -0.8 0.3 1.4 3.6 4.6US High Investment Grade Bond Fund Class A
The BofA Merrill Lynch U.S. Corporates, A2 Rated and above Index 16-Dec-2004 -0.4 0.7 0.5 1.7 2.5 4.0 2.8 4.2
US High Yield Bond Fund Class A The BofA Merrill Lynch US High Yield Constrained Index 26-Aug-2005 -9.2 -4.7 -2.2 1.6 2.2 4.9 3.0 6.0
US Investment Grade Bond Fund Class A The BofA Merrill Lynch U.S. Corporates, BBB3 - A3 Rated Index 01-Mar-2005 -3.0 -1.5 0.4 1.4 3.9 4.8 4.3 5.4
US Strategic Income Bond Fund Class D 45% Barclays US Aggregate Index + 45% Barclays US High Yield Index + 10% Barclays Global Aggregate ex-USD Index 15-Jun-2015 -4.5 -3.0
US Total Return Bond Fund Class D Barclays Capital U.S. Aggregate Index 15-Jun-2015 -1.1 0.6Vietnam Equity Fund Class J FTSE Vietnam All Share Index 02-Jul-2007 10.3 4.3 16.7 11.7 7.0 5.0 -3.3 -6.4World Value Equity Fund Class A MSCI World Index Net Div TR 09-Dec-2003 -6.5 -0.9 7.8 9.6 5.0 7.7 4.2 6.9
Source: Eastspring Investments (Singapore) Limited, bid-to-bid, net income reinvested, as at 31 December 2015.Note: Benchmarks for US Investment Grade Bond, US High Yield Bond, US High Investment Grade Bond, US Corporate Bond, US Bond,North American Value, North America and Latin American Equity are adjusted to T-1.* The benchmark description presents the benchmark which the Sub-Funds are managed against as at December 31, 2015. Details of any historicalchanges in benchmarks are not disclosed.† The Sub-fund has no dedicated benchmark per the Prospectus.
REPORT OF THE INVESTMENT MANAGERAs at December 31, 2015 (continued)
EASTSPAING INVESTMENTS
RE PORT OF TH E REVISEUR D'ENTREPRI SES AG REE
To the Shareholders of Eastspring Investments 26, boulevard Royal L-2449 Luxembourg Grand Duchy of Luxembourg
Following our appointment by the annual general meeting of the Shareholders of April 10, 2015, we have audited the accompanying financial statements of Eastspring Investments and each of its sub-funds, which comprise the combined statement of net assets and the statement of investments as at December 31, 2015 and the combined statement of operations and changes in net assets for the year then ended, and a summary of significant accounting policies and other explanatory information.
Board of Directors of the SICAV responsibility for the financial statements The Board of Directors of the SICAV is responsible for the preparation and fair presentation of these financial statements in accordance with Luxembourg legal and regulatory requirements relating to the preparation of the financial statements, and for such internal control as the Board of Directors of the SICAV determines is necessary to enable the preparation of financial statements that are free from material misstatement, whether due to fraud or error.
Responsibility of t he Reviseur d 'Entreprises agree Our responsibil ity is to express an opinion on these financial statements based on our audit. We conducted our audit in accordance with International Standards on Auditing as adopted for Luxembourg by the Commission de Surveillance du Secteur Financier. Those standards require that we comply with ethical requirements and plan and perform the audit to obtain reasonable assurance about whether the financial statements are free from material misstatement.
An audit involves performing procedures to obtain audit evidence about the amounts and disclosures in the financial statements. The procedures selected depend on the judgement of the Reviseur d'Entreprises agree, including the assessment of the risks of material misstatement of the financial statements, whether due to fraud or error. In making those risk assessments, the Reviseur d'Entreprises agree considers internal control relevant to the entity's preparation and fair presentation of the financial statements in order to design audit procedures that are appropriate in the circumstances, but not for the purpose of expressing an opinion on the effectiveness of the entity's internal control.
An audit also includes evaluating the appropriateness of accounting policies used and the reasonableness of accounting estimates made by the Board of Directors of the SICAV, as well as evaluating the overall presentation of the financial statements.
We believe that the audit evidence we have obtained is sufficient and appropriate to provide a basis for our audit opinion.
Opinion In our opinion, the financial statements give a true and fair view of the financial position of Eastspring Investments and each of its sub-funds as of December 31, 2015, and of the results of their operations and changes in their net assets for the year then ended in accordance with Luxembourg legal and regulatory requirements relating to the preparation of the financial statements.
Other matter Supplementary information included in the annual report has been reviewed in the context of our mandate but has not been subject to specific audit procedures carried out in accordance with the standards described above. Consequently, we express no opinion on such information. However, we have no observation to make concerning such information in the context of the financial statements taken as a whole.
Luxembourg, March 18, 2016
8
KPMG Luxembourg Societe cooperative
Cabinet de revis· agree
The accompanying notes form an integral part of these financial statements. 9
EASTSPRING INVESTMENTS
Combined Statement of Net AssetsAs at December 31, 2015 (continued)
Asia PacificEquity
Fund
AsianBondFund
AsianDynamic
Fund
AsianEquity
FundNotes USD USD USD USD
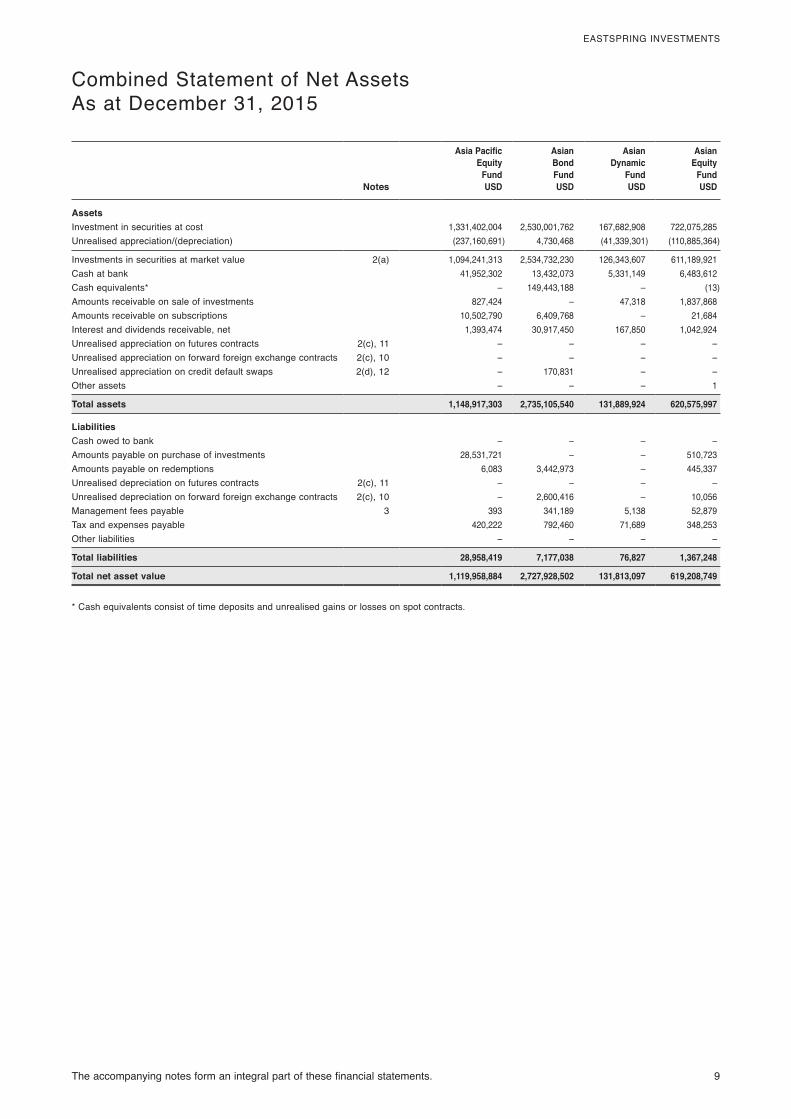
AssetsInvestment in securities at cost 1,331,402,004 2,530,001,762 167,682,908 722,075,285 Unrealised appreciation/(depreciation) (237,160,691) 4,730,468 (41,339,301) (110,885,364)
Investments in securities at market value 2(a) 1,094,241,313 2,534,732,230 126,343,607 611,189,921 Cash at bank 41,952,302 13,432,073 5,331,149 6,483,612 Cash equivalents* – 149,443,188 – (13)Amounts receivable on sale of investments 827,424 – 47,318 1,837,868 Amounts receivable on subscriptions 10,502,790 6,409,768 – 21,684 Interest and dividends receivable, net 1,393,474 30,917,450 167,850 1,042,924 Unrealised appreciation on futures contracts 2(c), 11 – – – – Unrealised appreciation on forward foreign exchange contracts 2(c), 10 – – – – Unrealised appreciation on credit default swaps 2(d), 12 – 170,831 – – Other assets – – – 1
Total assets 1,148,917,303 2,735,105,540 131,889,924 620,575,997
LiabilitiesCash owed to bank – – – – Amounts payable on purchase of investments 28,531,721 – – 510,723 Amounts payable on redemptions 6,083 3,442,973 – 445,337 Unrealised depreciation on futures contracts 2(c), 11 – – – – Unrealised depreciation on forward foreign exchange contracts 2(c), 10 – 2,600,416 – 10,056 Management fees payable 3 393 341,189 5,138 52,879 Tax and expenses payable 420,222 792,460 71,689 348,253 Other liabilities – – – –
Total liabilities 28,958,419 7,177,038 76,827 1,367,248
Total net asset value 1,119,958,884 2,727,928,502 131,813,097 619,208,749
* Cash equivalents consist of time deposits and unrealised gains or losses on spot contracts.
Combined Statement of Net Assets

10 The accompanying notes form an integral part of these financial statements.
EASTSPRING INVESTMENTS
Combined Statement of Net AssetsAs at December 31, 2015 (continued)
AsianEquity
IncomeFund
Asian HighYield Bond
Fund
AsianInfrastructure
EquityFund
AsianLocalBondFund
Notes USD USD USD USD
AssetsInvestment in securities at cost 399,665,442 137,972,790 26,161,870 2,138,817,939Unrealised appreciation/(depreciation) (72,737,407) (7,002,680) (1,892,218) (137,094,411)
Investments in securities at market value 2(a) 326,928,035 130,970,110 24,269,652 2,001,723,528Cash at bank 4,448,139 2,603,817 514,772 9,624,729 Cash equivalents* 712 10,316,933 – 63,546,323Amounts receivable on sale of investments 462,017 – 7,637 5,193,305 Amounts receivable on subscriptions 449,339 285,003 105,332 1,690,946 Interest and dividends receivable, net 835,428 2,538,453 70,287 23,944,461 Unrealised appreciation on futures contracts 2(c), 11 – – – 295,422 Unrealised appreciation on forward foreign exchange contracts 2(c), 10 – – – – Unrealised appreciation on credit default swaps 2(d), 12 – – – – Other assets 3,556 – 5 –
Total assets 333,127,226 146,714,316 24,967,685 2,106,018,714
LiabilitiesCash owed to bank – – – – Amounts payable on purchase of investments 163,673 – – – Amounts payable on redemptions 828,276 88,784 45,310 77,893 Unrealised depreciation on futures contracts 2(c), 11 – – – – Unrealised depreciation on forward foreign exchange contracts 2(c), 10 2,205,464 72,579 – 81,809 Management fees payable 3 176,040 81,978 25,040 28,291 Tax and expenses payable 231,599 91,170 30,761 616,303 Other liabilities – – – –
Total liabilities 3,605,052 334,511 101,111 804,296
Total net asset value 329,522,174 146,379,805 24,866,574 2,105,214,418
* Cash equivalents consist of time deposits and unrealised gains or losses on spot contracts.
The accompanying notes form an integral part of these financial statements. 11
EASTSPRING INVESTMENTS
Combined Statement of Net AssetsAs at December 31, 2015 (continued)
AsianProperty
SecuritiesFund
ChinaEquity
Fund
DevelopedAsia
EquityFund
DragonPeacock
FundNotes USD USD USD USD
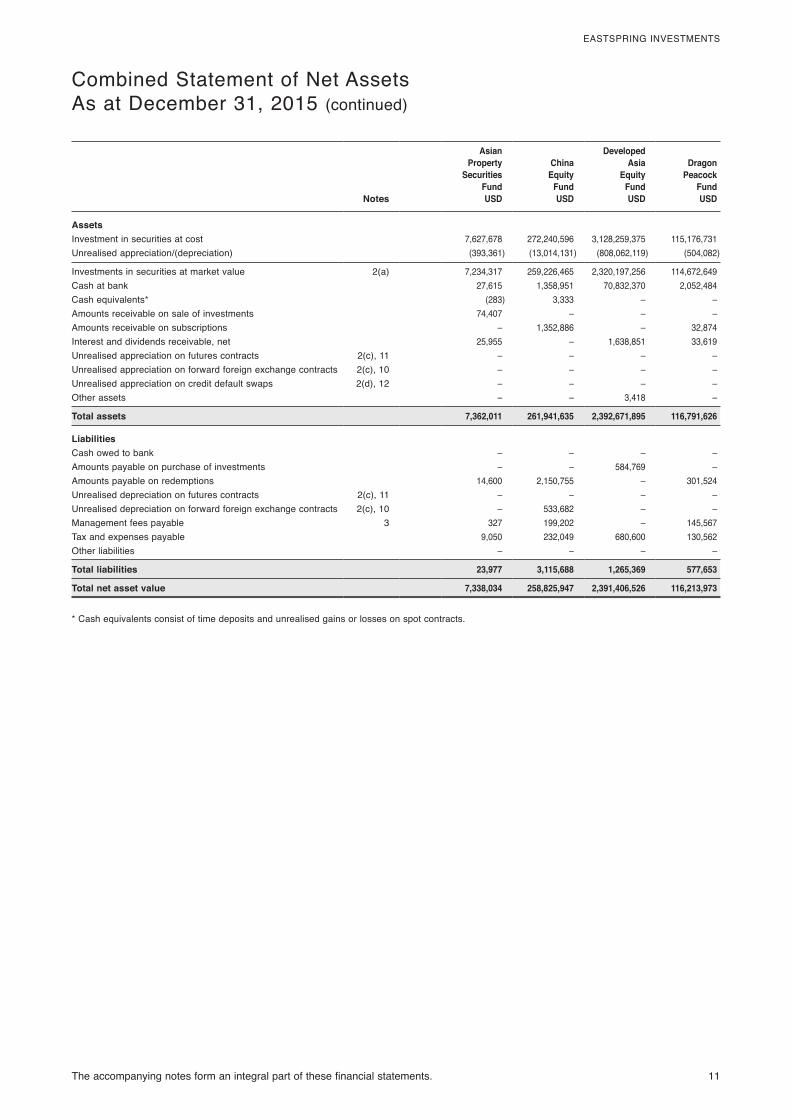
AssetsInvestment in securities at cost 7,627,678 272,240,596 3,128,259,375 115,176,731 Unrealised appreciation/(depreciation) (393,361) (13,014,131) (808,062,119) (504,082)
Investments in securities at market value 2(a) 7,234,317 259,226,465 2,320,197,256 114,672,649 Cash at bank 27,615 1,358,951 70,832,370 2,052,484 Cash equivalents* (283) 3,333 – – Amounts receivable on sale of investments 74,407 – – – Amounts receivable on subscriptions – 1,352,886 – 32,874 Interest and dividends receivable, net 25,955 – 1,638,851 33,619 Unrealised appreciation on futures contracts 2(c), 11 – – – – Unrealised appreciation on forward foreign exchange contracts 2(c), 10 – – – – Unrealised appreciation on credit default swaps 2(d), 12 – – – – Other assets – – 3,418 –
Total assets 7,362,011 261,941,635 2,392,671,895 116,791,626
LiabilitiesCash owed to bank – – – – Amounts payable on purchase of investments – – 584,769 – Amounts payable on redemptions 14,600 2,150,755 – 301,524 Unrealised depreciation on futures contracts 2(c), 11 – – – – Unrealised depreciation on forward foreign exchange contracts 2(c), 10 – 533,682 – – Management fees payable 3 327 199,202 – 145,567 Tax and expenses payable 9,050 232,049 680,600 130,562 Other liabilities – – – –
Total liabilities 23,977 3,115,688 1,265,369 577,653
Total net asset value 7,338,034 258,825,947 2,391,406,526 116,213,973
* Cash equivalents consist of time deposits and unrealised gains or losses on spot contracts.
12 The accompanying notes form an integral part of these financial statements.
EASTSPRING INVESTMENTS
Combined Statement of Net AssetsAs at December 31, 2015 (continued)
EmergingAsia
EquityFund
EmergingEurope,
Middle Eastand Africa
DynamicFund
EuropeanInvestment
GradeBondFund
GlobalBond
NavigatorFund
Notes USD USD EUR USD
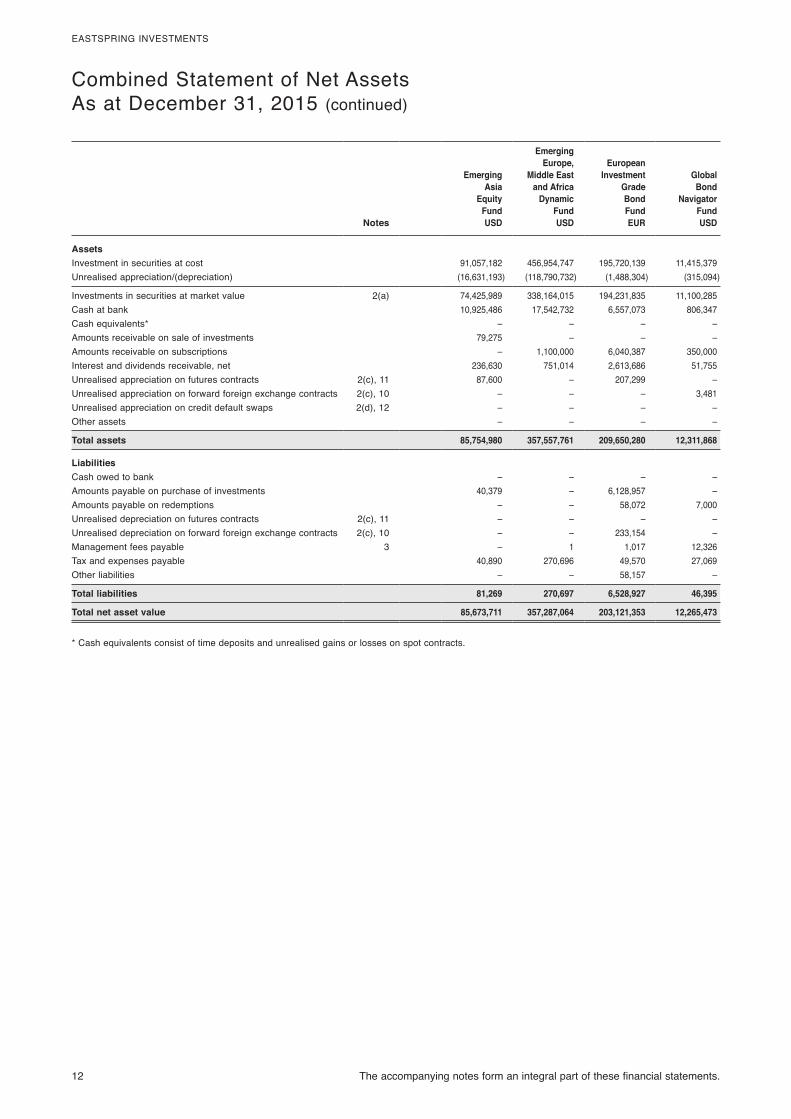
AssetsInvestment in securities at cost 91,057,182 456,954,747 195,720,139 11,415,379 Unrealised appreciation/(depreciation) (16,631,193) (118,790,732) (1,488,304) (315,094)
Investments in securities at market value 2(a) 74,425,989 338,164,015 194,231,835 11,100,285 Cash at bank 10,925,486 17,542,732 6,557,073 806,347 Cash equivalents* – – – – Amounts receivable on sale of investments 79,275 – – – Amounts receivable on subscriptions – 1,100,000 6,040,387 350,000 Interest and dividends receivable, net 236,630 751,014 2,613,686 51,755 Unrealised appreciation on futures contracts 2(c), 11 87,600 – 207,299 – Unrealised appreciation on forward foreign exchange contracts 2(c), 10 – – – 3,481 Unrealised appreciation on credit default swaps 2(d), 12 – – – – Other assets – – – –
Total assets 85,754,980 357,557,761 209,650,280 12,311,868
LiabilitiesCash owed to bank – – – – Amounts payable on purchase of investments 40,379 – 6,128,957 – Amounts payable on redemptions – – 58,072 7,000 Unrealised depreciation on futures contracts 2(c), 11 – – – – Unrealised depreciation on forward foreign exchange contracts 2(c), 10 – – 233,154 – Management fees payable 3 – 1 1,017 12,326 Tax and expenses payable 40,890 270,696 49,570 27,069 Other liabilities – – 58,157 –
Total liabilities 81,269 270,697 6,528,927 46,395
Total net asset value 85,673,711 357,287,064 203,121,353 12,265,473
* Cash equivalents consist of time deposits and unrealised gains or losses on spot contracts.

The accompanying notes form an integral part of these financial statements. 13
EASTSPRING INVESTMENTS
Combined Statement of Net AssetsAs at December 31, 2015 (continued)
GlobalEmerging
MarketsBond Fund
GlobalEmerging
MarketsDynamic
Fund
GlobalEquity
NavigatorFund
GlobalLow
VolatilityEquity
Fund(1)
Notes USD USD USD USD
AssetsInvestment in securities at cost 752,635,025 550,980,272 68,839,872 97,596,834 Unrealised appreciation/(depreciation) (40,823,307) (109,995,346) 1,232,550 3,064,003
Investments in securities at market value 2(a) 711,811,718 440,984,926 70,072,422 100,660,837 Cash at bank 1,573,349 15,082,896 12,272,681 2,484,889 Cash equivalents* 38,039,796 839 – – Amounts receivable on sale of investments – 35,536 – – Amounts receivable on subscriptions 4,004,769 3,241 – – Interest and dividends receivable, net 12,018,621 1,338,683 33,226 255,869 Unrealised appreciation on futures contracts 2(c), 11 – – 197,283 – Unrealised appreciation on forward foreign exchange contracts 2(c), 10 – – – – Unrealised appreciation on credit default swaps 2(d), 12 – – – – Other assets – 1,940 – 490
Total assets 767,448,253 457,448,061 82,575,612 103,402,085
LiabilitiesCash owed to bank – – – – Amounts payable on purchase of investments – 1,482,708 – – Amounts payable on redemptions 141,402 2,246 – – Unrealised depreciation on futures contracts 2(c), 11 – – – – Unrealised depreciation on forward foreign exchange contracts 2(c), 10 2,151,923 – – – Management fees payable 3 48,509 – 8 – Tax and expenses payable 216,533 205,029 28,134 13,500 Other liabilities – – – –
Total liabilities 2,558,367 1,689,983 28,142 13,500
Total net asset value 764,889,886 455,758,078 82,547,470 103,388,585
* Cash equivalents consist of time deposits and unrealised gains or losses on spot contracts.(1) New Sub-Fund launched, see Note 1.
14 The accompanying notes form an integral part of these financial statements.
EASTSPRING INVESTMENTS
Combined Statement of Net AssetsAs at December 31, 2015 (continued)
GlobalMarket
NavigatorFund
GlobalTechnology
Fund
GreaterChina
EquityFund
Hong KongEquity
FundNotes USD USD USD USD
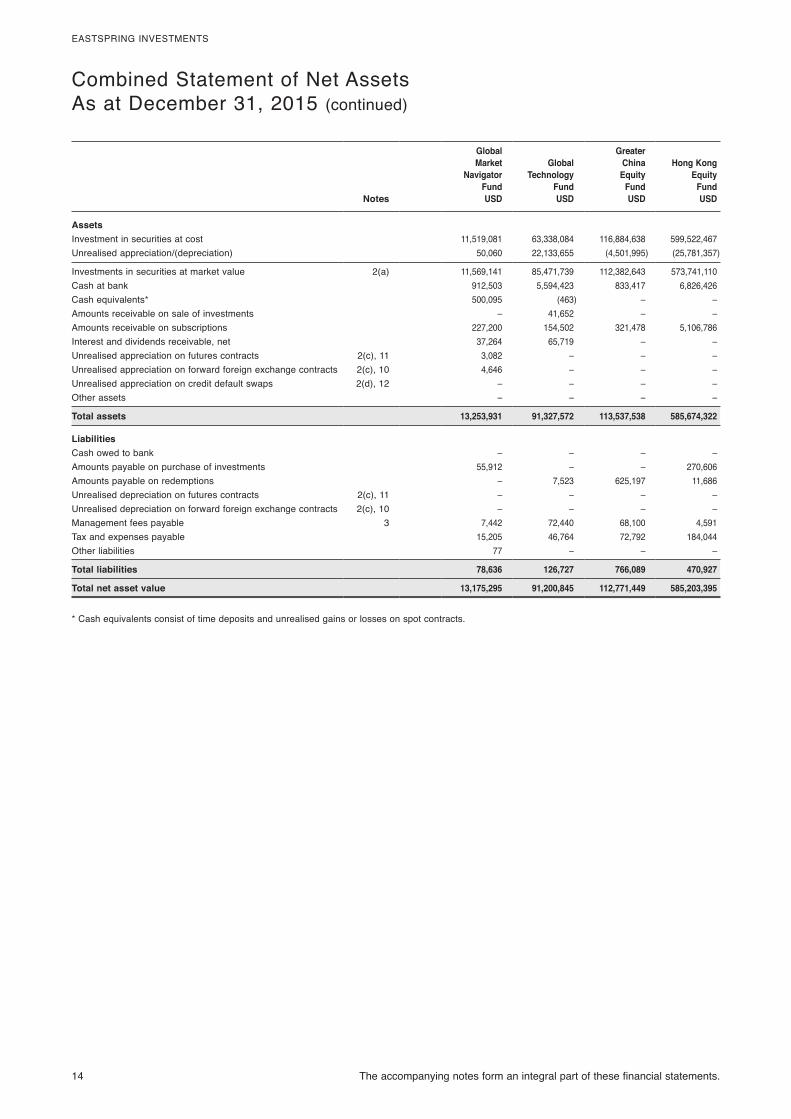
AssetsInvestment in securities at cost 11,519,081 63,338,084 116,884,638 599,522,467 Unrealised appreciation/(depreciation) 50,060 22,133,655 (4,501,995) (25,781,357)
Investments in securities at market value 2(a) 11,569,141 85,471,739 112,382,643 573,741,110 Cash at bank 912,503 5,594,423 833,417 6,826,426 Cash equivalents* 500,095 (463) – – Amounts receivable on sale of investments – 41,652 – – Amounts receivable on subscriptions 227,200 154,502 321,478 5,106,786 Interest and dividends receivable, net 37,264 65,719 – – Unrealised appreciation on futures contracts 2(c), 11 3,082 – – – Unrealised appreciation on forward foreign exchange contracts 2(c), 10 4,646 – – – Unrealised appreciation on credit default swaps 2(d), 12 – – – – Other assets – – – –
Total assets 13,253,931 91,327,572 113,537,538 585,674,322
LiabilitiesCash owed to bank – – – – Amounts payable on purchase of investments 55,912 – – 270,606 Amounts payable on redemptions – 7,523 625,197 11,686 Unrealised depreciation on futures contracts 2(c), 11 – – – – Unrealised depreciation on forward foreign exchange contracts 2(c), 10 – – – – Management fees payable 3 7,442 72,440 68,100 4,591 Tax and expenses payable 15,205 46,764 72,792 184,044 Other liabilities 77 – – –
Total liabilities 78,636 126,727 766,089 470,927
Total net asset value 13,175,295 91,200,845 112,771,449 585,203,395
* Cash equivalents consist of time deposits and unrealised gains or losses on spot contracts.
The accompanying notes form an integral part of these financial statements. 15
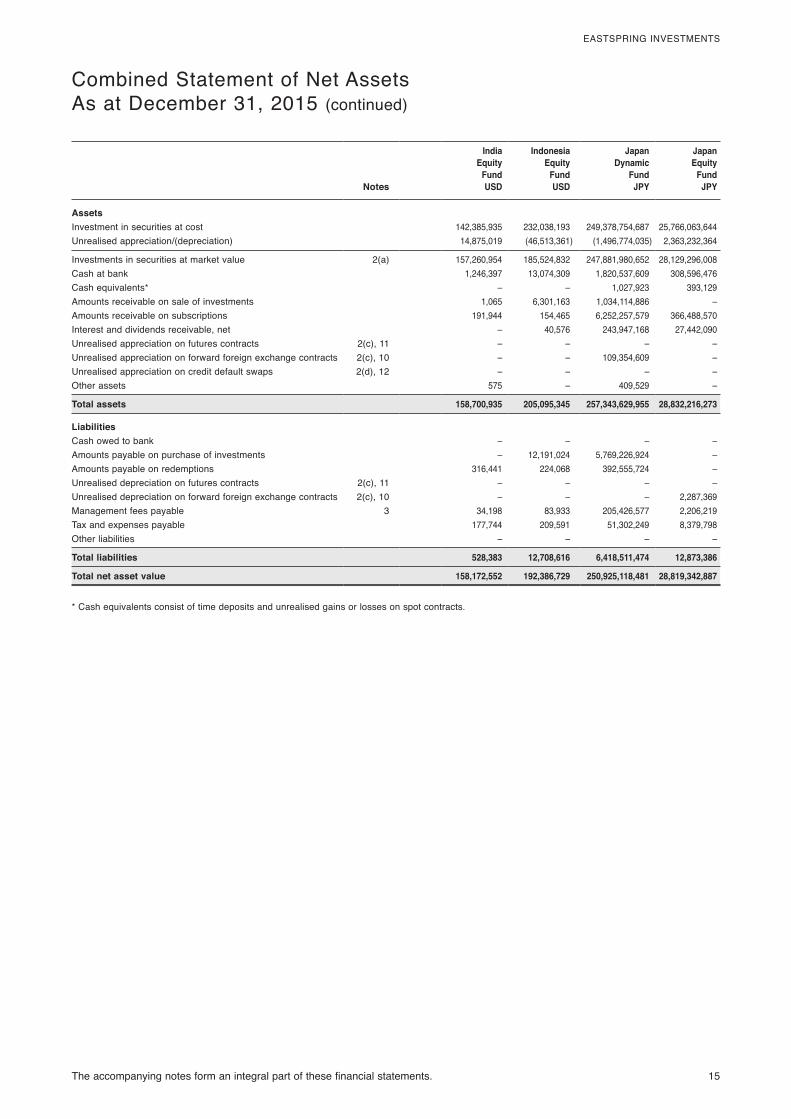
EASTSPRING INVESTMENTS
Combined Statement of Net AssetsAs at December 31, 2015 (continued)
IndiaEquity
Fund
IndonesiaEquity
Fund
JapanDynamic
Fund
JapanEquity
FundNotes USD USD JPY JPY
AssetsInvestment in securities at cost 142,385,935 232,038,193 249,378,754,687 25,766,063,644 Unrealised appreciation/(depreciation) 14,875,019 (46,513,361) (1,496,774,035) 2,363,232,364
Investments in securities at market value 2(a) 157,260,954 185,524,832 247,881,980,652 28,129,296,008 Cash at bank 1,246,397 13,074,309 1,820,537,609 308,596,476 Cash equivalents* – – 1,027,923 393,129 Amounts receivable on sale of investments 1,065 6,301,163 1,034,114,886 – Amounts receivable on subscriptions 191,944 154,465 6,252,257,579 366,488,570 Interest and dividends receivable, net – 40,576 243,947,168 27,442,090 Unrealised appreciation on futures contracts 2(c), 11 – – – – Unrealised appreciation on forward foreign exchange contracts 2(c), 10 – – 109,354,609 – Unrealised appreciation on credit default swaps 2(d), 12 – – – – Other assets 575 – 409,529 –
Total assets 158,700,935 205,095,345 257,343,629,955 28,832,216,273
LiabilitiesCash owed to bank – – – – Amounts payable on purchase of investments – 12,191,024 5,769,226,924 – Amounts payable on redemptions 316,441 224,068 392,555,724 – Unrealised depreciation on futures contracts 2(c), 11 – – – – Unrealised depreciation on forward foreign exchange contracts 2(c), 10 – – – 2,287,369 Management fees payable 3 34,198 83,933 205,426,577 2,206,219 Tax and expenses payable 177,744 209,591 51,302,249 8,379,798 Other liabilities – – – –
Total liabilities 528,383 12,708,616 6,418,511,474 12,873,386
Total net asset value 158,172,552 192,386,729 250,925,118,481 28,819,342,887
* Cash equivalents consist of time deposits and unrealised gains or losses on spot contracts.
16 The accompanying notes form an integral part of these financial statements.
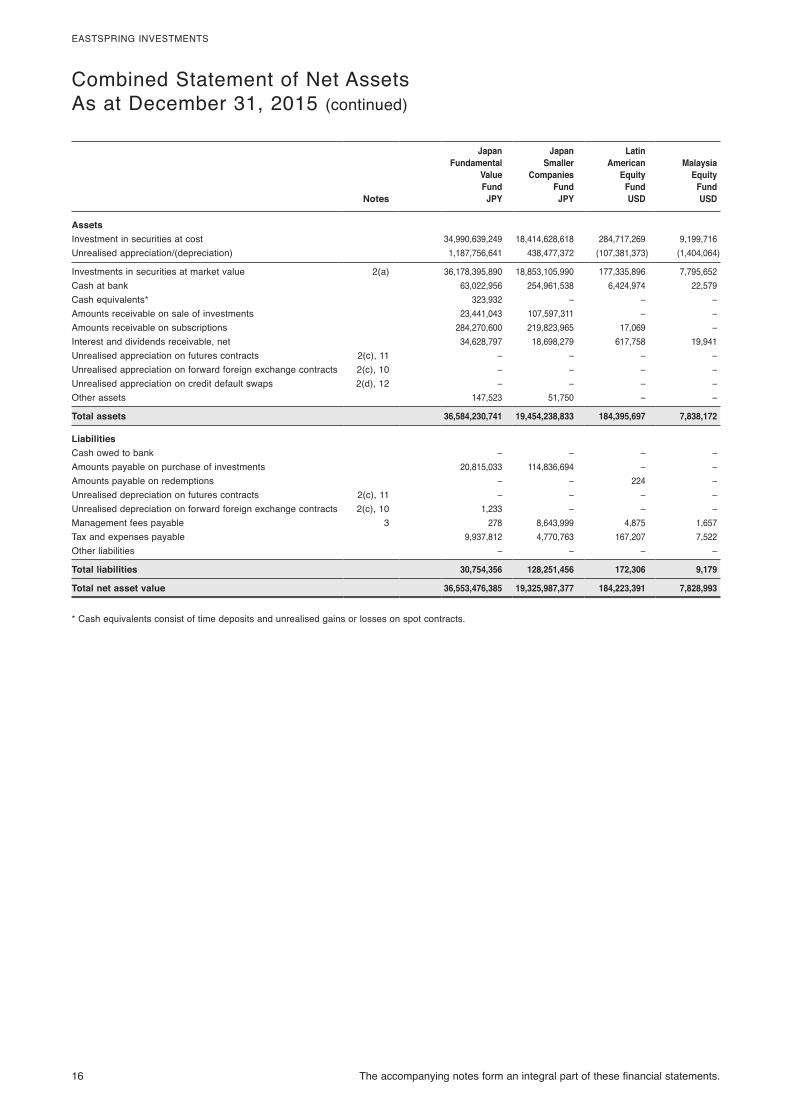
EASTSPRING INVESTMENTS
Combined Statement of Net AssetsAs at December 31, 2015 (continued)
JapanFundamental
ValueFund
JapanSmaller
CompaniesFund
LatinAmerican
EquityFund
MalaysiaEquity
FundNotes JPY JPY USD USD
AssetsInvestment in securities at cost 34,990,639,249 18,414,628,618 284,717,269 9,199,716 Unrealised appreciation/(depreciation) 1,187,756,641 438,477,372 (107,381,373) (1,404,064)
Investments in securities at market value 2(a) 36,178,395,890 18,853,105,990 177,335,896 7,795,652 Cash at bank 63,022,956 254,961,538 6,424,974 22,579 Cash equivalents* 323,932 – – – Amounts receivable on sale of investments 23,441,043 107,597,311 – – Amounts receivable on subscriptions 284,270,600 219,823,965 17,069 – Interest and dividends receivable, net 34,628,797 18,698,279 617,758 19,941 Unrealised appreciation on futures contracts 2(c), 11 – – – – Unrealised appreciation on forward foreign exchange contracts 2(c), 10 – – – – Unrealised appreciation on credit default swaps 2(d), 12 – – – – Other assets 147,523 51,750 – –
Total assets 36,584,230,741 19,454,238,833 184,395,697 7,838,172
LiabilitiesCash owed to bank – – – – Amounts payable on purchase of investments 20,815,033 114,836,694 – – Amounts payable on redemptions – – 224 – Unrealised depreciation on futures contracts 2(c), 11 – – – – Unrealised depreciation on forward foreign exchange contracts 2(c), 10 1,233 – – – Management fees payable 3 278 8,643,999 4,875 1,657 Tax and expenses payable 9,937,812 4,770,763 167,207 7,522 Other liabilities – – – –
Total liabilities 30,754,356 128,251,456 172,306 9,179
Total net asset value 36,553,476,385 19,325,987,377 184,223,391 7,828,993
* Cash equivalents consist of time deposits and unrealised gains or losses on spot contracts.
The accompanying notes form an integral part of these financial statements. 17
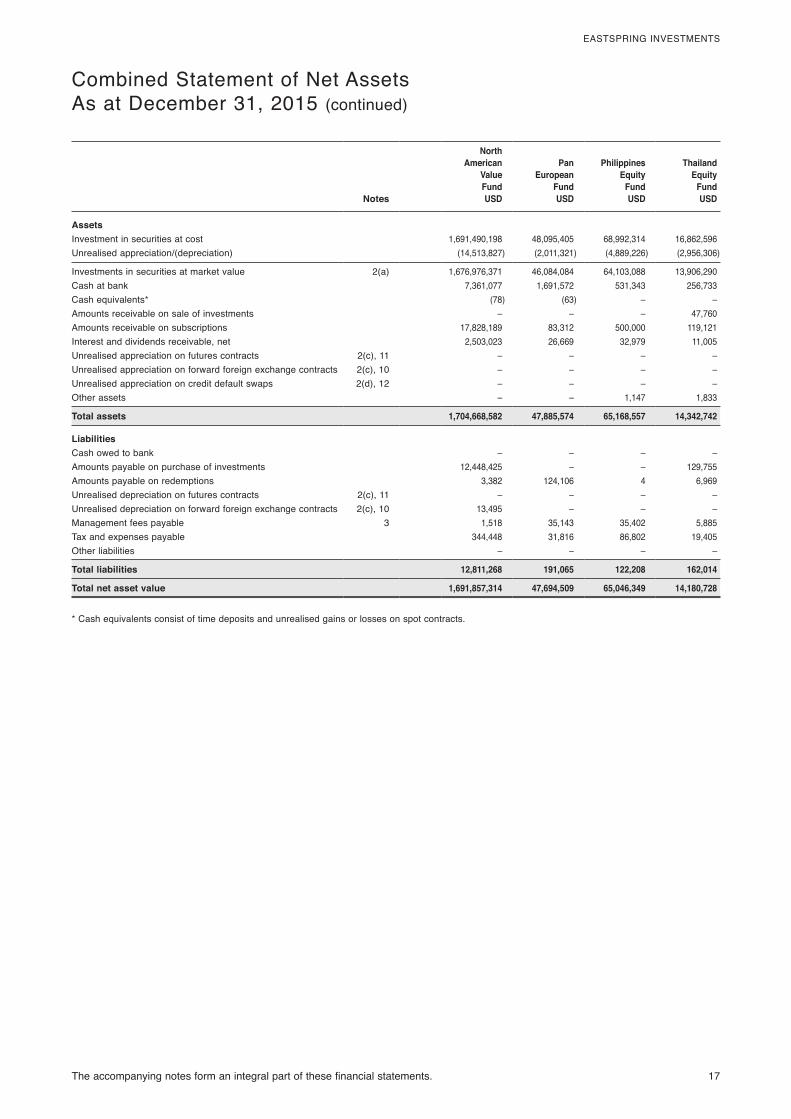
EASTSPRING INVESTMENTS
Combined Statement of Net AssetsAs at December 31, 2015 (continued)
NorthAmerican
ValueFund
PanEuropean
Fund
PhilippinesEquity
Fund
ThailandEquity
FundNotes USD USD USD USD
AssetsInvestment in securities at cost 1,691,490,198 48,095,405 68,992,314 16,862,596 Unrealised appreciation/(depreciation) (14,513,827) (2,011,321) (4,889,226) (2,956,306)
Investments in securities at market value 2(a) 1,676,976,371 46,084,084 64,103,088 13,906,290 Cash at bank 7,361,077 1,691,572 531,343 256,733 Cash equivalents* (78) (63) – – Amounts receivable on sale of investments – – – 47,760 Amounts receivable on subscriptions 17,828,189 83,312 500,000 119,121 Interest and dividends receivable, net 2,503,023 26,669 32,979 11,005 Unrealised appreciation on futures contracts 2(c), 11 – – – – Unrealised appreciation on forward foreign exchange contracts 2(c), 10 – – – – Unrealised appreciation on credit default swaps 2(d), 12 – – – – Other assets – – 1,147 1,833
Total assets 1,704,668,582 47,885,574 65,168,557 14,342,742
LiabilitiesCash owed to bank – – – – Amounts payable on purchase of investments 12,448,425 – – 129,755 Amounts payable on redemptions 3,382 124,106 4 6,969 Unrealised depreciation on futures contracts 2(c), 11 – – – – Unrealised depreciation on forward foreign exchange contracts 2(c), 10 13,495 – – – Management fees payable 3 1,518 35,143 35,402 5,885 Tax and expenses payable 344,448 31,816 86,802 19,405 Other liabilities – – – –
Total liabilities 12,811,268 191,065 122,208 162,014
Total net asset value 1,691,857,314 47,694,509 65,046,349 14,180,728
* Cash equivalents consist of time deposits and unrealised gains or losses on spot contracts.

18 The accompanying notes form an integral part of these financial statements.
EASTSPRING INVESTMENTS
Combined Statement of Net AssetsAs at December 31, 2015 (continued)
US BondFund
US CorporateBondFund
US HighInvestment
Grade BondFund
US HighYieldBondFund
US InvestmentGradeBondFund
Notes USD USD USD USD USD
AssetsInvestment in securities at cost 52,657,474 4,355,538,992 247,405,142 2,138,367,417 338,665,868 Unrealised appreciation/(depreciation) 441,036 (58,347,126) 623,456 (348,610,266) 420,524
Investments in securities at market value 2(a) 53,098,510 4,297,191,866 248,028,598 1,789,757,151 339,086,392 Cash at bank – 1,284 68,829 1,354,922 713,393 Cash equivalents* 57 (597) 220 (11,706) 6 Amounts receivable on sale of investments – – 496,360 – – Amounts receivable on subscriptions 120,881 15,477,499 334,468 1,040,905 1,754,608 Interest and dividends receivable, net 291,437 33,876,401 1,906,304 34,906,295 3,556,302 Unrealised appreciation on futures contracts 2(c), 11 – 153,938 19,281 – 34,906 Unrealised appreciation on forward foreign exchange contracts 2(c), 10 70,618 – – – 16,052 Unrealised appreciation on credit default swaps 2(d), 12 – – – – – Other assets – – – – –
Total assets 53,581,503 4,346,700,391 250,854,060 1,827,047,567 345,161,659
LiabilitiesCash owed to bank 30,752 365,769 – – – Amounts payable on purchase of investments 1,887,916 – 2,668,361 – – Amounts payable on redemptions 33,534 10,335,185 319,125 5,553,527 448,868 Unrealised depreciation on futures contracts 2(c), 11 – – – – – Unrealised depreciation on forward foreign exchange contracts 2(c), 10 – 6,335,661 – 61,325,341 – Management fees payable 3 14,848 195,213 28,176 1,168,228 211,037 Tax and expenses payable 41,775 1,110,924 81,400 860,822 189,189 Other liabilities 3,406 – 23,922 – –
Total liabilities 2,012,231 18,342,752 3,120,984 68,907,918 849,094
Total net asset value 51,569,272 4,328,357,639 247,733,076 1,758,139,649 344,312,565
* Cash equivalents consist of time deposits and unrealised gains or losses on spot contracts.

The accompanying notes form an integral part of these financial statements. 19
EASTSPRING INVESTMENTS
Combined Statement of Net AssetsAs at December 31, 2015 (continued)
US StrategicIncome
BondFund(1)
US TotalReturn
BondFund(1)
VietnamEquity
Fund
WorldValue
EquityFund Combined(2)
Notes USD USD USD USD USD
AssetsInvestment in securities at cost 45,420,360 48,124,256 2,249,279 315,484,202 26,779,750,906Unrealised appreciation/(depreciation) (2,664,967) (1,189,496) 314,755 3,096,632 (2,267,321,852)
Investments in securities at market value 2(a) 42,755,393 46,934,760 2,564,034 318,580,834 24,512,429,054Cash at bank 7,053,699 8,868,830 9,863 11,909,051 321,584,616 Cash equivalents* – – – (735) 261,852,070Amounts receivable on sale of investments – 1,705,131 – 279,101 27,122,938 Amounts receivable on subscriptions – – – 459,556 135,986,211 Interest and dividends receivable, net 494,056 370,227 20,408 330,911 161,945,523 Unrealised appreciation on futures contracts 2(c), 11 – 15,542 – 245,105 1,277,751 Unrealised appreciation on forward foreign exchange contracts 2(c), 10 – – – – 1,003,862 Unrealised appreciation on credit default swaps 2(d), 12 – – – – 170,831 Other assets – – 7,410 – 25,436
Total assets 50,303,148 57,894,490 2,601,715 331,803,823 25,423,398,292
LiabilitiesCash owed to bank – – – – 396,521 Amounts payable on purchase of investments 2,543,971 8,435,834 – 283,191 127,986,031 Amounts payable on redemptions – – – 301,084 29,189,618 Unrealised depreciation on futures contracts 2(c), 11 6,617 – – – 6,617 Unrealised depreciation on forward foreign exchange contracts 2(c), 10 – – – 634,391 76,237,571 Management fees payable 3 – – 2,203 230,254 5,121,049 Tax and expenses payable 14,629 13,147 17,010 154,430 8,975,589 Other liabilities 3,508 13,279 – – 107,482
Total liabilities 2,568,725 8,462,260 19,213 1,603,350 248,020,478
Total net asset value 47,734,423 49,432,230 2,582,502 330,200,473 25,175,377,814
* Cash equivalents consist of time deposits and unrealised gains or losses on spot contracts.(1) New Sub-Fund launched, see Note 1.(2) See Note 2(e).
20 The accompanying notes form an integral part of these financial statements.
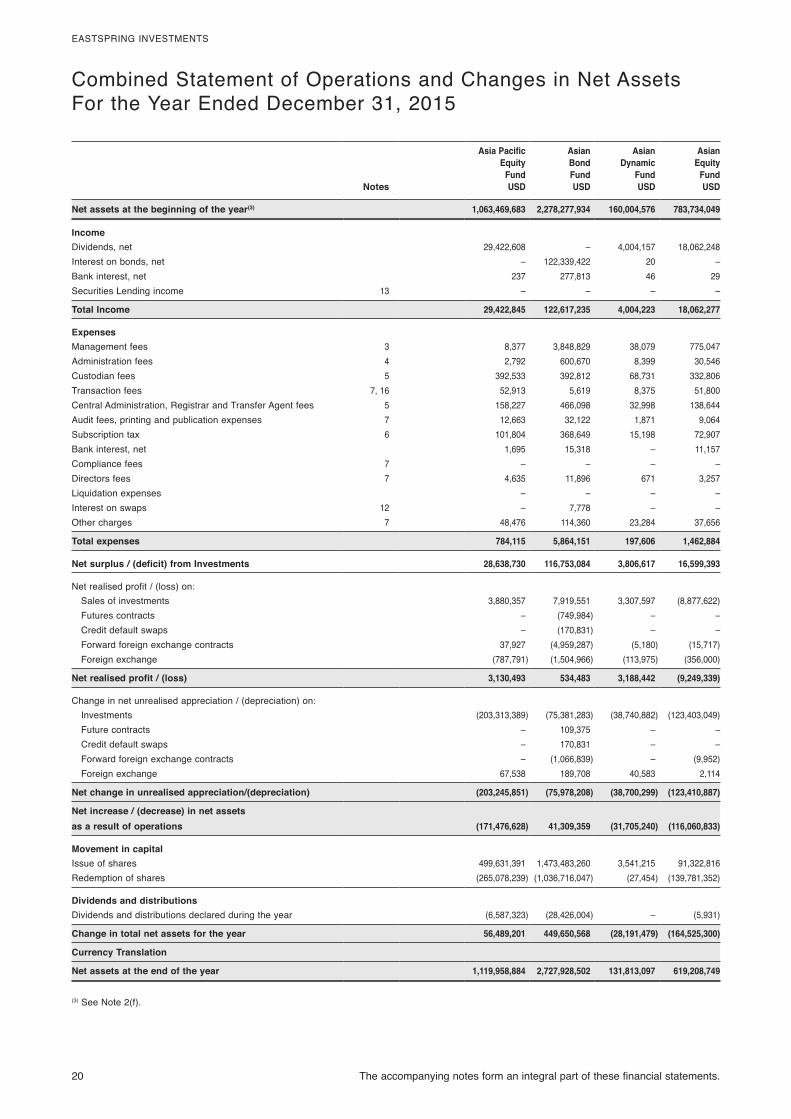
EASTSPRING INVESTMENTS
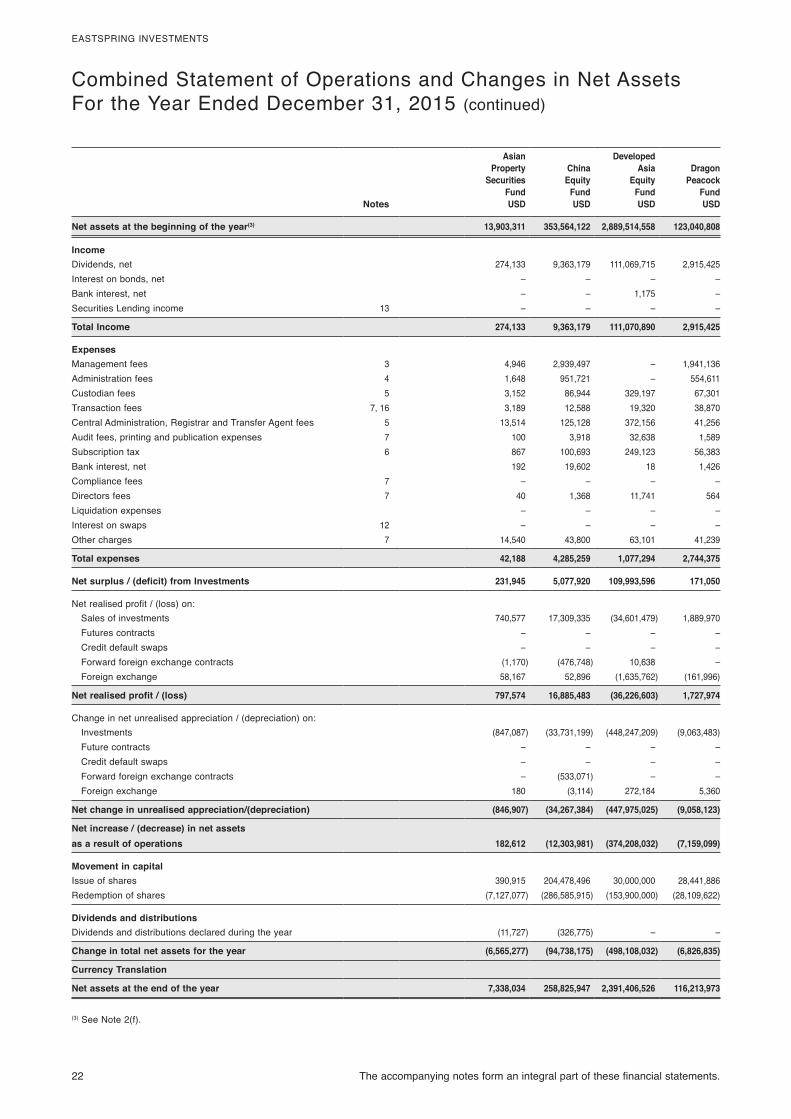
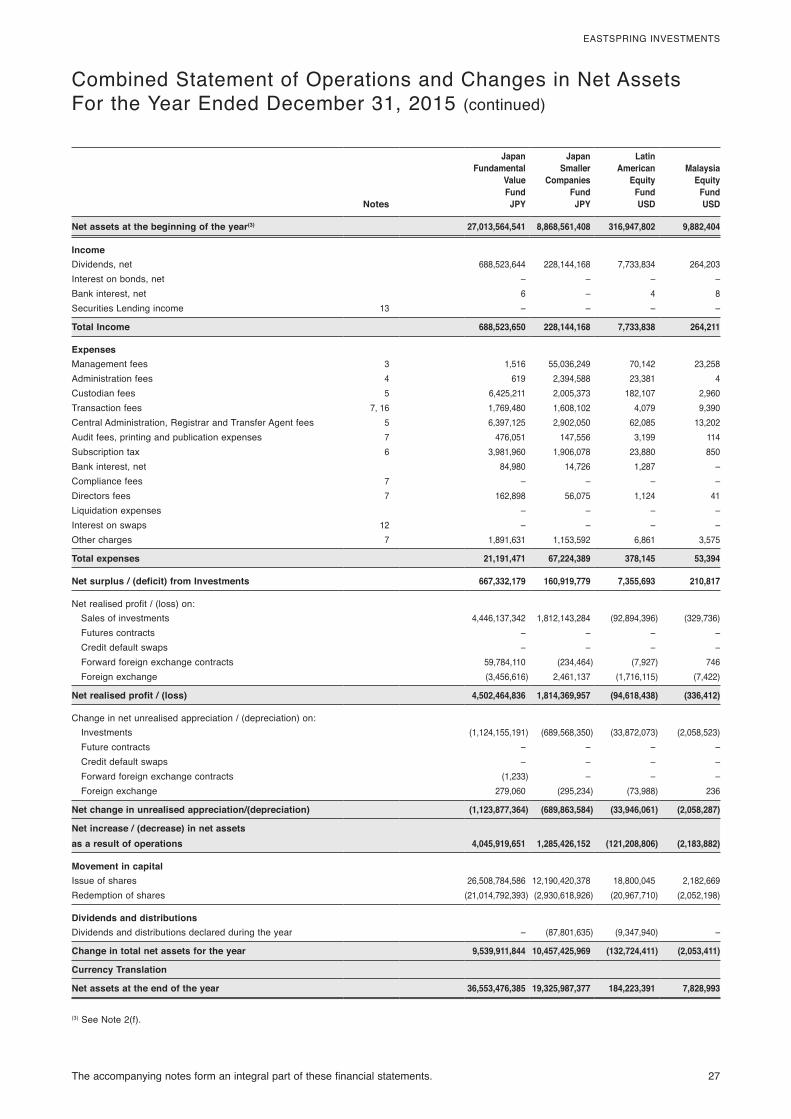
Combined Statement of Operations and Changes in Net AssetsFor the Year Ended December 31, 2015 (continued)
Asia PacificEquity
Fund
AsianBondFund
AsianDynamic
Fund
AsianEquity
FundNotes USD USD USD USD
Net assets at the beginning of the year(3) 1,063,469,683 2,278,277,934 160,004,576 783,734,049
IncomeDividends, net 29,422,608 – 4,004,157 18,062,248 Interest on bonds, net – 122,339,422 20 – Bank interest, net 237 277,813 46 29 Securities Lending income 13 – – – –
Total Income 29,422,845 122,617,235 4,004,223 18,062,277
ExpensesManagement fees 3 8,377 3,848,829 38,079 775,047 Administration fees 4 2,792 600,670 8,399 30,546 Custodian fees 5 392,533 392,812 68,731 332,806 Transaction fees 7, 16 52,913 5,619 8,375 51,800 Central Administration, Registrar and Transfer Agent fees 5 158,227 466,098 32,998 138,644 Audit fees, printing and publication expenses 7 12,663 32,122 1,871 9,064 Subscription tax 6 101,804 368,649 15,198 72,907 Bank interest, net 1,695 15,318 – 11,157 Compliance fees 7 – – – – Directors fees 7 4,635 11,896 671 3,257 Liquidation expenses – – – – Interest on swaps 12 – 7,778 – – Other charges 7 48,476 114,360 23,284 37,656
Total expenses 784,115 5,864,151 197,606 1,462,884
Net surplus / (deficit) from Investments 28,638,730 116,753,084 3,806,617 16,599,393
Net realised profit / (loss) on:Sales of investments 3,880,357 7,919,551 3,307,597 (8,877,622)Futures contracts – (749,984) – – Credit default swaps – (170,831) – – Forward foreign exchange contracts 37,927 (4,959,287) (5,180) (15,717)Foreign exchange (787,791) (1,504,966) (113,975) (356,000)
Net realised profit / (loss) 3,130,493 534,483 3,188,442 (9,249,339)
Change in net unrealised appreciation / (depreciation) on:Investments (203,313,389) (75,381,283) (38,740,882) (123,403,049)Future contracts – 109,375 – – Credit default swaps – 170,831 – – Forward foreign exchange contracts – (1,066,839) – (9,952)Foreign exchange 67,538 189,708 40,583 2,114
Net change in unrealised appreciation/(depreciation) (203,245,851) (75,978,208) (38,700,299) (123,410,887)
Net increase / (decrease) in net assets as a result of operations (171,476,628) 41,309,359 (31,705,240) (116,060,833)
Movement in capitalIssue of shares 499,631,391 1,473,483,260 3,541,215 91,322,816 Redemption of shares (265,078,239) (1,036,716,047) (27,454) (139,781,352)
Dividends and distributionsDividends and distributions declared during the year (6,587,323) (28,426,004) – (5,931)
Change in total net assets for the year 56,489,201 449,650,568 (28,191,479) (164,525,300)
Currency Translation
Net assets at the end of the year 1,119,958,884 2,727,928,502 131,813,097 619,208,749
(3) See Note 2(f).
Combined Statement of Operations and Changes in Net Assets

The accompanying notes form an integral part of these financial statements. 21
EASTSPRING INVESTMENTS
Combined Statement of Operations and Changes in Net AssetsFor the Year Ended December 31, 2015 (continued)
AsianEquity
IncomeFund
Asian HighYield Bond
Fund
AsianInfrastructure
EquityFund
AsianLocalBondFund
Notes USD USD USD USD
Net assets at the beginning of the year(3) 553,732,607 154,915,259 28,956,918 938,734,744
IncomeDividends, net 16,880,654 – 708,133 – Interest on bonds, net – 10,265,893 19 61,182,671Bank interest, net 172 9,701 – 93,235 Securities Lending income 13 – – – –
Total Income 16,880,826 10,275,594 708,152 61,275,906
ExpensesManagement fees 3 3,216,194 1,085,668 346,746 517,667 Administration fees 4 – 216,743 87,761 82,731 Custodian fees 5 218,378 26,904 11,451 431,272 Transaction fees 7, 16 80,578 5,755 17,983 14,700 Central Administration, Registrar and Transfer Agent fees 5 143,837 73,174 22,806 269,296 Audit fees, printing and publication expenses 7 5,335 1,853 353 17,404 Subscription tax 6 108,333 48,247 9,221 173,895 Bank interest, net 14,702 949 3,794 836 Compliance fees 7 – – – – Directors fees 7 1,938 684 126 6,665 Liquidation expenses – – – – Interest on swaps 12 – – – – Other charges 7 37,087 16,241 19,159 112,587
Total expenses 3,826,382 1,476,218 519,400 1,627,053
Net surplus / (deficit) from Investments 13,054,444 8,799,376 188,752 59,648,853
Net realised profit / (loss) on:Sales of investments (375,168) (2,848,071) (4,912,774) (13,810,597)Futures contracts – – – (761,691)Credit default swaps – – – – Forward foreign exchange contracts (9,627,956) (7,093,884) 1,048 (9,123,254)Foreign exchange (406,256) (19,158) 7,002 (3,407,141)
Net realised profit / (loss) (10,409,380) (9,961,113) (4,904,724) (27,102,683)
Change in net unrealised appreciation / (depreciation) on:Investments (60,653,303) (1,635,067) 887,169 (92,881,321)Future contracts – – – 299,329 Credit default swaps – – – – Forward foreign exchange contracts 1,414,698 3,040,081 – 1,075,780 Foreign exchange 8,994 (456) 18 382,127
Net change in unrealised appreciation/(depreciation) (59,229,611) 1,404,558 887,187 (91,124,085)
Net increase / (decrease) in net assets as a result of operations (56,584,547) 242,821 (3,828,785) (58,577,915)
Movement in capitalIssue of shares 152,886,570 44,825,013 10,289,929 1,457,053,878 Redemption of shares (305,005,023) (47,361,709) (10,551,488) (194,653,748)
Dividends and distributionsDividends and distributions declared during the year (15,507,433) (6,241,579) – (37,342,541)
Change in total net assets for the year (224,210,433) (8,535,454) (4,090,344) 1,166,479,674
Currency Translation
Net assets at the end of the year 329,522,174 146,379,805 24,866,574 2,105,214,418
(3) See Note 2(f).
22 The accompanying notes form an integral part of these financial statements.
EASTSPRING INVESTMENTS
Combined Statement of Operations and Changes in Net AssetsFor the Year Ended December 31, 2015 (continued)
AsianProperty
SecuritiesFund
ChinaEquity
Fund
DevelopedAsia
EquityFund
DragonPeacock
FundNotes USD USD USD USD
Net assets at the beginning of the year(3) 13,903,311 353,564,122 2,889,514,558 123,040,808
IncomeDividends, net 274,133 9,363,179 111,069,715 2,915,425 Interest on bonds, net – – – – Bank interest, net – – 1,175 – Securities Lending income 13 – – – –
Total Income 274,133 9,363,179 111,070,890 2,915,425
ExpensesManagement fees 3 4,946 2,939,497 – 1,941,136 Administration fees 4 1,648 951,721 – 554,611 Custodian fees 5 3,152 86,944 329,197 67,301 Transaction fees 7, 16 3,189 12,588 19,320 38,870 Central Administration, Registrar and Transfer Agent fees 5 13,514 125,128 372,156 41,256 Audit fees, printing and publication expenses 7 100 3,918 32,638 1,589 Subscription tax 6 867 100,693 249,123 56,383 Bank interest, net 192 19,602 18 1,426 Compliance fees 7 – – – – Directors fees 7 40 1,368 11,741 564 Liquidation expenses – – – – Interest on swaps 12 – – – – Other charges 7 14,540 43,800 63,101 41,239
Total expenses 42,188 4,285,259 1,077,294 2,744,375
Net surplus / (deficit) from Investments 231,945 5,077,920 109,993,596 171,050
Net realised profit / (loss) on:Sales of investments 740,577 17,309,335 (34,601,479) 1,889,970 Futures contracts – – – – Credit default swaps – – – – Forward foreign exchange contracts (1,170) (476,748) 10,638 – Foreign exchange 58,167 52,896 (1,635,762) (161,996)
Net realised profit / (loss) 797,574 16,885,483 (36,226,603) 1,727,974
Change in net unrealised appreciation / (depreciation) on:Investments (847,087) (33,731,199) (448,247,209) (9,063,483)Future contracts – – – – Credit default swaps – – – – Forward foreign exchange contracts – (533,071) – – Foreign exchange 180 (3,114) 272,184 5,360
Net change in unrealised appreciation/(depreciation) (846,907) (34,267,384) (447,975,025) (9,058,123)
Net increase / (decrease) in net assets as a result of operations 182,612 (12,303,981) (374,208,032) (7,159,099)
Movement in capitalIssue of shares 390,915 204,478,496 30,000,000 28,441,886 Redemption of shares (7,127,077) (286,585,915) (153,900,000) (28,109,622)
Dividends and distributionsDividends and distributions declared during the year (11,727) (326,775) – –
Change in total net assets for the year (6,565,277) (94,738,175) (498,108,032) (6,826,835)
Currency Translation
Net assets at the end of the year 7,338,034 258,825,947 2,391,406,526 116,213,973
(3) See Note 2(f).

The accompanying notes form an integral part of these financial statements. 23
EASTSPRING INVESTMENTS
Combined Statement of Operations and Changes in Net AssetsFor the Year Ended December 31, 2015 (continued)
EmergingAsia
EquityFund
EmergingEurope,
Middle Eastand Africa
DynamicFund
EuropeanInvestment
GradeBondFund
GlobalBond
NavigatorFund
Notes USD USD EUR USD
Net assets at the beginning of the year(3) 99,086,095 416,801,170 113,759,431 62,609,036
IncomeDividends, net 2,278,858 11,811,597 – 570,999 Interest on bonds, net – – 3,309,674 1,005,734 Bank interest, net 1 251,765 146 – Securities Lending income 13 – – – –
Total Income 2,278,859 12,063,362 3,309,820 1,576,733
ExpensesManagement fees 3 – 13 36,036 150,905 Administration fees 4 – 3 4,324 60,362 Custodian fees 5 36,851 395,300 26,138 17,898 Transaction fees 7, 16 3,310 7,830 7,878 1,234 Central Administration, Registrar and Transfer Agent fees 5 18,148 104,926 49,298 15,097 Audit fees, printing and publication expenses 7 1,170 4,936 1,675 623 Subscription tax 6 9,135 38,209 16,347 8,465 Bank interest, net – 168 11,013 177 Compliance fees 7 – – 2,685 – Directors fees 7 421 1,731 679 189 Liquidation expenses – – – – Interest on swaps 12 – – – – Other charges 7 39,923 8,190 13,838 1,633
Total expenses 108,958 561,306 169,911 256,583
Net surplus / (deficit) from Investments 2,169,901 11,502,056 3,139,909 1,320,150
Net realised profit / (loss) on:Sales of investments (2,184,230) (39,909,253) 5,577,604 (2,234,359)Futures contracts (1,293,009) – (1,001,881) – Credit default swaps – – – – Forward foreign exchange contracts (3) (436,620) 310,618 (133,724)Foreign exchange (28,750) (769,009) (1,005,288) (11,549)
Net realised profit / (loss) (3,505,992) (41,114,882) 3,881,053 (2,379,632)
Change in net unrealised appreciation / (depreciation) on:Investments (12,218,831) (49,950,745) (8,372,838) (356,775)Future contracts 166,500 – 451,477 – Credit default swaps – – – – Forward foreign exchange contracts – – (233,154) 3,481 Foreign exchange (23,962) 18,294 (14,704) (9,891)
Net change in unrealised appreciation/(depreciation) (12,076,293) (49,932,451) (8,169,219) (363,185)
Net increase / (decrease) in net assets as a result of operations (13,412,384) (79,545,277) (1,148,257) (1,422,667)
Movement in capitalIssue of shares – 80,527,522 124,596,657 7,985,333 Redemption of shares – (60,496,351) (34,032,624) (55,422,905)
Dividends and distributionsDividends and distributions declared during the year – – (53,854) (1,483,324)
Change in total net assets for the year (13,412,384) (59,514,106) 89,361,922 (50,343,563)
Currency Translation
Net assets at the end of the year 85,673,711 357,287,064 203,121,353 12,265,473
(3) See Note 2(f).
24 The accompanying notes form an integral part of these financial statements.
EASTSPRING INVESTMENTS
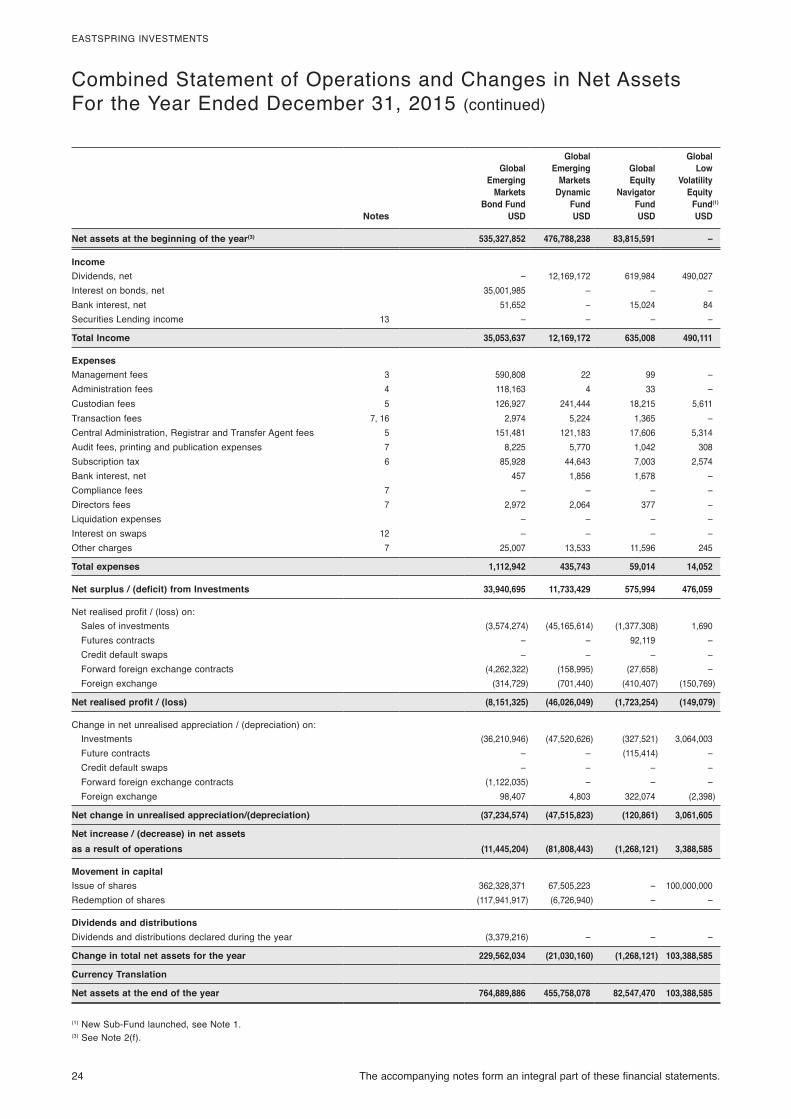
Combined Statement of Operations and Changes in Net AssetsFor the Year Ended December 31, 2015 (continued)
GlobalEmerging
MarketsBond Fund
GlobalEmerging
MarketsDynamic
Fund
GlobalEquity
NavigatorFund
GlobalLow
VolatilityEquity
Fund(1)
Notes USD USD USD USD
Net assets at the beginning of the year(3) 535,327,852 476,788,238 83,815,591 –
IncomeDividends, net – 12,169,172 619,984 490,027 Interest on bonds, net 35,001,985 – – – Bank interest, net 51,652 – 15,024 84 Securities Lending income 13 – – – –
Total Income 35,053,637 12,169,172 635,008 490,111
ExpensesManagement fees 3 590,808 22 99 – Administration fees 4 118,163 4 33 – Custodian fees 5 126,927 241,444 18,215 5,611 Transaction fees 7, 16 2,974 5,224 1,365 – Central Administration, Registrar and Transfer Agent fees 5 151,481 121,183 17,606 5,314 Audit fees, printing and publication expenses 7 8,225 5,770 1,042 308 Subscription tax 6 85,928 44,643 7,003 2,574 Bank interest, net 457 1,856 1,678 – Compliance fees 7 – – – – Directors fees 7 2,972 2,064 377 – Liquidation expenses – – – – Interest on swaps 12 – – – – Other charges 7 25,007 13,533 11,596 245
Total expenses 1,112,942 435,743 59,014 14,052
Net surplus / (deficit) from Investments 33,940,695 11,733,429 575,994 476,059
Net realised profit / (loss) on:Sales of investments (3,574,274) (45,165,614) (1,377,308) 1,690 Futures contracts – – 92,119 – Credit default swaps – – – – Forward foreign exchange contracts (4,262,322) (158,995) (27,658) – Foreign exchange (314,729) (701,440) (410,407) (150,769)
Net realised profit / (loss) (8,151,325) (46,026,049) (1,723,254) (149,079)
Change in net unrealised appreciation / (depreciation) on:Investments (36,210,946) (47,520,626) (327,521) 3,064,003 Future contracts – – (115,414) – Credit default swaps – – – – Forward foreign exchange contracts (1,122,035) – – – Foreign exchange 98,407 4,803 322,074 (2,398)
Net change in unrealised appreciation/(depreciation) (37,234,574) (47,515,823) (120,861) 3,061,605
Net increase / (decrease) in net assets as a result of operations (11,445,204) (81,808,443) (1,268,121) 3,388,585
Movement in capitalIssue of shares 362,328,371 67,505,223 – 100,000,000 Redemption of shares (117,941,917) (6,726,940) – –
Dividends and distributionsDividends and distributions declared during the year (3,379,216) – – –
Change in total net assets for the year 229,562,034 (21,030,160) (1,268,121) 103,388,585
Currency Translation
Net assets at the end of the year 764,889,886 455,758,078 82,547,470 103,388,585
(1) New Sub-Fund launched, see Note 1.(3) See Note 2(f).
The accompanying notes form an integral part of these financial statements. 25
EASTSPRING INVESTMENTS
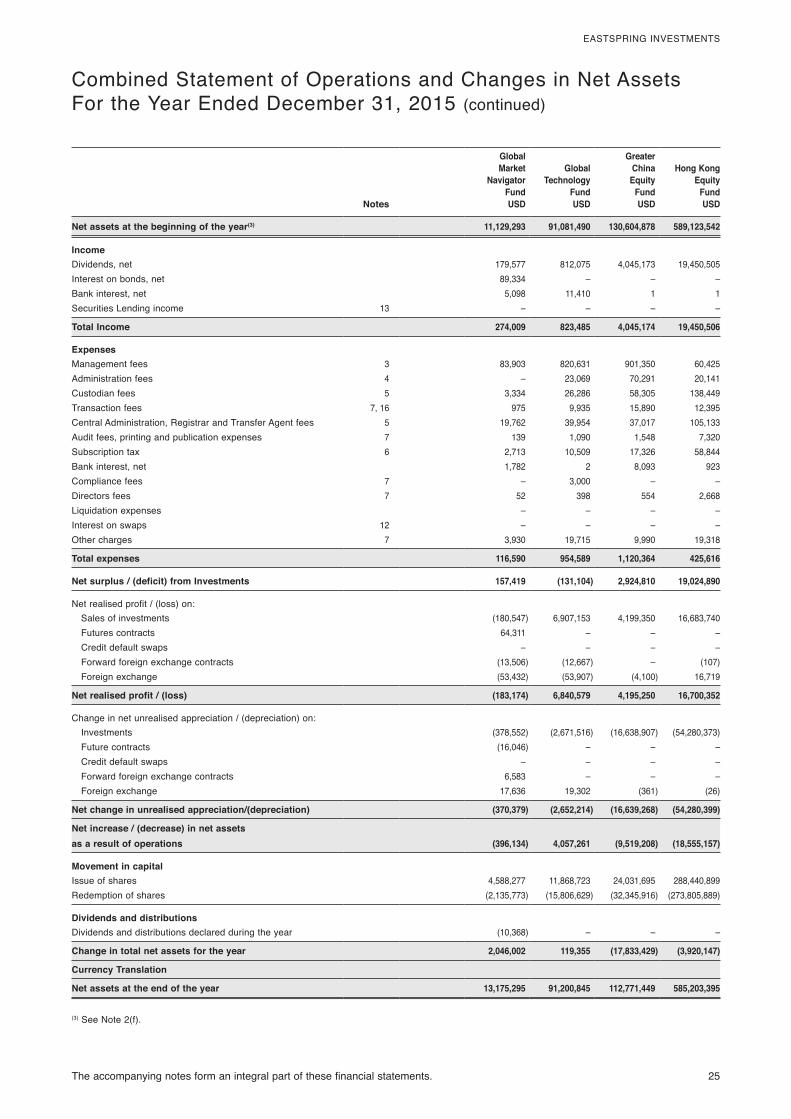
Combined Statement of Operations and Changes in Net AssetsFor the Year Ended December 31, 2015 (continued)
GlobalMarket
NavigatorFund
GlobalTechnology
Fund
GreaterChina
EquityFund
Hong KongEquity
FundNotes USD USD USD USD
Net assets at the beginning of the year(3) 11,129,293 91,081,490 130,604,878 589,123,542
IncomeDividends, net 179,577 812,075 4,045,173 19,450,505 Interest on bonds, net 89,334 – – – Bank interest, net 5,098 11,410 1 1 Securities Lending income 13 – – – –
Total Income 274,009 823,485 4,045,174 19,450,506
ExpensesManagement fees 3 83,903 820,631 901,350 60,425 Administration fees 4 – 23,069 70,291 20,141 Custodian fees 5 3,334 26,286 58,305 138,449 Transaction fees 7, 16 975 9,935 15,890 12,395 Central Administration, Registrar and Transfer Agent fees 5 19,762 39,954 37,017 105,133 Audit fees, printing and publication expenses 7 139 1,090 1,548 7,320 Subscription tax 6 2,713 10,509 17,326 58,844 Bank interest, net 1,782 2 8,093 923 Compliance fees 7 – 3,000 – – Directors fees 7 52 398 554 2,668 Liquidation expenses – – – – Interest on swaps 12 – – – – Other charges 7 3,930 19,715 9,990 19,318
Total expenses 116,590 954,589 1,120,364 425,616
Net surplus / (deficit) from Investments 157,419 (131,104) 2,924,810 19,024,890
Net realised profit / (loss) on:Sales of investments (180,547) 6,907,153 4,199,350 16,683,740 Futures contracts 64,311 – – – Credit default swaps – – – – Forward foreign exchange contracts (13,506) (12,667) – (107)Foreign exchange (53,432) (53,907) (4,100) 16,719
Net realised profit / (loss) (183,174) 6,840,579 4,195,250 16,700,352
Change in net unrealised appreciation / (depreciation) on:Investments (378,552) (2,671,516) (16,638,907) (54,280,373)Future contracts (16,046) – – – Credit default swaps – – – – Forward foreign exchange contracts 6,583 – – – Foreign exchange 17,636 19,302 (361) (26)
Net change in unrealised appreciation/(depreciation) (370,379) (2,652,214) (16,639,268) (54,280,399)
Net increase / (decrease) in net assets as a result of operations (396,134) 4,057,261 (9,519,208) (18,555,157)
Movement in capitalIssue of shares 4,588,277 11,868,723 24,031,695 288,440,899 Redemption of shares (2,135,773) (15,806,629) (32,345,916) (273,805,889)
Dividends and distributionsDividends and distributions declared during the year (10,368) – – –
Change in total net assets for the year 2,046,002 119,355 (17,833,429) (3,920,147)
Currency Translation
Net assets at the end of the year 13,175,295 91,200,845 112,771,449 585,203,395
(3) See Note 2(f).
26 The accompanying notes form an integral part of these financial statements.
EASTSPRING INVESTMENTS
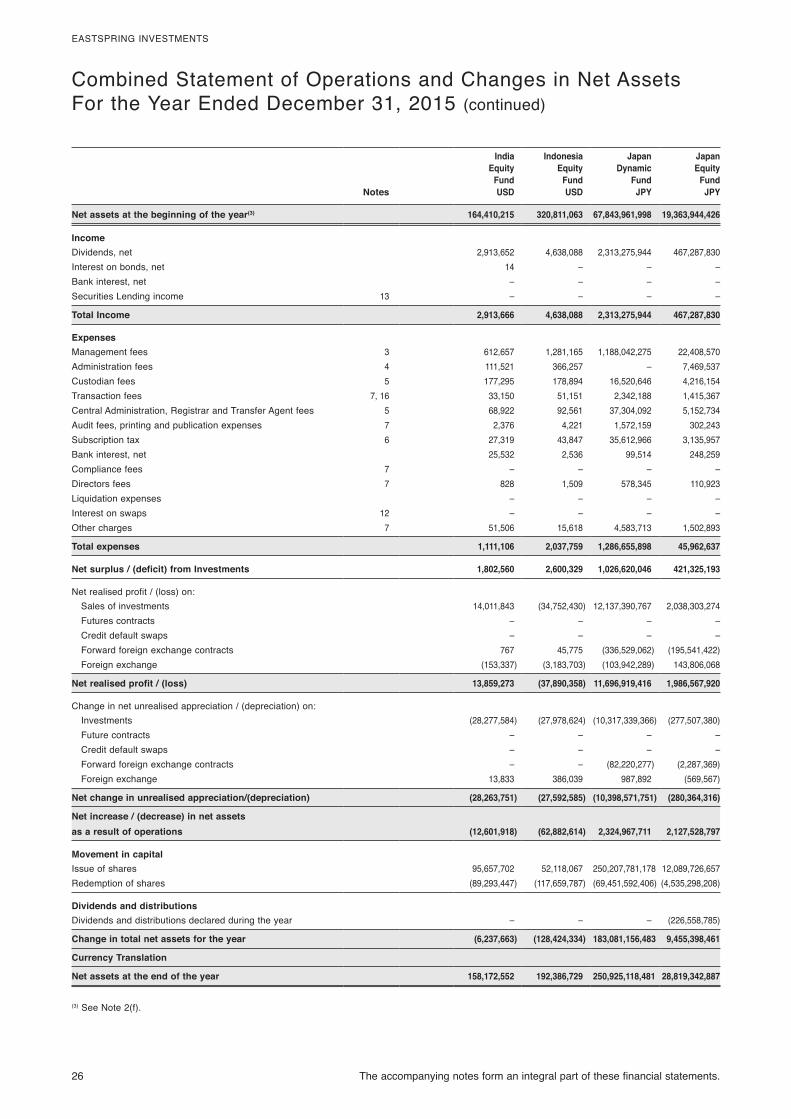
Combined Statement of Operations and Changes in Net AssetsFor the Year Ended December 31, 2015 (continued)
IndiaEquity
Fund
IndonesiaEquity
Fund
JapanDynamic
Fund
JapanEquity
FundNotes USD USD JPY JPY
Net assets at the beginning of the year(3) 164,410,215 320,811,063 67,843,961,998 19,363,944,426
IncomeDividends, net 2,913,652 4,638,088 2,313,275,944 467,287,830 Interest on bonds, net 14 – – – Bank interest, net – – – – Securities Lending income 13 – – – –
Total Income 2,913,666 4,638,088 2,313,275,944 467,287,830
ExpensesManagement fees 3 612,657 1,281,165 1,188,042,275 22,408,570 Administration fees 4 111,521 366,257 – 7,469,537 Custodian fees 5 177,295 178,894 16,520,646 4,216,154 Transaction fees 7, 16 33,150 51,151 2,342,188 1,415,367 Central Administration, Registrar and Transfer Agent fees 5 68,922 92,561 37,304,092 5,152,734 Audit fees, printing and publication expenses 7 2,376 4,221 1,572,159 302,243 Subscription tax 6 27,319 43,847 35,612,966 3,135,957 Bank interest, net 25,532 2,536 99,514 248,259 Compliance fees 7 – – – – Directors fees 7 828 1,509 578,345 110,923 Liquidation expenses – – – – Interest on swaps 12 – – – – Other charges 7 51,506 15,618 4,583,713 1,502,893
Total expenses 1,111,106 2,037,759 1,286,655,898 45,962,637
Net surplus / (deficit) from Investments 1,802,560 2,600,329 1,026,620,046 421,325,193
Net realised profit / (loss) on:Sales of investments 14,011,843 (34,752,430) 12,137,390,767 2,038,303,274 Futures contracts – – – – Credit default swaps – – – – Forward foreign exchange contracts 767 45,775 (336,529,062) (195,541,422)Foreign exchange (153,337) (3,183,703) (103,942,289) 143,806,068
Net realised profit / (loss) 13,859,273 (37,890,358) 11,696,919,416 1,986,567,920
Change in net unrealised appreciation / (depreciation) on:Investments (28,277,584) (27,978,624) (10,317,339,366) (277,507,380)Future contracts – – – – Credit default swaps – – – – Forward foreign exchange contracts – – (82,220,277) (2,287,369)Foreign exchange 13,833 386,039 987,892 (569,567)
Net change in unrealised appreciation/(depreciation) (28,263,751) (27,592,585) (10,398,571,751) (280,364,316)
Net increase / (decrease) in net assets as a result of operations (12,601,918) (62,882,614) 2,324,967,711 2,127,528,797
Movement in capitalIssue of shares 95,657,702 52,118,067 250,207,781,178 12,089,726,657 Redemption of shares (89,293,447) (117,659,787) (69,451,592,406) (4,535,298,208)
Dividends and distributionsDividends and distributions declared during the year – – – (226,558,785)
Change in total net assets for the year (6,237,663) (128,424,334) 183,081,156,483 9,455,398,461
Currency Translation
Net assets at the end of the year 158,172,552 192,386,729 250,925,118,481 28,819,342,887
(3) See Note 2(f).
The accompanying notes form an integral part of these financial statements. 27
EASTSPRING INVESTMENTS
Combined Statement of Operations and Changes in Net AssetsFor the Year Ended December 31, 2015 (continued)
JapanFundamental
ValueFund
JapanSmaller
CompaniesFund
LatinAmerican
EquityFund
MalaysiaEquity
FundNotes JPY JPY USD USD
Net assets at the beginning of the year(3) 27,013,564,541 8,868,561,408 316,947,802 9,882,404
IncomeDividends, net 688,523,644 228,144,168 7,733,834 264,203 Interest on bonds, net – – – – Bank interest, net 6 – 4 8 Securities Lending income 13 – – – –
Total Income 688,523,650 228,144,168 7,733,838 264,211
ExpensesManagement fees 3 1,516 55,036,249 70,142 23,258 Administration fees 4 619 2,394,588 23,381 4 Custodian fees 5 6,425,211 2,005,373 182,107 2,960 Transaction fees 7, 16 1,769,480 1,608,102 4,079 9,390 Central Administration, Registrar and Transfer Agent fees 5 6,397,125 2,902,050 62,085 13,202 Audit fees, printing and publication expenses 7 476,051 147,556 3,199 114 Subscription tax 6 3,981,960 1,906,078 23,880 850 Bank interest, net 84,980 14,726 1,287 – Compliance fees 7 – – – – Directors fees 7 162,898 56,075 1,124 41 Liquidation expenses – – – – Interest on swaps 12 – – – – Other charges 7 1,891,631 1,153,592 6,861 3,575
Total expenses 21,191,471 67,224,389 378,145 53,394
Net surplus / (deficit) from Investments 667,332,179 160,919,779 7,355,693 210,817
Net realised profit / (loss) on:Sales of investments 4,446,137,342 1,812,143,284 (92,894,396) (329,736)Futures contracts – – – – Credit default swaps – – – – Forward foreign exchange contracts 59,784,110 (234,464) (7,927) 746 Foreign exchange (3,456,616) 2,461,137 (1,716,115) (7,422)
Net realised profit / (loss) 4,502,464,836 1,814,369,957 (94,618,438) (336,412)
Change in net unrealised appreciation / (depreciation) on:Investments (1,124,155,191) (689,568,350) (33,872,073) (2,058,523)Future contracts – – – – Credit default swaps – – – – Forward foreign exchange contracts (1,233) – – – Foreign exchange 279,060 (295,234) (73,988) 236
Net change in unrealised appreciation/(depreciation) (1,123,877,364) (689,863,584) (33,946,061) (2,058,287)
Net increase / (decrease) in net assets as a result of operations 4,045,919,651 1,285,426,152 (121,208,806) (2,183,882)
Movement in capitalIssue of shares 26,508,784,586 12,190,420,378 18,800,045 2,182,669 Redemption of shares (21,014,792,393) (2,930,618,926) (20,967,710) (2,052,198)
Dividends and distributionsDividends and distributions declared during the year – (87,801,635) (9,347,940) –
Change in total net assets for the year 9,539,911,844 10,457,425,969 (132,724,411) (2,053,411)
Currency Translation
Net assets at the end of the year 36,553,476,385 19,325,987,377 184,223,391 7,828,993
(3) See Note 2(f).
28 The accompanying notes form an integral part of these financial statements.
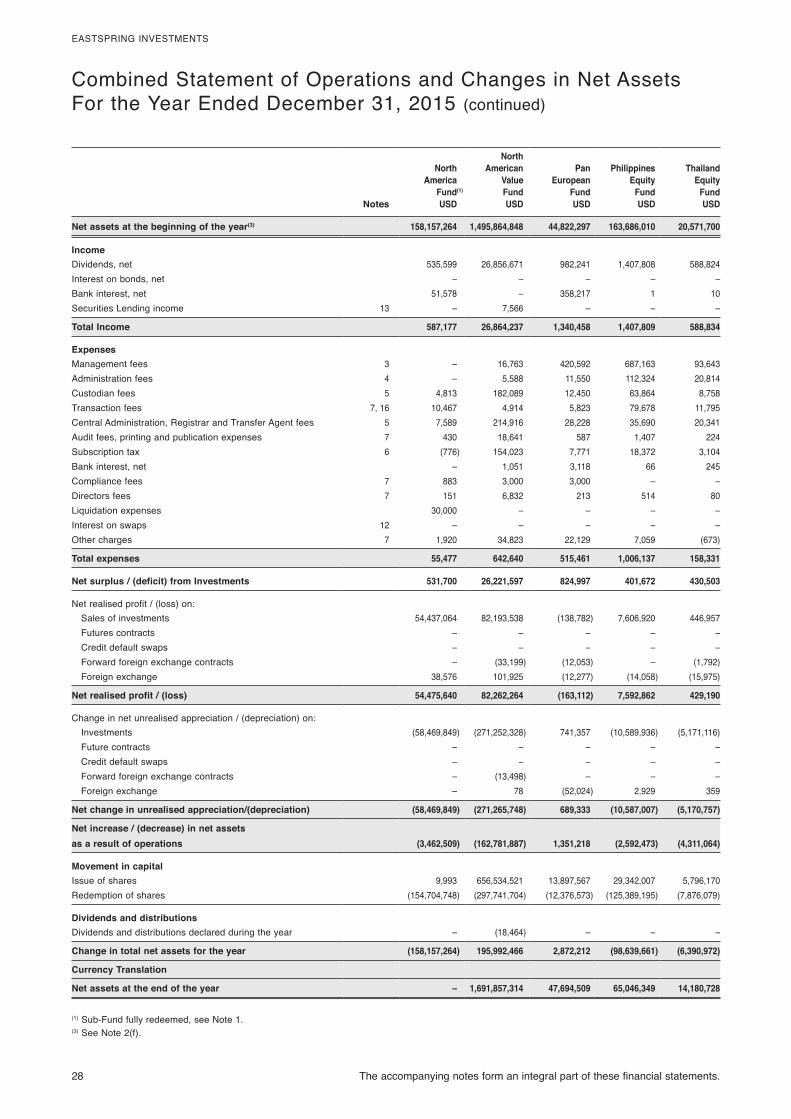
EASTSPRING INVESTMENTS
Combined Statement of Operations and Changes in Net AssetsFor the Year Ended December 31, 2015 (continued)
NorthAmerica
Fund(1)
NorthAmerican
ValueFund
PanEuropean
Fund
PhilippinesEquity
Fund
ThailandEquity
FundNotes USD USD USD USD USD
Net assets at the beginning of the year(3) 158,157,264 1,495,864,848 44,822,297 163,686,010 20,571,700
IncomeDividends, net 535,599 26,856,671 982,241 1,407,808 588,824 Interest on bonds, net – – – – – Bank interest, net 51,578 – 358,217 1 10 Securities Lending income 13 – 7,566 – – –
Total Income 587,177 26,864,237 1,340,458 1,407,809 588,834
ExpensesManagement fees 3 – 16,763 420,592 687,163 93,643 Administration fees 4 – 5,588 11,550 112,324 20,814 Custodian fees 5 4,813 182,089 12,450 63,864 8,758 Transaction fees 7, 16 10,467 4,914 5,823 79,678 11,795 Central Administration, Registrar and Transfer Agent fees 5 7,589 214,916 28,228 35,690 20,341 Audit fees, printing and publication expenses 7 430 18,641 587 1,407 224 Subscription tax 6 (776) 154,023 7,771 18,372 3,104 Bank interest, net – 1,051 3,118 66 245 Compliance fees 7 883 3,000 3,000 – – Directors fees 7 151 6,832 213 514 80 Liquidation expenses 30,000 – – – – Interest on swaps 12 – – – – – Other charges 7 1,920 34,823 22,129 7,059 (673)
Total expenses 55,477 642,640 515,461 1,006,137 158,331
Net surplus / (deficit) from Investments 531,700 26,221,597 824,997 401,672 430,503
Net realised profit / (loss) on:Sales of investments 54,437,064 82,193,538 (138,782) 7,606,920 446,957 Futures contracts – – – – – Credit default swaps – – – – – Forward foreign exchange contracts – (33,199) (12,053) – (1,792)Foreign exchange 38,576 101,925 (12,277) (14,058) (15,975)
Net realised profit / (loss) 54,475,640 82,262,264 (163,112) 7,592,862 429,190
Change in net unrealised appreciation / (depreciation) on:Investments (58,469,849) (271,252,328) 741,357 (10,589,936) (5,171,116)Future contracts – – – – – Credit default swaps – – – – – Forward foreign exchange contracts – (13,498) – – – Foreign exchange – 78 (52,024) 2,929 359
Net change in unrealised appreciation/(depreciation) (58,469,849) (271,265,748) 689,333 (10,587,007) (5,170,757)
Net increase / (decrease) in net assets as a result of operations (3,462,509) (162,781,887) 1,351,218 (2,592,473) (4,311,064)
Movement in capitalIssue of shares 9,993 656,534,521 13,897,567 29,342,007 5,796,170 Redemption of shares (154,704,748) (297,741,704) (12,376,573) (125,389,195) (7,876,079)
Dividends and distributionsDividends and distributions declared during the year – (18,464) – – –
Change in total net assets for the year (158,157,264) 195,992,466 2,872,212 (98,639,661) (6,390,972)
Currency Translation
Net assets at the end of the year – 1,691,857,314 47,694,509 65,046,349 14,180,728
(1) Sub-Fund fully redeemed, see Note 1.(3) See Note 2(f).
The accompanying notes form an integral part of these financial statements. 29
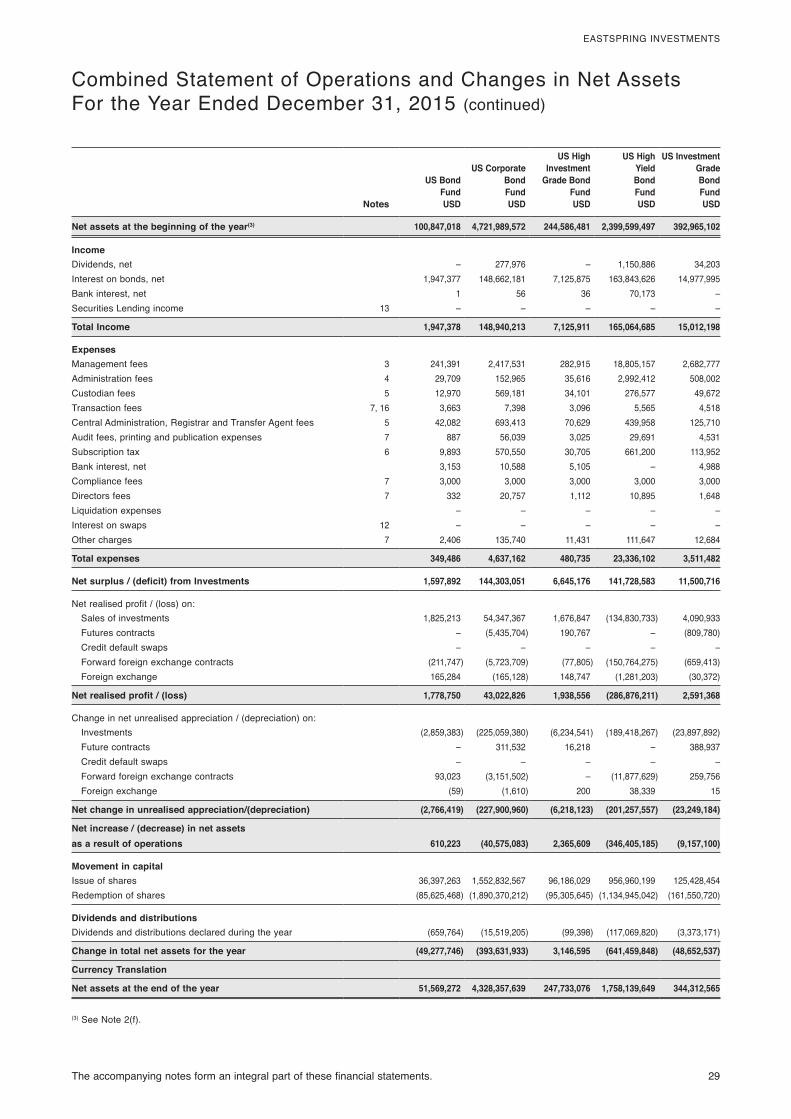
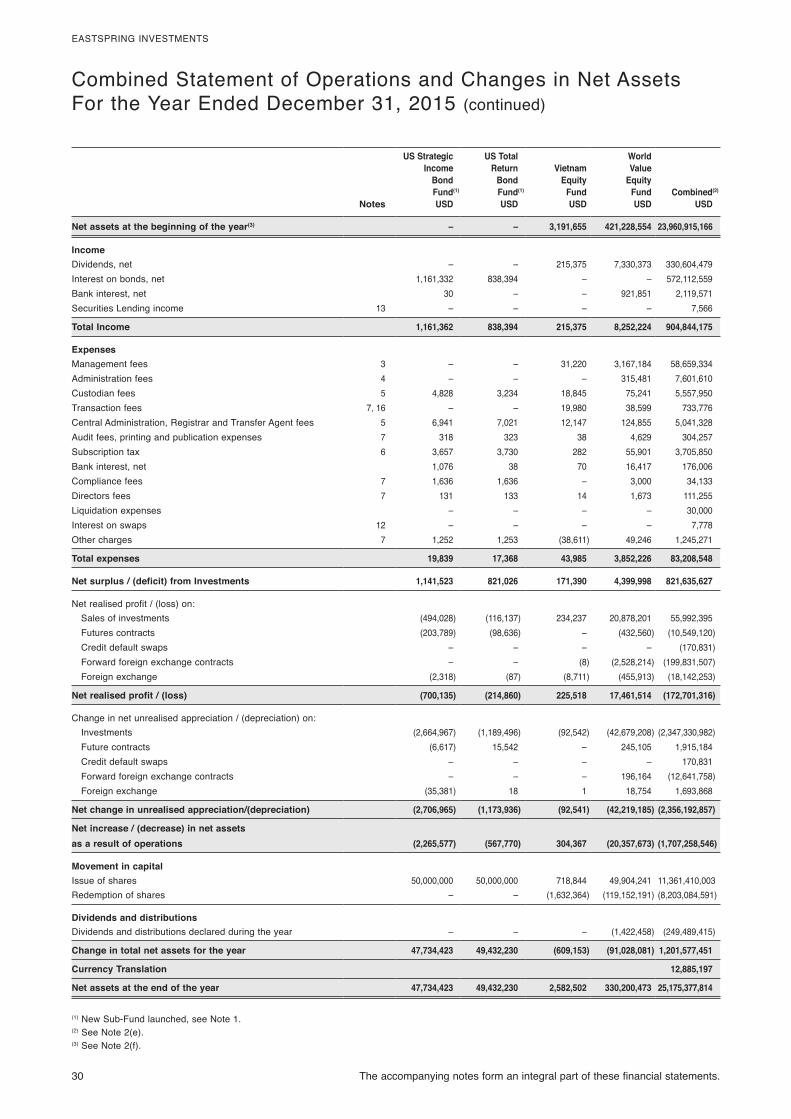
EASTSPRING INVESTMENTS
Combined Statement of Operations and Changes in Net AssetsFor the Year Ended December 31, 2015 (continued)
US BondFund
US CorporateBondFund
US HighInvestment
Grade BondFund
US HighYieldBondFund
US InvestmentGradeBondFund
Notes USD USD USD USD USD
Net assets at the beginning of the year(3) 100,847,018 4,721,989,572 244,586,481 2,399,599,497 392,965,102
IncomeDividends, net – 277,976 – 1,150,886 34,203 Interest on bonds, net 1,947,377 148,662,181 7,125,875 163,843,626 14,977,995 Bank interest, net 1 56 36 70,173 – Securities Lending income 13 – – – – –
Total Income 1,947,378 148,940,213 7,125,911 165,064,685 15,012,198
ExpensesManagement fees 3 241,391 2,417,531 282,915 18,805,157 2,682,777 Administration fees 4 29,709 152,965 35,616 2,992,412 508,002 Custodian fees 5 12,970 569,181 34,101 276,577 49,672 Transaction fees 7, 16 3,663 7,398 3,096 5,565 4,518 Central Administration, Registrar and Transfer Agent fees 5 42,082 693,413 70,629 439,958 125,710 Audit fees, printing and publication expenses 7 887 56,039 3,025 29,691 4,531 Subscription tax 6 9,893 570,550 30,705 661,200 113,952 Bank interest, net 3,153 10,588 5,105 – 4,988 Compliance fees 7 3,000 3,000 3,000 3,000 3,000 Directors fees 7 332 20,757 1,112 10,895 1,648 Liquidation expenses – – – – – Interest on swaps 12 – – – – – Other charges 7 2,406 135,740 11,431 111,647 12,684
Total expenses 349,486 4,637,162 480,735 23,336,102 3,511,482
Net surplus / (deficit) from Investments 1,597,892 144,303,051 6,645,176 141,728,583 11,500,716
Net realised profit / (loss) on:Sales of investments 1,825,213 54,347,367 1,676,847 (134,830,733) 4,090,933 Futures contracts – (5,435,704) 190,767 – (809,780)Credit default swaps – – – – – Forward foreign exchange contracts (211,747) (5,723,709) (77,805) (150,764,275) (659,413)Foreign exchange 165,284 (165,128) 148,747 (1,281,203) (30,372)
Net realised profit / (loss) 1,778,750 43,022,826 1,938,556 (286,876,211) 2,591,368
Change in net unrealised appreciation / (depreciation) on:Investments (2,859,383) (225,059,380) (6,234,541) (189,418,267) (23,897,892)Future contracts – 311,532 16,218 – 388,937 Credit default swaps – – – – – Forward foreign exchange contracts 93,023 (3,151,502) – (11,877,629) 259,756 Foreign exchange (59) (1,610) 200 38,339 15
Net change in unrealised appreciation/(depreciation) (2,766,419) (227,900,960) (6,218,123) (201,257,557) (23,249,184)
Net increase / (decrease) in net assets as a result of operations 610,223 (40,575,083) 2,365,609 (346,405,185) (9,157,100)
Movement in capitalIssue of shares 36,397,263 1,552,832,567 96,186,029 956,960,199 125,428,454 Redemption of shares (85,625,468) (1,890,370,212) (95,305,645) (1,134,945,042) (161,550,720)
Dividends and distributionsDividends and distributions declared during the year (659,764) (15,519,205) (99,398) (117,069,820) (3,373,171)
Change in total net assets for the year (49,277,746) (393,631,933) 3,146,595 (641,459,848) (48,652,537)
Currency Translation
Net assets at the end of the year 51,569,272 4,328,357,639 247,733,076 1,758,139,649 344,312,565
(3) See Note 2(f).
30 The accompanying notes form an integral part of these financial statements.
EASTSPRING INVESTMENTS
Combined Statement of Operations and Changes in Net AssetsFor the Year Ended December 31, 2015 (continued)
US StrategicIncome
BondFund(1)
US TotalReturn
BondFund(1)
VietnamEquity
Fund
WorldValue
EquityFund Combined(2)
Notes USD USD USD USD USD
Net assets at the beginning of the year(3) – – 3,191,655 421,228,554 23,960,915,166
IncomeDividends, net – – 215,375 7,330,373 330,604,479 Interest on bonds, net 1,161,332 838,394 – – 572,112,559Bank interest, net 30 – – 921,851 2,119,571 Securities Lending income 13 – – – – 7,566
Total Income 1,161,362 838,394 215,375 8,252,224 904,844,175
ExpensesManagement fees 3 – – 31,220 3,167,184 58,659,334 Administration fees 4 – – – 315,481 7,601,610 Custodian fees 5 4,828 3,234 18,845 75,241 5,557,950 Transaction fees 7, 16 – – 19,980 38,599 733,776 Central Administration, Registrar and Transfer Agent fees 5 6,941 7,021 12,147 124,855 5,041,328 Audit fees, printing and publication expenses 7 318 323 38 4,629 304,257 Subscription tax 6 3,657 3,730 282 55,901 3,705,850 Bank interest, net 1,076 38 70 16,417 176,006 Compliance fees 7 1,636 1,636 – 3,000 34,133 Directors fees 7 131 133 14 1,673 111,255 Liquidation expenses – – – – 30,000 Interest on swaps 12 – – – – 7,778 Other charges 7 1,252 1,253 (38,611) 49,246 1,245,271
Total expenses 19,839 17,368 43,985 3,852,226 83,208,548
Net surplus / (deficit) from Investments 1,141,523 821,026 171,390 4,399,998 821,635,627
Net realised profit / (loss) on:Sales of investments (494,028) (116,137) 234,237 20,878,201 55,992,395Futures contracts (203,789) (98,636) – (432,560) (10,549,120)Credit default swaps – – – – (170,831)Forward foreign exchange contracts – – (8) (2,528,214) (199,831,507)Foreign exchange (2,318) (87) (8,711) (455,913) (18,142,253)
Net realised profit / (loss) (700,135) (214,860) 225,518 17,461,514 (172,701,316)
Change in net unrealised appreciation / (depreciation) on:Investments (2,664,967) (1,189,496) (92,542) (42,679,208) (2,347,330,982)Future contracts (6,617) 15,542 – 245,105 1,915,184 Credit default swaps – – – – 170,831 Forward foreign exchange contracts – – – 196,164 (12,641,758)Foreign exchange (35,381) 18 1 18,754 1,693,868
Net change in unrealised appreciation/(depreciation) (2,706,965) (1,173,936) (92,541) (42,219,185) (2,356,192,857)
Net increase / (decrease) in net assets as a result of operations (2,265,577) (567,770) 304,367 (20,357,673) (1,707,258,546)
Movement in capitalIssue of shares 50,000,000 50,000,000 718,844 49,904,241 11,361,410,003 Redemption of shares – – (1,632,364) (119,152,191) (8,203,084,591)
Dividends and distributionsDividends and distributions declared during the year – – – (1,422,458) (249,489,415)
Change in total net assets for the year 47,734,423 49,432,230 (609,153) (91,028,081) 1,201,577,451
Currency Translation 12,885,197
Net assets at the end of the year 47,734,423 49,432,230 2,582,502 330,200,473 25,175,377,814
(1) New Sub-Fund launched, see Note 1.(2) See Note 2(e).(3) See Note 2(f).
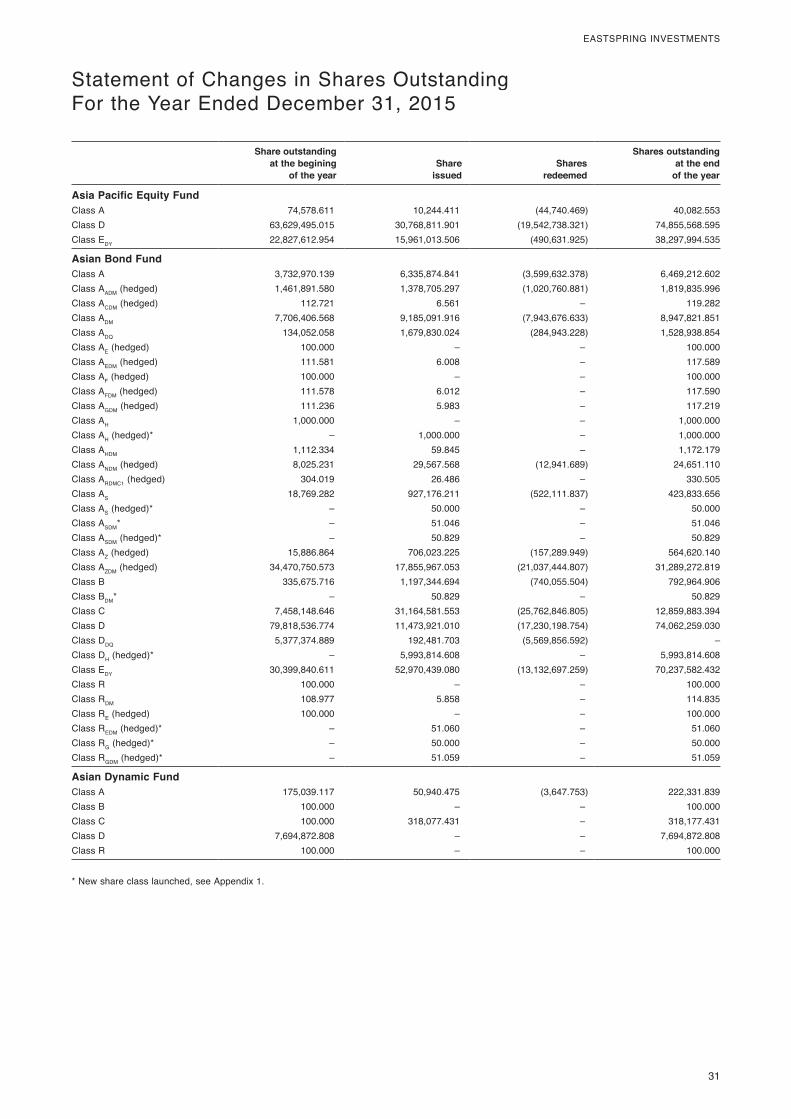
31
EASTSPRING INVESTMENTS
Statement of Changes in Shares OutstandingFor the Year Ended December 31, 2015 (continued)
Share outstanding at the begining
of the yearShare
issuedShares
redeemed
Shares outstanding at the end
of the year
Asia Pacific Equity FundClass A 74,578.611 10,244.411 (44,740.469) 40,082.553Class D 63,629,495.015 30,768,811.901 (19,542,738.321) 74,855,568.595Class EDY 22,827,612.954 15,961,013.506 (490,631.925) 38,297,994.535
Asian Bond FundClass A 3,732,970.139 6,335,874.841 (3,599,632.378) 6,469,212.602Class AADM (hedged) 1,461,891.580 1,378,705.297 (1,020,760.881) 1,819,835.996Class ACDM (hedged) 112.721 6.561 – 119.282Class ADM 7,706,406.568 9,185,091.916 (7,943,676.633) 8,947,821.851Class ADQ 134,052.058 1,679,830.024 (284,943.228) 1,528,938.854Class AE (hedged) 100.000 – – 100.000Class AEDM (hedged) 111.581 6.008 – 117.589Class AF (hedged) 100.000 – – 100.000Class AFDM (hedged) 111.578 6.012 – 117.590Class AGDM (hedged) 111.236 5.983 – 117.219Class AH 1,000.000 – – 1,000.000Class AH (hedged)* – 1,000.000 – 1,000.000Class AHDM 1,112.334 59.845 – 1,172.179Class ANDM (hedged) 8,025.231 29,567.568 (12,941.689) 24,651.110Class ARDMC1 (hedged) 304.019 26.486 – 330.505Class AS 18,769.282 927,176.211 (522,111.837) 423,833.656Class AS (hedged)* – 50.000 – 50.000Class ASDM* – 51.046 – 51.046Class ASDM (hedged)* – 50.829 – 50.829Class AZ (hedged) 15,886.864 706,023.225 (157,289.949) 564,620.140Class AZDM (hedged) 34,470,750.573 17,855,967.053 (21,037,444.807) 31,289,272.819Class B 335,675.716 1,197,344.694 (740,055.504) 792,964.906Class BDM* – 50.829 – 50.829Class C 7,458,148.646 31,164,581.553 (25,762,846.805) 12,859,883.394Class D 79,818,536.774 11,473,921.010 (17,230,198.754) 74,062,259.030Class DDQ 5,377,374.889 192,481.703 (5,569,856.592) –Class DH (hedged)* – 5,993,814.608 – 5,993,814.608Class EDY 30,399,840.611 52,970,439.080 (13,132,697.259) 70,237,582.432Class R 100.000 – – 100.000Class RDM 108.977 5.858 – 114.835Class RE (hedged) 100.000 – – 100.000Class REDM (hedged)* – 51.060 – 51.060Class RG (hedged)* – 50.000 – 50.000Class RGDM (hedged)* – 51.059 – 51.059
Asian Dynamic FundClass A 175,039.117 50,940.475 (3,647.753) 222,331.839Class B 100.000 – – 100.000Class C 100.000 318,077.431 – 318,177.431Class D 7,694,872.808 – – 7,694,872.808Class R 100.000 – – 100.000
Statement of Changes in Shares Outstanding
* New share class launched, see Appendix 1.
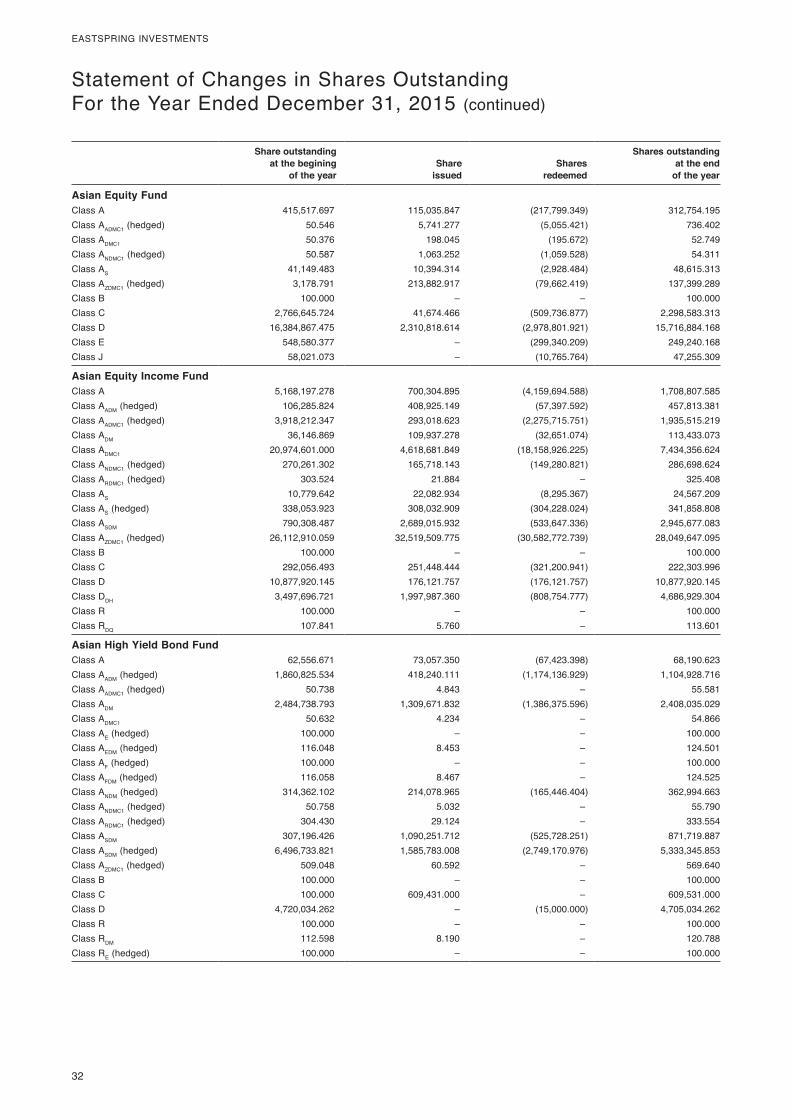
32
EASTSPRING INVESTMENTS
Statement of Changes in Shares OutstandingFor the Year Ended December 31, 2015 (continued)
Share outstanding at the begining
of the yearShare
issuedShares
redeemed
Shares outstanding at the end
of the year
Asian Equity FundClass A 415,517.697 115,035.847 (217,799.349) 312,754.195Class AADMC1 (hedged) 50.546 5,741.277 (5,055.421) 736.402Class ADMC1 50.376 198.045 (195.672) 52.749Class ANDMC1 (hedged) 50.587 1,063.252 (1,059.528) 54.311Class AS 41,149.483 10,394.314 (2,928.484) 48,615.313Class AZDMC1 (hedged) 3,178.791 213,882.917 (79,662.419) 137,399.289Class B 100.000 – – 100.000Class C 2,766,645.724 41,674.466 (509,736.877) 2,298,583.313Class D 16,384,867.475 2,310,818.614 (2,978,801.921) 15,716,884.168Class E 548,580.377 – (299,340.209) 249,240.168Class J 58,021.073 – (10,765.764) 47,255.309
Asian Equity Income FundClass A 5,168,197.278 700,304.895 (4,159,694.588) 1,708,807.585Class AADM (hedged) 106,285.824 408,925.149 (57,397.592) 457,813.381Class AADMC1 (hedged) 3,918,212.347 293,018.623 (2,275,715.751) 1,935,515.219Class ADM 36,146.869 109,937.278 (32,651.074) 113,433.073Class ADMC1 20,974,601.000 4,618,681.849 (18,158,926.225) 7,434,356.624Class ANDMC1 (hedged) 270,261.302 165,718.143 (149,280.821) 286,698.624Class ARDMC1 (hedged) 303.524 21.884 – 325.408Class AS 10,779.642 22,082.934 (8,295.367) 24,567.209Class AS (hedged) 338,053.923 308,032.909 (304,228.024) 341,858.808Class ASDM 790,308.487 2,689,015.932 (533,647.336) 2,945,677.083Class AZDMC1 (hedged) 26,112,910.059 32,519,509.775 (30,582,772.739) 28,049,647.095Class B 100.000 – – 100.000Class C 292,056.493 251,448.444 (321,200.941) 222,303.996Class D 10,877,920.145 176,121.757 (176,121.757) 10,877,920.145Class DDH 3,497,696.721 1,997,987.360 (808,754.777) 4,686,929.304Class R 100.000 – – 100.000Class RDQ 107.841 5.760 – 113.601
Asian High Yield Bond FundClass A 62,556.671 73,057.350 (67,423.398) 68,190.623Class AADM (hedged) 1,860,825.534 418,240.111 (1,174,136.929) 1,104,928.716Class AADMC1 (hedged) 50.738 4.843 – 55.581Class ADM 2,484,738.793 1,309,671.832 (1,386,375.596) 2,408,035.029Class ADMC1 50.632 4.234 – 54.866Class AE (hedged) 100.000 – – 100.000Class AEDM (hedged) 116.048 8.453 – 124.501Class AF (hedged) 100.000 – – 100.000Class AFDM (hedged) 116.058 8.467 – 124.525Class ANDM (hedged) 314,362.102 214,078.965 (165,446.404) 362,994.663Class ANDMC1 (hedged) 50.758 5.032 – 55.790Class ARDMC1 (hedged) 304.430 29.124 – 333.554Class ASDM 307,196.426 1,090,251.712 (525,728.251) 871,719.887Class ASDM (hedged) 6,496,733.821 1,585,783.008 (2,749,170.976) 5,333,345.853Class AZDMC1 (hedged) 509.048 60.592 – 569.640Class B 100.000 – – 100.000Class C 100.000 609,431.000 – 609,531.000Class D 4,720,034.262 – (15,000.000) 4,705,034.262Class R 100.000 – – 100.000Class RDM 112.598 8.190 – 120.788Class RE (hedged) 100.000 – – 100.000
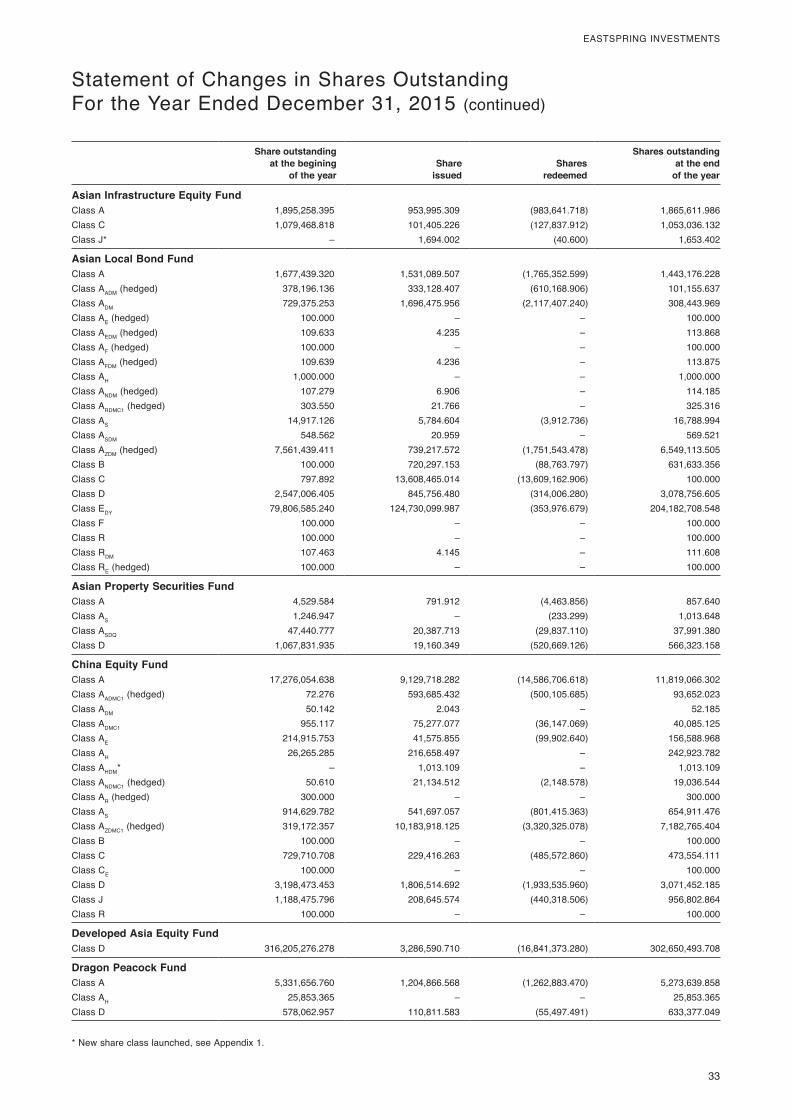
33
EASTSPRING INVESTMENTS
Statement of Changes in Shares OutstandingFor the Year Ended December 31, 2015 (continued)
Share outstanding at the begining
of the yearShare
issuedShares
redeemed
Shares outstanding at the end
of the year
Asian Infrastructure Equity FundClass A 1,895,258.395 953,995.309 (983,641.718) 1,865,611.986Class C 1,079,468.818 101,405.226 (127,837.912) 1,053,036.132Class J* – 1,694.002 (40.600) 1,653.402
Asian Local Bond FundClass A 1,677,439.320 1,531,089.507 (1,765,352.599) 1,443,176.228Class AADM (hedged) 378,196.136 333,128.407 (610,168.906) 101,155.637Class ADM 729,375.253 1,696,475.956 (2,117,407.240) 308,443.969Class AE (hedged) 100.000 – – 100.000Class AEDM (hedged) 109.633 4.235 – 113.868Class AF (hedged) 100.000 – – 100.000Class AFDM (hedged) 109.639 4.236 – 113.875Class AH 1,000.000 – – 1,000.000Class ANDM (hedged) 107.279 6.906 – 114.185Class ARDMC1 (hedged) 303.550 21.766 – 325.316Class AS 14,917.126 5,784.604 (3,912.736) 16,788.994Class ASDM 548.562 20.959 – 569.521Class AZDM (hedged) 7,561,439.411 739,217.572 (1,751,543.478) 6,549,113.505Class B 100.000 720,297.153 (88,763.797) 631,633.356Class C 797.892 13,608,465.014 (13,609,162.906) 100.000Class D 2,547,006.405 845,756.480 (314,006.280) 3,078,756.605Class EDY 79,806,585.240 124,730,099.987 (353,976.679) 204,182,708.548Class F 100.000 – – 100.000Class R 100.000 – – 100.000Class RDM 107.463 4.145 – 111.608Class RE (hedged) 100.000 – – 100.000
Asian Property Securities FundClass A 4,529.584 791.912 (4,463.856) 857.640Class AS 1,246.947 – (233.299) 1,013.648Class ASDQ 47,440.777 20,387.713 (29,837.110) 37,991.380Class D 1,067,831.935 19,160.349 (520,669.126) 566,323.158
China Equity FundClass A 17,276,054.638 9,129,718.282 (14,586,706.618) 11,819,066.302Class AADMC1 (hedged) 72.276 593,685.432 (500,105.685) 93,652.023Class ADM 50.142 2.043 – 52.185Class ADMC1 955.117 75,277.077 (36,147.069) 40,085.125Class AE 214,915.753 41,575.855 (99,902.640) 156,588.968Class AH 26,265.285 216,658.497 – 242,923.782Class AHDM* – 1,013.109 – 1,013.109Class ANDMC1 (hedged) 50.610 21,134.512 (2,148.578) 19,036.544Class AR (hedged) 300.000 – – 300.000Class AS 914,629.782 541,697.057 (801,415.363) 654,911.476Class AZDMC1 (hedged) 319,172.357 10,183,918.125 (3,320,325.078) 7,182,765.404Class B 100.000 – – 100.000Class C 729,710.708 229,416.263 (485,572.860) 473,554.111Class CE 100.000 – – 100.000Class D 3,198,473.453 1,806,514.692 (1,933,535.960) 3,071,452.185Class J 1,188,475.796 208,645.574 (440,318.506) 956,802.864Class R 100.000 – – 100.000
Developed Asia Equity FundClass D 316,205,276.278 3,286,590.710 (16,841,373.280) 302,650,493.708
Dragon Peacock FundClass A 5,331,656.760 1,204,866.568 (1,262,883.470) 5,273,639.858Class AH 25,853.365 – – 25,853.365Class D 578,062.957 110,811.583 (55,497.491) 633,377.049
* New share class launched, see Appendix 1.
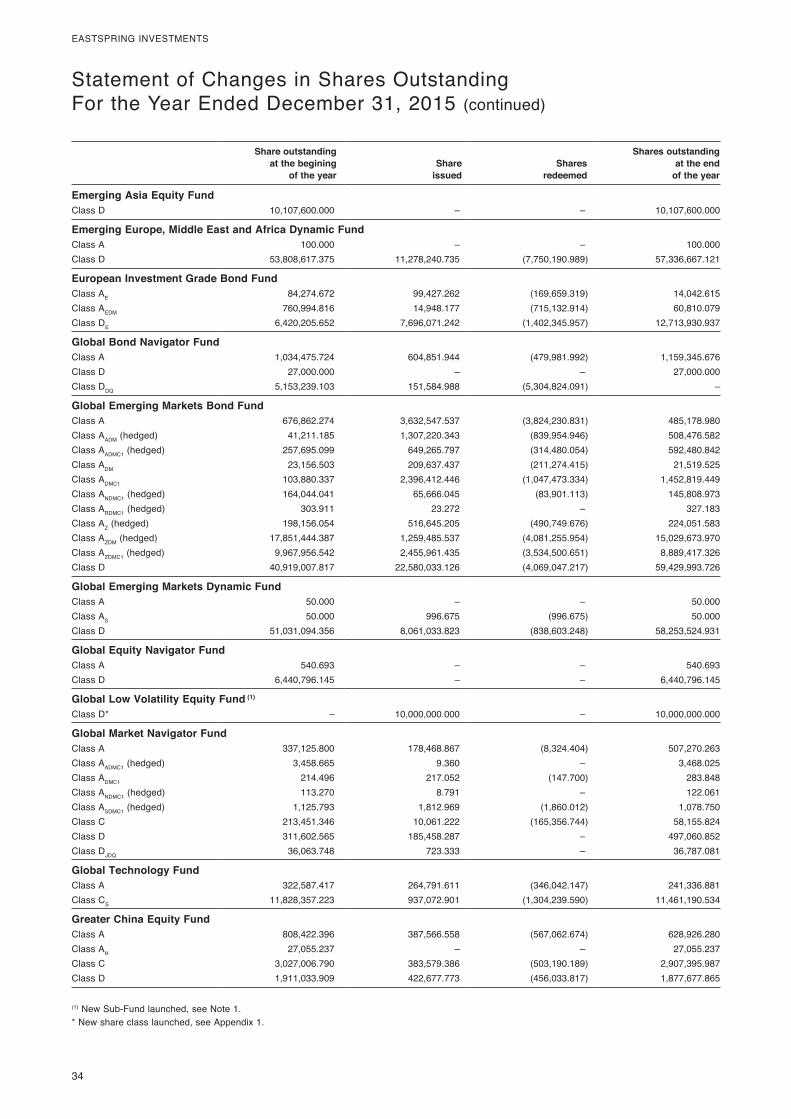
34
EASTSPRING INVESTMENTS
Statement of Changes in Shares OutstandingFor the Year Ended December 31, 2015 (continued)
Share outstanding at the begining
of the yearShare
issuedShares
redeemed
Shares outstanding at the end
of the year
Emerging Asia Equity FundClass D 10,107,600.000 – – 10,107,600.000
Emerging Europe, Middle East and Africa Dynamic FundClass A 100.000 – – 100.000Class D 53,808,617.375 11,278,240.735 (7,750,190.989) 57,336,667.121
European Investment Grade Bond FundClass AE 84,274.672 99,427.262 (169,659.319) 14,042.615Class AEDM 760,994.816 14,948.177 (715,132.914) 60,810.079Class DE 6,420,205.652 7,696,071.242 (1,402,345.957) 12,713,930.937
Global Bond Navigator FundClass A 1,034,475.724 604,851.944 (479,981.992) 1,159,345.676Class D 27,000.000 – – 27,000.000Class DDQ 5,153,239.103 151,584.988 (5,304,824.091) –
Global Emerging Markets Bond FundClass A 676,862.274 3,632,547.537 (3,824,230.831) 485,178.980Class AADM (hedged) 41,211.185 1,307,220.343 (839,954.946) 508,476.582Class AADMC1 (hedged) 257,695.099 649,265.797 (314,480.054) 592,480.842Class ADM 23,156.503 209,637.437 (211,274.415) 21,519.525Class ADMC1 103,880.337 2,396,412.446 (1,047,473.334) 1,452,819.449Class ANDMC1 (hedged) 164,044.041 65,666.045 (83,901.113) 145,808.973Class ARDMC1 (hedged) 303.911 23.272 – 327.183Class AZ (hedged) 198,156.054 516,645.205 (490,749.676) 224,051.583Class AZDM (hedged) 17,851,444.387 1,259,485.537 (4,081,255.954) 15,029,673.970Class AZDMC1 (hedged) 9,967,956.542 2,455,961.435 (3,534,500.651) 8,889,417.326Class D 40,919,007.817 22,580,033.126 (4,069,047.217) 59,429,993.726
Global Emerging Markets Dynamic FundClass A 50.000 – – 50.000Class AS 50.000 996.675 (996.675) 50.000Class D 51,031,094.356 8,061,033.823 (838,603.248) 58,253,524.931
Global Equity Navigator FundClass A 540.693 – – 540.693Class D 6,440,796.145 – – 6,440,796.145
Global Low Volatility Equity Fund (1)
Class D* – 10,000,000.000 – 10,000,000.000
Global Market Navigator FundClass A 337,125.800 178,468.867 (8,324.404) 507,270.263Class AADMC1 (hedged) 3,458.665 9.360 – 3,468.025Class ADMC1 214.496 217.052 (147.700) 283.848Class ANDMC1 (hedged) 113.270 8.791 – 122.061Class ASDMC1 (hedged) 1,125.793 1,812.969 (1,860.012) 1,078.750Class C 213,451.346 10,061.222 (165,356.744) 58,155.824Class D 311,602.565 185,458.287 – 497,060.852Class DJDQ 36,063.748 723.333 – 36,787.081
Global Technology FundClass A 322,587.417 264,791.611 (346,042.147) 241,336.881Class CS 11,828,357.223 937,072.901 (1,304,239.590) 11,461,190.534
Greater China Equity FundClass A 808,422.396 387,566.558 (567,062.674) 628,926.280Class AH 27,055.237 – – 27,055.237Class C 3,027,006.790 383,579.386 (503,190.189) 2,907,395.987Class D 1,911,033.909 422,677.773 (456,033.817) 1,877,677.865
(1) New Sub-Fund launched, see Note 1.* New share class launched, see Appendix 1.
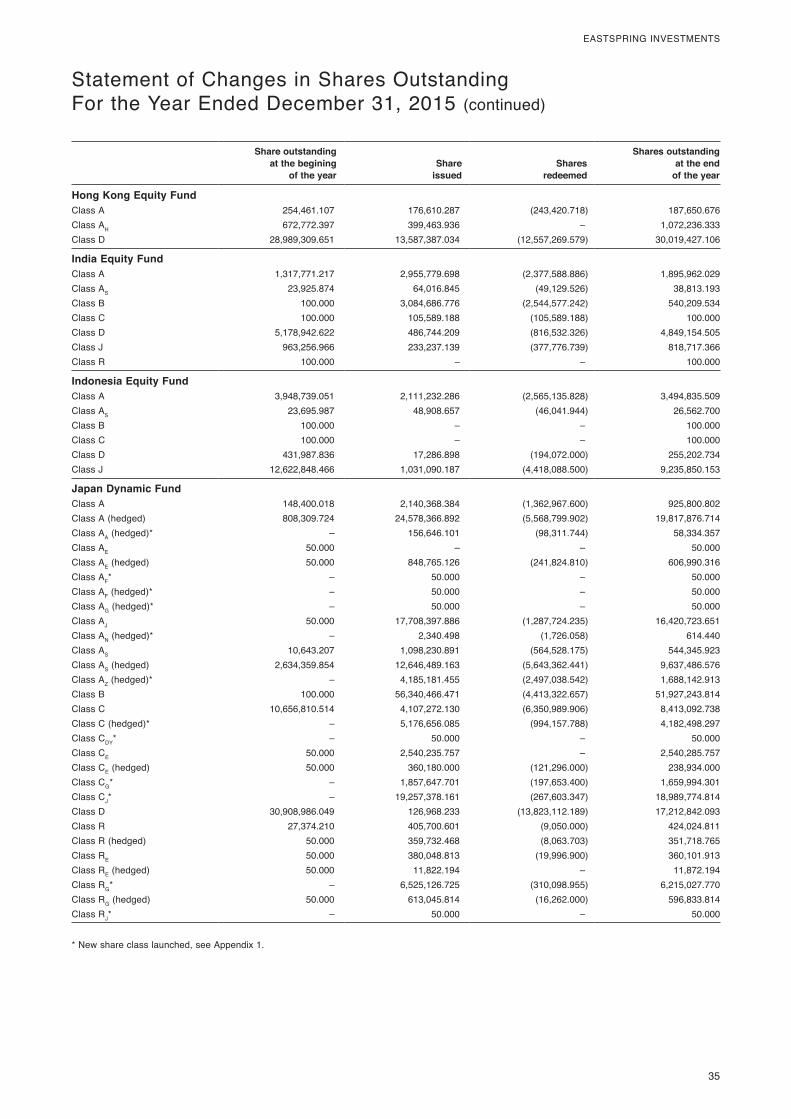
35
EASTSPRING INVESTMENTS
Statement of Changes in Shares OutstandingFor the Year Ended December 31, 2015 (continued)
Share outstanding at the begining
of the yearShare
issuedShares
redeemed
Shares outstanding at the end
of the year
Hong Kong Equity FundClass A 254,461.107 176,610.287 (243,420.718) 187,650.676Class AH 672,772.397 399,463.936 – 1,072,236.333Class D 28,989,309.651 13,587,387.034 (12,557,269.579) 30,019,427.106
India Equity FundClass A 1,317,771.217 2,955,779.698 (2,377,588.886) 1,895,962.029Class AS 23,925.874 64,016.845 (49,129.526) 38,813.193Class B 100.000 3,084,686.776 (2,544,577.242) 540,209.534Class C 100.000 105,589.188 (105,589.188) 100.000Class D 5,178,942.622 486,744.209 (816,532.326) 4,849,154.505Class J 963,256.966 233,237.139 (377,776.739) 818,717.366Class R 100.000 – – 100.000
Indonesia Equity FundClass A 3,948,739.051 2,111,232.286 (2,565,135.828) 3,494,835.509Class AS 23,695.987 48,908.657 (46,041.944) 26,562.700Class B 100.000 – – 100.000Class C 100.000 – – 100.000Class D 431,987.836 17,286.898 (194,072.000) 255,202.734Class J 12,622,848.466 1,031,090.187 (4,418,088.500) 9,235,850.153
Japan Dynamic FundClass A 148,400.018 2,140,368.384 (1,362,967.600) 925,800.802Class A (hedged) 808,309.724 24,578,366.892 (5,568,799.902) 19,817,876.714Class AA (hedged)* – 156,646.101 (98,311.744) 58,334.357Class AE 50.000 – – 50.000Class AE (hedged) 50.000 848,765.126 (241,824.810) 606,990.316Class AF* – 50.000 – 50.000Class AF (hedged)* – 50.000 – 50.000Class AG (hedged)* – 50.000 – 50.000Class AJ 50.000 17,708,397.886 (1,287,724.235) 16,420,723.651Class AN (hedged)* – 2,340.498 (1,726.058) 614.440Class AS 10,643.207 1,098,230.891 (564,528.175) 544,345.923Class AS (hedged) 2,634,359.854 12,646,489.163 (5,643,362.441) 9,637,486.576Class AZ (hedged)* – 4,185,181.455 (2,497,038.542) 1,688,142.913Class B 100.000 56,340,466.471 (4,413,322.657) 51,927,243.814Class C 10,656,810.514 4,107,272.130 (6,350,989.906) 8,413,092.738Class C (hedged)* – 5,176,656.085 (994,157.788) 4,182,498.297Class CDY* – 50.000 – 50.000Class CE 50.000 2,540,235.757 – 2,540,285.757Class CE (hedged) 50.000 360,180.000 (121,296.000) 238,934.000Class CG* – 1,857,647.701 (197,653.400) 1,659,994.301Class CJ* – 19,257,378.161 (267,603.347) 18,989,774.814Class D 30,908,986.049 126,968.233 (13,823,112.189) 17,212,842.093Class R 27,374.210 405,700.601 (9,050.000) 424,024.811Class R (hedged) 50.000 359,732.468 (8,063.703) 351,718.765Class RE 50.000 380,048.813 (19,996.900) 360,101.913Class RE (hedged) 50.000 11,822.194 – 11,872.194Class RG* – 6,525,126.725 (310,098.955) 6,215,027.770Class RG (hedged) 50.000 613,045.814 (16,262.000) 596,833.814Class RJ* – 50.000 – 50.000
* New share class launched, see Appendix 1.
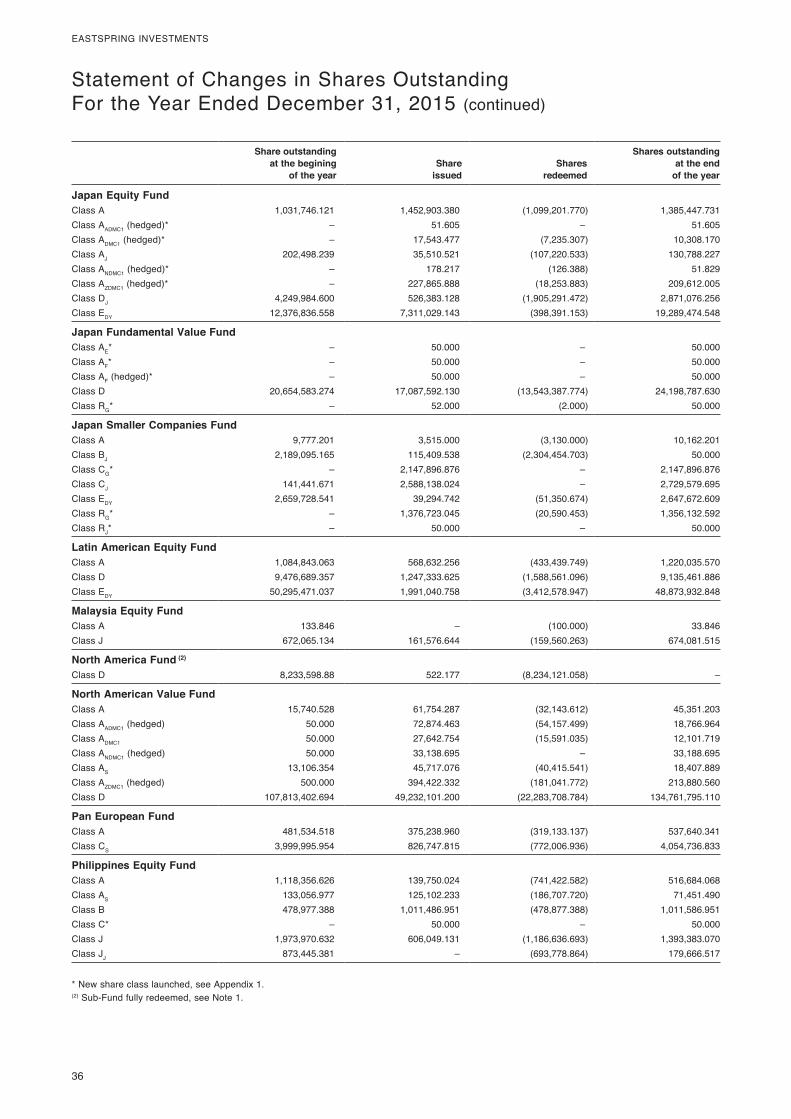
36
EASTSPRING INVESTMENTS
Statement of Changes in Shares OutstandingFor the Year Ended December 31, 2015 (continued)
Share outstanding at the begining
of the yearShare
issuedShares
redeemed
Shares outstanding at the end
of the year
Japan Equity FundClass A 1,031,746.121 1,452,903.380 (1,099,201.770) 1,385,447.731Class AADMC1 (hedged)* – 51.605 – 51.605Class ADMC1 (hedged)* – 17,543.477 (7,235.307) 10,308.170Class AJ 202,498.239 35,510.521 (107,220.533) 130,788.227Class ANDMC1 (hedged)* – 178.217 (126.388) 51.829Class AZDMC1 (hedged)* – 227,865.888 (18,253.883) 209,612.005Class DJ 4,249,984.600 526,383.128 (1,905,291.472) 2,871,076.256Class EDY 12,376,836.558 7,311,029.143 (398,391.153) 19,289,474.548
Japan Fundamental Value FundClass AE* – 50.000 – 50.000Class AF* – 50.000 – 50.000Class AF (hedged)* – 50.000 – 50.000Class D 20,654,583.274 17,087,592.130 (13,543,387.774) 24,198,787.630Class RG* – 52.000 (2.000) 50.000
Japan Smaller Companies FundClass A 9,777.201 3,515.000 (3,130.000) 10,162.201Class BJ 2,189,095.165 115,409.538 (2,304,454.703) 50.000Class CG* – 2,147,896.876 – 2,147,896.876Class CJ 141,441.671 2,588,138.024 – 2,729,579.695Class EDY 2,659,728.541 39,294.742 (51,350.674) 2,647,672.609Class RG* – 1,376,723.045 (20,590.453) 1,356,132.592Class RJ* – 50.000 – 50.000
Latin American Equity FundClass A 1,084,843.063 568,632.256 (433,439.749) 1,220,035.570Class D 9,476,689.357 1,247,333.625 (1,588,561.096) 9,135,461.886Class EDY 50,295,471.037 1,991,040.758 (3,412,578.947) 48,873,932.848
Malaysia Equity FundClass A 133.846 – (100.000) 33.846Class J 672,065.134 161,576.644 (159,560.263) 674,081.515
North America Fund (2)
Class D 8,233,598.88 522.177 (8,234,121.058) –
North American Value FundClass A 15,740.528 61,754.287 (32,143.612) 45,351.203Class AADMC1 (hedged) 50.000 72,874.463 (54,157.499) 18,766.964Class ADMC1 50.000 27,642.754 (15,591.035) 12,101.719Class ANDMC1 (hedged) 50.000 33,138.695 – 33,188.695Class AS 13,106.354 45,717.076 (40,415.541) 18,407.889Class AZDMC1 (hedged) 500.000 394,422.332 (181,041.772) 213,880.560Class D 107,813,402.694 49,232,101.200 (22,283,708.784) 134,761,795.110
Pan European FundClass A 481,534.518 375,238.960 (319,133.137) 537,640.341Class CS 3,999,995.954 826,747.815 (772,006.936) 4,054,736.833
Philippines Equity FundClass A 1,118,356.626 139,750.024 (741,422.582) 516,684.068Class AS 133,056.977 125,102.233 (186,707.720) 71,451.490Class B 478,977.388 1,011,486.951 (478,877.388) 1,011,586.951Class C* – 50.000 – 50.000Class J 1,973,970.632 606,049.131 (1,186,636.693) 1,393,383.070Class JJ 873,445.381 – (693,778.864) 179,666.517
* New share class launched, see Appendix 1.(2) Sub-Fund fully redeemed, see Note 1.
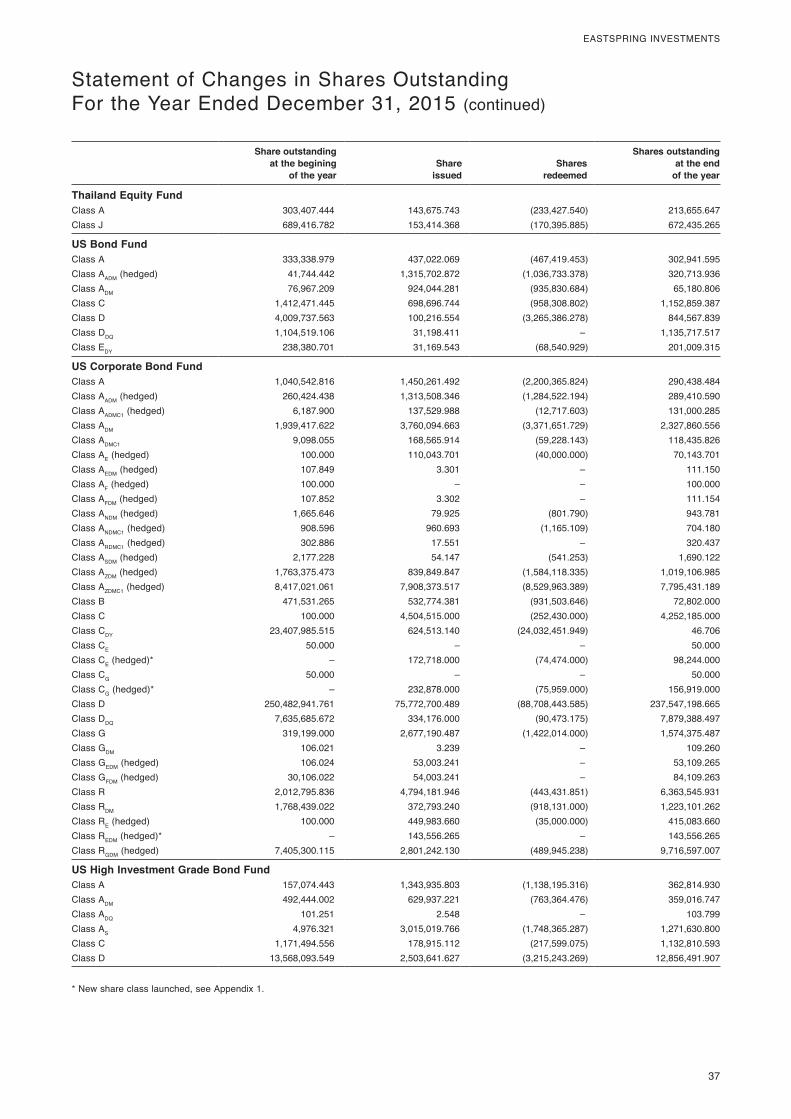
37
EASTSPRING INVESTMENTS
Statement of Changes in Shares OutstandingFor the Year Ended December 31, 2015 (continued)
Share outstanding at the begining
of the yearShare
issuedShares
redeemed
Shares outstanding at the end
of the year
Thailand Equity FundClass A 303,407.444 143,675.743 (233,427.540) 213,655.647Class J 689,416.782 153,414.368 (170,395.885) 672,435.265
US Bond FundClass A 333,338.979 437,022.069 (467,419.453) 302,941.595Class AADM (hedged) 41,744.442 1,315,702.872 (1,036,733.378) 320,713.936Class ADM 76,967.209 924,044.281 (935,830.684) 65,180.806Class C 1,412,471.445 698,696.744 (958,308.802) 1,152,859.387Class D 4,009,737.563 100,216.554 (3,265,386.278) 844,567.839Class DDQ 1,104,519.106 31,198.411 – 1,135,717.517Class EDY 238,380.701 31,169.543 (68,540.929) 201,009.315
US Corporate Bond FundClass A 1,040,542.816 1,450,261.492 (2,200,365.824) 290,438.484Class AADM (hedged) 260,424.438 1,313,508.346 (1,284,522.194) 289,410.590Class AADMC1 (hedged) 6,187.900 137,529.988 (12,717.603) 131,000.285Class ADM 1,939,417.622 3,760,094.663 (3,371,651.729) 2,327,860.556Class ADMC1 9,098.055 168,565.914 (59,228.143) 118,435.826Class AE (hedged) 100.000 110,043.701 (40,000.000) 70,143.701Class AEDM (hedged) 107.849 3.301 – 111.150Class AF (hedged) 100.000 – – 100.000Class AFDM (hedged) 107.852 3.302 – 111.154Class ANDM (hedged) 1,665.646 79.925 (801.790) 943.781Class ANDMC1 (hedged) 908.596 960.693 (1,165.109) 704.180Class ARDMC1 (hedged) 302.886 17.551 – 320.437Class ASDM (hedged) 2,177.228 54.147 (541.253) 1,690.122Class AZDM (hedged) 1,763,375.473 839,849.847 (1,584,118.335) 1,019,106.985Class AZDMC1 (hedged) 8,417,021.061 7,908,373.517 (8,529,963.389) 7,795,431.189Class B 471,531.265 532,774.381 (931,503.646) 72,802.000Class C 100.000 4,504,515.000 (252,430.000) 4,252,185.000Class CDY 23,407,985.515 624,513.140 (24,032,451.949) 46.706Class CE 50.000 – – 50.000Class CE (hedged)* – 172,718.000 (74,474.000) 98,244.000Class CG 50.000 – – 50.000Class CG (hedged)* – 232,878.000 (75,959.000) 156,919.000Class D 250,482,941.761 75,772,700.489 (88,708,443.585) 237,547,198.665Class DDQ 7,635,685.672 334,176.000 (90,473.175) 7,879,388.497Class G 319,199.000 2,677,190.487 (1,422,014.000) 1,574,375.487Class GDM 106.021 3.239 – 109.260Class GEDM (hedged) 106.024 53,003.241 – 53,109.265Class GFDM (hedged) 30,106.022 54,003.241 – 84,109.263Class R 2,012,795.836 4,794,181.946 (443,431.851) 6,363,545.931Class RDM 1,768,439.022 372,793.240 (918,131.000) 1,223,101.262Class RE (hedged) 100.000 449,983.660 (35,000.000) 415,083.660Class REDM (hedged)* – 143,556.265 – 143,556.265Class RGDM (hedged) 7,405,300.115 2,801,242.130 (489,945.238) 9,716,597.007
US High Investment Grade Bond FundClass A 157,074.443 1,343,935.803 (1,138,195.316) 362,814.930Class ADM 492,444.002 629,937.221 (763,364.476) 359,016.747Class ADQ 101.251 2.548 – 103.799Class AS 4,976.321 3,015,019.766 (1,748,365.287) 1,271,630.800Class C 1,171,494.556 178,915.112 (217,599.075) 1,132,810.593Class D 13,568,093.549 2,503,641.627 (3,215,243.269) 12,856,491.907
* New share class launched, see Appendix 1.
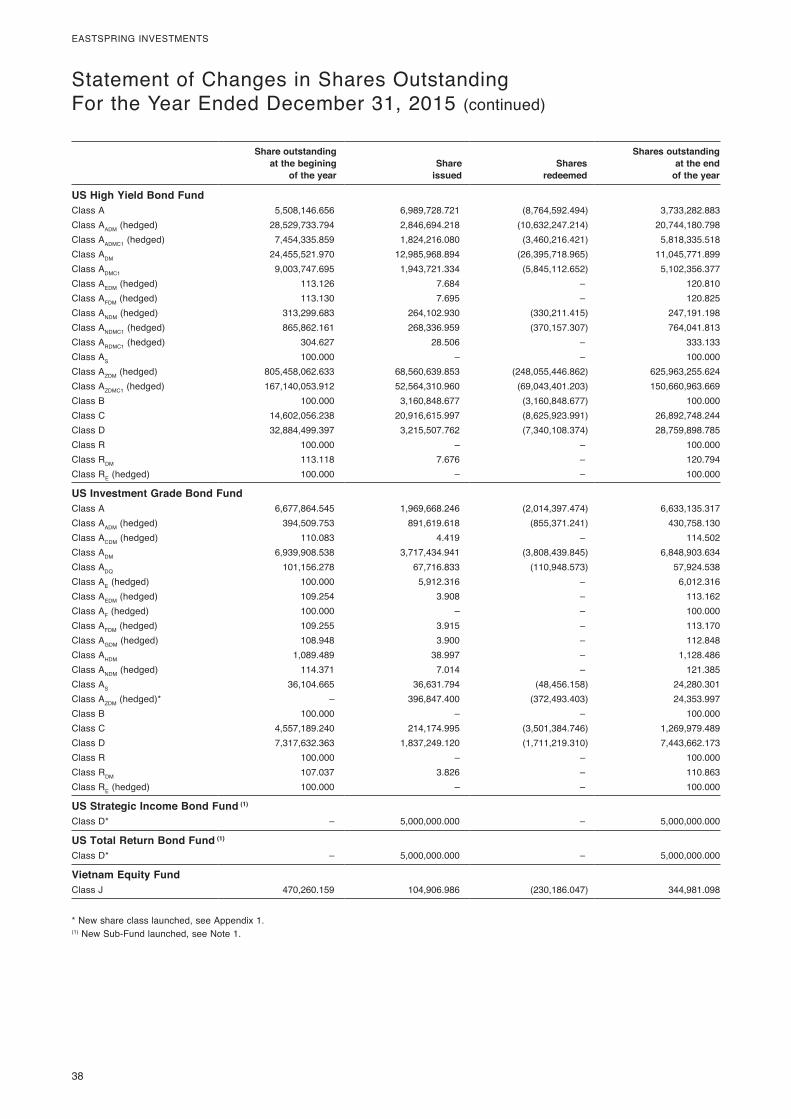
38
EASTSPRING INVESTMENTS
Statement of Changes in Shares OutstandingFor the Year Ended December 31, 2015 (continued)
Share outstanding at the begining
of the yearShare
issuedShares
redeemed
Shares outstanding at the end
of the year
US High Yield Bond FundClass A 5,508,146.656 6,989,728.721 (8,764,592.494) 3,733,282.883Class AADM (hedged) 28,529,733.794 2,846,694.218 (10,632,247.214) 20,744,180.798Class AADMC1 (hedged) 7,454,335.859 1,824,216.080 (3,460,216.421) 5,818,335.518Class ADM 24,455,521.970 12,985,968.894 (26,395,718.965) 11,045,771.899Class ADMC1 9,003,747.695 1,943,721.334 (5,845,112.652) 5,102,356.377Class AEDM (hedged) 113.126 7.684 – 120.810Class AFDM (hedged) 113.130 7.695 – 120.825Class ANDM (hedged) 313,299.683 264,102.930 (330,211.415) 247,191.198Class ANDMC1 (hedged) 865,862.161 268,336.959 (370,157.307) 764,041.813Class ARDMC1 (hedged) 304.627 28.506 – 333.133Class AS 100.000 – – 100.000Class AZDM (hedged) 805,458,062.633 68,560,639.853 (248,055,446.862) 625,963,255.624Class AZDMC1 (hedged) 167,140,053.912 52,564,310.960 (69,043,401.203) 150,660,963.669Class B 100.000 3,160,848.677 (3,160,848.677) 100.000Class C 14,602,056.238 20,916,615.997 (8,625,923.991) 26,892,748.244Class D 32,884,499.397 3,215,507.762 (7,340,108.374) 28,759,898.785Class R 100.000 – – 100.000Class RDM 113.118 7.676 – 120.794Class RE (hedged) 100.000 – – 100.000
US Investment Grade Bond FundClass A 6,677,864.545 1,969,668.246 (2,014,397.474) 6,633,135.317Class AADM (hedged) 394,509.753 891,619.618 (855,371.241) 430,758.130Class ACDM (hedged) 110.083 4.419 – 114.502Class ADM 6,939,908.538 3,717,434.941 (3,808,439.845) 6,848,903.634Class ADQ 101,156.278 67,716.833 (110,948.573) 57,924.538Class AE (hedged) 100.000 5,912.316 – 6,012.316Class AEDM (hedged) 109.254 3.908 – 113.162Class AF (hedged) 100.000 – – 100.000Class AFDM (hedged) 109.255 3.915 – 113.170Class AGDM (hedged) 108.948 3.900 – 112.848Class AHDM 1,089.489 38.997 – 1,128.486Class ANDM (hedged) 114.371 7.014 – 121.385Class AS 36,104.665 36,631.794 (48,456.158) 24,280.301Class AZDM (hedged)* – 396,847.400 (372,493.403) 24,353.997Class B 100.000 – – 100.000Class C 4,557,189.240 214,174.995 (3,501,384.746) 1,269,979.489Class D 7,317,632.363 1,837,249.120 (1,711,219.310) 7,443,662.173Class R 100.000 – – 100.000Class RDM 107.037 3.826 – 110.863Class RE (hedged) 100.000 – – 100.000
US Strategic Income Bond Fund (1)
Class D* – 5,000,000.000 – 5,000,000.000
US Total Return Bond Fund (1)
Class D* – 5,000,000.000 – 5,000,000.000
Vietnam Equity FundClass J 470,260.159 104,906.986 (230,186.047) 344,981.098
* New share class launched, see Appendix 1.(1) New Sub-Fund launched, see Note 1.
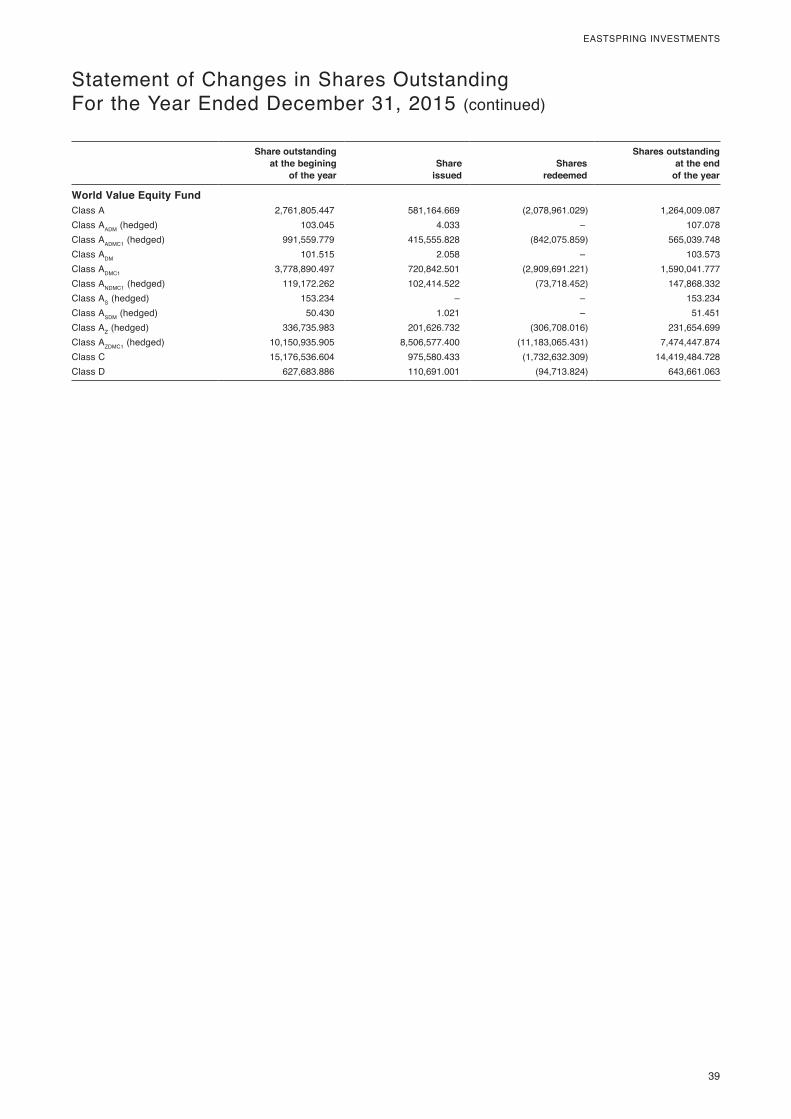
39
EASTSPRING INVESTMENTS
Statement of Changes in Shares OutstandingFor the Year Ended December 31, 2015 (continued)
Share outstanding at the begining
of the yearShare
issuedShares
redeemed
Shares outstanding at the end
of the year
World Value Equity FundClass A 2,761,805.447 581,164.669 (2,078,961.029) 1,264,009.087Class AADM (hedged) 103.045 4.033 – 107.078Class AADMC1 (hedged) 991,559.779 415,555.828 (842,075.859) 565,039.748Class ADM 101.515 2.058 – 103.573Class ADMC1 3,778,890.497 720,842.501 (2,909,691.221) 1,590,041.777Class ANDMC1 (hedged) 119,172.262 102,414.522 (73,718.452) 147,868.332Class AS (hedged) 153.234 – – 153.234Class ASDM (hedged) 50.430 1.021 – 51.451Class AZ (hedged) 336,735.983 201,626.732 (306,708.016) 231,654.699Class AZDMC1 (hedged) 10,150,935.905 8,506,577.400 (11,183,065.431) 7,474,447.874Class C 15,176,536.604 975,580.433 (1,732,632.309) 14,419,484.728Class D 627,683.886 110,691.001 (94,713.824) 643,661.063
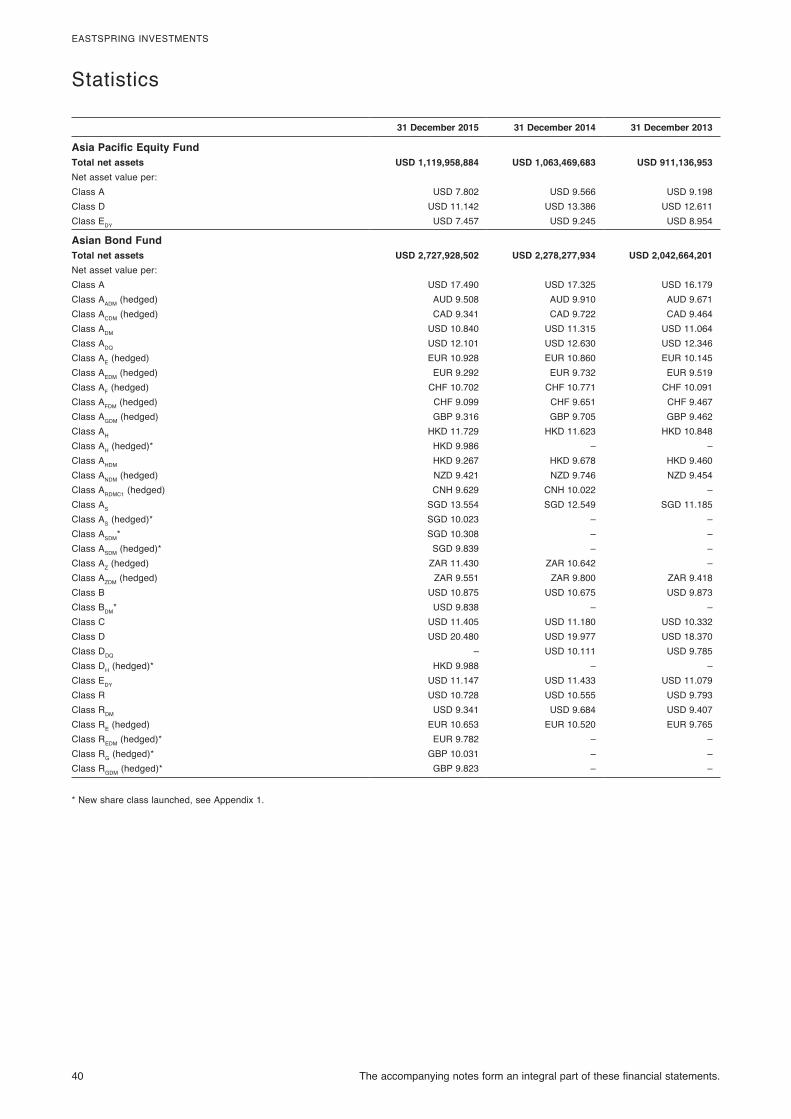
40 The accompanying notes form an integral part of these financial statements.
EASTSPRING INVESTMENTS
Statistics (continued)
31 December 2015 31 December 2014 31 December 2013
Asia Pacific Equity FundTotal net assets USD 1,119,958,884 USD 1,063,469,683 USD 911,136,953Net asset value per:Class A USD 7.802 USD 9.566 USD 9.198Class D USD 11.142 USD 13.386 USD 12.611Class EDY USD 7.457 USD 9.245 USD 8.954
Asian Bond FundTotal net assets USD 2,727,928,502 USD 2,278,277,934 USD 2,042,664,201Net asset value per:Class A USD 17.490 USD 17.325 USD 16.179Class AADM (hedged) AUD 9.508 AUD 9.910 AUD 9.671Class ACDM (hedged) CAD 9.341 CAD 9.722 CAD 9.464Class ADM USD 10.840 USD 11.315 USD 11.064Class ADQ USD 12.101 USD 12.630 USD 12.346Class AE (hedged) EUR 10.928 EUR 10.860 EUR 10.145Class AEDM (hedged) EUR 9.292 EUR 9.732 EUR 9.519Class AF (hedged) CHF 10.702 CHF 10.771 CHF 10.091Class AFDM (hedged) CHF 9.099 CHF 9.651 CHF 9.467Class AGDM (hedged) GBP 9.316 GBP 9.705 GBP 9.462Class AH HKD 11.729 HKD 11.623 HKD 10.848Class AH (hedged)* HKD 9.986 – –Class AHDM HKD 9.267 HKD 9.678 HKD 9.460Class ANDM (hedged) NZD 9.421 NZD 9.746 NZD 9.454Class ARDMC1 (hedged) CNH 9.629 CNH 10.022 –Class AS SGD 13.554 SGD 12.549 SGD 11.185Class AS (hedged)* SGD 10.023 – –Class ASDM* SGD 10.308 – –Class ASDM (hedged)* SGD 9.839 – –Class AZ (hedged) ZAR 11.430 ZAR 10.642 –Class AZDM (hedged) ZAR 9.551 ZAR 9.800 ZAR 9.418Class B USD 10.875 USD 10.675 USD 9.873Class BDM* USD 9.838 – –Class C USD 11.405 USD 11.180 USD 10.332Class D USD 20.480 USD 19.977 USD 18.370Class DDQ – USD 10.111 USD 9.785Class DH (hedged)* HKD 9.988 – –Class EDY USD 11.147 USD 11.433 USD 11.079Class R USD 10.728 USD 10.555 USD 9.793Class RDM USD 9.341 USD 9.684 USD 9.407Class RE (hedged) EUR 10.653 EUR 10.520 EUR 9.765Class REDM (hedged)* EUR 9.782 – –Class RG (hedged)* GBP 10.031 – –Class RGDM (hedged)* GBP 9.823 – –
Statistics
* New share class launched, see Appendix 1.
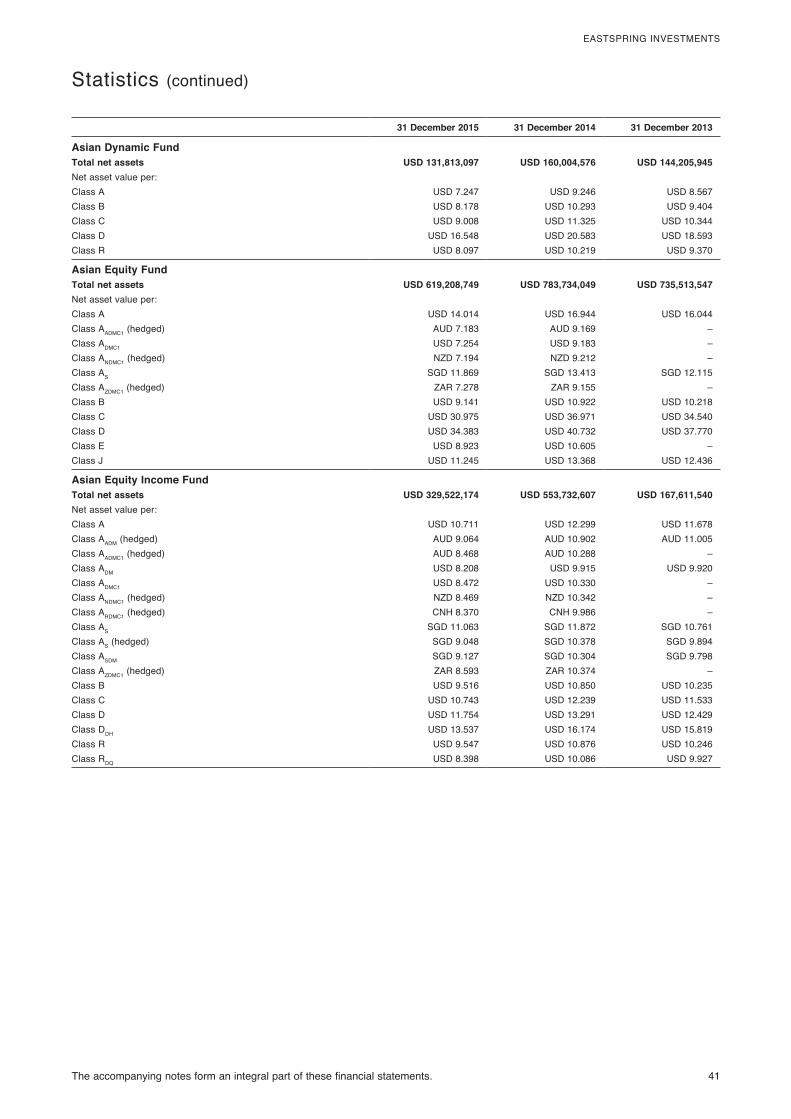
The accompanying notes form an integral part of these financial statements. 41
EASTSPRING INVESTMENTS
Statistics (continued)
31 December 2015 31 December 2014 31 December 2013
Asian Dynamic FundTotal net assets USD 131,813,097 USD 160,004,576 USD 144,205,945Net asset value per:Class A USD 7.247 USD 9.246 USD 8.567Class B USD 8.178 USD 10.293 USD 9.404Class C USD 9.008 USD 11.325 USD 10.344Class D USD 16.548 USD 20.583 USD 18.593Class R USD 8.097 USD 10.219 USD 9.370
Asian Equity FundTotal net assets USD 619,208,749 USD 783,734,049 USD 735,513,547Net asset value per:Class A USD 14.014 USD 16.944 USD 16.044Class AADMC1 (hedged) AUD 7.183 AUD 9.169 –Class ADMC1 USD 7.254 USD 9.183 –Class ANDMC1 (hedged) NZD 7.194 NZD 9.212 –Class AS SGD 11.869 SGD 13.413 SGD 12.115Class AZDMC1 (hedged) ZAR 7.278 ZAR 9.155 –Class B USD 9.141 USD 10.922 USD 10.218Class C USD 30.975 USD 36.971 USD 34.540Class D USD 34.383 USD 40.732 USD 37.770Class E USD 8.923 USD 10.605 –Class J USD 11.245 USD 13.368 USD 12.436
Asian Equity Income FundTotal net assets USD 329,522,174 USD 553,732,607 USD 167,611,540Net asset value per:Class A USD 10.711 USD 12.299 USD 11.678Class AADM (hedged) AUD 9.064 AUD 10.902 AUD 11.005Class AADMC1 (hedged) AUD 8.468 AUD 10.288 –Class ADM USD 8.208 USD 9.915 USD 9.920Class ADMC1 USD 8.472 USD 10.330 –Class ANDMC1 (hedged) NZD 8.469 NZD 10.342 –Class ARDMC1 (hedged) CNH 8.370 CNH 9.986 –Class AS SGD 11.063 SGD 11.872 SGD 10.761Class AS (hedged) SGD 9.048 SGD 10.378 SGD 9.894Class ASDM SGD 9.127 SGD 10.304 SGD 9.798Class AZDMC1 (hedged) ZAR 8.593 ZAR 10.374 –Class B USD 9.516 USD 10.850 USD 10.235Class C USD 10.743 USD 12.239 USD 11.533Class D USD 11.754 USD 13.291 USD 12.429Class DDH USD 13.537 USD 16.174 USD 15.819Class R USD 9.547 USD 10.876 USD 10.246Class RDQ USD 8.398 USD 10.086 USD 9.927

42 The accompanying notes form an integral part of these financial statements.
EASTSPRING INVESTMENTS
Statistics (continued)
31 December 2015 31 December 2014 31 December 2013
Asian High Yield Bond FundTotal net assets USD 146,379,805 USD 154,915,259 USD 183,648,226Net asset value per:Class A USD 11.485 USD 11.229 USD 10.697Class AADM (hedged) AUD 9.621 AUD 9.995 AUD 10.052Class AADMC1 (hedged) AUD 9.296 AUD 9.754 –Class ADM USD 9.361 USD 9.818 USD 9.968Class ADMC1 USD 9.187 USD 9.725 –Class AE (hedged) EUR 11.355 EUR 11.143 EUR 10.624Class AEDM (hedged) EUR 9.123 EUR 9.602 EUR 9.757Class AF (hedged) CHF 11.067 CHF 11.051 CHF 10.565Class AFDM (hedged) CHF 8.884 CHF 9.519 CHF 9.699Class ANDM (hedged) NZD 9.370 NZD 9.653 NZD 9.635Class ANDMC1 (hedged) NZD 9.402 NZD 9.784 –Class ARDMC1 (hedged) CNH 9.416 CNH 9.749 –Class ASDM SGD 10.533 SGD 10.325 SGD 10.004Class ASDM (hedged) SGD 9.334 SGD 9.753 SGD 9.923Class AZDMC1 (hedged) ZAR 9.527 ZAR 9.813 –Class B USD 11.007 USD 10.663 USD 10.069Class C USD 11.758 USD 11.454 USD 10.862Class D USD 13.629 USD 13.127 USD 12.312Class R USD 10.942 USD 10.617 USD 10.042Class RDM USD 9.060 USD 9.429 USD 9.505Class RE (hedged) EUR 10.836 EUR 10.566 EUR 10.012
Asian Infrastructure Equity FundTotal net assets USD 24,866,574 USD 28,956,918 USD 37,523,657Net asset value per:Class A USD 8.018 USD 9.211 USD 9.416Class C USD 9.394 USD 10.653 USD 10.750Class J* USD 9.807 – –
Asian Local Bond FundTotal net assets USD 2,105,214,418 USD 938,734,744 USD 821,384,600Net asset value per:Class A USD 12.356 USD 13.035 USD 12.497Class AADM (hedged) AUD 8.502 AUD 9.319 AUD 9.287Class ADM USD 9.687 USD 10.611 USD 10.561Class AE (hedged) EUR 9.457 EUR 10.015 EUR 9.629Class AEDM (hedged) EUR 8.306 EUR 9.135 EUR 9.117Class AF (hedged) CHF 9.259 CHF 9.929 CHF 9.573Class AFDM (hedged) CHF 8.130 CHF 9.055 CHF 9.064Class AH HKD 9.689 HKD 10.223 HKD 9.788Class ANDM (hedged) NZD 9.430 NZD 10.289 NZD 10.179Class ARDMC1 (hedged) CNH 9.068 CNH 9.902 –Class AS SGD 11.400 SGD 11.241 SGD 10.285Class ASDM SGD 9.979 SGD 10.219 SGD 9.707Class AZDM (hedged) ZAR 8.401 ZAR 9.033 ZAR 8.846Class B USD 9.310 USD 9.730 USD 9.276Class C USD 9.957 USD 10.397 USD 9.862Class D USD 15.119 USD 15.708 USD 14.828Class EDY USD 9.931 USD 10.778 USD 10.635Class F USD 9.684 USD 10.125 USD 9.618Class R USD 9.274 USD 9.714 USD 9.242Class RDM USD 8.311 USD 9.040 USD 8.927Class RE (hedged) EUR 9.149 EUR 9.629 EUR 9.200
* New share class launched, see Appendix 1.
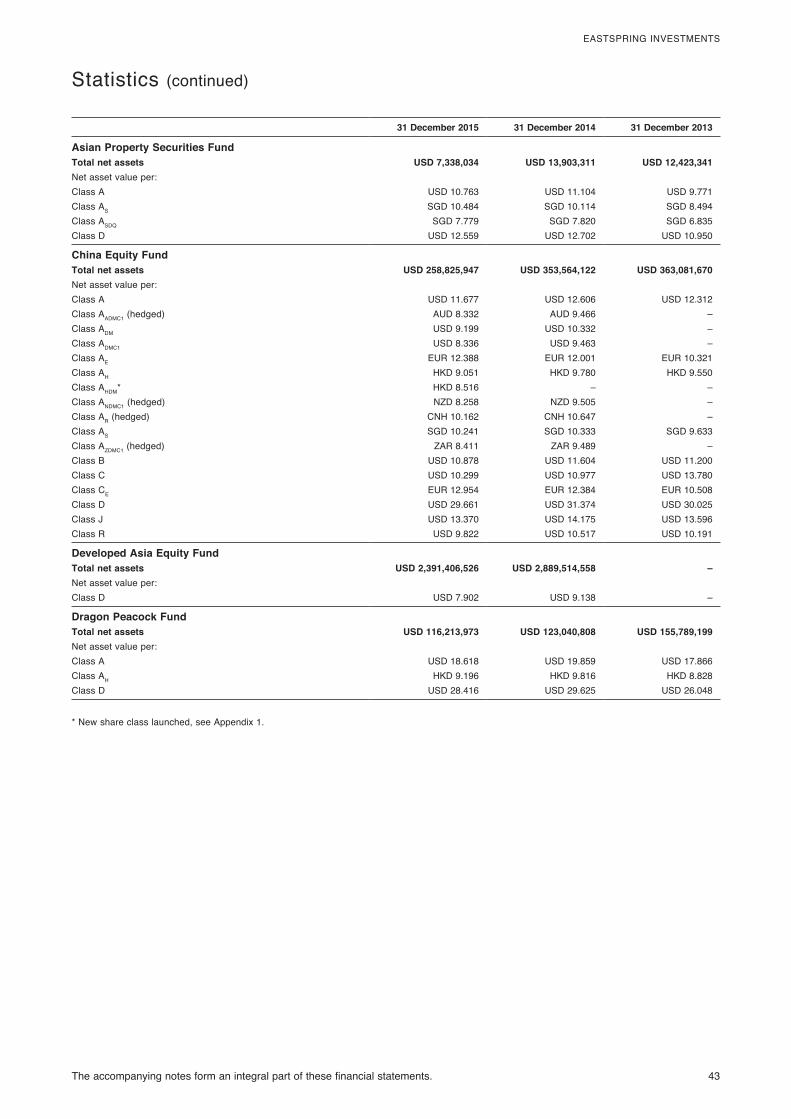
The accompanying notes form an integral part of these financial statements. 43
EASTSPRING INVESTMENTS
Statistics (continued)
31 December 2015 31 December 2014 31 December 2013
Asian Property Securities FundTotal net assets USD 7,338,034 USD 13,903,311 USD 12,423,341Net asset value per:Class A USD 10.763 USD 11.104 USD 9.771Class AS SGD 10.484 SGD 10.114 SGD 8.494Class ASDQ SGD 7.779 SGD 7.820 SGD 6.835Class D USD 12.559 USD 12.702 USD 10.950
China Equity FundTotal net assets USD 258,825,947 USD 353,564,122 USD 363,081,670Net asset value per:Class A USD 11.677 USD 12.606 USD 12.312Class AADMC1 (hedged) AUD 8.332 AUD 9.466 –Class ADM USD 9.199 USD 10.332 –Class ADMC1 USD 8.336 USD 9.463 –Class AE EUR 12.388 EUR 12.001 EUR 10.321Class AH HKD 9.051 HKD 9.780 HKD 9.550Class AHDM* HKD 8.516 – –Class ANDMC1 (hedged) NZD 8.258 NZD 9.505 –Class AR (hedged) CNH 10.162 CNH 10.647 –Class AS SGD 10.241 SGD 10.333 SGD 9.633Class AZDMC1 (hedged) ZAR 8.411 ZAR 9.489 –Class B USD 10.878 USD 11.604 USD 11.200Class C USD 10.299 USD 10.977 USD 13.780Class CE EUR 12.954 EUR 12.384 EUR 10.508Class D USD 29.661 USD 31.374 USD 30.025Class J USD 13.370 USD 14.175 USD 13.596Class R USD 9.822 USD 10.517 USD 10.191
Developed Asia Equity FundTotal net assets USD 2,391,406,526 USD 2,889,514,558 –Net asset value per:Class D USD 7.902 USD 9.138 –
Dragon Peacock FundTotal net assets USD 116,213,973 USD 123,040,808 USD 155,789,199Net asset value per:Class A USD 18.618 USD 19.859 USD 17.866Class AH HKD 9.196 HKD 9.816 HKD 8.828Class D USD 28.416 USD 29.625 USD 26.048
* New share class launched, see Appendix 1.
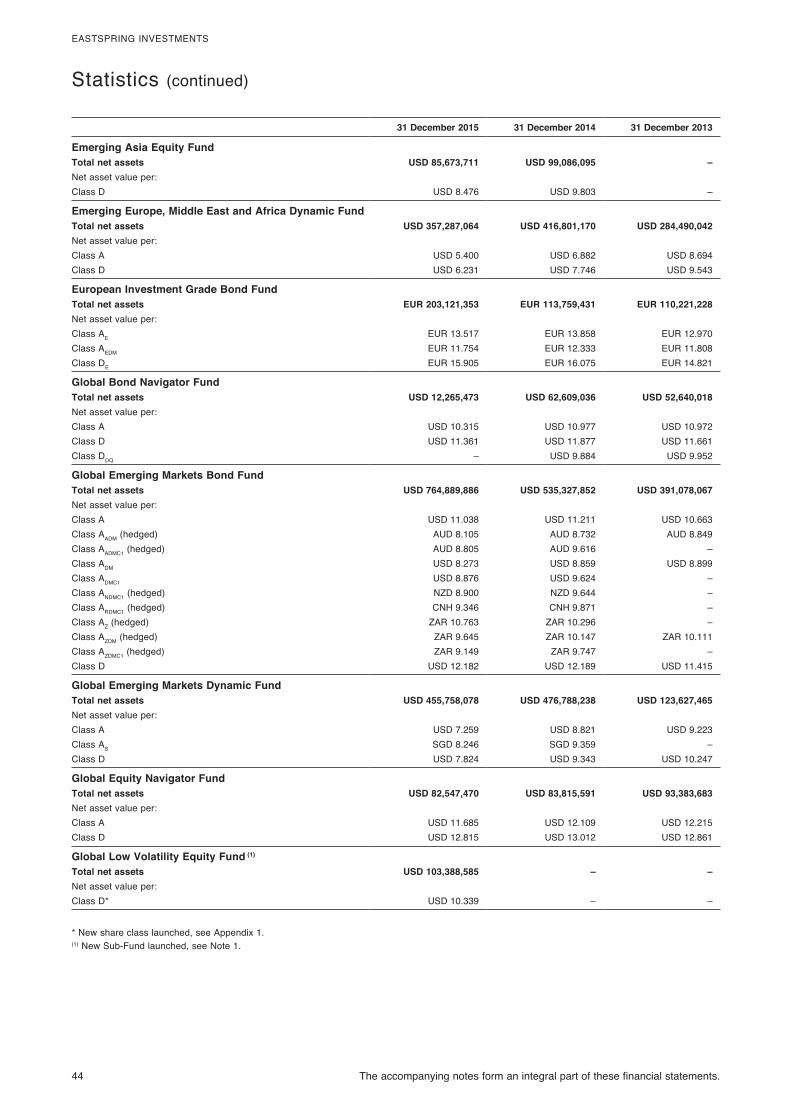
44 The accompanying notes form an integral part of these financial statements.
EASTSPRING INVESTMENTS
Statistics (continued)
31 December 2015 31 December 2014 31 December 2013
Emerging Asia Equity FundTotal net assets USD 85,673,711 USD 99,086,095 –Net asset value per:Class D USD 8.476 USD 9.803 –
Emerging Europe, Middle East and Africa Dynamic FundTotal net assets USD 357,287,064 USD 416,801,170 USD 284,490,042Net asset value per:Class A USD 5.400 USD 6.882 USD 8.694Class D USD 6.231 USD 7.746 USD 9.543
European Investment Grade Bond FundTotal net assets EUR 203,121,353 EUR 113,759,431 EUR 110,221,228Net asset value per:Class AE EUR 13.517 EUR 13.858 EUR 12.970Class AEDM EUR 11.754 EUR 12.333 EUR 11.808Class DE EUR 15.905 EUR 16.075 EUR 14.821
Global Bond Navigator FundTotal net assets USD 12,265,473 USD 62,609,036 USD 52,640,018Net asset value per:Class A USD 10.315 USD 10.977 USD 10.972Class D USD 11.361 USD 11.877 USD 11.661Class DDQ – USD 9.884 USD 9.952
Global Emerging Markets Bond FundTotal net assets USD 764,889,886 USD 535,327,852 USD 391,078,067Net asset value per:Class A USD 11.038 USD 11.211 USD 10.663Class AADM (hedged) AUD 8.105 AUD 8.732 AUD 8.849Class AADMC1 (hedged) AUD 8.805 AUD 9.616 –Class ADM USD 8.273 USD 8.859 USD 8.899Class ADMC1 USD 8.876 USD 9.624 –Class ANDMC1 (hedged) NZD 8.900 NZD 9.644 –Class ARDMC1 (hedged) CNH 9.346 CNH 9.871 –Class AZ (hedged) ZAR 10.763 ZAR 10.296 –Class AZDM (hedged) ZAR 9.645 ZAR 10.147 ZAR 10.111Class AZDMC1 (hedged) ZAR 9.149 ZAR 9.747 –Class D USD 12.182 USD 12.189 USD 11.415
Global Emerging Markets Dynamic FundTotal net assets USD 455,758,078 USD 476,788,238 USD 123,627,465Net asset value per:Class A USD 7.259 USD 8.821 USD 9.223Class AS SGD 8.246 SGD 9.359 –Class D USD 7.824 USD 9.343 USD 10.247
Global Equity Navigator FundTotal net assets USD 82,547,470 USD 83,815,591 USD 93,383,683Net asset value per:Class A USD 11.685 USD 12.109 USD 12.215Class D USD 12.815 USD 13.012 USD 12.861
Global Low Volatility Equity Fund (1)
Total net assets USD 103,388,585 – –Net asset value per:Class D* USD 10.339 – –
* New share class launched, see Appendix 1.(1) New Sub-Fund launched, see Note 1.

The accompanying notes form an integral part of these financial statements. 45
EASTSPRING INVESTMENTS
Statistics (continued)
31 December 2015 31 December 2014 31 December 2013
Global Market Navigator FundTotal net assets USD 13,175,295 USD 11,129,293 USD 11,692,942Net asset value per:Class A USD 11.230 USD 11.668 USD 11.542Class AADMC1 (hedged) AUD 8.940 AUD 9.853 AUD 10.342Class ADMC1 USD 8.953 USD 9.876 USD 10.357Class ANDMC1 (hedged) NZD 9.178 NZD 10.000 NZD 10.355Class ASDMC1 (hedged) SGD 8.920 SGD 9.818 SGD 10.313Class C USD 12.239 USD 12.616 USD 12.375Class D USD 12.784 USD 13.080 USD 12.734Class DJDQ JPY 1,240 JPY 1,286 JPY 1,117
Global Technology FundTotal net assets USD 91,200,845 USD 91,081,490 USD 84,900,665Net asset value per:Class A USD 18.766 USD 18.136 USD 16.536Class CS SGD 10.709 SGD 9.537 SGD 8.181
Greater China Equity FundTotal net assets USD 112,771,449 USD 130,604,878 USD 120,093,155Net asset value per:Class A USD 18.423 USD 20.336 USD 19.630Class AH HKD 9.007 HKD 9.949 HKD 9.600Class C USD 28.381 USD 30.926 USD 29.467Class D USD 9.927 USD 10.736 USD 10.153
Hong Kong Equity FundTotal net assets USD 585,203,395 USD 589,123,542 USD 627,677,108Net asset value per:Class A USD 11.538 USD 12.266 USD 12.142Class AH HKD 10.295 HKD 10.952 HKD 10.832Class D USD 19.375 USD 20.182 USD 19.559
India Equity FundTotal net assets USD 158,172,552 USD 164,410,215 USD 163,845,872Net asset value per:Class A USD 11.132 USD 12.020 USD 9.249Class AS SGD 13.397 SGD 13.522 SGD 9.932Class B USD 12.077 USD 12.891 USD 9.802Class C USD 13.198 USD 14.067 USD 10.682Class D USD 24.693 USD 26.126 USD 19.696Class J USD 12.744 USD 13.513 USD 10.210Class R USD 11.839 USD 12.676 USD 9.678
Indonesia Equity FundTotal net assets USD 192,386,729 USD 320,811,063 USD 356,995,380Net asset value per:Class A USD 13.528 USD 17.442 USD 14.222Class AS SGD 8.870 SGD 10.678 SGD 8.349Class B USD 7.484 USD 9.537 USD 7.683Class C USD 7.888 USD 10.044 USD 8.085Class D USD 7.619 USD 9.625 USD 7.689Class J USD 15.483 USD 19.614 USD 15.706
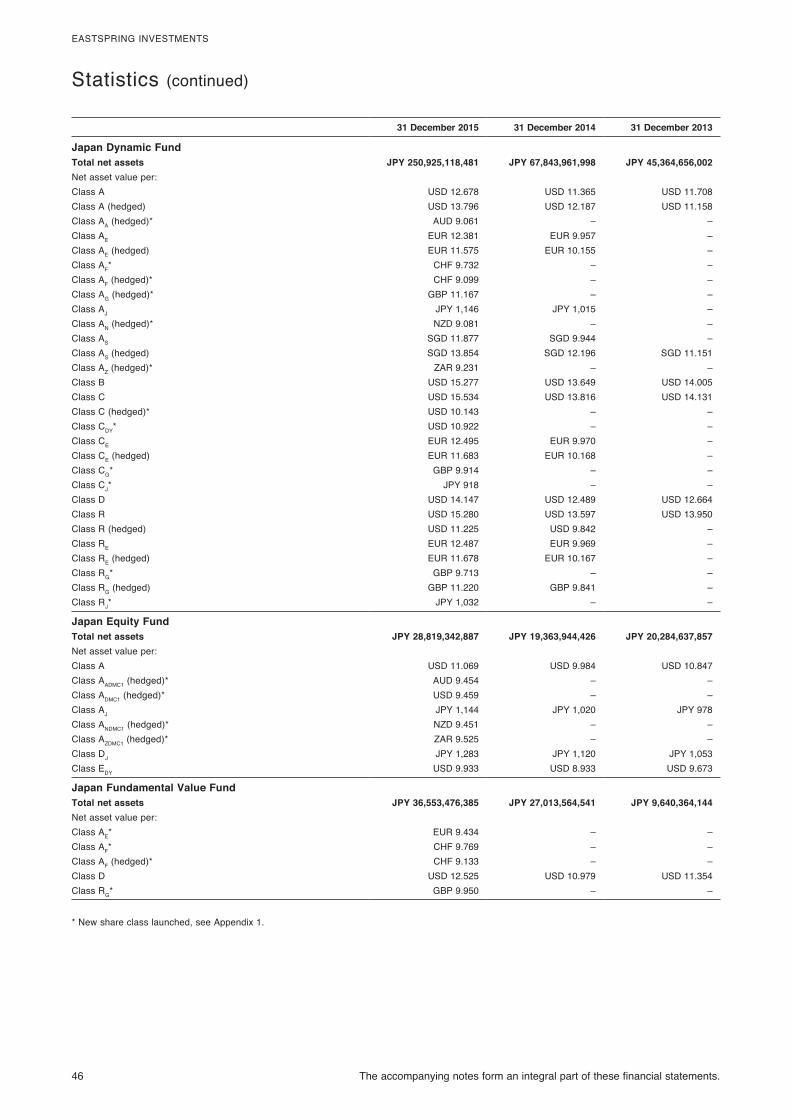
46 The accompanying notes form an integral part of these financial statements.
EASTSPRING INVESTMENTS
Statistics (continued)
31 December 2015 31 December 2014 31 December 2013
Japan Dynamic FundTotal net assets JPY 250,925,118,481 JPY 67,843,961,998 JPY 45,364,656,002Net asset value per:Class A USD 12.678 USD 11.365 USD 11.708Class A (hedged) USD 13.796 USD 12.187 USD 11.158Class AA (hedged)* AUD 9.061 – –Class AE EUR 12.381 EUR 9.957 –Class AE (hedged) EUR 11.575 EUR 10.155 –Class AF* CHF 9.732 – –Class AF (hedged)* CHF 9.099 – –Class AG (hedged)* GBP 11.167 – –Class AJ JPY 1,146 JPY 1,015 –Class AN (hedged)* NZD 9.081 – –Class AS SGD 11.877 SGD 9.944 –Class AS (hedged) SGD 13.854 SGD 12.196 SGD 11.151Class AZ (hedged)* ZAR 9.231 – –Class B USD 15.277 USD 13.649 USD 14.005Class C USD 15.534 USD 13.816 USD 14.131Class C (hedged)* USD 10.143 – –Class CDY* USD 10.922 – –Class CE EUR 12.495 EUR 9.970 –Class CE (hedged) EUR 11.683 EUR 10.168 –Class CG* GBP 9.914 – –Class CJ* JPY 918 – –Class D USD 14.147 USD 12.489 USD 12.664Class R USD 15.280 USD 13.597 USD 13.950Class R (hedged) USD 11.225 USD 9.842 –Class RE EUR 12.487 EUR 9.969 –Class RE (hedged) EUR 11.678 EUR 10.167 –Class RG* GBP 9.713 – –Class RG (hedged) GBP 11.220 GBP 9.841 –Class RJ* JPY 1,032 – –
Japan Equity FundTotal net assets JPY 28,819,342,887 JPY 19,363,944,426 JPY 20,284,637,857Net asset value per:Class A USD 11.069 USD 9.984 USD 10.847Class AADMC1 (hedged)* AUD 9.454 – –Class ADMC1 (hedged)* USD 9.459 – –Class AJ JPY 1,144 JPY 1,020 JPY 978Class ANDMC1 (hedged)* NZD 9.451 – –Class AZDMC1 (hedged)* ZAR 9.525 – –Class DJ JPY 1,283 JPY 1,120 JPY 1,053Class EDY USD 9.933 USD 8.933 USD 9.673
Japan Fundamental Value FundTotal net assets JPY 36,553,476,385 JPY 27,013,564,541 JPY 9,640,364,144Net asset value per:Class AE* EUR 9.434 – –Class AF* CHF 9.769 – –Class AF (hedged)* CHF 9.133 – –Class D USD 12.525 USD 10.979 USD 11.354Class RG* GBP 9.950 – –
* New share class launched, see Appendix 1.

The accompanying notes form an integral part of these financial statements. 47
EASTSPRING INVESTMENTS
Statistics (continued)
31 December 2015 31 December 2014 31 December 2013
Japan Smaller Companies FundTotal net assets JPY 19,325,987,377 JPY 8,868,561,408 JPY 4,183,182,553Net asset value per:Class A USD 20.810 USD 19.068 USD 18.611Class BJ JPY 1,255 JPY 1,124 –Class CG* GBP 9.902 – –Class CJ JPY 2,330 JPY 2,084 JPY 1,775Class EDY USD 21.104 USD 19.225 USD 18.653Class RG* GBP 9.887 – –Class RJ* JPY 942 – –
Latin American Equity FundTotal net assets USD 184,223,391 USD 316,947,802 USD 351,688,946Net asset value per:Class A USD 3.085 USD 5.110 USD 6.205Class D USD 3.876 USD 6.290 USD 7.481Class EDY USD 2.968 USD 5.006 USD 6.121
Malaysia Equity FundTotal net assets USD 7,828,993 USD 9,882,404 USD 13,369,184Net asset value per:Class A USD 10.191 USD 13.106 USD 14.984Class J USD 11.614 USD 14.702 USD 16.489
North America Fund (2)
Total net assets – USD 158,157,264 USD 461,412,805Net asset value per:Class D – USD 19.209 USD 16.944
North American Value FundTotal net assets USD 1,691,857,314 USD 1,495,864,848 USD 986,911,720Net asset value per:Class A USD 10.775 USD 12.159 USD 10.949Class AADMC1 (hedged) AUD 8.704 AUD 10.078 –Class ADMC1 USD 8.693 USD 10.075 –Class ANDMC1 (hedged) NZD 8.698 NZD 10.076 –Class AS SGD 11.891 SGD 12.542 SGD 10.780Class AZDMC1 (hedged) ZAR 8.794 ZAR 10.078 –Class D USD 12.546 USD 13.872 USD 12.239
Pan European FundTotal net assets USD 47,694,509 USD 44,822,297 USD 46,058,198Net asset value per:Class A USD 13.641 USD 13.288 USD 14.505Class CS SGD 14.095 SGD 12.713 SGD 13.118
Philippines Equity FundTotal net assets USD 65,046,349 USD 163,686,010 USD 208,066,479Net asset value per:Class A USD 17.847 USD 19.907 USD 16.298Class AS SGD 11.775 SGD 12.314 SGD 9.649Class B USD 9.699 USD 10.690 USD 8.653Class C* USD 8.898 – –Class J USD 20.358 USD 22.315 USD 17.949Class Jj JPY 11,432 JPY 12,574 JPY 8,798
Thailand Equity FundTotal net assets USD 14,180,728 USD 20,571,700 USD 27,124,760Net asset value per:Class A USD 14.396 USD 19.052 USD 17.096Class J USD 16.514 USD 21.455 USD 18.880
* New share class launched, see Appendix 1.(2) Sub-Fund fully redeemed, see Note 1.
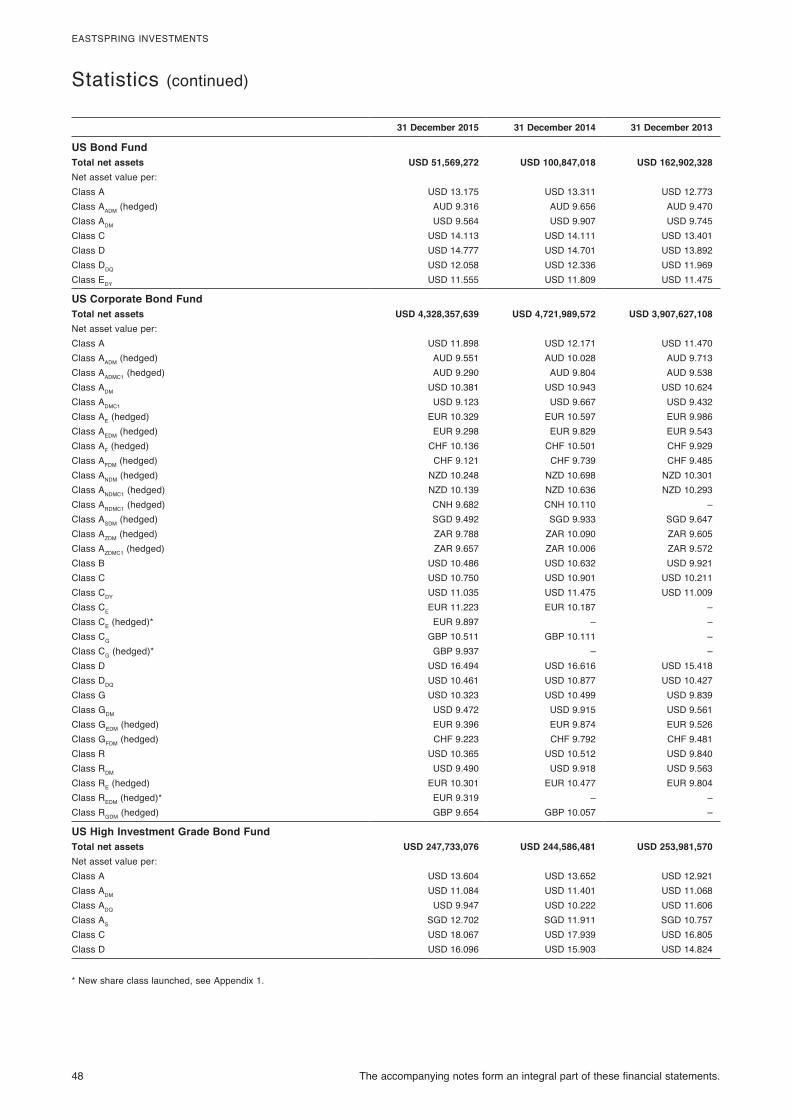
48 The accompanying notes form an integral part of these financial statements.
EASTSPRING INVESTMENTS
Statistics (continued)
31 December 2015 31 December 2014 31 December 2013
US Bond FundTotal net assets USD 51,569,272 USD 100,847,018 USD 162,902,328Net asset value per:Class A USD 13.175 USD 13.311 USD 12.773Class AADM (hedged) AUD 9.316 AUD 9.656 AUD 9.470Class ADM USD 9.564 USD 9.907 USD 9.745Class C USD 14.113 USD 14.111 USD 13.401Class D USD 14.777 USD 14.701 USD 13.892Class DDQ USD 12.058 USD 12.336 USD 11.969Class EDY USD 11.555 USD 11.809 USD 11.475
US Corporate Bond FundTotal net assets USD 4,328,357,639 USD 4,721,989,572 USD 3,907,627,108Net asset value per:Class A USD 11.898 USD 12.171 USD 11.470Class AADM (hedged) AUD 9.551 AUD 10.028 AUD 9.713Class AADMC1 (hedged) AUD 9.290 AUD 9.804 AUD 9.538Class ADM USD 10.381 USD 10.943 USD 10.624Class ADMC1 USD 9.123 USD 9.667 USD 9.432Class AE (hedged) EUR 10.329 EUR 10.597 EUR 9.986Class AEDM (hedged) EUR 9.298 EUR 9.829 EUR 9.543Class AF (hedged) CHF 10.136 CHF 10.501 CHF 9.929Class AFDM (hedged) CHF 9.121 CHF 9.739 CHF 9.485Class ANDM (hedged) NZD 10.248 NZD 10.698 NZD 10.301Class ANDMC1 (hedged) NZD 10.139 NZD 10.636 NZD 10.293Class ARDMC1 (hedged) CNH 9.682 CNH 10.110 –Class ASDM (hedged) SGD 9.492 SGD 9.933 SGD 9.647Class AZDM (hedged) ZAR 9.788 ZAR 10.090 ZAR 9.605Class AZDMC1 (hedged) ZAR 9.657 ZAR 10.006 ZAR 9.572Class B USD 10.486 USD 10.632 USD 9.921Class C USD 10.750 USD 10.901 USD 10.211Class CDY USD 11.035 USD 11.475 USD 11.009Class CE EUR 11.223 EUR 10.187 –Class CE (hedged)* EUR 9.897 – –Class CG GBP 10.511 GBP 10.111 –Class CG (hedged)* GBP 9.937 – –Class D USD 16.494 USD 16.616 USD 15.418Class DDQ USD 10.461 USD 10.877 USD 10.427Class G USD 10.323 USD 10.499 USD 9.839Class GDM USD 9.472 USD 9.915 USD 9.561Class GEDM (hedged) EUR 9.396 EUR 9.874 EUR 9.526Class GFDM (hedged) CHF 9.223 CHF 9.792 CHF 9.481Class R USD 10.365 USD 10.512 USD 9.840Class RDM USD 9.490 USD 9.918 USD 9.563Class RE (hedged) EUR 10.301 EUR 10.477 EUR 9.804Class REDM (hedged)* EUR 9.319 – –Class RGDM (hedged) GBP 9.654 GBP 10.057 –
US High Investment Grade Bond FundTotal net assets USD 247,733,076 USD 244,586,481 USD 253,981,570Net asset value per:Class A USD 13.604 USD 13.652 USD 12.921Class ADM USD 11.084 USD 11.401 USD 11.068Class ADQ USD 9.947 USD 10.222 USD 11.606Class AS SGD 12.702 SGD 11.911 SGD 10.757Class C USD 18.067 USD 17.939 USD 16.805Class D USD 16.096 USD 15.903 USD 14.824
* New share class launched, see Appendix 1.
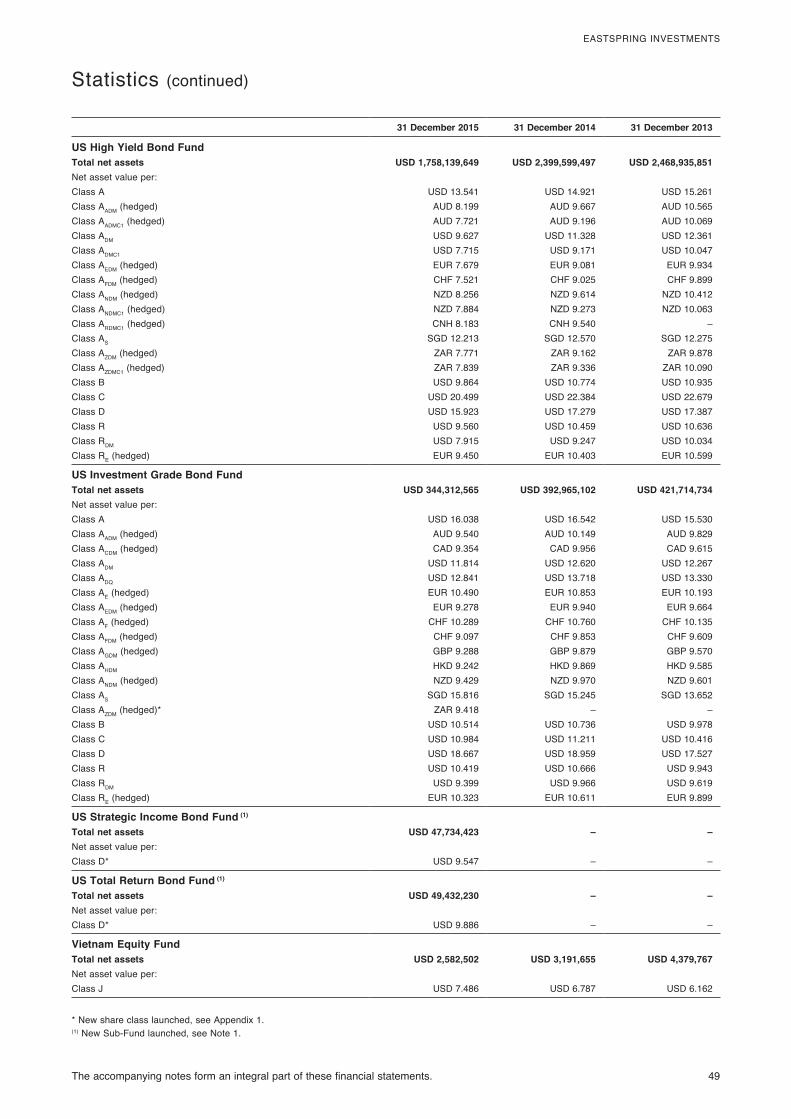
The accompanying notes form an integral part of these financial statements. 49
EASTSPRING INVESTMENTS
Statistics (continued)
31 December 2015 31 December 2014 31 December 2013
US High Yield Bond FundTotal net assets USD 1,758,139,649 USD 2,399,599,497 USD 2,468,935,851Net asset value per:Class A USD 13.541 USD 14.921 USD 15.261Class AADM (hedged) AUD 8.199 AUD 9.667 AUD 10.565Class AADMC1 (hedged) AUD 7.721 AUD 9.196 AUD 10.069Class ADM USD 9.627 USD 11.328 USD 12.361Class ADMC1 USD 7.715 USD 9.171 USD 10.047Class AEDM (hedged) EUR 7.679 EUR 9.081 EUR 9.934Class AFDM (hedged) CHF 7.521 CHF 9.025 CHF 9.899Class ANDM (hedged) NZD 8.256 NZD 9.614 NZD 10.412Class ANDMC1 (hedged) NZD 7.884 NZD 9.273 NZD 10.063Class ARDMC1 (hedged) CNH 8.183 CNH 9.540 –Class AS SGD 12.213 SGD 12.570 SGD 12.275Class AZDM (hedged) ZAR 7.771 ZAR 9.162 ZAR 9.878Class AZDMC1 (hedged) ZAR 7.839 ZAR 9.336 ZAR 10.090Class B USD 9.864 USD 10.774 USD 10.935Class C USD 20.499 USD 22.384 USD 22.679Class D USD 15.923 USD 17.279 USD 17.387Class R USD 9.560 USD 10.459 USD 10.636Class RDM USD 7.915 USD 9.247 USD 10.034Class RE (hedged) EUR 9.450 EUR 10.403 EUR 10.599
US Investment Grade Bond FundTotal net assets USD 344,312,565 USD 392,965,102 USD 421,714,734Net asset value per:Class A USD 16.038 USD 16.542 USD 15.530Class AADM (hedged) AUD 9.540 AUD 10.149 AUD 9.829Class ACDM (hedged) CAD 9.354 CAD 9.956 CAD 9.615Class ADM USD 11.814 USD 12.620 USD 12.267Class ADQ USD 12.841 USD 13.718 USD 13.330Class AE (hedged) EUR 10.490 EUR 10.853 EUR 10.193Class AEDM (hedged) EUR 9.278 EUR 9.940 EUR 9.664Class AF (hedged) CHF 10.289 CHF 10.760 CHF 10.135Class AFDM (hedged) CHF 9.097 CHF 9.853 CHF 9.609Class AGDM (hedged) GBP 9.288 GBP 9.879 GBP 9.570Class AHDM HKD 9.242 HKD 9.869 HKD 9.585Class ANDM (hedged) NZD 9.429 NZD 9.970 NZD 9.601Class AS SGD 15.816 SGD 15.245 SGD 13.652Class AZDM (hedged)* ZAR 9.418 – –Class B USD 10.514 USD 10.736 USD 9.978Class C USD 10.984 USD 11.211 USD 10.416Class D USD 18.667 USD 18.959 USD 17.527Class R USD 10.419 USD 10.666 USD 9.943Class RDM USD 9.399 USD 9.966 USD 9.619Class RE (hedged) EUR 10.323 EUR 10.611 EUR 9.899
US Strategic Income Bond Fund (1)
Total net assets USD 47,734,423 – –Net asset value per:Class D* USD 9.547 – –
US Total Return Bond Fund (1)
Total net assets USD 49,432,230 – –Net asset value per:Class D* USD 9.886 – –
Vietnam Equity FundTotal net assets USD 2,582,502 USD 3,191,655 USD 4,379,767Net asset value per:Class J USD 7.486 USD 6.787 USD 6.162
* New share class launched, see Appendix 1.(1) New Sub-Fund launched, see Note 1.
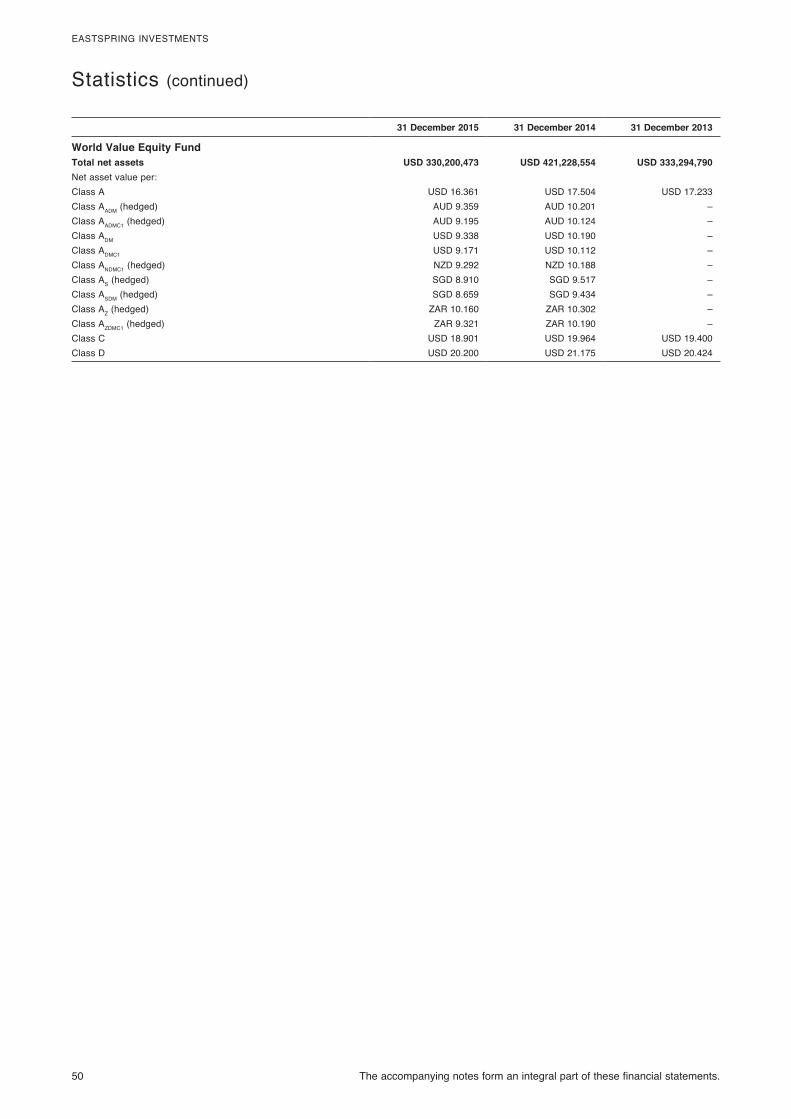
50 The accompanying notes form an integral part of these financial statements.
EASTSPRING INVESTMENTS
Statistics (continued)
31 December 2015 31 December 2014 31 December 2013
World Value Equity FundTotal net assets USD 330,200,473 USD 421,228,554 USD 333,294,790Net asset value per:Class A USD 16.361 USD 17.504 USD 17.233Class AADM (hedged) AUD 9.359 AUD 10.201 –Class AADMC1 (hedged) AUD 9.195 AUD 10.124 –Class ADM USD 9.338 USD 10.190 –Class ADMC1 USD 9.171 USD 10.112 –Class ANDMC1 (hedged) NZD 9.292 NZD 10.188 –Class AS (hedged) SGD 8.910 SGD 9.517 –Class ASDM (hedged) SGD 8.659 SGD 9.434 –Class AZ (hedged) ZAR 10.160 ZAR 10.302 –Class AZDMC1 (hedged) ZAR 9.321 ZAR 10.190 –Class C USD 18.901 USD 19.964 USD 19.400Class D USD 20.200 USD 21.175 USD 20.424
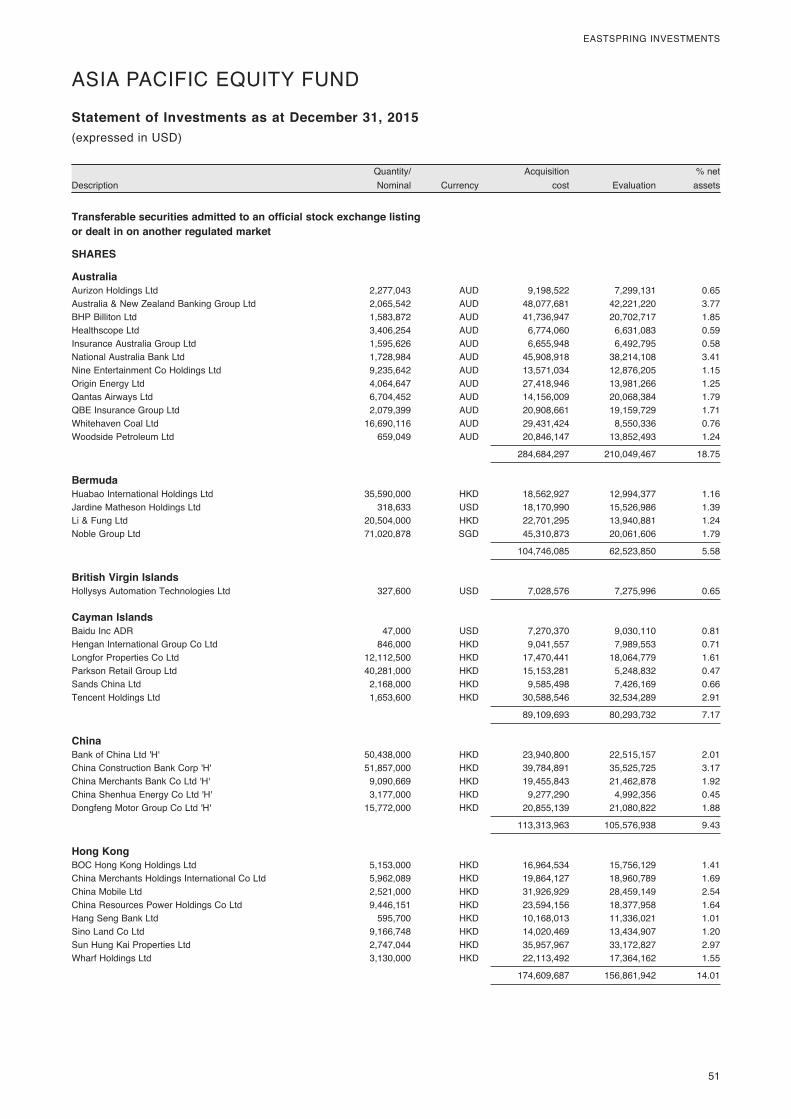
51
EASTSPRING INVESTMENTS
DescriptionQuantity/ Nominal Currency
Acquisition cost Evaluation
% net assets
Statement of Investments as at December 31, 2015
Transferable securities admitted to an official stock exchange listing or dealt in on another regulated market
SHARES
Australia Aurizon Holdings Ltd 2,277,043 AUD 9,198,522 7,299,131 0.65Australia & New Zealand Banking Group Ltd 2,065,542 AUD 48,077,681 42,221,220 3.77BHP Billiton Ltd 1,583,872 AUD 41,736,947 20,702,717 1.85Healthscope Ltd 3,406,254 AUD 6,774,060 6,631,083 0.59Insurance Australia Group Ltd 1,595,626 AUD 6,655,948 6,492,795 0.58National Australia Bank Ltd 1,728,984 AUD 45,908,918 38,214,108 3.41Nine Entertainment Co Holdings Ltd 9,235,642 AUD 13,571,034 12,876,205 1.15Origin Energy Ltd 4,064,647 AUD 27,418,946 13,981,266 1.25Qantas Airways Ltd 6,704,452 AUD 14,156,009 20,068,384 1.79QBE Insurance Group Ltd 2,079,399 AUD 20,908,661 19,159,729 1.71Whitehaven Coal Ltd 16,690,116 AUD 29,431,424 8,550,336 0.76Woodside Petroleum Ltd 659,049 AUD 20,846,147 13,852,493 1.24
284,684,297 210,049,467 18.75
Bermuda Huabao International Holdings Ltd 35,590,000 HKD 18,562,927 12,994,377 1.16Jardine Matheson Holdings Ltd 318,633 USD 18,170,990 15,526,986 1.39Li & Fung Ltd 20,504,000 HKD 22,701,295 13,940,881 1.24Noble Group Ltd 71,020,878 SGD 45,310,873 20,061,606 1.79
104,746,085 62,523,850 5.58
British Virgin Islands Hollysys Automation Technologies Ltd 327,600 USD 7,028,576 7,275,996 0.65
Cayman Islands Baidu Inc ADR 47,000 USD 7,270,370 9,030,110 0.81Hengan International Group Co Ltd 846,000 HKD 9,041,557 7,989,553 0.71Longfor Properties Co Ltd 12,112,500 HKD 17,470,441 18,064,779 1.61Parkson Retail Group Ltd 40,281,000 HKD 15,153,281 5,248,832 0.47Sands China Ltd 2,168,000 HKD 9,585,498 7,426,169 0.66Tencent Holdings Ltd 1,653,600 HKD 30,588,546 32,534,289 2.91
89,109,693 80,293,732 7.17
China Bank of China Ltd 'H' 50,438,000 HKD 23,940,800 22,515,157 2.01China Construction Bank Corp 'H' 51,857,000 HKD 39,784,891 35,525,725 3.17China Merchants Bank Co Ltd 'H' 9,090,669 HKD 19,455,843 21,462,878 1.92China Shenhua Energy Co Ltd 'H' 3,177,000 HKD 9,277,290 4,992,356 0.45Dongfeng Motor Group Co Ltd 'H' 15,772,000 HKD 20,855,139 21,080,822 1.88
113,313,963 105,576,938 9.43
Hong Kong BOC Hong Kong Holdings Ltd 5,153,000 HKD 16,964,534 15,756,129 1.41China Merchants Holdings International Co Ltd 5,962,089 HKD 19,864,127 18,960,789 1.69China Mobile Ltd 2,521,000 HKD 31,926,929 28,459,149 2.54China Resources Power Holdings Co Ltd 9,446,151 HKD 23,594,156 18,377,958 1.64Hang Seng Bank Ltd 595,700 HKD 10,168,013 11,336,021 1.01Sino Land Co Ltd 9,166,748 HKD 14,020,469 13,434,907 1.20Sun Hung Kai Properties Ltd 2,747,044 HKD 35,957,967 33,172,827 2.97Wharf Holdings Ltd 3,130,000 HKD 22,113,492 17,364,162 1.55
174,609,687 156,861,942 14.01
(expressed in USD)
ASIA PACIFIC EQUITY FUND

52
EASTSPRING INVESTMENTS
DescriptionQuantity/ Nominal Currency
Acquisition cost Evaluation
% net assets
Statement of Investments as at December 31, 2015(expressed in USD)
ASIA PACIFIC EQUITY FUND (continued)
India Cairn India Ltd 3,175,226 INR 8,371,479 6,628,230 0.59Housing Development Finance Corp Ltd 1,346,784 INR 23,317,508 25,726,953 2.29Infosys Ltd 1,119,270 INR 17,074,588 18,701,807 1.67Punjab National Bank 2,576,386 INR 5,918,572 4,505,817 0.40Reliance Industries Ltd 463,745 INR 6,328,552 7,112,190 0.64Vedanta Ltd 8,507,601 INR 22,181,385 11,625,316 1.04
83,192,084 74,300,313 6.63
Indonesia Bank Negara Indonesia Persero Tbk PT 44,001,000 IDR 17,283,023 15,927,819 1.42Salim Ivomas Pratama Tbk PT 171,715,990 IDR 12,139,951 4,135,633 0.37
29,422,974 20,063,452 1.79
Malaysia CIMB Group Holdings Bhd 23,429,269 MYR 33,214,838 24,774,344 2.21Genting Malaysia Bhd 10,988,300 MYR 13,013,667 11,209,654 1.00
46,228,505 35,983,998 3.21
Philippines Philippine Long Distance Telephone Co 152,850 PHP 9,527,504 6,691,552 0.60
Singapore CapitaLand Ltd 4,309,600 SGD 10,310,664 10,195,334 0.91DBS Group Holdings Ltd 979,054 SGD 13,122,373 11,539,385 1.03Oversea-Chinese Banking Corp Ltd 1,966,600 SGD 14,293,806 12,221,327 1.09
37,726,843 33,956,046 3.03
South Korea Hana Financial Group Inc 1,116,439 KRW 32,910,803 22,470,649 2.01Hyundai Engineering & Construction Co Ltd 61,533 KRW 2,010,890 1,498,245 0.13Hyundai Motor Co 278,975 KRW 45,337,874 35,450,320 3.17KT Corp 669,560 KRW 20,130,389 16,131,567 1.44LG Corp 236,167 KRW 13,776,798 14,260,051 1.27Samsung Electronics Co Ltd 52,358 KRW 58,741,991 56,262,911 5.02SK Innovation Co Ltd 82,349 KRW 9,343,514 9,129,990 0.82
182,252,259 155,203,733 13.86
Taiwan Compal Electronics Inc 17,338,000 TWD 12,446,855 9,765,069 0.87HON HAI Precision Industry Co Ltd 9,999,900 TWD 24,348,652 24,598,669 2.20Taiwan Semiconductor Manufacturing Co Ltd 11,074,000 TWD 40,834,769 48,210,889 4.31Uni-President Enterprises Corp 9,461,833 TWD 15,866,398 15,814,381 1.41
93,496,674 98,389,008 8.79
Thailand Bangkok Bank PCL (Foreign Market) 3,729,341 THB 20,333,711 16,011,760 1.43PTT Exploration & Production PCL (Foreign Market) 5,833,300 THB 23,124,062 9,280,435 0.83
43,457,773 25,292,195 2.26
United Kingdom Standard Chartered Plc 2,581,196 HKD 32,605,087 21,779,091 1.94
Total Shares 1,331,402,004 1,094,241,313 97.70
Total Investments 1,331,402,004 1,094,241,313 97.70
Other Net Assets 25,717,571 2.30
Total Net Assets 1,119,958,884 100.00
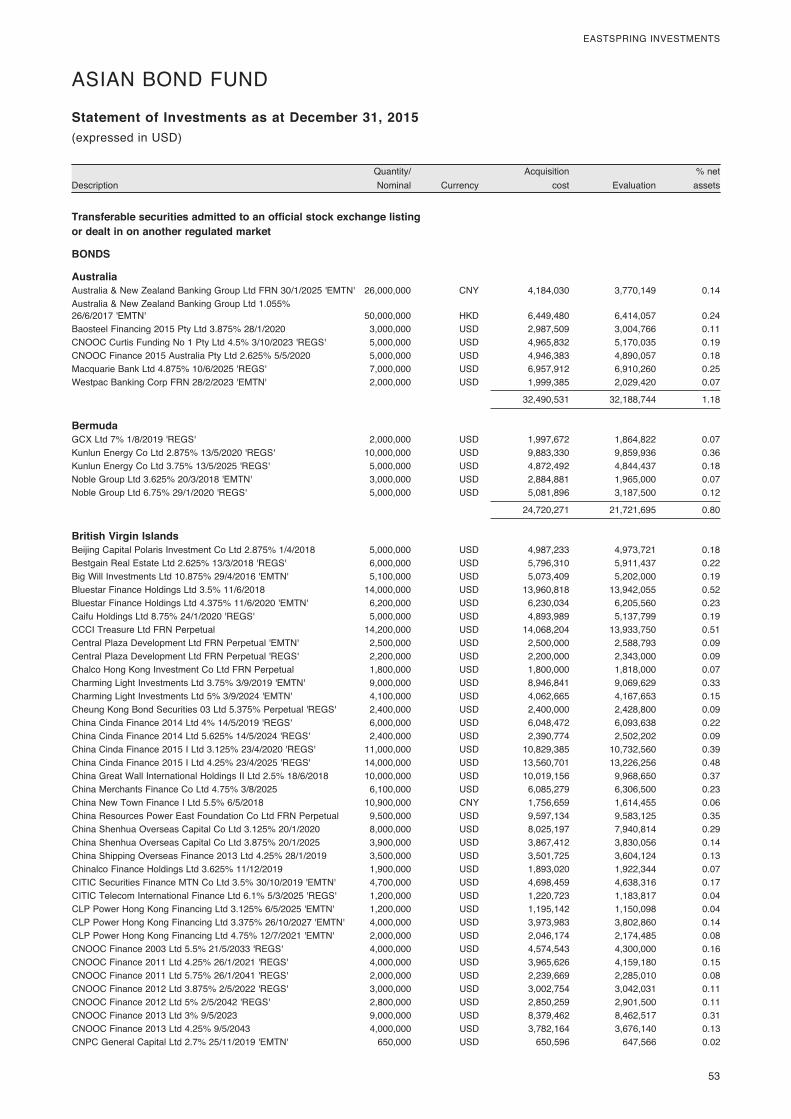
53
EASTSPRING INVESTMENTS
DescriptionQuantity/ Nominal Currency
Acquisition cost Evaluation
% net assets
Statement of Investments as at December 31, 2015
Transferable securities admitted to an official stock exchange listing or dealt in on another regulated market
BONDS
Australia Australia & New Zealand Banking Group Ltd FRN 30/1/2025 'EMTN' 26,000,000 CNY 4,184,030 3,770,149 0.14Australia & New Zealand Banking Group Ltd 1.055% 26/6/2017 'EMTN' 50,000,000 HKD 6,449,480 6,414,057 0.24Baosteel Financing 2015 Pty Ltd 3.875% 28/1/2020 3,000,000 USD 2,987,509 3,004,766 0.11CNOOC Curtis Funding No 1 Pty Ltd 4.5% 3/10/2023 'REGS' 5,000,000 USD 4,965,832 5,170,035 0.19CNOOC Finance 2015 Australia Pty Ltd 2.625% 5/5/2020 5,000,000 USD 4,946,383 4,890,057 0.18Macquarie Bank Ltd 4.875% 10/6/2025 'REGS' 7,000,000 USD 6,957,912 6,910,260 0.25Westpac Banking Corp FRN 28/2/2023 'EMTN' 2,000,000 USD 1,999,385 2,029,420 0.07
32,490,531 32,188,744 1.18
Bermuda GCX Ltd 7% 1/8/2019 'REGS' 2,000,000 USD 1,997,672 1,864,822 0.07Kunlun Energy Co Ltd 2.875% 13/5/2020 'REGS' 10,000,000 USD 9,883,330 9,859,936 0.36Kunlun Energy Co Ltd 3.75% 13/5/2025 'REGS' 5,000,000 USD 4,872,492 4,844,437 0.18Noble Group Ltd 3.625% 20/3/2018 'EMTN' 3,000,000 USD 2,884,881 1,965,000 0.07Noble Group Ltd 6.75% 29/1/2020 'REGS' 5,000,000 USD 5,081,896 3,187,500 0.12
24,720,271 21,721,695 0.80
British Virgin Islands Beijing Capital Polaris Investment Co Ltd 2.875% 1/4/2018 5,000,000 USD 4,987,233 4,973,721 0.18Bestgain Real Estate Ltd 2.625% 13/3/2018 'REGS' 6,000,000 USD 5,796,310 5,911,437 0.22Big Will Investments Ltd 10.875% 29/4/2016 'EMTN' 5,100,000 USD 5,073,409 5,202,000 0.19Bluestar Finance Holdings Ltd 3.5% 11/6/2018 14,000,000 USD 13,960,818 13,942,055 0.52Bluestar Finance Holdings Ltd 4.375% 11/6/2020 'EMTN' 6,200,000 USD 6,230,034 6,205,560 0.23Caifu Holdings Ltd 8.75% 24/1/2020 'REGS' 5,000,000 USD 4,893,989 5,137,799 0.19CCCI Treasure Ltd FRN Perpetual 14,200,000 USD 14,068,204 13,933,750 0.51Central Plaza Development Ltd FRN Perpetual 'EMTN' 2,500,000 USD 2,500,000 2,588,793 0.09Central Plaza Development Ltd FRN Perpetual 'REGS' 2,200,000 USD 2,200,000 2,343,000 0.09Chalco Hong Kong Investment Co Ltd FRN Perpetual 1,800,000 USD 1,800,000 1,818,000 0.07Charming Light Investments Ltd 3.75% 3/9/2019 'EMTN' 9,000,000 USD 8,946,841 9,069,629 0.33Charming Light Investments Ltd 5% 3/9/2024 'EMTN' 4,100,000 USD 4,062,665 4,167,653 0.15Cheung Kong Bond Securities 03 Ltd 5.375% Perpetual 'REGS' 2,400,000 USD 2,400,000 2,428,800 0.09China Cinda Finance 2014 Ltd 4% 14/5/2019 'REGS' 6,000,000 USD 6,048,472 6,093,638 0.22China Cinda Finance 2014 Ltd 5.625% 14/5/2024 'REGS' 2,400,000 USD 2,390,774 2,502,202 0.09China Cinda Finance 2015 I Ltd 3.125% 23/4/2020 'REGS' 11,000,000 USD 10,829,385 10,732,560 0.39China Cinda Finance 2015 I Ltd 4.25% 23/4/2025 'REGS' 14,000,000 USD 13,560,701 13,226,256 0.48China Great Wall International Holdings II Ltd 2.5% 18/6/2018 10,000,000 USD 10,019,156 9,968,650 0.37China Merchants Finance Co Ltd 4.75% 3/8/2025 6,100,000 USD 6,085,279 6,306,500 0.23China New Town Finance I Ltd 5.5% 6/5/2018 10,900,000 CNY 1,756,659 1,614,455 0.06China Resources Power East Foundation Co Ltd FRN Perpetual 9,500,000 USD 9,597,134 9,583,125 0.35China Shenhua Overseas Capital Co Ltd 3.125% 20/1/2020 8,000,000 USD 8,025,197 7,940,814 0.29China Shenhua Overseas Capital Co Ltd 3.875% 20/1/2025 3,900,000 USD 3,867,412 3,830,056 0.14China Shipping Overseas Finance 2013 Ltd 4.25% 28/1/2019 3,500,000 USD 3,501,725 3,604,124 0.13Chinalco Finance Holdings Ltd 3.625% 11/12/2019 1,900,000 USD 1,893,020 1,922,344 0.07CITIC Securities Finance MTN Co Ltd 3.5% 30/10/2019 'EMTN' 4,700,000 USD 4,698,459 4,638,316 0.17CITIC Telecom International Finance Ltd 6.1% 5/3/2025 'REGS' 1,200,000 USD 1,220,723 1,183,817 0.04CLP Power Hong Kong Financing Ltd 3.125% 6/5/2025 'EMTN' 1,200,000 USD 1,195,142 1,150,098 0.04CLP Power Hong Kong Financing Ltd 3.375% 26/10/2027 'EMTN' 4,000,000 USD 3,973,983 3,802,860 0.14CLP Power Hong Kong Financing Ltd 4.75% 12/7/2021 'EMTN' 2,000,000 USD 2,046,174 2,174,485 0.08CNOOC Finance 2003 Ltd 5.5% 21/5/2033 'REGS' 4,000,000 USD 4,574,543 4,300,000 0.16CNOOC Finance 2011 Ltd 4.25% 26/1/2021 'REGS' 4,000,000 USD 3,965,626 4,159,180 0.15CNOOC Finance 2011 Ltd 5.75% 26/1/2041 'REGS' 2,000,000 USD 2,239,669 2,285,010 0.08CNOOC Finance 2012 Ltd 3.875% 2/5/2022 'REGS' 3,000,000 USD 3,002,754 3,042,031 0.11CNOOC Finance 2012 Ltd 5% 2/5/2042 'REGS' 2,800,000 USD 2,850,259 2,901,500 0.11CNOOC Finance 2013 Ltd 3% 9/5/2023 9,000,000 USD 8,379,462 8,462,517 0.31CNOOC Finance 2013 Ltd 4.25% 9/5/2043 4,000,000 USD 3,782,164 3,676,140 0.13CNPC General Capital Ltd 2.7% 25/11/2019 'EMTN' 650,000 USD 650,596 647,566 0.02
(expressed in USD)
ASIAN BOND FUND
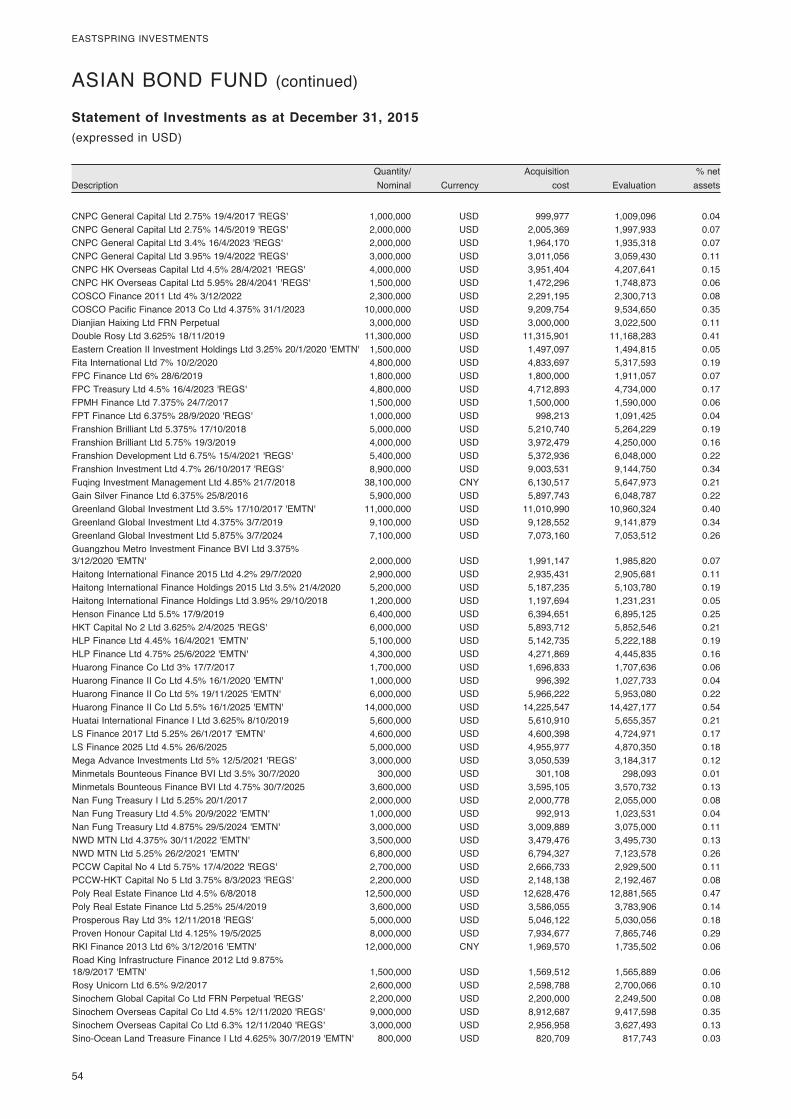
54
EASTSPRING INVESTMENTS
DescriptionQuantity/ Nominal Currency
Acquisition cost Evaluation
% net assets
Statement of Investments as at December 31, 2015(expressed in USD)
ASIAN BOND FUND (continued)
CNPC General Capital Ltd 2.75% 19/4/2017 'REGS' 1,000,000 USD 999,977 1,009,096 0.04CNPC General Capital Ltd 2.75% 14/5/2019 'REGS' 2,000,000 USD 2,005,369 1,997,933 0.07CNPC General Capital Ltd 3.4% 16/4/2023 'REGS' 2,000,000 USD 1,964,170 1,935,318 0.07CNPC General Capital Ltd 3.95% 19/4/2022 'REGS' 3,000,000 USD 3,011,056 3,059,430 0.11CNPC HK Overseas Capital Ltd 4.5% 28/4/2021 'REGS' 4,000,000 USD 3,951,404 4,207,641 0.15CNPC HK Overseas Capital Ltd 5.95% 28/4/2041 'REGS' 1,500,000 USD 1,472,296 1,748,873 0.06COSCO Finance 2011 Ltd 4% 3/12/2022 2,300,000 USD 2,291,195 2,300,713 0.08COSCO Pacific Finance 2013 Co Ltd 4.375% 31/1/2023 10,000,000 USD 9,209,754 9,534,650 0.35Dianjian Haixing Ltd FRN Perpetual 3,000,000 USD 3,000,000 3,022,500 0.11Double Rosy Ltd 3.625% 18/11/2019 11,300,000 USD 11,315,901 11,168,283 0.41Eastern Creation II Investment Holdings Ltd 3.25% 20/1/2020 'EMTN' 1,500,000 USD 1,497,097 1,494,815 0.05Fita International Ltd 7% 10/2/2020 4,800,000 USD 4,833,697 5,317,593 0.19FPC Finance Ltd 6% 28/6/2019 1,800,000 USD 1,800,000 1,911,057 0.07FPC Treasury Ltd 4.5% 16/4/2023 'REGS' 4,800,000 USD 4,712,893 4,734,000 0.17FPMH Finance Ltd 7.375% 24/7/2017 1,500,000 USD 1,500,000 1,590,000 0.06FPT Finance Ltd 6.375% 28/9/2020 'REGS' 1,000,000 USD 998,213 1,091,425 0.04Franshion Brilliant Ltd 5.375% 17/10/2018 5,000,000 USD 5,210,740 5,264,229 0.19Franshion Brilliant Ltd 5.75% 19/3/2019 4,000,000 USD 3,972,479 4,250,000 0.16Franshion Development Ltd 6.75% 15/4/2021 'REGS' 5,400,000 USD 5,372,936 6,048,000 0.22Franshion Investment Ltd 4.7% 26/10/2017 'REGS' 8,900,000 USD 9,003,531 9,144,750 0.34Fuqing Investment Management Ltd 4.85% 21/7/2018 38,100,000 CNY 6,130,517 5,647,973 0.21Gain Silver Finance Ltd 6.375% 25/8/2016 5,900,000 USD 5,897,743 6,048,787 0.22Greenland Global Investment Ltd 3.5% 17/10/2017 'EMTN' 11,000,000 USD 11,010,990 10,960,324 0.40Greenland Global Investment Ltd 4.375% 3/7/2019 9,100,000 USD 9,128,552 9,141,879 0.34Greenland Global Investment Ltd 5.875% 3/7/2024 7,100,000 USD 7,073,160 7,053,512 0.26Guangzhou Metro Investment Finance BVI Ltd 3.375% 3/12/2020 'EMTN' 2,000,000 USD 1,991,147 1,985,820 0.07Haitong International Finance 2015 Ltd 4.2% 29/7/2020 2,900,000 USD 2,935,431 2,905,681 0.11Haitong International Finance Holdings 2015 Ltd 3.5% 21/4/2020 5,200,000 USD 5,187,235 5,103,780 0.19Haitong International Finance Holdings Ltd 3.95% 29/10/2018 1,200,000 USD 1,197,694 1,231,231 0.05Henson Finance Ltd 5.5% 17/9/2019 6,400,000 USD 6,394,651 6,895,125 0.25HKT Capital No 2 Ltd 3.625% 2/4/2025 'REGS' 6,000,000 USD 5,893,712 5,852,546 0.21HLP Finance Ltd 4.45% 16/4/2021 'EMTN' 5,100,000 USD 5,142,735 5,222,188 0.19HLP Finance Ltd 4.75% 25/6/2022 'EMTN' 4,300,000 USD 4,271,869 4,445,835 0.16Huarong Finance Co Ltd 3% 17/7/2017 1,700,000 USD 1,696,833 1,707,636 0.06Huarong Finance II Co Ltd 4.5% 16/1/2020 'EMTN' 1,000,000 USD 996,392 1,027,733 0.04Huarong Finance II Co Ltd 5% 19/11/2025 'EMTN' 6,000,000 USD 5,966,222 5,953,080 0.22Huarong Finance II Co Ltd 5.5% 16/1/2025 'EMTN' 14,000,000 USD 14,225,547 14,427,177 0.54Huatai International Finance I Ltd 3.625% 8/10/2019 5,600,000 USD 5,610,910 5,655,357 0.21LS Finance 2017 Ltd 5.25% 26/1/2017 'EMTN' 4,600,000 USD 4,600,398 4,724,971 0.17LS Finance 2025 Ltd 4.5% 26/6/2025 5,000,000 USD 4,955,977 4,870,350 0.18Mega Advance Investments Ltd 5% 12/5/2021 'REGS' 3,000,000 USD 3,050,539 3,184,317 0.12Minmetals Bounteous Finance BVI Ltd 3.5% 30/7/2020 300,000 USD 301,108 298,093 0.01Minmetals Bounteous Finance BVI Ltd 4.75% 30/7/2025 3,600,000 USD 3,595,105 3,570,732 0.13Nan Fung Treasury I Ltd 5.25% 20/1/2017 2,000,000 USD 2,000,778 2,055,000 0.08Nan Fung Treasury Ltd 4.5% 20/9/2022 'EMTN' 1,000,000 USD 992,913 1,023,531 0.04Nan Fung Treasury Ltd 4.875% 29/5/2024 'EMTN' 3,000,000 USD 3,009,889 3,075,000 0.11NWD MTN Ltd 4.375% 30/11/2022 'EMTN' 3,500,000 USD 3,479,476 3,495,730 0.13NWD MTN Ltd 5.25% 26/2/2021 'EMTN' 6,800,000 USD 6,794,327 7,123,578 0.26PCCW Capital No 4 Ltd 5.75% 17/4/2022 'REGS' 2,700,000 USD 2,666,733 2,929,500 0.11PCCW-HKT Capital No 5 Ltd 3.75% 8/3/2023 'REGS' 2,200,000 USD 2,148,138 2,192,467 0.08Poly Real Estate Finance Ltd 4.5% 6/8/2018 12,500,000 USD 12,628,476 12,881,565 0.47Poly Real Estate Finance Ltd 5.25% 25/4/2019 3,600,000 USD 3,586,055 3,783,906 0.14Prosperous Ray Ltd 3% 12/11/2018 'REGS' 5,000,000 USD 5,046,122 5,030,056 0.18Proven Honour Capital Ltd 4.125% 19/5/2025 8,000,000 USD 7,934,677 7,865,746 0.29RKI Finance 2013 Ltd 6% 3/12/2016 'EMTN' 12,000,000 CNY 1,969,570 1,735,502 0.06Road King Infrastructure Finance 2012 Ltd 9.875% 18/9/2017 'EMTN' 1,500,000 USD 1,569,512 1,565,889 0.06Rosy Unicorn Ltd 6.5% 9/2/2017 2,600,000 USD 2,598,788 2,700,066 0.10Sinochem Global Capital Co Ltd FRN Perpetual 'REGS' 2,200,000 USD 2,200,000 2,249,500 0.08Sinochem Overseas Capital Co Ltd 4.5% 12/11/2020 'REGS' 9,000,000 USD 8,912,687 9,417,598 0.35Sinochem Overseas Capital Co Ltd 6.3% 12/11/2040 'REGS' 3,000,000 USD 2,956,958 3,627,493 0.13Sino-Ocean Land Treasure Finance I Ltd 4.625% 30/7/2019 'EMTN' 800,000 USD 820,709 817,743 0.03
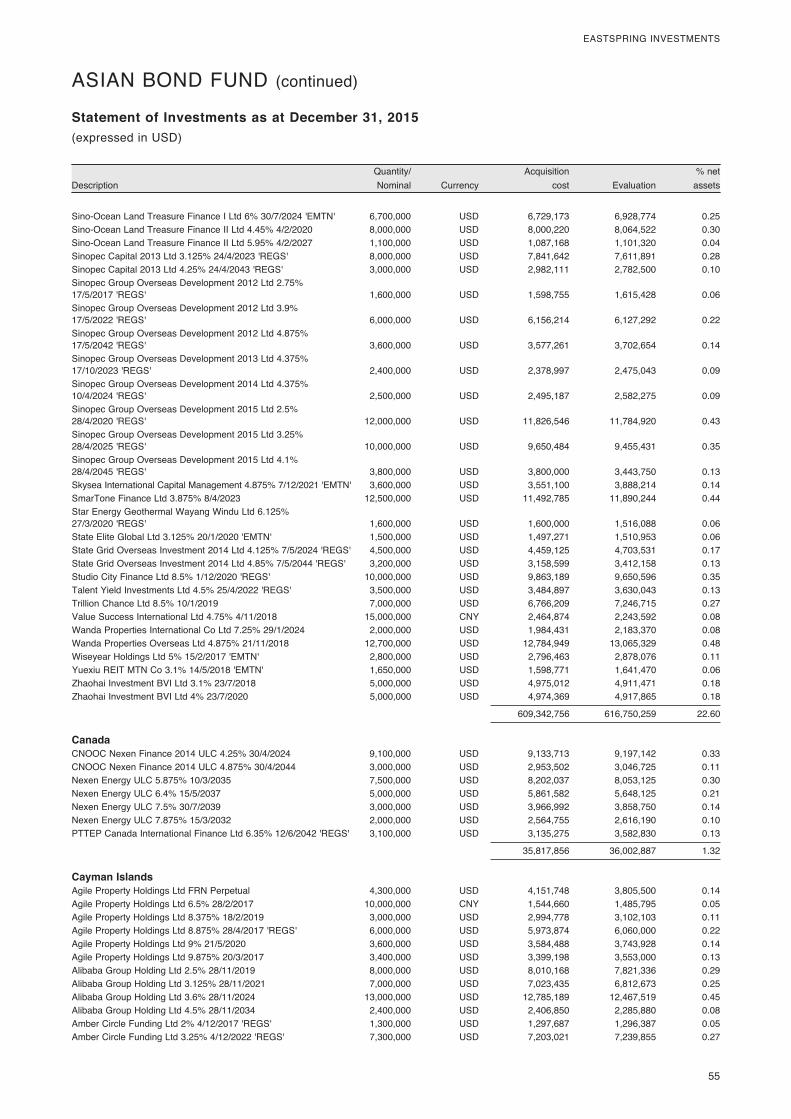
55
EASTSPRING INVESTMENTS
DescriptionQuantity/ Nominal Currency
Acquisition cost Evaluation
% net assets
Statement of Investments as at December 31, 2015(expressed in USD)
ASIAN BOND FUND (continued)
Sino-Ocean Land Treasure Finance I Ltd 6% 30/7/2024 'EMTN' 6,700,000 USD 6,729,173 6,928,774 0.25Sino-Ocean Land Treasure Finance II Ltd 4.45% 4/2/2020 8,000,000 USD 8,000,220 8,064,522 0.30Sino-Ocean Land Treasure Finance II Ltd 5.95% 4/2/2027 1,100,000 USD 1,087,168 1,101,320 0.04Sinopec Capital 2013 Ltd 3.125% 24/4/2023 'REGS' 8,000,000 USD 7,841,642 7,611,891 0.28Sinopec Capital 2013 Ltd 4.25% 24/4/2043 'REGS' 3,000,000 USD 2,982,111 2,782,500 0.10Sinopec Group Overseas Development 2012 Ltd 2.75% 17/5/2017 'REGS' 1,600,000 USD 1,598,755 1,615,428 0.06Sinopec Group Overseas Development 2012 Ltd 3.9% 17/5/2022 'REGS' 6,000,000 USD 6,156,214 6,127,292 0.22Sinopec Group Overseas Development 2012 Ltd 4.875% 17/5/2042 'REGS' 3,600,000 USD 3,577,261 3,702,654 0.14Sinopec Group Overseas Development 2013 Ltd 4.375% 17/10/2023 'REGS' 2,400,000 USD 2,378,997 2,475,043 0.09Sinopec Group Overseas Development 2014 Ltd 4.375% 10/4/2024 'REGS' 2,500,000 USD 2,495,187 2,582,275 0.09Sinopec Group Overseas Development 2015 Ltd 2.5% 28/4/2020 'REGS' 12,000,000 USD 11,826,546 11,784,920 0.43Sinopec Group Overseas Development 2015 Ltd 3.25% 28/4/2025 'REGS' 10,000,000 USD 9,650,484 9,455,431 0.35Sinopec Group Overseas Development 2015 Ltd 4.1% 28/4/2045 'REGS' 3,800,000 USD 3,800,000 3,443,750 0.13Skysea International Capital Management 4.875% 7/12/2021 'EMTN' 3,600,000 USD 3,551,100 3,888,214 0.14SmarTone Finance Ltd 3.875% 8/4/2023 12,500,000 USD 11,492,785 11,890,244 0.44Star Energy Geothermal Wayang Windu Ltd 6.125% 27/3/2020 'REGS' 1,600,000 USD 1,600,000 1,516,088 0.06State Elite Global Ltd 3.125% 20/1/2020 'EMTN' 1,500,000 USD 1,497,271 1,510,953 0.06State Grid Overseas Investment 2014 Ltd 4.125% 7/5/2024 'REGS' 4,500,000 USD 4,459,125 4,703,531 0.17State Grid Overseas Investment 2014 Ltd 4.85% 7/5/2044 'REGS' 3,200,000 USD 3,158,599 3,412,158 0.13Studio City Finance Ltd 8.5% 1/12/2020 'REGS' 10,000,000 USD 9,863,189 9,650,596 0.35Talent Yield Investments Ltd 4.5% 25/4/2022 'REGS' 3,500,000 USD 3,484,897 3,630,043 0.13Trillion Chance Ltd 8.5% 10/1/2019 7,000,000 USD 6,766,209 7,246,715 0.27Value Success International Ltd 4.75% 4/11/2018 15,000,000 CNY 2,464,874 2,243,592 0.08Wanda Properties International Co Ltd 7.25% 29/1/2024 2,000,000 USD 1,984,431 2,183,370 0.08Wanda Properties Overseas Ltd 4.875% 21/11/2018 12,700,000 USD 12,784,949 13,065,329 0.48Wiseyear Holdings Ltd 5% 15/2/2017 'EMTN' 2,800,000 USD 2,796,463 2,878,076 0.11Yuexiu REIT MTN Co 3.1% 14/5/2018 'EMTN' 1,650,000 USD 1,598,771 1,641,470 0.06Zhaohai Investment BVI Ltd 3.1% 23/7/2018 5,000,000 USD 4,975,012 4,911,471 0.18Zhaohai Investment BVI Ltd 4% 23/7/2020 5,000,000 USD 4,974,369 4,917,865 0.18
609,342,756 616,750,259 22.60
Canada CNOOC Nexen Finance 2014 ULC 4.25% 30/4/2024 9,100,000 USD 9,133,713 9,197,142 0.33CNOOC Nexen Finance 2014 ULC 4.875% 30/4/2044 3,000,000 USD 2,953,502 3,046,725 0.11Nexen Energy ULC 5.875% 10/3/2035 7,500,000 USD 8,202,037 8,053,125 0.30Nexen Energy ULC 6.4% 15/5/2037 5,000,000 USD 5,861,582 5,648,125 0.21Nexen Energy ULC 7.5% 30/7/2039 3,000,000 USD 3,966,992 3,858,750 0.14Nexen Energy ULC 7.875% 15/3/2032 2,000,000 USD 2,564,755 2,616,190 0.10PTTEP Canada International Finance Ltd 6.35% 12/6/2042 'REGS' 3,100,000 USD 3,135,275 3,582,830 0.13
35,817,856 36,002,887 1.32
Cayman Islands Agile Property Holdings Ltd FRN Perpetual 4,300,000 USD 4,151,748 3,805,500 0.14Agile Property Holdings Ltd 6.5% 28/2/2017 10,000,000 CNY 1,544,660 1,485,795 0.05Agile Property Holdings Ltd 8.375% 18/2/2019 3,000,000 USD 2,994,778 3,102,103 0.11Agile Property Holdings Ltd 8.875% 28/4/2017 'REGS' 6,000,000 USD 5,973,874 6,060,000 0.22Agile Property Holdings Ltd 9% 21/5/2020 3,600,000 USD 3,584,488 3,743,928 0.14Agile Property Holdings Ltd 9.875% 20/3/2017 3,400,000 USD 3,399,198 3,553,000 0.13Alibaba Group Holding Ltd 2.5% 28/11/2019 8,000,000 USD 8,010,168 7,821,336 0.29Alibaba Group Holding Ltd 3.125% 28/11/2021 7,000,000 USD 7,023,435 6,812,673 0.25Alibaba Group Holding Ltd 3.6% 28/11/2024 13,000,000 USD 12,785,189 12,467,519 0.45Alibaba Group Holding Ltd 4.5% 28/11/2034 2,400,000 USD 2,406,850 2,285,880 0.08Amber Circle Funding Ltd 2% 4/12/2017 'REGS' 1,300,000 USD 1,297,687 1,296,387 0.05Amber Circle Funding Ltd 3.25% 4/12/2022 'REGS' 7,300,000 USD 7,203,021 7,239,855 0.27
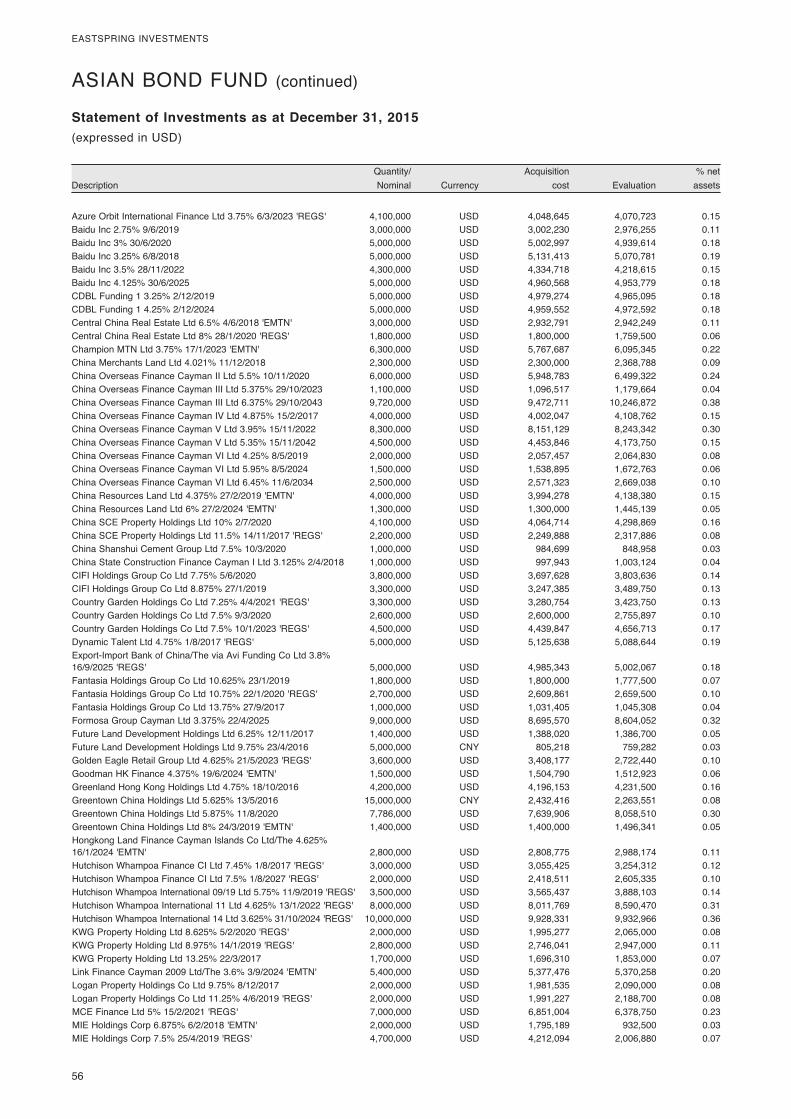
56
EASTSPRING INVESTMENTS
DescriptionQuantity/ Nominal Currency
Acquisition cost Evaluation
% net assets
Statement of Investments as at December 31, 2015(expressed in USD)
ASIAN BOND FUND (continued)
Azure Orbit International Finance Ltd 3.75% 6/3/2023 'REGS' 4,100,000 USD 4,048,645 4,070,723 0.15Baidu Inc 2.75% 9/6/2019 3,000,000 USD 3,002,230 2,976,255 0.11Baidu Inc 3% 30/6/2020 5,000,000 USD 5,002,997 4,939,614 0.18Baidu Inc 3.25% 6/8/2018 5,000,000 USD 5,131,413 5,070,781 0.19Baidu Inc 3.5% 28/11/2022 4,300,000 USD 4,334,718 4,218,615 0.15Baidu Inc 4.125% 30/6/2025 5,000,000 USD 4,960,568 4,953,779 0.18CDBL Funding 1 3.25% 2/12/2019 5,000,000 USD 4,979,274 4,965,095 0.18CDBL Funding 1 4.25% 2/12/2024 5,000,000 USD 4,959,552 4,972,592 0.18Central China Real Estate Ltd 6.5% 4/6/2018 'EMTN' 3,000,000 USD 2,932,791 2,942,249 0.11Central China Real Estate Ltd 8% 28/1/2020 'REGS' 1,800,000 USD 1,800,000 1,759,500 0.06Champion MTN Ltd 3.75% 17/1/2023 'EMTN' 6,300,000 USD 5,767,687 6,095,345 0.22China Merchants Land Ltd 4.021% 11/12/2018 2,300,000 USD 2,300,000 2,368,788 0.09China Overseas Finance Cayman II Ltd 5.5% 10/11/2020 6,000,000 USD 5,948,783 6,499,322 0.24China Overseas Finance Cayman III Ltd 5.375% 29/10/2023 1,100,000 USD 1,096,517 1,179,664 0.04China Overseas Finance Cayman III Ltd 6.375% 29/10/2043 9,720,000 USD 9,472,711 10,246,872 0.38China Overseas Finance Cayman IV Ltd 4.875% 15/2/2017 4,000,000 USD 4,002,047 4,108,762 0.15China Overseas Finance Cayman V Ltd 3.95% 15/11/2022 8,300,000 USD 8,151,129 8,243,342 0.30China Overseas Finance Cayman V Ltd 5.35% 15/11/2042 4,500,000 USD 4,453,846 4,173,750 0.15China Overseas Finance Cayman VI Ltd 4.25% 8/5/2019 2,000,000 USD 2,057,457 2,064,830 0.08China Overseas Finance Cayman VI Ltd 5.95% 8/5/2024 1,500,000 USD 1,538,895 1,672,763 0.06China Overseas Finance Cayman VI Ltd 6.45% 11/6/2034 2,500,000 USD 2,571,323 2,669,038 0.10China Resources Land Ltd 4.375% 27/2/2019 'EMTN' 4,000,000 USD 3,994,278 4,138,380 0.15China Resources Land Ltd 6% 27/2/2024 'EMTN' 1,300,000 USD 1,300,000 1,445,139 0.05China SCE Property Holdings Ltd 10% 2/7/2020 4,100,000 USD 4,064,714 4,298,869 0.16China SCE Property Holdings Ltd 11.5% 14/11/2017 'REGS' 2,200,000 USD 2,249,888 2,317,886 0.08China Shanshui Cement Group Ltd 7.5% 10/3/2020 1,000,000 USD 984,699 848,958 0.03China State Construction Finance Cayman I Ltd 3.125% 2/4/2018 1,000,000 USD 997,943 1,003,124 0.04CIFI Holdings Group Co Ltd 7.75% 5/6/2020 3,800,000 USD 3,697,628 3,803,636 0.14CIFI Holdings Group Co Ltd 8.875% 27/1/2019 3,300,000 USD 3,247,385 3,489,750 0.13Country Garden Holdings Co Ltd 7.25% 4/4/2021 'REGS' 3,300,000 USD 3,280,754 3,423,750 0.13Country Garden Holdings Co Ltd 7.5% 9/3/2020 2,600,000 USD 2,600,000 2,755,897 0.10Country Garden Holdings Co Ltd 7.5% 10/1/2023 'REGS' 4,500,000 USD 4,439,847 4,656,713 0.17Dynamic Talent Ltd 4.75% 1/8/2017 'REGS' 5,000,000 USD 5,125,638 5,088,644 0.19Export-Import Bank of China/The via Avi Funding Co Ltd 3.8% 16/9/2025 'REGS' 5,000,000 USD 4,985,343 5,002,067 0.18Fantasia Holdings Group Co Ltd 10.625% 23/1/2019 1,800,000 USD 1,800,000 1,777,500 0.07Fantasia Holdings Group Co Ltd 10.75% 22/1/2020 'REGS' 2,700,000 USD 2,609,861 2,659,500 0.10Fantasia Holdings Group Co Ltd 13.75% 27/9/2017 1,000,000 USD 1,031,405 1,045,308 0.04Formosa Group Cayman Ltd 3.375% 22/4/2025 9,000,000 USD 8,695,570 8,604,052 0.32Future Land Development Holdings Ltd 6.25% 12/11/2017 1,400,000 USD 1,388,020 1,386,700 0.05Future Land Development Holdings Ltd 9.75% 23/4/2016 5,000,000 CNY 805,218 759,282 0.03Golden Eagle Retail Group Ltd 4.625% 21/5/2023 'REGS' 3,600,000 USD 3,408,177 2,722,440 0.10Goodman HK Finance 4.375% 19/6/2024 'EMTN' 1,500,000 USD 1,504,790 1,512,923 0.06Greenland Hong Kong Holdings Ltd 4.75% 18/10/2016 4,200,000 USD 4,196,153 4,231,500 0.16Greentown China Holdings Ltd 5.625% 13/5/2016 15,000,000 CNY 2,432,416 2,263,551 0.08Greentown China Holdings Ltd 5.875% 11/8/2020 7,786,000 USD 7,639,906 8,058,510 0.30Greentown China Holdings Ltd 8% 24/3/2019 'EMTN' 1,400,000 USD 1,400,000 1,496,341 0.05Hongkong Land Finance Cayman Islands Co Ltd/The 4.625% 16/1/2024 'EMTN' 2,800,000 USD 2,808,775 2,988,174 0.11Hutchison Whampoa Finance CI Ltd 7.45% 1/8/2017 'REGS' 3,000,000 USD 3,055,425 3,254,312 0.12Hutchison Whampoa Finance CI Ltd 7.5% 1/8/2027 'REGS' 2,000,000 USD 2,418,511 2,605,335 0.10Hutchison Whampoa International 09/19 Ltd 5.75% 11/9/2019 'REGS' 3,500,000 USD 3,565,437 3,888,103 0.14Hutchison Whampoa International 11 Ltd 4.625% 13/1/2022 'REGS' 8,000,000 USD 8,011,769 8,590,470 0.31Hutchison Whampoa International 14 Ltd 3.625% 31/10/2024 'REGS' 10,000,000 USD 9,928,331 9,932,966 0.36KWG Property Holding Ltd 8.625% 5/2/2020 'REGS' 2,000,000 USD 1,995,277 2,065,000 0.08KWG Property Holding Ltd 8.975% 14/1/2019 'REGS' 2,800,000 USD 2,746,041 2,947,000 0.11KWG Property Holding Ltd 13.25% 22/3/2017 1,700,000 USD 1,696,310 1,853,000 0.07Link Finance Cayman 2009 Ltd/The 3.6% 3/9/2024 'EMTN' 5,400,000 USD 5,377,476 5,370,258 0.20Logan Property Holdings Co Ltd 9.75% 8/12/2017 2,000,000 USD 1,981,535 2,090,000 0.08Logan Property Holdings Co Ltd 11.25% 4/6/2019 'REGS' 2,000,000 USD 1,991,227 2,188,700 0.08MCE Finance Ltd 5% 15/2/2021 'REGS' 7,000,000 USD 6,851,004 6,378,750 0.23MIE Holdings Corp 6.875% 6/2/2018 'EMTN' 2,000,000 USD 1,795,189 932,500 0.03MIE Holdings Corp 7.5% 25/4/2019 'REGS' 4,700,000 USD 4,212,094 2,006,880 0.07
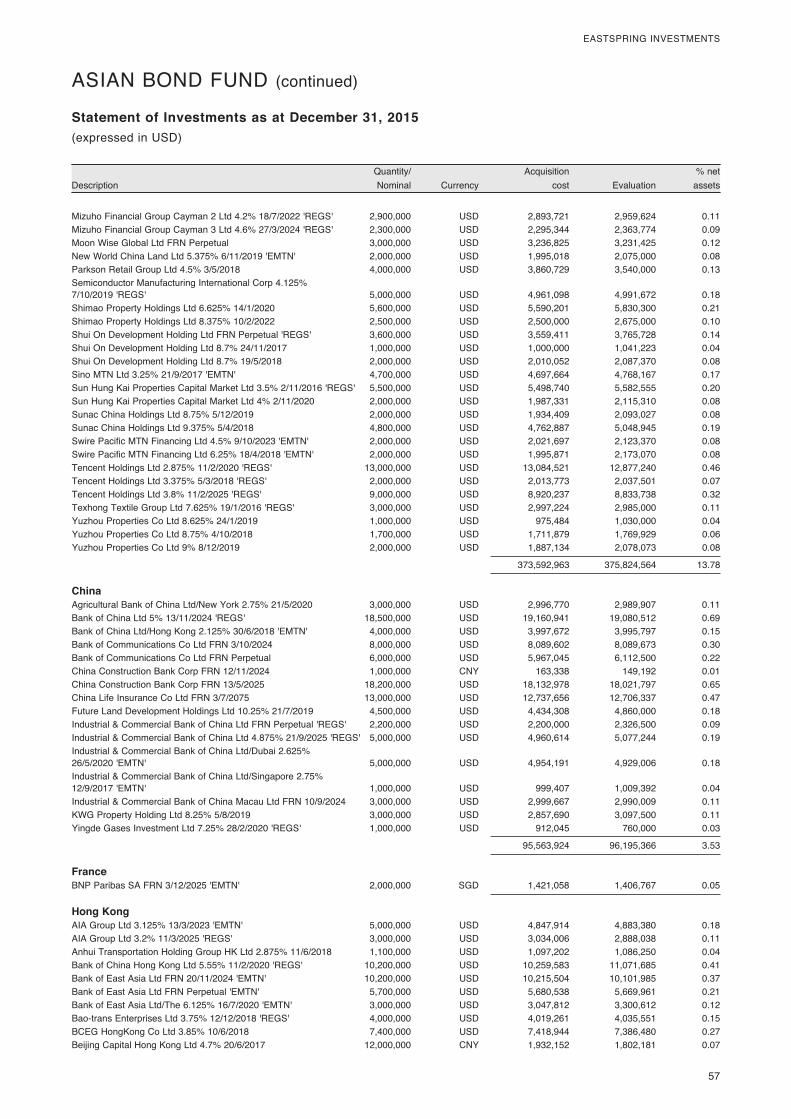
57
EASTSPRING INVESTMENTS
DescriptionQuantity/ Nominal Currency
Acquisition cost Evaluation
% net assets
Statement of Investments as at December 31, 2015(expressed in USD)
ASIAN BOND FUND (continued)
Mizuho Financial Group Cayman 2 Ltd 4.2% 18/7/2022 'REGS' 2,900,000 USD 2,893,721 2,959,624 0.11Mizuho Financial Group Cayman 3 Ltd 4.6% 27/3/2024 'REGS' 2,300,000 USD 2,295,344 2,363,774 0.09Moon Wise Global Ltd FRN Perpetual 3,000,000 USD 3,236,825 3,231,425 0.12New World China Land Ltd 5.375% 6/11/2019 'EMTN' 2,000,000 USD 1,995,018 2,075,000 0.08Parkson Retail Group Ltd 4.5% 3/5/2018 4,000,000 USD 3,860,729 3,540,000 0.13Semiconductor Manufacturing International Corp 4.125% 7/10/2019 'REGS' 5,000,000 USD 4,961,098 4,991,672 0.18Shimao Property Holdings Ltd 6.625% 14/1/2020 5,600,000 USD 5,590,201 5,830,300 0.21Shimao Property Holdings Ltd 8.375% 10/2/2022 2,500,000 USD 2,500,000 2,675,000 0.10Shui On Development Holding Ltd FRN Perpetual 'REGS' 3,600,000 USD 3,559,411 3,765,728 0.14Shui On Development Holding Ltd 8.7% 24/11/2017 1,000,000 USD 1,000,000 1,041,223 0.04Shui On Development Holding Ltd 8.7% 19/5/2018 2,000,000 USD 2,010,052 2,087,370 0.08Sino MTN Ltd 3.25% 21/9/2017 'EMTN' 4,700,000 USD 4,697,664 4,768,167 0.17Sun Hung Kai Properties Capital Market Ltd 3.5% 2/11/2016 'REGS' 5,500,000 USD 5,498,740 5,582,555 0.20Sun Hung Kai Properties Capital Market Ltd 4% 2/11/2020 2,000,000 USD 1,987,331 2,115,310 0.08Sunac China Holdings Ltd 8.75% 5/12/2019 2,000,000 USD 1,934,409 2,093,027 0.08Sunac China Holdings Ltd 9.375% 5/4/2018 4,800,000 USD 4,762,887 5,048,945 0.19Swire Pacific MTN Financing Ltd 4.5% 9/10/2023 'EMTN' 2,000,000 USD 2,021,697 2,123,370 0.08Swire Pacific MTN Financing Ltd 6.25% 18/4/2018 'EMTN' 2,000,000 USD 1,995,871 2,173,070 0.08Tencent Holdings Ltd 2.875% 11/2/2020 'REGS' 13,000,000 USD 13,084,521 12,877,240 0.46Tencent Holdings Ltd 3.375% 5/3/2018 'REGS' 2,000,000 USD 2,013,773 2,037,501 0.07Tencent Holdings Ltd 3.8% 11/2/2025 'REGS' 9,000,000 USD 8,920,237 8,833,738 0.32Texhong Textile Group Ltd 7.625% 19/1/2016 'REGS' 3,000,000 USD 2,997,224 2,985,000 0.11Yuzhou Properties Co Ltd 8.625% 24/1/2019 1,000,000 USD 975,484 1,030,000 0.04Yuzhou Properties Co Ltd 8.75% 4/10/2018 1,700,000 USD 1,711,879 1,769,929 0.06Yuzhou Properties Co Ltd 9% 8/12/2019 2,000,000 USD 1,887,134 2,078,073 0.08
373,592,963 375,824,564 13.78
China Agricultural Bank of China Ltd/New York 2.75% 21/5/2020 3,000,000 USD 2,996,770 2,989,907 0.11Bank of China Ltd 5% 13/11/2024 'REGS' 18,500,000 USD 19,160,941 19,080,512 0.69Bank of China Ltd/Hong Kong 2.125% 30/6/2018 'EMTN' 4,000,000 USD 3,997,672 3,995,797 0.15Bank of Communications Co Ltd FRN 3/10/2024 8,000,000 USD 8,089,602 8,089,673 0.30Bank of Communications Co Ltd FRN Perpetual 6,000,000 USD 5,967,045 6,112,500 0.22China Construction Bank Corp FRN 12/11/2024 1,000,000 CNY 163,338 149,192 0.01China Construction Bank Corp FRN 13/5/2025 18,200,000 USD 18,132,978 18,021,797 0.65China Life Insurance Co Ltd FRN 3/7/2075 13,000,000 USD 12,737,656 12,706,337 0.47Future Land Development Holdings Ltd 10.25% 21/7/2019 4,500,000 USD 4,434,308 4,860,000 0.18Industrial & Commercial Bank of China Ltd FRN Perpetual 'REGS' 2,200,000 USD 2,200,000 2,326,500 0.09Industrial & Commercial Bank of China Ltd 4.875% 21/9/2025 'REGS' 5,000,000 USD 4,960,614 5,077,244 0.19Industrial & Commercial Bank of China Ltd/Dubai 2.625% 26/5/2020 'EMTN' 5,000,000 USD 4,954,191 4,929,006 0.18Industrial & Commercial Bank of China Ltd/Singapore 2.75% 12/9/2017 'EMTN' 1,000,000 USD 999,407 1,009,392 0.04Industrial & Commercial Bank of China Macau Ltd FRN 10/9/2024 3,000,000 USD 2,999,667 2,990,009 0.11KWG Property Holding Ltd 8.25% 5/8/2019 3,000,000 USD 2,857,690 3,097,500 0.11Yingde Gases Investment Ltd 7.25% 28/2/2020 'REGS' 1,000,000 USD 912,045 760,000 0.03
95,563,924 96,195,366 3.53
France BNP Paribas SA FRN 3/12/2025 'EMTN' 2,000,000 SGD 1,421,058 1,406,767 0.05
Hong Kong AIA Group Ltd 3.125% 13/3/2023 'EMTN' 5,000,000 USD 4,847,914 4,883,380 0.18AIA Group Ltd 3.2% 11/3/2025 'REGS' 3,000,000 USD 3,034,006 2,888,038 0.11Anhui Transportation Holding Group HK Ltd 2.875% 11/6/2018 1,100,000 USD 1,097,202 1,086,250 0.04Bank of China Hong Kong Ltd 5.55% 11/2/2020 'REGS' 10,200,000 USD 10,259,583 11,071,685 0.41Bank of East Asia Ltd FRN 20/11/2024 'EMTN' 10,200,000 USD 10,215,504 10,101,985 0.37Bank of East Asia Ltd FRN Perpetual 'EMTN' 5,700,000 USD 5,680,538 5,669,961 0.21Bank of East Asia Ltd/The 6.125% 16/7/2020 'EMTN' 3,000,000 USD 3,047,812 3,300,612 0.12Bao-trans Enterprises Ltd 3.75% 12/12/2018 'REGS' 4,000,000 USD 4,019,261 4,035,551 0.15BCEG HongKong Co Ltd 3.85% 10/6/2018 7,400,000 USD 7,418,944 7,386,480 0.27Beijing Capital Hong Kong Ltd 4.7% 20/6/2017 12,000,000 CNY 1,932,152 1,802,181 0.07
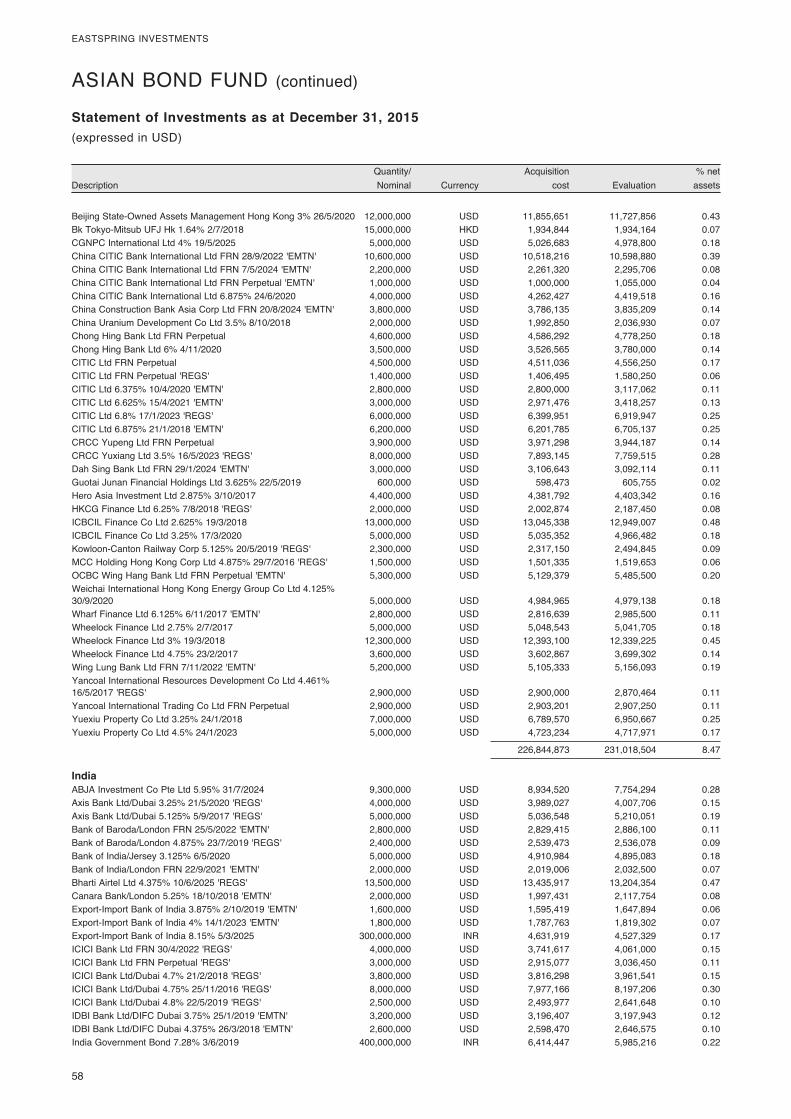
58
EASTSPRING INVESTMENTS
DescriptionQuantity/ Nominal Currency
Acquisition cost Evaluation
% net assets
Statement of Investments as at December 31, 2015(expressed in USD)
ASIAN BOND FUND (continued)
Beijing State-Owned Assets Management Hong Kong 3% 26/5/2020 12,000,000 USD 11,855,651 11,727,856 0.43Bk Tokyo-Mitsub UFJ Hk 1.64% 2/7/2018 15,000,000 HKD 1,934,844 1,934,164 0.07CGNPC International Ltd 4% 19/5/2025 5,000,000 USD 5,026,683 4,978,800 0.18China CITIC Bank International Ltd FRN 28/9/2022 'EMTN' 10,600,000 USD 10,518,216 10,598,880 0.39China CITIC Bank International Ltd FRN 7/5/2024 'EMTN' 2,200,000 USD 2,261,320 2,295,706 0.08China CITIC Bank International Ltd FRN Perpetual 'EMTN' 1,000,000 USD 1,000,000 1,055,000 0.04China CITIC Bank International Ltd 6.875% 24/6/2020 4,000,000 USD 4,262,427 4,419,518 0.16China Construction Bank Asia Corp Ltd FRN 20/8/2024 'EMTN' 3,800,000 USD 3,786,135 3,835,209 0.14China Uranium Development Co Ltd 3.5% 8/10/2018 2,000,000 USD 1,992,850 2,036,930 0.07Chong Hing Bank Ltd FRN Perpetual 4,600,000 USD 4,586,292 4,778,250 0.18Chong Hing Bank Ltd 6% 4/11/2020 3,500,000 USD 3,526,565 3,780,000 0.14CITIC Ltd FRN Perpetual 4,500,000 USD 4,511,036 4,556,250 0.17CITIC Ltd FRN Perpetual 'REGS' 1,400,000 USD 1,406,495 1,580,250 0.06CITIC Ltd 6.375% 10/4/2020 'EMTN' 2,800,000 USD 2,800,000 3,117,062 0.11CITIC Ltd 6.625% 15/4/2021 'EMTN' 3,000,000 USD 2,971,476 3,418,257 0.13CITIC Ltd 6.8% 17/1/2023 'REGS' 6,000,000 USD 6,399,951 6,919,947 0.25CITIC Ltd 6.875% 21/1/2018 'EMTN' 6,200,000 USD 6,201,785 6,705,137 0.25CRCC Yupeng Ltd FRN Perpetual 3,900,000 USD 3,971,298 3,944,187 0.14CRCC Yuxiang Ltd 3.5% 16/5/2023 'REGS' 8,000,000 USD 7,893,145 7,759,515 0.28Dah Sing Bank Ltd FRN 29/1/2024 'EMTN' 3,000,000 USD 3,106,643 3,092,114 0.11Guotai Junan Financial Holdings Ltd 3.625% 22/5/2019 600,000 USD 598,473 605,755 0.02Hero Asia Investment Ltd 2.875% 3/10/2017 4,400,000 USD 4,381,792 4,403,342 0.16HKCG Finance Ltd 6.25% 7/8/2018 'REGS' 2,000,000 USD 2,002,874 2,187,450 0.08ICBCIL Finance Co Ltd 2.625% 19/3/2018 13,000,000 USD 13,045,338 12,949,007 0.48ICBCIL Finance Co Ltd 3.25% 17/3/2020 5,000,000 USD 5,035,352 4,966,482 0.18Kowloon-Canton Railway Corp 5.125% 20/5/2019 'REGS' 2,300,000 USD 2,317,150 2,494,845 0.09MCC Holding Hong Kong Corp Ltd 4.875% 29/7/2016 'REGS' 1,500,000 USD 1,501,335 1,519,653 0.06OCBC Wing Hang Bank Ltd FRN Perpetual 'EMTN' 5,300,000 USD 5,129,379 5,485,500 0.20Weichai International Hong Kong Energy Group Co Ltd 4.125% 30/9/2020 5,000,000 USD 4,984,965 4,979,138 0.18Wharf Finance Ltd 6.125% 6/11/2017 'EMTN' 2,800,000 USD 2,816,639 2,985,500 0.11Wheelock Finance Ltd 2.75% 2/7/2017 5,000,000 USD 5,048,543 5,041,705 0.18Wheelock Finance Ltd 3% 19/3/2018 12,300,000 USD 12,393,100 12,339,225 0.45Wheelock Finance Ltd 4.75% 23/2/2017 3,600,000 USD 3,602,867 3,699,302 0.14Wing Lung Bank Ltd FRN 7/11/2022 'EMTN' 5,200,000 USD 5,105,333 5,156,093 0.19Yancoal International Resources Development Co Ltd 4.461% 16/5/2017 'REGS' 2,900,000 USD 2,900,000 2,870,464 0.11Yancoal International Trading Co Ltd FRN Perpetual 2,900,000 USD 2,903,201 2,907,250 0.11Yuexiu Property Co Ltd 3.25% 24/1/2018 7,000,000 USD 6,789,570 6,950,667 0.25Yuexiu Property Co Ltd 4.5% 24/1/2023 5,000,000 USD 4,723,234 4,717,971 0.17
226,844,873 231,018,504 8.47
India ABJA Investment Co Pte Ltd 5.95% 31/7/2024 9,300,000 USD 8,934,520 7,754,294 0.28Axis Bank Ltd/Dubai 3.25% 21/5/2020 'REGS' 4,000,000 USD 3,989,027 4,007,706 0.15Axis Bank Ltd/Dubai 5.125% 5/9/2017 'REGS' 5,000,000 USD 5,036,548 5,210,051 0.19Bank of Baroda/London FRN 25/5/2022 'EMTN' 2,800,000 USD 2,829,415 2,886,100 0.11Bank of Baroda/London 4.875% 23/7/2019 'REGS' 2,400,000 USD 2,539,473 2,536,078 0.09Bank of India/Jersey 3.125% 6/5/2020 5,000,000 USD 4,910,984 4,895,083 0.18Bank of India/London FRN 22/9/2021 'EMTN' 2,000,000 USD 2,019,006 2,032,500 0.07Bharti Airtel Ltd 4.375% 10/6/2025 'REGS' 13,500,000 USD 13,435,917 13,204,354 0.47Canara Bank/London 5.25% 18/10/2018 'EMTN' 2,000,000 USD 1,997,431 2,117,754 0.08Export-Import Bank of India 3.875% 2/10/2019 'EMTN' 1,600,000 USD 1,595,419 1,647,894 0.06Export-Import Bank of India 4% 14/1/2023 'EMTN' 1,800,000 USD 1,787,763 1,819,302 0.07Export-Import Bank of India 8.15% 5/3/2025 300,000,000 INR 4,631,919 4,527,329 0.17ICICI Bank Ltd FRN 30/4/2022 'REGS' 4,000,000 USD 3,741,617 4,061,000 0.15ICICI Bank Ltd FRN Perpetual 'REGS' 3,000,000 USD 2,915,077 3,036,450 0.11ICICI Bank Ltd/Dubai 4.7% 21/2/2018 'REGS' 3,800,000 USD 3,816,298 3,961,541 0.15ICICI Bank Ltd/Dubai 4.75% 25/11/2016 'REGS' 8,000,000 USD 7,977,166 8,197,206 0.30ICICI Bank Ltd/Dubai 4.8% 22/5/2019 'REGS' 2,500,000 USD 2,493,977 2,641,648 0.10IDBI Bank Ltd/DIFC Dubai 3.75% 25/1/2019 'EMTN' 3,200,000 USD 3,196,407 3,197,943 0.12IDBI Bank Ltd/DIFC Dubai 4.375% 26/3/2018 'EMTN' 2,600,000 USD 2,598,470 2,646,575 0.10India Government Bond 7.28% 3/6/2019 400,000,000 INR 6,414,447 5,985,216 0.22
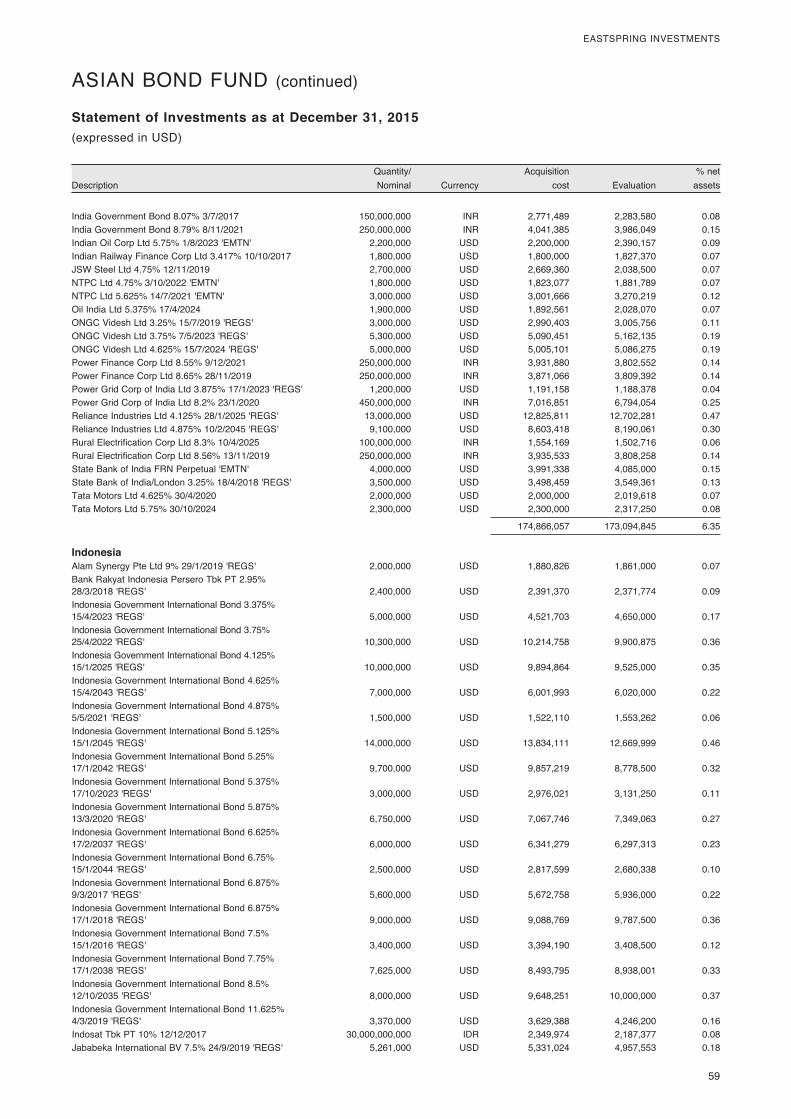
59
EASTSPRING INVESTMENTS
DescriptionQuantity/ Nominal Currency
Acquisition cost Evaluation
% net assets
Statement of Investments as at December 31, 2015(expressed in USD)
ASIAN BOND FUND (continued)
India Government Bond 8.07% 3/7/2017 150,000,000 INR 2,771,489 2,283,580 0.08India Government Bond 8.79% 8/11/2021 250,000,000 INR 4,041,385 3,986,049 0.15Indian Oil Corp Ltd 5.75% 1/8/2023 'EMTN' 2,200,000 USD 2,200,000 2,390,157 0.09Indian Railway Finance Corp Ltd 3.417% 10/10/2017 1,800,000 USD 1,800,000 1,827,370 0.07JSW Steel Ltd 4.75% 12/11/2019 2,700,000 USD 2,669,360 2,038,500 0.07NTPC Ltd 4.75% 3/10/2022 'EMTN' 1,800,000 USD 1,823,077 1,881,789 0.07NTPC Ltd 5.625% 14/7/2021 'EMTN' 3,000,000 USD 3,001,666 3,270,219 0.12Oil India Ltd 5.375% 17/4/2024 1,900,000 USD 1,892,561 2,028,070 0.07ONGC Videsh Ltd 3.25% 15/7/2019 'REGS' 3,000,000 USD 2,990,403 3,005,756 0.11ONGC Videsh Ltd 3.75% 7/5/2023 'REGS' 5,300,000 USD 5,090,451 5,162,135 0.19ONGC Videsh Ltd 4.625% 15/7/2024 'REGS' 5,000,000 USD 5,005,101 5,086,275 0.19Power Finance Corp Ltd 8.55% 9/12/2021 250,000,000 INR 3,931,880 3,802,552 0.14Power Finance Corp Ltd 8.65% 28/11/2019 250,000,000 INR 3,871,066 3,809,392 0.14Power Grid Corp of India Ltd 3.875% 17/1/2023 'REGS' 1,200,000 USD 1,191,158 1,188,378 0.04Power Grid Corp of India Ltd 8.2% 23/1/2020 450,000,000 INR 7,016,851 6,794,054 0.25Reliance Industries Ltd 4.125% 28/1/2025 'REGS' 13,000,000 USD 12,825,811 12,702,281 0.47Reliance Industries Ltd 4.875% 10/2/2045 'REGS' 9,100,000 USD 8,603,418 8,190,061 0.30Rural Electrification Corp Ltd 8.3% 10/4/2025 100,000,000 INR 1,554,169 1,502,716 0.06Rural Electrification Corp Ltd 8.56% 13/11/2019 250,000,000 INR 3,935,533 3,808,258 0.14State Bank of India FRN Perpetual 'EMTN' 4,000,000 USD 3,991,338 4,085,000 0.15State Bank of India/London 3.25% 18/4/2018 'REGS' 3,500,000 USD 3,498,459 3,549,361 0.13Tata Motors Ltd 4.625% 30/4/2020 2,000,000 USD 2,000,000 2,019,618 0.07Tata Motors Ltd 5.75% 30/10/2024 2,300,000 USD 2,300,000 2,317,250 0.08
174,866,057 173,094,845 6.35
Indonesia Alam Synergy Pte Ltd 9% 29/1/2019 'REGS' 2,000,000 USD 1,880,826 1,861,000 0.07Bank Rakyat Indonesia Persero Tbk PT 2.95% 28/3/2018 'REGS' 2,400,000 USD 2,391,370 2,371,774 0.09Indonesia Government International Bond 3.375% 15/4/2023 'REGS' 5,000,000 USD 4,521,703 4,650,000 0.17Indonesia Government International Bond 3.75% 25/4/2022 'REGS' 10,300,000 USD 10,214,758 9,900,875 0.36Indonesia Government International Bond 4.125% 15/1/2025 'REGS' 10,000,000 USD 9,894,864 9,525,000 0.35Indonesia Government International Bond 4.625% 15/4/2043 'REGS' 7,000,000 USD 6,001,993 6,020,000 0.22Indonesia Government International Bond 4.875% 5/5/2021 'REGS' 1,500,000 USD 1,522,110 1,553,262 0.06Indonesia Government International Bond 5.125% 15/1/2045 'REGS' 14,000,000 USD 13,834,111 12,669,999 0.46Indonesia Government International Bond 5.25% 17/1/2042 'REGS' 9,700,000 USD 9,857,219 8,778,500 0.32Indonesia Government International Bond 5.375% 17/10/2023 'REGS' 3,000,000 USD 2,976,021 3,131,250 0.11Indonesia Government International Bond 5.875% 13/3/2020 'REGS' 6,750,000 USD 7,067,746 7,349,063 0.27Indonesia Government International Bond 6.625% 17/2/2037 'REGS' 6,000,000 USD 6,341,279 6,297,313 0.23Indonesia Government International Bond 6.75% 15/1/2044 'REGS' 2,500,000 USD 2,817,599 2,680,338 0.10Indonesia Government International Bond 6.875% 9/3/2017 'REGS' 5,600,000 USD 5,672,758 5,936,000 0.22Indonesia Government International Bond 6.875% 17/1/2018 'REGS' 9,000,000 USD 9,088,769 9,787,500 0.36Indonesia Government International Bond 7.5% 15/1/2016 'REGS' 3,400,000 USD 3,394,190 3,408,500 0.12Indonesia Government International Bond 7.75% 17/1/2038 'REGS' 7,625,000 USD 8,493,795 8,938,001 0.33Indonesia Government International Bond 8.5% 12/10/2035 'REGS' 8,000,000 USD 9,648,251 10,000,000 0.37Indonesia Government International Bond 11.625% 4/3/2019 'REGS' 3,370,000 USD 3,629,388 4,246,200 0.16Indosat Tbk PT 10% 12/12/2017 30,000,000,000 IDR 2,349,974 2,187,377 0.08Jababeka International BV 7.5% 24/9/2019 'REGS' 5,261,000 USD 5,331,024 4,957,553 0.18

60
EASTSPRING INVESTMENTS
DescriptionQuantity/ Nominal Currency
Acquisition cost Evaluation
% net assets
Statement of Investments as at December 31, 2015(expressed in USD)
ASIAN BOND FUND (continued)
Lembaga Pembiayaan Ekspor Indonesia 3.75% 26/4/2017 'EMTN' 1,800,000 USD 1,796,995 1,815,444 0.07Pelabuhan Indonesia II PT 4.25% 5/5/2025 'REGS' 5,000,000 USD 4,802,593 4,443,750 0.16Pelabuhan Indonesia II PT 5.375% 5/5/2045 'REGS' 7,800,000 USD 7,203,467 6,132,750 0.22Pelabuhan Indonesia III PT 4.875% 1/10/2024 'REGS' 5,000,000 USD 4,973,788 4,755,389 0.17Pertamina Persero PT 4.3% 20/5/2023 'REGS' 7,000,000 USD 6,624,932 6,361,250 0.23Pertamina Persero PT 4.875% 3/5/2022 'REGS' 5,100,000 USD 5,031,210 4,883,250 0.18Pertamina Persero PT 5.25% 23/5/2021 'REGS' 3,800,000 USD 3,771,655 3,790,500 0.14Pertamina Persero PT 5.625% 20/5/2043 'REGS' 11,200,000 USD 10,074,066 8,795,304 0.32Pertamina Persero PT 6% 3/5/2042 'REGS' 11,300,000 USD 10,610,221 9,278,262 0.35Pertamina Persero PT 6.45% 30/5/2044 'REGS' 5,500,000 USD 5,432,821 4,805,625 0.18Pertamina Persero PT 6.5% 27/5/2041 'REGS' 2,000,000 USD 1,980,304 1,760,000 0.06Perusahaan Gas Negara Persero Tbk 5.125% 16/5/2024 'REGS' 5,000,000 USD 5,009,025 4,837,500 0.18Perusahaan Listrik Negara PT 5.25% 24/10/2042 'REGS' 4,700,000 USD 4,666,154 3,735,002 0.14Perusahaan Listrik Negara PT 5.5% 22/11/2021 'REGS' 4,400,000 USD 4,442,684 4,482,500 0.16
203,349,663 196,126,031 7.19
Isle of Man Genting Singapore Plc 5.125% Perpetual 3,750,000 SGD 2,944,326 2,611,788 0.10
Japan Dai-ichi Life Insurance Co Ltd FRN Perpetual 'REGS' 900,000 USD 900,000 936,000 0.03Fukoku Mutual Life Insurance Co FRN Perpetual 4,600,000 USD 4,597,004 4,582,520 0.17Meiji Yasuda Life Insurance Co FRN 20/10/2045 'REGS' 2,300,000 USD 2,300,000 2,366,125 0.09Mitsubishi UFJ Lease & Finance Co Ltd 2.75% 21/10/2020 'EMTN' 3,000,000 USD 2,998,936 2,949,120 0.11Mizuho Financial Group Inc 4.353% 20/10/2025 'REGS' 4,300,000 USD 4,300,000 4,274,673 0.16Sumitomo Mitsui Banking Corp/Hong Kong 1.1% 26/6/2017 'FXCD' 50,000,000 HKD 6,442,463 6,417,476 0.23
21,538,403 21,525,914 0.79
Luxembourg Doosan Power System SA FRN 3/12/2045 5,000,000 USD 4,987,284 4,976,150 0.18
Malaysia AMBB Capital L Ltd FRN Perpetual 1,200,000 USD 1,165,089 1,197,000 0.04CIMB Bank Bhd/Hong Kong 0.75% 3/6/2016 'FXCD' 30,000,000 HKD 3,870,031 3,865,503 0.14Export-Import Bank of Malaysia Bhd 2.875% 14/12/2017 'EMTN' 3,000,000 USD 3,013,086 3,036,255 0.11Hong Leong Bank Bhd 3.125% 19/4/2017 'EMTN' 2,000,000 USD 1,996,578 2,022,613 0.07IOI Investment L Bhd 4.375% 27/6/2022 'EMTN' 2,000,000 USD 1,990,769 1,970,140 0.07Malayan Banking Bhd FRN 20/9/2022 'EMTN' 8,900,000 USD 8,870,866 8,892,588 0.33Petronas Capital Ltd 3.125% 18/3/2022 'REGS' 5,000,000 USD 4,989,598 4,912,500 0.18Petronas Capital Ltd 3.5% 18/3/2025 'REGS' 4,000,000 USD 3,961,153 3,842,874 0.14Petronas Capital Ltd 4.5% 18/3/2045 'REGS' 8,000,000 USD 7,801,790 7,537,240 0.28Petronas Capital Ltd 5.25% 12/8/2019 'REGS' 13,000,000 USD 13,247,081 14,031,346 0.52Petronas Capital Ltd 7.875% 22/5/2022 'REGS' 5,696,000 USD 6,583,188 7,081,692 0.26
57,489,229 58,389,751 2.14
Mongolia Development Bank of Mongolia LLC 5.75% 21/3/2017 'EMTN' 3,500,000 USD 3,494,472 3,341,838 0.12Mongolia Government International Bond 4.125% 5/1/2018 'REGS' 2,800,000 USD 2,696,278 2,569,000 0.09Mongolia Government International Bond 5.125% 5/12/2022 'REGS' 6,500,000 USD 5,938,167 5,175,626 0.19Mongolia Government International Bond 7.5% 30/6/2018 'GMTN' 25,000,000 CNY 4,029,946 3,429,404 0.13Trade & Development Bank of Mongolia LLC 9.375% 19/5/2020 'REGS' 7,650,000 USD 7,857,289 7,324,875 0.27
24,016,152 21,840,743 0.80
Netherlands Bharti Airtel International Netherlands BV 5.125% 11/3/2023 'REGS' 8,300,000 USD 8,138,295 8,602,217 0.32Bharti Airtel International Netherlands BV 5.35% 20/5/2024 'REGS' 1,000,000 USD 999,297 1,047,018 0.04Indo Energy Finance BV 7% 7/5/2018 'REGS' 4,000,000 USD 3,935,281 2,284,319 0.08Indo Energy Finance II BV 6.375% 24/1/2023 'REGS' 4,700,000 USD 3,798,375 1,968,125 0.07Majapahit Holding BV 7.25% 28/6/2017 'REGS' 3,000,000 USD 3,025,267 3,187,500 0.12Majapahit Holding BV 7.75% 20/1/2020 'REGS' 6,000,000 USD 6,323,914 6,712,500 0.25Majapahit Holding BV 7.875% 29/6/2037 'REGS' 3,000,000 USD 3,206,483 3,241,257 0.12Majapahit Holding BV 8% 7/8/2019 'REGS' 2,700,000 USD 2,768,351 3,024,296 0.11
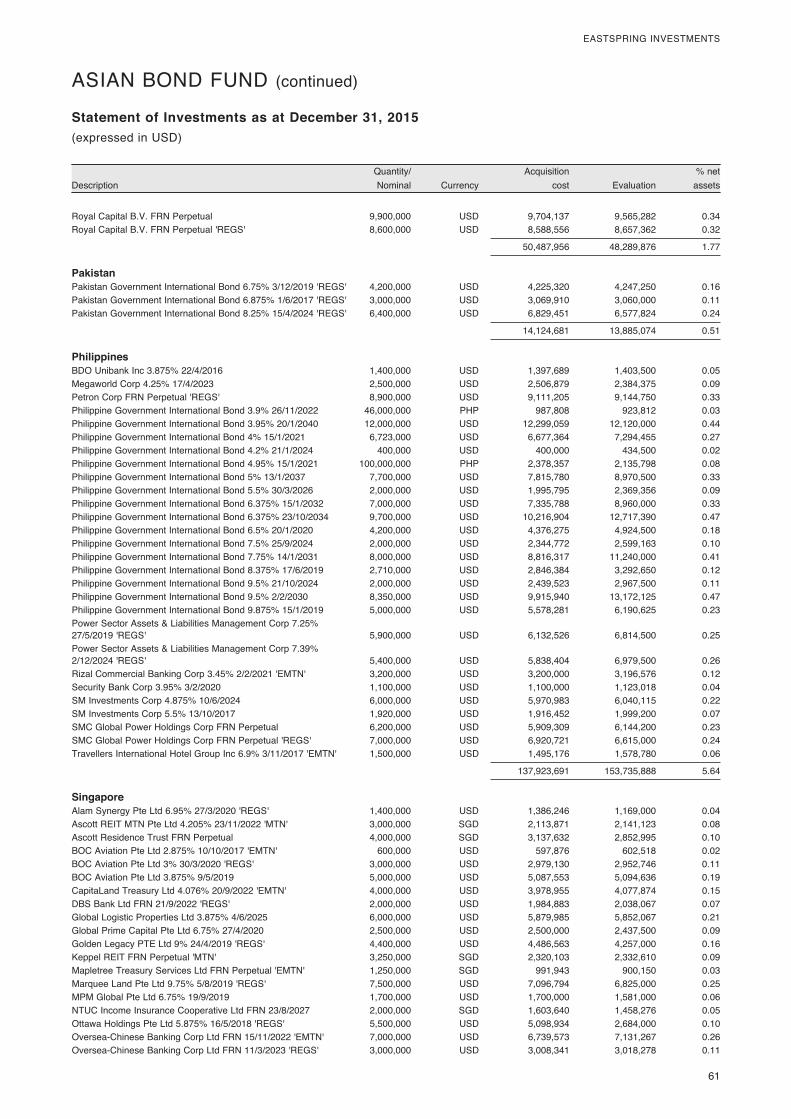
61
EASTSPRING INVESTMENTS
DescriptionQuantity/ Nominal Currency
Acquisition cost Evaluation
% net assets
Statement of Investments as at December 31, 2015(expressed in USD)
ASIAN BOND FUND (continued)
Royal Capital B.V. FRN Perpetual 9,900,000 USD 9,704,137 9,565,282 0.34Royal Capital B.V. FRN Perpetual 'REGS' 8,600,000 USD 8,588,556 8,657,362 0.32
50,487,956 48,289,876 1.77
Pakistan Pakistan Government International Bond 6.75% 3/12/2019 'REGS' 4,200,000 USD 4,225,320 4,247,250 0.16Pakistan Government International Bond 6.875% 1/6/2017 'REGS' 3,000,000 USD 3,069,910 3,060,000 0.11Pakistan Government International Bond 8.25% 15/4/2024 'REGS' 6,400,000 USD 6,829,451 6,577,824 0.24
14,124,681 13,885,074 0.51
Philippines BDO Unibank Inc 3.875% 22/4/2016 1,400,000 USD 1,397,689 1,403,500 0.05Megaworld Corp 4.25% 17/4/2023 2,500,000 USD 2,506,879 2,384,375 0.09Petron Corp FRN Perpetual 'REGS' 8,900,000 USD 9,111,205 9,144,750 0.33Philippine Government International Bond 3.9% 26/11/2022 46,000,000 PHP 987,808 923,812 0.03Philippine Government International Bond 3.95% 20/1/2040 12,000,000 USD 12,299,059 12,120,000 0.44Philippine Government International Bond 4% 15/1/2021 6,723,000 USD 6,677,364 7,294,455 0.27Philippine Government International Bond 4.2% 21/1/2024 400,000 USD 400,000 434,500 0.02Philippine Government International Bond 4.95% 15/1/2021 100,000,000 PHP 2,378,357 2,135,798 0.08Philippine Government International Bond 5% 13/1/2037 7,700,000 USD 7,815,780 8,970,500 0.33Philippine Government International Bond 5.5% 30/3/2026 2,000,000 USD 1,995,795 2,369,356 0.09Philippine Government International Bond 6.375% 15/1/2032 7,000,000 USD 7,335,788 8,960,000 0.33Philippine Government International Bond 6.375% 23/10/2034 9,700,000 USD 10,216,904 12,717,390 0.47Philippine Government International Bond 6.5% 20/1/2020 4,200,000 USD 4,376,275 4,924,500 0.18Philippine Government International Bond 7.5% 25/9/2024 2,000,000 USD 2,344,772 2,599,163 0.10Philippine Government International Bond 7.75% 14/1/2031 8,000,000 USD 8,816,317 11,240,000 0.41Philippine Government International Bond 8.375% 17/6/2019 2,710,000 USD 2,846,384 3,292,650 0.12Philippine Government International Bond 9.5% 21/10/2024 2,000,000 USD 2,439,523 2,967,500 0.11Philippine Government International Bond 9.5% 2/2/2030 8,350,000 USD 9,915,940 13,172,125 0.47Philippine Government International Bond 9.875% 15/1/2019 5,000,000 USD 5,578,281 6,190,625 0.23Power Sector Assets & Liabilities Management Corp 7.25% 27/5/2019 'REGS' 5,900,000 USD 6,132,526 6,814,500 0.25Power Sector Assets & Liabilities Management Corp 7.39% 2/12/2024 'REGS' 5,400,000 USD 5,838,404 6,979,500 0.26Rizal Commercial Banking Corp 3.45% 2/2/2021 'EMTN' 3,200,000 USD 3,200,000 3,196,576 0.12Security Bank Corp 3.95% 3/2/2020 1,100,000 USD 1,100,000 1,123,018 0.04SM Investments Corp 4.875% 10/6/2024 6,000,000 USD 5,970,983 6,040,115 0.22SM Investments Corp 5.5% 13/10/2017 1,920,000 USD 1,916,452 1,999,200 0.07SMC Global Power Holdings Corp FRN Perpetual 6,200,000 USD 5,909,309 6,144,200 0.23SMC Global Power Holdings Corp FRN Perpetual 'REGS' 7,000,000 USD 6,920,721 6,615,000 0.24Travellers International Hotel Group Inc 6.9% 3/11/2017 'EMTN' 1,500,000 USD 1,495,176 1,578,780 0.06
137,923,691 153,735,888 5.64
Singapore Alam Synergy Pte Ltd 6.95% 27/3/2020 'REGS' 1,400,000 USD 1,386,246 1,169,000 0.04Ascott REIT MTN Pte Ltd 4.205% 23/11/2022 'MTN' 3,000,000 SGD 2,113,871 2,141,123 0.08Ascott Residence Trust FRN Perpetual 4,000,000 SGD 3,137,632 2,852,995 0.10BOC Aviation Pte Ltd 2.875% 10/10/2017 'EMTN' 600,000 USD 597,876 602,518 0.02BOC Aviation Pte Ltd 3% 30/3/2020 'REGS' 3,000,000 USD 2,979,130 2,952,746 0.11BOC Aviation Pte Ltd 3.875% 9/5/2019 5,000,000 USD 5,087,553 5,094,636 0.19CapitaLand Treasury Ltd 4.076% 20/9/2022 'EMTN' 4,000,000 USD 3,978,955 4,077,874 0.15DBS Bank Ltd FRN 21/9/2022 'REGS' 2,000,000 USD 1,984,883 2,038,067 0.07Global Logistic Properties Ltd 3.875% 4/6/2025 6,000,000 USD 5,879,985 5,852,067 0.21Global Prime Capital Pte Ltd 6.75% 27/4/2020 2,500,000 USD 2,500,000 2,437,500 0.09Golden Legacy PTE Ltd 9% 24/4/2019 'REGS' 4,400,000 USD 4,486,563 4,257,000 0.16Keppel REIT FRN Perpetual 'MTN' 3,250,000 SGD 2,320,103 2,332,610 0.09Mapletree Treasury Services Ltd FRN Perpetual 'EMTN' 1,250,000 SGD 991,943 900,150 0.03Marquee Land Pte Ltd 9.75% 5/8/2019 'REGS' 7,500,000 USD 7,096,794 6,825,000 0.25MPM Global Pte Ltd 6.75% 19/9/2019 1,700,000 USD 1,700,000 1,581,000 0.06NTUC Income Insurance Cooperative Ltd FRN 23/8/2027 2,000,000 SGD 1,603,640 1,458,276 0.05Ottawa Holdings Pte Ltd 5.875% 16/5/2018 'REGS' 5,500,000 USD 5,098,934 2,684,000 0.10Oversea-Chinese Banking Corp Ltd FRN 15/11/2022 'EMTN' 7,000,000 USD 6,739,573 7,131,267 0.26Oversea-Chinese Banking Corp Ltd FRN 11/3/2023 'REGS' 3,000,000 USD 3,008,341 3,018,278 0.11
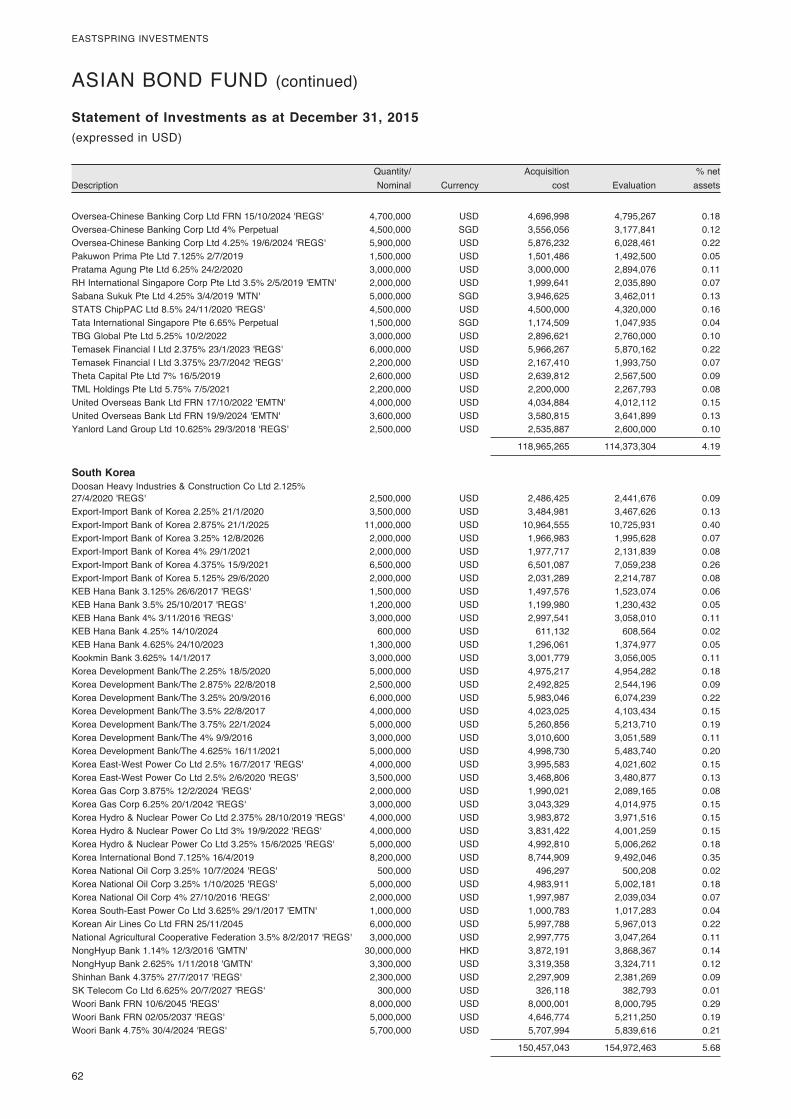
62
EASTSPRING INVESTMENTS
DescriptionQuantity/ Nominal Currency
Acquisition cost Evaluation
% net assets
Statement of Investments as at December 31, 2015(expressed in USD)
ASIAN BOND FUND (continued)
Oversea-Chinese Banking Corp Ltd FRN 15/10/2024 'REGS' 4,700,000 USD 4,696,998 4,795,267 0.18Oversea-Chinese Banking Corp Ltd 4% Perpetual 4,500,000 SGD 3,556,056 3,177,841 0.12Oversea-Chinese Banking Corp Ltd 4.25% 19/6/2024 'REGS' 5,900,000 USD 5,876,232 6,028,461 0.22Pakuwon Prima Pte Ltd 7.125% 2/7/2019 1,500,000 USD 1,501,486 1,492,500 0.05Pratama Agung Pte Ltd 6.25% 24/2/2020 3,000,000 USD 3,000,000 2,894,076 0.11RH International Singapore Corp Pte Ltd 3.5% 2/5/2019 'EMTN' 2,000,000 USD 1,999,641 2,035,890 0.07Sabana Sukuk Pte Ltd 4.25% 3/4/2019 'MTN' 5,000,000 SGD 3,946,625 3,462,011 0.13STATS ChipPAC Ltd 8.5% 24/11/2020 'REGS' 4,500,000 USD 4,500,000 4,320,000 0.16Tata International Singapore Pte 6.65% Perpetual 1,500,000 SGD 1,174,509 1,047,935 0.04TBG Global Pte Ltd 5.25% 10/2/2022 3,000,000 USD 2,896,621 2,760,000 0.10Temasek Financial I Ltd 2.375% 23/1/2023 'REGS' 6,000,000 USD 5,966,267 5,870,162 0.22Temasek Financial I Ltd 3.375% 23/7/2042 'REGS' 2,200,000 USD 2,167,410 1,993,750 0.07Theta Capital Pte Ltd 7% 16/5/2019 2,600,000 USD 2,639,812 2,567,500 0.09TML Holdings Pte Ltd 5.75% 7/5/2021 2,200,000 USD 2,200,000 2,267,793 0.08United Overseas Bank Ltd FRN 17/10/2022 'EMTN' 4,000,000 USD 4,034,884 4,012,112 0.15United Overseas Bank Ltd FRN 19/9/2024 'EMTN' 3,600,000 USD 3,580,815 3,641,899 0.13Yanlord Land Group Ltd 10.625% 29/3/2018 'REGS' 2,500,000 USD 2,535,887 2,600,000 0.10
118,965,265 114,373,304 4.19
South Korea Doosan Heavy Industries & Construction Co Ltd 2.125% 27/4/2020 'REGS' 2,500,000 USD 2,486,425 2,441,676 0.09Export-Import Bank of Korea 2.25% 21/1/2020 3,500,000 USD 3,484,981 3,467,626 0.13Export-Import Bank of Korea 2.875% 21/1/2025 11,000,000 USD 10,964,555 10,725,931 0.40Export-Import Bank of Korea 3.25% 12/8/2026 2,000,000 USD 1,966,983 1,995,628 0.07Export-Import Bank of Korea 4% 29/1/2021 2,000,000 USD 1,977,717 2,131,839 0.08Export-Import Bank of Korea 4.375% 15/9/2021 6,500,000 USD 6,501,087 7,059,238 0.26Export-Import Bank of Korea 5.125% 29/6/2020 2,000,000 USD 2,031,289 2,214,787 0.08KEB Hana Bank 3.125% 26/6/2017 'REGS' 1,500,000 USD 1,497,576 1,523,074 0.06KEB Hana Bank 3.5% 25/10/2017 'REGS' 1,200,000 USD 1,199,980 1,230,432 0.05KEB Hana Bank 4% 3/11/2016 'REGS' 3,000,000 USD 2,997,541 3,058,010 0.11KEB Hana Bank 4.25% 14/10/2024 600,000 USD 611,132 608,564 0.02KEB Hana Bank 4.625% 24/10/2023 1,300,000 USD 1,296,061 1,374,977 0.05Kookmin Bank 3.625% 14/1/2017 3,000,000 USD 3,001,779 3,056,005 0.11Korea Development Bank/The 2.25% 18/5/2020 5,000,000 USD 4,975,217 4,954,282 0.18Korea Development Bank/The 2.875% 22/8/2018 2,500,000 USD 2,492,825 2,544,196 0.09Korea Development Bank/The 3.25% 20/9/2016 6,000,000 USD 5,983,046 6,074,239 0.22Korea Development Bank/The 3.5% 22/8/2017 4,000,000 USD 4,023,025 4,103,434 0.15Korea Development Bank/The 3.75% 22/1/2024 5,000,000 USD 5,260,856 5,213,710 0.19Korea Development Bank/The 4% 9/9/2016 3,000,000 USD 3,010,600 3,051,589 0.11Korea Development Bank/The 4.625% 16/11/2021 5,000,000 USD 4,998,730 5,483,740 0.20Korea East-West Power Co Ltd 2.5% 16/7/2017 'REGS' 4,000,000 USD 3,995,583 4,021,602 0.15Korea East-West Power Co Ltd 2.5% 2/6/2020 'REGS' 3,500,000 USD 3,468,806 3,480,877 0.13Korea Gas Corp 3.875% 12/2/2024 'REGS' 2,000,000 USD 1,990,021 2,089,165 0.08Korea Gas Corp 6.25% 20/1/2042 'REGS' 3,000,000 USD 3,043,329 4,014,975 0.15Korea Hydro & Nuclear Power Co Ltd 2.375% 28/10/2019 'REGS' 4,000,000 USD 3,983,872 3,971,516 0.15Korea Hydro & Nuclear Power Co Ltd 3% 19/9/2022 'REGS' 4,000,000 USD 3,831,422 4,001,259 0.15Korea Hydro & Nuclear Power Co Ltd 3.25% 15/6/2025 'REGS' 5,000,000 USD 4,992,810 5,006,262 0.18Korea International Bond 7.125% 16/4/2019 8,200,000 USD 8,744,909 9,492,046 0.35Korea National Oil Corp 3.25% 10/7/2024 'REGS' 500,000 USD 496,297 500,208 0.02Korea National Oil Corp 3.25% 1/10/2025 'REGS' 5,000,000 USD 4,983,911 5,002,181 0.18Korea National Oil Corp 4% 27/10/2016 'REGS' 2,000,000 USD 1,997,987 2,039,034 0.07Korea South-East Power Co Ltd 3.625% 29/1/2017 'EMTN' 1,000,000 USD 1,000,783 1,017,283 0.04Korean Air Lines Co Ltd FRN 25/11/2045 6,000,000 USD 5,997,788 5,967,013 0.22National Agricultural Cooperative Federation 3.5% 8/2/2017 'REGS' 3,000,000 USD 2,997,775 3,047,264 0.11NongHyup Bank 1.14% 12/3/2016 'GMTN' 30,000,000 HKD 3,872,191 3,868,367 0.14NongHyup Bank 2.625% 1/11/2018 'GMTN' 3,300,000 USD 3,319,358 3,324,711 0.12Shinhan Bank 4.375% 27/7/2017 'REGS' 2,300,000 USD 2,297,909 2,381,269 0.09SK Telecom Co Ltd 6.625% 20/7/2027 'REGS' 300,000 USD 326,118 382,793 0.01Woori Bank FRN 10/6/2045 'REGS' 8,000,000 USD 8,000,001 8,000,795 0.29Woori Bank FRN 02/05/2037 'REGS' 5,000,000 USD 4,646,774 5,211,250 0.19Woori Bank 4.75% 30/4/2024 'REGS' 5,700,000 USD 5,707,994 5,839,616 0.21
150,457,043 154,972,463 5.68

63
EASTSPRING INVESTMENTS
DescriptionQuantity/ Nominal Currency
Acquisition cost Evaluation
% net assets
Statement of Investments as at December 31, 2015(expressed in USD)
ASIAN BOND FUND (continued)
Sri Lanka Bank of Ceylon 5.325% 16/4/2018 6,000,000 USD 6,002,867 5,801,545 0.21Bank of Ceylon 6.875% 3/5/2017 'REGS' 5,200,000 USD 5,211,831 5,207,732 0.19National Savings Bank 5.15% 10/9/2019 'REGS' 3,600,000 USD 3,570,674 3,336,523 0.12Sri Lanka Government International Bond 5.125% 11/4/2019 'REGS' 4,500,000 USD 4,531,902 4,297,365 0.16Sri Lanka Government International Bond 5.875% 25/7/2022 'REGS' 7,600,000 USD 7,637,599 6,953,999 0.25Sri Lanka Government International Bond 6.125% 3/6/2025 'REGS' 6,000,000 USD 5,878,003 5,328,994 0.20Sri Lanka Government International Bond 6.25% 4/10/2020 'REGS' 3,000,000 USD 2,993,383 2,908,056 0.11Sri Lanka Government International Bond 6.25% 27/7/2021 'REGS' 5,000,000 USD 4,980,300 4,765,092 0.17Sri Lanka Government International Bond 6.85% 3/11/2025 'REGS' 2,700,000 USD 2,700,000 2,521,125 0.09SriLankan Airlines Ltd 5.3% 27/6/2019 6,000,000 USD 5,974,730 5,602,708 0.21
49,481,289 46,723,139 1.71
Thailand Bangkok Bank PCL/Hong Kong 2.75% 27/3/2018 'REGS' 2,000,000 USD 1,997,292 2,011,639 0.07Bangkok Bank PCL/Hong Kong 3.875% 27/9/2022 'REGS' 2,300,000 USD 2,290,361 2,351,974 0.09Bangkok Bank PCL/Hong Kong 9.025% 15/3/2029 'REGS' 1,150,000 USD 1,248,365 1,603,175 0.06Kasikornbank PCL 8.25% 21/8/2016 'REGS' 1,850,000 USD 1,860,793 1,917,498 0.07Kasikornbank PCL/Hong Kong 3% 20/3/2018 'EMTN' 3,200,000 USD 3,198,827 3,232,130 0.12Krung Thai Bank PCL/Cayman Islands FRN 26/12/2024 'EMTN' 5,900,000 USD 6,049,180 6,018,202 0.23PTT Exploration & Production PCL FRN Perpetual 'REGS' 5,700,000 USD 5,715,881 5,586,000 0.20PTT Global Chemical PCL 4.25% 19/9/2022 'REGS' 3,100,000 USD 3,081,444 3,179,068 0.12PTT PCL 3.375% 25/10/2022 'REGS' 4,000,000 USD 3,989,235 3,942,574 0.14PTT PCL 4.5% 25/10/2042 'REGS' 4,400,000 USD 4,363,596 3,982,000 0.15Siam Commercial Bank Ltd/Hong Kong 3.375% 19/9/2017 'REGS' 2,000,000 USD 1,991,908 2,034,694 0.07Thai Oil PCL 3.625% 23/1/2023 'REGS' 2,500,000 USD 2,485,366 2,451,259 0.09Thai Oil PCL 4.875% 23/1/2043 'REGS' 1,500,000 USD 1,428,955 1,413,750 0.05
39,701,203 39,723,963 1.46
United Kingdom HSBC Holdings Plc FRN Perpetual 1,000,000 USD 999,505 987,500 0.04HSBC Holdings Plc Non-EOM FRN Perpetual 3,200,000 USD 3,199,901 3,196,000 0.12Standard Chartered Plc FRN Perpetual 'REGS' 4,900,000 USD 4,949,931 4,694,543 0.17Standard Chartered Plc 3.95% 11/1/2023 'REGS' 3,000,000 USD 2,975,748 2,889,210 0.11Standard Chartered Plc 5.3% 9/1/2043 'REGS' 4,000,000 USD 4,086,569 3,781,840 0.14Vedanta Resources Plc 6% 31/1/2019 'REGS' 8,400,000 USD 7,875,848 5,313,000 0.19Vedanta Resources Plc 6.75% 7/6/2016 'REGS' 4,000,000 USD 3,953,344 3,580,000 0.13Vedanta Resources Plc 7.125% 31/5/2023 'REGS' 3,600,000 USD 3,600,000 1,962,000 0.07Vedanta Resources Plc 8.25% 7/6/2021 'REGS' 4,000,000 USD 3,666,267 2,308,420 0.08Vedanta Resources Plc 9.5% 18/7/2018 'REGS' 3,000,000 USD 2,895,014 2,220,000 0.08
38,202,127 30,932,513 1.13
United States of America CNOOC Finance 2015 USA LLC 3.5% 5/5/2025 13,000,000 USD 12,625,494 12,366,421 0.45Hyundai Capital America 4% 8/6/2017 'REGS' 4,800,000 USD 4,792,789 4,918,315 0.18Reliance Holding USA Inc 4.5% 19/10/2020 'REGS' 7,560,000 USD 7,505,777 8,002,293 0.29Reliance Holding USA Inc 5.4% 14/2/2022 'REGS' 7,700,000 USD 7,714,644 8,350,402 0.31Reliance Holding USA Inc 6.25% 19/10/2040 'REGS' 500,000 USD 490,991 546,560 0.02
33,129,695 34,183,991 1.25
Vietnam Vietnam Government International Bond 4.8% 19/11/2024 'REGS' 8,600,000 USD 8,543,466 8,238,011 0.30
Total Bonds 2,530,001,762 2,534,732,230 92.92
Total Investments 2,530,001,762 2,534,732,230 92.92
Other Net Assets 193,196,272 7.08
Total Net Assets 2,727,928,502 100.00
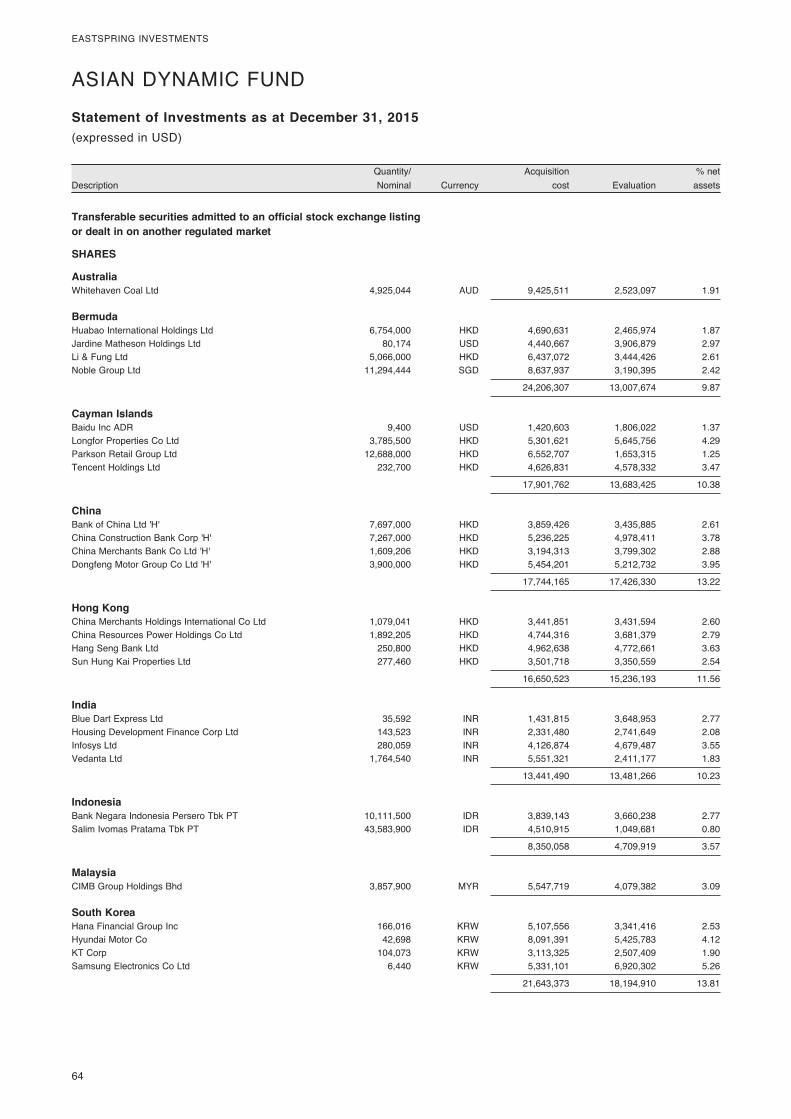
64
EASTSPRING INVESTMENTS
DescriptionQuantity/ Nominal Currency
Acquisition cost Evaluation
% net assets
Statement of Investments as at December 31, 2015
Transferable securities admitted to an official stock exchange listing or dealt in on another regulated market
SHARES
Australia Whitehaven Coal Ltd 4,925,044 AUD 9,425,511 2,523,097 1.91
Bermuda Huabao International Holdings Ltd 6,754,000 HKD 4,690,631 2,465,974 1.87Jardine Matheson Holdings Ltd 80,174 USD 4,440,667 3,906,879 2.97Li & Fung Ltd 5,066,000 HKD 6,437,072 3,444,426 2.61Noble Group Ltd 11,294,444 SGD 8,637,937 3,190,395 2.42
24,206,307 13,007,674 9.87
Cayman Islands Baidu Inc ADR 9,400 USD 1,420,603 1,806,022 1.37Longfor Properties Co Ltd 3,785,500 HKD 5,301,621 5,645,756 4.29Parkson Retail Group Ltd 12,688,000 HKD 6,552,707 1,653,315 1.25Tencent Holdings Ltd 232,700 HKD 4,626,831 4,578,332 3.47
17,901,762 13,683,425 10.38
China Bank of China Ltd 'H' 7,697,000 HKD 3,859,426 3,435,885 2.61China Construction Bank Corp 'H' 7,267,000 HKD 5,236,225 4,978,411 3.78China Merchants Bank Co Ltd 'H' 1,609,206 HKD 3,194,313 3,799,302 2.88Dongfeng Motor Group Co Ltd 'H' 3,900,000 HKD 5,454,201 5,212,732 3.95
17,744,165 17,426,330 13.22
Hong Kong China Merchants Holdings International Co Ltd 1,079,041 HKD 3,441,851 3,431,594 2.60China Resources Power Holdings Co Ltd 1,892,205 HKD 4,744,316 3,681,379 2.79Hang Seng Bank Ltd 250,800 HKD 4,962,638 4,772,661 3.63Sun Hung Kai Properties Ltd 277,460 HKD 3,501,718 3,350,559 2.54
16,650,523 15,236,193 11.56
India Blue Dart Express Ltd 35,592 INR 1,431,815 3,648,953 2.77Housing Development Finance Corp Ltd 143,523 INR 2,331,480 2,741,649 2.08Infosys Ltd 280,059 INR 4,126,874 4,679,487 3.55Vedanta Ltd 1,764,540 INR 5,551,321 2,411,177 1.83
13,441,490 13,481,266 10.23
Indonesia Bank Negara Indonesia Persero Tbk PT 10,111,500 IDR 3,839,143 3,660,238 2.77Salim Ivomas Pratama Tbk PT 43,583,900 IDR 4,510,915 1,049,681 0.80
8,350,058 4,709,919 3.57
Malaysia CIMB Group Holdings Bhd 3,857,900 MYR 5,547,719 4,079,382 3.09
South Korea Hana Financial Group Inc 166,016 KRW 5,107,556 3,341,416 2.53Hyundai Motor Co 42,698 KRW 8,091,391 5,425,783 4.12KT Corp 104,073 KRW 3,113,325 2,507,409 1.90Samsung Electronics Co Ltd 6,440 KRW 5,331,101 6,920,302 5.26
21,643,373 18,194,910 13.81
(expressed in USD)
ASIAN DYNAMIC FUND

65
EASTSPRING INVESTMENTS
DescriptionQuantity/ Nominal Currency
Acquisition cost Evaluation
% net assets
Statement of Investments as at December 31, 2015(expressed in USD)
ASIAN DYNAMIC FUND (continued)
Taiwan HON HAI Precision Industry Co Ltd 1,947,918 TWD 4,427,186 4,791,667 3.64Taiwan Mobile Co Ltd 1,217,000 TWD 3,763,440 3,705,059 2.81Taiwan Semiconductor Manufacturing Co Ltd 1,233,000 TWD 5,277,691 5,367,891 4.07
13,468,317 13,864,617 10.52
Thailand Bangkok Bank PCL (Foreign Market) 959,500 THB 5,391,401 4,119,570 3.13PTT Exploration & Production PCL (Foreign Market) 963,700 THB 5,089,251 1,533,190 1.16
10,480,652 5,652,760 4.29
United Kingdom Standard Chartered Plc 531,435 HKD 8,823,031 4,484,034 3.40
Total Shares 167,682,908 126,343,607 95.85
Total Investments 167,682,908 126,343,607 95.85
Other Net Assets 5,469,490 4.15
Total Net Assets 131,813,097 100.00
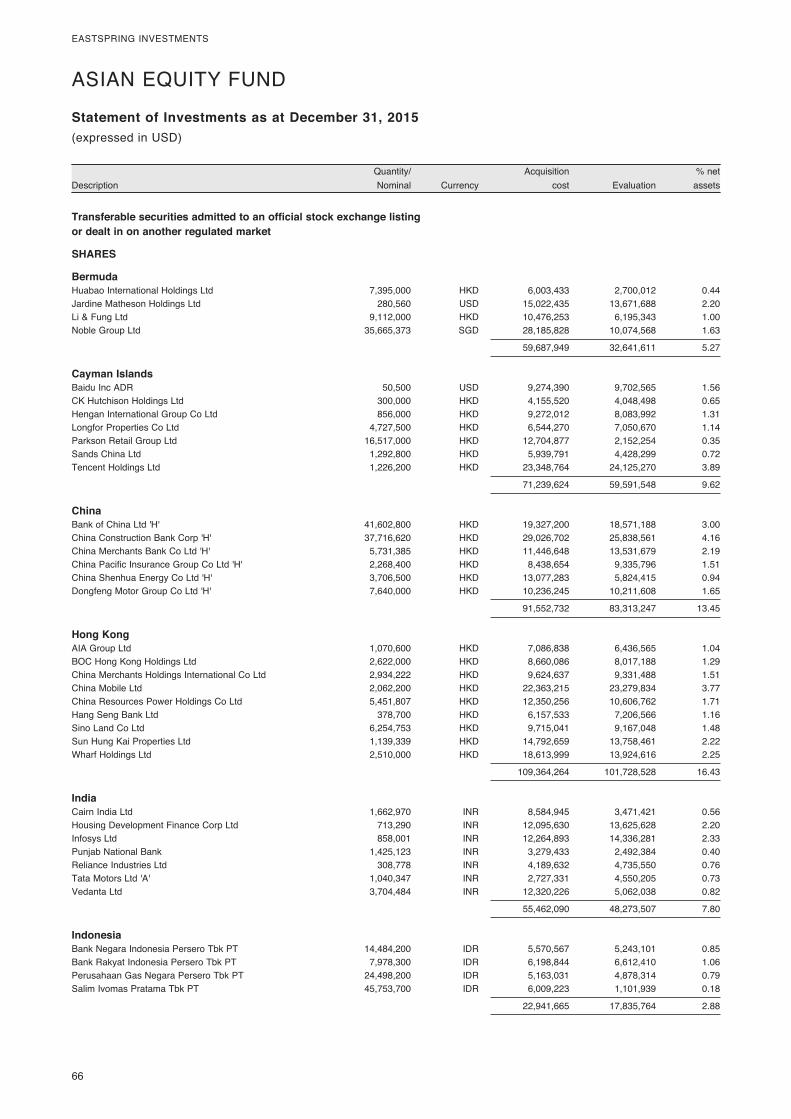
66
EASTSPRING INVESTMENTS
DescriptionQuantity/ Nominal Currency
Acquisition cost Evaluation
% net assets
Statement of Investments as at December 31, 2015
Transferable securities admitted to an official stock exchange listing or dealt in on another regulated market
SHARES
Bermuda Huabao International Holdings Ltd 7,395,000 HKD 6,003,433 2,700,012 0.44Jardine Matheson Holdings Ltd 280,560 USD 15,022,435 13,671,688 2.20Li & Fung Ltd 9,112,000 HKD 10,476,253 6,195,343 1.00Noble Group Ltd 35,665,373 SGD 28,185,828 10,074,568 1.63
59,687,949 32,641,611 5.27
Cayman Islands Baidu Inc ADR 50,500 USD 9,274,390 9,702,565 1.56CK Hutchison Holdings Ltd 300,000 HKD 4,155,520 4,048,498 0.65Hengan International Group Co Ltd 856,000 HKD 9,272,012 8,083,992 1.31Longfor Properties Co Ltd 4,727,500 HKD 6,544,270 7,050,670 1.14Parkson Retail Group Ltd 16,517,000 HKD 12,704,877 2,152,254 0.35Sands China Ltd 1,292,800 HKD 5,939,791 4,428,299 0.72Tencent Holdings Ltd 1,226,200 HKD 23,348,764 24,125,270 3.89
71,239,624 59,591,548 9.62
China Bank of China Ltd 'H' 41,602,800 HKD 19,327,200 18,571,188 3.00China Construction Bank Corp 'H' 37,716,620 HKD 29,026,702 25,838,561 4.16China Merchants Bank Co Ltd 'H' 5,731,385 HKD 11,446,648 13,531,679 2.19China Pacific Insurance Group Co Ltd 'H' 2,268,400 HKD 8,438,654 9,335,796 1.51China Shenhua Energy Co Ltd 'H' 3,706,500 HKD 13,077,283 5,824,415 0.94Dongfeng Motor Group Co Ltd 'H' 7,640,000 HKD 10,236,245 10,211,608 1.65
91,552,732 83,313,247 13.45
Hong Kong AIA Group Ltd 1,070,600 HKD 7,086,838 6,436,565 1.04BOC Hong Kong Holdings Ltd 2,622,000 HKD 8,660,086 8,017,188 1.29China Merchants Holdings International Co Ltd 2,934,222 HKD 9,624,637 9,331,488 1.51China Mobile Ltd 2,062,200 HKD 22,363,215 23,279,834 3.77China Resources Power Holdings Co Ltd 5,451,807 HKD 12,350,256 10,606,762 1.71Hang Seng Bank Ltd 378,700 HKD 6,157,533 7,206,566 1.16Sino Land Co Ltd 6,254,753 HKD 9,715,041 9,167,048 1.48Sun Hung Kai Properties Ltd 1,139,339 HKD 14,792,659 13,758,461 2.22Wharf Holdings Ltd 2,510,000 HKD 18,613,999 13,924,616 2.25
109,364,264 101,728,528 16.43
India Cairn India Ltd 1,662,970 INR 8,584,945 3,471,421 0.56Housing Development Finance Corp Ltd 713,290 INR 12,095,630 13,625,628 2.20Infosys Ltd 858,001 INR 12,264,893 14,336,281 2.33Punjab National Bank 1,425,123 INR 3,279,433 2,492,384 0.40Reliance Industries Ltd 308,778 INR 4,189,632 4,735,550 0.76Tata Motors Ltd 'A' 1,040,347 INR 2,727,331 4,550,205 0.73Vedanta Ltd 3,704,484 INR 12,320,226 5,062,038 0.82
55,462,090 48,273,507 7.80
Indonesia Bank Negara Indonesia Persero Tbk PT 14,484,200 IDR 5,570,567 5,243,101 0.85Bank Rakyat Indonesia Persero Tbk PT 7,978,300 IDR 6,198,844 6,612,410 1.06Perusahaan Gas Negara Persero Tbk PT 24,498,200 IDR 5,163,031 4,878,314 0.79Salim Ivomas Pratama Tbk PT 45,753,700 IDR 6,009,223 1,101,939 0.18
22,941,665 17,835,764 2.88
(expressed in USD)
ASIAN EQUITY FUND
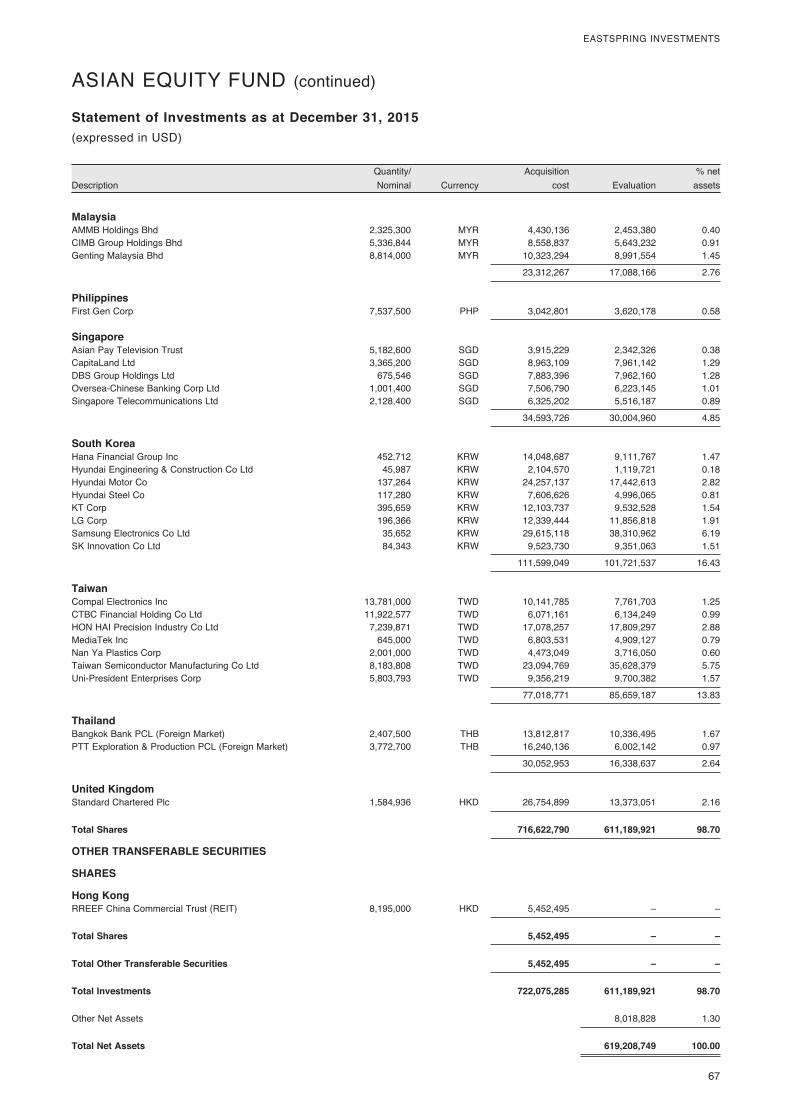
67
EASTSPRING INVESTMENTS
DescriptionQuantity/ Nominal Currency
Acquisition cost Evaluation
% net assets
Statement of Investments as at December 31, 2015(expressed in USD)
ASIAN EQUITY FUND (continued)
Malaysia AMMB Holdings Bhd 2,325,300 MYR 4,430,136 2,453,380 0.40CIMB Group Holdings Bhd 5,336,844 MYR 8,558,837 5,643,232 0.91Genting Malaysia Bhd 8,814,000 MYR 10,323,294 8,991,554 1.45
23,312,267 17,088,166 2.76
Philippines First Gen Corp 7,537,500 PHP 3,042,801 3,620,178 0.58
Singapore Asian Pay Television Trust 5,182,600 SGD 3,915,229 2,342,326 0.38CapitaLand Ltd 3,365,200 SGD 8,963,109 7,961,142 1.29DBS Group Holdings Ltd 675,546 SGD 7,883,396 7,962,160 1.28Oversea-Chinese Banking Corp Ltd 1,001,400 SGD 7,506,790 6,223,145 1.01Singapore Telecommunications Ltd 2,128,400 SGD 6,325,202 5,516,187 0.89
34,593,726 30,004,960 4.85
South Korea Hana Financial Group Inc 452,712 KRW 14,048,687 9,111,767 1.47Hyundai Engineering & Construction Co Ltd 45,987 KRW 2,104,570 1,119,721 0.18Hyundai Motor Co 137,264 KRW 24,257,137 17,442,613 2.82Hyundai Steel Co 117,280 KRW 7,606,626 4,996,065 0.81KT Corp 395,659 KRW 12,103,737 9,532,528 1.54LG Corp 196,366 KRW 12,339,444 11,856,818 1.91Samsung Electronics Co Ltd 35,652 KRW 29,615,118 38,310,962 6.19SK Innovation Co Ltd 84,343 KRW 9,523,730 9,351,063 1.51
111,599,049 101,721,537 16.43
Taiwan Compal Electronics Inc 13,781,000 TWD 10,141,785 7,761,703 1.25CTBC Financial Holding Co Ltd 11,922,577 TWD 6,071,161 6,134,249 0.99HON HAI Precision Industry Co Ltd 7,239,871 TWD 17,078,257 17,809,297 2.88MediaTek Inc 645,000 TWD 6,803,531 4,909,127 0.79Nan Ya Plastics Corp 2,001,000 TWD 4,473,049 3,716,050 0.60Taiwan Semiconductor Manufacturing Co Ltd 8,183,808 TWD 23,094,769 35,628,379 5.75Uni-President Enterprises Corp 5,803,793 TWD 9,356,219 9,700,382 1.57
77,018,771 85,659,187 13.83
Thailand Bangkok Bank PCL (Foreign Market) 2,407,500 THB 13,812,817 10,336,495 1.67PTT Exploration & Production PCL (Foreign Market) 3,772,700 THB 16,240,136 6,002,142 0.97
30,052,953 16,338,637 2.64
United Kingdom Standard Chartered Plc 1,584,936 HKD 26,754,899 13,373,051 2.16
Total Shares 716,622,790 611,189,921 98.70
OTHER TRANSFERABLE SECURITIES
SHARES
Hong Kong RREEF China Commercial Trust (REIT) 8,195,000 HKD 5,452,495 – –
Total Shares 5,452,495 – –
Total Other Transferable Securities 5,452,495 – –
Total Investments 722,075,285 611,189,921 98.70
Other Net Assets 8,018,828 1.30
Total Net Assets 619,208,749 100.00
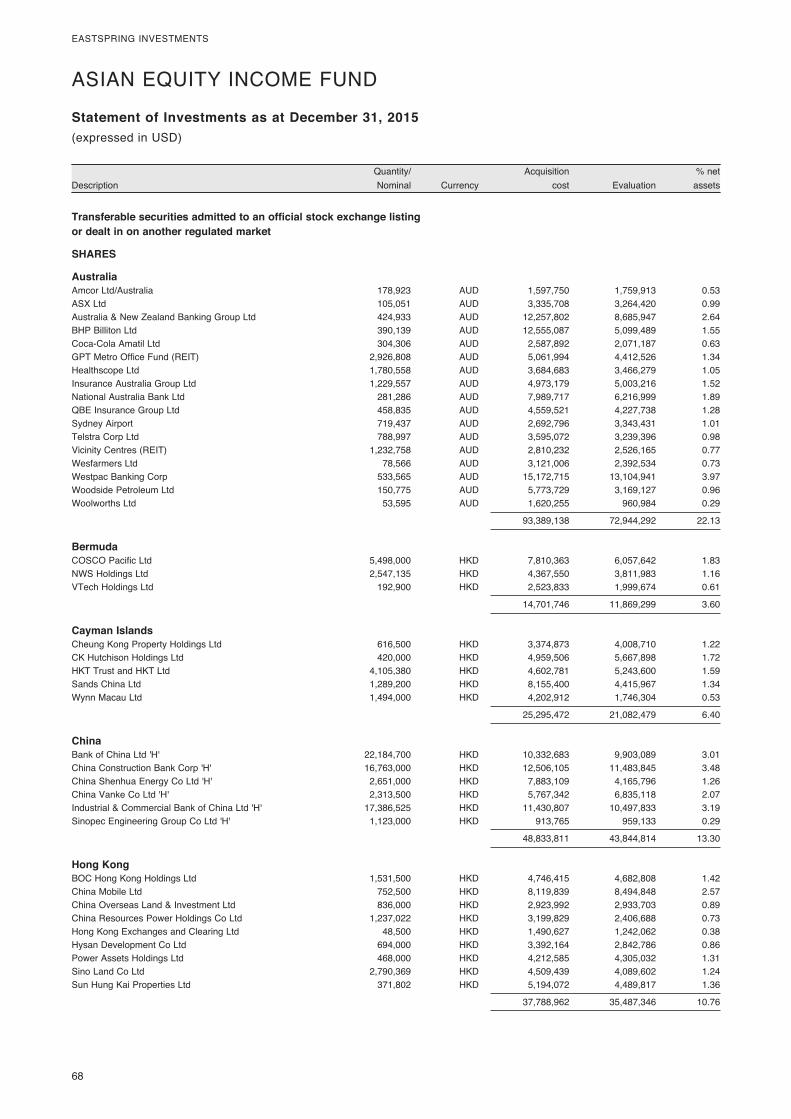
68
EASTSPRING INVESTMENTS
DescriptionQuantity/ Nominal Currency
Acquisition cost Evaluation
% net assets
Statement of Investments as at December 31, 2015
Transferable securities admitted to an official stock exchange listing or dealt in on another regulated market
SHARES
Australia Amcor Ltd/Australia 178,923 AUD 1,597,750 1,759,913 0.53ASX Ltd 105,051 AUD 3,335,708 3,264,420 0.99Australia & New Zealand Banking Group Ltd 424,933 AUD 12,257,802 8,685,947 2.64BHP Billiton Ltd 390,139 AUD 12,555,087 5,099,489 1.55Coca-Cola Amatil Ltd 304,306 AUD 2,587,892 2,071,187 0.63GPT Metro Office Fund (REIT) 2,926,808 AUD 5,061,994 4,412,526 1.34Healthscope Ltd 1,780,558 AUD 3,684,683 3,466,279 1.05Insurance Australia Group Ltd 1,229,557 AUD 4,973,179 5,003,216 1.52National Australia Bank Ltd 281,286 AUD 7,989,717 6,216,999 1.89QBE Insurance Group Ltd 458,835 AUD 4,559,521 4,227,738 1.28Sydney Airport 719,437 AUD 2,692,796 3,343,431 1.01Telstra Corp Ltd 788,997 AUD 3,595,072 3,239,396 0.98Vicinity Centres (REIT) 1,232,758 AUD 2,810,232 2,526,165 0.77Wesfarmers Ltd 78,566 AUD 3,121,006 2,392,534 0.73Westpac Banking Corp 533,565 AUD 15,172,715 13,104,941 3.97Woodside Petroleum Ltd 150,775 AUD 5,773,729 3,169,127 0.96Woolworths Ltd 53,595 AUD 1,620,255 960,984 0.29
93,389,138 72,944,292 22.13
Bermuda COSCO Pacific Ltd 5,498,000 HKD 7,810,363 6,057,642 1.83NWS Holdings Ltd 2,547,135 HKD 4,367,550 3,811,983 1.16VTech Holdings Ltd 192,900 HKD 2,523,833 1,999,674 0.61
14,701,746 11,869,299 3.60
Cayman Islands Cheung Kong Property Holdings Ltd 616,500 HKD 3,374,873 4,008,710 1.22CK Hutchison Holdings Ltd 420,000 HKD 4,959,506 5,667,898 1.72HKT Trust and HKT Ltd 4,105,380 HKD 4,602,781 5,243,600 1.59Sands China Ltd 1,289,200 HKD 8,155,400 4,415,967 1.34Wynn Macau Ltd 1,494,000 HKD 4,202,912 1,746,304 0.53
25,295,472 21,082,479 6.40
China Bank of China Ltd 'H' 22,184,700 HKD 10,332,683 9,903,089 3.01China Construction Bank Corp 'H' 16,763,000 HKD 12,506,105 11,483,845 3.48China Shenhua Energy Co Ltd 'H' 2,651,000 HKD 7,883,109 4,165,796 1.26China Vanke Co Ltd 'H' 2,313,500 HKD 5,767,342 6,835,118 2.07Industrial & Commercial Bank of China Ltd 'H' 17,386,525 HKD 11,430,807 10,497,833 3.19Sinopec Engineering Group Co Ltd 'H' 1,123,000 HKD 913,765 959,133 0.29
48,833,811 43,844,814 13.30
Hong Kong BOC Hong Kong Holdings Ltd 1,531,500 HKD 4,746,415 4,682,808 1.42China Mobile Ltd 752,500 HKD 8,119,839 8,494,848 2.57China Overseas Land & Investment Ltd 836,000 HKD 2,923,992 2,933,703 0.89China Resources Power Holdings Co Ltd 1,237,022 HKD 3,199,829 2,406,688 0.73Hong Kong Exchanges and Clearing Ltd 48,500 HKD 1,490,627 1,242,062 0.38Hysan Development Co Ltd 694,000 HKD 3,392,164 2,842,786 0.86Power Assets Holdings Ltd 468,000 HKD 4,212,585 4,305,032 1.31Sino Land Co Ltd 2,790,369 HKD 4,509,439 4,089,602 1.24Sun Hung Kai Properties Ltd 371,802 HKD 5,194,072 4,489,817 1.36
37,788,962 35,487,346 10.76
(expressed in USD)
ASIAN EQUITY INCOME FUND
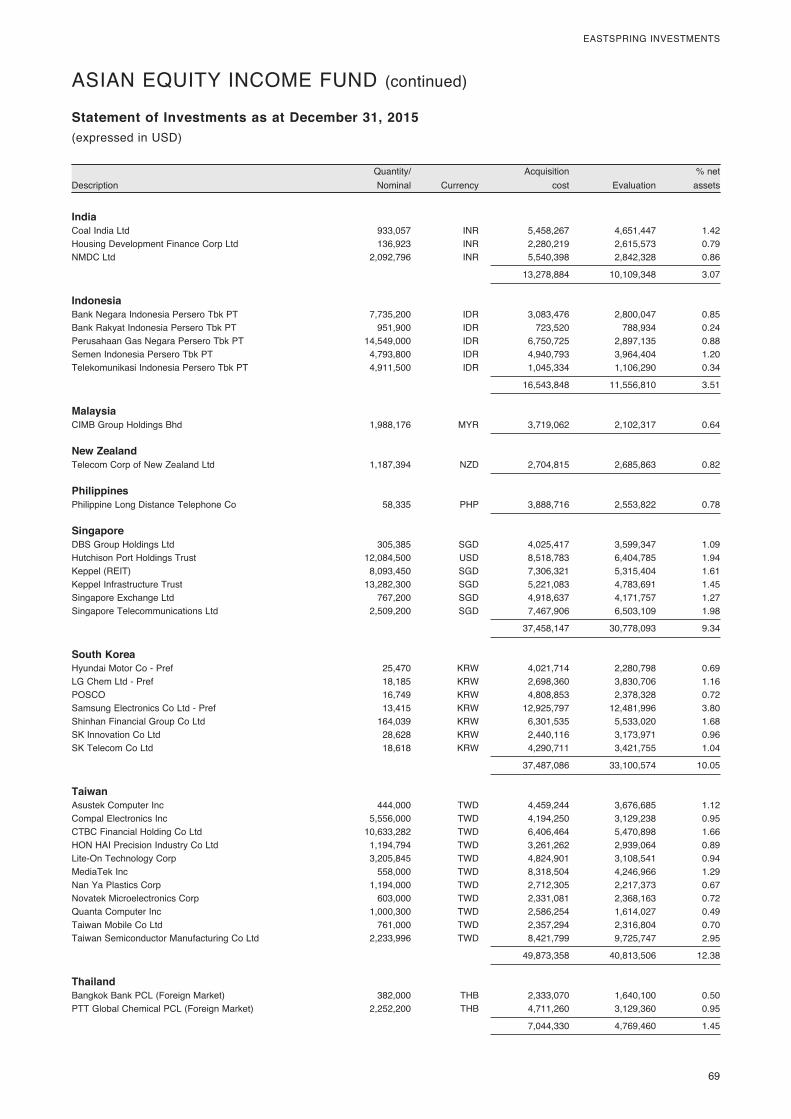
69
EASTSPRING INVESTMENTS
DescriptionQuantity/ Nominal Currency
Acquisition cost Evaluation
% net assets
Statement of Investments as at December 31, 2015(expressed in USD)
ASIAN EQUITY INCOME FUND (continued)
India Coal India Ltd 933,057 INR 5,458,267 4,651,447 1.42Housing Development Finance Corp Ltd 136,923 INR 2,280,219 2,615,573 0.79NMDC Ltd 2,092,796 INR 5,540,398 2,842,328 0.86
13,278,884 10,109,348 3.07
Indonesia Bank Negara Indonesia Persero Tbk PT 7,735,200 IDR 3,083,476 2,800,047 0.85Bank Rakyat Indonesia Persero Tbk PT 951,900 IDR 723,520 788,934 0.24Perusahaan Gas Negara Persero Tbk PT 14,549,000 IDR 6,750,725 2,897,135 0.88Semen Indonesia Persero Tbk PT 4,793,800 IDR 4,940,793 3,964,404 1.20Telekomunikasi Indonesia Persero Tbk PT 4,911,500 IDR 1,045,334 1,106,290 0.34
16,543,848 11,556,810 3.51
Malaysia CIMB Group Holdings Bhd 1,988,176 MYR 3,719,062 2,102,317 0.64
New Zealand Telecom Corp of New Zealand Ltd 1,187,394 NZD 2,704,815 2,685,863 0.82
Philippines Philippine Long Distance Telephone Co 58,335 PHP 3,888,716 2,553,822 0.78
Singapore DBS Group Holdings Ltd 305,385 SGD 4,025,417 3,599,347 1.09Hutchison Port Holdings Trust 12,084,500 USD 8,518,783 6,404,785 1.94Keppel (REIT) 8,093,450 SGD 7,306,321 5,315,404 1.61Keppel Infrastructure Trust 13,282,300 SGD 5,221,083 4,783,691 1.45Singapore Exchange Ltd 767,200 SGD 4,918,637 4,171,757 1.27Singapore Telecommunications Ltd 2,509,200 SGD 7,467,906 6,503,109 1.98
37,458,147 30,778,093 9.34
South Korea Hyundai Motor Co - Pref 25,470 KRW 4,021,714 2,280,798 0.69LG Chem Ltd - Pref 18,185 KRW 2,698,360 3,830,706 1.16POSCO 16,749 KRW 4,808,853 2,378,328 0.72Samsung Electronics Co Ltd - Pref 13,415 KRW 12,925,797 12,481,996 3.80Shinhan Financial Group Co Ltd 164,039 KRW 6,301,535 5,533,020 1.68SK Innovation Co Ltd 28,628 KRW 2,440,116 3,173,971 0.96SK Telecom Co Ltd 18,618 KRW 4,290,711 3,421,755 1.04
37,487,086 33,100,574 10.05
Taiwan Asustek Computer Inc 444,000 TWD 4,459,244 3,676,685 1.12Compal Electronics Inc 5,556,000 TWD 4,194,250 3,129,238 0.95CTBC Financial Holding Co Ltd 10,633,282 TWD 6,406,464 5,470,898 1.66HON HAI Precision Industry Co Ltd 1,194,794 TWD 3,261,262 2,939,064 0.89Lite-On Technology Corp 3,205,845 TWD 4,824,901 3,108,541 0.94MediaTek Inc 558,000 TWD 8,318,504 4,246,966 1.29Nan Ya Plastics Corp 1,194,000 TWD 2,712,305 2,217,373 0.67Novatek Microelectronics Corp 603,000 TWD 2,331,081 2,368,163 0.72Quanta Computer Inc 1,000,300 TWD 2,586,254 1,614,027 0.49Taiwan Mobile Co Ltd 761,000 TWD 2,357,294 2,316,804 0.70Taiwan Semiconductor Manufacturing Co Ltd 2,233,996 TWD 8,421,799 9,725,747 2.95
49,873,358 40,813,506 12.38
Thailand Bangkok Bank PCL (Foreign Market) 382,000 THB 2,333,070 1,640,100 0.50PTT Global Chemical PCL (Foreign Market) 2,252,200 THB 4,711,260 3,129,360 0.95
7,044,330 4,769,460 1.45
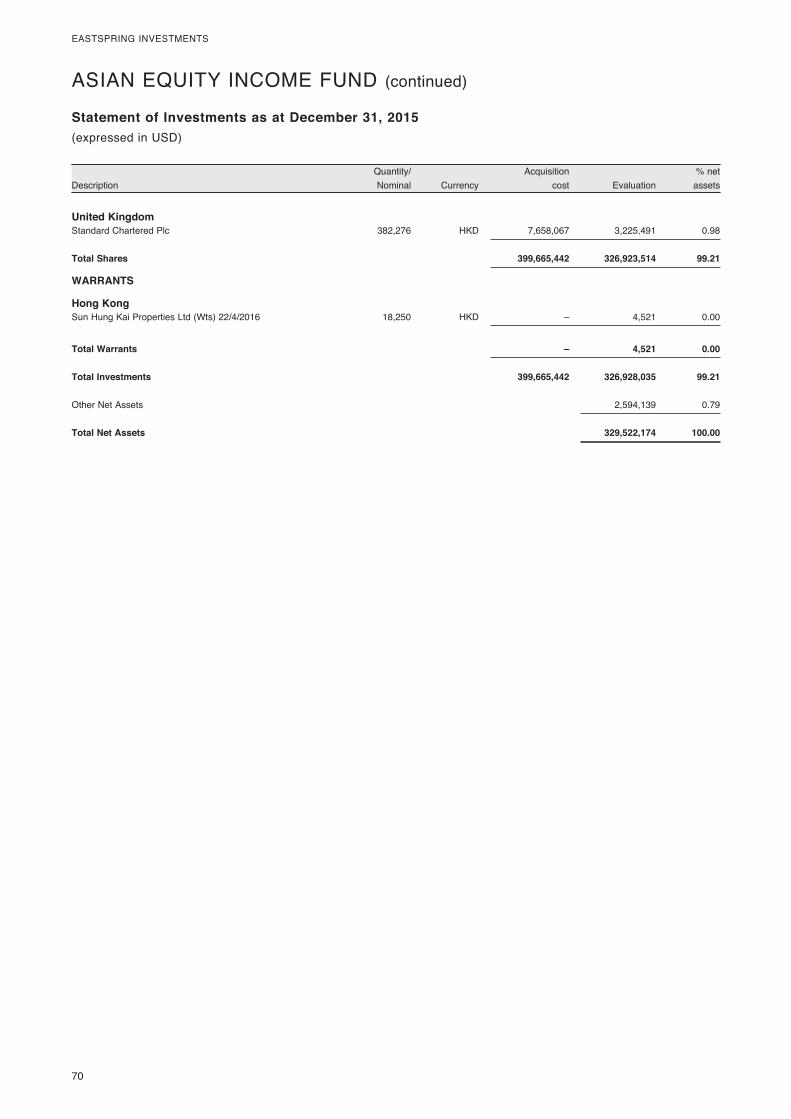
70
EASTSPRING INVESTMENTS
DescriptionQuantity/ Nominal Currency
Acquisition cost Evaluation
% net assets
Statement of Investments as at December 31, 2015(expressed in USD)
ASIAN EQUITY INCOME FUND (continued)
United Kingdom Standard Chartered Plc 382,276 HKD 7,658,067 3,225,491 0.98
Total Shares 399,665,442 326,923,514 99.21
WARRANTS
Hong Kong Sun Hung Kai Properties Ltd (Wts) 22/4/2016 18,250 HKD – 4,521 0.00
Total Warrants – 4,521 0.00
Total Investments 399,665,442 326,928,035 99.21
Other Net Assets 2,594,139 0.79
Total Net Assets 329,522,174 100.00
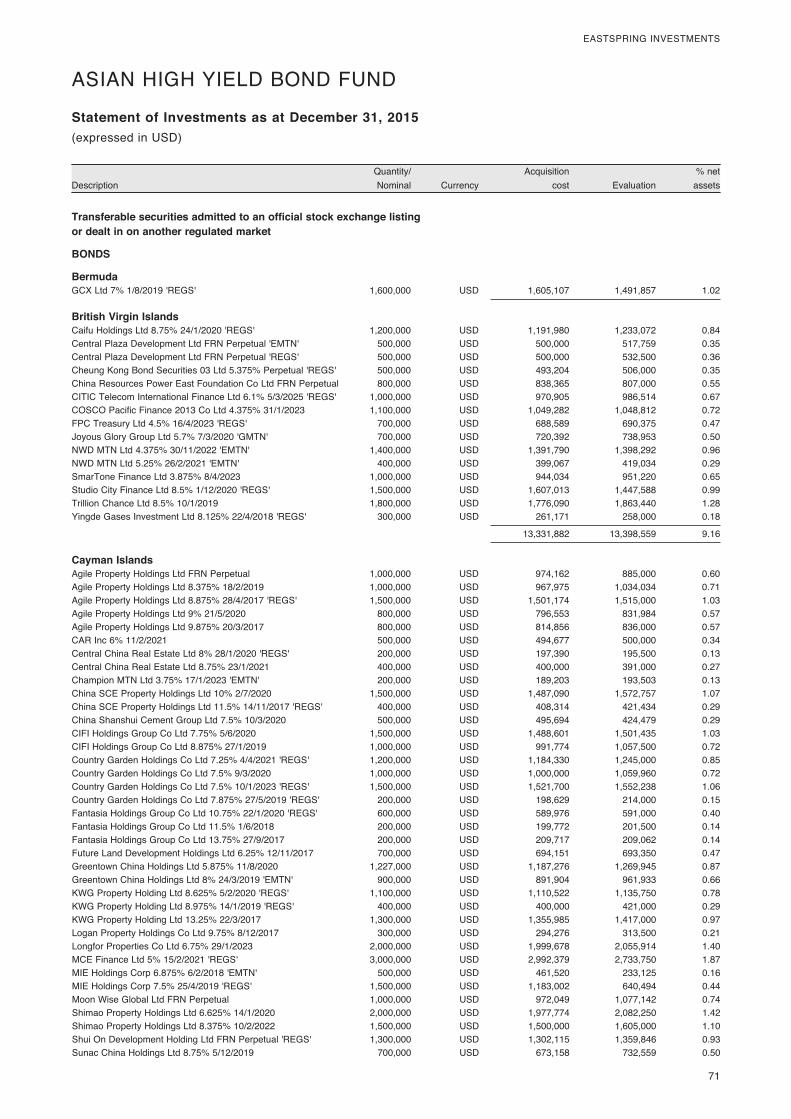
71
EASTSPRING INVESTMENTS
DescriptionQuantity/ Nominal Currency
Acquisition cost Evaluation
% net assets
Statement of Investments as at December 31, 2015
Transferable securities admitted to an official stock exchange listing or dealt in on another regulated market
BONDS
Bermuda GCX Ltd 7% 1/8/2019 'REGS' 1,600,000 USD 1,605,107 1,491,857 1.02
British Virgin Islands Caifu Holdings Ltd 8.75% 24/1/2020 'REGS' 1,200,000 USD 1,191,980 1,233,072 0.84Central Plaza Development Ltd FRN Perpetual 'EMTN' 500,000 USD 500,000 517,759 0.35Central Plaza Development Ltd FRN Perpetual 'REGS' 500,000 USD 500,000 532,500 0.36Cheung Kong Bond Securities 03 Ltd 5.375% Perpetual 'REGS' 500,000 USD 493,204 506,000 0.35China Resources Power East Foundation Co Ltd FRN Perpetual 800,000 USD 838,365 807,000 0.55CITIC Telecom International Finance Ltd 6.1% 5/3/2025 'REGS' 1,000,000 USD 970,905 986,514 0.67COSCO Pacific Finance 2013 Co Ltd 4.375% 31/1/2023 1,100,000 USD 1,049,282 1,048,812 0.72FPC Treasury Ltd 4.5% 16/4/2023 'REGS' 700,000 USD 688,589 690,375 0.47Joyous Glory Group Ltd 5.7% 7/3/2020 'GMTN' 700,000 USD 720,392 738,953 0.50NWD MTN Ltd 4.375% 30/11/2022 'EMTN' 1,400,000 USD 1,391,790 1,398,292 0.96NWD MTN Ltd 5.25% 26/2/2021 'EMTN' 400,000 USD 399,067 419,034 0.29SmarTone Finance Ltd 3.875% 8/4/2023 1,000,000 USD 944,034 951,220 0.65Studio City Finance Ltd 8.5% 1/12/2020 'REGS' 1,500,000 USD 1,607,013 1,447,588 0.99Trillion Chance Ltd 8.5% 10/1/2019 1,800,000 USD 1,776,090 1,863,440 1.28Yingde Gases Investment Ltd 8.125% 22/4/2018 'REGS' 300,000 USD 261,171 258,000 0.18
13,331,882 13,398,559 9.16
Cayman Islands Agile Property Holdings Ltd FRN Perpetual 1,000,000 USD 974,162 885,000 0.60Agile Property Holdings Ltd 8.375% 18/2/2019 1,000,000 USD 967,975 1,034,034 0.71Agile Property Holdings Ltd 8.875% 28/4/2017 'REGS' 1,500,000 USD 1,501,174 1,515,000 1.03Agile Property Holdings Ltd 9% 21/5/2020 800,000 USD 796,553 831,984 0.57Agile Property Holdings Ltd 9.875% 20/3/2017 800,000 USD 814,856 836,000 0.57CAR Inc 6% 11/2/2021 500,000 USD 494,677 500,000 0.34Central China Real Estate Ltd 8% 28/1/2020 'REGS' 200,000 USD 197,390 195,500 0.13Central China Real Estate Ltd 8.75% 23/1/2021 400,000 USD 400,000 391,000 0.27Champion MTN Ltd 3.75% 17/1/2023 'EMTN' 200,000 USD 189,203 193,503 0.13China SCE Property Holdings Ltd 10% 2/7/2020 1,500,000 USD 1,487,090 1,572,757 1.07China SCE Property Holdings Ltd 11.5% 14/11/2017 'REGS' 400,000 USD 408,314 421,434 0.29China Shanshui Cement Group Ltd 7.5% 10/3/2020 500,000 USD 495,694 424,479 0.29CIFI Holdings Group Co Ltd 7.75% 5/6/2020 1,500,000 USD 1,488,601 1,501,435 1.03CIFI Holdings Group Co Ltd 8.875% 27/1/2019 1,000,000 USD 991,774 1,057,500 0.72Country Garden Holdings Co Ltd 7.25% 4/4/2021 'REGS' 1,200,000 USD 1,184,330 1,245,000 0.85Country Garden Holdings Co Ltd 7.5% 9/3/2020 1,000,000 USD 1,000,000 1,059,960 0.72Country Garden Holdings Co Ltd 7.5% 10/1/2023 'REGS' 1,500,000 USD 1,521,700 1,552,238 1.06Country Garden Holdings Co Ltd 7.875% 27/5/2019 'REGS' 200,000 USD 198,629 214,000 0.15Fantasia Holdings Group Co Ltd 10.75% 22/1/2020 'REGS' 600,000 USD 589,976 591,000 0.40Fantasia Holdings Group Co Ltd 11.5% 1/6/2018 200,000 USD 199,772 201,500 0.14Fantasia Holdings Group Co Ltd 13.75% 27/9/2017 200,000 USD 209,717 209,062 0.14Future Land Development Holdings Ltd 6.25% 12/11/2017 700,000 USD 694,151 693,350 0.47Greentown China Holdings Ltd 5.875% 11/8/2020 1,227,000 USD 1,187,276 1,269,945 0.87Greentown China Holdings Ltd 8% 24/3/2019 'EMTN' 900,000 USD 891,904 961,933 0.66KWG Property Holding Ltd 8.625% 5/2/2020 'REGS' 1,100,000 USD 1,110,522 1,135,750 0.78KWG Property Holding Ltd 8.975% 14/1/2019 'REGS' 400,000 USD 400,000 421,000 0.29KWG Property Holding Ltd 13.25% 22/3/2017 1,300,000 USD 1,355,985 1,417,000 0.97Logan Property Holdings Co Ltd 9.75% 8/12/2017 300,000 USD 294,276 313,500 0.21Longfor Properties Co Ltd 6.75% 29/1/2023 2,000,000 USD 1,999,678 2,055,914 1.40MCE Finance Ltd 5% 15/2/2021 'REGS' 3,000,000 USD 2,992,379 2,733,750 1.87MIE Holdings Corp 6.875% 6/2/2018 'EMTN' 500,000 USD 461,520 233,125 0.16MIE Holdings Corp 7.5% 25/4/2019 'REGS' 1,500,000 USD 1,183,002 640,494 0.44Moon Wise Global Ltd FRN Perpetual 1,000,000 USD 972,049 1,077,142 0.74Shimao Property Holdings Ltd 6.625% 14/1/2020 2,000,000 USD 1,977,774 2,082,250 1.42Shimao Property Holdings Ltd 8.375% 10/2/2022 1,500,000 USD 1,500,000 1,605,000 1.10Shui On Development Holding Ltd FRN Perpetual 'REGS' 1,300,000 USD 1,302,115 1,359,846 0.93Sunac China Holdings Ltd 8.75% 5/12/2019 700,000 USD 673,158 732,559 0.50
(expressed in USD)
ASIAN HIGH YIELD BOND FUND
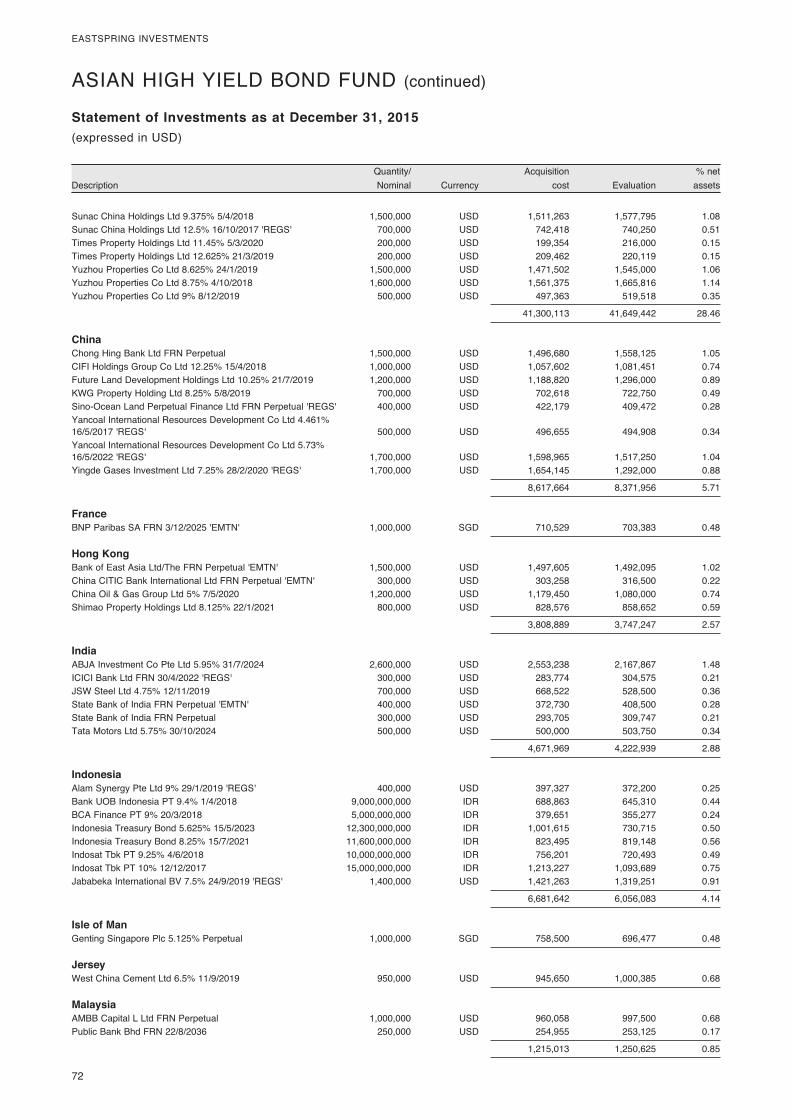
72
EASTSPRING INVESTMENTS
DescriptionQuantity/ Nominal Currency
Acquisition cost Evaluation
% net assets
Statement of Investments as at December 31, 2015(expressed in USD)
ASIAN HIGH YIELD BOND FUND (continued)
Sunac China Holdings Ltd 9.375% 5/4/2018 1,500,000 USD 1,511,263 1,577,795 1.08Sunac China Holdings Ltd 12.5% 16/10/2017 'REGS' 700,000 USD 742,418 740,250 0.51Times Property Holdings Ltd 11.45% 5/3/2020 200,000 USD 199,354 216,000 0.15Times Property Holdings Ltd 12.625% 21/3/2019 200,000 USD 209,462 220,119 0.15Yuzhou Properties Co Ltd 8.625% 24/1/2019 1,500,000 USD 1,471,502 1,545,000 1.06Yuzhou Properties Co Ltd 8.75% 4/10/2018 1,600,000 USD 1,561,375 1,665,816 1.14Yuzhou Properties Co Ltd 9% 8/12/2019 500,000 USD 497,363 519,518 0.35
41,300,113 41,649,442 28.46
China Chong Hing Bank Ltd FRN Perpetual 1,500,000 USD 1,496,680 1,558,125 1.05CIFI Holdings Group Co Ltd 12.25% 15/4/2018 1,000,000 USD 1,057,602 1,081,451 0.74Future Land Development Holdings Ltd 10.25% 21/7/2019 1,200,000 USD 1,188,820 1,296,000 0.89KWG Property Holding Ltd 8.25% 5/8/2019 700,000 USD 702,618 722,750 0.49Sino-Ocean Land Perpetual Finance Ltd FRN Perpetual 'REGS' 400,000 USD 422,179 409,472 0.28Yancoal International Resources Development Co Ltd 4.461% 16/5/2017 'REGS' 500,000 USD 496,655 494,908 0.34Yancoal International Resources Development Co Ltd 5.73% 16/5/2022 'REGS' 1,700,000 USD 1,598,965 1,517,250 1.04Yingde Gases Investment Ltd 7.25% 28/2/2020 'REGS' 1,700,000 USD 1,654,145 1,292,000 0.88
8,617,664 8,371,956 5.71
France BNP Paribas SA FRN 3/12/2025 'EMTN' 1,000,000 SGD 710,529 703,383 0.48
Hong Kong Bank of East Asia Ltd/The FRN Perpetual 'EMTN' 1,500,000 USD 1,497,605 1,492,095 1.02China CITIC Bank International Ltd FRN Perpetual 'EMTN' 300,000 USD 303,258 316,500 0.22China Oil & Gas Group Ltd 5% 7/5/2020 1,200,000 USD 1,179,450 1,080,000 0.74Shimao Property Holdings Ltd 8.125% 22/1/2021 800,000 USD 828,576 858,652 0.59
3,808,889 3,747,247 2.57
India ABJA Investment Co Pte Ltd 5.95% 31/7/2024 2,600,000 USD 2,553,238 2,167,867 1.48ICICI Bank Ltd FRN 30/4/2022 'REGS' 300,000 USD 283,774 304,575 0.21JSW Steel Ltd 4.75% 12/11/2019 700,000 USD 668,522 528,500 0.36State Bank of India FRN Perpetual 'EMTN' 400,000 USD 372,730 408,500 0.28State Bank of India FRN Perpetual 300,000 USD 293,705 309,747 0.21Tata Motors Ltd 5.75% 30/10/2024 500,000 USD 500,000 503,750 0.34
4,671,969 4,222,939 2.88
Indonesia Alam Synergy Pte Ltd 9% 29/1/2019 'REGS' 400,000 USD 397,327 372,200 0.25Bank UOB Indonesia PT 9.4% 1/4/2018 9,000,000,000 IDR 688,863 645,310 0.44BCA Finance PT 9% 20/3/2018 5,000,000,000 IDR 379,651 355,277 0.24Indonesia Treasury Bond 5.625% 15/5/2023 12,300,000,000 IDR 1,001,615 730,715 0.50Indonesia Treasury Bond 8.25% 15/7/2021 11,600,000,000 IDR 823,495 819,148 0.56Indosat Tbk PT 9.25% 4/6/2018 10,000,000,000 IDR 756,201 720,493 0.49Indosat Tbk PT 10% 12/12/2017 15,000,000,000 IDR 1,213,227 1,093,689 0.75Jababeka International BV 7.5% 24/9/2019 'REGS' 1,400,000 USD 1,421,263 1,319,251 0.91
6,681,642 6,056,083 4.14
Isle of Man Genting Singapore Plc 5.125% Perpetual 1,000,000 SGD 758,500 696,477 0.48
Jersey West China Cement Ltd 6.5% 11/9/2019 950,000 USD 945,650 1,000,385 0.68
Malaysia AMBB Capital L Ltd FRN Perpetual 1,000,000 USD 960,058 997,500 0.68Public Bank Bhd FRN 22/8/2036 250,000 USD 254,955 253,125 0.17
1,215,013 1,250,625 0.85
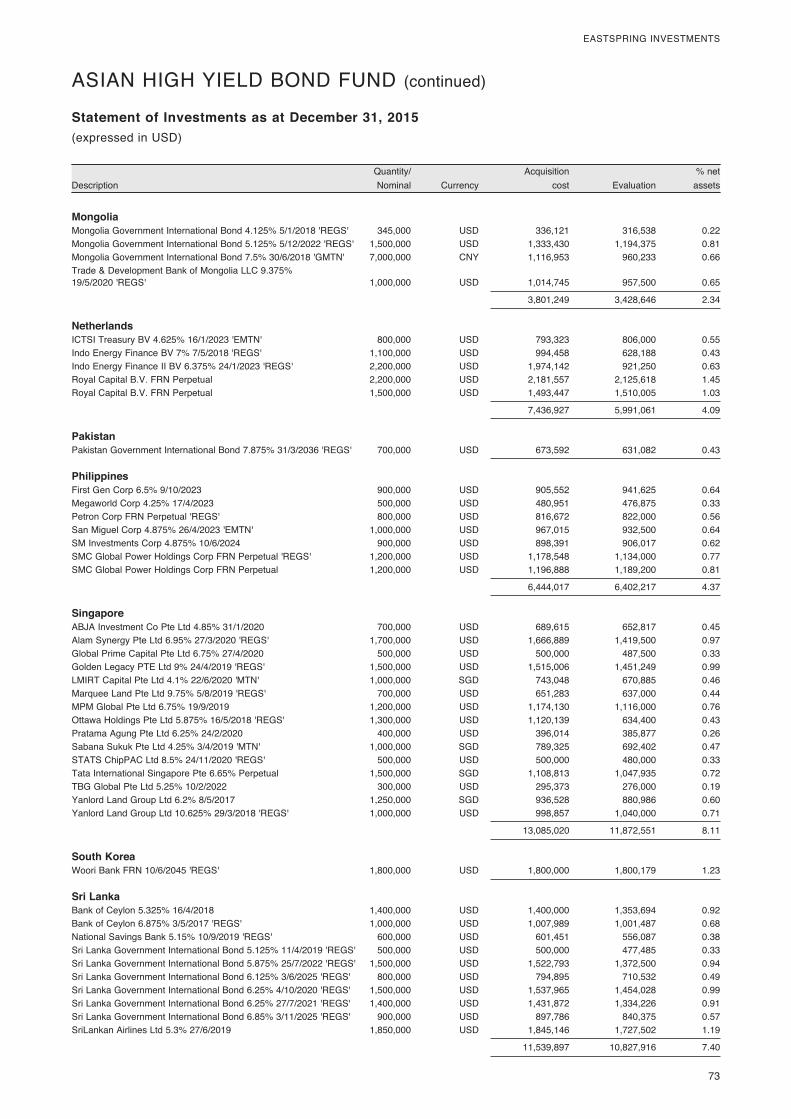
73
EASTSPRING INVESTMENTS
DescriptionQuantity/ Nominal Currency
Acquisition cost Evaluation
% net assets
Statement of Investments as at December 31, 2015(expressed in USD)
ASIAN HIGH YIELD BOND FUND (continued)
Mongolia Mongolia Government International Bond 4.125% 5/1/2018 'REGS' 345,000 USD 336,121 316,538 0.22Mongolia Government International Bond 5.125% 5/12/2022 'REGS' 1,500,000 USD 1,333,430 1,194,375 0.81Mongolia Government International Bond 7.5% 30/6/2018 'GMTN' 7,000,000 CNY 1,116,953 960,233 0.66Trade & Development Bank of Mongolia LLC 9.375% 19/5/2020 'REGS' 1,000,000 USD 1,014,745 957,500 0.65
3,801,249 3,428,646 2.34
Netherlands ICTSI Treasury BV 4.625% 16/1/2023 'EMTN' 800,000 USD 793,323 806,000 0.55Indo Energy Finance BV 7% 7/5/2018 'REGS' 1,100,000 USD 994,458 628,188 0.43Indo Energy Finance II BV 6.375% 24/1/2023 'REGS' 2,200,000 USD 1,974,142 921,250 0.63Royal Capital B.V. FRN Perpetual 2,200,000 USD 2,181,557 2,125,618 1.45Royal Capital B.V. FRN Perpetual 1,500,000 USD 1,493,447 1,510,005 1.03
7,436,927 5,991,061 4.09
Pakistan Pakistan Government International Bond 7.875% 31/3/2036 'REGS' 700,000 USD 673,592 631,082 0.43
Philippines First Gen Corp 6.5% 9/10/2023 900,000 USD 905,552 941,625 0.64Megaworld Corp 4.25% 17/4/2023 500,000 USD 480,951 476,875 0.33Petron Corp FRN Perpetual 'REGS' 800,000 USD 816,672 822,000 0.56San Miguel Corp 4.875% 26/4/2023 'EMTN' 1,000,000 USD 967,015 932,500 0.64SM Investments Corp 4.875% 10/6/2024 900,000 USD 898,391 906,017 0.62SMC Global Power Holdings Corp FRN Perpetual 'REGS' 1,200,000 USD 1,178,548 1,134,000 0.77SMC Global Power Holdings Corp FRN Perpetual 1,200,000 USD 1,196,888 1,189,200 0.81
6,444,017 6,402,217 4.37
Singapore ABJA Investment Co Pte Ltd 4.85% 31/1/2020 700,000 USD 689,615 652,817 0.45Alam Synergy Pte Ltd 6.95% 27/3/2020 'REGS' 1,700,000 USD 1,666,889 1,419,500 0.97Global Prime Capital Pte Ltd 6.75% 27/4/2020 500,000 USD 500,000 487,500 0.33Golden Legacy PTE Ltd 9% 24/4/2019 'REGS' 1,500,000 USD 1,515,006 1,451,249 0.99LMIRT Capital Pte Ltd 4.1% 22/6/2020 'MTN' 1,000,000 SGD 743,048 670,885 0.46Marquee Land Pte Ltd 9.75% 5/8/2019 'REGS' 700,000 USD 651,283 637,000 0.44MPM Global Pte Ltd 6.75% 19/9/2019 1,200,000 USD 1,174,130 1,116,000 0.76Ottawa Holdings Pte Ltd 5.875% 16/5/2018 'REGS' 1,300,000 USD 1,120,139 634,400 0.43Pratama Agung Pte Ltd 6.25% 24/2/2020 400,000 USD 396,014 385,877 0.26Sabana Sukuk Pte Ltd 4.25% 3/4/2019 'MTN' 1,000,000 SGD 789,325 692,402 0.47STATS ChipPAC Ltd 8.5% 24/11/2020 'REGS' 500,000 USD 500,000 480,000 0.33Tata International Singapore Pte 6.65% Perpetual 1,500,000 SGD 1,108,813 1,047,935 0.72TBG Global Pte Ltd 5.25% 10/2/2022 300,000 USD 295,373 276,000 0.19Yanlord Land Group Ltd 6.2% 8/5/2017 1,250,000 SGD 936,528 880,986 0.60Yanlord Land Group Ltd 10.625% 29/3/2018 'REGS' 1,000,000 USD 998,857 1,040,000 0.71
13,085,020 11,872,551 8.11
South Korea Woori Bank FRN 10/6/2045 'REGS' 1,800,000 USD 1,800,000 1,800,179 1.23
Sri Lanka Bank of Ceylon 5.325% 16/4/2018 1,400,000 USD 1,400,000 1,353,694 0.92Bank of Ceylon 6.875% 3/5/2017 'REGS' 1,000,000 USD 1,007,989 1,001,487 0.68National Savings Bank 5.15% 10/9/2019 'REGS' 600,000 USD 601,451 556,087 0.38Sri Lanka Government International Bond 5.125% 11/4/2019 'REGS' 500,000 USD 500,000 477,485 0.33Sri Lanka Government International Bond 5.875% 25/7/2022 'REGS' 1,500,000 USD 1,522,793 1,372,500 0.94Sri Lanka Government International Bond 6.125% 3/6/2025 'REGS' 800,000 USD 794,895 710,532 0.49Sri Lanka Government International Bond 6.25% 4/10/2020 'REGS' 1,500,000 USD 1,537,965 1,454,028 0.99Sri Lanka Government International Bond 6.25% 27/7/2021 'REGS' 1,400,000 USD 1,431,872 1,334,226 0.91Sri Lanka Government International Bond 6.85% 3/11/2025 'REGS' 900,000 USD 897,786 840,375 0.57SriLankan Airlines Ltd 5.3% 27/6/2019 1,850,000 USD 1,845,146 1,727,502 1.19
11,539,897 10,827,916 7.40

74
EASTSPRING INVESTMENTS
DescriptionQuantity/ Nominal Currency
Acquisition cost Evaluation
% net assets
Statement of Investments as at December 31, 2015(expressed in USD)
ASIAN HIGH YIELD BOND FUND (continued)
Thailand Krung Thai Bank PCL FRN Perpetual 500,000 USD 522,932 503,750 0.34Krung Thai Bank PCL/Cayman Islands FRN 26/12/2024 'EMTN' 700,000 USD 703,190 714,024 0.49
1,226,122 1,217,774 0.83
United Kingdom Standard Chartered Plc FRN Perpetual 'REGS' 1,200,000 USD 1,182,142 1,149,684 0.78Vedanta Resources Plc 6% 31/1/2019 'REGS' 1,200,000 USD 1,109,755 759,000 0.52Vedanta Resources Plc 7.125% 31/5/2023 'REGS' 1,100,000 USD 1,081,866 599,500 0.41Vedanta Resources Plc 8.25% 7/6/2021 'REGS' 1,900,000 USD 1,979,836 1,096,500 0.75Vedanta Resources Plc 9.5% 18/7/2018 'REGS' 1,000,000 USD 1,018,409 740,000 0.51
6,372,008 4,344,684 2.97
Vietnam Vietnam Government International Bond 4.8% 19/11/2024 'REGS' 1,947,000 USD 1,947,000 1,865,047 1.27
Total Bonds 137,972,790 130,970,110 89.47
Total Investments 137,972,790 130,970,110 89.47
Other Net Assets 15,409,695 10.53
Total Net Assets 146,379,805 100.00
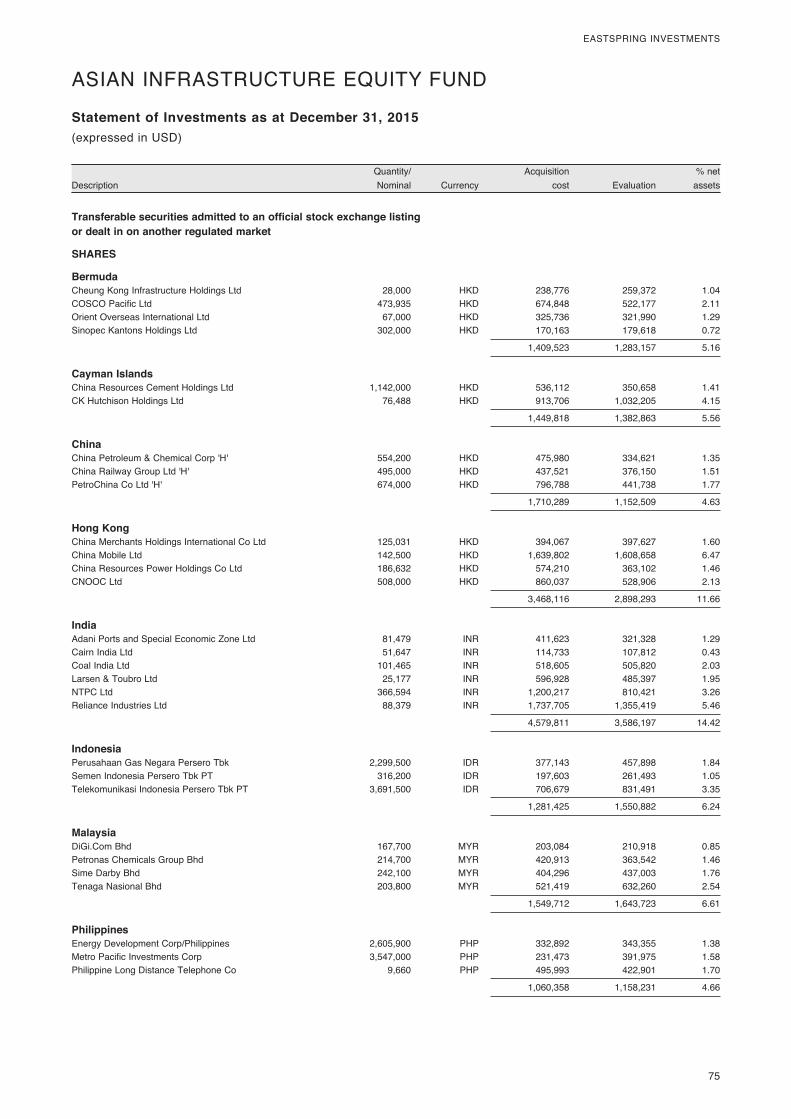
75
EASTSPRING INVESTMENTS
DescriptionQuantity/ Nominal Currency
Acquisition cost Evaluation
% net assets
Statement of Investments as at December 31, 2015
Transferable securities admitted to an official stock exchange listing or dealt in on another regulated market
SHARES
Bermuda Cheung Kong Infrastructure Holdings Ltd 28,000 HKD 238,776 259,372 1.04COSCO Pacific Ltd 473,935 HKD 674,848 522,177 2.11Orient Overseas International Ltd 67,000 HKD 325,736 321,990 1.29Sinopec Kantons Holdings Ltd 302,000 HKD 170,163 179,618 0.72
1,409,523 1,283,157 5.16
Cayman Islands China Resources Cement Holdings Ltd 1,142,000 HKD 536,112 350,658 1.41CK Hutchison Holdings Ltd 76,488 HKD 913,706 1,032,205 4.15
1,449,818 1,382,863 5.56
China China Petroleum & Chemical Corp 'H' 554,200 HKD 475,980 334,621 1.35China Railway Group Ltd 'H' 495,000 HKD 437,521 376,150 1.51PetroChina Co Ltd 'H' 674,000 HKD 796,788 441,738 1.77
1,710,289 1,152,509 4.63
Hong Kong China Merchants Holdings International Co Ltd 125,031 HKD 394,067 397,627 1.60China Mobile Ltd 142,500 HKD 1,639,802 1,608,658 6.47China Resources Power Holdings Co Ltd 186,632 HKD 574,210 363,102 1.46CNOOC Ltd 508,000 HKD 860,037 528,906 2.13
3,468,116 2,898,293 11.66
India Adani Ports and Special Economic Zone Ltd 81,479 INR 411,623 321,328 1.29Cairn India Ltd 51,647 INR 114,733 107,812 0.43Coal India Ltd 101,465 INR 518,605 505,820 2.03Larsen & Toubro Ltd 25,177 INR 596,928 485,397 1.95NTPC Ltd 366,594 INR 1,200,217 810,421 3.26Reliance Industries Ltd 88,379 INR 1,737,705 1,355,419 5.46
4,579,811 3,586,197 14.42
Indonesia Perusahaan Gas Negara Persero Tbk 2,299,500 IDR 377,143 457,898 1.84Semen Indonesia Persero Tbk PT 316,200 IDR 197,603 261,493 1.05Telekomunikasi Indonesia Persero Tbk PT 3,691,500 IDR 706,679 831,491 3.35
1,281,425 1,550,882 6.24
Malaysia DiGi.Com Bhd 167,700 MYR 203,084 210,918 0.85Petronas Chemicals Group Bhd 214,700 MYR 420,913 363,542 1.46Sime Darby Bhd 242,100 MYR 404,296 437,003 1.76Tenaga Nasional Bhd 203,800 MYR 521,419 632,260 2.54
1,549,712 1,643,723 6.61
Philippines Energy Development Corp/Philippines 2,605,900 PHP 332,892 343,355 1.38Metro Pacific Investments Corp 3,547,000 PHP 231,473 391,975 1.58Philippine Long Distance Telephone Co 9,660 PHP 495,993 422,901 1.70
1,060,358 1,158,231 4.66
(expressed in USD)
ASIAN INFRASTRUCTURE EQUITY FUND
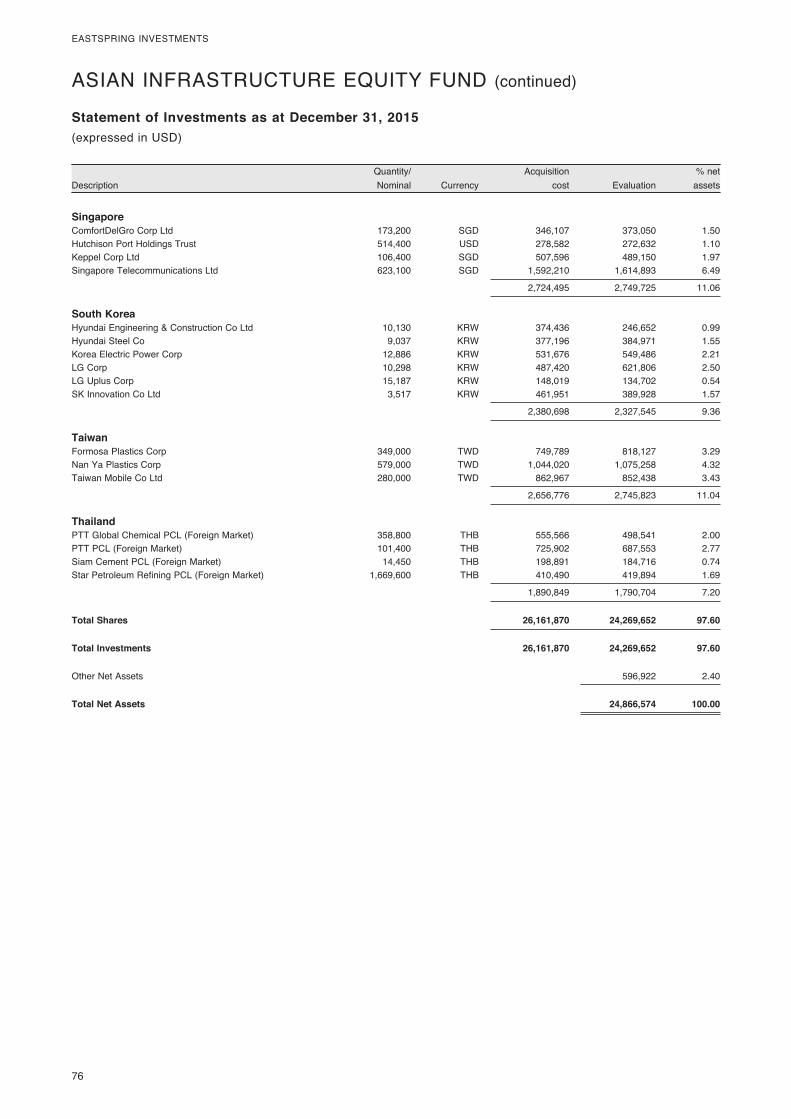
76
EASTSPRING INVESTMENTS
DescriptionQuantity/ Nominal Currency
Acquisition cost Evaluation
% net assets
Statement of Investments as at December 31, 2015(expressed in USD)
ASIAN INFRASTRUCTURE EQUITY FUND (continued)
Singapore ComfortDelGro Corp Ltd 173,200 SGD 346,107 373,050 1.50Hutchison Port Holdings Trust 514,400 USD 278,582 272,632 1.10Keppel Corp Ltd 106,400 SGD 507,596 489,150 1.97Singapore Telecommunications Ltd 623,100 SGD 1,592,210 1,614,893 6.49
2,724,495 2,749,725 11.06
South Korea Hyundai Engineering & Construction Co Ltd 10,130 KRW 374,436 246,652 0.99Hyundai Steel Co 9,037 KRW 377,196 384,971 1.55Korea Electric Power Corp 12,886 KRW 531,676 549,486 2.21LG Corp 10,298 KRW 487,420 621,806 2.50LG Uplus Corp 15,187 KRW 148,019 134,702 0.54SK Innovation Co Ltd 3,517 KRW 461,951 389,928 1.57
2,380,698 2,327,545 9.36
Taiwan Formosa Plastics Corp 349,000 TWD 749,789 818,127 3.29Nan Ya Plastics Corp 579,000 TWD 1,044,020 1,075,258 4.32Taiwan Mobile Co Ltd 280,000 TWD 862,967 852,438 3.43
2,656,776 2,745,823 11.04
Thailand PTT Global Chemical PCL (Foreign Market) 358,800 THB 555,566 498,541 2.00PTT PCL (Foreign Market) 101,400 THB 725,902 687,553 2.77Siam Cement PCL (Foreign Market) 14,450 THB 198,891 184,716 0.74Star Petroleum Refining PCL (Foreign Market) 1,669,600 THB 410,490 419,894 1.69
1,890,849 1,790,704 7.20
Total Shares 26,161,870 24,269,652 97.60
Total Investments 26,161,870 24,269,652 97.60
Other Net Assets 596,922 2.40
Total Net Assets 24,866,574 100.00

77
EASTSPRING INVESTMENTS
DescriptionQuantity/ Nominal Currency
Acquisition cost Evaluation
% net assets
Statement of Investments as at December 31, 2015
Transferable securities admitted to an official stock exchange listing or dealt in on another regulated market
BONDS
Australia Australia & New Zealand Banking Group Ltd FRN 23/3/2027 'EMTN' 10,000,000 SGD 7,153,678 6,986,378 0.34Australia & New Zealand Banking Group Ltd 1.055% 26/6/2017 'EMTN' 50,000,000 HKD 6,449,480 6,414,057 0.30
13,603,158 13,400,435 0.64
British Virgin Islands China New Town Finance I Ltd 5.5% 6/5/2018 16,100,000 CNY 2,597,972 2,389,740 0.11HLP Finance Ltd 3.55% 5/10/2022 'EMTN' 10,000,000 HKD 1,279,040 1,291,197 0.06HLP Finance Ltd 4.35% 20/1/2021 'EMTN' 15,000,000 HKD 1,932,469 2,037,312 0.10HLP Finance Ltd 4.6% 16/5/2024 'EMTN' 20,000,000 HKD 2,571,360 2,736,207 0.13Hongkong Electric Finance Ltd 3.95% 10/5/2030 'MTN' 5,000,000 HKD 644,093 677,880 0.03Hongkong Land Notes Co Ltd 4% 15/2/2027 'EMTN' 5,000,000 HKD 641,231 689,660 0.03Hongkong Land Notes Co Ltd 4.04% 5/4/2027 'EMTN' 5,000,000 HKD 628,499 689,069 0.03Hysan MTN Ltd 3.78% 31/8/2020 'MTN' 15,000,000 HKD 1,930,070 1,993,111 0.09Hysan MTN Ltd 4% 18/1/2022 'EMTN' 5,000,000 HKD 642,664 669,867 0.03Hysan MTN Ltd 4.1% 1/12/2023 'EMTN' 10,000,000 HKD 1,286,868 1,353,176 0.06Nan Fung Treasury I Ltd 4.425% 29/8/2022 'MTN' 10,000,000 HKD 1,297,125 1,332,211 0.06NWD MTN Ltd 4.375% 30/11/2022 'EMTN' 3,500,000 USD 3,479,476 3,492,475 0.17NWD MTN Ltd 5.9% 18/9/2023 'EMTN' 20,000,000 HKD 2,549,617 2,710,301 0.13R-REIT International Finance Ltd 4.125% 22/3/2018 'EMTN' 20,000,000 HKD 2,577,594 2,612,636 0.12Start Plus Investments Ltd 5.55% 24/6/2018 61,000,000 CNY 9,826,421 9,240,024 0.45Wing Tai Properties Finance Ltd 4.25% 29/11/2022 'EMTN' 5,000,000 SGD 3,719,856 3,514,798 0.18
37,604,355 37,429,664 1.78
Cayman Islands CIFI Holdings Group Co Ltd 7.75% 5/6/2020 9,000,000 USD 8,555,531 8,966,250 0.44HKR International Ltd 4.3% 21/5/2020 'EMTN' 7,000,000 HKD 894,218 881,667 0.04New World China Land Ltd 5% 28/1/2022 'EMTN' 20,000,000 HKD 2,568,480 2,620,635 0.12Swire Pacific MTN Financing Ltd 3.9% 5/11/2030 'EMTN' 20,000,000 HKD 2,576,660 2,597,122 0.12
14,594,889 15,065,674 0.72
China Bank of China Ltd/Hong Kong 1.7% 15/6/2016 'FXCD' 30,000,000 CNY 4,801,752 4,527,101 0.22Bank of China Ltd/Hong Kong 3.15% 22/6/2016 'FXCD' 100,000,000 CNY 16,103,575 15,183,051 0.71Bank of China Ltd/Hong Kong 3.9% 31/5/2021 'FXCD' 5,000,000 HKD 640,113 673,076 0.03Bank of China Ltd/Paris 3.35% 15/7/2016 'EMTN' 10,000,000 CNY 1,611,717 1,513,997 0.07Bank of China Ltd/Singapore 3.3% 4/3/2016 'EMTN' 40,000,000 CNY 6,444,410 6,075,412 0.29Bank of Communications Co Ltd/Hong Kong 1.2% 25/2/2016 'FXCD' 114,000,000 HKD 14,713,338 14,703,767 0.70CITIC Ltd 4.35% 25/7/2024 'EMTN' 40,000,000 HKD 5,143,384 5,213,145 0.25
49,458,289 47,889,549 2.27
France BNP Paribas SA FRN 3/12/2025 'EMTN' 5,000,000 SGD 3,552,644 3,518,823 0.17
Hong Kong Bank of East Asia Ltd/The FRN 13/9/2022 3,750,000 SGD 2,751,932 2,673,730 0.13Bank of East Asia Ltd/The FRN Perpetual 'EMTN' 5,000,000 USD 4,976,795 4,964,350 0.24Bk Tokyo-Mitsub UFJ Hk 1.64% 2/7/2018 100,000,000 HKD 12,898,959 12,894,429 0.61China Construction Bank Asia Corp Ltd 3.25% 13/3/2016 'EMTN' 50,000,000 CNY 8,054,444 7,579,499 0.36Henderson Land MTN Ltd 4.8% 10/11/2031 'EMTN' 5,000,000 HKD 642,626 647,140 0.03HKCG Finance Ltd 4.72% 23/9/2039 'MTN' 2,000,000 HKD 258,061 295,909 0.01Vast Expand Ltd 5.2% 11/9/2017 5,000,000 CNY 813,166 757,379 0.04
30,395,983 29,812,436 1.42
(expressed in USD)
ASIAN LOCAL BOND FUND
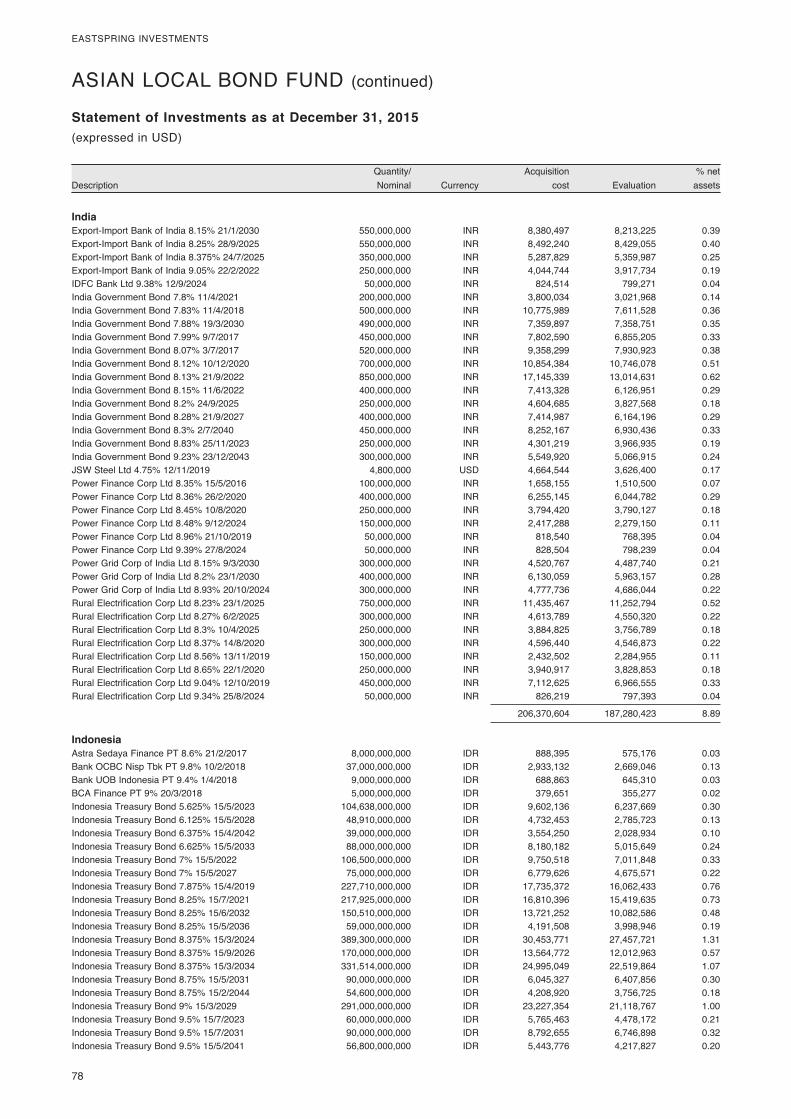
78
EASTSPRING INVESTMENTS
DescriptionQuantity/ Nominal Currency
Acquisition cost Evaluation
% net assets
Statement of Investments as at December 31, 2015(expressed in USD)
ASIAN LOCAL BOND FUND (continued)
India Export-Import Bank of India 8.15% 21/1/2030 550,000,000 INR 8,380,497 8,213,225 0.39Export-Import Bank of India 8.25% 28/9/2025 550,000,000 INR 8,492,240 8,429,055 0.40Export-Import Bank of India 8.375% 24/7/2025 350,000,000 INR 5,287,829 5,359,987 0.25Export-Import Bank of India 9.05% 22/2/2022 250,000,000 INR 4,044,744 3,917,734 0.19IDFC Bank Ltd 9.38% 12/9/2024 50,000,000 INR 824,514 799,271 0.04India Government Bond 7.8% 11/4/2021 200,000,000 INR 3,800,034 3,021,968 0.14India Government Bond 7.83% 11/4/2018 500,000,000 INR 10,775,989 7,611,528 0.36India Government Bond 7.88% 19/3/2030 490,000,000 INR 7,359,897 7,358,751 0.35India Government Bond 7.99% 9/7/2017 450,000,000 INR 7,802,590 6,855,205 0.33India Government Bond 8.07% 3/7/2017 520,000,000 INR 9,358,299 7,930,923 0.38India Government Bond 8.12% 10/12/2020 700,000,000 INR 10,854,384 10,746,078 0.51India Government Bond 8.13% 21/9/2022 850,000,000 INR 17,145,339 13,014,631 0.62India Government Bond 8.15% 11/6/2022 400,000,000 INR 7,413,328 6,126,951 0.29India Government Bond 8.2% 24/9/2025 250,000,000 INR 4,604,685 3,827,568 0.18India Government Bond 8.28% 21/9/2027 400,000,000 INR 7,414,987 6,164,196 0.29India Government Bond 8.3% 2/7/2040 450,000,000 INR 8,252,167 6,930,436 0.33India Government Bond 8.83% 25/11/2023 250,000,000 INR 4,301,219 3,966,935 0.19India Government Bond 9.23% 23/12/2043 300,000,000 INR 5,549,920 5,066,915 0.24JSW Steel Ltd 4.75% 12/11/2019 4,800,000 USD 4,664,544 3,626,400 0.17Power Finance Corp Ltd 8.35% 15/5/2016 100,000,000 INR 1,658,155 1,510,500 0.07Power Finance Corp Ltd 8.36% 26/2/2020 400,000,000 INR 6,255,145 6,044,782 0.29Power Finance Corp Ltd 8.45% 10/8/2020 250,000,000 INR 3,794,420 3,790,127 0.18Power Finance Corp Ltd 8.48% 9/12/2024 150,000,000 INR 2,417,288 2,279,150 0.11Power Finance Corp Ltd 8.96% 21/10/2019 50,000,000 INR 818,540 768,395 0.04Power Finance Corp Ltd 9.39% 27/8/2024 50,000,000 INR 828,504 798,239 0.04Power Grid Corp of India Ltd 8.15% 9/3/2030 300,000,000 INR 4,520,767 4,487,740 0.21Power Grid Corp of India Ltd 8.2% 23/1/2030 400,000,000 INR 6,130,059 5,963,157 0.28Power Grid Corp of India Ltd 8.93% 20/10/2024 300,000,000 INR 4,777,736 4,686,044 0.22Rural Electrification Corp Ltd 8.23% 23/1/2025 750,000,000 INR 11,435,467 11,252,794 0.52Rural Electrification Corp Ltd 8.27% 6/2/2025 300,000,000 INR 4,613,789 4,550,320 0.22Rural Electrification Corp Ltd 8.3% 10/4/2025 250,000,000 INR 3,884,825 3,756,789 0.18Rural Electrification Corp Ltd 8.37% 14/8/2020 300,000,000 INR 4,596,440 4,546,873 0.22Rural Electrification Corp Ltd 8.56% 13/11/2019 150,000,000 INR 2,432,502 2,284,955 0.11Rural Electrification Corp Ltd 8.65% 22/1/2020 250,000,000 INR 3,940,917 3,828,853 0.18Rural Electrification Corp Ltd 9.04% 12/10/2019 450,000,000 INR 7,112,625 6,966,555 0.33Rural Electrification Corp Ltd 9.34% 25/8/2024 50,000,000 INR 826,219 797,393 0.04
206,370,604 187,280,423 8.89
Indonesia Astra Sedaya Finance PT 8.6% 21/2/2017 8,000,000,000 IDR 888,395 575,176 0.03Bank OCBC Nisp Tbk PT 9.8% 10/2/2018 37,000,000,000 IDR 2,933,132 2,669,046 0.13Bank UOB Indonesia PT 9.4% 1/4/2018 9,000,000,000 IDR 688,863 645,310 0.03BCA Finance PT 9% 20/3/2018 5,000,000,000 IDR 379,651 355,277 0.02Indonesia Treasury Bond 5.625% 15/5/2023 104,638,000,000 IDR 9,602,136 6,237,669 0.30Indonesia Treasury Bond 6.125% 15/5/2028 48,910,000,000 IDR 4,732,453 2,785,723 0.13Indonesia Treasury Bond 6.375% 15/4/2042 39,000,000,000 IDR 3,554,250 2,028,934 0.10Indonesia Treasury Bond 6.625% 15/5/2033 88,000,000,000 IDR 8,180,182 5,015,649 0.24Indonesia Treasury Bond 7% 15/5/2022 106,500,000,000 IDR 9,750,518 7,011,848 0.33Indonesia Treasury Bond 7% 15/5/2027 75,000,000,000 IDR 6,779,626 4,675,571 0.22Indonesia Treasury Bond 7.875% 15/4/2019 227,710,000,000 IDR 17,735,372 16,062,433 0.76Indonesia Treasury Bond 8.25% 15/7/2021 217,925,000,000 IDR 16,810,396 15,419,635 0.73Indonesia Treasury Bond 8.25% 15/6/2032 150,510,000,000 IDR 13,721,252 10,082,586 0.48Indonesia Treasury Bond 8.25% 15/5/2036 59,000,000,000 IDR 4,191,508 3,998,946 0.19Indonesia Treasury Bond 8.375% 15/3/2024 389,300,000,000 IDR 30,453,771 27,457,721 1.31Indonesia Treasury Bond 8.375% 15/9/2026 170,000,000,000 IDR 13,564,772 12,012,963 0.57Indonesia Treasury Bond 8.375% 15/3/2034 331,514,000,000 IDR 24,995,049 22,519,864 1.07Indonesia Treasury Bond 8.75% 15/5/2031 90,000,000,000 IDR 6,045,327 6,407,856 0.30Indonesia Treasury Bond 8.75% 15/2/2044 54,600,000,000 IDR 4,208,920 3,756,725 0.18Indonesia Treasury Bond 9% 15/3/2029 291,000,000,000 IDR 23,227,354 21,118,767 1.00Indonesia Treasury Bond 9.5% 15/7/2023 60,000,000,000 IDR 5,765,463 4,478,172 0.21Indonesia Treasury Bond 9.5% 15/7/2031 90,000,000,000 IDR 8,792,655 6,746,898 0.32Indonesia Treasury Bond 9.5% 15/5/2041 56,800,000,000 IDR 5,443,776 4,217,827 0.20
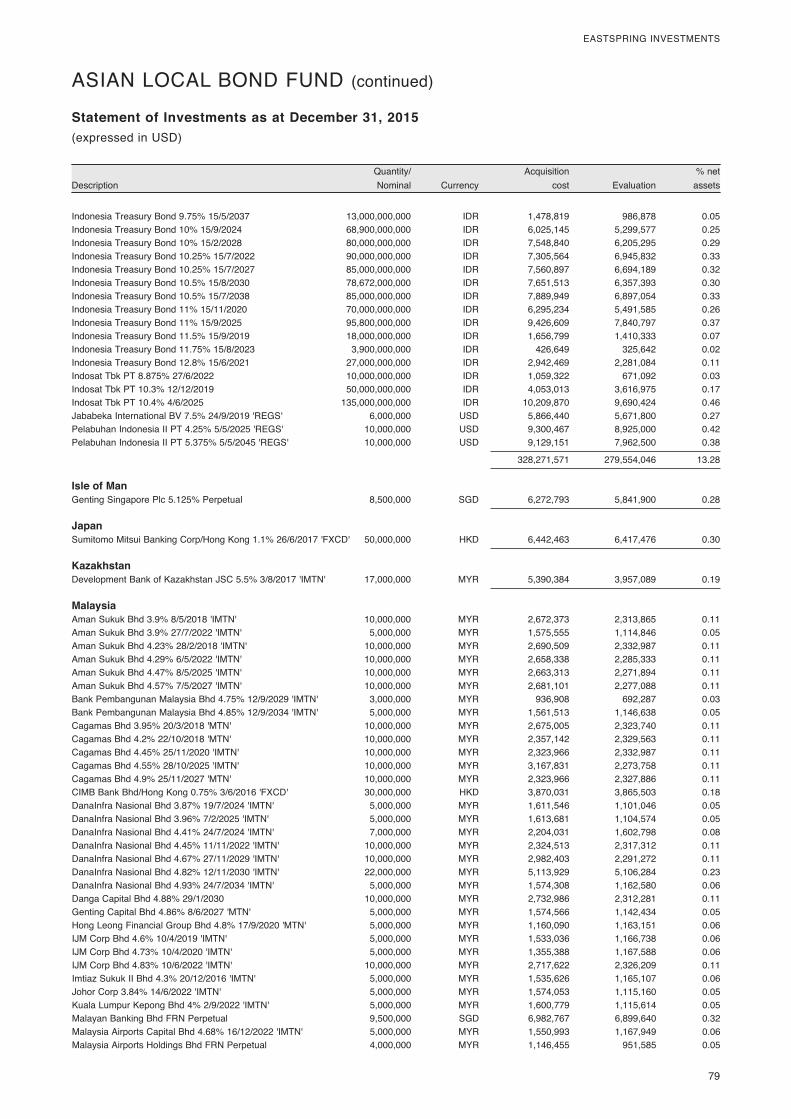
79
EASTSPRING INVESTMENTS
DescriptionQuantity/ Nominal Currency
Acquisition cost Evaluation
% net assets
Statement of Investments as at December 31, 2015(expressed in USD)
ASIAN LOCAL BOND FUND (continued)
Indonesia Treasury Bond 9.75% 15/5/2037 13,000,000,000 IDR 1,478,819 986,878 0.05Indonesia Treasury Bond 10% 15/9/2024 68,900,000,000 IDR 6,025,145 5,299,577 0.25Indonesia Treasury Bond 10% 15/2/2028 80,000,000,000 IDR 7,548,840 6,205,295 0.29Indonesia Treasury Bond 10.25% 15/7/2022 90,000,000,000 IDR 7,305,564 6,945,832 0.33Indonesia Treasury Bond 10.25% 15/7/2027 85,000,000,000 IDR 7,560,897 6,694,189 0.32Indonesia Treasury Bond 10.5% 15/8/2030 78,672,000,000 IDR 7,651,513 6,357,393 0.30Indonesia Treasury Bond 10.5% 15/7/2038 85,000,000,000 IDR 7,889,949 6,897,054 0.33Indonesia Treasury Bond 11% 15/11/2020 70,000,000,000 IDR 6,295,234 5,491,585 0.26Indonesia Treasury Bond 11% 15/9/2025 95,800,000,000 IDR 9,426,609 7,840,797 0.37Indonesia Treasury Bond 11.5% 15/9/2019 18,000,000,000 IDR 1,656,799 1,410,333 0.07Indonesia Treasury Bond 11.75% 15/8/2023 3,900,000,000 IDR 426,649 325,642 0.02Indonesia Treasury Bond 12.8% 15/6/2021 27,000,000,000 IDR 2,942,469 2,281,084 0.11Indosat Tbk PT 8.875% 27/6/2022 10,000,000,000 IDR 1,059,322 671,092 0.03Indosat Tbk PT 10.3% 12/12/2019 50,000,000,000 IDR 4,053,013 3,616,975 0.17Indosat Tbk PT 10.4% 4/6/2025 135,000,000,000 IDR 10,209,870 9,690,424 0.46Jababeka International BV 7.5% 24/9/2019 'REGS' 6,000,000 USD 5,866,440 5,671,800 0.27Pelabuhan Indonesia II PT 4.25% 5/5/2025 'REGS' 10,000,000 USD 9,300,467 8,925,000 0.42Pelabuhan Indonesia II PT 5.375% 5/5/2045 'REGS' 10,000,000 USD 9,129,151 7,962,500 0.38
328,271,571 279,554,046 13.28
Isle of Man Genting Singapore Plc 5.125% Perpetual 8,500,000 SGD 6,272,793 5,841,900 0.28
Japan Sumitomo Mitsui Banking Corp/Hong Kong 1.1% 26/6/2017 'FXCD' 50,000,000 HKD 6,442,463 6,417,476 0.30
Kazakhstan Development Bank of Kazakhstan JSC 5.5% 3/8/2017 'IMTN' 17,000,000 MYR 5,390,384 3,957,089 0.19
Malaysia Aman Sukuk Bhd 3.9% 8/5/2018 'IMTN' 10,000,000 MYR 2,672,373 2,313,865 0.11Aman Sukuk Bhd 3.9% 27/7/2022 'IMTN' 5,000,000 MYR 1,575,555 1,114,846 0.05Aman Sukuk Bhd 4.23% 28/2/2018 'IMTN' 10,000,000 MYR 2,690,509 2,332,987 0.11Aman Sukuk Bhd 4.29% 6/5/2022 'IMTN' 10,000,000 MYR 2,658,338 2,285,333 0.11Aman Sukuk Bhd 4.47% 8/5/2025 'IMTN' 10,000,000 MYR 2,663,313 2,271,894 0.11Aman Sukuk Bhd 4.57% 7/5/2027 'IMTN' 10,000,000 MYR 2,681,101 2,277,088 0.11Bank Pembangunan Malaysia Bhd 4.75% 12/9/2029 'IMTN' 3,000,000 MYR 936,908 692,287 0.03Bank Pembangunan Malaysia Bhd 4.85% 12/9/2034 'IMTN' 5,000,000 MYR 1,561,513 1,146,638 0.05Cagamas Bhd 3.95% 20/3/2018 'MTN' 10,000,000 MYR 2,675,005 2,323,740 0.11Cagamas Bhd 4.2% 22/10/2018 'MTN' 10,000,000 MYR 2,357,142 2,329,563 0.11Cagamas Bhd 4.45% 25/11/2020 'IMTN' 10,000,000 MYR 2,323,966 2,332,987 0.11Cagamas Bhd 4.55% 28/10/2025 'IMTN' 10,000,000 MYR 3,167,831 2,273,758 0.11Cagamas Bhd 4.9% 25/11/2027 'MTN' 10,000,000 MYR 2,323,966 2,327,886 0.11CIMB Bank Bhd/Hong Kong 0.75% 3/6/2016 'FXCD' 30,000,000 HKD 3,870,031 3,865,503 0.18DanaInfra Nasional Bhd 3.87% 19/7/2024 'IMTN' 5,000,000 MYR 1,611,546 1,101,046 0.05DanaInfra Nasional Bhd 3.96% 7/2/2025 'IMTN' 5,000,000 MYR 1,613,681 1,104,574 0.05DanaInfra Nasional Bhd 4.41% 24/7/2024 'IMTN' 7,000,000 MYR 2,204,031 1,602,798 0.08DanaInfra Nasional Bhd 4.45% 11/11/2022 'IMTN' 10,000,000 MYR 2,324,513 2,317,312 0.11DanaInfra Nasional Bhd 4.67% 27/11/2029 'IMTN' 10,000,000 MYR 2,982,403 2,291,272 0.11DanaInfra Nasional Bhd 4.82% 12/11/2030 'IMTN' 22,000,000 MYR 5,113,929 5,106,284 0.23DanaInfra Nasional Bhd 4.93% 24/7/2034 'IMTN' 5,000,000 MYR 1,574,308 1,162,580 0.06Danga Capital Bhd 4.88% 29/1/2030 10,000,000 MYR 2,732,986 2,312,281 0.11Genting Capital Bhd 4.86% 8/6/2027 'MTN' 5,000,000 MYR 1,574,566 1,142,434 0.05Hong Leong Financial Group Bhd 4.8% 17/9/2020 'MTN' 5,000,000 MYR 1,160,090 1,163,151 0.06IJM Corp Bhd 4.6% 10/4/2019 'IMTN' 5,000,000 MYR 1,533,036 1,166,738 0.06IJM Corp Bhd 4.73% 10/4/2020 'IMTN' 5,000,000 MYR 1,355,388 1,167,588 0.06IJM Corp Bhd 4.83% 10/6/2022 'IMTN' 10,000,000 MYR 2,717,622 2,326,209 0.11Imtiaz Sukuk II Bhd 4.3% 20/12/2016 'IMTN' 5,000,000 MYR 1,535,626 1,165,107 0.06Johor Corp 3.84% 14/6/2022 'IMTN' 5,000,000 MYR 1,574,053 1,115,160 0.05Kuala Lumpur Kepong Bhd 4% 2/9/2022 'IMTN' 5,000,000 MYR 1,600,779 1,115,614 0.05Malayan Banking Bhd FRN Perpetual 9,500,000 SGD 6,982,767 6,899,640 0.32Malaysia Airports Capital Bhd 4.68% 16/12/2022 'IMTN' 5,000,000 MYR 1,550,993 1,167,949 0.06Malaysia Airports Holdings Bhd FRN Perpetual 4,000,000 MYR 1,146,455 951,585 0.05
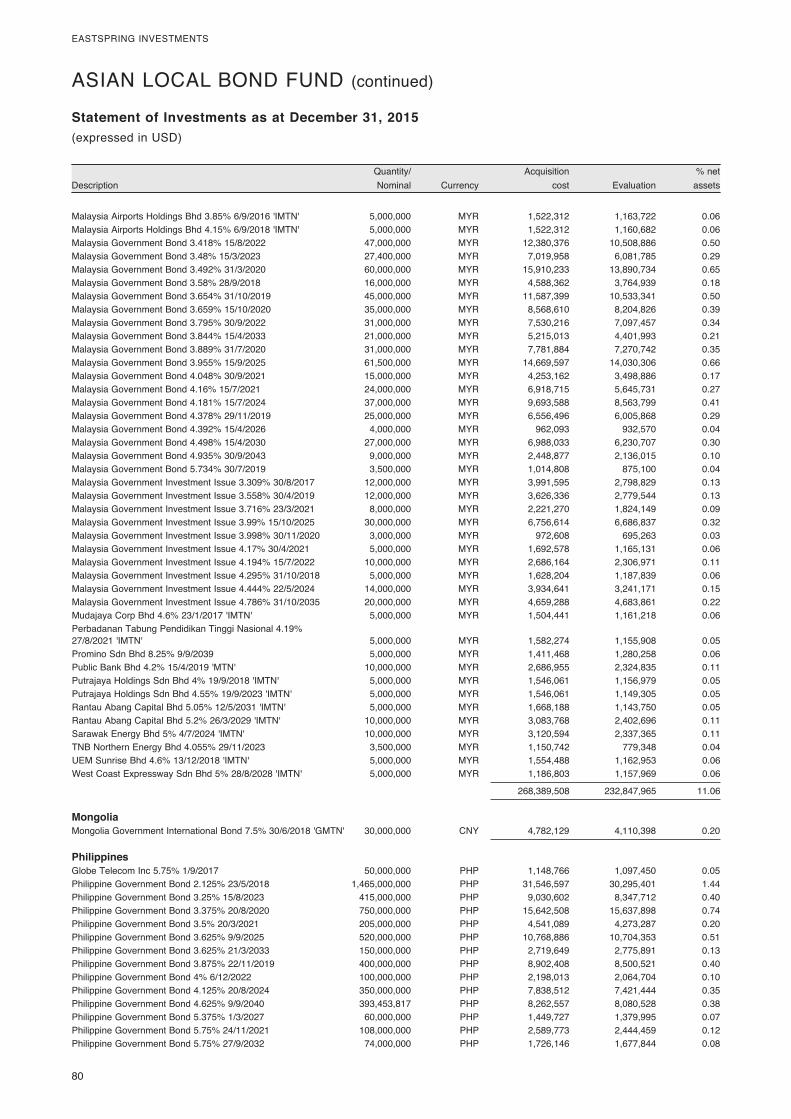
80
EASTSPRING INVESTMENTS
DescriptionQuantity/ Nominal Currency
Acquisition cost Evaluation
% net assets
Statement of Investments as at December 31, 2015(expressed in USD)
ASIAN LOCAL BOND FUND (continued)
Malaysia Airports Holdings Bhd 3.85% 6/9/2016 'IMTN' 5,000,000 MYR 1,522,312 1,163,722 0.06Malaysia Airports Holdings Bhd 4.15% 6/9/2018 'IMTN' 5,000,000 MYR 1,522,312 1,160,682 0.06Malaysia Government Bond 3.418% 15/8/2022 47,000,000 MYR 12,380,376 10,508,886 0.50Malaysia Government Bond 3.48% 15/3/2023 27,400,000 MYR 7,019,958 6,081,785 0.29Malaysia Government Bond 3.492% 31/3/2020 60,000,000 MYR 15,910,233 13,890,734 0.65Malaysia Government Bond 3.58% 28/9/2018 16,000,000 MYR 4,588,362 3,764,939 0.18Malaysia Government Bond 3.654% 31/10/2019 45,000,000 MYR 11,587,399 10,533,341 0.50Malaysia Government Bond 3.659% 15/10/2020 35,000,000 MYR 8,568,610 8,204,826 0.39Malaysia Government Bond 3.795% 30/9/2022 31,000,000 MYR 7,530,216 7,097,457 0.34Malaysia Government Bond 3.844% 15/4/2033 21,000,000 MYR 5,215,013 4,401,993 0.21Malaysia Government Bond 3.889% 31/7/2020 31,000,000 MYR 7,781,884 7,270,742 0.35Malaysia Government Bond 3.955% 15/9/2025 61,500,000 MYR 14,669,597 14,030,306 0.66Malaysia Government Bond 4.048% 30/9/2021 15,000,000 MYR 4,253,162 3,498,886 0.17Malaysia Government Bond 4.16% 15/7/2021 24,000,000 MYR 6,918,715 5,645,731 0.27Malaysia Government Bond 4.181% 15/7/2024 37,000,000 MYR 9,693,588 8,563,799 0.41Malaysia Government Bond 4.378% 29/11/2019 25,000,000 MYR 6,556,496 6,005,868 0.29Malaysia Government Bond 4.392% 15/4/2026 4,000,000 MYR 962,093 932,570 0.04Malaysia Government Bond 4.498% 15/4/2030 27,000,000 MYR 6,988,033 6,230,707 0.30Malaysia Government Bond 4.935% 30/9/2043 9,000,000 MYR 2,448,877 2,136,015 0.10Malaysia Government Bond 5.734% 30/7/2019 3,500,000 MYR 1,014,808 875,100 0.04Malaysia Government Investment Issue 3.309% 30/8/2017 12,000,000 MYR 3,991,595 2,798,829 0.13Malaysia Government Investment Issue 3.558% 30/4/2019 12,000,000 MYR 3,626,336 2,779,544 0.13Malaysia Government Investment Issue 3.716% 23/3/2021 8,000,000 MYR 2,221,270 1,824,149 0.09Malaysia Government Investment Issue 3.99% 15/10/2025 30,000,000 MYR 6,756,614 6,686,837 0.32Malaysia Government Investment Issue 3.998% 30/11/2020 3,000,000 MYR 972,608 695,263 0.03Malaysia Government Investment Issue 4.17% 30/4/2021 5,000,000 MYR 1,692,578 1,165,131 0.06Malaysia Government Investment Issue 4.194% 15/7/2022 10,000,000 MYR 2,686,164 2,306,971 0.11Malaysia Government Investment Issue 4.295% 31/10/2018 5,000,000 MYR 1,628,204 1,187,839 0.06Malaysia Government Investment Issue 4.444% 22/5/2024 14,000,000 MYR 3,934,641 3,241,171 0.15Malaysia Government Investment Issue 4.786% 31/10/2035 20,000,000 MYR 4,659,288 4,683,861 0.22Mudajaya Corp Bhd 4.6% 23/1/2017 'IMTN' 5,000,000 MYR 1,504,441 1,161,218 0.06Perbadanan Tabung Pendidikan Tinggi Nasional 4.19% 27/8/2021 'IMTN' 5,000,000 MYR 1,582,274 1,155,908 0.05Promino Sdn Bhd 8.25% 9/9/2039 5,000,000 MYR 1,411,468 1,280,258 0.06Public Bank Bhd 4.2% 15/4/2019 'MTN' 10,000,000 MYR 2,686,955 2,324,835 0.11Putrajaya Holdings Sdn Bhd 4% 19/9/2018 'IMTN' 5,000,000 MYR 1,546,061 1,156,979 0.05Putrajaya Holdings Sdn Bhd 4.55% 19/9/2023 'IMTN' 5,000,000 MYR 1,546,061 1,149,305 0.05Rantau Abang Capital Bhd 5.05% 12/5/2031 'IMTN' 5,000,000 MYR 1,668,188 1,143,750 0.05Rantau Abang Capital Bhd 5.2% 26/3/2029 'IMTN' 10,000,000 MYR 3,083,768 2,402,696 0.11Sarawak Energy Bhd 5% 4/7/2024 'IMTN' 10,000,000 MYR 3,120,594 2,337,365 0.11TNB Northern Energy Bhd 4.055% 29/11/2023 3,500,000 MYR 1,150,742 779,348 0.04UEM Sunrise Bhd 4.6% 13/12/2018 'IMTN' 5,000,000 MYR 1,554,488 1,162,953 0.06West Coast Expressway Sdn Bhd 5% 28/8/2028 'IMTN' 5,000,000 MYR 1,186,803 1,157,969 0.06
268,389,508 232,847,965 11.06
Mongolia Mongolia Government International Bond 7.5% 30/6/2018 'GMTN' 30,000,000 CNY 4,782,129 4,110,398 0.20
Philippines Globe Telecom Inc 5.75% 1/9/2017 50,000,000 PHP 1,148,766 1,097,450 0.05Philippine Government Bond 2.125% 23/5/2018 1,465,000,000 PHP 31,546,597 30,295,401 1.44Philippine Government Bond 3.25% 15/8/2023 415,000,000 PHP 9,030,602 8,347,712 0.40Philippine Government Bond 3.375% 20/8/2020 750,000,000 PHP 15,642,508 15,637,898 0.74Philippine Government Bond 3.5% 20/3/2021 205,000,000 PHP 4,541,089 4,273,287 0.20Philippine Government Bond 3.625% 9/9/2025 520,000,000 PHP 10,768,886 10,704,353 0.51Philippine Government Bond 3.625% 21/3/2033 150,000,000 PHP 2,719,649 2,775,891 0.13Philippine Government Bond 3.875% 22/11/2019 400,000,000 PHP 8,902,408 8,500,521 0.40Philippine Government Bond 4% 6/12/2022 100,000,000 PHP 2,198,013 2,064,704 0.10Philippine Government Bond 4.125% 20/8/2024 350,000,000 PHP 7,838,512 7,421,444 0.35Philippine Government Bond 4.625% 9/9/2040 393,453,817 PHP 8,262,557 8,080,528 0.38Philippine Government Bond 5.375% 1/3/2027 60,000,000 PHP 1,449,727 1,379,995 0.07Philippine Government Bond 5.75% 24/11/2021 108,000,000 PHP 2,589,773 2,444,459 0.12Philippine Government Bond 5.75% 27/9/2032 74,000,000 PHP 1,726,146 1,677,844 0.08
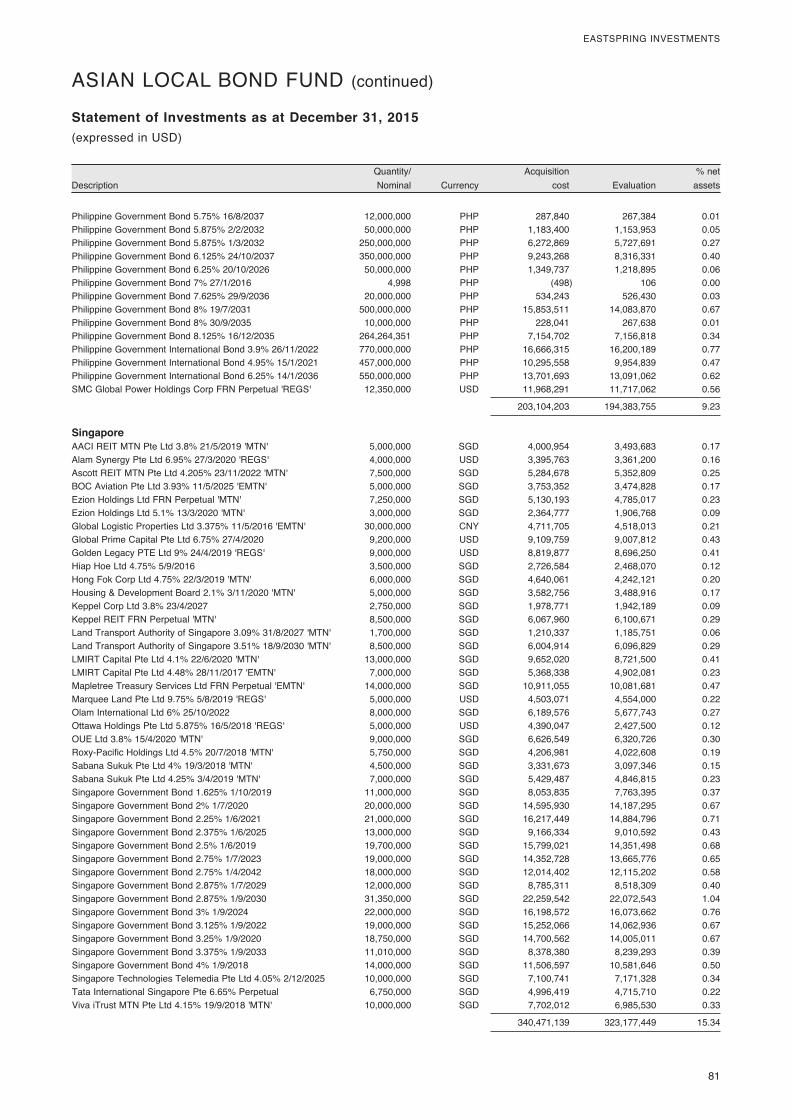
81
EASTSPRING INVESTMENTS
DescriptionQuantity/ Nominal Currency
Acquisition cost Evaluation
% net assets
Statement of Investments as at December 31, 2015(expressed in USD)
ASIAN LOCAL BOND FUND (continued)
Philippine Government Bond 5.75% 16/8/2037 12,000,000 PHP 287,840 267,384 0.01Philippine Government Bond 5.875% 2/2/2032 50,000,000 PHP 1,183,400 1,153,953 0.05Philippine Government Bond 5.875% 1/3/2032 250,000,000 PHP 6,272,869 5,727,691 0.27Philippine Government Bond 6.125% 24/10/2037 350,000,000 PHP 9,243,268 8,316,331 0.40Philippine Government Bond 6.25% 20/10/2026 50,000,000 PHP 1,349,737 1,218,895 0.06Philippine Government Bond 7% 27/1/2016 4,998 PHP (498) 106 0.00Philippine Government Bond 7.625% 29/9/2036 20,000,000 PHP 534,243 526,430 0.03Philippine Government Bond 8% 19/7/2031 500,000,000 PHP 15,853,511 14,083,870 0.67Philippine Government Bond 8% 30/9/2035 10,000,000 PHP 228,041 267,638 0.01Philippine Government Bond 8.125% 16/12/2035 264,264,351 PHP 7,154,702 7,156,818 0.34Philippine Government International Bond 3.9% 26/11/2022 770,000,000 PHP 16,666,315 16,200,189 0.77Philippine Government International Bond 4.95% 15/1/2021 457,000,000 PHP 10,295,558 9,954,839 0.47Philippine Government International Bond 6.25% 14/1/2036 550,000,000 PHP 13,701,693 13,091,062 0.62SMC Global Power Holdings Corp FRN Perpetual 'REGS' 12,350,000 USD 11,968,291 11,717,062 0.56
203,104,203 194,383,755 9.23
Singapore AACI REIT MTN Pte Ltd 3.8% 21/5/2019 'MTN' 5,000,000 SGD 4,000,954 3,493,683 0.17Alam Synergy Pte Ltd 6.95% 27/3/2020 'REGS' 4,000,000 USD 3,395,763 3,361,200 0.16Ascott REIT MTN Pte Ltd 4.205% 23/11/2022 'MTN' 7,500,000 SGD 5,284,678 5,352,809 0.25BOC Aviation Pte Ltd 3.93% 11/5/2025 'EMTN' 5,000,000 SGD 3,753,352 3,474,828 0.17Ezion Holdings Ltd FRN Perpetual 'MTN' 7,250,000 SGD 5,130,193 4,785,017 0.23Ezion Holdings Ltd 5.1% 13/3/2020 'MTN' 3,000,000 SGD 2,364,777 1,906,768 0.09Global Logistic Properties Ltd 3.375% 11/5/2016 'EMTN' 30,000,000 CNY 4,711,705 4,518,013 0.21Global Prime Capital Pte Ltd 6.75% 27/4/2020 9,200,000 USD 9,109,759 9,007,812 0.43Golden Legacy PTE Ltd 9% 24/4/2019 'REGS' 9,000,000 USD 8,819,877 8,696,250 0.41Hiap Hoe Ltd 4.75% 5/9/2016 3,500,000 SGD 2,726,584 2,468,070 0.12Hong Fok Corp Ltd 4.75% 22/3/2019 'MTN' 6,000,000 SGD 4,640,061 4,242,121 0.20Housing & Development Board 2.1% 3/11/2020 'MTN' 5,000,000 SGD 3,582,756 3,488,916 0.17Keppel Corp Ltd 3.8% 23/4/2027 2,750,000 SGD 1,978,771 1,942,189 0.09Keppel REIT FRN Perpetual 'MTN' 8,500,000 SGD 6,067,960 6,100,671 0.29Land Transport Authority of Singapore 3.09% 31/8/2027 'MTN' 1,700,000 SGD 1,210,337 1,185,751 0.06Land Transport Authority of Singapore 3.51% 18/9/2030 'MTN' 8,500,000 SGD 6,004,914 6,096,829 0.29LMIRT Capital Pte Ltd 4.1% 22/6/2020 'MTN' 13,000,000 SGD 9,652,020 8,721,500 0.41LMIRT Capital Pte Ltd 4.48% 28/11/2017 'EMTN' 7,000,000 SGD 5,368,338 4,902,081 0.23Mapletree Treasury Services Ltd FRN Perpetual 'EMTN' 14,000,000 SGD 10,911,055 10,081,681 0.47Marquee Land Pte Ltd 9.75% 5/8/2019 'REGS' 5,000,000 USD 4,503,071 4,554,000 0.22Olam International Ltd 6% 25/10/2022 8,000,000 SGD 6,189,576 5,677,743 0.27Ottawa Holdings Pte Ltd 5.875% 16/5/2018 'REGS' 5,000,000 USD 4,390,047 2,427,500 0.12OUE Ltd 3.8% 15/4/2020 'MTN' 9,000,000 SGD 6,626,549 6,320,726 0.30Roxy-Pacific Holdings Ltd 4.5% 20/7/2018 'MTN' 5,750,000 SGD 4,206,981 4,022,608 0.19Sabana Sukuk Pte Ltd 4% 19/3/2018 'MTN' 4,500,000 SGD 3,331,673 3,097,346 0.15Sabana Sukuk Pte Ltd 4.25% 3/4/2019 'MTN' 7,000,000 SGD 5,429,487 4,846,815 0.23Singapore Government Bond 1.625% 1/10/2019 11,000,000 SGD 8,053,835 7,763,395 0.37Singapore Government Bond 2% 1/7/2020 20,000,000 SGD 14,595,930 14,187,295 0.67Singapore Government Bond 2.25% 1/6/2021 21,000,000 SGD 16,217,449 14,884,796 0.71Singapore Government Bond 2.375% 1/6/2025 13,000,000 SGD 9,166,334 9,010,592 0.43Singapore Government Bond 2.5% 1/6/2019 19,700,000 SGD 15,799,021 14,351,498 0.68Singapore Government Bond 2.75% 1/7/2023 19,000,000 SGD 14,352,728 13,665,776 0.65Singapore Government Bond 2.75% 1/4/2042 18,000,000 SGD 12,014,402 12,115,202 0.58Singapore Government Bond 2.875% 1/7/2029 12,000,000 SGD 8,785,311 8,518,309 0.40Singapore Government Bond 2.875% 1/9/2030 31,350,000 SGD 22,259,542 22,072,543 1.04Singapore Government Bond 3% 1/9/2024 22,000,000 SGD 16,198,572 16,073,662 0.76Singapore Government Bond 3.125% 1/9/2022 19,000,000 SGD 15,252,066 14,062,936 0.67Singapore Government Bond 3.25% 1/9/2020 18,750,000 SGD 14,700,562 14,005,011 0.67Singapore Government Bond 3.375% 1/9/2033 11,010,000 SGD 8,378,380 8,239,293 0.39Singapore Government Bond 4% 1/9/2018 14,000,000 SGD 11,506,597 10,581,646 0.50Singapore Technologies Telemedia Pte Ltd 4.05% 2/12/2025 10,000,000 SGD 7,100,741 7,171,328 0.34Tata International Singapore Pte 6.65% Perpetual 6,750,000 SGD 4,996,419 4,715,710 0.22Viva iTrust MTN Pte Ltd 4.15% 19/9/2018 'MTN' 10,000,000 SGD 7,702,012 6,985,530 0.33
340,471,139 323,177,449 15.34
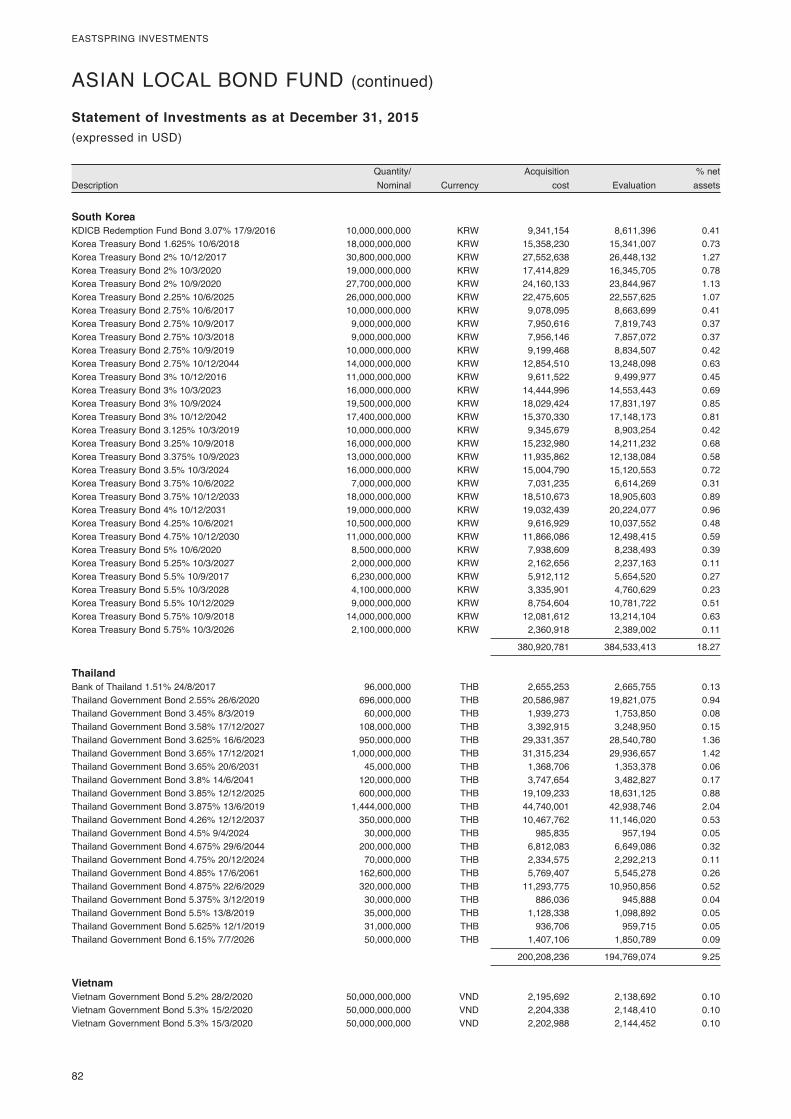
82
EASTSPRING INVESTMENTS
DescriptionQuantity/ Nominal Currency
Acquisition cost Evaluation
% net assets
Statement of Investments as at December 31, 2015(expressed in USD)
ASIAN LOCAL BOND FUND (continued)
South Korea KDICB Redemption Fund Bond 3.07% 17/9/2016 10,000,000,000 KRW 9,341,154 8,611,396 0.41Korea Treasury Bond 1.625% 10/6/2018 18,000,000,000 KRW 15,358,230 15,341,007 0.73Korea Treasury Bond 2% 10/12/2017 30,800,000,000 KRW 27,552,638 26,448,132 1.27Korea Treasury Bond 2% 10/3/2020 19,000,000,000 KRW 17,414,829 16,345,705 0.78Korea Treasury Bond 2% 10/9/2020 27,700,000,000 KRW 24,160,133 23,844,967 1.13Korea Treasury Bond 2.25% 10/6/2025 26,000,000,000 KRW 22,475,605 22,557,625 1.07Korea Treasury Bond 2.75% 10/6/2017 10,000,000,000 KRW 9,078,095 8,663,699 0.41Korea Treasury Bond 2.75% 10/9/2017 9,000,000,000 KRW 7,950,616 7,819,743 0.37Korea Treasury Bond 2.75% 10/3/2018 9,000,000,000 KRW 7,956,146 7,857,072 0.37Korea Treasury Bond 2.75% 10/9/2019 10,000,000,000 KRW 9,199,468 8,834,507 0.42Korea Treasury Bond 2.75% 10/12/2044 14,000,000,000 KRW 12,854,510 13,248,098 0.63Korea Treasury Bond 3% 10/12/2016 11,000,000,000 KRW 9,611,522 9,499,977 0.45Korea Treasury Bond 3% 10/3/2023 16,000,000,000 KRW 14,444,996 14,553,443 0.69Korea Treasury Bond 3% 10/9/2024 19,500,000,000 KRW 18,029,424 17,831,197 0.85Korea Treasury Bond 3% 10/12/2042 17,400,000,000 KRW 15,370,330 17,148,173 0.81Korea Treasury Bond 3.125% 10/3/2019 10,000,000,000 KRW 9,345,679 8,903,254 0.42Korea Treasury Bond 3.25% 10/9/2018 16,000,000,000 KRW 15,232,980 14,211,232 0.68Korea Treasury Bond 3.375% 10/9/2023 13,000,000,000 KRW 11,935,862 12,138,084 0.58Korea Treasury Bond 3.5% 10/3/2024 16,000,000,000 KRW 15,004,790 15,120,553 0.72Korea Treasury Bond 3.75% 10/6/2022 7,000,000,000 KRW 7,031,235 6,614,269 0.31Korea Treasury Bond 3.75% 10/12/2033 18,000,000,000 KRW 18,510,673 18,905,603 0.89Korea Treasury Bond 4% 10/12/2031 19,000,000,000 KRW 19,032,439 20,224,077 0.96Korea Treasury Bond 4.25% 10/6/2021 10,500,000,000 KRW 9,616,929 10,037,552 0.48Korea Treasury Bond 4.75% 10/12/2030 11,000,000,000 KRW 11,866,086 12,498,415 0.59Korea Treasury Bond 5% 10/6/2020 8,500,000,000 KRW 7,938,609 8,238,493 0.39Korea Treasury Bond 5.25% 10/3/2027 2,000,000,000 KRW 2,162,656 2,237,163 0.11Korea Treasury Bond 5.5% 10/9/2017 6,230,000,000 KRW 5,912,112 5,654,520 0.27Korea Treasury Bond 5.5% 10/3/2028 4,100,000,000 KRW 3,335,901 4,760,629 0.23Korea Treasury Bond 5.5% 10/12/2029 9,000,000,000 KRW 8,754,604 10,781,722 0.51Korea Treasury Bond 5.75% 10/9/2018 14,000,000,000 KRW 12,081,612 13,214,104 0.63Korea Treasury Bond 5.75% 10/3/2026 2,100,000,000 KRW 2,360,918 2,389,002 0.11
380,920,781 384,533,413 18.27
Thailand Bank of Thailand 1.51% 24/8/2017 96,000,000 THB 2,655,253 2,665,755 0.13Thailand Government Bond 2.55% 26/6/2020 696,000,000 THB 20,586,987 19,821,075 0.94Thailand Government Bond 3.45% 8/3/2019 60,000,000 THB 1,939,273 1,753,850 0.08Thailand Government Bond 3.58% 17/12/2027 108,000,000 THB 3,392,915 3,248,950 0.15Thailand Government Bond 3.625% 16/6/2023 950,000,000 THB 29,331,357 28,540,780 1.36Thailand Government Bond 3.65% 17/12/2021 1,000,000,000 THB 31,315,234 29,936,657 1.42Thailand Government Bond 3.65% 20/6/2031 45,000,000 THB 1,368,706 1,353,378 0.06Thailand Government Bond 3.8% 14/6/2041 120,000,000 THB 3,747,654 3,482,827 0.17Thailand Government Bond 3.85% 12/12/2025 600,000,000 THB 19,109,233 18,631,125 0.88Thailand Government Bond 3.875% 13/6/2019 1,444,000,000 THB 44,740,001 42,938,746 2.04Thailand Government Bond 4.26% 12/12/2037 350,000,000 THB 10,467,762 11,146,020 0.53Thailand Government Bond 4.5% 9/4/2024 30,000,000 THB 985,835 957,194 0.05Thailand Government Bond 4.675% 29/6/2044 200,000,000 THB 6,812,083 6,649,086 0.32Thailand Government Bond 4.75% 20/12/2024 70,000,000 THB 2,334,575 2,292,213 0.11Thailand Government Bond 4.85% 17/6/2061 162,600,000 THB 5,769,407 5,545,278 0.26Thailand Government Bond 4.875% 22/6/2029 320,000,000 THB 11,293,775 10,950,856 0.52Thailand Government Bond 5.375% 3/12/2019 30,000,000 THB 886,036 945,888 0.04Thailand Government Bond 5.5% 13/8/2019 35,000,000 THB 1,128,338 1,098,892 0.05Thailand Government Bond 5.625% 12/1/2019 31,000,000 THB 936,706 959,715 0.05Thailand Government Bond 6.15% 7/7/2026 50,000,000 THB 1,407,106 1,850,789 0.09
200,208,236 194,769,074 9.25
Vietnam Vietnam Government Bond 5.2% 28/2/2020 50,000,000,000 VND 2,195,692 2,138,692 0.10Vietnam Government Bond 5.3% 15/2/2020 50,000,000,000 VND 2,204,338 2,148,410 0.10Vietnam Government Bond 5.3% 15/3/2020 50,000,000,000 VND 2,202,988 2,144,452 0.10
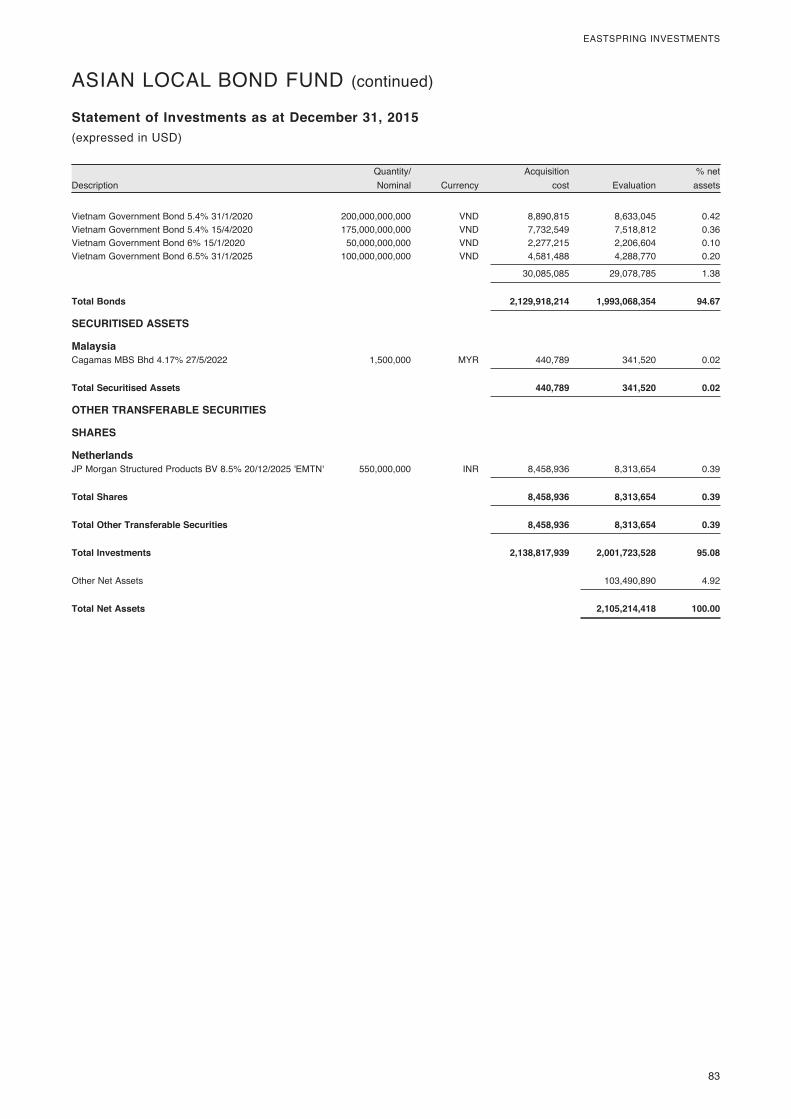
83
EASTSPRING INVESTMENTS
DescriptionQuantity/ Nominal Currency
Acquisition cost Evaluation
% net assets
Statement of Investments as at December 31, 2015(expressed in USD)
ASIAN LOCAL BOND FUND (continued)
Vietnam Government Bond 5.4% 31/1/2020 200,000,000,000 VND 8,890,815 8,633,045 0.42Vietnam Government Bond 5.4% 15/4/2020 175,000,000,000 VND 7,732,549 7,518,812 0.36Vietnam Government Bond 6% 15/1/2020 50,000,000,000 VND 2,277,215 2,206,604 0.10Vietnam Government Bond 6.5% 31/1/2025 100,000,000,000 VND 4,581,488 4,288,770 0.20
30,085,085 29,078,785 1.38
Total Bonds 2,129,918,214 1,993,068,354 94.67
SECURITISED ASSETS
Malaysia Cagamas MBS Bhd 4.17% 27/5/2022 1,500,000 MYR 440,789 341,520 0.02
Total Securitised Assets 440,789 341,520 0.02
OTHER TRANSFERABLE SECURITIES
SHARES
Netherlands JP Morgan Structured Products BV 8.5% 20/12/2025 'EMTN' 550,000,000 INR 8,458,936 8,313,654 0.39
Total Shares 8,458,936 8,313,654 0.39
Total Other Transferable Securities 8,458,936 8,313,654 0.39
Total Investments 2,138,817,939 2,001,723,528 95.08
Other Net Assets 103,490,890 4.92
Total Net Assets 2,105,214,418 100.00
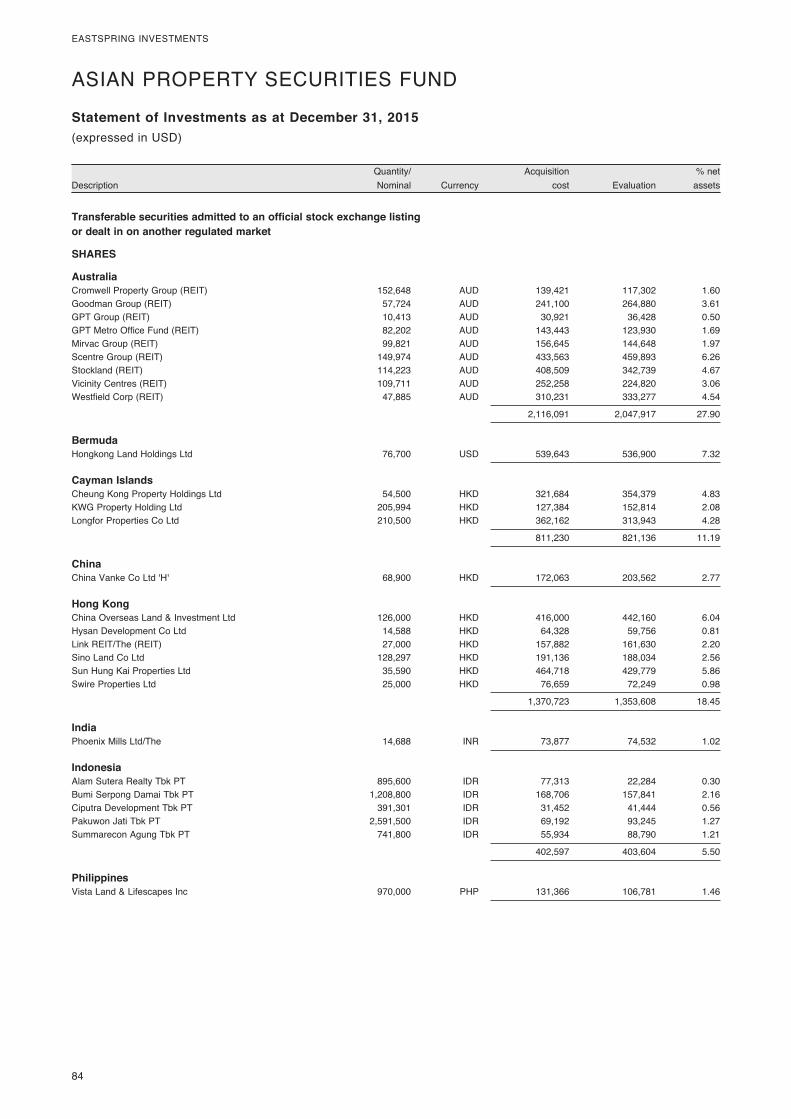
84
EASTSPRING INVESTMENTS
DescriptionQuantity/ Nominal Currency
Acquisition cost Evaluation
% net assets
Statement of Investments as at December 31, 2015
Transferable securities admitted to an official stock exchange listing or dealt in on another regulated market
SHARES
Australia Cromwell Property Group (REIT) 152,648 AUD 139,421 117,302 1.60Goodman Group (REIT) 57,724 AUD 241,100 264,880 3.61GPT Group (REIT) 10,413 AUD 30,921 36,428 0.50GPT Metro Office Fund (REIT) 82,202 AUD 143,443 123,930 1.69Mirvac Group (REIT) 99,821 AUD 156,645 144,648 1.97Scentre Group (REIT) 149,974 AUD 433,563 459,893 6.26Stockland (REIT) 114,223 AUD 408,509 342,739 4.67Vicinity Centres (REIT) 109,711 AUD 252,258 224,820 3.06Westfield Corp (REIT) 47,885 AUD 310,231 333,277 4.54
2,116,091 2,047,917 27.90
Bermuda Hongkong Land Holdings Ltd 76,700 USD 539,643 536,900 7.32
Cayman Islands Cheung Kong Property Holdings Ltd 54,500 HKD 321,684 354,379 4.83KWG Property Holding Ltd 205,994 HKD 127,384 152,814 2.08Longfor Properties Co Ltd 210,500 HKD 362,162 313,943 4.28
811,230 821,136 11.19
China China Vanke Co Ltd 'H' 68,900 HKD 172,063 203,562 2.77
Hong Kong China Overseas Land & Investment Ltd 126,000 HKD 416,000 442,160 6.04Hysan Development Co Ltd 14,588 HKD 64,328 59,756 0.81Link REIT/The (REIT) 27,000 HKD 157,882 161,630 2.20Sino Land Co Ltd 128,297 HKD 191,136 188,034 2.56Sun Hung Kai Properties Ltd 35,590 HKD 464,718 429,779 5.86Swire Properties Ltd 25,000 HKD 76,659 72,249 0.98
1,370,723 1,353,608 18.45
India Phoenix Mills Ltd/The 14,688 INR 73,877 74,532 1.02
Indonesia Alam Sutera Realty Tbk PT 895,600 IDR 77,313 22,284 0.30Bumi Serpong Damai Tbk PT 1,208,800 IDR 168,706 157,841 2.16Ciputra Development Tbk PT 391,301 IDR 31,452 41,444 0.56Pakuwon Jati Tbk PT 2,591,500 IDR 69,192 93,245 1.27Summarecon Agung Tbk PT 741,800 IDR 55,934 88,790 1.21
402,597 403,604 5.50
Philippines Vista Land & Lifescapes Inc 970,000 PHP 131,366 106,781 1.46
(expressed in USD)
ASIAN PROPERTY SECURITIES FUND
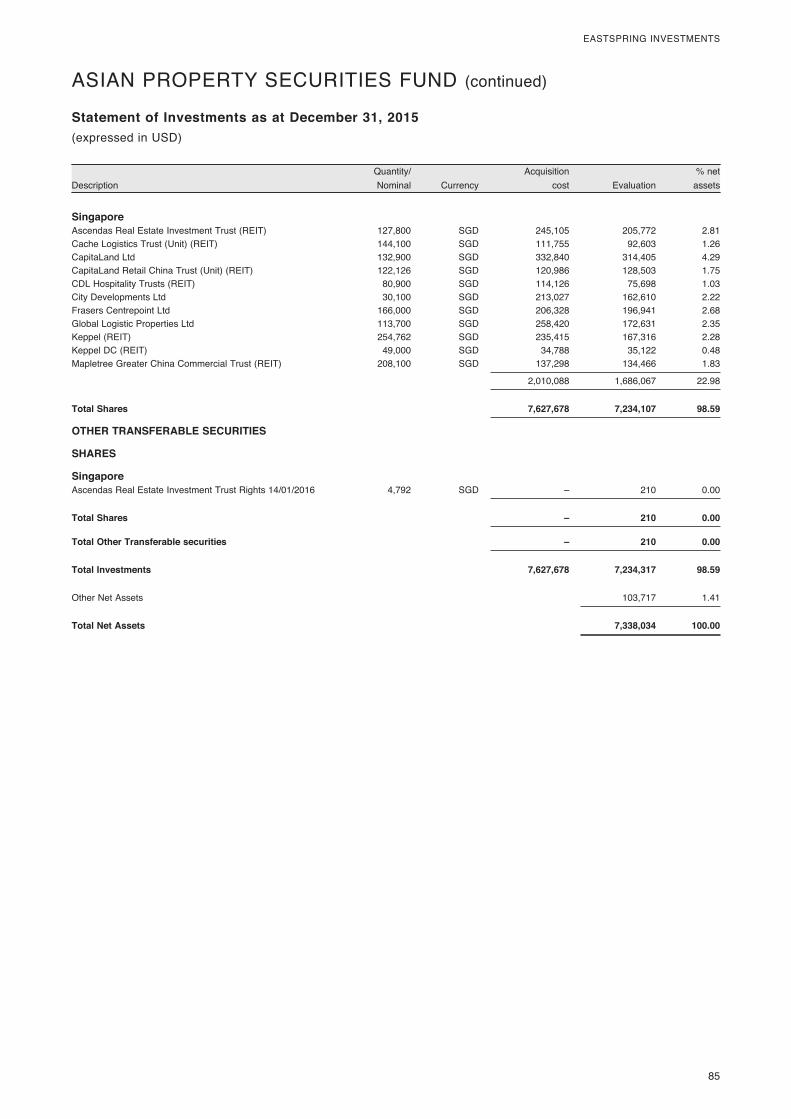
85
EASTSPRING INVESTMENTS
DescriptionQuantity/ Nominal Currency
Acquisition cost Evaluation
% net assets
Statement of Investments as at December 31, 2015(expressed in USD)
ASIAN PROPERTY SECURITIES FUND (continued)
Singapore Ascendas Real Estate Investment Trust (REIT) 127,800 SGD 245,105 205,772 2.81Cache Logistics Trust (Unit) (REIT) 144,100 SGD 111,755 92,603 1.26CapitaLand Ltd 132,900 SGD 332,840 314,405 4.29CapitaLand Retail China Trust (Unit) (REIT) 122,126 SGD 120,986 128,503 1.75CDL Hospitality Trusts (REIT) 80,900 SGD 114,126 75,698 1.03City Developments Ltd 30,100 SGD 213,027 162,610 2.22Frasers Centrepoint Ltd 166,000 SGD 206,328 196,941 2.68Global Logistic Properties Ltd 113,700 SGD 258,420 172,631 2.35Keppel (REIT) 254,762 SGD 235,415 167,316 2.28Keppel DC (REIT) 49,000 SGD 34,788 35,122 0.48Mapletree Greater China Commercial Trust (REIT) 208,100 SGD 137,298 134,466 1.83
2,010,088 1,686,067 22.98
Total Shares 7,627,678 7,234,107 98.59
OTHER TRANSFERABLE SECURITIES
SHARES
Singapore Ascendas Real Estate Investment Trust Rights 14/01/2016 4,792 SGD – 210 0.00
Total Shares – 210 0.00
Total Other Transferable securities – 210 0.00
Total Investments 7,627,678 7,234,317 98.59
Other Net Assets 103,717 1.41
Total Net Assets 7,338,034 100.00
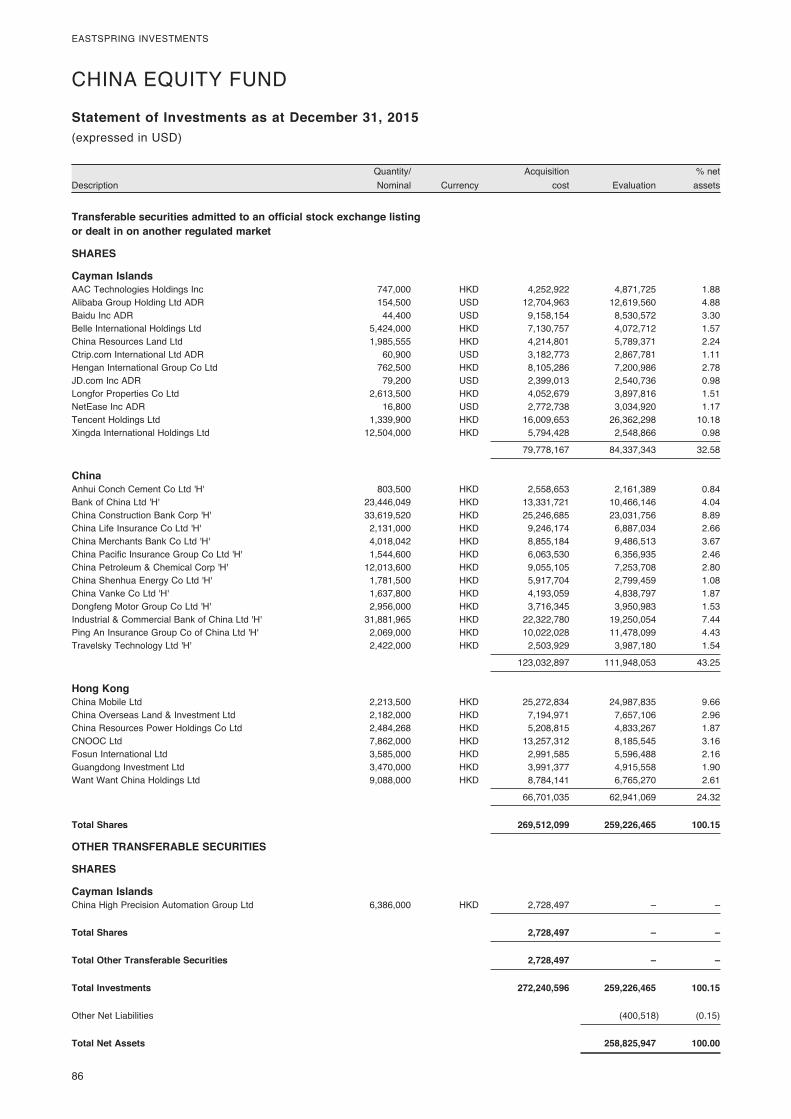
86
EASTSPRING INVESTMENTS
DescriptionQuantity/ Nominal Currency
Acquisition cost Evaluation
% net assets
Statement of Investments as at December 31, 2015
Transferable securities admitted to an official stock exchange listing or dealt in on another regulated market
SHARES
Cayman Islands AAC Technologies Holdings Inc 747,000 HKD 4,252,922 4,871,725 1.88Alibaba Group Holding Ltd ADR 154,500 USD 12,704,963 12,619,560 4.88Baidu Inc ADR 44,400 USD 9,158,154 8,530,572 3.30Belle International Holdings Ltd 5,424,000 HKD 7,130,757 4,072,712 1.57China Resources Land Ltd 1,985,555 HKD 4,214,801 5,789,371 2.24Ctrip.com International Ltd ADR 60,900 USD 3,182,773 2,867,781 1.11Hengan International Group Co Ltd 762,500 HKD 8,105,286 7,200,986 2.78JD.com Inc ADR 79,200 USD 2,399,013 2,540,736 0.98Longfor Properties Co Ltd 2,613,500 HKD 4,052,679 3,897,816 1.51NetEase Inc ADR 16,800 USD 2,772,738 3,034,920 1.17Tencent Holdings Ltd 1,339,900 HKD 16,009,653 26,362,298 10.18Xingda International Holdings Ltd 12,504,000 HKD 5,794,428 2,548,866 0.98
79,778,167 84,337,343 32.58
China Anhui Conch Cement Co Ltd 'H' 803,500 HKD 2,558,653 2,161,389 0.84Bank of China Ltd 'H' 23,446,049 HKD 13,331,721 10,466,146 4.04China Construction Bank Corp 'H' 33,619,520 HKD 25,246,685 23,031,756 8.89China Life Insurance Co Ltd 'H' 2,131,000 HKD 9,246,174 6,887,034 2.66China Merchants Bank Co Ltd 'H' 4,018,042 HKD 8,855,184 9,486,513 3.67China Pacific Insurance Group Co Ltd 'H' 1,544,600 HKD 6,063,530 6,356,935 2.46China Petroleum & Chemical Corp 'H' 12,013,600 HKD 9,055,105 7,253,708 2.80China Shenhua Energy Co Ltd 'H' 1,781,500 HKD 5,917,704 2,799,459 1.08China Vanke Co Ltd 'H' 1,637,800 HKD 4,193,059 4,838,797 1.87Dongfeng Motor Group Co Ltd 'H' 2,956,000 HKD 3,716,345 3,950,983 1.53Industrial & Commercial Bank of China Ltd 'H' 31,881,965 HKD 22,322,780 19,250,054 7.44Ping An Insurance Group Co of China Ltd 'H' 2,069,000 HKD 10,022,028 11,478,099 4.43Travelsky Technology Ltd 'H' 2,422,000 HKD 2,503,929 3,987,180 1.54
123,032,897 111,948,053 43.25
Hong Kong China Mobile Ltd 2,213,500 HKD 25,272,834 24,987,835 9.66China Overseas Land & Investment Ltd 2,182,000 HKD 7,194,971 7,657,106 2.96China Resources Power Holdings Co Ltd 2,484,268 HKD 5,208,815 4,833,267 1.87CNOOC Ltd 7,862,000 HKD 13,257,312 8,185,545 3.16Fosun International Ltd 3,585,000 HKD 2,991,585 5,596,488 2.16Guangdong Investment Ltd 3,470,000 HKD 3,991,377 4,915,558 1.90Want Want China Holdings Ltd 9,088,000 HKD 8,784,141 6,765,270 2.61
66,701,035 62,941,069 24.32
Total Shares 269,512,099 259,226,465 100.15
OTHER TRANSFERABLE SECURITIES
SHARES
Cayman Islands China High Precision Automation Group Ltd 6,386,000 HKD 2,728,497 – –
Total Shares 2,728,497 – –
Total Other Transferable Securities 2,728,497 – –
Total Investments 272,240,596 259,226,465 100.15
Other Net Liabilities (400,518) (0.15)
Total Net Assets 258,825,947 100.00
(expressed in USD)
CHINA EQUITY FUND
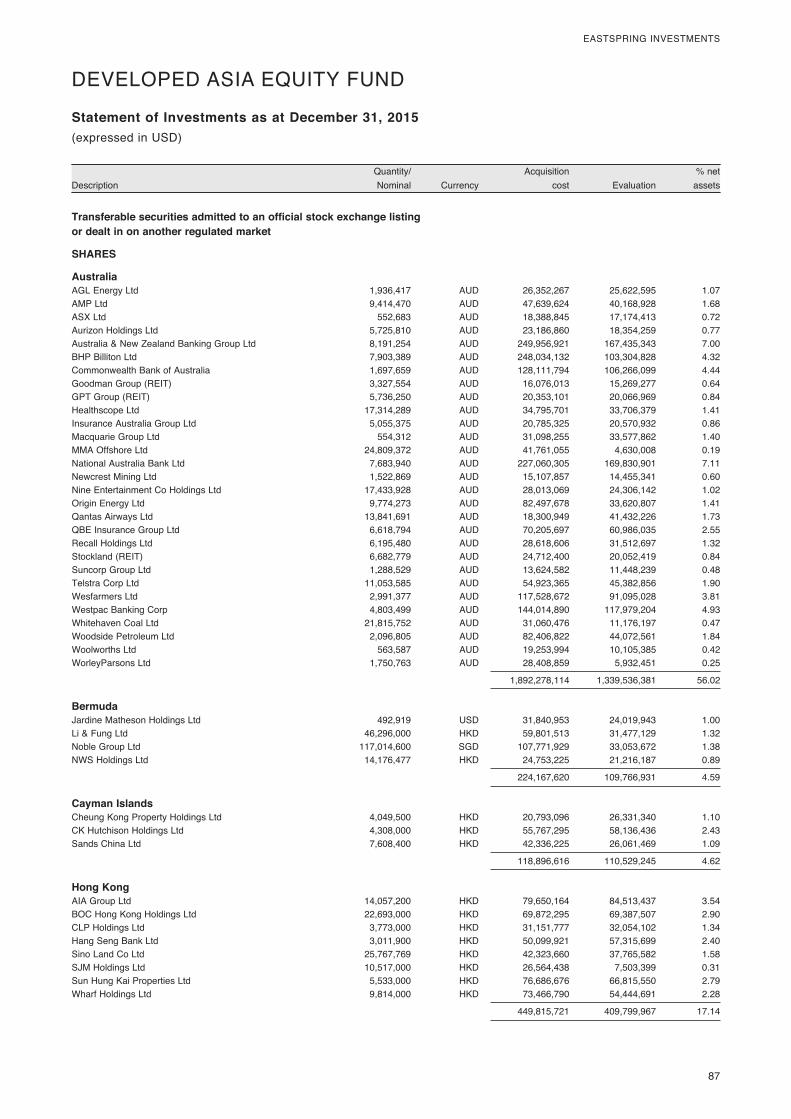
87
EASTSPRING INVESTMENTS
DescriptionQuantity/ Nominal Currency
Acquisition cost Evaluation
% net assets
Statement of Investments as at December 31, 2015
Transferable securities admitted to an official stock exchange listing or dealt in on another regulated market
SHARES
Australia AGL Energy Ltd 1,936,417 AUD 26,352,267 25,622,595 1.07AMP Ltd 9,414,470 AUD 47,639,624 40,168,928 1.68ASX Ltd 552,683 AUD 18,388,845 17,174,413 0.72Aurizon Holdings Ltd 5,725,810 AUD 23,186,860 18,354,259 0.77Australia & New Zealand Banking Group Ltd 8,191,254 AUD 249,956,921 167,435,343 7.00BHP Billiton Ltd 7,903,389 AUD 248,034,132 103,304,828 4.32Commonwealth Bank of Australia 1,697,659 AUD 128,111,794 106,266,099 4.44Goodman Group (REIT) 3,327,554 AUD 16,076,013 15,269,277 0.64GPT Group (REIT) 5,736,250 AUD 20,353,101 20,066,969 0.84Healthscope Ltd 17,314,289 AUD 34,795,701 33,706,379 1.41Insurance Australia Group Ltd 5,055,375 AUD 20,785,325 20,570,932 0.86Macquarie Group Ltd 554,312 AUD 31,098,255 33,577,862 1.40MMA Offshore Ltd 24,809,372 AUD 41,761,055 4,630,008 0.19National Australia Bank Ltd 7,683,940 AUD 227,060,305 169,830,901 7.11Newcrest Mining Ltd 1,522,869 AUD 15,107,857 14,455,341 0.60Nine Entertainment Co Holdings Ltd 17,433,928 AUD 28,013,069 24,306,142 1.02Origin Energy Ltd 9,774,273 AUD 82,497,678 33,620,807 1.41Qantas Airways Ltd 13,841,691 AUD 18,300,949 41,432,226 1.73QBE Insurance Group Ltd 6,618,794 AUD 70,205,697 60,986,035 2.55Recall Holdings Ltd 6,195,480 AUD 28,618,606 31,512,697 1.32Stockland (REIT) 6,682,779 AUD 24,712,400 20,052,419 0.84Suncorp Group Ltd 1,288,529 AUD 13,624,582 11,448,239 0.48Telstra Corp Ltd 11,053,585 AUD 54,923,365 45,382,856 1.90Wesfarmers Ltd 2,991,377 AUD 117,528,672 91,095,028 3.81Westpac Banking Corp 4,803,499 AUD 144,014,890 117,979,204 4.93Whitehaven Coal Ltd 21,815,752 AUD 31,060,476 11,176,197 0.47Woodside Petroleum Ltd 2,096,805 AUD 82,406,822 44,072,561 1.84Woolworths Ltd 563,587 AUD 19,253,994 10,105,385 0.42WorleyParsons Ltd 1,750,763 AUD 28,408,859 5,932,451 0.25
1,892,278,114 1,339,536,381 56.02
Bermuda Jardine Matheson Holdings Ltd 492,919 USD 31,840,953 24,019,943 1.00Li & Fung Ltd 46,296,000 HKD 59,801,513 31,477,129 1.32Noble Group Ltd 117,014,600 SGD 107,771,929 33,053,672 1.38NWS Holdings Ltd 14,176,477 HKD 24,753,225 21,216,187 0.89
224,167,620 109,766,931 4.59
Cayman Islands Cheung Kong Property Holdings Ltd 4,049,500 HKD 20,793,096 26,331,340 1.10CK Hutchison Holdings Ltd 4,308,000 HKD 55,767,295 58,136,436 2.43Sands China Ltd 7,608,400 HKD 42,336,225 26,061,469 1.09
118,896,616 110,529,245 4.62
Hong Kong AIA Group Ltd 14,057,200 HKD 79,650,164 84,513,437 3.54BOC Hong Kong Holdings Ltd 22,693,000 HKD 69,872,295 69,387,507 2.90CLP Holdings Ltd 3,773,000 HKD 31,151,777 32,054,102 1.34Hang Seng Bank Ltd 3,011,900 HKD 50,099,921 57,315,699 2.40Sino Land Co Ltd 25,767,769 HKD 42,323,660 37,765,582 1.58SJM Holdings Ltd 10,517,000 HKD 26,564,438 7,503,399 0.31Sun Hung Kai Properties Ltd 5,533,000 HKD 76,686,676 66,815,550 2.79Wharf Holdings Ltd 9,814,000 HKD 73,466,790 54,444,691 2.28
449,815,721 409,799,967 17.14
(expressed in USD)
DEVELOPED ASIA EQUITY FUND
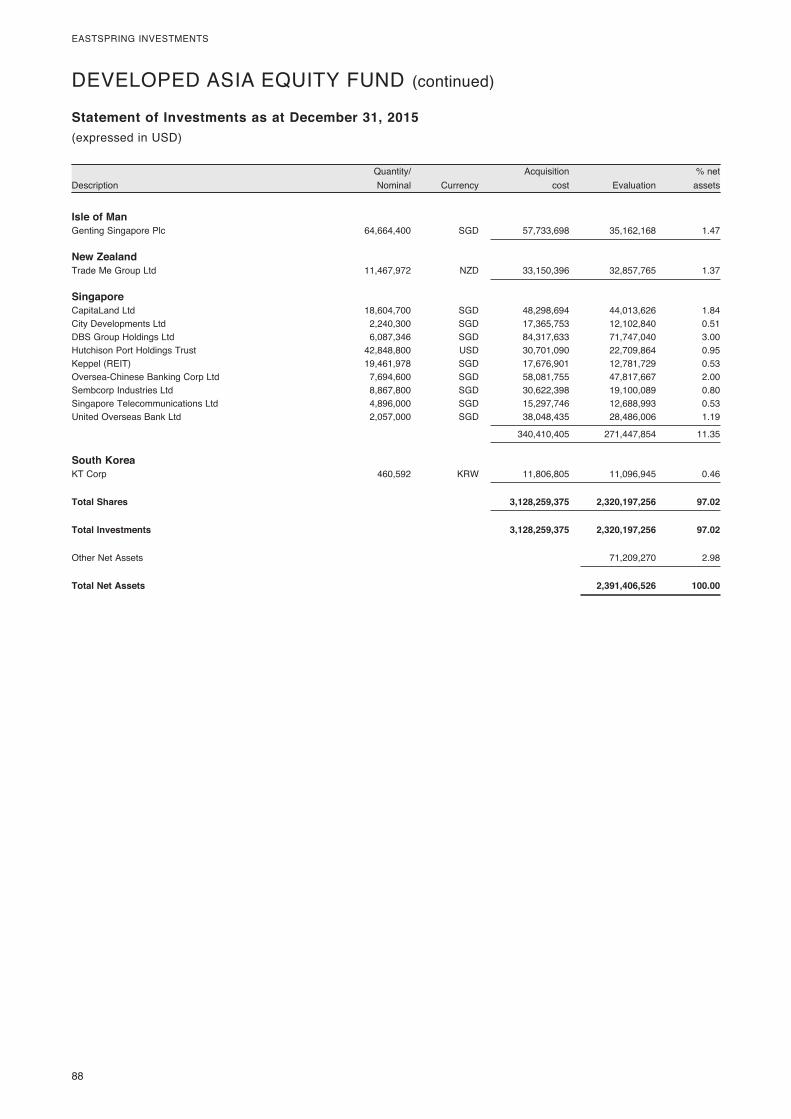
88
EASTSPRING INVESTMENTS
DescriptionQuantity/ Nominal Currency
Acquisition cost Evaluation
% net assets
Statement of Investments as at December 31, 2015(expressed in USD)
DEVELOPED ASIA EQUITY FUND (continued)
Isle of Man Genting Singapore Plc 64,664,400 SGD 57,733,698 35,162,168 1.47
New Zealand Trade Me Group Ltd 11,467,972 NZD 33,150,396 32,857,765 1.37
Singapore CapitaLand Ltd 18,604,700 SGD 48,298,694 44,013,626 1.84City Developments Ltd 2,240,300 SGD 17,365,753 12,102,840 0.51DBS Group Holdings Ltd 6,087,346 SGD 84,317,633 71,747,040 3.00Hutchison Port Holdings Trust 42,848,800 USD 30,701,090 22,709,864 0.95Keppel (REIT) 19,461,978 SGD 17,676,901 12,781,729 0.53Oversea-Chinese Banking Corp Ltd 7,694,600 SGD 58,081,755 47,817,667 2.00Sembcorp Industries Ltd 8,867,800 SGD 30,622,398 19,100,089 0.80Singapore Telecommunications Ltd 4,896,000 SGD 15,297,746 12,688,993 0.53United Overseas Bank Ltd 2,057,000 SGD 38,048,435 28,486,006 1.19
340,410,405 271,447,854 11.35
South Korea KT Corp 460,592 KRW 11,806,805 11,096,945 0.46
Total Shares 3,128,259,375 2,320,197,256 97.02
Total Investments 3,128,259,375 2,320,197,256 97.02
Other Net Assets 71,209,270 2.98
Total Net Assets 2,391,406,526 100.00
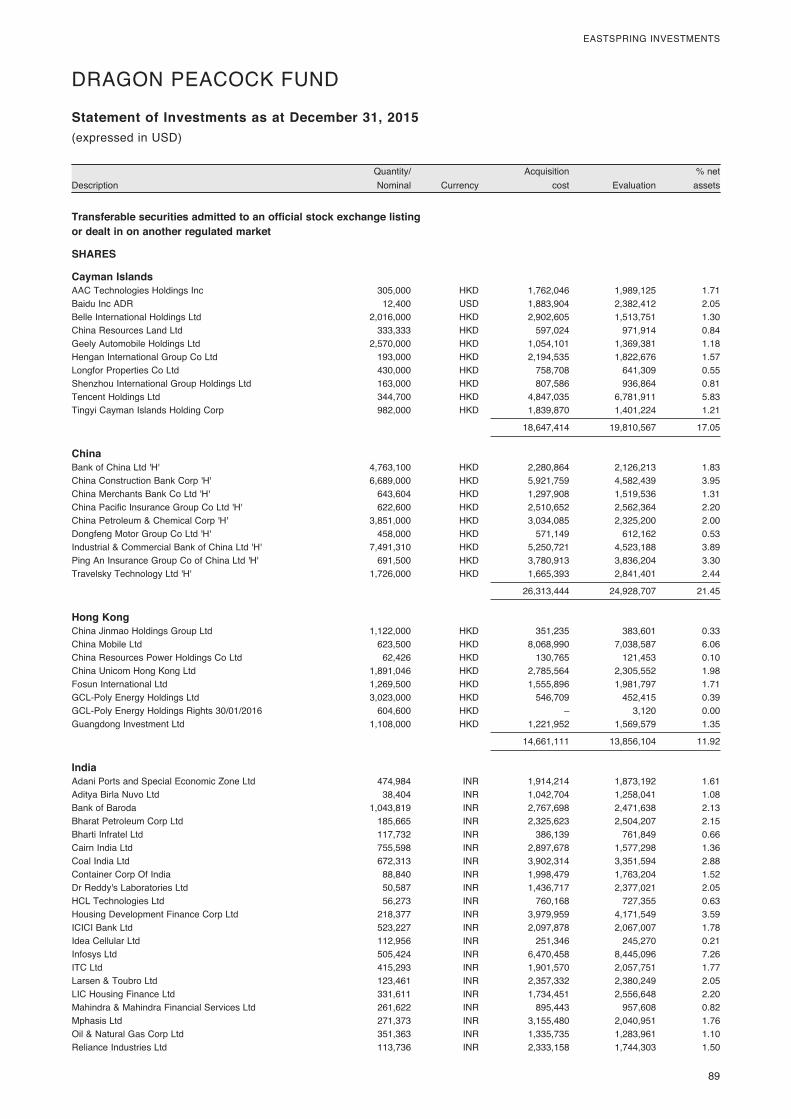
89
EASTSPRING INVESTMENTS
DescriptionQuantity/ Nominal Currency
Acquisition cost Evaluation
% net assets
Statement of Investments as at December 31, 2015
Transferable securities admitted to an official stock exchange listing or dealt in on another regulated market
SHARES
Cayman Islands AAC Technologies Holdings Inc 305,000 HKD 1,762,046 1,989,125 1.71Baidu Inc ADR 12,400 USD 1,883,904 2,382,412 2.05Belle International Holdings Ltd 2,016,000 HKD 2,902,605 1,513,751 1.30China Resources Land Ltd 333,333 HKD 597,024 971,914 0.84Geely Automobile Holdings Ltd 2,570,000 HKD 1,054,101 1,369,381 1.18Hengan International Group Co Ltd 193,000 HKD 2,194,535 1,822,676 1.57Longfor Properties Co Ltd 430,000 HKD 758,708 641,309 0.55Shenzhou International Group Holdings Ltd 163,000 HKD 807,586 936,864 0.81Tencent Holdings Ltd 344,700 HKD 4,847,035 6,781,911 5.83Tingyi Cayman Islands Holding Corp 982,000 HKD 1,839,870 1,401,224 1.21
18,647,414 19,810,567 17.05
China Bank of China Ltd 'H' 4,763,100 HKD 2,280,864 2,126,213 1.83China Construction Bank Corp 'H' 6,689,000 HKD 5,921,759 4,582,439 3.95China Merchants Bank Co Ltd 'H' 643,604 HKD 1,297,908 1,519,536 1.31China Pacific Insurance Group Co Ltd 'H' 622,600 HKD 2,510,652 2,562,364 2.20China Petroleum & Chemical Corp 'H' 3,851,000 HKD 3,034,085 2,325,200 2.00Dongfeng Motor Group Co Ltd 'H' 458,000 HKD 571,149 612,162 0.53Industrial & Commercial Bank of China Ltd 'H' 7,491,310 HKD 5,250,721 4,523,188 3.89Ping An Insurance Group Co of China Ltd 'H' 691,500 HKD 3,780,913 3,836,204 3.30Travelsky Technology Ltd 'H' 1,726,000 HKD 1,665,393 2,841,401 2.44
26,313,444 24,928,707 21.45
Hong Kong China Jinmao Holdings Group Ltd 1,122,000 HKD 351,235 383,601 0.33China Mobile Ltd 623,500 HKD 8,068,990 7,038,587 6.06China Resources Power Holdings Co Ltd 62,426 HKD 130,765 121,453 0.10China Unicom Hong Kong Ltd 1,891,046 HKD 2,785,564 2,305,552 1.98Fosun International Ltd 1,269,500 HKD 1,555,896 1,981,797 1.71GCL-Poly Energy Holdings Ltd 3,023,000 HKD 546,709 452,415 0.39GCL-Poly Energy Holdings Rights 30/01/2016 604,600 HKD – 3,120 0.00Guangdong Investment Ltd 1,108,000 HKD 1,221,952 1,569,579 1.35
14,661,111 13,856,104 11.92
India Adani Ports and Special Economic Zone Ltd 474,984 INR 1,914,214 1,873,192 1.61Aditya Birla Nuvo Ltd 38,404 INR 1,042,704 1,258,041 1.08Bank of Baroda 1,043,819 INR 2,767,698 2,471,638 2.13Bharat Petroleum Corp Ltd 185,665 INR 2,325,623 2,504,207 2.15Bharti Infratel Ltd 117,732 INR 386,139 761,849 0.66Cairn India Ltd 755,598 INR 2,897,678 1,577,298 1.36Coal India Ltd 672,313 INR 3,902,314 3,351,594 2.88Container Corp Of India 88,840 INR 1,998,479 1,763,204 1.52Dr Reddy's Laboratories Ltd 50,587 INR 1,436,717 2,377,021 2.05HCL Technologies Ltd 56,273 INR 760,168 727,355 0.63Housing Development Finance Corp Ltd 218,377 INR 3,979,959 4,171,549 3.59ICICI Bank Ltd 523,227 INR 2,097,878 2,067,007 1.78Idea Cellular Ltd 112,956 INR 251,346 245,270 0.21Infosys Ltd 505,424 INR 6,470,458 8,445,096 7.26ITC Ltd 415,293 INR 1,901,570 2,057,751 1.77Larsen & Toubro Ltd 123,461 INR 2,357,332 2,380,249 2.05LIC Housing Finance Ltd 331,611 INR 1,734,451 2,556,648 2.20Mahindra & Mahindra Financial Services Ltd 261,622 INR 895,443 957,608 0.82Mphasis Ltd 271,373 INR 3,155,480 2,040,951 1.76Oil & Natural Gas Corp Ltd 351,363 INR 1,335,735 1,283,961 1.10Reliance Industries Ltd 113,736 INR 2,333,158 1,744,303 1.50
(expressed in USD)
DRAGON PEACOCK FUND

90
EASTSPRING INVESTMENTS
DescriptionQuantity/ Nominal Currency
Acquisition cost Evaluation
% net assets
Statement of Investments as at December 31, 2015(expressed in USD)
DRAGON PEACOCK FUND (continued)
Rural Electrification Corp Ltd 126,666 INR 430,656 433,764 0.37State Bank of India 627,449 INR 2,663,836 2,128,763 1.83Steel Authority of India Ltd 517,356 INR 698,384 378,107 0.33Tata Consultancy Services Ltd 62,110 INR 2,609,601 2,287,808 1.97Tata Motors Ltd 285,634 INR 1,345,224 1,689,464 1.45Tata Motors Ltd 'A' 581,556 INR 1,862,517 2,543,573 2.19
55,554,762 56,077,271 48.25
Total Shares 115,176,731 114,672,649 98.67
Total Investments 115,176,731 114,672,649 98.67
Other Net Assets 1,541,324 1.33
Total Net Assets 116,213,973 100.00
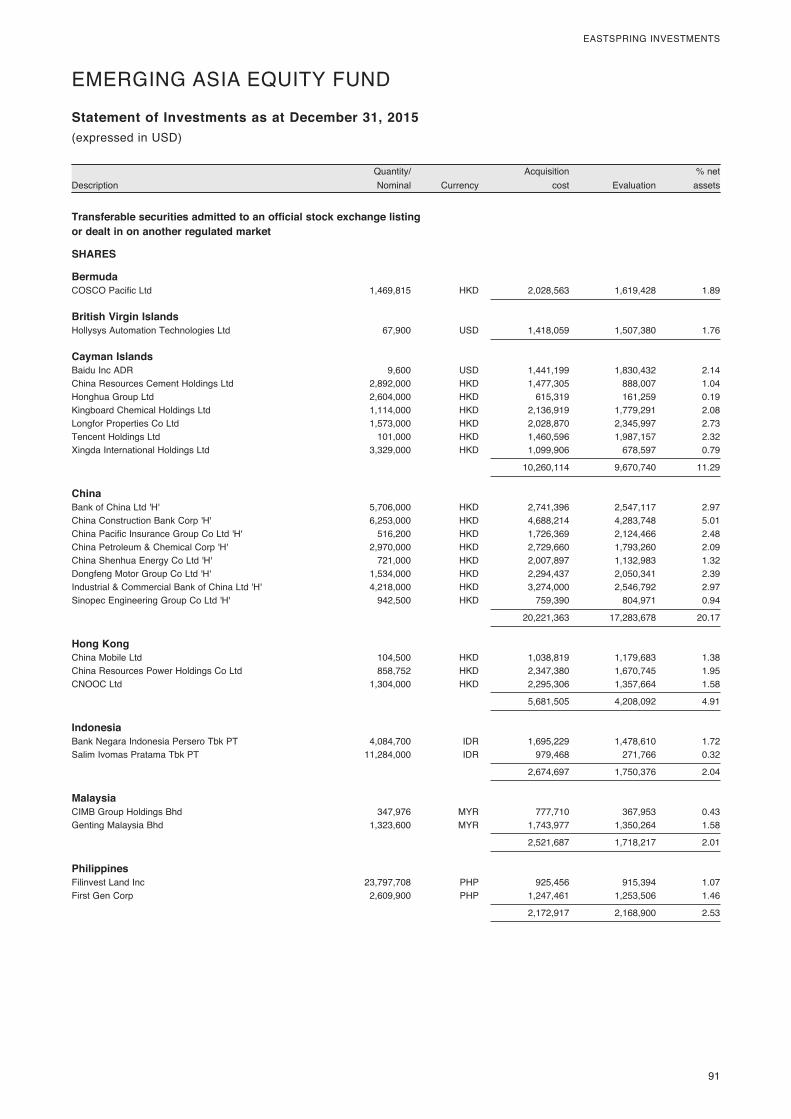
91
EASTSPRING INVESTMENTS
DescriptionQuantity/ Nominal Currency
Acquisition cost Evaluation
% net assets
Statement of Investments as at December 31, 2015
Transferable securities admitted to an official stock exchange listing or dealt in on another regulated market
SHARES
Bermuda COSCO Pacific Ltd 1,469,815 HKD 2,028,563 1,619,428 1.89
British Virgin Islands Hollysys Automation Technologies Ltd 67,900 USD 1,418,059 1,507,380 1.76
Cayman Islands Baidu Inc ADR 9,600 USD 1,441,199 1,830,432 2.14China Resources Cement Holdings Ltd 2,892,000 HKD 1,477,305 888,007 1.04Honghua Group Ltd 2,604,000 HKD 615,319 161,259 0.19Kingboard Chemical Holdings Ltd 1,114,000 HKD 2,136,919 1,779,291 2.08Longfor Properties Co Ltd 1,573,000 HKD 2,028,870 2,345,997 2.73Tencent Holdings Ltd 101,000 HKD 1,460,596 1,987,157 2.32Xingda International Holdings Ltd 3,329,000 HKD 1,099,906 678,597 0.79
10,260,114 9,670,740 11.29
China Bank of China Ltd 'H' 5,706,000 HKD 2,741,396 2,547,117 2.97China Construction Bank Corp 'H' 6,253,000 HKD 4,688,214 4,283,748 5.01China Pacific Insurance Group Co Ltd 'H' 516,200 HKD 1,726,369 2,124,466 2.48China Petroleum & Chemical Corp 'H' 2,970,000 HKD 2,729,660 1,793,260 2.09China Shenhua Energy Co Ltd 'H' 721,000 HKD 2,007,897 1,132,983 1.32Dongfeng Motor Group Co Ltd 'H' 1,534,000 HKD 2,294,437 2,050,341 2.39Industrial & Commercial Bank of China Ltd 'H' 4,218,000 HKD 3,274,000 2,546,792 2.97Sinopec Engineering Group Co Ltd 'H' 942,500 HKD 759,390 804,971 0.94
20,221,363 17,283,678 20.17
Hong Kong China Mobile Ltd 104,500 HKD 1,038,819 1,179,683 1.38China Resources Power Holdings Co Ltd 858,752 HKD 2,347,380 1,670,745 1.95CNOOC Ltd 1,304,000 HKD 2,295,306 1,357,664 1.58
5,681,505 4,208,092 4.91
Indonesia Bank Negara Indonesia Persero Tbk PT 4,084,700 IDR 1,695,229 1,478,610 1.72Salim Ivomas Pratama Tbk PT 11,284,000 IDR 979,468 271,766 0.32
2,674,697 1,750,376 2.04
Malaysia CIMB Group Holdings Bhd 347,976 MYR 777,710 367,953 0.43Genting Malaysia Bhd 1,323,600 MYR 1,743,977 1,350,264 1.58
2,521,687 1,718,217 2.01
Philippines Filinvest Land Inc 23,797,708 PHP 925,456 915,394 1.07First Gen Corp 2,609,900 PHP 1,247,461 1,253,506 1.46
2,172,917 2,168,900 2.53
(expressed in USD)
EMERGING ASIA EQUITY FUND

92
EASTSPRING INVESTMENTS
DescriptionQuantity/ Nominal Currency
Acquisition cost Evaluation
% net assets
Statement of Investments as at December 31, 2015(expressed in USD)
EMERGING ASIA EQUITY FUND (continued)
South Korea E-MART Inc 9,644 KRW 2,200,344 1,554,489 1.81GS Holdings 44,817 KRW 1,904,771 1,937,846 2.26Hana Financial Group Inc 59,206 KRW 2,127,653 1,191,643 1.39Hankook Tire Co Ltd 42,666 KRW 2,565,945 1,712,025 2.00Hyundai Engineering & Construction Co Ltd 6,227 KRW 315,085 151,619 0.18Hyundai Mobis Co Ltd 8,969 KRW 2,348,333 1,885,513 2.20Korea Electric Power Corp 38,515 KRW 1,488,495 1,642,361 1.92KT Corp 35,416 KRW 1,029,469 853,270 1.00POSCO 11,494 KRW 3,024,422 1,632,127 1.91Samsung Electronics Co Ltd 3,904 KRW 5,381,845 4,195,165 4.89Samsung Fire & Marine Insurance Co Ltd 6,738 KRW 1,728,773 1,767,033 2.06
24,115,135 18,523,091 21.62
Taiwan CTBC Financial Holding Co Ltd 3,267,863 TWD 2,010,891 1,681,338 1.96HON HAI Precision Industry Co Ltd 1,086,750 TWD 3,155,307 2,673,287 3.12MediaTek Inc 165,000 TWD 2,001,009 1,255,823 1.47Taiwan Semiconductor Manufacturing Co Ltd 1,031,000 TWD 4,218,083 4,488,480 5.24Tripod Technology Corp 851,000 TWD 1,547,152 1,450,849 1.69Unimicron Technology Corp 2,295,000 TWD 1,641,135 974,679 1.14Wistron Corp 1,855,345 TWD 1,855,843 1,050,612 1.23
16,429,420 13,575,068 15.85
Thailand Bangkok Bank PCL (Foreign Market) 358,500 THB 2,131,249 1,539,204 1.79PTT PCL (Foreign Market) 127,100 THB 1,402,473 861,815 1.01
3,533,722 2,401,019 2.80
Total Shares 91,057,182 74,425,989 86.87
Total Investments 91,057,182 74,425,989 86.87
Other Net Assets 11,247,722 13.13
Total Net Assets 85,673,711 100.00
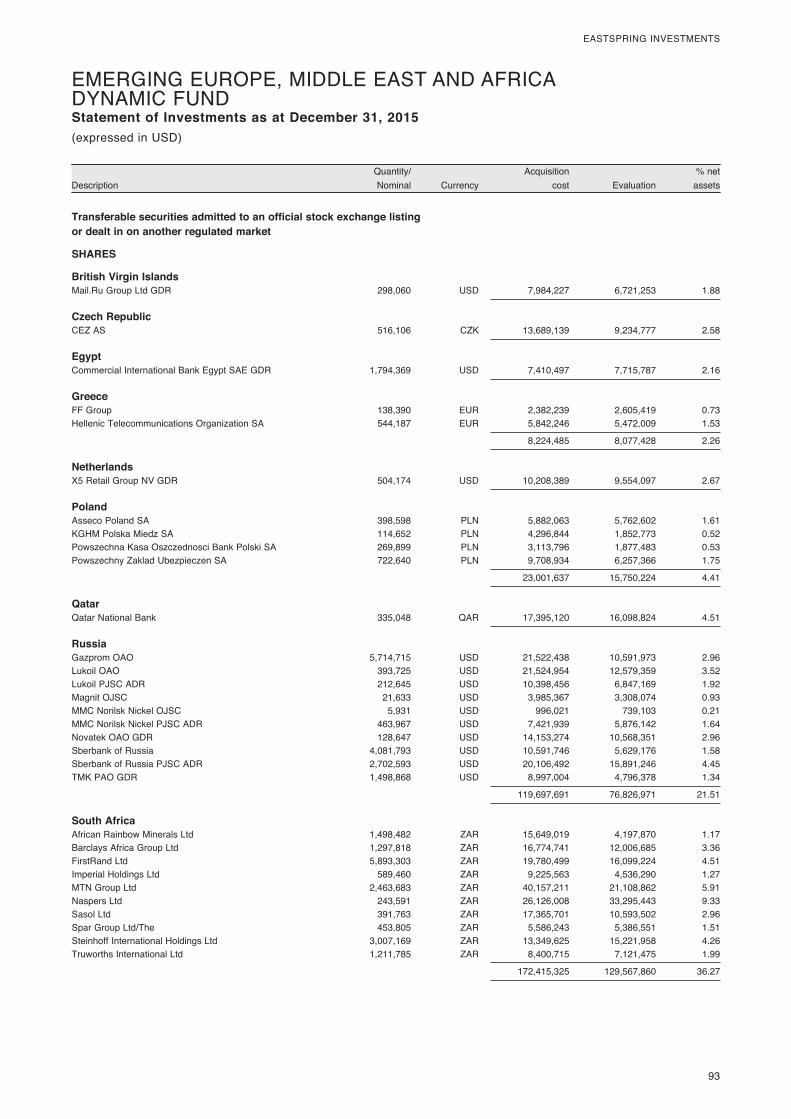
93
EASTSPRING INVESTMENTS
DescriptionQuantity/ Nominal Currency
Acquisition cost Evaluation
% net assets
Statement of Investments as at December 31, 2015
Transferable securities admitted to an official stock exchange listing or dealt in on another regulated market
SHARES
British Virgin Islands Mail.Ru Group Ltd GDR 298,060 USD 7,984,227 6,721,253 1.88
Czech Republic CEZ AS 516,106 CZK 13,689,139 9,234,777 2.58
Egypt Commercial International Bank Egypt SAE GDR 1,794,369 USD 7,410,497 7,715,787 2.16
Greece FF Group 138,390 EUR 2,382,239 2,605,419 0.73Hellenic Telecommunications Organization SA 544,187 EUR 5,842,246 5,472,009 1.53
8,224,485 8,077,428 2.26
Netherlands X5 Retail Group NV GDR 504,174 USD 10,208,389 9,554,097 2.67
Poland Asseco Poland SA 398,598 PLN 5,882,063 5,762,602 1.61KGHM Polska Miedz SA 114,652 PLN 4,296,844 1,852,773 0.52Powszechna Kasa Oszczednosci Bank Polski SA 269,899 PLN 3,113,796 1,877,483 0.53Powszechny Zaklad Ubezpieczen SA 722,640 PLN 9,708,934 6,257,366 1.75
23,001,637 15,750,224 4.41
Qatar Qatar National Bank 335,048 QAR 17,395,120 16,098,824 4.51
Russia Gazprom OAO 5,714,715 USD 21,522,438 10,591,973 2.96Lukoil OAO 393,725 USD 21,524,954 12,579,359 3.52Lukoil PJSC ADR 212,645 USD 10,398,456 6,847,169 1.92Magnit OJSC 21,633 USD 3,985,367 3,308,074 0.93MMC Norilsk Nickel OJSC 5,931 USD 996,021 739,103 0.21MMC Norilsk Nickel PJSC ADR 463,967 USD 7,421,939 5,876,142 1.64Novatek OAO GDR 128,647 USD 14,153,274 10,568,351 2.96Sberbank of Russia 4,081,793 USD 10,591,746 5,629,176 1.58Sberbank of Russia PJSC ADR 2,702,593 USD 20,106,492 15,891,246 4.45TMK PAO GDR 1,498,868 USD 8,997,004 4,796,378 1.34
119,697,691 76,826,971 21.51
South Africa African Rainbow Minerals Ltd 1,498,482 ZAR 15,649,019 4,197,870 1.17Barclays Africa Group Ltd 1,297,818 ZAR 16,774,741 12,006,685 3.36FirstRand Ltd 5,893,303 ZAR 19,780,499 16,099,224 4.51Imperial Holdings Ltd 589,460 ZAR 9,225,563 4,536,290 1.27MTN Group Ltd 2,463,683 ZAR 40,157,211 21,108,862 5.91Naspers Ltd 243,591 ZAR 26,126,008 33,295,443 9.33Sasol Ltd 391,763 ZAR 17,365,701 10,593,502 2.96Spar Group Ltd/The 453,805 ZAR 5,586,243 5,386,551 1.51Steinhoff International Holdings Ltd 3,007,169 ZAR 13,349,625 15,221,958 4.26Truworths International Ltd 1,211,785 ZAR 8,400,715 7,121,475 1.99
172,415,325 129,567,860 36.27
(expressed in USD)
EMERGING EUROPE, MIDDLE EAST AND AFRICA DYNAMIC FUND
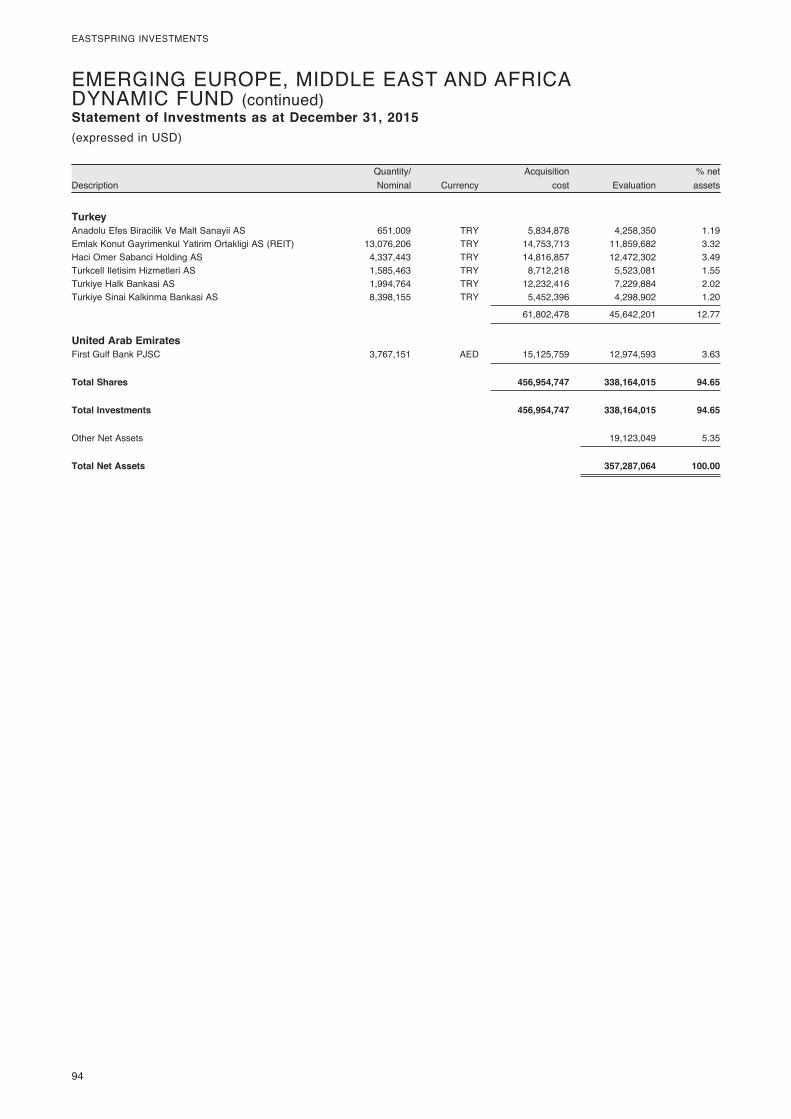
94
EASTSPRING INVESTMENTS
DescriptionQuantity/ Nominal Currency
Acquisition cost Evaluation
% net assets
Statement of Investments as at December 31, 2015(expressed in USD)
EMERGING EUROPE, MIDDLE EAST AND AFRICA DYNAMIC FUND (continued)
Turkey Anadolu Efes Biracilik Ve Malt Sanayii AS 651,009 TRY 5,834,878 4,258,350 1.19Emlak Konut Gayrimenkul Yatirim Ortakligi AS (REIT) 13,076,206 TRY 14,753,713 11,859,682 3.32Haci Omer Sabanci Holding AS 4,337,443 TRY 14,816,857 12,472,302 3.49Turkcell Iletisim Hizmetleri AS 1,585,463 TRY 8,712,218 5,523,081 1.55Turkiye Halk Bankasi AS 1,994,764 TRY 12,232,416 7,229,884 2.02Turkiye Sinai Kalkinma Bankasi AS 8,398,155 TRY 5,452,396 4,298,902 1.20
61,802,478 45,642,201 12.77
United Arab Emirates First Gulf Bank PJSC 3,767,151 AED 15,125,759 12,974,593 3.63
Total Shares 456,954,747 338,164,015 94.65
Total Investments 456,954,747 338,164,015 94.65
Other Net Assets 19,123,049 5.35
Total Net Assets 357,287,064 100.00
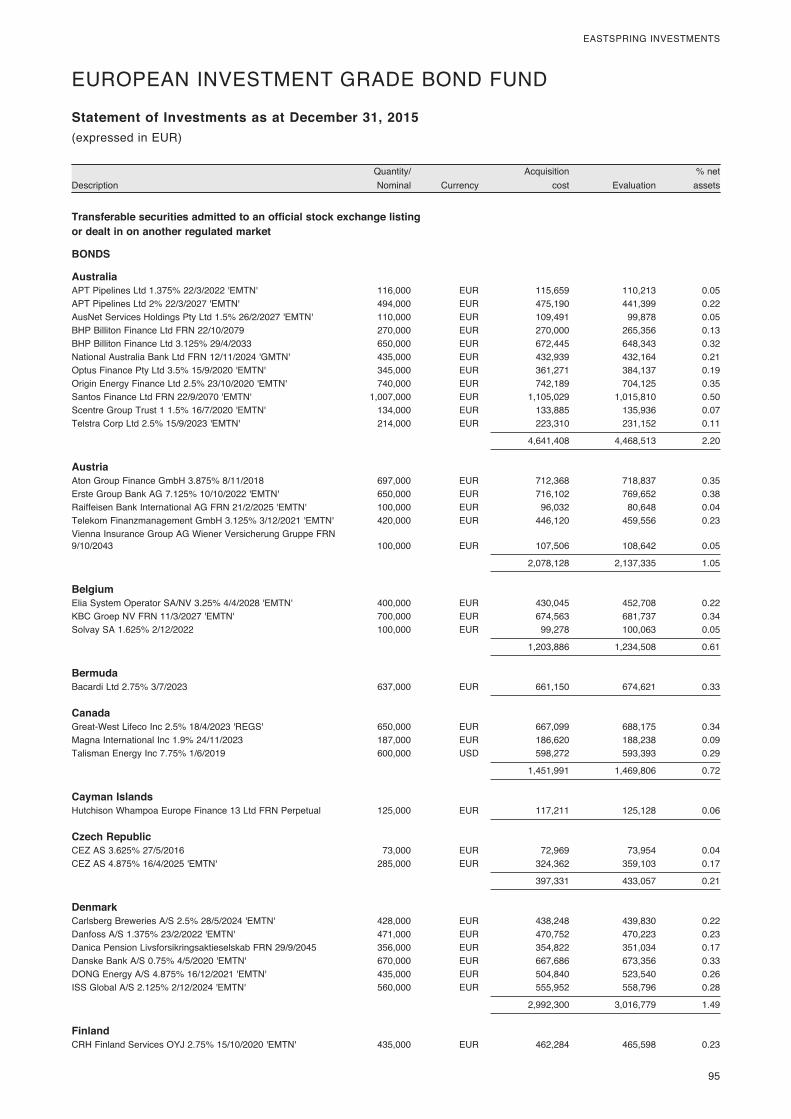
95
EASTSPRING INVESTMENTS
DescriptionQuantity/ Nominal Currency
Acquisition cost Evaluation
% net assets
Statement of Investments as at December 31, 2015
Transferable securities admitted to an official stock exchange listing or dealt in on another regulated market
BONDS
Australia APT Pipelines Ltd 1.375% 22/3/2022 'EMTN' 116,000 EUR 115,659 110,213 0.05APT Pipelines Ltd 2% 22/3/2027 'EMTN' 494,000 EUR 475,190 441,399 0.22AusNet Services Holdings Pty Ltd 1.5% 26/2/2027 'EMTN' 110,000 EUR 109,491 99,878 0.05BHP Billiton Finance Ltd FRN 22/10/2079 270,000 EUR 270,000 265,356 0.13BHP Billiton Finance Ltd 3.125% 29/4/2033 650,000 EUR 672,445 648,343 0.32National Australia Bank Ltd FRN 12/11/2024 'GMTN' 435,000 EUR 432,939 432,164 0.21Optus Finance Pty Ltd 3.5% 15/9/2020 'EMTN' 345,000 EUR 361,271 384,137 0.19Origin Energy Finance Ltd 2.5% 23/10/2020 'EMTN' 740,000 EUR 742,189 704,125 0.35Santos Finance Ltd FRN 22/9/2070 'EMTN' 1,007,000 EUR 1,105,029 1,015,810 0.50Scentre Group Trust 1 1.5% 16/7/2020 'EMTN' 134,000 EUR 133,885 135,936 0.07Telstra Corp Ltd 2.5% 15/9/2023 'EMTN' 214,000 EUR 223,310 231,152 0.11
4,641,408 4,468,513 2.20
Austria Aton Group Finance GmbH 3.875% 8/11/2018 697,000 EUR 712,368 718,837 0.35Erste Group Bank AG 7.125% 10/10/2022 'EMTN' 650,000 EUR 716,102 769,652 0.38Raiffeisen Bank International AG FRN 21/2/2025 'EMTN' 100,000 EUR 96,032 80,648 0.04Telekom Finanzmanagement GmbH 3.125% 3/12/2021 'EMTN' 420,000 EUR 446,120 459,556 0.23Vienna Insurance Group AG Wiener Versicherung Gruppe FRN 9/10/2043 100,000 EUR 107,506 108,642 0.05
2,078,128 2,137,335 1.05
Belgium Elia System Operator SA/NV 3.25% 4/4/2028 'EMTN' 400,000 EUR 430,045 452,708 0.22KBC Groep NV FRN 11/3/2027 'EMTN' 700,000 EUR 674,563 681,737 0.34Solvay SA 1.625% 2/12/2022 100,000 EUR 99,278 100,063 0.05
1,203,886 1,234,508 0.61
Bermuda Bacardi Ltd 2.75% 3/7/2023 637,000 EUR 661,150 674,621 0.33
Canada Great-West Lifeco Inc 2.5% 18/4/2023 'REGS' 650,000 EUR 667,099 688,175 0.34Magna International Inc 1.9% 24/11/2023 187,000 EUR 186,620 188,238 0.09Talisman Energy Inc 7.75% 1/6/2019 600,000 USD 598,272 593,393 0.29
1,451,991 1,469,806 0.72
Cayman Islands Hutchison Whampoa Europe Finance 13 Ltd FRN Perpetual 125,000 EUR 117,211 125,128 0.06
Czech Republic CEZ AS 3.625% 27/5/2016 73,000 EUR 72,969 73,954 0.04CEZ AS 4.875% 16/4/2025 'EMTN' 285,000 EUR 324,362 359,103 0.17
397,331 433,057 0.21
Denmark Carlsberg Breweries A/S 2.5% 28/5/2024 'EMTN' 428,000 EUR 438,248 439,830 0.22Danfoss A/S 1.375% 23/2/2022 'EMTN' 471,000 EUR 470,752 470,223 0.23Danica Pension Livsforsikringsaktieselskab FRN 29/9/2045 356,000 EUR 354,822 351,034 0.17Danske Bank A/S 0.75% 4/5/2020 'EMTN' 670,000 EUR 667,686 673,356 0.33DONG Energy A/S 4.875% 16/12/2021 'EMTN' 435,000 EUR 504,840 523,540 0.26ISS Global A/S 2.125% 2/12/2024 'EMTN' 560,000 EUR 555,952 558,796 0.28
2,992,300 3,016,779 1.49
Finland CRH Finland Services OYJ 2.75% 15/10/2020 'EMTN' 435,000 EUR 462,284 465,598 0.23
(expressed in EUR)
EUROPEAN INVESTMENT GRADE BOND FUND

96
EASTSPRING INVESTMENTS
DescriptionQuantity/ Nominal Currency
Acquisition cost Evaluation
% net assets
Statement of Investments as at December 31, 2015(expressed in EUR)
EUROPEAN INVESTMENT GRADE BOND FUND (continued)
Elenia Finance OYJ 2.875% 17/12/2020 'EMTN' 652,000 EUR 665,845 692,255 0.34Fingrid OYJ 3.5% 3/4/2024 'EMTN' 370,000 EUR 424,329 427,687 0.21Sampo OYJ 1.5% 16/9/2021 'EMTN' 600,000 EUR 600,349 604,266 0.30Teollisuuden Voima OYJ 2.125% 4/2/2025 'EMTN' 426,000 EUR 399,783 372,085 0.18Teollisuuden Voima OYJ 4.625% 4/2/2019 'EMTN' 500,000 EUR 536,039 541,540 0.27
3,088,629 3,103,431 1.53
France Accor SA 2.375% 17/9/2023 100,000 EUR 99,771 100,911 0.05Aeroports de Paris 1.5% 24/7/2023 500,000 EUR 504,482 509,165 0.25Aeroports de Paris 3.886% 10/5/2020 350,000 EUR 389,288 399,105 0.20Areva SA 3.125% 20/3/2023 'EMTN' 200,000 EUR 199,186 182,268 0.09Autoroutes du Sud de la France SA 2.95% 17/1/2024 'EMTN' 300,000 EUR 298,212 331,974 0.16Autoroutes du Sud de la France SA 5.625% 4/7/2022 'EMTN' 600,000 EUR 759,371 764,676 0.38AXA SA FRN Perpetual 'EMTN' 825,000 EUR 824,114 810,563 0.40Banque Federative du Credit Mutuel SA 2.625% 18/3/2024 'EMTN' 400,000 EUR 438,541 436,688 0.21Banque Federative du Credit Mutuel SA 3% 21/5/2024 'EMTN' 849,000 EUR 882,755 881,007 0.43Banque Federative du Credit Mutuel SA 3% 11/9/2025 'EMTN' 300,000 EUR 297,340 308,544 0.15BioMerieux 2.875% 14/10/2020 300,000 EUR 312,961 319,224 0.16BNP Paribas Cardif SA FRN Perpetual 900,000 EUR 889,120 852,750 0.42BPCE SA 4.25% 6/2/2023 'EMTN' 400,000 EUR 486,199 478,180 0.24BPCE SA 4.625% 18/7/2023 800,000 EUR 896,843 917,576 0.45Bureau Veritas SA 3.125% 21/1/2021 600,000 EUR 633,624 634,968 0.31CARMILA SAS 2.375% 18/9/2023 300,000 EUR 300,076 302,946 0.15Casino Guichard Perrachon SA 2.798% 5/8/2026 'EMTN' 500,000 EUR 473,753 438,135 0.22Casino Guichard Perrachon SA 4.726% 26/5/2021 'EMTN' 700,000 EUR 776,529 761,663 0.37Christian Dior SE 1.375% 19/6/2019 400,000 EUR 403,285 407,308 0.20CNP Assurances FRN Perpetual 300,000 EUR 294,212 283,842 0.14CNP Assurances FRN 14/9/2040 150,000 EUR 145,497 166,880 0.08Credit Agricole Assurances SA FRN Perpetual 600,000 EUR 590,188 568,668 0.28Credit Agricole Assurances SA FRN Perpetual 600,000 EUR 601,133 575,250 0.28Credit Agricole SA 2.625% 17/3/2027 435,000 EUR 419,510 414,107 0.20Credit Agricole SA/London 2.375% 27/11/2020 'EMTN' 1,000,000 EUR 1,070,046 1,075,250 0.53Credit Agricole SA/London 2.375% 20/5/2024 'EMTN' 700,000 EUR 758,286 745,941 0.37Edenred 1.375% 10/3/2025 700,000 EUR 629,847 611,744 0.30Electricite de France SA FRN Perpetual 'EMTN' 300,000 EUR 314,737 293,304 0.14Electricite de France SA 2.75% 10/3/2023 'EMTN' 800,000 EUR 845,872 879,392 0.43Electricite de France SA 4% 12/11/2025 'EMTN' 400,000 EUR 452,244 479,956 0.24Electricite de France SA 4.125% 25/3/2027 'EMTN' 500,000 EUR 576,038 607,930 0.30Electricite de France SA 5.625% 21/2/2033 'EMTN' 137,000 EUR 177,641 190,511 0.09Electricite de France SA 6.25% 25/1/2021 'EMTN' 850,000 EUR 1,072,802 1,080,852 0.54Engie SA FRN Perpetual 600,000 EUR 662,083 633,000 0.31Engie SA 6.375% 18/1/2021 'EMTN' 559,000 EUR 669,607 713,144 0.35France Telecom SA 8.125% 28/1/2033 'EMTN' 190,000 EUR 290,972 314,507 0.15Gecina SA 2% 17/6/2024 'EMTN' 300,000 EUR 293,806 298,779 0.15Gecina SA 2.875% 30/5/2023 'EMTN' 100,000 EUR 98,998 107,427 0.05ICADE 1.875% 14/9/2022 800,000 EUR 796,096 805,544 0.40Iliad SA 2.125% 5/12/2022 500,000 EUR 494,100 491,920 0.24Imerys SA 2% 10/12/2024 'EMTN' 300,000 EUR 302,140 304,548 0.15Mercialys SA 1.787% 31/3/2023 600,000 EUR 594,919 576,180 0.28Orange SA FRN Perpetual 'EMTN' 500,000 EUR 521,775 492,585 0.24RCI Banque SA 1.375% 17/11/2020 'EMTN' 1,107,000 EUR 1,107,609 1,113,121 0.56RTE Reseau de Transport d'Electricite SA 1.625% 27/11/2025 'EMTN' 300,000 EUR 298,670 297,573 0.15RTE Reseau de Transport d'Electricite SA 2.875% 12/9/2023 'EMTN' 400,000 EUR 422,084 443,232 0.22Sanofi 4% 29/3/2021 917,000 USD 887,516 900,129 0.44Schneider Electric SE 1.5% 8/9/2023 'EMTN' 300,000 EUR 298,409 303,246 0.15Schneider Electric SE 2.5% 6/9/2021 'EMTN' 400,000 EUR 416,413 433,936 0.21SCOR SE FRN Perpetual 600,000 EUR 624,654 606,006 0.30SEB SA 2.375% 25/11/2022 200,000 EUR 199,650 202,180 0.10SNCF Mobilites Group 4.875% 12/6/2023 'EMTN' 850,000 EUR 1,080,031 1,094,850 0.55Societe Des Autoroutes Paris-Rhin-Rhone 1.125% 15/1/2021 'EMTN' 400,000 EUR 397,827 401,864 0.20Societe Fonciere Lyonnaise SA 2.25% 16/11/2022 100,000 EUR 99,856 100,596 0.05Sogecap SA FRN Perpetual 700,000 EUR 685,646 661,178 0.33
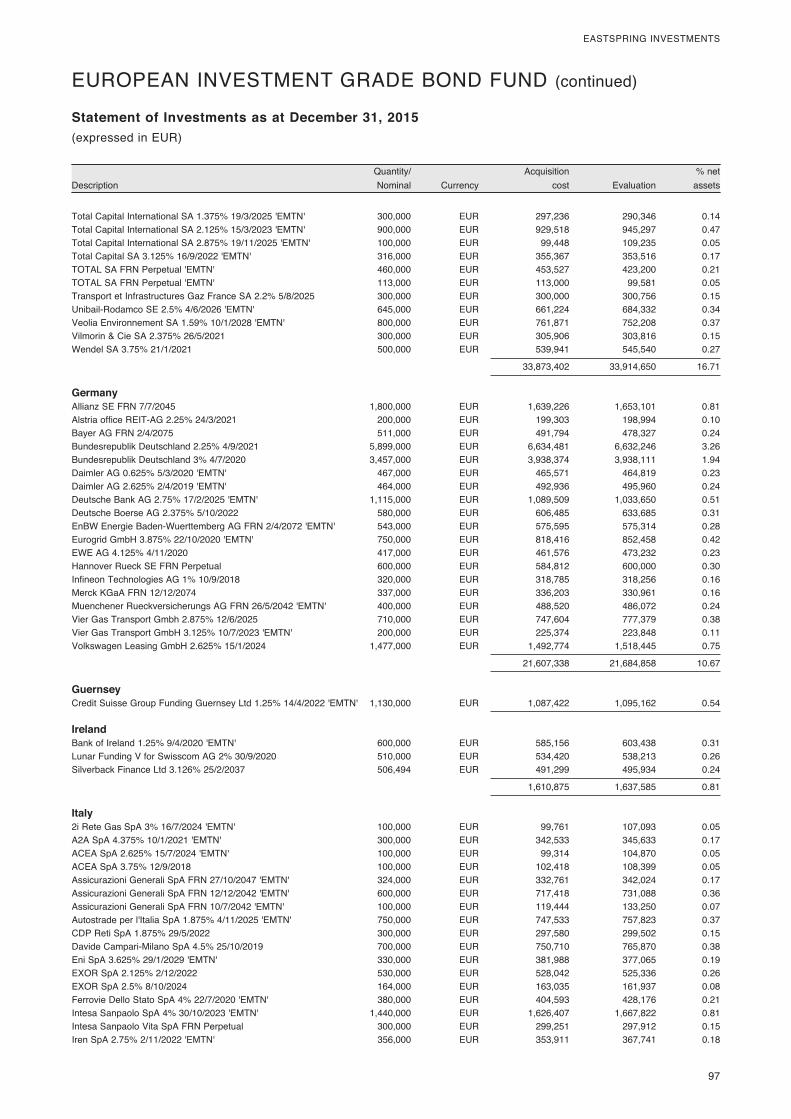
97
EASTSPRING INVESTMENTS
DescriptionQuantity/ Nominal Currency
Acquisition cost Evaluation
% net assets
Statement of Investments as at December 31, 2015(expressed in EUR)
EUROPEAN INVESTMENT GRADE BOND FUND (continued)
Total Capital International SA 1.375% 19/3/2025 'EMTN' 300,000 EUR 297,236 290,346 0.14Total Capital International SA 2.125% 15/3/2023 'EMTN' 900,000 EUR 929,518 945,297 0.47Total Capital International SA 2.875% 19/11/2025 'EMTN' 100,000 EUR 99,448 109,235 0.05Total Capital SA 3.125% 16/9/2022 'EMTN' 316,000 EUR 355,367 353,516 0.17TOTAL SA FRN Perpetual 'EMTN' 460,000 EUR 453,527 423,200 0.21TOTAL SA FRN Perpetual 'EMTN' 113,000 EUR 113,000 99,581 0.05Transport et Infrastructures Gaz France SA 2.2% 5/8/2025 300,000 EUR 300,000 300,756 0.15Unibail-Rodamco SE 2.5% 4/6/2026 'EMTN' 645,000 EUR 661,224 684,332 0.34Veolia Environnement SA 1.59% 10/1/2028 'EMTN' 800,000 EUR 761,871 752,208 0.37Vilmorin & Cie SA 2.375% 26/5/2021 300,000 EUR 305,906 303,816 0.15Wendel SA 3.75% 21/1/2021 500,000 EUR 539,941 545,540 0.27
33,873,402 33,914,650 16.71
Germany Allianz SE FRN 7/7/2045 1,800,000 EUR 1,639,226 1,653,101 0.81Alstria office REIT-AG 2.25% 24/3/2021 200,000 EUR 199,303 198,994 0.10Bayer AG FRN 2/4/2075 511,000 EUR 491,794 478,327 0.24Bundesrepublik Deutschland 2.25% 4/9/2021 5,899,000 EUR 6,634,481 6,632,246 3.26Bundesrepublik Deutschland 3% 4/7/2020 3,457,000 EUR 3,938,374 3,938,111 1.94Daimler AG 0.625% 5/3/2020 'EMTN' 467,000 EUR 465,571 464,819 0.23Daimler AG 2.625% 2/4/2019 'EMTN' 464,000 EUR 492,936 495,960 0.24Deutsche Bank AG 2.75% 17/2/2025 'EMTN' 1,115,000 EUR 1,089,509 1,033,650 0.51Deutsche Boerse AG 2.375% 5/10/2022 580,000 EUR 606,485 633,685 0.31EnBW Energie Baden-Wuerttemberg AG FRN 2/4/2072 'EMTN' 543,000 EUR 575,595 575,314 0.28Eurogrid GmbH 3.875% 22/10/2020 'EMTN' 750,000 EUR 818,416 852,458 0.42EWE AG 4.125% 4/11/2020 417,000 EUR 461,576 473,232 0.23Hannover Rueck SE FRN Perpetual 600,000 EUR 584,812 600,000 0.30Infineon Technologies AG 1% 10/9/2018 320,000 EUR 318,785 318,256 0.16Merck KGaA FRN 12/12/2074 337,000 EUR 336,203 330,961 0.16Muenchener Rueckversicherungs AG FRN 26/5/2042 'EMTN' 400,000 EUR 488,520 486,072 0.24Vier Gas Transport Gmbh 2.875% 12/6/2025 710,000 EUR 747,604 777,379 0.38Vier Gas Transport GmbH 3.125% 10/7/2023 'EMTN' 200,000 EUR 225,374 223,848 0.11Volkswagen Leasing GmbH 2.625% 15/1/2024 1,477,000 EUR 1,492,774 1,518,445 0.75
21,607,338 21,684,858 10.67
Guernsey Credit Suisse Group Funding Guernsey Ltd 1.25% 14/4/2022 'EMTN' 1,130,000 EUR 1,087,422 1,095,162 0.54
Ireland Bank of Ireland 1.25% 9/4/2020 'EMTN' 600,000 EUR 585,156 603,438 0.31Lunar Funding V for Swisscom AG 2% 30/9/2020 510,000 EUR 534,420 538,213 0.26Silverback Finance Ltd 3.126% 25/2/2037 506,494 EUR 491,299 495,934 0.24
1,610,875 1,637,585 0.81
Italy 2i Rete Gas SpA 3% 16/7/2024 'EMTN' 100,000 EUR 99,761 107,093 0.05A2A SpA 4.375% 10/1/2021 'EMTN' 300,000 EUR 342,533 345,633 0.17ACEA SpA 2.625% 15/7/2024 'EMTN' 100,000 EUR 99,314 104,870 0.05ACEA SpA 3.75% 12/9/2018 100,000 EUR 102,418 108,399 0.05Assicurazioni Generali SpA FRN 27/10/2047 'EMTN' 324,000 EUR 332,761 342,024 0.17Assicurazioni Generali SpA FRN 12/12/2042 'EMTN' 600,000 EUR 717,418 731,088 0.36Assicurazioni Generali SpA FRN 10/7/2042 'EMTN' 100,000 EUR 119,444 133,250 0.07Autostrade per l'Italia SpA 1.875% 4/11/2025 'EMTN' 750,000 EUR 747,533 757,823 0.37CDP Reti SpA 1.875% 29/5/2022 300,000 EUR 297,580 299,502 0.15Davide Campari-Milano SpA 4.5% 25/10/2019 700,000 EUR 750,710 765,870 0.38Eni SpA 3.625% 29/1/2029 'EMTN' 330,000 EUR 381,988 377,065 0.19EXOR SpA 2.125% 2/12/2022 530,000 EUR 528,042 525,336 0.26EXOR SpA 2.5% 8/10/2024 164,000 EUR 163,035 161,937 0.08Ferrovie Dello Stato SpA 4% 22/7/2020 'EMTN' 380,000 EUR 404,593 428,176 0.21Intesa Sanpaolo SpA 4% 30/10/2023 'EMTN' 1,440,000 EUR 1,626,407 1,667,822 0.81Intesa Sanpaolo Vita SpA FRN Perpetual 300,000 EUR 299,251 297,912 0.15Iren SpA 2.75% 2/11/2022 'EMTN' 356,000 EUR 353,911 367,741 0.18

98
EASTSPRING INVESTMENTS
DescriptionQuantity/ Nominal Currency
Acquisition cost Evaluation
% net assets
Statement of Investments as at December 31, 2015(expressed in EUR)
EUROPEAN INVESTMENT GRADE BOND FUND (continued)
Societa Esercizi Aereoportuali SpA Sea 3.125% 17/4/2021 343,000 EUR 345,986 343,936 0.17UniCredit SpA FRN 28/10/2025 'EMTN' 189,000 EUR 188,862 203,965 0.10UniCredit SpA 3.25% 14/1/2021 'EMTN' 658,000 EUR 692,988 713,022 0.35UniCredit SpA 6.95% 31/10/2022 'EMTN' 263,000 EUR 268,683 307,063 0.15
8,863,218 9,089,527 4.47
Japan Bank of Tokyo-Mitsubishi UFJ Ltd/The 0.875% 11/3/2022 'EMTN' 1,067,000 EUR 1,049,687 1,042,726 0.51Nomura Europe Finance NV 1.5% 12/5/2021 'EMTN' 178,000 EUR 177,266 177,838 0.09Toyota Motor Credit Corp 1% 10/9/2021 'EMTN' 573,000 EUR 571,176 576,598 0.28
1,798,129 1,797,162 0.88
Jersey Delphi Automotive Plc 1.5% 10/3/2025 378,000 EUR 358,629 349,268 0.17
Luxembourg Alpha Trains Finance SA 2.064% 30/6/2025 'EMTN' 634,000 EUR 612,860 546,470 0.27DH Europe Finance SA 2.5% 8/7/2025 720,000 EUR 737,314 762,912 0.38GELF Bond Issuer I SA 3.125% 3/4/2018 'EMTN' 600,000 EUR 612,875 626,298 0.31Glencore Finance Europe SA 1.75% 17/3/2025 'EMTN' 1,260,000 EUR 876,228 793,800 0.39Glencore Finance Europe SA 3.75% 1/4/2026 'EMTN' 1,130,000 EUR 1,067,924 827,724 0.41Grand City Properties SA 1.5% 17/4/2025 400,000 EUR 376,165 360,900 0.18Prologis International Funding II SA 1.876% 17/4/2025 'EMTN' 465,000 EUR 446,069 430,795 0.21SES SA 4.75% 11/3/2021 'EMTN' 300,000 EUR 352,405 352,800 0.17Tyco International Finance SA 1.375% 25/2/2025 649,000 EUR 625,604 611,287 0.30
5,707,444 5,312,986 2.62
Mexico America Movil SAB de CV 3% 12/7/2021 520,000 EUR 563,217 567,533 0.28Petroleos Mexicanos 2.75% 21/4/2027 'EMTN' 400,000 EUR 376,084 293,876 0.14
939,301 861,409 0.42
Netherlands ABN AMRO Bank NV FRN 30/6/2025 'EMTN' 1,225,000 EUR 1,237,974 1,256,139 0.61ABN AMRO Bank NV 2.125% 26/11/2020 'EMTN' 490,000 EUR 524,273 520,522 0.26ABN AMRO Bank NV 7.125% 6/7/2022 'EMTN' 100,000 EUR 127,067 125,182 0.06Achmea BV FRN Perpetual 'EMTN' 1,010,000 EUR 1,010,746 937,270 0.46Adecco International Financial Services BV 1.5% 22/11/2022 'EMTN' 865,000 EUR 859,604 862,682 0.42Aegon NV FRN 25/4/2044 'EMTN' 800,000 EUR 807,939 769,216 0.38Alliander NV 2.25% 14/11/2022 'EMTN' 715,000 EUR 762,333 771,085 0.38ASML Holding NV 3.375% 19/9/2023 610,000 EUR 681,105 685,274 0.34ASR Nederland NV FRN 29/9/2045 625,000 EUR 620,045 625,219 0.31Atrium European Real Estate Ltd 3.625% 17/10/2022 416,000 EUR 424,327 426,412 0.21BAT Netherlands Finance BV 3.125% 6/3/2029 'EMTN' 320,000 EUR 335,762 345,389 0.17BMW Finance NV 0.875% 17/11/2020 'EMTN' 1,620,000 EUR 1,619,329 1,619,076 0.79Cooperatieve Centrale Raiffeisen-Boerenleenbank BA/Netherlands FRN 26/5/2026 1,445,000 EUR 1,455,060 1,458,683 0.71Cooperatieve Centrale Raiffeisen-Boerenleenbank BA/Netherlands 4.125% 12/1/2021 'EMTN' 896,000 EUR 1,037,634 1,039,181 0.51Cooperatieve Centrale Raiffeisen-Boerenleenbank BA/Netherlands 4.125% 14/7/2025 750,000 EUR 932,113 916,485 0.45CRH Funding BV 1.875% 9/1/2024 'EMTN' 100,000 EUR 99,418 100,730 0.05Delta Lloyd NV FRN Perpetual 'EMTN' 1,030,000 EUR 973,066 863,274 0.43Deutsche Bahn Finance BV 3% 8/3/2024 'EMTN' 206,000 EUR 219,082 236,991 0.12Deutsche Bahn Finance BV 3.75% 1/6/2021 'EMTN' 949,000 EUR 1,100,968 1,109,465 0.55E.ON International Finance BV 5.75% 7/5/2020 'EMTN' 443,000 EUR 523,974 529,478 0.26E.ON International Finance BV 6.75% 27/1/2039 'EMTN' 250,000 GBP 413,031 424,447 0.21ELM BV for RELX Finance 2.5% 24/9/2020 'EMTN' 400,000 EUR 413,648 428,152 0.21Enbw International Finance BV 6.125% 7/7/2039 'EMTN' 355,000 EUR 518,248 516,422 0.25Enexis Holding NV 1.875% 13/11/2020 'EMTN' 500,000 EUR 523,007 524,145 0.26Generali Finance BV FRN Perpetual 'EMTN' 350,000 EUR 345,664 338,072 0.17Heineken NV 1.5% 7/12/2024 'EMTN' 475,000 EUR 470,187 467,039 0.23
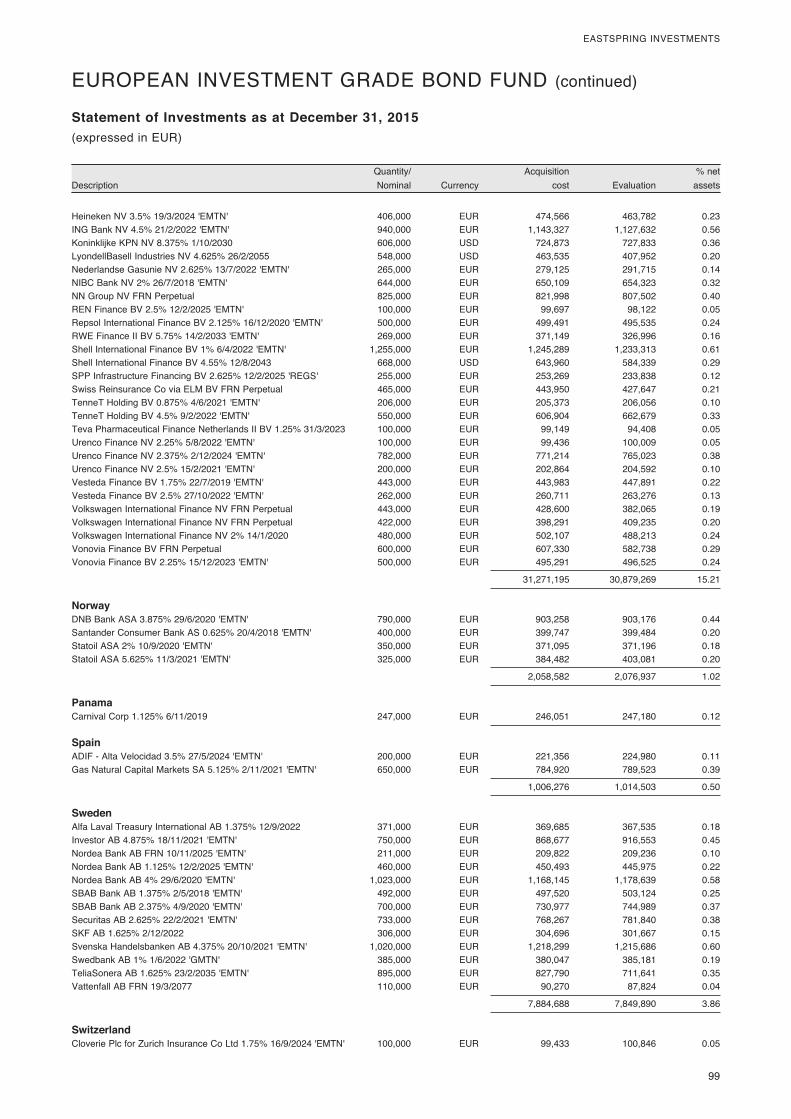
99
EASTSPRING INVESTMENTS
DescriptionQuantity/ Nominal Currency
Acquisition cost Evaluation
% net assets
Statement of Investments as at December 31, 2015(expressed in EUR)
EUROPEAN INVESTMENT GRADE BOND FUND (continued)
Heineken NV 3.5% 19/3/2024 'EMTN' 406,000 EUR 474,566 463,782 0.23ING Bank NV 4.5% 21/2/2022 'EMTN' 940,000 EUR 1,143,327 1,127,632 0.56Koninklijke KPN NV 8.375% 1/10/2030 606,000 USD 724,873 727,833 0.36LyondellBasell Industries NV 4.625% 26/2/2055 548,000 USD 463,535 407,952 0.20Nederlandse Gasunie NV 2.625% 13/7/2022 'EMTN' 265,000 EUR 279,125 291,715 0.14NIBC Bank NV 2% 26/7/2018 'EMTN' 644,000 EUR 650,109 654,323 0.32NN Group NV FRN Perpetual 825,000 EUR 821,998 807,502 0.40REN Finance BV 2.5% 12/2/2025 'EMTN' 100,000 EUR 99,697 98,122 0.05Repsol International Finance BV 2.125% 16/12/2020 'EMTN' 500,000 EUR 499,491 495,535 0.24RWE Finance II BV 5.75% 14/2/2033 'EMTN' 269,000 EUR 371,149 326,996 0.16Shell International Finance BV 1% 6/4/2022 'EMTN' 1,255,000 EUR 1,245,289 1,233,313 0.61Shell International Finance BV 4.55% 12/8/2043 668,000 USD 643,960 584,339 0.29SPP Infrastructure Financing BV 2.625% 12/2/2025 'REGS' 255,000 EUR 253,269 233,838 0.12Swiss Reinsurance Co via ELM BV FRN Perpetual 465,000 EUR 443,950 427,647 0.21TenneT Holding BV 0.875% 4/6/2021 'EMTN' 206,000 EUR 205,373 206,056 0.10TenneT Holding BV 4.5% 9/2/2022 'EMTN' 550,000 EUR 606,904 662,679 0.33Teva Pharmaceutical Finance Netherlands II BV 1.25% 31/3/2023 100,000 EUR 99,149 94,408 0.05Urenco Finance NV 2.25% 5/8/2022 'EMTN' 100,000 EUR 99,436 100,009 0.05Urenco Finance NV 2.375% 2/12/2024 'EMTN' 782,000 EUR 771,214 765,023 0.38Urenco Finance NV 2.5% 15/2/2021 'EMTN' 200,000 EUR 202,864 204,592 0.10Vesteda Finance BV 1.75% 22/7/2019 'EMTN' 443,000 EUR 443,983 447,891 0.22Vesteda Finance BV 2.5% 27/10/2022 'EMTN' 262,000 EUR 260,711 263,276 0.13Volkswagen International Finance NV FRN Perpetual 443,000 EUR 428,600 382,065 0.19Volkswagen International Finance NV FRN Perpetual 422,000 EUR 398,291 409,235 0.20Volkswagen International Finance NV 2% 14/1/2020 480,000 EUR 502,107 488,213 0.24Vonovia Finance BV FRN Perpetual 600,000 EUR 607,330 582,738 0.29Vonovia Finance BV 2.25% 15/12/2023 'EMTN' 500,000 EUR 495,291 496,525 0.24
31,271,195 30,879,269 15.21
Norway DNB Bank ASA 3.875% 29/6/2020 'EMTN' 790,000 EUR 903,258 903,176 0.44Santander Consumer Bank AS 0.625% 20/4/2018 'EMTN' 400,000 EUR 399,747 399,484 0.20Statoil ASA 2% 10/9/2020 'EMTN' 350,000 EUR 371,095 371,196 0.18Statoil ASA 5.625% 11/3/2021 'EMTN' 325,000 EUR 384,482 403,081 0.20
2,058,582 2,076,937 1.02
Panama Carnival Corp 1.125% 6/11/2019 247,000 EUR 246,051 247,180 0.12
Spain ADIF - Alta Velocidad 3.5% 27/5/2024 'EMTN' 200,000 EUR 221,356 224,980 0.11Gas Natural Capital Markets SA 5.125% 2/11/2021 'EMTN' 650,000 EUR 784,920 789,523 0.39
1,006,276 1,014,503 0.50
Sweden Alfa Laval Treasury International AB 1.375% 12/9/2022 371,000 EUR 369,685 367,535 0.18Investor AB 4.875% 18/11/2021 'EMTN' 750,000 EUR 868,677 916,553 0.45Nordea Bank AB FRN 10/11/2025 'EMTN' 211,000 EUR 209,822 209,236 0.10Nordea Bank AB 1.125% 12/2/2025 'EMTN' 460,000 EUR 450,493 445,975 0.22Nordea Bank AB 4% 29/6/2020 'EMTN' 1,023,000 EUR 1,168,145 1,178,639 0.58SBAB Bank AB 1.375% 2/5/2018 'EMTN' 492,000 EUR 497,520 503,124 0.25SBAB Bank AB 2.375% 4/9/2020 'EMTN' 700,000 EUR 730,977 744,989 0.37Securitas AB 2.625% 22/2/2021 'EMTN' 733,000 EUR 768,267 781,840 0.38SKF AB 1.625% 2/12/2022 306,000 EUR 304,696 301,667 0.15Svenska Handelsbanken AB 4.375% 20/10/2021 'EMTN' 1,020,000 EUR 1,218,299 1,215,686 0.60Swedbank AB 1% 1/6/2022 'GMTN' 385,000 EUR 380,047 385,181 0.19TeliaSonera AB 1.625% 23/2/2035 'EMTN' 895,000 EUR 827,790 711,641 0.35Vattenfall AB FRN 19/3/2077 110,000 EUR 90,270 87,824 0.04
7,884,688 7,849,890 3.86
Switzerland Cloverie Plc for Zurich Insurance Co Ltd 1.75% 16/9/2024 'EMTN' 100,000 EUR 99,433 100,846 0.05
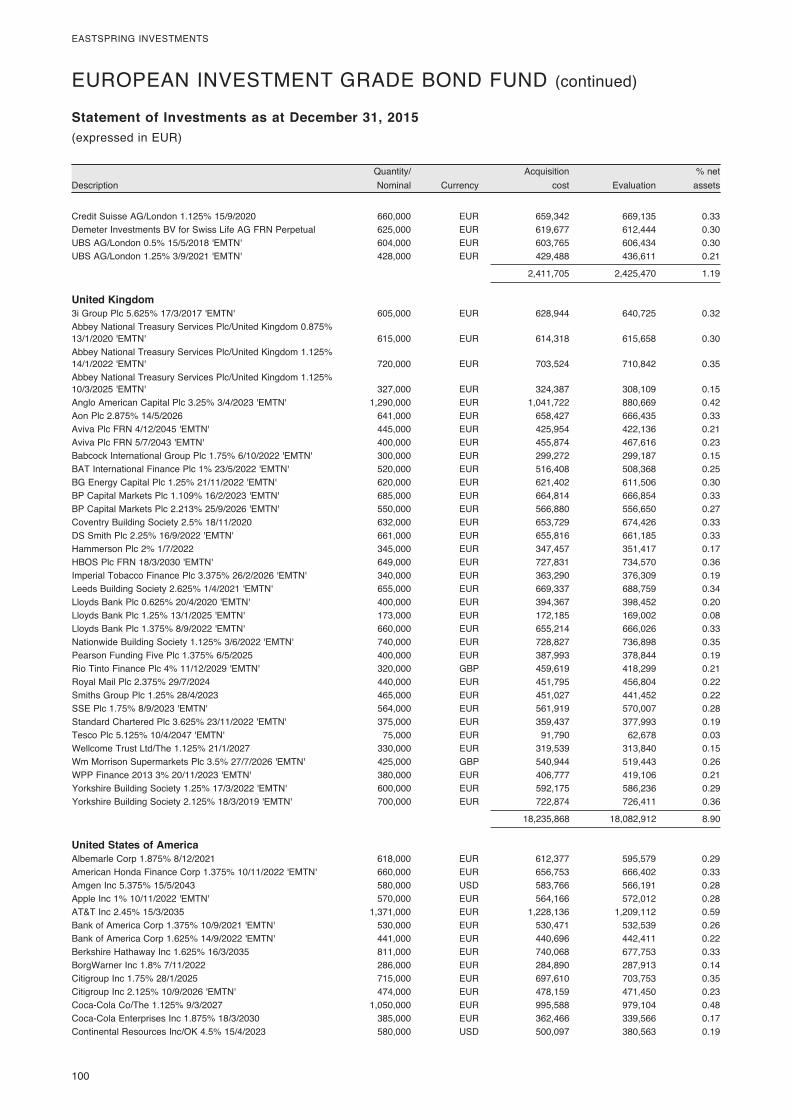
100
EASTSPRING INVESTMENTS
DescriptionQuantity/ Nominal Currency
Acquisition cost Evaluation
% net assets
Statement of Investments as at December 31, 2015(expressed in EUR)
EUROPEAN INVESTMENT GRADE BOND FUND (continued)
Credit Suisse AG/London 1.125% 15/9/2020 660,000 EUR 659,342 669,135 0.33Demeter Investments BV for Swiss Life AG FRN Perpetual 625,000 EUR 619,677 612,444 0.30UBS AG/London 0.5% 15/5/2018 'EMTN' 604,000 EUR 603,765 606,434 0.30UBS AG/London 1.25% 3/9/2021 'EMTN' 428,000 EUR 429,488 436,611 0.21
2,411,705 2,425,470 1.19
United Kingdom 3i Group Plc 5.625% 17/3/2017 'EMTN' 605,000 EUR 628,944 640,725 0.32Abbey National Treasury Services Plc/United Kingdom 0.875% 13/1/2020 'EMTN' 615,000 EUR 614,318 615,658 0.30Abbey National Treasury Services Plc/United Kingdom 1.125% 14/1/2022 'EMTN' 720,000 EUR 703,524 710,842 0.35Abbey National Treasury Services Plc/United Kingdom 1.125% 10/3/2025 'EMTN' 327,000 EUR 324,387 308,109 0.15Anglo American Capital Plc 3.25% 3/4/2023 'EMTN' 1,290,000 EUR 1,041,722 880,669 0.42Aon Plc 2.875% 14/5/2026 641,000 EUR 658,427 666,435 0.33Aviva Plc FRN 4/12/2045 'EMTN' 445,000 EUR 425,954 422,136 0.21Aviva Plc FRN 5/7/2043 'EMTN' 400,000 EUR 455,874 467,616 0.23Babcock International Group Plc 1.75% 6/10/2022 'EMTN' 300,000 EUR 299,272 299,187 0.15BAT International Finance Plc 1% 23/5/2022 'EMTN' 520,000 EUR 516,408 508,368 0.25BG Energy Capital Plc 1.25% 21/11/2022 'EMTN' 620,000 EUR 621,402 611,506 0.30BP Capital Markets Plc 1.109% 16/2/2023 'EMTN' 685,000 EUR 664,814 666,854 0.33BP Capital Markets Plc 2.213% 25/9/2026 'EMTN' 550,000 EUR 566,880 556,650 0.27Coventry Building Society 2.5% 18/11/2020 632,000 EUR 653,729 674,426 0.33DS Smith Plc 2.25% 16/9/2022 'EMTN' 661,000 EUR 655,816 661,185 0.33Hammerson Plc 2% 1/7/2022 345,000 EUR 347,457 351,417 0.17HBOS Plc FRN 18/3/2030 'EMTN' 649,000 EUR 727,831 734,570 0.36Imperial Tobacco Finance Plc 3.375% 26/2/2026 'EMTN' 340,000 EUR 363,290 376,309 0.19Leeds Building Society 2.625% 1/4/2021 'EMTN' 655,000 EUR 669,337 688,759 0.34Lloyds Bank Plc 0.625% 20/4/2020 'EMTN' 400,000 EUR 394,367 398,452 0.20Lloyds Bank Plc 1.25% 13/1/2025 'EMTN' 173,000 EUR 172,185 169,002 0.08Lloyds Bank Plc 1.375% 8/9/2022 'EMTN' 660,000 EUR 655,214 666,026 0.33Nationwide Building Society 1.125% 3/6/2022 'EMTN' 740,000 EUR 728,827 736,898 0.35Pearson Funding Five Plc 1.375% 6/5/2025 400,000 EUR 387,993 378,844 0.19Rio Tinto Finance Plc 4% 11/12/2029 'EMTN' 320,000 GBP 459,619 418,299 0.21Royal Mail Plc 2.375% 29/7/2024 440,000 EUR 451,795 456,804 0.22Smiths Group Plc 1.25% 28/4/2023 465,000 EUR 451,027 441,452 0.22SSE Plc 1.75% 8/9/2023 'EMTN' 564,000 EUR 561,919 570,007 0.28Standard Chartered Plc 3.625% 23/11/2022 'EMTN' 375,000 EUR 359,437 377,993 0.19Tesco Plc 5.125% 10/4/2047 'EMTN' 75,000 EUR 91,790 62,678 0.03Wellcome Trust Ltd/The 1.125% 21/1/2027 330,000 EUR 319,539 313,840 0.15Wm Morrison Supermarkets Plc 3.5% 27/7/2026 'EMTN' 425,000 GBP 540,944 519,443 0.26WPP Finance 2013 3% 20/11/2023 'EMTN' 380,000 EUR 406,777 419,106 0.21Yorkshire Building Society 1.25% 17/3/2022 'EMTN' 600,000 EUR 592,175 586,236 0.29Yorkshire Building Society 2.125% 18/3/2019 'EMTN' 700,000 EUR 722,874 726,411 0.36
18,235,868 18,082,912 8.90
United States of America Albemarle Corp 1.875% 8/12/2021 618,000 EUR 612,377 595,579 0.29American Honda Finance Corp 1.375% 10/11/2022 'EMTN' 660,000 EUR 656,753 666,402 0.33Amgen Inc 5.375% 15/5/2043 580,000 USD 583,766 566,191 0.28Apple Inc 1% 10/11/2022 'EMTN' 570,000 EUR 564,166 572,012 0.28AT&T Inc 2.45% 15/3/2035 1,371,000 EUR 1,228,136 1,209,112 0.59Bank of America Corp 1.375% 10/9/2021 'EMTN' 530,000 EUR 530,471 532,539 0.26Bank of America Corp 1.625% 14/9/2022 'EMTN' 441,000 EUR 440,696 442,411 0.22Berkshire Hathaway Inc 1.625% 16/3/2035 811,000 EUR 740,068 677,753 0.33BorgWarner Inc 1.8% 7/11/2022 286,000 EUR 284,890 287,913 0.14Citigroup Inc 1.75% 28/1/2025 715,000 EUR 697,610 703,753 0.35Citigroup Inc 2.125% 10/9/2026 'EMTN' 474,000 EUR 478,159 471,450 0.23Coca-Cola Co/The 1.125% 9/3/2027 1,050,000 EUR 995,588 979,104 0.48Coca-Cola Enterprises Inc 1.875% 18/3/2030 385,000 EUR 362,466 339,566 0.17Continental Resources Inc/OK 4.5% 15/4/2023 580,000 USD 500,097 380,563 0.19
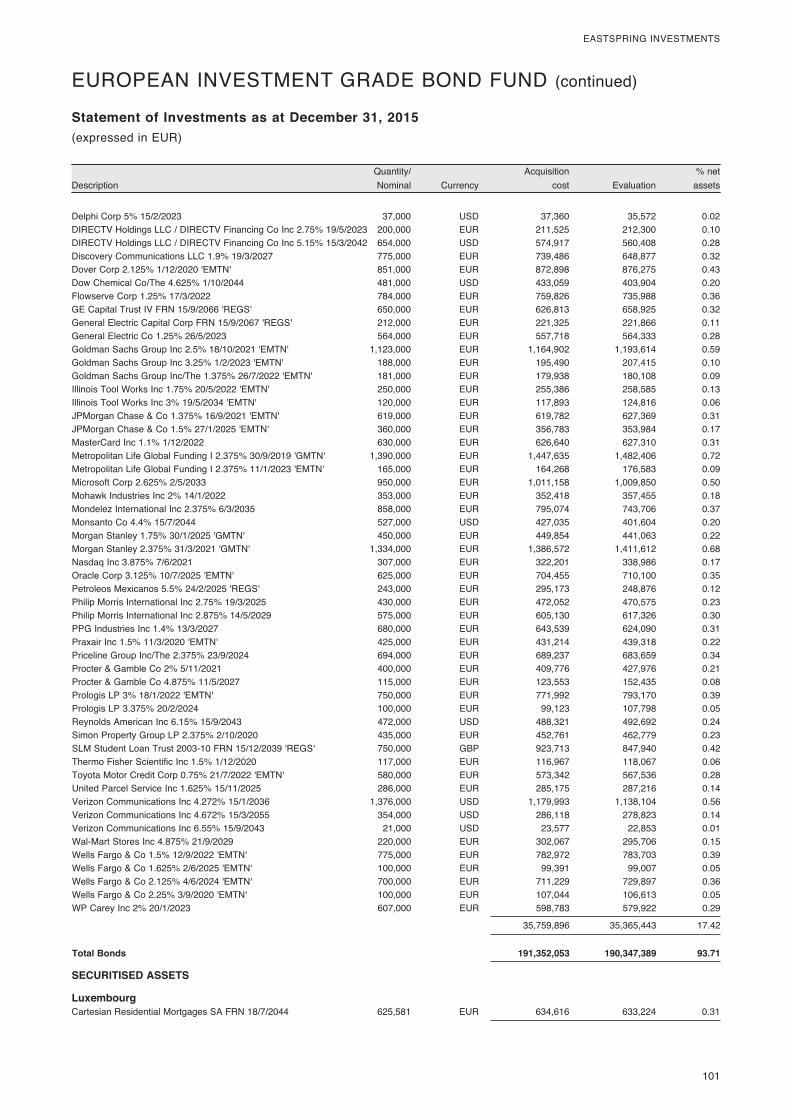
101
EASTSPRING INVESTMENTS
DescriptionQuantity/ Nominal Currency
Acquisition cost Evaluation
% net assets
Statement of Investments as at December 31, 2015(expressed in EUR)
EUROPEAN INVESTMENT GRADE BOND FUND (continued)
Delphi Corp 5% 15/2/2023 37,000 USD 37,360 35,572 0.02DIRECTV Holdings LLC / DIRECTV Financing Co Inc 2.75% 19/5/2023 200,000 EUR 211,525 212,300 0.10DIRECTV Holdings LLC / DIRECTV Financing Co Inc 5.15% 15/3/2042 654,000 USD 574,917 560,408 0.28Discovery Communications LLC 1.9% 19/3/2027 775,000 EUR 739,486 648,877 0.32Dover Corp 2.125% 1/12/2020 'EMTN' 851,000 EUR 872,898 876,275 0.43Dow Chemical Co/The 4.625% 1/10/2044 481,000 USD 433,059 403,904 0.20Flowserve Corp 1.25% 17/3/2022 784,000 EUR 759,826 735,988 0.36GE Capital Trust IV FRN 15/9/2066 'REGS' 650,000 EUR 626,813 658,925 0.32General Electric Capital Corp FRN 15/9/2067 'REGS' 212,000 EUR 221,325 221,866 0.11General Electric Co 1.25% 26/5/2023 564,000 EUR 557,718 564,333 0.28Goldman Sachs Group Inc 2.5% 18/10/2021 'EMTN' 1,123,000 EUR 1,164,902 1,193,614 0.59Goldman Sachs Group Inc 3.25% 1/2/2023 'EMTN' 188,000 EUR 195,490 207,415 0.10Goldman Sachs Group Inc/The 1.375% 26/7/2022 'EMTN' 181,000 EUR 179,938 180,108 0.09Illinois Tool Works Inc 1.75% 20/5/2022 'EMTN' 250,000 EUR 255,386 258,585 0.13Illinois Tool Works Inc 3% 19/5/2034 'EMTN' 120,000 EUR 117,893 124,816 0.06JPMorgan Chase & Co 1.375% 16/9/2021 'EMTN' 619,000 EUR 619,782 627,369 0.31JPMorgan Chase & Co 1.5% 27/1/2025 'EMTN' 360,000 EUR 356,783 353,984 0.17MasterCard Inc 1.1% 1/12/2022 630,000 EUR 626,640 627,310 0.31Metropolitan Life Global Funding I 2.375% 30/9/2019 'GMTN' 1,390,000 EUR 1,447,635 1,482,406 0.72Metropolitan Life Global Funding I 2.375% 11/1/2023 'EMTN' 165,000 EUR 164,268 176,583 0.09Microsoft Corp 2.625% 2/5/2033 950,000 EUR 1,011,158 1,009,850 0.50Mohawk Industries Inc 2% 14/1/2022 353,000 EUR 352,418 357,455 0.18Mondelez International Inc 2.375% 6/3/2035 858,000 EUR 795,074 743,706 0.37Monsanto Co 4.4% 15/7/2044 527,000 USD 427,035 401,604 0.20Morgan Stanley 1.75% 30/1/2025 'GMTN' 450,000 EUR 449,854 441,063 0.22Morgan Stanley 2.375% 31/3/2021 'GMTN' 1,334,000 EUR 1,386,572 1,411,612 0.68Nasdaq Inc 3.875% 7/6/2021 307,000 EUR 322,201 338,986 0.17Oracle Corp 3.125% 10/7/2025 'EMTN' 625,000 EUR 704,455 710,100 0.35Petroleos Mexicanos 5.5% 24/2/2025 'REGS' 243,000 EUR 295,173 248,876 0.12Philip Morris International Inc 2.75% 19/3/2025 430,000 EUR 472,052 470,575 0.23Philip Morris International Inc 2.875% 14/5/2029 575,000 EUR 605,130 617,326 0.30PPG Industries Inc 1.4% 13/3/2027 680,000 EUR 643,539 624,090 0.31Praxair Inc 1.5% 11/3/2020 'EMTN' 425,000 EUR 431,214 439,318 0.22Priceline Group Inc/The 2.375% 23/9/2024 694,000 EUR 689,237 683,659 0.34Procter & Gamble Co 2% 5/11/2021 400,000 EUR 409,776 427,976 0.21Procter & Gamble Co 4.875% 11/5/2027 115,000 EUR 123,553 152,435 0.08Prologis LP 3% 18/1/2022 'EMTN' 750,000 EUR 771,992 793,170 0.39Prologis LP 3.375% 20/2/2024 100,000 EUR 99,123 107,798 0.05Reynolds American Inc 6.15% 15/9/2043 472,000 USD 488,321 492,692 0.24Simon Property Group LP 2.375% 2/10/2020 435,000 EUR 452,761 462,779 0.23SLM Student Loan Trust 2003-10 FRN 15/12/2039 'REGS' 750,000 GBP 923,713 847,940 0.42Thermo Fisher Scientific Inc 1.5% 1/12/2020 117,000 EUR 116,967 118,067 0.06Toyota Motor Credit Corp 0.75% 21/7/2022 'EMTN' 580,000 EUR 573,342 567,536 0.28United Parcel Service Inc 1.625% 15/11/2025 286,000 EUR 285,175 287,216 0.14Verizon Communications Inc 4.272% 15/1/2036 1,376,000 USD 1,179,993 1,138,104 0.56Verizon Communications Inc 4.672% 15/3/2055 354,000 USD 286,118 278,823 0.14Verizon Communications Inc 6.55% 15/9/2043 21,000 USD 23,577 22,853 0.01Wal-Mart Stores Inc 4.875% 21/9/2029 220,000 EUR 302,067 295,706 0.15Wells Fargo & Co 1.5% 12/9/2022 'EMTN' 775,000 EUR 782,972 783,703 0.39Wells Fargo & Co 1.625% 2/6/2025 'EMTN' 100,000 EUR 99,391 99,007 0.05Wells Fargo & Co 2.125% 4/6/2024 'EMTN' 700,000 EUR 711,229 729,897 0.36Wells Fargo & Co 2.25% 3/9/2020 'EMTN' 100,000 EUR 107,044 106,613 0.05WP Carey Inc 2% 20/1/2023 607,000 EUR 598,783 579,922 0.29
35,759,896 35,365,443 17.42
Total Bonds 191,352,053 190,347,389 93.71
SECURITISED ASSETS
Luxembourg Cartesian Residential Mortgages SA FRN 18/7/2044 625,581 EUR 634,616 633,224 0.31
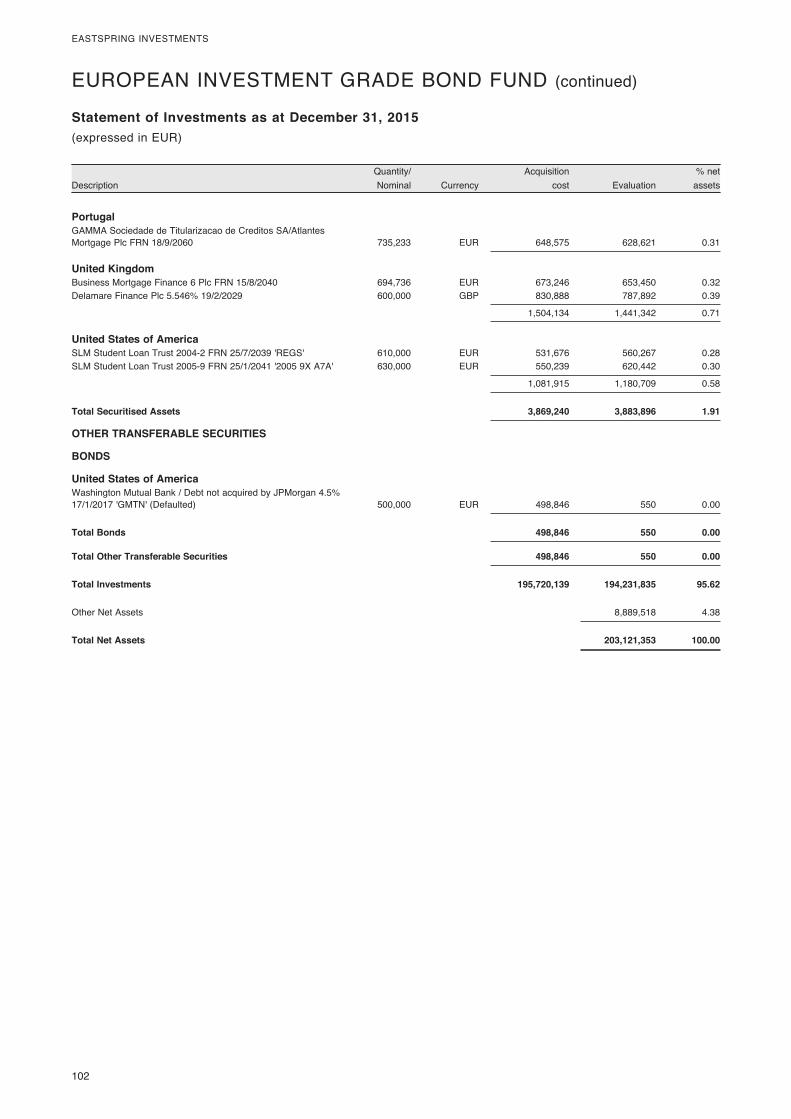
102
EASTSPRING INVESTMENTS
DescriptionQuantity/ Nominal Currency
Acquisition cost Evaluation
% net assets
Statement of Investments as at December 31, 2015(expressed in EUR)
EUROPEAN INVESTMENT GRADE BOND FUND (continued)
Portugal GAMMA Sociedade de Titularizacao de Creditos SA/Atlantes Mortgage Plc FRN 18/9/2060 735,233 EUR 648,575 628,621 0.31
United Kingdom Business Mortgage Finance 6 Plc FRN 15/8/2040 694,736 EUR 673,246 653,450 0.32Delamare Finance Plc 5.546% 19/2/2029 600,000 GBP 830,888 787,892 0.39
1,504,134 1,441,342 0.71
United States of America SLM Student Loan Trust 2004-2 FRN 25/7/2039 'REGS' 610,000 EUR 531,676 560,267 0.28SLM Student Loan Trust 2005-9 FRN 25/1/2041 '2005 9X A7A' 630,000 EUR 550,239 620,442 0.30
1,081,915 1,180,709 0.58
Total Securitised Assets 3,869,240 3,883,896 1.91
OTHER TRANSFERABLE SECURITIES
BONDS
United States of America Washington Mutual Bank / Debt not acquired by JPMorgan 4.5% 17/1/2017 'GMTN' (Defaulted) 500,000 EUR 498,846 550 0.00
Total Bonds 498,846 550 0.00
Total Other Transferable Securities 498,846 550 0.00
Total Investments 195,720,139 194,231,835 95.62
Other Net Assets 8,889,518 4.38
Total Net Assets 203,121,353 100.00
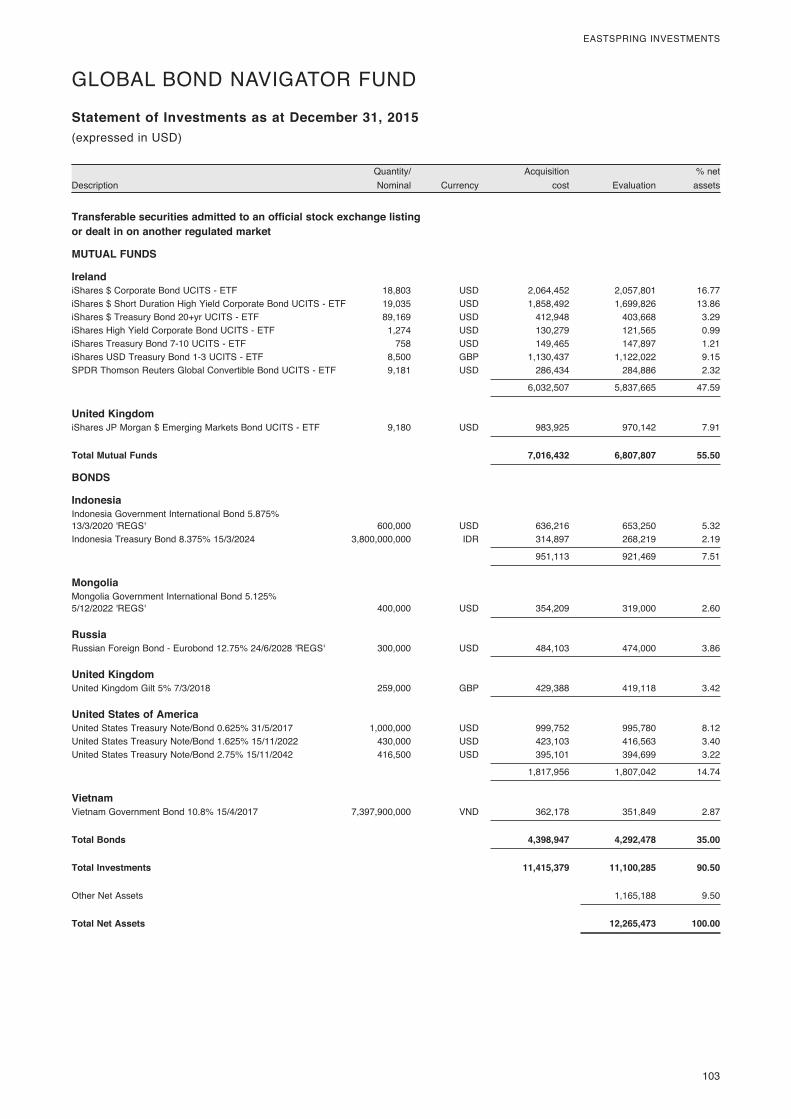
103
EASTSPRING INVESTMENTS
DescriptionQuantity/ Nominal Currency
Acquisition cost Evaluation
% net assets
Statement of Investments as at December 31, 2015
Transferable securities admitted to an official stock exchange listing or dealt in on another regulated market
MUTUAL FUNDS
Ireland iShares $ Corporate Bond UCITS - ETF 18,803 USD 2,064,452 2,057,801 16.77iShares $ Short Duration High Yield Corporate Bond UCITS - ETF 19,035 USD 1,858,492 1,699,826 13.86iShares $ Treasury Bond 20+yr UCITS - ETF 89,169 USD 412,948 403,668 3.29iShares High Yield Corporate Bond UCITS - ETF 1,274 USD 130,279 121,565 0.99iShares Treasury Bond 7-10 UCITS - ETF 758 USD 149,465 147,897 1.21iShares USD Treasury Bond 1-3 UCITS - ETF 8,500 GBP 1,130,437 1,122,022 9.15SPDR Thomson Reuters Global Convertible Bond UCITS - ETF 9,181 USD 286,434 284,886 2.32
6,032,507 5,837,665 47.59
United Kingdom iShares JP Morgan $ Emerging Markets Bond UCITS - ETF 9,180 USD 983,925 970,142 7.91
Total Mutual Funds 7,016,432 6,807,807 55.50
BONDS
Indonesia Indonesia Government International Bond 5.875% 13/3/2020 'REGS' 600,000 USD 636,216 653,250 5.32Indonesia Treasury Bond 8.375% 15/3/2024 3,800,000,000 IDR 314,897 268,219 2.19
951,113 921,469 7.51
Mongolia Mongolia Government International Bond 5.125% 5/12/2022 'REGS' 400,000 USD 354,209 319,000 2.60
Russia Russian Foreign Bond - Eurobond 12.75% 24/6/2028 'REGS' 300,000 USD 484,103 474,000 3.86
United Kingdom United Kingdom Gilt 5% 7/3/2018 259,000 GBP 429,388 419,118 3.42
United States of America United States Treasury Note/Bond 0.625% 31/5/2017 1,000,000 USD 999,752 995,780 8.12United States Treasury Note/Bond 1.625% 15/11/2022 430,000 USD 423,103 416,563 3.40United States Treasury Note/Bond 2.75% 15/11/2042 416,500 USD 395,101 394,699 3.22
1,817,956 1,807,042 14.74
Vietnam Vietnam Government Bond 10.8% 15/4/2017 7,397,900,000 VND 362,178 351,849 2.87
Total Bonds 4,398,947 4,292,478 35.00
Total Investments 11,415,379 11,100,285 90.50
Other Net Assets 1,165,188 9.50
Total Net Assets 12,265,473 100.00
(expressed in USD)
GLOBAL BOND NAVIGATOR FUND
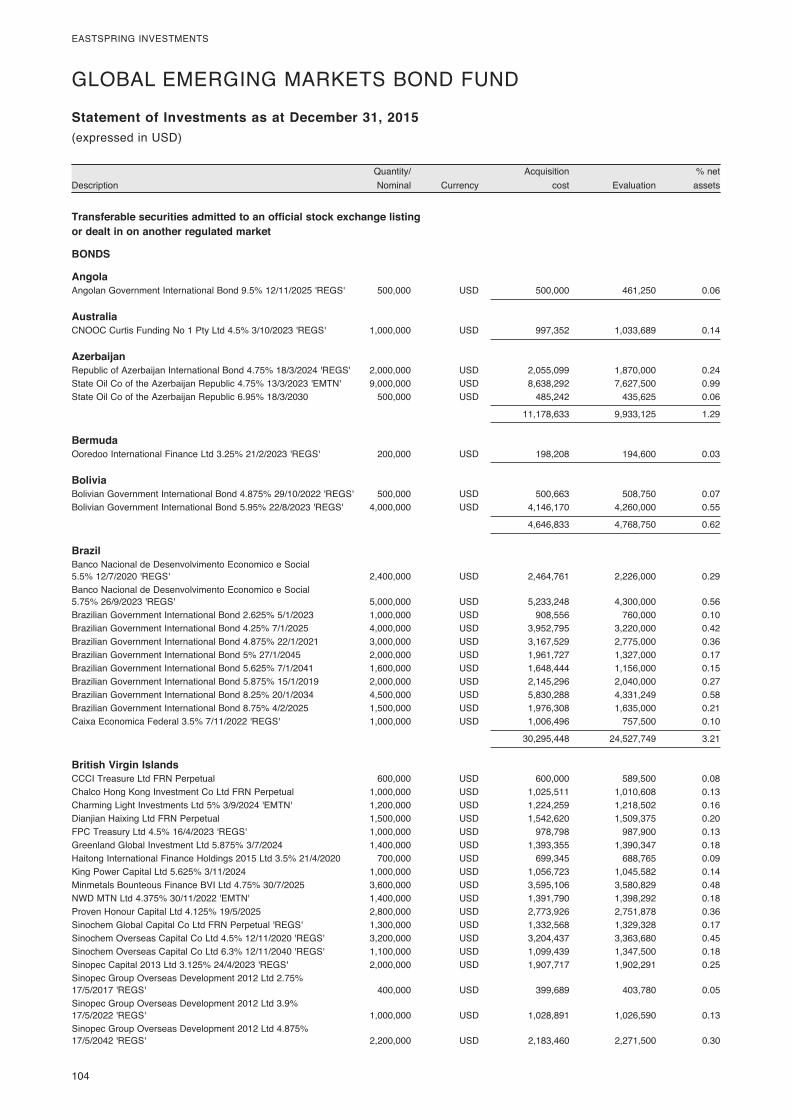
104
EASTSPRING INVESTMENTS
DescriptionQuantity/ Nominal Currency
Acquisition cost Evaluation
% net assets
Statement of Investments as at December 31, 2015
Transferable securities admitted to an official stock exchange listing or dealt in on another regulated market
BONDS
Angola Angolan Government International Bond 9.5% 12/11/2025 'REGS' 500,000 USD 500,000 461,250 0.06
Australia CNOOC Curtis Funding No 1 Pty Ltd 4.5% 3/10/2023 'REGS' 1,000,000 USD 997,352 1,033,689 0.14
Azerbaijan Republic of Azerbaijan International Bond 4.75% 18/3/2024 'REGS' 2,000,000 USD 2,055,099 1,870,000 0.24State Oil Co of the Azerbaijan Republic 4.75% 13/3/2023 'EMTN' 9,000,000 USD 8,638,292 7,627,500 0.99State Oil Co of the Azerbaijan Republic 6.95% 18/3/2030 500,000 USD 485,242 435,625 0.06
11,178,633 9,933,125 1.29
Bermuda Ooredoo International Finance Ltd 3.25% 21/2/2023 'REGS' 200,000 USD 198,208 194,600 0.03
Bolivia Bolivian Government International Bond 4.875% 29/10/2022 'REGS' 500,000 USD 500,663 508,750 0.07Bolivian Government International Bond 5.95% 22/8/2023 'REGS' 4,000,000 USD 4,146,170 4,260,000 0.55
4,646,833 4,768,750 0.62
Brazil Banco Nacional de Desenvolvimento Economico e Social 5.5% 12/7/2020 'REGS' 2,400,000 USD 2,464,761 2,226,000 0.29Banco Nacional de Desenvolvimento Economico e Social 5.75% 26/9/2023 'REGS' 5,000,000 USD 5,233,248 4,300,000 0.56Brazilian Government International Bond 2.625% 5/1/2023 1,000,000 USD 908,556 760,000 0.10Brazilian Government International Bond 4.25% 7/1/2025 4,000,000 USD 3,952,795 3,220,000 0.42Brazilian Government International Bond 4.875% 22/1/2021 3,000,000 USD 3,167,529 2,775,000 0.36Brazilian Government International Bond 5% 27/1/2045 2,000,000 USD 1,961,727 1,327,000 0.17Brazilian Government International Bond 5.625% 7/1/2041 1,600,000 USD 1,648,444 1,156,000 0.15Brazilian Government International Bond 5.875% 15/1/2019 2,000,000 USD 2,145,296 2,040,000 0.27Brazilian Government International Bond 8.25% 20/1/2034 4,500,000 USD 5,830,288 4,331,249 0.58Brazilian Government International Bond 8.75% 4/2/2025 1,500,000 USD 1,976,308 1,635,000 0.21Caixa Economica Federal 3.5% 7/11/2022 'REGS' 1,000,000 USD 1,006,496 757,500 0.10
30,295,448 24,527,749 3.21
British Virgin Islands CCCI Treasure Ltd FRN Perpetual 600,000 USD 600,000 589,500 0.08Chalco Hong Kong Investment Co Ltd FRN Perpetual 1,000,000 USD 1,025,511 1,010,608 0.13Charming Light Investments Ltd 5% 3/9/2024 'EMTN' 1,200,000 USD 1,224,259 1,218,502 0.16Dianjian Haixing Ltd FRN Perpetual 1,500,000 USD 1,542,620 1,509,375 0.20FPC Treasury Ltd 4.5% 16/4/2023 'REGS' 1,000,000 USD 978,798 987,900 0.13Greenland Global Investment Ltd 5.875% 3/7/2024 1,400,000 USD 1,393,355 1,390,347 0.18Haitong International Finance Holdings 2015 Ltd 3.5% 21/4/2020 700,000 USD 699,345 688,765 0.09King Power Capital Ltd 5.625% 3/11/2024 1,000,000 USD 1,056,723 1,045,582 0.14Minmetals Bounteous Finance BVI Ltd 4.75% 30/7/2025 3,600,000 USD 3,595,106 3,580,829 0.48NWD MTN Ltd 4.375% 30/11/2022 'EMTN' 1,400,000 USD 1,391,790 1,398,292 0.18Proven Honour Capital Ltd 4.125% 19/5/2025 2,800,000 USD 2,773,926 2,751,878 0.36Sinochem Global Capital Co Ltd FRN Perpetual 'REGS' 1,300,000 USD 1,332,568 1,329,328 0.17Sinochem Overseas Capital Co Ltd 4.5% 12/11/2020 'REGS' 3,200,000 USD 3,204,437 3,363,680 0.45Sinochem Overseas Capital Co Ltd 6.3% 12/11/2040 'REGS' 1,100,000 USD 1,099,439 1,347,500 0.18Sinopec Capital 2013 Ltd 3.125% 24/4/2023 'REGS' 2,000,000 USD 1,907,717 1,902,291 0.25Sinopec Group Overseas Development 2012 Ltd 2.75% 17/5/2017 'REGS' 400,000 USD 399,689 403,780 0.05Sinopec Group Overseas Development 2012 Ltd 3.9% 17/5/2022 'REGS' 1,000,000 USD 1,028,891 1,026,590 0.13Sinopec Group Overseas Development 2012 Ltd 4.875% 17/5/2042 'REGS' 2,200,000 USD 2,183,460 2,271,500 0.30
(expressed in USD)
GLOBAL EMERGING MARKETS BOND FUND
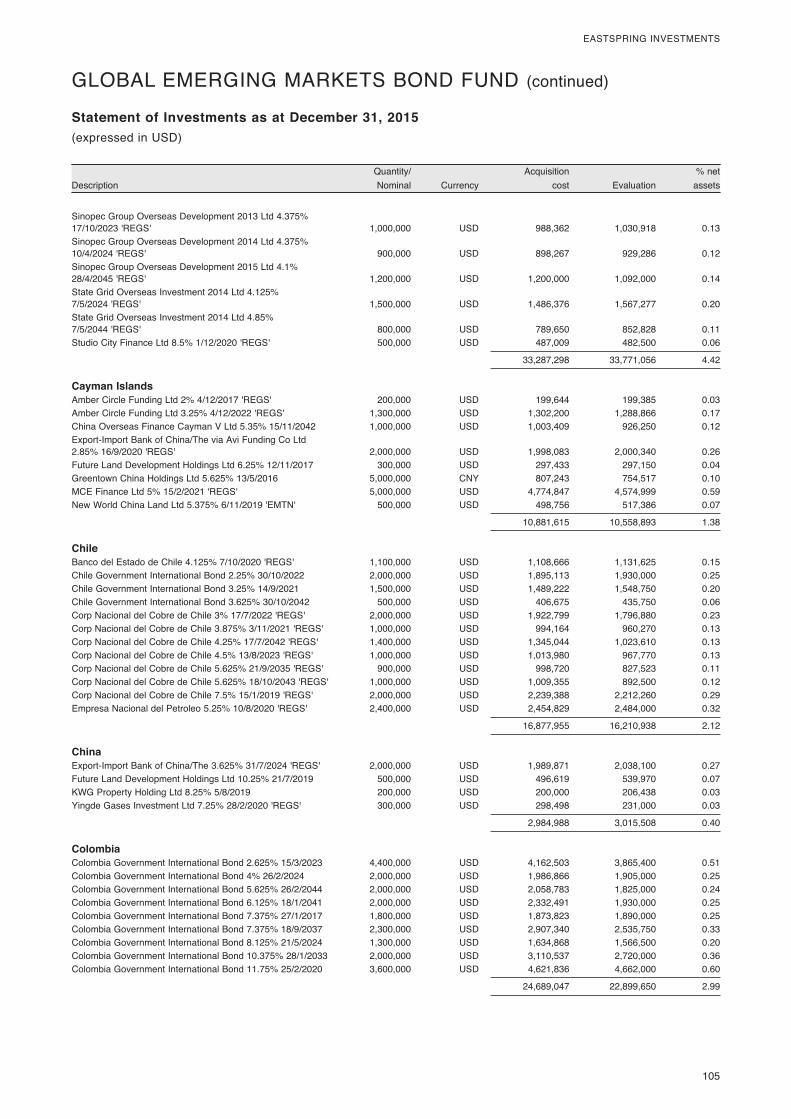
105
EASTSPRING INVESTMENTS
DescriptionQuantity/ Nominal Currency
Acquisition cost Evaluation
% net assets
Statement of Investments as at December 31, 2015(expressed in USD)
GLOBAL EMERGING MARKETS BOND FUND (continued)
Sinopec Group Overseas Development 2013 Ltd 4.375% 17/10/2023 'REGS' 1,000,000 USD 988,362 1,030,918 0.13Sinopec Group Overseas Development 2014 Ltd 4.375% 10/4/2024 'REGS' 900,000 USD 898,267 929,286 0.12Sinopec Group Overseas Development 2015 Ltd 4.1% 28/4/2045 'REGS' 1,200,000 USD 1,200,000 1,092,000 0.14State Grid Overseas Investment 2014 Ltd 4.125% 7/5/2024 'REGS' 1,500,000 USD 1,486,376 1,567,277 0.20State Grid Overseas Investment 2014 Ltd 4.85% 7/5/2044 'REGS' 800,000 USD 789,650 852,828 0.11Studio City Finance Ltd 8.5% 1/12/2020 'REGS' 500,000 USD 487,009 482,500 0.06
33,287,298 33,771,056 4.42
Cayman Islands Amber Circle Funding Ltd 2% 4/12/2017 'REGS' 200,000 USD 199,644 199,385 0.03Amber Circle Funding Ltd 3.25% 4/12/2022 'REGS' 1,300,000 USD 1,302,200 1,288,866 0.17China Overseas Finance Cayman V Ltd 5.35% 15/11/2042 1,000,000 USD 1,003,409 926,250 0.12Export-Import Bank of China/The via Avi Funding Co Ltd 2.85% 16/9/2020 'REGS' 2,000,000 USD 1,998,083 2,000,340 0.26Future Land Development Holdings Ltd 6.25% 12/11/2017 300,000 USD 297,433 297,150 0.04Greentown China Holdings Ltd 5.625% 13/5/2016 5,000,000 CNY 807,243 754,517 0.10MCE Finance Ltd 5% 15/2/2021 'REGS' 5,000,000 USD 4,774,847 4,574,999 0.59New World China Land Ltd 5.375% 6/11/2019 'EMTN' 500,000 USD 498,756 517,386 0.07
10,881,615 10,558,893 1.38
Chile Banco del Estado de Chile 4.125% 7/10/2020 'REGS' 1,100,000 USD 1,108,666 1,131,625 0.15Chile Government International Bond 2.25% 30/10/2022 2,000,000 USD 1,895,113 1,930,000 0.25Chile Government International Bond 3.25% 14/9/2021 1,500,000 USD 1,489,222 1,548,750 0.20Chile Government International Bond 3.625% 30/10/2042 500,000 USD 406,675 435,750 0.06Corp Nacional del Cobre de Chile 3% 17/7/2022 'REGS' 2,000,000 USD 1,922,799 1,796,880 0.23Corp Nacional del Cobre de Chile 3.875% 3/11/2021 'REGS' 1,000,000 USD 994,164 960,270 0.13Corp Nacional del Cobre de Chile 4.25% 17/7/2042 'REGS' 1,400,000 USD 1,345,044 1,023,610 0.13Corp Nacional del Cobre de Chile 4.5% 13/8/2023 'REGS' 1,000,000 USD 1,013,980 967,770 0.13Corp Nacional del Cobre de Chile 5.625% 21/9/2035 'REGS' 900,000 USD 998,720 827,523 0.11Corp Nacional del Cobre de Chile 5.625% 18/10/2043 'REGS' 1,000,000 USD 1,009,355 892,500 0.12Corp Nacional del Cobre de Chile 7.5% 15/1/2019 'REGS' 2,000,000 USD 2,239,388 2,212,260 0.29Empresa Nacional del Petroleo 5.25% 10/8/2020 'REGS' 2,400,000 USD 2,454,829 2,484,000 0.32
16,877,955 16,210,938 2.12
China Export-Import Bank of China/The 3.625% 31/7/2024 'REGS' 2,000,000 USD 1,989,871 2,038,100 0.27Future Land Development Holdings Ltd 10.25% 21/7/2019 500,000 USD 496,619 539,970 0.07KWG Property Holding Ltd 8.25% 5/8/2019 200,000 USD 200,000 206,438 0.03Yingde Gases Investment Ltd 7.25% 28/2/2020 'REGS' 300,000 USD 298,498 231,000 0.03
2,984,988 3,015,508 0.40
Colombia Colombia Government International Bond 2.625% 15/3/2023 4,400,000 USD 4,162,503 3,865,400 0.51Colombia Government International Bond 4% 26/2/2024 2,000,000 USD 1,986,866 1,905,000 0.25Colombia Government International Bond 5.625% 26/2/2044 2,000,000 USD 2,058,783 1,825,000 0.24Colombia Government International Bond 6.125% 18/1/2041 2,000,000 USD 2,332,491 1,930,000 0.25Colombia Government International Bond 7.375% 27/1/2017 1,800,000 USD 1,873,823 1,890,000 0.25Colombia Government International Bond 7.375% 18/9/2037 2,300,000 USD 2,907,340 2,535,750 0.33Colombia Government International Bond 8.125% 21/5/2024 1,300,000 USD 1,634,868 1,566,500 0.20Colombia Government International Bond 10.375% 28/1/2033 2,000,000 USD 3,110,537 2,720,000 0.36Colombia Government International Bond 11.75% 25/2/2020 3,600,000 USD 4,621,836 4,662,000 0.60
24,689,047 22,899,650 2.99
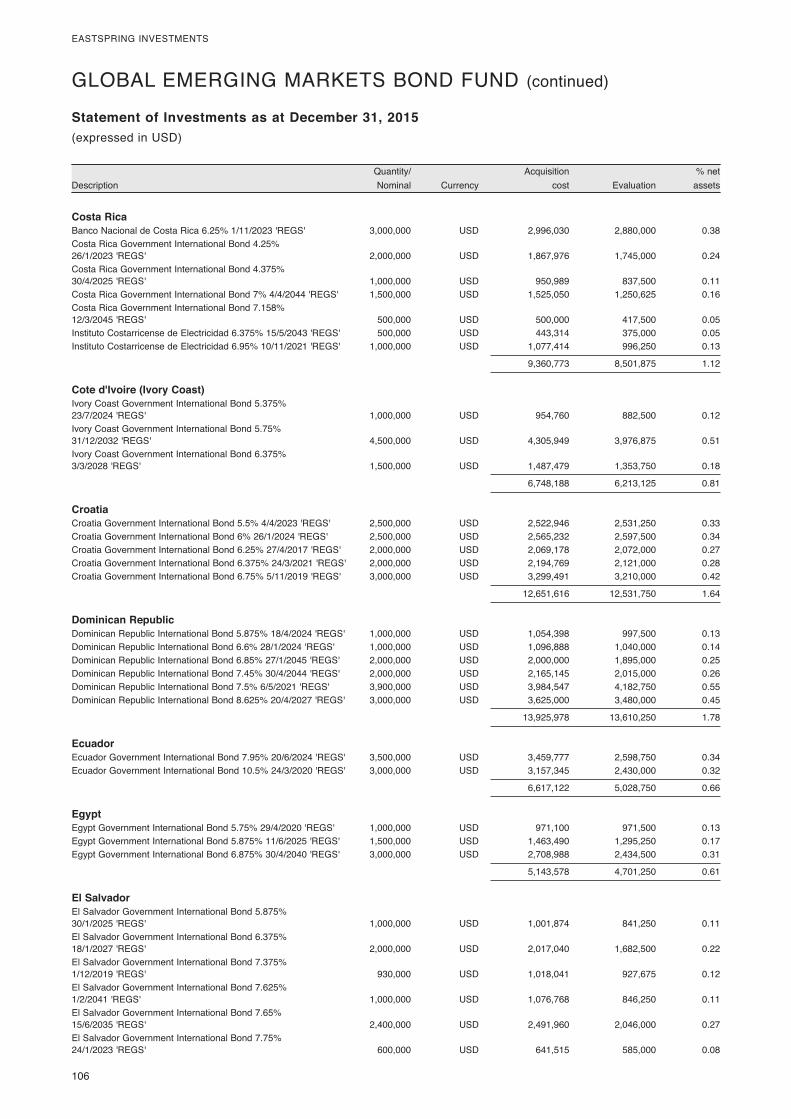
106
EASTSPRING INVESTMENTS
DescriptionQuantity/ Nominal Currency
Acquisition cost Evaluation
% net assets
Statement of Investments as at December 31, 2015(expressed in USD)
GLOBAL EMERGING MARKETS BOND FUND (continued)
Costa Rica Banco Nacional de Costa Rica 6.25% 1/11/2023 'REGS' 3,000,000 USD 2,996,030 2,880,000 0.38Costa Rica Government International Bond 4.25% 26/1/2023 'REGS' 2,000,000 USD 1,867,976 1,745,000 0.24Costa Rica Government International Bond 4.375% 30/4/2025 'REGS' 1,000,000 USD 950,989 837,500 0.11Costa Rica Government International Bond 7% 4/4/2044 'REGS' 1,500,000 USD 1,525,050 1,250,625 0.16Costa Rica Government International Bond 7.158% 12/3/2045 'REGS' 500,000 USD 500,000 417,500 0.05Instituto Costarricense de Electricidad 6.375% 15/5/2043 'REGS' 500,000 USD 443,314 375,000 0.05Instituto Costarricense de Electricidad 6.95% 10/11/2021 'REGS' 1,000,000 USD 1,077,414 996,250 0.13
9,360,773 8,501,875 1.12
Cote d'Ivoire (Ivory Coast) Ivory Coast Government International Bond 5.375% 23/7/2024 'REGS' 1,000,000 USD 954,760 882,500 0.12Ivory Coast Government International Bond 5.75% 31/12/2032 'REGS' 4,500,000 USD 4,305,949 3,976,875 0.51Ivory Coast Government International Bond 6.375% 3/3/2028 'REGS' 1,500,000 USD 1,487,479 1,353,750 0.18
6,748,188 6,213,125 0.81
Croatia Croatia Government International Bond 5.5% 4/4/2023 'REGS' 2,500,000 USD 2,522,946 2,531,250 0.33Croatia Government International Bond 6% 26/1/2024 'REGS' 2,500,000 USD 2,565,232 2,597,500 0.34Croatia Government International Bond 6.25% 27/4/2017 'REGS' 2,000,000 USD 2,069,178 2,072,000 0.27Croatia Government International Bond 6.375% 24/3/2021 'REGS' 2,000,000 USD 2,194,769 2,121,000 0.28Croatia Government International Bond 6.75% 5/11/2019 'REGS' 3,000,000 USD 3,299,491 3,210,000 0.42
12,651,616 12,531,750 1.64
Dominican Republic Dominican Republic International Bond 5.875% 18/4/2024 'REGS' 1,000,000 USD 1,054,398 997,500 0.13Dominican Republic International Bond 6.6% 28/1/2024 'REGS' 1,000,000 USD 1,096,888 1,040,000 0.14Dominican Republic International Bond 6.85% 27/1/2045 'REGS' 2,000,000 USD 2,000,000 1,895,000 0.25Dominican Republic International Bond 7.45% 30/4/2044 'REGS' 2,000,000 USD 2,165,145 2,015,000 0.26Dominican Republic International Bond 7.5% 6/5/2021 'REGS' 3,900,000 USD 3,984,547 4,182,750 0.55Dominican Republic International Bond 8.625% 20/4/2027 'REGS' 3,000,000 USD 3,625,000 3,480,000 0.45
13,925,978 13,610,250 1.78
Ecuador Ecuador Government International Bond 7.95% 20/6/2024 'REGS' 3,500,000 USD 3,459,777 2,598,750 0.34Ecuador Government International Bond 10.5% 24/3/2020 'REGS' 3,000,000 USD 3,157,345 2,430,000 0.32
6,617,122 5,028,750 0.66
Egypt Egypt Government International Bond 5.75% 29/4/2020 'REGS' 1,000,000 USD 971,100 971,500 0.13Egypt Government International Bond 5.875% 11/6/2025 'REGS' 1,500,000 USD 1,463,490 1,295,250 0.17Egypt Government International Bond 6.875% 30/4/2040 'REGS' 3,000,000 USD 2,708,988 2,434,500 0.31
5,143,578 4,701,250 0.61
El Salvador El Salvador Government International Bond 5.875% 30/1/2025 'REGS' 1,000,000 USD 1,001,874 841,250 0.11El Salvador Government International Bond 6.375% 18/1/2027 'REGS' 2,000,000 USD 2,017,040 1,682,500 0.22El Salvador Government International Bond 7.375% 1/12/2019 'REGS' 930,000 USD 1,018,041 927,675 0.12El Salvador Government International Bond 7.625% 1/2/2041 'REGS' 1,000,000 USD 1,076,768 846,250 0.11El Salvador Government International Bond 7.65% 15/6/2035 'REGS' 2,400,000 USD 2,491,960 2,046,000 0.27El Salvador Government International Bond 7.75% 24/1/2023 'REGS' 600,000 USD 641,515 585,000 0.08
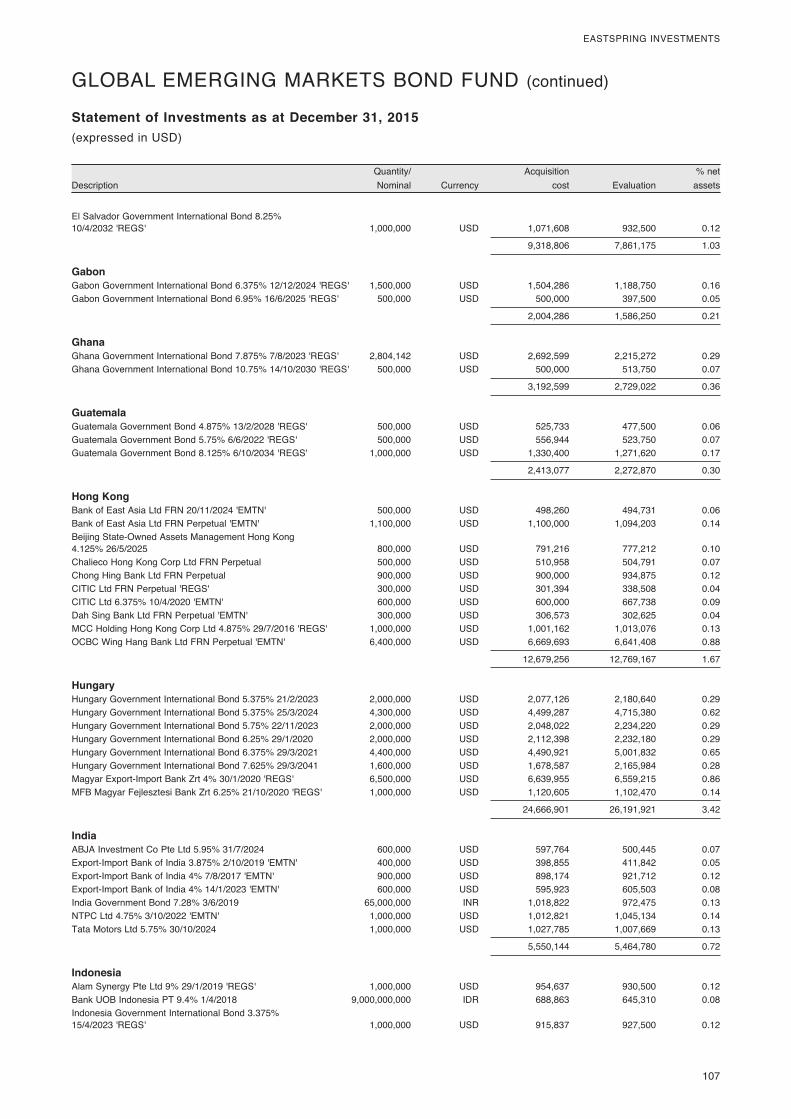
107
EASTSPRING INVESTMENTS
DescriptionQuantity/ Nominal Currency
Acquisition cost Evaluation
% net assets
Statement of Investments as at December 31, 2015(expressed in USD)
GLOBAL EMERGING MARKETS BOND FUND (continued)
El Salvador Government International Bond 8.25% 10/4/2032 'REGS' 1,000,000 USD 1,071,608 932,500 0.12
9,318,806 7,861,175 1.03
Gabon Gabon Government International Bond 6.375% 12/12/2024 'REGS' 1,500,000 USD 1,504,286 1,188,750 0.16Gabon Government International Bond 6.95% 16/6/2025 'REGS' 500,000 USD 500,000 397,500 0.05
2,004,286 1,586,250 0.21
Ghana Ghana Government International Bond 7.875% 7/8/2023 'REGS' 2,804,142 USD 2,692,599 2,215,272 0.29Ghana Government International Bond 10.75% 14/10/2030 'REGS' 500,000 USD 500,000 513,750 0.07
3,192,599 2,729,022 0.36
Guatemala Guatemala Government Bond 4.875% 13/2/2028 'REGS' 500,000 USD 525,733 477,500 0.06Guatemala Government Bond 5.75% 6/6/2022 'REGS' 500,000 USD 556,944 523,750 0.07Guatemala Government Bond 8.125% 6/10/2034 'REGS' 1,000,000 USD 1,330,400 1,271,620 0.17
2,413,077 2,272,870 0.30
Hong Kong Bank of East Asia Ltd FRN 20/11/2024 'EMTN' 500,000 USD 498,260 494,731 0.06Bank of East Asia Ltd FRN Perpetual 'EMTN' 1,100,000 USD 1,100,000 1,094,203 0.14Beijing State-Owned Assets Management Hong Kong 4.125% 26/5/2025 800,000 USD 791,216 777,212 0.10Chalieco Hong Kong Corp Ltd FRN Perpetual 500,000 USD 510,958 504,791 0.07Chong Hing Bank Ltd FRN Perpetual 900,000 USD 900,000 934,875 0.12CITIC Ltd FRN Perpetual 'REGS' 300,000 USD 301,394 338,508 0.04CITIC Ltd 6.375% 10/4/2020 'EMTN' 600,000 USD 600,000 667,738 0.09Dah Sing Bank Ltd FRN Perpetual 'EMTN' 300,000 USD 306,573 302,625 0.04MCC Holding Hong Kong Corp Ltd 4.875% 29/7/2016 'REGS' 1,000,000 USD 1,001,162 1,013,076 0.13OCBC Wing Hang Bank Ltd FRN Perpetual 'EMTN' 6,400,000 USD 6,669,693 6,641,408 0.88
12,679,256 12,769,167 1.67
Hungary Hungary Government International Bond 5.375% 21/2/2023 2,000,000 USD 2,077,126 2,180,640 0.29Hungary Government International Bond 5.375% 25/3/2024 4,300,000 USD 4,499,287 4,715,380 0.62Hungary Government International Bond 5.75% 22/11/2023 2,000,000 USD 2,048,022 2,234,220 0.29Hungary Government International Bond 6.25% 29/1/2020 2,000,000 USD 2,112,398 2,232,180 0.29Hungary Government International Bond 6.375% 29/3/2021 4,400,000 USD 4,490,921 5,001,832 0.65Hungary Government International Bond 7.625% 29/3/2041 1,600,000 USD 1,678,587 2,165,984 0.28Magyar Export-Import Bank Zrt 4% 30/1/2020 'REGS' 6,500,000 USD 6,639,955 6,559,215 0.86MFB Magyar Fejlesztesi Bank Zrt 6.25% 21/10/2020 'REGS' 1,000,000 USD 1,120,605 1,102,470 0.14
24,666,901 26,191,921 3.42
India ABJA Investment Co Pte Ltd 5.95% 31/7/2024 600,000 USD 597,764 500,445 0.07Export-Import Bank of India 3.875% 2/10/2019 'EMTN' 400,000 USD 398,855 411,842 0.05Export-Import Bank of India 4% 7/8/2017 'EMTN' 900,000 USD 898,174 921,712 0.12Export-Import Bank of India 4% 14/1/2023 'EMTN' 600,000 USD 595,923 605,503 0.08India Government Bond 7.28% 3/6/2019 65,000,000 INR 1,018,822 972,475 0.13NTPC Ltd 4.75% 3/10/2022 'EMTN' 1,000,000 USD 1,012,821 1,045,134 0.14Tata Motors Ltd 5.75% 30/10/2024 1,000,000 USD 1,027,785 1,007,669 0.13
5,550,144 5,464,780 0.72
Indonesia Alam Synergy Pte Ltd 9% 29/1/2019 'REGS' 1,000,000 USD 954,637 930,500 0.12Bank UOB Indonesia PT 9.4% 1/4/2018 9,000,000,000 IDR 688,863 645,310 0.08Indonesia Government International Bond 3.375% 15/4/2023 'REGS' 1,000,000 USD 915,837 927,500 0.12
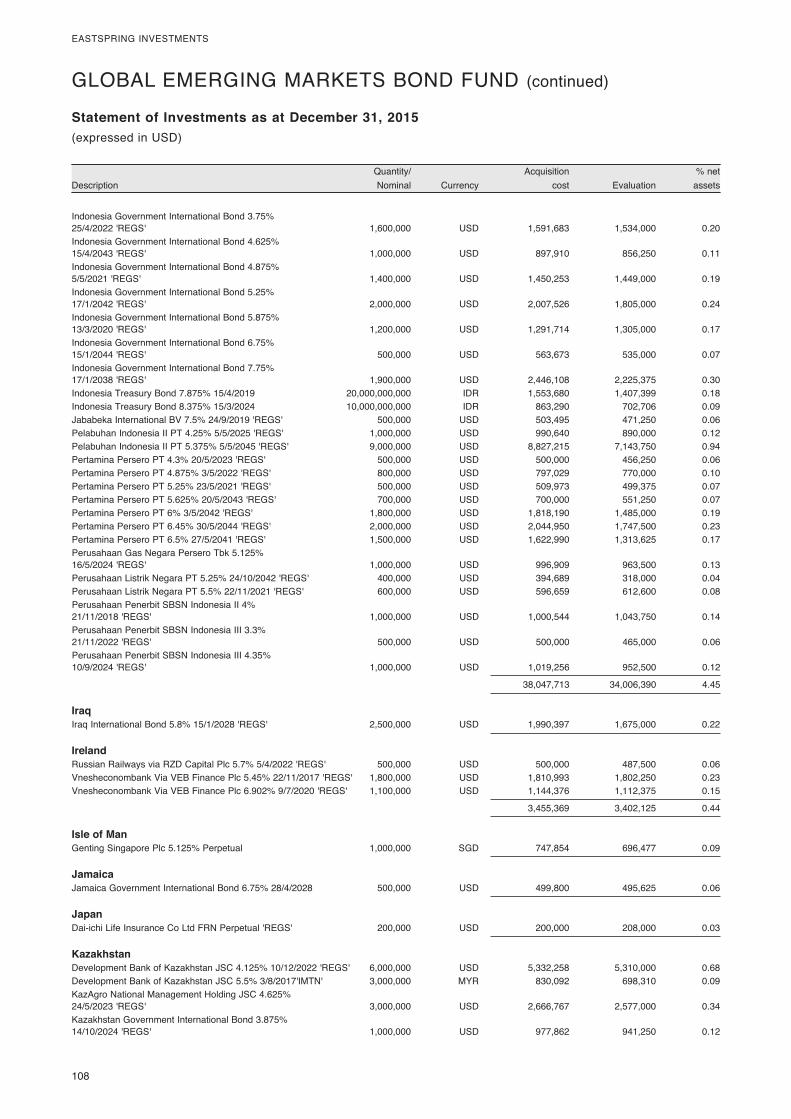
108
EASTSPRING INVESTMENTS
DescriptionQuantity/ Nominal Currency
Acquisition cost Evaluation
% net assets
Statement of Investments as at December 31, 2015(expressed in USD)
GLOBAL EMERGING MARKETS BOND FUND (continued)
Indonesia Government International Bond 3.75% 25/4/2022 'REGS' 1,600,000 USD 1,591,683 1,534,000 0.20Indonesia Government International Bond 4.625% 15/4/2043 'REGS' 1,000,000 USD 897,910 856,250 0.11Indonesia Government International Bond 4.875% 5/5/2021 'REGS' 1,400,000 USD 1,450,253 1,449,000 0.19Indonesia Government International Bond 5.25% 17/1/2042 'REGS' 2,000,000 USD 2,007,526 1,805,000 0.24Indonesia Government International Bond 5.875% 13/3/2020 'REGS' 1,200,000 USD 1,291,714 1,305,000 0.17Indonesia Government International Bond 6.75% 15/1/2044 'REGS' 500,000 USD 563,673 535,000 0.07Indonesia Government International Bond 7.75% 17/1/2038 'REGS' 1,900,000 USD 2,446,108 2,225,375 0.30Indonesia Treasury Bond 7.875% 15/4/2019 20,000,000,000 IDR 1,553,680 1,407,399 0.18Indonesia Treasury Bond 8.375% 15/3/2024 10,000,000,000 IDR 863,290 702,706 0.09Jababeka International BV 7.5% 24/9/2019 'REGS' 500,000 USD 503,495 471,250 0.06Pelabuhan Indonesia II PT 4.25% 5/5/2025 'REGS' 1,000,000 USD 990,640 890,000 0.12Pelabuhan Indonesia II PT 5.375% 5/5/2045 'REGS' 9,000,000 USD 8,827,215 7,143,750 0.94Pertamina Persero PT 4.3% 20/5/2023 'REGS' 500,000 USD 500,000 456,250 0.06Pertamina Persero PT 4.875% 3/5/2022 'REGS' 800,000 USD 797,029 770,000 0.10Pertamina Persero PT 5.25% 23/5/2021 'REGS' 500,000 USD 509,973 499,375 0.07Pertamina Persero PT 5.625% 20/5/2043 'REGS' 700,000 USD 700,000 551,250 0.07Pertamina Persero PT 6% 3/5/2042 'REGS' 1,800,000 USD 1,818,190 1,485,000 0.19Pertamina Persero PT 6.45% 30/5/2044 'REGS' 2,000,000 USD 2,044,950 1,747,500 0.23Pertamina Persero PT 6.5% 27/5/2041 'REGS' 1,500,000 USD 1,622,990 1,313,625 0.17Perusahaan Gas Negara Persero Tbk 5.125% 16/5/2024 'REGS' 1,000,000 USD 996,909 963,500 0.13Perusahaan Listrik Negara PT 5.25% 24/10/2042 'REGS' 400,000 USD 394,689 318,000 0.04Perusahaan Listrik Negara PT 5.5% 22/11/2021 'REGS' 600,000 USD 596,659 612,600 0.08Perusahaan Penerbit SBSN Indonesia II 4% 21/11/2018 'REGS' 1,000,000 USD 1,000,544 1,043,750 0.14Perusahaan Penerbit SBSN Indonesia III 3.3% 21/11/2022 'REGS' 500,000 USD 500,000 465,000 0.06Perusahaan Penerbit SBSN Indonesia III 4.35% 10/9/2024 'REGS' 1,000,000 USD 1,019,256 952,500 0.12
38,047,713 34,006,390 4.45
Iraq Iraq International Bond 5.8% 15/1/2028 'REGS' 2,500,000 USD 1,990,397 1,675,000 0.22
Ireland Russian Railways via RZD Capital Plc 5.7% 5/4/2022 'REGS' 500,000 USD 500,000 487,500 0.06Vnesheconombank Via VEB Finance Plc 5.45% 22/11/2017 'REGS' 1,800,000 USD 1,810,993 1,802,250 0.23Vnesheconombank Via VEB Finance Plc 6.902% 9/7/2020 'REGS' 1,100,000 USD 1,144,376 1,112,375 0.15
3,455,369 3,402,125 0.44
Isle of Man Genting Singapore Plc 5.125% Perpetual 1,000,000 SGD 747,854 696,477 0.09
Jamaica Jamaica Government International Bond 6.75% 28/4/2028 500,000 USD 499,800 495,625 0.06
Japan Dai-ichi Life Insurance Co Ltd FRN Perpetual 'REGS' 200,000 USD 200,000 208,000 0.03
Kazakhstan Development Bank of Kazakhstan JSC 4.125% 10/12/2022 'REGS' 6,000,000 USD 5,332,258 5,310,000 0.68Development Bank of Kazakhstan JSC 5.5% 3/8/2017'IMTN' 3,000,000 MYR 830,092 698,310 0.09KazAgro National Management Holding JSC 4.625% 24/5/2023 'REGS' 3,000,000 USD 2,666,767 2,577,000 0.34Kazakhstan Government International Bond 3.875% 14/10/2024 'REGS' 1,000,000 USD 977,862 941,250 0.12
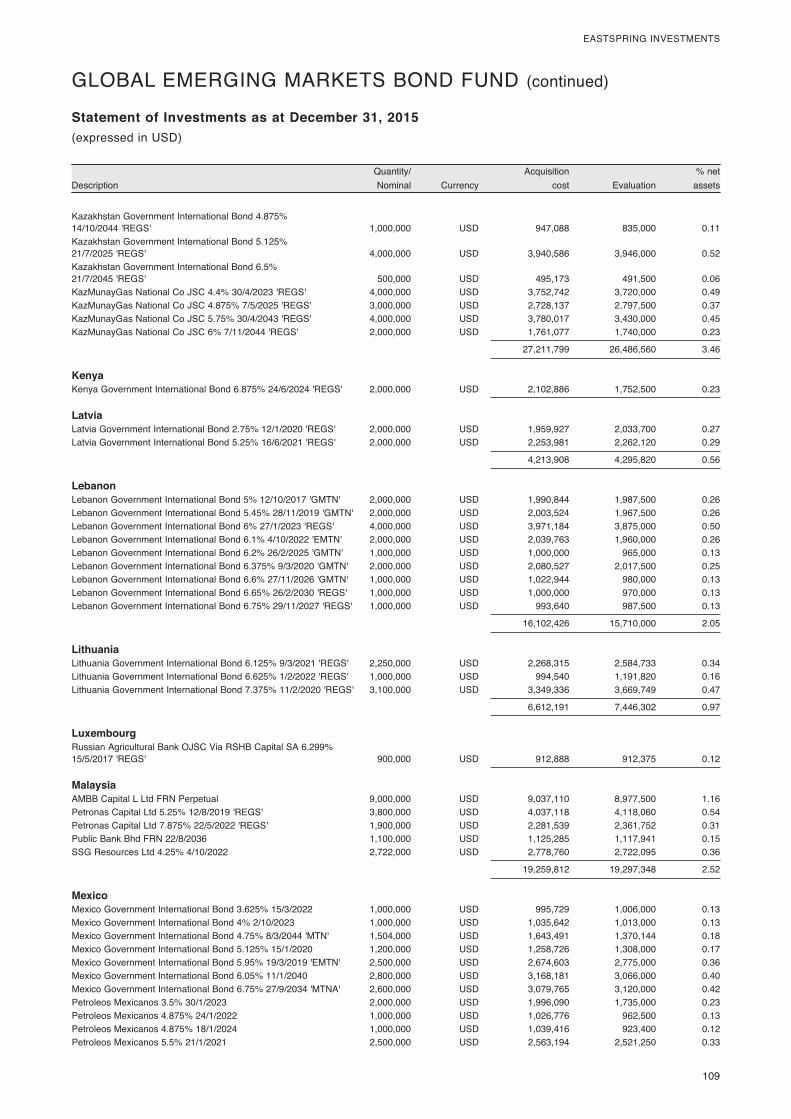
109
EASTSPRING INVESTMENTS
DescriptionQuantity/ Nominal Currency
Acquisition cost Evaluation
% net assets
Statement of Investments as at December 31, 2015(expressed in USD)
GLOBAL EMERGING MARKETS BOND FUND (continued)
Kazakhstan Government International Bond 4.875% 14/10/2044 'REGS' 1,000,000 USD 947,088 835,000 0.11Kazakhstan Government International Bond 5.125% 21/7/2025 'REGS' 4,000,000 USD 3,940,586 3,946,000 0.52Kazakhstan Government International Bond 6.5% 21/7/2045 'REGS' 500,000 USD 495,173 491,500 0.06KazMunayGas National Co JSC 4.4% 30/4/2023 'REGS' 4,000,000 USD 3,752,742 3,720,000 0.49KazMunayGas National Co JSC 4.875% 7/5/2025 'REGS' 3,000,000 USD 2,728,137 2,797,500 0.37KazMunayGas National Co JSC 5.75% 30/4/2043 'REGS' 4,000,000 USD 3,780,017 3,430,000 0.45KazMunayGas National Co JSC 6% 7/11/2044 'REGS' 2,000,000 USD 1,761,077 1,740,000 0.23
27,211,799 26,486,560 3.46
Kenya Kenya Government International Bond 6.875% 24/6/2024 'REGS' 2,000,000 USD 2,102,886 1,752,500 0.23
Latvia Latvia Government International Bond 2.75% 12/1/2020 'REGS' 2,000,000 USD 1,959,927 2,033,700 0.27Latvia Government International Bond 5.25% 16/6/2021 'REGS' 2,000,000 USD 2,253,981 2,262,120 0.29
4,213,908 4,295,820 0.56
Lebanon Lebanon Government International Bond 5% 12/10/2017 'GMTN' 2,000,000 USD 1,990,844 1,987,500 0.26Lebanon Government International Bond 5.45% 28/11/2019 'GMTN' 2,000,000 USD 2,003,524 1,967,500 0.26Lebanon Government International Bond 6% 27/1/2023 'REGS' 4,000,000 USD 3,971,184 3,875,000 0.50Lebanon Government International Bond 6.1% 4/10/2022 'EMTN' 2,000,000 USD 2,039,763 1,960,000 0.26Lebanon Government International Bond 6.2% 26/2/2025 'GMTN' 1,000,000 USD 1,000,000 965,000 0.13Lebanon Government International Bond 6.375% 9/3/2020 'GMTN' 2,000,000 USD 2,080,527 2,017,500 0.25Lebanon Government International Bond 6.6% 27/11/2026 'GMTN' 1,000,000 USD 1,022,944 980,000 0.13Lebanon Government International Bond 6.65% 26/2/2030 'REGS' 1,000,000 USD 1,000,000 970,000 0.13Lebanon Government International Bond 6.75% 29/11/2027 'REGS' 1,000,000 USD 993,640 987,500 0.13
16,102,426 15,710,000 2.05
Lithuania Lithuania Government International Bond 6.125% 9/3/2021 'REGS' 2,250,000 USD 2,268,315 2,584,733 0.34Lithuania Government International Bond 6.625% 1/2/2022 'REGS' 1,000,000 USD 994,540 1,191,820 0.16Lithuania Government International Bond 7.375% 11/2/2020 'REGS' 3,100,000 USD 3,349,336 3,669,749 0.47
6,612,191 7,446,302 0.97
Luxembourg Russian Agricultural Bank OJSC Via RSHB Capital SA 6.299% 15/5/2017 'REGS' 900,000 USD 912,888 912,375 0.12
Malaysia AMBB Capital L Ltd FRN Perpetual 9,000,000 USD 9,037,110 8,977,500 1.16Petronas Capital Ltd 5.25% 12/8/2019 'REGS' 3,800,000 USD 4,037,118 4,118,060 0.54Petronas Capital Ltd 7.875% 22/5/2022 'REGS' 1,900,000 USD 2,281,539 2,361,752 0.31Public Bank Bhd FRN 22/8/2036 1,100,000 USD 1,125,285 1,117,941 0.15SSG Resources Ltd 4.25% 4/10/2022 2,722,000 USD 2,778,760 2,722,095 0.36
19,259,812 19,297,348 2.52
Mexico Mexico Government International Bond 3.625% 15/3/2022 1,000,000 USD 995,729 1,006,000 0.13Mexico Government International Bond 4% 2/10/2023 1,000,000 USD 1,035,642 1,013,000 0.13Mexico Government International Bond 4.75% 8/3/2044 'MTN' 1,504,000 USD 1,643,491 1,370,144 0.18Mexico Government International Bond 5.125% 15/1/2020 1,200,000 USD 1,258,726 1,308,000 0.17Mexico Government International Bond 5.95% 19/3/2019 'EMTN' 2,500,000 USD 2,674,603 2,775,000 0.36Mexico Government International Bond 6.05% 11/1/2040 2,800,000 USD 3,168,181 3,066,000 0.40Mexico Government International Bond 6.75% 27/9/2034 'MTNA' 2,600,000 USD 3,079,765 3,120,000 0.42Petroleos Mexicanos 3.5% 30/1/2023 2,000,000 USD 1,996,090 1,735,000 0.23Petroleos Mexicanos 4.875% 24/1/2022 1,000,000 USD 1,026,776 962,500 0.13Petroleos Mexicanos 4.875% 18/1/2024 1,000,000 USD 1,039,416 923,400 0.12Petroleos Mexicanos 5.5% 21/1/2021 2,500,000 USD 2,563,194 2,521,250 0.33
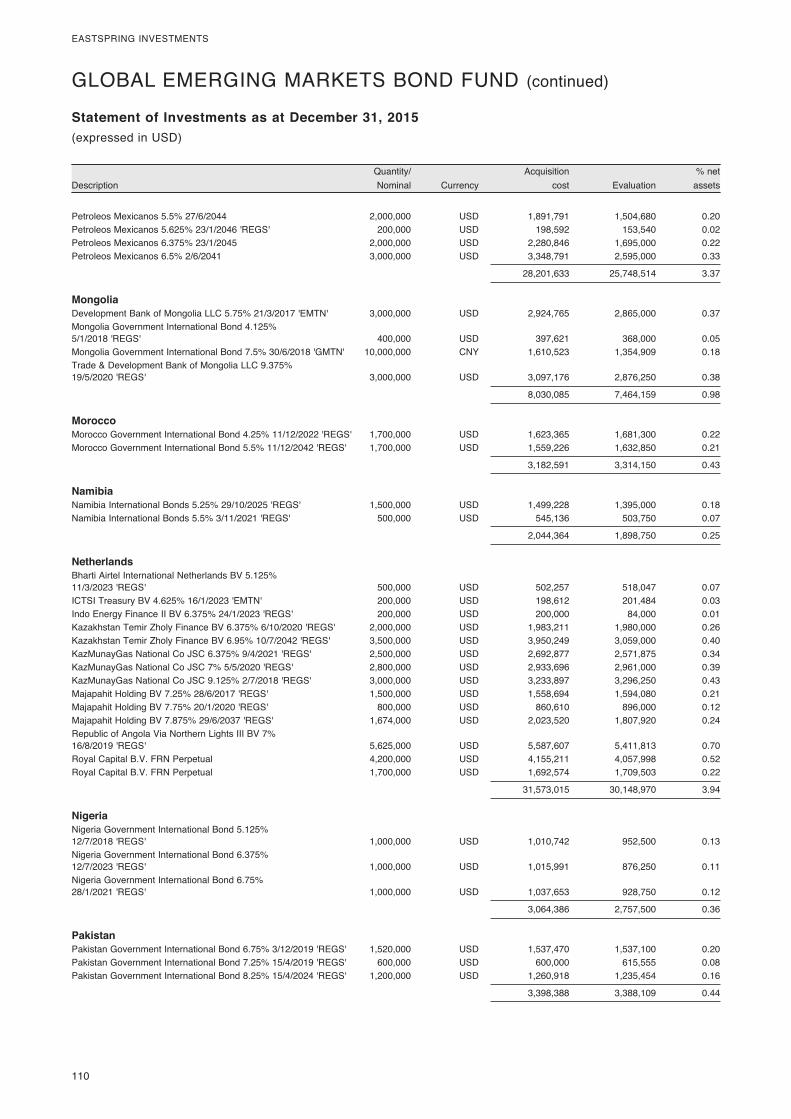
110
EASTSPRING INVESTMENTS
DescriptionQuantity/ Nominal Currency
Acquisition cost Evaluation
% net assets
Statement of Investments as at December 31, 2015(expressed in USD)
GLOBAL EMERGING MARKETS BOND FUND (continued)
Petroleos Mexicanos 5.5% 27/6/2044 2,000,000 USD 1,891,791 1,504,680 0.20Petroleos Mexicanos 5.625% 23/1/2046 'REGS' 200,000 USD 198,592 153,540 0.02Petroleos Mexicanos 6.375% 23/1/2045 2,000,000 USD 2,280,846 1,695,000 0.22Petroleos Mexicanos 6.5% 2/6/2041 3,000,000 USD 3,348,791 2,595,000 0.33
28,201,633 25,748,514 3.37
Mongolia Development Bank of Mongolia LLC 5.75% 21/3/2017 'EMTN' 3,000,000 USD 2,924,765 2,865,000 0.37Mongolia Government International Bond 4.125% 5/1/2018 'REGS' 400,000 USD 397,621 368,000 0.05Mongolia Government International Bond 7.5% 30/6/2018 'GMTN' 10,000,000 CNY 1,610,523 1,354,909 0.18Trade & Development Bank of Mongolia LLC 9.375% 19/5/2020 'REGS' 3,000,000 USD 3,097,176 2,876,250 0.38
8,030,085 7,464,159 0.98
Morocco Morocco Government International Bond 4.25% 11/12/2022 'REGS' 1,700,000 USD 1,623,365 1,681,300 0.22Morocco Government International Bond 5.5% 11/12/2042 'REGS' 1,700,000 USD 1,559,226 1,632,850 0.21
3,182,591 3,314,150 0.43
Namibia Namibia International Bonds 5.25% 29/10/2025 'REGS' 1,500,000 USD 1,499,228 1,395,000 0.18Namibia International Bonds 5.5% 3/11/2021 'REGS' 500,000 USD 545,136 503,750 0.07
2,044,364 1,898,750 0.25
Netherlands Bharti Airtel International Netherlands BV 5.125% 11/3/2023 'REGS' 500,000 USD 502,257 518,047 0.07ICTSI Treasury BV 4.625% 16/1/2023 'EMTN' 200,000 USD 198,612 201,484 0.03Indo Energy Finance II BV 6.375% 24/1/2023 'REGS' 200,000 USD 200,000 84,000 0.01Kazakhstan Temir Zholy Finance BV 6.375% 6/10/2020 'REGS' 2,000,000 USD 1,983,211 1,980,000 0.26Kazakhstan Temir Zholy Finance BV 6.95% 10/7/2042 'REGS' 3,500,000 USD 3,950,249 3,059,000 0.40KazMunayGas National Co JSC 6.375% 9/4/2021 'REGS' 2,500,000 USD 2,692,877 2,571,875 0.34KazMunayGas National Co JSC 7% 5/5/2020 'REGS' 2,800,000 USD 2,933,696 2,961,000 0.39KazMunayGas National Co JSC 9.125% 2/7/2018 'REGS' 3,000,000 USD 3,233,897 3,296,250 0.43Majapahit Holding BV 7.25% 28/6/2017 'REGS' 1,500,000 USD 1,558,694 1,594,080 0.21Majapahit Holding BV 7.75% 20/1/2020 'REGS' 800,000 USD 860,610 896,000 0.12Majapahit Holding BV 7.875% 29/6/2037 'REGS' 1,674,000 USD 2,023,520 1,807,920 0.24Republic of Angola Via Northern Lights III BV 7% 16/8/2019 'REGS' 5,625,000 USD 5,587,607 5,411,813 0.70Royal Capital B.V. FRN Perpetual 4,200,000 USD 4,155,211 4,057,998 0.52Royal Capital B.V. FRN Perpetual 1,700,000 USD 1,692,574 1,709,503 0.22
31,573,015 30,148,970 3.94
Nigeria Nigeria Government International Bond 5.125% 12/7/2018 'REGS' 1,000,000 USD 1,010,742 952,500 0.13Nigeria Government International Bond 6.375% 12/7/2023 'REGS' 1,000,000 USD 1,015,991 876,250 0.11Nigeria Government International Bond 6.75% 28/1/2021 'REGS' 1,000,000 USD 1,037,653 928,750 0.12
3,064,386 2,757,500 0.36
Pakistan Pakistan Government International Bond 6.75% 3/12/2019 'REGS' 1,520,000 USD 1,537,470 1,537,100 0.20Pakistan Government International Bond 7.25% 15/4/2019 'REGS' 600,000 USD 600,000 615,555 0.08Pakistan Government International Bond 8.25% 15/4/2024 'REGS' 1,200,000 USD 1,260,918 1,235,454 0.16
3,398,388 3,388,109 0.44

111
EASTSPRING INVESTMENTS
DescriptionQuantity/ Nominal Currency
Acquisition cost Evaluation
% net assets
Statement of Investments as at December 31, 2015(expressed in USD)
GLOBAL EMERGING MARKETS BOND FUND (continued)
Panama Panama Government International Bond 4.3% 29/4/2053 2,000,000 USD 1,720,843 1,705,000 0.22Panama Government International Bond 5.2% 30/1/2020 3,000,000 USD 3,170,369 3,255,000 0.43Panama Government International Bond 6.7% 26/1/2036 4,000,000 USD 5,357,271 4,750,000 0.63Panama Government International Bond 8.875% 30/9/2027 3,000,000 USD 4,180,733 4,155,000 0.54Panama Government International Bond 9.375% 1/4/2029 3,100,000 USD 4,425,542 4,464,000 0.58
18,854,758 18,329,000 2.40
Paraguay Republic of Paraguay 4.625% 25/1/2023 'REGS' 2,000,000 USD 2,028,332 1,940,000 0.25Republic of Paraguay 6.1% 11/8/2044 'REGS' 3,500,000 USD 3,856,272 3,360,000 0.44
5,884,604 5,300,000 0.69
Peru Corp Financiera de Desarrollo SA FRN 15/7/2029 'REGS' 1,000,000 USD 1,036,885 980,000 0.13Corp Financiera de Desarrollo SA 4.75% 8/2/2022 'REGS' 2,000,000 USD 2,123,517 2,030,000 0.26Fondo MIVIVIENDA SA 3.5% 31/1/2023 'REGS' 2,000,000 USD 1,979,740 1,866,000 0.24Peruvian Government International Bond 5.625% 18/11/2050 1,200,000 USD 1,352,930 1,221,000 0.16Peruvian Government International Bond 5.625% 18/11/2050 1,000,000 USD 1,053,576 1,017,500 0.13Peruvian Government International Bond 6.55% 14/3/2037 2,500,000 USD 3,204,017 2,893,750 0.38Peruvian Government International Bond 7.35% 21/7/2025 3,900,000 USD 4,622,617 4,884,750 0.64Peruvian Government International Bond 8.75% 21/11/2033 3,500,000 USD 4,937,873 4,917,500 0.65
20,311,155 19,810,500 2.59
Philippines First Gen Corp 6.5% 9/10/2023 800,000 USD 846,942 836,785 0.11Petron Corp FRN Perpetual 'REGS' 3,000,000 USD 3,080,317 3,079,781 0.40Philippine Government International Bond 4.2% 21/1/2024 1,200,000 USD 1,223,286 1,300,500 0.17Philippine Government International Bond 5% 13/1/2037 1,200,000 USD 1,200,000 1,401,000 0.18Philippine Government International Bond 6.375% 15/1/2032 1,000,000 USD 1,334,557 1,276,250 0.17Philippine Government International Bond 6.375% 23/10/2034 2,100,000 USD 2,429,640 2,751,000 0.36Philippine Government International Bond 7.75% 14/1/2031 1,000,000 USD 1,345,986 1,403,750 0.18Philippine Government International Bond 9.5% 2/2/2030 3,100,000 USD 4,301,380 4,882,500 0.64Philippine Government International Bond 9.875% 15/1/2019 1,000,000 USD 1,163,323 1,238,750 0.16Philippine Government International Bond 10.625% 16/3/2025 2,700,000 USD 3,800,524 4,259,250 0.56Power Sector Assets & Liabilities Management Corp 7.25% 27/5/2019 'REGS' 900,000 USD 982,813 1,038,375 0.14Power Sector Assets & Liabilities Management Corp 7.39% 2/12/2024 'REGS' 2,000,000 USD 2,450,934 2,580,000 0.34SMC Global Power Holdings Corp FRN Perpetual 'REGS' 5,500,000 USD 5,456,620 5,197,499 0.67SMC Global Power Holdings Corp FRN Perpetual 1,000,000 USD 957,362 988,650 0.13
30,573,684 32,234,090 4.21
Poland Poland Government International Bond 3% 17/3/2023 4,000,000 USD 3,874,559 3,945,760 0.52Poland Government International Bond 4% 22/1/2024 2,000,000 USD 2,012,262 2,092,260 0.27Poland Government International Bond 5% 23/3/2022 5,000,000 USD 5,354,475 5,520,250 0.72Poland Government International Bond 6.375% 15/7/2019 6,300,000 USD 6,746,398 7,161,714 0.94
17,987,694 18,719,984 2.45
Romania Romanian Government International Bond 4.375% 22/8/2023 'REGS' 2,000,000 USD 1,984,323 2,080,000 0.27Romanian Government International Bond 4.875% 22/1/2024 'REGS' 1,000,000 USD 1,027,562 1,072,500 0.14Romanian Government International Bond 6.125% 22/1/2044 'REGS' 2,200,000 USD 2,577,901 2,568,500 0.34Romanian Government International Bond 6.75% 7/2/2022 'REGS' 4,000,000 USD 4,162,897 4,696,000 0.61
9,752,683 10,417,000 1.36
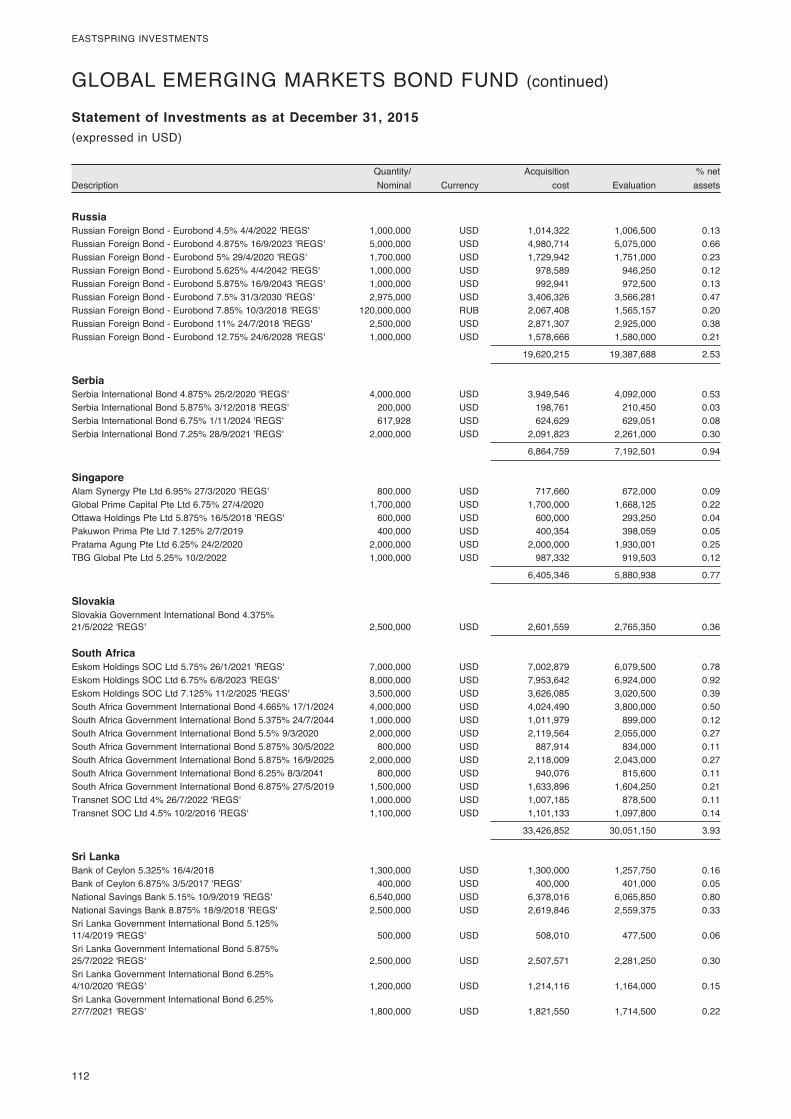
112
EASTSPRING INVESTMENTS
DescriptionQuantity/ Nominal Currency
Acquisition cost Evaluation
% net assets
Statement of Investments as at December 31, 2015(expressed in USD)
GLOBAL EMERGING MARKETS BOND FUND (continued)
Russia Russian Foreign Bond - Eurobond 4.5% 4/4/2022 'REGS' 1,000,000 USD 1,014,322 1,006,500 0.13Russian Foreign Bond - Eurobond 4.875% 16/9/2023 'REGS' 5,000,000 USD 4,980,714 5,075,000 0.66Russian Foreign Bond - Eurobond 5% 29/4/2020 'REGS' 1,700,000 USD 1,729,942 1,751,000 0.23Russian Foreign Bond - Eurobond 5.625% 4/4/2042 'REGS' 1,000,000 USD 978,589 946,250 0.12Russian Foreign Bond - Eurobond 5.875% 16/9/2043 'REGS' 1,000,000 USD 992,941 972,500 0.13Russian Foreign Bond - Eurobond 7.5% 31/3/2030 'REGS' 2,975,000 USD 3,406,326 3,566,281 0.47Russian Foreign Bond - Eurobond 7.85% 10/3/2018 'REGS' 120,000,000 RUB 2,067,408 1,565,157 0.20Russian Foreign Bond - Eurobond 11% 24/7/2018 'REGS' 2,500,000 USD 2,871,307 2,925,000 0.38Russian Foreign Bond - Eurobond 12.75% 24/6/2028 'REGS' 1,000,000 USD 1,578,666 1,580,000 0.21
19,620,215 19,387,688 2.53
Serbia Serbia International Bond 4.875% 25/2/2020 'REGS' 4,000,000 USD 3,949,546 4,092,000 0.53Serbia International Bond 5.875% 3/12/2018 'REGS' 200,000 USD 198,761 210,450 0.03Serbia International Bond 6.75% 1/11/2024 'REGS' 617,928 USD 624,629 629,051 0.08Serbia International Bond 7.25% 28/9/2021 'REGS' 2,000,000 USD 2,091,823 2,261,000 0.30
6,864,759 7,192,501 0.94
Singapore Alam Synergy Pte Ltd 6.95% 27/3/2020 'REGS' 800,000 USD 717,660 672,000 0.09Global Prime Capital Pte Ltd 6.75% 27/4/2020 1,700,000 USD 1,700,000 1,668,125 0.22Ottawa Holdings Pte Ltd 5.875% 16/5/2018 'REGS' 600,000 USD 600,000 293,250 0.04Pakuwon Prima Pte Ltd 7.125% 2/7/2019 400,000 USD 400,354 398,059 0.05Pratama Agung Pte Ltd 6.25% 24/2/2020 2,000,000 USD 2,000,000 1,930,001 0.25TBG Global Pte Ltd 5.25% 10/2/2022 1,000,000 USD 987,332 919,503 0.12
6,405,346 5,880,938 0.77
Slovakia Slovakia Government International Bond 4.375% 21/5/2022 'REGS' 2,500,000 USD 2,601,559 2,765,350 0.36
South Africa Eskom Holdings SOC Ltd 5.75% 26/1/2021 'REGS' 7,000,000 USD 7,002,879 6,079,500 0.78Eskom Holdings SOC Ltd 6.75% 6/8/2023 'REGS' 8,000,000 USD 7,953,642 6,924,000 0.92Eskom Holdings SOC Ltd 7.125% 11/2/2025 'REGS' 3,500,000 USD 3,626,085 3,020,500 0.39South Africa Government International Bond 4.665% 17/1/2024 4,000,000 USD 4,024,490 3,800,000 0.50South Africa Government International Bond 5.375% 24/7/2044 1,000,000 USD 1,011,979 899,000 0.12South Africa Government International Bond 5.5% 9/3/2020 2,000,000 USD 2,119,564 2,055,000 0.27South Africa Government International Bond 5.875% 30/5/2022 800,000 USD 887,914 834,000 0.11South Africa Government International Bond 5.875% 16/9/2025 2,000,000 USD 2,118,009 2,043,000 0.27South Africa Government International Bond 6.25% 8/3/2041 800,000 USD 940,076 815,600 0.11South Africa Government International Bond 6.875% 27/5/2019 1,500,000 USD 1,633,896 1,604,250 0.21Transnet SOC Ltd 4% 26/7/2022 'REGS' 1,000,000 USD 1,007,185 878,500 0.11Transnet SOC Ltd 4.5% 10/2/2016 'REGS' 1,100,000 USD 1,101,133 1,097,800 0.14
33,426,852 30,051,150 3.93
Sri Lanka Bank of Ceylon 5.325% 16/4/2018 1,300,000 USD 1,300,000 1,257,750 0.16Bank of Ceylon 6.875% 3/5/2017 'REGS' 400,000 USD 400,000 401,000 0.05National Savings Bank 5.15% 10/9/2019 'REGS' 6,540,000 USD 6,378,016 6,065,850 0.80National Savings Bank 8.875% 18/9/2018 'REGS' 2,500,000 USD 2,619,846 2,559,375 0.33Sri Lanka Government International Bond 5.125% 11/4/2019 'REGS' 500,000 USD 508,010 477,500 0.06Sri Lanka Government International Bond 5.875% 25/7/2022 'REGS' 2,500,000 USD 2,507,571 2,281,250 0.30Sri Lanka Government International Bond 6.25% 4/10/2020 'REGS' 1,200,000 USD 1,214,116 1,164,000 0.15Sri Lanka Government International Bond 6.25% 27/7/2021 'REGS' 1,800,000 USD 1,821,550 1,714,500 0.22
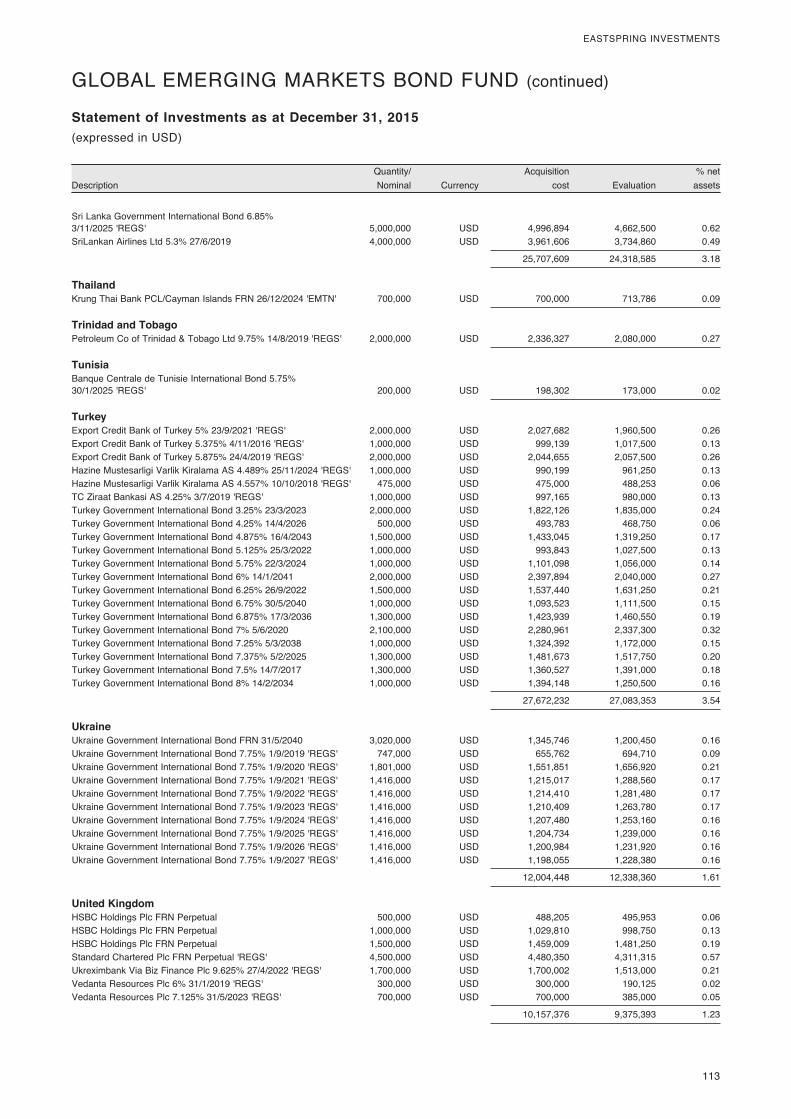
113
EASTSPRING INVESTMENTS
DescriptionQuantity/ Nominal Currency
Acquisition cost Evaluation
% net assets
Statement of Investments as at December 31, 2015(expressed in USD)
GLOBAL EMERGING MARKETS BOND FUND (continued)
Sri Lanka Government International Bond 6.85% 3/11/2025 'REGS' 5,000,000 USD 4,996,894 4,662,500 0.62SriLankan Airlines Ltd 5.3% 27/6/2019 4,000,000 USD 3,961,606 3,734,860 0.49
25,707,609 24,318,585 3.18
Thailand Krung Thai Bank PCL/Cayman Islands FRN 26/12/2024 'EMTN' 700,000 USD 700,000 713,786 0.09
Trinidad and Tobago Petroleum Co of Trinidad & Tobago Ltd 9.75% 14/8/2019 'REGS' 2,000,000 USD 2,336,327 2,080,000 0.27
Tunisia Banque Centrale de Tunisie International Bond 5.75% 30/1/2025 'REGS' 200,000 USD 198,302 173,000 0.02
Turkey Export Credit Bank of Turkey 5% 23/9/2021 'REGS' 2,000,000 USD 2,027,682 1,960,500 0.26Export Credit Bank of Turkey 5.375% 4/11/2016 'REGS' 1,000,000 USD 999,139 1,017,500 0.13Export Credit Bank of Turkey 5.875% 24/4/2019 'REGS' 2,000,000 USD 2,044,655 2,057,500 0.26Hazine Mustesarligi Varlik Kiralama AS 4.489% 25/11/2024 'REGS' 1,000,000 USD 990,199 961,250 0.13Hazine Mustesarligi Varlik Kiralama AS 4.557% 10/10/2018 'REGS' 475,000 USD 475,000 488,253 0.06TC Ziraat Bankasi AS 4.25% 3/7/2019 'REGS' 1,000,000 USD 997,165 980,000 0.13Turkey Government International Bond 3.25% 23/3/2023 2,000,000 USD 1,822,126 1,835,000 0.24Turkey Government International Bond 4.25% 14/4/2026 500,000 USD 493,783 468,750 0.06Turkey Government International Bond 4.875% 16/4/2043 1,500,000 USD 1,433,045 1,319,250 0.17Turkey Government International Bond 5.125% 25/3/2022 1,000,000 USD 993,843 1,027,500 0.13Turkey Government International Bond 5.75% 22/3/2024 1,000,000 USD 1,101,098 1,056,000 0.14Turkey Government International Bond 6% 14/1/2041 2,000,000 USD 2,397,894 2,040,000 0.27Turkey Government International Bond 6.25% 26/9/2022 1,500,000 USD 1,537,440 1,631,250 0.21Turkey Government International Bond 6.75% 30/5/2040 1,000,000 USD 1,093,523 1,111,500 0.15Turkey Government International Bond 6.875% 17/3/2036 1,300,000 USD 1,423,939 1,460,550 0.19Turkey Government International Bond 7% 5/6/2020 2,100,000 USD 2,280,961 2,337,300 0.32Turkey Government International Bond 7.25% 5/3/2038 1,000,000 USD 1,324,392 1,172,000 0.15Turkey Government International Bond 7.375% 5/2/2025 1,300,000 USD 1,481,673 1,517,750 0.20Turkey Government International Bond 7.5% 14/7/2017 1,300,000 USD 1,360,527 1,391,000 0.18Turkey Government International Bond 8% 14/2/2034 1,000,000 USD 1,394,148 1,250,500 0.16
27,672,232 27,083,353 3.54
Ukraine Ukraine Government International Bond FRN 31/5/2040 3,020,000 USD 1,345,746 1,200,450 0.16Ukraine Government International Bond 7.75% 1/9/2019 'REGS' 747,000 USD 655,762 694,710 0.09Ukraine Government International Bond 7.75% 1/9/2020 'REGS' 1,801,000 USD 1,551,851 1,656,920 0.21Ukraine Government International Bond 7.75% 1/9/2021 'REGS' 1,416,000 USD 1,215,017 1,288,560 0.17Ukraine Government International Bond 7.75% 1/9/2022 'REGS' 1,416,000 USD 1,214,410 1,281,480 0.17Ukraine Government International Bond 7.75% 1/9/2023 'REGS' 1,416,000 USD 1,210,409 1,263,780 0.17Ukraine Government International Bond 7.75% 1/9/2024 'REGS' 1,416,000 USD 1,207,480 1,253,160 0.16Ukraine Government International Bond 7.75% 1/9/2025 'REGS' 1,416,000 USD 1,204,734 1,239,000 0.16Ukraine Government International Bond 7.75% 1/9/2026 'REGS' 1,416,000 USD 1,200,984 1,231,920 0.16Ukraine Government International Bond 7.75% 1/9/2027 'REGS' 1,416,000 USD 1,198,055 1,228,380 0.16
12,004,448 12,338,360 1.61
United Kingdom HSBC Holdings Plc FRN Perpetual 500,000 USD 488,205 495,953 0.06HSBC Holdings Plc FRN Perpetual 1,000,000 USD 1,029,810 998,750 0.13HSBC Holdings Plc FRN Perpetual 1,500,000 USD 1,459,009 1,481,250 0.19Standard Chartered Plc FRN Perpetual 'REGS' 4,500,000 USD 4,480,350 4,311,315 0.57Ukreximbank Via Biz Finance Plc 9.625% 27/4/2022 'REGS' 1,700,000 USD 1,700,002 1,513,000 0.21Vedanta Resources Plc 6% 31/1/2019 'REGS' 300,000 USD 300,000 190,125 0.02Vedanta Resources Plc 7.125% 31/5/2023 'REGS' 700,000 USD 700,000 385,000 0.05
10,157,376 9,375,393 1.23

114
EASTSPRING INVESTMENTS
DescriptionQuantity/ Nominal Currency
Acquisition cost Evaluation
% net assets
Statement of Investments as at December 31, 2015(expressed in USD)
GLOBAL EMERGING MARKETS BOND FUND (continued)
United States of America Petroleos Mexicanos 5.75% 1/3/2018 700,000 USD 713,477 726,950 0.10Petroleos Mexicanos 6.625% 15/6/2035 4,000,000 USD 4,456,714 3,570,000 0.46
5,170,191 4,296,950 0.56
Uruguay Uruguay Government International Bond 4.125% 20/11/2045 3,113,065 USD 3,065,667 2,420,408 0.32Uruguay Government International Bond 4.5% 14/8/2024 2,000,000 USD 2,041,335 2,035,000 0.27Uruguay Government International Bond 5.1% 18/6/2050 2,750,000 USD 2,811,864 2,365,000 0.31Uruguay Government International Bond 6.875% 28/9/2025 1,200,000 USD 1,376,722 1,399,350 0.18Uruguay Government International Bond 7.625% 21/3/2036 1,700,000 USD 2,124,436 2,099,500 0.27Uruguay Government International Bond 7.875% 15/1/2033 2,300,000 USD 3,178,851 2,863,500 0.37
14,598,875 13,182,758 1.72
Venezuela Petroleos de Venezuela SA 5.25% 12/4/2017 'REGS' 1,000,000 USD 935,080 497,500 0.07Petroleos de Venezuela SA 5.375% 12/4/2027 3,000,000 USD 1,349,080 1,095,000 0.14Petroleos de Venezuela SA 5.5% 12/4/2037 'REGS' 6,500,000 USD 2,358,625 2,356,250 0.30Petroleos de Venezuela SA 6% 16/5/2024 'REGS' 3,000,000 USD 1,749,718 1,134,000 0.15Petroleos de Venezuela SA 6% 15/11/2026 'REGS' 6,000,000 USD 2,530,000 2,212,500 0.29Petroleos de Venezuela SA 8.5% 2/11/2017 'REGS' 1,400,000 USD 1,133,934 745,360 0.10Petroleos de Venezuela SA 9% 17/11/2021 'REGS' 2,000,000 USD 1,758,970 810,000 0.11Petroleos de Venezuela SA 9.75% 17/5/2035 'REGS' 1,000,000 USD 661,472 415,000 0.05Venezuela Government International Bond 6% 9/12/2020 'REGS' 1,000,000 USD 386,836 377,500 0.05Venezuela Government International Bond 7% 1/12/2018 'REGS' 1,000,000 USD 935,452 452,500 0.06Venezuela Government International Bond 7.65% 21/4/2025 'REGS' 1,000,000 USD 946,555 375,000 0.05Venezuela Government International Bond 7.75% 13/10/2019 'REGS' 3,000,000 USD 2,763,035 1,207,500 0.16Venezuela Government International Bond 8.25% 13/10/2024 'REGS' 1,000,000 USD 822,854 385,000 0.05Venezuela Government International Bond 9.25% 15/9/2027 1,000,000 USD 893,763 415,000 0.05Venezuela Government International Bond 9.25% 7/5/2028 'REGS' 2,000,000 USD 1,758,435 790,000 0.10Venezuela Government International Bond 11.75% 21/10/2026 'REGS' 1,000,000 USD 961,075 450,000 0.06Venezuela Government International Bond 11.95% 5/8/2031 'REGS' 1,000,000 USD 757,500 447,500 0.06Venezuela Government International Bond 12.75% 23/8/2022 'REGS' 1,100,000 USD 1,002,229 497,750 0.07
23,704,613 14,663,360 1.92
Vietnam Vietnam Government International Bond 4.8% 19/11/2024 'REGS' 1,568,000 USD 1,568,000 1,505,280 0.20Vietnam Government International Bond 6.75% 29/1/2020 'REGS' 1,200,000 USD 1,232,810 1,312,500 0.17
2,800,810 2,817,780 0.37
Zambia Zambia Government International Bond 5.375% 20/9/2022 'REGS' 500,000 USD 470,121 360,625 0.05Zambia Government International Bond 8.5% 14/4/2024 'REGS' 3,000,000 USD 3,169,606 2,377,500 0.31
3,639,727 2,738,125 0.36
Total Bonds 752,635,025 711,811,718 93.06
Total Investments 752,635,025 711,811,718 93.06
Other Net Assets 53,078,168 6.94
Total Net Assets 764,889,886 100.00
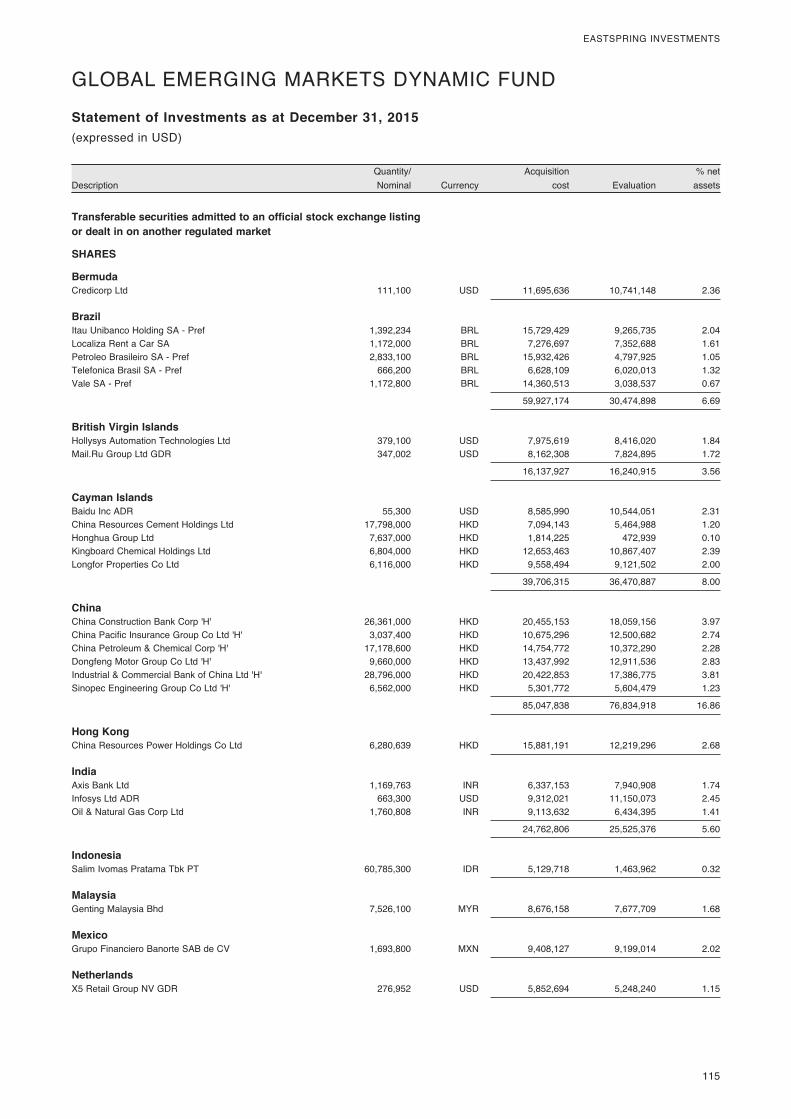
115
EASTSPRING INVESTMENTS
DescriptionQuantity/ Nominal Currency
Acquisition cost Evaluation
% net assets
Statement of Investments as at December 31, 2015
Transferable securities admitted to an official stock exchange listing or dealt in on another regulated market
SHARES
Bermuda Credicorp Ltd 111,100 USD 11,695,636 10,741,148 2.36
Brazil Itau Unibanco Holding SA - Pref 1,392,234 BRL 15,729,429 9,265,735 2.04Localiza Rent a Car SA 1,172,000 BRL 7,276,697 7,352,688 1.61Petroleo Brasileiro SA - Pref 2,833,100 BRL 15,932,426 4,797,925 1.05Telefonica Brasil SA - Pref 666,200 BRL 6,628,109 6,020,013 1.32Vale SA - Pref 1,172,800 BRL 14,360,513 3,038,537 0.67
59,927,174 30,474,898 6.69
British Virgin Islands Hollysys Automation Technologies Ltd 379,100 USD 7,975,619 8,416,020 1.84Mail.Ru Group Ltd GDR 347,002 USD 8,162,308 7,824,895 1.72
16,137,927 16,240,915 3.56
Cayman Islands Baidu Inc ADR 55,300 USD 8,585,990 10,544,051 2.31China Resources Cement Holdings Ltd 17,798,000 HKD 7,094,143 5,464,988 1.20Honghua Group Ltd 7,637,000 HKD 1,814,225 472,939 0.10Kingboard Chemical Holdings Ltd 6,804,000 HKD 12,653,463 10,867,407 2.39Longfor Properties Co Ltd 6,116,000 HKD 9,558,494 9,121,502 2.00
39,706,315 36,470,887 8.00
China China Construction Bank Corp 'H' 26,361,000 HKD 20,455,153 18,059,156 3.97China Pacific Insurance Group Co Ltd 'H' 3,037,400 HKD 10,675,296 12,500,682 2.74China Petroleum & Chemical Corp 'H' 17,178,600 HKD 14,754,772 10,372,290 2.28Dongfeng Motor Group Co Ltd 'H' 9,660,000 HKD 13,437,992 12,911,536 2.83Industrial & Commercial Bank of China Ltd 'H' 28,796,000 HKD 20,422,853 17,386,775 3.81Sinopec Engineering Group Co Ltd 'H' 6,562,000 HKD 5,301,772 5,604,479 1.23
85,047,838 76,834,918 16.86
Hong Kong China Resources Power Holdings Co Ltd 6,280,639 HKD 15,881,191 12,219,296 2.68
India Axis Bank Ltd 1,169,763 INR 6,337,153 7,940,908 1.74Infosys Ltd ADR 663,300 USD 9,312,021 11,150,073 2.45Oil & Natural Gas Corp Ltd 1,760,808 INR 9,113,632 6,434,395 1.41
24,762,806 25,525,376 5.60
Indonesia Salim Ivomas Pratama Tbk PT 60,785,300 IDR 5,129,718 1,463,962 0.32
Malaysia Genting Malaysia Bhd 7,526,100 MYR 8,676,158 7,677,709 1.68
Mexico Grupo Financiero Banorte SAB de CV 1,693,800 MXN 9,408,127 9,199,014 2.02
Netherlands X5 Retail Group NV GDR 276,952 USD 5,852,694 5,248,240 1.15
(expressed in USD)
GLOBAL EMERGING MARKETS DYNAMIC FUND
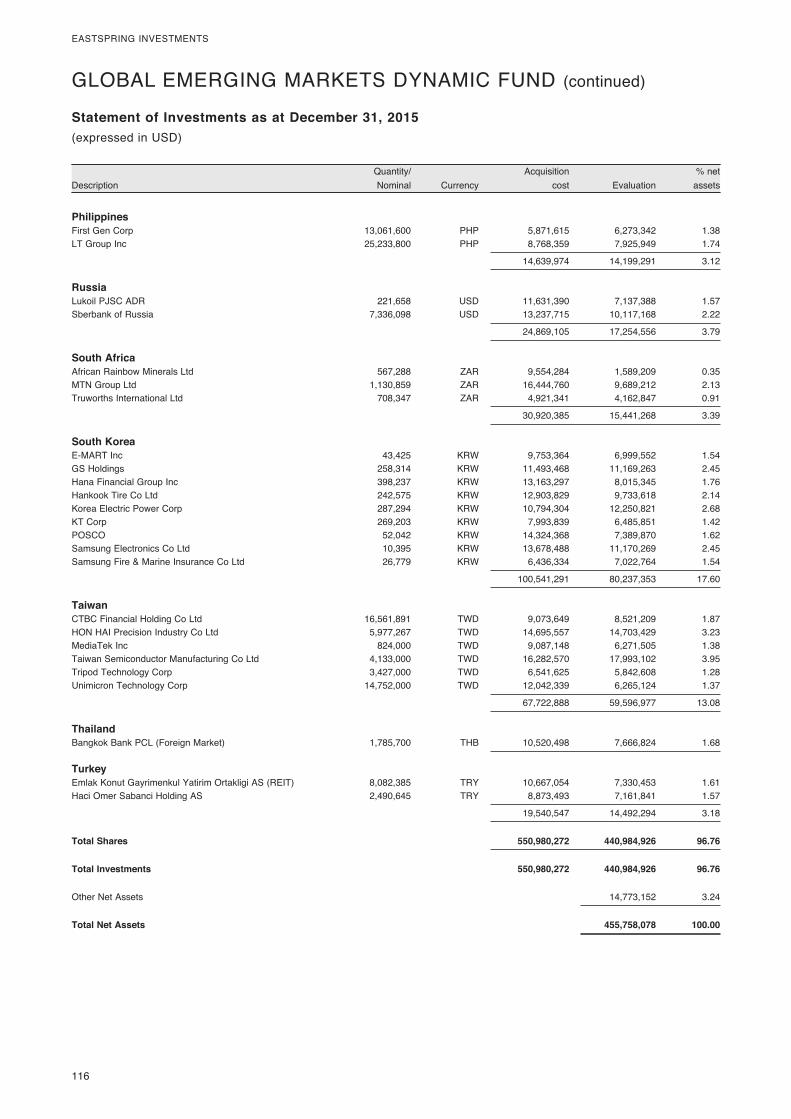
116
EASTSPRING INVESTMENTS
DescriptionQuantity/ Nominal Currency
Acquisition cost Evaluation
% net assets
Statement of Investments as at December 31, 2015(expressed in USD)
GLOBAL EMERGING MARKETS DYNAMIC FUND (continued)
Philippines First Gen Corp 13,061,600 PHP 5,871,615 6,273,342 1.38LT Group Inc 25,233,800 PHP 8,768,359 7,925,949 1.74
14,639,974 14,199,291 3.12
Russia Lukoil PJSC ADR 221,658 USD 11,631,390 7,137,388 1.57Sberbank of Russia 7,336,098 USD 13,237,715 10,117,168 2.22
24,869,105 17,254,556 3.79
South Africa African Rainbow Minerals Ltd 567,288 ZAR 9,554,284 1,589,209 0.35MTN Group Ltd 1,130,859 ZAR 16,444,760 9,689,212 2.13Truworths International Ltd 708,347 ZAR 4,921,341 4,162,847 0.91
30,920,385 15,441,268 3.39
South Korea E-MART Inc 43,425 KRW 9,753,364 6,999,552 1.54GS Holdings 258,314 KRW 11,493,468 11,169,263 2.45Hana Financial Group Inc 398,237 KRW 13,163,297 8,015,345 1.76Hankook Tire Co Ltd 242,575 KRW 12,903,829 9,733,618 2.14Korea Electric Power Corp 287,294 KRW 10,794,304 12,250,821 2.68KT Corp 269,203 KRW 7,993,839 6,485,851 1.42POSCO 52,042 KRW 14,324,368 7,389,870 1.62Samsung Electronics Co Ltd 10,395 KRW 13,678,488 11,170,269 2.45Samsung Fire & Marine Insurance Co Ltd 26,779 KRW 6,436,334 7,022,764 1.54
100,541,291 80,237,353 17.60
Taiwan CTBC Financial Holding Co Ltd 16,561,891 TWD 9,073,649 8,521,209 1.87HON HAI Precision Industry Co Ltd 5,977,267 TWD 14,695,557 14,703,429 3.23MediaTek Inc 824,000 TWD 9,087,148 6,271,505 1.38Taiwan Semiconductor Manufacturing Co Ltd 4,133,000 TWD 16,282,570 17,993,102 3.95Tripod Technology Corp 3,427,000 TWD 6,541,625 5,842,608 1.28Unimicron Technology Corp 14,752,000 TWD 12,042,339 6,265,124 1.37
67,722,888 59,596,977 13.08
Thailand Bangkok Bank PCL (Foreign Market) 1,785,700 THB 10,520,498 7,666,824 1.68
Turkey Emlak Konut Gayrimenkul Yatirim Ortakligi AS (REIT) 8,082,385 TRY 10,667,054 7,330,453 1.61Haci Omer Sabanci Holding AS 2,490,645 TRY 8,873,493 7,161,841 1.57
19,540,547 14,492,294 3.18
Total Shares 550,980,272 440,984,926 96.76
Total Investments 550,980,272 440,984,926 96.76
Other Net Assets 14,773,152 3.24
Total Net Assets 455,758,078 100.00

117
EASTSPRING INVESTMENTS
DescriptionQuantity/ Nominal Currency
Acquisition cost Evaluation
% net assets
Statement of Investments as at December 31, 2015
Transferable securities admitted to an official stock exchange listing or dealt in on another regulated market
MUTUAL FUNDS
Ireland iShares Core EURO STOXX 50 UCITS - ETF 36,607 GBP 3,792,410 3,688,360 4.47iShares Core FTSE 100 UCITS - ETF 6,242 GBP 740,764 799,066 0.97iShares Core S&P 500 UCITS - ETF 56,618 GBP 9,251,151 10,822,238 13.10iShares Gold Producers UCITS - ETF 289,407 GBP 1,655,783 1,651,872 2.00iShares MSCI AC Far East ex-Japan UCITS - ETF 94,802 GBP 3,886,866 3,872,781 4.69iShares MSCI Korea UCITS - ETF (Dist) 50,280 GBP 1,905,210 1,639,183 1.99iShares MSCI Taiwan UCITS - ETF 51,781 GBP 1,899,693 1,651,144 2.00iShares S&P 500 Minimum Volatility UCITS - ETF 109,963 USD 4,173,111 4,244,022 5.14SPDR S&P 500 UCITS - ETF 35,769 USD 6,951,362 7,369,666 8.93
34,256,350 35,738,332 43.29
Luxembourg db x-trackers - ATX UCITS (DR) - ETF 85,287 EUR 4,162,492 3,357,980 4.07db x-trackers - MSCI JAPAN TRN INDEX UCITS - ETF - 1C 102,053 USD 4,329,352 4,982,738 6.04Lyxor S&P 500 UCITS - ETF 758,219 USD 15,629,137 15,877,105 19.23
24,120,981 24,217,823 29.34
Singapore db x-trackers MSCI China TRN Index UCITS ETF DR - 1C 133,610 USD 2,032,912 1,663,445 2.02
United Kingdom iShares NASDAQ 100 UCITS - ETF 33,288 USD 8,429,629 8,452,822 10.24
Total Mutual Funds 68,839,872 70,072,422 84.89
Total Investments 68,839,872 70,072,422 84.89
Other Net Assets 12,475,048 15.11
Total Net Assets 82,547,470 100.00
(expressed in USD)
GLOBAL EQUITY NAVIGATOR FUND
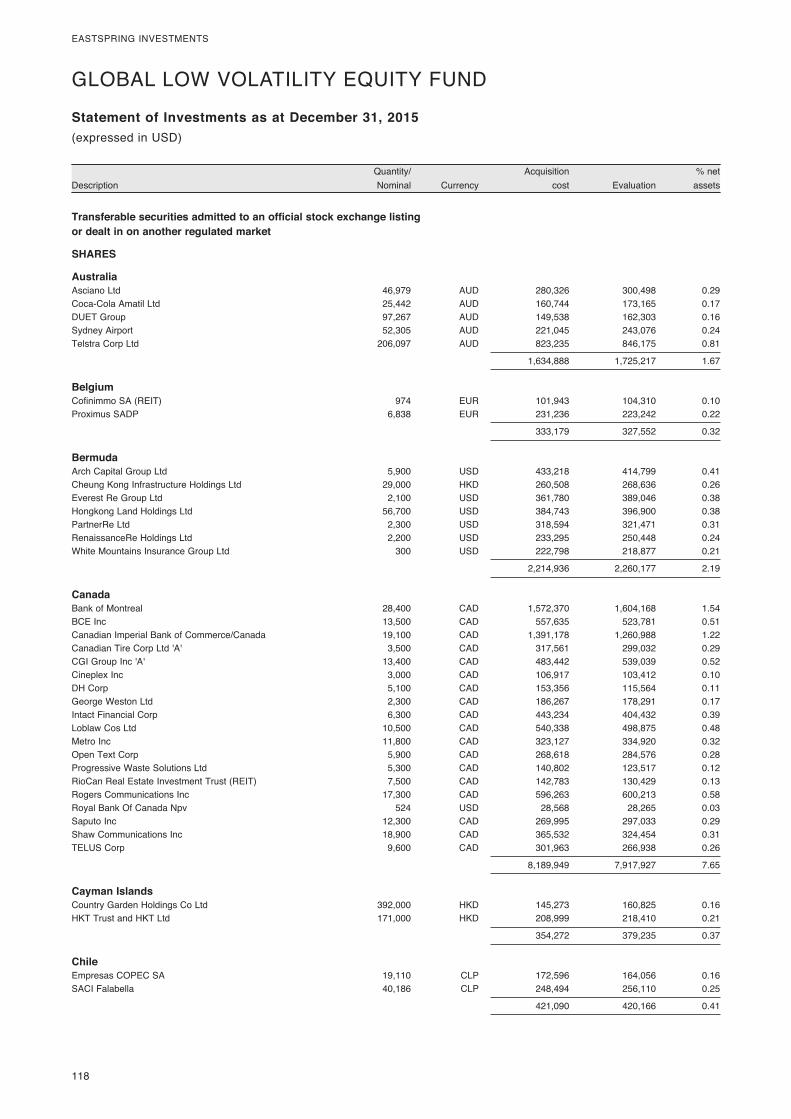
118
EASTSPRING INVESTMENTS
DescriptionQuantity/ Nominal Currency
Acquisition cost Evaluation
% net assets
Statement of Investments as at December 31, 2015
Transferable securities admitted to an official stock exchange listing or dealt in on another regulated market
SHARES
Australia Asciano Ltd 46,979 AUD 280,326 300,498 0.29Coca-Cola Amatil Ltd 25,442 AUD 160,744 173,165 0.17DUET Group 97,267 AUD 149,538 162,303 0.16Sydney Airport 52,305 AUD 221,045 243,076 0.24Telstra Corp Ltd 206,097 AUD 823,235 846,175 0.81
1,634,888 1,725,217 1.67
Belgium Cofinimmo SA (REIT) 974 EUR 101,943 104,310 0.10Proximus SADP 6,838 EUR 231,236 223,242 0.22
333,179 327,552 0.32
Bermuda Arch Capital Group Ltd 5,900 USD 433,218 414,799 0.41Cheung Kong Infrastructure Holdings Ltd 29,000 HKD 260,508 268,636 0.26Everest Re Group Ltd 2,100 USD 361,780 389,046 0.38Hongkong Land Holdings Ltd 56,700 USD 384,743 396,900 0.38PartnerRe Ltd 2,300 USD 318,594 321,471 0.31RenaissanceRe Holdings Ltd 2,200 USD 233,295 250,448 0.24White Mountains Insurance Group Ltd 300 USD 222,798 218,877 0.21
2,214,936 2,260,177 2.19
Canada Bank of Montreal 28,400 CAD 1,572,370 1,604,168 1.54BCE Inc 13,500 CAD 557,635 523,781 0.51Canadian Imperial Bank of Commerce/Canada 19,100 CAD 1,391,178 1,260,988 1.22Canadian Tire Corp Ltd 'A' 3,500 CAD 317,561 299,032 0.29CGI Group Inc 'A' 13,400 CAD 483,442 539,039 0.52Cineplex Inc 3,000 CAD 106,917 103,412 0.10DH Corp 5,100 CAD 153,356 115,564 0.11George Weston Ltd 2,300 CAD 186,267 178,291 0.17Intact Financial Corp 6,300 CAD 443,234 404,432 0.39Loblaw Cos Ltd 10,500 CAD 540,338 498,875 0.48Metro Inc 11,800 CAD 323,127 334,920 0.32Open Text Corp 5,900 CAD 268,618 284,576 0.28Progressive Waste Solutions Ltd 5,300 CAD 140,802 123,517 0.12RioCan Real Estate Investment Trust (REIT) 7,500 CAD 142,783 130,429 0.13Rogers Communications Inc 17,300 CAD 596,263 600,213 0.58Royal Bank Of Canada Npv 524 USD 28,568 28,265 0.03Saputo Inc 12,300 CAD 269,995 297,033 0.29Shaw Communications Inc 18,900 CAD 365,532 324,454 0.31TELUS Corp 9,600 CAD 301,963 266,938 0.26
8,189,949 7,917,927 7.65
Cayman Islands Country Garden Holdings Co Ltd 392,000 HKD 145,273 160,825 0.16HKT Trust and HKT Ltd 171,000 HKD 208,999 218,410 0.21
354,272 379,235 0.37
Chile Empresas COPEC SA 19,110 CLP 172,596 164,056 0.16SACI Falabella 40,186 CLP 248,494 256,110 0.25
421,090 420,166 0.41
(expressed in USD)
GLOBAL LOW VOLATILITY EQUITY FUND

119
EASTSPRING INVESTMENTS
DescriptionQuantity/ Nominal Currency
Acquisition cost Evaluation
% net assets
Statement of Investments as at December 31, 2015(expressed in USD)
GLOBAL LOW VOLATILITY EQUITY FUND (continued)
Denmark GN Store Nord A/S 7,812 DKK 143,102 142,738 0.14
Egypt Commercial International Bank Egypt SAE 19,186 EGP 104,352 93,332 0.09
France Atos SE 3,865 EUR 296,106 325,760 0.31Eutelsat Communications SA 8,090 EUR 245,611 242,988 0.24Orpea 2,258 EUR 177,907 181,296 0.18Sodexo SA 4,692 EUR 387,321 460,259 0.44
1,106,945 1,210,303 1.17
Germany Adidas AG 8,594 EUR 690,206 840,872 0.81Freenet AG 6,168 EUR 196,523 210,196 0.20HUGO BOSS AG 3,120 EUR 348,464 260,082 0.25Kabel Deutschland Holding AG 981 EUR 125,487 121,863 0.12Muenchener Rueckversicherungs-Gesellschaft AG in Muenchen 7,072 EUR 1,304,667 1,420,309 1.38
2,665,347 2,853,322 2.76
Guernsey Amdocs Ltd 7,500 USD 424,337 412,050 0.40
Hong Kong China Mobile Ltd 55,500 HKD 662,000 626,530 0.61China Resources Beer Holdings Company Ltd 56,000 HKD 107,075 119,933 0.12CLP Holdings Ltd 95,000 HKD 818,251 807,087 0.77Hopewell Holdings Ltd 31,500 HKD 109,565 113,182 0.11Hysan Development Co Ltd 30,000 HKD 128,241 122,887 0.12Link (REIT) 110,500 HKD 606,182 661,487 0.63Power Assets Holdings Ltd 62,500 HKD 598,487 574,924 0.56Swire Pacific Ltd 'A' 29,000 HKD 333,404 326,254 0.32
3,363,205 3,352,284 3.24
Indonesia Telekomunikasi Indonesia Persero Tbk PT 2,379,000 IDR 426,940 535,857 0.52
Ireland Paddy Power Plc 1,948 EUR 226,552 260,960 0.25Ryanair Holdings Plc 27,588 EUR 415,352 450,638 0.44
641,904 711,598 0.69
Israel Bank Hapoalim BM 50,935 ILS 255,092 260,477 0.25Bank Leumi Le-Israel BM 66,715 ILS 248,335 229,444 0.22Bezeq The Israeli Telecommunication Corp Ltd 89,936 ILS 168,877 195,762 0.19
672,304 685,683 0.66
Japan Aozora Bank Ltd 57,000 JPY 196,088 200,424 0.19Benesse Holdings Inc 4,400 JPY 117,056 127,648 0.12Canon Inc 51,100 JPY 1,511,568 1,561,035 1.51Daito Trust Construction Co Ltd 3,800 JPY 395,040 442,544 0.43Konica Minolta Inc 24,200 JPY 253,274 245,822 0.24NEC Corp 126,000 JPY 397,224 403,242 0.39Orix JREIT Inc (REIT) 108 JPY 150,544 140,409 0.14Ricoh Co Ltd 35,900 JPY 371,631 373,324 0.36Takeda Pharmaceutical Co Ltd 26,200 JPY 1,160,383 1,320,889 1.28
4,552,808 4,815,337 4.66
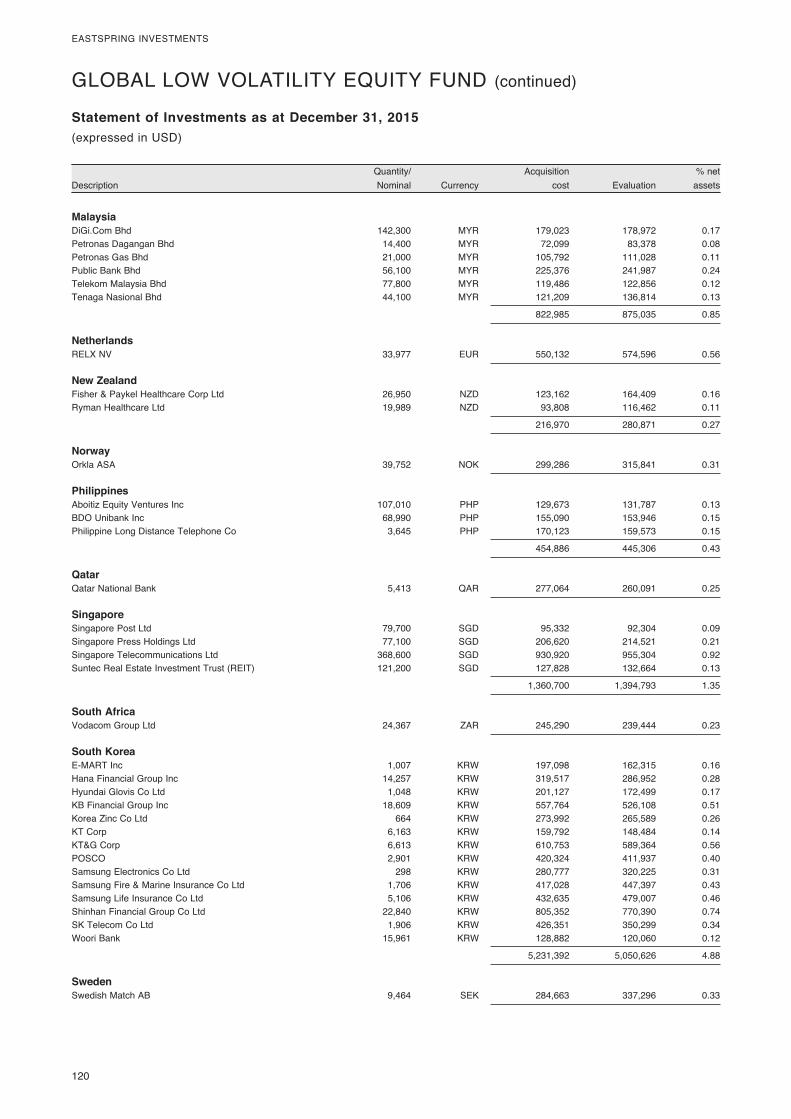
120
EASTSPRING INVESTMENTS
DescriptionQuantity/ Nominal Currency
Acquisition cost Evaluation
% net assets
Statement of Investments as at December 31, 2015(expressed in USD)
GLOBAL LOW VOLATILITY EQUITY FUND (continued)
Malaysia DiGi.Com Bhd 142,300 MYR 179,023 178,972 0.17Petronas Dagangan Bhd 14,400 MYR 72,099 83,378 0.08Petronas Gas Bhd 21,000 MYR 105,792 111,028 0.11Public Bank Bhd 56,100 MYR 225,376 241,987 0.24Telekom Malaysia Bhd 77,800 MYR 119,486 122,856 0.12Tenaga Nasional Bhd 44,100 MYR 121,209 136,814 0.13
822,985 875,035 0.85
Netherlands RELX NV 33,977 EUR 550,132 574,596 0.56
New Zealand Fisher & Paykel Healthcare Corp Ltd 26,950 NZD 123,162 164,409 0.16Ryman Healthcare Ltd 19,989 NZD 93,808 116,462 0.11
216,970 280,871 0.27
Norway Orkla ASA 39,752 NOK 299,286 315,841 0.31
Philippines Aboitiz Equity Ventures Inc 107,010 PHP 129,673 131,787 0.13BDO Unibank Inc 68,990 PHP 155,090 153,946 0.15Philippine Long Distance Telephone Co 3,645 PHP 170,123 159,573 0.15
454,886 445,306 0.43
Qatar Qatar National Bank 5,413 QAR 277,064 260,091 0.25
Singapore Singapore Post Ltd 79,700 SGD 95,332 92,304 0.09Singapore Press Holdings Ltd 77,100 SGD 206,620 214,521 0.21Singapore Telecommunications Ltd 368,600 SGD 930,920 955,304 0.92Suntec Real Estate Investment Trust (REIT) 121,200 SGD 127,828 132,664 0.13
1,360,700 1,394,793 1.35
South Africa Vodacom Group Ltd 24,367 ZAR 245,290 239,444 0.23
South Korea E-MART Inc 1,007 KRW 197,098 162,315 0.16Hana Financial Group Inc 14,257 KRW 319,517 286,952 0.28Hyundai Glovis Co Ltd 1,048 KRW 201,127 172,499 0.17KB Financial Group Inc 18,609 KRW 557,764 526,108 0.51Korea Zinc Co Ltd 664 KRW 273,992 265,589 0.26KT Corp 6,163 KRW 159,792 148,484 0.14KT&G Corp 6,613 KRW 610,753 589,364 0.56POSCO 2,901 KRW 420,324 411,937 0.40Samsung Electronics Co Ltd 298 KRW 280,777 320,225 0.31Samsung Fire & Marine Insurance Co Ltd 1,706 KRW 417,028 447,397 0.43Samsung Life Insurance Co Ltd 5,106 KRW 432,635 479,007 0.46Shinhan Financial Group Co Ltd 22,840 KRW 805,352 770,390 0.74SK Telecom Co Ltd 1,906 KRW 426,351 350,299 0.34Woori Bank 15,961 KRW 128,882 120,060 0.12
5,231,392 5,050,626 4.88
Sweden Swedish Match AB 9,464 SEK 284,663 337,296 0.33
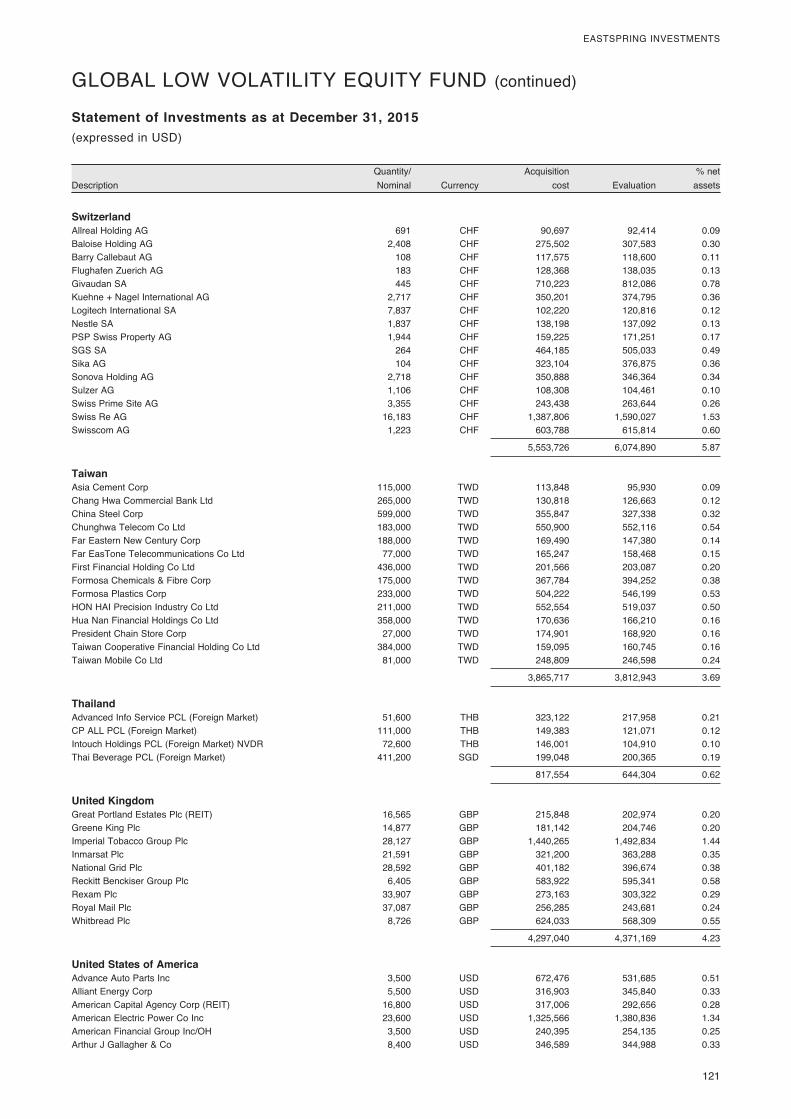
121
EASTSPRING INVESTMENTS
DescriptionQuantity/ Nominal Currency
Acquisition cost Evaluation
% net assets
Statement of Investments as at December 31, 2015(expressed in USD)
GLOBAL LOW VOLATILITY EQUITY FUND (continued)
Switzerland Allreal Holding AG 691 CHF 90,697 92,414 0.09Baloise Holding AG 2,408 CHF 275,502 307,583 0.30Barry Callebaut AG 108 CHF 117,575 118,600 0.11Flughafen Zuerich AG 183 CHF 128,368 138,035 0.13Givaudan SA 445 CHF 710,223 812,086 0.78Kuehne + Nagel International AG 2,717 CHF 350,201 374,795 0.36Logitech International SA 7,837 CHF 102,220 120,816 0.12Nestle SA 1,837 CHF 138,198 137,092 0.13PSP Swiss Property AG 1,944 CHF 159,225 171,251 0.17SGS SA 264 CHF 464,185 505,033 0.49Sika AG 104 CHF 323,104 376,875 0.36Sonova Holding AG 2,718 CHF 350,888 346,364 0.34Sulzer AG 1,106 CHF 108,308 104,461 0.10Swiss Prime Site AG 3,355 CHF 243,438 263,644 0.26Swiss Re AG 16,183 CHF 1,387,806 1,590,027 1.53Swisscom AG 1,223 CHF 603,788 615,814 0.60
5,553,726 6,074,890 5.87
Taiwan Asia Cement Corp 115,000 TWD 113,848 95,930 0.09Chang Hwa Commercial Bank Ltd 265,000 TWD 130,818 126,663 0.12China Steel Corp 599,000 TWD 355,847 327,338 0.32Chunghwa Telecom Co Ltd 183,000 TWD 550,900 552,116 0.54Far Eastern New Century Corp 188,000 TWD 169,490 147,380 0.14Far EasTone Telecommunications Co Ltd 77,000 TWD 165,247 158,468 0.15First Financial Holding Co Ltd 436,000 TWD 201,566 203,087 0.20Formosa Chemicals & Fibre Corp 175,000 TWD 367,784 394,252 0.38Formosa Plastics Corp 233,000 TWD 504,222 546,199 0.53HON HAI Precision Industry Co Ltd 211,000 TWD 552,554 519,037 0.50Hua Nan Financial Holdings Co Ltd 358,000 TWD 170,636 166,210 0.16President Chain Store Corp 27,000 TWD 174,901 168,920 0.16Taiwan Cooperative Financial Holding Co Ltd 384,000 TWD 159,095 160,745 0.16Taiwan Mobile Co Ltd 81,000 TWD 248,809 246,598 0.24
3,865,717 3,812,943 3.69
Thailand Advanced Info Service PCL (Foreign Market) 51,600 THB 323,122 217,958 0.21CP ALL PCL (Foreign Market) 111,000 THB 149,383 121,071 0.12Intouch Holdings PCL (Foreign Market) NVDR 72,600 THB 146,001 104,910 0.10Thai Beverage PCL (Foreign Market) 411,200 SGD 199,048 200,365 0.19
817,554 644,304 0.62
United Kingdom Great Portland Estates Plc (REIT) 16,565 GBP 215,848 202,974 0.20Greene King Plc 14,877 GBP 181,142 204,746 0.20Imperial Tobacco Group Plc 28,127 GBP 1,440,265 1,492,834 1.44Inmarsat Plc 21,591 GBP 321,200 363,288 0.35National Grid Plc 28,592 GBP 401,182 396,674 0.38Reckitt Benckiser Group Plc 6,405 GBP 583,922 595,341 0.58Rexam Plc 33,907 GBP 273,163 303,322 0.29Royal Mail Plc 37,087 GBP 256,285 243,681 0.24Whitbread Plc 8,726 GBP 624,033 568,309 0.55
4,297,040 4,371,169 4.23
United States of America Advance Auto Parts Inc 3,500 USD 672,476 531,685 0.51Alliant Energy Corp 5,500 USD 316,903 345,840 0.33American Capital Agency Corp (REIT) 16,800 USD 317,006 292,656 0.28American Electric Power Co Inc 23,600 USD 1,325,566 1,380,836 1.34American Financial Group Inc/OH 3,500 USD 240,395 254,135 0.25Arthur J Gallagher & Co 8,400 USD 346,589 344,988 0.33

122
EASTSPRING INVESTMENTS
DescriptionQuantity/ Nominal Currency
Acquisition cost Evaluation
% net assets
Statement of Investments as at December 31, 2015(expressed in USD)
GLOBAL LOW VOLATILITY EQUITY FUND (continued)
AT&T Inc 46,400 USD 1,510,148 1,602,656 1.55Atmos Energy Corp 4,900 USD 283,460 311,934 0.30AutoZone Inc 700 USD 515,703 522,613 0.51AvalonBay Communities Inc (REIT) 6,400 USD 1,122,161 1,185,856 1.15Becton Dickinson and Co 10,100 USD 1,335,787 1,567,369 1.52Bed Bath & Beyond Inc 8,200 USD 472,638 395,814 0.38Broadridge Financial Solutions Inc 5,700 USD 313,486 308,712 0.30Camden Property Trust (REIT) 4,200 USD 311,460 324,366 0.31Campbell Soup Co 8,700 USD 435,392 457,881 0.44CBOE Holdings Inc 4,000 USD 269,135 260,760 0.25Chimera Investment Corp (REIT) 9,900 USD 132,231 136,224 0.13Chubb Corp/The 10,900 USD 1,331,555 1,450,790 1.40Church & Dwight Co Inc 6,300 USD 528,204 540,666 0.52Cleco Corp 2,900 USD 154,154 151,090 0.15Clorox Co/The 6,200 USD 715,714 790,872 0.76CMS Energy Corp 13,300 USD 464,801 485,051 0.47Columbia Property Trust Inc (REIT) 6,000 USD 140,470 142,380 0.14Consolidated Edison Inc 14,100 USD 925,846 912,411 0.88Costco Wholesale Corp 10,300 USD 1,489,713 1,673,853 1.61DaVita HealthCare Partners Inc 8,200 USD 591,105 572,770 0.55Digital Realty Trust Inc (REIT) 6,500 USD 421,085 497,640 0.48Dollar General Corp 14,200 USD 1,014,955 1,025,524 0.99Dr Pepper Snapple Group Inc 9,200 USD 729,188 863,236 0.83Electronics For Imaging Inc 2,300 USD 98,811 108,675 0.11Equity Commonwealth (REIT) 6,300 USD 173,715 175,518 0.17Eversource Energy 15,300 USD 764,158 789,480 0.76Flowers Foods Inc 8,900 USD 223,324 191,795 0.19FNF Group 13,500 USD 486,108 467,100 0.45Foot Locker Inc 6,700 USD 476,943 437,175 0.42General Mills Inc 26,100 USD 1,462,070 1,503,882 1.45Genuine Parts Co 7,300 USD 595,101 630,428 0.61Henry Schein Inc 4,000 USD 536,628 640,480 0.62Highwoods Properties Inc (REIT) 4,500 USD 174,597 197,550 0.19Humana Inc 7,100 USD 1,279,136 1,270,545 1.23IDACORP Inc 2,400 USD 153,125 165,456 0.16Investors Bancorp Inc 17,300 USD 213,589 216,596 0.21Jack Henry & Associates Inc 3,900 USD 271,849 305,565 0.30Kilroy Realty Corp (REIT) 4,400 USD 288,872 278,960 0.27Laboratory Corp of America Holdings 4,900 USD 540,152 605,297 0.59Lancaster Colony Corp 900 USD 87,001 104,949 0.10Liberty Property Trust (REIT) 7,200 USD 227,130 225,504 0.22LKQ Corp 14,700 USD 418,277 436,590 0.42McCormick & Co Inc/MD 5,600 USD 440,828 481,208 0.47MEDNAX Inc 4,500 USD 344,467 322,515 0.31MFA Financial Inc (REIT) 17,800 USD 121,813 118,548 0.11New York Community Bancorp Inc 21,400 USD 386,891 350,532 0.34Nordstrom Inc 6,700 USD 478,820 335,737 0.32Omega Healthcare Investors Inc (REIT) 7,800 USD 275,087 274,404 0.27O'Reilly Automotive Inc 2,100 USD 529,255 539,259 0.52Panera Bread Co 'A' 1,200 USD 231,740 233,988 0.23Patterson Cos Inc 4,200 USD 181,489 190,386 0.18Paychex Inc 15,500 USD 746,543 822,895 0.80Pepco Holdings Inc 12,200 USD 297,707 316,834 0.31Philip Morris International Inc 13,100 USD 1,041,446 1,153,848 1.12Piedmont Office Realty Trust Inc (REIT) 7,300 USD 131,831 138,554 0.13Pinnacle West Capital Corp 5,300 USD 336,400 343,440 0.33Pool Corp 2,100 USD 152,599 170,604 0.17Post Properties Inc (REIT) 2,600 USD 153,113 155,194 0.15ProAssurance Corp 2,600 USD 127,620 126,698 0.12Procter & Gamble Co/The 20,600 USD 1,482,912 1,641,408 1.59Radian Group Inc 10,100 USD 160,670 134,835 0.13Realty Income Corp (REIT) 11,300 USD 535,323 586,244 0.57Republic Services Inc 11,600 USD 478,275 514,344 0.50
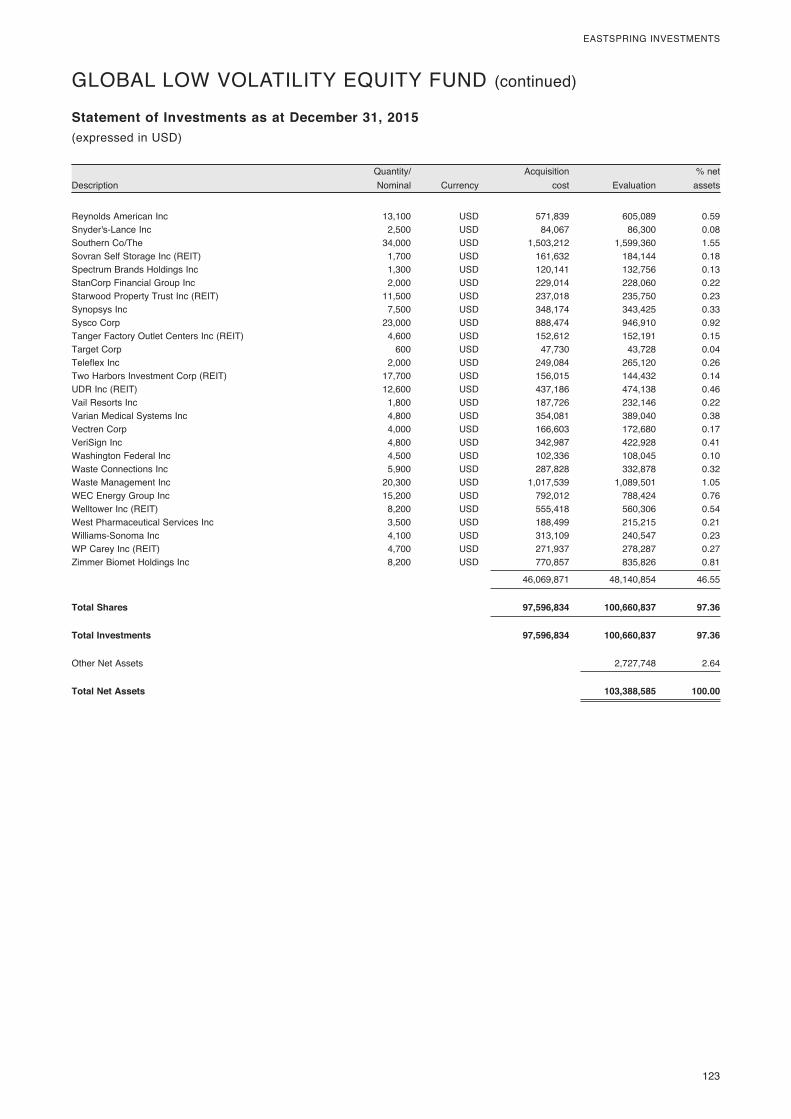
123
EASTSPRING INVESTMENTS
DescriptionQuantity/ Nominal Currency
Acquisition cost Evaluation
% net assets
Statement of Investments as at December 31, 2015(expressed in USD)
GLOBAL LOW VOLATILITY EQUITY FUND (continued)
Reynolds American Inc 13,100 USD 571,839 605,089 0.59Snyder's-Lance Inc 2,500 USD 84,067 86,300 0.08Southern Co/The 34,000 USD 1,503,212 1,599,360 1.55Sovran Self Storage Inc (REIT) 1,700 USD 161,632 184,144 0.18Spectrum Brands Holdings Inc 1,300 USD 120,141 132,756 0.13StanCorp Financial Group Inc 2,000 USD 229,014 228,060 0.22Starwood Property Trust Inc (REIT) 11,500 USD 237,018 235,750 0.23Synopsys Inc 7,500 USD 348,174 343,425 0.33Sysco Corp 23,000 USD 888,474 946,910 0.92Tanger Factory Outlet Centers Inc (REIT) 4,600 USD 152,612 152,191 0.15Target Corp 600 USD 47,730 43,728 0.04Teleflex Inc 2,000 USD 249,084 265,120 0.26Two Harbors Investment Corp (REIT) 17,700 USD 156,015 144,432 0.14UDR Inc (REIT) 12,600 USD 437,186 474,138 0.46Vail Resorts Inc 1,800 USD 187,726 232,146 0.22Varian Medical Systems Inc 4,800 USD 354,081 389,040 0.38Vectren Corp 4,000 USD 166,603 172,680 0.17VeriSign Inc 4,800 USD 342,987 422,928 0.41Washington Federal Inc 4,500 USD 102,336 108,045 0.10Waste Connections Inc 5,900 USD 287,828 332,878 0.32Waste Management Inc 20,300 USD 1,017,539 1,089,501 1.05WEC Energy Group Inc 15,200 USD 792,012 788,424 0.76Welltower Inc (REIT) 8,200 USD 555,418 560,306 0.54West Pharmaceutical Services Inc 3,500 USD 188,499 215,215 0.21Williams-Sonoma Inc 4,100 USD 313,109 240,547 0.23WP Carey Inc (REIT) 4,700 USD 271,937 278,287 0.27Zimmer Biomet Holdings Inc 8,200 USD 770,857 835,826 0.81
46,069,871 48,140,854 46.55
Total Shares 97,596,834 100,660,837 97.36
Total Investments 97,596,834 100,660,837 97.36
Other Net Assets 2,727,748 2.64
Total Net Assets 103,388,585 100.00
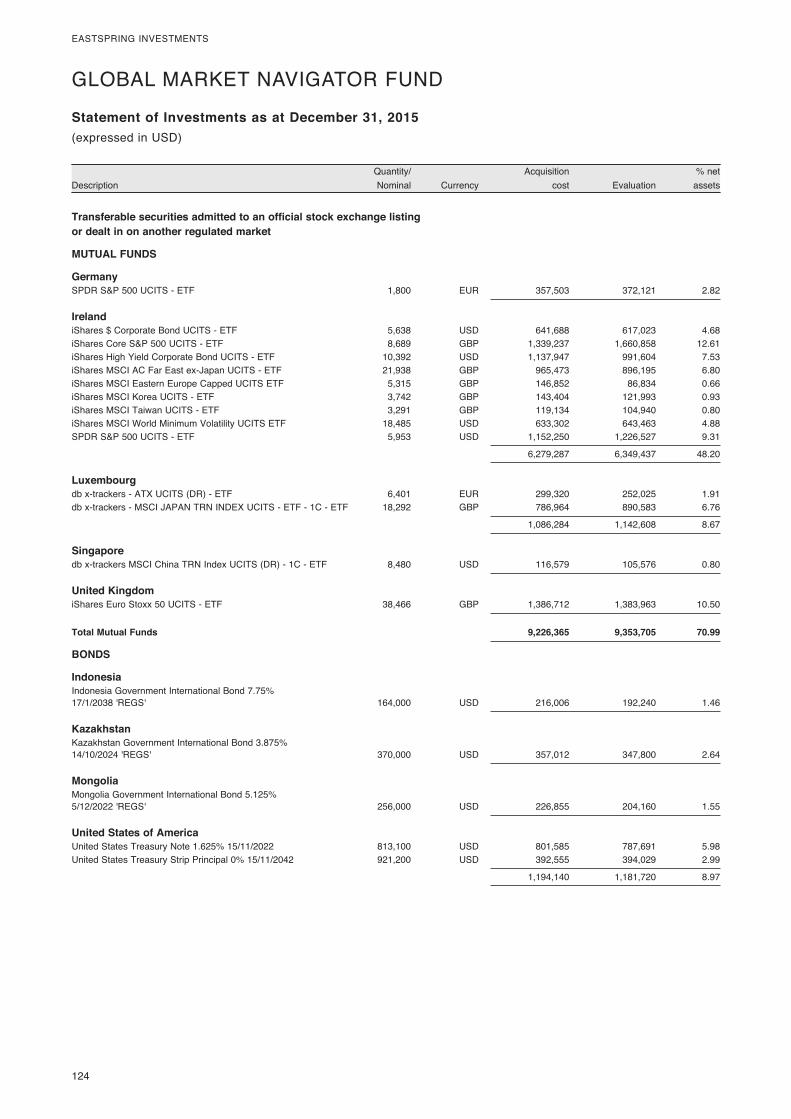
124
EASTSPRING INVESTMENTS
DescriptionQuantity/ Nominal Currency
Acquisition cost Evaluation
% net assets
Statement of Investments as at December 31, 2015
Transferable securities admitted to an official stock exchange listing or dealt in on another regulated market
MUTUAL FUNDS
Germany SPDR S&P 500 UCITS - ETF 1,800 EUR 357,503 372,121 2.82
Ireland iShares $ Corporate Bond UCITS - ETF 5,638 USD 641,688 617,023 4.68iShares Core S&P 500 UCITS - ETF 8,689 GBP 1,339,237 1,660,858 12.61iShares High Yield Corporate Bond UCITS - ETF 10,392 USD 1,137,947 991,604 7.53iShares MSCI AC Far East ex-Japan UCITS - ETF 21,938 GBP 965,473 896,195 6.80iShares MSCI Eastern Europe Capped UCITS ETF 5,315 GBP 146,852 86,834 0.66iShares MSCI Korea UCITS - ETF 3,742 GBP 143,404 121,993 0.93iShares MSCI Taiwan UCITS - ETF 3,291 GBP 119,134 104,940 0.80iShares MSCI World Minimum Volatility UCITS ETF 18,485 USD 633,302 643,463 4.88SPDR S&P 500 UCITS - ETF 5,953 USD 1,152,250 1,226,527 9.31
6,279,287 6,349,437 48.20
Luxembourg db x-trackers - ATX UCITS (DR) - ETF 6,401 EUR 299,320 252,025 1.91db x-trackers - MSCI JAPAN TRN INDEX UCITS - ETF - 1C - ETF 18,292 GBP 786,964 890,583 6.76
1,086,284 1,142,608 8.67
Singapore db x-trackers MSCI China TRN Index UCITS (DR) - 1C - ETF 8,480 USD 116,579 105,576 0.80
United Kingdom iShares Euro Stoxx 50 UCITS - ETF 38,466 GBP 1,386,712 1,383,963 10.50
Total Mutual Funds 9,226,365 9,353,705 70.99
BONDS
Indonesia Indonesia Government International Bond 7.75% 17/1/2038 'REGS' 164,000 USD 216,006 192,240 1.46
Kazakhstan Kazakhstan Government International Bond 3.875% 14/10/2024 'REGS' 370,000 USD 357,012 347,800 2.64
Mongolia Mongolia Government International Bond 5.125% 5/12/2022 'REGS' 256,000 USD 226,855 204,160 1.55
United States of America United States Treasury Note 1.625% 15/11/2022 813,100 USD 801,585 787,691 5.98United States Treasury Strip Principal 0% 15/11/2042 921,200 USD 392,555 394,029 2.99
1,194,140 1,181,720 8.97
(expressed in USD)
GLOBAL MARKET NAVIGATOR FUND
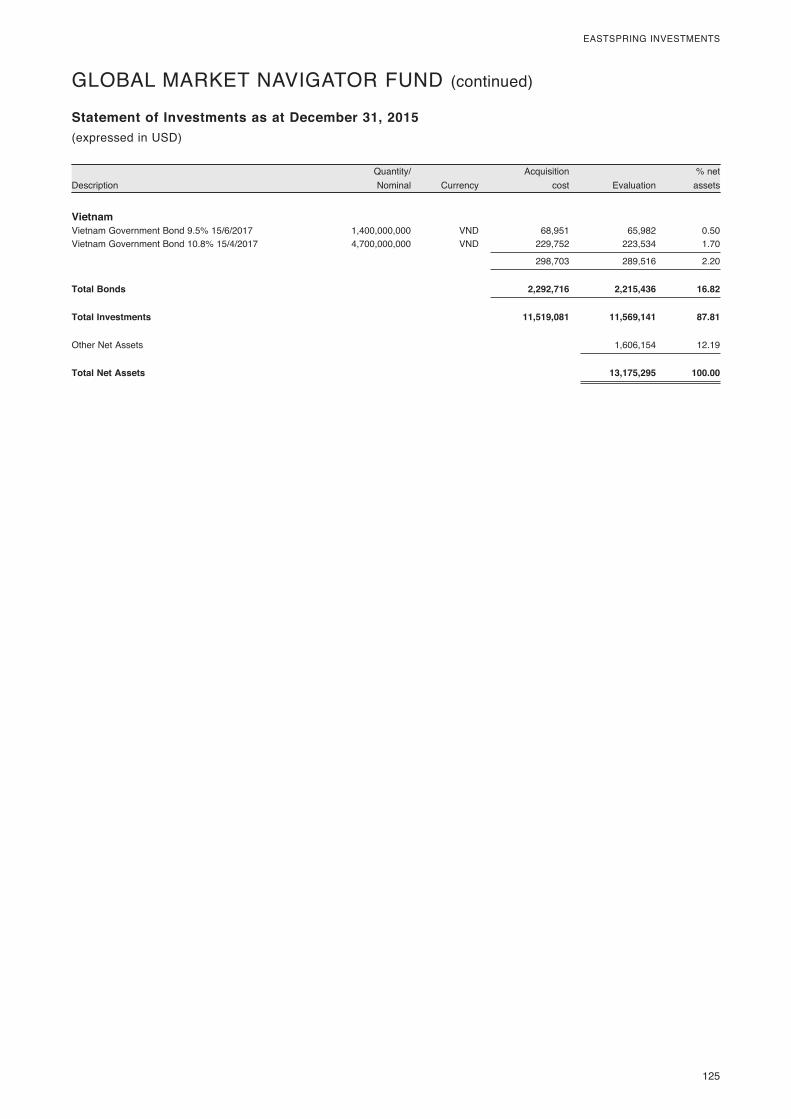
125
EASTSPRING INVESTMENTS
DescriptionQuantity/ Nominal Currency
Acquisition cost Evaluation
% net assets
Statement of Investments as at December 31, 2015(expressed in USD)
GLOBAL MARKET NAVIGATOR FUND (continued)
Vietnam Vietnam Government Bond 9.5% 15/6/2017 1,400,000,000 VND 68,951 65,982 0.50Vietnam Government Bond 10.8% 15/4/2017 4,700,000,000 VND 229,752 223,534 1.70
298,703 289,516 2.20
Total Bonds 2,292,716 2,215,436 16.82
Total Investments 11,519,081 11,569,141 87.81
Other Net Assets 1,606,154 12.19
Total Net Assets 13,175,295 100.00

126
EASTSPRING INVESTMENTS
DescriptionQuantity/ Nominal Currency
Acquisition cost Evaluation
% net assets
Statement of Investments as at December 31, 2015
Transferable securities admitted to an official stock exchange listing or dealt in on another regulated market
SHARES
Cayman Islands NetEase Inc ADR 5,955 USD 348,446 1,080,535 1.18Tencent Holdings Ltd 128,953 HKD 1,863,604 2,537,127 2.79Vipshop Holdings Ltd ADR 37,046 USD 846,272 565,322 0.62YY Inc ADR 9,299 USD 600,773 586,023 0.64
3,659,095 4,769,007 5.23
France Criteo SA ADR 11,802 USD 508,392 465,117 0.51Orange SA 27,872 EUR 473,034 469,684 0.51
981,426 934,801 1.02
Germany Deutsche Telekom AG 50,316 EUR 873,618 913,880 1.00Siltronic AG 8,141 EUR 274,159 200,134 0.22
1,147,777 1,114,014 1.22
Israel Check Point Software Technologies Ltd 11,601 USD 951,728 952,326 1.04
Japan Alps Electric Co Ltd 15,200 JPY 228,244 418,853 0.46
Netherlands ASM International NV 13,942 EUR 572,935 548,631 0.60NXP Semiconductors NV 15,311 USD 1,091,219 1,298,679 1.43
1,664,154 1,847,310 2.03
Singapore Avago Technologies Ltd 'A' 11,704 USD 1,029,859 1,704,571 1.87
South Korea Samsung Electronics Co Ltd 2,537 KRW 2,620,962 2,726,212 2.99Samsung Electronics Co Ltd - Pref 510 KRW 419,112 474,530 0.52SK Hynix Inc 32,225 KRW 1,252,854 845,097 0.93Wonik IPS Co Ltd 60,191 KRW 630,459 582,634 0.64
4,923,387 4,628,473 5.08
Sweden Telefonaktiebolaget LM Ericsson 'B' 19,398 SEK 200,370 189,532 0.21
Taiwan Taiwan Semiconductor Manufacturing Co Ltd 161,169 TWD 510,710 701,653 0.77
United Kingdom BT Group Plc 76,159 GBP 491,982 531,624 0.58Computacenter Plc 32,517 GBP 174,659 409,985 0.45Just Eat Plc 101,872 GBP 660,605 744,279 0.82Rightmove Plc 12,312 GBP 112,575 751,571 0.82
1,439,821 2,437,459 2.67
United States of America Activision Blizzard Inc 43,996 USD 991,855 1,707,925 1.87Adobe Systems Inc 16,724 USD 1,442,796 1,583,261 1.74Alphabet Inc 'A' 5,002 USD 2,035,338 3,929,771 4.31Alphabet Inc 'C' 6,750 USD 2,403,173 5,181,840 5.68Amazon.com Inc 2,592 USD 972,225 1,779,304 1.95
(expressed in USD)
GLOBAL TECHNOLOGY FUND
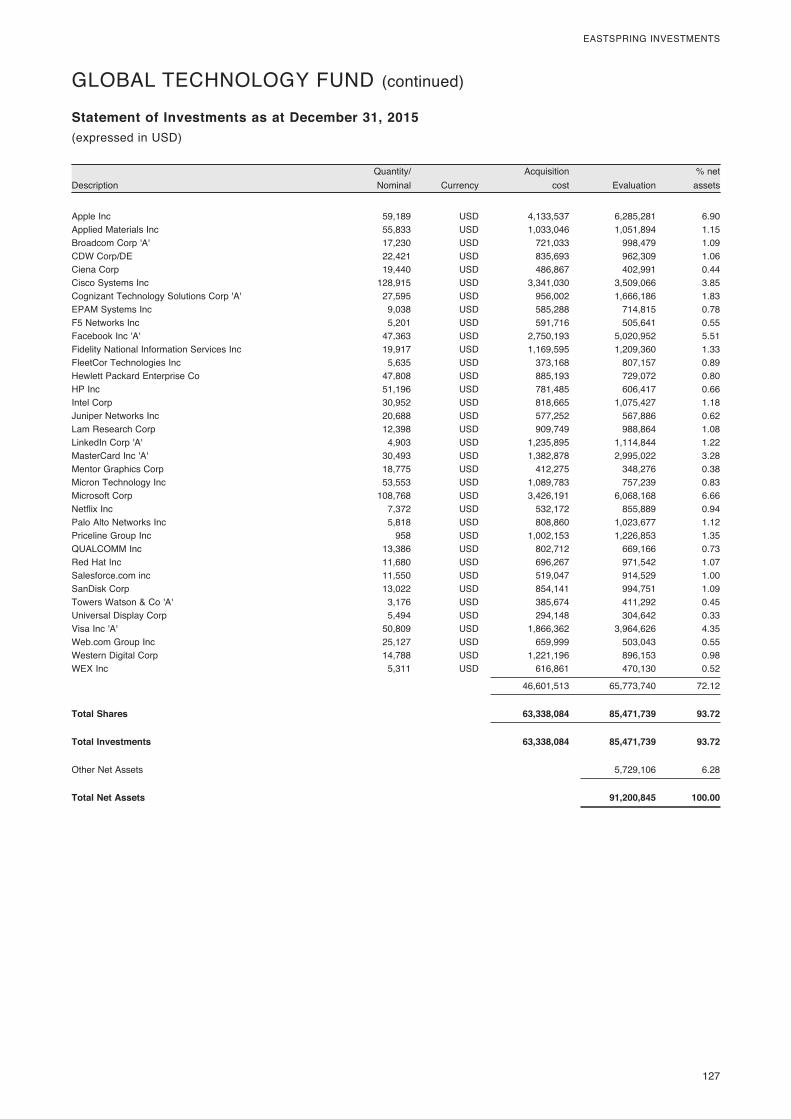
127
EASTSPRING INVESTMENTS
DescriptionQuantity/ Nominal Currency
Acquisition cost Evaluation
% net assets
Statement of Investments as at December 31, 2015(expressed in USD)
GLOBAL TECHNOLOGY FUND (continued)
Apple Inc 59,189 USD 4,133,537 6,285,281 6.90Applied Materials Inc 55,833 USD 1,033,046 1,051,894 1.15Broadcom Corp 'A' 17,230 USD 721,033 998,479 1.09CDW Corp/DE 22,421 USD 835,693 962,309 1.06Ciena Corp 19,440 USD 486,867 402,991 0.44Cisco Systems Inc 128,915 USD 3,341,030 3,509,066 3.85Cognizant Technology Solutions Corp 'A' 27,595 USD 956,002 1,666,186 1.83EPAM Systems Inc 9,038 USD 585,288 714,815 0.78F5 Networks Inc 5,201 USD 591,716 505,641 0.55Facebook Inc 'A' 47,363 USD 2,750,193 5,020,952 5.51Fidelity National Information Services Inc 19,917 USD 1,169,595 1,209,360 1.33FleetCor Technologies Inc 5,635 USD 373,168 807,157 0.89Hewlett Packard Enterprise Co 47,808 USD 885,193 729,072 0.80HP Inc 51,196 USD 781,485 606,417 0.66Intel Corp 30,952 USD 818,665 1,075,427 1.18Juniper Networks Inc 20,688 USD 577,252 567,886 0.62Lam Research Corp 12,398 USD 909,749 988,864 1.08LinkedIn Corp 'A' 4,903 USD 1,235,895 1,114,844 1.22MasterCard Inc 'A' 30,493 USD 1,382,878 2,995,022 3.28Mentor Graphics Corp 18,775 USD 412,275 348,276 0.38Micron Technology Inc 53,553 USD 1,089,783 757,239 0.83Microsoft Corp 108,768 USD 3,426,191 6,068,168 6.66Netflix Inc 7,372 USD 532,172 855,889 0.94Palo Alto Networks Inc 5,818 USD 808,860 1,023,677 1.12Priceline Group Inc 958 USD 1,002,153 1,226,853 1.35QUALCOMM Inc 13,386 USD 802,712 669,166 0.73Red Hat Inc 11,680 USD 696,267 971,542 1.07Salesforce.com inc 11,550 USD 519,047 914,529 1.00SanDisk Corp 13,022 USD 854,141 994,751 1.09Towers Watson & Co 'A' 3,176 USD 385,674 411,292 0.45Universal Display Corp 5,494 USD 294,148 304,642 0.33Visa Inc 'A' 50,809 USD 1,866,362 3,964,626 4.35Web.com Group Inc 25,127 USD 659,999 503,043 0.55Western Digital Corp 14,788 USD 1,221,196 896,153 0.98WEX Inc 5,311 USD 616,861 470,130 0.52
46,601,513 65,773,740 72.12
Total Shares 63,338,084 85,471,739 93.72
Total Investments 63,338,084 85,471,739 93.72
Other Net Assets 5,729,106 6.28
Total Net Assets 91,200,845 100.00
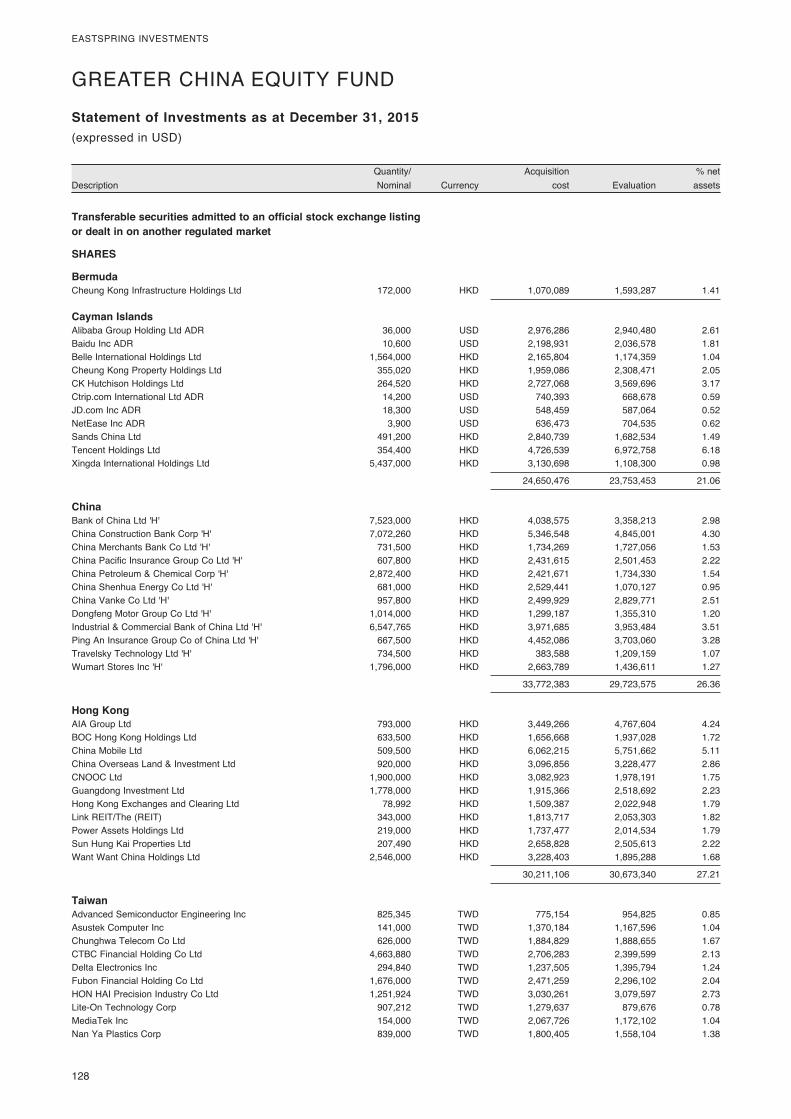
128
EASTSPRING INVESTMENTS
DescriptionQuantity/ Nominal Currency
Acquisition cost Evaluation
% net assets
Statement of Investments as at December 31, 2015
Transferable securities admitted to an official stock exchange listing or dealt in on another regulated market
SHARES
Bermuda Cheung Kong Infrastructure Holdings Ltd 172,000 HKD 1,070,089 1,593,287 1.41
Cayman Islands Alibaba Group Holding Ltd ADR 36,000 USD 2,976,286 2,940,480 2.61Baidu Inc ADR 10,600 USD 2,198,931 2,036,578 1.81Belle International Holdings Ltd 1,564,000 HKD 2,165,804 1,174,359 1.04Cheung Kong Property Holdings Ltd 355,020 HKD 1,959,086 2,308,471 2.05CK Hutchison Holdings Ltd 264,520 HKD 2,727,068 3,569,696 3.17Ctrip.com International Ltd ADR 14,200 USD 740,393 668,678 0.59JD.com Inc ADR 18,300 USD 548,459 587,064 0.52NetEase Inc ADR 3,900 USD 636,473 704,535 0.62Sands China Ltd 491,200 HKD 2,840,739 1,682,534 1.49Tencent Holdings Ltd 354,400 HKD 4,726,539 6,972,758 6.18Xingda International Holdings Ltd 5,437,000 HKD 3,130,698 1,108,300 0.98
24,650,476 23,753,453 21.06
China Bank of China Ltd 'H' 7,523,000 HKD 4,038,575 3,358,213 2.98China Construction Bank Corp 'H' 7,072,260 HKD 5,346,548 4,845,001 4.30China Merchants Bank Co Ltd 'H' 731,500 HKD 1,734,269 1,727,056 1.53China Pacific Insurance Group Co Ltd 'H' 607,800 HKD 2,431,615 2,501,453 2.22China Petroleum & Chemical Corp 'H' 2,872,400 HKD 2,421,671 1,734,330 1.54China Shenhua Energy Co Ltd 'H' 681,000 HKD 2,529,441 1,070,127 0.95China Vanke Co Ltd 'H' 957,800 HKD 2,499,929 2,829,771 2.51Dongfeng Motor Group Co Ltd 'H' 1,014,000 HKD 1,299,187 1,355,310 1.20Industrial & Commercial Bank of China Ltd 'H' 6,547,765 HKD 3,971,685 3,953,484 3.51Ping An Insurance Group Co of China Ltd 'H' 667,500 HKD 4,452,086 3,703,060 3.28Travelsky Technology Ltd 'H' 734,500 HKD 383,588 1,209,159 1.07Wumart Stores Inc 'H' 1,796,000 HKD 2,663,789 1,436,611 1.27
33,772,383 29,723,575 26.36
Hong Kong AIA Group Ltd 793,000 HKD 3,449,266 4,767,604 4.24BOC Hong Kong Holdings Ltd 633,500 HKD 1,656,668 1,937,028 1.72China Mobile Ltd 509,500 HKD 6,062,215 5,751,662 5.11China Overseas Land & Investment Ltd 920,000 HKD 3,096,856 3,228,477 2.86CNOOC Ltd 1,900,000 HKD 3,082,923 1,978,191 1.75Guangdong Investment Ltd 1,778,000 HKD 1,915,366 2,518,692 2.23Hong Kong Exchanges and Clearing Ltd 78,992 HKD 1,509,387 2,022,948 1.79Link REIT/The (REIT) 343,000 HKD 1,813,717 2,053,303 1.82Power Assets Holdings Ltd 219,000 HKD 1,737,477 2,014,534 1.79Sun Hung Kai Properties Ltd 207,490 HKD 2,658,828 2,505,613 2.22Want Want China Holdings Ltd 2,546,000 HKD 3,228,403 1,895,288 1.68
30,211,106 30,673,340 27.21
Taiwan Advanced Semiconductor Engineering Inc 825,345 TWD 775,154 954,825 0.85Asustek Computer Inc 141,000 TWD 1,370,184 1,167,596 1.04Chunghwa Telecom Co Ltd 626,000 TWD 1,884,829 1,888,655 1.67CTBC Financial Holding Co Ltd 4,663,880 TWD 2,706,283 2,399,599 2.13Delta Electronics Inc 294,840 TWD 1,237,505 1,395,794 1.24Fubon Financial Holding Co Ltd 1,676,000 TWD 2,471,259 2,296,102 2.04HON HAI Precision Industry Co Ltd 1,251,924 TWD 3,030,261 3,079,597 2.73Lite-On Technology Corp 907,212 TWD 1,279,637 879,676 0.78MediaTek Inc 154,000 TWD 2,067,726 1,172,102 1.04Nan Ya Plastics Corp 839,000 TWD 1,800,405 1,558,104 1.38
(expressed in USD)
GREATER CHINA EQUITY FUND
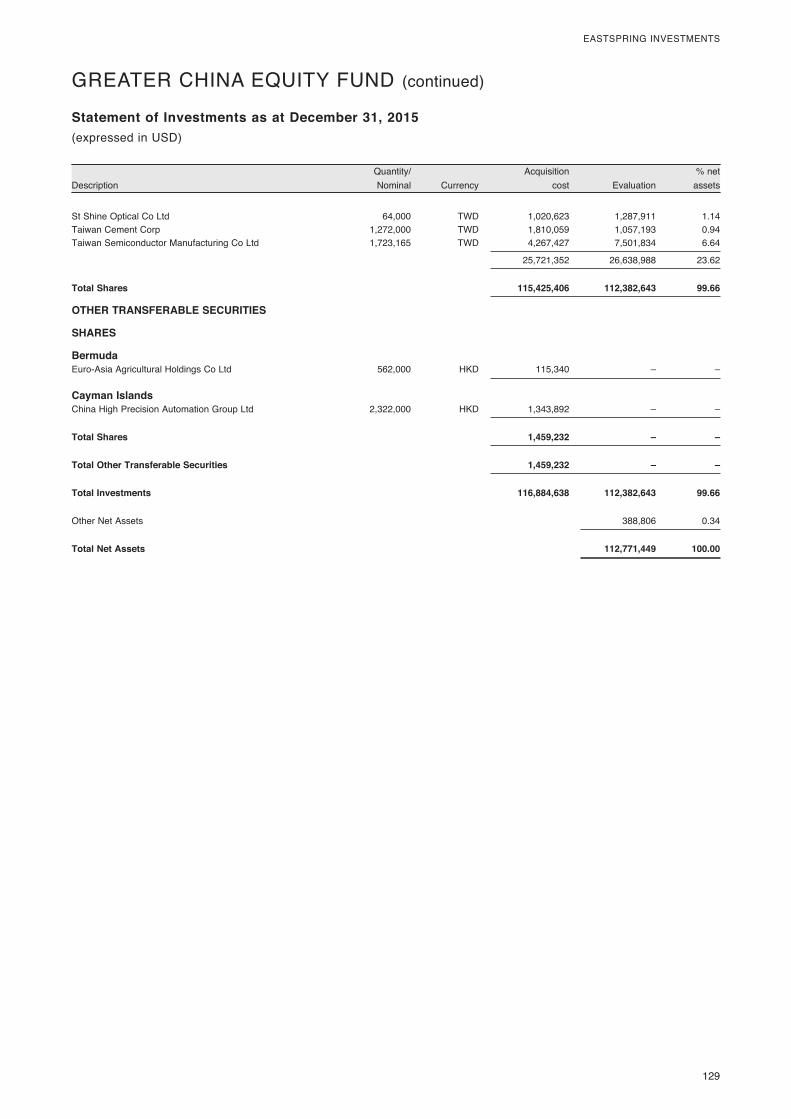
129
EASTSPRING INVESTMENTS
DescriptionQuantity/ Nominal Currency
Acquisition cost Evaluation
% net assets
Statement of Investments as at December 31, 2015(expressed in USD)
GREATER CHINA EQUITY FUND (continued)
St Shine Optical Co Ltd 64,000 TWD 1,020,623 1,287,911 1.14Taiwan Cement Corp 1,272,000 TWD 1,810,059 1,057,193 0.94Taiwan Semiconductor Manufacturing Co Ltd 1,723,165 TWD 4,267,427 7,501,834 6.64
25,721,352 26,638,988 23.62
Total Shares 115,425,406 112,382,643 99.66
OTHER TRANSFERABLE SECURITIES
SHARES
Bermuda Euro-Asia Agricultural Holdings Co Ltd 562,000 HKD 115,340 – –
Cayman Islands China High Precision Automation Group Ltd 2,322,000 HKD 1,343,892 – –
Total Shares 1,459,232 – –
Total Other Transferable Securities 1,459,232 – –
Total Investments 116,884,638 112,382,643 99.66
Other Net Assets 388,806 0.34
Total Net Assets 112,771,449 100.00
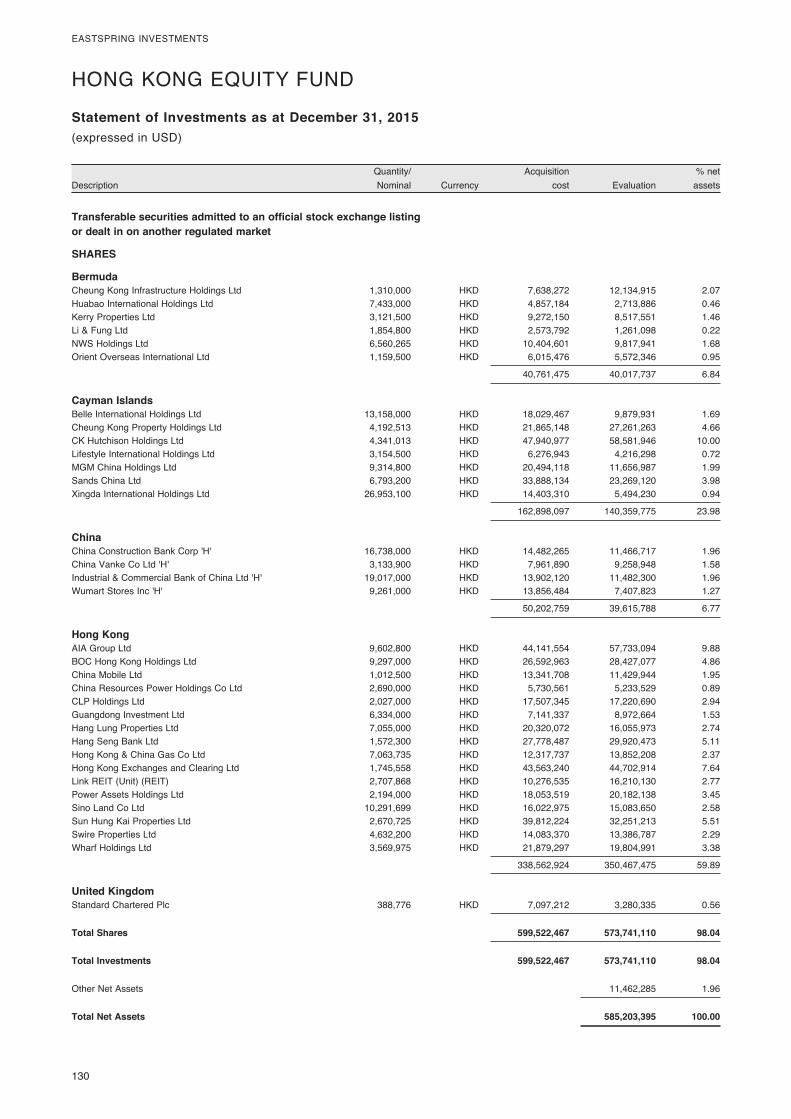
130
EASTSPRING INVESTMENTS
DescriptionQuantity/ Nominal Currency
Acquisition cost Evaluation
% net assets
Statement of Investments as at December 31, 2015
Transferable securities admitted to an official stock exchange listing or dealt in on another regulated market
SHARES
Bermuda Cheung Kong Infrastructure Holdings Ltd 1,310,000 HKD 7,638,272 12,134,915 2.07Huabao International Holdings Ltd 7,433,000 HKD 4,857,184 2,713,886 0.46Kerry Properties Ltd 3,121,500 HKD 9,272,150 8,517,551 1.46Li & Fung Ltd 1,854,800 HKD 2,573,792 1,261,098 0.22NWS Holdings Ltd 6,560,265 HKD 10,404,601 9,817,941 1.68Orient Overseas International Ltd 1,159,500 HKD 6,015,476 5,572,346 0.95
40,761,475 40,017,737 6.84
Cayman Islands Belle International Holdings Ltd 13,158,000 HKD 18,029,467 9,879,931 1.69Cheung Kong Property Holdings Ltd 4,192,513 HKD 21,865,148 27,261,263 4.66CK Hutchison Holdings Ltd 4,341,013 HKD 47,940,977 58,581,946 10.00Lifestyle International Holdings Ltd 3,154,500 HKD 6,276,943 4,216,298 0.72MGM China Holdings Ltd 9,314,800 HKD 20,494,118 11,656,987 1.99Sands China Ltd 6,793,200 HKD 33,888,134 23,269,120 3.98Xingda International Holdings Ltd 26,953,100 HKD 14,403,310 5,494,230 0.94
162,898,097 140,359,775 23.98
China China Construction Bank Corp 'H' 16,738,000 HKD 14,482,265 11,466,717 1.96China Vanke Co Ltd 'H' 3,133,900 HKD 7,961,890 9,258,948 1.58Industrial & Commercial Bank of China Ltd 'H' 19,017,000 HKD 13,902,120 11,482,300 1.96Wumart Stores Inc 'H' 9,261,000 HKD 13,856,484 7,407,823 1.27
50,202,759 39,615,788 6.77
Hong Kong AIA Group Ltd 9,602,800 HKD 44,141,554 57,733,094 9.88BOC Hong Kong Holdings Ltd 9,297,000 HKD 26,592,963 28,427,077 4.86China Mobile Ltd 1,012,500 HKD 13,341,708 11,429,944 1.95China Resources Power Holdings Co Ltd 2,690,000 HKD 5,730,561 5,233,529 0.89CLP Holdings Ltd 2,027,000 HKD 17,507,345 17,220,690 2.94Guangdong Investment Ltd 6,334,000 HKD 7,141,337 8,972,664 1.53Hang Lung Properties Ltd 7,055,000 HKD 20,320,072 16,055,973 2.74Hang Seng Bank Ltd 1,572,300 HKD 27,778,487 29,920,473 5.11Hong Kong & China Gas Co Ltd 7,063,735 HKD 12,317,737 13,852,208 2.37Hong Kong Exchanges and Clearing Ltd 1,745,558 HKD 43,563,240 44,702,914 7.64Link REIT (Unit) (REIT) 2,707,868 HKD 10,276,535 16,210,130 2.77Power Assets Holdings Ltd 2,194,000 HKD 18,053,519 20,182,138 3.45Sino Land Co Ltd 10,291,699 HKD 16,022,975 15,083,650 2.58Sun Hung Kai Properties Ltd 2,670,725 HKD 39,812,224 32,251,213 5.51Swire Properties Ltd 4,632,200 HKD 14,083,370 13,386,787 2.29Wharf Holdings Ltd 3,569,975 HKD 21,879,297 19,804,991 3.38
338,562,924 350,467,475 59.89
United Kingdom Standard Chartered Plc 388,776 HKD 7,097,212 3,280,335 0.56
Total Shares 599,522,467 573,741,110 98.04
Total Investments 599,522,467 573,741,110 98.04
Other Net Assets 11,462,285 1.96
Total Net Assets 585,203,395 100.00
(expressed in USD)
HONG KONG EQUITY FUND
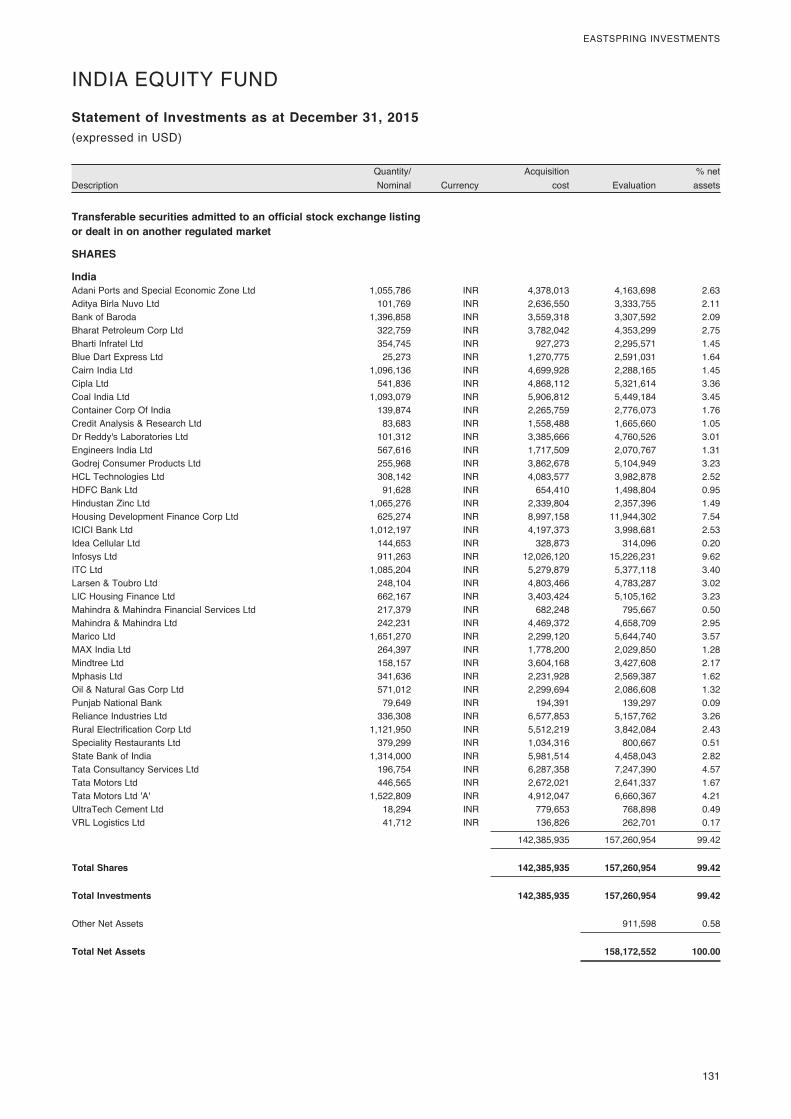
131
EASTSPRING INVESTMENTS
DescriptionQuantity/ Nominal Currency
Acquisition cost Evaluation
% net assets
Statement of Investments as at December 31, 2015
Transferable securities admitted to an official stock exchange listing or dealt in on another regulated market
SHARES
India Adani Ports and Special Economic Zone Ltd 1,055,786 INR 4,378,013 4,163,698 2.63Aditya Birla Nuvo Ltd 101,769 INR 2,636,550 3,333,755 2.11Bank of Baroda 1,396,858 INR 3,559,318 3,307,592 2.09Bharat Petroleum Corp Ltd 322,759 INR 3,782,042 4,353,299 2.75Bharti Infratel Ltd 354,745 INR 927,273 2,295,571 1.45Blue Dart Express Ltd 25,273 INR 1,270,775 2,591,031 1.64Cairn India Ltd 1,096,136 INR 4,699,928 2,288,165 1.45Cipla Ltd 541,836 INR 4,868,112 5,321,614 3.36Coal India Ltd 1,093,079 INR 5,906,812 5,449,184 3.45Container Corp Of India 139,874 INR 2,265,759 2,776,073 1.76Credit Analysis & Research Ltd 83,683 INR 1,558,488 1,665,660 1.05Dr Reddy's Laboratories Ltd 101,312 INR 3,385,666 4,760,526 3.01Engineers India Ltd 567,616 INR 1,717,509 2,070,767 1.31Godrej Consumer Products Ltd 255,968 INR 3,862,678 5,104,949 3.23HCL Technologies Ltd 308,142 INR 4,083,577 3,982,878 2.52HDFC Bank Ltd 91,628 INR 654,410 1,498,804 0.95Hindustan Zinc Ltd 1,065,276 INR 2,339,804 2,357,396 1.49Housing Development Finance Corp Ltd 625,274 INR 8,997,158 11,944,302 7.54ICICI Bank Ltd 1,012,197 INR 4,197,373 3,998,681 2.53Idea Cellular Ltd 144,653 INR 328,873 314,096 0.20Infosys Ltd 911,263 INR 12,026,120 15,226,231 9.62ITC Ltd 1,085,204 INR 5,279,879 5,377,118 3.40Larsen & Toubro Ltd 248,104 INR 4,803,466 4,783,287 3.02LIC Housing Finance Ltd 662,167 INR 3,403,424 5,105,162 3.23Mahindra & Mahindra Financial Services Ltd 217,379 INR 682,248 795,667 0.50Mahindra & Mahindra Ltd 242,231 INR 4,469,372 4,658,709 2.95Marico Ltd 1,651,270 INR 2,299,120 5,644,740 3.57MAX India Ltd 264,397 INR 1,778,200 2,029,850 1.28Mindtree Ltd 158,157 INR 3,604,168 3,427,608 2.17Mphasis Ltd 341,636 INR 2,231,928 2,569,387 1.62Oil & Natural Gas Corp Ltd 571,012 INR 2,299,694 2,086,608 1.32Punjab National Bank 79,649 INR 194,391 139,297 0.09Reliance Industries Ltd 336,308 INR 6,577,853 5,157,762 3.26Rural Electrification Corp Ltd 1,121,950 INR 5,512,219 3,842,084 2.43Speciality Restaurants Ltd 379,299 INR 1,034,316 800,667 0.51State Bank of India 1,314,000 INR 5,981,514 4,458,043 2.82Tata Consultancy Services Ltd 196,754 INR 6,287,358 7,247,390 4.57Tata Motors Ltd 446,565 INR 2,672,021 2,641,337 1.67Tata Motors Ltd 'A' 1,522,809 INR 4,912,047 6,660,367 4.21UltraTech Cement Ltd 18,294 INR 779,653 768,898 0.49VRL Logistics Ltd 41,712 INR 136,826 262,701 0.17
142,385,935 157,260,954 99.42
Total Shares 142,385,935 157,260,954 99.42
Total Investments 142,385,935 157,260,954 99.42
Other Net Assets 911,598 0.58
Total Net Assets 158,172,552 100.00
(expressed in USD)
INDIA EQUITY FUND
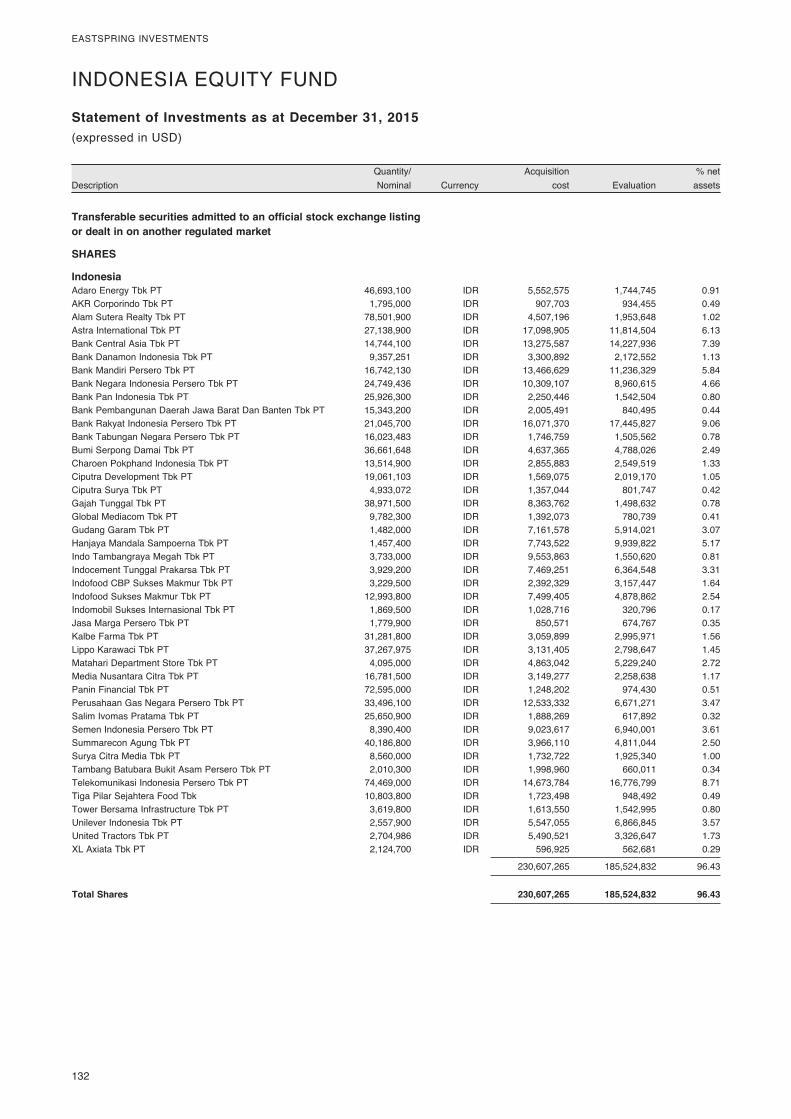
132
EASTSPRING INVESTMENTS
DescriptionQuantity/ Nominal Currency
Acquisition cost Evaluation
% net assets
Statement of Investments as at December 31, 2015
Transferable securities admitted to an official stock exchange listing or dealt in on another regulated market
SHARES
Indonesia Adaro Energy Tbk PT 46,693,100 IDR 5,552,575 1,744,745 0.91AKR Corporindo Tbk PT 1,795,000 IDR 907,703 934,455 0.49Alam Sutera Realty Tbk PT 78,501,900 IDR 4,507,196 1,953,648 1.02Astra International Tbk PT 27,138,900 IDR 17,098,905 11,814,504 6.13Bank Central Asia Tbk PT 14,744,100 IDR 13,275,587 14,227,936 7.39Bank Danamon Indonesia Tbk PT 9,357,251 IDR 3,300,892 2,172,552 1.13Bank Mandiri Persero Tbk PT 16,742,130 IDR 13,466,629 11,236,329 5.84Bank Negara Indonesia Persero Tbk PT 24,749,436 IDR 10,309,107 8,960,615 4.66Bank Pan Indonesia Tbk PT 25,926,300 IDR 2,250,446 1,542,504 0.80Bank Pembangunan Daerah Jawa Barat Dan Banten Tbk PT 15,343,200 IDR 2,005,491 840,495 0.44Bank Rakyat Indonesia Persero Tbk PT 21,045,700 IDR 16,071,370 17,445,827 9.06Bank Tabungan Negara Persero Tbk PT 16,023,483 IDR 1,746,759 1,505,562 0.78Bumi Serpong Damai Tbk PT 36,661,648 IDR 4,637,365 4,788,026 2.49Charoen Pokphand Indonesia Tbk PT 13,514,900 IDR 2,855,883 2,549,519 1.33Ciputra Development Tbk PT 19,061,103 IDR 1,569,075 2,019,170 1.05Ciputra Surya Tbk PT 4,933,072 IDR 1,357,044 801,747 0.42Gajah Tunggal Tbk PT 38,971,500 IDR 8,363,762 1,498,632 0.78Global Mediacom Tbk PT 9,782,300 IDR 1,392,073 780,739 0.41Gudang Garam Tbk PT 1,482,000 IDR 7,161,578 5,914,021 3.07Hanjaya Mandala Sampoerna Tbk PT 1,457,400 IDR 7,743,522 9,939,822 5.17Indo Tambangraya Megah Tbk PT 3,733,000 IDR 9,553,863 1,550,620 0.81Indocement Tunggal Prakarsa Tbk PT 3,929,200 IDR 7,469,251 6,364,548 3.31Indofood CBP Sukses Makmur Tbk PT 3,229,500 IDR 2,392,329 3,157,447 1.64Indofood Sukses Makmur Tbk PT 12,993,800 IDR 7,499,405 4,878,862 2.54Indomobil Sukses Internasional Tbk PT 1,869,500 IDR 1,028,716 320,796 0.17Jasa Marga Persero Tbk PT 1,779,900 IDR 850,571 674,767 0.35Kalbe Farma Tbk PT 31,281,800 IDR 3,059,899 2,995,971 1.56Lippo Karawaci Tbk PT 37,267,975 IDR 3,131,405 2,798,647 1.45Matahari Department Store Tbk PT 4,095,000 IDR 4,863,042 5,229,240 2.72Media Nusantara Citra Tbk PT 16,781,500 IDR 3,149,277 2,258,638 1.17Panin Financial Tbk PT 72,595,000 IDR 1,248,202 974,430 0.51Perusahaan Gas Negara Persero Tbk PT 33,496,100 IDR 12,533,332 6,671,271 3.47Salim Ivomas Pratama Tbk PT 25,650,900 IDR 1,888,269 617,892 0.32Semen Indonesia Persero Tbk PT 8,390,400 IDR 9,023,617 6,940,001 3.61Summarecon Agung Tbk PT 40,186,800 IDR 3,966,110 4,811,044 2.50Surya Citra Media Tbk PT 8,560,000 IDR 1,732,722 1,925,340 1.00Tambang Batubara Bukit Asam Persero Tbk PT 2,010,300 IDR 1,998,960 660,011 0.34Telekomunikasi Indonesia Persero Tbk PT 74,469,000 IDR 14,673,784 16,776,799 8.71Tiga Pilar Sejahtera Food Tbk 10,803,800 IDR 1,723,498 948,492 0.49Tower Bersama Infrastructure Tbk PT 3,619,800 IDR 1,613,550 1,542,995 0.80Unilever Indonesia Tbk PT 2,557,900 IDR 5,547,055 6,866,845 3.57United Tractors Tbk PT 2,704,986 IDR 5,490,521 3,326,647 1.73XL Axiata Tbk PT 2,124,700 IDR 596,925 562,681 0.29
230,607,265 185,524,832 96.43
Total Shares 230,607,265 185,524,832 96.43
(expressed in USD)
INDONESIA EQUITY FUND
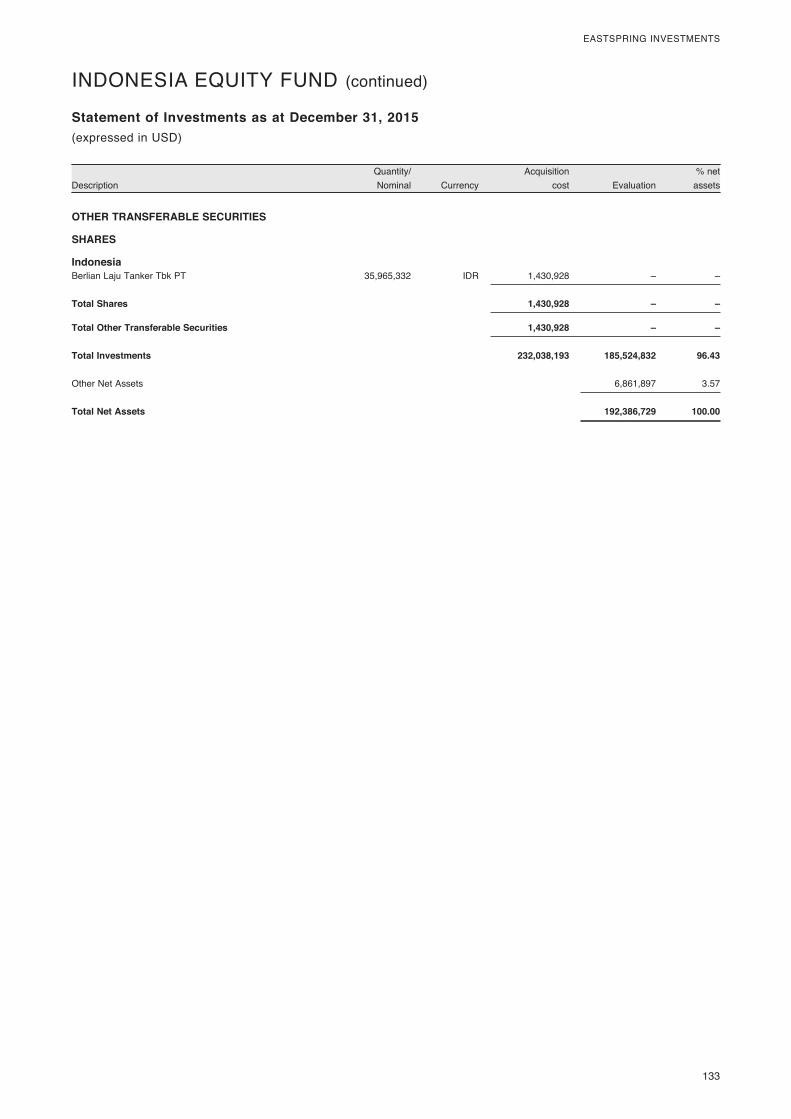
133
EASTSPRING INVESTMENTS
DescriptionQuantity/ Nominal Currency
Acquisition cost Evaluation
% net assets
Statement of Investments as at December 31, 2015(expressed in USD)
INDONESIA EQUITY FUND (continued)
OTHER TRANSFERABLE SECURITIES
SHARES
Indonesia Berlian Laju Tanker Tbk PT 35,965,332 IDR 1,430,928 – –
Total Shares 1,430,928 – –
Total Other Transferable Securities 1,430,928 – –
Total Investments 232,038,193 185,524,832 96.43
Other Net Assets 6,861,897 3.57
Total Net Assets 192,386,729 100.00
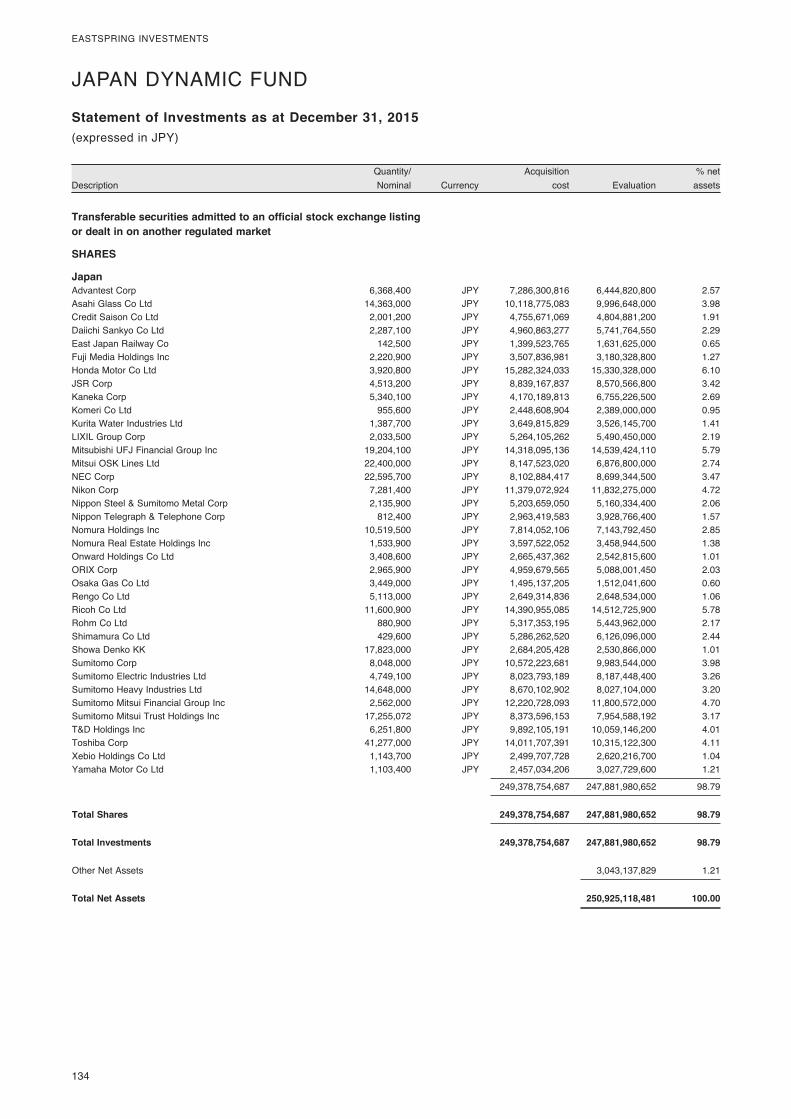
134
EASTSPRING INVESTMENTS
DescriptionQuantity/ Nominal Currency
Acquisition cost Evaluation
% net assets
Statement of Investments as at December 31, 2015
Transferable securities admitted to an official stock exchange listing or dealt in on another regulated market
SHARES
Japan Advantest Corp 6,368,400 JPY 7,286,300,816 6,444,820,800 2.57Asahi Glass Co Ltd 14,363,000 JPY 10,118,775,083 9,996,648,000 3.98Credit Saison Co Ltd 2,001,200 JPY 4,755,671,069 4,804,881,200 1.91Daiichi Sankyo Co Ltd 2,287,100 JPY 4,960,863,277 5,741,764,550 2.29East Japan Railway Co 142,500 JPY 1,399,523,765 1,631,625,000 0.65Fuji Media Holdings Inc 2,220,900 JPY 3,507,836,981 3,180,328,800 1.27Honda Motor Co Ltd 3,920,800 JPY 15,282,324,033 15,330,328,000 6.10JSR Corp 4,513,200 JPY 8,839,167,837 8,570,566,800 3.42Kaneka Corp 5,340,100 JPY 4,170,189,813 6,755,226,500 2.69Komeri Co Ltd 955,600 JPY 2,448,608,904 2,389,000,000 0.95Kurita Water Industries Ltd 1,387,700 JPY 3,649,815,829 3,526,145,700 1.41LIXIL Group Corp 2,033,500 JPY 5,264,105,262 5,490,450,000 2.19Mitsubishi UFJ Financial Group Inc 19,204,100 JPY 14,318,095,136 14,539,424,110 5.79Mitsui OSK Lines Ltd 22,400,000 JPY 8,147,523,020 6,876,800,000 2.74NEC Corp 22,595,700 JPY 8,102,884,417 8,699,344,500 3.47Nikon Corp 7,281,400 JPY 11,379,072,924 11,832,275,000 4.72Nippon Steel & Sumitomo Metal Corp 2,135,900 JPY 5,203,659,050 5,160,334,400 2.06Nippon Telegraph & Telephone Corp 812,400 JPY 2,963,419,583 3,928,766,400 1.57Nomura Holdings Inc 10,519,500 JPY 7,814,052,106 7,143,792,450 2.85Nomura Real Estate Holdings Inc 1,533,900 JPY 3,597,522,052 3,458,944,500 1.38Onward Holdings Co Ltd 3,408,600 JPY 2,665,437,362 2,542,815,600 1.01ORIX Corp 2,965,900 JPY 4,959,679,565 5,088,001,450 2.03Osaka Gas Co Ltd 3,449,000 JPY 1,495,137,205 1,512,041,600 0.60Rengo Co Ltd 5,113,000 JPY 2,649,314,836 2,648,534,000 1.06Ricoh Co Ltd 11,600,900 JPY 14,390,955,085 14,512,725,900 5.78Rohm Co Ltd 880,900 JPY 5,317,353,195 5,443,962,000 2.17Shimamura Co Ltd 429,600 JPY 5,286,262,520 6,126,096,000 2.44Showa Denko KK 17,823,000 JPY 2,684,205,428 2,530,866,000 1.01Sumitomo Corp 8,048,000 JPY 10,572,223,681 9,983,544,000 3.98Sumitomo Electric Industries Ltd 4,749,100 JPY 8,023,793,189 8,187,448,400 3.26Sumitomo Heavy Industries Ltd 14,648,000 JPY 8,670,102,902 8,027,104,000 3.20Sumitomo Mitsui Financial Group Inc 2,562,000 JPY 12,220,728,093 11,800,572,000 4.70Sumitomo Mitsui Trust Holdings Inc 17,255,072 JPY 8,373,596,153 7,954,588,192 3.17T&D Holdings Inc 6,251,800 JPY 9,892,105,191 10,059,146,200 4.01Toshiba Corp 41,277,000 JPY 14,011,707,391 10,315,122,300 4.11Xebio Holdings Co Ltd 1,143,700 JPY 2,499,707,728 2,620,216,700 1.04Yamaha Motor Co Ltd 1,103,400 JPY 2,457,034,206 3,027,729,600 1.21
249,378,754,687 247,881,980,652 98.79
Total Shares 249,378,754,687 247,881,980,652 98.79
Total Investments 249,378,754,687 247,881,980,652 98.79
Other Net Assets 3,043,137,829 1.21
Total Net Assets 250,925,118,481 100.00
(expressed in JPY)
JAPAN DYNAMIC FUND
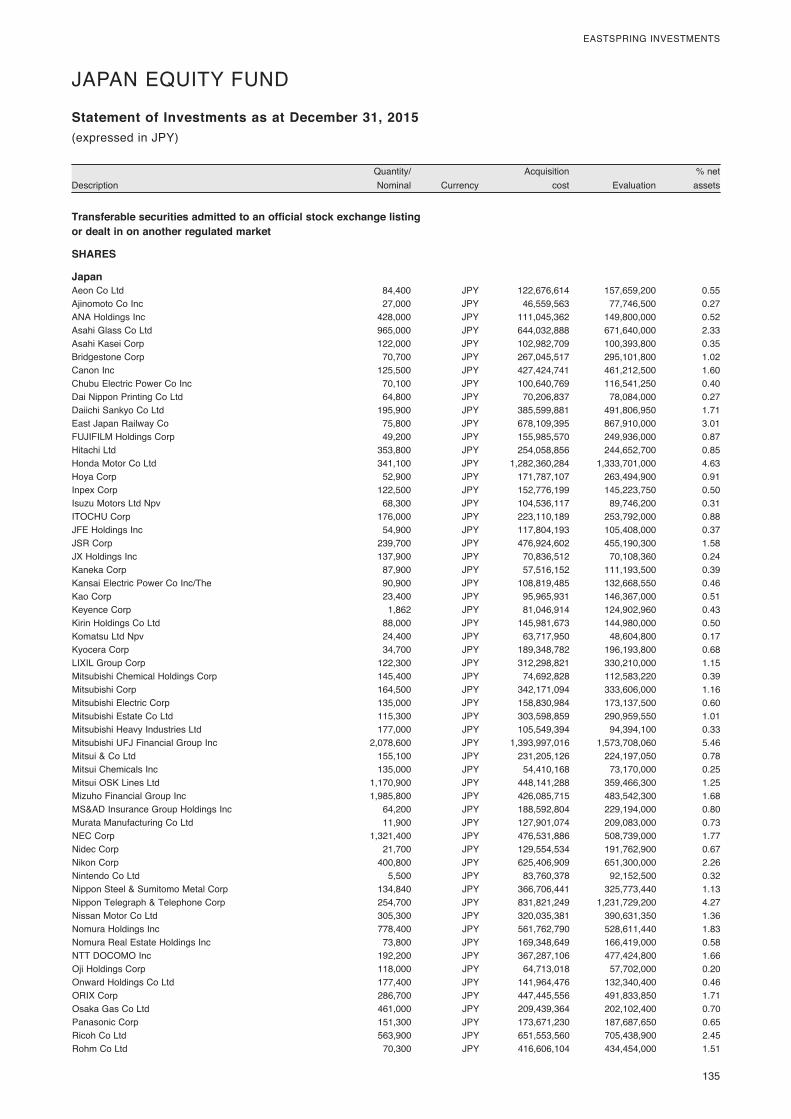
135
EASTSPRING INVESTMENTS
DescriptionQuantity/ Nominal Currency
Acquisition cost Evaluation
% net assets
Statement of Investments as at December 31, 2015
Transferable securities admitted to an official stock exchange listing or dealt in on another regulated market
SHARES
Japan Aeon Co Ltd 84,400 JPY 122,676,614 157,659,200 0.55Ajinomoto Co Inc 27,000 JPY 46,559,563 77,746,500 0.27ANA Holdings Inc 428,000 JPY 111,045,362 149,800,000 0.52Asahi Glass Co Ltd 965,000 JPY 644,032,888 671,640,000 2.33Asahi Kasei Corp 122,000 JPY 102,982,709 100,393,800 0.35Bridgestone Corp 70,700 JPY 267,045,517 295,101,800 1.02Canon Inc 125,500 JPY 427,424,741 461,212,500 1.60Chubu Electric Power Co Inc 70,100 JPY 100,640,769 116,541,250 0.40Dai Nippon Printing Co Ltd 64,800 JPY 70,206,837 78,084,000 0.27Daiichi Sankyo Co Ltd 195,900 JPY 385,599,881 491,806,950 1.71East Japan Railway Co 75,800 JPY 678,109,395 867,910,000 3.01FUJIFILM Holdings Corp 49,200 JPY 155,985,570 249,936,000 0.87Hitachi Ltd 353,800 JPY 254,058,856 244,652,700 0.85Honda Motor Co Ltd 341,100 JPY 1,282,360,284 1,333,701,000 4.63Hoya Corp 52,900 JPY 171,787,107 263,494,900 0.91Inpex Corp 122,500 JPY 152,776,199 145,223,750 0.50Isuzu Motors Ltd Npv 68,300 JPY 104,536,117 89,746,200 0.31ITOCHU Corp 176,000 JPY 223,110,189 253,792,000 0.88JFE Holdings Inc 54,900 JPY 117,804,193 105,408,000 0.37JSR Corp 239,700 JPY 476,924,602 455,190,300 1.58JX Holdings Inc 137,900 JPY 70,836,512 70,108,360 0.24Kaneka Corp 87,900 JPY 57,516,152 111,193,500 0.39Kansai Electric Power Co Inc/The 90,900 JPY 108,819,485 132,668,550 0.46Kao Corp 23,400 JPY 95,965,931 146,367,000 0.51Keyence Corp 1,862 JPY 81,046,914 124,902,960 0.43Kirin Holdings Co Ltd 88,000 JPY 145,981,673 144,980,000 0.50Komatsu Ltd Npv 24,400 JPY 63,717,950 48,604,800 0.17Kyocera Corp 34,700 JPY 189,348,782 196,193,800 0.68LIXIL Group Corp 122,300 JPY 312,298,821 330,210,000 1.15Mitsubishi Chemical Holdings Corp 145,400 JPY 74,692,828 112,583,220 0.39Mitsubishi Corp 164,500 JPY 342,171,094 333,606,000 1.16Mitsubishi Electric Corp 135,000 JPY 158,830,984 173,137,500 0.60Mitsubishi Estate Co Ltd 115,300 JPY 303,598,859 290,959,550 1.01Mitsubishi Heavy Industries Ltd 177,000 JPY 105,549,394 94,394,100 0.33Mitsubishi UFJ Financial Group Inc 2,078,600 JPY 1,393,997,016 1,573,708,060 5.46Mitsui & Co Ltd 155,100 JPY 231,205,126 224,197,050 0.78Mitsui Chemicals Inc 135,000 JPY 54,410,168 73,170,000 0.25Mitsui OSK Lines Ltd 1,170,900 JPY 448,141,288 359,466,300 1.25Mizuho Financial Group Inc 1,985,800 JPY 426,085,715 483,542,300 1.68MS&AD Insurance Group Holdings Inc 64,200 JPY 188,592,804 229,194,000 0.80Murata Manufacturing Co Ltd 11,900 JPY 127,901,074 209,083,000 0.73NEC Corp 1,321,400 JPY 476,531,886 508,739,000 1.77Nidec Corp 21,700 JPY 129,554,534 191,762,900 0.67Nikon Corp 400,800 JPY 625,406,909 651,300,000 2.26Nintendo Co Ltd 5,500 JPY 83,760,378 92,152,500 0.32Nippon Steel & Sumitomo Metal Corp 134,840 JPY 366,706,441 325,773,440 1.13Nippon Telegraph & Telephone Corp 254,700 JPY 831,821,249 1,231,729,200 4.27Nissan Motor Co Ltd 305,300 JPY 320,035,381 390,631,350 1.36Nomura Holdings Inc 778,400 JPY 561,762,790 528,611,440 1.83Nomura Real Estate Holdings Inc 73,800 JPY 169,348,649 166,419,000 0.58NTT DOCOMO Inc 192,200 JPY 367,287,106 477,424,800 1.66Oji Holdings Corp 118,000 JPY 64,713,018 57,702,000 0.20Onward Holdings Co Ltd 177,400 JPY 141,964,476 132,340,400 0.46ORIX Corp 286,700 JPY 447,445,556 491,833,850 1.71Osaka Gas Co Ltd 461,000 JPY 209,439,364 202,102,400 0.70Panasonic Corp 151,300 JPY 173,671,230 187,687,650 0.65Ricoh Co Ltd 563,900 JPY 651,553,560 705,438,900 2.45Rohm Co Ltd 70,300 JPY 416,606,104 434,454,000 1.51
(expressed in JPY)
JAPAN EQUITY FUND

136
EASTSPRING INVESTMENTS
DescriptionQuantity/ Nominal Currency
Acquisition cost Evaluation
% net assets
Statement of Investments as at December 31, 2015(expressed in JPY)
JAPAN EQUITY FUND (continued)
Secom Co Ltd 27,400 JPY 181,521,072 225,776,000 0.78Seven & i Holdings Co Ltd 76,500 JPY 323,133,150 424,575,000 1.47Shimamura Co Ltd 11,800 JPY 120,563,743 168,268,000 0.58Shin-Etsu Chemical Co Ltd 40,200 JPY 259,337,997 266,003,400 0.92SMC Corp/Japan 4,900 JPY 128,920,786 155,673,000 0.54SoftBank Group Corp 24,100 JPY 166,080,540 147,949,900 0.51Sony Corp 121,300 JPY 268,639,428 364,142,600 1.26Sumitomo Corp 516,900 JPY 684,779,699 641,214,450 2.22Sumitomo Electric Industries Ltd 388,300 JPY 623,350,539 669,429,200 2.32Sumitomo Heavy Industries Ltd 601,000 JPY 327,590,781 329,348,000 1.14Sumitomo Mitsui Financial Group Inc 256,600 JPY 1,189,238,658 1,181,899,600 4.10Sumitomo Mitsui Trust Holdings Inc 1,225,408 JPY 599,554,356 564,913,088 1.96T&D Holdings Inc 407,000 JPY 596,870,710 654,863,000 2.27Takeda Pharmaceutical Co Ltd 123,100 JPY 640,440,164 746,601,500 2.59TDK Corp 6,600 JPY 31,817,434 51,612,000 0.18Tokio Marine Holdings Inc 29,200 JPY 108,828,724 137,590,400 0.48Tokyo Electron Ltd 18,400 JPY 103,086,311 134,724,800 0.47Tokyo Gas Co Ltd 263,300 JPY 154,425,592 150,291,640 0.52Toshiba Corp 2,129,000 JPY 804,770,070 532,037,100 1.85Toyota Motor Corp 231,700 JPY 1,539,129,296 1,734,969,600 6.02
25,766,063,644 28,129,296,008 97.61
Total Shares 25,766,063,644 28,129,296,008 97.61
Total Investments 25,766,063,644 28,129,296,008 97.61
Other Net Assets 690,046,879 2.39
Total Net Assets 28,819,342,887 100.00
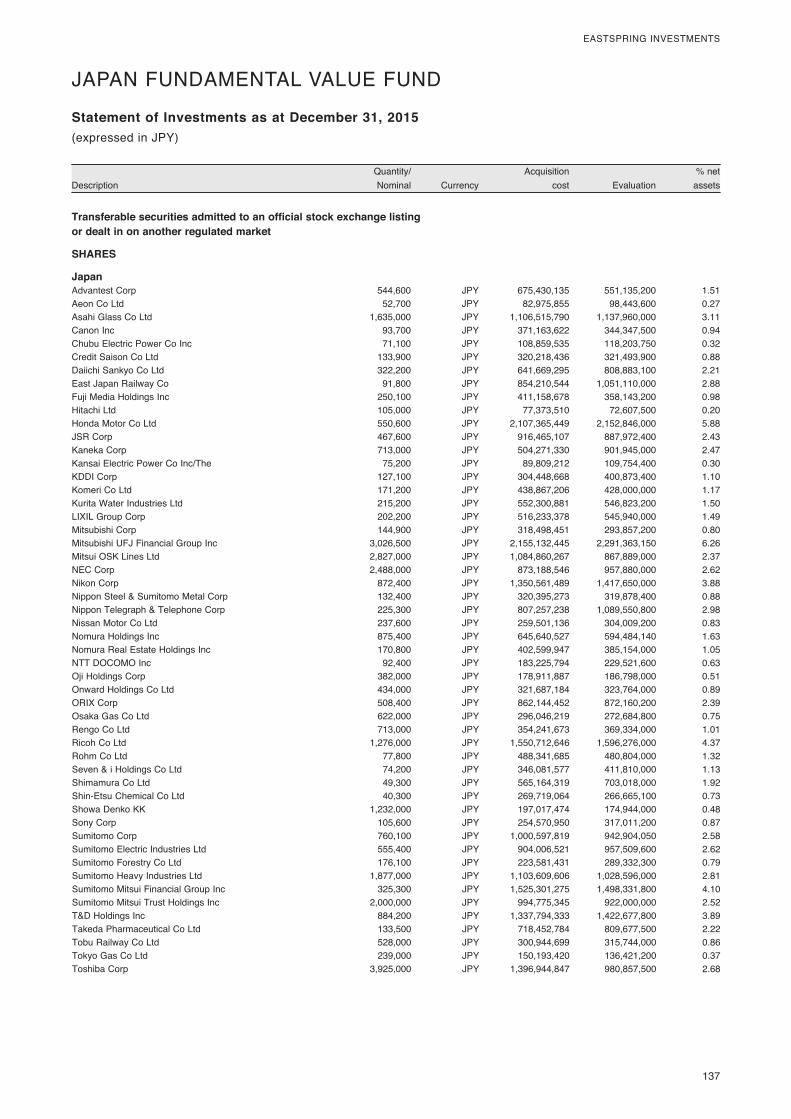
137
EASTSPRING INVESTMENTS
DescriptionQuantity/ Nominal Currency
Acquisition cost Evaluation
% net assets
Statement of Investments as at December 31, 2015
Transferable securities admitted to an official stock exchange listing or dealt in on another regulated market
SHARES
Japan Advantest Corp 544,600 JPY 675,430,135 551,135,200 1.51Aeon Co Ltd 52,700 JPY 82,975,855 98,443,600 0.27Asahi Glass Co Ltd 1,635,000 JPY 1,106,515,790 1,137,960,000 3.11Canon Inc 93,700 JPY 371,163,622 344,347,500 0.94Chubu Electric Power Co Inc 71,100 JPY 108,859,535 118,203,750 0.32Credit Saison Co Ltd 133,900 JPY 320,218,436 321,493,900 0.88Daiichi Sankyo Co Ltd 322,200 JPY 641,669,295 808,883,100 2.21East Japan Railway Co 91,800 JPY 854,210,544 1,051,110,000 2.88Fuji Media Holdings Inc 250,100 JPY 411,158,678 358,143,200 0.98Hitachi Ltd 105,000 JPY 77,373,510 72,607,500 0.20Honda Motor Co Ltd 550,600 JPY 2,107,365,449 2,152,846,000 5.88JSR Corp 467,600 JPY 916,465,107 887,972,400 2.43Kaneka Corp 713,000 JPY 504,271,330 901,945,000 2.47Kansai Electric Power Co Inc/The 75,200 JPY 89,809,212 109,754,400 0.30KDDI Corp 127,100 JPY 304,448,668 400,873,400 1.10Komeri Co Ltd 171,200 JPY 438,867,206 428,000,000 1.17Kurita Water Industries Ltd 215,200 JPY 552,300,881 546,823,200 1.50LIXIL Group Corp 202,200 JPY 516,233,378 545,940,000 1.49Mitsubishi Corp 144,900 JPY 318,498,451 293,857,200 0.80Mitsubishi UFJ Financial Group Inc 3,026,500 JPY 2,155,132,445 2,291,363,150 6.26Mitsui OSK Lines Ltd 2,827,000 JPY 1,084,860,267 867,889,000 2.37NEC Corp 2,488,000 JPY 873,188,546 957,880,000 2.62Nikon Corp 872,400 JPY 1,350,561,489 1,417,650,000 3.88Nippon Steel & Sumitomo Metal Corp 132,400 JPY 320,395,273 319,878,400 0.88Nippon Telegraph & Telephone Corp 225,300 JPY 807,257,238 1,089,550,800 2.98Nissan Motor Co Ltd 237,600 JPY 259,501,136 304,009,200 0.83Nomura Holdings Inc 875,400 JPY 645,640,527 594,484,140 1.63Nomura Real Estate Holdings Inc 170,800 JPY 402,599,947 385,154,000 1.05NTT DOCOMO Inc 92,400 JPY 183,225,794 229,521,600 0.63Oji Holdings Corp 382,000 JPY 178,911,887 186,798,000 0.51Onward Holdings Co Ltd 434,000 JPY 321,687,184 323,764,000 0.89ORIX Corp 508,400 JPY 862,144,452 872,160,200 2.39Osaka Gas Co Ltd 622,000 JPY 296,046,219 272,684,800 0.75Rengo Co Ltd 713,000 JPY 354,241,673 369,334,000 1.01Ricoh Co Ltd 1,276,000 JPY 1,550,712,646 1,596,276,000 4.37Rohm Co Ltd 77,800 JPY 488,341,685 480,804,000 1.32Seven & i Holdings Co Ltd 74,200 JPY 346,081,577 411,810,000 1.13Shimamura Co Ltd 49,300 JPY 565,164,319 703,018,000 1.92Shin-Etsu Chemical Co Ltd 40,300 JPY 269,719,064 266,665,100 0.73Showa Denko KK 1,232,000 JPY 197,017,474 174,944,000 0.48Sony Corp 105,600 JPY 254,570,950 317,011,200 0.87Sumitomo Corp 760,100 JPY 1,000,597,819 942,904,050 2.58Sumitomo Electric Industries Ltd 555,400 JPY 904,006,521 957,509,600 2.62Sumitomo Forestry Co Ltd 176,100 JPY 223,581,431 289,332,300 0.79Sumitomo Heavy Industries Ltd 1,877,000 JPY 1,103,609,606 1,028,596,000 2.81Sumitomo Mitsui Financial Group Inc 325,300 JPY 1,525,301,275 1,498,331,800 4.10Sumitomo Mitsui Trust Holdings Inc 2,000,000 JPY 994,775,345 922,000,000 2.52T&D Holdings Inc 884,200 JPY 1,337,794,333 1,422,677,800 3.89Takeda Pharmaceutical Co Ltd 133,500 JPY 718,452,784 809,677,500 2.22Tobu Railway Co Ltd 528,000 JPY 300,944,699 315,744,000 0.86Tokyo Gas Co Ltd 239,000 JPY 150,193,420 136,421,200 0.37Toshiba Corp 3,925,000 JPY 1,396,944,847 980,857,500 2.68
(expressed in JPY)
JAPAN FUNDAMENTAL VALUE FUND
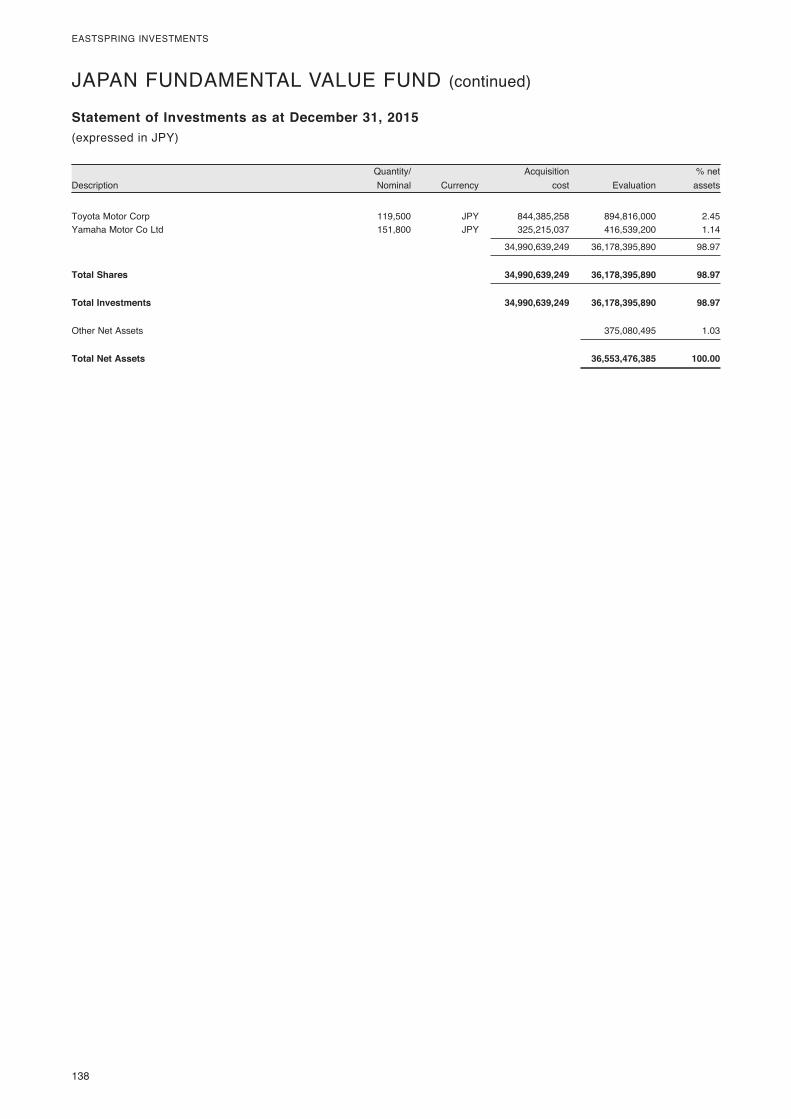
138
EASTSPRING INVESTMENTS
DescriptionQuantity/ Nominal Currency
Acquisition cost Evaluation
% net assets
Statement of Investments as at December 31, 2015(expressed in JPY)
JAPAN FUNDAMENTAL VALUE FUND (continued)
Toyota Motor Corp 119,500 JPY 844,385,258 894,816,000 2.45Yamaha Motor Co Ltd 151,800 JPY 325,215,037 416,539,200 1.14
34,990,639,249 36,178,395,890 98.97
Total Shares 34,990,639,249 36,178,395,890 98.97
Total Investments 34,990,639,249 36,178,395,890 98.97
Other Net Assets 375,080,495 1.03
Total Net Assets 36,553,476,385 100.00
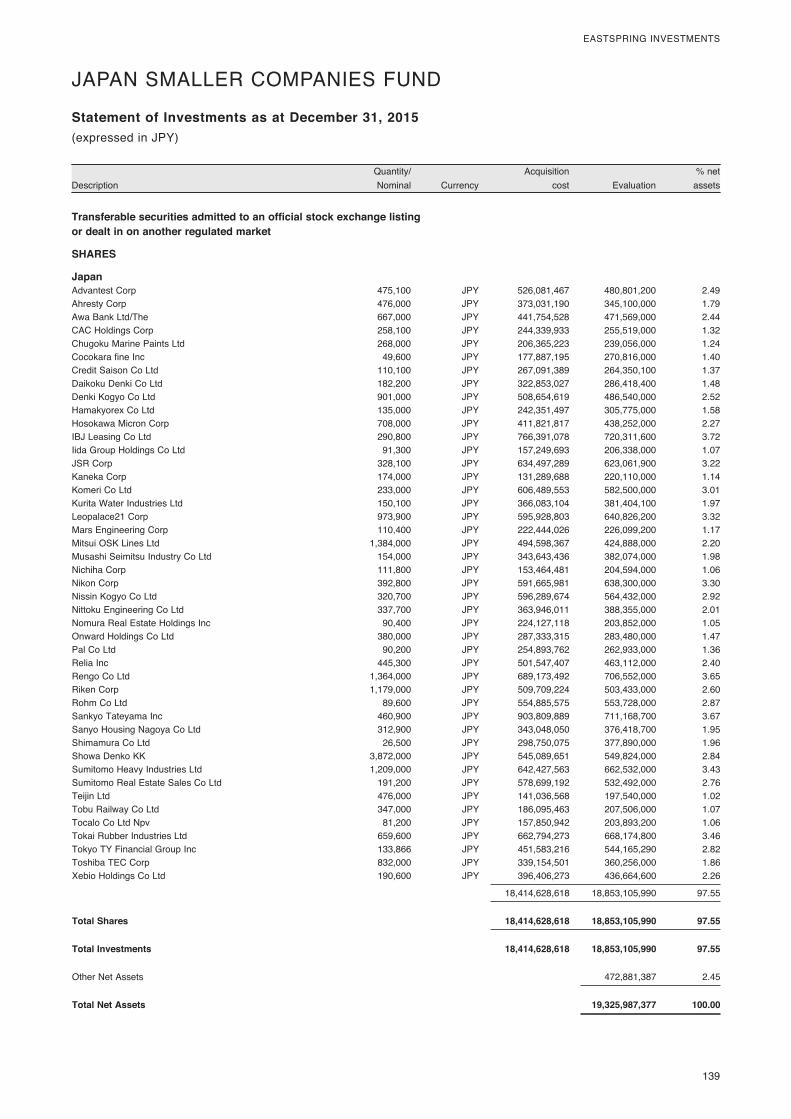
139
EASTSPRING INVESTMENTS
DescriptionQuantity/ Nominal Currency
Acquisition cost Evaluation
% net assets
Statement of Investments as at December 31, 2015
Transferable securities admitted to an official stock exchange listing or dealt in on another regulated market
SHARES
Japan Advantest Corp 475,100 JPY 526,081,467 480,801,200 2.49Ahresty Corp 476,000 JPY 373,031,190 345,100,000 1.79Awa Bank Ltd/The 667,000 JPY 441,754,528 471,569,000 2.44CAC Holdings Corp 258,100 JPY 244,339,933 255,519,000 1.32Chugoku Marine Paints Ltd 268,000 JPY 206,365,223 239,056,000 1.24Cocokara fine Inc 49,600 JPY 177,887,195 270,816,000 1.40Credit Saison Co Ltd 110,100 JPY 267,091,389 264,350,100 1.37Daikoku Denki Co Ltd 182,200 JPY 322,853,027 286,418,400 1.48Denki Kogyo Co Ltd 901,000 JPY 508,654,619 486,540,000 2.52Hamakyorex Co Ltd 135,000 JPY 242,351,497 305,775,000 1.58Hosokawa Micron Corp 708,000 JPY 411,821,817 438,252,000 2.27IBJ Leasing Co Ltd 290,800 JPY 766,391,078 720,311,600 3.72Iida Group Holdings Co Ltd 91,300 JPY 157,249,693 206,338,000 1.07JSR Corp 328,100 JPY 634,497,289 623,061,900 3.22Kaneka Corp 174,000 JPY 131,289,688 220,110,000 1.14Komeri Co Ltd 233,000 JPY 606,489,553 582,500,000 3.01Kurita Water Industries Ltd 150,100 JPY 366,083,104 381,404,100 1.97Leopalace21 Corp 973,900 JPY 595,928,803 640,826,200 3.32Mars Engineering Corp 110,400 JPY 222,444,026 226,099,200 1.17Mitsui OSK Lines Ltd 1,384,000 JPY 494,598,367 424,888,000 2.20Musashi Seimitsu Industry Co Ltd 154,000 JPY 343,643,436 382,074,000 1.98Nichiha Corp 111,800 JPY 153,464,481 204,594,000 1.06Nikon Corp 392,800 JPY 591,665,981 638,300,000 3.30Nissin Kogyo Co Ltd 320,700 JPY 596,289,674 564,432,000 2.92Nittoku Engineering Co Ltd 337,700 JPY 363,946,011 388,355,000 2.01Nomura Real Estate Holdings Inc 90,400 JPY 224,127,118 203,852,000 1.05Onward Holdings Co Ltd 380,000 JPY 287,333,315 283,480,000 1.47Pal Co Ltd 90,200 JPY 254,893,762 262,933,000 1.36Relia Inc 445,300 JPY 501,547,407 463,112,000 2.40Rengo Co Ltd 1,364,000 JPY 689,173,492 706,552,000 3.65Riken Corp 1,179,000 JPY 509,709,224 503,433,000 2.60Rohm Co Ltd 89,600 JPY 554,885,575 553,728,000 2.87Sankyo Tateyama Inc 460,900 JPY 903,809,889 711,168,700 3.67Sanyo Housing Nagoya Co Ltd 312,900 JPY 343,048,050 376,418,700 1.95Shimamura Co Ltd 26,500 JPY 298,750,075 377,890,000 1.96Showa Denko KK 3,872,000 JPY 545,089,651 549,824,000 2.84Sumitomo Heavy Industries Ltd 1,209,000 JPY 642,427,563 662,532,000 3.43Sumitomo Real Estate Sales Co Ltd 191,200 JPY 578,699,192 532,492,000 2.76Teijin Ltd 476,000 JPY 141,036,568 197,540,000 1.02Tobu Railway Co Ltd 347,000 JPY 186,095,463 207,506,000 1.07Tocalo Co Ltd Npv 81,200 JPY 157,850,942 203,893,200 1.06Tokai Rubber Industries Ltd 659,600 JPY 662,794,273 668,174,800 3.46Tokyo TY Financial Group Inc 133,866 JPY 451,583,216 544,165,290 2.82Toshiba TEC Corp 832,000 JPY 339,154,501 360,256,000 1.86Xebio Holdings Co Ltd 190,600 JPY 396,406,273 436,664,600 2.26
18,414,628,618 18,853,105,990 97.55
Total Shares 18,414,628,618 18,853,105,990 97.55
Total Investments 18,414,628,618 18,853,105,990 97.55
Other Net Assets 472,881,387 2.45
Total Net Assets 19,325,987,377 100.00
(expressed in JPY)
JAPAN SMALLER COMPANIES FUND
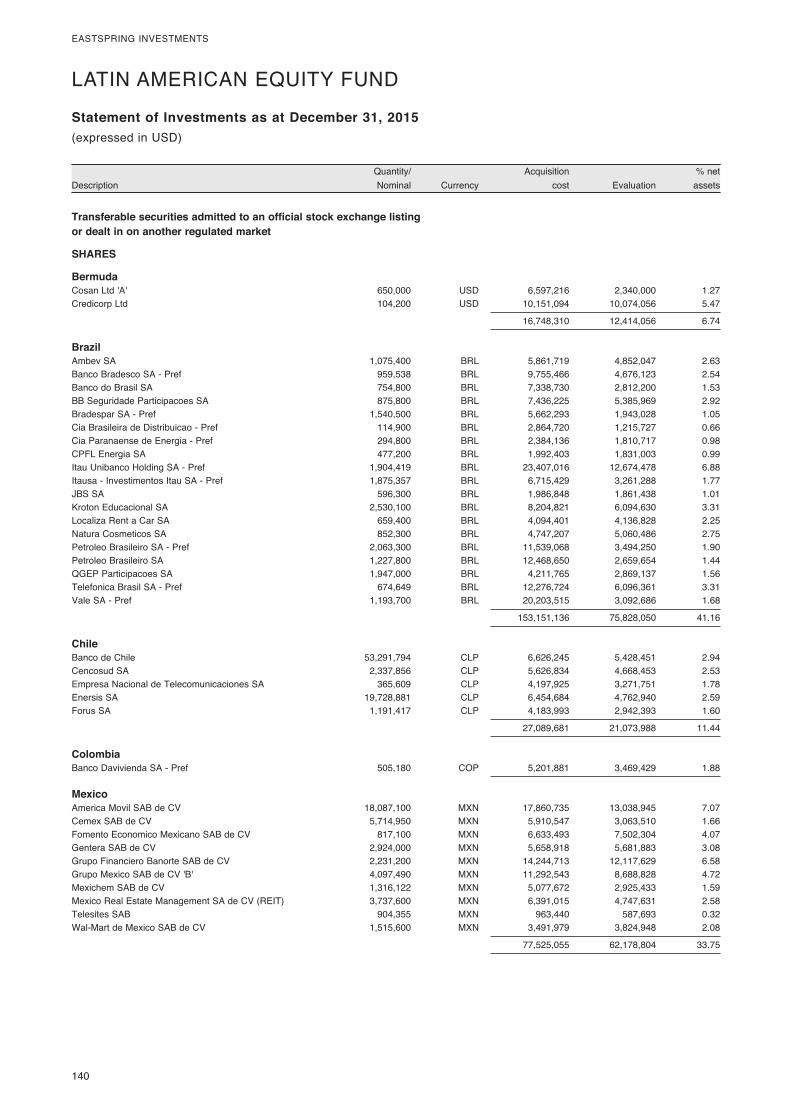
140
EASTSPRING INVESTMENTS
DescriptionQuantity/ Nominal Currency
Acquisition cost Evaluation
% net assets
Statement of Investments as at December 31, 2015
Transferable securities admitted to an official stock exchange listing or dealt in on another regulated market
SHARES
Bermuda Cosan Ltd 'A' 650,000 USD 6,597,216 2,340,000 1.27Credicorp Ltd 104,200 USD 10,151,094 10,074,056 5.47
16,748,310 12,414,056 6.74
Brazil Ambev SA 1,075,400 BRL 5,861,719 4,852,047 2.63Banco Bradesco SA - Pref 959,538 BRL 9,755,466 4,676,123 2.54Banco do Brasil SA 754,800 BRL 7,338,730 2,812,200 1.53BB Seguridade Participacoes SA 875,800 BRL 7,436,225 5,385,969 2.92Bradespar SA - Pref 1,540,500 BRL 5,662,293 1,943,028 1.05Cia Brasileira de Distribuicao - Pref 114,900 BRL 2,864,720 1,215,727 0.66Cia Paranaense de Energia - Pref 294,800 BRL 2,384,136 1,810,717 0.98CPFL Energia SA 477,200 BRL 1,992,403 1,831,003 0.99Itau Unibanco Holding SA - Pref 1,904,419 BRL 23,407,016 12,674,478 6.88Itausa - Investimentos Itau SA - Pref 1,875,357 BRL 6,715,429 3,261,288 1.77JBS SA 596,300 BRL 1,986,848 1,861,438 1.01Kroton Educacional SA 2,530,100 BRL 8,204,821 6,094,630 3.31Localiza Rent a Car SA 659,400 BRL 4,094,401 4,136,828 2.25Natura Cosmeticos SA 852,300 BRL 4,747,207 5,060,486 2.75Petroleo Brasileiro SA - Pref 2,063,300 BRL 11,539,068 3,494,250 1.90Petroleo Brasileiro SA 1,227,800 BRL 12,468,650 2,659,654 1.44QGEP Participacoes SA 1,947,000 BRL 4,211,765 2,869,137 1.56Telefonica Brasil SA - Pref 674,649 BRL 12,276,724 6,096,361 3.31Vale SA - Pref 1,193,700 BRL 20,203,515 3,092,686 1.68
153,151,136 75,828,050 41.16
Chile Banco de Chile 53,291,794 CLP 6,626,245 5,428,451 2.94Cencosud SA 2,337,856 CLP 5,626,834 4,668,453 2.53Empresa Nacional de Telecomunicaciones SA 365,609 CLP 4,197,925 3,271,751 1.78Enersis SA 19,728,881 CLP 6,454,684 4,762,940 2.59Forus SA 1,191,417 CLP 4,183,993 2,942,393 1.60
27,089,681 21,073,988 11.44
Colombia Banco Davivienda SA - Pref 505,180 COP 5,201,881 3,469,429 1.88
Mexico America Movil SAB de CV 18,087,100 MXN 17,860,735 13,038,945 7.07Cemex SAB de CV 5,714,950 MXN 5,910,547 3,063,510 1.66Fomento Economico Mexicano SAB de CV 817,100 MXN 6,633,493 7,502,304 4.07Gentera SAB de CV 2,924,000 MXN 5,658,918 5,681,883 3.08Grupo Financiero Banorte SAB de CV 2,231,200 MXN 14,244,713 12,117,629 6.58Grupo Mexico SAB de CV 'B' 4,097,490 MXN 11,292,543 8,688,828 4.72Mexichem SAB de CV 1,316,122 MXN 5,077,672 2,925,433 1.59Mexico Real Estate Management SA de CV (REIT) 3,737,600 MXN 6,391,015 4,747,631 2.58Telesites SAB 904,355 MXN 963,440 587,693 0.32Wal-Mart de Mexico SAB de CV 1,515,600 MXN 3,491,979 3,824,948 2.08
77,525,055 62,178,804 33.75
(expressed in USD)
LATIN AMERICAN EQUITY FUND
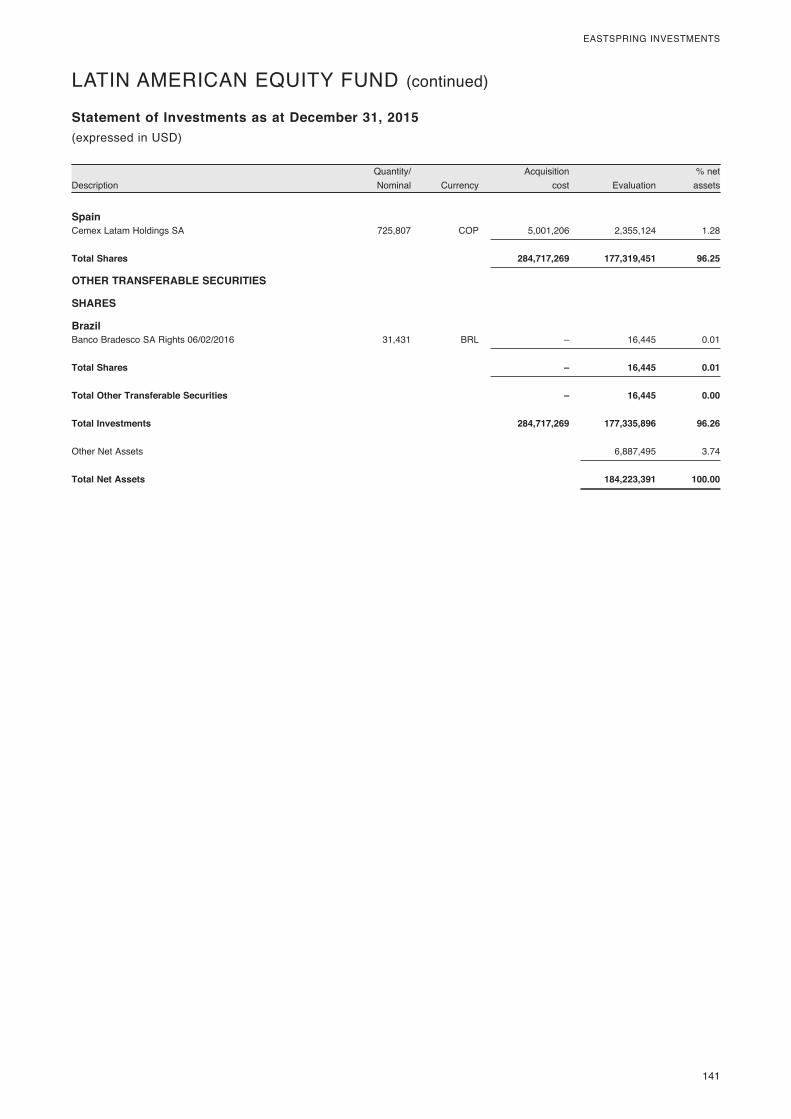
141
EASTSPRING INVESTMENTS
DescriptionQuantity/ Nominal Currency
Acquisition cost Evaluation
% net assets
Statement of Investments as at December 31, 2015(expressed in USD)
LATIN AMERICAN EQUITY FUND (continued)
Spain Cemex Latam Holdings SA 725,807 COP 5,001,206 2,355,124 1.28
Total Shares 284,717,269 177,319,451 96.25
OTHER TRANSFERABLE SECURITIES
SHARES
Brazil Banco Bradesco SA Rights 06/02/2016 31,431 BRL – 16,445 0.01
Total Shares – 16,445 0.01
Total Other Transferable Securities – 16,445 0.00
Total Investments 284,717,269 177,335,896 96.26
Other Net Assets 6,887,495 3.74
Total Net Assets 184,223,391 100.00

142
EASTSPRING INVESTMENTS
DescriptionQuantity/ Nominal Currency
Acquisition cost Evaluation
% net assets
Statement of Investments as at December 31, 2015
Transferable securities admitted to an official stock exchange listing or dealt in on another regulated market
SHARES
Malaysia Alliance Financial Group Bhd 265,900 MYR 282,169 220,473 2.82AMMB Holdings Bhd 101,800 MYR 145,205 107,407 1.37APM Automotive Holdings Bhd 32,300 MYR 51,299 28,963 0.37Astro Malaysia Holdings Bhd 156,400 MYR 145,277 100,539 1.28Axiata Group Bhd 212,158 MYR 299,132 316,742 4.05British American Tobacco Malaysia Bhd 12,200 MYR 205,535 159,351 2.04Bumi Armada Bhd 333,100 MYR 80,264 79,134 1.01CIMB Group Holdings Bhd 466,397 MYR 864,301 493,173 6.30Dialog Group Bhd 228,900 MYR 97,251 85,301 1.09DiGi.Com Bhd 188,900 MYR 206,331 237,582 3.03Gamuda Bhd 104,600 MYR 119,892 113,529 1.45Genting Bhd 242,700 MYR 567,833 414,910 5.30Genting Malaysia Bhd 353,300 MYR 368,321 360,417 4.60Genting Plantations Bhd 33,700 MYR 95,956 83,200 1.06Hong Leong Bank Bhd 26,500 MYR 105,467 82,953 1.06Hong Leong Financial Group Bhd 42,281 MYR 159,041 137,473 1.76Ihh Healthcare Bhd 86,300 MYR 121,688 132,259 1.69IJM Corp Bhd 243,600 MYR 193,909 191,770 2.45IJM Plantations Bhd 148,600 MYR 137,976 122,867 1.57IOI Corp Bhd 190,884 MYR 234,587 198,286 2.53Kuala Lumpur Kepong Bhd 15,400 MYR 94,815 82,066 1.05Malakoff Corp Bhd 101,600 MYR 48,852 37,862 0.48Malayan Banking Bhd 316,004 MYR 777,855 618,242 7.90Malaysia Airports Holdings Bhd 32,900 MYR 45,131 42,988 0.55Maxis Bhd 51,600 MYR 90,608 81,723 1.04Media Prima Bhd 94,200 MYR 67,461 27,864 0.36MISC Bhd 77,700 MYR 166,446 169,570 2.17Petronas Chemicals Group Bhd 197,000 MYR 368,096 333,571 4.26Petronas Gas Bhd 38,800 MYR 211,796 205,138 2.62PPB Group Bhd 20,100 MYR 80,798 74,436 0.95Public Bank Bhd 165,590 MYR 780,414 714,269 9.12RHB Capital Bhd 34,831 MYR 73,908 45,998 0.59SapuraKencana Petroleum Bhd 140,400 MYR 117,758 66,055 0.84Sime Darby Bhd 184,668 MYR 480,968 333,335 4.26SP Setia Bhd Group 181,728 MYR 184,194 135,444 1.73Telekom Malaysia Bhd 69,991 MYR 116,685 110,525 1.41Tenaga Nasional Bhd 243,300 MYR 636,615 754,803 9.63UEM Sunrise Bhd 142,700 MYR 37,888 37,225 0.48UMW Holdings Bhd 19,900 MYR 40,632 36,477 0.47YTL Corp Bhd 445,633 MYR 220,076 162,954 2.08YTL Power International Bhd 141,555 MYR 71,189 48,795 0.62
9,193,619 7,785,669 99.44
Singapore Ihh Healthcare Bhd 6,700 SGD 6,097 9,983 0.13
Total Shares 9,199,716 7,795,652 99.57
Total Investments 9,199,716 7,795,652 99.57
Other Net Assets 33,341 0.43
Total Net Assets 7,828,993 100.00
(expressed in USD)
MALAYSIA EQUITY FUND
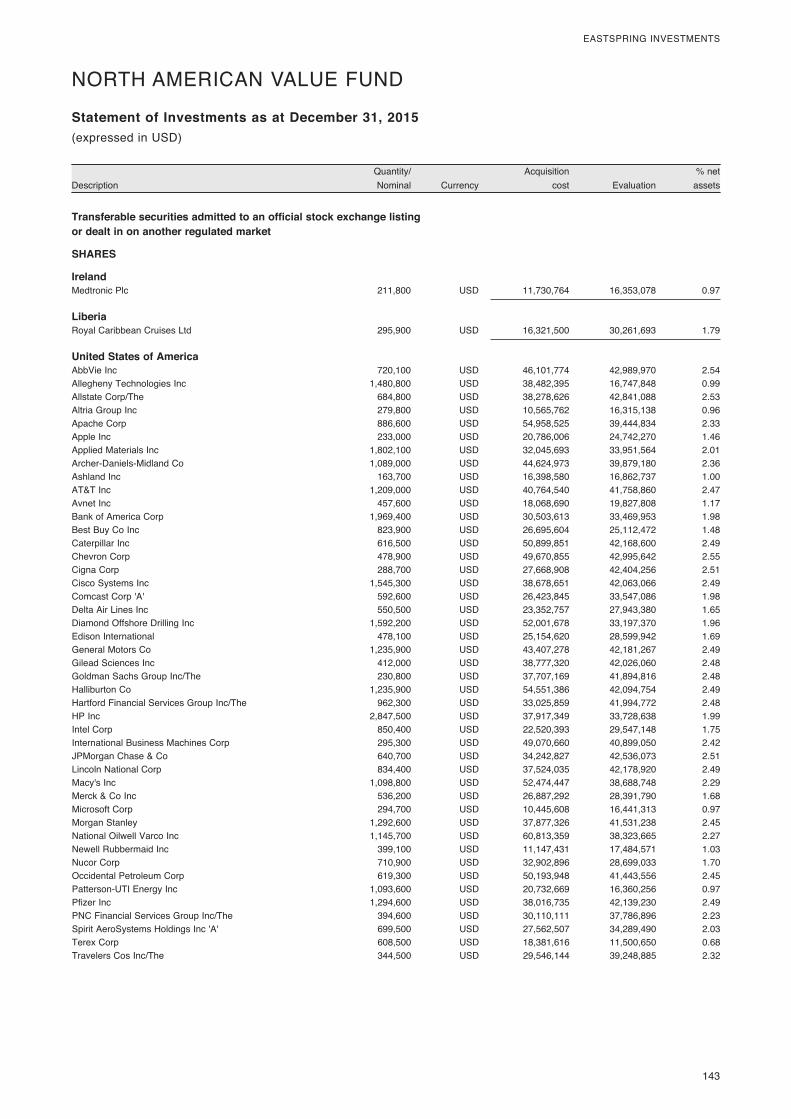
143
EASTSPRING INVESTMENTS
DescriptionQuantity/ Nominal Currency
Acquisition cost Evaluation
% net assets
Statement of Investments as at December 31, 2015
Transferable securities admitted to an official stock exchange listing or dealt in on another regulated market
SHARES
Ireland Medtronic Plc 211,800 USD 11,730,764 16,353,078 0.97
Liberia Royal Caribbean Cruises Ltd 295,900 USD 16,321,500 30,261,693 1.79
United States of America AbbVie Inc 720,100 USD 46,101,774 42,989,970 2.54Allegheny Technologies Inc 1,480,800 USD 38,482,395 16,747,848 0.99Allstate Corp/The 684,800 USD 38,278,626 42,841,088 2.53Altria Group Inc 279,800 USD 10,565,762 16,315,138 0.96Apache Corp 886,600 USD 54,958,525 39,444,834 2.33Apple Inc 233,000 USD 20,786,006 24,742,270 1.46Applied Materials Inc 1,802,100 USD 32,045,693 33,951,564 2.01Archer-Daniels-Midland Co 1,089,000 USD 44,624,973 39,879,180 2.36Ashland Inc 163,700 USD 16,398,580 16,862,737 1.00AT&T Inc 1,209,000 USD 40,764,540 41,758,860 2.47Avnet Inc 457,600 USD 18,068,690 19,827,808 1.17Bank of America Corp 1,969,400 USD 30,503,613 33,469,953 1.98Best Buy Co Inc 823,900 USD 26,695,604 25,112,472 1.48Caterpillar Inc 616,500 USD 50,899,851 42,168,600 2.49Chevron Corp 478,900 USD 49,670,855 42,995,642 2.55Cigna Corp 288,700 USD 27,668,908 42,404,256 2.51Cisco Systems Inc 1,545,300 USD 38,678,651 42,063,066 2.49Comcast Corp 'A' 592,600 USD 26,423,845 33,547,086 1.98Delta Air Lines Inc 550,500 USD 23,352,757 27,943,380 1.65Diamond Offshore Drilling Inc 1,592,200 USD 52,001,678 33,197,370 1.96Edison International 478,100 USD 25,154,620 28,599,942 1.69General Motors Co 1,235,900 USD 43,407,278 42,181,267 2.49Gilead Sciences Inc 412,000 USD 38,777,320 42,026,060 2.48Goldman Sachs Group Inc/The 230,800 USD 37,707,169 41,894,816 2.48Halliburton Co 1,235,900 USD 54,551,386 42,094,754 2.49Hartford Financial Services Group Inc/The 962,300 USD 33,025,859 41,994,772 2.48HP Inc 2,847,500 USD 37,917,349 33,728,638 1.99Intel Corp 850,400 USD 22,520,393 29,547,148 1.75International Business Machines Corp 295,300 USD 49,070,660 40,899,050 2.42JPMorgan Chase & Co 640,700 USD 34,242,827 42,536,073 2.51Lincoln National Corp 834,400 USD 37,524,035 42,178,920 2.49Macy's Inc 1,098,800 USD 52,474,447 38,688,748 2.29Merck & Co Inc 536,200 USD 26,887,292 28,391,790 1.68Microsoft Corp 294,700 USD 10,445,608 16,441,313 0.97Morgan Stanley 1,292,600 USD 37,877,326 41,531,238 2.45National Oilwell Varco Inc 1,145,700 USD 60,813,359 38,323,665 2.27Newell Rubbermaid Inc 399,100 USD 11,147,431 17,484,571 1.03Nucor Corp 710,900 USD 32,902,896 28,699,033 1.70Occidental Petroleum Corp 619,300 USD 50,193,948 41,443,556 2.45Patterson-UTI Energy Inc 1,093,600 USD 20,732,669 16,360,256 0.97Pfizer Inc 1,294,600 USD 38,016,735 42,139,230 2.49PNC Financial Services Group Inc/The 394,600 USD 30,110,111 37,786,896 2.23Spirit AeroSystems Holdings Inc 'A' 699,500 USD 27,562,507 34,289,490 2.03Terex Corp 608,500 USD 18,381,616 11,500,650 0.68Travelers Cos Inc/The 344,500 USD 29,546,144 39,248,885 2.32
(expressed in USD)
NORTH AMERICAN VALUE FUND
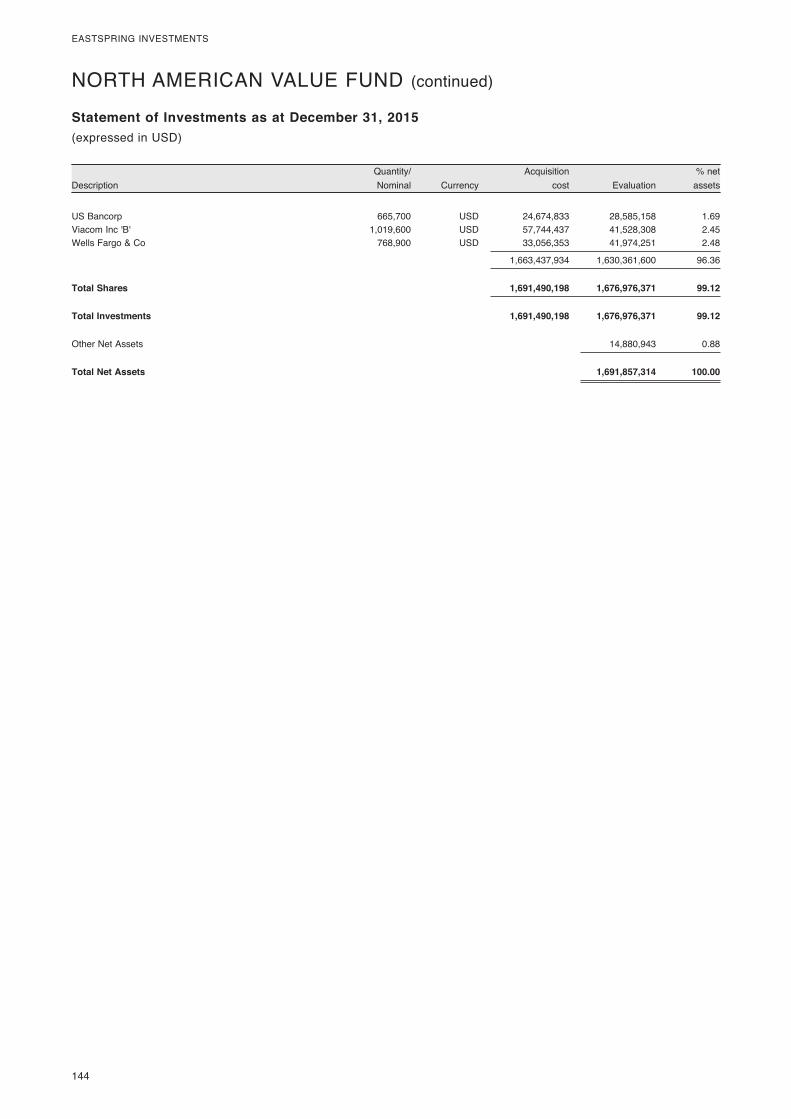
144
EASTSPRING INVESTMENTS
DescriptionQuantity/ Nominal Currency
Acquisition cost Evaluation
% net assets
Statement of Investments as at December 31, 2015(expressed in USD)
NORTH AMERICAN VALUE FUND (continued)
US Bancorp 665,700 USD 24,674,833 28,585,158 1.69Viacom Inc 'B' 1,019,600 USD 57,744,437 41,528,308 2.45Wells Fargo & Co 768,900 USD 33,056,353 41,974,251 2.48
1,663,437,934 1,630,361,600 96.36
Total Shares 1,691,490,198 1,676,976,371 99.12
Total Investments 1,691,490,198 1,676,976,371 99.12
Other Net Assets 14,880,943 0.88
Total Net Assets 1,691,857,314 100.00
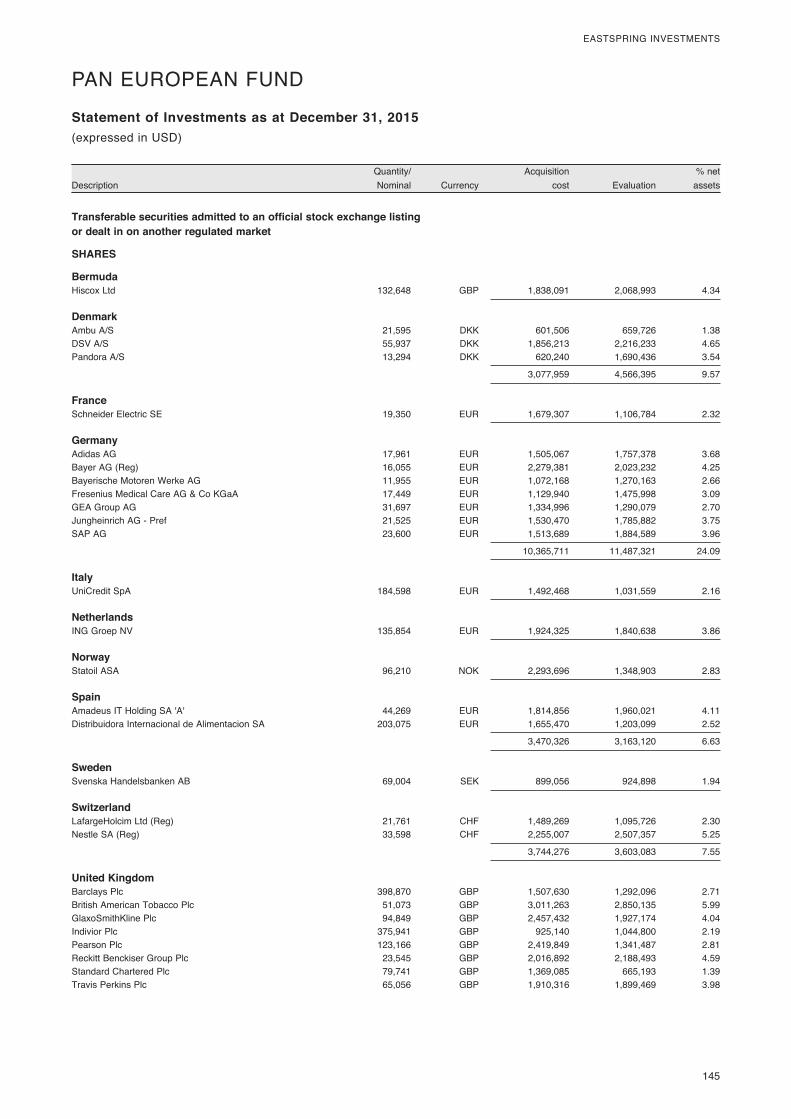
145
EASTSPRING INVESTMENTS
DescriptionQuantity/ Nominal Currency
Acquisition cost Evaluation
% net assets
Statement of Investments as at December 31, 2015
Transferable securities admitted to an official stock exchange listing or dealt in on another regulated market
SHARES
Bermuda Hiscox Ltd 132,648 GBP 1,838,091 2,068,993 4.34
Denmark Ambu A/S 21,595 DKK 601,506 659,726 1.38DSV A/S 55,937 DKK 1,856,213 2,216,233 4.65Pandora A/S 13,294 DKK 620,240 1,690,436 3.54
3,077,959 4,566,395 9.57
France Schneider Electric SE 19,350 EUR 1,679,307 1,106,784 2.32
Germany Adidas AG 17,961 EUR 1,505,067 1,757,378 3.68Bayer AG (Reg) 16,055 EUR 2,279,381 2,023,232 4.25Bayerische Motoren Werke AG 11,955 EUR 1,072,168 1,270,163 2.66Fresenius Medical Care AG & Co KGaA 17,449 EUR 1,129,940 1,475,998 3.09GEA Group AG 31,697 EUR 1,334,996 1,290,079 2.70Jungheinrich AG - Pref 21,525 EUR 1,530,470 1,785,882 3.75SAP AG 23,600 EUR 1,513,689 1,884,589 3.96
10,365,711 11,487,321 24.09
Italy UniCredit SpA 184,598 EUR 1,492,468 1,031,559 2.16
Netherlands ING Groep NV 135,854 EUR 1,924,325 1,840,638 3.86
Norway Statoil ASA 96,210 NOK 2,293,696 1,348,903 2.83
Spain Amadeus IT Holding SA 'A' 44,269 EUR 1,814,856 1,960,021 4.11Distribuidora Internacional de Alimentacion SA 203,075 EUR 1,655,470 1,203,099 2.52
3,470,326 3,163,120 6.63
Sweden Svenska Handelsbanken AB 69,004 SEK 899,056 924,898 1.94
Switzerland LafargeHolcim Ltd (Reg) 21,761 CHF 1,489,269 1,095,726 2.30Nestle SA (Reg) 33,598 CHF 2,255,007 2,507,357 5.25
3,744,276 3,603,083 7.55
United Kingdom Barclays Plc 398,870 GBP 1,507,630 1,292,096 2.71British American Tobacco Plc 51,073 GBP 3,011,263 2,850,135 5.99GlaxoSmithKline Plc 94,849 GBP 2,457,432 1,927,174 4.04Indivior Plc 375,941 GBP 925,140 1,044,800 2.19Pearson Plc 123,166 GBP 2,419,849 1,341,487 2.81Reckitt Benckiser Group Plc 23,545 GBP 2,016,892 2,188,493 4.59Standard Chartered Plc 79,741 GBP 1,369,085 665,193 1.39Travis Perkins Plc 65,056 GBP 1,910,316 1,899,469 3.98
(expressed in USD)
PAN EUROPEAN FUND
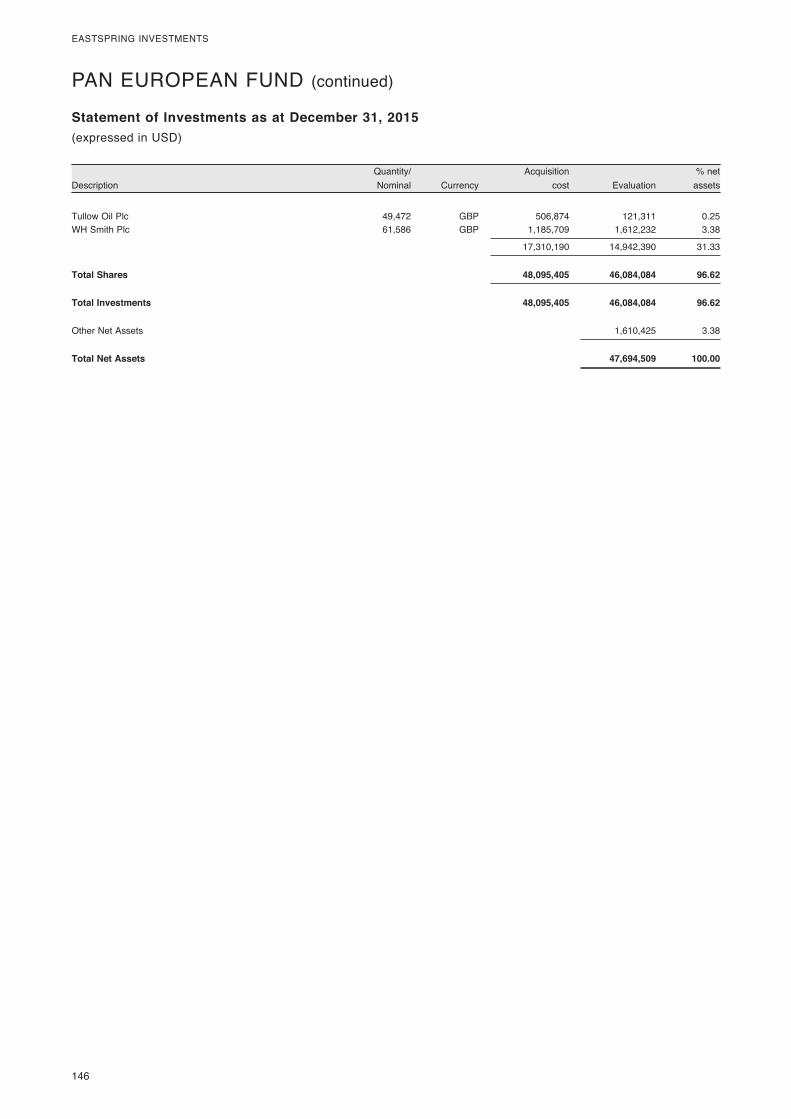
146
EASTSPRING INVESTMENTS
DescriptionQuantity/ Nominal Currency
Acquisition cost Evaluation
% net assets
Statement of Investments as at December 31, 2015(expressed in USD)
PAN EUROPEAN FUND (continued)
Tullow Oil Plc 49,472 GBP 506,874 121,311 0.25WH Smith Plc 61,586 GBP 1,185,709 1,612,232 3.38
17,310,190 14,942,390 31.33
Total Shares 48,095,405 46,084,084 96.62
Total Investments 48,095,405 46,084,084 96.62
Other Net Assets 1,610,425 3.38
Total Net Assets 47,694,509 100.00
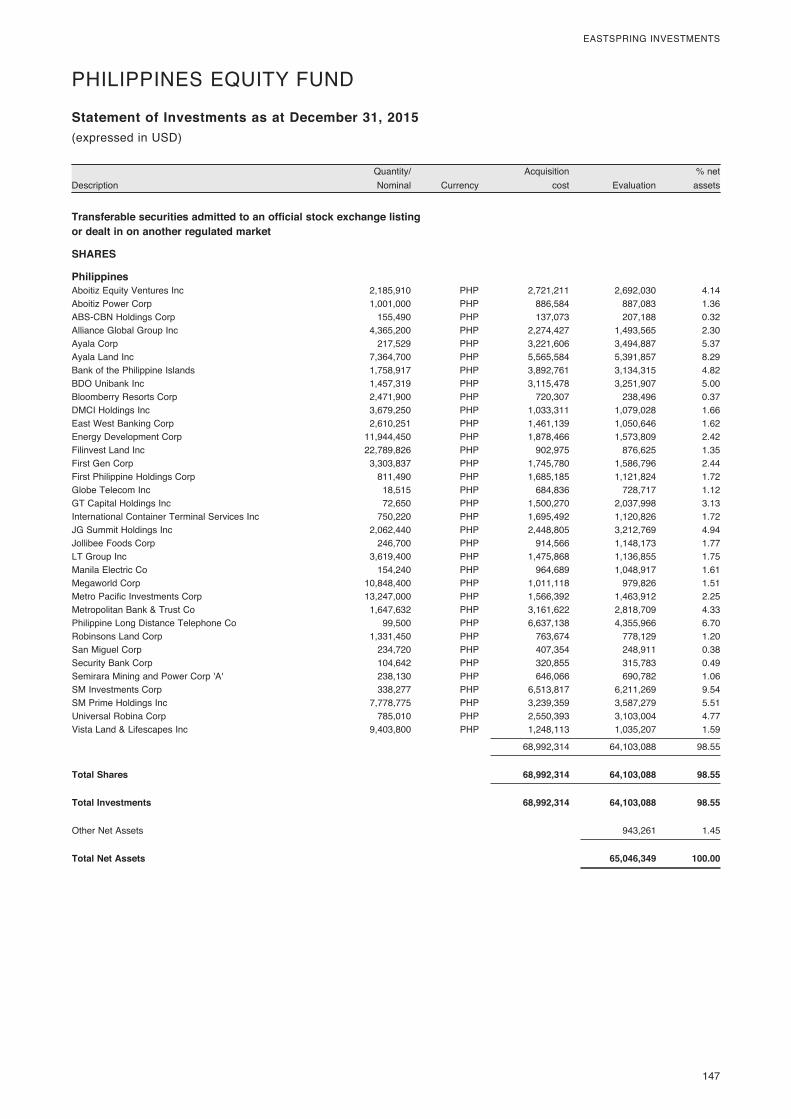
147
EASTSPRING INVESTMENTS
DescriptionQuantity/ Nominal Currency
Acquisition cost Evaluation
% net assets
Statement of Investments as at December 31, 2015
Transferable securities admitted to an official stock exchange listing or dealt in on another regulated market
SHARES
Philippines Aboitiz Equity Ventures Inc 2,185,910 PHP 2,721,211 2,692,030 4.14Aboitiz Power Corp 1,001,000 PHP 886,584 887,083 1.36ABS-CBN Holdings Corp 155,490 PHP 137,073 207,188 0.32Alliance Global Group Inc 4,365,200 PHP 2,274,427 1,493,565 2.30Ayala Corp 217,529 PHP 3,221,606 3,494,887 5.37Ayala Land Inc 7,364,700 PHP 5,565,584 5,391,857 8.29Bank of the Philippine Islands 1,758,917 PHP 3,892,761 3,134,315 4.82BDO Unibank Inc 1,457,319 PHP 3,115,478 3,251,907 5.00Bloomberry Resorts Corp 2,471,900 PHP 720,307 238,496 0.37DMCI Holdings Inc 3,679,250 PHP 1,033,311 1,079,028 1.66East West Banking Corp 2,610,251 PHP 1,461,139 1,050,646 1.62Energy Development Corp 11,944,450 PHP 1,878,466 1,573,809 2.42Filinvest Land Inc 22,789,826 PHP 902,975 876,625 1.35First Gen Corp 3,303,837 PHP 1,745,780 1,586,796 2.44First Philippine Holdings Corp 811,490 PHP 1,685,185 1,121,824 1.72Globe Telecom Inc 18,515 PHP 684,836 728,717 1.12GT Capital Holdings Inc 72,650 PHP 1,500,270 2,037,998 3.13International Container Terminal Services Inc 750,220 PHP 1,695,492 1,120,826 1.72JG Summit Holdings Inc 2,062,440 PHP 2,448,805 3,212,769 4.94Jollibee Foods Corp 246,700 PHP 914,566 1,148,173 1.77LT Group Inc 3,619,400 PHP 1,475,868 1,136,855 1.75Manila Electric Co 154,240 PHP 964,689 1,048,917 1.61Megaworld Corp 10,848,400 PHP 1,011,118 979,826 1.51Metro Pacific Investments Corp 13,247,000 PHP 1,566,392 1,463,912 2.25Metropolitan Bank & Trust Co 1,647,632 PHP 3,161,622 2,818,709 4.33Philippine Long Distance Telephone Co 99,500 PHP 6,637,138 4,355,966 6.70Robinsons Land Corp 1,331,450 PHP 763,674 778,129 1.20San Miguel Corp 234,720 PHP 407,354 248,911 0.38Security Bank Corp 104,642 PHP 320,855 315,783 0.49Semirara Mining and Power Corp 'A' 238,130 PHP 646,066 690,782 1.06SM Investments Corp 338,277 PHP 6,513,817 6,211,269 9.54SM Prime Holdings Inc 7,778,775 PHP 3,239,359 3,587,279 5.51Universal Robina Corp 785,010 PHP 2,550,393 3,103,004 4.77Vista Land & Lifescapes Inc 9,403,800 PHP 1,248,113 1,035,207 1.59
68,992,314 64,103,088 98.55
Total Shares 68,992,314 64,103,088 98.55
Total Investments 68,992,314 64,103,088 98.55
Other Net Assets 943,261 1.45
Total Net Assets 65,046,349 100.00
(expressed in USD)
PHILIPPINES EQUITY FUND
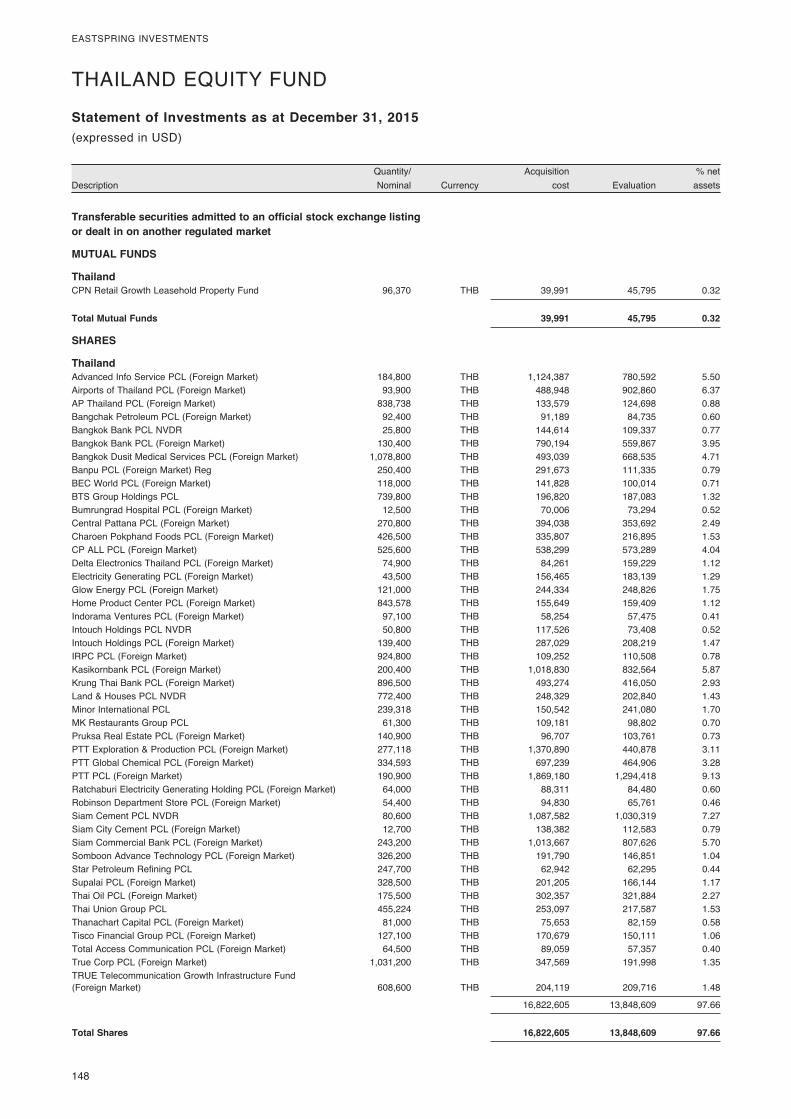
148
EASTSPRING INVESTMENTS
DescriptionQuantity/ Nominal Currency
Acquisition cost Evaluation
% net assets
Statement of Investments as at December 31, 2015
Transferable securities admitted to an official stock exchange listing or dealt in on another regulated market
MUTUAL FUNDS
Thailand CPN Retail Growth Leasehold Property Fund 96,370 THB 39,991 45,795 0.32
Total Mutual Funds 39,991 45,795 0.32
SHARES
Thailand Advanced Info Service PCL (Foreign Market) 184,800 THB 1,124,387 780,592 5.50Airports of Thailand PCL (Foreign Market) 93,900 THB 488,948 902,860 6.37AP Thailand PCL (Foreign Market) 838,738 THB 133,579 124,698 0.88Bangchak Petroleum PCL (Foreign Market) 92,400 THB 91,189 84,735 0.60Bangkok Bank PCL NVDR 25,800 THB 144,614 109,337 0.77Bangkok Bank PCL (Foreign Market) 130,400 THB 790,194 559,867 3.95Bangkok Dusit Medical Services PCL (Foreign Market) 1,078,800 THB 493,039 668,535 4.71Banpu PCL (Foreign Market) Reg 250,400 THB 291,673 111,335 0.79BEC World PCL (Foreign Market) 118,000 THB 141,828 100,014 0.71BTS Group Holdings PCL 739,800 THB 196,820 187,083 1.32Bumrungrad Hospital PCL (Foreign Market) 12,500 THB 70,006 73,294 0.52Central Pattana PCL (Foreign Market) 270,800 THB 394,038 353,692 2.49Charoen Pokphand Foods PCL (Foreign Market) 426,500 THB 335,807 216,895 1.53CP ALL PCL (Foreign Market) 525,600 THB 538,299 573,289 4.04Delta Electronics Thailand PCL (Foreign Market) 74,900 THB 84,261 159,229 1.12Electricity Generating PCL (Foreign Market) 43,500 THB 156,465 183,139 1.29Glow Energy PCL (Foreign Market) 121,000 THB 244,334 248,826 1.75Home Product Center PCL (Foreign Market) 843,578 THB 155,649 159,409 1.12Indorama Ventures PCL (Foreign Market) 97,100 THB 58,254 57,475 0.41Intouch Holdings PCL NVDR 50,800 THB 117,526 73,408 0.52Intouch Holdings PCL (Foreign Market) 139,400 THB 287,029 208,219 1.47IRPC PCL (Foreign Market) 924,800 THB 109,252 110,508 0.78Kasikornbank PCL (Foreign Market) 200,400 THB 1,018,830 832,564 5.87Krung Thai Bank PCL (Foreign Market) 896,500 THB 493,274 416,050 2.93Land & Houses PCL NVDR 772,400 THB 248,329 202,840 1.43Minor International PCL 239,318 THB 150,542 241,080 1.70MK Restaurants Group PCL 61,300 THB 109,181 98,802 0.70Pruksa Real Estate PCL (Foreign Market) 140,900 THB 96,707 103,761 0.73PTT Exploration & Production PCL (Foreign Market) 277,118 THB 1,370,890 440,878 3.11PTT Global Chemical PCL (Foreign Market) 334,593 THB 697,239 464,906 3.28PTT PCL (Foreign Market) 190,900 THB 1,869,180 1,294,418 9.13Ratchaburi Electricity Generating Holding PCL (Foreign Market) 64,000 THB 88,311 84,480 0.60Robinson Department Store PCL (Foreign Market) 54,400 THB 94,830 65,761 0.46Siam Cement PCL NVDR 80,600 THB 1,087,582 1,030,319 7.27Siam City Cement PCL (Foreign Market) 12,700 THB 138,382 112,583 0.79Siam Commercial Bank PCL (Foreign Market) 243,200 THB 1,013,667 807,626 5.70Somboon Advance Technology PCL (Foreign Market) 326,200 THB 191,790 146,851 1.04Star Petroleum Refining PCL 247,700 THB 62,942 62,295 0.44Supalai PCL (Foreign Market) 328,500 THB 201,205 166,144 1.17Thai Oil PCL (Foreign Market) 175,500 THB 302,357 321,884 2.27Thai Union Group PCL 455,224 THB 253,097 217,587 1.53Thanachart Capital PCL (Foreign Market) 81,000 THB 75,653 82,159 0.58Tisco Financial Group PCL (Foreign Market) 127,100 THB 170,679 150,111 1.06Total Access Communication PCL (Foreign Market) 64,500 THB 89,059 57,357 0.40True Corp PCL (Foreign Market) 1,031,200 THB 347,569 191,998 1.35TRUE Telecommunication Growth Infrastructure Fund (Foreign Market) 608,600 THB 204,119 209,716 1.48
16,822,605 13,848,609 97.66
Total Shares 16,822,605 13,848,609 97.66
(expressed in USD)
THAILAND EQUITY FUND
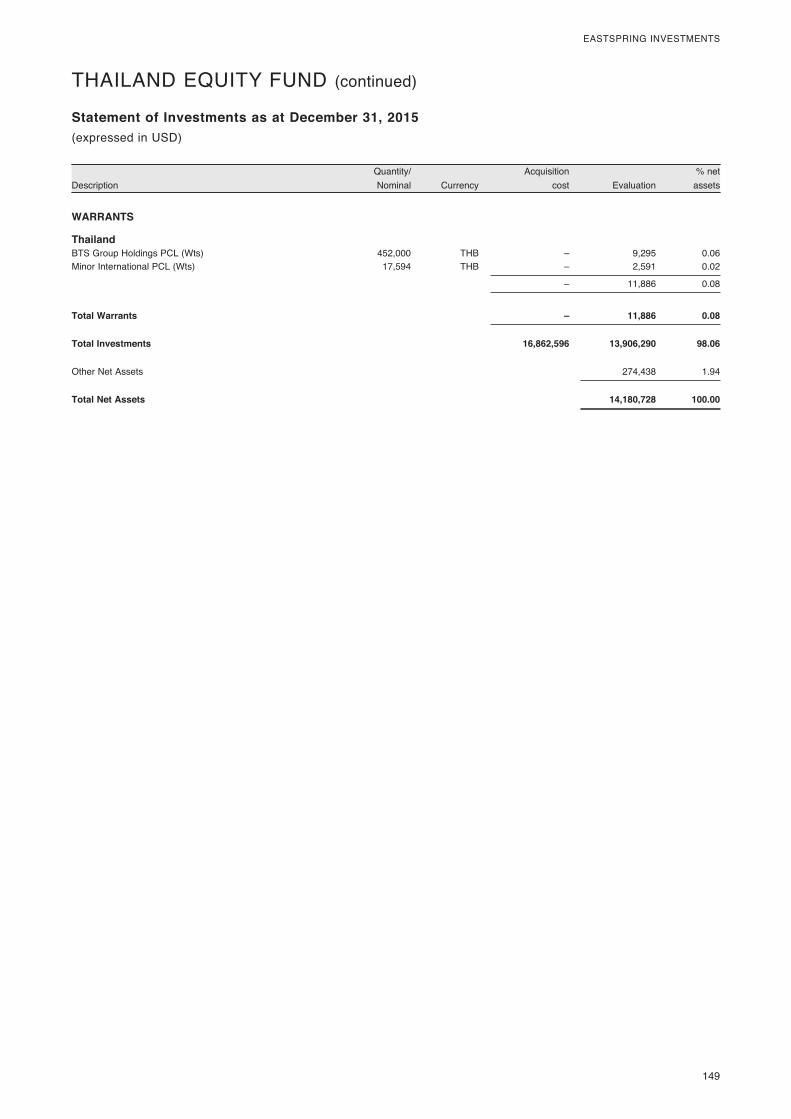
149
EASTSPRING INVESTMENTS
DescriptionQuantity/ Nominal Currency
Acquisition cost Evaluation
% net assets
Statement of Investments as at December 31, 2015(expressed in USD)
THAILAND EQUITY FUND (continued)
WARRANTS
Thailand BTS Group Holdings PCL (Wts) 452,000 THB – 9,295 0.06Minor International PCL (Wts) 17,594 THB – 2,591 0.02
– 11,886 0.08
Total Warrants – 11,886 0.08
Total Investments 16,862,596 13,906,290 98.06
Other Net Assets 274,438 1.94
Total Net Assets 14,180,728 100.00
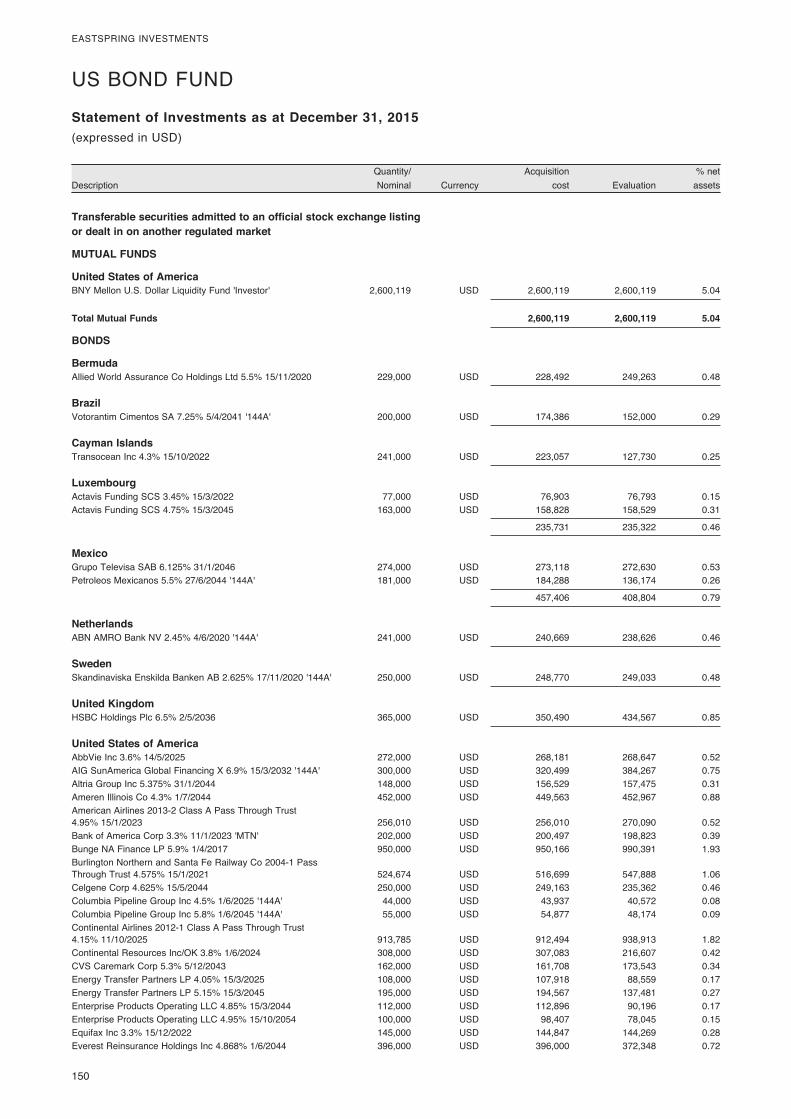
150
EASTSPRING INVESTMENTS
DescriptionQuantity/ Nominal Currency
Acquisition cost Evaluation
% net assets
Statement of Investments as at December 31, 2015
Transferable securities admitted to an official stock exchange listing or dealt in on another regulated market
MUTUAL FUNDS
United States of America BNY Mellon U.S. Dollar Liquidity Fund 'Investor' 2,600,119 USD 2,600,119 2,600,119 5.04
Total Mutual Funds 2,600,119 2,600,119 5.04
BONDS
Bermuda Allied World Assurance Co Holdings Ltd 5.5% 15/11/2020 229,000 USD 228,492 249,263 0.48
Brazil Votorantim Cimentos SA 7.25% 5/4/2041 '144A' 200,000 USD 174,386 152,000 0.29
Cayman Islands Transocean Inc 4.3% 15/10/2022 241,000 USD 223,057 127,730 0.25
Luxembourg Actavis Funding SCS 3.45% 15/3/2022 77,000 USD 76,903 76,793 0.15Actavis Funding SCS 4.75% 15/3/2045 163,000 USD 158,828 158,529 0.31
235,731 235,322 0.46
Mexico Grupo Televisa SAB 6.125% 31/1/2046 274,000 USD 273,118 272,630 0.53Petroleos Mexicanos 5.5% 27/6/2044 '144A' 181,000 USD 184,288 136,174 0.26
457,406 408,804 0.79
Netherlands ABN AMRO Bank NV 2.45% 4/6/2020 '144A' 241,000 USD 240,669 238,626 0.46
Sweden Skandinaviska Enskilda Banken AB 2.625% 17/11/2020 '144A' 250,000 USD 248,770 249,033 0.48
United Kingdom HSBC Holdings Plc 6.5% 2/5/2036 365,000 USD 350,490 434,567 0.85
United States of America AbbVie Inc 3.6% 14/5/2025 272,000 USD 268,181 268,647 0.52AIG SunAmerica Global Financing X 6.9% 15/3/2032 '144A' 300,000 USD 320,499 384,267 0.75Altria Group Inc 5.375% 31/1/2044 148,000 USD 156,529 157,475 0.31Ameren Illinois Co 4.3% 1/7/2044 452,000 USD 449,563 452,967 0.88American Airlines 2013-2 Class A Pass Through Trust 4.95% 15/1/2023 256,010 USD 256,010 270,090 0.52Bank of America Corp 3.3% 11/1/2023 'MTN' 202,000 USD 200,497 198,823 0.39Bunge NA Finance LP 5.9% 1/4/2017 950,000 USD 950,166 990,391 1.93Burlington Northern and Santa Fe Railway Co 2004-1 Pass Through Trust 4.575% 15/1/2021 524,674 USD 516,699 547,888 1.06Celgene Corp 4.625% 15/5/2044 250,000 USD 249,163 235,362 0.46Columbia Pipeline Group Inc 4.5% 1/6/2025 '144A' 44,000 USD 43,937 40,572 0.08Columbia Pipeline Group Inc 5.8% 1/6/2045 '144A' 55,000 USD 54,877 48,174 0.09Continental Airlines 2012-1 Class A Pass Through Trust 4.15% 11/10/2025 913,785 USD 912,494 938,913 1.82Continental Resources Inc/OK 3.8% 1/6/2024 308,000 USD 307,083 216,607 0.42CVS Caremark Corp 5.3% 5/12/2043 162,000 USD 161,708 173,543 0.34Energy Transfer Partners LP 4.05% 15/3/2025 108,000 USD 107,918 88,559 0.17Energy Transfer Partners LP 5.15% 15/3/2045 195,000 USD 194,567 137,481 0.27Enterprise Products Operating LLC 4.85% 15/3/2044 112,000 USD 112,896 90,196 0.17Enterprise Products Operating LLC 4.95% 15/10/2054 100,000 USD 98,407 78,045 0.15Equifax Inc 3.3% 15/12/2022 145,000 USD 144,847 144,269 0.28Everest Reinsurance Holdings Inc 4.868% 1/6/2044 396,000 USD 396,000 372,348 0.72
(expressed in USD)
US BOND FUND
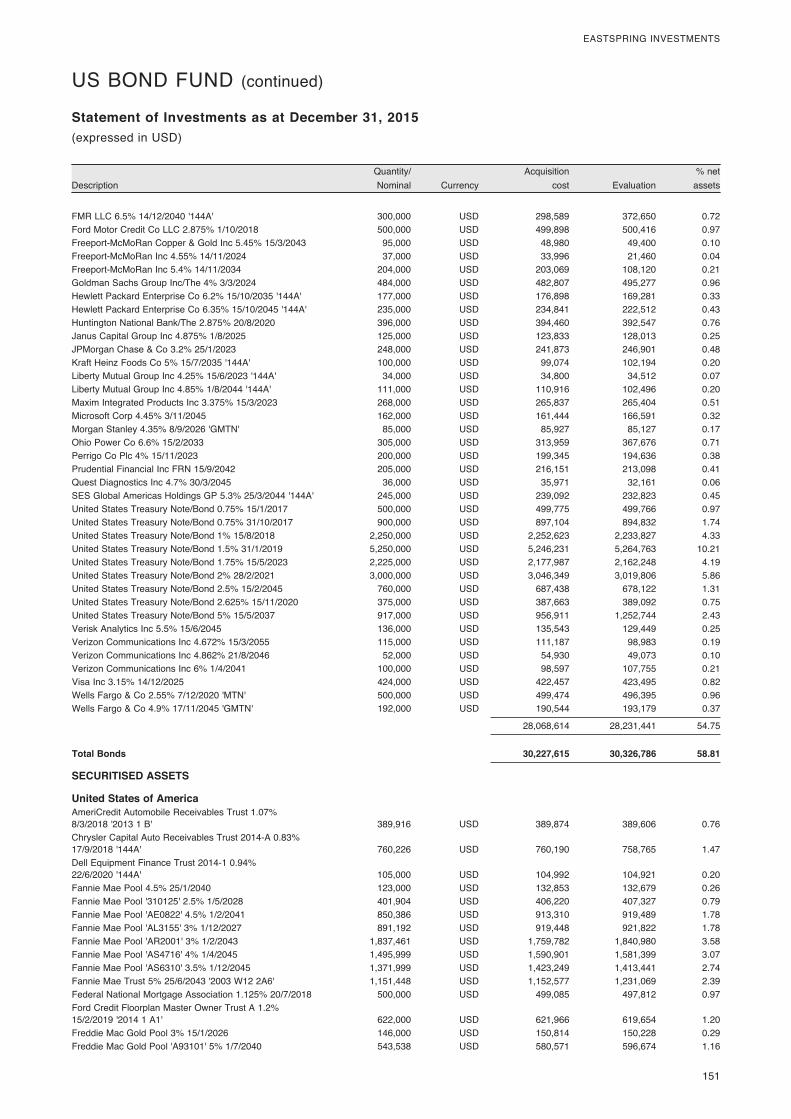
151
EASTSPRING INVESTMENTS
DescriptionQuantity/ Nominal Currency
Acquisition cost Evaluation
% net assets
Statement of Investments as at December 31, 2015(expressed in USD)
US BOND FUND (continued)
FMR LLC 6.5% 14/12/2040 '144A' 300,000 USD 298,589 372,650 0.72Ford Motor Credit Co LLC 2.875% 1/10/2018 500,000 USD 499,898 500,416 0.97Freeport-McMoRan Copper & Gold Inc 5.45% 15/3/2043 95,000 USD 48,980 49,400 0.10Freeport-McMoRan Inc 4.55% 14/11/2024 37,000 USD 33,996 21,460 0.04Freeport-McMoRan Inc 5.4% 14/11/2034 204,000 USD 203,069 108,120 0.21Goldman Sachs Group Inc/The 4% 3/3/2024 484,000 USD 482,807 495,277 0.96Hewlett Packard Enterprise Co 6.2% 15/10/2035 '144A' 177,000 USD 176,898 169,281 0.33Hewlett Packard Enterprise Co 6.35% 15/10/2045 '144A' 235,000 USD 234,841 222,512 0.43Huntington National Bank/The 2.875% 20/8/2020 396,000 USD 394,460 392,547 0.76Janus Capital Group Inc 4.875% 1/8/2025 125,000 USD 123,833 128,013 0.25JPMorgan Chase & Co 3.2% 25/1/2023 248,000 USD 241,873 246,901 0.48Kraft Heinz Foods Co 5% 15/7/2035 '144A' 100,000 USD 99,074 102,194 0.20Liberty Mutual Group Inc 4.25% 15/6/2023 '144A' 34,000 USD 34,800 34,512 0.07Liberty Mutual Group Inc 4.85% 1/8/2044 '144A' 111,000 USD 110,916 102,496 0.20Maxim Integrated Products Inc 3.375% 15/3/2023 268,000 USD 265,837 265,404 0.51Microsoft Corp 4.45% 3/11/2045 162,000 USD 161,444 166,591 0.32Morgan Stanley 4.35% 8/9/2026 'GMTN' 85,000 USD 85,927 85,127 0.17Ohio Power Co 6.6% 15/2/2033 305,000 USD 313,959 367,676 0.71Perrigo Co Plc 4% 15/11/2023 200,000 USD 199,345 194,636 0.38Prudential Financial Inc FRN 15/9/2042 205,000 USD 216,151 213,098 0.41Quest Diagnostics Inc 4.7% 30/3/2045 36,000 USD 35,971 32,161 0.06SES Global Americas Holdings GP 5.3% 25/3/2044 '144A' 245,000 USD 239,092 232,823 0.45United States Treasury Note/Bond 0.75% 15/1/2017 500,000 USD 499,775 499,766 0.97United States Treasury Note/Bond 0.75% 31/10/2017 900,000 USD 897,104 894,832 1.74United States Treasury Note/Bond 1% 15/8/2018 2,250,000 USD 2,252,623 2,233,827 4.33United States Treasury Note/Bond 1.5% 31/1/2019 5,250,000 USD 5,246,231 5,264,763 10.21United States Treasury Note/Bond 1.75% 15/5/2023 2,225,000 USD 2,177,987 2,162,248 4.19United States Treasury Note/Bond 2% 28/2/2021 3,000,000 USD 3,046,349 3,019,806 5.86United States Treasury Note/Bond 2.5% 15/2/2045 760,000 USD 687,438 678,122 1.31United States Treasury Note/Bond 2.625% 15/11/2020 375,000 USD 387,663 389,092 0.75United States Treasury Note/Bond 5% 15/5/2037 917,000 USD 956,911 1,252,744 2.43Verisk Analytics Inc 5.5% 15/6/2045 136,000 USD 135,543 129,449 0.25Verizon Communications Inc 4.672% 15/3/2055 115,000 USD 111,187 98,983 0.19Verizon Communications Inc 4.862% 21/8/2046 52,000 USD 54,930 49,073 0.10Verizon Communications Inc 6% 1/4/2041 100,000 USD 98,597 107,755 0.21Visa Inc 3.15% 14/12/2025 424,000 USD 422,457 423,495 0.82Wells Fargo & Co 2.55% 7/12/2020 'MTN' 500,000 USD 499,474 496,395 0.96Wells Fargo & Co 4.9% 17/11/2045 'GMTN' 192,000 USD 190,544 193,179 0.37
28,068,614 28,231,441 54.75
Total Bonds 30,227,615 30,326,786 58.81
SECURITISED ASSETS
United States of America AmeriCredit Automobile Receivables Trust 1.07% 8/3/2018 '2013 1 B' 389,916 USD 389,874 389,606 0.76Chrysler Capital Auto Receivables Trust 2014-A 0.83% 17/9/2018 '144A' 760,226 USD 760,190 758,765 1.47Dell Equipment Finance Trust 2014-1 0.94% 22/6/2020 '144A' 105,000 USD 104,992 104,921 0.20Fannie Mae Pool 4.5% 25/1/2040 123,000 USD 132,853 132,679 0.26Fannie Mae Pool '310125' 2.5% 1/5/2028 401,904 USD 406,220 407,327 0.79Fannie Mae Pool 'AE0822' 4.5% 1/2/2041 850,386 USD 913,310 919,489 1.78Fannie Mae Pool 'AL3155' 3% 1/12/2027 891,192 USD 919,448 921,822 1.78Fannie Mae Pool 'AR2001' 3% 1/2/2043 1,837,461 USD 1,759,782 1,840,980 3.58Fannie Mae Pool 'AS4716' 4% 1/4/2045 1,495,999 USD 1,590,901 1,581,399 3.07Fannie Mae Pool 'AS6310' 3.5% 1/12/2045 1,371,999 USD 1,423,249 1,413,441 2.74Fannie Mae Trust 5% 25/6/2043 '2003 W12 2A6' 1,151,448 USD 1,152,577 1,231,069 2.39Federal National Mortgage Association 1.125% 20/7/2018 500,000 USD 499,085 497,812 0.97Ford Credit Floorplan Master Owner Trust A 1.2% 15/2/2019 '2014 1 A1' 622,000 USD 621,966 619,654 1.20Freddie Mac Gold Pool 3% 15/1/2026 146,000 USD 150,814 150,228 0.29Freddie Mac Gold Pool 'A93101' 5% 1/7/2040 543,538 USD 580,571 596,674 1.16
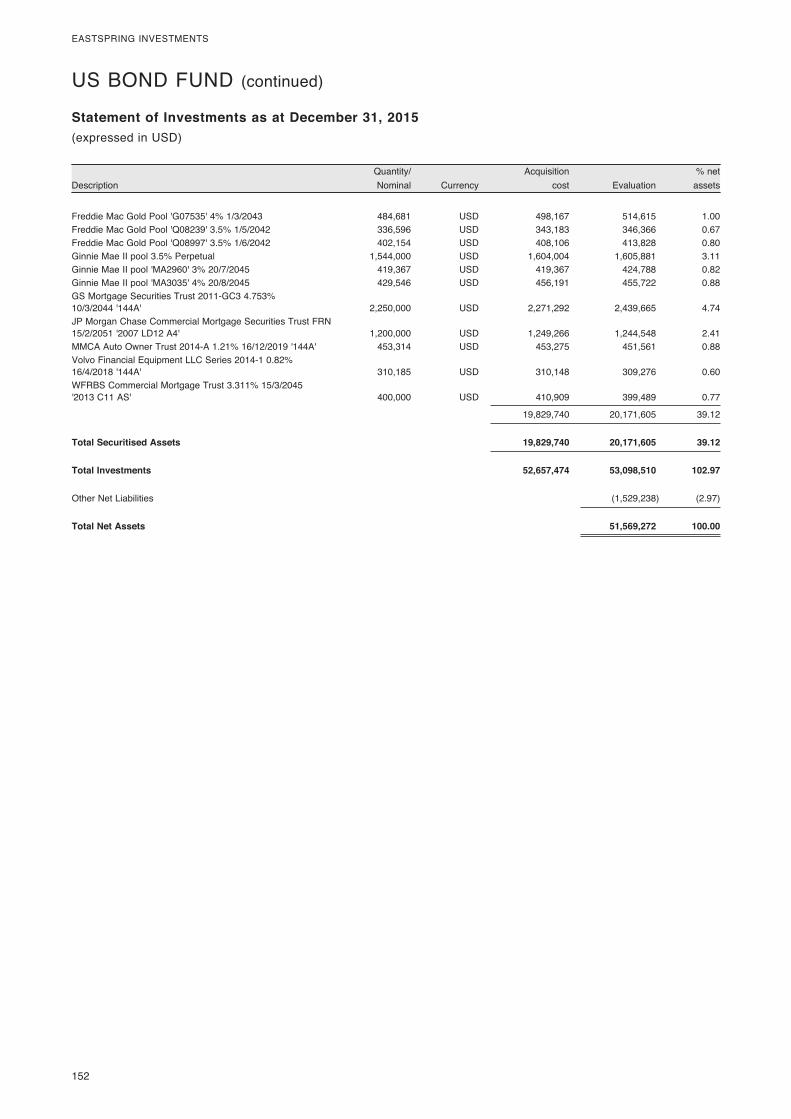
152
EASTSPRING INVESTMENTS
DescriptionQuantity/ Nominal Currency
Acquisition cost Evaluation
% net assets
Statement of Investments as at December 31, 2015(expressed in USD)
US BOND FUND (continued)
Freddie Mac Gold Pool 'G07535' 4% 1/3/2043 484,681 USD 498,167 514,615 1.00Freddie Mac Gold Pool 'Q08239' 3.5% 1/5/2042 336,596 USD 343,183 346,366 0.67Freddie Mac Gold Pool 'Q08997' 3.5% 1/6/2042 402,154 USD 408,106 413,828 0.80Ginnie Mae II pool 3.5% Perpetual 1,544,000 USD 1,604,004 1,605,881 3.11Ginnie Mae II pool 'MA2960' 3% 20/7/2045 419,367 USD 419,367 424,788 0.82Ginnie Mae II pool 'MA3035' 4% 20/8/2045 429,546 USD 456,191 455,722 0.88GS Mortgage Securities Trust 2011-GC3 4.753% 10/3/2044 '144A' 2,250,000 USD 2,271,292 2,439,665 4.74JP Morgan Chase Commercial Mortgage Securities Trust FRN 15/2/2051 '2007 LD12 A4' 1,200,000 USD 1,249,266 1,244,548 2.41MMCA Auto Owner Trust 2014-A 1.21% 16/12/2019 '144A' 453,314 USD 453,275 451,561 0.88Volvo Financial Equipment LLC Series 2014-1 0.82% 16/4/2018 '144A' 310,185 USD 310,148 309,276 0.60WFRBS Commercial Mortgage Trust 3.311% 15/3/2045 '2013 C11 AS' 400,000 USD 410,909 399,489 0.77
19,829,740 20,171,605 39.12
Total Securitised Assets 19,829,740 20,171,605 39.12
Total Investments 52,657,474 53,098,510 102.97
Other Net Liabilities (1,529,238) (2.97)
Total Net Assets 51,569,272 100.00
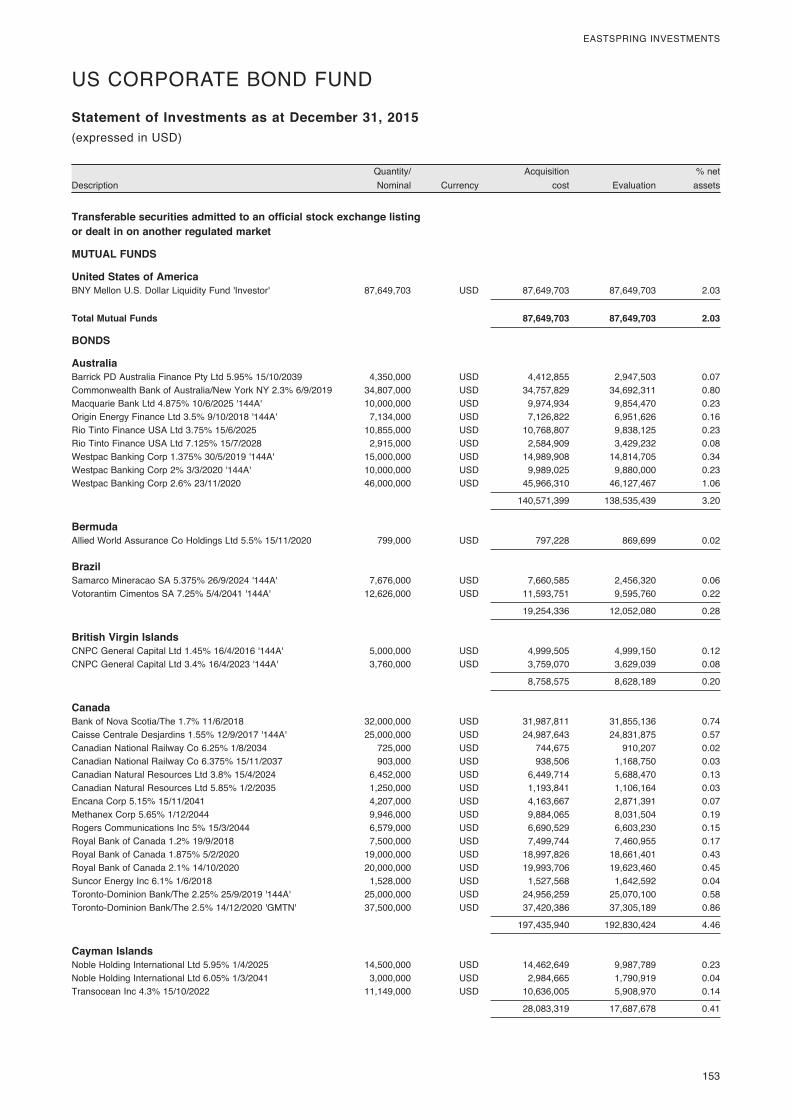
153
EASTSPRING INVESTMENTS
DescriptionQuantity/ Nominal Currency
Acquisition cost Evaluation
% net assets
Statement of Investments as at December 31, 2015
Transferable securities admitted to an official stock exchange listing or dealt in on another regulated market
MUTUAL FUNDS
United States of America BNY Mellon U.S. Dollar Liquidity Fund 'Investor' 87,649,703 USD 87,649,703 87,649,703 2.03
Total Mutual Funds 87,649,703 87,649,703 2.03
BONDS
Australia Barrick PD Australia Finance Pty Ltd 5.95% 15/10/2039 4,350,000 USD 4,412,855 2,947,503 0.07Commonwealth Bank of Australia/New York NY 2.3% 6/9/2019 34,807,000 USD 34,757,829 34,692,311 0.80Macquarie Bank Ltd 4.875% 10/6/2025 '144A' 10,000,000 USD 9,974,934 9,854,470 0.23Origin Energy Finance Ltd 3.5% 9/10/2018 '144A' 7,134,000 USD 7,126,822 6,951,626 0.16Rio Tinto Finance USA Ltd 3.75% 15/6/2025 10,855,000 USD 10,768,807 9,838,125 0.23Rio Tinto Finance USA Ltd 7.125% 15/7/2028 2,915,000 USD 2,584,909 3,429,232 0.08Westpac Banking Corp 1.375% 30/5/2019 '144A' 15,000,000 USD 14,989,908 14,814,705 0.34Westpac Banking Corp 2% 3/3/2020 '144A' 10,000,000 USD 9,989,025 9,880,000 0.23Westpac Banking Corp 2.6% 23/11/2020 46,000,000 USD 45,966,310 46,127,467 1.06
140,571,399 138,535,439 3.20
Bermuda Allied World Assurance Co Holdings Ltd 5.5% 15/11/2020 799,000 USD 797,228 869,699 0.02
Brazil Samarco Mineracao SA 5.375% 26/9/2024 '144A' 7,676,000 USD 7,660,585 2,456,320 0.06Votorantim Cimentos SA 7.25% 5/4/2041 '144A' 12,626,000 USD 11,593,751 9,595,760 0.22
19,254,336 12,052,080 0.28
British Virgin Islands CNPC General Capital Ltd 1.45% 16/4/2016 '144A' 5,000,000 USD 4,999,505 4,999,150 0.12CNPC General Capital Ltd 3.4% 16/4/2023 '144A' 3,760,000 USD 3,759,070 3,629,039 0.08
8,758,575 8,628,189 0.20
Canada Bank of Nova Scotia/The 1.7% 11/6/2018 32,000,000 USD 31,987,811 31,855,136 0.74Caisse Centrale Desjardins 1.55% 12/9/2017 '144A' 25,000,000 USD 24,987,643 24,831,875 0.57Canadian National Railway Co 6.25% 1/8/2034 725,000 USD 744,675 910,207 0.02Canadian National Railway Co 6.375% 15/11/2037 903,000 USD 938,506 1,168,750 0.03Canadian Natural Resources Ltd 3.8% 15/4/2024 6,452,000 USD 6,449,714 5,688,470 0.13Canadian Natural Resources Ltd 5.85% 1/2/2035 1,250,000 USD 1,193,841 1,106,164 0.03Encana Corp 5.15% 15/11/2041 4,207,000 USD 4,163,667 2,871,391 0.07Methanex Corp 5.65% 1/12/2044 9,946,000 USD 9,884,065 8,031,504 0.19Rogers Communications Inc 5% 15/3/2044 6,579,000 USD 6,690,529 6,603,230 0.15Royal Bank of Canada 1.2% 19/9/2018 7,500,000 USD 7,499,744 7,460,955 0.17Royal Bank of Canada 1.875% 5/2/2020 19,000,000 USD 18,997,826 18,661,401 0.43Royal Bank of Canada 2.1% 14/10/2020 20,000,000 USD 19,993,706 19,623,460 0.45Suncor Energy Inc 6.1% 1/6/2018 1,528,000 USD 1,527,568 1,642,592 0.04Toronto-Dominion Bank/The 2.25% 25/9/2019 '144A' 25,000,000 USD 24,956,259 25,070,100 0.58Toronto-Dominion Bank/The 2.5% 14/12/2020 'GMTN' 37,500,000 USD 37,420,386 37,305,189 0.86
197,435,940 192,830,424 4.46
Cayman Islands Noble Holding International Ltd 5.95% 1/4/2025 14,500,000 USD 14,462,649 9,987,789 0.23Noble Holding International Ltd 6.05% 1/3/2041 3,000,000 USD 2,984,665 1,790,919 0.04Transocean Inc 4.3% 15/10/2022 11,149,000 USD 10,636,005 5,908,970 0.14
28,083,319 17,687,678 0.41
(expressed in USD)
US CORPORATE BOND FUND

154
EASTSPRING INVESTMENTS
DescriptionQuantity/ Nominal Currency
Acquisition cost Evaluation
% net assets
Statement of Investments as at December 31, 2015(expressed in USD)
US CORPORATE BOND FUND (continued)
Colombia Colombia Government International Bond 6.125% 18/1/2041 8,000,000 USD 8,684,007 7,720,000 0.18Ecopetrol SA 5.375% 26/6/2026 8,750,000 USD 8,693,979 7,437,500 0.17
17,377,986 15,157,500 0.35
Curacao Teva Pharmaceutical Finance Co BV 3.65% 10/11/2021 384,000 USD 383,178 388,919 0.01
France Electricite de France SA FRN Perpetual '144A' 11,275,000 USD 11,205,008 10,598,500 0.24Total Capital International SA 2.7% 25/1/2023 8,500,000 USD 8,487,633 8,134,840 0.19
19,692,641 18,733,340 0.43
Germany Deutsche Bank AG/London 1.875% 13/2/2018 15,268,000 USD 15,255,176 15,134,405 0.35KFW 0.75% 17/3/2017 19,000,000 USD 18,987,790 18,936,141 0.44KFW 1.5% 20/4/2020 20,000,000 USD 19,934,266 19,679,260 0.46KFW 1.875% 1/4/2019 10,000,000 USD 9,979,208 10,066,470 0.23KFW 1.875% 30/11/2020 15,385,000 USD 15,353,567 15,290,844 0.35
79,510,007 79,107,120 1.83
Hong Kong AIA Group Ltd 3.2% 11/3/2025 '144A' 11,100,000 USD 11,087,062 10,688,789 0.25
International European Investment Bank 1% 15/6/2018 35,000,000 USD 34,970,390 34,636,979 0.80European Investment Bank 1.625% 15/6/2017 22,838,000 USD 23,081,207 23,012,231 0.53European Investment Bank 1.75% 15/3/2017 13,500,000 USD 13,485,702 13,613,576 0.31European Investment Bank 1.75% 17/6/2019 15,000,000 USD 14,956,778 15,023,250 0.35Inter-American Development Bank 1.375% 15/7/2020 10,000,000 USD 9,982,018 9,812,280 0.23International Bank for Reconstruction & Development 1% 15/11/2017 27,000,000 USD 26,998,113 26,946,891 0.62International Bank for Reconstruction & Development 1% 15/6/2018 12,174,000 USD 12,157,748 12,067,831 0.28International Bank for Reconstruction & Development 1.375% 10/4/2018 30,000,000 USD 29,935,594 30,104,580 0.70
165,567,550 165,217,618 3.82
Ireland GE Capital International Funding Co 4.418% 15/11/2035 '144A' 15,981,000 USD 15,190,073 16,299,645 0.38
Italy Eni SpA 5.7% 1/10/2040 '144A' 2,708,000 USD 2,638,885 2,425,147 0.06
Luxembourg Actavis Funding SCS 3.45% 15/3/2022 4,170,000 USD 4,164,776 4,158,799 0.10Actavis Funding SCS 4.75% 15/3/2045 13,456,000 USD 13,320,713 13,086,875 0.30Covidien International Finance SA 6.55% 15/10/2037 300,000 USD 311,695 375,142 0.01Pentair Finance SA 2.65% 1/12/2019 5,800,000 USD 5,792,402 5,616,726 0.13Prologis International Funding II SA 4.875% 15/2/2020 '144A' 7,723,000 USD 7,690,330 8,138,273 0.19Schlumberger Investment SA 2.4% 1/8/2022 '144A' 5,500,000 USD 5,493,927 5,169,896 0.12SES SA 3.6% 4/4/2023 '144A' 4,956,000 USD 4,938,692 4,830,613 0.11
41,712,535 41,376,324 0.96
Mexico America Movil SAB de CV 6.125% 30/3/2040 1,800,000 USD 1,780,937 1,970,102 0.05Grupo Televisa SAB 6.125% 31/1/2046 15,624,000 USD 15,573,722 15,545,880 0.35Mexico Government International Bond 4% 2/10/2023 5,000,000 USD 5,034,374 5,065,000 0.11Mexico Government International Bond 5.75% 12/10/2110 4,420,000 USD 4,178,006 4,121,650 0.10Petroleos Mexicanos 5.5% 27/6/2044 '144A' 13,067,000 USD 13,304,356 9,830,827 0.23Petroleos Mexicanos 6.5% 2/6/2041 11,552,000 USD 11,521,006 9,986,704 0.23
51,392,401 46,520,163 1.07
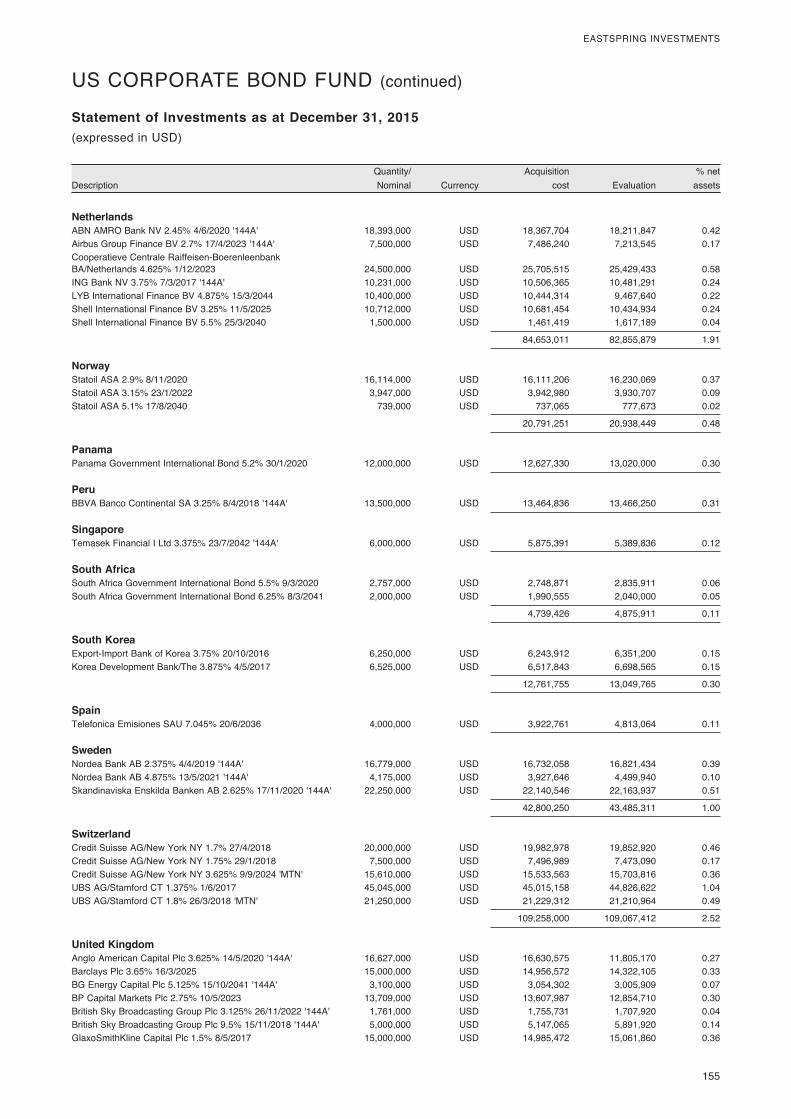
155
EASTSPRING INVESTMENTS
DescriptionQuantity/ Nominal Currency
Acquisition cost Evaluation
% net assets
Statement of Investments as at December 31, 2015(expressed in USD)
US CORPORATE BOND FUND (continued)
Netherlands ABN AMRO Bank NV 2.45% 4/6/2020 '144A' 18,393,000 USD 18,367,704 18,211,847 0.42Airbus Group Finance BV 2.7% 17/4/2023 '144A' 7,500,000 USD 7,486,240 7,213,545 0.17Cooperatieve Centrale Raiffeisen-Boerenleenbank BA/Netherlands 4.625% 1/12/2023 24,500,000 USD 25,705,515 25,429,433 0.58ING Bank NV 3.75% 7/3/2017 '144A' 10,231,000 USD 10,506,365 10,481,291 0.24LYB International Finance BV 4.875% 15/3/2044 10,400,000 USD 10,444,314 9,467,640 0.22Shell International Finance BV 3.25% 11/5/2025 10,712,000 USD 10,681,454 10,434,934 0.24Shell International Finance BV 5.5% 25/3/2040 1,500,000 USD 1,461,419 1,617,189 0.04
84,653,011 82,855,879 1.91
Norway Statoil ASA 2.9% 8/11/2020 16,114,000 USD 16,111,206 16,230,069 0.37Statoil ASA 3.15% 23/1/2022 3,947,000 USD 3,942,980 3,930,707 0.09Statoil ASA 5.1% 17/8/2040 739,000 USD 737,065 777,673 0.02
20,791,251 20,938,449 0.48
Panama Panama Government International Bond 5.2% 30/1/2020 12,000,000 USD 12,627,330 13,020,000 0.30
Peru BBVA Banco Continental SA 3.25% 8/4/2018 '144A' 13,500,000 USD 13,464,836 13,466,250 0.31
Singapore Temasek Financial I Ltd 3.375% 23/7/2042 '144A' 6,000,000 USD 5,875,391 5,389,836 0.12
South Africa South Africa Government International Bond 5.5% 9/3/2020 2,757,000 USD 2,748,871 2,835,911 0.06South Africa Government International Bond 6.25% 8/3/2041 2,000,000 USD 1,990,555 2,040,000 0.05
4,739,426 4,875,911 0.11
South Korea Export-Import Bank of Korea 3.75% 20/10/2016 6,250,000 USD 6,243,912 6,351,200 0.15Korea Development Bank/The 3.875% 4/5/2017 6,525,000 USD 6,517,843 6,698,565 0.15
12,761,755 13,049,765 0.30
Spain Telefonica Emisiones SAU 7.045% 20/6/2036 4,000,000 USD 3,922,761 4,813,064 0.11
Sweden Nordea Bank AB 2.375% 4/4/2019 '144A' 16,779,000 USD 16,732,058 16,821,434 0.39Nordea Bank AB 4.875% 13/5/2021 '144A' 4,175,000 USD 3,927,646 4,499,940 0.10Skandinaviska Enskilda Banken AB 2.625% 17/11/2020 '144A' 22,250,000 USD 22,140,546 22,163,937 0.51
42,800,250 43,485,311 1.00
Switzerland Credit Suisse AG/New York NY 1.7% 27/4/2018 20,000,000 USD 19,982,978 19,852,920 0.46Credit Suisse AG/New York NY 1.75% 29/1/2018 7,500,000 USD 7,496,989 7,473,090 0.17Credit Suisse AG/New York NY 3.625% 9/9/2024 'MTN' 15,610,000 USD 15,533,563 15,703,816 0.36UBS AG/Stamford CT 1.375% 1/6/2017 45,045,000 USD 45,015,158 44,826,622 1.04UBS AG/Stamford CT 1.8% 26/3/2018 'MTN' 21,250,000 USD 21,229,312 21,210,964 0.49
109,258,000 109,067,412 2.52
United Kingdom Anglo American Capital Plc 3.625% 14/5/2020 '144A' 16,627,000 USD 16,630,575 11,805,170 0.27Barclays Plc 3.65% 16/3/2025 15,000,000 USD 14,956,572 14,322,105 0.33BG Energy Capital Plc 5.125% 15/10/2041 '144A' 3,100,000 USD 3,054,302 3,005,909 0.07BP Capital Markets Plc 2.75% 10/5/2023 13,709,000 USD 13,607,987 12,854,710 0.30British Sky Broadcasting Group Plc 3.125% 26/11/2022 '144A' 1,761,000 USD 1,755,731 1,707,920 0.04British Sky Broadcasting Group Plc 9.5% 15/11/2018 '144A' 5,000,000 USD 5,147,065 5,891,920 0.14GlaxoSmithKline Capital Plc 1.5% 8/5/2017 15,000,000 USD 14,985,472 15,061,860 0.36
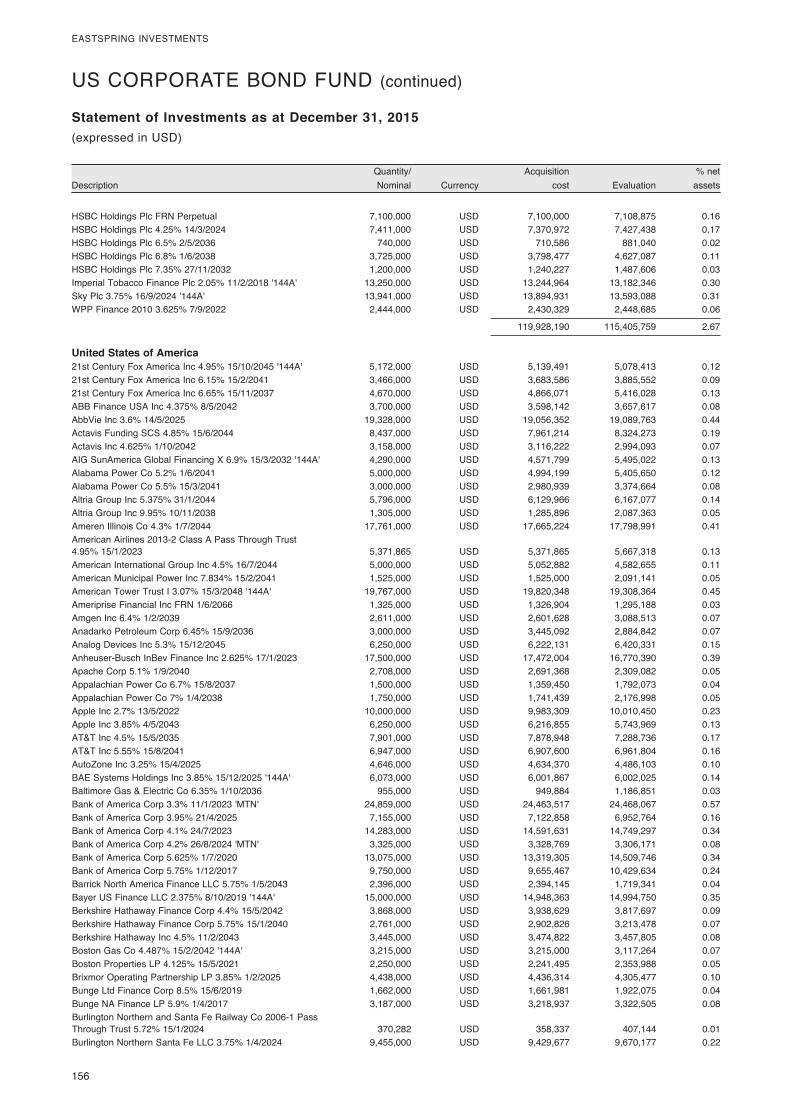
156
EASTSPRING INVESTMENTS
DescriptionQuantity/ Nominal Currency
Acquisition cost Evaluation
% net assets
Statement of Investments as at December 31, 2015(expressed in USD)
US CORPORATE BOND FUND (continued)
HSBC Holdings Plc FRN Perpetual 7,100,000 USD 7,100,000 7,108,875 0.16HSBC Holdings Plc 4.25% 14/3/2024 7,411,000 USD 7,370,972 7,427,438 0.17HSBC Holdings Plc 6.5% 2/5/2036 740,000 USD 710,586 881,040 0.02HSBC Holdings Plc 6.8% 1/6/2038 3,725,000 USD 3,798,477 4,627,087 0.11HSBC Holdings Plc 7.35% 27/11/2032 1,200,000 USD 1,240,227 1,487,606 0.03Imperial Tobacco Finance Plc 2.05% 11/2/2018 '144A' 13,250,000 USD 13,244,964 13,182,346 0.30Sky Plc 3.75% 16/9/2024 '144A' 13,941,000 USD 13,894,931 13,593,088 0.31WPP Finance 2010 3.625% 7/9/2022 2,444,000 USD 2,430,329 2,448,685 0.06
119,928,190 115,405,759 2.67
United States of America 21st Century Fox America Inc 4.95% 15/10/2045 '144A' 5,172,000 USD 5,139,491 5,078,413 0.1221st Century Fox America Inc 6.15% 15/2/2041 3,466,000 USD 3,683,586 3,885,552 0.0921st Century Fox America Inc 6.65% 15/11/2037 4,670,000 USD 4,866,071 5,416,028 0.13ABB Finance USA Inc 4.375% 8/5/2042 3,700,000 USD 3,598,142 3,657,617 0.08AbbVie Inc 3.6% 14/5/2025 19,328,000 USD 19,056,352 19,089,763 0.44Actavis Funding SCS 4.85% 15/6/2044 8,437,000 USD 7,961,214 8,324,273 0.19Actavis Inc 4.625% 1/10/2042 3,158,000 USD 3,116,222 2,994,093 0.07AIG SunAmerica Global Financing X 6.9% 15/3/2032 '144A' 4,290,000 USD 4,571,799 5,495,022 0.13Alabama Power Co 5.2% 1/6/2041 5,000,000 USD 4,994,199 5,405,650 0.12Alabama Power Co 5.5% 15/3/2041 3,000,000 USD 2,980,939 3,374,664 0.08Altria Group Inc 5.375% 31/1/2044 5,796,000 USD 6,129,966 6,167,077 0.14Altria Group Inc 9.95% 10/11/2038 1,305,000 USD 1,285,896 2,087,363 0.05Ameren Illinois Co 4.3% 1/7/2044 17,761,000 USD 17,665,224 17,798,991 0.41American Airlines 2013-2 Class A Pass Through Trust 4.95% 15/1/2023 5,371,865 USD 5,371,865 5,667,318 0.13American International Group Inc 4.5% 16/7/2044 5,000,000 USD 5,052,882 4,582,655 0.11American Municipal Power Inc 7.834% 15/2/2041 1,525,000 USD 1,525,000 2,091,141 0.05American Tower Trust I 3.07% 15/3/2048 '144A' 19,767,000 USD 19,820,348 19,308,364 0.45Ameriprise Financial Inc FRN 1/6/2066 1,325,000 USD 1,326,904 1,295,188 0.03Amgen Inc 6.4% 1/2/2039 2,611,000 USD 2,601,628 3,088,513 0.07Anadarko Petroleum Corp 6.45% 15/9/2036 3,000,000 USD 3,445,092 2,884,842 0.07Analog Devices Inc 5.3% 15/12/2045 6,250,000 USD 6,222,131 6,420,331 0.15Anheuser-Busch InBev Finance Inc 2.625% 17/1/2023 17,500,000 USD 17,472,004 16,770,390 0.39Apache Corp 5.1% 1/9/2040 2,708,000 USD 2,691,368 2,309,082 0.05Appalachian Power Co 6.7% 15/8/2037 1,500,000 USD 1,359,450 1,792,073 0.04Appalachian Power Co 7% 1/4/2038 1,750,000 USD 1,741,439 2,176,998 0.05Apple Inc 2.7% 13/5/2022 10,000,000 USD 9,983,309 10,010,450 0.23Apple Inc 3.85% 4/5/2043 6,250,000 USD 6,216,855 5,743,969 0.13AT&T Inc 4.5% 15/5/2035 7,901,000 USD 7,878,948 7,288,736 0.17AT&T Inc 5.55% 15/8/2041 6,947,000 USD 6,907,600 6,961,804 0.16AutoZone Inc 3.25% 15/4/2025 4,646,000 USD 4,634,370 4,486,103 0.10BAE Systems Holdings Inc 3.85% 15/12/2025 '144A' 6,073,000 USD 6,001,867 6,002,025 0.14Baltimore Gas & Electric Co 6.35% 1/10/2036 955,000 USD 949,884 1,186,851 0.03Bank of America Corp 3.3% 11/1/2023 'MTN' 24,859,000 USD 24,463,517 24,468,067 0.57Bank of America Corp 3.95% 21/4/2025 7,155,000 USD 7,122,858 6,952,764 0.16Bank of America Corp 4.1% 24/7/2023 14,283,000 USD 14,591,631 14,749,297 0.34Bank of America Corp 4.2% 26/8/2024 'MTN' 3,325,000 USD 3,328,769 3,306,171 0.08Bank of America Corp 5.625% 1/7/2020 13,075,000 USD 13,319,305 14,509,746 0.34Bank of America Corp 5.75% 1/12/2017 9,750,000 USD 9,655,467 10,429,634 0.24Barrick North America Finance LLC 5.75% 1/5/2043 2,396,000 USD 2,394,145 1,719,341 0.04Bayer US Finance LLC 2.375% 8/10/2019 '144A' 15,000,000 USD 14,948,363 14,994,750 0.35Berkshire Hathaway Finance Corp 4.4% 15/5/2042 3,868,000 USD 3,938,629 3,817,697 0.09Berkshire Hathaway Finance Corp 5.75% 15/1/2040 2,761,000 USD 2,902,826 3,213,478 0.07Berkshire Hathaway Inc 4.5% 11/2/2043 3,445,000 USD 3,474,822 3,457,805 0.08Boston Gas Co 4.487% 15/2/2042 '144A' 3,215,000 USD 3,215,000 3,117,264 0.07Boston Properties LP 4.125% 15/5/2021 2,250,000 USD 2,241,495 2,353,988 0.05Brixmor Operating Partnership LP 3.85% 1/2/2025 4,438,000 USD 4,436,314 4,305,477 0.10Bunge Ltd Finance Corp 8.5% 15/6/2019 1,662,000 USD 1,661,981 1,922,075 0.04Bunge NA Finance LP 5.9% 1/4/2017 3,187,000 USD 3,218,937 3,322,505 0.08Burlington Northern and Santa Fe Railway Co 2006-1 Pass Through Trust 5.72% 15/1/2024 370,282 USD 358,337 407,144 0.01Burlington Northern Santa Fe LLC 3.75% 1/4/2024 9,455,000 USD 9,429,677 9,670,177 0.22
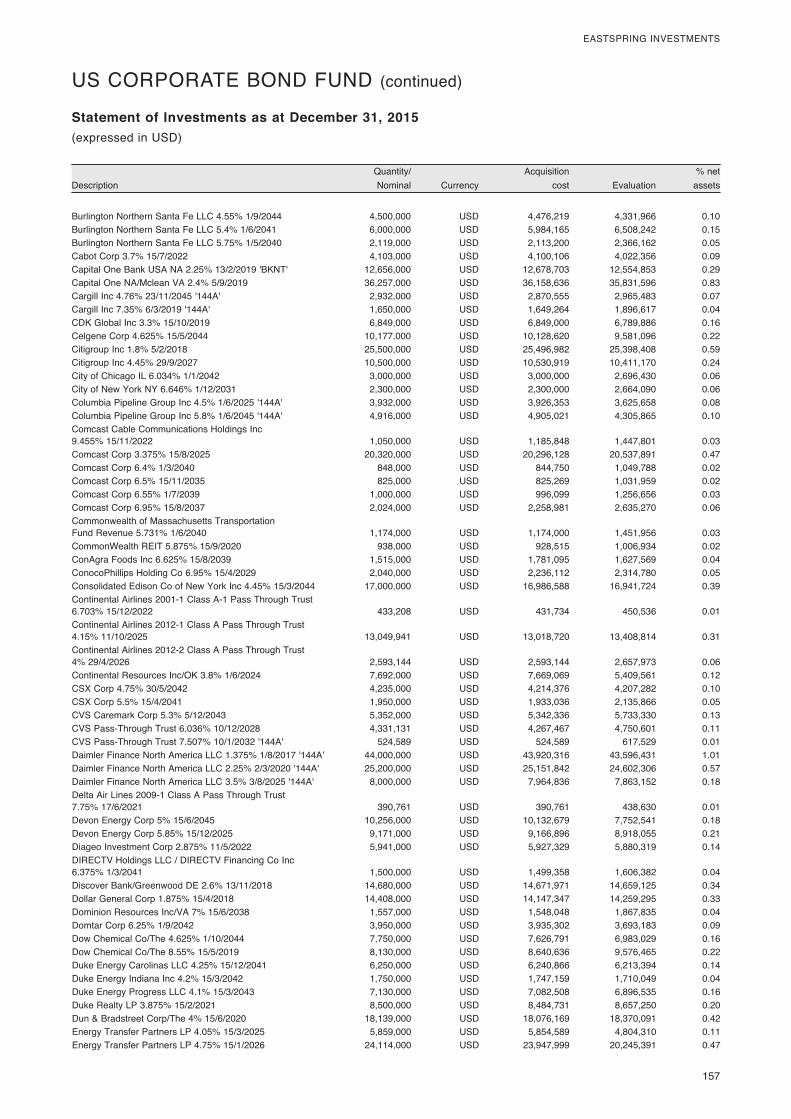
157
EASTSPRING INVESTMENTS
DescriptionQuantity/ Nominal Currency
Acquisition cost Evaluation
% net assets
Statement of Investments as at December 31, 2015(expressed in USD)
US CORPORATE BOND FUND (continued)
Burlington Northern Santa Fe LLC 4.55% 1/9/2044 4,500,000 USD 4,476,219 4,331,966 0.10Burlington Northern Santa Fe LLC 5.4% 1/6/2041 6,000,000 USD 5,984,165 6,508,242 0.15Burlington Northern Santa Fe LLC 5.75% 1/5/2040 2,119,000 USD 2,113,200 2,366,162 0.05Cabot Corp 3.7% 15/7/2022 4,103,000 USD 4,100,106 4,022,356 0.09Capital One Bank USA NA 2.25% 13/2/2019 'BKNT' 12,656,000 USD 12,678,703 12,554,853 0.29Capital One NA/Mclean VA 2.4% 5/9/2019 36,257,000 USD 36,158,636 35,831,596 0.83Cargill Inc 4.76% 23/11/2045 '144A' 2,932,000 USD 2,870,555 2,965,483 0.07Cargill Inc 7.35% 6/3/2019 '144A' 1,650,000 USD 1,649,264 1,896,617 0.04CDK Global Inc 3.3% 15/10/2019 6,849,000 USD 6,849,000 6,789,886 0.16Celgene Corp 4.625% 15/5/2044 10,177,000 USD 10,128,620 9,581,096 0.22Citigroup Inc 1.8% 5/2/2018 25,500,000 USD 25,496,982 25,398,408 0.59Citigroup Inc 4.45% 29/9/2027 10,500,000 USD 10,530,919 10,411,170 0.24City of Chicago IL 6.034% 1/1/2042 3,000,000 USD 3,000,000 2,696,430 0.06City of New York NY 6.646% 1/12/2031 2,300,000 USD 2,300,000 2,664,090 0.06Columbia Pipeline Group Inc 4.5% 1/6/2025 '144A' 3,932,000 USD 3,926,353 3,625,658 0.08Columbia Pipeline Group Inc 5.8% 1/6/2045 '144A' 4,916,000 USD 4,905,021 4,305,865 0.10Comcast Cable Communications Holdings Inc 9.455% 15/11/2022 1,050,000 USD 1,185,848 1,447,801 0.03Comcast Corp 3.375% 15/8/2025 20,320,000 USD 20,296,128 20,537,891 0.47Comcast Corp 6.4% 1/3/2040 848,000 USD 844,750 1,049,788 0.02Comcast Corp 6.5% 15/11/2035 825,000 USD 825,269 1,031,959 0.02Comcast Corp 6.55% 1/7/2039 1,000,000 USD 996,099 1,256,656 0.03Comcast Corp 6.95% 15/8/2037 2,024,000 USD 2,258,981 2,635,270 0.06Commonwealth of Massachusetts Transportation Fund Revenue 5.731% 1/6/2040 1,174,000 USD 1,174,000 1,451,956 0.03CommonWealth REIT 5.875% 15/9/2020 938,000 USD 928,515 1,006,934 0.02ConAgra Foods Inc 6.625% 15/8/2039 1,515,000 USD 1,781,095 1,627,569 0.04ConocoPhillips Holding Co 6.95% 15/4/2029 2,040,000 USD 2,236,112 2,314,780 0.05Consolidated Edison Co of New York Inc 4.45% 15/3/2044 17,000,000 USD 16,986,588 16,941,724 0.39Continental Airlines 2001-1 Class A-1 Pass Through Trust 6.703% 15/12/2022 433,208 USD 431,734 450,536 0.01Continental Airlines 2012-1 Class A Pass Through Trust 4.15% 11/10/2025 13,049,941 USD 13,018,720 13,408,814 0.31Continental Airlines 2012-2 Class A Pass Through Trust 4% 29/4/2026 2,593,144 USD 2,593,144 2,657,973 0.06Continental Resources Inc/OK 3.8% 1/6/2024 7,692,000 USD 7,669,069 5,409,561 0.12CSX Corp 4.75% 30/5/2042 4,235,000 USD 4,214,376 4,207,282 0.10CSX Corp 5.5% 15/4/2041 1,950,000 USD 1,933,036 2,135,866 0.05CVS Caremark Corp 5.3% 5/12/2043 5,352,000 USD 5,342,336 5,733,330 0.13CVS Pass-Through Trust 6.036% 10/12/2028 4,331,131 USD 4,267,467 4,750,601 0.11CVS Pass-Through Trust 7.507% 10/1/2032 '144A' 524,589 USD 524,589 617,529 0.01Daimler Finance North America LLC 1.375% 1/8/2017 '144A' 44,000,000 USD 43,920,316 43,596,431 1.01Daimler Finance North America LLC 2.25% 2/3/2020 '144A' 25,200,000 USD 25,151,842 24,602,306 0.57Daimler Finance North America LLC 3.5% 3/8/2025 '144A' 8,000,000 USD 7,964,836 7,863,152 0.18Delta Air Lines 2009-1 Class A Pass Through Trust 7.75% 17/6/2021 390,761 USD 390,761 438,630 0.01Devon Energy Corp 5% 15/6/2045 10,256,000 USD 10,132,679 7,752,541 0.18Devon Energy Corp 5.85% 15/12/2025 9,171,000 USD 9,166,896 8,918,055 0.21Diageo Investment Corp 2.875% 11/5/2022 5,941,000 USD 5,927,329 5,880,319 0.14DIRECTV Holdings LLC / DIRECTV Financing Co Inc 6.375% 1/3/2041 1,500,000 USD 1,499,358 1,606,382 0.04Discover Bank/Greenwood DE 2.6% 13/11/2018 14,680,000 USD 14,671,971 14,659,125 0.34Dollar General Corp 1.875% 15/4/2018 14,408,000 USD 14,147,347 14,259,295 0.33Dominion Resources Inc/VA 7% 15/6/2038 1,557,000 USD 1,548,048 1,867,835 0.04Domtar Corp 6.25% 1/9/2042 3,950,000 USD 3,935,302 3,693,183 0.09Dow Chemical Co/The 4.625% 1/10/2044 7,750,000 USD 7,626,791 6,983,029 0.16Dow Chemical Co/The 8.55% 15/5/2019 8,130,000 USD 8,640,636 9,576,465 0.22Duke Energy Carolinas LLC 4.25% 15/12/2041 6,250,000 USD 6,240,866 6,213,394 0.14Duke Energy Indiana Inc 4.2% 15/3/2042 1,750,000 USD 1,747,159 1,710,049 0.04Duke Energy Progress LLC 4.1% 15/3/2043 7,130,000 USD 7,082,508 6,896,535 0.16Duke Realty LP 3.875% 15/2/2021 8,500,000 USD 8,484,731 8,657,250 0.20Dun & Bradstreet Corp/The 4% 15/6/2020 18,139,000 USD 18,076,169 18,370,091 0.42Energy Transfer Partners LP 4.05% 15/3/2025 5,859,000 USD 5,854,589 4,804,310 0.11Energy Transfer Partners LP 4.75% 15/1/2026 24,114,000 USD 23,947,999 20,245,391 0.47
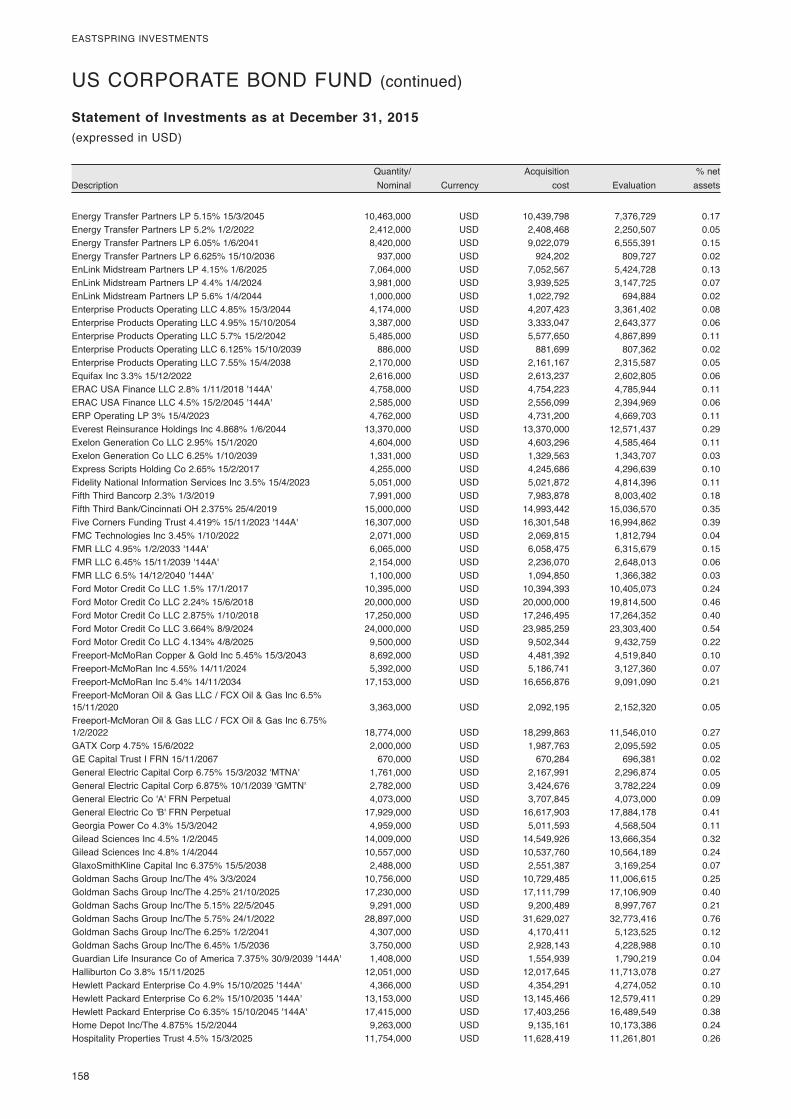
158
EASTSPRING INVESTMENTS
DescriptionQuantity/ Nominal Currency
Acquisition cost Evaluation
% net assets
Statement of Investments as at December 31, 2015(expressed in USD)
US CORPORATE BOND FUND (continued)
Energy Transfer Partners LP 5.15% 15/3/2045 10,463,000 USD 10,439,798 7,376,729 0.17Energy Transfer Partners LP 5.2% 1/2/2022 2,412,000 USD 2,408,468 2,250,507 0.05Energy Transfer Partners LP 6.05% 1/6/2041 8,420,000 USD 9,022,079 6,555,391 0.15Energy Transfer Partners LP 6.625% 15/10/2036 937,000 USD 924,202 809,727 0.02EnLink Midstream Partners LP 4.15% 1/6/2025 7,064,000 USD 7,052,567 5,424,728 0.13EnLink Midstream Partners LP 4.4% 1/4/2024 3,981,000 USD 3,939,525 3,147,725 0.07EnLink Midstream Partners LP 5.6% 1/4/2044 1,000,000 USD 1,022,792 694,884 0.02Enterprise Products Operating LLC 4.85% 15/3/2044 4,174,000 USD 4,207,423 3,361,402 0.08Enterprise Products Operating LLC 4.95% 15/10/2054 3,387,000 USD 3,333,047 2,643,377 0.06Enterprise Products Operating LLC 5.7% 15/2/2042 5,485,000 USD 5,577,650 4,867,899 0.11Enterprise Products Operating LLC 6.125% 15/10/2039 886,000 USD 881,699 807,362 0.02Enterprise Products Operating LLC 7.55% 15/4/2038 2,170,000 USD 2,161,167 2,315,587 0.05Equifax Inc 3.3% 15/12/2022 2,616,000 USD 2,613,237 2,602,805 0.06ERAC USA Finance LLC 2.8% 1/11/2018 '144A' 4,758,000 USD 4,754,223 4,785,944 0.11ERAC USA Finance LLC 4.5% 15/2/2045 '144A' 2,585,000 USD 2,556,099 2,394,969 0.06ERP Operating LP 3% 15/4/2023 4,762,000 USD 4,731,200 4,669,703 0.11Everest Reinsurance Holdings Inc 4.868% 1/6/2044 13,370,000 USD 13,370,000 12,571,437 0.29Exelon Generation Co LLC 2.95% 15/1/2020 4,604,000 USD 4,603,296 4,585,464 0.11Exelon Generation Co LLC 6.25% 1/10/2039 1,331,000 USD 1,329,563 1,343,707 0.03Express Scripts Holding Co 2.65% 15/2/2017 4,255,000 USD 4,245,686 4,296,639 0.10Fidelity National Information Services Inc 3.5% 15/4/2023 5,051,000 USD 5,021,872 4,814,396 0.11Fifth Third Bancorp 2.3% 1/3/2019 7,991,000 USD 7,983,878 8,003,402 0.18Fifth Third Bank/Cincinnati OH 2.375% 25/4/2019 15,000,000 USD 14,993,442 15,036,570 0.35Five Corners Funding Trust 4.419% 15/11/2023 '144A' 16,307,000 USD 16,301,548 16,994,862 0.39FMC Technologies Inc 3.45% 1/10/2022 2,071,000 USD 2,069,815 1,812,794 0.04FMR LLC 4.95% 1/2/2033 '144A' 6,065,000 USD 6,058,475 6,315,679 0.15FMR LLC 6.45% 15/11/2039 '144A' 2,154,000 USD 2,236,070 2,648,013 0.06FMR LLC 6.5% 14/12/2040 '144A' 1,100,000 USD 1,094,850 1,366,382 0.03Ford Motor Credit Co LLC 1.5% 17/1/2017 10,395,000 USD 10,394,393 10,405,073 0.24Ford Motor Credit Co LLC 2.24% 15/6/2018 20,000,000 USD 20,000,000 19,814,500 0.46Ford Motor Credit Co LLC 2.875% 1/10/2018 17,250,000 USD 17,246,495 17,264,352 0.40Ford Motor Credit Co LLC 3.664% 8/9/2024 24,000,000 USD 23,985,259 23,303,400 0.54Ford Motor Credit Co LLC 4.134% 4/8/2025 9,500,000 USD 9,502,344 9,432,759 0.22Freeport-McMoRan Copper & Gold Inc 5.45% 15/3/2043 8,692,000 USD 4,481,392 4,519,840 0.10Freeport-McMoRan Inc 4.55% 14/11/2024 5,392,000 USD 5,186,741 3,127,360 0.07Freeport-McMoRan Inc 5.4% 14/11/2034 17,153,000 USD 16,656,876 9,091,090 0.21Freeport-McMoran Oil & Gas LLC / FCX Oil & Gas Inc 6.5% 15/11/2020 3,363,000 USD 2,092,195 2,152,320 0.05Freeport-McMoran Oil & Gas LLC / FCX Oil & Gas Inc 6.75% 1/2/2022 18,774,000 USD 18,299,863 11,546,010 0.27GATX Corp 4.75% 15/6/2022 2,000,000 USD 1,987,763 2,095,592 0.05GE Capital Trust I FRN 15/11/2067 670,000 USD 670,284 696,381 0.02General Electric Capital Corp 6.75% 15/3/2032 'MTNA' 1,761,000 USD 2,167,991 2,296,874 0.05General Electric Capital Corp 6.875% 10/1/2039 'GMTN' 2,782,000 USD 3,424,676 3,782,224 0.09General Electric Co 'A' FRN Perpetual 4,073,000 USD 3,707,845 4,073,000 0.09General Electric Co 'B' FRN Perpetual 17,929,000 USD 16,617,903 17,884,178 0.41Georgia Power Co 4.3% 15/3/2042 4,959,000 USD 5,011,593 4,568,504 0.11Gilead Sciences Inc 4.5% 1/2/2045 14,009,000 USD 14,549,926 13,666,354 0.32Gilead Sciences Inc 4.8% 1/4/2044 10,557,000 USD 10,537,760 10,564,189 0.24GlaxoSmithKline Capital Inc 6.375% 15/5/2038 2,488,000 USD 2,551,387 3,169,254 0.07Goldman Sachs Group Inc/The 4% 3/3/2024 10,756,000 USD 10,729,485 11,006,615 0.25Goldman Sachs Group Inc/The 4.25% 21/10/2025 17,230,000 USD 17,111,799 17,106,909 0.40Goldman Sachs Group Inc/The 5.15% 22/5/2045 9,291,000 USD 9,200,489 8,997,767 0.21Goldman Sachs Group Inc/The 5.75% 24/1/2022 28,897,000 USD 31,629,027 32,773,416 0.76Goldman Sachs Group Inc/The 6.25% 1/2/2041 4,307,000 USD 4,170,411 5,123,525 0.12Goldman Sachs Group Inc/The 6.45% 1/5/2036 3,750,000 USD 2,928,143 4,228,988 0.10Guardian Life Insurance Co of America 7.375% 30/9/2039 '144A' 1,408,000 USD 1,554,939 1,790,219 0.04Halliburton Co 3.8% 15/11/2025 12,051,000 USD 12,017,645 11,713,078 0.27Hewlett Packard Enterprise Co 4.9% 15/10/2025 '144A' 4,366,000 USD 4,354,291 4,274,052 0.10Hewlett Packard Enterprise Co 6.2% 15/10/2035 '144A' 13,153,000 USD 13,145,466 12,579,411 0.29Hewlett Packard Enterprise Co 6.35% 15/10/2045 '144A' 17,415,000 USD 17,403,256 16,489,549 0.38Home Depot Inc/The 4.875% 15/2/2044 9,263,000 USD 9,135,161 10,173,386 0.24Hospitality Properties Trust 4.5% 15/3/2025 11,754,000 USD 11,628,419 11,261,801 0.26
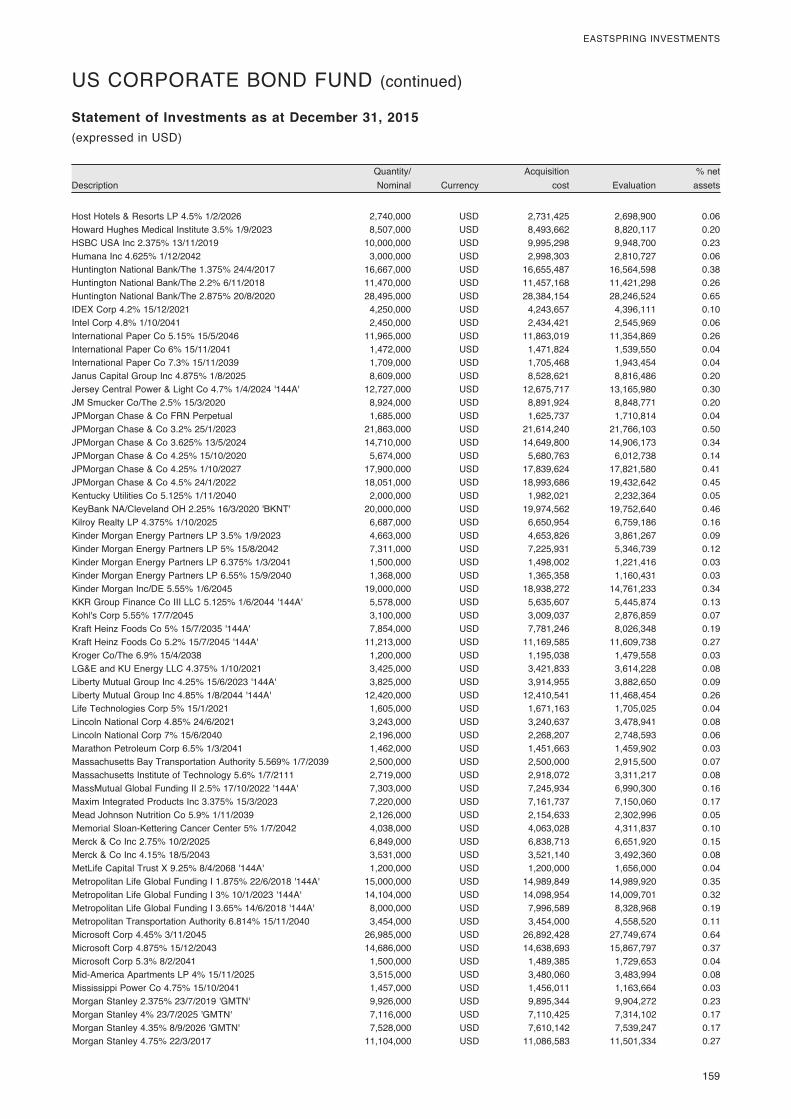
159
EASTSPRING INVESTMENTS
DescriptionQuantity/ Nominal Currency
Acquisition cost Evaluation
% net assets
Statement of Investments as at December 31, 2015(expressed in USD)
US CORPORATE BOND FUND (continued)
Host Hotels & Resorts LP 4.5% 1/2/2026 2,740,000 USD 2,731,425 2,698,900 0.06Howard Hughes Medical Institute 3.5% 1/9/2023 8,507,000 USD 8,493,662 8,820,117 0.20HSBC USA Inc 2.375% 13/11/2019 10,000,000 USD 9,995,298 9,948,700 0.23Humana Inc 4.625% 1/12/2042 3,000,000 USD 2,998,303 2,810,727 0.06Huntington National Bank/The 1.375% 24/4/2017 16,667,000 USD 16,655,487 16,564,598 0.38Huntington National Bank/The 2.2% 6/11/2018 11,470,000 USD 11,457,168 11,421,298 0.26Huntington National Bank/The 2.875% 20/8/2020 28,495,000 USD 28,384,154 28,246,524 0.65IDEX Corp 4.2% 15/12/2021 4,250,000 USD 4,243,657 4,396,111 0.10Intel Corp 4.8% 1/10/2041 2,450,000 USD 2,434,421 2,545,969 0.06International Paper Co 5.15% 15/5/2046 11,965,000 USD 11,863,019 11,354,869 0.26International Paper Co 6% 15/11/2041 1,472,000 USD 1,471,824 1,539,550 0.04International Paper Co 7.3% 15/11/2039 1,709,000 USD 1,705,468 1,943,454 0.04Janus Capital Group Inc 4.875% 1/8/2025 8,609,000 USD 8,528,621 8,816,486 0.20Jersey Central Power & Light Co 4.7% 1/4/2024 '144A' 12,727,000 USD 12,675,717 13,165,980 0.30JM Smucker Co/The 2.5% 15/3/2020 8,924,000 USD 8,891,924 8,848,771 0.20JPMorgan Chase & Co FRN Perpetual 1,685,000 USD 1,625,737 1,710,814 0.04JPMorgan Chase & Co 3.2% 25/1/2023 21,863,000 USD 21,614,240 21,766,103 0.50JPMorgan Chase & Co 3.625% 13/5/2024 14,710,000 USD 14,649,800 14,906,173 0.34JPMorgan Chase & Co 4.25% 15/10/2020 5,674,000 USD 5,680,763 6,012,738 0.14JPMorgan Chase & Co 4.25% 1/10/2027 17,900,000 USD 17,839,624 17,821,580 0.41JPMorgan Chase & Co 4.5% 24/1/2022 18,051,000 USD 18,993,686 19,432,642 0.45Kentucky Utilities Co 5.125% 1/11/2040 2,000,000 USD 1,982,021 2,232,364 0.05KeyBank NA/Cleveland OH 2.25% 16/3/2020 'BKNT' 20,000,000 USD 19,974,562 19,752,640 0.46Kilroy Realty LP 4.375% 1/10/2025 6,687,000 USD 6,650,954 6,759,186 0.16Kinder Morgan Energy Partners LP 3.5% 1/9/2023 4,663,000 USD 4,653,826 3,861,267 0.09Kinder Morgan Energy Partners LP 5% 15/8/2042 7,311,000 USD 7,225,931 5,346,739 0.12Kinder Morgan Energy Partners LP 6.375% 1/3/2041 1,500,000 USD 1,498,002 1,221,416 0.03Kinder Morgan Energy Partners LP 6.55% 15/9/2040 1,368,000 USD 1,365,358 1,160,431 0.03Kinder Morgan Inc/DE 5.55% 1/6/2045 19,000,000 USD 18,938,272 14,761,233 0.34KKR Group Finance Co III LLC 5.125% 1/6/2044 '144A' 5,578,000 USD 5,635,607 5,445,874 0.13Kohl's Corp 5.55% 17/7/2045 3,100,000 USD 3,009,037 2,876,859 0.07Kraft Heinz Foods Co 5% 15/7/2035 '144A' 7,854,000 USD 7,781,246 8,026,348 0.19Kraft Heinz Foods Co 5.2% 15/7/2045 '144A' 11,213,000 USD 11,169,585 11,609,738 0.27Kroger Co/The 6.9% 15/4/2038 1,200,000 USD 1,195,038 1,479,558 0.03LG&E and KU Energy LLC 4.375% 1/10/2021 3,425,000 USD 3,421,833 3,614,228 0.08Liberty Mutual Group Inc 4.25% 15/6/2023 '144A' 3,825,000 USD 3,914,955 3,882,650 0.09Liberty Mutual Group Inc 4.85% 1/8/2044 '144A' 12,420,000 USD 12,410,541 11,468,454 0.26Life Technologies Corp 5% 15/1/2021 1,605,000 USD 1,671,163 1,705,025 0.04Lincoln National Corp 4.85% 24/6/2021 3,243,000 USD 3,240,637 3,478,941 0.08Lincoln National Corp 7% 15/6/2040 2,196,000 USD 2,268,207 2,748,593 0.06Marathon Petroleum Corp 6.5% 1/3/2041 1,462,000 USD 1,451,663 1,459,902 0.03Massachusetts Bay Transportation Authority 5.569% 1/7/2039 2,500,000 USD 2,500,000 2,915,500 0.07Massachusetts Institute of Technology 5.6% 1/7/2111 2,719,000 USD 2,918,072 3,311,217 0.08MassMutual Global Funding II 2.5% 17/10/2022 '144A' 7,303,000 USD 7,245,934 6,990,300 0.16Maxim Integrated Products Inc 3.375% 15/3/2023 7,220,000 USD 7,161,737 7,150,060 0.17Mead Johnson Nutrition Co 5.9% 1/11/2039 2,126,000 USD 2,154,633 2,302,996 0.05Memorial Sloan-Kettering Cancer Center 5% 1/7/2042 4,038,000 USD 4,063,028 4,311,837 0.10Merck & Co Inc 2.75% 10/2/2025 6,849,000 USD 6,838,713 6,651,920 0.15Merck & Co Inc 4.15% 18/5/2043 3,531,000 USD 3,521,140 3,492,360 0.08MetLife Capital Trust X 9.25% 8/4/2068 '144A' 1,200,000 USD 1,200,000 1,656,000 0.04Metropolitan Life Global Funding I 1.875% 22/6/2018 '144A' 15,000,000 USD 14,989,849 14,989,920 0.35Metropolitan Life Global Funding I 3% 10/1/2023 '144A' 14,104,000 USD 14,098,954 14,009,701 0.32Metropolitan Life Global Funding I 3.65% 14/6/2018 '144A' 8,000,000 USD 7,996,589 8,328,968 0.19Metropolitan Transportation Authority 6.814% 15/11/2040 3,454,000 USD 3,454,000 4,558,520 0.11Microsoft Corp 4.45% 3/11/2045 26,985,000 USD 26,892,428 27,749,674 0.64Microsoft Corp 4.875% 15/12/2043 14,686,000 USD 14,638,693 15,867,797 0.37Microsoft Corp 5.3% 8/2/2041 1,500,000 USD 1,489,385 1,729,653 0.04Mid-America Apartments LP 4% 15/11/2025 3,515,000 USD 3,480,060 3,483,994 0.08Mississippi Power Co 4.75% 15/10/2041 1,457,000 USD 1,456,011 1,163,664 0.03Morgan Stanley 2.375% 23/7/2019 'GMTN' 9,926,000 USD 9,895,344 9,904,272 0.23Morgan Stanley 4% 23/7/2025 'GMTN' 7,116,000 USD 7,110,425 7,314,102 0.17Morgan Stanley 4.35% 8/9/2026 'GMTN' 7,528,000 USD 7,610,142 7,539,247 0.17Morgan Stanley 4.75% 22/3/2017 11,104,000 USD 11,086,583 11,501,334 0.27
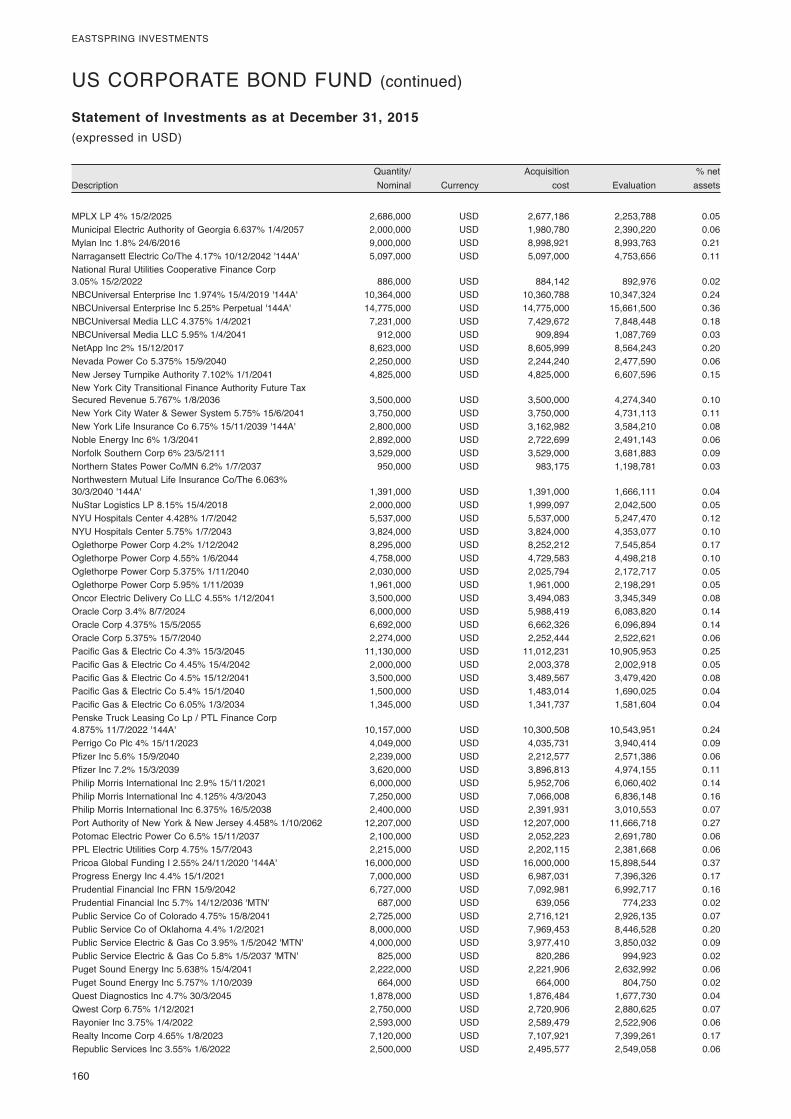
160
EASTSPRING INVESTMENTS
DescriptionQuantity/ Nominal Currency
Acquisition cost Evaluation
% net assets
Statement of Investments as at December 31, 2015(expressed in USD)
US CORPORATE BOND FUND (continued)
MPLX LP 4% 15/2/2025 2,686,000 USD 2,677,186 2,253,788 0.05Municipal Electric Authority of Georgia 6.637% 1/4/2057 2,000,000 USD 1,980,780 2,390,220 0.06Mylan Inc 1.8% 24/6/2016 9,000,000 USD 8,998,921 8,993,763 0.21Narragansett Electric Co/The 4.17% 10/12/2042 '144A' 5,097,000 USD 5,097,000 4,753,656 0.11National Rural Utilities Cooperative Finance Corp 3.05% 15/2/2022 886,000 USD 884,142 892,976 0.02NBCUniversal Enterprise Inc 1.974% 15/4/2019 '144A' 10,364,000 USD 10,360,788 10,347,324 0.24NBCUniversal Enterprise Inc 5.25% Perpetual '144A' 14,775,000 USD 14,775,000 15,661,500 0.36NBCUniversal Media LLC 4.375% 1/4/2021 7,231,000 USD 7,429,672 7,848,448 0.18NBCUniversal Media LLC 5.95% 1/4/2041 912,000 USD 909,894 1,087,769 0.03NetApp Inc 2% 15/12/2017 8,623,000 USD 8,605,999 8,564,243 0.20Nevada Power Co 5.375% 15/9/2040 2,250,000 USD 2,244,240 2,477,590 0.06New Jersey Turnpike Authority 7.102% 1/1/2041 4,825,000 USD 4,825,000 6,607,596 0.15New York City Transitional Finance Authority Future Tax Secured Revenue 5.767% 1/8/2036 3,500,000 USD 3,500,000 4,274,340 0.10New York City Water & Sewer System 5.75% 15/6/2041 3,750,000 USD 3,750,000 4,731,113 0.11New York Life Insurance Co 6.75% 15/11/2039 '144A' 2,800,000 USD 3,162,982 3,584,210 0.08Noble Energy Inc 6% 1/3/2041 2,892,000 USD 2,722,699 2,491,143 0.06Norfolk Southern Corp 6% 23/5/2111 3,529,000 USD 3,529,000 3,681,883 0.09Northern States Power Co/MN 6.2% 1/7/2037 950,000 USD 983,175 1,198,781 0.03Northwestern Mutual Life Insurance Co/The 6.063% 30/3/2040 '144A' 1,391,000 USD 1,391,000 1,666,111 0.04NuStar Logistics LP 8.15% 15/4/2018 2,000,000 USD 1,999,097 2,042,500 0.05NYU Hospitals Center 4.428% 1/7/2042 5,537,000 USD 5,537,000 5,247,470 0.12NYU Hospitals Center 5.75% 1/7/2043 3,824,000 USD 3,824,000 4,353,077 0.10Oglethorpe Power Corp 4.2% 1/12/2042 8,295,000 USD 8,252,212 7,545,854 0.17Oglethorpe Power Corp 4.55% 1/6/2044 4,758,000 USD 4,729,583 4,498,218 0.10Oglethorpe Power Corp 5.375% 1/11/2040 2,030,000 USD 2,025,794 2,172,717 0.05Oglethorpe Power Corp 5.95% 1/11/2039 1,961,000 USD 1,961,000 2,198,291 0.05Oncor Electric Delivery Co LLC 4.55% 1/12/2041 3,500,000 USD 3,494,083 3,345,349 0.08Oracle Corp 3.4% 8/7/2024 6,000,000 USD 5,988,419 6,083,820 0.14Oracle Corp 4.375% 15/5/2055 6,692,000 USD 6,662,326 6,096,894 0.14Oracle Corp 5.375% 15/7/2040 2,274,000 USD 2,252,444 2,522,621 0.06Pacific Gas & Electric Co 4.3% 15/3/2045 11,130,000 USD 11,012,231 10,905,953 0.25Pacific Gas & Electric Co 4.45% 15/4/2042 2,000,000 USD 2,003,378 2,002,918 0.05Pacific Gas & Electric Co 4.5% 15/12/2041 3,500,000 USD 3,489,567 3,479,420 0.08Pacific Gas & Electric Co 5.4% 15/1/2040 1,500,000 USD 1,483,014 1,690,025 0.04Pacific Gas & Electric Co 6.05% 1/3/2034 1,345,000 USD 1,341,737 1,581,604 0.04Penske Truck Leasing Co Lp / PTL Finance Corp 4.875% 11/7/2022 '144A' 10,157,000 USD 10,300,508 10,543,951 0.24Perrigo Co Plc 4% 15/11/2023 4,049,000 USD 4,035,731 3,940,414 0.09Pfizer Inc 5.6% 15/9/2040 2,239,000 USD 2,212,577 2,571,386 0.06Pfizer Inc 7.2% 15/3/2039 3,620,000 USD 3,896,813 4,974,155 0.11Philip Morris International Inc 2.9% 15/11/2021 6,000,000 USD 5,952,706 6,060,402 0.14Philip Morris International Inc 4.125% 4/3/2043 7,250,000 USD 7,066,008 6,836,148 0.16Philip Morris International Inc 6.375% 16/5/2038 2,400,000 USD 2,391,931 3,010,553 0.07Port Authority of New York & New Jersey 4.458% 1/10/2062 12,207,000 USD 12,207,000 11,666,718 0.27Potomac Electric Power Co 6.5% 15/11/2037 2,100,000 USD 2,052,223 2,691,780 0.06PPL Electric Utilities Corp 4.75% 15/7/2043 2,215,000 USD 2,202,115 2,381,668 0.06Pricoa Global Funding I 2.55% 24/11/2020 '144A' 16,000,000 USD 16,000,000 15,898,544 0.37Progress Energy Inc 4.4% 15/1/2021 7,000,000 USD 6,987,031 7,396,326 0.17Prudential Financial Inc FRN 15/9/2042 6,727,000 USD 7,092,981 6,992,717 0.16Prudential Financial Inc 5.7% 14/12/2036 'MTN' 687,000 USD 639,056 774,233 0.02Public Service Co of Colorado 4.75% 15/8/2041 2,725,000 USD 2,716,121 2,926,135 0.07Public Service Co of Oklahoma 4.4% 1/2/2021 8,000,000 USD 7,969,453 8,446,528 0.20Public Service Electric & Gas Co 3.95% 1/5/2042 'MTN' 4,000,000 USD 3,977,410 3,850,032 0.09Public Service Electric & Gas Co 5.8% 1/5/2037 'MTN' 825,000 USD 820,286 994,923 0.02Puget Sound Energy Inc 5.638% 15/4/2041 2,222,000 USD 2,221,906 2,632,992 0.06Puget Sound Energy Inc 5.757% 1/10/2039 664,000 USD 664,000 804,750 0.02Quest Diagnostics Inc 4.7% 30/3/2045 1,878,000 USD 1,876,484 1,677,730 0.04Qwest Corp 6.75% 1/12/2021 2,750,000 USD 2,720,906 2,880,625 0.07Rayonier Inc 3.75% 1/4/2022 2,593,000 USD 2,589,479 2,522,906 0.06Realty Income Corp 4.65% 1/8/2023 7,120,000 USD 7,107,921 7,399,261 0.17Republic Services Inc 3.55% 1/6/2022 2,500,000 USD 2,495,577 2,549,058 0.06
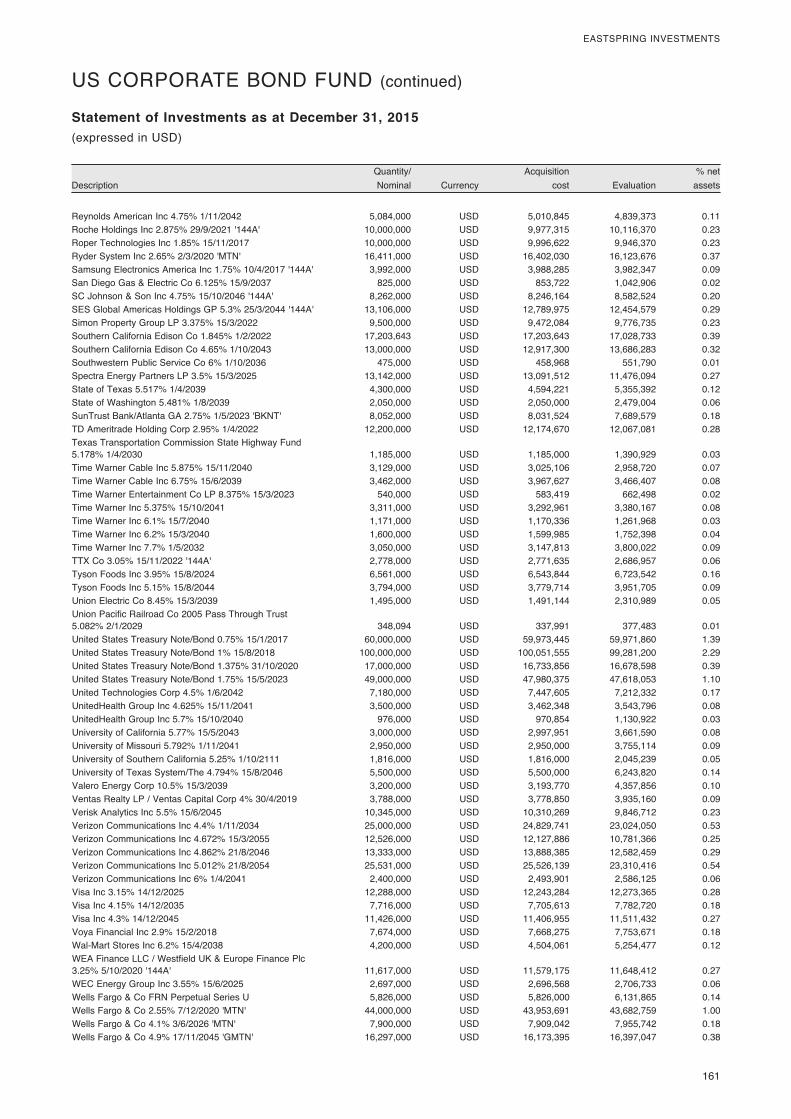
161
EASTSPRING INVESTMENTS
DescriptionQuantity/ Nominal Currency
Acquisition cost Evaluation
% net assets
Statement of Investments as at December 31, 2015(expressed in USD)
US CORPORATE BOND FUND (continued)
Reynolds American Inc 4.75% 1/11/2042 5,084,000 USD 5,010,845 4,839,373 0.11Roche Holdings Inc 2.875% 29/9/2021 '144A' 10,000,000 USD 9,977,315 10,116,370 0.23Roper Technologies Inc 1.85% 15/11/2017 10,000,000 USD 9,996,622 9,946,370 0.23Ryder System Inc 2.65% 2/3/2020 'MTN' 16,411,000 USD 16,402,030 16,123,676 0.37Samsung Electronics America Inc 1.75% 10/4/2017 '144A' 3,992,000 USD 3,988,285 3,982,347 0.09San Diego Gas & Electric Co 6.125% 15/9/2037 825,000 USD 853,722 1,042,906 0.02SC Johnson & Son Inc 4.75% 15/10/2046 '144A' 8,262,000 USD 8,246,164 8,582,524 0.20SES Global Americas Holdings GP 5.3% 25/3/2044 '144A' 13,106,000 USD 12,789,975 12,454,579 0.29Simon Property Group LP 3.375% 15/3/2022 9,500,000 USD 9,472,084 9,776,735 0.23Southern California Edison Co 1.845% 1/2/2022 17,203,643 USD 17,203,643 17,028,733 0.39Southern California Edison Co 4.65% 1/10/2043 13,000,000 USD 12,917,300 13,686,283 0.32Southwestern Public Service Co 6% 1/10/2036 475,000 USD 458,968 551,790 0.01Spectra Energy Partners LP 3.5% 15/3/2025 13,142,000 USD 13,091,512 11,476,094 0.27State of Texas 5.517% 1/4/2039 4,300,000 USD 4,594,221 5,355,392 0.12State of Washington 5.481% 1/8/2039 2,050,000 USD 2,050,000 2,479,004 0.06SunTrust Bank/Atlanta GA 2.75% 1/5/2023 'BKNT' 8,052,000 USD 8,031,524 7,689,579 0.18TD Ameritrade Holding Corp 2.95% 1/4/2022 12,200,000 USD 12,174,670 12,067,081 0.28Texas Transportation Commission State Highway Fund 5.178% 1/4/2030 1,185,000 USD 1,185,000 1,390,929 0.03Time Warner Cable Inc 5.875% 15/11/2040 3,129,000 USD 3,025,106 2,958,720 0.07Time Warner Cable Inc 6.75% 15/6/2039 3,462,000 USD 3,967,627 3,466,407 0.08Time Warner Entertainment Co LP 8.375% 15/3/2023 540,000 USD 583,419 662,498 0.02Time Warner Inc 5.375% 15/10/2041 3,311,000 USD 3,292,961 3,380,167 0.08Time Warner Inc 6.1% 15/7/2040 1,171,000 USD 1,170,336 1,261,968 0.03Time Warner Inc 6.2% 15/3/2040 1,600,000 USD 1,599,985 1,752,398 0.04Time Warner Inc 7.7% 1/5/2032 3,050,000 USD 3,147,813 3,800,022 0.09TTX Co 3.05% 15/11/2022 '144A' 2,778,000 USD 2,771,635 2,686,957 0.06Tyson Foods Inc 3.95% 15/8/2024 6,561,000 USD 6,543,844 6,723,542 0.16Tyson Foods Inc 5.15% 15/8/2044 3,794,000 USD 3,779,714 3,951,705 0.09Union Electric Co 8.45% 15/3/2039 1,495,000 USD 1,491,144 2,310,989 0.05Union Pacific Railroad Co 2005 Pass Through Trust 5.082% 2/1/2029 348,094 USD 337,991 377,483 0.01United States Treasury Note/Bond 0.75% 15/1/2017 60,000,000 USD 59,973,445 59,971,860 1.39United States Treasury Note/Bond 1% 15/8/2018 100,000,000 USD 100,051,555 99,281,200 2.29United States Treasury Note/Bond 1.375% 31/10/2020 17,000,000 USD 16,733,856 16,678,598 0.39United States Treasury Note/Bond 1.75% 15/5/2023 49,000,000 USD 47,980,375 47,618,053 1.10United Technologies Corp 4.5% 1/6/2042 7,180,000 USD 7,447,605 7,212,332 0.17UnitedHealth Group Inc 4.625% 15/11/2041 3,500,000 USD 3,462,348 3,543,796 0.08UnitedHealth Group Inc 5.7% 15/10/2040 976,000 USD 970,854 1,130,922 0.03University of California 5.77% 15/5/2043 3,000,000 USD 2,997,951 3,661,590 0.08University of Missouri 5.792% 1/11/2041 2,950,000 USD 2,950,000 3,755,114 0.09University of Southern California 5.25% 1/10/2111 1,816,000 USD 1,816,000 2,045,239 0.05University of Texas System/The 4.794% 15/8/2046 5,500,000 USD 5,500,000 6,243,820 0.14Valero Energy Corp 10.5% 15/3/2039 3,200,000 USD 3,193,770 4,357,856 0.10Ventas Realty LP / Ventas Capital Corp 4% 30/4/2019 3,788,000 USD 3,778,850 3,935,160 0.09Verisk Analytics Inc 5.5% 15/6/2045 10,345,000 USD 10,310,269 9,846,712 0.23Verizon Communications Inc 4.4% 1/11/2034 25,000,000 USD 24,829,741 23,024,050 0.53Verizon Communications Inc 4.672% 15/3/2055 12,526,000 USD 12,127,886 10,781,366 0.25Verizon Communications Inc 4.862% 21/8/2046 13,333,000 USD 13,888,385 12,582,459 0.29Verizon Communications Inc 5.012% 21/8/2054 25,531,000 USD 25,526,139 23,310,416 0.54Verizon Communications Inc 6% 1/4/2041 2,400,000 USD 2,493,901 2,586,125 0.06Visa Inc 3.15% 14/12/2025 12,288,000 USD 12,243,284 12,273,365 0.28Visa Inc 4.15% 14/12/2035 7,716,000 USD 7,705,613 7,782,720 0.18Visa Inc 4.3% 14/12/2045 11,426,000 USD 11,406,955 11,511,432 0.27Voya Financial Inc 2.9% 15/2/2018 7,674,000 USD 7,668,275 7,753,671 0.18Wal-Mart Stores Inc 6.2% 15/4/2038 4,200,000 USD 4,504,061 5,254,477 0.12WEA Finance LLC / Westfield UK & Europe Finance Plc 3.25% 5/10/2020 '144A' 11,617,000 USD 11,579,175 11,648,412 0.27WEC Energy Group Inc 3.55% 15/6/2025 2,697,000 USD 2,696,568 2,706,733 0.06Wells Fargo & Co FRN Perpetual Series U 5,826,000 USD 5,826,000 6,131,865 0.14Wells Fargo & Co 2.55% 7/12/2020 'MTN' 44,000,000 USD 43,953,691 43,682,759 1.00Wells Fargo & Co 4.1% 3/6/2026 'MTN' 7,900,000 USD 7,909,042 7,955,742 0.18Wells Fargo & Co 4.9% 17/11/2045 'GMTN' 16,297,000 USD 16,173,395 16,397,047 0.38

162
EASTSPRING INVESTMENTS
DescriptionQuantity/ Nominal Currency
Acquisition cost Evaluation
% net assets
Statement of Investments as at December 31, 2015(expressed in USD)
US CORPORATE BOND FUND (continued)
Wyndham Worldwide Corp 4.25% 1/3/2022 3,289,000 USD 3,271,923 3,306,596 0.08Wyndham Worldwide Corp 5.1% 1/10/2025 7,485,000 USD 7,482,532 7,545,172 0.17Xcel Energy Inc 3.3% 1/6/2025 6,897,000 USD 6,870,206 6,731,265 0.16
2,694,555,585 2,676,700,490 61.84
Total Bonds 3,924,830,901 3,869,586,200 89.40
SECURITISED ASSETS
United States of America AmeriCredit Automobile Receivables Trust 1.07% 8/3/2018 '2013 1 B' 3,116,752 USD 3,116,419 3,114,271 0.07AmeriCredit Automobile Receivables Trust 2012-4 1.31% 8/11/2017 '2012 4 B' 2,041,051 USD 2,040,912 2,041,168 0.05AOA 2015-1177 Mortgage Trust FRN 13/12/2029 '144A' 5,624,000 USD 5,755,525 5,542,549 0.13BAMLL Commercial Mortgage Securities Trust 2015-200P 3.218% 14/4/2033 '144A' 10,000,000 USD 10,299,770 9,864,134 0.23BAMLL Commercial Mortgage Securities Trust 2015-200P 3.49% 14/4/2033 '144A' 6,494,000 USD 6,688,450 6,344,380 0.15BBCMS Trust 2015-MSQ 3.593% 15/9/2032 '144A' 14,000,000 USD 14,419,888 14,447,300 0.33BWAY 2015-1740 Mortgage Trust 2.917% 13/1/2035 '144A' 15,000,000 USD 14,964,108 14,187,752 0.33California Republic Auto Receivables Trust 2015-4 2.04% 15/1/2020 '144A' 8,000,000 USD 7,999,642 7,982,170 0.18Chrysler Capital Auto Receivables Trust 2015-A 1.22% 15/7/2019 '144A' 25,000,000 USD 24,997,611 24,866,937 0.57Chrysler Capital Auto Receivables Trust 2015-B 1.91% 16/3/2020 '144A' 14,458,000 USD 14,456,068 14,408,747 0.33Citigroup Commercial Mortgage Trust 2004-C2 FRN 15/10/2041 '2004 C2 B' 443,188 USD 429,119 442,975 0.01COBALT CMBS Commercial Mortgage Trust 2007-C3 FRN 15/5/2046 '2007 C3 A4' 883,996 USD 820,563 918,039 0.02COMM 2014-CCRE21 Mortgage Trust 3.528% 10/12/2047 '2014 CR21 A3' 10,315,000 USD 10,624,966 10,369,543 0.24DBUBS 2011-LC1 Mortgage Trust 3.742% 10/11/2046 '144A' 1,620,961 USD 1,648,472 1,624,019 0.04Dell Equipment Finance Trust 2014-1 0.94% 22/6/2020 '144A' 2,770,000 USD 2,769,747 2,767,919 0.06Dell Equipment Finance Trust 2014-1 1.36% 22/6/2020 '144A' 814,000 USD 813,937 811,305 0.02Dell Equipment Finance Trust 2015-1 1.3% 23/3/2020 '144A' 4,980,000 USD 4,979,660 4,941,044 0.11Dell Equipment Finance Trust 2015-1 1.81% 23/3/2020 '144A' 3,350,000 USD 3,349,604 3,323,641 0.08Ford Credit Auto Owner Trust 2014-C 1.97% 15/4/2020 '2014 C B' 5,263,000 USD 5,262,093 5,267,664 0.12Ford Credit Floorplan Master Owner Trust A 1.2% 15/2/2019 '2014 1 A1' 11,822,000 USD 11,821,355 11,777,419 0.27Ford Credit Floorplan Master Owner Trust A 1.42% 15/1/2020 '2015 1 A1' 37,138,000 USD 37,131,253 36,845,701 0.85GE Equipment Midticket LLC Series 2014-1 1.14% 22/5/2018 '2014 1 A3' 15,000,000 USD 14,999,941 14,929,982 0.34GreatAmerica Leasing Receivables Funding LLC Series 2015-1 2.02% 21/6/2021 '144A' 3,175,000 USD 3,174,692 3,156,944 0.07GS Mortgage Securities Trust 2011-GC3 4.753% 10/3/2044 '144A' 5,500,000 USD 5,550,533 5,963,629 0.14GS Mortgage Securities Trust 2012-GCJ7 4.085% 10/5/2045 '2012 GCJ7 AS' 7,857,000 USD 7,996,657 8,175,568 0.19Houston Galleria Mall Trust 2015-HGLR 3.087% 5/3/2037 '144A' 17,000,000 USD 17,163,939 16,503,248 0.38JP Morgan Chase Commercial Mortgage Securities Trust FRN 15/2/2051 '2007 LD12 A4' 7,900,000 USD 8,225,188 8,193,276 0.19Marriott Vacation Club Owner Trust 2012-1 2.51% 20/5/2030 '144A' 5,021,203 USD 5,020,505 5,015,651 0.12MMCA Auto Owner Trust 2014-A 1.21% 16/12/2019 '144A' 7,314,680 USD 7,314,049 7,286,386 0.17Morgan Stanley Bank of America Merrill Lynch Trust 2015-C21 3.652% 15/3/2048 '2015 C21 AS' 1,324,000 USD 1,362,602 1,309,523 0.03Morgan Stanley Bank of America Merrill Lynch Trust 2015-C23 3.451% 15/7/2050 '2015 C23 A3' 10,000,000 USD 10,099,347 9,965,365 0.23Morgan Stanley Re-REMIC Trust 2009-GG10 FRN 12/8/2045 '144A' 4,271,630 USD 3,622,533 4,388,459 0.10
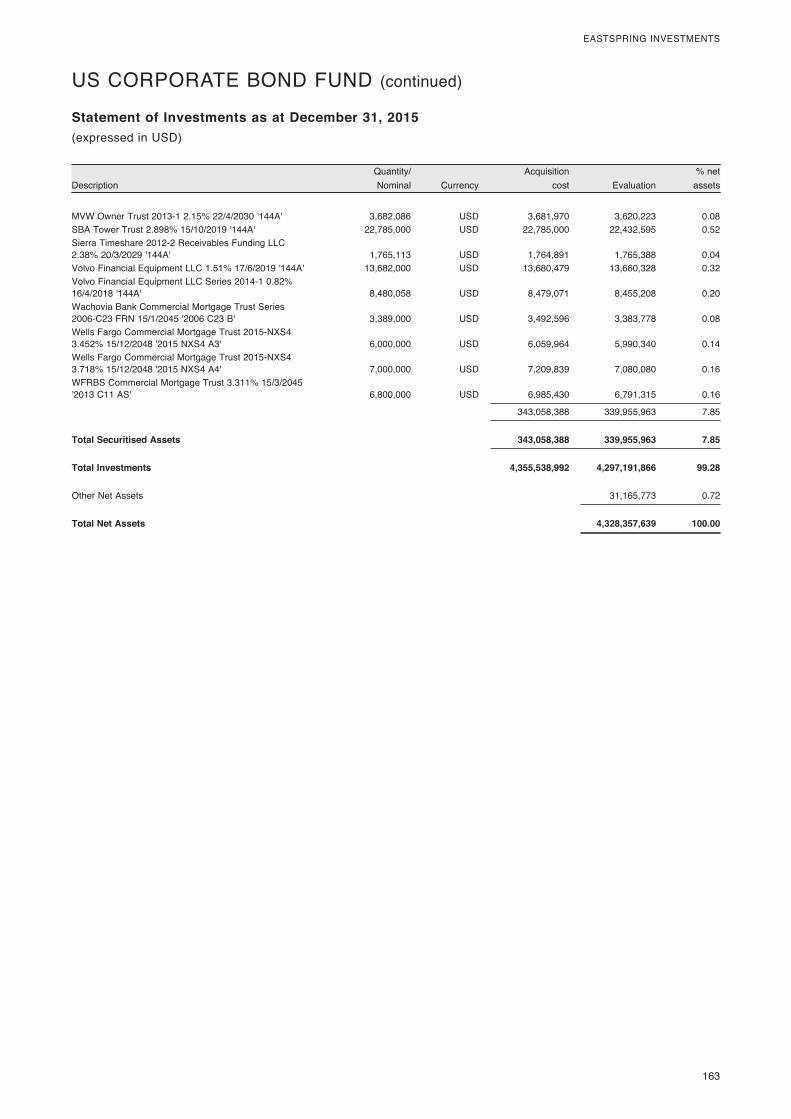
163
EASTSPRING INVESTMENTS
DescriptionQuantity/ Nominal Currency
Acquisition cost Evaluation
% net assets
Statement of Investments as at December 31, 2015(expressed in USD)
US CORPORATE BOND FUND (continued)
MVW Owner Trust 2013-1 2.15% 22/4/2030 '144A' 3,682,086 USD 3,681,970 3,620,223 0.08SBA Tower Trust 2.898% 15/10/2019 '144A' 22,785,000 USD 22,785,000 22,432,595 0.52Sierra Timeshare 2012-2 Receivables Funding LLC 2.38% 20/3/2029 '144A' 1,765,113 USD 1,764,891 1,765,388 0.04Volvo Financial Equipment LLC 1.51% 17/6/2019 '144A' 13,682,000 USD 13,680,479 13,660,328 0.32Volvo Financial Equipment LLC Series 2014-1 0.82% 16/4/2018 '144A' 8,480,058 USD 8,479,071 8,455,208 0.20Wachovia Bank Commercial Mortgage Trust Series 2006-C23 FRN 15/1/2045 '2006 C23 B' 3,389,000 USD 3,492,596 3,383,778 0.08Wells Fargo Commercial Mortgage Trust 2015-NXS4 3.452% 15/12/2048 '2015 NXS4 A3' 6,000,000 USD 6,059,964 5,990,340 0.14Wells Fargo Commercial Mortgage Trust 2015-NXS4 3.718% 15/12/2048 '2015 NXS4 A4' 7,000,000 USD 7,209,839 7,080,080 0.16WFRBS Commercial Mortgage Trust 3.311% 15/3/2045 '2013 C11 AS' 6,800,000 USD 6,985,430 6,791,315 0.16
343,058,388 339,955,963 7.85
Total Securitised Assets 343,058,388 339,955,963 7.85
Total Investments 4,355,538,992 4,297,191,866 99.28
Other Net Assets 31,165,773 0.72
Total Net Assets 4,328,357,639 100.00
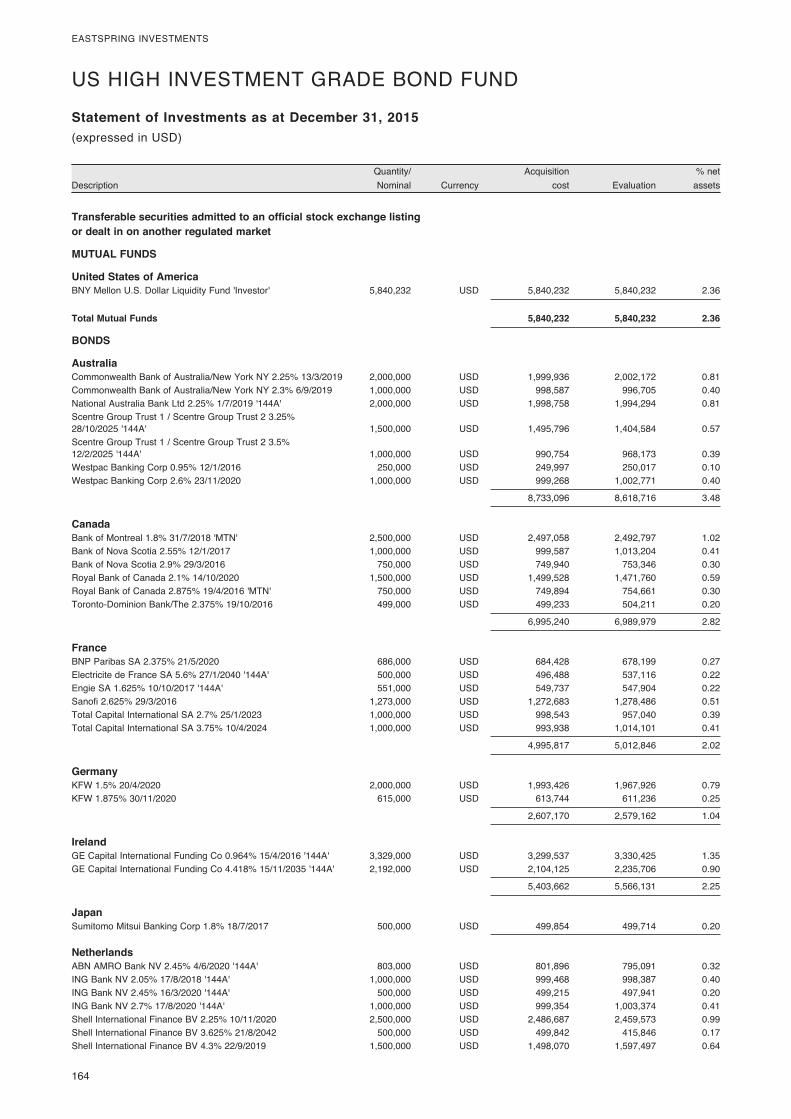
164
EASTSPRING INVESTMENTS
DescriptionQuantity/ Nominal Currency
Acquisition cost Evaluation
% net assets
Statement of Investments as at December 31, 2015
Transferable securities admitted to an official stock exchange listing or dealt in on another regulated market
MUTUAL FUNDS
United States of America BNY Mellon U.S. Dollar Liquidity Fund 'Investor' 5,840,232 USD 5,840,232 5,840,232 2.36
Total Mutual Funds 5,840,232 5,840,232 2.36
BONDS
Australia Commonwealth Bank of Australia/New York NY 2.25% 13/3/2019 2,000,000 USD 1,999,936 2,002,172 0.81Commonwealth Bank of Australia/New York NY 2.3% 6/9/2019 1,000,000 USD 998,587 996,705 0.40National Australia Bank Ltd 2.25% 1/7/2019 '144A' 2,000,000 USD 1,998,758 1,994,294 0.81Scentre Group Trust 1 / Scentre Group Trust 2 3.25% 28/10/2025 '144A' 1,500,000 USD 1,495,796 1,404,584 0.57Scentre Group Trust 1 / Scentre Group Trust 2 3.5% 12/2/2025 '144A' 1,000,000 USD 990,754 968,173 0.39Westpac Banking Corp 0.95% 12/1/2016 250,000 USD 249,997 250,017 0.10Westpac Banking Corp 2.6% 23/11/2020 1,000,000 USD 999,268 1,002,771 0.40
8,733,096 8,618,716 3.48
Canada Bank of Montreal 1.8% 31/7/2018 'MTN' 2,500,000 USD 2,497,058 2,492,797 1.02Bank of Nova Scotia 2.55% 12/1/2017 1,000,000 USD 999,587 1,013,204 0.41Bank of Nova Scotia 2.9% 29/3/2016 750,000 USD 749,940 753,346 0.30Royal Bank of Canada 2.1% 14/10/2020 1,500,000 USD 1,499,528 1,471,760 0.59Royal Bank of Canada 2.875% 19/4/2016 'MTN' 750,000 USD 749,894 754,661 0.30Toronto-Dominion Bank/The 2.375% 19/10/2016 499,000 USD 499,233 504,211 0.20
6,995,240 6,989,979 2.82
France BNP Paribas SA 2.375% 21/5/2020 686,000 USD 684,428 678,199 0.27Electricite de France SA 5.6% 27/1/2040 '144A' 500,000 USD 496,488 537,116 0.22Engie SA 1.625% 10/10/2017 '144A' 551,000 USD 549,737 547,904 0.22Sanofi 2.625% 29/3/2016 1,273,000 USD 1,272,683 1,278,486 0.51Total Capital International SA 2.7% 25/1/2023 1,000,000 USD 998,543 957,040 0.39Total Capital International SA 3.75% 10/4/2024 1,000,000 USD 993,938 1,014,101 0.41
4,995,817 5,012,846 2.02
Germany KFW 1.5% 20/4/2020 2,000,000 USD 1,993,426 1,967,926 0.79KFW 1.875% 30/11/2020 615,000 USD 613,744 611,236 0.25
2,607,170 2,579,162 1.04
Ireland GE Capital International Funding Co 0.964% 15/4/2016 '144A' 3,329,000 USD 3,299,537 3,330,425 1.35GE Capital International Funding Co 4.418% 15/11/2035 '144A' 2,192,000 USD 2,104,125 2,235,706 0.90
5,403,662 5,566,131 2.25
Japan Sumitomo Mitsui Banking Corp 1.8% 18/7/2017 500,000 USD 499,854 499,714 0.20
Netherlands ABN AMRO Bank NV 2.45% 4/6/2020 '144A' 803,000 USD 801,896 795,091 0.32ING Bank NV 2.05% 17/8/2018 '144A' 1,000,000 USD 999,468 998,387 0.40ING Bank NV 2.45% 16/3/2020 '144A' 500,000 USD 499,215 497,941 0.20ING Bank NV 2.7% 17/8/2020 '144A' 1,000,000 USD 999,354 1,003,374 0.41Shell International Finance BV 2.25% 10/11/2020 2,500,000 USD 2,486,687 2,459,573 0.99Shell International Finance BV 3.625% 21/8/2042 500,000 USD 499,842 415,846 0.17Shell International Finance BV 4.3% 22/9/2019 1,500,000 USD 1,498,070 1,597,497 0.64
(expressed in USD)
US HIGH INVESTMENT GRADE BOND FUND

165
EASTSPRING INVESTMENTS
DescriptionQuantity/ Nominal Currency
Acquisition cost Evaluation
% net assets
Statement of Investments as at December 31, 2015(expressed in USD)
US HIGH INVESTMENT GRADE BOND FUND (continued)
Shell International Finance BV 4.55% 12/8/2043 500,000 USD 505,464 484,784 0.20Shell International Finance BV 5.5% 25/3/2040 500,000 USD 492,325 539,063 0.22Siemens Financieringsmaatschappij NV 6.125% 17/8/2026 '144A' 500,000 USD 499,452 612,156 0.25
9,281,773 9,403,712 3.80
Norway Statoil ASA 2.65% 15/1/2024 1,500,000 USD 1,497,764 1,401,044 0.56Statoil ASA 3.15% 23/1/2022 395,000 USD 394,597 393,369 0.16Statoil ASA 3.7% 1/3/2024 1,000,000 USD 999,421 1,011,568 0.41
2,891,782 2,805,981 1.13
Sweden Nordea Bank AB 2.5% 17/9/2020 '144A' 2,500,000 USD 2,494,412 2,482,349 1.00Skandinaviska Enskilda Banken AB 2.375% 20/11/2018 '144A' 2,000,000 USD 1,998,975 2,010,100 0.81Svenska Handelsbanken AB 2.4% 1/10/2020 'GMTN' 2,000,000 USD 1,998,141 1,982,354 0.80Swedbank AB 1.75% 12/3/2018 '144A' 1,500,000 USD 1,497,248 1,491,011 0.60Swedbank AB 2.2% 4/3/2020 '144A' 2,000,000 USD 1,998,902 1,973,808 0.80Swedbank AB 2.375% 27/2/2019 '144A' 1,500,000 USD 1,498,402 1,501,049 0.61
11,486,080 11,440,671 4.62
Switzerland Credit Suisse AG/New York NY 1.75% 29/1/2018 2,000,000 USD 1,999,198 1,992,824 0.80Credit Suisse AG/New York NY 2.3% 28/5/2019 'GMTN' 2,429,000 USD 2,425,600 2,429,401 0.99
4,424,798 4,422,225 1.79
United Kingdom Abbey National Treasury Services Plc/United Kingdom 1.65% 29/9/2017 1,000,000 USD 999,426 1,000,712 0.40Abbey National Treasury Services Plc/United Kingdom 2% 24/8/2018 'GMTN' 2,000,000 USD 1,994,876 1,995,447 0.81Abbey National Treasury Services Plc/United Kingdom 3.05% 23/8/2018 1,245,000 USD 1,243,546 1,276,782 0.52AstraZeneca Plc 4% 18/9/2042 1,250,000 USD 1,243,068 1,162,070 0.47BP Capital Markets Plc 1.846% 5/5/2017 1,500,000 USD 1,500,000 1,506,969 0.61BP Capital Markets Plc 4.742% 11/3/2021 2,000,000 USD 2,228,899 2,193,697 0.88GlaxoSmithKline Capital Plc 2.85% 8/5/2022 735,000 USD 731,832 739,839 0.30HSBC Bank Plc 1.5% 15/5/2018 '144A' 500,000 USD 499,557 494,415 0.20HSBC Bank Plc 4.75% 19/1/2021 '144A' 200,000 USD 199,914 219,983 0.09HSBC Holdings Plc 4% 30/3/2022 686,000 USD 683,206 718,676 0.29HSBC Holdings Plc 5.1% 5/4/2021 250,000 USD 278,340 277,526 0.11Lloyds Bank Plc 2% 17/8/2018 1,000,000 USD 998,284 999,941 0.40Reckitt Benckiser Treasury Services Plc 2.125% 21/9/2018 '144A' 1,905,000 USD 1,898,185 1,885,939 0.76
14,499,133 14,471,996 5.84
United States of America Alabama Power Co 3.75% 1/3/2045 1,000,000 USD 993,249 896,138 0.36Alabama Power Co 4.1% 15/1/2042 250,000 USD 249,001 236,967 0.10Alabama Power Co 6% 1/3/2039 70,000 USD 69,895 83,009 0.03American Honda Finance Corp 1.6% 16/2/2018 '144A' 1,500,000 USD 1,499,637 1,487,772 0.60American Honda Finance Corp 2.125% 28/2/2017 '144A' 250,000 USD 249,998 252,660 0.10American Honda Finance Corp 2.45% 24/9/2020 'MTN' 1,500,000 USD 1,499,078 1,500,671 0.61American Tower Trust I 1.551% 15/3/2043 '144A' 2,000,000 USD 2,000,000 1,968,078 0.79American Tower Trust I 3.07% 15/3/2048 '144A' 1,619,000 USD 1,619,000 1,581,436 0.64Apple Inc 2.1% 6/5/2019 2,000,000 USD 2,011,623 2,023,959 0.82Apple Inc 2.5% 9/2/2025 1,500,000 USD 1,498,077 1,430,156 0.58Bank of America NA 1.25% 14/2/2017 'BKNT' 2,000,000 USD 1,999,340 1,998,006 0.81Bank of New York Mellon Corp/The 1.3% 25/1/2018 500,000 USD 499,719 495,243 0.20Bank of New York Mellon Corp/The 2.6% 17/8/2020 'MTN' 2,500,000 USD 2,498,916 2,506,697 1.01Bear Stearns Cos LLC/The 7.25% 1/2/2018 970,000 USD 969,447 1,069,538 0.43Berkshire Hathaway Finance Corp 4.3% 15/5/2043 1,250,000 USD 1,227,339 1,221,548 0.49Berkshire Hathaway Finance Corp 4.4% 15/5/2042 500,000 USD 521,861 493,498 0.20
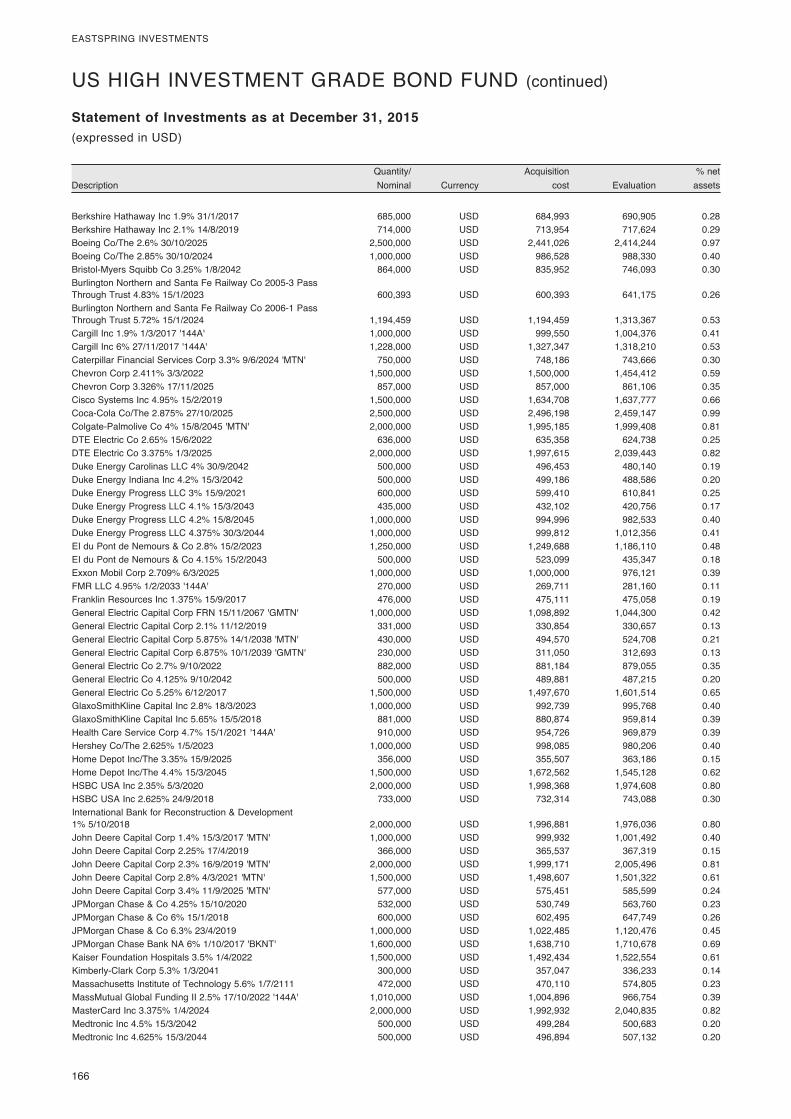
166
EASTSPRING INVESTMENTS
DescriptionQuantity/ Nominal Currency
Acquisition cost Evaluation
% net assets
Statement of Investments as at December 31, 2015(expressed in USD)
US HIGH INVESTMENT GRADE BOND FUND (continued)
Berkshire Hathaway Inc 1.9% 31/1/2017 685,000 USD 684,993 690,905 0.28Berkshire Hathaway Inc 2.1% 14/8/2019 714,000 USD 713,954 717,624 0.29Boeing Co/The 2.6% 30/10/2025 2,500,000 USD 2,441,026 2,414,244 0.97Boeing Co/The 2.85% 30/10/2024 1,000,000 USD 986,528 988,330 0.40Bristol-Myers Squibb Co 3.25% 1/8/2042 864,000 USD 835,952 746,093 0.30Burlington Northern and Santa Fe Railway Co 2005-3 Pass Through Trust 4.83% 15/1/2023 600,393 USD 600,393 641,175 0.26Burlington Northern and Santa Fe Railway Co 2006-1 Pass Through Trust 5.72% 15/1/2024 1,194,459 USD 1,194,459 1,313,367 0.53Cargill Inc 1.9% 1/3/2017 '144A' 1,000,000 USD 999,550 1,004,376 0.41Cargill Inc 6% 27/11/2017 '144A' 1,228,000 USD 1,327,347 1,318,210 0.53Caterpillar Financial Services Corp 3.3% 9/6/2024 'MTN' 750,000 USD 748,186 743,666 0.30Chevron Corp 2.411% 3/3/2022 1,500,000 USD 1,500,000 1,454,412 0.59Chevron Corp 3.326% 17/11/2025 857,000 USD 857,000 861,106 0.35Cisco Systems Inc 4.95% 15/2/2019 1,500,000 USD 1,634,708 1,637,777 0.66Coca-Cola Co/The 2.875% 27/10/2025 2,500,000 USD 2,496,198 2,459,147 0.99Colgate-Palmolive Co 4% 15/8/2045 'MTN' 2,000,000 USD 1,995,185 1,999,408 0.81DTE Electric Co 2.65% 15/6/2022 636,000 USD 635,358 624,738 0.25DTE Electric Co 3.375% 1/3/2025 2,000,000 USD 1,997,615 2,039,443 0.82Duke Energy Carolinas LLC 4% 30/9/2042 500,000 USD 496,453 480,140 0.19Duke Energy Indiana Inc 4.2% 15/3/2042 500,000 USD 499,186 488,586 0.20Duke Energy Progress LLC 3% 15/9/2021 600,000 USD 599,410 610,841 0.25Duke Energy Progress LLC 4.1% 15/3/2043 435,000 USD 432,102 420,756 0.17Duke Energy Progress LLC 4.2% 15/8/2045 1,000,000 USD 994,996 982,533 0.40Duke Energy Progress LLC 4.375% 30/3/2044 1,000,000 USD 999,812 1,012,356 0.41EI du Pont de Nemours & Co 2.8% 15/2/2023 1,250,000 USD 1,249,688 1,186,110 0.48EI du Pont de Nemours & Co 4.15% 15/2/2043 500,000 USD 523,099 435,347 0.18Exxon Mobil Corp 2.709% 6/3/2025 1,000,000 USD 1,000,000 976,121 0.39FMR LLC 4.95% 1/2/2033 '144A' 270,000 USD 269,711 281,160 0.11Franklin Resources Inc 1.375% 15/9/2017 476,000 USD 475,111 475,058 0.19General Electric Capital Corp FRN 15/11/2067 'GMTN' 1,000,000 USD 1,098,892 1,044,300 0.42General Electric Capital Corp 2.1% 11/12/2019 331,000 USD 330,854 330,657 0.13General Electric Capital Corp 5.875% 14/1/2038 'MTN' 430,000 USD 494,570 524,708 0.21General Electric Capital Corp 6.875% 10/1/2039 'GMTN' 230,000 USD 311,050 312,693 0.13General Electric Co 2.7% 9/10/2022 882,000 USD 881,184 879,055 0.35General Electric Co 4.125% 9/10/2042 500,000 USD 489,881 487,215 0.20General Electric Co 5.25% 6/12/2017 1,500,000 USD 1,497,670 1,601,514 0.65GlaxoSmithKline Capital Inc 2.8% 18/3/2023 1,000,000 USD 992,739 995,768 0.40GlaxoSmithKline Capital Inc 5.65% 15/5/2018 881,000 USD 880,874 959,814 0.39Health Care Service Corp 4.7% 15/1/2021 '144A' 910,000 USD 954,726 969,879 0.39Hershey Co/The 2.625% 1/5/2023 1,000,000 USD 998,085 980,206 0.40Home Depot Inc/The 3.35% 15/9/2025 356,000 USD 355,507 363,186 0.15Home Depot Inc/The 4.4% 15/3/2045 1,500,000 USD 1,672,562 1,545,128 0.62HSBC USA Inc 2.35% 5/3/2020 2,000,000 USD 1,998,368 1,974,608 0.80HSBC USA Inc 2.625% 24/9/2018 733,000 USD 732,314 743,088 0.30International Bank for Reconstruction & Development 1% 5/10/2018 2,000,000 USD 1,996,881 1,976,036 0.80John Deere Capital Corp 1.4% 15/3/2017 'MTN' 1,000,000 USD 999,932 1,001,492 0.40John Deere Capital Corp 2.25% 17/4/2019 366,000 USD 365,537 367,319 0.15John Deere Capital Corp 2.3% 16/9/2019 'MTN' 2,000,000 USD 1,999,171 2,005,496 0.81John Deere Capital Corp 2.8% 4/3/2021 'MTN' 1,500,000 USD 1,498,607 1,501,322 0.61John Deere Capital Corp 3.4% 11/9/2025 'MTN' 577,000 USD 575,451 585,599 0.24JPMorgan Chase & Co 4.25% 15/10/2020 532,000 USD 530,749 563,760 0.23JPMorgan Chase & Co 6% 15/1/2018 600,000 USD 602,495 647,749 0.26JPMorgan Chase & Co 6.3% 23/4/2019 1,000,000 USD 1,022,485 1,120,476 0.45JPMorgan Chase Bank NA 6% 1/10/2017 'BKNT' 1,600,000 USD 1,638,710 1,710,678 0.69Kaiser Foundation Hospitals 3.5% 1/4/2022 1,500,000 USD 1,492,434 1,522,554 0.61Kimberly-Clark Corp 5.3% 1/3/2041 300,000 USD 357,047 336,233 0.14Massachusetts Institute of Technology 5.6% 1/7/2111 472,000 USD 470,110 574,805 0.23MassMutual Global Funding II 2.5% 17/10/2022 '144A' 1,010,000 USD 1,004,896 966,754 0.39MasterCard Inc 3.375% 1/4/2024 2,000,000 USD 1,992,932 2,040,835 0.82Medtronic Inc 4.5% 15/3/2042 500,000 USD 499,284 500,683 0.20Medtronic Inc 4.625% 15/3/2044 500,000 USD 496,894 507,132 0.20
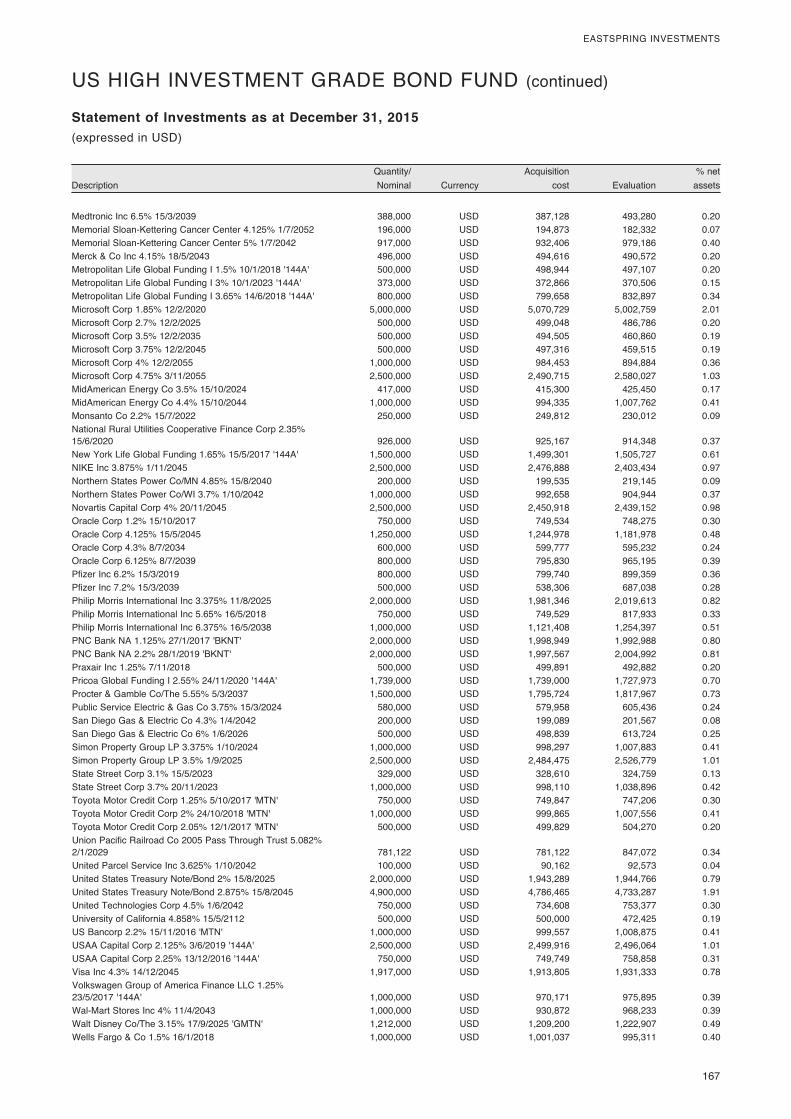
167
EASTSPRING INVESTMENTS
DescriptionQuantity/ Nominal Currency
Acquisition cost Evaluation
% net assets
Statement of Investments as at December 31, 2015(expressed in USD)
US HIGH INVESTMENT GRADE BOND FUND (continued)
Medtronic Inc 6.5% 15/3/2039 388,000 USD 387,128 493,280 0.20Memorial Sloan-Kettering Cancer Center 4.125% 1/7/2052 196,000 USD 194,873 182,332 0.07Memorial Sloan-Kettering Cancer Center 5% 1/7/2042 917,000 USD 932,406 979,186 0.40Merck & Co Inc 4.15% 18/5/2043 496,000 USD 494,616 490,572 0.20Metropolitan Life Global Funding I 1.5% 10/1/2018 '144A' 500,000 USD 498,944 497,107 0.20Metropolitan Life Global Funding I 3% 10/1/2023 '144A' 373,000 USD 372,866 370,506 0.15Metropolitan Life Global Funding I 3.65% 14/6/2018 '144A' 800,000 USD 799,658 832,897 0.34Microsoft Corp 1.85% 12/2/2020 5,000,000 USD 5,070,729 5,002,759 2.01Microsoft Corp 2.7% 12/2/2025 500,000 USD 499,048 486,786 0.20Microsoft Corp 3.5% 12/2/2035 500,000 USD 494,505 460,860 0.19Microsoft Corp 3.75% 12/2/2045 500,000 USD 497,316 459,515 0.19Microsoft Corp 4% 12/2/2055 1,000,000 USD 984,453 894,884 0.36Microsoft Corp 4.75% 3/11/2055 2,500,000 USD 2,490,715 2,580,027 1.03MidAmerican Energy Co 3.5% 15/10/2024 417,000 USD 415,300 425,450 0.17MidAmerican Energy Co 4.4% 15/10/2044 1,000,000 USD 994,335 1,007,762 0.41Monsanto Co 2.2% 15/7/2022 250,000 USD 249,812 230,012 0.09National Rural Utilities Cooperative Finance Corp 2.35% 15/6/2020 926,000 USD 925,167 914,348 0.37New York Life Global Funding 1.65% 15/5/2017 '144A' 1,500,000 USD 1,499,301 1,505,727 0.61NIKE Inc 3.875% 1/11/2045 2,500,000 USD 2,476,888 2,403,434 0.97Northern States Power Co/MN 4.85% 15/8/2040 200,000 USD 199,535 219,145 0.09Northern States Power Co/WI 3.7% 1/10/2042 1,000,000 USD 992,658 904,944 0.37Novartis Capital Corp 4% 20/11/2045 2,500,000 USD 2,450,918 2,439,152 0.98Oracle Corp 1.2% 15/10/2017 750,000 USD 749,534 748,275 0.30Oracle Corp 4.125% 15/5/2045 1,250,000 USD 1,244,978 1,181,978 0.48Oracle Corp 4.3% 8/7/2034 600,000 USD 599,777 595,232 0.24Oracle Corp 6.125% 8/7/2039 800,000 USD 795,830 965,195 0.39Pfizer Inc 6.2% 15/3/2019 800,000 USD 799,740 899,359 0.36Pfizer Inc 7.2% 15/3/2039 500,000 USD 538,306 687,038 0.28Philip Morris International Inc 3.375% 11/8/2025 2,000,000 USD 1,981,346 2,019,613 0.82Philip Morris International Inc 5.65% 16/5/2018 750,000 USD 749,529 817,933 0.33Philip Morris International Inc 6.375% 16/5/2038 1,000,000 USD 1,121,408 1,254,397 0.51PNC Bank NA 1.125% 27/1/2017 'BKNT' 2,000,000 USD 1,998,949 1,992,988 0.80PNC Bank NA 2.2% 28/1/2019 'BKNT' 2,000,000 USD 1,997,567 2,004,992 0.81Praxair Inc 1.25% 7/11/2018 500,000 USD 499,891 492,882 0.20Pricoa Global Funding I 2.55% 24/11/2020 '144A' 1,739,000 USD 1,739,000 1,727,973 0.70Procter & Gamble Co/The 5.55% 5/3/2037 1,500,000 USD 1,795,724 1,817,967 0.73Public Service Electric & Gas Co 3.75% 15/3/2024 580,000 USD 579,958 605,436 0.24San Diego Gas & Electric Co 4.3% 1/4/2042 200,000 USD 199,089 201,567 0.08San Diego Gas & Electric Co 6% 1/6/2026 500,000 USD 498,839 613,724 0.25Simon Property Group LP 3.375% 1/10/2024 1,000,000 USD 998,297 1,007,883 0.41Simon Property Group LP 3.5% 1/9/2025 2,500,000 USD 2,484,475 2,526,779 1.01State Street Corp 3.1% 15/5/2023 329,000 USD 328,610 324,759 0.13State Street Corp 3.7% 20/11/2023 1,000,000 USD 998,110 1,038,896 0.42Toyota Motor Credit Corp 1.25% 5/10/2017 'MTN' 750,000 USD 749,847 747,206 0.30Toyota Motor Credit Corp 2% 24/10/2018 'MTN' 1,000,000 USD 999,865 1,007,556 0.41Toyota Motor Credit Corp 2.05% 12/1/2017 'MTN' 500,000 USD 499,829 504,270 0.20Union Pacific Railroad Co 2005 Pass Through Trust 5.082% 2/1/2029 781,122 USD 781,122 847,072 0.34United Parcel Service Inc 3.625% 1/10/2042 100,000 USD 90,162 92,573 0.04United States Treasury Note/Bond 2% 15/8/2025 2,000,000 USD 1,943,289 1,944,766 0.79United States Treasury Note/Bond 2.875% 15/8/2045 4,900,000 USD 4,786,465 4,733,287 1.91United Technologies Corp 4.5% 1/6/2042 750,000 USD 734,608 753,377 0.30University of California 4.858% 15/5/2112 500,000 USD 500,000 472,425 0.19US Bancorp 2.2% 15/11/2016 'MTN' 1,000,000 USD 999,557 1,008,875 0.41USAA Capital Corp 2.125% 3/6/2019 '144A' 2,500,000 USD 2,499,916 2,496,064 1.01USAA Capital Corp 2.25% 13/12/2016 '144A' 750,000 USD 749,749 758,858 0.31Visa Inc 4.3% 14/12/2045 1,917,000 USD 1,913,805 1,931,333 0.78Volkswagen Group of America Finance LLC 1.25% 23/5/2017 '144A' 1,000,000 USD 970,171 975,895 0.39Wal-Mart Stores Inc 4% 11/4/2043 1,000,000 USD 930,872 968,233 0.39Walt Disney Co/The 3.15% 17/9/2025 'GMTN' 1,212,000 USD 1,209,200 1,222,907 0.49Wells Fargo & Co 1.5% 16/1/2018 1,000,000 USD 1,001,037 995,311 0.40
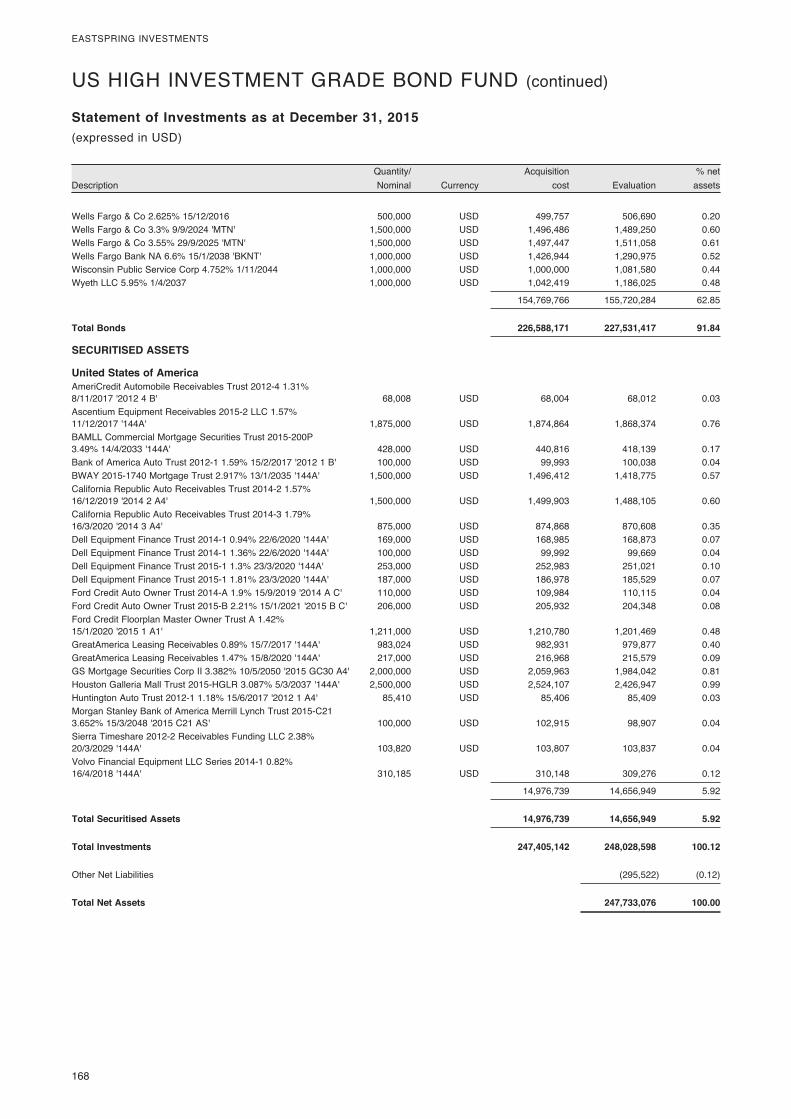
168
EASTSPRING INVESTMENTS
DescriptionQuantity/ Nominal Currency
Acquisition cost Evaluation
% net assets
Statement of Investments as at December 31, 2015(expressed in USD)
US HIGH INVESTMENT GRADE BOND FUND (continued)
Wells Fargo & Co 2.625% 15/12/2016 500,000 USD 499,757 506,690 0.20Wells Fargo & Co 3.3% 9/9/2024 'MTN' 1,500,000 USD 1,496,486 1,489,250 0.60Wells Fargo & Co 3.55% 29/9/2025 'MTN' 1,500,000 USD 1,497,447 1,511,058 0.61Wells Fargo Bank NA 6.6% 15/1/2038 'BKNT' 1,000,000 USD 1,426,944 1,290,975 0.52Wisconsin Public Service Corp 4.752% 1/11/2044 1,000,000 USD 1,000,000 1,081,580 0.44Wyeth LLC 5.95% 1/4/2037 1,000,000 USD 1,042,419 1,186,025 0.48
154,769,766 155,720,284 62.85
Total Bonds 226,588,171 227,531,417 91.84
SECURITISED ASSETS
United States of America AmeriCredit Automobile Receivables Trust 2012-4 1.31% 8/11/2017 '2012 4 B' 68,008 USD 68,004 68,012 0.03Ascentium Equipment Receivables 2015-2 LLC 1.57% 11/12/2017 '144A' 1,875,000 USD 1,874,864 1,868,374 0.76BAMLL Commercial Mortgage Securities Trust 2015-200P 3.49% 14/4/2033 '144A' 428,000 USD 440,816 418,139 0.17Bank of America Auto Trust 2012-1 1.59% 15/2/2017 '2012 1 B' 100,000 USD 99,993 100,038 0.04BWAY 2015-1740 Mortgage Trust 2.917% 13/1/2035 '144A' 1,500,000 USD 1,496,412 1,418,775 0.57California Republic Auto Receivables Trust 2014-2 1.57% 16/12/2019 '2014 2 A4' 1,500,000 USD 1,499,903 1,488,105 0.60California Republic Auto Receivables Trust 2014-3 1.79% 16/3/2020 '2014 3 A4' 875,000 USD 874,868 870,608 0.35Dell Equipment Finance Trust 2014-1 0.94% 22/6/2020 '144A' 169,000 USD 168,985 168,873 0.07Dell Equipment Finance Trust 2014-1 1.36% 22/6/2020 '144A' 100,000 USD 99,992 99,669 0.04Dell Equipment Finance Trust 2015-1 1.3% 23/3/2020 '144A' 253,000 USD 252,983 251,021 0.10Dell Equipment Finance Trust 2015-1 1.81% 23/3/2020 '144A' 187,000 USD 186,978 185,529 0.07Ford Credit Auto Owner Trust 2014-A 1.9% 15/9/2019 '2014 A C' 110,000 USD 109,984 110,115 0.04Ford Credit Auto Owner Trust 2015-B 2.21% 15/1/2021 '2015 B C' 206,000 USD 205,932 204,348 0.08Ford Credit Floorplan Master Owner Trust A 1.42% 15/1/2020 '2015 1 A1' 1,211,000 USD 1,210,780 1,201,469 0.48GreatAmerica Leasing Receivables 0.89% 15/7/2017 '144A' 983,024 USD 982,931 979,877 0.40GreatAmerica Leasing Receivables 1.47% 15/8/2020 '144A' 217,000 USD 216,968 215,579 0.09GS Mortgage Securities Corp II 3.382% 10/5/2050 '2015 GC30 A4' 2,000,000 USD 2,059,963 1,984,042 0.81Houston Galleria Mall Trust 2015-HGLR 3.087% 5/3/2037 '144A' 2,500,000 USD 2,524,107 2,426,947 0.99Huntington Auto Trust 2012-1 1.18% 15/6/2017 '2012 1 A4' 85,410 USD 85,406 85,409 0.03Morgan Stanley Bank of America Merrill Lynch Trust 2015-C21 3.652% 15/3/2048 '2015 C21 AS' 100,000 USD 102,915 98,907 0.04Sierra Timeshare 2012-2 Receivables Funding LLC 2.38% 20/3/2029 '144A' 103,820 USD 103,807 103,837 0.04Volvo Financial Equipment LLC Series 2014-1 0.82% 16/4/2018 '144A' 310,185 USD 310,148 309,276 0.12
14,976,739 14,656,949 5.92
Total Securitised Assets 14,976,739 14,656,949 5.92
Total Investments 247,405,142 248,028,598 100.12
Other Net Liabilities (295,522) (0.12)
Total Net Assets 247,733,076 100.00
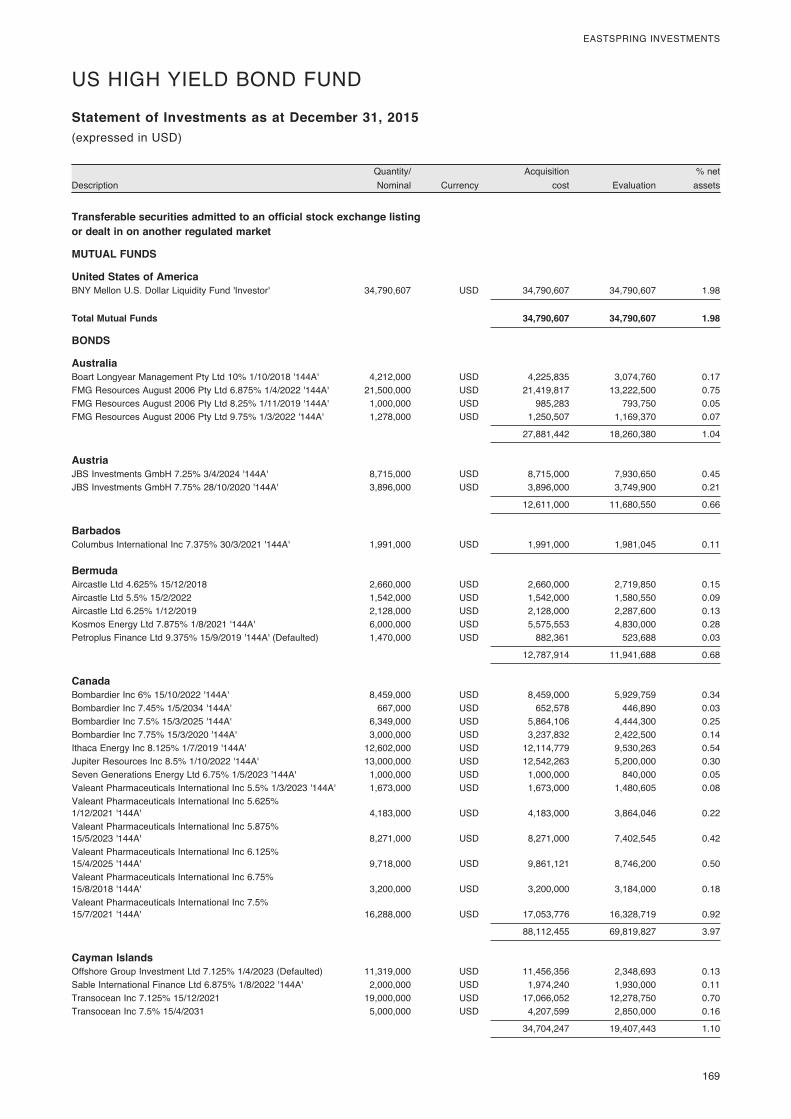
169
EASTSPRING INVESTMENTS
DescriptionQuantity/ Nominal Currency
Acquisition cost Evaluation
% net assets
Statement of Investments as at December 31, 2015
Transferable securities admitted to an official stock exchange listing or dealt in on another regulated market
MUTUAL FUNDS
United States of America BNY Mellon U.S. Dollar Liquidity Fund 'Investor' 34,790,607 USD 34,790,607 34,790,607 1.98
Total Mutual Funds 34,790,607 34,790,607 1.98
BONDS
Australia Boart Longyear Management Pty Ltd 10% 1/10/2018 '144A' 4,212,000 USD 4,225,835 3,074,760 0.17FMG Resources August 2006 Pty Ltd 6.875% 1/4/2022 '144A' 21,500,000 USD 21,419,817 13,222,500 0.75FMG Resources August 2006 Pty Ltd 8.25% 1/11/2019 '144A' 1,000,000 USD 985,283 793,750 0.05FMG Resources August 2006 Pty Ltd 9.75% 1/3/2022 '144A' 1,278,000 USD 1,250,507 1,169,370 0.07
27,881,442 18,260,380 1.04
Austria JBS Investments GmbH 7.25% 3/4/2024 '144A' 8,715,000 USD 8,715,000 7,930,650 0.45JBS Investments GmbH 7.75% 28/10/2020 '144A' 3,896,000 USD 3,896,000 3,749,900 0.21
12,611,000 11,680,550 0.66
Barbados Columbus International Inc 7.375% 30/3/2021 '144A' 1,991,000 USD 1,991,000 1,981,045 0.11
Bermuda Aircastle Ltd 4.625% 15/12/2018 2,660,000 USD 2,660,000 2,719,850 0.15Aircastle Ltd 5.5% 15/2/2022 1,542,000 USD 1,542,000 1,580,550 0.09Aircastle Ltd 6.25% 1/12/2019 2,128,000 USD 2,128,000 2,287,600 0.13Kosmos Energy Ltd 7.875% 1/8/2021 '144A' 6,000,000 USD 5,575,553 4,830,000 0.28Petroplus Finance Ltd 9.375% 15/9/2019 '144A' (Defaulted) 1,470,000 USD 882,361 523,688 0.03
12,787,914 11,941,688 0.68
Canada Bombardier Inc 6% 15/10/2022 '144A' 8,459,000 USD 8,459,000 5,929,759 0.34Bombardier Inc 7.45% 1/5/2034 '144A' 667,000 USD 652,578 446,890 0.03Bombardier Inc 7.5% 15/3/2025 '144A' 6,349,000 USD 5,864,106 4,444,300 0.25Bombardier Inc 7.75% 15/3/2020 '144A' 3,000,000 USD 3,237,832 2,422,500 0.14Ithaca Energy Inc 8.125% 1/7/2019 '144A' 12,602,000 USD 12,114,779 9,530,263 0.54Jupiter Resources Inc 8.5% 1/10/2022 '144A' 13,000,000 USD 12,542,263 5,200,000 0.30Seven Generations Energy Ltd 6.75% 1/5/2023 '144A' 1,000,000 USD 1,000,000 840,000 0.05Valeant Pharmaceuticals International Inc 5.5% 1/3/2023 '144A' 1,673,000 USD 1,673,000 1,480,605 0.08Valeant Pharmaceuticals International Inc 5.625% 1/12/2021 '144A' 4,183,000 USD 4,183,000 3,864,046 0.22Valeant Pharmaceuticals International Inc 5.875% 15/5/2023 '144A' 8,271,000 USD 8,271,000 7,402,545 0.42Valeant Pharmaceuticals International Inc 6.125% 15/4/2025 '144A' 9,718,000 USD 9,861,121 8,746,200 0.50Valeant Pharmaceuticals International Inc 6.75% 15/8/2018 '144A' 3,200,000 USD 3,200,000 3,184,000 0.18Valeant Pharmaceuticals International Inc 7.5% 15/7/2021 '144A' 16,288,000 USD 17,053,776 16,328,719 0.92
88,112,455 69,819,827 3.97
Cayman Islands Offshore Group Investment Ltd 7.125% 1/4/2023 (Defaulted) 11,319,000 USD 11,456,356 2,348,693 0.13Sable International Finance Ltd 6.875% 1/8/2022 '144A' 2,000,000 USD 1,974,240 1,930,000 0.11Transocean Inc 7.125% 15/12/2021 19,000,000 USD 17,066,052 12,278,750 0.70Transocean Inc 7.5% 15/4/2031 5,000,000 USD 4,207,599 2,850,000 0.16
34,704,247 19,407,443 1.10
(expressed in USD)
US HIGH YIELD BOND FUND

170
EASTSPRING INVESTMENTS
DescriptionQuantity/ Nominal Currency
Acquisition cost Evaluation
% net assets
Statement of Investments as at December 31, 2015(expressed in USD)
US HIGH YIELD BOND FUND (continued)
France Electricite de France SA FRN Perpetual '144A' 5,000,000 USD 4,917,389 4,700,000 0.27Societe Generale SA FRN Perpetual '144A' 3,990,000 USD 3,990,000 3,766,560 0.21
8,907,389 8,466,560 0.48
Germany Fresenius Medical Care US Finance II Inc 4.125% 15/10/2020 '144A' 1,683,000 USD 1,683,000 1,699,830 0.10Fresenius Medical Care US Finance II Inc 4.75% 15/10/2024 '144A' 1,143,000 USD 1,143,000 1,114,425 0.06Unitymedia Hessen GmbH & Co KG / Unitymedia NRW GmbH 5% 15/1/2025 '144A' 10,136,000 USD 10,136,000 9,679,880 0.55
12,962,000 12,494,135 0.71
Ireland AerCap Ireland Capital Ltd / AerCap Global Aviation Trust 3.75% 15/5/2019 5,000,000 USD 5,000,000 4,993,750 0.28AerCap Ireland Capital Ltd / AerCap Global Aviation Trust 4.5% 15/5/2021 2,145,000 USD 2,145,000 2,179,856 0.12Ardagh Packaging Finance Plc / Ardagh Holdings USA Inc FRN 15/12/2019 '144A' 10,000,000 USD 10,000,000 9,775,000 0.57Endo Ltd / Endo Finance LLC / Endo Finco Inc 6% 15/7/2023 '144A' 2,708,000 USD 2,708,000 2,701,230 0.15Grifols Worldwide Operations Ltd 5.25% 1/4/2022 3,459,000 USD 3,502,619 3,497,914 0.20
23,355,619 23,147,750 1.32
Italy Enel SpA FRN 24/9/2073 '144A' 6,882,000 USD 6,827,910 7,836,878 0.45
Liberia Royal Caribbean Cruises Ltd 5.25% 15/11/2022 1,308,000 USD 1,308,000 1,340,700 0.08
Luxembourg Altice Financing SA 6.5% 15/1/2022 '144A' 4,000,000 USD 4,164,876 3,950,000 0.22Altice Financing SA 6.625% 15/2/2023 '144A' 6,000,000 USD 6,000,000 5,940,000 0.34Altice Finco SA 9.875% 15/12/2020 '144A' 3,979,000 USD 4,408,746 4,207,793 0.24Altice Luxembourg SA 7.75% 15/5/2022 '144A' 5,204,000 USD 5,313,505 4,683,600 0.27Atento Luxco 1 SA 7.375% 29/1/2020 '144A' 3,182,000 USD 3,182,000 2,967,215 0.17Beverage Packaging Holdings Luxembourg II SA / Beverage Packaging Holdings II Is 6% 15/6/2017 '144A' 1,458,000 USD 1,458,000 1,408,793 0.08Capsugel SA 7% 15/5/2019 '144A' 7,600,000 USD 7,645,836 7,429,000 0.42Coveris Holdings SA 7.875% 1/11/2019 '144A' 9,682,000 USD 9,765,229 8,447,544 0.48DH Services Luxembourg Sarl 7.75% 15/12/2020 '144A' 1,423,000 USD 1,423,000 1,430,115 0.08Intelsat Jackson Holdings SA 5.5% 1/8/2023 3,000,000 USD 2,966,330 2,355,000 0.13Intelsat Luxembourg SA 6.75% 1/6/2018 4,000,000 USD 4,112,869 2,960,000 0.17Intelsat Luxembourg SA 7.75% 1/6/2021 9,146,000 USD 9,619,284 4,252,890 0.24Intelsat Luxembourg SA 8.125% 1/6/2023 5,000,000 USD 5,244,495 2,275,000 0.13Mallinckrodt International Finance SA / Mallinckrodt CB LLC 4.875% 15/4/2020 '144A' 4,354,000 USD 4,354,000 4,147,185 0.24Nielsen Co Luxembourg SARL/The 5.5% 1/10/2021 '144A' 3,223,000 USD 3,223,000 3,307,604 0.19Stena International SA 5.75% 1/3/2024 '144A' 7,500,000 USD 7,500,000 6,300,000 0.36
80,381,170 66,061,739 3.76
Malta VistaJet Malta Finance Plc / VistaJet Co Finance LLC 7.75% 1/6/2020 '144A' 7,000,000 USD 6,937,424 5,250,000 0.30
Mexico Cemex SAB de CV 5.7% 11/1/2025 '144A' 11,719,000 USD 11,719,000 9,770,716 0.56Cemex SAB de CV 7.25% 15/1/2021 '144A' 6,000,000 USD 6,000,000 5,796,600 0.33
17,719,000 15,567,316 0.89

171
EASTSPRING INVESTMENTS
DescriptionQuantity/ Nominal Currency
Acquisition cost Evaluation
% net assets
Statement of Investments as at December 31, 2015(expressed in USD)
US HIGH YIELD BOND FUND (continued)
Netherlands JLL/Delta Dutch Pledgeco BV 8.75% 1/5/2020 '144A' 4,000,000 USD 4,000,000 3,860,000 0.22NXP BV / NXP Funding LLC 5.75% 15/3/2023 '144A' 2,268,000 USD 2,361,176 2,341,710 0.13Schaeffler Finance BV 4.25% 15/5/2021 '144A' 10,769,000 USD 10,707,420 10,688,232 0.61Schaeffler Finance BV 4.75% 15/5/2021 '144A' 2,628,000 USD 2,628,000 2,641,140 0.15Schaeffler Holding Finance BV 6.875% 15/8/2018 '144A' 2,000,000 USD 1,994,499 2,060,000 0.12Sensata Technologies BV 5.625% 1/11/2024 '144A' 1,363,000 USD 1,363,000 1,393,668 0.08Ziggo Bond Finance BV 5.875% 15/1/2025 '144A' 2,248,000 USD 2,248,000 2,085,020 0.12
25,302,095 25,069,770 1.43
Singapore Flextronics International Ltd 4.625% 15/2/2020 5,000,000 USD 5,000,000 5,168,750 0.29
Sweden Stena AB 7% 1/2/2024 '144A' 8,659,000 USD 8,659,000 7,360,150 0.42
United Kingdom EnQuest Plc 7% 15/4/2022 '144A' 15,676,000 USD 15,675,999 5,467,005 0.31HSBC Holdings Plc FRN Perpetual 9,710,000 USD 9,745,405 9,697,862 0.56Inmarsat Finance Plc 4.875% 15/5/2022 '144A' 5,771,000 USD 5,733,743 5,626,725 0.32International Game Technology Plc 6.25% 15/2/2022 '144A' 6,543,000 USD 6,548,923 6,117,705 0.35Royal Bank of Scotland Group Plc FRN Perpetual 7,738,000 USD 7,738,000 8,057,193 0.46Royal Bank of Scotland Group Plc 5.125% 28/5/2024 5,971,000 USD 5,931,560 6,040,467 0.34Royal Bank of Scotland Group Plc 6.125% 15/12/2022 1,165,000 USD 1,243,806 1,277,441 0.07
52,617,436 42,284,398 2.41
United States of America 24 Hour Holdings III LLC 8% 1/6/2022 '144A' 7,389,000 USD 7,389,000 6,003,563 0.34ADS Waste Holdings Inc 8.25% 1/10/2020 2,737,000 USD 2,737,000 2,757,528 0.16ADT Corp/The 6.25% 15/10/2021 4,000,000 USD 4,000,000 4,200,000 0.24Advanced Micro Devices Inc 6.75% 1/3/2019 8,500,000 USD 8,515,350 6,162,500 0.35Advanced Micro Devices Inc 7% 1/7/2024 4,687,000 USD 4,687,000 3,046,550 0.17AECOM 5.75% 15/10/2022 2,044,000 USD 2,044,000 2,100,210 0.12AECOM 5.875% 15/10/2024 5,155,000 USD 5,155,000 5,251,656 0.30AES Corp/VA FRN 1/6/2019 3,864,000 USD 3,857,455 3,545,220 0.20AES Corp/VA 5.5% 15/4/2025 6,000,000 USD 5,947,628 5,295,000 0.30Ally Financial Inc 2.75% 30/1/2017 3,000,000 USD 2,996,109 2,992,500 0.17Ally Financial Inc 4.125% 30/3/2020 3,000,000 USD 3,016,129 2,985,000 0.17Ally Financial Inc 5.5% 15/2/2017 10,000,000 USD 10,172,091 10,249,999 0.58Alphabet Holding Co Inc 7.75% 1/11/2017 5,171,000 USD 4,995,093 5,041,725 0.29Alta Mesa Holdings LP / Alta Mesa Finance Services Corp 9.625% 15/10/2018 5,368,000 USD 4,410,869 1,878,800 0.11AMC Entertainment Inc 5.75% 15/6/2025 12,000,000 USD 12,000,000 12,059,999 0.69AMC Networks Inc 7.75% 15/7/2021 6,583,000 USD 6,928,220 6,912,150 0.39American Airlines 2013-2 Class B Pass Through Trust 5.6% 15/7/2020 '144A' 12,479,962 USD 12,479,962 12,729,560 0.71American Energy - Woodford LLC/AEW Finance Corp 9% 15/9/2022 '144A' 5,000,000 USD 4,828,333 400,000 0.02American Energy - Woodford LLC/AEW Finance Corp 12% 30/12/2020 '144A' 50,000 USD 31,490 9,750 0.00American Greetings Corp 7.375% 1/12/2021 2,951,000 USD 2,951,000 3,083,795 0.18Ancestry.com Holdings LLC 9.625% 15/10/2018 '144A' 6,862,000 USD 6,853,670 6,759,070 0.38Apex Tool Group LLC 7% 1/2/2021 '144A' 5,000,000 USD 4,886,784 3,900,000 0.22Aramark Services Inc 5.125% 15/1/2024 '144A' 713,000 USD 713,000 723,695 0.04Archrock Partners LP / Archrock Partners Finance Corp 6% 1/4/2021 2,073,000 USD 2,051,802 1,705,043 0.10Archrock Partners LP / Archrock Partners Finance Corp 6% 1/10/2022 3,500,000 USD 3,454,718 2,852,500 0.16Argos Merger Sub Inc 7.125% 15/3/2023 '144A' 3,286,000 USD 3,327,505 3,258,069 0.19AT&T Inc 3.4% 15/5/2025 10,957,000 USD 10,926,783 10,485,717 0.60Atlas Energy Holdings Operating Co LLC / Atlas Resource Finance Corp 9.25% 15/8/2021 12,054,000 USD 11,994,836 2,471,070 0.14B&G Foods Inc 4.625% 1/6/2021 2,308,000 USD 2,308,000 2,273,380 0.13
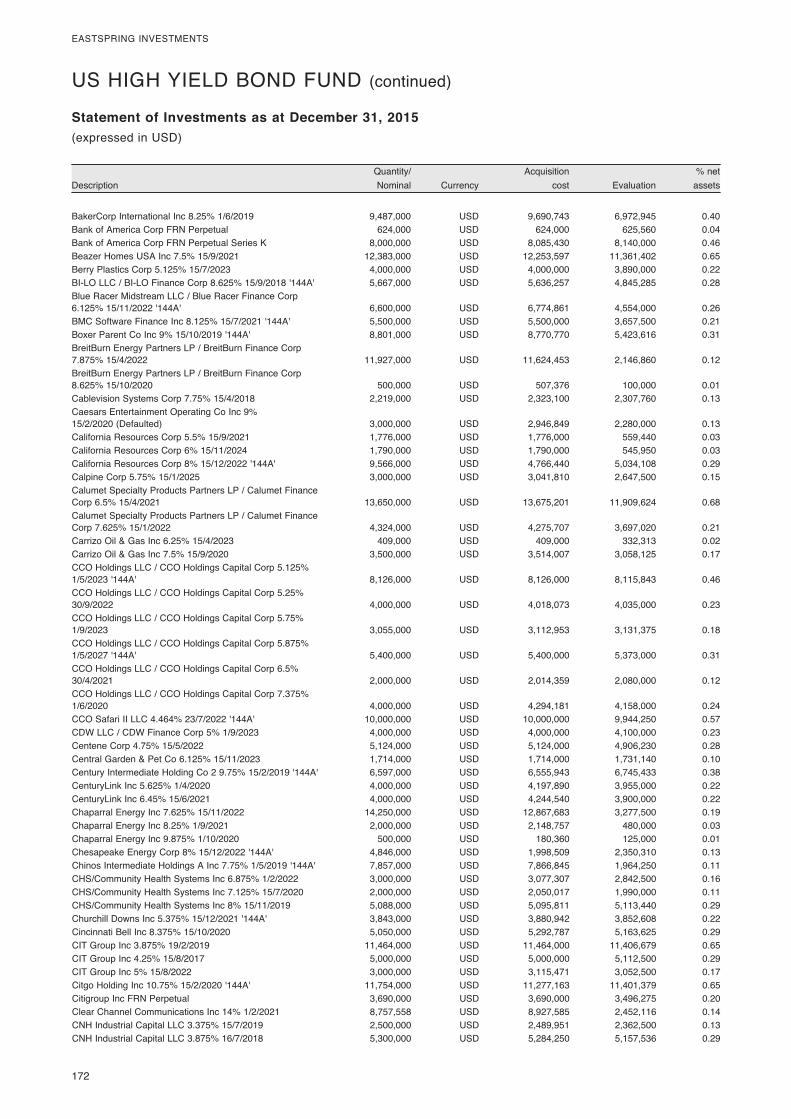
172
EASTSPRING INVESTMENTS
DescriptionQuantity/ Nominal Currency
Acquisition cost Evaluation
% net assets
Statement of Investments as at December 31, 2015(expressed in USD)
US HIGH YIELD BOND FUND (continued)
BakerCorp International Inc 8.25% 1/6/2019 9,487,000 USD 9,690,743 6,972,945 0.40Bank of America Corp FRN Perpetual 624,000 USD 624,000 625,560 0.04Bank of America Corp FRN Perpetual Series K 8,000,000 USD 8,085,430 8,140,000 0.46Beazer Homes USA Inc 7.5% 15/9/2021 12,383,000 USD 12,253,597 11,361,402 0.65Berry Plastics Corp 5.125% 15/7/2023 4,000,000 USD 4,000,000 3,890,000 0.22BI-LO LLC / BI-LO Finance Corp 8.625% 15/9/2018 '144A' 5,667,000 USD 5,636,257 4,845,285 0.28Blue Racer Midstream LLC / Blue Racer Finance Corp 6.125% 15/11/2022 '144A' 6,600,000 USD 6,774,861 4,554,000 0.26BMC Software Finance Inc 8.125% 15/7/2021 '144A' 5,500,000 USD 5,500,000 3,657,500 0.21Boxer Parent Co Inc 9% 15/10/2019 '144A' 8,801,000 USD 8,770,770 5,423,616 0.31BreitBurn Energy Partners LP / BreitBurn Finance Corp 7.875% 15/4/2022 11,927,000 USD 11,624,453 2,146,860 0.12BreitBurn Energy Partners LP / BreitBurn Finance Corp 8.625% 15/10/2020 500,000 USD 507,376 100,000 0.01Cablevision Systems Corp 7.75% 15/4/2018 2,219,000 USD 2,323,100 2,307,760 0.13Caesars Entertainment Operating Co Inc 9% 15/2/2020 (Defaulted) 3,000,000 USD 2,946,849 2,280,000 0.13California Resources Corp 5.5% 15/9/2021 1,776,000 USD 1,776,000 559,440 0.03California Resources Corp 6% 15/11/2024 1,790,000 USD 1,790,000 545,950 0.03California Resources Corp 8% 15/12/2022 '144A' 9,566,000 USD 4,766,440 5,034,108 0.29Calpine Corp 5.75% 15/1/2025 3,000,000 USD 3,041,810 2,647,500 0.15Calumet Specialty Products Partners LP / Calumet Finance Corp 6.5% 15/4/2021 13,650,000 USD 13,675,201 11,909,624 0.68Calumet Specialty Products Partners LP / Calumet Finance Corp 7.625% 15/1/2022 4,324,000 USD 4,275,707 3,697,020 0.21Carrizo Oil & Gas Inc 6.25% 15/4/2023 409,000 USD 409,000 332,313 0.02Carrizo Oil & Gas Inc 7.5% 15/9/2020 3,500,000 USD 3,514,007 3,058,125 0.17CCO Holdings LLC / CCO Holdings Capital Corp 5.125% 1/5/2023 '144A' 8,126,000 USD 8,126,000 8,115,843 0.46CCO Holdings LLC / CCO Holdings Capital Corp 5.25% 30/9/2022 4,000,000 USD 4,018,073 4,035,000 0.23CCO Holdings LLC / CCO Holdings Capital Corp 5.75% 1/9/2023 3,055,000 USD 3,112,953 3,131,375 0.18CCO Holdings LLC / CCO Holdings Capital Corp 5.875% 1/5/2027 '144A' 5,400,000 USD 5,400,000 5,373,000 0.31CCO Holdings LLC / CCO Holdings Capital Corp 6.5% 30/4/2021 2,000,000 USD 2,014,359 2,080,000 0.12CCO Holdings LLC / CCO Holdings Capital Corp 7.375% 1/6/2020 4,000,000 USD 4,294,181 4,158,000 0.24CCO Safari II LLC 4.464% 23/7/2022 '144A' 10,000,000 USD 10,000,000 9,944,250 0.57CDW LLC / CDW Finance Corp 5% 1/9/2023 4,000,000 USD 4,000,000 4,100,000 0.23Centene Corp 4.75% 15/5/2022 5,124,000 USD 5,124,000 4,906,230 0.28Central Garden & Pet Co 6.125% 15/11/2023 1,714,000 USD 1,714,000 1,731,140 0.10Century Intermediate Holding Co 2 9.75% 15/2/2019 '144A' 6,597,000 USD 6,555,943 6,745,433 0.38CenturyLink Inc 5.625% 1/4/2020 4,000,000 USD 4,197,890 3,955,000 0.22CenturyLink Inc 6.45% 15/6/2021 4,000,000 USD 4,244,540 3,900,000 0.22Chaparral Energy Inc 7.625% 15/11/2022 14,250,000 USD 12,867,683 3,277,500 0.19Chaparral Energy Inc 8.25% 1/9/2021 2,000,000 USD 2,148,757 480,000 0.03Chaparral Energy Inc 9.875% 1/10/2020 500,000 USD 180,360 125,000 0.01Chesapeake Energy Corp 8% 15/12/2022 '144A' 4,846,000 USD 1,998,509 2,350,310 0.13Chinos Intermediate Holdings A Inc 7.75% 1/5/2019 '144A' 7,857,000 USD 7,866,845 1,964,250 0.11CHS/Community Health Systems Inc 6.875% 1/2/2022 3,000,000 USD 3,077,307 2,842,500 0.16CHS/Community Health Systems Inc 7.125% 15/7/2020 2,000,000 USD 2,050,017 1,990,000 0.11CHS/Community Health Systems Inc 8% 15/11/2019 5,088,000 USD 5,095,811 5,113,440 0.29Churchill Downs Inc 5.375% 15/12/2021 '144A' 3,843,000 USD 3,880,942 3,852,608 0.22Cincinnati Bell Inc 8.375% 15/10/2020 5,050,000 USD 5,292,787 5,163,625 0.29CIT Group Inc 3.875% 19/2/2019 11,464,000 USD 11,464,000 11,406,679 0.65CIT Group Inc 4.25% 15/8/2017 5,000,000 USD 5,000,000 5,112,500 0.29CIT Group Inc 5% 15/8/2022 3,000,000 USD 3,115,471 3,052,500 0.17Citgo Holding Inc 10.75% 15/2/2020 '144A' 11,754,000 USD 11,277,163 11,401,379 0.65Citigroup Inc FRN Perpetual 3,690,000 USD 3,690,000 3,496,275 0.20Clear Channel Communications Inc 14% 1/2/2021 8,757,558 USD 8,927,585 2,452,116 0.14CNH Industrial Capital LLC 3.375% 15/7/2019 2,500,000 USD 2,489,951 2,362,500 0.13CNH Industrial Capital LLC 3.875% 16/7/2018 5,300,000 USD 5,284,250 5,157,536 0.29

173
EASTSPRING INVESTMENTS
DescriptionQuantity/ Nominal Currency
Acquisition cost Evaluation
% net assets
Statement of Investments as at December 31, 2015(expressed in USD)
US HIGH YIELD BOND FUND (continued)
Cogent Communications Group Inc 5.375% 1/3/2022 '144A' 3,000,000 USD 3,000,000 2,917,500 0.17CommScope Holding Co Inc 6.625% 1/6/2020 '144A' 2,710,000 USD 2,710,000 2,740,488 0.16CommScope Inc 5% 15/6/2021 '144A' 4,546,000 USD 4,546,000 4,358,478 0.25CommScope Technologies Finance LLC 6% 15/6/2025 '144A' 6,278,000 USD 6,278,000 6,042,575 0.34Communications Sales & Leasing Inc / CSL Capital LLC 8.25% 15/10/2023 3,000,000 USD 2,918,996 2,535,000 0.14Community Choice Financial Inc 10.75% 1/5/2019 3,000,000 USD 3,000,000 765,000 0.04Constellation Brands Inc 4.25% 1/5/2023 693,000 USD 693,000 691,268 0.04Constellation Brands Inc 4.75% 15/11/2024 545,000 USD 545,000 556,581 0.03Constellation Brands Inc 4.75% 1/12/2025 1,562,000 USD 1,562,000 1,587,383 0.09Continental Airlines 2003-ERJ1 Pass Through Trust 7.875% 2/1/2020 133,352 USD 133,784 138,686 0.01Crimson Merger Sub Inc 6.625% 15/5/2022 '144A' 7,500,000 USD 7,500,000 5,175,000 0.29DCP Midstream LLC FRN 21/5/2043 '144A' 6,721,000 USD 6,721,000 5,242,380 0.30DCP Midstream Operating LP 3.875% 15/3/2023 3,000,000 USD 2,778,941 2,260,290 0.13Denbury Resources Inc 4.625% 15/7/2023 5,000,000 USD 3,407,963 1,587,000 0.09Denver Parent Corp 12.25% 15/8/2018 12,370,992 USD 12,185,742 61,855 0.00DISH DBS Corp 5.125% 1/5/2020 9,248,000 USD 9,313,182 9,132,400 0.52DISH DBS Corp 5.875% 15/7/2022 4,000,000 USD 4,070,918 3,725,000 0.21DJO Finco Inc / DJO Finance LLC / DJO Finance Corp 8.125% 15/6/2021 '144A' 2,685,000 USD 2,685,000 2,403,075 0.14Dollar General Corp 3.25% 15/4/2023 6,769,000 USD 6,209,801 6,435,058 0.37Downstream Development Authority of the Quapaw Tribe of Oklahoma 10.5% 1/7/2019 '144A' 8,000,000 USD 7,974,517 8,200,000 0.47DPL Inc 7.25% 15/10/2021 10,143,000 USD 10,675,717 9,635,850 0.55El Paso LLC 8.05% 15/10/2030 'GMTN' 1,000,000 USD 813,070 970,034 0.06Endo Finance LLC 5.75% 15/1/2022 '144A' 5,238,000 USD 5,238,000 5,080,860 0.29Energizer Holdings Inc 5.5% 15/6/2025 '144A' 4,058,000 USD 4,058,000 3,804,375 0.22Energy XXI Gulf Coast Inc 6.875% 15/3/2024 6,493,000 USD 6,493,000 714,230 0.04Energy XXI Gulf Coast Inc 7.5% 15/12/2021 6,341,000 USD 6,341,000 697,510 0.04Exelon Corp 3.95% 15/6/2025 '144A' 7,068,000 USD 7,054,311 7,047,326 0.40First Data Corp 7% 1/12/2023 '144A' 4,444,000 USD 4,444,000 4,452,844 0.25FirstEnergy Corp 4.25% 15/3/2023 1,005,000 USD 943,740 1,021,343 0.06FirstEnergy Transmission LLC 4.35% 15/1/2025 '144A' 3,000,000 USD 3,172,843 3,036,525 0.17Florida East Coast Holdings Corp 6.75% 1/5/2019 '144A' 2,739,000 USD 2,739,000 2,507,555 0.14Florida East Coast Holdings Corp 9.75% 1/5/2020 '144A' 5,878,000 USD 5,878,000 3,879,480 0.22Forestar USA Real Estate Group Inc 8.5% 1/6/2022 '144A' 2,500,000 USD 2,500,000 2,437,500 0.14Forum Energy Technologies Inc 6.25% 1/10/2021 12,545,000 USD 12,629,282 10,412,349 0.59Freeport-McMoRan Inc 4.55% 14/11/2024 5,000,000 USD 2,783,889 2,900,000 0.16Fresenius US Finance II Inc 4.25% 1/2/2021 '144A' 2,781,000 USD 2,781,000 2,822,715 0.16Frontier Communications Corp 7.45% 1/7/2035 1,500,000 USD 1,047,095 1,042,500 0.06Frontier Communications Corp 7.625% 15/4/2024 5,825,000 USD 5,972,348 4,893,000 0.28Frontier Communications Corp 8.125% 1/10/2018 7,000,000 USD 7,487,832 7,253,750 0.41Frontier Communications Corp 8.5% 15/4/2020 1,871,000 USD 1,951,301 1,875,678 0.11Frontier Communications Corp 9% 15/8/2031 1,635,000 USD 1,547,206 1,381,575 0.08Frontier Communications Corp 10.5% 15/9/2022 '144A' 2,878,000 USD 2,878,000 2,878,000 0.16Frontier Communications Corp 11% 15/9/2025 '144A' 2,878,000 USD 2,878,000 2,849,220 0.16General Motors Co 3.5% 2/10/2018 8,000,000 USD 8,000,000 8,080,320 0.46General Motors Co 4.875% 2/10/2023 4,000,000 USD 4,063,666 4,082,852 0.23General Motors Financial Co Inc 3.45% 10/4/2022 7,500,000 USD 7,486,766 7,183,125 0.41General Motors Financial Co Inc 4.375% 25/9/2021 4,094,000 USD 4,094,000 4,146,379 0.24GenOn Energy Inc 7.875% 15/6/2017 1,000,000 USD 980,998 870,000 0.05GenOn Energy Inc 9.5% 15/10/2018 2,857,000 USD 3,065,815 2,307,970 0.13GenOn Energy Inc 9.875% 15/10/2020 9,926,000 USD 10,053,221 7,345,240 0.42Genworth Holdings Inc 7.625% 24/9/2021 2,926,000 USD 2,887,520 2,399,320 0.14Gibson Brands Inc 8.875% 1/8/2018 '144A' 5,502,000 USD 5,616,914 3,191,160 0.18GLP Capital LP / GLP Financing II Inc 5.375% 1/11/2023 2,424,000 USD 2,424,000 2,363,400 0.13Goodyear Tire & Rubber Co/The 5.125% 15/11/2023 2,636,000 USD 2,636,000 2,682,130 0.15Graphic Packaging International Inc 4.75% 15/4/2021 1,412,000 USD 1,412,000 1,440,240 0.08Greektown Holdings LLC/Greektown Mothership Corp 8.875% 15/3/2019 '144A' 5,500,000 USD 5,623,417 5,555,000 0.32Halcon Resources Corp 8.625% 1/2/2020 '144A' 2,395,000 USD 2,395,000 1,652,550 0.09Halcon Resources Corp 12% 15/2/2022 '144A' 7,081,000 USD 4,854,305 4,850,485 0.28HCA Inc 4.25% 15/10/2019 4,831,000 USD 4,831,000 4,903,465 0.28
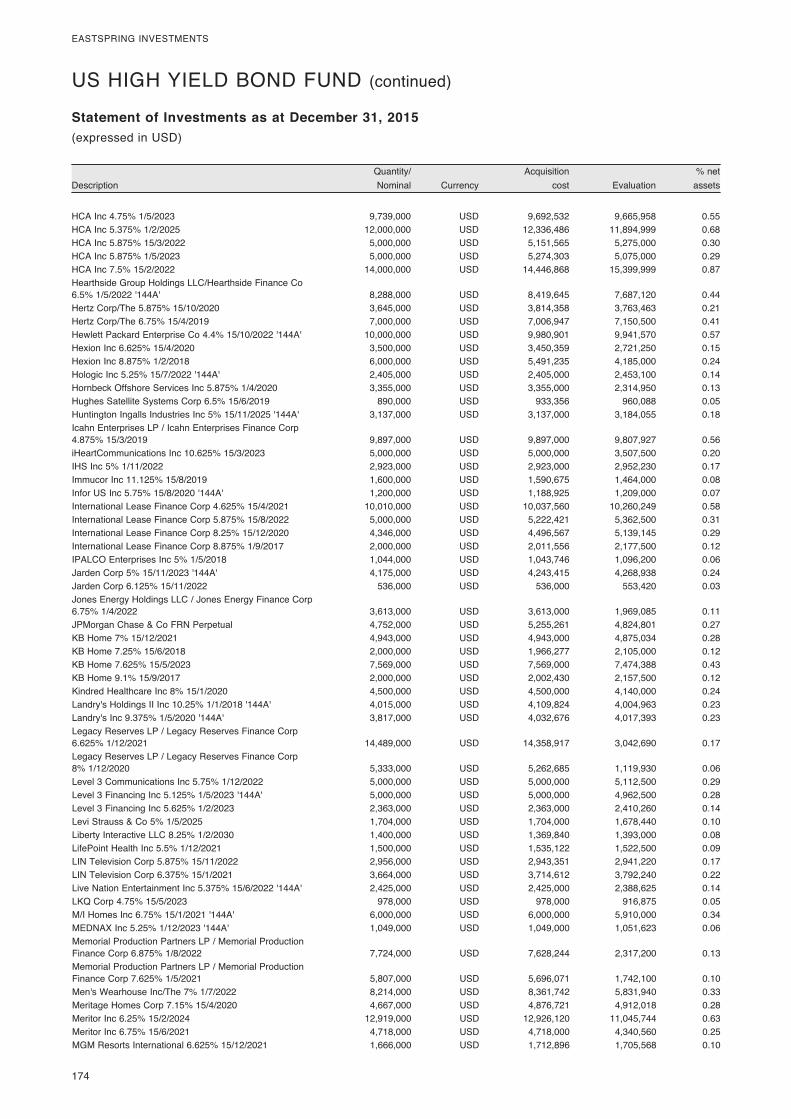
174
EASTSPRING INVESTMENTS
DescriptionQuantity/ Nominal Currency
Acquisition cost Evaluation
% net assets
Statement of Investments as at December 31, 2015(expressed in USD)
US HIGH YIELD BOND FUND (continued)
HCA Inc 4.75% 1/5/2023 9,739,000 USD 9,692,532 9,665,958 0.55HCA Inc 5.375% 1/2/2025 12,000,000 USD 12,336,486 11,894,999 0.68HCA Inc 5.875% 15/3/2022 5,000,000 USD 5,151,565 5,275,000 0.30HCA Inc 5.875% 1/5/2023 5,000,000 USD 5,274,303 5,075,000 0.29HCA Inc 7.5% 15/2/2022 14,000,000 USD 14,446,868 15,399,999 0.87Hearthside Group Holdings LLC/Hearthside Finance Co 6.5% 1/5/2022 '144A' 8,288,000 USD 8,419,645 7,687,120 0.44Hertz Corp/The 5.875% 15/10/2020 3,645,000 USD 3,814,358 3,763,463 0.21Hertz Corp/The 6.75% 15/4/2019 7,000,000 USD 7,006,947 7,150,500 0.41Hewlett Packard Enterprise Co 4.4% 15/10/2022 '144A' 10,000,000 USD 9,980,901 9,941,570 0.57Hexion Inc 6.625% 15/4/2020 3,500,000 USD 3,450,359 2,721,250 0.15Hexion Inc 8.875% 1/2/2018 6,000,000 USD 5,491,235 4,185,000 0.24Hologic Inc 5.25% 15/7/2022 '144A' 2,405,000 USD 2,405,000 2,453,100 0.14Hornbeck Offshore Services Inc 5.875% 1/4/2020 3,355,000 USD 3,355,000 2,314,950 0.13Hughes Satellite Systems Corp 6.5% 15/6/2019 890,000 USD 933,356 960,088 0.05Huntington Ingalls Industries Inc 5% 15/11/2025 '144A' 3,137,000 USD 3,137,000 3,184,055 0.18Icahn Enterprises LP / Icahn Enterprises Finance Corp 4.875% 15/3/2019 9,897,000 USD 9,897,000 9,807,927 0.56iHeartCommunications Inc 10.625% 15/3/2023 5,000,000 USD 5,000,000 3,507,500 0.20IHS Inc 5% 1/11/2022 2,923,000 USD 2,923,000 2,952,230 0.17Immucor Inc 11.125% 15/8/2019 1,600,000 USD 1,590,675 1,464,000 0.08Infor US Inc 5.75% 15/8/2020 '144A' 1,200,000 USD 1,188,925 1,209,000 0.07International Lease Finance Corp 4.625% 15/4/2021 10,010,000 USD 10,037,560 10,260,249 0.58International Lease Finance Corp 5.875% 15/8/2022 5,000,000 USD 5,222,421 5,362,500 0.31International Lease Finance Corp 8.25% 15/12/2020 4,346,000 USD 4,496,567 5,139,145 0.29International Lease Finance Corp 8.875% 1/9/2017 2,000,000 USD 2,011,556 2,177,500 0.12IPALCO Enterprises Inc 5% 1/5/2018 1,044,000 USD 1,043,746 1,096,200 0.06Jarden Corp 5% 15/11/2023 '144A' 4,175,000 USD 4,243,415 4,268,938 0.24Jarden Corp 6.125% 15/11/2022 536,000 USD 536,000 553,420 0.03Jones Energy Holdings LLC / Jones Energy Finance Corp 6.75% 1/4/2022 3,613,000 USD 3,613,000 1,969,085 0.11JPMorgan Chase & Co FRN Perpetual 4,752,000 USD 5,255,261 4,824,801 0.27KB Home 7% 15/12/2021 4,943,000 USD 4,943,000 4,875,034 0.28KB Home 7.25% 15/6/2018 2,000,000 USD 1,966,277 2,105,000 0.12KB Home 7.625% 15/5/2023 7,569,000 USD 7,569,000 7,474,388 0.43KB Home 9.1% 15/9/2017 2,000,000 USD 2,002,430 2,157,500 0.12Kindred Healthcare Inc 8% 15/1/2020 4,500,000 USD 4,500,000 4,140,000 0.24Landry's Holdings II Inc 10.25% 1/1/2018 '144A' 4,015,000 USD 4,109,824 4,004,963 0.23Landry's Inc 9.375% 1/5/2020 '144A' 3,817,000 USD 4,032,676 4,017,393 0.23Legacy Reserves LP / Legacy Reserves Finance Corp 6.625% 1/12/2021 14,489,000 USD 14,358,917 3,042,690 0.17Legacy Reserves LP / Legacy Reserves Finance Corp 8% 1/12/2020 5,333,000 USD 5,262,685 1,119,930 0.06Level 3 Communications Inc 5.75% 1/12/2022 5,000,000 USD 5,000,000 5,112,500 0.29Level 3 Financing Inc 5.125% 1/5/2023 '144A' 5,000,000 USD 5,000,000 4,962,500 0.28Level 3 Financing Inc 5.625% 1/2/2023 2,363,000 USD 2,363,000 2,410,260 0.14Levi Strauss & Co 5% 1/5/2025 1,704,000 USD 1,704,000 1,678,440 0.10Liberty Interactive LLC 8.25% 1/2/2030 1,400,000 USD 1,369,840 1,393,000 0.08LifePoint Health Inc 5.5% 1/12/2021 1,500,000 USD 1,535,122 1,522,500 0.09LIN Television Corp 5.875% 15/11/2022 2,956,000 USD 2,943,351 2,941,220 0.17LIN Television Corp 6.375% 15/1/2021 3,664,000 USD 3,714,612 3,792,240 0.22Live Nation Entertainment Inc 5.375% 15/6/2022 '144A' 2,425,000 USD 2,425,000 2,388,625 0.14LKQ Corp 4.75% 15/5/2023 978,000 USD 978,000 916,875 0.05M/I Homes Inc 6.75% 15/1/2021 '144A' 6,000,000 USD 6,000,000 5,910,000 0.34MEDNAX Inc 5.25% 1/12/2023 '144A' 1,049,000 USD 1,049,000 1,051,623 0.06Memorial Production Partners LP / Memorial Production Finance Corp 6.875% 1/8/2022 7,724,000 USD 7,628,244 2,317,200 0.13Memorial Production Partners LP / Memorial Production Finance Corp 7.625% 1/5/2021 5,807,000 USD 5,696,071 1,742,100 0.10Men's Wearhouse Inc/The 7% 1/7/2022 8,214,000 USD 8,361,742 5,831,940 0.33Meritage Homes Corp 7.15% 15/4/2020 4,667,000 USD 4,876,721 4,912,018 0.28Meritor Inc 6.25% 15/2/2024 12,919,000 USD 12,926,120 11,045,744 0.63Meritor Inc 6.75% 15/6/2021 4,718,000 USD 4,718,000 4,340,560 0.25MGM Resorts International 6.625% 15/12/2021 1,666,000 USD 1,712,896 1,705,568 0.10

175
EASTSPRING INVESTMENTS
DescriptionQuantity/ Nominal Currency
Acquisition cost Evaluation
% net assets
Statement of Investments as at December 31, 2015(expressed in USD)
US HIGH YIELD BOND FUND (continued)
MGM Resorts International 7.75% 15/3/2022 3,333,000 USD 3,567,663 3,541,313 0.20Michaels Stores Inc 5.875% 15/12/2020 '144A' 3,907,000 USD 3,951,713 4,038,861 0.23Micron Technology Inc 5.25% 15/1/2024 '144A' 5,000,000 USD 5,000,000 4,400,000 0.25Micron Technology Inc 5.625% 15/1/2026 '144A' 5,000,000 USD 5,000,000 4,337,500 0.25Midstates Petroleum Co Inc / Midstates Petroleum Co LLC 9.25% 1/6/2021 8,068,000 USD 8,068,000 927,820 0.05Mohegan Tribal Gaming Authority 9.75% 1/9/2021 '144A' 1,310,000 USD 1,340,593 1,306,725 0.07MPLX LP 4% 15/2/2025 876,000 USD 873,126 735,040 0.04MPLX LP 4.875% 1/12/2024 '144A' 9,545,000 USD 9,493,867 8,590,500 0.49MPLX LP 5.5% 15/2/2023 '144A' 1,143,000 USD 1,135,377 957,285 0.05Mustang Merger Corp 8.5% 15/8/2021 '144A' 6,240,000 USD 6,271,918 6,474,000 0.37Navient Corp 5.5% 15/1/2019 'MTN' 2,000,000 USD 1,987,171 1,880,000 0.11Navient Corp 5.5% 25/1/2023 5,000,000 USD 4,842,967 4,000,000 0.23Navistar International Corp 8.25% 1/11/2021 7,750,000 USD 7,745,315 5,153,750 0.29NBCUniversal Enterprise Inc 5.25% Perpetual '144A' 5,402,000 USD 5,402,000 5,726,120 0.33NCL Corp Ltd 5.25% 15/11/2019 '144A' 2,932,000 USD 2,932,000 2,976,039 0.17Neiman Marcus Group Ltd LLC 8% 15/10/2021 '144A' 3,272,000 USD 3,329,686 2,437,640 0.14Neiman Marcus Group Ltd LLC 8.75% 15/10/2021 '144A' 7,000,000 USD 7,129,394 4,375,000 0.25Neptune Finco Corp 10.875% 15/10/2025 '144A' 4,000,000 USD 4,000,000 4,190,000 0.24Netflix Inc 5.375% 1/2/2021 3,000,000 USD 3,107,076 3,148,500 0.18Netflix Inc 5.75% 1/3/2024 3,882,000 USD 3,882,000 3,988,755 0.23Nielsen Finance LLC / Nielsen Finance Co 5% 15/4/2022 '144A' 5,625,000 USD 5,662,156 5,540,625 0.32Northern Oil and Gas Inc 8% 1/6/2020 6,267,000 USD 6,012,545 4,167,555 0.24NRG Energy Inc 7.875% 15/5/2021 3,000,000 USD 3,245,715 2,812,200 0.16ONEOK Inc 7.5% 1/9/2023 6,573,000 USD 6,480,286 5,488,455 0.31PaperWorks Industries Inc 9.5% 15/8/2019 '144A' 9,000,000 USD 9,031,659 8,235,000 0.47PBF Logistics LP / PBF Logistics Finance Corp 6.875% 15/5/2023 4,828,000 USD 4,828,000 4,441,760 0.25Penn Virginia Corp 7.25% 15/4/2019 1,345,000 USD 1,345,000 181,575 0.01Platform Specialty Products Corp 10.375% 1/5/2021 '144A' 1,410,000 USD 1,410,000 1,406,475 0.08Post Holdings Inc 7.375% 15/2/2022 5,000,000 USD 5,230,989 5,212,500 0.30Post Holdings Inc 8% 15/7/2025 '144A' 2,058,000 USD 2,058,000 2,176,335 0.12PRA Holdings Inc 9.5% 1/10/2023 '144A' 3,724,000 USD 3,724,000 4,049,850 0.23Prestige Brands Inc 5.375% 15/12/2021 '144A' 912,000 USD 912,000 875,520 0.05Quicksilver Resources Inc 9.125% 15/8/2019 (Defaulted) 6,475,000 USD 6,735,904 178,063 0.01Quicksilver Resources Inc 11% 1/7/2021 (Defaulted) 12,000,000 USD 11,529,028 330,000 0.02Radio Systems Corp 8.375% 1/11/2019 '144A' 900,000 USD 900,000 933,750 0.05Rain CII Carbon LLC / CII Carbon Corp 8.25% 15/1/2021 '144A' 13,181,000 USD 13,425,178 10,281,179 0.58RCN Telecom Services LLC / RCN Capital Corp 8.5% 15/8/2020 '144A' 1,500,000 USD 1,523,458 1,515,000 0.09Regency Energy Partners LP / Regency Energy Finance Corp 5% 1/10/2022 1,325,000 USD 1,330,462 1,172,265 0.07Regency Energy Partners LP / Regency Energy Finance Corp 5.875% 1/3/2022 8,748,000 USD 8,886,738 8,234,239 0.47Regions Bank/Birmingham AL 7.5% 15/5/2018 'BKNT' 395,000 USD 425,852 438,654 0.02Reynolds Group Issuer Inc / Reynolds Group Issuer LLC / Reynolds Group Issuer Lu 5.75% 15/10/2020 3,000,000 USD 3,124,563 3,045,000 0.17Reynolds Group Issuer Inc / Reynolds Group Issuer LLC / Reynolds Group Issuer Lu 8.25% 15/2/2021 1,000,000 USD 1,031,431 967,500 0.06RHP Hotel Properties LP / RHP Finance Corp 5% 15/4/2023 4,500,000 USD 4,472,915 4,500,000 0.26Rice Energy Inc 7.25% 1/5/2023 '144A' 1,642,000 USD 1,630,605 1,198,660 0.07Rivers Pittsburgh Borrower LP/Rivers Pittsburgh Finance Corp 9.5% 15/6/2019 '144A' 493,000 USD 493,000 510,255 0.03Rose Rock Midstream LP / Rose Rock Finance Corp 5.625% 15/7/2022 3,324,000 USD 3,324,000 2,360,040 0.13Sabine Pass Liquefaction LLC 5.625% 1/3/2025 '144A' 13,824,000 USD 13,764,605 11,784,959 0.67Sabine Pass Liquefaction LLC 5.75% 15/5/2024 1,452,000 USD 1,452,000 1,234,200 0.07Sally Holdings LLC / Sally Capital Inc 5.625% 1/12/2025 9,000,000 USD 9,143,962 9,162,000 0.52Sanchez Energy Corp 6.125% 15/1/2023 6,000,000 USD 5,182,752 3,240,000 0.18Sanchez Energy Corp 7.75% 15/6/2021 2,355,000 USD 1,875,371 1,436,550 0.08Sanmina Corp 4.375% 1/6/2019 '144A' 8,397,000 USD 8,397,000 8,501,963 0.48Scientific Games International Inc 6.625% 15/5/2021 15,000,000 USD 14,921,666 7,050,000 0.40Scientific Games International Inc 10% 1/12/2022 8,000,000 USD 7,302,149 5,680,000 0.32
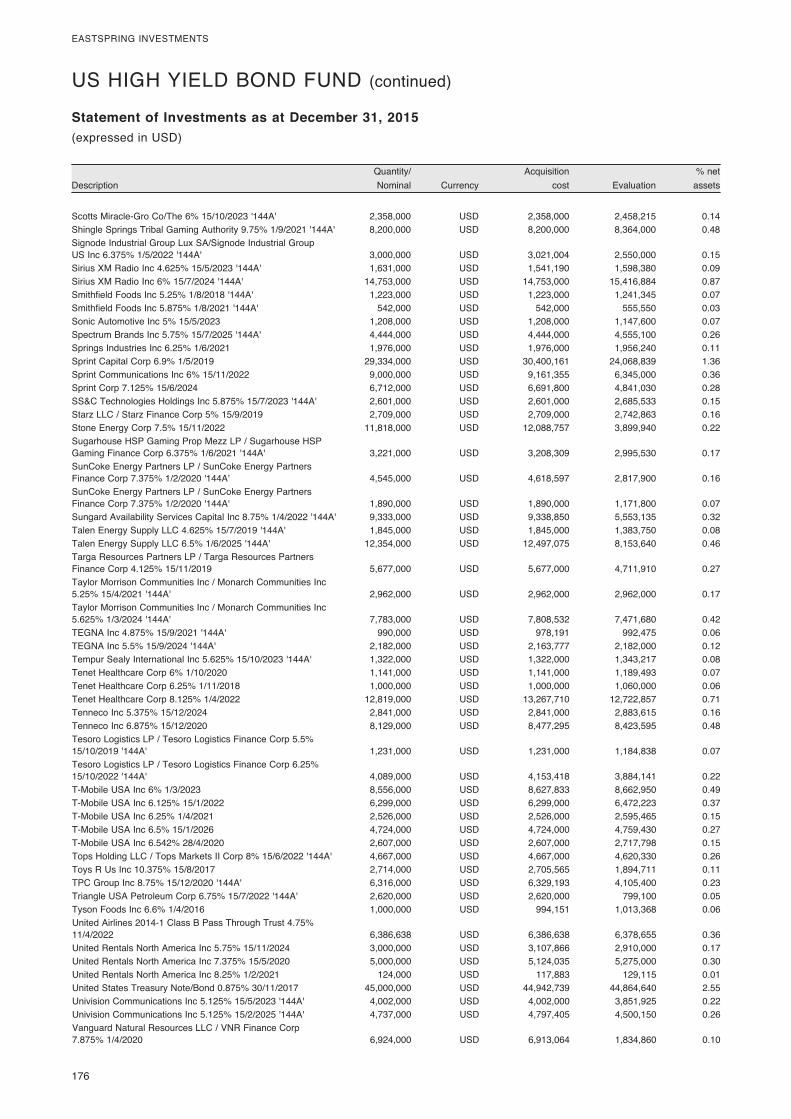
176
EASTSPRING INVESTMENTS
DescriptionQuantity/ Nominal Currency
Acquisition cost Evaluation
% net assets
Statement of Investments as at December 31, 2015(expressed in USD)
US HIGH YIELD BOND FUND (continued)
Scotts Miracle-Gro Co/The 6% 15/10/2023 '144A' 2,358,000 USD 2,358,000 2,458,215 0.14Shingle Springs Tribal Gaming Authority 9.75% 1/9/2021 '144A' 8,200,000 USD 8,200,000 8,364,000 0.48Signode Industrial Group Lux SA/Signode Industrial Group US Inc 6.375% 1/5/2022 '144A' 3,000,000 USD 3,021,004 2,550,000 0.15Sirius XM Radio Inc 4.625% 15/5/2023 '144A' 1,631,000 USD 1,541,190 1,598,380 0.09Sirius XM Radio Inc 6% 15/7/2024 '144A' 14,753,000 USD 14,753,000 15,416,884 0.87Smithfield Foods Inc 5.25% 1/8/2018 '144A' 1,223,000 USD 1,223,000 1,241,345 0.07Smithfield Foods Inc 5.875% 1/8/2021 '144A' 542,000 USD 542,000 555,550 0.03Sonic Automotive Inc 5% 15/5/2023 1,208,000 USD 1,208,000 1,147,600 0.07Spectrum Brands Inc 5.75% 15/7/2025 '144A' 4,444,000 USD 4,444,000 4,555,100 0.26Springs Industries Inc 6.25% 1/6/2021 1,976,000 USD 1,976,000 1,956,240 0.11Sprint Capital Corp 6.9% 1/5/2019 29,334,000 USD 30,400,161 24,068,839 1.36Sprint Communications Inc 6% 15/11/2022 9,000,000 USD 9,161,355 6,345,000 0.36Sprint Corp 7.125% 15/6/2024 6,712,000 USD 6,691,800 4,841,030 0.28SS&C Technologies Holdings Inc 5.875% 15/7/2023 '144A' 2,601,000 USD 2,601,000 2,685,533 0.15Starz LLC / Starz Finance Corp 5% 15/9/2019 2,709,000 USD 2,709,000 2,742,863 0.16Stone Energy Corp 7.5% 15/11/2022 11,818,000 USD 12,088,757 3,899,940 0.22Sugarhouse HSP Gaming Prop Mezz LP / Sugarhouse HSP Gaming Finance Corp 6.375% 1/6/2021 '144A' 3,221,000 USD 3,208,309 2,995,530 0.17SunCoke Energy Partners LP / SunCoke Energy Partners Finance Corp 7.375% 1/2/2020 '144A' 4,545,000 USD 4,618,597 2,817,900 0.16SunCoke Energy Partners LP / SunCoke Energy Partners Finance Corp 7.375% 1/2/2020 '144A' 1,890,000 USD 1,890,000 1,171,800 0.07Sungard Availability Services Capital Inc 8.75% 1/4/2022 '144A' 9,333,000 USD 9,338,850 5,553,135 0.32Talen Energy Supply LLC 4.625% 15/7/2019 '144A' 1,845,000 USD 1,845,000 1,383,750 0.08Talen Energy Supply LLC 6.5% 1/6/2025 '144A' 12,354,000 USD 12,497,075 8,153,640 0.46Targa Resources Partners LP / Targa Resources Partners Finance Corp 4.125% 15/11/2019 5,677,000 USD 5,677,000 4,711,910 0.27Taylor Morrison Communities Inc / Monarch Communities Inc 5.25% 15/4/2021 '144A' 2,962,000 USD 2,962,000 2,962,000 0.17Taylor Morrison Communities Inc / Monarch Communities Inc 5.625% 1/3/2024 '144A' 7,783,000 USD 7,808,532 7,471,680 0.42TEGNA Inc 4.875% 15/9/2021 '144A' 990,000 USD 978,191 992,475 0.06TEGNA Inc 5.5% 15/9/2024 '144A' 2,182,000 USD 2,163,777 2,182,000 0.12Tempur Sealy International Inc 5.625% 15/10/2023 '144A' 1,322,000 USD 1,322,000 1,343,217 0.08Tenet Healthcare Corp 6% 1/10/2020 1,141,000 USD 1,141,000 1,189,493 0.07Tenet Healthcare Corp 6.25% 1/11/2018 1,000,000 USD 1,000,000 1,060,000 0.06Tenet Healthcare Corp 8.125% 1/4/2022 12,819,000 USD 13,267,710 12,722,857 0.71Tenneco Inc 5.375% 15/12/2024 2,841,000 USD 2,841,000 2,883,615 0.16Tenneco Inc 6.875% 15/12/2020 8,129,000 USD 8,477,295 8,423,595 0.48Tesoro Logistics LP / Tesoro Logistics Finance Corp 5.5% 15/10/2019 '144A' 1,231,000 USD 1,231,000 1,184,838 0.07Tesoro Logistics LP / Tesoro Logistics Finance Corp 6.25% 15/10/2022 '144A' 4,089,000 USD 4,153,418 3,884,141 0.22T-Mobile USA Inc 6% 1/3/2023 8,556,000 USD 8,627,833 8,662,950 0.49T-Mobile USA Inc 6.125% 15/1/2022 6,299,000 USD 6,299,000 6,472,223 0.37T-Mobile USA Inc 6.25% 1/4/2021 2,526,000 USD 2,526,000 2,595,465 0.15T-Mobile USA Inc 6.5% 15/1/2026 4,724,000 USD 4,724,000 4,759,430 0.27T-Mobile USA Inc 6.542% 28/4/2020 2,607,000 USD 2,607,000 2,717,798 0.15Tops Holding LLC / Tops Markets II Corp 8% 15/6/2022 '144A' 4,667,000 USD 4,667,000 4,620,330 0.26Toys R Us Inc 10.375% 15/8/2017 2,714,000 USD 2,705,565 1,894,711 0.11TPC Group Inc 8.75% 15/12/2020 '144A' 6,316,000 USD 6,329,193 4,105,400 0.23Triangle USA Petroleum Corp 6.75% 15/7/2022 '144A' 2,620,000 USD 2,620,000 799,100 0.05Tyson Foods Inc 6.6% 1/4/2016 1,000,000 USD 994,151 1,013,368 0.06United Airlines 2014-1 Class B Pass Through Trust 4.75% 11/4/2022 6,386,638 USD 6,386,638 6,378,655 0.36United Rentals North America Inc 5.75% 15/11/2024 3,000,000 USD 3,107,866 2,910,000 0.17United Rentals North America Inc 7.375% 15/5/2020 5,000,000 USD 5,124,035 5,275,000 0.30United Rentals North America Inc 8.25% 1/2/2021 124,000 USD 117,883 129,115 0.01United States Treasury Note/Bond 0.875% 30/11/2017 45,000,000 USD 44,942,739 44,864,640 2.55Univision Communications Inc 5.125% 15/5/2023 '144A' 4,002,000 USD 4,002,000 3,851,925 0.22Univision Communications Inc 5.125% 15/2/2025 '144A' 4,737,000 USD 4,797,405 4,500,150 0.26Vanguard Natural Resources LLC / VNR Finance Corp 7.875% 1/4/2020 6,924,000 USD 6,913,064 1,834,860 0.10
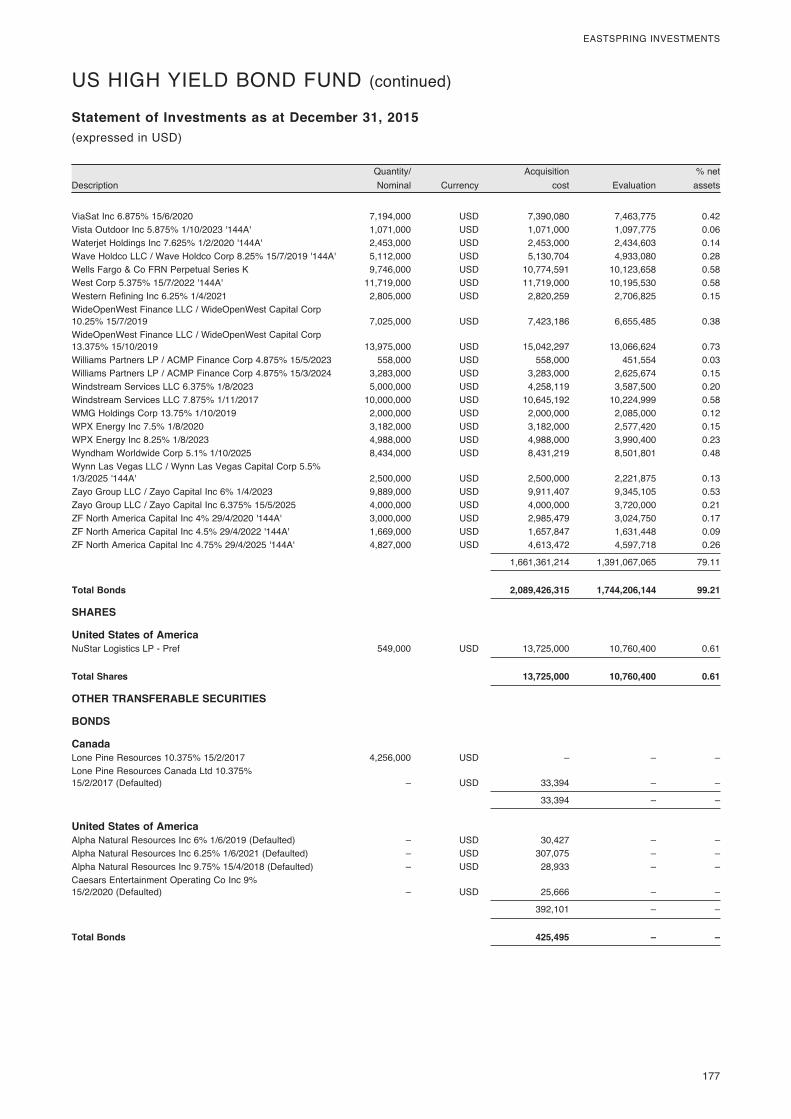
177
EASTSPRING INVESTMENTS
DescriptionQuantity/ Nominal Currency
Acquisition cost Evaluation
% net assets
Statement of Investments as at December 31, 2015(expressed in USD)
US HIGH YIELD BOND FUND (continued)
ViaSat Inc 6.875% 15/6/2020 7,194,000 USD 7,390,080 7,463,775 0.42Vista Outdoor Inc 5.875% 1/10/2023 '144A' 1,071,000 USD 1,071,000 1,097,775 0.06Waterjet Holdings Inc 7.625% 1/2/2020 '144A' 2,453,000 USD 2,453,000 2,434,603 0.14Wave Holdco LLC / Wave Holdco Corp 8.25% 15/7/2019 '144A' 5,112,000 USD 5,130,704 4,933,080 0.28Wells Fargo & Co FRN Perpetual Series K 9,746,000 USD 10,774,591 10,123,658 0.58West Corp 5.375% 15/7/2022 '144A' 11,719,000 USD 11,719,000 10,195,530 0.58Western Refining Inc 6.25% 1/4/2021 2,805,000 USD 2,820,259 2,706,825 0.15WideOpenWest Finance LLC / WideOpenWest Capital Corp 10.25% 15/7/2019 7,025,000 USD 7,423,186 6,655,485 0.38WideOpenWest Finance LLC / WideOpenWest Capital Corp 13.375% 15/10/2019 13,975,000 USD 15,042,297 13,066,624 0.73Williams Partners LP / ACMP Finance Corp 4.875% 15/5/2023 558,000 USD 558,000 451,554 0.03Williams Partners LP / ACMP Finance Corp 4.875% 15/3/2024 3,283,000 USD 3,283,000 2,625,674 0.15Windstream Services LLC 6.375% 1/8/2023 5,000,000 USD 4,258,119 3,587,500 0.20Windstream Services LLC 7.875% 1/11/2017 10,000,000 USD 10,645,192 10,224,999 0.58WMG Holdings Corp 13.75% 1/10/2019 2,000,000 USD 2,000,000 2,085,000 0.12WPX Energy Inc 7.5% 1/8/2020 3,182,000 USD 3,182,000 2,577,420 0.15WPX Energy Inc 8.25% 1/8/2023 4,988,000 USD 4,988,000 3,990,400 0.23Wyndham Worldwide Corp 5.1% 1/10/2025 8,434,000 USD 8,431,219 8,501,801 0.48Wynn Las Vegas LLC / Wynn Las Vegas Capital Corp 5.5% 1/3/2025 '144A' 2,500,000 USD 2,500,000 2,221,875 0.13Zayo Group LLC / Zayo Capital Inc 6% 1/4/2023 9,889,000 USD 9,911,407 9,345,105 0.53Zayo Group LLC / Zayo Capital Inc 6.375% 15/5/2025 4,000,000 USD 4,000,000 3,720,000 0.21ZF North America Capital Inc 4% 29/4/2020 '144A' 3,000,000 USD 2,985,479 3,024,750 0.17ZF North America Capital Inc 4.5% 29/4/2022 '144A' 1,669,000 USD 1,657,847 1,631,448 0.09ZF North America Capital Inc 4.75% 29/4/2025 '144A' 4,827,000 USD 4,613,472 4,597,718 0.26
1,661,361,214 1,391,067,065 79.11
Total Bonds 2,089,426,315 1,744,206,144 99.21
SHARES
United States of America NuStar Logistics LP - Pref 549,000 USD 13,725,000 10,760,400 0.61
Total Shares 13,725,000 10,760,400 0.61
OTHER TRANSFERABLE SECURITIES
BONDS
Canada Lone Pine Resources 10.375% 15/2/2017 4,256,000 USD – – –Lone Pine Resources Canada Ltd 10.375% 15/2/2017 (Defaulted) – USD 33,394 – –
33,394 – –
United States of America Alpha Natural Resources Inc 6% 1/6/2019 (Defaulted) – USD 30,427 – –Alpha Natural Resources Inc 6.25% 1/6/2021 (Defaulted) – USD 307,075 – –Alpha Natural Resources Inc 9.75% 15/4/2018 (Defaulted) – USD 28,933 – –Caesars Entertainment Operating Co Inc 9% 15/2/2020 (Defaulted) – USD 25,666 – –
392,101 – –
Total Bonds 425,495 – –
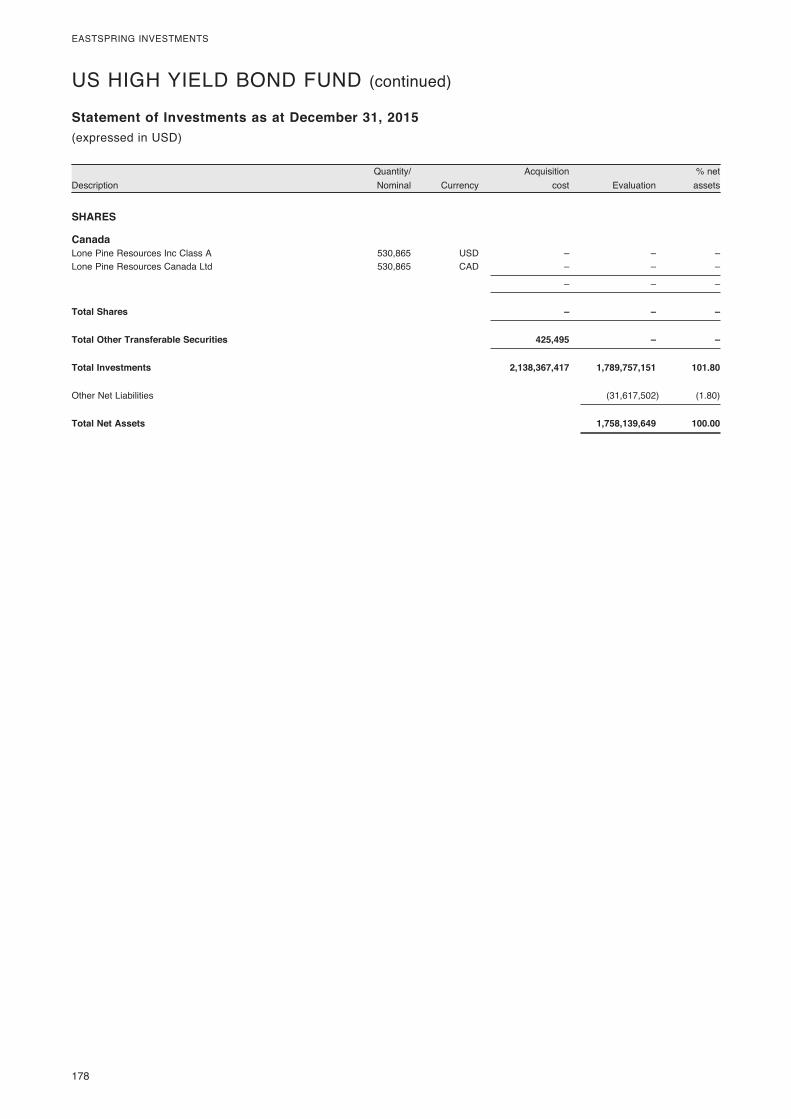
178
EASTSPRING INVESTMENTS
DescriptionQuantity/ Nominal Currency
Acquisition cost Evaluation
% net assets
Statement of Investments as at December 31, 2015(expressed in USD)
US HIGH YIELD BOND FUND (continued)
SHARES
Canada Lone Pine Resources Inc Class A 530,865 USD – – –Lone Pine Resources Canada Ltd 530,865 CAD – – –
– – –
Total Shares – – –
Total Other Transferable Securities 425,495 – –
Total Investments 2,138,367,417 1,789,757,151 101.80
Other Net Liabilities (31,617,502) (1.80)
Total Net Assets 1,758,139,649 100.00

179
EASTSPRING INVESTMENTS
DescriptionQuantity/ Nominal Currency
Acquisition cost Evaluation
% net assets
Statement of Investments as at December 31, 2015
Transferable securities admitted to an official stock exchange listing or dealt in on another regulated market
MUTUAL FUNDS
United States of America BNY Mellon U.S. Dollar Liquidity Fund 'Investor' 2,359,082 USD 2,359,082 2,359,082 0.69
Total Mutual Funds 2,359,082 2,359,082 0.69
BONDS
Australia Barrick PD Australia Finance Pty Ltd 5.95% 15/10/2039 650,000 USD 659,392 440,432 0.13Macquarie Bank Ltd 4.875% 10/6/2025 '144A' 865,000 USD 862,832 852,412 0.25Macquarie Group Ltd 6% 14/1/2020 '144A' 1,025,000 USD 1,025,735 1,130,303 0.33Origin Energy Finance Ltd 3.5% 9/10/2018 '144A' 1,463,000 USD 1,461,526 1,425,600 0.41Rio Tinto Finance USA Ltd 7.125% 15/7/2028 600,000 USD 532,056 705,845 0.21Westpac Banking Corp 2.6% 23/11/2020 4,000,000 USD 3,997,071 4,011,084 1.16
8,538,612 8,565,676 2.49
Bermuda Allied World Assurance Co Holdings Ltd 5.5% 15/11/2020 572,000 USD 570,727 622,613 0.18Bacardi Ltd 8.2% 1/4/2019 '144A' 500,000 USD 499,947 575,620 0.17
1,070,674 1,198,233 0.35
Brazil Votorantim Cimentos SA 7.25% 5/4/2041 '144A' 1,685,000 USD 1,562,260 1,280,600 0.37
Canada Barrick Gold Corp 4.1% 1/5/2023 290,000 USD 291,017 248,362 0.07Glencore Finance Canada Ltd 4.25% 25/10/2022 '144A' 1,306,000 USD 1,313,930 992,560 0.29Husky Energy Inc 6.8% 15/9/2037 390,000 USD 389,564 406,056 0.12Methanex Corp 5.65% 1/12/2044 877,000 USD 871,539 708,187 0.21Petro-Canada 6.05% 15/5/2018 236,000 USD 235,903 252,837 0.07Rogers Communications Inc 5% 15/3/2044 604,000 USD 614,239 606,225 0.18Royal Bank of Canada FRN 3/2/2017 'GMTN' 2,000,000 USD 2,000,000 1,996,330 0.58Suncor Energy Inc 6.1% 1/6/2018 1,295,000 USD 1,312,296 1,392,119 0.40Toronto-Dominion Bank/The 2.5% 14/12/2020 'GMTN' 2,500,000 USD 2,494,693 2,487,012 0.72TransCanada PipeLines Ltd 7.25% 15/8/2038 417,000 USD 416,876 494,419 0.14
9,940,057 9,584,107 2.78
Cayman Islands Noble Holding International Ltd 5.95% 1/4/2025 500,000 USD 498,712 344,407 0.10Transocean Inc 4.3% 15/10/2022 726,000 USD 671,951 384,780 0.11Transocean Inc 6.5% 15/11/2020 600,000 USD 599,799 417,900 0.12
1,770,462 1,147,087 0.33
Colombia Ecopetrol SA 5.375% 26/6/2026 1,250,000 USD 1,241,997 1,062,500 0.31
Curacao Teva Pharmaceutical Finance Co BV 3.65% 10/11/2021 105,000 USD 104,775 106,345 0.03
France BPCE SA 5.15% 21/7/2024 '144A' 600,000 USD 617,104 603,956 0.18Electricite de France SA FRN Perpetual '144A' 1,500,000 USD 1,489,606 1,410,000 0.40
2,106,710 2,013,956 0.58
Ireland GE Capital International Funding Co 4.418% 15/11/2035 '144A' 839,000 USD 796,924 855,729 0.25
(expressed in USD)
US INVESTMENT GRADE BOND FUND
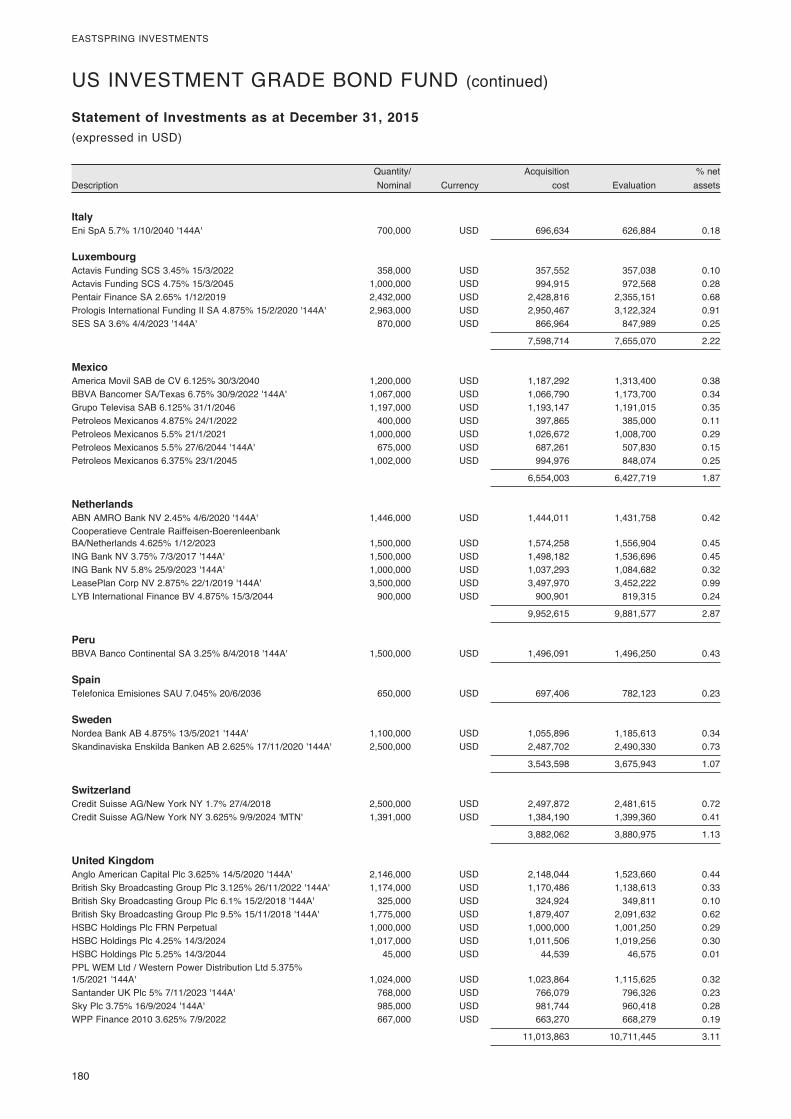
180
EASTSPRING INVESTMENTS
DescriptionQuantity/ Nominal Currency
Acquisition cost Evaluation
% net assets
Statement of Investments as at December 31, 2015(expressed in USD)
US INVESTMENT GRADE BOND FUND (continued)
Italy Eni SpA 5.7% 1/10/2040 '144A' 700,000 USD 696,634 626,884 0.18
Luxembourg Actavis Funding SCS 3.45% 15/3/2022 358,000 USD 357,552 357,038 0.10Actavis Funding SCS 4.75% 15/3/2045 1,000,000 USD 994,915 972,568 0.28Pentair Finance SA 2.65% 1/12/2019 2,432,000 USD 2,428,816 2,355,151 0.68Prologis International Funding II SA 4.875% 15/2/2020 '144A' 2,963,000 USD 2,950,467 3,122,324 0.91SES SA 3.6% 4/4/2023 '144A' 870,000 USD 866,964 847,989 0.25
7,598,714 7,655,070 2.22
Mexico America Movil SAB de CV 6.125% 30/3/2040 1,200,000 USD 1,187,292 1,313,400 0.38BBVA Bancomer SA/Texas 6.75% 30/9/2022 '144A' 1,067,000 USD 1,066,790 1,173,700 0.34Grupo Televisa SAB 6.125% 31/1/2046 1,197,000 USD 1,193,147 1,191,015 0.35Petroleos Mexicanos 4.875% 24/1/2022 400,000 USD 397,865 385,000 0.11Petroleos Mexicanos 5.5% 21/1/2021 1,000,000 USD 1,026,672 1,008,700 0.29Petroleos Mexicanos 5.5% 27/6/2044 '144A' 675,000 USD 687,261 507,830 0.15Petroleos Mexicanos 6.375% 23/1/2045 1,002,000 USD 994,976 848,074 0.25
6,554,003 6,427,719 1.87
Netherlands ABN AMRO Bank NV 2.45% 4/6/2020 '144A' 1,446,000 USD 1,444,011 1,431,758 0.42Cooperatieve Centrale Raiffeisen-Boerenleenbank BA/Netherlands 4.625% 1/12/2023 1,500,000 USD 1,574,258 1,556,904 0.45ING Bank NV 3.75% 7/3/2017 '144A' 1,500,000 USD 1,498,182 1,536,696 0.45ING Bank NV 5.8% 25/9/2023 '144A' 1,000,000 USD 1,037,293 1,084,682 0.32LeasePlan Corp NV 2.875% 22/1/2019 '144A' 3,500,000 USD 3,497,970 3,452,222 0.99LYB International Finance BV 4.875% 15/3/2044 900,000 USD 900,901 819,315 0.24
9,952,615 9,881,577 2.87
Peru BBVA Banco Continental SA 3.25% 8/4/2018 '144A' 1,500,000 USD 1,496,091 1,496,250 0.43
Spain Telefonica Emisiones SAU 7.045% 20/6/2036 650,000 USD 697,406 782,123 0.23
Sweden Nordea Bank AB 4.875% 13/5/2021 '144A' 1,100,000 USD 1,055,896 1,185,613 0.34Skandinaviska Enskilda Banken AB 2.625% 17/11/2020 '144A' 2,500,000 USD 2,487,702 2,490,330 0.73
3,543,598 3,675,943 1.07
Switzerland Credit Suisse AG/New York NY 1.7% 27/4/2018 2,500,000 USD 2,497,872 2,481,615 0.72Credit Suisse AG/New York NY 3.625% 9/9/2024 'MTN' 1,391,000 USD 1,384,190 1,399,360 0.41
3,882,062 3,880,975 1.13
United Kingdom Anglo American Capital Plc 3.625% 14/5/2020 '144A' 2,146,000 USD 2,148,044 1,523,660 0.44British Sky Broadcasting Group Plc 3.125% 26/11/2022 '144A' 1,174,000 USD 1,170,486 1,138,613 0.33British Sky Broadcasting Group Plc 6.1% 15/2/2018 '144A' 325,000 USD 324,924 349,811 0.10British Sky Broadcasting Group Plc 9.5% 15/11/2018 '144A' 1,775,000 USD 1,879,407 2,091,632 0.62HSBC Holdings Plc FRN Perpetual 1,000,000 USD 1,000,000 1,001,250 0.29HSBC Holdings Plc 4.25% 14/3/2024 1,017,000 USD 1,011,506 1,019,256 0.30HSBC Holdings Plc 5.25% 14/3/2044 45,000 USD 44,539 46,575 0.01PPL WEM Ltd / Western Power Distribution Ltd 5.375% 1/5/2021 '144A' 1,024,000 USD 1,023,864 1,115,625 0.32Santander UK Plc 5% 7/11/2023 '144A' 768,000 USD 766,079 796,326 0.23Sky Plc 3.75% 16/9/2024 '144A' 985,000 USD 981,744 960,418 0.28WPP Finance 2010 3.625% 7/9/2022 667,000 USD 663,270 668,279 0.19
11,013,863 10,711,445 3.11
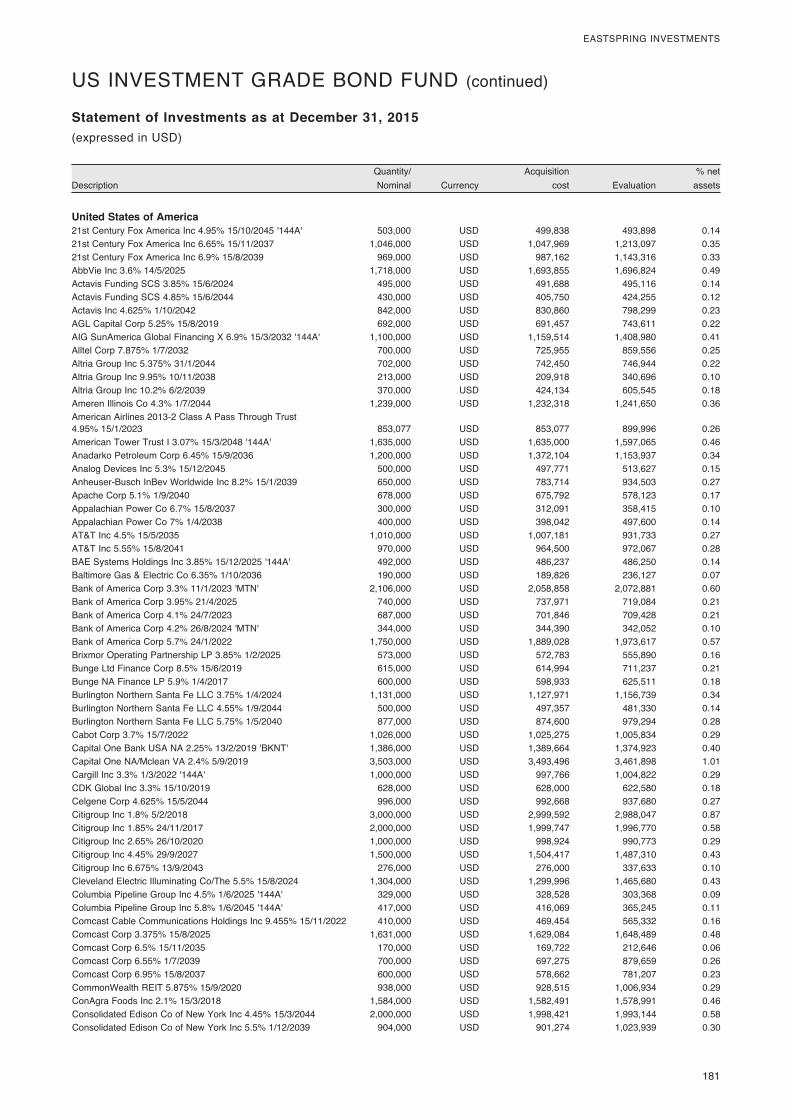
181
EASTSPRING INVESTMENTS
DescriptionQuantity/ Nominal Currency
Acquisition cost Evaluation
% net assets
Statement of Investments as at December 31, 2015(expressed in USD)
US INVESTMENT GRADE BOND FUND (continued)
United States of America 21st Century Fox America Inc 4.95% 15/10/2045 '144A' 503,000 USD 499,838 493,898 0.1421st Century Fox America Inc 6.65% 15/11/2037 1,046,000 USD 1,047,969 1,213,097 0.3521st Century Fox America Inc 6.9% 15/8/2039 969,000 USD 987,162 1,143,316 0.33AbbVie Inc 3.6% 14/5/2025 1,718,000 USD 1,693,855 1,696,824 0.49Actavis Funding SCS 3.85% 15/6/2024 495,000 USD 491,688 495,116 0.14Actavis Funding SCS 4.85% 15/6/2044 430,000 USD 405,750 424,255 0.12Actavis Inc 4.625% 1/10/2042 842,000 USD 830,860 798,299 0.23AGL Capital Corp 5.25% 15/8/2019 692,000 USD 691,457 743,611 0.22AIG SunAmerica Global Financing X 6.9% 15/3/2032 '144A' 1,100,000 USD 1,159,514 1,408,980 0.41Alltel Corp 7.875% 1/7/2032 700,000 USD 725,955 859,556 0.25Altria Group Inc 5.375% 31/1/2044 702,000 USD 742,450 746,944 0.22Altria Group Inc 9.95% 10/11/2038 213,000 USD 209,918 340,696 0.10Altria Group Inc 10.2% 6/2/2039 370,000 USD 424,134 605,545 0.18Ameren Illinois Co 4.3% 1/7/2044 1,239,000 USD 1,232,318 1,241,650 0.36American Airlines 2013-2 Class A Pass Through Trust 4.95% 15/1/2023 853,077 USD 853,077 899,996 0.26American Tower Trust I 3.07% 15/3/2048 '144A' 1,635,000 USD 1,635,000 1,597,065 0.46Anadarko Petroleum Corp 6.45% 15/9/2036 1,200,000 USD 1,372,104 1,153,937 0.34Analog Devices Inc 5.3% 15/12/2045 500,000 USD 497,771 513,627 0.15Anheuser-Busch InBev Worldwide Inc 8.2% 15/1/2039 650,000 USD 783,714 934,503 0.27Apache Corp 5.1% 1/9/2040 678,000 USD 675,792 578,123 0.17Appalachian Power Co 6.7% 15/8/2037 300,000 USD 312,091 358,415 0.10Appalachian Power Co 7% 1/4/2038 400,000 USD 398,042 497,600 0.14AT&T Inc 4.5% 15/5/2035 1,010,000 USD 1,007,181 931,733 0.27AT&T Inc 5.55% 15/8/2041 970,000 USD 964,500 972,067 0.28BAE Systems Holdings Inc 3.85% 15/12/2025 '144A' 492,000 USD 486,237 486,250 0.14Baltimore Gas & Electric Co 6.35% 1/10/2036 190,000 USD 189,826 236,127 0.07Bank of America Corp 3.3% 11/1/2023 'MTN' 2,106,000 USD 2,058,858 2,072,881 0.60Bank of America Corp 3.95% 21/4/2025 740,000 USD 737,971 719,084 0.21Bank of America Corp 4.1% 24/7/2023 687,000 USD 701,846 709,428 0.21Bank of America Corp 4.2% 26/8/2024 'MTN' 344,000 USD 344,390 342,052 0.10Bank of America Corp 5.7% 24/1/2022 1,750,000 USD 1,889,028 1,973,617 0.57Brixmor Operating Partnership LP 3.85% 1/2/2025 573,000 USD 572,783 555,890 0.16Bunge Ltd Finance Corp 8.5% 15/6/2019 615,000 USD 614,994 711,237 0.21Bunge NA Finance LP 5.9% 1/4/2017 600,000 USD 598,933 625,511 0.18Burlington Northern Santa Fe LLC 3.75% 1/4/2024 1,131,000 USD 1,127,971 1,156,739 0.34Burlington Northern Santa Fe LLC 4.55% 1/9/2044 500,000 USD 497,357 481,330 0.14Burlington Northern Santa Fe LLC 5.75% 1/5/2040 877,000 USD 874,600 979,294 0.28Cabot Corp 3.7% 15/7/2022 1,026,000 USD 1,025,275 1,005,834 0.29Capital One Bank USA NA 2.25% 13/2/2019 'BKNT' 1,386,000 USD 1,389,664 1,374,923 0.40Capital One NA/Mclean VA 2.4% 5/9/2019 3,503,000 USD 3,493,496 3,461,898 1.01Cargill Inc 3.3% 1/3/2022 '144A' 1,000,000 USD 997,766 1,004,822 0.29CDK Global Inc 3.3% 15/10/2019 628,000 USD 628,000 622,580 0.18Celgene Corp 4.625% 15/5/2044 996,000 USD 992,668 937,680 0.27Citigroup Inc 1.8% 5/2/2018 3,000,000 USD 2,999,592 2,988,047 0.87Citigroup Inc 1.85% 24/11/2017 2,000,000 USD 1,999,747 1,996,770 0.58Citigroup Inc 2.65% 26/10/2020 1,000,000 USD 998,924 990,773 0.29Citigroup Inc 4.45% 29/9/2027 1,500,000 USD 1,504,417 1,487,310 0.43Citigroup Inc 6.675% 13/9/2043 276,000 USD 276,000 337,633 0.10Cleveland Electric Illuminating Co/The 5.5% 15/8/2024 1,304,000 USD 1,299,996 1,465,680 0.43Columbia Pipeline Group Inc 4.5% 1/6/2025 '144A' 329,000 USD 328,528 303,368 0.09Columbia Pipeline Group Inc 5.8% 1/6/2045 '144A' 417,000 USD 416,069 365,245 0.11Comcast Cable Communications Holdings Inc 9.455% 15/11/2022 410,000 USD 469,454 565,332 0.16Comcast Corp 3.375% 15/8/2025 1,631,000 USD 1,629,084 1,648,489 0.48Comcast Corp 6.5% 15/11/2035 170,000 USD 169,722 212,646 0.06Comcast Corp 6.55% 1/7/2039 700,000 USD 697,275 879,659 0.26Comcast Corp 6.95% 15/8/2037 600,000 USD 578,662 781,207 0.23CommonWealth REIT 5.875% 15/9/2020 938,000 USD 928,515 1,006,934 0.29ConAgra Foods Inc 2.1% 15/3/2018 1,584,000 USD 1,582,491 1,578,991 0.46Consolidated Edison Co of New York Inc 4.45% 15/3/2044 2,000,000 USD 1,998,421 1,993,144 0.58Consolidated Edison Co of New York Inc 5.5% 1/12/2039 904,000 USD 901,274 1,023,939 0.30
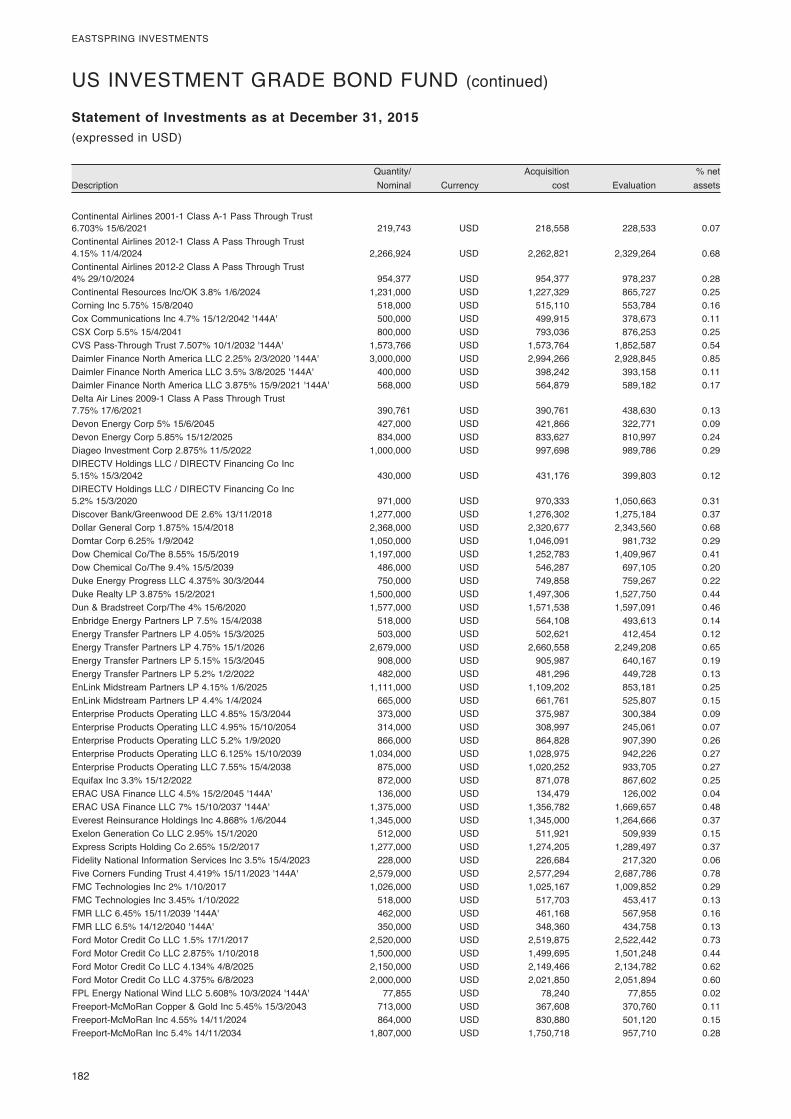
182
EASTSPRING INVESTMENTS
DescriptionQuantity/ Nominal Currency
Acquisition cost Evaluation
% net assets
Statement of Investments as at December 31, 2015(expressed in USD)
US INVESTMENT GRADE BOND FUND (continued)
Continental Airlines 2001-1 Class A-1 Pass Through Trust 6.703% 15/6/2021 219,743 USD 218,558 228,533 0.07Continental Airlines 2012-1 Class A Pass Through Trust 4.15% 11/4/2024 2,266,924 USD 2,262,821 2,329,264 0.68Continental Airlines 2012-2 Class A Pass Through Trust 4% 29/10/2024 954,377 USD 954,377 978,237 0.28Continental Resources Inc/OK 3.8% 1/6/2024 1,231,000 USD 1,227,329 865,727 0.25Corning Inc 5.75% 15/8/2040 518,000 USD 515,110 553,784 0.16Cox Communications Inc 4.7% 15/12/2042 '144A' 500,000 USD 499,915 378,673 0.11CSX Corp 5.5% 15/4/2041 800,000 USD 793,036 876,253 0.25CVS Pass-Through Trust 7.507% 10/1/2032 '144A' 1,573,766 USD 1,573,764 1,852,587 0.54Daimler Finance North America LLC 2.25% 2/3/2020 '144A' 3,000,000 USD 2,994,266 2,928,845 0.85Daimler Finance North America LLC 3.5% 3/8/2025 '144A' 400,000 USD 398,242 393,158 0.11Daimler Finance North America LLC 3.875% 15/9/2021 '144A' 568,000 USD 564,879 589,182 0.17Delta Air Lines 2009-1 Class A Pass Through Trust 7.75% 17/6/2021 390,761 USD 390,761 438,630 0.13Devon Energy Corp 5% 15/6/2045 427,000 USD 421,866 322,771 0.09Devon Energy Corp 5.85% 15/12/2025 834,000 USD 833,627 810,997 0.24Diageo Investment Corp 2.875% 11/5/2022 1,000,000 USD 997,698 989,786 0.29DIRECTV Holdings LLC / DIRECTV Financing Co Inc 5.15% 15/3/2042 430,000 USD 431,176 399,803 0.12DIRECTV Holdings LLC / DIRECTV Financing Co Inc 5.2% 15/3/2020 971,000 USD 970,333 1,050,663 0.31Discover Bank/Greenwood DE 2.6% 13/11/2018 1,277,000 USD 1,276,302 1,275,184 0.37Dollar General Corp 1.875% 15/4/2018 2,368,000 USD 2,320,677 2,343,560 0.68Domtar Corp 6.25% 1/9/2042 1,050,000 USD 1,046,091 981,732 0.29Dow Chemical Co/The 8.55% 15/5/2019 1,197,000 USD 1,252,783 1,409,967 0.41Dow Chemical Co/The 9.4% 15/5/2039 486,000 USD 546,287 697,105 0.20Duke Energy Progress LLC 4.375% 30/3/2044 750,000 USD 749,858 759,267 0.22Duke Realty LP 3.875% 15/2/2021 1,500,000 USD 1,497,306 1,527,750 0.44Dun & Bradstreet Corp/The 4% 15/6/2020 1,577,000 USD 1,571,538 1,597,091 0.46Enbridge Energy Partners LP 7.5% 15/4/2038 518,000 USD 564,108 493,613 0.14Energy Transfer Partners LP 4.05% 15/3/2025 503,000 USD 502,621 412,454 0.12Energy Transfer Partners LP 4.75% 15/1/2026 2,679,000 USD 2,660,558 2,249,208 0.65Energy Transfer Partners LP 5.15% 15/3/2045 908,000 USD 905,987 640,167 0.19Energy Transfer Partners LP 5.2% 1/2/2022 482,000 USD 481,296 449,728 0.13EnLink Midstream Partners LP 4.15% 1/6/2025 1,111,000 USD 1,109,202 853,181 0.25EnLink Midstream Partners LP 4.4% 1/4/2024 665,000 USD 661,761 525,807 0.15Enterprise Products Operating LLC 4.85% 15/3/2044 373,000 USD 375,987 300,384 0.09Enterprise Products Operating LLC 4.95% 15/10/2054 314,000 USD 308,997 245,061 0.07Enterprise Products Operating LLC 5.2% 1/9/2020 866,000 USD 864,828 907,390 0.26Enterprise Products Operating LLC 6.125% 15/10/2039 1,034,000 USD 1,028,975 942,226 0.27Enterprise Products Operating LLC 7.55% 15/4/2038 875,000 USD 1,020,252 933,705 0.27Equifax Inc 3.3% 15/12/2022 872,000 USD 871,078 867,602 0.25ERAC USA Finance LLC 4.5% 15/2/2045 '144A' 136,000 USD 134,479 126,002 0.04ERAC USA Finance LLC 7% 15/10/2037 '144A' 1,375,000 USD 1,356,782 1,669,657 0.48Everest Reinsurance Holdings Inc 4.868% 1/6/2044 1,345,000 USD 1,345,000 1,264,666 0.37Exelon Generation Co LLC 2.95% 15/1/2020 512,000 USD 511,921 509,939 0.15Express Scripts Holding Co 2.65% 15/2/2017 1,277,000 USD 1,274,205 1,289,497 0.37Fidelity National Information Services Inc 3.5% 15/4/2023 228,000 USD 226,684 217,320 0.06Five Corners Funding Trust 4.419% 15/11/2023 '144A' 2,579,000 USD 2,577,294 2,687,786 0.78FMC Technologies Inc 2% 1/10/2017 1,026,000 USD 1,025,167 1,009,852 0.29FMC Technologies Inc 3.45% 1/10/2022 518,000 USD 517,703 453,417 0.13FMR LLC 6.45% 15/11/2039 '144A' 462,000 USD 461,168 567,958 0.16FMR LLC 6.5% 14/12/2040 '144A' 350,000 USD 348,360 434,758 0.13Ford Motor Credit Co LLC 1.5% 17/1/2017 2,520,000 USD 2,519,875 2,522,442 0.73Ford Motor Credit Co LLC 2.875% 1/10/2018 1,500,000 USD 1,499,695 1,501,248 0.44Ford Motor Credit Co LLC 4.134% 4/8/2025 2,150,000 USD 2,149,466 2,134,782 0.62Ford Motor Credit Co LLC 4.375% 6/8/2023 2,000,000 USD 2,021,850 2,051,894 0.60FPL Energy National Wind LLC 5.608% 10/3/2024 '144A' 77,855 USD 78,240 77,855 0.02Freeport-McMoRan Copper & Gold Inc 5.45% 15/3/2043 713,000 USD 367,608 370,760 0.11Freeport-McMoRan Inc 4.55% 14/11/2024 864,000 USD 830,880 501,120 0.15Freeport-McMoRan Inc 5.4% 14/11/2034 1,807,000 USD 1,750,718 957,710 0.28
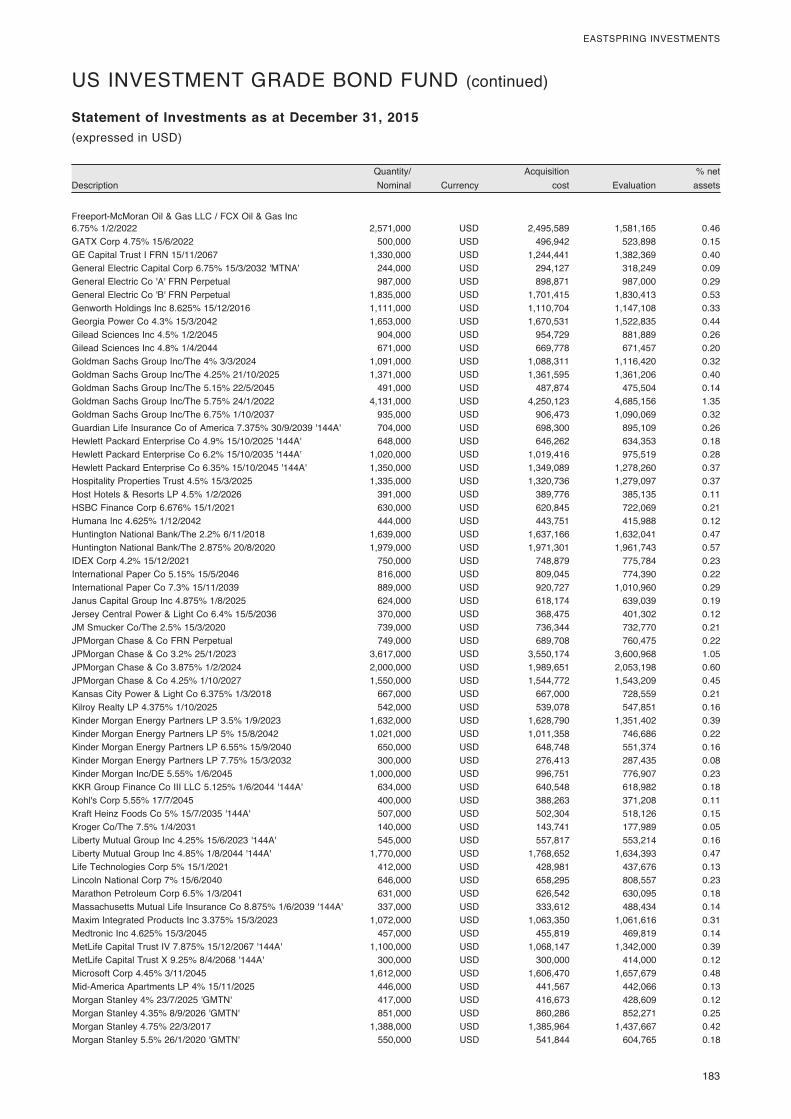
183
EASTSPRING INVESTMENTS
DescriptionQuantity/ Nominal Currency
Acquisition cost Evaluation
% net assets
Statement of Investments as at December 31, 2015(expressed in USD)
US INVESTMENT GRADE BOND FUND (continued)
Freeport-McMoran Oil & Gas LLC / FCX Oil & Gas Inc 6.75% 1/2/2022 2,571,000 USD 2,495,589 1,581,165 0.46GATX Corp 4.75% 15/6/2022 500,000 USD 496,942 523,898 0.15GE Capital Trust I FRN 15/11/2067 1,330,000 USD 1,244,441 1,382,369 0.40General Electric Capital Corp 6.75% 15/3/2032 'MTNA' 244,000 USD 294,127 318,249 0.09General Electric Co 'A' FRN Perpetual 987,000 USD 898,871 987,000 0.29General Electric Co 'B' FRN Perpetual 1,835,000 USD 1,701,415 1,830,413 0.53Genworth Holdings Inc 8.625% 15/12/2016 1,111,000 USD 1,110,704 1,147,108 0.33Georgia Power Co 4.3% 15/3/2042 1,653,000 USD 1,670,531 1,522,835 0.44Gilead Sciences Inc 4.5% 1/2/2045 904,000 USD 954,729 881,889 0.26Gilead Sciences Inc 4.8% 1/4/2044 671,000 USD 669,778 671,457 0.20Goldman Sachs Group Inc/The 4% 3/3/2024 1,091,000 USD 1,088,311 1,116,420 0.32Goldman Sachs Group Inc/The 4.25% 21/10/2025 1,371,000 USD 1,361,595 1,361,206 0.40Goldman Sachs Group Inc/The 5.15% 22/5/2045 491,000 USD 487,874 475,504 0.14Goldman Sachs Group Inc/The 5.75% 24/1/2022 4,131,000 USD 4,250,123 4,685,156 1.35Goldman Sachs Group Inc/The 6.75% 1/10/2037 935,000 USD 906,473 1,090,069 0.32Guardian Life Insurance Co of America 7.375% 30/9/2039 '144A' 704,000 USD 698,300 895,109 0.26Hewlett Packard Enterprise Co 4.9% 15/10/2025 '144A' 648,000 USD 646,262 634,353 0.18Hewlett Packard Enterprise Co 6.2% 15/10/2035 '144A' 1,020,000 USD 1,019,416 975,519 0.28Hewlett Packard Enterprise Co 6.35% 15/10/2045 '144A' 1,350,000 USD 1,349,089 1,278,260 0.37Hospitality Properties Trust 4.5% 15/3/2025 1,335,000 USD 1,320,736 1,279,097 0.37Host Hotels & Resorts LP 4.5% 1/2/2026 391,000 USD 389,776 385,135 0.11HSBC Finance Corp 6.676% 15/1/2021 630,000 USD 620,845 722,069 0.21Humana Inc 4.625% 1/12/2042 444,000 USD 443,751 415,988 0.12Huntington National Bank/The 2.2% 6/11/2018 1,639,000 USD 1,637,166 1,632,041 0.47Huntington National Bank/The 2.875% 20/8/2020 1,979,000 USD 1,971,301 1,961,743 0.57IDEX Corp 4.2% 15/12/2021 750,000 USD 748,879 775,784 0.23International Paper Co 5.15% 15/5/2046 816,000 USD 809,045 774,390 0.22International Paper Co 7.3% 15/11/2039 889,000 USD 920,727 1,010,960 0.29Janus Capital Group Inc 4.875% 1/8/2025 624,000 USD 618,174 639,039 0.19Jersey Central Power & Light Co 6.4% 15/5/2036 370,000 USD 368,475 401,302 0.12JM Smucker Co/The 2.5% 15/3/2020 739,000 USD 736,344 732,770 0.21JPMorgan Chase & Co FRN Perpetual 749,000 USD 689,708 760,475 0.22JPMorgan Chase & Co 3.2% 25/1/2023 3,617,000 USD 3,550,174 3,600,968 1.05JPMorgan Chase & Co 3.875% 1/2/2024 2,000,000 USD 1,989,651 2,053,198 0.60JPMorgan Chase & Co 4.25% 1/10/2027 1,550,000 USD 1,544,772 1,543,209 0.45Kansas City Power & Light Co 6.375% 1/3/2018 667,000 USD 667,000 728,559 0.21Kilroy Realty LP 4.375% 1/10/2025 542,000 USD 539,078 547,851 0.16Kinder Morgan Energy Partners LP 3.5% 1/9/2023 1,632,000 USD 1,628,790 1,351,402 0.39Kinder Morgan Energy Partners LP 5% 15/8/2042 1,021,000 USD 1,011,358 746,686 0.22Kinder Morgan Energy Partners LP 6.55% 15/9/2040 650,000 USD 648,748 551,374 0.16Kinder Morgan Energy Partners LP 7.75% 15/3/2032 300,000 USD 276,413 287,435 0.08Kinder Morgan Inc/DE 5.55% 1/6/2045 1,000,000 USD 996,751 776,907 0.23KKR Group Finance Co III LLC 5.125% 1/6/2044 '144A' 634,000 USD 640,548 618,982 0.18Kohl's Corp 5.55% 17/7/2045 400,000 USD 388,263 371,208 0.11Kraft Heinz Foods Co 5% 15/7/2035 '144A' 507,000 USD 502,304 518,126 0.15Kroger Co/The 7.5% 1/4/2031 140,000 USD 143,741 177,989 0.05Liberty Mutual Group Inc 4.25% 15/6/2023 '144A' 545,000 USD 557,817 553,214 0.16Liberty Mutual Group Inc 4.85% 1/8/2044 '144A' 1,770,000 USD 1,768,652 1,634,393 0.47Life Technologies Corp 5% 15/1/2021 412,000 USD 428,981 437,676 0.13Lincoln National Corp 7% 15/6/2040 646,000 USD 658,295 808,557 0.23Marathon Petroleum Corp 6.5% 1/3/2041 631,000 USD 626,542 630,095 0.18Massachusetts Mutual Life Insurance Co 8.875% 1/6/2039 '144A' 337,000 USD 333,612 488,434 0.14Maxim Integrated Products Inc 3.375% 15/3/2023 1,072,000 USD 1,063,350 1,061,616 0.31Medtronic Inc 4.625% 15/3/2045 457,000 USD 455,819 469,819 0.14MetLife Capital Trust IV 7.875% 15/12/2067 '144A' 1,100,000 USD 1,068,147 1,342,000 0.39MetLife Capital Trust X 9.25% 8/4/2068 '144A' 300,000 USD 300,000 414,000 0.12Microsoft Corp 4.45% 3/11/2045 1,612,000 USD 1,606,470 1,657,679 0.48Mid-America Apartments LP 4% 15/11/2025 446,000 USD 441,567 442,066 0.13Morgan Stanley 4% 23/7/2025 'GMTN' 417,000 USD 416,673 428,609 0.12Morgan Stanley 4.35% 8/9/2026 'GMTN' 851,000 USD 860,286 852,271 0.25Morgan Stanley 4.75% 22/3/2017 1,388,000 USD 1,385,964 1,437,667 0.42Morgan Stanley 5.5% 26/1/2020 'GMTN' 550,000 USD 541,844 604,765 0.18
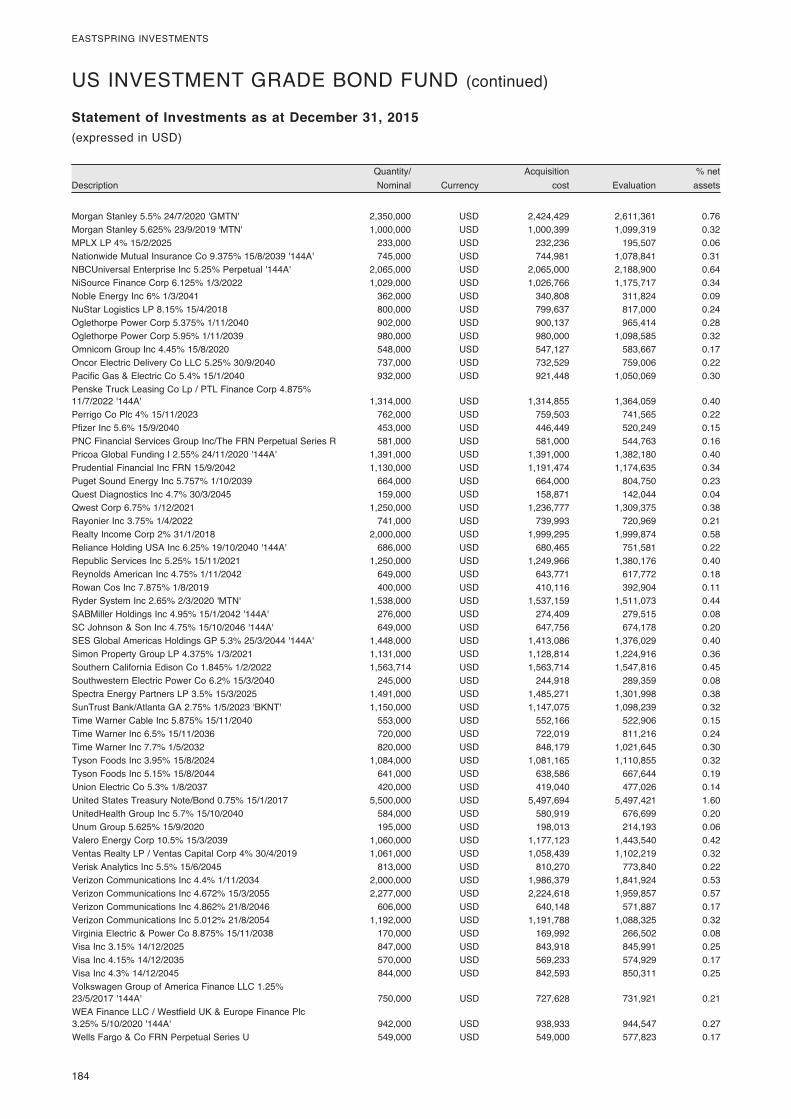
184
EASTSPRING INVESTMENTS
DescriptionQuantity/ Nominal Currency
Acquisition cost Evaluation
% net assets
Statement of Investments as at December 31, 2015(expressed in USD)
US INVESTMENT GRADE BOND FUND (continued)
Morgan Stanley 5.5% 24/7/2020 'GMTN' 2,350,000 USD 2,424,429 2,611,361 0.76Morgan Stanley 5.625% 23/9/2019 'MTN' 1,000,000 USD 1,000,399 1,099,319 0.32MPLX LP 4% 15/2/2025 233,000 USD 232,236 195,507 0.06Nationwide Mutual Insurance Co 9.375% 15/8/2039 '144A' 745,000 USD 744,981 1,078,841 0.31NBCUniversal Enterprise Inc 5.25% Perpetual '144A' 2,065,000 USD 2,065,000 2,188,900 0.64NiSource Finance Corp 6.125% 1/3/2022 1,029,000 USD 1,026,766 1,175,717 0.34Noble Energy Inc 6% 1/3/2041 362,000 USD 340,808 311,824 0.09NuStar Logistics LP 8.15% 15/4/2018 800,000 USD 799,637 817,000 0.24Oglethorpe Power Corp 5.375% 1/11/2040 902,000 USD 900,137 965,414 0.28Oglethorpe Power Corp 5.95% 1/11/2039 980,000 USD 980,000 1,098,585 0.32Omnicom Group Inc 4.45% 15/8/2020 548,000 USD 547,127 583,667 0.17Oncor Electric Delivery Co LLC 5.25% 30/9/2040 737,000 USD 732,529 759,006 0.22Pacific Gas & Electric Co 5.4% 15/1/2040 932,000 USD 921,448 1,050,069 0.30Penske Truck Leasing Co Lp / PTL Finance Corp 4.875% 11/7/2022 '144A' 1,314,000 USD 1,314,855 1,364,059 0.40Perrigo Co Plc 4% 15/11/2023 762,000 USD 759,503 741,565 0.22Pfizer Inc 5.6% 15/9/2040 453,000 USD 446,449 520,249 0.15PNC Financial Services Group Inc/The FRN Perpetual Series R 581,000 USD 581,000 544,763 0.16Pricoa Global Funding I 2.55% 24/11/2020 '144A' 1,391,000 USD 1,391,000 1,382,180 0.40Prudential Financial Inc FRN 15/9/2042 1,130,000 USD 1,191,474 1,174,635 0.34Puget Sound Energy Inc 5.757% 1/10/2039 664,000 USD 664,000 804,750 0.23Quest Diagnostics Inc 4.7% 30/3/2045 159,000 USD 158,871 142,044 0.04Qwest Corp 6.75% 1/12/2021 1,250,000 USD 1,236,777 1,309,375 0.38Rayonier Inc 3.75% 1/4/2022 741,000 USD 739,993 720,969 0.21Realty Income Corp 2% 31/1/2018 2,000,000 USD 1,999,295 1,999,874 0.58Reliance Holding USA Inc 6.25% 19/10/2040 '144A' 686,000 USD 680,465 751,581 0.22Republic Services Inc 5.25% 15/11/2021 1,250,000 USD 1,249,966 1,380,176 0.40Reynolds American Inc 4.75% 1/11/2042 649,000 USD 643,771 617,772 0.18Rowan Cos Inc 7.875% 1/8/2019 400,000 USD 410,116 392,904 0.11Ryder System Inc 2.65% 2/3/2020 'MTN' 1,538,000 USD 1,537,159 1,511,073 0.44SABMiller Holdings Inc 4.95% 15/1/2042 '144A' 276,000 USD 274,409 279,515 0.08SC Johnson & Son Inc 4.75% 15/10/2046 '144A' 649,000 USD 647,756 674,178 0.20SES Global Americas Holdings GP 5.3% 25/3/2044 '144A' 1,448,000 USD 1,413,086 1,376,029 0.40Simon Property Group LP 4.375% 1/3/2021 1,131,000 USD 1,128,814 1,224,916 0.36Southern California Edison Co 1.845% 1/2/2022 1,563,714 USD 1,563,714 1,547,816 0.45Southwestern Electric Power Co 6.2% 15/3/2040 245,000 USD 244,918 289,359 0.08Spectra Energy Partners LP 3.5% 15/3/2025 1,491,000 USD 1,485,271 1,301,998 0.38SunTrust Bank/Atlanta GA 2.75% 1/5/2023 'BKNT' 1,150,000 USD 1,147,075 1,098,239 0.32Time Warner Cable Inc 5.875% 15/11/2040 553,000 USD 552,166 522,906 0.15Time Warner Inc 6.5% 15/11/2036 720,000 USD 722,019 811,216 0.24Time Warner Inc 7.7% 1/5/2032 820,000 USD 848,179 1,021,645 0.30Tyson Foods Inc 3.95% 15/8/2024 1,084,000 USD 1,081,165 1,110,855 0.32Tyson Foods Inc 5.15% 15/8/2044 641,000 USD 638,586 667,644 0.19Union Electric Co 5.3% 1/8/2037 420,000 USD 419,040 477,026 0.14United States Treasury Note/Bond 0.75% 15/1/2017 5,500,000 USD 5,497,694 5,497,421 1.60UnitedHealth Group Inc 5.7% 15/10/2040 584,000 USD 580,919 676,699 0.20Unum Group 5.625% 15/9/2020 195,000 USD 198,013 214,193 0.06Valero Energy Corp 10.5% 15/3/2039 1,060,000 USD 1,177,123 1,443,540 0.42Ventas Realty LP / Ventas Capital Corp 4% 30/4/2019 1,061,000 USD 1,058,439 1,102,219 0.32Verisk Analytics Inc 5.5% 15/6/2045 813,000 USD 810,270 773,840 0.22Verizon Communications Inc 4.4% 1/11/2034 2,000,000 USD 1,986,379 1,841,924 0.53Verizon Communications Inc 4.672% 15/3/2055 2,277,000 USD 2,224,618 1,959,857 0.57Verizon Communications Inc 4.862% 21/8/2046 606,000 USD 640,148 571,887 0.17Verizon Communications Inc 5.012% 21/8/2054 1,192,000 USD 1,191,788 1,088,325 0.32Virginia Electric & Power Co 8.875% 15/11/2038 170,000 USD 169,992 266,502 0.08Visa Inc 3.15% 14/12/2025 847,000 USD 843,918 845,991 0.25Visa Inc 4.15% 14/12/2035 570,000 USD 569,233 574,929 0.17Visa Inc 4.3% 14/12/2045 844,000 USD 842,593 850,311 0.25Volkswagen Group of America Finance LLC 1.25% 23/5/2017 '144A' 750,000 USD 727,628 731,921 0.21WEA Finance LLC / Westfield UK & Europe Finance Plc 3.25% 5/10/2020 '144A' 942,000 USD 938,933 944,547 0.27Wells Fargo & Co FRN Perpetual Series U 549,000 USD 549,000 577,823 0.17
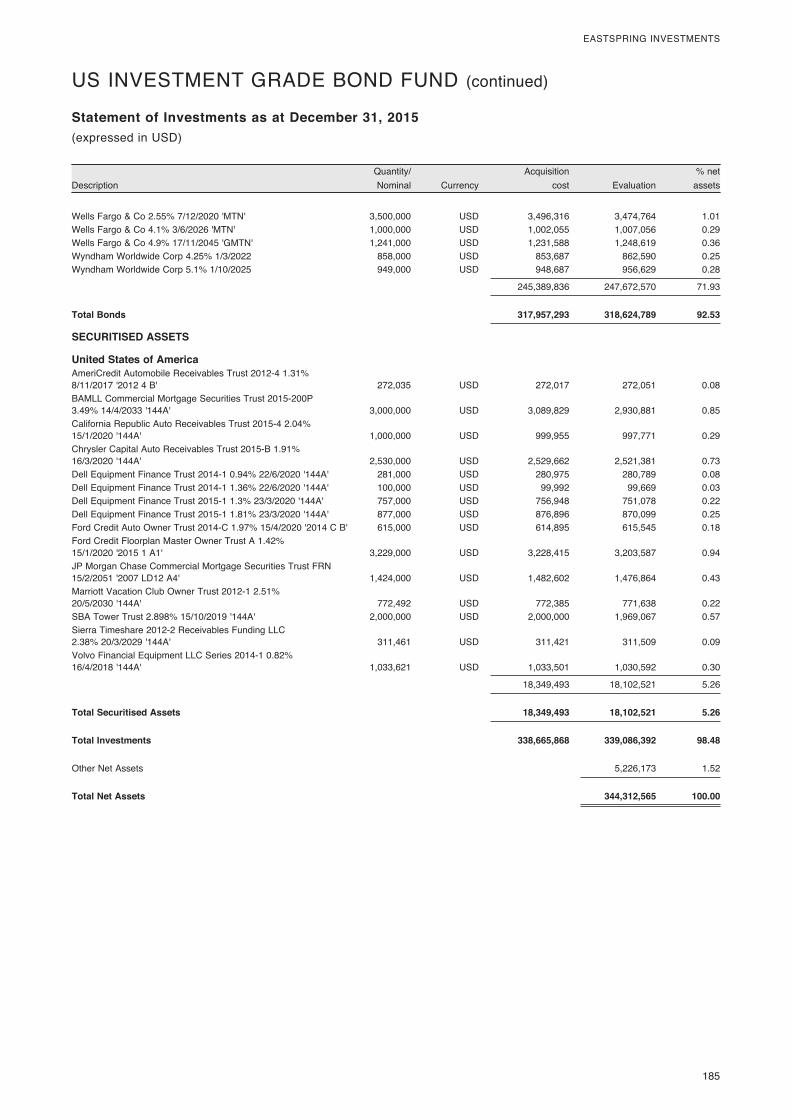
185
EASTSPRING INVESTMENTS
DescriptionQuantity/ Nominal Currency
Acquisition cost Evaluation
% net assets
Statement of Investments as at December 31, 2015(expressed in USD)
US INVESTMENT GRADE BOND FUND (continued)
Wells Fargo & Co 2.55% 7/12/2020 'MTN' 3,500,000 USD 3,496,316 3,474,764 1.01Wells Fargo & Co 4.1% 3/6/2026 'MTN' 1,000,000 USD 1,002,055 1,007,056 0.29Wells Fargo & Co 4.9% 17/11/2045 'GMTN' 1,241,000 USD 1,231,588 1,248,619 0.36Wyndham Worldwide Corp 4.25% 1/3/2022 858,000 USD 853,687 862,590 0.25Wyndham Worldwide Corp 5.1% 1/10/2025 949,000 USD 948,687 956,629 0.28
245,389,836 247,672,570 71.93
Total Bonds 317,957,293 318,624,789 92.53
SECURITISED ASSETS
United States of America AmeriCredit Automobile Receivables Trust 2012-4 1.31% 8/11/2017 '2012 4 B' 272,035 USD 272,017 272,051 0.08BAMLL Commercial Mortgage Securities Trust 2015-200P 3.49% 14/4/2033 '144A' 3,000,000 USD 3,089,829 2,930,881 0.85California Republic Auto Receivables Trust 2015-4 2.04% 15/1/2020 '144A' 1,000,000 USD 999,955 997,771 0.29Chrysler Capital Auto Receivables Trust 2015-B 1.91% 16/3/2020 '144A' 2,530,000 USD 2,529,662 2,521,381 0.73Dell Equipment Finance Trust 2014-1 0.94% 22/6/2020 '144A' 281,000 USD 280,975 280,789 0.08Dell Equipment Finance Trust 2014-1 1.36% 22/6/2020 '144A' 100,000 USD 99,992 99,669 0.03Dell Equipment Finance Trust 2015-1 1.3% 23/3/2020 '144A' 757,000 USD 756,948 751,078 0.22Dell Equipment Finance Trust 2015-1 1.81% 23/3/2020 '144A' 877,000 USD 876,896 870,099 0.25Ford Credit Auto Owner Trust 2014-C 1.97% 15/4/2020 '2014 C B' 615,000 USD 614,895 615,545 0.18Ford Credit Floorplan Master Owner Trust A 1.42% 15/1/2020 '2015 1 A1' 3,229,000 USD 3,228,415 3,203,587 0.94JP Morgan Chase Commercial Mortgage Securities Trust FRN 15/2/2051 '2007 LD12 A4' 1,424,000 USD 1,482,602 1,476,864 0.43Marriott Vacation Club Owner Trust 2012-1 2.51% 20/5/2030 '144A' 772,492 USD 772,385 771,638 0.22SBA Tower Trust 2.898% 15/10/2019 '144A' 2,000,000 USD 2,000,000 1,969,067 0.57Sierra Timeshare 2012-2 Receivables Funding LLC 2.38% 20/3/2029 '144A' 311,461 USD 311,421 311,509 0.09Volvo Financial Equipment LLC Series 2014-1 0.82% 16/4/2018 '144A' 1,033,621 USD 1,033,501 1,030,592 0.30
18,349,493 18,102,521 5.26
Total Securitised Assets 18,349,493 18,102,521 5.26
Total Investments 338,665,868 339,086,392 98.48
Other Net Assets 5,226,173 1.52
Total Net Assets 344,312,565 100.00
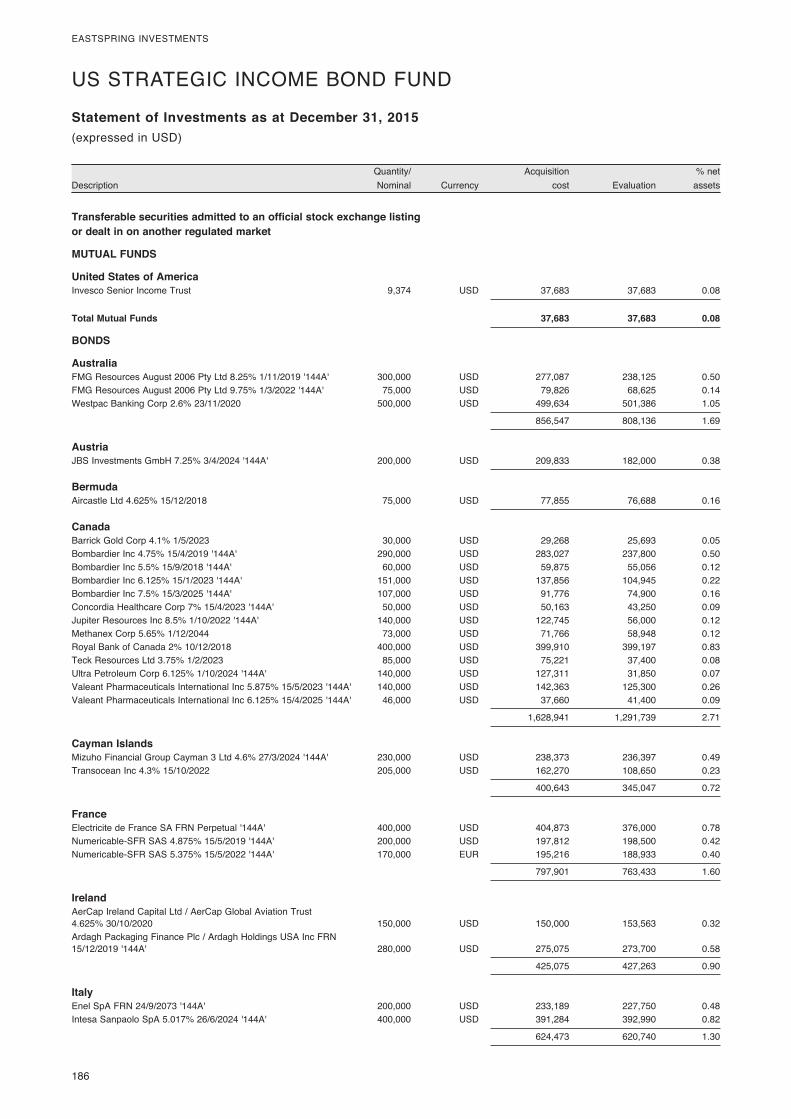
186
EASTSPRING INVESTMENTS
DescriptionQuantity/ Nominal Currency
Acquisition cost Evaluation
% net assets
Statement of Investments as at December 31, 2015
Transferable securities admitted to an official stock exchange listing or dealt in on another regulated market
MUTUAL FUNDS
United States of America Invesco Senior Income Trust 9,374 USD 37,683 37,683 0.08
Total Mutual Funds 37,683 37,683 0.08
BONDS
Australia FMG Resources August 2006 Pty Ltd 8.25% 1/11/2019 '144A' 300,000 USD 277,087 238,125 0.50FMG Resources August 2006 Pty Ltd 9.75% 1/3/2022 '144A' 75,000 USD 79,826 68,625 0.14Westpac Banking Corp 2.6% 23/11/2020 500,000 USD 499,634 501,386 1.05
856,547 808,136 1.69
Austria JBS Investments GmbH 7.25% 3/4/2024 '144A' 200,000 USD 209,833 182,000 0.38
Bermuda Aircastle Ltd 4.625% 15/12/2018 75,000 USD 77,855 76,688 0.16
Canada Barrick Gold Corp 4.1% 1/5/2023 30,000 USD 29,268 25,693 0.05Bombardier Inc 4.75% 15/4/2019 '144A' 290,000 USD 283,027 237,800 0.50Bombardier Inc 5.5% 15/9/2018 '144A' 60,000 USD 59,875 55,056 0.12Bombardier Inc 6.125% 15/1/2023 '144A' 151,000 USD 137,856 104,945 0.22Bombardier Inc 7.5% 15/3/2025 '144A' 107,000 USD 91,776 74,900 0.16Concordia Healthcare Corp 7% 15/4/2023 '144A' 50,000 USD 50,163 43,250 0.09Jupiter Resources Inc 8.5% 1/10/2022 '144A' 140,000 USD 122,745 56,000 0.12Methanex Corp 5.65% 1/12/2044 73,000 USD 71,766 58,948 0.12Royal Bank of Canada 2% 10/12/2018 400,000 USD 399,910 399,197 0.83Teck Resources Ltd 3.75% 1/2/2023 85,000 USD 75,221 37,400 0.08Ultra Petroleum Corp 6.125% 1/10/2024 '144A' 140,000 USD 127,311 31,850 0.07Valeant Pharmaceuticals International Inc 5.875% 15/5/2023 '144A' 140,000 USD 142,363 125,300 0.26Valeant Pharmaceuticals International Inc 6.125% 15/4/2025 '144A' 46,000 USD 37,660 41,400 0.09
1,628,941 1,291,739 2.71
Cayman Islands Mizuho Financial Group Cayman 3 Ltd 4.6% 27/3/2024 '144A' 230,000 USD 238,373 236,397 0.49Transocean Inc 4.3% 15/10/2022 205,000 USD 162,270 108,650 0.23
400,643 345,047 0.72
France Electricite de France SA FRN Perpetual '144A' 400,000 USD 404,873 376,000 0.78Numericable-SFR SAS 4.875% 15/5/2019 '144A' 200,000 USD 197,812 198,500 0.42Numericable-SFR SAS 5.375% 15/5/2022 '144A' 170,000 EUR 195,216 188,933 0.40
797,901 763,433 1.60
Ireland AerCap Ireland Capital Ltd / AerCap Global Aviation Trust 4.625% 30/10/2020 150,000 USD 150,000 153,563 0.32Ardagh Packaging Finance Plc / Ardagh Holdings USA Inc FRN 15/12/2019 '144A' 280,000 USD 275,075 273,700 0.58
425,075 427,263 0.90
Italy Enel SpA FRN 24/9/2073 '144A' 200,000 USD 233,189 227,750 0.48Intesa Sanpaolo SpA 5.017% 26/6/2024 '144A' 400,000 USD 391,284 392,990 0.82
624,473 620,740 1.30
(expressed in USD)
US STRATEGIC INCOME BOND FUND
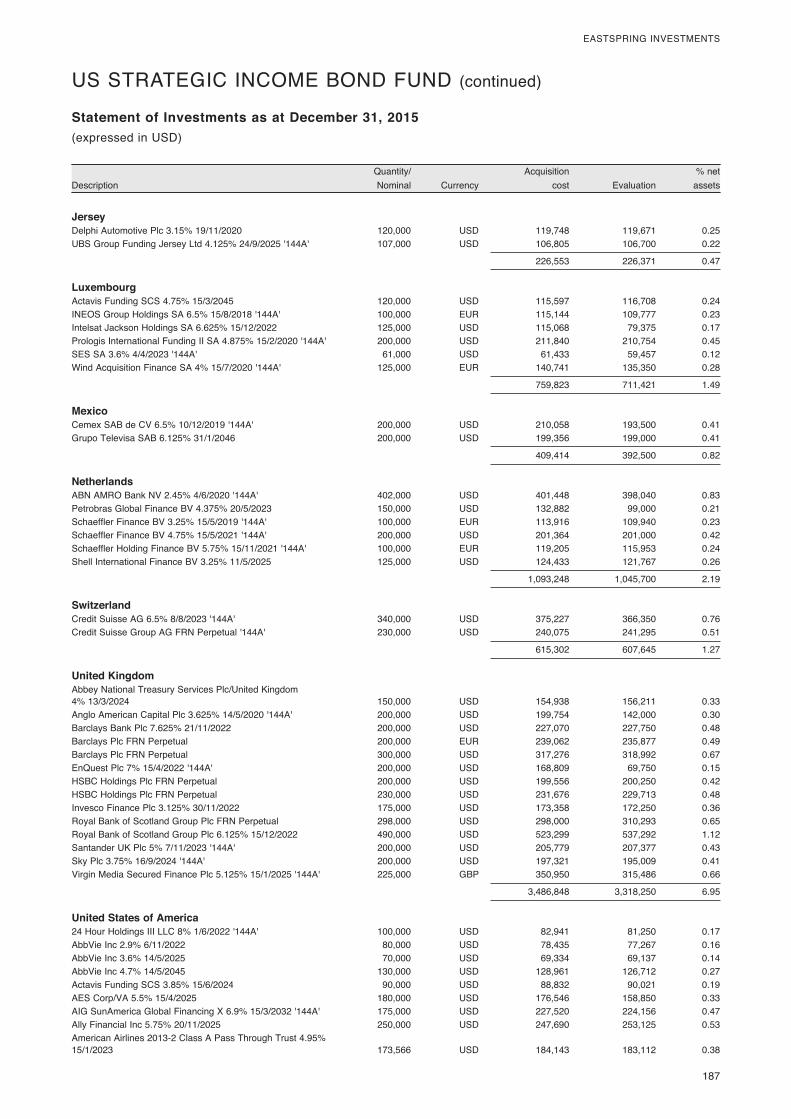
187
EASTSPRING INVESTMENTS
DescriptionQuantity/ Nominal Currency
Acquisition cost Evaluation
% net assets
Statement of Investments as at December 31, 2015(expressed in USD)
US STRATEGIC INCOME BOND FUND (continued)
Jersey Delphi Automotive Plc 3.15% 19/11/2020 120,000 USD 119,748 119,671 0.25UBS Group Funding Jersey Ltd 4.125% 24/9/2025 '144A' 107,000 USD 106,805 106,700 0.22
226,553 226,371 0.47
Luxembourg Actavis Funding SCS 4.75% 15/3/2045 120,000 USD 115,597 116,708 0.24INEOS Group Holdings SA 6.5% 15/8/2018 '144A' 100,000 EUR 115,144 109,777 0.23Intelsat Jackson Holdings SA 6.625% 15/12/2022 125,000 USD 115,068 79,375 0.17Prologis International Funding II SA 4.875% 15/2/2020 '144A' 200,000 USD 211,840 210,754 0.45SES SA 3.6% 4/4/2023 '144A' 61,000 USD 61,433 59,457 0.12Wind Acquisition Finance SA 4% 15/7/2020 '144A' 125,000 EUR 140,741 135,350 0.28
759,823 711,421 1.49
Mexico Cemex SAB de CV 6.5% 10/12/2019 '144A' 200,000 USD 210,058 193,500 0.41Grupo Televisa SAB 6.125% 31/1/2046 200,000 USD 199,356 199,000 0.41
409,414 392,500 0.82
Netherlands ABN AMRO Bank NV 2.45% 4/6/2020 '144A' 402,000 USD 401,448 398,040 0.83Petrobras Global Finance BV 4.375% 20/5/2023 150,000 USD 132,882 99,000 0.21Schaeffler Finance BV 3.25% 15/5/2019 '144A' 100,000 EUR 113,916 109,940 0.23Schaeffler Finance BV 4.75% 15/5/2021 '144A' 200,000 USD 201,364 201,000 0.42Schaeffler Holding Finance BV 5.75% 15/11/2021 '144A' 100,000 EUR 119,205 115,953 0.24Shell International Finance BV 3.25% 11/5/2025 125,000 USD 124,433 121,767 0.26
1,093,248 1,045,700 2.19
Switzerland Credit Suisse AG 6.5% 8/8/2023 '144A' 340,000 USD 375,227 366,350 0.76Credit Suisse Group AG FRN Perpetual '144A' 230,000 USD 240,075 241,295 0.51
615,302 607,645 1.27
United Kingdom Abbey National Treasury Services Plc/United Kingdom 4% 13/3/2024 150,000 USD 154,938 156,211 0.33Anglo American Capital Plc 3.625% 14/5/2020 '144A' 200,000 USD 199,754 142,000 0.30Barclays Bank Plc 7.625% 21/11/2022 200,000 USD 227,070 227,750 0.48Barclays Plc FRN Perpetual 200,000 EUR 239,062 235,877 0.49Barclays Plc FRN Perpetual 300,000 USD 317,276 318,992 0.67EnQuest Plc 7% 15/4/2022 '144A' 200,000 USD 168,809 69,750 0.15HSBC Holdings Plc FRN Perpetual 200,000 USD 199,556 200,250 0.42HSBC Holdings Plc FRN Perpetual 230,000 USD 231,676 229,713 0.48Invesco Finance Plc 3.125% 30/11/2022 175,000 USD 173,358 172,250 0.36Royal Bank of Scotland Group Plc FRN Perpetual 298,000 USD 298,000 310,293 0.65Royal Bank of Scotland Group Plc 6.125% 15/12/2022 490,000 USD 523,299 537,292 1.12Santander UK Plc 5% 7/11/2023 '144A' 200,000 USD 205,779 207,377 0.43Sky Plc 3.75% 16/9/2024 '144A' 200,000 USD 197,321 195,009 0.41Virgin Media Secured Finance Plc 5.125% 15/1/2025 '144A' 225,000 GBP 350,950 315,486 0.66
3,486,848 3,318,250 6.95
United States of America 24 Hour Holdings III LLC 8% 1/6/2022 '144A' 100,000 USD 82,941 81,250 0.17AbbVie Inc 2.9% 6/11/2022 80,000 USD 78,435 77,267 0.16AbbVie Inc 3.6% 14/5/2025 70,000 USD 69,334 69,137 0.14AbbVie Inc 4.7% 14/5/2045 130,000 USD 128,961 126,712 0.27Actavis Funding SCS 3.85% 15/6/2024 90,000 USD 88,832 90,021 0.19AES Corp/VA 5.5% 15/4/2025 180,000 USD 176,546 158,850 0.33AIG SunAmerica Global Financing X 6.9% 15/3/2032 '144A' 175,000 USD 227,520 224,156 0.47Ally Financial Inc 5.75% 20/11/2025 250,000 USD 247,690 253,125 0.53American Airlines 2013-2 Class A Pass Through Trust 4.95% 15/1/2023 173,566 USD 184,143 183,112 0.38
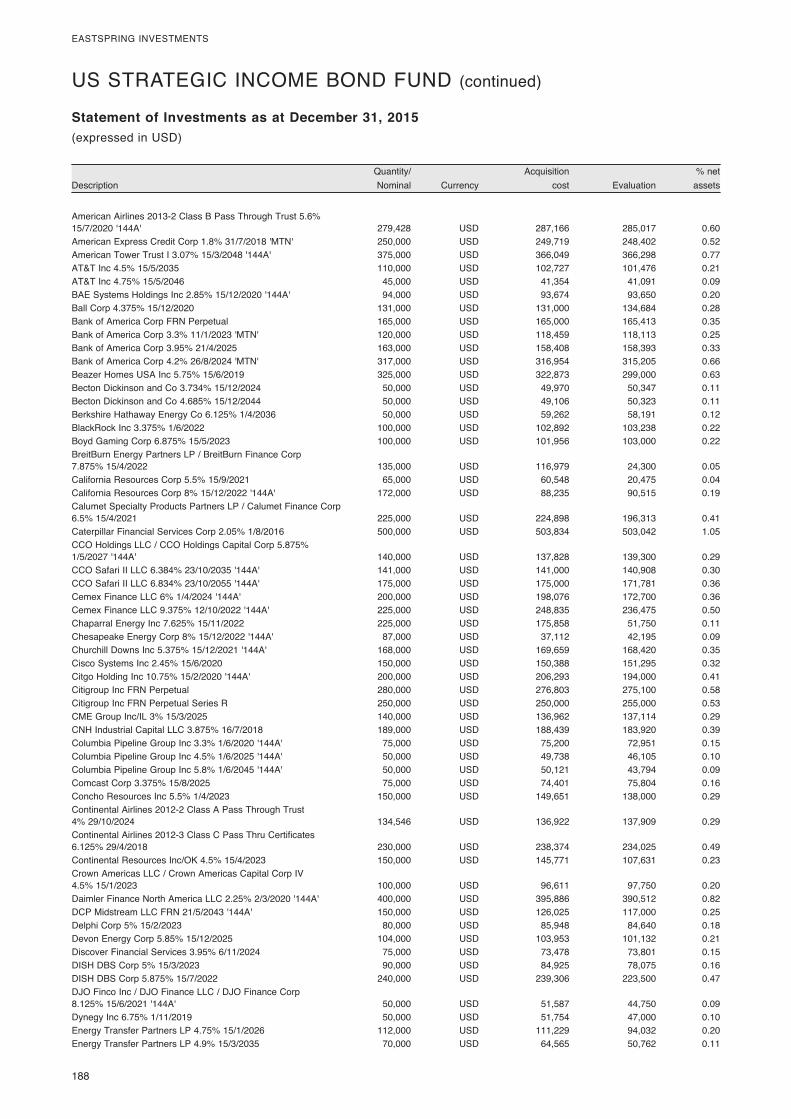
188
EASTSPRING INVESTMENTS
DescriptionQuantity/ Nominal Currency
Acquisition cost Evaluation
% net assets
Statement of Investments as at December 31, 2015(expressed in USD)
US STRATEGIC INCOME BOND FUND (continued)
American Airlines 2013-2 Class B Pass Through Trust 5.6% 15/7/2020 '144A' 279,428 USD 287,166 285,017 0.60American Express Credit Corp 1.8% 31/7/2018 'MTN' 250,000 USD 249,719 248,402 0.52American Tower Trust I 3.07% 15/3/2048 '144A' 375,000 USD 366,049 366,298 0.77AT&T Inc 4.5% 15/5/2035 110,000 USD 102,727 101,476 0.21AT&T Inc 4.75% 15/5/2046 45,000 USD 41,354 41,091 0.09BAE Systems Holdings Inc 2.85% 15/12/2020 '144A' 94,000 USD 93,674 93,650 0.20Ball Corp 4.375% 15/12/2020 131,000 USD 131,000 134,684 0.28Bank of America Corp FRN Perpetual 165,000 USD 165,000 165,413 0.35Bank of America Corp 3.3% 11/1/2023 'MTN' 120,000 USD 118,459 118,113 0.25Bank of America Corp 3.95% 21/4/2025 163,000 USD 158,408 158,393 0.33Bank of America Corp 4.2% 26/8/2024 'MTN' 317,000 USD 316,954 315,205 0.66Beazer Homes USA Inc 5.75% 15/6/2019 325,000 USD 322,873 299,000 0.63Becton Dickinson and Co 3.734% 15/12/2024 50,000 USD 49,970 50,347 0.11Becton Dickinson and Co 4.685% 15/12/2044 50,000 USD 49,106 50,323 0.11Berkshire Hathaway Energy Co 6.125% 1/4/2036 50,000 USD 59,262 58,191 0.12BlackRock Inc 3.375% 1/6/2022 100,000 USD 102,892 103,238 0.22Boyd Gaming Corp 6.875% 15/5/2023 100,000 USD 101,956 103,000 0.22BreitBurn Energy Partners LP / BreitBurn Finance Corp 7.875% 15/4/2022 135,000 USD 116,979 24,300 0.05California Resources Corp 5.5% 15/9/2021 65,000 USD 60,548 20,475 0.04California Resources Corp 8% 15/12/2022 '144A' 172,000 USD 88,235 90,515 0.19Calumet Specialty Products Partners LP / Calumet Finance Corp 6.5% 15/4/2021 225,000 USD 224,898 196,313 0.41Caterpillar Financial Services Corp 2.05% 1/8/2016 500,000 USD 503,834 503,042 1.05CCO Holdings LLC / CCO Holdings Capital Corp 5.875% 1/5/2027 '144A' 140,000 USD 137,828 139,300 0.29CCO Safari II LLC 6.384% 23/10/2035 '144A' 141,000 USD 141,000 140,908 0.30CCO Safari II LLC 6.834% 23/10/2055 '144A' 175,000 USD 175,000 171,781 0.36Cemex Finance LLC 6% 1/4/2024 '144A' 200,000 USD 198,076 172,700 0.36Cemex Finance LLC 9.375% 12/10/2022 '144A' 225,000 USD 248,835 236,475 0.50Chaparral Energy Inc 7.625% 15/11/2022 225,000 USD 175,858 51,750 0.11Chesapeake Energy Corp 8% 15/12/2022 '144A' 87,000 USD 37,112 42,195 0.09Churchill Downs Inc 5.375% 15/12/2021 '144A' 168,000 USD 169,659 168,420 0.35Cisco Systems Inc 2.45% 15/6/2020 150,000 USD 150,388 151,295 0.32Citgo Holding Inc 10.75% 15/2/2020 '144A' 200,000 USD 206,293 194,000 0.41Citigroup Inc FRN Perpetual 280,000 USD 276,803 275,100 0.58Citigroup Inc FRN Perpetual Series R 250,000 USD 250,000 255,000 0.53CME Group Inc/IL 3% 15/3/2025 140,000 USD 136,962 137,114 0.29CNH Industrial Capital LLC 3.875% 16/7/2018 189,000 USD 188,439 183,920 0.39Columbia Pipeline Group Inc 3.3% 1/6/2020 '144A' 75,000 USD 75,200 72,951 0.15Columbia Pipeline Group Inc 4.5% 1/6/2025 '144A' 50,000 USD 49,738 46,105 0.10Columbia Pipeline Group Inc 5.8% 1/6/2045 '144A' 50,000 USD 50,121 43,794 0.09Comcast Corp 3.375% 15/8/2025 75,000 USD 74,401 75,804 0.16Concho Resources Inc 5.5% 1/4/2023 150,000 USD 149,651 138,000 0.29Continental Airlines 2012-2 Class A Pass Through Trust 4% 29/10/2024 134,546 USD 136,922 137,909 0.29Continental Airlines 2012-3 Class C Pass Thru Certificates 6.125% 29/4/2018 230,000 USD 238,374 234,025 0.49Continental Resources Inc/OK 4.5% 15/4/2023 150,000 USD 145,771 107,631 0.23Crown Americas LLC / Crown Americas Capital Corp IV 4.5% 15/1/2023 100,000 USD 96,611 97,750 0.20Daimler Finance North America LLC 2.25% 2/3/2020 '144A' 400,000 USD 395,886 390,512 0.82DCP Midstream LLC FRN 21/5/2043 '144A' 150,000 USD 126,025 117,000 0.25Delphi Corp 5% 15/2/2023 80,000 USD 85,948 84,640 0.18Devon Energy Corp 5.85% 15/12/2025 104,000 USD 103,953 101,132 0.21Discover Financial Services 3.95% 6/11/2024 75,000 USD 73,478 73,801 0.15DISH DBS Corp 5% 15/3/2023 90,000 USD 84,925 78,075 0.16DISH DBS Corp 5.875% 15/7/2022 240,000 USD 239,306 223,500 0.47DJO Finco Inc / DJO Finance LLC / DJO Finance Corp 8.125% 15/6/2021 '144A' 50,000 USD 51,587 44,750 0.09Dynegy Inc 6.75% 1/11/2019 50,000 USD 51,754 47,000 0.10Energy Transfer Partners LP 4.75% 15/1/2026 112,000 USD 111,229 94,032 0.20Energy Transfer Partners LP 4.9% 15/3/2035 70,000 USD 64,565 50,762 0.11
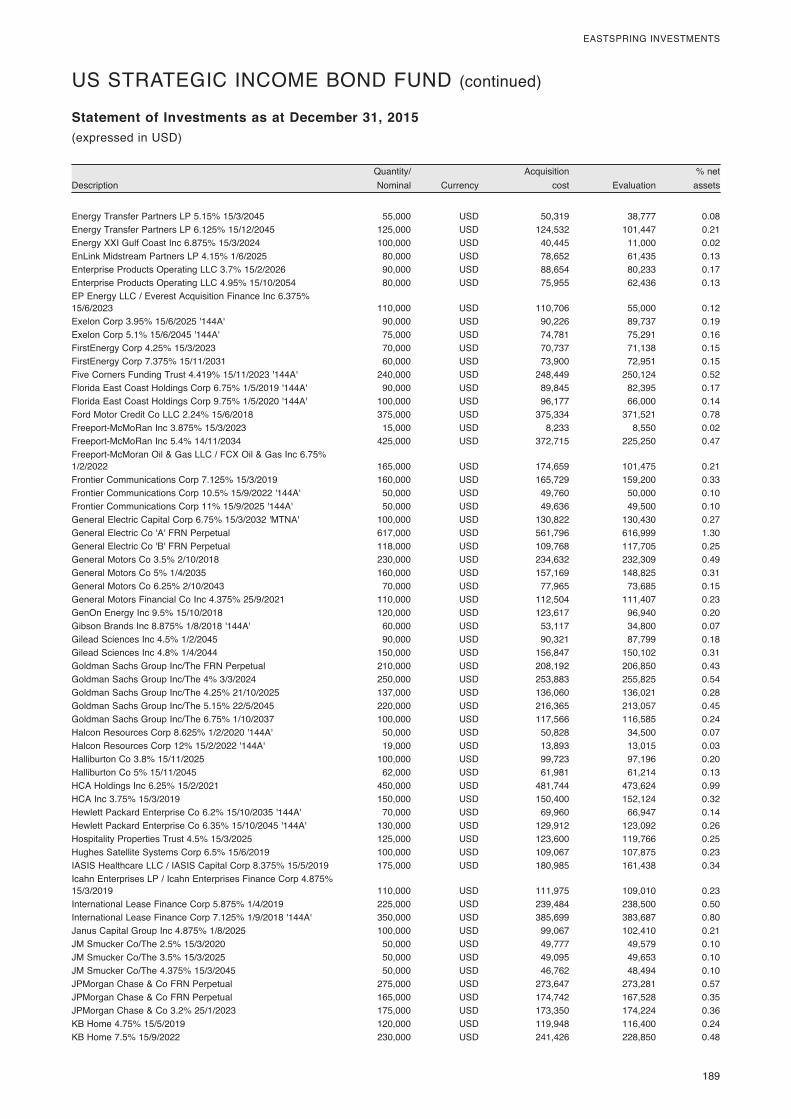
189
EASTSPRING INVESTMENTS
DescriptionQuantity/ Nominal Currency
Acquisition cost Evaluation
% net assets
Statement of Investments as at December 31, 2015(expressed in USD)
US STRATEGIC INCOME BOND FUND (continued)
Energy Transfer Partners LP 5.15% 15/3/2045 55,000 USD 50,319 38,777 0.08Energy Transfer Partners LP 6.125% 15/12/2045 125,000 USD 124,532 101,447 0.21Energy XXI Gulf Coast Inc 6.875% 15/3/2024 100,000 USD 40,445 11,000 0.02EnLink Midstream Partners LP 4.15% 1/6/2025 80,000 USD 78,652 61,435 0.13Enterprise Products Operating LLC 3.7% 15/2/2026 90,000 USD 88,654 80,233 0.17Enterprise Products Operating LLC 4.95% 15/10/2054 80,000 USD 75,955 62,436 0.13EP Energy LLC / Everest Acquisition Finance Inc 6.375% 15/6/2023 110,000 USD 110,706 55,000 0.12Exelon Corp 3.95% 15/6/2025 '144A' 90,000 USD 90,226 89,737 0.19Exelon Corp 5.1% 15/6/2045 '144A' 75,000 USD 74,781 75,291 0.16FirstEnergy Corp 4.25% 15/3/2023 70,000 USD 70,737 71,138 0.15FirstEnergy Corp 7.375% 15/11/2031 60,000 USD 73,900 72,951 0.15Five Corners Funding Trust 4.419% 15/11/2023 '144A' 240,000 USD 248,449 250,124 0.52Florida East Coast Holdings Corp 6.75% 1/5/2019 '144A' 90,000 USD 89,845 82,395 0.17Florida East Coast Holdings Corp 9.75% 1/5/2020 '144A' 100,000 USD 96,177 66,000 0.14Ford Motor Credit Co LLC 2.24% 15/6/2018 375,000 USD 375,334 371,521 0.78Freeport-McMoRan Inc 3.875% 15/3/2023 15,000 USD 8,233 8,550 0.02Freeport-McMoRan Inc 5.4% 14/11/2034 425,000 USD 372,715 225,250 0.47Freeport-McMoran Oil & Gas LLC / FCX Oil & Gas Inc 6.75% 1/2/2022 165,000 USD 174,659 101,475 0.21Frontier Communications Corp 7.125% 15/3/2019 160,000 USD 165,729 159,200 0.33Frontier Communications Corp 10.5% 15/9/2022 '144A' 50,000 USD 49,760 50,000 0.10Frontier Communications Corp 11% 15/9/2025 '144A' 50,000 USD 49,636 49,500 0.10General Electric Capital Corp 6.75% 15/3/2032 'MTNA' 100,000 USD 130,822 130,430 0.27General Electric Co 'A' FRN Perpetual 617,000 USD 561,796 616,999 1.30General Electric Co 'B' FRN Perpetual 118,000 USD 109,768 117,705 0.25General Motors Co 3.5% 2/10/2018 230,000 USD 234,632 232,309 0.49General Motors Co 5% 1/4/2035 160,000 USD 157,169 148,825 0.31General Motors Co 6.25% 2/10/2043 70,000 USD 77,965 73,685 0.15General Motors Financial Co Inc 4.375% 25/9/2021 110,000 USD 112,504 111,407 0.23GenOn Energy Inc 9.5% 15/10/2018 120,000 USD 123,617 96,940 0.20Gibson Brands Inc 8.875% 1/8/2018 '144A' 60,000 USD 53,117 34,800 0.07Gilead Sciences Inc 4.5% 1/2/2045 90,000 USD 90,321 87,799 0.18Gilead Sciences Inc 4.8% 1/4/2044 150,000 USD 156,847 150,102 0.31Goldman Sachs Group Inc/The FRN Perpetual 210,000 USD 208,192 206,850 0.43Goldman Sachs Group Inc/The 4% 3/3/2024 250,000 USD 253,883 255,825 0.54Goldman Sachs Group Inc/The 4.25% 21/10/2025 137,000 USD 136,060 136,021 0.28Goldman Sachs Group Inc/The 5.15% 22/5/2045 220,000 USD 216,365 213,057 0.45Goldman Sachs Group Inc/The 6.75% 1/10/2037 100,000 USD 117,566 116,585 0.24Halcon Resources Corp 8.625% 1/2/2020 '144A' 50,000 USD 50,828 34,500 0.07Halcon Resources Corp 12% 15/2/2022 '144A' 19,000 USD 13,893 13,015 0.03Halliburton Co 3.8% 15/11/2025 100,000 USD 99,723 97,196 0.20Halliburton Co 5% 15/11/2045 62,000 USD 61,981 61,214 0.13HCA Holdings Inc 6.25% 15/2/2021 450,000 USD 481,744 473,624 0.99HCA Inc 3.75% 15/3/2019 150,000 USD 150,400 152,124 0.32Hewlett Packard Enterprise Co 6.2% 15/10/2035 '144A' 70,000 USD 69,960 66,947 0.14Hewlett Packard Enterprise Co 6.35% 15/10/2045 '144A' 130,000 USD 129,912 123,092 0.26Hospitality Properties Trust 4.5% 15/3/2025 125,000 USD 123,600 119,766 0.25Hughes Satellite Systems Corp 6.5% 15/6/2019 100,000 USD 109,067 107,875 0.23IASIS Healthcare LLC / IASIS Capital Corp 8.375% 15/5/2019 175,000 USD 180,985 161,438 0.34Icahn Enterprises LP / Icahn Enterprises Finance Corp 4.875% 15/3/2019 110,000 USD 111,975 109,010 0.23International Lease Finance Corp 5.875% 1/4/2019 225,000 USD 239,484 238,500 0.50International Lease Finance Corp 7.125% 1/9/2018 '144A' 350,000 USD 385,699 383,687 0.80Janus Capital Group Inc 4.875% 1/8/2025 100,000 USD 99,067 102,410 0.21JM Smucker Co/The 2.5% 15/3/2020 50,000 USD 49,777 49,579 0.10JM Smucker Co/The 3.5% 15/3/2025 50,000 USD 49,095 49,653 0.10JM Smucker Co/The 4.375% 15/3/2045 50,000 USD 46,762 48,494 0.10JPMorgan Chase & Co FRN Perpetual 275,000 USD 273,647 273,281 0.57JPMorgan Chase & Co FRN Perpetual 165,000 USD 174,742 167,528 0.35JPMorgan Chase & Co 3.2% 25/1/2023 175,000 USD 173,350 174,224 0.36KB Home 4.75% 15/5/2019 120,000 USD 119,948 116,400 0.24KB Home 7.5% 15/9/2022 230,000 USD 241,426 228,850 0.48
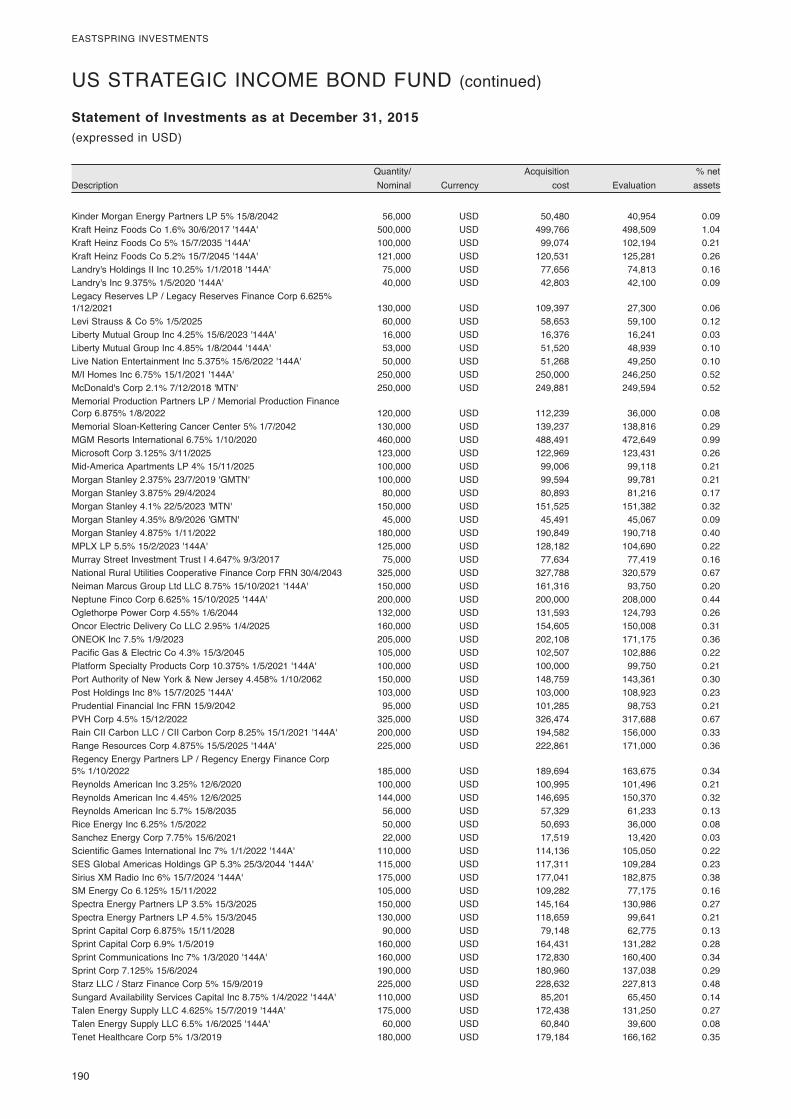
190
EASTSPRING INVESTMENTS
DescriptionQuantity/ Nominal Currency
Acquisition cost Evaluation
% net assets
Statement of Investments as at December 31, 2015(expressed in USD)
US STRATEGIC INCOME BOND FUND (continued)
Kinder Morgan Energy Partners LP 5% 15/8/2042 56,000 USD 50,480 40,954 0.09Kraft Heinz Foods Co 1.6% 30/6/2017 '144A' 500,000 USD 499,766 498,509 1.04Kraft Heinz Foods Co 5% 15/7/2035 '144A' 100,000 USD 99,074 102,194 0.21Kraft Heinz Foods Co 5.2% 15/7/2045 '144A' 121,000 USD 120,531 125,281 0.26Landry's Holdings II Inc 10.25% 1/1/2018 '144A' 75,000 USD 77,656 74,813 0.16Landry's Inc 9.375% 1/5/2020 '144A' 40,000 USD 42,803 42,100 0.09Legacy Reserves LP / Legacy Reserves Finance Corp 6.625% 1/12/2021 130,000 USD 109,397 27,300 0.06Levi Strauss & Co 5% 1/5/2025 60,000 USD 58,653 59,100 0.12Liberty Mutual Group Inc 4.25% 15/6/2023 '144A' 16,000 USD 16,376 16,241 0.03Liberty Mutual Group Inc 4.85% 1/8/2044 '144A' 53,000 USD 51,520 48,939 0.10Live Nation Entertainment Inc 5.375% 15/6/2022 '144A' 50,000 USD 51,268 49,250 0.10M/I Homes Inc 6.75% 15/1/2021 '144A' 250,000 USD 250,000 246,250 0.52McDonald's Corp 2.1% 7/12/2018 'MTN' 250,000 USD 249,881 249,594 0.52Memorial Production Partners LP / Memorial Production Finance Corp 6.875% 1/8/2022 120,000 USD 112,239 36,000 0.08Memorial Sloan-Kettering Cancer Center 5% 1/7/2042 130,000 USD 139,237 138,816 0.29MGM Resorts International 6.75% 1/10/2020 460,000 USD 488,491 472,649 0.99Microsoft Corp 3.125% 3/11/2025 123,000 USD 122,969 123,431 0.26Mid-America Apartments LP 4% 15/11/2025 100,000 USD 99,006 99,118 0.21Morgan Stanley 2.375% 23/7/2019 'GMTN' 100,000 USD 99,594 99,781 0.21Morgan Stanley 3.875% 29/4/2024 80,000 USD 80,893 81,216 0.17Morgan Stanley 4.1% 22/5/2023 'MTN' 150,000 USD 151,525 151,382 0.32Morgan Stanley 4.35% 8/9/2026 'GMTN' 45,000 USD 45,491 45,067 0.09Morgan Stanley 4.875% 1/11/2022 180,000 USD 190,849 190,718 0.40MPLX LP 5.5% 15/2/2023 '144A' 125,000 USD 128,182 104,690 0.22Murray Street Investment Trust I 4.647% 9/3/2017 75,000 USD 77,634 77,419 0.16National Rural Utilities Cooperative Finance Corp FRN 30/4/2043 325,000 USD 327,788 320,579 0.67Neiman Marcus Group Ltd LLC 8.75% 15/10/2021 '144A' 150,000 USD 161,316 93,750 0.20Neptune Finco Corp 6.625% 15/10/2025 '144A' 200,000 USD 200,000 208,000 0.44Oglethorpe Power Corp 4.55% 1/6/2044 132,000 USD 131,593 124,793 0.26Oncor Electric Delivery Co LLC 2.95% 1/4/2025 160,000 USD 154,605 150,008 0.31ONEOK Inc 7.5% 1/9/2023 205,000 USD 202,108 171,175 0.36Pacific Gas & Electric Co 4.3% 15/3/2045 105,000 USD 102,507 102,886 0.22Platform Specialty Products Corp 10.375% 1/5/2021 '144A' 100,000 USD 100,000 99,750 0.21Port Authority of New York & New Jersey 4.458% 1/10/2062 150,000 USD 148,759 143,361 0.30Post Holdings Inc 8% 15/7/2025 '144A' 103,000 USD 103,000 108,923 0.23Prudential Financial Inc FRN 15/9/2042 95,000 USD 101,285 98,753 0.21PVH Corp 4.5% 15/12/2022 325,000 USD 326,474 317,688 0.67Rain CII Carbon LLC / CII Carbon Corp 8.25% 15/1/2021 '144A' 200,000 USD 194,582 156,000 0.33Range Resources Corp 4.875% 15/5/2025 '144A' 225,000 USD 222,861 171,000 0.36Regency Energy Partners LP / Regency Energy Finance Corp 5% 1/10/2022 185,000 USD 189,694 163,675 0.34Reynolds American Inc 3.25% 12/6/2020 100,000 USD 100,995 101,496 0.21Reynolds American Inc 4.45% 12/6/2025 144,000 USD 146,695 150,370 0.32Reynolds American Inc 5.7% 15/8/2035 56,000 USD 57,329 61,233 0.13Rice Energy Inc 6.25% 1/5/2022 50,000 USD 50,693 36,000 0.08Sanchez Energy Corp 7.75% 15/6/2021 22,000 USD 17,519 13,420 0.03Scientific Games International Inc 7% 1/1/2022 '144A' 110,000 USD 114,136 105,050 0.22SES Global Americas Holdings GP 5.3% 25/3/2044 '144A' 115,000 USD 117,311 109,284 0.23Sirius XM Radio Inc 6% 15/7/2024 '144A' 175,000 USD 177,041 182,875 0.38SM Energy Co 6.125% 15/11/2022 105,000 USD 109,282 77,175 0.16Spectra Energy Partners LP 3.5% 15/3/2025 150,000 USD 145,164 130,986 0.27Spectra Energy Partners LP 4.5% 15/3/2045 130,000 USD 118,659 99,641 0.21Sprint Capital Corp 6.875% 15/11/2028 90,000 USD 79,148 62,775 0.13Sprint Capital Corp 6.9% 1/5/2019 160,000 USD 164,431 131,282 0.28Sprint Communications Inc 7% 1/3/2020 '144A' 160,000 USD 172,830 160,400 0.34Sprint Corp 7.125% 15/6/2024 190,000 USD 180,960 137,038 0.29Starz LLC / Starz Finance Corp 5% 15/9/2019 225,000 USD 228,632 227,813 0.48Sungard Availability Services Capital Inc 8.75% 1/4/2022 '144A' 110,000 USD 85,201 65,450 0.14Talen Energy Supply LLC 4.625% 15/7/2019 '144A' 175,000 USD 172,438 131,250 0.27Talen Energy Supply LLC 6.5% 1/6/2025 '144A' 60,000 USD 60,840 39,600 0.08Tenet Healthcare Corp 5% 1/3/2019 180,000 USD 179,184 166,162 0.35
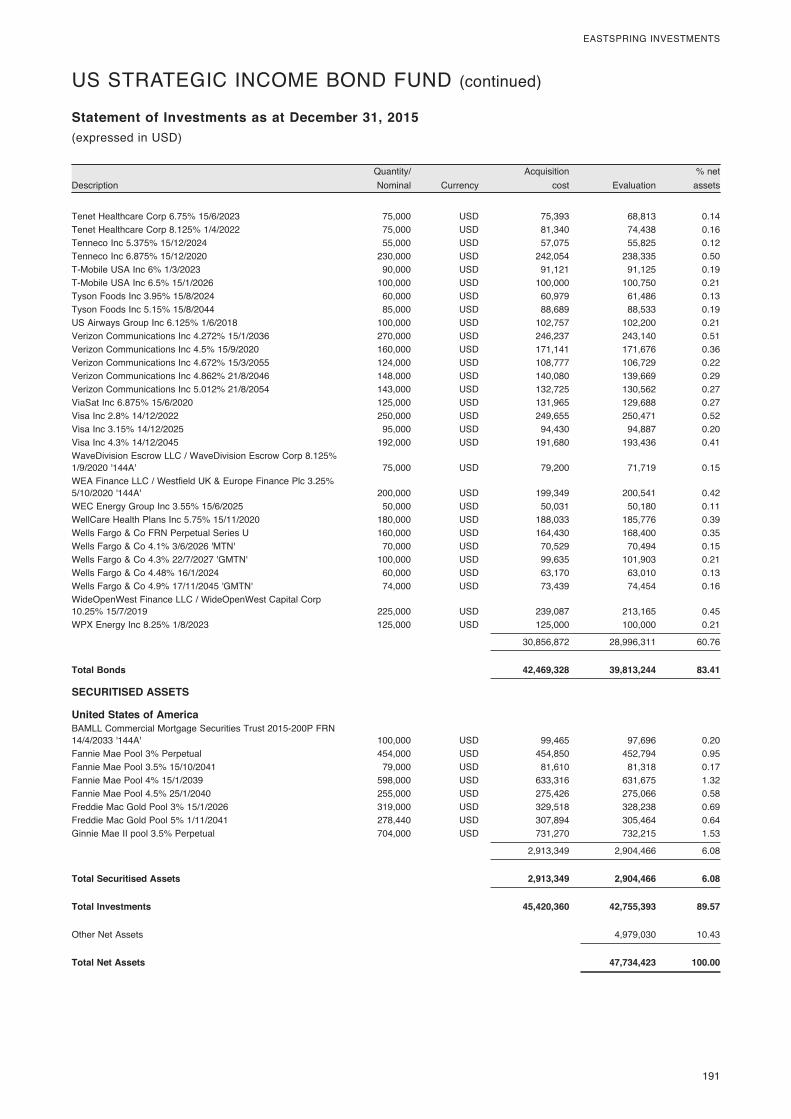
191
EASTSPRING INVESTMENTS
DescriptionQuantity/ Nominal Currency
Acquisition cost Evaluation
% net assets
Statement of Investments as at December 31, 2015(expressed in USD)
US STRATEGIC INCOME BOND FUND (continued)
Tenet Healthcare Corp 6.75% 15/6/2023 75,000 USD 75,393 68,813 0.14Tenet Healthcare Corp 8.125% 1/4/2022 75,000 USD 81,340 74,438 0.16Tenneco Inc 5.375% 15/12/2024 55,000 USD 57,075 55,825 0.12Tenneco Inc 6.875% 15/12/2020 230,000 USD 242,054 238,335 0.50T-Mobile USA Inc 6% 1/3/2023 90,000 USD 91,121 91,125 0.19T-Mobile USA Inc 6.5% 15/1/2026 100,000 USD 100,000 100,750 0.21Tyson Foods Inc 3.95% 15/8/2024 60,000 USD 60,979 61,486 0.13Tyson Foods Inc 5.15% 15/8/2044 85,000 USD 88,689 88,533 0.19US Airways Group Inc 6.125% 1/6/2018 100,000 USD 102,757 102,200 0.21Verizon Communications Inc 4.272% 15/1/2036 270,000 USD 246,237 243,140 0.51Verizon Communications Inc 4.5% 15/9/2020 160,000 USD 171,141 171,676 0.36Verizon Communications Inc 4.672% 15/3/2055 124,000 USD 108,777 106,729 0.22Verizon Communications Inc 4.862% 21/8/2046 148,000 USD 140,080 139,669 0.29Verizon Communications Inc 5.012% 21/8/2054 143,000 USD 132,725 130,562 0.27ViaSat Inc 6.875% 15/6/2020 125,000 USD 131,965 129,688 0.27Visa Inc 2.8% 14/12/2022 250,000 USD 249,655 250,471 0.52Visa Inc 3.15% 14/12/2025 95,000 USD 94,430 94,887 0.20Visa Inc 4.3% 14/12/2045 192,000 USD 191,680 193,436 0.41WaveDivision Escrow LLC / WaveDivision Escrow Corp 8.125% 1/9/2020 '144A' 75,000 USD 79,200 71,719 0.15WEA Finance LLC / Westfield UK & Europe Finance Plc 3.25% 5/10/2020 '144A' 200,000 USD 199,349 200,541 0.42WEC Energy Group Inc 3.55% 15/6/2025 50,000 USD 50,031 50,180 0.11WellCare Health Plans Inc 5.75% 15/11/2020 180,000 USD 188,033 185,776 0.39Wells Fargo & Co FRN Perpetual Series U 160,000 USD 164,430 168,400 0.35Wells Fargo & Co 4.1% 3/6/2026 'MTN' 70,000 USD 70,529 70,494 0.15Wells Fargo & Co 4.3% 22/7/2027 'GMTN' 100,000 USD 99,635 101,903 0.21Wells Fargo & Co 4.48% 16/1/2024 60,000 USD 63,170 63,010 0.13Wells Fargo & Co 4.9% 17/11/2045 'GMTN' 74,000 USD 73,439 74,454 0.16WideOpenWest Finance LLC / WideOpenWest Capital Corp 10.25% 15/7/2019 225,000 USD 239,087 213,165 0.45WPX Energy Inc 8.25% 1/8/2023 125,000 USD 125,000 100,000 0.21
30,856,872 28,996,311 60.76
Total Bonds 42,469,328 39,813,244 83.41
SECURITISED ASSETS
United States of America BAMLL Commercial Mortgage Securities Trust 2015-200P FRN 14/4/2033 '144A' 100,000 USD 99,465 97,696 0.20Fannie Mae Pool 3% Perpetual 454,000 USD 454,850 452,794 0.95Fannie Mae Pool 3.5% 15/10/2041 79,000 USD 81,610 81,318 0.17Fannie Mae Pool 4% 15/1/2039 598,000 USD 633,316 631,675 1.32Fannie Mae Pool 4.5% 25/1/2040 255,000 USD 275,426 275,066 0.58Freddie Mac Gold Pool 3% 15/1/2026 319,000 USD 329,518 328,238 0.69Freddie Mac Gold Pool 5% 1/11/2041 278,440 USD 307,894 305,464 0.64Ginnie Mae II pool 3.5% Perpetual 704,000 USD 731,270 732,215 1.53
2,913,349 2,904,466 6.08
Total Securitised Assets 2,913,349 2,904,466 6.08
Total Investments 45,420,360 42,755,393 89.57
Other Net Assets 4,979,030 10.43
Total Net Assets 47,734,423 100.00
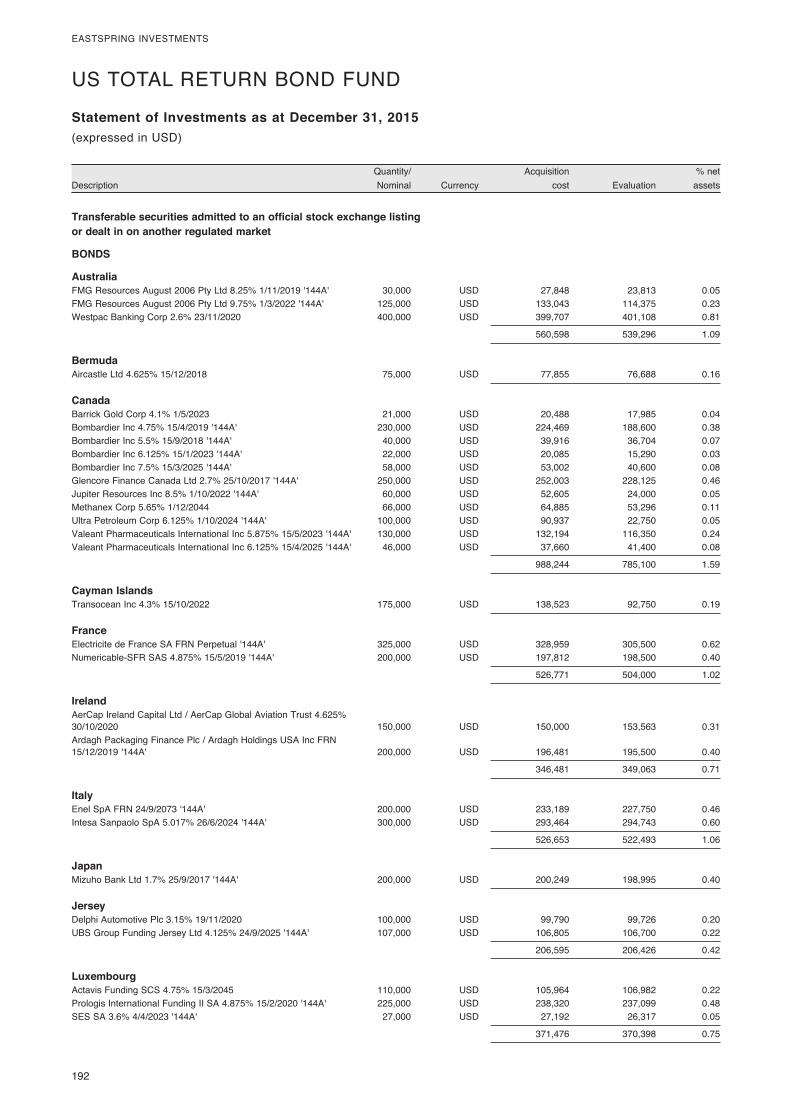
192
EASTSPRING INVESTMENTS
DescriptionQuantity/ Nominal Currency
Acquisition cost Evaluation
% net assets
Statement of Investments as at December 31, 2015
Transferable securities admitted to an official stock exchange listing or dealt in on another regulated market
BONDS
Australia FMG Resources August 2006 Pty Ltd 8.25% 1/11/2019 '144A' 30,000 USD 27,848 23,813 0.05FMG Resources August 2006 Pty Ltd 9.75% 1/3/2022 '144A' 125,000 USD 133,043 114,375 0.23Westpac Banking Corp 2.6% 23/11/2020 400,000 USD 399,707 401,108 0.81
560,598 539,296 1.09
Bermuda Aircastle Ltd 4.625% 15/12/2018 75,000 USD 77,855 76,688 0.16
Canada Barrick Gold Corp 4.1% 1/5/2023 21,000 USD 20,488 17,985 0.04Bombardier Inc 4.75% 15/4/2019 '144A' 230,000 USD 224,469 188,600 0.38Bombardier Inc 5.5% 15/9/2018 '144A' 40,000 USD 39,916 36,704 0.07Bombardier Inc 6.125% 15/1/2023 '144A' 22,000 USD 20,085 15,290 0.03Bombardier Inc 7.5% 15/3/2025 '144A' 58,000 USD 53,002 40,600 0.08Glencore Finance Canada Ltd 2.7% 25/10/2017 '144A' 250,000 USD 252,003 228,125 0.46Jupiter Resources Inc 8.5% 1/10/2022 '144A' 60,000 USD 52,605 24,000 0.05Methanex Corp 5.65% 1/12/2044 66,000 USD 64,885 53,296 0.11Ultra Petroleum Corp 6.125% 1/10/2024 '144A' 100,000 USD 90,937 22,750 0.05Valeant Pharmaceuticals International Inc 5.875% 15/5/2023 '144A' 130,000 USD 132,194 116,350 0.24Valeant Pharmaceuticals International Inc 6.125% 15/4/2025 '144A' 46,000 USD 37,660 41,400 0.08
988,244 785,100 1.59
Cayman Islands Transocean Inc 4.3% 15/10/2022 175,000 USD 138,523 92,750 0.19
France Electricite de France SA FRN Perpetual '144A' 325,000 USD 328,959 305,500 0.62Numericable-SFR SAS 4.875% 15/5/2019 '144A' 200,000 USD 197,812 198,500 0.40
526,771 504,000 1.02
Ireland AerCap Ireland Capital Ltd / AerCap Global Aviation Trust 4.625% 30/10/2020 150,000 USD 150,000 153,563 0.31Ardagh Packaging Finance Plc / Ardagh Holdings USA Inc FRN 15/12/2019 '144A' 200,000 USD 196,481 195,500 0.40
346,481 349,063 0.71
Italy Enel SpA FRN 24/9/2073 '144A' 200,000 USD 233,189 227,750 0.46Intesa Sanpaolo SpA 5.017% 26/6/2024 '144A' 300,000 USD 293,464 294,743 0.60
526,653 522,493 1.06
Japan Mizuho Bank Ltd 1.7% 25/9/2017 '144A' 200,000 USD 200,249 198,995 0.40
Jersey Delphi Automotive Plc 3.15% 19/11/2020 100,000 USD 99,790 99,726 0.20UBS Group Funding Jersey Ltd 4.125% 24/9/2025 '144A' 107,000 USD 106,805 106,700 0.22
206,595 206,426 0.42
Luxembourg Actavis Funding SCS 4.75% 15/3/2045 110,000 USD 105,964 106,982 0.22Prologis International Funding II SA 4.875% 15/2/2020 '144A' 225,000 USD 238,320 237,099 0.48SES SA 3.6% 4/4/2023 '144A' 27,000 USD 27,192 26,317 0.05
371,476 370,398 0.75
(expressed in USD)
US TOTAL RETURN BOND FUND

193
EASTSPRING INVESTMENTS
DescriptionQuantity/ Nominal Currency
Acquisition cost Evaluation
% net assets
Statement of Investments as at December 31, 2015(expressed in USD)
US TOTAL RETURN BOND FUND (continued)
Mexico Cemex SAB de CV 6.5% 10/12/2019 '144A' 300,000 USD 315,086 290,250 0.59Grupo Televisa SAB 6.125% 31/1/2046 200,000 USD 199,356 199,000 0.40
514,442 489,250 0.99
Netherlands ABN AMRO Bank NV 2.45% 4/6/2020 '144A' 281,000 USD 280,614 278,232 0.56Petrobras Global Finance BV 4.375% 20/5/2023 115,000 USD 101,876 75,900 0.15Schaeffler Finance BV 4.75% 15/5/2021 '144A' 200,000 USD 201,364 201,000 0.41Schaeffler Holding Finance BV 5.75% 15/11/2021 '144A' 120,000 EUR 143,045 139,143 0.28Shell International Finance BV 3.25% 11/5/2025 110,000 USD 109,501 107,155 0.22
836,400 801,430 1.62
Sweden Swedbank AB 2.2% 4/3/2020 '144A' 200,000 USD 198,350 197,381 0.40
Switzerland Credit Suisse AG 6.5% 8/8/2023 '144A' 340,000 USD 375,227 366,350 0.75Credit Suisse AG/New York NY 3.625% 9/9/2024 'MTN' 75,000 USD 74,740 75,451 0.15Credit Suisse Group AG FRN Perpetual '144A' 200,000 USD 208,760 209,822 0.42
658,727 651,623 1.32
United Kingdom Abbey National Treasury Services Plc/United Kingdom 4% 13/3/2024 140,000 USD 144,609 145,797 0.29Anglo American Capital Plc 3.625% 14/5/2020 '144A' 200,000 USD 199,754 142,000 0.29Barclays Bank Plc 3.75% 15/5/2024'BKNT' 50,000 USD 50,481 50,885 0.10Barclays Bank Plc 7.625% 21/11/2022 200,000 USD 227,070 227,749 0.46Barclays Plc FRN Perpetual 200,000 USD 211,517 212,662 0.43HSBC Holdings Plc FRN Perpetual 200,000 USD 199,556 200,250 0.41HSBC Holdings Plc FRN Perpetual 200,000 USD 201,457 199,750 0.40Invesco Finance Plc 3.125% 30/11/2022 75,000 USD 74,296 73,822 0.15Royal Bank of Scotland Group Plc FRN Perpetual 298,000 USD 298,000 310,292 0.63Royal Bank of Scotland Group Plc 6.125% 15/12/2022 385,000 USD 411,163 422,158 0.86Santander UK Plc 5% 7/11/2023 '144A' 200,000 USD 205,779 207,377 0.42Sky Plc 3.75% 16/9/2024 '144A' 240,000 USD 236,785 234,010 0.47
2,460,467 2,426,752 4.91
United States of America AbbVie Inc 2.9% 6/11/2022 70,000 USD 68,631 67,609 0.14AbbVie Inc 3.6% 14/5/2025 120,000 USD 118,859 118,521 0.24AbbVie Inc 4.7% 14/5/2045 60,000 USD 59,520 58,482 0.12Actavis Funding SCS 3.85% 15/6/2024 110,000 USD 108,572 110,026 0.22AIG SunAmerica Global Financing X 6.9% 15/3/2032 '144A' 100,000 USD 130,011 128,089 0.26Ally Financial Inc 5.75% 20/11/2025 250,000 USD 247,690 253,125 0.51American Airlines 2013-2 Class A Pass Through Trust 4.95% 15/1/2023 173,566 USD 184,143 183,112 0.37American Tower Trust I 3.07% 15/3/2048 '144A' 275,000 USD 268,436 268,619 0.54AT&T Inc 1.7% 1/6/2017 125,000 USD 125,360 125,311 0.25AT&T Inc 4.5% 15/5/2035 90,000 USD 84,049 83,026 0.17AT&T Inc 4.75% 15/5/2046 25,000 USD 22,974 22,828 0.05BAE Systems Holdings Inc 2.85% 15/12/2020 '144A' 94,000 USD 93,674 93,650 0.19Ball Corp 4.375% 15/12/2020 131,000 USD 131,000 134,684 0.27Bank of America Corp FRN Perpetual 135,000 USD 135,000 135,338 0.27Bank of America Corp 3.3% 11/1/2023 'MTN' 170,000 USD 167,817 167,327 0.34Bank of America Corp 3.95% 21/4/2025 130,000 USD 126,338 126,326 0.26Bank of America Corp 4.2% 26/8/2024 'MTN' 221,000 USD 220,877 219,748 0.44Becton Dickinson and Co 3.734% 15/12/2024 50,000 USD 49,970 50,347 0.10Becton Dickinson and Co 4.685% 15/12/2044 50,000 USD 49,106 50,323 0.10BlackRock Inc 3.375% 1/6/2022 50,000 USD 51,446 51,619 0.10
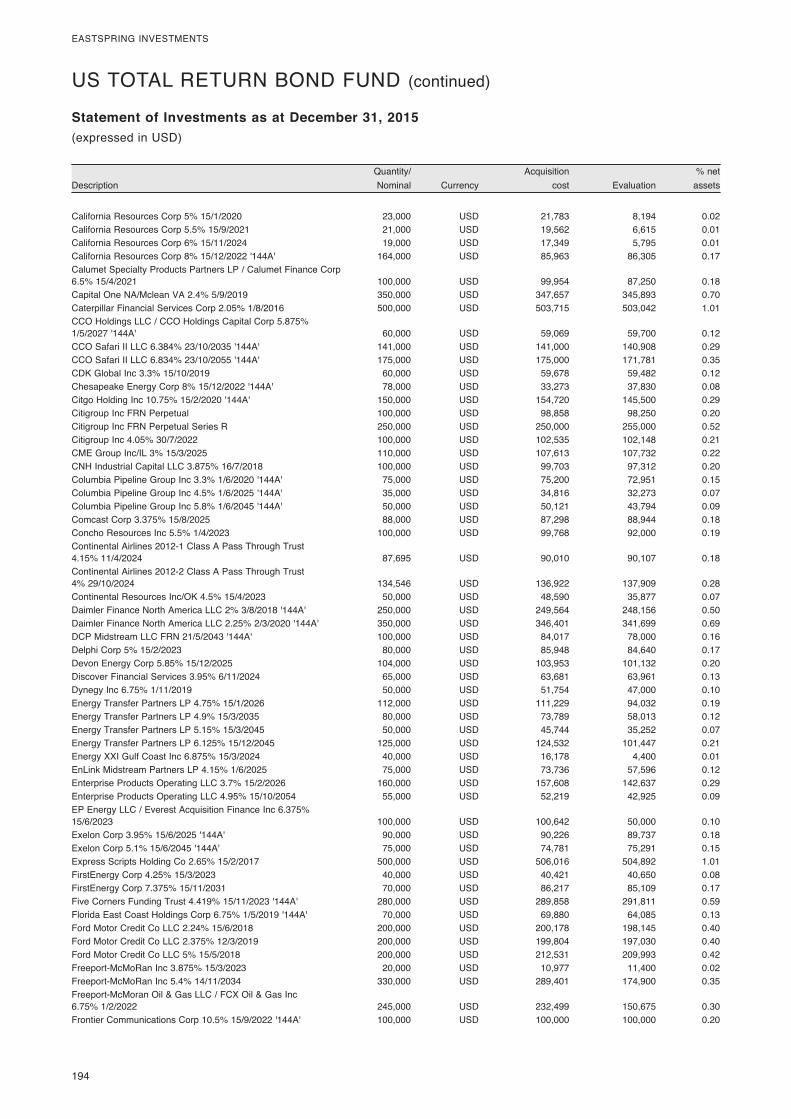
194
EASTSPRING INVESTMENTS
DescriptionQuantity/ Nominal Currency
Acquisition cost Evaluation
% net assets
Statement of Investments as at December 31, 2015(expressed in USD)
US TOTAL RETURN BOND FUND (continued)
California Resources Corp 5% 15/1/2020 23,000 USD 21,783 8,194 0.02California Resources Corp 5.5% 15/9/2021 21,000 USD 19,562 6,615 0.01California Resources Corp 6% 15/11/2024 19,000 USD 17,349 5,795 0.01California Resources Corp 8% 15/12/2022 '144A' 164,000 USD 85,963 86,305 0.17Calumet Specialty Products Partners LP / Calumet Finance Corp 6.5% 15/4/2021 100,000 USD 99,954 87,250 0.18Capital One NA/Mclean VA 2.4% 5/9/2019 350,000 USD 347,657 345,893 0.70Caterpillar Financial Services Corp 2.05% 1/8/2016 500,000 USD 503,715 503,042 1.01CCO Holdings LLC / CCO Holdings Capital Corp 5.875% 1/5/2027 '144A' 60,000 USD 59,069 59,700 0.12CCO Safari II LLC 6.384% 23/10/2035 '144A' 141,000 USD 141,000 140,908 0.29CCO Safari II LLC 6.834% 23/10/2055 '144A' 175,000 USD 175,000 171,781 0.35CDK Global Inc 3.3% 15/10/2019 60,000 USD 59,678 59,482 0.12Chesapeake Energy Corp 8% 15/12/2022 '144A' 78,000 USD 33,273 37,830 0.08Citgo Holding Inc 10.75% 15/2/2020 '144A' 150,000 USD 154,720 145,500 0.29Citigroup Inc FRN Perpetual 100,000 USD 98,858 98,250 0.20Citigroup Inc FRN Perpetual Series R 250,000 USD 250,000 255,000 0.52Citigroup Inc 4.05% 30/7/2022 100,000 USD 102,535 102,148 0.21CME Group Inc/IL 3% 15/3/2025 110,000 USD 107,613 107,732 0.22CNH Industrial Capital LLC 3.875% 16/7/2018 100,000 USD 99,703 97,312 0.20Columbia Pipeline Group Inc 3.3% 1/6/2020 '144A' 75,000 USD 75,200 72,951 0.15Columbia Pipeline Group Inc 4.5% 1/6/2025 '144A' 35,000 USD 34,816 32,273 0.07Columbia Pipeline Group Inc 5.8% 1/6/2045 '144A' 50,000 USD 50,121 43,794 0.09Comcast Corp 3.375% 15/8/2025 88,000 USD 87,298 88,944 0.18Concho Resources Inc 5.5% 1/4/2023 100,000 USD 99,768 92,000 0.19Continental Airlines 2012-1 Class A Pass Through Trust 4.15% 11/4/2024 87,695 USD 90,010 90,107 0.18Continental Airlines 2012-2 Class A Pass Through Trust 4% 29/10/2024 134,546 USD 136,922 137,909 0.28Continental Resources Inc/OK 4.5% 15/4/2023 50,000 USD 48,590 35,877 0.07Daimler Finance North America LLC 2% 3/8/2018 '144A' 250,000 USD 249,564 248,156 0.50Daimler Finance North America LLC 2.25% 2/3/2020 '144A' 350,000 USD 346,401 341,699 0.69DCP Midstream LLC FRN 21/5/2043 '144A' 100,000 USD 84,017 78,000 0.16Delphi Corp 5% 15/2/2023 80,000 USD 85,948 84,640 0.17Devon Energy Corp 5.85% 15/12/2025 104,000 USD 103,953 101,132 0.20Discover Financial Services 3.95% 6/11/2024 65,000 USD 63,681 63,961 0.13Dynegy Inc 6.75% 1/11/2019 50,000 USD 51,754 47,000 0.10Energy Transfer Partners LP 4.75% 15/1/2026 112,000 USD 111,229 94,032 0.19Energy Transfer Partners LP 4.9% 15/3/2035 80,000 USD 73,789 58,013 0.12Energy Transfer Partners LP 5.15% 15/3/2045 50,000 USD 45,744 35,252 0.07Energy Transfer Partners LP 6.125% 15/12/2045 125,000 USD 124,532 101,447 0.21Energy XXI Gulf Coast Inc 6.875% 15/3/2024 40,000 USD 16,178 4,400 0.01EnLink Midstream Partners LP 4.15% 1/6/2025 75,000 USD 73,736 57,596 0.12Enterprise Products Operating LLC 3.7% 15/2/2026 160,000 USD 157,608 142,637 0.29Enterprise Products Operating LLC 4.95% 15/10/2054 55,000 USD 52,219 42,925 0.09EP Energy LLC / Everest Acquisition Finance Inc 6.375% 15/6/2023 100,000 USD 100,642 50,000 0.10Exelon Corp 3.95% 15/6/2025 '144A' 90,000 USD 90,226 89,737 0.18Exelon Corp 5.1% 15/6/2045 '144A' 75,000 USD 74,781 75,291 0.15Express Scripts Holding Co 2.65% 15/2/2017 500,000 USD 506,016 504,892 1.01FirstEnergy Corp 4.25% 15/3/2023 40,000 USD 40,421 40,650 0.08FirstEnergy Corp 7.375% 15/11/2031 70,000 USD 86,217 85,109 0.17Five Corners Funding Trust 4.419% 15/11/2023 '144A' 280,000 USD 289,858 291,811 0.59Florida East Coast Holdings Corp 6.75% 1/5/2019 '144A' 70,000 USD 69,880 64,085 0.13Ford Motor Credit Co LLC 2.24% 15/6/2018 200,000 USD 200,178 198,145 0.40Ford Motor Credit Co LLC 2.375% 12/3/2019 200,000 USD 199,804 197,030 0.40Ford Motor Credit Co LLC 5% 15/5/2018 200,000 USD 212,531 209,993 0.42Freeport-McMoRan Inc 3.875% 15/3/2023 20,000 USD 10,977 11,400 0.02Freeport-McMoRan Inc 5.4% 14/11/2034 330,000 USD 289,401 174,900 0.35Freeport-McMoran Oil & Gas LLC / FCX Oil & Gas Inc 6.75% 1/2/2022 245,000 USD 232,499 150,675 0.30Frontier Communications Corp 10.5% 15/9/2022 '144A' 100,000 USD 100,000 100,000 0.20
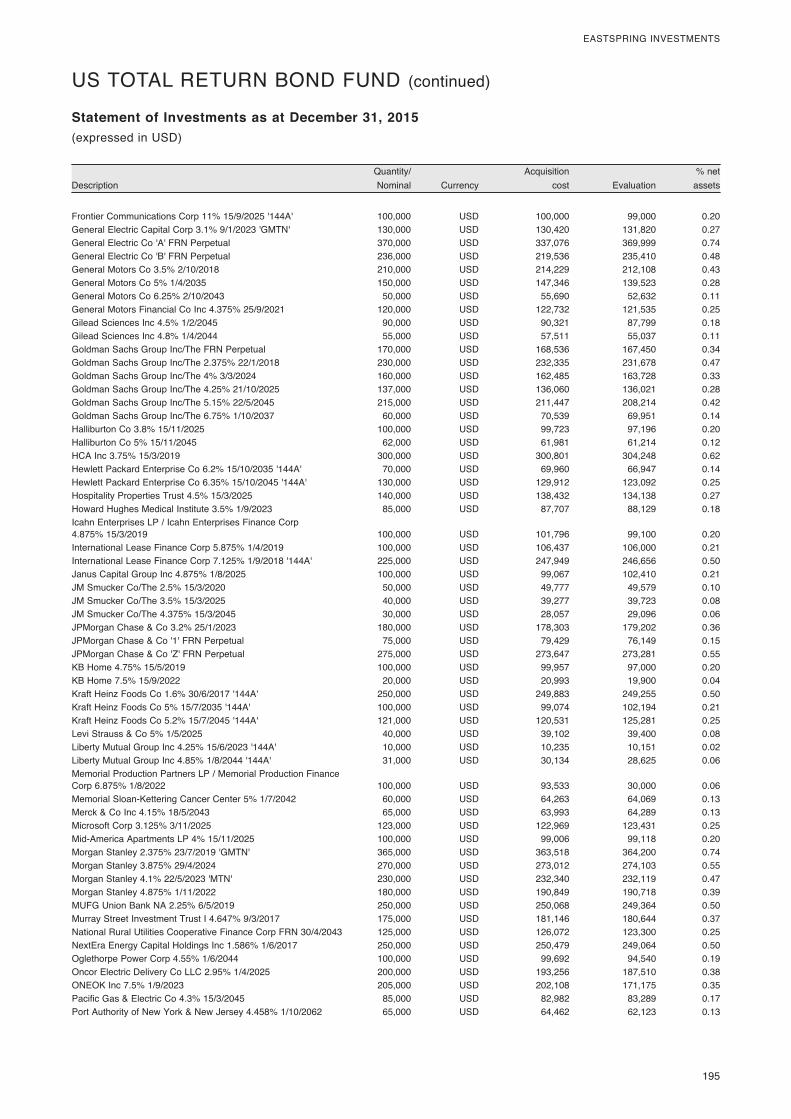
195
EASTSPRING INVESTMENTS
DescriptionQuantity/ Nominal Currency
Acquisition cost Evaluation
% net assets
Statement of Investments as at December 31, 2015(expressed in USD)
US TOTAL RETURN BOND FUND (continued)
Frontier Communications Corp 11% 15/9/2025 '144A' 100,000 USD 100,000 99,000 0.20General Electric Capital Corp 3.1% 9/1/2023 'GMTN' 130,000 USD 130,420 131,820 0.27General Electric Co 'A' FRN Perpetual 370,000 USD 337,076 369,999 0.74General Electric Co 'B' FRN Perpetual 236,000 USD 219,536 235,410 0.48General Motors Co 3.5% 2/10/2018 210,000 USD 214,229 212,108 0.43General Motors Co 5% 1/4/2035 150,000 USD 147,346 139,523 0.28General Motors Co 6.25% 2/10/2043 50,000 USD 55,690 52,632 0.11General Motors Financial Co Inc 4.375% 25/9/2021 120,000 USD 122,732 121,535 0.25Gilead Sciences Inc 4.5% 1/2/2045 90,000 USD 90,321 87,799 0.18Gilead Sciences Inc 4.8% 1/4/2044 55,000 USD 57,511 55,037 0.11Goldman Sachs Group Inc/The FRN Perpetual 170,000 USD 168,536 167,450 0.34Goldman Sachs Group Inc/The 2.375% 22/1/2018 230,000 USD 232,335 231,678 0.47Goldman Sachs Group Inc/The 4% 3/3/2024 160,000 USD 162,485 163,728 0.33Goldman Sachs Group Inc/The 4.25% 21/10/2025 137,000 USD 136,060 136,021 0.28Goldman Sachs Group Inc/The 5.15% 22/5/2045 215,000 USD 211,447 208,214 0.42Goldman Sachs Group Inc/The 6.75% 1/10/2037 60,000 USD 70,539 69,951 0.14Halliburton Co 3.8% 15/11/2025 100,000 USD 99,723 97,196 0.20Halliburton Co 5% 15/11/2045 62,000 USD 61,981 61,214 0.12HCA Inc 3.75% 15/3/2019 300,000 USD 300,801 304,248 0.62Hewlett Packard Enterprise Co 6.2% 15/10/2035 '144A' 70,000 USD 69,960 66,947 0.14Hewlett Packard Enterprise Co 6.35% 15/10/2045 '144A' 130,000 USD 129,912 123,092 0.25Hospitality Properties Trust 4.5% 15/3/2025 140,000 USD 138,432 134,138 0.27Howard Hughes Medical Institute 3.5% 1/9/2023 85,000 USD 87,707 88,129 0.18Icahn Enterprises LP / Icahn Enterprises Finance Corp 4.875% 15/3/2019 100,000 USD 101,796 99,100 0.20International Lease Finance Corp 5.875% 1/4/2019 100,000 USD 106,437 106,000 0.21International Lease Finance Corp 7.125% 1/9/2018 '144A' 225,000 USD 247,949 246,656 0.50Janus Capital Group Inc 4.875% 1/8/2025 100,000 USD 99,067 102,410 0.21JM Smucker Co/The 2.5% 15/3/2020 50,000 USD 49,777 49,579 0.10JM Smucker Co/The 3.5% 15/3/2025 40,000 USD 39,277 39,723 0.08JM Smucker Co/The 4.375% 15/3/2045 30,000 USD 28,057 29,096 0.06JPMorgan Chase & Co 3.2% 25/1/2023 180,000 USD 178,303 179,202 0.36JPMorgan Chase & Co '1' FRN Perpetual 75,000 USD 79,429 76,149 0.15JPMorgan Chase & Co 'Z' FRN Perpetual 275,000 USD 273,647 273,281 0.55KB Home 4.75% 15/5/2019 100,000 USD 99,957 97,000 0.20KB Home 7.5% 15/9/2022 20,000 USD 20,993 19,900 0.04Kraft Heinz Foods Co 1.6% 30/6/2017 '144A' 250,000 USD 249,883 249,255 0.50Kraft Heinz Foods Co 5% 15/7/2035 '144A' 100,000 USD 99,074 102,194 0.21Kraft Heinz Foods Co 5.2% 15/7/2045 '144A' 121,000 USD 120,531 125,281 0.25Levi Strauss & Co 5% 1/5/2025 40,000 USD 39,102 39,400 0.08Liberty Mutual Group Inc 4.25% 15/6/2023 '144A' 10,000 USD 10,235 10,151 0.02Liberty Mutual Group Inc 4.85% 1/8/2044 '144A' 31,000 USD 30,134 28,625 0.06Memorial Production Partners LP / Memorial Production Finance Corp 6.875% 1/8/2022 100,000 USD 93,533 30,000 0.06Memorial Sloan-Kettering Cancer Center 5% 1/7/2042 60,000 USD 64,263 64,069 0.13Merck & Co Inc 4.15% 18/5/2043 65,000 USD 63,993 64,289 0.13Microsoft Corp 3.125% 3/11/2025 123,000 USD 122,969 123,431 0.25Mid-America Apartments LP 4% 15/11/2025 100,000 USD 99,006 99,118 0.20Morgan Stanley 2.375% 23/7/2019 'GMTN' 365,000 USD 363,518 364,200 0.74Morgan Stanley 3.875% 29/4/2024 270,000 USD 273,012 274,103 0.55Morgan Stanley 4.1% 22/5/2023 'MTN' 230,000 USD 232,340 232,119 0.47Morgan Stanley 4.875% 1/11/2022 180,000 USD 190,849 190,718 0.39MUFG Union Bank NA 2.25% 6/5/2019 250,000 USD 250,068 249,364 0.50Murray Street Investment Trust I 4.647% 9/3/2017 175,000 USD 181,146 180,644 0.37National Rural Utilities Cooperative Finance Corp FRN 30/4/2043 125,000 USD 126,072 123,300 0.25NextEra Energy Capital Holdings Inc 1.586% 1/6/2017 250,000 USD 250,479 249,064 0.50Oglethorpe Power Corp 4.55% 1/6/2044 100,000 USD 99,692 94,540 0.19Oncor Electric Delivery Co LLC 2.95% 1/4/2025 200,000 USD 193,256 187,510 0.38ONEOK Inc 7.5% 1/9/2023 205,000 USD 202,108 171,175 0.35Pacific Gas & Electric Co 4.3% 15/3/2045 85,000 USD 82,982 83,289 0.17Port Authority of New York & New Jersey 4.458% 1/10/2062 65,000 USD 64,462 62,123 0.13
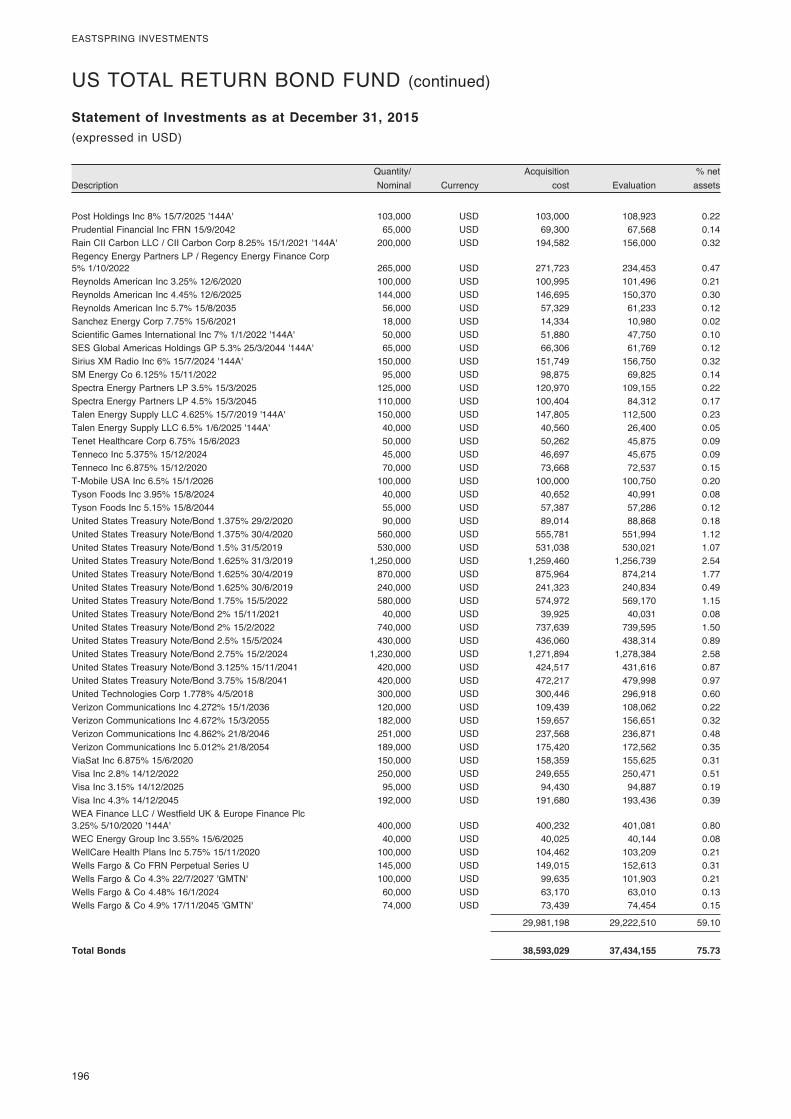
196
EASTSPRING INVESTMENTS
DescriptionQuantity/ Nominal Currency
Acquisition cost Evaluation
% net assets
Statement of Investments as at December 31, 2015(expressed in USD)
US TOTAL RETURN BOND FUND (continued)
Post Holdings Inc 8% 15/7/2025 '144A' 103,000 USD 103,000 108,923 0.22Prudential Financial Inc FRN 15/9/2042 65,000 USD 69,300 67,568 0.14Rain CII Carbon LLC / CII Carbon Corp 8.25% 15/1/2021 '144A' 200,000 USD 194,582 156,000 0.32Regency Energy Partners LP / Regency Energy Finance Corp 5% 1/10/2022 265,000 USD 271,723 234,453 0.47Reynolds American Inc 3.25% 12/6/2020 100,000 USD 100,995 101,496 0.21Reynolds American Inc 4.45% 12/6/2025 144,000 USD 146,695 150,370 0.30Reynolds American Inc 5.7% 15/8/2035 56,000 USD 57,329 61,233 0.12Sanchez Energy Corp 7.75% 15/6/2021 18,000 USD 14,334 10,980 0.02Scientific Games International Inc 7% 1/1/2022 '144A' 50,000 USD 51,880 47,750 0.10SES Global Americas Holdings GP 5.3% 25/3/2044 '144A' 65,000 USD 66,306 61,769 0.12Sirius XM Radio Inc 6% 15/7/2024 '144A' 150,000 USD 151,749 156,750 0.32SM Energy Co 6.125% 15/11/2022 95,000 USD 98,875 69,825 0.14Spectra Energy Partners LP 3.5% 15/3/2025 125,000 USD 120,970 109,155 0.22Spectra Energy Partners LP 4.5% 15/3/2045 110,000 USD 100,404 84,312 0.17Talen Energy Supply LLC 4.625% 15/7/2019 '144A' 150,000 USD 147,805 112,500 0.23Talen Energy Supply LLC 6.5% 1/6/2025 '144A' 40,000 USD 40,560 26,400 0.05Tenet Healthcare Corp 6.75% 15/6/2023 50,000 USD 50,262 45,875 0.09Tenneco Inc 5.375% 15/12/2024 45,000 USD 46,697 45,675 0.09Tenneco Inc 6.875% 15/12/2020 70,000 USD 73,668 72,537 0.15T-Mobile USA Inc 6.5% 15/1/2026 100,000 USD 100,000 100,750 0.20Tyson Foods Inc 3.95% 15/8/2024 40,000 USD 40,652 40,991 0.08Tyson Foods Inc 5.15% 15/8/2044 55,000 USD 57,387 57,286 0.12United States Treasury Note/Bond 1.375% 29/2/2020 90,000 USD 89,014 88,868 0.18United States Treasury Note/Bond 1.375% 30/4/2020 560,000 USD 555,781 551,994 1.12United States Treasury Note/Bond 1.5% 31/5/2019 530,000 USD 531,038 530,021 1.07United States Treasury Note/Bond 1.625% 31/3/2019 1,250,000 USD 1,259,460 1,256,739 2.54United States Treasury Note/Bond 1.625% 30/4/2019 870,000 USD 875,964 874,214 1.77United States Treasury Note/Bond 1.625% 30/6/2019 240,000 USD 241,323 240,834 0.49United States Treasury Note/Bond 1.75% 15/5/2022 580,000 USD 574,972 569,170 1.15United States Treasury Note/Bond 2% 15/11/2021 40,000 USD 39,925 40,031 0.08United States Treasury Note/Bond 2% 15/2/2022 740,000 USD 737,639 739,595 1.50United States Treasury Note/Bond 2.5% 15/5/2024 430,000 USD 436,060 438,314 0.89United States Treasury Note/Bond 2.75% 15/2/2024 1,230,000 USD 1,271,894 1,278,384 2.58United States Treasury Note/Bond 3.125% 15/11/2041 420,000 USD 424,517 431,616 0.87United States Treasury Note/Bond 3.75% 15/8/2041 420,000 USD 472,217 479,998 0.97United Technologies Corp 1.778% 4/5/2018 300,000 USD 300,446 296,918 0.60Verizon Communications Inc 4.272% 15/1/2036 120,000 USD 109,439 108,062 0.22Verizon Communications Inc 4.672% 15/3/2055 182,000 USD 159,657 156,651 0.32Verizon Communications Inc 4.862% 21/8/2046 251,000 USD 237,568 236,871 0.48Verizon Communications Inc 5.012% 21/8/2054 189,000 USD 175,420 172,562 0.35ViaSat Inc 6.875% 15/6/2020 150,000 USD 158,359 155,625 0.31Visa Inc 2.8% 14/12/2022 250,000 USD 249,655 250,471 0.51Visa Inc 3.15% 14/12/2025 95,000 USD 94,430 94,887 0.19Visa Inc 4.3% 14/12/2045 192,000 USD 191,680 193,436 0.39WEA Finance LLC / Westfield UK & Europe Finance Plc 3.25% 5/10/2020 '144A' 400,000 USD 400,232 401,081 0.80WEC Energy Group Inc 3.55% 15/6/2025 40,000 USD 40,025 40,144 0.08WellCare Health Plans Inc 5.75% 15/11/2020 100,000 USD 104,462 103,209 0.21Wells Fargo & Co FRN Perpetual Series U 145,000 USD 149,015 152,613 0.31Wells Fargo & Co 4.3% 22/7/2027 'GMTN' 100,000 USD 99,635 101,903 0.21Wells Fargo & Co 4.48% 16/1/2024 60,000 USD 63,170 63,010 0.13Wells Fargo & Co 4.9% 17/11/2045 'GMTN' 74,000 USD 73,439 74,454 0.15
29,981,198 29,222,510 59.10
Total Bonds 38,593,029 37,434,155 75.73
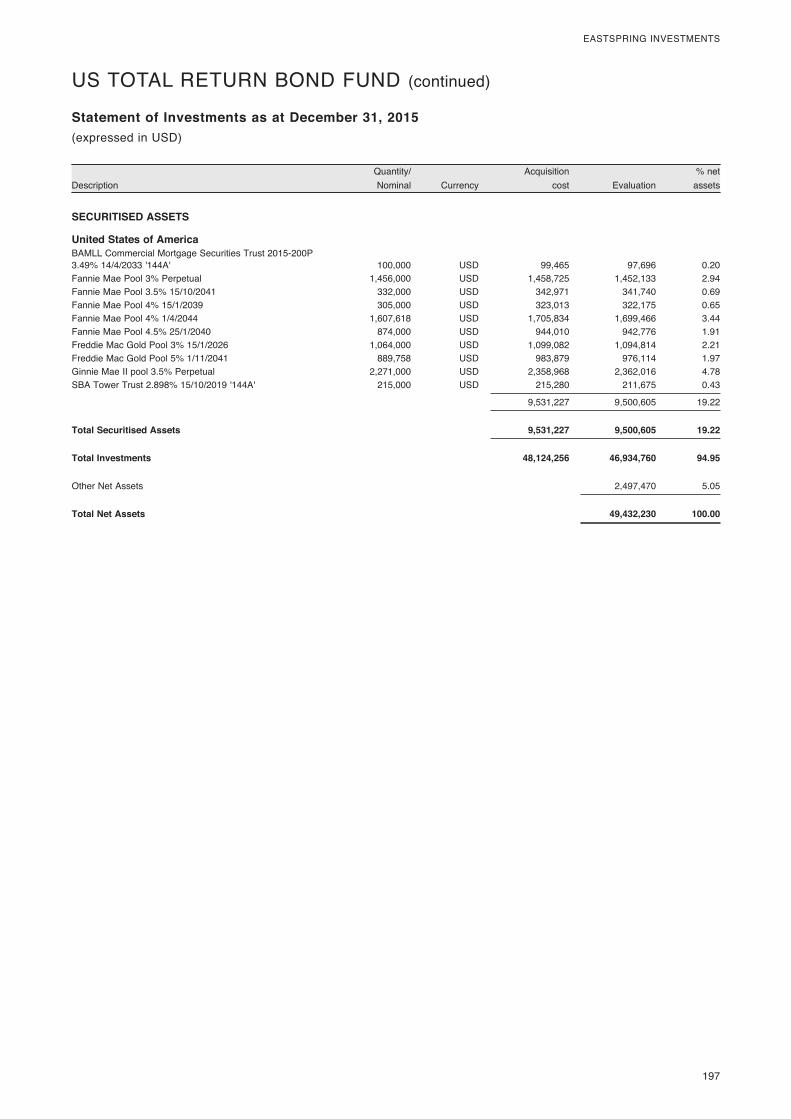
197
EASTSPRING INVESTMENTS
DescriptionQuantity/ Nominal Currency
Acquisition cost Evaluation
% net assets
Statement of Investments as at December 31, 2015(expressed in USD)
US TOTAL RETURN BOND FUND (continued)
SECURITISED ASSETS
United States of America BAMLL Commercial Mortgage Securities Trust 2015-200P 3.49% 14/4/2033 '144A' 100,000 USD 99,465 97,696 0.20Fannie Mae Pool 3% Perpetual 1,456,000 USD 1,458,725 1,452,133 2.94Fannie Mae Pool 3.5% 15/10/2041 332,000 USD 342,971 341,740 0.69Fannie Mae Pool 4% 15/1/2039 305,000 USD 323,013 322,175 0.65Fannie Mae Pool 4% 1/4/2044 1,607,618 USD 1,705,834 1,699,466 3.44Fannie Mae Pool 4.5% 25/1/2040 874,000 USD 944,010 942,776 1.91Freddie Mac Gold Pool 3% 15/1/2026 1,064,000 USD 1,099,082 1,094,814 2.21Freddie Mac Gold Pool 5% 1/11/2041 889,758 USD 983,879 976,114 1.97Ginnie Mae II pool 3.5% Perpetual 2,271,000 USD 2,358,968 2,362,016 4.78SBA Tower Trust 2.898% 15/10/2019 '144A' 215,000 USD 215,280 211,675 0.43
9,531,227 9,500,605 19.22
Total Securitised Assets 9,531,227 9,500,605 19.22
Total Investments 48,124,256 46,934,760 94.95
Other Net Assets 2,497,470 5.05
Total Net Assets 49,432,230 100.00
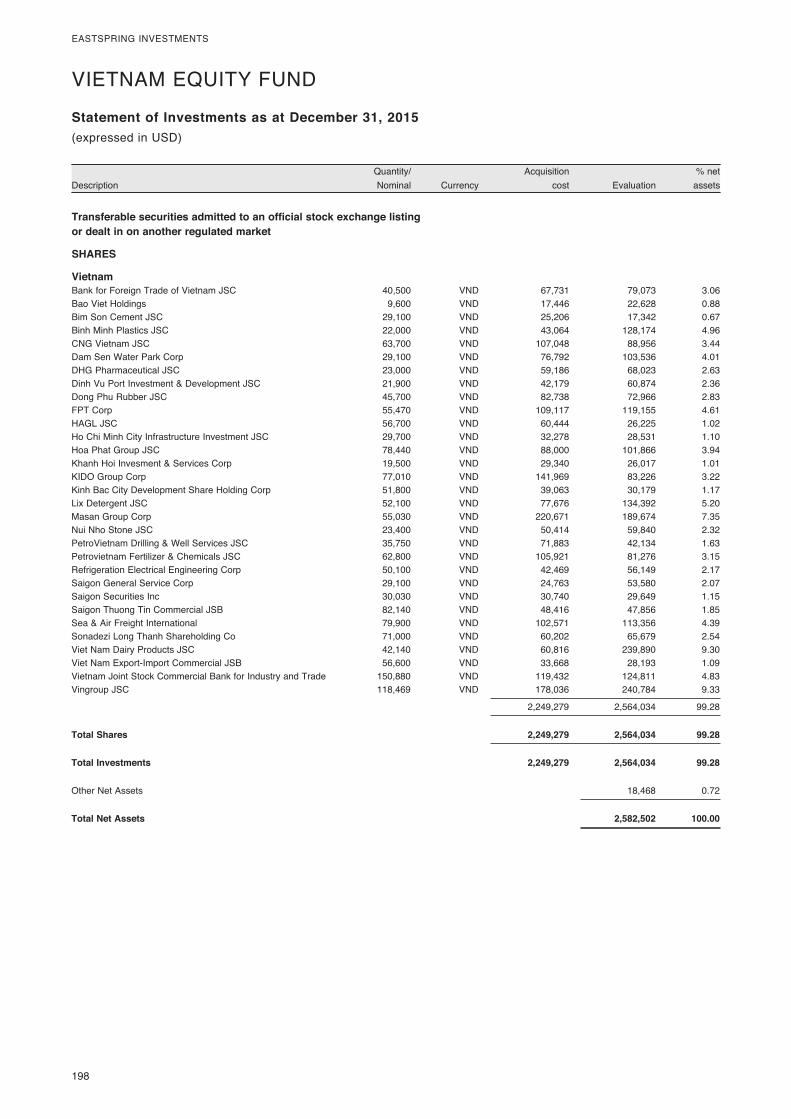
198
EASTSPRING INVESTMENTS
DescriptionQuantity/ Nominal Currency
Acquisition cost Evaluation
% net assets
Statement of Investments as at December 31, 2015
Transferable securities admitted to an official stock exchange listing or dealt in on another regulated market
SHARES
Vietnam Bank for Foreign Trade of Vietnam JSC 40,500 VND 67,731 79,073 3.06Bao Viet Holdings 9,600 VND 17,446 22,628 0.88Bim Son Cement JSC 29,100 VND 25,206 17,342 0.67Binh Minh Plastics JSC 22,000 VND 43,064 128,174 4.96CNG Vietnam JSC 63,700 VND 107,048 88,956 3.44Dam Sen Water Park Corp 29,100 VND 76,792 103,536 4.01DHG Pharmaceutical JSC 23,000 VND 59,186 68,023 2.63Dinh Vu Port Investment & Development JSC 21,900 VND 42,179 60,874 2.36Dong Phu Rubber JSC 45,700 VND 82,738 72,966 2.83FPT Corp 55,470 VND 109,117 119,155 4.61HAGL JSC 56,700 VND 60,444 26,225 1.02Ho Chi Minh City Infrastructure Investment JSC 29,700 VND 32,278 28,531 1.10Hoa Phat Group JSC 78,440 VND 88,000 101,866 3.94Khanh Hoi Invesment & Services Corp 19,500 VND 29,340 26,017 1.01KIDO Group Corp 77,010 VND 141,969 83,226 3.22Kinh Bac City Development Share Holding Corp 51,800 VND 39,063 30,179 1.17Lix Detergent JSC 52,100 VND 77,676 134,392 5.20Masan Group Corp 55,030 VND 220,671 189,674 7.35Nui Nho Stone JSC 23,400 VND 50,414 59,840 2.32PetroVietnam Drilling & Well Services JSC 35,750 VND 71,883 42,134 1.63Petrovietnam Fertilizer & Chemicals JSC 62,800 VND 105,921 81,276 3.15Refrigeration Electrical Engineering Corp 50,100 VND 42,469 56,149 2.17Saigon General Service Corp 29,100 VND 24,763 53,580 2.07Saigon Securities Inc 30,030 VND 30,740 29,649 1.15Saigon Thuong Tin Commercial JSB 82,140 VND 48,416 47,856 1.85Sea & Air Freight International 79,900 VND 102,571 113,356 4.39Sonadezi Long Thanh Shareholding Co 71,000 VND 60,202 65,679 2.54Viet Nam Dairy Products JSC 42,140 VND 60,816 239,890 9.30Viet Nam Export-Import Commercial JSB 56,600 VND 33,668 28,193 1.09Vietnam Joint Stock Commercial Bank for Industry and Trade 150,880 VND 119,432 124,811 4.83Vingroup JSC 118,469 VND 178,036 240,784 9.33
2,249,279 2,564,034 99.28
Total Shares 2,249,279 2,564,034 99.28
Total Investments 2,249,279 2,564,034 99.28
Other Net Assets 18,468 0.72
Total Net Assets 2,582,502 100.00
(expressed in USD)
VIETNAM EQUITY FUND
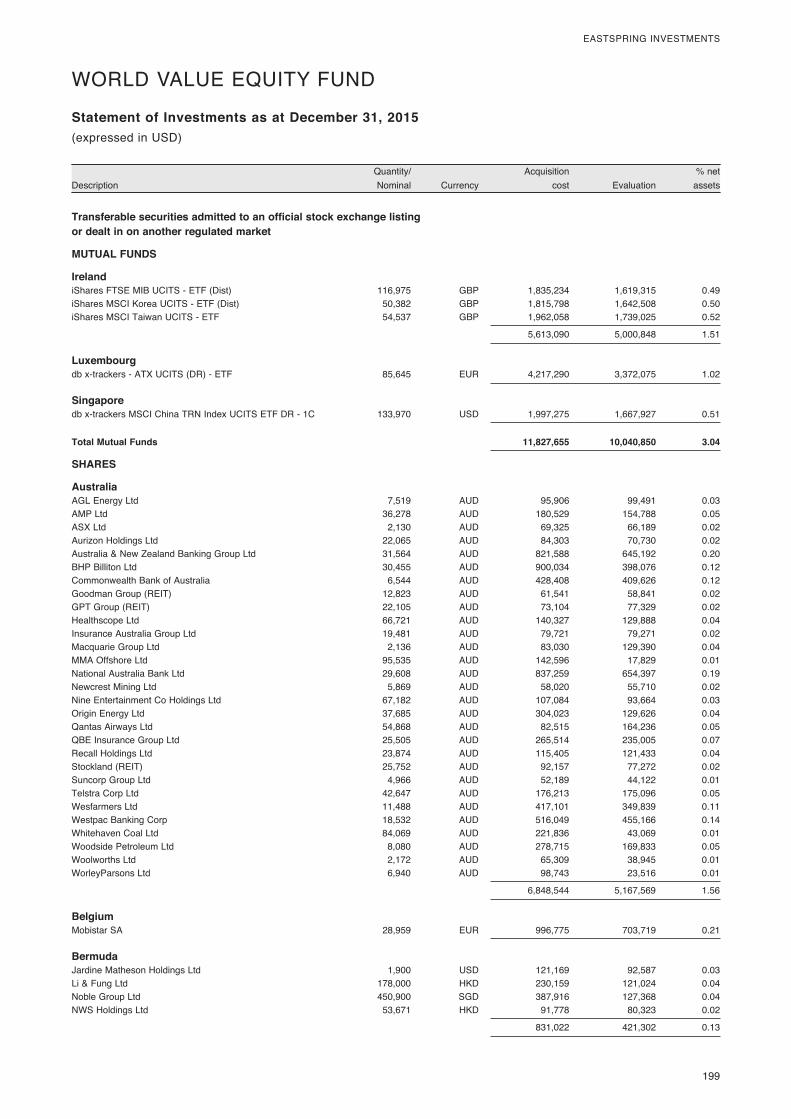
199
EASTSPRING INVESTMENTS
DescriptionQuantity/ Nominal Currency
Acquisition cost Evaluation
% net assets
Statement of Investments as at December 31, 2015
Transferable securities admitted to an official stock exchange listing or dealt in on another regulated market
MUTUAL FUNDS
Ireland iShares FTSE MIB UCITS - ETF (Dist) 116,975 GBP 1,835,234 1,619,315 0.49iShares MSCI Korea UCITS - ETF (Dist) 50,382 GBP 1,815,798 1,642,508 0.50iShares MSCI Taiwan UCITS - ETF 54,537 GBP 1,962,058 1,739,025 0.52
5,613,090 5,000,848 1.51
Luxembourg db x-trackers - ATX UCITS (DR) - ETF 85,645 EUR 4,217,290 3,372,075 1.02
Singapore db x-trackers MSCI China TRN Index UCITS ETF DR - 1C 133,970 USD 1,997,275 1,667,927 0.51
Total Mutual Funds 11,827,655 10,040,850 3.04
SHARES
Australia AGL Energy Ltd 7,519 AUD 95,906 99,491 0.03AMP Ltd 36,278 AUD 180,529 154,788 0.05ASX Ltd 2,130 AUD 69,325 66,189 0.02Aurizon Holdings Ltd 22,065 AUD 84,303 70,730 0.02Australia & New Zealand Banking Group Ltd 31,564 AUD 821,588 645,192 0.20BHP Billiton Ltd 30,455 AUD 900,034 398,076 0.12Commonwealth Bank of Australia 6,544 AUD 428,408 409,626 0.12Goodman Group (REIT) 12,823 AUD 61,541 58,841 0.02GPT Group (REIT) 22,105 AUD 73,104 77,329 0.02Healthscope Ltd 66,721 AUD 140,327 129,888 0.04Insurance Australia Group Ltd 19,481 AUD 79,721 79,271 0.02Macquarie Group Ltd 2,136 AUD 83,030 129,390 0.04MMA Offshore Ltd 95,535 AUD 142,596 17,829 0.01National Australia Bank Ltd 29,608 AUD 837,259 654,397 0.19Newcrest Mining Ltd 5,869 AUD 58,020 55,710 0.02Nine Entertainment Co Holdings Ltd 67,182 AUD 107,084 93,664 0.03Origin Energy Ltd 37,685 AUD 304,023 129,626 0.04Qantas Airways Ltd 54,868 AUD 82,515 164,236 0.05QBE Insurance Group Ltd 25,505 AUD 265,514 235,005 0.07Recall Holdings Ltd 23,874 AUD 115,405 121,433 0.04Stockland (REIT) 25,752 AUD 92,157 77,272 0.02Suncorp Group Ltd 4,966 AUD 52,189 44,122 0.01Telstra Corp Ltd 42,647 AUD 176,213 175,096 0.05Wesfarmers Ltd 11,488 AUD 417,101 349,839 0.11Westpac Banking Corp 18,532 AUD 516,049 455,166 0.14Whitehaven Coal Ltd 84,069 AUD 221,836 43,069 0.01Woodside Petroleum Ltd 8,080 AUD 278,715 169,833 0.05Woolworths Ltd 2,172 AUD 65,309 38,945 0.01WorleyParsons Ltd 6,940 AUD 98,743 23,516 0.01
6,848,544 5,167,569 1.56
Belgium Mobistar SA 28,959 EUR 996,775 703,719 0.21
Bermuda Jardine Matheson Holdings Ltd 1,900 USD 121,169 92,587 0.03Li & Fung Ltd 178,000 HKD 230,159 121,024 0.04Noble Group Ltd 450,900 SGD 387,916 127,368 0.04NWS Holdings Ltd 53,671 HKD 91,778 80,323 0.02
831,022 421,302 0.13
(expressed in USD)
WORLD VALUE EQUITY FUND
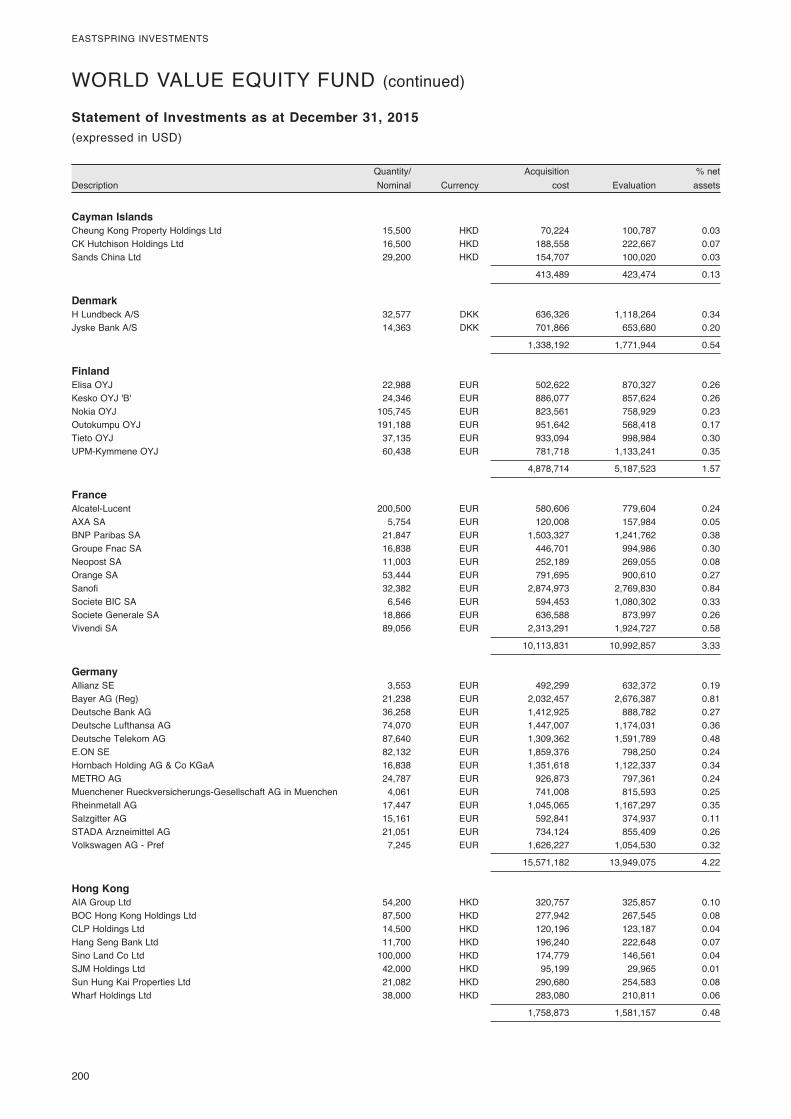
200
EASTSPRING INVESTMENTS
DescriptionQuantity/ Nominal Currency
Acquisition cost Evaluation
% net assets
Statement of Investments as at December 31, 2015(expressed in USD)
WORLD VALUE EQUITY FUND (continued)
Cayman Islands Cheung Kong Property Holdings Ltd 15,500 HKD 70,224 100,787 0.03CK Hutchison Holdings Ltd 16,500 HKD 188,558 222,667 0.07Sands China Ltd 29,200 HKD 154,707 100,020 0.03
413,489 423,474 0.13
Denmark H Lundbeck A/S 32,577 DKK 636,326 1,118,264 0.34Jyske Bank A/S 14,363 DKK 701,866 653,680 0.20
1,338,192 1,771,944 0.54
Finland Elisa OYJ 22,988 EUR 502,622 870,327 0.26Kesko OYJ 'B' 24,346 EUR 886,077 857,624 0.26Nokia OYJ 105,745 EUR 823,561 758,929 0.23Outokumpu OYJ 191,188 EUR 951,642 568,418 0.17Tieto OYJ 37,135 EUR 933,094 998,984 0.30UPM-Kymmene OYJ 60,438 EUR 781,718 1,133,241 0.35
4,878,714 5,187,523 1.57
France Alcatel-Lucent 200,500 EUR 580,606 779,604 0.24AXA SA 5,754 EUR 120,008 157,984 0.05BNP Paribas SA 21,847 EUR 1,503,327 1,241,762 0.38Groupe Fnac SA 16,838 EUR 446,701 994,986 0.30Neopost SA 11,003 EUR 252,189 269,055 0.08Orange SA 53,444 EUR 791,695 900,610 0.27Sanofi 32,382 EUR 2,874,973 2,769,830 0.84Societe BIC SA 6,546 EUR 594,453 1,080,302 0.33Societe Generale SA 18,866 EUR 636,588 873,997 0.26Vivendi SA 89,056 EUR 2,313,291 1,924,727 0.58
10,113,831 10,992,857 3.33
Germany Allianz SE 3,553 EUR 492,299 632,372 0.19Bayer AG (Reg) 21,238 EUR 2,032,457 2,676,387 0.81Deutsche Bank AG 36,258 EUR 1,412,925 888,782 0.27Deutsche Lufthansa AG 74,070 EUR 1,447,007 1,174,031 0.36Deutsche Telekom AG 87,640 EUR 1,309,362 1,591,789 0.48E.ON SE 82,132 EUR 1,859,376 798,250 0.24Hornbach Holding AG & Co KGaA 16,838 EUR 1,351,618 1,122,337 0.34METRO AG 24,787 EUR 926,873 797,361 0.24Muenchener Rueckversicherungs-Gesellschaft AG in Muenchen 4,061 EUR 741,008 815,593 0.25Rheinmetall AG 17,447 EUR 1,045,065 1,167,297 0.35Salzgitter AG 15,161 EUR 592,841 374,937 0.11STADA Arzneimittel AG 21,051 EUR 734,124 855,409 0.26Volkswagen AG - Pref 7,245 EUR 1,626,227 1,054,530 0.32
15,571,182 13,949,075 4.22
Hong Kong AIA Group Ltd 54,200 HKD 320,757 325,857 0.10BOC Hong Kong Holdings Ltd 87,500 HKD 277,942 267,545 0.08CLP Holdings Ltd 14,500 HKD 120,196 123,187 0.04Hang Seng Bank Ltd 11,700 HKD 196,240 222,648 0.07Sino Land Co Ltd 100,000 HKD 174,779 146,561 0.04SJM Holdings Ltd 42,000 HKD 95,199 29,965 0.01Sun Hung Kai Properties Ltd 21,082 HKD 290,680 254,583 0.08Wharf Holdings Ltd 38,000 HKD 283,080 210,811 0.06
1,758,873 1,581,157 0.48
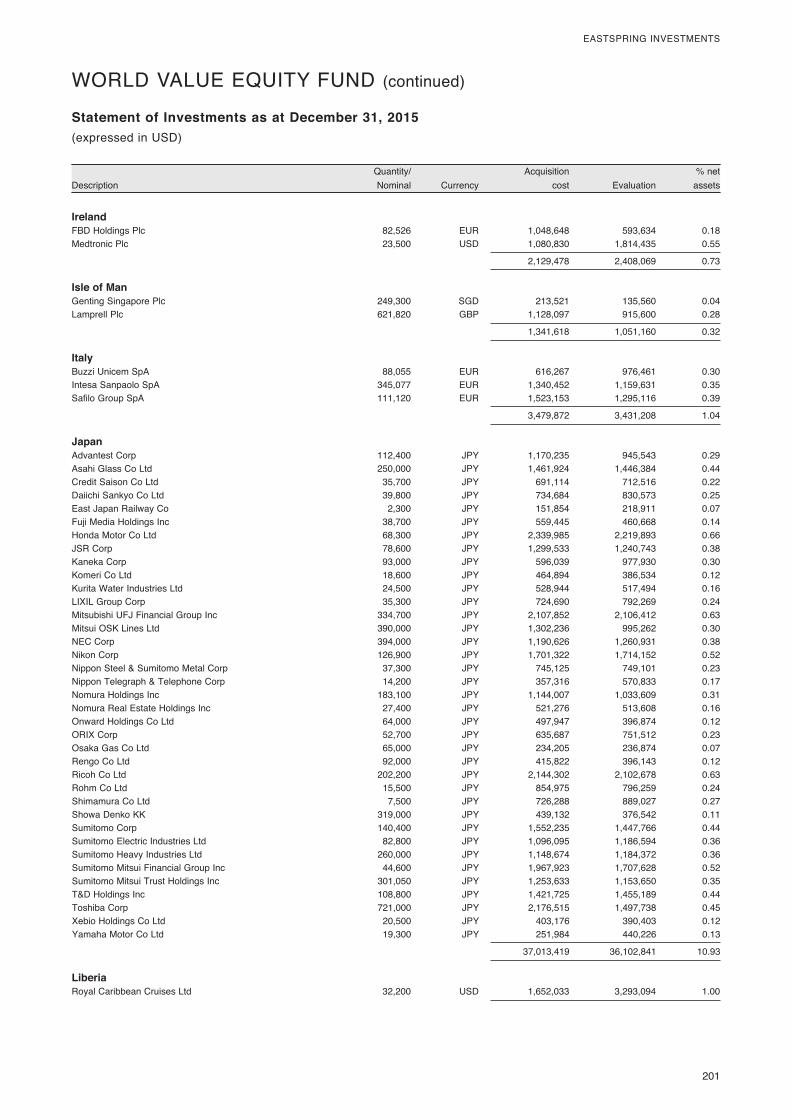
201
EASTSPRING INVESTMENTS
DescriptionQuantity/ Nominal Currency
Acquisition cost Evaluation
% net assets
Statement of Investments as at December 31, 2015(expressed in USD)
WORLD VALUE EQUITY FUND (continued)
Ireland FBD Holdings Plc 82,526 EUR 1,048,648 593,634 0.18Medtronic Plc 23,500 USD 1,080,830 1,814,435 0.55
2,129,478 2,408,069 0.73
Isle of Man Genting Singapore Plc 249,300 SGD 213,521 135,560 0.04Lamprell Plc 621,820 GBP 1,128,097 915,600 0.28
1,341,618 1,051,160 0.32
Italy Buzzi Unicem SpA 88,055 EUR 616,267 976,461 0.30Intesa Sanpaolo SpA 345,077 EUR 1,340,452 1,159,631 0.35Safilo Group SpA 111,120 EUR 1,523,153 1,295,116 0.39
3,479,872 3,431,208 1.04
Japan Advantest Corp 112,400 JPY 1,170,235 945,543 0.29Asahi Glass Co Ltd 250,000 JPY 1,461,924 1,446,384 0.44Credit Saison Co Ltd 35,700 JPY 691,114 712,516 0.22Daiichi Sankyo Co Ltd 39,800 JPY 734,684 830,573 0.25East Japan Railway Co 2,300 JPY 151,854 218,911 0.07Fuji Media Holdings Inc 38,700 JPY 559,445 460,668 0.14Honda Motor Co Ltd 68,300 JPY 2,339,985 2,219,893 0.66JSR Corp 78,600 JPY 1,299,533 1,240,743 0.38Kaneka Corp 93,000 JPY 596,039 977,930 0.30Komeri Co Ltd 18,600 JPY 464,894 386,534 0.12Kurita Water Industries Ltd 24,500 JPY 528,944 517,494 0.16LIXIL Group Corp 35,300 JPY 724,690 792,269 0.24Mitsubishi UFJ Financial Group Inc 334,700 JPY 2,107,852 2,106,412 0.63Mitsui OSK Lines Ltd 390,000 JPY 1,302,236 995,262 0.30NEC Corp 394,000 JPY 1,190,626 1,260,931 0.38Nikon Corp 126,900 JPY 1,701,322 1,714,152 0.52Nippon Steel & Sumitomo Metal Corp 37,300 JPY 745,125 749,101 0.23Nippon Telegraph & Telephone Corp 14,200 JPY 357,316 570,833 0.17Nomura Holdings Inc 183,100 JPY 1,144,007 1,033,609 0.31Nomura Real Estate Holdings Inc 27,400 JPY 521,276 513,608 0.16Onward Holdings Co Ltd 64,000 JPY 497,947 396,874 0.12ORIX Corp 52,700 JPY 635,687 751,512 0.23Osaka Gas Co Ltd 65,000 JPY 234,205 236,874 0.07Rengo Co Ltd 92,000 JPY 415,822 396,143 0.12Ricoh Co Ltd 202,200 JPY 2,144,302 2,102,678 0.63Rohm Co Ltd 15,500 JPY 854,975 796,259 0.24Shimamura Co Ltd 7,500 JPY 726,288 889,027 0.27Showa Denko KK 319,000 JPY 439,132 376,542 0.11Sumitomo Corp 140,400 JPY 1,552,235 1,447,766 0.44Sumitomo Electric Industries Ltd 82,800 JPY 1,096,095 1,186,594 0.36Sumitomo Heavy Industries Ltd 260,000 JPY 1,148,674 1,184,372 0.36Sumitomo Mitsui Financial Group Inc 44,600 JPY 1,967,923 1,707,628 0.52Sumitomo Mitsui Trust Holdings Inc 301,050 JPY 1,253,633 1,153,650 0.35T&D Holdings Inc 108,800 JPY 1,421,725 1,455,189 0.44Toshiba Corp 721,000 JPY 2,176,515 1,497,738 0.45Xebio Holdings Co Ltd 20,500 JPY 403,176 390,403 0.12Yamaha Motor Co Ltd 19,300 JPY 251,984 440,226 0.13
37,013,419 36,102,841 10.93
Liberia Royal Caribbean Cruises Ltd 32,200 USD 1,652,033 3,293,094 1.00

202
EASTSPRING INVESTMENTS
DescriptionQuantity/ Nominal Currency
Acquisition cost Evaluation
% net assets
Statement of Investments as at December 31, 2015(expressed in USD)
WORLD VALUE EQUITY FUND (continued)
Netherlands Aperam NPV 25,650 EUR 554,103 915,004 0.28ASM International NV 8,252 EUR 300,500 324,724 0.10Euronext NV '144A' 7,412 EUR 198,126 381,404 0.12ING Groep NV 130,106 EUR 1,821,388 1,762,761 0.53STMicroelectronics NV 34,265 EUR 250,664 230,482 0.07Wolters Kluwer NV 70,934 EUR 1,629,788 2,390,298 0.72
4,754,569 6,004,673 1.82
New Zealand Trade Me Group Ltd 44,192 NZD 126,720 126,618 0.04
Norway Orkla ASA 93,332 NOK 792,766 741,548 0.22Petroleum Geo-Services ASA 137,367 NOK 678,270 565,950 0.17Storebrand ASA 242,516 NOK 1,074,076 960,679 0.30
2,545,112 2,268,177 0.69
Singapore CapitaLand Ltd 71,700 SGD 193,913 169,623 0.05City Developments Ltd 8,900 SGD 68,354 48,081 0.01DBS Group Holdings Ltd 23,400 SGD 302,060 275,797 0.09Hutchison Port Holdings Trust 165,200 USD 113,286 87,556 0.03Keppel (REIT) 73,800 SGD 66,673 48,468 0.01Oversea-Chinese Banking Corp Ltd 29,600 SGD 222,021 183,948 0.07Sembcorp Industries Ltd 34,300 SGD 117,151 73,878 0.02Singapore Telecommunications Ltd 18,900 SGD 58,869 48,983 0.01United Overseas Bank Ltd 8,000 SGD 131,211 110,787 0.03
1,273,538 1,047,121 0.32
South Korea KT Corp 1,776 KRW 49,064 42,789 0.01
Spain Repsol SA 35,443 EUR 817,181 390,335 0.12
Sweden Securitas AB 'B' 155,929 SEK 1,653,802 2,406,555 0.73Svenska Cellulosa AB SCA 'B' 71,169 SEK 1,422,776 2,082,731 0.63Telefonaktiebolaget LM Ericsson 'B' 127,403 SEK 1,317,210 1,244,815 0.38
4,393,788 5,734,101 1.74
Switzerland Baloise Holding AG 6,189 CHF 686,187 790,544 0.24BKW AG 22,478 CHF 842,481 855,060 0.26Metall Zug AG 79 CHF 211,344 199,368 0.06Nestle SA 3,357 CHF 188,299 250,527 0.08Novartis AG 41,404 CHF 2,653,110 3,597,635 1.09Oriflame Holding AG 32,890 SEK 803,632 531,041 0.16UBS Group AG 50,734 CHF 754,881 991,366 0.30Valora Holding AG 3,504 CHF 754,602 733,104 0.22Vetropack Holding AG 256 CHF 469,096 399,779 0.12
7,363,632 8,348,424 2.53
Turkey Turkcell Iletisim Hizmetleri AS 152,350 TRY 846,267 530,723 0.16

203
EASTSPRING INVESTMENTS
DescriptionQuantity/ Nominal Currency
Acquisition cost Evaluation
% net assets
Statement of Investments as at December 31, 2015(expressed in USD)
WORLD VALUE EQUITY FUND (continued)
United Kingdom AstraZeneca Plc 27,981 GBP 1,553,159 1,911,586 0.58Aviva Plc 259,253 GBP 1,519,326 1,979,663 0.60BP Plc 524,589 GBP 4,195,036 2,748,148 0.84BTG Plc 26,896 GBP 236,351 274,037 0.08Darty Plc 869,437 GBP 1,221,738 1,325,235 0.40Enterprise Inns Plc 463,576 GBP 789,003 762,858 0.23GlaxoSmithKline Plc 52,433 GBP 1,284,270 1,065,352 0.32Home Retail Group Plc 332,087 GBP 967,593 489,227 0.15Ladbrokes Plc 739,196 GBP 1,593,699 1,309,397 0.40LivaNova Plc 13,446 USD 829,483 802,054 0.24Lloyds Banking Group Plc 1,566,840 GBP 1,179,288 1,694,265 0.51Ophir Energy Plc 281,420 GBP 525,564 410,004 0.12Royal Bank of Scotland Group Plc 229,722 GBP 1,127,143 1,026,661 0.31Royal Dutch Shell Plc 'A' 810 GBP 19,583 18,292 0.01Royal Dutch Shell Plc 'B' 42,261 GBP 1,587,883 964,991 0.29Tullow Oil Plc 292,129 GBP 1,162,040 716,333 0.22Vodafone Group Plc 416,533 GBP 1,360,167 1,362,258 0.41William Hill Plc 366,321 GBP 2,092,704 2,146,717 0.65
23,244,030 21,007,078 6.36
United States of America AbbVie Inc 77,700 USD 5,026,941 4,638,690 1.40Allegheny Technologies Inc 168,900 USD 4,701,399 1,910,259 0.58Allstate Corp/The 77,000 USD 3,777,001 4,817,120 1.46Altria Group Inc 32,700 USD 1,000,437 1,906,737 0.58Apache Corp 90,800 USD 6,447,712 4,039,692 1.22Apple Inc 24,400 USD 2,017,595 2,591,036 0.78Applied Materials Inc 200,000 USD 3,385,854 3,768,000 1.14Archer-Daniels-Midland Co 121,300 USD 4,383,055 4,442,006 1.35Ashland Inc 16,600 USD 1,499,896 1,709,966 0.52AT&T Inc 140,900 USD 4,548,761 4,866,685 1.46Avnet Inc 49,300 USD 1,734,349 2,136,169 0.65Bank of America Corp 215,800 USD 3,265,661 3,667,521 1.11Best Buy Co Inc 92,900 USD 2,824,640 2,831,592 0.86Caterpillar Inc 65,200 USD 5,617,908 4,459,680 1.35Chevron Corp 51,600 USD 4,847,449 4,632,648 1.40Cigna Corp 31,900 USD 2,077,772 4,685,472 1.42Cisco Systems Inc 169,400 USD 4,091,393 4,611,068 1.40Comcast Corp 'A' 61,500 USD 2,043,765 3,481,515 1.05Delta Air Lines Inc 62,100 USD 2,569,686 3,152,196 0.95Diamond Offshore Drilling Inc 175,900 USD 6,971,167 3,667,515 1.11Edison International 51,500 USD 2,485,118 3,080,730 0.93General Motors Co 132,400 USD 4,668,666 4,518,812 1.37Gilead Sciences Inc 43,600 USD 3,875,420 4,447,418 1.35Goldman Sachs Group Inc/The 25,500 USD 3,848,092 4,628,760 1.40Halliburton Co 122,900 USD 5,894,034 4,185,974 1.27Hartford Financial Services Group Inc/The 101,200 USD 2,784,656 4,416,368 1.34HP Inc 295,700 USD 3,951,402 3,502,567 1.06Intel Corp 98,200 USD 2,343,099 3,411,959 1.03International Business Machines Corp 33,000 USD 5,287,631 4,570,500 1.38JPMorgan Chase & Co 70,700 USD 3,345,339 4,693,773 1.42Lincoln National Corp 86,300 USD 2,931,036 4,362,465 1.32Macy's Inc 111,500 USD 4,701,233 3,925,915 1.19Merck & Co Inc 59,600 USD 2,638,475 3,155,820 0.96Microsoft Corp 32,600 USD 1,008,210 1,818,754 0.55Morgan Stanley 136,200 USD 3,499,689 4,376,106 1.33National Oilwell Varco Inc 121,000 USD 6,779,769 4,047,450 1.23Newell Rubbermaid Inc 43,500 USD 926,549 1,905,735 0.58Nucor Corp 76,700 USD 3,484,065 3,096,379 0.94Occidental Petroleum Corp 62,800 USD 5,130,350 4,202,576 1.27Patterson-UTI Energy Inc 121,600 USD 2,371,173 1,819,136 0.55Pfizer Inc 139,700 USD 3,658,558 4,547,235 1.38

204
EASTSPRING INVESTMENTS
DescriptionQuantity/ Nominal Currency
Acquisition cost Evaluation
% net assets
Statement of Investments as at December 31, 2015(expressed in USD)
WORLD VALUE EQUITY FUND (continued)
PNC Financial Services Group Inc/The 42,600 USD 2,796,429 4,079,376 1.24Spirit AeroSystems Holdings Inc 'A' 72,700 USD 2,383,202 3,563,754 1.08Terex Corp 84,600 USD 2,411,379 1,598,940 0.48Travelers Cos Inc/The 38,400 USD 2,722,114 4,374,912 1.32US Bancorp 72,000 USD 2,230,805 3,091,680 0.94Viacom Inc 'B' 110,300 USD 5,858,279 4,492,519 1.36Wells Fargo & Co 84,700 USD 3,028,391 4,623,773 1.40
169,875,604 176,554,953 53.46
Total Shares 303,656,547 308,539,984 93.44
Total Investments 315,484,202 318,580,834 96.48
Other Net Assets 11,619,639 3.52
Total Net Assets 330,200,473 100.00
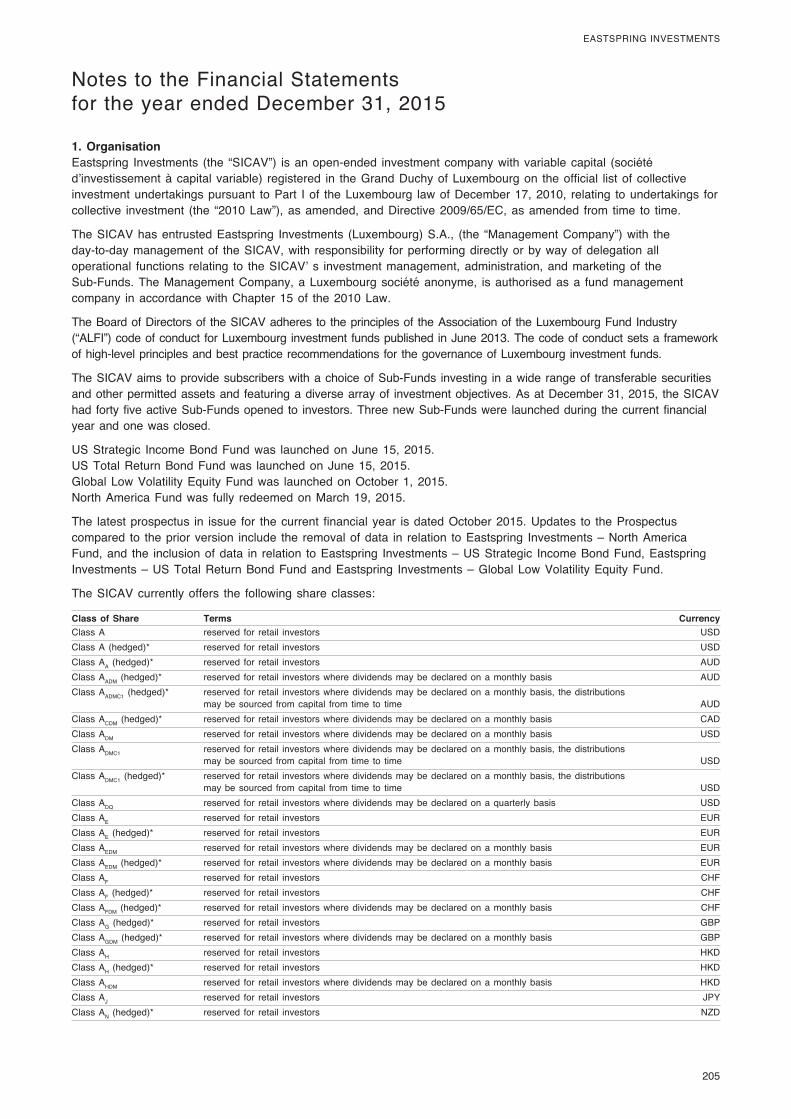
205
EASTSPRING INVESTMENTS
Notes to the Financial Statementsfor the year ended December 31, 2015 (continued)
1. OrganisationEastspring Investments (the “SICAV”) is an open-ended investment company with variable capital (société d’investissement à capital variable) registered in the Grand Duchy of Luxembourg on the official list of collective investment undertakings pursuant to Part I of the Luxembourg law of December 17, 2010, relating to undertakings for collective investment (the “2010 Law”), as amended, and Directive 2009/65/EC, as amended from time to time.
The SICAV has entrusted Eastspring Investments (Luxembourg) S.A., (the “Management Company”) with the day-to-day management of the SICAV, with responsibility for performing directly or by way of delegation all operational functions relating to the SICAV’ s investment management, administration, and marketing of the Sub-Funds. The Management Company, a Luxembourg société anonyme, is authorised as a fund management company in accordance with Chapter 15 of the 2010 Law.
The Board of Directors of the SICAV adheres to the principles of the Association of the Luxembourg Fund Industry (“ALFI”) code of conduct for Luxembourg investment funds published in June 2013. The code of conduct sets a framework of high-level principles and best practice recommendations for the governance of Luxembourg investment funds.
The SICAV aims to provide subscribers with a choice of Sub-Funds investing in a wide range of transferable securities and other permitted assets and featuring a diverse array of investment objectives. As at December 31, 2015, the SICAV had forty five active Sub-Funds opened to investors. Three new Sub-Funds were launched during the current financial year and one was closed.
US Strategic Income Bond Fund was launched on June 15, 2015.US Total Return Bond Fund was launched on June 15, 2015.Global Low Volatility Equity Fund was launched on October 1, 2015.North America Fund was fully redeemed on March 19, 2015.
The latest prospectus in issue for the current financial year is dated October 2015. Updates to the Prospectus compared to the prior version include the removal of data in relation to Eastspring Investments – North America Fund, and the inclusion of data in relation to Eastspring Investments – US Strategic Income Bond Fund, Eastspring Investments – US Total Return Bond Fund and Eastspring Investments – Global Low Volatility Equity Fund.
The SICAV currently offers the following share classes:
Class of Share Terms Currency Class A reserved for retail investors USDClass A (hedged)* reserved for retail investors USDClass AA (hedged)* reserved for retail investors AUDClass AADM (hedged)* reserved for retail investors where dividends may be declared on a monthly basis AUDClass AADMC1 (hedged)* reserved for retail investors where dividends may be declared on a monthly basis, the distributions
may be sourced from capital from time to time AUDClass ACDM (hedged)* reserved for retail investors where dividends may be declared on a monthly basis CADClass ADM reserved for retail investors where dividends may be declared on a monthly basis USDClass ADMC1 reserved for retail investors where dividends may be declared on a monthly basis, the distributions
may be sourced from capital from time to time USDClass ADMC1 (hedged)* reserved for retail investors where dividends may be declared on a monthly basis, the distributions
may be sourced from capital from time to time USDClass ADQ reserved for retail investors where dividends may be declared on a quarterly basis USDClass AE reserved for retail investors EURClass AE (hedged)* reserved for retail investors EURClass AEDM reserved for retail investors where dividends may be declared on a monthly basis EURClass AEDM (hedged)* reserved for retail investors where dividends may be declared on a monthly basis EURClass AF reserved for retail investors CHFClass AF (hedged)* reserved for retail investors CHFClass AFDM (hedged)* reserved for retail investors where dividends may be declared on a monthly basis CHFClass AG (hedged)* reserved for retail investors GBPClass AGDM (hedged)* reserved for retail investors where dividends may be declared on a monthly basis GBPClass AH reserved for retail investors HKDClass AH (hedged)* reserved for retail investors HKDClass AHDM reserved for retail investors where dividends may be declared on a monthly basis HKDClass AJ reserved for retail investors JPYClass AN (hedged)* reserved for retail investors NZD
Notes to the Financial Statements

206
EASTSPRING INVESTMENTS
Notes to the Financial Statementsfor the year ended December 31, 2015 (continued)
Class of Share Terms Currency Class ANDM (hedged)* reserved for retail investors where dividends may be declared on a monthly basis NZDClass ANDMC1 (hedged)* reserved for retail investors where dividends may be declared on a monthly basis, the distributions
may be sourced from capital from time to time NZDClass AR (hedged)* reserved for retail investors RMB-CNHClass ARDMC1 (hedged)* reserved for retail investors where dividends may be declared on a monthly basis, the distributions
may be sourced from capital from time to time RMB-CNHClass AS reserved for retail investors SGDClass AS (hedged)* reserved for retail investors SGDClass ASDM reserved for retail investors where dividends may be declared on a monthly basis SGDClass ASDM (hedged)* reserved for retail investors where dividends may be declared on a monthly basis SGDClass ASDMC1 (hedged)* reserved for retail investors where dividends may be declared on a monthly basis, the distributions
may be sourced from capital from time to time SGDClass ASDQ reserved for retail investors where dividends may be declared on a quarterly basis SGDClass AZ (hedged)* reserved for retail investors ZARClass AZDM (hedged)* reserved for retail investors where dividends may be declared on a monthly basis ZARClass AZDMC1 (hedged)* reserved for retail investors where dividends may be declared on a monthly basis, the distributions
may be sourced from capital from time to time ZARClass B reserved for institutional investors USDClass BDM reserved for institutional investors where dividends may be declared on a monthly basis USDClass BJ reserved for institutional investors JPYClass C reserved for large institutional investors USDClass C (hedged)* reserved for large institutional investors USDClass CDY reserved for large institutional investors where dividends will be distributed on an annual basis USDClass CE reserved for large institutional investors EURClass CE (hedged)* reserved for large institutional investors EURClass CG reserved for large institutional investors GBPClass CG (hedged)* reserved for large institutional investors GBPClass CJ reserved for large institutional investors JPYClass CS reserved for large institutional investors SGDClass D reserved for certain institutional investors specifically approved by the SICAV USDClass DDH reserved for certain institutional investors specifically approved by the SICAV where dividends will be
distributed on a semi-annual basis USDClass DDQ reserved for certain institutional investors specifically approved by the SICAV where dividends may be
declared on a quarterly basis USDClass DE reserved for certain institutional investors specifically approved by the SICAV EURClass DH (hedged)* reserved for certain institutional investors specifically approved by the SICAV where dividends will be
distributed on a semi-annual basis HKDClass DJ reserved for certain institutional investors specifically approved by the SICAV JPYClass DJDQ reserved for certain institutional investors specifically approved by the SICAV where dividends may be
declared on a quarterly basis JPYClass E reserved for institutional investors where dividends will be distributed USDClass EDY reserved for institutional investors where dividends will be distributed on an annual basis USDClass F reserved for retail investors of certain distributors specifically approved by the SICAV USDClass G reserved for retail investors of certain distributors USDClass GDM reserved for retail investors of certain distributors where dividends may be declared on a monthly basis USDClass GEDM (hedged)* reserved for retail investors of certain distributors where dividends may be declared on a monthly basis EURClass GFDM (hedged)* reserved for retail investors of certain distributors where dividends may be declared on a monthly basis CHFClass J reserved for institutional investors of Japan mutual fund or investment trust that are categorized as fund
of funds USDClass JJ reserved for institutional investors of Japan mutual fund or investment trust that are categorized as fund
of funds JPYClass R reserved for retail investors of certain distributors who have separate fee arrangements with their clients
(which provide nominee facilities to investors) and to other retail investors at the discretion of the SICAV USDClass R (hedged)* reserved for retail investors of certain distributors who have separate fee arrangements with their clients
(which provide nominee facilities to investors) and to other retail investors at the discretion of the SICAV USDClass RDM reserved for retail investors of certain distributors who have separate fee arrangements with their clients
(which provide nominee facilities to investors) and to other retail investors at the discretion of the SICAV where dividends may be declared on a monthly basis USD
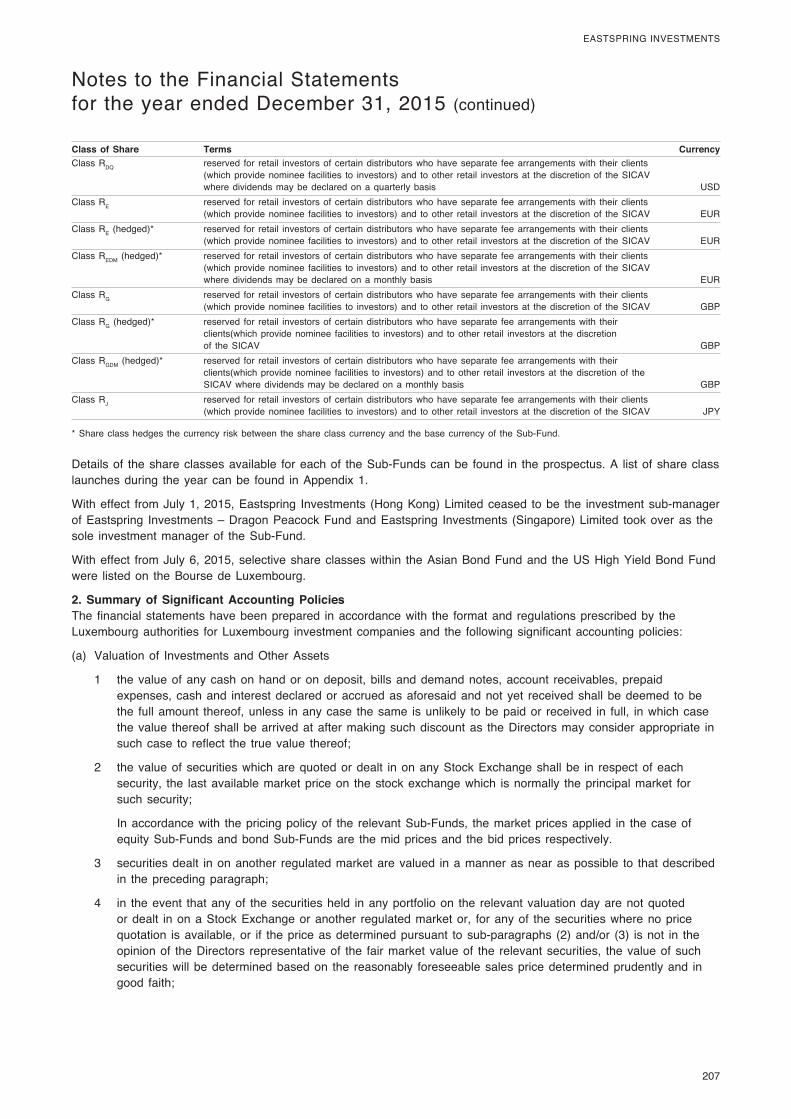
207
EASTSPRING INVESTMENTS
Notes to the Financial Statementsfor the year ended December 31, 2015 (continued)
Class of Share Terms Currency Class RDQ reserved for retail investors of certain distributors who have separate fee arrangements with their clients
(which provide nominee facilities to investors) and to other retail investors at the discretion of the SICAV where dividends may be declared on a quarterly basis USD
Class RE reserved for retail investors of certain distributors who have separate fee arrangements with their clients (which provide nominee facilities to investors) and to other retail investors at the discretion of the SICAV EUR
Class RE (hedged)* reserved for retail investors of certain distributors who have separate fee arrangements with their clients (which provide nominee facilities to investors) and to other retail investors at the discretion of the SICAV EUR
Class REDM (hedged)* reserved for retail investors of certain distributors who have separate fee arrangements with their clients (which provide nominee facilities to investors) and to other retail investors at the discretion of the SICAV where dividends may be declared on a monthly basis EUR
Class RG reserved for retail investors of certain distributors who have separate fee arrangements with their clients (which provide nominee facilities to investors) and to other retail investors at the discretion of the SICAV GBP
Class RG (hedged)* reserved for retail investors of certain distributors who have separate fee arrangements with their clients(which provide nominee facilities to investors) and to other retail investors at the discretion of the SICAV GBP
Class RGDM (hedged)* reserved for retail investors of certain distributors who have separate fee arrangements with their clients(which provide nominee facilities to investors) and to other retail investors at the discretion of the SICAV where dividends may be declared on a monthly basis GBP
Class RJ reserved for retail investors of certain distributors who have separate fee arrangements with their clients (which provide nominee facilities to investors) and to other retail investors at the discretion of the SICAV JPY
* Share class hedges the currency risk between the share class currency and the base currency of the Sub-Fund.
Details of the share classes available for each of the Sub-Funds can be found in the prospectus. A list of share class launches during the year can be found in Appendix 1.
With effect from July 1, 2015, Eastspring Investments (Hong Kong) Limited ceased to be the investment sub-manager of Eastspring Investments – Dragon Peacock Fund and Eastspring Investments (Singapore) Limited took over as the sole investment manager of the Sub-Fund.
With effect from July 6, 2015, selective share classes within the Asian Bond Fund and the US High Yield Bond Fund were listed on the Bourse de Luxembourg.
2. Summary of Significant Accounting PoliciesThe financial statements have been prepared in accordance with the format and regulations prescribed by the Luxembourg authorities for Luxembourg investment companies and the following significant accounting policies:
(a) Valuation of Investments and Other Assets
1 the value of any cash on hand or on deposit, bills and demand notes, account receivables, prepaid expenses, cash and interest declared or accrued as aforesaid and not yet received shall be deemed to be the full amount thereof, unless in any case the same is unlikely to be paid or received in full, in which case the value thereof shall be arrived at after making such discount as the Directors may consider appropriate in such case to reflect the true value thereof;
2 the value of securities which are quoted or dealt in on any Stock Exchange shall be in respect of each security, the last available market price on the stock exchange which is normally the principal market for such security;
In accordance with the pricing policy of the relevant Sub-Funds, the market prices applied in the case of equity Sub-Funds and bond Sub-Funds are the mid prices and the bid prices respectively.
3 securities dealt in on another regulated market are valued in a manner as near as possible to that described in the preceding paragraph;
4 in the event that any of the securities held in any portfolio on the relevant valuation day are not quoted or dealt in on a Stock Exchange or another regulated market or, for any of the securities where no price quotation is available, or if the price as determined pursuant to sub-paragraphs (2) and/or (3) is not in the opinion of the Directors representative of the fair market value of the relevant securities, the value of such securities will be determined based on the reasonably foreseeable sales price determined prudently and in good faith;
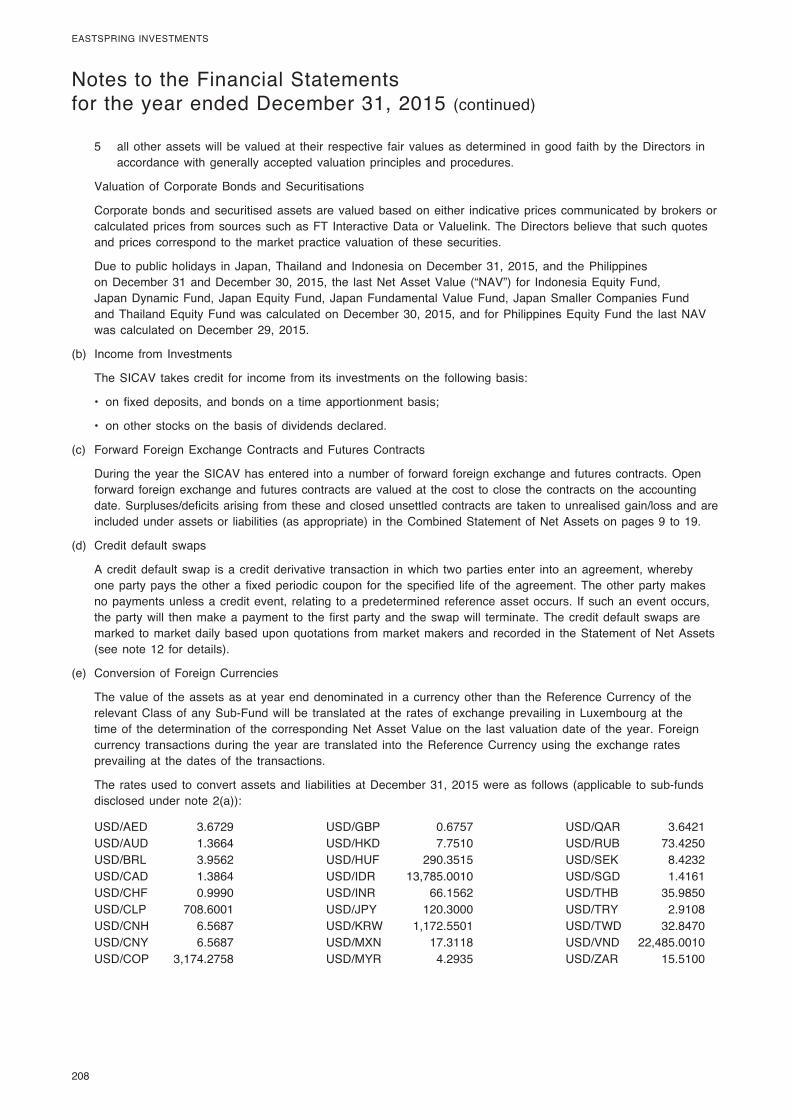
208
EASTSPRING INVESTMENTS
Notes to the Financial Statementsfor the year ended December 31, 2015 (continued)
5 all other assets will be valued at their respective fair values as determined in good faith by the Directors in accordance with generally accepted valuation principles and procedures.
Valuation of Corporate Bonds and Securitisations
Corporate bonds and securitised assets are valued based on either indicative prices communicated by brokers or calculated prices from sources such as FT Interactive Data or Valuelink. The Directors believe that such quotes and prices correspond to the market practice valuation of these securities.
Due to public holidays in Japan, Thailand and Indonesia on December 31, 2015, and the Philippines on December 31 and December 30, 2015, the last Net Asset Value (“NAV”) for Indonesia Equity Fund, Japan Dynamic Fund, Japan Equity Fund, Japan Fundamental Value Fund, Japan Smaller Companies Fund and Thailand Equity Fund was calculated on December 30, 2015, and for Philippines Equity Fund the last NAV was calculated on December 29, 2015.
(b) Income from Investments
The SICAV takes credit for income from its investments on the following basis:
• on fixed deposits, and bonds on a time apportionment basis;
• on other stocks on the basis of dividends declared.
(c) Forward Foreign Exchange Contracts and Futures Contracts
During the year the SICAV has entered into a number of forward foreign exchange and futures contracts. Open forward foreign exchange and futures contracts are valued at the cost to close the contracts on the accounting date. Surpluses/deficits arising from these and closed unsettled contracts are taken to unrealised gain/loss and are included under assets or liabilities (as appropriate) in the Combined Statement of Net Assets on pages 9 to 19.
(d) Credit default swaps
A credit default swap is a credit derivative transaction in which two parties enter into an agreement, whereby one party pays the other a fixed periodic coupon for the specified life of the agreement. The other party makes no payments unless a credit event, relating to a predetermined reference asset occurs. If such an event occurs, the party will then make a payment to the first party and the swap will terminate. The credit default swaps are marked to market daily based upon quotations from market makers and recorded in the Statement of Net Assets (see note 12 for details).
(e) Conversion of Foreign Currencies
The value of the assets as at year end denominated in a currency other than the Reference Currency of the relevant Class of any Sub-Fund will be translated at the rates of exchange prevailing in Luxembourg at the time of the determination of the corresponding Net Asset Value on the last valuation date of the year. Foreign currency transactions during the year are translated into the Reference Currency using the exchange rates prevailing at the dates of the transactions.
The rates used to convert assets and liabilities at December 31, 2015 were as follows (applicable to sub-funds disclosed under note 2(a)):
USD/AED 3.6729 USD/GBP 0.6757 USD/QAR 3.6421USD/AUD 1.3664 USD/HKD 7.7510 USD/RUB 73.4250USD/BRL 3.9562 USD/HUF 290.3515 USD/SEK 8.4232USD/CAD 1.3864 USD/IDR 13,785.0010 USD/SGD 1.4161USD/CHF 0.9990 USD/INR 66.1562 USD/THB 35.9850USD/CLP 708.6001 USD/JPY 120.3000 USD/TRY 2.9108USD/CNH 6.5687 USD/KRW 1,172.5501 USD/TWD 32.8470USD/CNY 6.5687 USD/MXN 17.3118 USD/VND 22,485.0010USD/COP 3,174.2758 USD/MYR 4.2935 USD/ZAR 15.5100
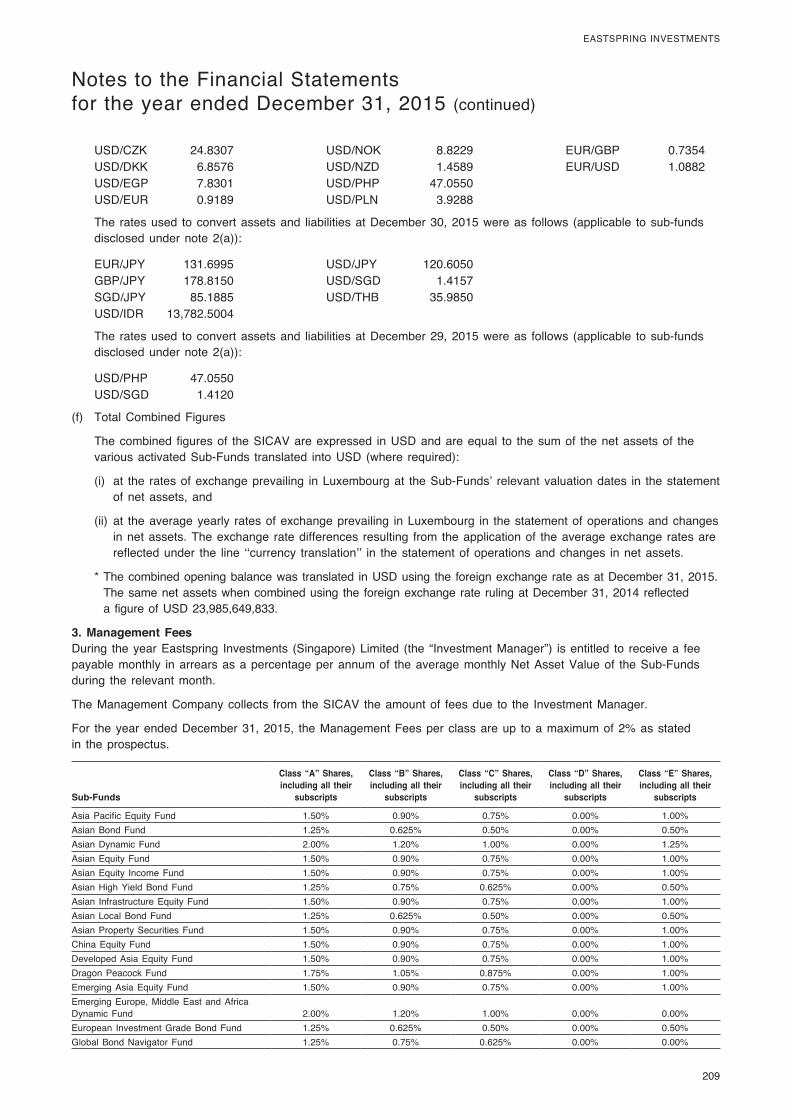
209
EASTSPRING INVESTMENTS
Notes to the Financial Statementsfor the year ended December 31, 2015 (continued)
USD/CZK 24.8307 USD/NOK 8.8229 EUR/GBP 0.7354USD/DKK 6.8576 USD/NZD 1.4589 EUR/USD 1.0882USD/EGP 7.8301 USD/PHP 47.0550USD/EUR 0.9189 USD/PLN 3.9288
The rates used to convert assets and liabilities at December 30, 2015 were as follows (applicable to sub-funds disclosed under note 2(a)):
EUR/JPY 131.6995 USD/JPY 120.6050GBP/JPY 178.8150 USD/SGD 1.4157SGD/JPY 85.1885 USD/THB 35.9850USD/IDR 13,782.5004
The rates used to convert assets and liabilities at December 29, 2015 were as follows (applicable to sub-funds disclosed under note 2(a)):
USD/PHP 47.0550USD/SGD 1.4120
(f) Total Combined Figures
The combined figures of the SICAV are expressed in USD and are equal to the sum of the net assets of the various activated Sub-Funds translated into USD (where required):
(i) at the rates of exchange prevailing in Luxembourg at the Sub-Funds’ relevant valuation dates in the statement of net assets, and
(ii) at the average yearly rates of exchange prevailing in Luxembourg in the statement of operations and changes in net assets. The exchange rate differences resulting from the application of the average exchange rates are reflected under the line ‘‘currency translation’’ in the statement of operations and changes in net assets.
* The combined opening balance was translated in USD using the foreign exchange rate as at December 31, 2015. The same net assets when combined using the foreign exchange rate ruling at December 31, 2014 reflected a figure of USD 23,985,649,833.
3. Management FeesDuring the year Eastspring Investments (Singapore) Limited (the “Investment Manager”) is entitled to receive a fee payable monthly in arrears as a percentage per annum of the average monthly Net Asset Value of the Sub-Funds during the relevant month.
The Management Company collects from the SICAV the amount of fees due to the Investment Manager.
For the year ended December 31, 2015, the Management Fees per class are up to a maximum of 2% as stated in the prospectus.
Sub-Funds
Class “A” Shares,including all their
subscripts
Class “B” Shares,including all their
subscripts
Class “C” Shares,including all their
subscripts
Class “D” Shares,including all their
subscripts
Class “E” Shares,including all their
subscripts
Asia Pacific Equity Fund 1.50% 0.90% 0.75% 0.00% 1.00%Asian Bond Fund 1.25% 0.625% 0.50% 0.00% 0.50%Asian Dynamic Fund 2.00% 1.20% 1.00% 0.00% 1.25%Asian Equity Fund 1.50% 0.90% 0.75% 0.00% 1.00%Asian Equity Income Fund 1.50% 0.90% 0.75% 0.00% 1.00%Asian High Yield Bond Fund 1.25% 0.75% 0.625% 0.00% 0.50%Asian Infrastructure Equity Fund 1.50% 0.90% 0.75% 0.00% 1.00%Asian Local Bond Fund 1.25% 0.625% 0.50% 0.00% 0.50%Asian Property Securities Fund 1.50% 0.90% 0.75% 0.00% 1.00%China Equity Fund 1.50% 0.90% 0.75% 0.00% 1.00%Developed Asia Equity Fund 1.50% 0.90% 0.75% 0.00% 1.00%Dragon Peacock Fund 1.75% 1.05% 0.875% 0.00% 1.00%Emerging Asia Equity Fund 1.50% 0.90% 0.75% 0.00% 1.00%Emerging Europe, Middle East and Africa Dynamic Fund 2.00% 1.20% 1.00% 0.00% 0.00%European Investment Grade Bond Fund 1.25% 0.625% 0.50% 0.00% 0.50%Global Bond Navigator Fund 1.25% 0.75% 0.625% 0.00% 0.00%

210
EASTSPRING INVESTMENTS
Notes to the Financial Statementsfor the year ended December 31, 2015 (continued)
Sub-Funds
Class “A” Shares,including all their
subscripts
Class “B” Shares,including all their
subscripts
Class “C” Shares,including all their
subscripts
Class “D” Shares,including all their
subscripts
Class “E” Shares,including all their
subscripts
Global Emerging Markets Bond Fund 1.25% 0.75% 0.625% 0.00% 0.50%Global Emerging Markets Dynamic Fund 1.50% 1.20% 1.00% 0.00% 1.25%Global Equity Navigator Fund 1.50% 0.90% 0.75% 0.00% 1.00%Global Low Volatility Equity Fund 1.50% 0.90% 0.75% 0.00% 0.00%Global Market Navigator Fund 1.50% 0.90% 0.75% 0.00% 1.00%Global Technology Fund 1.75% 1.05% 0.875% 0.00% 1.00%Greater China Equity Fund 1.50% 0.90% 0.75% 0.00% 1.00%Hong Kong Equity Fund 1.50% 0.90% 0.75% 0.00% 1.00%India Equity Fund 1.50% 0.90% 0.75% 0.00% 1.00%Indonesia Equity Fund 1.50% 0.90% 0.75% 0.00% 1.00%Japan Dynamic Fund 1.50% 1.20% 0.75% 0.00% 1.25%Japan Equity Fund 1.50% 0.90% 0.75% 0.00% 1.00%Japan Fundamental Value Fund 1.50% 0.90% 0.75% 0.00% 1.00%Japan Smaller Companies Fund 1.50% 1.05% 0.875% 0.00% 1.00%Latin American Equity Fund 1.50% 0.90% 0.75% 0.00% 1.00%Malaysia Equity Fund 1.50% 0.90% 0.75% 0.00% 1.00%North America Fund* 1.50% 0.90% 0.75% 0.00% 1.00%North American Value Fund 1.50% 0.90% 0.75% 0.00% 1.00%Pan European Fund 1.50% 0.90% 0.75% 0.00% 1.00%Philippines Equity Fund 1.50% 0.90% 0.75% 0.00% 1.00%Thailand Equity Fund 1.50% 0.90% 0.75% 0.00% 1.00%US Bond Fund 1.25% 0.625% 0.50% 0.00% 0.50%US Corporate Bond Fund 1.25% 0.625% 0.50% 0.00% 0.50%US High Investment Grade Bond Fund 1.25% 0.625% 0.50% 0.00% 0.50%US High Yield Bond Fund 1.25% 0.75% 0.625% 0.00% 0.50%US Investment Grade Bond Fund 1.25% 0.625% 0.50% 0.00% 0.50%US Strategic Income Bond Fund 1.25% 0.625% 0.50% 0.00% 0.50%US Total Return Bond Fund 1.25% 0.625% 0.50% 0.00% 0.50%Vietnam Equity Fund 2.00% 1.20% 1.00% 0.00% 1.75%World Value Equity Fund 1.50% 0.90% 0.75% 0.00% 1.00%
* Sub-Fund was fully redeemed, see Note 1.
Sub-Funds
Class “F” Shares,including all their
subscripts
Class “G” Shares,including all their
subscripts
Class “J” Shares,including all their
subscripts
Class “R” Shares,including all their
subscripts
Asia Pacific Equity Fund 1.00% 1.50% 1.00% 0.75%Asian Bond Fund 0.50% 0.70% 0.50% 0.625%Asian Dynamic Fund 1.25% 2.00% 1.25% 1.00%Asian Equity Fund 1.00% 1.50% 1.00% 0.75%Asian Equity Income Fund 1.00% 1.50% 1.00% 0.75%Asian High Yield Bond Fund 0.625% N/A 0.50% 0.625%Asian Infrastructure Equity Fund 1.00% 1.50% 0.425%** 0.75%Asian Local Bond Fund 0.50% 0.70% 0.50% 0.625%Asian Property Securities Fund 1.00% 1.50% 1.00% 0.75%China Equity Fund 1.00% 1.50% 0.225% 0.75%Developed Asia Equity Fund 1.00% 1.50% 1.00% 0.75%Dragon Peacock Fund N/A 1.75% 1.00% 0.875%Emerging Asia Equity Fund 1.00% 1.50% 1.00% 0.75%Emerging Europe, Middle East and Africa Dynamic Fund 1.25% 2.00% 1.25% 1.00%European Investment Grade Bond Fund 0.50% 0.70% 0.50% 0.625%Global Bond Navigator Fund N/A N/A 0.50% 0.625%Global Emerging Markets Bond Fund 0.625% N/A 0.50% 0.625%Global Emerging Markets Dynamic Fund 1.25% 2.00% 1.25% 0.625%Global Equity Navigator Fund 1.00% 1.50% 0.50% 1.00%Global Low Volatility Equity Fund N/A N/A N/A 0.75%Global Market Navigator Fund 1.00% 1.50% 1.00% 0.75%Global Technology Fund N/A N/A 1.00% 0.875%Greater China Equity Fund 1.00% 1.50% 1.00% 0.75%
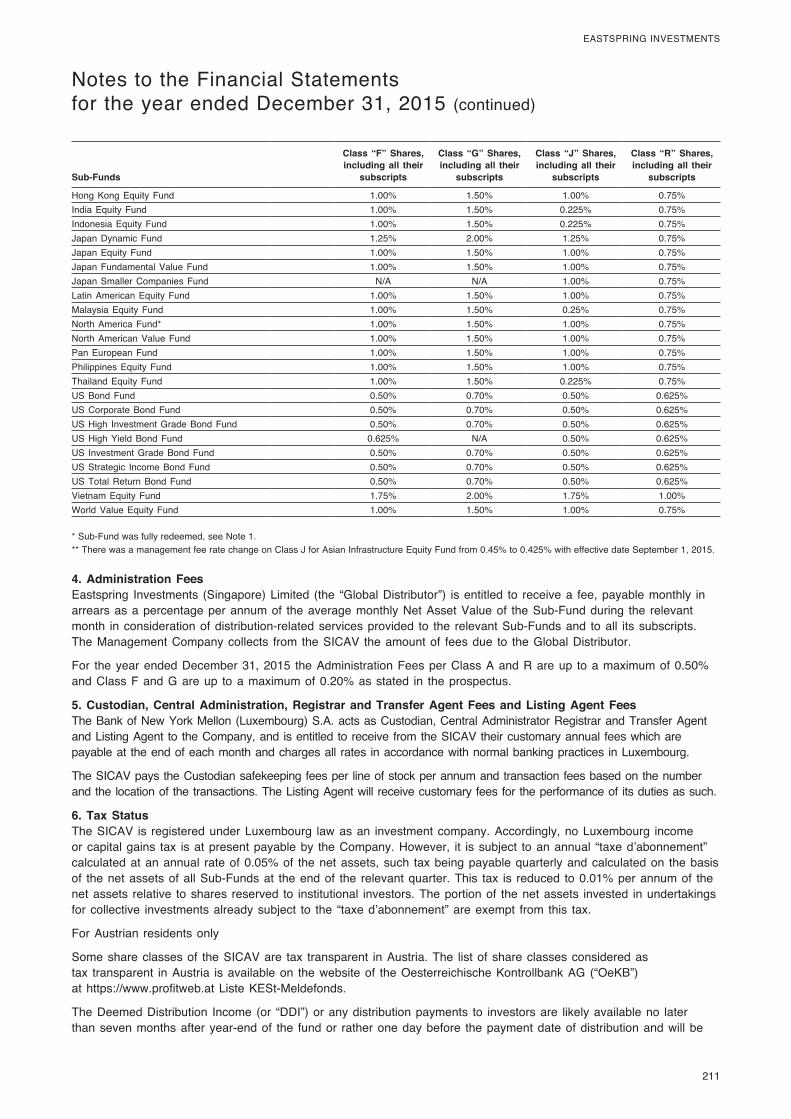
211
EASTSPRING INVESTMENTS
Notes to the Financial Statementsfor the year ended December 31, 2015 (continued)
Sub-Funds
Class “F” Shares,including all their
subscripts
Class “G” Shares,including all their
subscripts
Class “J” Shares,including all their
subscripts
Class “R” Shares,including all their
subscripts
Hong Kong Equity Fund 1.00% 1.50% 1.00% 0.75%India Equity Fund 1.00% 1.50% 0.225% 0.75%Indonesia Equity Fund 1.00% 1.50% 0.225% 0.75%Japan Dynamic Fund 1.25% 2.00% 1.25% 0.75%Japan Equity Fund 1.00% 1.50% 1.00% 0.75%Japan Fundamental Value Fund 1.00% 1.50% 1.00% 0.75%Japan Smaller Companies Fund N/A N/A 1.00% 0.75%Latin American Equity Fund 1.00% 1.50% 1.00% 0.75%Malaysia Equity Fund 1.00% 1.50% 0.25% 0.75%North America Fund* 1.00% 1.50% 1.00% 0.75%North American Value Fund 1.00% 1.50% 1.00% 0.75%Pan European Fund 1.00% 1.50% 1.00% 0.75%Philippines Equity Fund 1.00% 1.50% 1.00% 0.75%Thailand Equity Fund 1.00% 1.50% 0.225% 0.75%US Bond Fund 0.50% 0.70% 0.50% 0.625%US Corporate Bond Fund 0.50% 0.70% 0.50% 0.625%US High Investment Grade Bond Fund 0.50% 0.70% 0.50% 0.625%US High Yield Bond Fund 0.625% N/A 0.50% 0.625%US Investment Grade Bond Fund 0.50% 0.70% 0.50% 0.625%US Strategic Income Bond Fund 0.50% 0.70% 0.50% 0.625%US Total Return Bond Fund 0.50% 0.70% 0.50% 0.625%Vietnam Equity Fund 1.75% 2.00% 1.75% 1.00%World Value Equity Fund 1.00% 1.50% 1.00% 0.75%
* Sub-Fund was fully redeemed, see Note 1.** There was a management fee rate change on Class J for Asian Infrastructure Equity Fund from 0.45% to 0.425% with effective date September 1, 2015.
4. Administration FeesEastspring Investments (Singapore) Limited (the “Global Distributor”) is entitled to receive a fee, payable monthly in arrears as a percentage per annum of the average monthly Net Asset Value of the Sub-Fund during the relevant month in consideration of distribution-related services provided to the relevant Sub-Funds and to all its subscripts. The Management Company collects from the SICAV the amount of fees due to the Global Distributor.
For the year ended December 31, 2015 the Administration Fees per Class A and R are up to a maximum of 0.50% and Class F and G are up to a maximum of 0.20% as stated in the prospectus.
5. Custodian, Central Administration, Registrar and Transfer Agent Fees and Listing Agent FeesThe Bank of New York Mellon (Luxembourg) S.A. acts as Custodian, Central Administrator Registrar and Transfer Agent and Listing Agent to the Company, and is entitled to receive from the SICAV their customary annual fees which are payable at the end of each month and charges all rates in accordance with normal banking practices in Luxembourg.
The SICAV pays the Custodian safekeeping fees per line of stock per annum and transaction fees based on the number and the location of the transactions. The Listing Agent will receive customary fees for the performance of its duties as such.
6. Tax StatusThe SICAV is registered under Luxembourg law as an investment company. Accordingly, no Luxembourg income or capital gains tax is at present payable by the Company. However, it is subject to an annual “taxe d’abonnement” calculated at an annual rate of 0.05% of the net assets, such tax being payable quarterly and calculated on the basis of the net assets of all Sub-Funds at the end of the relevant quarter. This tax is reduced to 0.01% per annum of the net assets relative to shares reserved to institutional investors. The portion of the net assets invested in undertakings for collective investments already subject to the “taxe d’abonnement” are exempt from this tax.
For Austrian residents only
Some share classes of the SICAV are tax transparent in Austria. The list of share classes considered as tax transparent in Austria is available on the website of the Oesterreichische Kontrollbank AG (“OeKB”) at https://www.profitweb.at Liste KESt-Meldefonds.
The Deemed Distribution Income (or “DDI”) or any distribution payments to investors are likely available no later than seven months after year-end of the fund or rather one day before the payment date of distribution and will be

212
EASTSPRING INVESTMENTS
Notes to the Financial Statementsfor the year ended December 31, 2015 (continued)
published on the OeKB website upon availability. If the shares are held by individuals and corporations tax resident in Austria and subject to Austrian withholding tax at an Austrian deposit Austrian banks deduct the Austrian withholding tax at investor level.
For German residents only
Some share classes of the SICAV are tax transparent in Germany. The share classes considered as tax transparent in Germany are displayed on https://www.bundesanzeiger.de/.
The Deemed Distribution Income (or “DDI”) and the distributed income are likely available no later than four months after year-end or distribution decision date, respectively. Both later will be made available on https://www.bundesanzeiger.de/.
The daily German tax figures and Accumulated Deemed Distributed Income (or “ADDI”) will be published on www.fundinfo.com and WM-Daten per each Valuation date.
Investors are responsible for reporting and disclosing the relevant DDI and distributed income where necessary in their own tax return.
For Swiss residents only
Some share classes of the SICAV are tax transparent in Switzerland and are visible on https://www.ictax.admin.ch.
The Net Investment Income (“NII”) will be published on the website of the Swiss Federal Tax Administration upon availability at https://www.ictax.admin.ch.
Investors are responsible for reporting and disclosing the relevant tax figures and distributed income where necessary in their own tax return.
For UK residents only
The United Kingdom Reporting Fund Status (“UK RFS”) has been granted to some share classes of the SICAV. Details of which funds have UK RFS can be found on the HMRC’s website at https://www.gov.uk/government/publications/offshore-funds-list-of-reporting-funds. This list reflects as well the ceased date when the share classes withdraw from the regime.
Reportable income figures are likely available six months after year end and will be published on the website of the Management Company (www.eastspring.lu) upon availability.
Investors are responsible for reporting and disclosing the relevant excess of reportable income and distributed income where necessary in their own tax return.
7. Audit Fees, Printing, Publication Expenses, Compliance Fee and Other ChargesThe SICAV bears all its operating expenses, including without limitation the costs of buying and selling securities, governmental charges, legal and auditing fees, interest, printing, reporting and publication expenses, paying agency fees, postage and telephone.
Any charges and costs attributable to a specific Sub-Fund will be allocated directly to that Sub-Fund.
Any charges and costs that cannot be directly attributable to a specific Sub-Fund will be allocated equally to the various Sub-Funds or, if the amounts so require, they will be allocated to the Sub-Funds in proportion to their respective net assets.
The Management Company is entitled to receive from the SICAV on demand reimbursement for its reasonable cash disbursements in the performance of its duties, including but not limited to out-of-pocket expenses.
Fees paid out to Directors in consideration of their duties for the year ended December 31, 2015 amounted to EUR 123,483 gross of taxation. Currently only Independent Directors are remunerated by the SICAV.
8. Registration and Distribution of Sub-FundsA list of countries where the Sub-Funds are registered, notified and distributed for sale is provided in Appendix 2.
9. Risk ManagementThe method used to calculate the global exposure of the Sub-Funds is the commitment approach.

213
EASTSPRING INVESTMENTS
Notes to the Financial Statementsfor the year ended December 31, 2015 (continued)
10. Forward Foreign Exchange ContractsAs at December 31, 2015, the SICAV has the following open forward foreign exchange contracts:
CurrencyAmount
Purchased CurrencyAmount
Sold Maturity Counterparty
Unrealised appreciation/
(depreciation)
Asian Bond Fund USDUSD 9,432,479 CNY 60,000,000 4/1/2016 UBS AG 298,260 USD 3,183,362 PHP 150,000,000 5/2/2016 UBS AG (5,059)USD 17,526,640 SGD 25,000,000 12/2/2016 UBS AG (103,970)USD 8,413,967 SGD 12,000,000 11/1/2016 UBS AG (58,091)AUD Class Hedges AUD 19,747,383 USD 14,273,052 15/1/2016 BNY Mellon Corp 171,208 USD 1,677,576 AUD 2,354,247 15/1/2016 BNY Mellon Corp (44,456)CAD Class Hedges CAD 1,123 USD 863 15/1/2016 BNY Mellon Corp (53)CHF Class Hedges CHF 2,156 USD 2,238 15/1/2016 BNY Mellon Corp (78)CNH Class Hedges CNY 3,187 USD 498 15/1/2016 BNY Mellon Corp (13)EUR Class Hedges EUR 3,767 USD 4,254 15/1/2016 BNY Mellon Corp (153)GBP Class Hedges GBP 2,108 USD 3,237 15/1/2016 BNY Mellon Corp (117)HKD Class Hedges HKD 60,396,692 USD 7,795,032 15/1/2016 BNY Mellon Corp (2,074)NZD Class Hedges NZD 297,440 USD 197,297 15/1/2016 BNY Mellon Corp 6,432 USD 43,897 NZD 64,927 15/1/2016 BNY Mellon Corp (574)SGD Class Hedges SGD 1,004 USD 713 15/1/2016 BNY Mellon Corp (5)ZAR Class Hedges USD 2,419,752 ZAR 34,835,673 15/1/2016 BNY Mellon Corp 180,496 ZAR 340,160,251 USD 24,904,295 15/1/2016 BNY Mellon Corp (3,042,169)
Total net unrealised depreciation (2,600,416)
Underlying exposure to forward foreign exchange contracts BNY Mellon Corp 48,404,654 UBS AG 38,555,724
Asian Equity Fund USDAUD Class Hedges AUD 6,197 USD 4,479 15/1/2016 BNY Mellon Corp 54 USD 611 AUD 861 15/1/2016 BNY Mellon Corp (18)NZD Class Hedges NZD 456 USD 303 15/1/2016 BNY Mellon Corp 10 USD 41 NZD 62 15/1/2016 BNY Mellon Corp (2)ZAR Class Hedges USD 12,377 ZAR 181,738 15/1/2016 BNY Mellon Corp 685 ZAR 1,178,316 USD 86,580 15/1/2016 BNY Mellon Corp (10,785)
Total net unrealised depreciation (10,056)
Underlying exposure to forward foreign exchange contracts BNY Mellon Corp 93,210
Asian Equity Income Fund USDAUD Class Hedges AUD 24,013,937 USD 17,353,137 15/1/2016 BNY Mellon Corp 211,903 USD 2,517,455 AUD 3,527,159 15/1/2016 BNY Mellon Corp (62,510)CNH Class Hedges CNY 3,014 USD 470 15/1/2016 BNY Mellon Corp (12)USD 46 CNY 299 15/1/2016 BNY Mellon Corp 1 NZD Class Hedges NZD 2,849,344 USD 1,889,900 15/1/2016 BNY Mellon Corp 61,733 USD 286,302 NZD 430,582 15/1/2016 BNY Mellon Corp (8,620)
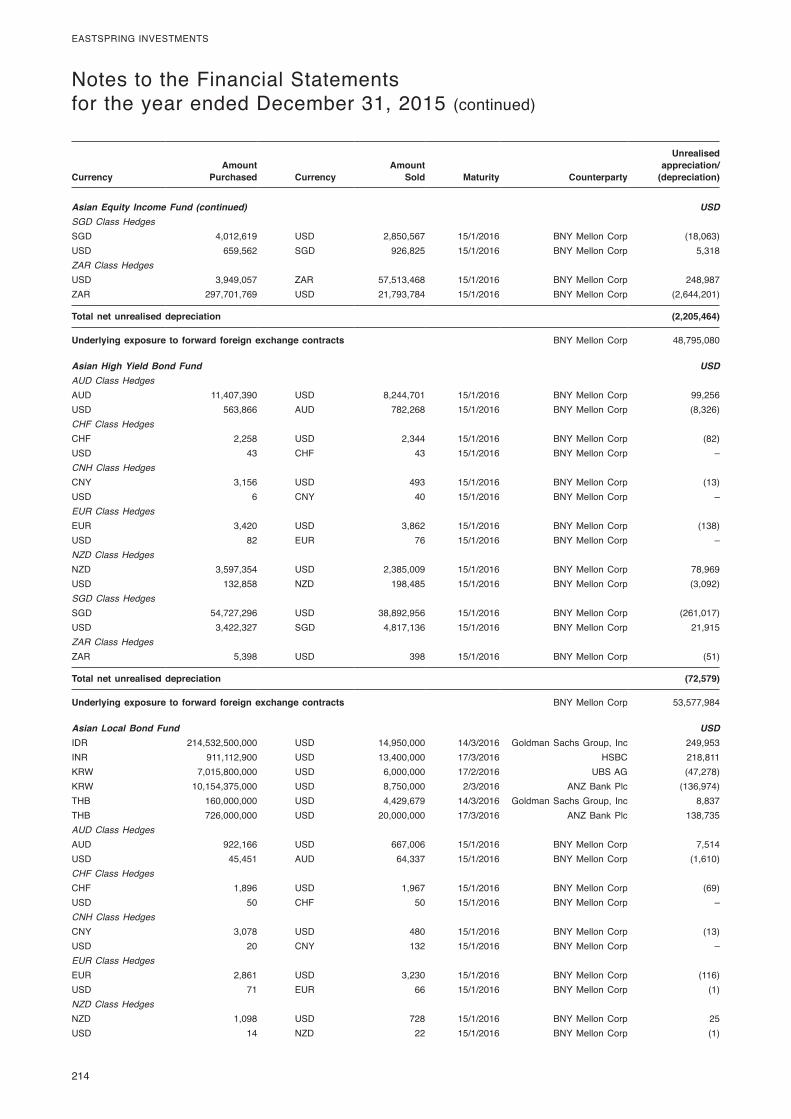
214
EASTSPRING INVESTMENTS
Notes to the Financial Statementsfor the year ended December 31, 2015 (continued)
CurrencyAmount
Purchased CurrencyAmount
Sold Maturity Counterparty
Unrealised appreciation/
(depreciation)
Asian Equity Income Fund (continued) USDSGD Class Hedges SGD 4,012,619 USD 2,850,567 15/1/2016 BNY Mellon Corp (18,063)USD 659,562 SGD 926,825 15/1/2016 BNY Mellon Corp 5,318 ZAR Class Hedges USD 3,949,057 ZAR 57,513,468 15/1/2016 BNY Mellon Corp 248,987 ZAR 297,701,769 USD 21,793,784 15/1/2016 BNY Mellon Corp (2,644,201)
Total net unrealised depreciation (2,205,464)
Underlying exposure to forward foreign exchange contracts BNY Mellon Corp 48,795,080
Asian High Yield Bond Fund USDAUD Class Hedges AUD 11,407,390 USD 8,244,701 15/1/2016 BNY Mellon Corp 99,256 USD 563,866 AUD 782,268 15/1/2016 BNY Mellon Corp (8,326)CHF Class Hedges CHF 2,258 USD 2,344 15/1/2016 BNY Mellon Corp (82)USD 43 CHF 43 15/1/2016 BNY Mellon Corp –CNH Class Hedges CNY 3,156 USD 493 15/1/2016 BNY Mellon Corp (13)USD 6 CNY 40 15/1/2016 BNY Mellon Corp –EUR Class Hedges EUR 3,420 USD 3,862 15/1/2016 BNY Mellon Corp (138)USD 82 EUR 76 15/1/2016 BNY Mellon Corp – NZD Class Hedges NZD 3,597,354 USD 2,385,009 15/1/2016 BNY Mellon Corp 78,969 USD 132,858 NZD 198,485 15/1/2016 BNY Mellon Corp (3,092)SGD Class Hedges SGD 54,727,296 USD 38,892,956 15/1/2016 BNY Mellon Corp (261,017)USD 3,422,327 SGD 4,817,136 15/1/2016 BNY Mellon Corp 21,915 ZAR Class Hedges ZAR 5,398 USD 398 15/1/2016 BNY Mellon Corp (51)
Total net unrealised depreciation (72,579)
Underlying exposure to forward foreign exchange contracts BNY Mellon Corp 53,577,984
Asian Local Bond Fund USDIDR 214,532,500,000 USD 14,950,000 14/3/2016 Goldman Sachs Group, Inc 249,953INR 911,112,900 USD 13,400,000 17/3/2016 HSBC 218,811KRW 7,015,800,000 USD 6,000,000 17/2/2016 UBS AG (47,278)KRW 10,154,375,000 USD 8,750,000 2/3/2016 ANZ Bank Plc (136,974)THB 160,000,000 USD 4,429,679 14/3/2016 Goldman Sachs Group, Inc 8,837THB 726,000,000 USD 20,000,000 17/3/2016 ANZ Bank Plc 138,735AUD Class Hedges AUD 922,166 USD 667,006 15/1/2016 BNY Mellon Corp 7,514USD 45,451 AUD 64,337 15/1/2016 BNY Mellon Corp (1,610)CHF Class Hedges CHF 1,896 USD 1,967 15/1/2016 BNY Mellon Corp (69)USD 50 CHF 50 15/1/2016 BNY Mellon Corp –CNH Class Hedges CNY 3,078 USD 480 15/1/2016 BNY Mellon Corp (13)USD 20 CNY 132 15/1/2016 BNY Mellon Corp –EUR Class Hedges EUR 2,861 USD 3,230 15/1/2016 BNY Mellon Corp (116)USD 71 EUR 66 15/1/2016 BNY Mellon Corp (1)NZD Class HedgesNZD 1,098 USD 728 15/1/2016 BNY Mellon Corp 25USD 14 NZD 22 15/1/2016 BNY Mellon Corp (1)
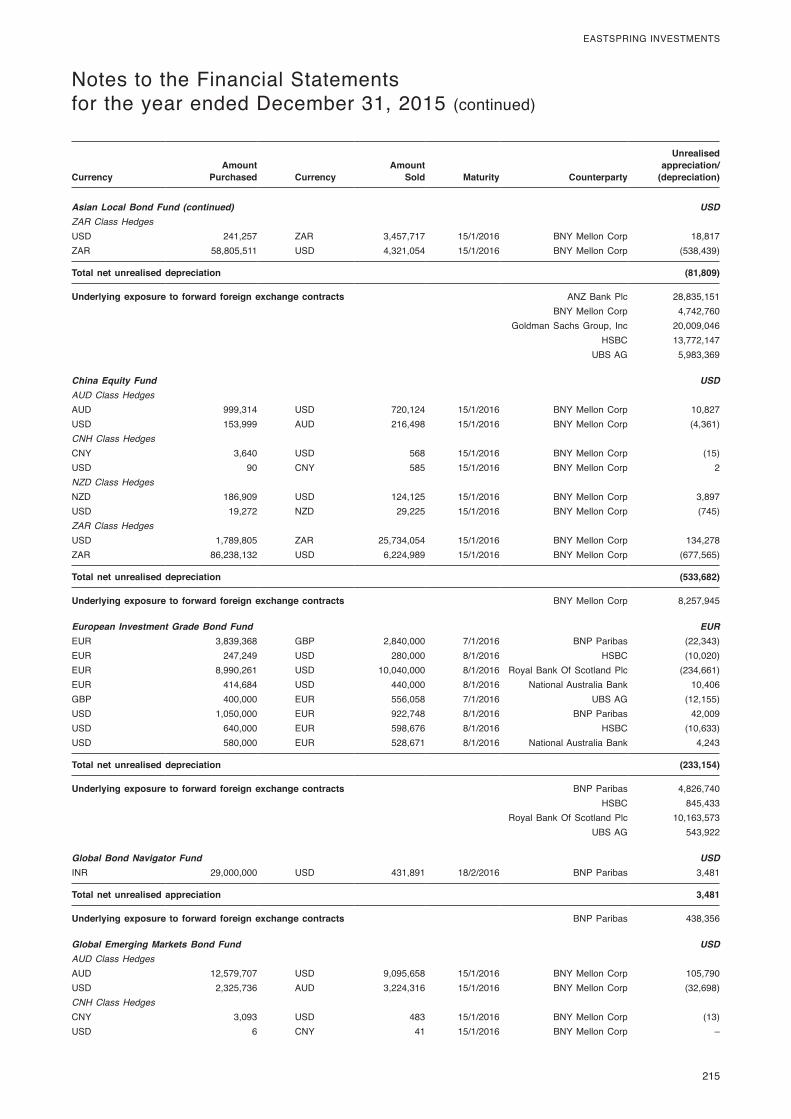
215
EASTSPRING INVESTMENTS
Notes to the Financial Statementsfor the year ended December 31, 2015 (continued)
CurrencyAmount
Purchased CurrencyAmount
Sold Maturity Counterparty
Unrealised appreciation/
(depreciation)
Asian Local Bond Fund (continued) USDZAR Class Hedges USD 241,257 ZAR 3,457,717 15/1/2016 BNY Mellon Corp 18,817ZAR 58,805,511 USD 4,321,054 15/1/2016 BNY Mellon Corp (538,439)
Total net unrealised depreciation (81,809)
Underlying exposure to forward foreign exchange contracts ANZ Bank Plc 28,835,151 BNY Mellon Corp 4,742,760
Goldman Sachs Group, Inc 20,009,046 HSBC 13,772,147
UBS AG 5,983,369
China Equity Fund USDAUD Class Hedges AUD 999,314 USD 720,124 15/1/2016 BNY Mellon Corp 10,827 USD 153,999 AUD 216,498 15/1/2016 BNY Mellon Corp (4,361)CNH Class Hedges CNY 3,640 USD 568 15/1/2016 BNY Mellon Corp (15)USD 90 CNY 585 15/1/2016 BNY Mellon Corp 2 NZD Class Hedges NZD 186,909 USD 124,125 15/1/2016 BNY Mellon Corp 3,897 USD 19,272 NZD 29,225 15/1/2016 BNY Mellon Corp (745)ZAR Class Hedges USD 1,789,805 ZAR 25,734,054 15/1/2016 BNY Mellon Corp 134,278 ZAR 86,238,132 USD 6,224,989 15/1/2016 BNY Mellon Corp (677,565)
Total net unrealised depreciation (533,682)
Underlying exposure to forward foreign exchange contracts BNY Mellon Corp 8,257,945
European Investment Grade Bond Fund EUREUR 3,839,368 GBP 2,840,000 7/1/2016 BNP Paribas (22,343)EUR 247,249 USD 280,000 8/1/2016 HSBC (10,020)EUR 8,990,261 USD 10,040,000 8/1/2016 Royal Bank Of Scotland Plc (234,661)EUR 414,684 USD 440,000 8/1/2016 National Australia Bank 10,406GBP 400,000 EUR 556,058 7/1/2016 UBS AG (12,155)USD 1,050,000 EUR 922,748 8/1/2016 BNP Paribas 42,009USD 640,000 EUR 598,676 8/1/2016 HSBC (10,633)USD 580,000 EUR 528,671 8/1/2016 National Australia Bank 4,243
Total net unrealised depreciation (233,154)
Underlying exposure to forward foreign exchange contracts BNP Paribas 4,826,740 HSBC 845,433
Royal Bank Of Scotland Plc 10,163,573 UBS AG 543,922
Global Bond Navigator Fund USDINR 29,000,000 USD 431,891 18/2/2016 BNP Paribas 3,481
Total net unrealised appreciation 3,481
Underlying exposure to forward foreign exchange contracts BNP Paribas 438,356
Global Emerging Markets Bond Fund USDAUD Class Hedges AUD 12,579,707 USD 9,095,658 15/1/2016 BNY Mellon Corp 105,790 USD 2,325,736 AUD 3,224,316 15/1/2016 BNY Mellon Corp (32,698)CNH Class Hedges CNY 3,093 USD 483 15/1/2016 BNY Mellon Corp (13)USD 6 CNY 41 15/1/2016 BNY Mellon Corp –
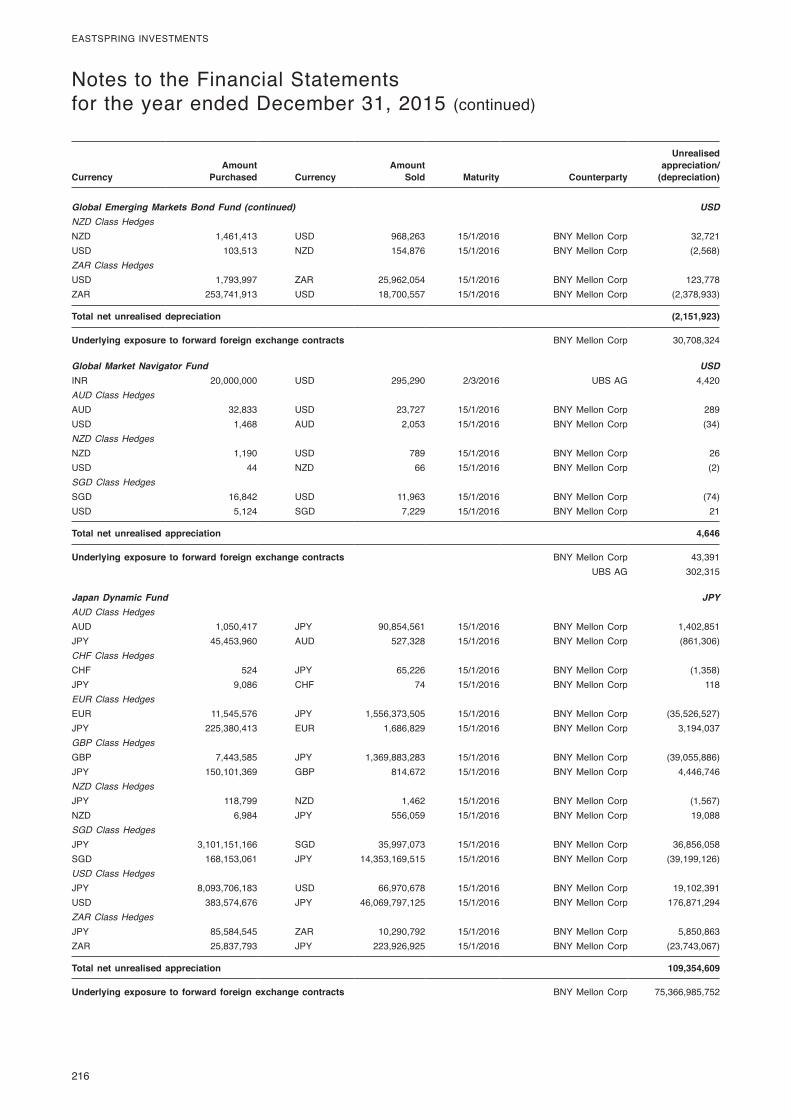
216
EASTSPRING INVESTMENTS
Notes to the Financial Statementsfor the year ended December 31, 2015 (continued)
CurrencyAmount
Purchased CurrencyAmount
Sold Maturity Counterparty
Unrealised appreciation/
(depreciation)
Global Emerging Markets Bond Fund (continued) USDNZD Class Hedges NZD 1,461,413 USD 968,263 15/1/2016 BNY Mellon Corp 32,721 USD 103,513 NZD 154,876 15/1/2016 BNY Mellon Corp (2,568)ZAR Class Hedges USD 1,793,997 ZAR 25,962,054 15/1/2016 BNY Mellon Corp 123,778 ZAR 253,741,913 USD 18,700,557 15/1/2016 BNY Mellon Corp (2,378,933)
Total net unrealised depreciation (2,151,923)
Underlying exposure to forward foreign exchange contracts BNY Mellon Corp 30,708,324
Global Market Navigator Fund USDINR 20,000,000 USD 295,290 2/3/2016 UBS AG 4,420 AUD Class Hedges AUD 32,833 USD 23,727 15/1/2016 BNY Mellon Corp 289 USD 1,468 AUD 2,053 15/1/2016 BNY Mellon Corp (34)NZD Class Hedges NZD 1,190 USD 789 15/1/2016 BNY Mellon Corp 26 USD 44 NZD 66 15/1/2016 BNY Mellon Corp (2)SGD Class Hedges SGD 16,842 USD 11,963 15/1/2016 BNY Mellon Corp (74)USD 5,124 SGD 7,229 15/1/2016 BNY Mellon Corp 21
Total net unrealised appreciation 4,646
Underlying exposure to forward foreign exchange contracts BNY Mellon Corp 43,391 UBS AG 302,315
Japan Dynamic Fund JPYAUD Class Hedges AUD 1,050,417 JPY 90,854,561 15/1/2016 BNY Mellon Corp 1,402,851JPY 45,453,960 AUD 527,328 15/1/2016 BNY Mellon Corp (861,306)CHF Class Hedges CHF 524 JPY 65,226 15/1/2016 BNY Mellon Corp (1,358)JPY 9,086 CHF 74 15/1/2016 BNY Mellon Corp 118EUR Class Hedges EUR 11,545,576 JPY 1,556,373,505 15/1/2016 BNY Mellon Corp (35,526,527)JPY 225,380,413 EUR 1,686,829 15/1/2016 BNY Mellon Corp 3,194,037GBP Class Hedges GBP 7,443,585 JPY 1,369,883,283 15/1/2016 BNY Mellon Corp (39,055,886)JPY 150,101,369 GBP 814,672 15/1/2016 BNY Mellon Corp 4,446,746NZD Class Hedges JPY 118,799 NZD 1,462 15/1/2016 BNY Mellon Corp (1,567)NZD 6,984 JPY 556,059 15/1/2016 BNY Mellon Corp 19,088SGD Class HedgesJPY 3,101,151,166 SGD 35,997,073 15/1/2016 BNY Mellon Corp 36,856,058SGD 168,153,061 JPY 14,353,169,515 15/1/2016 BNY Mellon Corp (39,199,126)USD Class Hedges JPY 8,093,706,183 USD 66,970,678 15/1/2016 BNY Mellon Corp 19,102,391USD 383,574,676 JPY 46,069,797,125 15/1/2016 BNY Mellon Corp 176,871,294ZAR Class Hedges JPY 85,584,545 ZAR 10,290,792 15/1/2016 BNY Mellon Corp 5,850,863ZAR 25,837,793 JPY 223,926,925 15/1/2016 BNY Mellon Corp (23,743,067)
Total net unrealised appreciation 109,354,609
Underlying exposure to forward foreign exchange contracts BNY Mellon Corp 75,366,985,752
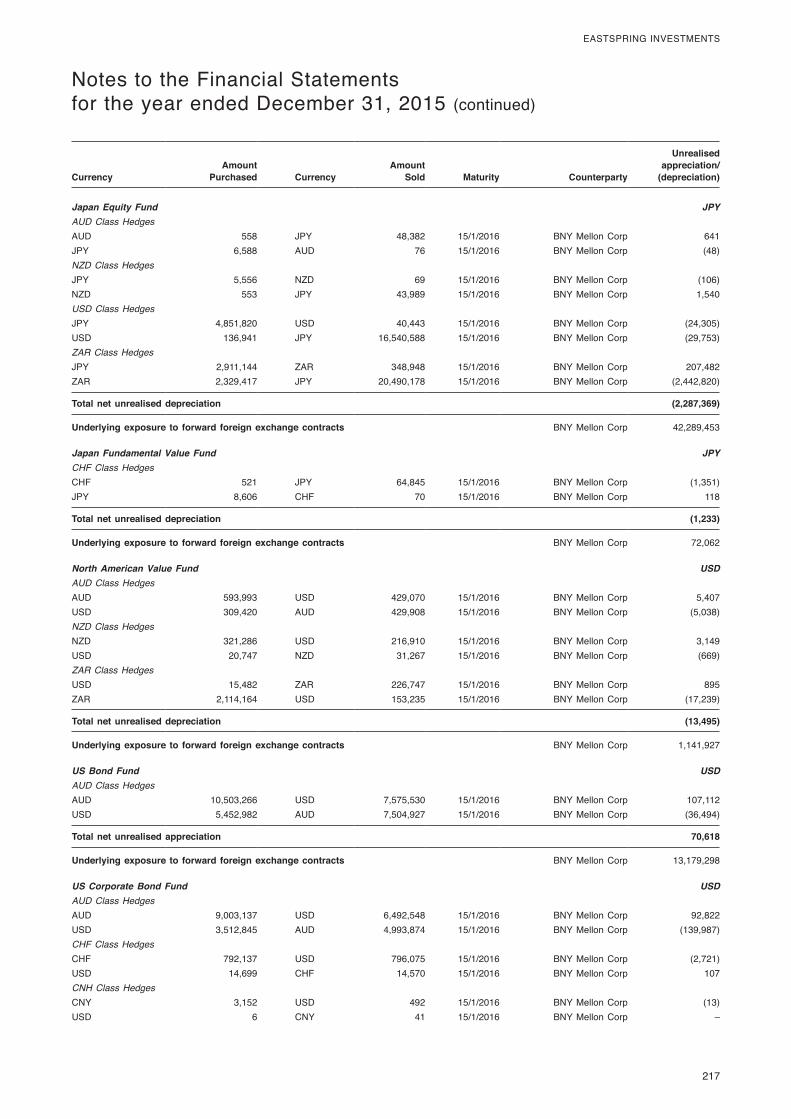
217
EASTSPRING INVESTMENTS
Notes to the Financial Statementsfor the year ended December 31, 2015 (continued)
CurrencyAmount
Purchased CurrencyAmount
Sold Maturity Counterparty
Unrealised appreciation/
(depreciation)
Japan Equity Fund JPYAUD Class Hedges AUD 558 JPY 48,382 15/1/2016 BNY Mellon Corp 641JPY 6,588 AUD 76 15/1/2016 BNY Mellon Corp (48)NZD Class Hedges JPY 5,556 NZD 69 15/1/2016 BNY Mellon Corp (106)NZD 553 JPY 43,989 15/1/2016 BNY Mellon Corp 1,540USD Class Hedges JPY 4,851,820 USD 40,443 15/1/2016 BNY Mellon Corp (24,305)USD 136,941 JPY 16,540,588 15/1/2016 BNY Mellon Corp (29,753)ZAR Class Hedges JPY 2,911,144 ZAR 348,948 15/1/2016 BNY Mellon Corp 207,482ZAR 2,329,417 JPY 20,490,178 15/1/2016 BNY Mellon Corp (2,442,820)
Total net unrealised depreciation (2,287,369)
Underlying exposure to forward foreign exchange contracts BNY Mellon Corp 42,289,453
Japan Fundamental Value Fund JPYCHF Class Hedges CHF 521 JPY 64,845 15/1/2016 BNY Mellon Corp (1,351)JPY 8,606 CHF 70 15/1/2016 BNY Mellon Corp 118
Total net unrealised depreciation (1,233)
Underlying exposure to forward foreign exchange contracts BNY Mellon Corp 72,062
North American Value Fund USDAUD Class Hedges AUD 593,993 USD 429,070 15/1/2016 BNY Mellon Corp 5,407 USD 309,420 AUD 429,908 15/1/2016 BNY Mellon Corp (5,038)NZD Class Hedges NZD 321,286 USD 216,910 15/1/2016 BNY Mellon Corp 3,149 USD 20,747 NZD 31,267 15/1/2016 BNY Mellon Corp (669)ZAR Class Hedges USD 15,482 ZAR 226,747 15/1/2016 BNY Mellon Corp 895 ZAR 2,114,164 USD 153,235 15/1/2016 BNY Mellon Corp (17,239)
Total net unrealised depreciation (13,495)
Underlying exposure to forward foreign exchange contracts BNY Mellon Corp 1,141,927
US Bond Fund USDAUD Class Hedges AUD 10,503,266 USD 7,575,530 15/1/2016 BNY Mellon Corp 107,112 USD 5,452,982 AUD 7,504,927 15/1/2016 BNY Mellon Corp (36,494)
Total net unrealised appreciation 70,618
Underlying exposure to forward foreign exchange contracts BNY Mellon Corp 13,179,298
US Corporate Bond Fund USDAUD Class Hedges AUD 9,003,137 USD 6,492,548 15/1/2016 BNY Mellon Corp 92,822 USD 3,512,845 AUD 4,993,874 15/1/2016 BNY Mellon Corp (139,987)CHF Class Hedges CHF 792,137 USD 796,075 15/1/2016 BNY Mellon Corp (2,721)USD 14,699 CHF 14,570 15/1/2016 BNY Mellon Corp 107 CNH Class Hedges CNY 3,152 USD 492 15/1/2016 BNY Mellon Corp (13)USD 6 CNY 41 15/1/2016 BNY Mellon Corp –

218
EASTSPRING INVESTMENTS
Notes to the Financial Statementsfor the year ended December 31, 2015 (continued)
CurrencyAmount
Purchased CurrencyAmount
Sold Maturity Counterparty
Unrealised appreciation/
(depreciation)
US Corporate Bond Fund (continued) USDEUR Class Hedges EUR 8,998,863 USD 9,952,113 15/1/2016 BNY Mellon Corp (156,353)USD 1,280,144 EUR 1,179,216 15/1/2016 BNY Mellon Corp (3,491)GBP Class Hedges GBP 99,041,499 USD 151,985,461 15/1/2016 BNY Mellon Corp (5,414,192)USD 4,889,187 GBP 3,229,886 15/1/2016 BNY Mellon Corp 109,289 NZD Class Hedges NZD 16,975 USD 11,247 15/1/2016 BNY Mellon Corp 380 USD 65 NZD 99 15/1/2016 BNY Mellon Corp (3)SGD Class Hedges SGD 16,212 USD 11,517 15/1/2016 BNY Mellon Corp (73)ZAR Class Hedges USD 1,050,774 ZAR 15,004,407 15/1/2016 BNY Mellon Corp 85,522 ZAR 100,194,587 USD 7,351,902 15/1/2016 BNY Mellon Corp (906,948)
Total net unrealised depreciation (6,335,661)
Underlying exposure to forward foreign exchange contracts BNY Mellon Corp 180,934,847
US High Yield Bond Fund USDAUD Class Hedges AUD 249,474,265 USD 180,288,843 15/1/2016 BNY Mellon Corp 2,189,582 USD 26,223,346 AUD 36,561,206 15/1/2016 BNY Mellon Corp (519,529)CHF Class Hedges CHF 974 USD 1,011 15/1/2016 BNY Mellon Corp (36)USD 73 CHF 72 15/1/2016 BNY Mellon Corp – CNH Class Hedges CNY 2,889 USD 451 15/1/2016 BNY Mellon Corp (12)USD 30 CNY 193 15/1/2016 BNY Mellon Corp – EUR Class Hedges EUR 2,009 USD 2,269 15/1/2016 BNY Mellon Corp (82)USD 165 EUR 152 15/1/2016 BNY Mellon Corp – NZD Class Hedges NZD 9,130,973 USD 6,051,755 15/1/2016 BNY Mellon Corp 202,430 USD 759,834 NZD 1,144,936 15/1/2016 BNY Mellon Corp (24,379)ZAR Class Hedges USD 78,920,362 ZAR 1,166,485,421 15/1/2016 BNY Mellon Corp 3,873,308 ZAR 7,203,325,537 USD 530,392,306 15/1/2016 BNY Mellon Corp (67,046,623)
Total net unrealised depreciation (61,325,341)
Underlying exposure to forward foreign exchange contracts BNY Mellon Corp 756,022,217
US Investment Grade Bond Fund USDAUD Class Hedges AUD 4,589,407 USD 3,316,557 15/1/2016 BNY Mellon Corp 40,373 USD 329,311 AUD 454,668 15/1/2016 BNY Mellon Corp (3,256)CAD Class Hedges CAD 1,087 USD 836 15/1/2016 BNY Mellon Corp (51)USD 11 CAD 15 15/1/2016 BNY Mellon Corp – CHF Class Hedges CHF 2,100 USD 2,180 15/1/2016 BNY Mellon Corp (77)USD 34 CHF 33 15/1/2016 BNY Mellon Corp – EUR Class Hedges EUR 66,451 USD 75,048 15/1/2016 BNY Mellon Corp (2,712)USD 1,161 EUR 1,062 15/1/2016 BNY Mellon Corp 4 GBP Class Hedges GBP 1,064 USD 1,633 15/1/2016 BNY Mellon Corp (59)USD 22 GBP 14 15/1/2016 BNY Mellon Corp –
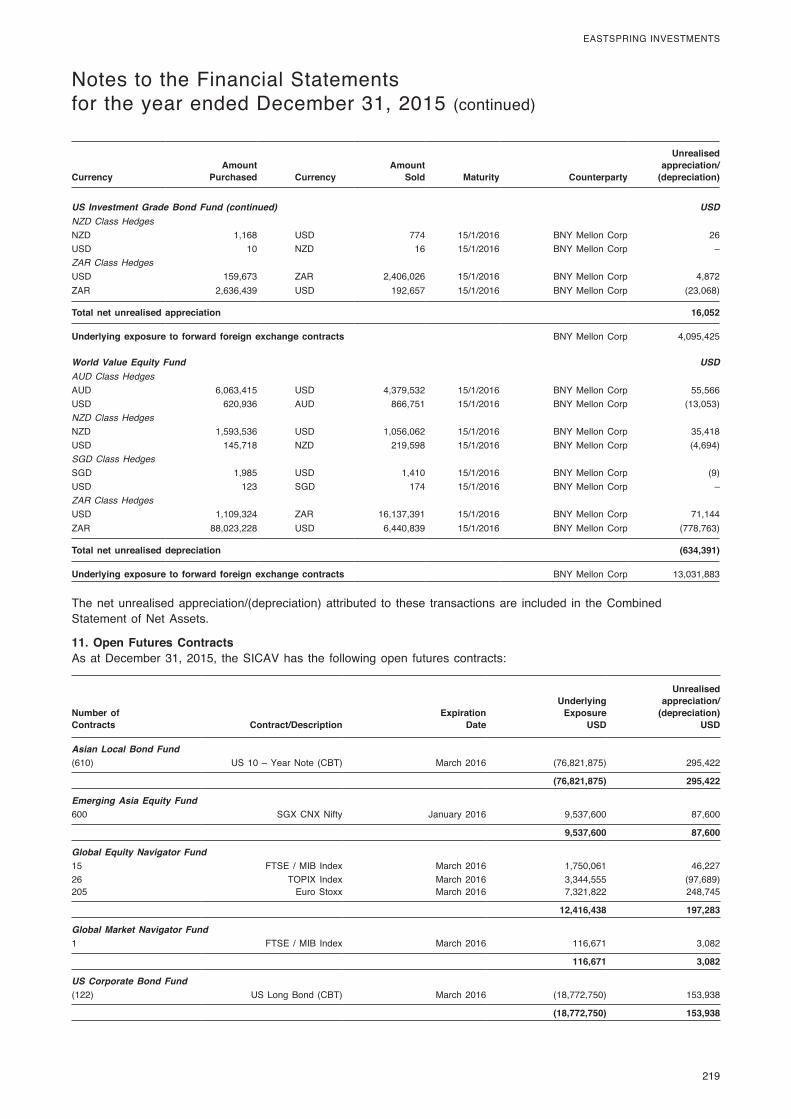
219
EASTSPRING INVESTMENTS
Notes to the Financial Statementsfor the year ended December 31, 2015 (continued)
CurrencyAmount
Purchased CurrencyAmount
Sold Maturity Counterparty
Unrealised appreciation/
(depreciation)
US Investment Grade Bond Fund (continued) USDNZD Class Hedges NZD 1,168 USD 774 15/1/2016 BNY Mellon Corp 26 USD 10 NZD 16 15/1/2016 BNY Mellon Corp – ZAR Class Hedges USD 159,673 ZAR 2,406,026 15/1/2016 BNY Mellon Corp 4,872 ZAR 2,636,439 USD 192,657 15/1/2016 BNY Mellon Corp (23,068)
Total net unrealised appreciation 16,052
Underlying exposure to forward foreign exchange contracts BNY Mellon Corp 4,095,425
World Value Equity Fund USDAUD Class Hedges AUD 6,063,415 USD 4,379,532 15/1/2016 BNY Mellon Corp 55,566 USD 620,936 AUD 866,751 15/1/2016 BNY Mellon Corp (13,053)NZD Class Hedges NZD 1,593,536 USD 1,056,062 15/1/2016 BNY Mellon Corp 35,418 USD 145,718 NZD 219,598 15/1/2016 BNY Mellon Corp (4,694)SGD Class Hedges SGD 1,985 USD 1,410 15/1/2016 BNY Mellon Corp (9)USD 123 SGD 174 15/1/2016 BNY Mellon Corp – ZAR Class Hedges USD 1,109,324 ZAR 16,137,391 15/1/2016 BNY Mellon Corp 71,144 ZAR 88,023,228 USD 6,440,839 15/1/2016 BNY Mellon Corp (778,763)
Total net unrealised depreciation (634,391)
Underlying exposure to forward foreign exchange contracts BNY Mellon Corp 13,031,883
The net unrealised appreciation/(depreciation) attributed to these transactions are included in the Combined Statement of Net Assets.
11. Open Futures ContractsAs at December 31, 2015, the SICAV has the following open futures contracts:
Number of Contracts Contract/Description
Expiration Date
Underlying Exposure
USD
Unrealised appreciation/
(depreciation) USD
Asian Local Bond Fund(610) US 10 – Year Note (CBT) March 2016 (76,821,875) 295,422
(76,821,875) 295,422
Emerging Asia Equity Fund600 SGX CNX Nifty January 2016 9,537,600 87,600
9,537,600 87,600
Global Equity Navigator Fund15 FTSE / MIB Index March 2016 1,750,061 46,22726 TOPIX Index March 2016 3,344,555 (97,689)205 Euro Stoxx March 2016 7,321,822 248,745
12,416,438 197,283
Global Market Navigator Fund1 FTSE / MIB Index March 2016 116,671 3,082
116,671 3,082
US Corporate Bond Fund(122) US Long Bond (CBT) March 2016 (18,772,750) 153,938
(18,772,750) 153,938

220
EASTSPRING INVESTMENTS
Notes to the Financial Statementsfor the year ended December 31, 2015 (continued)
Number of Contracts Contract/Description
Expiration Date
Underlying Exposure
USD
Unrealised appreciation/
(depreciation) USD
US High Investment Grade Bond Fund(150) US 5 – Year Note (CBT) March 2016 (17,750,390) 33,398(4) US 2 – Year Note (CBT) March 2016 (869,063) 1,31317 US Ultra Bond (CBT) March 2016 2,692,375 (15,430)
(15,927,078) 19,281
US Investment Grade Bond Fund(26) US Long Bond (CBT) March 2016 (4,000,750) 34,906
(4,000,750) 34,906
US Strategic Income Bond Fund*(19) US Ultra Bond (CBT) March 2016 (3,009,124) (8,312)(8) US Long Bond (CBT) March 2016 (1,231,000) (2,000)(5) US 5 – Year Note (CBT) March 2016 (591,680) 648(5) US 10 – Year Note (CBT) March 2016 (629,688) 2,578(2) US 2 – Year Note (CBT) March 2016 (434,531) 469
(5,896,023) (6,617)
US Total Return Bond Fund*(25) US 5 – Year Note (CBT) March 2016 (2,958,398) 7,093(13) US 10 – Year Note (CBT) March 2016 (1,637,188) 5,891(6) US Ultra Bond (CBT) March 2016 (950,250) (1,516)(6) US 2 – Year Note (CBT) March 2016 (1,303,593) 1,969(1) Euro FX Currency March 2016 (136,263) 1,9252 US Long Bond (CBT) March 2016 307,750 180
(6,677,942) 15,542
World Value Equity Fund202 Euro Stoxx March 2016 7,214,673 245,105
7,214,673 245,105
Number of Contracts Contract/Description
Expiration Date
Underlying Exposure
EUR
Unrealised appreciation/
(depreciation) EUR
European Investment Grade Bond Fund(114) Euro Bund March 2016 (18,002,880) 236,930(45) Euro Bobl March 2016 (5,880,150) 12,180(32) US Ultra Bond (CBT) March 2016 (4,657,039) (21,857)(20) Euro Buxl 30 Year Bond March 2016 (3,028,000) 37,763(16) Long Gilt March 2016 (2,539,547) 16,318(12) US 10 – Year Note (CBT) March 2016 (1,388,704) 3,360337 Euro Schatz March 2016 37,578,870 (77,395)
2,082,550 207,299
* New Sub-fund launched, see Note 1.
The net appreciation/(depreciation) attributed to these transactions are included in the Combined Statement of Net Assets.
12. Credit Default SwapsAs at December 31, 2015, the SICAV has the following credit default swaps contracts:
Purchase/Sale of protection
Denomination/ Description Counterparty
Deal Spread
Expiry Date
Nominal Value Currency
Unrealised appreciation
Asian Bond Fund USDPurchase iTraxx Asia Ex-Japan IG HSBC Bank USA 1.00% 20/12/2020 10,000,000 USD 170,831
Total unrealised appreciation on credit default swaps 170,831
Total unrealised appreciation on credit default swaps 170,831
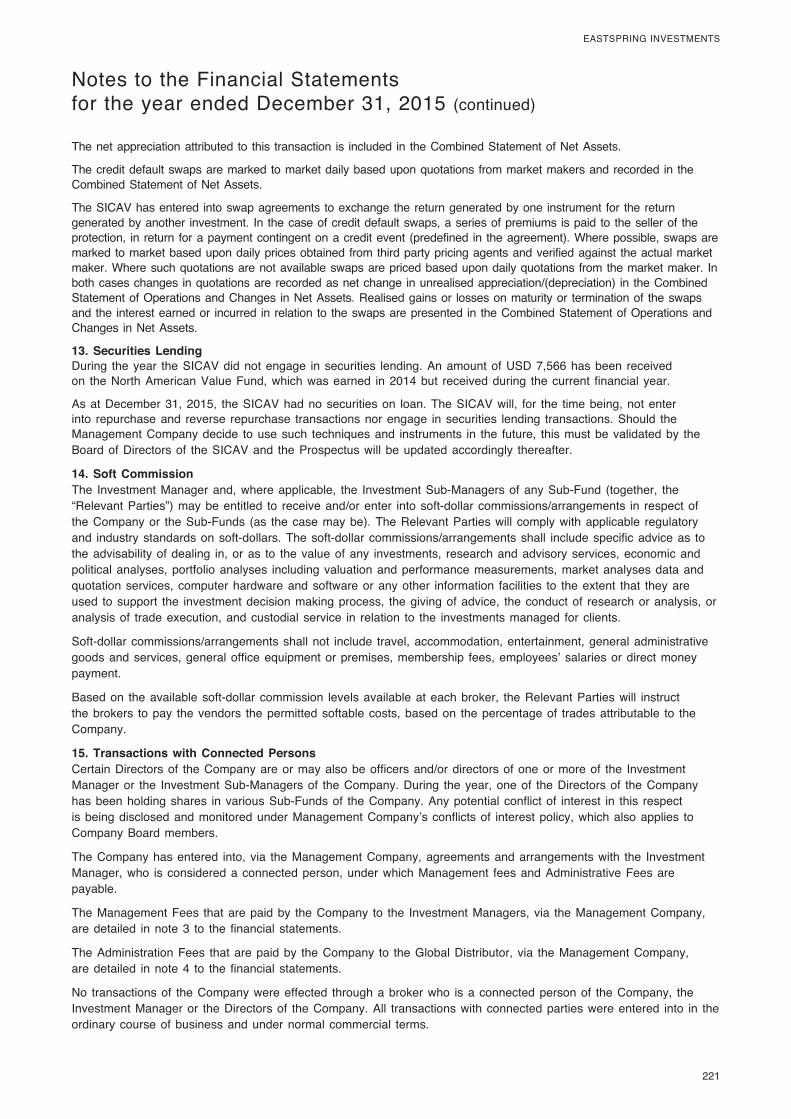
221
EASTSPRING INVESTMENTS
Notes to the Financial Statementsfor the year ended December 31, 2015 (continued)
The net appreciation attributed to this transaction is included in the Combined Statement of Net Assets.
The credit default swaps are marked to market daily based upon quotations from market makers and recorded in the Combined Statement of Net Assets.
The SICAV has entered into swap agreements to exchange the return generated by one instrument for the return generated by another investment. In the case of credit default swaps, a series of premiums is paid to the seller of the protection, in return for a payment contingent on a credit event (predefined in the agreement). Where possible, swaps are marked to market based upon daily prices obtained from third party pricing agents and verified against the actual market maker. Where such quotations are not available swaps are priced based upon daily quotations from the market maker. In both cases changes in quotations are recorded as net change in unrealised appreciation/(depreciation) in the Combined Statement of Operations and Changes in Net Assets. Realised gains or losses on maturity or termination of the swaps and the interest earned or incurred in relation to the swaps are presented in the Combined Statement of Operations and Changes in Net Assets.
13. Securities LendingDuring the year the SICAV did not engage in securities lending. An amount of USD 7,566 has been received on the North American Value Fund, which was earned in 2014 but received during the current financial year.
As at December 31, 2015, the SICAV had no securities on loan. The SICAV will, for the time being, not enter into repurchase and reverse repurchase transactions nor engage in securities lending transactions. Should the Management Company decide to use such techniques and instruments in the future, this must be validated by the Board of Directors of the SICAV and the Prospectus will be updated accordingly thereafter.
14. Soft CommissionThe Investment Manager and, where applicable, the Investment Sub-Managers of any Sub-Fund (together, the “Relevant Parties”) may be entitled to receive and/or enter into soft-dollar commissions/arrangements in respect of the Company or the Sub-Funds (as the case may be). The Relevant Parties will comply with applicable regulatory and industry standards on soft-dollars. The soft-dollar commissions/arrangements shall include specific advice as to the advisability of dealing in, or as to the value of any investments, research and advisory services, economic and political analyses, portfolio analyses including valuation and performance measurements, market analyses data and quotation services, computer hardware and software or any other information facilities to the extent that they are used to support the investment decision making process, the giving of advice, the conduct of research or analysis, or analysis of trade execution, and custodial service in relation to the investments managed for clients.
Soft-dollar commissions/arrangements shall not include travel, accommodation, entertainment, general administrative goods and services, general office equipment or premises, membership fees, employees’ salaries or direct money payment.
Based on the available soft-dollar commission levels available at each broker, the Relevant Parties will instruct the brokers to pay the vendors the permitted softable costs, based on the percentage of trades attributable to the Company.
15. Transactions with Connected PersonsCertain Directors of the Company are or may also be officers and/or directors of one or more of the Investment Manager or the Investment Sub-Managers of the Company. During the year, one of the Directors of the Company has been holding shares in various Sub-Funds of the Company. Any potential conflict of interest in this respect is being disclosed and monitored under Management Company’s conflicts of interest policy, which also applies to Company Board members.
The Company has entered into, via the Management Company, agreements and arrangements with the Investment Manager, who is considered a connected person, under which Management fees and Administrative Fees are payable.
The Management Fees that are paid by the Company to the Investment Managers, via the Management Company, are detailed in note 3 to the financial statements.
The Administration Fees that are paid by the Company to the Global Distributor, via the Management Company, are detailed in note 4 to the financial statements.
No transactions of the Company were effected through a broker who is a connected person of the Company, the Investment Manager or the Directors of the Company. All transactions with connected parties were entered into in the ordinary course of business and under normal commercial terms.
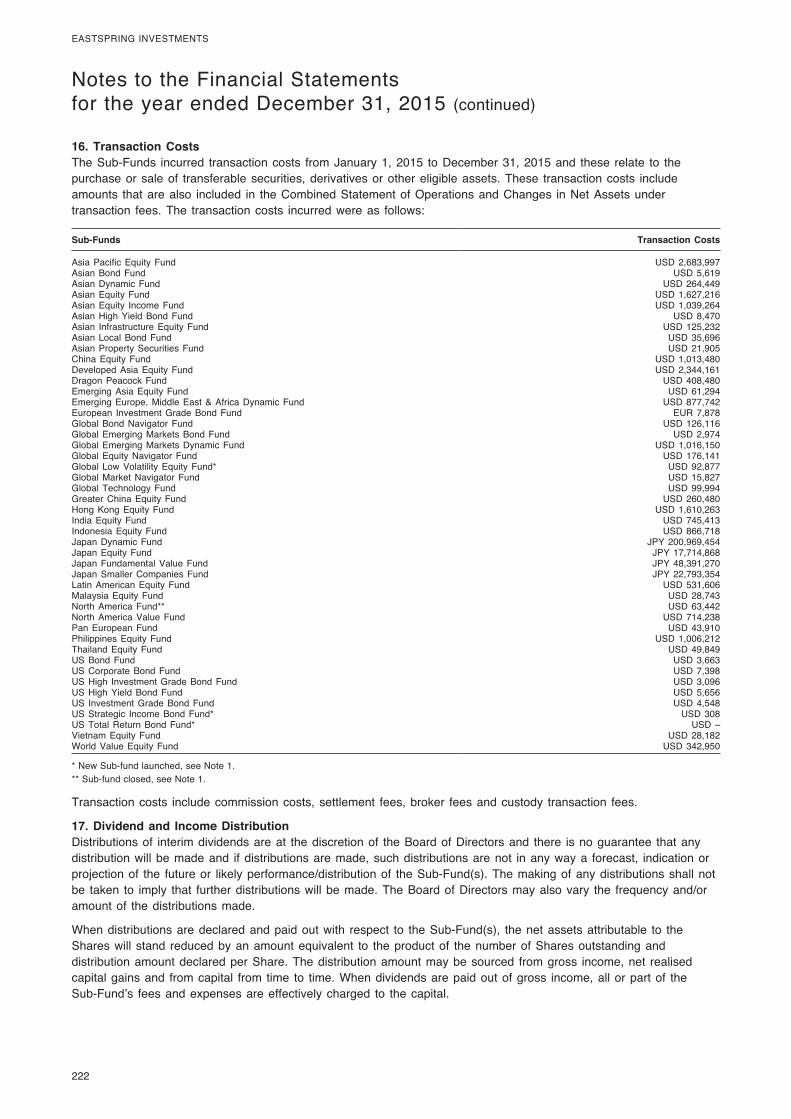
222
EASTSPRING INVESTMENTS
Notes to the Financial Statementsfor the year ended December 31, 2015 (continued)
16. Transaction CostsThe Sub-Funds incurred transaction costs from January 1, 2015 to December 31, 2015 and these relate to the purchase or sale of transferable securities, derivatives or other eligible assets. These transaction costs include amounts that are also included in the Combined Statement of Operations and Changes in Net Assets under transaction fees. The transaction costs incurred were as follows:
Sub-Funds Transaction Costs
Asia Pacific Equity Fund USD 2,683,997Asian Bond Fund USD 5,619Asian Dynamic Fund USD 264,449Asian Equity Fund USD 1,627,216Asian Equity Income Fund USD 1,039,264Asian High Yield Bond Fund USD 8,470Asian Infrastructure Equity Fund USD 125,232Asian Local Bond Fund USD 35,696Asian Property Securities Fund USD 21,905China Equity Fund USD 1,013,480Developed Asia Equity Fund USD 2,344,161Dragon Peacock Fund USD 408,480Emerging Asia Equity Fund USD 61,294Emerging Europe, Middle East & Africa Dynamic Fund USD 877,742European Investment Grade Bond Fund EUR 7,878Global Bond Navigator Fund USD 126,116Global Emerging Markets Bond Fund USD 2,974Global Emerging Markets Dynamic Fund USD 1,016,150Global Equity Navigator Fund USD 176,141Global Low Volatility Equity Fund* USD 92,877Global Market Navigator Fund USD 15,827Global Technology Fund USD 99,994Greater China Equity Fund USD 260,480Hong Kong Equity Fund USD 1,610,263India Equity Fund USD 745,413Indonesia Equity Fund USD 866,718Japan Dynamic Fund JPY 200,969,454Japan Equity Fund JPY 17,714,868Japan Fundamental Value Fund JPY 48,391,270Japan Smaller Companies Fund JPY 22,793,354Latin American Equity Fund USD 531,606Malaysia Equity Fund USD 28,743North America Fund** USD 63,442North America Value Fund USD 714,238Pan European Fund USD 43,910Philippines Equity Fund USD 1,006,212Thailand Equity Fund USD 49,849US Bond Fund USD 3,663US Corporate Bond Fund USD 7,398US High Investment Grade Bond Fund USD 3,096US High Yield Bond Fund USD 5,656US Investment Grade Bond Fund USD 4,548US Strategic Income Bond Fund* USD 308US Total Return Bond Fund* USD –Vietnam Equity Fund USD 28,182World Value Equity Fund USD 342,950
* New Sub-fund launched, see Note 1.** Sub-fund closed, see Note 1.
Transaction costs include commission costs, settlement fees, broker fees and custody transaction fees.
17. Dividend and Income Distribution Distributions of interim dividends are at the discretion of the Board of Directors and there is no guarantee that any distribution will be made and if distributions are made, such distributions are not in any way a forecast, indication or projection of the future or likely performance/distribution of the Sub-Fund(s). The making of any distributions shall not be taken to imply that further distributions will be made. The Board of Directors may also vary the frequency and/or amount of the distributions made.
When distributions are declared and paid out with respect to the Sub-Fund(s), the net assets attributable to the Shares will stand reduced by an amount equivalent to the product of the number of Shares outstanding and distribution amount declared per Share. The distribution amount may be sourced from gross income, net realised capital gains and from capital from time to time. When dividends are paid out of gross income, all or part of the Sub-Fund’s fees and expenses are effectively charged to the capital.
223
EASTSPRING INVESTMENTS
Notes to the Financial Statementsfor the year ended December 31, 2015 (continued)
The Board of Directors may amend the distribution policy and by giving not less than one month’s prior notice to investors. The Board of Directors may in future review the distribution amount depending on prevailing market conditions, dividend payout of the underlying stocks and dividend policy of the SICAV. Distribution payments shall, subject to determination by the Directors, be made out of either (a) income; or (b) net capital gains; or (c) capital of the Fund or a combination of (a) and/or (b) and/or (c).
For the launch of a new Class of Share which distributes, the first distribution will usually be declared after the said Class of Share has been launched for a full period of the fund distribution frequency for the monthly and quarterly distributing Classes of Shares, i.e. a full calendar month for a monthly distributing Class of Share, a full quarter for a quarterly distributing Class of Share.
For capital distributing Classes of Shares with subscripts D followed by C1, C2 or C3, the Classes of Shares may declare a stable rate or amount of distribution. The Board of Directors may determine if and to what extent dividends paid include realised capital gains and/or capital.
The Board of Directors may at its discretion pay dividends out of the capital of a Sub-Fund or pay dividends out of gross income while charging/paying all or part of a Sub-Fund’s fees and expenses to/out of the capital of the relevant Sub-Fund, resulting in an increase in distributable income for the payment of dividends by the Sub-Fund and therefore, the Sub-Fund may effectively pay dividends out of capital.
Payment of dividends out of capital amounts to a return or withdrawal of part of an investor’s original investment or from any capital gains attributable to that original investment. Any distributions involving payment of dividends out of a Sub-Fund’s capital or payment of dividends effectively out of the Sub-Fund’s capital (as the case may be) may result in an immediate reduction of the Net Asset Value per share. However, the payment of distributions will never result in the net assets of the SICAV falling below the legal minimum of € 1,250,000.
An income equalisation amount may be calculated so that the distribution of dividends corresponds to the actual entitlement.
18. Significant Events after year endThere was an Extraordinary General Meeting (“EGM”) held on January 29, 2016, to approve general restatement of the Articles in order to reflect updated resolutions discussed in the EGM, to harmonise the terminology and definitions used throughout the Articles and to ensure consistency with those contained in the Company’s prospectus. The full text of the revised articles of incorporation (with mark-up changes) is available upon request and free of charge at the registered office of the Company.
Effective February 15, 2016, the Eastspring Investments – Developed Asia Equity Fund changed name to Eastspring Investments – Developed and Emerging Asia Equity Fund.
On February 29, 2016, a Notice was sent to the shareholders advising that the board of directors has decided to amend the prospectus of the SICAV dated October 2015.
On March 1, 2016, a new Sub-Fund, Eastspring Investments – Global Multi Asset Income Plus Growth Fund, was launched.
On April 1, 2016, a price adjustment policy to mitigate the effect of dilution caused by shareholders activity (“Swing Pricing”) will be introduced.
There were no other significant events after the year end.

224
EASTSPRING INVESTMENTS
Appendix 1
The following share classes were launched during the year:
Sub-Fund Class of Share Launch Date
Asian Bond Fund Class AH (hedged) June 15, 2015Asian Bond Fund Class AS (hedged) June 15, 2015Asian Bond Fund Class ASDM June 15, 2015Asian Bond Fund Class ASDM (hedged) July 21, 2015Asian Bond Fund Class BDM July 21, 2015Asian Bond Fund Class DH (hedged) May 18, 2015Asian Bond Fund Class REDM (hedged) June 15, 2015Asian Bond Fund Class RG (hedged) June 15, 2015Asian Bond Fund Class RGDM (hedged) June 15, 2015Asian Infrastructure Equity Fund Class J September 1, 2015China Equity Fund Class AHDM July 21, 2015Global Low Volatility Equity Fund Class D October 1, 2015Japan Dynamic Fund Class AA (hedged) June 15, 2015Japan Dynamic Fund Class AF July 21, 2015Japan Dynamic Fund Class AF (hedged) July 21, 2015Japan Dynamic Fund Class AG (hedged) February 2, 2015Japan Dynamic Fund Class AN (hedged) June 15, 2015Japan Dynamic Fund Class AZ (hedged) June 15, 2015Japan Dynamic Fund Class C (hedged) February 23, 2015Japan Dynamic Fund Class CDY February 2, 2015Japan Dynamic Fund Class CG July 21, 2015Japan Dynamic Fund Class CJ July 21, 2015Japan Dynamic Fund Class RG June 15, 2015Japan Dynamic Fund Class RJ September 15, 2015Japan Equity Fund Class AADMC1 (hedged) March 20, 2015Japan Equity Fund Class ADMC1 (hedged) March 20, 2015Japan Equity Fund Class ANDMC1 (hedged) March 20, 2015Japan Equity Fund Class AZDMC1 (hedged) March 20, 2015Japan Fundamental Value Fund Class AE July 21, 2015Japan Fundamental Value Fund Class AF July 21, 2015Japan Fundamental Value Fund Class AF (hedged) July 21, 2015Japan Fundamental Value Fund Class RG July 21, 2015Japan Smaller Companies Fund Class CG May 18, 2015Japan Smaller Companies Fund Class RG May 18, 2015Japan Smaller Companies Fund Class RJ May 18, 2015Philippines Equity Fund Class C June 15, 2015US Corporate Bond Fund Class CE (hedged) June 15, 2015US Corporate Bond Fund Class CG (hedged) June 15, 2015US Corporate Bond Fund Class REDM (hedged) February 2, 2015US Investment Grade Bond Fund Class AZDM (hedged) April 20, 2015US Strategic Income Bond Fund Class D June 15, 2015US Total Return Bond Fund Class D June 15, 2015

225
EASTSPRING INVESTMENTS
Appendix 2
The following tables list the Sub-Funds registered or notified for sale in Austria, Belgium, Chile, Denmark, Dubai International Financial Centre (“DIFC”), Finland, France, Germany, Italy, Hong Kong, Luxembourg, Macau, Netherlands, Norway, Singapore, South Korea, Spain, Sweden, Switzerland, Taiwan, United Arab Emirates (“UAE”) and the United Kingdom.
Registration, Notification or Distribution of Sub-Funds
Luxembourg Austria Belgium
Asia Pacific Equity FundAsian Bond FundAsian Dynamic FundAsian Equity FundAsian Equity Income Fund Asian High Yield Bond FundAsian Infrastructure Equity FundAsian Local Bond FundAsian Property Securities FundChina Equity FundDeveloped Asia Fund Dragon Peacock FundEmerging Asia FundEmerging Europe, Middle Eastand Africa Dynamic FundEuropean Investment Grade Bond FundGlobal Bond Navigator FundGlobal Emerging Markets Bond FundGlobal Emerging Markets Dynamic FundGlobal Equity Navigator FundGlobal Low Volatility Equity FundGlobal Market Navigator FundGlobal Technology FundGreater China Equity FundHong Kong Equity Fund India Equity FundIndonesia Equity FundJapan Dynamic FundJapan Equity FundJapan Fundamental Value FundJapan Smaller Companies FundLatin American Equity FundMalaysia Equity FundNorth American Value FundPan European FundPhilippines Equity FundThailand Equity FundUS Bond FundUS Corporate Bond FundUS High Investment Grade Bond FundUS High Yield Bond FundUS Investment Grade Bond FundUS Strategic Income Bond FundUS Total Return Bond FundVietnam Equity FundWorld Value Equity Fund
Asian Bond FundJapan Dynamic FundJapan Fundamental Value FundUS Corporate Bond Fund
Asian Bond FundJapan Dynamic FundJapan Fundamental Value FundUS Corporate Bond Fund
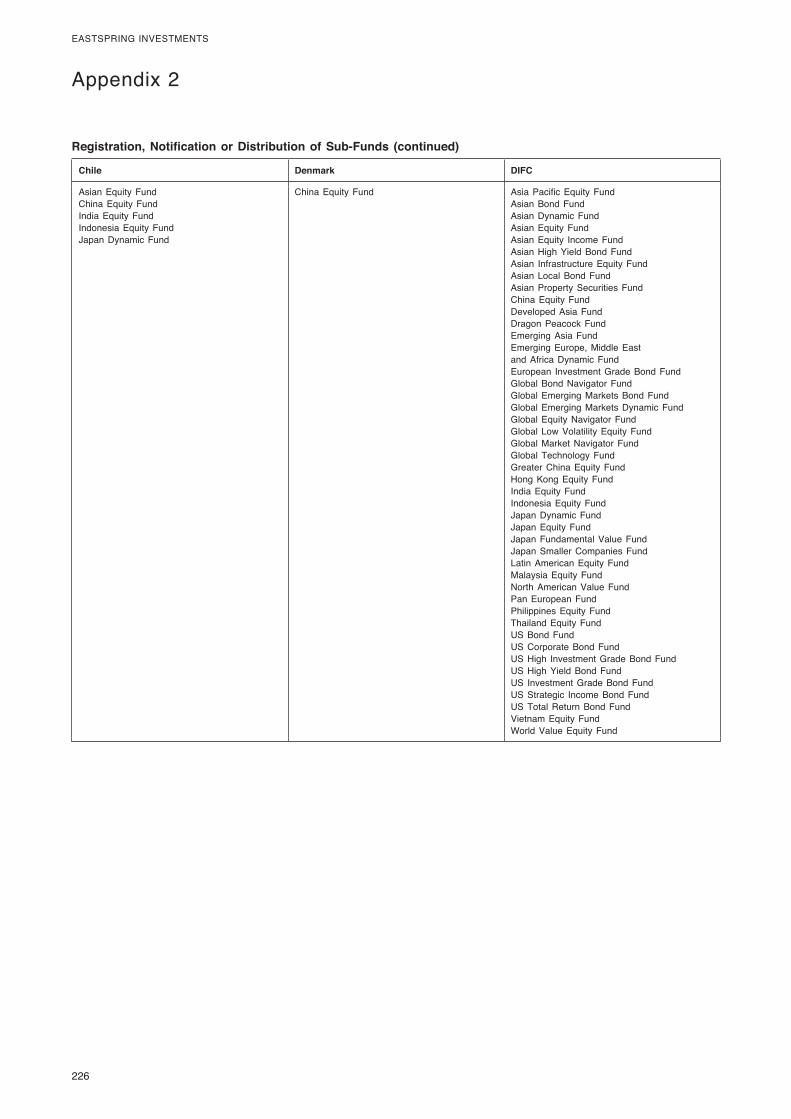
226
EASTSPRING INVESTMENTS
Appendix 2
Registration, Notification or Distribution of Sub-Funds (continued)
Chile Denmark DIFC
Asian Equity FundChina Equity FundIndia Equity FundIndonesia Equity FundJapan Dynamic Fund
China Equity Fund Asia Pacific Equity FundAsian Bond FundAsian Dynamic FundAsian Equity FundAsian Equity Income FundAsian High Yield Bond FundAsian Infrastructure Equity FundAsian Local Bond FundAsian Property Securities FundChina Equity FundDeveloped Asia FundDragon Peacock FundEmerging Asia FundEmerging Europe, Middle Eastand Africa Dynamic FundEuropean Investment Grade Bond FundGlobal Bond Navigator FundGlobal Emerging Markets Bond FundGlobal Emerging Markets Dynamic FundGlobal Equity Navigator FundGlobal Low Volatility Equity FundGlobal Market Navigator FundGlobal Technology FundGreater China Equity FundHong Kong Equity FundIndia Equity FundIndonesia Equity FundJapan Dynamic FundJapan Equity FundJapan Fundamental Value FundJapan Smaller Companies FundLatin American Equity FundMalaysia Equity FundNorth American Value FundPan European FundPhilippines Equity FundThailand Equity FundUS Bond FundUS Corporate Bond FundUS High Investment Grade Bond FundUS High Yield Bond FundUS Investment Grade Bond FundUS Strategic Income Bond FundUS Total Return Bond FundVietnam Equity FundWorld Value Equity Fund

227
EASTSPRING INVESTMENTS
Appendix 2
Registration, Notification or Distribution of Sub-Funds (continued)
Finland France Germany
China Equity FundJapan Dynamic Fund
Asian Bond FundJapan Dynamic FundJapan Fundamental Value FundUS Corporate Bond Fund
Asian Bond FundJapan Dynamic FundJapan Fundamental Value FundUS Corporate Bond Fund
Hong Kong Italy Macau
Asian Bond FundAsian Equity FundAsian Equity Income FundAsian High Yield Bond FundAsian Infrastructure Equity FundAsian Local Bond FundAsian Property Securities FundChina Equity FundDragon Peacock FundEmerging Europe, Middle Eastand Africa Dynamic FundEuropean Investment Grade Bond FundGlobal Emerging Markets Dynamic FundGlobal Market Navigator FundGreater China Equity FundHong Kong Equity FundIndia Equity FundIndonesia Equity FundJapan Dynamic FundLatin American Equity FundNorth American Value FundThailand Equity FundUS Corporate Bond FundUS High Investment Grade Bond FundUS High Yield Bond FundUS Investment Grade Bond FundWorld Value Equity Fund
Asian Bond FundJapan Dynamic FundJapan Fundamental Value FundUS Corporate Bond Fund
Asian Bond FundAsian Equity FundAsian Equity Income FundAsian High Yield Bond FundAsian Infrastructure Equity FundAsian Local Bond FundAsian Property Securities FundChina Equity FundDragon Peacock FundEmerging Europe, Middle Eastand Africa Dynamic FundEuropean Investment Grade Bond FundGlobal Emerging Markets Dynamic FundGlobal Market Navigator FundGreater China Equity FundHong Kong Equity FundIndia Equity FundIndonesia Equity FundJapan Dynamic FundLatin American Equity FundNorth American Value FundPan European FundUS Corporate Bond FundUS High Investment Grade Bond FundUS High Yield Bond FundUS Investment Grade Bond FundWorld Value Equity Fund
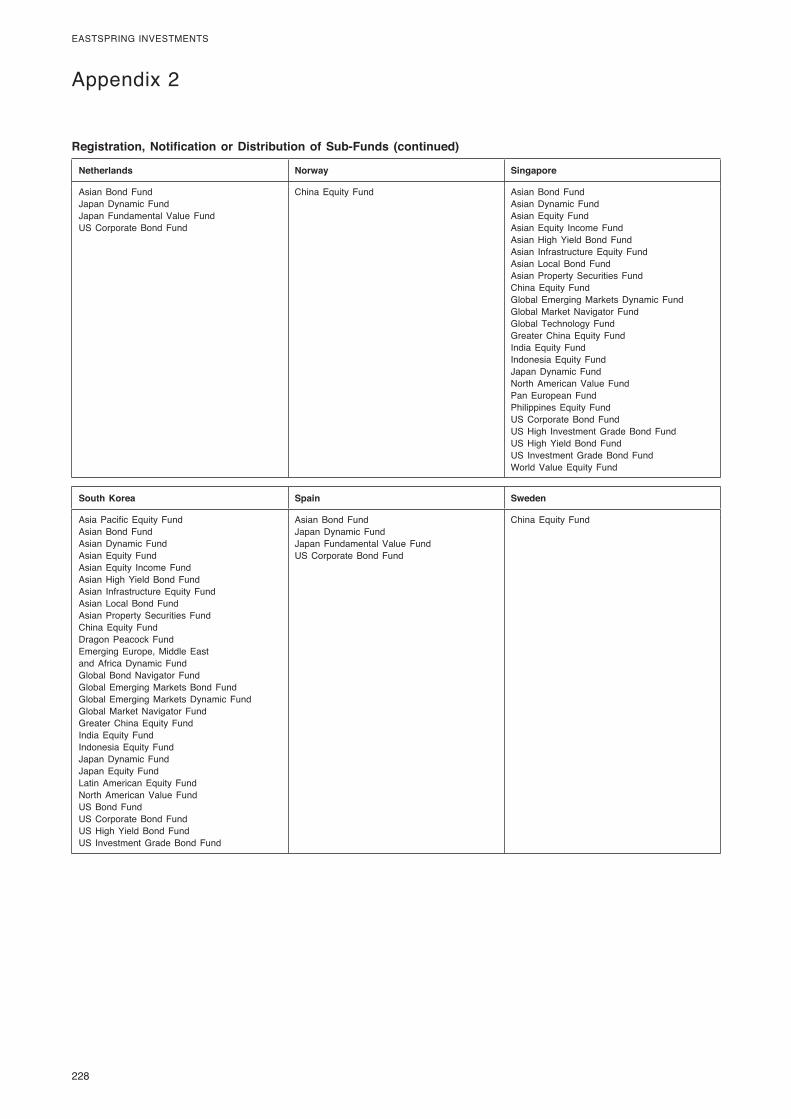
228
EASTSPRING INVESTMENTS
Registration, Notification or Distribution of Sub-Funds (continued)
Netherlands Norway Singapore
Asian Bond FundJapan Dynamic FundJapan Fundamental Value FundUS Corporate Bond Fund
China Equity Fund Asian Bond FundAsian Dynamic FundAsian Equity FundAsian Equity Income FundAsian High Yield Bond FundAsian Infrastructure Equity FundAsian Local Bond FundAsian Property Securities FundChina Equity FundGlobal Emerging Markets Dynamic FundGlobal Market Navigator FundGlobal Technology FundGreater China Equity FundIndia Equity FundIndonesia Equity FundJapan Dynamic FundNorth American Value FundPan European FundPhilippines Equity FundUS Corporate Bond FundUS High Investment Grade Bond FundUS High Yield Bond FundUS Investment Grade Bond FundWorld Value Equity Fund
South Korea Spain Sweden
Asia Pacific Equity FundAsian Bond FundAsian Dynamic FundAsian Equity FundAsian Equity Income FundAsian High Yield Bond FundAsian Infrastructure Equity FundAsian Local Bond FundAsian Property Securities FundChina Equity FundDragon Peacock FundEmerging Europe, Middle Eastand Africa Dynamic FundGlobal Bond Navigator FundGlobal Emerging Markets Bond FundGlobal Emerging Markets Dynamic FundGlobal Market Navigator FundGreater China Equity FundIndia Equity FundIndonesia Equity FundJapan Dynamic FundJapan Equity FundLatin American Equity FundNorth American Value FundUS Bond FundUS Corporate Bond FundUS High Yield Bond FundUS Investment Grade Bond Fund
Asian Bond FundJapan Dynamic FundJapan Fundamental Value FundUS Corporate Bond Fund
China Equity Fund
Appendix 2
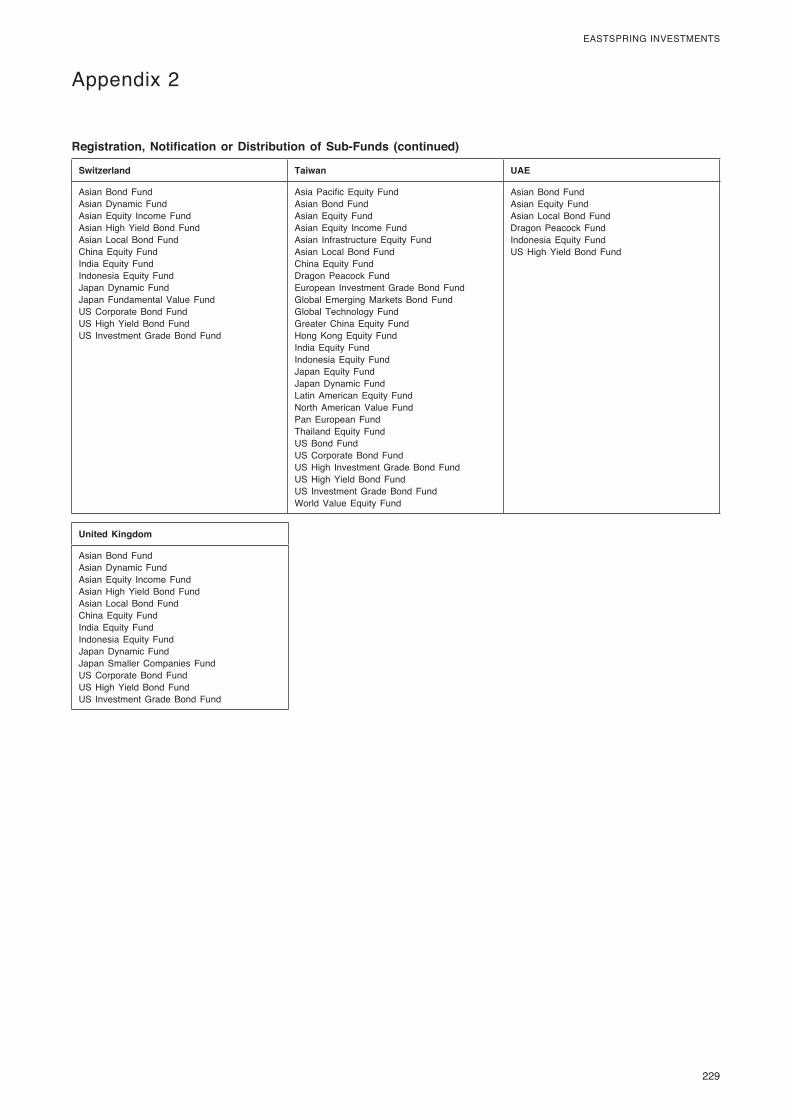
229
EASTSPRING INVESTMENTS
Appendix 2
Registration, Notification or Distribution of Sub-Funds (continued)
Switzerland Taiwan UAE
Asian Bond FundAsian Dynamic FundAsian Equity Income FundAsian High Yield Bond FundAsian Local Bond FundChina Equity FundIndia Equity FundIndonesia Equity FundJapan Dynamic FundJapan Fundamental Value FundUS Corporate Bond FundUS High Yield Bond FundUS Investment Grade Bond Fund
Asia Pacific Equity FundAsian Bond FundAsian Equity FundAsian Equity Income FundAsian Infrastructure Equity FundAsian Local Bond FundChina Equity FundDragon Peacock FundEuropean Investment Grade Bond FundGlobal Emerging Markets Bond FundGlobal Technology FundGreater China Equity FundHong Kong Equity FundIndia Equity FundIndonesia Equity FundJapan Equity FundJapan Dynamic FundLatin American Equity FundNorth American Value FundPan European FundThailand Equity FundUS Bond FundUS Corporate Bond FundUS High Investment Grade Bond FundUS High Yield Bond FundUS Investment Grade Bond FundWorld Value Equity Fund
Asian Bond FundAsian Equity FundAsian Local Bond FundDragon Peacock FundIndonesia Equity FundUS High Yield Bond Fund
United Kingdom
Asian Bond FundAsian Dynamic FundAsian Equity Income FundAsian High Yield Bond FundAsian Local Bond FundChina Equity FundIndia Equity FundIndonesia Equity FundJapan Dynamic FundJapan Smaller Companies FundUS Corporate Bond FundUS High Yield Bond FundUS Investment Grade Bond Fund
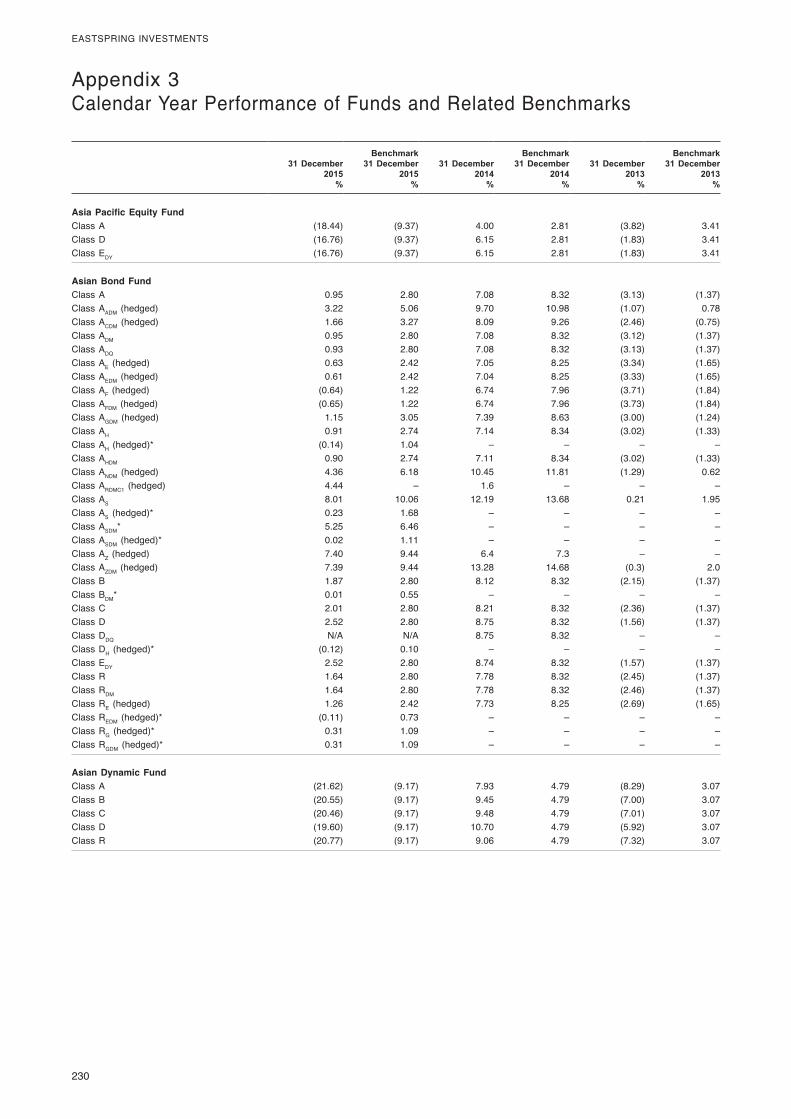
230
EASTSPRING INVESTMENTS
Appendix 3 Calendar Year Performance of Funds and Related Benchmarks
31 December 2015
%
Benchmark 31 December
2015%
31 December 2014
%
Benchmark 31 December
2014%
31 December 2013
%
Benchmark 31 December
2013%
Asia Pacific Equity FundClass A (18.44) (9.37) 4.00 2.81 (3.82) 3.41Class D (16.76) (9.37) 6.15 2.81 (1.83) 3.41Class EDY (16.76) (9.37) 6.15 2.81 (1.83) 3.41
Asian Bond FundClass A 0.95 2.80 7.08 8.32 (3.13) (1.37) Class AADM (hedged) 3.22 5.06 9.70 10.98 (1.07) 0.78Class ACDM (hedged) 1.66 3.27 8.09 9.26 (2.46) (0.75) Class ADM 0.95 2.80 7.08 8.32 (3.12) (1.37) Class ADQ 0.93 2.80 7.08 8.32 (3.13) (1.37) Class AE (hedged) 0.63 2.42 7.05 8.25 (3.34) (1.65) Class AEDM (hedged) 0.61 2.42 7.04 8.25 (3.33) (1.65) Class AF (hedged) (0.64) 1.22 6.74 7.96 (3.71) (1.84) Class AFDM (hedged) (0.65) 1.22 6.74 7.96 (3.73) (1.84) Class AGDM (hedged) 1.15 3.05 7.39 8.63 (3.00) (1.24) Class AH 0.91 2.74 7.14 8.34 (3.02) (1.33) Class AH (hedged)* (0.14) 1.04 – – – –Class AHDM 0.90 2.74 7.11 8.34 (3.02) (1.33) Class ANDM (hedged) 4.36 6.18 10.45 11.81 (1.29) 0.62Class ARDMC1 (hedged) 4.44 – 1.6 – – –Class AS 8.01 10.06 12.19 13.68 0.21 1.95Class AS (hedged)* 0.23 1.68 – – – –Class ASDM* 5.25 6.46 – – – –Class ASDM (hedged)* 0.02 1.11 – – – –Class AZ (hedged) 7.40 9.44 6.4 7.3 – –Class AZDM (hedged) 7.39 9.44 13.28 14.68 (0.3) 2.0Class B 1.87 2.80 8.12 8.32 (2.15) (1.37)Class BDM* 0.01 0.55 – – – –Class C 2.01 2.80 8.21 8.32 (2.36) (1.37) Class D 2.52 2.80 8.75 8.32 (1.56) (1.37) Class DDQ N/A N/A 8.75 8.32 – –Class DH (hedged)* (0.12) 0.10 – – – –Class EDY 2.52 2.80 8.74 8.32 (1.57) (1.37)Class R 1.64 2.80 7.78 8.32 (2.45) (1.37) Class RDM 1.64 2.80 7.78 8.32 (2.46) (1.37) Class RE (hedged) 1.26 2.42 7.73 8.25 (2.69) (1.65) Class REDM (hedged)* (0.11) 0.73 – – – –Class RG (hedged)* 0.31 1.09 – – – –Class RGDM (hedged)* 0.31 1.09 – – – –
Asian Dynamic FundClass A (21.62) (9.17) 7.93 4.79 (8.29) 3.07Class B (20.55) (9.17) 9.45 4.79 (7.00) 3.07Class C (20.46) (9.17) 9.48 4.79 (7.01) 3.07Class D (19.60) (9.17) 10.70 4.79 (5.92) 3.07Class R (20.77) (9.17) 9.06 4.79 (7.32) 3.07
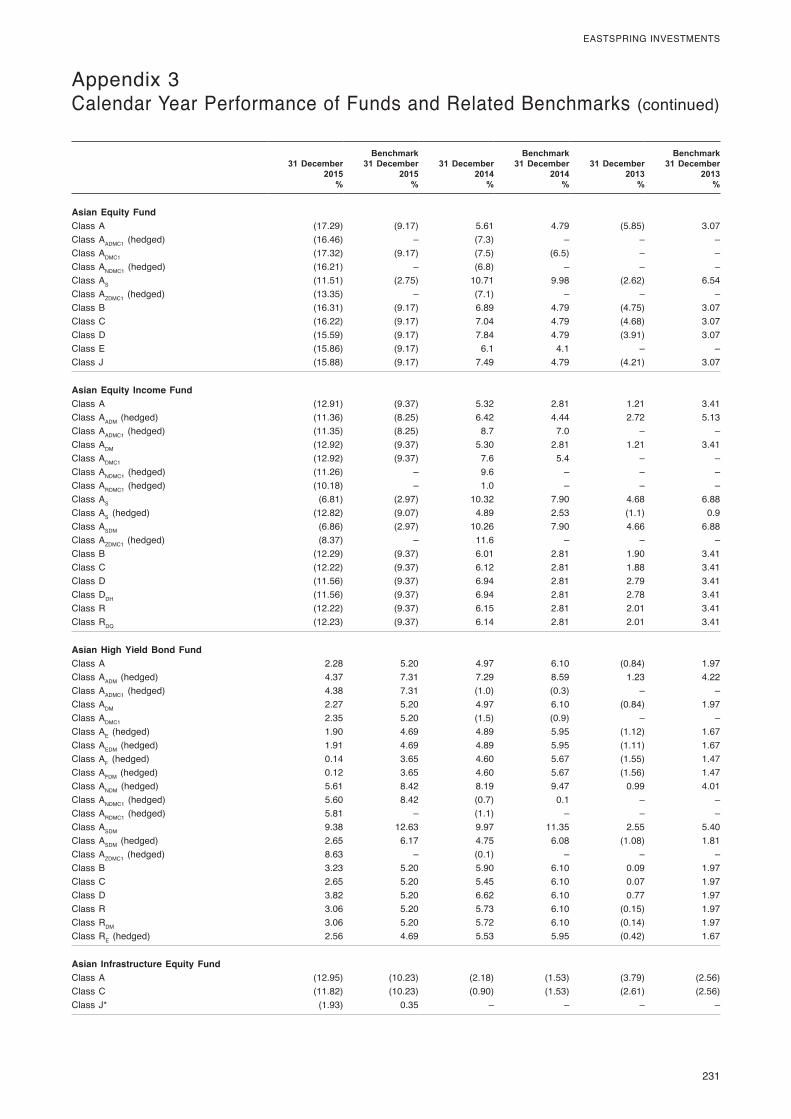
231
EASTSPRING INVESTMENTS
Appendix 3 Calendar Year Performance of Funds and Related Benchmarks (continued)
31 December 2015
%
Benchmark 31 December
2015%
31 December 2014
%
Benchmark 31 December
2014%
31 December 2013
%
Benchmark 31 December
2013%
Asian Equity FundClass A (17.29) (9.17) 5.61 4.79 (5.85) 3.07Class AADMC1 (hedged) (16.46) – (7.3) – – –Class ADMC1 (17.32) (9.17) (7.5) (6.5) – –Class ANDMC1 (hedged) (16.21) – (6.8) – – –Class AS (11.51) (2.75) 10.71 9.98 (2.62) 6.54Class AZDMC1 (hedged) (13.35) – (7.1) – – –Class B (16.31) (9.17) 6.89 4.79 (4.75) 3.07Class C (16.22) (9.17) 7.04 4.79 (4.68) 3.07Class D (15.59) (9.17) 7.84 4.79 (3.91) 3.07Class E (15.86) (9.17) 6.1 4.1 – –Class J (15.88) (9.17) 7.49 4.79 (4.21) 3.07
Asian Equity Income FundClass A (12.91) (9.37) 5.32 2.81 1.21 3.41Class AADM (hedged) (11.36) (8.25) 6.42 4.44 2.72 5.13Class AADMC1 (hedged) (11.35) (8.25) 8.7 7.0 – –Class ADM (12.92) (9.37) 5.30 2.81 1.21 3.41Class ADMC1 (12.92) (9.37) 7.6 5.4 – –Class ANDMC1 (hedged) (11.26) – 9.6 – – –Class ARDMC1 (hedged) (10.18) – 1.0 – – –Class AS (6.81) (2.97) 10.32 7.90 4.68 6.88Class AS (hedged) (12.82) (9.07) 4.89 2.53 (1.1) 0.9Class ASDM (6.86) (2.97) 10.26 7.90 4.66 6.88Class AZDMC1 (hedged) (8.37) – 11.6 – – –Class B (12.29) (9.37) 6.01 2.81 1.90 3.41Class C (12.22) (9.37) 6.12 2.81 1.88 3.41Class D (11.56) (9.37) 6.94 2.81 2.79 3.41Class DDH (11.56) (9.37) 6.94 2.81 2.78 3.41Class R (12.22) (9.37) 6.15 2.81 2.01 3.41Class RDQ (12.23) (9.37) 6.14 2.81 2.01 3.41
Asian High Yield Bond FundClass A 2.28 5.20 4.97 6.10 (0.84) 1.97Class AADM (hedged) 4.37 7.31 7.29 8.59 1.23 4.22Class AADMC1 (hedged) 4.38 7.31 (1.0) (0.3) – –Class ADM 2.27 5.20 4.97 6.10 (0.84) 1.97Class ADMC1 2.35 5.20 (1.5) (0.9) – –Class AE (hedged) 1.90 4.69 4.89 5.95 (1.12) 1.67Class AEDM (hedged) 1.91 4.69 4.89 5.95 (1.11) 1.67Class AF (hedged) 0.14 3.65 4.60 5.67 (1.55) 1.47Class AFDM (hedged) 0.12 3.65 4.60 5.67 (1.56) 1.47Class ANDM (hedged) 5.61 8.42 8.19 9.47 0.99 4.01Class ANDMC1 (hedged) 5.60 8.42 (0.7) 0.1 – –Class ARDMC1 (hedged) 5.81 – (1.1) – – –Class ASDM 9.38 12.63 9.97 11.35 2.55 5.40Class ASDM (hedged) 2.65 6.17 4.75 6.08 (1.08) 1.81Class AZDMC1 (hedged) 8.63 – (0.1) – – –Class B 3.23 5.20 5.90 6.10 0.09 1.97Class C 2.65 5.20 5.45 6.10 0.07 1.97Class D 3.82 5.20 6.62 6.10 0.77 1.97Class R 3.06 5.20 5.73 6.10 (0.15) 1.97Class RDM 3.06 5.20 5.72 6.10 (0.14) 1.97Class RE (hedged) 2.56 4.69 5.53 5.95 (0.42) 1.67
Asian Infrastructure Equity FundClass A (12.95) (10.23) (2.18) (1.53) (3.79) (2.56)Class C (11.82) (10.23) (0.90) (1.53) (2.61) (2.56)Class J* (1.93) 0.35 – – – –
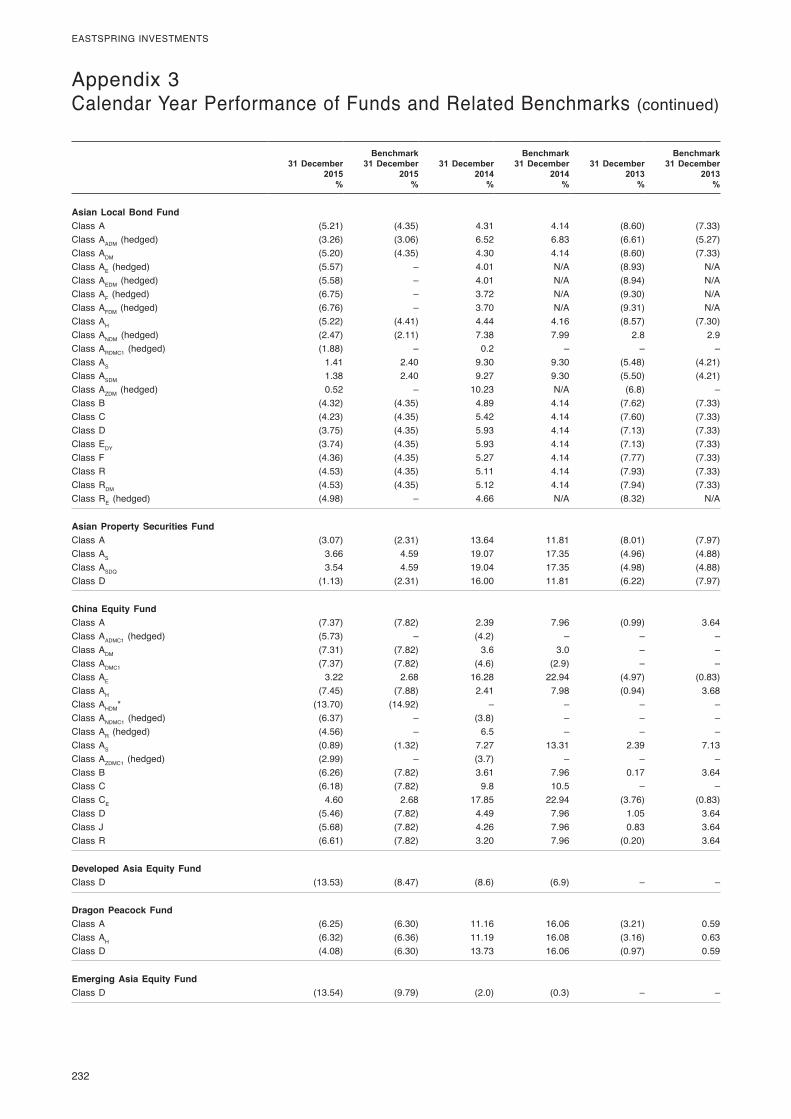
232
EASTSPRING INVESTMENTS
Appendix 3 Calendar Year Performance of Funds and Related Benchmarks (continued)
31 December 2015
%
Benchmark 31 December
2015%
31 December 2014
%
Benchmark 31 December
2014%
31 December 2013
%
Benchmark 31 December
2013%
Asian Local Bond FundClass A (5.21) (4.35) 4.31 4.14 (8.60) (7.33)Class AADM (hedged) (3.26) (3.06) 6.52 6.83 (6.61) (5.27)Class ADM (5.20) (4.35) 4.30 4.14 (8.60) (7.33)Class AE (hedged) (5.57) – 4.01 N/A (8.93) N/AClass AEDM (hedged) (5.58) – 4.01 N/A (8.94) N/AClass AF (hedged) (6.75) – 3.72 N/A (9.30) N/AClass AFDM (hedged) (6.76) – 3.70 N/A (9.31) N/AClass AH (5.22) (4.41) 4.44 4.16 (8.57) (7.30)Class ANDM (hedged) (2.47) (2.11) 7.38 7.99 2.8 2.9Class ARDMC1 (hedged) (1.88) – 0.2 – – –Class AS 1.41 2.40 9.30 9.30 (5.48) (4.21)Class ASDM 1.38 2.40 9.27 9.30 (5.50) (4.21)Class AZDM (hedged) 0.52 – 10.23 N/A (6.8) –Class B (4.32) (4.35) 4.89 4.14 (7.62) (7.33)Class C (4.23) (4.35) 5.42 4.14 (7.60) (7.33) Class D (3.75) (4.35) 5.93 4.14 (7.13) (7.33) Class EDY (3.74) (4.35) 5.93 4.14 (7.13) (7.33) Class F (4.36) (4.35) 5.27 4.14 (7.77) (7.33) Class R (4.53) (4.35) 5.11 4.14 (7.93) (7.33) Class RDM (4.53) (4.35) 5.12 4.14 (7.94) (7.33) Class RE (hedged) (4.98) – 4.66 N/A (8.32) N/A
Asian Property Securities FundClass A (3.07) (2.31) 13.64 11.81 (8.01) (7.97) Class AS 3.66 4.59 19.07 17.35 (4.96) (4.88) Class ASDQ 3.54 4.59 19.04 17.35 (4.98) (4.88) Class D (1.13) (2.31) 16.00 11.81 (6.22) (7.97)
China Equity FundClass A (7.37) (7.82) 2.39 7.96 (0.99) 3.64Class AADMC1 (hedged) (5.73) – (4.2) – – –Class ADM (7.31) (7.82) 3.6 3.0 – –Class ADMC1 (7.37) (7.82) (4.6) (2.9) – –Class AE 3.22 2.68 16.28 22.94 (4.97) (0.83)Class AH (7.45) (7.88) 2.41 7.98 (0.94) 3.68Class AHDM* (13.70) (14.92) – – – –Class ANDMC1 (hedged) (6.37) – (3.8) – – –Class AR (hedged) (4.56) – 6.5 – – –Class AS (0.89) (1.32) 7.27 13.31 2.39 7.13Class AZDMC1 (hedged) (2.99) – (3.7) – – –Class B (6.26) (7.82) 3.61 7.96 0.17 3.64Class C (6.18) (7.82) 9.8 10.5 – –Class CE 4.60 2.68 17.85 22.94 (3.76) (0.83)Class D (5.46) (7.82) 4.49 7.96 1.05 3.64Class J (5.68) (7.82) 4.26 7.96 0.83 3.64Class R (6.61) (7.82) 3.20 7.96 (0.20) 3.64
Developed Asia Equity FundClass D (13.53) (8.47) (8.6) (6.9) – –
Dragon Peacock FundClass A (6.25) (6.30) 11.16 16.06 (3.21) 0.59Class AH (6.32) (6.36) 11.19 16.08 (3.16) 0.63Class D (4.08) (6.30) 13.73 16.06 (0.97) 0.59
Emerging Asia Equity FundClass D (13.54) (9.79) (2.0) (0.3) – –
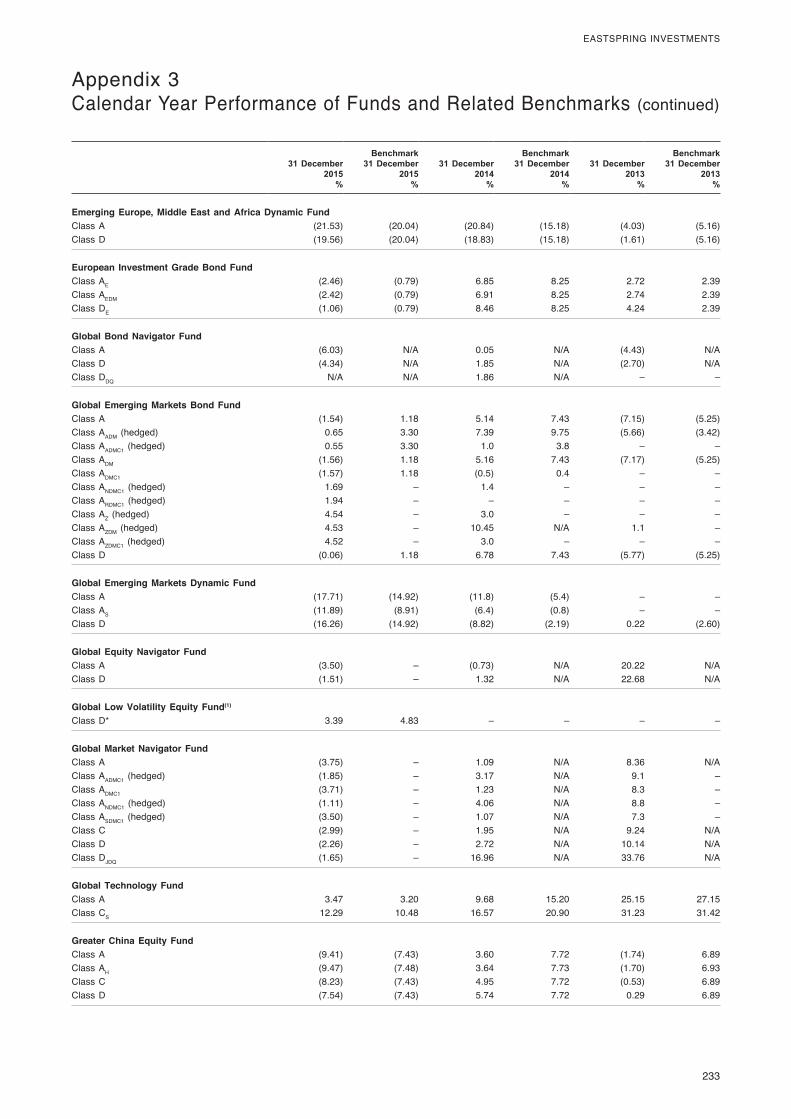
233
EASTSPRING INVESTMENTS
31 December 2015
%
Benchmark 31 December
2015%
31 December 2014
%
Benchmark 31 December
2014%
31 December 2013
%
Benchmark 31 December
2013%
Emerging Europe, Middle East and Africa Dynamic FundClass A (21.53) (20.04) (20.84) (15.18) (4.03) (5.16) Class D (19.56) (20.04) (18.83) (15.18) (1.61) (5.16)
European Investment Grade Bond FundClass AE (2.46) (0.79) 6.85 8.25 2.72 2.39Class AEDM (2.42) (0.79) 6.91 8.25 2.74 2.39 Class DE (1.06) (0.79) 8.46 8.25 4.24 2.39
Global Bond Navigator FundClass A (6.03) N/A 0.05 N/A (4.43) N/AClass D (4.34) N/A 1.85 N/A (2.70) N/AClass DDQ N/A N/A 1.86 N/A – –
Global Emerging Markets Bond FundClass A (1.54) 1.18 5.14 7.43 (7.15) (5.25) Class AADM (hedged) 0.65 3.30 7.39 9.75 (5.66) (3.42) Class AADMC1 (hedged) 0.55 3.30 1.0 3.8 – –Class ADM (1.56) 1.18 5.16 7.43 (7.17) (5.25) Class ADMC1 (1.57) 1.18 (0.5) 0.4 – –Class ANDMC1 (hedged) 1.69 – 1.4 – – –Class ARDMC1 (hedged) 1.94 – – – – –Class AZ (hedged) 4.54 – 3.0 – – –Class AZDM (hedged) 4.53 – 10.45 N/A 1.1 –Class AZDMC1 (hedged) 4.52 – 3.0 – – –Class D (0.06) 1.18 6.78 7.43 (5.77) (5.25)
Global Emerging Markets Dynamic FundClass A (17.71) (14.92) (11.8) (5.4) – –Class AS (11.89) (8.91) (6.4) (0.8) – –Class D (16.26) (14.92) (8.82) (2.19) 0.22 (2.60)
Global Equity Navigator FundClass A (3.50) – (0.73) N/A 20.22 N/AClass D (1.51) – 1.32 N/A 22.68 N/A
Global Low Volatility Equity Fund(1)
Class D* 3.39 4.83 – – – –
Global Market Navigator FundClass A (3.75) – 1.09 N/A 8.36 N/AClass AADMC1 (hedged) (1.85) – 3.17 N/A 9.1 –Class ADMC1 (3.71) – 1.23 N/A 8.3 –Class ANDMC1 (hedged) (1.11) – 4.06 N/A 8.8 –Class ASDMC1 (hedged) (3.50) – 1.07 N/A 7.3 –Class C (2.99) – 1.95 N/A 9.24 N/AClass D (2.26) – 2.72 N/A 10.14 N/AClass DJDQ (1.65) – 16.96 N/A 33.76 N/A
Global Technology FundClass A 3.47 3.20 9.68 15.20 25.15 27.15Class CS 12.29 10.48 16.57 20.90 31.23 31.42
Greater China Equity FundClass A (9.41) (7.43) 3.60 7.72 (1.74) 6.89Class AH (9.47) (7.48) 3.64 7.73 (1.70) 6.93Class C (8.23) (7.43) 4.95 7.72 (0.53) 6.89Class D (7.54) (7.43) 5.74 7.72 0.29 6.89
Appendix 3 Calendar Year Performance of Funds and Related Benchmarks (continued)
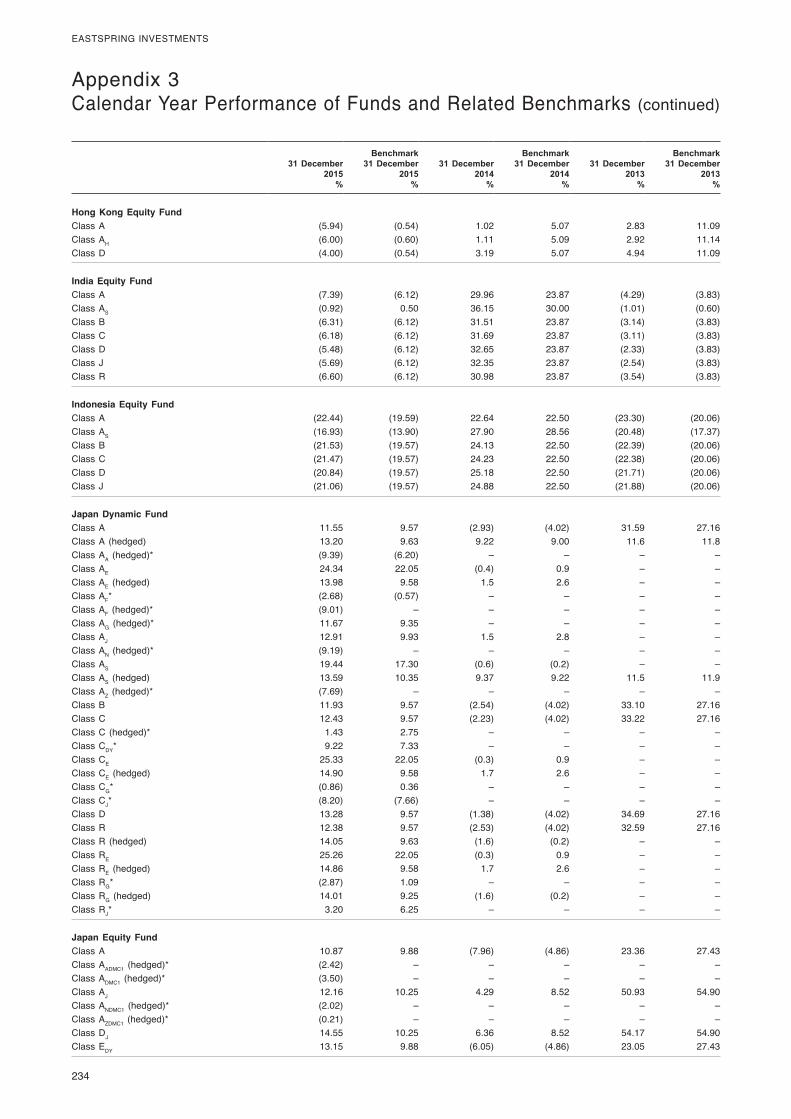
234
EASTSPRING INVESTMENTS
Appendix 3 Calendar Year Performance of Funds and Related Benchmarks (continued)
31 December 2015
%
Benchmark 31 December
2015%
31 December 2014
%
Benchmark 31 December
2014%
31 December 2013
%
Benchmark 31 December
2013%
Hong Kong Equity FundClass A (5.94) (0.54) 1.02 5.07 2.83 11.09Class AH (6.00) (0.60) 1.11 5.09 2.92 11.14Class D (4.00) (0.54) 3.19 5.07 4.94 11.09
India Equity FundClass A (7.39) (6.12) 29.96 23.87 (4.29) (3.83) Class AS (0.92) 0.50 36.15 30.00 (1.01) (0.60) Class B (6.31) (6.12) 31.51 23.87 (3.14) (3.83) Class C (6.18) (6.12) 31.69 23.87 (3.11) (3.83) Class D (5.48) (6.12) 32.65 23.87 (2.33) (3.83) Class J (5.69) (6.12) 32.35 23.87 (2.54) (3.83) Class R (6.60) (6.12) 30.98 23.87 (3.54) (3.83)
Indonesia Equity FundClass A (22.44) (19.59) 22.64 22.50 (23.30) (20.06) Class AS (16.93) (13.90) 27.90 28.56 (20.48) (17.37) Class B (21.53) (19.57) 24.13 22.50 (22.39) (20.06) Class C (21.47) (19.57) 24.23 22.50 (22.38) (20.06) Class D (20.84) (19.57) 25.18 22.50 (21.71) (20.06) Class J (21.06) (19.57) 24.88 22.50 (21.88) (20.06)
Japan Dynamic FundClass A 11.55 9.57 (2.93) (4.02) 31.59 27.16Class A (hedged) 13.20 9.63 9.22 9.00 11.6 11.8Class AA (hedged)* (9.39) (6.20) – – – –Class AE 24.34 22.05 (0.4) 0.9 – –Class AE (hedged) 13.98 9.58 1.5 2.6 – –Class AF* (2.68) (0.57) – – – –Class AF (hedged)* (9.01) – – – – –Class AG (hedged)* 11.67 9.35 – – – –Class AJ 12.91 9.93 1.5 2.8 – –Class AN (hedged)* (9.19) – – – – –Class AS 19.44 17.30 (0.6) (0.2) – –Class AS (hedged) 13.59 10.35 9.37 9.22 11.5 11.9Class AZ (hedged)* (7.69) – – – – –Class B 11.93 9.57 (2.54) (4.02) 33.10 27.16Class C 12.43 9.57 (2.23) (4.02) 33.22 27.16Class C (hedged)* 1.43 2.75 – – – –Class CDY* 9.22 7.33 – – – –Class CE 25.33 22.05 (0.3) 0.9 – –Class CE (hedged) 14.90 9.58 1.7 2.6 – –Class CG* (0.86) 0.36 – – – –Class CJ* (8.20) (7.66) – – – –Class D 13.28 9.57 (1.38) (4.02) 34.69 27.16Class R 12.38 9.57 (2.53) (4.02) 32.59 27.16Class R (hedged) 14.05 9.63 (1.6) (0.2) – –Class RE 25.26 22.05 (0.3) 0.9 – –Class RE (hedged) 14.86 9.58 1.7 2.6 – –Class RG* (2.87) 1.09 – – – –Class RG (hedged) 14.01 9.25 (1.6) (0.2) – –Class RJ* 3.20 6.25 – – – –
Japan Equity FundClass A 10.87 9.88 (7.96) (4.86) 23.36 27.43Class AADMC1 (hedged)* (2.42) – – – – –Class ADMC1 (hedged)* (3.50) – – – – –Class AJ 12.16 10.25 4.29 8.52 50.93 54.90Class ANDMC1 (hedged)* (2.02) – – – – –Class AZDMC1 (hedged)* (0.21) – – – – –Class DJ 14.55 10.25 6.36 8.52 54.17 54.90Class EDY 13.15 9.88 (6.05) (4.86) 23.05 27.43
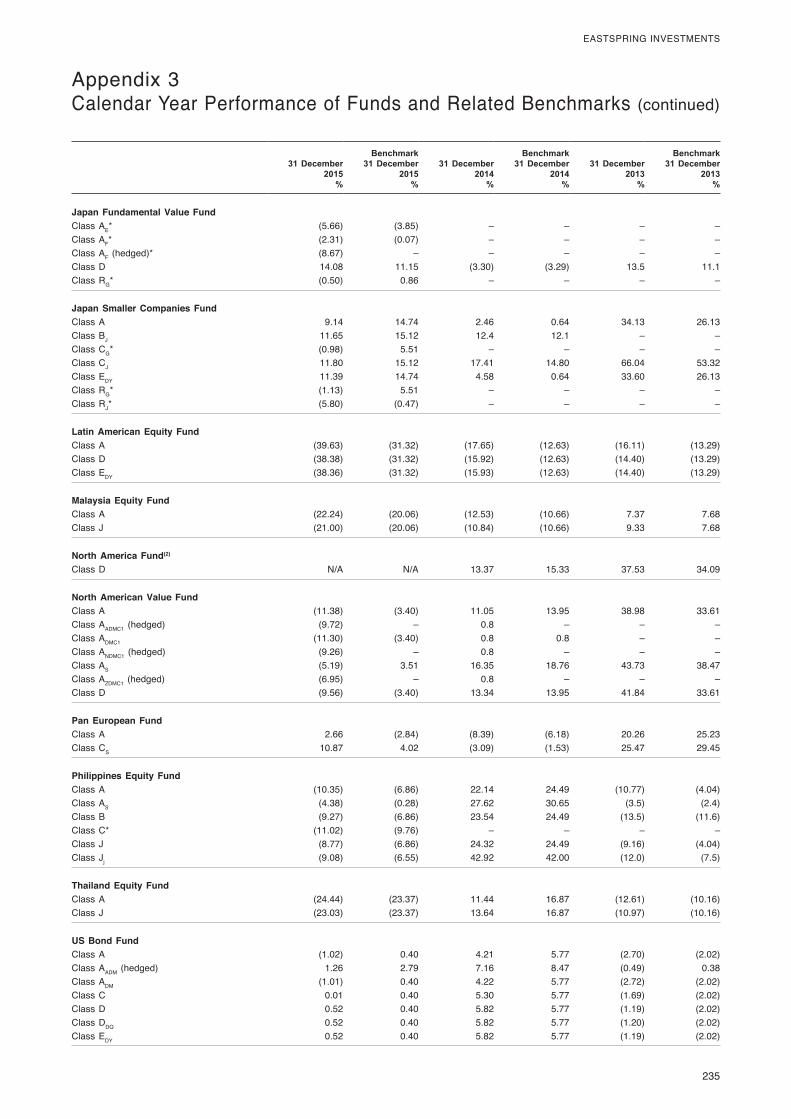
235
EASTSPRING INVESTMENTS
Appendix 3 Calendar Year Performance of Funds and Related Benchmarks (continued)
31 December 2015
%
Benchmark 31 December
2015%
31 December 2014
%
Benchmark 31 December
2014%
31 December 2013
%
Benchmark 31 December
2013%
Japan Fundamental Value FundClass AE* (5.66) (3.85) – – – –Class AF* (2.31) (0.07) – – – –Class AF (hedged)* (8.67) – – – – –Class D 14.08 11.15 (3.30) (3.29) 13.5 11.1Class RG* (0.50) 0.86 – – – –
Japan Smaller Companies FundClass A 9.14 14.74 2.46 0.64 34.13 26.13Class BJ 11.65 15.12 12.4 12.1 – –Class CG* (0.98) 5.51 – – – –Class CJ 11.80 15.12 17.41 14.80 66.04 53.32Class EDY 11.39 14.74 4.58 0.64 33.60 26.13Class RG* (1.13) 5.51 – – – –Class RJ* (5.80) (0.47) – – – –
Latin American Equity FundClass A (39.63) (31.32) (17.65) (12.63) (16.11) (13.29)Class D (38.38) (31.32) (15.92) (12.63) (14.40) (13.29)Class EDY (38.36) (31.32) (15.93) (12.63) (14.40) (13.29)
Malaysia Equity FundClass A (22.24) (20.06) (12.53) (10.66) 7.37 7.68Class J (21.00) (20.06) (10.84) (10.66) 9.33 7.68
North America Fund(2)
Class D N/A N/A 13.37 15.33 37.53 34.09
North American Value FundClass A (11.38) (3.40) 11.05 13.95 38.98 33.61Class AADMC1 (hedged) (9.72) – 0.8 – – –Class ADMC1 (11.30) (3.40) 0.8 0.8 – –Class ANDMC1 (hedged) (9.26) – 0.8 – – –Class AS (5.19) 3.51 16.35 18.76 43.73 38.47Class AZDMC1 (hedged) (6.95) – 0.8 – – –Class D (9.56) (3.40) 13.34 13.95 41.84 33.61
Pan European FundClass A 2.66 (2.84) (8.39) (6.18) 20.26 25.23Class CS 10.87 4.02 (3.09) (1.53) 25.47 29.45
Philippines Equity FundClass A (10.35) (6.86) 22.14 24.49 (10.77) (4.04)Class AS (4.38) (0.28) 27.62 30.65 (3.5) (2.4)Class B (9.27) (6.86) 23.54 24.49 (13.5) (11.6)Class C* (11.02) (9.76) – – – –Class J (8.77) (6.86) 24.32 24.49 (9.16) (4.04)Class Jj (9.08) (6.55) 42.92 42.00 (12.0) (7.5)
Thailand Equity FundClass A (24.44) (23.37) 11.44 16.87 (12.61) (10.16)Class J (23.03) (23.37) 13.64 16.87 (10.97) (10.16)
US Bond FundClass A (1.02) 0.40 4.21 5.77 (2.70) (2.02)Class AADM (hedged) 1.26 2.79 7.16 8.47 (0.49) 0.38Class ADM (1.01) 0.40 4.22 5.77 (2.72) (2.02)Class C 0.01 0.40 5.30 5.77 (1.69) (2.02)Class D 0.52 0.40 5.82 5.77 (1.19) (2.02)Class DDQ 0.52 0.40 5.82 5.77 (1.20) (2.02)Class EDY 0.52 0.40 5.82 5.77 (1.19) (2.02)
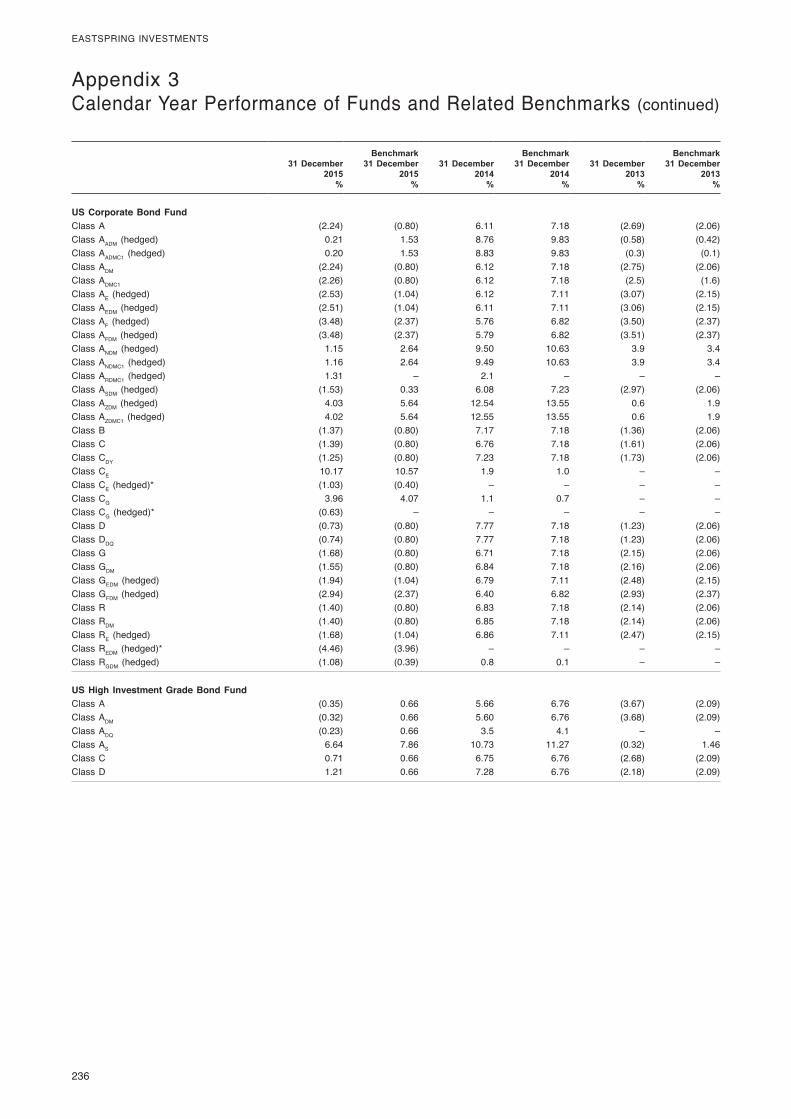
236
EASTSPRING INVESTMENTS
Appendix 3 Calendar Year Performance of Funds and Related Benchmarks (continued)
31 December 2015
%
Benchmark 31 December
2015%
31 December 2014
%
Benchmark 31 December
2014%
31 December 2013
%
Benchmark 31 December
2013%
US Corporate Bond FundClass A (2.24) (0.80) 6.11 7.18 (2.69) (2.06)Class AADM (hedged) 0.21 1.53 8.76 9.83 (0.58) (0.42)Class AADMC1 (hedged) 0.20 1.53 8.83 9.83 (0.3) (0.1)Class ADM (2.24) (0.80) 6.12 7.18 (2.75) (2.06)Class ADMC1 (2.26) (0.80) 6.12 7.18 (2.5) (1.6)Class AE (hedged) (2.53) (1.04) 6.12 7.11 (3.07) (2.15)Class AEDM (hedged) (2.51) (1.04) 6.11 7.11 (3.06) (2.15)Class AF (hedged) (3.48) (2.37) 5.76 6.82 (3.50) (2.37)Class AFDM (hedged) (3.48) (2.37) 5.79 6.82 (3.51) (2.37)Class ANDM (hedged) 1.15 2.64 9.50 10.63 3.9 3.4Class ANDMC1 (hedged) 1.16 2.64 9.49 10.63 3.9 3.4Class ARDMC1 (hedged) 1.31 – 2.1 – – –Class ASDM (hedged) (1.53) 0.33 6.08 7.23 (2.97) (2.06)Class AZDM (hedged) 4.03 5.64 12.54 13.55 0.6 1.9Class AZDMC1 (hedged) 4.02 5.64 12.55 13.55 0.6 1.9Class B (1.37) (0.80) 7.17 7.18 (1.36) (2.06)Class C (1.39) (0.80) 6.76 7.18 (1.61) (2.06)Class CDY (1.25) (0.80) 7.23 7.18 (1.73) (2.06)Class CE 10.17 10.57 1.9 1.0 – –Class CE (hedged)* (1.03) (0.40) – – – –Class CG 3.96 4.07 1.1 0.7 – –Class CG (hedged)* (0.63) – – – – –Class D (0.73) (0.80) 7.77 7.18 (1.23) (2.06)Class DDQ (0.74) (0.80) 7.77 7.18 (1.23) (2.06)Class G (1.68) (0.80) 6.71 7.18 (2.15) (2.06)Class GDM (1.55) (0.80) 6.84 7.18 (2.16) (2.06)Class GEDM (hedged) (1.94) (1.04) 6.79 7.11 (2.48) (2.15)Class GFDM (hedged) (2.94) (2.37) 6.40 6.82 (2.93) (2.37)Class R (1.40) (0.80) 6.83 7.18 (2.14) (2.06)Class RDM (1.40) (0.80) 6.85 7.18 (2.14) (2.06)Class RE (hedged) (1.68) (1.04) 6.86 7.11 (2.47) (2.15)Class REDM (hedged)* (4.46) (3.96) – – – –Class RGDM (hedged) (1.08) (0.39) 0.8 0.1 – –
US High Investment Grade Bond FundClass A (0.35) 0.66 5.66 6.76 (3.67) (2.09)Class ADM (0.32) 0.66 5.60 6.76 (3.68) (2.09)Class ADQ (0.23) 0.66 3.5 4.1 – –Class AS 6.64 7.86 10.73 11.27 (0.32) 1.46Class C 0.71 0.66 6.75 6.76 (2.68) (2.09)Class D 1.21 0.66 7.28 6.76 (2.18) (2.09)

237
EASTSPRING INVESTMENTS
Appendix 3 Calendar Year Performance of Funds and Related Benchmarks (continued)
31 December 2015
%
Benchmark 31 December
2015%
31 December 2014
%
Benchmark 31 December
2014%
31 December 2013
%
Benchmark 31 December
2013%
US High Yield Bond FundClass A (9.25) (4.65) (2.23) 2.55 5.50 7.38Class AADM (hedged) (7.51) (2.53) (0.15) 4.84 8.01 9.84Class AADMC1 (hedged) (7.51) (2.53) (0.16) 4.84 0.7 0.6Class ADM (9.25) (4.65) (2.21) 2.55 5.50 7.38Class ADMC1 (9.26) (4.65) (2.24) 2.55 0.5 0.5Class AEDM (hedged) (9.70) (6.26) (2.45) 2.32 5.18 6.89Class AFDM (hedged) (11.00) (6.81) (2.71) 2.03 4.83 6.74Class ANDM (hedged) (6.50) (1.24) 0.51 5.67 5.6 5.1Class ANDMC1 (hedged) (6.49) (1.24) 0.50 5.67 0.6 0.6Class ARDMC1 (hedged) (6.20) – (3.1) – – –Class AS (2.84) 2.17 2.40 6.89 9.18 11.28Class AZDM (hedged) (4.29) 0.96 3.45 8.42 5.8 8.0Class AZDMC1 (hedged) (4.29) 0.96 3.43 8.42 0.9 0.8Class B (8.45) (4.65) (1.47) 2.55 6.44 7.38Class C (8.42) (4.65) (1.30) 2.55 6.50 7.38Class D (7.85) (4.65) (0.62) 2.55 7.14 7.38Class R (8.60) (4.65) (1.66) 2.55 6.19 7.38Class RDM (8.60) (4.65) (1.66) 2.55 6.19 7.38Class RE (hedged) (9.16) (6.26) (1.85) 2.32 5.84 6.89
US Investment Grade Bond FundClass A (3.05) (1.53) 6.52 7.38 (1.93) (1.39)Class AADM (hedged) (0.60) 0.91 9.32 12.35 0.17 0.65Class ACDM (hedged) (2.28) (0.17) 7.74 12.65 (1.22) (0.90)Class ADM (3.04) (1.53) 6.52 7.38 (1.92) (1.39)Class ADQ (3.04) (1.53) 6.53 7.38 (1.93) (1.39)Class AE (hedged) (3.34) (2.95) 6.48 8.15 (2.22) (1.81)Class AEDM (hedged) (3.33) (2.95) 6.49 8.15 (2.20) (1.81)Class AF (hedged) (4.38) (3.82) 6.17 6.89 (2.64) (2.02)Class AFDM (hedged) (4.37) (3.82) 6.17 6.89 (2.62) (2.02)Class AGDM (hedged) (2.62) (1.49) 6.88 7.13 (1.88) (1.43)Class AHDM (3.01) (1.61) 6.60 7.41 (1.78) (1.35)Class ANDM (hedged) 0.36 2.37 10.03 12.91 0.01 0.52Class AS 3.75 5.51 11.67 11.92 1.47 2.19Class AZDM (hedged)* (1.64) – – – – – Class B (2.07) (1.53) 7.60 7.38 (0.90) (1.39)Class C (2.02) (1.53) 7.63 7.38 (0.90) (1.39)Class D (1.54) (1.53) 8.17 7.38 (0.40) (1.39)Class R (2.32) (1.53) 7.27 7.38 (1.22) (1.39)Class RDM (2.32) (1.53) 7.27 7.38 (1.22) (1.39)Class RE (hedged) (2.71) (2.95) 7.19 8.15 (1.63) (1.81)
US Strategic Income Bond Fund(1)
Class D* (4.53) (3.05) – – – –
US Total Return Bond Fund(1)
Class D* (1.14) 0.57 – – – –
Vietnam Equity FundClass J 10.30 4.29 10.14 4.96 30.97 27.22
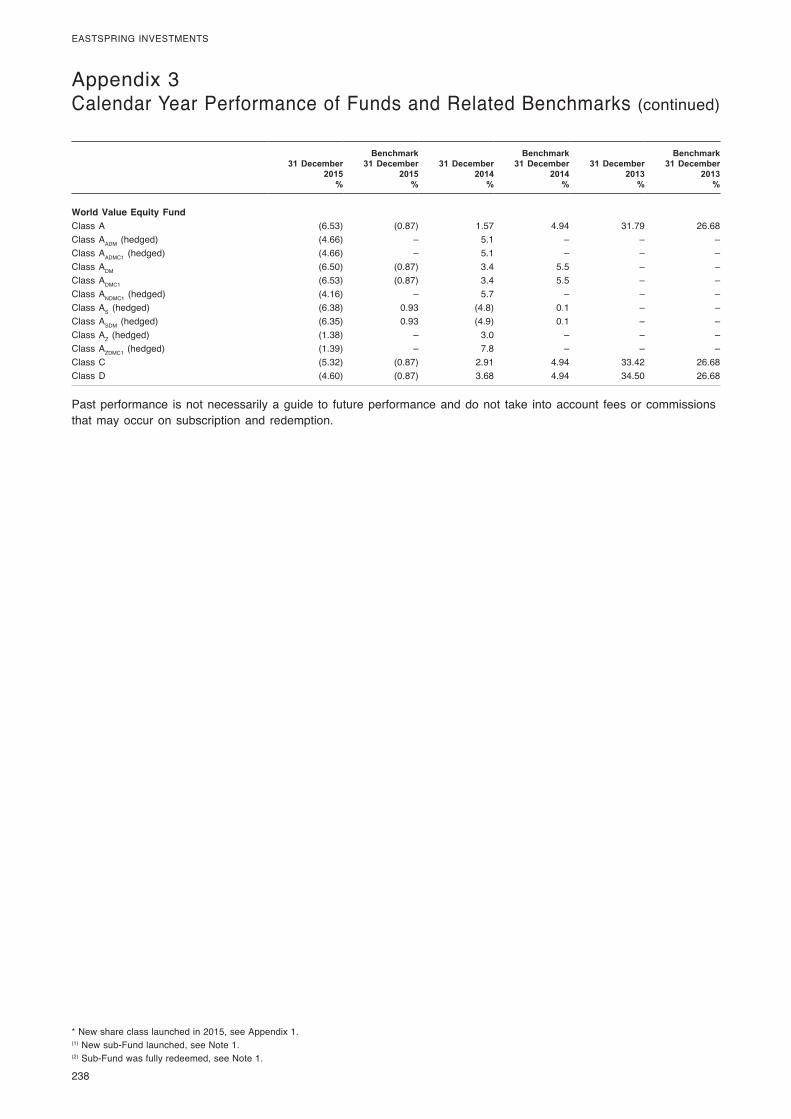
238
EASTSPRING INVESTMENTS
Appendix 3 Calendar Year Performance of Funds and Related Benchmarks (continued)
31 December 2015
%
Benchmark 31 December
2015%
31 December 2014
%
Benchmark 31 December
2014%
31 December 2013
%
Benchmark 31 December
2013%
World Value Equity FundClass A (6.53) (0.87) 1.57 4.94 31.79 26.68Class AADM (hedged) (4.66) – 5.1 – – –Class AADMC1 (hedged) (4.66) – 5.1 – – –Class ADM (6.50) (0.87) 3.4 5.5 – –Class ADMC1 (6.53) (0.87) 3.4 5.5 – –Class ANDMC1 (hedged) (4.16) – 5.7 – – –Class AS (hedged) (6.38) 0.93 (4.8) 0.1 – –Class ASDM (hedged) (6.35) 0.93 (4.9) 0.1 – –Class AZ (hedged) (1.38) – 3.0 – – –Class AZDMC1 (hedged) (1.39) – 7.8 – – –Class C (5.32) (0.87) 2.91 4.94 33.42 26.68Class D (4.60) (0.87) 3.68 4.94 34.50 26.68
Past performance is not necessarily a guide to future performance and do not take into account fees or commissions that may occur on subscription and redemption.
* New share class launched in 2015, see Appendix 1.(1) New sub-Fund launched, see Note 1.(2) Sub-Fund was fully redeemed, see Note 1.