Goldman Sachs Funds Table of Contents - Fundsquare
133
-
Upload
khangminh22 -
Category
Documents
-
view
0 -
download
0
Transcript of Goldman Sachs Funds Table of Contents - Fundsquare
Goldman Sachs Funds Table of Contents
Directors and Other Information
Investment Advisor's Report
Auditor's Report
Schedules of Investments
Goldman Sachs Funds-Regional Equi ty Port fo l ios
Goldrnan Sachs Funds-Asia Portfolio
Goldman Sachs Funds-Europe Equity Target Alpha Portfolio
Goldman Sachs Funds-Europe Portfolio
Goldrnan Sachs Funds-Europe Small Cap Portfolio
Goldrnan Sachs Funds-Global Emerging Markets Equity Portfolio
Goldman Sachs Funds-Global Equity Portfolio
Goldrnan Sachs Funds-GMS Alpha+ World Equity Portfolio
Goldman Sachs Funds-Japan Portfolio
Goldman Sachs Funds-Japan Small Cap Portfolio
Goldman Sachs Funds-UK Equity Portfolio
Goldman Sachs Funds-US Growth Equity Portfolio
Goldman Sachs Funds-US Growth Opportunities Portfolio
Goldman Sachs Funds-Regional CORE Equi ty Port fo l ios
Goldrnan Sachs Funds-Europe CORE5" Equity Portfolio
Goldrnan Sachs Funds-Global CORE'" Equity Portfolio
Goldrnan Sachs Funds-US CORE'" Equity Portfolio
Goldman Sachs Funds-Sector Equi ty Port fo l ios
Goldman Sachs Funds-Global Financial Services Portfolio
Goldman Sachs F u n d s G l o b a l Technology Portfolio
G ND
Goldrnan Sachs Funds-Euro Fixed Income Portfolio
Goldrnan Sachs Funds-Global Emerging Markets Debt Portfolio
Goldman Sachs Funds--Global Fixed h o m e Portfolio
Goldman Sachs Funds-Global Fixed Income Portfolio (Hedged)
Goldrnan Sachs Funds-Global High Yield Portfolio
Goldrnan Sachs Funds-Sterling Broad Fixed Income Portfolio
Goldrnan Sachs Funds-US Fixed Income Portfolio
Goldrnan Sachs Funds-US Mortgage Backed Securities Portfolio
Statements of Assets and Liabilities
Statements of Operations
Statements of Changes in Shareholders' Equity
Statistical Information
Notes to the Financial Statements
Appendix I
Additional Information
" "
6
a 9
11
13
15
17
19
21
23
25
26
28
30
33
36
38
39 44
49
57
62
77
83
92
98
100
102
104
106
126
128
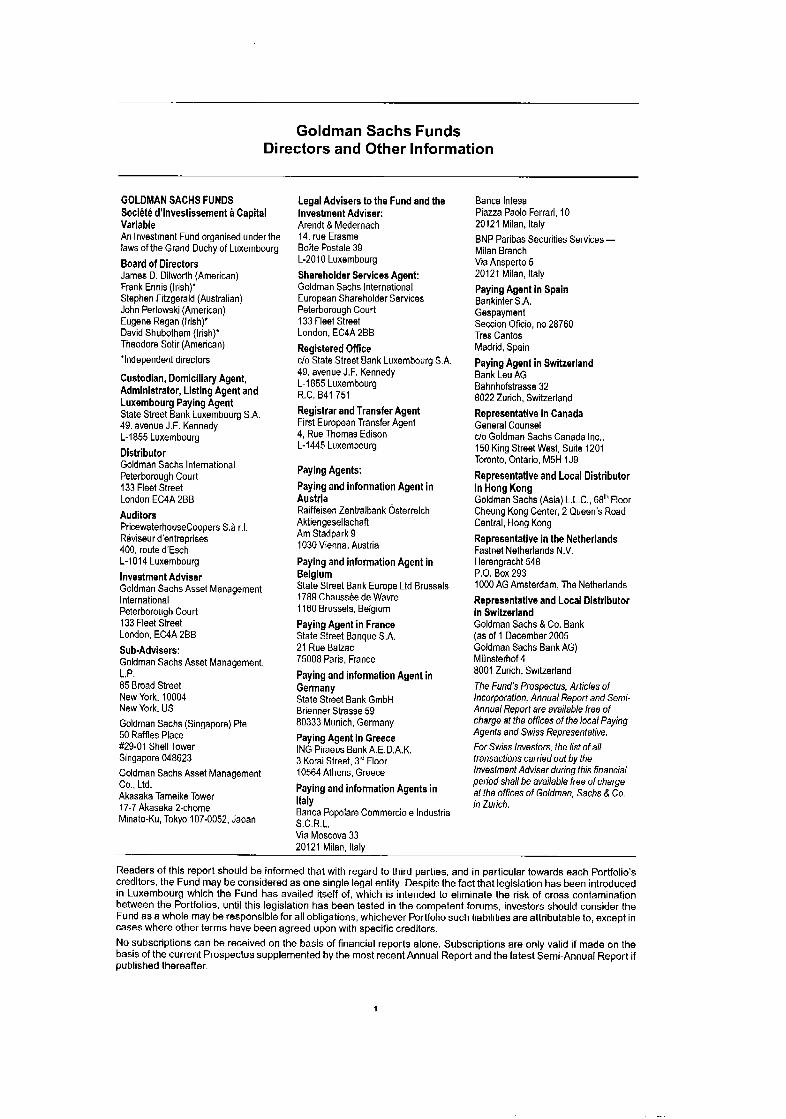
Goldman Sachs Funds Directors and Other Information
GOLDMAN SACHS FUNDS SociOte d'lnvestissement a Capital Variable An Investment Fund organised underthe laws of the Grand Duchy of Luxembourg
Board of Directors James 0. Dilworth (American) Frank Ennis (Irish)" Stephen Fitzgerald (Australian) John Perlowski (American) Eugene Regan (Irish)' David Shubotham (Irish)" Theodore Sotir (American)
*Independent directors
Custodian, Domiciliaty Agent, Administrator, Listing Agent and Luxembourg Paying Agent State Street Bank Luxembourg S.A. 49. avenue J.F. Kennedy L-1855 Luxembourg
Distributor Goldman Sachs International Peterborough Court 133 Fleet Street London EC4A 268
Auditors PricewaterhouseCoopers S.a r.l Reviseur d'entreprises 400, route d'Esch L-I014 Luxembourg
Investment Adviser Goldman Sachs Asset Management International Peterborough Court 133 Fleet Street London, EC4A 288
Sub-Advisers: Goldman Sachs Asset Management, L.P. 85 Broad Street New York, 10004 New York, US Goldman Sachs (Singapore) Pte 50 Raffles Place #29-01 Shell Tower Singapore 048623
Goldman Sachs Asset Management Co., Ltd. Akasaka Tameike Tower 17-7 Akasaka 2-chome Minato-Ku, Tokyo 107-0052, Japan
Legal Advisers to the Fund and the Investment Adviser: Arendt 8 Medernach 14. rue Erasme Bolte Postale 39 L-2010 Luxembourg
Shareholder Services Agent: Goldman Sachs International European Shareholder Services Peterborough Court 133 Fleet Street London, EC4A 288
Registered Office c/o State Street Bank Luxembourg S.A. 49, avenue J.F. Kennedy L-1855 Luxembourg R.C. 841 751
Registrar and Transfer Agent First European Transfer Agent 4, Rue Thomas Edison L-1445 Luxembourg
Paying Agents:
Paying and information Agent In Austria Raiffeisen Zentralbank Osterreich Aktiengesellschafi Am Stadpark 9 1030 Vienna, Austria
Paying and information Agent in Belgium State Street Bank Europe Ltd Brussels 1789 Chaussee de Wavre 1160 Brussels. Belgium
Paying Agent In France State Street Banque S.A. 21 Rue Balzac 75008 Paris, France
Paying and information Agent in Germany State Street Bank GmbH Brienner Strasse 59 80333 Munich, Germany
Paying Agent in Greece ING Piraeus Bank A.E.D.A.K. 3 Komi Street, 3d Floor 10564 Athens, Greece
Paying and Information Agents in Italy Banca Popolare Commercio e Industria S.C.R.L. Via Moscova 33 20121 Milan, Italy
Banca Mesa Piazza Paolo Ferrari, 10 20121 Milan, Italy
BNP Paribas Securities Services - Milan Branch Via Ansperto 5 20121 Milan, Italy
Paying Agent in Spain Bankinter S.A. Gespayment Seccion Oficio, no 28760 Tres Cantos Madrid, Spain
Paying Agent in Switzerland Bank Leu AG Bahnhofstrasse 32 8022 Zurich, Switzerland
Representative in Canada General Counsel c/o Goldman Sachs Canada Inc., 150 King Street West, Suite 1201 Toronto, Ontario. M5H 1 J9
Representative and Local Distributor In Hong Kong Goldman Sachs (Asia) L.L.C., 68'" Floor Cheung Kong Center, 2 Queen's Road Central, Hong Kong
Representative in the Netherlands Fastnet Netherlands N.V. Herengracht 548 P.O. Box 293 1000 AG Amsterdam, The Netherlands
Representative and Local Distributor in Switzerland Goldman Sachs & Co. Bank (as of 1 December 2005 Goldman Sachs Bank AG) Miinsterhof 4 8001 Zurich. Switzerland
The Fund's Prospectus, Articles of Incorporation, Annual Report and Semi- Annual Report are available free of charge at the offices of the local Paying Agents and Swiss Representative.
For Swiss Investors. the list of all transactions carried out by fhe lnvestment Adviser during fhis financial period shall be available free of charge at the offices of Goldman, Sachs & Co. in Zurich.
Readers of this report should be informed that with regard to third parties, and in particular towards each Portfolio's creditors, the Fund may be considered as one single legal entity. Despite the fact that legislation has been introduced in Luxembourg which the Fund has availed itself of, which is intended to eliminate the risk of cross contamination between the Portfolios, until this legislation has been tested in the competent forums, investors should consider the Fund as a whole may be responsible for all obligations, whichever Portfolio such liabilities are attributable to, except in cases where other terms have been agreed upon with specific creditors.
No subscriptions can be received on the basis of financial reports alone. Subscriptions are only valid if made on the basis of the current Prospectus supplemented by the most recent Annual Report and the latest Semi-Annual Report if published thereafter.
1
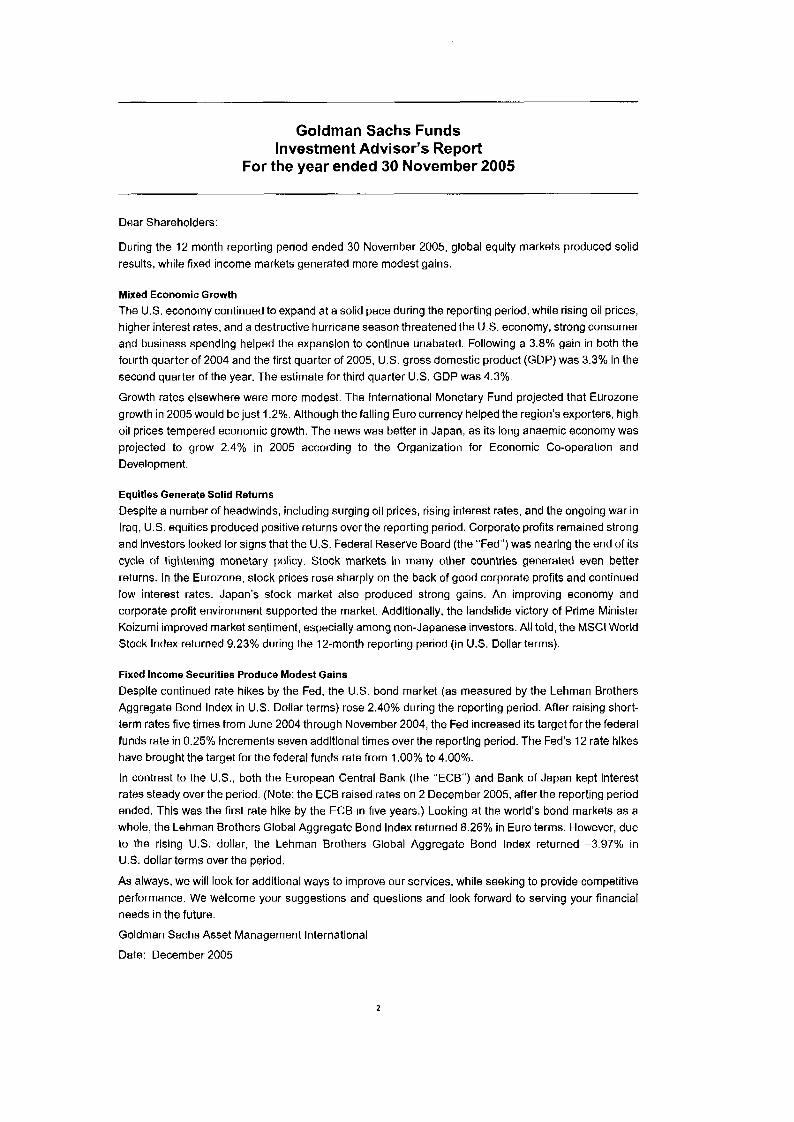
Goldman Sachs Funds Investment Advisor’s Report
For the year ended 30 November 2005
Dear Shareholders:
During the 12 month reporting period ended 30 November 2005, global equity markets produced solid results, while fixed income markets generated more modest gains.
Mixed Economic Growth
The U.S. economy continued to expand at a solid pace during the reporting period, while rising oil prices, higher interest rates, and a destructive hurricane season threatened the US. economy, strong consumer and business spending helped the expansion to continue unabated. Following a 3.8% gain in both the fourth quarter of 2004 and the first quarter of 2005, U.S. gross domestic product (GDP) was 3.3% in the second quarter of the year. The estimate for third quarter US. GDP was 4.3%.
Growth rates elsewhere were more modest. The International Monetary Fund projected that Eurozone growth in 2005 would be just I .2%. Although the falling Euro currency helped the region’s exporters, high oil prices tempered economic growth. The news was better in Japan, as its long anaemic economy was projected to grow 2.4% in 2005 according to the Organization for Economic Co-operation and Development.
Equities Generate Solid Returns
Despite a number of headwinds, including surging oil prices, rising interest rates, and the ongoing war in Iraq, U.S. equities produced positive returns over the reporting period. Corporate profits remained strong and investors looked for signs that the US. Federal Reserve Board (the “Fed”) was nearing the end of its cycle of tightening monetary policy. Stock markets in many other countries generated even better returns. In the Eurozone, stock prices rose sharply on the back of good corporate profits and continued low interest rates. Japan’s stock market also produced strong gains. An improving economy and corporate profit environment supported the market. Additionally, the landslide victory of Prime Minister Koizumi improved market sentiment, especially among non-Japanese investors. All told, the MSCl World Stock Index returned 9.23% during the 12-month reporting period (in U S . Dollar terms).
Fixed Income Securities Produce Modest Gains
Despite continued rate hikes by the Fed, the U.S. bond market (as measured by the Lehman Brothers Aggregate Bond Index in U.S. Dollar terms) rose 2.40% during the reporting period. After raising short- term rates five times from June 2004 through November 2004, the Fed increased its target for the federal funds rate in 0.25% increments seven additional times over the reporting period, The Fed’s 12 rate hikes have brought the target for the federal funds rate from 1 .OO% to 4.00%.
In contrast to the U.S., both the European Central Bank (the “ECB”) and Bank of Japan kept interest rates steady over the period. (Note: the ECB raised rates on 2 December 2005, after the reporting period ended. This was the first rate hike by the ECB in five years.) Looking at the world’s bond markets as a whole, the Lehman Brothers Global Aggregate Bond Index returned 8.26% in Euro terms. However, due to the rising U.S. dollar, the Lehman Brothers Global Aggregate Bond Index returned -3.97% in U.S. dollar terms over the period.
As always, we will look for additional ways to improve our services, while seeking to provide competitive performance. We welcome your suggestions and questions and look forward to serving your financial needs in the future.
Goldman Sachs Asset Management International
Date: December 2005
2
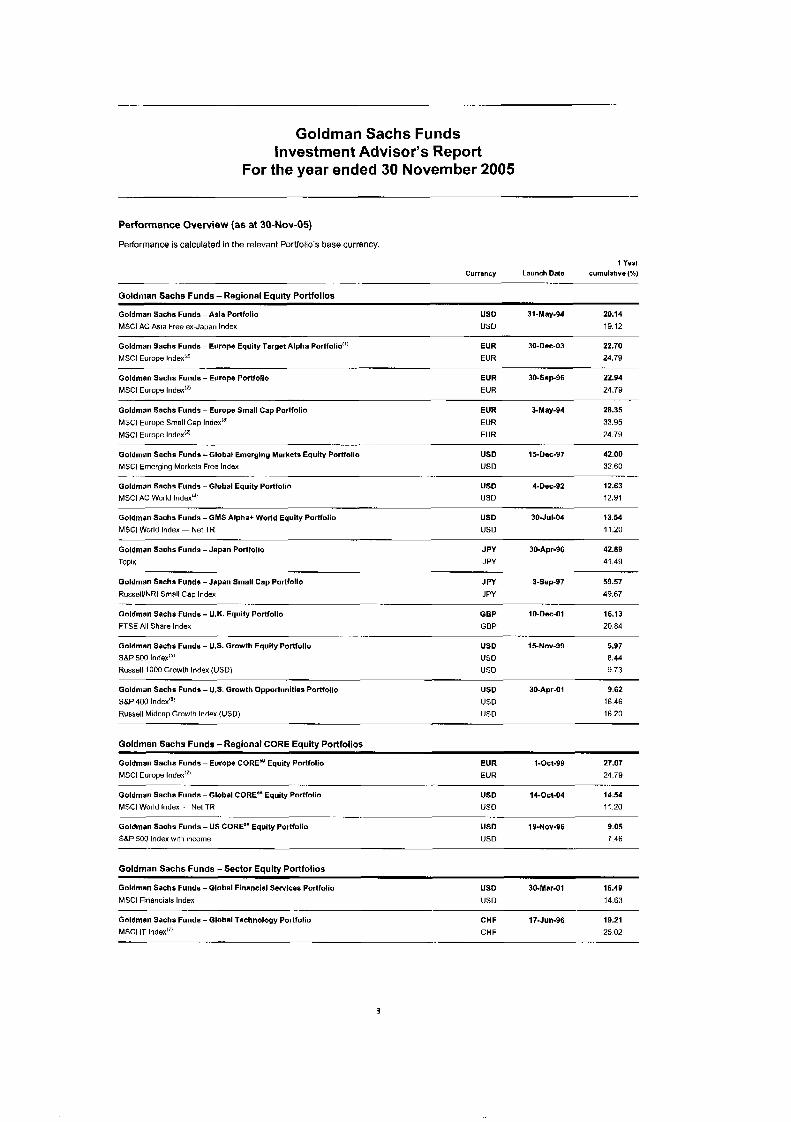
Goldman Sachs Funds Investment Advisor's Report
For the year ended 30 November 2005
Performance Overview (as at 30-Nov-05)
Performance is calculated in the relevant Portfolio's base currency.
I Year Currsncy Launch Date cumulative (x)
. ..... - -. Goldman Sachs Funds - Regional Equity Portfolios
Goldman Sachs Funds - Asla Portfolio us0 31-May-94 20.14
MSCl AC Asia Free ex-Japan Index USD 19.12
Goldman Sachs Funds - Europe Equity Target Alpha Portfolio"' EUR 30-Dec-03 22.70
MSCl Europe Index!" EUR 24.79
Goldman Sachs Funds - Europe Porlfollo EUR 30-Sap96 22.94
MSCl Europe Index"' EUR 24.79
Goldman Sachs Fundr - Europe Small Cap Portfolio EUR 3-May-94 28.35
MSCl Europe Index"' EUR 24.79
Goldman Sachs Funds - Global Emerglng Markets Equity Portfolio USD 15-Doc-97 42.00
MSCI Emerging Markets Free Index US0 32 60
Goldman Sachs Funds - Global Equity Portfolio US0 4-DeC-92 12.63
MSCl Europe Small Cap Index"! EUR 33.Y5
-- . .. . ... -. . . .-
. . - .- - -.
MSCl AC World Index'4; USD 12.91
Goldman Sachs Funds - GMS Alpha+ World Equity Portfolio
MSCI World Index - Net TR
USD 30-JuI-04 13.54
USD 11.20
Goldman Sachs Funds - Japan Portfolio
Topix
JPY 3bApr-96 42.89
JPY 41.49
Goldman Sachs Fundr - Japan Small Cap Portfolio
RussellINRI Small Cap Index
Goldman Sachs Funds - U.K. Equity Portfollo
FTSE All Share Index
Goldman Sachs Funds - U.S. Growth Equlty Porlfollo S8P 500 Index!" Russell 1000 Growth Index (USD)
-- - ...
J PY 3-Sep.97 59.57
JPY 49.67 ~~~
GBP IO-Doc-01 16.13 GBP 20.84
USD 15-Nov-99 5.97
USD 8.44 USD Y.73
Goldman Sschs Funds - U.S. Growth Opportunities Portfolio
sap 400 Index'" Russell Midcap Growth Index (USD)
US0 30-Apr-01 9.62
US0 16.46
US0 16.20
Goldman Sachs Funds - Reaional C O R E E a u i t v Portfolios
Goldman Sachs Funds - Europe CORE'" Equity Portfolio
MSCl Europe Index"'
Goldman Sachs Funds - Global CORE*" Equity Portfolio MSCl World Index Net TR
Goldman Sachs Funds - US CORE'" Equlty Portfolio
S&P 500 Index with income
- - .~
EUR 1-Oct-99 27.07
EUR 24 79
US0 14-Oct-04 14.54
US0 11 20
USD 19-NOV-96 9.05 USD 7 46
. - "~
__
Goldman Sachs Funds - Sector Equi ty Portfolios
Goldman Sachs Funds - Global Financial Servlces Portfolio US0 30-Mer-01 16.49
MSCl Financials Index USD 14.63
Goldman Sachs Funds -Global Technology Portfolio
MSCl IT Index"' CHF 17-Jun-98 19.21
CHF 25 02
3
Goldman Sachs Funds Investment Advisor's Report
For the year ended 30 November 2005
1 Year Currency Launch D a b CumuIatIvo (X)
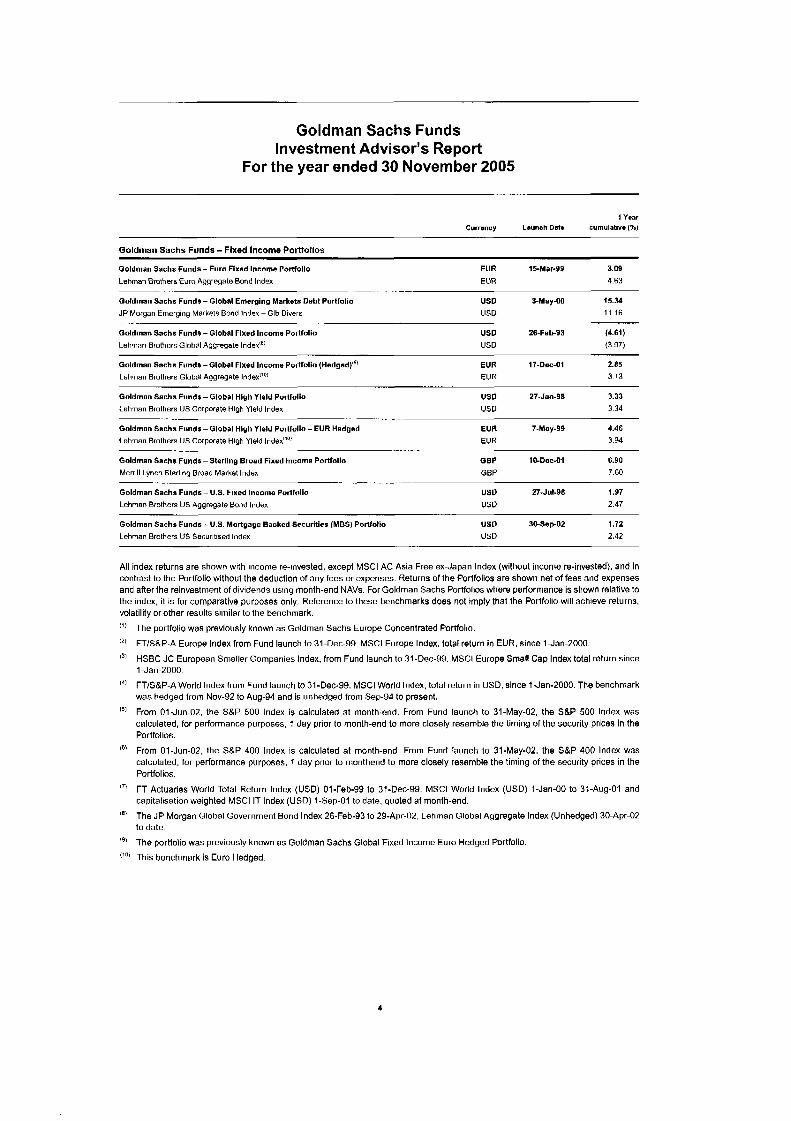
Goldman Sachs Funds - Fixed Income Porlfollos
Goldman Sachs Funds - Euro Fixed Income Portfolio EUR 15-Mar-99 3.09 Lehman Brothers Euro Aggregate Bond Index EUR 4.63
Goldman Sachs Funds - Global Emerging Markets Debt Portfolio USD 3-May-00 15.34 JP Morgan Emerging Markets Bond Index - Glb Divers USD 11.16
Goldman Sachs Funds - Global Fixed Income Portfolio USD 26-Feb93 (4.61)
~. . - - . -. . . . .
Lehnan Brothers Global Aggregate Index"' USD (3.97)
Goldman Sachs Funds - Global Flxed Income Portfolio (Hedgad)'" EUR 17-Dec-01 2.85
Lehman Brothers Global Aggregate Index""' EUR 3 13
Goldman Sacha Funds-Global Hlgh Yleld Portfolio USD 27-Jan-98 3.33 Lehnan Brothers US Cnrporate High Yield Index USD 3.34
Lehnan Brothers US Corporate High Yield Index""! EUR 3.94
~. ,. . . . -. . ._
Goldman Sacha Funds-Global Hlgh Yield Portfolio - EUR Hedgad EUR 7-May99 4.46
- - .. -
Goldman Sachs Funds - Sterllng Broad Fixed Income Portfolio GBP 1CbDec-01 6.90 Merrill Lynch Sterling Broad Marker Index GBP 7.60
Goldman Sachs Funds - U.S. Fixed Income Portfolio USD 27-Jul-98 1.97 Lehman Brothers US Aggregate Bond Index USD 2.47
Goldman Sachs Funds - U.S. Mortgage Backed Securities (MBS) Portfolio US0 3WSep02 1.72 Lehman Brothers US Socuritisnd Index USD 2.42
- .. .. - - - . . .-
All index returns are shown with income re-invested, except MSCl AC Asia Free ex-Japan Index (without income re-invested). and in contrast to the Portfolio without the deduction of any fees or expenses. Returns of the Portfolios are shown net of fees and expenses and afler the reinvestment of dividends using month-end NAVs. For Goldman Sachs Portfolios where performance is shown relative to the index, it is for comparative purposes only. Reference to these benchmarks does not imply that the Portfolio will achieve returns, volatility or other results similar to the benchmark.
The portfolio was previously known as Goldman Sachs Europe Concentrated Portfolio.
FTISBP-A Europe Index from Fund launch to 31-Dec-99 MSCl Europe Index. total return in EUR. since I-Jan-2000.
HSBC JC European Smaller Companies Index. from Fund launch to 31-Dec-99. MSCl Europe Small Cap Index total return since I-Jan-2000.
FT/SLP-A World Index from Fund launch to 31-Dec-99. MSCl World Index, total return in USD, since 1-Jan-2000. The benchmark was hedged from Nov-92 to Aug-94 and is unhedged from Sep-94 to present.
From 01-Jun-02, the S&P 500 Index is calculated at month-end. From Fund launch to 31-May-02, the SBP 500 Index was calculated, for performance purposes, 1 day prior to month-end to more closely resemble the timing of the security prices in the Portfolios.
From 01-Jun-02. the SBP 400 Index is calculated at month-end. From Fund launch to 31-May-02, the S&P 400 Index was calculated. for performance purposes, 1 day prlor to monthend to more closely resemble the timing of the security prices in the Portfolios.
FT Actuaries World Total Return Index (USD) 01-Feb-99 to 31-Dec-99. MSCl World Index (USD) I-Jan-00 to 31-Aug-01 and capitalisation weighted MSCl IT Index (USD) I-Sep-01 to date, quoted at month-end.
The JP Morgan Global Government Bond Index 26-Feb-93 to 29-Apr-02. Lehman Global Aggregate Index (Unhedged) 30-Apr-02 to date.
The portfolio was previously known as Goldman Sachs Global Fixed Income Euro Hedged Portfolio.
This benchmark is Euro Hedged.
4

Goldman Sachs Funds Auditor's Report
To the Shareholders of Goldman Sachs Funds:
We have audited the Financial Statements which consist of the Statements of Assets and Liabilities, the Statements of Operations, the Statements of Changes in Shareholders' Equity, the Schedules of Investments and the Notes to the Financial Statements of Goldman Sachs Funds (the "SICAV") and of each of its Sub-Funds for the year ended 30 November 2005. These Financial Statements are the responsibility of the Board of Directors of the SICAV. Our responsibility is to express an opinion on these Financial Statements based on our audit.
We conducted our audit in accordance with International Standards on Auditing. Those standards require that we plan and perform the audit to obtain reasonable assurance about whether the Financial Statements are free of material misstatement. An audit includes examining, on a test basis, evidence supporting the amounts and disclosures in the Financial Statements. An audit also includes assessing the accounting principles used and significant estimates made by the Board of Directors of the SICAV, in preparing the Financial Statements, as well as evaluating the overall Financial Statements presentation. We believe that our audit provides a reasonable basis for our opinion.
In our opinion, the attached Financial Statements described above give, in conformity with the Luxem- bourg legal and regulatory requirements, a true and fair view of the financial position of the SICAV and of each of its Sub-Funds at 30 November 2005 and of the results of their operations and changes in their net assets for the year then ended.
Supplementary information included in the Annual Report has been reviewed in the context of our mandate but has not been subject to specific audit procedures carried out in accordance with the standards described above. Consequently, we express no opinion on such information. We have no observation to make concerning such information in the context of the Financial Statements taken as a whole.
PricewaterhouseCoopers S.a r.1. Reviseur d'entreprises Represented by
Luxembourg, 27 February 2006.
John Parkhouse
5
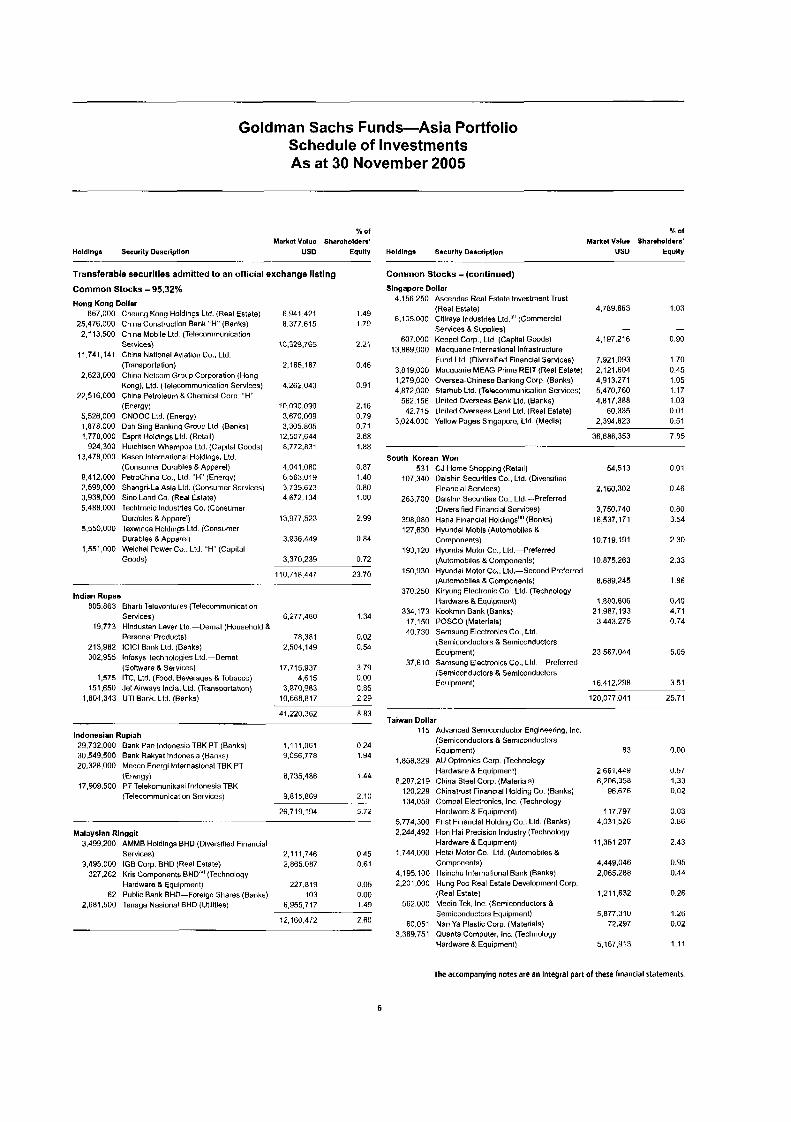
Goldman Sachs Funds-Asia Portfolio Schedule of Investments As at 30 November 2005
% of O h Of
Market Value Shareholders' Market Valu. Sharoholdors' Holdlngs Security Descrlpllon us0 Equity Holdlngs Sacurlly Description US0 Eqully
T r a n s f e r a b l e secur i t ies a d m i t t e d to an off ic ial exchange l ist ing
C o m m o n S t o c k s - 95.32%
-.I- - --
C o m m o n S t o c k s - (cont inued)
Slngapore Dollar
Hong Kong Dollar 667,000 Cheunq Kong Holdings Lld. (Real Estate)
25,476,000 Ch na Construction Bank ' H' (Banks) 2,113.500 Ch na Mobile Ltd (Telecommunication
Services) 11.741.141 Ch,na National Aviation Cu.. Lld.
(Transportation) 2,623,000 Chlna Netcom Group Corporation (Hong
Knng). Ltd. (Telecommunicalion Services) 22.516.000 China Petroleum 8 Chemical Corp. "H"
(ErergY) 5.526.000 CNOOC Ltd. (Energy) 1.878.000 Dah Sing Banking Group Ltd (Banks1 1,778,000 Esprit Holdings Ltd. (Retsil)
924,300 Hutchison Whampoa Ltd. (Capital Goods) 13,478,000 Kasen International Holdings, Lld
(Consumer Durables 8 Apparel) 8.412.000 PetroChina Go.. Ltd. "H ' (Energy) 2.598.000 Shangri-La Asia Ltd. (Consumer Services) 3.938.000 Sino Land Co. (Real Estate) 5.488.000 Techtronic Industries Co. (Consumer
Durables 8 Apparel) 5,550.000 Texwinca Holdings Ltd. (Consumer
Durables 8 Apparel) 1,551,000 Weichai Power Co.. Lld. "H" (Capital
Goods)
6.941.421 8.377.615
10,329,765
2,165,187
4,262,043
iomo.o9o 3.670.009 3,305.H05
12,507,644 8,772.R31
4,041,OHO 6,563,014 3,735,623 4.672.104
13,977,523
3,936,449
3,370,239
1.49 1.79
2.21
0.46
0.91
2.16 0.79 0.71 2.68 1.88
0.87 1.40 9.80 1 .uo
2.99
0 84
0 72
110.718.447 23 70 ~. . . ..
Indian Rupee 805.863 Bharti Tolowntuves (Telecommunication
Services) 6,277,480 1.34 19,773 Hindustan Lever Ltd.-Demal (Household 8.
Personal Products) 78,381 0.02 213,982 lClCl Bank Ltd. (Banks) 2,504,149 0.54 302.955 lnfosys Technologies Ltd -Demal
(Software 8 Services) 17,715,937 3.79 1.575 ITC. Ltd. (Food. Beveraqes 8 Tobacco) 4,615 0.00
151,650 Jet Airways India. Lld. (Transportation) 3,R70,903 0.85 1,804,343 UTI Bank. Ltd. (Banks) 10,66R,017 2.29
41220,362 8.83
Indonesian Rupiah 29.732.000 Bank Pan Indonesia TBK PT (Banks) 1,111,061 0.24 30,549,500 Bank Rakyal Indonesia (Banks) 9,056,778 1.94 20.328.000 Medco Energi lnternasional TBK PT
17,909,500 PT Telekomunikasi Indonesia TBK (Energy) 6,735,486 3.44
2.10
26.719.194 5.72 . -.
(Telecommunication Services) 9.815.869
Malayslan Ringgit 3,499200 AMMB Holdings BHD (Diversified Financial
Services) 9.495.000 IGB Corp. BHD (Real Estate)
Hardware 8 Equipment) 62 Public Bank BHD-Foreign Shares (Banks)
327.262 Kris Components BHW' (Technuloqy
2,681,500 Tenaga Nasional EHD (Utilities)
2,111,746 0.45 2,865.0H7 0.61
227,H19 103
6,955,717
12.160.472
0.05 0.00 1.49
2.60
4,156,250 Ascendas Real Estate Investment Trust
6,105.000 Citiraya Industries Ltd!" (Commercial (Real Estate)
Services a Supplies) 607,000 Keppel Corp.. Ltd (Capital Gwds)
Fund Ltd. (Diversifind Financial Services) 3.819.000 Macquarie MEAG Prime RElT (Real Estate) 1.279.000 Oversea-Chinese Banking Gorp, (Banks) 4.872.000 Slarhub Ltd (Telecommunication Services)
13.889.000 Macquarie International Infrastructure
562.156 United Overseas Bank Lld. (Banks) 42.715 United Overseas Land Ltd. (Real Estate)
3.024.000 Yellow Pages Singapore. Lld. (Media)
4,789,863
-
4,197216
7.921.093 2,121.604 4.913.271 5.470.760 4.817.388
60.335 2.394.823
-
0.90
1.70 0.45 1.05 1.17 1.03 0.01 0.51 -
36.686.353 7.85 ... -
Soulh Korean Won 531 CJ Home Shopping (Retail) 54,513 0.01
107.340 Daishin Securities Co.. Ltd. (Diversified Financial Services) 2.160.302 0.46
263.700 Daishin Securilies Co.. Ltd.----Preferred (Diversified Financial Services) 3.750.740 0.80
388,080 Hana Financial Holdings'" (Banks) 16,537.171 3.54 127.630 Hyundai Mobis (Automobiles a
Components) 10.719.191 2.30 193.120 Hyundai Motor Co.. Ltd.-Preferred
(Autnmnbiles & Components) 10.875.263 2.33 150.Y30 Hyundai Motor Co.. Ltd.-Second Preferred
(Automobiles &Components) 8.689.245 1.86 370.250 Kiryung Elactronic Go.. Ltd (Technology
Hardware 8 Equiprnant) 1.8ao.ao6 0.40 334.173 Kookmin Bank (Banks) 21.9a7.193 A.71
17.150 POSCO (Materials) 3.443.275 0.74 40.730 Samsung Electronics Co.. Ltd
(Semiconductors 8 Semiconductors Equipment) 23,567.044 5.05
(Semiconductors 8 Semiconduclors Equipment) 16.412.298 3 51
120.077.041 25.71
37.610 Samsung Electronics Go.. Ltd.-Preferred
Taiwan Dollar 115 Advanced Semiconductor Engineering. Inc.
(Semiconductors 8 Semiconductors Equipment) 83 0.00
8.287.219 China Steel Corp. (Materials) 6,206,358 1.33 120,228 Chinalrusl Financial Holding Co. (Banks) 96.676 0.02
1.858.329 AU Optronics Corp. (Technology Hardware 8 Equipment) 2,661.449 0.57
134,059 Compel Eleclronics. Inc (Technology Hardware a Equipment)
5.77A.300 First Financlal Holding Co.. Lld (Banks) 2,244,492 Hon Hai Precision Industry (Technology
Hardware 8 Equipment) 1.744.000 Holai Motor Co., Ltd (Automobiles &
Components) 4.195.100 Hsinchu International Bank (Banks) 2,201,000 Hung Po0 Real Estate Developmenl Gorp,
(Real Eslate) 562,000 Media Tek. Inc. (Semiconductors 8
Semiconductors Equipment) 60,051 Nan Ya Plastic Corp. (Materials)
3.369.751 Quanta Computer. Inc. (Technology Hardware a Equipment)
117,797 4,031,526
11,351,207
A.A49.046 2.065.288
1.211.632
5,877,310 72.297
5,167,913
0.03 0.H6
2.43
0.95 0.44
0.26
1.26 0.02
1.11
The accompanying nales are an Integral part of these financial statements.
6

Goldman Sachs Funds-Asia Portfolio Schedule of Investments As at 30 November 2005
% O f
Market Valu. Sharsholdars' Holdlnge Security Doscrlptlon USD Equlty
Common Stocks - (cont lnued)
Taiwan Dollar- (contlnued)
.-
5.474.000
6,892.556
5,239,000 2,906,640
61 10,140,740
7.1 17.729
Shin Kong Financinl Holding Co.. Ltd. (Insurance) Siliconware Precision Industries Co. (Semiconductors 8 Serniconduclors EqJipment) Siropac Holdings Co (Banks) Synnex Technology International Corp. (Technology Hardware 8 Equipment) Taishin Financial Holdings Co., Ltd. (Banks) Taiwan Semiconductor Manufacturing Co.. Ltd. (Semiconductors 8 Semiconductors Equipment) Un led Micrneleclronics Corp.. Ltd (Semiconductors 8 Semiconductors Equipment)
4,132.184
7.310.957 2.303.815
3,SIY ,93" 32
18,002,835
3,Y71,343
82,629,680 --
0.88
1.57 0.51
0.75 0 00
3.85
0.05
17.69 ~ -. .. - r .
Thailand Baht 1,722,600 Advanced Info Service PIC.-Foreign
Shares (Telecommunication Services) 4.136.747 3.88
Estate) 4.213.293 0.90 12.495.900 Amata Corporation Public Co.. Ltd. (Real
11.276.199 CPN Retail Growth Properly Fund (Real Estate) 2.926.752 a.63
11,276.792 2.41 ~
United States Dallar 1,100,000 Hongkong Land Holdings Ltd. (Real Estate) 3,776.000 0.01
T O T A L T R A N S F E R A B L E S E C U R I T I E S A D M I T T E D TO A N O F F I C I A L E X C H A N G E L I S T I N G ( c o s t U S 0 3 7 7 . 9 9 4 . 7 5 0 ) 445,264,341 95.32
. __ ..
Other t ransferable secur l t les
Common Stocks - 1.03% Taiwan Dollar
4,796,709 Career Technology Go., Ltd. (Technology Hardware 8 Equipment) 4,787,335 103
~~
T O T A L C O M M O N S T O C K S ( c o s t U S D 6 , 0 2 0 , 0 0 2 )
~
4787.335 1.03
Rights - 0.00% Hong Kong Dollar
20.843 Cheung Kong Holdings Ltd.. exp. 11/06---Rights (Real Estate) - -
. . ..
Thailand Baht 37,032 True Corp.. PIC.. exp, 09106-Rights
(Telecornrnunicalion Services) - .-
( c o s t USD n i l ) - -
. . . T O T A L R I G H T S
- . - T O T A L O T H E R T R A N S F E R A B L E S E C U R I T I E S ( c o s t U S D 6 . 0 2 0 . 0 0 2 ) 4,787,335 1.03
% of
Markel Value Shareholders' Holdlnga Security Description USD Equity
Mutual Funds Unitad Statss Dollar
9.867.483 Goldrnan Sachs USD Liquid Reserves Fund
.. --
Yield 3 OIY%'bi 9,867,483 2 11
T O T A L M U T U A L F U N D S ( c o s t U S D 9 , 8 6 7 . 4 8 3 ) 9,867.483 2.11
M A R K E T V A L U E O F I N V E S T M E N T S ( c o s t U S D 3 9 3 , 8 8 2 , 2 3 5 ) 459,919,159 98.46
O T H E R A S S E T S A N D L I A B I L I T I E S 7,205.503 1.54
S H A R E H O L D E R S ' E 9 U l T Y 467,124,662 100.00
T O T A L I N V E S T M E N T S
Total Common Stocks (cost US0 304.014.752) 450.05 1,676 Y6.35 Total Rights (cost USD nil) - - Total Mutual Funds (cost US0 9.867.4R3) 9,867,483 2.11 Other Assets and Liabilities 7,205,503 1.54
Shareholders' Equity 467,124,662 100.00
w These securities are fair valued. See Note 3(c).
This security is admit ted to an ofkial exchange listing.
The accompanying nates are an integral part of these financlal statements.
7
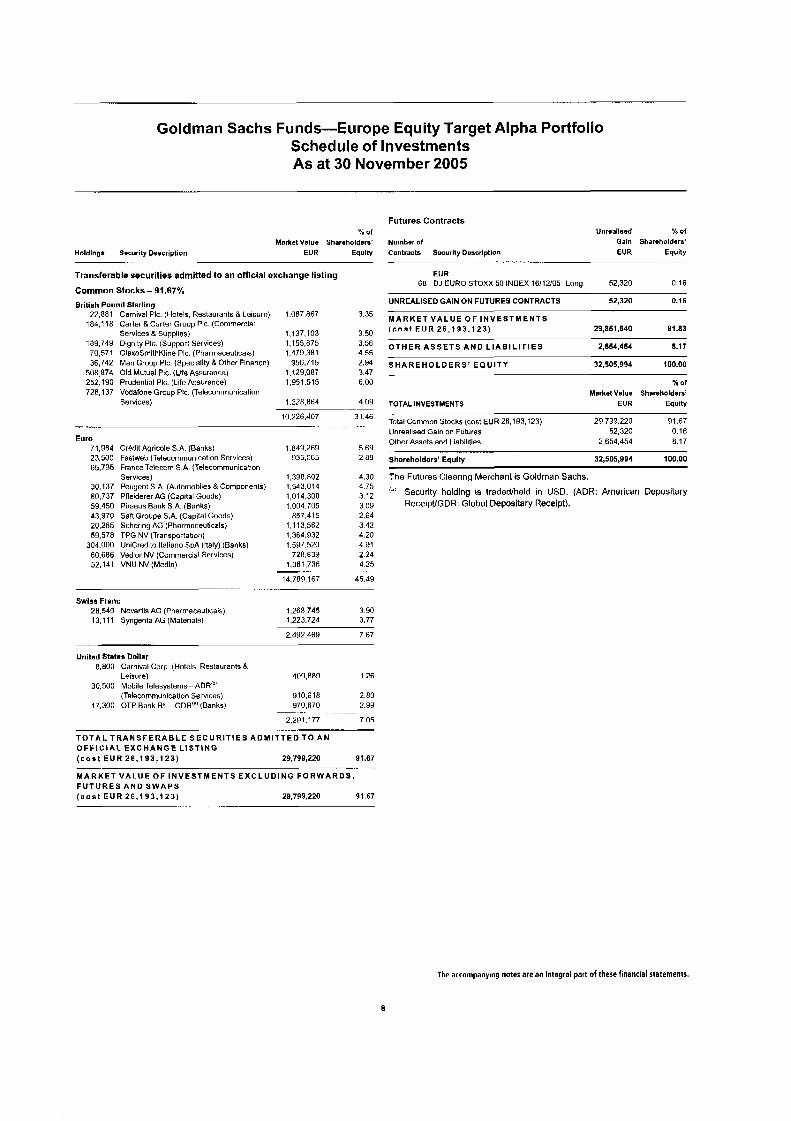
Goldman Sachs Funds-Europe Equity Target Alpha Portfolio Schedule of Investments As at 30 November 2005
Futures Contracts % of Unrmllssd % O f
Market Value Sharsholdors' Numbsr of Galn Shareholdara' Holdlnga Security Description EUR Equlty Contrecls Securlly Des~rlptlon EUR Equity
- - . .... ~ -_ . _ Transferab le secur i t ies admitted to an offlclal exchange listing
Common Stocks - 91.67%
EUR 6H DJ EURO STOXX 50 INDEX lfi112105 Long 52.320 0.16
UNREALISED GAIN ON FUTURES CONTRACTS ~ Z , J Z O 0.16 British Pound Sterling
3'35 M A R K E T V A L U E O F I N V E S T M E N T S 22,881 Carnival PIC. (Hotels. Restaurants & Lnisurn) 1.007.867
3.50 ( c o a t E U R 26 .193 .123) 29,851,540 91.83 184,118 Carter 8 Carter Group PIC. (Commercial Services & Supplios) 1,137.103
189.749 Dignity Plc. (Support Services) 1,155,875 i::: O T H E R A S S E T S A N D L I A B I L I T I E S 2,654.454 8.17 70,571 GlaxoSrnithKline PIC. (Pharmaceuticals) 1.479.3ai 36,742 Man Group PIC. (Speciality 8 Other Financc) 956,715 2,94 S H A R E H 0 L 0 E R S ' E Q U I TY 32,505,994 100.00
508,874 Old Mutual PIC. (LIM Assurance) 1.129.087 3.47 252,190 Prudential Plc. (Life Assurance) 1.951.515 6.00 726,137 Vodafone Group PIC. (Telecommunication
4.0y TOTAL INVESTMENTS __ Services) 1,328,864
K ai Market Value Shareholders'
EUR Equity
Other Assets and Liabilities 2,654,454 8.17 Euro 71.984 Credit Agricole S A (Banks) 1.849.269 5.69
65.795 France Telecom S.A. (Telecommunication 23,500 Fastweb (Telecommunication Services) Y35,0fi5 RH Shareholders' Equity 32,505,994 100.00
Euro 71.984 Credit Aoricole S A (Banks)
Other Assets and Liabilities 2,654,454 8.17 1.849.269 5.69
iity 32,505,994 100.00
Services) 1,390,flOZ 4,30 The Futures Clearing Merchant is Goldman Sachs. 4 7s 3,12 (a' Security holding is tradedlheld in USD. (ADR: American Depositary 30,137 Peuyeot S A (Automobiles 8 Components) 1,543,014
59.450 Piraeus Bank S A. (Banks) 1,004,705 3 09 ReceipVGDR: Global Depositary Receipt). 60,737 Pfleiderer AG (Capital Goods) i ,014,308
43,970 SaH Groupe S A (Capital Goods) 857,415 2.64 20,265 Schering AG (Pharmaceuticals) 1 , i 13,562 3 42 59,578 TPG NV (Transportation) 1,364.932 4.20
304.000 UniCredito ltaliano SpA (Italy) (Banks) 1.597.520 4.91 60,686 Vedior NV (Commercial Services) 72A,R3Y 2 24 52.141 VNU NV (Media) 1,381,73fi 4 25
Swlss Franc 28.549 No\'artis AG (Pharmaceuticals) 13, l i 1 Syngenta AG (Materials)
Unitsd States Dollar 8,800 Carnival Corp. (Hotels. Restaurants 8
Leisure)
(Tnlncornrnunication Services) 30.500 Mobile Telesystems-ADR'"''
17.300 OTP Bank RI.-GDR!"(Banks)
14,709,167 45.49
i.2tja.745 390
2.492.469 7 67
1.223.724 3.77
409.889 I 26
910.618 2 ao 2 99
.-. - Y70.fi70
2.2Y 1,177 7 05
T O T A L T R A N S F E R A B L E S E C U R I T I E S A D M I T T E D T O A N O F F I C I A L E X C H A N G E L I S T I N G ( c o s t E U R 2 6 . 1 9 3 , 1 2 3 ) 29,799,220 91.67
M A R K E T V A L U E OF I N V E S T M E N T S E X C L U D I N G F O R W A R D S , F U T U R E S A N D S W A P S ( c o s t E U R 2 6 , 1 9 3 , 1 2 3 ) 29.799.220 91.67
. .
The accompanying notes are an integral part of these financial statements.
8

Goldman Sachs Funds-Europe Portfolio Schedule of Investments As at 30 November 2005
Holdings Sacurlty Deacrlptlon
x Of
Market Value Shareholders' EUR Equlty Holdlnga Securlty Oescrlpllon
% of Market Value Shareholders'
EUR Equity
Transferable securities admitted to an official exchange listing
Common Stocks - 97.18%
British Pound Sterllng 111,707 BAA PIC. (Transportation) 1.041.400 549,163 British Sky Broadcasting PIC. (Media) 3.979.695
36.667 Carnival PIC. (Hotels, Restaurants 8. Leisure) 1.743.316
991.871 Cattle6 PIC. (Speclalily 8 Other Finance) 4,310,574 613,152 GlaxoSmithKline PIC. (Pharmaceuticals) 12,053,517 248.856 HBOS PIC. (Banks) 3.185.188 229,969 HSBC Holdings PIC. (Banks) 3.123.934
97.605 Man Group PIC. (Speciality 8. Other Finance) 2,541.51 1 2,072,913 Old Mutual PIC (Life Assurancn) 4.599.367 1,348,550 Prudential PIC. (Life Assurance) 10,435,448
259,l i f Reckilt Benckiser PIC. (Personal Care L Household Products) 6,804.097
642.126 Rexam PIC. (Support Scrvtcos) 4,808.810 526.988 Rolls-Royce Group PIC. (Aerospace &
Defense) 3.011.132 18,940,071 Rolls-Royce Group PIC. "8" (Aeruspace L
Defense) 27.785 493.677 Royal Bank of Scotland Gruup PIC. (Banks) 11,94Y.464 270.426 Royal Dutch Shell PIC. "B' (Oil R Gas) 7,398.5HR
1,633.457 Tesco PIC. (Food. Beverages 8 Tobacco) 7,260,590 6,771,657 Vodafone Group PIC. (Telecommunication
Services) 12,392,447 535,591 WPP Group PIC. (Media) 4,478.470
105,945,333 -. - -
Danish Krone 127,993 Now Nordisk AIS "6'. (Pharmaceuticals) 5.839.094
0.29 1.11
0.48 1 .20 3.58 0.89 0.87 0 71 128 2.91
1.89 1 34
0.84
0.01 3.33 2.06 2.02
3.45 1.25
29 51
1.63
Euro 48.433 4.178
298,455
1,355,889 239,734
852.029
350.R95 365.290 28.053
106,040 77,000
408.806
305.570
332,868
238,902
83.696
' 1 . I 90,234 96,757 40,224
161,702 122,996 132,202
Air Liquidn (Materials) Anglo Irish Bank Corp.. PIC. (Banks) Anglo Irish Bank Corp , PIC. (Dublin listing) (Banks) Banca Intesa SPA (Banks) Banco BilbaoVizcaya Argcntaria S.A. (Banks) Banco Santander Central Hispano S A (Banks) Credit Ayricole S.A. (Banks) CRH PIC. (Materials) CRH PIC. (Dublin listing) (Materials) E.ON AG (Utilities) Fastweb (Telecommunication Services) France Telecom S A (Teleconinlunication Services) Hellenic Tolecommunications Organization S.A (Telecommunication Services) ING Groep NV (Diversified Financial Services) Koninklijke Philips Electronics NV (Consumer Durables 8 Apparel) Louis Vuitlon Mob1 Hennosy S A. (LVMH) (Consumer Durahles &Apparel) M-real Oyj .'E' (Materials) PagesJaunes S.A. (Media) Peuyeot S.A. (Autornohilns & Components) Royal Dutch Shnll PIC. " A ' (Oil 8 Gas) Sanofi-Aventis (Pharmaceuticals) Schering AG (Pharmaceuticals)
1,429,622 2.07 48.883 0.01
3,479,985 0.97 5,559,145 1 55
3.600.805 1 00
9.201.913 2.56 9,014,492 2 51 8.219.025 2.29
629,790 0.18 8.569.092 2.39 3,063,H:iU 0.85
8.691.216 2.42
5.555.263 1.55
g,16n.s27 2.55
5,669.144 1.58
6,093,069 1.70 4.832.350 1 35 1,999,000 0.56 2.059.469 0 57 4,223,656 1.18 8,437.52fi 2.35 7,264.500 2 02
Common Stocks - (continued) Euro - (continued)
132,732 Siemens AG (Capital Goods) 369.439 Telefonica S A (Telecommunication
Sewces) 96,230 Total S A (Energy)
284.441 TPG NV (Transporlalion)
234,470 Vedior NV (Commercial Services) 21 1.841 VNU NV (Media)
1.454.500 UniCredito ltaliano SpA (Italy) (Banks)
0,539,977 2.38
4,640,154 1.29 20,439,252 5.69
6,516,543 1.82 7,643,397 2.13 2.815.985 0.78 5.613.786 1.56
179.01 1.396 49.86
Swedish Krona 190.782 Svenska Cellulosa AB "8" (Materials) 157.769 Svenska Handelsbanken " A ' (Banks)
1,564,426 Telefunaktiebolaget LM Ericsson "E" (Technology Hardware 8 Equipment)
5.630.385 1 57 2.974.271 0.83
4,337,639 1.21
. . . -
Swiss Franc 273.249 Crbdil Suisse Group (Diversified Financial
Services) 292,015 Novartis AG (Pharmaceuticals)
86,502 Syngenta AG (Materials)
12,942,295 3.61
3.15 11.296.846 12.977.428 3.61 8.073.725 2.25
32,347,999 9.01
United States Dollar 197,500 Carnival Corp. (Ho~R~s. Restaurants &
Leisure) 9,199,202 2.56 63.800 OTP Bank Rt.-GDR'"' (Banks) 3.579.698 1.00
12,778,900 3.56
T O T A L T R A N S F E R A B L E S E C U R I T I E S A D M I T T E D T O A N O F F I C I A L E X C H A N G E L I S T I N G ( c o s t E U R 3 0 1 . 9 4 3 . 3 6 3 ) 348,885,017 97.18
Mutual Funds Euro 9,341,395 Goldman Sachs Euro Liquid Reserves Fund
Yield 1.982%"' 9,341395 2.60
T O T A L M U T U A L F U N D S ( c o s t E U R 9 , 3 4 1 , 3 9 5 ) 9,341,395 2.60
M A R K E T V A L U E O F I N V E S T M E N T S E X C L U D I N G F O R W A R D S , F U T U R E S A N D S W A P S ( c o s t E U R 311,284,758) 358.206.412 99.78
Futures Contracts Unreallsed 'h of
Numbmr of Geln Shareholders' Contracts Securlty Deacrlptlon EUR Equlty
-- - - .- .. -_
EUR 130 DJ EURO STOXX 50 INDEX 16/12/05Long 249.600 0.07
GBP 26 FTSE 100 INDEX 16/12/05 Long 91,539 0.03
~ .- UNREALISED GAIN ON FUTURES CONTRACTS 341,139 0.10
The accompanying notes are an integral pan of these financial statements.
9
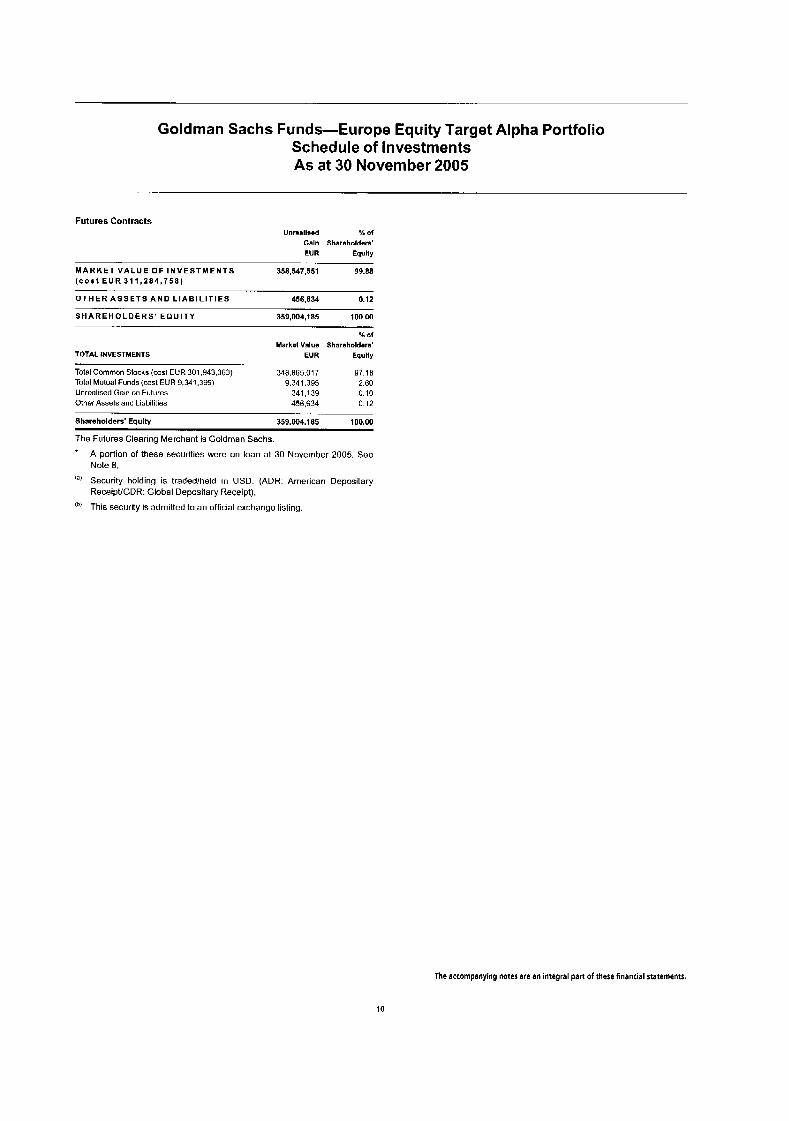
Goldman Sachs Funds-Europe Equity Target Alpha Portfolio Schedule of Investments As at 30 November 2005
Futures Contracts Unrealised % Of
Galn Shareholders' EUR Equity
. . .
M A R K E T V A L U E O F I N V E S T M E N T S 358,547.551 99.88 ( c o s t E U R 3 1 1 , 2 8 4 , 7 5 8 )
O T H E R A S S E T S A N D L I A B I L I T I E S 456,634 0.12
S H A R E H O L D E R S ' E Q U I T Y 359,004,185 100.00
TOTALINVESTMENTS
X of Market Value Sharsholdara'
EUR Equlty
Total Common Slacks (cast EUR 301,943,363) 348.865.017 97 18 Total Mutual Funds (cost EUR 9.341.3Y5) 9,341,395 2 60 Unrealised Gain on Futures 341 .I 39 0 10 Other Assets anc Liabilities 456.634 0 12
Shareholders' Eaultv 359.004.185 100.00 -- .
The Futures Clearing Merchant is Goldman Sachs ' A portion of these securities were on loan at 30 November 2005. See
Note 8. la) Security holding is traded/held in USD. (ADR: American Depositary
ReceiptlGDR: Global Depositary Receipt). (b) This security is admitted to an official exchange listing.
The accompanying notes are an integral part of these financial statements.
10

Goldman Sachs Funds-Europe Small Cap Portfolio Schedule of Investments As at 30 November 2005
X of % Of
Market Value Shareholders' Marka Value Shereholders' Holdlngs Securlty Description EUR Equity Holdings Socunty Doscrlptlon EUR Equity
Transferable securities admitted to an offlclal exchange listing
Common Stocks - 99.05%
_- . -. - . ..
Common Stocks - (contlnuad)
Euro - Icontinuad)
Brltlrh Pound Slerling 1,816,203 Augean PIC. (Commercial Servicns 8
Supplies) 2.148.920 Billing Services Group Ltd (Software 8
Services) 678.009 Carter 8 Carter Group PIC (Commercial
Services 8 Supplies) 703,394 Caltles PIC. (Speciality & Other Finance)
2,553,065 Christian Salvesen PIC. (Transportation) 1,517.826 Chrysalis Group PIC. (Media)
1 1.563.958 Corporate Services Group PIC. (Commercial Services 8 Supplies)
Services) 3,062,407 Dawnay Day Carpathian PIC. (Real Estate)
485.483 DIC Entertainment Holdings. Inc. (Media) 472.848 Dignity PIC (Support Services)
1,627.412 European Nickel PIC. (Materials) 499,207 First Calgary Petroleums Ltd. (Energy) 406.847 Genus PIC. (Agriculture)
1,596,926 Heywood Williams Group PIC. (Capital GwdS)
303.048 Cykrscan Technology, Inc. (Consumer
41 Holidaybreak PIC. (Consumor Services) 236,550 Imperial Energy Corp., Ltd. (Energy)
1,453,503 lnspicio PIC. (Commercial Services a Supplies)
204,476 Luminar PIC (Consumer Services) 705,699 MBC Saatchi (Media) 196.231 March Networks Corp. (Sofiwaro &
Services) 1.802529 Melrose PIC. (Machinery 8 Engineoring) 2.302.031 MFI Furniture PIC. (Rntail) 1,172,753 Mowlem PIC. (Capital Goods)
683.441 My Travel Group. PIC. (Consumer Services) 403,149 Oilexco. Inc. (Energy)
534.718 Petrofac. Ltd. (Energy) 841 .1 15 Raymarine PIC. (Technology Hardware 8
Equ.pment) 600.897 Ricardo PIC (Commercial Services 8
Sup?lies)
3,027,436 Oriel Resources PIC. (Matnrialn)
7,000,422 Sanztuary Group PIC. (Media) 363,931 Sibir Energy PIC. (Energy) 268.888 Spo:tingbet PIC. (Consumer Services)
1.270.718 Strategic Equity Capital PIC. (Diversified Financial Services)
1,022,499 Taylor Nelson Sofres PIC. (Media) 632,686 Unite Group PIC. (Real Estate) 447,316 Wolfson Microelectronics PIC (Technology
Hardware & Equipment)
3.916.547
2,947,497
4,187.349 3.056.882 2,799,591 3.451.241
1,323.191
2,820,750 5,009.096 1,780.474 2.880.400
728.147 2,416,664 1.975.517
2,541,769 398
1.552.879
2,196,214 1.478.805 1,061,121
3,569.529 3,424,314 2.524.317 3.268.750 1.794.633 1,16S,U74 1,065,879 1,796,312
2,936.662
2,521,086 395,373
1,735,090 1.402.273
1,859,446 3,382,447 3,294,869
1.896.417
Euro 84.480 Aalberts Industries NV (Capital Goods) 27.548 Agrana Beteiligungs AG (Food, Beverages 8
Tobacco) 22,603 Arques Industries AG (Diversified Financial
Services)
80,273 Ballast Nedam NV (Capital Goods)
Supplies) 120,238 CENTROTEC Sustainable AG (Materials) 499,260 Curanum AG (Healthcare Equipment &
Services)
496.500 Astaldi SpA (Capital Goods)
' 325,361 Buhrmann NV (Commercial Services &
59,566 DCC PIC. (Capital Goods)
144.821 DCC Plc.(Dublin Listing) (Capital Gwds) 110,459 ElrlngKlinger AG (Automobiles 8
Components) 113.606 Grammer AG (Automobiles & Components)
1.310.994 Gruppo Coin SpA (Retail)
2.06
69.676 Heijmans NV (Capital Goods) 232.590 laws Group Plc.(lreland) (Food,
Beverages 8 Tobacco) 2.20
i::: * 123.965 IDS Scheer AG (Software 8 Services) 23,117 lnterhyp AG (Banks)
117,710 OPAP S.A. (Hotels. Restaurants & Leisure) 32.790 Paragon AG (Technology Hardware &
Equipment) o,70
.48 2,63
0-94
234,003 Pileiderer AG (Capital Goods) 902,793 Risanamento SpA (Real Estate) 131.555 Saft Groupe S.A. (Capital Goods) 714.836 Sirii SPA (Technology Hardware a
1.3L
0 38 127 1.04
1.34 0 00 0.82
1.16 0.78 0.56
1.HH 1.80 1.33 1.72 0.94 0.61 0.56 0.94
1.54
1.33 0.21 0.91 0.74
O.YH 1.70 1.73
1 .oo 86.157.01 1
-
3.586.176
2.121.196
2.328.109 2.283.900 2,829,623
3,657.058 2.981.902
3,065,456 920.295
45.33
1.89
1.12
1.22 1.20 1.4Y
1.92 1.57
1.61 0.48
Equipment) 74.814 Surteco AG (Consumer Durables I Apparel)
Services 8 Supplios) 95,900 Techem AG (Commercial Services 8
Supplies) 139.270 Thielert AG (Machinery 8 Engineering) 203.76R Trader Classified Media NV " A (Media) 221.763 Vacon Oyj (Capital Goods)
745.961 TATriumph-Adler AG (Commercial
* 153.434 Valentino Fashion Group SpA (Consumer Durables 6 Apparel) -
2.212.865
3,539,106 2.135.793 3,474,134 2,632,359
2.774.799 1.926.416 1,588.1 38 3,149,920
494,801 3.907.850 3,340,334 2,565,323
1.16
1 86 1.12 1.83 1.39
1.46 1.01 0.84 1.66
0.26 2 06 1.76 1.35
1.729.903 0.91 1,942,172 1.02
1,044,345 0.55
3,516,653 1.85 1.980.419 1.04 2.642.871 1.39 3.769.971 1.98
3,153,069 1.66
77,294356 40.66
Nomeglrn Krone 46.143 Aker Kvaerner ASA (Energy) 2,097,263 1.10 27.565 Aktiv Kapital ASA (Diversified Financial
Services) 332,252 0.18 1 .H99.476 Stepstone ASA (Commercial Services 8
Supplies) 2.122.572 1.12 77.632 TGS Nopec Geophysical Co ASA (Energy) 2,534,269 1.33
7,086,356 3.73
Swedlsh Krona + 443.662 lntrum Justitia AB (Commercial Services 8
* 796,234 Observer AB (Commercial Services 8 Supplies) 3,296,652 1.74
Supplios) 2,383.307 125 116.933 Observer AB-Sub Shares (Commercial
Services 8 Supplies) 350.007 0.18
6,029,966 3.17
Swiss Franc 2,430 JD Group Lid -Bearer (Retail) 2,771,547 1 46
Tobacco) 1,142,352 0 60
3.913.899 2 06
799 Lindt 8 Spruengli AG (Food. Beverages 8
United States Dollar 528.990 Energy XXI Acquisition Corp Bermuda Ltd.
(Enerw) 2,338,474 1.23 618.970 International Metal Enterprises. Inc
(Materials) 2,762,553 1.45 77,747 NOS Group Plc.-ADR'"' (Software 8.
Services) 2,693,352 1.42
7,794,379 4.10
The accompanying notes are an integral part of these financial statements.
11

Goldman Sachs Funds-Europe Small Cap Portfolio Schedule of Investments As at 30 November 2005
Holdlnga Securlty Deacriptlon
x Of
Msrkot Valua Shareholdara' EUR Equlty
T O T A L C O M M O N S T O C K S ( c o s t E U R 162 ,610 ,751) 188,276,567 99.05
Warrants - 0.22% United States Dollar
1,237,940 lnlernalional Metal Enterprises. Inc.. exp 10106-Warrants (cost EUR 255,214) 420.961 0.22
- T O T A L W A R R A N T S ( c o s t E U R 2 5 5 , 2 1 4 ) 420,961 0.22
T O T A L T R A N S F E R A B L E S E C U R I T I E S A D M I T T E D T O A N O F F I C I A L E X C H A N G E L I S T I N G ( c o s t E U R 162 .865 .965) 188.697.528 99 27
Transferable securltles dealt In on another regulated market
Common Stocks - 0.34%
British Pound Sterling 902,994 Sierra Leone Diamond Co. (Materials) 635.840 0.34
T O T A L T R A N S F E R A B L E S E C U R I T I E S D E A L T I N O N A N O T H E R R E G U L A T E D M A R K E T ( c o s t E U R 979 .614) 635,840 0.34
Other transferable securities
Warrants - 0.26%
British Pound Sterling 104,721 Oriel Renourcns PIC,
exp. 02/10-Warranls'"!(cosl EUR nil) _ .. . .. . .
United Slates Dollar 1,057,980 Energy XXI Acquisition Corp Bermuda Ltd..
exp 10109-Warrarrts (cost EUR 220,791) 494,677 0.26
T O T A L OTHER T R A N S F E R A B L E S E C U R I T I E S ( c o s t E U R 220 ,791) 4 9 4,6 7 7 0.26
Mutual Funds Euro
825.228 Goldman Sachs Euro Liquid Reserves Fund YlOl3 1 982%'" 825,228 0.43
T O T A L M U T U A L F U N D S ( c o s t E U R 825 ,228) 825.228 0.43
M A R K E T V A L U E O F I N V E S T M E N T S EXCLUDING F O R W A R D S , F U T U R E S A N D S W A P S ( c o s t E U R 164 ,891 ,598) 190,653,273 100.30
Forward Currency Contracts
Msturlty Date
19/12/2005 20/12/2005 20/12/2005 04/0 112006 04/0 112006 15/02/2006 15/02/2006
Amount Bought
EUR DKK USD CHF EUR EUR GBP
5,385,269 67,466,627
1.218.828 14.554.590
551,000 40,856,757
1.241.421
SEK EUR DKK EUR CHF GBP EUR
Amount Sold
51,229,796 9,044,046 7,522,000 9.404.723
849.31 1 27.8 15,057
1,007,613
Unraallaad X of Galn Sharaholdsrs' EUR Equity
2,491 0.00 8,842 0.00
12,852 0.01 3,547 0.00 1,994 0.00
233,061 0.12 5,475 0.00
UNREALISED GAIN ON FORWARD CURRENCY CONTRACTS 268,262 0.13
__ . . . . . -
Unreallsed % Of
Maturlty Amount Amount Loss Shareholders' Data Bought Sold EUR Equity
. . .. . .. . , . . ___ 19/12/2005 SEK 149,244,000 EUR 15,888.165 (206,915) (0.11) 2011212005 DKK 7,522,000 USD 1,214,500 (11,014) (0.01) 20/12/2005 EUR 1.845.147 DKK 13,765,627 (1,969) 0.00 16/02/2006 NOK 23.137.202 EUR 2,971,355 (66,241) (0 03)
UNREALISED LOSS ON FORWARD CURRENCY CONTRACTS (286,i 39) (0.15)
M A R K E T V A L U E O F I N V E S T M E N T S ( c o s t E U R 164.891.598) 190,635.396 100.28
OTHER A S S E T S A N D L I A B I L I T I E S (550,601) (0.28)
S H A R E H O L D E R S ' EQUITY 190,084,795 100.00
TOTAL INVESTMENTS
x of Market Value Shareholders'
EUR Equity
Total Common Slocks (cost EUR 163,590,365) 188,912,407 99 39 Total Warrants (cost EUR 476.005) 915,638 0 48 Total Mutual Funds (cost EUR 825.228) 825,228 u 43 Unrealised Gain on Forward Currency Contracts 268,262 0.13 Unrealised Loss on Forward Currency Contracts (286.139) (0.15) Other Assets and Liabililies (550.601) (0 28)
Shareholders' Equity 190.084.795 1DD.UD
The counterparties for forwards currency contracts are UBS AG. Deutsche Bank AG. Morgan Stanley, Lehman Brothers Bank, Barclays Bank PIC, Merrill Lynch International. Credit Suisse First Boston USA lnc.. JP Morgan Chase and Co.. and Royal Bank of Canada. * A portion of these securities were on loan at 3 0 November 2005. S e e
Note 8.
Security holding is traded/held in USD. (ADR: American Depositary ReceipVGDR: Global Depositary Receipt).
'br This securitity is fair valued. See Note 3(c).
w This security is admitted to an official exchange listing.
The accompanying nates are an integral part of these financial statements.
12
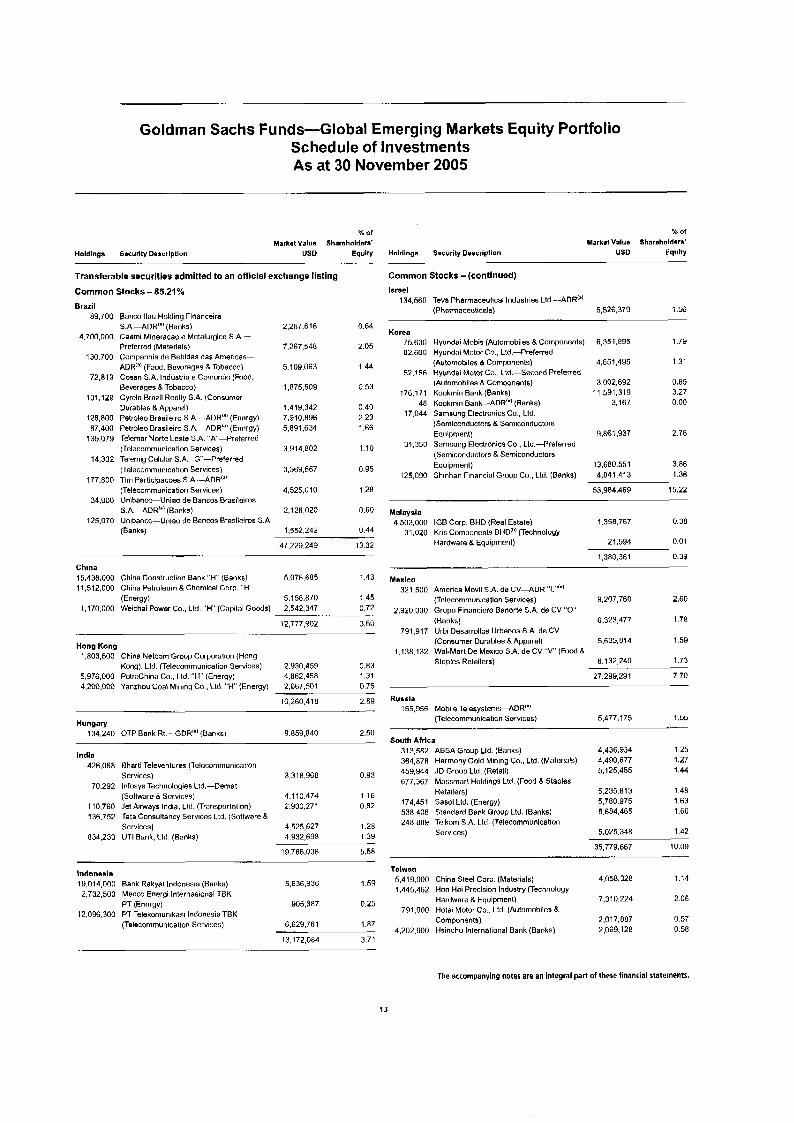
Goldman Sachs Funds-Global Emerging Markets Equity Portfolio Schedule of Investments As at 30 November 2005
% Of % Of
Market Value Shareholders' Market Value Shareholdera' Holdlnga Securlty Descrlpllon US0 Equity Holdlngs Security Description US0 Equlty
-... - - -
Transferable securities admitted to an official exchange listing
Common Stocks -85.21% Israel
Common Stocks - (continued)
Brazil 89.700
4,700,000
130,700
72.813
131.129
128,800 87.400
135,079
14,332
177.800
34,000
125.070
Banco ltau Holding Financeira S.A.-ADR'" (Banks) Caemi Mineracao e Metalurgica Preferred (Materials) Conpanhia de Bebidas das Americas- ADR"' (Food, Bovnragns d Tobacco) Cosan S.A. Industria e Comorcin (Fnod. Beverages & Tobacco) Cyrela Brazil Realty S A. (Consumnr Durables &Apparel) Petroleo Brasileiro S.A: ADR'" (Enorgy) Pelroleo Brasileiro S.A.-ADR'." (Energy) Telemar NorteLesta S.A 'A-Preferred (Telecommunication Services) Telemig Cnlular S.A. ..G' --Preferred (Telecommunication Services) Tim Parlicipacoes S.A.--ADR'"
2,267.616
7,267,548
5.109.063
1,075,509
1,419,342 7.910.896 5.891.634
3.914.802
3.369.567
0.64
2 05
1 44
0 53
0.40 2 23 1 66
1 1 0
0 95
134,560 Teva Pharmaceutical Industries Lld.---ADR'a' (Phermaceuticals) 5,526,379 1.56
75,630 Hyundai Mobis (Automobiles 8. Components) 6,351,895 1.7Y Korea
82.600 Hyundai Motor Co.. Ltd.-Preferred (Automobiles & Components) 4,651,495 1.31
52,156 Hyundai Motor Co.. Ud.-Second Preferred 0.85 (Automobilnr 8 Components)
176,171 Kookmin Bank (Banks) 11,591.31 9 3.27 3.002.692
48 Kookmtn Bank-ADR'" (Eanks) 3,167 0.00
Equipment) 9861.937 2 78
17,044 Samsung Electronics Co , Ltd. (Semiconductors & Snmiconductors
31.350 Samsung Electronics Co.. Ltd.-Preferred (Semiconductors 8. Semiconductors Equipment) 13,680,551 3.86
125.090 Shinhan Financial Group Go.. Ltd. (Banks) 4.841.413 1.36
(Telecommunication Servicos) 4,525,010 1.28 53.984.469 15.22 Unlbanc-Uniao de Bancos Brasiloiros
S.A -ADR"'(Banks) 2,126,020 o.60 Malaysia Unibanco-Uniao de Bancos Brasiieiros S.A 4,503,000 IGB Corp. BHD (Real Estate) 1.358.767 0.38 (Banks) 1.552242 0.44 31,020 Kris Components BHD'"' (Technology
Hardware & Equipment) 21,594 0.01 47.229.249 13.32
China 15,438,000 China Construction Bank "H' (Banks) 11,512,000 China Petroleum 8 Chemical Gorp "H.
1,170.000 Weishai Power Cn., Ltd. "H" (Capital Goods) (Energy)
. _. .
Honp Kong 1.803.500 China Netcom Group Corporation (Hong
Kong). Ltd. (Telecommunication Services) 5,976.000 PetloChina Co.. Ltd. "H" (Energy) 4,200,000 Yanzhou Coal Mining Co , Lld. "H" (Energy)
5,076,685 1.43
5.158370 1.45 2.542.347 0.72
12,777.902 3.60 ., .
2.930.459 0.83 4,662.4SH 1.31 2,667,501 0.75
10,260.418 2.89
HunQaty 134,240 OTP Bank Rt .- GDR'"' (Banks) 8,059,840 2.50
India 426.068 Eharti Televenturcs (Telecommunication
Services)
(Software 8 Services) 110.760 Jet Airways India. Ltd. (Transportalion) 136.752 lata Consultancy Services Ltd. (Software &
Services) 834.233 UTI Bank, Ltd (Banks)
70.292 lnfosys Technologies Ltd.-Demat 3.318.968 0.93
4.110.474 1.16 2,900,271 U.82
4,525,627 1.28 4,932,698 1.3Y
19,780.038 5.58
1,380361 0.39
Maxico 321,500 America Movil S.A. de CV-ADR "L ""'
2.60 9.207.760 (Tclocommunlcation Services) 2,920,000 Grupo Financier0 Banorte S A de CV "0'
791.917 Urbi Desarrollos Urbanos S.A. deCV (Consumer Durables B Apparel) 5,635,614 1.5Y
(Eanks) 6,323,477 1.78
1.138.132 Wal-MartDeMexicoS.A.deCV"V'(Food8 Staples Retailers) 6,132,240 1.73
27.299.291 7 70
Russia 155.956 Mobile Telesystems-ADR!"'
(Telecommunication Sorvices) 5.477.175 1.55
South Africa 313.582 AESA Group Ltd. (Banks) 4.436.934 1.25 364,878 Harmony Gold Mining Go.. Ltd. (Materials) 4,490,677 1.27 459.944 JD Group Ltd. (Retail) 5.125.455 1.44 677,361 Massmart Holdings Lld. (Food 8 Staples
Retailers) 5.235.813 1.48 174,451 Sasol L t d (Energy) 5,780.975 1.63 53R,406 Standard Bank Group Ltd. (Banks) 5.684.465 1.60 24R,8R9 Telkom S.A. Ltd. (Telecommunication
Services) 5.025.348 1.42
35.779.667 10.09
Taiwan 1.59 5,419,000 China Steel Corp. (Materials) 4.058.328 1.14 lndonsaia
19.Ot4,OOU Bank Rakyat Indonesia (Banks) 5,636,936 1,445,462 Hun Hai Precision Industry (Technology
791,000 Hotai Molor Co.. Ltd. (Automobiles & Components) 2,017,887 0.57
2,069,128 0.58
Hardware & Equipment) 7,310.224 2.06 2,732,500 Mecco Energi Internasional TBK
12,096,300 PT Telekomunikasi Indonesia TBK PT (Energy) 905,387 0.25
6.62Y.761 1.87 (Tnlecommunication Services)
13,172,004 3.71 4.202.900 Hsinchu International Bank (Banks1
.. .
The accompanying notes are an integral part of these financial statements.
13
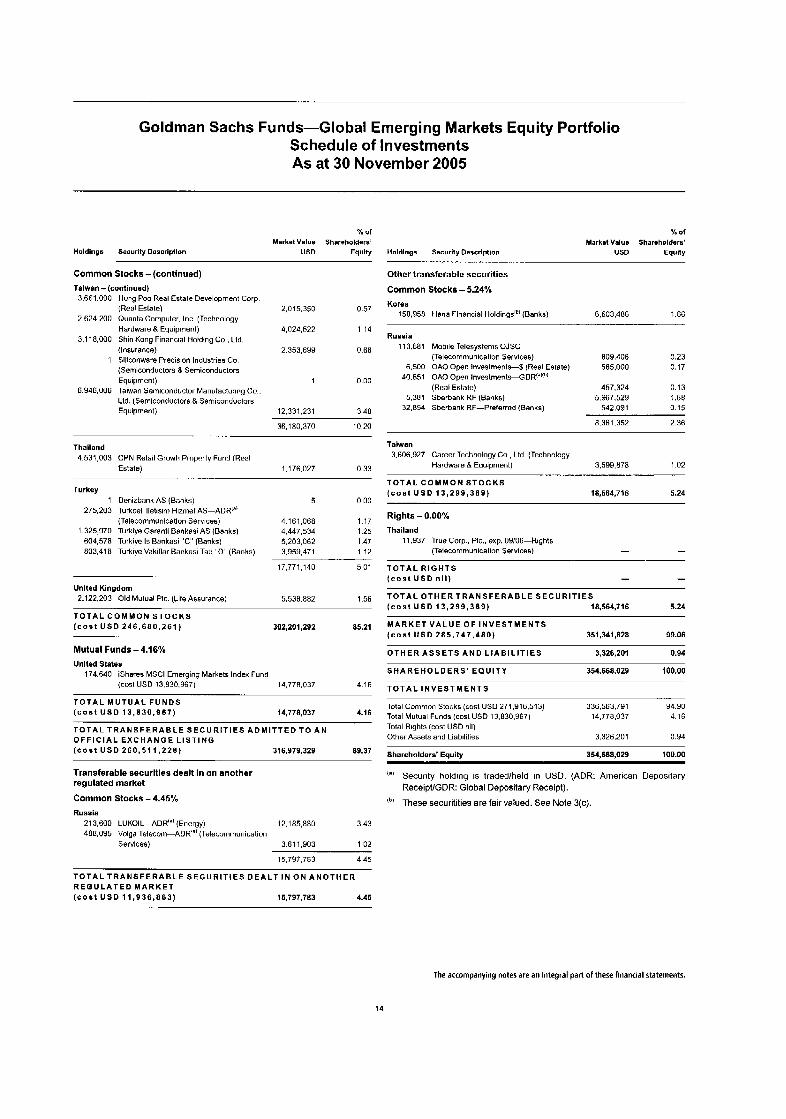
Goldman Sachs Funds-Global Emerging Markets Equity Portfolio Schedule of Investments As at 30 November 2005
% of Market Value Shareholders'
Holding- Security Deooriptlon USD Equity
Common Stocks -(continued)
Talwan - (continued) 3,661,000
2,624,200
3,118,000
1
6.Y46.006
Hurg Po0 Real Estate Development Corp (Real Estate) 2,015.350 0.57 Quanta Computer, Inc (Technology Hardware & Equipment) 4,024,522 1.14 Shin Kong Financial Holding Co.. Ltd. (Insurance) 2.353,6YY 0.66 Siliconware Precision Industries Co (Semiconductors 8 Semiconductors Equipment) 1 0.00 Taiwan Semiconductvr Manufacturing Co.. Ltd. (Semiconductors 8 Semiconductors Equipment) 12.331.231 3 48
36.1 80,370 10.20 .
Thailand 4,531,003 CPN Retail Growh Property Fund (Real
Estate) 1.176.027 0.33 . .
Turkey 1 Denizbank AS (Banks) 5 0 00
(Telscommunication Services) 4,161,068 1.17
604,578 Turkiye Is Bankasi "C" (Banks) 5203,062 1.47 H03.4lH Turkiye Vakiflar Bankasi Tau ' D' (Banks) 3.Y5Y,471 112
275,203 Turkcell lletisim Hizmet AS-ADR"'
1.325,Y7U Turkiyn Garantl Bankasi AS (Banks) 4,447,534 1.25
17,771,140 5 01
Unlted Kingdom 2.122,203 Old Mutual PIC. (Life Assurance) 5.538.882 1.56
T O T A L C O M M O N S T O C K S ( c o a t U S 0 246 ,680 .261) 302,201,292 85.21
Mutual Funds - 4.16% Unlted States
174,640 ishares MSCl Emerging Markets Index Fund (cost USD 13.830.967) 14,778.037 4.16
T O T A L M U T U A L F U N D S ( c o s t U S 0 13 .830 .967) 14,778,037 4.16
T O T A L T R A N S F E R A B L E S E C U R I T I E S A D M I T T E D T O A N O F F I C I A L E X C H A N G E L I S T I N G ( c o s t U S D 260 ,511 ,228) 316.979.329 89.37
% Of
Markmt Valus Shareholders' Holding- Securily Description USD Equity
Other transferable securities
Common Stocks - 5.24%
Korea
" - ..
158,958 Hana Financial HuIdinQs") (Banks) 6,603,486 1.86
Russia 11 3.681 Mobile Wlesystems OJSC
(Telecommunication Services) 809,408 0.23 6.500 OAO Open Investments-$ (Real Estate) 585,000 0.17
(Real Estate) 457,324 0.13 5,381 Sberbank RF (Banks) 5,967,529 1.68
32.854 Sberbank RF-Prsfnrrnd (Banks) 542,091 0.15
8,361,352 2.36
40.651 OAO Open Investrnents-GDR"m"'
Taiwan 3.606.927 Career Technology Co.. Ltd. (Technology
Hardware 8 Equipment) 3,593,878 1 m T O T A L C O M M O N S T O C K S ( c o s t U S D 13 ,299 ,389) 18,564,716 5.24
Rights - 0.00%
Thailand 11.937 True Corp , PIC.. exp. 09106-Rights
(Telmmmmunication Services) - -
T O T A L R I G H T S ( c o a t U S 0 n i l ) - - T O T A L O T H E R T R A N S F E R A B L E S E C U R I T I E S ( c o a t U S 0 13 ,299 ,389) 18,564,716 5.24
M A R K E T V A L U E O F I N V E S T M E N T S ( c o s t US0 285,747,480) 351,341,828 99.06
O T H E R A S S E T S A N D L I A B I L I T I E S 3,326,201 0.84
S H A R E H O L D E R S ' E Q U I T Y 354.668.029 100.00
T O T A L I N V E S T M E N T S
Total Common Stocks (cost US0 271,916,513) 336,563,791 Y4.90
Total Rights (cost US0 nil) - - Total Mutual Funds (cost USD 13,83O,Y67) 14,778,037 4.16
Other A5sets and Liabilities 3,326,201 0.94
Shareholders' Eauitv 354.~a.029 100.00
Transferable securltles dealt in on another regulated market
Common Stocks - 4.45%
Russia 213,600 LUKOIL-ADR'"! (Energy) 12.1 85,880 3 43 488,095 Vnlga Telecom-ADR'"' (Telecummunication
Services) 3.61 1.903 I 02
15,7Yf,783 4 45
''I Security holding is traded/held in USD. (ADR: American Depositary ReceipVGDR: Global Depositary Receipt).
!b! These securitities are fair valued. See Note 3(c)
T O T A L T R A N S F E R A B L E S E C U R I T I E S D E A L T I N O N A N O T H E R R E G U L A T E D M A R K E T ( c o s t U S D 11 ,936 ,863) 15.797.783 4.45
The accompanying notes are an Integral part of these financial statements.
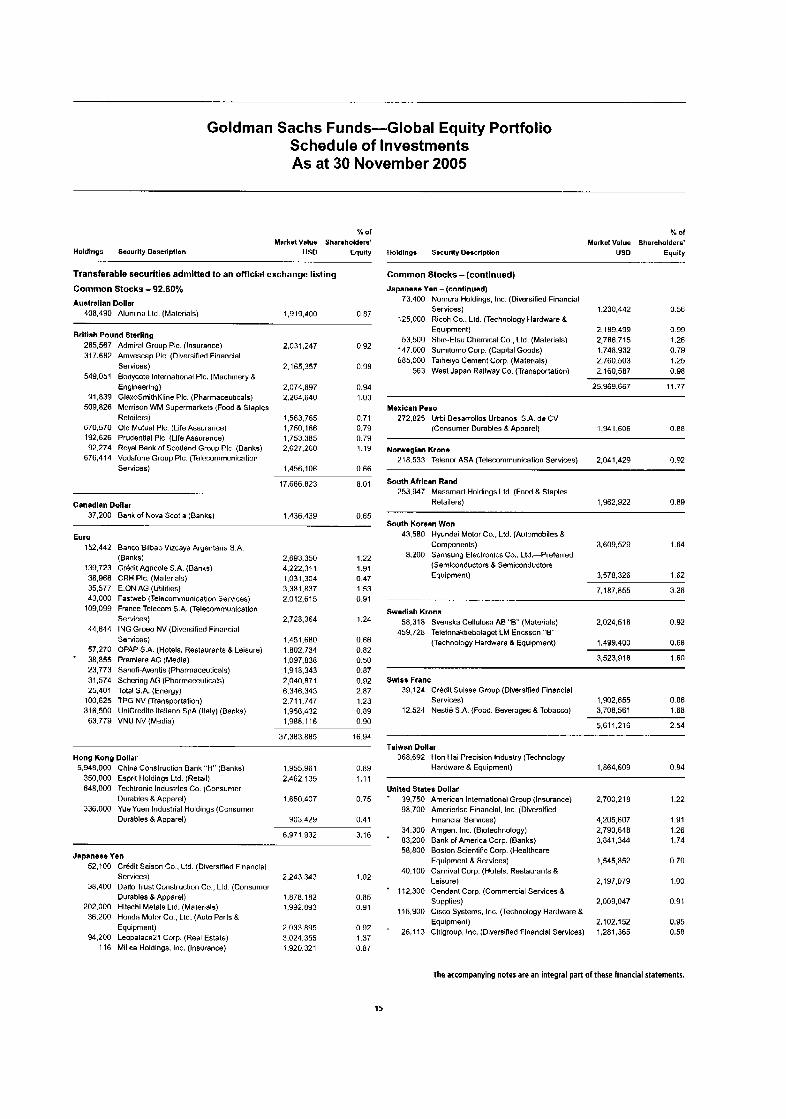
Goldman Sachs Funds-Global Equity Portfolio Schedule of Investments As at 30 November 2005
% of % of Market Value Sharmholders' Market Value Shareholders'
Holdlngs Security Descrlptlon us0 Equity Holdlngs Suurlty Doscriptlon US0 Equity -- -- .
Transferable securities admitted to an offlclal exchange listing Common Stocks -(continued) Common Stocks - 92.60% Japanese Yen - (continued)
Austrrllan Dollar 408.490 Alumina Ltd. (Materials) 1,919,400 0.07
British Found Sterllng 265,567 Admiral Group PIC. (Insurance) 317.682 Amvescap PIC. (Diversified Financial
Services) 549,051 Bndycote International PIC. (Machinery &
Engineering) 91,839 GlaxoSmithKline PIC. (Pharmaceuticals)
509.826 Morrison WM Supermarkets (Food & Staplcs Retailers)
670,570 Old Mutual PIC. (Life Assurance) 192.626 Prudential PIC. (Life Assurnnce) 92.274 Royal Bank of Scotland Group PIC. (Banks)
676,414 Vodafone Group PIC. (Tnlrcommunication Services)
2.031.247
2,165,357
2,074,897 2264.640
1563,765
1,753,385 2.627.260
1.456.106
1,750,166
0.92
0.98
0.94 1.03
0.71 0.79
1.19
0.66
0.79
-- .
Canrdlan Dollar 37,200 Bank of Nova Scotia (Banks)
17.686.823 8.01
1.436.439 0.65
Euro 152.442 Banco Bilbao Vizcaya Aryentaria S.A.
(Banks) 139,723 Credit Agricole S.A. (Banks) 38,966 CRH PIC. (Materials) 35,577 E.ON AG (Utilities) 43,000 Fas:web (Telecommunication Services)
109,099 France Telecom S.A. (Telecommunication Services)
44.844 ING Groep NV (Diversified Financial Services)
57,270 OPAP S.A. (Hotels, Restaurants 8 Leisure) * 38,855 Premiers AG (Media)
23,773 Sanofi-Awntis (Pharmaceuticals) 31.574 Schering AG (Pharmaceulicals) 25,401 Total S.A. (Energy)
100,625 TPG NV (Transportation) 316.500 UniCredito ltaliano SpA (Italy) (Banks) 63.779 VNU NV (Media)
2,693,350 1.22 4222,311 1 9 1
3,381,837 1.53 2,012,615 0.9 1
2.728.364 1.24
1,451,680 0.66 1,802,734 0.82 1,097,838 0.50 1,918,343 0.87 2,040.R71 0.92 6.346.343 2.H7 2.71 1,747 1.23 1.956.432 0 89 1.988.116 0 90
1,031,304 0.47
37.383.885 16 94
Hong Konp Dollar 5,948.000 China Conslruclion Bank "H" (Banks)
350,000 Esprit Holdings Ltd. (Retail) 648.000 Techtronic Industries Co. (Consumer
336,000 YueYuen Industrial Holdings (Consumni Durables &Apparel)
Durables & Apparel)
1,955,961 0.89 2,462,135 1.11
1.650.407 0.75
903,429 0.41
6,971,932
Japanese Yen 52,100 Credit Saison Co , Ltd. (Diversified Financial
Services) 2,243,343 38.400 Daito Trust Conslruction Co., Ltd. (Consumnr
Durables 8 Apparel) l.87H.182 202.000 Hitachi Metals Ltd. (Materials) 1.992.893
36.200 Honda Motnr Co.. Ltd. (Auto Parts 8 Equipmont) 2.033.895
94.200 LeopalacaZl Corp. (Real Estate) 3.024.355
73.400 Nomura Holdings. Inc. (Diversified Financial Services) 1,230,442 0 56
125.000 Ricoh Co.. Lld. (Technology Hardware 8 Equipmenl) 2.189.499 0.99
53.500 Shin-Elsu Chemical Co.. Ltd. (Materials) 2,786.715 1.26 147.000 Sumilomo Corp. (Capital Goods) 1.748.932 0.79 685,000 Taiheiyo Coment Corp. (Materials) 2,760,503 1.25
563 West Japan Railway Co. (Transportation) 2,160,587 0.98
25,969,667 11.77
Mexlcsn Peso 272.825 Urbi Desarrollos Urbanos S.A. de CV
(Consumer Durables 8 Apparel) 1,Y41,606 0.88
Norwegian Krone 218.533 Telenor ASA (Telecommunication Services) 2,041,429 0.92
South African Rand 253.947 Massmart Holdings Ltd. (Food 8 Staples
Retailers) 1.962.Y22 0.83
South Korean Won 43,580 Hyundai Motor Co.. Ltd. (Automobiles 8
Components) 3,609,529 1.64 8.200 Samsung Electronics Co., Ltd.-Preferred
(Semiconductors 8 Semiconductors Equipment) 3.578.326 1.62
7,187,855 3.26 - . . ..
Swedish Krona 58,318 Svenska Cellulosa AB "B" (Materials) 2,024,518 0.92
459.728 Telcfnnakliebolaget LM Ericsson "8" (Technology Hardware & Equipment) 1,499,400 0.68
3.523.918 1.60
Swiss Franc 39,124 Credit Suisse Group (Diversified Financial
Services) 1,902,655 0.86 12.524 Nestle S.A (Food. Beverages 8 Tobacco) 3.708.561 1.68
561 1,216 2 54
Taiwan Dollar 368.692 Hon Hal Precision Industry (Technology
Hardware 8. Equipment) 1.864.609 0.84
United Stales Dollar + 39.750 American International Group (Insurance) 2.700.218 1.22
Financial Services) 4,205,607 1.91 98.700 Ameriprise Financial. Inc (Diversified
34.300 Amgen. Inc. (Biotechnology) 2,790,648 - * 83.200 Bank of America Corp. (Banks) 3,841,344
58.800 Boston Scientific Corp. (Healthcare Equipment 8 Services) 1,545,852
40.100 Carnival Corp. (Hotels. Restaurants 8. Leisure) 2,197,079
Supplies) 2,009,047 lIH,900 Cisco Systems. lnc. (Technology Hardware 8.
Equipment) 2,102,152 o.y2 ' 26.1 13 Citigroup, Inc. (Diversnfied Financial Services) 1.281.365 1.37
116 Millea Holdings. Inc. (Insurance) 1.920.321 0.87
1.02
O.H5 + 112,300 Cendant Corp (Commercial Services L
The accompanying notes are an integral pan of these financial statements.
1.26 1.74
0.70
1.00
0.91
0.95 0.58
15
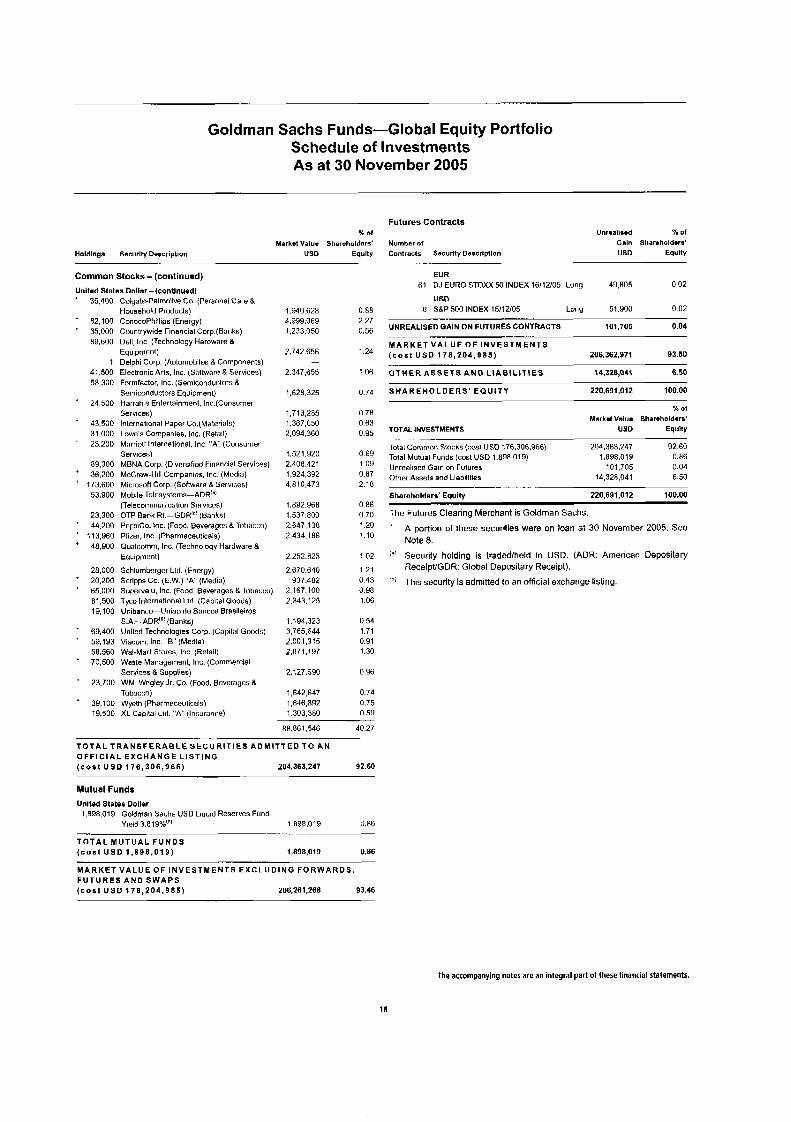
Goldman Sachs Funds-Global Equity Portfolio Schedule of Investments As at 30 November 2005
% Of
Market Value Shareholders' Holdlngs Securlty Description US0 Equlty
-- -..
Common Stocks - (con t inued)
United Stataa Dollar -(continued) * 35.400
* 82,100 * 35,000
89.600
1 41.500 58.300
* 24,500
* 43.500 31.000
* 23.200
89,300 * 36,200 ' 173,600
53,900
23,300 + 44.200 + 113,960 ' 48,900
28,000 + 20,200 + 65.000
81.500 19,100
* 69,400 59,193 58.560
* 70,500
+ 23.700
* 39,100 19.500
Colgate-Palmolive Go. (Personal Care S Household Products) ConocoPhillips (Energy) Countrywide Financial Corp (Banks) Dell, Inc (Technology Hardware & Equipment) Delphi Corp. (Automobilos & Compnnents) Electronic Arts, Inc. (Sofrware 8 Services) Formfactor. Inc. (Semiconductors 8 Seniconductors Equipment) Harrah s Entertainment. Inc.(Consumer Services) International Paper Co.(Matertals) Lowe's Companies, Inc. (Retail) Marriott International. Inc. "A" (Consumer Services) MBNA Corp. (Diversifind Financial Services) McGraw-Hill Companies, Inc. (Media) Microsoft Corp. (Software & Services) Moblle Telesystems-ADR'"' (Telacommunication Snrvices) OTP Bank Rt.-GDR'"' (Banks) PeFsiCo. Inc. (Food. Beverages &Tobacco) Pfizer. Inc (Pharmaceuticals) Qualcomm. Inc. (Technoloqy Hardware 8 EqLipment)
Schlumberger Ltd. (Energy) Scripps Co. (E.W ) " A ' (Media) Supervalu. Inc. (Fond, Beverages 8 Tobacco) Tyco International Ltd (Capital Goods) Unibanco-Uniao de Banco6 Brasileiros S.A.. ADR"!(Banks) Uniled Technologies C o p (Capital Goods) Viacom. Inc. "E' (Media) Wal-Mart Stores, Inc. (Retail) Waste Management, Inc. (Commercial Serwces & Supplies) WM. Wrigley Jr. Go. (Food, Beverages 8 Tobacco) Wyeth (Pharmaceulicnls) XL Capital Ltd. " A ' (Insurance)
1,940.628 4,999,069 1,233,050
2.742.656
2,347,655
1,628,325
1,713,285 1,387,650 2,094,360
1,521,920 2.408.421 1.924.392 4,810.473
1,892.968 1,537.800 2,647,138 2.434.186
2.252.823
2.670.640 937,482
2,167,100 2.343.125
1,194,323 3,765,644 2,001,315 2,U71,197
2.127.69O
1,642,647 1,646,892 1,303,380
-
0.88 2.27 0.56
1.24
1.06
-
(1.74
0.78 0.63 0.95
0.69 1.09 0.87 2.18
0.86 0.70 1 20 110
102
1.21 0.43 0.98 1.06
0.54 1.71 0.91 1.30
0.96
0.74 0.75 0.59
88.861.546 40.27
T O T A L T R A N S F E R A B L E S E C U R I T I E S A D M I T T E D T O A N O F F I C I A L E X C H A N G E L I S T I N G ( c o s t U S D 1 7 8 , 3 0 6 , 9 6 6 ) 204.363.247 92.60
Mutual Funds United States Dollar
1,898,019 Goldman Sachs US0 Liquid Reserves Fund Yiek! 3 819%"' 1,898.019 0 86 -- .-
T O T A L M U T U A L F U N D S ( c o a t U S 0 1 , 8 9 8 , 0 1 9 ) 1,898,019 0.86
M A R K E T V A L U E OF I N V E S T M E N T S E X C L U D I N G F O R W A R D S , F U T U R E S A N D S W A P S ( c o s t U S D 1 7 8 , 2 0 4 . 9 8 5 ) 206.261.266 83.46
Futures Con t rac ts Unrmalismd % O f
Galn Sharoholdara' Number of
Contracts Security Description US0 Equlty
EUR 61 DJ EURO STOXX 50 INDEX 16/12/05 Long 49.805 0 02
R SSP 500 INDEX 15/12/05 Long 51.900 0 02 us0
UNREALISED GAIN ON FUTURES CONTRACTS 101.705 0.04
M A R K E T V A L U E O F I N V E S T M E N T S ( c o s t U S D 1 7 8 , 2 0 4 , 9 8 5 ) 206.362.971 93.50
O T H E R A S S E T S A N D L I A B I L I T I E S 14,328,041 6.50
S H A R E H O L D E R S ' E Q U I T Y 220,691,012 100.00
% Of
Markot Valum Sharoholdsrs' TOTAL INVESTMENTS USD Equlty
Total Common Stocks (cost US0 176306.966) 204,363,247 92.60 Total Mutual Funds (cost USD 1.8g8.019) 1,898,019 0.86 Unrealised Gain on Futures 101,705 0.04 Other Assets and Liabilities 14,328,041 6.50
. .
. Shareholders' Equity 220,691,012 100.00
The Futures Clearing Merchant is Goldman Sachs.
A port ion of these securit ies were on loan at 30 November 2005. See Note 8.
(a' Security holding is traded/held in USD. (ADR: American Depositary Receipt lGDR: Global Depositary Receipt).
''I This security is admitted to an official exchange listing.
The accompanying notes are an integral part of these financial statements.
16
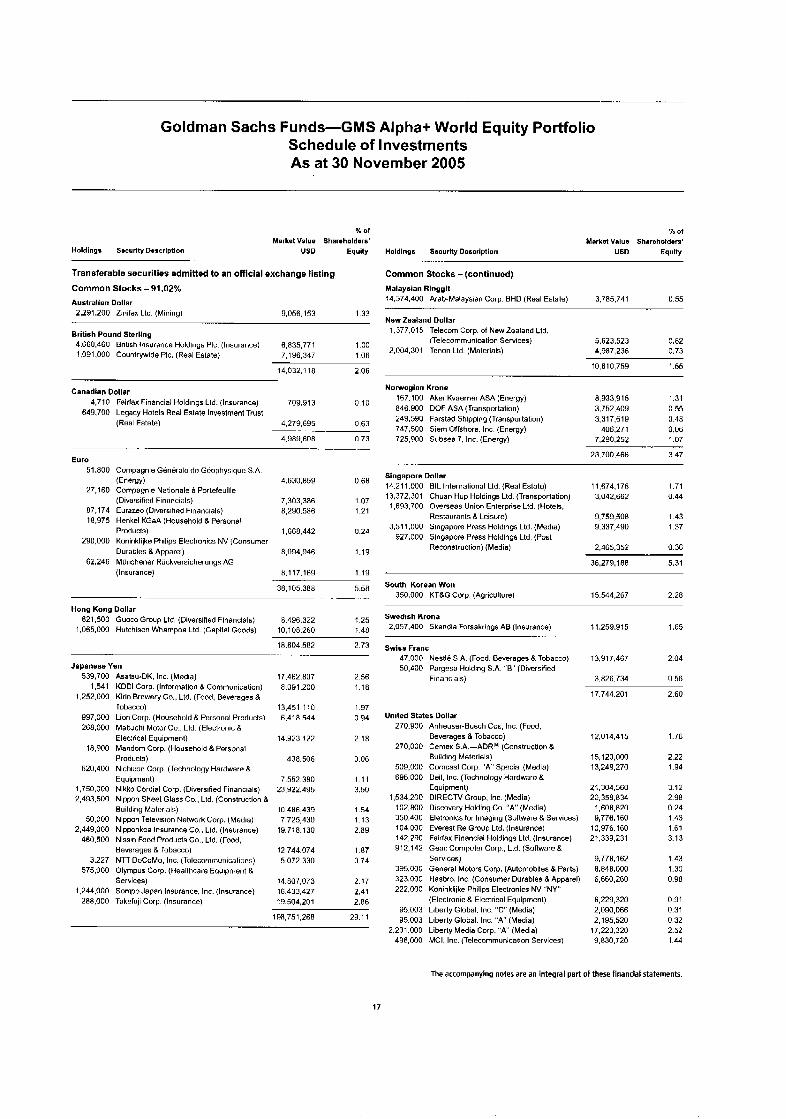
Goldrnan Sachs Funds-GMS Alpha+ World Equity Portfolio Schedule of Investments As at 30 November 2005
Holdings Smcurlty Dmacrlptlon
% of Market Value Sharmholdors'
USD Equity Holdlngs Sacurlty Description
% of Market Value Shareholdws'
US0 Equity
Transferable securities admitted to an officlal exchange listing
Common Stocks-91.02% Australian Dollar 2,291,200 Zinibx Ltd. (Mining) 9.056.153 1.33
British Pound Sterllng 4,660,460 British Insurance Huldings PIC. (Insurance) 6,835,771 1 .oo 1,091,000 Countrywide PIC. (Real Eslate) 7,l 96,347 1.06
14,0~~,11 0 2.06
4,630,859
7,303,386 8,290,986
1,668.442
8,094,946
0 68
1.07 1.21
0.24
1.19
Common Stocks - (continued) Malayalan Rlngglt 14,374,400 ArabMalaysian Corp. BHD (Real Estate) 3,785,741 u.55
New Zealand Dollar 1.377.015 Telecom Corp. of Newtoaland Lld.
(Telecommunication Services) 5,623,523 0.82 2,004,301 Tenon Ltd. (Materials) 4,987,236 0.73
10,610,759 1.55
Norweglan Krons 167,100 Aker Kvaerner ASA (Energy) 8,933,915 1.31
i1,63 249,590 Farstad Shipping (Transportation) 3,317,619 0.48 406,271 0.06
4,989,608 0 73 725,900 Subsea 7. Inc. (Energy) 7,290,252 1 07
23.700.466 3 47
Canadian Dollar
l o 846.900 DOF ASA (Transportation) 3,752.409 0 55 4,710 Fairfax Financial Holdings Ltd. (Insurancn) 709.913
649.700 Legacy Hotels Real Estate Investment Trust (Real Estate) 4,279,695
~ . 747,500 Siem Offshore, Inc (Energy)
-. -. .
Euro 51.800 Compagnie Genlraln dn Geophysique S A
27.160 Corpagnie Nationale a Portefeuille (Diversified Financial$)
87.174 Eurzzeo (Divnrsifind Financials) 18.975 Henkel KGaA (Household 8 Personal
Products) 290.000 Koninklijke Philips Electronics NV (Consumer
Durables 8 Apparel)
K n e w )
..
Singapora Dollar 14.21 1,000 BIL International Ltd. (Real Eslato) 13,372,301 Chum Hup Holdings Ltd. (Transportation) 1,693,700 Overseas Union Enterprise Ltd. (Holels.
Restaurants R Leisure) 3.51 1,000 Singapore Press Holdings Lld. (Media) 827.000 Singapore Press Holdings Lld (Post
Reconstruclion) (Media)
11,674,176 1.71 3,042,662 0.44
9,759,508 1.43 9,337,490 1.37
2.465.352 0.36
62,246 Munzhener Ruckversicherungs AG 36.279.188 5.31 (Insurance) 8.1 17.169 1.19 ~
~
5.s0 South Korean Won 38.105.38n -- . -- - . . 350,000 KT8G Corp (Agricullure) 15.544.267 2.28
Hong Kong Dollar 821.500 Guoso Group Ltd. (Diversified Financials) 8,496,322 125
1.065.000 Hutchison Wharnpoa Ltd (Capital Goods) 10.108.260 148
JapaneseYen 539,700 Asatsu-DK. Inc. (Mndia) 1.541 KDDl Corp (Information 8 Communication)
1,252,000 Kirin Brewery Go.. Ltd. (Food. Beverages R Tobacco)
997.000 Lion Corp. (Household 8 Persunal Products) 268,000 MabJchi Motor Cu.. Lld. (Electronic 8
Elec:rical Equipment) 18,900 Mandom Corp. (Household 8 Pnrsonal
Products) 620,400 Nichicon Corp. (Technology Hardware &
Equipment) 1,750,000 Nikko Cordial Corp. (Diversified Financials) 2,493,500 Nippn Sheet Glass Co.. Ltd. (Construction 8
Building Materials) 50.000 Nippan Television Network Corp. (Media)
2.449.000 Nippnkoa Insurance Co.. Ltd. (Insurance) 460.500 Nissn Food Products Go.. Ltd. (Food,
Beverages 8 Tobacco) 3.227 NTT DoCoMo, Inc. (Tnlecnrnmunications)
575.000 Olyrnpus Corp. (Healthcare Equipment 8 Services)
1,244,000 Sompo Japan Insurance. Inc. (Insurance) 288,000 Takefuji Corp. (Insurance)
18.604.502 -
17.462.807 8.09 1,200
13,451.1 10 6,418,544
14,923,122
438,506
7.552.380 23,922,495
111,486,439 7,725,430 19.718.130
12.744.074 5.072.330
14,807,073 16,433,427 19.504.201
2.73
2.56 1.18
1 .Y7 0.94
2.18
0.06
1.11 3.50
1 .54 1.13 2.89
1.87 0.74
2 17 2.41 2.86
198,751,268 29.1 1
Swedish Krona 2,057,400 Skandia Forsakrings AB (Insurance) 11,259,915 1.65
Swiss Franc 47,000 Nesllb S A. (Fuod. Beverages R Tobacco) 13.917.467 2.04 50,400 Pargesa Holding S A "8" (Diversified
3.826.734 0 56 Financials)
17.744.201 2.60
United States Dollar 270.900 Anheuser-Busch Cos. Inc. (Food,
Beverages 8 Tobacco) 270,000 Cernex S.A.-ADR'" (Construction &
Building Materials) 509.000 Comcasl Corp "A' Special (Media) 696.000 Ddl, Inc. (Tnchnology Hardware &
Equipment)
102,800 Discovery Holding Co. "A' (Media) 350,400 Eletronics for Imaging (Software & Services) 104,000 Everest Re Group Ltd. (Insurance) 142.290 Fairfax Financial Holdings Ltd. (Insurance) 9 12,142 Geac Cornputor Corp.. Ltd. (Software 8
Services) 395.000 General Motors Corp. (Automobiles R Parts) 323,000 Hasbro. Inc. (Consumer Durables R Apparel) 222,000 Koninklijke Philips Electronics NV "NY'
(Electronic R Electrical Equipment) 95.003 Liberty Global. Inc. "C' (Media) 95.003 Liberly Global. Inc. " A (Media)
2.231.000 Liberty Media Corp. ' .A' (Media) 496,000 MCI. lnc, (Telecommunicalion Services)
1.534.200 DIRECTV Group, Inc. (Media)
12,014,415
15,120,000 13,249,270
21,304,560 20,358,834 1,608,820 9,776.160 10.976.160 21,339,231
9.778.162 8.848.000 6,660,260
6.229.320 2,090,066 2,195,520 17,223.320 9.830.720
1.76
2.22 1.94
3.12 2.98 0.24 1.43 1.61 3.13
1.43 1.30 0.98
0.91 0.31 0 32 2.52 1.44
The accompanying notes are an integral part of these financial statements.
17
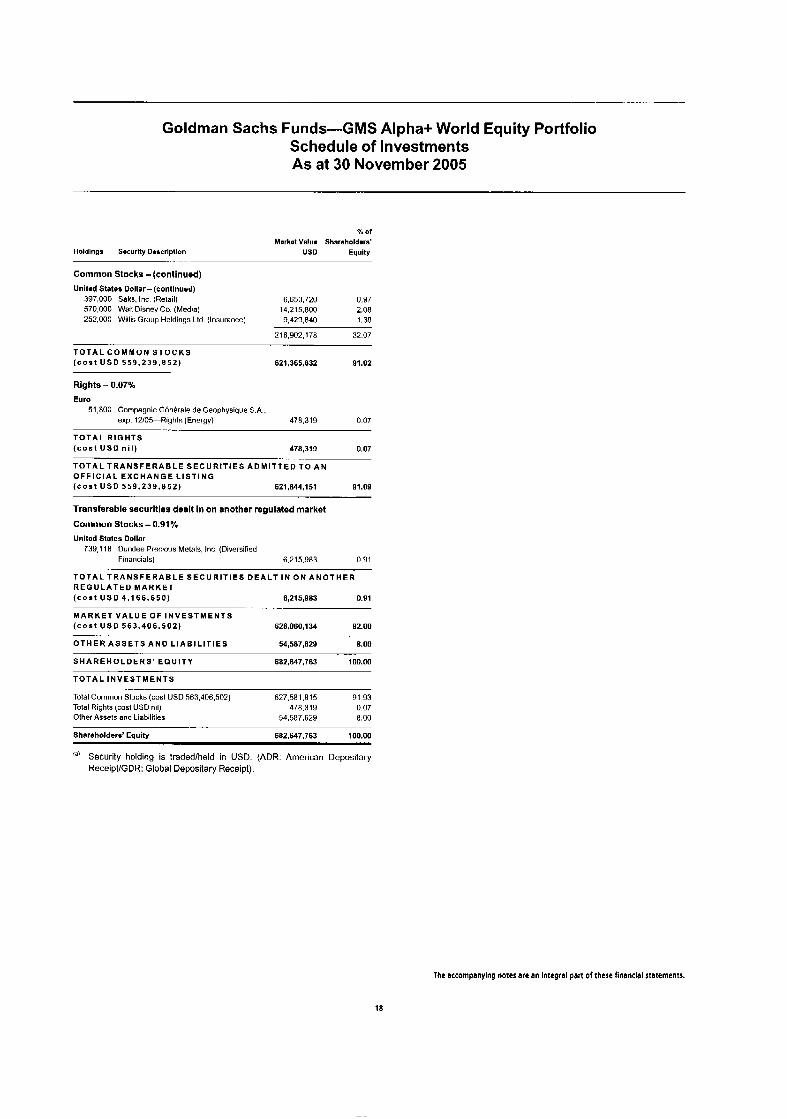
Goldman Sachs Funds-GMS Alpha+ World Equity Portfolio Schedule of Investments As at 30 November 2005
Holdlnga Sacurlty Daacrlptlon
% O f
Market Valum Sharsholdwa' US0 Equity
Common Stocks - (continued)
United States Dollar - (contlnued) 397,000 Salts. Inc (Retail) 6.653.720 0.97 570,000 Wal: Disney Co. (Media) 14.215.800 2.08 252,000 Wlllls Gruup Holdings Ltd. (Insurance) 9,429,840 1.30
218,902,178 32.07
T O T A L C O M M O N S T O C K S ( c o s t U S 0 559,239,852) 821,365,832 91.02
Rlghts - 0.07%
Euro 51,800 Cornpagnie Gbnkrale de Geophysique S A .
exp. 12105-Righls (Energy) 478.319 0.07
T O T A L R I G H T S ( c o s t U S 0 n i l ) 478,319 0.07
T O T A L T R A N S F E R A B L E S E C U R I T I E S A D M I T T E D T O AN O F F I C I A L E X C H A N G E L I S T I N G
-. .
( c o a t U S 0 559,239,852) 621,844,151 91.09
Transferable securities dealt in on another regulated market
Common Stocks - 0.91% Unlted States Dollar
739,118 Dundee Precious Metals. Inc. (Diversified Financials) 6.215.983 0.91
T O T A L T R A N S F E R A B L E S E C U R I T I E S D E A L T I N O N A N O T H E R R E G U L A T E D M A R K E T ( c o s t U S 0 4.166.650) 6,215,983 0.91
( c o s t U S 0 563.406.502) 628,060,134 92 00
O T H E R A S S E T S A N D L I A B I L I T I E S 54,587,629 8.00
.- M A R K E T V A L U E OF I N V E S T M E N T S
... -.
S H A R E H O L D E R S ' E Q U I T Y 682,647,763 10o.MI
T O T A L I N V E S T M E N T S
Total Common Stocks (cost USD 563,406.502) 627.581.815 81 93 Total Rights (cost US0 nil) 478.319 0.07 Other Assets and Liabilities 54,507,629 8.00
Shareholders' Equity 682.647.763 100.00
Security holding is tradedlheld in USD. (ADR: American Depositary ReceiptlGDR: Global Depositary Receipt).
The acrompanylng notes are an Integral part of these financlal statements.
18
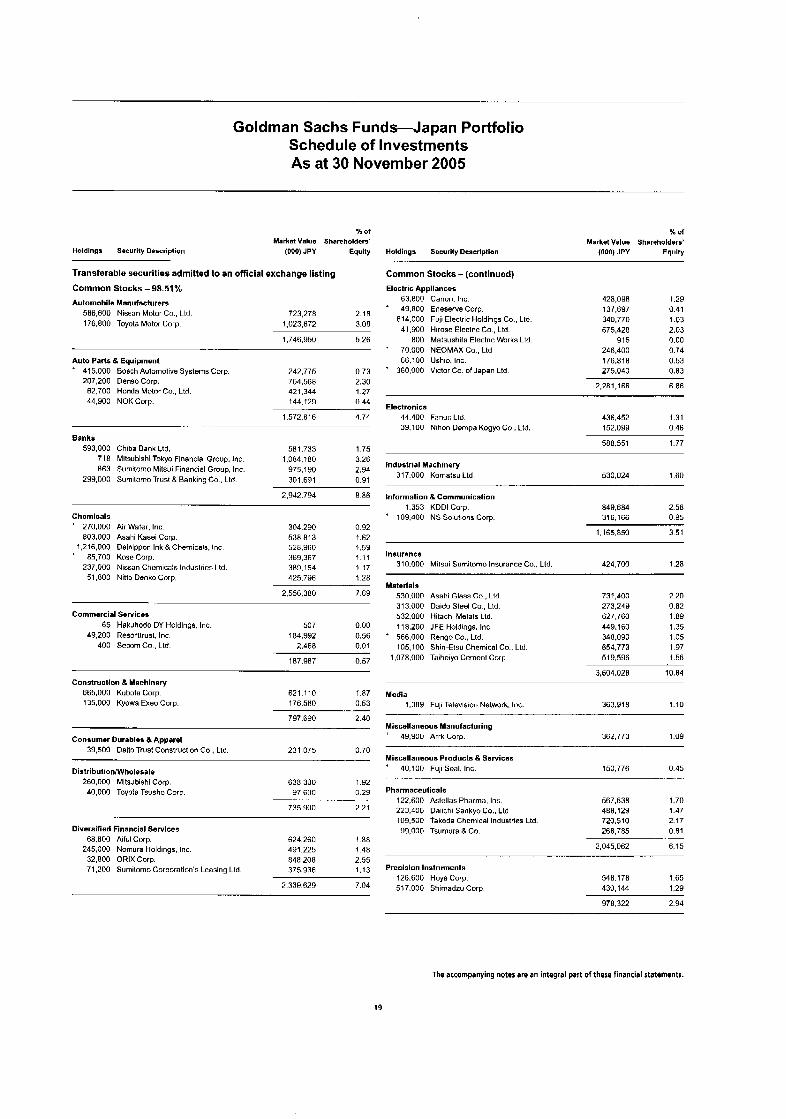
Goldman Sachs Funds-Japan Portfolio Schedule of Investments As at 30 November 2005
X of Market Value Shareholders'
(000) JPY Equlty
X 01 Market Value Shareholders'
Holdlnga Security Description (000) JPY Equity
Transferable secur i t ies admitted to an offlclal exchange listing
Common Stocks -98.51%
- .~
Automobile Manufacturers 586.600 Nisean Molar Co.. Ltd. 723,278 2.18 176.800 Toyola Motor Corp. 1,023,672 3.08
Holdings Security Doscriplion
Common Stocks - (cont inued)
Electric Appllances 63.800 Canon. Inc
* 49.800 Eneserve Corp. 614,000 Fuji Electric Holdings Co.. Ltd.
800 Matsushita Electric Works Ltd. 41.900 Hirose Electric Co.. Ltd.
70,000 NEOMAX Co., Ltd 66.100 Ushio. Inc.
' 360,000 Victor Co. of Japan Lld
428,OYR 1.29 137,697 0.41 340,770 1.03 675.428 2.03
915 0.00 246,400 0.74 176.818 0.53 275,040 0.83
1,746,950 5.26
Auto Parts L Equipment 415,000 Bosch Aulomolive Systems Corp. 207.200 Denso Corp.
62.700 Honda Molar Co.. Ltd. 44,900 NOK Corp.
242,775 764.568 421,344 144.129
0 73 2.30 127 0 44
4 74 - -
175 3 26 2.94 0 91
2,281,166 6.86
EIectronics 44.400 Fanuc Lld 436,452 1.31 39,100 Nihon Oernpa KogyoCo.. Ltd. 152,099 0 46
588.551 177
1,572.816
Banks 593,000 Chiba Bank Ltd.
718 Mitsubishi Tokyo Financial Group, Inc 863 Sumitomo Mitsui Financial Group, Inc.
299,000 Sumitomo Trus18 Banking Co.. Lld.
581,733 1,084,180
975.190 301.691
Industrial Machinery 317.000 Komslsu Ltd 530,024 1.60
Information 8 Communication
' 109.400 NS Solutions Corp. 1.353 KDDl Corp
2,942.794 8 86
849.684 2.56 316,166 0 95
1.165.850 3 51
Chemlcals + 270,000 Air Water, Inc.
803.000 Asahi Kasei Corp 1,216,000 Dainippon Ink a Chemicals, Inc
237,000 Nissan Chemicals Industries Lld * 85,700 KoseCorp.
51,800 Nilto Denko Gorp.
304.290 538.813 52H.960 369.367 389,154 425.796
0.92 1.62 1.59 1 1 1 117 1.28
Insurance 310.000 Milsui Sumitomo Insurance Co.. Ltd. 424,700 1.28
Materials 530.000 Asahi Glass Co.. Ltd. 313.000 Datdo Steel Co.. Ltd. 532.000 Hitachi Metals Ltd. 118,200 JFE Holdings. Inc.
* 566,000 Rengo Co.. Ltd. 105,100 Shln-Etsu Chemical Co.. Lld
1,078,000 Taihetyo Cement Corp.
2,556,380 7.69 731,400 2.20 273.249 0.82 627,760 1 .a9 449,160 1.35 348.090 1.05 654.773 1.97 519.596 1.56
Commercial Servicss 65 HakJhodo DY Holdinqs. Inc
49,200 Ressrrlrusl. Inc 400 Secorn Co , Ltd
507 184.992
2.468
0 00 0.56 0.01
187.967 0.57 3,604,026 10.84
Constructlon B Machinery 665,000 Kubota Corp. 135.000 Kyowa Exeo Corp.
Media 1,ORg Fuji Television Network. Inc.
621,110 1.87 176.580 0.53
797.690 2.40
363.918 1.10
Miscellanaous Manufacturing 49,900 ArrkCorp. Consumer Ourables 8 Apparel
39.500 Oaito Trust Construction Co.. Lld. 231,075 0.70
362,773 1.09
Miscellansous Products a Services * 40.100 Fuji Seal, Inc.
Pharmaceuticals
. . . ...
122,600 Astellas Pharma. Inc. 223,400 Daiichi Sankyo Co.. Ltd 10Y.500 Takeda Chcrnical Industrims Ltd. 93.000 Tsumura & Go.
DistributionMlholesale 260.000 MilSJbiShi COtp.
40,000 Toyota Tsusho Corp
150,776 0.45
638,300 1.92 Y7,6l)0 0.29
735,YOU 2.21 . . . . 567.638 1.70
488.129 1.47 720,510 2.17 268.785 0.81 Divarsified Financial Services
68.600 Aiful Gorp. 624.260 1.88 245,000 Nomura Holdings, lnc 491.225 1.48
32.800 ORlX Corp. 848,208 2.55 71,200 Sumitorno Corporation's Leasing Ltd. 375.936 1.13
2.045.062 6.15
Precislon Instruments 126,600 Hoya Corp 517,000 Shirnadzu Corp
548.178 1.65 430,144 1.29
978,322 2.94
2,339,629 7.04
The accompanying notes are an integral part of these financial statements.
19
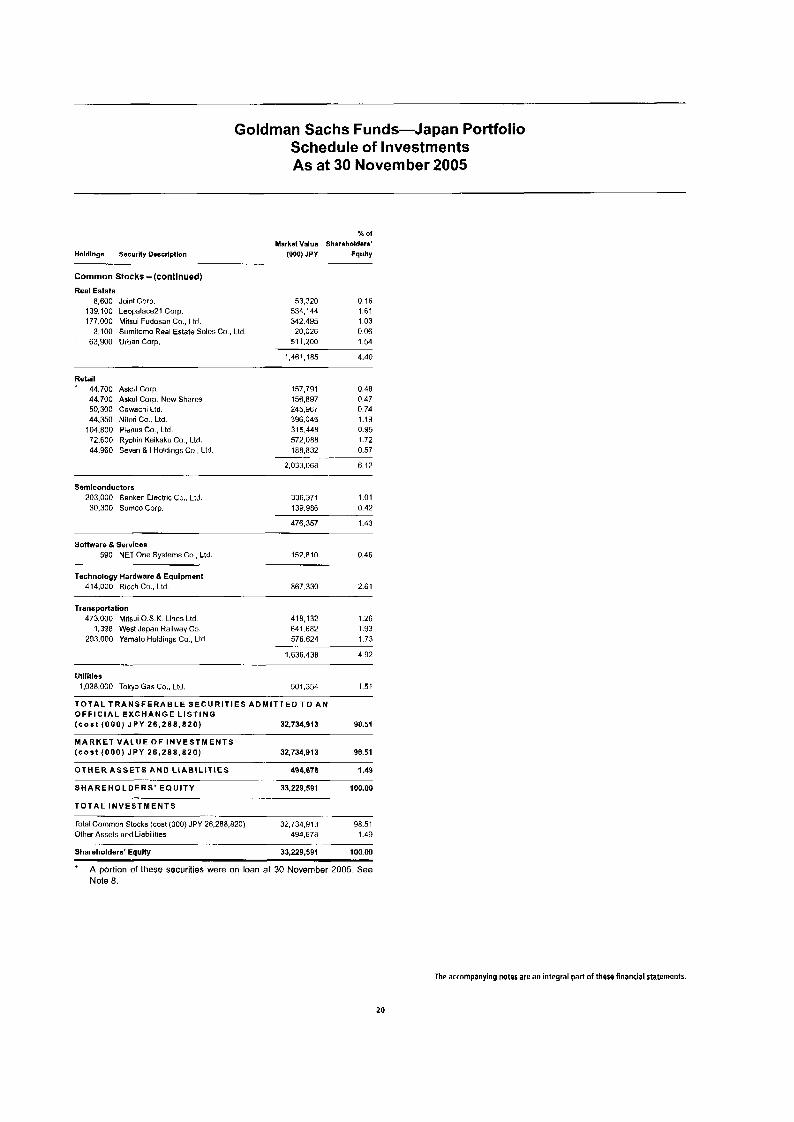
Goldman Sachs Funds-Japan Portfolio Schedule of Investments As at 30 November 2005
Holdlnga Security Dmscrlprlon
X of Markot Valua Shareholders'
(000) JPY Equlty
Common Stocks -(continued) Real Estate
8,600 Joint Corp. 139.100 LeopalaceZl Corp. 177,000 Mitsui Fudosan Go.. Ltd.
3.100 Sumitorno Real Estate Sales Co., Lld. + 63,900 UrbanCorp.
53,320 0 16 534,144 1.61 342.495 1.03 20,026 0.06
51 I .mo 1.54
1,461.1R5 4.40
Retail * 44.700 AskACorp.
44.700 Askul Gorp.-New Shares 50,300 Cawachi Ltd. 44,350 Nitori Co.. Ltd
104.800 Plenus Co.. Ltd. 72,600 Ryohin Keikaku Co.. Ltd. 44,960 Seven 8 I Holdings Co.. Ltd
157,791 156,897 245.Y67 396.045 315.448 572,088 1HH.H32
2.033.06R .
0.48 0.47 0.74 1.19
1.72 0.57
0.95
6.12
Semiconductors 203,000 Sanken Elnctric Co., Ltd.
30,300 Sumco Corp. 336.371 1.01 139.986 0.42
476.357 1.43
Software & Services 590 NET One Systems Co.. Ltd 152.810 0.46
Technology Hardware L Equipment 414.UU0 Ricch Co.. Ltd.
Transportation 473,000 MltsJi O.S.K. Lines Ltd
1.398 West Japan Railway Co 2Y3.000 Yamato Holdings Co.. Ltd.
867.330 2.61
418.132 1 2fi 641,682 1 Y3 576.624 1.73
1.636.438 4 92 -- .
Utllltles 1.038.000 Tokyo Gas Co., Ltd. 501,354 1.51
T O T A L T R A N S F E R A B L E S E C U R I T I E S A D M I T T E D T O A N O F F I C I A L E X C H A N G E L I S T I N G ( c o s t (000) J P Y 26 .288 .820) 32.734.913 98.51
M A R K E T V A L U E OF I N V E S T M E N T S (cost (000) J P Y 2 6 , 2 6 8 , 8 2 0 ) 32.734.913 98.51
O T H E R A S S E T S A N D L I A B I L I T I E S 484.618 I .49
S H A R E H O L D E R S ' E Q U I T Y 33.229.591 100.00
T O T A L I N V E S T M E N T S
Total Common Stocks (cost (000) JPY 26.2R8.820) 32,734,913 98.51
.-- ... . .
.
-. . -~ . .. .
Other Assets and Liabilities 4Y4.678 1.49
Shareholders' Equity 33,229,591 loo.w + A portion of these securities were on loan at 30 November 2005. See
Note 8.
_ . . . . ..
The accompanying notes are an integral part of these financial statements.
20

Goldman Sachs Funds-Japan Small Cap Portfolio Schedule of Investments As at 30 November 2005
% O f
Market Value Shareholders' Holdlngs Sacurlty Dewription (000) JPY Equity
-- .
Transferable securities admitted to an oftlclal exchange listing
Common Stocks -91.69%
Banks 1.642,OOO Higashl-Nlppon Bank. Ltd 1,018,040 183
% Of
Market Value Shareholders' Holdlngs Sacurlty Dascrlptlon (000) JPY Eqully
Common Stocks -(continued) Food, Beverages B Tobacco
... -
208,100 Maxvalu Nishinihon Co , Ltd 309.653 0 56
Information 8 Communlcatlon I 330,500 Intage, Inc.
408,300 Tohokushinsha Film Corp 234,510 UsenCorp.
746.930 1.34 1,355,556 2 44 703.530 1.27
Chemicals 261.000 C Uyemura 8 Co.. Ltd. 1,2ai,5io 2.30 878.000 Nihon Parkerizing Co.. Ltd. 1,376,704 2.48
'2,193,000 Rasa Industries, Ltd 962.727 1.73 645.600 Seiko PMC Gorp. 415.766 0.75
4.6s7.a27 8.38
' 1,941.000 Nippon Chemical Industrial Co , Lld. 621,120 1.12
-.. .. .
Commercial Servicas 1.763 KK DaVinci Advisors 1.1Y5.314 2.15
79,243 Moshi Moshi Hotline. Inr: 931 .lo6 1.68 526,000 Nissha Printing Co.. Ltd. 1,551.700 2.79
+ 458.000 Space Co.. Ltd. 776.310 1.40 395.400 Watabe Wedding Corp. 786,055 1.41
fi,474,968 11.65
+ 328.320 Resorttrust, Inc. 1.234.483 2.22
Construction 82Y,100 Japan Airport Terminal Co.. Ltd. 878.846 1 .5R
744,300 Sho.Bond Corp. 986.942 1.77 1,480,000 Meisei Industrial Go., Ltd. 1,021,200 1.84
117.000 Takzmatsu Corp. ti31 .ROO 114
5.05 2.806.016
Machinery + 1,228,000 CKD Corp. 1,666.396 3.00
507,000 Daihatsu Diafal Manufacturing Co.. Ltd. 31 1,805 0.56 81,000 Daihen Corp. 42.039 0.08
1,128,000 Juki Corp. 725,304 1.30 211.000 Makino Milling Machine Co.. Ltd. 231,678 0 42
* 286,900 Mudec. lnc. 912,342 1.64
378.600 Hitachi Tool Engineering. Ltd. 75 1.900 1.35
4,641,464 8.35
Materials ' 394.200 Tocalo Co.. Lld 1,592,568 2.87
Miscellaneous Manufacturlng * 221.300 ArrkCorp.
Miscellaneous Products 8 SoNices * 161.400 Fuji Seal. Inc 606,864 1 09
+ 401.000 Tsumura L C o 1.088.715 1 96 Pharmaceuticals
:3.518.78R -. ~
6 33
DistributionMlholesale + 153.300 Doshisha Co.. Ltd. + 2.560 Japan Wind Development Co.. Ltd
360,900 Katc Sangyo Co.. Ltd.
608,900 Takechiho Electric Co.. Ltd 429.300 Tomen Eleclronics Corp. 267,000 Toshin Denki Co.. Ltd. 424,400 Trusco Nakayama Corp.
1.768,OOO San-Ai Oil Co.. Lld.
383.250 565.760 732.627
1,044,888 1.013.818 1,236,384
1,188,320 ~a1.100
0.69 1.02 1.32 1 .R8 1 .R2 2.22 1.59 2.14
Real Estate ~ 244,900 Arnesl One Corp.
28 Grandy House Corp 783,680 1.41 14.000 0.03
797.680 1.44
Retail * 182,400 Askul Corp. * 182,400 Askul Corp.-New Shares
123.800 Mac House Co., Lld. * 1.188 Rex Holdings Co , Ltd.
127.000 Ryohin Keikaku Co.. Ltd. 223,800 Tsutsumi Jewelry Co.. Ltd
643.872 116 640,224 11s 381,304 0.6Y 891 ,000 1.60
1,000,760 1.80 939.960 1.69
7,046,147 12.68
Diversifiad Flnanclal Services * 482.100 PochetCard Co., Ltd. 1,465,584 2.64
20,500 UCS Co.. Ltd. 112.545 0.20 + 131.200 UFJ Central Leasmg Co , Ltd. 772,768 1 3Y 4,497,120 8.09
2.350.897 4.23 - . -- .
Elactric Appllances 386,000 Endo Lighting Corp. 509,520 0.92
* 74.800 Eneserve Corp. 206.R22 0.37 801.000 ON0 Sokki Co., Ltd 597,546 1.07
1.313.888 2 36 -- ..
- - .. -_ Electronics
420.000 As One Gorp. 1.050.000 1.89 170.700 Lasertec Gorp. 903.003 1.63 104,300 Senshu Electric Co , Ltd. 262.836 0.47
Technology Hardware L Equlpment * 70.500 Ahresty Corp.
135,800 Fujilsu Frontech. Ltd. 1,242,000 Kitz Corp. ' 2.708 Netmarks, Inc.
176,250 0.32 171.651 0.31
s98.46a 1.07 1,038,312 1.87
Telecommunlcations 601,000 Daimei Telecom Engincaring Gorp. 817.360 1.47 427,900 Forval Corp. 522.894 0.94
1.340.254 2.41
2,215,839 3.99
The accompanying notes are an integral part of these financial statements.
21
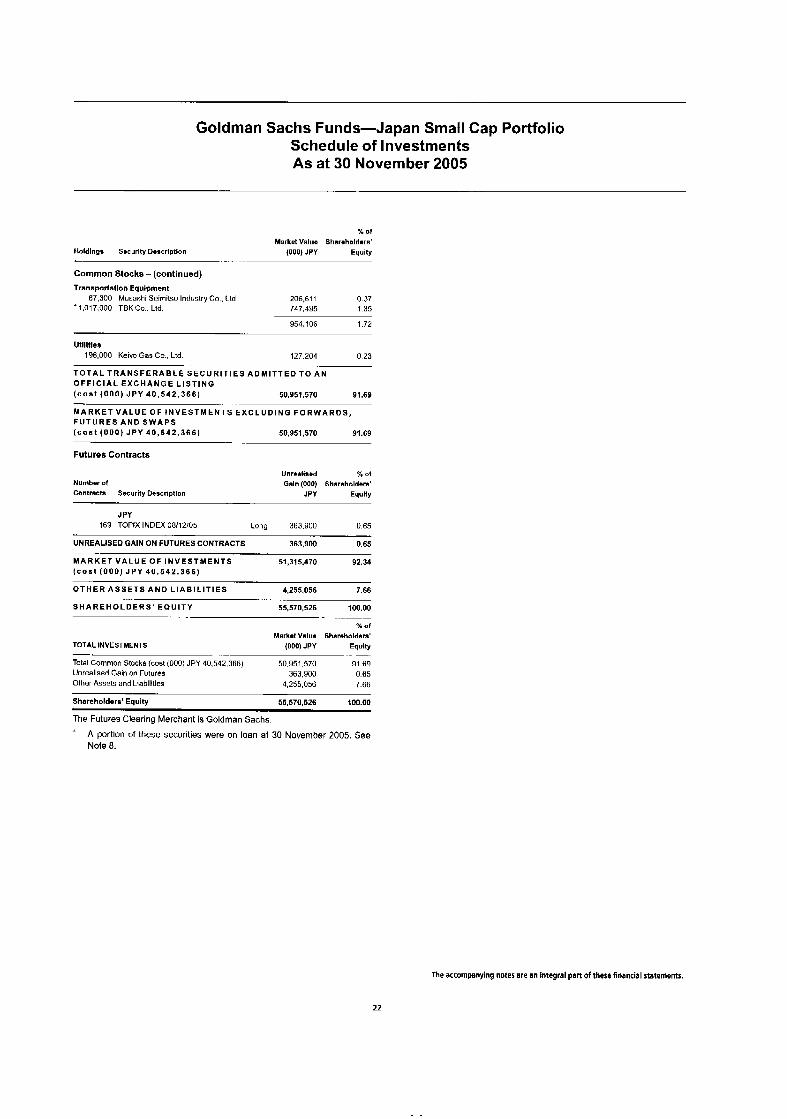
Goldman Sachs Funds-Japan Small Cap Portfolio Schedule of Investments As at 30 November 2005
% O f
Market Value Sharmholdors' Holdings Socurlty Dsacrlptlon (000) JPY Equlty
Common Stocks - (continued) Tranaportatlon Equlpment
67,300 Musashl Seimitsu Industry Co.. Ltd 206.61 1 0.37 * 1,017,000 TBKCo.. Ltd. 747,495 1.35
__ . .. . . ..
954,106 1.72
Utilities 196,000 K e l p Gas Co , Ltd 127.204 0 23
T O T A L T R A N S F E R A B L E S E C U R I T I E S A D M I T T E D T O A N O F F I C I A L E X C H A N G E L I S T I N G ( c o a t (000) J P Y 40 .542 .366) 50.951.570 91.69
M A R K E T V A L U E O F I N V E S T M E N T S E X C L U D I N G F O R W A R D S , F U T U R E S A N D S W A P S (cos t ( 0 0 0 ) J P Y 40 ,542 ,366) 50,951,570 91.69
Futures Contracts
-
- - -
Number of
Contracts Security Deacriptlon
Unreallsed 7. of
Galn (000) Shareholdera' JPY Equlty
JPY 169 TOPIX INDEX 08/12/05 long 363.900 0.65
UNREALISED GAIN ON FUTURES CONTRACTS 363,900 0.65
M A R K E T V A L U E O F I N V E S T M E N T S 51.31 5.470 92.34 ( c o s t (000) J P Y 40 .542 .366)
O T H E R A S S E T S A N D L I A B I L I T I E S 4.255.056 7.66
S H A R E H O L D E R S ' E P U l T Y - . .-
TOTAL INVESTMENTS --
Total Common Stocks (cost (000) JPY 40,542,366) Unrealised Gain on Futures Other Assets and Llabilities
55,570,526 100.00
x of
Markmt Value Shareholdera' (000) JPY Equlty
50.951570 91 64 363.900 0 65
4,255,056 7 66
~-
__
Shareholders' Equity 55,570,526 100.00 .-
The Futures Clearing Merchant is Goldman Sachs. * A portion of these securities were on loan at 30 November 2005. See
Note 0.
The accompanying notes are an integral part of these financial statements.
22

Goldman Sachs Funds-UK Equity Portfolio Schedule of Investments As at 30 November 2005
% of Msrket Value Shareholders'
GBP Equity
% O f
Market Valua Shareholders' Holdings Securlty Dascrlptlon GBP Equity
Transferable securities admitted to an official e x c h a n g e listing
Common S t o c k s - 97.82%
. - . -
Aerospace I Defense 554.799 BAE Systems PIC 1 ,877,994 2.91 190.231 Rolls-Royce Grnup PIC 740,950 1.15
8.144 0 01
2.627,00R 4.07 -. ...
8,143.755 Rolls-Royce Group PIC. "B"
Holdings Suurlty Dascrlptlon
Common S t o c k s - (continued)
Machlnery 8 Engineering 173,809 Bodycole International PIC
177.015 Melrnse PIC 3ig.aoo FKI pic
380.642 0.59 361.374 0.56 229,234 0.36
971.250 1.51
Media 167,990 British Sky Broadcasting PIC 829.871 1.29 250,566 Reulers Group PIC 1,004,770 1.56 238.712 Taylor Nelson Sofres PIC 538.295 0.83 167.173 WPP Group PIC 952,886 i .48
3,325,822 5.16
Banks 319,585 Barclays PIC
396.286 HSBC Holdings PIC 94,974 Lloyds TSB Group PIC 49.146 Northern Rock PIC
96,938 HBOS pic
186,828 Royal Bank of Scotland Group PIC
i,a87.i50 2.Y3 845,784 1.31
3.669.608 5.69 446.853 0.69 409.386 0.63
3,082,662 4.78 Mlnlng 1 1 3.292 Anglo American PIC
8 308 Xstrata PIC 2,057,383 3.lY
0.17
2,166,550 3.36 -.- 109,167
10,341,443 16.03 ~. ..
Chemicals 35,445 Boc Group PIC 394,503 0.61
Oil 8 Gas 209,656 BG Group PIC 751.518 BPPlC 124,964 Royal Durch Shell PIC. "A' 157,320 Royal Dutch Shell PIC. " E
1,133,191 1.75 4,764,624 7.39 2.225.033 3.45 2.934.018 4.55
Constructlon 8 Building Materials 54,537 Berkeley Group Holdings PIC 554,641 0.86 19.986 Travis Pnrkins PIC 253,622 0.39 90.857 Wolselny PIC 1 .1 18,450 1.74
1,926.71 3 2.99
Consumer Services 53.289 Luminar PIC 70.772 Sportingbet PIC
Personal Cars 8 Household Products 59.137 Reckltt Benckiser PIC 262.715 0 41
251,594 0.39 1.058352 1.64
Pharmaceuticals 43,129 AstraZeneca PIC
62.529 Shirc PIC 355,567 GlaxoSmilhKline PIC
514,309 0.80 1.150.682 1.78 5,081,052 7.88 443.018 0.69 Food, Beverages &Tobacco
67,142 Imperial Tobacco Group PIC 624,921 Tesco PIC
1,157,528 1.79 1.893.51 1 2.94
3.051.039 4.73
6,674,752 10.35
Speclallty I Other Finance 203.195 Cattles PIC 4U.825 Man Group PIC
601,965 0.93 724.644 1.13 General Retailers
24,443 Jessops PIC 121,001 Marks 8 Spencer Group PIC
19.9112 0.03 552.975 0.86
572.957 0.89
1.326.609 2.06
Support Servlces 149,520 Capita Group PIC 586,iim 0.91 155.354 Dignity PIC 645.107 1.00 144.994 Michael Page International PIC 371,185 0.58 187.731 Mille Group PIC 319.143 0.49 149,353 Rexam PIC 762.447 1.18
Hotels, Restaurants I Lelsure 19,300 Carnival Corp. 29,296 Carnival PIC
612,800 0.95 949,484 147
1,562,284 2.42 ~
Insurance 116,182 Admiral Group PIC 43.894 Aviva PIC
2,684,000 4.16 - .
Telecommunication Services 699.371 02 PIC 1,370,767 2 13
3.649.018 Vodafone Group PIC 4,552,150 7.06 8.85n vodafone Group PIC -ADR") 1 1 1,292 0 17
514.977 0 80 301,332 0.46
1116,309 1.26
Investment Companies 118.405 3i Group PIC 1,004.074 1.56
Llfe Assurance 246.YY6 Friecds Provident PIC 471,145 0 73 704.856 Old Mutual PIC 1,066,095 1.65 42R.171 Prudential PIC 2.258.602 3.50
3.795.842 5.88 . - . -
6.034.209 9.36
Transportation ia6.699 BAA PIC 1, 186,472 I .A4
T O T A L T R A N S F E R A B L E S E C U R I T I E S A D M I T T E D T O A N O F F I C I A L E X C H A N G E L I S T I N G ( c o s t G B P 5 5 , 0 3 6 , 6 0 7 ) 63,091,643 97.82
The accompanying notes are an integral part of these financial statements.
23
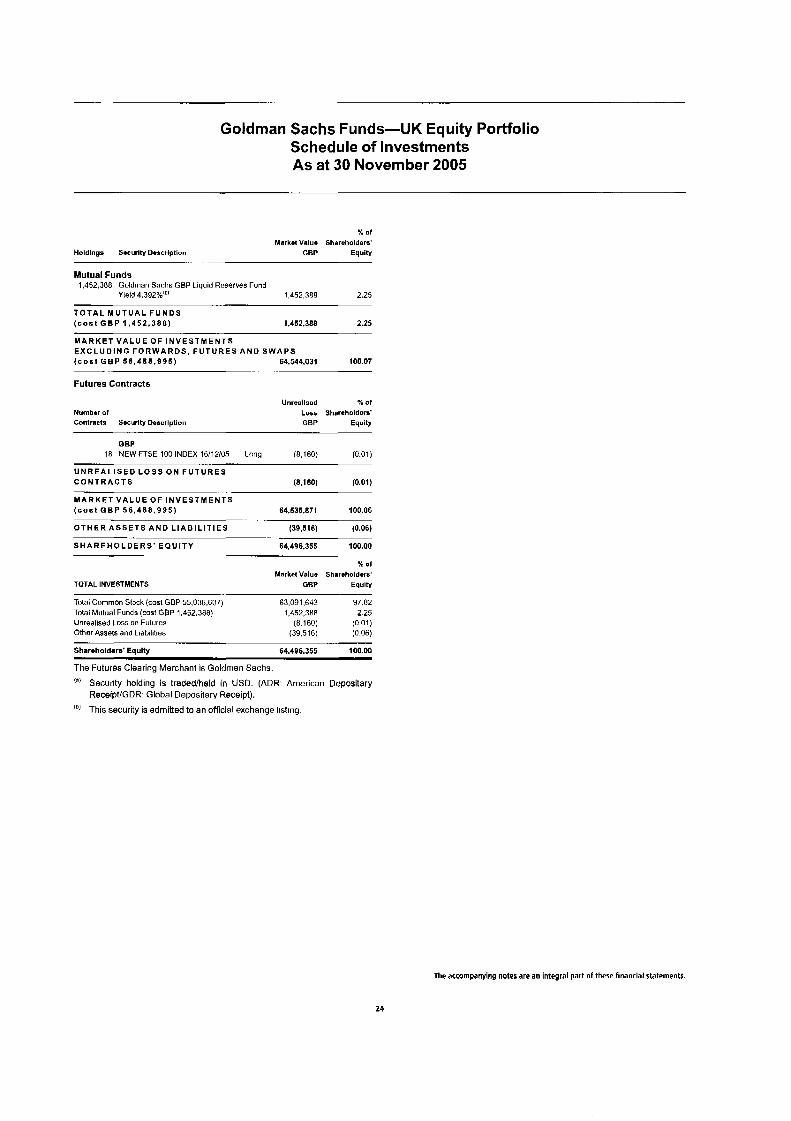
Goldman Sachs Funds-UK Equity Portfolio Schedule of Investments As at 30 November 2005
% o f
Marka Value Shareholders' Holdings Socurlty Descrlptlon GBP Equity
- . .
Mutual Funds 1,452,388 Goldman Sachs GBP Liquid Reserves Fund
YieM 4.392%"' 1,452,388 2.25
T O T A L M U T U A L F U N D S ( c o s t GBP 1 , 4 5 2 , 3 8 8 ) 1.452.388 2.25
~________
M A R K E T V A L U E O F I N V E S T M E N T S E X C L U D I N G F O R W A R D S , F U T U R E S A N D S W A P S ( c o a t G E P 5 6 . 4 8 8 . 9 9 5 ) 64.544.031 100.07
Futures Contracts
- .
Number of Contracts Sscurlty Descrlptlon
Unrealised X of Loss Shareholders' GBP Equity
GEP 1R NEWFTSE 100 INDEX 16/12/05 Long (8.160) (0.01)
C O N T R A C T S (8,160) (0.01) U N R E A L I S E D L O S S O N F U T U R E S
- M A R K E T V A L U E O F I N V E S T M E N T S ( c o a t GBP 5 6 , 4 8 8 , 9 9 5 ) 64.535.871 100.06
O T H E R A S S E T S A N D L I A B I L I T I E S (39.516) (0.06)
S H A R E H O L D E R S ' E Q U I T Y 64.496355 100.00
. ..
-- ..
% of Market Value Sharsholdors'
TOTAL INVESTMENTS GBP Equlty
Total Common Sbck (cost GBP 55.036.607) 63,091,643 37.A2
Unrealised Loss on Futures (8.160) (0.01)
Shareholders' Equlty 64.496.355 100.00
The Futures Clearing Merchant is Goldman Sachs. (I) Security holding is tradedlheld in USD. (ADR: American Depositary
ReceiptlGDR: Global Depositary Receipt). la) This security is admitted to an official exchange listing
Total Mutual Funds (cost GBP 1.A52.388) 1,452,388 2.25
Other Assets and Liabilities (39.516) (0.06)
The accompanying notes are an integral part of these flnanclal statements.
24

Goldman Sachs Funds-US Growth Equity Portfolio Schedule of Investments As at 30 November 2005
% Of
Market Value Shareholders' Holdlngs Security Description USD Equlty
Transferable securltles admitted to an official exchange llstlng
Common Stocks - 99.63%
Banks
...
* 22,700 Golden West Financial Corp 1,496,838 0 f i l - .
Blotechnology 73.931 Amgen. Inc. 6,015,026 2.47
Commercial Servicas B Supplies
* 64,260 Moody's Corp 3,889,658 160
8,801,321 3 62
* 274,548 Cendant Corp. 4,911,663 2 02
- .. -. Consumer Servlces + 64,876 Harrah's Entertainment. Inc. * 67,803 Marriotl International, Inc "A
4,536,778 1.06 4,447.877 1.R3
8,984,655 - . . -- .-
Dlverslfled Financial Services 23.300 American Express Co 1,209,270
+ 199.960 Federal Home Lnan Mortgage Corp 12,687,462 * 447,777 The Charles Schwab Corp 6,895.766
3.69 ..
0.50 5.21 2.R3
20,792.498
Ensrgy 113,000 Sch umberger Ltd. 10,777,940 08.300 Suncor Energy, Inc. 5,031,334
0.54
4 43 2.07
15.009.274 6 50 ~
Food, Beverages EL Tobacco + 35,200 Fortune Brands. Inc 2,764,960 1.14
144,443 Pepaico. Inc. 8.650.691 3.55 * 61,092 WM Wrigley Jr. Co. 4,234,287 1.74
~ .. 15,649,938 6.43
Hotels, Restaurants 8 Lelsure 90,450 Carnival Corp. 4.955.755 2 04
Insurance 30,300 Willis Group Holdings Ltd.
- .
Media * 106.375 Cloar Channel Communications. Inc.
57,106 Lamar Advertising Co '.A' * 193.720 McGraw-Hill Cornpanias, Inc.
233.296 Time Warner. Inc 216,028 Unibision Communications, Inc. " A
52,334 Valassis Communications. Inc. + 198.998 Viacom. Inc. "E
1,433.1R6 .
3.440.168 2,631,445
10,298,155 4.203.994 6,534,047
6,720,122 i , 5 ~ ~ . 8 5 0
0.59
1.41 1 .oo 4.23 1.73 2.69 0.66 2.76
35,436,581 14.56
Medlcal Products 70,400 Fisher Scientific International 4,549,952 1.87
+ 100,750 Medtronic. Inc. 5,646,030 2.32
1.11
15,232,308 6.28
55,400 Stryker Corp. 2,398,266 0.90
- . . .. .. 43,100 Zimmer Holdings. Inc. 2.698.060
.. .
Personal Care 8 Household Products + 39.170 Procter R GambleCo. 2,263,243 0.93
Holdlngs Securlty Descrlption
% Of
Markmt Valua Shareholdars' US0 Equlty
Common Stocks - (continued) Pharmaceutlcalr
89,540 Caremark Rx. Inc. + 40.661 Eli Lilly 8 Co 'dl
96,860 Medco Health Solutions. Inc. 83.167 Pfizer. Inc.
* 77.674 Wyeth
4,642,649 191 2,053,787 0.84 5,226.566 2.15 1,776,447 0.73 3,271,629 1.34
16,971,078 6.97
Retail
* 53.600 Target Corp. 11 1,100 Luwe's Companies, Inc
123.341 Wal-Marl Stores, Inc.
7,505,916 3.00 2.888.504 1.19 6,047,409 2.49
16.441.829 6.76 . -
Semiconductors & Semlconductors Equipment
~ 141,400 Linear Technology Corp 5,277,046 2.17
7,945,492 3.27
* 99.680 IntelCorp. 2,660,444 1.10
Softwars 8 Services R3.300 Electronic Arts. Inc
* 228.337 First Data Corp. 11,140 Google. Inc."A'
* 410,709 Microsoft Corp. 61.490 Yahoo!. Inc.
4,712.281 1.93 9.996.594 4.11 4,495,101 1.85
11,380,787 4.68 2,481,122 1.02
33.065.885 13.59 --- . .-
Technology Hardwara a Equipment 329,230 Cisco Systems. Inc. 5,820,707 2.39 203,490 Doll. Inc. 6,228,829 2 56 166,253 EMC Gorp, 2,334,l 92 0.96 210.574 Qualcomm, Inc. 9,701,144 3.99
24.084.952 9.90
Telacommunicatlons Equlpment L Services 94.000 American Tower Corp "A" 2566.200 1.06
160,296 Crown Castle International Corp. 4,436,993 1.02
7.003.193 2 88
T O T A L T R A N S F E R A B L E S E C U R I T I E S A D M I T T E D T O A N O F F I C I A L E X C H A N G E L I S T I N G ( C o s 1 U S 0 209 .385 .524) 242.443.052 99.63
M A R K E T V A L U E O F I N V E S T M E N T S ( c o s t U S D 209 ,385 ,524) 242,443,052 99.63
O T H E R A S S E T S A N D L I A B I L I T I E S 891,549 0.37
-
.
.- - ., . .
S H A R E H O L D E R S ' E Q U I T Y 243,334,601 100.00 . . ..- T O T A L I N V E S T M E N T S
Total Common Stocks (cos1 USD 209385524) 242,443,052 99.63 Other Assets and Liabilities 891.549 0.37
Shareholders' Equity 243,334,601 100.00
A portion of these securities were on loan at 30 November 2005. See Note 8.
The accompanying notes are an integral part of these financial statements.
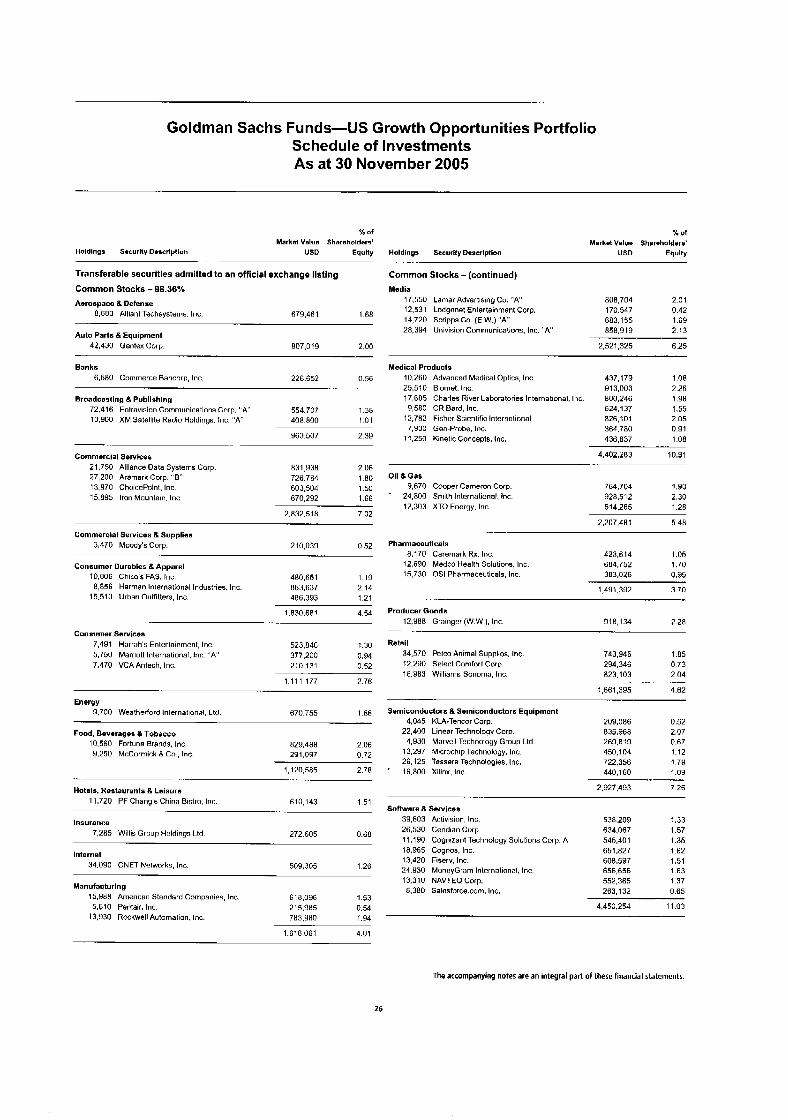
Goldman Sachs Funds-US Growth Opportunities Portfolio Schedule of Investments As at 30 November 2005
% of
Markel Value Shareholders' Holdings Securlly Daacrlprlon USD Equlty
Transferable securities admitted to an official exchange listing
Common Stocks - W.36% Aerospace LL Defenoe
8.883 Alliant Techsystems. Inc 679,461 1 E8
Auto Parts B Equipment 42,430 Gentex Corp.
x of Market Value Shareholders'
Holdings Scourlty Doscrlpllon USD Eqully . ... .
Common Stocks -(continued) Media
17,550 Lamar Advertising Cu. " A ' 808,704 2.01 12,531 Lodgonnt Enlertainrnent Corp. 170,547 0.42 14,720 Scripps Co (E.W.)"A' 683.155 1.69 28.394 Univision Communications. Inc. "A" 858.919 2.13
807.019 2.00 2,521,325 6.25
Banks 6.680 Commerce Bancorp, Inc
-
226,652 (1.56
Broadcasting & Publishing 72,416 Entransion Communications Corp. "A" 554.707 1.38 13,900 XM Satellite Radio Holdings, Inc. " A 408,800 101
963,507 2.39 - ..
Commsrcial Sewlces 21,750 Alliance Data Systems Corp. 831,938 2.06
13,970 ChoicePolnt. Inc. 603.504 1.5U 15.895 Iron Mountain. Inc. 670.292 1.66
27,200 Aramark Corp. ' E 726.784 1.80
2.832.518 7.02
Commerclal Services 8 Supplisa 3,470 Moody's Corp. 210.03Y 0.52
Consumer Durable$ L Apparel 10,806 Chico.6 FAS. Inc. 480,651 1.19
15.510 Urban Oumtters. Inc. 4R6.393 121 8,856 Harnan International Industries. Inc. 063,637 2 14
1.830.681 4 54 . .. __
Consumer Services 7.491 Harrah's Entertainment. Inc. 523.846 1.30 5,750 Marriolt International, Inc .'A'' 377,200 0.94 7,470 VCAAntech. Inc. 21u,131 0.52
1.11 1,177 2.76
Energy 9,700 Weatherford International, Ltd. 670.755 1.66
Food, Bevarages &Tobacco 10.560 Fortune Brands. Inc. 9,250 McCormick 8 Co.. Inc
829,488 2.06 291.097 0.72
1,12(1,585 2.78 .. . .- .~
Hotsls. Restaurants 8 Leisure 11,720 PF Chang's China Bistro. Inc. 610,143 1.51
- .
Insurance 7.285 Willis Group Holdings Ltd. 272.605 0.68
Internet 34.090 CNET Networks, Inti. 509,305 126
Manufacturlng 1 5 3 8 American Standard Companies, Inc. 618,096 1.53 5,610 Penlair. Inc. 215,985 0.54
13,930 Rocrwell Automation. Inc. 783.980 1.94
Medical Products 10,260 Advanced Medical Optics. Inc. 437,179 1.08 25,510 Biurnel. Inc. 913,003 2.26 17,685 Charles River Laboratories International. Inc. 800,246 1.98 9,580 CR Bard. Inc. 624,137 1.55
12,782 Fisher Scientific International 826,101 2.05 7,930 Gnn-Probe, Inc. 364.780 0.91
11.250 Kinetic Concepts. Inc. 436,837 I .on 4,402,283 10.91
Oil &Gas 9,670 Cooper Cameron Corp.
* 24,800 Smith International. Inc 12,303 XTO Energy, Inc.
764,704 1.90 928.512 2.30 514.265 1.28
2,207,481 5.48
Pharmaceutlcals 8,170 Caremark Rx. Inc.
12,690 Medco Health Solutions, Inc 15,730 OS1 Pharmaceuticals. Inc.
423,614 1.05 684.752 1.70 383.026 0.95
1,4Y 1.392 3.70
Producer Goods
12.Y6R Grainger (W.W.). Inc. 918,134 2.28 - -
Retail 34.570 Pelco Animal Supplies. Inc. 743,946 1.85 12.290 Select Comfort Corp. 294,346 0 73 18.983 Williams-Sonoma, Inc. 823.103 2.04
1,861,395 4.62
Semiconductors 8 Semiconductors Equipment 4,045 KLA-Tencor Corp. 209,086 0.52
22,400 Linear Technology Corp. 835,968 2.07 4.930 Marvel1 Technology Group Lld. 269,819 0.67
13.297 Microchip Technology. Inc. 450,104 1.12 26,125 Tessnra Technologies. Inc. 722,356 178
* 16.800 Xilinx. Inc. 440.160 1.09
-.. . - . Software 8 Sarvices
39,603 Activision, Inc. 26.530 Ceridian Corp. 11,190 Cognizant Technology Solutions Corp. A 18.965 Cognos, Inc. 13,420 Fiserv. Inc. 24.930 MoneyGram International. Inc. 13,310 NAVTEQ Corp. 8,380 Salcsforce.com. Inc.
2,927.493
538,209 634,067 545,401 651,827 6on.597 656,656 552,365 263,132
7.26 -
1.33 1.57 1.35 1.62 1.51 1.63 1.37 0.65
4.450.254 11.03
1,618,061 A.01
The accompanying notes are an integral part of these financial statements.
26

Goldman Sachs Funds-US Growth Opportunities Portfolio Schedule of Investments As at 30 November 2005
Marker Value Holdings Sacurlty Deacrlpllon USD - .. - .. .
Common Stocks - (continued) Technology Hardware EL Equlpment
20,765 Am-ent Corp. 25.530 Cogent. Inc. 1R.830 Dolby Laboratories, Inc. " A 16,440 Juniper Networks. Inc. 19,890 Zebra Technologios Corp. "A'
625.4A2
3 16,344 375.983 903.006
589.998
Y, of
Shareholders' Equity
_. _.
1.55 1.46 0.79 0.93 2.24
Telecommunication Servlces 7,790 NeuStar. Inc. "A" 241,490 0 60
Telecommunications Equlpment 8 Servicas 15,996 Amphenol Corp. "K 664.154 1.64 28.128 Crown Castle International Corp 770.583 1.Y3 38.020 Flir System$. Inc. 934,912 2.32
2,377.649 5 89 .- T O T A L T R A N S F E R A B L E S E C U R I T I E S A D M I T T E D TO A N O F F I C I A L E X C H A N G E L I S T I N G ( c o s t U S 0 36 ,654 ,989) 39,672.177 88.36
M A R K E T V A L U E OF I N V E S T M E N T S ( c o s t U S 0 36 ,654 ,989) 39.672.177 98.36
O T H E R A S S E T S A N D L I A B I L I T I E S 661,533 1.64
S H A R E H O L D E R S ' E Q U I T Y 40,333,710 1ao.oa
T O T A L I N V E S T M E N T S
Total Common Sbcks (cost US0 36.654.989) 39.672.177 ~ 8 . 3 6
Shareholders' Equity 40,333,710 100.00
Other Assets and Liabilities 661,533 1.64 -- . ..
~~ ~
+ A portion of these securities were on loan at 30 November 2005. See Note 8.
The accompanying notes are an integral part of these financial statements.
27
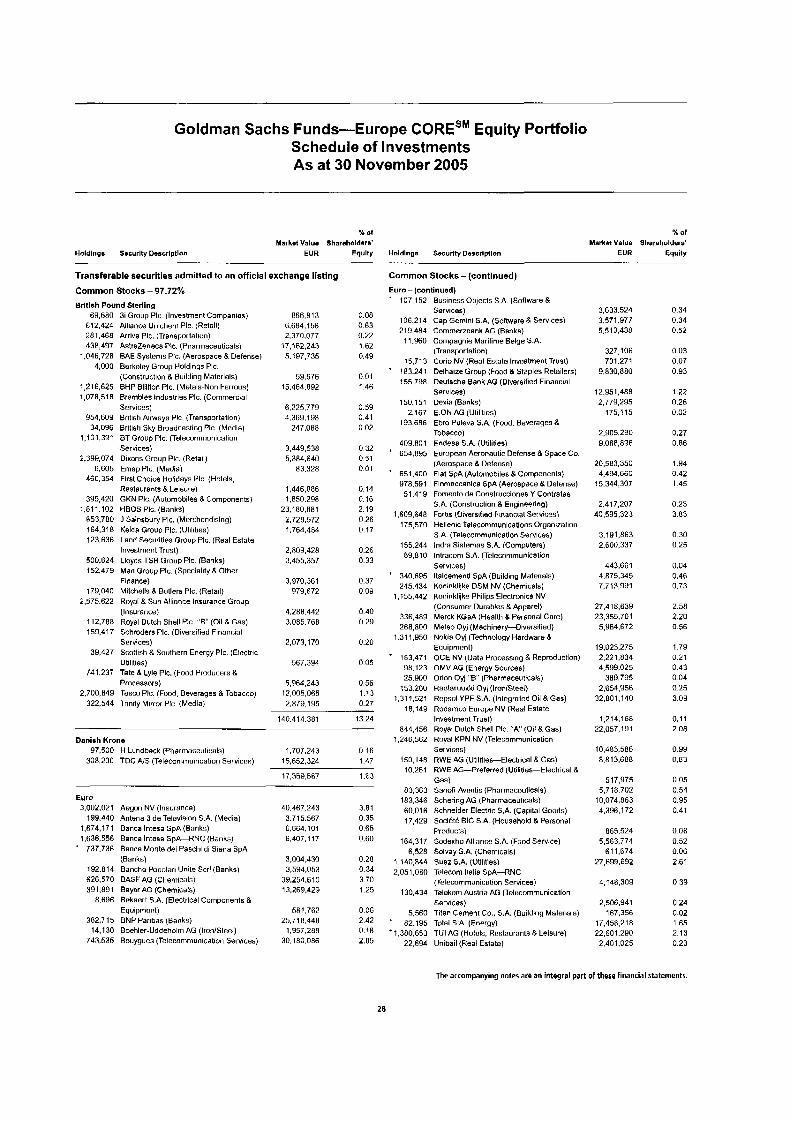
Goldman Sachs Funds-Europe CORESM Equity Portfolio Schedule of Investments As at 30 November 2005
% Of % of Markd Value Shareholders' Market Value Shareholders'
Holdlngs Smcurlty Descrlptlon EUR Equlty Holdlnge Security Description EUR Equity .. - - . -- __
Transferable securities admitted to an official exchange listing
Common Stocks - 97.72%
Common Stocks - (continued) Euro - (continued)
Brltlsh Pound Sterling 69,680 3i Group PIC. (Investment Companies)
612.424 Alliance Unichem PIC. (Retail) 281,468 Arriva PIC. (Transportation) 438,497 AstraZeneca PIC. (Pharmaceuticals)
1,046,728 BAE Systems PIC. (Aerospace 6 Defense)
(Construction L Building Materials) 1,216.625 BHP Billiton PIC. (Metals-Non Ferrous) 1,078.51 8 Brambles Industries PIC. (Commercial
Services)
34.096 British Sky Broadcasting PIC. (Media)
Services)
fi,605 Emap PIC. (Media)
4,000 Berkeley Group Holdings PIC.
954,609 British Airways PIC (Transportation)
1.101.381 BT Group PIC. (Telecommunication
2.399.074 Dixons Group PIC. (Retail)
460,354 First Choice Holidays PIC. (Hotels, Restaurants 8. Leisure)
395,420 GUN PIC. (Automobiles 8 Components)
653,780 J Sainsbury PIC. (Merchandising) 164.318 Kelda Group PIC. (Utilities) 123.636 Land Socurilies Group PIC. (Real Estate
Investment Trust) 500,624 Llokds TSB Group PIC (Banks) 152.479 Man Group PIC (Speciality L Other
Finance) 179,040 Mitchells 8 Butlers PIC. (Retail)
2.575.622 Royal B Sun Alliance Insurance Group (Insurance)
112,788 Royal Dutch Shell PIC 'E" (Oil &Gas) 15Y.417 Schroders PIC. (Diversified Financial
1.011.102 HBOS PIC. (Banks)
Services) 39.427 Scottish 8. Southern Energy PIC (Elcctric
Utilities) 741.237 Tale & Lyle PIC. (Food Producers 8
Processors) 2,700,849 Tesco PIC. (Food, Beverages 6 Tobacco)
322,544 Trinity Mirror PIC (Media)
Danish Krona 97.500 H Lundheck (Pharmaceuticals)
308.200 TDC AIS (Telecommunication Serviccs)
' 107,152 Business Objects S A (Software 8 Servicns)
106.214 Cap Gemini S.A. (Software8 Services) 219.484 Commerzbank AG (Bankfi)
11,960 Compagnie Maritime Belge S.A. (Transportation)
15.713 Corio NV (Real Estato lnwslment Trust)
866,813 6,684,158 2.370.077
17,162,243 5.197.735
O 63
0'49
* 183.241 Delhaize Group (Food &Staples Retailers)
:i 155.798 Deutsche Bank AG (Diversified Financial Services)
59.676 15.464.892
6.225.779 0.59 4.369.198 0.41
247,088 0 02
3.449.538 0 32
83.328 0.01
1,446,086 0.14 1,650.298 0.16
23,180.8R1 2.19 2,728,572 0.26 1,764,484 0.17
2.609.420 0.26 3.455.357 0.33
3,970.361 0.37 979,672 0 09
4.288.442 0.40 3.085.768 0.29
2.073.170 0.20
567,394 0.05
5,964,243 0 56 12,005,065 1.13 2.879.195 0.27
140.414.381 13.24
5,384,640 0 51
1,707,243 0.16 15,652,324 1.47
17,369,567 1.63
Euro 3,002,021 Aegon NV (Insurancn)
1,674,171 Banca Mesa SpA(Banks) 1,636,556 Banca Mesa SPA-RNC (Banks)
199,440 Antena 3 de Telnvision S A (Medin)
* 737.736 Banca Monte del Paschi di Siena SpA (Banks)
192.814 Banchn Popolari Unite Scrl (Banks) 626.570 B A S AG (Chemicals) 391.891 Bayer AG (Chemicals)
8.696 Bekaert S.A. (Electrical Components 6 Equipment)
382.715 BNP Paribas (Banks)
743.535 Bouygues (Telecommunication Services) 14.130 Boehler-Uddeholm AG (IronISteel)
40.467.243 3.81 3.715.567 0.35 6 . a~4 . io i 0.65 6,407.1 17 0.60
3.004.430 0.28 3,594,053 0.34
39.254.610 3.70 13269,429 1.25
581,762 0 06 25,718,440 2.42
1,957,288 0.18 30.180.086 2.85
150.151 Dexia (Banks)
193.686 Ebro Puleva S.A. (Food. Beverages 6 Tobacco)
409.801 Endesa S.A. (Utilities) 654,895 European Aeronautic Defense 8 Space Co.
(Aerospace 8 Defense)
978.591 Finmeccanica SpA (Aerospace 8. Defense) 51.419 Foment0 de Conslrucciones Y Contratas
S A. (Construction 8 Engineering)
175,570 Hellenic Telecommunications Organization
155.244 lndra Sistemas S.A. (Computers)
2.167 E.ON AG (Utilities)
* 651,400 Fiat SPA (Automobiles 8 Components)
1.609.648 F o r k (Oiversified Financial Services)
5 A. (Tnlecommunication Services)
89.810 lntracom S.A. (Telecommumcation Services)
' 340.695 ltalcementi SpA (Building Materials) 245.434 Koninklijke DSM NV (Chemicals)
1,155.442 Koninklijke Philips Electronics NV (Consumer Durables R Apparel)
336.489 Merck KGaA (Health 8 Personal Care) 268.800 Metso Oyj (Machinery-Diversified)
1.31 1,950 Nokia Oyj (Technology Hardware L Equipment)
* 183,471 OCE NV (Data Processing L Reproduction) YB.123 OMVAG (Energy Sources) 25.930 Orion Oy] "6" (Pharmaceuticals)
153.200 Rautaruukkt Oyj (IrmrSreel) 1.31 1.521 Repsol YPF S.A. (Integrated Oil &Gas)
1R.149 Rodamco Europe NV (Real Estate Investment Trust)
844.456 Royal Dutch Shell PIC "A" (Oil 8 Gas)
services) 150,148 RWE AG (Utilities-Electrical 6 Gas)
Gas)
1.246.562 Royal KPN NV (Telecommunication
10,261 RWE AG-Preferred (Utilities-Electrical 6
83.363 Sanofi-Aventis (Pharmaceuticals)
60.016 Schneider Electric S A (Capital Goods) 17,429 Societe BIC S.A. (Household & Personal
Products) 164,317 Sodexho Alliance S.A. (Food Service)
183.346 Schering AG (Pharmaceuticals)
6,528 Solvay S.A. (Chemicals) 1,140,844 Suez S A (utilities) 2,051,080 Telecom ltalia SPA-RNC
(Telecommunication Services) 130,434 TeIekOni Austria AG (Telecommunication
services) 5.560 Titan Cement Co.. S A (Building Materials)
+ 82.195 Total 5 A. (Energy) '1.380.653 TU1 AG (Hotols. Restaurants 8 Leisure)
22.694 Unibail (Real Estatn)
The accompanying nates ate an integral part
3,633.524 0.34 3,571.977 0.34 5513.438 0.52
327,106 0.03 701.271 0 07
9,830,880 0.93
12.~51,488 1 .zz 2,779.295 0.26
175,115 0.02
2,905,290 0.27 9,068,896 0.86
1.94 4,494,660 0.42
15,344,307 1.45
2.417.207 0.23
20,583,350
40,595,323 3 83
3,191,863 0.30 2,600,337 0 25
443,661 0.04 4.875.345 0.46 7,713.YY1 u.73
2.20 2.58
5,964,672 0 56
19,023,275 1 7 9 2.221.834 0.21 4,599.025 0.43
389.795 0.04 2,654,956 0.25
32,801, I40 3.09
1,214,168 0.11
27,418,639 23,355,701
22.057,l 9 1 2.08
10,483,506 0.YY o.ai3.688 0.83
517.975 0.05 5,718,702 0.54
10,074,863 0.95 4,396,172 0.41
865.524 0.08 5,563,774 0.52
611,674 0.06 27,699,692 2.61
4,148,303 0.39
2,506.941 0,24 167,356 0.02
17,458.21 8 1.65 22,601.290 2.13 2.401.025 0.23
of these financial statements.
28
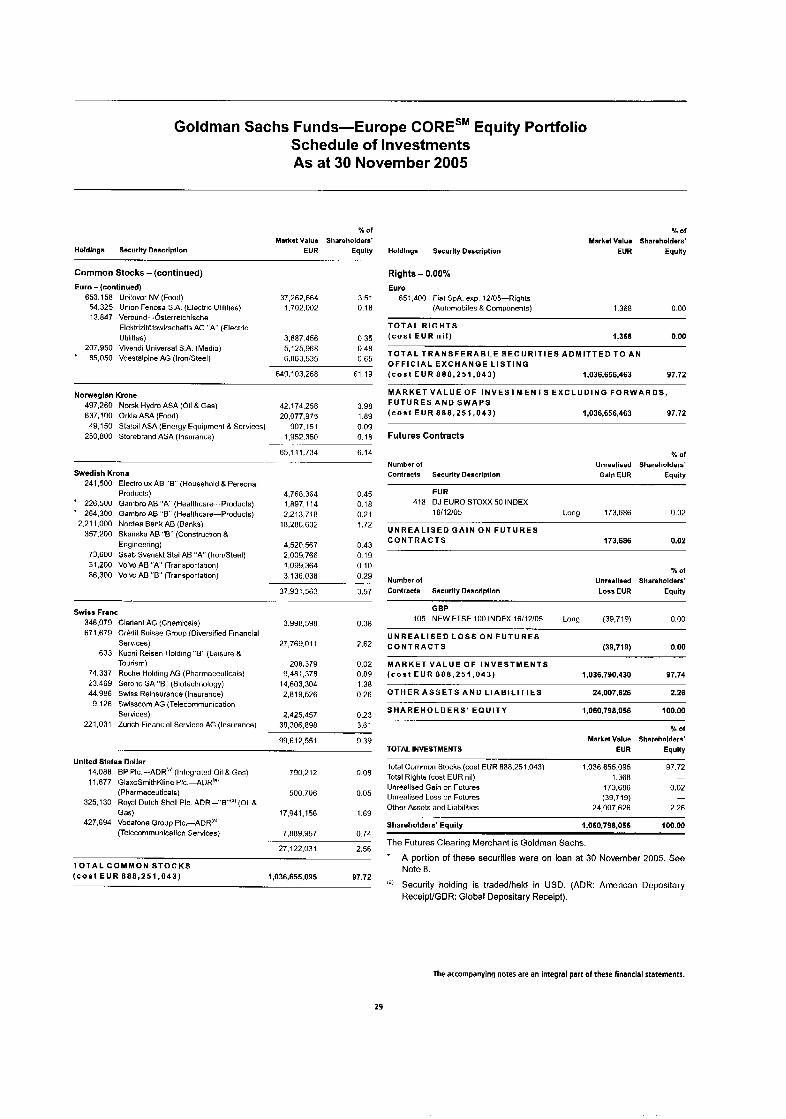
Goldman Sachs Funds-Europe CORESM Equity Portfolio Schedule of Investments As at 30 November 2005
Holdlnga Securlty Descrlpllon
Common Stocks - (continued) Euro - (continued)
653.158 Uni'ever NV (Fnod) 54.325 Uniin Fenosa S.A. (Electric Utilities) 13.847 VerDund- .Osterreichische
Elekt~izithtswirschafts AG "A" (Electric Utilitles)
207.950 Vivendi Universal S.A. (Media) ' R5.050 Voestalpine AG (IronlSteel)
% Of
Markst Value Shareholders' EUR Equity
-- ,-
37,262,664 3.51 1.702.002 0.16
3,687.456 0 35 6,125,968 0 48 6.863.535 0.65
649.103.268 61 19
Nomeglan Krone 497,260 Norsk Hydro ASA (Oil 8 Gas) 42.174.258 3.98 637,100 Orkla ASA (Food) 20.077.975 1.89 49.150 Sta!oil ASA (Energy Equipment 8 Services) 907,151 0.09
1,952,350 0.18
65,111.734 6.14 .
250,800 Storebrand ASA (Insurance)
-- .. .. ~ __ Swedlah Krona
241,500
* 226.500 ' 264,300 2.211.000
357.200
73,600 31,200 R6.300
Electrolux AB " 6 (Household 8 Personal Products) Ganibro AB "A" (Healthcare. Products) Gambro AB "E" (Healthcare-Products) Nordea Bank AB (Banks) Skanska AB "8' (Construction 8 Engineering) Ssab Svenskt Stal AB " A ' (IronISteeI) Volw AB "A" (Transportation) Volw AB "0' (Transportation)
4.768.364 1 ,897,114
18,286,632
4,520,567 2.009.766 1,099,364 3.136.038
2,213,710
37,931,563
Swiss Franc 346,079 Clariant AG (Chemicals) 671.679 Cradit Suisse Group (Diversified Financial
Services) 633 Kuoni Reisen Holding "B" (Leisure 8
Tourism) 74.337 Roche Holdlng AG (Pharmaceuticals) 23.469 Serono SA"B' (Biotechnology) 44.986 Swiss Reinsurance (Insurance)
9.126 Swtsscom AG (Telecommunication Services)
221.031 Zurich Financial Services AG (Insurance)
0.45 0.18 0.21 1.72
0.43 0.19 0.10 0.29
3.57 - .
3.Y9R.59R 0.38
27,769.01 1 2.62
208,379 0.02 9,481,378 0.89
14.603.304 1.38 2.R19.526 0.26
2,425,457 0.23 30,306.898 3.61
99.6 12,551 9 39
Unlted States Dollar 14.088 BP Plc.---ADR'" (Integrated Oil 8 Gas) 790.212 0.08 11.877 GlaxoSmithKlinn Plc -ADP,'"'
(Pharmaceuticals) 500.706 0.05 325.130 Royal Dutch Shell PIC. ADR--"B':"'(OiI d
Gas) 17,941,156 1.69 427,694 Vodafone Group Plc.-ADR("'
(Telecommunication Services) 7,RR9.957 0.74
27.122.(131 2.56
T O T A L C O M M O N S T O C K S ( c o s t E U R 888 ,251 .043) 1,036,655,095 87.72
Holdlnga Security Description
% O f
Markd Valu. Sharaholdws' EUR Equlty
Rights - 0.00% Euro
651,400 Fiat SpA. exp 12/05--Righls (Automobiles 8 Components) 1.368 0.00
T O T A L R I G H T S ( c o a t E U R n i l ) 1,368 0.00
T O T A L T R A N S F E R A B L E S E C U R I T I E S A D M I T T E D T O A N O F F I C I A L E X C H A N G E L I S T I N G ( c o a t E U R 888 ,251 ,043) 1.036.656.463 97.72
M A R K E T V A L U E O F I N V E S T M E N T S E X C L U D I N G F O R W A R D S , F U T U R E S A N D S W A P S ( c o a t E U R 8a8 .251 .043) 1,036,656,463 97.72
Futures Contracts
Number of Contracts SmcurltyDaacrlpllon
% of Unresliaed Shareholders'
GaIn EUR Equity
EUR 418 DJ EURO STOXX 50 INDEX
16/12/05 Long 173.686 0.02
U N R E A L I S E D G A I N O N F U T U R E S C O N T R A C T S 173.686 0.02
Number of Contracts Sscurlty Daacrlptlon
% Of
Unraallsed Shareholders' Loss EUR Equity
GBP 105 NEW FTSE 100 INDEX 16/12/05 Long (39,719) 0.00
C O N T R A C T S (39,719) 0.00
( c o a t E U R 888 ,251 ,043) 1.036.790.430 97.74
U N R E A L I S E D L O S S O N F U T U R E S
M A R K E T V A L U E O F I N V E S T M E N T S
O T H E R A S S E T S A N D L I A B I L I T I E S 24,007.626 2.26
S H A R E H O L D E R S ' E Q U I T Y 1,060,798,056 100.00
% Of
Market Value Shareholders' TOTAL INVESTMENTS EUR Equity
Total Common Stocks (cost EUR 888.251.043) 1,036,655,095 97.72 Total Righls (cost EUR nil) 1,360 - Unrealised Gain on Futures 173.686 0.02 Unrealised Loss on Futures (39,719) - Othnr Assets and Liabilities 24,007,626 2.26
Sharsholdsra' Equity 1.060.798.056 100.00
The Futures Clearing Merchant is Goldman Sachs. + A portion of these securities were on loan at 30 November 2005. See
Note 8.
Id' Security holding is tradedlheld in USD. (ADR: American Depositary ReceiptlGDR: Global Depositary Receipt),
The accompanying notes are an integral part of these flnanclal statements.
29
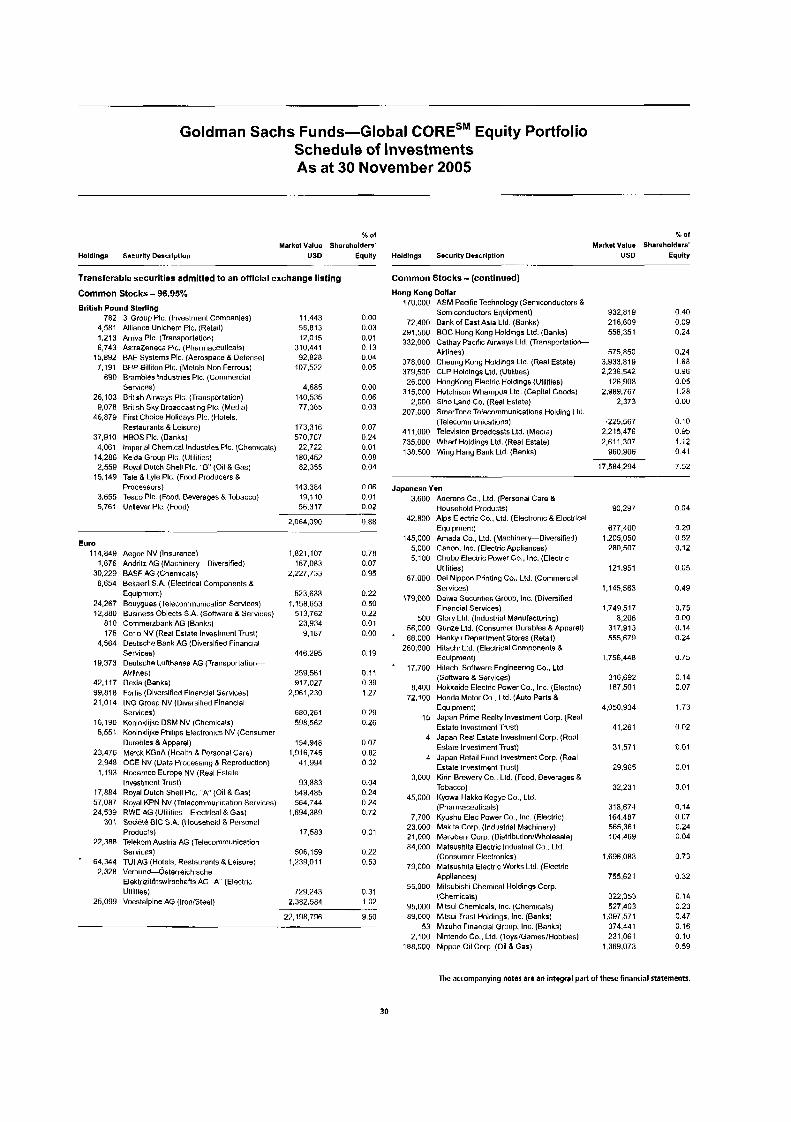
Goldman Sachs Funds-Global CORESM Equity Portfolio Schedule of Investments As at 30 November 2005
% of % O f
Market Value Shareholders' Market Value Shareholdws' Holdlngs Sncurlty Deacrlptlan US0 Equity Holdlngs Sncurlty Daacrlptlon u50 Eqully
Transferable securities admitted to an offlclal exchange listing
- . . . .~
Common Stocks - (continued)
Common Stocks - 96.95% British Pound Sterling
782 31 Group PIC. (Investment Companies) 4,581 Alliance Unichem PIC. (Retail) 1.21 3 Arriva PIC (Transportation) 6,743 AsmZnneca PIC. (Pharmaceuticals)
15.892 BAE Systems PIC. (Aerospace & Defense) 7.191 BHP Billiton PIC. (Melals-Nun Ferrous)
690 Brambles Industries PIC. (Commercial Servicns)
26.103 Brilish Airways PIC. (Transportation) 9,078 British Sky Broadcasting PIC. (Media)
46.879 First Choice Holidays PIC. (Hotels. Restaurants & Leisure)
37.910 HBOS PIC. (Banks) 4,061 Imperial Chemical Industries PIC. (Chnmicals)
14.286 Keda Group PIC. (Utilities) 2.559 Royal Dutch Shell PIC. "E' (Oil &Gas)
15,149 Tale 8 Lyle PIC. (Food Producers 8 Processors)
3,655 Tesco PIC. (Food. Beverages 6 Tobacco) 5,761 Unilever PIC. (Food)
11,443 58,813 12,015
310,441 92.828
107,522
4.685 140.535 77.385
173.316 570.767 22.722
180.452 82.355
143,384 19,110 56.317
0.00 0.03 0.01 0 13 0 04 0.05
0.00 0.06 0.03
0.07 0 24 0.01 0.08 0.04
U.06 0 01 0 02
Eum 114,849 Aegon NV (Insurance)
30,229 BASF AG (Chemicals) 1,676 Andritz AG (Machinery-Diversified)
6,654 Bekaett S A. (Electrical Components 8 Equipment)
24.267 Bouygues (Telecommunication Servicos) 12,880 Business Objects S.A. (sortware 8 Services)
810 Conmerzbank AG (Banks) 175 Cwio NV (Real Estate Investment Trusl)
4.564 Deutsche Bank AG (Diversified Financial Services)
Airlines) 19.373 Deutsche Luithansa AG (Trnnsportalion-
42,117 Dexia (Banks) 99.818 Fortis (Diversified Financial Services) 21,014 ING Groep NV (Diversified Financial
Services) 16.190 Koninklijke DSM NV (Chemicals) 5,551 Koninklijke Philips Electronics NV (Consumer
Durables & Apparel) 23.476 Me'ck KGaA (Health &Personal Care)
2.948 OCE NV (Data Processins L Reproduction) 1,193 Rodamco Europe NV (Real Estale
Investment Trust) 17,884 Royal Dutch Shell PIC. "A" (Oil 6 Gas) 57,087 Royal KPN NV (Tolncommunicatiun Services) 24.539 RWE AG (Utilities-Electrical6 Gas)
301 SocieteBIC S.A. (Household 8 Personal Products)
22.388 Telekom Austria AG (Telecommunication Services)
* 64.344 TU1 AG (Hotels, Restaurants 8 Leisure) 2,328 Verbund-Osterreichische
Elektrizitdtswirschafts AG ..A' (Electric Utilities)
25,099 Voestalpine AG (IrnnlSteel)
1,821,107 167,083
2,227,733
523.633 1.158.653
513,762 23.934 Y.lH7
446,295
259,5!il 917.027
2,Y61,230
680,261 598.562
154.948 1,916,745
41.994
93.883 549.485 564.714
1,694.389
17,583
506,159 1,239,011
729,243 2,382,504
0.88
0.78 0.07 0 95
0.22 0.50 0.22 0.01 0.00
0.19
0.11 0 39 1.27
0.29 0.26
0.07 0.82 0 02
0.04 0.24 0.24 0.72
0 01
0.22 0.53
u 31 1.02
9.50
Hong Kong Dollar 170,000 ASM Pacific Technology (Semiconductors &
Semiconductors Equipment) 72,400 Bank of East Asia Ltd (Banks)
291.500 BOC Hong Kong Holdings Ltd. (Banks) 332,000 Cathay Pacific Airways Ltd. (Transportation-
Airlines) 378.000 Cheung Kong Holdings Ltd. (Real Estate) 379,500 CLP Holdings Ltd. (Utililies) 26.000 HongKong Electric Holdings (Utilities)
315.000 Hutchison Whampoa Ltd. (Capital Goods) 2,000 Sino Land Co. (Real Estate)
207.000 SmarTone Telecommunications Holding Ltd. (Telecommunications)
41 1,000 Television Broadcasts Ltd. (Media) 735,000 Wharf Holdings Ltd. (Real Estate) 138.500 Wing Hang Bank Ltd. (Banks)
JapaneseYen 3,600 Aderans Co.. Ltd. (Personal Care &
Household Producta) 42,800 Alps Electric Co.. Ltd. (Electronic 8 Electrical
Equipment) 145.000 Amada Co.. Ltd. (Machinery-Diversified)
5.000 Canon, Inc. (Electric Appliances) 5.100 Chubu Eloctric POwer Go.. Inc. (Electric
Ulililies) 67.000 Dai Nippon Printing Co.. Lld (Commercial
Services) 179,000 Daiwa Sncurities Group, lnc. (Diversified
Financial Services)
56.000 Gunze Ltd. (Consumer Durables 8 Apparel)
260,000 Hitachi Ltd. (Electrical Components 8 Equipment)
* 17,700 Hitachi Software Engineering Co.. Ltd. (Software B Services)
8,400 Hokkaido Eleclric Power Co.. Inc (Electric) 72,100 Honda Motor Co , Lld. (Auto Parts 8
Equipment) 15 Japan Prime Realty Investment Corp. (Real
Estato Investment Trust) 4 Japan Real Estate Investment Corp. (Real
Estate lnvestmenl Trusl) 4 Japan Retail Fund Investment Corp. (Roal
Estate Investment Trust) 3.000 Kirin Brewery Co.. Lld. (Food. Beverages &
Tobacco) 45,000 Kyowa Hakko Kogyo Co.. Ltd.
(Pharmaceuticals) 7,700 Kyushu Elec Power Co., Inc. (Electric)
500 Glory Ltd. (Industrial Manufacturing)
* 66.000 Hankyu Department Stores (Relail)
23.000 Makita Corp. (Industrial Machinery) 21,000 Marubeni Corp. (DistributionlWholesalR) 84,000 Matsushita Electric Industrial Co.. Ltd.
(Consumer Electronics) 79.000 Matsushita Electric Works Ltd. (Electric
Appliances) 55.000 Mitsubishi Chemical Holdings Corp.
(Chemicals) 95,000 Mitsui Chemicals, Inc. (Chemicals) 89.000 Mitsui Trust Holdinga. Inc. (Banks)
53 Mizuho Financial Group, Inc. (Banks) 2,100 Nintendo Co.. Ltd. (TnysIGameslHobbies)
lRR.OOO Nippon Oil Corp. (Oil 8 Gas)
932,819 216,609 556,351
575,R50 3.933.819 2,236.542
126,908 2,989,767
2,373
,225,567 2,215,476 2.61 1,307
960,906
17,584,294
0.40 0.09 0.24
0.24 1.68 0.96 0.05 1.28 0.00
0.10 0.95 t12 0.41
7.52
90,297
677,400 1,205,050
280,507
121,951
1,145,563
1,749,517 8,206
317,913 555,679
1,756,448
316,692 167,501
4,050.934
41,261
31.57 1
29.965
32,231
318,674 164.487 565,361 104,469
1,696,083
755,621
322,353 527.403
1,097,571 374.441 231,061
1,369,073
U.04
0.29 0.52 0.12
0.05
0.49
0.75 0.00 0.14 n 24
0.75
0.14 0.07
1.73
0.02
0 01
0.01
0.01
0.14 0.07 0.24 0.04
0.73
0.32
0.14 0.23 0.47 0.16 0.10 0.59
The accompanying notes are an integral part
30
of these financial statements.
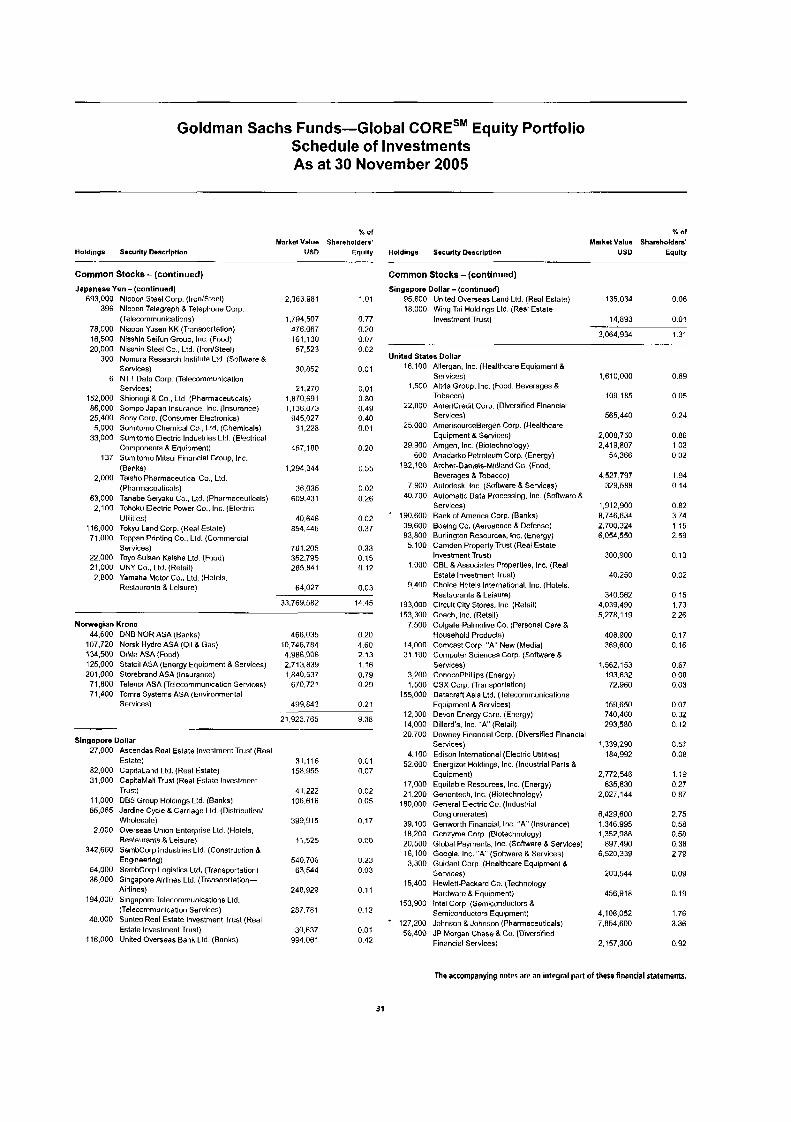
Goldman Sachs Funds-Global CORESM Equity Portfolio Schedule of Investments As at 30 November 2005
Holdings Socurtly Doscription -_ Common Stocks - (continued) Japanese Yen - (continued)
693.000 NipDOn Steel Corp. (IronISteel) 396 Nipmn Telegraph 8 Telephone Corp.
(Telecommunications) 78.000 Nipson Yusen KK (Transportation) 16,500 Nisshin Seifun Group, Inc (Food) 20,000 Nisshin Steel Co.. Ltd. (IronlSteel)
300 Nomura Research Institute Ltd. (Software 8 Sorvices)
Services) 152.000 Shionogi 8 Co., Ltd (Pharmaceuticals) 86,000 Sompo Japan Insurance, Inc. (Insurance) 25.400 Sony Corp. (Consumer Electronics) 5,000 Sumitorno Chemical Co.. Lid. (Chemicals)
33,000 Sumltomo Electric Industries Lld. (Electrical Conponentr & Equipment)
137 Sumitorno Mitsui Financial Group, Inc. (Banks)
(Pharmaceuticals) 63,000 Tanabe Seiyaku Co.. Ltd. (Pharmaceulicals) 2.100 Tohoku Electric Power Go.. Inc. (Electric
Utilities) 116,000 Tokyu Land Corp. (Real Estate) 71.000 Toppan Printing Co.. Ltd. (Commercial
Sergices) 22.000 Toyo Suisan Kaisha Ltd. (Food) 21,000 UNY Co.. Ltd. (Retail) 2.800 Yamaha Motor Co.. Ltd. (Holels.
Restaurants 8 Leisure)
6 NTT Data Corp. (Telecommunicatiun
2,000 Taisho Pharmaceutical Co.. Lid
Market Value US0
2.363.981
1 ,794,507 476.067 161,130 57,523
30.852
21,270 1.870.691 1,136.073
945,027 31,228
467.1l70
1,294,344
36,035 61)9.431
40.646 854,446
7~1 .zns 352,795 285.841
64,027
x Of
Shareholders' Equity
~
1.01
0.77 0.20 0.07 0 02
0.01
0.01 0.80 0.49 0.40 0.01
0 20
0.55
0.02 0.26
0 02 0.37
0.33 0.15 0.12
0.03
33.769.582 14.45
Norwegian Krone 44.600 DNB NOR ASA (Banks)
107,720 Norsk Hydro ASA (Oil & Gas) 134,500 Orkla ASA (Foud) 125,000 Statoil ASA (Energy Equipment8 services) 201,000 Storebrand ASA (Insurance) 71.800 Telenor ASA (Telecommunication Services) 71,400 Tomra Systems ASA (Environmental
Services)
Singapore Dollar 27,000 Ascendas Roal Estate Inveslment Trust (Roal
Estate) 82.000 CapitaLand Ltd. (Real Estate) 31,000 CapitaMall Trust (Real Estate Investment
Trust) 11,000 DES Group Holdings Ltd. (Banks) 65,065 Jardine Cycle & Carriage Ltd. (Distribution1
Wholesale) 2,000 Owseas Union Enterprise Ltd. (Hotels.
Restaurants a Leisure) 342,660 SembCorp Industries Lld. (Construction L
Eng neering) 64,000 SerrbCorp Logistics Ltd. (Transportalion) 36,000 Sinsapore Airlines Lld. (Transportation-
Airlines)
(Telecommunication Services) 48.000 Suntec Real Estate Investment Trust (Real
Estate Investment Trust) 116,000 United Overseas Bank Ltd. (Banks)
194.000 Singapore Telecommunications Ltd.
466,035 10,746.7114 4.986.006 2.713.839 1,840,537
670,721
499.843
21,923.765 .-
31.116 158.Y55
41,222 106.61 6
399,Y 15
t 1.525
540.706 63.544
248.929
287.781
30.637 994.061
0.20 4.60 2.13 1.16 0.79 0.29
0.21
9.38 -
0 01 0.07
0.02 0.05
0.17
0.00
0.23 0.03
0.11
0.12
0.01 0.42
Y Of
Market Valus Shareholders' Holdings Securlty Descrlptlon USD Equity
Common Stocks - (continued) Singapore Dollar - (continued)
95,600 United Overseas Land Ltd (Real Estate) 135,034 0.06 18,000 Wing Tai Holdings Ltd. (Real Estale
Investment Trust) 14,893 0 01
..
United States Dollar 16,100 Allergan. Inc. (Healthcare Equipment 8
Services) 1,500 Altria Group. Inc. (Food. Beverages 8
Tobacco)
Services)
Equipment & Services)
22,800 AmeriCredit Corp. (Diversified Financial
25.000 AmerisourceBergen Corp. (Healthcare
29,900 Amgen, Inc. (Biotechnology) 600 Anadarko Petroleum Corp. (Energy)
192,100 Archnr-Dani~s-Midland Co. (Food. Beverages 8 Tobacco)
7,900 Autodesk. Inc. (Software 8 Services) 40.700 Automatic Data Processing. Inc. (Software 8
Services)
39.600 Boeing Co. (Aerospace 8 Defense) 83.800 Burlington Resources. Inc. (Energy) 5.100 Camden Property Trust (Real Estate
Investmenl Trust) 1,000 CBL 8 Associates Properties, Inc. (Real
Estate Inveslment Trust) 9,400 Choice Hotels International. Inc. (Hotels.
Restaurants 8 Leisurn) 193,000 Circuit City Stores. Inc (Relail) 153,300 Coach. Inc. (Retail)
7.500 Colgale-Palmolive Co. (Personal Care 8. Household Products)
14,000 Comcast Corp. "A' New (Media) 31,100 Computer Sciences Corp (Software &
Services)
* 190,600 Bank of America Corp. (Banks)
3,200 ConocoPhillips (Energy) 1,500 CSX Corp. (Transportation)
155,000 Datacraft Asia Ltd. (Telecommunications Equipment 8 Services)
12.300 Devnn Enorgy Corp. (Energy) 14,000 Dillards. Inc. "A' (Retail) 20.700 Downey Financial Corp. (Diversified Financial
Services)
52.600 Energizer Holdings. Inc. (Industrial Parts 8 Equipment)
17,000 Equitable Resources. Inc. (Enorgy) 21.200 Gnnonlech. Inc. (Biotechnology)
4.100 Edison International (Electric Utilities)
180,000 General Electric Co. (Industrial Conglomerates)
39,100 Genworth Financial. Inc. " A ' (Insurance) 18,200 Genzyme Cnrp. (Biotechnology) 20,500 Global Payments. Inc. (Software & Services) 16,100 Googln, Inc. "A" (Software 8 Services) 3.300 Guidant Corp. (Healthcare Equipment 8
Sorvices) 15,400 Hewlett-Packard Co. (Technology
Hardware 8 Equipment)
Semiconductors Equipment)
56.400 JP Morgan Chase 8 Co. (Diversified Financial Services)
153,900 Intel Corp (Semiconductors 8
* 127,200 Johnson 8 Johnson (Pharmaceuticals)
3,064,934 1.31
1,610,000
109.185
565,440
2.008.750 2,419,807
54.366
4,527,797 329.588
1.912.900 8,746,634 2.700.32A 6,054,550
300,900
40,250
340.562 4.039.490 5,278,119
408.900 369,600
1,562.1 53 193.632 72,960
159.650 740,460 293.580
1.339.290 184,992
2.772.546 635,630
2,027,144
6,429,600 1.346.995 1,352,988
897.490 6,520,339
203,544
456.918
4.106.052 7,054,600
2.157.300
0.69
0.05
0.24
0.86 1.03 0.02
1.94 0.14
0.82 3.74 1.15 2.59
0.13
0.02
0 15 1.73 2.26
0.17 0.16
0.67 0.00 0.03
0.07 0.32 0.12
0.57 0.08
1.19 0.27 0.87
2.75 0.58 0.58 0.38 2.79
0.09
0.19
1 76 3.36
0.92
The accompanying notes are an integral part of these financial statements.
31
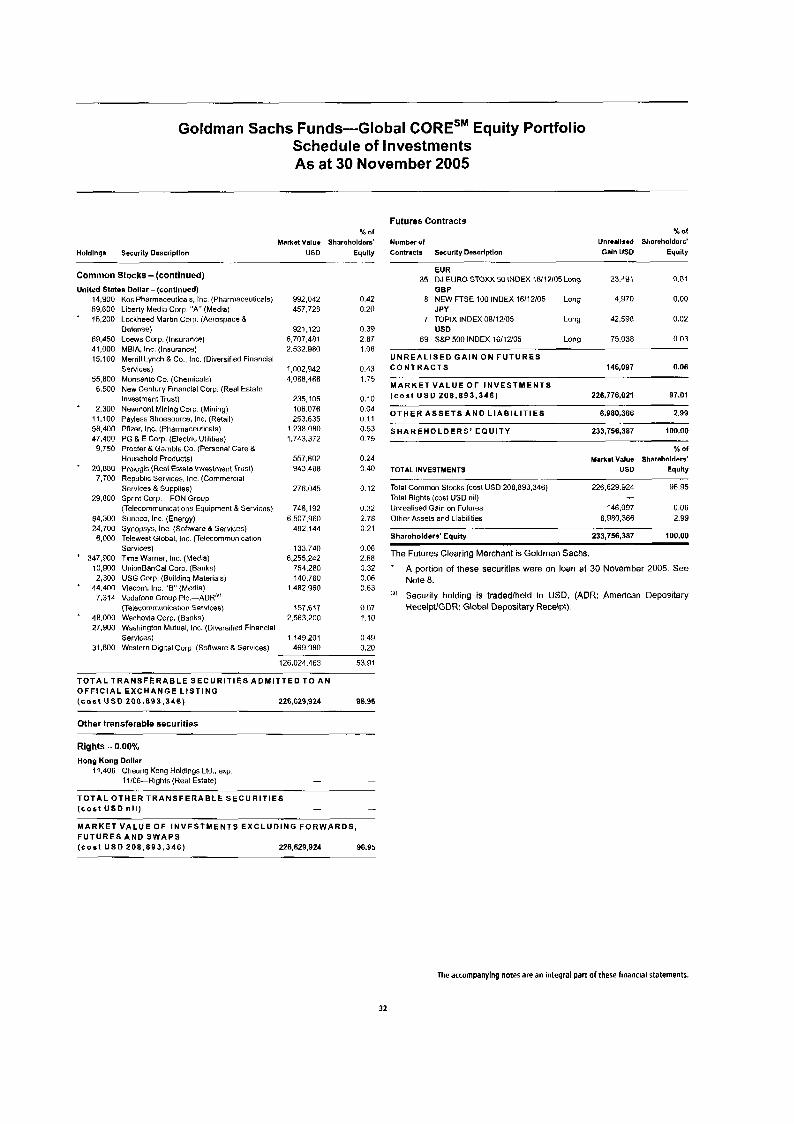
Goldman Sachs Funds-Global CORESM Equity Portfolio Schedule of Investments As at 30 November 2005
% O f
Market Valus Shareholders' Holdlngs Security Descriptlon US0 Equity
-- - - .-
Common Stocks -(continued) United States Dollar - (continued1
14.900 59,600
* 15,200
69.450 41,000 15,100
55,800 6,500
* 2.300 11,100 58,400 47,400
9.750
+ 20.800 7,700
29,800
64,300
6,000
' 3A7.900 io.yoa 2,300
* 44.400 7.314
48.000 27,900
31,500
24.700
I ~I
Kos Pharmaceuticals, Ihc (Pharmaceulicals) Liberty Media Corp. "A ' (Media) Lockheed Martin Corp. (Aerospace 8 Defense) L o w s Corp. (Insurance) MBIA. Inc. (Insurance) Merrill Lynch & Co., Inc (Diversified Financial Services) Monsanto Co (Chemicals) New Century Financial Corp. (Real Estatc Investment Trust) Newrnont Mining Corp. (Mining) Payless Shoesource. Inc. (Rerail) Pfizer. Inc. (Pharmaceuticals) PG 8 E Corp. (Electric Utililies) Procter & Gamble Co (Personal Care 8 Household Products) Prologis (Real Estate Investment Trust) Republic Services, Inc. (Commercial Servlces 8 Supplies) Spr nt Cor*,-FON Group (Telecommunications Equipment 8 Servicns) Sunoco, Inc (Energy) Synopsys. Inc. (Softwarn 8 Services) Telewest Global, Inc. (Telecommunication Services) Tim- Warner, Inc. (Media) UnionBanCal Corp. (Banks) USG Corp. (Building Materials) Viacorn. Inc. "0' (Media) Vodafono Group Plc.-ADR'R' (Telecommunication services) Wachovia Corp. (Banks) Washington Mutual, Inc. (Diversified Financial Services) Western Digital Corp. (Software 8 Services)
YY2,042 457.728
921,120 6,707,481 ~ . s ~ ~ . Y R o
1.002342 4,088,466
235,105 106.076 253.635
1,143,372
557,602 943,680
276,045
746.192 6.507.960
482,144
133.740 6.255.242
7 5 4 3 0 140,760
1,482,960
157.617 2,563,200
1,149,201
1.238.0~0
4 6 ~ .Y a0
0.42 0.20
0.39
1.08
0.43 1.75
0.10 0.Od 0.11 0.53 0.75
0.24 0 40
0.12
(1.32 2.78 0 21
0.06 2.68 0.32 0.06 0 63
0.07 1.10
0 49 0.20
2 a7
126,024,463 53.91
T O T A L T R A N S F E R A B L E S E C U R I T I E S A D M I T T E D T O A N O F F I C I A L E X C H A N G E L I S T I N G (cost U S 0 208,893,546) 226,629,924 96.95
Other transferable securities
Rights - 0.00% Honp Kong Dollar
11,406 Cheung Kong Holdings Ltd., exp 1 1IOfi-Rights (Real Estate) - -
T O T A L O T H E R T R A N S F E R A B L E S E C U R I T I E S (cost USD n i l ) - - M A R K E T V A L U E OF I N V E S T M E N T S E X C L U D I N Q F O R W A R D S , F U T U R E S A N D S W A P S ( c o s t U S D 208 ,883 ,346) 226,629,924 96.95
Futures Contracts
Number of Contracts Securlty Descrfptlon
x or Unreallaed Shsreholderd Gain US0 Equity
EUR
GBP
JPY
USD
35 DJ EURO STOXX50 INDEX 16H2105Long 23,491 0.01
8 NEW FTSE 100 INDEX 16/12/05 Long 4,Y70 0.00
7 TOPlX INDEX 08/12/05 Long A2.598 0.02
69 SBP 500 INDEX 16/12/05 Long 75.038 0.03
U N R E A L I S E D G A I N O N F U T U R E S C O N T R A C T S 146,097 0.06
M A R K E T V A L U E O F I N V E S T M E N T S ( c o s t U S 0 208 ,893 ,346) 228,776,021 97.01
O T H E R A S S E T S A N D L I A B I L I T I E S 6,980,366 2.99
S H A R E H O L D E R S ' E Q U I T Y 233,756,387 100.00
TOTAL INVESTMENTS
% of Market Value Shareholder9
US0 Equity
Total Common Stocks (cost US0 208,893,346) 226.629.924 Y6 95
Unrealised Gain on Futures 146,097 0.06 Total Rights (cos1 USD nil)
Other Assel5 and Liabilities fi.YB0.366 2 99
-
shareholders' Equity 233,756,387 100.00 . -~
The Futures Clearing Merchant is Goldrnan Sachs. A portion of these securities were on loan at 30 November 2005. See No te 8. Security holding is traded/held in USD. (ADR: American Depositary ReceipWGDR Global Depositary Receipt).
The accompanying nates are an integral pan of these financial statements.
32
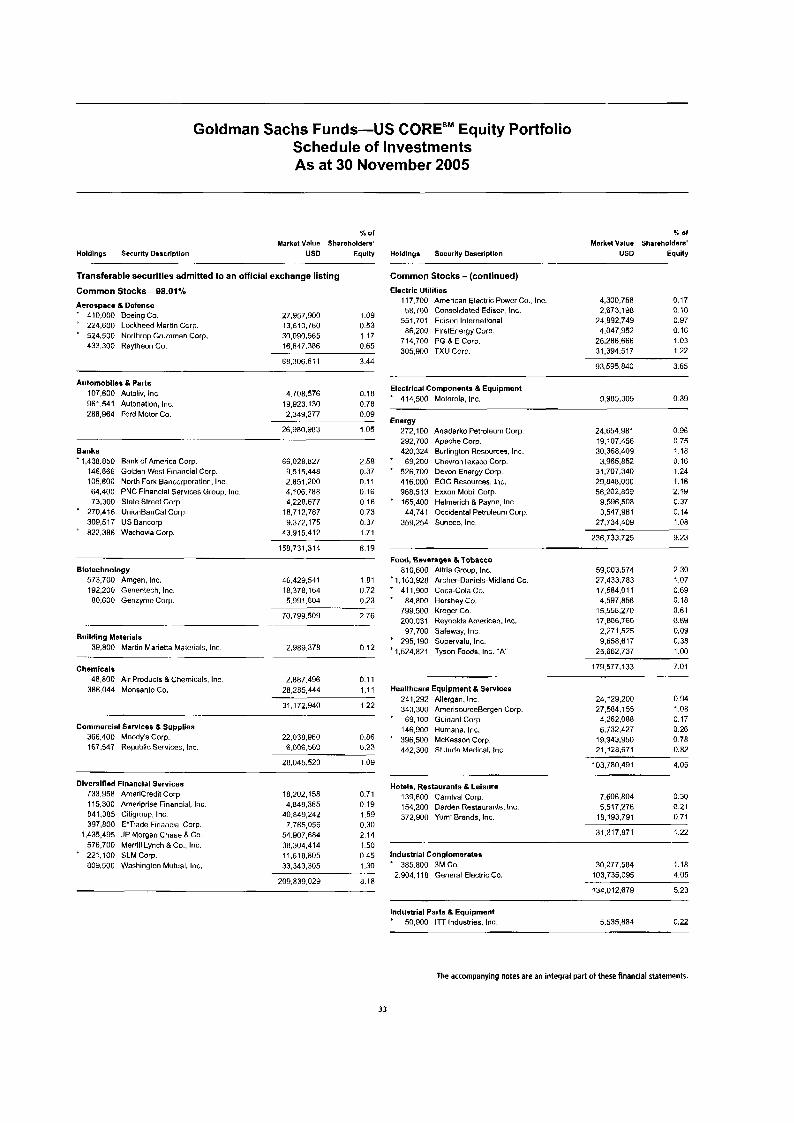
Goldman Sachs Funds-US CORE"" Equity Portfolio Schedule of Investments As at 30 November 2005
% O f
Market Value Shareholders' Holdlngs Security Descrlptlan us0 Equlty
Trans ferab le securltles admitted to an official e x c h a n g e listing
Common Stocks - 98.01%
Aerospace S Defense * 410,000 Boeing Co. 27.957.900 1 .OY * 224,600 Lockheed Martin Corp. 13,610,760 0.53
524,500 Norlhrop Grumman Gorp. m.09o.565 1.17 433.300 Raytheon Co. 16,647,306 0.65
-- .
RH,306.611 3.44
Automoblles a Parts 107,600 Autoliv. Inc. 4.708.576 0.18 961.541 Autsnation, Inc. 19,923.130 0.78
2,349.277 0.09 288,964 Ford Motor Co.
26.9R0.9R3 105 ~. .
. . ..
Banks 1.438.850
146.866 105,600 64,400 73,300
' 270,416 309,517 822.386
Bank of America Corp. Goldan West Financial Corp. North Fork Bancorporation. Inc. PNC Financial Services Group, Inc. State Street Corp. UniunBanCal Corp. US Bancorp Wachovia Gorp.
66,028,827
2.851.200 4,106.788 4,228.677
18,712,787 9,372,175
43.915.412
9.515.448 2.58 0.37 0.11 0.16 0 16 0 73 0.37 1.71
158,731,314 6.19
Biotechnology 573,700 Amgen. Inc. 192.200 Genentech. Inc 80.600 Genzyme Corp.
Building Materials 39,800 Martin Marietta Materials. Inc.
-. . - .
Chemicals 48,800 Air Products 8 Chemicals, Inc.
386.044 Monsanto Co.
46.429,54 1 181 18,378,164 0.72 5.YYt.8U4 0.23
70.799.509 2.76
2.989.378 0 12
2,087,496 0.11 28,285,444 1.11
31,172,940 1.22
Commercial Sarvices a Supplies 366.400 Moody's Corp. 167,547 Republic Services. Inc.
Diversified Financlal Services 733.958 AmeriCredit Corp 115.300 Ameriprise Financial, Inc. 841.385 Citigrnup, Inc. 397.800 E'Trade Financial Corp.
1.435.495 JP Morgan Chase 8 Co. 576,700 Mer'ill Lynch 8 Co.. Inc.
80Y.500 Washington Mutual. Inc. + 221.100 SLMCorp
22.03a.y6u 0.86 6.006.560 0.23
28.045.520 1 OY
18,2(12,15R 0.71 4.848.36s 0.19
40,849,242 1.59 7,765,056 0.30
54.Y07.684 2 14 38,304,414 1.50 11,618,805 0.45 33,343,305 1.30
209.839.029 R.1R
Holdings Security Doscriptlon _. .. .. -~
Common Stocks -(continued) Electric Utilities
11 7.700 American Electric Power Co.. Inc. SR.700 Consolidated Edison, Inc.
551.701 Edisun International Rfi.200 FirstEnergy Corp.
714.700 PG 8 E Corp 305.900 TXU Corp.
Electrical Components 8 Equipment * 414.500 Motnrnla. Inc.
% Of
Market Value Shar.holdsrs' USD Equity
4,300,758 0.17 2,673,198 0.10
24.892.749 0 97 4,047,952 0.16
26.286.666 1.03 31.394.517 1.22
93.595.840 3.65
9.985.305 0.39
Energy 272,100 Anadarko Petroleum Corp 292.700 Apache Corp. 420,324 Burlington Resuurces. Inc.
* 69,200 ChevronTexaco Corp. * 526.700 Devon Energy Corp.
416.000 EOG Resources, lnc, 968,513 Exxon Mobil Corp.
* 165,400 Helmerich 8 Payne, Inc 44,741 Occidental Petroleum Gorp.
359,254 Sunoco, Inc
24.654.981 19.107.456 30.368.409 3,965,852
31,707,340 29,848,000
9,596,508 3,547,961
27,734,409
236,733,725
56.202.nog
0.96 0.75 1.18 0.16 1.24 1.16 2.19 0.37 0.14 1.08
9.23 ~
Food, Bevsrages L Tobacco 810.600 Altria Group, Inc.
* 1,163,928 Archer-Daniels-Midland Co. + 41 1,900 Coca-Cola Co. + 84.800 HorsheyCo.
799.500 Kroger Go. 200.031 Reynolds American. Inc.
97,700 Safeway. Inc * 295,190 Supervalu. Inc. * 1.524.821 Tyson Foods, Inc. "A'
59.003574 27.433.783 17.584,01 1 4,597,856
15,558,270 17,806,760 2,271.525
25,662,737 9,658,617
2.30 1.07 0.69 0.18 0.61 0.69 0.09 0.38 1 .oo
119,577,133 7.01
Healthcare Equipment L Servlces 241,292 Allergan. Inc 343.300 AmerisourceBergen Corp
' 69,100 Guidanl Corp 146,900 Humana, Inc.
* 396,500 McKesson Corp. 442,300 S1 Judo Medical, Inc.
Hotels, Restaurants Leisure 139,600 Carnival Corp. 154,200 Darden Restaurants. Inc. 372,900 Yum! Brands, Inc
24,129,200 27.584.155 4,262.088 6,732.427
19,843,950 zi.12n.671
103,780.4Y1
7.606.804 5,517,276
18,193,791
0 94 1 08 0 17 0 26 0 78 0.82
4.05 - -
0 30
0 71 a 21
1.22 31,317,871
Industrial Conglomerates + 385.800 3MCo.
2.904.1 18 General Electric Co. 30,277,584 1.18
103,735,095 4.05
5.23 134,012,679
Industrial Parts S Equipment ' 50,900 In Industries. Inc
The accompanying notes are an iotegrai part of these financial statements.
33
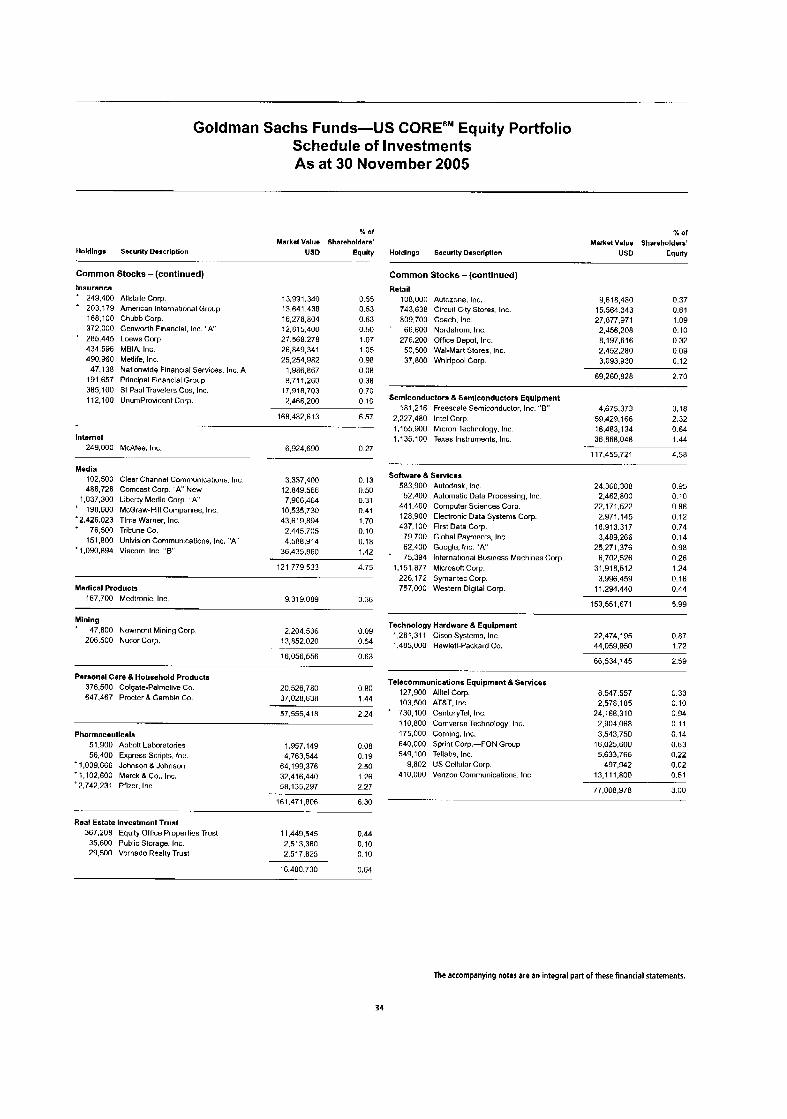
Goldman Sachs Funds-US COREsM Equity Portfolio Schedule of Investments As at 30 November 2005
% Of x of MarketVslue Shareholders'
Holdlngs Security Description USD Equity Holdings Securlty Dascrlptlon USD Equity Market Value Shareholders'
-. -.
Common Stocks -(continued) Common Stocks - (contlnued) Insurance + 249,400 + 203.179
168.100 372,000
+ 285.445 434,596 490,960 47.138
191.657 385,100 112,100
Allstate Corp. American Intnrnatinnal Group Chubb Corp. Genworth Financial. Inc "A' Loews Corp MBIA. Inc. Me!life. Inc. Nationwide Financial Services, lnc. Principal Financial Group St Paul Travelefs Cos. lnc, UnumProvident Corp.
13,991,340 13.641.430 16,278,804 12,8 15,400 27,568,278 26,849,341 25,254,982
A 1,986,R67 9,711,260
17,918,703 2,466,200
0 55 0.53 0.63 0.50 1.07 1.05 0.90 0.08 0.38 0.70 0 i o
lntsrnet 249,000 McAfee. lnc.
168,482,613 6.57
6,924,690 0.27
Media 102,500 Clear Channel Communicalions. Inc 486.726 Comcast Corp ..A" Ncw
1,037,300 Liberly Media Corp. . 'A' 190.600 McGraw-Hill Companies. Inc.
'2,426,023 Tlrre Warner, Inc. * 76,500 TribuneCo.
'1,090,894 Viacom. Inc. " 0 151.800 Unitision Communications, Inc. "A '
3.337.400 12.849.566
43,619,894 2,445,705 4.sa8.914
36.435.R60
7.966.464 10,535,730
0.13
0.31
1.70 0.10 0.18 1.42
n 50
0.41
121,779,533 4.75
Msdical Products 167,700 Medtronic. Inc. ~ . ~ ~ Y . o B Y 0 36
Mining * 47,800 Newmont Mining Corp 2.204536 0.09
206.500 Nucor Corp. 13.052.020 0.54
16,056,556 0.63 . . ... - _
Parsonal Care L Household Products 376,500 Colgate-Palmolivo Co. 20,526,781) 0.80 647,467 Procter 8 Gamble Co. 37,02H,638 1.44
51.555.418 2.24
Pharmaceuticals 51.900 Abbott Laboratories 1.957.149 0.08 56.400 Exprns6 Scripts, Inc. 4,763,544 0.19
'2.742.231 Pfizer. Inc 58,135,297 2.27
+ 1,039.666 Johnson 8 Johnson 64,199,376 2.50 '1.102.600 Mnrck & Cn.. lnc, 32,416,440 1.26
. - . - 161.471,806 6 30 -.
R a d Estate Investment Trust 367,208 Equity Office Properties Trust 11,449.54s 0.44 35.600 Putlic Storage. Inc 2,513,360 0.10 29,500 Vornado Realty Trust 2.517.825 0.10
16.4ao.730 0.64
Rstail 108,000 Autozone, Inc. 743.638 Circuit City Stores, Inc 809.700 Coach. Inc.
* 66.600 Nordstrom. Inc. 276,200 Office Depot. Inc.
50,500 Wal.Mart Stores, Inc. 37.800 Whirlpool Corp.
9,618,480 0.37 15,564,343 0.61 27,077,911 1.09 2.456.208 0.10 0,197,616 0.32 2.452.280 0 09 3.093.930 0.12
Semiconductors B semiconductors Equlpment 1R1.216 Freescale Semiconductor. Inc. "0 '
2,227.480 Intel Corp. 4.675373 U.18
59,429,166 2.32 1.155.900 Micron Technology, Inc. 16.483.1 34 0.64 1,135,100 Texas Instruments, Inc. 36,860,040 1.44
117,455,721 4.50 .
Software 8 Sarvicas 583.900 Autodesk, Inc. 24.360.308 0.95
52,400 Automatic Data Processing. Inc. 2,462,800 0.10 441,400 Computer Sciences Corp. 22,171,522 0.86 128,900 Electronic Data Systems Corp. 2,971,145 0.12 437.100 First Data Corp. 18.913.317 0.74
79.700 Global Payments. Inc. 3,489,266 0.14 62,400 Googlc. Inc. "A" 25,271,376 0.98
' 75.394 International Business Machines Corp. 6,702,526 0.26 1,151,877 Microsoft Corp. 31.91 8.512 1.24
226.172 Symantec Carp. 3.996.459 0.16 757.000 Western Digital Corp. 11,294,440 0.44
153,551,671 5.99 --- . -
Technology Hardware & Equipment 1,2R1.311 Cisco Systems. Inc 22,474,195 0.07 1,485,000 Hewlelt-Packard Co. 44,059,950 1.72
66,534,145 2.59 -. . . .-
Telecommunications Equipment 8 Sarvices 127.900 Alltel Carp. 8547.557 0.33 103.500 ATBT. Inc. 2.578.185 0.10
+ 730,100 CenturyTnl. Inc. 24,166.310 0.94 110,800 Comverse Technology. Inc. 2,904,068 0.11 175.000 Corning. Inc. 3,543,750 0.14 640,000 Sprint Corp.-FON Group 16.025.600 0.63 549.100 Tellabs. Inc. 5,633.7fi6 0.22
9.002 US Cellular Corp. 497,942 0.02 410,000 Verizon Communications. Inc 13,111.000 0.51
77,008.Y78 3.00 .
The accompanylng notes are an integral part of these financial statements.
34
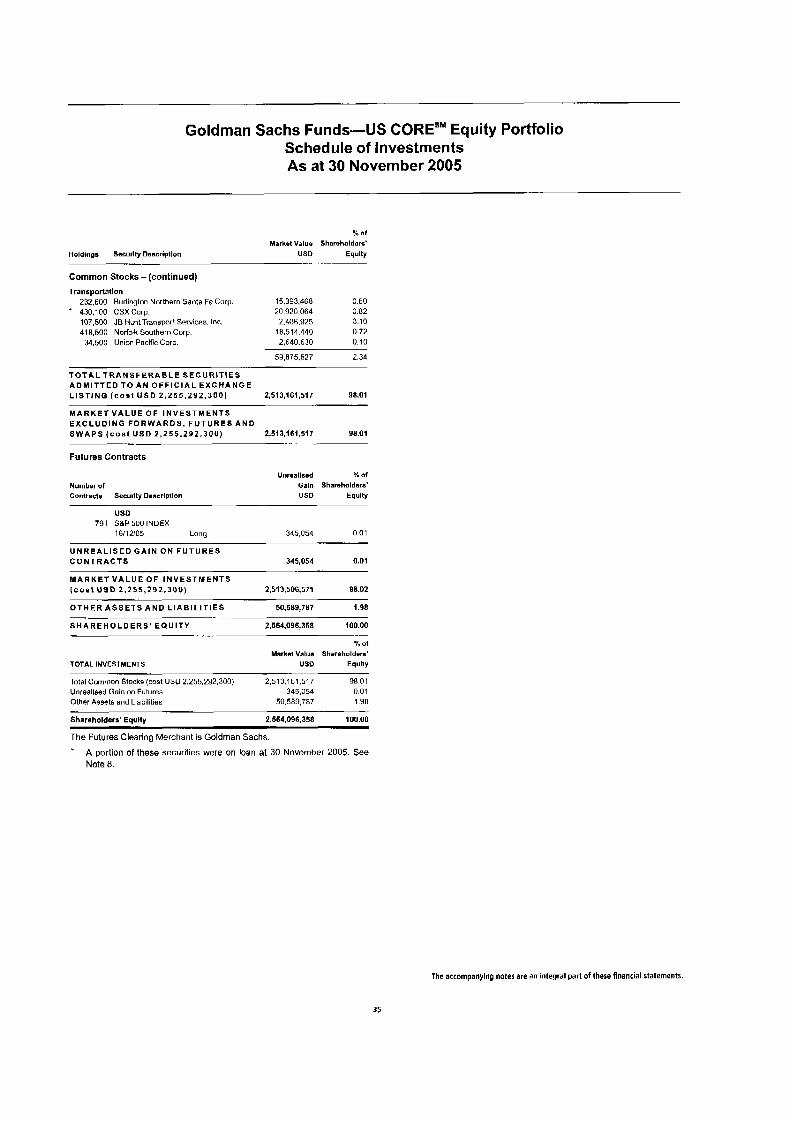
Goldman Sachs Funds-US CORESM Equity Portfolio Schedule of Investments As at 30 November 2005
Holdings Securlty Deacripllon
Common Stocks -(continued)
Transpottallon 232.600 Burlington Northern Sanla Fe Corp
* 430,100 CSXCorp. 107.500 JB Hunt Transport Services. Inc. 418.500 Nodo k Southern Corp.
34,500 Unior Pacific Corp.
% O f
Marketvalue Shareholders' USD Equlty
15,393,468 0.60 20,920.064 0.82
2.406.925 0.10 18,514.440 0.72 2.640.630 0.10
s~a75.527 2.34
T O T A L T R A N S F E R A B L E S E C U R I T I E S A D M I T T E D T O A N O F F I C I A L E X C H A N G E L I S T I N G ( c o s 1 U S 0 2 , 2 5 5 , 2 3 2 , 3 0 0 ) 2,513,161,517 98.01
M A R K E T V A L U E O F I N V E S T M E N T S E X C L U D I N G F O R W A R D S , F U T U R E S A N D S W A P S ( c o s t U S 0 2 , 2 5 5 , 2 9 2 , 3 0 0 ) 231 3,161,517 98.01
Futures Contracts
. - --
Unrmlissd x Of
Number of Galn Shareholders' Contracts Security Dmscrlptlon USD Equity
us0 791 S8P 500 INDEX
16112'05 Long 345,u54 0.01
C O N T R A C T S 345,054 0.01 U N R E A L I S E D G A I N O N F U T U R E S
M A R K E T V A L U E O F I N V E S T M E N T S ( c o o l U S 0 2 , 2 5 5 , 2 9 2 . 3 0 0 ) 2,513,506,571 98.02
O T H E R A S S E T S A N D L I A B I L I T I E S 50,58n,rai 1.98
S H A R E H O L D E R S ' E Q U I T Y 2,564,096,358 100.00 -. .. .
_- . .. Y" Of
Market Value Shareholders' TOTAL INVESTMENTS USD Equlty
Total Common Stocks (cost USD 2,255,292,300) 2,513.161.517 98 01 Unrealised Gain on Futures 345.054 0 01 Other AsselS and Liabilities 50.589.7a7 198
Shareholders' Equity 2.564.096,358 100.00
The Futures Clearing Merchant is Goldman Sachs. * A portion of these securities were on loan at 30 November 2005. See
Note 0.
The accompanying notes are an integral part of these financial statements.
35
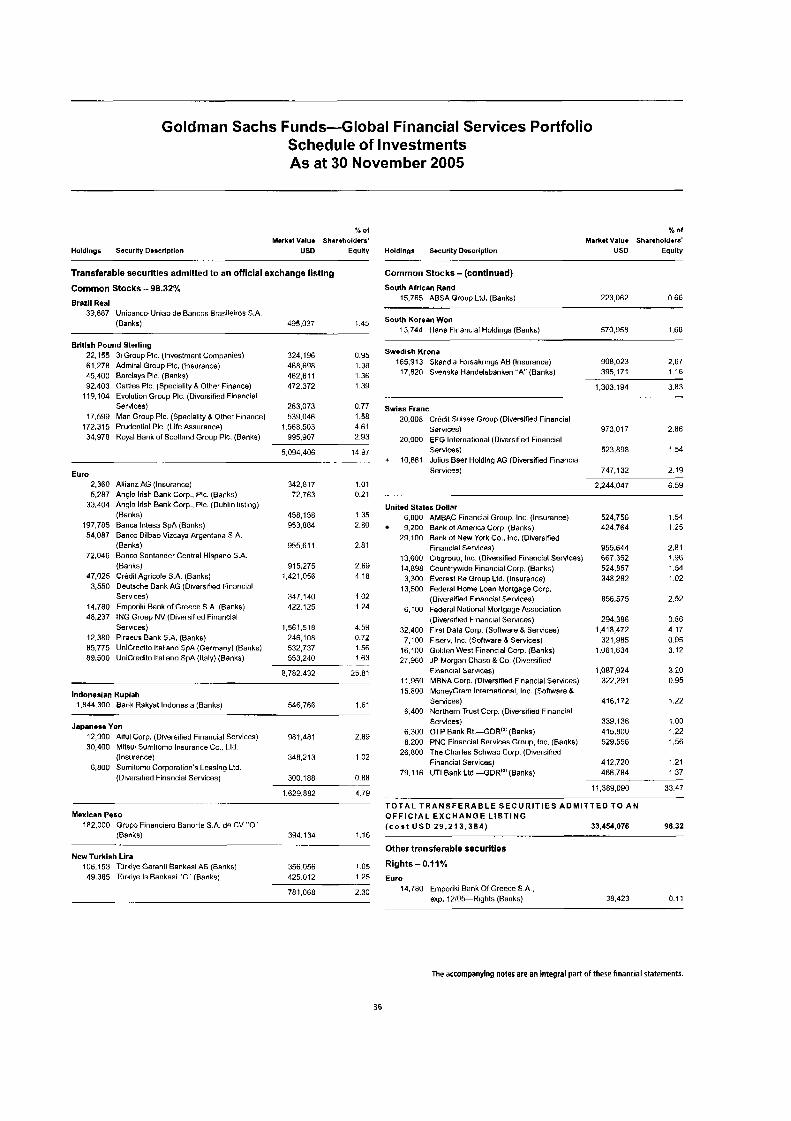
Goldman Sachs Funds-Global Financial Services Portfolio Schedule of Investments As at 30 November 2005
% O f
Market Value Sharoholdors' Holdlngs Socurlty Dsscrlptlon US0 Eqully
.. . . Transferable securities admitted to an official exchange listing
Common Stocks - 98.32%
Brerll Real 39,887 Unibanco-Uniao de Bancns Brasileiros S A
(Banks) 495,037 1.45
Brltlsh Pound Sterling 22,155 31 Group PIC. (Investment Companies) 61.278 Admiral Group PIC. (Insurance) 45.400 Barclays PIC. (Banks) 92,403 Cattles PIC. (Speciality & Other Finance)
119,104 Evolution Group PIC. (DivorsiRed Financial Services)
17,599 Man Group PIC. (Spnciality 8 Other Finance)
34,978 Royzl Bank of Scotland Group PIC. (Banks) 172,315 Prudential PIC. (Life Assurance)
324.196 468.6Y8 462,611 472.372
263,073 539,046
1,568,503 995,907
0.95 1.38 1.36 1.3Y
0 77 1.58 4.61 2 93
Euro 2,360 5,287
33,404
197,785 54,087
72,046
47,025 3,550
14,780 40,237
12.380 85.775 89,500
5.094.406
Allianz AG (Insurance) Anglo Irish Bank Corp.. PIC. (Banks) Anglo Irish Bank Corp.. PIC. (Duhlin listing) (Banks) Banca lntesa SpA (Banks) Banco Bilbao Vizcaya Argentaria S.A. (Banks) Banco Santander Central Hispano S.A. (Banks) Crbdil Agricole S.A. (Banks) Deutsche Bank AG (Divnrsified Financial Serv ces) Emporiki Bank of Greece S.A. (Banks) ING Groep NV (Diversified Financial Services) Piraeus Bank S A (Banks) UniCredito ltaliano SPA (Germany) (Banks) UniCredito ltaliano SPA (Italy) (Banks)
14 97
342.817 72.763
458,158 953.884
955.61 1
915,275 1,421,056
347.140 422.125
1,561,518 246,108 532,737 553.240
8.782.432
1.01 0.21
1.35 2.80
2.81
2.69 4 18
1 02 1.24
4.59 0.72 1.56 1.63
25.81 . .
Indonesian Ruplah 1.844.300 Bank Rakyal Indonesia (Banks) 546,766 1.61
JapanessYen 12,90U Aiful Corp. (Diversified Financial Services) 30,400 Mitsui Sumitomo Insurance Co.. Ltd.
(Insurance) 6.800 Sumltomo Corporation's Leasing Ltd
(Diversified Financial Services)
Mexican Peso 182,000 Grupo Financier0 Banorte S.A. do CV "0'
(Ban<s) . New Turkish Lira
106.153 Turkie Garanti Bankasi AS (Banks) 49,385 Tiirkiye Is Bankasi "C (Banks)
981,481 2.89
348,213 1.02
300.188 0.88
1.629.882 4 79
394.134 1.16 --
356.056 YO5 425.012 1.25
781,068 2.30
% Of
Mwrkml Value Sharoholdors' Holdlngs Sacurlty Descrlpllon USD Eqully
Common Stocks - (continued)
-. . . . __
South African Rand 15,765 ABSA Group Lld. (Banks) 223,062 0.66
South Korean Won 13,744 Hana Financial Holdings (Banks) 570.Y58 1.68
Swedish Krona 165,913 Skandla Forsakrings AB (Insurance) 17,820 Svenska Handelsbanken " A (Banks)
Y08.023 2.67 395,171 1.16
1,303.1Y4 3.83
Swiss Franc 20,008 Credit Suisse Group (Diversified Financial
Services) 20,000 EFG lnlernalional (Diversified Financial
Services) + 10,661 Julius Baer Holding AG (Diversified Financial
Services)
973.017 2.86
523.898 1.54
747,132 2.19
2,244,047 6.59
United States Dollar
9,200 Bank Of America Corp, (Banks) 424.764 125 6.800 AMBAC Financial Group, Inc (Insurance) 524,756 1.54
29.100 Bank Of New York Go., Inc. (Diversified
13.600 Citigroup. Inc. (Diversified Financial Services) 667,352 1.96 14.898 Counlrywidn Financial Corp. (Banks) 524,857 1.54
13,500 Federal Home L o w Mortgage Corp. (Diversifind Financial Services) 856,575 2.52
(Diversified Financial Services) 294.386 0.86 32,400 First Data Corp (Software L Services) 1,418,472 4.17 7,100 Fiserv. Inc. (Soflware L Services) 321,985 0.Y5
16,100 Golden West Financial Corp (Banks) 1,061,634 3.12 27.Y60 JP Morgan Chase & Co. (Diversified
Financial ServirRs) 1,087,924 3 20 11 .Y50 MBNA Corp. (Divnrsifind Financial Services) 322,291 0.95 15,800 MoneyGram International, Inc. (Software 8
Services) 416,172 1.22 6.400 Northern Trust Corp. (Diversified Financial
Services) 339,136 1 .oo 6.300 OTP Bank Rt.-GDR'"! (Banks) 415.800 1.22
Financial Services) 412,720 1.21
Financial Services) 955,644 2.81
3,300 Everest RR Group Ltd. (Insurance) 348,282 1.02
6,100 Federal National Mortgage Association
8.200 PNC Financial Services Group. Inc. (Banks) 529,556 1.56 26.800 The Charles Schwab Corp. (Diversified
79.116 UTI Bank Ltd.--GDR'"'(Banks) 466,784 1.37
11,389,090 33.41 - . - T O T A L T R A N S F E R A B L E S E C U R I T I E S A D M I T T E D TO A N O F F I C I A L E X C H A N O E L I S T I N G ( c o s t U S 0 29,213.3E.A) 33,454,076 98.32
Other transferable securities
Rights - 0.11% Euro
14,780 Emporikl Bank OfGreece S.A. exp. 12105-Rights (Banks) 38,423 0.1 1
The accompanying notes are an integral pan of these financial statements.
36

Goldman Sachs Funds-Global Financial Services Portfolio Schedule of Investments As at 30 November 2005
x of Market Value Shareholders'
US0 Eqully - .-
T O T A L O T H E R T R A N S F E R A B L E S E C U R I T I E S ( c o s t U S 0 n i l ) 38,423 0.1 1
M A R K E T V A L U E O F I N V E S T M E N T S ( c o s t U S 0 29.213.384) 33.h92.499 98.43
O T H E R A S S E T S A N D L I A B I L I T I E S 535.273 1.57
S H A R E H O L D E R S ' E Q U I T Y 34,an,772 100.00
T O T A L I N V E S T M E N T S
Total Common Stocks (cost USD 29,213,384) 33.454.076 ya.32 Total Rights (cos1 USD nil) 38.423 0.1 1 Other Assets and Liabilities 535,273 i .5r
Sharaholders' Equity 34.027.772 ioo.oa
* A portion of these securities were on loan at 30 November 2005. See Note 8.
'" Security holding is traded/held in USD. (ADR: American Depositary
ReceiptlGDR: Global Depositary Receipt).
The accompanying notes are an integral pan of these financial statements.
37
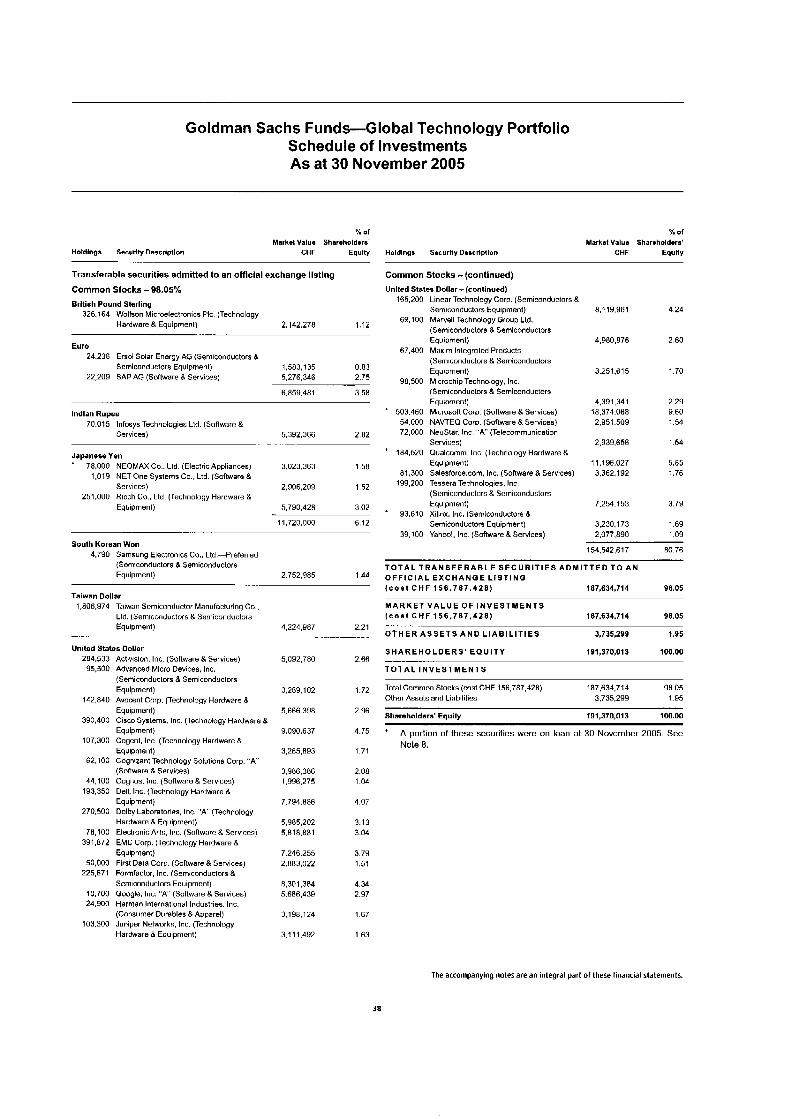
Goldman Sachs Funds-Global Technology Portfolio Schedule of Investments As at 30 November 2005
% Of
Market Value Sharsholdmrs' Holdlngs Security Desdptlon CHF Equlty
Transferable securities admitted to an official exchange llstlng
Common Stocks - 98.05%
Brltish Pound Sterling
~
326,164 Wolkon Microelectronics PIC (Technology Hardware & Equipment) 2 . 1 4 ~ 7 n 1.12
Euro 24.238 Ersol Solar Energy AG (Semiconductors &
Semiconductors Equipment) 1,583.135 0.83 22,209 SAP AG (Software 8 Services) 5,276,346 2.75
6.859.481 3 58
lndlan Rupee 70.015 lnfosys Technologies Lid. (Software &
Serbices) 5,392,366 2.02 -
Japanese Yen 70,000 NEOMAX Co.. Ltd (Electric Appliances) 3.023.363 I 58
1,019 NET One Systems Co.. Lid (Saftwaro 8 Services) 2.906209 1.52
251,000 Ricoh Co.. Ltd. (Technology Hardware 8 Equipment) 5.790.428 3.02
11,720,000 6.12
South Korean Wan 4.790 Samrung Electronics Co.. Ltd.-Preferred
(Semiconductors & Semiconductors Equipment) 2.752.905 1.44
--
Taiwan Dollar 1,006,974 Taiwan Semiconductor Manufacturing Co..
Lld. [Semiconductors 8 Semiconductors Equipment) 4,224,987 2.21
- . .
United States Dollar Activision. Inc. (Software 8 Services) 5,092,780 2.66 284.533
95.500
142,840
390,400
107,300
62,100
44.100 193,350
270,500
78,100 391,072
50,000 225,671
10,700 24,900
103.300
Advanced Micro Devices, Inc. (Semiconductors 8 Semiconductors Equipment) Avocent Cnrp. (Technology Hardware 8. Equipment) Cisco Systems. Inc. (Technology Hardwere 8 Equipment) Cogent. Inc. (Technology Hardware 8 Equipment) Cognizant Technology Solutions Corp. "A" (Softwara & Services) Cognos. Inc. (software & Services) Dell, Inc. (Tnchnolngy Hardware 8 Equipment) Dolby Laboratories. Inc. " A ' (Technology Hardware 8 Equipment) Electronic Arts, Inc. (Software R Services) EMC Corp. (Technology Hardware 8 Equipment) First Data Corp. (Software 8 Services) Formfactor. Inc. (Semiconductors 8 Semiconductors Equipment) Google. Inc. "A ' (Software 8 Services) Harman International Industries. Inc. (Consumer Durables 8 Apparel) Juniper Networks, lnc, (Technology Hardware 8 Equipmnnt)
3,289,102
5.666.398
9,090,637
3,265.H93
3.986.386 1.996.275
7,794,886
5,905,202 5.818.881
7.246.255 2.HH3.022
8,301,384 5.686.A39
3.198.124
3.111.492
1.72
2.96
4.75
1.71
2.08 1.04
4.07
3.13 3.04
3 79 1.51
4.34 2.97
167
163
Holdlngs Socurlly Daacrlptlon
% O f
Market Value Sharmholdora' CHF Equlty
Common Stocks - (continued) United States Dollar -(continued)
165,200 Linear Technology Corp. (Semiconductors 8 Semiconductors Equipment)
(Semiconductors 8 Semiconductors Equipment)
(Semiconductors R Semiconductors Equipment)
(Semiconductors 8 Semiconductors Equipment)
* 503.460 M~crosoft Corp (Software R Services) 54.000 NAVTEO Corp. (Software R Services) 72,000 NeuStar. Inc "A" (Telecommunication
Services) ' 184,520 Qualcomm. Inc. (Technology Hardware 8.
Equipment) 01,300 Salesforce.com. Inc. (Software R Services)
(Semiconductors 8 Semiconductors Equipment)
Semiconductors Equipment) 39,100 Yahoo!. Inc. (Software 8 Services)
69.100 Marvel1 Technology Group Ltd.
67,400 Maxim Integrated Products
98.500 Microchip Technology, Inc.
199.200 Tessera Technologies. Inc.
+ 93,610 Xilinx. Inc. (Semiconductors R
8.1 19.96 1
4,980,876
3.251.61 5
439 1,341 18,374,068 2,951.509
2,939,656
11,196,027 3,362,192
7.254.153
3.230.173 2.077.890
4.24
2.60
1.70
2.29 9.60 1.54
1.54
5.85 1.76
3.79
1.69 1.09
154,542,617 00.76
T O T A L T R A N S F E R A B L E S E C U R I T I E S A D M I T T E D TO A N O F F I C I A L E X C H A N G E L I S T I N G ( c o s t C H F 156 .787 .428) 187,634,714 98.05
M A R K E T V A L U E O F I N V E S T M E N T S ( c a s t C H F 156 .787 .428) 187.634.714 98.05
O T H E R A S S E T S A N D L I A B I L I T I E S 3,735,299 1.95 .
S H A R E H O L D E R S ' E Q U I T Y 191,370,Ol 3 100.00
T O T A L I N V E S T M E N T S
Total Common Stocks (cost CHF 156,707,428) 107,634,714 98.05 Othor Assets and Liahililies 3,735,299 1 .95
Sharahaldara' Esuilv 191.370.013 100.00
+ A portion of these securities were on loan at 30 November 2005. S e e Note 8.
The accompanying notes are an integral part of these financial statements.
38
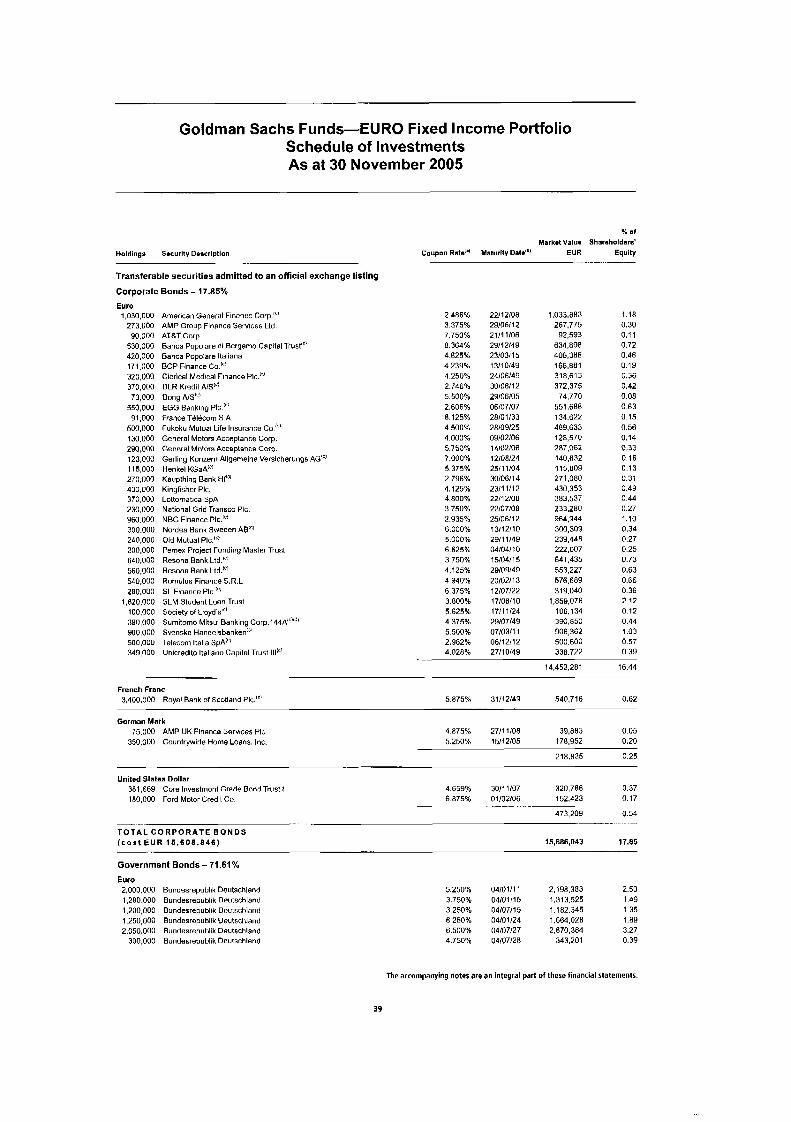
Goldman Sachs Funds-EURO Fixed Income Portfolio Schedule of Investments As at 30 November 2005
% O f
Mark.1 Value Shareholders' Holdings Securlty Deacrlptlon Coupon Rats"' Maturlty Dale") EUR Equlty
Transferable securities admitted to an official exchange listing
Corporate Bonds - 17.85%
--
Euro 1,030,000
2'3.000 90,000
530.000 420,000 171,000 320.000 310,000 73,000
550,000 91,000
500,000 130,000 290,000 123.000 115,000 270,000 430,000 370,000 230,000 960.000 300.000 240,000 200.000 640,000 560.000 540,000 280,000
1,820.000 100,000 390,000
500,000 349.000
mo,ooo
American General Finance Corp."! AMP Group Finance Services Ltd. ATLT Corp. Banca Popolare di Bcrgarno Capital Trust"' Banca Popolare ltaliana BCP Finance Co."' Clerical Medical Finance PIC." DLR Kredit AIS'"! Dong AJS"' EGG Banking PIC.'" France Tblbcurn S A. Fukoku Mutual Life lnsurancm Co "-' General Motors Acceptance Gorp. General Motors Accaptancxl Corp. Gerling-Konzern Allgerneine Versicherungs AG!" Henkel KGaA(<' Kaupthing Bank Hf"' Kingfisher PIC. Lottornatica SpA National Grid Transco PIC. NBG Finance PIC.'" Nordea Bank Sweden AB"' Old Mutual PIC."! Pernex Project Funding Master Trust Resona Bank Ltd."! Resona Bank Ltd "I Rornulus Finance S R L SL Finance PIC SLM Student Loan Trust Sociely of Lloyd's''' Surnitorno Mitsui Banking Corp.144p"" Svenska Handelsbankentc' Telecom ltalia SpA'P' Unicredito Italian0 Caoilal Trust Illic'
2.486% 3.375% 7.750% 8.364% 4.625% 4.239% 4.250% 2.746% 5 500% 2.606% 8.125% 4.500% 4.000% 5.750% 7.000% 5.375% 2.796% 4.125% 4.800% 3.750% 2.935% 6.000% 5.000% 6.625% 3 750% 4.125% 4.940% 6 375% 3 800% 5 625% 4.375% 5.500% 2.982% 4.020%
22112/0a 29/06/12 21111106 29112149 23/03/15 13/1014Y 24/06/49 30/06/12 29/06/05 06/07/07 28/01/33 28/09/25 09/02/06 14102106 12/08/24 2511 1/04 30106114 23/11/12 22/12108 22l07108 25/0611:! 13/12110 2911 1/49 04104110 15/04/15 2YIOY149 20/02/13 12/07/22 17/06/10 17/11/24 29/07/49 07/03/11 06/12/12 27/10149
1,033,883 267,775 92.593
634,898 406,386 1 6 6 m 318.613 372.375 74,770
551,686 134.622 489.633 128,570 287,062 140,632 115,809 271,080 430,353 383.537 233.280 964.944 300,309 239,448 222,007 641,435 553,227 576.689 319.040
1,859,076 106,134 390.850 906,362 500.600 338.722
1.18 0.30 0.11 0.72 0.46 0.19 0.36 0.42 0.08 0.63 0.15 0.56 0.14 0.33 0.16 0.13 0.31 0.49 0.44 0.27 1.10 0.34 0.27 0.25 0.73 0.63 0.66 0.36 2.12 0.12 0.44 1.03 0.57 0.39
16.44 14,453.281
French Franc 3,400,000 Royal Bank of Scotland PIC IP' 5 875% 31/12/49 540.718 0.62
German Mark 75.000 AMP UK Finance Services PIC
350,000 Countrywide Home Loans, lnc 4.875% 27/1 1/00 39,883 0 05 5.250% 15/12/05 178.952 0.20
218.835 0.25
United States Dollar 381.669 Core Investment Grade Bond Trust I 4 659% 30/11107 320,7a6 0.37
6.875% 01/02/06 152,423 0.17 180,000 Ford Motor Credit Co.
473,209 0.54 ~- - . .. ..
-I -. . ... . - - ...
T O T A L C O R P O R A T E B O N D S ( c o a t EUR 15 .608 .846) 15,686,043 17.85
Government Bonds - 71.61% Euro 2,000.000 1,280,000 1,200,000 1,250,000 2,050,000
300.000
Bundesrepublik Doutschland Bundesrepuhlik Deutschland Bundesrepuhlik Deutscliland Bundesrcpubltk Deutschland Bundesrepublik Deutschland Bundesrewblik Deutschland
5.250% 04/01/11 2.198.383 2.50 3.750% 04/01/15 1.313.525 149 3.250% 04/07/15 1.182.345 1.35
6.500% 04/07/27 2.870.384 3.27 4.750% 04/07/28 343,201 0.39
6.250% 04/01/24 1,664,028 1.89
The accompanying notes are an integral part of these financial statements.
39
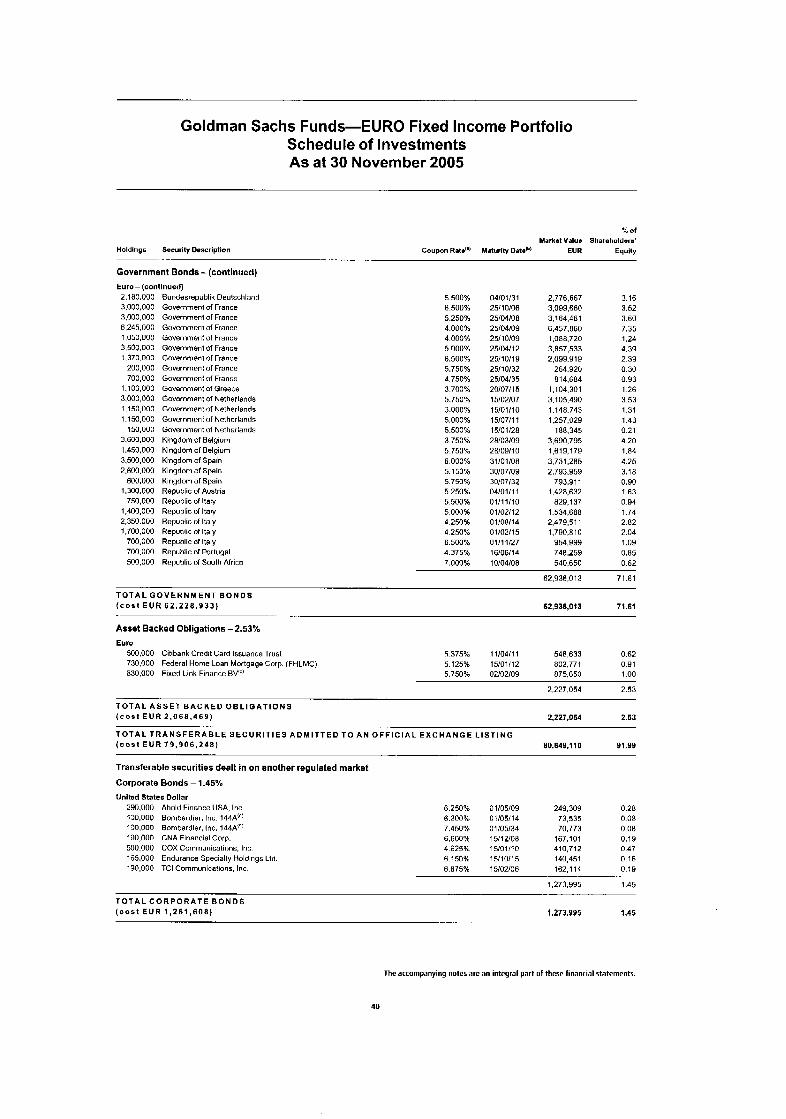
Goldman Sachs Funds-EURO Fixed Income Portfolio Schedule of Investments As at 30 November 2005
% of Markat Valua Shareholders'
Holdlngs Security Dsscriptlon Coupon Rat.''' Maturlty Date+' EUR Equity - - -
Government Bonds - (continued) Euro - lcontlnued) 2.1~0.000 3,000,000 3.M10.000 6.245.000 1,050,000 3,500.000 1.370.000
200,000 700,000
1,100,000 3,000,000 1,150,000 1,150,000
150,000 3.600.000 1,450,000 3,500,000 2.600.000
800,000 1,300,000
750,000 1,400,000 2,350.000 1,700,000
700.000 700.000 500,000
Bundesrepublik Deutschland Government of France Government of France Government of France Government of France Government of France Government of France Government of France Government of France Govnrnmnnt of Greece Government of Netherlands Government of Netherlands Government of Netherlands Government of Netherlands Kingdom of Belgium Kingdom of Belgium Kingdom of Spain Kingdom of Spain Kingdom of Spain Republic or Austria Republic vf Italy Republic uf Italy Republic of Italy Republic of Italy Republic of Italy Republic of Portugal Rcnublic of South Africa
5.500% 6.500% 5.250% 4.000% 4.000% 5.000%
5.750% 4.750% 3.700% 5.750% 3.000% 5.000% 5.500% 3.750% 5.750% 6 000% 5.150% 5.750% 5.250% 5 500% 5 000% 4.250% 4.250% 6.500% 4.375% 7.000%
a . 5 0 0 ~ ~
04/01/3 1 25/10/06 25/04/08 25/04/09 25/10/0Y 25/04/12 25/10/19 25/10/32 25/04/35 20/07/15 15/02/07 15/01/10 15/07/11 15/01/28 28/03/09 28/09/10 31101108 30/07/09 30107132 0410111 1 01/11/10 01/02/12
01102H 5 01/11/27 16/06/14 10104108
o 1/0a/i4
2,776,667 3.16 3,099,660 3.52 3,164,461 3.60 6.457.a60 7.35 1,088,720 1.24 3.857.533 4.39 2.099.9 19 2.39
264.920 0.30 814.684 0.93
1,104.301 1.26 3.105.490 3.53 1.148.743 1.31 1,257,029 1.43
188,345 0.21 3,690,795 4.20 1,61Y,17Y 1.84 3,731,285 4.25 2,793,959 3.18
793.91 1 0.90 1,428,632 1.63
829, i 37 0.94 1.534.688 1.74 2.479.51 1 2.82 1,790,810 2.04
954,999 1.09 740,259 0.05 540.650 0.62
62,936,013 71.61
T O T A L G O V E R N M E N T B O N D S ( c o s t E U R 62.228.933) 62,936,013 71.61
Asset Backed Obligations - 2.53%
-- .. ..
Euro 500.000 Citibank Crcdit Card Issuance Trust 730,000 Federal Home Loan Mortgagn Corp. (FHLMC) 830.000 Fired-Link Finance BV")
5.375% 11/04/11 548,633 0.62 5.125% 15/01/12 802,771 0.91 5.750% 02/02/09 875.650 1 .oo
2,227,054 2.53
T O T A L A S S E T B A C K E D O B L I G A T I O N S ( c o s t E U R 2 , 0 6 8 , 4 6 9 ) 2.227.054 2.53
T O T A L T R A N S F E R A B L E S E C U R I T I E S A D M I T T E D T O A N O F F I C I A L E X C H A N G E L I S T I N G ( c o s t E U R 7 9 , 9 0 6 , 2 4 8 ) 80,849.1 10 91.99
Transferable securities dealt in on another regulated market
Corporate Bonds - 1.45%
Unlted Stales Dollar 290.000 Ahold Finance USA, Inc. 130,000 Bombardier. Inc. 144A": 100,000 Bombardier. Inc. 144A'"' 130,000 CNA Financial Corp. 500.000 COX Communications. Inr: 165.000 Endurance Specialty Holdings Ltd 130,000 TCI Communications, Inc
6.250% 01/05/09 249.309 0.28 6.300% 01/05/14 73,535 0.08 7.450% 01/05/34 70,773 0.08 6.600% 15112108 167,101 0.19 4.625% 15/01/10 410,712 0.47 6.150% 15110115 140,451 0.16 6.875% 15/02/06 162.114 0.19
1.273.YY5 1.45
T O T A L C O R P O R A T E B O N D S ( c o s t E U R 1 ,261 ,608) 1.273.995 1.45
The accompanying notes are an integral part of these financial statements.
40
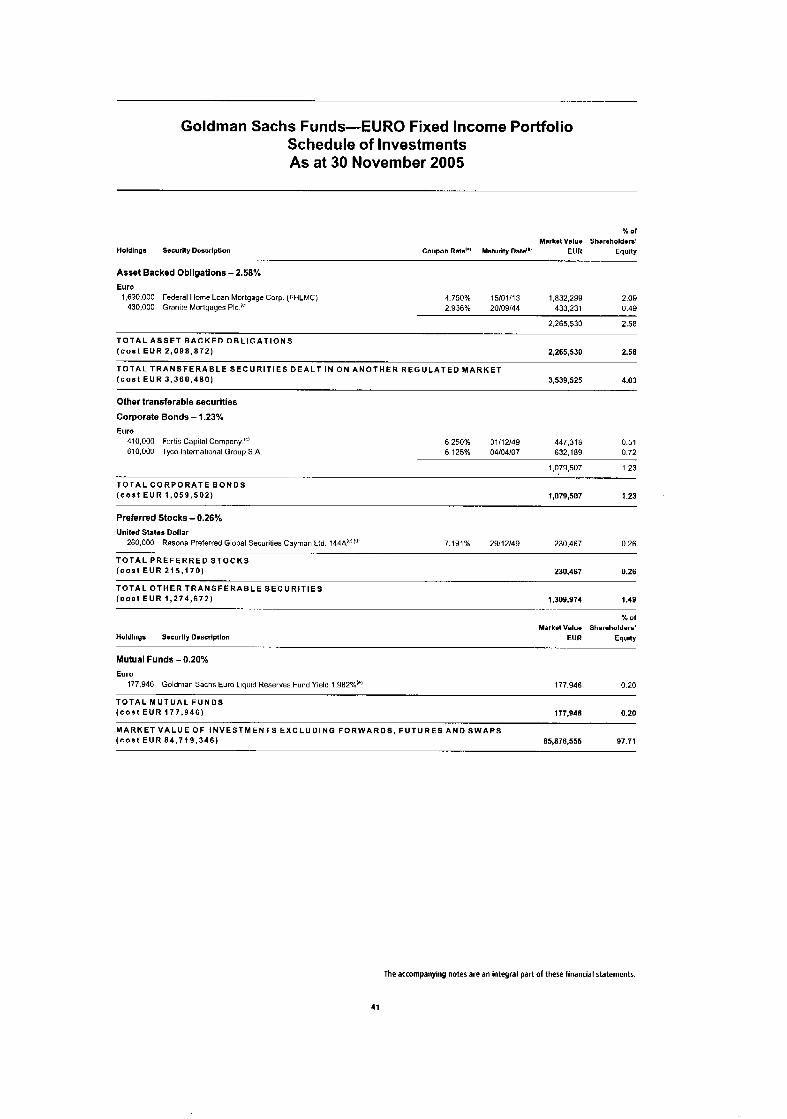
Goldman Sachs Funds-EURO Fixed Income Portfolio Schedule of Investments As at 30 November 2005
x Of
Market Value Shareholders' Holdlnga Security Description Coupon Rata'" Maturity Date''' EUR Equity
~ - . ..
Asset Backed Obllgatlons - 2.58%
Euro 1,690,000 Federal Home Loan Mortgage Corp. (FHLMC)
430,000 Granite Mortgages PIC.(" 4.750% 15/01/13 1,832,299 2.09 2.536% 20/05/44 433,231 0.49
2,265,530 2.58
T O T A L A S S E T B A C K E D O B L I G A T I O N S ( c o s t E U R 2.098.872) 2,265,530 2.58
T O T A L T R A N S F E R A B L E S E C U R I T I E S D E A L T I N O N A N O T H E R R E G U L A T E D M A R K E T ( c o s t E U R 3 .360 .480) 3,539,525 4.03
Other transferable securities
Corporate Bonds - 1.23%
Euro 410.000 Fortis Capltal Company"' 6 250% 31/12/45 447,318 0 51 610.000 Tyco International Group S A 6 125% 04/04/07 632,189 0 72
1,079,507 123 - - .. .-_
T O T A L C O R P O R A T E B O N D S ( c o s t E U R 1 ,059 ,502) 1,079,507 1.23
Preferred Stocks - 0.26%
Unltud States Dollar 280.000 Resona Preferred Global Securilies Cayman Ltd 144A""" 7.191% 29/12/49 230.467 0.26
T O T A L P R E F E R R E D S T O C K S ( c o s t E U R 215 ,170) 230.467 0.26
T O T A L O T H E R T R A N S F E R A B L E S E C U R I T I E S ( c o s t E U R 1 ,274 ,672) 1.309.974 1.49 - .-.
Y. of Marknt Value Shareholders'
Holdlngs Security Doscrlptlon EUR Equity -_ ._.
Mutual Funds - 0.20%
Euro 177.546 Goldrnan Sachs Euro Liquid Reserves Fund Yield 1.Y82%n'e' 177,946 0.20
T O T A L M U T U A L FUNDS ( c o s t E U R 1 7 7 , 9 4 6 ) 177,946 0.20
M A R K E T V A L U E O F I N V E S T M E N T S E X C L U D I N G F O R W A R D S , F U T U R E S A N D S W A P S ( c o s t E U R 84 ,719 ,346) 85,876,555 97.71
The accompanying notes are an integral part of these financial statements.
41

Goldman Sachs Funds-EURO Fixed Income Portfolio Schedule of Investments As at 30 November 2005
Futures Contracts
Unreallsed */e Of
Number of Galn Shareholders' Contracts Security Description EUR Equity
(8) EURIBOR 19/12/05 Short 7.800 0.01 (4) Germany Federal Republic Bonds lOYR 08/12/05 Short 2,130 0.00
9,930 0.01
. . . . . EUR
GBP (7) UK Treasury Bonds 29/03/06 Short 1.849 0.00
... USD
(7) US Treasury Bonds 22/03/06 Short 5,579 0.01 (19) US Treasury Notes2YR 31/03/06 Shorl 4,290 0.00 (26) US Treasury Nntes 5YR 22/03/06 Shorl 6.389 0.01 (24) US Treasury Notes lOYR 22/03/06 Short 7.651 0.01
23.909 0.03 - - . . ......
J PY (2) Japan Govt Bonds lOYR 09/12/05 Short 1,279 0.00
....... -- . UNREALISED GAIN ON FUTURES CONTRACTS 36,967 0.04
Unrealised % Of
Number of Loss Shareholdors' Contracts Securlly Descrlptlon EUR Equlty
-. .....
AUD 47 Australian 1OYR Bonds 15/12/05 Long (6.060) (0.01)
EUR 99 Germany Fedoral Republic Bonds 2YR 08/12/05 Long (84.239) (0.10)
UNREALISED LOSS ON FUTURES CONTRACTS (90,299) (0.11)
Forward Currency Contracts
- . . . . .
Unrealised tc O f
Maturity Gain Shareholdmrs' Date Amount Bought Amount Sold EUR Equlty
- - . .......
1211 212005 13/12/2005 2011212005
0.20 EUR 7,147,397 HUF 1,763.2fi2.815 179,564 PLN 17,501.693 EUR 4.373344 98.273 0.11
0 01 EUR 2,114,142 USD 2.476.117 11.421
UNREALISED GAIN ON FORWARD CURRENCY CONTRACTS 289,258 0.32
Unroallsmd X of Maturity Loss Shareholders' Date Amount Bought Amount Sold EUR Eqully
12/12/2005 HUF 1,735,632,347 EUR 6,917,202 (50,555) (0.07) 13/12/2005 EUR 4,457.371 PLN 17,669,911 (57.428) (0.07)
UNREALISED LOSS ON FORWARD CURRENCY CONTRACTS (1 15.983) (0.14) ......... .........
Swap Contracts
Net Local Notional Amount Security Descrlptlon
Unreallsed % of Galn Shareholdmrs'
Maturity Date EUR Equlty
interest Rate Swaps 845.000 Euro Interesl Rate Pay 6 month EUR EURIBOR floatinglReceive fixed 4.01% 0.03 17/05\35 24,359
UNREALISED GAIN ON INTEREST RATE SWAPS 24.359 0.03
TOTAL UNREALISED GAIN ON SWAPS 2A,359 0.03
The accompanying notes are an Integral part of these financial statements.
42
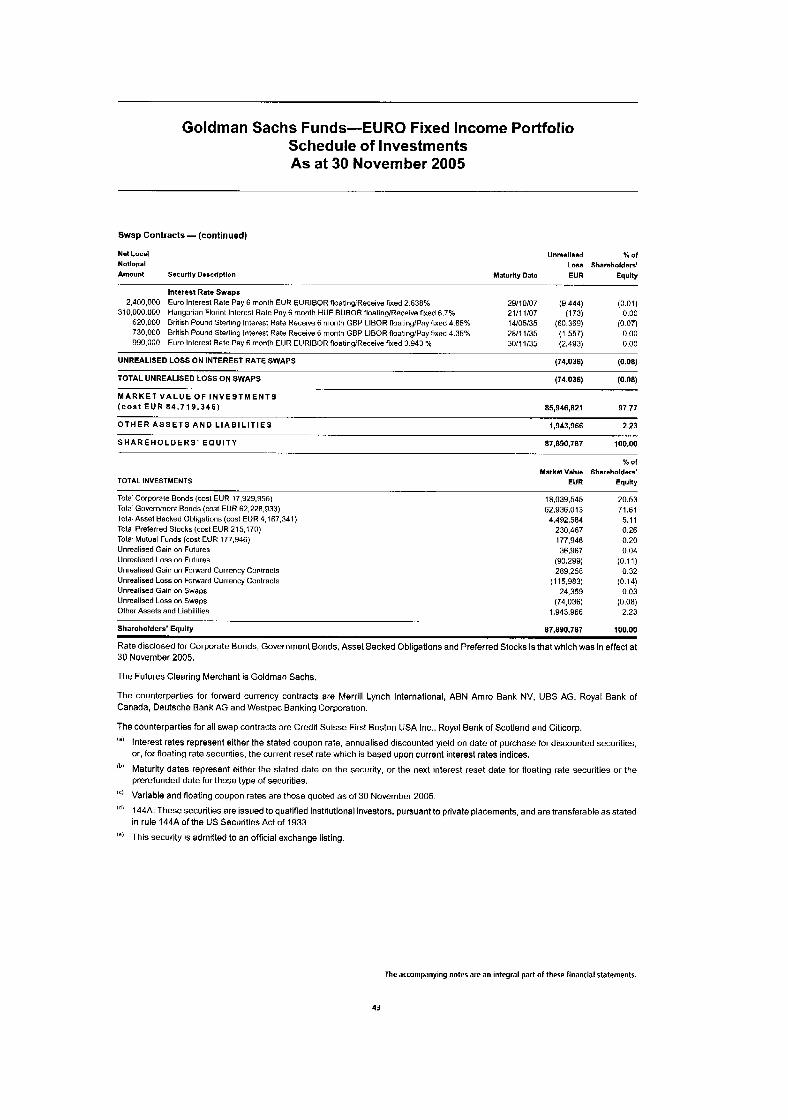
Goldman Sachs Funds-EURO Fixed Income Portfolio Schedule of Investments As at 30 November 2005
Swap Contracts - (continued)
Net Local
Notlonsl Amount
2,400,000 310,000.000
620.000 730.000 990,000
Securlty Ihscrlptlon Maturity Date
Interest Rate Swaps
Hungarian Florint Interest Rale Pay 6 month HUF BUEOR floatinglRnceive fixed 6.7% British Pound Sterling Interest Rate Receive 6 month GBP LlBOR floatinglPay fixed 4.65% British Pound Sterling Interest Rate Receive 6 month GBP LlBORfloatinglPayflxnd 435% Euro Interest Rate Pay 6 month EUR EURIBOR noalinqiReceive fixed 3.943 Oh
-.
Euro Interest Rate Pay 6 month EUR EURIBOR float1ng;Receive fixed 2.638% 2Y110/07 21H 1/07 14/05/35 20/11/35 3011 1/35
Unreallsad LOSS
EUR
(9,444) (173)
(60,369) (1.557) (2.493)
% of Shareholders'
Equity
(0.01) 0.00
(0.07) 0.00 0.00
UNREALISED LOSS ON INTEREST RATE SWAPS (74.036) (0.08)
TOTAL UNREALISED LOSS ON SWAPS (74,036) (0.08)
( c o s t E U R 84 .719 .346) 85,946,821 97.77 M A R K E T V A L U E O F I N V E S T M E N T S
O T H E R A S S E T S A N D L I A B I L I T I E S 1,943,966 2.23 -. _.. I -- .- ~. .
S H A R E H O L D E R S ' E Q U I T Y 87,890,787 100.00 - ..
% o f Market Value Shareholders'
TOTAL INVESTMENTS EUR Equity
Tota Corporate Bonds (cost EUR 17,Y29.956) Tota Government Bonds (cost EUR 62,228,933) Tota. Asset Backed Obligations (cost EUR 4,167,341) Tota Preferred Stocks (cost EUR 215,170) Tota Mutual Funds (cost EUR 177.946) Unrealised Gain on Futures Unrealised Loss on Futurns Unrealised Gain on Forward Currency Conlracts Unrealised Loss on Forward Currency Conlracts Unrealised Gain on Swaps Unrealised Loss on Swaps Other Assets and Liabilities
Shareholders' Equity . . .
18,039,545 62,936,013 4,492,504
230,467 177,946 36,967
(90,299) 289.250
(1 15.983) 24,359
(74,036) 1,943.966
20.53 71.61
5.11 0.26 0.20 0.04
(0.1 1) 0.32
(0.14) 0.03
(0.08) 2.23
100.00 ~
Rate disclosed for Corporate Bonds, Government Bonds, Asset Backed Obligations and Preferred Stocks is that which was in effect at 30 November 2005.
The Futures Clearing Merchant is Goldman Sachs
The counterparties for forward currency contracts are Merrill Lynch International, ABN Amro Bank NV. UBS AG. Royal Bank of Canada, Deutsche Bank AG and Westpac Banking Corporation.
The counterparties for all swap contracts are Credit Suisse First Boston USA Inc.. Royal Bank of Scotland and Citicorp la' Interest rates represent either the stated coupon rate, annualised discounted yield on date of purchase for discounted securities.
or, for floating rate securities. the current reset rate which is based upon current interest rates indices.
Maturity dates represent either the stated date on the security, or the next interest reset date for floatlng rate securities or the prerefunded date for those type of securities.
lei Variable and floating coupon rates are those quoted as of 30 November 2005.
144A: These securities are issued to qualified institutional investors, pursuant to private placements, and are transferable as stated in rule 144A of the US Securities Act of 1933.
(" This security is admitted to an official exchange listing,
Ib'
(di
The accompanying notes are an integral part of these financial statements.
43

Goldrnan Sachs Funds-Global Emerging Markets Debt Portfolio Schedule of Investments As at 30 November 2005
% Of
Market Value Shareholders' Hoidlngs Security Descrlpllon Coupon Rste'" Maturity Drte'" US0 Eqully
Transferable securities admitted to an official exchange listing
Corporate Bonds - 0.24%
, -. . -- - -
Germany 250,000 Aries Vermogensverwaltungs GmbH Y.600% 25/10/14 322,812 0.24
T O T A L C O R P O R A T E B O N D S ( c o s t U S D 315 ,971) 322,812 0.24
Emerging Markets Debt - 80.32%
Argentina 1.6O0,OOO Republic of Argentina"' 11.750% 20/05/11 317,556 0.24 6.203.750 Republic of Argentina'" 4.005% 03/08/12 5.633.005 4.24 3.800.000 Republic of Argentina'" 2.000% 03/01/16 2,194,775 165
175.000 Republic of Argentina"' 11.750% 13/11/26 33,680 0.03 2,500,000 Republic of Argentina',' 9.750% 19/09/27 750.000 0.56
10,016,497 Republic of Argnntina"' 5.830% 31/12/33 3,833,277 2.89 1,219,520 Republic of Argontina"' 0.000% 15/12/35 62.760 0.05 1,219,520 Republic of Argentina'"' 1.330% 31/12/38 455.461 0.34
800,000 Republic of Argentina"' 9 000% 24/05/49 310,543 0.23 350,000 Republic of Argentina"' 10.500% 14/11/49 67,887 0.05
10.38
365.700 Republic of Argentina"' 12.000% 19/06/31 111,539 0.08
145,000 Republic of Argentina'" 7.000% 18/03/49 28.343 0.02
13,798.826
Brazil 726,481 Republic of Brazil'"' 5.250% 15/04/12 713,761 0.54 440,000 Republic of Brazil 10.500% 14/07/14 523.380 0.39 450,000 Republic of Brazil 7.875% 07/03/15 460.125 0.35
1,100,000 Republic of Brazil 12.500% 05/01/16 463,773 0.35 1,540,000 Republic of Brazil 12.500% 05/01/16 649.282 0.49 1,310.000 Republic of Brazil R.750% 04/02/25 1.370.260 1.03
390,000 Republic of Brazil 10.125% 15/05/27 462.735 0.35
390,000 Republic of Brazil 8.250% 20/01/34 389,220 0.29 1,700,000 Republic of Brazil 12.250% 06/03/30 2,329,000 1.75
4,780,000 Republic of Brazil 11 000% 17/08/40 5,833,740 4.44
9.98 13,255,282 -. - -
Croatia 131.819 Republicof Croatia'" 4.750% 31/07/10 131,868 0.10
Domlnlcan Republic 510,000 Republic of Dominican 9.500% 2710911 1 540,600 0.40 565.051 Republic of Wominican 9.040% 23/01/18 594,716 0.45
1,135,316 0.85
Ecuador 2,690,000 Republic of Ecuador"""' 9 OOO%/lO 000% 15/08/30 2,477,490 1.86
.. . . -_ El Salvador 2,462,000 Republic of El Salvador fl 250% 10/04/32 2,689.735 2 02
570.000 Republlc of El Salvador 7.650% 15/06/35 582.825 044
3.272.560 2.46
Gualamala 2.170.000 Republic of Gualemala 10.250% 08/11/11 2,582,300 1.94 1.OflO.000 Republic of Guatemala 9.250% 01/08/13 1,255.500 0.95
470,000 Republic of Guatemala 8.125% 06/10/34 509.950 0.38
4.347.750 3.27
Hungary 514.000.000 Republic of Hungary 9 250% 12/10/07 2,494,403 1.88
- .. -. .. .~. .. ..
The accompanying notes are an integral part of these financial statements.
44
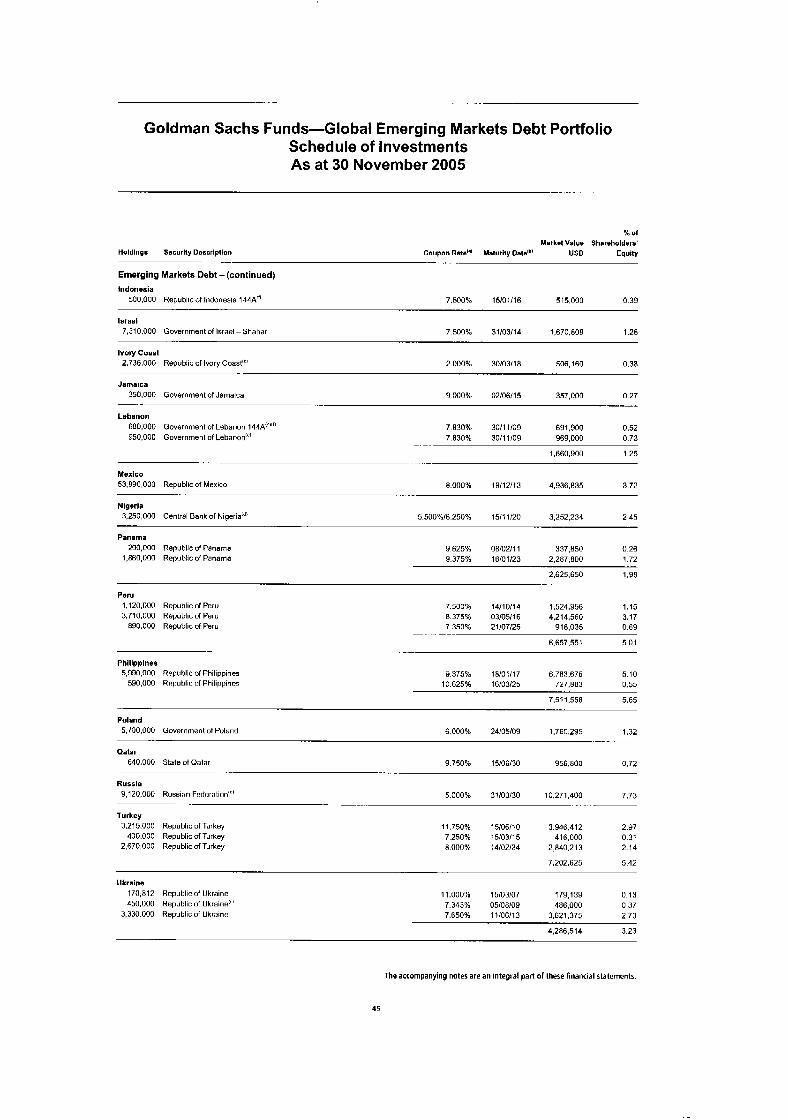
Goldman Sachs Funds-Global Emerging Markets Debt Portfolio Schedule of Investments As at 30 November 2005
% of Market Value Shareholders'
Holdlngs Sscurlly Dnacrlpllon Coupon Raid" Maturity Oete'Di USD Equity . .-
Emerging Markets Debt - (continued) Indonesia
500,000 Republic of Indonesia 144A'" 7.500% 15/01/16 515.000 0.39
Israel 7,310.000 Government of Israel - Shahar 7.500% 31/03/14 1,670,808 1.26
I V O I y Coast 2,736,000 Republic of lwry Coast'" 2.000% 30103118 506,lfiO 0.38
Jamaica 350,000 Government of Jamaica 9.000% 02/06/15 357,000 0.27
I-.-- .. .... .-.. ..
Lebanon 680,000 Government of Lebanon 144A!"'" 7.830% 30/1 1/09 6Y1,YOO 0.52 950,000 Government of Lebanon"' 7.830% 30/11/09 969.000 0.73
1,660,900 1.25 - .--- .
Mexico 53,890,000 Republic of Mexico 8.000% 19/12/13 4,936,835 3.72
Nigeria
,. .. ... .
2.45 3,250,000 Central Bank of Nigeria:d) 5.500%/6.250% 15/11/20 3.252.234
Panama 290,000 Republic of Panama
1,860,000 Republic of Panama 9 625% 0810211 1 337.850 0.26 9.375% 16/01/23 2,287,800 1.72
2,625,650 1.98
Peru 1,120,000 Republicof Peru 7.500% 14/10/14 1,524,956 1.15 3,710,000 Republic of Peru 8.375% 03/05/16 4214.560 3.17
890,000 Republic of Peru 7.350% 21/07/25 918.035 0.69
6,657,551 5 01 . -. - ..
Phlllpplnes 5.930.000 Republic of Philippines
530.000 Rnpublic of Philippines 9.375% 18/01/17 6.783.675 5.10
10 625% 16/03/25 727.883 0.55
7,511.55a 5.65
Poland
5.700.000 Government of Pvland 6.000% 24/05/09 1,760,295 1.32
Qatar
640,000 State of Qatar 9.750% 15/06/30 956,800 0.72 -.- -. . ..
Russla
9,120,000 Russian Federation"' 5.000% 31/03/30 10,271,400 7.73 .~ , . . .~ - - .
Turkey 3,215,000 Republic of Turkey 11.750% 15/06/10 3.946.412 2.97
400,000 Republic of Turkey 7.250% 15/03/15 416.000 0.31 2,670,000 Republic of Turkey 8.000% 14/02/34 2,840.213 2.14
7,202,625 5.42
Ukraine 170.812 Republic of Ukraine 11.000% 15/03/07 179,i 39 0.13 450,000 Republic of Ukrainn"' 7.343% 05/08/09 486,000 0.37
3,330.000 Republic of Ukraine 7.650% 11/06/13 3,621,375 2.73
4,286,514 3.23
The accompanying notes are an integral part of these financial statements.
45

Goldman Sachs Funds-Global Emerging Markets Debt Portfolio Schedule of Investments As at 30 November 2005
4: Of
Market Value Shareholdmrs' Holdings Security Description Coupon Rate'" Maturity Datd" USD Equlty
EmerQlng Markets Debt - (continued)
- . - -~
Uruguay 1,330,000 Republic of Uruguay
880,000 Republic of Uruguay 22,250 Rnpublic of Uruguay'''
9.250% 17/05/17 1,463,000 1.10 8.000% 18/11122 865,700 0.65 7.875% 15/01/33 21,360 0.02
2.350.060 1.77
Venezuela 4,895.000 Republic of Venezuela 10.750% 19/09/13 5.905.818 4.45 1,280.000 Republic of Venezuela 9.375% 13/01/34 1.478.400 1.11
734 .218 5.56
Vietnam 1.840 000 Socialist Ropublic of Viptnaltr 144A" 6 875% 15/01/16 1.899.800 143
- T O T A L E M E R G I N G M A R K E T S D E B T ( c o s t U S 0 103 ,448 ,098) 106,718,903 80.32
T O T A L T R A N S F E R A B L E S E C U R I T I E S A D M I T T E D TO A N O F F I C I A L E X C H A N G E L I S T I N G ( c o s t U S D 103 ,784 ,069) 107,041,715 80.56
_. ~-
Transferable securities dealt in on another regulated market
Corporate Bonds - 0.52%
Venezuela 686,171 Pelrozuala Finance, Inc. 144A!n 7.63046 01/04/09 696.1 71 0.52
T O T A L C O R P O R A T E B O N D S ( c o a t U S 0 690 .997) 696,171 0.52
Emerging Markets Debt - 2.98%
Gualemrla 430,000 Republic of Guatemala 144A" 8 125% 06/10/34 467,625 0 35 -
Turkay
2,310,000 Republic of Turkey 11 875% 15/01/30 3,495,375 2 63 - -- .. T O T A L E M E R G I N G M A R K E T S D E B T ( C o s t U S D 3,925,112) 3,963,000 2.98
T O T A L T R A N S F E R A B L E S E C U R I T I E S D E A L T I N O N A N O T H E R R E G U L A T E D M A R K E T ( c o s t U S 0 4,616,109) 4.659.171 3.50
Other transferable securltles
Emerging Markets Debt - 7.13%
Argsntinr 27,583,085 Republic of Argentina"' 1.000% 15/12/35 375,071 0.28
-_ .
Egypt 19,850.000 Egypt Treasury Bill 0.000% 21/03/06 3,358,340 2.53
Indonesia
- - . .-
300,000 Indonesia Stand By Loan 3.563% 25/01/06 297.000 0.22 - . ..
Russia 5.775.000 Russian Federation 3.000% 14/05/08 5,450,156 4.10
T O T A L E M E R G I N G M A R K E T S D E B T ( c o s t U S D 9 ,088 ,343) 9,480,567 7.13
The accompanying notes are an integral part of these financial statements.
46
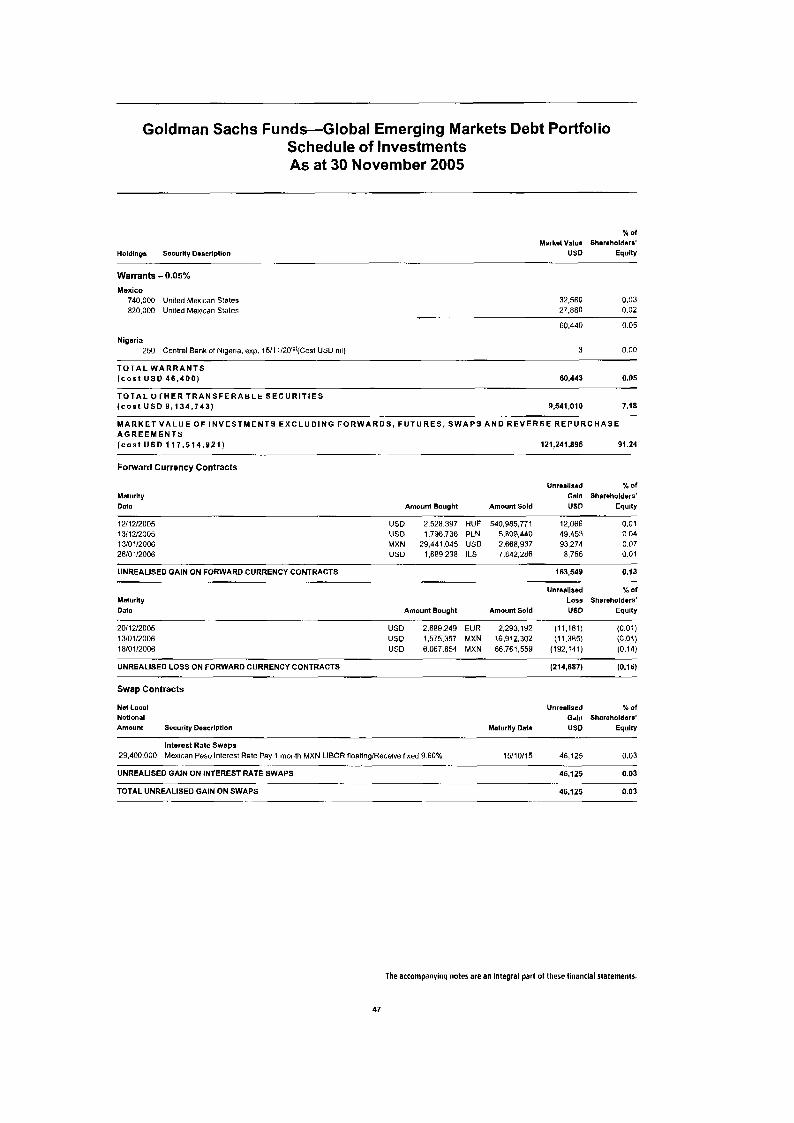
Goldrnan Sachs Funds-Global Emerging Markets Debt Portfolio Schedule of Investments As at 30 November 2005
% Of
Market Value Sharmholders' Holdlngs Security Dmcrlptlon USD Equity
.. -. . ..
Warrants - 0.05%
Mexico 740,000 United Mexican States 820.000 United Mexican Stales
Nigsrir 250 Central Bank of Nigeria. exp. 1511 1/2O'")(Cost US0 nil)
32,560 0.03 27,880 0.02
60.440 0.05
3 0.00
T O T A L W A R R A N T S ( c o s t USD 46.400) 60,443 0.05
T O T A L O T H E R T R A N S F E R A B L E S E C U R I T I E S ( c o s t U S D 9 ,134 .743) 9,541,010 7.18
M A R K E T V A L U E OF I N V E S T M E N T S E X C L U D I N G F O R W A R D S , F U T U R E S . S W A P S A N D R E V E R S E R E P U R C H A S E A G R E E M E N T S ( c o s t U S D 117 .514 .921) 121,241.896 91.24
Forward Currency Contracts
~. - . -. .
Maturlty Date
Unrsallsad % of Galn Shareholders'
Amount Sold US0 Equity Amount Bought
12/12/2005 13/12/2005 13/0'/2006 26/0'/2006
USD 2.528.397 HUF 540,985,771 12,066 0.01 US0 1,796,736 PLN 5.B09.AAO 49.453 0.04 MXN 29.441.045 US0 2,668,937 93,274 0.07 USD 1,689,238 ILS 7.842.286 8,756 0.01
UNREALISED GAIN ON FORWARD CURRENCY CONTRACTS 163,549 0.13
Unreellred % Of
Maturity Lo99 Shareholdws' Date Amount Bought Amount Sold USD Equlty
.-
20/12/2005 US0 2.689249 EUR 2,293.192 (11,161) (0 01) 13/01/2006 US0 1575.357 MXN 16,912,302 (11.385) (0 0') 18/01/2006 USD 6.067.854 MXN 66,761,559 (192.141) (0.14)
UNREALISED LOSS ON FORWARD CURRENCY CONTRACTS (214,687) (0.16)
Swap Contracts
Net Locel Notlonal Amount Security Doscrlptlon
Unroallsed % O f
Galn Shareholders' Maturlty Oats USD Equity
Interest Rate Swaps 29.400.000 Mexican Peso Interest Rate Pay 1 month MXN LIBOR floatinglReceive fixed 9.60% 15!10/15 46,125 0.03
UNREALISED GAIN ON INTEREST RATE SWAPS A6.125 0.03
TOTAL UNREALISED GAIN ON SWAPS 46.125 0.03
. ... -. .
.- .
. . -. .
The accompanying notes are an integral part of these financial statements.
47
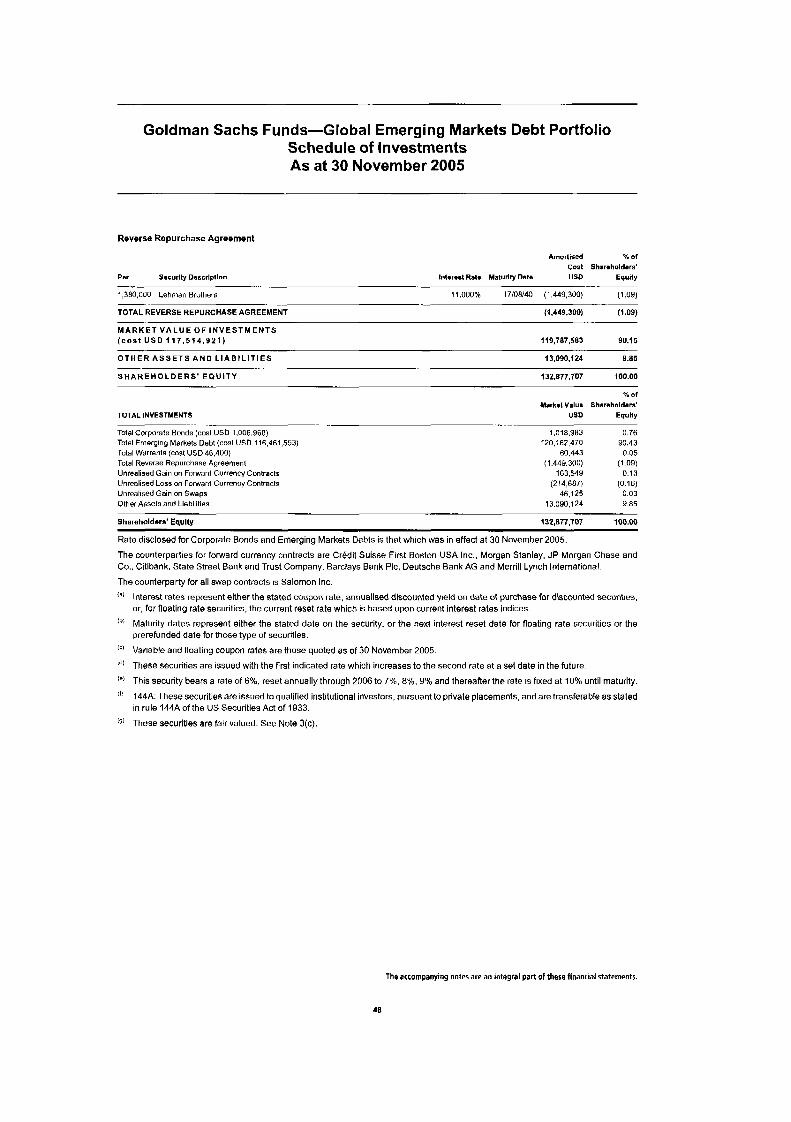
Goldman Sachs Funds-Global Emerging Markets Debt Portfolio Schedule of Investments As at 30 November 2005
Reverse Repurchase Agreement
Amortired x Of
Cost Sharohold*rs' Psr Socurlty Dascrlpllon Intoroat Ram Malurlty Data US0 Equity
. ... . .-
1,380,000 Lehman Brothers 11.000% 17/06/40 (1,449,300) (1 .OS)
TOTALREVERSEREPURCHASEAGREEMENT (1,449,300) (1.09) - ... .
M A R K E T V A L U E O F I N V E S T M E N T S ( C o s t U S D 1 1 7 . 5 1 4 . 9 2 1 ) 90.15 119,787,583
O T H E R A S S E T S A N D L I A B I L I T I E S 13,090,124 9.85
S H A R E H O L D E R S ' E P U l T Y 132.877.707 100.00
TOTAL INVESTMENTS
Total Corporate Bonds (cost US0 1,006,SSS) Total Emerging Markets Debt (cost US0 116,461,553) Total Warrants (cost USD 46.400) Tolal Reverse Repurchase Agreement Unrealised Gain on Forward Currency Conlracts Unrealised Loss on Forward Currency Contracts Unrealised Gain on Swaps Other Assets and Liabilities
- - .. -. .. .. .
% Of
Market Value Sharoholdars' USD Equlty
1.016.963 0.76 120,162,470 90.43
60.443 0.05 (1.449.300) (1.09)
163,549 0.13 (214,6871 (0.16)
46,125 0.03 13.090.124 9.85
Shareholdsrs' Equity 132,877.707 100.00
Rate disclosed for Corporate Bonds and Emerging Markets Debts is that which was in effect at 30 November 2005.
The counterparties for forward currency contracts are Credit Suisse First Boston USA Inc., Morgan Stanley. JP Morgan Chase and Co.. Citibank. State Street Bank and Trust Company, Barclays Bank PIC, Deutsche Bank AG and Merrill Lynch International.
The counterparty for all swap contracts is Salornon Inc.
Interest rates represent either the stated coupon rate, annualised discounted yield on date of purchase for discountsd securities, or, for floating rate securities. the currant reset rate which is based upon current interest rates indices.
Maturity dates represent either the stated date on the security, or the next interest reset date for floating rate securities or the prerefunded date for those type of securities.
Variable and floating coupon rates are those quoted as of 30 November 2005.
These Securities are issued with the first indicated rate which increases to the second rate at a set date in the future.
This security bears a rata of 6%, reset annually through 2006 to 7%. 8%, 9% and theraafler the rate is fixed at 10% until maturity.
144A: These securities are issued to qualified institutional investors. pursuant to private placements, and are transferable as stated in rule 144A of the US Securities Act of 1933.
These securities are fair valued. See Note 3(c).
The accompanying notes are an Integral part of there financial statements.
48
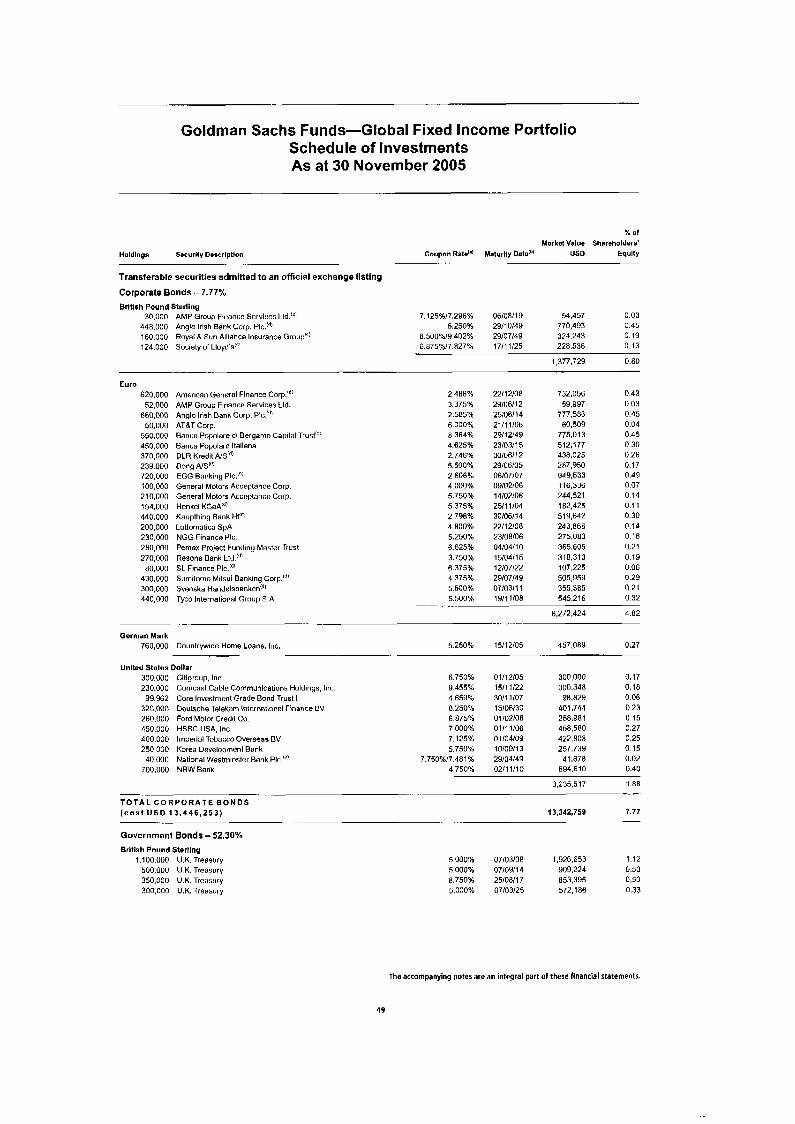
Goldman Sachs Funds-Global Fixed Income Portfolio Schedule of Investments As at 30 November 2005
% of Market Value Shareholders'
Holdings Sscurlly Deacrlptlon Coupon Rateiai Malurlty Date"' USD Eqully -. .... -- . ..
Transferable securities admitted to an official exchange llstlng
Corporate Bonds - 7.77% British Pound Sterling
30,000 AMP Group Finance Services Ltd."' 7.125%/7.296% 448.000 Anglo Irish Bank Corp, PIC.'"' 5.2509b 160,000 Royal 8 Sun Alliance Insurance Group"! 8.500%19 402% 124,000 Society of Ll0yd.s"' 6 875%/7.827%
Euro 620,000 52,000 660.000 50,000 550,000 450,000 370,000 23Y.000 720.000 100.000 210.000 154,000 440,000 200.000 230.000 280,000 270,000
ao.ooo 430.000 300,000 440,000
American General Finance Corp.") AMP Group Finance Services Ltd. Anglo Irish Bank Corp. PIC ATRT Corp. Banca Popolare dl Bergarno Capital Trust"' Banca Popolare ltaliana DLR Kredil AIS'"! Dong AIS"' EGG Bankirng PIC."! General Molnrs Acceptance Corp. General Motors Accnptance Corp. Henkel KGaAId' Kaupthing Bank Ht'"' Lottornalica SpA NGG Finance PIC. Pernnx Project Fundiny Master Trust Resona Bank Lld SL Finance PIC."' Sumitorno Mitsui Banking Corp."" Svenska Handelsbanken!d' Tvco lnlernational Grouo S A
2.486% 3.375% 2.585% 6.000% 8 364% 4.625% 2.746% 5.500% 2.606% 4.000% 5.750% 5.375% 2 796% 4.800% 5.250% 6.625% 3.750% 6.375% 4.375% 5.500% 5 500%
06/08/19 29/10/49 29/07/49 17/11/25
~
22/12/08 2910611 2 25106114 21/11/06 29/12/49 23/03/15 30/06/12 29/06/05 06/07/07 09102106 14/02/06 25/11/04 30106114 22/12/08 23/08/06 04/04/10 15/04/15 12/07/22 29/07/49 07103H1 1911 1/00
54,457 0.03 770.493 0.45 324.243 0.19 228.536 0.13
1,317,729 0.80
732,056 0.43 59,997 0.03 777.506 0.45 60,509 0.04 775,013 0.45 51 2,177 0.30 438.025 0.26 287.950 0.17 849,533 0.49 116,336 0.07 244,521 0 14 182.425 0 1 1 5 19,642 0.30 243.068 0.14 275.083 0.16 365,605 0.21 318.313 0.19 107.225 0.06 505,959 0.29 355.385 0.21 545.216 0.32
. , . 8.272.424 4.82
. .. --
German Mark 760,000 Countrywide Home Loans. Inc.
Unlted States Dollar 300.000 Citigroup. Inc 230.000 Corncasl Cable Communications Holdings. Inc. 99,962 Core Investment Grade Bond Trust I 320,000 Doutsche Telekom lnlernalional Finance EV 260,000 Ford Motor Credit Co 450,000 HSBC USA, Inc. 400.000 lrnparial Tnbacco Overseas BV 250,000 Korea Development Bank
700.000 NRW Bank 40,000 National Westminster Bank PIC.'"
5.250%
6.750% 9.455% 4.659% 8.250% 6.875% 7.000% 7 125% 5.750%
7 750%17.481% 4.750%
15/12/05
01/12105 1 9 1 1/22 3011 1107 I5106130 01/02/06 01/11/06 01104109 10109113 29/04/49 02/11/10
300,000 300.340 98.829 401.744 250.981 458.500 422.808 257,739
694,610 41.078
0.27 -
0.17 0.18 0.06 0 23 0 15 0.27 0.25 0.15 0.02 0.40
.. . .. - T O T A L C O R P O R A T E B O N D S ( c o s t U S 0 13,446,253)
Government Bonds - 52.30%
British Pound Sterllng 1.100,OOO U.K. Treasury
500,000 U.K. Treasury 350.0011 U.K. Treasury 300.000 U.K. Treasury
~. .- --
3,235,517 1.88
13,342,759 7.11
5.000% 07/03/08 1,926.653 1.12 5.000% 07/09/14 909,224 0.53 0.750% 25108/i7 853.395 0.50 5.000% 07/03/25 572,106 0.33
The accompanying notes are an integral part of these financlal statements.
49

Goldman Sachs Funds-Global Fixed Income Portfolio Schedule of Investments As at 30 November 2005
% O f
Markot Value Shareholders' Holdings Sscurlty Descrlpllon Coupon Rsto" Maturity D a t P US0 Equlty
..-. . . -
Government Bonds - (continued) Brltlsh Pound Sterling - (conllnued)
300.001 U.K. Treasury 4.250% 07/06/32 526.895 0.31
4,788,353 2.79 I
Danish Krone 3,000,000 Kingdom of Denmark 4 000% 15/08/08 486,923 0.29 4,000,000 Kingdom of Denmark 6 000% 15/11/11 727,018 0 42
1.213.941 0 71
Euro 4,500.00o 1,053,616 4.300.000 3.000.000 3.500.000
300.000 820.000
3,460,000 400,000 500.000
1,000,000 550.000
55,000 1,350,000
870,000 400,000 750,000
2,277 300,000
1,950,000 1,400,000 1,000,000
750.000 750,000 630.000
8,750,000
Bilndesrepublik Deutschland Bimdesrepublik Deutschland Bundesrepublik Deutschland Bundesrepublik Doutsrhland Bundesrepublik Deutschland Bundesrepuhlik Deutschland Bundesrepublik Deutschland Bundesrepublik Deutschland Government of France Government of France Government of France Guvernment of France Government of France Government of France Government of Nelherlands Government of Netherlands Kingdom of Belgium Kingdom uf Belgium Kingdom of Spain Kingdom of Spain Republic of Italy Republic of Italy Republic of Italy Republic of Italy Republic of Italy Reoublic of South Africa
6.000% 6.000% 5.250% 4.250% 3.750% 6 250% 6.500% 5.500% 3.750% 5.250% 4.000% 4.000% 5.500% 5.500% 5.000% 4.250% 5.750% 3.750% 6.000% 5.750% 4.500% 4 250% 3.000% 5.500% 5.250% 7.000%
04/01 107 04/07/07 04/0 1 /08 04107114 04lO1/15 04101124 04107127 04lOl 13 1 12/01/07
25/04/09 25/10/09 25/04/10 25/04/29 15/07/1 1 15/07/13 28/03/08 28/03/09 31/01/08 30/07/32 01105/0Y 011111OY 15101/10 01111110 0 1/08/17 10/04108
25/04m
5,478.067 3.19 1.300.342 0.76 5,304.050 3.09 3,754,506 2.18 4,224,802 2.46
469.775 0.27 1,350,574 0.79 5,183,960 3.02
476,006 0.28 620,393 0.36
1,216,395 0.71 670,823 0.39
11.318,514 6 5Y 81,751 0 05
1.735.799 1.01 1,087,058 0.63
500,767 0.29 9 0 4,4 7 6 0.53
2.855 0.00 466,939 0.27
2,404,409 1.40 1.719.650 1 .oo 1,172,442 0.68
975,314 0.57 1.013.083 0.59
801.318 0.47
54,234,148 31.58
Japanese Yen 1,370.000.OOO Government of Japan-Snries 13
Y20.000.000 Governmenl of Japan-Sarins 25 310.000.000 Government of Japan-Series 37 655,000,000 Government of Japan-Series 231 40,000,000 Government of Japan-Series 269
Swedish Krona 2,000,000 Kingdom of Sweden 4.850.000 Kingdom of Sweden
0.500% 20106/06 11.483.350 6.69 0,300% 2010308 7.694.601 4.48 0.800% 20/06/09 2,617,421 1.52 1.300% 20106111 5,606,040 3.26 2.400% 20103134 335,959 0.20
16.15 27.737371
3.500% 20104/06 248,689 0.14 6,750% 05/05/14 748,545 0.44
997.234 0.58 -- ...
Unitad States Dollar 650,000 Uniled Slates Treasury Bonds 6.250% 15/05/30 788.925 0.46 40.000 United States Treasury Notes 8.875% 15/08/17 55,036 0.03
843.961 0.49
T O T A L G O V E R N M E N T B O N D S ( C o s t U S 0 94 ,379 ,189) 89,815,008 52.30
The accompanying notes are an integral part of these flnanclal statements.
50
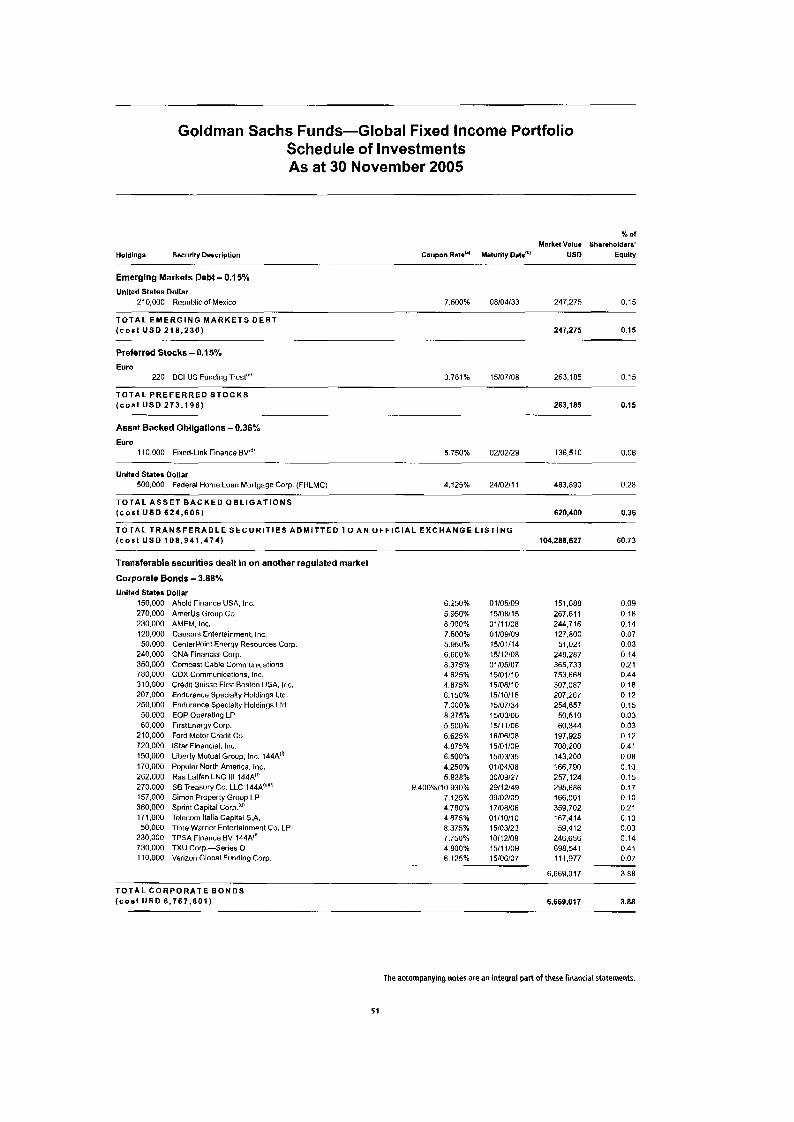
Goldman Sachs Funds-Global Fixed Income Portfolio Schedule of Investments As at 30 November 2005
% Of
Market Value 5har.holders' Holdlngs Sscurlty Desorlption Coupon Rats"' Malurlty Date"' USD Eqully
. .- - .
Emerging Markets Debt - 0.15% Unlled States Dollar
210,000 Republic of Mexico 7.500% 08/04/33 247,275 0 15
T O T A L E M E R G I N G M A R K E T S D E B T ( c o s t U S 0 218 .230) 241,215 0.15
Preferred Stocks -0.15% Eura
220 BCI US Funding Trust'"' 3 781% wo7108 263,185 0 15
T O T A L P R E F E R R E D S T O C K S ( c o a t U S 0 273 .196) 263.185 0.15
Asset Backed ObllgatlOns - 0.36%
Euro
- - .. -. - .
110.000 Fixed-Link Finance BVd' 5 750% 02/02/29 136,510 0.08 -- . .-
United States Dollar 500.000 Federal Home Loan Mortgage Cnrp. (FHLMC) 4.125% 24/02/11 483,890 0.28
T O T A L A S S E T B A C K E D O B L I G A T I O N S ( c o s t U S 0 6 2 4 , 6 0 6 ) 620,400 0.36
T O T A L T R A N S F E R A B L E S E C U R I T I E S A D M I T T E D T O A N O F F I C I A L E X C H A N G E L I S T I N G ( c o s t USD 108 ,941 ,474) 104.288.627 60.73
Transferable securities dealt In on another regulated market Corporate Bonds - 3.88% United Stales Dollar
150,000 270,000 230.000 120.000 50,000
240.000 350,000
310,000 207.000 250.000
50.000 60.000
210.000 720.000 150,000 170,000 262,000 270,000 157,000 360,000 171,000 50,000
230,000 730.000 110,000
7ao.000
Ahold Finance USA, Inc. AmerUs Group Co AMFM, Inc. Caosars Entertainment. Inc. CenterPoin1 Energy Resources Corp CNA Financial Corp. Corncast Cable Communications COX Communications, Inc Credit Suisse First Boston USA, lnc, Endurance Specialty Holdings Ltd. Endurance Specially Holdings Ltd. EOP Operating LP FirslEnergy Corp. Ford Motor Credit Co. istar Financial, Inc. Liberty Mutual Group, Inc. 144A" Popular North America. Inc. Ras Laffan LNG Ill 144A'" SE Treasury Co. LLC 144A""" Simon Proporty Group LP Sprint Capital cnrp.(d' Telecom ltalia Capital S A Time Warner Entertainment Co. LP TPSA Finance BV 144A" TXU Corp.-Series 0 Verizon Global Funding Corp.
f i . 2 5 0 ~ ~ 5.950% 8.000% 7.500% 5.950% 6.600% 8.375% 4 625%
6.150% 7.000% 8.37546 5 500% 6.625%
6.500% 4.250% 5.838%
9.400%/10 930% 7.125% 4.780% 4.815% 8.375% 7.750%
6.125%
4.875%
4.875%
4 800%
01/05/09 15/08/i 5
01/09/09 15/01/14
01 105107 15/01/10 15/08/10 15/10/15 15/07/34 15/03/06 1511 1/06 16/06/08 15/01/09 15/03/35 01/04/08 30/09/27 2911 2/49 09/02/OY 17/08/06 01/10/10 15/03/23 10/12/08 1Y11109 15/06/07
o i / i 1/08
I 511 2/08
151,688 267.61 1 244,7 16 127.800 51,021
248.287 365,733 753.668 307,087 207.267 254,657
50,510 60,344
197,925 708,200 143.200 166.790 257,124 295,686 166,001 359.702 167,414 59.412
246.656 698.541 111,977
0.09 0.16 0.14 0.07 0.03 0.14 0.21 0.44 0.18 0 12 0.15 0.03 0.03 0.12 0.41 0.08 0.10 0.15 0.17 0.10 0.21 0.10 0.03 0.14 0.41 0.07
6,669,017 3 88
T O T A L C O R P O R A T E B O N D S ( c o s t U S D 6 .767 .801) 6.669.017 3.88
The accompanying notes are an integral part of these financial statements.
51
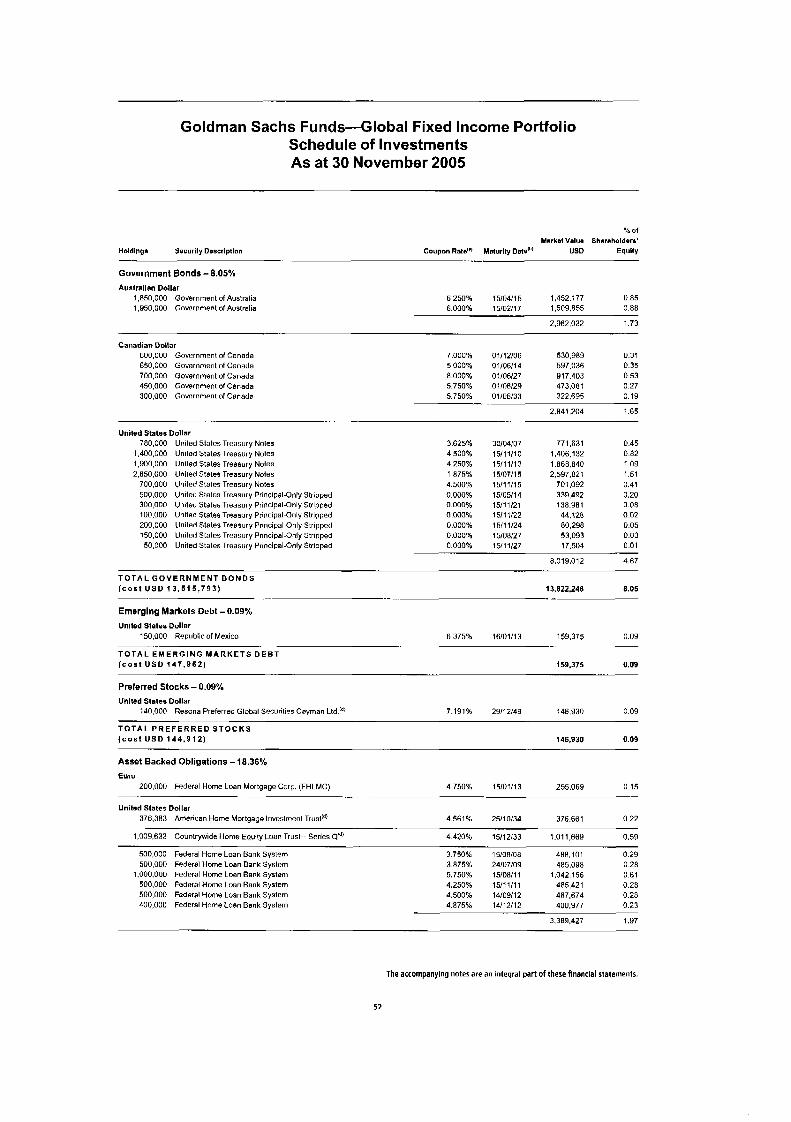
Goldman Sachs Funds-Global Fixed Income Portfolio Schedule of Investments As at 30 November 2005
% Of
Market Value Shareholders' Holdings Security Doscrlptlon Coupon Rat*''' Maturlty Date'" USD Equlty
Government Bonds - 8.05%
- -
Australian Dollar 1.850.000 Government of Australia 1,950,000 Gowrnment of Australia
6250% 15/04/15 1,452.177 0.85 6.000% 15/02/17 1,509,855 0.88
2,962,032 1.73
Canadian Dollar 530.989 0.31 7.000% 01/12/06 600,000 Government of Canada
650,000 Government of Canada 5 000% 01/06/14 597.036 0.35 917.403 0 53 8.000% 01/06/27 700,000 Government of Canada
450,000 Government of Canada 5.750% 01/06/29 473.081 0.27 5.750% 01/06/33 322,695 0.19 300,000 Government of Canada
2.841.204 1.65 -. .
- ... -- .. ..
United States Dollar 780.000 United States Treasury Notes 3.625% 30/04/07 771.631 0.45
1,400,000 Unitod States Treasury Notes 4500% 15/11/10 1,406,132 0.82 1,900,000 United States Treasury Notes 4.250% 15/11/13 1,868,840 109
500.000 United Slates Treasury Principal-Only Stripped 0.000% 15/05/14 339,492 0.20 300,000 United Slates Treasury Principal-Only Stripped 0.000% 15/11/21 138.Y81 0.08 100.000 Unitad States Treasury Principal-Only Stripped 0.000% 15/11/22 44.128 0.02
50.000 United Stales Treasury Principal-Only Strippad 0.000% 15/11/27 17.504 0.01
2,650,000 United States Treasury Notes 1.875% 15/07/15 2,597.821 1.51 700.000 United States Treasury Notes 4.500% 15/11/15 701,092 0.41
80.298 0.05 53,093 0.03
0.000% 15/11/24 0.000% 15/06/27
200.000 150,000
Unitad Slates Treasury Principal-Only Stripped Unitnd Stales Treasury Principal-Only Stripped
0,019,012 4.67
T O T A L G O V E R N M E N T B O N D S ( c o s t USD 13 ,515 ,793) 13.nzz.z4n 8.05
Emerging Markets Debt - 0.09%
United States Dollar
-. .- -- ... " -
150,000 Republic of Mexico 6.375% 16/01/13 1 59 ,375 0.09
( c o s t U S 0 1 4 7 . 9 6 2 ) 159,375 0.09
-. .. .. - . T O T A L E M E R G I N G M A R K E T S D E B T
Preferred Stocks - 0.09% Unlted States Dollar
140,000 Resona Preferred Global Securit~es Cayman Ltd.'d! 7.191% 2Y/lZ/49 146,930 0.09
( c o s t U S D 1 4 4 . 9 1 2 ) 146.930 0.09
Asset Backed Obligations - 18.36%
Euro
T O T A L P R E F E R R E D S T O C K S
200,000 Federal Home Loan Mortgage Gorp. (FHLMC) 4.750% 15/01/13 255,069 0.15 - - . .
Unitad States Dollar 376.383 American Home Mortgage Investment Trust"! 4.561% 25/10/34 376.661 0.22
1,009,633 Countrywide Home Equity Loan Trust-. Series P"' 4420% 15/12/33 1.011,669 0.59
500,000 Federal Home Loan Bank System 3.750% 15/OR/08 488.10 1 0.29 500,000 Federal Home Loan Bank System 3.875% 24/07/09 485.098 0.28
1.000.000 Federal Home Loan Bank System 5.750% 15/08/11 1,042,156 0.61 500.000 Fodaral Home Lonn Bank System 4.250% 15/11/11 485,421 0.28 500,000 Fndaral Home Loan Bank System 4.500% 14/09/12 487,674 0.28 400,000 Federal tinme Loan Bank System 4.875% 14/12/12 400,977 0.23
3,389,127 1.97
The accompanying notes are an integral part of these financial statements.
52

Goldrnan Sachs Funds-Global Fixed Income Portfolio Schedule of Investments As at 30 November 2005
% O f
Markmt Valum Shareholders'
Holdings Securlty Deacrlpllon Coupon Rsla'" Maturity Date'" USD Equlty
Asset B a c k e d O b l i g a t i o n s - (cont inued)
Unlted States Dollar - (continued)
-- ~ .-
700,000 Federal Home Loan Mortgage Gorp. (FHLMC) 4.250% 05/04/07 695.622 0.41 750,000
59,886 Federal Home Loan Mortgage Cnrp. (FHLMC) 5.500% 01/12/17 60,235 0.04 739,870 0.43
37.516 Federal Home Loan Mortgago Corp. (FHLMC) 5.500% 01/09/18 37.751 0.02 40,328 Federal Home Loan Mortgage Corp, (FHLMC) 5.500% 01/09/18 40,580 0.02 42,360 Federal Home Loan Mortgage Corp (FHLMC) 5.500% 01/09/18 42,625 0 02
4 250% 23/06/08 Federnl Home Loan Mortgage Corp. (FHLMC)
105.864 Federal Home Loan Mortgage Corp (FHLMC) 5.500% 01/09/18 106.525 0.06 229,635 Federal Home Loan Mortgage Gorp. (FHLMC) 5.500% 01/09/18 231.070 0.14 259,192 Federal Home Loan Mortgage Corp. (FHLMC) 5.500% 01/09/18 260.81 1 0.15
1275.884 Federal Home Loan Mortgage Corp. (FHLMC) 6 500% 01/12/32 1.309.798 0.76
3.524.887 2.05 - . . .
600,000 Federal National Mortgage Association (FNMA) 4.200% 08/06/09 586,100 0 34
204,834 Fadnral National Mortgage Association (FNMA) 5000% 01/12/17 202,523 0.12
158.461 Federal National Mortgage Assuciation (FNMA) 4.500% 01/10/18 153,828 0.09 221.017 Federal National Mortgage Association (FNMA) 6.500% 01/11/26 227,786 0.13
300.389 Federal National Mortgage Association (FNMA) 5.000% 01/12/17 297,001 0.17
439,499 Federal Natinnal Mortgage Association (FNMA) 5 000% 01/12/17 434,541 0.26
721.936 Federal National Mortgagn Association (FNMA) 6.500% 01/07/32 741.762 0.43 R09.039 Federal National Mortgage Association (FNMA)"' 3.489% 01/05/34 774.261 0.45
3.417.802 1.99
2,000,000 Federal National Mortgage Association (FNMA) 5.500% 2.008.124 117 1.000.000 Federal National Mortgage Association (FNMA) 5.500% 1.005.312 0.58 5,000,000 Federal Naliunal Mortgage Association (FNMA) TEA"' 5 500% 4,929,690 2.87 4,000,000 Federal National Mortgage Association (FNMA) TBA'O! 5.500% 3.948.752 2.30 1,000.000 Federal National Mortgage Association (FNMA) TEA'g' 6.000% 1,005,625 0.5Y
12,897,503 7.51
300.000 2.165.157 1.000.000
Federal National Mortgage Association Guaranteed Federal National Mortgage Association Guaranteed Federal National Mortgage Association Guaranteed
6.160% 18/12/07 308,556 0.18 6.500% 2511 1/23 2,239,090 1.30 6.500% 25/04/24 1.039.553 0.61
3,587,199 2.09
879,226 First Hnrizon Asset Back Trust'" 4.481% m w 3 4 881,776 0.51
778,028 Government National Mortgage Association (GNMA):"' 3.750% 20/02/34 767,833 0.45
1,419,480 Sequoia Mortgsqe Trust:"' 4.690% 20111134 1.419.313 0.83
31.274.070 18.21
-- .. -- . .
-- ... .. . - .-
T O T A L A S S E T B A C K E D O B L I G A T I O N S ( c o a t USD 31 ,743 ,513) 31.529.1 39 18.36
T O T A L T R A N S F E R A B L E S E C U R I T I E S D E A L T I N O N A N O T H E R R E G U L A T E D M A R K E T
( c o s t U S D 52 .319 .981) 52326.709 30.47
Other transferable securities
Corporate Bonds - 0.21% Euro
300,000 T ~ C O International Group S.A 6.125% 04/04/07 365,727 0.21 - . - .- ~-
T O T A L C O R P O R A T E B O N D S
( c o s t US0 352 .758) 365.727 0.21
Preferred S t o c k s - 0.24% Unlted States Dollar
390.000 Resona Preferred Global Securities Cayman Ltd. t44A!s'*J 7.191% 29/12/49 406,647 0.24
T O T A L P R E F E R R E D S T O C K S
( c o s t U S D 390,000) 406,647 0.24
The accompanying notes are an integral pan of these financial statements.
53
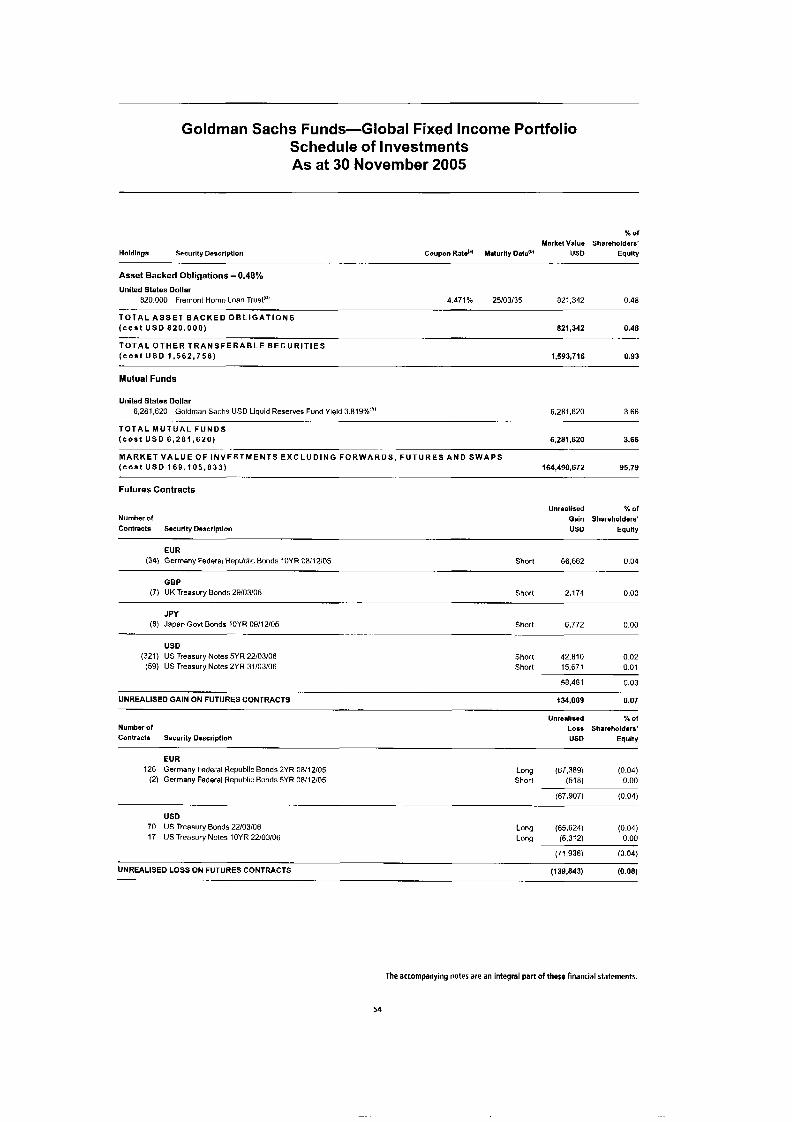
Goldman Sachs Funds-Global Fixed Income Portfolio Schedule of Investments As at 30 November 2005
X of Msrket Value Shareholders'
Holdlngs Security Deocrlptlon Coupon Rate(" Maturlty DatdD' USD Equity
Asset Backed Obligations - 0.48%
- .- -. - _
United States Dollar 820.000 Fremont Homo Loan Trust'" 4.471% 25/03/35 821,342 0.48
T O T A L A S S E T B A C K E D O B L I G A T I O N S ( c o s t U S D 8 2 0 . 0 0 0 ) 821,342 0.48
T O T A L O T H E R T R A N S F E R A B L E S E C U R I T I E S ( c o s t U S 0 1 , 5 6 2 , 7 5 8 )
~
1,593,716 0.93
Mutual Funds
United States Dollar 6.281.620 Goldman Sachs US0 Liquid Reserves Fund Yield 3 819%'" 6.281.620 3 66
~. - . T O T A L M U T U A L F U N D S ( C o s t U S 0 6 , 2 8 1 , 6 2 0 ) 6,261,620 3.66
M A R K E T V A L U E O F I N V E S T M E N T S E X C L U D I N G F O R W A R D S , F U T U R E S A N D S W A P S 95.79 164,490,672 ( c o a t U S D 1 8 9 , 1 0 5 , 8 3 3 )
Futures Contracts
Number of Contracts Sscurlty Descrlptlon
Unrealised % of Gain Shareholders' US0 Equlty
EUR (34) Germany Federal Republic Bonds 10YR 08112105 Shurl 66.662 0.04
GBP (7) UK Treasury Bonds 29/03/06 Short 2.174 0.00
JPY ( 6 ) Japan Govt Bonds lOYR 09/12/05 Short 6,772 0.00
-- .. ..
USD (321) US Treasury Notes SYR 22/03/06 Short 42.810 0.02
(59) US Treasury Notes 2YR 31/03/06 Short 15,671 0 01
58,481 0.03
UNREALISED GAIN ON FUTURES CONTRACTS 134,089 0.07
Number of Contracts Security Dmcripllcn
Unrealised % Of
Losa Sharehoidara' USD Equity
EUR 126 Germany Federal Republic Bonds 2YR 08/12/05 Long (67.389) (0.04)
(2) Germany Federal Republlc Bonds 5YR 08/12/05 Short (518) 0.00
(67.907) (0 04)
70 US Trcanury Bunds 22/03/06 Long (65.624) (0 04) 17 US Treasury Notes 10YR 22/03/06 Long (6.312) 0 00
(71,936) (0 04)
UNREALISED LOSS ON FUTURES CONTRACTS (139.843) (0.08)
US0
The accompanying notes are an integral part of these financial statements.
54
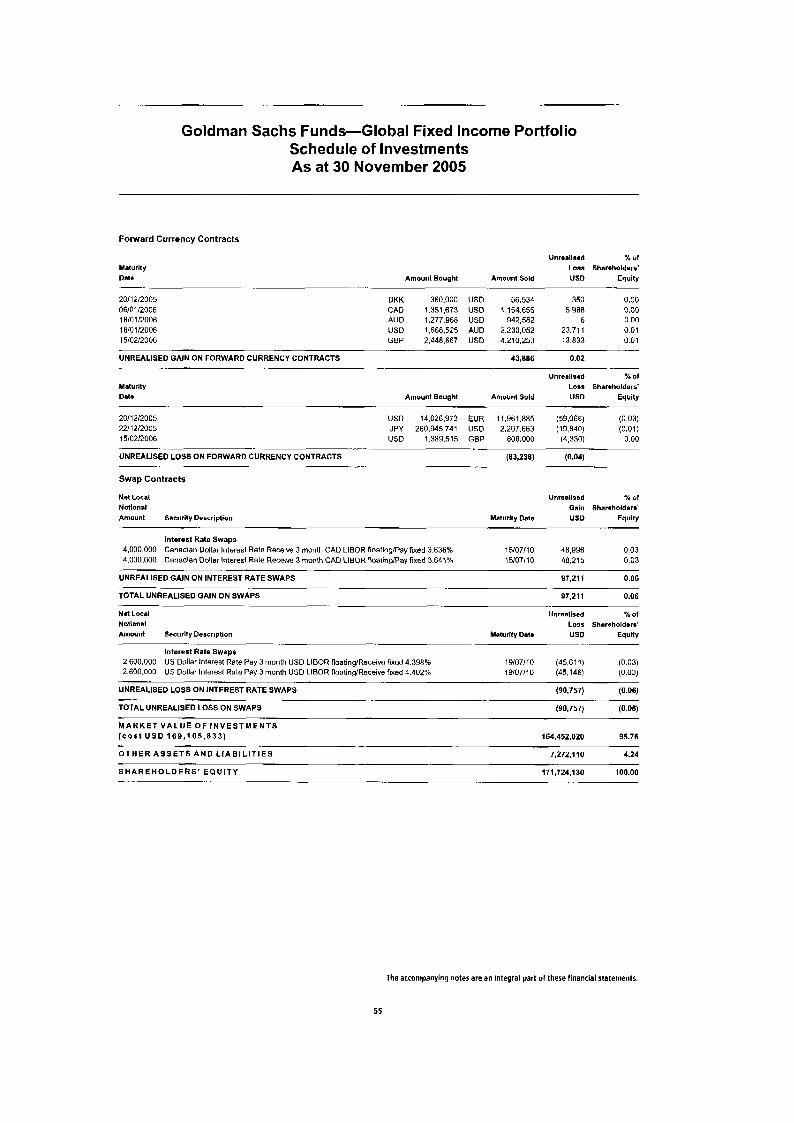
Goldman Sachs Funds-Global Fixed Income Portfolio Schedule of Investments As at 30 November 2005
Forward Currency Contracts
Maturlty Date
20/12/2005 Ofi/@1/2006 18/01 12006 18/01/2006 15/02/2006
-. .. -
Unroallsmd Loss
Amount Bought Amount Sold US0
% of Shereholdere'
Equity
DKK 360.000 USD 56,534 350 CAD 1,351,673 US0 1,154.655 5,986 AUO 1.277.968 US0 Y42.582 6 US0 1,668525 AUD 2,230,052 23,711 GBP 2.448.667 US0 4.210.253 13.833
0.00 0.00 0.00 0.01 0.01
UNREALISED GAIN ON FORWARD CURRENCY CONTRACTS 43,886 0.02
Maturlty Data
Unroallssd % Of
Loss Shareholders' US0 Equity Amount Sold Amount Bought
___ ~ _ _ _
20/12/2005 US0 14,026,973 EUR 11.961.885 (59,OfiH) (0.03) 22/12/2005 JPY 260,945,741 US0 2.207.663 (19.840) (0.01) 151C2/200fi US0 1.389.515 GBP 808,000 (4,330) 0.00 -- . . -- . . . UNREALISED LOSS ON FORWARD CURRENCY CONTRACTS (83,238) (0.04)
Swap Contracts
- - -
Net Local Notlonal Amount Security Description
Unreallsod ./a Of
Gain Shareholdera' Meturlty Date USD Equlty
Interest Rate Swaps 4,000,000 Canadian Dollar Interest Ralo Rnceiw 3 rnonth CAD LIBOR floating/Pay fixed 3.636% 15/07/10 48.996 0.03 4.030,OOO Canadian Dollar Interest Rate Receive 3 month CAD LIBOR tloatinDlPay fixed 3.641% 15/07/10 48.215 0.03
UNREALISED GAIN ON INTEREST RATE SWAPS 97.21 1 0.06
TOTAL UNREALISED GAIN ON SWAPS 97.211 0.06
Not Local Unrealised % Of
Notlonal Losa Shareholdors' Amount Securlty Descriptlon Maturlty Dato US0 Equlty
-. . . -. ..
.. . . .. -.
.- . - -. ~ . . - .. Interest Rate Swaps
2,600.000 US Dollar Interest Rate Pay 3 month US0 LIBOR floatinglReceivo fixed 4.398% 19/07/10 (45.611) (0.03) 2.600.000 US Dollar Interest Rate Pay 3 rnunth US0 LIBOR floatinglReceive fixed 4.402% 19/07/10 (45.146) (0.03)
~
UNREALISED LOSS ON INTEREST RATE SWAPS (90,757) (0.06)
TOTAL UNREALISED LOSS ON SWAPS (90,757) (0.06)
M A R K E T V A L U E O F I N V E S T M E N T S 95.76 ( c o s t U S D 169 ,105 .833)
O T H E R A S S E T S A N D L I A B I L I T I E S 7,272.110 4.24
lW452.020
S H A R E H O L D E R S ' E Q U I T Y 171,724.1 30 100.00 -- .
The accompanying notes are an integral part of there financial statements.
55

Goldman Sachs Funds-Global Fixed Income Portfolio Schedule of Investments As at 30 November 2005
TOTAL INVESTMENTS -..- - -,.
Total Corporate Bonds (cost US0 20366.812) Total Govarnrnent Bonds (cost USD 107.894.982) Total Emerging Markets Deb1 (cost US0 366,192) Total Proferred Stocks (cost USD 808,108) Total Asset Backed Obligations (cost US0 33.188.119) Total Mutual Funds (cost US0 6,2fll,620) Unrealised Gain on Futures Unrealised Loss on Futures Unrealised Gain on Forward Currency Contracts Unrealised Loss on Forward Currency Contracts Unrealised Gam on Swaps Unrealised Loss on Swaps Other Assets and Liabilities
Market Value USD
x of Shrreholdmra'
Equity
20.377503 103,637,256
406,650 816,762
6,281,620 134.089
(139.843) 43,886
(83.238) 97,211 (90.757)
7,272,110
32.970.a81
11.86 60.35 0.24 0.48 19.20 3.66 0.07
0.02 (0.04) 0.06
(0.06) 4.24
(0.08)
Shareholders' Equity 171,724,130 100.00
Rate disclosed for Corporate Bonds, Government Bonds, Emerging Markets Debts, Preferred Stocks and Asset Backed Obligations is that which was in effect at 30 November 2005. The Futures Clearing Merchant is Goldman Sachs.
The counterparties for forward currency contracts are Barclays Bank PIC. Citibank. Deutsche Bank AG, Crbdit Suisse First Boston USA Inc., JP Morgan Chase and Co.. Merrill Lynch International. State Street Bank and Trust Company and UBS AG.
The counterparty for all swap contracts is Merril Lynch International. r R J Interest rates represent either the stated coupon rate, annualised discounted yield on date of purchase for discounted securities,
or, for floating rate securities, the current reset rate which is based upon current interest rates indices.
Maturity dates represent either the stated date on the security. or the next interest reset date for floating rate securities or the prerefunded date for those type of securities.
These securities are issued wlth the first indicated rate which increases to the second rate at a set date in the future.
Variable and floating coupon rates are those quoted as of 30 November 2005.
These securities are issued with the first indicated rate which decreases to the second rate at a set date in the future.
144A: These securities are issued to qualified institutional investors, pursuant to private placements, and are transferable as stated in rule 144A of the US Securities Act of 1933.
m) TBA (To Be Announced) Securitles are purchased on a forward commitment basis with an approximate (generally +/-2.5%) principal amount and no defined maturity date. The actual principal amount and maturity date will be determined upon settlement when the specific mortgage pools are assigned.
This security is admitted to an official exchange listing.
IbJ
IC'
(')
I"
Ih'
The accompanying notes are an integral part of these financial statements.
56
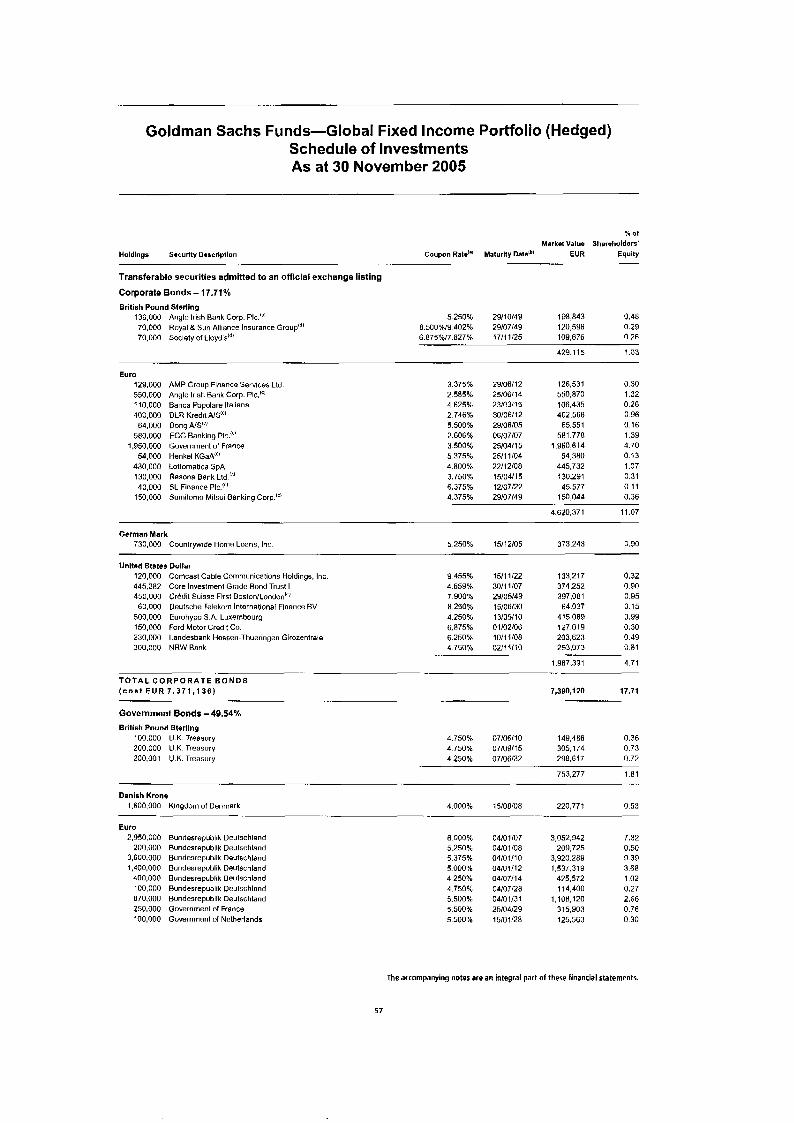
Goldman Sachs Funds-Global Fixed Income Portfolio (Hedged) Schedule of Investments As at 30 November 2005
Holdings S*curlty Daacrlptlon
% O f
Market Value Shareholders' Coupon Rat*'" Maturlty Oatsib) EUR Equity
Transferable securities admitted to an offlclal exchange listing
Corporate Bonds - 11.71% British Pound Sterling
136.000 Anglo Irish Bank Corp PIC ''! 70,000 Royal 8 Sun Alliance Insurance Group'"' 70,000 Society of Lloyd's'"'
198,843 0.48 0.500%/9.402% 29/07/49 120,596 0 29 6.875%/7.827% 17/11/25 109,676 0.26
429. 11 5 1.03
5.250% 29/10/49
Euro 129,000 AMP Group Finance Service$ Ltd. 550,000 Anglo Irish Bank Corp. PIC."' 110,000 Banca Fupolare ltaliana 400.000 DLR Kredil AIS"'
580,000 EGG Banking PIC.'" 1,950,000 Government of France
64,000 Dong A@'
54,000 Henkel KGaA"' 430,000 Lottomatica SpA 130,000 Rnsona Bank Ltd.'"' 40,000 SL Finance PIC.'"
150.000 Sumitomo Mitsui Banking Corp.'L'
3.375% 2.505% 4.625% 2 746% 5.500% 2.606% 3.500% 5.375% 4.800% 3.750% 6.375% 4.375%
29/06/12 25/06/14 23/03/15 30/06/12 29/06/05 06/07/07 25/04/15 25/11/04 22/12/08 15/04/15 12/07/22 29/07/49
126,531
106.435 402.560
65.551 581,778
1,960,614 54,380
445.732 130,291 45.577
150,044
5 5 0 m
4,620.371
0.30 1 32 0.26 0.96 0.16 1.39 4.70 0.13 1.07 0.31 0.11 0.36
11.07 -
German Mark 730,000 Countrywide Home Loans, Inc. 5 250% 15/12/05 373.243 0.90
Unitsd States Dollar 120,000 Comcasl Cable Communications Holdings. Inc 445,202 Core Investment Grade Bond Trust I 450,000 Crldit Suisse First Boslon/Lnndon"'
60,000 Deutsche Telekom International Finance BV 500,000 Eurohypo SA. Luxembourg 150,000 Ford Motor Credit Co. 230,000 Landesbank Hcasen-Thueringen Girozentraln 300.000 NRW Bank
9.455% 4.659% 7.900% 8 250% 4.250% 6.875% 6.250% 4.750%
15/11/22 30/11/07 29/05/49 15/06/30 13/05/10 01/02/06 1011 1 /08 02/1 1110
133,2 17 374,252 397.081 64,037
415,089 127.019 203.623 253,073
0.32 0.90 0.95 0.15 0.99 0.30 0.49 0.61
1,967,391 4 71 - . - _
T O T A L C O R P O R A T E B O N D S ( c o a t E U R 7 , 3 7 1 , 1 3 6 ) 7,390,120 17.71
Government Bonds - 49.54% British Pound Sterling
100,000 U.K. Treasury 200.000 U.K. Treasury 200.001 U.K. Treasurv
4.750% 07/06/10 149.486 0.36 305.174 0.73 4 750% 07/09/15
4.250% 07/06/32 298.617 0.72
753.277 1.81
Danish Krone 1,600.000 Kingdom of Denmark 4.000% 15/08/08 220.771 0.53
Euro 2,950,000
200,000 3.600.000 1,400,000
400,000 100,000 870.000 250.000 '00,000
Bundesrepublik Deutschland Bundosrepublik Deutschland Bundesrepublik Deutschland Bundesrepublik Deutschland Bundesrepublik Deutschland Bundesrepublik Deutschland Bundesrepublik Deutschland Government of France Governmnnt of Netherlands
6.000% 5.250% 5.375% 5.000% 4.250% 4 750% 5.500% 5.500% 5.500%
04/01/07 04/01 108 04/01/10 04/01/12 04/07/14
04/01/3 1 25/04/29 15/01/28
04/07/2a
3,052.942 209.725
3,920.289 1.537.319
425,572 114.400
315.Y03 125.563
1,108,120
7.32 0.50 9.39 3.68 1.02 0.27 2.66 0.76 0.30
The accompanying notes are an integral part of these financial statements.
57
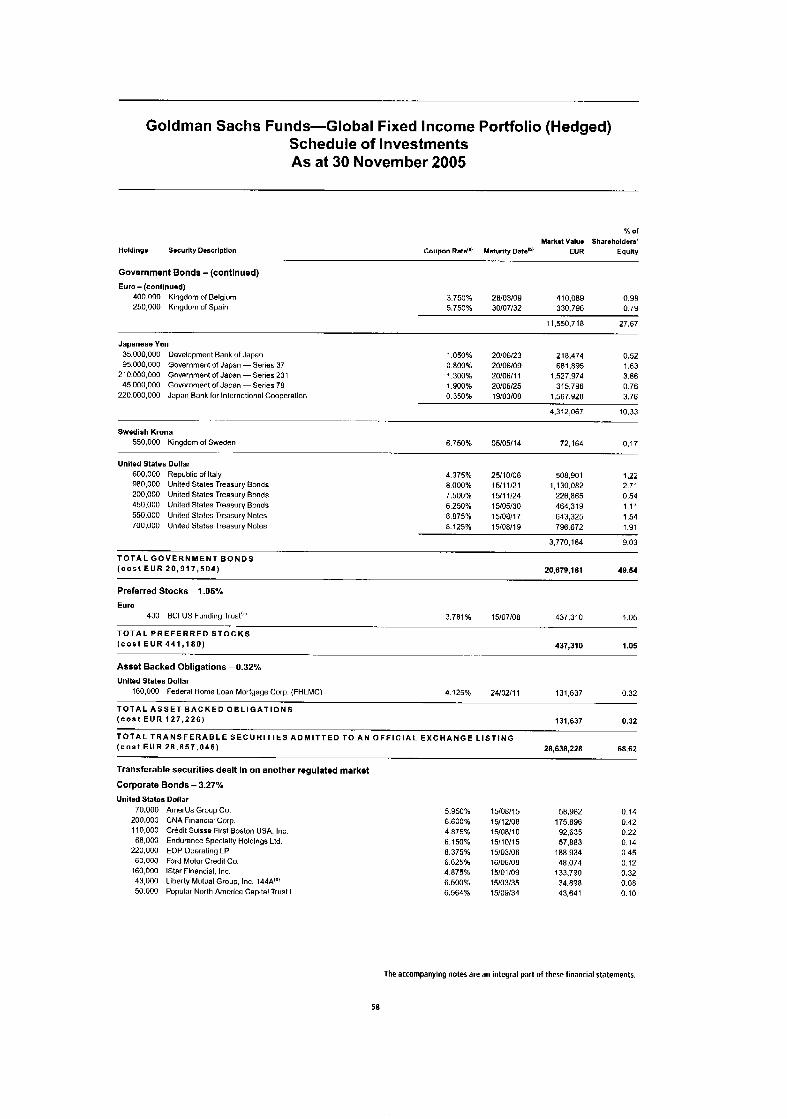
Goldman Sachs Funds-Global Fixed Income Portfolio (Hedged) Schedule of Investments As at 30 November 2005
% Of
Markot Valuo Shareholders' Holdings Socurlty Dascrlptlon Coupon Rate'" Maturity Date'b' EUR Equity
Government Bonds -(continued)
-_. . . -- .-
Euro - (continued) 400.000 Kingdom of Belgium 250,000 Kingdom of Spain
3.750% 28/03/09 410.089 0.98 5.750% 30/07/32 330,796 0.79
11,550,718 27.67
JapsneseYen 35.000.000 Development Bank uf Japan 1.050% 20/06/23 216,474 0.52 95 000,000 Government of Japan - Series 37 0.800% 20/06/09 661.895 1.63
210 000,000 Gnvernment of Japan -Series 231 1.300% 20/06/11 1,527,974 3.66 45 000,000 Gowrnment of Japan -Series 78 1.900% 20/06/25 315,796 0.76
220 000,000 Japan Bank fur International Cooperation 0.350% 19/03/08 1,567,926 3.76
4,312,067 10.33 -- - .. .- - . . .
Swedish Krona
550,000 Kinydom of Sweden 6.750% 05/05/14 72.164 0.17 - .- -.. .. .
United Slates Dollar
600,000 Republic of Italy 4 375% 25/10/06 508,901 1.22
450.000 United States Treasury Bonds 6 250% 15/05/30 464,319 1.11 550,000 United States Treasury Notes 8 875% 15/08/17 643,325 1.54 700.000 United Slates Treasury Notes 8.125% 15/08/19 796.672 1.91
980.000 United Stales Treasury Bonds 8000% 15/11/21 1,130,082 2.71 200,000 United States Treasury Bnnds 7.500% 15/11/24 226,865 0.54
3,770,164 9.03
T O T A L G O V E R N M E N T B O N D S ( c o s t E U R 20 ,917 ,504) 20.679.161 49.54
Preferred Stocks - 1.05% Euro
430 BCI US Funding Trusc' 3.781% 15/07/08 437,310 1.05 ~ .. -
T O T A L P R E F E R R E D S T O C K S
( c o s t E U R 441 ,180) 437,310 1.05
Asset Backed Obligations - 0.32%
- -, . - _ - .
Unlted States Dollar 160,000 Federal Home Loan Morlgaye Corp. (FHLMC) 131,637 0.32 4 125% 24/02/11
T O T A L A S S E T B A C K E D O B L I G A T I O N S ( c o s t E U R 127 ,226) 131.637 0.32
T O T A L T R A N S F E R A B L E S E C U R I T I E S A D M I T T E D T O A N O F F I C I A L E X C H A N G E L I S T I N G
( c o s t E U R 28 ,857 ,046) 28.638.228 68.62
Transferable securities dealt In on another regulated market
Corporate Bonds - 3.27%
Unitsd States Dollar 70,000 AmerUs Group Cn.
200,000 CNA Financial Gorp. 110,000 Credit SUISSO First Boston USA, Inc.
220,000 EOP Operating LP
160,000 istar Financial. Inc.
68,000 Endurance Specialty Holdings Lid
60,000 Ford Motor Credit Co.
43,000 Liherty Mutual Group, Inc. 144A"' 50.000 Popular North America Capital Trust I
5.950% 15/08/15 6.600% 15/12/08 4.875% 15/06/10 6.150% 15110115 8.375% 15/03/06 6.625% 16/06/08 4.875% 15/01/09 6.500% 15/03/35 6.564% 15/09/34
58,982 175.896 92.635 57,883
188.934 48,074
133,790 34.898 43,641
0.14 0.42 0.22 0 14 0.45 0.12 0.32 0.08 0.10
The accompanying notes are an integral part of these financial statements.
58
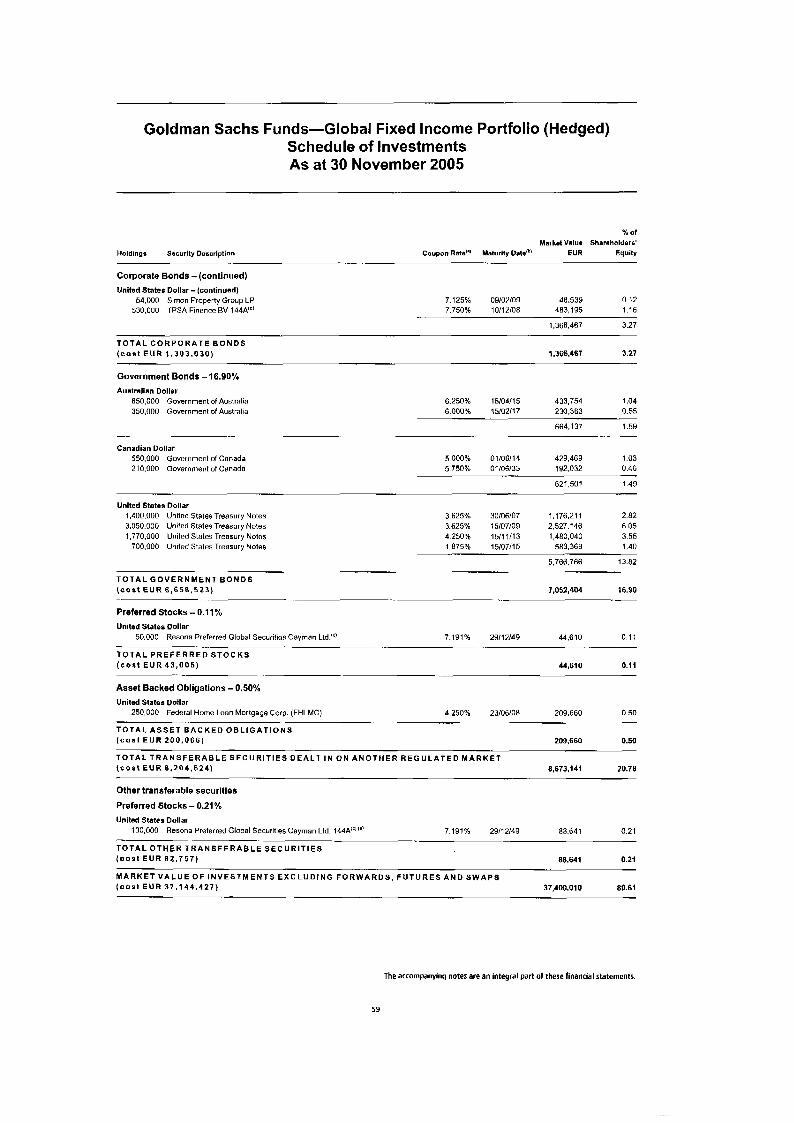
Goldman Sachs Funds-Global Fixed Income Portfolio (Hedged) Schedule of Investments As at 30 November 2005
% Of
Market Value Shareholders' Holdings Sncurlty Description Coupon Rate'" Maturity Date"' EUR Equity
.. . . . .
Corporate Bonds - (continued) United States Dollar - (continuad)
54,000 Simon Property Group LP 7.125% OY/OZ/O9 48.539 0.12 530,000 TPSA Finance BV 144A"' 7.750% 10112108 483.195 1.16
1,366,467 3.27
T O T A L C O R P O R A T E B O N D S ( c o s t E U R 1 .303 .030) 1.366.467 3.27
Government Bonds - 16.90%
Australian Dollar 650,000 Gvvernrnent of Australia 6.250% 15/04/15 433,754 1.04 350,000 Government of Australia 6.000% 15/02/17 230.383 0.55
664,137 1.59 - - . "~ - ....
Canadian Dollar 550.000 Government of Canada 5.000% 01/06/14 429.469 1.03
5.750% 01/06/33 192.032 0.46 210,000 Government of Canada
621.501 1.49 -
Unlted States Dollar 1.400.000 Unitnd States Treasury Notes 3 625% 30106107 1,176,211 2.82 3.050.000 United Slates Treasury Notes 3.625% 15/07/09 2.527.146 6.05 1,770.000 United States Treasury Notns 4.250% 15/11/13 1,480,040 3.55
700.000 United States Treasury Nolna 1.875% 15/07/15 583,369 1.40
5.766.766 13.82
T O T A L G O V E R N M E N T B O N D S (cort E U R 6 ,658 .523) 7,052,404 16.90
Preferred Stocks - 0.11% United States Dollar
50,000 Resona Prpfprred Global Securities Cayman Lld IC) 7 191% 29/12/49 44.610 0 11
( c o s t EUR 43 ,005) 44,610 0.11
- .~ T O T A L P R E F E R R E D S T O C K S
Asset Backed Obligations - 0.50% United States Dollar
250,000 Federal Home Loan Mortgage Corp. (FHLMC) 4.250% 23/06/08 209.660 0.50
T O T A L A S S E T B A C K E D O B L I G A T I O N S ( c o s t EUR 200,066) 209,660 0.50
T O T A L T R A N S F E R A B L E S E C U R I T I E S D E A L T I N ON A N O T H E R R E G U L A T E D M A R K E T ( C 0 9 t EUR 8 ,204 ,624) 8,673,141 20.76
Other transferable securities
Preferred Stocks - 0.21% United States Dollar
100,000 Resona Preferred Global Securities Cayman Ltd 144A'L'"' 7 191% 29/12/49 88.641 0.21
( c o s t EUR 8 2 . 7 5 7 ) 86.641 0.21
-_ - T O T A L O T H E R T R A N S F E R A B L E S E C U R I T I E S
M A R K E T V A L U E O F I N V E S T M E N T S E X C L U D I N G F O R W A R D S , F U T U R E S A N D S W A P S ( c o s t E U R 37 .144 .427) 37,400.010 89.61
The accompanying notes are an Integral part of these flnantial statements.
59

Goldman Sachs Funds-Global Fixed Income Portfolio (Hedged) Schedule of Investments As at 30 November 2005
Futures Contracts
Unrealised % of
Number of Gain Shareholders' Contracts Securlty Description EUR Equlty
. - . ...... EUR
(13) Germany Federal Rnpubllc Bonds 10YR 08112lO5 Short 30,040 0.07
GBP (3) UK Treasury Bond5 29/03/06 Short 792 0.00
JPY (3) Japan Govt Bonds lOYR 09/12/05 Short 4,194 0.01
.... USD
( 3 ) US Treasury Bonds 22/03/06 Short 2,550 0.01 (14) US Treasury Notes 2YR 31/03/06 Short 3,161 0.01 (74) US Treasury Notes 5YR 22/03/06 Short 8.952 0.02
UNREALISED GAIN ON FUTURES CONTRACTS 49,689 0.12
14,663 0.04 .. .. .
- . ....
Unrmsllssd Y O f
Number of Loss Shareholders' Contracts Securlty Descrlpllon EUR Equity
....... - -.. -- ,.
EUR
31 Germany FaderaI Republic Bonds 2YR 08/12/05 Long (14,095) (0.03) (1) Germany Federal Republic Bonds 5YR 08/12/05 Short 1220) 0.00
(14,315) (0.03)
USD 6 US Treasury Notes 10YR 22/03/06 Long (1.898) 0.00
UNREALISED LOSS ON FUTURES CONTRACTS (16,213) (0.03)
Forward Currency Contracts
-- - . _- -. . -
Unrealised % O f
Maturity Gain Shareholders' Dale Amount Bought Amount Sold EUR Equity ~ ... . . . . . . ....
19/12/2005 EUR 31,378 SEK 293,381 552 0.00
22/12/2005 EUR 4.393.797 JPY 616,182,195 7,127 0.02 18/01/2006 AUD 426.066 EUR 265,701 756 0.00 15/02/2006 GBP 157.866 EUR 229.761 800 0.00 15/02/2006 EUR 1.472.138 GBP 1,002,800 7,556 0.02
UNREALISED GAIN ON FORWARD CURRENCY CONTRACTS 89,735 0.21
20/12/2005 EUR 13.502.014 US0 15,813,775 72,944 0.17
Unresllaed X of
Maturity Loss Shareholders' Date Amount Bought Amount Sold EUR Equity
. . . ._ ... - .- ......
20/12/2005 EUR 244,190 DKK 1.821.731 (256) 0.00
18/01/2006 EUR 588.222 AUD 951,602 (6,900) (0.02) 06/01/2006 EUR 639,393 CAD 901,000 (17,007) (0.04)
..... -- .
UNREALISED LOSS ON FORWARD CURRENCY CONTRACTS (24.163) (0.06) . - .
The accompanying notes are an integral part of these financial statements.
60
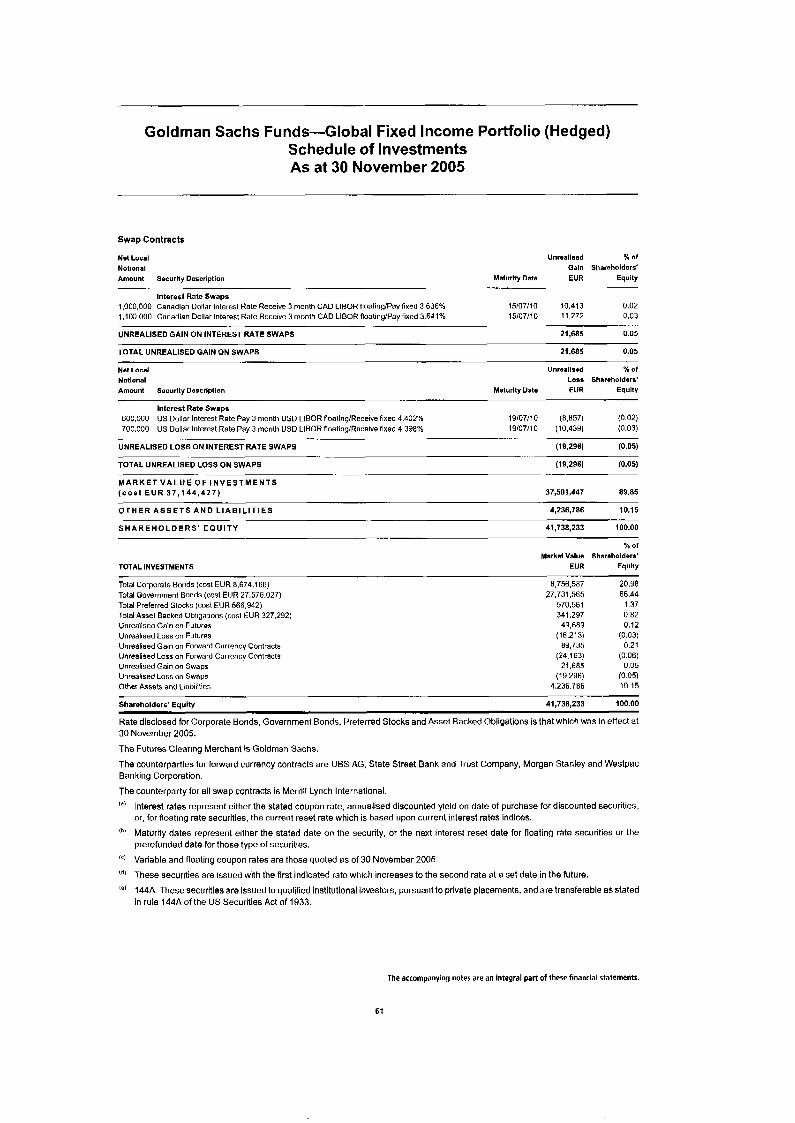
Goldman Sachs Funds-Global Fixed Income Portfolio (Hedged) Schedule of Investments As at 30 November 2005
Swap Contracts
Net Local Unrsallsed O h Of
Notional Galn Shareholders' Amount Security Description Maturity Date EUR Equity
._ .- -- ~ .. . _- Interest Rate Swaps
i,OOO.OOO Canadian Dollar Interest Rale Receive 3 month CAD LIBOR floatinglPay fixed 3 636% 15107l10 10.413 0.02 1,103,000 Canadian Dollar lntnrnst Rate Receive 3 month CAD LIBOR f loat inpay fixed 3 641% 15/07/10 11.272 0.03
UNREALISED GAIN ON INTEREST RATE SWAPS 21,685 0.05
TOTAL UNREALISED GAIN ON SWAPS 21,685 0.05
Net Local Unroallsod % O f
Loss Shar*holders' Notlonel Amount Sewrlty Descrlptlon Maturity Date EUR Equlty
Interest Rate Swaps 60C.000 US Dollar Interest Rate Pay 3 month US0 LIBOR IloatinglReceive fixed 4.402% 19/07/10 (8.857) (0.02) 70C.000 US Dollar lntarcst Rate Pay 3 month US0 LIBOR floating/Roctrivefixed 4.398% 19/07/i 0 (10,439) (0.03)
UNREALISED LOSS ON INTEREST RATE SWAPS (19.296) (0.05)
TOTAL UNREALISED LOSS ON SWAPS (19.296) (0.05)
M A R K E T V A L U E O F I N V E S T M E N T S
. .. .-- ...
... . .. .
- .... .- ..
( c o s t E U R 37,144,427) 37,501,147 89.85
O T H E R A S S E T S A N D L I A B I L I T I E S 4,236,786 10.15
S H A R E H O L D E R S ' E Q U I T Y 41,138,233 100.00
x of Market Value Sharaholdere'
TOTAL INVESTMENTS EUR Equlty
Total Corporate Bonds (cost EUR A.fi74.166) 8,756.587 20.98
Total Preferred Stocks (cost EUR 566.942) 570,561 1.37 Total Asset Backed Obligations (cost EUR 327.292) 341,297 0.82 Unrealised Gain on Futures 49.689 0.12 Unrealised Loss on Futures (16,213) (0.03) Unrealised Gain on Forward Currency Contracls 89,735 0.21 Unrealised Loss on Forward Currency Contracts (24,163) (0.06) Unrealised Gain on Swaps 21.685 0.05 Unrealised Loss on Swaps (19,296) (0.05) Other Assets and Liabilities 4.236.786 10.15
Total Government Bonds (cost EUR 27.576.027) 27,731,565 66.44
Shareholders' Equlty 41,738,233 100.00
Rate disclosed for Corporate Bonds, Government Bonds, Preferred Stocks and Asset Backed Obligations is that which was in effect at 30 November 2005.
The Futures Clearing Merchant is Goldman Sachs The counterparties for forward currency contracts are UBS AG. State Street Bank and Trust Company, Morgan Stanley and Westpac Banking Corporation.
The counterparty for all swap contracts is Merrill Lynch International.
Interest rates represent either the stated coupon rate, annualised discounted yield on date of purchase for discounted securities, or, far floating rate securities, the current reset rate which is based upon current interest rates indices.
Maturity dates represent either the stated date on the security, or the next interest reset date for floating rate securities or the prerefunded date for those type of securities.
Variable and floating coupon rates are those quoted as of 30 November 2005.
These securities are issued with the first indicated rate which increases to the second rate st a set date in the future.
144A: These securities are issued to qualified institutional investors, pursuant to private placements. and are transferable as stated in rule 144A of the US Securities Act of 1933.
The accompanying notes are an integral part of these financial statements.
61
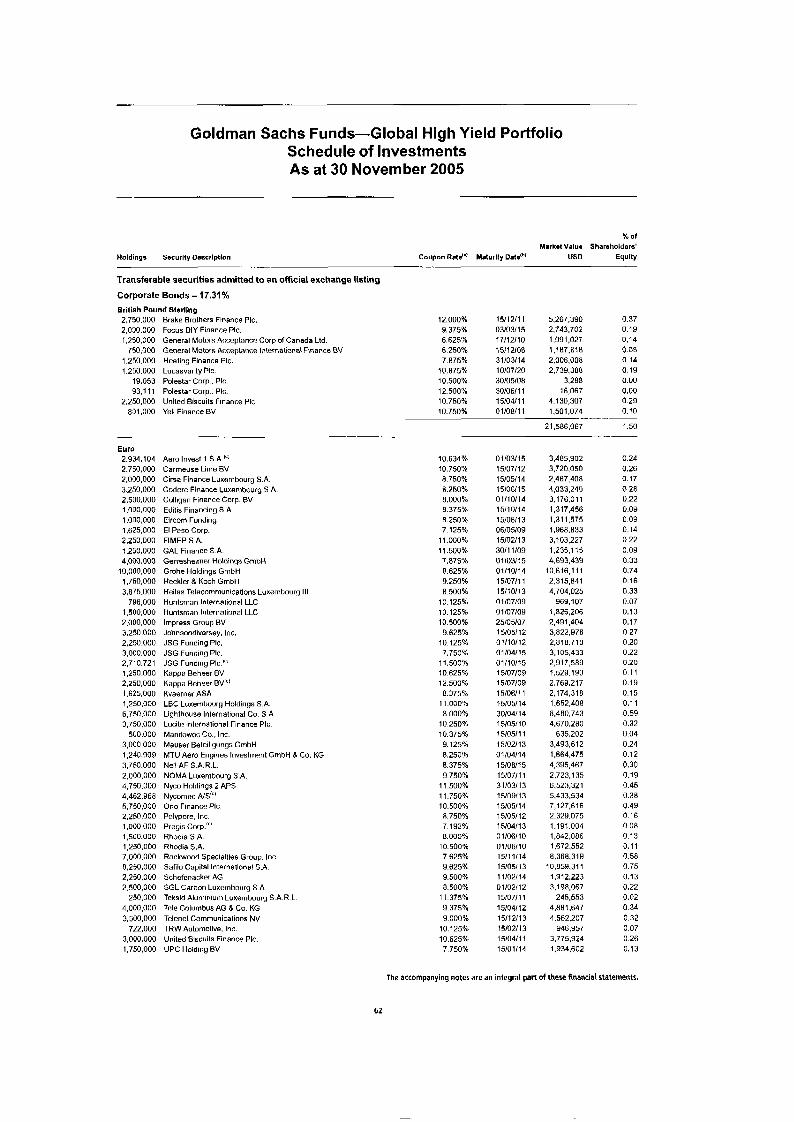
Goldman Sachs Funds-Global High Yield Portfolio Schedule of Investments As at 30 November 2005
% o f Markst Valua Sharaholders'
Holdings Socurlty Daacrlptlon Coupon Rate'" Maturny Dlto'" USD Equlty
Transferable securities admitted to an official exchange listing
Corporate Bonds - 17.31 %
- . ... .
British Pound Sterling 2.750.000 Brake Brothers Finance PIC. 12.000% 15/12/11 5,267,390 0.37
1,250.000 General Motors Acceptance Corp of Canada Ltd. 6.625% 17/12/10 1,991,027 0.14
1.250.000 Heating Finance PIC 7.875% 31/03/14 2,006,008 0.14
2,030,000 Focus DIY Finance PIC. 9.375% 03/03/15 2,743,702 0.19
750.000 General Motors Acmpiance Internstionat Finance BV 6.250% 1511 2108 1 ,I 87,816 O.OR
1.250.000 Lucasvarity PIC. 10.875% 10/07/20 2,739.388 0.13 19,053 Polestar Corp.. PIC. 10.500% 30/05/08 3,288 0.00 93.1 11 Polestar Corp.. PIC. 12.500% 30/06/11 16,067 0.00
2,250,000 United Biscuits Finance PIC. 10.750% 15/04/11 4,130,307 0 29 831,000 Yell Finance BV 10.750% 01/08/11 1.501.074 0.10
Euro 2.934.104 Aero Invest 1 S.A.": 2,750,000 Carmeuse Lime BV 2.0~0.000 Cirsa Finance Luxembourg S.A. 3.250.000 Codere Finance Luxembourg S.A. 2.500.000 Culligan Finance Corp. BV 1,000,000 Editis Financing S.A 1,000,000 Eircom Funding 1,625,000 El Peso Corp. 2.250.000 FlMEP S A. 1,250,000 GAL Finance S.A. 4,000,000 Gerresheimer Holdings GmbH
10,000,000 Grohe Holdings GmbH 1,750,000 Heckler L Koch GrnbH 3,875.000 Hellas Telecommunications Luxembourg 111
796,000 Huntsman Internalional LLC 1,500,000 Huntsman International LLC 2,000,000 lmpross Group BV 3,250,000 Johnsondivnrsey, Inc. 2,250.000 JSG Funding PIC. 3.000.000 JSG Funding PIC. 2,710,721 JSG Funding PIC 'I'
1.250.000 Kappa Beheer BV 2.250.000 Kappa Beheer BV"' 1,625,000 Kvaerner ASA 1,250,000 LBC Luxembourg Holdings S.A. 6,750,000 Lighthouse Internalional Co S A. 3,750.000 Lucite Intermtiunal Finance PIC
3,000,000 Mauser Beteiligungs GmbH 1,240,909 MTU Aero Engines Investment GmbH 8 Co. KG 3,750,000 Nell AF S.A R L 2,000,000 NOMA Luxembourg S.A. 4.750.000 Nyco Holdings 2 APS 4,462,968 Nycomed Als'" 5.750.000 Ono Finance PIC 2,250,000 Polypore. Inc 1 .oao.ooo Pregis Curp."' 1,500,000 Rhodie S A 1.250.000 Rhodia S.A. 7.000.000 Rockwood Specialties Group. Inc. 8.250.000 Safilo Capital lntern~lionel S.A 2,250.000 Schefcnacker AG 2,500,000 SGL Carbon Luxembourg SA.
250,000 Teksid Aluniinium Luxembourg S A.R L. 4,000,000 Tcle Columbus AG 8 Co KG 3,500,000 Telenet Communications NV
3,000,000 United Biscuits Finance PIC. 1.750.000 UPC Holding BV
500,000 Manitowoc Co.. Inc.
722,000 TRW Automotive, Inc.
21,586,067 1 S O
10.634% 10.750% 8.750% 8.250% 8.000% 8.375% 8.250% 7.125%
11.000% 11.500% 7,875% 8.625% 9.250% 8 500%
10.125% 10 125% 10 500% 9.625%
10.125% 7.750%
11.500% 10.625% 12.500% 8.375%
1 1 .OOO% 8.000%
10 250% 10.375% 9.125% 8.250% 8.375% 9.750%
11.500% 11.750% 10.500% 8.750% 7.192% 8.000%
10.500% 7.625% 9.625% 9.500% 8.500%
11.375% 9.375% 9.000%
10.125% 10.625% 7 750%
0 i/03/i 5 15/07/12 15/05/14 151061 15 01/10/14 15/10/14 15/08/13 06/05/09 15/02/13 30/11/09 0 11031 15 0 1/1 OH4 15/07/11 15/10/13 0 1/07/0Y 01/07/09 25/05/07 15/05/12 01/10/12 01 /04/15 01/10/15 15/07/09 15/07/09 15/06/11 15/05/11 30/04/14 15/05/10 15/05/11 15/02/13 0 1 /04/14 15/08/15 15/07/11 31/03/13 15/09/13 1 5/05/ 14 1 5/05/ 12 1 5/04/1 3 0 1/06Il 0 0 1 /06/10 15111114 15/05/13 1 1/02/14 01/02/12 15/07/11 151041 12 15/12/13 15/02/13 1510411 1 15/01/14
3,485,902 3,720,050 2,467,408 4,033.24U 3,176.0 1 1 1,317,456 1.31 1.575 1.968.833 3,103,227 1.235.1 15 4.693.439
10.616.111 2,315,841 4,704,025
969,107 1,826,206 2,491,404 3,822,976 2,818.710 3,105,433 2,917,589 1,529,190 2,769,217 2.174.318 1,652,408 8,480,743 4,670,280
635,202 3.493.612 1.664.475 4,395,467 2.723.135 6,523,321 5,433,534 7,127,616 2.329.075 1.191.004 1,842,086 1,672,552 8,366,319
10.859.31 1 1,912,223 3.198.067
245,553 4,881.647 4,562,207
Y46.957 3,775,924 1,934,602
0.24 0.2f1 0.17 0.28 0.22 0.09 0 09 0.14 0.22 0.09 0.33 0.74 0.16 0.33 0.07 0.13 0.17 0.27 0.20
0.20 0 11 0.19 0.15 0.1 1 0.59 0.32 0.04 0.24 0.12 0.30 0.19 0.45 0.38 0.49 0.16 0.08 0.13 0.11 0.58 0.75 0.13 0.22 0.02 0.34 0.32 0.07 0.26 0.13
0.22
The accompanying notes are an integral part of these financial statements.
62
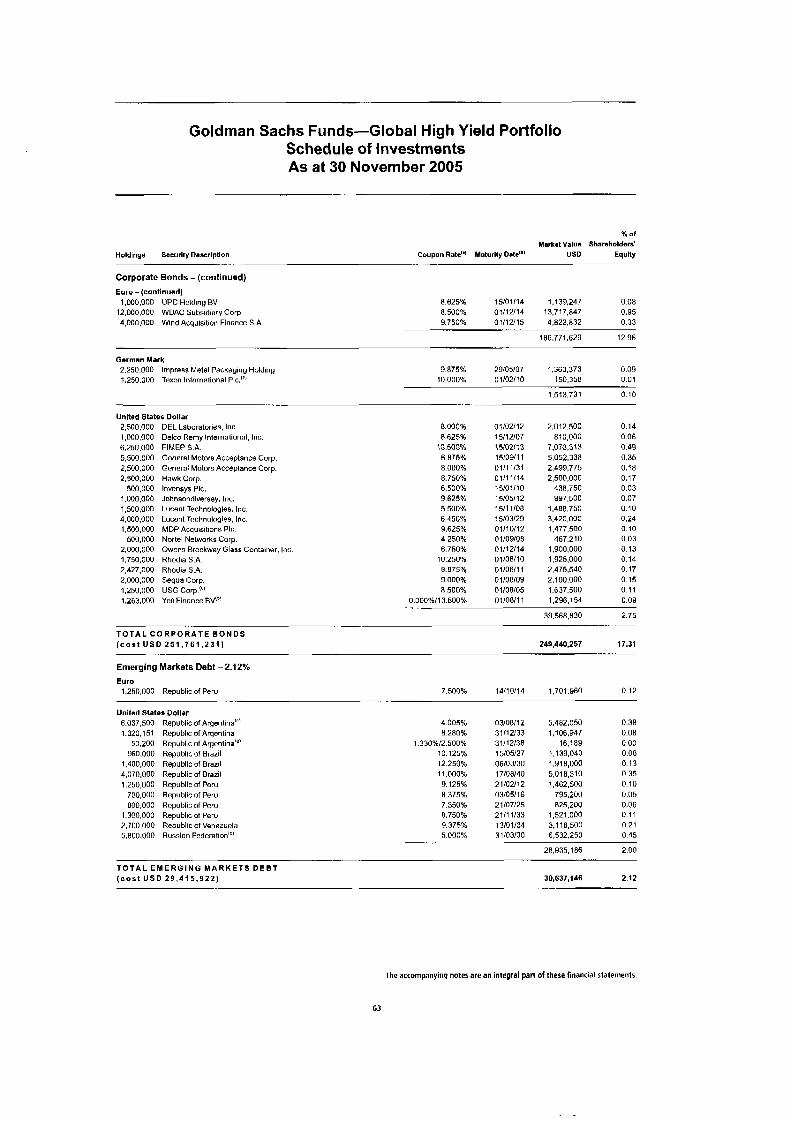
Goldman Sachs Funds-Global High Yield Portfolio Schedule of Investments As at 30 November 2005
x of
Mark.1 Value Shareholders' Holdings Socurlly Dascrlpllon Coupon Rete"' Maturity Dste'" USD Equity
Corporate Bonds - (continued)
-- . ... .. . . .
Euro - (continued)
12.000.000 WDAC Subsidmy Corp 1,000,000 UPC Holding BV
4,000,000 Wind AcquisiBon Finance S A
8.625% 15/01/14 1,139,247 0.08 8.500% 01/12/14 13.717.847 0.95 9.750% 01/12/15 4.822.832 0.33
186,771,629 12.96
German Mark 2,250,000 Impress Metal Packeyiny Holding 1.250.000 Texon lntnrnational PIC.'"
____ ~~
United States Dollar 2,500,000 DEL Laboratories, Inc. 1,000,000 Delco Rerny International. Inc. 6,250.000 FIMEP S.A. 5.500.000 General Motors Acceptance Corp. 2,500.000 General Motors Acceptance Corp. 2,500,000 Hawk Corp,
1,000,000 Johnsondiversey. Inc. 1,500,000 Lucent Technologies, Inc 4.000.000 Lucent Technologies, lm 1,500,000 MDP Acquisitions PIC.
500,000 Nortel Networks Corp. 2,000,000 Owens Brockway Glass Container. Inc 1,750,000 Rhodia S.A. 2,427,000 Rhodia S.A 2.OOV.000 Sequa Corp 1,250,000 USG Corp ('I
1,263,000 Yell Finance BV"'
500,000 Invcnsys PIC.
9.875% 29/05/07 1,363,373 0.09 10.000% 01/02/10 150,358 0.01
1,513,731 0.10
8 000% 8 625%
10 500% 6 875% 8 000% 8 750% 6 500% 9 625% 5 500% 6 450% 9 625% 4 250% 6 750%
10 250% 8 875% 9 000% R 500%
0 000%113 500% - .
0 1 /02/12 15/1 2/07 15/02/1 3 15/09/11 01/11/31 01/11/14 15/01/10 15/05/12 15/1 1/08 15/03/29 01/10/12 01/09/08 01/12/14 01 106/10 01106/11 01/08/09 01/08/05 01/08/11
2,012500
7,0703 13 5,052.338 2,499,775 2,500,000
438,750 997,500
1,488,750
1,477,500 467.210
1,900.000 1,925,000 2,415,540 2,100.000 1.637.500 1,296.154
39,568,830
810,000
3.42o.000
0.14 0.06 0.49 0.35 0.18 0.17 0.03 0.07 0.10 0.24 0.10 0.03 0.13 0.14 0.17 0.15 0.11 0.09
2.75 -
T O T A L C O R P O R A T E BONDS ( c o a t U S 0 2 5 1 . 7 6 1 . 2 3 1 ) 249.440.257 17.31
Emerging Markets Debt - 2.12% Euro
1,250,000 Republic of Peru 7.500% 14/lOll4 1.701.960 0.12 ~ ~~
United States Dollar 6.037.500 Republic of Argentina'C' 1,320,151 Republic of Arqenlina
50,200 Republic of Argentina'" Y60.000 Republic of Brad
1.40V.000 Republic of Brazil 4,070,000 Republic of Brazil 1,250,000 Republic of Pnru
700,000 Republic of Peru 800,000 Republic of Peru
1,300.000 Republic of Peru 2.700.000 Republic of Venazuela 5.8C0.000 Russian Federation'"
4.005% 8.280%
1.330%12.500% 10.125% 12.250% 11 .OOO% 9.125% 8 315% 7.3509b 8.750% 9.375% 5.000%
~ .
03/08/12 31/12/33 31/12/38 15/05/27 06/03/30 17/08/40 2 1/02/12 03/05/16 21/07/25 21/11/33 13/01/34 31/03/30
5,482,050 1,106,947
16.189 1,139,040 1,918,000 5.018.310 1,462,500
795,200 825,200
1,521,000 3.118,500 6,532,250
0.38 0 08 0 00 0 08 0 13 0 35 0 10 0.05 0.06 0 11 0 21 0 45
28.935.186 2.00
T O T A L E M E R G I N G M A R K E T S D E B T ( c o s 1 U S 0 2 9 , 4 1 5 , 9 2 2 ) 2.12 30,637,116
The accompanying notes are an integral part of these financial statements.
63
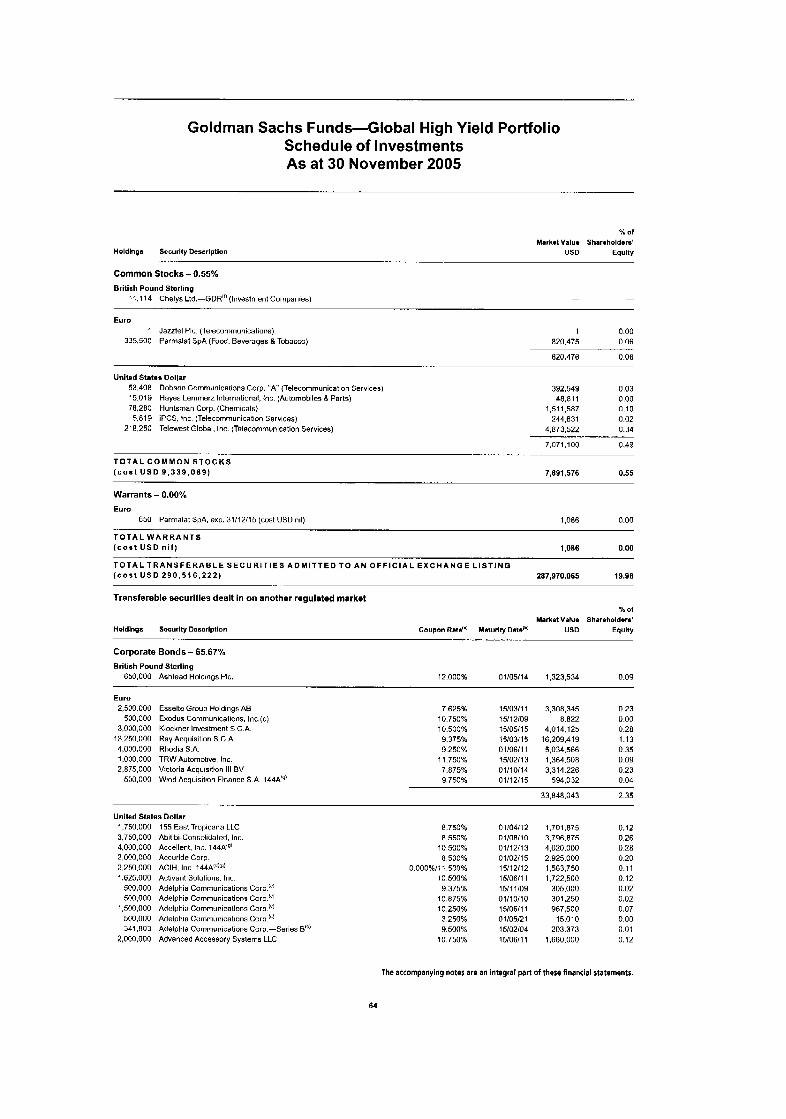
Goldman Sachs Funds-Global High Yield Portfolio Schedule of Investments As at 30 November 2005
% O f
Markot Valum Sharoholdsrs' Holdlnga Securlty Description USD Equlty
.... ... . . .~
Common Stocks - 0.55% British Pound Sterling
:1.114 Chelys Ltd.-GDR" (Investment Companies) - -
Euro 1 Jazztel PIC. (Telecommunications)
335,500 Parmalat SpA (Food. Beverages & Tobacco) 1 0.00
820.475 0.06
820,476 0.06
United Ststas Dollar 53.408 Dobson Communications Corp. "A ' (Telecommunication Services) 392,549 0.03 15.019 Hayes Lemmerz International. Inc. (Automnbiles R Park) 48,811 0.00 78,280 Huntsman Corp. (Chemicals) 1,511,587 0.10 5,819 iPCS. Inc (Telecommunicatinn Services) 244,631 0.02
2'8.250 Telewest Global, Inc (Tolecommunication Services) 4,873,522 0.34
7,071,100 0.49 - ~. .-
T O T A L C O M M O N S T O C K S ( c o s t USD 9 ,339 ,069) 7,881,576 0.55
Warran ts - 0.00% Euro
650 Parmalat SpA, exp. 31/12/15 (cost US0 nil) 1,086 0.00
( c o s t U S 0 n i l ) 1.086 0.00
( c o s t US0 290 ,516 ,222) 287,970,065 19.98
T O T A L W A R R A N T S
T O T A L T R A N S F E R A B L E S E C U R I T I E S A D M I T T E D TO A N O F F I C I A L E X C H A N G E L I S T I N G
Transferable securities dea l t in on ano the r regu la ted market % Of
Market Value Shareholders' Holdlnga Securlty Deacrlptlon Coupon Rats''i Maturlty Data"' US0 Equlty
~ .
Co rpo ra te Bonds - 65.67% British Found Sterling
650,000 Ashtead Holdings PIC. 12.000% 01/05/14 1,323,534 0.09
Euro 2.500.000 Esselte Group Holdings AB
3,000.000 Klockner Investment S C.A. 13.250.000 Ray Acquisition S.C.A 4,000,000 Rhodia S.A. 1,000,000 TAW Automotive, Inc 2.875.000 Victoria Acquisition 111 BV
500.000 Exodus Communications. Inc.(c)
500,000 Wind Acsuisition Finance S.A 144A'"'
- - . .
United States Dollar 1.750.000 3,750,000 4,000,000 3,000.000 2.250.000 1,625,000
5C0.000 500.000
1,5C0.000 5C0.000 341.R03
2.0c0.000
155 East Tropicana LLC Abitihi-Confiolidatecl. Inc. Accellent. Inc. 144A'O' Accuride Corp. ACIH. Inc. 144A'"""! Activant Solutions. Inc Adelphin Communications Corp.''' Adelphia Communications Corp."' Adelphia Communications Corp."' Adelphia Cummunicalions Corp Adelphia Cummunicalions Corp -Series B"' Advanced Accessory Systems LLC
7.625% 10.750% 10.500% 9.375% 9.250%
11.750% 7.875% 9.750%
15/03/11 15/12/09 15/05/i 5 15103115 01/06/11 15/02/13 01/10/14 01/12/15
3,308,345 8.822
4,014. I25 16.209.419 5,024,566 1,364508 3.314.226
594.032
0.23 0.00 0.28 1.13 0.35 0.09 0.23 0.04
33.848.043 2.35
8.750% 8.550%
10 500% 8 500%
0.000%/11,500% 10.500% 9.3755
10.875% 10.250% 3.250% 9.500%
10.750%
0 1/04/12 0 l l08 l l0 01/12/13 01/02/15 15/12/12 15/06/11 15/11/09 01/10/10 15106ll 1 01/05/21 15/02/01 15/06/11
1.701.875 3.796.875 4,020,000 2,925,000 1.563.750 1,722,500
305.000 301,250 967,500
15,010 203,373
1,660,000
0.12 0.26 0.28 0.20 0.11 0.12 0.02 0.02 0.07 0.00 0.01 0.12
The accompanying notes are an integral part of these financial statements.
64
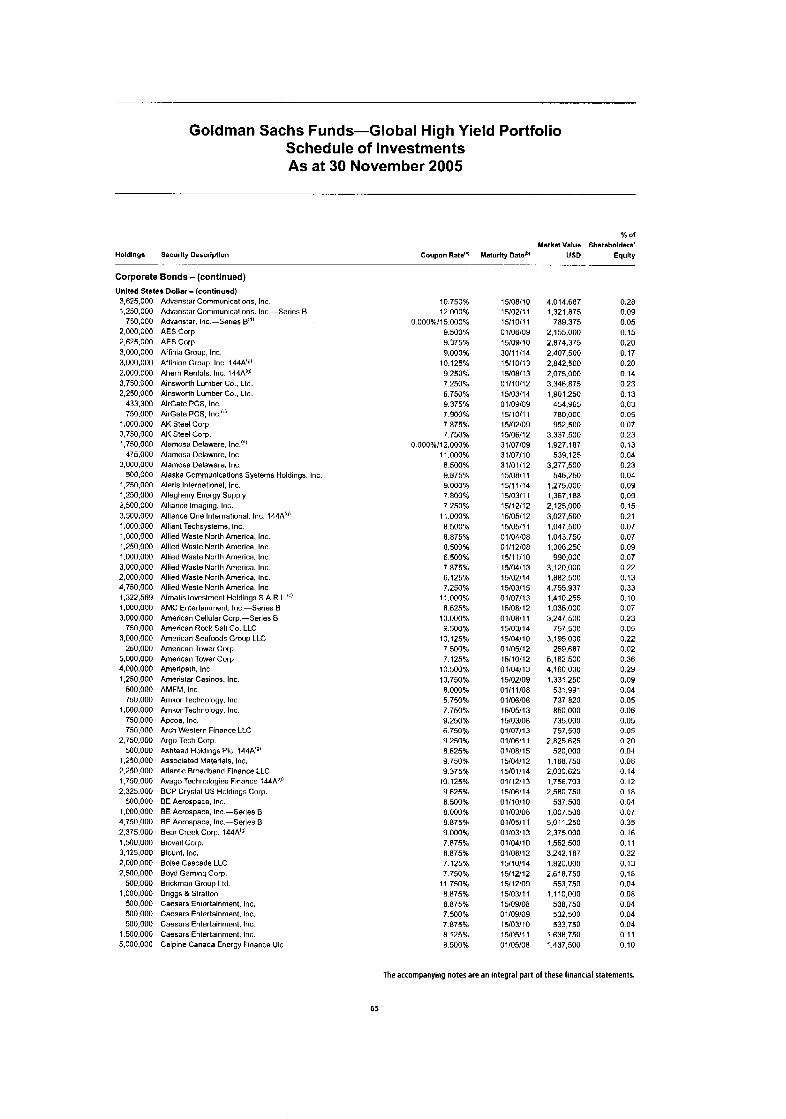
Goldman Sachs Funds-Global High Yield Portfolio Schedule of Investments As at 30 November 2005
Holdlnga Securlty Descrlptlon Coupon Maturlty Dateib)
Corporate Bonds - (continued)
United States Dollar - (continued)
~ - __ - .. __
3,625,000 1,250,000
750,000 2,000,000 2,625,000 3,000,000 3,000,000 2.000.000 3.750.000 2,250.000
433,300 750.000
1,000,000 3,750,000 1,750,000
475.000 3,000,000
500,000 1,250,000 1,250,000 2,500,000 3,500,000 1,000.000 1,000,000 1.250.000 1.000.000 3,000,000 2.000.000 4,750,000 1.322569 1,000,000 3,000,000
750.000 3,000,000
250,000 5,000,000 4,000,000 1,250,000
500,000 750,000
1,000,000 750,000 750,000
2,750,000 500,000
1.250.000 2,250.000 1,750,000 2,325.000
500.000 1,000.000 4,750.000 2,375.000 1,500,000 3,125,000 2.000.000 2,500,000
500,000 1,000,000
500,000 500.000 500,000
1,500,000 5,000.000
Advanstar Communlcalions. Inc. Advanstar Communications. Inc.-Series B Advanstar. Inc.-Snries 8'"' AES Corp AES Gorp. Affinia Group, Inc. Affinion Group, Inc. 144A'U' Ahern Rentals, Inc. 144AIg' Ainsworth Lumber Co.. Ltd. Ainsworth Lumber Co.. Ltd. AirGate PCS. Inc. AirGate PCS. Inc.'" AK Steel Corp AK Steel Corp. Alamusa Delaware, lnc.(d' Alamosa Delaware. Inc. Alamosa Delaware. Inc. Alaska Communications Systems Holdings. Inc. Alnris International. Inc. Allegheny Enorgy Supply Alliance Imaging. Inc. Alliance One International. Inc. 144AU' Allianl Techsyslems. Inc. Allied Waste North America, Inc. Allied Waste North America. Inc. Allied Waste North America. Inc. Allied Waste North America. Inc. Allied Waste North America, Inc. Allied Waste North America, Inc Almalis Inveslmenl Holdings S A.R L."! AMC Enterlninrnent. Inc.-Series B American Cellular Corp.-Series E American Rock Salt Co. LLC American Seafoods Group LLC American Tower Corp. American Tower Corp Ameripath. Inc. Ameristar Casinos. Inc. AMFM. Inc. Amkor Technology. Inc Arnkor Technology. Inc Apcoa. Inc. Arch Western Finance LLC ArgwTech Corp. Ashtead Holdings PIC. 144A:O' Associated Materials, Inc. Atlantic Broadband Finance LLC Avago Tochnologies Finance 144A'I' BCP Crystal US Holdings Corp. BE Aerospaco, Inc. BE Aerospaco, h-Ser ies B BE Anrospace, Inc.-Series B Boar Greek Corp. 144A'I' Biovail Corp. Blount. Inc. Boise Cascade LLC Boyd Gaming Curp. Bricknian Group Ltd. Briggs & Stratton Caesars Entnrtainnient. Inc. Caesars Entcrtainrnnnt. Inc. Caesars Entortainrnonl. Inc. Caesars Entertainrnont. Inc. Calpine Canada Energy Finance Ulc
10.750% 12.000%
0.000%/15.000% 9.500% 9.375% 9.000%
10.125% 9.250% 7.250% 6.750% 9.375% 7.900% 7.875% 7.750%
0.000%/12.000% 11 .OOO% 8.500% 9.875% 9.000% 7.800% 7.250%
11.000% 8.500% 8.875% 8.500% 6.500% 7.875% 6.125% 7.250%
11 .OOO% 8 625%
10.000% 9 s o O %
I O . 125% 7 500% 7.125%
10 500% 10.750% 8.000% 5 750% 7.750% 9.250% 6.750% 9.250% 8.625% 9.750% 9.375%
10.125% 9.625% 8.500% 8.000% 8.875% 9.000% 7.875% 8.875% 7.125% 7.750%
11.750% 8.875% 8.875% 7.500% 7.875% 8.125% 8.500%
i5/0a/io 15/02/11 15/10/11 01/06/09 15/09/10 30/11/14 15/10/13 15/08/13 01/10/12 15/03/14 01/09/09 15/10/1 1 15/02/09 15/06/12 31/07/09 31/07/10 31/01/12
1511 1/14 15/03/1 1 15/12/12 15/05/12 15/05/11 0 1 /04/08 01/12/08 15/11/10 15/04/13 15/02/14 15/03/15 01/07/i 3 15/08/12
15/03/14 15/04/ 10 01/05/12 15/10/12 01/04/13 15/02/09 01/1 1/08 01/06/06 15/05/13 15/03/08 01/07/13 01/06/11 01108115 151041 12 15/01/14 01/12/13 15/06/14 0 1/10/1 0 01103108 01/05/11 01/03/13 01/04/10 Oll08ll2 15/10/14 15/12/12 15/12/09 15/03/11 15/09/08 01/09/09 15/03/10 15/05/11 0 1 /05/08
i5/oa/i 1
o i / oa / i i
% Of
Market Value Shareholders' US0 Equlty
4,014,687 1.321.875
789.375 2,155,000 2,874,375 2,407,500 2,842,500 2,075,000 3,346,875 1,901,250
454.965 780,000 952.500
3.337.500 1,927.187
539,125 3,277,500
546,250 1,275,000 1.367.1 88 2,125,000 3,027,500 1,047,500 1,043,750 1.306.250
990,000 3,120,000 1,882,500 4,755,937 1,410,255 1,035,000 3,247,500
757,500 3,195,000
5,162,500 4,160,000 1,331,250
531,991 737.820 850,000 735,000 757,500
2,825,625 520,000
1,168.750 2,030.625 1,756,703 2,580.750
537.500 1,007,500 5,011,250 2,375,000 1,552,500 3,242,187 1,820,000
553,750 1.1 10,000
538,750 532,500 533,750
1,638,750 1,437,500
259,687
2.6ia.750
0.28 0.09 0.05 0.15 0.20 0.17 0.20 0.14 0 23 0.13 0.03 0.05 0 O f 0 23 0.13 0.04 0.23 0.04 0.09 0.09 0.15 0.21 0.07 0.07 0.09 0.07 0.22 0.13 0.33 0.10 0.07 0.23 0.05 0.22 0.02 0.36 0.29 0.09 0.04 0.05 0.06 0.05 0.05 0.20 0.04 0.08 0.14 0.12 0.18 0.04 0.07 0.35 0.16 0.11 0.22 0.13 0.18 0.04 0.08 0.04 0.04 0.04 0.11 0 10
The accompanying notes are an integral part of these financial statements.
65
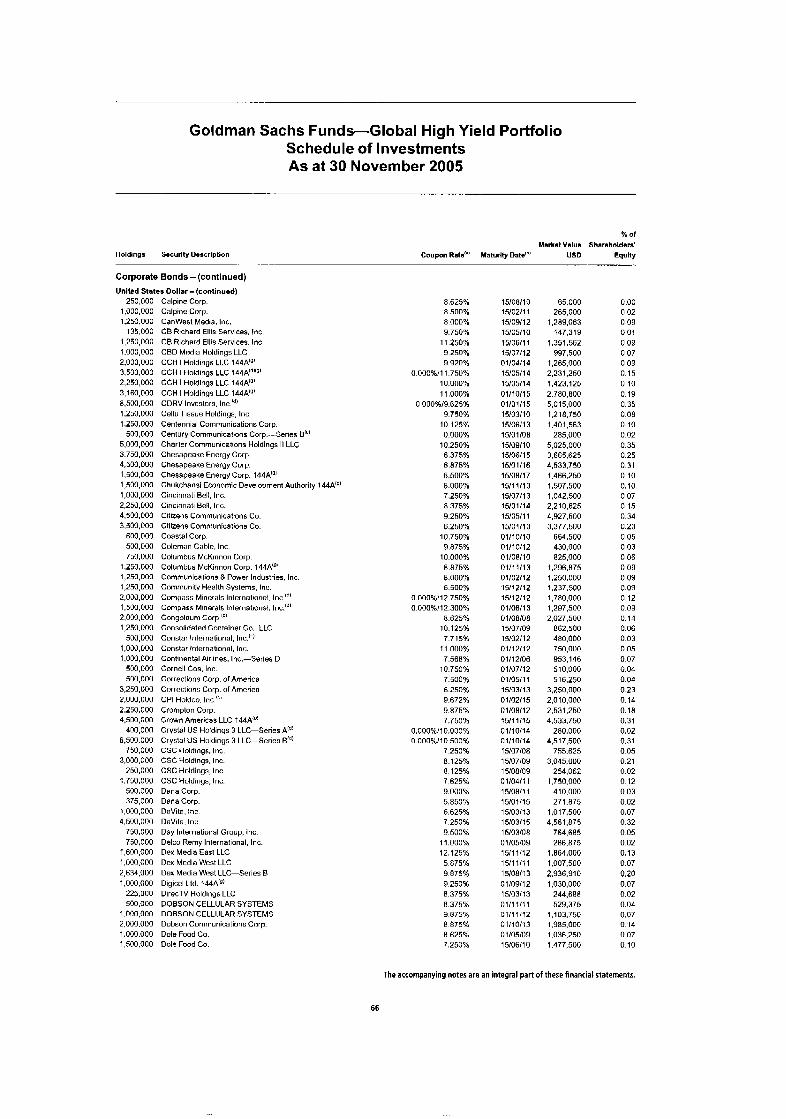
Goldman Sachs Funds-Global High Yield Portfolio Schedule of Investments As at 30 November 2005
% of Markat Value Sharsholdsrs'
Holdlngs Sacurlty Dsscrlptlon Coupon Rats'" Maturlty US0 Equlty
Corporate Bonds - (contlnuad) Unlted States Dollar - (continuad)
-. ..
250,000 1,030,000 1.250.000
1.230.000 1.000,000 2.030,000 3,500,000 2,230,000 3,180,000 8.500.000 1,250,000 1,250,000
500,000 5.000.000 3.750.000 4,500,000 1.500.000
135.000
1,530,000 1,000,000 2,250,000 4,530.000 3,500,000
600,000 500,000 750.000
1,250,000 1,250,000 1,250,000 2,000.000 1,500,000 2.000.000 1,250.000
500,000 1,000,000 1,000,000
500,000 500,000
3,250,000 2,000,000 2,250,000 4,500,000
400.000 6.500.000
750,000 3,000.000
250.000 1,750,000
500,000 375.000
1,000,000 4,500,000
750,000 760.000
1,600,000 1,000.000 2,634,000 1,000,000
225,000 500,000
1,000,000 2.000.000 1,000.000 1,500,000
Calpine Corp. Calpine Corp. CanWest Media. Inc. CB Richard Ellis Snrvices. Inc. CB Richard Ellis Services. Inc CBD Media Holdings LLC CCH I Holdings LLC 144A'Y' CCH I Holdings LLC 144A("i(gi CCH I Holdings LLC 144A'q' CGH I Holdings LLC 144A'I' CDRV Investors. lnc.'") Cellu Tissue Holdings, Inc Centennial Communications Corp. Century Communications Corp.---Series E''' Charter Communications Holdings II LLC Chesapeake Energy Corp. Chesapeake Energy Corp. Chesapeake Energy Corp. 144A'" Chukchansi Economic Development Authority 144A'O' Cincinnati Bell, Inc. Cincinnati Bell, Inc. Citizens Communications Co. Citizens Communications Co. Coastal Corp. Coleman Cable. Inc. Columbus McKinnon Corp. Columbus McKinnon Corp. 144A'O' Communicalions 8 Power Industries. Inc. Community Health Systems. Inc. Compass Minerals International. lnc!"' Compass Minerals International, Inc.'" Congoloum Corp Consolidatod Container Go., LLC Constar International, ~nc.': Constar International, Inc. Continental Airlines, Inc.-Series D Cornell Cos. Inc. Corrections Corp. of America Corrections Corp. of America CPI Holdco. Inc !" Cromplon Corp. Crown Americns LLC 144A'") Crystal US Holdlnqs 3 LLC-Series A"" Crystal US Holdings 3 LLC-Series 0'"; CSC Holdings. Inc. CSC Holdings. Inc. CSC Holdings, Inc. CSC Holdings, Inc. Dana Corp. Dana Corp. DaVita. Inc DaVita. Inc Day International Group, Inc. Delcu Remy International. Inc. Dex Media East LLC Dex Media West LLC Dex Media Wwt LLC-Series B Digicel Ltd. 144AIg' DirecTV Holdings LLC DOBSON CELLULAR SYSTEMS DOBSON CELLULAR SYSTEMS Dobson Communications Corp. Dole Food Co. Dole Food Co.
8.625% R 500% R 000% 9.750%
11 250% 9 250% 9.920%
0.000%/11.750% 10.000% 11.000%
0.000%/9.625% 9.750%
10.125% 0.000%
10.250% 6.375% 6.875% 6.500% 8.000% 7.250% 8.375% 9.250% 6.250%
10.750% 9.R75%
10.000% 8.875% 8.000% 6.500%
0.000%/12.750% 0.000%/12.300%
8.625% 10.125% 7.715%
11 .OOO%
10.750% 7.500% 6.250% 9.672% 9.075% 7.750%
0.000%110.000% 0.000%/10.500%
7.250%
8 125% 7 625% 9.000% 5.850% 6.625% 7.250% 9.500%
11 .OOO% 12.125% 5 875% 9 875% 9.250% 8.375% 8.375% 9 875% 8 875% 8.625% 7.250%
7.568%
a. 125%
15/08/10 15/02/11 15/09/12 15/05/10 15/06/11 15/07/12 01/04/14 15/05/14 15/05/14 01/10/15 01/01/15 15/03/10 15/06/13 15/01/08 15/09/10 15/06/15 15/01/16 15/08/17 15/11/13 15/07/13 15/01/14 15/05/11 15/01/13 01/10/10 01/10/12 01/08/10 01/11/13 01/02/12 15/12/12 15/12/12 01/06/13 01/08/08 15/07/09 15/02/12 0111211 2 0 1 I1 2/06 01/07/12 01/05/1 1 1510311 3 01/02/15 01/08/12 15/11/15 01/10/14 01/10114
15/07/09 15/08/09 01/04/11 15/08/11 15/01/15 15/03/13 15/03/15 15/03/08 01/05/09 15/11/12 15/11/11 15/08/13 01/09/1z 15/03/13 01/11/11 01/11/12 01/10/13 01/05/09 15/06/10
15/07/0a
65.000 265,000
1,289,063 147,319
1,351,562 997,500
1,265,000 2,231,250 1,423,125 2.780.800 5.015.000 1,218,750 1,401,563
285.000 5,025.000 3,665,625 4,533,750 1,466,250 1,507,500 1,042,500 2,210,625 4,927,500 3,377,500
664,500 430,000 825.000
1,250,000 1,237,500 1,780,000 1,297,500 2,027,500
862,500 480,000 750,000 953,146 510,000 516,250
3,250,000 2,010,000 2,531,250 4533.750
280,000 4,517,500
755,625 3,045,000
254.062 1,750,000
410.000 271.875
1,017,500 4.561.875
764.685 286.875
1,864,000 1,007,500 2,936,910 1,030,000
244.688 529,375
1,103,750 1,985,000 1,036,250 1,477,500
i.296.a75
0.00 0.02 0.09 0.01 0.09 0.07 0.09 0.15 0.10 0.19 0.35
0.10 0.02 0.35 0.25 0.31 0.10 0.10 0.07 0.15 0.34 0.23 0.05 0.03 0.06 0.09 0.09 0.09 0.12 0.09 0.14 0.06 0.03 0.05 0.07 0.04 0.04 0.23 0.14 0.18 0.31 0.02 0.31 0.05 0.21 0.02 0.12 0.03 0.02 0.07 0.32 0.05 0.02 0.13 0.07 0.20 0.07 0.02 0.04 0.07 0.14 0.07 0.10
0.08
The accompanying notes are an integral part of these financial statements.
66
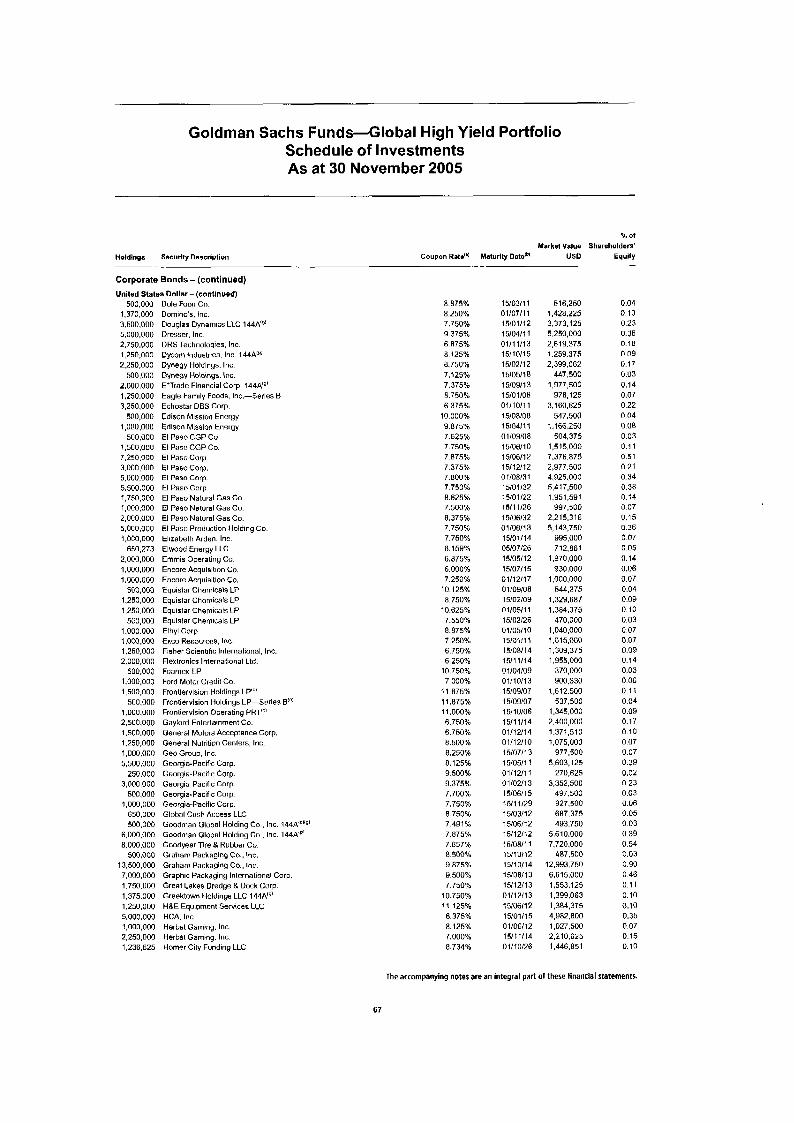
Goldman Sachs Funds-Global High Yield Portfolio Schedule of Investments As at 30 November 2005
Holdlnga Securlty Description
Corporate Bonds - (continued) United States Dollar - (continued)
..
500.000 Dole Food Co. 1.370.000 Domino's. Inc. 3,500,000 Douglas Dynamics LLC lA4A'I' 5,000,000 Dresser. Inc. 2,750,000 DRS Technologies. Inc. 1,250,000 Dycom Industries. Inc. 144A". 2,250,000 Dynegy Holdinys. Inc.
500,000 Dynegy Holdings. Inc. 2,000,000 E'Trade Financial Corp 14AAiq' 1,250,000 3.250.000 Echoslar DES Corp,
500.000 Edison Mission Energy 1 ,000,000 Edison Mission Energy
500.000 El Paso CGP Co 1.500.000 El Paso CGP Co. 7,250,000 El Paso Corp. 3.000.000 El Pas) Corp. 5.000.000 El Paso Cnrp 5.5G0.000 El Paso Corp 1.760.000 El Paso Natural Gas Co. l,OCO,OOO El Paso Natural Gas Co. 2.0C0.000 El Paso Natural Gas Co. 5.0C0.000 El Paso Production Holding Co. 1.0C0.000 Elizabelh Arden. Inc.
650.273 Elwood Energy LLC 2,000.000 Emmis Operating Co. 1,000,000 Encore Acquisition Co. 1,000,000 Encore Acquisition Co.
500,000 Equislar Chemicals LP 1.250.000 Equislar Chomicals LP 1,250,000 Equistar Chemicals LP
5C0,OOO Equislar Chemicals LP 1.000.000 Ethyl Corp. 1 .OCO.OOO Exco Resources. Inc. 1,250,000 Fisher Scientific Intnrnational. Inc. 2.0C0.000 Flextrunics International Ltd.
1,000,0110 Ford Molor Credit Co. 1.500.000 Frontiervision Holdings LP"'
1.000.000 Frontiervision Operating PRT"' 2,5UO,OOO Gaylord Entertainment Co. 1.500.000 General Motors Acceptanco Corp. 1,250,000 General Nulrition Centers. Inc. 1,000,000 Geo Group. Inc. 5,500,000 Georgia-Pacific Corp.
250,000 Georgia-Pacific Corp. 3,000,000 Georgia-Pacific Cnrp.
500,000 Georgia-Pacific Corp 1,000,000 Georgia-Pacific Corp
650,000 Global Cash Access LLC 500,000 Goodman Global Holding Co , Inc. 144A"""
6,000,000 Goodnian Global Holding Co., Inc. 144A" 8,000,000 Goodyear Tire B Rubber Co.
500,000 Graham Packaging Cn.. Inc. 13,500,000 Graham Packaging Co.. Inc
Eagle Family Foods. Inc.-Series B
5C0.000 Foamex-LP
500,000 Frontiervision Holdings LP-Series 0:''
7,000,000 Graphic Packaging International Corp. 1,750,000 Great Lakes Dredge R Dock Corp. 1.375.000 Greektown Holdings LLC 144Aiy' 1,250,000 H8E Equipment Services LLC 5,000,000 HCA. Inc 1,000,000 Herbst Gaming. Inc. 2,250,000 Herbs1 Gaming. Inc. 1,236,625 Homer City Funding LLC
Coupon Rata'" Maturity Date'* Market Value
USD
X of Shareholders'
Equity
8.875% 8.250% 7.750% 9 375% 6 875% 8 125% 8.750% 7,125% 7.375% 8.750% 6.375%
10.000% 9.875% 7.625% 7.750% 7.875% 7.375% 7.800% 7.750% 0.625%
8.375% 7.750% 7.750% 8.159% 6.875% 6.000% 7.250%
10.125% 8.750%
10.625% 7.550% 8.875% 7.250% 6.750% 6.250%
10.750% 7 000%
11.875% 1 1.875% 11.000% 6.750% 6.750% 8.500% 0.250% 8.125% 9 500% 9.375% 7.700% 7.750% 8.750% 7.491%
7.857% 8.500% 9.875% 9.500% 7 750%
10 750% 1 1,125% 6.375% 8.125% 7.000% 8.734%
7 . 5 o n ~ ~
7.875%
15/03/11 01/07/11 1 510 1 / I 2 15/04/11 01/11/13 15/10/15 15/02/12 1510511 E 1 5/09/13 15/01/08 01/10/1 1 15/06/08 15/04/11 01/09/08 15/06/1 0 15/06/12 15/12/12 01/08/31 15/01/32 15/01/22 1 511 1/26 15/06/32 01/06/13 15/01/14 05/07/26 15/05/12 15107115 01/12/17 01/09/08 15/02/09 01/05/1 1 15/02/26 01/05/10 15101111 15/08/14 i5/1 1/14 01/04/09 01/10/13 15/09/07 15/09/07 15/10/06 15/11/14 01/12/14 01/12/10 15/07/13 15/05/11 01/12/11 01/02/13 15/06/15 15/11/29 15/03/12 15/06/12 15/12/12 15/08/11 15110112 15/10/14 15/06/13 15/12/13 01/12/13 15/06/12 15/01/15 0 1/06/12 15/11/14 01/10/26
516,250 1,428.225 3,373,125 5,250,000 2,619.375 1.259.375 2.399.062
447,500 1,977,500
978.125 3.160.625
547,500 1,166,250
504.375 1,515.000 7.376.075 2,977.500 4,925,000 5,417,500 1.Y51.591
997,500 2,215.316 5,143,750
995.000 712,861
1,970,000 930,000
1,000,000 544,375
1.329.687 1.384.375
470,000 1,040,000 1.015.0OO 1,309,375 1.955.000
370,000 900.330
1,612.500 537.500
1.345.000 2,400,000 1,371,510 1,075,000
977.500 5,603,125
270,625 3,352,500
497.500 927,500 687.375 493.750
5,610.000 7,720,000
407.500 12,993,750 6,615,000 1.553.125 1.399.063 1,384,375
1,027,500 2,210,625 1,446,851
4,982,800
0.04 0.10 0.23 0.36 0.18 0.09 0.17 0.03 0.14 0.07 0.22 0.04 0.08 0.03 0.11 0.51 0.21 0 34 0 38 0.14 0.07 0.15 0.36 0.07 0.05 0.14 0.06 0.07 0.04 0.09 0.10 0.03 0 07 0.07 0.09 0.14 0.03 0.06 0.11 0.04 0.09 0.17 0.10 0.07 0.07 0.39 0.02 0.23 0.03 0.06 0.05 0.03 0 39 0.54 0.03 0.90 0.46 0.1 1 0.10 0.10 0.35 0.07 0.15 0.10
The accompanying notes are an integral part of these financial statements.
67
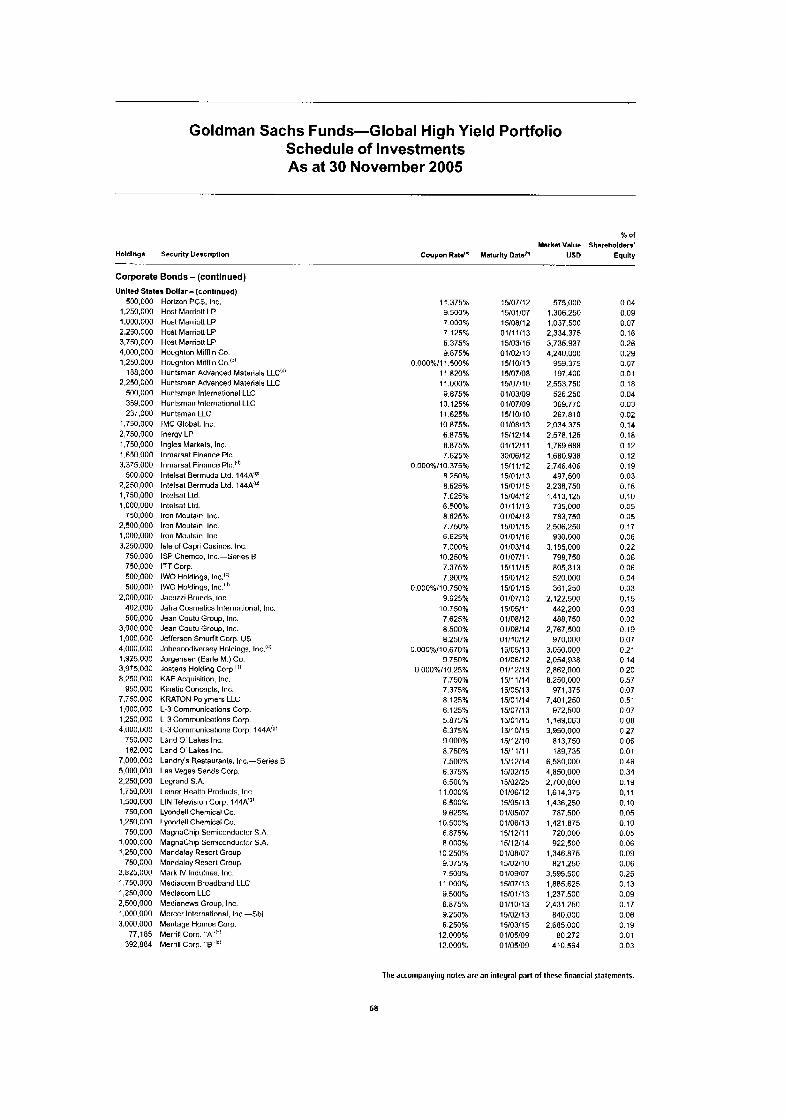
Goldman Sachs Funds-Global High Yield Portfolio Schedule of Investments As at 30 November 2005
Holdlnga Security Description
% of Market Value Shareholders'
Coupon Rate''' Maturity Dateib' US0 Equity
Corporate Bonds - (continued) Unlted States Dollar - (continued)
500.000 1,250,000 1,000,000 2.250.000 3,750,000 4,000,000 1,250,000
2,250,000 500,000 3jY.000 237,000
1,750,000 2,750,000 1,750,000 1.650.000 3.375.000
500,000 2,250,000 1,750,000 1,000,000
750,000 2.500.000 1,000,000 3,250,000
750.000 750,000 500,000 5oo.oon
2,000,000 402,000 500,000
3,000,000 1,000,000 4,000,000 1,925,000 3.Y'5.000 8.250.000
950.000 7,750,000 1,000,000 1,250,000 4,000,000
750,000 182,000
7,000,000 5,000,000 2,250,000
1,500,000 750,000
1,250,000 750.000
1,000.000 1,250,000
750,000 3.825.000 1,750,000 1,250,000 2,500,000 1,000.000 3,000.000
77.185 392,884
ia8,ooo
1,750.noo
Horizon PCS. Inc. Host Marriolt LP Host Marriolt LP Hust Marrioll LP Host Marriolt LP Houghron Mifflin Co. Hnughton Mifflin CO.'~' Huntsman Advanced Materials LLC:" Huntsman Advanced Materials LLC Huntsman International LLC Huntsman International LLC Huntsman LLC IMC Global, Inc lnergy LP lngles Markats, Inc. lnmarsat Finance PIC. lnmarsat Finance PIC.'"' Inlelsal Bermuda Ltd. 144A'g' lnlelsal Bermuda Lld. 144AU! Intelsat Ltd. lntelsal Ltd. Iron Moutain, Inc. Iron Moutain, Inc. Imn Moutain. Inc. Isle of Capri Casinos. Inc. ISP Chemco. Inc.-Series B ITT Corp. IWO Holdings. Inc."' IWO Holdings, Inc."' Jacuzzi Brands, Inc Jafra Cosmetics International. Inc. Jean Coutu Group. Inc. Jean Coutu Group. Inc Jefferson Srnurfit Corp. US Johnsondiversey Holdings. lnc.I0) Joryensen (Earle M )Go. Jostens Holding Corp."' K8F Acquisition, Inc. Kinetic Concopts, Inc. KRATON Polymers LLC L-3 Communications Corp. L-3 Communications Corp. L-3 Communications Corp. 144AIa! Land 0' Lakes Inc. Land 0' Lakes Inc. Landry's Rnstaurants. Inc.-Series B Las Vegas Sands Corp Legrand S A Leiner Health Producls. Inc. LIN Television Corp. 144A:u' Lyondell Chemical Co Lyondell Chemical Cu. MagnaChip Semiconductor S.A MagnaChip Scmiconduclor S A Mandalay Resort Group Mandalay Resort Group Mark IV Indutries. Inc. Mediacom Broadband LLC Mediacom LLC Medianews Group. Inc. Mercer International, Inc.-5bi Meritage Homos Gorp, Merrill Corp. ' A".' Merrill Cnrp. ' 6
11.375% 9 500% 7 000% 7.125% 6.375% 9.875%
0.000%/11.500% 11 820% 11 .OOO% 9.875%
10.125% 11.625% 10.875% 6.875% 8.875% 7 625%
0.000%/10 375% 8 250% 8.625% 7.625% 6.500% 8 625% 7.750% 6.625% 7.000%
10.250% 7.375% 7.900%
0.000%/10.750% 9.625%
10.750% 7.625% 8.500% 8.250%
0.000%/10.670% Y 750%
0 000%/10.25% 7.750% 7.375% 8 125% 6.125% 5.875% 6.375% Y.OOO% 8.750% 7.500% 6.375% 8.500%
1 1 .OOO% 6.500% 9.625%
10.500% 6.875% 8 000%
10 250% Y.375% 7 500%
11 .OOO% 9.500% 6.875% 9.250% 6.250%
12.000% 12,OOOY"
15/07/12 15/01/07 15/08/12 01/11/13 15/03/15 01/02/13 15/10/13 15/07/08 15/07/10 01/03/09 01/07/09 15/10/1 0 01/0811 3 15/12/14 O1/12/1 1 30/06/12 15/11/12 15/01/13 1 510 1 I1 5 15/04/12 01/11/13 01/04/13 15/01/15 01/01/16 01/03/i 4 01/07/11 15/i 1/15 15/01/12 15/01/15 01/07/10 15/05/1 1 01/08/12 01/08/14 01/10/12 15/05/13 01/06/12 01/12/13 15/11/14 15/05/13 1 5/0 1 I1 4 15/07/13 1 510 1 I1 5 1511 011 5 15/12/10 15/11/11 15/12/14 15/02/15 15/02/25 01/06/i 2 151051 13 0 1/05/07 01/06/13 15/12/11 15/12/14 01/08/07 15/02/10 01/09/07 15/07/13 15/01/13 01/10/13 15/02/13 15/03/15 01/05/09 01/05/09
575,000 1,306,250 1,037,500 2,334,375 3.735.937 4,240,000
Y5Y.375 197,400
2,553,750 526,250 369.770 267,810
2,034,375 2.578.125 1.769.688 1.680.938 2.746.406
497.500 2.238.750 1.413.125
735,000 783,750
2,506,250 930,000
3,185,000 798,750 805.313 520.000 361,250
2.122.500 442,200 488.750
2.767.500 970,000
3,050,000 2.054.938 2,862,000 8.250.000
971.375 7,401,250
972,500 1,189,063 3.950.000
8 13,750 189.735
6.580.000 4,850,000 2,700,000 1,614,375 1.436.250
787,50[3 1,421,875
720.000 922,500
1,346.875 821,250
3,595,500 1.885.625 1,237,500 2,431,250
840.000 2.685.000
80.272 410.564
0.04 0.09 0.07 0.16 0.26 0.29 0.07 0.01 0.18 0.04 0.03 0.02 0.14 0.18 0.12 0.12 0.19 0.03 0.16 0.10 0.05 0.05 0.17 0.06 0.22 0.06 0.06 0.04 0.03 0.15 0.03 0.03 0.19 0.07 0.21 0.14 0.20 0.57 0.07 0.51 0.07 0.08 0.27 0.06 0.01 0.46 0.34 0.19 0.11 0.10 0.05 0.10 0.05 0 06 0.09 0.06 0.25 0.13 0.09 0.17 0.06 0.1y
0.01 0.03
The accompanying notes are an integral part of these financial statements.
68
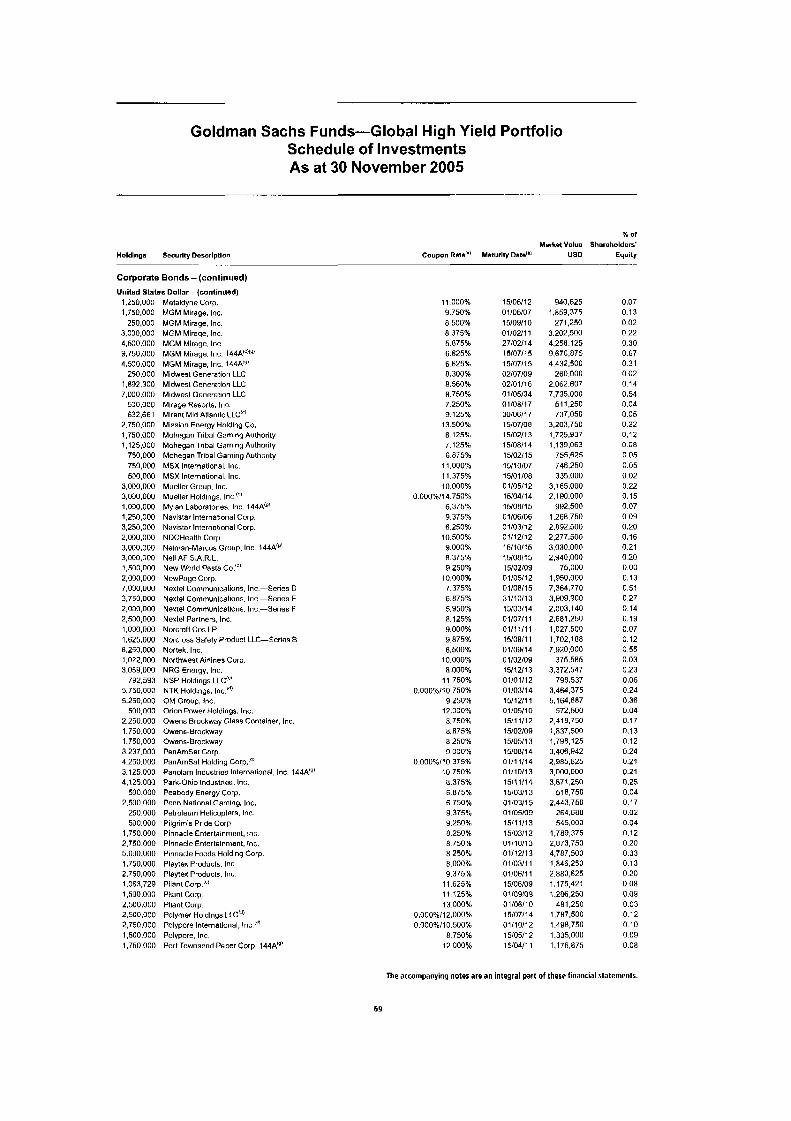
Goldman Sachs Funds-Global High Yield Portfolio Schedule of Investments As at 30 November 2005
Holdlngs Security Description . .. .
Corporate Bonds - (continued) United Stataa Dollar - (continued)
1,250,000 l.750.000
250,000 3.030.000 4.530.000 9,750,000 4.530.000
250,000 1,832,300 7.030.000
530,000 632,661
2,750,000 1,750,000 1,125,000
750,000 750,000 530.000
3,000,000 3,000,000 1,030,000 1,250,000 3.250.000 2.000.000 3,000,000 3,000,000 1,500,000 2,000,000 7,030,000 3,750,000 2,000,000 2.530.000 1,030,000 1,625,000 8.250.000 1,022,000 3,059,000
732.593 5,750,000 5,250,000
500,000 2.230.000 1.730.000 1.730.000 3.237.000 4.230.000 3,125,000 4.125.000
500.000 2.500.000
250.000 500.000
1.750.000 2,750,000 5.000.000 1,750,000 2,750,000 1,063,729 1,500,000 2.500.000 2,500,000 2,750,000 1,500,000 1,750,000
Melaldyne'Corp. MGM Mirage. Inc. MGM Mirage. Inc. MGM Miraqe. Inc. MGM Mirage. Inc. MGM Mirage, Inc. 144A'L"V: MGM Mirage, Inc. 144A"' Midwest Generation LLC Midwest Generation LLC Midwest Generalion LLC Mirage Resorts. Ino. Mirant Mid Atlantic LLC"' Mission Energy Holding Co. Mohegan Tribal Gaming Aulhority Mohegan Trihal Gaming Authority Mohegan Tribal Gaming Authority MSX International. Inc. MSX International. Inc. Mueller Group. Inc. Mueller Holdings. Inc ("I
Mylan Laboratories. Inc 144A'O' Navislar International Corp. Navislar International Corp. NDCHealth Corp Neiman-Marcus Group. Inc 144AlU' Nell AF S.A.R.L. New World Pasta Co."' NewPage Corp. Nextel Communicatiuns. h -Ser ies 0 Nextel Communications. Inc.-Series E Nexiel Communications. h -Ser ies F Nextel Partners. Inc. Norcraft Cos LP Norcross Safely Product LLC-Serins E Nortek. Inc. Northwest Airlines Corp. NRG Energy. Inc. NSP Holdings LLC"' NTK Holdings. Inc"! OM Group, lnc, Orion Power Holdings, lnc, Owens Brockway Glass Container. Inti. Owens-Bmckway Owens-Brockwa y PanAmSal Corp. PanAmSat Holding Gorp.'"' Panolam lndustrics International. lnc, 144A'O' Park-Ohio Industries. Inc. Peabody Energy Corp. Penn National Gaming. Inc. Petroleum Helicoptnrs, Inc. Pilgrim's Pride Corp Pinnacle Entortainment. lnc, Pinnacle Entertainmont. Inc. Pinnacle Fwds Holding Corp. Playlex Products. Inc. Playlex Products. Inc. Pliant Curp IC!
Pliant Gorp Pliant Corp. Polymer Huldings LLC'." Polypore International, Inc Id'
Polypore, Inc Port Townsend Paper Corp, 144A18'
x O f
Market Value Shareholders' Coupon Rale'" Maturlty Data'@' us0 Equity
_-
I I .OOO% 9.750% 8 500% 8.375% 5.875% 6.625% 6 625% 8.300% 8.560% 8.750% 7 250% 9.125%
13 500% 6.125% 7.125% 6.875%
11 .OOO% 11.375% 10.000%
0 000%/14 750% 6.375% 9.375% 6.250%
10.500% 9.000% 8.375% 9.250%
10.000% 7.375% 6.875% 5.950% 8.125% 9.000% 9.875% 8.500%
10.000% 8.000%
11.750% O.OOO%/l0.750%
9.250% 12.000%
8.875% 8 250% 9 000%
0.000%/10 375% 10 750% 8.375% 6 875% 6 750% 9.375% 9.250% 8.250% 8.750% 8.250% 8.000% 9.375%
11.625% 11.125% 13.000%
0.000%/12.000% 0.000%/10.500%
8 750% 12.000%
8.750%
1 5/06/1 2 01/06/07 15/09/10 01/02/11 27/02/14 15/07/15 15/07/15 02/07/09 02/01/16 01/05/34 01/08/17 30/06/17 15/07/08 15/02/13 15/08/14 15/02/ 15 15/10/07 15/01/08 0 1/05/12 15/04/14 15/08/15 01/06/06 01/03/12 01/12/12 15/10/15 15/08/15 15102109 01105112 01/08/15 31/10/13 15/03/14 01/07/11 01/11/11 15/08/1 1 01/09/14 01/02/09 15/12/13 01/01/12 01/03/14 15/12/11 0 1/05/10 15/11/12 15/02/09 151051 1 3 15/08/14 01/11/14 01/10/13 15111114 15/03/13 01/03/15 01/05/09 15/11/13 15/03/12 01/10/13 01/12/13 01/03/11 01/06/1 1 15/06/09 01/09/09 01/06/10 15/07/14 01/10/12 15/05/12 15/04/11
940,625 1.859.375
271,250 3,202,500 4.258.125 9.676.875 4,432,500
260.000 2.062.607 7,735,000
51 1,250 737.050
3,203,750 1,725,937 1,139,063
755.625 746,250 335,000
3.165.000 2.190.000
992,500 1,268,750 2.892.500 2,277500 3.030.000 2.940.000
75,000 1,950.000 7,364.770 3,909.900 2,003.140
1.027.500 1.702.188 7.920.000
375.585 3,372547
798.537 3.464.375 5.164.687
572.500 2,418.750 1,837,500 1,798,125 3,406,912 2,985,625 3,000.000 3,671,250
518,750 2,443,750
264.688 545,000
1,789,375 2,873,750 4,787,500 1,846,250 2,880,625 1,17542 1 1,286,250
481,250 1.787.500 1,498,750 1.335.000 1,176,875
2.6ai.250
0.07 0.13 0.02 0.22 0.30 0.67 0.31 0.02 0.14 0.54 0.04 0.05 0.22 0.12 0.08 0.05 0.05 0.02 0.22 0.15 0.07 0.09 0.20 0.16 0.21 0.20 0.00 0.13 0.51 0.27 0.14 0.19 0.07 0.12 0 55 0.03 0.23 0.06 0.24 0.36 0.04 0.17 0.13 0.12 0.24 0.21 0.21 0.25 0.04 0.17 0.02 0.04 0.12 0.20 0.33 0.13 0.20 0 08 0 09 0 03 0.12 0 10 0.09 0.08
The accompanying notes are an integral part of these financial statements.
69
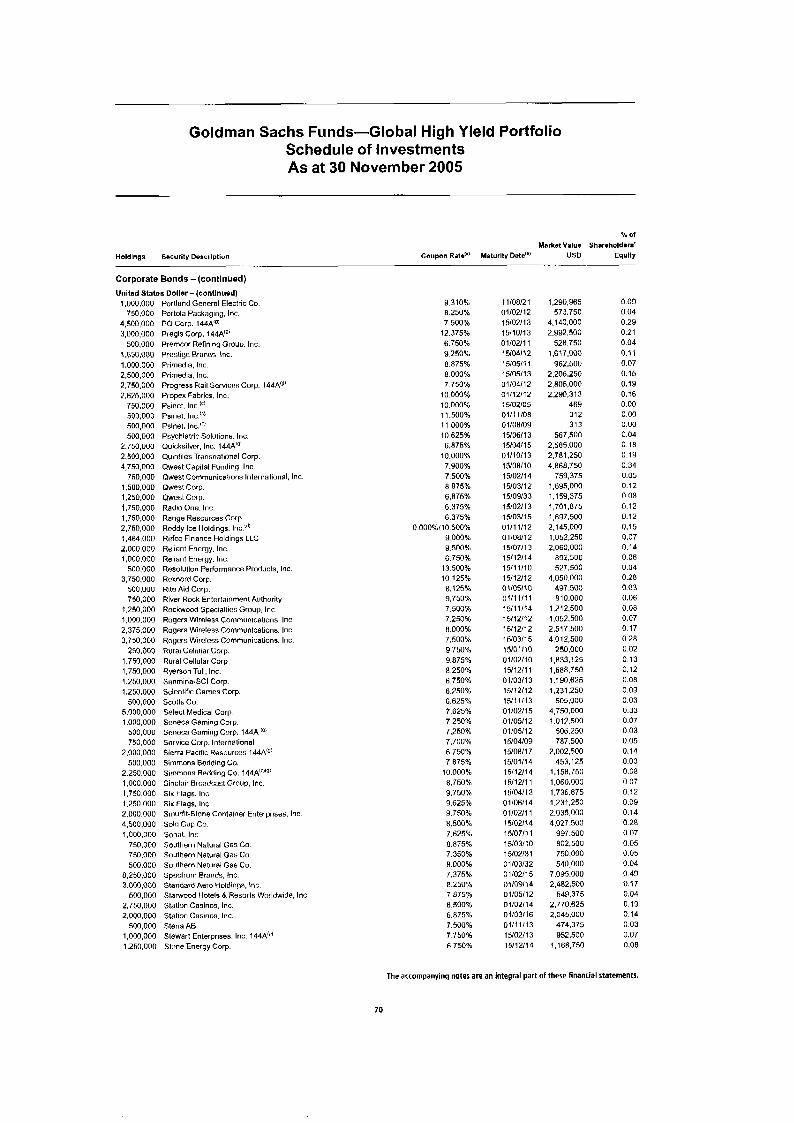
Goldman Sachs Funds-Global High Yield Portfolio Schedule of Investments As at 30 November 2005
% 01 Market Valut Shareholdmrs'
Holdlngs Security Descrlpllon Coupon Rate'" Msturlly Date"' USD Equity _. Corporate Bonds - (contlnued) Unitad States Dollar- (contlnued)
750,000 Portola Packaging, Inc. 1,000,000 Portland General Electric Co
4,500,000 PO Corp. 144A'I: 3,000,000 Pregis Corp. 144A'g'
1,650,000 Prestige Brands. Inc. 1,000.000 Primedia. Inc 2,500,000 Primedia. Inc 2.750.000 2,625,000 Propex Fabrics, Inc.
500,000 Premcor Refining Group. Inc.
Progress Rail Sorvicos Corp. 144A!g'
750,000 Psinet. Inc 500,000 Psinet. Inc!' 500,000 Psinet. Inti.'.: 500,000 Psychiatric Soiutions. Inc.
2.500.000 Quinllles Transnational Corp. 4,750,000 Qwest Capital Funding, Inc.
1,500,000 Qwest Corp. 1,250,000 Qwest Gorp. 1.750.000 Radio One. Inc. 1.750.000 Range Resources Corp. 2,750,000 Reddy Ice Holdings. Inc.'d' 1,464,000 Refco Finance Holdings LLC 2,000,000 Reliant Energy. Inc. 1,000,000 Reliant Energy, Inc.
500,000 Resoluliun Performance Products, Inc 3,750,000 Rexnord Corp.
500.000 Rite Aid Corp. 750.000 River Rock Entertainment Authority
1,250,000 Rockwood Specialties Group. Inc. 1,000.000 Rogers Wirnlesr Communications, Inc 2,375,000 Rogers Wireless Communicalions. Inc. 3,750,000 Rogers Wireless Communicalions. Inc.
250.000 Rural Cellular Corp. 1,750,000 Rural Cellular Corp. 1,750,000 Ryerson Tull. Inc. 1,250,000 Sanmina-SCI Corp 1,250,000 Scientific Games Corp.
5,000,000 Select Medical Corp. 1,000,000 Seneca Gaming Corp.
2,750,000 Quicksilver. Inc. 144A"'
750.000 QweSt Communications International. Inc.
500,000 Scotls Co.
500,000 Scneca Gaming Corp. 144Alni 750.000 Snrvice Corp. International
2,000,000 Sierra Pacific ResnurCeS 144Aiq' 500.000 Simmons Bedding Go.
2.250.000 Simmons Bedding Co. 144AirJig' 1.000.000 Sinclair Eroadcast Group, Inc. 1,750,000 Six Flags. Inc. 1,250,000 Six Flags. Inc. 2,000,000 Smurfit-Stone Container Enterprises. Inc. 4,500,000 Solo Cup Co. 1,000,000 Sonat. Inc.
750,000 Southern Natural Gas Co. 750,000 Southern Natural Gas Co. 500,000 Southern Natural Gas Co.
8.250.000 Spectrum Brands. Inc. 3.00,OOO Standard Aero Holdings. tnc.
2,750,000 Slatiun Casinos. Inc. 2,000,000 Stetion Casinos. Inc.
1,000,000 Stewart Enterprises. Inc. 144A'!" 1,250,000 Stune Energy Corp.
500,000 Slarwwd Hotels & Resorts Worldwide. Inc.
500,000 Stena AB
9.310% 8.250% 7.500%
12.375% 6.750% 9 250% a 875% 8 000% 7.750%
10.000% 10.000% 11.500% 11 000% 10.625%
10.000% 7.900% 7.500%
6.875%
a 875% 6.875% 6.375% 6.375%
0.000%/10.500% 9.0009b 9.500% 6.750%
13 500% 10 125% 8.125% 9.750% 7.500% 7.250% 8.000% 7.500% 9 750% 9.875%
6.750% 6.250% 6.625% 7.625% 7.250% 7.250% 7.700% 6.750% 7.875%
10.000% 8.750% 9.750% 9.625% 9.750% 8.500% 7.625%
7.350% 8.000% 7.375% 8.250% 7.875% 6.500% 6.875% 7.500% 7.750% 6.750%
8 . 2 5 0 ~ ~
8 . 8 7 5 ~ ~
I 1/08/2 1 01/02/12 15/02/13 15/10/13 01/02/11 15104112 1 YO511 1 15/05/13 01/04/12 01/12/12 1S102/05 01/11/08
15/06/13 15/04/15 01/10/13
15/02/14 15/03/12 15/09/33 15/02/13 15/03/15 01/11/12 01/08/12 15/07/13 15/12/14 15/11/10 15/12/12 01/05/10 01/11/11 15/11/14 15/12/12 15/12/12 15/03/15 15/01 /I 0 0 110211 0 15/12/11 04/03/13 1511 211 2 15/11 H 3 01/02/15 01/05/12 01/05/12 15/04/09 15/08/17 15/01/14 1511211 4 15/12/11 15/04/1 3 01/06/14 01/02/11 15102114 15/07/11 15/03/10 15/02/31 01/03/32 01/02/15 01/09I14 01/05/12 01/02/14 01/03/16 01/11/13 15/02/13 15/12/14
oi/oa/og
i5/0a/io
1,290,965 573.750
4.140.000 2.992.500
1,617,000 962.500
2206.250 2,805.000 2.290.313
A69 312 313
567.500 2.585.000 2.781.250 4.868.750
759.37s 1,695,000 1,159,375 1,701.875 1,697,500 2,145.0OO 1,052,250 2,060,000
892.500 527.500
4.050.000 497.500 810.000
1,212.500 1.052.500 2.517.500 4,012,500
250,000 1.833.125 1,688,750 1,190,625
528.750
1,231,250 505.000
4,750,000 1.012.500
506.250 787.500
2.002.500 453.125
1.060.000
1.231.250 2.035.000 4.027.500
997.500 802,500 750,000 540,000
7.095.000 2,402,500
549.375 2.770.625 ~,04s,oon
474,375 Y52.500
1,168.7SO
1,158,750
1,736,875
0.09 0.04 0.29 0.21 0.04 0.11 0.07 0.15 0.19 0.16 0.00 0.00 0.00 0.04 0.18 0.19 0.34 0.05 0.12
0.12 0.12 0.15 0.07 0.14 0.06 0.04
0.03 0.06 0.08 0.07 0 17
0 02 0.13 0.12 (1.08 0.09 0.03 0.33 0.07 0.03 0.05 0.14 0.03
0.07 0.12 0.09 0.14 0.28 0.07 0.05 0.05 0.04 0.49 0.17 0.04 0.19 0.14 0.03 0.07 0.08
0.08
0.28
o 28
0.08
The accompanying notes are an integral part of these financial statements.
70
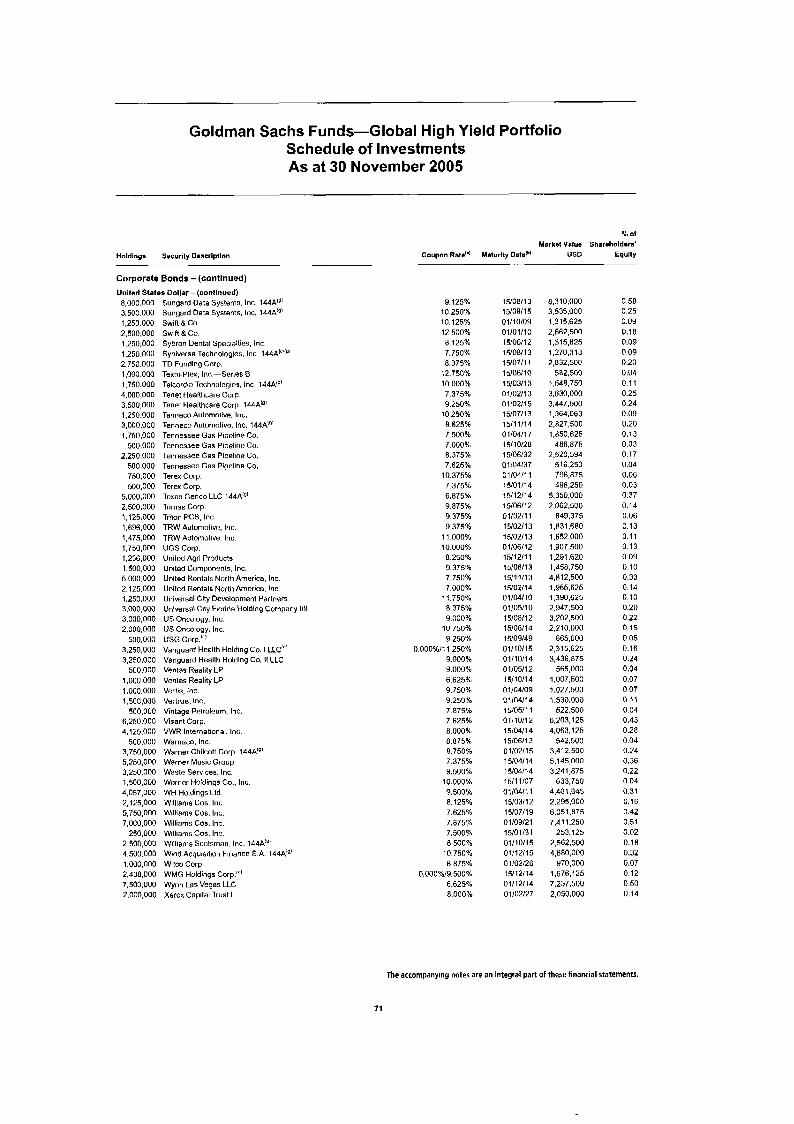
Goldman Sachs Funds-Global High Yield Portfolio Schedule of Investments As at 30 November 2005
Yo O f
Market Value Sharmholders'
- Holdings Security Descrlptlon Coupon Rate'.' Maturity Data'" USD
-- ..
Corporate Bonds - (contlnued) United States Dollar - (continued) 8,000.000 Sungard Data Syslems. Inc. 144AiPi 3,500.000 Sungard Data Systems. Inc. 144A'O' 1.250.000 Swift8 Co. 2,500,000 Swift & Co. 1,250.000 Sybron Dental specialties, lnc, 1.250.000 Synivnrsn Technologies. Inc 144A'C':U' 2.750.000 TO Funding Corp. 1,000.000 Tekni-Plew. 1nc.-Series B 1,750,000 Telcordia Technoloqies. Inc 144A"' 4,000,000 Tenet Healthcare Corp. 3,500,000 Tenet Healthcare Corp 144A'g' 1,250.000 Tenneco Automnlive. Inti.
3.000.000 Tenneco Automotive. Inc. l44AIg' 1,750.000 Tennessee Gas Pipeline Co.
500,000 Tennessee Gas Pipeline Co. 2,250,000 Tennessee Gas Pipoline Go.
500,000 Tennessee Gas Pipelinn Go. 750,000 Terex Corp. 500,000 Terex Corp.
5,000,000 Texas Genco LLC 144Aig' 2,500,000 Trimas Corp. 1,125,000 Triton PCS, Inc 1,696,000 TRW Automotive. Inc. 1,475,000 TRW Automotive. Inc. 1,750,000 UGS Corp. 1,236,000 United Agri Products 1.500.000 United Components. Inc. 5,000.000 United Rentals North America, Inc. 2.125.000 United Rentals North America, Inc 1,250,000 Universal City Devolopment Parrners 3,000,000 Universal City Florida Holding Cornpan) 3,000,000 US Oncology. Inc. 2,000,000 US Oncology. Inc.
3,250,000 Vanguard Health Holding Co. I LLC" 3,250,000 Vanguard Health Holding Co. I1 LLC
500.000 Ventas Reality LP 1,000,000 Ventas Reality LP 1,000.000 Verlis, Inc 1.5'?0.000 Vertruc. Inc.
5C0.000 Vintage Petroleum. Inc. 6,250,000 Visant Corp. 4.125.000 VWR International. Inc.
3,750,000 Warner Chilcott Corp. 144Aig' 5,250,000 Warner Music Group 3.250.000 Waste Services, Inc. 1,5F0,000 Werner Holdinps Co.. Inc. 4,057,000 WH Holdings Ltd. 2,125,000 Williams Cos. Inc. 5,750,000 Williams Cos. Inc. 7.0C0.000 Williams Cos. Inc.
250.000 Williams Cos. Inc. 2,500,000 Williams Scotsman. Inc. 144A"' 4.500.000 1.000.000 Witco Corp 2,438,000 WMG Holdings Corp.'"' 7,500,000 Wynn Las Vegas LLC 2,000,000 Xerox Capilal Trust I
5U0,OOO USG Corp."!
500,000 Warnaco. Inc.
Wind Acquisition Finance S.A. 144Ag!
9.125% 10.250% 10.125% 12.500% 8.125% 7.750% 8.375%
12.750% 10.000% 7.375% 9.250%
10 250% 8 625% 7 500% 7 000% 8.375% 7.625%
10.375% 7.375% 6.875% 9.875% 9 375% 9.375%
11 000% 10 000% 8.250% 9.375% 7.750% 7.000%
11.750% 8.375% 9.000%
10 750% 9.250%
0.000%/11 .250% 9.000% 9.000% 6.625% 9.750% 9.250% 7.875% 7.625% 8 000% 8.875% 8.750% 7.375% 9.500%
10.000% 9.500% 8.125% 7.625% 7.875% 7.500% 8.500%
10.750% 6.875%
0.000%/9.500% 6.625% 8.000%
15108113 15/08/15 0 1 I 1 0/09 01/01/10 151061 12 15/08/13 15/07/11 15/06l10 15/03/13 01/02/13 01/02/15 15/07/13 15/11/14 0110411 7 15110128 15/06/32 01/04/37 01/04/1 1 1 510 1 / I 4 15/12/14 15/06/12 01/02/1 1 15/02/13 15/02/13 01/06/12 15/12/11 15/06/1 3 15/11/13 15/02/14 01/04/10 01/05/10 15/08/12 15/08/14 15/09/49 01/10/15 01/10/14 0 1/05/12 1 5/10/l4 01/04/09 01/04/14 15/05/11 0 1/10/12 151041 14 15/06/13 0110211 5 15/04/14 15/04/14 1511 1/07 01/w11 15/03/12 15/07/19 01/09/21 15/01/31 01/10/1 5 01/12/15 01/02/26 15/12/14 0 1/ 1211 4 01/02/27
8.310.000 3.535.000 1,315,625 2,662,500 1,915,625 1,270,313 2,832,50[!
582.500 1,548,750 3.630.000 3,447,500 1,364,063 2,627,500 1.850.625
486.875 2,520,594
516,250 796,875 496,250
5,350,000 2.062.500
849.375 1,031.680 1,652,000 1,907.500 1,291.620 1,458,750 4,612,500 1,965,625 1,390,625 2,947,500 3,202,500 2.210.000
665,000 2,315,625 3,436,875
565,000 1,007,500 1,027,500 1.530.000
522,500 6,203,125 4,063,125
542,500 3,412,500 5,145,000 3,241,875
633,750 4,401,845 2.295.000 6.051.875 7,411.250
253,125 2.562.500 4,680,000
Y70,OOO 1,676,125 7,237.500 2.050.000
Eqully ~
0.58 0.25 0.0y
0.18 0.09 0.09 0.20 0.04 0.11 0.25 0.24 0.09 0.20 0.13 0.03 0.17 0.04 0.06 0.03 0.37 0.14 0.06 0.13 0.1 1 0.13 0.09 0.10 0.33 0 14 0.10 0.20 0.22 0.15 0.05 0.16 0.24 0.04 0.07 0 07 0.11 0.04 0.43 0.28 0.04 0.24 0.36 0.22 0.04 0.31 0.16 0.42 0.51 0.02 0.18 0.32 0.07 0.12 0.50 0.14
The accompanying notes are an integral part of these financial statements.
7'1
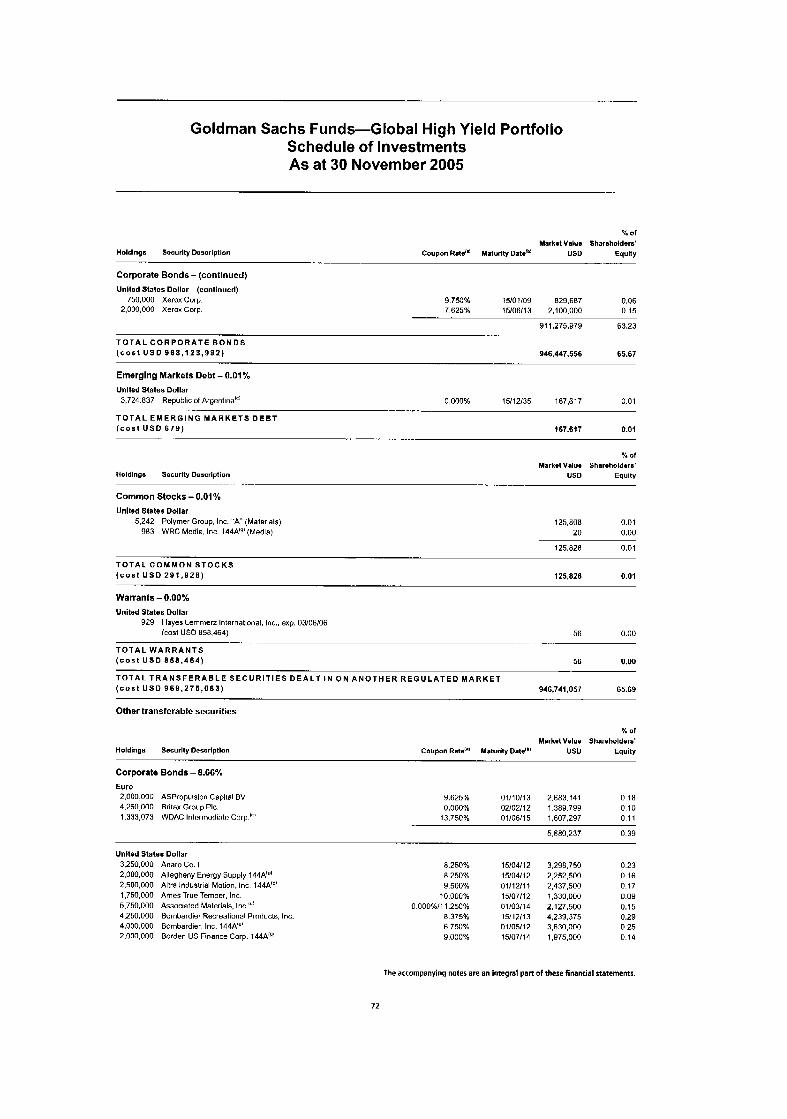
Goldman Sachs Funds-Global High Yield Portfolio Schedule of Investments As at 30 November 2005
% Of
Markmt Value Shareholders' Holdlngs Security Description Coupon R d " Maturity Dat."' USD Equity
... -- Corporate Bonds - (contlnued) Unlted States Dollar- (continued)
750,000 Xerox Curp. 9.750% 1510 1 IOY 829.687 0.06 2,000,000 Xerox Corp. 7 625% 15/06/13 2.100.000 0.15
91 1,275,979 63.23
T O T A L C O R P O R A T E B O N D S (cost U S D 988 ,123 ,992) 946.447.556 65.67
Emerging Markets Debt - 0.01%
Unlted States Dollar 3.724.837 Republic of Argentina"" 0.000% 15/12/35 167.617 0.01
( c o s t U S D 679) 187 $1 7 0.01
. . . . -_ T O T A L E M E R G I N G M A R K E T S D E B T
- . -- ........
% Of
Markmt Value Sharaholders' Holdlngs Security De-cription USD Equity
- . Common Stocks - 0.01%
United Stater Dollar 5,242 Polymer Group, Inc. "A" (Materials)
983 WRC Media, Inc. 144A'g'(Media) 125,808 0.01
20 0.00
125,026 0.01
T O T A L C O M M O N S T O C K S ( c o s t U S 0 291 ,928) 125,828 0.01
Warrants - 0.00%
United States Dollar 929 Hayes Lernrnerz Intornational. hc,, exp. 03/06/06
(cost US0 858.464) 56 0.00
T O T A L W A R R A N T S ( c o s t U S 0 858 .484) 56 0.00
... ._ .-
T O T A L T R A N S F E R A B L E S E C U R I T I E S D E A L T I N O N A N O T H E R R E G U L A T E D M A R K E T ( c o s t U S 0 969 ,275 ,063) 946,741,057 65.69
Other transferable securities
Holdlngs Securlty Description
% of Market Value Shareholders'
Coupon Rate'"' Maturity Dale"' us0 Equity
Corporate Bonds - 8.66%
Euro 2.000,OOU ASPropulsion Capital BV 9.625% 01/10/13 2.683.141 0 18 4,250,000 Britax Group PIC. 0.000% 02/02/12 1.389.799 0 10 1,333,073 WDAC Intormediate Corp.'" 13.750% 01/06/15 1,607,297 0 11
5.680.237 0.39
Unlted States Dollar 3,250,000 2,000.000 2.500.000 1,750,000 5,750,000 4,250,000 4,000,000 2,000,000
Aoaro Go. I Allegheny Energy Supply 144AIU' Altra Industrial Motion, Inc 144A'"' Ames True Temper, Inc. Associated Materials, Inc."" Bombardier Recreational Products. Inc. Bombardier. Inc. 144AU' Borden US Finance Corp. 144A:U'
8.250% 8.250% 9.500%
10.000% 0.000%/1 1.250%
8.375% 6.750% 9.000%
15/04/12 15/04/12 01/12/11 15/07/12 01/03/1 4 15/12/13 01/05/12 15/07/14
3.298.750 2,252,500 2,437,500 1,330,000 2,127,500 4.239.375 3,630,000 1 ,Y75,000
0.23 0.16 0.17 0.03 0.15 0.29 0.25 0.14
The accompanying notes are an integral part of these financial statements.
72
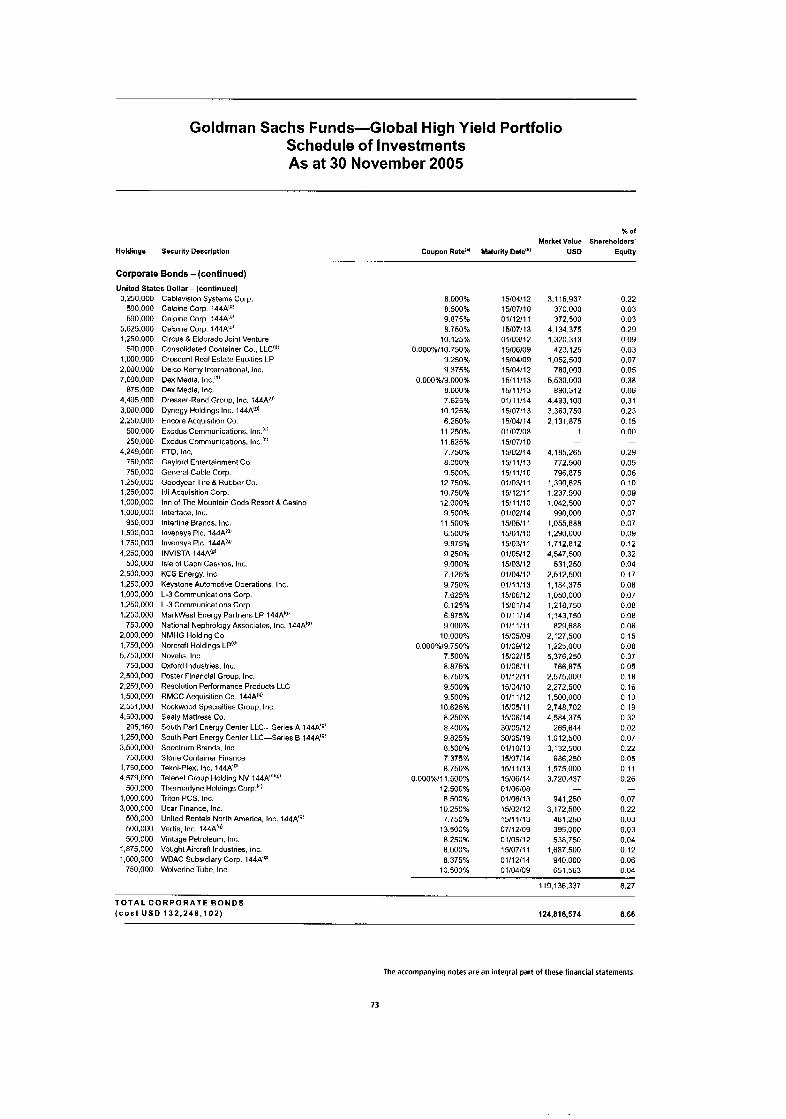
Goldman Sachs Funds-Global High Yield Portfolio Schedule of Investments As at 30 November 2005
% o f Market Value Shareholders'
Holdings Securlty Dsscrlptlon Coupon Rate'" Meturlty Date"' USD Equity
Corporate Bonds - (continued)
United State6 Dollar - (continued)
-- .-
3,250,000 500.000 500.000
5,625,000 1,250,000
550.000 1,000.000 2,000.000
875.000 7,000,000
4,405.000 3,000.000 2.250.000
500.000 250,000
4.24Y.000 750,000 750,000
1,250,000 1,250,000 1,000,000 1,000,000
Y50,OOO 1.500.000 1,750,000 4,250.000 500,000
2,500,000 1,250,000 1,000,000 1,250,000 1,250,000
750,000 2.000.000 1,750,000 5,750,000
750,000 2,500,000 2.250.000 1,500,000 2.551.000 4,500,000
295.160 1.250.000 3.500.000
760.000 1,750,000 4,579,000
500.000 1,000.000 3,000,000
500.000 500,000 500.000
1.875.000 1,000,000
750.000
Cablevision Systems Corp. Calpine Corp 144A"' Calpine Corp 144A:"' Calpine Corp 144AIU' Circus 8 Eldurado Joint Venture Consolidated Container Co.. LLC"! Crescent Real Estate Equities LP Delcn Remy International. Inc. Dex Media. lnc.'"' Dnx Media, Inc. Dressnr-Rand Group, Inc. 144A@ Dynegy Holdings Inc. 144ACg) Encore Acquisition Co. Exodus Communications, Inc.'.' Exodus Communications. lnc.(" FTD. Inc. Gaylord Entertainment Cu. General Cable Corp. Goodycar Tired Rubber Co. Idi Acquisition Corp. Inn of The Mountain Gods Resort 8. Casino Interface. Inc. Interline Brands. Inc. Invensys PIC. 144A'g' Inmnsys PIC. 144A!gJ INVISTA 144A!g' Isle of Capri Casinos. Inc. KCS Energy, Inc. Keystone Automalive Operations, Inc. L-3 Communications Corp. L-3 Communications Corp. MarkWest Energy Partners LP 144A1gr National Nephrology Associates. Inc. 144A'y' NMHG Holding Co Norcraft Holdings LP'" Novelis. Inc. Oxford Industries. Inc. Poster Financial Group, Inc. Resolution Performance Products LLC RMCC Acquisition Co. 144A'"! Rockwood Specialties Group, Inc. Sealy Mattress Co South Part Energy Center LLC-- Series A 144A'g! South Part Energy Center LLC-Series B 1A4A(g! Spectrum Brands, Inc. Stone Container Finance Tekni-Plex. Inc. 144A'I' Tolenet Group Holding NV 144A'""' Thnrmadyne Holdings Corp."! Triton PCS. Inc. Ucar Finance, Inc United Rentals North America. Inc. 144A'g' Vertis, Inc. 144AIU' Vintage Petroleum. Inc. Vought Aircraft Industries. Inc. WDAC Subsidiary Corp. 144A'!' Wulverine Tube, Inc.
8.000% 8 . 5 0 0 ~ ~ 9.875% 8.750%
10.125% 0.000%110.750%
9.250% 9.375%
0.000%/9.000% 8.000% 7.625%
10.125% 6.250%
11.250% 11.625% 7.750% 8.000% 3.500%
12.750% 10.750% 12.000% 9.500%
11 500% 6.500% 9.875% 9 250% 9.000% 7.125% 9.750% 7.625% 6.125% 6.875% 9.000%
10.000% 0.000%/9.750%
7.500% 8.875% 8.750% 9.500% 9.500%
10.625% 8.250% 8.400% 9.825%
7 375% 8.750%
O.OOO%/I 1.500% 12.500% 8.500%
10.250% 7.750%
13.500%
8.000% 8.375%
10.500%
8.500%
8.250%
15/04/12 1 5/07/ 10 01/12/11 15/07/13 01/03/12 15/06/09 15/04/09 15/04/12 15/11/13 15/11/13 01/11/14 15/07/13 15/04/14
15/07/10 15/02/14 15/11/13 15/11/10 0 110311 1 15/i2/i 1 15/11/10 01/02/14 1510511 1 15/01110 15/03/11 01/05/12 15/03/12 01/04/12 01/11/13 15/06/12 15/01/14 01/11/14 01/11/11 15/05/OY Ol/OY/12 15/02/15 01/06/11 01/12/11 15/04/10 01/11/12 15/05/1 1 15/06/14 30/05/12 30/05/19 01/10/13 15/07/14 15/11/13 15/06/14 01/06/08 01106113 15/02/12 15/11/13 07/12/09 01/05/12 15/07/11 01/12/14 01/04/09
o I /07/08
3.115.937 370.000 372,500
4.134.375 1,320,313
423,125 1,052,500
5,530,000 R90.312
4.A93.100 3,363,750 2,131,875
1
4,185,265 772,500
1,390,625 1.237.500 1,042,500
990,000 1,055,686 1,290,000 1,712,812 A.547.500
531,250 2,512,500 1,184,375 1,050,000
1,143,750
2,127,500 1,225,000 5,376,250
766.875 2,575,000 2,272,500 1,500,000
7ao.000
-
796,875
i.21a.750
82y.688
2,748,702 4.584.375
265,644 1.012.500 3,132,500
686,250 1.575.000 3,720,437
941,250 3,172,500
481.250 395,000
-
538.750 1,687,500
940.000 651,563
0.22 0.03 0.03 0.29 0.09 0.03 0.07 0.05 0.38 0.06 0.31 0.23 0 15 0.00
0.29 0.05 0.06 0.10 0.09 0.07 0.07 0.07 0.09 0.12 0.32 0.04 0.17 0.08 0.07
0.08 0.06 0 15
0.37 0 05
0.16 0 10 0 19 0.32 0.02 0.07 0.ZZ 0.05 0.1 1 0.26
0.07 0.22 0.03 0.03 0.04 0.12 0 06 0 04
-
0.08
0.08
0.18
-
119,136,337 8.27
T O T A L C O R P O R A T E B O N D S ( c o s t U S D 1 3 2 , 2 4 8 , 1 0 2 ) 124,816,574 8.66
The accompanying notes are an integral part of these financial statements.
73
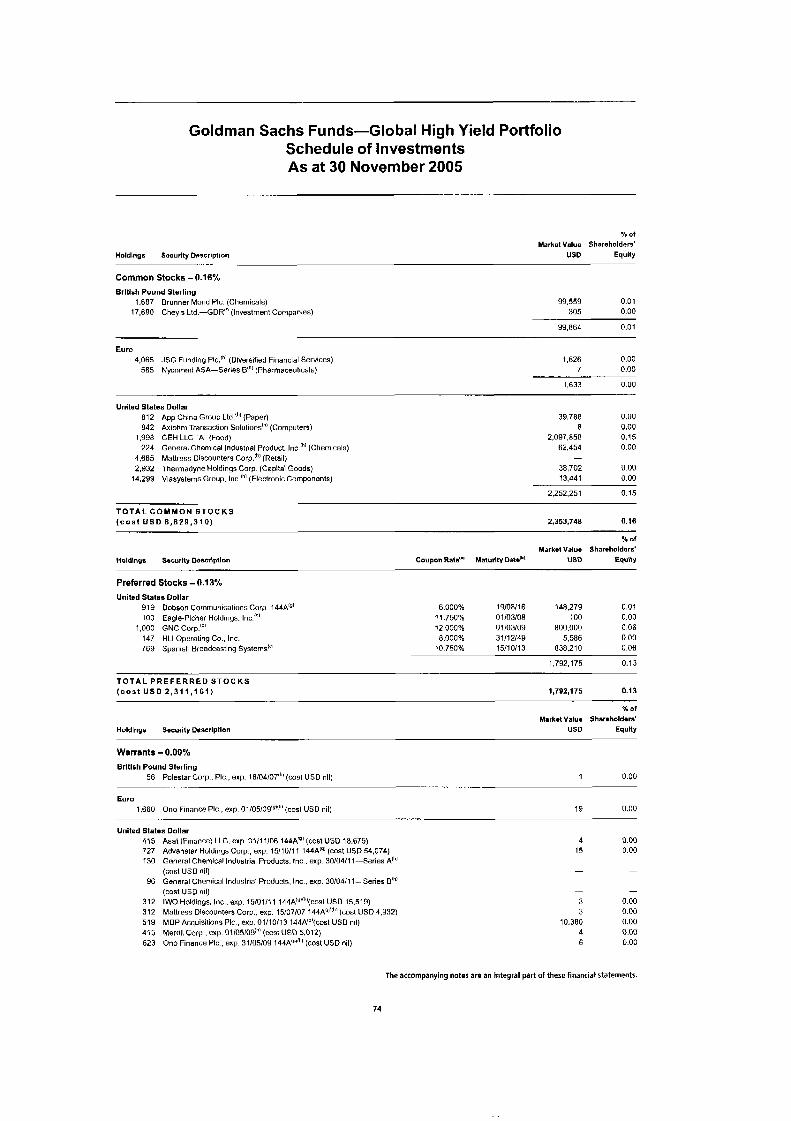
Goldman Sachs Funds-Global High Yield Portfolio Schedule of Investments As at 30 November 2005
% of MarketVslue Shareholders'
Holdlngs Security Description USD Equity -. . ...
Common Stocks - 0.16%
Brltlsh Pound Sterling 1.687 Brunner Mond PIC. (Chemicals) 99.559 0.01
17.680 Cheyls Ltd.-GDR" (Investment Companios) 305 0.00
99,864 0.01
Euro 4,065 JSG Funding PIC.(^' (Diversified Financial Services)
585 Nycomod ASA-Series Wh' (Pharmaceulicals) 1,626 0.00
7 0.00
1,633 0.00
United States Dollar 812 App China Group Ltd."" (Paper) 842 Axiohrn Transaction Solutions!h' (Computers)
1.YY8 CEHLLC"A(Food) 224 General Chnmical Industrial Product, I ~ c . ' ~ ' (Chemicals)
4.665 Mattress Discounters Corp.!h' (Retail) 2,932 Thermadyne Holdings Corp (Capital Goods)
1A.299 Viasystems Group, lnc.lh' (Electronic Cornpononts)
39,788 0.00 8 0.00
2,097,050 0.15 62,454 0.00
38,702 0.00 13,441 0.00
- -
2,252,251 0.15
T O T A L C O M M O N S T O C K S ( c o a t US0 6 , 6 2 9 , 3 1 0 ) 2,353,746 0.16
Holdlngs Sacurlty Descrlptlon
%of
Markat Valua Sharaholders' Coupon Rata"' Yaturlty Date'b1 USD Equlty
Preferred Stocks - 0.13%
United States Dollar Y1Y Dobson Communications Corp. 144Aig' 6.000% 19/08/16 1AU.279 0.01 100 Eagle-Pichet Holdings. Inc."' 11.750% 01/03/oa 100 0.00
147 HLI Operating Co.. Inc. 8.000% 31/12/49 5.586 0.00 1,000 GNC Corp.'" 12.000% 01/03/09 800,000 0.06
769 Spanish Broadcasting Systems'c' 10.750% i5/1 O/I 3 838,210 0.06
1,792,175 0.13
T O T A L P R E F E R R E D S T O C K S ( c o s t U S 0 2,311,161) 1,192,175 0.13
X of Markot Valuo Sharoholdora'
Holdlngs Security D*acription USD Equity
Warrants - 0.00% British Pound Sterling
56 Polestar Corp.. PIC.. RXP. 16/04/07"" (cost USD nil) 1 0.00
1,660 Ono Finance PIC.. exp. 01/05/0~'p'~"(cost US0 nil) 19 0.00
- - -.. .. .
Eura
.-
United States Dollar 415 727 130
96
312 312 519 415 623
Asal (Finance) LLC. exp. 01111106 l44A'@' (cosl USD 18.675) Advanstar Holdings Corp.. exp. 1511Ul11 144Aiq' (cost USD 54,074) Gnnnral Chemical Industrial Products. Inc . exp. 3010411 I--Series AIh' (cost USD nil) Gennral Chemical Industrial Producls. Inc , exp. 3010411 1- Series B'"' (cost US0 nil) IWO Holdings. Inc.. exp. 15/01111 144A""i"(cost USD 15.51Y) Mattress Discounters Corp.. exp. 15/07/07 144A'~"'" (cost USD 4.Y32) MDP Acquisitions PIC, exp. 01/10/13 144AiU'(cost US0 nil) Merrill Corp.. exp. 01/05/09("' (cost US0 5.012) Ono Finance PIC., exp. 3110510Y 144A'U"''! (cost USD nil)
4 15
-
-
3 3
10.380 4 6
0.00 0.00
-
-
0.00 0.00 0.00 0.00 0.00
The accompanying notes are an integral part of these financial statements.
74
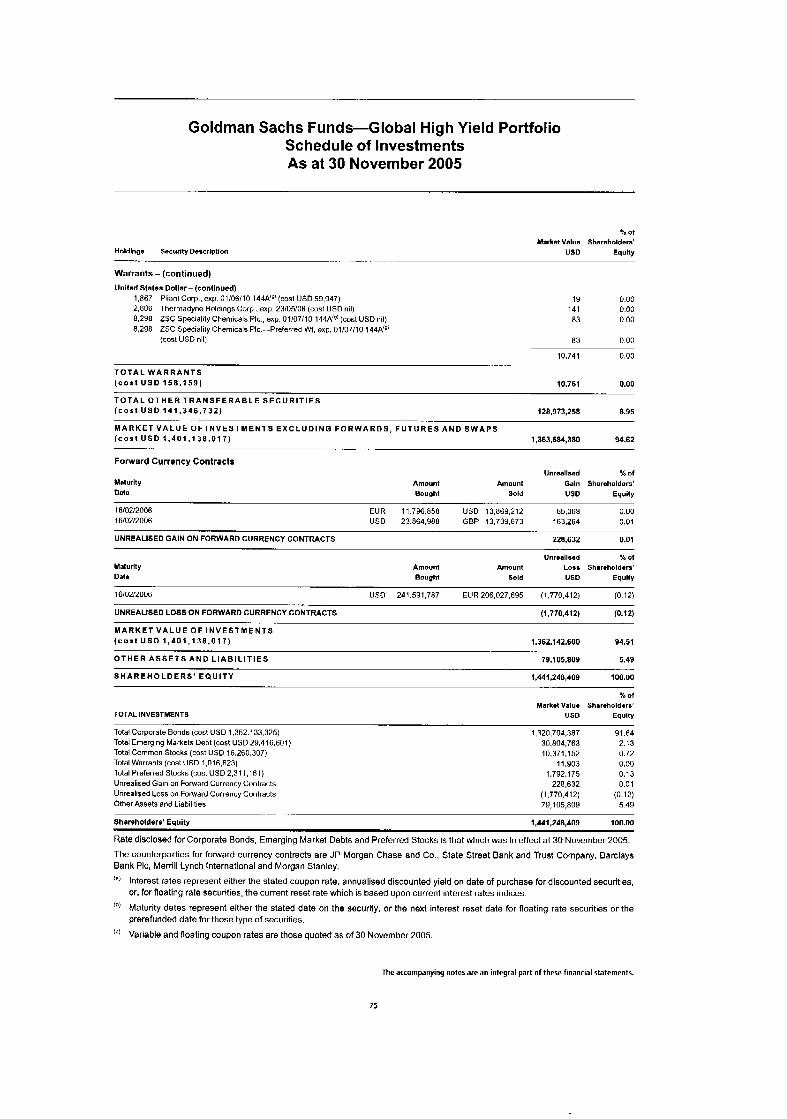
Goldman Sachs Funds-Global High Yield Portfolio Schedule of Investments As at 30 November 2005
% Of
Market Value Shareholdera' Holdlnga Security Descrlptlon US0 Equity
- - - . .
Warrants - (continued) Unitad States Dollar - (contlnued)
1.867 Pliant Corp., exp. 01/06/10 144A'q!(cost USD59.947) 2,806 Thcrmadyne Holdings Corp , exp. 23/05/06 (cost US0 nil) 8.298 ZSC Speciality Chemicals PIC., exp. 01/07/10 144A'Y' (cost USD nil) 8,290 ZSC Specielily Chemicals PIC.---Preferred Wt. exp. 01/07/10 144Alq'
(cos1 USD nil)
1Y 0.00 141 0.00 03 0.00
83 0.00
10,741 0.00
T O T A L W A R R A N T S ( c o s t U S D 158 .159) 10.761 0.00
T O T A L O T H E R T R A N S F E R A B L E S E C U R I T I E S ( c o s t U S 0 111 ,346 ,732) 128,973,258 8.95
-- _... .. M A R K E T V A L U E OF I N V E S T M E N T S E X C L U D I N G F O R W A R D S , F U T U R E S A N D S W A P S ( c o s t U S D 1,401.1;8.017) 1,363,684,380 94.62 ~. I
Forward Currency Contracts
Maturity Date
Amount Bought
Unraallaed x Of
Amount Gain Shareholders' Sold US0 Equity
16/02/2006 16/02/2006
EUR 11.796.050 USD 13,869,212 65,368 0.00 USD 23,064,988 GBP 13,739,673 163,261 0.01
UNREALISED GAIN ON FORWARD CURRENCY CONTRACTS 228,632 0.01
Maturlty Data
Unrsallaad X of Amount Amount Loss Sharmholdsrs' Bought Sold USD Equity
16/02/2006 US0 241,591,707 EUR 206.027.695 (1 770 412) (0 12)
UNREALISED LOSS ON FORWARD CURRENCY CONTRACTS (1,770,412) (0.12) - . _
- .. M A R K E T V A L U E O F I N V E S T M E N T S ( c o a t U S D 1 ,401 .138 .017) 1.362.142.600 94.51
O T H E R A S S E T S A N D L I A B I L I T I E S 79.105.809 5.49
S H A R E H O L D E R S ' E Q U I T Y 1,441,248,409 100.00
TOTAL INVESTMENTS
% Of
Mark*tValu* Shar*hold*rs' USD Equity
Total Corporate Bonds (cost US0 1.352.133.325) 1.320.704.387 91.64 Total Emerging Markets Deht (cost USD 29,416,601) 30.804.763 2.13 Total Common Stocks (cost USD 16,260,307) 10,371,152 0.72
Total Preferred Stocks(costUSD2,311.161) 1,792,175 0.13 Total Warrants (cost USD 1,016,623) 11,903 0.00
Unrealised Gain on Forward Currency Contracts 228.632 0.01 Unrealised Loss on Forward Currency Contracts (1.770.412) (0.12) Other Assets and Liabillties 7g,i05.80~ 5.4Y
Shareholders' Equity 1,441,248,409 100.00
Rate disclosed for Corporate Bonds, Emerging Market Debts and Preferred Stocks is that which was In effect at 30 November 2005.
The counterparties for forward currency contracts are JP Morgan Chase and Co.. State Street Bank and Trust Company, Barclays Bank PIC, Merrlll Lynch International and Morgan Stanley.
Interest rates represent either the stated coupon rate, annualised discounted yield on date of purchase for discounted securities, or. for floating rate securities, the current reset rate which is based upon current interest rates indices.
"! Maturity dates represent either the stated date on the security, or the next interest reset date for floating rate securities or the prerefunded date for those type of securities,
Variable and floating coupon rates are those quoted as of 30 November 2005.
. .. . ..
The accompanying notes are an integral part of these financial statements.
75
Goldman Sachs Funds-Global High Yield Portfolio Schedule of Investments As at 30 November 2005
(dl These securities are issued with a zero coupon which increases to the second rate at a set date in the future.
('I These securities are issued with the first indicated rate which increases to the second rate at a set date in the future.
If' Security holding is traded/held in USD. (ADR: American Depositary ReceipWGDR: Global Depositary Receipt).
(I' 144A: These securities are issued to qualified institutional investors, pursuant to private placements, and are transferable as stated In rule 144A of the US Securities Act of 1933.
'" These securitities are fair valued. See Note 3(c).
The accompanying notes are an integral part of these financial statements.
76
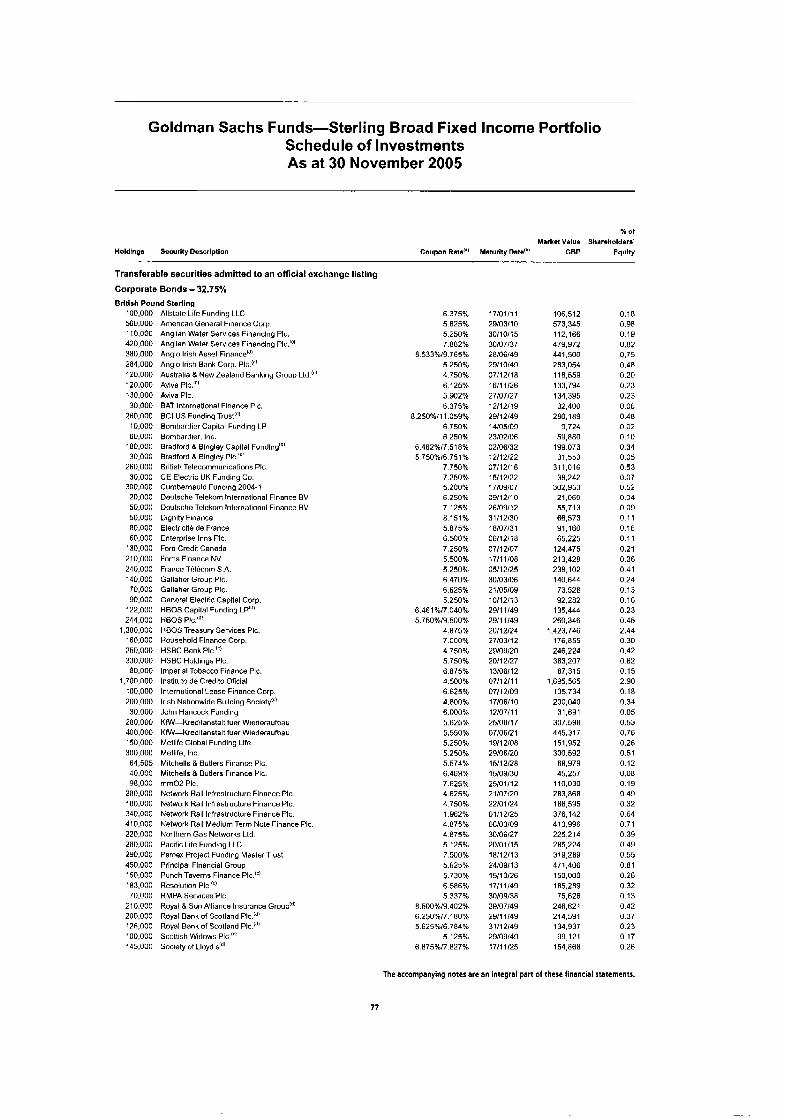
Goldman Sachs Funds-Sterling Broad Fixed Income Portfolio Schedule of Investments As at 30 November 2005
% of Marka Value Shareholders'
Holdlngs Security Oescrlpllon Coupon Rate(" Maturity DadbJ GBP Equity
Transferable securities admitted to an official exchange listing
Corporate Bonds - 32.75% Brltish Pound Sterling
.. -_ .-
100,000 560,000 110,000 420,000 380,000 204,000 vo,ono 120,000 130.000 30,000
260,000 10,000 60,000
30,000 260,000
30.000
iao.ooo
3oo.noo 2o.noo 50,oon 50,noo 80.000 60,000
130,000 210.000 240,000 140,000 70,000 90,000
122,000 244.000
1.380.000 160,000 250,000 330,000 00,000
1,700,000 100,000 200.000
30.000 280,000 400,000 150,000 300,000 64,505 40.000 98,000
280.000
340.000 410,000 220,000 280.000 290.000 450,000 150,000 183.000 70,000
210.000 200.000 126,000 100,000 145,000
iao.ooo
Allstate Life Funding LLC American General Finance Corp. Anglian Water Services Financing PIC. Anglian Water Services Financing PIC.'^' Anglo Irish Asset Financelo' Anglo Irish Bank Corp, PIC.'" Australia 8 New Zealand Banking Group Aviva PIC."' Aviva PIC. BAT Intornational Finance PIC. BCI US Funding Trust'") Bombardier Capital Funding LP Bombardier. Inc. Bradfnrd 8 Bingley Capital Funding"' Bradford 8 Bingloy PIC '" British Telecommunications Pic. CE Electric UK Funding Co. Cumbernauld Funding 2004-1 Oeutsche Telekom lnlernational Finance BV Oeutsche Teleknm International Finance BV Dignity Finance Electricite de France Enterprise Inns PIC. Ford Credit Canada Fortis Financn NV France Tel6cnm S.A. Gailahnr Group PIC. Gallahnr Grnup PIC. Goncral Electric Capital Corp. HBOS Capital Funding LP"' HBOS Pic."! HBOS Treasury Services PIC. Household Finance Corp. HSBC Bank PIC."' HSBC Holdings PIC. Imperial Tobacco Finance PIC. Instituto de Credito Oflcial International Lease Finance Corp. Irish Nationwide Building Sacioty'"' John Hancock Funding Kfh-Kreditanstalt funr Wiederaufbau KfW-Kreditanstalt fuer Windnraufhau Metlife Global Funding Life Metlifo. Inc. Mitchells 8 Butlers Financo PIC. Mitchells 8 Butlers Financo PIC. mm02 PIC. Network Rail Infrastructure Finance PIC. Network Rail Infrastruclure Finance PIC. Network Rail Infrastructure Finance PIC. Network Rail Medium Term Nole Finance PIC Northern Gas Networks Ltd. Pacific Life Funding LLC Pernex Project Funding Master Trust Principal Financial Group Punch Taverns Finance PIC."! Resolution PIC ' I )
RMPA Services PIC Royal 8 Sun Alliance Insurance Groupcd' Royal Bank of Scotland PIC."' Royal Bank of Scotland PIC (" Scottish Widows PIC.'*' snciety of ~ ~ o y d s''C
6.375% 5.625% 5.250%
8.533%/9.765% 5.250% 4.750% 6 125% 5 902% 6.375%
8.2505611 1.059% 6.750% 6 250%
6.462%/7.518% 5 7509616 751%
7 750% 7.250% 5.200% 6.250% 7 125% 8.1 5 1 %
6.500% 7.250% 5.500% 5.250% 6.470% 6.625% 5.250%
6.461%/7 040% 5.750%/9.500%
4.875% 7.000% 4.750% 5.750% 6.875% 4.500% 6.625% 4.800% 6.000% 5.625% 5.550% 5.250% 5.250% 5.574% 6.469% 7.625% 4.625% 4.750% 1.962% 4.875% 4.875% 5.125% 7.500% 5.625% 5.730% 6.586% 5.337%
8.500%/9.402% 6.250%/7.180% 5.625%/6.704%
5.125% 6.875%/7.827%
7.082%
5 . 8 7 5 ~ ~
17/01/11 29/03/10 30110115 30107137 28/06/49 2911014Y 07/12/18 16/11/26 27/07/27 1211 211 9 29/12/49 14/05/0Y 23/02/06 02/06/32 12/12/22 07/12/16 15/12/22 17/09/07 09/12/10 26/09/12 31/12/30 18/07/31 0611 2/1 8 07/12/07 17H 1/08 05/12/25 30103106 2 1/05/09 10112113 2911 1/49 29/1 1/49 20112124 27/03/12 28/09/20 20/12/27 13106112 07/12/11 07/12/09 17/06/10 12/07/11 25/00/17 07/06/21 1911 2/08 29/06/20 15H 2/28 15/09/30 2510111 2 21/07/20 22/01/24 0111 2/25 06/03/09 30106127 20/01/15 18/12/13 2410YH 3 1511 0126 17/11/49
29/07/49 2911 1/49 3111 2/49 29/09/49 17/11/25
3n/owa
106,512 573.345 112,166 479.972 441,500 283,054 118.559 133,794 134.395 32,400
280.189 9.724
59,880 199.073 31.553
311.016 38.242
302.Y53 21,060 55.713 66,573 Y1.160 65,225
124,475 213.428 238.102 140,644 73.528 92.282
135,444 260,346
1,423,746 176,855 246,224 363,207 87,315
1,695,565 105,734 200,040
31,691 307,590 445,317 151.952 300,592
45,257
283,868
376,142 413,996 225,214 285.224 319,289 471 ,406 150,000 185.2R9 75,626
246,621 214,591 134,937
154,868
68,979
I 10,030
186,595
99,121
0.18 0.98 0.19 0.82 0.75 0.48 0.20 0.23 0.23 0.06 0.48 0.02 0.10 0.34 0.05 0.53 0.07 0.52 0.04 0.09 0.1 1 0.16 0.1 1 0.21 0.36 0.41 0.24 0.13 0.16 0.23 0.45 2.44 0 30 0.42 0.62 0.15 2.90 0.18 0.34 0.05 0.53 0.76 0.26 0.51 0.12 0.08 0 19 0 49 0 32 0.64 0.71 0 39 0 49 0 55 0.81 0.26 0.32 0 13 0.42 0.37 0.23 0 17 0.26
The accompanylng notes are an integral part of these financial statements.
77
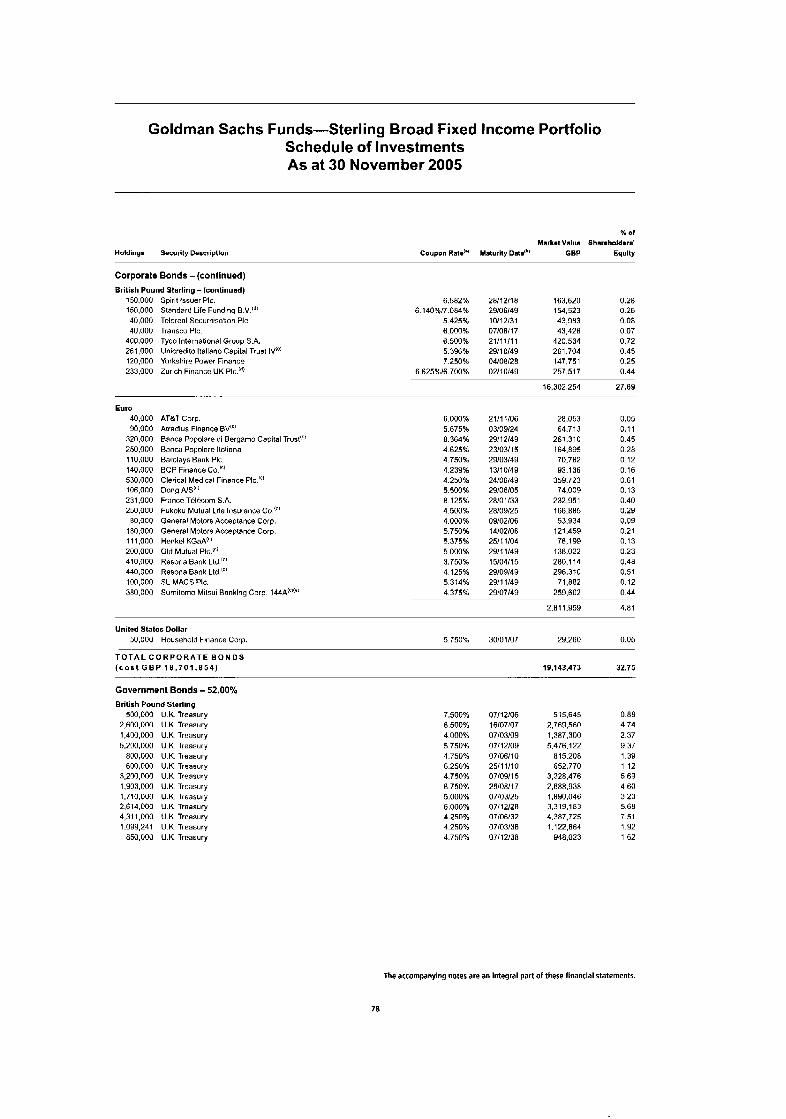
Goldman Sachs Funds-Sterling Broad Fixed Income Portfolio Schedule of Investments As at 30 November 2005
Holdings Security Descriptlon
% Of
Markmt Valus Sharmholdmrs' Coupon Rat.'" Malurlly Daldb' GBP Equlty
Corporate Bonds -(continued) British Pound Sterling - (continued)
150.000 Spirit Issuer PIC. 150,000 Standard Lire Fundinq B V."'! 40,000 Telereal Seumlisalion PIC 40,000 Transco PIC.
400,000 Tyco International Group S.A. 261,000 Unicreditu Italiano Capital Trust IV": 120.000 Yorkshire Power Finance 233.000 Zurich Finance UK PIC.'"!
6.582% 6.140%17.084%
5.425% 6.000% 6.500% 5.396% 7.250%
6.625%/6.700%
20/1 2/1 8 29106149 10112131 07/06/17 21/1 1/11 29/10/49 04/08/28 02/10/49
163,620 154,523 43,983 43,426
420.534 261.704 147.751 257.517
0.28 0.26 0.08 0.07 0.72 0.45 0.25 0.44
16,302,254 27.89
Euro 40,000 90,000
320,000 250,000 110,000 140,000 530,000 106.000 231,000 250.000
80,000 180,000 11 1,000 200.000 A10.000 450.000 100,000 380.000
ATBT Corp Atradius Finance BV'L' Batrca Popolare di Bergamo Capltal Trust"! Banca Popolare ltaliana Barclays Bank PIC. BCP Finance Co."' Clerical Medical Finance PIC IC' Dong AIS'" France TBlBcum S A . Fukoku Mutual Life Insurance Co.!" General Motors Acceptance Corp. General Mutors Acceptance Corp. Henkel KGaA"' Old Mutual PIC."' Resona Bank Ltd."' Resona Bank Ltd.'" SL MAC5 PIC. Sumilomo Milsui Banking Corp. 144A'C"B'
6 000% 5 875% 8 364% 4 625% 4 75046 4 239% 4 250% 5 500% a 125% 4 5oor0 4 000% 5 750% 5.375% 5 000% 3.750% 4 125% 5 3 14% 4 375%
2111 1/06 03/09/24 29/12/49 2310311 5 29/03/49 13110149 24/06/49 29/06/05 28/01/33 28/09/25 09/02/06 14/02/06 25/1 1/04 29/1 1/49 15/04/1 5 29/09/49 29/1 1/49 29/07/49
28.053 64,713
261.310 164,895 70,762 93.136
359.723 74,009
232,951
53,934 121,459 76,199
136,022 200,114 296,310
259,602
166,885
71,882
2.811.959
0.05 0.11 0.45 0.28 0.12 0.16 0.61 0.13 0.40 0.29 0.09 0.21 0.13 0.23 0.A8 0.51 0.12 0 44
4.81 -
United Slates Dollar 50,000 Household Finance Curp 5 750% 30/01/07 29,260 0.05
T O T A L C O R P O R A T E B O N D S ( c o a t G B P 18 .701 .854) 19.1 43.473 32.75
Government Bonds - 52 British Pound Sterling
500,000 U.K. Treasury 2,600.000 U.K. Treasury 1.400.000 U.K. Treasury 5.200.000 U.K. Treasury
800,000 U.K. Treasury 600.000 U.K. Treasury
3.200.000 U.K. Treasury 1.903.000 U.K. Treasury 1,710,000 U.K. Treasury 2,614,000 U.K Troasury 4,311.000 U.K Treasury 1.0YY.241 U.K Treasury
850,000 U.K Treasury
.OO%
7.500% 8.500% 4.000% 5.750% 4.750% 6.250% 4.750% 8.750% 5.000% 6.000% A.250% 4.250% 4.750%
07/12/06 16/07/07 07/03/09 07/12/09 071061 10 25/11/10 07/09/1 5 25/08/17 07/03/25 07/12/28 07/06/32 07/03/36 07/12/38
515.645 2,769,560 1,387,300 5.476.122
815.208 652,770
3.328.476 2.688.938
3,319,183 4,387,725 1,122,864
948.023
1,890,046
0.88 4.74 2.37 9.37 1.39 1.12 5.69 4.60 3.23 5.68 7.51 1.92 1 62
The accompanying notes are an integral part of these financial statements.
78
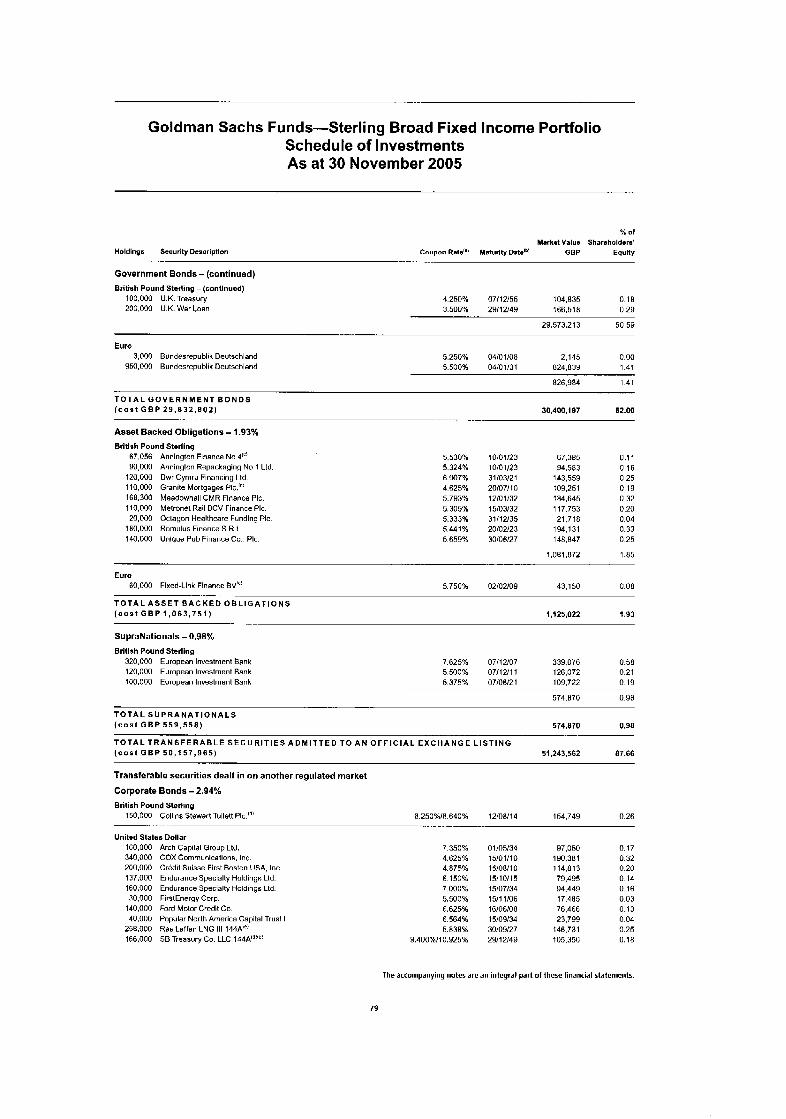
Goldman Sachs Funds-Sterling Broad Fixed Income Portfolio Schedule of Investments As at 30 November 2005
% O f
Market Valuo Sharoholdars' Holdlnga Security Description Coupon Rate''' Maturlty Date'" QBP Equlty
Government Bonds - (continued) British Pound Starling - (contlnued)
--. ... . .. .
100,000 U.K. Treasury 4.250% 07/12/55 104.835 0.18 200.000 U.K. War Loan 3.500% 29/12/49 166.518 0.29
29,573,213 50.59
Euro 3,000 Bundesrepublik Deutschland
950,000 Bundesrepublik Deutschland 5.250% 04/01/08 2,145 0.00 5.500% 04/01/31 824.839 1.41
T O T A L G O V E R N M E N T B O N D S ( c o s t G B P 29 ,832 ,602)
Asset Backed Obligations - 1.93%
Brlrlsh Pound Sterling 67.056 Annington Financn No 4'" 90,000 Annington Repackaging NO 1 Ltd.
120,000 Dwr Cymru Financing Ltd. 110,000 Granite Mortgages PIC.'" 168.300 Meadowhall CMR Finance PIC. 110,000 Metronet Rail BCV Finance PIC.
180,000 Romulus Finance S.R.L. 140,000
- .
20,000 Octagon Healthcare Funding PIC.
Unlque Pub Finance Co.. PIC
., .
5.530% 5.324% 6.YO7% 4.625% 5.793% 5.305% 5.333% 5.441 % 5.659%
826.984 1.41
30,400,187 52.00
1010 1/23 1010 1/23 3110312 1 20107110 12/01/32 15/03/32 31/12/35 20102123 30106127
67.385 0.11 94.583 0.16
143,559 0.25 109.251 0.19 184,645 0.32 117.753 0.20 21.718 0.04
194.131 0.33 148.847 0.25
1,081,872 1.85
Euro 60.000 Fixed-Link Finance BV"' 5.750% 02/02/09 43,150 0.08
.-
T O T A L A S S E T B A C K E D O B L I G A T I O N S ( c o s t G B P 1 ,063 ,751) 1,125,022 1.93
SupraNationals - 0.98% Britlsh Pound Sterling
-
320.000 European Investment Bank 7.625% 07/12/07 339.076 0.58 120,000 European Investment Bank 5.500% 07/12/11 126.072 0.21 100,000 European Investment Bank 5.375% 07/06/21 109,722 0.19
574.870 0.98
T O T A L S U P R A N A T I O N A L S ( c o s t G B P 5 5 9 . 5 5 8 ) 574.870 0.98
T O T A L T R A N S F E R A B L E S E C U R I T I E S A D M I T T E D T O A N O F F I C I A L E X C H A N G E L I S T I N G ( c o s t G B P 50 ,157 ,965) 51,243,562 87.66
Transferable securities dealt in on another regulated market
Corporate Bonds - 2.94%
British Pound Sterling 150,000 Collins Stewart Tullert PIL 8 250%/R 640% 12/08/14 154,749 0.26
-- . . . . - ~. -.
Unitmd States Dollar 160,000 340.000 200.000 137,000 160,000 30,000
140,000 40,000
258.000 166,000
Arch Capital Group Ltd. COX Communications. Inc. Credit Suisse First Boston USA, Inc Endurance Specialty Holdings Lld. Endurance Specialty Holdings Ltd. FirstEnergy Corp Ford Motor Credit Co. Popular North America Capital Trust I Ras Ldlan LNG 111 144A'*! SB Treasury Co LLC 144Ai'!"!
7.350% 4.625%
6.150% 7.000% 5.500% 6.625% 6.564% 5.838%
9.400%/10.925%
4.875%
o i / n m 4 15/01/10 i5/08/i 0 15/10/15 15/07/34 15/11/06 16/06/08 15/09/34 30/09/27 29/12/49
97,050 1YO,381 114,813 79,495 94.449 17.485 76,466 23,799
146,731 105.350
0.17 0.32 0.20 0.14 0.16 0.03 0.13 0 04 0.25 0.18
The accompanying notes are an integral part of these financial statements.
79
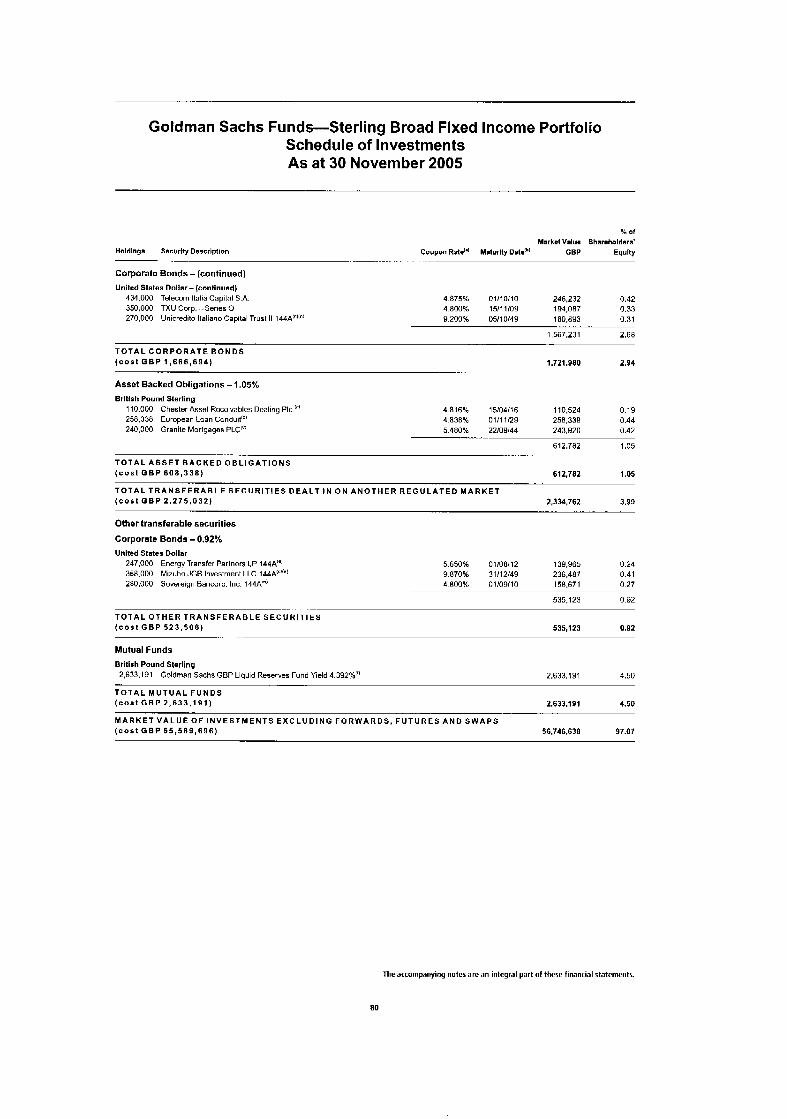
Goldman Sachs Funds-Sterling Broad Fixed Income Portfolio Schedule of Investments As at 30 November 2005
% Of
Market Value Sharmholdsrs' Holdlngs Security Description Coupon Rato"' Maturity Date''' GBP Equlty
.- .. . .-
Corporate Bonds - (continued) United States Dollar- (continued)
434.000 Telecom ltalia Capital S.A. 350,000 TXU Corp. --Series 0 27O.OOO Unicredito ltaliano Capital Trust II 144A:'"':
4 875% 01/10/10 246,232 0.42 4 800% 15/11/09 194,087 0.33 9 200% 05/10/49 180,893 0.31
1,567.231 2.68
T O T A L C O R P O R A T E B O N D S ( c o s t G B P 1 ,666 ,694) 1.721.980 2.94
Asset Backed Obligations - 1.05% Brltlsh Pound Sterling
1 10,000 Chester Assnt Receivables Dealing PIC.'" 258.338 European Loan Conduit'" 240.000 Granite Mortgages PLC'"
4.816% 15/04/16 110,524 0.19 258.338 0.44 4.838% 01/11/29
5.480% 22/09/44 243,920 0.42
612.782 1.05 -.. ..
T O T A L A S S E T B A C K E D O B L I G A T I O N S ( c o s t G B P 608 ,338) 612,761 1.05
T O T A L T R A N S F E R A B L E S E C U R I T I E S D E A L T I N O N A N O T H E R R E G U L A T E D M A R K E T ( c o s t G B P 2 ,275 ,032) 2.334.762 3.99
Other transferable securities
Corporate Bonds - 0.92% Unlted States Dollar
247,000 368,000 280.000 Sovereign Bancorp. Inc. 144A"'
Energy Transfer Partncrs LP 144A'" Mizuho JGB Investment LLC 144A"""
5.650% 01/08/12 139,965 0.24 9.870% 31/12/49 236.487 0.41 4 800% 01/09/10 158.671 0.27
535.123 0 92 - ..
T O T A L OTHER T R A N S F E R A B L E S E C U R I T I E S ( c o s t G B P 523 ,508) 535,123 0.92
- -
Mutual Funds British Pound Sterling 2,633.191 Goldman Sachs GBP Liquid Reserves Fund Yield 4 392%'' 2,633,191 4.50
T O T A L M U T U A L F U N D S ( c o s t G B P 2,633,191) 2.633.191 4.50
M A R K E T V A L U E O F I N V E S T M E N T S E X C L U D I N G FORWARDS, F U T U R E S A N D S W A P S ( c o s t G B P 55 ,589 ,696) 56,746,638 97.07
The accompanying notes are an integral part of these financial statements.
80
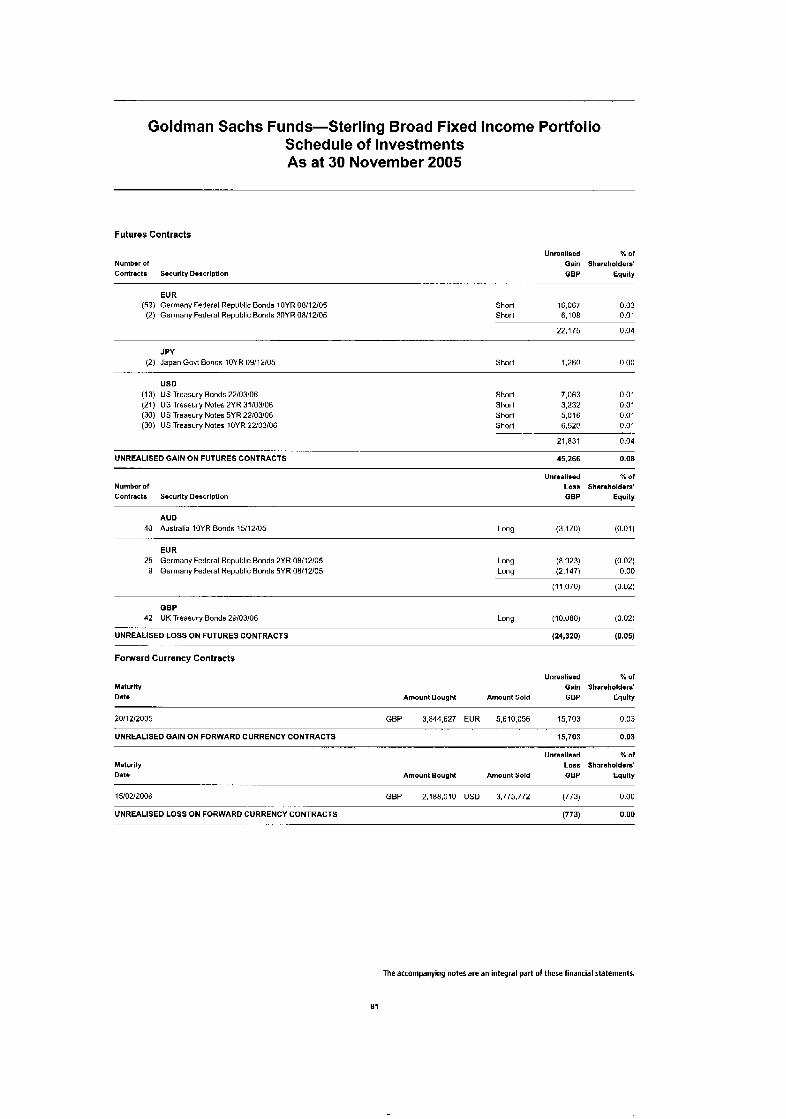
Goldman Sachs Funds-Sterling Broad Fixed Income Portfolio Schedule of Investments As at 30 November 2005
Futures Contracts
Unrealised x of Numbmr of Gain Shareholders' Contracts Sacurlly Descriptlon GBP Equity
. . . . .. .. . . ... . . . . . . . . EUR
(59) Germany Federal Republic Bonds 10YR 08/12/05 Short 16.067 0.03 (2) Germany Federal Republic Bonds 30YR OR/12/05 Short 6,108 0.01
22,175 0.04
J PY (2) Japan Govt Bonds lOYR 03/12/05 Short 1,260 0.00
US0 (13) US Treasury Bonds 22/03/06 (21) US Treasury Notes 2YR 31/03/06 (30) US Treasury Notes 5YR 22/03/06 (30) US Treasury Notes lOYR 22/03/06
Shorl 7,063 0.01 Short 3,232 0.01 Short 5.016 0.01 Short 6,520 0.01
21.831 0.04
UNREALISED GAIN ON FUTURES CONTRACTS 45.266 0.08 , ..
Number of Contracts Securlry Descrlprlon
Unraaiised % O f
Loss Sharoholdors' GBP Equity
AUD 40 Australia lOYR Bonds 15/12/05 Long (3.170) (0.01)
EUR 25 Germany Federal Republic Bonds 2YR 08/12/05
9 Germany Federal Republic Bonds 5YR 08/12/05 Long (8.923) (0.02) Long (2.147) 0.00
(11,070) (0.02)
GBP 42 UK Treasury Bonds 29/03/06 Long (10,080) (0.02)
UNREALISED LOSS ON FUTURES CONTRACTS (24,320) (0.05)
Forward Currency Contracts
~-
Maturlty Date
Unrealisod % o f Gain Shareholders'
Amount Bought Amount Sold GBP Equity
201 12/2005 GBP 3.844.627 EUR 5,610,056 15,703 0 03
UNREALISED GAIN ON FORWARD CURRENCY CONTRACTS 15,703 0.03
Unrealised % Of
Maturity Loss Shareholders' Data Amounl Bough1 Amount Sold OBP Equity
-_
15/02/2006 GBP 2,188.010 USD 3,775,772 (773) 0 00
UNREALISED LOSS ON FORWARD CURRENCY CONTRACTS (773) 0.00
The accompanying notes are an integral part of these financial statements.
81
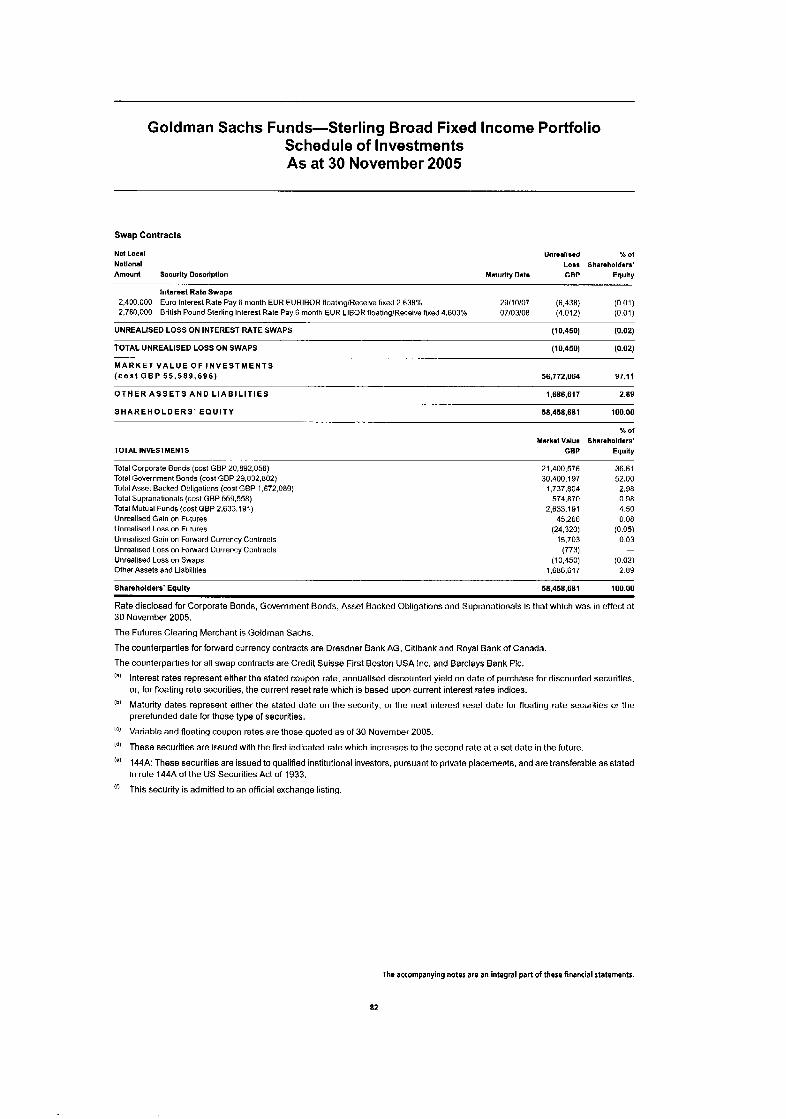
Goldman Sachs Funds-Sterling Broad Fixed Income Portfolio Schedule of Investments As at 30 November 2005
Swap Contracts
Net Local Unrmallsmd % Of
Notlonal Loss Sharaholdars' Amount Securlly Descrlptlon Malurlty Data GBP Equlty
.. . ~- lntarest Rate Swaps
2.400.000 Euro Interest Rate Pay 6 month EUR EURIBOR floatinplReceive fixed 2.638% 29/10/07 (6,438) (0.01) 2,760,000 British Pound Sterling Interest Rate Pay 6 month EUR LIBOR iloatinglReceive fired 4.603% 07/03/08 (4.012) (001)
UNREALISED LOSS ON INTEREST RATE SWAPS (10.450) (0.02)
TOTAL UNREALBED LOSS ON SWAPS (10.450) (0.02)
M A R K E T V A L U E O F I N V E S T M E N T S ( c o s t Q B P 5 5 . 5 8 9 . 6 9 6 ) 56,772,064 97.1 1
O T H E R A S S E T S A N D L I A B I L I T I E S 1.686.617 2.69
S H A R E H O L D E R S ' E Q U I T Y 56.458.681 100.00 ... .
. ,.
% Of
Markmt Valus Sharmholdsrs' TOTALINVESTMENTS GHP Equlty
Total Corporate Bonds (cost GBP 20,892,056) 21,400,576 36.61 Total Government Bonds (cost GBP 29,832,802) 30,400,197 52.00 Total Asset Backed Oblipatiuns (cos1 GBP 1372,089) 1,737,804 2.98
Total Mutual Funds (cost GEP 2,633,191) 2.633.191 4.50 Unrealised Gain on Futures 45,266 0.08 Unrealised Loss on Futures (24,320) (0.05) Unrealised Gain on Forward Currency Contracts 15,703 0.03
- .. ..-
Total Supranationals (cost GBP 559.558) 574,870 0.98
Unrealised Loss on Forward Currency Contracts (773) - Unrealised Loss un Swaps (10.450) (0.02) Other Assets and Liabilities 1,686,617 2 89
Shareholders' Eaultv 56.458.681 100.00
Rate disclosed for Corporate Bonds, Government Bonds, Asset Backed Obligations and Supranationals is that which was in effect at 30 November 2005. The Futures Clearing Merchant is Goldman Sachs.
The counterparties for forward currency contracts are Dresdner Bank AG. Citibank and Royal Bank of Canada.
Thecounterparties for all swap contracts are Credit Suisse First Boston USA Inc. and Barclays Bank PIC.
Interest rates represent either the stated coupon rate, annualised discounted yield on date of purchase for discounted securities. or, for floating rate securities. the current reset rate which is based upon current interest rates indlces.
Maturity dates represent either the stated date on the security, or the next interest reset date for floatlng rate securities or the prerefunded date for those type of securities.
Variable and floating coupon rates are those quoted as of 30 November 2005. These securities are issued with the first indicated rate which increases to the second rate at a set date in the future.
144A: These securities are issued to qualified institutional investors. pursuant to private placements, and are transferable as stated in rule 144A of the US Securities Act of 1933.
This security is admitted to an official exchange listing.
The accompanying notes are an integral part of these financial statements.
82
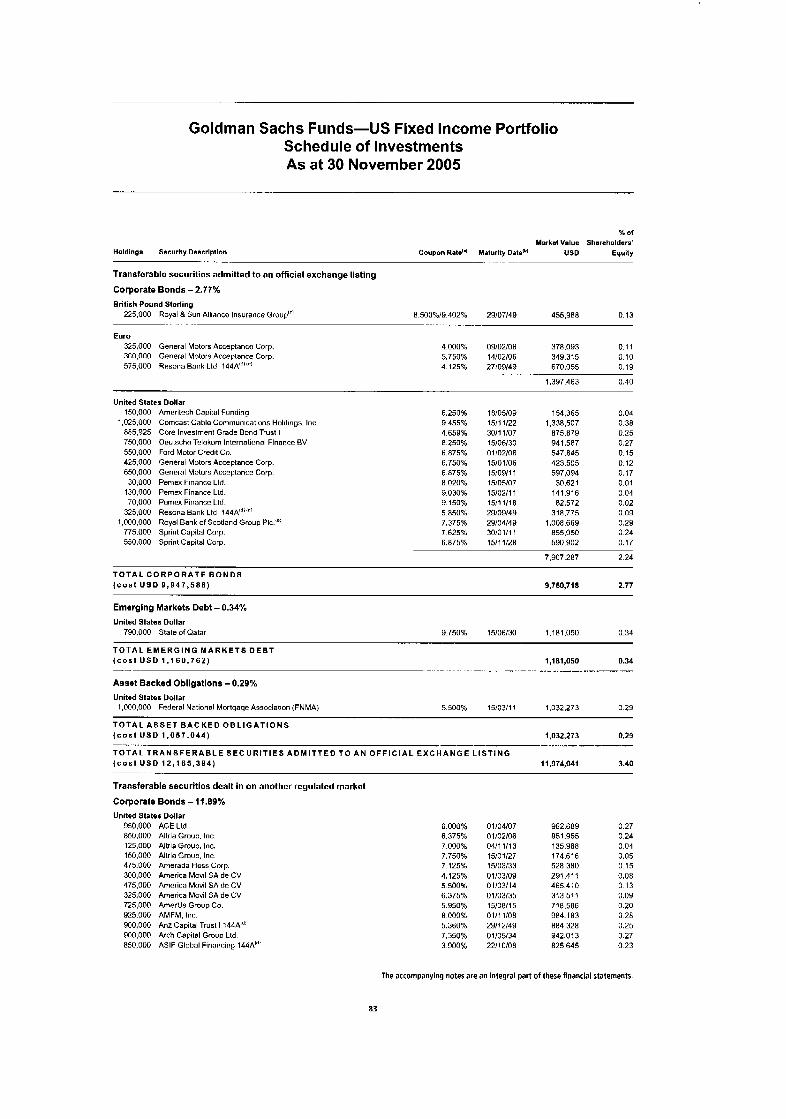
Goldman Sachs Funds-US Fixed Income Portfolio Schedule of Investments As at 30 November 2005
% Of
Market Value Shareholders' Holdlngs Security Deacrlption Coupon Rale'" Maturlly Date'@' us0 Equity
Transferable securities admitted to an official exchange listing
Corporate Bonds - 2.7?%
British Pound Sterling
.. .. .
225,000 Royal 8 Sun Allianco Insurance Group'" 8.500%/Y.402% 29/07/49 455,968 0.13 --- - . . - - . .
Euro 325.000 General Motors Acceptanco Corp. 3C0.000 General Motors Acceplance Corp. 575.000 Resona Bank Lld. 144A'""P'
4.000% 09/02/06 378.093 0.1 1 5.750% 14/02/06 349,315 0.10 4.125% 27/09/49 670,055 0.19
1,397,463 0.40 .- .~ .. .
United States Dollar 150.000 Ameritech Capltal Funding
1,025,000 Corncast Cable Communications Huldin~s. Inc 865,925 Core Inveslrnenl Grade Bond Trust I 750,000 Deutschn Telekom International Finance BV 550,000 Ford Motor Credit Go. 425,000 General Motors Acceptance Corp. 650,000 General Motors Acceplance Corp. 30,000 Pernex Finance Ltd.
130,000 Pernex Finance Ltd. 70.000 Pernex Finance Lld.
325.000 Resona Bank Ltd 14AA"'''p'
775.000 Sprint Capital Corp 550,000 Sprinl Capital Corp.
1,[email protected] Royal Bank of Scotland Group PIC.'',
6.250% Y.455% 4.659% 8.250% 6.875% 6.750% 6.875% 8.020% 9.030% 9.150% 5.850% 7.375% 7.625% 6.875%
18/05/09 15/11/22 30/1 1/07 15/06/30 01/02/06 1510 1/06 1510911 1 15/05/07 15/02/1 1 15/11/18 2Y/09/4Y 29/04/49 30101111 15/11/28
154,365 1.338507
875,879 941.587 547.845 423,505 597,094
30,621 141,916 82,572
318,775 1.008.669
855,050 590.902
7.907.287
0.04
0.25 0.27 0.15 0.12 0.17 0.01 0 04 0.02 0.09 0.29 0.24 0.17
2.24
0.38
-
T O T A L C O R P O R A T E B O N D S ( c o s t U S 0 9 ,947 ,588) 9,760,718 2.77
Emerglng Markets Debt - 0.34%
United Statsa Dollar 780.000 State of Qatar 9.750% 15/06/30 1,181,050 0.34
T O T A L E M E R G I N G M A R K E T S D E B T ( c o s t U S 0 1,160,762) 1,181,050 0.34
Asset Backed Obligations - 0.29% Unitad States Dollar
. .. .. . . ...,..
1,[email protected] Federal National Mortgage Association (FNMA) 5 500% 15/03/11 1,032,273 0.29
T O T A L A S S E T B A C K E D O B L I G A T I O N S ( c o s t U S D 1 .057 .044) 1,092,273 0.29
T O T A L T R A N S F E R A B L E S E C U R I T I E S A D M I T T E D TO A N O F F I C I A L E X C H A N G E L I S T I N G ( c o s t U S 0 12 ,165 ,394) 11,974,041 3.40
Transferable securities dealt in on another regulated market
Corporate Bonds - 11.89%
United States Dollar 950.000 AGE Ltd. 850.000 Allria Group, Inc. 125,000 Allria Group, Inc. 150,000 Allria Group, Inc. 475.000 Arnerada HQSS Cnrp. 300,000 America Movil SA de CV 475,000 America Mwi l SA de CV 325,000 America Movil SA de CV 715.000 AmerUs Group Co. 925.000 AMFM. Inc. 900,000 Anz Capilal Trust I 144A'l: 9G0.000 Arch Capital Group Lld 850,000 ASIF Global Financing 144A'"'
6 000% 6.375% 7 000% 7.750% 7 125% 4.125% 5 500% 6.375% 5 950% 8 000% 5.360% 7.350% 3 900%
01/04/07 01/02/06 0411 1/13 15/01/27 15/03/33 0 1 /03/09 01/03/14 01/03/35
01/11/08 29/12/49 01/05/34 22110108
15/oa115
962.689
135,988 174.6 16 528,380 291,411 465,410 313,511 718.586 984.183 884,328 942,013 825,645
851,955 0.27 0.24 0.04 0.05 0.15 0.08 0.13 0.09 0.20 0.28 0.25 0.27 0.23
The accompanying notes are an integral part of these financial statements.
83
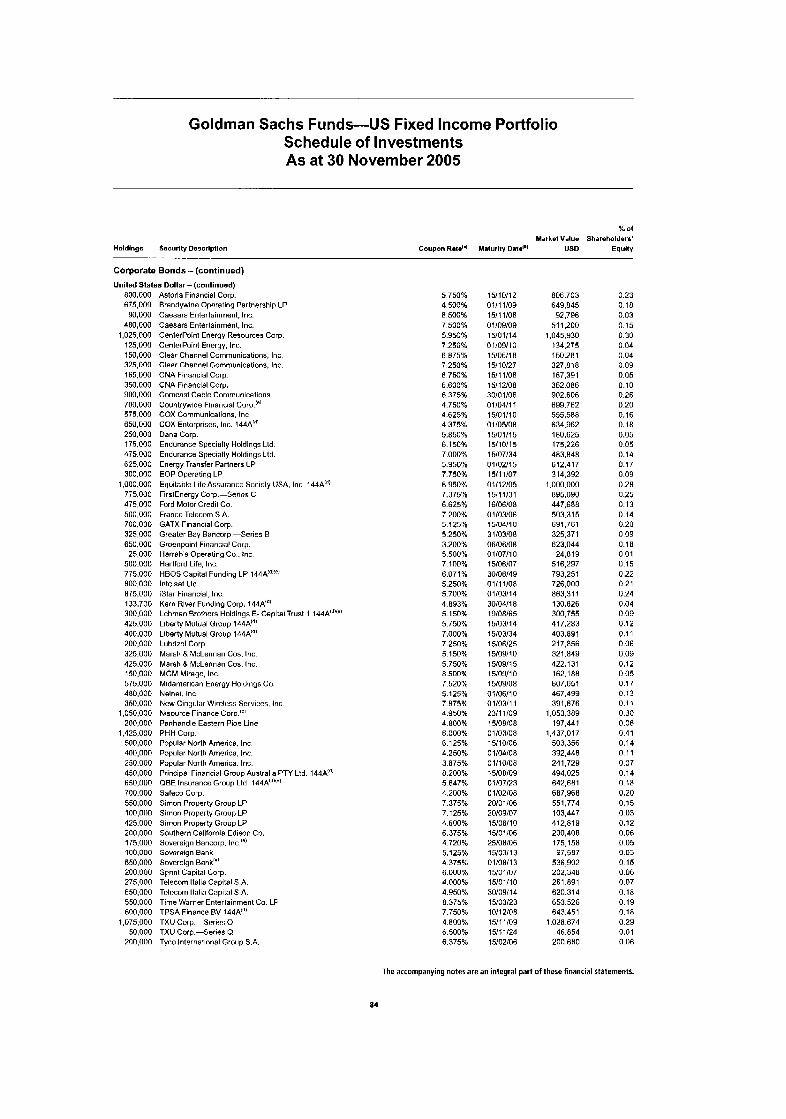
Goldman Sachs Funds-US Fixed Income Portfolio Schedule of Investments As at 30 November 2005
% of Market Value Shareholders'
Holdlnge Security Description Coupon Ralo" Maturlty Dad"' US0 Equlty
Corporate Bonds - (cont inued)
United States Dollar - lconiinuadl
.. .
800,000 675,000
90,000 480,000
1,025,000 125,000 150,000 325,000 165,000 350,000 900,000 700,000 575.000 650,000 250,000 175,000 475.000 625.000 300,000
1,000,000 7i5.000 475,000 500,000 700.000 325,000 650.000
25,000 500.000 775,000 800,000
133,700 300.000 425,000 400,000 200.000 325.000 425,000 150,000 575,000 480.000 350,000
1,050,000 200.000
1,425,000 500,000 400,001) 250.000 450,000 650,000 700.000 550,000
425.000 200.000 175,000 100.000 550,000 200.000 275,000 650,000 550.000 600,000
1,075,000 50,000
200,000
075,000
ioo.ono
Astoria Financial Corp. Brandyinn Opnrating Partnership LP Caesars Entertainment, Inc. Caesars Entertainment. Inc. Centerpoint Energy Resources Corp. Centerpoint Energy, Inc. Clear Channel Communications. Inc Clear Channel Communications. Inc. CNA Financial Corp. CNA Financial Corp. Corncast Cable Communications Countrwide Financial Gorp.'" COX Communications. Inc COX Enterprises, lnc. 144A"' Dana Corp. Endurance Specialty Holdings Lld. Endurance Specially Holdings Ltd. Energy Transfer Partners LP EOP Operating LP Equitable Life Assurance Society USA, Inc. 144A'") FirstEnergy Corp -Serins C Ford Motor Credil Co. France Telecom S.A. GATX Financial Corp. Greater Bay Bancorp -Series B Grnenpoinl Financial Corp. Harrah's Operaling Cu , Inc Hartford Life, Inc. HBOS Capital Funding LP 144A!'!!e) lnlelsal Lld iStar Financial, Inc. Kern River Funding Corp. 144A'"' Lehman Brothers Holdings E- Capital Trust 1 144A'd"'' Liberty Mutual Group 144A"' Liberty Mutual Group 144A'"' Luhrizol Corp Marsh 8 McLennan Cos, Inc Marsh 8 McLennan Cos. Inc MGM Mirage, Inc. Midamerican Energy Holdmgs Co. Nnlnet. Inc New Clngular Wireless Services. Inti. Nisource Finance Corp."' Panhandle Eastern Pipe Line PHH Corp. Popular North America. Inc Popular North America, Inc. Popular North America, Inc. Principal Financial Group Australia PTY Ltd. 144A:"' OBE Insurance Group Ltd 144A'''te' Safeco Corp. Simun Property Group LP Simon Property Group LP Simon Property Group LP Southern California Edison Co. Sovereign Bancorp. Inc (') Sowreign Bank Sovereign Bank"' Srrinl Capital Corp. Telecom ltalia Capital S.A. Telecom ltalia Capital S.A. Time Warner Entertainment Co. LP TPSA Finance BV 144A:" TXU Gorp.-Serins 0 TXU Corp.-Series Q Tyco lntornatinnal Group S.A.
5 750% 4.500% 8.500% 7 500% 5.950% 7.250% 6 875% 7 250% 6.750% 6.600% 6.375% 4.750% 4.625% 4.375% 5.850% 6.150% 7.000% 5.950% 7.750% 6.950% 7.375% 6.625% 7.200% 5 125% 5 250% 3.200% 5 500% 7 100% 6.071% 5.250% 5.700% 4 893% 5.150% 5.750% 7.000% 7.250% 5.150% 5.750% 8.500% 7.520% 5.125% 7.875% 4.950% 4.80096 6.000% 6.125% 4.250% 3.875% 8.200% 5 647% 4.200% 7.375% 7.125% 4 600% 6.375% 4.720% 5.125% 4 375% 6 000% 4.000% 4.950% 8.375% 7.750% 4.800% 6.500% 6.375%
15/10112 01/11/09 15/1 1/06 01/09/09 15/01/14 01/09/10 15/06/18 15/10/27 15/1 1/06 1511 2/08 30/01/06 01104/11 15/01/10
15/01/15 15110115 15/07/34 0110211 5 15/1 1/07 0 1 / I 2/05 15/11/31 16/06/08 01/03/06 1510411 0 31/03/08 06/06/08 01/07/10 15/06/07 30106/49
01/03/14 30/04/18 19/08/65 15/03/14 15/03/34 15/06/25 15/09/10 15/09/15 15/09/10
01/06/10 01/03/11 23/1 1/09
01 /03/08 15/10/06 01/04/08 0 i/iO/O8 15/08/09 01107123 01/02/08 20101106 20109107 15/06/1 0 15/01/06
15/03/13 01/08/i 3 15/01/07 15/01/10 30109114 15/03/23 10/12/08 15/11/09 15/11/24 15/02/06
o 1 /o5/00
o i / i i / o a
15/09/00
w o w 0 8
25/oa/o6
806,703 649.845 92,796
51 1,200 1,045,930
134,275 150.28 1 327,818 167,391 362,086 902,606 699,762 555.588 634.962 180,625 175,226
612,417 314.392
1.000.000
447,688 503.315 691,781 325.371 623,044 24,819
516,297 793,251 726,000 863,311
300,755 417,283
217,856 321.849 422,131 162.1 88 607,651 467.AY9 391,676
1,053.389 197,441
1,437,017 503,356 392.448 241.729 494,025 642,681 687,968 551.774 103,447 412,819 200.408 175,158 97,587
536,902 202,348
620,314 653.526 643,451
1,028.674 46,854
200,680
403,848
895,090
130,026
403,891
2 6 1 . ~ 1
0.23 0 18 0.03 0.15 0 30 0.04 0.04 0 09 0.05 0.10 0.26 0.20 0.16 0.18 0.05 0.05 0.14 0.17 0.09 0.28 0.25 0.13 0.14 0.20 0.09 0.18 0.01 0.15 0.22 0 21 0.24 0.04 0.09 0.12 0.1 1 0.06 0.09 0.12 0.05 0.17 0.13 0.11 0.30 0.06 0.41 0.14 0.11 0.07 0.14 0.18 0.20 0.15 0 03 0.12 0.06 0.05 0.03 0.15 0.06 0.07 0.18 0.19
0.29 0.01 0.06
0.18
The accompanying notes are an integral part of these financial statements.
a4

Goldman Sachs Funds-US Fixed Income Portfolio Schedule of Investments As at 30 November 2005
% of MsrhelVelue Shsreholdem'
Holdlngs Socurlly Dascrlptlon Coupon Ratd.l Maturlty Data"' USD Equity
Corporate Bonds - (continued)
. . . . .
United States Dollar - (continued) 100,000 Tyson Foods, Inc 750.000 Union Plantors Bank. National A$$nciatiiin 600,000 Waste Manaqement, Inc 750.000 Zurich Capital Trust I 14AA'"'
7.250% 01/10/06 101.840 0.03 6.500% 15/03/08 771,094 0.22 7.375% 01/08/10 653,938 0.lY 8.376% 01/06/37 810.374 0.23
T O T A L C O R P O R A T E B O N D S ( c o s t U S D 42 .074 .496)
Government Bonds - 11.14%
United States Dollar 7,200,000 United States Treasury N o h 1,900.000 United States Treasury Notes 2,300,000 United Slates Treasury Notes 5.400.000 United States Troasury Notes 1,000,000 United States Treasury Notes 2,000,000 United States Treasury Principal-Only Slripped 1,800,000 United States Treasury Principal-Only Strippod 1,900,000 United States Treasury Principal-Only Stripped
23.300.000 United States Treasury Principal-Only Stripped 8,200,000 United States Treasury Principal-Only Strippod
10,000,000 United States Treasury Principal-Only Stripped
41.866.171 11.89
41,866.171 1 I .a9
3.625% 4.500% 4.125% 1 .875% 4 500% 0.000% 0.000% 0.000% 0.000% 0.000% 0.000%
30104107 15/11/10 15/05/15 15/07/15 15/1 1/15 15/02/14 15/02/19 15/08/21 1511 1121 15/1 1/22 1511 1/24
7,122,744 1,308,322 2.230.379 5,293,674 1,001,560 1,375,520
961.434 891,252
10,794,191 3,618,496 4,014,899
2.02 0.54 0.63 1.51 0.29 0.39 0.27 0.25 3.07 1.03 1.14
39.2 i2,47 1 11.14
T O T A L G O V E R N M E N T B O N D S ( c o s t U S 0 39 ,543 ,215) 39,212,471 11, IA
Asset Backed Obligations - 58.15% Unitad Statas Dollar
1.820.097 ABN Amro Mortgage Corp. 5.500% 25/06/33 191.716 0.05
1,487.796 American Home Mortgagn Investment Trust'"! 4 481% 25/1 1/45 1.486.495 0.42 - ..... ........
247.054 Bear Stearns Adjuslable Rate Mortgage Trust 4,134% 25/08/33 247,684 0.07
12,700,000 Bear Stearns Commercial Mortgage Securities 144A": 1260% 13/03/40 591,757 0 17
346,343 Chase Commercial Mortgage Sncurities Corp. 7 370% 19/06/29 351.943 0.10
2.809.840 Countrywide Alternativu Loan Trustlc: 4 541% 25/09/35 2,808,393 0 80
1,661.036 Countrywide Home Equity Loan Trust Series D"' 4 629% 15/06/29 1,661,391 0.47
1.296.183 Countrywide Home Equity Loan Trust-Series E'" 4629% 15/10/28 1.297.616 0.37 ........................ - . . . . ....... "-
3,425.066 Countrywide Home Loans Mortgage Pass Through Trust. Inc. 0.390% 25/10/33 20.443 0.01
341,546 CS First Boston Mortgage Securities Corp. 5.100% 25/03/33 340.3 12 0.10 121,459 CS First Buslon Mortgage Securities Corp. 5.500% 25/06/33 6,840 0.00
1.337,04Y CS First Boston Mortgage Securities Corp. 0.7R2% 25/07/33 12,745 0.00
1.406,llY CS First Boston Mortgage Securities Corp. 0.605% 25/08/33 10,400 0.00
2.198.229 CS First Boston Mortgago Socurities Corp. 6.500% 25/03/32 2.210.333 0.63
1.913.053 CS First Boston Mortgage Securities Corp. 5.250% 25/07/33 200.737 0.06
1,100,000 CS First Boston Mortgage Securities Corp 7.545% 15/04/62 1,193,462 0.34
3,974.829 1.13
6,980,651 CS First Boston Morlyage Securities Corp. 144A' I) 1.799% 15/11/36 366.745 0.10 7.457.030 CS First Boston Morlyaye Securities Corp. 144A!'I 1.997% 15/05/38 421,747 0.12
788.492 0.22
1,000,000 Federal Farm Credit Bank 3.625% 04/01/08 978.918 0.28 3,600,000 Fedoral Farm Credit Bank 4.700% 10108/15 3.542.594 1 .oo
4,521,512 1.28
The accompanying notes are an Integral part of these financial statements.
85
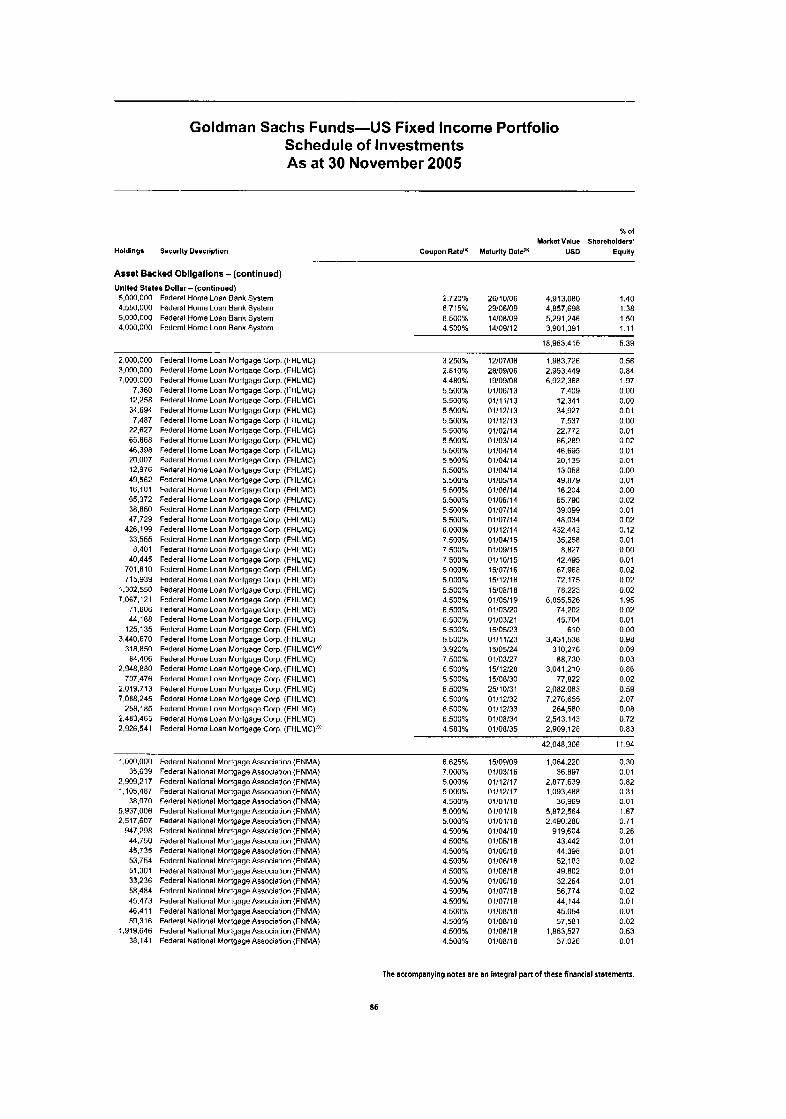
Goldman Sachs Funds-US Fixed Income Portfolio Schedule of Investments As at 30 November 2005
% of Market Value Shareholders'
Holdlnga Sesurlly Description Coupon Rate"' Maturity Dale"' USD Equity - - -.
Asset Backed Obllgatlons - (continued)
United States Dollar - (continued) 5.000.000 Federal Home Lnan Bank System 4,550,000 Federal Home Loan Bank System 5,000,000 Federal Home Loan Bank System 4,000,000 Federal Home Loan Bank System
2 720% 26/10/06 4,813,080 1.40 6.715% 29/06/09 4,857,698 1 38 6 500% 14/08/09 5.291.246 150 4500% 14/09/12 3,901,391 1 1 1
18,963,415 5.39
2,000.000 3,000,000 7,000.000
7,360 12,258 34.694 7.487
22.Ki7 65.868 46.398 20.007 12,976 49,562 16.101 65.372 38.850 47,729
426,199 33,555 8,401
40.445 701.610 715,939
1,302,550 7,067,121
71,606 44.168
125,135 3,440,670
318.850 84.406
2.948,880 707.476
2,019,713 7.088.245
258.185 2,483,465 2.926.541
Federal Home Loan Mortgage Corp. (FHLMC) Federal Home Loan Mortgage Corp. (FHLMC) Federal Home Loan Mortgage Corp. (FHLMC) Federal Home Loan Mortgage Corp. (FHLMC) Federal Home Loan Mortgage Corp. (FHLMC) Federal Home Loan Mortgage Corp, (FHLMC) Federal Home Loan Mortgage Corp (FHLMC) Federal Home Loan Mortgage Corp. (FHLMC) Federal Home Loan Mortgage Corp, (FHLMC) Federal Home Loan Mortgage Corp (FHLMC) Federal Home Loan Mortgage Corp, (FHLMC) Federal Home Loan Mortyage Corp (FHLMC) Federal Home Lnan Mortgage Corp. (FHLMC) Federal Home Loan Mortgage Corp (FHLMC) Federal Home Loan Mortgage Corp. (FHLMC) Federal Home Loan Mortgage Corp (FHLMC) Federal Home Loan Mortgage Corp. (FHLMC) Federal Home Loan Mortgago Corp (FHLMC) Federal Home Loan Mortgage Corp (FHLMC) Federal Home Loan Mortgage Corp. (FHLMC) Federal Home Loan Mortgage Gorp, (FHLMC) Federal Home Loan Mortgage Corp (FHLMC) Federal Home Loan Mortoaqe Corp. (FHLMC) Federal Home Loan Mortgage Corp. (FHLMC) Federal Home Loan Mortgage Corp. (FHLMC) Federal Home Loan Mortgage Corp. (FHLMC) Federal Home Loan Mortgage Corp. (FHLMC) Federal Home Loan Mortgage Corp. (FHLMC) Federal Home Loan Mortgage Corp. (FHLMC) Federal Home Loan Mortgage Corp. (FHLMC)'" Federal Home Loan Mortgage Corp. (FHLMC) Federal Homc Loan Mortgage Corp. (FHLMC) Federal Home Loan Mortgage Corp. (FHLMC) Federal Home Loan Mortgage Corp. (FHLMC) Fedoral Home Loan Mortgage Corp. (FHLMC) Federal Home Loan Mortgage Corp. (FHLMC) Federal Home Loan Mortgage Corp. (FHLMC) Federal Homo Loan Mortoaae Corn. (FHLMC)"!
3 250% Z.R10% 4.480% 5.500% 5.500% 5 500% 5.500% 5 500% 5.500% 5.500% 5 500% 5.500% 5.500% 5.500% 5.500% 5.500% 5.500% 6.000% 7.500% 7 500% 7 500% 5 000% 5.000% 5.500% 4,500% 6.500% 6.500% 5.500% 5 500% 3.920% 7.500% 6 500% 5.500% 6.500% 6 500% 6.500% 6.500% 4 583%
12/07/06
19/09/08 01/06/13 01/11/13 0 1/12/13 01/12/13 0 1/02/14 0 1/03/14 01/04/14 01/04/14 01/04/14 01/05/14 0 1 /06/1 4 0 1/06/14 01/07/14 01/07/14 0 1 I1 2/14 01/04/15 OI/OY/1 5 01/10/15 15/07/16 1511 2/1 6 15/08/18 01/05/i 9 01/03/20 01/03/21 15105123 01/11/23 15/05/24 01/03/27 15/12/28 15/08/30 25110131 01/1 2/32 01/12/33 01/08/34 01/08/35
2a/09/06 1,983,726 0.56 2,953,449 0.84 6.922.368 1 .Y7
7.409 0.00 12,341 0.00 34,927 0.01 7,537 0.00
22,772 0.01 66.289 0.02 46.695 0.01 20,135 0.01 13.058 0.00 49.879 0.01 16,204 0.00 65,790 0.02 39.099 0.01 48,034 0.02
432,443 0.12 35,258 0.01
8,827 0.00 42.495 0.01 67.968 0.02 72,175 0.02 78,223 0.02
6,855.526 1.95 74,202 0.02 45,704 0.01
610 0.00 3.431.536 0.98
310,276 0.09 88,730 0.03
3,041,210 0.86 77.822 0.02
z,n8z.o83 0.59 7.276.655 2.07
264.580 0.08 2,543,143 0.72 2.909.128 0.83 _ _ , ,
42,048,306 11 94
1,000,000 35,639
2.909.217 1,105,487
5,937,006 2,517,607
947.298 4A.750 45,735 53,754 51.301 33,236 58.484 45.473 46.41 1 59,316
1.919.646 38.141
3~.070
Federal National Mortgage Association (FNMA) Federal National Mortgage Association (FNMA) Federal National Mortgagn Associalion (FNMA) Federal National Mortgage Association (FNMA) Federal National Mortyage Association (FNMA) Federal National Mortgage Association (FNMA) Federal National Mortgage Assvciation (FNMA) Federal National Mortgage Association (FNMA) Federal National Mortgage Association (FNMA) Federal National Mortgage Association (FNMA) Federal National Mortgage Association (FNMA) Federal National Mortgage Association (FNMA) Federal National Mortgage Association (FNMA) Federal National Mortgage Association (FNMA) Federal National Mortgage Association (FNMA) Federal National Mortgage Associalion (FNMA) Federal National Mortgage Association (FNMA) Federal National Mortgage Association (FNMA) Fednral National Mortgage Association (FNMA)
6.625% 7.000% 5.000% 5.000% 4.500% 5.000% 5.000% 4 500% 4 500% 4.500% 4.500% 4 500% 4.500% 4 500% 4.500% 4.500% 4.500% 4.500% 4.500%
15/09/09 01/03/16 01/12/17 01/12/1 7 01/01/18 01/01/18 0 110111 8 01/04/18 0 110511 8 0 i/06/i 8 01/06/18 01/06/18 01/06/18 0 i/07/1 8 01/07/18 01/08/18 01/08/1 8
01/08/18 oi/o8/ia
1,064,220 36.897
2.877.639 1.093.488
36,969 5.872.564 2,490,280
919.604 43,442 44.398 52.183 49.802 32,264 56,774 44,144 45,054 57,581
1,863.527 37.026
0.30 0 01 0.82 0 31 0 01 1.67 0.71 0.26 0.01 0 01 0.02 0.01 0.01 0 02 0.01 0.01 0.02 0.53 0 01
The accompanying notes are an integral part of these financial statements.
86

Goldman Sachs Funds-US Fixed Income Portfolio Schedule of Investments As at 30 November 2005
x of Markmt Valum Sharmholdmra'
Holdlngs Security Deacription Coupon Rwtd" Maturity Datdb' US0 Equlty . ..
Asset Backed Obligations -(continued) Unlted States Dollar - (continued)
49,484 Fndoral National Mortgage Association (FNMA) 44,593 Federal National Mortgage Association (FNMA) 63.035 Federal National Mortgage Association (FNMA)
122,612 Federal National Mortgage Association (FNMA) 47.486 Federal National Mortgage Association (FNMA) 55.185 Federal National Mortgago Association (FNMA) 49,318 Federal National Mortgage Association (FNMA) 13.247 Federal National Mortgage Association (FNMA)
708,555 Federal National Mortgage Association (FNMA) E0.500 Federal National Mortgage Association (FNMA) 22,565 Federal National Mortgage Association (FNMA) 65,713 Federal National Mortgage Association (FNMA) 44,515 Federal National Mortgage Association (FNMA)
1.827.871 Federal National Mortgage Association (FNMA) 146,932 Federal National Mortgage Association (FNMA) 287.448 Federal National Mortgagn Associatinn (FNMA)
F1.557 Federal National Mortgage Association (FNMA) 1,833,382 Federal National Mortgage Association (FNMA)
919,690 Fednral National Mortgage Association (FNMA) 45,616 Federal National Mortgagc Association (FNMA) 39,499 Federal National Mortgage Association (FNMA) 47.368 Federal National Mortgage Association (FNMA) 27,754 Federal National Mortgage Assuciation (FNMA) 44.361 Federal National Mortgage Association (FNMAl 61.841 Federal National Mortgage Afisociation (FNMA) 40.902 Federal National Mortgage Association (FNMA) 49.779 Federal National Mortgage Association (FNMA)
400.475 Federal National Mortgage Association (FNMA) 436,976 Federal Natiunal Murtyaqe Association (FNMA) 135.008 Federal National Mortgage Association (FNMA)'"
2,150,279 Federal National Mortgaqe Association (FNMA)"' 1.783.618 Federal National Mortuaoe Associatiun (FNMA):"'
4.500% 4.500% 4.500% 6.000% 4 500% 4.500% 4 500% 4.50040 5 000% 4.500% 4 500% 4.500% 4 500% 4 500% 4.500% 4.500% 4.500% 4.500% 4.500% 4.500% 4 500% 4.500% 6.000% 6.000% 6.000% 6.000% 7.000% 6.500% 7.000% 4.491% 4.381% 4.585%
01/08/18 0110811 8 01/08/18 0 1 /OW1 R 01/05/18 01/09/18 0 1 /OW1 8 01/0Y/l8 01/05/18 01/10/18 01/1 1/18 01/12/18 01/12/18 0 1 10 1 / I 5 01/01/15 01/01/19 01101119 01/0211 5 01/02/19 01 lOZll9 01 10211 9 01/01/20 0 1/03/28 0111 2/28 01 10 1/29 01/08/29 0111 0/29 0111 2/29 01/03/31 01/03/33 01/12/33
48,038 0.01 43.2R9 0.01 61,192 0.02
124,305 0.04 46.058 0.01 34,157 0.01 47.876 0.01 12,860 0.01
700.425 0.20 78.535 0.02 21.905 0.01 63,752 0.02 43,217 0.01
1,774.435 0.50 142,636 0.04 288,467 0.08 60,146 0.02
1,779.784 0.51 891.923 0.25 44.239 0.01 38.306 0.01 45,938 0.01 28,028 0.01 44,799 0.01 62,454 0 02 41,254 0.01 51,996 0.02
411,877 0.12 456,347 0.13 139,064 0.04
2,124,626 0.60 01/02/35 1.748.454 0.50
28.21832 8.02
2,000,000 Federal National Mortgage Association (FNMA) TBA'O 24,000,000 Federal National Mortgage Association (FNMA) TBA" 18,000,000 Federal National Mortgage Association (FNMA) TBA"' 6,000,000 Federal National Mortqaqe Association (FNMA) TBA'"
158,347 Federal National Mortgage Association Guaranteed 228,613 Federal National Mortgage Association Guarantoed 165.592 Federal National Mortgage Association Guaranteed"' 75.269 Federal National Mnrtgago Association Guaranteed"'
626,185 Federal National Mortgage Association Guaranteed 1.804.694 Federal National Mortgage Associntion Guaranteed 2.186.965 Federal National Mortgage Association Guaranteed"'
5 500% 5 500% 5.500% 5.500%
2,010.624 0.57 23.662.512 6.72 17,769,384 5.05 6,024,372 1.71
49,466,882
6.500% 25/05/08 160,245 6.500% 25/06/08 231,532 3.800% 25/09/08 163.030
12.458% 25109108 81,883 6.500% 25101105 635,645 7.000% 25/04/24 1,878.247 4.452% 28/11/35 2,185.3Y7
14.05
0.05 0.07 0.05 0 02 0.18 0.53 0.62
5,335,583 1 52
492.938 First Union Commercial Mortqage Securities. Inc 7 380% 18/04/25 502,566 0.14
1,000,000 First Union National Bank Cornrnorcial Mortgage Trust 7.202% 15110132 1,082,947 0.31
3,000,000 GMAC Commercial Mortgage Security. Inc. 6.278% 15/1 1/39 3,163.393 0.90
21.422 Government National Mortgage Association (GNMA) 35.938 Government National Mortgage Association (GNMA) 10.775 Government National Mortgage Association (GNMA) 95.835 Government National Mortqaqe Association (GNMA)
6.500% 15/01/28 22.264 0.01 7.500% 15/12/28 38,042 0.01 7.500% 15/09/29 11,364 0.00 7.500% 15/12/29 101,299 0.03
172,96Y 0.05 .. .. . ........ . ..
24.253 Government National Mortgage Association Guaranteed'" 12.123% 16/11/24 26.873 0.01 80.1 38 Government National Mortgage Association Guaranteed" 12.285% 16/10/31 90.183 0.02 63.859 Government National Mortpage Association Guaranteed'" 13.563% 16/10/31 73,076 0.02
The accompanying notes are an integral part of these financial statements.
87
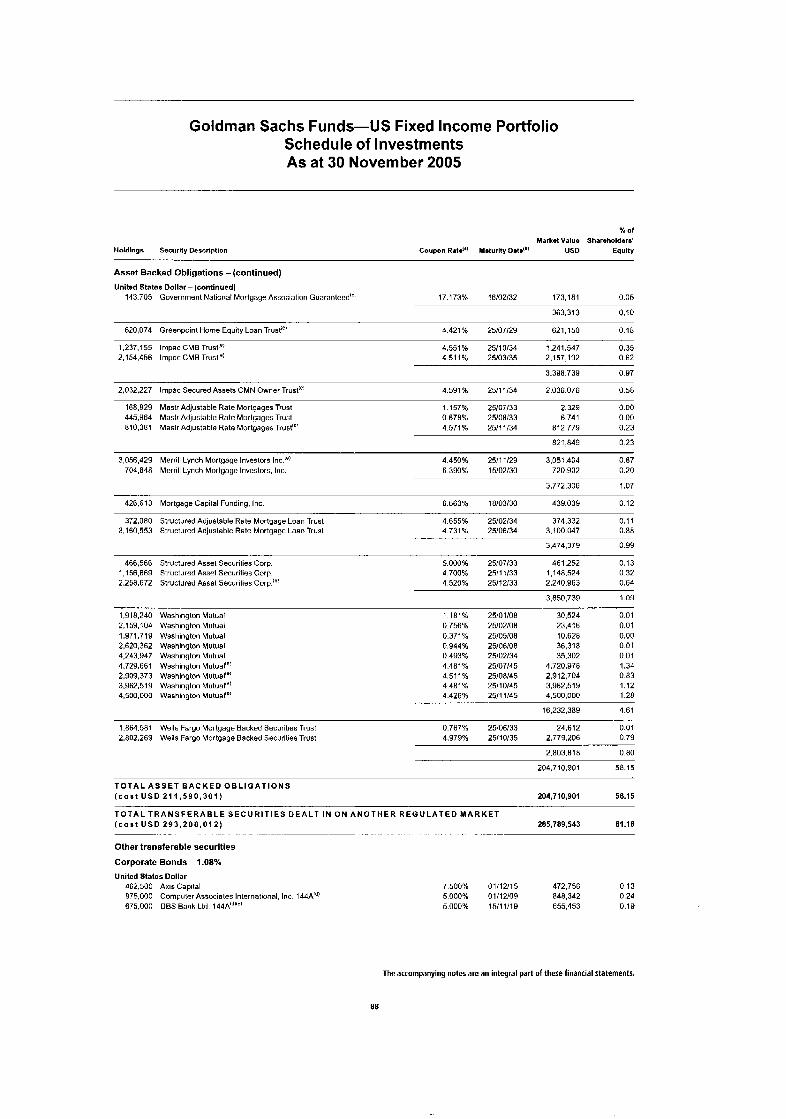
Goldman Sachs Funds-US Fixed Income Portfolio Schedule of Investments As at 30 November 2005
y. Of
Market Value Shareholders' Holdings Security Description Coupon Rat.") Maturlly Datm@) US0 Equity ~. - - -
Asset Backed Obligations -(continued)
United States Dollar - (contlnued) 143.705 Government National Mortgage Association Guaranteed"' 17.1 73% 16/02/32 173.181 0.05
363,313 0.10
620,074 Greenpoinl Home Equity Loan Trustie' 4 421 % 25/07/29 621,150 0 18
1,237,155 lmpac CMB Trust": 2,154,456 lmpac CMB Trust'';
4.551% 25/10/34 1,241,547 0.35 4511% 25/03/35 2,157,192 0.62
3398.739 0.97
2,032,227 lmpac Secured Ass& CMN Owner Trust(e! 4.591% 25/11/34 2,036.076 0.58
166.629 Mastr Adjustable Rate Mortgages Trust 445.Y64 Mastr Adjustable Rate Morlqages Trust 810,381 Mask Adjustable Rate Mortgages Trust'"
1.157% 25/07/33 2,328 0.00 0.678% 25/08/33 6.741 0.00 4.571% 25/11/34 812.779 0.23
621,849 0.23
3,056,429 Merrill Lynch Mortgage lnveslors Inc In)
704,84A Merrill Lynch Mortgage Investors. Inc. 4.450% 25/1 1/29 3,051,404 0.67 6.390% 15/02/30 720,902 0.20
3,772,306 1.07
426.613 Mortgage Capital Funding, Inc. 6.663% 18/03/30 43Y.03Y 0.12
372,ORO Structured Adjustable Rale Mortgage Loan Trust 3.160.553 Structured Adjustable Rate Mortgage Loan Trust
4.655% 25/02/34 374,332 0.11 4.731% 25/06/34 3.100.047 0.88
466,566 1.156,66Y 2,256,672
3.474379 0.YY
Structured Assel Securilies Corn. 5.000% 25/07/33 461.252 0.13 Structured Asset Securities Gorp. Structured Assel Securilies Coru.:'!
4.700% 25/11/33 1,148,524 0.32 4 520% 25/12/33 2.240.963 0.64
3,850.739 1 .OY
1,9i6.240 2,159,104 1,971,719 2,620,362 4.243.947 4,729,661 2309.373 3,962,519 4,500,000
Washingtun Mutual Washington Mutual Washington Mutual Washington Mutual Washington Mutual Washington Mutual": Washington Mutual'"' Washington MutuaP' Washington Mutual'"
1181% 0.756% 0.371% 0.944% 0.4Y3% 4.481% 4.511% 4.481% 4.426%
. -. . .
25/01/08
25/05/08 25/06/08 25/02/34 25/07/45 25/08/45 25/10/45 25/11/45
2510210a 30.524 23,416
36.318 35,302
4,720,976 2,912,704 3,962,519 4.500.00C
10.62.9
16,232,389
0.01 0.01 0.00 0.01 0.01 1.34
1.12 1.28
4.61
0.83
~
1.864.561 Wells Fargo Mortgage Backed Securities Trust 2,802,269 Wells Fargo Mortgage Backed Securities Trust
0.767% 25/06/33 24,612 0.01 4.979% 25/10/35 2.779206 0.7Y
2.803.818 0.60
58.15 204,710,901
T O T A L A S S E T B A C K E D O B L I G A T I O N S ( c o s t USD 2 1 1 , 5 9 0 , 3 0 1 ) 204,710,901 58.15
T O T A L T R A N S F E R A B L E S E C U R I T I E S D E A L T I N O N A N O T H E R R E G U L A T E D M A R K E T ( c o s t USD 2 9 3 , 2 0 8 , 0 1 2 ) 285,789,543 81.18
Other transferable securities
Corporate Bonds - 1.08%
United States Dollar
. . ..... . .. .. - ~~ ,- . .. ... ... . . . . .. . . . . ~. . . .. .
462.500 Axis Capital 7 500% 01/12/15 472,756 0 13 875.000 Computer Associates International. Inc 144A"' 5.000% 01/12/09 848.342 0.24 675,000 DES Bank Ltd 144A'"''' 5.000% 15/11/19 655,453 0.19
The accompanying notes are an integral part of these financial statements.
88
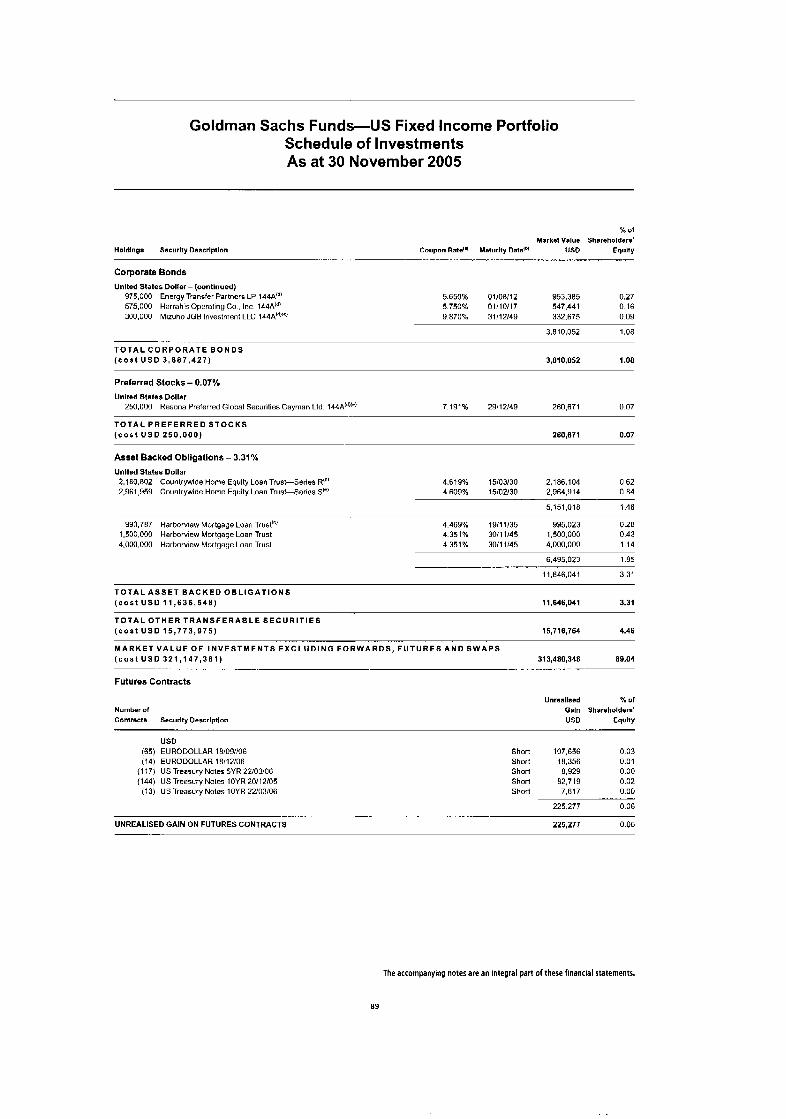
Goldman Sachs Funds-US Fixed Income Portfolio Schedule of Investments As at 30 November 2005
% of Market Value Shareholders'
Holdlngs Sscurlty Deacrlptlon Coupon R d * Msturlly Date'" us0 Equlty .......... _..-._....__._...___c.._ ........
Corporate Bonds Unlted Stales Dollar - (continued)
975.000 Energy Transfer Partners LP 144A') 575,000 Harrah s Operating Co , Inc 144A:" 300,000 Mizuho JGB Investment LLC 144A'":"'
5.650% o i / o a m 953.385 0.27 5.750% 01H 0/1 7 547,441 0.16 9.870% 31/12/49 332.675 0.09
3,810,052 1.08 ~ ......
T O T A L C O R P O R A T E B O N D S (cost U S D 3.887.427) 3,810,052 1.08
Preferred Stocks - 0.07% United States Dollar
250,000 Resona Preferred Global Securities Cayman Ltd. 144A'""'! 7.191% 2Y/12/49 260,671 0.07
T O T A L P R E F E R R E D S T O C K S (cost U S D 250 ,000) 260,671 0.07
Asset Backed Obligations - 3.31%
Unlted States Dollar 2.180.802 Countrywide Home Equity Loan Trust-Series R'"' 2,961,959 Countrywide Home Equity Loan Trust-Sones $'"
4.619% 15/03/30 2,186,104 0.62 4.609% 15/02/30 2.964.Yl4 0.84
5.151 ,om 1.46
YY3.7R7 Harborview Mortgage Loan Trust": 1.500.000 Harborview Mortgaqe Loan Trust 4,000,000 Harborview Mortqaqe Loan Trusl
4.469% 19/1 1/35 995,023 0.28 4.351% 30/11/45 1,500,000 0.43 4.351% 30/11/45 4,000,000 1.14
6,495,023 1 .a5
11,646,041 3.31
T O T A L A S S E T B A C K E D O B L I G A T I O N S ( c o s t U S D 11 ,636 .548) 11,646,041 3.31
T O T A L O T H E R T R A N S F E R A B L E S E C U R I T I E S ( c o s t U S D 15 ,773 ,975) 15,716,764 4.46
M A R K E T V A L U E O F I N V E S T M E N T S E X C L U D I N G F O R W A R D S , F U T U R E S A N D S W A P S ( c o s t U S D 321 ,147 ,381) 313,480,348 89.04
Futures Contracts
__ - ........ - ~ ..
Number of Contrecta Securlty Oescrlptlon
Unrsallssd % of Galn Shareholders' us0 Eqmy
US0 (65) EURODOLLAR 181091106 (14) EURODOLLAR in / iz /o6
(1 17) US Treasury Notes 5YR 22/03/06 (144) US Treasury Noles 10YR 20/12/05
(13) US Treasury Notes lIlYR 22/03/06
Short 107,656 0.03 Short 10,356 0.01 Short 8,929 0.00 Short 82.719 0.02 Short 7,617 0.00
225,277 0.06
UNREALISED GAIN ON FUTURES CONTRACTS 225,271 0 06
The accompanying notes are an integral part of these financial statements.
89
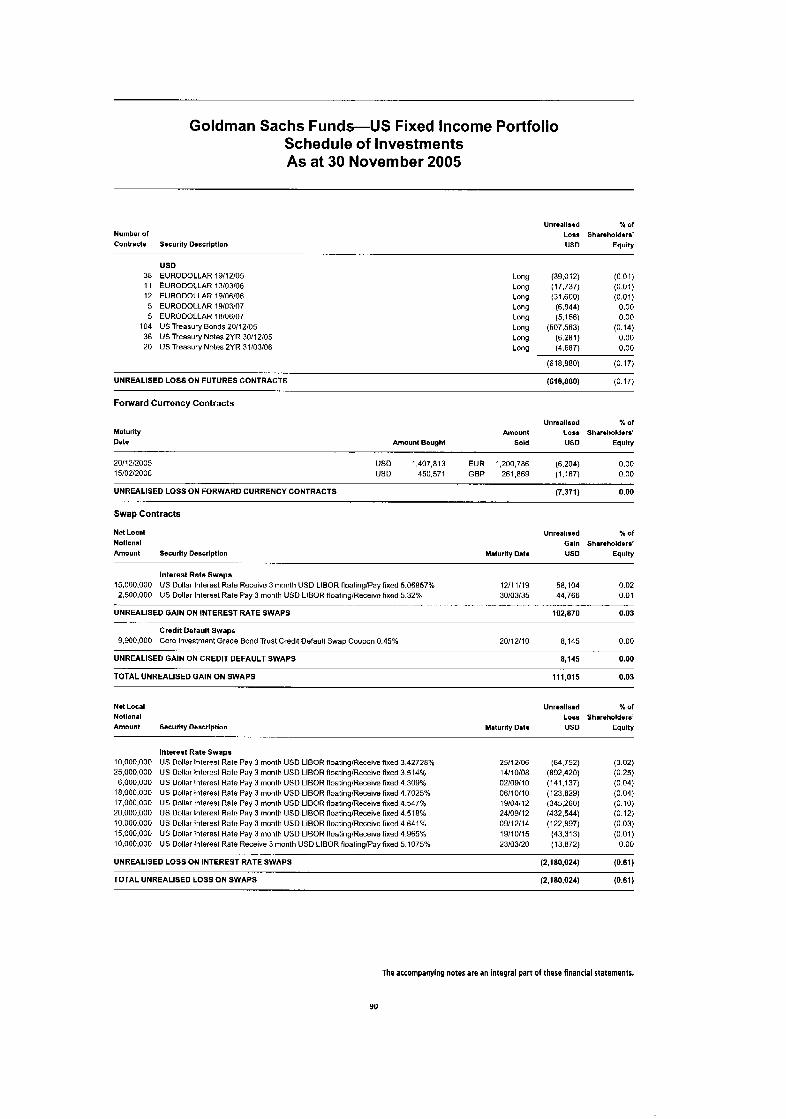
Goldman Sachs Funds-US Fixed Income Portfolio Schedule of Investments As at 30 November 2005
Number of Contracts Socurlry Doscrlptlon
Unreallsod *A Of
Loss Shareholders' US0 Equlty
USD 38 EURODOLLAR 19/12/05 11 EURODOLLAR 13/03/06 12 EURODOLLAR 19/06/06 5 EURODOLLAR 19/03/07 5 EURODOLLAR 1RIO6107
104 US Treasury Bonds 20/12/05 36 US Treasury Notes 2YR 30/12/05 20 US Treasury Notes 2YR 31/03/06
- .~ UNREALISED LOSS ON FUTURES CONTRACTS
Long Long Long Long Long Long Long Long
(39,012) (17,737) (31,600) (6.844 (5.156)
(507.563) (6.281) (4.687)
(618.880)
(0 01) (0.01) (0.01)
0.00 0.00
(0.14) 0.00 0.00
(0.17) ~
(618,880) (0.17)
Forward Currency Contracts
Maturity Date
Unreellsed % Of
Amount Loss Shareholders' Amount Bought Sold US0 Equlty
20/12/2005 US0 1,407,813 EUR 1,200,786 (6.20A) 0.00 15/02/2006 USD 450.571 GBP 261,869 (1.167) 0.00
UNREALISED LOSS ON FORWARD CURRENCY CONTRACTS (7.371) 0.00
Swap Contracts
Net Local Unroalioed X of Notional Galn Sharmholdsrs' Amount Securlty Descrlptlon Maturlty Datm US0 Equlty
. -
Interest Rate Swaps 15.000.000 US Dollar Interest Rate Receive 3 month US0 LIBOR floatinglpay fixed 5.06857% 12/11/19 58.104 0.02 2,500,000 US Dollar Interest Rate Pay 3 month USD LIBOR floatinglReceivn fixed 5.32% 30103135 4A,766 0 01
-.. . . . . .. .~... - - .~ ... . .. UNREALISED GAIN ON INTEREST RATE SWAPS 102,870 0.03
Credit Default Swaps Y.YO0,OOO Corn Investment Grade Bond Trust Credit Default Swap Coupon 0.45% 20/12/10 8.145 0.00
UNREALISED GAIN ON CREDIT DEFAULT SWAPS 8,145 0.00
TOTAL UNREALISED GAIN ON SWAPS 11 1.01 5 0.03
Net Local Unroallsod % of Nollonal Loss Shrreholdera' Amount Securlty Descrlptlon Maturlty Oat* US0 Equity
-- . . .. ... -
Interest Rate Swaps 10,000,000 US Dollar Interest Rate Pay 3 month USD LIBOR floatinglReceive fixed 3.42728% 25/12/06 (64,752) (0.02) 25,000,000 US Dollar Interest Rate Pay 3 month USD LIBOR floatinglReceive fixed 3.514% 1 411 0/08 (8Y2,420) (0.25) 6,000.000 US Dollar Interest Rate Pay 3 month USD LlBOR floatinglReceive fixed 4.30Y% 02/09/10 (141,137) (0.04)
18,000,000 US Dollar Interest Rate Pay 3 month USD LlBOR floatinglReceive fixed 4.7025% 06/10/10 (123,829) (0.04) 17,000,000 US Dollar Interest Rate Pay 3 month USD LIBOR floatinglReceive fixed 4.547% 1Y/O4/12 (345,260) (0.10) 20.000.000 US Dollar Interest Ratn Pay 3 month USD LlBOR floating/Receive fixed 4.518% 24/09/12 (432.544) (0.12)
15,000,000 US Dollar Interest Rate Pay 3 month USD LIBOR floatinglReceive fixed 4.965% 1Y/10/15 (43,313) (0.01) 10,000,000 US Dollar Interest Rate Receive 3 month USD LIBOR floatinglPayfixed 5.1075% 23/03/20 (13.872) 0.00
10.000.000 US Dollar Interest Rate Pay 3 month US0 LIBOR floating/Receive fixed 4.641 % 09/12/14 (122,897) (0.03)
UNREALISED LOSS ON INTEREST RATE SWAPS (2,180,024) (0.61)
TOTAL UNREALISED LOSS ON SWAPS (2.180.024) (0.61)
The accompanying notes are an integral part of these financial statements.
90
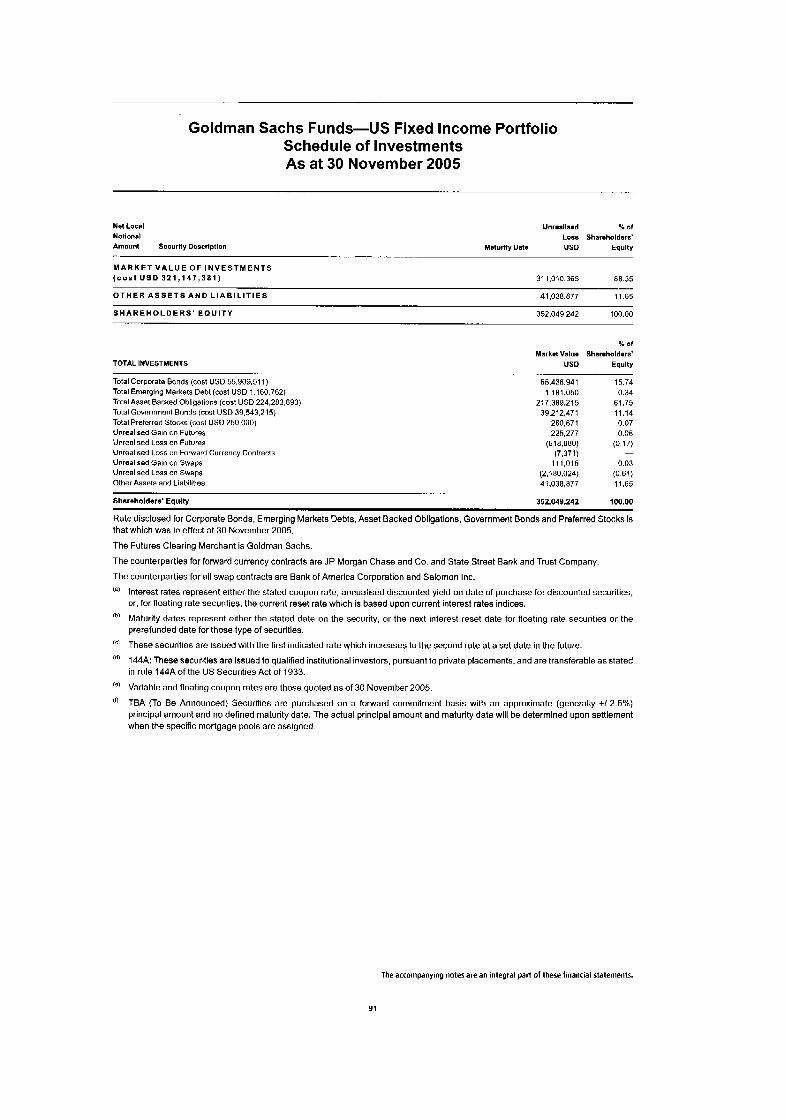
Goldman Sachs Funds-US Fixed Income Portfolio Schedule of Investments As at 30 November 2005
Net Local Unrmalismd % Of
Notional Loss Shareholders' Amounl Security Description Maturity Date USD Equlty
M A R K E T V A L U E O F I N V E S T M E N T S ( c o s t U S 0 3 2 1 , 1 4 7 , 3 8 1 ) 31 1,010,365 88 35
- --- -
OTHER A S S E T S A N D L I A B I L I T I E S 41.03a.a77 11.65
S H A R E H O L D E R S ' E Q U I T Y 352,049,242 100.00
TOTAL INVESTMENTS
Total Corporaln Bonds (cost USD 55,90951 1) Total Emerging Markets Debt (cost USD 1.160.762) Total Asset Backed Obllgatlons (cust USD 224.283.893) Total Govnrnmenl Bonds (cost USD 39.543.215) Total Preforred Slocks (cost US0 250,000) Unrealised Gain on Futures Unrealised Loss on Futuros Unrealised Loss un Fumard Currency Contracts Unraalisnd Gain on Swaps Unrealised Loss on Swaps Other Assets and Liabilities
% Of
Mark& Valu. Sharmholdws' US0 Equlty
55,436,941 15.74 1.101 ,050 0.34
217,309,215 61.75 39.2 12.47 1 11.14
260,671 0.07 225,277 0.06
(618.880) (0 17) (7.371) -
1 1 1,015 0.03 (0.61) (2.1 80.024)
41.038.877 11.65
Shareholders' Equlty 352,048,242 100.00
Rate disclosed for Corporate Bonds, Emerging Markets Debts, Asset Backed Obligations, Government Bonds and Preferred Stocks is that which was in effect at 30 November 2005.
The Futures Clearing Merchant is Goldman Sachs.
The counterparties for forward currency contracts are JP Morgan Chase and Co. and State Street Bank and Trust Company,
The counterparties for all swap contracts are Bank of America Corporation and Salomon Inc.
Interest rates represent either the stated coupon rate, annualised discounted yield on date of purchase for discounted securities. or, for floating rate securities, the current reset rate which IS based upon current interest rates indices.
Maturity dates represent either the stated date on the security, or the next interest reset date for floating rate securities or the prerefunded date for those type of securities.
These securities are issued with the first indicated rate which increases to the second rate at a set date in the future.
144A: These securities are issued to qualified institutional investors. pursuant to private placements. and are transferable as stated in rule 144A of the US Securities Act of 1933.
Variable and floating coupon rates are those quoted as of 30 November 2005.
TEA (To Be Announced) Securities are purchased on a forward commitment basis with an approximate (generally +/-2.5%) principal amount and no defined maturity date. The actual principal amount and maturity date will be determined upon settlement when the specific mortgage pools are assigned.
The accompanying notes are an integral part of these financial statements.
91
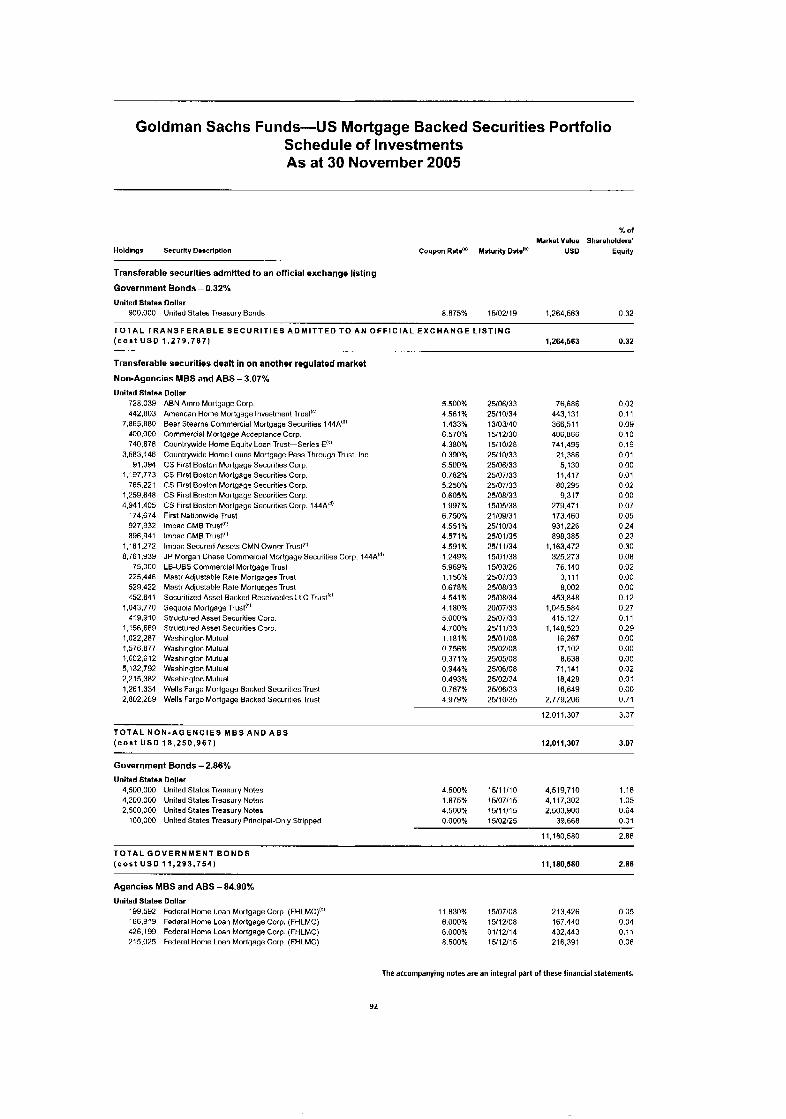
Goldman Sachs Funds-US Mortgage Backed Securities Portfolio Schedule of Investments As at 30 November 2005
Y. at Market Value Shareholders'
Holdings Security Dascrlptlon Coupon Rate"' Maturty Date'" USD Equity
Transferable securities admltted to an official exchange listing
Government Bonds - 0.32%
United States Dollar 900,000 United Stales Treasury Bonds 8 875% 15/02/19 1,264,563 0 32
T O T A L T R A N S F E R A B L E S E C U R I T I E S A D M I T T E D TO AN O F F I C I A L E X C H A N G E L IST ING ( c o a t USD 1 .279 .787) 1,264,563 0.32
Transferable securities dealt in on another regulated market
Non-Agencies MBS and ABS - 3.07% Unitod Statsa Dollar
728,039 442.803
400.000 740,676
91,094 1,'97,773
765,221 1,259,648 4,941,405
i74.674 927,932 896,941
1 ,'61,272 8,i61,939
75.000 225,446 529.422 452,841
1,043,770 419,910
1.'56.669 1,022,287 1,576,877 1,602,612 5,132.792 2.215.382 1,261.334 2,802.269
~ , F ~ . R B O
3.5n3.146
ABN Amro Mortgage Corp. American Home Mortgage Investmen1 Trust(" Bear Stearns Commercial Morlgaqe Securities 144A"' Commercial Mortgage Acceptance Corp Countrywide Home Equity Loan Trust-Series E'?' Countrywide Home Loans Mortgage Pass Through Trust. Inc CS First Boston Morlgaqe Securities Corp. CS First Boston Mortgage Securities Corp. CS First Boston Mortgage Securities Corp. CS First Boston Mortgage Securities Corp. CS First Boston Mortgage Securities Corp. 144A'3! First Nationwide Trust Impar: CMB Trust'P! Impar: CMB Trust:" Impar: Sncurnd Assets CMN Owner Trust'" JP Morgan Chase Commercial Mortgage Securities Corp. 144A"' LB-UBS Commercial Mortyaoe Trusl Mastr Adjustable Rate Morlgaqes Trust Mastr Adjustable Rate Morlyages Trust Securitized Asset Backed Receivables LLC Trust"' Sequoia Mortgage Trusl'*' Struclured Asset Securities Corp. Structured Asset Securities Corp. Washington Mutual Washington Mutual Washington Mutual Washington Mutual Washington Mutual Wells Fargo Mortgago Backnd Securities Trust Wells Fargo Mortgage Backed Securities Trust
5.500% 4.561% 1.433% 6 570% 4 380% 0 390% 5 500%
5.250% 0 605% 1997% 6 750% 4 551 % 4 571% 4 591 % 1.249% 5.969% 1.156% 0 678% 4.541% 4.180% 5.000% 4.700% 1.181 % 0.756% 0.371% 0.944% 0.493% 0.767% 4.979%
o 7a2%
25/06/33 25110134 13/03/40 15/12/30 1511 0128 25110133 25/06/33 25/07/33 25/07/33 25/08/33 15/05/38 2 1 /09/3 1 25/10/34 25/01/35 25/11/34 15/01/38 15/03/26 25/07/33 25/08/33 25/08/34 20107133 25/07/33 25/11/33 25/0 1 /08
25/05/08
25/02/34 25/06/33 25/10/35
25/02/0n
25/06/08
76,686 0.02 443,131 0.1 1 366.51 1 0.09 406.886 0 10 741,495 0.19 21,386 0.01
5.130 0 OD 11,417 0.01 80,295 0 02 9.317 0 00
279.471 0.07 173.460 0.05 931,226 0.24 898.385 0.23
1,163,472 0.30 325.273 0.08 76.140 0.02
3.111 0.00 8.002 0.00
453.848 0.12 1.045.584 0.27
41 5.127 0.11 1.148.523 0.29
16.267 0.00 17,102 0.00 8.638 0.00
71,141 0.02 ia.42n 0.01 16,649 0.00
2,779,206 0.71
12.01 1,307 3.07
T O T A L N O N - A G E N C I E S M B S A N D A B S ( c o s t U S D 1 8 . 2 5 0 . 9 6 7 ) 12,Ol 1,307 3.07
Government Bonds - 2.86% United States Dollar
4,500.000 United Slatcs Trnasury Notes 4,200.000 United States Treasury Notns 2,500,000 Uniled Stales Treasury Notes
100,000 United States Treasury Principal-Only Stripped
4.500% 15/11/10 4,519,710 1.16 1.875% 15/07/15 4,117,302 1.05 4.500% 15/11/15 2,503,900 0.64 0.000% 15/02/25 39.668 0.01
i i , in0,580 2.86
T O T A L G O V E R N M E N T B O N D S ( c o s t U S D 11 ,293 ,754) 2.86 11,160,580
Agencies MBS and ABS - 84.90% United States Dollar
'99,592 Federal Home Loan Mortgage Corp. (FHLMC)'" '66.919 Fndoral Home Loan Mortgage Corp. (FHLMC) 426,199 Fedcral Homn Loan Mortgage Corp. (FHLMC) 215.025 Federal Home Loan Mortgage Corp. (FHLMC)
11.830% 15/07/08 213.426 0.05 6.000% 15/12/08 167.440 0.04 6.000% 01/12/14 432,443 0.11 8.500% 15/12/15 216,391 0.06
The accompanying notes are an integral part of these financial statements.
92
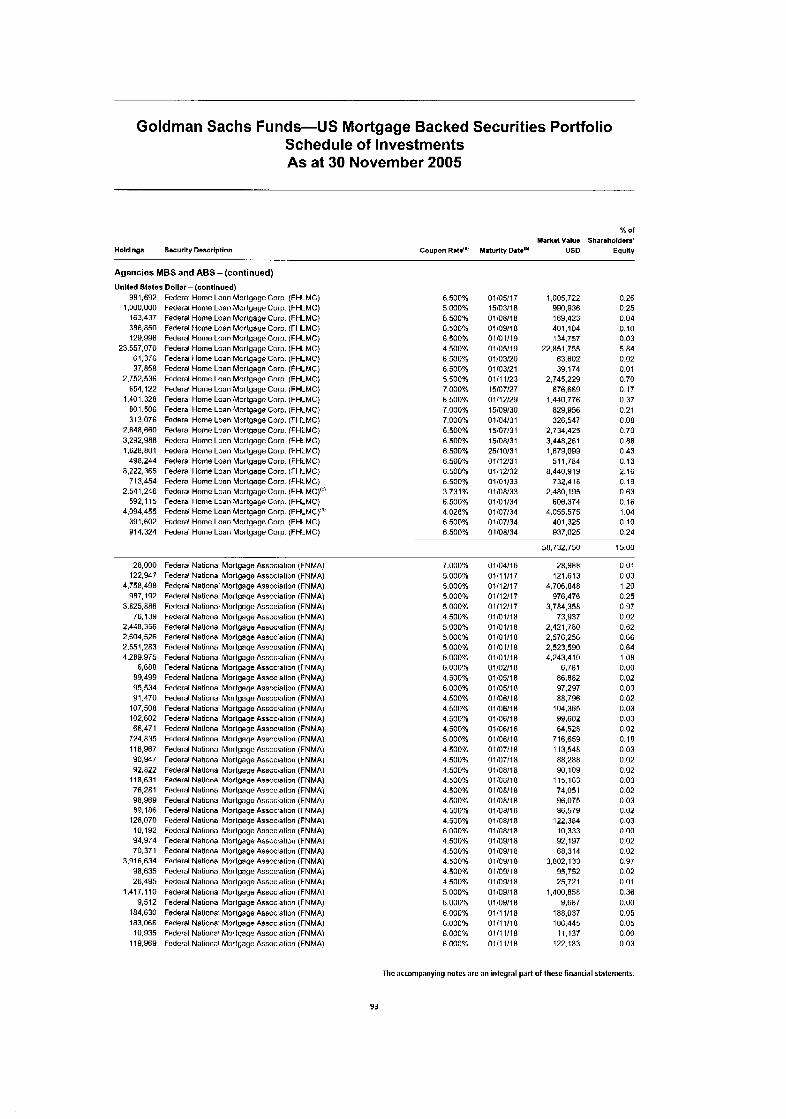
Goldman Sachs Funds-US Mortgage Backed Securities Portfolio Schedule of Investments As at 30 November 2005
Holdlnga Sacurlty Deacrlplion - . . . -. .. .
Agencies MBS and ABS - (continued) Unltrd States Dollar - (continued)
981,692 Federal Home Loan Mortgage Corp. (FHLMC) 1,000,000 Federal Home Loan Mortgage Corp. (FHLMC)
163.437 Federal Home Loan Mortgage Corp. (FHLMC) 386,850 Federal Home Loan Mortynye Corp. (FHLMC) 129,996 Federal Home Loan Mortgage Gorp. (FHLMC)
23,557,070 Federal Homo Loan Mortgage Corp. (FHLMC) 61.376 Federal Home Loan Mortgage Cnrp. (FHLMC) 37.858 Federal Home Loan Mortgage Corp. (FHLMC)
2,752,536 Federal Home Loan Mortgago Corp. (FHLMC) 654.122 Federal Home Loan Mortgage Gorp (FHLMC)
1.401.328 Federal Home Loan Mortgage Cnrp (FHLMC) 801,506 Federal Home Loan Mnrtgage Gorp. (FHLMC) 313,076 Fodnral Home Loan Mortgage Corp. (FHLMC)
2,648,660 Federal Home Loan Mortgage Corp (FHLMC) 3.292.9RR Federal Home Loan Mortgage Corp. (FHLMC) 1,628,801 Federal Home Loan Mortgage Corp (FHLMC)
498.2A4 Federal Home Loan Mortgage Corp (FHLMC) 8.222.365 Federal Home Loan Mortgage Corp (FHLMC)
713.454 Federal Home Loan Mortgage Corp (FHLMC) 2,541,246 Federal Home Loan Mortgage Corp. (FHLMC)'C'
592.1 15 Federal Home Loan Mortgage Corp. (FHLMC) 4.094.455 Federal Home Loan Mortgage Cnrp. (FHLMC)"!
391,602 Federal Home Loan Mortgage Corp (FHLMC) 914,324 Federal Home Loan Mortgage Corp. (FHLMC)
% Of
Mark.( Value Sharsholdsra' Coupon Rrtd'' Mwturlty Dwt*"' USD Eqully
6.500% 5 000% 6 500% 6.500% 6 500% 4 500% 6 500% 6.500% 5.500% 7.000% 6 500% 7.000% 7.000% 6.500% 6.500% 6.500% 6.500% 6.500% 6.500% 3.731% 6.500% 4.028% 6.500% 6.500%
01/05/17 15/03/18 01108118 01/09/18 01/01/19 01 /Owl 9 0 1 /03/20 01 /03/21 01H 1/23 15/07/27 01 / l 2/29 15/09/30 01 10413 1 15/07/31 15/08/31 2511 013 1 0111213 1 (1 1 / I 2/32 01/01/33 01 108133 01 10 1/34 01 107134 01/07/34 01/08/34
1,005,722 990.936 169,423 401,104 134.757
22.851.755 63.602 39.174
2.745.229 676.669
1.440.776 829.956 326,547
2,734,425 3.4A8.261 1,679,099
511,784 8,440,919
732.418 2,480,195
606,374 4,055,575
401,325 937.025
0.26 0.25 0.0.1 0.10 0.03 5.84 0.02 0.01 0.70 0.17 0.37 0.21 0.08 0.70 0.88 0.43 0.13 2.16 0.19 0.63 0.16 1.04 0.10 0.24
58.732.750 15.00
28.000 Federal National Mortgage Association (FNMA) 122.947 Federal National Mortgage Association (FNMA)
4,758.498 Federal National Mortgage Association (FNMA) 987.1YZ Federal National Mortgage Association (FNMA)
3,825,686 Federal National Mortgage Association (FNMA) 76,139 Federal National Morlgaqe Association (FNMA)
2,448,356 Federal National Mortgaye Association (FNMA) 2,604,526 Federal National Mortgage Association (FNMA) 2,551.283 Federal Natinnal Mortgage Association (FNMA) 4.289.975 Federal National Mortgage Assnciation (FNMA)
6,688 Federal National Mortgage Association (FNMA) 89,499 Federal National Mortgage Association (FNMA) 95,534 Federal National Mortgage Association (FNMA) 91,470 Federal National Mortgage Association (FNMA)
107.508 Federal National Mortgago Association (FNMA) 102.602 Federal National Mortgage Association (FNMA) 66,471 Federal National Mortgage Association (FNMA)
724.835 Federal National Mortgage Assnciatinn (FNMA) 116,967 Fedoral National Mortgage Association (FNMA) 9 0 9 7 Federal National Mortgage Association (FNMA) 92,822 Federal National Morlgaqe Association (FNMA)
118.631 Federal National Mortgage Association (FNMA) 76,281 Federal National Mortgage Association (FNMA) 98.969 Federal National Mortgago Asnociatinn (FNMA) 89.106 Federal National Mortgage Association (FNMA)
126,070 Federal National Morlgage Association (FNMA) 10,192 Federal Nalmnal Murlgage Association (FNMA) 94.974 Fcdnral National Mortgage Association (FNMA) 70,371 Fcdnral National Mortgage Association (FNMA)
3,916,634 Federal National Mortgage Association (FNMA) 98,635 Federal National Mortgage Assouation (FNMA) 26,495 Federal National Mortgage Association (FNMA)
1,417,110 Federal National Mortgage Association (FNMA) 9,512 Federal National Mortgage Associatinn (FNMA)
184,630 Federal National Mortgage Association (FNMA) 183.066 Federal Natinnal Mortgage Association (FNMA) 10.935 FRdoral National Mortgage Association (FNMA)
119.969 Foderal National Mortgage Association (FNMA)
7.000% 5.000% 5.000% 5.000% 5.000% 4 500% 5 000% 5 000% 5 000% 5.000% 6.000% 4.500% 6.000% 4.500% 4.500% 4.500% 4.500% 5.000% 4 500% 4.500% 4.500% 4.500% 4.500% 4.500% 4.500% 4.500% 6 000% 4.500% 4.500% 4.500% 4.500% 4 500% 5 000% 6.000% 6 000% 6.000% 6.000% 6.000%
01/04/16 01H 1/17 01/12/17 01/12/17 01/12/17 01 10 111 8 01 10 1 I1 8 01/01/18 01/01/18 01/01/18 01/02/18 01/05/18 01/05/18 01 /06/1 8 01 /06/1 8 01 10611 8 01/06/18 01 /06/1 8 01/07/18 01 /07H 8 01/OH/18 0 1 /OB/l 8 01/08/18 01/08/10 01 10 811 8 O l l O H l l R 01/08/18 01 10911 8 01 10911 8 01/09/18 01 10911 8
Ol/OY/l8 01/09/1 8 01/11/18 01/11/18 01/11/18 01/11/18
o 1 / o w a
28.988 0.01 121.61 3 0.03
4.706.848 1.20 976,476 0.25
3,784.358 0.97 73,937 0.02
2,421,780 0.62 2,576,256 0.66 2523.590 0.64 4,243,410 1.08
6,781 0.00 86.882 0.02 97,297 0.03 88.796 0.02
104,365 0.03 99,602 0.03 64.528 0.02
716,659 0.10 113.548 0.03 88.288 0.02 90,109 0.02
115.163 0.03 74.051 0.02 96,075 0.03 86,579 0.02
122.384 0.03 10,333 0.00 92,197 0.02 68,314 0.02
95.752 0.02 25,721 0.01
1,400,858 0.36 9.687 0.00
188,037 0.05 186.445 0.05 11,137 0.00
122.183 0.03
3,802,133 0.97
The accompanying notes are an integral part of these financial statements.
93
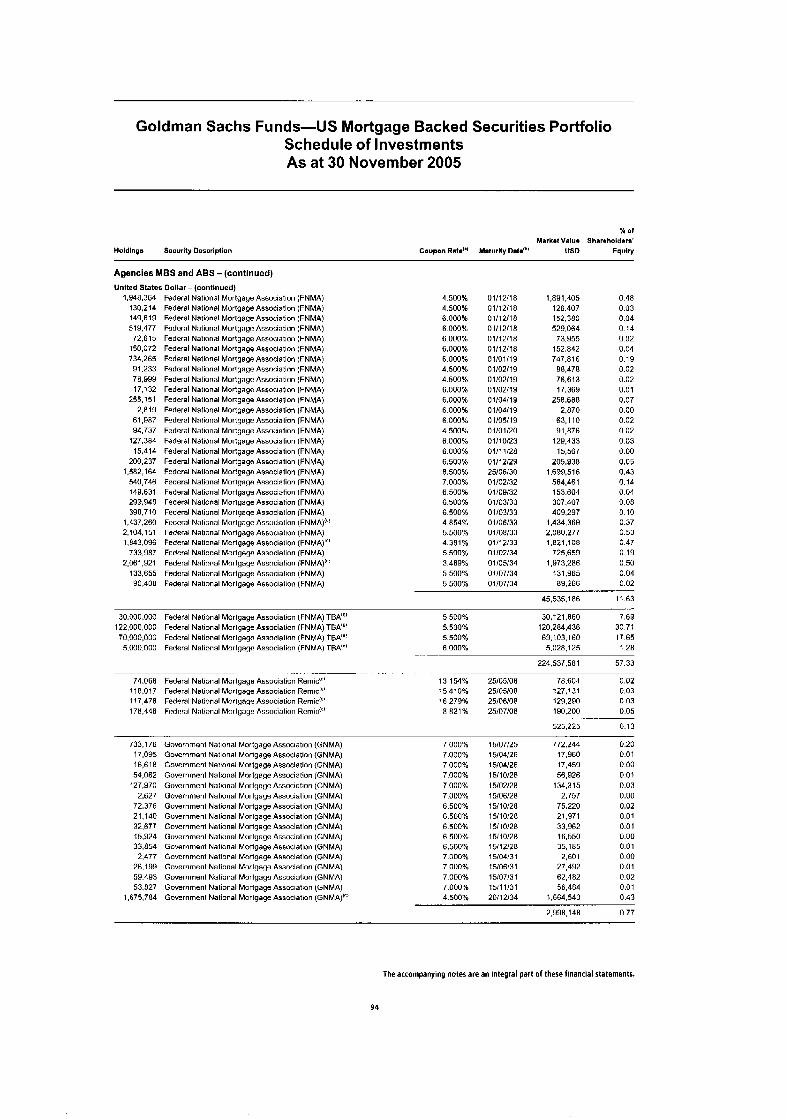
Goldman Sachs Funds-US Mortgage Backed Securities Portfolio Schedule of Investments As at 30 November 2005
Holdlnga Security Description
x Of
Market Value Shareholders' Coupon Ratm"' Malurlty Oat."' US0 Equity
Agencies MBS and ABS - (contlnued) United States Dollar - (continued)
1,948,364 Federal National Mortgage Association (FNMA) 130,214 Federal National Mortgage Association (FNMA) 149.619 Federal National Mortgage Association (FNMA) 519.477 Federal National Mortgage Association (FNMA) 72.615 Federal Natinnal Mortgage Association (FNMA)
150.072 Federal National Mortgage Association (FNMA) 734.265 Federal National Mortgage Association (FNMA) 91,233 Fodoral National Mortgage Assnciatinn (FNMA) 78.999 Federal National Mortgage Associatinn (FNMA) 17.132 Federal National Mortgage Association (FNMA)
255,151 Federal National Mortgagn Association (FNMA) 2,819 Federal National Mortgage Association (FNMA)
61.987 Federal National Mortgage Association (FNMA) 94.737 Federal National Mortgage Association (FNMA)
127.384 Federal National Murtqage Association (FNMA) 15,414 Federal National Mortgage Association (FNMA)
200,237 Federal National Mortgago Association (FNMA) 1,582,164 Federal National Mortgago Association (FNMA)
540,746 Federal National Mortgage Association (FNMA) 149,631 Federal National Mortgage Association (FNMA) 299,940 Federal National Mortgage Association (FNMA) 398.710 Federal National Morlgaqe Association (FNMA)
1.437.260 Federal National Murtgage Assuciatiun (FNMA)'"' 2,104,151 Faderal National Mortgage Association (FNMA) 1,843.096 Federal National Mortgage Association (FNMA)"'
733.987 Federal National Mortgago Association (FNMA) 2,061 ,921 Federal National Mortgage Association (FNMA)":
133,655 Federal National Mortgage Association (FNMA) 90.408 Federal National Mortgage Association (FNMA)
4.500% 4.500% 6.000% 6.000% 6.000% 6.000% 6.000% 4.50096 4.500% 6.000% 6.000% 6 000% 6.000% 4.500% 6 000% 6 000% 6.500% 8.500% 7.000% 6.500% 6.500% 6.500%
5.500% 4.301% 5.500% 3.489% 5 500% 5.500%
4.854%
01/12/18 01/12/18 01/12/18 01/12/18 01/12/18 01/12/18 01/01/19 01/02/19 01/02/1 9 0 110211 9 01/04/19 01/04/19 0 110511 9 0 1/01/20 0 1 I 1 0123
0 1 / I 2/29 25/06/30 01/02/32 01/09/32 01/03/33 0 1/03/33 01/06/33 01/08/33 01 / I 2/33 01102134 01 105134 01/07/34 01/07/34
oiiiii2a
i . a ~ i . 4 0 5 0.48 126.407 0.03 152,380 0.04 529.064 0.14 73,955 0.02
152,842 0.04 747.0 16 0.19
08.478 0.02 76,613 0.02 17,369 0.01
250.680 0.07 2.870 0.00
63,110 0.02 Y 1,876 0.02
129.433 0.03 15,567 0 00
205,938 0.05 1,699,516 0.43
564,461 0.14 153.604 0.04
409.297 0.10 1,434,369 0.37 2,000,277 0.53 1,821,108 0.47
725,659 0.19 1,973,286 0.50
131,965 0.04 89.266 0.02
307.407 0.08
45,535,186 11.63
30,000,000 Federal National Mortgage Association (FNMA) TBA'" 122,000,000 Federal National Mortgage Association (FNMA) TBA'" 70,000,000 Federal National Mortgage Association (FNMA) T0A'" 5.000.000 Federal National Mortgago Association (FNMA) TBA'"
5 500% 5.500% 5.500% 6.000%
30.121.860 7.69 120.284.436 30.71 69,103,160 17.65
5,028,125 1.28
224,537,581 57.33
74.068 Federal National Mortgage Association Remic'" 13 154% 25/05/08 78.604 0.02 11 0,017 Federal National Mortgage Association Remic:"' 15 410% 25/05/08 127,131 0.03
... . . . . . - . - -.
117,478 Federal National Mortgage Associalion Remidc' 16.279% 25/06/08 129,290 0.03 178.448 Federal National Mortgage Association Remid" fl.flZI% 25/07/08 190,200 0.05
525,225 0.13
733,176 17.095
54,062 '27,970
2,627 72,376 21.140 32.677 15,924
2.477 26.199 59.493
1.675.784
16.618
33,854
53.827
Govnrnrnent National Mortgage Association (GNMA) Govcrnmnnt National Mortgage Association (GNMA) Governmcnt National Mnrtgage Association (GNMA) Gowrnment National Mortgage Association (GNMA) Government National Mortgage Association (GNMA) Government Nalional Morlgage Association (GNMA) Governmenl National Mortgage Association (GNMA) Government Nalional Morlgage Association (GNMA) Government National Mortgage Association (GNMA) Government Naliunal Mortgage Association (GNMA) Government National Mortgage Association (GNMA) Govcrnrnnnt National Mortgage Association (GNMA) Government National Mortgage Association (GNMA) Government National Mortgago Association (GNMA) Government National Mortgage Association (GNMA) Government National Mortgage Association (GNMA)'"
7.000% 7.000% 7.000% 7.000% 7.000% 7.000% 6.500% 6.500% 6.500% 6.500% 6.500% 7.000% 7.000% 7.000% 7 000% 4.500%
15/07/25 15/04/26 15/04/26 15/10/26 15/02/20 15/06/28 15/10/28
15110128 15/10/28 15/12/28 15/04/31 15/06/31 15107131 15/11/31 20112134
15/10/2a
772,244 17,960 17,459 56,926
134,315 2.757
75,220 21.971 33.962 16,550 35,185 2,601
27.492 62,482 56,404
1,664,540
~ . Y Y ~ , I ~ E
0.20 0.01 0.00 0.01 0.03 0.00 0.02 0.01 0.01 0.00 0.01 0.00 0.01 0.02 0.01 0.43
0.77
The accompanying notes are an integral part of these financial statements.
94
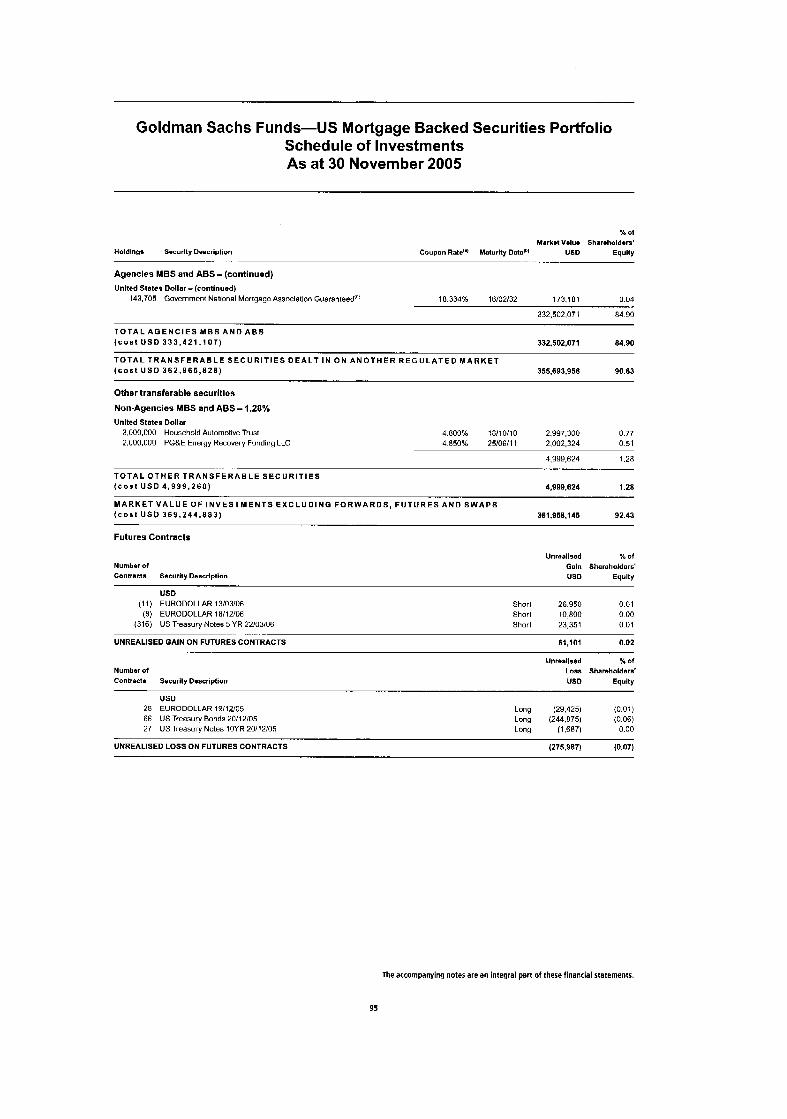
Goldman Sachs Funds-US Mortgage Backed Securities Portfolio Schedule of Investments As at 30 November 2005
X of Markmt Valuo Shareholdom'
Holdings Security Description Coupon Rate"' Maturity Dste"' USD Equity
Agencles MBS and ABS - (continued) Unlted States Dollar - (continued)
-- . . .
143,705 Government National Mortgage Assncialion Guaranteed'" 18 334% 16/02/32 173.181 u.04
332.502.071 84.90
T O T A L A G E N C I E S M B S A N D A B S ( c o s t USD 3 3 3 . 4 2 1 . 1 0 7 ) 332.502.071 84.90
T O T A L T R A N S F E R A B L E S E C U R I T I E S D E A L T I N O N A N O T H E R R E G U L A T E D M A R K E T ( c o s t U S D 3 6 2 , 9 6 5 , 8 2 8 ) 355,693,958 90.83
Other transferable securities
Non-Agencies MBS and ABS - 1.28% Unlted States Dollar
3,000,000 Household Automotive Trust 2,000,000 PG&E Energy Recovery Funding LLC
4.800% 18/10/10 2,997,300 0.77 4.850% 2510611 1 2,002,324 0.51
4,999,624 128 - ~
T O T A L O T H E R T R A N S F E R A B L E S E C U R I T I E S ( c o s t U S 0 4,999,268) 4,999.624 1.28
M A R K E T V A L U E OF I N V E S T M E N T S E X C L U D I N G F O R W A R D S , F U T U R E S A N D S W A P S ( c o s t U S D 3 6 9 . 2 4 4 . a a 3 ) 361.95a.145 92.43
Futures Contracts
Unreslised % of Number of Gain Shareholders' Contracts Security Description US0 Equity
USD (11) EURODOLLAR 13/03/06 Shorl 26.950 0.01
(8) EURODOLLAR 18/12/06 Shorl 10,800 0 00 (316) US Treasury Notes 5 YR 22/(13/06 Shorl 23,351 0.01
UNREALISED GAIN ON FUTURES CONTRACTS 61,101 0.02 . .. .
- .
Unreellsed % Of
Number of Loss Shareholders' Contracts Security Description us0 Equity
US0 28 EURODOLLAR 19/12/05 Long (29,425) (0.01)
27 US Treasury Noles 10YR 20112105 Long (1.687) 0.00 66 US Treasury Bonds 20112105 Long (244.875) (0.06)
UNREALISED LOSS ON FUTURES CONTRACTS (275,987) (0.07)
The accompanying notes are an integral part of these financial statements.
95
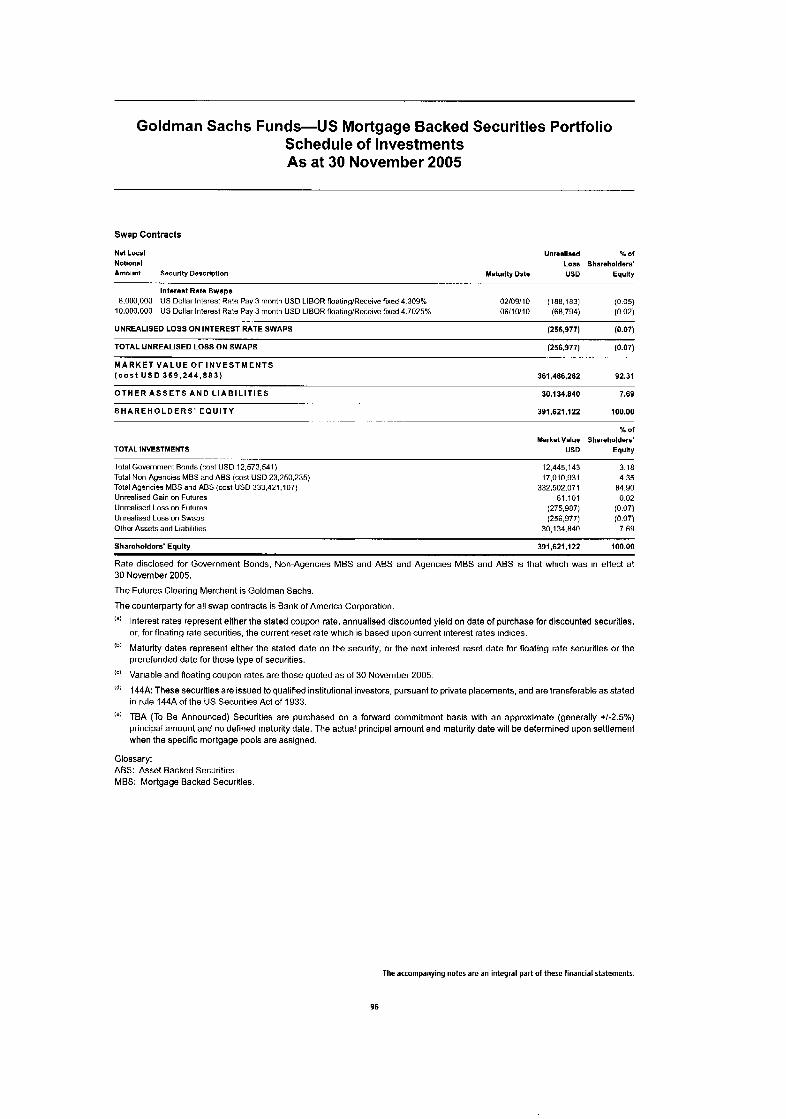
Goldman Sachs Funds-US Mortgage Backed Securities Portfolio Schedule of Investments As at 30 November 2005
Swap Contracts
Net Local Notional Amount Security Description
Unr*allsod % O f
Loss Sharsholders' Maturity Date usu Equlty
Interest Rata Swaps 8,000,000 US Dollar Interest Rata Pay 3 mnnth US0 LIBOR floating1Receive fixed 4 309%
10,000,000 US Dollar Interest Rate Pay 3 month USD LIBOR floatingIReceive flxed 4.7025% 02/09/10 (188.183) (0.05) 06/10/10 (68.794) (0.02)
UNREALISED LOSS ON INTEREST RATE SWAPS (256,977) (0.07)
TOTAL UNREALISED LOSS ON SWAPS (256,977) (0.07)
M A R K E T V A L U E O F I N V E S T M E N T S ( c o s t U S 0 369 ,244 ,883) 381,486,282 92.31
O T H E R A S S E T S A N D L I A B I L I T I E S
S H A R E H O L D E R S ' E Q U I T Y -
- -
TOTAL INVESTMENTS -- ..- . . .. .
Total Government Bonds (cost US0 12.573.541) Total Non-Agencies MBS and ABS (cost USD 23,250,235) Total Agencies MBS and ABS (cost USD 333,421,107) Unrealised Gain on Futures Unrealised Loss on Futuros Unrealised Loss on Swaps Othor Assets and Liabilities
30,134,840 7.69
391,621,122 100.00
x of Market Value Shareholders'
US0 Equlty
12,445,143 3.18 17,010,931 4.35
332.502.071 84.90 61,101 0.02
(275,987) (0.07) (256,977) (0.07)
30,134,840 7.69
Shareholders' Equlty 391,621 ,I 22 100.00
Rate disclosed for Government Bonds. Non-Agencies MBS and ABS and Agencies MBS and ABS IS that which was in effect at 30 November 2005.
The Futures Clearing Merchant is Goldman Sachs.
The counterparty for all swap contracts is Bank of America Corporation.
Interest rates represent either the stated coupon rate, annualised discounted yield on date of purchase for discounted securities, or, for floating rate securities. the current reset rate which is based upon current interest rates indices.
Maturity dates represent either the stated date on the security, or the next interest reset date for floating rate securities or the prerefunded date for those type of securities.
Variable and floating coupon rates are those quoted as of 30 November 2005.
144A: These securities are issued to qualifted institutional investors, pursuant to private placements, and are transferable as stated in rule 144A of the US Securities Act of 1933.
TBA (To Be Announced) Securities are purchased on a forward commitment basis with an approximate (generally +/-2.5%) principal amount and no defined maturity date. The actual principal amount and maturity date will be determined upon settlement when the specific mortgage pools are assigned.
Glossary: ABS: Asset Backed Securities. MBS: Mortgage Backed Securities
The accompanying notes are an integral part of these financial statements.
96

This page intentionally left blank
97
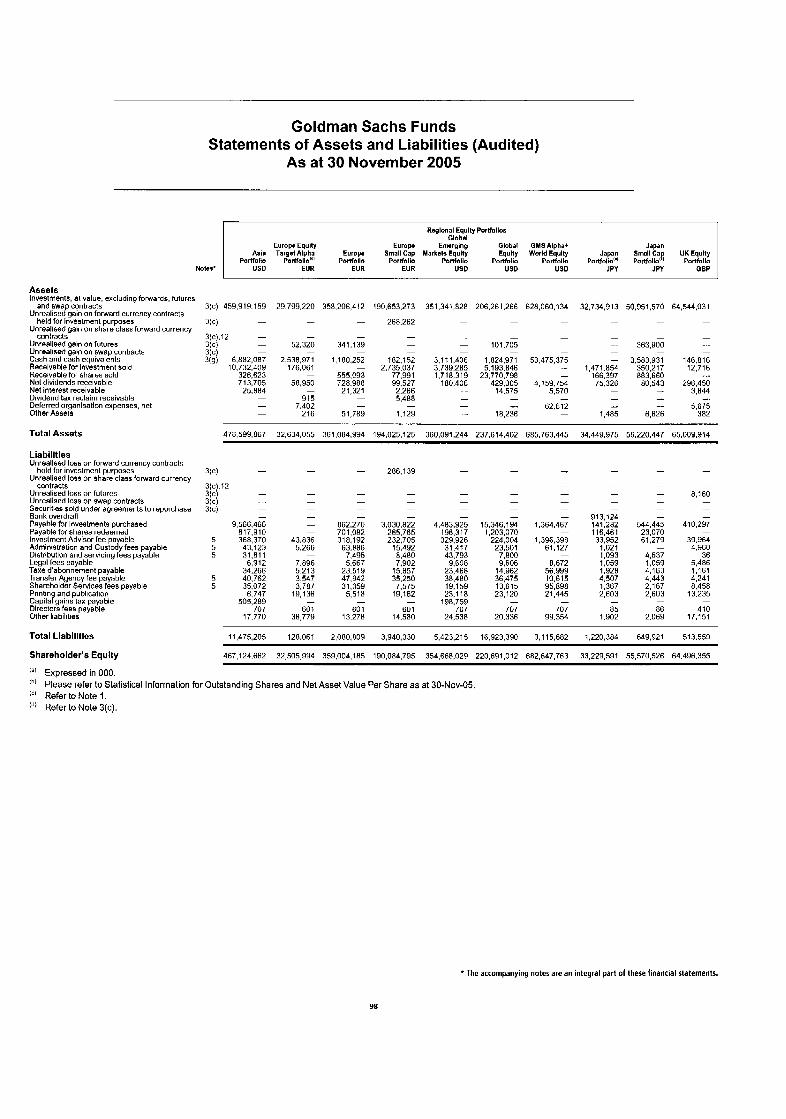
Goldman Sachs Funds Statements of Assets and Liabilities (Audited)
As at 30 November 2005
Notes'
Rsglonal Eqully Po~olloa
Europe Equity Europ. Emarglng Global GMSAIpha+ Japan Global
Asia Targst Alpha Europi Small Cap Mahsls Eqully Equlty World Equlty Japan Small Ca UK Equlty pomolio pomoiio~c' Portfolio Portlollo pomoiio podollo Portlalta Portfolio"' p o r t f o d porttall0
US0 EUR EUR EUR US0 USD USD JPY JPY GBP
Assets Investments. a1 value, excluding forwards. futurcs
Unrealised gain on forward currency contracts
Unrealised gain on share class forward currency
Unrealised gain on futures Unrealised gain on swap contracts Cash and cash equivalents Receivable for investment Sold Receivable for shares sold Net dividends receivable Net interest receivable Dividend tax reclaim receivable Deferred organisation expenses, net Other Assets
Total Assets
Liabillties
and swap contracts
held for investment purpose3
contracts
Unreallsed loss on forward currency contracts
Unrealised loss on share class forward currency
Unrealised loss on futures Unrealised loss on swap contracts Securities sold under agreements to repurchase Bank overdraft Payable for investments purchased Payable for shares redeemed Investment Advisor fee pa able Administration and Custodl fees pa ble Distribution and servicing Le, Davage Legal fees payable Taxe d'abonnement payable Transfer Agency fee payable Shareholder Services fees payable Printin and publication Capitaygains tax payable Directors fees payable Other liabilities
held for investment purposes
contracts
Total Llabllltles
Shareholder's Equity
la' Expressed in 000.
3(c) 459,919.159 29.799.220 358.206,41 2
3(C)
3(c).12 - - -
- - -
- 52,320 341,139 21 - - -
190,653,273
268.262
351,341.828
-
206,261,266 628,060,134 32,734,913 50,951,570 64,544,031
- 101.705
- - 53,475,375
-
6.882.087 2.538.971 1,180.252 10,732,409 176,061 -
326,623 - 555.093 713.705 58.950 728.988
- 21,321 -
25.884 - 915
182.1 52 2.735.037
77.991 99.527 2.266 5.488
3.111.406 3.739.285 1.718.319
180.406
1.824.971 5.193.846
23.770.798 429.005
14.575 4.159.754
5,570 - - 3,844
- _ _ 5,675 1,485 6,626 382
- - -. - -. 18.236
- 62.612
- -
- . _ - 7,402 - 216 51,789
- 1.129
-- -_ -- 478,599,867 32.634.055 361,084,934 184,025,125 360,091,244 237,614,402 605,763,445 34,449,975 56,220,447 65,009,914
- - - - - - - 913,124 - - 9,566.466 - 862.270 3,030,822 4,483.925 15,346,194 1,364,467 141,262 544,445 410,297
817,910 - 701.082 265,765 196.317 1,203,070 - 116,461 23,070 - 5 368.370 43,836 318.192 232,705 329.926 224,004 1,396,398 33,952 61,279 39.Y64 5 43,123 5,266 63.P86 15,492 31.417 23,501 61.127 1,021 - 4.960 5 31.811 - 7,495 8.480 43.793 7,800 - 1,093 4,537 36
1,059 1,059 5.486 34,266 5.213 23.519 15.857 23,468 14,962 56.999 1.928 4,163 1,161
5 40.762 3,547 47.942 35.250 38,480 36,475 10.615 4.507 4,443 4,241 5 35.072 3,787 31,359 7.575 19.159 13,615 95.898 1,367 2.167 8.458
2,603 2,603 13.235
707 601 60 1 601 707 707 707 85 86 410 17.770 38,779 13.278 14.580 24,538 20,336 99.354 1.902 2,069 17,151
6,912 7,896 5.667 7,902 9.608 9,606 8.672
- - - 6.747 19,136 5.518 19.162 23.118 23,120 21,445
505,289 - - - 198.759 - -
11,475,205 128.061 2,080.809 3,940,330 5.423.215 16,923,390 3.115.682 1,220,384 649,921 513.559
467,124,662 32,505,994 359,004,185 190,084,795 354,668,029 220,691,012 682,647,763 33,229,591 55,570,526 64.496.355
''I Please refer to Statistical Information for Outstanding Shares and Net Asset Value Per Share as at 30-Nov-05. Refer to Note 1.
(') Refer to Note 3(c).
* The accompanying notes are an integral part of these financial statements.
98
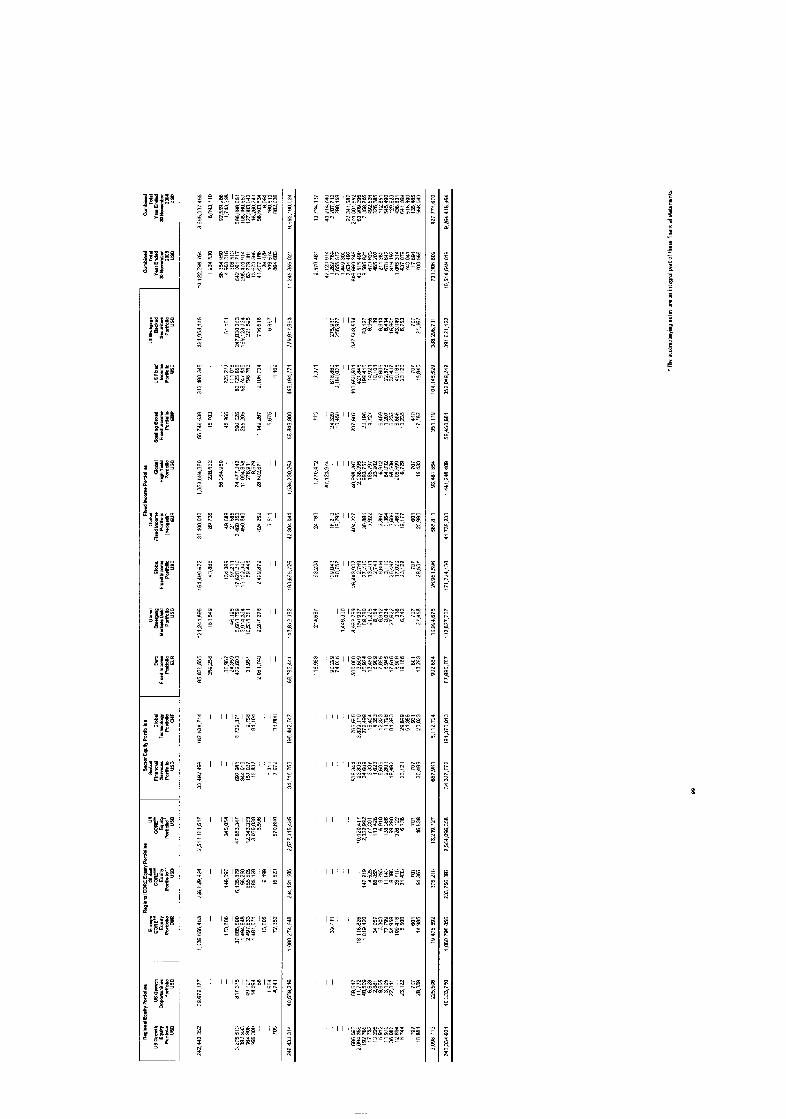
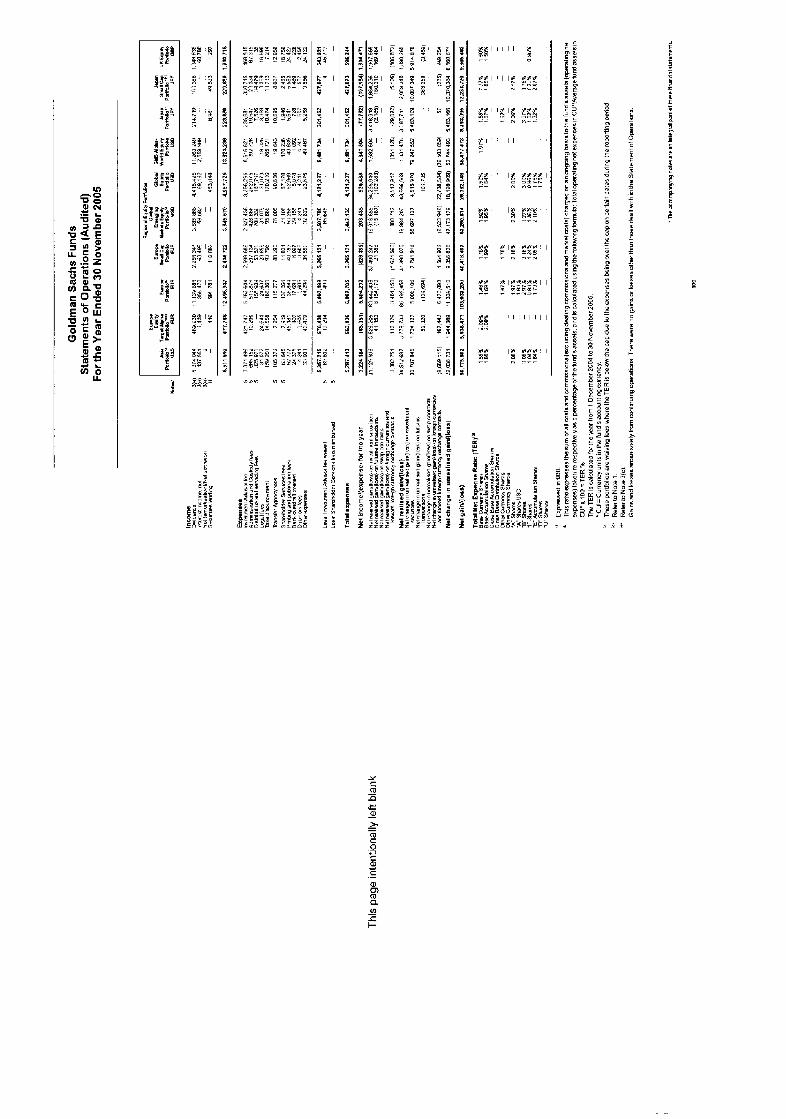
*, 99 'I
h i 5 , 5
? ' E L 2 2
- N 1 - Y
X C m
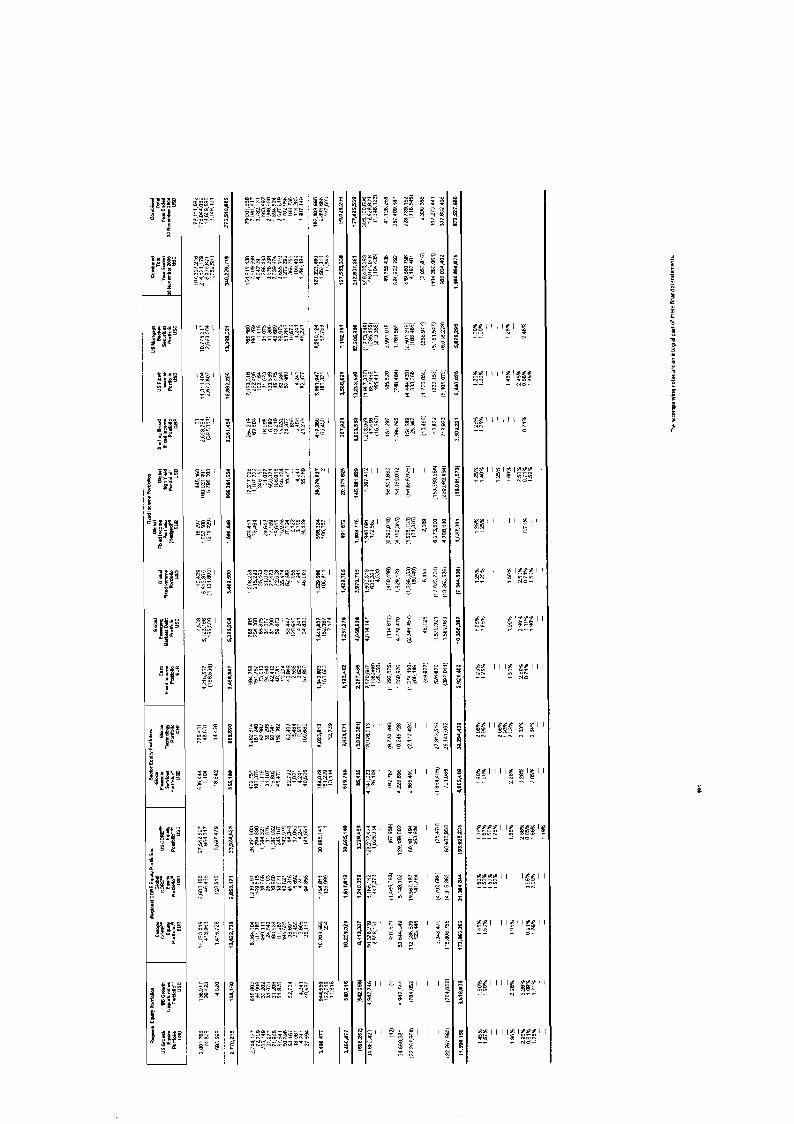
i

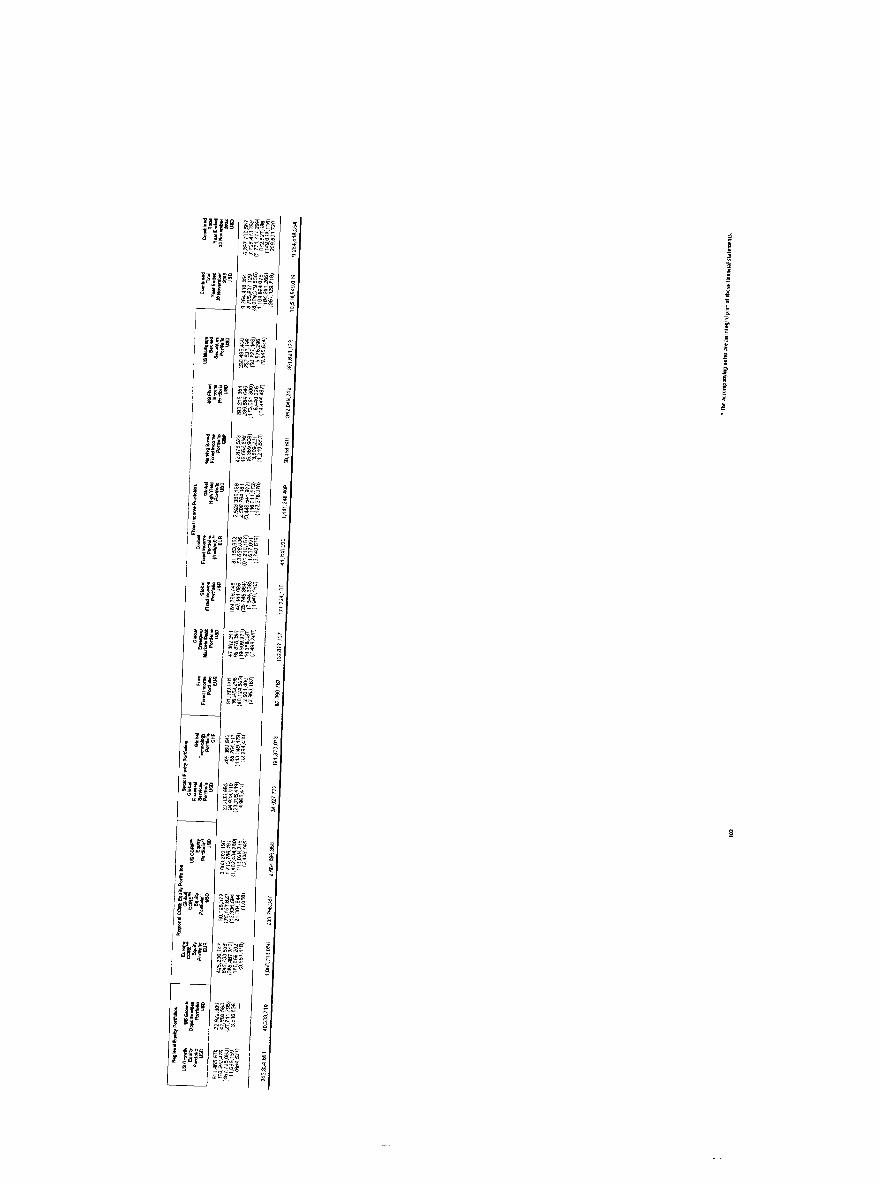
.. .
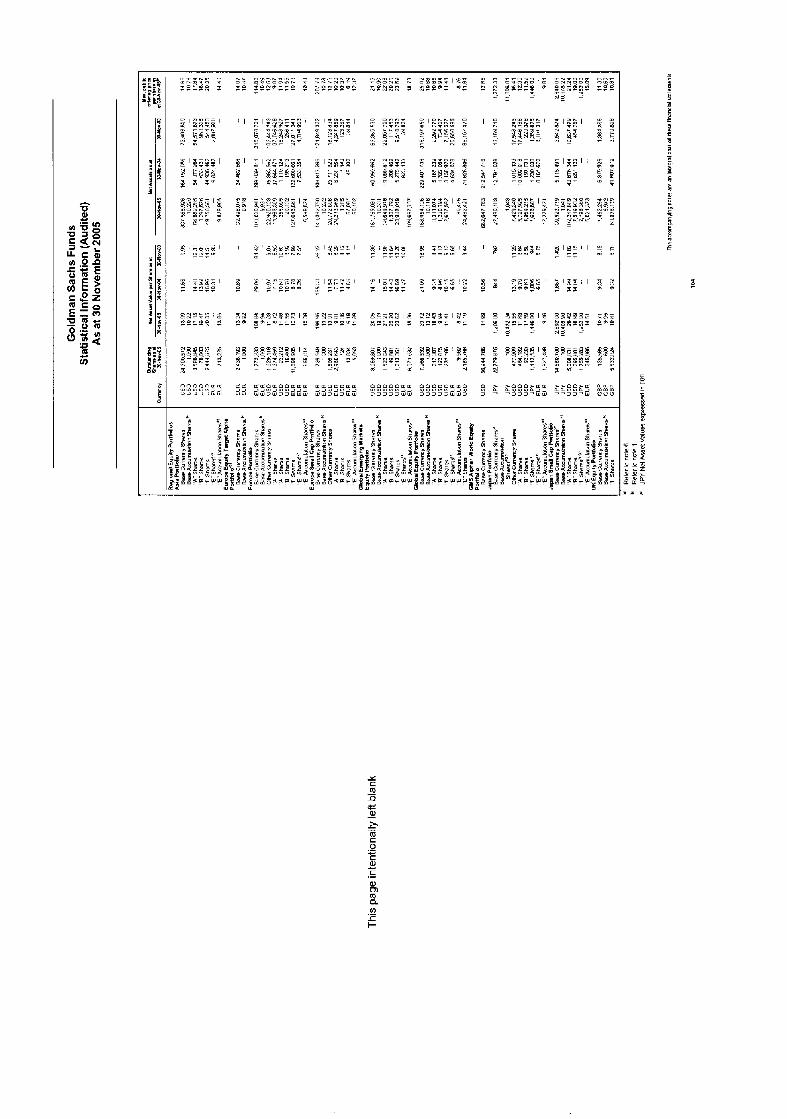
I
I
v) .-
E

6 1 O
-. ... .
d 0 0
> 4 E
-
m c k
n c 9
Lo a a CY
a
7
Tu C
a m
n 1
C
9 - VI m
Y ; P
c -
c N
Y c m
Goldman Sachs Funds Notes to the Financial Statements (Audited)
For the year ended 30 November 2005 (Continued)
3 S i g n i f i c a n t A c c o u n t i n g P o l i c i e s
( a ) P r e s e n t a t i o n o f F i n a n c i a l S t a t e m e n t s
The financial statements have been prepared in accordance with the Luxembourg law on Undertakings for Collective Investment.
( b ) B a s i s o f A c c o u n t i n g
The financial statements have been prepared under the historical cost convention as modified by the revaluation of financial instruments to market value which requires management to make estimates and assumptions that may affect the amounts reported in the financial statements and accompanying notes. Actual amounts could differ from these estimates. The comparative figures are as of 30 November 2004 for the Statements of Assets and Liabilities, the Statements of Operations and the Statements of Changes in Shareholders' Equity.
( c ) V a l u a t i o n o f I n v e s t m e n t s a n d F i n a n c i a l I n s t r u m e n t s
All long positions in equity securities for which accurate market quotations are readily available are valued via electronic feeds by the administrator. All equity portfolio securities are valued at the last sale price on the exchange or system in which they are principally traded at the valuation time. If there is no sale at the valuation time, the equity will be valued at the bid price.
All long positions in fixed income portfolio securities for which accurate market quotations are readily available are valued via electronic feeds by the administrator. Such feeds contain dealer supplied bid quotations or bid quotations from a recognised pricing service. Securities for which a pricing service either does not supply a quotation or supplies a quotation that the administrator does not believe to be accurate (based upon failure of agreed upon tolerance levels or in consultation with the investment advisor), will be valued through the use of broker quotes, if possible. When it is not possible, the securities are priced at cost.
Securities sold under agreements to repurchase and reverse repurchase represent short-term collateralised financing transactions and are carried at their contractual amounts. As of 30 November 2005, the Fund gave the following amounts of underlying securities as collateral under reverse repurchase agreements:
Global Emerging Markets Debt Portfolio
Upon entering into a futures contract, a Portfolio is required to deposit with a broker an amount of cash or securities equal to the minimum "initial margin" requirement of the futures exchange on which the contract is traded. Subsequent payments are made or received by a Portfolio each day, dependent on the daily fluctuations in the value of the underlying index or security which are recorded for financial reporting purposes as unrealised gains or losses by a Portfolio. When entering into a closing transaction, a Portfolio will realise a gain or loss equal to the difference between the value of the futures contract to sell and the futures contract to buy or the amounts received on the sale of the futures.
A Portfolio may write and purchase call and put options on any securities in which it may invest. All options written by a Portfolio must be covered, which means that the Portfolio will own the underlying securities subject to the option, or match the call options against any other instruments (such as warrants) providing sufficient coverage, so long as the option is outstanding. The daily fluctuations in the
$1,701,540
107

Goldman Sachs Funds Notes to the Financial Statements (Audited)
For the year ended 30 November 2005 (Continued)
3 S i g n i f i c a n t A c c o u n t i n g P o l i c i e s ( c o n t i n u e d )
( c ) V a l u a t i o n o f I n v e s t m e n t s a n d F i n a n c i a l I n s t r u m e n t s ( c o n t i n u e d )
value of the underlying security are recorded for financial reporting purposes as unrealised gains or losses by a Portfolio and are recorded as a realised gains and losses when the position is closed.
Exchange-traded options and futures contracts are valued at the last sale or last bid price on the exchange where such contracts and options are principally traded.
Forward currency contracts are valued at their respective fair market values determined on the basis of prices supplied by independent sources.
Over-the-counter (OTC) derivatives are valued by the Administrator at the value provided by a broker identified by the Investment Advisor. The OTC derivatives include, but are not limited to, interest rate swaps, credit default swaps, total return index swaps, put/call option combos, total return basket swaps, index volatility and FX variance swaps and correlation swaps. Where the broker does not provide a price, the Administrator valuation models for OTC derivatives is applied.
Money market instruments with a maturity of ninety days or less are valued at amortised cost, which approximates market value.
Securities which do not have a readily available price are valued at fair value pursuant to procedures established by the Board of Directors of the Fund.
The following portfolios held securities valued at fair value (% of closing Net Assets): Asia Portfolio (3.59%); Europe Small Cap Portfolio (0.00%); Global Emerging Markets Equity Portfolio (2.00%); Global Emerging Markets Debt Portfolio (0.00%); Global High Yield Portfolio (0.00%).
In the case of certain Portfolios, the Fund may decide to issue share classes which have different Valuation Points, e.g. “snap” and “close”, where the “snap” Valuation Point takes a value at a time other than at market close. In consequence, the net asset values per Share of such share classes are expected to differ from each other as a result of the application of such different Valuation Points.
For the year ended 30 November 05, such “snap” and “close” share classes as described above are applicable to the US CORESM Equity Portfolio and Global CORESM Equity Portfolio.
For financial reporting purposes only, the Schedules of Investments, the Statements of Assets and Liabilities, the Statements of Operations, and the Statements of Changes in Shareholders’ Equity of Global CORESM Equity Portfolio and US CORESM Equity Portfolio have been presented using prices as of close of all markets.
If the Schedules of Investments, the statements of Assets and Liabilities, the Statements of Operations and the Statements of Changes in Shareholders’ Equity were to be presented using the snapshot prices, then the total market value would be USD 227,728,71 I and USD 2,530,707,094, the unrealised gain on futures would be USD 179,888 and USD 720,778 and the total net assets would be USD 234,888,965 and USD 2,582,017,659 for Global CORESM Equity Portfolio and US CORESM Equity Portfolio respectively.
108
Goldman Sachs Funds Notes to the Financial Statements (Audited)
For the year ended 30 November 2005 (Continued)
3 S i g n i f i c a n t A c c o u n t i n g P o l i c i e s ( c o n t i n u e d )
( d ) A c c o u n t i n g f o r I n v e s t m e n t a n d F i n a n c i a l I n s t r u m e n t T r a n s a c t i o n s
Security transactions are recorded on trade date plus one business day (the day after the date on which an order is transacted). Realised gains or losses on investments are determined on an average cost basis.
Each Portfolio is authorised to enter into forward currency contracts in order to protect a Portfolio against adverse movement in the value of a Portfolio’s base currency. Each Portfolio may enter into contracts for the purchase or sale of a specific foreign currency at a fixed price on a future date as a hedge or cross- hedge against either specific transactions, portfolio positions or the risks inherent in portfolio positioning. The aggregate principal amounts of the contracts for which delivery is anticipated are reflected in the Schedules of Investments.
Certain risks may arise upon entering into futures, options, or forward currency contracts. These risks may include changes in the value of the contract that may not directly correlate with changes in the value of the underlying securities, or that the counterparty to a contract may default on its obligations to perform.
All commitments are “marked-to-market’’ at the applicable translation rates and any resulting unrealised gains or losses are recorded in each Portfolio’s financial statements.
Each Portfolio records realised gains or losses at the time the forward currency contract is offset by entry into a closing transaction or extinguished by delivery of the currency. Risks may arise upon entering into these contracts from the potential inability of counterparties to meet the terms of their contracts and from unanticipated movements in the value of a foreign currency relative to the base currency.
Each Portfolio may enter into interest rate swaps, total return swaps and credit default swaps with highly rated financial institutions specialising in such operations. Interest rate swaps involve the exchange by a Portfolio with another party of their respective commitments to pay or receive interest, such as an exchange of fixed rate payments for floating rate payments. Total return swaps involve the exchange of the right to receive the total return, coupons plus capital gains or losses, of a specified reference asset, index or basket of assets against the right to make fixed or floating payments. A credit default swap is a bilateral financial contract in which one counterparty (the protection buyer) pays a periodic fee in return for a contingent payment by the protection seller following a credit event of a reference issuer.
Where a Portfolio enters into interest rate or total return swaps on a net basis, the two payment streams are netted out, with each Portfolio receiving or paying, as the case may be, only the net amount of the two payments. Interest rate or total return swaps entered into on a net basis do not involve the physical delivery of investments, other underlying assets or principal. Accordingly, it is intended that the risk of loss with respect to interest rate swaps is limited to the net amount of interest payments that each Portfolio is contractually obligated to make or in the case of total return swaps, the net amount of the difference between the total rate of return of a reference investment, index or basket of investments and the fixed or floating payments. If the other party to an interest rate or total return swap defaults, in normal circumstances each Portfolio’s risk of loss consists of the net amount of interest or total return payments that each Portfolio is contractually entitled to receive.
109
Goldman Sachs Funds Notes to the Financial Statements (Audited)
For the year ended 30 November 2005 (Continued)
3 S i g n i f i c a n t A c c o u n t i n g P o l i c i e s ( c o n t i n u e d )
( e ) I n v e s t m e n t I n c o m e a n d E x p e n s e s
Dividend income is recorded on the ex-dividend date and interest income is recorded on the basis of interest accrued, premiums amortised and discounts earned. Income and realised gains and losses of all Portfolios are allocated to each share class based on their relative net assets at each valuation date. Any premium or discount on the acquisition of bonds is amortised/accreted over the residual life of the bond on a straight line basis and is shown in the caption "Net (amortisation)/net accretion" in the Statements of Operations.
When a bond has been identified as being in default, the interest accrual on the defaulted security is stopped. On confirmation of default from relevant parties, the amount receivable is written off in line with procedure.
Expenses incurred by the Fund that do not specifically relate to an individual Portfolio of the Fund are allocated to the Portfolios based on the nature of the charges.
Organisation related costs are amortised on a straight-line basis over a period of five years
( f ) F o r e i g n C u r r e n c y T r a n s l a t i o n
The books and records of all Portfolios are maintained in their base currency. Please refer to Appendix I for the base currency of each Portfolio.
Assets and liabilities denominated in currencies other than the base currency are translated at closing rates of exchange at the end of the period. Transactions during the period are translated at the rate of exchange on the date of the transaction. Foreign currency transaction gains and losses are included in the Statements of Operations.
( 9 ) C a s h a n d C a s h E q u i v a l e n t s
The Fund considers all highly liquid investments with a maturity date of less than 90 days at the time of purchase and not held for resale to be cash equivalents. Cash equivalents are held at cost plus accrued interest (amortised cost), which approximates market value.
4 T a x a t i o n
Each Portfolio is subject to Luxembourg law with respect to its tax status. Under legislation and regulations in Luxembourg, each Portfolio is subject to a tax (taxe d'abonnement) of 0.05% per annum of each Portfolio's net assets that are attributable to all share classes except "I" share class and to a tax of 0.01% per annum of the net assets attributable to the "I" share class. The taxe d'abonnement is payable quarterly on the basis of the value of the net assets of each share class as of the end of each calendar quarter. Generally, under present law, neither the Portfolios nor their shareholders are subject to any Luxembourg tax on income, capital gains, withholding taxes or estate taxes. There is no Luxembourg tax or duty payable on the issuance of the shares.
Dividends, interest, income and gains received by a Portfolio on its investments may be subject to non- recoverable withholding or other taxes in the countries of origin.
110

Goldman Sachs Funds Notes to the Financial Statements (Audited)
For the year ended 30 November 2005 (Continued)
4 T a x a t i o n ( c o n t i n u e d )
Under the United Kingdom Income and Corporation Taxes Act, 1988, offshore funds, (which includes individual share classes), must distribute substantially all of their income every year, and meet certain investment restrictions, in order to apply to the United Kingdom Inland Revenue authorities for certification as a distributing fund. Such certification is granted retrospectively for each accounting period.
Prospective investors should consult their own taxation advisors in relation to their own individual circumstances as they may differ from the general statements that appear above. Each Portfolio is subject to taxation on capital gains, interest and dividends in certain jurisdictions in which each Portfolio invests. It is the policy of each Portfolio to accrue for such taxes when the dividend is declared or interest is earned. At each valuation date, taxation on unrealised appreciation of securities is accrued for at statutory rates.
5 S i g n i f i c a n t Ag reemen ts
Investment Advisors
Goldman Sachs Asset Management International ("GSAMI"), an affiliate of Goldman, Sachs & Co. ("Goldman Sachs") acts as each Portfolio's investment advisor pursuant to an Investment Advisory Agreement dated 14 November 2005. Under the Investment Advisory Agreement, GSAMI, subject to the general supervision of the Fund's Board of Directors, manages the Fund's Portfolios.
GSAMI relies upon Goldman Sachs Asset Management, the U.S. sub-advisor, in connection with the selection of securities of U.S. issuers and issuers in many emerging market countries; upon the asset management division of Goldman Sachs (Singapore) PTE, the Asian sub-advisor, in connection with the selection of Asian issuers; and, upon Goldman Sachs Asset Management Go., Ltd, the Japanese sub- advisor, in connection with the selection of Japanese issuers.
GSAMI has entered into sub-advisory agreements with each of the following sub-advisors in connection with the management of the Goldman Sachs GMS Alpha+ World Equity Portfolio: Peter Cundill 8 Associates (Bermuda) Ltd; Southeastern Asset Management, Inc.; and, Third Avenue Management LLC. None of these investment advisors is an affiliate of GSAMI. As compensation for the services rendered under the Investment Advisory Agreement, GSAMI receives a fee, payable monthly, at an annual rate. A portion of the Investment Advisor's fees may be remitted to the sub-advisor.
GSAMl has voluntarily agreed to limit total ordinary expenses in respect of certain Portfolios. Therefore, to the extent that total ordinary expenses would exceed the expense cap, GSAMI has voluntarily agreed to reduce its advisory fees accordingly for the year ended 30 November 2005. There is no guarantee that the existence or level of these expense caps will continue in the future and no obligation on the part of GSAMl to agree to limit total expenses in this way.
To the extent permitted by applicable law and the terms of the Prospectus, any Portfolio may invest all or some of its short term cash investments in any money market fund advised or managed by Goldman Sachs and may invest in other investment funds advised or managed by Goldman Sachs. Subject to applicable law and the terms of the Prospectus, the Fund may be required to bear its proportionate share of any fees (including investment advisory and management fees) applicable to investment in such investment funds.
111

Goldman Sachs Funds Notes to the Financial Statements (Audited)
For the year ended 30 November 2005 (Continued)
5 S i g n i f i c a n t A g r e e m e n t s ( c o n t i n u e d )
Investment Advisors (continued)
Details of advisory fee rates and the expense caps as of 30 November 2005 are detailed in Appendix I.
Commissions
In the normal course of its operations, each Portfolio may enter into transactions on securities or other instruments with Goldman Sachs or other Goldman Sachs affiliates (together “GS Affiliates”). For the year ended 30 November 2005, the following transactions were entered into with GS Affiliates with total brokerage commissions paid to GS Affiliates being split between commissions related to security transactions and futures contracts:
Porlfolloa
GOLDMAN SACHS EQUITY PORTFOLIOS
Regional Equity Portfolios Asia Portfolio Europe Equity Target Alpha
Portfolio Europe Portfolio Europe Small Cap Portfolio Global Emerging Markets Equity
Global Equity Portfolio GMS Alphat World Equity
Japan Portfolio Japan Small Cap Portfolio UK Equity Portfolio US Growth Equity Portfolio US Growth Opportunities
Reglonal CORE Equity
Europe CORE’” Equity Portfolio Global CORE‘” Equity Portfolio US CORE” Equity Portfolio
Sector Equity Portfolios Global Financial Services
Global Technology Portfolio
Portfolio
Portfolio
Portfolio
Poltfollos
Portfolio
Securlty (excludlng
Futures Transactlons)
Currency Value’ Total Aggregate Percent of
US0 1,528.740
EUR -
EUR 160,776,924 EUR 5,603,576
- USD USD 3.525.318
USD 4,632,666 JPY JPY 3,907,856,662 GBP 8.138.781 USD 165.840.735
-
USD 9.333.081
- EUR USD -
USD 41,893.462
USD 3,152,547 CHF 4,114.686
0.30%
-
20.64% 1.79%
-
0.86%
1.11%
8.01% 23.11% 50.61%
9.51%
-
- -
0.81%
5.45% 1.91%
... .
Securlty Transactlona Percent of
USD
EUR EUR EUR
USD USD
USD JPY JPY GBP USD
USD
EUR USD US0
USD CHF
7.670 0.51% -
418 16.894 1.92% 34.708 5,164 1.27% 5,041
- -
I - 4,105 6,656 2.70% 150,652
- 11,214 1.15% - - 985,800
15,436,610 14.03% 1,476,700 10,143 20.00% 1,598 67.193 17.12% -
6.052 6.65% -
- - 60,172 - - 163,193
9.928 15.23% 57,520
5,535 6.04% 1,043 9,854 2.51% -
112
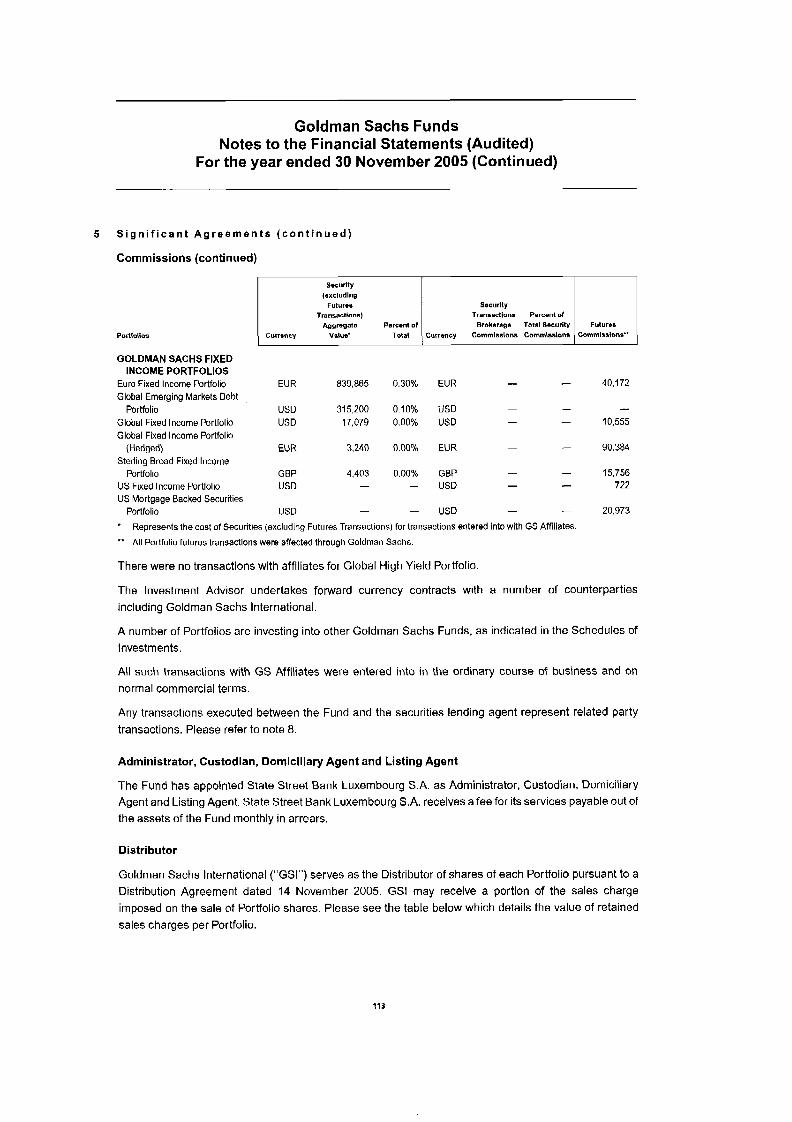
Goldman Sachs Funds Notes to the Financial Statements (Audited)
For the year ended 30 November 2005 (Continued)
Socurlty (oxcludlng
Futuros Socurlty Transactions) Trsnaactiona Percent of
Aggregate Percent of Brokerage Total Security , Currsncy Value' Total Currency Commlaalons Commlaalons
5 S i g n i f i c a n t A g r e e m e n t s ( c o n t i n u e d )
Commissions (continued)
Portfolios
GOLDMAN SACHS FIXED INCOME PORTFOLIOS
Euro Fixed Income Portfolio Global Emerging Markets Debt
Global Fixed Income Portfolio Global Fixed Income Portfolio
Sterling Broad Fixed Income
US Fixed Income Portfolio US Mortgage Backed Securities
Portfolio
(Hedged)
Portfolio
Portfolio
Futures Commlaalons"
EUR 839,865 0.30% EUR I - 40,172
USD 315,200 0.10% USD - - I
USD 17,079 0.00% USD - - 10.555
EUR 3,240 0.00% EUR - - 90.384
GBP 4,403 0.00% GBP - - 15.756 USD - - USD - - 722
USD - - USD - - 20,973 *
"
Represents the cost of Securities (excluding Futures Transactions) for transactions entered into with GS Affiliates.
All Portfolio futures transactions were affected through Goldman Sachs.
There were no transactions with affiliates for Global High Yield Portfolio.
The Investment Advisor undertakes forward currency contracts with a number of counterparties including Goldman Sachs International.
A number of Portfolios are investing into other Goldman Sachs Funds, as indicated in the Schedules of Investments.
All such transactions with GS Affiliates were entered into in the ordinary course of business and on normal commercial terms.
Any transactions executed between the Fund and the securities lending agent represent related party transactions. Please refer to note 8.
Administrator, Custodian, Domiciliary Agent and Listing Agent
The Fund has appointed State Street Bank Luxembourg S.A. as Administrator, Custodian, Domiciliary Agent and Listing Agent. State Street Bank Luxembourg S.A. receives a fee for its services payable out of the assets of the Fund monthly in arrears.
Distributor
Goldman Sachs International ("GSI") serves as the Distributor of shares of each Portfolio pursuant to a Distribution Agreement dated 14 November 2005. GSI may receive a portion of the sales charge imposed on the sale of Portfolio shares. Please see the table below which details the value of retained sales charges per Portfolio.
113
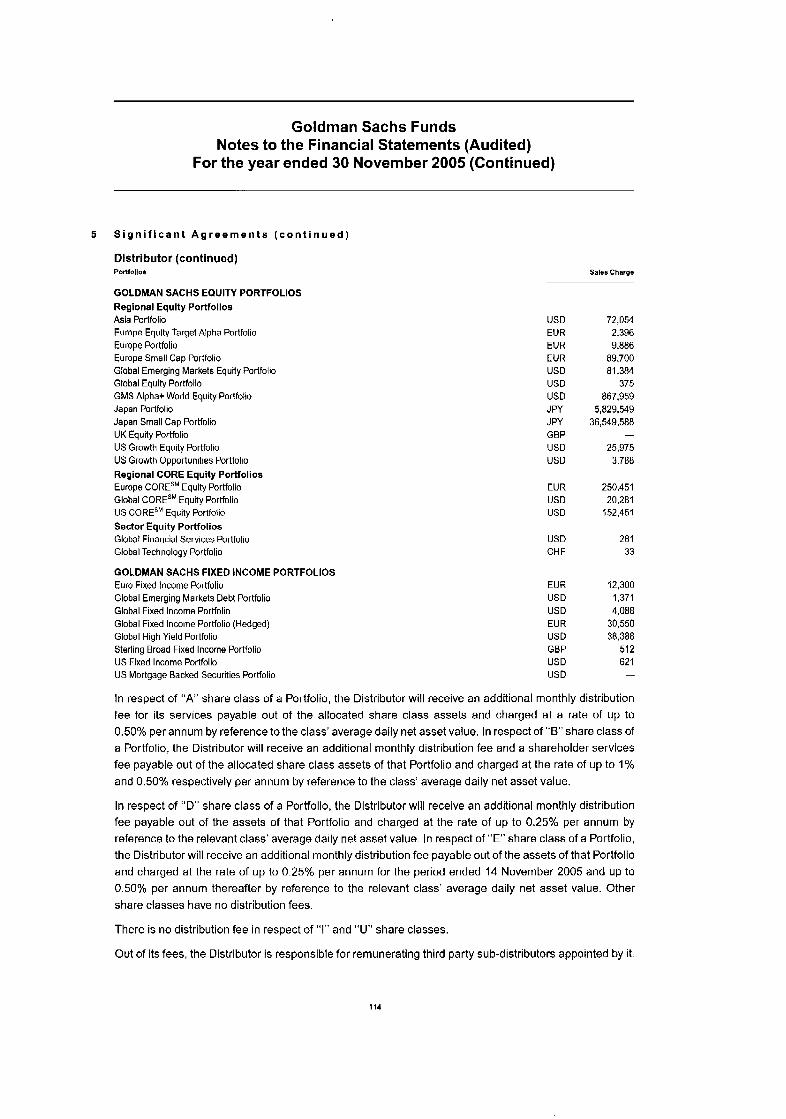
Goldman Sachs Funds Notes to the Financial Statements (Audited)
For the year ended 30 November 2005 (Continued)
5 S i g n i f i c a n t A g r e e m e n t s ( c o n t i n u e d )
Dlstributor (continued) Pontolloa Sales Charge
GOLDMAN SACHS EQUITY PORTFOLIOS Regional Equlty Portfolios Asia Portfolio Europe Equity Target Alpha Portfolio Europe Portfolio Europe Small Cap Portfolio Global Emerging Markets Equity Portfolio Global Equity Portfolio GMS Alphat World Equity Portfolio Japan Portfolio Japan Small Cap Portfolio UK Equity Portfolio US Growth Equity Portfolio US Growth Opportunities Portfolio Regional CORE Equity Porifolios Europe COREsM Equity Portfolio Global CORESM Equity Portfolio US CORESM Equity Portfolio Sector Equity Portfolios Global Financial Services Portfolio Global Technology Portfolio
GOLDMAN SACHS FIXED INCOME PORTFOLIOS Euro Fixed Income Portfolio Global Emerging Markets Debt Portfolio Global Fixed Income Portfolio Global Fixed Income Portfolio (Hedged) Global High Yield Portfolio Sterling Broad Fixed Income Portfolio US Fixed Income Portfolio US Mortgage Backed Securities Portfolio
USD EUR EUR EUR USD USD USD J PY JPY GBP USD USD
EUR USD USD
USD CHF
EUR USD USD EUR USD GBP US0 USD
72,054 2,396 9.886
89.700 81,384
375 867.959
5,829,549 36,549,588
25,975 3,788
250,451 20,281
152.451
281 33
-
12,300 1,371 4,088
30,550
512 621
38.3a8
-
In respect of “A” share class of a Portfolio, the Distributor will receive an additional monthly distribution fee for its services payable out of the allocated share class assets and charged at a rate of up to 0.50% per annum by reference to the class’ average daily net asset value. In respect of “B” share class of a Portfolio, the Distributor will receive an additional monthly distribution fee and a shareholder services fee payable out of the allocated share class assets of that Portfolio and charged at the rate of up to 1% and 0.50% respectively per annum by reference to the class’ average daily net asset value.
In respect of “D” share class of a Portfolio, the Distributor will receive an additional monthly distribution fee payable out of the assets of that Portfolio and charged at the rate of up to 0.25% per annum by reference to the relevant class’ average daily net asset value. In respect of “E” share class of a Portfolio, the Distributor will receive an additional monthly distribution fee payable out of the assets of that Portfolio and charged at the rate of up to 0.25% per annum for the period ended 14 November 2005 and up to 0.50% per annum thereafter by reference to the relevant class’ average daily net asset value. Other share classes have no distribution fees.
There is no distribution fee in respect of “I” and “U” share classes.
Out of its fees, the Distributor is responsible for remunerating third party sub-distributors appointed by it.
114
Goldman Sachs Funds Notes to the Financial Statements (Audited)
For the year ended 30 November 2005 (Continued)
5 S i g n i f i c a n t A g r e e m e n t s ( c o n t i n u e d )
Transfer Agent and Shareholder Services Agent
The Fund has appointed First European Transfer Agent S.A. as registrar and transfer agent (the "Transfer Agent") for the Fund pursuant to the Registrar and Transfer Agent Agreement between the Fund and the Transfer Agent dated 14 November 2005. The day-to-day services provided to the Fund by the Transfer Agent include receiving and processing subscription and redemption orders, allotting and issuing shares and maintaining the shareholder register for the shares. The Transfer Agent is paid a fee quarterly in arrears out of the net assets of the Fund. The amount payable to First European Transfer Agent was USD 2,039,874 for the period ended 30 November 2005 (USD 1,694,524 for the period ended 30 November 2004).
Additionally GSI, through its European Shareholder Services Group, also receives a fee from the Fund. This is in respect of investor services provided to shareholders in the Fund and is payable quarterly in arrears. The amount payable to GSI was USD 2,577,267 for the period under review (USD 1,840,016 for the period ended 30 November 2004).
In total the combined fee payable, excluding the Transfer Agency Out of Pocket fee payable, to the Transfer Agent and the GSI European Shareholder Services Group will not exceed 0.04% of the Net Asset Value of each Portfolio per annum.
6 S h a r e C a p i t a l
Shares of each Portfolio may be purchased through the Distributor and any sub-distribution agent daily, at the net asset value per share of the relevant class of shares of the Portfolio on such date, plus any applicable sales charge. For Base and Other Currency shares and "U" shares the sales charge will not exceed 5.5% of the purchase price of these shares. For "A', "0" and "E" shares the sales charge will not exceed 4%. The "B" shares of each Portfolio have no upfront sales charge but are subject to a Contingent Deferred Sales Charge ("COSC") which varies between 4% and 0% of the lower of either initial purchase price or total net asset value of the shares being redeemed. The "I" shares of each Portfolio have no sales charge.
The minimum initial investment for "I" shares is, depending on the currency of such share classes, USD 5 million, EUR 5 million, GBP 5 million or JPY 500 million. The minimum initial investment for Base shares and for Base Accumulation shares is, depending on the currency of such share class, USD 5,000, EUR 5,000, GBP 3,000, JPY 500,000 or CHF 7,500. For all other share classes the minimum initial investment is USD 1,500, EUR 1,500, JPY 150,000, GBP 1,500 and CHF 2,500 in each USD, EUR, JPY, GBP and CHF denominated share classes, respectively. The minimum initial investment for "U" shares is USD 20 million. The minimum initial subscription level for Base Shares in the GMS Alpha + World Equity Portfolio is USD 200,000. The minimum subsequent subscription level for the GMS Alpha +World Equity Portfolio is USD 50,000 in respect of all share classes, Shares are redeemable on a daily basis prior to 2pm CET, cut-off time, at the option of the shareholder, at the net asset value per share determined on such date.
115

Goldman Sachs Funds Notes to the Financial Statements (Audited)
For the year ended 30 November 2005 (Continued)
6 S h a r e C a p i t a l ( c o n t i n u e d )
Base Bare currency currency Accumulatlon "A" share "8" share "I" share "E, Accumulation
share class share cia$$* class class class share class* USD US0 USD USD USD EUR
Asia Portfolio Shares at start of year 14,076,269 - 3,775,445 45,501 2,650,101 661,624 Shares issued during year 15.176.081 1,000 1.738.750 62,768 1,036.275 507,403 Shares redeemed during year (4,951,838) - (1,615,350) (29,466) (1,241,701) (455,802)
Shares in issue at end of year 24,300,512 1,000 3398.845 78.803 2,444,675 713,225
Base Base currency currency Accumulation
share class share cluss' EUR EUR
Europe Equity Target Alpha Portfolio
Shares at start of year 2.248.022 - Shares issued during year 216,983 1,000 Shares redeemed during year (28,812) - Shares In Issue at end of year 2,436,193 1,000
. .~
Bass currency Basa currnncy Accumulation Other currency "A" share "A" share "8" share "I" share
share class share class' share class class class class class EUR EUR US0 EUR US0 USD EUR
Europe Portolio Shares at start of year 4.480.453 - 3,267,236 5,266,239 104,711 18,109 13,963,307 Shares issued during year 1,829,955 1,000 760,878 2,651,530 13,006 - 3,315,142 Shares redeemed during year (4,537,175) - (2,098,998) (6,543,310) (95,505) (7,709) (5,379,544)
Shares in issue at end of year 1,773,233 1,000 1,929,116 1,374,459 22,212 10,400 11,898,905
" E ' Accumulation
share class' EUR
Europe Portoiio Shares at start of year 912,323 Shares issued during year 3,372 Shares redeemed during year (260,681)
Shares in issue at end of year 655,014
Basa currnncy Othar " E ' Base currency Accumulation currsncy "A" sham " 0 share "I" share Accumulation
share class share class. shara class class class class sharo class' EUR EUR US0 EUR US0 EUR EUR
Europe Small Cap Portfolio Shares at start of year 707,127 - 2,228,120 809,181 100 10,163 -
Shares redeemed during year (421,029) - (865,189) (1,364,333) - Shares issued during year 440,451 1,000 233,300 3,535,795 24 671 5,053
- - . . . " -
Shares In Issue at end of year 726,549 1,000 1,596,231 2.980.643 124 10,834 5,053
Base currency "E" Base currency Accumulation "A" sharo "0" shara "I" share Accumulation
share class share class. class class class sharo class. US0 US0 US0 USD US0 EUR
Global Emerging Markets
Shares at start of year 4,304,454 - 1,273,432 14,305 316,127 73,065 Shares issued during year 5,430,693 1,000 1,553,439 60,204 798,140 6,881,771 Shares redeemed during year (I ,665,340) - (1,004,828) (24,628) (100,906) (881,204)
Shares in issue at end of year 8,069,807 1,000 1,822,043 49,881 1,013,361 6,073,632
Equity Portfolio
* Refer to note 1.
116
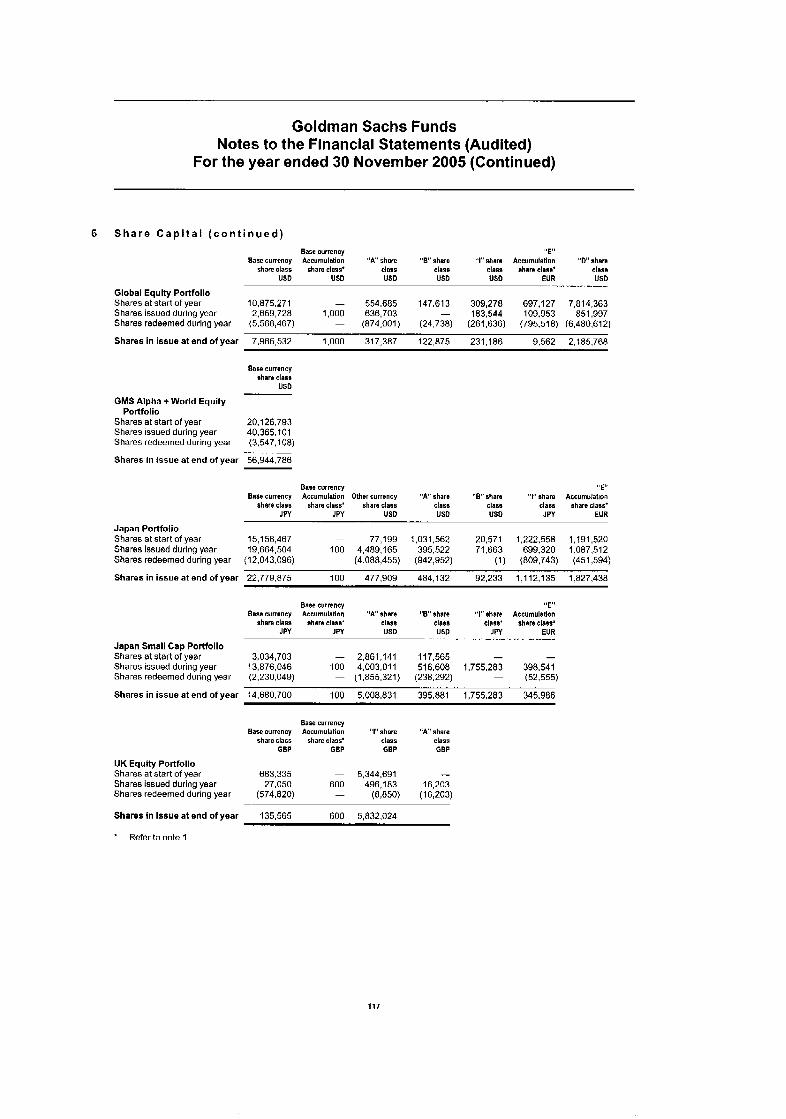
Goldman Sachs Funds Notes to the Financial Statements (Audited)
For the year ended 30 November 2005 (Continued)
6 S h a r e C a p i t a l ( c o n t i n u e d )
Bare currency Base currency Aceumulatlon "A" share "8" share
share cIa$6 share class' class class US0 US0 US0 US0
"I" sham class US0
"E" Accumulation "D" sham
sham class. class EUR USD
Global Equity Portfolio Shares at start of year 10,875,271 - 554.685 147,613
Shares redeemed during year (5,568,467) - (874,001) (24,738)
Shares in issue at end of year 7.966,532 1,000 317,387 122.875
Shares issued during year 2,659,728 1,000 636,703 - 309,278 183,544
(261.636)
231.186
697,127 7,814,363 109.953 851,997
(795.518) (6,480,612)
9.562 2,185,768
Base currency shara class
US0
GMS Alpha +World Equity
Shares at start of year 20,126,793 Shares issued during year 40,365,101 Shares redeemed during year (3,547,108)
Shares In issue at end of year -56,944,786
Portfolio
Base currency "E" Base currency Accumulation Other currency " A ' ahara " E ' sham "I" share Accumulation
share class share CI~BS' sham class class class class shara class. JPY JPY US0 US0 US0 JPY EUR
Japan Portfolio Shares at start of year 15,158,467 - 77,199 1,031,562 20.571 1.222.558 1,191,520 Shares issued during year 19,664,504 100 4,489,165 395,522 71,663 699.320 1.087.512 Shares redeemed during year (12,043,096) - (4,088,455) (942,952) (1) (809,743) (451,594)
Shares in issue at end of year 22.779875 100 477,909 484,132 92,233 1,112,135 1,827,438
Base currency Easa cunancy Accumulation "A" share " 6 share
share class shara class* clam class USD
. ~
JPY JPY USD
Japan Small Cap Portfolio Shares at start of year 3,034,703 - 2.861.141 117,565 Shares issued during year 13,876,046 100 4,003,011 516,608 Shares redeemed during year (2,230,049) - (1,855.321) (238.292)
"E" "I" share Accumulallon
class' share class' JPY EUR .- -. . . ..
- - 1.755.283 398,541
- (52,555)
Shares in issue at end of year 14,680,700 100 5,006,831 395,881 1,755.283 345,986
Base currency Base currency Accumulation "I" share "A" share
share Cla66 share Class' class class GBP GBP GBP GBP
UK Equity Portfolio Shares at start of year 683.335 - 5,344,691 - Shares issued during year 27.050 600 496.183 16,203 Shares redeemed during year (574,820) - (8,850) (16,203)
Shares In Issue at end of year 135,565 600 5,832,024 -
* Refer to note 1
117
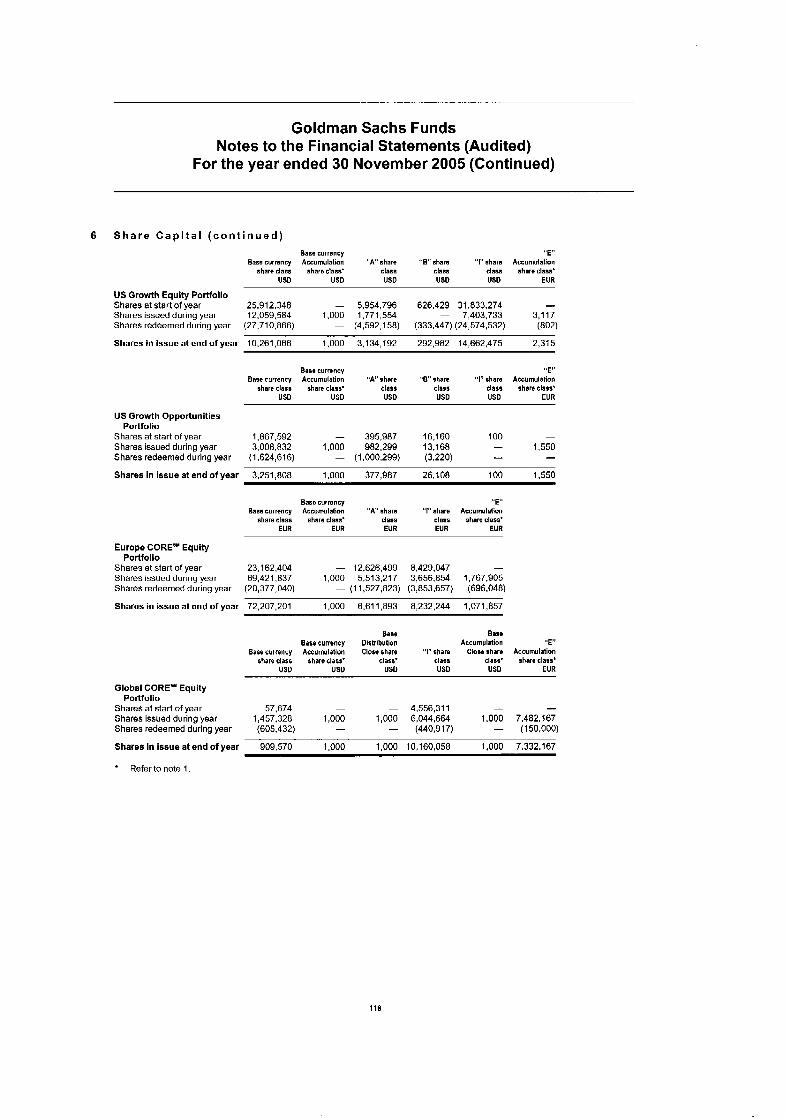
Goldman Sachs Funds Notes to the Financial Statements (Audited)
For the year ended 30 November 2005 (Continued)
6 S h a r e C a p i t a l ( c o n t i n u e d )
Base currnncy "E" Base currancy Accumulation " A sharo "8" sharo "I" sharo Accumulation
share class share class. class class class sharo class' USD US0 USD US0 USD EUR
US Growth Equity Portfolio Shares at start of year 25,912,348 - 5.954.796 626,429 31 333.274 - Shares redeemed during year (27,710,866) - (4,592,158) (333,447) (24,574,532) (802) Shares issued during year 12,059,584 1,000 1,771,554 - 7,403,733 3,117
- Shares In Issue at end of year 10,261,066 1,000 3,134,192 292.982 14,662,475 2,315
Basa currency "E" Base currency Accumulation "A" share " E ahare "I" share Accumulation
share class share class. class class class share class' US0 USD USD US0 US0 EUR
US Growth Opportunities Portfolio
Shares at start of year 1.867.592 - 395.987 16,160 100 - Shares issued during year 3.008.832 1,000 982,299 13,168 - 1,550 Shares redeemed during year (1,624,616) - (1,000,299) (3,220) I - Shares in issue at end of year 3,251,808 1,000 377,987 26,108 100 1,550
Base currency " E ' Bass curroncy Accumulation "A" share "I" share Accumulation
share class share class' class class share class* EUR EUR EUR EUR EUR
Europe CORE'* Equity POrtfOilO
Shares at start of year 23,162,404 - 12,626,499 8,429.047 I
Shares issued during year 69,421,837 1,000 5,513,217 3,656.854 1.767.905 Shares redeemed during year (20,377,040) - (1 1,527,823) (3,853.657) (696.048)
Shares in issue at end of year 72,207,201 1,000 6.61 1,893 8,232,244 1,071,857
Base Basa Ease currency Distribution Accumulation "E"
Esse currency Aecumulatlon Close share "I" share Close share Accumulation share class share class' class+ class class' share class'
US0 US0 USD USD US0 EUR
Global CORE'" Equity Portfolio
Shares at start of year 57,674 - - 4,558,311 - - Shares issued during year 1,457,328 1,000 1,000 6,044,664 1,000 7.482.167 Shares redeemed during year (605,432) - - (440,917) - (150,000)
Shares In issue at end of year 909,570 1,000 1,000 10,160,058 1,000 7.332.167
* Refer to note 1.
118

Goldman Sachs Funds Notes to the Financial Statements (Audited)
For the year ended 30 November 2005 (Continued)
6 S h a r e C a p i t a l ( c o n t i n u e d )
Basa currency Base currency Accumulation
share class shara class' US0
- .~ US0
US CORE'" Equity Portfolio Shares at start of year 55,087,867 - Shares issued during year 51,391,216 1,000 Shares redeemed during year (45,191,188) -
Base Distribution Close share
class' USD
Base Accumulation
Closerhare "A" share " E shara '(1"shai-e class' class class class
USD US0 US0 US0
- 1,000 -
- 10,875,077 134.377 28.698.033 1,000 13,568,691 7.197 15.111,517 - (17.548.609) (34,870) (17,024,389)
Shares in issue at end of year 61,287,895 1,000 1,000 1,000 6,895,159 106,704 26,785,161
"E" Accumulation "U" share
share class. class EUR US0
US CORE" Equity Portfolio Shares at start of year 19,344,600 48,971,158 Shares issued during year 20,169,233 30,870,287 Shares redeemed during year (13,347,935) (11,980.329)
Shares in issue at end of year 26.165.898 67.861.1 16
Base currency "E' Ease currency Accumulation "A" shara " E share Accumulation
share class share class' class class shara class' US0 USD US0 US0 EUR
Global Financial Services
Shares at start of year 1,790.109 -
Shares redeemed during year (1,530,246) -
Portfolio - 167,624 33,706
(38.961) (I 5,863) Shares issued during year 1.542.338 1,000 140,125 1,999 150
-
Shares in Issue at end of year 1.802.201 1,000 268.788 19,842 150
Base curroncy Other Ease currancy Accumulation currency
shara class share class' share class CHF CHF US0
Global Technology Portfolio Shares at start of year 5,414,307 - 16,651,019 Shares issued during year 665,337 1,000 6.959.696 Shares redeemed during year (1,642,167) - (10,535,621)
Other "E" currency "A" share "E" share Accumulation
share chs8 class class share class' GBP US0 US0 EUR
- -
238,736 2,012,762 213,306 37,638 - 327,280 47,770 38.704
(230,035) (1,107,798) (15,801) (25,269)
Shares In issue at end of year 4.437.477 1 .OOO 13,075,094 8.701 1.232.244 245,275 51,073
* Refer to note 1
119
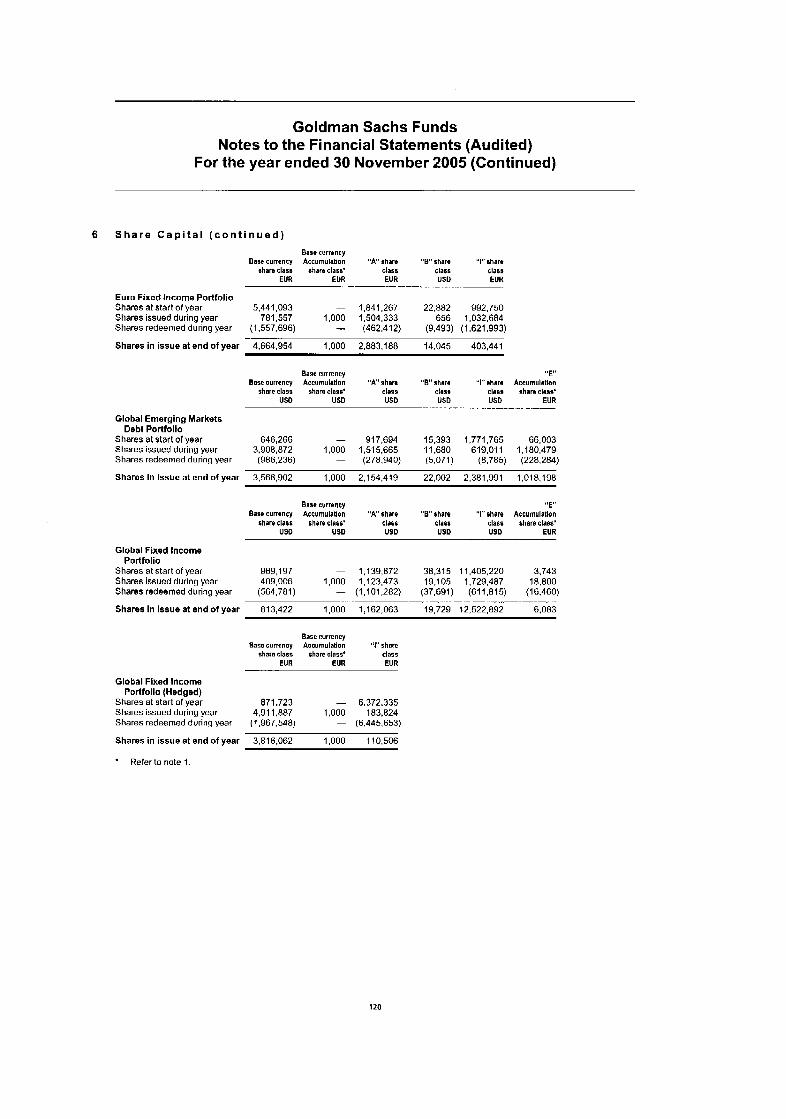
Goldman Sachs Funds Notes to the Financial Statements (Audited)
For the year ended 30 November 2005 (Continued)
6 S h a r e C a p i t a l ( c o n t i n u e d )
Base currency Base currencv Accumulation " A shara " E ' shars "I" shara
share class shara class. class class class EUR EUR EUR USD EUR
. . . .. . . . ...
Euro Fixed Income Portfolio Shares at start of year 5,441,093 - 1.841.267 22.882 992.750 Shares issued during year 781,557 1,000 1,504,333 656 1.032.684 Shares redeemed during year (1,557,696) - (462,412) (9,493) (1.621.993)
Shares in issue at end of year 4,664,954 1,000 2.883.188 14.045 403,441
Base currency Base currency Accumulation " A 3 share
share class share class' class USD US0 US0
Global Emerging Markets Debt Portfolio
Shares at start of year 646,266 - 917,694 Shares issued during year 3308,872 1,000 1,515,665 Shares redeemed during year (986,236) - (278,940)
"E" "E" shara "I" shara Accumulation
class class shara class. USD USD EUR
---- - - -
15,393 1,771,765 66,003 11,680 619,011 1,180,479 (5,071) (8,785) (228,284)
Shares In Issue at end of year 3,568,902 1,000 2,154,419 22,002 2.381.991 1,018,198
Basa currency " E Basa currency Accumulation "A' share "8" share "I" share Accumulatlon
share clasi share class' class class class share class' US0 USD US0 USD USD EUR
Global Fixed Income Portfolio
Shares at start of year 969,197 - 1,139,872 38,315 11,405,220 3,743 Shares issued during year 409,006 1,000 1,123,473 19,105 1.729.487 18,800 Shares redeemed during year (564,781) - (1,101,282) (37,691) (611.815) (16,460)
Shares in issue at end of year 813,422 1,000 1,162,063 19,729 12,522.892 6,083 . ~ __ __. - .
Base currency Base currency Accumulatlon "111 share
sharn class share class' class EUR EUR EUR
Global Flxed Income Portfolio (Hedged)
Shares at start of year 871 -723 - 6372.335 Shares issued during year 4.91 1,887 1.000 183,824 Shares redeemed during year (1,967,548) - (6,445,653)
Shares in issue at end of year 3,816,062 1,000 110,506
* Refer to note I.
120
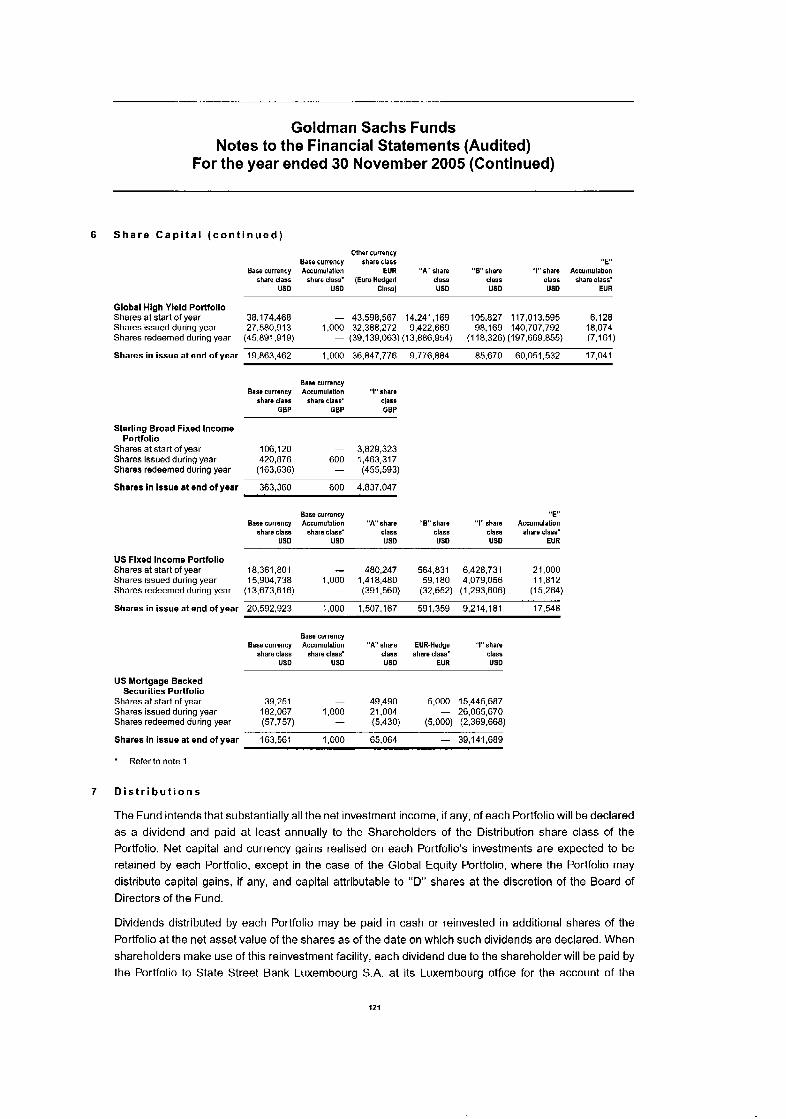
Goldman Sachs Funds Notes to the Financial Statements (Audited)
For the year ended 30 November 2005 (Continued)
6 S h a r e C a p i t a l ( c o n t i n u e d )
Other currency Base currency share class "E,
Base currency Accurnulatlon EUR "A'share " 6 share "I" share Accumulation share elas$ $hare class' (Euro Hedged class class clase share class'
US0 US0 Class) USD USD USD EUR
Global High Yield Portfolio Shares at start of year 38.174.468 - 43,598,567 14,241,169 105.827 117,013,595 6,128 Shares issued during year 27,580,913 1,000 32,388,272 9,422,669 98.169 140,707,792 18,074 Shares redeemed during year (45,891,919) - (39,139,063) (13.886.954) (1 18,326) (197,669,855) (7,161)
Shares in issue at end of year 19.863.462 1,000 36.847.776 9,776,884 85.670 60,051,532 17,041
Basa currancy Base currency Accumulation "111 shara
share class share classf class GBP GBP GBP
Sterling Broad Fixed Income
Shares at start of year 106,120 - 3,829,323 Shares issued during year 420,876 600 1,463,317
Portfolio
Shares redeemed during year (163,636) - (455,593)
Shares in issue at end of year 363,360 600 4,837,047
Rase currency "E" Base currency Accumulation "A" share "0" share "I" share Accumulation
share class share cIa& class class class sham class' US0 USD US0 US0 USD EUR
US Flxed Income Portfolio
Shares issued during year 15,904,738 1,000 1,418,480 59,180 4,079,056 11,812 Shares redeemed during year (13,673,616) - (391,560) (32,652) (1,293,606) (15,264)
Shares at start of year 18,361.801 - 480.247 564.831 6.428.731 21,000
Shares in issue at end of year 20,592,923 1,000 1,507,167 591,359 9.214.181 17.548
Bass currancy Base currency Accumulation "A" share EUR-Hedge "111 share
share class share class. class share class' class USD US0 US0 EUR US0
US Mortgage Backed Securities Portfolio
Shares at start of year 39,251 - 49,490 5,000 15,445,687 Shares issued during year 182,067 1,000 21,004 - 26,065,670 Shares redeemed during year (57,757) - (5,430) (5,000) (2,369,668)
Shares in issue at end of year 163,561 1,000 65,064 - 39,141,689
* Refer to note 1
7 D i s t r i b u t i o n s
The Fund intends that substantially all the net investment income, if any, of each Portfolio will be declared as a dividend and paid at least annually to the Shareholders of the Distribution share class of the Portfolio. Net capital and currency gains realised on each Portfolio's investments are expected to be retained by each Portfolio, except in the case of the Global Equity Portfolio, where the Portfolio may distribute capital gains, if any, and capital attributable to "0" shares at the discretion of the Board of Directors of the Fund.
Dividends distributed by each Portfolio may be paid in cash or reinvested in additional shares of the Portfolio at the net asset value of the shares as of the date on which such dividends are declared. When shareholders make use of this reinvestment facility, each dividend due to the shareholder will be paid by the Portfolio to State Street Bank Luxembourg S.A. at its Luxembourg office for the account of the
121
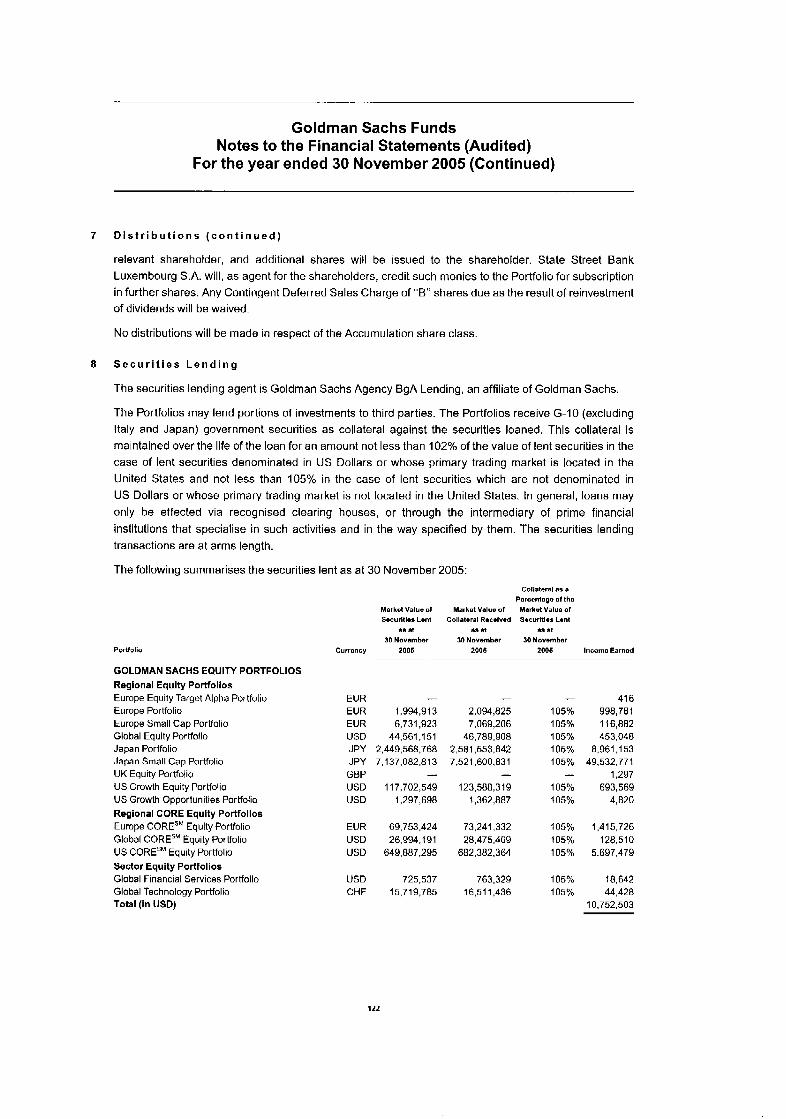
Goldman Sachs Funds Notes to the Financial Statements (Audited)
For the year ended 30 November 2005 (Continued)
D l s t r i b u t i o n s ( c o n t i n u e d )
relevant shareholder, and additional shares will be issued to the shareholder. State Street Bank Luxembourg S.A. will, as agent for the shareholders, credit such monies to the Portfolio for subscription in further shares. Any Contingent Deferred Sales Charge of "B" shares due as the result of reinvestment of dividends will be waived,
No distributions will be made in respect of the Accumulation share class.
S e c u r i t i e s L e n d i n g
The securities lending agent is Goldman Sachs Agency BgA Lending, an affiliate of Goldman Sachs.
The Portfolios may lend portions of investments to third parties. The Portfolios receive G-IO (excluding Italy and Japan) government securities as collateral against the securities loaned. This collateral is maintained over the life of the loan for an amount not less than 102% of the value of lent securities in the case of lent securities denominated in US Dollars or whose primary trading market is located in the United States and not less than 105% in the case of lent securities which are not denominated in US Dollars or whose primary trading market is not located in the United States. In general, loans may only be effected via recognised clearing houses, or through the intermediary of prime financial institutions that specialise in such activities and in the way specified by them. The securities lending transactions are at arms length.
The following summarises the securities lent as at 30 November 2005:
Portfolio
GOLDMAN SACHS EQUITY PORTFOLIOS Regional Equity Portfolios Europe Equity Target Alpha Portfolio Europe Portfolio Europe Small Cap Portfolio Global Equity Portfolio Japan Portfolio Japan Small Cap Portfolio UK Equity Portfolio US Growth Equity Portfolio US Growth Opportunities Portfolio Regional CORE Equlty Portfollos Europe CORESM Equity Portfolio Global CORE''"' Equity Portfolio US CORESM Equity Portfolio Sector Equity Portfolios Global Financial Services Portfolio Global Technology Portfolio Total (in USD)
Collateral as a Percentage of the
Market Value of Market Value of Merkd Value of Sacurltlaa Lent Collataral Racalvad Sacurltlaa Lant
as at ea at as at 30 Novamber 30 Novamber 30 Novamber
Currency 2005 2005 2005 Income Earned
EUR EUR EUR USD JPY JPY GBP USD USD
- 1,994,913 6,731,923
44,561,151 2,449,568,768 7,137,082.813
11 7,702,549 1,297,698
I
- 2,094,825 7,069,206
46,789.908 2,581,553,842 7,521,600,831
123,588,319 1,362,887
I
- 105% 105% 105% 105% 105%
105% 105%
I
41 6 998,781 1 16,882 453.048
8,961 ,I 53 49,532,771
1,297 693,569
4,820
EUR 69,753,424 73,241,332 105% 1,415,726 USD 26,994,191 28.475.409 105% 128.510 USD 649.887.295 682.382364 105% 5,697,479
USD 725.537 763.329 105% 18,642 CHF 15,719,785 16.51 1,436 105% 44,428
10,752,503
122
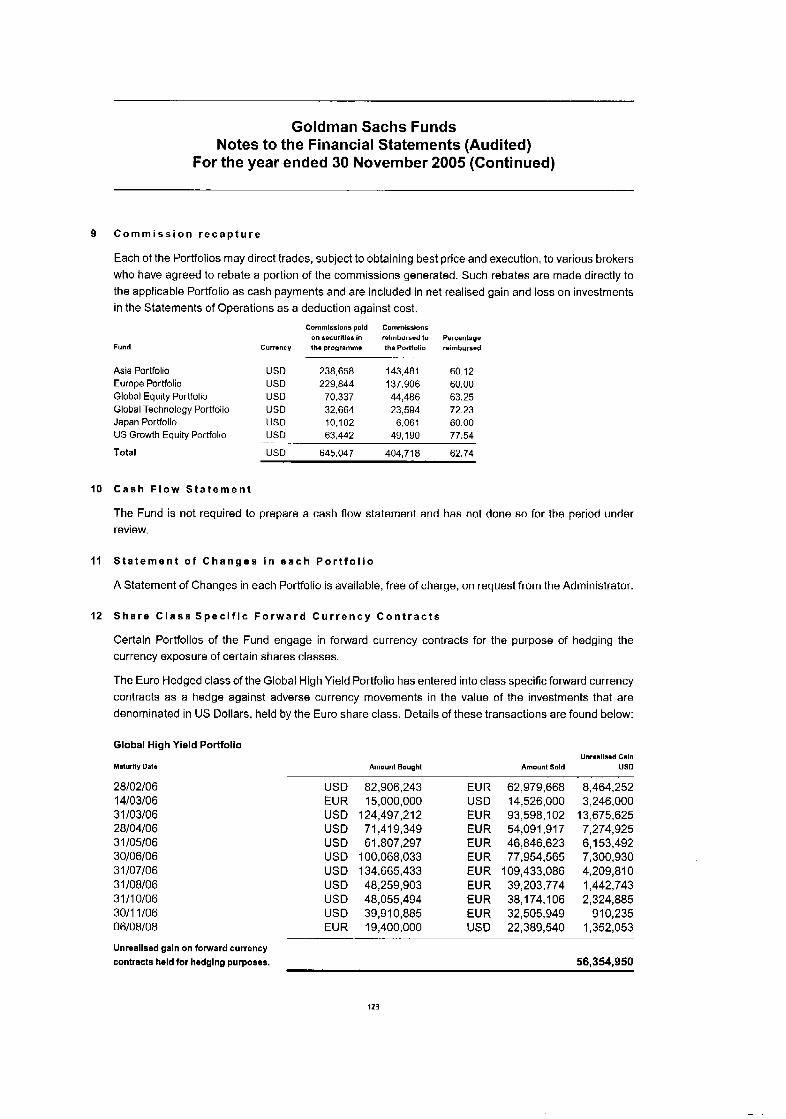
Goldman Sachs Funds Notes to the Financial Statements (Audited)
For the year ended 30 November 2005 (Continued)
9 C o m m i s s i o n r e c a p t u r e
Each of the Portfolios may direct trades, subject to obtaining best price and execution, to various brokers who have agreed to rebate a portion of the commissions generated. Such rebates are made directly to the applicable Portfolio as cash payments and are included in net realised gain and loss on investments in the Statements of Operations as a deduction against cost.
Fund
Cornmlsalona pald Commisslons on aecurltlea In relmbursed to Percentage
Curroncy Iha programma the Potitolio reimbursed
Asia Portfolio USD 238,658 143.481 60.12 Europe Portfolio USD 229.844 137,906 60.00 Global Equity Portfolio USD 70.337 44,486 63.25 Global Technology Portfolio USD 32,664 23,594 72.23 Japan Portfolio USD 10,102 6,061 60 00
USD 63,442 49,190 77.54 US Growth Equity Portfolio
Total USD 645,047 404,718 62.74 -- - .
10 C a s h F l o w S t a t e m e n t
The Fund is not required to prepare a cash flow statement and has not done so for the period under review,
I 1 S t a t e m e n t o f C h a n g e s i n e a c h P o r t f o l i o
A Statement of Changes in each Portfolio is available, free of charge, on request from the Administrator.
12 S h a r e C l a s s S p e c i f i c F o r w a r d C u r r e n c y C o n t r a c t s
Certain Portfolios of the Fund engage in forward currency contracts for the purpose of hedging the currency exposure of certain shares classes.
The Euro Hedged class of the Global High Yield Portfolio has entered into class specific forward currency contracts as a hedge against adverse currency movements in the value of the investments that are denominated in US Dollars, held by the Euro share class. Details of these transactions are found below:
Global High Yield Portfolio
Maturlty Data Amount Bought Unrsalhd Galn
Amount Sold USD
28102106 14103106 31 103106 28104106 31 105106 30/06/06 31 107106 31l08106 31l10106 3011 1 IO6 06108108
USD EUR USD USD USD USD USD USD USD USD EUR
82,906,243 15,000,000
124,497,212 71,419,349 61,807,297
100,068,033 134,665,433 48,259,903
39,910,885 19,400,000
48,055,494
EUR USD EUR EUR EU R EUR EUR EUR EUR EUR USD
62,979,668 14,526,000 93,598,102 54,091,917
77,954.565 109,433,086 39,203,774 38,174,106 32,505,949 22 389,540
46,846,623
8,464,252 3,246,000
13,675,625 7,274,925 6,153,492 7,300,930 4,209,aio 1,442,743 2,324,885
910,235 1,352,053
Unrealised gain on forward currency contracts held for hedging purposes.
123
56.354.950
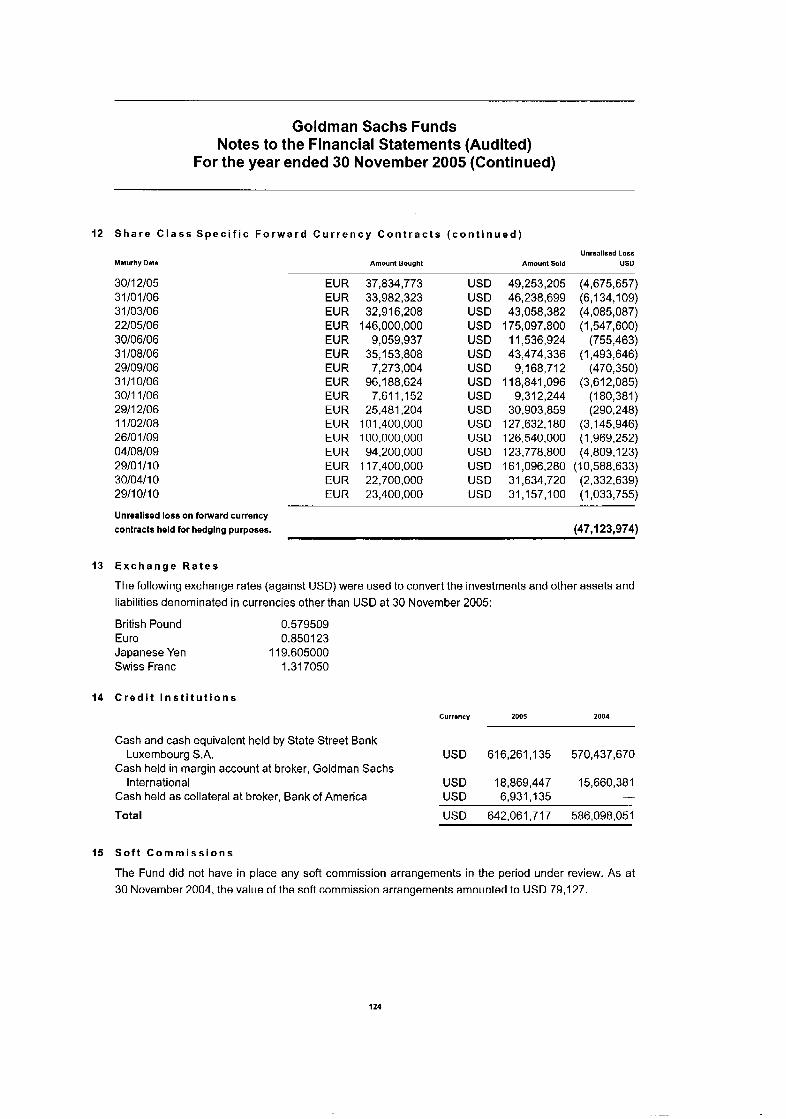
Goldman Sachs Funds Notes to the Financial Statements (Audited)
For the year ended 30 November 2005 (Continued)
12 S h a r e C l a s s S p e c i f i c F o r w a r d C u r r e n c y C o n t r a c t s ( c o n t i n u e d )
Maturlly Dale Amount Bought Unraallsad Loss
Amount Sold US0
3011 2/05 31 10 1 I06 31/03/06 22/05/06 30106106 31 108106 29/09/06 31 I1 0106 3011 1 I06 2911 2/06 1 1/02/08 26/01/09 04/08/09 29/01/10 30/04/10 2911 011 0
EUR EUR EUR EUR EUR EUR EUR EUR EUR EUR EUR EUR EUR EUR EUR EUR
37,834,773 33,982,323 32,916,208
146,000,000 9,059,937
35,153,808 7,273,004
96,188,624 7,611,152
25,481,204 101,400,000 100,000,000 94,200,000
11 7,400,000 22,700,000 23,400,000
USD USD USD USD USD USD USD USD USD USD USD USD USD USD USD USD
49,253,205 (4,675,657) 46,238,699 (6,134,109) 43,058,382 (4,085,087)
175,097,800 ( I ,547,600) I 1,536,924 (755,463) 43,474,336 (1,493,646)
9,168,712 (470,350) 118,841,096 (3,612,085)
9,312,244 ( I 80,381) 30,903,859 (290,248)
127,632,180 (3,145,946) 126,540,000 (1,969,252) 123,778,800 (4,809,123) 161,096,280 (10,588,633) 31,634,720 (2,332,639) 31 ,I 57,100 (1,033,755)
Unrealised loss on forward currency contracts held for hedging purposes. (47,123,974)
13 E x c h a n g e R a t e s
The following exchange rates (against USD) were used to convert the investments and other assets and liabilities denominated in currencies other than USD at 30 November 2005:
British Pound 0.579509 Euro 0.850123 Japanese Yen 1 19.605000 Swiss Franc 1.31 7050
14 C r e d i t I n s t i t u t i o n s
Currency 2005 2004
Cash and cash equivalent held by State Street Bank Luxembourg S.A. USD 616,261,135 570,437,670
Cash held in margin account at broker, Goldman Sachs International USD 18,869,447 15,660,381
Cash held as collateral at broker, Bank of America
Total USD 642,061,717 586,098,051
- .__
USD 6,931,135
15 S o f t C o m m i s s i o n s
The Fund did not have in place any soft commission arrangements in the period under review. As at 30 November 2004, the value of the soft commission arrangements amounted to USD 79,127.
124
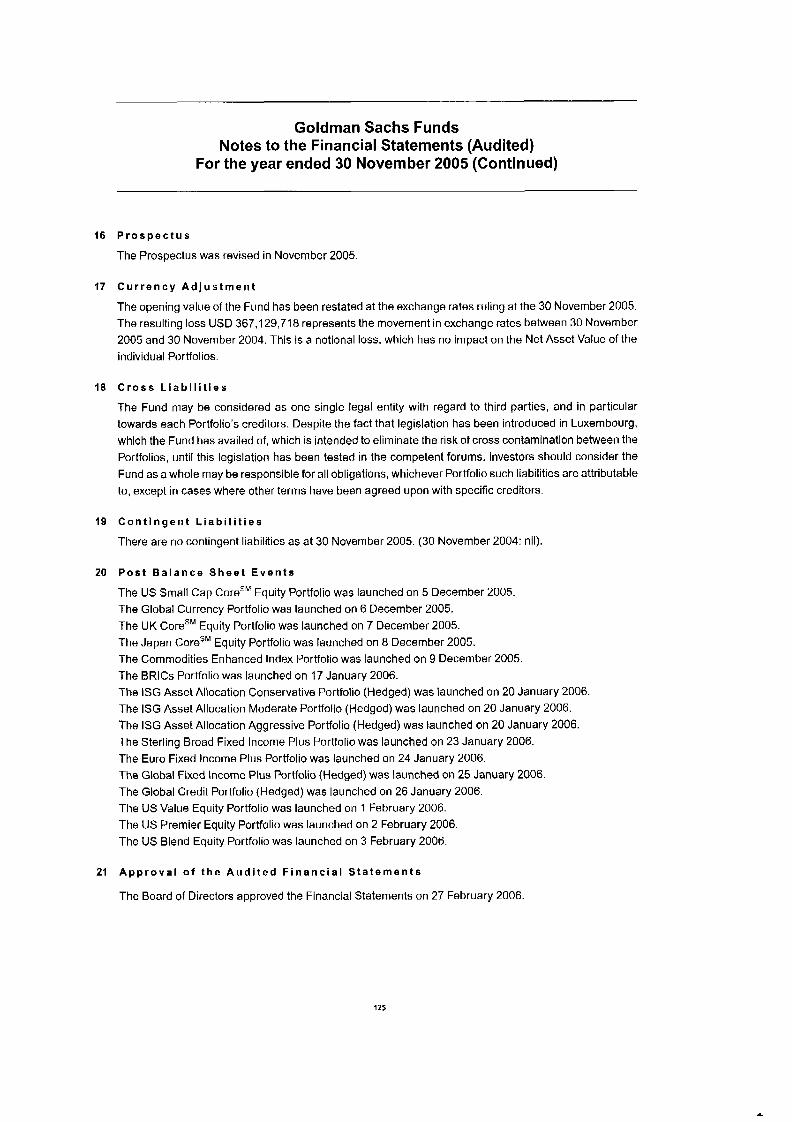
Goldman Sachs Funds Notes to the Financial Statements (Audited)
For the year ended 30 November 2005 (Continued)
16 P r o s p e c t u s
The Prospectus was revised in November 2005.
17 C u r r e n c y A d j u s t m e n t
The opening value of the Fund has been restated at the exchange rates ruling at the 30 November 2005. The resulting loss USD 367,129,718 represents the movement in exchange rates between 30 November 2005 and 30 November 2004. This is a notional loss, which has no impact on the Net Asset Value of the individual Portfolios.
18 C r o s s L i a b l l i t l e s
The Fund may be considered as one single legal entity with regard to third parties, and in particular towards each Portfolio's creditors. Despite the fact that legislation has been introduced in Luxembourg, which the Fund has availed of, which is intended to eliminate the risk of cross contamination between the Portfolios, until this legislation has been tested in the competent forums, investors should consider the Fund as a whole may be responsible for all obligations, whichever Portfolio such liabilities are attributable to, except in cases where other terms have been agreed upon with specific creditors.
19 C o n t i n g e n t L i a b i l i t i e s
There are no contingent liabilities as at 30 November 2005. (30 November 2004: nil).
20 P o s t B a l a n c e S h e e t E v e n t s
The US Small Cap CoreSM Equity Portfolio was launched on 5 December 2005. The Global Currency Portfolio was launched on 6 December 2005. The UK CoreSM Equity Portfolio was launched on 7 December 2005. The Japan CoreSM Equity Portfolio was launched on 8 December 2005. The Commodities Enhanced Index Portfolio was launched on 9 December 2005. The BRlCs Portfolio was launched on 17 January 2006. The ISG Asset Allocation Conservative Portfolio (Hedged) was launched on 20 January 2006. The ISG Asset Allocation Moderate Portfolio (Hedged) was launched on 20 January 2006. The ISG Asset Allocation Aggressive Portfolio (Hedged) was launched on 20 January 2006. The Sterling Broad Fixed Income Plus Portfolio was launched on 23 January 2006. The Euro Fixed Income Plus Portfolio was launched on 24 January 2006. The Global Fixed Income Plus Portfolio (Hedged) was launched on 25 January 2006. The Global Credit Portfolio (Hedged) was launched on 26 January 2006. The US Value Equity Portfolio was launched on 1 February 2006. The US Premier Equity Portfolio was launched on 2 February 2006. The US Blend Equity Portfolio was launched on 3 February 2006.
21 A p p r o v a l o f t h e A u d i t e d F i n a n c i a l S t a t e m e n t s
The Board of Directors approved the Financial Statements on 27 February 2006.
125
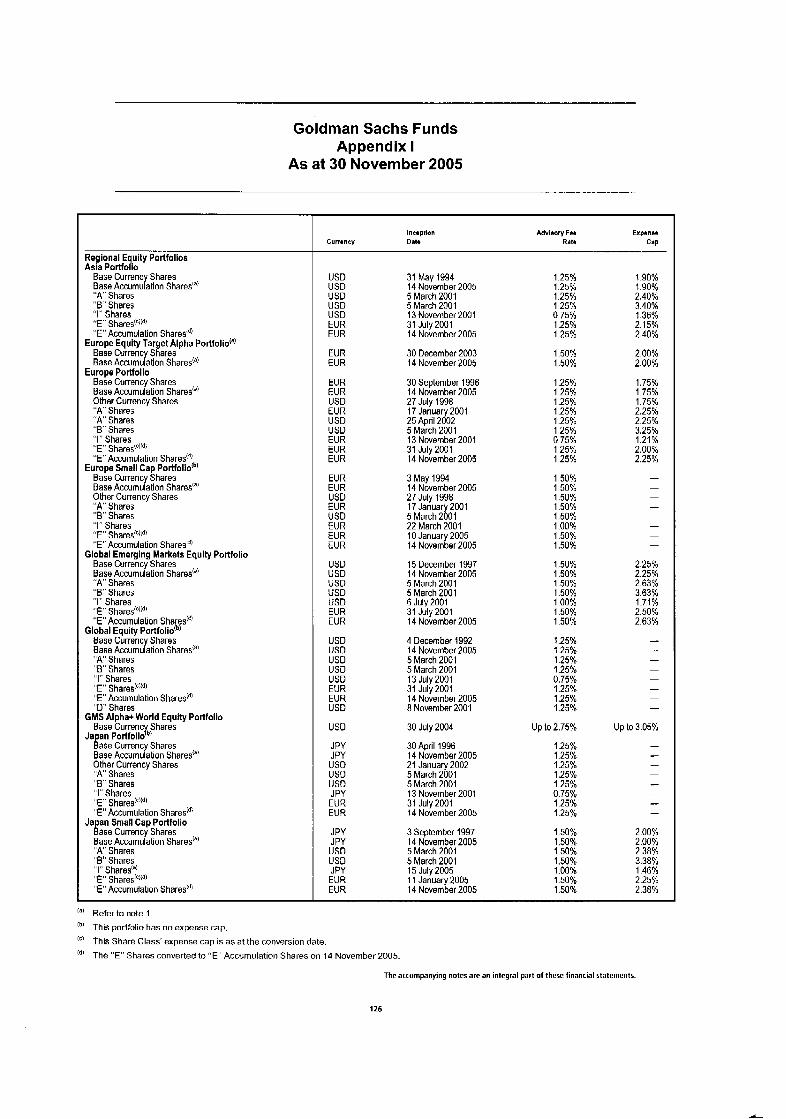
Goldman Sachs Funds Appendix I
As at 30 November 2005
Regional Equity Portfollos Asia Portfolio
Base Currency Shares Base Accumulation Shares'"! "A ' Shares "E' Shares "I" Shares
"E" Accumulation Shares d,
Base Currenc Shares Base Accumuhon Shares!"!
Base Currency Shares Base Accumulation Shares'"' Other Currency Shares "A ' Shares "A ' Shares "E" Shares "I" Shares
"E" Accumulation Shares"! Europe Small Cap Portfoliolb'
Base Currency Shares Base Accumulation Shares'" Other Currency Shares "A ' Shares "B" Shares "I" Shares
"E" Accumulation Shares')
"E" Shares(W#
Europe Equlty Target Alpha Portfoliol"'
Europe Pottfollo
"E" SharesW!'dj
"E" SharejWI
Global Emerging Markets Equlty Portfolio Base Currency Shares Base Accumulation Shares'"' "A ' Shares "B" Shares "I" Shares
"E" Accumulation Shares(<! Global Equity Portfoliolbl
Base Currency Shares Base Accumulation Shares'" " A ' Shares "B" Shares
"E" Shares'W
"I" Shares
"E" Accumulation Sharesmd' "D" Shares
Base Currenc Shares
lase Currenc Shares Base Accumuhon Shares'"' Other Currency Shares " A ' Shares "B Shares "I" Shares "E Shares(c"d) "E Accumulation Sharestd'
"E" Shares(cdd)
GMS Alpha+ World Equlty Portfolio
Ja an PortfoliJb'
Ja an Small Cap Portfolio lase Currency Shares Base Accumulation Shares'"' "A" Shares "B" Shares "I" Shares'"'
"E" Accumulation Shares"" "E" Shares"ltd)
lncrpllon Currancy Dale
Advlaory Fan Expense Rate
USD USD USD USD USD EUR EUR
EUR EUR
EUR EUR USD EUR USD USD EUR EUR EUR
EUR EUR USD EUR USD EUR EUR EUR
USD USD USD USD USD EUR EUR
USD USD US0 USD USD EUR EUR US0
US0
JPY JPY USD USD USD JPY EUR EUR
JPY JPY US0 US0 JPY EUR EUR
31 May 1994 14 November 2005 5 March 2001 5 March 2001 13 November 2001 31 July 2001 14 November 2005
30 December 2003 14 November 2005
30 September 1996 14 November 2005 27 July 1998 17 January2001 25 April 2002 5 March 2001 13 November 2001 31 July2001 14 November 2005
3 May 1994 14 November 2005 27 July 1998 17 Januar 2001 5 March 2101 22 March 2001 10 January 2005 14 November 2005
15 December 1997 14 November 2005 5 March 2001 5 March 2001 6 July 2001 31 July 2001 14 November 2005
4 December 1992 14 November 2005 5 March 2001 5 March 2001 13 Julv2001 31 July 2001 14 November 2005 8 November 2001
30 July 2004
30 April 1996 14 November 2005 21 January 2002 5 March 2001 5 March 2001 13 November 2001 31 July 2001 14 November 2005
3 September 1997 14 November 2005 5 March 2001 5 March 2001 15 July 2005 11 Januar 2005 14 Novernier 2005
1.25% 1.25% 1.25% 1.25% 0 75% 1.25% 1.25%
1.50% 1 SO%
1.25% 1.25% 1.25% 1.25% 1.25% 1.25% 0.75% 1.25% 1.25%
1.50% 1.50% 1.50% 1.50% 1.50% 1.00% 1.50% 1.50%
1.50% 1.50% 1 SO% 1.50% 1 .OO% 1.50% 1.50%
1.25% 1.25% 1.25% 1.25% 0.75%
1.25% 1.25%
1.25%
Up lo 2.75%
1.25% 1.25% 1.25% 1.25% 1.25% 0.75% 1.25% 1.25%
1.50% 1.50% 1.50% 1.50% 1.00% 1.50% 1.50%
1.90% 1.90% 2.40% 3.40% 1.36% 2.15% 2.40%
2.00% 2.00%
1.75% 1.75% 1.75% 2.25% 2.25% 3.25% 1.21% 2.00% 2.25%
- - - - - - - -
2.25% 2.25% 2.63% 3.63% 1.71% 2.50% 2.63%
- I
- - - - - -
Up to 3.05%
- - - - - - I
- 2.00% 2.00% 2.38% 3.38% 1.46% 2.25% 2.38%
la' Refer to note 1 'b' This portfolio has no expense cap. ''I
'dl
This Share Class' expense cap is as at the conversion date. The "E' Shares converted to "E" Accumulation Shares on 14 November 2005.
The accompanying notes are an integral part of these financial statements.
126
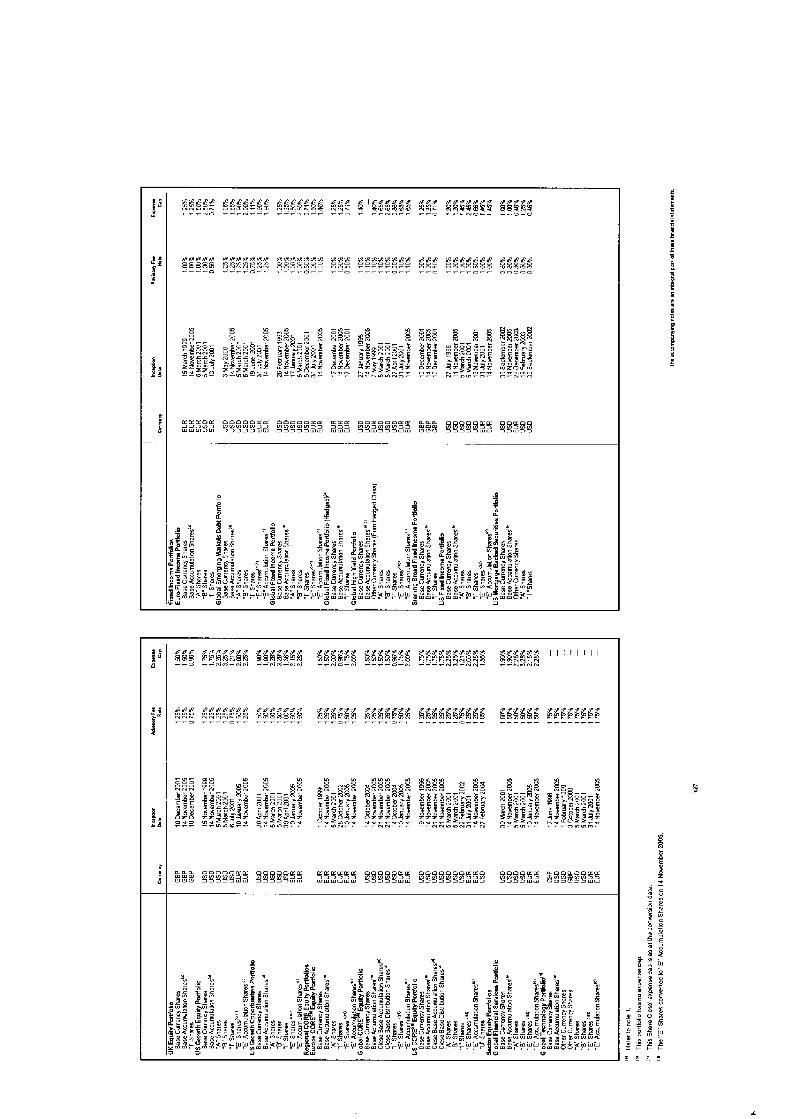
c
PI
Goldman Sachs Funds Additional Information
References to market or composite indices, benchmarks or other measures of relative market petormance over a specified period of time (each, an “index”) are provided for your information only. Reference to an index does not imply that the Portfolio will achieve returns, volatility or other results similar to the index. The composition of the index may not reflect the manner in which a Portfolio is constructed in relation to expected or achieved returns, portfolio guidelines, restrictions, sectors, correlations, concentrations, volatility or tracking error targets, all of which are subject to change over time.
This material is not a product of the Goldman Sachs Global Investment Research Department. Any reference to a specific security listed herein does not constitute a recommendation to buy, sell or hold such securities. Such information pertains to past performance or is the basis for previously made discretionary investment decisions and may not be current. Goldman Sachs Asset Management (GSAM) has no obligation to provide any updates or changes to such information. Accordingly, such information should not be relied upon in whole or in part in making an investment decision and should not be construed as research or investment advice regarding a particular security. The views and opinions expressed herein may differ from the views and opinions expressed by the Global Investment Research Department or other departments or divisions of Goldman Sachs and its affiliates.
There is no assurance that any of the securities discussed herein will remain in any strategy’s Portfolio or that securities sold have not been repurchased. Any securities discussed may represent only a small percentage of a strategy’s Portfolio holdings, and should not be deemed representative of the entire strategy’s Portfolio holdings. It should not be assumed that future Portfolio holdings will be profitable or will equal the performance of the securities mentioned herein. The information should not be deemed representative of actual or future characteristics for the referenced strategy or account.
The securities of emerging markets may be less liquid and more volatile and are subject to a number of additional risks, including but not limited to currency fluctuations and political instability.
High-yield lower-rated securities involve greater price volatility and present greater risks than higher- rated fixed income securities. At times, the Portfolio may be unable to sell certain of its portfolio securities without a substantial drop in price, if at all. The portfolio risk management process includes an effort to monitor and manage risk, but should not be confused with and does not imply low risk.
The currency market affords investors a substantial degree of leverage. This leverage presents the potential for substantial profits but also entails a high degree of risk including the risk that losses may be similarly substantial. Such transactions are considered suitable only for investors who are experienced in transactions of that kind. Currency fluctuations will also affect the value of an investment.
The strategy may include the use of derivatives. Derivatives often involve a high degree of financial risk because a relatively small movement in the price of the underlying security or benchmark may result in a disproportionately largely movement in the price of the derivative and are not suitable for all investors. No representation regarding the suitability of these instruments and strategies for a particular investor is made.
Indices are unmanaged. The figures for the index reflect the reinvestment of dividends but do not reflect the deduction of any fees or expenses which would reduce returns. Investors cannot invest directly in indices.
129

Goldman Sachs Funds Additional Information
No part of this material may, without Goldman Sachs Asset Management’s prior written consent, be i) copied, photocopied or duplicated in any form, by any means, or ii) distributed to any person that is not an employee, officer, director or authorised agent of the recipient.
CORESM IS a registered service mark of Goldman, Sachs & Go.
CopyrightcJ 2006 Goldman, Sachs & Co. All rights reserved.
130