Untitled - Fundsquare
111
-
Upload
khangminh22 -
Category
Documents
-
view
2 -
download
0
Transcript of Untitled - Fundsquare


0 5 AVR. 2001
GOLDMAN SACHS FUNDS . S.I.C.A.V.
Table of Contents
Goldman Sachs Asia Portfolio ............................ . . . . . . . . . . . . . . . . . . . . . . . . . . . . . . . . . . . . . . .
Goldman Sachs Europe Portfolio . . . . . . . . . . . . . . . . . . . . . . . . . . . . . . . . . . . . . . . . . . . . . . . . . . . . . . . . . . . . . . . . . . . . .
Goldman Sachs Europc CORESM Equity Portfolio . . . . . . . . . . . . . . . . . . . . . . . . . . . . . . . . . . . . . . . . . . . . . . . . . . . . . . . .
Goldman Sachs Euro Fixed Income Portfolio . . . . . . . . . . . . . . . . . . . . . . . . . . . . . . . . . . . . . . . . . . . . . . . . . . . . . . . . . . .
Goldman Sachs European Specialist Portfolio . . . . . . . . . . . . . . . . . . . . . . . . . . . . . . . . . . . . . . . . . . . . . . . . . . . . . . . .
Goldman Sachs Glohal Emerging Markets Debt Portfolio . . . . . . . . . .
Goldman Sachs Global Emerging Markcts Equity Portfolio . . . . . . . . . . . . . . . . . . . . . . . . . . . . . . . . . . . . . . . . . . . . . . . .
Goldman Sachs Global Equity Portfolio . . . . . . . . . . . . . . . . . . . . . . . . . . . . . . . . . . . . . . . . . . . . . . . . . . . . . . . . . . . . . . .
Goldman Sachs Global Fixed Income Portfolio . . . . . . . . . . . . . . . . . . . . . . . . . . . . . . . . . . . . . . . . . . . . . . . . . . . . . . . . .
Goldman Sachs Glohal High Yield Portfolio . . . . . . . . . . . . . . . . . . . . . . . . . . . . . . . . . . . . . . . . . . . . .
Goldman Sachs Internet TollkeeperSM Portfolio ......................... .............................
Goldman Sachs Japan Portfolio . . . . . . . . . . . . . . . . . . . . . . . . . . . . . . . . . . . . . . . . .
Goldman Sachs Japan Small cap Portfolio . . . . . . . . . . . . . . . . . . . . . . . . . . . . .
Coldman Sachs Technology Portfolio . . . . . . . . . . . . . . . . . . . . . . . . . . . . . . . . .
Goldman Sachs US CORE”‘ Equity Portfolio ...........................
Goldman Sachs US Fixed Income Portfolio . . . . . . . . . . . . . . . . .
Coldman Sachs US Growth Equitv Portfolio .........................
Financial Statemcnts .............................
. . . . . . . . . . . . . . . .
. . . . . . . . . . . . . . . . . .
. . . . . . . . . . . . . . . . . . . . . . . . . . . . .
. . . . . . . . . . . . . . . . . . . . . . . . . . . . . . . . . . . . . . . . . . .
Statistical Information . . . . . . . . . . . . . . . . . . . . . . . . . . . . . . . . . . . . . . . . . . . . . . . . . . . . . . . . . . . .
Notes to Financial Statements . . . . . . . . . . . . . . . . . . . . . . . . . . . . .
Auditor’s Report . . . . . . . . . . . . . . . . . . . . . . . . . . . . . . . . . . . . . . . . . . . . . . . . . . . . . . . . . . . . . . . . . . .
1
5
9
15
18
22
25
33
40
45
55
58
62
66
70
76
82
Xb
92
Y4
107
Additional Notes . . . . . . . . . . . . . . . . . . . . . . . . . . . . . . . . . . . . . . . . . . . . . . . . . . . . . . . . . . . . . . . . . . . . . . . . . . . . . . . . . 108
. . .

G O L D M A N SACHS ASIA PORTFOLIO
Letter to Shareholders 30 November 2000
Dear Shareholders:
On behalf of Goldman Sachs, we welcome the opportunity to review thc performancc of the Goldman Sachs Asia Portfolio for the one-year period that cnded 30 November 2000.
Market Review
After generating strong performance early in the reporting period. Asian stocks as a whole have fallen sharply through Novcmber 2000. At the rcgional levcl, rising global interest rates had the largest ncgative impact, with thc banking and property sectors throughout thc region taking the brunt of the dccline. Individual countries were also hurt by spccific events. The lndonesian market suffercd under continued conflict and thc eventual disintegration of East Timor, and Korea fell sharply, as no progrcss was made on the corporate restructuring front. In addition, volatilc relations between Taiwan and China, and weak performance in semiconductor stocks, weighed hcavily on the Taiwanese market.
Portfolio Positioning
The Portfolio reduccd its exposure to thc volatile technology sector in the second and third quarters, as fundamentals in tho scmiconductor industry continued to deteriorate. The exposure to encrgy, banking and utility sectors was increased. In the third quarter, as it becamc increasingly probablc that US interest rates would not be increascd and may well he decreased in early 2001, we incrcased our exposure to property stocks in Hong Kong and Singapore. Overall, we increascd our emphasis on dividend payment and dividend growth prospects as key evaluation critcria for stocks.
Looking ahcad, we continue to belicve that looser monetary policy in the US will be a key catalyst for many sectors in Asia. Valuations in Asia arc significantly lower than in the US, European and Japancse markets, and while a modest slowdown in economic growth is expected, growth in the region is likely to be higher than in thc US, Europe o r Japan.
Performance Review
Ovcr the onc-year period ended 30 November 2000, the Portfolio’s cumulative total return was -19.64 %. This compared to the -31.03 % return for the Portfolio’s benchmark, the Morgan Stanley Capital International Asia Free cx Japan Index (without income reinvcsted and, in contrast to the Portfolio, without the dcduction of any expenses). (For more information on thc performance of the Portfolio and a description of its bcnchmark, refer to page 108. Portfolio returns are shown nct of management fecs with income reinvestcd using month-end NAVs.)
The portfolio’s rclative outperformance versus the benchmark was largely attributable to successful stock selection. Our overweight positions in thc energy, banking and utility sectors, and in selective Consumer stocks, workcd in our favour, as did our relative underweighting of Technology stocks.
Wc thank you for your support in what has bcen a challenging period for the Asian markcts and we look forward to reporting to you in the futurc.
Goldman Sachs Asia Portfolio Managcmcnt Team
Singaporc, 15 Deccmber 2000
1
,

GOLDMAN SACHS ASIA PORTFOLIO
Statement of Investments 30 November 2000
Value %of Value %of U5D Net Asset5 Shares Description U D NetAssets Shares Oescrlption
Common Stocks - 91.1% Hong Kong I China India
Common Stocks - (continued)
982,500
2,892,000
74,000
564,000
3,660.000
3,006,000
188,000
366,600
152,000
1,936,000
161,000
285,000
383.300
702,500
462,000
202,300
139.000
18,773,000
387.00n
347.000
355,500
350,000
2,009,000
Amoy Properties Ltd. (Real Estate) Beijing North Star Co. (Rcal Estate) Cheung Kong Iloldings Ltd. (Real Estate) China Mobile (Telecommunications) China Overseas Land & Tnvcstment Ltd. (Rcal Estate) China Kesuurccs Beijing Land Ltd. (Real Estatc) CLP Holdings Ltd. (Electric) Dah Sing Financial Group (Banks) Dao Heng Bank Group (Hanks) Giordano International Ltd. (Rctail) Great Eagle Holdings J.td. (Lodging) Cruangdong Kclon Electrical Holdings Co., Ltd. (Household Appliances) Hang Seng Rank Ltd. (Banks) Hongkong Elcctric Holdings Ltd. (Electric) Hongkong Land Holdings Ltd.-ADR (4 (Real Estate) Hutchison Whampoa (Holding Companics- Diversified) Li & Fung Ltd. (Distribution/Wholesale) PetroChina Co., Ltd. (Oil & Gas Producers) South China Morning Post (Media) Sun Hung Kai Propertics Ltd. (Real Estate) Swire Pacific Ltd. (Holding Companics -Diversified) TCL lntemalional IIoldings Ltd. (Elcctronics) Yanzhou Coal Mining Co., Ltd. “ H (Mining Services)
869,151
270,667
832,516
2,522,305
398,854
608.920
874,940
1,617.131
740,527
949.403
236,344
52,616
4,459,634
2,422,77 1
951.720
2.418,569
290,480
3,225,167
255,524
2,691,526
2,274,332
78,976
509,987
29,547,060
1.0
0.3
0.9
2.9
0.4
0.7
1.0
1 .8
0.8
1.1
0.3
0.1
5.1
2.7
1.1
2.7
0.3
3.7
0.3
3.0
2.6
0.1
0.6
33.5
64,479 Rharat Petroleum Corp., Ltd. (Oil & Gas Producers)
430 Glaxo India Ltd. (Pharmaceuticals)
200 HCL Tcchnologics Ltd. (Software)
300 HCL Technologies IAd. -Demat (Software)
(Consumer Goods)
Demat (Consumer Goods)
5,900 Hindustan Lcver Ltd.
483,690 Hindustan Lever Ltd.-
303,245 Hindustan Petroleum Corp. (Oil & Gas Producers)
570 1TC Ltd. (Tobacco) 129,945 ITC Ltd.-Demat
(Tobacco) 65,500 Mahanagar Telephone
Nigam Ltd. (Tclccommunications)
176,125 Nestle India Ltd.- Demat (Food)
5 Satyam Computer Serviccs Ltd.- Demat (Softwarc)
118,100 Slate Bank of India Ltd.-Demat (Banks)
313,770 Videsh Sanchar Nigam Ltd.-Dcmat (Telecommunications)
298,379
4,222
2,557
3,835
24,650
1,990.5 1 I
823,325 9,906
2,258,297
230.054
2,03 1,922
36
457,779
1,949,259
10,084,732
0.3
0.0
0.0
0.0
0.0
2.3
0.9 0.0
2.6
0.3
2.3
0.0
0.5
2.2
11.4 ~ ~
Indonesia 215.100 Gulf Indonesia Resources
Ltd.-ADR (3)
(Oil & Gas Producers) 1,922,456 2.2
Sampocrna (Tobacco) 238,585 0.3
(Tobacco) 675,220 0.8
Indonesia (Telecommunications) 266,059 0.3
72,500 Kamayana Lestari (Retail) 37,428 0.0
3,139,748 3.6
162.000 Hanjaya Mandala
488,000 PT Gudang Garam TRK
1,036,000 PT Telekomunikasi
Korea 84,950 Hana Bank (Banks) 437,255 0.5 16,080 Hite Rrewcry Co., Ltd.
(Beveragcs) 503,224 0.6 49,808 Housing & Commercial
Bank (Banks) 1,066.509 1.2 24,033 Kookmin Bank (Banks) 268,188 0.3
(Telecommunications) 372,082 0.4 7,530 Korea Telecom Corp.
2 The accompanying notes are an integral part of these financial statements.

G O L D M A N S A C H S A S I A P O R T F O L I O
Statement of Investments
Singapore
17.3.000 ('it? Lkvclopmcnls I Id 7xs.004
2.30~1..:5(J
7 7 0 3 5 0
Kh4.273
5 10.370
::.2 IO, io0
i).; 0.3
The accompanying notes are an integral pan of these financial statements. 3

G O L D M A N S A C H S ASIA PORTFOLIO
Statement of Investments
Principal Value 96 of Amount Dercriplion USD Net Assets
Short Term Investments - 5.5% United States
4.S7O.I)i)(l S~:ltr Stri.ct Danh b.ill'i.
.. - . .
d l l C i l l ; ' l : ? Y l o 4,s70.000 5.5 _-
TOTAL SHORT TERM
I N V E S T M E N T S
( c o s t USD 4,879,000) 1.S7O.Oi)O 5.? . ..
TOTAL I N V E S T M E N T S
( c o s t USD 30,124,475) s5. 137.7s.3 Wf>
, \ I 1 sccuril! holdings ot t h i h pi r t l l i l io :ire ~ r : ~ ~ i s l i ~ r ~ ~ l ~ l i ~ wciiri- tics dcalt (in i\ r cy la1 i~d maikct.
i ' r l S L ~ I I ~ I I ~ . /iolr/iil,y i~ ~ r o d ~ ~ ~ l ' / i ~ ~ l ~ l 111 l.',V)
4 The accompanying notes are an integral part of these financial statements.

GOLDMAN SACHS EUROPE PORTFOLIO
Letter to Shareholders
T h e mirkrts rernaiiicd liighl!! vohlile, cornpoundcd by th in trdirig volumes ; ind Illling liquidity Icvcls. The 'l'bl'l'
sector rallied in (he simmcr. o n l y to tlcclinr sharply ag:iin i i i the l.iill. ;is earnings forecasts Cor rnany high growth cumpii i i ics wci-c I-rducecl. Investors continued LO rotale from iicw economy sectors tuw;ii-ds [he safer havciis of oil,
ph ;i irm ;ice Li t i c;i I s ; i ~ i d tit cs. Tow;irtls the enel of the repoi-ting period. cyclicals (chemicals atid ccrt;iin basic
industry stocks) performLd \trongly, iis inveslors searched for v;iI tie oulsiclc tccli-rcl;itcd seclors.
'l'lic pcrforiii:incc ol. h e euro \vas w ~ i k ovcr the period. 'Ihc ci i ru fell sharply vcrsus tlic U S doll i ir (-15.7'T) during the period. iis investors \vert atlructcrl to tlic higher growth r:itcs i n the US. C.'oordinatctl cflorls Lo support the currency 11x1 iici s~icccss. ;IS marly oC the world's ccnliwl hariks failed to 1i;ivc ;i maijor impact u11 the euro.
Portfolio Positioning
Over the pci-iod the I'ortfolio h;is had ;in emphasis 011 'long durulion' asscts, typic;illy with viriiblc growlh prospects, cndui-iiig Crarichiscs and strong iwlalivrl pricing power. As oC 30 Novcmhcr 2000. It i t . I'ortfol io w;is
(wr\vcight in I~iii~i~ici~ils, 'lklccum Sei-vices. Materials. Cunsriincr Staples anel Infc)rm;ition 'l'echnology, ;ind was
unclcr\vciglit ii i the ('onsumrr Discretionary, Induslrials iiiicl Hcalthc;irc.
Performance Review
(3vci- the onc-.ye;ir zncled 30 Nnvcmhcr 2000, [he I'orlfolio's cuiiiu1:itive ~ o t a l rt'lurn was 15.00~%. This cornpared to thc
H.S3 irctiirii h i - (he l'ortfolio's bcnchimrk, the Morgan Stiinlcy C'apilal Iriternation;il r:ilrope lridex (with incoiiic rcinvcstcd ;ind. in contrast to the Portfolio- withoul the deduction ol any ~.xpc~iscs . Pi-ior lo 31 Deccrnbcr IOW the
Poi-tfolio's henclimark was the PT-,\ctuaries Europe Indcu.) (For more informiition o n lhr perhm;ii iuc of the
Portli)lio and ;I clescription of its hcnchniark. refer to lxigc IOX. Portli)lio returns ;ire shown n e l of miitiiigctiiciil k e s
with income rririvcstcd iisi ng iiioiilh-end NAVs.)
We t o o k ;rdvant;igc 01 lhe strong initial pcri.oriii;ince o f 'I'MT stocks ;ind tienefitcd froni ;i well-limed rcductiun in esposurc to the i i cw economy sectors. The proceeds were then used t o purchase 'dcfcnsivc' compariics. with relatively visiblc ciirnings pi-ospects. O u r undci-weightirig of ccotiotiiic sensitive stocks. whose earnings have bccn con i 11 11 ;I I1 y dow iig r;i dc d, h ;is t iec 11 posit i vc. I? T ;i m p I es o C top pc rfo r in i iig stocks w 11 ic h co 11 t r i b Li lr cl to I11 c
Porllolio's r)utl)~rf~7riiiaticc were 'l'elrcorii Equipiiicnt 1.ii-m Ni ik iu (3.1 ol. lhe portfolio) :in(] f-in;incial conglomcralc ING Cir(>Iil.' (2.1 '); 01. the por t f to l io ) . Positive prrforrnxicc wiis ;ilso gericratcd i n the Inlormaliorl
Technology. 1:iriaricials a ~ i d C'onsumci- seclors.
5
G O L D M A N SACHS EUROPE PORTFOLIO
Letter to Shareholders
Wc thntih yoti Cor your invcstiiicnt and look ftorwarcl io yoiii- conliniicd confidciicc.
6
.. . . . .

GOLDMAN SACHS EUROPE PORTFOLIO
Statement of Investments 30 November 2000
Value % o f Value %of Shares Description EUR Net Assets Shares Description EUR NetAssets
Common Stocks - 93.7% British Pound Sterling Danish Krone
Common Stocks - (continued)
104,508
62,790
151,146
590,272
267,686
61,343
345,494
24,361
139,309 341,974 129,721
275,512
256,828
563,555
266,008
78,324
140,677
277,252
68,040
46,923
99,464
201,288
386,526
629,302 6 11,749
2,813,624
83,291
112
Amvescap PIC. (Diversificd
AstraZeneca Group PIC (Pharmaccuticals) 3,614,794 1.4 BAE Systcms PIC. (Aerospace/DeFense) 901,659 0.4 UP Amoco PIC. (Oil & Gas Producers) 5,502,720 2.2 British American Tobacco (Tobacco) 2,186.813 0.9 British Sky Broadcasting
Financial Services) 1,961,339 0.8
PIC. (Media) British Telecom PIC. (Telecommunications) Cable & Wireless PIC. (Telccomm unications) CGNU PIC. (Insurance) Diageo PIC. (Beverages) Glaxo Wellcome PIC. (Pharmaceuticals) HSUC Holdings PIC. (Banks) Imperial Chcmical Industries Pic. (Chemicals) lnvensys PIC. (Miscellaneous Manufacturing) Iloyds TSB Group PIC. (Banks) Marconi PIC. (Telecommunications Equipmcnt) National Grid Group PIC. (Elcctric) P&O Princcss Cruises PIC. (Leisure) Reckitt Benckiser PIC. (Houschold ProductsNares) Rcuters Group PIC. (Media) Royal Bank of Scotland Group Plc. (Banks) Scottish & Southern Energy PIC. (Electric) SniithKline Beccham PIC. (Pharmaceuticals) Tesco PIC. (Food) Unilever PIC. (Food) Vodafone Group PIC. (Telecommunications) WPP Group PIC. (Advertising)
973,166
3,418,584
344,238 2,394,596 4,095,462
4318,489
4,208,601
1,995,200
1,541,533
2,986,659
853,459
1,414,975
1,138,148
987,605
782,774
2,357,136
1,123,381
S,84Y,089 2,881,825 5.790,482
11,124,563
1,050,275
0.4
1.4
0.1 1.0 1.6
1.7
1.7
0.8
0.6
1.2
0.3
0.6
0.5
0.4
0.3
0.9
0.9
2.3 1.2 2.3
4.4
0.4
7,577 Group 4 FalckNS (Commercial Services) 1,107,606 0.4
Euro 48,940 Acerinox SA (Iron/Stcel) 1,454,007 0.6 21,501 Air Liquide (Chcmicals) 3,227,300 1.3 53,097 Alcatel SA
(Telecommunications Equipment) 3.053,078 1.2
7.013 Allianz AG (Insurance) 2,833,252 1.1 45,827 Alstom (Machinery-
Diversified) 26,050 Altadis SA (Tobacco) 60,861 ASM Lithography
Holding NV (Computers) 18.562 Avvcntis SA
(Pharmaceuticals) 20,278 AXA (Insurancc)
487,163 Banca Nazionalc del Lavoro SpA (Banks)
137,461 Banco Santander Ccntral Hispano SA (Banks)
154,051 Bank of Ireland (Banks) 15,660 BNP Paribas SA (Banks) 2,191 Cap Gemini SA
(Computcrs) 33,976 Carrefour SA (Food) 20,284 DaimlerChrysler AG
(Auto Manufacturers) 51,143 Deutsche Bank AG
(Banks) 70,176 Deutschc Telekom AG
(Telcphonc) 46,408 E.On AG (Electric)
378,400 Electricidade de Portugal SA (Elcctric)
212,000 EN1 Sph (Oil & Gas Producers)
4,386 Equant NV (Computcrs) 25,427 Fortis (NL) NV
(Divcrsified Financial Services)
28.506 France Telecom SA (Telephone)
72,320 Havas Advertising SA (Advertising)
63.263 TNG Froep NV (Insurance)
9,452 Intershop Communications AG (Internet)
109,152 Koninklijke (Royal) KPN NV (Telecommunications)
1,231,372 440,245
1,448,492
1,701,207 3,268,814
1,734,300
1,413,099 1,446,985 1,388,259
352,532 973,428
920,691
4.280,669
2,589,494 3,082,883
1.278,992
1,526,400 151,755
859,433
2.723.748
1,084,800
5,272,971
312,861
1,682,032
0.5 0.2
0.6
0.7 1.3
0.7
0.h 0.h 0.6
0.1 0.4
0.4
1.7
1.0 1.2
0.5
0.6 0.1
0.3
1.1
0.4
2.1
0.1
0.7 - Zurich Financial Services 12,467 L‘Orial SA
(Insurance) 69,728 0.0 (Cosmetics/Personal Care) 1,132,627 0 3
76,867,293 30.7
The accompanying notes are an integral part of these financial statements. 7

GOLDMAN SACHS EUROPE PORTFOLIO
Statement of Investments 30 November 2000
Shares Description Value %of
EUR Net Assets Shares Description Value %of EUR Net Assets
~~~~~~~~~
Common Stocks - (continued) Euro - (continued)
29,842 Lafarge SA
13.929 Louis Vuitton Moet (Building MatCriak) 2,572,380
IIennesy (LVMH) (Beverages) 1,055,122
6,217 Miinchcner Riickversicherungs- gesellschaft AG (Insurance) 2,362,460
165,307 Nokia (AB) OY (‘Telccommunications Equipment) 7,843.81 7
(Electronics) 3.762,979
(Oil k Gas Producers) 1,444,913
Co. (Oil & Gas Producers) 7,026,816
(Banks) 3.142,W
(Software) 2,787,452
(Miscellaneous Manufacturing) 1,485,916
(Telecommunications) 549,362
SA (Water) 2,025.423
(Telecommunicalions) 1.218,280
(Telcphonc) 2,607.963
(Telephone) 3,639,603
(Oil & Gas Scrviccs) 4,766,181
(Banks) 2.591,610
Communications NV (Telecommunicalions) 1,349,944
32,518 Vivendi (Commercial Services) 2,320,159
28,412 Vivendi Environncment (Environmental Control) 1,341,046
42,266 VNU NV (Media) 2,121,753
110.880,957
98,122 Philips Electronics NV
77.062 Repsol-YPF S A
100,960 Royal Dutch Petroleum
176,124 San Paolo-lM1 SpA
18,584 SAP AG-Preferrcd
11.206 Siemens AG
25,085 Sonera Oyj
10,318 Suez Lyonnaise des Eaux
133,000 Tdecom Italia Mobile SpA
191,762 Telecom Ttalia SPA
200.972 Telefonica SA
28,921 Tutal Fina SA
451,500 Unicredito ltaliano SpA
104,082 United Pan-Europe
1.0
0.4
J .(I
3.1
1,s
0.6
2.8
1.3
1.1
0.6
0.2
0.8
0.5
1 .0
1.5
1.3
I .0
0.5
0.9
0.5 0.9
Common Stocks - (continued) Swedish Krona -(continued)
106.269 Securitas AB (Commercial Services)
172,675 Skandia Forsakrinp AB (Insurance)
417,264 Tclefrmaktiebolagct LM Ericscon “ B (Telccommunications Equipment)
1,991,795 0.8
3,008,102 1.2
5,421,753 2.2
Swiss Franc 19.11 1 ARB Ltd. (Engineering
& Construction) 1,214 Adecco SA (Commercial
Services) 9.238 Credit Suisse Group
(Banks) 2,321 Ncstl6 SA (Food) 2,589 Novartis AG
(Pharmaceuticals) 415 Roche Holding
AG- Preferred (Pharmaccuticak)
1.21 8 Schweizerische Riickversicherungs- gescllschaft (Insurance)
(Chemicals) J ,502 Syngenta AG
19,218 URSAG (Banks) 2,869 Zurich Financial
Services AG (Insurance)
16,73.5,002 6.7
2,010,281 0.8
872,552 0.4
1,857,653 0.8 S.833303 2.3
4.831.606 1.9
4,764.730 1 .9
3,141,190 1.3
77,054 0.0 3,102,452 1.2
1.799.312 0.7
28,290,133 11.3
United States Dollar 15,000 Scagram Co., Ltd. (Media) 856,599 0.3
T O T A L COMMON STOCKS
( c o s t EUR 2 4 2 , 0 4 5 , 2 2 9 ) 234,737.590 93.7
Principal Value %of Amount Description EUR Net Assets
Short Term Investments - 6.2% Euro 15,476,914 State Strcet Bank 4.701,
due 01/12/00 15,476,914 6.2
44.3
Swedish Krona 167,9Y2 Investor AB (Investment
307,256 Nordbankcn Holding AB Companies) 2,588,474 1 .0
(Banks) 2,526,136 1.0
(Hand/Machine rook) 1,198,742 0.5 47,821 Sandvik AB
T O T A L S H O R T T E R M
I N V E S T M E N T S
(cost EUR 1 5 , 4 7 6 . 9 1 4 ) 15,476,914 6.2
T O T A L IN V E STM EN T S
(cost EUR 2 5 7 , 5 2 2 , 1 4 3 ) 250,214.504 99.9
All security holdings of this portfolio are transferable securi- ties deal1 on a regulated market.
8 The accompanying notes are an integral part of these financial statements.

GOLDMAN SACHS EUROPE COREsM EQUITY PORTFOLIO”
Letter to Shareholders 30 November 2000
Dear Shareholders:
On behalf of Goldman Sachs, we welcome the opportunity to rcvicw the performance of the Goldman Sachs Europe COREsM Equity Portfolio lor thc one-year period that ended 30 November 2000.
Market Review
Early in the reporting period, European equitics generated solid results. However, as was the case in thc US, the rally was very narrow, with the tcchnolngy. media and telccom (‘TMT) scctors moving sharply forward. This strong performance overshadowed the poor results in virtually all other areas of the market. Then, in March, a sharp correction in thc TMT sector occurred, dragging down much of the market. As the period progressed, concern over thc direction of interest rates: the prospccts for ’new economy’ stocks and the falling euro undermined investor confidence. European markets were also unsettled by several intercst rate hikes by the Europcan Central Bank (ECB). Extreme volatility continued to characterizc the market, compounded by thin trading volumes. However, the market had several mini-rebounds, helping to bolster the returns of many European markcts.
It is also important to note that the perfotmancc of the euro currency has been weak. Thc euro fell sharply versus the US dollar during much of the period under review, as investors were drawn to the higher growth rates in the US. Coordinated efflorts to support the currency by Euroland finance ministcrs and many of the world’s central banks failed to make a major impact.
Portfolio Positioning
The Portfolio focuses on adding valuc from both country allocation and stock selection. Proprietary quantitative models arc applied to assess the comparative investment characteristics of countries, and within countries, of equities. In general, stocks with strong momentum that are undervalued are favoured. In addition, the investment process prekrs stocks with stable prices and earnings over their morc-volatile countcrparts. The investment proccss is also conscious of the Portfolio’s risk profile, so that Portfolio style characteristics are closcly monitored relative to benchmark characteristics.
Performance Review
Over the onc-year ended 30 November 2000, the Portfolio’s cumulative total return was 7.17%. This compared to the 9.58 % return for the Portfolio’s bcnchmark, thc Morgan Stanley Capital International Europe Index (with income reinvested and, in contrast to the Portfolio, without the deduction of any expenses). (For more information on the performance of the Portfolio and a description of its benchmark, refer to pagc 108. Portfolio returns are shown ne1 of management fecs with incomc reinvested using month-end NAVs.)
Country allocation worked in our favour during the period. Our overweights in Belgium and Norway ovcrcame the weakcr performance from our positions in Denmark and Spain. Results from stock selection were positive across many countries. However, poor selection in Germany and Switzerland worked against us, resulting in overall ncgative returns for the period. Underwcights in the Informalion Tcchnology and Hcalthcare sectors also detractcd from Portfolio rcturns. Even so, stock selection in the Consumer Cyclical and Industrials sectors was strong, counterbalancing the negative effects of stock selection in the Financials and Utilitics sectors. The recent short- term volatility created a pervcrse environment for the portfolio. Over the long term, however, we remain confidcnt that our primary themes of Momentum and Value will enhance thc Portfolio’s returns from both country allocation and stock selection.
9

GOLDMAN SACHS EUROPE CORE’” EQUITY PORTFOLIO*
Letter to Shareholders 30 November 2000
Wc thank you for your investment and look forward to your continued confidcnce.
Goldman Sachs Europe CORE Equity Portfolio Managcment Team New York, 15 Dccember 2000
*CORE is a registered service murk of Goldman, Sachs & Cb.
10

GOLDMAN SACHS EUROPE COREsM EQUITY PORTFOLIO
Statement of Investments 30 November 2000
Shares Description Value %of
EUR Net Assets Shares Description Value %of
EUR Net Assets
Common Stocks - 99.7% British Pound Sterling
900
3,813
1,475
3,200
1.800 5,200
1,000
6,200
1,400 1,200
15,700 29.900
3,000
3,400
2.259
8.900
300
500 3,300 6,200
200
15,300
5,100
1,000
1,000 11,700
4,9110
135
4.100
600
1,900
Abbey National PIC. (Uanks) Amvescap PIC. (Diversified Financial Serviccs) ARM Holdings PIC. (Scmiconductors) Astrazeneca Froup PIC. (Pharmaceuticals) AWG Plc. (Watcr) BAA PIC. (Engineering & Construction) BAE Systems Plc. (Acrospacc/Defense) Balfvur Bcatty Plc. (Engineering & Construction) Rarclavs PIC. (Banks) Bass PIC. (BCVerageS) BG Group PIC. (Gas) BPAmoco PIC. (Oil & Gas Produccrs) British Airways Plc. (Airlincs) British American Tobacco (Tobacco) British Sky Broadcasting Plc. (Media) British Tclecom Plc. (Telecommunications) Cadbury Schwcppes Plc. (Food) Ccntrica Plc. (Gas) CGNU Plc. (Insurance) Chubb Plc. (Electronics) CMG PIC. (Computer Services) Coats Viyella PIC. (Textiles) Dc La Rue Plc. (Commercial Services) Electrocomponents PIC. (Electronics) EM1 Grvup PIC. (Leisure) FKI PIC. (Miscellaneous Manuhcturing) Glaxo Wellcome PIC. (Pharmaceuticals) Granada Compass Plc. (Mcdia) Great Vnivcrsal Stores PIC. (Retail) Greencore Group PIC. ( h d ) l idy% PIC. (Commercial Services)
16,041
71.560
10.554
184.223 18,179
51,070
5,965
12,472 43,687 14,347 75,042
278.738
1'3,675
27,776
35,838
88,063
2,397 1,956
56,724 22,815
2.695
10.134
3 1,779
10,974 9,069
40,950
163,124
1,463
34,919
1,472
10,697
(1.1
0.5
0.1
1.4 0.1
0.4
0.1
0.1 0.3 0.1 0.6
2.1
0.2
0.2
0.3
0.7
0.0 0.0 0.4 0.2
0.0
0.1
0.2
0.1 0.1
0.3
1.2
0.0
0.3
0.0
0.1
Common Stocks - (continued) British Pound Sterling - (continued)
5,800
19,200
1,800
2,000
6,400
900
2,100 1 ,no0
6,200
700
6,200
1,600
4,110
562 800 700
2,100
1,800
2,279 1,600
500
1.700 600
4,600
2,200
4,200
2,200 3,900
1.100
Ililton Group Plc. (Entcrtainmcnt) HSBC Holdings PIC. (Banks) Independcnt News & Media PIC. (Mcdia) International Power Plc. (Electric) Invensys PIC. (Miscellancous Manufacturing) Irish Lifc & Permanent PIC. (Diversified Financial Services) J Sainsbury Plc. (Retail) Johnson Matthey PIC. (Electronics) Kidde PIC. (Cvmmercial Scrvices) Land Sccurities (Real Estate) Lasmo PIC. (Oil & Gas Produccrs) Legal & General Group Plc. (Insurance) Llvyds TSB Group PIC. (Banks) Logica PIC. (Computcrs) Lonmin PIC. (Mining) Marconi Plc. (Telecommunications Equipment) National Grid Group Plc. (Elcctric) Nycomed Amersham PIC. (Health Care) Pearson PIC. (Mcdia) Pilkington PIC. (Building Materials) Provident Financial PIC. (Divcrsified Financial Services) Prudential PIC. (Insurance) Kailtrack Group PIC. (Transportation) Recd International PIC. (Media) Reuters Group Plc. (Media) Kexam PIC. (Miscclkneous Manufacturing) Rio Tinto Ltd. (Mining) Royal Bank of Scotland Group PIC. (Hanks) Ryanair Holdings PIC. (Airlincs)
18,308
293,291
5,387
8,406
17.506
11,395 14,107
30.9 11
5,780
9.436
17.997
4,566
46,146 11,995 12,626
7,628
21,123
15,882 57,773
2,636
8,153 29,215
9,254
47,472
36,701
15,370 37,672
92,424
11,568
0.1
2.2
0.0
0.1
0.1
0.1 0.1
0.2
0.0
0.1
0.1
0.0
0.4 0.1 0.1
0.1
0.2
0.1 0.4
0.0
0.1 0.2
0.1
0.4
0.3
0.1 0.3
0.7
0.1
The accompanying notes are an integral part of these financial Statements. 11

GOLDMAN SACHS EUROPE COREsM EQUITY PORTFOLIO
Statement of Investments 30 November 2000
Shares Description Value 96 of
EUR Net Assets Shares DescriDtion
Common Stocks - (continued)
British Pound Sterling -(continued)
1,222 Sagc Group PIC. ( S o h are)
700 SEMA Group PIC. (Compulers)
5,500 Slough Eslates PIC. (Real Estate)
8,027 Smith & Nephew PIC. (Ilealth Carc)
7.700 SmithKline Uecchani PIC. (Pharmaceuticals)
200 Smiths Industries PIC. (Miscellaneous Manufacturing)
Group (Forest Products & Papcr)
9.300 Tesco PIC. (Food)
3,600 Smurfit (Jefferson)
900 Uniled Utilities PIC. (Water)
(Telccomniunications) 2.400 Waterford Wedgwood
PIC. (Housewarcs) 1,100 WPP Group PIC.
(Advertising)
801 71 Vodafme Group PIC.
7,675 0.1
3.263 0.0
34,355 0.3
41,485 0.3
116.520 0.9
2,574 0.0
7,101 0.1 42.588 0.3
10,318 0.1
316,982 1.4
3,1150 0.0
13,871 0.1
2354,918 21.7
Euro 7,422 ABN AMRO Holding
550 Accor SA (Lodging) 1.300 Acerinox SA (Iron/Steel)
502 Aegon NV (Insurance) 400 Akzo Nobcl NV
NV (Banks)
1,885
800 2,900
1,000
1.200
1,250 1 50
10,900
652
19,000
1,050 1 :ZOO 1,300
(('hemicais) Alcalel SA (Tcleconimunicatiotis Equipment) Allianz AG (Insurance) Allied Irish Uanks PIC. (Banks) ASM 1,ithography Holding NV (Computers) Aventis SA (Pharmaceuticals) AXA (Insurancc) AXA Colonia Konzcrn AG (Insurance) Banco Bilbari Vizcaya Argcnlaria SA (Banks) Banco Espirito Santo SA (Banks) Banco Santandcr Central Hispano SA (Banks) BASF AG (Chemicals) Uayer AG (Chemicals) Uckaert SA (Electrical Components & Equipment)
~
181,765 1.4 23,700 0.2 38,623 0.3 23,945 0.2
21,840
108,388 323,200
36,105
23.800
109,980 201.500
19,800
166,770
11,338
195.320 46,064 61.212
59,150
0.2
0.8 2.5
0.3
0.7
0.8 1 .s
0.2
1.3
0.1
1.5 0.4 0.5
0.4
Value % o f EUR Net Assets
Common Stocks -(continued)
Euro - (continued) 2,800 Bcnetton Group SPA
1.4SO BNP Paribas SA (Banks) 2,600 Ruhrmann NV
(Distributiorl/Wholes~~le)
(Appare 1)
100 Bulgari SpA (Retail) 100 Canal Plus (Media) 50 Casino Guichard-Perrachon
SA (Food) 300 Coflcxip Stena Offshorc
(Oil 6i Gas Services) 800 Compagnie Maritime
Uclge SA (Transportation)
Matcrials) 68 DaimlerChryslcr AC
(Auto Manufacturcrs) 91 Dassault Systemcs SA
(Softwarc) 2,273 Deutsche Bank AG
(Banks) 3,430 Deutsche Lufthansa A(;
(Airlines) 4,471 Deutschc Telekom AG
(Telephone) 511 Dresdner Bank AG
(Banks)
1,300 CRH PIC. (Building
7.100 Eircom PIC. (Telephonc) 300 Elscvicr NV (Media)
9,206 Endesa SA (Eleclric) 13,967 Enel SPA (Electric) 26,992 EN1 SpA
(Oil &: Gas Produccrs) 1,620 France Telecom SA
(Tclephone) 274 Croup Rruxclles
Lambert SA (lnvcslment Companies)
450 Groupc Danone (Food) 800 Gruppo Edikirialc
L'Espresso SPA (Media) 500 Hagcmeyer NV
(Houschold ProductsiWares)
300 Hcineken NV (Beverages) 125 Hugo Boss AG (Apparel)
4.302 1NG Groep NV (Insurance)
(Hand/Machinc Tools) 100 KBC Uaticassurance
Holding (Ranks) 3,200 K1.M Royal Dutch
Airlines (Airlines) 6,319 Koninklijke (Royal)
KPN NV (l'elccomi~iiinica~irns)
200 Koninklijke Vopak NV (Transportation)
17 lWKAAG
6,100 0.0 128,543 1.0
73,320 0.h 1,386 0.0
14.480 0.1
5,425 0.0
40,680 0.3
64,400 0.5
21.775 0.2
3,087 0.0
7,335 0.1
190,750 1.4
85,905 0.7
164,980 1.3
22,188 0.2 18,815 0.1 4,362 0.0
172,336 1.3 60,477 0.5
194.342 1.5
154,791
72,007 67,635
8,680
12,560 19.245 43,825
34 1,902
188
4,485
72,960
97,376
4,550
1.2
0.5 0.5
0.1
0. I 0.1 0.3
2.6
0.0
0.0
0.6
0.7
0.0
12 The accompanying notes are an integral part of these financial statements.

GOLDMAN SACHS EUROPE COREsM EQUITY PORTFOLIO
Statement of Investments 30 November 2000
Shares Description Value %of
EUR Net Assets Shares Description Value 96 of
EUR Net Assets
Common Stocks - (continued) Euro - (continued)
4.400
1,050
403 635
200
2,900
4,200 2,762 1.750
600
269
200
8,076
2,600
19,096
26,098
29
200
10,600
20,800
969
700
380
100 10,700
5,720
5,720
Koninklijke Wessancn NV (Food) L‘Or6al SA (CosmcticsiPcrsonal Care) Lagardere S.C.A. (Media) Louis Vuitton Moet Hennesy (LVMH) (Beverages) MAN AG (Misccllaneous Manufacturing) MAN AG-Preferred (Miscellaneous Manufacturing) Marzotlo SpA (Apparel) Mcdiaset SpA (Media) Mcrck KGaA (Pharmaceuticals) Mondadori (Amoldo) Editore SPA (Mcdia) Munchener Riickvcrsicherungs- gescllschaft AC (Insurance) Natexis Banques Populaires (Diversificd Financial Services) Nokia (AB) OY (Telecommunications Equip m c n t ) Occ N V (Office/Business Equipment) Olivetti SPA (Telecommunications) Parmalat Finanziaria SPA (Food) Philips Electronics NV (Elcctronics) Pinault-Printemps-Redoute SA (Ketail) Pirelli SPA (Auto Parts & Equipmcnt) Pirclli SPA-RNC (Auto Parts R: Equipment) Pohjola Group Insurance Corp. “A” (Tnsurancc) Pohjola Group Insurancc Corp. “E” (Insurance) PSA Pcugcot Citrocn (Auto Manufacturers) Publicis SA (Advertising) Kepsol-YPF SA (Oil Pr Gas Producers) Riunione Adriatica di Sicurta SPA (Insurancc) Royal Dutch Petroleum Co. (Oil & Gas Producers)
62,260 0.5
95,393 0.7 23,434 0.2
48.101 0.4
6,202 0.0
68.875 0.5 55,398 0.4 41,430 0.3
80,063 0.6
6,942 0.1
102,220 0.8
18,560 0.1
383,206 2.9
46,150 0.4
65,117 0.5
48.020 0.4
1,112 0.0
41,040 0.3
38,690 0.3
69,264 0.5
44,574 0.3
32,480 0.2
88,996 0.7 3,385 0.0
200.625 1.5
90.376 0.7
398,112 3.0
Common Stocks - (continued) Euro - (continued)
5,595
900
321 23 1
400
600
998
1,853
1,682 1,200 7,400 1.149
1.374
350
29,834
3,700
9.674
1,100
19,047
211
100
894
4,500
1 on
824
250
200
San Paolo-IMI SPA (Banks) Sanofi-Synthelabo SA (Pharmaceuticals) SAP A F (Software) SAP AG-Preferrcd (Software) Schcring AG (Pharmaceuticals) Schneider Electric SA (Hand/Machinc Tools) Seat-Pagine Gialle SpA (Mcdia) Siemens AG (Miscellaneous Manufacturing) Societe Generale (Banks) Solvay SA (Chemicals) Sonac SGPS SA (Retail) Sonera Oyj (Telecommunications) STMicroelectronics (Semiconductors) Sucz Lyonnaise des Eaux SA (Water) Tclccom ltalia Mobile SpA (Tclccommunications) Tclecom ltalia Mobile
(Telecommunications) Telecom Italia SPA (Telephone) Telccom Italia SpA- RNC (Tclephone) Telefonica SA (Telephone) Thomson CSF (Aerospaceinelensc) TNT Post Group NV (Transportation) Total Fina SA (Oil & Gas Services) Union Electrica Fenosa SA (Electric) Union Minicrc SA (Mining) Vivendi (Commercial Serviccs) Volkswagen AG (Auto Manufacturers) Zeltia SA (Pharmaccuticals)
SPA -RNC
99,815 0.8
63.585 0.5 39.451 0.3
34,650 0.3
25,440 0.7
42,510 0.3
2,854 0.0
245,708 1.9 102,686 0.8
9,h20 0.1
25.163 0.2
66,502 0.5
68.705 0.5
273,279 2.1
66,420 0.5
19,499 0.1
131,566 1.0
6,908 0.1
344,941 2.6
10,423 0.1
2.713 0.0
147,331 1.1
93,105 0.7
3,976 0.0
58,792 0.4
14,455 0.1
4,454 0.0
7,998,526 60.8
Norwegian Krone 3,300 Bcrgcscn DY A/S “ A
(Transportation) 65,670 0.5
The accompanying notes are an integral part of these financial statements. I 3

GOLDMAN SACHS EUROPE COREIM EQUITY PORTFOLIO
Statement of Investments 30 November 2000
Shares Description Value %of
EUR Net Assets Shares Description
Common Stocks - (continued) Norwegian Krone - (continued)
20,300 DnB Holding ASA (Banks) 107,809 0.8
800 Elkem ASA (Mining) 14,676 0.1 700 Frontline Ltd.
(Transportation) 12,363 0.1 600 Nor\k Hydro ASA
(Miscellancous Manufacturing) 27,760 0.2
3,600 Schibsted ASA (Media) 52,387 0.4
384,518 2.9
5,000 Orkla ASA (Food) 103,853 0.8
Swedish Krona
1,100
3,300
400
300
1,500 1,100
2,818
7,200
400
3,600
5,300
17,200
24.439
Assa Abloy AB (Metal FahricatelHardware) Gamhro AB (Health CaroProducls) NetCom Au (‘lelecommunications) OM Gruppen AB (Diversified Financial Scrviccs) Sapa AB (Mining) Securitas AB (Commcrcial Scrvices) Skandia Forsakrings AB (Insurance) Skandinaviska Enskilda Banken (SEB) (Banks) Skanska AI3 (Engineering & Construction) Svenska Cellulosa AB (Forest Products & Paper) Svenska Handelshanken AB (Banks) Swcdish Match AB (Tobacco) Tclcfonakticholaget LM Ericsson “E?’ (Telecommunications Equipmcnl)
22,009
25,234
15,776
8,866 23.371
20,617
49,OY 1
90,242
18,352
80,514
98,728
70,805
3 17,550
0.2
0.2
0.1
0.1 0.2
0.2
0.4
0.7
0.1
0.6
0.7
0.5
2.4
841,155 6.4
Swiss Franc 657
77
246
44
108
32
Credit Suisse Group (Banks) 132,115 1.0 Forho Holding AG (Building Materials) 36,231 0.3 Givaudan (Cosmc ticsPcrsonal Carc) 70,610 OS lelmoli SA-Uearcr
Jelmoli SA-Registered (Retail) 34,691 0.3 Ncstl6 SA (Food) 80,425 0.6
(Retail) 70,om 0,s
Value %of EUR Net Assets
Common Stocks - (continued) Swiss Franc - (continued)
58 Novartis RG (Pharmaccuticals)
2 Roche Holding AG- Preferred (Pharmaceulicals)
38 Schindler Holding AG (1 iand/Machine Tools)
(Building Materials) 50 Societe Generale de
Surveillance Holding SA (Commercial Services)
(Ketail)
Registered (Retail)
(Telephone)
(Chcmicals) 125 UBS AG (Banks)
(Semiconductors)
(Retail)
A(; (Insurance)
197 Sika Finanz AG
5 Swatch Group AG
21 Swatch Group AG-
276 Swisscum AG
96 Syngenla AG
20 Unaxis Holding AG
243 Valora Holding AG
YO Zurich Financial Services
22,963 0.2
62,795 0.5
60.141 0.5
69,717 0.5
6,703 0.1
5,805 0.0
76,931 0.6
4,925 0.0 20,179 0.2
4,818 0.0
57,250 0.4
56.444 0.4
981,065 7.4
United States Dollar 900 Elan Corp.. PIC.-ADR
100 IONA Technologies (Pharmaceuticals) 55,419 0.4
P1c.-ADR (Software) 6,439 0.1
61,858 0.5
TOTAL I N V E S T M E N T S
(cost E U R 12,456,732) 13,122,040 99.7
All security holdings of this portfolio are transferable securi- ties dealt o n a regulated market.
14 The accompanying notes are an integral part of these financial statements.

GOLDMAN SACHS EURO F I X E D INCOME PORTFOLIO
Letter to Shareholders 30 November 2000
Dear Shareholders:
On behalf of Goldman Sachs, we welcome the opportunity to review the performance of the Goldman Sachs Euro Fixed Income Portfolio for the one-ycar pcriod that ended 30 November 2000.
Market Review
Throughout much of Continental Europe there has been a continuation of the economic rebound that took hold during 2000. An increase in economic activity, falling unemploymcnt rates and strong consumer confidencc, coupled with an upturn in inflation, prompted the European Ccntral Bank (ECB) to raise interest ratcs incrementally over the period. Dcspitc strong economic fundamentals in the region, the euro fell sharply against the US dollar over the period, as investors continued to be attracted to the stronger growth scenario in the US. However, the euro managed to make back somc of these losses towards the end of the period. Wcaker economic data pointed to a substantial global slowdown, which risked being especially pronounced in thc US. This brought support for the euro, as future growth differentials between the US and Euroland narrowed.
In the UK, stronger than expected growth, a pick-up in overseas demand, tight labour market conditions, and rapidly rising property prices prompted the Monetary Policy Committee (MPC) to tighten rates by 25 basis points on two occasions at the beginning of the period. Then, following some weakcr than expected economic data, thc markct bcgan to speculate about slower growth towards the end of the ycar. Consequently the MPC chose to hold interest rates in place from February through November. Economic data continued to come in on the soft side, with weakcr than cxpcctcd rctail sales and falling house prices. Initially, Gilts failcd to rally, as sterling fell to a seven year low against the dollar. Howcvcr, they recovered later in the period as the inflation outlook improved, and the MPC’s voting pattern began to indicatc a lcss hawkish stance.
Portfolio Positioning
In thc earlicr part of the year the Portfolio was positioned to reflect our concern about the strength of global growth and thc tightcning bias of most central banks. As such, we initially implemcntcd neutrdl/short duration positions. Later on in the year, our outlook for global growth began to deteriorate and we reflected this through long duration positions and curve flattcning trades. Within this we were especially favorable towards Europe, where we initiated a long duration position.
Performance Review
Over the one-year period ended 30 November 2000, the Portfolio’s cumulative total return was 3.41%. This compared to the 4.7Y% return of the Portfolio’s benchmark, the Lchman Brothers Euro Aggregate Bond Index (with income reinvested and, in contrast to the Portfolio, without thc dcduction of any expenses). (For more information on thc pcrformance of the Portfolio and a description of its benchmark, refer to page 108. Portfolio rcturns are shown net of management fees with income reinvested using month-end NAVs.)
Factors that contributcd positively to performance included our long duration position in Europe towards the end of the period. Ncgativc returns came from our overweight exposure to the UK corporate sector in the fourth quarter of 2000. However, recently this position has turned positive for performance, as UK corporate spreads have tightened again.
We thank you for your investment and look forward to your continued confidence.
Goldman Sachs Euro Fixed Income Portfolio Management Team London, 15 December 2000
15

G O L D M A N SACHS EURO F I X E D INCOME PORTFOLIO
Statement of Investments 30 November 2000
Principal Amount Description
Value %of EUR Net Assets
Principal Amount Description
Value %of EUR Net Assets
Corporate Bonds - 23.8% British Pound Sterling
100,000 Aggregate Industries PIC. 6.25'%, due 08/07/09
100,000 Lehman Brothers Holdings Plc. 6.956, due 22/06/04
152,791 0.3
163,601 0.3
316,392 0.6
Eum 300,000 Ahold Finance USA, Inc.
6.375%, due 08/06/05 100,000 Air Products & Chemicals,
Inc. 6.00%. due 30/03/05 150,000 Rank of Scotland 5.50%,
due 21/01/09 100,000 BAT International
Finance PIC. 4.25%, due 14/04/04
Finance PIC. 4.875%~, due 25/02/09
200,000 BSCH Issuance Ltd. 5.125%. due 06/07/09
200,000 Clear Channcl Communications, Inc. 6.50%. due 07/07/05
100,000 Countrywide Home T.mn 4.12S'%, due 22/07/02
700,000 Credit Suisse Groupe Financc US, Inc. 6.625%. duc 05/10/10
5.875'%, due 06/08/08
Accept" Corp. 5.00%. due 18/01/05
400,000 Household Finance Corp. 6.25%, due 21/09/05
350,000 Household Finance Corp. 5.125%, due 24/06/09
600,000 Hypothekenhank in Essen AG 4.25%, due 06/07/09
500,000 lntcrnational Lease Financc Corp. 4.125%, due 12/07/04
500,000 Merrill Lynch & Co., Inc. 5.7.555, due 08/08/03
100,000 National Westminster Bank Plc. 6.00% due 21/01/10
200,000 North West Water Finance Plc. 6.625%. due OW1 1/07
500~000 Osprey Trust 6.3756, duc 15/01/03
250,000 Pearson PIC. 4.6251, due 08/07/04
100,000 BAT International
409,033 Gallaher Group PIC.
400,000 General Motors
304,590 0.6
100,290 0.2
141,645 0.3
94.200 0.2
85,640 0.2
181.168 0.4
197,124 0.4
97,371 0.2
704,578 1.4
387.600 0.8
392,960 0.8
404,060 0.8
311,990 0.7
544,740 1.1
475,735 1.0
502,900 1.0
98,040 0.2
202,196 0.4
500,800 1.0
238,775 0.5
Corporate Bonds - (continued) Euro - (continued)
700,000 San Paolo-IMI SpA
150,000 Standard Chartered PIC.
400,000 Tecnost International NV
500,000 TXU Europc Funding
450,000 q c o International Group
350,000 UniCredito Italiano SpA
500,000 Vodafonc AirTouch Plc.
6.375%, due 06/04/10 692,195 1.4
5.375%, due 06/05/09 137,820 0.3
6.125%, duc 30/07/09 368,400 0.8
Ltd. 7.00%. duc 30/11/05 501,795 1.0
SA6.125%. due 04/04/07 444,555 O.Y
15.25%~ due 14/06/10 351,956 0.7
5.75%, duc 27/10/06 493,400 1.0
8,956,523 18.3
German Mark 700,000 Citicorp 5.50%,
due 30/06/10 329,719 0.7
5.25%, duc 15/12/05 487,824 1.0
Plc. 5.25%. due 22/07/08 144,085 0.3
1,000,000 Countrywide Home Loan
300.000 Royal Bank of Scotland
961,628 2.0
United States Dollar 400,000 Ford Motor Credit Co.
400,000 Imperial Tobacco 7.60%, due 01/08/05 464,936 1.0
Overseas BV 7.1256,
80,000 Phillips Petroleum Co.
180,000 Simon Property Group,
200,000 TRW, Inc. 6.625%.
due 01/04/09 42.5,002 0.9
8.50%, due 25/05/05 98,173 0.2
lnc. 7 125%, due 24/06/05 203,185 0.4
due 01/06/04 71Y,687 0.4
1,410,983 2.9
TOTAL CORPORATE BONDS
(cost E U R 11,583,494) 11,645,526 23.8
Government Bonds - 68.2% British Pound Sterling 1,200.000 UK Treasury 8.50%,
Danish Krone due 07/12/05 2,237,658 4.6
300,000 Kingdom of Denmark 8.00%, due 15/05/03 42,663 0.1
Eum 4,300,000 Bundesrepuhlik
Dcutschland 6.00%, due 04/07/07 4.538,220 9.3
Deutschland 4.50%, due 04/07/09 96,460 0.2
100,000 Uundesrepublik
16 The accompanying notes are an integral part of these financial statements.

GOLDMAN SACHS EURO FIXED INCOME PORTFOLIO
Statement of Investments 30 Novemhcr 2000
Principal Amount Description
Value % o f EUR Net Assets
Principal Amount DescriDtion
Value %of EUR Net Assets
Government Bonds - (continued) Euro - (continued)
200,000 Bundcsrcpublik Dcutschland 6.25%, due 04/01/24
Deutschland 6.50%, due 04/07/27
2,000,000 Govcrnmcnt of France 3.00%. duc 12/07/01
3,000,000 Government of France 4.50%. due 12/07/03
2,945,000 Government of Francc 3.508, due 12/07/04
1,500,000 Governmenl of Francc 5.00%, due 12/07/05
700.000 Govcrnrncnt of France &SO%, due 25/10/06
3.550.000 Government of France 5.50%, due 25/04/10
500,000 Government o i Francc 8.50%. duc 25/10/19
1,550,000 Govcrnmcnt of Irance 5.50%. due 25/04/20
500,000 Kingdom of Belgium 5.75’%, due 28/03/08
3.25%, duc 15/04/04
6.75%. due 01/07/07
4.25%, due 01/11/09
6.50%, due 01/11/27
5.25%, duc 01/11/29
200.000 Bundesrepublik
3,000,000 Republic of Italy
2,200.000 Kepublic of Italy
720,000 Republic of Italy
1,100,000 Republic of Italy
500,000 Republic of Italy
218.720 0.4
227,160 0.5
1,976,200 4.0
2,970,300 6.1
2,809,530 5.7
1,503,900 3.1
753,830 1.5
3,640,880 7.5
674.850 1 4
1,539,305 3.2
513,000 1.0
2332,600 5.8
2,382,380 4.9
664,128 1.4
1,191,XSO 2.4
458,650 0.9
31272,284 64.0
Greek Drachma 680.000.000 Republic of Greece
6.30%, duc 79/01/09 2,074,131 4.2
TOTAL G O V E R N M E N T B O N D S
(cost EUR 3 3 , 1 1 0 , 4 0 7 ) 33,346.415 68.2
Value % o f
Shares Description EUR Net Assets
Mutual Funds - 0.1% Euro
70,000 Goldman Sachs Euro Liquid Rcscrves Fund 70,000 0.1
- . .
TOTAL MUTUAL FUNDS (cost E U R 70,000) 70,000 0.1
Short Term Investments - 5.0% Euro
2,417,732 State Street Bank 4.70%, due 01/12/00 2,417,732 5.0
TOTAL SHORT T E R M
I N V E S T M E N T S
(cost EUR 2 , 4 1 7 , 7 3 2 ) 2,417,732 5.0
TOTAL I N V E ST M E NTS
(cost EUR 4 7 , 1 8 1 , 6 3 3 ) 47,479,673 97.1
All security holdings of this portfolio are transferable securi- tics dcalt on a regulated market.
The accompanying notes are an integral part of these financial statements. 17

GOLDMAN SACHS EUROPEAN SPECIALIST PORTFOLIO
Letter to Shareholders 30 November 2000
Dear Shareholders:
On behalf of Goldman Sachs, wc welcome the opportunity to review the performance of thc Goldman Sachs European Specialist Portfolio for the one-year period that ended 30 November 2000.
Market Review
Over thc reporting period the MSCI Europe Index was up 8.83 % in euro terms. The MSCl Europe Small Cap Index was up 12.65 %. The markets were highly volatile, lcd in both directions by technology, media and telecoms (TMT) -the new economy sectors, whose strong initial performance overshadowed virtually all other areas of the market. This strong rally was followed by a well-publicised sharp correction in mid-March in the technology market. Concerns over rising intcrest rates, continued oil price hikes and the prospects for ‘new economy’ company earnings (notably the “dotcoms”) undermined investor confidence. In addition, European markets remained unsettled due to scvcral interest rate hikes by the European Central Rank (ECB).
Markets rcmained highly volatile, compounded by thin trading volumes and falling liquidity levels. The TMT sector rallied in the summer, only to decline sharply once again in the fall, as earnings forecasts for many high growth companies were reduced. lnvestors continucd to rotate from new economy sectors (TMT) towards the safer havens of oil, pharmaceuticals and utilitics. Towards the end of the year cyclicals (chemicals and certain basic industry stocks) performed strongly, as investors searched for value outside tech-related sectors.
The performance of the euro was wcak over the period. The euro fell sharply versus the US dollar (-15.7%) during the period, as investors were attractcd to the higher growth rates in the US. Coordinated efforts to support the currency had little succcss, as many of the world’s central banks failed to impact thc value of the euro.
In terms of Small Cap European growth stocks, in which the Portfolio primarily invests, they initially performed well. However, gains generated early in the period were given back during the market correction that started in mid-March. This was particularly evident in TMT and utilities sectors, where valuation concerns prompted a scll- off in many growth-orientated stocks.
Portfolio Positioning
Our strategy aims to identify fast growing companies at compelling valuations that either benefit from a structural change within their market, or operate in a particularly attractive market niche. Examples of structural changes that occurred during the period include the increasing penetration of temporary employment in Germany, and the outsourcing of a variety of different services across Europc, including IT services and facilities management. Other areas that are experiencing changes are Telecom and Media sectors, where the Portfolio also has a large weighting. We believe the substantial sell-off in markets since March now provides us with many new opportunities to take advantage of lower valuations.
Performance Review
Over the one-year ended 30 November 2000, the Portfolio’s cumulative total return was 22.83 %. This compared to the 12.65 % return for the Portfolio’s benchmark, the MSCI Europe Small Cap Index (a pricc index quoted without income reinvested and, in contrast to the Portfolio, without the deduction of any expenses). Prior to 31 December 1999 the Portfolio’s benchmark was the HSBC James Cape1 Smaller Companies Index. (For more information on the performance of the Portfolio and a description of its benchmark, refer to page 108. Portfolio returns arc shown net of management fees with income reinvcsted using month-end NAVs.)

GOLDMAN SACHS EUROPEAN SPECIALIST PORTFOLIO
Letter to Shareholders 30 November 2000
Performance Review (continued)
Some of the key contributors to performance over the year included Vestas Wind Systems (2.7% of the Portfolio), thc markct lcader in wind turbine production. Vestas continues to benefit from the structural growth of wind power from very low levcls. Othcr key contributors to performance included Thiel h g i s t i k (2.5 %), a German provider of data processing and e-commerce software as well as the Irish online IT training provider Smartforce (2.5 %). Towards the end of the year, strong performance from Matalan (1.Y %), the UK retailer and Kudelski (1.3%) ensured that significant out-performance early in the year was not lost during the market correction at the end of the year.
We thank you for your investment and look forward to your continued confidence.
Coldman Sachs European Specialist Portfolio Management Team London, 15 December 2000
19

GOLDMAN SACHS EUROPEAN SPECIALIST PORTFOLIO
Statement of Investments 30 November 2000
Shares Description Value % o f
EUR Net Assets Shares Description Value %of EUR Net Assets
Common Stocks - 95.6% British Pound Sterling 1.631.222 Bcrkclcy Group PIC.
(Homc Builders) 2,426,805 Brown (N) Group Plc.
(Retail) 621,049 Cannons Group PIC.
(Lcisurc) 2,822,060 Countrywide Assured
Group PIC. (Real Estate)
(Commercial Services)
& Media PIC. (Media)
775,091 Guardian IT Plc.
2,756,541 Independent News
600,970 ITNET PIC. (Computers) 159,300 Kingspan Group PIC.
(Building Materials)
Securities (Real Estate)
(Divcrsificd Financial Services)
973,861 Matalan PIC. (Rctail)
2,818,560 h n d o n Merchant
1,189,9117 Man Froup PIC.
1,061,881 Serco Group (Commercial Services)
Common Stocks - (continued) Euro - (continued)
84,505 Compagnie Generale de Geophysique SA (Oil & Gas Scrviccs)
92,833 D. Logistics AG (Transportation)
131,513 Deutscher Industrie Service AG (Commcrcial Scrviccs)
69,647 Diosos (Miscellaneous Manufacturing)
880,786 Elior (Food Service) 201.651 Elisa Communications Oyj
(Telecommunications)
(Commcrcial Scrviccs)
Metalurgico SA (Energy -Alternate Sources)
626,000 Fruppo Coin SpA (Retail)
562.808 IFCO Systems NV (Packaging A? Containcrs)
97,765 Intcrshop Communications AG (Internet)
77,392 IPSOS (Advcrtising)
24,639 GFKAG
279,994 Grupo Auxiliar
190,868 Jazztcl Plc. (Telecommunications)
1.362,218 Jot Automation Group Oyj (Machinery- Diversified)
306,162 Kalisto Entertainment (software)
2.070,022 Kingspan Group Plc. (Uuilding Materials)
46,807 LVL Medical SA
42.573 Nokian Renkaat OY
90.013 Omepa Pharma SA
(Health Care)
(Auto Parts & Equipment)
18,815,102 3.1 5,526.627 0.9
6,015,578 1.0 11367,425 1.9
1,186,367 0.2
4.984,716 0.8 4,602:955 0.8
12,106.162 2.0 2,872,939 0.5 12,163,655 2.0
8,250,228 1.3 1,425,185 0.2 4.930,367 0.8
931,354 0.2 468,963 0.1
7,329,508 1.2 7,279,844 1.2
9,967,710 1.6
3.039,163 0.5
11,647,363 1.9 11,475,758 1.9
7362,796 1.3
97.519,573 15.9 3,236,022 0.5 8,180,334 1.3 Danish Krone
305,996 Dc Sammcnslut Vogn A/S (Transportation)
118,250 Group 4 Falck A/S (Commercial Services)
157,600 NEG Micon AfS (Electrical Components C Equipment)
297.207 Vcsta Wind Systems AIS (Elcctrical Componcnts & Equipment)
(Health Care) 152,550 William Demant AfS
2,624,435 0.4 9.734336 1.6
17,285.791 2.8 3,146,724 0.5
4,485.273 0.7
6.417,068 1.1
3,430.953 0.6
749,285 0.1
3,614,022 0.6
2.041,765 0.3
8,797,500 1.4
7,862,502 1.3
16,740,558 2.7
7,365,060 1.2
58,988,747 9.6 I
(Pharmaceuticals) Pa rade SFPS SA (Softwarc) Porschc AG (Auto Manufacturcrs) Promotora de Informaciones SA (Media) Rhoen-Klinikum AG (Hcalth Carc) Rhocn-Klinikum AG- Preferred (Health Care) Royal Canin S A (Food) Saipem SpA (Oil & Gas Services) Samas Grocp NV (Office Furnishings)
Euro 187,467 94.809
6 9 6,8 4 8
2:550
325.737
Aldeasa SA (Retail) Allbecon AG (Commercial Services) Altran Technologies SA (Engineering 61 Construction) Banca Popolarc Commercio e Industria (Banks) Ranca Pvpoliue di Milano (BPM) (Ranks) BKN Intcrnational AG (Media) Brembo SpA (Auto Parts & Equipment) Coface (Insurance)
4.780,409
2.607,248
0.8
0.4 62,532
13.694,508 2.2 6,130,370 1.0 586.750 11 6,560 7,786.208 1.3 10,590,837 1.7 170.521 2,090,653
103.144
1,118,473
11 1,614
10363,776 1.7 12,581,877 2.1 15,282,673 2.5 108,934
1,407,154 4,022,616 0.7 8,062,992 1.3 43.793 10,938,666
12,612,382 1.8 2.1 766,378 0.1
20 The accompanying notes are an integral pan of these financial statements.

G O L D M A N SACHS EUROPEAN SPECIALIST PORTFOLIO
Statement of Investments 30 November 2000
Value %of Shares Description EUR Net Assets
Common Stocks - (continued) Euro -(continued)
720.337
7,203
3 1 6,802 160,656
123,953
58,479 696,817
442,406
159.802
90,130
Sociedad General dc Aguas de Barcelona SA (Water) Sociedad General de &was de Barcelona SA- New shares (Water) Sogecablc SA (Media) SR Teleperformance (Advertising) Thiel Logistik AG (Software) Unibail (Rcal Estate) Vedior NV (Commercial Services) VersaTel Telecom International (Telephone) Wedeco AG Water Technology (Environmcntal Control) Zapf Creation AG (Toys/Games/Hubbies)
11,049,970
110,494 7,935,890
5,899.288
15,122.266 9,824,472
8,988,939
5,109,789
6,136,397
3,695,330
1.8
0.0 1.3
1.0
2.5 1 .6
1.5
0.8
1 .o
0.6
298,347,348 48.8
Norwegian Kmne 941.462 Tomra Systems ASA
(Environmental Control) 19,554,713 3.2
Swedish Krona 1,175,480 Eniro AB (Media) 13,111,047 2.2
741,283 Europolitan Holdings AB (Telecommunications Equipment) 6,478,106 1.1
569,106 HIQ Intemational Au (Computers) 4.417,203 0.7
158,334 Profiicc AB (Commercial Services) 4,915,734 0.8
504,373 Sifo Group AB (Commercial Services) 6,959,587 1.1
35,881,677 5.9
Swiss Franc 9.448
79,779
62,740
6,700
11,324 28,859
13,060
17,490 6,294
Belimo Holding AG (Building Materials) EMTS Technologie AG (Telecommunications) Komax Group (Machincry-Divcrsified) Kudelski SA (Telecommunications) Lindt & Spruengli (Food) Logitech Intemational SA (Computers) Societe Generalc d' Affichage (Advertising) Tamedia AG (Media) Think Tools AG (Software)
5,003,649 0.8
6.327,040 1 .O
6,578,785 1.1
8,079,302 1.3 6,613,428 1.1
9,384,723 1.5
6,630,537 1.1 2,362,100 0.4
1,883,855 0.3
52,863,419 8.6
Shares Description Value % o f
EUR Net Assets
Common Stocks - (continued) United States Dollar
114,300 MTH Ltd. (Mcdia) 2,134,554 0.4 79,300 NDS Group Pk.-
ADR (3) (Internet) 4,551,425 0.7
ADR (a) (Software) 15,053,472 2.5
21,739,451 3.6
380,800 SmartForcc P1c.-
T O T A L C O M M O N STOCKS
(cost EUR 5 8 8 , 4 6 1 , 3 1 9 ) 584.894,928 95.6
Warrants - 0.0% Euro
7,045 IPSOS, exp. 21/06/03 47,554 0.0
T O T A L W A R R A N T S
(cost EUR 0 ) 47,554 0.0
Principal Value % o f Amount Description EUR Net Assets
Short Term Investments - 4.0% Euro 24,259,674 State Street Bank
4.70%, due 01/12/00 24,259,674 4.0
T O T A L S H O R T T E R M
I N V E S T M E N T S
(cost EUR 2 4 , 2 5 9 , 6 7 4 ) 24,259,674 4.0
T O T A L I N V E S T M E N T S
(cost EUR 612,720,993) 609,202,156 99.6
All security holdings of this portfolio are transferable securi- ties dealt on a regulated market. (a) SccuriQ holding is tmdedlheld in USD.
The accompanying notes are an integral part of these financial statements. 21

. .- . .. .. ... . .. -.
GOLDMAN SACHS GLOBAL EMERGING MARKETS DEBT PORTFOLIO
Letter to Shareholders 30 November 2000
Dear Shareholders:
On behalf of Goldman Sachs, we welcome the opportunity to review the performance of thc Goldman Sachs Global Emerging Markets Debt Portfolio since its inception on 3 May 2000 through 30 November 2000.
Market Review
During the initial phases of the Portfolio’s opcration, the emerging debt market was volatile US interest rates were increased by 50 basis points before the market reached consensus that the Federal Reserve Board had successfully engineered a soft economic landing. Latin America was thc worst performing region, largely due to political volatility in Peru and Venczucla. Argcntina also performed poorly, as the economy remained in a slump and thc fiscal situation continucd to deteriorate.
In thc third quarter the market rallied on the back of improving country fundamcntals in Russia, Brazil and Mcxico: and signs that a peak in US rates had occurred. Strong outpcrformancc in Russia, the Ukraine, Nigeria and Mexico was stimulated by high oil prices. Ecuador also performed wcll following successful debt restructuring.
The fourth quarter has so far seen a weaker emerging markct debt market. This has been mainly attributable to fears of a severe credit event in Argentina, a confidcnce crisis in Turkey, and concerns of the impact of a global
slowdown.
Portfolio Positioning
The main overweights in the Portfolio arc currcntly Russia, Qatar, Bulgaria and Brazil, based on strong fundamentals and attractive relativc valuc. Thc largest country underweights are in Argentina and Turkey. In Argentina, investors rcmain concerned about slack growth and mounting fiscal pressures, which have forccd the country to ask the International Monetary Fund for an aid package. The deteriorating health of the banking systcm and an overvalucd currcncy within a fixed exchange rate syslem, which may require currency devaluation, lcad us
to retain a cautious view on Turkish exposure.
Performance Review
During the pcriod under review the Portfolio’s cumulative total return was 4.50%. This compared to thc 5.46% return for the Portfolio’s bcnchmark, the J.P. Morgan Global Emerging Markets Bond Index (globally constrained is calculated 1 day prior to year end to more closely resemble the timing of the security priccs in the portfolio with incomc reinvested and, in contrast to the Portfolio without the deduction of any cxpcnscs). (For more information on the performancc of the Portfolio and a description of its benchmark, refer to page 108. Portfolio returns arc shown net of managemcnt fccs with income reinvested using month-end NAVs.) Underperformance during thc pcriod can he largely attributcd to rccent price weakness in Bulgaria, Russia and the Philippines.
Wc thank you for your investment and look forward to your continucd confidence.
Goldman Sachs Global Emcrging Markets Debt Portfolio Management Team London, 15 Dccember 2000
22
. ~- . . .

GOLDMAN SACHS GLOBAL E M E R G I N G MARKETS D E B T PORTFOLIO
Statement of Investments 30 November 2000
Principal Amount Description
Value X of US0 Net Assets
Principal Amount Description
Value % o f USD Net Assets
Corporate Bonds - 6.1 % Iceland
250,000 Partner Communications Co., Ltd. 13.00%, due 15/08/10 207,500 0.9
Korea 300,000 Hanvit Bank 11.75%,
due o i / n w n 282.000 1.2
Mauritius 220,000 lndah Kiat Finance
Mauritius 10.00%, due 01/07/07 80,300 0.3
Mexico 200,000 TFM SA cv, o.oo/
11.75% (a), due 15/06/09 148,750 0.6
Netherland Antilles 150,000 Cellco Finance NV
Turkcell 12.75%, due 01/08/05 141,000 0.6
Netherlands 320,000 FTC International
Finance BV, 0.00/10.756 (a),
due 01/07/07 217,600 0.9
Cu. NV 11.25% @), due 30/03/07 403.062 1.6
620,662 2.5
500,000 Slovak Wireless Financc
TOTAL CORPORATE BONDS
(cost USD 1,655,355) 1,480,212 6.1
Emerging Markets Debt - 80.9% Argentina
560,OllO Kepublic of Argentina
930,000 Republic of Argentina 11.75%, due 15/06/15 474,600 1.9
10.25%, due 21/07/30 706,800 2.9
1,181,400 4.8
Brazil 480,000 Rcpublic of Brazil
3,149,000 Kepublic of Brazil 8.0096, due 15/04/14 504,900 2.1
ll.OO%, due 17/08/40 2,368,048 9.7
2,872,948 11.8
Emerging Markets Debt - (continued) Croatia
209,OY 1 Republic of Croatia 7.75%, due 31/07/10 193,409 0.8
Ecuador 44,000 Kepublic of Ecuador
1,225,000 Republic of Ecuador, 12.00%, due 15/11/12 29,370 0.1
4.00/5.001 (a),
due 15/08/30 453,251) 1.9
487,620 2.0
Korea 1,150,000 Republic uf Korea
8.875%, due is/o4/nx 1,200,312 4.9
Mexico 2,560,000 United Mexican States
9.87596, due 01/02/10 2,673,600 11.0 ~
Nigeria 750,000 Central Bank of Nigeria,
5.50/6.25% (a),
due 15/11/20 427,500 1.8
Panama 613,928 Republic of Panama
500,000 Republic of Panama 7.733%, due 14/05/02 602,417 2.5
9.375%, due O I / O ~ / ~ Y 476,875 1.9
1,079,292 4.4
Peru 560,000 Republic of Peru 3.75%,
due 07/03/17 296,800 1.2
Philippines 90,000 Republic of Philippines
1,230,000 Republic of Philippines 9.875%, due 15/01/19 67,950 0.3
10.6258, due 16/03/25 953,250 3.9
1,021,200 4.2
Poland 390,000 Government of Poland,
30,000 Government of Poland. 3,75/4.00% (a), due 27/10/24 249,356 1.0
4.25/4.50% (a), due 27/10/24 20,925 0.1
270,281 1.1
Bulgaria 1,890,000 Kepublic of Bulgaria
3.00%, due 28/07/12 1,293,469 5.3
Qatar 670,000 State of Qatar 9.75%,
due 15/06/30 656,466 2.7
Colombia 600,000 Republic of Colombia
8.625%, due 01/04/08 459,000 1.9
Russia 200,000 Russian Federation
2,530,000 Russian Federation 8.75%, due 24/07/0S 151,500 0.b
8.25%, due 31/03/10 1,581,250 6.5
The accompanylng notes are an integral part of these financial statements. 23
.

GOLDMAN SACHS GLOBAL EMERGING MARKETS DEBT PORTFOLIO
Statement of Investments 30 November 2000
Principal Amount Description
Value % o f USD Net Assets Shares Description
Emerging Markets Debt - (continued) Russia - (continued) 2,125,000 Russian Federation,
2.S0/5.00% (a),
duc 31/03/30 780,937 3.2
2,513,687 10.3
South Africa 270,000 Republic of South Africa
Y.125%,, due 19/05/09 264,600 1.1
Turkey 900,000 Rcpuhlic of Turkey
12.375%. due 1S/06/0Y X10,000 3.3
Ukraine 750,000 Republic of Ukraine
11 .00%, due 15/03/07 162,500 0.7
Venezuela 1,428,562 Republic of Venezuela
1,000,000 Republic of Venezuela 7.875%, due 18/12/07 1,192,850 4.9
Y.25%, due 15/09/27 665,000 2.7
1,857,850 7.6
T O T A L E M E R G I N G M A R K E T S
DEBT
(cost U S D 20,177,326) 19,716,934 80.9
Value %of US0 Net Assets
Warrants - 0.0% Nigeria
250.000 Central Bank of Nigeria, exp. 15/11/20 0 0.0
TOTAL W A R R A N T S
(cost US0 0 ) 0 0.0
Principal Amount Description
Value %of USD NetA55ats
Short Term Investments- 11.2% United States 2,730.000 State Street Hank 6.50%.
due 01/12/00 2,730,000 11.2
T O T A L S H O R T T E R M
I N V E S T M E N T S
(cost U S D 2,730,000) 2,730,000 1 I .2
TOTAL I N V E S T M E N T S
23.927.146 98.2 (cost U S D 24,562.6811
All security holdings of this portfolio are transfcrablc sccuri- ties dealt on a regulated market. (u) Thessc securitic.s urc issued with un initiul determined rate which
(h) Security holding is tradedlheld in EUR. increuses to the sfufcd rute ut u .sef dute in thefuture.
24 The accompanying notes are an integral part of these financial statemenis.

GOLDMAN SACHS GLOBAL EMERGING MARKETS EQUITY PORTFOLIO
Letter to Shareholders 30 November 2000
Dear Shareholders:
On behalf of Goldman Sachs? wc welconie the opportunity to revicw the performance of the Goldman Sachs Global Emerging Markets Equity Portfolio for the one-year period that ended 30 November 2000.
Market Review
In the early part of the rcporting period emerging markcts equities performed strongly, as improving macroeconomic fundamcntals led to strong earnings momcntum, particularly in the telecom and technology sectors. However, late in the first quartcr of2000, emerging markets cxpcricnced a substantial correction duc to the Nasdaq correction, an increase in oil prices and tightening in the US monetary policy. Looking forward, lower oil prices, a reversal in the US intcrcst rate cycle and a weakening dollar may potentially lead to better overall performancc in emerging markets.
Asia - For most of the reporting period, Asia underperformed. Higher oil prices have combined with thc volatility in thc technology sector have negatively impacted the earnings outlook for the region. However, sincc late September. the region has started to outperform as valuations fell to very low levels. Although we maintained a cautious view throughout the year, we rccognised that there was much valuc in selected markets, especially Korca. As such, we started to increase our cxposure to the region and havc also increased our weights in India and Thailand.
Latin America - Latin America significantly outperformcd during the reporting period. As opposed to Asia, high oil prices have benefited thc rcgion as it has helped the overall current account deficit. In addition, the main markets of Brazil and Mexico have been experiencing strong cconomic performance. Brazil has been our favourite market in Latin America. This is bascd primarily on our assessmcnt that the Brazilian economy’s non-inflationary growth will continue to allow for reductions in interest rates. Wc turned more cautious on Mexico, due to an assessment that modcrating US growth will create aftershocks in the Mexican economy- an outcomc that, in our opinion, is not reflected in thc current valuation of the markct. We have also been cautious on Argentina, where poor economic growth prospects precipitated a scries of resignations in the administration and a crisis of confidence. This has caused the government to accelerate a number of economic reforms, which thcn allowed the International Monetary Fund (IMF) to present a liquidity package, restoring confidcncc. However, as the growth outlook is still unclear our stance is negativc on Argentina.
Europe, Middle East, Africa (EMEA) -As in Latin America, thc EMEAalso performed strongly until the last month of the reporting pcriod. Improving earnings momentum and strong economic growth in developed Europe sparked strong performance. Israel’s breakdown in talks with the Palestinians in the fall darkened thc regional outlook somewhat, and thcn Russia’s tough stance on servicing its Paris Club debt further clouded the picture. Subsequently, in November. a liquidity crisis erupted in Turkey, driving interest rates: temporarily, north of .IO00% and necessitating another IMF package. Although thc Turkish crisis seems to have passed, real damage is inflicted on economies that endure crises like this, and we believe that the economy will suffcr ncxt year.
Portfolio Positioning
At the end of the reporting pcriod the Portfolio was overweight in Latin America, while maintaining a slight underweight in Asia and a more significant one in the EMEA. The largcst overweight positions were in Brazil and Korea. The largest underweight positions wcre in Malaysia, where corporate governance is underdeveloped. and Taiwan, with its large exposure to the personal computer industry.
25

GOLDMAN SACHS GLOBAL EMERGING MARKETS EQUITY PORTFOLIO
Letter to Shareholders 30 November 2000
Performance Review
Over the one-year period that cnded 30 November 2000, the Portfolio’s cumulativc total return was -15.50%. This compared to thc -23.63 return for the Portfolio’s benchmark, the Morgan Stanley Capital International Emerging Markets Frec Index (with income reinvested and, in contrast to the Portfolio, without the deduction of any cxpenscs). (For more information on the performance of thc Portfolio and a description of its benchmark, rcfcr to page 108. Portfolio returns are shown net of management fccs with income reinvested using month-end NAVs.)
Overall country asset allocation had a positive impact on performance, and stock selection also strongly enhanced rclative results versus the benchmark.
We thank you for your investment and look forward to your continued confidence.
Goldman Sachs Global Emerging Markets Equity Portfolio Management Team New York, Singapore and London, 15 December 2000
26

G O L D M A N SACHS GLOBAL EMERGING MARKETS EQUITY PORTFOLIO
Statement of Investments 30 November 2000
Value %of Value %of Shares Description US0 Net Assets Shares Description US0 NetAssets
Common Stocks - 95.4% Argentina Chile - (continued)
Common Stocks - (continued)
24,600 Frupo Financiero Galicia 21,100 Embotelladora Andina SA-ADR (a) (Diversified SA-ADR (a)
Financial Scrviccs) 343.247 0.9 (Beverages) 197,812 O S 12,823 Emprcsa Nacional de
Brazil 16,200
38,114,063
2,778,000
8,898
26.113
8,100
200
29,100
22,834
5,400 44,200
31,198
43383,288
28,100
16,600
Aracrm Celulose SA-ADR (Forest Products & Paper) Banco Rradesco SA- Prcfcrrcd (Banks) Banco do Estado de Sao Paulo SA (Banks) Brad Telecom Participacoes SA-ADR (a)
(Tclccommunications) Companhia de Uebidas das Americas-ADK (a)
(Beverages) Companhia Siderurgica Nacional-ADR (a)
(Iron/Steel) Companhia Vale do Rio Doce-ADR (a) (Mining) Companhia Vale do Rio Doce-Prel'erred (Mining) Emhratel Participacoes SA-ADR (a) (Tclcphone) IdeiasNet (Internet) Petroleo Brasileiro
(Oil & Gas Producers) Tclc Nortc Lestc-ADR (a)
(Tclcphonc) Telesp Participacoes S A-Preferred (Telephone) Ultrapar Participacoes SA-ADR (8) (Chcmicals) Votorantim Celulose e Papel SA-ADR (a)
SA-ADR (a)
194,400
275,723
96,719
420,430
571,222
219,713
4,063
587,653
301,123 9,663
L ,174,062
600,561
402,488
256,413
0.5
0.7
0.2
1.0
I .4
0.5
0.0
1 .5
0.8 0.0
2.9
1.5
1 .o
0.6
Electricidad-ADR (n) (Electric) 139,450 0.4
(Electric) 251,055 0.6
de Chile SA-ADR (a)
(Telephone) 411,844 1.0
1,715,821 4.3
14,346 Enersis SA-ADR (a)
28,650 Telecomunicaciones
~
Colombia 3,700 Banco Ganadero SA-
ADR (a) (Banks) 13,181 0.0 72,800 Bavaria SA (Beverages) 229,463 0.6
242,644 0.6
Czech Republic 9,400 Ccska Sporitelna AS
(Banks) 48,958 0.1 400 Ceske Radiomunikace
A M D R (a)
(Telephone) 12,500 0.0 11,950 Ccsky Tclccom AS
(Telecommunications) 114,005 0.3 46,191 Ccz (Elcctric) 95.998 0.3
271,461 0.7
Greece 8,447 Alpha Credit Rank
2,148 Attica Enlcrpriscs
5.530 Commercial Bank
9,930 EFG Eurobank Ergasbas
9,760 Hellenic Bottling Co.,
3.150 Intracom SA
(Banks) 255.911 0.6
(Transportation) 15,585 0.0
of Greece SA (Banks) 235,679 0.6
(Banks) 219,942 0.5
SA (Beveragcs) 132,067 0.3
(Forest Products & Paper) 224,100 0.6 (Tclccommunications 5,338,333 13.2
Chile 400 Banco Santander Chile-
8,500 Banco SantiageADK (4
4,600 BBV Banco BHJF-
5,486 Ccrvccerias Unidas SA-
ADR (a) (Banks) 6,000 0.0
(Banks) 171,063 0.4
ADR (a) (Banks) 64,688 0.2
ADR (a) (Bcvcragcs) 109,034 0.3 21,000 Distribucion y Servicio
D&S SA-ADR (a)
(Retail) 364,875 0.9
Equipment) 65,881 0.2
(Banks) 465,422 1.2
(Telecommunications) 180,419 0.5
(Building Materials) 87,256 0.2
1,658,162 4.1
14,743 National Bank of Greece
12,621 OTE
2,406 Tilan Cemcntos
Hong KonglChina 1,200,000 Beijing North Star Co.
(Kea1 Estate) 112,310 0.3 146,000 China Evcrbright Ltd.
(Diversified Financial Scrviccs) 132,900 0.3
The accompanying notes are an integral part of these financial statements. 27

GOLDMAN SACHS GLOBAL EMERGING MARKETS EQUITY PORTFOLIO
Statement of Investments 30 November 2000
Shares Description Value %of
US0 Net Assets Shares Description Value %of
US0 Net Assets
Common Stocks - (continued) Hong KonglChina - (continued) 1.040.000 China Kesources Beijing
1,and I td. (Real Estate) 250,500 China Telccom
(Telecommunications)
(Holding Companies- Diversified)
560.000 Denway Motors Ltd. (Auto Manufacturers)
538,000 Huaneng Power International, Inc. (Electric)
751,635 PetroChina Co., Ltd. (Oil & Gas Producers)
590.000 Yanihou Coal Mining Co.. Ltd. " H (C'ommcrcial Scrviccs)
31,000 Citic Paciiic Ltd.
210,671
1,361.718
106,714
89,745
210,376
1 29,129
149.772
2.503,335
0.5
3.4
0.3
0.2
0.5
0.3
0.4
6.2
Hungary 626 Gedeon Kichter-GDK (a)
(Pharmaceuticals) 28,052 0.1
(Oil & Gas Producers) 33,847 0.1
2,634 Magya Olaj Es Gaipari-GDR (a)
6.410 Matav-ADR (a)
1.585 North American Uusiness (Telephone) 108.970 0.3
Industries Kt. (Auto Manufacturers) 26,200 0.0
1,247 OTP Bank Rt.-GnR (4 (Banks) 54,506 0.1
252,475 0.6
India 8,215 Cadbury India Ltd.
(Food) 4,315 Cipla Ltd.
(Pharmaceuticals) 2,630 Cipla T.td.-Demat
(Pharmaceuticals) 6,880 Dr. Rcddy's Laboratories
Ltd. (Pharmaceuticals) 2,200 Gas Authority of India
7,400 Gas Aulhority of India
4,710 Hindalco lndustrics
1,td. (Gas)
Ltd.-GDR (a) (Gas)
Ltd.-Deinat (Mining)
Deniat (Household ProductsWares)
114,845 llitidustan Lever Ltd.-
24,800 Housing Dcvclopmciit
99,141
9 1,098
55.525
198,448
2,155
38.850
69,826
472.61 7
0.2
0.2
0.1
0.5
0.0
0.1
0.2
1.2
Finance Corp., Ltd.- Demat (Diversified Iinancial Services) 279.867 0.7
Common Stocks - (continued) India - (continued)
1,850 lnfosys Technologies Ltd.-Dcmat (Software)
12,795 ITC Ltd.-Demat (lo bacco)
5,500 Mukta Arts Ltd. (Entertainment)
I.td.-DemaI (Food) 2,640 NTIT Lld.-Demat
(Softwarc) 9,635 Ranbaxv Laboratories
l,td.-T)eniat (Phamiaceulicals)
(Chcmicals) 4,015 Satyam Computer
Services Ltd.-Demat (Software)
24,250 State Rank of India 1.td.-Demat (Banks)
8,300 Vidcsh Sanchar Nigam Ltd.-ADR (4 (Telecommnnications)
72,300 Videsh Sanchar Nigam I .td.--Demat (Telecrrmmunicaticlns)
13.270 Nestli India
35,700 Reliance Industries Ltd.
282,681 0.7
396.151 1.0
26.338 0.1
153,094 0.4
95,668 0.2
159,517 0.4
249,780 0.6
28.958 0.1
93,998 0.2
75.210 0.2
449,155 1.1
3,318,092 8.2
Indonesia 2,240 Gull'lndonesia Rcsourccs
Lld.-ADR (a)
(Oil & Gas Producers)
Sampoerna (Tobacco)
TBK (Food)
TUK-Demat (Telecommunications)
224,000 PT Astra International TBK (Retail)
(Tohacco) 179,000 PT Indah Kiat Pulp
C Paper Corp. 'IBK (Forest Products Rr Paper')
& Paper Corp. TBK- Scriplcss (Forest Products & Paper)
554,000 p1' Matahari Putra Prima 'TBK (Retail)
627,440 PT Telekoniunikasi Indonesia (Telecommunications)
37,500 Hanjaya Mandala
494,000 Tndolood Sukses Makmur
31 .OOO Indosat (Pcrscro)
46,000 PT Gudang Garam TBK
127,500 PT lndah Kial Pulp
20,020 0.1
55.228 0.1
42.720 0.1
29,245 0.1
53,417 0.1
63.648 0.2
11.360 0.0
34.843 0.1
161,135 0.4
28 The accompanying notes are an integral part of these financial statements.

G O L D M A N SACHS GLOBAL EMERGING MARKETS EQUITY PORTFOLIO
Statement of Investments 30 November 2000
Value % o f USD Net Assets
Value 96 of Shares Description USD Net Assets
Common Stocks - (continued) Indonesia - (continued)
105,000 PT Tempo Scan Pacific TBK (Pharmaceuticals) 35,495 0.1
80,400 Ramayana Lestari (Retail) 41,506 0.1
564,566 1.4
Shares Dexription
Common Stocks - (continued) Korea - (continued)
4,681 Samsung Fire & Marine Insurance (Insurance)
46,948 Shinhan Bank (Banks)
(Telecommunications) 5,045 SK Telccom
113,724 0.3 431,106 1.1
1,013,778 2.5
Israel 82,837 94.497 22,767
4,745,255 11.8 Bank Hapoidim (Ranks) Bank Leumi (Banks) Bezek Israeli Telecommunication Corp., Ltd. (Tclcphonc) Chcck Point Software Technologies Ltd. (4 (In ternel) First International Bank of Israel (Banks) Gilat Satellite Networks Ltd. (Telecommunications) IDB IIolding Corp.. Ltd. (Investment Companies) Israel Chemicals Ltd. (Chemicals) Koors Industries-ADR (8)
(Investment Companies) Matav-Cable Systems Media J.,td. (Media) Orbotech Ltd. (Electronics) Tcva Pharmaceutical Industries Ltd.-ADR (a)
(Pharmaceuticals)
218,269 204,224
0.5 0.5 Malaysia
64.300 Arab-Malaysian Finance Berhad-Foreign (Diversified Financial Services) British American Tobacco (Malaysia) Berhad (Tobacco) Hong k o n g Bank Berhad (Banks) IO1 Corp., Berhad (Agriculture) Malakoff Berhad (Electric) Malayan Banking
Malayan Ccmcnt Bcrhad (Building Materials) Malaysian Pacific Industries Berhad (Semiconductors) Public Bank Berhad (Banks) Public Bank Berhad- Foreign Shares (Banks) Resorts World Berhad (Leisure) RHB Capital Berhad (Banks) Sime Darby Berhad (Holding Companies- Divcrsified) Star Publications (Malaysia) Berhad (Media) Tanjong PIC. (Ixisure) Telekom Malaysia Berhad (Telecommunications) Tenaga Nasional Uerhad (Elcctric) Unisem (M) Berhad (Semiconductors)
Berhdd (Ranks)
117,477 0.3 4.450 52,794 0.1
28.200 458,350
32,894
44,914
99,225
64.516
62,268
28,022
89.482
1.1
0.1
0.1
0.2
0.2
0.2
0.1
0.2
5,272 283,855 0.7
64,400 0.2
82,105 0.2
45,711 0.1
197,842 0.5
20,612 0.1
76,000
120,000
18,000
53,700
65,271
8,000
3,116
59.597
4,134
1,700
1.845 44,842 0.1
38,342 0.1
5,501 0.0
26,856 0.1
35,763 0.1
4,090 47,000
6,700
17,595
45,000
72.500
270.451 0.7
1,690,092 4.2
Korea 16,690 Dongwon Securities Co.
(Diversified Financial Services)
40,400 Hana Bank (Banks) 9,940 Hire Brewery Co.. Ltd.
(Beverages) 19,048 Housing & Commercial
Bank (Banks) 30,570 Hyundai Motor Co , Ltd
(Auto Manutacturers) 10,674 Kookmin Bank (Banks) 18,389 Korca Electric Power
11,400 Korea Electric Power-
1,810 Korea Telecom Corp.
7.000 Korea Telecom
(Elcctric)
ADR ( 8 ) (Electric)
(Tclccommunications)
Corp.--ADK (a)
(Telecommunications) 7,450 Samsung Electronics
(Electrical Components & Equipment)
63,709 207,947
0.1 0.5
89,289 0.2 36.400 311.073 0.8
100,579 0.3 55,336 0.1
407?863 1 .o 28,313 16,300 0.8
0.3 327,288 119,113 53,189 0.1
17.500 58.487 0.1 348,320 0.9
6,000 18,632 0.1 123,262 0.3
1,273,935 3.2 89,438 0.2
Mexico 21,900 Apasco SA “Scr *”
(Building Materials) SX,000 Grupo Carso SA “Al”
(Ilolding Companies- Diversified)
114.736 0.3 194.687 0.5
993,947 2.5 170,733 0.4
The accompanying notes are an integral part of these financial statements. 29

GOLDMAN SACHS GLOBAL EMERGING MARKETS EOUITY PORTFOLIO
Statement of Investments 30 November 2000
Shares Description Value % o f
USD Net Assets Shares Description Value % o f
US0 Net Assets
Common Stocks - (continued) Mexico - (continued)
576,300 Grupo Financicro Uancomer SA (Diversified Financial Services)
241,XSl Grupo Modelo SA “C” (Beverages)
2,500 Grupo Televisa SA- GDR (3) (Mcdia)
74,000 Kimberly Clark de Mexico “A” (Forest Products & Paper)
35,800 Organizacion Soriana “ B (Retail)
35,145 Telefonos de Mexico- ADR “L” ( 8 ) (Telephone)
210,000 Wal-Mart de Mexico SA CV “C” (Retail)
32,000 Wil-Mart de Mexico SA CV “v” (Retail)
351,537 0.9
615,551 1.5
120.938 0.3
185,983 0.5
106,335 0.3
1,746.267 4.3
420,000 1.0
70,393 0.2
3,902,473 9.7
Peru 4,400 Crcdicorp Ltd. (Banks) 26.675 0.1
Philippines 69,700 ABS-CBN Broadcasting
Coy. (Media) 31 7,600 Ayah Corp. (Holding
CompanicsDivcrsified) 250,550 Benpres Holdings Corp.
(Holding Companies- Diversified)
25,560 Manila Electric Co. (Electric)
Telephone Co. (relecommunica tions)
900 Philippine Long Distance Telephone Co.-ADR (a)
(Tclcphonc) 28.228 San Miguel Corp. (Food)
4,250 Philippine Long Distancc
407,200 SM Prime Holdings (Real Estate)
65,344 0.2
46.103 0.1
13,386 0.0
22.932 0.0
68,977 0.2
14,569 0.0 29,025 0.1
41.048 0.1
301,384 0.7
Poland
3,049 Rank Polska K:IM Opicki
241 Bank Romoju Eksport SA (Banks) 39,335 0.1
(Banks) 6,278 0.0 2.111 Elektrim (Electrical
Components & Equipment) 19,588 0.0
(Metal-Divcrsificd) 26,702 0.1 4,758 KGHM Polska Miedr SA
Common Stocks - (continued) Poland -(continued)
400 Nctia Holdings SA-ADR (a)
(Telecommunications) 5,600 0.0
SA-GDR (a)
4,444 Polski Koncern Naftowy
(Oil & Gas Services) 39,329 0.1
(Softwarc) 18,535 0.0 549 Prokom Software
11,073 Tclckomunikacja Polska SA (Mephone) 60,162 0.2
215,529 0.5
Russia 4,600 AO Tatneft-ADR (4
(Oil & Gas Producers) 20,844 Lukoil Holding-ADR (4
(Oil & Gas Produccrs) 3,000 Mobile Telcsystems-
ADK (a)
(Telecommunications) 4,177 Norilsk Nickel (Mining)
19,630 Surgutneflegaz-ADR (a)
4,400 Surgutneftegaz-ADR (a)
(Oil & Gas Producers)
Preferred (Oil & Gas Producers)
Russia-GDR (a) (Electric) 9,853 Unified Energy Systems
41,400
406,458
73,500 27,151
213,967
53,900
91,140
0.1
1 .o
0.2 0.1
0.5
0.2
0.2
907,516 2.3
South Africa 21,600 ABSA Group Ltd.
(Banks) 67.853 0.2 7.750 h g 1 0 American Platinum
4,329 Anglogold (Mining) 105,770 0.3 6.800 Barlow Ltd. (Holding
Companies-Oiversified) 36,569 0.1
(Holding Companies- Diversified) 58,689 0.1
Financial Services) 48,553 0.1
(Metal-Diversified) 312,585 0.8
10.887 Bidvest Group Ltd.
102,900 BOE Ltd. (Diversificd
22.300 Comparex Holdings Ltd. (Computers) 22.486 0.0
(Investment Companies) 33,482 0. I 29.872 Dc Bccrs Ccntcnary
(Mining) 807.091 2.0 20,758 Dimension Data
Holdings-GDR (Software) 141,151. 0.3
Financial Serviccs) 154:866 0.4 24,314 Gold Ficlds Ltd. (Mining) 68321 0.2
2,800 Coronation Holdings Ltd.
171,138 Firstrand (Diversified
30 The accompanying notes are an integral part of these financial statements.

GOLDMAN SACHS GLOBAL EMERGING MARKETS EQUITY PORTFOLIO
Statement of Investments 30 November 2000
Shares Description Value % o f
USD Net Assets
Common Stocks - (continued) South Africa -(continued)
2,400
5,272
2,770
2,043
7,881
1,266
2,563
242
18,200
9,036 17,600
2
109,400 9,323
44,251
17,852
5,116 13.400
Impala Platinum Holdings Ltd. (Metal-Diversified) Imperial Holdings Ltd. (Holding Companies- Diversified) Investec Group Lld. (Banks) Johnnic Communications Ltd. (Media) Libcrty Group Ltd. (Insurancc) Mobile Industries Ltd. (Transportation) Mobile Industries L1d.-New shares (Transportation) Mobile Industries, Ltd.-Debentures (Transportation) Nampak 1-td. (Packaging 6 Containers) Nedcor Lld. (Banks) Rcmgro Ltd. (Holding Companics-Diversified) RMB Holdings Ltd. (Diversified Financial Scrviccs) Sanlam Ltd. (Insurance) Sappi Ltd. (Forest Products & Paper) Sasol Etd. (Oil & Gas Producers) South African Breweries (Beverages) Tiger Oats (Food) Vcnfin Ltd. (Holding Companies-Diversified)
11 3,244
37,484
80.212
25.354
60,619
54
109
34
24.704 183,395
100,337
3 114,272
59,659
312,912
106,390 36,375
29.705
0.3
0.1
0.2
0.1
0.1
0.0
0.0
0.0
0.1 0.4
0.2
0.0 0.3
0.1
0.8
0.3 0. I
0.1
3,142,568 7.8
Taiwan 54,275
37,040
14x1 84
86,121
60,200
59,500
277,000
Ambit Microsystems Corp. (Electrical Components & Equipment) Asustek Computer, Inc. (Eleclronics) Cathay Life Insurance Co., Ltd. (Insurancc) Chinatrust Commercial Bank (Ranks) Compeq Manufacturing Co., Ltd. (Elcctronics) Dclta Elcctronics, Inc. (Elcctrical Components & Equipment) Far Eastern Textile Ltd. (Textiles)
274,000
156,199
255,377
46,601
262,966
203,250
219,389
0.7
0.4
0.6
0.1
0.7
0.5
0.5
Value %of US0 Net Assets Shares Description
Common Stocks - (continued) Taiwan -(continued)
117,943
50,676
116,000
107,994
1 10,864
54.520
9,501
261,241
240,000
5,000
180,000
Formosa Chemicals & Fibre Corp. (Chemicals) Hon Hai Prccision Industry (Electronics) Macronix Intemational Co., Ltd. (Semiconductors) Nan Ya Plastic Corp. (Chemicals) Presidcnt Chain Store (Retail) Procomp Informatics Co., Ltd. (Electronics) Siliconware Precision Industries Co.-ADR (a)
(Scmiconductors) Taiwan Semiconductor Manufacturing Co. (Semiconductors) United Microelectronics Corp., Ltd. (Semiconductors) Via Tcchnologies, lnc. (Scmiconductors) Winbond Electronics Corp. (Semiconductors)
84,143
288,001
187,606
132,218
298,274
173,877
36,s 13
706,804
377,267
31.288
180,653
0.2
0.7
0.5
0.3
0.7
0.4
0.1
1.8
0.9
0.1
0.5
3,914,726 9.7
Thailand 8,461 Advanced Info Scrvicc PIC.
(Tclccommunications) 53,740 Bangkok Bank PIC.-
Foreign Shares (Banks) 29,242 UEC World Plc. (Media) 14,900 Delta Electronics
(Thailand) PIC. (Electronics)
(Kea1 Estate)
& Production PIC. (Oil & Gas Producers)
(Computers)
(Building Materials)
(Telephonc) 11,937 TclccomAsia Corp.,
PIC.-Kights (Telephone) 79,400 Thai Farmcrs Bank Plc.
(Banks)
98,400 Land & House PIC.
42,300 P7T Exploration
30,100 Shin Corp., PIC.
5,300 Siam Cement PIC.
132,800 TelecomAsia Corp., PIC.
84,620 0.2
47,549 0.1 149,S65 0.4
87.097 0.2
35,949 0.1
108.177 0.3
107,905 0.3
54.458 0.1
62,920 0.1
0 0.0
39,886 0.1
778,126 1.9 - _ Turkey 3,983,900 Akcansa Cimcnto AS.
(Building Materials) 36,033 0.1
The accompanying notes are an integral part of these financial statements. 31

GOLDMAN SACHS GLOBAL EMERGING MARKETS EQUITY PORTFOLIO
Statement of Investments 30 November 2000
Value % o f Value % af Shares Descrlptlon USD Net Assets Shares Description USD Net Assets
Common Stocks - (continued) Turkey - (continued) Thailand
Warrants - 0.0%
3,618,517
1,766,250
642.000
2,120,000
1.238.439
2,oss,1so
228,174 2,173,406
1,522,100
7,000
5.656.880
Anadolu Biracilik (Beverages) Arcclik A S . (Home Furnishings) Aygaz A S . (DistributioniWholesale) Dogan Sirketler Grubu Holdings (Holding Companies-Diversified) Eregli Demir Ve Celik Fahrik (Iron/Sleel) Ford Otomotivc Sanayii AS. (Auto Manufacturers) Migros (Food) Tofas Turk Otvmohil Fabrik (Auto Manufacturcrs) 'I'upras-'hrkiye Pctrol Kafinerileri AS. (Oil & Gas Producers) Turkcell Jletisim Hizmet AS.-ADR (4 (Telccommunicalions) Turkyie Garanti Uankasi (AS. Banks)
182,593
33,584
19,484
16,744
24.001
87.172 21.025
19,073
52,874
48,563
34,750
0.5
0.1
0.1
0.0
0.1
0.2 0.1
0.0
0.1
0.1
0.1 36,397,186 Turkyie IS Rankasi
(Banks) 206,254 0.5 385,538 Vcstel Eleklronik Sanayi
(Homc Furnishings) 52,161 0.1
(Banks) 375,563 0.4 33,332,268 Yapi Vc Krcdi Bankasi
1,019,874 2.5
United Kingdom 12,620 Dimension Data
Holdings (Software) 86,054 0.2
United States 7,100 Ampal-American Israel
Corp. (Investment Companies) 51.475 0.1
Venezuela 12,800 Nacional Telefonos de
Venezuela-ADR (a)
(Telephone) 214,400 0.5
T O T A L COMMON STOCKS
(cost USD 45,057,185) 38,478,218 95.4
30,300 Siam Commcrcial Bank PIC., expiring 10/05/02 2,283 0.0
T O T A L W A R R A N T S
(cost USD 0 ) 2,283 0.0
Call Option Purchased - 0.3% United States
54 Telefonos de Mexico 133,646 0.3
T O T A L CALL O P T I O N
PURCHASED
(cost U S D 125,550) 133,646 0.3
T O T A L I N V E S T M E N T S
(cost USD 45.182.735) 38,614,147 95.7
All security holdings of this portfolio are transferable secu- rities dealt on a regulated market. (u) Srcurirj holding is trudrdlhcld in U.W.
32 The accompanying notes are an integral part of these financial statements

GOLDMAN SACHS GLOBAL EQUITY PORTFOLIO
Letter to Shareholders 30 November. 2000
Dear Shareholders:
On behalf of Goldman Sachs: we welcome thc opportunity to review the performance of the Goldman Sachs Global Equity Portfolio for the one-year period that ended 30 Novcmber 2000.
Market Review
US - Thc rcporting period began on a positive note Cor the US market, as stocks rose bcforc cxpcricncing a sharp corrcction in mid-March. Continued strong economic growth, inflationary pressures and rising intcrcst rates formed a high prcssurc cnvironment for equities. While other types of stocks were dragged down, technology issues expericnccd thc brunt of the fall. Within a few weeks the technology-laden Nasdaq had fallen 37% from its peak. The equity markets expericnced a bricf rcbound late in the summer, as investors were hopeful that signs of moderating economic growth would result in an cnd to intcrcst rate hikes by the Federal Reserve Board. However, the reporting period concluded on a down note: as unccrtainty regarding corporate profits and continued high energy prices took their toll.
Europe - Early in the reporling period, European equities generated solid rcsults. However, as was the case in the US, the rally was very narrow, with the technology: media and telccom (TMT) scctors moving sharply
forward. This strong pcrformance overshadowed the poor results in virtually all other areas of thc markct. Thcn, in March, a sharp correction in the TMT sector occurred, dragging down much of thc markct. As the period progressed, concern over the dircction of interest rates, the prospects for ‘new economy’ stocks and the falling euro undermined investor confidcncc. Europcan markets were also unsettled by several interest rate hikes by the European Central Bank (ECB). Extrcme volatility continued to characterise the market, compounded by thin trading volumes. While the market had several mini-rebounds, these were not sustained and most European markets were down during the rcporting period.
Japan -As the reporling period began the Japanese stock market continued to be highly polarised, with only a handful of large-cap, high-growth stocks in kchnology related areas making a significant contribution to the rise in thc markct. Thcsc valuations were eventually stretched to unsustainable levels, and when thc global stock market correction occurrcd in thc spring, Japanese equities as a whole fell sharply. Despite the weakness in the stock market, corporate results have confirmed improving fundamentals. In addition, restructuring plans by companies in a variety of industrics hclpcd to contribute to respectable earnings, in spite of continued contraction in revenues.
As the period ended, current price-to-earnings had fallcn to more reasonable levels. The supply/demand trend in the market looks to be weak, due to large equity issuancc slatcd over coming quarters. A decelerating global economy is also a negative factor, since a rapid growth in cxport has strongly buttressed the Japanese economy as well as the corporate earnings during the currcnt up-cyclc. Finally, sustainability of earnings
growth is unccrtain and it appears that a growing number of investors are becoming sceptical about top-linc growth amid pcrsistcnt domestic deflationary pressures.
Asia - Aftcr gcncrating strong performance during the fourth quarter of 1999, Asian stocks as a wholc fcll during the first 11 months of 2000. At the regional level, rising global interest rates had the largest influence with the banking and property sectors throughout thc rcgion taking the brunt of the impact. Individual countries were also negatively impacted by specific cvcnts.
33

GOLDMAN SACHS GLOBAL EQUITY PORTFOLIO
Letter to Shareholders 30 November 2000
Market Review (continued)
Looking ahead, a potential easing of monetary policy in the US, driven by a slowing economy and potential for continued US stock market volatility, is likely to benefit the interest rate sensitive sectors of property and banks, particularly in Hong Kong and Singapore. On the other hand, Asia’s technology sector continues to look weak in the absence of strong demand growth figures coming through. In our opinion, it is likely to be further aggravatcd by the fact that most stocks already have high earnings growth expectations built into their prices.
Portfolio Positioning
Our asset allocation strategy was relatively benign during the period, as we prefer to derive the majority of our excess returns from stock and sector selection. As earnings uncertainty and global economic slowdown continue to take their toll on global equity markets, we continue to believe in the importance of focusing on companies with strong pricing power and dominant, enduring franchises that we believe the market will continue to value at a premium. In this respect, we have maintained a more defensive stance in the portfolio, preferring non-bank financials, pharmaceuticals and selected consumer and business services companies. We also maintained our overweight in broadcast media. Wc continuc to undcrwcight industrials and decp cyclicals, which we bclieve will find it difficult to thrive in the current environment.
Performance Review
Over the one-year ended 30 November 2000, the Portfolio’s cumulative total return was -3.26% This compared to the -8.08 % return for the Portfolio’s benchmark, the Morgan Stanley Capital International World Index (with income reinvested and, in contrast to the Portfolio, without the deduction of any expenses. Prior to 31 December 1999 the Portfolio’s benchmark was the FT-Actuaries World Index. For more information on the performance of the Portfolio and a description of its benchmark, refer to page 108. Portfolio returns are shown net of managcmcnt fees with income reinvested using month-end NAVs.)
The Portfolio outperformed its benchmark through successful stock and sector selection. At the asset allocation levcl, thc majority of returns were derived from North America, although Europe and Asia were also positive. Our slight overweight in Japan over the period detracted from performance. At the sector level, our overweight in Financials and underweight in Information Technology predominantly enhanced relative returns.
Thc markets rotated back towards defensive sectors, as investors looked for stocks that would not be affected by cconomic events. In addition defensive issues were boosted by expectations of an early end to monetary tightening. For similar reasons, our overweights in Pharmaceutical stocks were also positive for performance. Our approach of selectively overweighting high-quality Technology companies, whilst being underweight in the sector as a whole, greatly helped relative returns.
We thank you for your investment and look forward to your continued confidencc.
Goldman Sacbs Global Equity Portfolio Mandgemcnt Team New York, London, Tokyo and Singaporc, 15 Dccember 2000
34

GOLDMAN SACHS GLOBAL EQUITY PORTFOLIO
Statement of Investments 30 November 2000
Value % o f Shares Description USD Net Assets
Common Stocks - 93.9% Australian Dollar
12,163 Brambles Industrics Ltd. (Commercial Scrvices) 288,232 0.2
68,679 Rroken Hill Proprictary Co.. Ltd. (Mining) 703,156 0.5
38,551 News Corp.. Ltd. (Media) 342,537 0.2 75,581 Tab Corporation
Holdings Ltd. (Leisure) 445,931 0.3 84,817 Woolworths Ltd. (Rctail) 345,970 0.2
2,125.826 1.4
British Pound Sterling 15,606 Amvcscap PIC.
(Diversified Financial Services)
3,X64 RstraZeneca Group Plc. (Pharmaceuticals)
64,948 BAE Systems PIC. (AerospaceiDeknsc)
85,262 B P h o c o PIC. (Oil XC Gas Producers)
86,860 Uritish Telecom Plc. (Telecommunications)
10,618 Cable & Wireless Plc. (Teleccimmunications)
105,260 Diagco Plc. (Beverages) 39,954 Glaxo Wcllcome PIC.
68,229 HSBC Holdings Plc.
66,194 Imperial Chemical
(Pharmaceuticals)
(Banks)
Industries Plc. (Chemicals)
(Miscellaneous Manufacturing)
69,609 Lloyds TSB Group PIC. (Banks)
60,530 P&O Princess Cruiscs PIC. (Lcisurc)
10,664 Rcuters Group PIC. (Mcdia)
22,501 Royal Bank of Scotland Group PIC. (Banks)
42,903 Scottish Power PIC. (Elcctric)
85,236 SmithKline Beecham PIC. (pharmaceuticals)
90,237 Invcnsys Plc.
151,237 Tesco PIC. (Food) 137,684 Unilever PIC. (Food) 585,687 Vodafone Group Plc.
(Telecommunications)
(hdvcrtising) 16,hlB WPP Group PIC.
253,871 0.2
192.818 0.1
335,838 0.2
688,YhX 0.5
744,979 0.5
130,054 0.1 1,092,676 0.7
1,152,923 0.8
903,410 0.6
445,739 0.3
213,954 0.1
677,446 O S
215,384 0.1
154,202 0.1
462,210 0.3
319.617 0.2
1,118,024 0.7 600,323 0.4
1,129,649 0.7
2,007,247 1.3
383,636 0.1
13,020,968 8.5
Shares Description Value %of
US0 Net Assets
Common Stocks - (continued) Euro
7,615 3.647
13,352
1,864 19,885
23,819
6,007
4,803 58,226
50,106 624
2,905 8,971
10,584
8,598 140,270
11,416
4,313
31,043
14,718
99
6.814
2,940
1,365
37,749
30,713
27,961
45.759
Acerinox SA (Iron/Steel) Air Liquide (Chemicals) Alcatel SA (Telecommunications Equipment) Allianz AG (Insurance) Alstom (Machincry- Diversified) ASM Lithography Holding NV (Computcrs) Aventis SA (Pharmaceuticals) hxA (Insurance) Banca Nazionale del Lavoro SpA (Banks) Bank of Ireland (Banks) Cap Gemini SA (Computers) Carrcfour SA (Food) Deutsche Bank AG (Banks) Deutsche Telekom AG (Telephone) E.On AG (Electric) Electricidade de Portugal SA (Electric) Fortis (NL) NV (Diversified Financial Services) France Telecom SA (Telephone) Havas Advertising SA (Advertising) ING Groep NV (Insurance) Koninklijke (Royal) KPN Nv (Telecommunications) Lafage SA (Building Materials) Louis Vuitton Moet Hennesy (LVMH) (Beverages) Miinchener Riickversicherungs- gesellschaft AG (Insurance) Nokia (AB) OY (Telecommunications Equipmen t) Philips Electronics NV (Electronics) Royal Dutch Petroleum Co. (Oil & Gas Producers) San Pado-1MI SpA (Banks)
196,106 0.1 474,499 0.3
665,477 0.4 652,749 0.4
463,140 0.3
491,382 0.3
477,209 0.3 671,114 0.4
179,674 0.1 407,943 0.3
87,028 0.0 175,382 0.1
650,856 0.4
338,528 0.2 495,086 0.3
410,961 0.3
334,464 0.2
357,214 0.2
403,621 0.3
1,063,343 0.7
1,322 0.0
509,129 0.3
193,041 0.1
449,609 0.3
1,552,603 1 .O
1,020,955 0.7
1,686,867 1.1
707,604 0.5
The accompanying notes are an Integral part of these financial statements. 35
. .. . . . . .

GOLDMAN SACHS GLOBAL EQUITY PORTFOLIO
Statement of Investments 30 November 2000
Sharer Description Value
USD % of
Net Assets Shares Description Value %of
USD Net Assets
Common Stocks - (continued) Euro - (continued)
4,264 SAP AG-Preferred
2,561 Sicmcns AG (Software)
(Miscellancous Manufacturing)
5.240 Sonera Oyj (Telecommunications)
3,380 Sucz Lyonnaise des Eaux SA (Watcr)
S0,000 Telecom Mia Mobilc SpA (Telecommunications)
37,471 Teleconi Italia SpA (Telephone)
46.104 Telefonica SA (Tclcphonc)
9,504 Total Fina SA (Oil & Gas Services)
(Banks) 4,594 Vivendi
(Commcrcial Scrvict.5) 13,485 Vivendi Lnvironncmcnt
(Environmental Control) 11.590 VNU NV(Media)
88,500 Unicredito Italiano SpA
Common Stocks - (continued) Japanese Yen -(continued)
25>000 Daiwa Securities Group, hC. (Diversified Financial Services)
3,200 FANUC Ltd. (Electronics) 15.000 Fuji Pholo Film Co.
(Miscellaneous Manufacturing)
21,000 Kao Corp. (Cosmetics/ Pcrsonal Care)
44,000 Grin Brewcry Co. (Beverages)
22,000 Minebea Co., Ltd. (Electronics)
S0,OOO Mitsui Marine & Fire (Insurance)
88 Mizuho Holdings, Inc. (Banks)
3.400 Murata Manufacturing Co., T,td. (Electronics)
20,000 NEC Corp. (Scmiconduclors)
23,000 NGK Insulators Ltd. (Electronics)
2,700 Nintendo Co.
554.406 0.4 262,707 0.2 257.755 0.2
294,355 0.2
99.471 0.1 603.437 0.4
644,027 0.4
418,707 0.3
225,030 0.2
293,600 0.2
569,125 0.4
453,885 0.3
376,133 0.2
298.742 0.2
404.032 0.3
575.116
396.994
0.4
0.3
441,726 0.3
723,729 0.5
1,357,633 0.9
440,326
284.121
0.3
0.2
551,711 504,320
0.4 0.3
(Entertainment) 21,340,814 13.9 127 Nippon Telegraph
Hong Kong Dollar 174.000 Ginrdano International
Ltd. (Rctail) 57,500 Hang Seng Bank Ltd.
(Banks) 31,100 Hutchison Whampoa
(Holding Companie5- Divcrsificd)
(Distribution/Wholesale)
(Holding Companies- Diversified)
188.000 Li & Fung Lld.
34,000 Swire Pacific Ltd.
& Tclcphone Corp. (Tclccommunications)
Ltd. (Diversified
35,000 Ricoh Co., I-td. (Office/
85,329 0.1 15,000 Nomura Sccuritics Co.,
669,003 0.3 Fin ancia1 Services)
Business Equipment)
(Semiconductors)
T,td. (Retail)
371,812 0.2 2,100 Rohm Co., Ltd.
392,879 0.3 1,200 Ryohin Keikaku Co.,
32,000 Sakura Bank T.td. (Ranks) 217,517 0.1 35,000 Sanwa Rank Ltd. (Ranks)
56,000 Sanyo Elcctric Co., Lld. (Electrical Comuonents 1,736.540 1.1
1,093,988 0.7
315.248 0.2
621,612 0.4
505.750 0.3
54,228 0.0 184,729 0.1 251,928 0.2
Br Equipment)
(Elcctronics)
(Electrical Components Br Equipment)
6,000 Shin-Etw Chemical Co. (Chemical\)
11,000 Skylark (Rctail)
5,000 Sccom Co., Ltd.
25,000 Sharp Corp.
1.200 SMC Corp.
2,800 Sony Corp. (hlectronics)
(Dislrihulion/Whole5ale)
Industries Ltd.
(lland/Machinc Tools)
31 .000 Sumitomo Corp.
9,000 Takcda Chcmical
435,918
349,975
0.3
0.7
Japanese Yen 9,400 Aderans Co., Ltd.
1:800 Advantest Corp. (Cosmeticsil'ersonal Care)
(Elcctronics) 72,000 Asahi Chemical Industry
Co., Ltd. (Chemicals) 39.000 Asahi Glass Co., Lld.
(Iiousewarcs) 15,000 Canon, Inc.
(Office/Husiness Equipmenl)
57,000 Chiba Bank Lld. (Ranks) 10,160 Circlc K Japan Co.
(Retail)
326,433 0.2
211.392 0.1
450,061 0.3
382,736 0.3
297.659 0.2
268,435 297.659
0.2 0.2
175,348 211 .I40
0.1 0.1 588,554 0.4
221,080 0.1 245.226 0.2
364,739 0.2
(Pharmaceuticals) 556,894 0.1
36 The accompanying notes are an integral part of these financial statements.

G O L D M A N SACHS GLOBAL EQUITY PORTFOLIO
Statement of Investments 30 November 2000
Shares Description
Common Stocks - (continued) Japanese Yen -(continued)
5,100 Takefuji Corp. (Diversified Financial Services)
15,000 'l'erumo Corp. (Health Care)
21,900 Tokyo Electric Powcr Co., Inc. (Elcctric)
18,200 Toppan Forms (Commercial Services)
13,000 Toyota Motor Corp. (Auto Manul'acturcrs)
13,000 Yamanouchi Pharmaccutical (Pharmaceuticals)
Value % o f US0 Net Assets
302,692 0.2
296,983 0.2
517,548 0.3
303,703 0.2
363,176 0.3
Shares Description
Common Stocks - (continued) Swiss Franc - (continued)
136 Roche Holding AG- Preferred (Pharmaceuticals)
357 Schweizerischc Riickversichcrungs- gesellschaft (Insurance)
96 Syngenta AG (Chemicals)
5YY Zurich Financial Serviccs 5,456 UBS AG (Banks)
AG (Insurance)
632,030 0.4
15,734,044 10.3
Singapore Dollar 60,000 City Developments I.td.
26.260 UUS Group Holdings
13,000 Singaporc Prcss
(Kea1 Estate) 273,504 0.2
T,td. (Banks) 297,763 0.2
Holdings (Media) 202,222 0.1 209,000 Singapore Technologies
Ltd. (Miscellaneous Manufacturing) 312,011 0.2
Telecommunications (Telccommunications) 379,351 0.2
1,464,851 0.9
228,000 Singapore
Swedish Krona 67,361 Investor AB
81,669 Nordhankcn Holding AB
30,403 Securitas AI3
39,877 Skandia Foryakring5 AB
92,796 Telefonaktiebolagcl LM
(Investment Companies) 899,668 0.6
(Banks) 582,013 0.4
(Commercial Service\) 493,939 0.3
(Insurance) 602,149 0.4
Ericsson "B" (Telecommunications Equipment) 1,045,146 0.7
3,622,915 2.4
Swiss Franc 4,571 ABB Ltd.
(Engincering & Construction) 416,777
(Commercial Services) 170.703
(Banks) 252,042 654 NcstlE SA (Food) 1,424,741 257 Novartis AC
(Pharmaceuticals) 415,730
274 AdeccoSA
1,446 Credit Suisse Group
United States Dollar 22.200 AES Corp. (Electric) 21,400 AH Belo Cop. (Media) 15,100 AMBAC Financial
Group, Inc. (Insurance)
(Internet) 22,300 American Home Products
Corp. (Pharmaceuticals) 21,750 Amcrican Intemational
Group (Insurance) 10,486 ATLT COT. (Tclcphone) 74,800 AT&T COT.- Libcrty
Media Group (Media) 18,800 Avon Products, Inc.
(Cosmctics/Personal Care) 30,700 Bristol Myers Squihb Co.
(Pharmaceuticals) 29,600 Cendant Corp.
(Commercial Scrviccs) 6,590 CheckFrec Corp.
(Internet) 48,100 Cisco Systems, Inc.
(Telecommunications Equipment)
(Diversified Financial Services)
6,486 Clcar Channel Communications, Inc. (Media)
(Beverages)
9,800 America Online, Inc.
41,933 Citigroup, Inc.
22,100 Coca-Cola Co.
12,900 Coming, Inc.
0.1
0.2 0.9
Value %of US0 Net Assets
1,353,467 0.9
798,057 0.5 4,269 0.0
763,466 0.5
325,628 0.2
5,924.880 3.9
12,800
0.3
0.3
22,600 1
- (Telecommunications Equipmcnt) Crown Castle Intcrnational Corp. (Telecommunications) CVS Corp. (Retail) Delphi Automotivc Systems Corp. (Auto Parts & Equipment) DoubleClick, Inc. (Internet)
1,230.712 0.8 378.513 0.2
1.151,375 0.7
424,928 0.3
1,343,575 0.9
2.088,OOO 1.4 199,234 0.1
1,023,825 0.7
787.250 0.5
2,216,156 1.4
279,350 0.2
345,151 0.2
2,486,169 1.6
2,073,063 1.4
310,112 0.2
1.372.962 0.9
803.025
305,600 1,265,600
14
160,038
0.5
0.2 0.8
0.0
0.1
The accompanying notes are an integral pan of these financial statements. 37

GOLDMAN SACHS GLOBAL EQUITY PORTFOLIO
Statement of Investments 30 November 2000
Shares Descrimion Value % o f
US0 Net Assets Shares Description Value
USD % of
Net Assets
Common Stocks - (continued) United States Dollar - (continued)
6,800 EchoStar Communications Corp. (Telecommunications)
8,300 Elan Corp., Pk-ALlK (Pharmaceuticals)
12,700 Eli Lilly Kr Co. (Pharmaceuticals)
21,000 EMC Corp. (Computers) 15,266 Encrgizcr Holdings, Inc.
(Electrical Components & Equipment)
(Oil & Gas Producers)
Mortgage Corp. (Diversi fied Financial Scrvices)
23,800 Federal National Mortgagc Association (Diversified Financial Services)
29,300 First Data Corp. (Software)
10,100 Gannett: Inc. (Media) 57,100 General Elcctric Co.
21,600 Exxon Corp.
23,100 Federal Home Loan
(Miscellaneous Manufacturing)
17,000 General Motors Corp. “ H (Telecommunications)
5,800 Gillette Co. (Cosmetics/ Pcrsonal Care)
16,100 Harrah’s Entertainmcnt, lnc. (Lodging)
19.650 Home Depot, Inc. (Ketail) 32,300 Honeywell International.
Inc. (Miscellaneous Manufacturing)
15,600 Infinity Broadcasting Corp. (Mcdia)
56,600 lntel Corp. (Semiconductors)
11,800 Intemational Business Machines. Inc. (Computers)
7,300 JnS Uniphase Corp. (Telecommunications Equipment)
12,300 Johnson & Johnson (Hcalth Care)
16,400 Marriott International, Inc. (Lodging)
34,300 MBNA Corp. (Diversified Financial Services)
14,700 McDonald’s Corp. (Retail)
Common Stocks - (continued) United States Dollar - (continued)
7,400 Mcrck & Co. (Pharmaceuticals)
34,300 Metlifc, Inc. (Insurance) 35.700 Microsoft Corp.
(Software) 4,600 Minnesota Mining
& Manuracturing Co. (Misccllancous Manufacturing)
12,300 New York ’limes Co.
34,900 Nortel Networks Corp. (Media)
(Telecommunications Equipment)
(Telecommunications) 5,350 NTL, Inc.
45,400 Oracle Corp. (Software) 9,800 Pepsico, Inc. (Ueveragcs)
53,975 PFizer, lnc. (Pharmaceuticals)
44,700 Philip Morris Cos.: Inc. (Tobacco)
1,900 PMC-Sierra, Inc. (Semiconductors)
8,000 Procter & Gamble co. (CnsmeticsPersonal Care)
6,800 Qualcomm, Inc. (Tclccommunications Equipment)
4,250 KadioShack C o p (Retail)
17,506 SBC Communications, Inc. (Telephone)
14,000 Schcring Plough Corp. (Pharmaceuticals)
14,100 Schluniberger Ltd. (Oil & Cas Services)
12,400 Seagram Co., Ltd. (Media)
5,100 Sprint Corp. (PCS Group) (Telephone)
& Resorts Worlwide, Inc. (Lodging)
11,300 State Strcct Corp. (Banks) 9,800 Sun Microsystcms, Inc.
(Computers) 11,400 Texas Instruments, Inc.
(Semiconductors) 12,550 The Charles Schwab
Corp. (Internet) 27,500 Time Warner, Inc.
(Media)
21,900 Stanvood Hotcls
5,800 Tribune Co. (Mcdia) 19,400 UnitedGlobalCom, Inc.
(Media)
702,075 956,113
0.5 0.6 186,894 0.1
443,013 0.3 2,973,356 1.9
1,200,150 0.8 1536,937 1 .O
460,575
433,575
0.3
0.3 293,871 0.2
1,921,050 1.3 1,241,131 0.8
148,463 1,038,525
444,675
0.1 0.7 0.3
1,374,450 0.9
2,462,609 1.6 1393,587 1.2
1,718,156 1.1 1,483.312 1 . 0
541,613 0.4 196,680 0.1
604,500 0.4 2,837,156 1.8
386,750 0.3 561.850
215,953
966.112
790.125
931,481
613,800
120,488
0.4
0.1
0.6
0.5
0.6
0.4
0.1
199,375 0.1
457,844 0.3 786,000 0.5
1,560,494 1.0
478,725 0.3
2,419,650 1.6
1,177,787 0.8 728,175 1,463,915
0.5 1.0
419,750 0.3
1,233.075 0.8
676,500 0.4
781,550 0.5
445.3 13 0.3
362,381 0.2
1,771,000 21 7.500
1.2 0.1 1.247,662 0.8
477,750 0.3 305,247 0.2
38 The accompanying notes are an integral part of these financial statements.

GOLDMAN SACHS GLOBAL EQUITY PORTFOLIO
Statement of Investments 30 November 2000
Shares Description Value %of
US0 Net Assets
Common Stocks - (continued) United States Dollar - (continued)
21,900
5,303 1x,x44
28,921 35,200
50,600 13,200 5,900
12,000
22,500
3,600
Valassis Communications, Inc. (Commercial Services) VeriSign? Inc. (Internet) Verizon Communications (Tclcphonc) Viacom, lnc. (Media) Wal-Mart Stores, Inc. (Retail) Walgreen Co. (Retail) Walt Disncy Co. (Mcdia) Wclls Fargo & Co. (Banks) Wm. Wrigley Jr. Co. (Food) Worldcom, Inc. (Telephone) ~ d h o o ! , Inc. (Inlemel)
622,781 428,177
1,051,731 1,503,892
1,826,000 2,254,862
380,325
276,931
1 ,OY 1,250
364,219 140,625
0.4 0.3
0.7 1.0
1.2 1.5 0.2
0.2
0.7
0.2 0.1
79,074,363 51.5
TOTAL C O M M O N STOCKS
(cost USD 1 4 3 , 6 6 2 , 4 0 2 ) 144,045,001 93.9
Principal Amount Description
Value %of USD NetArsets
Short Term Investments - 5.1%
United States Dollar 7,755,000 State Street Bank 6.50%,,
due 01/12/00 7,755,000 5.1
TOTAL SHORT TERM
INVESTMENTS
(cost U S D 7 .755 .000) 7,755,000 5.1
TOTAL IN VE STM EN TS
(cost U S D 1 5 1 , 4 1 7 . 4 0 2 ) 151,800,001 99.0
All security holdings of this portfolio are transkrable securi- ties dealt on a regulated market.
The accompanying notes are an integral part of these financial statements. 39

G O L D M A N SACHS GLOBAL FIXED INCOME PORTFOLIO
Letter to Shareholders 30 November 2000
Dear Shareholders:
On behalf of Goldman Sachs, we welcome the opportunity to review the performance of the Goldman Sachs Global Fixcd Incomc Portfolio for thc onc-year pcriod that endcd 30 Novcmbcr 2000.
Market Review
The Dollar Bloc - During the first half of the reporting period the overall US bond market faltered, as the Federal Reserve Board (the “Fed”) continued to raise interest rates in an atlempl to slow down the accelerating economy. Then, in June, it appeared that the worst was over. Consumer spending appeared to be moderating, while cmployee productivity was strong and inflation. asidc from energy prices, was not a concern. With the Fed choosing to bold interest rates steady during the summer the prices of government bonds rallied strongly.
Throughout this period, the US bond market was also affected by thc Trcasury Departmcnt’s repurchasc of long maturity debt. The reduction in supply is aimed at reducing the avcragc maturity and intcrcst cost of Treasury debt. ’This led to a sharp increase in demand for 30-year bonds, resulting in strong performance for longer maturity issues and an inverted yield curve.
Elsewhere, the Australian and New Zealand markets initially performed well, but, as the period progressed, a steep decline in their respective currencies versus the US dollar caused their spreads to widen.
Europe - The European Central Rank raised interest rates on numerous occasions during the period. Solid economic growth in many Buroland countries continucd, prompting concerns that this could trigger an incrcase in inflation. In addition. the steep rise in oil prices fucllcd inflationary prcssures and the cur0 continued to depreciate, despite efforts to support the currency.
Japan - In Japan, the bond market has been relatively weak, due to mixed signals on thc cconomic front. Initially, data pointed to a gradual rccovery and an casing of deflationary prcssurcs. In August, thc Bank of Japan raised rates for the first time in 10 years, resulting in a steepening of the yield curve. Despite stable growth, houschold spcnding and rctail salcs continuc to bc wcakcr than cxpcctcd.
Portfolio Positioning
In the earlicr part of thc rcporting pcriod the Portfolio was positioned to rcflcct our concern about the strength of global growth and the tightening bias of most central banks. As such: we initially implemented neutralhhort duration positions. Latcr in the period our outlook for global growth bcgan to dctcrioratc, and wc rcflcctcd this through long duration positions and curvc flattcning tradcs. Within this we wcre especially favourable towards Europe, where we establishcd a long duration position. We also implemented a long duration position in Japan where we bclicvc thc cconomic outlook is dctcriorating and thc markct is rcmaining over-optimistic about Japanese growth potcntial.
Performance Review
Over the one-year period that ended 30 November 2000, the Portfolio’s cumulative total return was -3.18%) compared to the -1.50% return for the Portfolio’s benchmark, the JP Morgan Global Government Bond Index (US$, unhedged with income reinvested and, in contrast to the Portfolio, without the deduction of any expenses. For inorc information on thc pcrformancc of thc Portfolio and a dcscription of its bcnchmark, refer to pagc 108. Portfolio rcturns arc shown nct of managcmcnt fccs with incomc rcinvcstcd using month-cnd NAVs.)
40

GOLDMAN SACHS GLOBAL F I X E D INCOME PORTFOLIO
Letter to Shareholders 30 November. 2000
Performance Review (continued)
The Portfolio's underperformancc vcrsus its benchmark was attributable to several factors. In recent months, the exposure to credit in the Portfolio had a ncgativc impact, due to a widening of corporate bond spreads particularly in the US, currency management also dctractcd from overall results, caused mainly by the fall in the Australian dollar. However, duration and yield curve positioning wcrc positive contributors to performance over the period.
We thank you for your investment and look forward to your continucd confidence.
Goldman Sachs Global Fixed Income Portfolio Management Team
London, 15 December 2000
41

GOLDMAN SACHS GLOBAL FIXED INCOME PORTFOLIO
Statement of Investments 30 November 2000
Principal Amount Description
Value 96 of US0 Net Assets
Principal Amount Description
Value %of USD Net Assets
Corporate Bonds - 26.3% British Pound Sterling
600,000 Ford Motnr Credit Co.
600.000 General Motors 7.2576, duc 22/02/05
Acceptance Corp. 6.8754, due 09/09/04
1,000,000 ING Rank NV 7.008, duc 05/10/10
Holdings Plc. 6.95%, due 22/06/04
409,000 North American Capital Corp. 8.258, due 17/11/03
1.100,000 Vodatonc AirTouch Plc. 7.50%, duc 19/03/04
800,000 Lchman Brothcrs
869.056 0.5
861,018 0.5
1,455,345 0.8
1,134,471 0.7
597,996 0.4
1,610,251 0.9
6,528,137 3.8
Euro 500,000 Ahold Finance USA, Inc.
900,000 Air Products & 6.375%, due 08/06/05
Chemicals, Inc. 6.0075, due 30/03/05
1,500,000 BAT lntcrnational Financc PIC. 4.254:, due 14/04/04
Communications. Inc. 6.50%', due 07/07/05
800,000 Credit Suisse Groupe Finance US, Tnc. 6.6258, duc 05/10/10
5.8754, due 06/08/08
Holdings PIC. 4.75%, duc 12/07/04
Financc PIC. 6.625%, due 08/11/07
1,100,000 Osprey Trust 6.375%, due 15/01/03
900,000 Tecnost Inlernational NV 6.12576, duc 30/07/09
1,400,000 TXU Europe Funding Ltd. 7.00%, due 30/11/05
520,000 Tyco International Group SA 6.1 2S%, due 04/04/07
900,000 Clear Channel
1,636,134 Gallaher Group PIC.
1,900,000 Lehman Brothers
800,000 North Wcst Watcr
440.031 0.3
782,382 0.4
1.224,788 0.7
768.902 0.4
697,975 0.4
1,343.887 0.8
1,583,513 0.9
701,054 0.4
955.005 0.6
718,490 0.4
1,217.876 0.7
445,282 0.3
10,879,185 6.3
German Mark 2,200,000 Countrywidc Home Loan
5.25%, duc 15/12/05 930,260 0.5
Japanese Yen 50,000,000 Ford Motor Credit Co.
1.204, due 07/02/05 442,385 0.3
Corporate Bonds - (continued) United States Dollar
600,000 Ahold Finance USA, Tnc. 8.2570, due 15/07/10
1,000,000 Uank of America Corp. 6.6256, due 15/06/04
1,900,000 Cable & Wireless PIC. 6.504, due 16/12/03
1.200,000 European Investment Bank 5.37570, duc 16/09/08
Bank 6.875%, due 16/06/09
500,000 Furd Motor Credit Co. 7.6076, due 01/08/05
1,500,000 Household Financc Corp. 6.125%. duc 27/02/03
1,500.000 HSUC USA, Inc. 7.00%'. due 01/11/06
1,900,000 Imperial Tobacco Overseas BV 7.12575, due 01 /04/09
400,000 Isracl Elcctric Corp. 8.25s.. due 15/10/09
2,100,000 Natexis Banque 7.00%, due 14/11/05
700,000 National Australia Bank Ltd. 8.60%, due 19/OS/IO
500,000 National Westminster Bank PIC. 7.375%, duc 01/10/09
756,098 Niagara Mohawk Power 7.6254, due 01/10/05
600,000 Philip Morris Capital COT. 7.50%, due 16/07/09
670,000 Phillips Petroleum Co. 8.50%, due 25/05/05
1,700,000 Rothmans Nederland Holdings BV 6.50%, due 06/05/03
1,000,000 Simon Property Group, Inc. 7.12570. due 24/06/05
1,000,000 Sparebanken Rogaland 9.204, due 18/08/09
1,060,000 Textron Financial Corp. 7.1255, due 09/12/04
1,000,000 TRW. Inc. 6.62Su/, due 01/06/04
1,000,000 Tyco International Group SA 6.8754, due 05/09/02
1,000,000 Wells Fargo Bank NA 6.625%, due 15/07/04
3,300,000 Europcan lnvcstmcnt
612,846 0.4
987,317 0.6
1,868,840 1.1
1,110,960 0.7
3,337,620 1.9
503,758 0.3
1,464,300 0.8
1,486,032 0.9
1,749,862 1 .0
392,336 0.2
2,065,980 1.2
750,994 0.4
496,990 0.3
767,292 0.4
554,880 0.3
711.808 0.4
1,652,400 1.0
978,450 0.6
1,029,232 0.6
1,0S6,155 0.6
952,124 0.5
997,282 0.6
993,826 0.6
26,521,284 15.4
T O T A L CORPORATE B O N D S
(cost U S D 47,736,875) 45,301,251 26.3
42 The accompanying notes are an integral part of thme financial statements.

G O L D M A N SACHS GLOBAL FIXED INCOME PORTFOLIO
Statement of Investments 30 November 2000
Principal Amount Description
Value X of US0 Nat Assets
Prlnclpal Amount Description
Value %of US0 Net Assets
Government Bonds - 68.8% British Pound Sterling
5,300.000 UK Trearury 8.5076,
400,000 UK Treasury 9.00%.
700.000 UK Treasury 8.00%,
1,000,000 UK Trcasury 6.001,
due 07/12/05 8,566,565 5.0
due 06/08/12 771,145 0.5
due 07/06/21 1,450.028 0.8
due 07/12/28 1,794,886 1 .0
12,582,624 7.3
Canadian Dollar 5,300.000 Government of
Canada 5.50%, due 01 /06/09 3,424,136 2.0
Danish Krone 24,500.000 Kingdom of Denmark
8.001, due 15/05/03 3,020,064 1.8
Euro 1,200,000 Rundesrepuhlik
Deulschland 4.50%, duc 04/07/09
12,900,000 Government of France 4.50%. due 12/07/02
795>000 Government of Francc 3.50%, duc 12/07/04
7,100,000 Government of France 6.50%, due 25/1 O/O6
2,100,000 Government of France 5.50%. due 25/04/10
2,500,000 Govcrnmcnt of France 8.50%, due 25/1 n/ 1 9
2.200,OOO Govcrnmcnt of Francc 5.50%. due 25/04/29
400.000 Kingdom of Relgium 6.50%, duc 31/03/05
1,300,000 Kingdom of Belgium 4.7576, duc 28/09/05
7,000,000 Rcpublic of Italy 4.251,due 01/11/09
4,200,000 Kepublic of Italy 6.50%,, due 01/11/27
1,003,338
11.1 10,154
657.407
6,627,542
1366,879
2,924,799
1,893,801
364.819
1,108.134
5,596,752
3,944,546
0.6
6.5
0.4
3.8
1.1
1.7
1.1
0.2
0.6
3.2
2.3
37,098,171 21.5
Greek Drachma 1,480,000,000 Rcpublic of Greece
6.301, due 29/01/09 3,912,982 2.3
Japanese Yen 300,000.000 Government of Japan
1.10%, due 20/06/05 2,726,614 1.6
Government Bonds - (continued) Japanese Yen - (continued)
780.000,OOO Government of Japan
1,260.000,000 Govcrnment of Japan
410,000,000 Government of Japan
70.000,000 Government of Japan
90,000,000 Government of Japan
220.000,000 Government of Japan
280,000.000 Republic of Italy
1.208, due 20/09/05 7.106,854 4.1
0.90%', due 22/12/08 10,852,150 6.3
1.9076, duc 20/12/10 3.797,451 2.2
1.50%. due 20/03/19 568,202 0.4
2.50%, due 21/12/20 858,809 0.5
2.40%, due 20/02/30 1,921.689 1.1
3.75%, duc 08/06/05 2,844,198 1.6
30,675.967 17.8
New Zealand Dollar 8,600,000 Government of
New Zealand 8.0070, due 15/11/06 3.763,695 2.2
Swedish Krona 23,000,000 Kingdom of Sweden
3.50%, due 20/04/06 2,137,870 1.2
United States Dollar 8.100,OOO United Sales
Treasury Bonds 8.125%, due 15/08/19 10,194,579 5.9
Treasury Bonds 6.25%, due 15/05/30 9.112.656 5.3
Trcasury Notes 3.62596, due is/nI/o8 1.800,818 1.1
Trcasury Notes 6.00%, due 15/08/09 718,487 0.4
8,400,000 United States
1,827,092 United Statcs
700,000 United States
21,826,540 12.7 .
TOTAL G O V E R N M E N T B O N D S
(cost U S D 120,798,780) 118,442,049 68.8
Value %of Shares Description US0 Net Assets
Mutual Funds - 0.5% United States Dollar
824,339 Goldmm Sachs USD Liquid Reserves Fund 824,339 0.5
T O T A L M U T U A L F U N D S
(cost USD 824,339) 824,339 0.5
The accompanying notes are an integral part of these financial statements. 43

G O L D M A N SACHS GLOBAL FIXED INCOME PORTFOLIO
Statement 30 November 2000
Principal Amount Description
of Investments
Value 96 of USD Net Arsetr
Short Term Investments - 3.6% United States Dollar
6.227,000 State Street Bank 6.50% due 01/12/00 6,227,000 3.6
T O T A L S H O R T T E R M
I N V E S T M E N T S
(cost USD 6 ,227 ,000) 6,227,000 3.6
T O T A L I N V E ST M E NTS
(cost USD 175,586,994) 170,794,639 99.2
All security holdings of this portfolio are transferable securilies dealt On a regulated market.
44 The accompanying notes are an integral part of these financial statemeno.

GOLDMAN SACHS GLOBAL HIGH YIELD PORTFOLIO
Letter to Shareholders 30 November 2000
Dear Shareholders:
On behalf of Goldman Sachs, we welcome the opportunity to review the performance of the Goldman Sachs Global High Yield Portfolio for the one-year period that endcd 30 November 2000.
Market Review
The Portfolio’s fiscal year began on a positivc note, as investor confidence improvcd on the heels of a rally in the stock market. However, this was short livcd, as high yield bonds faltered after the traditional New Year rally failed to materialise. February was dominatcd by credit-specific problems. In March, markct returns were then hurt by a sharp sell-off. Rising short-term interest rates in thc US, an increase in defaults and accelerating outflows from mutual funds were the main culprits. The market briefly stabiliscd during the second quarter, as selling prcssures abatcd and mutual fund redemptions slowed. However, as the reporting period progressed, steadily rising intercst ratcs lcd to conccrns that an economic slowdown in the US and abroad could lead to a further increase in default rates.
These concerns camc to a hcad in October and November, with the high yicld market experiencing two of its worst months since 1980, as invcstor jittcrs caused a dramatic widening in risk premiums. Technicals were poor, with continuing mutual fund outflows. The telecom sector was heavily pounded amidst heightening fears that many companies would run out of cash bcforc completing their ambitious plans. Industrials were impacted by fears of a US recession, with the building products and automotive sectors particularly affected.
Portfolio Positioning
Throughout the rcporting pcriod we remained focused on our credit-bascd invcstment philosophy that we believe lead to the most compclling risk-adjusted returns. We have been activcly involved in the European market and have scaled back our exposure to thc cmerging telecoms sector. Both of these strategies served to enhance relative performance. In addition, corporate takeovcr activity bolstered the returns of several Fund holdings, which partially helped to mitigate the weakness in thc ovcrall high yield sector.
Performance Review
Over the one-year period that cndcd 30 November 2000, the Portfolio’s cumulativc total return was -S.22%. This compared to the 6.61% rcturn for the Portfolio’s benchmark, the Lehman Brothcrs High Yield Index (with income reinvested and, in contrast to thc Portfolio, without the deduction of any expcnscs). During that same period the Global High Yield Portfolio Euro hedged share class generated a cumulative total return of -11.35%. This compared to the -7.69 5% return for thc bcnchmark, the customised Lehman Brothers US Corporate Bond High Yield Index (Euro Hedged)*. (For more information on the performance of the Portfolio and a description ot its bcnchmark, refer to page 108. Portfolio returns are shown nct of management fees with income reinvcstcd using month-cnd NAVs.)
Thc Portfolio’s rclative outperformance versus its benchmark was largely due to sector allocation. In addition, carcful credit selection helped to minimise losses from defaults during a period when default rates were on thc risc.

G O L D M A N SACHS GLOBAL HIGH YIELD PORTFOLIO
Letter to Shareholders 30 November 2000
Performance Review (continued)
l h e pattern of market returns in 1999 and 2000 is similar to that of I989 and 1990, where a long, slow dccline ended with a sharp sell-off. Wc believe that the widcspread market capitulation provides good opportunities to purchase attractive assets at historically wide levels, and that good quality, well-funded companies will be able to weather tbc current storm.
Goldman Sachs Global High Yield Portfolio Management Tcam New York, 15 December 2000
* 7’hr Lehmun Brothers US Corporate High Eeld Bond Index (Euro Hedged) ha, brrn adjusted for lramformutioii of
currmry und interest rate risk for US dollar to euro5, using a four-year rouponlcoupon FX swap.
46

GOLDMAN SACHS GLOBAL HIGH YIELD PORTFOLIO
Statement of Investments 30 November 2000
Value %of Shares Description USD Net Assets
Common Stocks - 0.2% Swedish Krona
36,404 Telel Europe Holding AB-ADR (b)
(Telecommunications) 200,222 0.0
United States Dollar 37,500 Complete1 Holding LLC
(Telecommunications Equipmcnt) 300,000 0.1
4,567 McLeodUSA, Inc.
1,500 Ono Finance (Telccommunications) 58,228 0.0
(Diversified Financial
20,005 Pathmark Stores, hc.
3,142 World Accew, Inc.
Services) 105.000 0.0
(Food) 330.082 0.1
(Tclccommunications Equipment) 10,015 0.0
2.367 WRC Media,Tnc./JLC Learning Corp. (Media) 0 0.0
803J2.5 0.2
TOTAL COMMON STOCKS
(cost USD 505,340) 1,003,547 0.2
Principal Amount Description
Corporate Bonds - 91.2% British Pound Sterling 1,766.382 Coral Group Holdings
PIC. 13.50%, due 30/09/09
1,500,000 Coral Group PIC. 10.00%~. due 15/02/09
1,375,000 Fala Group Holdings PIC. 12.00%, duc 01/06/10 IPC
750,000 Magazines Group PIC, 0.00/10.7S% tal, duc 15/03/08
1,875.000 IPC Magazines Group PIC. 9.625%. due 15/03/08
9,500,000 Telewest Communications PIC., 0.00/9.875% (a),
due 15/04/09 1,500,000 William Hill Financc Plc.
10.625% due 30/04/08
Value X of US0 Net Assets
2,454,(328 0.6
2,083,935 0.5
1,977,922 0.4
648,574 0.1
2,312.541 0.5
5.656,421 1.3
2,083,945 0.5
17.217,376 3.9
Euro 625,000 Alfa Lava1 Special
Finance AI3 12.125%, due 15/11/10 552,585 0.1
250,000 BSN Financing Co.. SA 10.25%. due 01/08/09 175.527 0.0
Principal Amount Description
Value % o f US0 Net Assets
Corporate Bonds - (continued) Euro - (continued) 1,500,000 Clondalkin Industries Plc.
10.625%, due 15/01/10 500.000 Colt Telecom Group PIC.
8.875%, due 30/11/07 4,000,000 Colt Telecom Group PIC.
7.62576, due 31/07/08 1,500,000 Complete1 Europe NV
14.00%, due 15/04/10 4,000,000 CP Kelco APS/CP Kclco
Capital Corp. 11.875'46, due 15/09/10
1,750,000 Enitel ASA 12.50%. due 15/04/10
1,000,000 Exodus Communications, Inc. 10.75%, due 15/12/09
4,000,000 FLAG Telecom Holdings Ltd. 11.62576, due 30/03/10
500,000 Flowserve Finance BV 12.25%, duc 15/08/10
2.1 25,000 Grohe Holdings GmbH 11.50'46, due 15/11/10
3.000,OOO tiuntsman IC1 Chemicals LLC 10.125%, due 0 1 /07/09
5.000,OOO Impress Metal Packaging 9.875%. due 29/05/07
due 30/04/05 2,000,000 Ineos PIC. 10.25%,
due 15/05/10 1,000,000 Jnzztel PIC. 14.00%,
due 01 /04/09 250~000 Jones Lang LaSalle
Finance BV 9.00%, duc 15/06/07
3,000,000 IIICOS PIC. 8.625%,,
5,500,000 Kappa Beheer BV, 0.00/12.50% (a),
due 15/07/09 4>500,000 Kappa Beheer BV
10.625%. due 15/07/09 3,500.000 Level 3 Communications,
Inc. 10.7570, due 15/03/08
Network. Inc. 10.00%, duc 15/12/09
2,000,000 NTL Communications Corp., 0.00/11 .50% (a),
due 15/11/09 7,750,000 NTL Communications
Corp. 9.875%,
2.000,OOO Metromcdia Fiber
due 15/11/09
due 01/05/09
Vermiigensvcrwaltung 14.00%, duc 15/07/10
4,000,000 Ono Finance 13.008,
500,000 Pecunia 1
1,170,180 0.3
206,082 0.1
1,524,566 0.3
1,014,156 0.2
2,219,007 0.5
872,217 0.2
676,104 0.2
2,565,727 0.6
433,400 0.1
1,860,369 0.4
2,522,387 0.6
1,994345 0.5
1,229.846 0.3
1,577,576 0.3
580,756 0.1
223,201 0.1
3,241,831 0.7
3,978,611 0.9
2.184,335 0.5
1.421,552 0.3
702.108 0.1
5,172,627 1.2
2,271.015 0.5
370,225 0.1
The accompanying notes are an integral part of these financial statements. 47

GOLDMAN SACHS GLOBAL HIGH YIELD PORTFOLIO
Statement of Investments 30 November 2000
Principal Value % o f Amount Description USD Net Assets
Corporate Bonds - (continued) Euro - (continued) 1,680,000 PTC International
Finance 11 SA 11.25%. due 01/12/09 1,252,352 0.3
5.250,000 Sirona Dental Systems 9.12546, due 15/07/08 1,349,507 0.3
750,000 Slovak Wircless Financc Co. NV 11.250/0,
1 .OOO,OOO Ttlel Europe UV
1,000.000 Telel Europe BV
1,250,000 Tcxori International PIC.
2,500.000 United Pan-Europe
due 30103107 604,593 0.1
13.00%, due 15/05/09 788,787 0.2
11.8758, due01/12/09 745,448 0.1
10.00%, due 01/02/08 704,692 0.1
Communications NV 11.25%, due 01/02/10 1354,375 0.3
12.00%, due 01/08/10 1.369,544 0.3
48.518,633 10.9
2.000,000 Vantico Group SA
United States Dollar 1.750,OOO 360networks, Tnc.
2.250,OOO Accuridc Corp. 9 .3%. 12.50%. due 15/12/05
due 01/02/08
Communications Corp. 9.50%. duc 15/02/04
Communications Corp. 9.375%, due 15/11/09
1,000.000 Advance Holding Corp., 0.00/12.875% (a),
due 15/04/09
10.259, due 15/04/08
Communications, Inc. 9.25?6, due 01/05/08
2,000>000 AEP Industries, Inc. 9.8754, due 15/11/07
500,000 Agrilink Foods, Inc. 11.87S%, due 01/11/08
4,000,000 Ainswtlrth 1.umber Ltd. 12.50%. due 15/07/07
1,500,000 Alamosa PCS Holdings. Inc., 0.00/12.875%' (a).
due 15/02/10
0.00/11.125% w,
341,803 Adelphia
2.000,OOO Adclphia
2S0,OOO Advance Stores Co., Inc.
3,000,000 Advanstar
2,500.000 Alaris Medical, Inc.,
due 01/08/08 250,000 Nlcgiancc Tclccom. Tnc..
0.00/11.7% (:I), due 15/02/08 750,000 Allegiance Telecom, Inc.
12.875%, due 15/05/08
1,3 12,500
1,575,000
297,360
1,500,000
360,000
177.500
3,030.000
1,660.000
330,000
3,200,000
615,000
225,000
145,000
690,000
0.3
0.4
0.1
0.3
0.1
0.0
0.7
0.4
0.1
0.7
0.1
0.0
0.0
0.2
Principal Amount Oescriptlon
Value %of US0 NetArsets
Corporate Bonds - (continued) United States Dollar - (continued) 1,000,000 Allied Waste North
America, Inc. 7.6255, due 01/01/06
America. Inc. 7.875%, due 01/01/09
America, Tnc. 10.00%, due 01/08/09
Property Lld. 12.00%, duc 15/02/08
& Manufacturing, Inc.
4,000,000 Nlicd Wastc North
5,000,000 Allied Waste North
2,500.000 Amatek Industries
3.000,OOO American Axle
9.75%, due 01/03/09 I.S00,000 American Lawyer Media,
Inc. 9.75%. due 15/12/07 2,000,000 Apcoa, Inc. 9.25%.
due 15/03/08 APP 480,000 China Group Ltd.
14.004, due 15/03/10 3,750,000 Argo-'Itch Corp.
8.625%, due 01/10/07
Scrics D 8.625%, dnc 01/10/07
0.00/9.95% (a). due 15/06/08
10.62570, due 01/11/08
10.509, due 01/05/09
9.87570, due 15/02/07
8.75%. due 01/07/08
500,000 Argo-Tech Gorp.-
3,500,000 AT&T Canada, Inc.,
550,000 AT&T Canada, Tnc.
1,000,000 Atrium Cos., Inc.
1.820,OOO Aurora Foods, Tnc.
2,000.000 Aurora Foods, Inc.
6,000,000 Avecia Group PIC. 1 1.005, due 01/07/09
250,000 Axiohm Transaction Solutions, Inc. 9.75%. due 01/10/07
500,000 Uenton Oil Rc Gas Co. 9.375%. due 01/11/07
& Aggregates Co. 1,500,000 Better Minerals
13.00%~ due is/09/09 250,000 Birch Tclcconi 14.00%.
due 15/06/08
Plc. ll.OO%,. due 15/07/08
750,000 Burke Industries, Tnc. 1 0.005, due 1 5/08/07
1 .OOO,OOO Rrunner Mond Group
1,500,000 Cabot Safcty Acquisition Corp. 12.50°', due 15/07/05
due 15/02/09 2,000,000 Carrier1 13.25%,
890.000 0.2
3,440.000 0.8
4,300,000 0.9
1,800,ooo 0 4
2,655,000 0.6
i,245,000 0.3
700,000 0.2
153.600 0.0
7.962,500 0.7
395,000 0.1
2,870,000 0.7
607.750 0.1
830,000 0.2
1.328,600 0.3
1,440,000 0.3
5,700,000 1.3
25,000 0.0
300,000 0.1
1 170,000 0.3
150.000 0.0
280,000 0.1
240,000 0.1
1,483,125 0.3
1,420.000 0.3
48 The accompanying notes are an integral part of these financial statements

GOLDMAN SACHS GLOBAL HIGH YIELD PORTFOLIO
Statement of Investments 30 November 2000
Principal Value %of Principal Value %of US0 Net Assets Amount Destrlption USD Net Assets Amount Description
Corporate Bonds - (continued) United States Dollar - (continued)
Corporate Bonds - (continued) United States Dollar - (continued)
1,250,000
3,000,000
2,000,000
2,000,000
1,000,000
i,5oo,noo
7,500,000
1,000,000
1,000.000
2.700.000
1,000,000
1.750.000
1,000,000
3,noo.oon
1.000.000
1 J~0(~,000
6,000.000
4J10(1.000
1,000,000
3.000,000
Cellco Finance NV Turkcell 12.75%, due 01/08/05 1 ,I 75,000 Centennial Ccllular Operating Co. J . J K 10.75%,, due 15/12/08 2,730,000 Chancellor Media Corp. 8.125Q. due 15/12/07 1.965,000 Charter Cotntnunications Holdings LLC 8.25%,, due 01/04/07 1,740,000 Charter Communications Holdings LLC 8.6255,. due 01/04/09 872.500 Charter Comtnunications Holdings LLC', 0.00/11.7SS+ (a). due 15/01/10 798.750 Charter Cominunications Holdings LLC, 0.00/9.92°i (a). due 01/04/11 Clear Channel Communications, Inc. 8.00%. due 01/11/08 982.500 Clcarnet Communications, Inc.. 0.00/10.12S% (a).
due 01/05/09 790,000 Colt Teleeom Group Plc.. 0.00/12.00% (81. due 1511 2/06 2.443,500 Communication Instrumcnts, Inc. 10.00%, due 15/09/04 875,000 Complete1 Europe NV, 0.00/14.00R (a),
due 15/02/09 840,000 Condor Systems, Tnc. 11.87 j%, due 01/05/09 -550.000 Corning Consumer
4.1 25,000
due 01/05/08 900,000
9.25%, duc 01/04/07 1.000,000 Cross 'limbers Oil Co.
Cross Timbers Oil Cu. 8 . 7 5 4 , due 01/1 1/09 975.000 Crown Castle lntcrtiational Corp., 0.00/10.625% (a', due 1511 1/07 4,605.000 Crown Castle International Corp., 0.00/10.3751 due 15/05/lI 2,540J100 Crown Castle International Corp. 9.00%,. due 15/05/11 937,500 Crown Castle International Corp., o.u0/11.25%J (a),
due 01/08/11 1,927,500
0.3
0.6
0.4
0.4
0.2
0.2
0.9
0.2
0.2
0.5
0.2
0.2
0.1
0.2
0.2
0.2.
1 .0
0.6
0.2
0.5
500.000 Crown Castle International Corp. 10.75%,. due 01/08/11
1,750.000 Day International Group, Inc. 9.50%, due 15/03/08
2,825,000 Dcl Monte Foods Co., 0.00/12.50~ (a),
due 1.W 2/07
0.00/12.50% (a),
duc 15/11/07 2,500,000 Dctails, Inc. 10.00%>
due 15/11/05 3,000,000 Dominos. Inc. 10,37S%,
due 15/01/09 1.500,OOO DR Horton, Tnc. 8.001,
due 01/02/09 1,250.000 Duane Keade, Inc. 9.25%.
due 15/02/08 1.500,000 Dunlop Standard
Aerospace Holdings PIC. 11.8754'0, duc 15/05/09
3.500,OOO Eagle Family Foods. Inc. 8.754'0, duc 15/01/08
2.750,OOO Eagle-Pitchcr Industries (Old) 9.375% due 01/03/08
2,000.000 Echostar DBS Corp. 9.375%, duc 01/02/09
3,000,000 Encrgis PIC. 9.75%. duc 15/06/09
1,000,000 Equistar Chemicals I P 7.55%, due 15/02/26
3,630,000 Esat 'I'elecom Group PIC. 11.875%, due 01/12/08
1.500,OOO Exodus Communications, Inc. 11.25%> due 0 1 /07/08
1,000,000 Exodus Communications, Inc. 10.75%, due 1.W 2/09
1,250,000 Exodus Communications. Inc. 11 .625%. duc 15/07/10
3,000,000 Federal-Mogul Corp. 7.501. due 15/01/09
8,000,000 Fisher Scientific International, Inc. 9.00%. due 01/02/08
2,000,000 Flextronics Intcrnational Ltd. 9.8757'~~ duc 01/07/10
1,000,000 Flowserve Corp. 12.255, due 15/08/10
3,250,000 Frontiervision Holding
1,750,000 Details Holding Corp.,
w. o.no/i 1.875% (a),
due 15/09/07
501,878
1,540,000
2,104,625
1,39 1,250
2,387,500
2,460,000
1,305,000
1.062.500
1,485,000
1,750,000
1,928,437
i.84o.oon
2,790,000
762.130
4,174,500
1,230.oon
810,000
1,050,000
472,500
7,326,250
2,040,000
9 75,000
2,551,250
0.1
0.3
0.5
0.3
0.5
0.6
0.3
0.2
0.3
0.4
0.4
0.4
0.6
0.2
0.9
0.3
0.2
0.2
0.1
1 .6
0.5
0.2
0.6
The accompanying notes are an integral part of these financial statements. 49

G O L D M A N SACHS GLOBAL H I G H YIELD PORTFOLIO
Statement of Investments 30 November 2000
Value %of Principal Value %of Prlncipal Amount Description US0 Net Assets Amount Description USD Net Assets
Corporate Bonds - (continued) United States Dollar - (continued)
Corporate Bonds - (continued) United States Dollar - (continued)
2,o()0,000
1,000,000
1,500,000
1,000.000
500,000
500,000
1,500,000
1,000,000
2,000,000
1 ,noo,ooo
1,000,000
1 ,(XK),OOO
2,ow,000
3,500.()00
1,310,000
1,250,000
2,000,000
1,270,000
2,000,000
l,O(X),000
1,000.000
Frontiervision Oper Partners 11.008, due 15/10/0h Galey 82 Lord, Inc. 9.125%, due 01/03/08 General Chemical Industrial Products, Inc. 10.625'70, due 01/05/09 General Portable Products LLC 11.2570, due 01/07/06 Genesis Iiealth Ventures, Inc. 9.25%,, due Ol/l0/06 Gcnesis Health Ventures, Inc. 9.87546, duc 15/01/09 Gentek, Inc. 11.00%, due 01/08/09 Global Crossing I$olding Ltd. 9.125%, due 15/11/06 Glohal Crossing Holding Ltd. 9.h2570, due 15/05/08 Global Crossing Holding Ltd. 9.50%, due 15/11/09 Globe Manufacturing
due 01/08/08 Globix Corp. 12.50%, due 01/02/10 Graham Packaging Co. 8.75%, due 15/01/08 Graham Packaging Co., 0.0()/10.7S% (a),
due 15/01/09 Grupo Industrial Durango SA 12.6258, due 01/08/03 Grupo lusaccll SA CV 14.25%. due 01/12/06 GST Network Funding. Inc. 10.50%c, due 01 /05/08 Hanvit Bank 11.75%. due 01/03/10 Hayes Wheels International. 1nc.- Series B 9.1256, due 15/07/07 Haynn International. Inc. 11.625%, due 01/09/04 Hermcs Europe Railtel BV 11.5076, due 15/08/07
Corp. 10.00%,
1,860,000
500,000
570,000
200,000
55,000
44,375
1,462,500
nno,ooo
1,750,000
875,000
100,000
380,000
1,28O,O(W)
1,470.000
1,329,850
1,271,875
Y00,Oo()
1,193,800
1,320,000
710.000
450,000
0.4
0.1
0.1
0.0
0.0
0.0
0.3
0.2
0.4
0.2
0.0
0.1
0.3
0.3
0.3
0.3
0.2
0.3
0.3
0.2
0.1
2.000,OOO Hexcel Corp. 9.75%,
1,2.50,000 Horizon PCS, Inc., due 15/01/09
o.on/i4.00% w, due 01/10/10
Care, Inc. 9.125'46, due 15/04/08
1,500,000 Huntsman IC1 Chemicals LLC 10.125%, due 01/07/09
5,000,000 Huntsman IC1 Chemicals LLC' Zcro Coupon, due 31/12/09
2,500,000 Hudson Rcspiratory
4,000,000 Huntsman Packaging Corp. 13,008, duc 01/06/10
1.750,OOO IASIS Hcalthcare Corp. 13.00%, due lS/lO/OY
3,000.000 ICC Holdings, Inc., 0.00/11.625% (a):
due 15/03/07 800,000 Indah f i a t Finance
Mauritius 10.00%, due 01/07/07
Communications, Inc., 0.00/11.25%, ("), due 15/07/07
Communications, Inc.,
duc 01/03/09
Communications. Inc. 0.50%,. due 01/03/09
2,500.000 Inlersil Corp. 13.258, due 15/08/09
2,250,000 Intertek Finance PIC. 10.254, due 01/11/06
5,500,000 Intermedia
1,000.000 Intermedia
0.00/12.2570 (a),
1,000,000 Intermedia
1.of)f),ooo Illlira Gorp. 1,00%, duc 01/02/10
1,500,000 IT Group, Inc. 11.2570, due 01/04/09
250,000 Jazztel PIC. 14.001, due 01/04/09
2,000~000 Jugensen Earle M. GI. 9.50%, due 01/04/05
1,500,000 Jostcns, Inc. 12.75%, due 01/05/10
3,000.000 K&F Industries, Inc. 9.25%, due 15/70/07
1,500,000 Kinetic Concepts. Inc. 9.62570, due 01/11/07
1,000,000 Leap Wireless Intcrnational, Inc., O.W/14.50% (a),
due 15/04/10
1,837,500 0.4
550.000 0.1
1,500:000 0.3
1.406,250 0.3
1,325,000 0.3
2,480,000 0.6
1,540,000 0.3
270,000 0.1.
292.000 0.1
4,455,000 1 .O
580.000 0.1
930,000 0.2
2,775,000 0.6
i,izs,ooo 0.3
532,900 0.1
1,275,000 0.3
167,500 0.0
1,680,000 0.4
1,372.500 0.3
2,872,500 0.6
1,273,125 0.3
207,500 0.0
50 The accompanying notes are an integral part of thest financial statements.

GOLDMAN SACHS GLOBAL HIGH YIELD PORTFOLIO
Statement of Investments 30 November 2000
Principal Amount Descriotion
Value X of USD Net Assets
Corporate Bonds - (continued) United States Dollar - (continued)
International, Inc. 500,000 Leap Wireless
12.50'%, due 15/04/10 2,000,000 Level 3 Communicalions,
Inc. 9.125%, due OI/OS/OX
0.00/10.00% (a).
due 01 /03/08 3,000,000 Lyondell Chemical Co.
9.87570, due 01/05/07 1,250,000 Lyondcll Chemical Co.
10.875%, duc 01/05/09 750,000 Mattress Discounters
Corp. 12.625%, due 15/07/07
0.00/10.50% (a),
3,250,000 Lin Holdings Corp.,
3,500,000 McLeodUSA, Inc..
duc 01/03/07
8.125%, due 15/02/09
due 01/03/08
due 01/05/09
Network, Inc. lO.OOs"0, due 15/11/08
Network, Inc. 10.00%, due 15/12/09
3,000,000 Millicom International Cellular, 0.00/13.50%' (a),
duc 01/06/06
11.375%, due 15/01/08
1.250.000 McLeodUSA, Inc.
1,000.000 MCMS, Inc. 9.75%>
1,000,000 Merrill Curp. 12.0076,
1 >500,000 Melromcdia Fiber
1,000,000 Metromedia Fiber
1.000,000 MSX International
1,000,000 Multicanal SA 13.125%,
1,000,000 Musicland Group, Inc. 9.00%, due 15/06/03
2,000,000 National Equipment Services, Inc. 10.008, due 30/11/04
1,500,000 New World Pasta Co. 9.2570, due 15/02/09
1,000,000 Newport News Shipbuilding, Inc. 9.258, due 01/12/06
1,500,000 Nextel Communicalions, Tnc., 0.00/10.65% (a).
due 15/09/07 1,500,000 Nextel Communications,
Inc., 0.00/9.75% (a),
due 31/10/07 7,500,000 Nextel Communicalions,
Inc., 0.00/9.95% (a),
due 15/02/08
due is/04/09
300,000
1.3&0,000
2,323,750
2,880,000
1.175,OOO
678,750
2,668,750
1,031,250
600,000
540,000
1,155,000
770,000
2,370,000
920,000
770,000
91 0,000
1.120,ooo
705,000
1,005:000
1,125,000
1,065,000
5,250,000
0.1
0.3
0.5
0.6
0.3
0.2
0.6
0.2
0.1
0.1
0.2
0.2
0.5
0.2
0.2
0.2
0.3
0.2
0.2
0.3
0.2
1.2
Principal Value % o f Amount Description US0 Net Assets
Corporate Bonds - (continued) United States Dollar - (continued) 2,500,000 Nextel Communications,
Inc 9.37570, due 15/11/09
325,000 Ncxtcl Partners, Inc., 0.00/14.08 (a),
due 01/02/09
11 .OO%, due 15/03/10
Communications, Inc. 9.625%, due 01/10/07
Communications, Inc. 9.008, due 15/03/08
Communications, Inc. 10.75%, due 01/06/09
due 01/03/04
due 01/09/07
duc 01/08/08
Communications Group, Inc. 12.8758, due 15/02/10
1,500,000 Ono Financc 13.00%. due 01/05/09
3,500,000 Orange PIC. 9.008, due 01/06/09
1,000,000 Outdoor Systems, Inc. 9.375%, due 15/10/0h
1,500,000 Outdoor Systems, Inc. 8.875%, due 15/06/07
1,500,000 P&L Coal Holdings Corp. 9.625%, due 15/05/08
of America 9.625%, due 01/04/09
4,000.000 Packard Bioscience, h c . 9.375%. due 01/03/07
1,000,000 Partner Communications Co., Ltd. 13.0070, due lS/08/10
250,000 Pathnet, Inc. 12.25% due 15/04/08
Vermogensvenvaltung 14.00%, due 15/07/10
2,000,000 Pinnacle Holdings, Inc.,
1,000,000 Nextel Partners, Inc.
1,000,000 Ncxtlink
750,000 Nextlink
2,500,000 Nextlink
1,500,000 Nortek, Inc. 9.875%,
1.500,OOO Norlek, Inc. 9.12596,
1,500,000 Nortck, Inc. 8.875%,
t,OOO,000 Northpoint
5,000,000 Packaging Corp.
2,750,000 Pecunia 1
0.00/10.00% (a),
due 15/03/08 2,000,000 Playtex Products, Inc.
X.875%, due 15/07/04 1,500,000 Polaroid Corp. 11.50%,
due 15/02/06
2,275,000
212,875
945,000
662,500
483.750
1,756,250
1,372,500
1,335,000
1,316,250
140,000
1,020,000
3,605,000
1,059,410
154 1,250
1,458,750
5,137,500
3,480,000
830,000
32,500
2,392,500
1,050,000
1,880,000
1,125 .000
0.5
0.1
0.2
0.2
0.1
0.4
0.3
0.3
0.3
0.0
0.2
0.8
0.2
0.4
0.3
1.2
0.8
0.2
0.0
0.5
0.2
0.4
0.3
The accompanying notes are an integral part of these financial statements. 51

G O L D M A N SACHS GLOBAL HIGH YIELD PORTFOLIO
Statement of Investments 30 November 2000
Principal Amount Description
Value % o f US0 Net Assets
Corporate Bonds - (continued) United States Dollar - (continued) 1,500,000 Po ly" Group, Inc.
9.00%, duc 01/07/07 1,000.000 Polymer Group, Inc.
8.75%. due 01/03/08 2.000,000 Premier International
Foods PIC. 12.00%, due 01/09/09
2,000.000 Premicr Parks, Inc. 9.25%), due 01/04/06
1,296,000 Prestolite Electric. lnc. 9.6255", due 01/02/08
2,500,000 Prinlpack, Inc. 9.8756. duc 15/08/04
1,500,000 Printpack, Inc. 10.625%: due 15/08/06
1,750,000 Psinet, Inc. lO.OO%,, due 15/02/05
750,000 Psinct. Inc. 11.50%, duc 01/11/08
1,000,000 Psinct, Inc. 11 .00%, due 01/08/09
BV. 0.00/10.75% (3):
due 01/07/07
0.00/9.625% (a),
due 01/02/06 1,000,000 R&B Falcon Corp.
6.75%, due 15/04/05 1,000,000 REF Finance Co.
11.375%. due 15/03/09 1,750.000 Rcnaissance Media Group
LLC', 0.00/10.00% (a),
due 15/04/08 1,000,000 Repap New Urunswick.
Tnc. 10.625%, due 15/04/05
2,000.000 Rcpublic Group, Inc. 9.50%, duc 15/07/08
1,500,000 Republic Technologics International LLC/RTI Capilal Corp. 13.75%, duc 15/07/0(3
5,000,000 Riverwood lntcrnational Corp. 10.25%. due 01/04/06
6,500,000 Rivenvood International Corp. 10.8755, duc 01/04/08
540.000 PTC International Finance
750.000 PX Escrow Corp.,
?.000,000 RSL (hmmunications PIC., 0.00/10.125% (a),
due 01/03/08 1,000,000 RST. Communications PIC.
1,750.000 RSL Communications PIC. 9,1256, d ~ e 01/03/08
10.50%, duc 15/11/08
1,050,000
687,500
1,540,000
i,xso,oon
777,1500
2,475.000
1,395,noo
630,000
285.000
360,000
367,200
210,000
940.000
1,155,000
1,137,500
1,030,000
2,000,000
127.500
4,925.000
5.898,750
100,000
80,000
262,500
0.2
0.2
0.3
0.4
0.2
0.6
0.3
0.1
0.1
0.1
0.1
0.0
0.2
0.3
0.3
0.2
0.4
0.0
1.1
1.3
0.0
0.0
0.1
Value %of Principal Amount Description US0 NetAssets
Corporate Bonds - (continued) United States Dollar - (continued) 4:500,000 SCG Holding COT.
12.00%, due 01/08/00 1,500.000 Sealy Mattrcss Co.
9.875%. duc 15/12/07 2,000,000 Simmons Co. 10.25%.
due 15/03/09 1.000,OOO Simonds Industries, Inc.
10.25'%, due 01/07/08 2,000.000 Slccpmastcr LLC 1 1.00%
due 15/05/09 750,000 Sovcrcign Spccialty
Chemicals 11.875 % . due 15/03/10
1.500,000 Spcctrasitc Holdings, Inc., 0.00/11.25% (a),
due 15/04/09 1,000.000 Spectrasite Iloldings,
lnc. 10.759, due 15/03/10
1,500.000 Stanadyne Automotive carp. 10.25%, duc 1511 2/07
1,000,000 Telcl Europc BV 13.00%, due 15/05/09
1,000,000 TeleCorp PCS, Jnc. 10.625'70, due 15/07/10
5,000.000 Telewcst Communications PIC.. 0.00/11.00~ (>I),
due 01/10/07
Communiciitiuns Plc. 11.25%, due 01/11/08
Communications PIC.. 0.00/11.37S% (a),
due 01/02/10
Communications PIC.
1 ,500,000 Telewest
2,000.000 Tclcwcst
1.250,OOO Tclcwcst
9.875%). duc 01/02/10 1,000,000 'l'hermadyne Holdings.
o.oo/r 2.50% (3). due 0 1 /06/08
3.500,000 Thcrmadync Manufacturing 9.87570, due 01/06/08
1,500,000 Transdigm, Inc. 10.3754, due 01/12/08
1,500,000 Transwestern Publishing Co. 9.625%, due 15/11/07
1,500.000 Trcnch Electric SA 10.25%, duc 15/12/07
1,000.000 Triton PCS Iloldings, Inc., 0.00/11.00%~ (it),
due 01/05/08 1,250,000 Unitcd Industries Corp.
9.875%, duc 01/04/09
4,320.000
1.425,ooo
l,Xh0,000
698,750
1,575,000
712,500
742,500
890.000
1,125,000
900,oon
982.500
4.200,000
1,192.500
7Y0,000
925.000
270.000
2,485.000
1.335,000
1,470.000
93 1,875
750,000
687.500
1.0
0.3
0.4
0.2
0.4
0.2
0.2
0.2
0.3
0.1
0.2
0.9
0.3
0.2
0.2
0.1
0.6
0.3
0.3
0.2
0.2
0.2
52 The accompanying notes are an integral part of these financial statements.

G O L D M A N SACHS GLOBAL HIGH YIELD PORTFOLIO
Statement of Investments 30 November 2000
Principal Value %of Amount Description USD Net Assets
Corporate Bonds - (continued) United States Dollar - (continued)
750,000 United Pan-Europe Communications NV 0.00/13.754. (a),
due 01/02/10 225.000 0.1
Communications N V 11.25%. duc 01/02/10 1,350,000 0.3
9.50%, due 01/06/08 2.117.500 0.5
8.8070, due imx/ox 1.687,SOO 0.4
2,250,000 United Pan-Europc
2,750,000 Unitcd Rentals, Inc.
2.250.000 United Rentals, Inc.
137,000 V2 Finance SA 6.5046,
1 ,000>000 Venture Holdings Trust
1~000,000 Venture Holdings Trust
5.500,OOO Viasystems, Tnc. 9.75%,
due 30/06/12 31,510 0.0
9.50%. due 01/07/05 500,000 0.1
]LOO%> due 01/06/07 550,000 0.1
1 ,000,odo
2,779.000
2,000.000
2,000,000
250,000
4,000,0(30
6,250.000
1.500.000
500,000
1,000,000
duc 01/06/07 Viasystcms, 1nc.- Series B 9.75%. due 01/06/07 Viatel, Inc. 11 .TO%,, due 15/03/09 Vintage Petroleum, Inc. 9.75%, duc 30/06/09 Volumc Services America, Inc. 11.255, due 0 1/03/09 Wam!Ncl, Inc..
duc 01/03/05 Wcrncr Holdings Co., Inc. 10.008, due 15/11/07 Wesco Distributicm, Tnc. 9.12570, due 01/06/08 We\tinghouse Air Brake Co. 9.375%. duc 15/06/05 WHX Corp. 10.50%, due 15/04/05 Williams Communications Group, Inc. 10.70%, due 01/10/07
O . O ~ / I ~ . ~ S L ; / O (a).
1,500,000 Williams Communications Group, Inc. 10.87570, due 01/10/0Y
500,000 Williams Scotsman, Inc. 9.875%. due 01/06/07
4,000,000 Willis Corroon Corp. 9.00%, due 01/02/09
583,000 World Acceis. Inc. 13.25%, due 15/01/08
500,000 Worldwide Flight Services 12.25%, duc 15/08/07
4.647.500
845.000
861,490
2,100,000
1,830,000
11 1,875
3.790,OOO
5.500,000
1.147,500
330,000
770,000
1.0
0.2
0.2
0.5
0.4
0.0
0.9
1.2
0.3
0.1
0.2
Principal Value %of Amount Deicrlption USD Net Assets
Corporate Bonds - (continued) United States Dollar - (continued) 1,750,000 WRC Media, Inc./JLC
Leaming Corp. 12.7570, due 15/11/09 1,435,000 0.3
lnc. 8.7574 due 15/06/07 l,XOO,O00 0.4
340,475,624 76.4
2,000,000 Young Broadcasting.
TOTAL CORPORATE B O N D S
(cost U S D 506,739,026) 406.211,633 91.2
Government Bonds - 0.2% United States Dollar
860,000 Unitcd Mexican States 9.875%, due 01/02/10 898,163 0.2
T O T A L G O V E R N M E N T B O N D S
(cost U S D 877,003) 898,163 0.2
Emerging Markets Debt - 1.3% United States Dollar
560,000 Government of Poland,
duc 27/10/24 680,000 Govcrnment of Poland,
due 27/10/24 440,000 Repuhlic of Brazil
14.50%. duc 15/10/09 400,000 Republic of Brazil
12.258, due 06/03/30 380,000 Kepublic of Brazil
11.00%,, due 17/08/40 2,180,000 Republic of Bulgaria
3.00%, due 28/07/12 378,487 Republic of Panama
7.733%, due 14/05/02 350,000 Rcpublic of Panama
9.3758, due 01/04/29
10.0070, duc 26/06/07 500,000 State of Qatar 9.75%,.
duc 15/06/30
3.50/3.75% (a),
4.25/4.50%, (a),
1.600,OOO Russian Federation
358.050
474,300
462.825
340.500
28s.760
1,491,938
371.391
333.81 2
489,900
0.1
0.1
0.1
0.1
0.0
0.3
0.1
0.1
0.3
0.1
TOTAL E M E R G I N G M A R K E T S DEBT
1.140.000 0.2 ( c o s t USD 5.994.241) 5,780,476 1.3
425,000 0.1 Value %of Shares Descrlption USD Net Assets
37520.000 o.8 Preferred Stocks - 2.3% United States Dollar
23,328 Avecia Group PIC. 349,800 0.1
16.00%, due 01/07/10 629.856 0.1
Intemational Corp. 12.757’0, duc 15/12/10 1,010,192 0.2
1,065 Crown Castle 343,750 0.1
The accompanying notes are an integral part of these financial statements. 53

GOLDMAN SACHS GLOBAL HIGH
Statement 30 November 2000
Shares Description
YIELD PORTFOLIO
of Investments
Value %of US0 Net Assets Sharer Description
Preferred Stocks - (continued) United States Dollar - (continued)
42,618
100
7,500
354
906
1,656
2,124
CSC Holding, 1nc.- Series M 11.125%, due 01/04/08 Baglc-Pitchcr Holdings, Inc. 11.75/11.75% (a),
due 01/03/08 Global Crossing Holding Ltd. I0.50%, due 01/12/08 lnlermedia Communications, Inc. 13.50%, due 31/03/09 Ncxtcl Communications, Inc. 11.125%, due 15/02/10 River Holding Corp. 11 ,505, due 15/04/10 Rural Ccllular Cop. 12.2546, duc 15/05/11
4,570,772 1.0
200,000 0.1
675.000 0.2
298,893 0.1
887,880 0.2
49.686 0.0
1,762,920 0.4
10.085,199 2.3
T O T A L PREFERRED STOCKS
(cost USD 9,968,000) 10,085.199 2.3
Warrants - 0.3% British Pound Sterling
1,500 Coral Group PIC., cxp. 30/09/09 (cost GDP 0) 127,588 0.0
Euro 1,750 Enitel ASA, exp.
5,000 Jazztcl PIC., exp 01/04/09
4,000 Onu Finance, exp.
05/04/05 (cost EUR 0) 0 0.0
(cost EUR 0) 227,535 0.0
01/05/09 (cost EUR 0 ) 242,704 0.1
470,239 0.1
United States Dollar 1 ,000
480
250
4,000
5,620
1,500
1.500
Asat (Finance) LLC, exp. 01/11/06 (cost USD 45,000) 85,000 0.0 Asia Pulp & Papcr Co.. T.td., exp 15/03/05 (cost USD 20,027) 21,120 0.0 Birch Telecum, exp. 15/06/08 (cost usn 0) 13,750 0.0 Huntsman Packaging Corp., cxp. 01/06/10 (cost USD 144:485) 0 0.0 lntira Corp.. cxp. 02/02/25 (cost USD 5,620) 0 0.0 Jostens, Inc., exp. 01/05/10 (cost USD 71,119) 30,000 0.0 Lcap Wireless Intcrnational, Inc., exp. 15/04/10 (cost USD 300.866) 0 0.0
Value %of USD Net Assets
Warrants -(continued) United States Dollar - (continued)
750
1,000
250
1,500
250
750
500
20,000
20,000
Mattrcss Discounters Corp., exp. 15/07/07 (cost USD 11,855) Merrill Curp,, exp. 01/05/09 (cost USD 12,079) athnct, Inc., exp. 15/04/08 (cost USD 1,250) Republic Technologies Tnlernational LLC/RTI Capilal Cnrp., cxp. 15/07/09 (cost USD 162,309) V2 Music Holdings PIC., exp.15/04/08 (cost USI) 0) Wam!Nei, Tnc., exp. 01/03/05 (cost usn 0) Worldwidc Flight Services, cxp. 15/08/07 (cost USD 0) ZSC Speciality Chemicals PIC., exp. 01/07/10 (cost USD 0) ZSC Speciality Chcmicals P k - Prefcrrcd Wt, cxp. 01/07/10 (cost USD 0)
7,500 0.0
0 0.0
2,500 0.0
27,750 0.0
0 0.0
8,250 0.0
50 0.0
125,000 0.1
325,000 0.1
645,920 0.2
T O T A L W A R R A N T S
(cost USD 774,610) 1,243,747 0.3
Principal Amount Description
Value % o f USD Net Assets
Short Term Investments - 3.1% United States Dollar 13,970,000 Statc Strect Bank 6.505,
duc 01/12/00 13,970,000 3.1
TOTAL SHORT T E R M I N V E S T M E N T S
(cost USD 13,970,000) 13,970,000 3.1
T O T A L I N VE ST M E NTS
(cost USD 538.828.2201 439.192.765 98.6
All sccurity holdings o f this portfolio are transferable secu- rities dealt on a rcgulatcd market. (a) These securidrs are issued wirh an inirinl defermined rate which
(b) Securit). holding is rradediheld in USD. increases ro the stared rate ar a sei dale in the future
54 The accompanying notes are an integral part of these financial statements,

GOLDMAN SACHS INTERNET TOLLKEEPERI'" PORTFOLIO*
Letter to Shareholders 30 November 2000
Dear Shareholders:
On behalf of Goldman Sachs, we welcome the opportunity to review the performance of thc Goldman Sachs Internet TollkeeperSM Portfolio since its inception on 3 April 2000 through 30 Novembcr 2000.
Market Review
The US markcts continued to experience significant volatility, and began to show signs of an economic slowdown during the period. High cncrgy prices, a weak euro, inflationary pressures, and the unccrtainty of the US presidential election have been particularly damaging to stocks with premium valuations, especially in the high- growth technology sector. During the reporting period the Fedcral Reserve Board left interest rates unchasged. However, stocks continued to spiral downward as many market leaders such as Intel, Apple, Gateway, and Sprint PCS announced they would fall short of earnings expectations. Investors severely punished those companies that disappointed, as many stocks had been priccd for perfection leaving no room for error.
Portfolio Positioning
Our goal is to identify companies in the Internet-related industry whose stock will apprcciate substantially as a result of above average sustaincd growth of their underlying busincss. As such, we look for quality companies with enduring competitive advantagcs. We will continue to invest in businesses that exhibit a strong foundation for long-term growth, including brand name franchises, excellent management tcams and free cash flow.
Goldman Sachs Internet TollkeeperSM Portfolio is positioned as a more "conservative" approach to the Internet, as wc would expect to underperform the more aggressive nct funds in times of high-momentum markets, but outperform such funds in down markets. We believe that our disciplined approach will benefit investors over the long-term.
Performance Review
During thc period under review the Portfolio's cumulative total return was -30.50%. (For more information on the performancc of thc Portfolio, refer to page 108. Portfolio returns are shown net of management fees with income reinvested using month-end NAVs.)
While the Portfolio was launched during a period of extrcme weakness in the technology sector, we believe that recent market activity offers an opportunity to purchasc thc high quality companies wc seek to invest in at more reasonable valuations. Furthcrmore, while we neither makc nor rely on economic forecasts to make investment decisions, we are generally bullish on the US economy. Over the last decade, global communication has increased, resulting from significant technological advanccs as well as a generally peaceful world political environment. Wc believe that this trcnd, combined with favourable dcmogrdphic trends, will benefit US companies over the long term. Morc fundamentally, though, we continuc to focus o n the core business characteristics that provide a foundation for long-term growth, such as strength of franchise, quality of management, and free cash flow, along with favouriible demographic trends. We believc that the enduring competitive advantage of the companies wc own - based on the criteria mentioned abovc -will withstand even an uncertain market environment.
We thank you for your investment and look forward to your continued confidence.
Goldman Sachs Internet Tollkeepcr Management Team London, 15 December 2000
* Internel Ibllkrrper is a registered service murk of Goldman, Sachs & Co.
55

GOLDMAN SACHS INTERNET TOLLKEEPERLM PORTFOLIO"
Statement of Investments 30 November 2000
Value ?4 of Shares Description US0 Net Assets
Common Stocks - 92.6% Computers
1.460 Brocade Communications Systems, Inc.
5,610 Mcdata Corp. 1,410 Rcdback Networks, Tnc. 7.620 Sun Microsystems, Tnc. 4,550 VEKITAS Software Cop.
11.680 EMC Corp. 224.475 0.8 854,830 3.2 241.230 0.9 98,171 0.4
607,695 2.2 300,4on 1.5
Electric 6>300 AES Corp.
2,426,801 9.0
349,256 1.3
Electrical Components & Equipment 12,010 Encrgizcr Holdings, Tnc. 231,192 0.9
Internet 3,270 1.800 7.630
7,740 3,830
8,450 17,798 7.520
40.640 15,890 3,260 3,720 6,750
9.510 1.332 6,840
16,615
9.130 3,210
12,579 5.280
America Online. Inc. Ariba, Inc. Art Technology Group, Inc. Broadvision, lnc. Check Point Software Technologies Ltd. (a)
CheckFree Corp. CNET Networks, Inc. Commerce One, lnc. DoublcC:lick. Inc. Epiphany, Inc. Expedia, Inc. Interland, Inc. Internap Network Services Corp. Interwoven, Inc. Openwavc Systcms, Inc. S1 Corp. The Charles Schwab Corp. Travelocity.com Tumbleweed Communications Corp. VcriSign, Inc. Yahoo!, Inc.
341,787 104,175
258,943 188.179
394,490 442,569 396,006 233,120 551,180 619.710 43,806 13,570
76,781 458,263
66,615 40,826
479,758 108,419
56.426 1,015,754
206,250
0.5 0.4
1.0 0.7
1 .5 1 .6 1.5 0.9 2. I 2.3 0.2 0.0
0.3 1.7 0.2 0.1
1.8 0.4
0.2
0.8 3.8
5,896,627 22.0
Leisure
21,400 Sabre Holdings Corp. 770,400 2.9
Media
37,570 AT&T Corp.- Liberty Media Group 514.239 1.9
9,YSO Cablevision Systems Corp. 749,981 2.8
Communications, Inc. 795,504 3.0
International, Inc. 323,189 1.2 29,390 Infinity Brrradcasting Corp. 901,906 3.3 8,550 Liberty Digital. Inc. 49.964 0.2
19,780 Time Wamer, Tnc. 1,273.832 4.7
16,638 Clear Channel
8,182 Gemstar-TV Guide
Shares Description Value %of
USD Net Assets
Common Stocks - (continued) Media -(continued)
h,620 UnitedGlobalCom, Inc. 104,162 0.4 10,160 UniviGon
Communications, Inc. 348,615 1.3 12,698 Viacom, Inc. 660,296 2.5
20.040 Wcstwoiid One. Inc. 345.690 1.3 3,890 Walt Disney Co. 112.081 0.4
6,179.459 23.0
Semiconductors 6,326 Applicd Micro Circuits
4,990 ARM Holdings PIC.- Corp. 322,626 1.2
ADR (4 97,617 0.3
230,589 0.9 Systems, Inc. 6.060 PMC-Sierra. Inc. 627,304 2.3
540 'liansmeta Corp. 12,859 0.0 6,130 Xilinx, Inc. 263.590 1 .O
1,554,585 5.8
13,870 Intcgrated Circuit
Software 6,940 First Data Corp. 351,337 1.3
Corp. 123,670 0.5 8.010 Intuit, Inc. 380,475 1.4
16,980 Microsoft Corp. 1,104.761 4.1 14,360 Oracle Corp. 328.485 1.2 4,620 Witness Systems, Inc. 68,434 0.3
23,010 Intertrust Technologies
2,357,171 8.8
Telecommunications
2,470 Avici Systems, Inc. 48,783 0.2 3,550 Corvis Corp. 102,506 0.4
International Corp. 1,179.664 4.4 5.310 EchoStar
Communications Corp. 145,942 0.5 6.930 NTL. Tnc. 192,307 0.7
1,669,202 6.2
49,410 Crown Castle
Telecommunications Equipment 11.020 American Tower Corp. 12,Y 10 Cixo Systems. Inc. 16,290 Comcast Corp. 4,840 Corning, Inc. 6,368 .IDS Uniphase Corp. 4,500 Nortel Networks Corp. 2,780 Qudlcomm, Inc. 1,120 SDT., Inc.
345,064 667.286 631.237 301,290 366,160 160.031 229.698 235.340
1.3 2.5 2.3 1.1 1.4 0.6 0.8 0.9
2,936,l Oh 10.9
Telephone 20,630 Sprint Corp. (PCS Group) 487,384 1.8
TOTAL COMMON STOCKS
(cost USD 33,096,719) 24,858,183 92.6
56 The accompanying notes are an integral part of these financial statements.

G 0 L 0 M A N 5 A C H S I N T E R N ET TO L L K E E P E R I M PO RT FO L I 0 *
Statement of Investments 30 November 2000
Principal Amount Description
Value % o f USD Net Assets
Short Term Investments - 7.5% United States Dollar 2.005.000 Stale Strect Bank, 6.50%'
due 01/12/00 2,005.000 7.5
TOTAL SHORT TERM
INVESTMENTS
(cost USD 2 , 0 0 5 , 0 0 0 ) 2,005.000 7.5
TOTAL I NVESTM E NTS (cost USD 35.101.719) 26,863,183 100.1
All sccurity holdings of this portfolio are transfcrablc securi- ties dealt on a regulated market.
(a) Securiw h o l l i n ~ i.s rrodrdlheld in USD.
The accompanying notes are an integral part of these financial statements. 57

GOLDMAN SACHS JAPAN PORTFOLIO
Letter to Shareholders 30 November 2000
Dear Shareholders:
On behalf of Goldman Sachs, we wclcomc the opportunity to review the performance of thc activity of the Goldman Sachs Japan Portfolio for the onc-ycar pcriod that ended 30 November 2000.
Market Review
During the period undcr review the Japanese market performcd wcakly. After a rally through early part of this year. led by tcchnology: media and telecom (TMT) stocks, invcstor sentiment deteriorated substantially. This was partly triggered by a sharp correction in the US Nasdaq market. Supply-demand conditions in the equity market rcmaincd poor throughout the period, with foreign invcstors turning to large net sellers this year, putting a dampner on overall market sentiment.
Added to fragile cquity markets abroad, concerns of glohal economic slowdown began to cast doubt on sustainability of corporatc earnings growth. Interim results did post robust earnings growth with non-financials’ recurring profit rising 40%’. However, given a low visibility of the surrounding cnvironment, many investors became incrcasingly concerned about earnings risk going forward - especially those of export-oriented companies.
Portfolio Positioning
The Portfolio continucd to favour companies that were globally competitivc, and that possessed a relatively high return on capital and a favourable growth outlook. For this rcason, we maintained overweight positions in technology sectors such as electronics components and business machincs for most of the period. As the global economy startcd to show clearer signs oldeceleration, we rcduccd cxposurc to such sectors. On the other hand, we incrcascd positions in a number of defensive, domcstic-oriented areas such as pharmaceuticals, foods, and services.
We initiated new positions in a number of stocks during the period, including Skylark (1.2%), the largest restaurant chain operator. Thc company changed its business strategy from less efficicnt, multi-store formatting lo the one with a clear focus on corc store types. A newly introduced incentive plans for storc managers is also contributing positively to Skylark’s undcrling business.
We sold TDK, a hard-disc drive (HDD) heads maker. The company continucd to suffer from fewer heads used per HDD, duc to stronger demand Cor cheaper IIDD with fcwcr heads. As a result, we believed the company’s carnings growth would be subdued in coming years.
Performance Review
Over the onc-ycar period that ended 30 November 2000, the Portfolio’s cumulative total return was -11.8Y %. This compared to thc -16.99 % return for the Portfolio’s benchmark, the TOPIX Indcx (without income reinvested and, in contrast to the Portfolio, without the deduction of any expcnscs. For more information on the performance of the Portfolio and a dcscription of its benchmark, refer to page 108. Portfolio rcturns arc shown net of management fees with income reinvested using month-end NAVs.)
*
The Portfolio’s ~dVOurdhk relative pcrformance was primarily due 10 successful stock selection. Good pcrformers during the period included Mitsui Mining and Smelting (2.0 %), the leading electro-deposited coppcr foil maker, which advanced 76% during thc pcriod. The company’s TAB (tape automated bonding tapes) arc also selling very strongly for LCD displays on thc back of production capacity adds-ons by TFT-T,CD makcrs.

GOLDMAN SACHS JAPAN PORTFOLIO
Letter to Shareholders 30 November 2000
We apprcciate your continued support and look forward to reporting on the Portfolio’s progress in the future.
Goldman Sachs Japan Portfolio Management Team Tokyo, 15 December 2000
59

GOLDMAN SACHS JAPAN PORTFOLIO
Statement of Investments 30 November 2000
Shares Description Value 96 of
(000) JPY Net Assets .-
Common Stocks - 93.7% Auto Manufacturers
74,000 Honda Motor Co. 287,120 0.6 323.000 Toyota Motor Corp. 1275,850 2.6
1,562,970 3.2
Auto Parts &Equipment 231,000 Bridgestone Corp. 318,318 0.7
Banks
417,000 77 Bank T,td. 303,159 0.6 690.000 Chiha Bank I.ld. 296,700 0.6 883.000 Daiwa Bank Ltd. 180,132 0.4
1,161 Mizuho Holdings. lnc. 832.437 1.7 571,000 Sakura Bank Ltd. 365,440 0.7 633,000 Sanwa Bank Ltd. 505,134 1.0 645,000 Sumitomo Trust
& Banking Co. 491,490 1.0
2,974,492 6.0
Beverages 30 Coca-Cola West Japan
CO.. 80 0.0 633,000 Ltd. Kirin Brewery Co. 678,365 1.4
678.445 1.4
Chemicals 1,514,000 Asahi Chemical Industry
Co., Ltd. 1,049,202 2.1 724,000 Kaneka COT. 669,700 1.4 115.000 Shin-Etsu Chemical Co. 570,400 1.2 447.000 Sumitomti Bakelite 551,151 1.1 22,300 Taiyo Ink Manuf:iilcturing 104,810 0.2
2.945.263 6.0
Commercial Services 72,000 Nippoii Kanzai Co., Ltd. 90,000 0.2
296,100 'Toppan Forms 547.785 1.1
637,785 1.3
Computers 220,000 Fujitw T,td. 151,000 Mcitcc Corp. 388.960 0.8
611,550 1.2
1,000.510 2.0
Cosmetics/Personal Care
752,000 Kaiicbo Ltd. 227,856 0.5 362,000 Kao Corp. 1,230,800 2.5
1,458,656 3.0
Distri bution/Wholesale 1,068,000 Sumitoino Corp. 936,636 1.9
Diversified Financial Services 618,000 Uaiwa Securities Group.
Inc. 719,970 1.5
Value %of Shares Description (000) JPY Net Assets
Common Stocks - (continued) Diversified Financial Services - (continued)
346,000 Nomura Securities Co.. Ltd. 806.180 1.6
71,300 Takefuji Corp. 4h9,154 0.9
1,995,304 4.0
Electric 306,500 Tokyo Electric Power
Co., Inc. 803,030 1 .6
Electrical Components & Equipment 810,000 Sanyo Electric Co., T,td . 699.030 1.4 491.000 Sharp Corp. 648,120 1.3
1,347,150 2.7
Electronics 36>000 S7,XOO 19,200
730,000 82,800
364.000 63,500 75.600
Advantest Corp. FANUC Ltd. Keyence Gorp. Minehea Co., T.td. Murala Manulacluring Co., Ltd. NGK Insulators Ltd. Secom Co.. Ltd. Soiiy Corp.
468,720 516,154 559,680 827.820
1,225,440 524,160 492,760 632,Ol 6
5,246,750
0.9 1 .o 1.1 1.7
2.5 1.1 1.0 1.3
10.6
Entertainment 50,900 Nintendo Co. 844.431 1.7 30,700 Toho Corp. 455.588 0.9
1,300.019 2.6
Food 69,300 Katokichi Co., I.td. 198,198 0.4
Hand/Machine Tools 17,800 SMC Corp. 288,360 0.6
I ~ Y , S O O THK co.. i.td. 448,500 0.9 93,000 Toyoda Machine Works 61,380 0.1
798,240 1.6
Health Care
201,000 Tcrumo Corp. 441,195 0.9
Housewares 873,000 Asahi Glass Co.. Ltd. 949,821 1.9
Insurance 449,000 Sumitomo Marine Br
Firc Insurance Co.. Lid. 333,607 0.7
Machinery-Diversified 551,000 hjitec Co.. Ltd. 341,620 0.7
667,000 Tsuhakimoto Chain Co. 234,117 0.5 71,300 Sato Corp. 181,815 0.3
757,552 1.5
60 The accompanying notes are an integral part of these financial statements.

GOLDMAN SACHS JAPAN PORTFOLIO
Statement of Investments 30 Noveniher 2000
Shares Descriution Value %of
(000) JPY Net Assets Shares Description
Common Stocks - (continued) Media
79,000 Tokyo Broadcasling Syslem 323.900 0.7
Mining 1,078,000 Mitsui Mining
& Smelting Co., Lld. 966,320 2.0
& Mctals Co., Ltd. 371,544 0.7 548,000 Nippon Mining
1,337,863 2.7
Miscellaneous Manufacturing 249,000 Fuji Photo bilm Co. 1,110,540 2.2 72h,000 Matsushita Electric
Works Ltd. 914,760 1.9
2,025,300 4.1
Office/Business Equipment 257,000 Canon, Tnc. 1,117,950 2.3 502,000 Ricoh Co.. Ltd. 988,438 7.0
2,106,388 4.3
Office Furnishings 3X7,OOO Kokuyo Co., Ltd. 614,943 1.3
Oil &Gas Producers 713,000 Japan Energy Corp. 173,259 0.4
Pharmaceuticals 71,000 Eisai Co., Ltd. 269,800 0.6
Industries Ltd. 1,351,420 2.7
Pharmaceutical 846.230 1.7
1 Y7,OOO Takeda Chemical
157.000 Yamdnouchi
2,467.450 5.0
Real Estate 19,000 Able, Inc. 16,720 0.0 50,100 Sumilomo Rcal Estatc Sales 194,889 0.4
2 11.609 0.4
Retail 70
53,400 255,600
3,900 72,000
192,000 21 2,800
2,696
Family Mart Co. Matsumotokiyoshi Mini<lop Co., Ltd. Ryohin Keikaku Co., Ltd. Seven-ElevcnJapan Skylark York-Bcnimaru Co., Ltd. Yoshinoya U&C Co.
200 208.260 595,548
19.539 583.200 576,000 530.936 563.464
0.0 0.4 1.2 0.0 1.2 1.2 1.1 1.1
3,077,147 6.2
Semiconductors 311.000 NEC Corp. 648,435 1.3 45.700 Kohm c'o , TAd. 1.220,lYO 2.5
.I ,8hX,625 3.8
Value %of (000) JPY Net Assets
Common Stocks - (continued) Software
94,000 Nihon Unisys 137,240 0.3 -
Telecommunications 836 Nippon Tclegraph
& Tclcphone Corp. 798,380 1.6
Communication Network, Inc. 3,412,980 6.9
4.211,360 8.5
1,206 NTI Mobile
-.
Telephone 664 DDICorp. 346,608 0.7
Transportation 1,024 East Japan Railway Co. 653,312 1.3
T O T A L I N V E ST M E N T 5
(cost JPY 49,975,875) 46.238.949 93.7
All security holdings of this portfolio are transferable sccuri- ties dealt on a rcgulatcd market.
The accompanying notes are an integral part of these financial statements. 61

G O L D M A N SACHS JAPAN SMALL CAP PORTFOLIO
Letter to Shareholders 30 November. 2000
Dear Shareholders:
On behalf of Goldman Sachs, we welcomc thc opportunity to review the performance of the Goldman Sachs Japan Small Cap Portfolio for the one-ycar pcriod that ended 30 November 2000.
Market Review
During the rcporting period the Japanese Small Cap stocks registcrcd almost flat performance, while strongly outperforming thc broader stock market indices. Abnormally crratic market movements occurred in the period, in which almost all thc outperformance made by growth stocks ovcr valuc stocks in 2000 swept out.
Toward the end of 1999, Information Tcchnology and Internet stocks soared, partly due to exccptionally high money supply growth and thc worldwide phenomena to deal with potential Y2K problems. Tcchnology, media and telecom (TMT) issues led growth stock outperformance versus value stocks, regardlcss of the size of market capitalisation. This continucd until the middle of the first quarter 2000, as most TMT stock valuation levels reached a point whcrc historical valuation measures were no longer applicablc. Thc performance of Small Cap stocks in general laggcd the Large Cap growth stocks by significant margin during this period.
However, thc investment environment changed toward thc cnd of March. A series of downward revisions of earnings estimatcs from several highly visible growth companics, as well as sharp correction of the US Nasdaq markct, triggered a change of sentiment in thc global equity market. As a result, Japanese large-cap growth stocks, which had generated spectacular performancc sincc the 4th quarter of 1999, experienced a relatively quick and large correction in April and May. Convcrsely, investors suddenly started paying more attention to reasonable valuation levels and fundamcntal earnings for their investment portfolios. As a result, prcviously ignored sectors, such as inexpensively valucd stocks and low priced stocks, primarily represented by small-cap value stocks, gained momentum. All told, this sharp change in market sentiment causcd thc broader market to underperform the Small Chp stock index during the one-year reporting period.
Portfolio Positioning
At the end of the reporting period thc Portfolio consisted of 62 stocks, compared to 37 stocks 12 months ago and 50 stocks six months ago. The volatile market environment offered us a varicty of opportunities to purchase growth at inexpensive valuation levels. Those stocks included not only “ignorcd” non-TMT stocks, but also high quality technology stocks.
In terms of sector allocation. we continue to have a relatively large exposurc to the wholesale sector (approximately 20% of the Portfolio). Our exposure to this sector consists of diversified businesses such as electronics components, processed foods, scientific laboratory tools and machinery parts.
Performance Review
1)
*
Over the one-year ended 30 Novcmber 2000, the Portfolio’s cumulative total return was -18.91%. This compared to the -3.77 %# return for thc Portfolio’s benchmark, the Russell/Nomura Small Cap Indcx (with income reinvested and, in contrast to the Portfolio, without the deduction of any expenses. For morc information on the performance of the Portfolio and a description of its benchmark, refer to page 108. Portfolio rcturns are shown net of management fecs with income reinvested using month-end NAVs.)
62

GOLDMAN SACHS JAPAN SMALL CAP PORTFOLIO
Letter to Shareholders 30 November 2000
Performance Review (continued)
The primary reason for the Portfolio’s underperformance relativc to the benchmark was its higher exposure to growth stocks versus the benchmark. Aftcr a lengthy period of underpcrformance, value stocks havc performed very wcll since March. As a result, a Portfolio focuscd on buying quality growth at reasonable price could not fully participatc in the recovery of the Small Cap indcx. In addition, the Japanese OTC stocks market, Jasdaq, fcll 34.77%, and approximately a quarter of the Portfolio was exposed to the Jasdaq markct.
Looking ahead, we bclicve the fundamentals of the Portfolio are very competitive to thc overall market level. We are now carefully rcviewing each stock’s fundamcntals from the viewpoint of buying quality growth at inexpensive valuations, which i s our investment principlc.
We appreciate your continucd support and look forward to reporting on the Portfolio‘s progress in the future.
Goldman Sachs Japan Small Cap Portfolio Managcment Team Tokyo, 15 Dcccmber 2000
63

GOLDMAN SACHS JAPAN SMALL CAP PORTFOLIO
Statement of Investments 30 Noventber 2000
Value %of Shares Dercrlptlon (000) JPY Net Assets
Common Stocks - 99.0% Apparel
27,900 Nagailcbcn Co., Ltd. 61,101 1.0
Auto Parts & Equipment 131,000 Ogura Clutch Co. 102,049 1.8
Chemicals 3 1,500 Fujimi, Inc. 107,100 1.8 24,300 Tiliyo Ink Manufacturing 114,210 2.0
221,310 3.8
Commercial Services
15 Intelligence Ltd. 15,000 0.2 34,600 Koekisha Co., Ltd. 163,312 2.8
101,200 Nippon Kaniai Co., Ltd. 126,500 2.2 31.000 PA To., Ltd 27,900 0.5 19,000 Sogo Medical Co., I ld . 41,040 0.7
373,752 6.4
Computers
53.000 Japan Business
31,600 Meilec Corp. 127,980 2.2 21 Sotcc Co., Ud. 27,930 0.5
Computer Co. 115,010 1.9
Value %of Shares Description (000) JPY Net Assets
Common Stocks - (continued) Food -(continued)
15,200 Ozcki Co., Ltd. 50,ihn 0.9 27,400 Rock Field C,o., Ltd. 146,590 2.5
313,310 5.4
Health Care 72,000 Fukuda Denqhi Co., 1.td. 156.960 2.7
118.000 Kawasumi Labs, Inc. 119,770 2.0 30,000 Medical Support Co.. Ltd. 51,600 0.9
328,330 5.6
Home Furnishings 76.000 Alpine Electronics. Inc. 95,076 1.6
108.000 Foster Electric Co.. Ltd. 60,480 1.1
155,556 2.7
Internet 24 Cyheragent I,td. 9,840 0.2 36 Rakutcn, Inc. 41,760 0.7
51,600 0.9
Leisure 8,800 Pcoplc Co., Ltd. 57,992 1.0
270,920 4.6
Cosmeticslpersonal Care 29,200 Adcrans Co.- Ltd. 112,420 1.9 12,600 Milbon Co., Ltd. 78,120 1.4
190,540 3.3
DistributionMlholesale
17,000 Fuji Electronics Co.. Ltd. 75,500 0.5 56,600 Hakuto Co. 182,252 3.1
107,800 Trusco Nakavania Corp. 157,927 2.7
365,679 6.3
Electrical Components & Equipment 30,000 Enwewe Corp. 129.000 2.2 15,100 Funai Electric Co., Ltd. 113.250 2.0 81,500 Japan CBM Corp. 76.692 1.3
318.942 5.5
Electronics 17,400 Citizen blcctronics ii6,s80 2.0 25,300 Enplas Corp. 106,766 1.8 83,500 Iuchi Seieido Co., Ltd. 132.765 2.3 43,500 Kuroda Denki Electric
To., Lld. 102,225 1.8 (i0,OOO Nippon Ceramic Co..
Ltd. S 136,800 2.3 100 Eikoh Ciken Co., Ltd. 2.900 0.1
23,000 Star Micronics Co.. Ltd. 34,500 0.6
632.536 10.9 ~
Food 188,oon Kato Sangyo Co.. Ltd. 116.560 2.0
Machinew-Diversified 133,000 Iujitec Co., Ltd. 82,460 1.4 140,000 Nippon Pillar Pack 10h,S40 1.8 60,800 Sato Corp. 155,040 2.7
344,040 5.9
Metal FabricatelHadware 61,1)00 Amatsuji Sleel Ball
MFG Co., Ltd. 140,000 Hitachi Powdcrcd Metals
59,170 1.0 144,200 2.5
203,370 3.5
Miscellaneous Manufacturing 17,000 Arrk Corp. 74.800 1.3 82,600 Mirai Industry Co., Ltd. 99,120 1.7 24,000 Suruga Co., J-td. 88,800 1.5
262,720 4.5
Off icelBusiness Equipment 106.000 IJchida Yoko Co., Tld. 78,016 1.3
Packaging &Containers 21,100 Fuji Seal, Inc. 47,475 0.8
Pharmaceuticals 76.000 Rohto Pharmaceutical
Co., Ltd. 117.100 1.9
Real Estate 7,000 Able, Inc. 6,160 0.1
18,400 Relocation Scrviccs Corp. 118,680 2.0 32,900 Sumitomo Real Estate
Sales 127,981 2.2
252,821 4.3
64 The accompanying notes are an integral part of these financial statementr.

G O L D M A N SACHS JAPAN SMALL CAP PORTFOLIO
Statement of Investments 30 November 2000
Shares Description Value %of
(000) JPY Net Assets
Common Stocks - (continued) Retail
9,000 13,100 33,000
56,600 112
57.400 35.000
623
ASKUL Corp. Cawachi Ltd. Culturc Convenience Club co., Ltd. Komeri Co.. Ltd. Kyoto Kimono Yuzen
Ministop Co.. Ltd. Mitta Co.. Ltd. Yoshinoya DCC Co.
co., Ltd.
59,400 97,149
54.450 140,934
49.840 133,742 92.750
130,207
1.0 1.7
0.9 2.4
0.9 2.3 I .6 2.2
758,472 13.0
Software 69.000 Mkc-Star Corp. 126,270 2.2
Telecommunications Ih NcxtCorn K.K. 139,040 2.4
T O T A L IN V E 5 T M E N T 5
(cost JPY 6,708,113) 5,767,941 99.0
All security holdings of this portfolio arc transtcrablc sccuri- ties dealt o n a regulated market.
The accompanying notes are an integral part of these financial statements. 65

GOLDMAN SACHS TECHNOLOGY PORTFOLIO*
Letter to Shareholders 30 November 2000
Dear Shareholders:
On behalf of Goldman Sachs, we welcome thc opportunity to review the performance of the Goldman Sachs Technology Portfolio for the one-ycar period that ended 30 November 2000.
Market Review
The reporting period started on a positive note with tcchnology, media and telecom (TMT) stocks recording impressive gains. Markets were led by these ncw cconomy sectors, whose strong performance overshadowed virtually all other areas of the market. A dramatic change in investor sentiment occurred in mid-March, which led to a sharp correction in the sector and subscqucnt high levels of volatility. Several factors led to this de-rating: namely, an increase in oil prices, coupled with signs of rising inflation in the US led to concerns that the Federal Reserve would continue to raisc interest rates, thereby slowing economic growth. This was likcly to ultimately impact revenue growth across all sectors, leading to reduced spending on technology products and scrviccs. Thc markets experienced a brief rebound in the summer, as investors became hopeful that signs of moderating economic growth would result in an end to these interest rate hikes and help to generate renewed enthusiasm for the sector.
However, the reporting period concluded on a negativc note with increased uncertainty regarding corporate profit warnings. Corporate earnings forecasts for 2000 were sct at thc end of last year when the economic outlook was more favourable, and as the environmcnt weakcncd during the course of this year, the forecast growth levels proved unattainable for many companics. This led to a series of profits warnings and subsequent earnings downgrades of many bellwcthcr stocks, such as Intel, Microsoft and Nortel.
Porffolio Positioning
As of 30 November 2000, the Portfolio’s largest sector exposures were in Application Software, Multimedia Net- working and Media, and the least exposure was in Computcr Scrvices, Wireline Telecommunications and Internet Scrvices.
Our strategy aims to invest in fast growing companics that are expected to benefit substantially from technological advancements globally. Wc bcncfit from a strong regional research presence and a broad interpretation of the sector, which includes tclccommunications.
Performance Review
Over the one-year period that ended 30 November 2000, thc Portfolio’s cumulative net total return was -13.97%. This compared to the -0.24 75 return for the Portfolio’s bcnchmark, the Morgan Stanley Capital International World Index (with income reinvested and, in contrast to the Portfolio, without thc deduction of any expenses. For morc information on the performance of the Portfolio and a description of its bcnchmark, refer to page 108. Portfolio returns are shown net of management fccs with income reinvested using month-end NAVs.)
On a sub-sector levcl, Multimedia Networking, Storage Hardware, Software and Enterprise, and Sccurity Software enhanced results, while the Portfolio was negatively impacted by our exposure to Media, Semiconductors and Tnternct Software and Services. Top stocks contributing to performance were I2 Technologies (1.6 %) and EMC Corp (3.6%). Both these companies are benefiting from the trend for individuals and businesses to conduct more transactions over a network. Weak contributors to performance wcrc Sprint ( O B % ) , due to its profit warnings resulting from slower growth in subscribers due to grcatcr competition.
66

GOLDMAN SACHS TECHNOLOGY PORTFOLIO*
Letter to Shareholders 30 November 2000
Performance Review (continued)
Dcspitc recent volatility, we remain confident in the long-term growth potential o f the technology businesses in which wc are investing. For example, we believc that the drive for business efficiency is a structural trend that enterprises need to invest in order to remain competitive, especially in an environment of slowing growth. Similarly, we believc that the optical networking sub-sector will perform strongly over the long-term, as demand for faster speeds and greater reliability over networks increases. Finally, another key theme in our portfolio is data storage. Companies such as EMC Corp address the need to store the ever-increasing volumes of information travelling over networks.
We thank you for your investment and continued support.
Goldman Sachs Technology Portfolio Management Team London. 15 Dccember 2000
* Global Technology Porrfolio Jrom 1st .lama? 2001.
67

G O L D M A N SACHS TECHNOLOGY PORTFOLIO
Statement of Investments 30 Noventber 2000
Value %of CHF Net Assets
Value % o f Sharer Description CHF Net Assets
Common Stocks - 89.6% Australian Dollar
500,556 News Corp.. Ltd. (Mcdia) 7,731,455 0.8
Shares Description
Common Stocks - (continued) Japanese Yen -(continued)
282,000 Sharp Corp. (Elcctrical Componcnts & Equipmcnt) 5,836.679 0.6
30,914,815 3.3
British Pound Sterling 925.560 ARM Holdings PIC.
134,537 GEO Interactive Media (Semiconductors)
Group PIC.-GDR (Intcmct)
(Commercial Scrviccs) 812,189 Guardian 1 1 PIC.
538.033 Logica PIC. (Computers) 3,147.666 Vodalone Group Plc.
(Telecommunications)
(Advertising) 511,300 WYP Group Plc.
9.979,04 I 1 . 1
Swedish Krona 145,102 Cyber Com Consulting
Group Scandinavia AI3 (Computers) 1.960,986 0.2
1,402.880 Enim AB (Media) 73,577,550 2.5 1,273.176 I'elefonakticbolagct LM
Ericssoii "B' (Telecommunications Equipment) 24,927.18~ 2.6
50,465,723 5.3
1,757,210 0.2
19,114,662 2.0 17.303,166 1.8
18,757,591 2.0
9.714,855 1.0
76,621,525 8.1 ~ ~~
Swiss Franc 17,421 Tamedia AG (Media) 3545,173 0.4 Euro
263.071 Alcatel SA (Telecommunications Equipment) 22.792,772 Elisa Communications Oyj ~l'elecommutiications) 2.989,157 Hivils Advertising SA (Advertising) 6,246,977 Tntershop Communications AC (Intcmct) 9.865,357 Philips Electronics NV (Electronics) 12,773,9 14 Promotora de lnformaciones SA (Media) 8,555.644 SAP AG-Preferred (Softwarc) 19,273,209 Soiiera Oyj (Ttlecommunications) 3,934,006 United Pan-Europe Communications N V (Tclec(ommunications) 15,583.613 Valtech (Commercial Scrviccs) 3,918,174 VNU NV (Mcdia) 24,039,771
129,972,594
United States Dollar 2 I 1,400 Amdocs Ltd. 2.4
0.3
0.7
(Telecommunications) Art Technology Group, hie. (Intcmct) Avici Systems, lnc. (Telccommunications) Urocadc Communications Systems, Inc. (Computers) Check Point Software Technologies Ltd, (Internet) Cisco Systcms. Inc. (ltlecommunications Equipment) Clear Channel Communicaticons. Inc. (Mcdia) Computer Network Technology Corp. (l'elecommunications) Corning, Tnc. (Telecommunications Equipmcnt) Corvis Corp. (Ttlecommunications) ( h w n Castle
20,395.544
8.790,295
4,07 1,825
15.608,649
2.2
0.9
0.4
1.7
149 .OD0
118,600
58.400
50,800 1.0
I .4
0.9
2.0
0.4
221,056
301.701
85,272
119,216
797.392
9,095,745 1.0 263,700
23.693.706 2.5 141,310
11,744.964 1.2 212,010
1.7 254,684
317.812
1 .o 9,069,728 0.4 2.5
13.7
107.800
1 1,665.288
4.336,837
1.2
0.5 86.400
610,000 Japanese Yen
24,200 Advanlesl Corp. (Elcctronics) 4,940,480 0.5
218,000 Fujitsu Ltd. (Computers) 6,043.402 0.7 175,000 NEC Corp.
(Semiconductors) 5,721.197 0.6 178,000 Nippon Ceramic Co.. Ltd.
(Electronics) 6,363,523 0.7
(Semiconductors) 2,009.534 0.2 4.800 Rohm Co., Ltd.
Intcrnational Corp. (Tclccommutiications)
270,400 EMC Corp. (Computers) 95,100 Galileo Technology Ltd.-
GDR ( n ) (Semiconductors) 98,850 12 Technologies, Inc.
(Internet) 101.800 lntcrnational Busincss
Machincs, Inc. (Computers)
15,3 16.901 34.401,781
2.7 3.6
2,521,086 0.3
15,540.413 1.6
17:663,227 1.9
68 The accompanying note5 are an integral part of these financial statements.

G O L D M A N SACHS TECHNOLOGY PORTFOLIO
Statement of Investments 30 November 2000
Value %of Shares Description CHF Nat Assets
Common Stocks - (continued) United States Dollar - (continued)
170.700 Mcdata Corp.
196,100 Microsoft Corp. (Computers) 12,759,666 1.4
(Software) 22.179,lYO 2.3 184,XOO MIH Ltd. (Media) 5,2oo,ixn 0.6 489,075 Motorola, Inc.
315,400 Nortel Networks Corp. (Telecommunications) 17.641,313 1.9
(Telecommunications Equipment) 19,498,056 2.1
469,100 Oracle Corp. (Software) 18,653,652 2.0 301.200 PMC-Sierra. Inc.
(Semiconductors) 18.210,579 1.9
(Computers) 10,953,455 1.2 335.300 REMEC, lnc.
(Aerospacc/Dcfcnsc) 9,908,771 1 .0 300,400 Resonate, Inc. (Software) 6,788,606 0.7 178,750 Scientific-Atlanta, Tnc.
90,500 Kedback Networks, Inc.
(Telecommunications Equipment) 12.972,983 1.4
(Software) 12.322,992 1.3 98,800 Siebel Systems, Tnc.
280,500 Silicon Image, Inc.
328,100 SmartForce Plc.-ADR ( a )
188,600 Sprint Corp. (PCS Group)
(Semiconductors) 3,367,538 0.4
(Software) 19.543,494 2.1
(Telephone) 7,745.525 0.8 28,200 SPX Corp.
(Miscellancous Manufacturing) 4,YY 1,000 0.5
187,100 Sun Microsystems, Inc. (Computers) 25,938.318 2.7
121,200 Sycamore Networks, Inc. (Telecommunications Equipment) 0,849,667 1.0
257.400 Time Warner, Inc. (Media) 28,815,870 3.0
(Semiconductors) 1,999,451 0.2 151,200 VeriSign, Inc. (Internet) 21,274,216 2.2 360,200 Viacom, Inc. (Media) 32,559,999 3.4
(Telecommunications) 7,680,554 0.8
(Telecommunicaliclns) 3,837,561 0.4
548,558.633 58.0
85.200 'l'ripath Technology, Tnc.
39,100 VoiccStrcam Wireless Corp.
55.800 Western Wireless Corp.
T O T A L C O M M O N STOCKS
(cost CHF 1 , 1 5 4 , 9 9 7 , 7 6 5 ) 847,809,019 89.6
Principal Amount Description
Value %of CHF Net Assets
Short Term Investments - 1.5% Swiss Franc 14,213,685 State Street Bank 2.60%.
due 01/12/00 14,213,685 1.5
TOTAL S H O R T T E R M I N V E S T M E N T S
( c o s t CHF 1 4 , 2 1 3 , 6 8 6 ) 14,213,685 1.5
T O T A L I N V E S T M E N T S
(cost CHF 1 , 1 6 9 , 2 1 1 , 4 5 0 ) 862,023,604 91.1
All security holdings of this portfolio ate lransferablc sccuri- ties dealt on a regulated market. (u) Securir) holding IS tradcdlhrld in IlsD
The accompanying notes are an integral part of these financial statements. 69

GOLDMAN SACHS US CORE’” EQUITV PORTFOLIO*
Letter to Shareholders 30 November. 2000
Dear Shareholders:
On bchalf of Goldman Sachs, we welcome thc opportunity to review the performance of the Goldman Sachs US CORESM Equity Portfolio Cor the one-year period that ended 30 November 2000.
Market Review
The reporting pcriod began on a positive note Cor the US markct, as stocks rose before experiencing ii sharp correction in mid-March. Continued strong economic growth, inflationary pressures and rising intercst ratcs wcre the catalysts behind the decline. While othcr types of stocks were dragged down, technology issues experienced the brunt of the Call. Within a few wccks thc technology-laden Nasdaq had fallen 37% from its peak.
The equity markets experienced a brief rebound late in the summer, as investors werc hopeful that signs of moderating economic growth would rcsult in an end to interest rate hikes by the Fedcral Rcscrve Board. However, the reporting period concluded on a down note, as uncertainty regarding corporate profits, the US presidential election and coiitinucd high energy prices took their toll.
Portfolio Positioning
In general, the Portfolio’s sector, sizc and other risk exposure approximates that of the bcnchmark. The Portfolio’s quantitative process then secks out stocks that research analysts prefer, with good momentum, and that also appear to be good values rclativc to other stocks in the same industry. Finally, thc Portfolio prefers stocks with a lower- than-average risk of rcporting earnings disappointments.
Ovcr thc 12-month reporting period. the returns to thc Valuc and Momentum themes were negative, on avcragc, and only stability produced positive results. However, thc avcrages mask a high degree of volatility in how the themcs fared. Each theme experienced onc of its best months since inception, as well as at least onc of its worst months ever. For example, Vdue had an cxtrcmely difficult February 2000, followed by returns in March that were better than all hut three months in thc history of the COKE product. For stability, six of the 12 months had recorded high or low returns. In addition, some months saw extremely positive rcturns for one variable and extremely negative for another-retlecting thc high overall return dispersion nature of the markct.
Performance Review
Ovcr the one-year period that ended 30 Novcmbcr 2000, the Portfolio’s cumulative total return was 4 . 0 9 9% vcrsus the -3.57 Oh return for thc Portfolio’s benchmark, the S&P 500 Index (quoted one day prior to month-end to closely resemble the timing of thc pricing of the Portfolio, with estimated income reinvcstcd and, in contrast to the Portfolio, without thc deduction of any expenses. For more information on thc pcrformance of the Portfolio and a
description of its bcnchmark, refer to page 108. Portfolio rcturns arc shown net of management fees with income reinvestcd using month-end NAVs.)
We chose the sct of investment variables we use because the returns in onc arc gcncrally not related to the returns in anothcr. In othcr words, we expect to see the benefits of divcrsification-when one factor or theme doesn’t work as expectcd, the slack should be picked up by a differcnt variable. However: over this period some returns wcre so cxtrcme that they could not necessarily be offsct by rcturns from different themes, even i f they were positive. We continue to view this as a vcry unusual market environment, and expect the sprcad bctwccn the best- and worst- performing stocks, and thus variables, to return to more normal levels.
70

GOLDMAN SACHS US CORELM EQUITY PORTFOLIO*
Letter to Shareholders 30 November 2000
We thank you for your invcstmcnt and look fc>rward to your continued confidcncc in the future.
Goldman Sachs US COKE Equity Portfolio Managcment Team New York, 15 December 2000
* COKE is a regislered service mark of Goldman, Sachs d Co.
71

GOLDMAN SACHS US COREIM EQUITY PORTFOLIO
Statement of Investments 30 November 2000
Shares Description Value %of
USD Net Assets Shares Description
Common Stocks - 99.0% Advertising
2.700 Umnicom Group Dclense 218,194 0.1
AerospacelDefense 6.400 R.F. Goodrich Co. 236.000 0.1
28,200 Boeing Co. 1,972,237 0.9 3,600 Gcncral Dynamics Cop. 269,775 0.1 9,900 Norlhrop Grumman Corp. 834,075 0.4
27,200 United 'I'echnologics Coy. 1,887,000 0.8
5,109,087 2.3
Airlines 3.100 AMK Corp. 105,400 0.0
18,200 Delta Air Lines. Inc. 879,287 0.4
984,687 0.4
Apparel 6,900 T.iz Claiborne, Inc. 283,763 0.1
Auto Manufacturers 62,235 Ford Motor Co. 1.520,868 0.7 39,600 General Motors Corp. 1,999,800 0.9
3.520,668 1 .6
Banks
35,050 Rank of America Corp. 1,463.082 0.7 41,800 Chase Manhattan Corp. 1,585,787 0.7 12,500 Firstar C:nrp. 242,188 0.1 30,300 FlcctBoslon Financial
Uorp. 1,458,356 0.6
4,800 SunTrust Banks, lnc. 244,800 0.1 17,000 Wells Fargo C Co. 797,937 0.4
7,400 PNC Bank Corp. 489,788 0.2
6,281,938 2.8
Beverages 19.100 Coca-Cola Co. 1,186,588 0.5 28,000 Pepsi Bottling Group, Inc. 1,074,500 0.5 64,900 Pepsico, Inc. 2.944,837 1.3
5,205,925 2.3
Biotechnology 22,800 Amgen. Inc. 1.553,250 0.7 10,300 Chiron Corp. 450,625 0.2 I1,200 Genenlech, lnc. 759.500 0.3 3,700 Gcnzvmc Corp. 330,456 0.2
3,093,831 1.4
Chemicals 7,900 Air Products and
Chemicals, Inc. 271,562 0.1 9,500 Cahot Corp. 231,563 0.1
63,000 Dow Chcmical Co. 1.968,750 0.9 3.400 Praxair, Inc. 124.100 0.1
2,595,975 1.2
Value %of USD Net Assets
Common Stocks - (continued) Commercial Services
21,100 Comdisco, Tnc. 257,156 0.1 14,100 McKessun HROC, Tnc. 463,537 0.2 10.200 Robert Half Intcriiational,
Inc. 30Y9t88 0.2
Computers 20,200 Coinpaq Computer Corp. 6,000 Computer Sciences Corp. 8,600 DST Systems, Inc.
17,400 Electronic nata Systems
39,400 EMC Corp. 60,800 Hewlett Packard Co. 34.200 International Business
Machines. lnc. 34,000 Sun Microsystenis, Inc. 13,853 VERITAS Sollware Corp.
Corp.
1,029.881 0.5
458,540 0.2 405,000 0.2 605.225 0.3
902,625 0.4 2.883,588 1.3 2.101,400 0.9
3,413.587 1.5 2,711,500 1.2 1,219,055 0.5
I4.700,520 6.5
CosmeticslPersonal Care 13,800 Avon Products, lnc. 577:875 0.3 16,200 Colgate Palmolive Uo. 965,196 0.4 13,900 Kimberly-Clark Corp. 970,394 0.4 3,200 Procter & Famble Co. 241,800 0.1
2..755,265 1.2
Diversified Financial Services
7,500 118,133
9,700
2,900 1 x , m
8,500 20,300 7,700
19,100
11.500
American Express Co. Ciligroup, Inc. Fcdcral National Mortgage Association J.P. Morgan & Co., Inc. Lehman Brothers Holdings, Inc. MBNA Corp. Merrill Lynch & Co., Inc. Metris Cos, Inc. Morgan Stanley Dean Witter & Co. Providian Financial Corp.
427,031 s,x40,20n
771,756 406,906
956,450 309,188
1,225.613 195.869
1,241,500 1,069,500
12,444,013
0.2 2.6
0.3 0.2
0.4 0.1 0.5 0.1
0.6 0.5
5.5
Electric 23,800 Calpinc Corp. 935.637 0.4 44,900 Entergy Corp. 1,871,769 0.8 5,550 Exelon Corp. 359,709 0.2. 7,000 FPL Group, Tnc. 464,388 0.2
Group 573,750 0.3
4,2ns.os3 1.9
13,600 Public Scrvicc Enterprise
Electrical Components & Equipment 11,000 Emerson Electric Co. 814,687 0.4 16.200 Molex, Inc. 701,663 0.3
1,516,350 0.7
72 The accompanying notes are an integral part of these financial statements.

G O L D M A N SACHS US COREIY EQUITY PORTFOLIO
Statement of Investments 30 November. 2000
Value %of Value % o f US0 Net Assets Shares Descrlptlon USD Net Assets Shares Description
Common Stocks - (continued) Common Stocks - (continued) Electronics
11,700 Advanced Micro Devices,
5.400 Agilent Technolugie\, lnc. Inc.
11.700 Arrow Eleclmnics, Inc. 10,000 Avncl, IIIC. 10,700 AVX Coy. 9,300 Johnson Controls, Inc. Y,OOO Kemet Corp.
lY , lOO Parker-IIannifin Corp. 2,100 PerkinElnier, lnc. 2,300 Sanmina Corp. 7,700 Soleclron Corp. 7,200 Tcktronix, Inc.
18.750 Vishay Intertechnology. Inc.
199,63 1
282,163 290.925
185.000 216.006 533,006 171,000 753,256 192,413 202,400 252,656 178,650
367.969
0.1 0.1 0.1 0.1 0.1 0.2 0.1 0.3 0.1 0.1 0.1 0. I
0.2
3,825,175 1.7
Entertainment 8,700 Metro-Goldwyn-Mayer.
Tnc. 152,794 0.1
Food 25.300 6.400
24,900 23,300 7,000
7.Y00 14,400 10.700 11.600 21.000
ConAgra. Inc. Heinz (1i.J.) Co. TRP, Tnc Kroger Co. Nabisco Group Holdings Corp. Safeway, Inc. Supervalu, Inc. Syw) Corp. Tyson Foods, Inc. Unilever NV
65 1.475
550,913 625,Y50
204,750 458,200 255,600 603.212 160.225
1,257.375
282.000
5.049.700
0.3 0.1 0.2 0.3
0.1
0.1 0.3 0.1 0.6
2.3
0.2
-
Forest Products & Paper 22.200 Gcorgia Paciiic Corp. 571.650 0.3 7,000 Weyerhaeuser Co. 313,250 0.1
884,900 0.4
Gas 1 1,600 Keyspdn Energy Corp. 443,700 0.2
Health Care 14,100 Baxtcr Intcrnational. Inc. 1,225,819 0.6 8,500 IICA- I'he Ilealthcare Co. 349,562 0.2
44.600 Johnson L lohnson 4,471,150 2 4,400 Medtronic, Tnc. 238.700 0.1 7,000 Tenet Hcalthcarc C'orp. 294.438 0.1
14,100 UnitcdHcalth Group, Inc. 1,667,325 0.7
Insurance - (continued) 41,219 American International
Group 11.700 CTGNA Corp. 13,700 Hartford Financial
20,500 Locws Corp. 9,200 Marsh R: McLennan COS.
12,600 MGIC Investmenl Corp. 4,900 PMI Group, Inc. 5,400 St Paul Cos.
Services Group, Inc.
3,957,024 1,462,383
1,006,003 1,942,375 1,064.325
806.400 318.806 272.700
13,265,619
1.8 0.6
0.4 0.9 0.5 0.4 0.1 0. I
5.9
Internet 1,886,160 0.x
3,400 Broadvision, Inc. 106,975 0.1 2,900 Sapient Corp. 52,925 0 6,300 Syniantec Cop. 217:350 0.1
25,550 The Charles Schwah Corp. 737,756 0.3
10,000 Yahoo!, Inc. 390,625 0.2
43,500 Amcrica Onlinc. Inc.
3.391.791 1.5
Leisure 1,740 Sahrc Holdings Corp. 62,640 0
Media 13,300 now Jones & Co., Inc. 758.931 0.3 12,900 Fox Entertainment
Group. Inc. 208,013 0.1 265,440 0.1 4,800 Harcourt General, Inc.
45,600 Infinity Broadcasting Corp. 1,399,350 0.6
24,YOO 'lime Warner, Tnc. 1,603,560 0.7 19,700 Viacom, Inc. 1,024.400 0.5 81,600 Walt nisney Co. 2,351.100 1.1
7,610,794 3.4
Mining 13,100 Alcan Aluminum I.td. 398,731 0.2 15,400 Barrick Gold Corp. 224,263 0.1
622,994 0.3
Miscellaneous Manufacturing 195.000 General Electric Co. 14.800 Honeywell Tnlernational.
Tnc. 7,900 TTT Industries. Inc.
16,400 Minnesota Mining
24,500 Tyco Intcrnational Ltd. R: Manufacturing Co.
8,246.994 3.7
9,689,062
715,025 261,194
1,642,050 1,335,250
4.3
0.3 0.1
0.8 0.6
13.642.581 6.1
Oil & Gas Producers Insurance
10,500 Apache Uorp. 598,500 0.3 24,800 Chevron Corp. 2,036.700 0.Y 17,768 Conoco. Inc. 453,084 0.2
5,200 Aetna, Inc. 349,050 0.2 44,000 Allstate Corp. 1 ,hH3,000 0.7 5,300 American General Corp. 403,462 0.2
The accompanying notes are an integral part of these financial statements. 73

GOLDMAN SACHS US C O R E s H EQUITY PORTFOLIO
Statement of Investments 30 November 2000
Shares Description Value % o f
US0 Net Assets Shares Dercrlptlon Value %of
US0 Net Assets
Common Stocks - (continued) Oil &Gas Producers - (continued)
16.400 Devon Encrgy Corp. 73,249 Exxon Corp. 28,200 Kerr-McGee Corp. 7,400 Noble Afriliale5, Tnc. 5.900 Noble Drilling Corp. 11,400 Occidental Pctrolcum
22,700 Phillips Petroleum Co. 16,400 Royal Dutch Petroleum
10,100 Texaco, Tnc. 13,200 USX-Marathon Group
Corp.
CU-GDR (")
Common Stocks - (continued) Semiconductors - (continued)
7,200 Applied Micro Circuits
4,400 Broadcom Corp. 11,700 Integrated Dcvicc
Technology, Inc.
Corp.
I1 2,600 Intel Corp. 3,200 ma-Tencor Corp. 11,800 Micron Technology, Inc. 19,000 National Semiconductor
C O r p . 3,500 PMC-Sierra, Inc. 23,500 Texas Instruments, Inc. 10,300 Transwitch Corp. 3,300 Vitesse Semiconductor
Corp. 7,500 Xilinx, Inc.
847,880 6,514,583 1,778,363 286,750 191.381
0.4 2.9 0.8 0.1 0.1
367,200 0.2 418,000 0.2
434,362 0.2 4,813,650 2.1 95,800 0.0 404,887 0.2
755,075 1.340,719
0. I O.6
1,001.425 594,006 363,000
0.3 0.3 0.1
378,813 0.2 362,305 0.1 917,969 0.4 302,563 0.1 16,261,466 7.2
162,319 0.1 322.500 0.1
Oil &Gas Services 5.000 BJ Scrviccs Co. 278.438 0.1
9,992,530 4.4 Pharmaceuticals
41,900 Abbott Laboratories 16,800 Allergan, Inc. 9,700 Bristol Myers Squibb Co. 9.400 Cardinal Health, Tnc. 9,800 Eli Lilly B Co. 6,400 IVAX Corp. 62,800 Merck & Co.
23,317 Pharmacia Corp. 115,900 Plizer, Tnc.
2.335,925 1.550,850 700,219 943.525 926,100 264, i2x
5,958.150 5,287.937 1,420,880
1.0 0.7 0.3 0.4 0.4 0.1 2.7 2.4 0.6 -
-8.6
Software 5,700 Automatic Data
Processing, Inc. 17,000 First Data Corp. 83,800 Microsoft Corp. 109,600 Oracle Corp. 7,700 Sicbcl Systcms, Inc.
378,694 0.2 860,625 0.4
5,452.237 2.4 2,507,100 1.1 552.475 0.2
9,751,131 4.3
Telecommunications 1,208 Avaya, Inc.
11,000 W E , Inc. 12,200 Citizen Communications
22,000 General Motors Corp. 15,600 H Metromedia Fiber
Network, Inc. 24,500 Motorola. Inc. 5,500 Network Appliance. Inc. 10,320 Palm, Inc. 21,400 Qwest Communications
6,400 United States Cellular
Co .
International. Inc.
Corp.
is,ioo 0.0 297,000 0.1
." Pipelines
11,400 Dynegy, Inc. S50,76: 0.2 171,562 0.1 500,500 0.2 Retail
9.300 Abercrombic B Fitch Co.
4,200 Rest Ruy Co., Inc. 7,900 Brinker Intemational. lnc.
12,200 Autozone, Inc.
11,200 Federated Dcpartmcnt Stores, Inc.
17,200 Home Depot, Inc. 24,400 Intimate Brands, Inc. 4,800 Kohls Corp. 41,400 Limited, Inc. 14,800 Lowe's Cos. 63,000 Sears, Roebuck & Co
9,200 Talbots, Inc. 19.700 Tiffany gL Co. 18,100 Toys "K" Us, Inc. 17,300 Tricon Glohal
69,400 Wal-Mart Stores, Inc. Restaurants, Jnc.
262,144 317,963 125,213 325,381
0.1 0.1 0.0 0.1
174,525 0.1 508,375 0.2 275,000 0.1 356.040 0.2
355,600 688,000 373,625 250,800 843,525 605,875
2,065,140 446,775 705,600 358.606
0.2 0.3 0.2 0.1 0.4 0.3 0.9 0.2 0.3 0.2
839,950 0.4
362,240 0.2
3,500,292 1.6
Telecommunications Equipment 16,100 ADC
Telecommunications. Inc. 132,600 Cisco Sptem5, Inc. 32,000 Corning, Tnc. 36,700 JDS Uniphasc Corp. 14,500 Luccnt Technologies, Inc. 69,974 Nortcl Networks Corp. 5,800 Scientific-Atlanta, Inc. 1,700 SDL, Inc. 3,700 Terayon COT.
306,906 0.1 6,853,763 3.1 1,992,000 0.9 2,110,250 0.9 729,281 0.1
2,488,450 1.1 242,150 0.1 357.213 0.2 47.117 0.0
646,587 3,600,125
0.3 1.6
5.3 -
11,970.959
Semiconductors 11,400 Analog Dcviccs. Inc. 591,375 0.3 9,800 Applied Materials, Inc. 420,787 0.7
14,627.130 6.5
74 The accompanying notes are an integral part of these financial statements.

G O L D M A N SACHS US COREIM EQUITY PORTFOLIO
Statement of Investments 30 November 2000
Shares Description Value % o f
USD Net Assets Principal Amount Description
Common Stocks - (continued) Telephone
74,550 63.600 62.622
11,900 8,400
40.490 41.600
AT&T Cory. BcllSouth Corp. SBC Communications, Inc. Sprint Corp. (FON Group) Telephone & Data Systcms, Inc. Verizon Communications Worldcom, Inc.
1.416,450 2.714,925
3,455,952 284.1 12
71r2,300 2.259,848
673,400
11,566,987
0.6 1.2
1.6 0.1
0.4 1 .0 0.3
5.2 ~
Tobacco 57,500 Philip Morris Cos., Tnc. 2,210,1.56 1.0 14,100 R.J. Reynolds Trrbacco
Holdings, Inc. 528.750 0.2
2,738,906 1.2
Transportation 16,900 Burlington Northern
7,400 Canadian National Santa Fe Corp. 438.344 0.2
Railway Co. 230,787 0.1
669.131 0.3
TOTAL C O M M O N STOCKS
(cost USD 2 2 6 , 1 2 6 , 1 8 8 ) 222,530,279 99.0
Value % o f US0 NetAssets
Short Term Investments - 0.5% United States Dollar 1,037,000 State Street Bank, 6.50%
due 01/12/00 1,037,000 0.5
TOTAL SHORT TERM INVESTMENTS
(cost USD 1 , 0 3 7 , 0 0 0 ) 1.037.000 0.5
T O T A L INVESTMENTS
(cost USD 2 2 7 , 1 6 3 , 1 8 8 ) 223,567,279 99.5
All security holdings of this portfolio arc transferable securi- ties dealt o n a regulated market. (u) Srcuriiy holding is tmdedlhdd in USD.
The accompanying note5 are an integral part of these financial statements. 75

GOLDMAN SACHS US FIXED INCOME PORTFOLIO
Letter to Shareholders 30 November 2000
Dear Shareholders:
On behalf of Goldman Sachs, we welcome the opportunity to review the performance of the Goldman Sachs US Fixed Income Portfolio for the one-year period that ended 30 November 2000.
Market Review
During the first hair (if the reporting period the overdl US bond market filtered. as the Federal Rcscrve Boiird (the ”Fed”) continued to raise interest rates in an attempt to slow down thc accelerating economy. Thcn, in Junc. it appeared that the worst was ovcr. Consumer spcnding appcarcd to bc modcrating, whilc cmployee productivity was strong and inflation, asidc from cncrgy prices, was not a concern. With the Fed choosing to hold interest rates stcady during thc summer the prices of many bonds rallied.
Throughout the period the US bond market was also arfected by the Treasury Departmenl’s repurchase of long maturity debt. The reduction in supply is aimed at reducing the average maturity and interest cost of Treasury debt, This led to a sharp increase in demand for 30-year bonds, resulting in strong performance for longer maturity issues and an inverted yield curve.
Portfolio Positioning
During the period, we maintained our strategy of focusing on sectors and securities that we believe will generate a competitive total rate of return relative to the benchmark. In addition, to a lesser degree, we implemented several term structure and yield curve trades when we saw opportunities to add value. Moreover, during the period under review, we underweighted Treasury and agency sectors rekitive to the benchmark, and overweighted corporate, mortgage- and asset-hacked and emerging market debt sectors.
Performance Review
Over the one pear ended 30 November 2000, the I’ortfolio’s cumulative total return was 8.62%. This compared to the 8.87% return for the Portfolio’s benchmark, the Lehman Brothers Aggregate Bond Index (with income reinvested and, in contrast to the Portfolio, without the deduction of any expenses. For more information on the performance of the Portfolio and a description of its benchmark. refer to page 108. Portfolio returns iirc shown net of managcmcnt fccs with incomc rcinvcstcd using month-end NAVs.)
The portfolio’s undcrwcight corporatc sprcad duration position bcncfitcd pcrformancc: as corporate spreads widcncd throughout most of thc ycar. Ovcnvcight allocations mortgagc pass-throughs also bcncfitcd returns over the pcriod.
Wc thank you for your investment and look forward to your continued confidence.
Goldman Sachs U S Fixed Income Portfolio Management Team New York. 15 Dcccmbcr 2000.
76

GOLDMAN SACHS US FIXED INCOME PORTFOLIO
Statement of Investments 30 November 2000
Principal Amount Dercription
Value %of USD Net Assets
Corporate Bonds - 27.9% United States Dollar
225,000 360 Communicalions Co.
140,000 Ahold Finance IJSA, Tnc.
105,000 American Gcncral
7.1255%, due 01/03/03
8.25%, due 15/07/10
Financc 7.70%. due 26/06/03
Finance 5.75T0, due 01/11/03
550,000 Associatcs Coy. North America 5.80%. due 20104104
110,000 Associates Corp. North America 6.004. due 15107105
500,000 American General
280,000 ATgLT Canada. Inc., 0.00/9.95% (C),
due 15/06/08 155,000 AXA Financial, Inc.
7.75570, due 01/08/10 535,000 Bank of America Corp.
6.625%, due 15/06/04 65,000 Bank of America Corp.
7.25%, due 15110125 220,000 Bank of New York Co..
Inc. 7.625%, due 15/07/02 190,000 Bank of New York Co..
lnc. 8.50%, due 15/12/04 1 65,000 Bellsoulh Capilal
Funding 7.875%, duc 15/02/30
350,000 Capital One Bank 6.375%, due 15/02/03
100,000 Capilal One Rank 6.65%, due 15/03/04
100,000 Chpilal One Bank 8.25%, due 15/06/05
150,000 CBS Corp. h.875%, due 01/09/03
185,000 Cendant Cop. 7.75%, due 01/12/03
70,000 Cilicorp 8.00%,, due 01/02/03
100,000 Citicorp 7.20%, due 15/06/07
300,000 Citigroup, Tnc. 7.454, duc 06/06/02
160,000 Clear Channel Communications, Inc. 8.00%, due 01/11/08
200.000 Comdisco, Inc. 9.50%, due 15/08/03
130,000 Comdisco, Inc. MTN 6.34%, due 11/01/02
90,000 Conseco, Inc. X.50%, duc 1 5/10/02
226,l I6
142.997
107,074
485,815
53 1,597
ios,3nr
229,600
157,980
~28,215
57,746
222,466
201,315
l66,Y80
338,635
94.023
98,532
149,977
180, I46
71,415
99,902
303,777
157,200
167,500
111,316
72,900
0.2
0.1
0.1
0.5
0.6
0.1
0.2
0.2
0.5
0.1
0.2
0.2
0.2
0.3
0.1
0.1
0.2
0.2
0.1
0.1
0.3
0.2
0.2
0.1
0.1
Principal Value %of Amount Description US0 Net Assets
Corporate Bonds - (continued) United States Dollar - (continued)
190,839 Contincntal Airlines, Inc
740,000 Countrywide Home 7.256%, due 15/03/20
Loans, Inc. 6.85%, due 15/06/04
Loans. Inc. 6.84%, due 22/10/04
140,000 COX Communications, Inc. 7.50%, duc 15/08/04
50,000 COX Communications, Tnc. 7.75%, due 15/08/06
X0,000 COX Communications, Tnc. 6.401, due 01/08/08
130,000 COX Communications, Inc. 6.80%, due 01/08/28
195,000 DaimlcrChrysler NA Holding Corp. 6.90%, due 01/09/04
Tntemalional Financc BV 7.75%. duc 15/06/05
75.000 Dime Bancorp, Inc. 6.375%, due 30/01/01
150.000 Dime Bancorp, Inc. 7.00%, due 25/07/01
205.000 Enron Corp. 8.00%> due 15/08/05
250,000 Eop Operating LP 6.375%, due 15/02/03
60,000 Federated Department Stores, Inc. 8.50470, due 15/06/03
135,000 First Union Corp. 7.10%, duc 15/08/04
150,000 FlectBoston Financial
due 15/07/03 325.000 IleetBoston €inancia1
Corp. 7.25%, due 15/09/05
5.755, due 23/02/04
6.70%, due 16/07/04
100,000 Countrywide Home
320,000 Deutsche Telekom
Corp. 6.875%,
1,165,000 Ford Motor Credit Co.
180.000 Ford Motor Credit Co.
25,000 Ford Motor Credit Co.
100,000 Fred Meyer, Inc. 7.375%, duc 01/03/05
155,000 Fred Meyer, Inc. 7.4S%, due 01/03/08
100,000 General Motors Acceptance COT. 7.48%, due 28/02/03
Acccptancc Corp. 5.75%,, due 10/11/03
6.62.5%, due 01/10/2s
380,000 General Molors
186,644
728,537
99,458
140,884
50,742
74,470
110,488
191.546
324,238
71,7971
149,321
210,208
245,137
60,422
133,627
149.465
326,638
1,116,119
177,077
20.717
100,270
152,549
101.208
366,584
0.2
0.8
0.1
0.1
0.1
0. I
0.1
0.2
0.3
0.1
0.1
0.2
0.3
0.1
0.1
0.2
0.3
1.2
0.2
0.0
0.1
0.2
0.1
0.4
The accompanying notes are an integral part of these financial statements. 77

GOLDMAN SACHS US F IXED INCOME PORTFOLIO
Statement of Investments 30 November 2000
Principal Amount Description
Value %of USD Net Assets
Principal Amount Description
Corporate Bonds - (continued) United States Dollar - (continued)
470,000
100.000
80,000
2h5,noo
150.000
100.000
100.000
100,000
425,000
400.000
100,000
225,000
225,000
100,000
90,000
4no.000
285,000
170,000
265,000
260.000
200.000
350.000
50,000
75,000
15,000
General Motors Acceptance Corp. 6.8574 duc 17/06/04 GTE Chlifornia, Inc. 7.65%, duc 15/03/07 CTE California, Inc. 6.75%, due 15/05/27 Heller Financial, Tnc. 7.50%, duc 23/08/02 Hertz Corp. 6.70%, due 15/06/02 Hertz Corp. 7.00%, due 15/07/03 Homeside Lending, Inc. 6.8758, due 30/06/02 Homeside T.ending, Tnc. 6.205, due 15/05/03 Household Finance Corp. 6.001, due 01/05/04 Household Finance Corp. 8.00%. due 09/05/05 HSBC Holdings Plc. 7.50%: duc 15/07/09 Intcrnational Papcr Co.
J Seagram C Sons 6.258, due 15/12/01 KeySpan Corp. 7.25%, due 15/11/05 Korca Elcctric Powcr
due 01/04/13 T.dest Communications, Tnc. 8.37S%, due 01/11/05 Long Island Savings Bank 7.00%. due 13/06/02 Merita Bank 6.50%. due 01/04/09 Midamerican Energy Holdings Co. 7.23'76, duc 15/09/05 National Wcstminster Rank PIC. 7.3758, due 01 /I n/oo Nationsbank Corp. 6.125%, duc 15/07/04 NCNU Corp. 9.50%'. due 01/06/04 New England Telephone & Telegraph Co. 7.65%, due 15/06/07 New Jersey Bell Tclcphoric 8.00%, duc 01/06/22 News America Iloldings. Inc. 8.008, due 17/10/16
8.00'%, dnc 08/07/03
Corp. 7.75%,
468,101 0.5
103,134 0.1
71,278 0.1
265,326 0.3
148,914 0.2
100,096 0.1
100,121 0.1
98,279 0.1
411,611 0.4
409,568 0.4
99.946 0.1
22Y.426 0.2
224,584 0.2
100.968 0.1
84,810 0.1
419,893 0.4
280.828 0.3
158,072 0.2
263,974 0.3
258,960 0.3
194,216 0.2
376,946 0.4
51,440 0.0
77,186 0.1
14,132 0.0
Value % o f USD Net Asretr
Corporate Bonds - (continued) United States Dollar - (continued)
25,000
80.000
100.000
3 75 ,000
200,000
95,000
327,387
246,769
265,000
30,000
165,000
190,000
60,000
130.000
70.000
350,000
1 00,000
250.000
225,000
125,000
500,000
345,000
400,000
55,000
Ncws Atncrica Holdings, Inc. 8.15%, due 17/10/36 News America. Inc. 7.259;, due 18/05/18 Niagara Mohawk Power Corp. 6.875%, due 01/04/03 Niagara Mohawk Powcr Corp. 7.375%. due 01 /OW03 Niagara Mohawk Power Corp. 8.008, due 01 /06/04 Norsk Hydro ASA 7.15%, duc 15/01/29 Northwcst Airlines Corp. 7.6796, due 02/01/15 Northwcst Airlines Corp. 7,575'%, due 01/03/19 Occidental Pctrolcum Corp. 7.65%. due 15/02/06 Occidental Petroleum Corp. 7.20%, due 01/04/28 Osprey Trust/ Osprey I, Tnc. 7.797%, duc 15/01/03 Panamsat Corp. 6.125%, due 15/01/05 Pemex Finance Lld. 8.02%, due 15/05/07 Pcmcx Finance Ltd. 9.03%'. due 15/02/11 Pemex Finance Ltd. 9.15%, due 15/11/18 Philip Morris Cos., Tnc. 7.62570, due 15/05/02 Philip Morris Cos.. Inc. 8.25%, due 15/10/03 Philip Morris Cos., lnc. 7.50%. due 01/04/04 Phillips Petroleum Co. 8.50%, due 25/05/05 Owest Capital lhd ing , Inc. 6.8758, due 15/07/28 Qwest Corp. 7.625%. due 09/06/03 R.J. Reynolds Tobacco Holdings, Inc. 7.375%. duc 15/05/03 Kaytheon Co. 5.70%, due 01/11/03 Raytheun Co. 6.50%, due 15/07/0s
23,521 0.0
72,362 0.1
100,212 0.1
379.103 0.4
205.571 0.2
88,287 0.1
325,851 0.3
244.529 0.3
270,840 0.3
27,512 0.0
165.738 0.2
176,499 0.2
58,616 0.1
134.446 0.1
71.229 0.1
348,982 0.4
101.238 0.1
249,343 0.2
239,332 0.2
108.225 0.1
505,906 0.5
32(1,306 0.3
386,912 0.4
53,622 0.1
78 The accompanying notes are an integral part of these financial statements.

GOLDMAN SACHS US FIXED INCOME PORTFOLIO
Statement of Investments 30 November 2000
Principal Value %of Principal Value %of Amount Description US0 Net Assets Amount Dercrlptlon USD Net Assets
Corporate Bonds - (continued) United States Dollar - (continued)
Corporate Bonds - (continued) United States Dollar - (continued)
95.000
175,000
50,000
260,000
isn,o~o
200.000
265.000
200,000
200,000
2ns.ooo
175.000
50,000
45.000
60.000
350,000
225,000
560,000
175,000
485,000
240,000
370,000
380,000
100.000
470.000
200,000
100.000
Rcpublic New York COT. 7.75%. due 15/05/09 Kepublic Services, Inc. 6.625%, due 15/05/04 Safeway, Inc. 5.875%, due lS/lI/Ol Safeway, Inc. 6.05%: due 1511 1/03 Scars Roebuck Rcccptance Corp. 6.638, due 09/07/02 Sears Roebuck Acceptancc Corp. 6.00%, duc 20/03/03 Scars Roebuck Acceptance Corp. 6.71%, due 17/09/03 Simon Debartolo Group TP 6.6255, due 15/06/03 Simon Propcrty Group, Inc. h.75%, duc 09/02/04 Sprint Capital Corp. 5.87596, due 01/05/04 TCI Communications, Inc. 8.65% due 15/09/04 TCT Communications, Inc. 8.00%, duc 01/08/05 Tclccomunicaciones dc Pucrto Kico 6.158, due 15/05/02 Telecomunicaciones de Puerto Rico 6.65%, due 15/05/06 Tcxas Utilities Electric Co. 6.75%, due 01/04/03 Time Warner, Tnc. 7.9755’6, due 15/08/04 Time Warncr, Inc. 7.75%, due 15/06/05 Timc Warner, Inc. 8.11%, due 15/08/06 m w , Inc. 6.625%, due 01/06/04 Tyco lntemational Group 5.875%, due 01/11/04 q c o International Group 6.375%,, due 15/06/05 Viacom, Inc. 7.75%, due 01/06/05 Viacom, Inc. 7.70%, duc 30/07/10 Vodafone AirTouch PIC. 7.75% due 15/02/10 Waste Management, Tnc. 7. l25%, due 15/06/01 Waste Managcmcnt, Inc. 6.125%, due 15/07/01
96,274
165.870
49.447
254.015
149,492
194,619
263.190
195,022
193,059
271,351
182,348
5 1,238
44,245
57,738
349,3 15
231,503
575,436
182.561
161,780
230.5~9
360.550
388,630
101,144
482.300
197.826
9X.411
0.1
0.2
0.0
0.3
0.1
0.2
0.3
0.2
0.2
0.3
0.2
0.0
0.0
0.1
0.4
0.2
0.6
0.2
0.5
0.2
0.4
0.4
0.1
0.5
0.2
0.1
360,000 Well$ Fargo Bank NA
300,000 Wells Fargo Bank NA
21 0,000 Williams Cos., Tnc.
120,000 Williams Cos., Inc.
100,000 Worldcom, Inc. 6.40%,
6.62576, due 15/07/04 356,227 0.4
7.80%, due 15/06/10 311,732 0.3
6.20%, due 0 I /OW02 207,228 0.2
6.1259’0, due 15/02/12 117,998 0.1
due 15/08/05 96,079 0.1
26,895,884 27.9
TOTAL CORPORATE B O N D S
(cost USD 26,769,263) 26.895.884 27.9
Government Bonds - 17.7% Euro 1,900,000 Bundesrepnblik
Deutschland 5.25%, due 04/07/10 1,668,455 1.7
5.00%, duc 12/07/05 1,694,654 1.8
3,363,109 3.5
1.950,OOO Governmcnt of France
New Zealand Dollar 2,350,000 Government of
New Zealand 8.00%. due 15/11/06 1.026,632 1.1
United States Dollar 600,000 Provincc of Ouebec
160,000 Province of Quebec
10,000 Provincc ot Ouebec,
duc 02/03/26 105,000 Province of Sa<katchcwan
8.509’0, due 15/07/22 340,000 United Mexican States
9.875%, duc 01/02/10 430,000 United Statcs Treasury
Bonds 8.7S%7 due 15/08/20
500,000 United States Trcasury Bonds 7.88%. due 15/02/21
Bonds 6.88%.. due 15/08/25
150.000 United State5 Trcasury Intere\t-Only Stripped 5.20% (h), duc 15/05/08
900,000 United Statcs Treasury Notcs 6.00%. due 15/08/09
7.50%. due 15/07/23
7.1258, due 09/02/24
5.735/7.485% (C),
1,550,000 United States Treasury
615,378
155,633
10,175
119,068
355,088
5,927,349
619.845
1.760.792
98,995
924.286
0.6
0.2
0.0
0.1
0.4
6.2
0.6
1 .8
0.1
1.0
The accompanying notes ate an integral part of these financial statements. 79

GOLDMAN SACHS US FIXED INCOME PORTFOLIO
Statement of Investments 30 November 2000
Principal Amount Description
Government Bonds - (continued)
Value USD
United States Dollar - (continued) 000,000 United States Treasury
Principal-Only Strippcd 10.75% (h), due 15/08/05
Principal-Only Stripped 10.73% (I)), due 15/11/09 775.541
Principal-Only Stripped 8.75% (b), due 15/05/20 256,840
69 1,029 1,300,000 IJnited States 'lreasurv
800,000 Unitcd Statcs Treasury
320,000 United Slates Treasury
Value % o f Net Assets Amount Descriptian USD NetAssets
% of Principal
Asset Backed Obligations - (continued) Chemical Master Credit Card Trust I - 1.7% 1,600.000 7.09% 15/02/09 l.h43,008 1.7
Citibank Credit Card Issuance Trust - 1.7% 1 ,600,000 6.88% 15/11/09 1,619.501 1.7
0.7
O,x Citibank Credit Card Master Trust I - 0.3% 300,000 6.65% 15/11/06 300,609 0.3
Conreco Finance Securitizations Corp. - 1.1% 0.3 i.noo,ooo 7.47% 01/02/32 1,013,750 1.1
Principal-Only Stripped 6.88% (h)- due 15/08/25 77,171 0.1
Principal-Only Strippcd 200,000 United Statcs Trcasury
6.75%' (b), ~ U C 15/08/26 45,616 0.0 1,010,000 United States Treasury
Principal-Only Stripped 6.50% (h', due 15/11/26 227,229 0.2
12.660,065 13.1
TOTAL GOVERNMENT BONDS
(cos t USD 16,526,395) 17,049.806 17.7
Emerging Markets Debt - 0.9% United States Dollar
180,000 Govcriimcnl 01 Poland, 3.75/4.00% (C ) ,
due 27110/24 115,087 0.1 290,000 Government of Poland,
4.25/1.50% (t) ,
due 27/10/24 202,275 0.2
8.875%, duc 15/04/08 240,364 0.3 230,000 Rcpublic of Korea
20,000 State of Oatar 9.50°/u.
290.000 %ale of Qatar 9.7S%, due 21/05/09 20,600 0.0
due 15/06/30 284,142 0.3
862,468 0.9
Federal Home Loan Mortgage Corp (FHLMC) - 5.0%
990,580 8.63% 15/03/24 650,000 6.00% 15/09/26
1.432,188 6.00% 01/02/29 985,349 6.5096 01/02/29 949,280 8,00% 01/07/30
950,050 1.0 598,503 0.6
1,356,539 1.4 959,o2i 1.0 968.047 1.0
4,832,060 5.0
Rderal National Mortgage Association (FNMA) - 22.9%
(967,689) 6.00% TBA - 20 (a)
(1.000,OOO) 6.00% TBA - 30 (a)
4,000,000 7.50% TUA - 30 (a)
1,000.000 8.00% 'lBA - 15 ('1
5,000,000 8.00% TBA - 30 In) 2,000,000 8.50% TRA - 30 ( '8 )
1,390,000 7.2S% 15/01/10 967.689 6.00% 01/01/19
1,000,000 6.50% 2s/12/21 993,396 7.93% 25/02/22 651,787 5.64% 25/11/23
3,878,390 6.0070 01/04/28 47,657 6.00% 01/11/28
1.459.010 6.50% 01/11/28 839.364 6.00% 01/02/29 80.262 6.50%) 01/02/29
564,551 6.00%' 01/10/29 300,081 8.50% 01/07/30
(920.586) (0.9) (946,250) (1.0)
4,020,000 4.2 1,023,130 1.0 5,090,650 5.3 2,051.250 2.1 1,457,405 1.5
930,685 1.0 1.023,549 1.1
453,052 0.5 3,671,110 3.8
45,110 0.0 1,413,868 1.5
794,508 0.8 77,728 0.1
307,829 0 3
1,02h,418 1 1
534.381 0.5
TOTAL EMERGING MARKETS 22,044,837 22.9 DEBT
( c o s t USD 865,950) 1,543,695 1.6 862.468 o,9 Fingerhut Master Trust - 1.6% i,sss,oon 6.23% 15/02/07
Asset Backed Obligations - 50.7% United States Dollar Aesop Funding II LLC - 0.1%
First Sierra Equipement Contract Trust - 0.5% 500,000 5.63%. 12/08/04 594,295 0.5
120,000 6.14% 20/05/06 6,465 0.1 Government National Mortaaae _ _ Association (GNMA) - 6.4%
Chase Commercial Mortgage Securities (995,273) 8.00% TBA- 30 (') (1,016.422) (1.0)
725,237 8.00% 15/02/22 742.679 0.8 Corp. - 4.0% 270,489 8.00% 15/12/21 277,248 0.3
6,232 8.001 15/05/22 6,387, 0.0
1,886,826 7.09% 15/08/08 1,907,577 2.0 1.885,126 7.03% 15/10/08 1,907,542 2.0
3,815,119 4.0 42,395 7.00% 15/11/23 42,223 0.0 3,184,692 6.50% 15/04/24 3,112.200 3.2
80 The accompanying notes are an integral part of these financial statements.

GOLDMAN SACHS US FIXED INCOME PORTFOLIO
Statement of Investments 30 November 2000
Principal Value Amount Description USD
Asset Backed Obligations - (continued) Government National Mortgage Association (GNMA) - (continued)
238,667 6.50% isin2126 29,X08 6.50% 15/04/26
717,652 6.508 15/05/26 990,181 7.00% 20/05/28 167,215 8.00% 15/04/30 332,864 8.00% 15/06/30 257.252 8.00% 15/07/30 237.942 8.00% w o w n
44 8.00% ifi/09/3o
232,476
699,036 978,428 170,769 339,937 261,850 243,119
45
29,1135
% of Net Assets
0.2
0.7 1.0 0.2 0.4 0.3 0.3 0.0
n.n
6 , 120,005 6.4
Green Tree Financial Corp. - 1.0% 1,007,498 6.86% 15/09/16 969,717 1.0
Imc Home Equity Loan Trust - 0.3% 250,000 8.058 25/0X/26 255.460 0.3
Merrill Lynch Mortgage Investors, Inc. - 1.5%
1 ,zoo,nnn 6.39% i5/o2/3o 1,261,259 1.3 201.185 8.00L;b 01/03/31 196,198 0.2
1,357,457 1.5
Option One Mortgage Securities Corp. - 0.4% ~ ~ 2 9 10.65% 2(iiin/30 429.328 0.4
Union Financial Services -Class A9 - 0.7% 7n0,noo 573% o1!12/os 676.053 0.7
WFS Financial Owner Trust - 1.5% 1,400,000 7.846;) 20/02/06 1,433,860 1.5
TOTAL ASSET BACKED OBLIGATIONS
(cost USD 48,023,405) 48,765.228 50.7
Short Term Investments - 12.8% United States Dollar 12,347,000 Statc Strcct Bank 6.50%.
duc 01/12/00 12,347.000 12.8
TOTAL SHORT TERM
INVESTMENTS
( c o s t USD 12,347,000) 12,347,000 12.8
TOTAL I NV E STM E NTS
(cost USD 104.532.013) 105.920.386 110.0
All security holdings of this porlhlio arc transfcrable securi- ties dealt on a rcgulatcd markct.
(u ) TB.4 (To be Assigned) srcurities urcpurc.ku.sed on u fijrwurd commitment bnsis with un upproximutr (gimerully +I- 2.51) priritipul um(iuiit unrl no (/(!finire mulurily dart,. The actual pririripul umounl urid muturii.v dure will be determined upon sc,ttlrmenr whm diu .qieciJic morrguge pools arc assigned,
yields to marrrrig
increases to the stntrd rate (it u wt dutr in fhr rutitre.
(h) 7hi. inleresl rule d i s d o . w d ~ ~ r rhtw securities reprrsents c!ff(!c.tiw
( c ) These .stwririt?s are issued with an initial dc twmind rule wkkh
The accompanying notes are an integral part of these financial statements. 81

GOLDMAN SACHS US GROWTH EQUITY PORTFOLIO
Letter to Shareholders 30 November 2000
Dear Shareholders:
On behalf of Goldman Sachs, we welcome the opportunity to review the performance of the Goldman Sachs US Growth Equity Portfolio for the one-year period that ended 30 November 2000.
Market Review
The reporting pcriod began on a positive note for the US market, as stocks rose before experiencing a sharp corrcction in mid-March. Continued strong cconomic growth, inflationary pressures and rising intcrcst rates were thc catalysts behind the decline. While othcr types of stocks were dragged down, technology issucs experienced the brunt of the fall. Within a few wceks the technology-laden Nasdaq had fallen 37% from its peak.
The equity markets experienced a bricf rcbound late in the summer, as investors were hopcful that signs of moderating economic growth would result in an end to interest rate hikes by the Federal Reserve. However, the reporting period concluded on a down note, as uncertainty regarding corporate profits and continued high energy prices took their toll.
Porffolio Positioning
The Portfolio is an actively managcd Large Cap Portfolio that invests in US companics that we believe are strategically poised for long-term growth. We seek to identify high quality companies with strategic competitive advantages that we believc will endure for over a decade. We manage the portfolio with an awareness of long-term global trends, and we look for those US companies that are poised to benefit most from these developments.
Performance Review
Ovcr the one-year ended 30 November 2000, the Portfolio’s cumulative total return was 1.29%. This compared to
the -3.57 % return for the Portfolio’s benchmark, the S&P 500 Index (quoted one day prior to month-end to closely resemble the timing of the pricing of the Portfolio, with estimated income reinvested and, in contrast to the Portfolio, without the deduction of any expenses. For more information on the performance of the Portfolio and a description of its benchmark, refer to page 108. Portfolio returns are shown net of management fees with income reinvested using month-end NAVs.)
Although our technology holdings were down for the period along with their peers, on a relative basis, we added the most value in this sector. We benefited from an underweight position in technology versus the SBP SO0 (1Y % vs 24%). In addition, we had strong stock selection relative to the benchmark, owning high quality tech companies that are thc dominant players within their industry.
Wc also added value in financial services and consumer staples. These sectors were up strongly, espccially after March when investors began rotating out of highly valued technology stocks and into these stocks, which are perccived to be safer investments. We were hclpcd by an overweight in both sectors as well as significantly stronger performance than the Index.
Wc thank you for your investment and look forward to your continued confidence.
Goldman Sachs US Growth Equity Portfolio Management Team New York, 15 Decembcr 2000
82

GOLDMAN 5ACHS US GROWTH EQUITY PORTFOLIO
Statement of Investments 30 November 2000
Shares Desrriotion Value %of
US0 Net Assets Shares Descrlption Value %of
US0 Net Assets
Common Stocks - 89.1 % Banks
13.800 Slate Strcct Corp. 1,787,790 2.6 5,950 Wells Fargo & Co. 279,278 0.4
2,067,068 3.0
Beverages 16,100 Cocd-Coh CO. 1,000,213 1.5 15,200 Pepsico, Inc. 689,700 1.0
1,689.913 2.5
Biotechnology 2,875 Amgen, Inc. 195,859 0.3
Chemicals 4.150 L)u Pont (EL)
de Nemours & Co. 172,484 0.3
Commercial Services 24,750 Ccndant Corp. 233,578 0.3
Communications, Jnc. 278,688 0.4
512.266 0.7
9,800 Valassis
Computers 14,050 EMC Corp. 1,028,284 1.5 7,800 International Business
Machines, lnc. 778,538 1.1 12,100 Sun Microsystems, Inc. 964,975 1.4
2,771,797 4.0
CosmeticsIPersonal Care 13,850 Avon Products, Inc. 21,100 Colgate Palmolive Co. 5,750 Gillette Co. 7,450 Procter & Gamble Co.
579,969 0.9 1,257.138 1.8
197,656 0.3 562,941 0.8
2,597,704 3.8
Diversified Financial Services 31,650 Citigroup. Inc. 25,350 Fcdcral Home Loan
Mortgage Corp. 20,250 Federal Nativnal
Mortgage Association 28,900 MRNA Corp.
1,564,697 2.3
1,508,325 2.2
1.611,141 2.3 1.051.237 1.5
5,735,400 8.3
Electric 26,750 AES Corp. 1,482,953 2.2
Electrical Components & Equipment 14,966 Energizer Holdings, Inc. 288,096 0.4
Food 13,650 Nabisco Group Holdings
Corp. 399.262 0.6 9,060 Wm. Wrigley Jr. GI. 823.894 1.2
1.223,156 1.8
Common Stocks - (continued) Health Care
7,500 Johnson &Johnson 751,875 1.1
Insurance 17,300 AMBAC Financial
Group, Tnc. 1,319,125 1.9 11,825 American International
Group 1,135,200 1.6 18,900 Metlife, Inc. 526,837 0.8
2,981,162 4.3
Internet 5,500 CheckFree Corp. 288,063 0.4 6,500 Doubleclick, Tnc. 88.156 0.1
650 S1 Corp. 3,880 0.0 12,725 Thc Charles Schwab Corp. 367,434 0.S
2.725 Yahoo!, Inc. 106,445 0.2
1,162,524 1.7
3,821 VeriSign, Inc. 308,546 0.5
Leisure 5,800 Sabre Holdings Corp. 208,800 0.3
Lodging 19,950 Harrah’s Entertainment,
9,100 Marriott International, Inc. 567,328 0.8
lnc. 375,375 0.6
& Resorts Worlwide, Inc. 422,275 0.6 12,700 Starwood Hotels
1,364,978 2.0
Media 19,900 AH Belo Corp. 79,300 AT&T Corp- Liberty
Media Group
Communications, Tnc.
18,687 Infinity Broadcasting
11,800 New York Times Co. 19,750 Time Wamer, Tnc.
5,676 Clear Channel
7,300 Gannett, Inc.
Corp.
5,750 Tribune Co. 5,550 Univision
Communications, Inc. 22,820 Viacom, Inc. 9,550 Walt Disney Co.
351.981
1,085,419
271,384 391.463
573,457 415,950
1,271,900 215.625
190,434 1,186,640
275.159
0.5
1 .6
0.4 0.6
0.8 0.6 1.8 0.3
0.3 1.7 0.4
6,229,412 9.0
Miscellaneous Manufacturing 51,850 General Electric Co. 2,.576,297 3.7
& Manufacturing Co. 342,928 0.5
2,919,225 4.2
3,425 Minnesota Mining
Oil & Gas Producers 5,750 Exxon Corp. 511,391 0.7
The accompanying notes are an integral pan of these financial statements. 83

G O L D M A N SACHS US GROWTH EQUITY PORTFOLIO
Statement of Investments 30 November 2000
Share5 Description Value % o f
USD Net Assets Shares Description Value
US0 % of
Net Assets
Common Stocks - (continued) Telephone
11.725 ATCIrT Corp. 14,850 SBC Comniunications. Inc. 4,875 Sprint Chp. (FON Group) 7:750 Sprint Corp. (PCS Group)
12,238 Vcrizon Communications 10,750 Worldconi. Inc.
Common Stocks - (continued) Oil & Gas Services
12,250 Schlumbcrger Lld.
Pharmaceuticals 10,100 American Home
Products Corp. 30.650 Hristol Myers Squihh Co. 6,050 Eli Lilly LQ Co. 3,800 Merck & C:O.
52,875 Pfizer, Inc. 14.650 Schering Plough Corp.
809.266 1.2 222,775 81 9,534 115.197 183,094 683.033 174.016
0.3 1.2 0.2 0.3 1 .0 0.2
608,525 2,212.547
571.725 360,525
2,410,141 826.809
0.9 3.2 0.8 0.S 3.5 1.2
2,197.649 3.2
Tobacco 14.800 Philip Morris Cos., Inc. 568,875 0.8
6,990,272 10.1 T O T A L C O M M O N STOCKS
(cost USD 65,138,148) 61,437.615 89.1 Retail 12,900 CVS Corp. 722,400 1.1 12,850 Home Dcpot, Inc. 514,000 0.7 16,850 McDonald's Corp. 547.625 0.8 4,300 RadivShack Corp. 218,394 0.3
23,800 Wal-Mart Store\, Inc. 1,234,625 1.8 30.900 Walgreen Co. 1,376,981 2.0
Principal Amount Description
Value %of EUR Net Assets
Short Term Investments - 4.4% United States Dollar 3,015.000 State Street Bank, 6.5096
due 01/12/00 3.015,000 4.4 4,614,125 6.7
Semiconductors 35,400 Intel Corp. 1.513,350 2.2
1,025 PMC-Sicrra, Inc. 106,104 0.1 8,400 Texas Instruments. Inc. 328,125 0.5
T O T A L S H O R T T E R M
I N V E S T M E N T S
(cost USD 3,015,000) 3,015,000 4.4
1,947,570 2.8 T 0 TAL I N V E S T M E N TS
(cost USD 68.153.148) 64,452,615 93.5
All security holdings of this portfolio are transferable securi- ties dealt on 11 regulated market.
Software 18,000 Fin1 nata Corp. 911,250 1.3 35,750 Microsoft Corp. 2,325,984 3.4 31.200 Oracle Cnrp. 713,700 1.0
3.950,934 5.7
Telecommunications 18,850 Crown Castlc
15,300 EchoStar Intemational Corp. 350.044 0.7
15.550 Gcncral Motors Corp. 353,7h2 0.5 Communication\ Corp. 420,511 0.(i
5,450 I1 Vodafonc Group PIC. 189,728 0.3
1,414.045 2.1
Telecommunications Equipment 36,650 Cisco Systems. Inc. 4,650 Comcast Corp. 7,100 Corning, Inc. 5,150 JDS Uniphase Corp.
11,750 Lnccnt Tcchnologies, Inc. 16.300 Nortel Nctworks Corp. 6,060 Qualcoinm, Inc.
2.8 0.3 0.6 0.4 0.3 0.8 0.7
5.9 ~
1.894,347 180,187 441.975 296,125 185,797 579,669 500,707
4,078,807
84 The accompanying notes are an integral part of these financial statementr.
. - . ... ... . .- .. . ... .~ . .. . . .- . . .-

This page is intentionally left blank
as

GOLDMAN SACHS FUNDS, S.I.C.A.V.
Outstanding shares, no par value per sharc (unlimited number of shares authorised)
Net valuc and redemption price per share
Maximum public offering price per sharc
11.101,871
(net assetsishares outstanding) 7.94
(nct asset value per share*1.055) 8.38
Statements of Assets and Liabilities 30 November 2000
. .
EUR Class USD Class EUR Class USD Class
1,843,933 1,722,577 1,096,717 4,949.527 2,703.761 425,428 2,330,940 4,383.581 6,373,588
125.13 9.94 12.00 9.88 207.98 10.06 10.45 9.21 24.06
132.01 10.49 12.66 10.42 219.42 10.61 11.03 9.72 25.39
Europe Global Global
CORE'" Eum European Emerging Emerglng Global
Portfolio Ponfolio Portfolio Portfolio Portfolio Portfolio Portfolio Portfolio
USD EUR EUR EUR EUR USD USD US0
&la Eumpe Equily F d l m spda tda!!eUD&l M&?UEsuny wily
Assets Investment in sccuritics, at cos1 85,245,475 142,045,229 12,356.732 41,763,901 588,461.319 21,832,681 45.182,735 133,662,402
Investment in securities at value 80,258.783 234,737,590 13,122,040 45.061,941 584,542,382 21 , I 97,146 38,614.147 144.045,001 Short-term investments 4,879,000 15,476,914 - 2.417,732 24,259.674 2.730,OOO - 7.755,OOO
1,743 2,036,175 24,550 1.548,258 535,645 Cash 1,567,s 1 6 11,285 -
Receivables: Investment securities sold 920,471 509,629 192,343 309,055 2,045,808 507,260 126,572 722,913 Fund shares sold 2.130,749 556,621 47.500 1,217.626 1.151,723 -
Dividend tax reclaim, at value - 14,111 2,538 123 24,889 - -
Spot foreign currency exchange contracts - 1,567 33,879 - 786 -
650,755 1,585.456 Dividends and interest, net I 2n,4 12 177.409 7,149 906.449 106,097 602,209 53,407 121,397
Forward foreign currency exchange 10.4 - - - - - 38.772 contracts -
- 4,867 Variation margin - 1,199,789 10,113 35,890 326,103 4,906 - 300,772 Deferred organisation cxpcnscs, net - 3,246 19.156 13,584 3,616 72,118 20,407 - Other 67,511 - 31,034 - - - - - Total Assets 89.952,442 753,128,161 13,365,752 50,003,315 614,901,353 25,088.189 41,013,546 155,485,284
liabilities
Due to bank -
Payables:
Premium for written option, iit cost - - - - - - 222,743 -
- - - - - - 52.739
Investment securities purchased 1,788.246 2,292,740 165,637 999,271 1,708,260 641,823 309,905 1,816,374 - 8.414
lnvcstmcnt advisory fees 8,167 256,082 14,061 34.760 638,589 16,310 46,003 157,718
- 25.000
Fund shares repurchased 2,415 - - - 1.034,987 -
Capital gains tax - - - - - - 42,077 - Organisation fees -
Furward foreign currency exchange I - 51,126
Spot foreign currency exchange contracts Accrued expenses and other liabilities 6,868 103,332 44,705 67,070 139,296 69,638 31,496 75,270
- - - - -
contracts 1,310 - - 11,851 -
- - - - - - - 12
Total Liabilities 1,807.618 2,652,154 302,142 1,122,952 3,521,132 727,771 652.224 2.108,902
Net assets:
Accumulated undistributed net investment
Accumulated undistributed net realised gain
Paid in capital 163.585.129 201,812.495 11.448,215 48,673376 388,736,126 23,149,297 47,315.618
income (loss) (620,166) (28,770) 68.409 1,195.925 (6.846,577) 1,533.269 (260,508) (1,067.308)
(loss) from investments and futures transactions (25.1 12,696) 53,435,527 842,640 (1,054.989) 216.559,893 311,032 2,711,145 56,289,896
(loss) from foreign currency transactions (44,763,899) 2.674,135 139,359 (233,891) 17,296,581 (869) (2.841,138) (6,051.348) Accumulated undistributcd net realised gain
Net unrealised appreciation (depreciation) of investments and futures transactions (3575,158) (7,998.530) 594,398 652,167 (7,219,244) (615,375) (5,021.160) 4,251,871
Net unrcaliscd appreciation (depreciation) of translation of assets and liabililies denominated in foreign currencies (1.368,386) 581,150 70.589 (352.4251 2.853.442 (16.936) (1.542.639) (4.273.959)
NET ASSETS: 88,144.824 250,176,007 13,163,610 48,880,363 61 1,380,221 24,360,418 40,361.322 153.376,382
86 The accompanying notes are an integral part of these financial statements.

GOLDMAN SACHS FUNDS, S.I.C.A.V.
Global Global Internet Japan
Fixed Income High Yield Tollkeeper‘” Japan Small Cap
Portfolio Portfolio portfolio portfolio[”
USD US0 US0 JPY JPV
Technology
Portfolio
CHF
US COREsM US Flxed US Growth
Equity Income Equity Combined
Portfolio Portfolio Portfolio Total
USD USD USD USD
169.359,994 524,858,220 33.096.719 19,975,875 6,708.113 1.154.997,765 226,126,188 Y2.185,013 65,138,148 3,339,858,152
165,567,639 425.222.765 24,858,183 46.138,’149 5.767,941. 847,809,919 222.530,279 03,573,386 61.437.615 2.983.816.175 6,227.000 13,970,000 1,005,000 - - 14,213,685 1,037.000 12.347,000 3,015,000 98.369,837
- - 53 1,90X,Xh5 82.468 67,220,984 122.393 38,118 97 hl,X38.906
688,543 2,178,493 - 28,345 7,077 19,565 10.606.718 301,715 1,070,736 103,696
2.541,167 12.231.552 2,613 87.850 13,163 - 718 - - - -_ ~ a 74.049 - - - 17.5 19.599
2,552.928 70,502,876
178,567 4,421
225,334 15,815.344 - 25,594,805 563,792 425,290 4.590,321 74,965,261 211.159 1,126,308 28,701 19.060,851
- - - 42.430
- I - 17,637,481 13.860 - - - - 84.442 - - - 98,050
- 21.561 21,707 148 1,642 6,807 4,821. 13,266 19,777 178,107 - - - - - 1.155 - - - 94.897
678.322 - - 183,794 - 3,970,997 993,145 62,283 - 7,306,956
- - - 222,743 - - - 4,987,124
- 2,187,279 222,703 30.897 27,243 49,998,692 198.139 26,764,857 - 67.392,943 680,118 79,021 - 40,356 103.034 5.982.695 376,414 167,974 - 6.856.154 126,989 472,371 41.653 54,243 7,286 1.096.5 16 269,121 62.955 60.812 3,254,203
- - - - I - - - - 42,077 - - - - - I - - I 21,531
922.694 29,507,493 - - I - I 49,983 - 30,551,425 - 1,181 - - - 32,1173 - - - 19,556
34.478 121,673 77.515 20,612 10,170 3,588,569 87,098 70.976 71.970 3,274,300
930.772 27,116,745 132,782 1 ih.h22,056 7,689,598 36.335.402 341,871 146,108 147,733 60,698,695
523,572,984 36,536.840 51,623.066 6.330,114 1,198,440,848 207,845,336 91.382,042 71,959,394 3.203.027,832
20,908,293 41,349,946 (307.827) (046,884) (1 15,275) (17.901.351) (2.347,8?.1) 3,467,996 (238.028) 37,819,457
689,116 (9,161,978) (1.143,078) 2,432.83 553,587 44,144,792 22,862>818 (117,583) 937,891 332.666,100
(12.039,776) 1,224,256 - - - 34,501,467 (48) 182.235 - (27,s 12,148)
2,469,912 (70,s 17.189) (8,238,535) (3,736,926) (910,172) (307,842,298) (3,602,834) 1.526,169 (3,700,533) (316,503,192)
(8,170.462) (41,052,733) - - - (5.545,372) - (156.609) I (57,026,349)
172,320,785 445.415,286 26.847,400 49.372,079 5,828,254 945,798,086 224,757,451 9h,284.250 68.958,m 3,172,381,700
87

G O L D M A N SACHS FUNDS, S.I.C.A.V.
Statements of Operations For the Ewr Ended 30 November 2000
Euro European Global Emerglng Global Emerging Asia Europe Europe CORE'" Wed Income Speclalirt Markets Markets Equity Global Equity
Portfolio Porlfollo Equity Portfolio Portfolio Portfolio Debt Portfolio(B) Portfolio Portfolio USD EUR EUR EUR EUR USD USD USD
Investment Income: Dividends Inlcrest
1,307.250 2.289,167 755,443 3.210,973 108.161 1,331,767 369.693 350,156 $,so3 1 ,S~S,SSO 1,137,106 1,803.607 59.536 561,770
Total income 1,676.943 2 . 6 3 ~ , 3 ~ 258,946 1 ,SXS,~SO w8,08n I .803,607 467.697 1,893,537
Expenses :
Invcstmcnl advisory fees 1,281.494 2,042.414 158,895 309.254 6,746,704 204,665 475,813 1,837.560 Custodian iintl administration fees 13s,x4x 262,i do 55,560 75,365 701,047 19.642 123.12 I 201,553
Taxe d'abonnement 63.663 106,962 7,901 20,538 344,745 i1.7on 20.776 92,080 Transfer agent fees 41.795 65,347 5,084 12.453 215,857 6,570 12,628 58,790 Printing fees 43,499 36,548 19,047 19,047 19,047 11,529 35,001 19,998
Prvfessional fees 34.999 85,881 52,379 52,379 22,379 31,707 44.000 44,9*
hiortisation of deferred organisation cxpcnscs
Other 3,770 5,008 4.401 2,882 1 0,002
271,442 65,30X 28.492 31,070 58.570 17.766 153,408 4 n , m
Total Expenses 1,872.740 2.h6n,370 332,366 524,507 8.1 08,349 306,569 873.749 2,294,981
Lcss - expenses rcimhurscd and fees
waived hy Goldman Sachs 282 131,829 134.~82 36,131 155,034
1,872,740 2,668.088 190.537 389,625 x,iox.34~ 270,338 718,715 2.295,981 Net expenses
NET INVESTMENT INCOME (LOSS) (195,797) (28,770) 68,409 1,195.925 (3.71i0.269) 1.533.269 (251.01s) (401,444)
Realised and unrealised gain (loss) on investments, futures and foreign currency transactions:
Realised apprcciation (dcprccialion) of : lnvcsimcnt and fulures transactions Foreign currency relaled transactions
Ne1 change in unrealised appreciation (dcprecialion) of :
(869) (768.789) 5.348.590 2X,OY5,201 790.570 (446,943) 96,374.866 311.032 3.971,312 14.632,4
(1,233.275) 2.0io,n50 147,653 (199,130) 7,310,883
Inveslmenls and futures (22,128.522) (21,928,998) (360,482) 460,769 (61.~78.070) (615.375) (9,321,155) (14,55n,m) Translation of assets and liabilities
denominated in foreign currencies (2,532.623) (819,842) (9,946) 228,821 598,291 (16,936) (1,150.589) (4,501,262)
Net realised and unrcalisud gain (loss) on investments, futures and foreign
currency transactions (20,545,830) 7,357,211 567,795 43,517 37.705.970 (322.148) (7,269.221) (7,174,477)
NET INCREASE (DECREASE) I N NET ASSETS RESULTING
FROM OPERATIONS (20,741.627) 7.328,441 636,204 1,239,442 33.945,701 1,2i 1,121 (7,520,239) (7.575,921)
(u) For the period 3 MUJ 2000 (cummtwccmtvt of operurions) to 30 Noivmber 2000. (0) For the period 3 Aprd 2000 (comm~memenl of op,rutirin.s) lo 30 Niiivmbrr 2000. (r) Ikprcwid iii 000.
88 The accompanying notes are an integral part of these financial statements.

GOLDMAN SACHS FUNDS, S.I.C.A.V.
Global Fiaed Internet lapan
Income Global High Tollkeeper'* Japan Small Cap Technology US CORE" US Fixed US Growth Combined
Portfolio Yield Portfolio Ponfoliolb) portfoliolll POrtfOli0"l Portfolio Equity Portfolio Income Portfolio Equity Portfolio Total US0 USD us0 JPY JPY CHF USD USD US0 USD
79.430 8.232 2os.xw 43.002 842.776 1,742,844 140.503 12,696,855
9.256.548 47,988,602 98,050 17: 8 3.181.596 420,447 4.208.651 133,764 69,365,645
9,256.518 48,068.032 106.?811 206.170 43.010 4,024.372 2,163.29 1 4,208,651 274.267 82,062.500
1.742.6 13 5.641.952 352,616 589,665 86,703 16,088.425 2,909.5 72 61 7.203 374,852 38,668,813
164.538 454.085 21 287 59,949 8,876 l,l60,670 21 2,501 79,706 45.386 3,681,153
37,!J99 40,500 38,020 575 5,775 I50,4YY 38,noo 61.001 54,999 757,629
1,898.575
70,271 205,162 8,054 18.869 2,310 367.736 93,109 24.693 11,986 1.190.621
19,999 37.500 13.223 2.100 2.100 38.500 19,999 43,241 10,998 404.438
104.412 304.494 12,949 31.972 3,700 603.685 145,395 43.488 20.845
9.Y99 3.192 366 94 1 I 2,507 4,999 5,008 5,004 71.433
54.000 60.999 19,837 8,350 3,223 85,000 52.000 30,001 30,001 1.040,098
2,193,832 6,754,691 419.278 711,846 11 3,628 18,507,022 3,475,575 004,341 s63,07.1 47,707,761
13,520 55,169 1,144 I ti3,hnh 51,657 724,059 ~ ~ ~
2.1 80.312 6.754,091 414.109 711.846 11 2,484 J 8,507.022 3,475,575 740,655 51 1,411 46.983,702 ~~ -. ~~
7,076,236 41.313.341 (307,827) (505,676) (69,474) (14,4X2,6SU) (1,312,284) 3,467,996 (237,147) 35.078,798
.97~,noo) (6.770,m) (1,143,078) 856,846 (68,824) (7,334,673) 8,717,181 587,567 930,982 135,030,274 Q 8.473,402) 908.41 5 28,496.643 (27) 171,396 7.772.713
5.398.75') (50.351,801) (8,238,535) (7.785,921) (L0Y4.717) (408.6Y2,023) (24.100,047) 2.124,961 (3,743,683) (510,227,899)
(8.046.70s) (29,528.614) - (12.811.84.5) (15 1.452) - (53.231.098)
(13.UYY.318) (85.742.463) (9,381,613) (6.929,OR) (1.163,541) (4W.341.898) (15,382.893) 2,732.472 (2.802,701) (420.656.010)
89

GOLDMAN SACHS FUNDS, S.I.C.A.V.
Statements of Changes in Net Assets For the Year Ended 30 November 2000
Europe Global Global
CORE'" Euro European Emerging Emerging Global
Asia Europe Equity Fixed income Specialist Markets Debt Markeu Equity Equity
POrtfOllO Portfolio Portfolio m f o i i o portfolio Portfolio(* Ponfolio POrtfOllO
USD EUR EUR EUR EUR US0 USD USD
From operations: Net investment income (loss) (195.797)
Net realised gain (loss) from invcstmcnts 5,348,590
and futures transactions Net realised gain (loss) from foreign (1,233.27s)
currency related transactions Ne1 change in unrcalised appreciation (22,128,522)
(depreciation) of investments and futures transactions
Net change in unrealised appreciation (2,532,623)
(dcprccialion) on translation of assets and liahililies denominatcd in loreign currencies
(28.770)
28,095.201
2,010.850
(21,928,998)
(X19,842)
68,409 1.195,925 790.570 (446,943)
147.653 (199,130)
(360.482) 460,769
(Y.946) 228,821
(3,760,269) 1,533,269
96,374,866 311.032
2,310,883 (869)
(61,578,070) (615,375)
598,291 (16,936)
(251,018) (401,444)
3,971,317- 14,632,471
(768,789) (2,746,823)
(9,321.15s) (14,558,863)
(1,150,589) (4,501,2 @
Net increase (decrease) in net assets resulting from operations (20,741,627) 7,328.441 636,204 1,239,442 33,943,701 1,211.121 (7,520,239) (7,575,921)
Distributions to shareholders from: Net invcstment income - (1,161.486) (3,134) (340,3673 - - (2,889) -
Total distributions to shareholders - (1,161,486) (3,134) (340.367) - - (2,889) -
From shares transactions : Net procceds from sales oi shares 92,573,342 191,585,414 2,951,612 54,442,181 420,953.893 31,661,797 36,437,568 89,502,132 Rcinveslment of distributionh - 926,664 3,134 227.729 - - 2.889 -
Cost ot share\ rcpurchascd (76,801,283) (49,096,619) (649,330) (28,768,673) (143,456,968) (8,512.500) (12.294,995) (52,118,948)
Net increase (decrease) in net assets resulting from share transactions 15,772,059 143,415,459 2.305,416 25,901,237 277.496,925 23,149.297 24,145.462 37,383,184
~ ~ ~ ~
TOTAL INCREASE (DECREASE) IN
NET ASSETS (4,969.568) 149.582.41 4 2.938.486 26.800.312 311.442.626 24,360.418 16.622.334
Net assets:
Beginning of the period 93,114,392 100,893,593 10,225,124 22,080,051 299,937,595 - 23,738.988 123,569,119
Rccvaluativn of opening combined NAV ~~ ~
End of thc period 88.144,824 250,476,007 13,163,610 48,880,363 611,380,221 23,360,418 40,361,322 153,376,382
(a) For rhr pwiorl3 May 2000 ((..ommcwt.ement of operution;) to 30 Nowmher 2000. ib) For rhe period 3 April 3000 (commmccmerir ofopt.ra1ion.y) io 30 Novembw 2000. (r) Exprcssed in 000.
90 The accompanying notes are an integral part of these financial statements.

GOLDMAN SACHS FUNDS, S.I.C.A.V.
Global Fixed Global Internet Japan US CORE5’ US Fixed US Growth Income High Yield TollkeepeP Japan Small Cap Technology Equity Income Equity Comblned
Portfolio portfolio portfolio(” Portfoliold portfolio[^ Portfolio Portfolio Portfolio Portfolio Total
USD USD US0 IPY JPY CHF USD US0 USD USD
7,076,236 (1.978.000)
(8.473.402)
5.398.759
41,313,341 (307.827) (6.770.463) (1,143.078)
908.415 -
(20528,614) -
(505,676) (69.474) XSh,846 (68,824)
(7,785.921) (1,094,717)
(14,482,650) (1,312,284) 3.467,996 (237.147) 35,078.798 (7,334.673) 8,717,181 587,567 940,982 135.030,274
28,496,643 (27) 171,396 - 7.772,713
(408,692,023) (24,100.047) 2,124,961 (3,743,683) (5 10,227,899)
(12,811,845) - (IS 1.452) - (53,231,098)
(6,023,112) (44,429,122) (9.68Y.440) (7,434.751) (1,233,015) (414,824,548) (16,695,177) 6,200.468 (3,039,848) (385,577,212)
(5,532,321) (30,390.614) - - - - - (1.302,480) I (38.524,473)
(5,532,321) (30,390,614) - - - - - (1,302,480) - (38,524.473)
103,381.306 225,079,059 45,140,728 43,655,228 5,545,795 1,561.949,997 231.081,336 85,042,900 95.064,420 2.945,068,050 4,350,41s 21,840,002 - - - - - 412,387 - 27,602.612
(106,847,391) (282,216,349) (8.603.888) (17,865,032) (2,246,883) (496,585,007) (164,4152,025) (13.522,951) (28,129.250) (1,408,768,166)
884,329 (35,297,288) 36,536,840 25,790.196 3.298,912 1,065,364,990 66.619,311 71,932.336 66.935,170 1.563,902,496
*10,671,104) (110,117,024) 26,847,400 18,355,445 2,065.897 650,540,442 49,924,134 76,830,323 63,89532 1 , I 39,800,811
IX2,791,889 S55,S32,310 - 31.016,634 3,762.357 295,257,641 174,833,317 19,453,926 5,063.402 2,141,829,809 (109,248,920)
172.120.785 445,415,286 26,847,400 49372,079 5,828,254 945.798,086 224.757,451 96,284,250 68,958,724 3.172,381.700
91
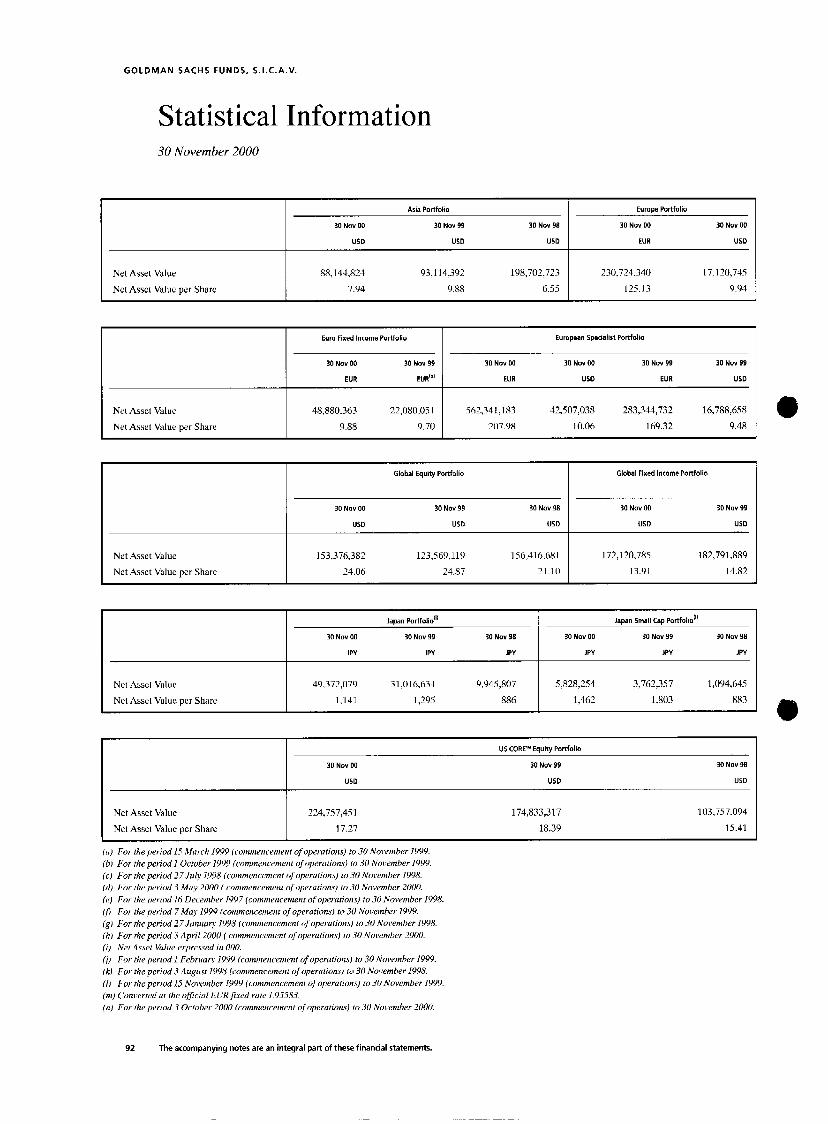
GOLDMAN SACHS FUNDS, S.I.C.A.V.
Euro Fixed Income Portfolio
30 Nov 00 30 Nov 99
EUR EUR(''
Stat istical Information
European Specialist Portfolio
30 Nov 00 30 Nov 00 30 Nov 99 30 Nov 99
EUR USD EUR USD
30 November 2000
Global Equity Portfolio
30 Nov 00 30 Nov 99 30 Nov 98
USD us0 US0
Net Asset Value 153.376,382 123.569.119 1 56,5 Ib,bH I
Net Asset Value per Share 24.06 24.87 21.10
Net Asset Value
Net Assct Valuc per Share
Global Flxed Income Portfolio
30 Nov 00 30 Nov 99
US0 USD
172, I ~ 1 , 7 8 5 182,791.889 l3.01 14.82
Aria Portfolio
30 Nov 00
USD
30 NO" 99
USD
30 Nov 98
US0
88,144,823 93,114.392 198,702.723 7.04 9.88 6.55
Europe Portfolio
30 Nov 00 30 Nov 00
EUR US0
?3O,725,341J I7,I20,745
125.13 9.04
Nct AwA Valuc Net Asset Value per Share
48,880.363 22,080,(15 I
9.88 9.70
562,341,183 11,507.038 283,344,732 16,788.658 207.08 I O.06 369.32 9.48
Ncr Asscl Vijluc
Nct Assct Valuc pcr Share
Jarran portfolio("
30 Nov 00 30 Nov 99 30 Nov 98
JPV JPY JPY
40.372,070 3 1,016.633 9.945,807
1.141 1,205 886
Japan Small cap Portfolio"'
30 Nov 00 30 Nov 99 30 Nov 98 1 JPY JPV JPY
5,828,254 3,762,357 1.004,645
1.462 1,803
US CORE'* Equity Portfolio
30 Nov 00 30 NOV 99 30 Nov 98
US0 USD US0
Nct Assct Valuc Nct Assct Value pcr Sliarc
214.757,45 I
17.27
174,833.317 18.39
I 03,757.094
15.41
92 The accompanying notes are an integral part of these financial statements.

GOLDMAN SACHS FUNDS. S.I.C.A.V.
USD'd)
24.360,418
10.45
Europe Portfolio (tontlnued)
30 Nov 99 30 Nov 99 30 NOV 98 30 Nov 98
EUA USD EUR~"') USD")
US0 USD USD")
40,361,322 23.738,988 15,630.918
9.21 10.90 7.84
97,265,584 3.670,819 8 1,299.414 6.870,L)XI
109.40 10.12 87.26 9.41
USD EUR USD EUR(" USDb)
Europe CORE* Equity Portfolio
30 Nov 00 30 Nov 99 1 EUR E d b )
USD(h)
European Specialist Ponfolio
US Fixed Income Portfolio
30 Nov 00 30 Nov 99 30 Nov 98
USD USD USDB)
96.284.250 19,453.926 25,99X3hX2
10.41 10.10 10.32
30 Nov 98 30 Nov 98
EUR("') USD"
US Growth Equity Portfolio
30 Nov 00 30 Nov 99
US0 USD")
hX,OSX,72? 5,086,402
10.21 10.08
243,223.09 I 2,846,591
126.84 8.14
Global Emerglng Markets Debt Portfolio
30 NOV oa
Global Emerging Markets Equity Portfolio
30 Nov 00 30 Nov P9 30 NOV 98
Global High Yield Portfolio
30 Nov 00 30 Nov 00 30 Nov 99 30 Nov 99 30 Nov 98
Internet Tollkeeper$"
Portfolio
30 Nov 00
342,550,549 118,671.858 474,270.278 80,314.354 225,543,s 1 h 2h,847,400
0.OY 8.12 10.23 9.45 10.15 6.05
Technology Portfolio
30 Nov 00 30 Nov 00 30 NOV 00 30 Nov 99 30 Nov 99 30 Nov 98
CHF USD GBP'") CHF USD' CHF
564,249,830 2 18.6 1 X,022 6 13,526 210.998,471 53,207,393 57,459,521
3X.hX 14.22 6.96 44.96 18.11 17.92
93
. ..

G O L D M A N SACHS FUNDS, S.I.C.A.V.
Notes to Financial Statements As of 30 November 2000
1. O R G A N I S A T I O N
Goldman Sachs Funds, S.I.C.A.V. (the “Fund”) was incorporated on 5 November 1992 under the laws of the Grand Duchy of Luxcmbourg as a “SociEtE d’lnvestissement h Capital Variable”, for an unlimited period of time. The Fund qualifies as a collcctivc investment undertaking under the Luxembourg law of 30 March 1Y88. The Fund is comprised of seventeen diffcrcnt portfolios. Included in this report are the financial statcmcnts for these portfolios. As of 30 November, the Fund offered sharcs in thc following Portfolios:
Portfolios Commencement
Date
Goldman Sachs Global Equity Portfolio (USD) Goldman Sachs Global Fixed Income Portfolio (USD) Goldman Sachs European Specialist Portfolio (EUR) Goldman Sachs Asia Portfolio (USD) Goldman Sachs Japan Portfolio (JPY) Goldman Sachs Technology Portfolio (CHF) Goldman Sachs Europe Portfolio (EUR) Goldman Sachs U S CORESh1 Equity Portfolio (USD) Goldman Sachs Japan Small Cap Portfolio (JPY) Goldman Sachs Global Emerging Markets Equity Portfolio (USD) Goldman Sachs Cilohal High Yield Portfolio (USD) Goldman Sachs US Fixed Income Portfolio (USD) Goldman Sachs Euro Fixed Income Portfolio (EUII) Goldman Sachs Europc C O R F M Equity Portfolio (EUR) Goldman Sachs US Growth Equity Portfolio (USD) Goldman Sachs Internet ToHkeeperSh‘ Portfolio (USD) Goldman Sachs Global Emerging Markets Debt Portfolio (USD)
4 December, 19Y2 17 December. 1992
3 May. 1994 31 May, 1994
30 April, 1996 17 June. 1996
30 September, 1 Y9h 19 November, lYYh 3 Scptcmbcr, 1997
16 Dcccmbcr, 1 997
27 January. 1998 27 July, 1998
15 March, 1999 I October, 1999
15 November, 1999 3 April, 2000 3 May, 2000
The investment objective of the Euro Fixcd Income Portfolio? the Global Fixed Incomc Portfolio, Global High Yield Portfolio, the US Fixed Income Portfolio and thc Global Emerging Markets Debt Portfolio is a high lcvel of total return. The investment objective of each other Portfolio is long-term capital appreciation. At 30 November 2000 the Fund offered two classcs of sharcs of each of the Europe Portfolio, the Europcan Specialist Portfolio, and the Cilohal High Yield Portfolio, one the Euro Share Class (“Euro Share Class”) priced in Euro Currency, and onc priccd in US Dollars, the USD Share Class (“USD Sharc Class”). The Euro Share Class of the Global High Yicld Portfolio is hedged, but otherwise Euro Share Classes are unhcdgcd. In addition, the Technology Portfolio offers thrcc classcs of sharcs, one class priced in Swiss Francs (‘;CHF Sharc Class”), one class priced in British Pounds r G B P Share Class”). as wcll as in US Dollars (“USD Share Class”). The USD Sharc Class of the Europe Portfolio and the European Specialist Portfolio cach commenced operations on 27 July 1998. Thc USD Share Class of the Technology Portfolio and the EUR Share Class of thc Glob;il High Yield Portfolio commenced opcrations on 1 February 1Y99 and 7 May, 1999 rcspcctivcly. The GRP Share Class of the Technology Portfolio commenced operations on 3 October. 2000.
94

GOLDMAN SACHS FUNDS, S.I.C.A.V.
Notes to Financial Statements As of 30 November 2000
2 . S I G N I F I C A N T A C C O U N T I N G P O L I C I E S
The financial statements have been preparcd in accordance with the Luxembourg Law on Undertakings for Collective Investment. The financial statcmcnts rcflcct the use of estimates and assumptions that may affect the reported amounts of assets and liabilities. Actual amounts could differ from these estimates. The significant accounting policies are summarised as follows :
A. Investment Valuation
Investmcnts in cquity and debt securities are valued on the basis of dealer-supplied quotations or by a pricing scrvice selectcd by the Investmcnt Adviscr and approved by the Board of Directors. The prices derived by a pricing agcnt rcflcct broker/dealer-supplied valuations and electronic data proccssing techniques. In certain markets that trade both domestic and foreign shares: foreign prices are generally utiliscd after the foreign investor limits for a particular security have been reached. Options and futures contracts are valued at thc last salcs price on the market where any such option or futures contract is principally traded. Forward currcncy contracts are valued at their respective fair market values determined on the basis of prices supplied by independcnt sourccs. Short-term debt obligations maturing in ninety days or less are valued at amortised cost. Restricted securitics: and other securities for which market quotations are not readily available, are valued at fair value pursuant to proccdurcs established by the Board
of Dircctors of thc Fund.
E. Foreign Currency Translations
The books and records of the Asia Portfolio, Global Emerging Markets Equity Portfolio, Global Equity Portfolio, Global Fixed Income Portfolio, Global High Yield Portfolio: US CORESL‘ Equity Portfolio, US Growth Equity Port- folio, US Fixed Income Portfolio, Internet TollkeepersL1 Portfolio and Global Emcrging Markets Deht Portfolio are maintained in US Dollars (“base currency”), the Technology Portfolio is maintained in Swiss Francs (“base currency’.), the Europe Portfolio, Euro Fixed Income Portfolio, Europe CORESM Equity Portfolio and Europcan Specialist Port- folio are maintained in Euro (“basc currcncy”). the Japan Portfolio and Japan Small Cap Portfolio are maintaincd in Japanese Yen (“base currency”). Amounts denominatcd in othcr currencies are translated into the respective Portfolio’s base currency, on the following basis : (i) investment valuations, other assets and liabilities initially expressed in other currencics are converted into the base currency based upon current exchange rates; (ii) purchases and sales of forcign currency denominated investments, income and expenses are converted into the base currency based upon currcncy exchange rates prevailing on the respective dates of such transactions. Net realised and unrcalised gains and losses on foreign currency transactions will represent: (i) foreign exchange gains and losscs from thc sale and holdings of foreign currencies and invest- ments; (ii) gains and losses between trade date and settlement date on invcstment securities transactions and forward exchange contracts; and (iii) gains and losses from the diffcrcncc bctwccn the amounts of dividends and
intcrcst recorded and the amounts ;ictually received.
In ordcr to prcparc combincd financial statements, financial statements of each Portfolio that is not USD denominatcd havc bccn convcrtcd into USD at the following exchange rates :
1 USD = 1.7549 CHF 1 USD = 1.1611 EUR 1 USD = 111.04 JPY
95

GOLDMAN SACHS FUNDS, S.I .C.A.V.
Notes to Financial Statements As of 30 November 2000
2 . S I G N I F I C A N T A C C O U N T I N G P O L I C I E S ( c o n t i n u e d )
C. Forward Foreign Currency Exchunge Contructs
Each I’ortfolio is authorised to enter into forward foreign exchange contracts in order to protect a Portfolio against adverse movement in the value of a Portfolio’s hase currency. Each Portfolio may enter into contracts for the purchase or sale rrf a specific foreign currency at a fixed price on a future date as a hedge or cross-hedge against either spccifjc transactions or portfolio positions. The aggregate principal amounts of the contracts for which dclivcry is anticipatcd arc rcflcctcd in Notc 7. Thc aggrcgatc principal amounts are reflected net in the accompa- nying Statement of Assets and Liabilities if a Portfolio iiitcnds to scttlc thc contract prior to dclivcry. All commitments are “marked-to-market” at the applicable translation rates and any resulting uiircaliscd gains or losses are recorded in each Portfolio’s financial statements.
Each Portfolio records realised gains or losses at the time the forward contract is offset by cntry into a closing transaction or extinguished by delivery of the currency. Kisks may arise upon entering these contracts from the potential inability of counterparties to meet the terms of their contracts and from unanticipated movements in the value of a foreign currency relative to the base currency.
D. Securip Transactions and Investment Income
Security transactions are recorded on trade date. Realised gains and losses on sales of portfolio securities arc calculated on an identified-cost basis. Dividend income is recorded on the ex-dividend date and interest income is recorded on the basis of interest accrued, premiums amortised and discounts earned. Income and realised gains and losses of the Europe Portfolio. the European Specialist Portfolio, the Global High Yield Portfolio and the Techno-
logy Portfolio are allocated to each class based on relative net assets at each valuation date.
E. Deferred Organisation Expenses
Organisation-rclated costs are being amortiscd on a straight-linc basis ovcr a period of five years.
E Expenses
Expenses incurred by the Fund that do not specifically relate to an individual Portfolio of thc Fund arc allocatcd to the Portfolios based on the nature of the charges.
G. Futures and Options Contracts
Upon entering into a futures contract, a Portfolio is required to deposit with a broker an amount of cash or securitics equal to the minimum ‘.initial margin” requirement of the futures exchange on which the contract is traded. Subse- quent payments (“variation margin”) are made or received by a Portfolio each day, dependent on the daily fluctua- tions in the value of the underlying index or security, and are recorded for financial reporting purposes as unrealised gains o r losses hy a Portfolio. When entering into a closing transaction, a Portfolio will realise a gain or loss equal to the difference hetween lhe value of the futures contract to sell and the futures contract to buy. A Portfolio may write and purchase call and put options o n any securities in which it may invest. All call options
writtcn by a Portfolio must bc covcrcd, which mcans that thc Portfolio will own the underlying securities subject to the option. or match thc call options or any other instruments (such as warrants) providing sufficient coverage, so
long [is thc option is outstanding. Thc daily fluctuations in thc value of the underlying security are recorded for financial reporting purposes as unrealised gains or losses by a Portfolio and arc rccordcd in rcaliscd gain or loss when entered into a closing transaction.
96

GOLDMAN SACHS FUNDS. S.I.C.A.V.
Notes to Financial Statements As of 30 November 2000
2 . S I G N I F I C A N T A C C O U N T I N G POLICIES ( c o n t i n u e d )
G. Futrtres and Options Contracts (continued)
Ccrtain risks may arise upon entering into futures, options, or forward currency cxchange contracts. These risks may includc changcs in the viilue of the contract that may not directly correlate with changcs in the valuc of the undcrlying sccuritics, or that thc counterparty to a contract may default on its obligations to pcrform.
H. Portfolios offering shares priced in various currencies
The net asset value per share of a particular class will be calculated by dividing (i) the total assets of the Portfolio attributable to that class less the total liab es of the Portfolio attributable to that class by (ii) the total number of outstanding shares of that class. Shares or each Portfolio and any additional portfolios in the Fund are expected Io pcrform diffcrcntly, and each Portfolio (and class if appropriate) will bear its own fccs and cxpenses (to the extent spccifically attributable to the Portfolio (or class). In particular, the costs associated with the conversion of monies in conncction with purchasc, rcdcmption and exchange of Shares 01 a Portfolio denominatcd in onc currcncy but also statcd in anothcr currciicy will be borne by the relevant class and will be reflectcd in thc nct assct value of such class of Sharcs. Conscqucntly, thc nct asset value per share of each Porthlio and of different classcs of a singlc Port- folio, if appropriate. is cxpcctcd to diffcr. Howcvcr, the Portfolio will be considered as a single pool of asscts. For thc USD Sharc Classcs of thc Europc Portfolio, the European Specialist Portfolio and thc Tcchnology I’ortfolio, the net asset valuc per sharc is thc net asset viilue attributable to the shares of each respectivc Portfolio calculated in Euro, Euro and Swiss Francs rcspcctivcly and converted into US Dollars at the current exchange ratc at 30 November 2000. For the EUR Share Class of the Global High Yield Portfolio, the net assct valuc pcr share is the net asset value attri- butable to the shares o f the Cilohal High Yield Portfolio calculated in US Dollars and converted into Euro at the
currcnt exchange rate at 30 November 2000. For the GBP Sharc Class of the Technology Portfolio, Ihe net asset value per share is thc net asset valuc attributable to thc sharcs of thc Tcchnology Portfolio calculated in Swiss Francs and converted into British Pounds at thc currcnt exchange ratc at 30 Novcmbcr 2000.
3 . SHARE I S S U A N C E S A N D R E D E M P T I O N S
Sharcs of each Portfolio may be purchased directly from the Furid or through the Distributor daily. at the net asset valuc pcr sharc on such datc, plus any applicable sales charge not to exceed 5 5 % of thc offcring pricc. Thc minimum initial invcstnicnt is USD 1,500, EUR 1 ,SO03 JPY 150,000, CiBl’ 1,500 and CHF 2300 in cach USD. EUR, JPY, GBP and CHF dcnoniinatcd Sharcs, rcspectively. Shares are redeemable on a daily basis at thc option of the shareholder, at thc nct assct valuc pcr sharc determined o n such date.
4 . D I V I D E N D P O L I C Y
Each Portfolio intends to distribute substantially all of its net invcstmcnt income, at least annually, to the sharcholdcrs of rccord of cach Portfolio. Net capital and currency gains realised on cach Portfolio’s investments arc cxpcctcd to bc retained by eiich Portfolio. Dividends distributed by each Portfolio may bc paid in cash or reinvested in additional shares of the Portfolio at the net asset valuc of thc sharcs as of the datc on which such dividends are declared. When shareholdcrs makc usc of this reinvestment facility, each dividcnd duc to the shareholder will he paid by the Portfolio to State Street Bank Luxembourg S.A. at its Luxembourg office for the account of thc rclcvant shareholder. State Street Bank Luxembourg S.A. will. as agent for the shareholders, crcdit such nionics to thc Portfolio in subscription lor further shares.
97

GOLDMAN SACHS FUNDS, S.I.C.A.V.
Notes to Financial Statements As of 30 November 2000
5 . A G R E E M E N T S
Goldman Sachs Asset Management International (“GSAMI”), an affiliate of Goldman, Sachs & Co. (“Goldman Sachs”) acts as each Portfolio’s invcstmcnt adviser pursuant to an Investment Advisory Agreement. Under the Investment Advisory Agreement, GSAMI, subject to the general supervision of the Fund’s Board of Directors, manages the Fund’s portfolios. GSAMl relies upon Goldman Sachs Assct Management, the US sub-adviser, in connection with the selection of secu- rities of US issuers and issuers in many emcrging countries, upon thc asset management division of Goldman Sachs (Singapore) PTE, the Asian sub-adviser, in connection with the selection of Asian issuers and upon Goldman Sachs Asset Mandgcmcnt Japan Limited, the Japanese sub-adviser, in connection with the selection of Japanese issuers. As compensation for the services rendered under the Investment Advisory Agreement, CiSAMl receives a fec, paya- blc monthly, at an annual rate equal to 1.75 o/r in the case of both the Technology Portfolio and the Internet Tollkccper’M Portfolio, 1.50% in the case of both the Global Emerging Markets Equity Portfolio and thc Japan Small Cap Portfolio: 1.10% in the case of the Global High Yield Portfolio, 1 .00% in the case of the Euro Fixed Income Portfolio, thc Global Fixed Income Portfolio and the US Fixed Income Portfolio and 1.25%) of cach of the other Portfolio’s average daily net assets. A portion of the Investment Adviser’s fccs may bc rcmittcd to the sub-adviser. GSAMI has voluntarily agreed to limit total ordinary expenses to 2.25 % for thc Global Emcrging Markets Equity Portfolio, 2.05 % for the Internet Tollkeeper’” Portfolio, 2.00 % and 1.75 % for the Japan Small Cap Portfolio and the US Growth Equity Portfolio, respcctivcly, 1.65 % for the Global Emerging Markets Debt Portfolio, 1.50% for the Europe CORE’” Equity Portfolio, 1.40% for the Global High Yield Portfolio, 1.25% for the Euro Fixed Income Portfolio and thc Global Fixed Income Portfolio, and 1.20% for the US Fixed Income Portfolio. To the extent that total ordinary expenses would otherwise exceed such level, GSAMI will reduce its advisory fees accordingly. GSAMI voluntarily agreed not to impose a portion of its advisory fee for the year ended 30 November 2000. Please see the attached table below for further details.Cio1dma.n Sachs International (“GSI”) serves as the Distributor of shares of each Portfolio pursuant to a Distribution Agreement. GSI may receive a portion of the sales chargc imposed on the sale of Portfolio shares. Please see the attached table below which details the value of retained sales chargcs per Portfolio.
Portfolio Waiver Sales Charge
Asia Portfolio Europe Portfolio Europe COREShi Equity Portfolio Euro Fixed Income Portfolio European Specialist Portfolio Global Emerging Markets Debt Portfolio Global Emerging Markets Equity Portfolio Global Equity Portfolio Global Fixed Income Portfolio
Global High Yield Portfolio lnternct TollkecpcrSM Portfolio Japan Portfolio Japan Small Cap Portfolio Technology Portfolio US CORESM Equity Portfolio US Fixed Income Portfolio US Growth Equity Portfolio
EUR 282 EUR 141,829 EUR 134,882
USD 36,131 USD 15S7034
-
USD 13,520 -
USD 55,169 -
JPY 1,144,682
I
USD 163,686 USD 51,657
USD 2,328 5,948
116 28
EUR 20,461 -
9 USD 6,202
7,418 USD 16J2.1
2,507 JPY 6,013
30 CHF 183,217 USD 5,013
200
98

GOLDMAN SACHS FUNDS, S.I.C.A.V.
Notes to Financial Statements A s of 30 Nmwnhor 2000
5 . A G R E E M E N T S ( c o n t i n u e d )
Each Portfolio’s Administrator, Custodian, Domiciliary Agent and Listing Agent is State Street Bank Luxembourg S A . . Each Portfolio’s Registrar and Transfer Agent is First European Transfer Agent S.A..
Bank Leu acts as each Portfolio’s Swiss Paying Agent, Citibank Belgium N.V./S.A. acts as Bclgian Paying Agcnt, Goldman Sachs (Asia) L.L.C. acts as Hong Kong Paying Agent, State Street Bank S.A. acts as Frcnch Paying Agent, State Street Bank GmbH acts as German Paying Agent, Piraeus Bank S.A. acts as Greck Paying Agcnt, Bank Inter S.A. acts as Spanish Paying Agent, Bank Austria acts as Austrian Paying Agent, and Banca Popolarc Commcrcio c Industrio as Italian Paying Agent.
6 . T A X A T I O N
Each Portfolio is subject to Luxembourg law with respect to its tax status. Under legislation and regulations
currently prcvailing in Luxcmbourg, cach Portfolio is subjcct to a tax (taxe d’abonnement) of 0.06 % per annum on its net assets: payable quarterly, on the basis of the value of each Portfolio’s aggregate net assets as of the end of each calendar quarter. Generally, under present law, neither the Portfolios nor their shareholdcrs arc subjcct to any Luxembourg tax on income, capital gains, withholding taxes or estate taxes. There is no Luxembourg tax or duty payable on the issuance of the shares. Under the United Kingdom Income and Corporation Taxcs Act, 1988, offshore funds must distribute substantially all of their income every year, in order to apply to the United Kingdom Inland Revenue for certilication as a distributing fund. Such approval is granted retrospectively for each accounting period. Investors who are resident in the United Kingdom should note that all distributions by each Portfolio are assessable to income tax or corporation tax under Case V of Schedule D, notwithstanding their reinvestment in further shares of cach Portfolio. Each Portfolio is subjcct to taxation on capital gains, intercst and dividends in certain jurisdictions in which each Portfolio invests. It is thc policy of cach Portfolio to accrue for such taxes when the dividend is declared or interest is earned. At each valuation date, taxation on unrealised appreciation of securities is accrucd for at statutory rates.
7 . O U T S T A N D I N G F O R W A R D F O R E I G N CURRENCY E X C H A N G E C O N T R A C T S
At 30 November 2000, outstanding forward foreign currency contracts, both to purchase and to sell forward foreign currencies were as follows:
Asia Portfolio
Forward Foreign Currency Purchase Contracts
Value on Settlement Unrealised
Date Current Value (Loss) US0 USD USD
Singapore Dollar
expiring 01/12/00 228,836 228,533 (303)
Forward Foreign Currency Sale Contracts
Value on Settlement Unrealised
Date Current Value (Loss) US0 US0 US0
Thailand Baht
expiring 04/12/00 4473 18 448,525 (1,007)
99

GOLDMAN SACHS FUNDS. S.I.C.A.V.
Notes to Financial Statements As oJ'30 November 2000
7 . OUTSTANDING FORWARD FOREIGN CURRENCY EXCHANGE CONTRACTS ( c o n t i n u e d )
Euro Fixed Income P o r t f o l i o
Forward Foreign Currency Purchase Contracts
Value on Settlement Unrealised
Date Current Value (Loss) EUR EUR EUR
United States Dollar
expiring 18/01/01 375,860 368,685 (7,175)
Forward Foreign Currency Sale Contracts
Value on Settlement Unrealised
Date Current Value Gain/( Loss) EUR EUR EUR
Brit ish Pound Sterling
expiring 14/12/00
expiring 24/0 1/0 1 Greek Drachma
expiring 18/01/01 United States Dollar
expiring 18/01/01
Danish Krone
2,561,159 2,522,427 38.732
45,610 45,s 70 40
2, IO6.614 2,107,139 (525)
1,778,995 1,793,146 (14,15 1)
TOTAL FORWARD FOREIGN CURRENCY SALE CONTRACTS 6:492,378 6:468,282 24.096
Global Eauitv P o r t f o l i o
Forward Foreign Currency Purchase Contracts
Value on Settlement Unrealised
Date Current Value Gain/(Loss) USD US0 USD
Euro cxpiring 18/01/01 Japanese Yen
cxpiring 23/02/01
576,046 578,880 2.834
1,901.999 1,879,345 (22,654)
TOTAL FORWARD FOREIGN CURRENCY PURCHASE CONTRACTS 2,478,045 2,458,225 ( I 9,820)
Forward Foreign Currency Sale Contracts
Value on
Settlement Unrealised Date Current Value Gain/(Loss) USD USD USD
Australian Dollar
cxpiring 19/01/01 Euro
cxpiring 18/01/01 Hong Kong Dollar
expiring 0811 2/00 Japanese Yen
expiring 23/02/01
1,93S7000 l,Y51,4Y2 (16,492)
566:YOl 578,881 (ll,Y80)
1,487,161 1:486,206 955
5,632,000 5,625,348 6$52
TOTAL FORWARD FOREIGN CURRENCY SALE CONTRACTS 9,621,062 O,64 1.927 (20,8653
100

GOLDMAN SACHS FUNDS, S.I.C.A.V.
Notes to Financial Statements As of 30 November 2000
7 . 0 UTSTAN D I N G FORWARD FORElG N CURRENCY EXCHANGE CONTRACTS ( c o n t i n u e d )
Global Fixed Income P o r t f o l i o
Value on Settlement Unrealised
Forward Foreign Currency Date Current Value Gainl(Loss1 Purchase Contracts US0 UED USD
Australian Dollar
expiring 19/01 /01 British Pound Sterling
expiring 14/12/00 Canadian Dollar
cxpiring 13/12/00 Euro
cxpiring 18/01/01
cxpiring 23/02/01 Japanese Yen
1,183,297 1,129,792 (53,505)
1,949,250 1 ,908,664 (40,586)
1.702,171 1,634,245 (67,926)
15.603,583 1 S,6S2,7O8 49,125
17,143,365 16.773,474 (369,89 I )
TOTAL FORWARD FOREIGN CURRENCY PURCHASE CONTRACTS 37,581,666 37,098,883 (482,783)
Forward Foreign Currency Sale Contracts
Value on Settlement Unrealised
Date Current Value Gain/(Loss) USD USD USD
Australian Dollar
expiring 19/01/01
expiring 14/12/00
expiring 13/12/00
expiring 24/01/01 Euro
expiring 14/12/00
expiring 18/01/01
expiring 23/02/01 New Zealand Dollar
cxpiring 16/02/01
British Pound Sterling
Canadian Dollar
Danish Krone
Greek Drachma
Japanese Yen
.I ;I 28,000
10,855,538
289,827
1,062,340
8,941,151)
3,861,693
7,482,000
3,579,815
1,137,614
10,834,519
289,580
1,087,454
9:146,765
3:907,461
7,478,342
3,682,271
(9.614)
21,019
247
(25,114)
(205,615)
(45,768)
3,658
(1 02,456)
TOTAL FORWARD FOREIGN CURRENCY SALE CONTRACTS 37,200,363 37,564,006 (363,643)
Forward Foreign Currency Cross Contracts
~
Value on Settlement Unrealised
Date Current Value (LOSS)
US0 US0 USD
Euro
expiring 14/12/00 328,207 330,426 (2,219)
101

GOLDMAN SACHS FUNDS. S.I.C.A.V.
Notes to Financial Statements As of 30 November 2000
7 . OUTSTANDING FORWARD FOREIGN CURRENCY EXCHANGE CONTRACTS ( c o n t i n u e d )
Global Hiah Yield Portfol io
Forward Foreign Currency Purchase Contracts
Value on Settlement Unrealised
Date Current Value (LOSS)
US0 US0 USD
Euro
cxpiring 15/12/00 cxpiring 16/01/01 cxpiring 01/02/01 expiring 01/06/01
1,270,48 1 17024,036 (246,445) 332,500 268,874 (63,626)
3,553,568 3,044,346 (509,222) 1,060,803 882,195 (178,608)
TOTAL FORWARD FOREIGN CURRENCY PURCHASE CONTRACTS 6,217,352 5,219,451 (997J01)
Forward Foreign Currency Sale Contracts
Value on Settlement Unrealised
Date Current Value Gain US0 US0 USD
British Pound Sterling
expiring 30/11/01 expiring 30/01/02 expiring 02/04/02 Euro
expiring 01/12/00 expiring 15/12/00
expiring 29/12/00
expiring 16/01/01 expiring 01/02/01 cxpiring 30/04/01 cxpiring 15/05/01 expiring 01/06/01 expiring 15/06/01 expiring 16/07/01
expiring 15/10/01 expiring 30/11/01 expiring 30/01/02 ex pi ri ng O2/O4/( 12
6,479,721 2,271,450
11,321.444
99.683 3,504.793 3,407,807 5,377,809 8,018,796 2,291,234
10,135,932 7,780,650 2,774,383
14,978,714
3,195,119 5,495.134
457,800 5,992,880
6,074,678 2,140,911
I I , 154,753
81,916 2,847,255 2,735,857 4,288,649 6,313,910 1,861,125 8,279,332 6,479,544 2,329,446
12,945,837
2,924,140 5,091,167
434,236
5,Y57,840
405,043 130,539 166,691
17,767 657,538 671,950
1,089,160 1,704,886
430,109 1,856,600 1,301,106
444,937 2,032,877
270,979 403,967
23,564 35,040
TOTAL FORWARD FOREIGN CURRENCY SALE CONTRACTS 93,583,349 8 1,940,596 11,642,753
US Fixed Income Portfol io
Forward Foreign Currency Sale Contracts
Value on Settlement Unrealised
Date Current Value Gain/(Loss) US0 USD USD
Euro expiring 18/01/01 N e w Zealand Dollar expiring 16/02/01
3,352,064 3,372,945 (20,881)
1,016,813 1,045,915 (29,102)
TOTAL FORWARD FOREIGN CURRENCY SALE CONTRACTS 4,368,877 4,418,860 (49,983)
102

GOLDMAN SACHS FUNDS, S.I.C.A.V.
Notes to Financial Statements As of 30 November 2000
7 . 0 UT STA N D I N G F 0 R W A R D F 0 R E I G N C U R R E N CY E XC H A N G E CO NT R ACT 5 (con t i n u e d )
Thc contractual amounts of forward foreign currency cxchange contracts do not necessarily rcprcscnt the amounts potentially wbject to risk. The measure of the risks associated with these instruments is mcaningful cmly when all rclated and offsetting transactions are considered. The following Portfolios have recorded a “Keceivable for forward foreign currency exchange contracts” and “Payable for forward forcign currency exchange contracts” resulting from open forward foreign currcncy exchange contracts: in the accompanying Statements of Assets and Liabilities:
Receivable Payable
Asia Portfolio Euro Fixed Income Porlfolio Global Equity Portfolio Global Fixed Income Portl‘olio
Global lligh Yield Portfolio US Fixed lnconie Portfolio
USD - USD ( 1,310) EUR 38.772 EUR (21 , M I )
USD 10,441 USD (5 1,126) usn 74,049 USD (922,694) USn 17,519,599 USD (29,507,493) USD - U SD (49,983)
Please see Note 12 for a breakdown of the forward foreign currency exchangc contracts receivable and payable attributable to the Euro-Hedged Sharc Class of the Global High Yield Portfolio.
8 . T R A N S A C T I O N S W I T H AFFILIATES
In the normal course of its operations, each Portfolio may cnter into transactions in currencies or other instruments with Goldman Sachs or other Goldman Sachs affiliates (togethcr “GS Affiliates”). For the year endcd 30 November 2000, thc following transactions were entered into with GS Aftiliates and total brokerage commissions were paid to GS Affiliates:
Total Brokerage Transactions Percent of commissions
Aggregate Value Total Aggregate Value
Asia Porthlio Europe Portfolio Europc CORE’h‘ Equity Portfolio Euro Fixed Income Portfolio European Specialist Portfolio Global Emerging Markets Debt Portfolio Global Emerging Markets Equity Portfolio Global Equity Portfolio Global Fixcd lnconie Portfolio Global High Yield Portfolio Intcrnet TollkeeperFM Portfolio Japan Portfolio Japan Small Cap Portfolio Tcchnology Portfolio US COREsM Equity Portlolio US Fixed Income Portfolio US Growth Equity Portfolio
USD EUR EUR EUR EUR USD usu USD USD USD USD JPY JPY CHF
USD usn USD
35,779.183 3.090,447
-
3,214,318 34,665,351
-
11,432,298 753,099
53,335,460 -
204,195 1,764,882,118
104,598,219 99,372,991
-
-
18,505,275
7.64 % USD 0.72 EUR - EUR
1.93 EUR 2.93 EUR - USD
11.30 U SD 0.33 U SD 7.78 USD - USD
0.25 USD 3.04 JPY 1.20 JPY 3.24 CHF
- USD - usn
16.83 USD
86,896 1,887 -
-
44904
17,569 50 -
-
230 4,558,614
359,071 120,557 -
-
22,338
Such transactions with GS Affiliates were entered into in the ordinary course of business and on normal commercial terms.
103

GOLDMAN SACHS FUNDS, S.I.C.A.V.
Notes to Financial Statements As of30 November 2000
9. S U M M A R Y O F SHARE T R A N S A C T I O N S
Share activity for the year ended 30 November 2000 was as follows:
Europe Euro COREsM
Fixed Income Europe Europe Equity Asla Portfolio Portfolio Portfolio Portfolio Portfolio
US0 EUR EUR U5D EUR
Shares outstanding as at 30 November 1999 0,424,400 2.275,504 889,090 362,686 9 12,640 Shares sold 8,990.675 5,614,154 1,307,313 1,634.551 236,850 Shares repurchased (7,3 i 3.204) (2,964.06n) (359,992) (277.029) (53.337) Reinxwtment of (htributions 23,929 7,522 2,369 504 -
Shares Outstanding as at 30 November 2000 11.101.871 4.949.527 1.843.933 1.722.577 1.096.717
Global Global Emerging
European European Emerglng Market$ Global Specialist Specialist Markets Debt Equity Equity Portfolio Portfolio Portfolio Portfolio Portfolio
EUR US0 USD US0 US0
Shares outstanding as at 30 November 1999 1,673,382 1.770.390 - 2.178,XIX 1.968,725 Sharcs sold 1.617,619 3,005,329 3,151.548 3.258,061 3,405.633 Shares repurchascd (587.240) (550,291) (820,608) (1.055,882) (2,000.750) Reinvestment of distributions I I - - 584
Shares outstanding as at 30 November 2000 2.703,7hl 4,225,428 2,330.940 4381,581 6,373,588 . -
Global Fixed Global Global Internet Japan
Income High Meld High Yield Tollkeepern" Japan Small Cap PorIfollo Portfolio Portfolio Portfolio Portfolio portfolio
US0 US0 EUR USD J PY JPY
Shares outstanding as at 30 November 1999 12.334.945 46.364,823 8,502,635 - 23.956,193 2.086.199 Shares sold 7,288,175 14,767,181 9,652,775 4,712,379 33,125,290 3,224.033 Shares repurchased (7.558.844) (25,717,109) (3,533.556) (848,lYl)(l3,826.660) (1,3?3,.t29)
- - - Rcinvcstmcnt of distrihulions 3 1 1.339 2,251,547 -
Shares outstanding as at 30 November 2000 12,375,615 37,666,442 14,62 1,854 3,864,188 33,254,823 3,986.803
US COREY US Flxsd US Growth Technology Technology Technology Equlty Income Equity
Portfolio Portfolio Portfolio Portfollo Portfolio Portfolio CHF USD GEP US0 USD US0
Shares outstanding as at 30 November 1999 4.692.810 2.937,422 I 9,509,266 1,925,692 502,396
Sharcs rcpurchased (4,541,683) (6,428,222) (671) (8.799.315) (1,345.631) (2574,084) Keinvestmcnt of distributions - 43.318 -
Shares outstanding as a t 30 November 2000 14,587,296 15,372,535 88.211 13:013,943 9,249,542 6,754,852
Shares sold 13.336,169 18:863,335 88,882 1 2 ,3n3>~~2 8,626,163 s,821i,540
- - -
IO. C H A N G E S I N I N V E S T M E N T P O R T F O L I O
The schedule of changcs in cadi investment portfolio is available upon request from the Administrator and thc Fund's paying agcnts.
104

GOLDMAN SACHS FUNDS, S.I.C.A.V.
Notes to Financial Statements As of30 November 2000
11. SOFT C O M M I S S I O N S
GSAMI is responsible for thc sclcction of brokers with whom it deals and. in some instanccs, has entered into soft commission arrarigemciits with these brokers whereby the Invcstment Adviser obtains scrviccs or benefits from third parties which are paid for by the hrnkers out of the commission they receive. Such scrviccs or heneCits relate primarily to performancc mcasurenient, valuation. and rcscarch services. The Investmcnt Adviser is satisfied that such soft ccimmission arrangcmcnts comply with relevant regulatory requirements.
1 2 . C LA S 5 - S P E C I F I C 0 U T STA N 0 I N G F I N A N C I A L I N ST R U M E N T 5
The Euro Hedge Class of the Global High Yield Portfolio has entered into class spccific forward foreign currency financial instruments as a hcdgc against adverse currency movements in the valuc of thc investments that are denominated in US Dollars, hcld by the Euro Shares Class. Any costs ;issocialed with thcsc hcdging contracts are home by the Euro Shares Class. The Euro (:lass Shares specific open financial instruments as of 30 November 2000 are as follows:
Value on Settlement Unrealised
Foreign Currency Date Current Value Gain/(Loss) Purchase Contracts US0 US0 USD
Euro
expiring 29/12/00 expiring 31/01/01 cxpiring 28/02/01 cxpiring 30/03/O 1 expiring 30/04/01 expiring 31/05/01 expiring 29/(J6/01 cxpiring 31/08/01 expiring 28/09/01 expiring 30/11/01 cxpiring 31/12/01 expiring 06/08/03 expiring 02/08/03
7,136,973 13.145,9xx 7,149,876 2,244,021 2.836,170 4,710.374 9,333,627 3,785,895 3,312,208
1 0,814594 8,968,068
16,117,868 74,780.43 1
5,935,734 10,9S 1.623 6,062,868 1,955,136 2,4X4.680 4,471,945 8,449,906 3,594,020 3,184,317
11,111,014 9,072,360
12,260,798 56,843,376
(1,201,239) (2,194,365) (1,087,008)
(288,885)
(238.429) (883,721)
(127,891) 296,420 104,292
(3,857.070) (1 7,937.0SS)
(35 1,390)
( I 9 I ,x7sj
TOTAL FOREIGN CURRENCY PURCHASE CONTRACTS I 64,336,093 136,377,777 (27,958,316)
Value on
Settlement Unraalised Foreign Currency Date Current Value Gain/(Loss) Sale Contracts U5D USD u50
Euro
cxpiring 04/ 12/00 cxpiring 3 I /O I /O I expiring 28/02/0 I expiring 30/03/01 expiring 30/04/01 expiring 3 1/05/01 expiring 31/08/01 expiring 31/10/01 expiring 30/11/01 expiring 31/12/01
14.032,200 2,015.841 5.708,885 2.184,530 2,578.065 3,s 8 9,9 2 7 9,098,035 1,861,223 2334,707 2,559.146
11,270,563 1,688.253 4,937,992 1,912,675 2,270,393 3.586,213 8,993,830 1,826,653 2,898,007 2,646,411
2,761,637 327,588 770,893 271,855 301$72 303,714 704,205 34,570
(63,300) (87:265)
TOTAL FOREIGN CURRENCY SALE CONTRACTS 47.362.559 42.036.990 5.325569
105

G O L D M A N SACHS FUNDS, S.I.C.A.V.
Notes to Financial Statements A s of 30 November 2000
13. O U T S T A N D I N G F I N A N C I A L FUTURES
On 30 Novemhcr 2000, the following futures contracts wcrc opcn as follows:
Number of Contracts Settlement Market Unrealised Portfolio Type Longl(Shorts) Month Currency Value Gain/ (Loss)
Europe DJ E1JRO STOXX 50 Index Future 144 December 2000 EUR 7,094,880 114.690 FTSE 100 Index Futures 28 December 2000 GBP 1,729,840 (36,890)
Europe COREsh' Equity 1;rSE 100 Index Future 143 December 2000 GBP 8,834,540 (435,760)
Euro Fixed Income EURX EUR Bund Futures 7 December 2000 EUR 747.1 1 0 12,930 IJS Treasury Notes 5YR Futures (7) December 2000 USD (71 1,375) (13,586) US Treasury Notes 1 OYR Futures (5 ) December 2000 USD (511,328) (1 1,563)
Global Emerging US Treasury Notes Markets Debt l0YR Futures 3 March 2001 IJSD 307,172 2.156
US TUonds 1 December 2000 USD 101,781 1.469 UJ EURO STOXX SO Index Future 116 December 2000 EUR 5,715,320 (237,630) ALL ORDS Index Futures 36 December 2000 AUD 2.971.800 (39,600) TDPTX Index Futures 11 Dcccmbcr 2000 JPY 148,445,000 (14,245.000) S&P 500 Index Futures 6 December 2000 USD 2,002,950 (82,800) FTSE 100 Index Futures (28) December 2000 GBP (1.729,840) 108,920
Bund Futures 55 Dccemher 2000 EUR 5,742.720 101 ,870 TSE l0YR Futures 10 March 2001 JPY 1,341,300,000 10,300.000 US Treasury Notes lOYR Futures (81) December 2000 USD (8,283,516) (160,591) US Treasury Notes 5YK Futures (49) December 7000 lJSn (4,979,625) (83,344)
Technology NASDAC) 100 60 December 2000 USD 15,106,200 (3,298.000) US CORE'" Equity S&P SO0
Index Futures 6 December 2000 USD 2,002,950 (6,925)
Glohal Equity
Global Fixed h o m e EURX EUR
US Fixed Income US Treasury Notes IOYR Futures 75 March 2001 USn 7,679,297 54.094 US T-Bonds 21 December 2000 IJSD 2,137,406 32,656 US 'Treasury Notes SYR Futures (72) March 2001 USD (7,321,448) (52,039) IJS Treasury Notes 5YR Futures (10) December 2000 USD (1,016,250) (3,594)
14. O U T S T A N D I N G W R I T T E N O P T I O N S
At 30 November 2000. the fdlowing written call option contracts werc outstanding: Expiration Number of Market Premlum Unrealised
Portfolio Underlying Security Date Contracts Currency Value received Gain
Global Emerging Markcis Equity I'elefonos de Mexico April 2001 (90) USD ~ 2 , 7 4 3 ) c") 47.257
106

G O L D M A N SACHS FUNDS. S.I.C.A.V.
Auditor’s Report
To the Shareholders of Goldman Sachs Funds, S K A V , :
We have auditcd thc financial statements, which consist of the statement of assets and liabilities, the statement of operations, the statcment of changes in net assets and the notes to the financial statements of Goldman Sachs Funds, S.I.C.A.V. (a Luxembourg open ended investment company with variable capital) and each of its portfolios for the year cnded Novcmbcr 30,2000. Thcsc financial statements are the responsibility of the Board of Directors of the Goldman Sachs Funds, S.I.C.A.V. Our rcsponsibility is to express an opinion on these financial statements based on our audit.
We conducted our audit in accordance with International Standards on Auditing. Those Standards require that we plan and perform the audit to obtain reasonable assurance about whether the financial statcmcnts arc free of material misstatement. An audit includes examining, on a test basis, evidence supporting the amounts and disclosures in the financial statements. An audit also includes assessing the accounting principles used and significant estimates made by thc Board of Directors of Goldman Sachs Funds, S.I.C.A.V. in preparing the financial statements: as well as cvaluating the overall financial statements presentation. We believe that our audit provides a reasonable basis for our opinion.
In our opinion, the attached financial statemcnts describcd abovc give, in conformity with the Luxembourg legal and regulatory requirements, a true and fair vicw of thc financial position of Goldman Sachs Funds, S.I.C.A.V. and each of its portfolios as of November 30: 2000 and the results of its opcrations and changes in its net assets for the year then ended.
Supplementary information included in the financial statements has bccn rcviewed in the context of our mandate but has not been subject to specific audit procedures carried out in accordance with the standards described above. Consequently, we express no opinion on such information. We have no observations to make concerning such
information in the context of the financial statements taken as a whole.
ARTHUR ANDERSEN Independent Auditors
December 19.2000
107

GOLDMAN SACHS FUNDS, S. I .C.A.V.
Additional Notes As or30 Novcmbcr 2000
This document is for informational purposes only and docs not constitutc a solicitation in any jurisdictioii in which
such a solicitation is unlawful or to any person to whom it is unlawful. Morcovcr, this documcnt ncithcr constitutcs
an offcr to cntcr into an invcstmcnt agrcemcnt with the recipient of this documcnt nor an invitation to respond to
thc document by making an offer to enter into an investment agreement. Goldman Sachs Funds. S.I.C.A.V. is a collcctivc invcstmcnt sclicmc rccogniscd undcr scctioii 86 of tlic Unitcd Kingdom Financial Scrviccs Act 1986. Pursuant to this recognition the Fund may be promoted to thc public in tlic Unitcd Kingdom. For purposcs of
applicable UK regulations, shares of the Portfolios of Goldman Sachs Funds, S.I.C.A.V. are distributed by
Goldman Sachs International. which is regulated by the Securities and Futures Authority. Shares of the Fund may
not be offered or sold Lo or for the henefit of any IJnited States person. Any reference to individual securities o r class of securities does not constitute a recommendation to purchase, sell or hold the investment. ‘I‘he securities
mentioned herein mav not continue to be held in the Fund. Goldman Sachs International and its affiliated entities,
or the accounts managed by them may have long or short positions in the securities mentioned herein. Past
performance is n o guide to the future. The value of the shares in the Fund and the income from them, if any, may
fall ;is well as rise. Rccausc the return and principii1 value of an investment in the Fund will tluctuate with changes
i n market conditions, an invcstor’s sharcs. whcn rcdccmcd, may bc worth morc or lcss than their original cost.
Investors may also incur ii salcs chargc whcn purchasing sharcs, iis ii result of which, in the absence of investment
rcturns, invcstors will not gct back thc amount invcstcd. This information docs not constitute tax advicc and as such sharcholdcrs should bc ridviscd to consult thcir own tax advisers regarding tax consequences of their
investment activitics. Opinions cxprcsscd iirc our currcnt opinions only.
Shares of cach Portfolio arc issucd solcly on thc basis of information sct out i n the currcnt Offering Circular of
Goldiiian Sachs Funds: S.I.C.A.V., which is available free of chargc at thc Fund’s rcgistcrcd officc in Luxembourg.
Thc chart below dctails thc currency dcnornination of cach Portfolio. If thc Portfolio is dcnominatcd in a currency
other than that in which the majority of the investor’s assets are held. the investor should be aware that changes in rates
of exchange may affect the value of its investment independently of the value of the Portfolio’s underlying assets.
Portfolio
Asia l’orlfolio
Europe Portfolio
Europc CORE”‘ Equity Portfolio Euro Fixed Income Portfolio
European Specialist Portfolio
Global Emerging Markets Debt l’ortlolio
Global Emerging Markets Equity I’ortColio
Global Equity Portfolio
Global Fixcd Income Portfolio
Global High Yicld Portfolio* Internet T~l lkeeper~“ Portfolio
Japan Portloolio
Japan Small Cap Portfolio
Tcchnology Portfolio’ * US CORE’h‘ Equity Portfolio
US Fixed Income IJS (irowth Equilv Portlklio
Base Currency
USL) EUR
EUR EIJR
ElJK USD USL) IISD USD
USD* usu JPY JPY
CHI? usn us13 USD
* I’ortfolio offers Euro-Hedged Share Class * * Effective .lanuary 200 I , the Portfolio changed i t s name to Cicildnian Sachs Global ‘Itchnology IJorlfolio.
108

GOLDMAN SACHS FUNDS, S.I.C.A.V.
Goldman Sachs Funds S.I.C.A.V. Societe d'lnvestissement a Capital Variable An Investment Fund organized under the laws of the Grand Duchy of Luxembourg
DIRECTORS Daniel W Stanton Lord Brian Griff iths of Fforestfach David B. Ford John P McNulty Peter Denis Sutherland
REGISTERED OFFICE 47, boulevard Royal L-2449 Luxembourg RC 541.751 Luxembourg
INVESTMENT ADVISER Goldman Sachs Asset Management International Peterborough Court 133 Fleet Street London, England EC4A 288
DISTRIBUTOR Goldman Sachs International Peterborough Court 133 Fleet Street London, England EC4A 2BB
AUDITOR Arthur Andersen 6, rue Jean Monnet L-2180 Luxembourg
CUSTODIAN, DOMICILIARY AGENT, ADMINISTRATOR, LISTING AGENT AND LUXEMBOURG PAYING AGENT State Street Bank Luxembourg S.A. 47, boulevard Royal P.O. Box 275 L-2449 Luxembourg
REGISTRAR AND TRANSFER AGENT First European Transfer Agent S. A. 11, bvd. GR.D. Charlotte L-1331 Luxembourg
LEGAL ADVISERS As to Luxembourg Law: Arendt & Medernach 8-10, rue Mathias Hardt Boite Portale 39 L-2010 Luxembourg
DISTRIBUTION in GERMANY Direkt Anlage Bank AG Landesberger Strasse 428 D-81241 Munich, Germany
AUSTRIAN PAYING AGENT Bank Austria Aktiengesellschaft Department 8819 Emissonen & Investor Relations Renngasre 2 A-I010 Vienna, Austria
BELGIAN PAYING AGENT Citibank Belgium N.V./S.A. Boulevard General Jacques 2639 8-1050 Brussels, Belgium
FRENCH PAYING AGENT State Street Bank S.A. 21, Rue Balzac F-75008 Paris, France
GERMAN PAYING AGENT State Street Bank GmbH Brienner Strasse 59 D-8033 Munich, Germany
GREEK PAYING AGENT Piraeus Bank S.A. Amalias Ave. & 5 Souri str. GR-10557 Athens, Greece
HONG KONG PAYING AGENT Goldman Sachs (Asia) L.L.C. Asia Pacific Finance Tower Citibank Plaza 3 Garden Road Central, Hong Kong
ITALIAN PAYING AGENT Banca Popolare Commercio e lndustrio S.C.R.L. Via Moscova 33 1-20121 Milan, Italy
SPANISH PAYING AGENT Bank Inter S.A. Paseo de la Castellana 29 E-28046 Madrid, Spain
SWISS PAYING AGENT Bank leu Bahnhofstrasse 32 CH-8001 Zurich, Switzerland
SWISS REPRESENTATIVE: Goldman Sachs & Co. Bank Munsterhof 4 CH-8022 Zurich, Switzerland
The Funds Offering Circular, Articles of Incorporation, Annual Report and Semi-Annual Report are available free of charge at the offices of the Swiss Represen ta rive.
I
Readers of this report should bc infornicd that with regard to third parties, and in particular towards each
Portfolio's creditors, the Fund will be considcrcd a s onc single legal entity. The Fund as a whole shall be
responsible for all obligations, whichever Portfolio such liabilitics are attributable to, except in cases where other
terms have been agreed upon with specific creditors.
N o subscriptions can be received on the basis of financial rcports. Subscriptions are only valid i f made on the
basis o f the currenl Offering Circular supplemented by the most rcccnt Annual Report and the latesl Semi-
Annual Report if published thereafter.
109