Co nte nt s - Fundsquare
129
-
Upload
khangminh22 -
Category
Documents
-
view
3 -
download
0
Transcript of Co nte nt s - Fundsquare


Co nte nt s
General information
Report of the Board of Directors
General introduction
Equity sub-funds
Investment results
Performance analysis
Sector equity sub-funds
Investment results
Performance analysis
Bond/absolute-return sub-funds
Investment results
Performance analysis
Financial statements
Statement of net assets Statement of operations and changes in net assets
Number of shares outstanding
Notes
General
Financial instruments
Summary of significant accounting principles
Other data
I nd e pend en t Auditor's Rep0 rt
Historical survey
Spread of net assets by country and currency
Investment portfolio:
Equity sub-funds
- Robeco Global Equities
- Robeco Global Growth Equities
- Robeco Global Vahe Equities
- Robeco North American Equities
- Robeco US Premium Equities (EUR)
- Robeco US Premium Equities
- Robeco US Midcap Equities
- Robeco US Value Equities
- Robeco European Equities
- Robeco European MidCap Equities
- Robeco European Oppurtunities
- Robeco Mult iManager Asia-Pacific Equities
- Robeco Emerging Markets Equities
- Robeco Emerging Stars Equities
- Robeco Chinese Equities
Sector equity sub-funds
- Robeco Financials Equities
- Robeco Food E3 Agri Equities
- Robeco Health Care Equities
- Robeco IT Equities
- Robeco Telecom Services Equities
- Robeco Consumer Goods Equities
- Robeco Industrials Equities
- Robeco Energy Equities
- Robeco Property Equities
Bond/absolute-return sub-funds
- Robeco Global Bonds
- Robeco All Strategy Euro Bonds
- Robeco High Yield Bonds
4 5 5
6
7
- Robeco Euro Credit Bonds
- Robeco Euro Credit Single A Bonds
- Robeco Euro Government Bonds
- Robeco Euro Bonds
- Robeco European Currencies High Yield Bonds
- Robeco Investment Grade ABS - Robeco Divirente VaR2
10 - Robeco Divirente VaR4
10
12
13
15
15 23
32
34 34
36 37 61
62 63 65
72 74
75 76 77
78 80 81
82
83 84 85 89 91
92
92
93 94 95 96
97 98 99
100
101
104
108
113
116
118
119
122
125
126 128
Robeco Capital Growth Funds 3

Cen era I Information
Robeco Capital Growth Funds, SICAV Subscriptions and publications (collective investment undertaking incorporated as a
‘Societe d’investissernent a capital variable‘ (SICAV) under
No subscriptions can be accepted on the basis of
financial reports such as this report. Subscriptions may
Luxembourg law) only be accepted on the basis of the current prospectus,
supplemented by the fund’s latest annual report, and in Register of Companies the event that the fund‘s annual report has been published
RCS Luxembourg B 58 959
Registered Office 69, route d’Esch
more than eight months previously, its latest semiannual
report. Financial reports and the prospectus may be
obtained free of charge from the fund’s registered office,
the Custodian and the designated banks.
L-1470 Luxembourg
Board of Directors
Michael Strating, Chairman, Senior Vice President Robeco,
Rotterdam
Frank A. de Boer, General Manager Robeco Institutional
Asset Management B.V., German office, Frankfurt am Main
Stefan F.A. Richter, General Manager Robeco Direct N.V.,
Belgian office, Brussels
General meeting of shareholders The General Meeting of Shareholders will be held on
29 November 2007 at 15:oo hours at the fund’s offices,
69, route d‘Esch, 1-1470 Luxembourg. Shareholders
wishing to attend and vote at the meeting should inform
the Company through RBC DEXlA Investor Services
Bank S.A., 14, Porte de France, L-4360 Esch-sur Alzette,
Luxembourg in writing, by 2 1 November 2007 at the latest.
This report i s also published in Dutch, French, German,
Management Company
Robeco Luxembourg S.A 287-289, route I’Arlon
L-1150 Luxembourg
Independent Auditor
PricewaterhouseCoopers S.a 1.1.
Reviseur d’entreprises
400, route d’Esch
1-1014 Luxembourg
P.0. BOX 1 4 4 3
Custodian and Paying Agent
Administrat ion and Domicil iary Agent
Registrar and Transfer Agent
RBC DEXIA Investor Services Bank S.A.
14, Porte de France
Luxem bou rg
1-4360 Esch-sur-Alzette
Investment Adviser
Robeco Institutional Asset Management B.V.
Coolsingel 1 2 0
NL-3011 AG Rotterdam
Internet: www.robeco.com
Italian, Spanish and Polish. The original English version
is the solely binding version and will be submitted to the
General Meeting of Shareholders.
Representative and paying agent in Switzerland Robeco (Schweiz) AG, Uraniastrasse 12, CH-8001 Zurich,
is the fund’s appointed representative in Switzerland.
Copies of the prospectus, Articles of Incorporation, (semi)
annual reports and a list of all purchases and sales in the
fund‘s securities portfolio during the reporting period are
available f rom the above address free of charge. UBS AG, Bahnhofstrasse 45, CH-8098 Zurich, is the fund‘s paying
agent in Switzerland.
4 Robeco Capital Growth Funds

Report of the Board of Directors
General
Website
We would like to inform you that up-to-date information
about the sub-funds' investment policies, returns, and
portfolios can be found on www.robeco.com.
Name changes sub-funds/share classes
-Effective 2 October 2006, the currency references 'EUR'
and 'USD'that form part of the sub-funds' names have
been deleted with the exception of the sub-fund Robeco
US Premium Equities (EUR), the name of which will
remain unchanged.
-Effective 2 October 2006, the names of the share classes
'B', 'D', 'E', 'I' and 'M' are changed into '6 EUR', '0 EUR', 'E EUR', 'I EUR ' and 'M EUR', with the exception of the share
classes 0, I and M of Robeco US Premium Equities (EUR).
-Effective 1 November 2006 the name of the sub-fund
Robeco European Bonds was changed into Robeco All
Strategy Euro Bonds.
Robeco High Yield ABS and Robeco European High Yield
Bonds were changed into Robeco High Income Bonds
and Robeco European Currencies High Yield Bonds,
respectively.
-Effective 5 October 2007, the name of the sub-fund
Robeco Mult iManager Asia-Pacific Equities wil l be
changed into Robeco Asia-Pacific Equities.
- Effective 17 December 2007, the name of the sub-fund
Robeco North American Equities wil l be changed into
Robeco 130/30 North American Equities.
-Effective 30 April 2007, the names of the sub-funds
Amalgamations
Effective 28 September 2007:
- t h e Class M EUR Shares of the sub-funds referred to under
items 1 to IO below will amalgamate into Class 0 EUR
Shares of the same sub-fund;
1. Robeco Global Equities - Class M EUR Shares
2 . Robeco Mult iManager Asia-Pacific Equities -
3. Robeco European Equities - Class M EUR Shares
4. Robeco European MidCap Equities - Class M EUR Shares
5. Robeco North American Equities - Class M EUR Shares
6. Robeco Financials Equities - Class M EUR Shares
7. Robeco Telecom Services Equities - Class M EUR Shares
8. Robeco Food E7 Agri Equities - Class M EUR Shares
9. Robeco Health Care Equities - Class M EUR Shares
10. Robeco IT Equities - Class M EUR Shares
-the Class M US0 Shares of the sub-fund Robeco US
Class M EUR Shares
Premium Equities will amalgamate into Class D USD Shares of the same sub-fund;
- the sub-fund Robeco US Premium Equities (EUR) (the
"Absorbed Sub-Fund") will amalgamate into the sub-fund
Robeco US Premium Equities (the "Absorbing Sub-Fund"),
Risk management
Risk management i s integrated into the investment
process Systems are in place to control the main risks
(price risk, credit risk and liquidity risk) on a continuous
basis In addition, checks on risk levels are carried out by an
independent risk-management department with separate
reporting lines to senior management
General introduction
Continued strong growth
This past year has been a very good one for the world
economy. Global economic growth amounted to more
than 5%. The Chinese and Indian economies grew at such a rapid pace that the risk of overheating increased
towards the end of the period under review. Economic
growth in the emerging economies in general was also
brisk, while growth in the euro zone maintained its upward momentum. In order to maintain price stability in
the medium term, the European Central Bank increased
interest rates several times and, by the end of the second
quarter of 2007, these had reached the 4% level. The
Japanese economy continued its recovery, although the
problem of falling prices (deflation) has proved to be a more persistent one than previously expected. Prices
are now falling again, albeit very modestly. The Bank of
Japan has abandoned its zero-interest-rate policy and has
twice hiked interest rates bringing them up t o the still very
low level of 0.5%. US economic growth was moderate
over the past year. As a result of the delayed impact of the step-by-step tightening of monetary policy, f rom an
interest-rate level of 1% up to 5.25%, the housing-market
boom came t o an end. Construction volumes fell and
residential-housing prices also started to decline. The
direct impact on growth was around 1 percentage point.
Growth slowed down from around 3.5% to around 2-2.5%.
Unemployment remained low during the period under
review and household consumption held up well. Inflation
turned out t o be rather persistent, but on balance core
inflation, which excludes food and energy prices, came
down gradually. The Fed (the US central bank) has kept
interest rates on hold at 5.25% since June last year.
Returns o n bonds under pressure The probability of further interest-rate hikes by many
central banks around the world provided a difficult
environment for bond markets. Long-term yields increased,
gradually at first but then at times with some volatility. At
the end of the second quarter, long-term yields increased
sharply. It has to be kept in mind, however, that yields had
been unusually low for some time, and long-term yields
in the United States and Europe had therefore reached a reasonable level by the end of the second quarter of this
year despite this sharp increase. In Japan, however, bond
yields remained very low.
Robeco Capital Growth Funds 5

Equity sub-funds
Corporate bonds outperformed government bonds, fuelled
macro-economic environment. Investors’ risk appetite was
high and this was illustrated by a willingness to finance
companies with a weak credit profile.
by strong equity markets and the continuing positive Investment results
Price as at Price as at Return in 96
30/06/2007 30/06/2006 o ~ / o ~ / z o o s -
Outlook for fixed-income markets
Now that long-term yields have reached more sustainable
levels in Europe and the United States, bond markets have
become more attractive than they have been over the past
few years. Yields have become higher and interest-rate
expectations have changed. A further increase in interest
rates can not be completely ruled out, but the probability
of this occurring has diminished, and the likelihood of a
decline in bond yields has increased. In other words, the
probability of lower bond prices has declined, while the
probability of higher bond prices has increased.
The prospects for corporate bonds are mixed. Companies
are putting more debt on their balance sheets, which, in
time, will lead to weaker credit metrics. However, as long
as global economic growth remains strong, this credit
deterioration will only be gradual and spreads can stay
tight for a while.
Good year for equity markets
Favorable global economic developments have provided
a strong stimulus for equity markets worldwide. The
raging mergers and acquisitions boom gave stock prices
an additional boost, particularly in the United States and
Europe. At the end of February/beginning of March there
was a short-lived, but rather sharp correction, triggered by
declines in the local Chinese equity markets. The markets
rebounded quickly and stock prices soon exceeded the
levels seen before the correction.
Outlook for equities
Over the past few years, equity markets have benefited
f rom a combination of low interest rates, very strong profit
growth and a large number of mergers and acquisitions
It is likely that bond yields will move sideways from the
current higher levels and that profit growth wil l decelerate
further, no longer reaching the highs recorded in the recent
past The boom in mergers and acquisitions may also lose momentum Smce most markets’ valuations have become
less favorable after the rate hike, one must be prepared
for stock prices to increase only moderately, while the
possibility of temporary corrections cannot be ruled out
Robeco Global Equities
0 EUR shares
DH EUR shares
M EUR shares
MSCl World Index (net return) ...............................
Robeco Global Growth Equities
0 EUR shares
Citigroup World Growth Primary Market ...............................
Robeco Global Value Equities
B EUR shares
D EUR shares
I EUR shares
M EUR shares
PH PLN shares
MSCl World Value Index (net return) ...............................
Robeco North American Equities
D EURshares
D USD shares
I EUR shares
M EUR shares
MSCl North America Index (net return) ...............................
Robeco US Premium Equities (EUR)
D shares
I shares
M shares Russell 3000 Value Index (hedged into E ...............................
Robeco US Premium Equities
D US0 shares
I USD shares
M USD shares
Russell 3000 Value Index ...............................
Robeco US MidCap Equities
D USD shares
DH EUR shares
I USDshares
Standard 6 Poors 400 Mid Cap Index ...............................
Robeco Global Equities
0 EUR shares
DH EUR shares
M EUR shares
MSCl World Index (net return) .......................................
Robeco Global Growth Equities
0 EUR shares
Citigroup World Growth Primary Market Index .......................................
Robeco Global Value Equities
B EUR shares
D EUR shares
I EUR shares
M EUR shares
PH PLN shares
MSCl World Value Index (net return) .......................................
Robeco North American Equities
D EURshares
D USD shares
I EUR shares
M EUR shares
MSCl North America Index (net return) ................................
Robeco US Premium Equities (EUR)
D shares
I shares
M shares Russell 3000 Value Index (hedged into EUR) .......................................
Robeco US Premium Equities
D US0 shares
I USD shares
M USD shares
Russell 3000 Value Index .......................................
Robeco US MidCap Equities
D USD shares
DH EUR shares
I USDshares
Standard 6 Poors 400 Mid Cap Index
Robeco US Value Equities
D USD shares
I USD Shares
Russell 1000 Value Index
.......................................
........................................
Robeco US Value Equities
D USD shares
I USD Shares
Russell 1000 Value Index ...............................
.......
Index
.......
. - .
.......
- . . . . 3 0 10 6 / 2 0 0 7
44 59 100 00
44 12
.............
128 86
.............
1 2 1 57 126 51
106 16
100 00
100 00
............
41 49 130 00
114.86
43 57
............
131.25
101 78
100 00
.............
102 a7
103 55 100 00
.............
100 00
100 00
100 00
.............
100.00
100 00
.............
6 Robeco Capital Growth Funds

-".-- Performance analysis Investment results
Robeco Global Equities
The fund realized an outperformance, mainly due to good
stock selection The fund strives for a stable performance
relative to its benchmark. Over the last year, the fund has
accomplished this mission.
Growth in corporate earnings wil l slow, as companies
have reached peak margins and wil l start to invest more in
capital goods and personnel. The valuation of worldwide
equity markets is still modest. With decent growth, modest
valuations but slowing earnings, equity markets are
expected t o record positive returns in 2007. Risk is building
up, however, and with higher long-term and short-term
interest rates, the valuation case is less compelling than it
has been unti l recently.
Robeco Global Growth Equities
Robeco Global Growth Equities had a good year, though
its overall return was held back by the weak US dollar
and Japanese yen. The fund performed in line with its
benchmark. Stock selection was strong in the sectors
energy, health-care and consumer-staples sectors. Its
exposure to emerging markets also helped performance.
Heavy exposure to Japan was a negative factor as
financials, in particular, fell back substantially. Growth
stocks underperformed slightlyfor the seventh consecutive
year, as investors have bid up cyclicals t o what we believe
are excessive levels Health care has become very cheap as a sector, while technology stocks are making a comeback
Robeco Global Value Equities
Shareholders in Robeco Global Value Equities enjoyed
another very good year. The global stock markets had a great run, and value once again beat growth. Materials
was the top-performing sector on the back of the
commodities boom. The strong euro (versus the US dollar
and the Japanese yen) prevented the fund from reporting
an even better return. The same was true for the weak
performance of the financials sector (both banks and
Price as at Price as at Return in %
30/06/2007 30/06/2006 01/07/2006-
30/06/2007
Robeco European Equities D EUR shares
M EUR shares
MSCl Europe Index (net return)
37 68
49 75
..........___.. ........................................
Robeco European MidCap Equities
D EUR shares
M EUR shares
DJ Stoxx Europe Small 200 Index
79.11
84 29
.......................................
Robeco European Opportunities
D EUR shares 100 00
I EUR shares ---._..._._-..- 100 00 ........................................
Robeco MultiManager Aria-Pacific Equities
D EUR shares 76.03
74 19
I EUR shares 140 20
M EUR shares
60% MSCl Asia-Paci f ic ex Japan G 40% T o p i x Japan Index
Robeco Emerging Markets Equities
D EUR shares 96 63
D USD shares 100 00
I EUR shares 164 02
......._..._.._ .______._... . ._..__________._... . . . .___
M EUR shares 75 00
P PLN shares 100.00
IFC Composite Index (net return)
Robeco Emerging Stars Equities
D EUR shares 100 00
........................................ -._....._____..
........................................ .._._..__..-_..
Robeco Chinese Equities
D EUR shares 26 96
MSCl 10/40 World China Index (net return) . - . . - -~ _....._...... _ _ ._.._.. ~ ..... _ " _ . . . -. . . . . . . . - - _ _ _ I ~" ~ ~ _ _ insurance lagged). Stock picking was good, in materials
Assuming reinvenment of :he dividend dmbuted. See me Other Data on page 61
Relates to the pernod 3 Notember 2006 - 30 June 2007
Relates to the perlod 3 September 2006 - 30 June 2007.
Relates to the period 2 Octaber 2006 - 30 June 2007
Relates to the period 16 Omber 2006 - 3G June 2007
Relates to the perrod 16 November 2006 - 30 June 2007.
Relates to the period 3 July 2006 - 30 June 2007
Relates to the perlod 17 Ocober 2006 - 30 June 2G07
Relates to the period 27 Apnl 2007 - 30 June 2007. Relate5 to the pemd 20 November 2006 - 30 June 7007
and technology in particular.
Robeco North American Equities
The fund underperformed for the year ending June 2007
Our proprietary stock-selection model provided a modest
positive contribution. The momentum factors and share
buyback factors very modestly helped performance, while
the valuation factors made a strong positive contribution
The technology-sector model made a very modest negative
contribution
Despite a positive contribution f rom the stock selection
model, the specific stocks selected for the portfolio led
to underperformance The stocks making the strongest
positive contribution to performance were Hewlett Packard
Robeco Caoital Growth Funds 7

(HPQ), Alcan (At) and A T b T Inc (T). The stocks hurting
performance the most were Office Depot (ODP), Advanced
Micro Devices (AMD) and Motorola (MOT).
Robeco US Premium Equities (EUR) / Robeco US Premium Equities Robeco US Premium Equities (EUR) / Robeco US
Premium Equities kept pace with a strong US equity
market in the year ending June. The fund's stock
selection outperformed the benchmark in the major i ty
of economic sectors. We have selectively upgraded
port fo l io quality wi thout sacrificing valuation. Our
investments in the insurance, technology and consumer
areas reflect these efforts and helped lead relative
performance. Although our health-care positions'
returns generally underperformed their potential, their
compell ing valuations and profitabil ity characteristics
have helped t o position the port fo l io for favorable
prospective performance.
Robeco US MidCap Equities The fund underperformed its benchmark for the year
ending June 2007. Our proprietary stock selection
model provided a very modest positive contribution.
The momentum factors made a very modest positive
contribution, while the valuation factors made a significant
positive contribution.
Despite a positive contribution f rom the stock selection
model, the specific stocks selected for the portfolio led
to underperformance. The stocks making the strongest
positive contribution t o performance were Precision
Castparts (PCP), MEMC Electric Materials (WFR) and
Cummins (CMI). The stocks hurting performance the most
were Alaska Air Group (ALK), Mentor (MENT) and Ryder
System (R).
Robeco US Value Equities In the two months since the inception of Robeco US Value
Equities, the fund has generated strong relative returns.
The biggest contributor to the positive performance came
from the technology sector, where the fund was helped
not only by a significant overweight relative to the Russell
1000 Value Index but also by very strong stock selection in
this sector. The best performing technology stocks in the
portfolio included International Business Machines, CGI
Croup, Harris and Nokia. The fund's performance was also greatly helped by very modest exposure to the RElT and
uti l i ty sectors, which were the t w o worst performing sectors
in the Russell 1000 Value Index for this period. As we enter
the second half of 2007, we continue to take advantage
of the tremendous compression in valuations that exists in
the US equity marketplace. This allows us to upgrade the
quality characteristics of the portfolio without having to
pay premium valuations.
Robeco European Equities This reporting period has been the fourth consecutive year
wi th double-digit returns for European stocks; this t ime
the MSCl index was up by 25.4%. Robeco CCF European
Equities has not been able to beat the index due t o
unfortunate stock selection among utilities and consumer
stocks.
Having n o positions in Spanish utilities (all rumored to be takeover targets), combined with our position in British
Energy, which had to shut down several nuclear-power
stations for safety reasons was not the right call.
Robeco European MidCap Equities The European economies have done well again in
2006/2007, and the improved economic-growth
forecasts had a significant impact on European midcap
performance, as midcaps have a more domestic bias: more
specifically, we increased our exposure t o Germany and
the Netherlands, as recovering economies lead t o high
earnings growth.
Our overexposure to cyclical stocks, such as industrial and construction-related companies, contributed significantly
t o the performance of the fund. The oil-services sector also
made a positive contribution and is still overrepresented as
i t continues to offer good growth prospects. The fund has
been avoiding interest-rate-sensitive names.
The fund showed very strong returns over the year, even
though i t underperformed its benchmark. Overall, we still
see positive developments ahead, as midcaps still offer
growth potential that provides some long-term support.
Robeco European Opportunities This fund was launched on 20 November 2006 when the
existing investment portfolio o f the Robeco Institutional
European Opportunities Fund was transferred to CCF Robeco European Opportunities.
The construction of this investment portfolio is not based
on an index; only the fund manager's very best 30-55
European equity-investment ideas will be included in the
portfolio. The fund has benefited significantly from investing
in undervalued and undiscovered European stocks.
Robeco MultiManager Asia-Pacific Equities In August 2006, value manager Maple-Brown Abbott
(MBA) was added to the fund to complement the growth-
oriented managers in the Pacific Basin and secure further
asset growth. Despite a relative underweight to China and
a slight underperformance versus the benchmark, the
fund's performance compared favorably with peers. Most
added value, as well as the positioning at fund level, was
derived from stock selection. Japan focused managers such
as JF benefited f rom domestic growth, while Bernstein
performed well with largecap export stocks.
8 Robeco Capital Growth Funds

Robeco Emerging Markets Equities
The emerging equity markets have enjoyed a stellar
performance over the last twelve months. The benign
macro economic situation across the globe helped
kindle the appetite for emerging assets. The strong
macroeconomic performance in China and India stood
out in particular and this has been a strong driving force
behind equity prices in the region and in countries such
as Russia and Brazil. These countries are resource-rich and
their exports to Asia skyrocketed. The emphasis in the fund
has been on emerging Asia and Brazil. Countries such as
Mexico and Russia have also had a substantial weight.
Performance lagged the benchmark, mainly because the
fund was underweight in smallcaps and midcaps, while i t
has a largecap bias, and i t was the smallcap and midcap
segment that showed the best performance.
Robeco Emerging Stars Equities
Robeco Emerging Stars Equities was launched in
November. It focuses exclusively on the most attractive
countries and stocks within emerging markets. The
fund invested around 50% in Brazil and Korea, which
both combine attractive valuations wi th solid economic
prospects. Other large positions were in China, Taiwan
and Mexico, complemented by a few stocks f rom other
emerging markets. Performance was very strong due to high returns in Brazil and successful stock selection in
almost all countries.
Robeto Chinese Equities
Robeco Chinese Equities generated a remarkable return
in both absolute and relative terms. The Chinese economy
continued to grow a: more than io% p.a. in the last
quarters. Exports and capital expenditure continued to
grow at the same strong rate, while domestic consumption
also took off. Benefiting f rom this strong economic growth,
many Chinese companies significantly improved their
profitability and investors also reaped the rewards. Many
initiatives of the 11 th five-year program were successfully
implemented and there are more on the way. These
initiatives wil l improve the long-term sustainability of Chinese economic growth.
Robeco Capital Growth Funds q

Sector equity sub-funds
_" I"-
Performance analysis
Robeco Financials Equities
In the 2006/2007 fiscal year, Robeco Financials Equities
underperformed its benchmark. Stock selection had a positive contribution to the performance, but could not
offset the negative impact f rom country and subsector
selection Over the past 12 months, several mergers
and acquisitions have been announced and the MbA cycle remains very strong. This, and the positive market
environment overall, was very beneficial for investment
banks The fund was overweight in this sector. Within the
emerging markets, wealth is increasing at a rapid pace,
which leads to an exponential need for financial products.
The fund's performance benefited f rom being overweight in
Investment results
Price as at Price as at Return in %
30/06/2007 30/06/2006 O ~ / O i ' / ~ O O 6 -
3 0 / 0 6 / 2 0 0 7
Robeco Finanrials Equities
D EUR shares 55 02
M EUR shares 110 84
MSCI World Financials Index (net return) ............... ........................................
Robeco Food G Agri Equities
0 EUR shares 49 38 M EUR shares 106 0 1
MSCI 10/40 World Consumer Staples Index
........................................ (net return) .............. emerging-market banks.
Robeco Health Care Equities
D EUR shares
M EUR shares 88.02
MSCI 10/40 World Health Care Index (net return)
Robeco IT Equities
....................................... M EUR shares
Robeco Telecorn Services Equities
Robeco Food 8 Agri Equities
Robeco Food b Agri Equities again showed a strong
outperformance in 2006-2007. As the fund i s driven by
bottom-up stock picking, individual stock selection was
responsible for most of the outperformance. The fund
profited from the stock picks in tobacco, a subsector which
enjoys pricing power and has benefited from Merger
bAcquisitions. Other overweights were the theme emerging-
market consumption growth, and the sub-sectors personal
care (due to its pricing power) and agricultural processors
that benefit from the biofuel boom. The risk budget is
allocated almost entirely to stock selection
Robeco Health Care Equities
During the year, Robeco Health Care Equities outperformed
its benchmark. The outperformance was the result
of subsector allocation, regional allocation and stock
selection. In terms of subsector allocation, the overweight
position in health-care equipment and health-care services,
and the underweight in pharmaceuticals had a positive
effect. The regional allocation benefited mainly f rom the
overweight position in emerging markets. Apart f rom
this, stock selection within subsectors and regions also
49.70
............... .......................................
D EUR shares 3 1 44
............. 34.80
D EUR shares 33 3 1
M EUR shares 47 24
MSCl 10/40 World Telecom Index (net return)
Robeco Consumer Goods Equities
........................................ MSCl World Consumer Discretionary Index (net return)
Robeco Industrials Equities
D EUR shares
MSCI 10/40 World Industrials index (net return)
Robeco Energy Equities
D EUR shares 93 48 contributed positively to the performance. MSCl 10/40 World Energy index (net return)
Robeco Property Equities
0 EUR shares
I EUR shares
....................................... Citigroup World Property Index ............... -. _ _ by strong secular growth, a dominant market position and
After a long period of digesting the excesses of the Internet
bubble, the fund managers believe that the technology
sector is ready for a new period of expansion The coming
years will mark the transition f rom client/server-based
technologies to network-centric computing This will result
in profound changes affecting all companies that are active
in the technology sector.
............... ........................................
D EUR shares 5 1 68
...............
46 42
............. ........................................
.............. ........................................ Robeco IT Equities
The fund's investment policy is aimed at selecting winners
within the different segments of the information-technology
sector. The companies that are selected are characterized
io0 89
97 33
return on invested capital well above the cost of capital I
io Robeco Capital Growth Funds
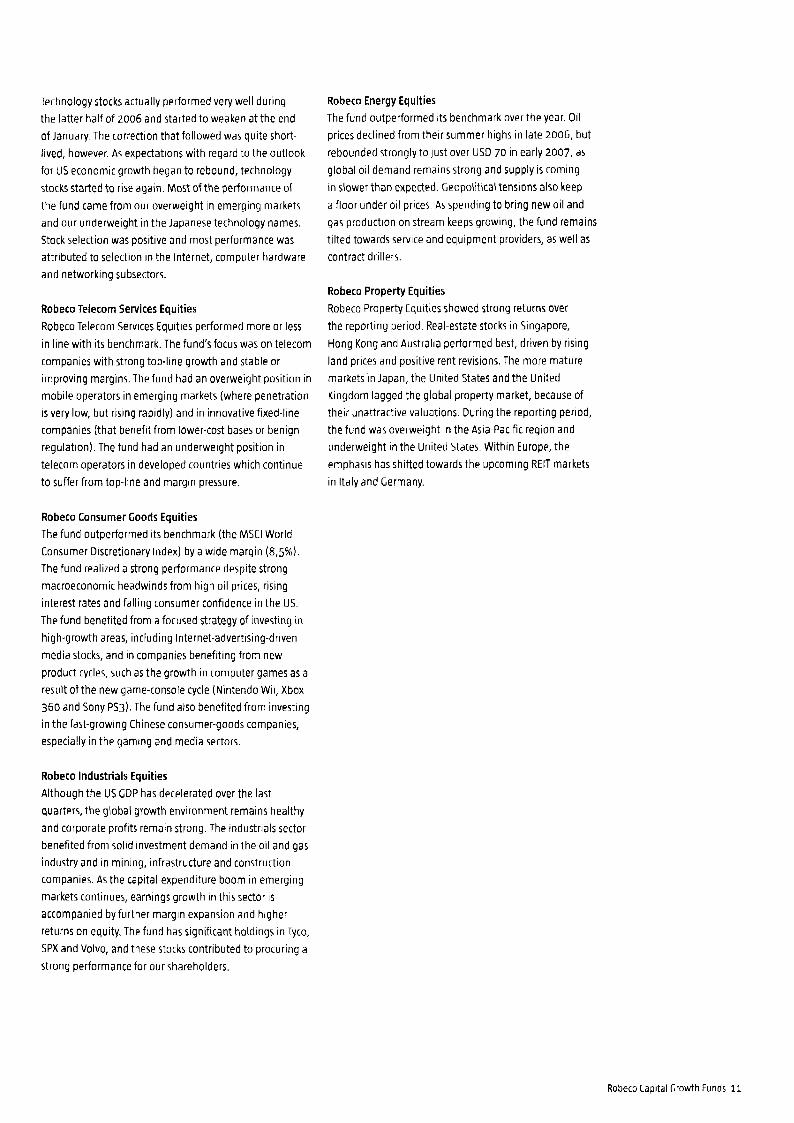
Technology stocks actually performed very well during
the latter half of 2006 and started to weaken at the end
of January. The correction that followed was quite short-
lived, however. As expectations wi th regard to the outlook
for US economic growth began to rebound, technology
stocks started t o rise again. Most of the performance of
the fund came from our overweight in emerging markets
and our underweight in the Japanese technology names.
Stock selection was positive and most performance was
attributed to selection in the Internet, computer hardware
and networking subsectors.
Robeco Telecom Services Equities
Robeco Telecom Services Equities performed more or less in line with its benchmark. The fund's focus was on telecom
companies with strong top-line growth and stable or improving margins. The fund had an overweight position in mobile operators in emerging markets (where penetration
is very low, but rising rapidly) and in innovative fixed-line
companies ( that benefit f rom lower-cost bases or benign
regulation). The fund had an underweight position in
telecom operators in developed countries which continue
to suffer f rom top-line and margin pressure.
Robeco Consumer Goods Equities
The fund outperformed its benchmark (the MSCl World
Consumer Discretionary Index) by a wide margin (8,5%). The fund realized a strong performance despite strong
macroeconomic headwinds from high oil prices, rising
interest rates and falling consumer confidence in the US. The fund benefited f rom a focused strategy of investing in high-growth areas, including Internet-advertising-driven
media stocks, and in companies benefiting f rom new
product cycles, such as the growth in computer games as a result of the new game-console cycle (Nintendo Wii, Xbox
360 and Sony PS3). The fund also benefited f rom investing
in the fast-growing Chinese consumer-goods companies,
especially in the gaming and media sectors.
Robeco industrials Equities Although the US GDP has decelerated over the last
quarters, the global growth environment remains healthy
and corporate profits remain strong. The industrials sector
benefited f rom solid investment demand in the oil and gas
industry and in mining, infrastructure and construction
companies. As the capital-expenditure boom in emerging
markets continues, earnings growth in this sector is
accompanied by further margin expansion and higher
returns on equity. The fund has significant holdings in Tyco,
SPX and Volvo, and these stocks contributed to procuring a
strong performance for our shareholders.
Robeco Energy Equities
The fund outperformed its benchmark over the year Oil
prices declined from their summer highs in late 2006, but
rebounded strongly to just over US0 70 in early 2007, as
global oil demand remains strong and supply is coming
in slower than expected Geopolitical tensions also keep
a floor under oil prices As spending to bring new oil and
gas production on stream keeps growing, the fund remains
ti l ted towards service and equipment providers, as well as
contract drillers
Robeco Property Equities
Robeco Property Equities showed strong returns over
the reporting period. Real-estate stocks in Singapore,
Hong Kong and Australia performed best, driven by rising
land prices and positive rent revisions. The more mature
markets in Japan, the United States and the United
Kingdom lagged the global property market, because of
their unattractive valuations. During the reporting period,
the fund was overweight in the Asia-Pacific region and
underweight in the united States. Within Europe, the
emphasis has shifted towards the upcoming RElT markets
in Italy and Germany.
Robeco Capital Growth Funds 11

Bond/absoIute-return su b-funds
Investment results
Robeto Global Bonds
B EUR shares
D EUR shares
E EUR shares
P PLN shares
Lehrnan Global Aggregate Index Hedged into EUR .......................................
Robeto All Strategy Euro Bonds
0 EUR shares
I EUR shares
Z EUR shares
Lehrnan Euro Aggregate Index
Hedged into EUR .......................................
Robeco High Yield Bonds
0 EUR shares
E EUR shares
I EUR shares
M EUR shares
P PLN shares
Z EUR shares
Lehrnan Brothers US Corporate High Yield G
PanEuro High Yield 2.5% Issuer Cap Index
Hedged into EUR ...................................
Robero Euro Credit Bonds
0 EUR shares
I EUR shares
Lehrnan Euro Corporate Bond Index .......................................
Robero Euro Credit Single A Bonds
0 EUR shares
I EUR shares
Lehman Euro Corporate ex BBBs Index .......................................
Robeco Euro Government Bonds
0 EUR shares
I EUR shares
2 EUR shares
Lehman Euro Aggregate Treasury Index ................................. ......
Robeco Euro Bonds
D EUR shares
E EUR shares
I EUR Shares
Z EUR shares
Lehrnan Euro Aggregate Index ......................................
Price as at Price as at Return in 96 30/06/2007 30/06/2006 01/07/2006-
30/06/2007
...............
96 05
63 48
98 62
100 00
.............
62.07
100 00
100 00
.............
70.39
99 98
101 13
69 57 100 00
100 00
............
99 23 100.13
............
99.50 100 42
............
100 40
101 39
100 00
.............
100 00
100 00
100 00
100 00
..............
12 Robeco Caoital Growth Funds

~ ____ ____
Investment results Performance analysis
Robeco European Currencies High Yield Bonds
D EUR shares
I EUR shares
Z EUR shares
Lehman Euro Aggregate Treasury index .................................
Robeco Investment Grade ABS
D EUR shares
I EUR shares
lehman Euro Floating ?ate ABS Index
Robeco Divirente VaR2
D EUR shares
E EUR shares
I EUR Shares
Z EUR shares
Merrill Lynch Euro Currency Libor Overnight
Index (EONIA)
.................................
.................................
Robeco Divirente VaR4
D EUR shares
E EUR shares
I EUR shares
Merrill lynch Euro Currency Libor Overnight
Index (EONIA) .................................
Price as at Price as at Return in %
30/06/2007 30 f 06 12006 OX/O7f 2006-
30/06/2001
101.72
102.15
100 00
........
100 00
100 00
........
100 00
100.00
100 00
100 00
........
100 00
100 00
100 00
........
Arrummg reinvestment ofthe d i d e n d See the Other Data on page 61
Relates to the period 2 Ocober 2006 - 30 June 2007.
Relater to the period 25 May 2007. 30 June 2007
Relates to fhe period 4 June 2007 - 30 lune 3007 Relates to the period 20 November 2006 - 30 June 2007
Relater to the perlod 3 November 2006 - 30 June 2007
tehman Pan-European Aggregate Index (hedged into EUR) for the period 1 .uly 2006 31 October 2006 and Lehman Euro Agqre
gate Index (hedged into FUR) for the period 1 Navember 2006 30 June 2007
Robeco Global Bonds The portfolio has been positioned to profit from a rise
in interest rates during most of the reporting period.
While in the last half of 2006 this resulted in some
underperformance, this was more than compensated in
the first half of 2007, as global interest rates increased
significantly. The portfolio also successfully anticipated a decline in the yield differential between the US and the euro
zone as the divergence in growth momentum and monetary
policy between the t w o blocs continued. Unfortunately our
active strategies did not generate enough outperformance
to compensate for fees.
Robeco All Strategy Euro Bonds The portfolio has been positioned t o profit f rom a rise in
interest rates in the euro zone during most of the reporting
period. While in the last half of 2006 this resulted in some
underperformance, this was more than compensated in the first half of 2007, as global interest rates increased
significantly. The portfolio has had less credit exposure than
the benchmark, which added some performance in the
second quarter of 2007. We preferred Tier 1 bonds issued
by banks and insurance companies over non-financial
companies. Unfortunately our active strategies did not
generate enough outperformance to compensate for fees.
Robeco High Yield Bonds The reporting period was very positive for the high-yield
bond market, driven by strong corporate earnings, a benign
macroeconomic environment and low default rates. Only
recently have worries about rising interest rates and the
US mortgage market led to an increase in volatility and
rising spreads. Apart from taking outspoken positions in
specific issuers, the fund employed a range of uncorrelated
strategies. We actively steered overall market exposure
with a bias towards a defensive positioning, we set up a number of long-short strategies in individual issuers using
credit-default swaps, and we invested off-benchmark in
sectors such as European asset-backed securities and project
financing in the Norwegian oil-service sector.
Robeco Euro Credit Bonds The portfolio's risk sensitiveness to the credit market was
actively managed during the reporting period. In the
second half of 2006 we chose a defensive stance towards
the market, followed by an overweight position during most
of 2007. Furthermore, we successfully applied relative-
value trades and implemented outspoken investment views
on specific issuers using credit-default swaps. We kept our
overweight position in subordinated financials. On balance,
the performance versus the benchmark was negative.
Robeco Capital Growth funds 13

Robeco Euro Credit Single A Bonds During the reporting period we scaled back our active credit
overweight as the compensation for credit risk decreased
significantly. Although the economy was performing solidly,
we saw credit risks increasing. Companies increased leverage
with funded share buybacks, mergers and acquisitions.
We added value by benefiting from the performance of
our overweight and preferred bonds issued by banks and
insurance companies over non-financial companies. The
environment of rising interest rates caused by a stronger
economic growth in the Euro-zone was an important
offsetting factor in the total return.
Robeco Euro Government Bonds
The portfolio has been positioned to profit f rom a rise
in interest rates during most of the reporting period.
While in the last half of 2006 this resulted in some
underperformance, this was compensated to some
extent in the first half of 2007, as interest rates in the
euro zone increased significantly. Furthermore, Robeco
Euro Government Bonds fund held several money-market
positions, anticipating rate hikes by the ECB. These money-
market positions contributed positively to the performance
of the fund.
Robeco Euro Bonds The inception date for this fund was 25 May 2007. The
portfolio has been positioned to profit f rom a rise in
interest rates in the euro zone since then. This resulted in an outperformance against the benchmark, as euro bond
yields increased significantly in June.
Robeco European Currencies High Yield Bonds
The reporting period was very positive for the high-yield
bond market, driven by strong corporate earnings, a
benign macroeconomic environment and low default rates
Only recently have worries about rising interest rates and
the US mortgage market led to an increase in volati l i tyand
rising spreads. Apart f rom taking outspoken positions in
specific issuers, the fund employed a range of uncorrelated
strategies. We actively steered overall market exposure
with a bias towards a defensive positioning, we set up a
number of long-short strategies in individual issuers using
credit-default swaps, and we invested off-benchmark in
sectors like European asset-backed securities and project
financing in the Norwegian oil-service sector.
Robeco Investment Grade ABS We have been overweight on risk sensitiveness to the
ABS market since the inception date (20 November
2006) as a result of our overweight in subordinated
paper (underweight AAA bonds) The resulting positive
carry difference has contributed positively to the relative
performance Recent concerns about the contagiousness
of the US mortgage-market crisis had a slightly negative
effect on our sector overweight in the UK non-conforming
mortgage market, but was mitigated by our underweight
in Spanish mortgages. Issue selection contributed
positively to the performance. On a net basis the overall
performance was slightly lower than the ABS benchmark.
Robeco Divirente VaRz
The inception date for this fund was 25 May 2007.
The sub-fund has pursued a well-diversified range of
active strategies to create performance in excess of
cash. The outperformance since inception came from
duration positions anticipating higher yields in the main
government-bond markets, the country-allocation position
anticipating a decline in the yield difference between the
euro zone and the US, and credit strategies.
Robeco Divirente VaR4
The sub-fund has pursued a well-diversified range of
active strategies to create performance in excess of cash.
Positive contributions in the reporting period came from
duration positions anticipating higher yields in the main
government-bond markets, the country-allocation position
anticipating a decline in the yield difference between
the euro zone and the US, the allocation to asset-backed
securities and subordinated financials, currency positions
and credit strategies in individual issuers. Yield-curve
strategies contributed negatively to the performance.
Luxembourg, 26 October 2007
The Board of Directors
14 Robeco Capital Growth Funds

Financial Statements
Statement of net assets In EUR x thousand Robeco Capital Robeco Robeco Robeco
Growth Funds Global Global Growth Global Value
investment portfolio at market value Deposits and other cash Unrealized gains on forward exchange transadions Unrealized gains on financial futures Unrealized gains on equity swaps Unrealized gains on interest.rate swaps Unrealized gains on credit-default swaps Options purchased at market value Other assets Total assets ..............................
Bank loans/overdrafts Unrealized losses on forward exchange transactions Unrealized losses on financial futures Unrealized losses on equity swaps Unrealized losses on interest-rate swaps Unrealized losses on credit-default swaps Unrealized losses on forward purchases of mortgaged-backed securities Options sold at market value Other liabilities Total liabilities Total net assets
.................................
.................................
Net asset value per B EUR share Net asset value per D EUR share Net asset value per OH EUR share Net asset value per I EUR share Net asset value per M EUR share Net asset value per PH PLN share
30/06/2007
Consolidated
30/06/2006
7,631,650 161,426
13,027 3,168
467
274 2,769
97,619 7,910,400
41,539 589
99
310
791 603
33,936 77,867
7,a32,s33
Equities
30/06/2006
81,001 761
59 -
468 82,289
256 308
81,981
Equities
30/06/2007 30/06/2006
5,979 125
-
-
-
- - -
107 6,211
- - -
-
- -
-
-
161 161
6,050
- 128.86 -
- - -
30/06/2007
Equities
57.110
121.57 126.51
106.16
-
- -
The accompanying notes set out on page 34 to 60 inclusive form an integral pan of the financial statements set out on pages 15 to 33 inclusive
Robeco Capital Growth Funds 15

Investment portfolio a t market value Deposits and other cash Unrealized gains on forward exchange transadions Unrealized gains on financial futures Unrealized gains on equityswaps Unrealized gains on interest-rate swaps Unrealized gains on credit-default swaps Options purchased at market value Other assets Total assets .......................................
Bank loans / overdrafts Unrealized losses on forward exchange transadions Unrealized losses on financial futures Unrealized losses on equity swaps Unrealized losses on interest-rate swaps Unrealized losses on credit-default swaps Unrealized losses on forward purchases of mortgaged-backed securities Options sold at market value Other liabilities Total liabilities Total net assets
.......................................
.......................................
Net asset value per D EUR share Net asset value per D USD share Net asset value per DH EUR share Net asset value per I EUR share Net asset value per I US0 share Net asset value per M EUR share Net asset value per M USD share
1 The refermce currency 8s the US dollar
; 0 share
I share
M snare.
16 Robeco Capital Growth Funds
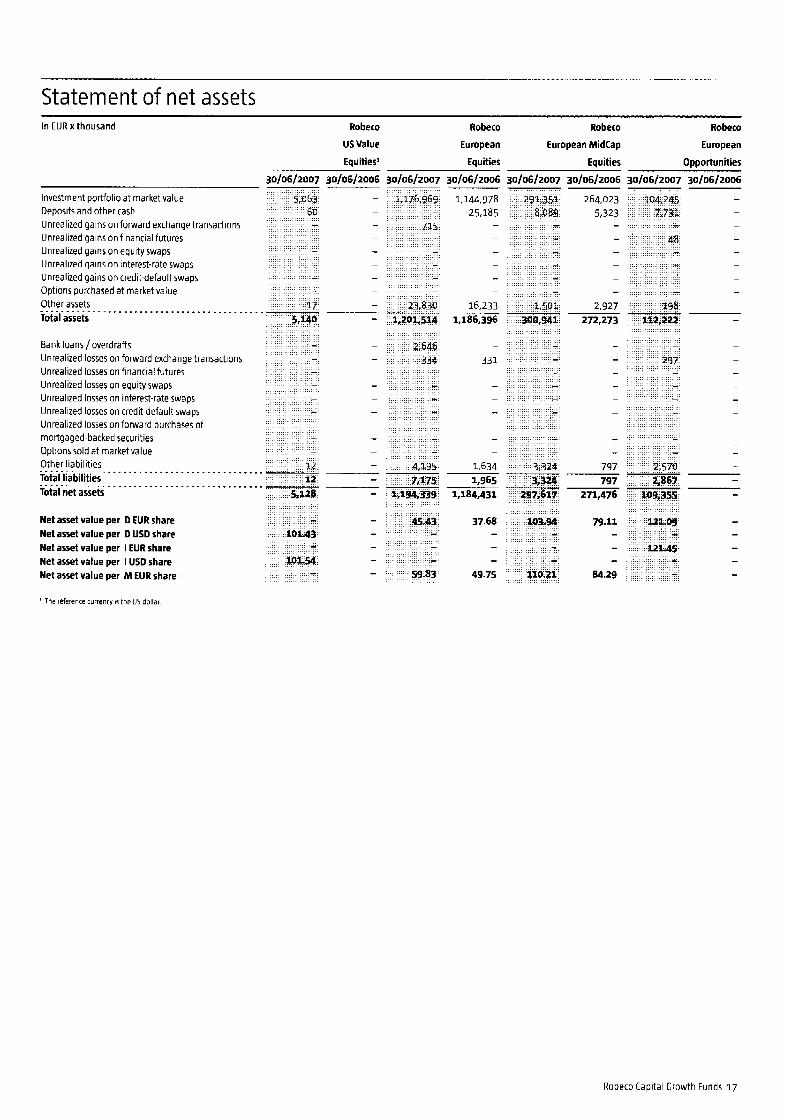
Statement of net assets In EUR x thousand Robeco Robeco Robeco Robeco
US Value European European MidCap European
Equities' Equities Equities Opportunities
30/06/2006 30/06/2007 30/06/2006 30/06/2007 30/06/2006 30/06/2006 30/06/2007
264,023 5,323
-
Investment portfolio at market value Deposits and other cash Unrealized gains on forward exchange transactions Unrealized gains on financial futures Unrealized gains on equity swaps Unrealized gains on interest-rate swaps Unrealized gains on credit-default swaps Options purchased at market value Other assets Total assets - - - . - -~------ ._. . . . ._._._._. ._. 2.927
272,273
Bank loans/ overdrafts Unrealized losses on forward exchange transactions Unrealized losses on financial futures Unrealized losses on equity swaps Unrealized losses on interest-rate swaps Unrealized losses on credit-default swaps Unrealized losses on forward purchases of mortgaged-backed securities Options sold at market value Other liabilities Total liabilities Total net assets
. . . - . . . . . . . . . .
- 797 797
1.634 1.965 .- -
1,184,431 271,476
Net asset value per D EUR share Net asset value per D USD share Net asset value per I EUR share Net asset value per I USD share Net asset value per M EUR share
37.68 - - -
49.75
' The reference currency IS the US dollar
Robeco Capital Growth funds 17

Statement of net assets In EUR x thousand Robeco
Chinese
Eauities
Unrealized losses on equity swaps Unrealized losses on interest-rate swaps Unrealized losses on credit-default swaps Unrealized losses on forward purchases of mortgaged-backed securities Options sold at market value Other liabilities Total liabilities Total net assets
.................................
.................................
Net asset value per D EUR share Net asset value per D USD share Net asset value per I EUR share Net asset value per M EUR share Net asset value per P PLN share
- . . 801,258 36,121
1,555
I
-
12,812 851.746
1,555 117 -
4,608 6,280
845,466
76.03 -
140.20 74.19
-
Robeco MultiManager Robecn Robeco
Asia-Pacific Emerging Markets Emerging Stars
Equities Equities Equities
30/06/z007 30/06/2006 30/06/2007 30/06/2006 30/06/2007 30/06/2006 30/06/2007 30/06/2006
investment portfolio a t market value Deposits and other cash Unrealized gains on forward exchange transadions Unrealized gains on financial futures Unrealized gains on equity swaps Unrealized gains on interest-rate swaps Unrealized gains on credit-default swaps Options purchased at market value Other assets Total assets
Bank loans / overdrafts Unrealized losses on forward exchange transactions Unrealized losses on financial futures
........................................
1,688,008 - - -
3,159 -
- - - -
- -
- -
- -
13,237 1,704,404
36,426 -
-
-
-
-
-
-
5,280 41,706
1,662,698
96.63
164.02 75.00
-
-
12 7,s 9 8 899 206 114
- - - -
1,201 130,318
-
-
-
-
- -
-
-
228 228
130,090
26.96 - - - -
18 Robeco Capital Growth Funds

~ ~
Statement of net assets In EUR x thousand Robeco Robeco Robeco Robeco
Equities Equities Equities Equities
Financial5 Food b Agri Health Care IT
30/06/2007 30/06/2006 30/06/2007 30/06/2006 30/06/2007 30/06/2006 30/06/2007 30/06/2006
Investment portfolio at market value 129,373 47,654 144,968 85,342 Deposits and other rash 203 707 2,087 1,126 Unrealized gains on forward exchange transactions 2 52 Unrealized gains on financial futures Unrealized gains on equity swaps 467 - Unrealized gains on interest-rate swaps - - -
Unrealized gains on credit-default swaps Options purchased at market value 2,769 Other assets 723 167 317 353
86,873 150,610
Bank loans /overdrafts - - - -
Unrealized losses on financial futures - - - - Unrealized losses on equity swaps - - - - Unrealized losses on interest-rate swaps - - - Unrealized losses on credit-default swaps - - - unrealized losses on forward purchases of mortgaged-backed securities - - - -
Options sold at market value - - - - Other liabilities 210 84 1,090 1,419 Total liabilities 260 129 1,090 1,419
- -
- - - -
- - -
- - - -
- - - , ........................................... Total assets 130,299 48,528
Unrealized losses on forward exchange transactions 50 45 - -
-
-
...........................................
........................................... Total net assets 130,039 48,399 149,520 85,454
Net asset value per 0 EUR share 55.02 49.38 49.70 31.44 Net asset value per M EUR share 110.84 106.01 88.02 34.80
In EUR x thousand Robeco Robeco Robeco Robeeo
Telecom Services Consumer Goods Industrials Energy
Equities
30/06/2007 30/06/2006 ~0/06/2007 30/06/2006 30/06/2007 30/06/2006 30/06/2007 30/06/2006
Investment portfolio at market value 48,513 19,475 13,190 152,679 Deposits and other cash 526 157 - - Unrealized gains on forward exchange transadions 44 Unrealized gains on financial futures - - - -
Unrealized gains on equityswaps - - - - Unrealized gains on interest-rate swaps - - - -
Unrealized gains on credit-default swaps - - - -
Options purchased at market value - - - - Other assets 448 39 133 1,542
Equities Equities Equities
- - -
.......................................... Total assets 49,487 19,671 13,323 154,265
Bank loans / overdrafts 10 1
Unrealized losses on forward exchange transadions 1 45 -
- -
-
Unrealized losses on financial futures - - - -
Unrealized losses on equtyswaps - - - - Unrealized losses on interest-rate swaps - - - - Unrealized losses on credit-default swaps - - - -
Unrealized losses on forward purchases of mortgaged-backed securities - - - - Options sold at market value I - - - Other liabilities 96 70 34 250 Total liabilities 97 70 89 251
154,014 Total net assets 49,390 19,601 13,234
..........................................
..........................................
Net asset value per D EUR share 33.31 51.68 46.42 93.48 Net asset value per M EUR share 47.24 - - -
Robeco Capital Growth Funds 19
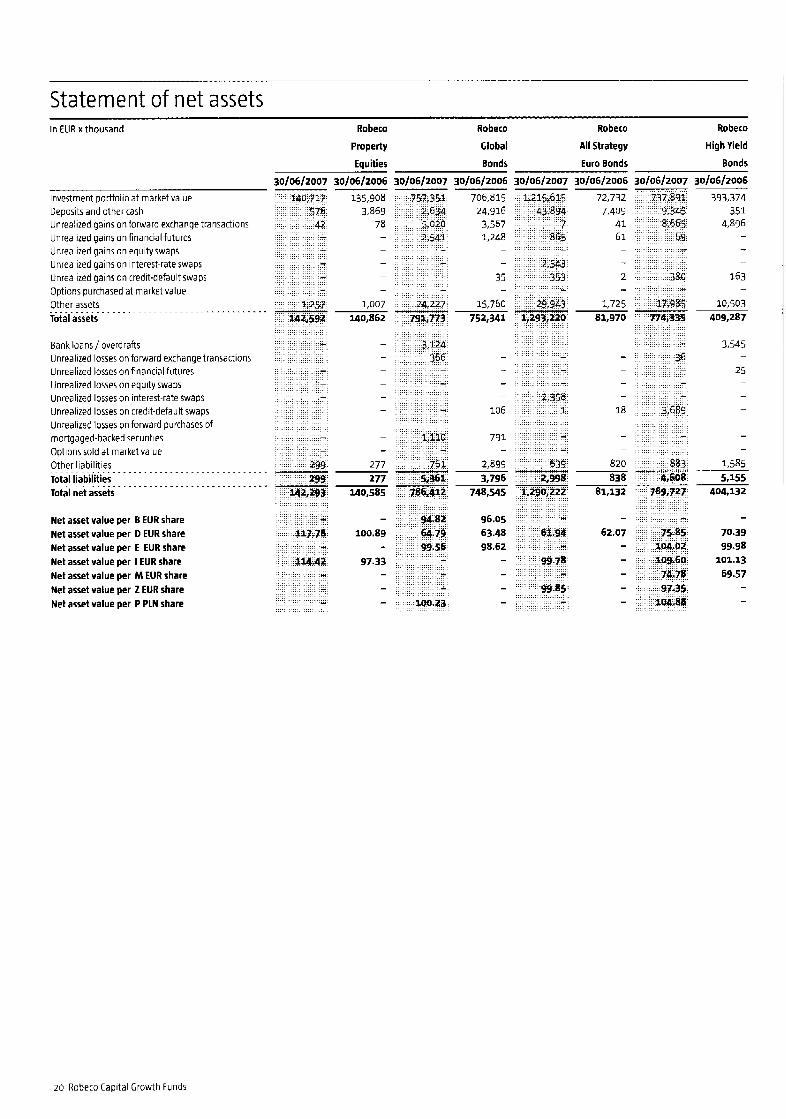
Statement of ne t assets In EUR x thousand
Investment portfolio at market value Deposits and other cash Unrealized gains on forward exchange transadions Unrealized gains on financial futures Unrealized gains on equity swaps Unrealized gains on interest-rate swaps Unrealized gains on credit.default swaps Options purchased at market value Other assets Total assets ................................
Bank loans / overdrafts Unrealized losses on forward exchange transactions Unrealized losses on financial futures Unrealized losses on equityswaps Unrealized losses on interest-rate swaps Unrealized losses on credit-default swaps Unrealized losses on forward purchases of mortgaged-backed securities Options sold at market value Other liabilities Total liabilities Total net assets
...............................
...............................
Net asset value per B EUR share Net asset value per D EUR share Net asset value per E EUR share Net asset value per I EUR share Net asset value per M EUR share Net asset value per 2 EUR share Net asset value per P PLN share
Robeco Robeco Robeco Robeco
Property Global Al l Strategy High Yield
Eouities Bonds Euro Bonds
30/06/2007
........
........
135,908 3.869
78 -
-
-
-
1,007 140,862
-
- 277 277
140,585
- 100.89
97.33
I
- - -
30/06/2007 30/06/2006
706.815 24,916 3,567 1,248
-
35
15,760 752,341
-
106
791
2,899 3,796
748,545
-
96.05 63.48 98.62
-
30/06/2007 30/06/2006
72,732 7,409
41 6 1
30/06/2007
Bonds
30/06/Z006
393,374 351
4,896 - - -
163
10,503 409.287
3,545
25
-
-
-
-
-
- -
1,585 5,155
404,132
- 70.39 99.98
101.13 69.57
- -
20 Robeco Capital Growth Funds

Statement of net assets In EUR x thousand Robeco Robeco Robeco Robeco
Euro Credit Euro Credit Single A Euro Government Euro
Bonds Bonds Bonds
30/06/2006 30/06/2007 30/06/2006 30/06/2006 30/06/2007
Investment portfolio at market value Deposits and other rash Unrealized gains on forward exchange transactions Unrealized gains on financial futures Unrealized gains on equity swaps Unrealized gains on interest-rate swaps Unrealized gains on credit-default swaps Options purchased at market value Other assets Total assets ...........................................
118,428 5,863
-
-
17
72
-
-
99,477 3,522
- - -
-
-
- 2,083
105,082
-
- 22 -
- -
-
-
102 124
104,958
- 99.50
100.42
-
- - -
. . . . . . . - . . . . . . . . . . . . - . . .
3,759 925 128,139 &I37
Bank loans/ overdrafts Unrealized losses on forward exchange transactions Unrealized losses on financial futures Unrealized losses on equity swaps Unrealized losses on interest-rate swaps Unrealized losses on credit-default swaps Unrealized losses on forward purchases of mortgaged-backed securities Options sold at market value Other liabilities Total liabilities Total net assets
.......................................
.......................................
-
-
- -
-
186
- -
1,267 1,453
126,686
Net asset value per 8 EUR share Net asset value per 0 EUR share Net asset value per E EUR share Net asset value per I EUR share Net asset value per M EUR share Net asset value per Z EUR share Net asset value per P PLN share
- 99.23
- 100.13
- - -
Robeco Capital Growth Funds 2 1

Statement of net assets Robeco Robeco Robeco Robeco
European Currencies Investment Divirente Divirente In EUR x thousand
Grade ABS VaR2 VaR4
30/06/2006
High Yield Bonds
30/06/2007 30/06/2006
Investment portfolio at market value 30,255 Deposits and other cash 1,583
7 Unrealized gains on financial futures - Unrealized gains on forward exchange transartions
30/06/2007 30/06/2006 30/06/2007 30/06/2007
Unrealized gains on equityswaps Unrealized gains on interest-rate swaps Unrealized gains on credit-default swaps Ootions ourchased at market value Other assets Total assets ................................... 795 576 ........
36,759 32,423
Bank loans / overdrafts Unrealized losses on forward exchange transactions Unrealized losses on financial futures Unrealized losses on equity swaps Unrealized losses on interest-rate swaps Unrealized losses on credit.default swaps Unrealized losses on forward purchases of mortgaged-backed securities Options sold at market value Other liabilities Total liabilities Total net assets
.......................................
....................................... .... ....
Net asset value per 0 EUR share Net asset value per E EUR share Net asset value per I EUR share Net asset value per 2 EUR share
101.72 -
102.15 -
22 Robero Capital Growth Funds

Statement of operations and changes in net assets Robeco Robeco
Global Global Growth
Eauities Eauities
Robeco
Global Value
Eguities
In EUR x thousand Robeco Capital
Growth Funds
Consolidated
2006/2007 2005/2006 2006/2007 2005/2006 2 0 0 6 12 0 0 7 2005/2006 2006/2007 2005/2006
88,970 5,815 44,688 Net assets at opening date
Exchange adjustments
Bond interest and dividend income
Bank and other interest
Other income
Total income .......................................
1,281
18
130
1,006
3 93
97 4 6
1,429 107 1,102
Management fee
Service fee
Performance fee
Custodian fee
Bank interest
Taxes
Other fees and expenses
Total expenses
Total net income on investments
Net realized and unrealized results on
investments and other financial instruments
Net increase / decrease (-) from operations
.......................................
.......................................
.......................................
633
62 -
23
22
23 -
1,127 108
- 41
5
44 -
113 11 -
11
1,325 140 763
104
9,603
-33
332
339
4.997
9,707 299 5,336
Distributed dividends -1,734
Proceeds from subscriptions
Payments for redemptions
Evolution of the capital
Net assets at closing date
.......................................
.......................................
15,566
-32,262
6,706
-6,770
22,138
-13,318 -16,696 8,820
81,981 6,050 57.110
Robeco Capital Growth Funds 23

Statement of operations and changes in net assets In EUR x thousand Robeco Robeco Robeco Robeco
North American US Premium US Premium US MidCap
Eauities (EUR) Eauities' Eguities' Equities
2 0 0 5 / 2 0 0 6 2005/2006 2006/2007 2 0 0 5 12 0 0 6 2005/2006 2 0 0 6 12 0 0 7 2006/2007 2006/2007
624.450 I
191
23
7
-
1,429
210
90
Net assets at opening date
Bond interest and dividend income
Bank and other interest
Other income
Total income .................................
9,435
98
1.952
11,485
9,160
880 -
88 113
371 -
221
106
11 - 29 -
3 -
Management fee
Service fee
Performance fee
Custodian fee
Bank interest
Taxes
Other fees and expenses
Total expenses
Total net income on investments
Net realized and unrealized results on
investments and other financial instruments
Net increase / decrease (-) from operations
........................................
........................................
........................................
10,612 149 1,186
873
10.764
72
-506
543
2,876 .. 11,637 4 3 4
-
33,262
-331
3,419
Distributed dividends
289,882
-187,845
Proceeds from subscriptions
Pavrnents for redemotions
206,748
-21,192
185.556 ..................... Evolution of the capital
Net assets at closing date .....................
.....................
..................... 10 2,O 3 7 32,931
32,497 188,975 738,124
1 The !eferente currcnry i j the US doliar
24 Robeco Capital Growth Funds

Statement of operations and changes in net assets In EUR x thousand Robeco
US Value
Eauities'
Robeco Robeco Robeco
European European Midcap European
Equities Opportunities Equities
2005/2006 2006/2007 2005/2006 2006/2007
c
2006/2007 2005/2006 2006/2007
292.961
2005/2006
- . .
4,743 126
690
Net assets at opening date 1,087,235
Bond interest and dividend income
Bank and other interest
Other income
Total income ............................
23,588
32
5.072 .. 28,692
14,956
1,398 -
198
496
599
2
5,559
4,489
359 -
71 4
146 -
Management fee
Service fee
Performance fee
Custodian fee Bank interest
Taxes
Other fees and expenses
Total expenses
Total net income on investments
Net realized and unrealized results on
investments and other financial instruments
Net increase / decrease (-1 from operations
........................................
........................................
........................................
17,649 5.069
11,043 490
66,399 169,570
180,613 ..
.....................
.....................
66,889
Distributed dividends
Proceeds from subscriptions
Payments for redemotions 132,952
-216.369
72,660
-161,034
-88.374 ..................... Evolution of the capital
Net assets at closing date ..................... -83.417
1,184,431 271.476
' Tne reference currency 15 the US dollar
Robeco Capital Growth Funds 25
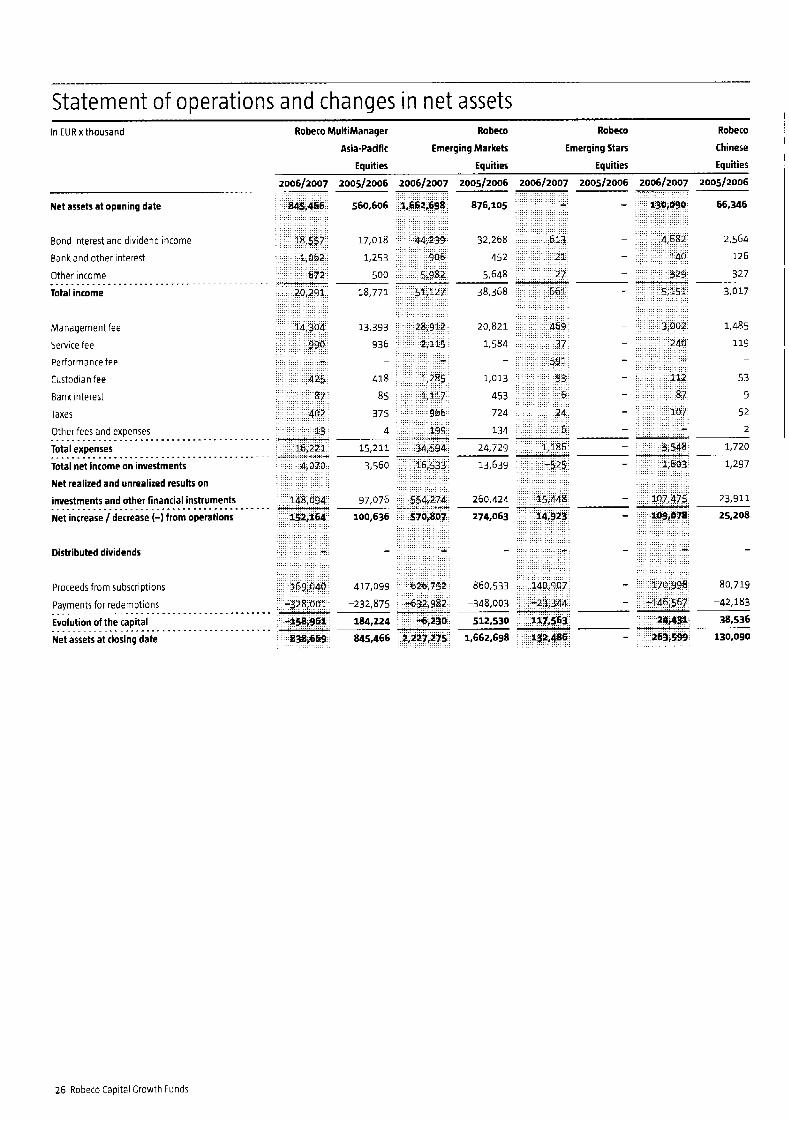
Statement of operations and changes in net assets In EUR x thousand Robeco MultiManager Robeco Robeco Robeco
Asia-Pacific Emerging Markets Emerging Stars Chinese
Equities Equities Equities Equities
2006/2007 2005/2006 2006/2007 2005/2006 2006/2007 2005/2006 2006/2007 2005/2006
560,606 876,105 - 66,346
Bond interest and dividend income 17,018 32,268 2,564 - 126 Bank and other interest 1,253 452
Other income 500 5,648 327 38,368 - 3,017 Total income 18,771
20,821 - 1,485
Service fee 936 1,584 119
Performance fee
Custodian fee 418 1,013 53
Bank interest 85 453 9
Taxes 375 724 52
Other fees and expenses 4 134 2
13,639 - 1,297
Net assets at opening date
-
- ..........................................
Management fee 13,393 -
- - - -
- - - -
.......................................... - Total expenses 15,211 24,729 1,720
Total net income on investments
Net realized and unrealized results on investments and other financial instruments 97,076 260,424
Net increase / decrease (-) from operations
.......................................... 3,560
- 23,911 ..........................................
100,636 274.063 - 25,208
Distributed dividends - - - -
860,533 - 80,719 Proceeds from subscriptions 417,099 - -42,183 Payments for redemptions -232,875 -348,003
Evolution of the capital 184,224 512,530 38,536
1,662,698 - 130,090
.......................................... .....................
845,466
26 Robeco Caoital Growth Funds

Statement of operations and changes in net assets In EUR x thousand Robeco Robeco Robeco Robeco
Financials Food G Agri Health Care IT
Equities Equities Equities Equities
2005/2006 2005/2006 2006/2007 2006/2007 2005/2006
37,672
2006/2007 2005/2006
204,266
2006/2007
Net assets at opening date 91,746
2,438
13
344
102,763
Bond interest and dividend income
Bank and other interes:
Other income
Total income .........................................
633 a
93
528
23
149
700
1,233
33
459
1,725 2,795
1,595
128 -
35
26
56 -
734
1,625
130 -
63
96
52
3
Management fee
Service fee
Performance fee
Custodian fee
Bank interest
Taxes
Other fees and expenses
Total expenses
Total net income on investments
Net realized and unrealized results on
investments and other financial instruments
Net increase / decrease (-1 from operations
.........................................
.........................................
.........................................
2,814
225 -
60
20
9 1 68
1,840 1,969 3,278
-1.553
744
955 -44
3,968
-1,235
3.730 10,089 13,085
14.040 3,924 8,536 2,495
Distributed dividends
Proceeds from subscriptions
Payments for redemptions
Evolution of the capital
Net assets at closing date
.........................................
.........................................
58,033
-33,780
25,280
-45,084
23,523 -16,720
6.803
21,345
-84,627
-63,282
149,520
24,253 -19,804
130,039 48,399 85,454
Robeco Capital Growth Funds 27

Statement of operations and changes in net assets In EUR x thousand Robeco Robeco
Telecom Services Consumer Goods
Eauities Eauities
Robeco
Energy
Equities
2005/2006
Robeco
Industrials
Equities
2005/2006 2006/2007 2005/2006 2006/2007 2005/2006 2 0 0 6 12 0 0 7 2006/2007
Net assets at opening date 56,585
1,248
4
169
8.374
133
5
38
23,313
188
4
11
62,760
1,547
19 177
Bond interest and dividend income
Bank and other interest
Other income
Total income ...........................
1,421
816
65 -
18
16
26
1
176
186
15 -
12
6
7
203
217
17 -
24
6
6 -
1,743
1,622
130 -
38 29
58 -
Management fee
Service fee
Performance fee
Custodian fee
Bank interest
Taxes
Other fees and expenses
Total expenses
Total net income on investments
Net realized and unrealized results on
investments and other financial instruments
Net increase /decrease (-1 from operations
....................................
....................................
....................................
1
942 227 270 1,877 479
3.254
-5 1
1,043
-67
2,450
-134
9,995
3,733 992
-
14,448
-4,213
2,383 9,861
Distributed dividends
Proceeds from subscriptions
Payments for redemptions
Evolution of the capital
Net assets at closing date
....................................
....................................
14.697
-25,625
6,323
-18,785
115,885
-34,492
-10,928 81,393
154,014
-12,462
4,234
10,235
19,601 49,390
28 Robeco Capital Growth Funds

Statement of operations and changes in net assets In EUR x thousand Robeco Robeco Robeco Robeco
Property Global All Strategy High Yield
Equities Bonds Euro Bonds Bonds 2006/2007 2005/2006 2006/2007 2005/2006 2006/2007 2005/2006 2006/2007 2005/2006
Net assets at opening date 107,852 285.368 90.386 332,654
3,759 23,060 3,418 30,051
Bank and other interest 4 1 633 56 240
Other income 338 -85 -20 689
Total income 4,138 23,608 3,454 30,980
Bond interest and dividend income
..........................................
Management fee 1,869 4,324 778 3,653 Service fee 148 462 62 292 Performance fee - - - -
57 113 20 52 Custodian fee
32 34 1 187 Bank interest
Taxes 64 302 39 164 - - Other fees and expenses 3 1 ..........................................
.......................................... Total expenses 2,170 5,238 900 4,349
Total net income on investments 1,968 18,370 2,554 26,631 Net realized and unrealized results on
13,020 -26,996 -4,106 -15,848 investments and other financial instruments
Net increase / decrease (-) from operations 14,988 -8,626 -1,552 10,783 ..........................................
-15,174 - - -
77,881 534,559 27,426 293,871
....... -60,136 -47,582 -35,128 -233,176
....... 17,745 486,977 -7,702 60,695
140,585 748,545 81,132 404,132
Distributed dividends
Proceeds from subscriptions
Payments for redemptions
Evolution of the capital
Net assets at closing date
.................................
.................................
Robeco Capital Growth Funds 29

Statement of operations and changes in net assets In EUR x thousand Robeco Robeco Robeco
Euro Credits Euro Credit Euro Government
Bonds Sinqle A Bonds Bonds
Robeco
Euro
Bonds
2 0 0 6 / 2 0 0 7 2005/2006 2005/2006 2006/2007 2005/2006 2006/2007 2005/2006 2006/2007
Net assets at opening date 198,770 359,455
6,725
167
-173
15,717
251
10
Bond interest and dividend income
Bank and other interest
Other income
Total income ...........................
5,125
97
5 ... ... 6,719
564
63 -
3 1 -
14 -
5,227
417
47 -
24 -
31 -
15,978
1,194
156 -
64 -
4 1 -
Management fee
Service fee
Performance fee
Custodian fee
Bank interest
Taxes
Other fees and expenses
Total expenses
Total net income on investments
Net realized and unrealized results on
investments and other financial instruments
Net increase / decrease (-) from operations
.......................................
.......................................
.......................................
672 1.455 499
4.728 14,523 6.047
-9,477 -7,442 -21,294
-6.771 -3.430 -2,714
I
Distributed dividends
81,317
-47,083 Proceeds from subscriptions
Payments for redemptions
Evolution of the capital
Net assets at closing date
......................
......................
3,804
-94.902
4,890
-233,431
-228,541
126,686
....................
.................... -91,098 34,234
104,958 386,918
30 Robeco Capital Growth Funds

Statement of operations and changes in net assets In EUR x thousand Robeco Robeco Robeco Robeco
European Currencies
High Yield Bonds
Investment Divirente
Grade ABS VaR2
2005/2006 2006/2007 2005/2006 2006/2007
Divirente
VaR4
2005/2006 2006/2007 2006/2007 2005/2006
- -~
......
Net assets at opening date
Bond interest and dlvidend income
Bank and other interest
Other income
Total income ...............................
1,558
42
-14
Management fee
Service fee
Performance fee
Custodian fee Bank interest
Taxes
Other fees and expenses
Total expenses
Total net income on investments
Net realized and unrealized results on
investments and other financial instruments
...................................
................................... 135 1,451
-785 ......................................... Net increase / decrease (-) from operations 666
Distributed dividends
Proceeds from subscriptions
Payments for redemptions
Evolution of the capital
Net assets at closing date
.........................................
.........................................
31,571
-27
31,544 32,210
Robeco Capital Growth Funds 31

Number of shares outstanding Movements over the period 1 July 2006 through 30 June 2007
Share Shares at Shares Shares Shares at
class opening date subscribed redeemed closing date
Robeco Global Equities
............................ Robeco Global Growth Equities Robeco Global Value Equities ............................
.......................... Robeco North American Equities
............................ Robeco US Premium Equities (EUR)
............................ Robeco US Premium Equities
............................ Robeco US MidCap Equities
D EUR 1,835,807 114,184 -418,723 1,531,268 M EUR 2,622 20 -821 1,821
DH EUR 0 23,934 -521 23,413 ......................................................................... D EUR 46,952 2,654 -7,810 41,796 B EUR 334,070 451,563 -424.376 361,257
.........................................................................
D EUR 4,541 94,347 -56.779 42,109 I EUR 150,000 - 150,000
M EUR 0 2,938 -500 2,438 PH PLN 0 148,421 -11,527 136,894
D EUR 17,720,154 5,315,834 -8,381,627 14,654,361 I EUR 25,000 - - 25,000
M EUR 1,104 1,104 D USD 0 561 561
D 46,781 1,848,753 -691,195 1,204,339 I 272,753 183,880 -72,754 383,879 M 0 545 545
I US0 923,391 m a 1 2 -250,25 7 1,25 1,946 M US0 0 500 500 D USD 0 1.364 -500 864
DH EUR 0 3,109 -716 2,393 I USD 0 100.000 - 100.000
-
............................................................................
- I
- ............................................................................
- ............................................................................
0 USD 907,585 819,528 -468,111 1,259,002
- ............................................................................
.......................................................................................................... - Robeco USValue Equities D US0 0 500 500
I USD 0 50,000 - 50,000
Robeco European Equities D EUR 31,427,625 4,251,569 -9,393,263 26,285,931 M EUR 2,724 - -241 2,483
..........................................................................................................
.......................................................................................................... Robeco European MidCap Equities D EUR 3,410,669 876,660 -1,436,345 2,850,984
M EUR 19,744 6,874 -15,041 11,577 .......................................................................................................... Robeco European Opportunities D EUR 0 731,501 -57,647 673,854
I EUR 0 230,285 -1,719 228,566 Robeco MultiManager Asia-Pacific Equities D EUR 9,953,409 2,010,034 -2,835,406 9,128,037
M EUR 7,216 385 -3,706 3,895 Robeco Emerging Markets Equities D EUR 16,469,244 5,404,003 -5,476,652 16,396,595
428,444 M EUR 16,594 21,573 -16,790 21.377 P PLN 0 282,903 -41,774 241,129
D USD 0 937 -500 437
Robeco Chinese Equities D EUR 4,824,731 5,035,620 -4,171,741 5,688,610 Robeco Finanrials Equities D EUR 2,359,416 960,628 -1,699,924 1,620,120
M EUR 1,985 217 -816 1,386
M EUR 1,465 146 -946 665 Robeco Health Care Equities D EUR 3,007,175 1,649,886 -1,725,677 2,931,384
M EUR 613 6 -183 436 Robeco IT Equities D EUR 2,716,800 2,708,444 -3,179,132 2,246,112
M EUR 1,206 266 -321 1,151
..........................................................................................................
I EUR 628,633 - -587,738 40,895
..........................................................................................................
427,159 105,377 -1OL,092 I EUR
.......................................................................................................... Robeco Emerging Stars Equities 0 EUR 0 1,179,128 -196,941 982,187 .......................................................................................................... ..........................................................................................................
.......................................................................................................... Robeco Food B Agri Equities D EUR 976,912 694,634 -645,692 1,025,854
..........................................................................................................
..........................................................................................................
.......................................................................................................... Robeco Telecom Services Equities D EUR 1,457,499 1,515,073 -1,566,841 1,405,731
M EUR 17,785 32,196 -15,227 34,754 Robeco Consumer Goods Equities D EUR 379,276 277,041 -293,128 363,189 Robeco Industrials Equities D EUR 285,081 656,901 -126,941 815,041 Robeco Energy Equities D EUR 1,647,495 786,054 -1,320,759 1,112,730
I EUR 500 464,406 -117,720 347,186
..........................................................................................................
..........................................................................................................
..........................................................................................................
.......................................................................................................... Robeco Property Equities D EUR 1,392,996 696,097 -1,218,239 870,854
..........................................................................................................
32 Robeco Capital Growth Funds

~
Number of shares outstanding Movements over the period 1 July 2006 through 30 June 2007
Share
class
Robeco Global Bonds B EUR
0 EUR
E EUR
P PLN
D EUR
I EUR
Z EUR
D EUR
E EUR
I EUR
M EUR
P PLN
2 EUR
D EUR
................................................. Robeco All Strategy Euro Bonds
................................................. Robeco High Yield Bonds
................................................. Robeco Euro Credit Bonds
.................................. Robeco Euro Credit Single A Bonds
..................................... Robeco Euro Government Bonds
................................. Robeco Euro Bonds
..................................... Robeco European Currencies High Yield Bonds
..................................... Robeco Investment Grade ABS
.................................. Robeco Divirente VaR2
..................................... Robeco Divirente VaRq
I EUR
D EUR
I EUR
0 EUR
I EUR
2 EUR
D EUR
E EUR
I EUR
Z EUR
D EUR
I EUR
...........
...........
...........
...........
Shares at Shares Shares Shares at
opening date subscribed redeemed closing date
6,705,165 2,294,647 -1,637,735 7,362,077
1,413,710 379,185 -588,696 1,204,199
149.432 67,030 -113,888 102,574
0 8.924 -4,154 4,770
1,307,011 167,742 -657,878 816,875 ........................................................
0 12,402,074 -6,015,438 6,386,636
0 6,032,822 - 6,032,822
3,665,438 1,881,639 -2,136,389 3,410,688
3,735 23,188 -1,024 25,899
1,436,374 3,340,102 -2,374,213 2,402,263
7.195 10,428 -2.857 14,766
0 95,505 -59,459 36,046
........................................................
0 2,762,075 -266,379 2,495,696 ........................................................ 35,604
1,229,885
531
1,044,693
32,888
3,783,468 0
0
0
0
0
501
314,817
...............
...............
...............
...............
71,300
1,841,662
496
469,793
156,980 6,988,860
..........
..........
1,137,376 .......... 500
500
9,081,745
8,578,699
341
15,119
..........
-104.886
-1,230,377
-532 ..............
-1,082,279
-173,390 -5,166,809
..............
Z EUR 0 338,181
D EUR 0 500 ...........................................
-7,881,453
-100,321 ............ -
-300,000
I EUR
D EUR
0 3,049,183 ................ 0 500
E EUR 0 500
I EUR 0 6,604,929
Z EUR 0 6,935,393
D EUR 0 48,968
E EUR 0 93,594
.......................................
2,018
1,841,170
49s
432,207
...........
........... 16,478
1,137,376
5,605.519
........... 500
500
1,200,292
8,478.378
842
29,936
...........
- 338.181 ......................... - 500
-1,663,497 1,385,686
500
500
......................... -
- -6,604,430 499
-179,395 6,755,998
-1,174 47,794
-20,988 72,606
.........................
I EUR 0 3,131,637 -148,001 2,983,636 ..........................................................................................................
Robeco Capital Growth Funds 33
Notes
General Robeco Capital Growth Funds, SICAV (the 'Company'),
incorporated to exist for an indefinite period, was created
on 2 May 1997. Its Articles of Incorporation were published
in the 'Memorial, Recueil des Societes et Associations'
of the Grand Duchy of Luxembourg (the 'Memorial')
on 6 June 1997. The Articles of Incorporation were last
amended on 10 January 2007 and such amendments are
published on 28 February 2007 in the Memorial.
Robeco Capital Growth Funds is a 'Societe d'lnvestissement
a Capital Variable' pursuant to the law of 10 August 191s on commercial companies and to part I of the law of 20
December 2002 on undertakings for collective investment
of the Grand Duchy of Luxembourg.
The Company takes the form of an umbrella fund. It
is made up of several sub-funds each representing
a securities portfolio and other assets and liabilities
corresponding to a different investment policy. The Board
of Directors has authority to issue different categories of
shares within each of the sub-funds. The Directors of the
Company may at any t ime establish new sub-funds and/
or may decide upon the issue of Class D, DH, DL, I, IH, IHI,
It, M, P, PH and Z shares (capital growth) and Class B, E, EH, IE and PE shares (distribution) in existing or new sub-
funds. The reference currency of all sub-funds is the euro
except for Robeco US MidCap Equities, Robeco US Premium
Equities and Robeco US Value Equities, which have the US
dollar as reference currency.
Legal entity The Company as a whole constitutes a single legal entity but the assets of any one sub-fund will only be available to satisfy
the rights of investors in relation to that sub-fund and the
rights o f creditors whose claims have arisen in connection
with the creation, operation or liquidation of the sub-fund.
For the purpose of the relations between shareholders, each
sub-fund is deemed to be a separate entity.
Share capital
The capital of the Company wil l automatically be adjusted
in case additional shares are issued or outstanding shares
are redeemed without special announcements or measure
of publicity being necessary in relation thereto.
Classes of shares
Class D shares are available t o all investors. Class B, DH,
E, EH, M, P, PE and PH shares wil l be available in certain
countries, subject to the relevant regulatory approval,
through specific distributors, selected by the Board
of Directors. Class DL and It shares are only available
for investors in Peru and Chile, selected by the Board
of Directors. Class Z shares wil l only be available for
Robeco affiliates, selected by the Board of Directors. The
possession, redemption and transfer of Class I, IE, IH , IHI and It shares is l imited to institutional investors as
defined from t ime to t ime by the Luxembourg supervisory
authority. The Company wil l not issue Class I, IE, IH, IHI
and It shares or contribute to the transfer of Class I, IE, IH, IHI and It shares to non-institutional investors. If i t
appears that Class I, IE, IH, IHI or It shares are being held
by non-institutional investors the Company wil l redeem
these shares. Class I, IE, IH, IHI and It shares have a
m in imum subscription amount of (the equivalent of)
EUR 1,000,000. The Board of Directors can waive this
min imum subscription amount at its discretion. Additional
subscriptions must be for a m in imum of ( the equivalent
of) EUR 10,000. Class I, IE, IH, IHI and It shares can only
be placed through a direct account of the shareholders
wi th the Registrar and Transfer Agent.
For the account of Class DH, IH, EH, PH shares (collectively
or individually referred to as 'Hedged Class(es)'), the
Company wil l engage in currency-hedging transactions in
order t o protect, to the extent possible, the value of the
assets of the Hedged Class in the currency of expression
against fluctuations of these currencies, provided that
these currencies have a substantial weight in the portfolio.
For Classes issued by bond sub-funds that already hedge
investments to preserve the value of the sub-fund's assets
in the reference currency of such sub-fund, the Company
wil l engage in currency-hedging transactions in order to protect, to the extent possible, the value of the assets in
the Classes' currency of expression against fluctuations in
the reference currency of the relevant sub-fund.
For the account of Class IHI (collectively or individually
referred to as 'Hedged Inflation Class(es)'), the Company
wil l engage in inflation hedging transactions in order to preserve, to the extent possible, the real return of the
classes instead of the nominal return of the relevant
subfund.
Investors should note tha t the sub-funds of the Company
have several classes of shares, which can have distinctive
reference currencies. As a result, the net asset value of a
class denominated in one currency can move unfavorably
in comparison with another class denominated in another
currency.
At balance-sheet date the share capital comprised forty
two sub-funds, each relating to a separate investment
portfolio consisting of securities, cash and other
instruments. Seven sub-funds were not yet introduced at
balance-sheet date.
The complete list of sub-funds is as follows:
Equity sub-funds - Robeco Global Equities
- Robeco Global Growth Equities
- Robeco Global Value Equities
- Robeco Global Conservative Equity:
- Robeco North American Equities
- Robeco US Premium Equities (EUR)
- Robeco US Premium Equities
34 Robeco Capital Growth Funds
- Robeco US MidCap Equities
- Robeco US Value Equities
- Robeco European Equities
- Robeco European MidCap Equities
- Robeco European Opportunities‘
- Robeco European Conservative Equity:
- Robeco 130/30 European Equities
- Robeco Mult iManager Asia-Pacific Equities
- Robeco Emerging Markets Equities
- Robeco Emerging Stars Equities
- Robeco Chinese EGuities
Sector equi ty sub-funds
- Robeco Financials Equities
- Robeco Food E7 Agri Equities
- Robeco Health Care Equities
- Robeco IT Equities
- Robeco Telecom Services Equities
- Robeco Consumer Goods Equities
- Robeco Industrials Equities
- Robeco Energy Equities
- Robeco Property Equities
Bond sub-funds
- Robeco Global Bonds
- Robeco All Strategy Euro Bonds
- Robeco High Yield Bonds
- Robeco Euro Credit Bonds
- Robeco Euro Credit Single A Bonds
- Robeco Euro Government Bonds
- Robeco Euro Bonds 7
- Robeco European Currencies High Yield Bonds E
- Robeco Emerging Debt
- Robeco Investment Grade ABS
- Robeco High Income ABS Absolute return sub+funds
- Robeco Divirente VaRz
- Robeco Divirente VaR4 5
- Robeco Divirente VaR8
Other sub-funds
- Robeco Liberty 40
Not yet introduced at balance-sheet date
introduced on 27 April 2007 Introduced on 20 November 2006 Introduced on 3 November 2006 Effective 1 November 2006 the name changed from Robeco European Bonds into Robeco A11 Strategy Euro Bonds Introduced on 25 May 2007 Effective 30 April2007the name changed from Robeco European High Yield Bonds into Robem European Currencies High Yield Bonds
’ Introduced on 3 July2006
a
Sales commissions
The max imum sales commission is 5% for equity sub-
funds, 3% for bond sub-funds and 4% for other sub-
funds. This commission rate is to be considered as a max imum rate and the sales agent or agents may decide
at their discretion t o waive this sales commission in
whole or in part
Dividend policy
The general policy regarding the appropriation of net
income and capital gains is as follows:
Class D, DH, DL, I, IH, IHI, II, M, P, PH and Z shares (capital
growth)
Income will be automatically reinvested and added t o the
relevant share class and wil l thus contribute to a further
increase in value of the total net assets.
Class B shares (distributing)
After the end of the financial year, the Company can
recommend what distribution wil l be made from the net
investment income and net capital gains attributable
to the Class B shares. The Annual General Meeting of
Shareholders wil l determine the dividend payment. The
Board of Directors of the Company may decide to distribute
interim dividends, in accordance with Luxembourg law.
Class E, EH, IE and PE shares (distributing)
With respect t o Class E, EH, IE and PE shares, the
shareholders are entitled to an appropriation of the annual
distribution of the net proceeds. Net proceeds should be
understood as being all revenues earned in relation to E, EH, IE and PE shares, minus fees, commissions and costs attendant to the said shares. After the end of the financial
year, the Annual General Meeting of Shareholders will determine the dividend payment. The Board of Directors of
the Company may decide to distribute interim dividends, in
accordance with Luxembourg Law.
General remarks
As provided by law, the Company may decide to distribute
dividends with no other l imit than the obligation that any
such dividend distribution does not reduce the net asset
value of the Company below the legal min imum amount.
Similarly, the Company may distribute interim dividends
and may decide to pay dividends in shares.
If dividends are distributed, payments of cash dividends to
registered shareholders wil l be made in the currency of the
relevant sub-fund to such shareholders at the addresses
they have given to the Registrar and Transfer Agent.
Dividend announcements (including names of paying
agents) and all other financial notices concerning Robeco
Capital Growth Funds shall be published in the d’Wort, and
a leading newspaper circulating in the countries where the
Company’s shares have been sold as determined by the
Board of Directors. Dividends not collected within five years
wil l lapse and accrue for the benefit of the Company in
accordance with Luxembourg law.
Presentation of f inancial statements
The financial statements are presented in accordance with
Luxembourg regulations on investment funds.
Open-end fund
Robeco Capital Growth Funds is an open-end investment
company meaning that, barring exceptional circumstances,
Robeco Capital Growth Funds issues and purchases its
Robeco Capital Growth Funds 35

shares on a daily basis at net asset value. The Company
reserves the right to refuse any subscription request at any t ime.
Swing pricing
Shares wil l be issued and redeemed on the basis of the
net asset value per share. However, the actual costs of
purchasing or selling assets and investments for a sub-fund
may deviate f rom the latest available price or net asset
value used, as appropriate, in calculating the net asset
value per share due to duties and charges and spread from
buying and selling prices of the underlying investments
('spreads'). These costs have an adverse effect on the value
of a sub-fund, which is known as dilution.
To migate the effects of dilution, the Directors may, at their
discretion, make a dilution adjustment to the net asset value per share. The Directors wil l retain the discretion in
relation to the circumstances under which to make such a
dilution adjustment.
Pooling and co-management
For the purpose of efficient management and t o reduce
administrative costs and if the investment policies of the
sub-funds allow such, the Board of Directors may decide
to co-manage some or all of the assets of certain sub-
funds and other Luxembourg UCls of the Robeco Croup
('co-managed units'). In this case, the assets f rom different
co-managed units will be jointly managed using the
technique of pooling. Assets that are co-managed will be
referred to using the term 'pool'. Such pools will only be
used for the purposes of internal management. They wil l
not constitute distinct legal entities and wil l not be directly
accessible to investors.
Affi l iated parties Robeco Capital Growth Funds is affiliated to the entities
belonging to Robeco Croep N.V. The affiliation with Robeco
Croep N.V. is the result of the possibility of having decisive
control or a substantial influence on the Company's
business policy. Robeco Groep N.V. belongs to Rabobank
Croup. The management structure of Robeco Groep
N.V. in which significant authorities are allocated to its
independent supervisory board, is such that Rabobank
does not have a meaningful say in or influence on the
Company's business policy. Robeco Groep N.V. pursues an
independent investment policy on behalf of its affiliated
investment companies, taking into account the interest
of the investors involved. Besides services of other market
parties, Robeco Capital Growth Funds also uses the services
of one or more of these affiliated entities including
transactions relating to securities, treasury, derivatives,
custody, securities lending, and sale and purchase of i ts own shares, as well as management activities. Transactions
are executed at market rates.
Financial instruments
Risks
Transactions in financial instruments may lead to the
Company being subject to the risks described below.
Price risk
Currency risk is the risk that the value of a financial
instrument wil l fluctuate as a result of changes in exchange
rates. Interest-rate risk is the risk that the value of a
financial instrument will fluctuate as a result of changes
in interest rates. The value of investments in fixed-income
securities depends directly on interest rates. Modif ied
duration is used as the measure for the portfolio's
sensitivity to market interest-rate movements. The
portfolio's sensitivity to fluctuations in market interest rates
can be influenced by changing the portfolio's duration.
Further information on the duration policy can be found in
the report of the Board of Directors. Market risk i s the risk
that the value of a financial instrument will fluctuate as a
result of changes in market prices, caused by factors that
exclusively apply to the individual instrument or its issuer
or by factors that affect all instruments traded in
the market.
The equity sub-funds minimize the risks by investing mainly
in well-known companies and by making a balanced
selection with regard to distribution across regions, sectors,
individual stocks and currencies. The risk relative to their
bench marks is mini mized by using quantitative techniques.
The bond sub-funds minimize the risks by making a
balanced selection with regard to distribution across
regions, sectors, individual bonds and currencies and by
investing in bonds with a min imum rating depending on
the sub-fund's investment policy. The risk relative to their
benchmarks is minimized by using quantitative techniques.
Credit risk
Credit risk is the risk that the counterparty of a financial
instrument wil l no longer meet its obligations, as a result
of which the Company will suffer a financial loss. The funds
minimize this risk by trading exclusively with reputable
counterparties and counterparties with a min imum rating.
Wherever it is customary in the market, the funds will
demand and obtain collateral.
Liquidity risk
Liquidity risk is the risk that the Company is not able
to obtain the financial means required to meet the
obligations arising f rom financial instruments and
redemptions. The funds minimize this risk by mainly
investing in financial instruments that are tradable on a daily basis.
36 Robeco Capital Growth Funds

insight in to actual risks
The report of the Board of Directors, the statement of
net assets, the notes and the spread of net assets, which
includes the geographic distribution of the investments
and the net currency position, give an insight into the
actual risks at balance-sheet date.
Risk management
Managing risk I S a part of the investment process as a
whole and with the help of advanced systems, the risks
outl ined above are limited, measured and monitored on the basis of fixed risk measures.
Policy regarding the use of derivatives
Investing implies that positions are taken. As it is possible to use various instruments, including derivative
instruments, to construct an identical position, the
selection of derivatives is subordinate to the positioning of
a portfolio. In our published information, attention is given
primarily to the overall position, and secondarily to the
nature and volume of the financial instruments employed.
Derivatives
The unrealized results of derivatives are reported in the
statement of net assets. Commitments to derivatives are
not included in the statement of net assets. They are,
however, explained in the notes.
Summary of significant accounting principles
General
Unless stated otherwise, the items shown in the financial
statements are included at their nominal value and
expressed in the reference currency of the sub-fund. This
annual report covers the period f rom 1 July 2006 through
30 June 2007.
Consolidated figures
The consolidated figures are expressed in euros and are
presented for information purposes only. The exchange rate
used for consolidation is USD 0.7404391.
Foreign currencies
Transactions in Currencies other than the reference
currency are converted into the reference currency at the
exchange rates valid at the time. Assets and liabilities
expressed in other currencies are converted into the
reference currency at the exchange rate prevailing at
balance-sheet date.
investment in securities
The cost price of securities acquired by any sub-fund,
denominated in currencies other than the reference
currency, is based on the exchange rates prevailing at the
t ime of acquisition. The market value of the securities has
been converted into the reference currency at the exchange
rates prevailing at balance-sheet date. Market values of
securities do not necessarily represent the amounts which
might be realized upon disposal of the investments; actual
amounts realized may be higher or lower than the market
values stated. All securities listed on recognized stock
exchanges are valued at the last available price as quoted
at the stock exchange constituting their main market.
Short-term discounted money-market instruments are
valued at net present value using reference interest rates
prevailing at closing date. Other securities are valued in
accordance with valuation principles adopted by the Board
of Directors of Robeco Capital Growth Funds.
Other income
Under this heading are included, among others, the
premiums paid for credit-default swaps. In some cases this
can result in a negative amount under this heading.
Options
As at 30 June 2007 the options on transferable securities
stated on page 41 were outstanding.
Open forward exchange transactions
forward exchange transactions current at balance-sheet date
are valued at the forward rates applicable to the remaining
life of the relevant contracts. The unrealized results of these
transactions have been included in the statements of net
assets under the heading 'Unrealized gains/losses on forward
exchange transactions'. Details of the contracts at balance-
sheet date, all with maturity dates f rom January through
June 2007, are stated on page 42 . Where applicable the
positions are distinguished in those with as purpose the
investment policy on the level of the sub-fund or with the
purpose of hedging certain share classes.
Financial futures
Regulated futures contracts are valued at the exchange-
quoted settlement price. Init ial margin deposits are made
upon entering into futures contracts. All open futures
contracts are marked to market with changes in market
value recognized as unrealized gains or losses. Variation
margin payments are made or received, depending on
whether unrealized losses or gains are incurred. When the
contract is closed, the fund records a realized gain or loss equal to the difference between the proceeds from (or
cost of) the closing transaction and price at which the fund
entered into the contract. The unrealized gains/losses on
financial futures are included in the statement of net assets
under the heading 'Unrealized gains/losses on financial
futures'. All margins are included in Deposits and other
cash. Details of open financial futures at balance-sheet
date are stated on page 44.
Robeco Capital Growth Funds 37

Forward purchases of mortgage-backed securities
Forward purchases of mortgage-backed securities current
at balance sheet are valued at the last available price as quoted on their main market. The unrealized gains/losses
on these transactions are included in the statement of
net assets under the heading 'Unrealized gains/losses on
forward purchases of mortgage-backed securities'. Forward
purchases of mortgage-backed securities current at
balance-sheet date represent a sum of USD 145.8 mill ion
for Robeco Global Bonds and are stated on page 46.
Interest-rate swaps Interest-rate swaps current at balance sheet date are
valued at the last available price on their main market.
The unrealized gains/losses on interest-rate swaps are
included in the statements of net assets under the heading
Unrealized gains/losses on interest-rate swaps. Interest
paid and received on these contracts is presented under
other income. Details of open interest-rate swaps are
stated on page 46.
Credit-default swaps Credit-default swaps current at balance sheet date are
valued at the last available price on their main market.
The unrealized gains/losses on credit-default swaps are
included in the statements of net assets under the heading
Unrealized gains/losses on credit-default swaps. Interest
paid and received on these contracts is presented under
other income. Details of open credit-default swaps are
stated on page 48
Equity swaps Synthetic equity swaps are customized vehicles that allow
investors to obtain the economic returns of cash investing
without actually holding the underlying equity. There are
various ways to package over the-counter (OTC) equity
exposure e.g. warrants, notes, options combinations and
equity swaps. An equity swap is a customized, negotiated
contract between the investor and a swap dealer that
provides the economic exposure to an underlying equity or equity-related security, basket of securities or index. Under
a swap agreement, t w o parties agree to exchange price
or total-return performance attributable to a single stock.
For example, in a typical long-side swap transaction, the
investor receives any positive performance on the reference
equity and pays any negative performance plus a LIBOR-
based rate of interest. Details of open equity swaps are
stated on page 53.
Securities lending
Robeco Securities Lending B.V. is the intermediary for
all Robeco Capital Growth Funds securities-lending
transactions. As compensation for its services Robeco
Securities tending B.V. receives a fee of the gross income
resulting f rom these securities-lending transactions. For
the reporting period up t i l l 1 April 2007 this percentage
was 35% for equity sub-fmds and 40% for bond sub-
funds. As f rom I April 2007 on the percentages can vary
for each sub-fund. In the table on page 53 the percentage
for each sub-fund is mentioned. A third party periodically
checks whether the agreement with Robeco Securities
Lending is still in line with market practice. The table on page 53 shows the position of the collateralized securities-
lending agreements with first-class financial institutions as described in the prospectus at balance-sheet date as well
as the income from securities lending over the reported
period for the different sub-funds and the income for
Robeco Securities Lending B.V. At balance-sheet date the total market value of the securities
lent amounted to EUR 2,680.6 mill ion. The received
collateral at balance-sheet date amounted to EUR 2,747.6
mill ion of which EUR 32.3 mill ion concerns cash-collateral.
Taxes Under the legislation and regulations currently prevailing
in Luxembourg, the Company is not subject to any taxes on
income or capital gains, except for the subscription duty
('taxe d'abonnement'). The Company is only subject to a
'taxe d'abonnement' at the rate of 0.05% (0.01% in case
of I, IE, IH, IHI, I t and 2 shares), calculated and payable
quarterly on the relevant net asset value of the Company at
the end of the relevant quarter.
Management company
The Directors of the Company have appointed Robeco
Luxembourg S.A. (the 'Management Company') as the
management company of Robeco Capital Growth Funds
to be responsible on a day-to-day basis, under supervision
of the Board of Directors of the Company, for providing
administration, marketing, investment-management and
investment-advisory services in respect of all sub-funds.
In respect of all sub-funds, the Management Company
has delegated its investment-management and
investment-advisory functions to Robeco Institutional
Asset Management B.V. (the 'Investment Adviser'). The
Management Company has delegated the administration
functions and registrar and transfer functions to RBC Oexia
Investor Services Bank S.A. (acting as 'Administration Agent'
and 'Registrar and Transfer Agent'). The Management
Company was incorporated as a 'Societe anonyme' under
the laws of the Grand Duchy of Luxembourg on 7 July
2005 and its Articles of Association were published in the
MPmorial on 26 July 2005. The Management Company
is approved as management company regulated by
chapter 13 of the Luxembourg law of 20 December 2002
relating to undertakings for collective investment. The
Management Company is part of Robeco Group and also acts as Management Company for Robeco Interest Plus Funds, Robeco lux-0-rente, Robeco liquidity Funds, Robeco
Structured Finance Fund and Robeco Income Funds.
38 Robeco Capital Growth Funds

Investment Adviser and investment sub-advisers
Robeco Institutional Asset Management B.V. ('RIAM'), an
investment management company, forming part of the
Robeco Group in Rotterdam, the Netherlands wil l manage
the assets of the Company on a day-to-day basis. The
Investment Advisory Agreement between the Management
Company and RlAM was concluded on 29 September
2005, for an indefinite period.
The Investment Adviser has appointed Robeco USA L.L.C. ('Robeco USA') as its Investment Sub-Adviser for the sub-
funds Robeco North American Equities and Robeco US MidCap Equities, Robeco Investment Management Inc. as
Investment Sub-Advisor for the sub-funds Robeco Global
Value Equities, Robeco US Value Equities, Robeco US Premium Equities (EUR) and Robeco US Premium Equities
and Russell Investments Ltd. as Investment Sub-Advisor for
the sub-fund Robeco Mult iManager Asia-Pacific Equities.
Russell Investments Ltd. i s authorized to appoint in its
discretion, one or more companies to invest and reinvest
the assets of the sub-fund ('investment managers'). The
list of the investment managers having acted for Robeco
Mult iManager Asia-Pacific Equities during the reporting
period is given on page 43. The investment Advisor has
appointed Robeco Gestions S.A.S. as i t5 Investment Sub-
Advisor for the sub-fund Robeco European MidCap Equities.
Robeco Cestion S.A.S. has taken over the day-to-day
management for this sub-fund from RlAM effective
30 April 2007.
Management and service fees
The Company or the different sub-funds and categories of
shares wil l incur an annual management fee payable to
the Management Company, which reflects all expenses
related to the management of the Company. Furthermore
the Company or the different sub-funds or categories of
shares wil l incur a fixed annual service fee payable to the
Management Company reflecting all remaining expenses
such as the fees of the Domiciliary and Listing Agent, the
Administration Agent, the Registrar and Transfer Agent,
auditors and legal advisers, the costs of preparing, printing
and distributing all prospectuses, memorandums, reports
and other necessary documents concerning the Company,
any fees and expenses involved in the registration of
the Company with any governmental agency and stock
exchange, the costs of publishing prices and operational
expenses, and the cost of holding shareholders' meetings.
The annual charges, both management fee and service fee,
are expressed as a percentage of the net asset value. The
charges are paid monthly, are based on net asset value of
the relevant period and are reflected in the share price. The
table on page 54 shows the percentages for the different
sub-funds and categories of shares.
Performance fees
For some sub-funds the Management Company is entitled
to a performance fee, payable annually in arrears after
the end of the financial year. The performance fee will
be calculated on a net asset value calculation that is
corresponding to the valuation moment of the index and
regardless of dilution adjustments as mentioned under
swing pricing. There are two categories of performance fee
namely category A and category B. For category A a performance fee for the relevant Class of
the sub-fund is only due when the relevant Class of the sub- fund outperforms the relevant index since inception or the
last payment of the performance fee. This outperformance
is the basis for the performance fee charge. In order to
outperform the index i t is not always necessary that the net
asset value of the relevant Class of the sub-fund reached a new all-t ime high.
For category B the performance for the relevant Class of the
sub-fund is not only measured as compared to an index,
but also defined percentage (hereafter 'the hurdle rate')
and also a high watermark. A performance fee is due if,
during the financial year, the relevant Class of the sub-fund
outperforms the relevant hurdle rate and a new all-time
high net asset value is reached. This all-time high net asset
value will be the high watermark for the next financial year.
If the performance from the high watermark to the net
asset value is less than the outperformance of the relevant
Class of the sub-fund compared to the hurdle rate, the
performance fee will be based on the first.
For the sub-funds Robeco High Income ABS, Robeco
Divirente VaR4 and Robeco Divirente VaR8 the category 6 performance fee is applicable and for the sub-funds Robeco
European Opportunities, Robeco 130/30 European Equities
and Robeco Emerging Stars Equities category A.
More details of the performance fees are stated in the
prospectus.
Other fees and expenses
The Company and its different sub-funds or categories
pay directly the normal commissions on transactions and
banking, brokerage and custody fees relating to the assets
of the Company or expenses incurred thereof, such as proxy
voting and the taxe d'abonnement as described under
Taxes. The costs of establishing the Company and the sub-
funds have been paid entirely. When additional sub-funds
are created in the future, these sub-funds will bear, in
principle, their own formation expenses.
Robeco Capital Growth Funds 39

Total expense rat io
The total expense ratio of the sub-funds, as shown on page 55,
expresses the costs charged to the sub-funds during the
mentioned period as a percentage of the average assets
entrusted, calculated on a daily basis, during the reporting
period The total expense ratio as shown does not include
transaction costs. Other costs concern the costs of the
custodian, bank charges, taxe d’abonnement and other
fees and expenses.
Transaction costs
Brokerage costs and exchange fees relating to investment
transactions are discounted in the cost price or the sales
value of the investments. Brokerage costs for the purchase
and sale of bonds are included in the bond price and
cannot be quantified separately. These costs and fees are
charged to the result. The table on page 58 shows the
transaction costs which are quantifiable as well as the
volume of these transactions as a percentage of the total
transaction volume.
Hard commissions, soft-dollar arrangements and
commission-sharing arrangements
Various independent research institutions/third parties
provide services to the Company to support its decision-
making process. Part of the commissions paid to brokers
IS used to pay for these services, so-called commission-
sharing arrangements. The amounts for commission-
sharing agreements for Robeco European Equities
amounted to EUR 80 thousand (EUR 1 4 6 thousand over
the period I July 2005 through 30 June 2006) and for
Robeco Global Equities amounted to EUR 4 thousand (EUR
19 thousand over the period 1 July 2005 through 30 June
2006). There were no hard commissions and soft-dollar
arrangements during the reported period.
Turnover rat io
This shows the turnover of the investments (including
derivatives) against the average assets entrusted and is a
measure of the incurred transaction costs resulting f rom
the portfolio policy pursued and the ensuing investment
transactions. In the calculation method that is used the
amount of turnover is determined by the sum of purchases
and sales of investments less the sum of issuance and
repurchase of own shares. If the outcome is negative, the
turnover ratio is zero. The turnover ratio is determined by
expressing the amount of turnover as a percentage of the
average assets entrusted. The table on page 59 shows the
turnover ratios of the sub-funds.
Changes in the investment port fo l io
The statement of changes in the investment portfolios
during the reporting period may be obtained free of charge
at the offices of the Company and the custodian.
Personnel costs
Robeco Capital Growth Funds does not employ personnel.
Informat ion concerning retrocessions and trailer fees
Trailer fees for the marketing of the Company (Commission
d’Etat) are paid to distributors and assets managers
f rom the flat management fee. No retrocession has been
granted during the reporting period.
Transactions w i t h affi l iated parties
Part of the transaction volume over the reporting period
relates to transactions with affiliated parties. The table on
page 60 shows the various types of transactions per sub-
fund.
40 Robeco Capital Growth Funds
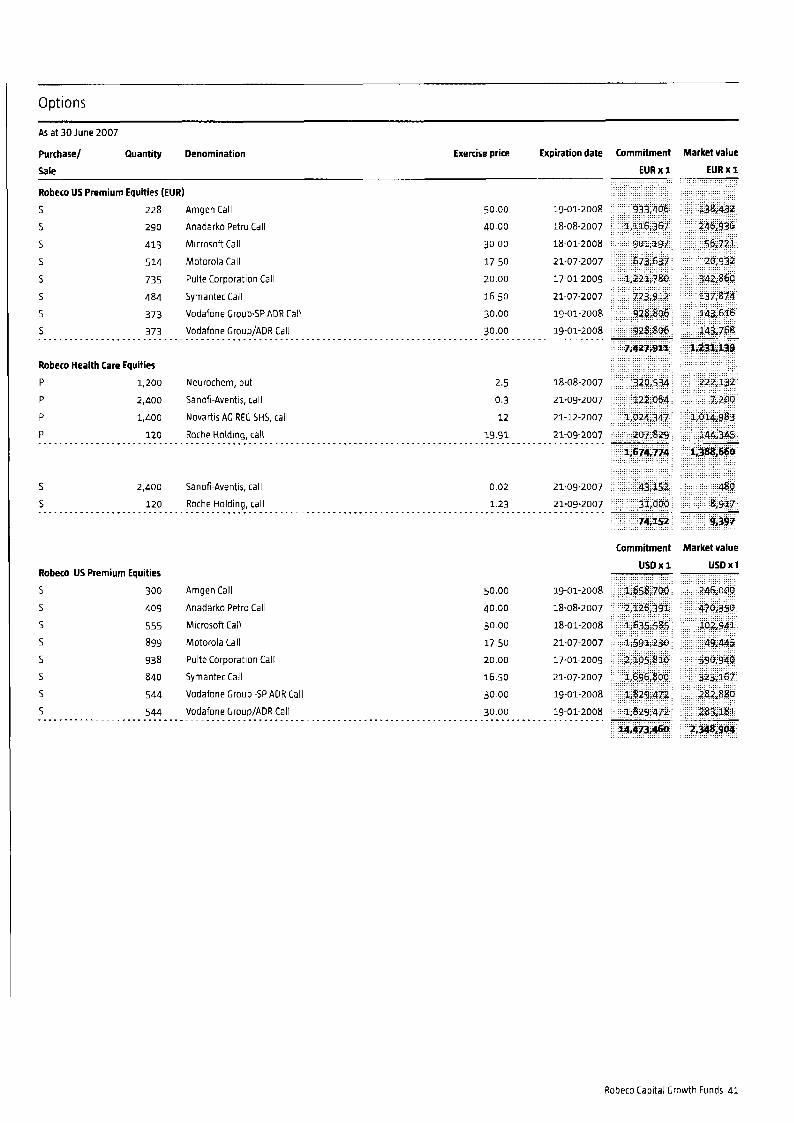
Options
As at 30 June 2007
Purchase/ Quantity Denomination
Sale
Exercise price Expiration date Commitment Market value
EUR X 1 EUA x 1
Robeco US Premium Equities (EUR)
S 228 Amqen Call
S 290 Anadarko Petro Call
S 413 Microsoft Call
S 514 Motorola Call
S 735 Puke Corporation Call
S 484 Syrnantec Call
S 373 Vodafone Croup-SP ADR Call
S 373 Vodafone Croup/ADR Call ................................................................................
Robeco Health Care Equities
P 1,200 Neurochem, put
P 2,400 Sanofi-Aventrs, call
P 1,400 Novartis AC REG SHS, call
P 120 Roche Holding, call ................................................................................
S 2,400 Sanofi-Aventis, call
S 120 Roche Holding, call ................................................
Robeco US Premium Equities
S 300
S 409
S 555
S 899 S 938
S 840
S 544
5 544 _._......~~...__._...._.
Amgen Call
Anadarko Petro Call
Microsoft Call
Motorola Call
PuIte Corporation Call
Symantec Call
Vodafone Croup -SP ADR Call
Vodafone Croup/ADR Call ...__.._....._._._.....
...
50.00
40.00
30.00
17.50
20.00
16.50
30.00
30.00
19-01-2008
18-08-2007
18-01-2008
21-07.2007
17-01-2009
21-07-2007
19-01-2008
19-01-2008
2.5 18-08-2007
0.3 21-09-2007
12 21-12-2007
19.91 21-09-2007 ._.....___._...._._._...
0.02 21-09-2007
1.23 21-09-2007 .._...._._....-.-.-..-..
50.00
40.00
30.00
17.50
20.00
16.50
30.00
30.00
Commitment Market value
US0 x 1 USD x 1
19-01-2008
18-08-2007
18-01-2008
21-07-2007
17-01-2009
21-07-2007
19-01-2008
19-01-2008 _.. .____._.
Robeco Caoital Growth Funds 41

Forward exchange transactio nsl
As at 30 June 2007
Robeco Global Equities
Purchases of AUD 1.1 million, CAD 1.6 million, CBP 2.4 million, JPY 72.9 million, SEK 0.8 million and USD 0.7 million against sales of
CHF 3.7 million, EUR 3.3 million and HKD 9.9 million.
For the purpose of preserving the currency of expression of the hedged share classes:
Purchases of EUR 2 .1 million against sales of AUD 0.1 million, CAD 0.1 million, CHF 0.1 million, CBP 0.2 million, HKD 0.2 million,
JPY 43.5 million, NOK 0.2 million, SEK c.4 million, SGD 0,03 million and USD 1.7 million.
Robeco Global Growth Equities
Purchases of AUD 0.2 million, CAD 0.1 million, GBP 0,02 million, HKD 1.2 million and EUR 0.5 million against sales of CHF 0.5 million,
USD 0.4 million and JPY 42 million.
Robeco Global Value Equities
Purchases of AUD 3.8 million, CAD 4.7 million, CHF 2.9 million and JPY 648 million against sales of EUR 6.3 million, GBP 0.7 million and
USD 5.4 million.
For the purpose of preserving the currency of expression of the hedged share classes:
Purchase of PLN 12.4 million against sales of EUR 0.8 million, CBP 0.3 million, JPY 61.4 million and USD 2.2 million.
Robeco North American Equities
Purchase of EUR 35.3 million against sale of USD 47.6 million.
Robeco US Premium Equities (EUR)
Purchase of EUR 189 7 million against sale of USD 252.6 million.
Robeco US MidCap Equities
For the purpose of preserving the currency of expression of the hedged share classes:
Purchase of EUR 0.2 million against sale of USD 0.3 million.
Robeco European Equities
Purchases of GBP 123.2 million and NOK 78.5 million against sales of CHF 79.6 million, EUR 117.8 million and SEK 244.8 million.
Robeco European Opportunities
Purchase of EUR 31.4 million against sales of CHF 2.8 million, GBP 1.7 million, NOK 202.3 million and USD 2.9 million
Robeco MultiManager Asia-Pacific Equities
Purchases of AUD 9.3 million, HKD 38.0 million, JPY 1,880.0 million, KRW 850.0 million, SCD 3.6 million and TWD 77.0 million against
sale of EUR 25.0 million.
Robeco Emerging Markets Equities
Purchases of EUR 454.5 million against sales of USD 605.1 million.
For the purpose of preserving the currency of expression of the hedged share classes:
Purchases of PLN 0.4 million against sales of EUR 0.1 million.
Robeco Emerging Stars Equities
Purchase of EUR 23.8 million against sales of USD 31.6 million.
Robeco Chinese Equities
Purchase of EUR 48.0 million against sale of USD 64.0 million.
Robero Financials Equities
Purchases of AUD 8.3 million, CAD 0.8 million, JPY 294.5 million and USD 3.4 million against sales of CHF 3.0 million, EUR 2.5 million,
GBP 1.7 million, NOK 10.5 million and SGD 4 .1 million.
Robeco Food G Agri Equities
Purchases of GPB 1 1 million and USD 3.1 million against sales of EUR 2.9 million and JPY 168.7 million.
Robeco IT Equities
Purchase of EUR 0.2 million against sale of USD 0.3 million.
Robeco Telecom Services Equities
Purchases of CAD 0.6 million, CHF 0.7 million, GBP 0.8 million, JPY 308.1 million and USD 0.5 million against sales of EUR 3.5 million
and SGD 1.6 million.
Robero Industrials Equities
Purchases of AUD 1.6 million, CAD 1.3 million, GBP 1.5 million and USD 1.3 million against sales of CHF 2,2 million, EUR 3 .1 million,
JPY 3 1 8 million and SEK 4.8 million.
Robeco Energy Equities
Purchases of AUD 3.9 million, CAD 4.3 million, GBP 8.9 million and JPY 136.1 million against sales of EUR 14.8 million,
HKD 17.1 million, NOK 7.2 million and USD 2.9 million.
42 Robeco Capital Growth Funds

Forward exchange transact ions’
As at 30 June 2007
Investment ma nag e rs Ro beco Mu It i Ma nager Asia-Pacif ic Equities
The following managers have acted for the sub-fund during the reporting period I
Robeco Property Equities
Purchases of AUD 11.5 million, JPY 478.5 million and EUR 2.8 million against sales of SGD 15.7 million, CAD 6.6 million, GBP 0.3 million
and USD 0.2 million.
Robeco Global Bonds
Purchase of EUR 380.6 million against sales of CAD 15.1 million, DKK 3.0 million, CBP 50.6 million, JPY 10,922.0 million,
SEK 15.8 million and US0 300.8 million.
For the purpose of preserving the currency of expression of the hedged share classes:
Purchase of PLN 0.5 million against sales of EUR 0.1 million.
Robeco All Strategy Euro Bonds
Purchase of EUR 0.8 million against sales of JPY 136.0 million and USD 0.03 million.
Robeco High Yield Bonds
Purchase of EUR 583.1 million against sales of GBP 9.7 million, NOK 37.4 million and USD 750.6 million.
For the purpose of preserving the currency of expression of the hedged share classes:
Purchase of PLN 3.8 million against sales of EUR 1.0 million.
Robeco European Currencies High Yield Bonds
Purchases of EUR 3.8 million against sales of GBP 1.9 million, USD 1.2 million and NOK 0.9 million.
Robeco Divirente VaR2
Purchase of AUD 13.5 million, BRL4.2 million, CAD 5.8 million, GBP 5.7 million, MXN 23.8 million and TRY 3.0 million against sales of CHF 14.0 million, EUR 0.05 million, JPY 681.9 million, and USD 17.7 million.
Robeco Divirente VaR4
Purchase of AUD 11.8 million, BRL4.0 million, CAD 6.1 million, GBP 5.2 million, MXN 23.3 million and TRY 2.8 million against sales of CHF 12.5 million, EUR 0.3 million, JPY 679.5 million and USD 15.9 million.
If no specific explanation IS given, these are positions in forward exchange transactions for the purpose 31 the investment p o i i ~ on the leuel of the sub-fund
Manager
JF Asset Management
Goldman Sachs
Alliance Bernstein
Balanced Equity Management
Lloyd George
Rexiter
Maple Brown Abbot (MBA)7 ...................................... ’
’ As of August 2006 Formerly named JF Morgan Fiemmlng
Role
Japanese growth manager
Japanese market-orientated (quant) manage1
Japanese value manager
Australian value (moderate) manager
Asian CARP (Growth At a Reasonable Price) manager
Asian market-orientated manager
Asian value manager ..................................................................
Robeco Capital Growth Funds 43

Financial futures
As at 30 June 2007
Purchase/ Quantity Denomination
Sale
Maturity Commitment
month
EUR x 1
Unrealized
gain/loss
EUR x 1
Robeco Global Equities
P 14 NIKKEI 225 INDEX, SINGAPORE (SCX)
P 4 SGP500 INDEX (CME) ........................................................
Robeco European Opportunities
5 65 IBEX 35 INDEX Madrid (MFM) ...............................................................
Robeco MultiManager Asia-Pacific Equities
P 123 S 6 P ASX 200 INDEX (SFE)
P 60 HANG SENG FUT INDEX (HKC)
P 154 TOKYO STOCK PRICE INDEX (TSE)
P 6 1 KOREA 200 INDEX (KFE)
P 58 MSCI SINGAPORE INDEX (SGX)
P 113 MSCI TAIWAN INDEX (SCX) ...............................................................
Robeco Emerging Markets Equities
P 300 KOREA 200 INDEX (KFE) ..........................................................
Robeco Global Bonds
P 221 LFB 5 YR 6% (LIF)
P 89 EURO-SCHATZ 2 YR 6% (EUX)
P
P
P
5
5
5
S
5 5 ...................
39
685 280
411
JPN 10 YR 6% (TSE)
US 10 YR 6% (CBT)
US 5 YR 6% (CBT)
CAN 10 YR 6% (MSE)
767 1,881
EURO-BOB1 5 YR 6% (EUX)
EURO-BUND 10 YR 6% (EUX)
186 LONG GILT FUTURE (LIF)
179 US 20 YR 6% (CBT)
187 US 2 YR 6% (CBT) .......................................
Robeco All Strategy Euro Bonds
P 1,609 US i o YR 6% (CBT)
P 3,006 EURO-BOB15 YR 6% (EUX)
S 21 EURO-BUXL 30 YR 4% (EUX)
S 1,972 EURO-BUND 10 YR 6% (EUX)
S 250 LIBOR, BBA (LIF)
5 213 US 2 YR 6% (CBT)
5 955 US 5 YR 6% (CBT)
5 311 US 20 YR 6% (CBT) .......................................................
Robeco High Yield Bonds
P 1,589 US 5 YR 6% (CBT)
S 211 EURO-BOB1 5 YR 6% (EUX) ..........................................................
.....
.....
September 2007
September 2007 ..............
JUIY 2007 ...............
September 2007
July 2007
September 2007
September 2007
Ju ly 2007
July 2007 ...............
September 2007 ...............
September 2007
September 2007
September 2007
September 2007
September 2007
September 2007
September 2007
September 2007
September 2007
September 2007
September 2007 ...............
September 2007
September 2007
September 2007
September 2007
September 2007
September 2007
September 2007
September 2007 ...............
September 2007
September 2007 .............
9,149
592
9,741
47.962
-200,617
58,362 -12,009
-52,714
14.529 -6,694
-199.143
203,322
64,090
-3,115
65,837
-495,313 -131,030
297,525
256,635
1,700,354
558,152
197,828
30,295
2,541,258
-75,925
-1,228,596
27,300
1,252.352
-9,285
54,214
464,047
381,396
865,503
-2,029
70,600
68,571
44 Robeco Capital Growth Funds

Financial futures
As at 30 June 2007
Purchase/ Quantity Denomination Maturity Commitment Unrealized
Sale month gain/losr
EUR x 1 EUR x 1
Robeco Euro Credit Bonds
P 4
P 443
P 40
5 2 1 . ._._~..~....~.~......~...
EURO.BUX1 30 YR 4% (EUX)
EURO-BOBL 5 YR 6% (EUX)
EURO-SCHATZ 2 YR 6% (EUX)
EURO-BUND 10 YR 6% (EUX) ...................................
Robeco Euro Credit Single A Bonds
P 16
P 98
P 36
5 4 ._...-..--......---_
Robeco Euro Government Bonds
S
S 73
221
Robeco Euro Bonds
P 466
5 155
S 439
S 912 ._....._______..-........__
Robeco Divirente VaR2
P 7 1
P 1,108
P 571
S 115
5 575
S 621
5 68
S 254
S 83 _._._.....____...-.._....._
Robeco Divirente VaR4
P P
P
S
115
150
435 286
S 694
500
148
203
274
63
LFB 5 YR 6% (LIF)
EURO-BOB1 5 YR 6% (EUX)
EURO-SCHATZ 2 YR 6% (EUX)
EURO.BUND 10 YR 6% (EUX) ..................................
EURO-BUXL 30 YR 4% (EUX)
EURO-BOB15 YR 6% (EUX)
EURO.SCHATZ 2 YR 6% (EUX)
EURO-BUND 10 YR 6% (EUX) ..................................
EURO.SCHATZ 2 YR 6% (EUX)
EURO-BUXL 30 YR 4% (EUX)
EURO-BOB1 5 YR 6% (EUX)
EURO-BUND 10 YR 6% (EUX) ..................................
EURO-BUXL 30 YR 4% (EUX)
EURO-BOBL 5 YR 6% (EUX)
US 10 YR 6% (CBT)
CAN 10 YR 6% (MSE)
EURO-SCHATZ 2 YR 6% (EUX)
EURO-BUND 10 YR 6% (EUX)
US 2 YR 6% (CBT)
US 5 YR 6% (CBT)
US 20 YR 6% (CBT) ..................................
EURO-BUXL 30 YR 4% (EUX)
EURO-BOB15 YR 6% (EUX)
US 10 YR 6% (CBT)
EURIBOR XllFFLO
EURO-BUND 10 YR 6% (EUX)
EURO-SCHATZ 2 YR 6% (EUX)
LIBOR BBA (LIF)
US 2 YR 6% (CBT)
US 5 YR 6% (CBT)
US 20 YR 6% (CBT) ..................................
. ..
. .
. ..
. .
- ..
- ..
September 2007 -6,080
September 2007 -23,110
September 2007 -11,100
-41,690
September 2007 -1,400
.._...._.....
September 2007 2,560 September 2007 -8,219
September 2007 -1,260
September 2007 -2,160 .._.._..._._. 1),079
September 2007 -113,880
September 2007 61,613
September 2007 3,395
September 2007 89,383
40,511 .......___._..
September 2007 -11,650
September 2007 201,500
September 2007 127,486
September 2007 646,782
964,118 -._.._...-...
September 2007 60,020
September 2007 324,090
September 2007 -244,426
September 2007 38.423
September 2007 34,765
September 2007 309,051
September 2007 7 87 September 2007 61,711
September 2007 61,456
645,877 .__.__._.-....
September 2007
September 2007
September 2007
September 2007
September 2007
September 2007
September 2007
September 2007
September 2007
September 2007 . . . . . - . - . . . . . .
97,216
19,230 -101,139
-3,575
274,506
28,649
3,120
-67,228
18,493 61,918
331,190
Robeco Capital Growth Funds 45

Forward purchase of mortgage-backed securities
As at 30 June 2007
% Denomination
Robeco Global Bonds
4.5
5 5
5
5
5
5.5 5.5
5.5 6
6
7
7 .................
FNMA TEA
FHLMC TBA
FHLMC TBA
FNMATBA
FNMATBA
CNMA TBA
FHLMCTBA
FNMA TEA
FNMA TEA
FNMA TEA
CNMA TBA
FHLMC TBA
FNMA TEA ...........
July 07
July 07
July 07
July 07
July 07
July 07
July 07
July 07
July 07
July 07
July 07
July 07
July 07
25.03-2021
15-03-2037
15-10-2021
25-03-2037
25-10-2021
15-07.2036
15-03-2037
25-01-2022
25-03-2037
25-01-2037
15-01-2037
15-08.2036
25-05-2036 ........................
Face value Market value Market value Unrealized gain/loss
USD x 1 USD x 1 EUR x 1 EUR x 1
9,300,000
11,400,000
12,500,000
1~,100,000
11,g00,ooo
15,000,000
4,600,000
6,100,000
25,300,000
12,100,000
9,400,000
6,500,000
11,100,000
-55,521
-124,970
-90,891
-140,643
-74,147
-40,778
-138,598
-33,953
-207,446
-78,666
-63,375
-29,828
-31,655
145,789,313 10?,94%104 -1,110,471
I nterest-rate swaps
As at 30 June 2007
Denomination Expiration date Currency Nominal Market Unrealized
value value gain/loss
EUR x 1 EUR x 1
Robeco All Strategy Euro Bonds
IRSTDOMLO P 6.6825% AUD R 6M IBOR
IRS DEUTFR P 3M IBOR CAD R 4.8875%
IRS TDOMLO P4.967% CAD R 3M IBOR
IR5 DEUTFR P 4.999% CAD R 3M IBOR
IRS DEUTFR P 6M IBOR CHF R 3.16325%
IRS SLIILO P 4.753% EUR R 3M IBOR
IRS ABNALO P 5.963% CBP R 6M IBOR
IRS JPMSLO P 6M IBOR CBP R 5.7925%
IRS JPMSLO P 6.18% GBP R 6M IBOR
IRS TDOMLO P 5.345% US0 R 3M IBOR
IRS DEUTFR P 5.705% U5D R 3M IBOR
IRS ABNALO P 5.8201% USD R 3M IBOR
IR5 ABNALO P 3M IBOR US0 R 5.6651%
IR5 ABNALO P 3M IBOR USD R 5.845%
IRS ABNALO P 5.505% USD R 3M IBOR
IRSTDOMLO P 3M IBOR USD R 5.466% ........................................... ............
Robeco Euro Credit Bonds
IRS SLIILO P 3M IBOR EUR R 4.2065%
IR5 SLllLO P 4.753% EUR R 3M IBOR
IRS ABNALO P 3M IBOR EUR R 4.925% ................................................ .-
Robeco Euro Credit Single A Bonds
IR5 5LllLO P 4 753% EUR R 3M IBOR ................................................................
04-06-2012
01-06-2012
01-06-2017
06-06-2037
05-06-2012
12-06-2012
01-06-2012
08-06-2017
08-06-2009
05-06.2012
08-06-2037
15-06-2014
15-06-2011
12-06-2017
12-06.2009
05-06-2017 .............
30-01-2009
12-06-2012
12-06-2037
12-06-2012 ..................
.........
AUD 124,600,000
CAD 168,600,000
CAD 59,200,000
CAD i i ,goo,ooo
CHF 186,400,000
EUR 294,900,000
GBP 81,900,000
GBP 23,300,000
GBP 94,350,000
USD 59,800,000
US0 12,100,000
USD 60,000,000
USD 96,500,000
USD 45,900,000
USD 184,300,000
USD 56,700,000 .................
EUR 23,800,000
EUR 43,100,000
EUR 2,400,000 .....................
EUR io,ioo,ooo ..........................
46 Robeco Capital Growth Funds

Interest-rate swaps*
As at 30 June 2007
Denomination Expiration date Currency Nominal Market Unrealized
value value gain/loss
EUR x 1 EUR x 1
Robeco Divirente VaR2
IRSABNALO P 6.915%AUD R 6M IBOR
IRS SLlltO P 4.753% EUR R 3M IBOR
IRS SLlllO P4.83853% EUR R 3M IBOR
IRS ABNALO P 3M IBOR USD R 5.48% ...................................
Robeco Divirente VaR4
IRS ABNALO P 6.5125% AUD R 6M IBOR
IRS MSINLO P 3M IBOR CAD R 4.466%
IRS ABNALO P 3M IBOR CAD R 4.4615%
IRS ABNALO P4.6625% CAD R 3M IBOR
IR5 DEUTFR P 4.999% CAD R 3M IBOR
IRS DEUTFR P 6M IBOR CHF R 3.16325%
IRS DEUTFR P 6M IBOR CHF R 3.16325%
IRS ABNALO P4.258% EUR R 6M IBOR
IRS JPMSLO P 3M IBOR EUR R 4.9525%
IRS SLIILO P 4.803% EUR R 3M IBOR
IRS JPMSLO P4.75% EUR R 3M IBOR
IRS ABNALO P 6M IBOR EUR R 4.308%
IRS SLlltO P 4.753% EUR R 3M IBOR
IRS BARCLO P 6M IBOR GBP R 5.138%
IRS BARCLO P 5.52% GBP R 6M IBOR
IRS BARCLO P 6M IBOR GBP R 5.36%
IRS CRESLO P 5.635% GBP R 6M IBOR
IRS BARCLO P 5.628% GBP R 6M IBOR
IRS BARCLO P 6M IBOR GBP R 5.935%
IRS BARCLO P 6.275% GBP R 6M IBOR
IRS ABNALO P 5.963% GBP R 6M IBOR
IRS BARCLO P 5.7775% GBP R 6M IBOR
IRS BARCLO P 6M IBOR CBP R 5.1625%
IRS BARCLO P 5.6085%GBP R 6M IBOR
IRS ABNALO P 5.15% USD R 3M IBOR
IRS MSINLO P 3M IBOR gSD R 5.1875%
IRS ABNALO P5.07625% USD R 3M IBOR
IRS ABNALO P 3M IBOR US0 R 5.6651%
IRS JPMSLO P 3M IBOR USD R 5.915%
IRS JPMSLO P 5.555% USD R 3M IBOR
IRS ABNALO P 5.8201% US0 R 3M IBOR
IRS DEUTFR P 5.705% USD R 3M IBOR
IRS ABNALO P 3M IBOR USD R 5.15%
IRS ABNALO P 3M IBOR US0 R 5.1825%
IRS MSINLO P 5.07% USD R 3M IBOR
IRS ABNALO P 3M IBOR JSD R 5.0525%
IRS ABNALO P 3M IBOR USD R 5.005%
IRS ABNALO P 4.9825% US0 R 3M IBOR ................................... The unrealized result IS d6rloIed by counterparties
................
28-06-2012
12-06-2012
19-06-2012
29-06-2012 ....................
27-04-2012
02-05-2012
02-05-2012
02-05-2017
06-06-2037
05-06-2012
05-06-2012
04-04-2009
15-06-2017
18-06-2012
15-06-2009
04-04-2017
12-06-2012
04-01-2017
04-01-2009
02-04-2017
03-04-2012
02-04-2012
13-06-2017
13-06-2009
01-06-2012
02-04-2009
06-03-2017
06-03-2009
12-04-2014
04-05-2017
10-05-2009
15-06-2011
15-06-2017
15-06-2009
15-06-2014
08-06-2037
10-05-2017
04-05-2017
04-05-2009
12-04-2011
30-04-2012
03-05-2012 ...............
-
......
......
I__
AU 0
EUR
EUR
USD ......
AUD
CAD
CAD
CAD
CAD
CHF
CHF
EUR
EUR
EUR
EUR
EUR
EUR
GBP
GBP
GBP
CBP
GBP
GBP
GBP
GBP
GBP
CBP
GEP
USD
USD
USD
USD
US0
USD
USD
US0
USD
USD
USD
USD
USD
US0
32,500,000
75,900,000
80,000,000
26,300,000 ............
33,150,000 18,450,000
ia,450,000
10,500,000
2,400,000
23,700,000
23,700,000
44,300,000
5,400,000
68,100,000
23,800,000
10,400,000
63,200,000
1,750,000
7,280,000
3,500,000
8,130,000
8,190,000
4,550,000 i6,150,000
5,000,000
17,360,000
L330,OOO
6,790,000
9,600,000
7,840,000
32,000,000
7,aoo,ooo
5,a00,000
23,100,000
4,800,000
2,450,000
7,800,000
9,800,000
32,060,000
15,600,000
26,350,000
33,880,000 ............
Robeco Capital Growth Funds 47
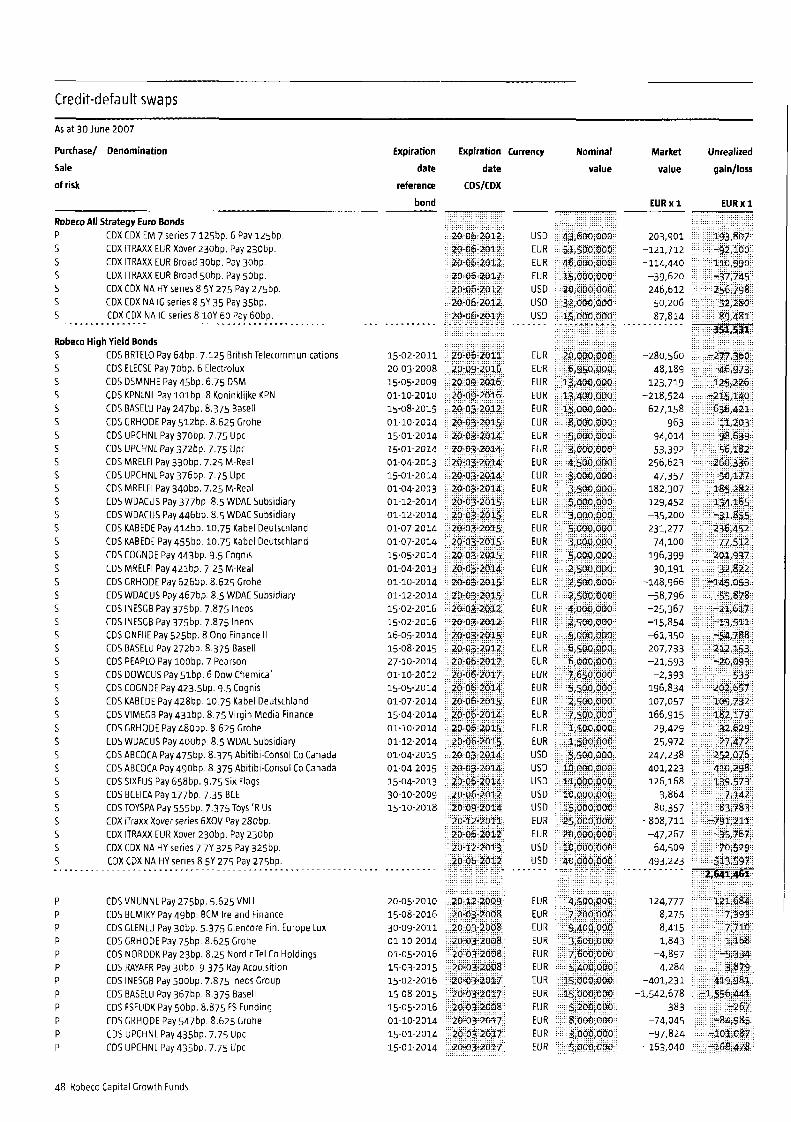
Credit-default swaps
Robeco All Strategy Euro Bonds P S S S S 5 S
Robeco High Yield Bonds
CDX CDX EM 7 series 7 125bp. 6 Pay 125bp. COX ITRAXX EUR Xover 230bp. Pay 230bp. CDX ITRAXX EUR Broad 30bp. Pay 30bp. CDX ITRAXX EUR Broad 5obp. Pay 50bp. CDX COX NA HY series 8 5Y 275 Pay 275bp. CDX COX NA IC series 8 5Y 35 Pay 35bp. CDX CDX NA IG series 8 1 O Y 60 Pay 60bp. ..............................................
As a t 30 June 2007
Purchase/ Denomination
Sale
of risk
.......
S S S S S S S S S S S S S S S S S S S S S S S 5 S S S S S S S S 5 S S S S 5 S _.
P P P P P P P P P P P P
CDS BRTELO Pay 64bp. 7.125 British Telecommunications CDS ELECSE Pay 70bp. 6 Electrolux CDS DSMNHE Pay45bp. 6.75 DSM CDS KPNLNL Pay 10lbp. 8 Koninklilke KPN CDS BASELU Pay 247bp. 8.375 Basell CDS GRHODE Pay 512bp. 8.625 Crohe CDS UPCHNL Pay 370bp. 7.75 Upc COS UPCHNL Pay372bp, 7.75 Upc CDS MRELFI Pay33obp. 7.25 M-Real CD5 UPCHNL Pay 376bp. 7.75 Upc CDS MRELFI Pay 340bp. 7.25 M-Real CDS WDACUS Pay 377bp. 8.5 WDAC Subsidiary CDS WDACUS Pay446bp. 8.5 WDAC Subsidiary CDS KABEDE Pay 414bp. 10.75 Kabel Deutschland COS KABEDE Pay 455bp. 10.75 Kabel Deutschland CDS COCNDE Pay443bp. 9.5 Cognis COS MRELFI Pay42ibp. 7.25 M-Real CDS GRHODE Pay 626bp. 8.625 Grohe CDS WDACUS Pay467bp. 8.5 WDAC Subsidiary COS INESGB Pay 375bp. 7.875 Inem COS INESGB Pay 375bp. 7.875 lneos CDS ONFllE Pay 525bp. 8 Ono Finance II CDS BASELU Pay 27Zbp. 8.375 Basell CDS PEAPLO Pay loobp. 7 Pearson CDS DOWCUS Paysibp. 6 Dow Chemical CDS COGNDE Pay423sbp. 9.5 Cognis COS KABEDE Pay428bp. 10.75 Kabel Deutschland CDSVIMEGB Pay 431bp. 8-75 Virgin Media Finance CDS GRHODE Pay 480bp. 8.625 Grohe CDS WDACUS Pay 400bp 8.5 WDAC Subsidiary COS ABCOCA Pay 475bp. 8.375 Abitibi-Consol Co Canada COS ABCOCA Pay 490bp. 8.375 Abitibi-Consol Co Canada CDS SIXFUS Pay 658bp. 9,75 Six Flags CDS BCEICA Pay 177bp. 7.35 BCE CD5 TOYSPA Pay 555bp. 7.375 Toys 'R Us COX iTraxx Xover series 6XOV Pay 280bp. CDX ITRAXX EUR Xover 230bp. Pay 230bp. CDX CDX NA HY series 7 7Y 325 Pay 325bp. CDX C3X NA HY series 8 5 Y 275 Pay 275bp. ...............................................
CDS VNUNNL Pay 275bp. 5.625 VNU CDS BCMIKY Pay4gbp. BCM Ireland Finance CDS GLENLU Pay 30bp 5.375 Clencore Fin. Europe Lux COS CRHODE Pay 75bp. 8.625 Grohe CDS NORDDK Pay 23bp. 8.25 NordicTel Co Holdings CDS RAYAFR Pay 30bp. 9.375 Ray Acquisition CDS INESGB Pay 5oobp. 7.875 lneos Group CDS BASELU Pay 367bp 8.375 Basell CDS FSFUDK Pay 50bp. 8.875 FS Funding CDS GRHODE Pay 547bp. 8.625 Grohe CDS UPCHNL Pay 435bp. 7.75 Upc CDS UPCHNL Pay 435bp. 7.75 Upc
Expiration Expiration
date
reference
bond
..........
15-02-2011 20-03-2008 15-05-2009 01.10-2010 15-08-2015 01.10-2014 15-01.2014 15-01-2014 01-04-2013 15-01-2014 01-04-2013 01-12-2014 01-12-2014 01-07-2014
date
CDS/CDX
01-07-2014 15.05-2014 01-042013 01-10-2014 01-12-2014 15-02-2016 15-02-2016 16-05-2014 15-08.2015 27-10-2014 01-10-2012 15-05.2014 01-07.2014 15-04.2014 01-10.2014 01-12.2014 01.042015 01-04-2015 15-04-2013 30-10-2009 15 10-2018
...............
20-05.2010 15-08-2016 30-09-2011 01-10-2014 01-05.2016 15-03-2015 15-02-2016 15-08-2015 15-05-2016 01-10-2014 15-01 2014 15-01.2014
Currency Nominal
value
USD EUR EUR EUR USD US0 USD
EUR EUR EUR EUR EUR EUR EUR EUR EUR EUR EUR EUR EUR EUR EUR EUR EUR EUR EUR EUR EUR EUR EUR EUR EUR EUR EUR EUR EUR EUR USD USD US0 USD USD E U R EUR USD USD .......
EUR EUR EUR EUR EUR EUR EUR EUR EUR EUR EUR EUR
Market Unrealized
value gain/loss
EUR x 1 EUR x 1
203,901 -121,712 -114,440
-39,620 246,612
50,206 87,814 ...........
-280,560 -48,189 123,719
-218,524 627,158
963 94,014 53,392
256,623 47,357
182,307 129,452 -35,200 231,277
74,100 196,399
30,191 -148,966
-58,796 -25,367 -15.854 -61,350 207,733 -21,593
-2,393 196.834 107,057 166,915
29,429 25,972
247,238 401,223 126,168
3,864 80,357
-808,711 -47,267
64,509 493,223 ...........
124,777 8,275 8,415 1,843
-4,897 4,284
-1,542,678 383
-74,045 -97,824
-163,040
-401,231
48 Robeco Capital Growth Funds

Credit-default swaps
As at 30 June 2007
Purchase/ Denomination
Sale
of risk
P P P P P P P P P P P P P P P P P P P P P P P P P P P P P P P P P P P P
Robeco Eui S S S S S 5 S S 5 S S S S S S S
- - - -__.. .
- - - -__ ._ .
CDS UPCHNL Pay445bp. 7.75 Upc CDS MRELFI Pay390bp. 7.25 M-Real CDS KABEDE Pay 456bp. 10.75 Kabel Deutschland CDS WDACUS Pay417bp. 8.5 WDACSubsidiary CDS WDACUS Pay487bp. 8.5 WDAC Subsidiary CDS KABEDE Pay4g5bp. 10.75 Kabel Deutsrhland CDS MRELFI Pay4OObp. 7.25 M-Real COS COGNDE Pay483bp. 9.5 Cognis COS GRHODE Pay 667bp. 8.625 Grohe CDS MREL-I Pay480bp. 7.25 M-Real CDS WDACUS Pay 505bp. 8.5 WDAC Subsidiary CDS ONFllE Pay565bp. 8 Ono Finance II CDS GFCOPA Pay 130bp. 4.875 Gecina CDS NORDDK Pay 243bp. 8.25 Nordic Tel Co Holdings COS COGNDE Pay 495bp. 9.5 Cognis CDS KABEDE Pay 475bp. 10.75 Kabel Deutschland COS VIMECB Pay 505bp. 8.75 Virgin Media Finance CDS GRHODE Pay 530bp. 8.625 Grohe CDS WDACUS Pay 450bp. 8.5 WDAC Subsidiary CDSVIMEGB Pay34obp. 8.75 Virgin Media Finance CDS NORDDK Pay 255bp. 8.25 Nordic Tel Co Holdings COS GMACDE Pay 50bp. 6.875 General Motors CDS RESIUS Pay 40bp. 6.375 Residential Capital CDS CLCHUS Pay 25bp. 6.875 Clear Channel Communications CDS FMCCUS Pay 65bp. 7 Ford Motor Credit CDS TOYSPA Pay 75bp. 7.375 Toys 'R Us CDS HARRUS Pay 25bp. 5.375 Harrah's Operating CDS ABCOCA Pay 545bp. 8.375 Abitibi-Consol Co Canada CDS ABCOCA Pay 530bp. 8.375 Abitibi4onsol Co Canada COS SIXFUS Pay 705bp. 9.75 Six Flags CDS SLMOJS Pay 176bp. 5.125 SLM CDS WINCUS Pay 98bp. 8.125 Windstream CD5 GEMODE Pay473bp. 7.125 General Motors CDS TOYSPA Pay 610hp. 7.375Toys 'R Us CDS FMCCUS Pay 170bp. 7 Ford Motor Credit COX CDX NA HY series 7 1oY 32 Pay 325bp. .....................................................
io Credit Bonds CDS BRTELO Pay 113.5bp. 7.125 British Telecommunications CDS ELECSE Pay 77bp. 6 Eledrolux AB CDS SYNGLU Pay 22bp. 4.125 Synqenta tux Finance CDS HENKDE Pay 48bp. 4.25 Henkel KGAA CDS TNTPL Pay 53bp. 3.875 TNT CDS NGGFGB Pay41bp. NGG Finance (FRN) CDS CITGUS Pay47bp. 7.75 CITGroup CDS DSMNHE Pay 51bp. 6.75 DSM. COS BATIUS Pay 44bp. 4.875 B A T . Finance CDS CARRFR Pay 27bp. 6.125 Carrefour CDS PEAPLO Pay 100bp. 7 Pearson COS DOWCUS Pay Slbp. 6 Dow Chemical CDS HNSNLO Pay 49bp. 7.875 Hanson CDS AKZOAR Pay 23.5bp. 4.25 Akzo Nobel CDS SAINGB Pay 6gbp. 5.625 Sainsbury J. COX ITRAXX EUR Broad 5obp Pay 5obp. _._. .................................................
COS IMPENL Pay 80bp. 7.125 Imperial Tobacco 0/5 CDS LINDNL Pay46bp. 6.375 Linde Finance COS KAUPIC Pay53bp. Kaupthtng Bank HF (FRN) COS DACHUS Pay 19bp. 6.5 Datmler-Chrysler NA Holdings CDS CDMIF3 Pay32.5bp. 6.75 AXA CDS DEUTAN Pay 27.5bp. 5.375 Deutsche Finance CDS LAISIS Pay 29bp. Landsbanki Islands (FRN)
Expiration Expiration Currency Nominal Market Unrealized
date date value value gain/loss
reference CDS/CDX
bond EUR x 1 EUR x 1
15-01 2014 01-04 2013 01-07-2014 01-12-2014 01-12.2014 01-07-2014 01-04-2013 15-05-2014 01.10-2014 01-04-2013 01-12-2014 16-05.2014 19 02.2010 01-05-2016 15-05-2014 01-07.2014 15-04.2014 01-10.2014 01-12-2014 15-04-2014 01-05-2016 28-08.2012 30-06-2010 15-06-2018 01-10-2013 15.10 2018 15.12-2013 01.042015 01-04-2015 15-04-2013 27-08-2012 01-08-2013 15-07.2013 15-10-2018 01-10-2013
..._._.._.
15-02-2011 20-03-2008 22-04-2015 10-06-2013 01-06-2015 23-08-2011 02-04.2012 15-05-2009 25-02-2009 26-05-2010 27.10 2014 01.10-2012 27-09-2010 14-06-2011 11-07-2008
._..._..__
01-04-2009 14.06-2007 01-12*2009 15-11 2013 15-12-2010
19-10-2010 27-03-2012
EUR EUR EUR EUR EUR EUR EUR EUR EUR EUR EUR EUR EUR EUR EUR EUR EUR EUR EUR EUR EUR USD USD USD US0 USD USD USD USD US0 USD USD US0 USD USD USD . - . - . - .
EUR EUR EUR EUR EUR EUR EUR EUR EUR EUR EUR EUR EUR EUR EUR EUR - -_. ._
EUR EUR EUR EUR EUR EUR EUR
-79,831 357,114
-272,605 -182,493
-17,584 -95,997
-257,273 -242.758
148,625 -66,723
43,011 47,028 38,815
-11,143 -244,992 -118,690 -203,822
-32,732
-31,269 -7,332
-29,327 -33,767 -18,896 -19,487 -21,942
-5,890 -343.179 -212,785 -165,307 -187,336 -137,862
-70,182 -112,620
-44,2 25 -240,808
-31,206
..__...-.-.
-50,235 -15,104
-4,740 -23,004 -17.677 -14,591
27,508 7,364
-20,406 -6,293 -3,599
-594 -6,078
3,013 17,626
-11,094 . .__.._.___
3,290 10,650 12,567 1,110
3,591 -4,231
3,677
Robeco Capital Growth Funds 49

Credit-default swaps
As at 30 June 2007
Purchase/ Denomination Expiration Expiration Currency Nominal
Sale date date
of risk reference CDS/CDX
bond
30-06-2010 15-01-2012 01-04-2012 18-01-2012
P P P P P P P P P P P
Robeco European Currencies High Yield Bonds
CDS RESIUS Pay 170bp. 6.375 Residential Capital CDS GOLDUS Pay 31.5bp. 6.6 Goldman Sachs Group CDS MSFRFR Pay 31.5bp. 6.6 Morgan Stanley CDS SLHINY Pay 40bp. 6.625 Lehman Brothers Holdings CDS GFCOPA Fay 130bp. 4.875 Cecina COS CHOLUS Pay 65bp. 4 Countrywide Home Loan CDS SLMOUS Pay 175bp. 5.125 SLM COS ICBASG Paysgbp. 5.75 IClCl Bank Ltd Singapore CDS MSFRFR Pay 30bp. 6.6 Morgan Stanley CDS KAUPIC Pay46bp. Kaupthing HF (FRN) COS RECAUS Pay 28bp. 5.75 Reed Elsevier Capital ......................................................
S S S S S S 5 S 5 5 S 5 5 5 S 5 5 5 S ..
P P P P P P P P P P P P P P P P P P P P P P P P P .. ~ . . . . . . .
CDS BRTELO Pay 64bp. 7.125 British Telecommunications CDS ELECSE Pay 70bp. 6 Elertrolux AB CDS DSMNHE Pay 45bp. 6.75 DSM CDS KPNLNL Pay 1olbp. 8 Koninklilke KPN CDS BASELU Pay 247bp. 8.375 Basell AF COS GRHODE Pay 512bp. 8.625 Grohe Holding CDS UPCHNL Pay370bp. 7.75 Upr Holding CDS MRELFI Pay 340bp. 7.25 M-Real CDS WDACUS Pay 377bp. 8.5 WDAC Subsidiary CDS KABEDE Pay 414bp. 10.75 Kabel Deutschland COS INESCB Pay 375bp. 7.875 lneos Group Holdings CDS BASELU Pay 272bp. 8.375 Basell AF CDS PEAPLO Pay 1oobp. 7 Pearson CDS DOWCUS Pay 51bp. 6 Dow Chemical CDS COCNDE Pay423.5bp. 9.5 Cognis CDS VIMECB Pay43ibp. 8.75 Virgin Media Finance CDS BCEICA Pay 177bp. 7.35 BCE COX iTraxx Xover series 6XOV Pay 28Obp. CDX COX NA HY series 8 5Y 275 Pay 275bp. ............................................ _..
...
~ . .
19-02-2010 22-03-2011
16.11.2010 01-04-2012
27-08-2012
01-12-2009 31-07-2008 ....._.__.
15.02-2011 20.03-2008 15-05.2009 01-10.2010 15-08-2015 01-10-2014 15-01-2014 01-04-2013 01-12-2014 01-07-2014 15-02-2016 15-08-2015 27.10-2014 01.10-2012 15-05.2014 15-04-2014 30-10-2009
......_...
CDS VNUNNL Pay 275bp 5.625 VNU COS BCMIKY Pay4gbp. BCM Ireland Finanre (FRN) CDS GLENLU Pay 30bp. 5.375 Glencore Fin. Europe lux COS GRHODE Pay 75bp. 8.625 Grohe Holding COS NORDDK Pay 23bp. 8.25 NordicTel CDS RAYAFR Pay3obp. 9.375 Ray Acquisition C O S INESGB Pay 500bp. 7.875 Inem Group Holdings COS BASELU Pay 367bp. 8.375 Basell AF CDS FSFUDK Pay 50bp. 8.875 FS Funding CDS GRHODE Pay 547bp. 8.625 Grohe Holding CDS UPCHNL Pay435bp. 7.75 Upc Holding CDS KABEDE Pay 456bp. 10.75 Kabel Deutschland CDS WDACUS Pay 417bp. 8.5 WDAC Subsidiary CDS MRELFI Pay 400bp. 7.25 M-Real CDS GFCOPA Pay 130bp. 4.875 Gecina CDS NORDDK Pay 243bp. 8.25 NordicTel CDS COGNDE Pay495bp. 9.5 Cognis CDS VIMEGB Pay 505bp. 8.75 Virgin Media Finance CDS VIMEGB Pay 340bp. 8.75 Virgin Media Finance
20-05-2010 15-08-2016 30.09-2011 01-10.2014 01-05-2016 15-03.2015 15-02-2016 15-08-2015 15-05-2016 01-10.2014 15-01-2014 01-07-2014 01-12-2014 01-04-2013 19-02-2010 01-05-2016 15-05-2014 15-04-2014 15-042014 28.08-2012 30-06-2010
CDS GMACDE Pay 50bp 6 875 General Motors Acceptance CDS RESIUS Pay40bp. 6 375 Residential Capital COS CLCHUS Pay 25bp 6 875 Clear Channel Communications 15-06-2018 CDS FMCCUS Pay 65bp 7 Ford Motor Credit CDS TOYSPA Pay 75bp 7 375 Toys 'R Us CDS HARRUS Pay 25bp 5.375 Harrah's Operating
01-10-2013 15-10-2018 15-12-2013 .................................................... . - .__- - - - -
value
EUR EUR EUR EUR EUR EUR EUR EUR EUR EUR EUR . . ~ - - - -
EUR EUR EUR EUR EUR EUR EUR EUR EUR EUR EUR EUR EUR EUR EUR EUR EUR EUR USD
......
EUR EUR EUR EUR EUR EUR EUR EUR EUR EUR EUR EUR EUR EUR EUR EUR EUR EUR EUR USD USD USD USD USD USD ...... l.l.l.".l...
Market Unrealized
value qainlloss
EUR x i
-9,724 62
-728 3,425 5,458
-1,379 -60,177
-5,843 -5,379 -7,135 -2,167
EUR x 1
...._......
-14,028 -2,080
5,540 -9,785 41,811
60 9,401
26,044 12,945 23,128 -3,171 15,979 -1,080
-109 17,894 11,128
193 -64,697
30,826 ._._. "_....
13,864 345 448
77 -258
159 -26,749
-102,845 29
-4,628 -16,304 -27,260 -18,249 -36,753
1,617 -2,786
-22,272 -13,588
-1,563 -1,235 -2,412
-400 -541 -798 -125
. . . . . . . .
50 Robeco Capital Growth Funds

~ ~
Credit-default swaps
As at 30 June 2007
Purchase/ Denomination
Sale
of risk
Robeco Divirente VaR2 S P
Robeco Divirente VaR4
CDX ITRAXX EUR Xover 230 bp Pa Pay CDX CDX EM 7 series 7 125 bp .............................................................. .
S S S S S S S S S S S S S S S S 5 S S S S S S S S 5 S S 5 S S S S S S S 5 S S S 5 S S S S S S S S S 5 S
P P P P
CDS HENKDE Pay 2gbp.4.25 Henkel KGAA CDS TNTPNL Pay 48bp.3.875 TNT CDS ELECSE Pay56bp.6 Electrolux CDS KPNLNL Pay 84bp.8 Koninklilke KPN CDS SYNGLU Pay 19bp.4.125 Syngenta Lux Finance COS BRTELO Pay 70bp.5.75 British Telecommunications CDS DSMNHE Pay 41bp.4 DSM CDS BASELU Pay 252bp.8.375 Basell AF CDS INESGB Pay 365bp.7.875 lneos Group Holdings CDS GRHODE Pay512bp.8.625 Grohe Holding CDS UPCHNL Pay 370bp.7.75 Upc Holding CDS MRELFI Pay 330bp.7.25 M-Real CDS WDACUS Pay 377bp.8.5 WDAC Subsidiary COS KABEDE Pay 414bp.10.75 Kabel Deutschland CDS COCNDE Pay443bp.g.5 Cognis CDS MRELFI Pay 421bp.7.25 M-Real CDS GRHODE Pay 626bp.8.625 Grohe Holding CDS WDACUS Pay 467bp.8.5 WDAC Subsidiary COS INESCB Pay 375bp.7.875 lneos Group Holdings COS ONFllE Pay 525bp.8 Ono Finance II CDS BASELU Pay 272bp.8.375 Basell AF CDS HENKDE Pay 29bp.4.25 Henkel KCAA CDS TNTPNL Pay 43bp.3.875 TNT COS KPNLNL Pay 87bp.8 Koninkliike KPN COS BRTELO Pay 70bp.5.75 British Telecommunications CDS ELECSE Pay 67bp.6 Eledrolux AB CDS SYNGLU Pay 42bp.4.125 Syngenta Lux Finance CDS CARRFR Pay 27bp.6.125 Carrefour CDS PEAPLO Pay 100bp.7 Pearson CDS GRHODE Pay 50obp.8.625 Grohe Holding CDS DOWCUS Pay 51bp.6 Dow Chemical CDS HNSNLO Pay4gbp.7.875 Hanson CDS COCNDE Pay 423.5bp.9.5 Cognis CDS KABEDE Pay 428bp.10.75 Kabel Deutschland CDS VlMEGB Pay 431bp.8.75 Virgin Media Finance COS GRHODE Pay480bp.8.625 Crohe Holding CDS UPCHNL Pay 370bp.7.75 Upc Holding CDS WDACUS Pay 4oobp.8.5 WDAC Subsidiary CDS INESGB Pay 437bp.7.875 lneos Croup Holdings CDS ONFIIE Pay415bp.8 Ono Finance II CDS MRELFI Pay405bp.7.25 M-Real CDS AKZOAR Pay 23.5bp4.25 Akzo Nobel COS SAINCB Pay 69bp.5.625 Sainsbury J. CDS ABCOCA Pay 490bp.8.375 Abitibi-Consol Co Canada CDS SIXFUS Pay 658bp.9.75 Six Flags CDS BCEICA Pay 177bp.7.35 BCE CDX ITRAXX EUR Xover 230bp. Pay 230bp. COX ITRAXX EUR Broad 30bp. Pay 30bp. CDX ITRAXX EUR Broad 50bp. Paysobp. CDX CDX NA HY series 8 5Y 275 Pay 275bp. CDX CDX NA IG series 8 5Y 35 Pay 35bp. CDX CDX NA IC series 8 1oY 60 Pay 60bp. ...............................................
CDS IMTOLO Pay 66bp.6.25 Imperial Tobacco Finance CDS LINDN. Pay 29bp.6.375 Linde Finance CDS KAUPIC Pay 5ibp.Kaupthing Bank HF (FRN) CDS DACHUS Pay lgbp.6.5 Dairnler-Chrysler NA Holdings
...
Expiration Expiration Currency Nominal
date date value
reference CDS/CDX
10-06-2013 01-06-2015 20-03-2008 01-10-2010 22-04-2015 07-12-2028 10-11-2015 15-08-2015 15-02-2016 01-10-2014 15-01.2014 01.04-2013 01-12-2014 01-07-2014 15-05-2014 01.04.2013 01-10-2014 01-12-2014 15-02-2016 16-05-2014 15-08-2015 10-06-2013 01-06-2015 01-10-2010 07.12-2028 20-03-2008 22-04 2015 26-05-2010 27.10-2014 01-10-2014 01-10-2012 27-09-2010 15-05-2014 01-07-2014 15-04-2014 01-10-2014 15-01-2014 01-12-2014 15-02-2016 16-05-2014 01-04-2013 14-06-2011 11-07-2008 01-04 2015 15-04-2013 30-10-2009
.-........
04.12-2018 14.06-2007 01.12-2009 15.11-2013
EUR USD . . . . . - .
EUR EUR EUR EUR EUR EUR EUR EUR EUR EUR EUR EUR EUR EUR EUR EUR EUR EUR EUR EUR EUR EUR EUR EUR EUR EUR EUR EUR EUR EUR EUR EUR EUR EUR EUR EUR EUR EUR EUR EUR EUR EUR EUR US0 USD USD EUR EUR EUR US0 USD USD ......
EUR EUR EUR EUR
Market value
EUR x 1
-40,177 106,627 .__._._...
-1,928 3,010
2,269 -2,610
-237 -10,224
13,404 39,840 -2,400
60 9,401
28,514 12,945 23,128 39,280
6,038 -29,793 -11,759
-3,171
15,980 -2,787
-20,939 -14,286
-8,481 -2,740
-471 -10,650
-6,118
-12,270
9,952 -782
-8,317 53,682 64,234 44,511
9,810 60,712 51,943 36,715 62,120 50,179
4,520 26,439 60,183 11,470
966 -44,903
-7,396 65,352
9.257 15,807
-28,610
....._.___
-4,082 2,153 4,829
617
Unrealized
gain/loss
EUR x 1
Robeco Capital Growth Funds 51

Cred it-default swaps*
As at 30 June 2007
Purchase/ Denomination
Sale
of risk
P P P P P P P P P P P P P P P P P P P P P P P P P P P P P P P P P P P P P P P P P P P P P P P P P P P P P P P P P P P P P
CDS BCMlKY Pay 4gbp.BCM Ireland Finance (FRN) CDS GLENLU Pay 30bp.5.375 Glencore Fin. Europe Lux CDS GRHODE Pay 75bp.8.625 Grohe Holding CDS NORDDK Pay 23bp.8.25 NordicTel Co Holdings COS RAYAFR Pay 30bp.g.375 Ray Acquisition CDS BASELU Pay 375bp.8.375 Basell AF CDS INESGB Pay 510bp.7.875 lneos Group Holdings CDS FSFUDK Pay 50bp.8.875 FS Funding CDS DEUTAN Pay 27.5bp.5.375 Deutsche Finance CDS LAlSlS Pay 29bp.Landsbanki Islands (FRN) COS CRHODE Pay 547bp.8.625 Grohe Holding CDS UPCHNL Pay 435bp.7.75 Upc Holding CDS MRELFI Pay 390bp.7.25 M-Real Corporation CDS KABEDE Pay456bp.lo.75 Kabel Deutschland COS WDACUS Pay 417bp.8.5 WDAC Subsidiary C O S GOLDUS Pay 31.5bp.6.6 Goldman Sachs Group CDS MSFRFR Pay 31.5bp.6.6 Morgan Stanley CDS GMACDE Pay 150bp.6.875 General Motors Acceptance CDS COCNDE Pay 483bp.9.5 Cognis CDS CRHODE Pay 667bp.8.625 Grohe Holding CDS MRELFI Pay 480bp.7.25 M-Real Corporation CDS WDACUS Pay 505bp.8.5 WDAC Subsidiary COS ONFllE Pay565bp.8 Ono Finance I1 CDS LAlSlS Pay 35.5bp.Landsbanki Islands (FRN) CDS MSFRFR Pay 32bp.6.6 Morgan Stanley CDS GFCOPA Pay 122bp.4.875 Gecina COS BARYAM Pay 25.5bp.Deutsche Bank (FRN) CDS KAUPIC Pay 54bp.Kaupthing Bank HF (FRN) CDS GOLDUS Pay 30bp.6.6 Goldman Sachs Group COS IMTOLO Pay 80bp.6.25 Imperial Tobacco Finance CDS CHOLUS Pay 65bp.4 Countrywide Home Loan COS CRHODE Pay 550bp.8.625 Grohe Holding COS NORDDK Pay 243bp.8.25 NordicTel Co Holdings CDS ICBASG Pay 59bp.5.75 IClCl Bank Ltd Singapore CDS COGNDE Pay 495bp.9.5 Cognis CDS KABEDE Pay475bp.10.75 Kabel Deutschland COS VIMEGB Pay 505bp.8.75 Virgin Media Finance CDS GRHODE Pay 53obp.8.625 Grohe Holding CDS UPCHNL Pay44obp.7.75 Upc Holding CDS WDACUS Pay 450bp.8.5 WDAC Subsidiary CDS INESGB Pay 510bp.7.875 lneos Group Holdings CDS ONFllE Pay480bp.8 Ono Finance II COS MRELFI Pay 472bp.7.25 M-Real Corporation CDS RECAUS Pay 28bp.5.75 Reed Elsevier Capital CDS GMACDE Pay 50bp.6.875 General Motors Acceptance CDS RESIUS Pay 40bp.6.375 Residential Capital CDS CLCHUS Pay 25bp.6.875 Clear Channel Communications CDS FMCCUS Pay 65bp.7 Ford Motor Credit COS TOYSPA Pay 75bp.7.375 Toys 'R Us CDS HARRUS Pay 25bp.5.375 Harrah's Operating CDS AGCOCA Pay 545bp.8.375 Abitibi-Consol Co Canada CDS SIXFUS Pay 705bp.9.75 Six Flags CDS CLCHUS Pay 45bp.6.875 Clear Channel Communications CDS SLMOUS Pay 176bp.5.125 SLM CDS WINCUS Pay 98bp.8.125 Windstrearn COS GMACDE Pay 148bp 6.875 General Motors Acceptance CDX iTraxx Broad series 6EU2 Pay 30bp. CDX iTraxx series 6EU4 50b Pay 50bp. CDX iTraxx Xover series 6XOV Pay 280bp.
CDX CDX EM 7 series 7 125bp 6 Pay 125bp. CDX ABX HE 2006-2 EBB. Pay 242bp.
.......................................................
. Ihe unreal#zed resJ ' 5 dirclose3 3y couiterpzrtler
52 Robeco Capital Growth Funds
Expiration Expiration Currency Nominal
date date value reference COS/CDX
bond
15-08.2016 EUR 30-09.2011 EUR 01-10-2014 EUR 01-05-2016 EUR 15.03-2015 EUR 15-08-2015 EUR 15-02-2016 EUR 15-05.2016 EUR 27-03-2012 EUR 19-10-2010 EUR 01-10-2014 EUR 15-01-2014 EUR 01.04-2013 EUR 01-07-2014 EUR 01-12-2014 EUR 15-01 2012 EUR 01-04.2012 EUR 28-08-2012 EUR 15-05-2014 EUR 01.10-2014 EUR 01-04-2013 EUR 01-12-2014 EUR 16-05-2014 EUR 19-10-2010 EUR 01-042012 EUR 19-02~2010 EUR 20-09-2016 EUR 01-12-2009 EUR 15.01-2012 EUR 04-12-2018 EUR 22-03-2011 EUR 01-10 2014 EUR 01-05-2016 EUR 16-11-2010 EUR 15-05-2014 EUR 01-07-2014 EUR 15-04.2014 EUR 01-10-2014 EUR 15-01-2014 EUR 01-12-2014 EUR 15-02-2016 EUR 16-05-2014 EUR 0 1 04-2013 EUR 31-07-2008 EUR 28-08-2012 USD 30-06-2010 USD 15-06-2018 USD 01.10-2013 US0 15-10.2018 USD 15-12-2013 USD 01-04-2015 US0 15-04.2013 USD 15-06.2018 USD 27-08-2012 USD 01-08-2013 USD 28-08-2012 USD
EUR EUR EUR USD USD ____....._ -.._..
Market Unrealized
value gainlloss
EUR x 1
575 537 128
EUR x 1
-322 317
-98.199 -20,932
29 -1,693
1,471 -4,628
-16,304 -39,679 -27,260 -18,249
41 -476
-5,139 -48,552
29,725 -13,345
8,602 9,406 5,345
-3,760 1,156
-19,632 11,830 -4,838
-373 -2,333
-11,295 -3,980 -7,381
-66,816 -71,214 -54,353 -10,911 -81,635 -62,412 -47,379 -85,076 -68,417
-3,251 -1,852 -2,412
-721 -1,624 -1,197
-225 -51,477 -i5,028
-760 -46,834 -41,358 -18,439
15,665 6,661
58,227 -552,596
98,677 ...._.__...

Equity swaps
As at 30 June ZOO7
Quantity Name Currency Market value
EUR X 1
Robeco Health Care Equities
Longposition
120,000 Johnson G Johnson USD 5,475,103
300,000 Pfizer US0 5,679,908 .................................................................. ..................................................................
Securities lending ~~
2006/2007 2005/2006 30/06/2007
Market value In % of Income funds Income Income funds Income
As at 30 June 2007
of securities lent investments RSL RSL
EUR x 1,000 EUR x 1 EUR X 1,000 EUR x 1,000 EUR x 1,000
Equity sub-funds Robeco Global Equities Robeco Global Growth Equities Robeco Global Value Equities Robeco North American Equities Robeco US Premium Ecuities (EUR) Robeco US Premium Equities1 Robeco US MidCap Equities 1,2 Robeco USValue Equities 1 ~ 3
Robeco European Equ i t i es
Robeco European MidCap Equities Robeco European Opportunities Robeco MultiManager Asia-Pacific Equities Robeco Emerging Markets Equities 5
Robeco Emerging Stars Equities Robeco Chinese Equities
Sector equity sub-funds Robeco Financials Equities Robeco Food G Agri Equities Robeco Health Care Equities Robeco IT Equities Robeco Telecom Services Equities Robeco Consumer Goods Equities Robeco Industrials Equities Robeco Energy Equities Robeco Property Equities
Bond/abrolute-return sub-funds Robeco Global Bonds Robeco All Strategy Euro Bonds Robeco High Yield Bonds Robeco Euro Credit Bonds Robeco Euro Credit Single A Bonds Robeco Euro Governmeit Bonds Robeco Euro Bonds Robeco European Currencies High Yield Bonds Robeco Investment Grade ABS Robeco Divirente VaR2 Robeco Divirente VaR46
....................................
....................................
A A A B A A A A A C A A B B B ........
A A A A A A A A A
7,592,579 363,591
14,668,402
14,764,623 42,468,238
725,643
152,023,381 24,565,538 21,977,170
111,017,810 369,346,636
8,602,103 79,431,819
93,892,395
-
.............
9.4 5-8
18.4 13.7
8.1 13,5
6.2 -
12.9 8.4
21.1 14.0 16.5
6.6 30.5 ..............
125 7
154 1,656
101
320 -
- 2,946
169 54
545 6,132
36 302 .............
6 1 3
74 892
5 1 163 -
-
1,341 58 24
279 3,382
19 162 ._.__.
130 6
96 1,836
8 90 -
- 2,546
164
581 5,716
96
-
-
_.._._
221 72
252 83
121 8
11
148 275
75 3
54 1,101
4 50 -
-
1,398 93
340 3,478
56
-
- ...........
123 4 1
145 50 7 1 5 6
84 168
......
......
12,590,997 7,596,216 5,912,071 3,818,844 7,486,212 4,927,122 1,596,731
19,491,477 23,245,861 .............
12.5 12.3
3.9 4.6
12.1 21.3
3.5 16.2 16.5 ..................
216 80
157 76
166 34 15
139 201 ..........
106 40 74 38 79 17
7 75
104 ...... ....... . - ................................. .....
C
438,878,696 235,172,880 725,825,226
-
57.9 19.3 98.4 -
166 10
764 2 6
86 -
87 4
478 1
3 45 -
C 5 1 34 C 1 1
B 632 421 C C C 10 7 C
- - - -
- - 261,078,380
- 39.2
-
2,680,584 -
7.5 -
0.8 -
0.4 -
A C C
.. ................................................................................................................................... Durlng the reporting penod the fee which Robeco Seruritaer lendinq 6.V IRSL) received as compenrat#on for its services rhanged The percentages for :he different rub.tunds are as follows A T i l l 1 April 2001 35% from the gross Income. As from 1 April 20Cl this percentage 15 30% B Till 1 April 2007 35% trom the gross Income As from 1 April2007 this percentage remalned 35% C T i l l 1 A w l 2007: 35% from the grorr income AS from 1 April 2001 thl5 pertentage is 20%
Amount5 In US dollar 3 July 2006 through 3U June 2007 27 April2007 through 30 lune 2007. 20 NovemOer 2006 through 30 June 2007 For an amount ot EUR A9 2 million. the securities lending agreements concern total return ruapr g w g :ne subfund ICle performance o!tne underlying securities ihere swaps nave been included In the portfolio The Positions in the porttolio which partly mcluoe r w a ~ s have been marked with an asterix 3 November 2006 through 30 June 2001. 25 May 2001 through 30 Junr 7007
Robeco Capital Growth Funds 53

Management and service fee
Service fee’
Share class B D OH DL E EH I IE IH IHI I1 M P PE PH B, D, l,lH, I1
In % Management fee’
Share class
DH,DL IHI,IE
E,EH
M, p,
PE, PH
Equity sub-funds Robeco Global Equities Robeco Global Growth Equities Robeco Global Value Equities Robeco Global Conservative Equity Robeco North American Equities Robeco US Premium Equities (EUR) Robeco US Premium Equities Robeco US MidCap Equities Robeco US Value Equities Robeco European Equities Robeco European MidCap Equities Robeco European Opportunities Robeco European Conservative Equity Robeco 130/30 European Equities Robeco MultiManager Asia-Pacific Equities Robeco Emerging Markets Equities Robeco Emerging Stars Equities a
Robeco Chinese Equities ...............................
- 1.25 1.25 - - 1.25 1.25 -
1.25 1.25 1.25 -
- 1.25 1.25 - - 1.50 - - - 1.50 1.50 -
- 1.50 1.50 -
- 1.25 1.25 -
- 1.25 - -
1.00 1.00 1.00 -
- 1.50 - - - 1.25 - 1.50
- 1-00 - -
- 1.75 - -
- 150 - - - 1.50 - 1.75
1.00 1.00 - -
- 1.50 - - .....................
- 0.70 - 0.70 - 0.70 - 0.60 - 0.70 - 0.70
1.50 0.70 1.50 0.90 1.25 0.70
- 0.70 - 0.90 - 0.70 - 0.60 - 0.70
- - 1.50 - - - 1.50 -
- - 1.50 - - - - - - - 1.50 -
- - 2.00 -
- 2.00 - -
- - - -
- - - -
- - 1.50 -
- - 2.00 -
- 0.70 - - - - - - - - 2.00 -
- - 0.12 0.08 - - - 0.12 0.08 - - 2.00 0.12 0.08 -
- -
1.25 1.00 1.25
- 1.50 1.50 1.25
- -
1.25 1.00
-
1.75 1.50 1.50
- .....
- - - - - - -
1.50 -
- -
- - I -
- -
- -
- - - 0.70 - 0.90 - 0.70
...
-.-
- 0.08 0.05 -
- 0.12 0.08 - - 0.12 0.08 -
- 0.12 0.08 -
- 0.12 0.08 -
- 0.12 0.08 -
- 0.12 0.08 -
- 0.12 0.08 -
- 0.12 0.08 0.08 - 0.08 0.05 -
- 0.12 0.08 -
- 0.90 - 1.10 - 1.10 - 1.10 ............
- - 2.00 -
- - 2.00 2.00 - 1.10 - -
- 2.00 - - .....................
- 0.12 0.08 -
- 0.12 0.08 -
- 0.12 0.08 0.12 - 0.12 0.08 - ................... .. ...
Sector equity sub-funds Roheco Financials Equities Robeco food b Agri Equities Robeco Health Care Equities Roheco IT Equities Robeco Telecom Services Equities Robeco Consumer Goods Equities Robeco Industrials Equities Robeco Energy Equities Robeco Property Equities
Bond sub-funds Robeco Global Bonds Roheco All Strategy Euro Bonds Robeco High Yield Bonds Robeco Euro Credit Bonds Robeco Euro Credit Single A Bonds Roheco Euro Government Bonds Robeco Euro Bonds Robeco European Currencies High Yield Bonds Robeco Emerging Debt Robeco Investment Grade ABS
...........................
- 1.50 -
- 1.50 -
- 1.50 -
- 1.50 -
- 1.50 -
- 1.50 -
- 1.50 -
- 1.50 -
- 1.50 - ................
- - 2.00 -
- - 2.00 -
- - 2.00 -
- 2.00 - - - 2.00 -
- 2.00 -
- - 2.00 -
- - 2.00 -
- - 2.00 -
-
-
.....................
- 0.12 -
- 0.12 -
- 0.12 -
- 0.12 - - 0.12 -
- 0.12 -
- 0.12 -
- 0.12 0.08 - 0.12 0.08 .............. ..
Robeco High Income ABS: - 1.35 - 2.00 1.35 ............................................................
Absolute-return sub-funds Robeco Divirente VaR2 0.48 0.48 - - 0.48 Robeco Divirente VaR4 j 0.80 0 8 0 - 1.00 0.80 Robeco Divirente VaR8 0.80 0.80 - 1.00 0.80 ............................................................
Other sub-funds
...
- 0.08 0.04 - 0.08 0.04 - 0.08 0.04 - 0.08 0.04 - 0.08 0.04 - 0.08 0.04 - 0.08 0.04
0.70 1.00 - - 1.00 -
0.90 1.00 - - 1.00 -
- 1.00 - - 1.00 -
0.70 1.00 -
- 1.00 - 1.00 - 1.00 - 1.00 - 1.00 - 1.00 - 1.00
- 0.30 0.30 - 0.30 0.30 - 0.50 0.50
- 0.35 0.35 - 0.35 0.35 - 0.30 0.30 - 0.35 0.35
- 1.50 - -
- - 0.35 -
- - 1.25 1.75 - - - - - - - -
0.35 - - -
0.40 - - -
- 1.00 -
- 1.20 -
- 0.70 -
- 1.00 - 1.20 - 0.70
- 0.50 0.50 - 0.80 0.80 - 0.25 - - 0.70 - ................
- - 1.25 - - - - - - - - - - 1.50 - - .....................
- 0.08 0.04 - 0.08 0.04 - 0.08 0.04 - 0.08 0.04 ..................
- - 0.80 -
- 0.70 1.10 -
- - 0.08 0.03 - - 0.08 0.03 - - 0.08 0.0’1
- 0.25 0.25 - 0.50 0.50 - 0.50 0.50 ~ .~ ............................................
- - - - - - _ -
- - 0.70 1.10 - - ..........................
- I Robeco Liberty40 - 1.40 - ....................................................................................................... - - 0.08 - - .......................... I All share Llasses are ment#cned except for the class Z share ?e percentage of the management fee and SeNlce fee fcr rhe class Z share 15 0%. Not all share classes were introduced at balance-sheet date The rlarrer which had
been introouced are mentioned on pages 55 tc 57 mclcr VP In the table lotal expense ratio
1’:ne assets of a rub-fund exceed EJR 1 bi!i-o?, the rewire fee for the asset5 above EUR 1 billion of the relevant sub.fund will be reduced by 0 02% and If the arrets of a rub-furia exceed EUR 5 billion, the service fee Iorthe arretr
above EUR 5 billior 3f t9e relevant sub-tund will ne redurpd by ano!ner C.02$ ?ur IUD func is also SJbierl IC a pedormance ~ P C
For 3. c l a n nf share the iervlce tee .I 0 08%
:
3
54 Robeco Capital Growth Funds

Total expense ratio
In % 2006/2007 2005/2006
Management Service Performance Other Total Manage- Service Other Total
fee
Equity sub-funds
Robeco Global Equities
M EUR shares 1.50
D EUR shares 1.25
DH EUR shares: 0.82 ..................................................
- fee fee costs
Robeco Global Growth Equities
0 EUR shares
Robeco Global Value Equities
B EUR shares
D EUR shares
I EUR shares
M EUR shares
P PLN shares
Robeco North American Equities
D EUR shares
I EUR shares
M EUR shares
D USD shares;
Robeco US Premium Equities (EUR)
D shares
I shares
M shares
Robeco US Premium Equities
0 USD shares
I US0 shares
M USD shares
Robeco US MidCap Equities
D USD shares
DH EUR shares Io
I USD Shares
...................................
...................................
...................................
...................................
...................................
1.25 .............
1.25
1.25
0.70
1.24
1.49 .............
1.25
0.70
1.50
0.88
..
1.50
0.70
1.20 ..........
1.50
0.70
1.20 .............
1.50
1.04
0.90
0 12 0 09 0 12 0 09
-
-
0.08 - 0.06 .............................
- 0.21 0.12 .............................
- 0.09
0.12 - 0.08
0.08 - 0.05
0.10 - 0.08
0.04 - 0.08
0.12
.............................
0.12 - 0.06
0.08 - 0.02
0.12 - 0.07
0.08 - 0.05 .............................
0.12 - 0.11
0.08 - 0.07 - 0 07 0 07 .............................
0 12 - 0 08
o 08 0 04 -
0.07 - 0.06 .............................
0.12 - 0.18
0.08 0.21 - . .
0.08 - 0.11 ................................................................................. Robeco US Value Equities
D USD shares 0.21
I USD shares 0.12
Robero European Equities
D EUR shares 1.25
I EUR shares l2 - M EUR shares 1.50
Robeco European MidCap Equities
0 EUR shares 1.50
M EUR shares 2.00
Robeco European Opportunities
0 EUR shares I3 0.77
I EURshareslj 0.43 Robeco MultiManager Asia-Pacific Equities
D EUR shares 1.75
...............................................
...............................................
...............................................
................................................
I EUR shares 0.90
M EUR shares 2.00 ................................................
0.02 - 0.01 - ..........................
0.12 - - -
0.12 - ...................... .-
0.12 - 0.12 - ..........................
0.07 3.55 0.05 1.63 .......................
0.12 - 0.08 - 0 12 - ..........................
0.01
0.00 .......
0.07
-
0.07 .......
0.07
0.07 .......
0.11
0.05 ......
0.10
0.06
0.10 ..................
rnent fee fee costs
125 0.12 0 10
1.50 0.12 0.10
.................................
1 2 5 0 12 0 10
1 2 5 0 12 0 10
0 46 0 05 0.01 - - -
- - - ............................
125 0.12 0.06 9.
0 70 0.08 0.03
1 5 0 0 12 0 06 - - -
.................................
0.87 0.07 0.17
0 41 0 05 0 13 - - -
.................................
1.13 0 09 0 11
0.52 0.06 0 05 - - -
- ................
Robeco Capital Growth Funds 55
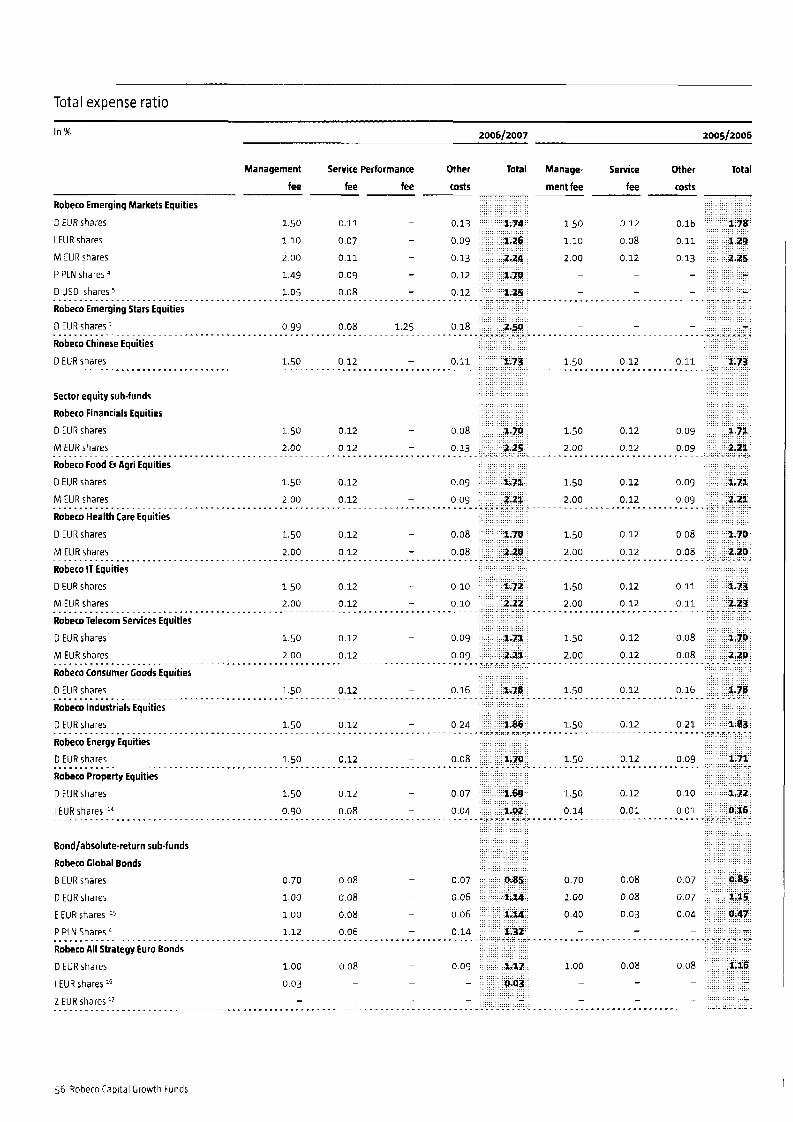
Total expense ratio
In % 2 0 0 6 / 2 0 0 7 2005/2006
Management Service Performance Other Total Manage- Service Other Total
fee fee fee costs ment fee fee costs
Robeco Emerging Markets Equities
D EUR shares 150 0.11 0 13 150 0 12 0 16 -
I EUR shares 110 0 07 - 0.09 110 0 ox 0 11
M EUR shares 2 00 0 11 0.13 2 00 0 12 0 13 P PLN shares 1 4 9 0 09 - 0.12 - - - D USD shares 5 1 0 5 0 08 0 12 - - Robeco Emerging Stars Equities DEURshares- 0 99 0 08 1.25 0 18 - - -
Robeco Chinese Equities D EUR sharer 1 5 0 0 12 - 0 11 150 0 12 0 11
-
- - ................................................................................. .................................
................................................................................. .................................
................................................................................. .................................
Sector equity sub-funds
Robeco Financials Equities D EUR shares 1 5 0 0 12 - 0 08 150 0.12 0 09
M EUR shares 2 00 0 12 0 33 2 00 0 12 0 09
Robeco Food Lt Agri Equities
D EUR shares 1.50 0.12 0 09 1 5 0 0 12 0 09
M EUR shares 2 00 0.12 0 09 2.00 0 12 0 09
- ................................................................................. .................................
-
- ................................................................................. .................................
0.08 150 0 12 0 08
0 08 2 00 0 12 0 08 ........ .................................
Robeco Health Care Equities
0 EUR shares 1.50 0.12
M EUR sharer 2.00 0 12
Robeco IT Equities
D EUR shares 1.50 0.12
M EUR shares 2.00 0.12
Robeco Telecom Services Equities
0 EUR shares 1.50 0.12
M EUR shares 2.00 0.12
Robeco Consumer Goods Equities
D EUR shares 1.50 0.12
Robeco Industrials Equities
D EUR shares 1.50 0.12
Robeco Energy Equities
0 EUR shares 1.50 0.12
Robeco Property Equities
D EUR shares 1.50 0.12
...........................................................
...........................................................
...........................................................
...........................................................
...........................................................
...........................................................
- ..............
0.12 0.11
0.12 0.11
0 10 1.50
0 10 2.00 ........ .............
0 09 150
0 09 2 00 .- ._.._. .............
0.16 150 ........ .............
0 24 150 ........ .............
0.08 1.50
0 07 1.50
I EUR shares I4 0 90 0 08 0.04 0 14
........ .............
- ................................................................................. .............
Bond/absolute-return sub-funds
Robeco Global Bonds - B EUR shares 0 70 0 os 0 07 0 70
0 EUR shares 1 0 0 0 08 - 0 06 1 00
E EUR shares :- 1 0 0 0 08 0 06 0 40
P PLN Shares 1 1 2 0 06 0 14
Robeco A l l Strategy Euro Bonds - 1 0 0 D EUR shares 100 0 08 0 09
I EUR shares A 0 03 - - - -
-
- - ................................................................................. ..............
0.12 0.08
0.12 0.08 ................. -
..............
0.12 0.16 .................
0.12 0.21 .................
0.12 0.09 ...................
0.12 0.10
0.01 0.01 ...................
0.08 0.07
0.08 0.07
0.03 0.04 - -
..................
0.08 0.08
- -
- - ...................
- ...........
2 EUR shares I i .................... -
........ . . . . . . . .
- . . . . . - - . . . . . . . ............................. ................ .....
56 Robeco Capital Growth Funds

Total expense ratio
In % 2006/2007 2005/2006
Management Service Performance Mher Total Manage- Setvice Other Total
fee fee fee costs ment fee fee -- costs
0.06
0.03
0.02
0.06 -
- ......
0.07
0.03 _.._._
0.08
0.03 ._.._.
0.06
0.03
- ......
- -
-
- _.__..
0.12
0.03 -
_._.._
-
- ......
-
-
-
- ......
-
-
-
Robeco High Yield Bonds
0 EUR shares 1.00
E EUR s h a w l 5 1.00
I EUR shares le 0.50
M EUR shares 1.25
P PLN shares 1.31
2 EUR shares l7
Robeco Euro Credit Bonds
- ................................................
0.08
0.03
0.03
0.08
-
0.08
0.08
0.04
0.08
0.06
- ......
0.08
0.04
1.00
0.40
0.42
1.25 -
-
0 06
0 08
0 02
0 07
0 06 -
......
0 07
0.03 ......
0 07
0 03 ......
0.07
0 02
- ......
0.01
0 01 -
- ......
0 08
0 04
0 0 1 ___.._
0 05
0 02 ._.._.
0 01
0 01
-
- - -_ .__
0 16
0 10
0 03 ......
D EUR shares
I EUR shares
Robeco Euro Credit Single A Bonds
D EUR shares
I EUR shares
Robeco Euro Government Bonds
D EUR shares
I EUR shares
2 EUR shares
Robeco Euro Bonds
D EUR shares l7
E EUR shares l7
I EUR Shares l6
Z EUR shares I7
...............................
...............................
...............................
...............................
1.00
0.35 ..............
1.00
0.35 ...........
0.08
0.04 ............ -
.......... .....
_.._.
.....
.....
._.-.
.....
.....
..-..
0.08
0.04
1.00
0.35
0.08
0.04
1.00
0.35 - ..........
0.99 0.30
- ..............
0.08
0.08
0.03 -
0.08
0.04 -
1.00
0.30 -
0.08
0.04 -
0.01
0.01 - -
Robeco European Currencies High Yield Bonds
D EUR shares 1.00
I EUR shares 0.50
2 EUR shares l7 - Robeco Investment Grade ABS
0 EUR shares l3 0.43 I EUR shares l3 0.15
................................................
0.08
0.04
0.75
0.37
0.06
0.03 -
.......... -
........... -
............
0.05
0.02 ..........
- -
..........
- -
........... -
............ .................................... Robeco Divirente VaR2
0 EUR shares :7
E EUR shares
I EUR shares l6
2 EUR shares:'
Robeco Divirente VaR4
D EUR shares
....................................
E EUR Shares ' I EUR shares .................................... ' 3 NovQmber 2006 through 30 June 2007
3 NovembQr 2005 through 30 June 2006
2 October 2006 through 30 lun? 2007
. 3 September 2006 through 30 lune 2007.
16 October 2006 through 30 lune 2007. 1 December 2005 through 30 June 2006 16 November 2006 throug3 30 June 2007 3 Oaober 2005 through 30 lune 2006 3 July 2006 through 30 June 2007 17 October 2006 through 30 lune 2007 27 ADrll2007 through 30 Jme 2007 1 July 2005 through 19 April 2006 20 November 2006 through 30 lune 2007 i May 2006 rhrough 30 lune 2006 6 Februan, 2006 through 30 June 2006 25 May 2007 through 30 June 2007 4 June 2007 through 30 June 2007 1 Septembe: 2 0 6 through 30 June 2006
' a
' '" ''
'' '*
'' In
I'
- ............
0.04
0.04
0.02
- ............
0.01
0.01 -
- ............
0.52
0.52
0.33 ............
0.05
0.05
0.02 ..........
- I
- ...........
- ..........
- ............
Robeco Capital Growth Funds 57

Transaction costs
2006/2007 2005/2006
Transadion type Volume ’ Transaction type Volume I
stocks
Equity sub-funds
Robero Global Equities
Robeco Global Growth Equities
Robeco Global Value Equities
Robeco North American Equities
Robeco US Premium Equities (EUR)’
Robeco US Premium Equities?
Robeco US MidCap Equities
Robeco US Value Equities ’ Robero European Equities
Robeco European MidCap Equities
Robeco European Opportunities
Robeco MultiManager Asia-Pacific Equities
Robeco Emerging Markets Equities
Robeco Emerging Stars Equities
Robeco Chinese Equities ......................................................
Sector equity sub-funds
Robeco Financials Equities
Robeco Food G Aqri Equities
Robero Health Care Equities
Robeco IT Equities
Robeco Telecom Services Equities
Robeco Consumer Goods Equities
Robeco Industrials Equities
Robero Energy Equities
Robeco Property Equities ...................................
Bond/absolute-return sub-funds
Robeco Global Bonds
Robeco All Strategy Euro Bonds
Robeco High Yield Bonds
Robero Euro Credit Bonds
Robeco Euro Credit Single A Bonds
Robeco Euro Government Bonds
Robeco Euro Bonds e
Robeco European Currencies High Yield Bonds
Robeco Investment Grade ABS E
Robeco Divirente VaR2
Rnbeco Divirente VaR4’
EUR x 1,000
Futures
76
4
272
916
165
232
2 1
2
5,071
830
387
1,448
4,712
252
621 ...........
341
71 200
587
247
79
45
148
408 ........................
........................ ..........
EUR x 1,000
% stocks Futures %
........
. . - . - . . - -
.........
-
133
14
145
970
40
234 -
-
5,623
1,613 -
2,307
4,607 -
382 .._._.
325
75
274
848
185
36
24
186
375 ._._..
-
-
-
-
-
-
-
-
- - -
......
4 -
85 7
4
9
5
2 1 -
- -
-
- ...............
1
:
1
If :ne volume of the quantif,able Iransaction ( o m :I less than
1 December 2005 through 30 June 2006 3 Ocobe. 2005 through 30 June 2006
3 July 2006:!1rou~b 30 June 20C7
27 Aprll2007 throuqb 30 Im 2007
13 Novprnber 2006 through 33 Jup.e7OC7 3 November 2306 throupb 30 June 2057
25 May 2337 throuoh 30 June 2007
7% of the total tranrarrlon volume, nu volume perCentage 15 glven
t
’
58 Robeco Capital Growth Funds

Turnover rat io
In %
Equity sub-funds
Robeco Global Equlties
Robeco Global Growth Equities
Robeco Global Value Equities
Robeco North Amerlcan Equities
Robeco US Premium Equities (EUR)
Robeco US Premium Equities?
Robeco US MidCap EqLities
Robeco US Value Equitmes ‘ Robeco European Equities
Robeco European MidCap Equities
Robeco European Opportunities 3
Robeco MultiManager Asia-Pacific Equities
Robeco Emerging Markets Equities
Robeco Emerging Stars Equities
Robeco Chinese Equities ._.__._._.._..... -_........_._....
Sector equity sub-funds
Robeco Financials Equities
Robeco Food G Agri Equities
Robeco Health Care Equities
Robeco IT Equities
Robeco Telecom Services Equities
Robeco Consumer Goods Equities
Robeco Industrials Equities
Robeco Energy Equities
Robeco Property Equities ....-.....________._........._______
Bond/a bsolute-return sub-funds
Robeco Global Bonds
Robeco All Strategy Euro Bonds
Robeco High Yield Bonds
Robeco Euro Credit Bonds
Robeco Euro Credit Single A Bonds
Robeco Euro Government Bonds
Robeco Euro Bonds
Robeco European Currencies High Yield Bonds
Robeco Investment Grade ABS
Robeco Divirente VaR2 ’ Robeco Divirente VaR4
-
.................................... 1 December 2005 through 30 June 2006 3 ORnber 2005 through 30 June 2006.
3 July 2006 through 30 Jule 2007 27 Aprfl2007 through 30 lune 2007
20 November 2006 through 30 June 2007 3 November 2006 thfougt 30 June 2007.
29 May 2007 through 30 June 2007
’ ‘
’
63
31
110
167
53 45 -
- 185
156 -
163
10 -
- ....
139 35 49 556
160
180
70
43 61 .._.
128
149
1
226
169
56 -
62 -
-
- ...
Robeco Capital Growth Funds 59

Transactions with affiliated parties
Part of the total volume in % 2 0 0 6 / 2 0 0 7 2 0 0 5 / 2 0 0 6
Transaction type Transaction type
Stocks/ Forward Others Stocks/ Forward Others
Bonds’ exchange Bonds exchange
transaction transaction
Equity sub-funds
Robeco Global Equities
Robeco Global Growth Equities
Robeco Global Value Equities
Robeco North American Equities
Robeco US Premium Equities (EUR)
Robeco US Premium Equities
Robeco US MidCap EquitiesA
Robeco US Value Equities ’
Robero European Equities
Robeco European MidCap Equities
Robeco European Opportunities
Robeco MultiManager Asia-Pacific Equities
Robeco Emerging Markets Equities
Robeco Emerging Stars Equities
Robeco Chinese Equities .............................................................
Sector equity sub-funds
Robeco Finanrials Equities
Robeco Food G Agri Equities
Robeco Health Care Equities
Robeco IT Equities
Robeco Telecom Services Equities
Robeco Consumer Goods Equities
Robeco Industrials Equities
Robeco Energy Equities
Robeco Property Equities ..............................................................
Bond/absolute-return sub-funds
Robeco Global Bonds
Robero All Strategy Euro Bonds
Robeco High Yield Bonds
Robeco Euro Credit Bonds
Robeco Euro Credit Single A Bonds
Robeco Euro Government Bonds
Robero Euro Bonds
Robeco European CJrrencies High Yield Bonds
Robeco Investment Grade ABS
Robeco Divirente VaR2’
Robeco Divirente VaR4’ ..............................................................
- 7.4
- 100.0
- 46.0
51.5 - 31.0
-
- -
- -
- - - 19.1
1.4
0.1 50.5
-
- -
- 16.7
48.7 -
- 25.0 .........................
-
1.4
3.2 1.2
0.3
4.7
0.1
4.7
43.8
9.7
4.7 .............. ...
92.2
0.7
-
- - -
15.2 - 91.6 -
17.4
93.7 14.6 -
11.5
-
-
I
................
16.2
95.2 81.7
96.7
42.2
-
20.6
62.9
-
23.2 -
34.7 .........
90.8
24.3 2.1
37.7
97.5 100.0
75.2
73.7
18.5 ............ ..
.. 1
. Stocks tor equity sub-funds d x 5ec3r eaurv sub-funds and bonds for bondlabsolute-rpturn sub-fund!
1 Decerber 20C5:!30ugh 30 JilnP 200E
3 3duber 2005 through 3C lune 2006
3 Ju!y 2006 through 30 June 2007
27 Apri’ 7007 !:roJgh 3C m e 2067
20 Novprnber 2006 throuok, 30 June 2007 3 November 200b ;n‘ough 3G lune iGG7 75 May 2007 throutn 3C , m e 7307
: o n t e ~ s call-”loiev
’
’
‘; :orlieris credr default swaps
60 Robeco Capital Growth Funds

Other data
Savings directive information The bond sub-funds of the Company are subject to the EL! savings directive.
Stock-exchange listing
Robeco Capital Growth Funds’ 0 shares are listed on the
Luxembourg Stock Exchange.
Distributions
In the reported period the following distributions took
place:
Distributions
I n E U R x l Amount EX- Pay per share dividend date
date
Robeco Global Value Equities
B EUR shares 1.26 15/09/2006 22/09/2006
1.33 15/12/2006 22/12/2006
1.34 16/03/2007 23/03/2007
1.38 15/06/2007 22/06/2007 ........................ - Total 5.31
Robeto Global Bonds
B EUR shares 0.88 15/09/2006 22/09/2006 0.88 15/12/2006 22/12/2006
0.88 16/03/2007 23/03/2007
0.86 15/06/2007 22/06/2007 .._.___._._..__._._..._ - Total 3.50
Robeco Global Bonds
E EUR shares 1.10 08/12/2006 15/12/2006 _.....__._.~...____.._.
Robeco High Yield Bonds
E EUR shares 3.62 08/12/2006 15/12/2006 ...._._.._...._.....__.
Proposed dividends
The Board of Directors proposes the following dividends
over the financial year ended 30 June 2007.
Robeco Global Value Equities B EUR shares
Besides the already distributed interim dividends no final
dividend is proposed.
Robeco Global Bonds B EUR shares
Besides the already distributed interim dividends no final
dividend is proposed.
Robeco High Yield Bonds E shares
A dividend of EUR 3.47 per share IS proposed. The dividend
wil l be payable on 14 December 2007 and the record
date will be 6 December 2007. The shares wil l be quoted
ex-dividend as of 7 December 2007.
Robeco Euro Bonds E EUR shares
A dividend of EUR 0 . 2 9 per share i s proposed. The dividend
wil l be payable on 14 December 2007 and the record
date will be 6 December 2007. The shares wil l be quoted
ex-dividend as of 7 December 2007.
Robeco Divirente VaRz E EUR shares
A dividend of EUR 0.38 per share is proposed. The dividend
wil l be payable on 14 December 2007 and the record
date wil l be 6 December 2007. The shares wil l be quoted
ex-dividend as of 7 December 2007.
Joint interest of directors At 1 July 2006 the members of the Board of Directors held
a joint interest of 4,398 shares of Robeco Capital Growth
Funds and the following joint interests in investments of
the fund: 130 shares Electronic Data Systems and 235 shares Veolia Environment.
As at 30 June 2007 the members of the Board of Directors
held a joint interest of 3,810 shares of Robeco Capital
Growth Funds and no interest in investments of the Fund.
Luxembourg, 26 October 2007
The Board of Directors
M. Strating
F.A. de Boer
S.F.A. Richter
Robeco Global Bonds E EUR shares
A dividend of E U R 8.18 per share is proposed. The dividend
wil l be payable on 14 December 2007 and the record
date will be 6 December 2007. The shares will be quoted
ex-dividend as of 7 December 2007.
Robeco Caoital Growth Funds 61
I nd epe ndent Auditor’s Report
To the shareholders of Robeco Capital Growth Funds We have audited the accompanying financial statements
of Robeco Capital Growth Funds and of each of i t s sub-
funds, which comprise the statement of net assets and the
investment portfolio as at 30 June 2007 and the statement
of operations and changes in net assets for the year then
ended, and a summary of significant accounting policies
and other explanatory notes to the financial statements
Board of Directors of the SICAV’s responsibility for the f inancial statements
The Board of Directors of the SICAV is responsible for
the preparation and fair presentation of these financial
statements in accordance with Luxembourg legal and
regulatory requirements relating t o the preparation of
the financial statements. This responsibility includes:
designing, implementing and maintaining internal
control relevant to the preparation and fair presentation
of financial statements that are free from material
misstatement, whether due to fraud or error; selecting
and applying appropriate accounting policies; and
making accounting estimates that are reasonable in the
circumstances.
Auditor’s responsibility
Our responsibility is to express an opinion on these
financial statements based on our audit. We conducted
our audit in accordance with International Standards
on Auditing as adopted by the ”lnstitut des Reviseurs
d’Entreprises’’. Those standards require that we comply
with ethical requirements and plan and perform the audit
to obtain reasonable assurance whether the financial
statements are free f rom material misstatement.
An audit involves performing procedures to obtain audit
evidence about the amounts and disclosures in the
financial statements. The procedures selected depend
on the Auditor’s judgment, including the assessment
of the risks of material misstatement of the financial
statements, whether due t o fraud or error. In making those
risk assessments, the Auditor considers internal control
relevant to the entity’s preparation and fair presentation
of the financial statements in order to design audit
procedures that are appropriate in the circumstances,
but not for the purpose of expressing an opinion on the
effectiveness of the entity’s internal control.
An audit also includes evaluating the appropriateness
of accounting policies used and the reasonableness of
accounting estimates made by the Board of Directors of the
SICAV, as well as evaluating the overall presentation of the
financial statements.
We believe that the audit evidence we have obtained is
sufficient and appropriate to provide a basis for our audit
opinion.
Opinion
In our opinion, these financial statements give a true and
fair view of the financial position of Robeco Capital Growth
Funds and of each of its sub-funds as of 30 June 2007,
and of the results of their operations and changes in their
net assets for the year then ended in accordance with
Luxembourg legal and regulatory requirements relating to
the preparation of the financial statements.
Other matters
Supplementary information included in the annual report
has been reviewed in the context of our mandate but
has not been subject to specific audit procedures carried
out in accordance with the standards described above
Consequently, we express no opinion on such information
However, we have no observation to make concerning
such information in the context of the financial statements
taken as a whole
Luxembourg, 26 October 2007
PricewaterhouseCoopers 5.h 1.1. Reviseur d‘entreprises
Represented by
Christelle Crepin
62 Robeco Capital Growth Funds
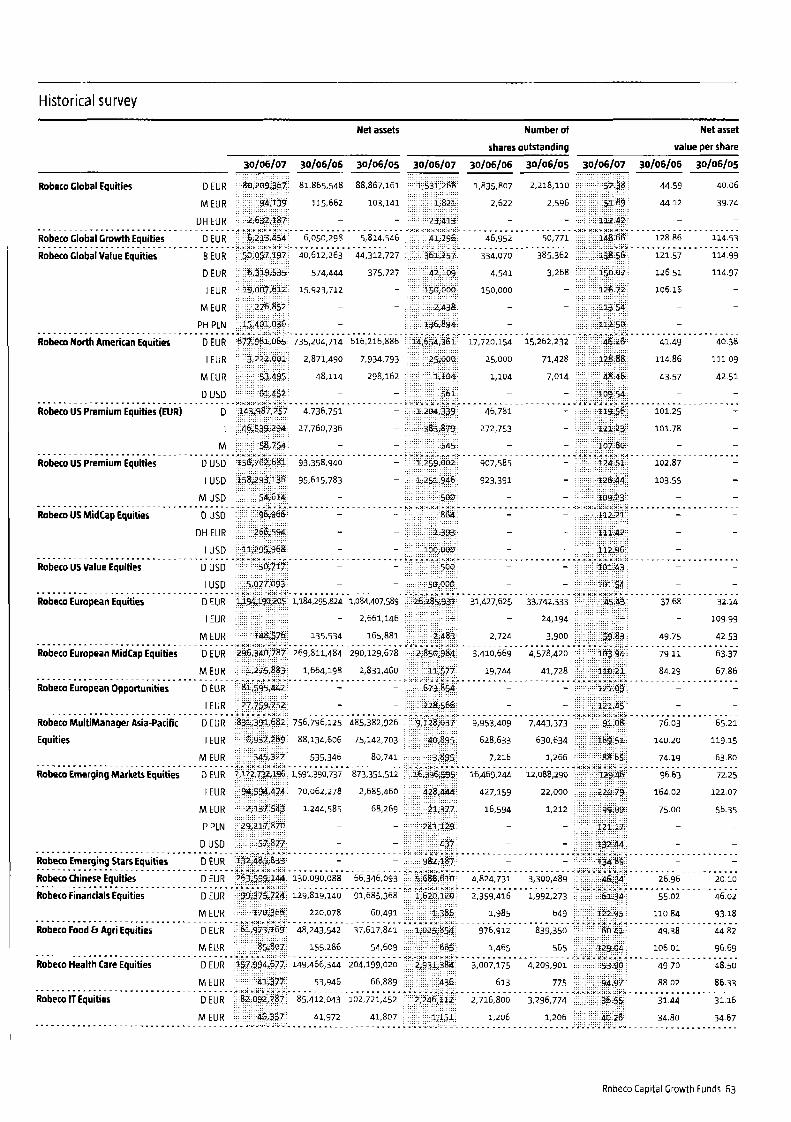
~
Historical survey
Net asset Net assets Number of
......................... Robeco US Value Equities
............................ Robeco European Equities
............................ Robeco European MidCap Equities
............................ Robeco European Opportunities
............................ Robeco MultiManager Asia-Pacific
Equities
............................ Robeco Emerging Markets Equities
shares outstanding value per share
30/06/07 30106 f 06 30 fob 105 30/06/07 30106 106 30/06/05 30/06/07 30/06/06 30/06/05
Robeco Global Equities D EUR 81,865,548 88,867,161 1,835,807 2,218,110 44 59 40 06
M EUR 115,662 103,141 2,622 2,596 44 12 39 74
- - - - - - ...................................... ...................... ..................... ..................... OH EUR
D EUR 6.050.298 5,814,546 46.952 50,771 12886 11453
Robeco Global Value Equities B EUR 40,612,263 44,312,727 33A.070 385,362 12157 11499
574,444 375.727 4,541 3.268 1 2 6 5 1 11497
...................................... ...................... ..................... ..................... Robeco Global Growth Equities
0 EUR
I EUR 15,923,712 150,000 106 1 6 - - -
M EUR
PH PLN
- - - - - -
- - - - - - ...................................... ...................... ..................... ...................... Robeco North American Equities D EUR 735,204,714 616,216,886 17,720,154 15,262,232 41.49 40 38
I EUR 2,871,490 7,334,793 25.000 71,428 11486 11109
M EUR 48,114 298,162 1,104 7,014 43 57 42 51 - - - - - -
...................................... ...................... ...................... ..................... D USD - 4.736.751 46,781 - 101 25 Robeco US Premium Equities (EUR) 0 -
I 27,760,736 2 7 2,7 5 3 - 101 78 -
Robeco US Premium Equities D US0 93.358.940 907,585 102 87 -
-
- - - - - - ...................................... ...................... .................... ..................... M
- -
- - I USD 95,615,783 923,391 103 55 - - - - - - -
..................................... ..................... ..................... ..................... M USD
Robeco US MidCap Equities 0 US0 - - - - - -
DH EUR
I USD
D US0
I USD
- - - - - - - - - - - -
.......... ...................... ..................... ..................... - - - - - -
- - - - - - .......... ...................... ..................... .....................
0 EUR 1.184.295.824 1,084,407,589 31,427525 33.742.333 37 68 32 14
I EUR - 2,661,146 - 24,194 - 10999
135.534 165,881 2,724 3.900 49 75 42 53 M EUR
D EUR 269,811,484 290,129,678 3.410.669 4,578,420 79 11 63 37
1,664.198 2,831,460 19,744 41.728 84 29 67 86 M EUR
D EUR
I EUR
.......... ...................... ..................... .....................
.......... ...................... ..................... ..................... - - - - - -
- - - - - - .......... ...................... ..................... .....................
D EUR 756,796,125 485,382,426 9,953,409 7,443,373 76 03 65 21
I EUR 88,134,606 75,142,703 628.633 630,634 14020 11915
535.346 80,741 7,216 1,266 74 19 63 80 M EUR
D EUR 1.591.390.737 873,351,512 16,469,244 12,088,290 96 63 72 25
I EUR 70,062,278 2,685.460 427,159 22,000 16402 12207
.......... ...................... ..................... .....................
M EUR 1244,585 68,269 16.594 1,212 75.00 56 35
P PLN
D USD
- - - - - -
- - - - - - ...................................... ...................... ..................... ..................... Robeco Emerging Stars Equities 0 EUR - - - - - -
130,090,088 66,346,093 4.824.731 3,300,489 26 96 20 10
Robeco Finanrials Equities D EUR 129,819,140 91,685,368 2.359.416 1,992,273 55 02 46 02
220,078 60.491 1.985 649 110 84 93 18
Robeco Food b Agri Equities D EUR 48243.542 37,617,841 976.912 839,350 49 38 44 82
...................................... ...................... ..................... .....................
...................................... ...................... ..................... ..................... Robeco Chinese Equities D EUR
...................................... ...................... ...................... ..................... M EUR
155.286 54.609 1.465 565 106 0 1 96 69
Robeco Health Care Equities D EUR 149,466,344 204,199,020 3.007.175 4,209,901 49 70 48 50
53,946 66.889 613 775 88 02 86 33
Robeco IT Equities D EUR 85,412.043 102,721,452 2,716,800 3,296,774 31 A4 3 1 16
41,972 41,807 1,206 1,206 34 80 34 67
...................................... ...................... M EUR ..................... .....................
...................................... ...................... ..................... ..................... M EUR
...................................... ...................... ...................... I. .................... M EUR
Robeco Capital Growth Funds 63
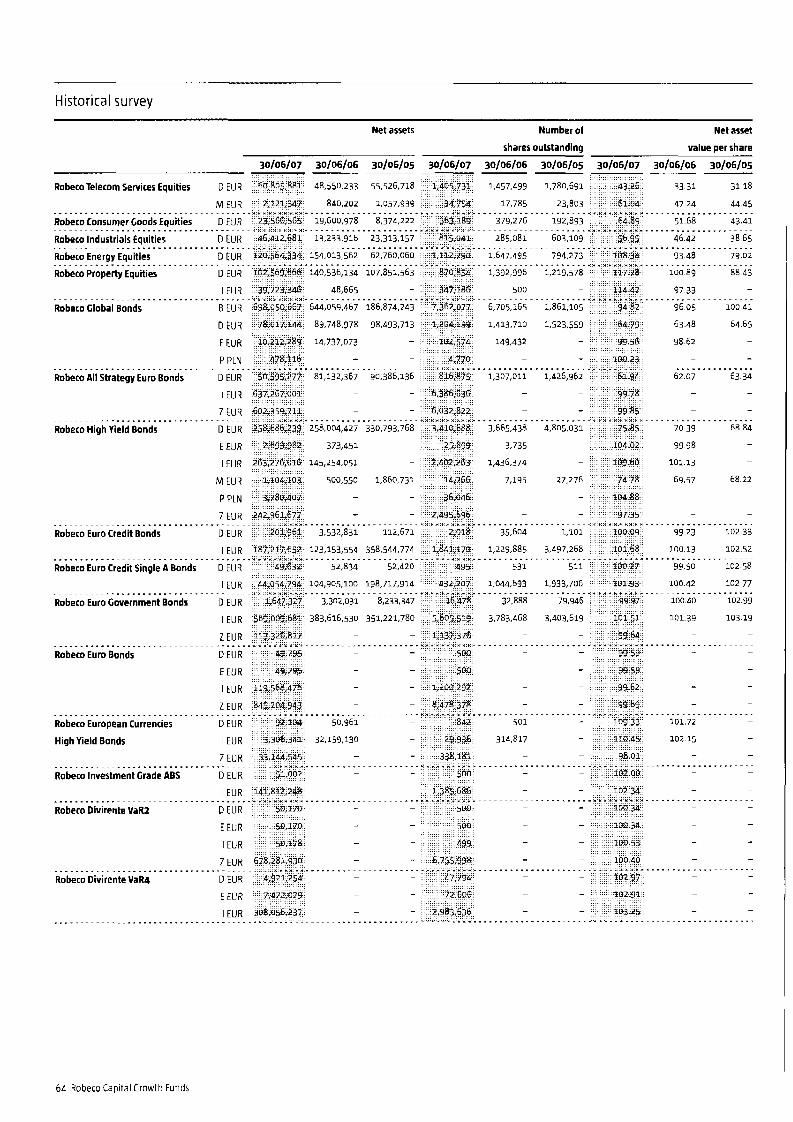
Historical survey
Net assets Number of Net asset
Robeco Investment Grade
..................... Robeco Divirente VaR2
................... Robeco Divirente VaR4
ABS
.......
...
~ . .
D EUR
I EUR
0 EUR
E EUR
I EUR
2 EUR
.........
0 EUR
E EUR
I EUR
shares outstanding value per share 30/06/07 30/06/06 30/06/05 30/06/07 30/06/06 30/06/05 30/06/07 30/06/06 30/06/05
RobecoTelecom Services Equities 0 EUR 48,550,233 55,526,718 1.457.499 1.780.691 33 31 31 18
840,202 1,057,939 17,785 23,803 47 24 44 45 ...................................... ...................... ..................... ..................... M EUR
19,600,978 8,374,222 379,276 192,893 51 68 43 4 1 Robero Consumer Goods Equities D EUR
13233,916 23,313,157 285.081 603,109 46 42 38 65 Robeco Industrials Equities D EUR 154,013,562 62,760,060 1.647.495 794,273 93 48 79 02 Robeco Energy Equities 0 EUR
Robeco Property Equities D EUR 140,536,134 107,851,563 1,392,996 1,219,578 100 89 88 43
48,665 500 97 33 -
...................................... ...................... ..................... .....................
...................................... ...................... ..................... .....................
...................................... ...................... ..................... .....................
- - ...................................... ...................... ...................... ..................... I EUR
Robeto Global Bonds B EUR 644,059,467 186,874,243 6,705,165 1,861,105 9605 10041
0 EUR 89,748,978 98,493,713 1,413,710 1,523,559 63 48 64 65
E EUR 14,737,073 149.432 98 62 -
P PLN
- -
- - - - - - ...................................... ...................... .................... Robeco A l l Strategy Euro Bonds D EUR 1,307,011 1,A26,962 62 07 63 34
I EUR
Z EUR
- - - - - -
- - - - - - ..................................... ...................... ...................... ..................... Robeco High Vield Bonds D EUR 258,004,427 330,793,768 3,665,438 4.805.031 70 39 68 84
E EUR 373,451 3.735 99 98 -
I EUR 145,254,051 1,436.374 101 13 -
- -
- -
M EUR 500,550 1,860,731 7,195 27.276 69 57 68 22
P PLN
Z EUR
- - - - - -
- - - - - - ...................................... ...................... ...................... .................... Robeco Euro Credit Bonds D EUR 3,532,831 112,671 35.604 1,101 9923 10233
1,229,885 3,497,268 100 13 10252
Robeco Euro Credit Single A Bonds D EUR 52,834 52,420 531 511 9950 10258
104,905,100 198,717,914 1.044593 1,933,706 100 42 102 77
Robeco Euro Government Bonds 0 EUR 3,302,031 8,233,347 32.888 79,946 100 40 102 99
123,153,554 358.544.774 ...................................... ...................... ..................... ..................... I EUR
..................................... ...................... ...................... ..................... I EUR
I EUR 383,616,530 351,221,780 3.783.468 3,403,619 10139 10319
- - - - - - ...................................... ...................... ...................... ..................... Z EUR
Robeco Euro Bonds D EUR
E EUR
I EUR
Z EUR
- - - - - -
- - - - - -
- - - - - -
- - - - - ...................... ...................... ..................... ......................................
- 501 - 101 72
32.159.130 - 314,817 - 102 15
Robeco European Currencies D EUR 50,961 -
High Yield Bonds I EUR
2 EUR
-
- - - - - - ...................... ...................... ..................... ...................................... - - - - -
- - - - - ........... ...................... .....................
- - - - -
- - - - -
- - - -
- - - - ........... ...................... .....................
- - - - - - - - - - - - - - -
...................... ..................... ..............
64 Robeco Capital Growth Funds

Spread of net assets by country and currency*
As at 30 June 2007 Robeco Robeco Robeco Robeco Robeco
Global Global Growth Global Value North American US Premium
Equities Equities Equities Equities Equities (EUR)
Currency Country Currency Country Currency Currency Country Currency Currency Country Country __r__
AMERICA
United States
Canada
Cayman Islands
Brazil .._.__.._._._.....__.__
EUROPE
Euro zone
Belgium
Finland
France
Germany
Greece
Ireland
Italy
Netherlands
Spain
Euro -----_.._...._._.......
Others
Denmark
Hungary
Norway
Sweden
Switzerland
United Kingdom - - - - - - -~~ . - - . . ___ . .__ . .
ASIA
Japan
South Korea
Hong Kong
Singapore
China ---_..__..__....._.____
AUSTRALIA
Australia
New Zealand
USD
CAD
US0
USD
48.4
3.1 -
-
45.5
4 4 -
-
41.7
4.9 -
-
88.1
7.7 -
-
1.9 -
-
1.9 95.8
EUR
EUR
EUR
EUR
EUR
EUR
EUR
EUR
EUR
EUR .___ . .____
-
-
98.1 9a.i 16.5
-
0.3 1.2
1.6
2.9 11.7
20.2
- -
1.5
0.1
1.7
9.6
22.6
0.8 -
0.9 -
4-2
10.6
16.5
9.7 -
0.8
- -
DKK
HUF
NOK
SEK
CHF
GBP
17.7
10.1 -
0.9
0.6 -
12.9
11.6 -
3.2 -
-
J PY
KRW
HKD
SGD
CNY
11.6
2.7 -
14.8
2.2 -
10.5
3.0
0.8
Operating capital
Total ~. . . .___.__. .__. . . . .__________. -
100.0 100.0 100.0 100.0 100.0
* If applicable the spreac by country of the equity funds includes the exposure in derivat ves except for forward exchange transactions The spread by currency includes the exposure in forward exchange transactlam
Robeco Capital Growth Funds 65

Spread of net assets by country and currency*
As at 30 June ZOO7 Robeco Robeco Robeco Robeco Robeco
US Premium US MidCap US Value European European MidCap
Equities Equities Equities Equities Equities
Currenw Country Currency Country Currency Country Currency Country Currency Country Currency
AMERICA
United States USD
Bermuda USD
Canada CAD .................................
97.9 -
-
100.0
- -
97.2 -
-
97.9 EUROPE
Euro zone
Austria
Belgium
Finland
France
Germany
Greece
Ireland
Italy
Netherlands
Spain
Euro ............................
EUR
EUR
EUR
EUR
EUR
EUR
EUR
EUR
EUR
EUR
EUR ..".. 2.8 50.7 70.2
6.9
1.2
4-1
17.6
Others
Norway
Sweden
Switzerland
United Kinqdom
NOK
SEK
CHF
GBP .........................
1.5
3.6
9.6 34.6
49.3
ASIA Japan J PY
South Korea KRW
Taiwan TWO .................................
AUSTRALIA
New Zealand AUD .................................
Operating capital
Total ............................
- 100.0 100.0 100.0 100.0 100.0
- If applicable the spread by country of :he equlty funds incluoes the exposure In derivatives except for forward exchange transactions The S D W d by currency includes the exposure In forward exchanqe transartions
66 Robeco Capital Growth Funds
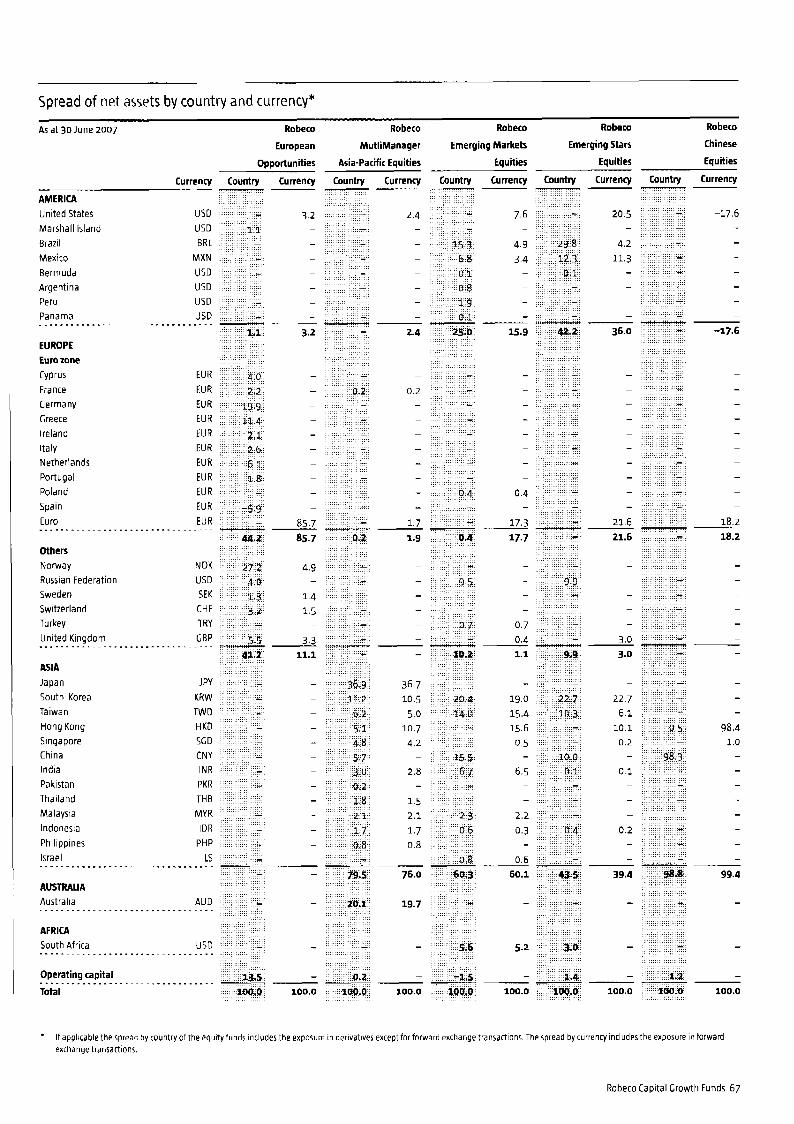
Spread of net assets by country and currency*
As at 30 June 2007 Robeco Robeco Robeco Robeco Robeco
European MutliManager Emerging Markets Emerging Stars Chinese
Opportunities Asia-Pacific Equities Equities Equities Equities
United States Marshall island Brazil Mexico Bermuda Argentina Peru Panama
EUROPE Euro zone Cyprus France Germany Greece ireland Italy Netherlands Portugal Poland Spain Euro
Others Norway Russian Federation Sweden Switzerland Turkey United Kingdom
ASIA Japan South Korea Taiwan Honq Kong Singapore China India Pakistan Thailand Malaysia Indonesia Philippines Israel
AUSTRALIA Australia
......................
......................
......................
......................
......................
AFRICA South Africa
Operating capital
Total
......................
......................
Currency
USD USD BRL
MXN USD USD USD USD
AMERICA
...........
EUR EUR EUR EUR EUR EUR EUR EUR EUR EUR EUR ...........
NOK USD SEK CHF TRY CBP ...........
J PY KRW TWD HKD SGD CNY INR PKR THB MY R IDR
PHP Its ...........
AUD ............
USD .........
............
Country ____11
100.0
Country Currency Country
* If applicable the spreac by country of the equity funds includes the exposure in derivatives except for forward exchange transartions. The spread by currency includes the exposure in forward exchange transactions.
Robeco Capital Growth Funds 67

Spread of net assets by country and currency*
As at 30 June 2007 Robeco
Food B Agri
Euuities
Robeco
IT
Eauities
Robeco
Telecarn Services
Eauities
Robeco
Finantials
Equities
Currencv
Robeco
Health Care
Equities
Currerim Currena Currency
USD BRL
MXN SGD US0 CAD .................
Country Country Country
AMERICA United States Brazil Mexico Netherlands Antilles Bermuda Canada ................
EUROPE Euro zone Belgium Cyprus Finland France Germany Greece I re land Italy Netherlands Portugal Spain Euro
EUR EUR EUR EUR EUR EUR EUR EUR EUR EUR EUR EUR
Others Denmark Norway Poland Sweden Switzerland Turkey United Kingdom .............
ASIA Japan South Korea Taiwan Hong Kong Singapore China India Thailand Malaysia Philippines Israel
AUSTRALIA Australia
.............
DKK NOK PLN SEK CHF TRY GBP .__.
2.3
2.6
0.6
7.7 1.4 -
- 0.9 - - - -
J PY KRW TWD H KD SCD CNY INR THE MY R PHP
Its ..... 13.2
-
-
- 100.0
AU D .................................
AFRICA South Africa ZA R
Operating capital
Total
.................................
............................... 100.0 100.0
" If applicable the spread by Country of t h e equity funds includes the exposure in derivatives except for forward exchange transactions The spread by currency includes the exposure in forward exchange transactions.
68 Robero Capital Growth Funds

~~
Spread of net assets by country a n d currency*
Robeco
Consumer Goods
Eauities
Robeco
Industrials
Equities
Robeco
Energy
Equities
Robeco
Property
Equities
As at 30 June 2007
Currency Country Currency -- 46 1
-
-
-
-
46.1
- -
-
-
-
-
-
-
-
12 5 12.5
-
-
-
-
-
- -
10.8
10.8
25 4 01
4 1 -
-
1.0 -
30.6
-
- 100.0
Currency Currency Currency country .. Country Countly
AMERICA
United States
Bermuda
Brazil
USD
USD
USD
47.0 -
37.3 -
-
13.4 -
Canada CAD
Mexico MXN ................................. 44.8 60.4 38.2
EUROPE
Euro zone
Austria
Finland
France
Germany
Greece
Ireland
Italy
Netherlands
Spain
Euro
EUR
EUR
EUR
EUR
EUR
EUR
EUR
EUR
EUR
EUR ~ .~. . . . .________. . .
- 11.5
19.3 11.5 9.2 Others
Denmark
Hungary
Norway
Russian Federation
Sweden
Switzerland
Turkey
United Kingdom --..--....____.._...._..__...
DKK
HUF
NOK
RUB
SEK
CHF
TRY
GBP
2.1 -
- 1.2
3.0 - -
3.8 3.1 -
5.9
- 8.5 21.3
25.5 14.9 8.5 ASIA
Japan
South Korea
Hong Kong
Singapore
China
India
Phillippines - -__.___. .
J PY
KRW HKD
SCD CNY
INR
PHP __..-.
17.6 -
1.3 -
0.7 -
-0.1 -
17.7 -
8.2
2.1 - -
1.2
18.9
2.1
-
0.6
2.0
-
29.2
14.9
-
AUSTRALIA
Australia AUD - .__. .__..__.. . . . . .______________
Operating capital
Total ~~. . . .______. . . ._~. . . . . ._______. .
100.0 100.0 100.0
* If applicable the spreac by tountry of the equityfundr includes the exposure in derivat yes except for forward exchange tranractlons The spread by currency includes the exposure in forward exchange tranradions
Robeco Capital Growth Funds 69

Spread of net assets by country and currency*
As at 30 June 2007 Robero Robeco Robeco Robeco
Global A l l Strategy High Yield Euro Credit
Bonds Euro Bonds Bonds Bonds
Countrv Currencv countw Currencv Countw Currencv Country Currencv --
0.1
--
0 8
- 0.8
98 9
0 2
-
0 1 -
-
-
Long-term investments
North Arnericu
US dollar
Canadian dollar .................... -
0.1 ...
Europe
Euro
British pound
Norwegian krona
Swedish krona
Danish krona
Deutsche Mark
Swiss Franc ..................
99.8 0.1 -
- 100.0
-
-
- 100.0
-- 57.0 100.0
......... 99.8
0.1
0.1
-
99.2
- Asia
Japanese yen ................... -0.1
- Austrulio
Australian Dollar ........................
Operating capital
Total ........................
- 100.0
-- 1oa.o 100.0 100.0
Spread of net assets by country and currency*
As at 30 June 2007 Robeco
Euro Credit
Sinale A Bonds
Robeco Robeco Robeco
Euro Government Euro European Currencies
Bonds Bonds High Yield Bonds
Country Currency Country Currency Country Currency Country Currency -- long-term investments
North America . . .
US dollar - - ....................................... 0.3
99.2
0.3 -
0.2
Europe Euro
British pound
Deutsche mark
Norwegian Krone ...............................
98 3 -
1 7 -
100.0
- 100.0
100.0
-
100.0
-
99.7
- Operating capital
Total ...........................
100.0 100.0 100.0
'The spread by county IS in fact the spread of the portfolio by currency The spread by Currency is the net currency position including the exposure in forward exchange transactions
70 Robeco Capital Growth Funds

Spread of net assets by country and currency*
As at 30 June 2007 Robeco Investment Robeco Robeco
long-term investments
North America
US dollar
Canadian dollar ...........................
South America
Brazilian Real
Mexican Peso ........................
Europe
Euro
British pound
Dutch guilder
Deutsche mark
Swiss Franc
Turkish lira ......................... ...
Asia
Japanese yen .................................
Australia
Australian dollar .................................
Operating capital
Total .................................
Grade ABS Divirente VaRz C O U ~ ~ N Currencv Country Currency --
-1 9 0 6
-1.3
0 2
0 2
0.4
98 2
1 3
1 2
0 4
-1.3
0 3
100.1
-0.5
1.3
- 100.0
Divirente VaR4 Country Currency --
2.4
- 100.0
.The spread by country IS i i fact the spread ofthe portfolio by currency The spread by Currency IS the net currency position including the exposure in forward exchange transactions.
Robeco Capital Growth Funds 71

Robeco Global Equities
Invest rnent portfolio Investment portfolio
At 30/06/2007 Quantity Market value In % of
net assets in EUR x 1
Transferable securities admitted to an official stock-exchange listing
At 33/06/2007 Quantity Market value In 96 of
net assets in EUR x 1
GlaxoSmithKline Manhew Old Mutual Petrofar Rio Tinto Royal Bank of Scotland Test0 Vodafone WPP 2005
40,296 781,197 28,006 253,371 70,000 175,637 14,000 93.382 8,433 479,434 79,971 752,011 83,611 519,813 216,218 538,979
0.94
0.21 0.11 0.58 0.90 0.63 0.65
0.31 AUD BHP Billiton Brambles Industries Macquarie Bank
42,069 925,764 1.12
4,329 231,156 0.28 45,886 351,096 0.42
1,508,016 1.82 CAD CDN Pacific Railway National Bank of Canada Petro-Canada/Varta ble Teck Corninco
7,400 378,950 0.46 5,000 213,587 0.26 10,880 429,778 0.52 13,000 409,007 0.49
1,431,322 1.73
35,345 393,014 5,983,111
0.47 7.21
HKD Esprit Sun Hung Kai Properties Swire Pacific/A
97,500 916,044 45,300 404,156
1.10 0.49
CHF ABB Aderco Cheserex cs Holcim Nestle Novartis Roche Swiss Reinsurance Syngenta (Novartisl UBS/New
41,300 341,675 1,661,875
0.41 2.00 30,800
7,180 11,100 5,362 1,713 18,036 2,986
1,750 8,540
6,268
517,303 411,878
430,204 482,273 751,863 392,192 423,749 252,900
585,781
0.62 0.50 0.71 0.52 0.58 0.91 0.47 0.51 0.30
HUF MOL Magyar Olal - Es Gaztpari 2,146
7,362 13,200 5,400 18,000 5,000 70
60,000 37
20,000 9,000 31,000 12,000 6,300
18,000 1,550 2,000 10,000 12,791 22,500 9,500 95
7,000 9,500
241,923 0.29
JPY Astellas Pharma Denso fanuc Honda Motor Jafco Co Japan Tabacco Kawasaki Heavy Industries KDDl Komatsu Millea Mitsubishi Mttsui Fudosan Nidec Nornura Orix Otsuka Shin-Etsu Chemical Shionogi Shiseido Sony Sumitorno Mitsui Financial T 6 D Tokyo Electric Power Yarnada Denki
236,592 0.28 381,470 0.46
485,652 0.58
255.177 0.31
202,541 0.24 429,292 0.52 273,044 0.33 600,349 0.72 248,941 0.30 273,476 0.33 259,014 0.31 301,569 0.36 140,419 0.17 528,221 0.64 154,149 0.19 354,796 0.43 360,551 0.43 655,030 0.79 349,609 0.42 225,558 0.27
411,833 0.50
170,278 0.21
181,310 0.22
0.46 5 5 8
379,739 4,627,882
EUR Air liquide Allied Irish Banks Axa Bayer BNP Paribas Carrefour Superrnarche CRH Danone Delhaize Deutsche Post Deutsche Telekom E ON Enel H e I I en i r Te I eco rn rn u n i cation ING Ko ni n kli) ke A ho Id Koninklijke KPN National Bank of Greece Nokia/A Reed Elsevier Regie National des Usines Renault Royal Dutch Shell RWE/A Saint-Gobain Sanofi-Synthelabo SAP/Stammaktien SNS R e a d Suez TNT Total Unicredito ltaliano Vinci Vivendi Universal (EUR) Wolters Kluwer
6,782 20,241 18,423 9,500
5,600 5,190 7,758 5,500 10,300 12,350 4,800 38,000 3,662 22,927 25,712 23,000 9,370 33,166 33,753
45,866 3,925 3,600 4,583 4,640 10,304 4,100 11,770 22,912 102,000 7,336
8,189
3,871
13.183
660,838 409,071 589,720 530,195 723,580 291,984 190,006 465,635 400.675 246,582 168,454 593,232 303,050 83,860 751,776 Z 3 9,8 9 3 283,360 397.288 690,184 477,267 461,462
1,384,695 308,152 300,132 275,438 175,670 172,592 174,209 393,471
1,380,677 676,260 407,001 420,670
0.80 0.49 0.71 0.64 0.87 0.35
0.56 0.48 0.30 0.20 0.72 0.37 0.10 0.91 0.29 0.34 0.48 0.83 0.58 0.56 1.67 0.37 0.36 0.33 0.21 0.21 0.21 0.47 1.66 0.82 0.49 0.51
0.23
0.46 9.47
0.38 0.29
4,900 378,401 7,857,272
33,300 318,103 10,300 236,942
NOK DNB Statoil Telenor 27,569 400,047 0.48
955.092 1.15 SEK SKF/B free Skandinaviska Enskilda Bank/A Tele2 AB/B Volvo/B
15,100 235,608 0.28 15,277 366,214 0.44
0.22 15,000 181,812 27,870 412,289 0.50
1,195,923 1.44 SGD Singapore Telecom United Overseas Bank
136,615 224,870 0.27 23,000 244,965 0.30
469,835 0.57 16,443 372,434 0.45
15,399,513 18.57 US0 Adobe Systems Aflac Alltei Altfia Am bev Arndocs American Standard Cos.
9,100 270,531 0.33 11,000 418,644 0.50 4,700 235,078 0.28 8,500 441,442 0.53 7,006 363,126 0.44 9,353 275.767 0.33 8,800 384,306 0.46
GBP BP BT Barclays British American Tobacco Debenhams
50,756 454,666 0.55
55,934 578,327 0.70 20,940 528,205 0.64
37,356 184,519 0.22
129,990 250,556 0.30
72 Robeco Capital Growth Funds

Investment portfolio
At 30/06/2007
Amgen Apache Apple Computers Applera.applied Biosys Assurant ATbT/new Avon Produrts Bank of America Bank of New York BJ'S Wholesale Club Blackstone Boeing Bristol Myers Broadcom Bunge Carnival ChevronTexaco Chico's Fas China Medical Tech-Spon Cisco Systems CIT Citigroup Coach Coca-Cola Enterprises ConocoPhillips Cooper Industries/A Corning cvs Data Domain Dell Computers DR. Horton eBay Edison International EMC Exelon Exxon Mobil Fannie Mae Firstenergy FPL Group Genentech General Electric Goldman Sachs Google Hewlett-Packard IAC/lnteractive Intel International Paper In Industries Johnson G Johnson JP Morgan Chase b Co KB Home Kraft Foods/A 1-3 Communications Lilly (Eli) Lincoln National Lowe's Companies MBlA Medtronir Merck Microsoft Mirant Molson Coors Brewing Monsanto Motorola Nabors Industries Newmont Mining News-Class B
. -
Quantity Market value In % of
in EUR x 1 net assets
5,074 6,994 3,800
12,500 4,300
30,252 13,700 22,668 13,300 7,000 2,360 3,300 8,075
12,250 6,134
14,490 20,200 11,800 54,588 13,384 19,350 23,940 19,200
6,272 9,550
20,000 11,300
7,500 8,500
16,500 4,700 7,700
29,200 1,200 7,020
5,400 5,200 4,768
19,989 4,250 1,780
16,700
8,638
12,900
13,200 33,307 11,200
7,704 15,100 23,300
8,400 20,881
5,400 8,600 7,310
4,561 12,900
9,500 27,929
7,200 7,650 9,500
10,400 8,400
10,200 27,890
23,200
207,724 422,525 343,380
187,595 929,590 3 7 2,7 9 3 820,583 408,094 186,746 51,147
234,962 188,699 265,309 383.787 311,609 903,808 364,050 278,017
1,125,672 543,367 734,857 840,040 341,194 364,557 403,694 378,364
127,726 179,623 243,490 111,988 319,962 391,337
64,507 435,998
282,663
304,976
624,010 258,815 218,465 267,111
682,083 689,805 551,741 338,271 585,964 323,838 389,493 688,950 835,871 244,869 545,004 389,401 355,831 384,025 527,199 210,126 495,349 350,302 609,431 227,374 523,727 475,088 136,300 207,613 295,000 473,730
566,568
0.25 0.51 0.41 0.34 0.23 1.12 0.45 0.99 0.49 0.22 0.06 0.28 0.23 0.32 0.46 0.38 1.09 0.44 0.33 1.36 0.65
1.01 0.41 0.44 0.49 0.46 0.37 0.15 0.22 0.29 0.13 0.39 0.47 0.08 0.53 0.75 0.31 0.26 0.32 0.68 0.82 0.83 0.67 0.41 0.71 0.39 0.47 0.83 1.01 0.30 0.66 0.47 0.43 0.46 0.64 0.25 0.60 0.42 0.74 0.27
0.57 0.16 0.25 0.36 0.57
0.89
0.63
Investment portfolio ~~~
At 30/06/2007 Quantity Market value In %of
net assets in EUR x 1
Oracle Parker-Hanmfin Pfizer Procter b Gamble Prudential Financial Raytheon Schlumberger Sprint-FON ST Jude Medical Symantec Texas Instruments Textron Time Warner Travelers Companies Valero Energy Wea t herford Wellpoint Yahoo! Zimmer
Total transferable securities admitted to an official stock-exchange listing
Transferable securities traded on other regulated markets
EUR Banco Bilbao Vizcaya Argentaria
US0 Orascom Telecom/GDR
65,000 5,250
29,764 9,464 7,400
10,200 10,400 13,300 12,200 16,000 16,300
2,800 44,000 11,200
9,200 10,300 10,860 13,100
6,100
948,614 1.14
563,523 0.68 428,790 0.52
407,003 0.49 654,086 0.79 203,949 0.25 374,794 0.45 239,310 0.29 454,162 0.55
685,469 0.83 443,671 0.54 503,139 0.61 421,289 0.51 641,926 0.77 263,154 0.32 383,421 0.46
38,672,617 46.63
80,004,381 96.46
380,606 0.46
532,747 0.64
228,283 0.28
0.72 32,632 593,902
3,200 153,774 0.19 Samsung Electronics/GDR 1/2 vgt.5 -144A- 1,572 360,249 0.43
514,023 0.62
Total transferable securities traded on other regulated markets
Other transferable securities
1,107,925 1.34
AUD Macquarie Bank/CLM/21-05-2007 5,079 0 0.00
GBP GlaxoSmithKIine/STK/02-05-2007 40,295 7,981 0.01 HSBC (75p)/STK/16-05-2007 48,926 13,729 0.01 Testo/STK/25-04-2007 58,611 6,608 0.01
28,318 0.03
Total other transferable securities 28,318 0.03
Total securities portfolio Operating capital
81,140,624 97.83 1,795,069 2.17
Total net assets 82,935,693 100.00
Robeco Capital Growth Funds 73

Robeco Global Growth Equities
Investment portfolio Investment portfolio
At 30/06/2007 Quantity Market value In % of
net assets in EUR x 1
Transferable securities admitted to an official stock-exchange listing
CAD Canadian Natural Resource Petro-Canada/Variable
CHF Adecco Cheserex Nestle Novartis Roche
EUR
ING Henkel
Metro Philips Electronics Public Power RHJ International Saint-Gobatn Total
GBP 888 Holdings Diageo HSBC Reckitt Benckiser Rio Tinto Royal Dutch Shell Sports Direct International
HKD Sun Hung Kai Properties
JPY Astellas Pharrna Aozora Bank Daikin Industries Fanuc Honda Motor Mitsubishi Mitsui Fudosan Orix Resona Bank Sekisui House Seven b I TGD
NOK Tel en or
USD Accenture Adobe Systems Amdors Arngen Avon Products Glackstone Brunswick Cisco Systems Citigroup ConocoPhillips crocs cvs Du Pont de Nemours Fannie Mae
1,900 93,608 1.51 2,600 102,704 1.65
196,312 3.16
1,400 80,311 1.29 400 112,615 1.81
2,200 91,711 1.48 1,000 131,344 2.11
415,981 6.69
1,902 2,500 1,700 2,400 2,200
4,500 800
3,500
67,236 81,975
104,040 75,744 45,980 65,700 66,696
210,910 718,281
1.08
1.67 1.22 0.74 1.06 1.07
1.32
3.39 11.55
22,000 37,748 0.61 6,000 92,431 1.49 3,000 40,778 0.66 2,455 99,746 1.60 1,700 96,649 1.56 4,650 143,890 2.31
18,000 48,533 0.78 559,775 9.01
9,800 87,433 1.41 87.433 1.41
3,600 12,000 3,000 1,200
4,600 4,400 3,500
250 47
6,000 3,140 2,000
6,200
2,100 3,000 2,700 2,300 3,000
175 2,800 7,500 3,400 2,000 1,600 2,600 1,800 2.500
115,693 32,737 80,762 91,518
124,111 85,211 72,608 48,640 83,130 59,178 66,269 99,888 -
959,745
1.86 0.53 1.30 1.47 2.00 1.37 1.17 0.78 1.34 0.95 1.07 1.61
15.45 -
89,967 1.45
66,691 1.07 89,186 1.44 79,608 1.28 94,159 1.52 81,633 1.31
67,649 1.09 3,793 0.06
154,659 2.49 129,122 2.08 116,249 1.87
50,978 0.82 70,171 1.13 67,759 1.09
120,932 1-95
At 30/06/2007 Quantity Market value In % of
net assets in EUR x 1
Intel I shares MSCI Emerging Markets Index Kinetic Concepts Met I ife Microsoft Mirant Monsanto Morgan Stanley Dean Witter G Co Neurocrine Biociences News-Class B Novellus Systems Office Depot Oracle Pfizer Plug Power RSC Sthering-Plough Schlumberger Time Warner Tyco International United Technologies Wellpoint Wveth
4,000 2,800 1,000 1,800 6,000 1,800 1,750 1.500 1,500 3,300 2,100 1,250 8,200 5,200
16,000 1,588 3,000 1,800 6,000 2,700 1,900 1,200 2.100
70,371 1.13
38,481 0.62 85,938 1.38
130,924 2.11 56,844 0.91 87,516 1.41
12,473 0.20 56,053 0.90
272,899 4.39
93,162 1.50
44,113 0.71 28,044 0.45
119,671 1.93 98.452 1.58 35,660 0.57 23,516 0.38
113,208 1.82 93,473 1.51
99,787 1.61 70,931 1.14
67,617 1.09
67,552 1.09
97,651 1.57 3,056,925 49.20
Total transferable securities admitted to an official stock-exchange listing 6,084,419 97.92
Transferable securities traded on other regulated markets
EUR Banco Santander Central Hispano 4,200 57,498 0.93 Camesa Corporation Tecnologica 1,500 40,500 0.65
97,998 1.58
US0 Sarnsung Electronics/GDR 1/2 vgts -144A.
Total transferable securities traded on other regulated markets
Total securities portfolio Operating capital
Total net assets
132.373 2.13
6,216,792 100.05 -3,338 -0.05
6,213,454 100.00
74 Robeco Capital Growth Funds
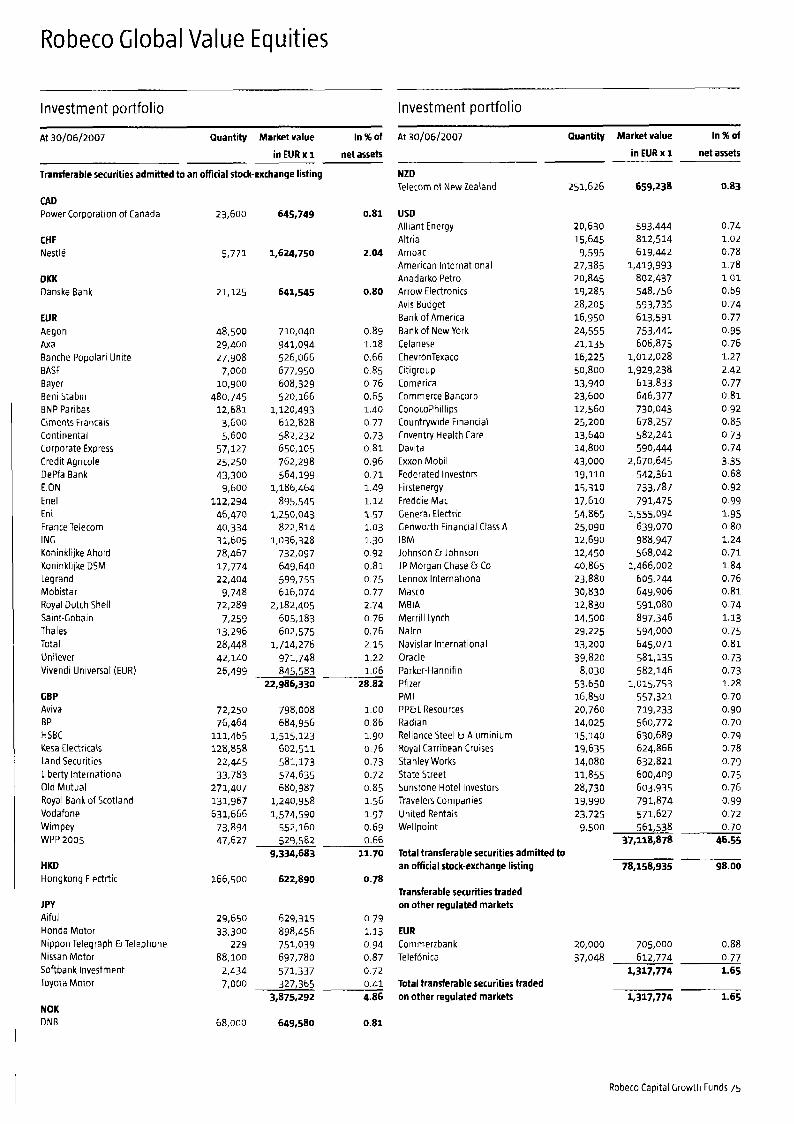
Robeco Global Value Equities
Investment portfolio
At 30/06/2007 Quantity Market value In 96 of
net assets in EUR x i
Transferable securities admitted to an official stock-exchange listing
CAD Power Corooration of Canada
CHF Nestle
DKK Danske Bank
EUR Aegon Axa Banche Popolari Unite BASF Bayer Beni Stabili BNP Paribas Ciments Francais Continental Corporate Express Credit Agricole DePfa Bank E ON Enel Em France Telecom ING Koninklilke Ahold Koninklilke DSM Legrand Mobistar Royal Dutch Shell Saint-Gobain Thales Total Unilever Vivendi Universal (EUR)
GBP Aviva BP HSBC Kesa Eledricals Land Securities Liberty Internationa Old Mutual Royal Bank of Scotland Vodafone Wimpey WPP 2005
HKD Hongkong Eledrtic
JPY Aiful Honda Motor Nippon Telegraph b Telephone Nissan Motor Softbank Investment Toyota Motor
NOK DNB
23,600
5,771
21,125
48,500 29,400 27,908
7,000 10,900
480,745 12,681 3,600 5,600
57,127 25,250 43,300
9,600 112,294
46,470 40,334 31.605 78,467 17,774 22,404
9,748 72,289
7,259 13,296 28,448 42,140
645,749
1,624,750
641,545
710,040 941,094 526,066 677,950 608,329 520,166
1,120,493 612,828 582,232 650,105 762.298 564,199
1,186,464 895,545
1,250,043 822,814
1,036,328 732,097 649,640 599,755 616,074
2,182,405 605,183 602,575
1,714,276 971,748
26,499 845,583 22,986,330
72,250 798,008 76,464 684,956
111,465 1,515,123 128,858 602,511
22,445 581,173 33,783 574,635
271,407 680,987 131,967 1,240,958 631,666 1,574,590
73,894 552,160 47,627 529,582
9,334,683
166,500 622,890
29,650 629,315 33,300 898,456
229 751,039 88,100 697,780
2,434 571,337 7,000 327,365
3,875,292
68,000 649,580
0.81
2.04
0.80
0.89
0.66
0.76
1.18
0.85
0.65 1.40 0.77 0.73 0.81 0.96 0.71 1.49 1.12 1.57 1.03
0.92
0.75 0.77 2.74 0.76 0.76 2.15 1.22 1.06 28.82
1.30
0.81
1.00 0.86 1.90 0.76 0.73 0.72 0.85
1.97 1.56
0.69 0.66 51.70
0.78
0.79 1.13 0.94 0.87 0.72 0.41 4.86
0.81
Investment portfolio
At 30/06/2007 Quantity Market value In % of
in EUR x 1 net assets
NZD Telecom of New Zealand
US0 Alliant Energy Altria Ambac American International Anadarko Petro Arrow Electronics Avis Budget Bank of America Bank of New York Celanese ChevronTexaco Citigroup Comerica Commerce Bancorp Conocophillips Countrywide Financial Coventry Health Care Davita Exxon Mobil Federated Investors Firstenergy Freddie Mac General Electric Genworth Financial Class A IBM Johnson 0 Johnson JP Morgan Chase 6 Co Lennox International Masco MBlA Merrill Lynch Nalco Navistar International Oracle Parker-Hannifin Pfizer PMI PPbL Resources Radian Reliance Steel b Aluminium Royal Carribean Cruises Stanley Works State Street Sunstone Hotel Investors Travelers Companies United Rentals Wellooint
251,626
20,630 15,645
9,595 27,385 20,845 19,285 28,205 16,950 24,555 21,135 16,225 50,800 13,940 23,600 12,560 25,200 13,640 14,800 43,000 19,110 15,310 17,610 54,865 25,090 12,690 12,450 40,865 23,880 30,830 12,830 14,500 29,225 13,200 39,820
8,030 53,650 16,850 20,760 14,025 15,140 19,635 14,080 11,855 28,730 19,990 23,725
659.238
593,444 812,514 619,442
1,419,993 802,437 548.756 593,735 613.591 753,441 606,875
1,012,028 1,929,238
613,833 646,377 730,043 678,257 582,241 590,444
2,670,645 542.361
791,475 1,555,094
639,070 988,947 568,042
1,466,002 605,244 649,906
897,346 594,000 645,071 581,135 582,146
1,015,753 557,321 719.233 560,772 630,689 624,866 632,821 600,409 603,935 791,874
733,787
591,080
571,627
0.83
0.74 1.02 0.78 1.78 1.01 0.69 0.74 0.77 0.95 0.76 1.27 2.42 0.77 0.81 0.92 0.85 0.73 0.74 3.35 0.68 0.92 0.99 1.95 0.80 1.24 0.71 1.84 0.76 0.81 0.74 1.13 0.75 0.81 0.73 0.73 1.28 0.70 0.90 0.70 0.79 0.78 0.79 0.75 0.76 0.99 0.72
9,500 561,538 0.70 37,118,878 46.55
Total transferable securities admitted to an official stock-exchange listing 78,158,935 98.00
Transferable securities traded on other regulated markets
EUR Comrnerzbank Telefbnica
Total transferable securities traded on other regulated markets
20,000 705,000 0.88 37,048 612,774 0.77
1,317,774 1.65
1,317,774 1.65
Robeco Capital Growth Funds 75

Robeco North American E q u it ies
I nvest m ent portfolio
At 30/06/2007 Quantity Market value In%of
net assets in EUR x 1
Other transferable securities
GBP
Land Securities/STK/20-06-2007 22,445 12,596 0.02 HSBC (75P)/STK 134,101 37,629 0.04
50,225 0.06
Total other transferable securities
Total securities portfolio Operating capital
Total net assets
50,225 0.06
79,526,934 99.71 228,650 0.29
79,755,584 100.00
Investment portfolio
At 30/06/2007 Quantity Market value In 96 of
net assets in EUR x 1
Transferable securities admitted to an official-stock exchange listing
CAD Alcan Aluminium Bank of Montreal EnCana Sun Life Financial
USD Accenture Allstate American Eagle Outfitters American Electric Power Apple Computers Bank of America Carolina CBS/B Chesapeake Energy Chubb CIT Citigroup Computer Sciences ConAgra Foods Coventry Health Care Eaton Edison International Expedia Exxon Mobil Franklin Resources Freeport McMoran Copper/B General Electric General Mills Cenworth Financial Class A Hewlett-Packard Hospira Host Marriott IBM Intel International Paper JP Morgan Chase b Co Kraft Foods/A Kroger Marathon Oil Mattel McDonald’s Merck Metlife Motorola Mylan Laboratories Northrop Crumrnan Office Depot Paccar Parker Hannifin Penny PCbE Procter G Gamble Schering-Plouq h Teradyne Tidewater Transocean Travelers Companies Union Pacific Verizon Communications Wal-Mart Stores Wellpoint Yum Brands
280,700 16,978,965 2.49 195,500 9,307,904 1-37 259,800 11,848,464 1.74 400,300 14,143,478 2.07
52,278,811 7.67
235,250 122,000 391,500 207,400 106,800 706,310
301,800 481,300 317,550 322,800
40,800 179,550 359,000 116,050 168,650 173,300 359,000 368,939 193,000 139,300
67,500 187,250 312,600 906,200 261,500 507,600 198,900 823,100 402,400 698,650
1 456,500 383,000 365,200 411,500 578,100 331,882
1,259,580 569,500 187,300 573,400 147,800 139,300 184,450 239,150 301,850 780,100 468,600 100,700 99,000
188,850 125,350 795,500
94,700 212,900 390,000
126,900
7,470,936 5,556,418 7,438,370 6,916,661 9,650,788
25,568,469 7,260,422 7,445,838
12,330,517 12,729,745 13,105,123
1,549,467 7,863,746 7,139,862 4,953,747
11,613,380 7,2C1,211 7,785,798
22,914,075 18,930,591
8,542,317 1,913,221 8,099,770 7,962,267
29,939,391 7,559,113 8,689,580
15,500,518 14,480,660 11,635,052 25,063,561
26 9,508,234
17,003,947 6,838,627
15,466,099 21,316,782 15,845,212 16,507,768
7,670,360 10,799,342 12,864,403
9,525,387 10,098,747
9,885,225 8,021,543
13,676,059 17,582,647
6,099,728 5,284,970 7,768,702 7,481,008
10,687,537 24,249,924
3,373,453 12,584,359
1.10 0.82 1.09 1.02 1.42 3-75 1.07 1.09 1.81 1.87 1.92 0.23
1.05 0.73 1.70 1.05 1.14 3.36 2.78 1.25 0.28 1.19 1.17 4-39 1.11 1.27 2.28 2.12 1.71 3.68 0.00 1.40 2.49 1.00 2.27 3.13 2.33 2.42 1.12 1.59 1.89 1.40 1.48 1.45 1.18 2.00 2.58 0.90 0.78 1.14 1.10
1.57 3.56 0.50 1.85
1.15
9,448,595 1.39 634,399,298 93.12
76 Robeco Capital Growth Funds

Robeco US Premium Equities (EUR)
Investment portfolio
At 30/06/2007 Quantity Market value In % of
net assets in EUR K i
Total transferable securities admitted to an official stock-exchange listing 686,678,109 100.79
Total securities portfolio Operating capital
Total net assets
686,678,109 100.79 -5,396,046 -0.79
681,282,063 100.00
Investment portfolio
At 30/06/2007 Quantity Market value In % of
net assets in EUR x 1
Transferable securities admitted to an official stock-exchange listing
USD A 0 N Ace Aeroflex Aq I I ysys Alleghany Allied World Assurance Ambac American International Amqen Anadarko Petro Annaly Capital Management Apache Arena Resources Ashford Hospitality Trust Aspen Insurance Astrazeneca Avery Dennison Avnet Becton Dicktnson Bel Fuse Broadridge Financial CERE Realty Finance Chevrontexaco Citigroup Clear Channel Communications ConocoPhillips Countrywide Financial Danaos Davita Devon Energy Dover Dun b Bradstreet Embarq Expedia Fidelity National Information First American First Data Flagstone Reinsurance Freddie Mac Friedman Billings Rarnsey/A Grainger GSI Croup H anove r Insurance Hasbro Hewlett-Packard IBM lndyrnac Bancorp IPC Holdings LTD Johnson b Johnson Jones Apparel Korea Electric Power Leggett G Platt Lincare Lincoln National Liz Claiborne Loews Luminent Mortgage Capital Makita Spons Marsh G Mctennan Mattel MBlA Mentor Meruelo Maddux Properties Microsoft
41,525
53,355 62,050 21,470 16,360 16,135 45,615 69,225 60,975 116,355 20,345 11,570 55,995 26,455 51,600 18,735
42.750 19,040 58,985
55,970 45.470 31,545 62,455 19,290 2,970 50,190 29,375 46,415
26,425
28,550 16,255 89.580 154,505 90,130 127,595
71,760 56,175 7,740
122,495 73,625 23,400 24,425 90,240 58,200 180,825 35,885 67,035 17,315 57,290 219,055
28,435 58,340 50,115 93,710 29,190 40.670 149,925
161,860
28,685
89,570
29,100
55,182
29,960
45,485
1,310,118 7,492,864 559,802
1,033,746
1,041,658
2,833,994
1,242,338
6,462,223 620,821
2,365,272
2,347,259
1,229,091 497,821 487,580 549,844
2,043,292 922,219 841,934
2,358,206 479,754 835,062 788,558
1,726,820
3,630,164 519,190 69,162
2,002,323 1,702,839 1,757,897 2,218,887 1,239,904 1,196,757 1,147,454 595,774
2,166,953 1,523,829 4,050,862 515,841
2,064,180 520,181
2,029,379 180,Oll
4,047,038 5,737,686 505,407 567,876
4,117,277 1,217,393 2,932,189 585,883
909,629
3,491,106
883,367
1,977,968
8,268,797 1,582,257
339.820 939,868
1,333,930 938,439
4,317,231 879,234 245,727
3,271,474
0.69 3-93 0.29 0.54 3.39 0.33 0.55 1.24 1.49
0.65 0.64 0.26 0.26 0.29 1.07 0.48 0.44 1.24 0.25 0.44 0.41 1.83 0.91 0.46 1.90 0.27 0.04 1.05 0.89 0.92 1.16 0.65 0.63 0.60 0.31 1.14 0.80 2.13 0.27 1.08 0.27 1.06 0.09 2-12 3.01 0.27 0.30 2.16 0.64 1-54 0.31 1.04 0.48 0.83 4.34 0.18 0.49 0.70 0.49 2.27 0.46 0.13 1.72
1.23
Robeco Capital Growth Funds 77

Robeco US Premium Equities
Investment portfolio
At 30/06/2007 Quantity Market value In % of
Millea Motorola National Atlantic National Presto Industries Natl Health Investors Nike Nokia Omnicom Oxford Industries Pacific Sunwear of California Parker Hannifin Pfizer Pioneer Natural Resources Platinum Underwriters Puke Quantas Capital Radian RAM Rent A Center Royal Dutch Shell Sanofi Aventis Security Capital Assurance SLM Specialty Underwriters’ Alliani Speedway Sybase Syrnantec Travelers Companies Tribune TronoxClass B-W/I Tupperware Brands Tyco International United Technologies UnitedHealth Unumprovident VF Vodafone Wesco Financial White Mountains Insurance Wyeth
:e
Total transferable securities admitted to an official stock-exchange listing
Transferable securities traded on other regulated markets
USD BankTech Reg Castle Point Castlepoint CBRE Realty Finanr Maiden Nest16 Peoples Choice Quest Resource Solar Capital TAC Acquisition
:e
Total transferable securities traded on other regulated markets
Total securities portfolio Operating capital
Total net assets
22,225 138,805
51,440 22,050 48,550 53,120 76,230 23,600 15,050 36,805 13,860
346,085 50,140 37,410 73,500 49,540 46,275 45,740 47,555 15,860 96,095 43,560 35,375 40,250 22,795 48,400 48,400 70,230 18,015
1 110,725 115,340
17,855 31,040
114,991 19,185
148,468 1,585 9,075
47,400
90,985 21,685
1,580 1,685
42,840 27,000
6,480 58,990 70,335
in EUR x 1 net assets
675,365 1,819,147
529,045 1,017,805 1,140,281 2,292,670 1,586,632
924,743 494,108 599,541
1,004,800 6,552,437 1,808,389
962,569 1,221,780
88,035 1,850,246
5 3 3,4 16 923,600 953.561
2,865,310 995,666
1,508,195 235,739 889,656 856,152 723,912
2,782,055 392,167
10 2,356,252 2,885,742
937,733 1,175,362 2,223,105 1,300,924 3,696,996
451,834 4,072,142
0.35 0.95 0.28 0.53 0.60 1.20 0.83 0.49 0.26 0.31 0.53 3.44 0.95 0.51 0.64 0.05 0.97 0.28 0.49 0.50 1.50
0.79 0.12 0.47 0.45 0.38 1.46 0.21 0.00 1.24 1.51 0.49 0.62 1.17 0.68 1.94
0.52
0.24 2.14
2,012,451 1.06 177,631,032 93.20
177,631,032 93.20
538,950 235,869
17,186 14,833
317,203 1,912,220
0 510,165 781,181
0.28 0.12 0.01 0.01 0.17 1.00 0.00 0.27 0.41
3,035 25 0.00 4,327,632 2.27
4,327,632 2.27
181,958,664 95.47 8,626,641 4.53
190,585,305 100.00
Investment portfolio
At 30/06/2007 Quantity Market value In % of
in USD x 1 net assets
Transferable securities admitted to an official stock-exchange listing
USD A 0 N Ace Aeroflex Agilysys Alleghany Allied World Assurance Ambac American International Amqen Anadarko Petro Annaly Capital Management Apache Arena Resources Ashford Hospitality Trust Aspen Insurance Astrazeneca Avery Dennison Avnet Becton Dickinson Bel Fuse Broadridge Financial CBRE Realty Finance Chevrontexaco Citigroup Clear Channel Communications ConocoPhillips Countrywide Financial Danaos Davita Devon Energy Dover Dun b Bradstreet Embarq Expedia Fidelity National Information First American First Data Flagstone Reinsurance Freddie Mac Friedman Billings Ramsey/A Grainger GSI Hanover Insurance Hasbro Hewlett.Packard IBM lndymac Bancorp I PC Johnson G Johnson Jones Apparel Korea Electric Power Leggett b Platt Lincare Lincoln National Liz Claiborne Loews Luminent Mortgage Capital Makita-Spons Marsh G Mctennan Mattel MBlA Mentor Meruelo Maddux Properties Microsoft
54,015 192,725 80,265 88,727 27,354 20,915 20,610 57,470 88,055 85,640
180,000 25,360 14,575 70,005 34,575 67,535 23,365 36,545 41,625 24,320 75,015
114,325 69,055 57,750 41,130 78,717 24,435
4,050 63,260 40,840 63,835 39.325 34,575 70,718 36,760 20,783
120,540 185,675 113,510 166,760 38,470 90,620 70,480 11,095
154,260 92,890 30,015 31,295
116,930 73,425
217,425 45,120 84,890 21,515 72,380
319,915 57,280 37,860 75,515 71,620
114,175 36,740 52,525
192,280
2,301,579 12,049,167
1,137,355 1,996,358
11,119,401 1,071,894 1,796.986 4,024,624 4,868,561 4,452,424 2,595,600 2,069,122
846,953 823,259 970,520
3,611,772 1,553,305 1,448,644 3,lCl,063
827,610 1,434,287 1,359,324 5,817,193 2,961,998 1,555,537 6,179,285
888,212 127,373
3,408,449 3,197,364 3,265,160 4,049,689 2,191,018 2,071,330 1,995,333 1,028,759 3,938,042 2,473,191 6,890,057
910.510 3,579,634
887,170 3,438,719
348,494 6,883,081 9,776,673
875,538 982,663
7,205,227 2,074,256 4,761,608
994,896 3,382,867 1,526,489 2,699,774
16,309,267 577,955
1,690,070 2,331,903 1,811,270 7,103,969 1,494,583
428,604 5,666,492
0.73 3.83 0.36 0.63 3.53 0.34 0.57 1.28 1.55 1.41 0.82 0.66
0.26 0.31
0.27
1.15 0.49 0.46 0.99 0.26 0.46 0.43 1.85 0.94 0.49 1.96 0.28 0.04 1.08 1.01 1.04 1.29 0.70 0.66 0.63 0.33 1.25 0.78 2.19 0.29 1.14 0.28 1.09 0.11 2.18
0.28 0.31
0.66 1.51 0.32
0.48 0.86 5.18 0.18 0.54 0.74 0.57 2.25 0.47 0.14 1.80
3.10
2.29
1.07
78 Robeco Capital Growth Funds

Investment portfolio
At 30/06/2007 Quantity Market value In 96 of
net assets in US0 x 1
Investment portfolio
Millea Motorola National Atlantic National Presto Industries Natl Health Investors Ntke Nokia Ornnicom Oxford Industries Pacific Sunwear of California Parker Hannifin Pfizer Pioneer Natural Resources Platinum Underwriters Puke Quantas Capital Radian Rait Financial Trust RAM Rent A Center Royal Dutch Shell Sanofi Aventis Security Capital Assurance SLM Specialty Underwriters' Alliance Speedway Sybase Syrnantec Travelers Companies Tribune Tupperware Brands Tyco International United Technologies UnitedHealth Unurnprovident VF Vodafone Wesco Financial White Mountains Insurance Wyeth
27,970 203,220
64,970 27,740 60,980 66,680 98,880 29,540 1a,955 45,595 17,765
372,635 63,260 47,440 93,800
269,385 57,660
1 58,135 60,125 20,520
124,430 54,125 46,830 50,915 27.740 61,645 84,000 87,865 22,860
135,540 153,970 23,225 39,105
145,742 24,600
198,052 2,890
11,495
1,147,889 3,596.994
902.433 1,729,312
3,886,777 2,779,517 1,563,257
840,465 1,003,090 1,739,371 9,528,277 3,081,395 1,648,540 2,105,810
646,524 3,113,640
26
1,577,079 1,666,224 5,010,796 1,670,839 2,696.471
402,738 1,462,175 1,472,699 1,696,800 4,700,778
672,084 3,895,420 5,202,646 1.647.349 1,999,830 3,805,324 2,252,868 6,660,489 1,112,650 6,966,200
1,934,286
915,626
0.36 1.14
0.55 0.61 1.23 0.88
0.29
0.50 0.27 0.32 0.55
0.98 0.52 0.67 0 .21 0.99 0.00 0.29 0.50 0.53 1-59 0.53 0.86 0.13 0.46 0.47 0.54 1.49 0.21 1.24 1.65 0.52 0.63 1.21 0.71 2.11 0.35 2.21
3.02
60,125 3,447,568 1.09 307,421,766 97.56
Total transferable securities admitted to an official stock-exchange listing 307,421,766 97.56
Transferable securities traded on other regulated markets
US0 Castlepoint Nestle Peoples Choice Finance Quest Resource TAC Acauisition
Total transferable securities traded on other regulated markets
Other transferable securities
US0 Bank Tech Reg CBRE Realty Finance Maiden Peoples Choice Solar Capital
52,500 771,225 0.24 34,005 3,252,567 1.04 10,700 0 0.00 72,570 847.618 0.27 55,635 612 0.00
4,872,022 1.55
116,230 929,840 0.29 29,200 347,188 0.11 54,735 547,350 0.17
5,666 0 0.00 96,200 1,443,000 0.46
3,267,378 1.03
At 30/06/2007 Quantity Market value In 96 of
net assets
Total other transferable securities 3,267,378 1.03
in US0 x 1
Total securities portfolio Operating capital
Total net assets
315,561,166 100.14 -450.734 -0.14
315,110,432 100.00
Robeco Capital Growth Funds 79

Robeco US MidCap Equities
Investment portfolio
At 30/06/2007 Quantity Market value In %of
net assets in USD x 1
Transferable securities admitted to an official stock-exchange listing
USD ADC Telecom Aeropostale ALL Resources Alaska Air Alliant Energy Allied Waste Industries American Eagle Outfitters American Financial Apria Healthcare Arrow Electronics Aspen Insurance Avis Budget Avnet Beckman Coulter Biovail (USD) BMC Software Bucyrus International Carolina CBL G Associates Properties Century Tel Entr Charles River Laboratories Charming Shoppes Chesapeake Energy Cimarex Energy ClT CNA Financial Coldwater Creek Commercial Metals Computer Sciences Coventry Health Care Cummins Cummins Engine Darden Restaurants Dollar Tree Stores Donnelley b Sons DST Systems East West Bancorp Eastman Chemical Energizer Ensco International Frontier Oil GFI CoodyearTire b Rubber Harris HCC Insurance Hillenbrand Industries lngram Micro/A Jarden King Pharmaceuticals Lifepoint Hospitals Lubrizol Marvel Entertainment MDU Resources MEMC Electronic Materials Mentor Graphics Nationwide Financial Services NRG Energy Nstar Petsmart Precision Castparts Realty Income Reinsurance of America Rent-A Center Ryder System
4,750 4,620 1,880 4,490 2,900 9,460 4,690 5,935 5,580 3,050 3,490 4.690 6,580 2,650 5,260 4,900 2,500 1,280 1,670 1,800 2,610 9,640 4,330 3,250 3,500 1,720 6,280 3,520 2,820 1,750 2,000
40 2,500 6,870 3,190 1,980 5,430 4,310 1,630 3,060 2,990 3,480 2,970 2,890 2,450 1,760 5,110 3,430 6,730 4,430 4,270 3,960 4,405 2,630 9,120 1,410 2,750 3,520 4,070 2,630 4,850 1,630 4,590 4,390
87,068 192,562 76,102 125,091 112,665 127,332 120,345 202,680 160,537 117,212 97,964 133,337 260,831 171,402 133,709 148,470 176.750 98,906 60,204 88,290 134,728 104,401 149,818 128,083 191,905 82,027 145,884 118,870 166,803 100,888 202,420 4,048
109,975 299,189
156,836 211,113 277,262 162,348 186,691 130,872 252,126 103,237 157,650 81,855 114,400 110,938 147,524 137,696 171,352 275,629 100,901 123.516 160,746 120,110 89,140 114,318 114,224 131,054 319,177 122,172 98,191 120,396 236,182
138,797
0.74 1.64 0.65
0.96 1.08 1.02 1.73 1.37 1.00 0.83
2.22 1.46 1.14 1.26 1.50 0.84 0.51 0.75 1.15 0.89 1.27 1.09 1.63 0.70 1.24 1.01 1.42 0.86
1.06
1.13
1.72 0.03 0.94 2.56 1.18 1.33 1.80 2.36 1.38 1.59 1.11 2.14 0.88 1.34 0.70 0.97 0.94 1.26 1.17 1.46 2.34 0.86
1.37 1.02 0.76 0.97 0.97 1.12 2.72 1.04 0.84 1.02 2.01
1.05
Invest rnent portfolio
At 30/06/2007 Quantity Market value In % of
in USD x 1 net assets
Seacor Sernpra Energy Snap-On Steel Dynamics Sunstone Hotel Investors 5VB Financial Tidewater Unit United Rentals valeant Pharmaceuticals International Wabtec Wellcare Health Plans Westar Energy Western Digital Whirlpool WR Berkley Xcel Energy
Total transferable securities admitted to an official stock-exchange listing
Total securities portfolio Operating capital
Total net assets
820 76,555 2,800 165,844 3,260 164,663 3,460 145,009 5,900 167,501 2,610 138,617 3,010 213,349
4,070 132,438 7,400 123,432 4,990 182,285 1,410 127,619 3,700 89,836 7,380 142,803 1,470 163,464 4,350 141,549 5,410 110,743
11,667,585
11,667,585
1,350 84,929
11,667,585 85.398
11,752,983
0.65 1.41 1.40 1.23 1.43 1.18 1.82 0.72 1.13 1.05 1.55 1.09 0.76 1.22 1.39 1.20 0.94
99.27
99.27
99.27 0.73
1m.m
80 Robeco Capital Growth Funds

Robeco US Value Equities
Invest rnent portfolio
At 30 /06/2007 Quantity Market value In % of
net assets in USD x 1
Transferable securities admitted to an official stock-exchange listing
USD ATbT Accenture Ace Altria Arnbac Arneren American International Arngen Anadarko Petro Arrow Electronics Avis Budget Bank of New York Berkshire Hath/B Broadridge Financial CA Cadence Design Carolina CBS/B CG I Chesapeake Energy ChevronTexaco Citigroup Clear Channel Communications CNA Financial Coca.Cola Commerce Bancorp ConocoPhillips Countrywide Financial Coventry Health Care Davita Dominion Resources Donnelley G Sons DTE Energy Emerson Electric Exxon Mobil Federated Investors First Data Freddie Mac Cenworth Financial Class A Harris HewletGPackard Home Depot Honeywell International ISM ldearc lngrarn Micro/A Johnson b Johnson JP Morgan Chase b Co Ltherty Media. Capital tincare Lincoln National Lockheed Martin Loews MBlA McAfee Medco Health Solutions Merrill lynch MClC Investments Microsoft Molson Coors Brewing Motorola Nationwide Financial Services Nike Nokia
1,295 790
1,065 1,305
270 49 5
1,885 290
1,510 130 960
1.130 35
1,920 1,425 1,175
380 1,160 4,315 1,400 1,270 3,775 1,085
625 770
1,395 2,390 1,365
685 930 430
1,430 515 550
1.835 1,340 2,115 1,515
965 1,335 3,125 1,750 1,010
655 575
1,620 1,025 3,985
380 1,010
550 1,140 1,175 1,415
840 370 570 385
1,265 640
1,840 480
1,060 2,410
53,743 33,883 66,584 91,533 23,541 24,260
132,006 16,034 78,505 4,996
27,293 46,827
126,175 36,710 36,808 25,803 29,363 38,651 48,414 48,440
106,985 193,620 41,035 29,806 40,279 51,601
187,615 49,618 39,490 50,108 37,113 62,219 24,833 25,740
153,920 51,362 69,097 91,961 33,196 72,824
139,438 68,863 56,843 68,939 20,315 35,170 63,161
193,072 44.718 40,249 39,023
107,308 59,902 88,041 29,568 28,856 47,641 21,891 37,280 59,174 32,568 30,346 61,787 67,745
1.05 0.66 1.30 1.79 0.46 0.47 2.58 0.31 1.53 0.10 0.53 0.91 2.46 0.72 0.72
0.57 0.75 0.94 0.94
3.78 0.80 0.58 0.79 1.01 3.66 0.97 0.77 0.98 0.72 1.21 0.48
0.50
2.09
0.50 3.00 1.00 1.35 1-79 0.65 1.42 2.72 1.34 1.11 1-34 0.40 0.69
3.77 0.87 0.78 0.76
1.23
2.09 1.17 1.72 0.58 0.56 0.93 0.43 0.73 1.15 0.64 0.59 1.20 1.32
Investment portfolio
At 30/06/2007 Quantity Market value In % of
net assets in USD x 1
Omnicom Oracle Pfizer Philips Electronics PPG Industries Proder G Gamble Quest Diagnostics Radian Ross Stores Royal Dutch Shell Sanofi-Aventis State Street Symantec Taiwan Semiconductor Telecom New Zealand Time Warner Total Travelers Companies Tyco International United Technologies Vodafone Windstrearn Wyeth
Total transferable securities admitted to an official stock-exchange listing
Transferable securities traded on other regulated markets
US0 Sun Microsystems Time Warner Cable
Total transferable securities traded on other regulated markets
Total securities portfolio Operating capital
Total net assets
490 2,425 4.370
610 350
1,230 755 785
1,105 535 550 365
2,650 2,561 1,430
675 1.355 1,555 1,495 1,515 2,620
4,480
25,931 0.51 47,797 0.93
111,741 2.18 25,815 0.50
75,264 1.47 38,996 0.76 42,390 0.83 34,034 0.66 43.442 0.85 22,149 0.43 24,966 0.49 53.530 1.04 28,504 0.56 39,926 0.78 94,259 1.84 54,662 1.07
26,639 0.52
72,493 1.41 52,543 1.02
106,039 2.07 50,949 0.99 38,671 0.75
1.065 61,067 1.19 5,015,696 97.81
5,015,696 97.81
2,020 10,624 0.21 945 37,015 0.72
47,639 0.93
47,639 0.93
5,063,335 98.74 64.475 1.26
5,127,810 100.00
Robeco Capital Growth Funds 8 1

Robeco European Equities
Investment portfolio Investment portfolio
At 30/06/2007 Quantity Market value In %of
net assets
ET 2,800,000 13,830,498 116 Centrica 1,700,000 9,811,335 0.82 GlaxoSmithKline 1,211,642 23,489,457 196 Land Securities 300,000 7,767,957 0.65 legal b General 3,800,000 8,473,297 0.71 Persimmon 394,277 6,782,630 0.57 Rolls-Royce 2,129,532 17,035,623 1.43 Slough Estates 1,191,964 11,067,036 0.93
228,755,323 19.15 NOK
in EUR x 1
Tomra Systems 1,150,900 7,459,277 0.62
At 30/06/2007 Quantity Market value In%of
net assets in EUR x 1
Transferable securities admitted to an official stock-exchange listing
CHF EFG International Nestle Nova rt is
Roche Swiss Reinsurance Swisscom Namensaktien The Swatch UBS Zurich Financial Services
214,001 120,000 500,000 145,000 250,000 45,000 35,000 616,700 80,000
7,291,963 33,784,437 20,843,403 19,044,828 16,901,281 11,384,576 7,379,773 27,422,136 18,330,111
162,382,508
0.61
1.75 1-59 1.42 0.95 0.62 2.30 1.53
13.60
2.83
SEK Ericsson/B 6,558,000 19,445,379 1.63 Hennes G Mauritz 210,000 9,217,737 0.77 Oriflame Cosmetics 359,100 12,505,170 1.05 Skandinaviska Enskilda Bank/A 591,430 14,177,534 119 Skanska AB/B 476,200 7,584,481 0 64
0.59 SKF/B free 450,000 7,021,418 69,951,719 5.87
Total transferable securities admitted to an official stock-exchange listing L,160.UL709 97.14
EUR Akzo Nobel Allied Irish Banks Alstria Office Banca lntesa BASF Beni Stabili BNP Paribas Business Ob1 CRH ( I E ) Daimler Chrysler Deutsche Bank Deutsche Lufthansa/VA Deutsche Telekom E ON Enel Euler Fiat Hellenic Telecommunication lmmofinanz lmmobilien Anlagen lnfineon Technologies ING Interbrew lntralot Koninklilke DSM/New Koninklilke KPN Man/Stamrnaktien Mediaset Munchener Ruckversicherung Nokia/A OMV Philios Electronics
22,386,000 13,991,120 5,441,573 30,340,345 14,527,500 8,057,822 48,940,572
9,529,000
21,440,000 7,224,000 18,596,776 24,718,000 17,545,000 5,850,047 8,386,600 1,923,600 6,976,882 15,925,000 39,348,000 7,647,900 5,542,914 8,462,348
9,531,000 11,482,500 16,962,500 27,053,000 27,466,950 33,541,968 7,831,244 6,530,000 21,210,000 17,668,676 17,192,567
156,810 12,452,350 8,770,000 32,863,083 11,974,638 18,300,000 6,143.638
7,728,573
24,228,750
17,557,836
1.87 1.17 0.46 2.54 1.22 0.67
0.65 0.80 2.03 1.80 0.60 1.56 2.07 1.47 0.49 0.70 0.16 0.58 1.33 3.29 0.64 0.46
1.47 0.80 0.96
2.27
2.81 0.66 0.55
1.48 1.44 0.01 1.04 0.73 2.75 100 1.53 0.51 1.02
57.90
4.10
0.71
1.42
2.30
1.78
2.15 1.17 1.04 0.70 2.35 2.99
350,000 692,287 360,847
5,486,500 150,000
7,447,155 553,877 264,496 260,000 355,000 200,000 350,000
1,363,400 200,000
2,200,000 55,556 380,000 84,000 645,410
1,300,000 1,200,000 130,000 232,700 231,528
1,425,149 90,000
1,500,000 125,000
1,300,000 555,000
1,062,800
Transferable securities traded on other regulated markets
EUR Cornmerz ban k 270,000 9,517,500 0.79 Hochtief 85,461 6,888,157 0.58
16,405,657 1.37 Total transferable securities traded on other regulated markets 16,405,657 1.37
Other transferable securities
EUR Unipol /CtM/04-06-2007 4,476,500 1,476 0.00
CBP GlaxoSmithKline/STK/02-0~-2007 Land Securities/STK/20-06-2007
1,371,663 271,690 0.02 300,000 168,363 0.02
440,053 0.04
441,529 0.04
1,176,968,895 98.55 17,369,886 1.45
Total other transferable securities
ProSieben Sat 1 Media/Vorzuqsaktien 269,300 Total securities portfolio Operating capital 200,000
1,500,000 225,050 286,066 5,541
673,100 200,000
1,425,112 4,476,500 1,000,000 154,324 380,ooo
Publicis Reed Elsevier RWE/A Sanofi-Synthelabo SBM Offshore Telekom Austria ThyssenKrupp U n i lever Unipol Spa UPM Kymmene Valeo Vivendi Universal (EUR)
1,194,338,781 100.00 Total net assets
12,125,800 691,572,882
. .
i,ooo,ooo 6,217,039 0 52
CBP Anglo American AstraZeneca (GBP) Babcock b Brown Public Partners Berkeley BG EP British Airways
586,728 25,669,078 350,000 13,950,085
7,516,808 12,422,861 315,065 8,335,895
2,300,000 28,068,781 4,000,247 35,833,751
82 Robeco Capital Growth Funds

Robeco European MidCap Equities
Investment portfolio
At 30/06/2007 Quantity Market value In %of
net assets in EUR x 1
Transferable securities admitted to an official-stock exchange listing
CHF Schindler Swissauote
EUR Amplifon Anglo Irish Bank Ansaldo Sts Spa Arques Industries Banca Popolare dt Milano Beter Bed BinckBank Boewe Systec Bonduelle CGC Cie Generale De Geophysique Commercial Bank of Greece Cosmote DCC Elisa OYJ-A Shares Forthnet Gerry Weber International Grafton Grontmtl Halcor Hellenic Exchanges Hellenic Technodomik lcos Vision Systems lmerys lntralot Irish Life G Permanent Jaakko Poyry KGS Kingspan Koninklilke Boskalis Westminster Manitou Omega Pharma Palfinger Permasteelisa Rheinmetall Stammaktien Rod r i g u ez Sabaf Sligro Food SR Teleperformance Titan Cement Tr tg a no Unit 4 United Drug USG People Versatel Washtec
GBP 2 Way Traffic Admiral Barratt Developments Burren Energy Carphone Warehouse Cattles Dignity Expro International Lonmin Mitie Premier Foods Tullow Oil
138,000 6.794.949 2.28 . .
148,692 5.389.995 1.81 12,104,944
500,000 160,083 450,000
19,068 350,000 160,000 303,000
22,511 40,000
330,000 37,000
150,000 130,000 238,399 200,000 272,786 244,562 492,468 117,716 550,000 100,000 350,000 105,000
55,000 160,000 150,000 271,570
4,265 213,748 210,000
95,195 95,000
120,176 210,195
30,000 80,000
116,115 206,294 130,000 65,000 73,063
283,350 1,059,478
127,500 225,000
3,085,000 2,433,262 4,396,500
608,269 3,962,000 4,009,600 4,257,150
938,484 3,668,000 3,293,400 6,879,780 3,225,000 2,974,400 5,948,055 4,044,000 2,684,214 5,417,048 5,200,462 4,108,288 2,926,000 1,940,000 3,402,000 3,738,000 4,131,050 3,811,200 2,803,500 4,467,327
484,717 4,437,408 6,197,100 4,493,204 6,101,850
4,390,974 2,061,300 3,412,000 3,282,571 6,339,415 4,192,500 2,782,000 3,203,813 5,695,335 4,290,886 4,447,200 4,950,000
4,915,198
220,000 3,454,000 177,483,460 59-64
2,500,000 230,000 350,000 209,898 700,000 600,000 602,525 352,492
65,792 1,609,980 1,100,000
510,000
4,828,047 3,037,510 5,163,039 2,547,525 3,434,227 3,494,021 6,050,760 5,113,399 3,929,048 6,314,116 4,730,744 3,697,244 -
52,339,680
4.09
1.04 0.82 1.48 0.20 1.33 1.35 1.43 0.32 1.23 1.11 2.31 1.08 1.00 2.00 1.36 0.90 1.82 1.75 1.38 0.98 0.65 1.14 1.26 1.39 1.28 0.94 1.50 0.16 1.49 2.09 1.51 2.05 1.65 1.48 0.69 1.15 1.10 2.13 3.41 0.94 1.08 1.91 1.44 1.49
1.16 1.66
1.62 1.02 1.74 0.86 1.15 1.17 2.03 1.72 1.32 2.13 1.59 1.24
17.59 -
Investment portfolio
At 30/06/2007
- NOK Aker Kvaerner Ekornes Asa Seadrill Subsea 7
SEK Alfa Lava1
Quantity Market value In % of
in EUR x 1 net assets
315,000 5,923,391 1.99 333,855 5,629,227 1.89 234,000 3,732,864 1.25
20,042,999 6.73 300,000 4,757,517 1.60
Total transferable securities admitted to an official stock-exchange listing 265,510,107 89.21
Transferable securities traded on other regulated markets
EUR Curanum Elringklinger Kloeckner taboratorios Almirall Rhoen-Klinikum Vossloh
455,000 3,467,100 1.16
90,000 4,815,000 1.62 257,880 3,777,942 1.27 130,330 5,812,718 1.95
53,974 3,616,258 1.22
50,094 4,351,666 1.46 25,a40,684 8.68
Total transferable securities traded on other regulated markets 25,840,684 8.68
Total securities portfolio Operating capital
291,350,791 97.89 6,265,880 2.11
Total net assets 297,616,671 100.00
Robeco Capital Growth Funds 83

Ro beco European Opportunities
Investment portfolio
At 30/06/2007 Quantity Market value In % of
in EUR x 1 net assets
Transferable securities admitted to an official stock-exchange listing
CHF Novartis
EUR Arques Industries Bank Of Cyprus Bank of Ireland E ON Forthnet Hellenic Telecommunication ING lntralot tottomatica Marfin Popular Bank Public Michaniki
Symrise Teixeira Duarte-Engenharia Terna Total Unit 4
O w
CBP GlaxoSmithKline Punch Taverns Tanfield
NOK Awilco Offshore Crew Gold Fairmount Heavy Transport Fred Olsen Energy Fred Olsen Production Funcorn MPF Petrolia Drilling Rocksource Scorpion Offshore Songa Offshore Wavefield lnseis
SEK Tanganyika Oil Company
USD Quintana Maritime RCI International
85,000
320,000 170,000 150,000 35,000 100,000 23,500 130,000 175,000 95,000 260,000 266,600 100,000 110,000 500,000 150,000 40,000
3,543,378
10,208,000 2,128,400
4,325,650 984,000 538,150
4,262,700 4,168,500
2,282,800 2,228,776
2,432,100
1,938,000 2,410,400
2,241,000
2,803,450
2,620,000
2,025,000
3.24
9.33 1.95 2.05 3.96 0.90 0.49 3.90 3.81 2.56 2.09 2.04 2.40 2.22 1.85 1.77 2.20
120,000 2,412,000 2.21 50,008,926 45.73
110,000 2,132,511 1.95 140,000 2,558,122 2.34 500,000 1,366,709 1.25
6,057,342 5.54
175,000
275,000 65,000 500,000 291,000 425,000
5,500,000 6,000,000
300,000 380,000
700,000
205,000
1,684,876 1,035,496 1,010,111 2,505,688 1,604,643 1,422,742 1,118,863 2,399,443 1,090,656 1,946,727 2,256,530 2,500,987 -
20,576,762
1.54 0.95 0.92 2.29 1.47 1.30 1.02 2.20 1.00 1.78 2.06
1.26 90.000 1,382,418
110,000 1,210,322 1.11 400,000 3,124,653 2.85
4,334,975 3.96 Total transferable securities admitted to an official stock-exchange listing 85,903,801 78.55
Transferable securities traded on other regulated markets
EUR Cintra Concesiones de lnfraestructuras de Transport 270,000 3,186,000 2.93 Cornrnerzbank
NOK Scanarc Seabird Exploration
135,000 4,758,750 4.36 7,944,750 7.27
350,000 1,842,833 1.69 1,350,000 7,277,309 6.65
9,120,142 8.34
Investment portfolio
At 30/06/2007 Quantity Market value In 96 of
net assets in EUR x 1
USD Afi Development 150,000 1,266,151 1.16
Total transferable securities traded on other regulated markets
Other transferable securities
GBP GlaxoSmithKline/STK/02-05-2oo7
Total other transferable securities
Total securities portfolio Operating capital
Total net assets
18,331,043 16.77
50,292 9,962 0.01
9,962 0.01
104,244,806 95.33 5,110,658 4.67
109,355,464 100.00
84 Robeco Capital Growth Funds

Robeco MultiManager Asia-Pacific Equities
Investment portfolio
At 30/06/2007 Quantity Market value
in EUR x 1
Transferable securities admitted to an official stock-exchange listing
AUD ABCLearningCentres ABCLearningCentres 2 ALL Energy Alinta Alumina Amcor AMP Ansell APN News b Media Asciano Australian b New Zealand Banking Australian Stock Exchange AXA Asia Pacific BHP Billiton BHP Steel Bora1 Brambles Industries CFS Retail Property Trust Coca-Cola Amatil Cochlear Coles Commonwealth Bank of Australia Commonwealth Property Office CSR DE Rreef Trust Downer ED1 Dyno Nobel Fa i rfax Foster’s Goodman Fielder Harvey Norman lluka Resources ING Industrial Fund Insurance Australia lnvesta Property James Hardies Leighton Lend Lease Lion Nathan Macquarie Bank Macquarie Bank Macquarie Communications MacQuarie lnfrastructm Macquarie Office Trust Multiplex National Australia Bank OneSteel Orica Origin Energy Pacific Brands Paperlinx Perpetual Trustees Australia Publishing b Broadcasting Qantas Airways QBE Insurance Rinker Rio Tinto Santos Sonic Healthcare St George Bank Stockland Suncorp.Metway Symbion Health Tabcoro
11,979 64,000
168,700 55,600
1,154,900 297,300 404,700
68,100 58,600 54,919
508,900 400
133,100 695,900 204,998
1,443,900 348,700 587,270 298,465
17,700 260,800 115,700 480,200 285,900 377,570
59,800 52,900
393,401 708,100
86,100 61,500
115,284 128,741 485,400 403,800 303,100
22,800 642,300 141,500
1,500 33,200 15,200
647,400 702,519
65,200 362,200 250,500 148,200 416,900 288,700 102,608
8,400 39,800
2,129,100 136,000 217,300
34,400 99,100 45,700 88,000
179 305,806 146,100 210,347
52,074 281,032
1,607,676 531,603
5,651,708
2,572.833 521,921 215,353
9,267,840 12,237
621,248 15,313,866
1,331,582 7,954,897 2,668,069
793,184 1,788,709
678,267 2,641,013 4,015,721
625,016 466,077 276,488
79,424 1,161,532 2,838,005
131,434 204,375 446,116 189,248
1,738,091 740,708
1,660,352 590,822
7,480,756 824,013
80,322 1,772,780
60,443 1,464,108
737,008 201,536
9,333,445 1,011,851 2,774,357 2,603,252
625,697 239.785 414,288
7,490,002 2,665,578 2,571,808 2,134,859
867,829 432,354
1,958,627
3,874,804 374,462
2,266,200
1,395,126
349,486
505,283
490,046
916
In %of
net assets
0.01 0.03 0.19 0.06 0.67
0.31 0.06 0.03 0.04 1.11 0.00
1.83 0.16 0.95 0.32 0.09 0.21 0.08
0.48 0.06 0.07 0.06 0.03 0.01
0.34 0.02 0.02
0.02 0.21 0.09 0.20 0.07 0.89 0.10 0.01 0.21 0.01 0.17 0.09 0.02 1.11 0.12 0.33 0.31 0.07 0.03 0.05 0.06 0.89 0.32 0.31 0.26 0.10 0.05 0.23 0.00 0.46 0.05 0.27
0.17
0.07
0.31
0.14
0.05
Investment portfolio
At 30/06/2007 Quantity Market value In %of
net assets in EUR x 1
Tattersall’s Telecom of New Zealand Telstra Telstra/lNS/Recp. Toll Transurban Wesfarmers Lim Westfield -Stapled Securit Westpac Banking Woodside Petroleum Woolworths WorleyParsons
HKD Bank of China (HK) Cheung Kong China Construction Bank China Life Insurance China Merchants China Merchants Bank China Mobile (Hong Kong) China Netcom Hongkong China Overseas Land G Investment China Petroleum b Chemical/H China Shipping Development CLP Cosco Pacific Dah Sing Financial Esprit Giordano International Come Electrical Appliances Great Eagle Hang tung Hang Lung Properties Hang Seng Bank Hutchison Whampoa ti b Fung Nine Dragons Paper Petrochina Shanghai Electric Shenzhen Sun Hung Kai Properties Swire PacificlA Television Broadcasts Yanzhou Coal Mining
IDR Astra International Bank Central Asia Kalbe Farma Telkom Indonesia
INR Bharat Forge Bharti Televentures HDFC Bank lnfosys Technologies Maruti Udyog National Thermal Power Oil b Natural Gas Satyam Computer Services Titan Industries
JPY Accordia Golf Aderans Aigan
77,832 593,900
1,825,700 585,846
9,700 120,624
64,268 419,200 516,600 188,417
27,707 78 I
229,802 1,567,726 5,264,292 1,144,568
88,295 606,966
1,846,264 5,256,294 8,327,390 5,415,132
469,949 1,666
1,482,500 486,000
5,777,000 1,174,000
826,000 311
772.500 1,072,600 2,629,000 7,057,000 1,890,000
789,360 1,280,000
182,100 425,500
4,718,000 1,375,000
59,000 736,000 942,000 216,300 596,000 906,000
1,609,000 4,608,000 6,339,000 3,042,600
262,000 253,000 294,000
2,634,000 .
156,887,866
2,608,797 4,718,022 2,938,167 3,124,455 2,957,139
703 6,153,105 2,194,277 3,012,838 5,788,124 3,239,964 3,921,213 2,479,152 1,138,292 3,997,708 1,724,825 1,562,729
153,110 2,460,664 2,404,415 2,163,318 4,383,162 2,424,077 2,776,542 5 , 0 ~ 0 , ~ 3 0 2,113,310 1,705,950 2,337,502 2,093,068 1,531,475
0.03 0.19 0.63 0.14 0 .01 0.07 0.22 0.63 0.99 0.65 0.06 0.00
18.71
0.31 0.56 0.35 0.37 0.35 0.00 0.73 0.26
0.69 0.39 0.47 0.29 0.14 0.48 0.21 0.19 0.02 0.29 0.29
0.52 0.29 0.33 0.60 0.25 0.20 0.28 0.25 0.18
0.36
0.26
2,988,632 0.36 86,104,925 10.27
1.8gg.000 2,630,103 0.31 2,920,500 1,304,412 0.16
30,746,000 3,502,391 0.42 8,241,500 6,652,787 0.79
14,089,693 1.68
282,373 189,119 127,471 133,490 108,407 976,010 153,707 254,923 133,221
1,583,211 2,874,199 2,657,551 4,681,956 1,466,625 2,711,309 2,521,005 2,165,739 3,243,421
23,905,016
0.19 0.34 0.32
0.17 0.32 0.30 0.26
0.56
0.39 2.85
243 173,378 0.02 700 10,891 0.00
9,700 55,134 0.01
Robero Capital Growth Funds 85

Investment portfolio Investment portfolio
At 30/06/2007 Quantity Market value In 96 of
net assets in EUR x 1
A a Insurance Airport Facilities Aisin Seiki Aloka Alps Electronic Amada Aoki International Aoyarna Trading Arcs Aronkasei Asahi Brewery Asahi Chemical Industry Autobacs Seven Bando Chemical Industries BankoftheRyukyus Bank of Yokohama Calsonic Kansei Canon Canon Electronics Canon Sales Capcom Cawachi Central Security Patrols Century Leasing System Chuba Electric Power Chubu Shiryo CJ CCV Coca-Cola West Computer Engineering b Consulting Cosmo Oil CSK DGM Dai Nippon Ink G Chemicals Daicel Chemical Industries Daiichi Sankyo Dainichiseika Color G Chem Daito Trust Construction Daiwa House Daiwa Securities Daiwasystem DC Denso Diamond Lease Duskin East Japan Railway Edion Eighteenth Bank Elpida Memory Full Heavy Industries Fuji Photo Film Fuji ku ra Fuiitsu Fukui Bank Fuyo General Lease Godo Steel Gunze Hankyu Department Stores Harima Chemicals Heiwa Real Estate Hitachi Hitachi Information Systems Hitachi Metals Hitachi Software Engineering Hokkaido Electric Power Hokuetsu Bank Honda Motor lbiden
148,000 700
79,300 9,000
248,700 216,000
2,200 17,200 8,990 7,000 1,000
308,000 17,200 15,000 3,600
188,000 265,000
6,000 48,500 18,900
400 300
9,400 55,900 15,000 19,900 2,600 8,800
237,000 9,900 2,000
834.000 148,000 129,600
1,000 20,700 45.000
205,000 7,600 4,000
56,400 12,000 13,800
829 126,200 34,000 26,300
412,000 25,600 37,000
473,000 37,000 46,100
459,000 284,000
25,000 8,000
64,000 110,000
5,400 62,000 14,700 2,000
38,000 321,200
43,200
213,200
710,778 3,920
2,153,829 76,463
1,837,073 1,995,705
31,064 391,879 105,108
23,167 11,458
1,495,807 400,129
71,679 44,248
973,894 805,552
9,241,988 144,257 732,794 260,633
8,754 2,185
97,164 1,095,972
72,218 448,622
44,662 67,694
966,267 257,611
6,451 2,380,197
712,553 2,540,930
3,843 728,532 475,399
1,613,833 157,207
16,524 1,629,919
398,594 165,481
4,721,913 1,211,408
104,985 856,240
1,457,435 845,729 203,428
2,575,057 84,078
1,138,775 1,601,679 1,226,001
196,659 37,989
346,120 577,086
89,036 502,212 243,258
32,077 74,503
8,666,185 2,061,753
0.09 0.00 0.26 0.01 0.22 0.24 0.00 0.05 0.01 0.00 0 00 0.18 0.05 0.01 0.01 0.12 0.10 1.10 0.02 0.09
0.00 0.00 0.01 0.13 0.01 0.05 0.01 0.01 0.12 0.03 0.00 0.29 0.08 0.30 0.00 0.09 0.06 0.19 0.02 0.00 0.20 0.05 0.02 0.56 0.15 0.01 0.10 0.17 0.10 0.02 0.31 0.01 0.14 0.19 0.15 0.02 0.00 0.04 0.07 0.01 0.06 0.03 0.00 0.01 1.03 0.25
0.03
At 30/06/2007 Quantity Market value In % of
net assets in EUR x 1
lnpex Iris0 Electronisc Isuzu Motor ltochu Itochu-Shokuhin ltoki lzumiya Japan Tabacco Jeans Mate JFE Joint Joshin Denki JSP Kanematsu Electronics Kansai Electric Power Kansai Paint Kato Sangyo Kato Works Kawasaki Kisen KDDl Kioritz K i m Brewery Kirindo Kitz Kobe Steel Komatsu KOMERI Kornori Konaka K's Holding Kubota Kyocera Kyushu Electric Power teopalace21 Makino Milling Machine Marubeni Matsushita Electric Industrial Mikuna Coca Cola Bottling Mitsu bishi Mitsubishi Electric Mitsubishi Gas Chem Mitsubishi Heavy Industries Mitsubishi Pencil Mitsubishi Tokyo Financial Mitsui b Co Mitsui Engineer G Shipbuilding Mitsui 0 S K, Lines Mitsui Petrochemical Mitsui Trust Mizuho Financial Mori Seiki Moshi Moshi Hotline Murata Manufacturing Namco Bandai NEC Fielding Neturen New Japan Radio Nichias Nidec Nihon Nohyaku Nintendo Nippon Beet Sugar Manufacturing Nippon Chemi.Con Nippon Express Nippon Konpo Unyu Soko Nippon Mining Nippon Oil
239 18,400
335,000 423,000
4,800 25,000
132,000 851
2,800 113,500 35,700
9,000 17,900
2,000 22,300 73,000
100 104,000 21,000
285 59,000 4,000 2,700
53,000 189,000 57,800
3,000 10
26,400 147,000 27,700 64,200
101,000 53,000 g0,ooo
174,000 26,200
311,900 272,000
98,000 269,000
19,100 1,590
135,000 lgl.000 66,000 12,000
601 26,100 24,600 31,900 82,500
3,000 6,900 3,000
25,000 20,200 12,000
3,200 74,000 79,000
437,000 27,000
808,500 167,000
21,900
381,000
1,647,918
1,341,718 3,621,667
114,254 149,893 711,498
3,102,223 19,592
5,219,527 828,360 44,626
176,546 11,560
389,747 472,263
958 468,288 189,746
1,560,111 134,777 44,200 17,403
341,287 530,332
1,240,654 430,683
51,983 70
544,505 881,368
2,182,303 1,243,304 2,549,432
559,279 547,707
2,550,751 200,915
370,678
6,040,290 1,862,408
662,201 1,275,759
210,255 12,965,101
533,407 1,917,029
370,786 77,273
3,073,714 599,348 811,218
1,774,919 962,580
28,078 56,181 12,213
196,209 876,859
50,004 861,462 144,197 495,449
1,836,705 257,881
5,729,773 1,147,469
5,608, loa
0.20 0 04 0.16 0.43 0.01 0.02 0.08 0.37 0.00 0.62 0.10 0.01 0.02 0.00 0.05 0.06 0.00 0.06 0.02 0.19 0.02 0.01 0.00 0.04 0.06 0.15 0.05 0.01 0.00 0.06 0.11 0.26
0.30 0.15
0.07
0.30 0.07
0.02 0.72 0.22 0.08 0.15 0.03 1.55 0.67 0.06 0.23 0.04 0.01 0.37 0.07 0.10 0.21 0.11 0.00 0.01 0.00 0.02 0.10 0.01 0.10 0.02 0.06 0.22
0.68 0.03
0.14
86 Robeco Capital Growth Funds

I nvest rn ent portfolio
At 30/06/2007 Quantity Market value In % of
net assets in EUR x 1
Nippon Seisen 1,000 Ntppon Sheet Class 32,000 Nippon Shokubai 48,000 Nippon Steel 915,000 Nippon System Development 400
Nippon Television Netwerk 3,270 Nippon Yusen 532,000 Nipro 2,000 Nishimatsuya Chain 40,400 Nissan Chemical 1ndus:ries 69,000 Nissan Motor 563,600 Nissan Shatai 42,000 Nisshin Seifun 144.500 Nisshinbo 34,000 Nitto Boseki 62,000
Nomura 139,700 Nomura Real Estate 42,500 Nomura Research Instiiute 30,000 NSK 106,000
Nippon Telegraph b Telephone 1,761
NOF 99,000
NTT Mobile Telecommunications DoCoMo 1,204 NTr Urban Development Obayasht Oki Electric Industries Okinawa Cellular Telephone Okuwa Orix Osaka Gas Pacific Golf Group International Pacific Management Pioneer Electronic Rengo Resona Bank Ricoh Ricoh Leasing Sakai Chemical Industry Sakata Inx San A Sa n kyo Sawafuli Electric Second Section S e i p Seiko Seiko Epson Sekisui House Sekisut Jushi Seven G I Sharp Shichie Shimachu Shimadzu Sh imamura Shindengen Electric Manufacturing Shin-Etsu Chemical Shinko Securities Shinko Sholi Shionogi Shoei Showa Showa Denko Showa Shell Sekiya Softbank Investment Sompo Japan Insurance Sony Stanley Electric Sumitomo
513 292,000 694,000
272 2,000 19,300 68,000
290 45
15,100 295,000 1,064
202,000 5,600 73,000 10,000 2,600 12,400 1,000 35,000 11,600 44,000 28,900 112,000 6,000 42,592 274,000
200 3,100 59,000 8,800
118,000 40,400 104,000 8,400
120,000 50,093 42,400 182,000 106,600 2.357
232,000 160,200 36,500 393,400
4,970 108,019 315,134
4,761,905 4,343
5,775,460 329,772
3,607,565 30,398 507,464 599,456
4,463,892 182,317
1,056,116 351,036 175,458 337,744
2,010,238 1,021,817 652,932 810,954
735,115
952,873 539,805 20,026
3,755,017 186,730 196,479 61,516 151,827
1,075,389 1,881,930 3,451,724
93,677
41,071 56,743
1,871 622,204
252,467
1,104,648 35,327 898,898
3,844,203 1,446 61,708
694,350 420,251
2,134,013 397,827 139,256
1,446,163 776.386 417.425
977,248
2,099,023 6,080,035
5,307,094
1,407,670
1,176,500
411,863
385,859
173,180
618,594
458.455
486,683
553,263
586,499
0.00 0.01 0.04 0.57 0.00 0.69 0.04 0.43 0.00 0.06 0.07 0.53 0.02 0.13
0.02 0.04
0.04 0.24 0.12 0.08 0.10 0.17 0.09 0.14 0.11 0.06 0.00 0.45 0.02 0.02 0.01 0.02 0.13 0.22 0.41 0.01 0.05 0.00 0.01 0.05 0.00 0.08 0.02 0.03 0.07 0.13 0.00 0.11 0.46 0.00 0.01 0.05 0.08 0.05 0.25 0.05 0.02 0.17 0.09 0.05 0.06 0.12 0.07
0.73 0.07 0.63
0.25
Investment portfolio
At 30/06/2007 Puantity Market value In % of
net assets in EUR x 1
Sumitomo Bakelite Sumitomo Chemical Sumitomo Electric Industries Sumitorno Heavy Industries Sumitomo Metal Industries Sumitomo Metal Mining Sumitomo Mitsui Financial Sumitomo Pipe G Tube Sumitomo Trust G Banking Suzuken Suzuki Motor Sysmex Tachibana Eletech Tatsho Pharmaceutical Takasago Therrninal Engineering Takashirnaya Takata Takeda Chemical Takihyo Tanabe Seiyaku The Juroku Bank The Kita Nippon Bank TKC Tohto Suisan Tokimec Toko Electric Tokyo Broadcasting System Tokyo Electric Power Tokyo Electron Tokyo Star Bank Tokyo Tatemono Tokyu Community Tokyu land Tokyu Store Chain Toppan Forms Toppan Printing Torit Pharmaceutical Toshiba Toshiba Machine Tosoh Totetsu Kogyo Toye Engineering Toyota Boshoku Toyota Motor Toyota Tsusho Trans Cosmos Tsurumi Manufacturing Uchida Yoko Ulvac Uni-Charm Unicharm Petcare U nY Urban u s 5 West Japan Railway Yamada Denki Yamaha Motor Yamanouchi Pharmaceutical Yarnato Kogyo Yamazawa Zensho Zephyr Zuken
KRW CJ CCV Daelim Industrial
48,000 195,000 73,900 102,000 586,000 30,000 1,341 7,000
362,000 2,100 54,500
200 36,000 7,000
144,000 13,500 122,900 50,000
15,800
37,000 1,000 100
9,000 62,000 14,000 3,000 11,800 248,100 2,200
7 104,000
500 147,000 24,000
100 51.000 1,700
336,000 52,000 g0,ooo 3,000
134,000 33,100 289,800 61,400 25,800 1,000 20,000 16.900 5,500 9,500 9,000
151,500 30,860 347
14,430 3,400 26,700 24,500 600
65,900 193
248,366 968,066 813,499 854,351
2,550,787 481,155
9,246,269 39.745
2,550,271 48,475
1,143,680 431,031 1,457
527,742 48,895
1,343,421 348,050
5,865,497 171,777 325,662 4,695 3,268
120,873 111,892 24,175 7.663
266,725 5,830,631 119,770 16,116 958,401 10,762
1,157,236 92,670
892 405,159 20,436
2,165,647 356,984 369,635 13,832 604,978 619,188
13,552,920 1,049,188 365,840 7,435 74,467 448,880 230,505 283,087 78,999
2,039,242 1,452,464 1,194,212 1,114,351 72,980 858,057 718,315 6,036
462,682 299,707
0.03 0.12 0.10 0.10 0.31 0.06 1.10 0.00 0.30 0.01 0.14 0.05 0.00 0.06 0.01 0.16 0.04 0.70 0.02 0.04 0.00 0.00 0.01 0.01 0.00 0.00 0.03 0.70 0.01 0.00 0.11 0.00 0.14 0.01 0.00 0.05 0.00 0.26 0.04 0.04 0.00 0.07 0.07 1.62 0.13 0.04 0.00 0.01 0.05 0.03 0.03 0.01 0.24 0.17 0.14 0.13 0.01 0.10 0.09 0.00 0.06 0.04
10,400 77,944 0.01 289,438,504 34.51
0.17 0.38
105,750 1,432,292 28,760 3,169,246
Robeco Capital Growth Funds 87
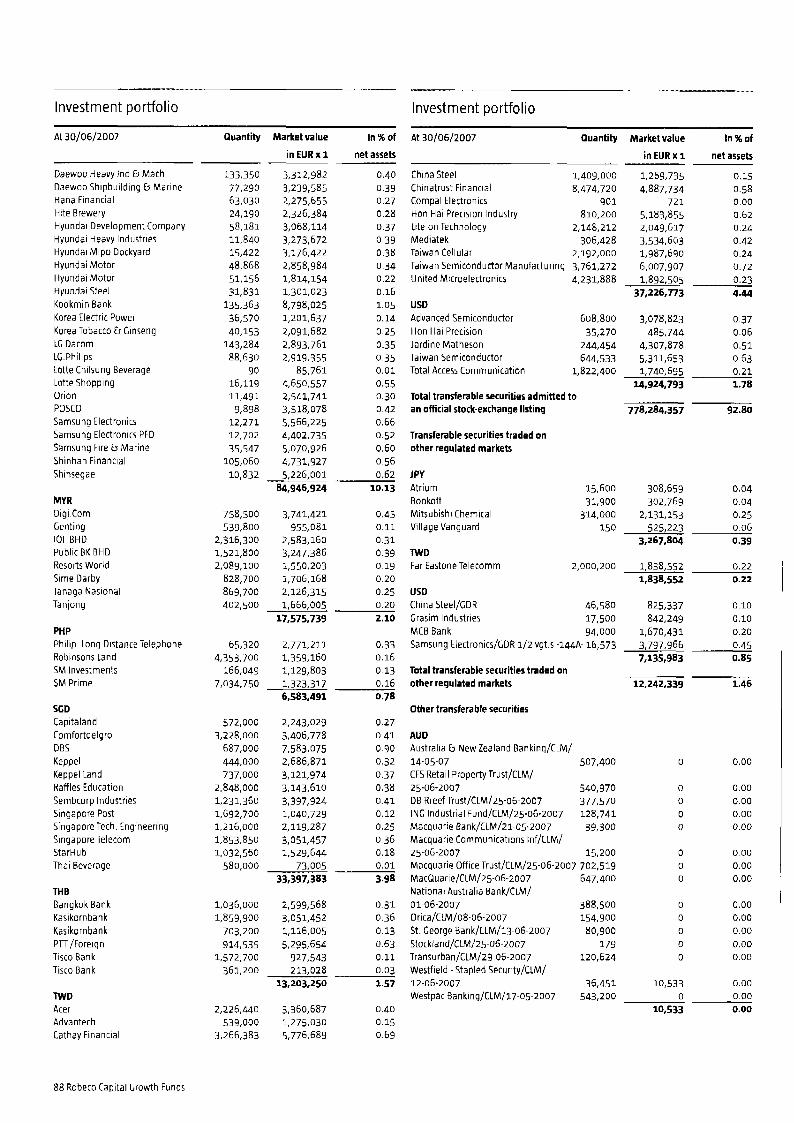
Investment portfolio
At 30/06/2007 Quantity Market value In 96 of
net assets in EUR x 1
Daewoo Heavy Ind 0 Mach Daewoo Shipbuilding G Marine Hana Financial H,te Brewery Hyundai Development Company Hyundai Heavy Industries Hyundai Mipo Dockyard Hyundai Motor Hyundai Motor Hyundai Steel Kookmin Bank Korea Electric Power Korea Tobacco G Ginseng LG Dacom LG Philips Lotte Chilsung Beverage Lotte Shopping Orion POSCO Samsung Electronics Samsung Electronits PFD Samsung Fire & Marine Shinhan Financial Shinsegae
MY R Digi.Com Centing I01 BHD Public BK BHD Resorts World Sime Darby Tanaga Nasional Tanjong
PHP Philip tong Distance Telephone Robinsons Land SM Investments SM Prime
SGD Capitaland Comfortdelgro DBS Keppel Keppel Land Raffles Education Sembcorp Industries Singapore Post Singapore Tech. Engineering Singapore Telecom StarHub Thai Beverage
TH B Bangkok Bank Kasi kornban k Kasikornbank PTr /Fo reign Tisco Bank Tisco Bank
M I D Acer Advantech Cathay Financial
88 Robeco Capital Growth Funds
133,350 77,290 63,030 24,190
11,840 15,422 48,868 51,156 31,831
135,363 36,570 40,153
143,284 88,630
90 16,119 11,491
9,898 12,271 12,702 35,547
105,060
58,181
3,312,982 3,239,585 2,275,655 2,326,384 3,068,114 3,273,672 3,176,422 2,858,984 1,814,154 1,301,023 8,798,025 1,201,637 2,091,682 2,893,761 2,919,355
85,761 4,650,557 2,541,741 3,518,078 5,566,225 4,402,735 5,070,926 4,731.927
0.40 0.39 0.27 0.28 0.37 0.39 0.38 0.34 0.22 0.16 1.05 0.14 0.25 0.35 0.35 0.01
0.55 0.30 0.42 0.66
0.60 0.56
0.52
10,832 5,226,001 0.62 84,946,924 10.13
758,500 533,800
2,316,300 1,521,800 2,089,100
828,700 869,700 402,500
3,741,421 955,081
2,583,160 3,247,386 1,550,203 1,706,168 2,126,315 1,666,005 17,575,739
0.45 0.11 0.31 0.39 0.19 0.20 0.25 0.20 2.10
65,320 2,771,211 0.33 4,353,700 1,359,160 0.16
166,049 1,129,803 0.13 7,034,750 1,323,317 0.16
6,583,491 0.78
572,000 3,228,000
687,000 444,OO 0 737,000
2,848,000 1,231,360 1,692,700 1,216,000 1,853,850 1,032,560
2,243,029 3,406,778 7,583,075 2,686,871 3,121,974 3,143,610 3,397,924 1,040,729 2,119,287 3,051,457 1,529,644
0.27 0.41 0.90 0.32 0.37 0.38 0.41 0.12
0.36 0.18
0.25
580,000 73,005 0.01
33,397,383 3.98
1,036,000 2,599,568 0.31 1,859,900 3,051,452 0.36
703,200 1,116,005 0.13 914,535 5,295,654 0.63
1,572,700 927,543 0.11 361,200 213,028 0.03
13,203,250 1.57
2,226,440 3,360,687 0.40
3,266,383 5,776,689 0.69 539,000 1,275,030 0.15
Investment portfolio
At 30/06/2007 ~~~ ..
Quantity Market value
in EUR x 1
China Steel Chinatrust Financial Compal Electronics Hon Hal Precision Industry Lite-on Technology Mediatek Taiwan Cellular Taiwan Semiconductor Manufacturing United Microelectronics
USD Advanced Semiconductor Hon Hal Precision Jardine Matheson Taiwan Semiconductor Total Access Communication 1,822,400 1,740,695
14,924,793 Total transferable securities admitted to an official stock-exchange listing 778,284,357
Transferable securities traded on other regulated markets
IPY Atrium 15,600 308,659 Bookoff 31,900 302,769 Mitsubishi Chemical 314,000 2,131,153 Village Vanguard 150 525,223
3,267,804 TWD Far Eastone Telecomm 2,000,200 1,838,552
1,838,552 us0 China Steel/CDR 46.580 825,337 Grasim Industries 17,500 842,249 MCB Bank 94,000 1,670,431 Sarnsung Electronics/GDR 1/2 vgt.s - 1 u A - 16,573 3,797,966
7,135,983 Total transferable securities traded on other regulated markets 12,242,339
Other transferable securities
AUD Australia E. New Zealand Banking/CLM/ 14.05-07 507,400 CFS Retail Property Trust/CLM/ 25-06-2007 540,970 DE Rreef Trust/CLM/25-06-2007 377,570 ING Industrial Fund/CLM/25.06-2007 128,741 Macquarie Bank/CLM/21-05-2007 39,300 Macquarie Communications Inf/CLM/ 25-06-2007 15,200 Macquarie Office Trust/CLM/25-06-2007 702,519 MacQuarie/CLM/25-06-2007 647,400 National Australia Bank/CLM/ 01-06-2007 388,500 Orica/CLM/08~06-2007 154,900 St George Bank/CLM/13-06-2007 80,900 Stockland/CLM/25-o6-2007 179 Transurban/CLM/z9-06-2oo7 120,624 Westfield -Stapled Security/CLM/ 12-06-2007 36,451 Westpac Bankinq/CLM/i7-05-2007 543,200 0
10.533
1,409,000 8,474,720
901 810,200
2,148,212 306,428
3,761,272 4,231,888
2,192,000
608,800 35,270
244,454 644,533
1,269,735
721 5,183,855 2,049,617 3,534,603
6,007,907
37,226,773
3,078,823
4,307,878
4,887,734
1,987,690
1,892,505
485,744
5,311,653
~
In %of
net assets
0.15 0.58 0.00 0.62 0.24 0.42 0.24 0.72
4.44
0.37 0.06
0.63 0.21 1.78
92.80
0.23
0.51
0.04 0.04
0.06 0.39
0.22 0.22
0.10 0.10 0.20 0.45 0.85
1.46
0.25
0 0.00
0 0.00 0 0.00 0 0.00 0 0.00
0 0.00 0 0.00 0 0.00
0 0.00 0 0.00 0 0.00 0 0.00 0 0.00
10,533 0.00 0.00 0.00

Robeco Emerging Markets Equities
Investment portfolio
At 30/06/2007 Quantity Market value In % of
net assets in EUR x 1
HKD China Merchants International/ClM/
Great Eagle/CLM/i6-05-2007 Shenzhen lnvt/CLM/11-05-2007
17.05-2007
THE True Wto8. F -Warrants 200
Total other transferable securities
Total securities portfolio Operating capital
Total net assets
826,000 0 0.00 803,000 0 0.00
2,579,200 0 0.00 0 0.00
45,157 0 0.00
10,533 0.00
790,537,229 94.26 4a,132,0a 5.74
838,669,273 100.00
Invest me nt portfolio
At 30/06/2007 Quantity Market value In 96 of
net assets in EUR x 1
Transferable securities admitted to an official stock-exchange listing
BRL AES Tiete 386,897,000 Banco do Brasil 819,000 Cemig 1,372,374 CIA Saneamento Minas Gerais 361,000 Gerdau 1.287.469 Petroleo Brasileiro 145,240 Sabesp 527,011 Usiminas 543,500 Usinas Siderurgicas de Minas Gerais 77,400
GBP Aquarius Platinum 411,900
HKD Aluminum of China Avichina Industry b Tech Bank Of China Chaoda Modern Agriculture China Construction Bank China High Speed Transmission China Mengniu Dairy China Merchants Bank China Mining Resources China Mobile (Honq Kong) China Overseas Land G Investment China Petroleum G Chemical/H China Power International China Shipping Container tines China Yurun Food CNOOC Donqfeng Motor Huanenq Power International Industrial and Comrn, Bank of China Jiangxi Copper Company KWC Property Lianhua Supermarket Lingbao Gold tuen Thai Pacific Basin Shipping Petrochina Shenzhou International Sunny Optical Tech Tack Fat Xiamen International
IDR International Nickel Indonesia
I15 Bank Hapoalim Partner Communications
INR Apollo Hospitals Enterprise Bharat Heavy Electricals Bharti Televentures Dabur India DLF Housing Development Finance lc ic i Bank Indian Bank lnfosys Technologies Ranbaxy Laboratories Satyam Computer Services
6,741,000 42,051,000 15,566,000 34,404,500 51,672,000
290,000 7,031,000 3,579,000
15,094,900 5,087,500
19,983,250 30,110,300 20,028,000 24,628,000 11,529,000 24,420,000 24,007,000 15,991,680 38,238,000
6,400,000 757,000
7,173,000 9,165,600
12,124,000 17,102,700
19,982,000 14,802,000
152,000 8,392,000
34,643,000
1,237,000
1,862,300 500,000
607,300 812,080
2,057,220 3,000,000
217,900 400,000 287,701 109,090 738,276 800,057
1,008,236
11,155,556
21,652,819 4,024,758
24,500,592 2,883,414 8,513,543
22,984,065 3,793,899
108,246,031
9,555,725
8,737,385
8,427,487 8,045,027 5,720,165
19,713,805 26,280,244
196,424 17,946,332
8,084,439 2,687,744
40,522,875 22,900,835 24,696,352 8,080,663
12,455,760 9,543,395
20,491,758 9,458,691
13,464,669 15,717,546 7,364,805
527,217 7,568,082 5,217,173 1,878,981
10,104,817 21,726,045
5,327,259 56,433
1,057,102 10,072,881
345,935,006
5,626,312
6,721,136 5,889,324
12,610,460
5,698,211
31,265,287 5,609,536 2,079,782
4,996,691 252,770
25,893,895 5,162,850 8,565.631
22,710,522
14,789,322
0.50 0.39 0.97 0.18 1.10
0.38 1.04 0.17 4.86
0.43
0.13
0.38 0.36 0.26 0.89 1.18 0.01 0.81 0.36 0.12 1.82
1.11 0.36 0.56 0.43 0.92 0.42 0.60 0.71 0.36 0.02 0.34
1.03
0.23 0.08 0.45 0.98 0.24 0.00 0.05 0.45
15.53
0.25
0.30 0.27 0.57
0.26 1.02 1.41 0.25 0.09 0.67 0.22 0.01 1.17 0.23 0.38
Robeco Capital Growth Funds 89

Investment portfolio Investment portfolio
At 30/06/2007 Quantity Market value In % of
in EUR x 1 net assets
84,254 2,336,400 0.10 500,950 10,466,712 0.47
At 30/06/2007 Quantity Market value In % of
net assets in EUR x 1
7,145,709 0.32 14,270,814 0.64
17,129,319 0.77 48,150,052 2.17
26,769,740 1.20
7,054,912 0.32
Powerchip Semiconductor * 15,780,000 Quanta Computer * 12,371,904 Siliconware Precision Industries 17,023,407 Taiwan Cellular 18,890,000 Taiwan Semiconductor Manufacturing 30,144,513 United Microelectronics 15,775,708 Walsin Lihwa 13,000,000
State Bank of India/Local Tata Consultancy Tata Motors 453,000 5,515,848 0.25
145,343,457 6.53 KRW Amore pacific Cheil Communication CJ Hana Financial Hanlin Shipping HankookTire MFG Pynix Semiconductor Hyundai Motor Kookmin Bank KT LG Chemicals LG Construction LC Electronics POSCO Samsung Electronics Samsung Electronics - PFD Sarnsung Heavy Industries Sarnsung SO1 Samsung Techwin Shinhan Financial Shinsegae SkTelecom
20,019 40,000
100,000 500,000 500,000 700,000
400,400 500,206 300,995 50,000
200,000 300,000 120,000 120,000 40,000
700,000 100,000 200,000 700,000
50,000 100.g00
700,100
11,744,048 9,120,247 8,975,990
18,052,159 16,309,054
9,312,590 18,712,002 23,425,091 32,511,282 10,420,952
3,129,575 17,711,552 18,368,723 42,651,982 54,432,969 13,864,699 25,357,172
4,808,566 7,805,906
31,528,166 24,122,974 17,224,044
419~a9.743
0.53 0.41 0.40 0.81 0.73 0.42 0.84
1.46 0.47 0.14 0.80 0.82 1.91 2.44 0.62 1.14 0.22 0.35 1.42 1.08
1.05
5,681,818 0.26 299,589,420 13.45
USD America Movil Banco Bradesco Banco ltau Financeira Buenaventua Cemex Credicorp Gafisa Mobile Telesystems Petroleo Brasileiro ADR Petroleo Brasileiro PREF/ADR Tele Norte teste Telecomunicacoes Tenaris Teva Pharmaceutical Industries Unibanco Vale Do Rio Dote
1,186,413 1,446,528
563,550 730,600 824,587 463,700
12,000 444,463 242,500 604,9 17
1,524,300 330,000 485,000 180,074 335,600
2,193,344
54,403,433 25,823,398 18,543,676 20,264,541 22,529,533 21,002,206
277,220 19,933,452 21,774,814 47,782.419 21,410,515
7,950,983 17,582,170
5,500,020 28,047,219 61,226,218
394,051,817
2.44 1.16 0.83 0 .91 1.01 0.94 0.01 0.89 0.98 2.15 0.96 0.36 0.79 0.25 1.26 2.75
17.69 0.77
18.83 ZAR Anglo American Platinum Ellerine Impala Platinum JD Network Healthcare S a m Standard Bank Steinhoff International Telkom South Africa
13,321,688 3,659,138
26,943,018 5,884,192 5,799,817
20,820,063 12,178,999
6,795,455 18,622,543
114,024,913
0.60 0.16 1.21 0.26 0.26 0.93 0.55 0.31 0.84 5.12 ,
109,000 500,000
1,188,000 789,430
3,828,000 745,460
1,180,000 2,673,300
994.187
MXN America Movil Consorcio Asa Controladora Comm Mexicana Crupo Financiero Banorte Lrupo Mexico Organization Soriana Sare
1,405,719 3,225,186 0.14 5,247,400 6,293,258 0.28 3,840,000 7,279,508 0.33 5,710,000 19,423,728 0.87
2,170,000 5,129,073 0.23 6,121,998 27,705,359 1.25
5,192,900 6,334,782 0.28 75,390,894 3.38
Total transferable securities admitted to an official stock-exchange listing
MYR 101 BHD' KLCC Property Public Bank Berhad Starhill Real Estate Investment YTL *
20,000,000 22,304,195 1.00 8,000,000 6,245,175 0.28 3,000,000 6,305,224 0.28
6,000,333 10,616,528 0.48 50,060,639 2.25
580,000 8,480,659 0.38
20,000,000 4,589,517 0.21
2,0~os6,272 90.42
Transferable securities traded on other regulated markets
TWD Coretronic 9,166,552 11,771,265 0.53 PLN
Polski Koncern Naftowy USD Evraz-CDR Gazprom Gravity Hindustan Construction-GDR Integra Group Intergroup Financial JSC MMC Norilsk Nickel Lotte Shopping CO-GDR Lukoil Raspadskaya Sberbank
293,121 2,923,417
600,500 1,800,000
269,100 230,000 175,870 500,000 559,018
2,250,000 8,467
8,920,274 90,697,252
2,814,532 3,065,418 3,626,390 2,683,944
28,909,068 7,189,664
31,540,611 4,364,888
24,387,569 208,199,610
0.40 4.07 0.13 0.14 0.16 0.13 1.29 0.32 1.42 0.20 1.09 9.35
SGD China Fishery Croup Golden Agri-Resources
3,550,000 4,434,063 0.20 5,247,000 6,604,473 0.30
11,038,536 0.50 TRY Ford Otomotiv Sanayi 2,085,512 14,542,660
12,073,297 13,456,350 10,813,881 12,121,489 17,400,565 13,162,957 13,412,106 10,246,197 12,964,548 15,919,454 36,104,295
5,711,917
0.65
0.54 0.60 0.49 0.54 0.78 0.59 0.60 0.46 0.58 0.71 1.62 0.26
TWD Acer Asustek Computer - AU Optronics * Chinatrust Financial * Delta Electronics * Evergreen Marine * Far Eastern Textile Formosa Chemicals G Fibre Formosa Plastics Fuban Financial Company * Hon Hal Precision Industry Mitac International
7,998,505 6,607,187 8,571,391
21,017,147 5,964,188
26,862,842 17,691,704
6,000,000 6,900,000
23,554,000 5,642,847 6,080,000
Total transferable securities traded on other regulated markets 219,970,875 9.88
Total securities portfolio Operating capital
Total net assets
2,234,057,147 100.30 -6,782,469 -0.30
2,227,274,678 100.00
* Part of the position concerns equity swaps
go Robeco Capital Growth funds

Robeco Emerging Stars Equities
~~
Investment portfolio
At 30/06/2007 Quantity Market value In % of
net assets in EUR x 1
Transferable securities admitted to an official stock-exchange listing
BRL Usiminas
GBP Aquarius Platinum
HKD Chaoda Modern Agriculture China High Speed Transmission China Mining Resources Delta Networks Denway Motors KWG Property Pacific Basin Shipping Tack Fat
IDR International Nickel Indonesia
INR DLF
KRW Amore pacific Hyundai Heavy Industries Hyundai Motor Kookmin Bank LG Construction POSCO Shinhan Financial Sk Telecom
MXN Controladora Comm Mexicana/UBC Crupo Financier0 Banorte Grupo Mexico Sare
SGD Golden Agri-Resources
M I D Mitac International
USD Cemig Cia Saneamento Basico Mobile Telesystems Petroleo Brasileiro Silicon Ware Precision Tele Norte teste Telecomunicatoes U ni ba nco Vale Do Rio Doce
132,600 5,607,520 4.23
171,000 3,967,053 2.99
8,080,000 7,000
855,100 210,000
8,230,000 44,000
6,843,000 156,000
4,629,846 4,741
152,256 89,502
2,860,657 30,644
5,703,337 19,651
13,490,634
3.50 0.00 0.11 0.07 2.16 0.02 4.31 0.01
10.18
56,500 256,982 0.19
12,543 119,719 0.09
2,640 15,800 67,270 73,400 46,500 11,610 100,350
15,730
1,548,743 1.17 4,368,582 3.30 3,935,579 2.97 4,770,691 3.60
4,126,579 3.11 4,519,788 3 .41 2,685,175 2.03
30,073,073 22.70
4,117,936 3.11
2,114,600 4,008,659 3.02 1,221,600 4,155,521 3.14
907,400 4,106,477 3.10 3,325,300 4,056,510 3.06
16,327,167 12.32
185,000 232,862 0.18
4,611,000 4,331,850 3.21
250,500 128,250
91,900 66,900
663,200 318,300 203,700
65,150
3,913,628 4,185,895 4,121,568 5,284,433 5,401,651 4,470,883 4,907,925 5,444,803
2.95 3.16 3.11 3.99 4.08 3.38 3.71 4.11
201,100 5,613,617 4.24 43,344,403 32.73
Total transferable securities admitted to an official stock-exchange listing 117,751,263 88.88
Investment portfolio
At 30/06/2007 Quantity Market value In %of
net assets in EUR x 1
Transferable securities traded on other regulated markets
M I D Coretronic
USD Gazprom Integra Group JSC MMC Norilsk Nickel
2.91 3,000,000 3,852,462
3.34 0.05
142,600 4,424,079 4,600 61,990
27,300 4,487,504 3.38 8,973,573 6.77
Total transferable securities traded on other regulated markets 12,826,035 9.68
Total securities portfolio Operating capital
130,577,298 98.56 1,908,535 1.44
Total net assets 132,485,833 100.00
Robeco Capital Growth Funds 91

Robeco Chinese Equities Robeco Financials Equities
Investment portfolio Investment portfolio __ At 30/06/2007 Quantity Market value In % of
net assets in EUR x 1
Transferable securities admitted to an official stock-exchange listing
At 30/06/2007 Quantity Market value In % of
net assets in EUR x 1
Transferable securities admitted to an official stock-exchange listing
AUD Centro Shopping America Trust 1,400,000 1,059,775 1.06
HKD Aluminum of China Anhui Tianda Oil Pipe/H Chaoda Modern Agriculture China Communications Const China Construction Bank China High Speed Transmission China Life Insurance China Merchants Bank C’lina Merchants China Direct China Mining Resources China Mobile (Hong Kong) China National Buildings China Overseas Land G Investment China Petroleum 6 Chemical/H China Power International China Resources Power China Shipping Container Lines China Telecom (HK) Cit ic Pacific CNOOC Dongfeng Motor Golden Meditech Huaneng Power International Industrial and Comrn Bank of China Jiangxi Copper Company KWG Property Luen Thai Pacific Basin Shipping Pacific Textiles Petrochina Shanghai Electric Shenzhou International Sunny Optical Tech Xiarnen International
8,605,000 5,620,000
14,657,000 4,066,000
38,045,000 13,000
6,445,000 3,441,000
480,000 1,781,000 2,657,300 8,300,000 9,442,000
14,223,000 8,813,700 4,238,000 7,912,000
21,772,697 2,384,000
23,659,000 7,528,000 7,578,000
10,988,000 21,237,000
7,038,000 87,000
9,618,000 4,019,000
332,000 18,225,868 10,608,000
8,035,000 278,000
31,445,000 -
10,757,829 3,683,344 8,398,472 5,391,322
19,349,587 8,805
17,152,565 7,772,718 1,172,899
317,119 21,165,884 13,505,202 10,820,547 11,665,650 3,556,049 7,505,893 4,001,542 9,444,469 8,884,865
19,853,174 2,966,011 3,229,735 9,251,672 8,729,367 8,758,797
60,592 1,056,678 3,349,658
252,503 19,816,636
3,536,519 2,891,807
103,212
4.08 1.40 3.19 2.05 7.34 0.00 6.51 2.95 0.44 0.12 8.03 5.12 4.10 4.43 1.35 2.85 1.52 3.58 3.37 7.53 1.13 1.23 3.51 3.31 3.32 0.02 0.40 1.27 0.06 7.52 1.34 1.10 0.04
CAD Canadian Apartment Prop. Real Estate 40,000 5L4,043 0.55 Canadian Imp, Bank of Commerce 38,000 2,538,976 2.55 National Bank of Canada 40,400 1,725,784 1.73
4,808,803 4.83 CHF Baloise c5 Swiss Life
7,500 5~8,725 47,700 2,517,276
6,000 1,174,480 4,240,481
0.55 2.53 1.18 4.26
EUR Aegon Allied Irish Banks Alstria Office Babis Vovos International Construction BNP Paribas Capitalia Hellenic Exchanges INC Irish Life G Permanent National Bank of Greece Risanamento 5N5 Reaal Societe GenPrale Unicredito ltaliano
90,000 1,317,600 73,000 1,475,330 35,000 527,800 20,000 478,000
1.32 1.48 0.53 0.48 2.43 1.19 1.36 2.47 1.09
0.44 0.57 2.07 1.86
18.36
1.07
27,400 160,000
70,000 75,000 58,000 25,000 80,000 33,750 15,000
280,000
2,421,064 1,179,200 1,358,000 2,459,250 1,084,020 1,060,000
436,400 565,313
2,062,950 1,856,400
18,281,327 CBP Barclays Clobeop Financial Service Lloyds TSB Man Old Mutual Royal Bank of Scotland Slough Estates Standard Life
250,000 2,584,862 500,000 1,894,080 302,760 2,500,699 174,000 1,574,181 340,000 853,094 315,000 2,962,118
60,000 557,082 274,911 1,348,724
14,274,840
2.60 1.90 2.51 1.58 0.86 2.98 0.56 1.35
14-34
9,143,023 3-47 257,454,145 97.68
2,010,000 2,510,553 0.95 SGD China Fishery
USD Yingli Green Energy
HKD Dah Sing Financial KWG Property Midland Realty
164,000 1,025,150 35,000 24,376
2,194,000 1,022,355 2,071,881
1.03
1.03 0.02
2.08
38,000 407,982 0.15
Total transferable securities admitted to an official stock-exchange listing 260,372,680 98.78
JPY Daiwa Securities Jafco Kennedy-Wilson Japan Millea Mizuho Financial NDmUra Orix Resona Bank TbD
Total securities portfolio Operating capital
Total net assets
260,372,680 98.78 3,226,464 1.22
100,000 1g,ooo
320 58,000
180 88,000
5,200 400
24,000
787,235 647,056 441,284
1,759,618 920,580
1,266,292 1,011,714
707,493
0.79 0.65 0.44 1.77 0.93 1.27 1.02 0.71
263,599,144 100.00
1,198,660 8,739,932
1.20 8.78
KRW Pusan Bank 60,000 641,944 0.64
MYR AMMB 800,000 741,186 0.74
NOK DNB Storebrand
0.64 0.65 1.29
67,000 640,027 56,000 646,571
1,286,598
92 Robeco Capital Growth Funds

Robeco Food 1 Agri Equities
Investment portfolio Investment portfolio
At 33/06/2007 Quantity Market value In %of
net assets in EUR x 1
Transferable securities admitted to an official stock-exchange listing
At 30/06/2007 Quantity Market value In % of
net assets in EUA x 1
PHP Banco de Oro-EPCI Filinvest Land Security Bank
400,000 445,064 0.45 20,000,000 691,610 0.69
277,700 373,450 0.38 1,510,124 1.52
BRL Cosan Industria Cornercio 1.11 56,782 688,068
SGD Cambridge Industrial Capitaland United Overseas Bank
CHF Nestle 14,856 4,1a2,513 6.74 1,500,000 686,241 0.69
230,000 901,917 0.91 155,000 1,650,852 1.65
3,239,010 3.25 EUR Carrefour Superrnarche Danone Hei ne ken Henkel lrnbev Kesko/B Koninklijke Ahold Pernod-Ricard
31,626 28,892 39,580 51,711 22,550 22,639
197,508 10,806
1,648,980
1,517,893 1,827,984 1,326,617 1,117,008 1,842,750 1,771,644
1,734,098
i2,786,97a
2.66 2.79 2.45 2.94 2.14
2.97 1.80
M I D ESun Financial SinoPac Financial Ta Chonq Bank
1,235,760 528,969 0.53 L500,OOO 530,558 0.53 2,250,000 555,059 0.56
1,614,586 1.62 USD Assurant Bank of America Blackstone CIT Citigroup Conseco Countrywide Financial F a m e Mae Globeop Financial Service Goldrnan Sachs Hanover Insurance Hartford Financial Services JP Morgan Chase b Co Merrill Lynch Nationwide Financial Services Penn Real Estate Invest PNC Bank Prudential Financial Radian Security Capital Assurance Wachovia
29,000 84,000
2,916 32,000
109,000 77,000 30,000 47,000
500,000 11,000 31,000 25,000
120,000 36,500 25,000 14,000 37,000 30,000 32,100 35,000
1,265,173 3,040,806
63,197 1,299,145 4,139,506 1,191,018
807,449 2,273,526 1,894,080 1,765,392 1,119,907 1,823,516 4,304,913 2,258,835 1,170,264
459,531 1,961,023 2,159,787 1,283,477
800,007
1.27 3.06 0.06 1.31 4.16 1.20 0.81 2.28 1.90 1.77 1.13 1.83 4.33 2.27 1.18 0.46 1.97 2.17 1.29 0.80
2.85 20.60
GBP Diageo Imperial Tohacco South African Breweries (GBP) Tesco
73,841 1,137,534 1.83 58,234 1,995,779 3.22 94,165 1,770,971 2.85
6,557,003 10.57 265,837 1,652,719 2.67
INR Balrarnpur Chini Mill 63,801 88.502 0.14
JPY Fancl Shiseido
99,400 1,078,710 1.74 107,780 1,699,549 2.74
2,778,259
1,517,266
304.996
738,832
3,853,325 1,808,530 1,433,586 1,590,028 1,996,016 1,469,375 1,199,140
927,478 1,946,339 1,733,335 1,584,839 1,641,722 1,786,760 1,226,150 3,496,376
4.48
2.44
0.49
1.19
6.21 2.91 2.31
3.22 2.37 1.93 1.49 3.14 2.79 2.55 2.65 2.88 1.98
2.56
5.64
SEK Oriflame Cosmetics 43.570
1,000,000
131,639
74,196 34.893 58,511 58,433 31,902 82,686 24,973 51,590 72,116 59,536 49,800 55,920 68.457 23,711 77,170
SCD Luzhou Bio-Chem Technology
61,000 2,314,798 2.33 37,395,350 37-58 TRY
Coca-Cola lcecek Uretim Total transferable securities admitted to an official stock-exchange listing 98,011,757 98.45
Transferable securities traded on other regulated markets
USD Altria Arnbev Archer-Daniels-Midland Avon Products Bunge Coca-Cola Enterprises Colgate-Palmolive Constellation Brands cvs Fernsa/Unit Hansen Natural Herbalife Kraft Foods/A Nutri/System Proder b Gamble Rite Aid
EUR Banco Bilbao Vizcaya Argentaria 160,000 2,912,000 2.93
Total transferable securities traded on other regulated markets 2,912,000 2.93
Other transferable securities
AUD Centro Shopping America Trust/CLM/ 25-06-2007 800,000 0 0.00
CBP HSBC (75p)/STK
200,000 944,800 1.52 28,637,799 46.15 210,888 59,176 0.06
Total transferable securities admitted to an official stock-exchange listing 58,280,212 93.91 Total other transferable securities 59,176 0.06
Total securities portfolio Operating capital
Total net assets
100,982,933 101.44 -1,436,843 -1.44
99,546,090 100.00
Robeco Capital Growth Funds 93

Robeco Health Care Equities
Investment portfolio
At 30/06/2007 Quantity Market value In % of
net assets in EUR x 1
Transferable securities traded on other regulated markets
Investment portfolio
At 30/06/2007 Quantity Market value In % of
in EUR x x net assets
Transferable securities admitted to an official stock-exchange listing
BRL Cremer Diagnosticos Da America Profarrna Distribuidora
EUR Altadis Ifr Capital
270.000 2,363.532 215,000 3,521,135
50,000 692,002 6,576,669
1.49
0.44 4.16
2.23 8,691 427,597 0.69 1,000,000 1,025,000 1.65
1,452,597 2.34 CHF Novartis Phonak Roche 5ynthes
USD Supervalu 53.758 1,843,746 2.97 101,000 4,210,367
14,000 930,401 60,845 7,991,604
2.66 0.59 5.06 1.07 9.38
GBP Tesco/STK/25-04-2007 255,837 28,842 0.05 19,000 1,686,261
14,818,633 Total transferable securities traded on other regulated markets
Total securities portfolio Operating capital
DKK Novo-Nordisk 3,325,185 5.36
61,605,397 99.27 453,578 0.73
29,000 2,338,144 1.48
EUR Sanofi-Synthela bo Tigenix
80,000 4,808,000 92,072 583,736
5,391,736
3.04 0.37
62,058,975 100.00 Total net assets 3.41 GBP AstraZeneca (GBP) ClaxoSrnithKline optos
3.62 6.52
143,600 5,723,521 531,000 10,294,214 435,000 1,633,310
17,651,045 1.03
11.17 INR Opto Circuits India Virnta Labs
139,999 978,130 0.62 408,601 1,009,532 0.64
1,987,662 1.26 J PY Astellas Pharrna Daiichi Sankyo Shionogi Takeda Chemical
72,000 2,313,861 1.46
75,000 903,852 0.57 88,000 1,725,323 1.09
1.36 45,000 2,147,660 7,090,696 4.48
SGD LMA International 895,381
709,337
4,559,809 1,609,418 3,356,988
949,746 536,855
1,109,178 590,633
5,000,807 2,754,964 1,365,962 1,595.646 1,117,212 1,571,406 3,826,620
819,074 380,645
6,159,491 1,216,882 4,551,331 2,561,268 2,136,633 3,993,514 7,227,278
801,007 1,633,409
0.57
0.45
2.89 1.02 2.12 0.60 0.34 0.70 0.37 3.17 1.74 0.86 1.01 0.71 0.99 2.42 0.52 0.24 3.90 0.77 2.88 1.62 1.35 2.53 4.57 0.51 1.03
2,700,000
460,000
115,000
82,000 42,000 85,000 28,000
214,000 64,900 32,000 50,000 35,000 28,050
133,300 20,000 16,000
135,000 21,000
110,000 58,000 37,000
104,000 196,000 30,000 40,000
44,000
52,000
TRY Selcuk Ecza Deposu Ticaret ve Sanoyi
USD Abbott Laboratories Aetna Amgen Applera-applied Biosys Atricure Biogen ldec Boston Scientific Bristol Myers Celqene Coventry Health Care Covidien CYtYC Cenentech Gilead Sciences Hologic IM5 Health Johnson 6 Johnson Laboratory of America Lilly (El i ) Mckesson HBOC Medco Health Solutions Medtronic Merck Ornnicare Pediatrix Medical
94 Robeco Capital Growth Funds

Robeco IT Equities
Investment portfolio Investment portfolio
At 30/06/2007 Quantity At 30/06/2007 Quantity Market value In % of
net assets in EUR x 1
Transferable securities admitted to an official stock-exchange listing
Market value In % of
in EUR x 1 net assets
5,490,578 3.48 1,075,229 0.68 1,354,715 0.86 1,182,333 0.75 1,974,011 1.25 1,685,002 1.07 5,376,977 3.40 3,132,790 1.98 5,498,153 3.48 2,199,956 1.39 90,395,520 57.20
147,854.an 93.56
Pfizer ST. Jude Medical St ry ke r Syneron Medical The Cooper Thermo-Electron UnitedHealth Wellpoint Wyet h Zimrner
290,000
29,000
50,000
35,000
64,000
44,000 142,000 53,000 129,500 35,000
CAD Onex Sandvine
14,000 358,612 0.44 55,000 225,873 0.27
584.485 0.71 EUR Alcatel Cap Gemini (FR) lnfineon Technologies Nokia/A SAPhmmakt ien
80,000 830,400 1.01 16,000 869,920 1.06 30,000 367.500 0.45 185,000 3,849,850 4.69 22,500 851,850 1.04
6,769,520 8.25 Total transferable securities admitted to an official stock-exchange listing
HKD ASM Pacific Technology Foxconn International
Transferable securities traded on other regulated markets
EUR Fresenius/Vorzugsaktien Laboratorios Almirall
140,000 751.152 0.91 200,000 422,410 0.51
1,173,562 1.42 INR lnfosys Technologies 22,000 771,616 0.94 19,500 1,098,240 0.69
85,960 1,259,314 0.80 2,357,554 1.49 JPY
Canon Nintendo
18,000 780,280 0.95 Total transferable securities traded on other regulated markets
5,000 1,346,035 1.64 2,126,315 2.59 2,357,554 1.49
KRW Samsung Electronics Other transferable securities 0.55 1,000 453.608
CBP GlaxoSmithKline/STK/02-05-2007
Total other transferable securities
NOK Renewable Energy 20,000 576,669 0.70 584,000 115,675 0.07
SEK Ericsson/B
115.675 0.07 1.59 441,701 1,309,705
Total securities portfolio Operating capital
150,328,052 95.12 7,708,003 4.88
158,036,055 100.00
TWD D Link Everlight Electronics High Tech Computer Hon Hal Precision Industry lnnolux Display Mediate k Realtek Semiconductor Richtek Technology Siliconware Precision Industries Taiwan Semiconductor Manufacturing
USD Accenture Activiston Adobe Systems Akarnai Amphenol/A Apple Computers Atheros Communications Auto Desk Bigband Networks Blackboard Broadcorn Cadence Design Cerner Chordiant Software CISCO Systems Cognizant Technology Solutions CommScope Corning Data Domain Dell Computers Double Take Software
250,000 150,000 27,000 140,000 150,000 75,000 100,000 70,000 500,000 301,499
439,316 397,074 357,062 895,754 459,592 865,114 367,223 820,056 786,263 481,587
5,869,041
0.53 0.48 0.43 1.09 0.56 1.05 0.45 1.00 0.96 0.59 7.14
1.16 0.50 1.36 0.48 0.96 4.07 0.56 1.57 0.41 0.57 0.33 0.79 0.55 0.51 5.65 0.95 0.53 1.50 0.16 0.90 0.52
Total net assets
30,000 30,000 37,502 11,000 30,000 37,000 20,000 37,000 35,000 15,000 12,500 40,000 11,000 37,000 225,000 14,000 10,000 65,000 7,500 35,000 35,000
952,723 414,720
1,114,883 396,165 791,900
3,343,438 456,703
1,289,815 339,750 467,809 270,723 650,402 451,794 417,245
4,639,776 778,394 432,046
1,229,684 127,726 739.625 425,271
Robeco Capital Growth Funds 95

Robeco Telecom Services Equities
Investment portfolio Investment portfolio
At 30/06/2007 Quantity Market value In 96 of
net assets in EUR x 1
Transferable securities admitted to an official stock-exchange listing
~~ ~
At 30/06/2007 Quantity Market value In 96 of
in EUR x 1 net assets
1,072,156 448,706 370,071 434,268
3,875,310 3,138,647 1,558,624 3,694,495
815,297 835,660 447,558 667,728 543,068 713,072 417,497
4,364,148 470,975 532,953 536,818 495,087 713,487 385,843 917,626
2,480,989 398.060 559,876
2,152,553 1,036,563
473,141 430,343 466,847 500,463
2,006,114 574,433 596,053 517,567 489,423 522,010 423,679 469,883
EMC Focus Media Foundry Networks Garnestop Gooqle Hewlett Packard IBM Intel Intersil/A Juniper Networks KLA Tencor Macrovision MEMC Electronic Materials Microchip Technology Micron Technology Microsoft National Semiconductor Navteq Netqear Netlogic Microsystems Network Appliances Nice Systems Nvidia Oracle Polycom Pr i cel I ne Qualcomm Research in Motion Sonus Networks Spreadtrum Communication Sunpower Taleo Corp Class A Texas Instruments Thermo Electron Trimble Navigation Ultra Clean Varian Semiconductor Equipment Ve r ifo n e Verigy Verisiqn Yahoo
80,000 12,000 30,000 15,000 10,000 95,000 20,000
210,000 35,000 45,000 11,000 30,000 12,000 26,000 45,000
200,000 22,500 17,000 20,000 21,000 33,000 15,000 30,000
170,000 16,000 11,000 67,000 7,000
75,000 40,000 10,000 30,000 72,000 15,000
50,000 16,500 20,000 20,000 20,000 20.000
25,000
1.31 0.55 0.45 0.53 4.72 3.82 1.90 4.50 0.99 1.02 0.54 0.81 0.66 0.87 0.51 5.31 0.57 0.65 0.65 0.60
0.47 1.12
0.48 0.68 2.62 1.26 0.58
0.87
3.02
0.52 0.57 0.61 2.44 0.70 0.73 0.63 0.60 0.64
0.57 0.52
CAD BCE Rogers Communications/B
16,700 468,923 0.75 45,400 1,435,331 2.28
1,904,254 3.03 EUR Bouygues Cosmote Deutsche Telekom Elisa OYJ-A Shares Forthnet France Telecom Hellenic Telecommunication Koninklilke KPN Portugal Telecom SGPS REG Telecom ltalia
20,000 10,700
158,720 33.619
112,595 78,432 80,080
245,000 76,000
1,243,800 244,816
2,164,941 679,776
1,1(37,935 1,600,013 1,833,832 3,018,400
777,480
1.98 0.39 3.44 1.08 1.76 2.54 2.91 4.80 1.24
1,603,500 2,634,551 4.19 15,305,544 24.33
GBP BT Cable and Wireless Vodafone
4.79 2.33 8.49
15.61
610,000 3,013,073 508,116 1,468,151
2,142,164 5,339,896 9,821,120
JPY KDDl 252 1,379,467 2.19 NTT Mobile Telecommunications DoCoMo 1,240 1,449,760 2.30 Softbank 21,900 349,274 0.56
3,178,501 5.05 KRW LG Dacom 22,050 445,321 0.71
MYR Telkom (Malaysia) 350,000 773,141 1.23
NOK Tel en or 1.66 71,821 1,042,176
PLN Netia 671,718 794,668 1.26
SEK Telez AB/B Teliasonera
401,762 0.49 61,679,445 75.11 152,900 1,853,268 2.95
Total transferable securities admitted to an official stock-exchange listing
Transferable securities traded on other regulated markets
200,000 1,090,601 1.73 2,943,869 4.68 81,313,966 99.00
SGD Singapore Telecom StarHub
721,450 1,187,515 1.89 458,333 678,979 1.08
1,866,494 2.97 TH B True -Foreign
USD Fiserv Sun Microsystems
2,667,062 431,853 0.69 11,000 462,626 0.56 100,000 389,471 0.47
852,097 1.03 USD A T b T American Tower China Unicom Embarq Equinix Leap Wireless International NII Sprint-FON Verizon Communications
Total transferable securities traded on other regulated markets
200,000 30,418 52,200 15,900
5,700 7,200
13,200 150,000 141,000
6,145,644 945,952 665,955 746,054 386,049 450,483 789,136
2,300,174
9.77 1.50 1.06 1.19 0.61 0.72
3.66 6.83
26.59
1.25
852,097 1.03
Other transferable securities
HKD BY D/CLM/18-06-2007 33,333 0 0.00
0 0.00
82,166,063 100.03
- 2 7,4 3 9 4.03
82,13a,624 100.00
Total other transferable securities 4,298,226 16,727,673
Total securities portfolio Operating capital
Total net assets
ZAR Telkom South Africa 34,000 636,869 1.01
Total transferable securities admitted to an official stock-exchange listing ss,a71,4a3 88.82
96 Robeco Capital Growth Funds

Robeco Consumer Goods Equities
I nvest ment portfolio . .. ___
At 30 /06/2007 Quantity Market value in % of net assets in EUR x 1
Transferable securities traded on other regulated markets
EUR Telefonica
Total transferable securities traded on other regulated markets
Other transferable securities
GBP Cable and WireIesr/STK/i3-06-2007
Total other transferable securities
Total securities portfolio Operating capital
Total net assets
370,000 6,119,800 9.73
6,119,800 9.73
508,116 34,806 0.06
34,806 0.06
62,026,089 98.61 901,139 1.39
62,927,228 100.00
Investment portfolio
At 30/06/2007 Quantity Market value In %of
net assets in EUR x 1
Transferable securities admitted to an official stock-exchange listing
EUR Antichi Pellettieri 20,000 215,000 0.92 Continental 3,000 311,910 1.32 Forthnet 115.000 1,131,600 4.80 Gameloft 60,000 362,400 1-54
1.01 lntralot 10,000 ProSieben Sat.1 Media /Vorzugsaktien 10,000 290,800 1.23
238,200
Reed Elsevier
CBP 2 Way Traff I C
Aegis Experian lnforrna Neteller Sports Direct International Taylor Nelson Sofres
HKD Esprit Coldlion Nagacorp Ports Design Rexcapital Financial
INR Wire G Wireless India Zee News Zee Telefilms
J PY Aisin Seiki Aun Consulting Bosch Automotive Systems Capcom Cyber Agent Denso Dwango Leo Honeys Kakaku Corn Macromill Matsushita Electric Industrial Mazda Motor Nippon Television Netwerk Opt Point Sony Square Enix Sumitorno Rubber industries Suzuki Motor Toyota Motor Zenrin
USD Adivision Build-A-Bear Workshop CNET Networks Coach Comcast /A CTRIP.COM International eBay Echostar Communications A shs Focus Media Gamestop
15,000 212,100 0.90 11.72 2,762,010
620,000 1,197,356 490,232 240,000
4 37 14,000 115,947 40,000 104,583 50,000 134,814 70,000 246,453 -
2,2a9,422
5.08 2.08 0.00 0.49 0.44 0.57
9.71 1.05
25,000 234,883 1.00 300,000 54.269 0.23 600,000 123,882 0.53 120,000 250,037 1.06
3,500,000 281,765 1.20 944,836 4.02
0.44 2 2 0.00
90,ooo 103,819
25,000 135,193 0.57 239,014 1.01
4,500 40
15,000 25,000
150 5,000
100
170 5,000
210 190
18,000 30,000
1,800 400
4,000 11,000 20,000 22,000 17,000 13,000 3,000
32,000 6,000
54,000 6,000
20,000 4,000
10,000 3,500
20,000 40,000
122,222 53,002 54,951
344,753 72,308
144,496 78,544
213,027 148,993 385,284 348,590 263,871 126,449 181,526 789,034 175,314 417,481 372,933 194,165
607,964 58,098
5,509,749
356,744
442,368 116,130 327,467 210,536 416,423 232,883 238,273 112,395
1,158,047 747,843
0.52 0.23 0.23 1.46 0.31 0.61 0.33 0.90 0.63 1.64 1.48 1.12 0.54 0.77 3.35 0.75 1.77 1.58 0.82 1.51 2.58 0.25
23.38
1.88 0.49 1.39 0.89 1.77 0.99 1.01 0.48 3.17 4.91
Robeco Capital Growth Funds 97

Robeco Industrials Equities
Investment portfolio Investment portfolio
At 30/06/2007 Quantity Market value In % of
net assets in EUR x 1
At 30/06/2007 Quantity Market value In %of
net assets in EUR x 1
Transferable securities admitted to an official stock-exchange listing Global Sources Heelys Interpublic of Company KB Home tear towe’s Companies Netease Corn - ADR News-Class B Penny Priceline.COM Sina Sirius Sattelite Radio Sohu com Standard Pacific The Childrens Place THE9 Time Warner Toll Brothers Viacom/B Wet Seal Yahoo1
30,000 6,000 45,000 10,000 10,000 11,000 12,000 26,000 4,000 6,000
110,000 11,000 22,000 2,000 20,000 40,000 5,000 14,000 50,000 17,000
8,000
563,067 114,176 379,845 291,511 270,705 249,965 149,006 441,627 214,372 305,387 247,958 245,974 260,553 285.558 76,473 685,052 623,154 92,481 431,543 201,029
2.39 0.48 1.61
115 1.06 0.63 1.87 0.91 1.30 1.05 1.04 1.11 1.21 0.33 2.91 2.65 0.39 1.83 0.85
1.24 CHF ABB Adecco Cheserex
89,328 1,500,313 3.23
2,752,813 5.93 21,834 1,252,500 2.70
DKK A.P. Moeller-Maersk 108 965,089 2.08
EUR Cargotec Corporate Express Deutsche Post Draka Holding European Aeronautic Def an Space Metso Ryanair Saint-Cobain Solarworld TNT Vinci Yit
16,159 85,893 41,696
10,270 12,124
22,483 243,149 9,034 14,800 42,443 16,943 26,050
737.982 977,462 998,202 454,650 247,712 985,205
1,201,156 753,165 504,680
1,418,869 9 3 9,9 9 8 608,268
9,827,349
1.59 2.11 2.15 0.98 0.53 2.12 2.59 1.62 1.09 3.06 2.02 1.31
21.17
341,498 10,473,299
1.45 44.44
Total transferable securities admitted to an official stock-exchange listing
CBP Wolseley 24,773 442,355 0.95 22,218,330 94.28
Transferable securities traded on other regulated markets
HKD China Communications Const Xiamen International
231,000 306,295 0.66 1,066,000 309,953 0.67
616,248 1.33 JPY Septeni 500 434,688 1.84 JPY
Amada Chiyoda Chemicals Daikin Industries Fanuc Glory ltochu JGC Kawasaki Heavy Industries Komori Obayashi Sumitomo Toto
74,000 23,000 14,800 18,900 17,000 171,000 25,000 399,000 34,000 34,000 49,800 136,000
1.47 0.70 0.86 3.10 0.59 3.15 0.75 2.60 1.27 0.30 1.45
683,714 324,068 398,426
1,441,414 275,203
1,464,078 346,252
1,205,711 589,137 136,990 671,818 870,048
8,406,859
KRW Neowiz Neowiz Games
681 17,083 0.08 217 9,565 0.04
26,648 0.12 USD Time Warner Cable 9,000 261,027 1.11
Total transferable securities traded on other regulated markets
Other transferable securities
722,363 3.07
1.87 18.11
SEK Atlas Copco VOlVO
CBP New Media tottery Services The Game Croup
270,000 134,368 0.57 91,500 1,067,061 2.30 78,630 1,163,197 2.51 40,000 99.384 0.42
233.752 0.99 2,230,250
1,000,506 184,193 600,720 722,000 961,534 727,363 699,557 262,370 615,885 648,446 135,106
1,323,059
1,145,471 55,089 613,521
1,550,678 4,137,7 14
1,572,428
4.81
2.16 0.40 1.29 1.55 2.07 1.57 1.51 0.57 1.33
0.29 2.85 3.38 2.47 0.12 1.32 3.34 8.91
1.40
US0 3M Accenture Boeing Cooper Industries/A Danaher Deere Eaton Empresa Bras de Aeronautica Ingersoll-Rand Company I n Industries Oshkosh Truck Parker-Hannifin Raytheon Rockwell Collins RSC Shaw s PX Tyco International
Total other transferable securities 15,569 5,800 8,437 17,080 17,200 8,136 10,159 7,350 15,173 12,826 2,900 18,250 39,407 21,900 3,720 17,900 23,850 165,380
233,752 0.99
Total securities portfolio Operating capital
23,174,445 98.34 392,120 1.66
23,566,565 100.00 Total net assets
98 Robeco Capital Growth Funds
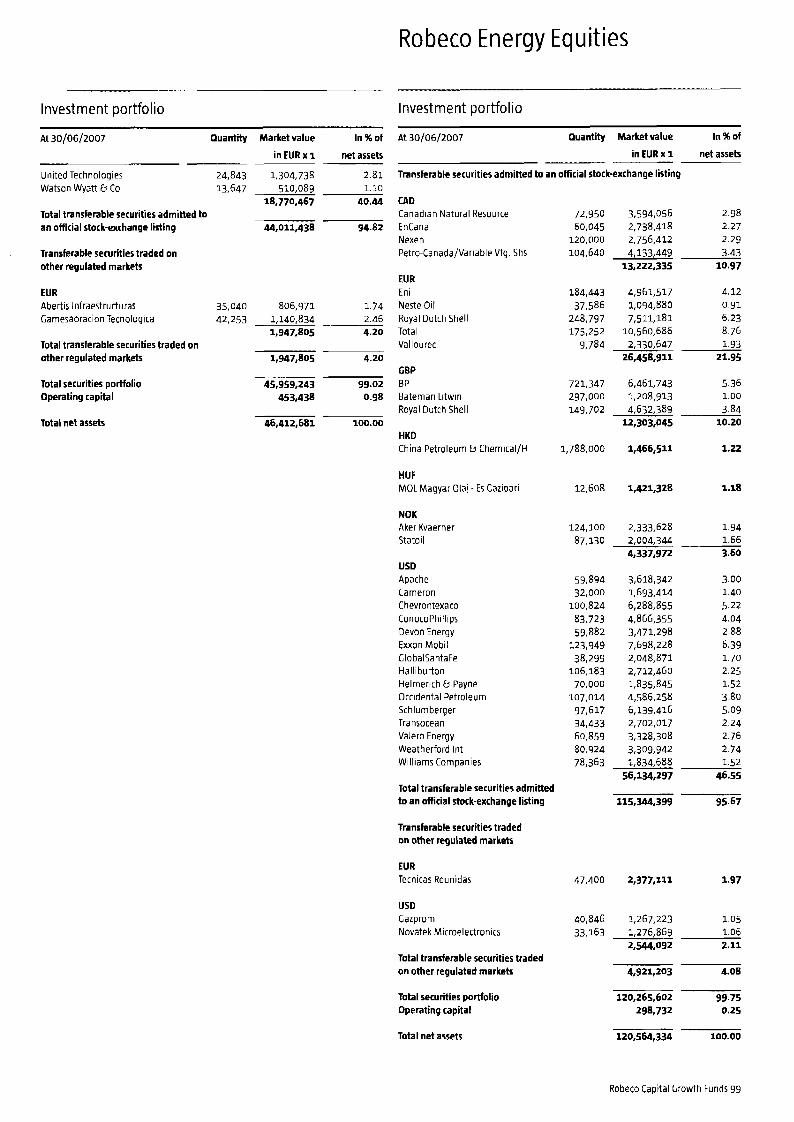
Robeco Energy Equities
Investment portfolio Investment portfolio
At 30/06/2007 Quantity Market value In % of
in EUR x 1 net assets
Transferable securities admitted to an official stock-exchange listing
At 30/06/2007 Quantity Market value In % of
net assets in EUR x 1
United Technologies 24,843 1,304,738 2 81 Watson Wyatt b Co 13,647 510,089 1.10
18,770,467 40.44 Total transferable securities admitted to an official stock-exchange listing 44,011,438 94.82
Transferable securities traded on other regulated markets
CAD Canadian Natural Resource EnCana Nexen Petro-Canada/Variable Vtg. Shs
72,950 3,594,056 60,045 2,738,418 120,000 2,756,412 104,640 4,133,449
13,2 2 2,3 3 5
2.98 2.27 2.29 3.43
10.97 EUR Eni Neste Oil Royal Dutch Shell Total Vallourec
EUR Abertis lnfraestruduras Gamesaoracion Tecnologica
Total transferable securities traded on other regulated markets
Total securities portfolio Operating capital
184,443 4,961,517 37,586 1,094,880 248,797 7,511,181 175,252 10,560,686
26,458,911
721,347 6,461,743 297,000 1,208,913 149,702 4,632,389
12,303,045
9,784 2,330,647
4.12 0.91 6.23 8.76 1.93
21.95
35,040 806,971 1.74 42,253 1,140,834 2.46
1,947,805 4.20
1,947,805 4.20 CBP BP Baternan Litwin Royal Dutch Shell
5.36 1.00
45,959,243 99.02 453,438 0.98
3.84 10.20 Total net assets 46,412,681 100.00
HKD China Petroleum G Chernical/H 1,788,000 1,466,511 1.22
HUF MOL Magyar Olal - Es Cazipari 12,608 1,421,328 1.18
NOK Aker Kvaerner Statoil
124,100 2,333,628 87,130 2,004,344
48337,972
1.94 1.66 3.60
USD Apache Cameron Chevrontexaco ConocoPhillips Devon Energy Exxon Mobil Glo balSantaFe Halliburton Helrnertrh G Payne Occidental Petroleum Schlumberger Transocean Valero Energy Weatherford Int Williams Companies
59,894 3,618,342 32,000 1,693,414 100,824 6,288,855 83,723 4,866,355 59,882 3,471,298 123,949 7,698,228 38,299 2,048,871 106,183 2,712,460 70,000 1,835,845 107,014 4,586,258 97,617 6,139,416 34,433 2,702,017 60,859 3,328,308 80,924 3,309,942
3.00 1.40 5.22 4.04 2.88 6.39 1.70 2.25 1.52 3.80 5.09 2.24 2.76 2.74 1.52
46.55 78,363 1,834,688
56,134,297 Total transferable securities admitted to an official stock-exchange listing
Transferable securities traded on other regulated markets
115,344,399 95.67
EUR Ternicas Reunidas 47,400 2,377,Xll 1.97
US0 Gazprorn Novatek Microelectronics
40,846 1,267,223 1.05 33,163 1,276,869 1.06
2,544,092 2.11 Total transferable securities traded on other regulated markets 4,921,203 4.08
99.75 298,732 0.25
120,265,602 Total securities portfolio Operating capital
Total net assets 120,564,334 100.00
Robeco Capital Growth Funds 99
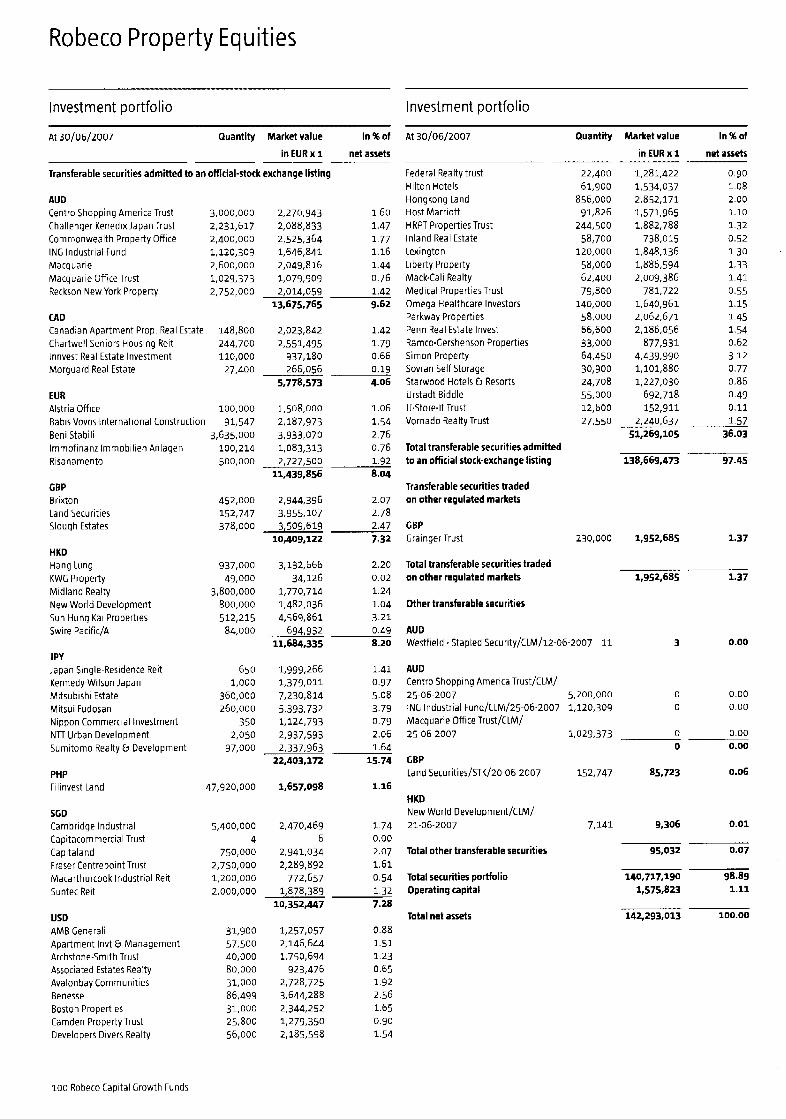
Robeco Property Equities
Investment portfolio Investment portfolio
At 30/06/2007 Quantity Market value In % of
net assets in EUR x 1
At 30/06/2007 Quantity Market value In % of
net assets in EUR x 1
Transferable securities admitted to an official-stock exchange listing Federal Realty trust Hilton Hotels Hongkong Land Host Marriott HRPT Properties Trust Inland Real Estate Lexington Liberty Property Mack-Cali Realty Medical Properties Trust Omega Healthcare Investors Parkway Properties Penn Real Estate Invest Ramco-Cershenson Properties Simon Property Sovran Self Storage Starwood Hotels b Resorts Urstadt Biddle U.Store-lt Trust Vornado Realty Trust
Total transferable securities admitted to an official stock-exchange listing
22,400 1,281,422 61,900 1,534,037
856,000 2,852,171 91,826 1,571.965
244,500 1,882,788 58,700 738,015
120,000 1,848,136 58,000 1,886,594 62,400 2,009,386 79,800 781,722
140,000 1,640,961 58,000 2,062,671 66,600 2,186,056 33,000 877,931 64,450 4,439,990 30,900 1,101,880 24,708 1,227,030 55,000 692,718 12,600 152,911 27,550 2,240,637 -
51,269,105
138,669,473 -
0.90 1.08 2.00 1.10 1.32
1.30
1.41
1.15
0.52
1.33
0.55
1-45 1.54 0.62 3.12 0.77 0.86 0.49 0.11
1.57 36.03
97.45
AUD
Challenger Kenedixlapan Trust 2,231,617 Commonwealth Property Office 2,400,000 ING Industrial Fund 1,120,309 Macquarie 2,600,000 Macquarie Office Trust 1,029,373 Reckson New York Property 2,752,000
Centro Shopping America Trust 3,000,000 2,270,943 2,088,833 2,525,364 1,646,841 2,049,816 1,079,909
1.60 1.47 1.77 1.16 1.44 0.76 1.42 9.62
~ 2,014,059
13,675,765 CAD Canadian Apartment Prop Real Estate 148,800 Chartwell Seniors Housing Reit 244,700 lnnvest Real Estate Investment 110,000 Morguard Real Estate 27,400
EUR
Babis Vovos International Construction 91,547 Alstria Office 100,000
2,023,842 2,551,495
937,180
1.42 1.79 0.66 0.19 4.06
266,056 5,7 7 8,s 7 3
1,508,000 2,187,973
1.06 1.54
Beni Stabili lrnrnofinanz lmmobilien Anlagen Risanamento
3,635,000 3,933,070 2.76 100,214 1,083,313 0.76 500,000 2,727,500 1.92
11,439,856 8.04 CBP Brixton Land Securities Slough Estates
Transferable securities traded on other regulated markets 452,000 2,944,396 2.07
152,747 3,955,107 2.78 378,000 3,509,619 2.47
10,409,122 7.32 CBP Grainger Trust
Total transferable securities traded on other regulated markets
230,000 1,952,685 1.37 HKD Hang tung KWG Property Midland Realty New World Development Sun Hung Kai Properties Swire Pacific/A
937,000 3,132,666 2.20 49,000 34,126 0.02
3,800,000 1,770,714 1.24
512,215 4,569,861 3.21
11,684,335 8.20
800,000 1,482,036 1.04
84,000 694,932 0.49
1,952,685 1.37
Other transferable securities
AUD Westfield . Stapled Security/CLM/l2-06-2007 11 3 0.00
J PY Japan Single-Residence Reit Kennedy-Wilson Japan Mitsubishi Estate Mitsui Fudosan Nippon Commercial Investment NTT Urban Development Sumitomo Realty b Development
AUD Centro Shopping America Trust/CLM/ 25-06-2007 5,200,000 0 0.00 INC Industrial Fund/CLM/25-06-2007 1,120,309 0 0.00
Macquarie Office Trust/CLM/
650 1,999,266 1.41 1,000 1,379,011 0.97
360,000 7,230,814 5.08 260,000 5,393,732 3.79
350 1,124,793 0.79 2,050 2,937,593 2.06
97,000 2,337,963 1.64 22,403,172 15.74
25-06-2007 1,029,373 0 0.00 0 0.00
GBP Land Securities/STK/20-06-2007 152,747 85,723 0.06 PHP
Filinvest Land 47,920,000 1,657,098 1.16 H KD New World Development/CLM/ 21-06-2007 7,141 9,306 0.01
SGD Cambridge Industrial Capitacommercial Trust Capitaland Fraser Centrepoint Trust Macarthurcook Industrial Reit Suntec Reit
5,400,000 2,470,469 1.74 4 6 0.00
750,000 2,941,034 2.07 2,750,000 2,289,892 1.61 1,200,000 772,657 0.54 2,000,000 1,878,389 1.32
10,352.447 7.28
Total other transferable securities
Total securities portfolio Operating capital
Total net assets
95,032 0.07
140,717,190 98.89 1 , 5 7 s m 1.11
142,293,013 100.00 USD AMB Cenerali Apartment lnvt b Management Archstone-Smith Trust Associated Estates Realty Avalonbay Communities Benesse Boston Properties Camden Property Trust Developers Divers Realty
31,900 57,500 40,000 80,000 31,000 86,499
25,800 56,000
31,000
1,257,057 2,146,644 1,750,694
923,476 2,728,725 3,644,288 2,344,252 1,279,350 2,185,598
0.88 1.51
0.65 1.92 2.56 1.65 0.90 1.54
1.23
l o o Robeco Capital Growth Funds

Robeco Global Bonds
Investment portfolio
At 30/06/2007 Expiration date Face value Market value
% in EUR x 1
Transferable securities admitted to an official stock-exchange listing
3.125 3.750 4.000 4.000 4.125 4.176 4.194 4.250 4.375 4.375 4.500 4.750 4.750 4.750 5.000
5.142 5.250 5.250 5.330 5.369 5.500 5.500
6.250 6.500 7.250 7.627 8.126 8.220
5.750
4.250 4.375 5.000 5.000
6.250
0.700 0.900 2.000
4.500
3.375 5.000 6.000 6.250
EUR Credit Suisse GP Finance Belgium Netherlancs Austria Parker-Hannifin ING Bank Svenska Handelsbanken Netherlands Allianz Finance Depfa ACS Bank Germany Germany France Mizuho Finance France Allied Irish Bank Austria Germany Deutsche Capital Trust IVTier I HSBC Capital Funding Belgium Netherlands Be I g i u m ING Fortis NL Tier I France Telecom Halifax Euro Finance Tier I Sanpaolo Tier I KBC Bank Funding Trust IV Tier I
CBP United Kingdom European Investment Bank United Kingdom United Kingdom United Kingdom
JPY Japan Japan Japan
SEK Sweden
US0 Federal Home Loan Banks United States General Electric Capital Freddie Mac
14-09-2012 28-03.2009 15-01-2037 15-07-2009 11-11-2015 08.06.2015 16.12-2015 15.07.2013 17.02-2017 15-01.2015 17-08-2007 04-07-2034 25-04-2035 15-04-2014 25-04-2012 16.06-2016 04-01-2011 04-01-2011 19-09-2013 24-03-2014 28-03-2028 15-07-2010 28-03-2008 21-06-2021 26-09-2011 28-01-2013 09-12-2011 10-11-2010 10-11-2009
07-06-2032 08-07-2015 07-09.2014 07-03-2008 25-11-2010
20-03-2013 20-12-2012 20-12-2024
Total transferable securities admitted to an oHicial stock-exchange listing
12-08-2015
14-09-2007 15-02-2011 15-06-2012 15-07-2032
2,050,000 8,980,000 11,800,000 8,600,000 1,100,000 1,000,000 1,250,000 23,100,000
500,000 200,000
79,200,000 27,200,000 7,600,000 1,500,000 18,810,000 1,250,000 15,100,000 12,250,000 2,800,000 250,000
4,630,000 14,090,000 24,600,000 4,650,000 1,500,000 1,000,000 200,000
2,000,000
750,000
5,200,000 2,500,000 12,200,000 2,200,000 7,050,000
3,760,000,000 3,301,500,000 3,016,g00.000
14,400,000
390,000 1,010,000 400,000
4,750,000
1,884,668 8,872,060 10,425,064 8,518,730 1,024,320 921,360
1,147,163 22,723,701
455.525 194,776
79,220,592 27,346,880 7,597.796 1,498,050 19,171,152 1,203,213 15,436,730 12,526,973 2,806,300
5,079,619 14,470,430 24,845,262 4,858,320 1,577,100 1,101,270 220,160
2,184,400 801,195
278,361,559
248.750
6,982,747 3,349,848 17,477,091 3,253,575 10,622,705 41,685,966
21,493,515 19,146,721 17,576,525 58,216,761
1,556,316
287.556 751.254 301,246
3,818,887 5,158,943
384,979,545
In % of
net assets
0.24 1.13
1.33
0.13 1.08
0.12 0.15 2.89 0.06 0.02 10.07 3.48 0.97 0.19 2.43 0.15 1.96
1.59 0.36 0.03 0.65 1.84 3.16 0.62 0.20 0.14 0.03 0.28 0.10
35.40
0.89 0.43 2.22 0.41 1.35 5.30
2.73 2.43 2.24 7.40
0.20
0.04 0.09 0.04 0.49 0.66
48.96
Robeco Capital Growth Funds 101

Investment portfolio
Expiration date Face value Market value In %of At 30/06/2007
% in EUR x 1 net assets
Transferable securities traded on other regulated markets
CAD Canada Canada Canada Canada Canada
01-06-2014 01-06-2012 01-06-2033 01-06-2029 01-06-2008
4,500,000 2,900,000 2,800,000 2,320,000 750.000
3,212,881 2,079,687 2,324,157 1,889,008 528,307
10,034,040
0.41 0.26 0.30 0.24
5.000 5.250 5.750 5.750 6.000
6.000
3.500 3.750 3.750 3.875 3.875 4.028 4.125 4.150 4.250 4.375 4.375 4.375 4.500 4.625 4.625 4.750 4.875 5.317 5.375 5.625 6.467 6.625 6.625 6.750 6.905 7.375
4.750 5.500 5.750 5.902 6.000
0.600
3.125 3.375 3.375 3.500 3.625 3.750 3.875 4.000 4.125 4.125
0.07 1.28
DKK Denmark 15-11-2011 3,000,000 424,696 0.05
EUR Germany Netherlands Belgium HBOS Treasury Services Bradford G Bingley BS Unicredito ltaliano Capital Trust Commerzbank MBNA Credit Card Master Note Unit Uti1 Water Rodarnco Europe Finance JP Morgan Chase Bank American International Fortum Lehrnan Brothers Anglian Water Telstra Societe GenCrale Generali Finance Volkswagen Finance Service Lloyds Bank Upper Tier II Royal Bank of Scotland Tier I North West Water BNP Paribas Capital Trust Tier I Axa Credit Suisse First Bost Tier I Lloyds TSB Capital 1 Tier I
01-04.2016 15-01-2023 28.09-2015 07-02-2020 04-05-2011 27.10-2015 13-09-2011 19-09-2012 24-01-2020 01-10-2014 1411.2016 26-04-2016 20-06-2016 14-03-2014 07-10-2013 15-07-2014 18-12-2014 16-06-2016 25-01-2012 15-07-2009 29-06-2012 08-11-2007 23.10-2011 15-12-2020 07-11-2011 07-02-2012
16,500,000 10,700,000 23,717,000 10,800,000 4,150,000 1,000,000
950,000 100,000 400,000
1,100,000 7,300,000 700,000 650,000
6,750,000 1,150,000 1,400,000 500,000
~ S 5 0 . 0 0 0 1,800,000 1,065,000 450,000 440,000 980,000
6,000,000 850,000
1,700,000
15,287,910 9,578,105 22,319,357 9,726,264 4,019,732 898,900 919,049 98,287 361,060
1,057,067 6,796,665 666,232 621,608
6,438,420 1,124,413 1,356,852 501,310
1,507,220 1,827,180 1,080,666 475,668 443,165
1,037,134 6,342,600 908,905
1,854,530 97,248,299
1.94 1.22 2.84 1.24 0.51 0.11 0.12 0.01 0.05 0.13 0.86 0.08 0.08 0.82 0.14 0.17 0.06 0.19 0.23 0.14 0.06 0.06 0.13 0.81 0.12 0.24
12.36
0.49 1.76 0.09 0.06 1.29
GBP HSBC Bank KFW American International Aviva United Kingdom
2,850,000 9,600,000 500,000 350,000
6,100,000
3,808,327 13,850,726
698,737 472,613
10,159,719 28,990,122
29-09-2015 07-12-2015 15-03-2017 27-07-2020 07-12-2028
3.69
2.93
0.04
0.22 0.53 0.67 0.54 0.03 0.06
0.03 0.21
JPY Japan 3,893,200,000 23,014,030 20-03-2010
USD USTreasury Note United States US Treasury Note United States US Treasury Note US Treasury Note USTreasury Note US Treasury Note US Treasury Note United States
312,483 1,707,063 4,130,968 5,263,190 4,241,456 216,040 461,219 235,730
1,640,048
15-04-2009 15 - 11 - 2 O O 8 15-10-2009 15-11-2009 15.07-2009 15-05-2008 15-05-2010 15-02-2015 15-08-2010 15-08-2008
435,000 2,355,000 5,765,000 7,335,000 5,870,000
295.000 640,000 340,000
2,265,000 495,000 363,149 0.05
102 Robeco Capital Growth Funds

Investment portfolio
At 30/06/2007
%
Expiration date
4.250
4.250 4.250 4.500 4.500 4.500
4.500 4.750 4.875
4.875 4.875
5.000
5.250 5.260 5.350 5.375 5.375 5.375 5.375 5.490 5.625 5.625
5.911 6.000
6.000 6.000 6.110 6.250 6.300 6.500 6.500 6.500 6.625 6.750 6.860 6.875 6.875 6.900 7.250 7.450 7.648 7.750 8.000 8.250 8.622
5.750
United States US Treasury Note US Treasury Note USTreasury Note US Treasury Note federal Home loan Mortgage US Treasury Note US Treasury Note Fannie Mae US Treasury Note United States Fannie Mae Washington Mutual Rabobank Capital Fund II Tier I Goldman Sachs Morgan Stanley Federal Home Loan Banks Wells Fargo G Company United States Bank of America BAC Capital Trust VI Wachovia Goldman Sachs HSBC Finance Cap Trust HBOS Cittgroup United States Merrill Lynch 0 Co United States AIL Sunamerita Global Finance I HSBC United States Hutchison Whamp International Federal Home Loan Mortgage General Electric Capital Barclays Bank Merrill Lynch Verizon Global FDG Aig Sunamer Glob Financial United States Hutchison Wham International Royal Bank of Scotland Verizon Global National Rural Utilities Deutsche Telekom UBS PFD Funding Trust I Tier I
j Total transferable securities traded on other regulated markets
Total securities portfolio Operating capital
15-11-2014 15 - 10 - 2 0 10 15-08-2015 15-11-2015 15-02.2036 15-01.2013 15-02-2009 15-05-2014 15-04-2009 15-08-2016 15-02-2012 15-03-2016 15-09-2017 31-12-2013 15-0 1-20 16 15-10-2015 18-05-2016 07-02-2035 15-02-2031 15-03-2019 08-03-2035 15-10-2016 01-10.2016 30-11.2015 01-11-2033 31-10-2033 15-08-2009 29-01-2037 15.05-2030 10-05-2011 02-05-2036 15-02-2010 13-02-2013 15-09-2009 15-03-2032 15-06-2032 15.11-2018 15-06-2012 15-03-2032 15-08.2022 24-11-2033 30-09-2031 01-12-2030 01-03-2032 15-06-2030 01-10-2010
Face value Market value
in EUR x 1
11,320,000 7,998,388 31,885,000 23,158,206 29,665,000 20,841,829 6,480,000 4,627,091 225,000 150,992
14,350,000 10,205,283 275,000 202,250
2,950,000 2,157,341 35,300,000 26,010,210
50,000 36,571 6,000,000 4,436,815 7,900,000 5,674,160 1,050,000 717,681 1,800,000 1,277,288 1,750,000 1,239,211 7,900,000 5,583,271 21,000,000 15,471,630
850,000 571,313 4,785,000 3,642,630 4,700,000 3,295,432 1,000,000 660,479 9,100,000 6,573,130 6,000,000 4,339,414 700,000 501,635 550,000 402,145
3,550,000 2,534,969 13,390,000 4,650,000 675,000
1,650,000 1,150,000 2,700,000 1,650,000
5,070,000
10,133,986 3234,259 571,687
1,251,254 874,232
2,076,994 1,257,228 3,864,657
5,300,000 4,253,931 350,000 264,894
1,400,000 1,104,368 570,000 444,136
1,350,000 1,071,164 5,690,000 5,101,430 700,000 572,341
1,200,000 986,682 600,000 499,690
1,400,000 1,283,339 1,450,000 1,284,810 2,050,000 1,648,574
212,660,366
In % of
net assets
1.02 2.94 2.65
0.59 0.02
1.30 0.03 0.27
3.31 0.00 0.56 0.72 0.09
0.16 0.16 0.71 1.97 0.07 0.46 0.42 0.08 0.84
0.55
0.05
0.06
0.32 1.29 0.41 0.07 0.16 0.11 0.26 0.16 0.49 0.54 0.03 0.14 0.06 0.14 0.65 0.07 0.13 0.06 0.16 0.16 0.21
27.03
372,371,553
757,351.09a 29,061,119
47.34
96.30 3.70
Total net assets 786,412,217 100.00
Robeco Capital Growth Funds 103

Robeco All Strategy Euro Bonds _I
Investment portfolio
At 30/06/2007 Expiration date Face value Market value In %of
% in EUR x 1 net assets
2.750 3.000
3.125 3.250 3.500 3.500 3.750 3.750 4.000 4.000 4.000 4.000 4.000 4.119 4.125 4.125 4.173 4.176 4.194 4.219 4.250 4.250 4.250 4.250
4.279 4.310 4.350 4.375 4.375 4.375 4.375 4.472 4.500 4.500 4.500 4.500
4.250
4.558 4.625 4.750 4.750 4.750 4.750 4.750
4.939 5.000 5.000
4.859
5.000 5.000 5.000 5.125 5.250 5.250 5.250 5.252 5.330 5.369
EUR France Netherlands Dexia Muni Agency Caisse d’Amort Dette France France Air Products G Chemicals Belgium Deutsche Telekom International Finance Belgium Austria European investment Bank Netherlands Magellan Mortgage (FRN) Parker-Hannifin Nationwide Bldg Society Granite Master Issuer (FRN) ING Bank Svenska Handelsbanken German Resid Asset (FRN) Germany France Netherlands Belgium Italy Delphinus (FRN) ABN-AMRO Bank Holmes Master Issuer (FRN) Allianz Finance Depfa ACS Bank Wachovia Bank Veolia Environnement Castellana Finance (FRN) MBNA America European Structure Germany Germany Ireland Holmes Master Issuer (FRN) European Investment Bank Germany Depfa Pfandbriefbank France Depfa Pfandbriefban k Mizuho Finance Delphinus (FRN) HBOS Capital Funding France Germany France France Italy RWE Finance Austria Germany Greece ELM (Swiss Rein) Deutsche Capital Trust IV Tier I HSBC Capital Funding LP
Transferable securities admitted to an official stock-exchange listing
104 Robero Capital Growth Funds
12-03-2008 15-07-2007 15-09-2015 25-04-2013 12-07-2009 12-01-2008 08-11-2013 28-03-2009 19-01-2015 28-03-2022 15-07-2009 15-10-2037 15-01-2037 20-07-2059 11-11-2015 27-02-2012 20-12-2054 08.06.2015 16-12-2015 20-07-2016 04-01-2014 25-042019 15-07-2013 28-09-2013 01-02-2015 28-09-2096 10-03-2016 15-07.2040 17-02-2017 15-01-2015 01-08-2016 11-12-2020 08-10-2049 17-01-2014 17-08-2007 04-01-2013 18-04-2020 15-07-2021 15-04-2020 04-07-2034 16-07-2007 25-04-2035 15-07-2008 15-04-2014 25-09-2096 23-05-2016 25-10-2016 04-01-2012 25-04-2012 25-10-2011 01-02-2012 23-07.2018 04-01-2011 04-01-2011 18-05-2012 25-05-2016 19-09-2013 24-03-2014
2,800,000 13,600,000 2,870,000
3,250,000 3,150,000
200,000 17,040,000
430,000 539,040
23,850,000 7,630,000 34,040,000 3,431,358 1,~0,000
9,540,000 2,240,000 2,130,000 520,113
7,140,000 47,195,000 39,150,000 14,000,000
400,000 10,200,000
14,570,000 810,000
2,070,000 100,000 600,000 100,000
3,000,000 820,000
15,800,000 33,315,000 1,050,000 800,000 750.000
37,070,000
20,350,000
6,200,000
40,000 7,730,000 1,000,000 2,150,000 600,000
13,470,000 2,115,000 2,800,000 30,890,000 1,300,000 33,100,000
80,000 31,100,000 31,280,000
550,000 13,700,000 3,690,000 2,840,000
2,769,872 13,593,608 2,547,469 3,020,713 3,090,812 20,263,513
185,706 16,835,179
397,320 498,073
23,624,618
6,614,981 30,073,659 3,431,998 1,340,928 6,032,786 9,543,323 2,063,846 1,954,765 521,175
7,016,264 45,525,713 38,512,247 13,745,900
389,544 10213,255 13,256,223
809,352 1,885,874
97,388 568.512 88,919
3,000,000 800,722
15,804,108
33,225,716 1,031,321 800,045 738,900
37,270,178 40,008
7,727,758 1,003,080 2,147,205 600,828
12,897,525 2,175,616 2,850,484 31,483,088 1,324,102 33,658,066
81,156 31,793,530 31,987,241
564,201
3,698,303 2,825,800
13,116,928
0.21 1.05 0.20 0.23 0.24
1.57 0.01 1.30 0.03 0.04 1.83 0.51 2.33 0.27 0.10 0.47 0.74 0.16 0.15 0.04 0.54 3.53 2.98 1.07 0.03 0.79 1.03 0.06 0.15 0.01 0.04 0.01 0.23 0.06
1.22 2.58 0.08 0.06
0.06 2.89 0.00 0.60 0.08 0.17 0.05 1.00 0.17 0.22 2.44 0.10 2.61 0.01 2.46 2.48 0.04 1.02 0.29 0.22

Investment portfolio
At 30/06/2007 Expiration date face value Market value In % of
net assets in EUR x 1 %
5.375 5.375 5.500 5.500 5.500 5.750 5.750 5.750 6.125 6.250 6.375 6.500 6.625 6.875 6.988 7.055 7.250 7.627
8.126 8.125
Germany Citibank Credit Card Master Trust Belgium Germany Netherlands Federal Home Loan Mortgage France Italy RWE INC INC Bank Fortis NL Tier I Deutsche Telekom International Finance KBC Bank Funding Trust II lntesabci Capital Trust Tier I HVB Funding Trust Vll l Tier I France Telecom Halifax Euro Finance Tier I France Telecom Sanpaolo Tier I
Total transferable securities admitted to an official stock-exchange listing
Transferable securities traded on other regulated markets
2.500 3.000 3.000 3.250 3.375 3.500 3.500
3.500 3.500 3.500 3.750 3.750 3.750 3.750 3.750
3.500
3.750 3.875 3.875 3.875 4.000 4.000 4.000 4.000 4.028 4.035 4.092 4.095 4.098 4.125 4.125 4.125 4.125 4.130
EUR Germany France France Bundesobligation Morgan Stanley France Austria KFW International Finance Bundesobligation Northern Rock Germany Goldman Sachs Hypothekenbank in Essen Morgan Stanley Germany Belgium Italy Bradford G Bingley BS WM Covered Bond Program J P Morgan Chase b Co I NC Verze kering en Allianz Finance II American International Italy Unicredito ltaliano Capital Trust Arran Residential Mortga (FAN) RCL Securitisation (FRN) Storm (FRN) Lusitano Mortgage (FRN) Commerzbank UBS Unicredo ltaliano EA Covered Bond Credit Agricde
04-01-2010 11-04-2011 28-03-2028 04-01-2031 15-07-2010 15-09-2010 25.10-2032 01.02-2033 26-10-2012 21-06-2021 07-05-2027 26-09-2011 11-07-2011 30-06-2009 12-07-2011 28-03-2012 28-01-2013 09-12-2011 28-01-2033 10-11-2010
08.10-2010 12-01-2010 12.01-2011 17-04-2009 20-07-2012 12-01-2009 15-09-2021 17-04-2009 08-04-2011 04-05-2009 01-04-2016 04-02-2013 28-09-2012 01-03-2013 04-01-2017 28-09-2015 01-08~202l 04-05-2011 27-09-2011 15-03-2013 18.09-2013 23.11-2016 20.09-2011 0 1-02-20 17 27-10-2015 12-04-2056 24-12-2014 22-04-2048 15-07-2059 13.09-2011 25-09-2013 20-09-2011 05-04-2012 09-11-2015
10,500,000 200,000
16,000,000 39,230,000 3,040,000 540,000 450.000
24,500,000 80,000
1,920,000 1,670,000 2,500,000 3,840,000 1,380,000
3,070,000 1,660,000 2,670,000 500,000 720,000 900,000
1,450,000 5,700,000 1,980,000 25,450,000
300,000 4,650,000 290,000
1,200,000 2,600,000 28,300,000
4,750,000 8,000,000 1,000,000
5,500,000 1,300,000 26,678,000 28,400,000
500,000 35,400,000
650,000 650,000 600,000 650,000
26,200,000 1,860,000 8,500,000 8,300,000 3,200,000 6,640,233 2,700,000 600,000 600,000 450,000
14,550,000
10,710,945 0.83
17,553,760 1.36 203,456 0.02
43,422,118 3.37 3,122,080 0.24 556,675 0.04 515.493 0.04
27,091,365 2.10 84,502 0.01
2,006,016 0.16 1,811,416 0.14 2,628,500 0.20 4,070,438 0.32 1,427,610 0.11 3,284,286 0.25 1,783,836 0.14 2,940,391 0.23 550,400 0.04 915,480 0.07 982,980 0.08
678,821,191 52.61
678,821,191 52.61
1,363,029 5,498,106 1,882,525 24,923,949
278,691 4,584,528 253,947
1,179,132 2,509,000 27,733.717
7,457,200 953,880
5129.795
25.105.865
484,305 34,156,752
611,716 618,339 555,588 628,284
24,704,504
8,502,036 8,294,091 3,200,828 6,641,031 2,612,034 571,866 580,794 437,036
4,401,065
1,219.855
25,145,644
1,671,954
13,298,700
0.11 0.43 0.15 1.93 0.02 0.36 0.02 0.09 0.19 2.15 0.34 0.58 0.07 0.40 0.09 1.95 1.95 0.04 2.65 0.05 0.05 0.04 0.05 1.91 0.13 0.66 0.64 0.25 0.51 0.20 0.04 0.05 0.03 1.03
Robeco Capital Growth Funds 105
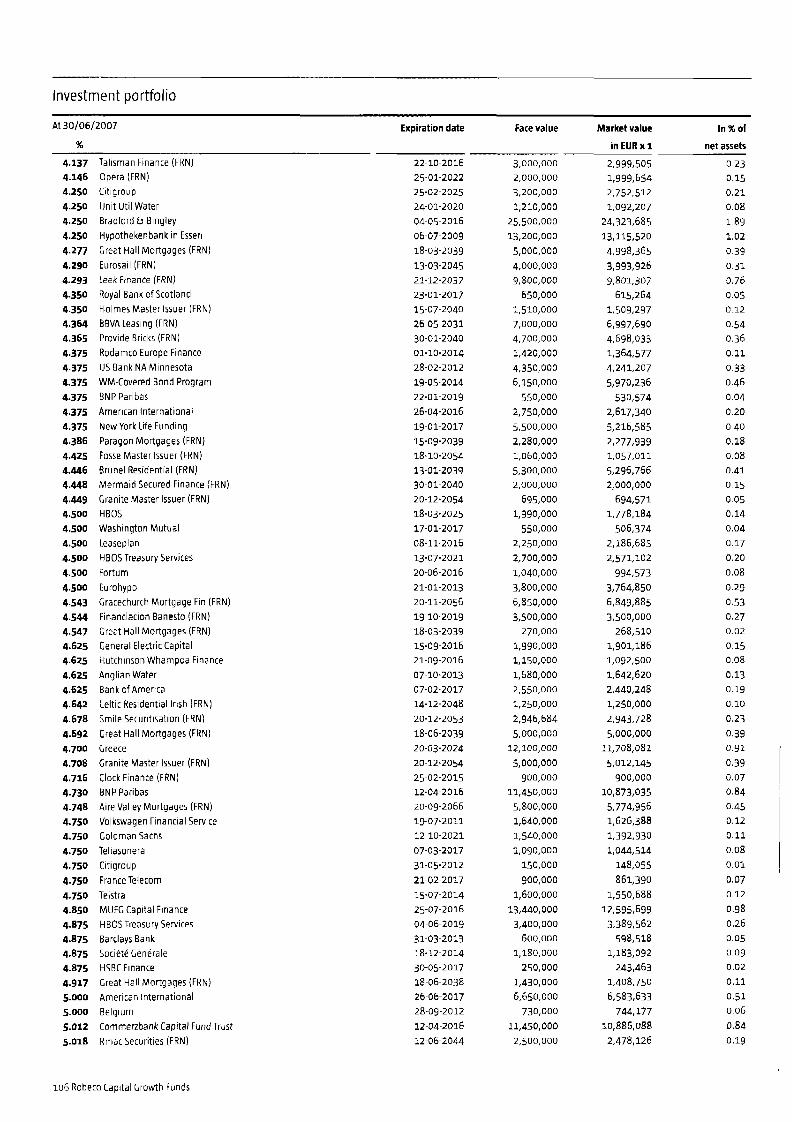
Investment portfolio
At 30/06/2007 Expiration date Face value Market value In % of
net assets % in EUR x 1
4.137 4.146 4.250 4.250 4.250 4.250 4.277 4.290 4.293 4.350 4.350 4.364 4.365 4.375 4.375 4.375 4.375 4.375 4.375 4.386 4.425 4.446 4.448 4.449 4.500 4.500 4.500 4.500 4.500 4.500 4.543 4.544 4.547 4.625 4.625 4.625 4.625 4.642 4.678 4.692 4.700 4.708 4.716 4.730 4.748 4.750 4.750 4.750 4.750 4.750 4.750 4.850 4.875 4.875 4.875 4.875 4.917 5.000 5.000 5.012
5.018
Talisman Finance (FRN) Opera (FRN) Citigroup Unit Uti1 Water Bradford b Bingley Hypothekenbank in Essen Great Hall Mortgages (FRN) Eurosail (FRN) Leek Finance (FRN) Royal Bank of Scotland Holmes Master Issuer (FRN) BBVA Leasing (FRN) Provide Bricks (FRN) Rodarnco Europe Finance US Bank NA Minnesota WM Covered Bond Program BNP Paribas American International New York Life Funding Paragon Mortgages (FRN) Fosse Master Issuer (FRN) Brunel Residential (FRN) Mermaid Secured Finance (FRN) Granite Master Issuer (FRN) HBOS Washington Mutual Leaseplan HBOS Treasury Services Fortum Eurohypo Gracechurch Mortgage Fin (FRN) Financiacion Banesto (FRN) Great Hall Mortgages (FRN) General Electric Capital Hutchinson Whampoa Finance Anglian Water Bank of America Celtic Residential Irish (FRN) Smile Securitisation (FRN) Great Hall Mortgages (FRN) Greece Granite Master Issuer (FRN) Clock Finance (FRN) BNP Paribas Aire Valley Mortgages (FRN) Volkswagen Financial Service Coldman Sachs Teliasonera Citigroup France Telecorn Telstra MUFG Capital Finance HBOS Treasury Services Barclays Bank Societe Generale HSBC Finance Great Hall Mortgages (FRN) American International Belgium Commerzbank Capital Fund Trust Rmac Securities (FRN)
22-10-2016 25-01.2022 25.02-2025 24-01-2020 04-05-2016 06-07-2009 18-03-2039 13-03-2045 21-12.2037 23-01-2017 15-07-2040 26-05-2031 30-01.2040 01-10-2014 28-02-2012 19-05-2014 22-01-2019 26-04-2016 19-01-2017 15-09-2039 18-10-2054 13-01-2039 30-01-2040 20-12-2054 18-03-2025 17-01-2017 08-11-2016 13-07-2021 20-06-2016 21-01-2013 20-11-2056 19-10-2019 18-03-2039 15-09-2016 21-09-2016 07-10-2013 07-02.2017 14-12-2048 20-12-2053 18-06-2039 20-03-2024 20-12-2054 25-02.2015 12-04-2016 20-09-2066 19-07-2011 12-10.2021 07-03-2017 31-05-2012 21-02-2017 15-07-2014 25-07-2016 04-06-2019 31-03-2013 18-12-2014 30-05-2017 18-06-2038 26-06-2017 28-09-2012 12-04-2016 12-06-2044
3,000,000 2,000,000 3,200,000 1,210,000
13,200,000 5,000,000
9,800,000
1,510,000
25,500,000
4,000,000
650,000
7,000,000 4,700,000 1,420,000 4,350,000 6,150,000 550,000
2,750,000 5,500,000 2,280,000 1,060,000 5,300,000 2,000,000 695,000
L990,OOO 550,000
2,250,000 2,700,000 1,040,000 3,800,000 6,850,000 3,500,000 270,000
L990,OOO 1,150,000 1,680,000 2,550,000 1,250,000
2,946,684 5,000,000 12,100,000 5,000,000 goo,ooo
11,450,000 5,800,000 1,640,000 1,540,000 1,090,000 150,000 goo,ooo
1,600,000 13,440,000 3,400,000 600,000
1,180,000 250,000
1,430,000 6,650,000 730,000
11.4~0.000 2,500,000
2,999,505 1,999,654 2,752.512 1,092,207 24,323,685 13,115,520 4,998,365 3,993,926 9,801,307 615,264
1,509,297 6,997,690 4,698,033 1,364,577 4,241,207 5,970236 530,574
2,617,340 5,216,585 2,277,939 1,057,011 5296,766 2,000,000
694,571 1,778,184 506,374
2,186,685 2,571,102 994,573
3,764,850 6,849,885 3,500,000 268,510
1,901,186 1,092,500 1,642,620 2,440,248 1,250,000 2,943,728 5,000,000 11,708,081 5,012,145 900,000
10,873,035 5,774,956 1,626,388 1,392,930 1,044,514 148,055 861,390
1,550,688 12,595,699 3,389,562 598,518
1,183,092 243,463
1,408,750 6,583,633 744,177
10,886,088
2,478,126
0.23 0.15 0.21 0.08 1.89 1.02 0.39 0.31 0.76 0.05 0.12 0.54 0.36 0.11 0.33 0.46 0.04 0.20 0.40 0.18 0.08
0.41 0.15 0.05 0.14 0.04 0.17 0.20 0.08 0.29 0.53 0.27 0.02 0.15 0.08 0.13 0.19 0.10 0.23
0.39 0.91
0.39 0.07 0.84 0.45 0.12 0.11 0.08 0.01 0.07 0.12 0.98 0.26 0.05 0.09 0.02 0.11 0.51
0.84 0 06
0.19
106 Robeco Capital Growth Funds

I nve st m e n t p o rtfo I io
At 30/06/2007 .
Expiration date Face value Market value In %of
96 in EUR x 1 net assets
Mituho Capital Invest 30-06-2011 1,g00,000 1,878,891 0.15 5.020
5.125 5.219 5.317 5.375 5.500 5.500 5.625 5.750 5.875 6.000 6.125 6.467 6.500 6.625 6.905
Lehrnan Brothers Anglo Irish Capital General1 Finance Volkswagen Finance Service France Belgium Lloyds Bank Upper Tier II Spain Lloyds Greece Allianz Finance It Royal Bankof Scotland Tier I Greece BNP Paribas Capital Trust Tier I Credit Suisse First Bost Tier I
Total transferable securities traded on other regulated markets
Total securities portfolio Operating capital
Total net assets
27-06-2014 29-09-2016 16-06-2016 25-01-2012 25-04-2029 28-09-2037 15-07-2009 30-07-2032 08-07-2014 19-05-2010 31-05-2012 29-06-2012 11.01-2014 23-10-2011 07-11.2011
7,750,000 13,660,000 2,000,000 1,230,000 882,000
6,800,000 2,280,000
1,450,000 450,000
10,300,000 2,730,000 2,250,000 1,027,146 2,070,000 2,010,000
7,685,675 12,920,857 1,944,800 1,248,573 970,712
7,266,548 2,313,539 1,654,697 474,404
10,684,076 2,855,471 2,378,340 1,129,337 2,190,681 2,149,293
536,794,186
0.60 1.00 0.15 0.10 0.08 0.56 0.18 0.13 0.04 0.83 0.22 0.18 0.09 0.17 0.16
41.61
536,794, 186 41.61
1,215,615,377 94.22 74,606,612 5.78
100.00 1,290,221,989
Robeco Capital Growth Funds 107

Robeco High Yield Bonds -I_-_
I nvest me nt portfolio
At 30/06/2007 Expiration date Face value Market value In % of
96 in EUR x 1 net assets Transferable securities admitted to an official stock-exchange listing
4.875 5.375 5.816 6.000 6.000 8.000
8.125 8.250 8.375 8.500
9-875 9.968
13.553
EUR Ford Motor Credit General Motors Monastery (FRN) CMAC Canada General Motors Thiel logistik Europcar Hayes Lemmerz Finance General Motors HTM Sport b Freizeit IT Finance Hellas II (FRN) Sta bi I ity
GBP 8.750 British Airways
NOK 9.520 MPU Offshore Li f t (FRN)
0.000
6.300 7.125 7.250 7.250 7.500 8.750 9.625
11.000
USD Africa Offshore Services (FRN) Bombardier Domtar Case Novelis William Lyon Homes Hanover Equip Trust Six Flags Cecon
Total transferable securities admitted to an official stock-enchmge listing
Transferable securities traded on other regulated markets
3.750 4.159 5.777 5.977 6.148 6.250 6.375 6.375 6.642
6.750
7.159 7.186 7.229 7.242 7.375 7.395 7.500 7.500 7.664 7.750
6.750
6.875
EUR Valeo Smart Sme AXA Bancala Fondo De Tituliz (FRN) Clondalkin Acquisition ( F R N ) Chesapeake Energy Solvay Finance TRW Automotive Whinston Capital Management (FRN) Owens-Brockway Class Rexam Huntsman International Smart FRN) Bombardier (FRN) Smile 2005 Synthetic (FRN) Stichting Memphis (FRN) Linde Finance Edcon Proprietary (FRN) Fage Dairy Industries Huntsman International (FRN) Skyline (FRN) UPC
15-01-2010 06.06-2011 17-11-2044 23-05-2012 03-07-2008 15-12-2012 15-05-2014 15-06-2013 05-07-2033 01-02-2014 15-11-2012 15-01-2015 0505-2022
23-08.2016
22-12-2011
29-06-2012 01-05-2014 15-08-2015 15-01-2016 15-02-2015 15-02-2014 01-09-2011 01-06-2014 04-05-2012
24-06-2013 27-12-2016 06-07-2016 22-05-2050 15-12-2013 15-01-2017 02-06-2016 15-03-2014 25-01-2055 01-12-2014 29-06-2067 15-11-2013 27.12-2016 15-11-2013 20-01-2015 25-042015 14.07-2066 15-06-2014 15-01-2015 01-01-201s 22-07-2043 15-01-2014
4,600,000 6,900,000 1,900,000 4,800,000 4,600,000 2,300,000 3,750,000 1,000,000 10,000,000 3,000,000 2,300,000 3,300,000 1,900,000
1,750,000
14,500,000
700,000 2,500,000 5,000,000 2,500,000 3,000,000
3,650,000 6,350,000 2,100,000 3,700,000
7,550,000 1,900,000 2,200,000 1,g00,000 7,750,000 7,400,000 2,550,000 1,goo,ooo 3,800,000 1,700,000 1,g00,000 4,600,000 1,900,000 1,000,000 2,567,147 2,900,000 4,400,000 6,650,000 1,250,000 4,450,000 3,800,000 5,000,000
4,390,194 6,617,514 1,900,000 4,650,000 4,599,356 2,369,000 3,928,125 1,002,370 9,475,000 2,880,000
2,489,750 3,397,350 1,g00,000
49,598,659
2,795,996
1,808,671
518,307
3,609,641 1,878,864 2,287,957 2,297,212 4,819,333 1,442,190
21,342,416
1,749,287
2,739,625
0.57 0.86 0.25 0.60 0.60 0.31 0.51 0.13 1.23 0.37 0.32 0.44 0.25 6.44
0.36
0.23
0.07 0.23 0.47 0.24 0.30 0.30 0.63 0.19 0.35 2.78
75,545,742
6,999,907 1,goo,ooo 2,207,128 1,886,320 7,788,750 7,400,000 2,656,896 1,871,500 3,849,020 1,708,500 1,900,513 4,807,000 1,901,520 1,041,500 2,623,624 2,945,279 4,619,780 6,610,965 1,212,500
4,650,250 3,800,000 4,962,500
9.81
0.91 0.25 0.29 0.24 1.01 0.96
0.35
0.50
0.25
i 0.24
0.22
0.62 0.25 0.14 0.34 0.38 0.60 0.86 0.16 0.60 0.49 0.64
108 Robeco Capital Growth Funds

Investment portfolio
At 30/06/2007 Expiration date Face value Market value In 96 of
% in EUR x 1 net assets
7.750 8.000
8.250 9.061 9.625
9.836 9.875
10.000 10.375 10.845 11.0oo 11.492 19.055
9.750
8.598 8.625 8.650 9.350
9.750 9.890
5.000 5.000 5.125 5.250 5.350 5.500 5.550 5.625 5.875 5.875 5.950 6.000
6.125 6.125 6.250 6.250 6.250 6.375 6.375 6.375 6.500 6.500
I 6.500 6.500 6.500 6.500 6.625 6.625 6.750 6.750 6.750 6.750 6.750 6.750 6.750 6.750
Peermont Global Savcio SPCM BCM Ireland (FRN) Johnson Diversey Wind Acquisition Clock Finance (FRN) lnvensys Louis No1 IFCO Systems Mars (FRN) Boats Invest Netherlands Stichting Memphis (FRN) Promise (FAN)
CBP Eurosail (FRN) Cable b Wireless International Finance Great Hall Mortgages (FRN) Resloc (FRN)
NOK Petromena Sevan Drilling (FRN)
USD Scholastic Deluxe GMAC American Axle b Manufacturing Potomac Edison Rogers Cable TXU Computer Associates KB Home MCM Mirage Northwest Pipeline Case New Holland Norske Skogsindustrier Grant Prideco Rogers Cable Home Citizens Communications Tenet Health H CA Resident Capital Nova Chemicals Lin Television Chesapeake Energy Electronic Data Systems United Rentals Harrah’s Operating Chesapeake Energy Tesoro Bombardier Ikon Office Solutions Silgan Stat5 Chippac Ainsworth Lumber Vail Resorts Hercules Service
30.04-2014 15-02-2013 15-06-2013 15-08-2016 15-05-2012 01-12-2015 25-02-2015 15-03-2011 0 1-12-20 16 15-10-2010 28.08.2014 31-03-2017 25-04-2015 12-05-2024
13.03.2045 25-03-2019 18-03-2039 15-12-2043
24-05-2012 07-12-2012
15-04.2013 15-12-2012 09-05-2008 11-02-2014 15-11-2014 15-03-2014 15-11-2014 01-12-2014 15-01.2015 27-02-2014 15-04-2017 01-06-2009 15-10-2015 15-08-2015 15-06-2013 15-06-2015 15-01-2013 01-12-2011 15-01-2015 30-06-2010 15-01.2012 15-05-2013 15-08-2017 01-08-2013 15-02-2012 01-06-2016 15-01-2016 01-11-2015 01-05-2012 01-12-2025 15-11-2013 15-11-2011 15-03-2014 15-02-2014 15-10-2029 01-04-2016
4,300,000 5,900,000 4,725,000 2,400,000 3,600,000 4,800,000 1,800,000 2,047,500 4,750,000
900,000 2,400,000 5,750,000
g00.000 1,845,417
2,351,131 2,500,000
900,000 2,575,000
13,000,000
12,000,000
3,000,000 4,575,000 2,975,000 4,700,000 2,300,000 4,000,000 3,000,000 3,000,000
3,250,000 6,300,000 1,000,000
3,800,000 5,500,000 1,500,000 1,000,000
3,250,000 850,000
7,000,000 5,500,000 4,400,000 4,500,000 4,500,000 1,250,000 3,000,000 4,700,000 8,000,000 2,000,000 4,500,000 1,900,000 3,000,000 2,500,000 5,000,000 2,000,000 4,900,000 1,750,000 5,000,000
4,300,000 6,136,000 5,079,375 2,448,000 3,762,000 5,460,000 1,800,000 2,211,300 4,702,500
958,500 2,399,280 5,824,409
913,566 1,817,182
127,155,564
3,459,754 3,881,007 1,309,255 3,306,912
11,956,928
1,711,202 1,560,766 3,271,968
1,951,672 3,048,758 2,182,389 3,027,655 1,650,080 2,851,905 1,885,863 2,072,491 2,093,772 4291.585
717,386 2,799,600 3,665,568 1,049,572
746,259 2,129,495
4,736,033 3,461,553 3,212,901 3,115,397 3,232,017
871,173 2,206,825 3,419,163 4.946.133 1,425,345 3,306,986 1,385,732 1,932,546 1,814,076 3,739,217 L095.850 3,537,448 1,256,895 3,517,086
601,051
0.56 0.80 0.66 0.32 0.49 0.71 0.23 0.29 0.61 0.12
0.31 0.76 0.12
0.24 16.52
0.45 0.50 0.17 0.43 1.55
0.22 0.21 0.43
0.25 0.40 0.28 0.39 0.21 0.37 0.25 0.27 0.27 0.56 0.09 0.36 0.48 0.14 0.10
0.28 0.08 0.62 0.45 0.42 0.40 0.42 0.11 0.29 0.44 0.64 0.19 0.43
0.25 0.18
0.24 0.49 0.14 0.46 0.16 0.46
Robeco Capital Growth Funds 109

Investment portfolio
At 30/06/2007 Expiration date Face value Market value In 46 of
% in EUR x 1 net assets
6.875 6.875 6.875 6.875 6.875 6.875 6.875 6.875 7.000 7.000 7.000 7.000
7.000
7.000 7.000 7.000 7.000
7.125 7.130 7.200 7.200 7.250 7.250 7.250 7.250 7.250 7.250 7.250 7.250 7.250 7.375 7.37s 7.375 7.375 7.375 7.375 7.400 7.450 7.500 7.500 7.500 7.625 7.625 7.625 7.625 7.750 7.750 7.750 7.750 7.750 7.750 7.750 7.750 7.750 7.750 7.750 7.850 7.857 7.875 7.875 7.875 7.875
General Motors Ahold Finance USA R H Donnelley Suburban Propane Partnrs Whouse Air Brake Qwest Capital Funding
W e g y Ch ernt u ra Visteon Hanaro Telecom Southern Cal Edison Mission Energy Belden Plains E 6 P Company Dean Foods Leucadia National Steinway Musical lnstrum Georgia Pacific Williams Cos Dillards Teco Energy Southern Union Interpublic Cascades Texas Industries Eastrnan Kodak TRW Automotive Ainsworth lumber Amerigas Partners Qwest Communications International Sabine Pass NRG Energy Huntsman International Radioshack Caraustar Industries Spectrum Brands Tenet Healthrare Enersis AI bertson’s H CA Rite Aid Cie Generale de Geophys Unumprovident Mosaic William Lyon Homes Mastec Semco Energy Eland Finance Fairfax Financial Edison Mission Energy El Paso Production HCA Valor Telecom Enter Phillips van Heusen AES Elizabeth Arden United Rentals Univision Comm Goodyear Cenveo Williams Cos Eurorhem Finance Rogers Cable
15-09-2011 01-05-2029 15-01-2013 15-12-2013 31-07-2013 15-09-2033 01-042011 01-06-2016 10-03-2014 01-02-2012 15-05-2017 15-03-2017 15-03-2017 01-06-2016 15-08.2013 01-03-2014 15-01.2015 01-09-2011 01-08-2018 01-05-2011 01-11-2011 15-08-2011 15-02-2013 15-07-2013 15-11-2013 15-03-2017 01-10-2012 20-05-2015 15-02-2011 30-11-2013 01-02-2016 01-01-2015 15-05-2011 01-06-2009 01-02-2015 01-02-2013 01-12-2016 01-08-2029 06.11-2033 15-01-201s 15-05-2015 01-03-2011 01-12-2016 15-12-2012 01.02-2017 15-05-2013 15-11-2011 15-06-2017 15-06-2016 01-06-2013 15-07.2036 15-02-2015 15-11-2023 01-03-2014 15-01-2014 15-11-2013 15-07-2011 15-08-2011 01-12-2013 01-09-2021 21-03.2012 01-05-2012
8,350,000 5,450,000 10,000,000 2,000,000 2,500,000 1,300,000 5,000,000 ~,100,000 2,500,000 3,500,000
500,000
4,000,000 4,000,000 3,000,000 3,000,000 3,000,000 2,000,000
9,300,000 3,000,000 ~,000,000
4,000,000 3,000,000 4,000,000 3,500,000 4,000,000 3,000,000 1,500,000 4,000,000 1,500,000 12,500,000 g,ooo,ooo 400,000
2,000,000 3,500,000 2,000,000 600,000
1,500,000 7,000,000 2,900,000
3,000,000 8,800,000
770,000 4,800,000 1,600,000 5,000,000 2,000,000 5,000,000 3,600,000 8,800,000 1,400,000 2,900,000 1,~00,000
2,500,000 3,950,000 6,550,000 4,000,000 1,600,000
3,108,000
3,000,000 800,000
5,500,000 1,450,000
6,074,470 4,149,393 7,015,660 1,436.452 1,832,587 900,004
3,646,662 3,549,665
2,598,016 349,857
2,954,352 2,828,477 2,132,465 2,176,891 2,165,784 1,429,047 7,058,236 2,112,917 3,841,028 2,952,797 2,232,424 2,872,904 2,591,537 2,961,756 2,121,358 855,207
1,118,989 9,162,934 6,613,972 310,984
1,531,717 2,487,875 1,184,703 401,503
1,193,869 5,058,167 1,819,814 6,450,705 2,221,317 600,566
3,678,501 1,012,921 3,720,706 1,497.538 3,706,823 2,598,941 6,483,285 1,092,468 1,836,821 1,178,242 2,393.336 1,869,609 2,946,670
3,050,609 1,208,397 2,176,891 624.931
4,101,215 1,155,791
1,601,200
2,946,948
4,849,876
0.79 0.54 0.91 0.19 0.24 0.12 0.47 0.46 0.21 0.34 0.05 0.38 0.37 0.28 0.28 0.28 0.19 0.92 0.27 0.50
0.38 0.29 0.37 0.34 0.38 0.28 0.11 0.38 0.15 1.19 0.86 0.04 0.20 0.32 0.15 0.05 0.16 0.66 0.24 0.84 0.29 0.08 0.48 0.13 0.48 0.19 0.48 0.34 0.84 0.14 0.24 0.15 0.31 0.24 0.38 0.63 0.40 0.16 0.28
0.08 0.53 0.15
110 Robeco Capital Growth Funds

Investment portfolio ~~
At 30/06/2007 Expiration date Face value Market value In 96 of
96 in EUR x 1 net assets
7.875 7.875 7.875 7.400 7.950 8.000 8.000 8.000 8.000 8.000 8.000
8.000
8.000
8.000 8.000 8.125 8.125
8.250
8.250
8.200
8.250
8.250 8.250 8.300 8.375 8.375 8.375 8.375 8.375 8.375 8.500 8.500 8.500 8.500
8.500 8.500 8.500 8.500 8.500
8.500
8.625 8.625 8.625 8.750
8.750 8.750
8.750
8.750 8.750 8.750 8.750 8.875 8.875 8.875 8.875 9.000
9.000
9.OOO 9.000
9.000 9.000
9.000
AEP Industries 15-03.2013 Buhrmann US AK Steel Blyth Bowater Canada Finance Sinclair broadcasting Playtex Products Xerox Capital Trust I Carnestop Stone Container AMC Entertainment Unisys Asbury Automotive Charter Communications Georgia Pacific Rite Aid Copano Energy Rock-Tenn Company CEO lntelsat Bermuda Allegheny Energy Supply Toll Brothers Owens-Brockway Glass Mirant Americas Canr Park-Ohio Industries Finlay Fine Jewelry Friendly Ice Cream Enterprise Products Oper Allegheny Technologies Charter Comrn Opt LLC/CAP Ship Finance International Tembec Industries Unisys Buckeye Technologies PSEG Energy Foot Locker Mediacom Accuride Williams Scotsman Yankee Acquisition Norske Skog Canada Sonic Automotive Tenneco Automotive IPSCO tear AES Continental Airlines Arvinrneritor Pathrnark Stores CCO Capital Quebecor World Creif R.H. Donnelley Qwest Communications Intc Georgia Pacific Finance Capital Finance Songa Offshore lntelsat Tech Olympic USA Blockbuster Agile Property PanAmSat
irnational
01-03.2015 15-02-2009 01-10-2009 15-11-2011
01-03-2011 15-03-2012
01-02-2027 01-10-2012 15-03-2017 01-03-2014 15-10-2012 15-03-2014 30-04-2012 15-01-2024 01-05-2010
15-08-2011 01.03-2016
15-07-2013 15-01-2013 15-04-2012 01-12-2011 15-05.2013 01-05-2011 15-11-2014 01-06-2012 15-06-2012 01-08-2016 15-12-2011 30-04-2014 15-12-2013 01-02-2011 15-10.2015 01-10-2013 15-06-2011 15-01-2022 15-10.2015 01-02-2015 01-10-2015 15-02-2015 15-06-2011 15-08-2013 15-11-2014 01-06-2013 01-12.2016 15-06-2008 01-12-2011 01-03-2012 01-02-2012 15-11-2013 15-03-2016 01-08.2012 15-01-2016 15-03-2012 15-05-2031 07-10-2014 08.09-2010 15-06-2016 01-07.2010 01-09-2012 22~09-2013 15-08-2014
3,000,000 3,000,000
3,349,000 2,000,000 3,000,000 2,498,000 3,000,000 5,000,000 4,500,000 7,000,000 2,000,000 2,000,000
500,000
5,650,000 500,000
5,000,000 4,000,000 4,000,000 2,540,000 6,000,000 2,300,000 2,250,000 6,000,000 3,500,000 4,000,000 4,000,000 1,500,000
3,700,000 1,500,000 10,000,000 3,000,000 3,800,000 2,000,000 4,000,000 5,000,000 3,000,000 2,000,000 3,500,000 8,500,000 1,000,000 3,000,000 2,250,000 800,000
3,000,000 5,000,000
750,000 1,000,000
4,400,000 1,700,000 10,000,000 4,500,000 2,390,000 6,600,000 3,100,000 2,350,000 5.300.0~0 2,100,000 6,000,000 4,100,000 1,500,000 2,500,000
6,000,000
2,221,317 2,187,997 2,557,721 1,517,900
1,905,105 2,287,957 3,771,612 3,469,420 5,131,243 1,451,261 1,436,452 373,922
4,225,316 355,411
3.757.728 3,006,183 3,050,609 1,937,137 4,542,594 1,805,190 1,690,978 4,598,127 2,675,762 2,872,904 2,621,154 1,152,308 2,898.797 1,171,745 7,552,479 2,276,850 1,487,727 1,458,665 3,050,609 3,905,816 2,260,190 1,488,283 2,565,621
721,928 2,143,571 1,711,803 610,122
2,351,042 3,535,597 565,742 727,481
3,290,511 1,299,656 7,552,479 3,281,996 1,854,770 5,082,374 2,473,252 1,740,032 4,146,248 1,632,668 4,664,766 2,899,189 1,027,359 1,906,631 4,631,446
2,088,038
6,498,278
0.29 0.28 0.33 0.20 0.27 0.25 0.30 0.49 0.45 0.67 0.19 0.19 0.05 0.55 0.05
0.49 0.39 0.40 0.25 0.59 0.23 0.22 0.60 0.35 0.37 0.34 0.15 0.38 0.15 0.98 0.30 0.19 0.19 0.40 0.51 0.29 0.19 0.33 0.84 0.09 0.28 0.22 0.08 0.31 0.46 0.07 0.09 0.43 0.17 0.98 0.43 0.24 0.66 0.32 0.23 0.54 0.21 0.61 0.38 0.13 0.25 0.60
Robeco Capital Growth Funds 111

I nvest m ent portfolio
At 30/06/2007 Expiration date Face value Market value In % of
% in EUR x 1 net assets
9.000
9.125 9.250 9.250 9.250 9.250 9.250
9.300 9.500 9.500 9.500 9.500 9.500 9.750 9.750 9.875 9.875
10.000
10.000 10.000
10.000
1o.oso 10.125 10.250 10.250 10.250
9.250
10.250 10.280
10.356 10.500 10.500 10.625 10.625 10.625 10.850 11.000
11.Ooo
11.000
11.355 11.500 11.500 12.000 12.110 12.250 14.875
Goodyear Tire b Rubber Vitro HCA Citizens Communications Allied Waste North America Arnkor Tech Mercer International WCA Waste Ddi Mediacorn Navios Martime Graphic Packaging lnternatic Georgia Pacific AE5 Offshore Rig Services Yankee Acquisition Fedders North America Tenet Healthcare American Cel Aventine Renewable Energy AMR Holdco/Emcar Arncare Young Broadcasting Ddi (FAN) Freescale Semiconductor Tenneco Automotive Bon Ton Dept Store Hines Nurserie Star Cas Partner/Finance Petroiack (FRN) Rubicon Offshore (FRN) Exide Technologies Standard Drilling Equistar Chemicals/Funding FMG Finance Polyone Petroprod Movie Gallary Alliance One International Constar International Petroprod (FRN) Stoneridge Frigstad Discoverer Orion Power MPF (FRN) Ci t i Tire Aquila
mal
Total transferable securities traded on other regulated markets
Other transferable securities
USD 0.000 Telligent
Total other transferable securities
Total securities portfolio Operating capital
01-07.2015 01-02-2017 15-11-2016 15-05-2011 01-09-2012 01-06-2016 15.02-2013 15-06-2014 26-04-2012 15-01-2013 15-12-2014 15-08-2013 01-12-2011 01-06-2009 27-042011 15-02-2017 01-03-2014 01-07-2014 01-08-2011 01-042017 15-02-2015 01-03-2011 15-03-2012 15-12-2016 15-07.2013 15-03-2014 01-10-2011 25-02-2013 30-05-2012 16-04-2012 15-03-2013 10-01-2011 01-05-2011 01-09-2016 15-05-2010 24-05-2013 01-05-2012 15-05-2012 01-12-2012 12-01-2012 01-05-2012 21-02-2012 01-05-2010 20-09-2011
01-07-2012 26-01-2012
01-03-2008
2,435,000 2,000,000 2,000,000 3,200,000 734,000
3,000,000 4,000,000 2,000,000 2,100,000 2,500,000 1,000,000 4,000,000 2,550,000 6,000,000 1,900,000 6,000,000 1,800,000 3,600,000 743,000
4,000,000 1,000,000 2,000,000 2,100,000 7,000,000 3,000,000 3,000,000 3,000,000 1,118,203 2,400,000 2,900,000 1,500,000 2,700,000 3,691,000 5,500,000 1,468,000 2,600,000 2,000,000
3,500,000 1,300,000 600,000
3,500,000 2,600,000 2,000,000 2,400,000 5,000,000 3,000,000
1,938,192 1,517,900 1,577,135 2,558,957 567,939
2,265,744 2,891,415 1,547,518 1,636,555 1,888,120 794,121
3,065418 2,020,288 4,642,553 1,470,142 4,298,249 446,485
2,638,925 576,278
2,902,521 799,674
1,473,474 1,648,217 4,872,089 2,399,023 2,243,530 1,721,521 885,918
1,848,136 2,158,010 1,143,978 1,993,186 2,869,609 4,846,174 1,141,313 1,958,832 992,188
2,844,212 875,939 453,149
2,721,114 1,925.142 1,673,392 1,768,169 3,746,177 2,843,286
519,959,233
0.25 0.20 0.20
0.33
0.29 0.07
0.38 0.20 0.21 0.25 0.10 0.40 0.26 0.60 0.19 0.56 0.06
0.34 0.07 0.38 0.10 0.19 0.21 0.63 0.31 0.29 0.22 0.12 0.24 0.28 0.15 0.26 0.37 0.63 0.15
0.13
0.37 0.11 0.06 0.35 0.25
0.26
0.22 0.23 0.49 0.37
67.55
662,343,693 86.05
700,000 1,555 0.00
1,555 0.00
737,890,990 95.86 3~a36.053 4.14
769,727,043 100.00 Total net assets
112 Robeco Capital Growth Funds

Robeco Euro Credit Bonds
Investment portfolio . .. .-.. -
At 33/06/2007 Expiration date Face value Market value In I of
net assets % in EUR x 1
Transferable securities admitted to an official stock-exchange listing
5.525
4.000 4.119 4.125 4.125 4.125 4.173 4.176 4.194 4.219 4.279 4.310 4-350 4.375 4.375 4.500 4.500 4.750 4.750 4.939 5.252 5.330 5.375 5.767 6.250 6.375 6.500 6.625 6.875 6.988 7.055 7.250 7.250 7.627 7.750 8.125 8.126
DEM MBNA America European Structure
EUR Deutsche Telekom International Finance Magellan Mortgage (FRN) Parker-Hannifin Lanxess Finance Nationwide Bldg Society Granite Master Issuer (FRN) ING Bank Svenska Handelsbanken German Resid Asset (FRN) Delphinus (FRN) ABN-AMRO Bank Holmes Master Issuer (FRN) Allianz Finance Daimler-Chrysler MBNA America European Structure Bouygues Mituho Finance Koninklijke KPN HBOS Capital Funding ELM (Swiss Rein) Deutsche capital trust IVTier I Citibank Credit Card Master Trust Munich Re Finance ING INC Bank Fortis NLTier I Deutsche Telekom International Finance KBC Bank Funding Trust II lntesabci Capital Trust Tier I HVB Fundinglrust VI11 Tier I France Telecom Olivetti International Finance Halifax Euro Finance Tier I Olivetti International Finance France Telecom Sanaaolo Tier I
Total transferable securities admitted to an official stock-exchange listing
Transferable securities traded on other regulated markets
5.875
3.250
3.750 3.500
3.875 3.875 3.875 3.875 4.028 4-035
OEM Batavia
EUR HBOS Treasury Services Banco Santander Central Hispan Vale0 Mol Magyar 01 Gati WM Covered Bond Program Bradford G Bingley Lehman Bros Cap Fund 1 1 1 Untcredito ltaliano Capital Trust Arran Residential Mortgage (FRN)
19-04-2008
19.01.2015 20-07-2059 11-11-2015 21-06-2012 27-02.2012 20-12-2054 08-06-2015 16-12-2015 20-07-2016 28-09-2096 10-03-2016 15-07-2040 17-02-2017 21-03-2013 17-01.2014 24-05-2013 15-04-2014 17-01-2017 23.05-2016 25-05-2016 19-09-2013 11-04-2011 29-06-2049 21-06-2021 07-05-2027 26-09-2011 11-07-2011 29-06-2049 12-07.2011 28-03-2012 28-01-2013 24-04-2012 09-12-2011 24-01-2033 28-01-2033 10-11-2010
16-03-2009
25.01-2013 06-02-2014 24-06.2013 05-10-2015 27-09-2011 04-05-2011 22-02-2011 27-10-2015 12-04-2056
150,000
350,000 1,762,049 1,090,000 920,000
4,600,000 2,310,000 1,760,000 1,680,000 4,019,055 2,500,000 1,620,000 1g0.000
1,620,000 1,1g0,000 600,000
1,350,000 1,680,000 850,000
1,550,000 1,600,000 2,910,000
50,000 2,000,000 1,510,000 1,310,000 1,g00,000 2,850,000 1,090,000 2,410,000 1,300,000 1,980,000
2,750,000
730,000 560,000 800,000
400,000
150,000
3,900,000 2,600,000 790,000 920,000
6,000,000 9,200,000 1,700,000 1,450,000 2,130,000
76,990
323,400
1,015,008 875,748
4,475,938 2,310,805 1,621,594 1,541,786 4,027,258 2,503,249 1,473,925 189,848
1,475,901 1,148,041 585,894
1,313,874 1,677,816 805,919
1,484,125 1,531,904 2,916,548
50,864 1,961,600
1,577,648 1,420,931 1,997,660 3,021,029 1,127,605 2,578.218 1,396,980 2,180,515 2,985,868 440,320 842,427 712,040 873,760
58,228,424
1,762.37a
58,305,414
77,884
3,612,453 2,404,740 732,441 819,536
5,789,280 8,911,212 1,620,542 1,303,405 2,130,510
0.04
0.17 0.94 0.54 0.47 2.39 1.23 0.86 0.82 2.15
1.34 0.79 0.10 0.79 0.61 0.31 0.70 0.89 0.43 0.79 0.82 1.56 0.03 1.05 0.84 0.76 1.07 1.61 0.60 1.38
0.75 1.16
1.59 0.23
0.45 0.38 0.47 31.07
31.11
0.01
1.93 1.28 0.39 0.44 3.09 4.75 0.86 0.70 1.14
Robeco Capital Growth Funds 113

Investment portfolio ~
At 30/06/2007 Expiration date Face value Market value In %of
net assets % inEURxi 4.066
4.092 4.095 4.098 4.125 4.125 4.130 4.245 4.250 4.250 4.293 4.350 4.365 4.375 4.375 4.375 4.375 4.386 4.425 4.446 4.500 4.500 4.500 4.543 4.547 4.625 4.625 4.625 4.625 4.642 4.650 4.678 4.716 4.748 4.750 4.750 4.750 4.750 4.793 4.799 4.805
4.875 4.917 5.000 5.000
5.000 5.018 5.020 5.1z5 5.125 5.125 5.219 5.317 5.375 5.375 5.375 5.543 5.625 5.750 5.777
4.850
Celtic Res (FRN) Irish RCL Securitisation (FRN) Storm (FRN) Lusitano Mortgage (FRN) National Grid Commerzbank Credit Agricole Permanent Financing (FRN) Citigroup Unit Uti1 Water Leek Finance (FRN) Holmes Master Issuer (FRN) Provide Bricks (FRN) Thyssen Krupp Rodarnco Europe Finance WM-Covered Bond Program American International Paragon Mortgages (FRN) Fosse Master Issuer (FRN) Brunel Residential (FRN) HBOS Adecco Financial Service Fortum Gracechurch Mortgage Finance (FRN) Great Hall Mortgages ( F R N ) General Electric Capital Anqlian Water Hutchinson Whampoa Finance Bank of America Celtic Residential Irish (FRN) Citigroup Smile Securitisation (FRN)
Clock Finance (FRN) Aire Valley Mortgages (FRN) Volkswagen Financial Service France Telecom Coldman Sachs Telstra Teliasonera BBVA Bancomer Promise (FRN) MUFC Capital Finance Societe GenCrale Great Hall Mortgages (FRN) Lafarqe Volvo Treasury Repsol Inter Fina Rmac Securities (FRN) Mituho Capital Invest Stora Enso Wolters Kluwer BAT International Finance Anglo Irish Capital Cenerali Finance Volkswagen Finance Service Vodafone Bat International Finance BCP Finance Bank Lloyds Bank UpperTier II ASML AXA
10-04.2048 24-12-2014 22.04-2048 15.07-2059 21-03-2013 13.09-2011 09-11-2015 10-06.2042 25-02-2025 24-01-2020 21-12-2037 15-07-2040 30-01-2040 18-03.2015 01-10-2014 19-05-2014 26-04-2016 15-09-2039 18-10-2054 13-01.2039 18-03-2025 25-04-2013 20-06-2016 20-11-2056 18-03-2039 15-09-2016 07-10-2013 21-09-2016 07-02-2017 14-12-2048 19-09-2016 20-12-2053 25-02-2015 20-09-2066 19-07-2011 21-02-2017 12-10-2021 15-07-2014 07-03-2017 17-05-2012 12-05-2024 25-07-2016 18-12-2014 18-06-2038 16-07-2014 31-05-2017 22-07-2013 12-06-2044 30-06-2011 23-06-2014 27-01-2014 09-07-2013 29-09-2016 16-06-2016 25-01-2012 06-06-2022 29-06-2017 09-06-2014 15-07-2009 13-06-2017 06-07-2016
1,250,000 900,000
2,000,000 2,020,940 1,850,000 1,600,000 1,800,000 1,730,000 2,310,000 900,000
1,200,000 290,000 550,000
1,600,000 1,110,000 4,900,000 2,150,000 670,000
1,120,000
1,250,000
1,430,000
1,560,000
770,000 1,450,000 230,000
1,560,000 1,240,000 900,000
1,600,000
2,600,000 649,434 100,000
1,100,000
1,700,000
1,240,000 710,000
1,210,000 1,150,000 850,000
2,000,000 3,395,000 1,210,000 920,000
1,930,000 520,000 950,000 880,000
1,450,000 l,!jOO,OOO 850,000
2,650,000 ~.fi90,000 1,550,000 920,000
1,goo,ooo 2,000,000 2,150,000 1,800,000 800,000
1,~00,000
790,000
1,250,773 899,359
2,000,518 2,021,183
1,762,514 1,547,872
1,730,804 1,986,970 812,385
1,200,160 289,865 549,770
1,506,080
1,066,677 4,756,773 2,046,284 669,394
1,425,967 1,119,317 1,393,954 1,207,888 736,366
1,449,976 228,730
1,490,377 1,212,410
855,000 1,531,136 1,700,000 2,414,100
100,000
1,095,250 1,229,708 679,541
1,094,445 1,114,557 814,530
1,958,580 3,394,383 1,133.988 922,410
1,901,320 511,862 929,129 872,054
1,437,313 1,483,335 828,172
2,643,375 1,503,965 1,507,220
1,645,200
648,782
782,566
933,892 1,a34,507 1,985,140 2,150,710 1,826,478 784,000
1,504,860
0.67 0.48 1.07 1.08 0.94 0.83 0.88 0.92 1.06 0.43 0.64 0.15 0.29 0.80 0.57 2.54 1.09 0.36 0.76 0.60
0.74 0.64 0.39 0.77 0.12 0.80 0.65 0.46 0.82 0.91 1.29 0.35 0.05 0.58 0.66 0.36 0.58 0.59 0.43 1.05 1.81 0.61 0.49 1.01 0.27 0.50
0.47 0.77 0.79 0.44 0.42 1.41 0.80 0.80 0.50 0.98 1.06 1.15 0.98 0.42 0.80
114 Robeco Capital Growth Funds

I nvest m ent portfolio
At 30/06/2007 Expiration date Face value Market value In % of
% in EUR x 1 net assets
6.125 Allianz Finance II 31-05-2012 2,150,000 2,248,814 1.20 6.156 Banca Pop Verona Novara 6.467 6.625
Royal Bank of Scotland Tier I BNP Paribas Capital Trust Tier I
21-06-2017 500,000 504,420 29-06-2012 1,770,000 1,870,961 23-10-2011 1,630,000 1,725,029
0.27 1.00 0.92
6.756 Banca Pop Verona Novara 21.06-2017 500,000 510,970 0.27 6.905 Credit Suisse First Bost Tier I 8.160 Standard Chartered BankTier I
Total transferable securities traded on other regulated markets
Total securities portfolio Operating capital
Total net assets
07-11-2011 1,590,000 1,700,187 0.91 23-03-2010 1,390,000 1,497,608 0.80
121,495,982 64.83
121,573,866 64.87
179.m.2ao 95.98 7,540,334 4.02
187,419,614 100.00
Robeco Capital Growth Funds 115

Robeco Euro Credit Single A Bonds
I nvest m ent portfolio
At 30/06/2007 Expiration date Face value Market value In 96 of
% in EUR x 1 net assets
Transferable securities admitted to an official stock-exchange listing
5.125
3.250 3.750 4.100 4.119 4.125 4.125 4.173 4.194 4.279 4.375 4.375 4.392 4.500 4.750 4.875 4.939 5.125 5.142 5.252 5.330 5.369 5.375 6.125 6.250
6.375 6.500 6.625 6.625 6.821 6.988 7.250 7.627 8.125 8.126 8.220
DEM MBNA America European Structure
EUR Dexia Municipal Agency Air Products b Chemicals Danske Bank Magellan Mortgage (FRN) Parker-Hannifin Nationwide Bldg Society Granite Master Issuer (FRN) Svenska Handelsbanken Delphinus (FRN) JP Morgan Chase Allianz Finance Stichting Memphis (FRN) MBNA America European Structure Mizuho Finance Veolia Environnement HBOS Capital Funding RWE Finance Allied Irish Bank ELM (Swiss Rein) Deutsche Capital Trust IV Tier I HSBC Capital Funding LP Citibank Credit Card Master Trust RWE INC INC Bank Fortis N L Tier I Deutsche Telekom International Finance Deutsche Telekom Dexia lntesabci CapitalTrust Tier I France Telecom Halifax Euro Finance Tier I France Telecom Sanpaolo Tier I KBC Bank Funding Trust IVTier I
Total transferable securities admitted to an official stock-exchange listing
Transferable securities traded on other regulated markets
5.875
3.500 3.500 3.750 3.750 3.875 3.875 3.875 3.875 3-875 3.875
DEM Batavia
EUR KFW International Finance Northern Rock Bayerische Landesbank Goldman Sachs HBOS Treasury Services Bradford G Bingley Northern Rock Depfa Pfandbriefbank WM Covered Bond Program Lehman Bros Cap Fund 1 1 1
19-04-2008 710,000 364,418 0.83
12.07-2008 08-11-2013 16-03-2015 20-07-2059 11-11.2015 27-02.2012 20-12-2054 16-12-2015 28-09-2096 12-11-2019 17.02-2017 25-04-2015 17-01-2014 15-04-2014 28-05-2013 23-05-2016 23-07.2018 16-06-2016 25-05-2016 19 ~ 0 9 - 2 0 13 24-03-2014 11 -042 0 11 26-10-2012 21-06-2021 07-05-2027 26-09-2011 11-07-2011 29-03-2018 06-07-2049 12-07-2011 28-01-2013 09-12-2011 28-01-2033 10-11-2010 10-11.2009
16-03-2009
17-04-2009 04.05-2009 23-05-2011 04-02-2013 07-02-2020
18-10-2011 04-05-2011
15-07-2013 27-09-2011 22-02-2011
110,000 740,000 530,000 185,479 370,000
1,200,000 450,000 500,000 500,000 850,000 420,000 500,000 730,000 850,000 280,000 370,000 220,000 370,000 400,000 710,000 500,000 100,000 260,000 640,000 590,000 600,000 400,000 600,000 190,000 360,000 760,000 170,000 270,000 600,000 320,000
730,000
1,610,000 1,150,000
990,000 600,000 250,000 550,000
1,500,000 530,000 400,000
160,000
108,668 687,112 494,877 185,513 344,544
1,167,636 450,157 458,865 500,650 809,294 382,641 500,406 712,838 848,895 277,225 354,275 223,179 356,151 382,976 711.598 497,500 101,728 274,633 668,672 639.961 630,840 424,004 660,660 202,009 385,128 836,965 187,136 343,305 655,320 341,843
16,807,204
17,171,622
379,036
1,582,002 1,126,989 154,979 922,829 540,348 242,153 530,981
1,431,135 511,386 381,304
0.25 1.56 1.12 0.42 0.78 2.65 1.02 1.04 1.13 1.83 0.87 1.13 1.62 1.92 0.63 0.80 0.51 0.81 0.87 1.61 1.13 0.23 0.62 1.52 1.45 1.43 0.96 1.50 0.46 0.87 1.90 0.42 0.78 1.49 0.78
38.11
38.94
0.86
3.59 2.56 0.35 2.09 1.23 0.55 1.20 3.24 1.16 0.86
116 Robeco Capital Growth Funds

Investment portfolio
At 30/06/2007 Expiration date Face value Market value In % of
% in EUR x 1 net assets
4.000 4.028 4.035 4.092 4.095
4.125 4.125 4.130 4.245 4.250 4.250 4.293 4.375 4.375 4.375 4.37s 4.500 4.500 4.500 4.500 4.500 4.625 4-875 5.000
5.000
4.098
5.125 5.125 5-317 5.375 5.543 5.625 6.467 6.625 6.905 7.375 7.875
WM Covered Bond Program Unicredito ltaliano Capital Trust Arran Residential Mortga (FRN) RCL Securitisation (FRN) Storm (FRN) Lusitano Mortgage (FRN) National Grid Cornmerzbank Credit Agricole Permanent Financing (FAN) Citigroup Unit Uti1 Water Leek Finance (FRN) Rodamco Europe Finance Nationwide Bldg Society American International Santander Zurich Finance (USA) HBOS Eurohypo Procter G Gamble Fortum Anglian Water HBOS Treasury Services Munchener Hypothekenbank Volvo Treasury Danske Bank Upper Tier II General Electric Capital Cenerali Finance Volkswagen Finance Service BCP Finance Bank Lloyds Bank Upper Tier II Royal Bankof Scotland Tier I BNP Paribas Capital Trust Tier I Credit Suisse First Bost Tier I Lloyds TSB Capital I Tier I Societe GenPrale Tier I
Total transferable securities traded on other regulated markets
Total securities portfolio Operating capital
Total net assets
27-09-2016 27.10-2015 12-04.2056 24-12-2014 22-04-2048 15-07-2059 21-03-2013 13-09-2011 09-11-2015 10-06.2042 25-02-2025 24.01.2020 21-12-2037 01-10-2014 28-02-2022 26-04-2016 10-12-2014 17-09-2014 18-03-2025 21-01-2013 12-05-2014 20-06-2016 07-10-2013 04-06-2019 16-01-2005 31-05-2017 12-11.2012 04.03-2009 16-06-2016 25-01-2012 09-06-2014 15.07-2009 29-06-2012 23-10-2011 07-11-2011 07-02-2012 22-02-2010
2,450,000 330,000 500,000 200,000
1,000,000 192,471 290,000 600,000 600,000 450,000 630,000 150,000 300,000 250,000 400,000 400,000 830,000 350,000 420,000
1,410,000 350,000 200,000 290,000 100,000 100,000 230,000 360,000 590,000 350.000 370,000 500,000 570,000 340,000 550,000 600,000 240,000 470,000
2,280,803 296,637 500,120
199.858 1,000,259 192,494 276,286
580,452 548,400 450,209 541,901 135,398 300,040 240,243 373,840 380,704 783,171 338,986 375,295
1,396,952
191,264 283.548 99.693 101,186 224,947 362,110 594,089 340,340 375,587 500,165 578.385 359,394 582,065 641,580 261,816 503,182
24,956,342
340,837
5.17 0.67 1.13
2.27 0.45
0.44 0.63 1.32 1.24 1.02 1.23 0.31 0.68 0.55 0.85 0.86 1.78 0.77 0.85 3.17 0.77 0.43 0.64 0.23 0.23 0.51 0.82
1.35 0.77 0.85 1.14 1.31 0.81 1.32
1.45 0.59 1.14
56.58
42,507,000 LS97.426
57.44
96.38 3.62
44,104A26 100.00
Robeco Capital Growth Funds 117

Robeco Euro Government Bonds
Investment portfolio ~~ ~~
At 30/06/2007 Expiration date Face value Market value In % of
% in EUR x 1 net assets Transferable securities admitted to an official stock-exchange listing
EUR 3.250 Netherlands 3.500 France 3.750 Belgium 3.750 Netherlands 4.000 Netherlands 4.000 France 4.000 Austria 4.250 Italy 4.250 Belgium 4.250 Netherlands 4.250 France 4.500 Germany 4.750 Germany 4.750 France 5.000 Germany 5.000 France 5.000 Italy 5.000 France 5.250 Germany 5.250 Germany 5.250 Austria 5.375 Germany 5.500 Net her lands 5.500 Germany 5.500 Netherlands 5.500 Belgium 5.750 Italy 6.000 Germany 8.250 Netherlands
Total transferable securities admitted to an official stock-exchange listing
Transferable securities traded on other regulated markets
3.000 3.000 3.250 3.750 3.750 3.750 3.900 4.000 4.700 4.750 5.000 5.000 5.500 5.750 6.000
EUR France Italy Bundesobligation Italy Belgium Germany Australia Italy Greece Spain Belgium Ireland Belgium Spain Greece
Total transferable securities traded on other regulated markets
Total securities portfolio Operating capital
Total net assets
15-07-2015 12-01-2008 28-03.2009 15-07-2009 15-01.2037 25-04-2014 15-07-2009 01-02-2015 28-09-2013 15-07-2013 25-04-2019 04-01-2013 04-07-2034 25-04-2035 04-07-2011 25-04-2012 01-02-2012 25-10-2011 0401-2008 04-01-2011 04-01-2011 04-01-2010 15-01-2028 04-01-2031 15-07-2010 28-03-2028 01-02-2033 04-07-2007 15-09-2007
12-01-2010 01-02-2009 17-04-2009 01-08-2021 28-09-2015 04-01-2017 15-07-2020 01.02-2017 20-03-2024 30-07-2014 28-09-2012 18-04-2013 28-09-2017 30-07-2032 19-05-2010
7,450,000 9,150,000 26,200,000 4,350,000 18,400,000 3 7,000,000 5,800,000 6,800,000 8,800,000 11,350,000 26,350,000 14,250,000 27,650,000 14,550,000 2,141,000 14,840,000 33,250,000 2,155,000 1,750,000 14,150,000 25,050,000
31,753,000 2,600,000 12,450,000
1,950,000 11,030,000 24,600,000 7,300,000 2,007,132
17,150,000 32,800,000 44,800,000 28,000,000 34,851,000 5,800,000 2,600,000 17,200,000 13,800,000 6,070,000 8,850,000 6,300,000 13,300,000 7,500,000 26,050,000
6,789,930 9,111,113 25,885,076 4,289,144 16,256,032 35,788,620 5,745,190 6,622,248 8,640,280 11,165,109 25,418,001 14,211.8 10 27,799,310 14,545,781 2,176,198 15,124,928 33,810,595 2,194,954 1,758,225 14,469,932 25,608,615 32,390,918 1,854,306 13,780,407 2,002,650 12,101,123 27,201,942 7,299,854 2,021,985
407,064,276
407,064,276
16,542,547 32,077,416 43,873,984 24,791,480 32,797,231 5,442,430 2,404,220
13,353,018 6,141,019 9,021,867 6,431,607 14,212,513 8,558,775
16,218,224
27,021,401 ~5a,aa7.732
25a,a87,732
0.99 1.33 3.78 0.63 2.38 5.23 0.84 0 97 1.26 1.63 3.72 2.08 4.06 2.13 0.32 2.21 4.94 0.32 0.26 2.11
3.74 4.73 0.42 2.01 0.29 1.77 3.98 1.07 0.30
59.50
59.50
4.69 6.41 3.62 4.79 0.80 0.35 2.37 1.95
1.32 i
0.94 2.08 1.25
0.90 I
3.95 37.84
37.84
97.34 2.66
1w.00
118 Robeco Capital Growth Funds
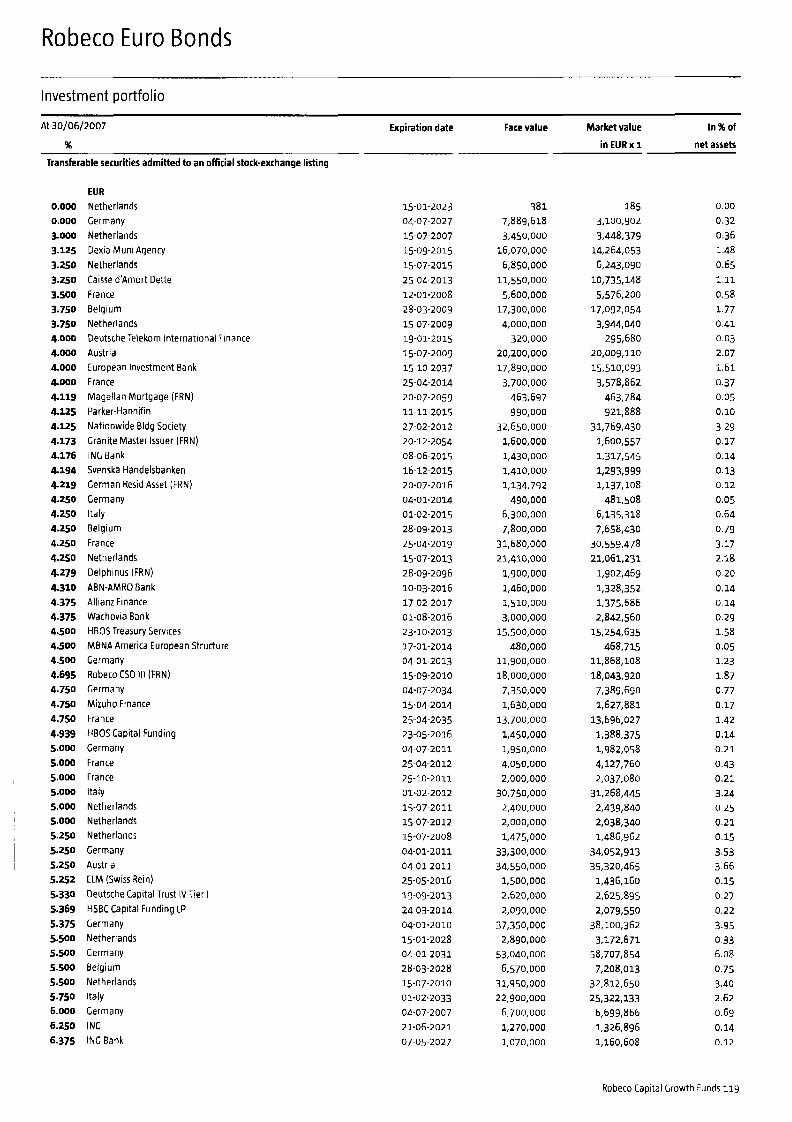
Robeco Euro Bonds
Investment portfolio
Market value In 96 of Expiration date Face value At 30/06/2007
% in EUR x 1 net assets
Transferable securities admitted to an official stock-exchange listing
0.000
0.000
3.000 3.125 3.250 3.250 3.500 3.750 3.750 4.000 4.000 4.000 4.000
4.119 4.125 4.125
4.176 4.194 4.219
4.173
4.250 4.250 4.250 4.250 4.250 4.279 4.310 4.375 4.375 4.500 4.500 4.500 4.695
4.750 4.750 4.939 5.000
5.000
5.000
4.750
5.000 5.000 5.000
5.250 5.250 5.250 5.252 5.330 5.369 5.375 5.500 5.500 5.500 5.500 5.750 6.000 6.250 6.375
EUR Netherlands Germany Netherlands Dexia Muni Agency Netherlands Caisse d’Amort Dette France Belgium Netherlands Deutsche felekom International Finance Austria European Investment Bank France Magellan Mortgage (FRN) Par ker-Ha nnif in Nationwide Bldg Society Granite Master Issuer (FRN) ING Bank Svenska Handelsbanken German Resid Asset (FRN) Germany Italy Belgium France Netherlands Delphinus (FRN) ABN-AMRO Bank Allianz Finance Wachovia Bank HBOS Treasury Services MBNA America European Structure Germany Robeco CSO I l l (FRN) Germany Miruho Finance France HBOS Capital Funding Germany France France Italy Netherlands Netherlands Netherlands Germany Austria ELM (Swiss Rein) Deutsche Capital Trust IV Tier I HSBC Capital Funding LP Germany Netherlands Germany Belgium Netherlands Italy Germany ING ING Bank
15-01-2023 04-07-2027 15-07-2007 15-09-2015 15-07-2015 25-04-2013 12-01-2008 28-03-2009 15-07.2009 19-01-2015 15-07-2009 15-10-2037 25-04-2014 20-07-2059 11-11-2015 27-02-2012 20-12-2054 08-06-2015 16-12-2015 20-07-2016 04-01-2014 01-02.2015 28-09-2013 25-04-2019 15-07-2013 28-09-2096 10-03-2016 17-02-2017 01-08-2016 23-10.2013 17-01-2014 04-01-2013 15-09-2010 04-07-2034 15-04-2014 25-04-2035 23-05-2016 04-07-2011 25-04-2012 25-10-2011 01-02-2012 15-07-2011 15-07-2012 15-07-2008 04-01-2011 04-01-2011 25-05-2016 19-09-2013 24-03-2014 04-01-2010 15-01-2028 04-01-2031 28-03-2028 15-07-2010 01-02-2033 04-07-2007 21-06-2021 07-05-2027
381 7,889,618 3,450,000 16,070,000 6,850,000 11,550,000 5,600,000 17,300,000 4,000,000 320,000
20,200,000
3,700,000 463,697 990,000
17,890,000
32,650,000 1,600,000 1,430,000 1,410,000 1,134,792 490,000
6,300,000 ~ , ~ O O , O O O
31,680,000 21,410,000 1,900,000 1,460,000 1,510,000 3,000,000 15,500,000
480,000 11,900,000 18,000,000 7,350,000 1,630,000 13,700,000 1,450,000 1,950,000 4,050,000 2,000,000 30,750,000 2,400,000 2,000,000
1,475,000 33,300,000 34,550,000 1,500,000
2,620,000 2,090,000 37,350,000 2,890,000 53,040,000 6,570,000 31,950,000 22,900,000 6,700,000 1,270,000 1,070,000
185 3,100,902 3.448.379 14,264,053 6,243,090 10,735,148 5,576,200 17,092,054 3,944,040 295,680
20,009,110
15,510,093 3,578,862 463,784
31,769,430 1,600,557 1,317,545 1,293,999 1,137,108 481,508
6,135,318 7,658,430 30,559,478 21,061,231
1,902,469 1,328,352 1,375,686 2,842,560 15,254,635
468,715 11,868,108
18,043,920 7,389,690 1,627,881 13,696,027 1,388,375 1,982,058 4,127,760 2,037,080 31,268,445 2,439,840 2,038,340 1,486,962 34,052,913 35,320,465 1,436,160 2.625895 2,079,550 38,100,362
3.172.671 58,707,854 7,208,013 32,812,650 25,322,133 6,699,866 1,326,896 1,160,608
921,888
0.00
0.32 0.36 1.48 0.65 1-11 0.58 1.77 0.41 0.03 2.07
0.37 0.05 0.10 3.29 0.17 0.14 0.13 0.12
1.61
0.05 0.64 0.79 3.17 2.18 0.20 0.14 0.14 0.29 1.58 0.05 1.23 1.87 0.77 0.17 1.42 0.14 0.21
0.43 0.21 3.24 0.25 0.21 0.15
3.53 3.66 0.15 0.27 0.22 3-95 0.33 6.08
0.75 3.40 2.62 0.69 0.14 0.12
Robeco Capital Growth Funds 119

Investment portfolio
6.500 6.625
6.875 6.988
7.055 7.250 7.627 8.125 8.126 8.250
At 30/06/2007 Expiration date Face value Market value In 96 of
% in EUR x 1 net assets
Fortis NLTier I 26.09.2011 1,800,000 1,892,520 0.20 Deutsche Telekorn International Finance KBC Bank Funding Trust I I lntesabri Capital Trust Tier I HVB Funding Trust Vl l l Tier I France Telecorn Halifax Euro Finance Tier I France Telecom Sanpaolo Tier I Netherlands
Total transferable securities admitted to an official stockexchange listing
Transferable securities traded on other regulated markets
3.250 3.500 3.625 3.750 3.750 3.750 3.750 3.750 3.875 3.875 3.875 3.900 4.000 4.000 4.000 4.028 4.035 4.066 4.092 4.095 4.098 4.125 4.125 4.125 4.130 4.245 4.250 4.250 4.250 4.250 4.293 4.350 4.365 4-375 4.375 4.375 4.375 4.375 4.375 4.386 4.425 4.446 4.500 4.500
EUR Bundesobligation KFW International Finance Caisse Arnor Dette Coldman Sachs Morgan Stanley Germany Italy Belgium J P Morgan Chase b Co WM Covered Bond Program Northern Rock Australia European Investment Bank WM Covered Bond Program Italy Unicredito ltaliano Capital Trust Arran Residential Mortgage (FRN) Celtic Res (FRN) Irish RCL Securitisation (FRN) Storm (FRN) Lusitano Mortgage (FRN) National Grid Comrnerzbank Caisse d'Amortissement de la 0 Credit Agricole Permanent Financing (FRN) Belgium Cittgroup Bradford G Bingley Unit Uti1 Water Leek Finance (FRN) Royal Bank of Scotland Provide Bricks (FRN) Santander American International Rodarnco Europe Finance WM-Covered Bond Program US Bank NA Minnesota New York Life Funding Paragon Mortgages (FRN) Fosse Master Issuer (FRN) Brunel Residential (FRN) HBOS Forturn
11-07-2011 30-06-2009 12-07-2011 28-03-2012 28-01-2013 09-12-2011 28-01-2033 10-11-2010 15-09-2007
17-04.2009 17-04-2009 25-04-2016 04-02-2013 01-03-2013 04-01-2017 01-08.2021 28-09-2015 15-03-2013 27-09-2011 16-11-2020 15-07-2020 15-042009 27-09-2016 01-02-2017 27-10-2015 12-04-2056 10-042048 24-12-2014 22-042048 15-07.2059 21-03-2013 13-09-2011 25-042017 09-11-2015 10-06-2042 28-09-2014 25-02-2025 04-05.2016 2401-2020 21-12-2037 23-01-2017 30-01.2040 10-12-2014 26-04.2016 01-10-2014 19-05-2014 28-02-2012 19-01-2017 15-09-2039 18-10-2054 13-01-2039 18-03-2025 20-06-2016
2,720,000 970,000
2,190,000 1,070,000 1,850,000 300,000 520,000 550,000
1,850,000
17,650,000 23,280,000 16,300,000 6,500,000 4,500,000 8,700,000 24,000,000 18,678,000 2,900,000 26,500,000 15,000,000 2,400,000 25,370,000
500,000 14,300,000 1,190,000 1,670,000 1,050,000
1,500,000
5 7 7,4 12 2,100,000
700,000
1,500,000 2,400,000 1,450,000 1,370,000 300,000
2,050,000 1,550,000 710,000 800,000
1,400,000 50,000
1,600,000 2,050,000 920,000
10,000,000 1,750,000 4,500,000
50,000 110,000 80,000
1,250,000 750.000
2,883,227 1,003,465 2,342,862 1,149,822 2,037,350 330,240 661,180 600,710
1,863,690 595,556,077
0.30 0.10 0.24 0.12 0.21 0.03 0.07 0.06 0.19 61.72
595,556077 61.72
17,285.175 22,875,161 15,062,504 6,058,975 4,197,105 8,163,645 21,249,840 17,577,305 2,733,656 25,569,320 13,387,800 2,219,280 25,180,740
465,470 13,483,756 1,069,691 1,670,400 1,050,650 699,502
1,500,388 577,481
2,000,691 1,451,130 2,287,032 1,325,300 1,370,637 293,556
1,763,328 1,478,499 640,882 800,107
1,325,184 49,979
1,509,728 1,951,108 884,092
9,707,700 1,706,233 4,268,115
49,955 109,630 79,951
1,116,950 717,240
1.79 2.37 1.56 0.63 0.43 0.85 2.20 1.82 0.28 2.65
1.39 0.23 2.61 0.05 1.40 0.11 0.17 0.11 0.07 0.16 0.06 0.21 0.15 0.24 0.14 0.14 0.03 0.18 0.15 I
0.07 0.08 '
0.14 0.01 0.16 0.20 0.09 1.01 0.18 0.44 0.01 0.01 0.01 0.12 0.07
i
120 Robeco Capital Growth Funds

Investment portfolio
At 33/06/2007 Expiration date Face value Market value
% in EUR x 1
4.500 4.500 4.500 4.543 4.625 4.625 4.625 4.625 4.642 4.650 4.678 4.700 4.748 4.750 4.750 4.750 4.750 4.750 4.750 4.805 4.850 4.875 4.917 5.000
5.000 5.000 5.000 5.018 5.020
5.125 5.219 5.317 5.375 5.625 5.750 6.000 6.125 6.467 6.625
6.905
Procter b Gamble Eurohypo Leaseplan Gracechurch Mortgage Finance (FRN) General Electric Capital Anglian Water Bank of America Hutchinson Whampoa Finance Celtic Residential Irish (FRN) Citigroup Smile Securitisation (FRN) Greece Aire Valley Mortgages (FRN) Volkswagen Financial Service Telstra Goldman Sachs Tellasonera Spain France Telecorn Promise (FRN) MUFG Capi:al Finance Societe GCnCrale Great Hall Mortgages (FRN) Austria Belgium American International Ireland Rmac Securities (FRN) Mituho Capital Invest Lehman Brothers Anglo Irish Capital Generali Finance Volkswagen Finance Service Lloyds Bank Upper Tier I1 Spain Greece Allianz Finance II Royal Bank of Scotland Tier I BNP Paribas Capital Trust Tier I Credit Suisse First Bost Tier I
Total transferable securities traded on other regulated markets
Total securities portfolio Operating capital
1 Total net assets
12.05-2014 2 1-01.20 13 08-11-2016 20-11-2056 15-09-2016 07-10-2013 07-02-2017 21-09-2016 14-12-2048 19-09-2016 20-12-2053 20-03-2024 20-09-2066 19-07-2011 15-07-2014 12-10-2021 07-03-2017 30-07-2014 21-02-2017 12-05-2024 25-07-2016 18-12-2014 18-06-2038 15.01-2008 28-03-2035 26-06-2017 18-04-2013 12-06-2044 30.06-2011 27-06-2014 29-09-2016 16-06-2016 25-01-2012 15-07-2009 30-07-2032 19-05-2010 31-05-2012 29-06-2012 23-10-2011 07-11-2011
goo,ooo 26,080,000 1,100,000 3,200,000 1,600,000 980,000
1,500,000 750,000 150,000
2,600,000 48,465
7,100,000 100,000
1,290,000 1,100,000 1,100,000 760,000
5,650,000 640,000 970,000
1,100,000 810,000 140,000
1,970,000 765,000
5,150,000
1,190,000 1,250,000 6,100,000 1,450,000 1,450,000
1,510,000 5,300,000 11,200,000 1,930,000 1,630,000 1,660,000
5,800,000
720,000
876,438 25,838,760 1,069,046 Ll99.980 1,528,592 958.195
1,435,440 712,500 150,000
2,414,100
6,870,031 99,568
1,279,293 1,066,098 994,950 728,285
5,716,105 612,544
1,030,898 812,122 137,920
1,977,191 788,868
5,098,603 5,921,162 1,179,588 1,236,113 6,049,370 1,371,541 1,409,980 730,872
1,532,212
11,617,648
1,722,975 1,756,778
48,417
969,824
6,048,201
2,018,703
1,450,000 1.550.479 347,524,321
347,524,321
943,080,398 21,792,611
964,873,009
in 96 of
net assets
0.09 2.68 0.11 0.12 0.16 0.10 0.15 0.07 0.02 0.25 0.01 0.71 0.01 0.13 0.11 0.10 0.08
0.59 0.06 0.10 0.11 0.08 0.01
0.20
0.08 0.53 0.61 0.12 0.13 0.63 0.14 0.15 0.08 0.16 0.63 1.20 0.21 0.18 0.18 0.16
36.02
36.02
97.74 2.26
Robeco Capital Growth Funds 121

Robeco European Currencies High Yield Bonds
I nvest me nt portfolio
At 30/06/2007 Expiration date Face value Market value In 96 of
96 in EUR x 1 net assets Transferable securities admitted to an official stock-exchange listing
4.750
5.375 5.816 6.000 6.000 6.375 7.625 8.125 8.375 8.500 8.500 8.750 8.875 9.000 9.000 9.625 9.750
9.968 13.553
4.875
9.875
EUR IS5 Global Ford Motor Credit General Motors Monastery (FRN) Scandinavian Airlines CMAC Canada Alcatel Rockwood Spec Europcar General Motors HTM Sport 0 Freizeit SGL Carbon Luxembourg lesy Repository Ardag Glass Finance Telenet Comm Mecachrome International Safilo Capital Durr IT Finance Hellas II (FRN) Stability
CBP 8.750 British Airways
NOK 9.520 MPU Offshore Lift (FRN)
USD 11.000 Cecon
Total transferable securities admitted to an official stock-exchange listing
Transferable securities traded on other regulated markets
3.750 4.159 4.625 5.000
5.125 5.125 5.125 5.625 5.625 5.625 5.750 5.750 5.777 5.875 5.875 5.977 6.125 6.148 6.250 6.250 6.375 6.375
EUR Valeo Smart Sme Clo Banca Popolare ltaliana Bayer TU1 Kazkornmertsbank International Degussa Peri Royal Carribean Cruises SC Parex Banka Ford Motor Credit Thornson AXA Stena Koninklilke Ahold Bancala Fondo De Tituliz (FRN) Hornbach Baum Clondalkin Acquisition (FRN) Crown Euro Chesapeake Energy Solvay Finance TRW Automotive
18-09-2010 15-01.2010 06-06-2011 17-11-2044 20-06-2008 23-05-2012 07-04-2014 15-11.2014 15-05-2014 15-07-2033 01-02-2014 01-02-2012 15-02-2015 01-07-2013 15-12-2013 15-05-2014 15-05-2013 15-07-2011 15-11-2012 15-01-2015 05-02-2022
23-08-2016
22-12-2011
04-05-2012
24-06-2013 27-12-2016 23-03-2015 29-07-2015 10-12-2012 23-03-2011 10-12-2013 15.12-2011 27-01-2014 05-os-2011 12-01-2009 25.09-2015 06-07-2016 01-02-2019 14-03-2012 22-05-2050 15-11-2014 15-12-2013 01-09-2011 15-01-2017 02-06-2016 15-03-2014
650,000 200,000
1,000,000 100,000 300,000 200,000
200,000 200,000 930,000 100,000 100,000 100,000 100,000 373,500 100,000 97,500 100,000 100,000 200,000 100,000
450,000
630,500 190,878 959,060 100,000
303,000 193,750 464,427 209,000
209,500 881,175 96,000 105,951 100.500 104,000
403,380 104,500 104,56 9 108,375 108,250 205,900 100,000
5,682,715
1.73 0.52 2.62 0.27 0.83 0.53 1.27 0.57 0.57 2.41 0.26 0.29 0.28 0.28 1.10 0.29 0.29 0.30 0.30 0.56 0.27 15.54
150,000 239,657 0.66
500,000 62,368 0.17
200,000 148,088 0.41
350,000 100,000 150,000
1,000,000 ~ 0 0 , 0 0 0
150,000
600,000
~ 0 0 , 0 0 0
150,000
250,000 100,000 200,000 850,000 100,000 150,000
250,000 500,000
350,000 100,000
450,000
700,000
450,000
6,132,828 16.78
324,499 100,000 142,341 926,370 284,250 143,453 584,700 450,000 492,415 147,141 696,668 217,813 100,324 187,000 868,700 99,280 153,000 452,250 255,250
364,672 98,500
600,000
0.89 0.27 0.39 2.54 0.78 0.39 1.60 1.23
1.35 0.40 1.91 0.60 0.27
2.38 0.27
I
0.51
0.42 1.24 0.70 1.64 1.00 0.27
122 Robeco Capital Growth Funds

Investment portfolio
At 30 /06/2007 Expiration date Face value
%
6.500 6.500 6.625 6.642 6.718
6.742 6.750 6.750 6.875 6.875 7.000 7.125 7.159 7.186 7.229 7.242 7.250 7.250 7.375 7.395 7.500 7.500 7.500 7.500 7.500 7.664 7.750 7.750 7.875 7.875 7.875 7.875 8.000 8.000 8.000
8.000
8.250 8.250 8.250 8.250 8.500 8.500 8.625 8.625 8.625 8.750 8.750 9.000
9.000 9.061 9.125 9.250 9.375 9.500 9.513 9.625
I 9.000
9.750 9.750 9.750 9.750
Kronos Wienerberger FKI Whinston Capital Management Rhodia (FRN) Banca Popolare Lodi Owens-Brockway Class Rexarn Aqco Huntsman International Chesapeake E l Paso Smart (FRN) Bombardier (FRN) Smile 2005 Synthetic (FRN) Stichtinq Memphis (FRN) Bombardier General Motors Linde finance Edcon Proprietary (FRN) Escada Faqe Dairy Industries Etab Econ Casino Guich Huntsman International (FRN) Corus Skyline (FRN) u PC Peermont Global Jenoptik lneos Gerresheimer Victoria Ac 111 Lighthouse International Savcio Clondalkin Industries Central Eur Distribution Codere Finance Luxembourg Central Euro Media Center Lottomatica Spa SPCM HellasTelecom Ill WDAC Subsidiary Crohe Levis Strauss Emi Cirsa Finance Luxembourg Polypore Nalco Momentive Performance Satka BCM Ireland (FRN) Mauser Beteilig Vac Finanzierung Klockner Pentaplast TVN Finance Nordic (FRN) Johnson Diversey Noma Luxembourg FMC Finance Gilderneister Wind Acquisition
15-04-2013 28-02-2049 22-02.2010 25-01-2055 15-10-2013 30-06-2015 01-12-2014 29-06-2067 23-04-2014 15-11-2013 15-12-2014 06-05-2009 27-12-2016 15-11-2013 20-01-2015 25-04-2015 15-11-2066 03-07-2013 14-07-2016 15-06-2014 01-042012 15-01-2015 20-01-2010 01-01-2015 01-10-2011 22-07-2043 15-01-2014 30-04-2014 15-11-2010 15-02-2016 01-03-2015 01-10-2014 30-04-2014 15-02.2013 15-03-2014 25-07-2012 15-06-2015 15-05-2012 31-03-2016 15-06.2013 15-10-2013 01-12-2014 01-10-2014 01-04-2013 15-10-2013 15-05-2014 15-05-2012 15-11.2013 01-12-2014 12-07.2021 15-08-2016 15-02-2013 15-04-2016 15-02-2012 15-12-2013 01-05-2016 15-05-2012 15-07-2011 01-09-2013 19-07-2011 01-12-2015
200,000 250,000 300,000 200,000 200.000 600,000 300,000 500,000 200,000 300,000 100,000
100,000 200,000
85.572 100,000 200,000 100,000
1,000,000
350,000 100,000 200,000 300,000 400,000 500,000 200,000 650,000 200,000 100,000 447,000 60,000 150,000 300,000 400,000 100,000
300,000 100,000 400,000 275,000 200,000 200,000 200,000 100,000
550,000 200,000 100,000 200,000 150,000 100,000 100,000 100,000 100,000 100,000 100,000 150,000 250,000 100,000 150,000 100,000 800,000
250,000
80,000
Market value In 96 of
net assets in EUR x 1
1g1.000
244,138 307.500 202,580
204,350 631,800 301,500 500,135 207,500 313,500 94,000 258,125 100,080 208,300 87,454 101,561
208,750 97,100
1,049,950 347,946 105,000
194,000 258,600 418,000 527,500 200,000
645,125 200,000 105,000 419,063 63,300 163,500 317,250 416,000 101,000 85,400 313,500 107,825 430,500 295,625 216,000 209,000 206,000 106,250 592,625 201,500 101,500 212,000 150,000 110,000 102,000 110,000 107,000 104,600 108,750 153,844 261,250 109,250 171,000
108,750 910,000
0.52 0.67 0.84 0.55 0.56 1.73 0.83
1.37 0.57 0.86 0.26 0.71 0.27 0.57 0.24 0.28 0.57 0.27 2.87 0.95 0.29 0.53 0.71 1.14 1.44 0.55 1.76 0.55 0.29 1.14 0.17 0.45 0.87 1.14 0.28 0.23 0.86 0.30 1.18 0.81 0.59 0.57 0.56 0.29 1.62 0.55 0.28 0.58 0.41 0.30 0.28 0.30 0.29 0.29 0.30 0.42 0.71 0.30 0.47 0.30 2.49
Robeco Capital Growth Funds 123

I nvest m en t po rtfo I io
At 30/06/2007 Expiration date Face value Market value
96 inEURxl
Clock Finance (FRN) 25-02-2015 9.836 9.875
10.000
10.000 10.125
10.375 10.500
10.845 10.875 11.000
11.000
11.492 19.055
6.625 7.000
7.250 8.125 8.598
8.750 9.350 9.375
11.750 12.000
8.750
9.750 9.890
9.000 9.300 9.750
10.080 10.280 10.356 10.515 10.850 11.355 11.500 12.110
I nve nsys Piaggio Finance louis No1 Eco-Bat Finance IFCO Systems Ono Finance Mars (FRN) Travel port Treofan Germany Boats Invest Netherlands Stichtinq Memphis (FRN) Promise (FRN)
CBP Allied Domecq British Energy Iron Mountain Warner Music Eurosail (FRN) Cable And Wireless H CA Resloc (FRN) Focus Diy Finance GI Crossing UK Finance Brake Bros Finance
NOK Petromena Sevan Drilling (FRN)
USD Songa Offshore Ddi Offshore Rig Services Ddi (FRN) Petrojack (FRN) Rubicon Offshore (FRN) Standard Drilling Petroprod Petroprod ( F R N ) Frigstad Discoverer MPF (FRN)
Total transferable securities traded on other regulated markets
Total securities portfolio Operating capital
15-03-2011 30-04-2012 01-12-2016 31-01-2013 15-10-2010 15.05-2014 28-08-2014 01-09-2016 01-08-2013 31-03-2017 25-042015 12-05-2024
18-04-2011 31-03-2022 15-04-2014 15-042014 13-03-2045 06-08-2012 01-11-2010 15-12-2043 03-03-2015 15-12-2014 15-12-2011
24-05-2012 07-12-2012
08-09-2010 26-042012 27-04.2011 15-03-2012 30-05-2012 16-04-2012 10-01-2011 24-05-2013 12-01-2012 21-02-2012 20-09-2011
100,000 292,500 100,000
550,000 100,000
100,000 200,000 100,000 100,000 100,000 250,000 100,000
97,000
450,000
286,395 125,000
50,000
110,641 200,000 200,000 125,000 50,000
50,000
100,000
100,000 315,900 112,750 544,500 107,250 106,500
220,500 99,970
111,500 99,500
253,235 101,507
95,516 25332.030
669,702 427,583 181,052
72,049 162,812 308,995 305,281 159,365 37,139 81,334
159,103 2,564,415
500,000 65,815 500,000 65,032
40.847
100,000 100,000 100,000 100,000 100,000 100,000 100,000 100,000 100,000
100,000 100,000
77,746 77,931 77,376
77,006 74,414 74,044 75,340 75,525 74,044
78,487
73,674 835,587
28,862,879
34,995,707 1,547,282
36,542,989
In %of
net assets
0.27 0.86 0.31
0.29 0.29 0.60 0.27 0.31
1.49
0.27 0.69 0.28 0.26
69.32
1.83 1.17 0.50 0.20 0.45 0.84
0.84 0.44 0.10
0.22 0.43 7.02
0.18 0.18
0.36
0.21 0.21 0.21 0.22 0.21 0.21 0.20 0.21 0.21 0.20 0.20 2.29
78.99
1 95.77 4.23
Total net assets 100.00
124 Robeco Capita Growth Funds
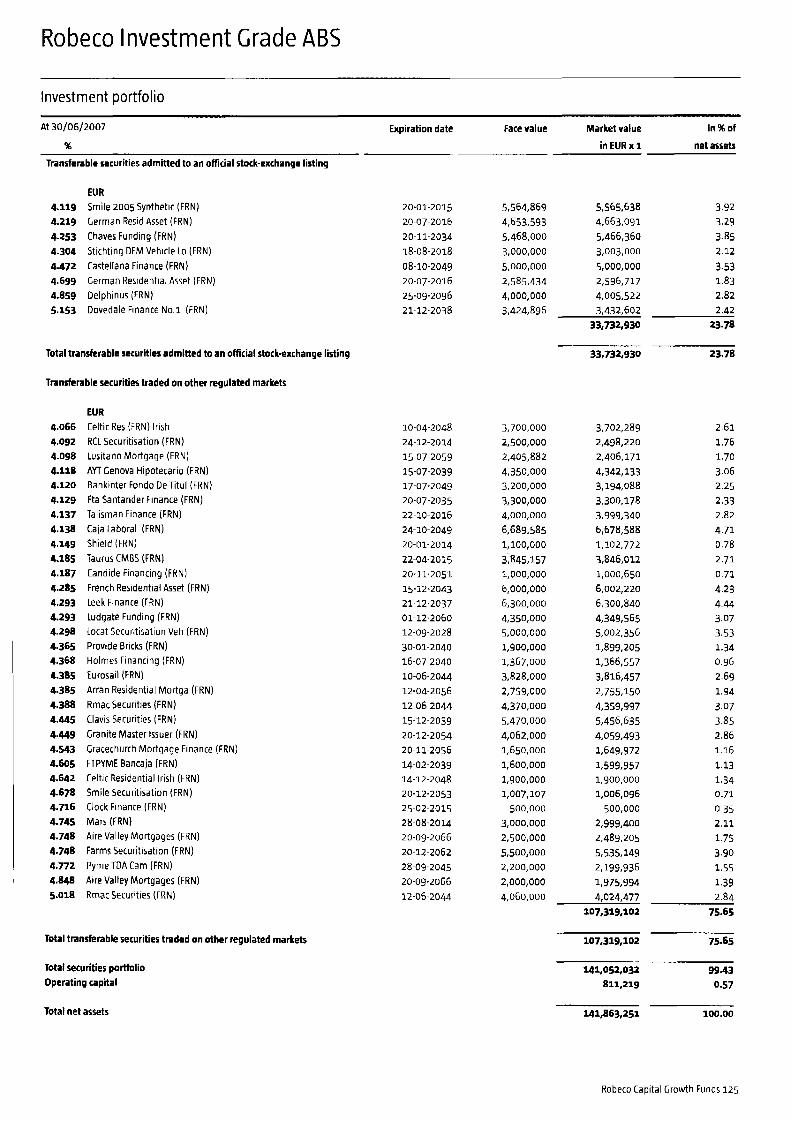
Robeco Investment Grade ABS
Investment portfolio
At 30/06/2007 Expiration date Face value Market value In % of
% in EUR x 1 net assets
Transferable securities admitted to an official stock-exchange listing
EUA 4.119 Smile 2005 Synthetic (FRN) 20-01-2015 5,564,869 5,565,638 3.92 4.219 German Resid Asset (FRN) 20-07-2016 4,653,593 4,663,091 3.29 4.253 Chaves Funding (FRN) 20-11-2034 5,468,000 5,466,360 3.85 4.304 Stichting DFM Vehicle Lo (FRN) 18-08-2018 3,000,000 3,003,000 2 12 4.472 Castellana Finance (FRN) 0&10-2049 5,000,000 5,000,000 3.53 4.699 German Residential Asset (FRN) 20-07-2016 2,585,434 2,546,717 1.83 4.859 Delphinus (FRN) 25-09-2096 4,000,000 4,005,522 2.82 5.153 Dovedale Finance No 1 (FRN) 21-12-2038 3,424,896 3,432,602 2.42
33,732,930 23.78
33,732.930 23.78 Total transferable securities admitted to an official stock-exchange listing
Transferable securities traded on other regulated markets
4.066 4.092 4.098 4.118 4.120 4.129 4.137 4.138 4.149 4.185 4.187 4.285 4.293 4.293 4.298
4.368
4.385
4.445 4.449 4.543 4.605 4.642 4.678 4.716 4.745
4.748 4.772 4.848 5.018
4.365
4.385
4.388
4.748
EUR Celtic Res (FAN) Irish RCL Securitisation (FRN) Lusitano Mortgage (FRN) AM Genova Hipotecario (FRN) Bankinter Fondo De Titul (FRN) Fta Santander Finance (FRN) Talisman Finance (FRN) Caja Laboral (FRN) Shield (FRN) Taurus CMBS (FRN) Candide Financing (FRN) French Residential Asset (FRN) Leek Finance (FRN) Ludgate Funding (FRN) Locat Securitisation Veh (FRN) Provide Bricks (FRN) Holmes Financing (FRN) Eurosail (FRN) Arran Residential Mortga (FRN) Rmac Securities (FRN) Clavis Securities (FRN) Granite Master Issuer (FRN) Gracechurch Mortgage Finance (FRN) FTPYME Bancaja (FRN) Celtic Residential Irish (FRN) Smile Securitisation (FRN) Clock Finance (FRN) Mars (FRN) Aire Valley Mortgages (FRN) Farms Securitisation (FRN) Pyme TDA Cam (FRN) Aire Valley Mortgages (FRN) Rmac Securities (FRN)
10-04-2048 24-12-2014 15-07-2059 15-07-2039 17-07-2049 20-07-203s 22-10-2016 24-10-2049 20-01-2014 22-04-2015 20-11.2051 15-12-2043 21~12.2037 01-12-2060 12-09-2028 30-01-2040 16.07-2040 10-06-2044 12-04-2056 12-06-2044 15-12-2039 20-12-2054 20-11-2056 14-02-2039 14-12-2048 20-12-2053 25-02-2015 28-08-2014 20-09-2066 20-12-2062 28-09-2045 20-09-2066 12-06-2044
3,700,000 2,500,000 2,405,882 4,350,000 3,200,000
3,300,000 4,000,000
6,689,585 1,100,000
3;845,157 1,000,000 6,000,000 6,300,000 4,350,000
1,900,000
1,367,000 3,828,000 2,759,000 4,370,000 5,470,000 4,062,000 1,650,000 1,600,000 1,g00,000 1,007,107 500,000
3,000,000 2,500,000
5,500,000 2,200,000 2,000,000
5,000,000
4,060,000
3,702,289 2,498,220 2,406,171 4,342,133 3,194,088 3,300,178 3,999,340 6,678,588 1,102,772 3,846,012 1,000,650 6,002,220 6,300,840 4.349.565 5,002,356 1,899,205 1,366,557
2,755,150 4,359,997 5,456,635 4,059,493 1.649.972 1,599,957 1,900,000 1,006,096 500,000
2,999,400 2,489,205 5,535,149 2,199,936 1,975,994 4,024.477
107,319,102
3,816,457
2.61 1.76 1.70 3.06 2.25
2.33 2.82 4.71 0.78 2.71 0.71 4.23 4.44 3.07 3.53 1.34 0.96 2.69 1.94 3.07 3.85 2.86 1.16 1.13 1.34 0.71 0.35 2.11 1.75 3.90 1.55 1.39 2.84
75.65
Total transferable securities traded on other regulated markets
Total securities portfolio Operating capital
107,319,102
141,051,032 811,219
75.65
99.43 0.57
Total net assets 141,863,251 100.00
Robeco Capital Growth Funds 125

Robeco Divirente VaR2
Investment portfolio
At 30/06/2007 Expiration date Face value Market value In % of
% in EUR x 1 net assets
Transferable securities admitted to an official stock-exchange listing
5.125
3.000
3.250 4.079 4.119 4.119 4.124 4.125 4.168
4.173 4.236 4.279 4.500 4.655 4.695 4.750 5.375 6.250 6.500 6.625 6.988 7.627 7.664 8.126 8.220
5.250 5.375 6.000 6.250
DEM MBNA America European Structure
EUR Netherlands Dexia Municipal Agency INC Verzekeringen (FRN) Smile 2005 Synthetic (FRN) Magellan Mortgage (FRN) Caisse Centrale Du Credit (FRN) Nationwide Bldg Society Anglo Irish Bank (FRN) Granite Master Issuer (FRN) AIL Sunamerica (FRN) Delphinus (FRN) Germany Ludgate Funding (FRN) Robeco CSO 1 1 1 (FRN) Mizuho Finance Citibank Credit Card Master Trust ING Fortis NL Tier I Deutsche Telekom International Finance lntesabci Capital Trust Tier I Halifax Euro FinanceTier I Skyline (FRN) SanpaoloTier I KBC Bank Funding Trust IVTier I
NLG European Mortgage Secs International Ned Bank ABN-AMRO Bank ABN.AMR0 Bank
Transferable securities admitted to an official stock-exchange listing
Transferable securities traded on other regulated markets
OEM 5.750 Credit Suisse (Londen) Sobord 5.875 Batavia
2.250 3.000
3.500 3.500 3.750 3.875 3.875 4.035 4.042 4.044 4.046 4.059 4.078 4.085
EUR Bundesschatzanweisungen DNB Nordbank Asa KFW International Finance Northern Rock Bayerische Landesbank lehman Bror Cap Fund 1 1 1 Bradford b Bingley BS Arran Residential Mortga (FRN)
ONE Nordbank Asa ( F R N ) HSBC Bank U5A (FRN) Cred Agricole (FRN) BMW (UK) Capital (FRN) BCP Finance Bank (FRN) General Electric Capital EUR (FRN)
19-04-2008
15-07-2007 12-07-2008 20-10-2010 20-01-2015 20-07-2059 27-01-2010 27-02-2012 10-02-2010 20-12-2054 25-11-2008 28-09-2096 17-08-2007 01-01-2061 15-09-2010 15-04-2014 11-04-2011 21-06-2021 26-09-2011 11-07-2011 12-07-2011 09-12-2011 22-07-2043 10-11-2010 10-11-2009
13-05-2008 10-03-2008 28-11-2007 14-01-2009
11-05-2010 16-03-2009
14-09-2007 30-07-2009 17-04-2009 0405-2009 23-05-2011 22-02-2011 04-05-2011
25-01-2010 12-04-2056
09-07-2008 11-07-2007 20-10-2008 20-10-2009 21.10-2009
1,640,000
60,000,000 3,440,000 5,000,000 7,658,077 370,958
3,864,000 2,950,000 4,000,000 1,100,000 10,000,000 1,000,000 65,700,000 4,000,000 16,000,000 2,050,000 300,000
1,370,000 1,400,000 1,150,000 950,000 530,000
4,000,000 1,640,000 800,000
4,000,000 5,510,000 4,855,000 3.230.000
841,753
59,971,800 3,398,342 4,999,924 7,659,136 371,027
3,867,168 2,870,439 4,001,240 1,100,383 9,994,500 1,001,299 65,717,082 4,000,000 16,039,040 2,047,335 305,184
1,431,376 1,471,960 1,219,012 1,016,310 583,424
4,000,000 1,791,208 854,608
199,711,797
1,824,196 2,513,146
1,496,710 8,050,374
2,216,322
0.12
8.84 0.50
0.74 1.13 0.05 0.57 0.42 0.59 0.16 1.47 0.15
9.69 0.59 2.36 0.30 0.04 0.21 0.22 0.18 0.15 0.09 0.59 0.26 0.13
29.43
0.27
0.37 0.33 0.22 1.19
208,603,924
2,309,000 1,206,932 1,670,000 867,111
2.074.043
65,000,000
3,500,000 4,400,000 4,400,000 470,000
1,050,000 1,150,000 1,200,000 4,000,000 4,100,000 10,000,000 3,200,000
3,500,000 g,ooo,ooo
64,764,167 3,389,400 4,323,484 4,311,956 455,251
1,000,923 1,113,902 1,200,287 3,943,760 4,103,116 10,000,645
3,199,806 3,496,605 9,003,060
30.74
0.18 0.13 0.31
9.55 0.50 0.64 0.64 0.07 0.15 0.16 0.18 0.59 0.60
1.47 0.47 0.52 1.33
126 Robeco Capital Growth Funds

Investment portfolio
At 30/06/2007 Expiration date Face value Market value In 96 of
% in EUR x 1 net assets
4.097 4.095 4.098 4.113 4.117 4.125 4.132 4.143 4.186 4.192 4.208
4.218 4.209
4.229 4.236 4.245 4.246 4.254 4.259 4.264 4.268 4.288 4.293 4.295 4.323 4.398 4.495 4-505 4.530 4.547 4.594 4.750 5.000 5.000 5.125 5.125 5.362 5.375 5.625 6.625 6.905 7.375 7.875
~ RCL Securitisation (FRN) 2412-2014 Storm (FRN) Lusitano Mortgage (FRN)
Wachovia (FRN) BCP Finance Bank (FRN) Commerzbank Rodamco Europe Finance (FRN) Citigroup (FRN) Key Bank (FRN) Bank of America (FRN) Eelgacom (FAN) DNB Nordbank Asa (FRN) Banque PSA Finance (FRN) Bear Stearns Cos (FRN) Merrill Lynch (FRN) Permanent Financing (FRN) Goldman Sachs (FRN) Royal Bankof Scotland (FRN) Westlb (FRN) Allied Irish Bank (FRN) EFC Hellas (FRN) J.P. Morgan Chase (FRN) leek Finance (FRN) SLM (FRN) Lehman Brothers Smile Securitisation (FRN) Morgan Stanley (FRN) Citigroup Countrywide Home Loan (FRN) Great Hall Mortgages (FRN) GC FTPYME Sabadell (FRN) France Munchener Hypothekenbank Buoni Polienali Del Tes General Electric Capital Danske Bank Upper Tier I1 Great Hall Mortgages (FRN) Volkswagen Finance Service Lloyds Bank Upper Tier II BNP Paribas Capital Trust Tier I Credit Suisse First Bost Tier 1 Lloyds TSB Capital 1 Tier I Societe Generate Tier I
Total transferable securities traded on other regulated markets
Other transferable securities
EUR 0.OOO Robeco Manetaire Quantiplus 0.000 Robeco Short Term
Total other transferable securities
Total securities portfolio Operating capital Total net assets
22-04-2048 15-07-2059 01-08-2011 03-02-2011 13-09-2011 01-10-2007 10-11-2008 05-11-2009 18-05-2010 23-11-2009 27-09~2010 16-07-2007 20-10-2009 08-02-2010 10-06-2042 11-05-2011 29-03.2011 25-09-2008 29-09-2008 19 - 0 9 - 2 0 0 8 01-06-2010 21-12-2037 15-06-2009 21-05-2009 20-12-2053 29-05-2008 13-05-2009 24-11-2008 18-03-2039 30-09-2039 12.07-2007 16-01-2012 15-10-2007 04-03-2009 12-11-2012 18-06-2039 25-01-2012 15-07-2009 23-10.2011 07-11-2011 07-02-2012 22-02-2010
500,000 1,100,000 481,176
5,500,000 5,000,000 1,600,000 3,000,000 7,000,000 3,500,000 5,000,000 2,900,000 1,749,000 3,159,000 3,500,000 10,000,000
900,000 8,000,000 4,000,000 8,000,000 10,000,000 2,300,000 6,500,000 600,000
2,500,000 3,500,000 484,652
8,750,000
3,000,000 1,000,000 3,900,000 65,000,000
650,000
2,232,000
50,000,000
930,000 5,700,000 500,000
1,640,000 1,480,000 1,550,000
980,000
600,000
499,644 1,100,285 481,234
5,491,090
1,547,872 3,000,486 7,003,500 3,500,035 4,995,900 2,901,645 1,746,289 3,159,436 3,489,780 10,015,600
900,418 8,010,080
3,999,840 8,010,137 10,005,600 2,300,092 6,501,885 600,080
2,446,250 3,505,740 484.391
5,001,600
8,776,863 2,241,174 3,003,150 994,480
3,900,000 65,005,850
657,709 50,105,750
986,791 935,450
5,700,000 507,550
1,664,124 1,566,284 1,657,415 654,540
0.07 0.16 0.07 0.81 0.74 0.23
1.03 0.52
0.44
0.74 0.43 0.26 0.47 0.51 1.48 0.13 1.18 0.59 1.18 1.47 0.34 0.96 0.09
0.36 0.52 0.07 1.29 0.33 0.44 0.14 0.57 9.58 0.10 7.38 0.15 0.14
0.07
0.23
0.84
0.25
0.24 0.10
1,230,000 1,316,838 0.19 364,729,239 53.76
366,803,282 54.07
1,583 15.535
5,015,005 0.74 60,165,191 8.87
65,180,196 9.61
37,845,047 5 . 9 678,432,449 100.00
Robeco Capital Growth Funds 127
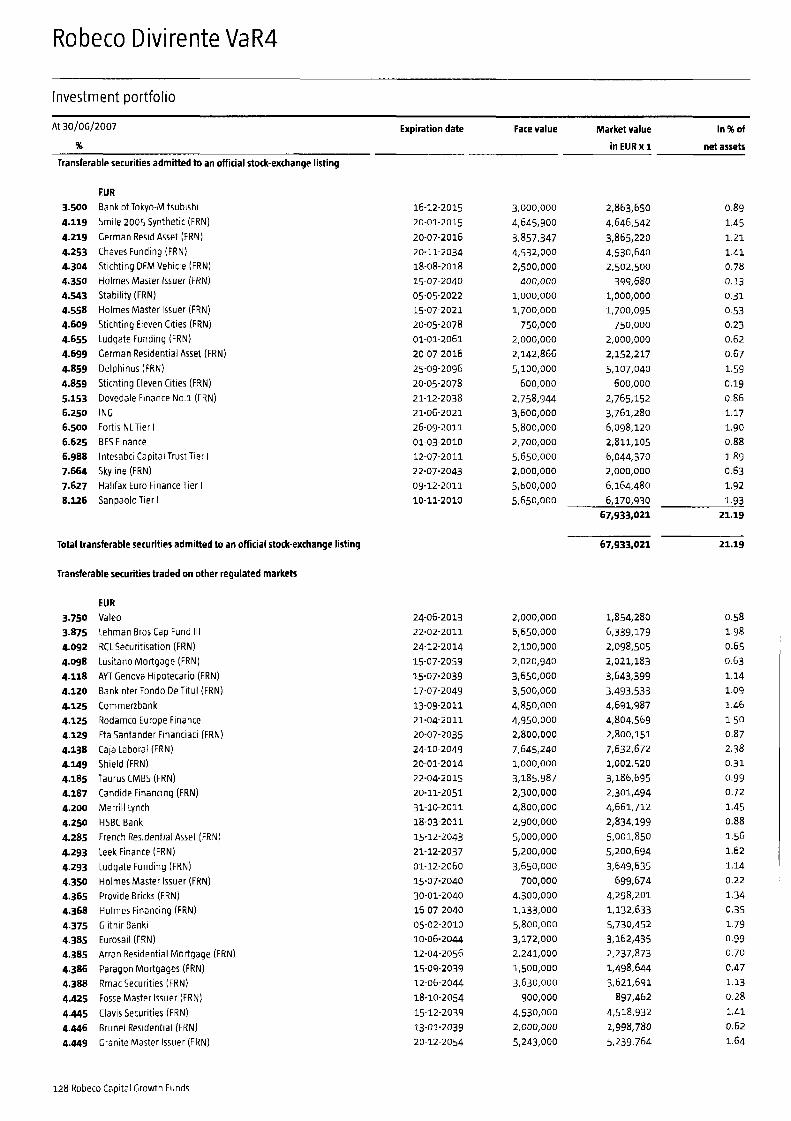
Robeco Divirente VaR4
Investment portfolio
At 30fQ6f2QO7 Expiration date Face value Market value In %of
% in EUR x 1 net assets
Transferable securities admitted to an official stock-exchange listing
3.500 4.119 4.219 4.253 4.304 4.350 4.543 4.558 4.609 4.655 4.699 4.859 4.859 5.153 6.250 6.500 6.625 6.988 7.664 7.627 8.126
EUR Bank of Tokyo Mitsubishi Smile 2005 Synthetic (FRN) German Resid Asset (FRN) Chaves Funding (FRN) Stichting DFM Vehicle (FRN) Holmes Master Issuer (FRN) Stability (FRN) Holmes Master Issuer ERN) Stichtinq Eleven Cities (FRN) ludqate Funding (FRN) German Residential Asset (FRN) Delphinus (FRN) Stichting Eleven Cities (FRN) Dovedale Finance No 1 (FRN) INC Fortis NlTier I BE5 Finance lntesabci Capital Trust Tier I Skyline (FRN) Halifax Euro FinanceTier I Sanpaolo Tier I
16-12-2015 20-01-2015 20-07-2016 20-11-2034 18-08-2018 15-07-2040 05-05-2022 15-07-2021 20-05-2078 01-01-2061 20-07-2016 25-09-2096 20-05-2078 21-12-2038 21-06-2021 26-09-2011 01-03-2010 12-07-2011 22-07-2043 09-12-2011 10-11-2010
3,000,000
4,645,900 3,857,347 4,532,000 2,500,000 400,000
1,000,000 1,700,000
750,000 2,000,000 2,142,866 5,100,000 600,000
2,758,944 3,600,000 5,800,000 2,700,000 5,650,000 2,000,000 5,600,000
5,650,000
2,863,650 4,646,542 3,865,220 4,530,640 2,502,500 399,680
1,000,000
1,700,095 750,000
2,000,000 2,152,217 5,107,040 600,000
2,765,152 3,761,280 6,098,120 2,811,105 6,044,370 2,000,000 6,164,480 6,170,930
67,933,021
0.89
1.45 1.21 1.41 0.78 0.13 0.31 0 53 0.23 0.62 0.67
1.59 0.19 0.86 1.17 1.90 0.88 1.89 0.63 1.92
1.93 21.19
Total transferable securities admitted to an official stock-exchange listing 67,933,021 21.19
Transferable securities traded on other regulated markets
3.750 3.875 4.092 4.098 4.118 4.120 4.125 4.125 4.129 4.138 4.149 4.185 4.187 4.200 4.250 4.285 4.293 4.293 4.350 4.365 4.368 4.375 4.385 4.385 4.386 4.388 4.425 4.445 4.446 4.449
EUR Valeo Lehman Bros Cap Fund Ill RCL Securitisatton (FRN) Lusitano Mortgage (FRN) AYT Genova Hipotecario (FRN) Bankinter Fondo DeTitul (FRN) Cornrnertbank Rodamco Europe Finance Fta Santander Financiaci (FRN) Cala Laboral FAN) Shield (FRN) Taurus CMBS (FRN) Candide Financing (FRN) Merrill Lynch HSBC Bank French Residential Asset (FRN) leek Finance (FRN) Ludgate Funding (FRN) Holmes Master Issuer (FRN) Provide Bricks (FRN) Holmes Financing (FRN) Glitnir Banki Eurosail (FRN) Arran Residential Mortgage (FRN) Paragon MDrtQaQeS (FRN) Rmac Securities (FRN) Fosse Master Issuer (FRN) Claws Securities (FRN) Brunel Residential (FRN) Granite Master Issuer (FRN)
24-06-2013 22.02-2011 24-12-2014 15-07-2059 15-07-2039 17-07-2049 13-09-2011 21-04-2011 20-07-2035 24-10-204g 20-01-2014 22-042015 20-11-2051 31-10-2011 18-03-2011 15-12-2043 21-12-2037 01-12.2060 15-07-2040 30-01-2040 16-07-2040 05-02-2010 10-06-2044 12-04-2056 15-09-2039 12-06-2044 18-10-2054 15-12.2039 13-01-2039 20-12-2054
2,000,000 6,650,000 2,100,000 2,020,940 3,650,000 3,500,000 4,850,000 4,950,000 2,800,000 7,645,240 1,000,000 3,185,987 2,300,000
2,900,000 5,000,000 5,200,000
3,650,000 700,000
4,300,000 1,133,000 5,800,000 3,172,000
1,500,000 3,630,000
goo,ooo 4,530,000 2,000,000 5,243,000
4,800,000
2,241,000
1,854,280 6,339,179 2,098,505 2,021,183 3,643,399 3,493,533 4,691,987 4,804,569 2,800,151
7,632,672
3,186,695 2,301,494 4,661,712 2,834,199 5,001,850 5,200,694 3,649,635 699,674
4,298,201 1,132,633 5,730,452 3,162,435 2,237,873 1,498,644 3,621,691
4,518,932
5,239,764
1,002,520
897,462
1,998,780
0.58 1.98 0.65 0.63 1.14 1.09 1.46 1.50 0.87 2.38 0.31 0.99 0.72 1.45 0.88 1.56 1.62 1.14 0.22 1.34 0.35 1.79 0.99 0.70 0.47 1.13 0.28 1.41 0.62 1.64
128 Robeco Capital Growth Funds

Investment portfolio
At 30/06/2007 Expiration date Face value Market value In 96 of
96 in EUR x 1 net assets
4.450 4.500 4.518 4.543 4.594 4.605 4.635 4.642 4.678 4.716 4.745 4.748 4.748 4.750 4.772 4.799 4.805 4.805 4 . w 5.000 5.018 5.020 5.063 5.362 5.625
6.250 6.625 6.750 6.905 7.125 7.400 7.500 7.500
5.750
7.875 8.048 8.160
Bankinter Fondo DeTitul (FRN) 17-07-2049 Leaseplan ltalfinance Securitisati (FRN) Gracechurch Mortgage Finance (FRN) GC FTPYME Sabadell (FRN) FTPYME Bancala (FRN) Permanent Financing (FRN) Celtic Residential Irish ( F R N ) Smile Securitisation (FRN) Clock Finance (FRN) Mars (FRN) Aire Valley Mortgages (FRN) Farms Securitisation (FRN) Citigroup Pyme TDA Cam (FRN) BBVA Bancomer Promise (FRN) Promise (FRN) Aire Valley Mortgages (FRN) Kredietbank Int Fin Upper Tier II Rmac Securities (FRN) Mizuho Capital Invest Generali Finance Great Hall Mortgages (FRN) Lloyds Bank Upper Tier II Aviva (ANN) BCP Finance Bank BNP Paribas Capital Trust Tier I Axa Credit Suisse First Bost Tier I Abbey National Bank of Ireland Barclays Tier I Allied Irish BankTier I Societe CCnerale Tier I Unicredito ltaliano Capital Trust Tier I Standard Chartered BankTier I
CD, CP, discount notes 0.000 Mane Funding
Total transferable securities traded on other regulated markets
Total securities portfolio Operating capital
Total net assets
08-11-2016 14-01-2026 20-11-2056 30-09-2039 14-02-2039 10-06-2042 14.12-2048 20-12-2053 25.02-2015 28-08-2014 20-09-2066 20-12-2062 31.05.2012 28-09-2045 17.05-2012 20-03-2017 12-05-2024 20-09-2066 11-05-2009 12-06-2044 30-06-2011 28-05-2019 18-06.2039 15-07-2009 14-11-2021 29-03-2011 23-10-2011 15-12-2020 07-11-2011 28-09-2010 07-03-2011 15-12-2010 28-02-2011 22-02-2010 05-10-1010 23-03-2010
29-08-2007
1,400,000 5,750,000
600,000 1,350,000 1,900,000 1,400,000 1,000,000
2,600,000 1,454,925 1,300,000 2,500,000 3,000,000 4,500,000 4,900,000 3,300,000 2,500,000 1,400,000 1,358,000 3,000,000 4,750,000 5,300,000 6,200,000 3,050,000
3,950,000
4,550,000 5,200,000 2,600,000 5,800,000 2,600,000 5,800,000
3,700,000 5,200,000 4,000,000 2,450,000 2,700,000
2,600,000
4,100,000
2,000,000
1,388,162 5,588,195
599.610 1,349,977 1,900,000 1,399,963
2,600,001 1,453,466 1,300,000 2,499,500 2,987,046 4,528,758 4,836,447 3299.903 2,448,225 1.399.859 1,357,753 2,963,991 4,756,545 5,253,628 6,131,118 3,064,640 2,600,000 4,008,105 4,217,998
5,503,160
6,201,940 2,767,102 6,242,540 3,988,970 5,613,764 4,282,400 2,669,030 2,909,034
214,853,143
i,000,a67
4 , ~ a . m
2,748,460
1,981,2a
0.43 1.74 0.19 0.42 0.59 0.44 0.31 0.81 0.45 0.41 0.78 0.93 1.41 1.51 1.03 0.76 0.44 0.42 0.92 1.49 1.64 1.91 0.96 0.81 1.25 1.32 1.48 1.72 0.86 1.94
1.95 1.25 1.75 1.35 0.83 0.91
70.17
0.87
0.62
226,834,367
294,767,388 15,691,847
70.79
91.98 8.02
320,459,235 100.00
Robeco Capital Growth Funds 129